Embed Size (px)
Citation preview
Production of Biogas using Palm Oil Mill Effluent (POME) in Anaerobic Digester
by
Ahmad Budiman Bin Yaacob
Dissertation submitted in partial fulfillment
of the requirements for the
Bachelor of Engineering (Hons)
(Chemical Engineering)
Jan 2010
Universiti Teknologi PETRONAS
Bandar Seri Iskandar
31750 Tronoh
Perak Darul Ridzuan
CERTIFICATION OF APPROVAL
Production of Biogas using Palm Oil Mill Effluent (POME) in an Anaerobic Digester
By
Ahmad Budiman Bin Yaacob
A project dissertation submitted to the
Chemical Engineering Programme
Universiti Teknologi PETRONAS
in partial fulfillment of the requirement for the
BACHELOR OF ENGINEERING (Hons)
(CHEMICAL ENGINEERING)
Approved by,
………………………………………..
(AP. Dr. Mohd Azmuddin Bin Abdullah)
UNIVERSITI TEKNOLOGI PETRONAS
TRONOH, PERAK
January 2010
CERTIFICATION OF ORIGINALITY
This is to certify that I am responsible for the work submitted is this project, that the
original work is my own except as specified in the references and acknowledgements,
and that the original work contained herein have not been undertaken or done by
unspecified sources or persons.
________________________
(Ahmad Budiman Yaacob)
i
ABSTRACT
The palm oil industry is one of the leading industries in Malaysia with a yearly
production of more than 13 million tons of crude palm oil and plantations covering 11%
of the Malaysian land area. However, the production of such amounts of crude palm oil
result in even larger amounts of palm oil mill effluent (POME), estimated at nearly three
times the quantity of crude palm oil. Palm oil mill effluent (POME) is a highly polluting
wastewater that pollutes the environment if discharged directly due to its high chemical
oxygen demand (COD) and biochemical oxygen demand (BOD) concentration.
Anaerobic digestion has been widely used for POME treatment with large emphasis
placed on capturing the methane gas released as a product of this biodegradation
treatment method. The anaerobic digestion method is recognized as a clean development
mechanism (CDM) under the Kyoto protocol. Certified emission reduction (CER) can
be obtained by using methane gas as a renewable energy. This project aim is to do a
research on the factors that contribute to the optimization of biogas production. Potential
factors to the anaerobic digestion process of POME were indentified and tested in
laboratory by using Anaerobic Respirometer. These factors such as addition of co-
substrate, volume of inoculums, volume of POME and PH of samples were analyzed
and monitored to see its relation to the production of biogas. The total gas production
volume and gas production rate in the experiment were gathered and their composition
were tested in Gas Chromatography to analyze the percentage of Methane present.
From this project those four (4) factors were identified to have significant effects to the
biogas production volume, rate as well as the percentage of Methane present in the
biogas composition. These factors are applicable to prove in this research by conducting
experiment in the laboratory with existing equipments.
ii
ACKNOWLEDGEMENT
Alhamdulillah, a great thank to The Great Almighty Allah s.w.t who grants me the
knowledge and determination to accomplish my Final Year Research Project. I would
like to express my genuine appreciation to Assoc. Prof. Dr. Mohd Azmuddin Abdullah,
my supervisor for his incessant support, guidance and encouragement throughout the
whole course of this study. It was a great pleasure to me to conduct this thesis under his
supervision.
The greatest appreciation goes to the FYP Coordinators, Mr.Tazli Azizan and Dr.Khalik
Mohamad Sabil for managing and guiding us as final year students in completing our
research projects. My appreciation also goes to Mr.Fazli Zainal, Mr.Jailani Kassim,
Mr.Fauzi Abu Bakar and all technicians of Chemical Engineering Department for their
kind of support to provide laboratory equipments and guidance in conducting the
experiment. Not forgetting, all my friends in UTP who have always provided an
enjoyable and friendly working environment.
Last but definitely not least, my deepest and most heart-felt gratitude to my beloved
mum, Mrs. Wan Minah Wan Leh and my adored dad, Mr.Yaacob Abdul Rahman for
their endless love and support. They instilled in me a love for knowledge and a strong
work ethic that has enabled me to accomplish anything I set my mind to. Thanks all for
everything.
Ahmad Budiman Bin Yaacob
May 2010
iii
TABLE OF CONTENTS
ABSTRACT . . . . . . . . i
ACKNOWLEDGEMENT . . . . . . . ii
LIST OF FIGURE . . . . . . . . v
LIST OF TABLE . . . . . . . vii
CHAPTER 1: INTRODUCTION . . . . . 1
1.1 Background of Study . . . . 1
1.2 Problem Statement . . . . 3
1.3 Objectives and Scope of Study . . 4
CHAPTER 2: LITERITURE RIVEW . . . . 4
2.1 OVERVIEW OF ANAEROBIC DIGESTION 5
2.2 ANAEROBIC DIGESTION PROCESS . 6
2.2.1 Hydrolisis . . . . 8
2.2.2 Acedogenesis . . . . 9
2.2.3 Acetogenesis . . . . 10
2.2.4 Methanogenesis. . . . . 10
2.3 BIOGAS PRODUCTION . . . 11 2.3.1 Nature of Biogas . . . . 11
2.4 FEEDSTOCK . . . 12
2.4.1 Overview . . . . . 12
2.4.2 Palm Oil Mills Waste . . . . 13
2.4.3 Liquid Waste from Palm Oil Mill . . 14
2.4.4 Solid Waste from Palm Oil Mill . . 15
2.5 FACTORS OF BIOGAS PRODUCTION . 18
2.5.1 Temperature . . . . . 18
2.5.2 Retention Time . . . . 19
2.5.3 Pre-treatment . . . . 21
2.5.4 Organic Loading Rate. . . . 23
2.5.5 Other Factors . . . . . 24
CHAPTER 3: METHODOLOGY . . . . . 23
iv
3.1 INTRODUCTION . . . . 25
3.1.1 Literature Review . . . . 25
3.1.2 Experimental Works . . . . 25
3.1.3 Result Analysis . . . . 27
3.2 FLOW CHART . . . . 28
3.3 PROJECT ACTIVITIES . . . 29
3.3.1 Preparing Sample . . . . 30
3.3.2 Experimental Setup . . . . 31
3.4 GANTT CHART . . . . 32
3.5 TOOLS AND EQUIPMENTS . . 33
CHAPTER 4: RESULTS AND DISCUSSION . . . 35
4.1 OVERALL RESULT . . . 35
4.2 DISCUSSIONS . . . . 36
CHAPTER 5: CONCLUSION AND RECOMMENDATIONS . 42
5.1 CONCLUSION . . . . 42
5.2 RECOMMENDATIONS . . . 43
REFERENCES . . . . . . . . 44
APPENDIXES . . . . . . . . 47
v
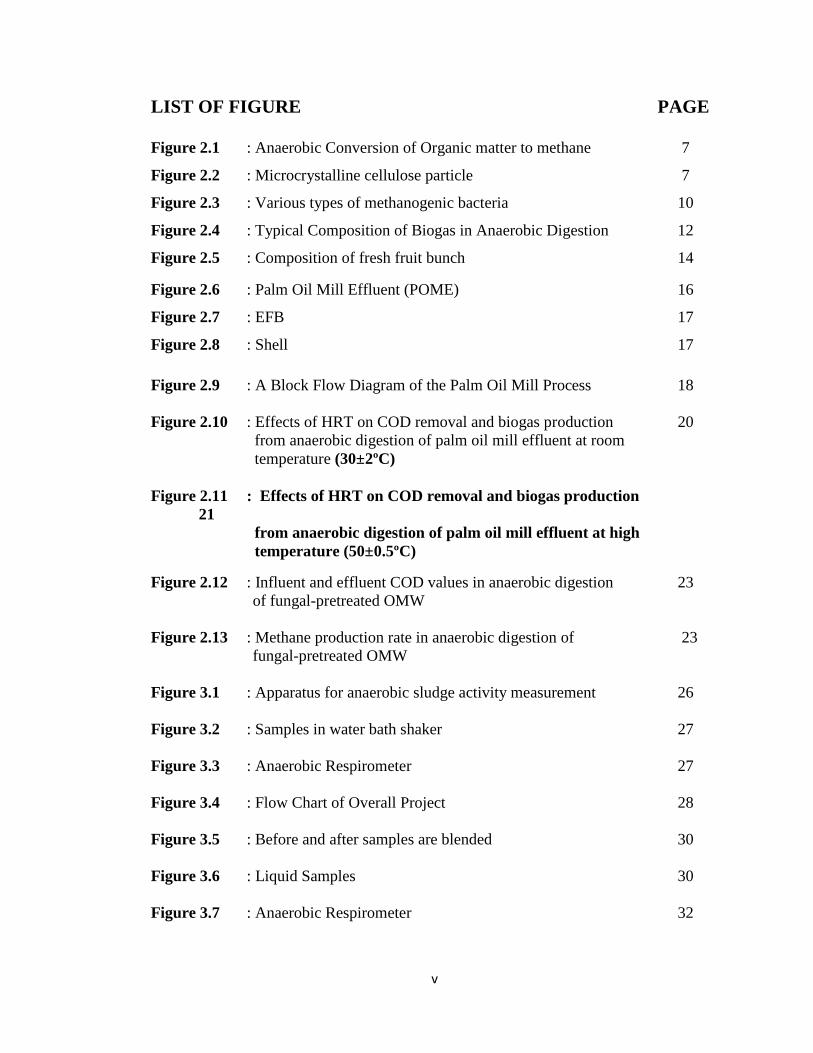
LIST OF FIGURE PAGE
Figure 2.1 : Anaerobic Conversion of Organic matter to methane 7
Figure 2.2 : Microcrystalline cellulose particle 7
Figure 2.3 : Various types of methanogenic bacteria 10
Figure 2.4 : Typical Composition of Biogas in Anaerobic Digestion 12
Figure 2.5 : Composition of fresh fruit bunch 14
Figure 2.6 : Palm Oil Mill Effluent (POME) 16
Figure 2.7 : EFB 17
Figure 2.8 : Shell 17
Figure 2.9 : A Block Flow Diagram of the Palm Oil Mill Process 18
Figure 2.10 : Effects of HRT on COD removal and biogas production 20
from anaerobic digestion of palm oil mill effluent at room
temperature (30±2ºC)
Figure 2.11 : Effects of HRT on COD removal and biogas production
21
from anaerobic digestion of palm oil mill effluent at high
temperature (50±0.5ºC)
Figure 2.12 : Influent and effluent COD values in anaerobic digestion 23
of fungal-pretreated OMW
Figure 2.13 : Methane production rate in anaerobic digestion of 23
fungal-pretreated OMW
Figure 3.1 : Apparatus for anaerobic sludge activity measurement 26
Figure 3.2 : Samples in water bath shaker 27
Figure 3.3 : Anaerobic Respirometer 27
Figure 3.4 : Flow Chart of Overall Project 28
Figure 3.5 : Before and after samples are blended 30
Figure 3.6 : Liquid Samples 30
Figure 3.7 : Anaerobic Respirometer 32
vi
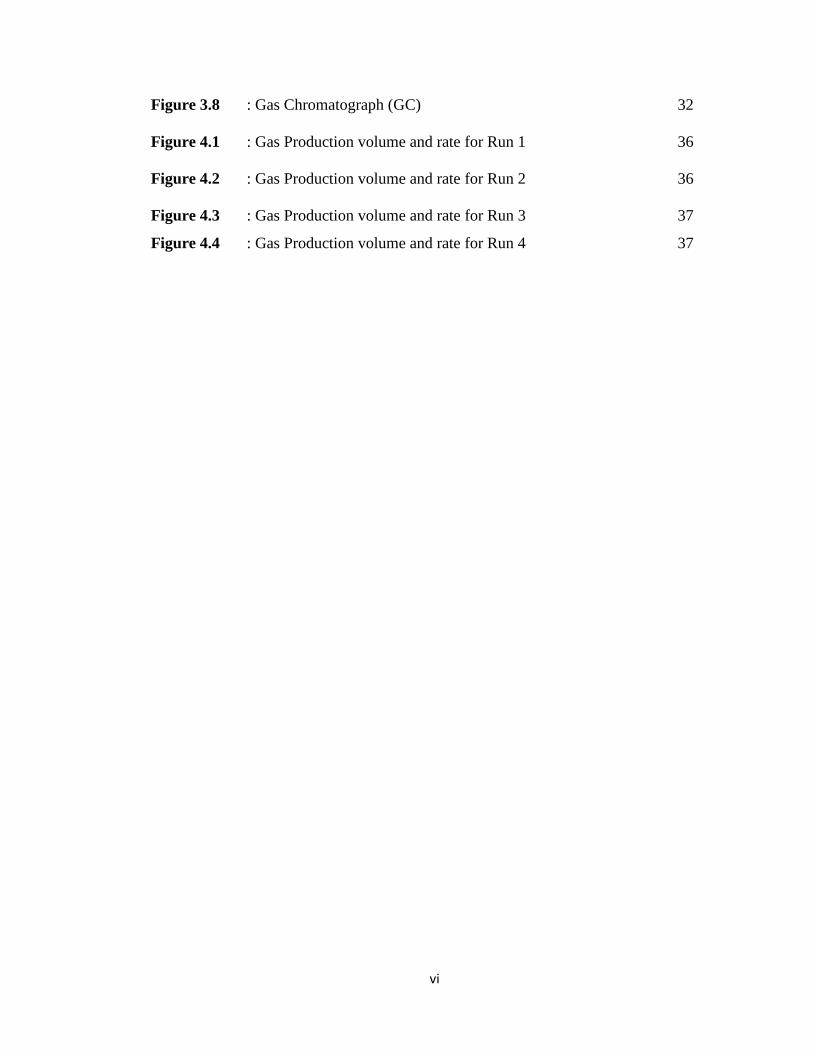
Figure 3.8 : Gas Chromatograph (GC) 32
Figure 4.1 : Gas Production volume and rate for Run 1 36
Figure 4.2 : Gas Production volume and rate for Run 2 36
Figure 4.3 : Gas Production volume and rate for Run 3 37
Figure 4.4 : Gas Production volume and rate for Run 4 37
vii
LIST OF TABLE PAGE
Table 2.1 : Typical characteristic of POME 15
Table 2.2 : Potential Power Generation from POM Solid Residues 16
Table 2.3 : Characteristic of the decanter effluent before and 20
after treatment
Table 3.1 : Gantt chart 33
Table 3.2 : Tools and equipments 34
Table 4.1 : Overall Result 35
Table 4.2 : Result of Experiment 1 36
Table 4.3 : Result of Experiment 2 38
Table 4.4 : Result of Experiment 3 39
Table 4.5 : Result of Experiment 4 40
1
CHAPTER 1
PROJECT BACKGROUND
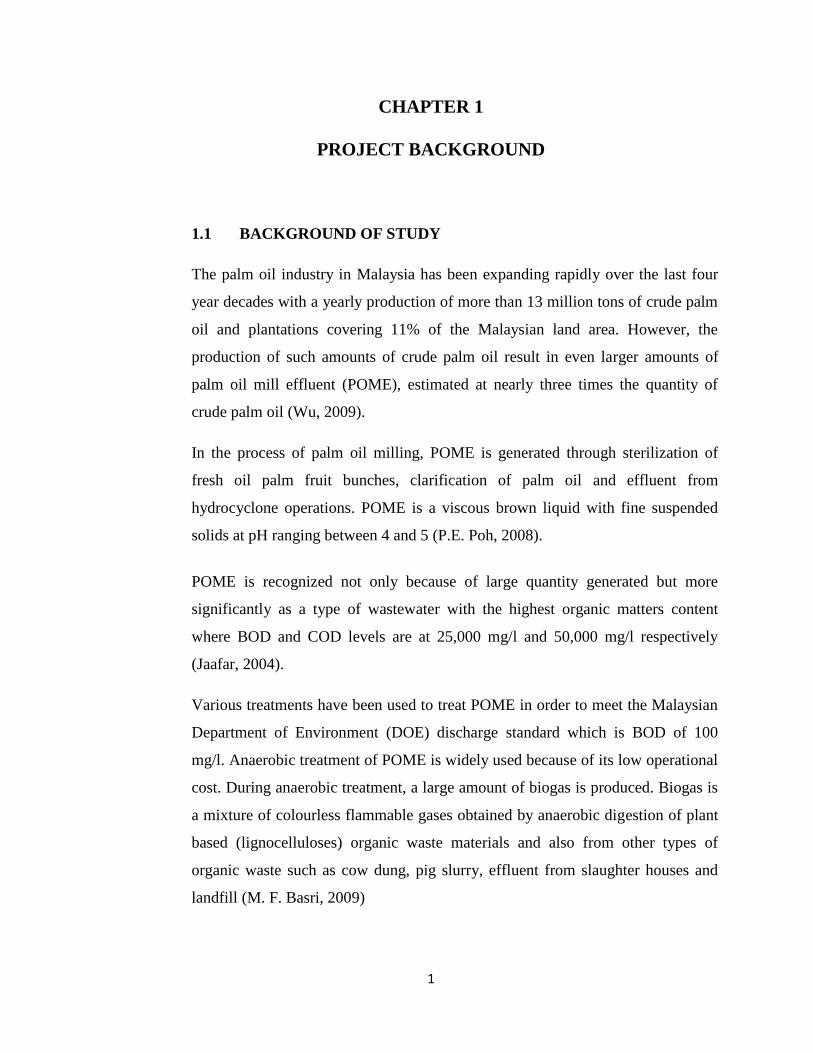
1.1 BACKGROUND OF STUDY
The palm oil industry in Malaysia has been expanding rapidly over the last four
year decades with a yearly production of more than 13 million tons of crude palm
oil and plantations covering 11% of the Malaysian land area. However, the
production of such amounts of crude palm oil result in even larger amounts of
palm oil mill effluent (POME), estimated at nearly three times the quantity of
crude palm oil (Wu, 2009).
In the process of palm oil milling, POME is generated through sterilization of
fresh oil palm fruit bunches, clarification of palm oil and effluent from
hydrocyclone operations. POME is a viscous brown liquid with fine suspended
solids at pH ranging between 4 and 5 (P.E. Poh, 2008).
POME is recognized not only because of large quantity generated but more
significantly as a type of wastewater with the highest organic matters content
where BOD and COD levels are at 25,000 mg/l and 50,000 mg/l respectively
(Jaafar, 2004).
Various treatments have been used to treat POME in order to meet the Malaysian
Department of Environment (DOE) discharge standard which is BOD of 100
mg/l. Anaerobic treatment of POME is widely used because of its low operational
cost. During anaerobic treatment, a large amount of biogas is produced. Biogas is
a mixture of colourless flammable gases obtained by anaerobic digestion of plant
based (lignocelluloses) organic waste materials and also from other types of
organic waste such as cow dung, pig slurry, effluent from slaughter houses and
landfill (M. F. Basri, 2009)
2
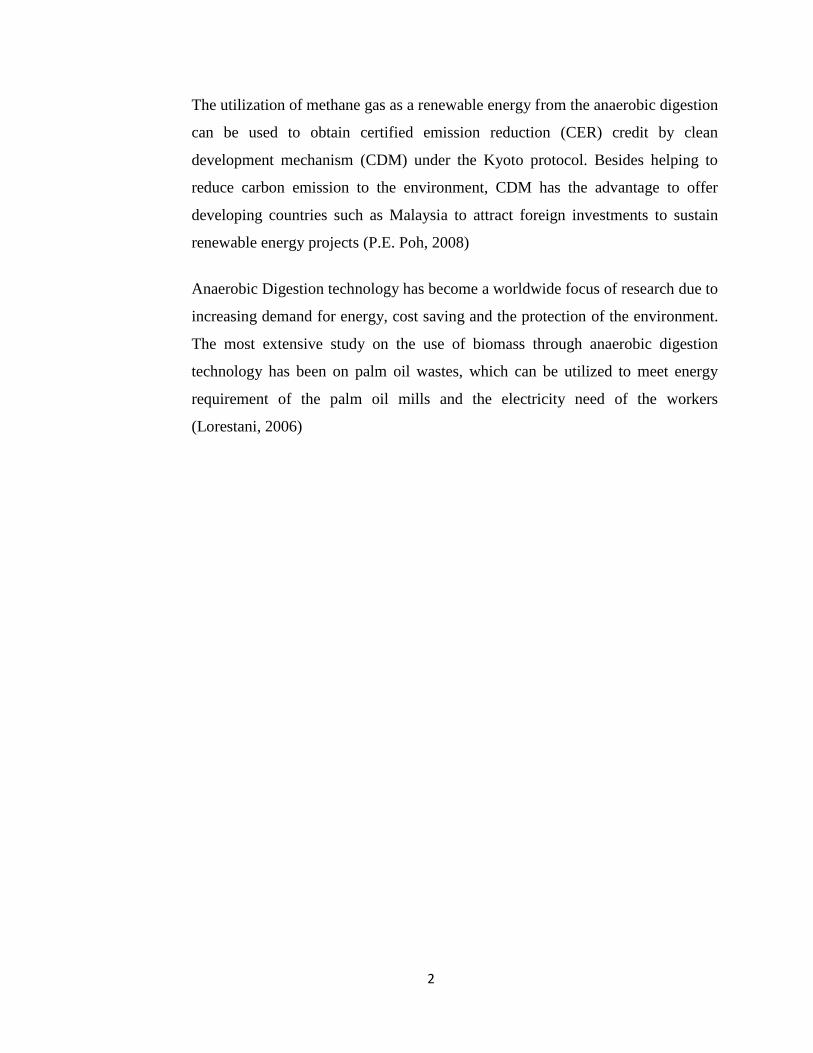
The utilization of methane gas as a renewable energy from the anaerobic digestion
can be used to obtain certified emission reduction (CER) credit by clean
development mechanism (CDM) under the Kyoto protocol. Besides helping to
reduce carbon emission to the environment, CDM has the advantage to offer
developing countries such as Malaysia to attract foreign investments to sustain
renewable energy projects (P.E. Poh, 2008)
Anaerobic Digestion technology has become a worldwide focus of research due to
increasing demand for energy, cost saving and the protection of the environment.
The most extensive study on the use of biomass through anaerobic digestion
technology has been on palm oil wastes, which can be utilized to meet energy
requirement of the palm oil mills and the electricity need of the workers
(Lorestani, 2006)
3
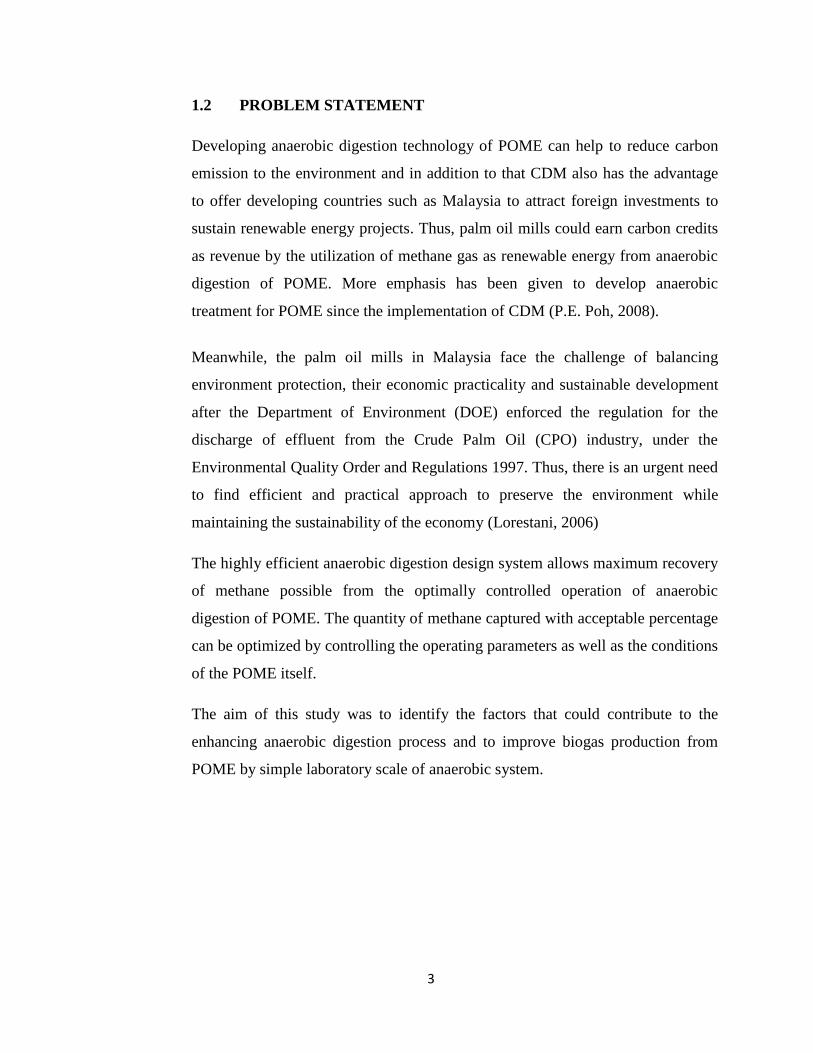
1.2 PROBLEM STATEMENT
Developing anaerobic digestion technology of POME can help to reduce carbon
emission to the environment and in addition to that CDM also has the advantage
to offer developing countries such as Malaysia to attract foreign investments to
sustain renewable energy projects. Thus, palm oil mills could earn carbon credits
as revenue by the utilization of methane gas as renewable energy from anaerobic
digestion of POME. More emphasis has been given to develop anaerobic
treatment for POME since the implementation of CDM (P.E. Poh, 2008).
Meanwhile, the palm oil mills in Malaysia face the challenge of balancing
environment protection, their economic practicality and sustainable development
after the Department of Environment (DOE) enforced the regulation for the
discharge of effluent from the Crude Palm Oil (CPO) industry, under the
Environmental Quality Order and Regulations 1997. Thus, there is an urgent need
to find efficient and practical approach to preserve the environment while
maintaining the sustainability of the economy (Lorestani, 2006)
The highly efficient anaerobic digestion design system allows maximum recovery
of methane possible from the optimally controlled operation of anaerobic
digestion of POME. The quantity of methane captured with acceptable percentage
can be optimized by controlling the operating parameters as well as the conditions
of the POME itself.
The aim of this study was to identify the factors that could contribute to the
enhancing anaerobic digestion process and to improve biogas production from
POME by simple laboratory scale of anaerobic system.
4
1.3 SCOPE OF STUDY
This research aims to scrutinize the performance of the biogas production volume
and rate as well as its composition in anaerobic digester. There are factors have
been identified that affects the production of biogas using POME such as
inoculums composition, co-substrate addition, PH, temperature, organic loading
rate (OLR), reactors type and design, retentation time and pretreatment process..
In this project the factors that appropriate with the existing anaerobic digestion
systems are analyzed in order to study the performance of different parameters
and conditions approaches.
The scope of research in this project is narrowed down so that the project is
feasible and could be completed within the allocated time frame. The present
research has the following objectives:
i) To understand the anaerobic digestion process of palm oil mill effluent.
ii) To identify the factors those affect the production of the biogas
iii) To study the best experimental method in monitoring the biogas
production volume and rate in anaerobic digestion process.
iv) To determine the factors and conditions that lead to the optimization of
biogas production volume, rate and composition.
5
CHAPTER 2
LITERATURE REVIEW
2.1 OVERVIEW OF ANAEROBIC DIGESTION
Anaerobic digestion is one of the biological processes that have received a new
fillip in recent years since the energy crisis of the early 1970s, especially
following the Gulf war and energy price rises. The Anaerobic digestion process
has captured many imaginations because it turns organic matter into a valuable
source of renewable energy. During Anaerobic digestion organic matter is
degraded in the absence of oxygen. The multi-step process results in a biogas
(Mshandete, 2009).
It is appropriate that nations invest in new technologies and new sources of
energy that will leave less of an environmental 'footprint' than coal or oil, and that
will be more sustainable. Anaerobic digestion has successfully been used for
many applications that have conclusively demonstrated its ability to recycle
biological wastes (Abraham, 2005)
Anaerobic digestion is a biological process in which biodegradable organic
matters are broken-down by bacteria into biogas, which consists of methane
(CH4), carbon dioxide (CO2), and other trace amount of gases. The biogas can be
used to generate heat and electricity. There is no Oxygen required in order for
anaerobic digestion to be occurred (Koyama, 2008).
The process is naturally occurring by the decomposition and decay, by which
organic matter is broken down to its simpler chemical components under
anaerobic conditions. Anaerobic microorganisms digest the organic materials in
the absence of oxygen, to produce methane and carbon dioxide as end products
under ideal conditions. The biogas produce in anaerobic digestion plant usually
contains small amount of hydrogen sulphide (H2S) and ammonia (NH3) as well as
trace amount of other gases (Monnet, 2003).
6
In the process of degrading POME into methane, carbon dioxide and water, there
is a sequence of reactions involved; hydrolysis, acidogenesis (including
acetogenesis) and methanogenesis. Hydrolysis is where complex molecules (i.e.,
carbohydrates, lipids, proteins) are converted into sugar, amino acid and etc. In
the step of acidogenesis, acidogenic bacteria will break down these sugar, fatty
acids and amino acids into organic acids which mainly consist of acetic acid
(from acetogenesis) together with hydrogen and carbon dioxide. Hydrogen and
carbon dioxide will be utilized by hydrogenotropic methanogens while acetic acid
and carbon dioxide will be utilized by acetoclastic methanogens to give methane
as a final product (P.E. Poh, 2008).
Methanogenesis is the rate limiting step in anaerobic digestion of POME. As
such, conventional anaerobic digesters require large reactors and long retention
time to ensure complete digestion of treated influent. Nonetheless, high-rate
anaerobic bioreactors have been proposed to reduce reactor volume, shorten
retention time as well as capture methane gas for utilization (P.E. Poh, 2008).
2.2 ANAEROBIC DIGESTION PROCESS
In anaerobic digestion, organic matters are degraded to methane (CH4) and carbon
dioxide (CO2) in discrete steps by the concerted action of several different
metabolite groups of microorganism.
The digestion process follows four (4) major steps which are hydrolisis,
acidogenesis, acetogenesis, and methanogenesis with hydrolisis as the rate
limiting step of overall process. During hydrolisis, bacteria will break down
insoluble organic polymers such a carbohydrate and to prepare them available for
other bacteria. Then, acetogenesis will convert the sugars and amino acids into
carbon dioxide, hydrogen, ammonia, and organic acids. Acetogenesis then
convert these resulting organic acids into acetic acid along with additional
ammonia, hydrogen, and carbon dioxide. Lastly, the methanogenesis process
7
takes place where the products are converted to methane and carbon dioxide
(Wikimedia Foundation, 2009).
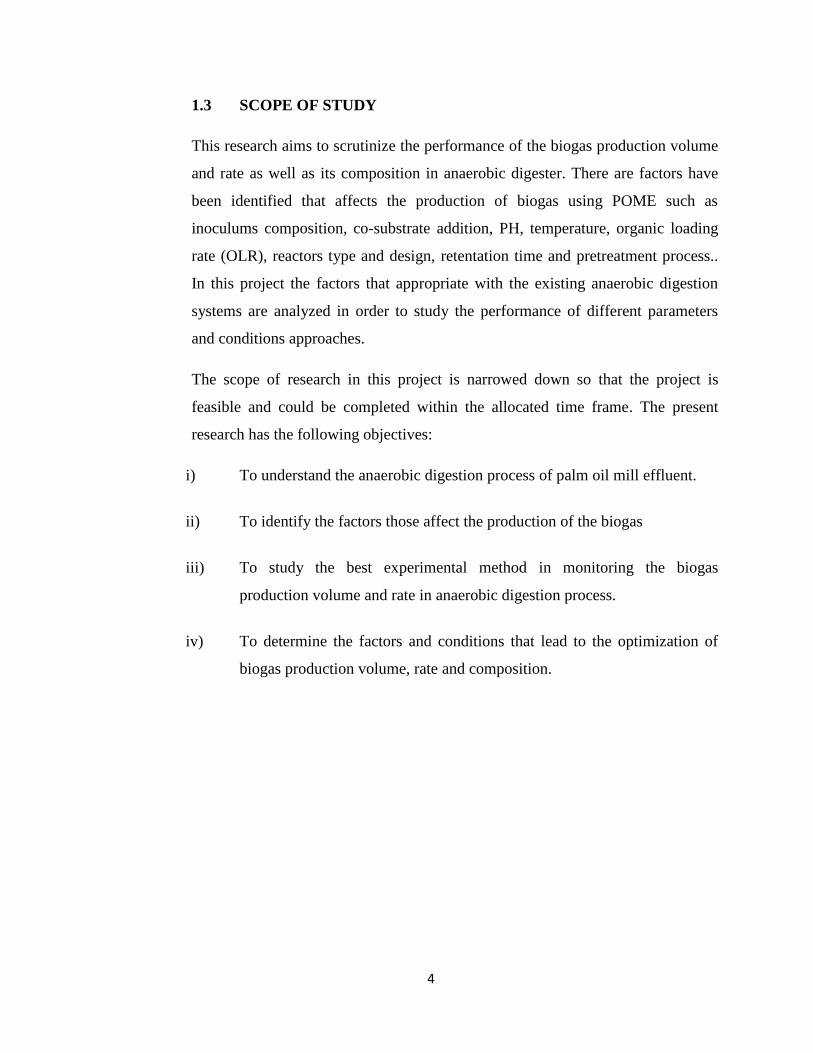
The main pathways of anaerobic digestion are shown in Figure 2.1. The salient
features of those bacteria involved in the stabilization process are as follows:
Figure 2.1: Anaerobic Conversion of Organic matter to methane (Lorestani, 2006)
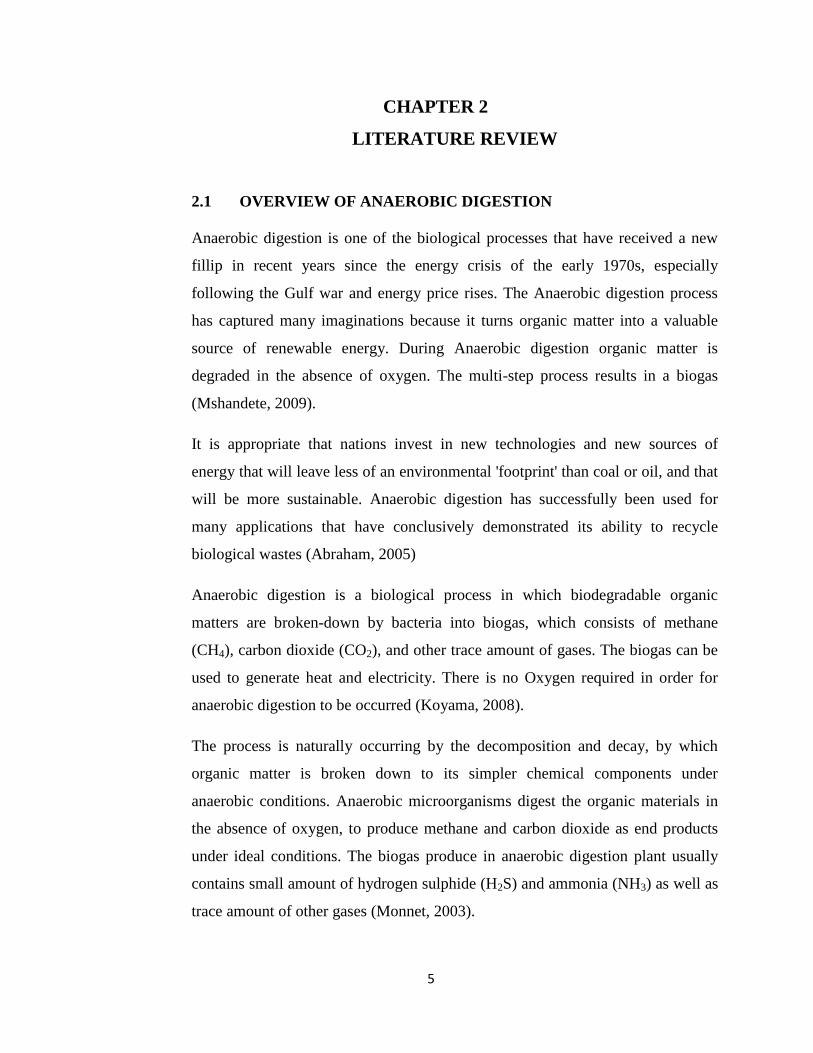
Figure 2.2: (a) Microcrystalline cellulose particle before digestion, (b) Microcrystalline
cellulose particle after anaerobic digestion for 9 days, (c) Microcrystalline cellulose
particle after 9 days of anaerobic digestion (Lorestani, 2006)
8
2.2.1 Hydrolysis
The first step for most digestion process is hydrolysis during which particulate
matters are converted to soluble compounds that can be hydrolyzed further to
simple monomers to be subsequently utilized by fermentative bacteria. The group
of non methanogenic responsible for the fermentation process consists of
facultative and obligate bacteria (Lorestani, 2006).
In most cases biomass is made up of large organic polymers. In order for the
bacteria in anaerobic digesters to access the energy potential of the material, these
chains must first be broken down into their smaller constituent parts. These
constituent parts or monomers such as sugars are readily available by other
bacteria. The process of breaking these chains and dissolving the smaller
molecules into solution is called hydrolysis. Therefore hydrolysis of these high
molecular weight polymeric components is the necessary first step in anaerobic
digestion (R.Mah, 2006).
Insoluble organic polymers such as carbohydrates, cellulose, proteins and fats are
broken down and liquefied by enzymes produced by hydrolytic bacteria.
Carbohydrates, proteins and lipids are hydrolysed to sugars which then
decompose further to form carbon dioxide, hydrogen, ammonia and organic acids.
Proteins decompose to form ammonia, carboxylic acids and carbon dioxide.
During this phase gas concentrations may rise to levels of 80 per cent carbon
dioxide and 20 per cent hydrogen (Residua, 2006).
The rate of hydrolisis is a function of factors such as PH, temperature and particle
size of the substrate. Volatile fatty acids (VFA) production from the hydrolysis-
acidification of the coffee pulp was investigated by Hourbroun and his coworkes
and 23% (COD based) hydrolysis was achieved at an organic loading rate (OLR)
of 5 g COD/Id (Lorestani, 2006)
9
2.2.2 Acidogenesis
In the acidogenesis step, the hydrolysis products are absorbed by the cells of
fermentative bacteria to be fermented or anaerobically converted into compounds
such as alcohols, short-chain fatty acids, formic acid, carbon dioxide, hydrogen,
ammonia and sulfide. The organic substrates serve as both the electron donor and
acceptors. The final products of the metabolic activities of these bacteria depend
upon the initial substrate in figure 2.1 as well as the environmental conditions. As
example consider the following reactions glucose;
C6H12O6 + 2H2O 2CH3COOH + 2CO2 + 4H2 (2.1)
C6H12O6 + 2H2 2CH3 CH2COOH + 2H2O (2.2)
C6H12O6 CH3 CH2 CH2COOH + 2CO2 + 2H2 (2.3)
The organic substrates serve as both the electron donors and acceptors. The final
products of the metabolic activities of these bacteria depend upon the initial
substrates as well as the environmental conditions (Lorestani, 2006).
Organic acids formed in the hydrolysis and fermentation stage are converted by
acetogenic micro-organisms to acetic acid. At the end of this stage carbon dioxide
and hydrogen concentrations begin to decrease (Residua, 2006).
10
2.2.3 Acetogenesis
Acetogenesis is a process through which acetate is produced by anaerobic bacteria
from a variety of energy (for example, hydrogen) and carbon (for example, carbon
dioxide) sources. The different bacterial species that are capable of acetogenesis
are collectively termed acetogens.
Acetogenesis is the third stage in anaerobic digestion process. Here simple
molecules create through the acidogenesis phase are further digested by acetogens
to produce largely acetic acid as well as carbon dioxide and hydrogen (A.D, 2007)
In the acetogenesis, about 68% of acetic acid and 32% of hydrogen are converted
from Volatile Fatty Acids (VFAs). The process is very sensitive to the Hydrogen
concentration and it was Syntrophic (mutually beneficial) relationship with the
methanogens (Dr. Michael Robinson, 2005).
2.2.4 Methanogenesis
Methanogenesis refers to an anaerobic process in which the electron equivalents
in organic matter (BODL) are used to reduce carbon to its most reduced oxidation
state in methane CH4. Anaerobic treatment by methanogenesis is widely used for
the stabilization of municipal wastewater sludge and municipal solid wastes
(Bruce E.Rittmann, 2001)
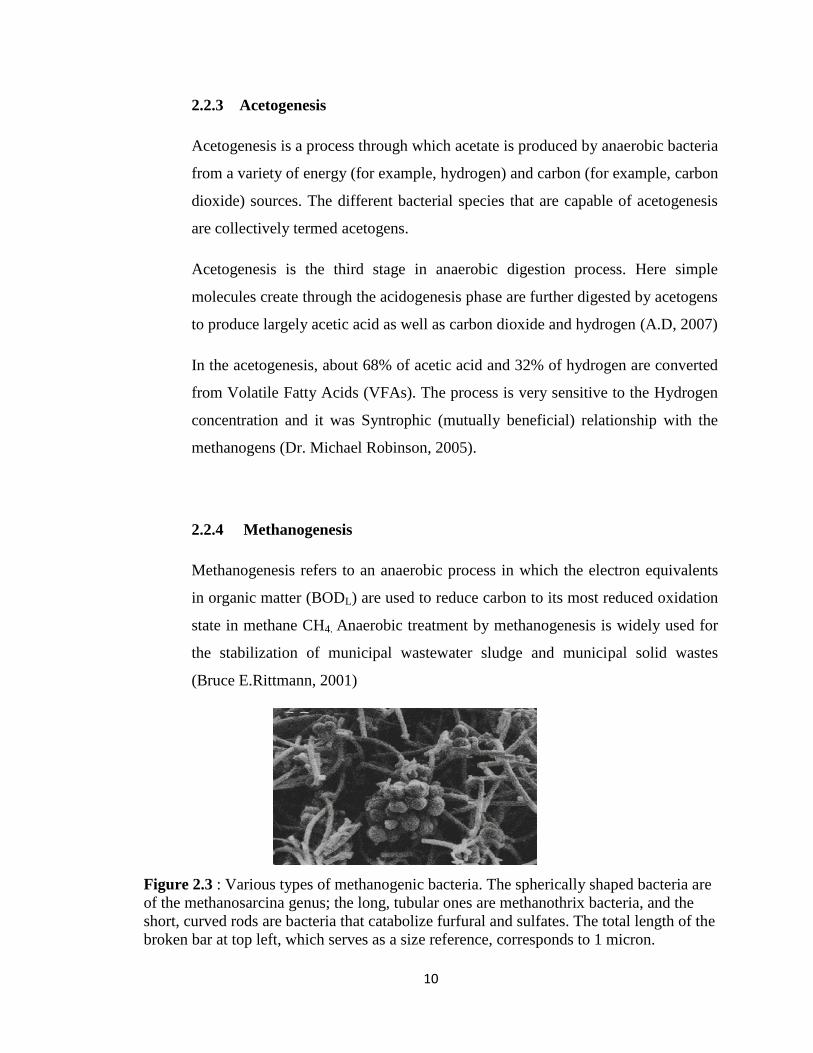
Figure 2.3 : Various types of methanogenic bacteria. The spherically shaped bacteria are
of the methanosarcina genus; the long, tubular ones are methanothrix bacteria, and the
short, curved rods are bacteria that catabolize furfural and sulfates. The total length of the
broken bar at top left, which serves as a size reference, corresponds to 1 micron.
11
This is the terminal stage of anaerobic digestion where the methanogens utilize
intermediate products of the preceding stages and convert them into methane
(CH4), carbon dioxide (CO2) and water (H20). It is these components makes up
the majority of the biogas emitted from the system. Methanogenesis is makes up
the majority of the biogas emitted from the system. Methanogenesis is sensitive to
both high and low pH and occurs between pH 6.5 and pH 8.
2.3 BIOGAS PRODUCTION
2.3.1 Nature of Biogas
Biogas originates from bacteria in the process of bio-degradation of organic
material under anaerobic conditions (without oxygen). The natural generation of
biogas is an important part of the biogeochemical carbon cycle. Methanogens
(methane producing bacteria) are the last link in a chain of micro-organisms which
degrade organic material and return the decomposition products to the
environment. In this process biogas is generated, a source of renewable energy.
Each year some 590-880 million tons of methane are released worldwide into the
atmosphere through microbial activity. About 90% of the emitted methane derives
from biogenic sources, i.e. from the decomposition of biomass. The remainder is
of fossil origin (e.g. petrochemical processes). In the northern hemisphere, the
present tropospheric methane concentration amounts to about 1.65 ppm
(Kossmann, 2007).
12
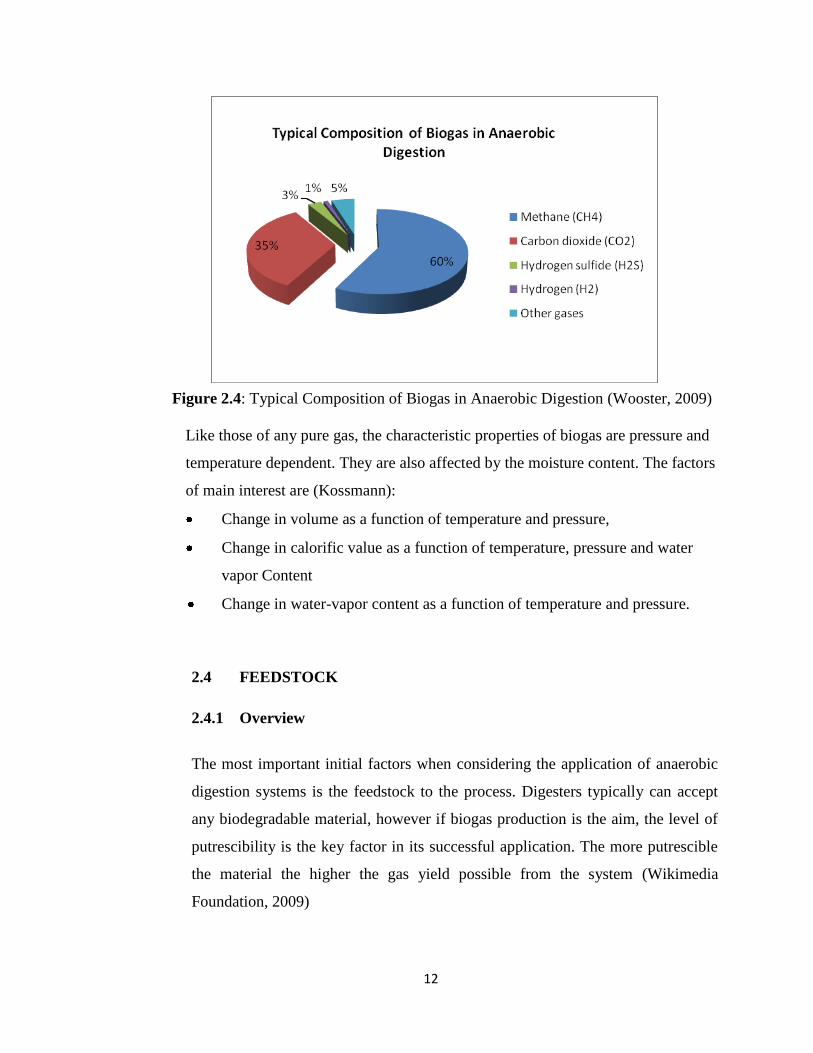
Figure 2.4: Typical Composition of Biogas in Anaerobic Digestion (Wooster, 2009)
Like those of any pure gas, the characteristic properties of biogas are pressure and
temperature dependent. They are also affected by the moisture content. The factors
of main interest are (Kossmann):
Change in volume as a function of temperature and pressure,
Change in calorific value as a function of temperature, pressure and water
vapor Content
Change in water-vapor content as a function of temperature and pressure.
2.4 FEEDSTOCK
2.4.1 Overview
The most important initial factors when considering the application of anaerobic
digestion systems is the feedstock to the process. Digesters typically can accept
any biodegradable material, however if biogas production is the aim, the level of
putrescibility is the key factor in its successful application. The more putrescible
the material the higher the gas yield possible from the system (Wikimedia
Foundation, 2009)
13
Substrate composition is a major factor in determining the methane yield and
methane production rates from the anaerobic digestion process. Techniques are
available to determine the compositional characteristics of the feedstock, whilst
parameters such as solids, elemental organic analyses are important for digester
design and operation (Wikimedia Foundation, 2009).
Various type of feedstock was suitable in having anaerobic digestion process.
Examples of feedstock are sewage sludge, organic farm waste, municipal solid
waste, green/botanical waste and organic commercial and industrial waste. In this
project, the wastes from the palm oil mill industry are identified to be the most
suitable substrates as a feedstock to be studied in anaerobic digestion
experimental process.
2.4.2 Palm Oil Mill Wastes
The Malaysian palm oil industry has grown rapidly over the years and Malaysia
has become the world's largest producer and exporter of palm oil and its products.
In 2003, more than 3.79 million hectares of land were under oil palm cultivation,
occupying more than one-third of the total cultivated area in Malaysia and 11% of
the total land area (Ta Yeong Wu, 2008). The industry is growing rapidly and
becomes a very important agriculture-based industry where the country today is
the world’s leading producer and exporter of palm oil, replacing Nigeria as the
chief producer since 1971 (S.Yusoff, 2006).
The main product in the Palm Oil Mills industry is the Crude Palm Oil (CPO).
Beside that the mills also generate many by-product and liquid or solids wastes
which may a significant impact on the environment if they are not dealt with
properly. These types of waste are give a significant impact in anaerobic digestion
process in order to produce biogas. There are various forms of solid and liquid
wastes from the mills. These include empty fruit bunches (EFB), Palm press fiber
(PPF), palm kernel cake (PKC), palm kernel shell (PKS), sludge cake (SC) and
14
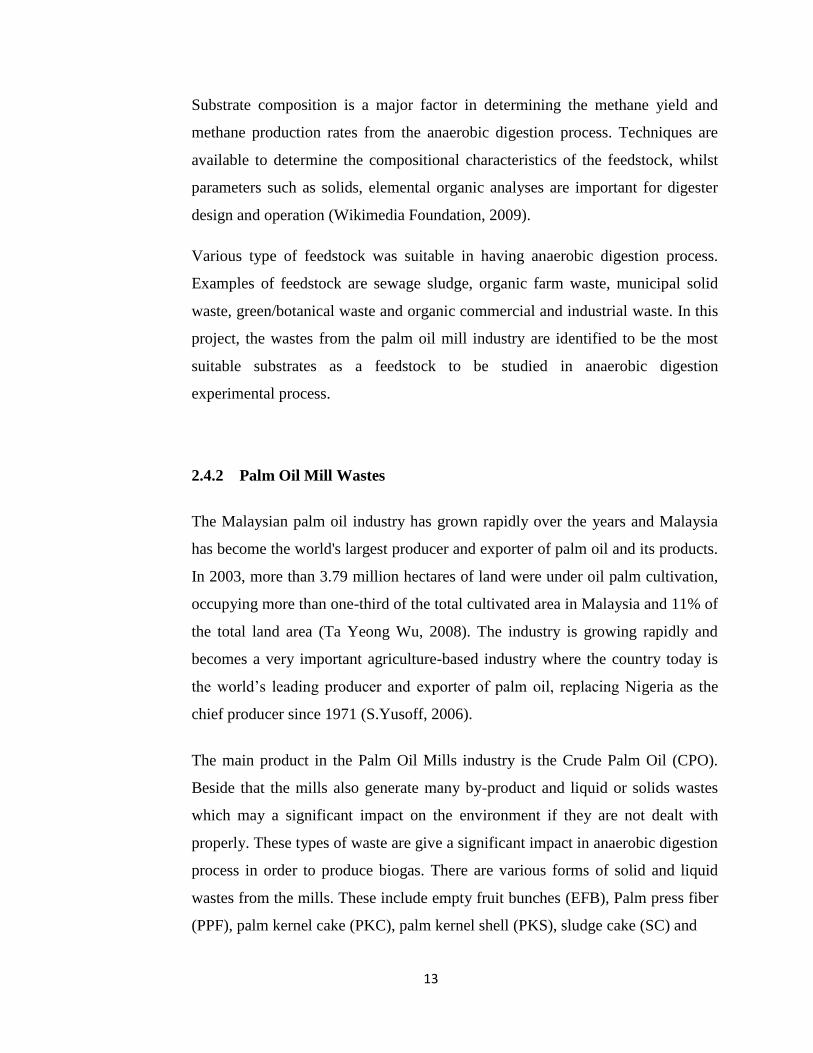
palm oil mill effluent (POME) appears in large quantities and are considered as
wastes (P.Prasertsan, 1996)
Figure 2.5: Composition of fresh fruit bunch (P.Prasertsan, 1996)
2.4.3 Liquid Waste from Palm Oil Mill
The production of palm oil result in the generation of large quantities of polluted
wastewater commonly referred to as palm oil mill effluent (POME). Typically, 1
tonne of crude palm oil production requires 5-7.5 tonnes of water; over 50% of
which ends up as POME. The POME comprise a combination of wastewater from
three main sources viz. clarification (60%), sterilization (36%) and hydrocyclone
(4%) units (Lorestani, 2006)
Concurrent to the production of palm oil industry in Malaysia, a huge volume of
Palm Oil Mill Effluent (POME) estimated at 35.7 million m3 was generated in
2002 from a total about 350 or so palm oil mills distributed throughout Peninsular
Malaysia, Sabah and Sarawak (Jaafar, 2004). POME is recognized not only
because of the large quantity generated but more significantly as a type of
wastewater with the highest organic matters content where BOD and COD levels
are at 25,000 mg/l and 50,000 mg/l respectively (Ma A.N, 1993)
Fresh Fruit Bunch (FFB)
100%
Empty Fruit Bunch (EFB)
59%
Fruit
41 %
Dry EFB
49.5%
Moisture
9.5%
Pericarp
26.7%
Nut
14.3%
Shell
10.6%
Kernel
1%
Moisture
2.7%
Moisture
1.3%
Fiber
13.9%
Oil
11.5%
15
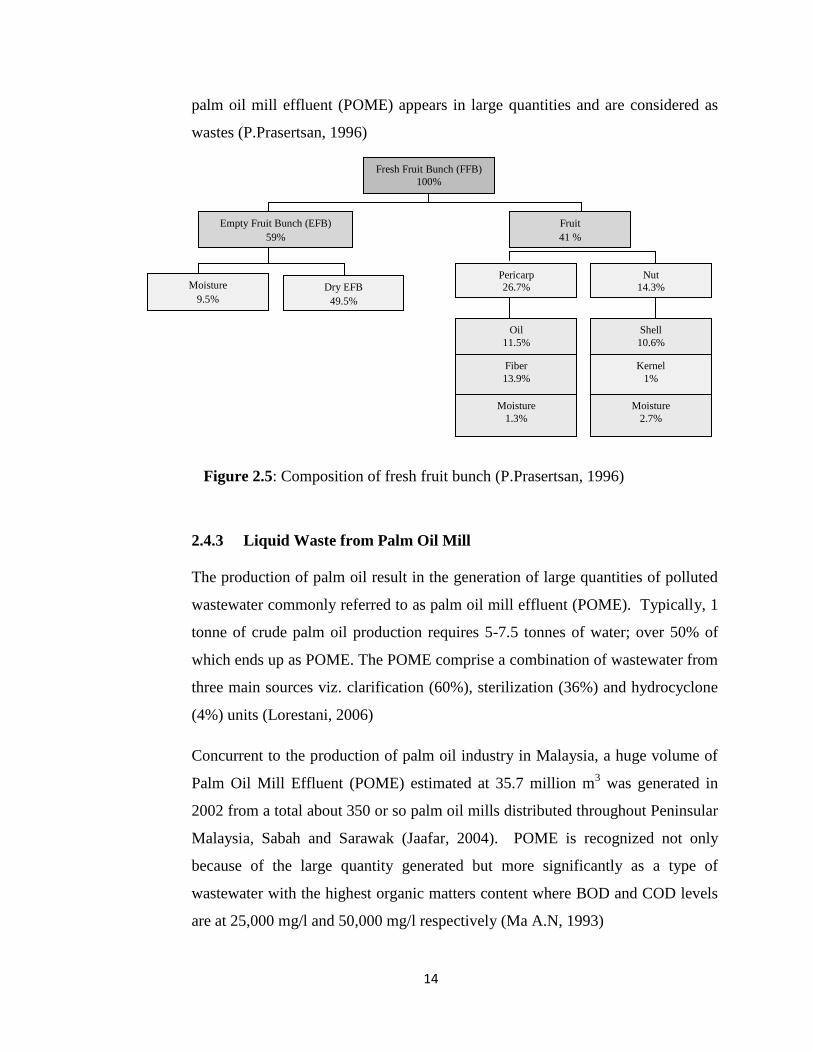
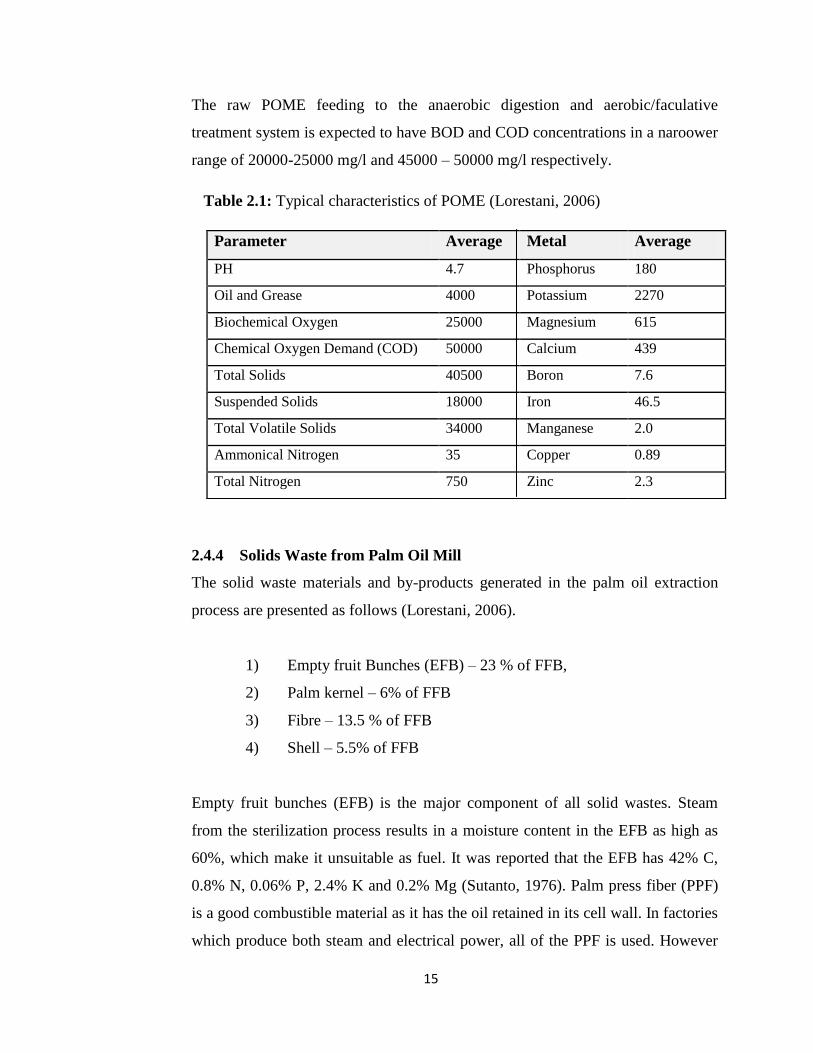
The raw POME feeding to the anaerobic digestion and aerobic/faculative
treatment system is expected to have BOD and COD concentrations in a naroower
range of 20000-25000 mg/l and 45000 – 50000 mg/l respectively.
Table 2.1: Typical characteristics of POME (Lorestani, 2006)
2.4.4 Solids Waste from Palm Oil Mill
The solid waste materials and by-products generated in the palm oil extraction
process are presented as follows (Lorestani, 2006).
1) Empty fruit Bunches (EFB) – 23 % of FFB,
2) Palm kernel – 6% of FFB
3) Fibre – 13.5 % of FFB
4) Shell – 5.5% of FFB
Empty fruit bunches (EFB) is the major component of all solid wastes. Steam
from the sterilization process results in a moisture content in the EFB as high as
60%, which make it unsuitable as fuel. It was reported that the EFB has 42% C,
0.8% N, 0.06% P, 2.4% K and 0.2% Mg (Sutanto, 1976). Palm press fiber (PPF)
is a good combustible material as it has the oil retained in its cell wall. In factories
which produce both steam and electrical power, all of the PPF is used. However
Parameter Average Metal Average
PH 4.7 Phosphorus 180
Oil and Grease 4000 Potassium 2270
Biochemical Oxygen 25000 Magnesium 615
Chemical Oxygen Demand (COD) 50000 Calcium 439
Total Solids 40500 Boron 7.6
Suspended Solids 18000 Iron 46.5
Total Volatile Solids 34000 Manganese 2.0
Ammonical Nitrogen 35 Copper 0.89
Total Nitrogen 750 Zinc 2.3
16
only 30% is consumed if power is not produced, therefore in some factories about
70% of PPF is considered as waste (P.Prasertsan, 1996).
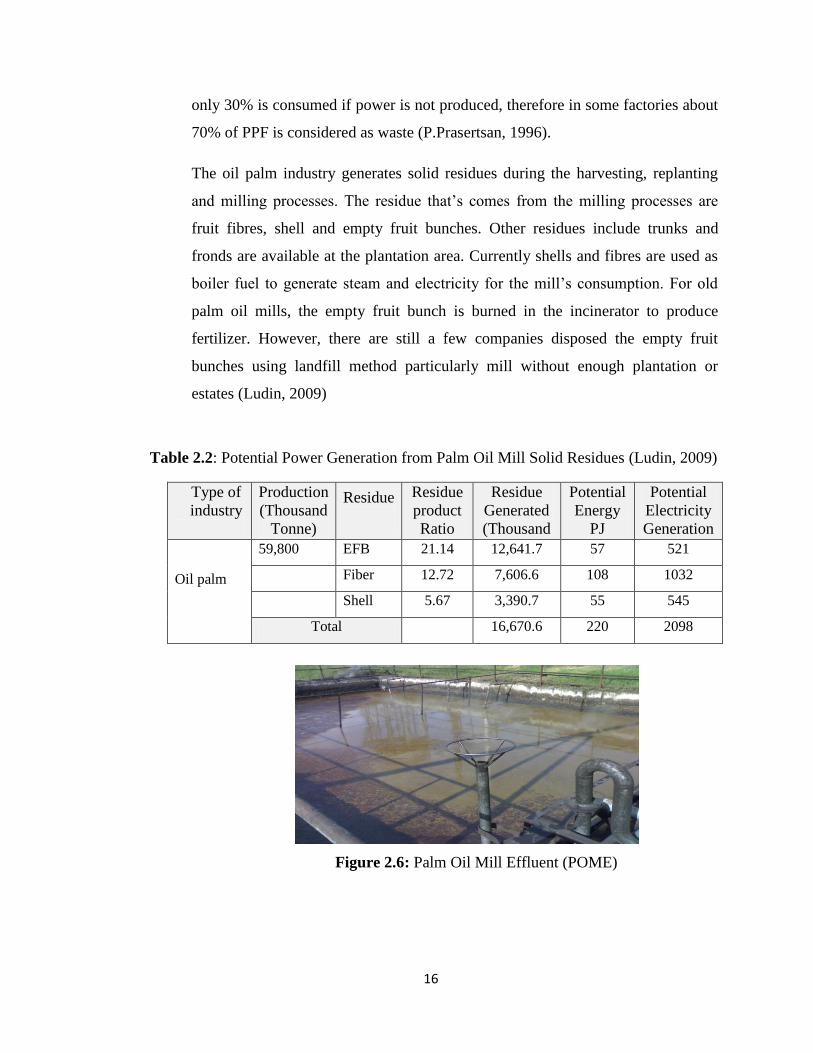
The oil palm industry generates solid residues during the harvesting, replanting
and milling processes. The residue that’s comes from the milling processes are
fruit fibres, shell and empty fruit bunches. Other residues include trunks and
fronds are available at the plantation area. Currently shells and fibres are used as
boiler fuel to generate steam and electricity for the mill’s consumption. For old
palm oil mills, the empty fruit bunch is burned in the incinerator to produce
fertilizer. However, there are still a few companies disposed the empty fruit
bunches using landfill method particularly mill without enough plantation or
estates (Ludin, 2009)
Table 2.2: Potential Power Generation from Palm Oil Mill Solid Residues (Ludin, 2009)
Type of
industry
Production
(Thousand
Tonne)
Residue
Residue
product
Ratio
(%)
Residue
Generated
(Thousand
Tonne)
Potential
Energy
PJ
Potential
Electricity
Generation
( MW)
Oil palm
59,800 EFB 21.14 12,641.7 57 521
Fiber 12.72 7,606.6 108 1032
Shell 5.67 3,390.7 55 545
Total 16,670.6 220 2098
Figure 2.6: Palm Oil Mill Effluent (POME)
17
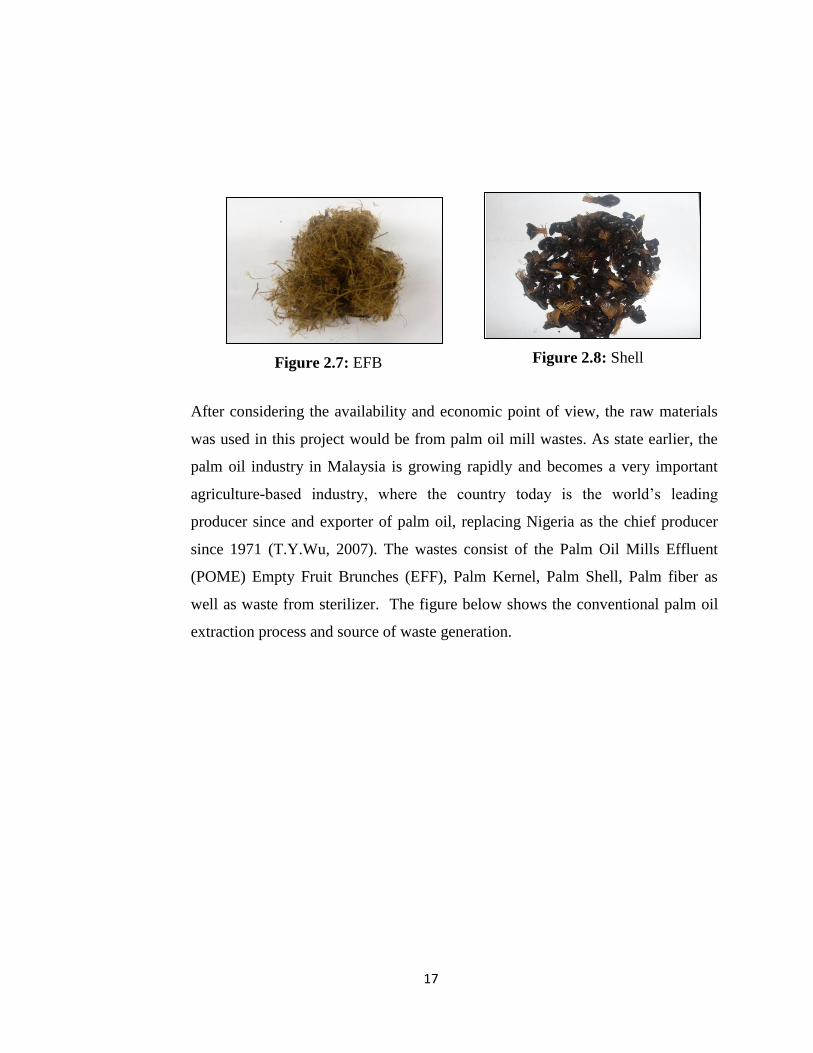
After considering the availability and economic point of view, the raw materials
was used in this project would be from palm oil mill wastes. As state earlier, the
palm oil industry in Malaysia is growing rapidly and becomes a very important
agriculture-based industry, where the country today is the world’s leading
producer since and exporter of palm oil, replacing Nigeria as the chief producer
since 1971 (T.Y.Wu, 2007). The wastes consist of the Palm Oil Mills Effluent
(POME) Empty Fruit Brunches (EFF), Palm Kernel, Palm Shell, Palm fiber as
well as waste from sterilizer. The figure below shows the conventional palm oil
extraction process and source of waste generation.
Figure 2.7: EFB Figure 2.8: Shell
18
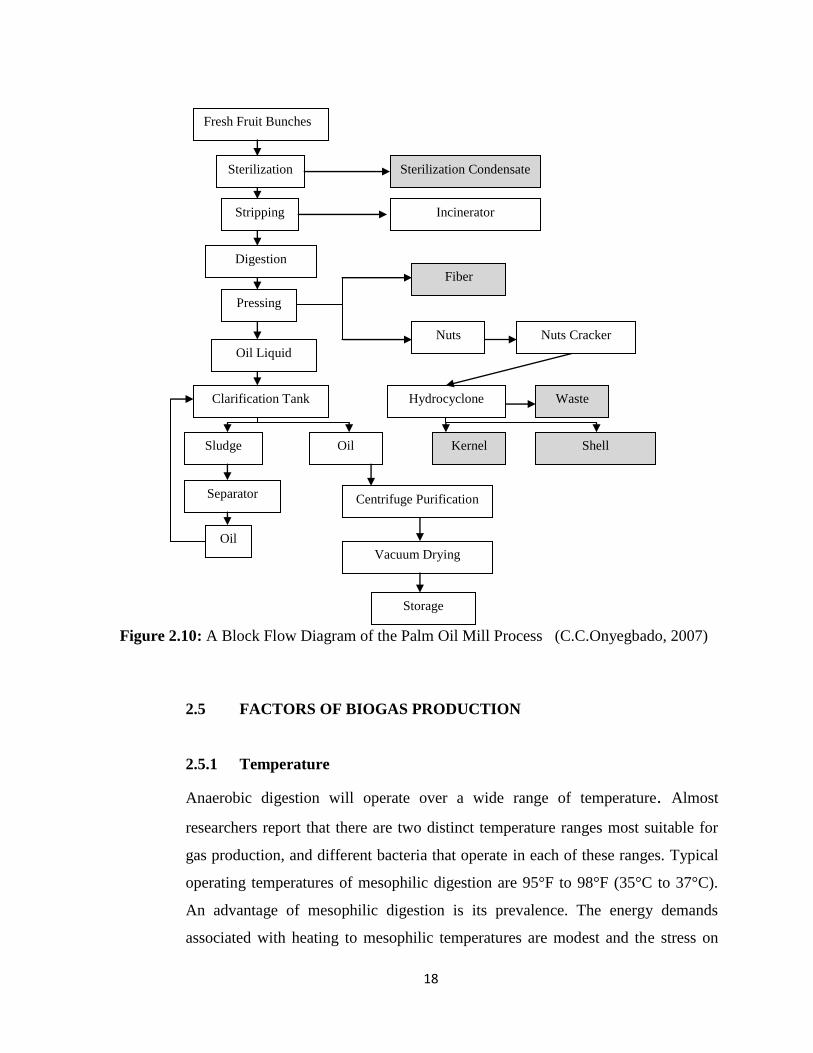
Figure 2.10: A Block Flow Diagram of the Palm Oil Mill Process (C.C.Onyegbado, 2007)
2.5 FACTORS OF BIOGAS PRODUCTION
2.5.1 Temperature
Anaerobic digestion will operate over a wide range of temperature. Almost
researchers report that there are two distinct temperature ranges most suitable for
gas production, and different bacteria that operate in each of these ranges. Typical
operating temperatures of mesophilic digestion are 95°F to 98°F (35°C to 37°C).
An advantage of mesophilic digestion is its prevalence. The energy demands
associated with heating to mesophilic temperatures are modest and the stress on
Fresh Fruit Bunches
Sterilization
Stripping
Digestion
Pressing
Oil
Separator
Sludge
Clarification Tank
Oil Liquid
Oil
Centrifuge Purification
Vacuum Drying
Storage
Sterilization Condensate
Incinerator
Fiber
Nuts Nuts Cracker
Hydrocyclone Waste
Kernel Shell
19
concrete tanks is reasonable. Mesophilic digestion reaction rates are slower than
more advanced process and therefore more tank volume would be required for the
same amount of solids (Dave Parry 2004)
High temperature anaerobic digestion is occurs at thermophilic temperatures
about 122°F to 135°F (50°C and 57°C). Thermophilic temperature is considerable
based on the principle that higher temperature reduce pathogens and thermophilic
bacteria result in more rapid reaction rates (Dave Parry 2004)
2.5.2 Retention Time
A critical factor in methane production is the amount of time substrates spend in
the digesters called retention time. Retention time is the time needed to achieve
complete degradation of the organic matter. The retention time varies with the
process parameters, such as process temperature and waste composition.
Too short retention time means an inefficient extraction of methane, so full
revenue is not realized. Too long retention time means too much was spent on
surplus capacity or not enough substrates are being added to maximize revenue.
The experiment was carried out to see the effect of Hydraulic Retention Time
(HRT) with the feedstock of palm oil mill effluent. Palm oil mil effluent (POME)
contains high amount of organic matter, oil & grease, total solids and suspended
solids. Anaerobic treatment of POME was conducted at room temperature
(30±2ºC) and high temperature (50±0.5ºC). The effects of hydraulic retention
time (HRT), organic loading rate (OLR), COD: N ratio and temperature on the
anaerobic digestion of POME were investigated. The Table 2.4 shows the
characteristics of the decanter effluent before and after treatment (Pechsuth.M,
2001)
20
Table 2.3: Characteristic of the decanter effluent before and after treatment
Parameter POME Biopretreatment
Stage
Anaerobic Digestion
POME Biotreated
POME
Color Brown dark brown blackish brown
blackish brown
PH 4.5 4.48 5.53 5.65
COD (mg/l) 90,700 34,800 39,800 24,900
COD removal (%) ND 61.6 56.1 72.6
Oil & grease (mg/l) 21,000 2,600 ND ND
Oil & grease removal
(%) ND 87.5% ND ND
Suspended solid
(mg/l) 35,300 5,000 ND ND
Suspended solid
removal (%) ND 85.7% ND ND
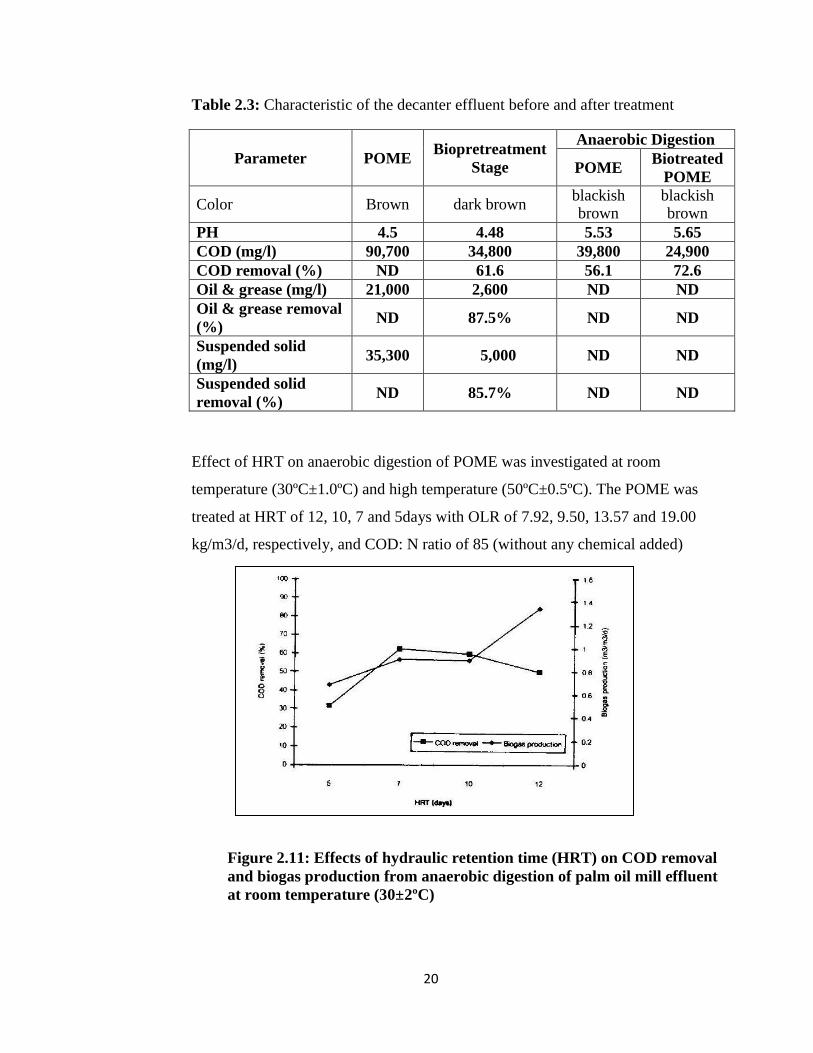
Effect of HRT on anaerobic digestion of POME was investigated at room
temperature (30ºC±1.0ºC) and high temperature (50ºC±0.5ºC). The POME was
treated at HRT of 12, 10, 7 and 5days with OLR of 7.92, 9.50, 13.57 and 19.00
kg/m3/d, respectively, and COD: N ratio of 85 (without any chemical added)
Figure 2.11: Effects of hydraulic retention time (HRT) on COD removal
and biogas production from anaerobic digestion of palm oil mill effluent
at room temperature (30±2ºC)
21
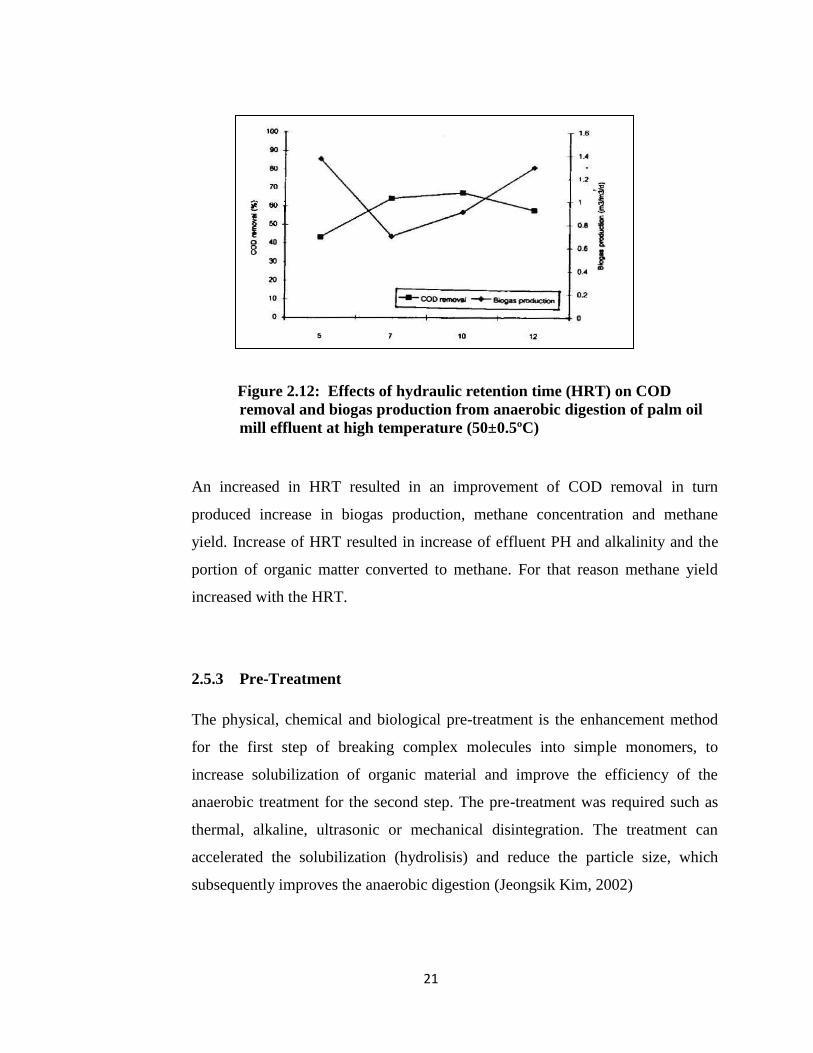
Figure 2.12: Effects of hydraulic retention time (HRT) on COD
removal and biogas production from anaerobic digestion of palm oil
mill effluent at high temperature (50±0.5ºC)
An increased in HRT resulted in an improvement of COD removal in turn
produced increase in biogas production, methane concentration and methane
yield. Increase of HRT resulted in increase of effluent PH and alkalinity and the
portion of organic matter converted to methane. For that reason methane yield
increased with the HRT.
2.5.3 Pre-Treatment
The physical, chemical and biological pre-treatment is the enhancement method
for the first step of breaking complex molecules into simple monomers, to
increase solubilization of organic material and improve the efficiency of the
anaerobic treatment for the second step. The pre-treatment was required such as
thermal, alkaline, ultrasonic or mechanical disintegration. The treatment can
accelerated the solubilization (hydrolisis) and reduce the particle size, which
subsequently improves the anaerobic digestion (Jeongsik Kim, 2002)
22
As example is in the effect of alkaline pre-treatment on anaerobic digestion of
solid waste, the chemical treatment was based on lime, Ca(OH)2 addition in order
to enhance chemical oxygen demand (COD) solubilization , followed by anaerobic
digestion of the organic fraction of municipal solid waste, OFMSW (Llorens,
2007)
The experiment was carried out in complexly mixed reactor, 1 L capacity. Optimal
conditions for COD solubilization in the first step of pre-treatment were 62.0 mEq
Ca(OH)2/L for 6.0 h. Under these conditions, 11.5% of the COD was solubilized.
The anaerobic digestion efficiency of the OFMSW, with and without pre-
treatment, was evaluated.
The highest methane yield under anaerobic digestion of the pre-treated waste was
0.15 m3 CH4/kg volatile solids (VS), 172.0% of the control. Under that condition
the soluble COD and VS removal were 93.0% and 94.0%, respectively. The results
have shown that chemical pre-treatment with lime, followed by anaerobic
digestion, provides the best results for stabilizing the OFMSW (Llorens, 2007).
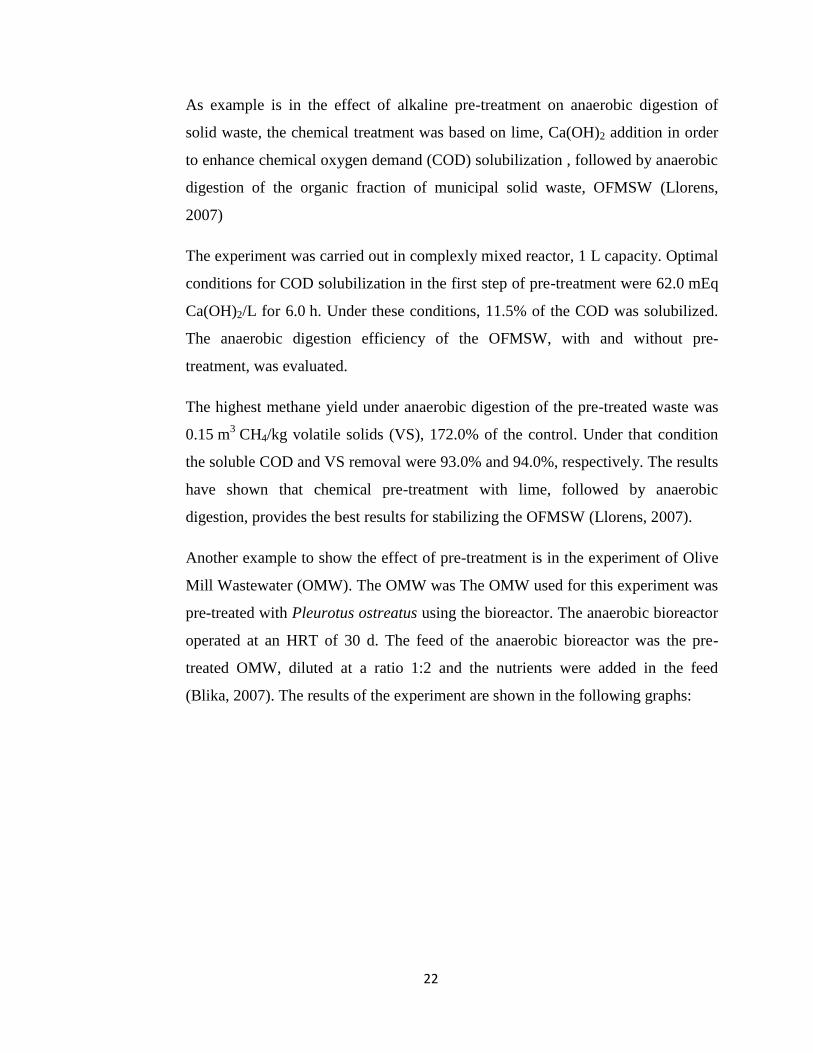
Another example to show the effect of pre-treatment is in the experiment of Olive
Mill Wastewater (OMW). The OMW was The OMW used for this experiment was
pre-treated with Pleurotus ostreatus using the bioreactor. The anaerobic bioreactor
operated at an HRT of 30 d. The feed of the anaerobic bioreactor was the pre-
treated OMW, diluted at a ratio 1:2 and the nutrients were added in the feed
(Blika, 2007). The results of the experiment are shown in the following graphs:
23
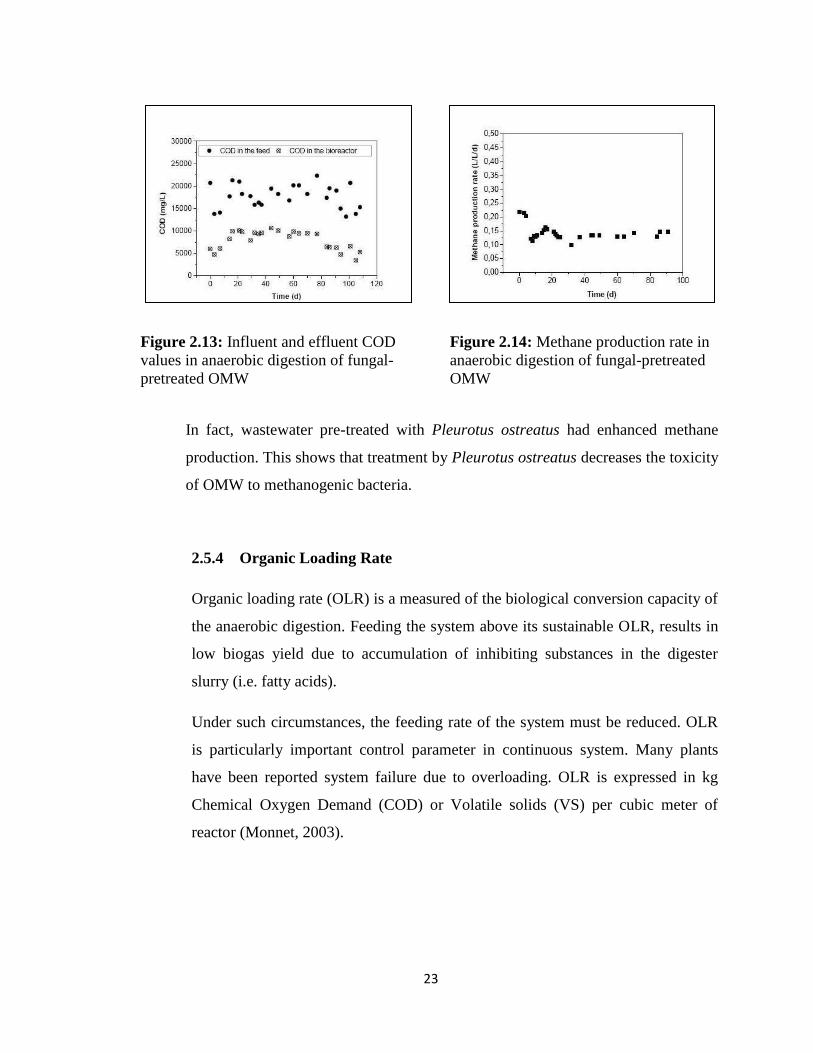
In fact, wastewater pre-treated with Pleurotus ostreatus had enhanced methane
production. This shows that treatment by Pleurotus ostreatus decreases the toxicity
of OMW to methanogenic bacteria.
2.5.4 Organic Loading Rate
Organic loading rate (OLR) is a measured of the biological conversion capacity of
the anaerobic digestion. Feeding the system above its sustainable OLR, results in
low biogas yield due to accumulation of inhibiting substances in the digester
slurry (i.e. fatty acids).
Under such circumstances, the feeding rate of the system must be reduced. OLR
is particularly important control parameter in continuous system. Many plants
have been reported system failure due to overloading. OLR is expressed in kg
Chemical Oxygen Demand (COD) or Volatile solids (VS) per cubic meter of
reactor (Monnet, 2003).
Figure 2.13: Influent and effluent COD
values in anaerobic digestion of fungal-
pretreated OMW
Figure 2.14: Methane production rate in
anaerobic digestion of fungal-pretreated
OMW
24
2.5.5 Other Factors
Another factors could be consider in optimization of biogas production in
anaerobic digestion. For example are reactor types and designs to be as digester in
the process system. CSTR is one of the reactor types which the effluent is added to
the reactor and mixing is accomplished with gas mixers, mechanical mixers and
recirculation pump. It has been proved as a technology that can achieve reasonable
conversion from solids to gas (Bertoldo, 2008). High installation and operating
costs, high hydraulic retention times are required to achieve an acceptable level of
degradation, signifying large reactor sizes.
Other types of reactor are Upflow Anaerobic Sludge Blanket (UASB) reactor and
Contact Digester. In UASB reactor, the biomass forms sludge granules, producing
a sludge bed which is completely retained in the reactor where formation of the
granular sludge bed requires a significant amount of time, causing longer start-up
times when compared to other reactors. In Contact Digester, biomass is retained by
separating and concentrating the solids in a separate reactor, returning these solids
to the influent. The Solids separation can be achieved with gravity separators,
solids thickeners, centrifuges, gravity belts, and membranes.
25
CHAPTER 3
METHODOLOGY
3.1 INTRODUCTION
Throughout this project, there were three (3) main phase of research methodology
which is Phase (I) was about literature review, Phase (II) based on the
experimental works and Phase (III) was related to the result analysis where the
problem statements of the project will be concluded.
3.1.1 Literature Review
A part of the literature reviews the problem statements of the project were
identified according to the project’s research title. The problem statements were
intended to be clarified to ensure the works were in line with the objective of the
research project. There were several sources which were used such as journal,
website, books and paperwork. In the earlier of the project started the main focus
was studying about the anaerobic digestion process. The information about this
process was gathered in terms of their mechanism, stage of process involved,
factors influencing anaerobic digester performance and the availability and
suitability of the feedstock. The suitable experimental work methods were
identified to be implemented in this project. Almost the information are getting
from previous work relating to research problem and previous works relating to
methodology and results.
3.1.2 Experimental Works
In the phase (II), the project was focused on the experimental works. Due to the
limitation of knowledge and facilities in the lab the experimental works and
procedures were varied from time to time. At the first, the apparatus of
26
experiment was constructed to predict whether the process using the POME
sample was produced a gas or not. It was based on reference from a project which
titled on Mathematical Model for the Estimation of Anaerobic Sludge Activity by
B.M.P Barampouti from National Technical University of Athens. The
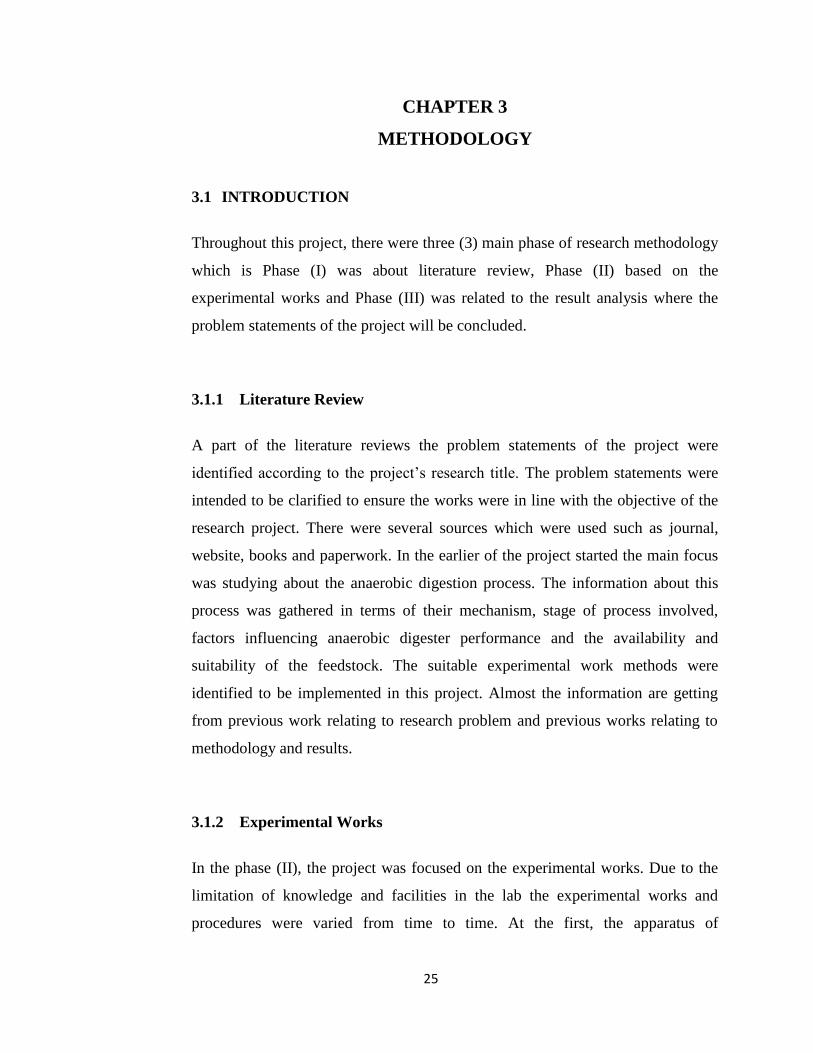
assembling of the apparatus is shown in figure 3.1.
Figure 3.1: Apparatus for anaerobic sludge activity measurement (E.M.P Barampouti, 2003)
The anaerobic activity analysis is run in apparatus as described in Figure 3.1
above and the standard procedure is described as follow; 1.0 L of POME with the
sludge is put in the digester of Figure 3.1 and stored for 24 hours at 35 °C. The
PH was corrected to 7.0 by using NaOH powder. The digester was connected
with the apparatus of Figure 3.1 after flushing with nitrogen gas and it placed in a
water bath at 35 °C on magnetic stirrer and thermal controller. The rising biogas
is collected in a graduated measuring cylinder of 2.0 l or more passing through an
alkaline scrubber in order to absorb CO2. The data of methane production is
collected by measuring the water displacement and in order to know the
composition of biogas, the sample is collected and tested in GC (E.M.P
Baramapouti, 2003)
As time goes by, this method was indentified not to be a practical enough to
collect the biogas and tested it in Gas Chromatograph. There was a problem when
the composition of the gas needs to be tested because the gas sample could not
27
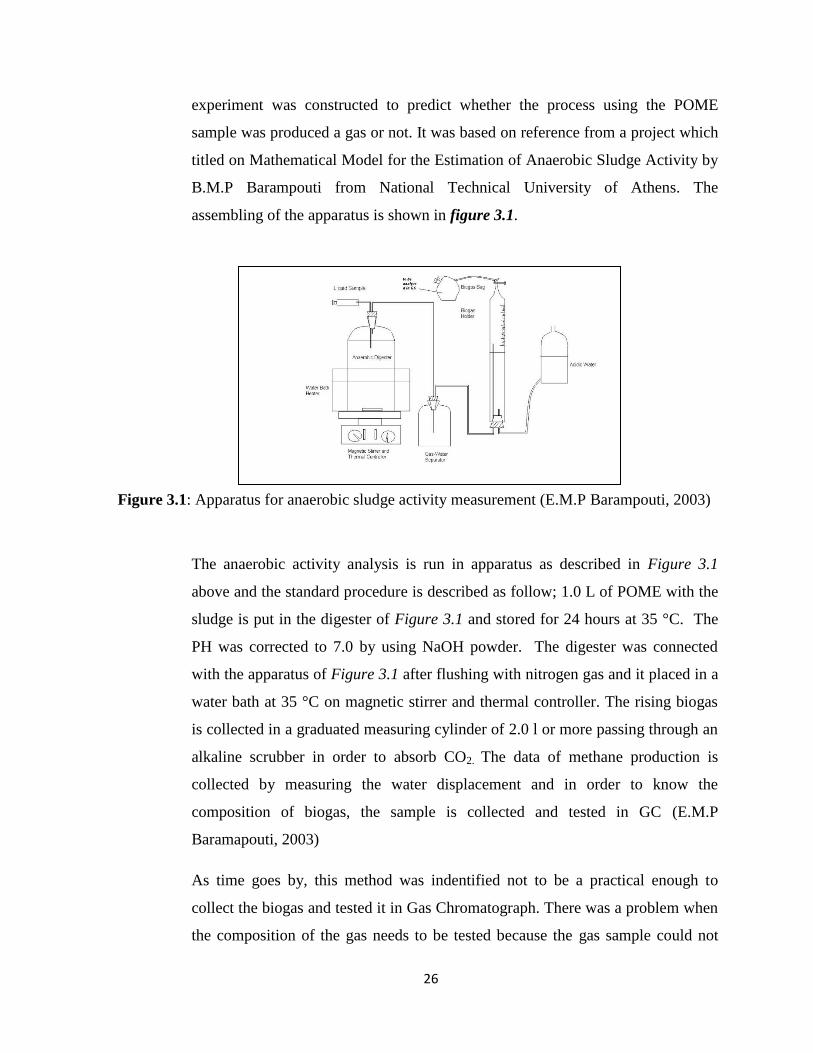
hold for a long time and in the inappropriate tool. Then the new method was
found where the digester itself is placed in the water bath shaker and the biogas
was collected by having the biogas bag as shown in Figure 3.2;
Figure 3.2: Samples in water bath shaker
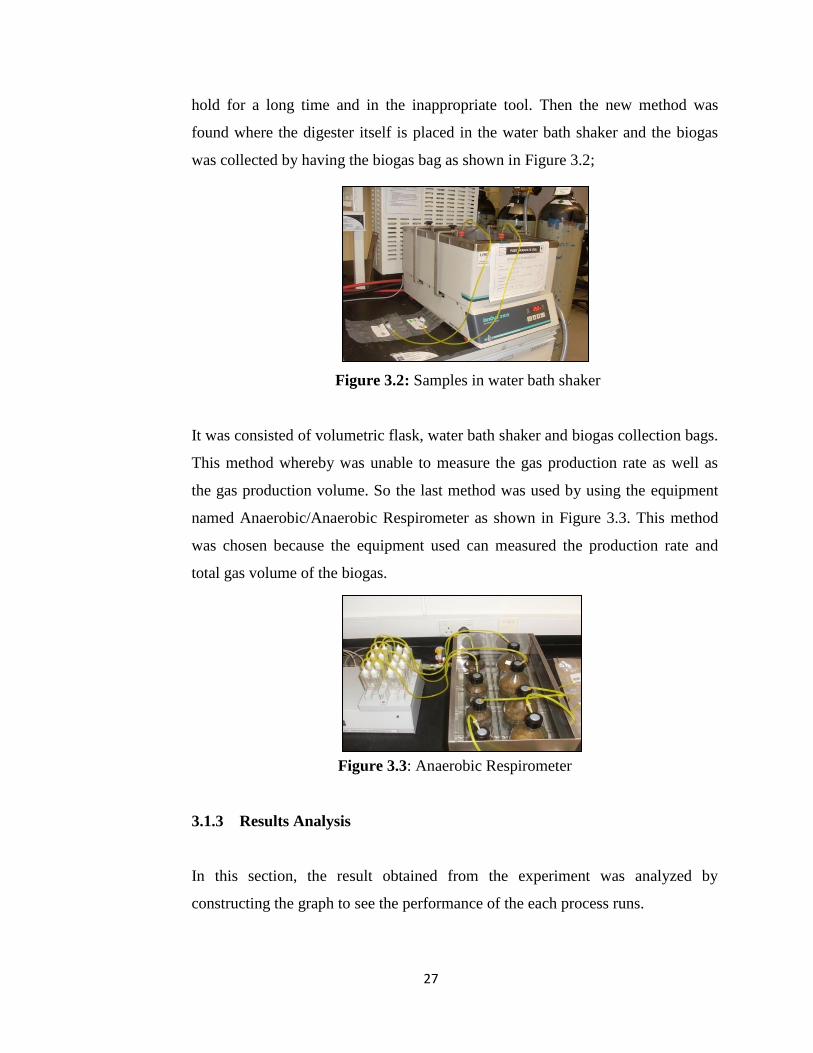
It was consisted of volumetric flask, water bath shaker and biogas collection bags.
This method whereby was unable to measure the gas production rate as well as
the gas production volume. So the last method was used by using the equipment
named Anaerobic/Anaerobic Respirometer as shown in Figure 3.3. This method
was chosen because the equipment used can measured the production rate and
total gas volume of the biogas.
Figure 3.3: Anaerobic Respirometer
3.1.3 Results Analysis
In this section, the result obtained from the experiment was analyzed by
constructing the graph to see the performance of the each process runs.
28
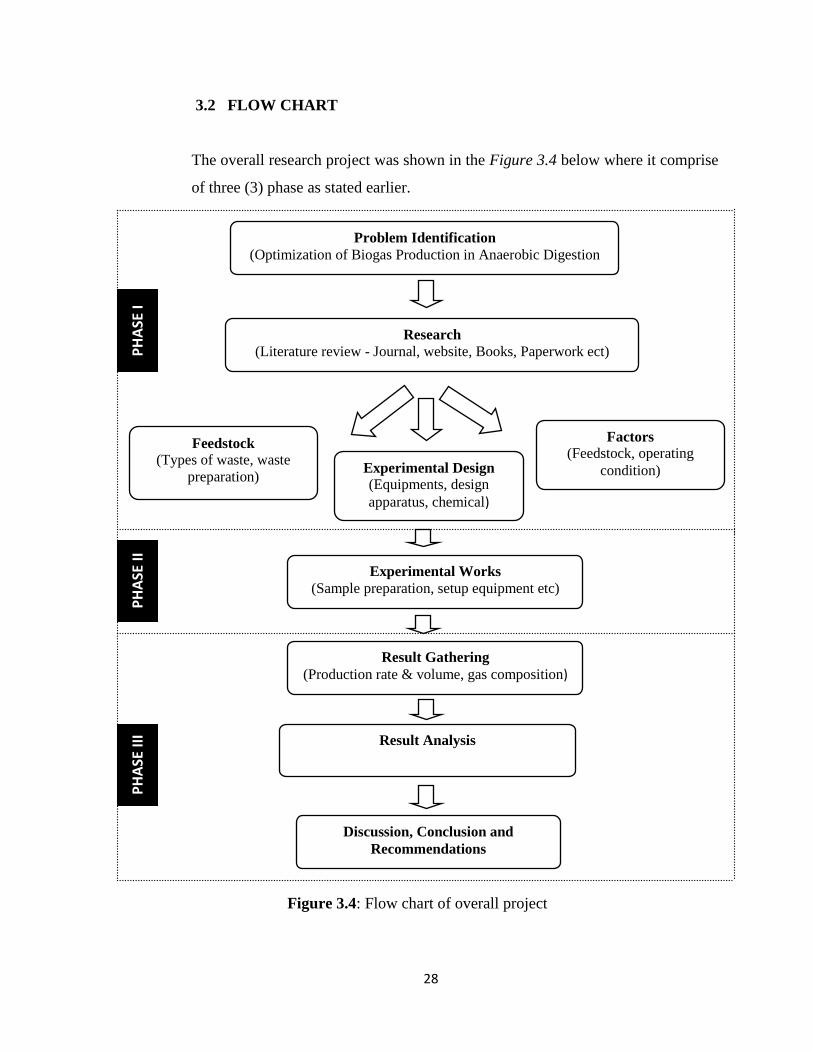
3.2 FLOW CHART
The overall research project was shown in the Figure 3.4 below where it comprise
of three (3) phase as stated earlier.
Figure 3.4: Flow chart of overall project
PH
ASE
I P
HA
SE II
P
HA
SE II
I
Problem Identification
(Optimization of Biogas Production in Anaerobic Digestion
Research
(Literature review - Journal, website, Books, Paperwork ect)
Feedstock
(Types of waste, waste
preparation)
Experimental Design
(Equipments, design
apparatus, chemical)
Factors
(Feedstock, operating
condition)
Experimental Works
(Sample preparation, setup equipment etc)
Result Gathering
(Production rate & volume, gas composition)
Result Analysis
Discussion, Conclusion and
Recommendations
29
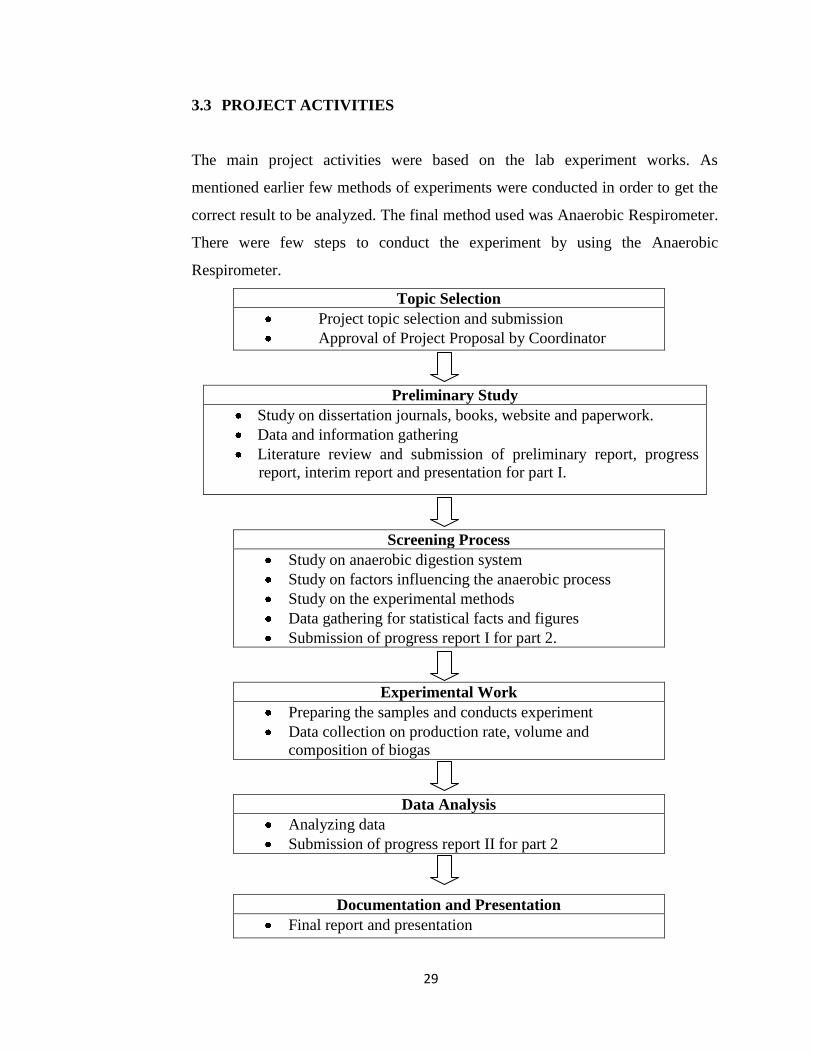
3.3 PROJECT ACTIVITIES
The main project activities were based on the lab experiment works. As
mentioned earlier few methods of experiments were conducted in order to get the
correct result to be analyzed. The final method used was Anaerobic Respirometer.
There were few steps to conduct the experiment by using the Anaerobic
Respirometer.
Topic Selection
Project topic selection and submission
Approval of Project Proposal by Coordinator
Preliminary Study
Study on dissertation journals, books, website and paperwork.
Data and information gathering
Literature review and submission of preliminary report, progress
report, interim report and presentation for part I.
Screening Process
Study on anaerobic digestion system
Study on factors influencing the anaerobic process
Study on the experimental methods
Data gathering for statistical facts and figures
Submission of progress report I for part 2.
Experimental Work
Preparing the samples and conducts experiment
Data collection on production rate, volume and
composition of biogas
Data Analysis
Analyzing data
Submission of progress report II for part 2
Documentation and Presentation
Final report and presentation
30
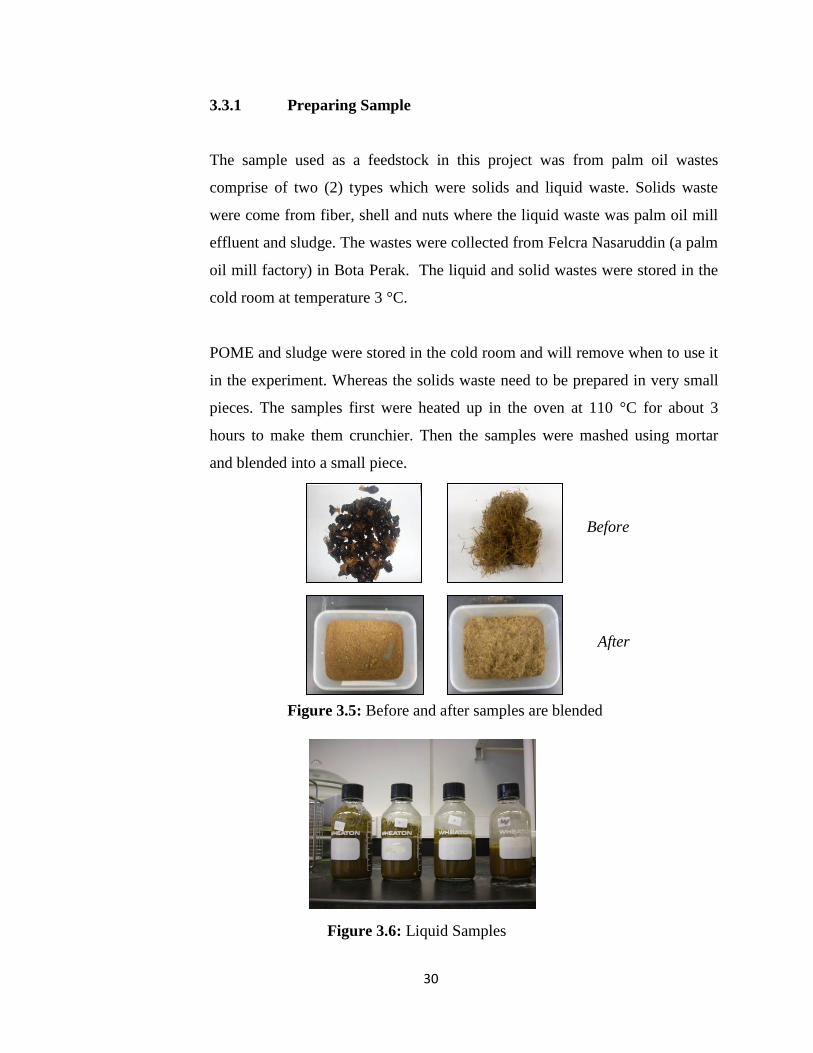
3.3.1 Preparing Sample
The sample used as a feedstock in this project was from palm oil wastes
comprise of two (2) types which were solids and liquid waste. Solids waste
were come from fiber, shell and nuts where the liquid waste was palm oil mill
effluent and sludge. The wastes were collected from Felcra Nasaruddin (a palm
oil mill factory) in Bota Perak. The liquid and solid wastes were stored in the
cold room at temperature 3 °C.
POME and sludge were stored in the cold room and will remove when to use it
in the experiment. Whereas the solids waste need to be prepared in very small
pieces. The samples first were heated up in the oven at 110 °C for about 3
hours to make them crunchier. Then the samples were mashed using mortar
and blended into a small piece.
Figure 3.5: Before and after samples are blended
Figure 3.6: Liquid Samples
Before
After
31
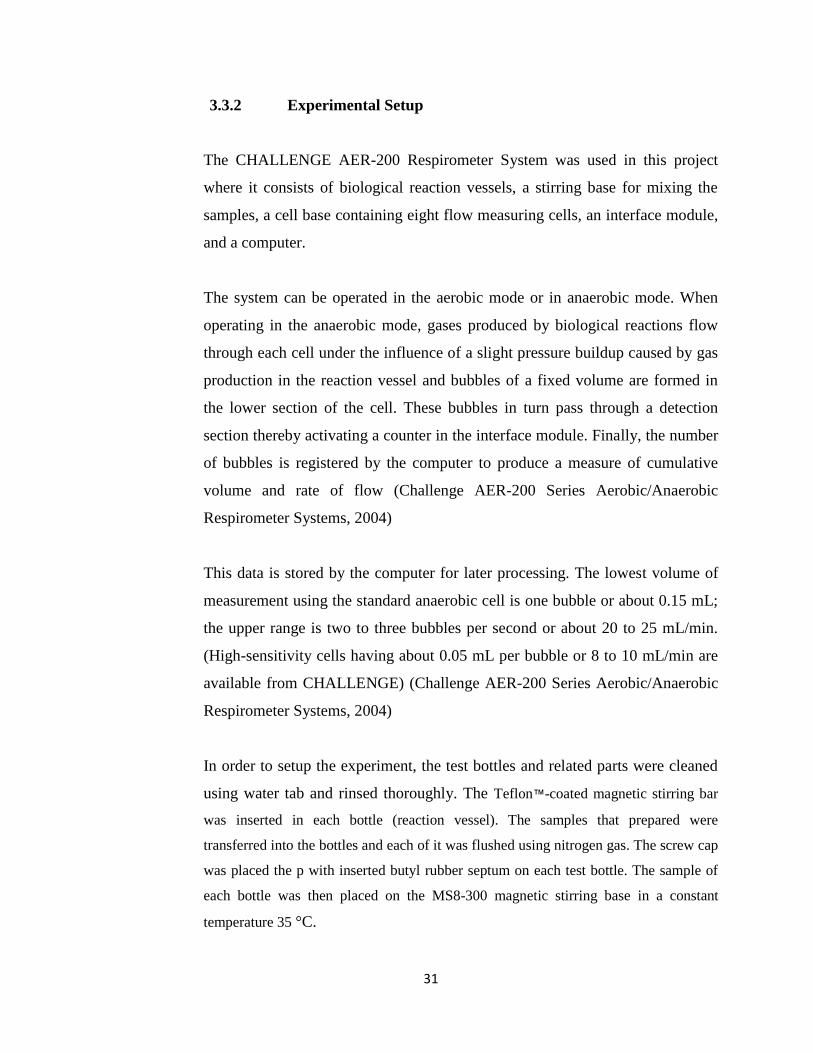
3.3.2 Experimental Setup
The CHALLENGE AER-200 Respirometer System was used in this project
where it consists of biological reaction vessels, a stirring base for mixing the
samples, a cell base containing eight flow measuring cells, an interface module,
and a computer.
The system can be operated in the aerobic mode or in anaerobic mode. When
operating in the anaerobic mode, gases produced by biological reactions flow
through each cell under the influence of a slight pressure buildup caused by gas
production in the reaction vessel and bubbles of a fixed volume are formed in
the lower section of the cell. These bubbles in turn pass through a detection
section thereby activating a counter in the interface module. Finally, the number
of bubbles is registered by the computer to produce a measure of cumulative
volume and rate of flow (Challenge AER-200 Series Aerobic/Anaerobic
Respirometer Systems, 2004)
This data is stored by the computer for later processing. The lowest volume of
measurement using the standard anaerobic cell is one bubble or about 0.15 mL;
the upper range is two to three bubbles per second or about 20 to 25 mL/min.
(High-sensitivity cells having about 0.05 mL per bubble or 8 to 10 mL/min are
available from CHALLENGE) (Challenge AER-200 Series Aerobic/Anaerobic
Respirometer Systems, 2004)
In order to setup the experiment, the test bottles and related parts were cleaned
using water tab and rinsed thoroughly. The Teflon™-coated magnetic stirring bar
was inserted in each bottle (reaction vessel). The samples that prepared were
transferred into the bottles and each of it was flushed using nitrogen gas. The screw cap
was placed the p with inserted butyl rubber septum on each test bottle. The sample of
each bottle was then placed on the MS8-300 magnetic stirring base in a constant
temperature 35 °C.
32
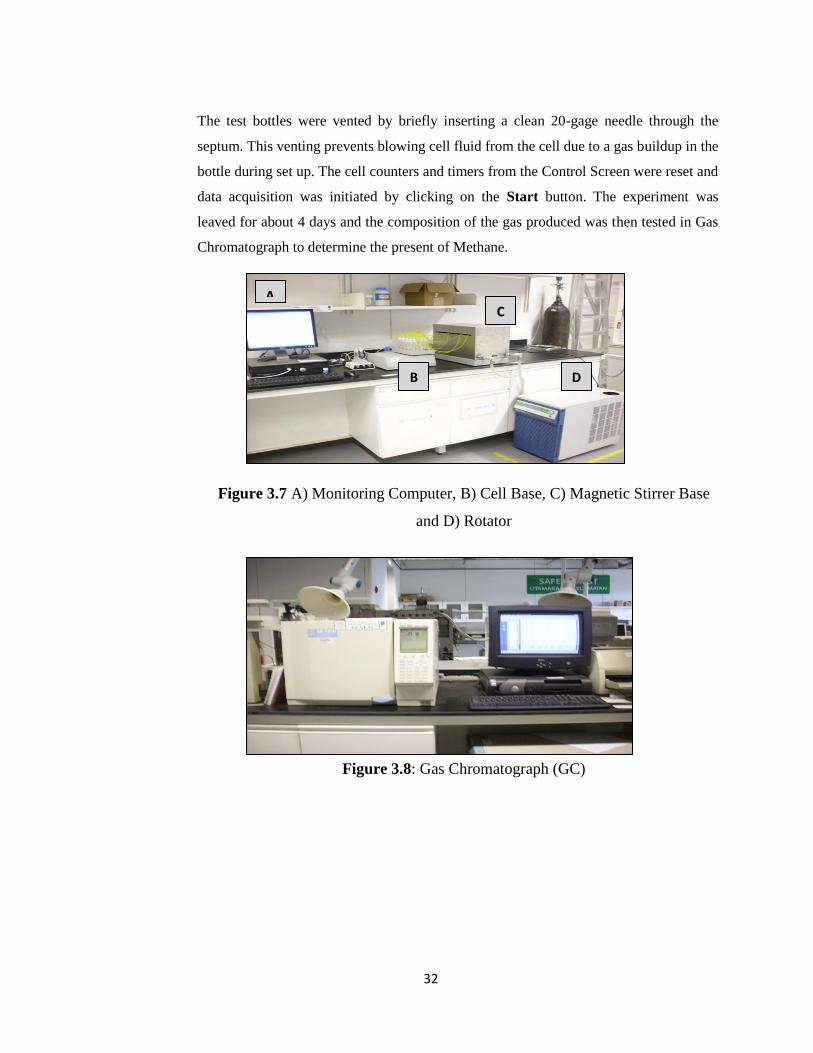
The test bottles were vented by briefly inserting a clean 20-gage needle through the
septum. This venting prevents blowing cell fluid from the cell due to a gas buildup in the
bottle during set up. The cell counters and timers from the Control Screen were reset and
data acquisition was initiated by clicking on the Start button. The experiment was
leaved for about 4 days and the composition of the gas produced was then tested in Gas
Chromatograph to determine the present of Methane.
Figure 3.7 A) Monitoring Computer, B) Cell Base, C) Magnetic Stirrer Base
and D) Rotator
Figure 3.8: Gas Chromatograph (GC)
A C
B D
33
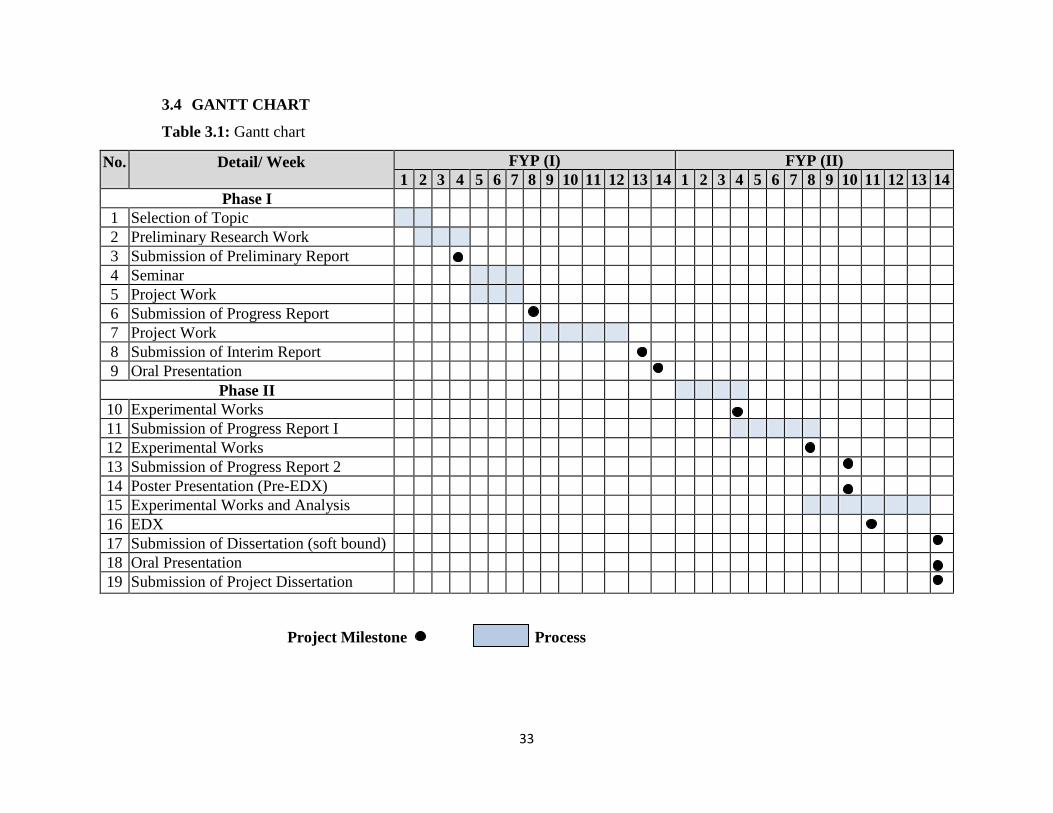
3.4 GANTT CHART
Table 3.1: Gantt chart
No. Detail/ Week FYP (I) FYP (II)
1 2 3 4 5 6 7 8 9 10 11 12 13 14 1 2 3 4 5 6 7 8 9 10 11 12 13 14
Phase I
1 Selection of Topic
2 Preliminary Research Work
3 Submission of Preliminary Report
4 Seminar
5 Project Work
6 Submission of Progress Report
7 Project Work
8 Submission of Interim Report
9 Oral Presentation
Phase II
10 Experimental Works
11 Submission of Progress Report I
12 Experimental Works
13 Submission of Progress Report 2
14 Poster Presentation (Pre-EDX)
15 Experimental Works and Analysis
16 EDX
17 Submission of Dissertation (soft bound)
18 Oral Presentation
19 Submission of Project Dissertation
(Hard) Bound)
Project Milestone Process
34
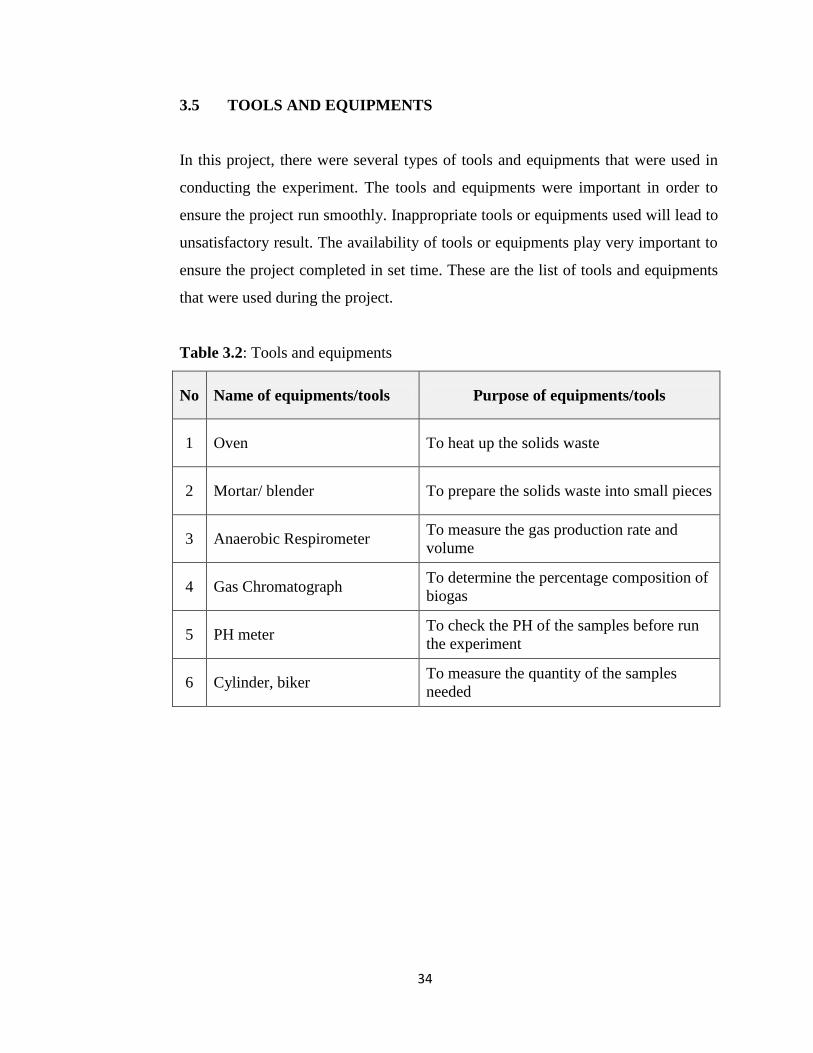
3.5 TOOLS AND EQUIPMENTS
In this project, there were several types of tools and equipments that were used in
conducting the experiment. The tools and equipments were important in order to
ensure the project run smoothly. Inappropriate tools or equipments used will lead to
unsatisfactory result. The availability of tools or equipments play very important to
ensure the project completed in set time. These are the list of tools and equipments
that were used during the project.
Table 3.2: Tools and equipments
No Name of equipments/tools Purpose of equipments/tools
1 Oven To heat up the solids waste
2 Mortar/ blender To prepare the solids waste into small pieces
3 Anaerobic Respirometer To measure the gas production rate and
volume
4 Gas Chromatograph To determine the percentage composition of
biogas
5 PH meter To check the PH of the samples before run
the experiment
6 Cylinder, biker To measure the quantity of the samples
needed
35
CHAPTER 4
RESULT AND DISCUSSION
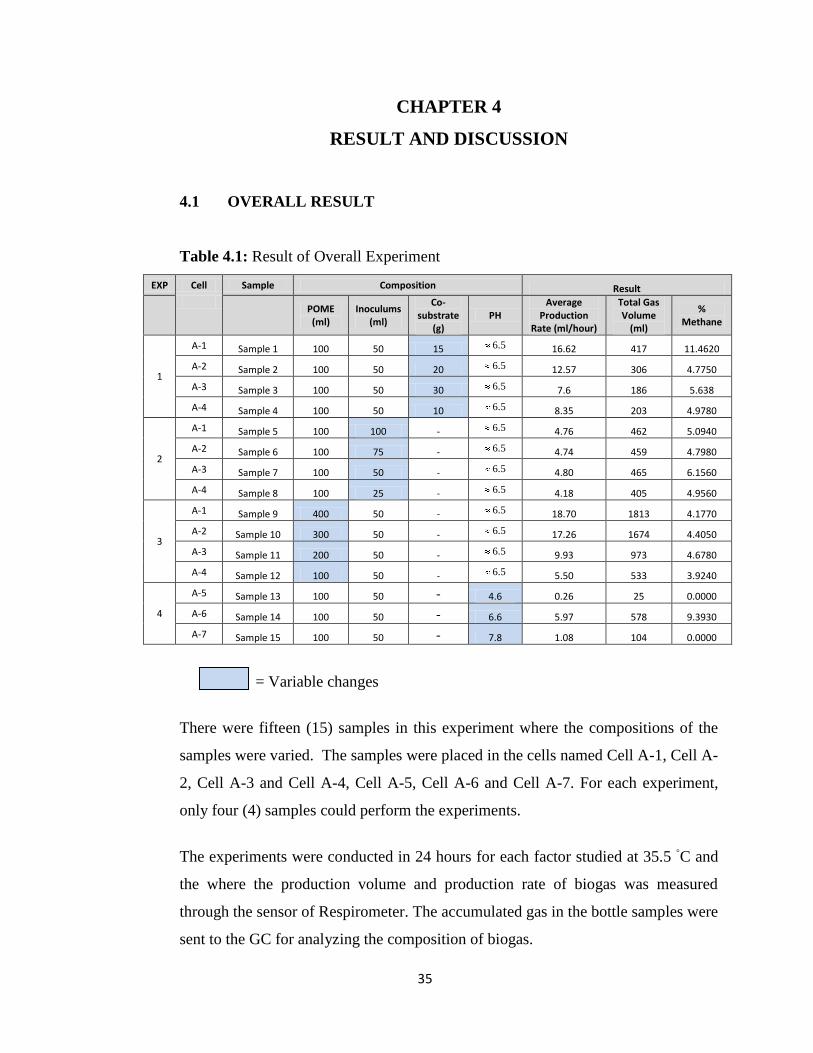
4.1 OVERALL RESULT
Table 4.1: Result of Overall Experiment
EXP Cell Sample Composition Result
POME (ml)
Inoculums (ml)
Co-substrate
(g) PH
Average Production
Rate (ml/hour)
Total Gas Volume
(ml)
% Methane
1
A-1 Sample 1 100 50 15 5.6 16.62 417 11.4620
A-2 Sample 2 100 50 20 5.6 12.57 306 4.7750
A-3 Sample 3 100 50 30 5.6 7.6 186 5.638
A-4 Sample 4 100 50 10 5.6 8.35 203 4.9780
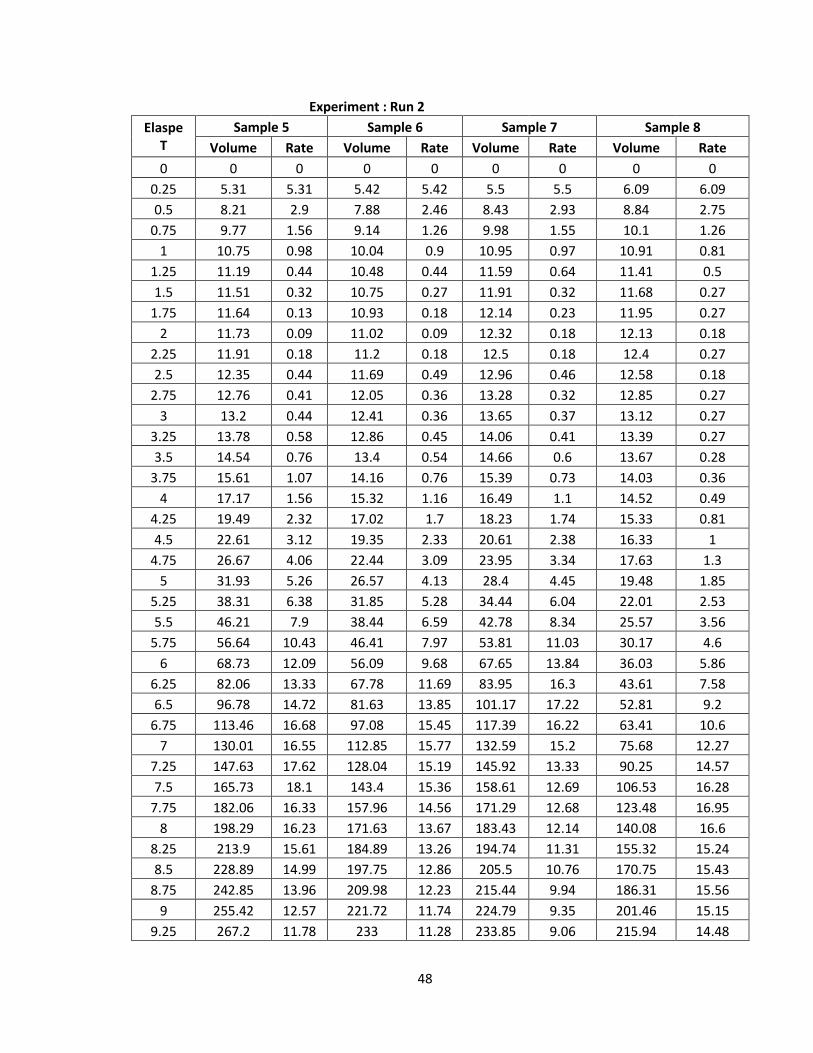
2
A-1 Sample 5 100 100 - 5.6 4.76 462 5.0940
A-2 Sample 6 100 75 - 5.6 4.74 459 4.7980
A-3 Sample 7 100 50 - 5.6 4.80 465 6.1560
A-4 Sample 8 100 25 - 5.6 4.18 405 4.9560
3
A-1 Sample 9 400 50 - 5.6 18.70 1813 4.1770
A-2 Sample 10 300 50 - 5.6 17.26 1674 4.4050
A-3 Sample 11 200 50 - 5.6 9.93 973 4.6780
A-4 Sample 12 100 50 - 5.6 5.50 533 3.9240
4
A-5 Sample 13 100 50 - 4.6 0.26 25 0.0000
A-6 Sample 14 100 50 - 6.6 5.97 578 9.3930
A-7 Sample 15 100 50 - 7.8 1.08 104 0.0000
= Variable changes
There were fifteen (15) samples in this experiment where the compositions of the
samples were varied. The samples were placed in the cells named Cell A-1, Cell A-
2, Cell A-3 and Cell A-4, Cell A-5, Cell A-6 and Cell A-7. For each experiment,
only four (4) samples could perform the experiments.
The experiments were conducted in 24 hours for each factor studied at 35.5 ◦C and
the where the production volume and production rate of biogas was measured
through the sensor of Respirometer. The accumulated gas in the bottle samples were
sent to the GC for analyzing the composition of biogas.
36
4.2 DISCUSSIONS
EXPERIMENT 1:
Table 4.2: Result of Experiment 1
EXP Cell Sample
Composition Result
POME (ml)
Inoculums (ml)
Co-substrate
(g) PH
Average Production
Rate (ml/hour)
Total Gas Volume
(ml)
% Methane
1
A-1 Sample 1 100 50 15 5.6 16.62 417 11.4620
A-2 Sample 2 100 50 20 5.6 12.57 306 4.7750
A-3 Sample 3 100 50 30 5.6 7.6 186 5.638
A-4 Sample 4 100 50 10 5.6 8.35 203 4.9780
a) b)
Figure 4.1: a) Gas Production rate for Experiment 1, b) Gas Production Volume for Experiment 1
Sample 1 = POME: 100 ml, Inoculums: 50 ml, Co-substrate: 15g
Sample 2 = POME: 100 ml, Inoculums: 50 ml, Co-substrate: 20g
Sample 3 = POME: 100 ml, Inoculums: 50 ml, Co-substrate: 30g
Sample 4 = POME: 100 ml, Inoculums: 50 ml, Co-substrate: 10g
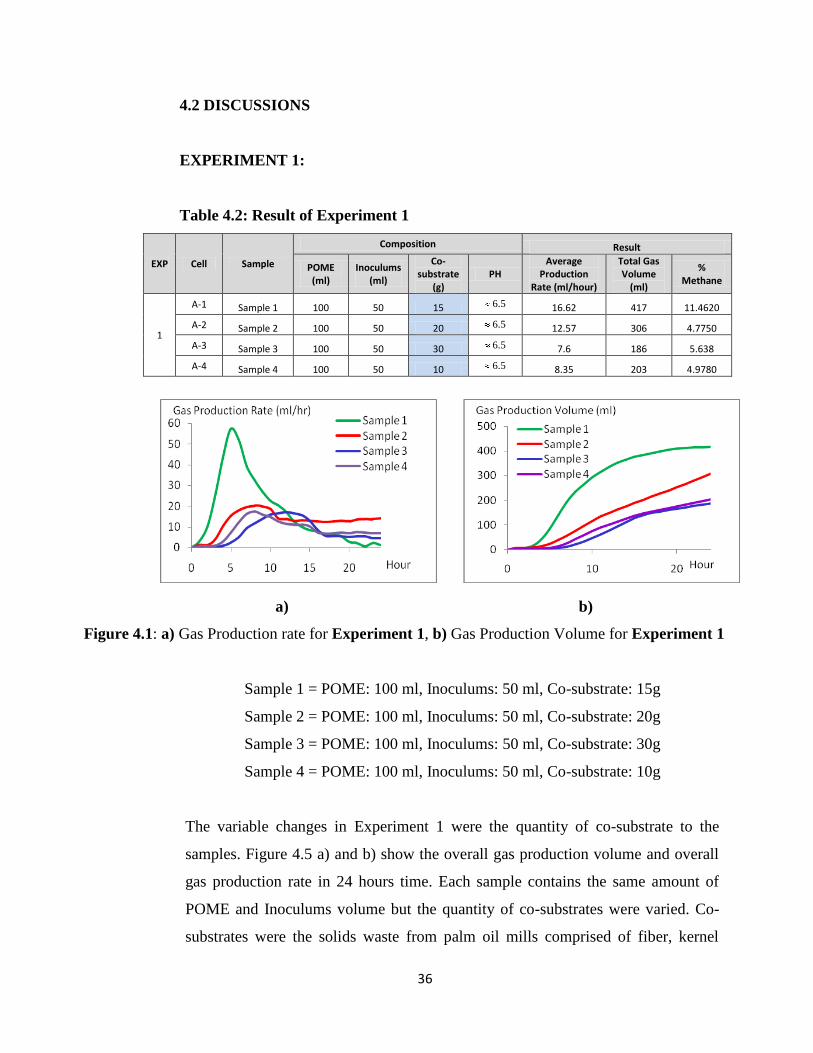
The variable changes in Experiment 1 were the quantity of co-substrate to the
samples. Figure 4.5 a) and b) show the overall gas production volume and overall
gas production rate in 24 hours time. Each sample contains the same amount of
POME and Inoculums volume but the quantity of co-substrates were varied. Co-
substrates were the solids waste from palm oil mills comprised of fiber, kernel
37
shell and EFB. At the beginning the gas production rate of sample 1 was very high
and the highest among others sample. After an about 6 hours, the production rate
was obviously decreasing until to the end of experiment.
For the sample 2, the gas production rate was also high at the beginning and not
constant until it apparently was dropped when approaching to the end. At that time
only small amount of gas was produced. For the sample 3 and sample 4, the trend
was slightly same where at the beginning both of them were increasing and start to
drop from hour 10 to 15.
The composition of substrate had a significant influence on the overall production
of biogas. The fermentation was done at 35.5 ◦C and initial PH 6.5 in the earlier of
experiment for all the samples. Figure 4.1 b shows the accumulated biogas profile
for different compositions of co-substrate and the result shows that the ratio of co-
substrate to the Inoculums volume, 10:3 as suitable ratio for optimal biogas
production which gave 417 ml day-1
of accumulated biogas. In this study, the
lowest biogas production obtained was 186 ml day-1
for sample 3 which contains
30 g of co-substrate. This might be due to the too high composition of solid wastes
causing the inhibition of bacteria in the sample.
38
EXPERIMENT 2:
Table 4.3: Result of Experiment 2
a) b)
Figure 4.2: a) Gas Production rate for Experiment 2, b) Gas Production Volume for Experiment 2
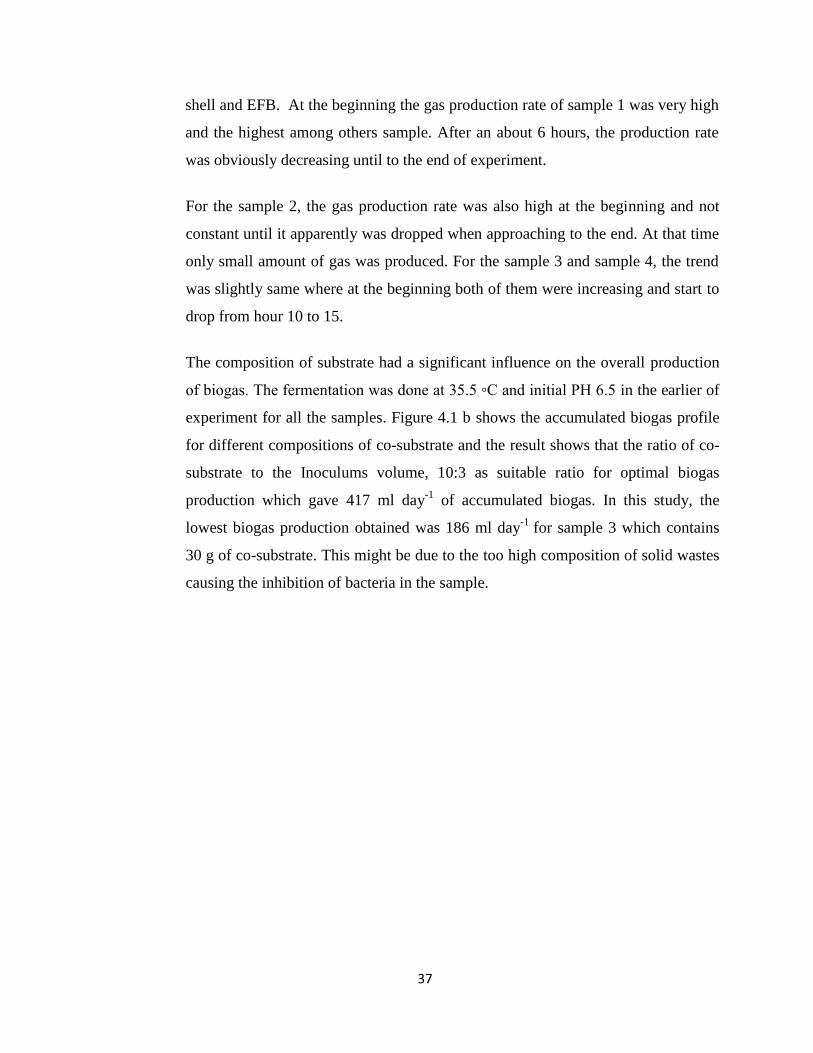
Sample 5 = POME: 100 ml, Inoculums: 100 ml
Sample 6 = POME: 100 ml, Inoculums: 75 ml
Sample 7 = POME: 100 ml, Inoculums: 50 ml
Sample 8 = POME: 100 ml, Inoculums: 25 ml
The variable changes in Experiment 2 were the volume of Inoculums added into
the samples. The changes of Inoculums volumes were 100 ml, 75 ml, 50 ml and 25
ml with the constant volume of POME which was 100 ml each. The graph 4.2 a
shows that the rates of biogas production for each sample were slightly same until
to the end of experiment. All the samples were increased at the beginning of
experiment and started to decreased when reached at hour 8. In this run, Sample 7
with ratio of inoculums to POME, 1:2 gave high total biogas production volume,
EXP Cell Sample
Composition Result
POME (ml)
Inoculums (ml)
Co-substrate
(g) PH
Average Production
Rate (ml/hour)
Total Gas Volume
(ml)
% Methane
2
A-1 Sample 5 100 100 - 5.6 4.76 462 5.0940
A-2 Sample 6 100 75 - 5.6 4.74 459 4.7980
A-3 Sample 7 100 50 - 5.6 4.80 465 6.1560
A-4 Sample 8 100 25 - 5.6 4.18 405 4.9560
39
biogas production rate and the percentage of methane (CH4). It composition was
(Composition: POME = 100 ml and Inoculums = 50 ml). The lowest biogas
production obtained was 405 ml day-1
for sample 8 which contains 25 ml of
inoculums. This might due to insufficient quantity of bacteria that could digest the
POME itself through the anaerobic digestion process. Too high composition of
inoculums also not necessarily gave the high production of biogas.
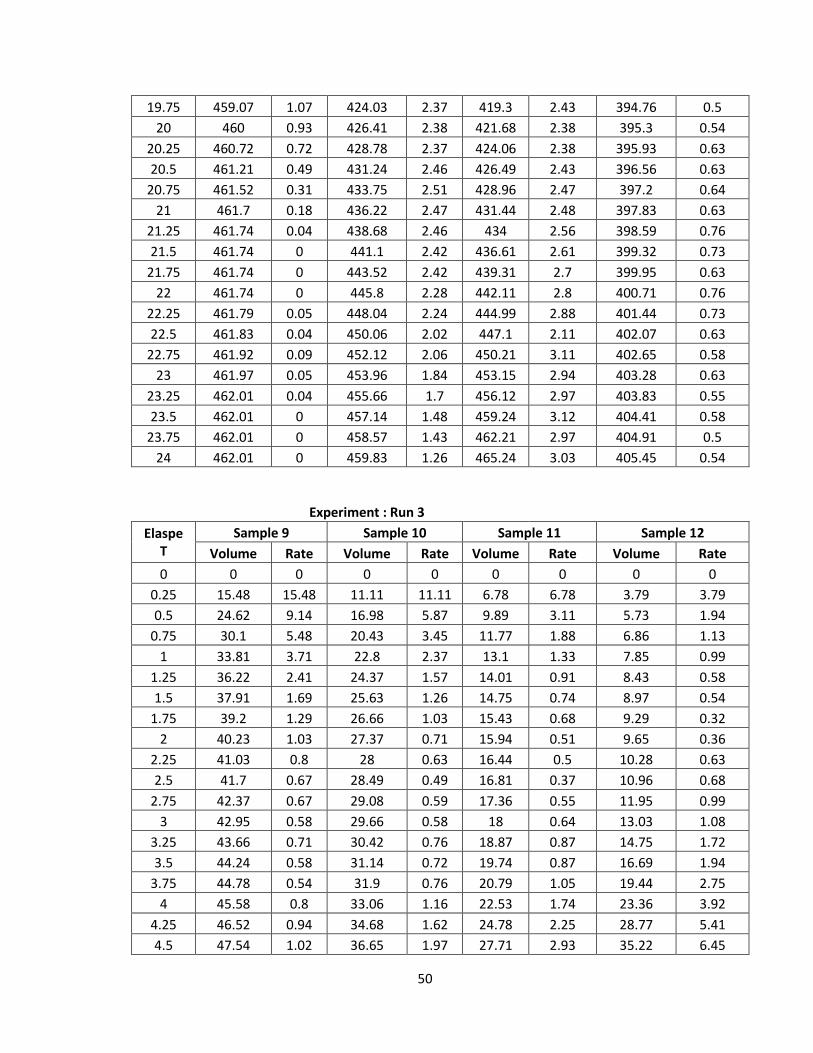
EXPERIMENT 3:
Table 4.4: Result of Experiment 3
EXP Cell Sample
Composition Result
POME (ml)
Inoculums (ml)
Co-substrate
(g) PH
Average Production
Rate (ml/hour)
Total Gas Volume
(ml)
% Methane
3
A-1 Sample 9 400 50 - 5.6 18.70 1813 4.1770
A-2 Sample 10 300 50 - 5.6 17.26 1674 4.4050
A-3 Sample 11 200 50 - 5.6 9.93 973 4.6780
A-4 Sample 12 100 50 - 5.6 5.50 533 3.9240
a) b)
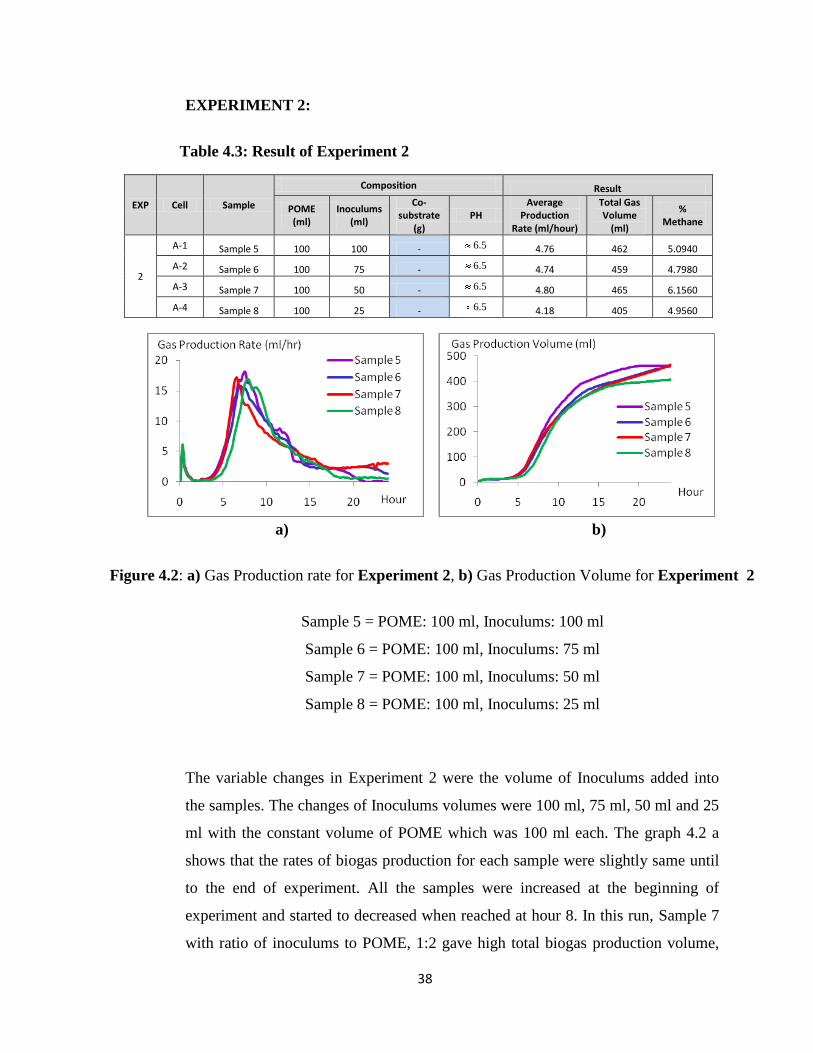
Figure 4.3: a) Gas Production rate for Experiment 3, b) Gas Production Volume for Experiment 3
Sample 9 = POME: 400 ml, Inoculums: 50 ml
Sample 10 = POME: 300 ml, Inoculums: 50 ml
Sample 11 = POME: 200 ml, Inoculums: 50 ml
Sample 12 = POME: 100 ml, Inoculums: 50 ml
40
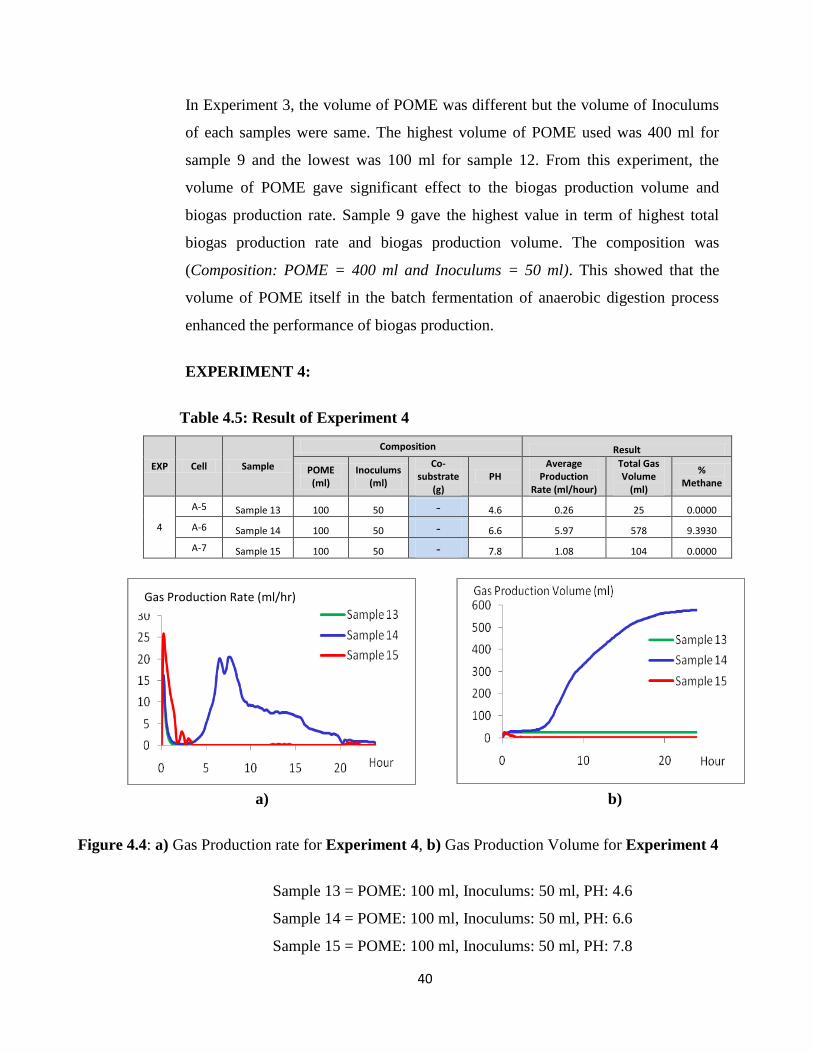
In Experiment 3, the volume of POME was different but the volume of Inoculums
of each samples were same. The highest volume of POME used was 400 ml for
sample 9 and the lowest was 100 ml for sample 12. From this experiment, the
volume of POME gave significant effect to the biogas production volume and
biogas production rate. Sample 9 gave the highest value in term of highest total
biogas production rate and biogas production volume. The composition was
(Composition: POME = 400 ml and Inoculums = 50 ml). This showed that the
volume of POME itself in the batch fermentation of anaerobic digestion process
enhanced the performance of biogas production.
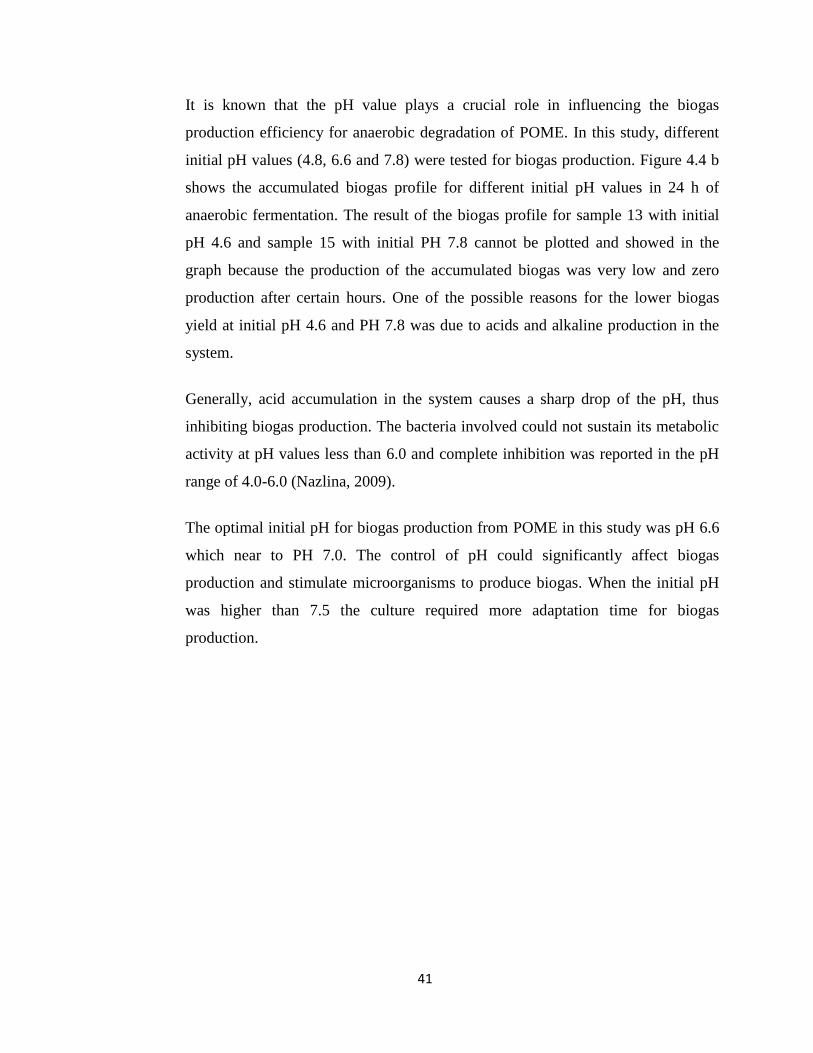
EXPERIMENT 4:
Table 4.5: Result of Experiment 4
EXP Cell Sample
Composition Result
POME (ml)
Inoculums (ml)
Co-substrate
(g) PH
Average Production
Rate (ml/hour)
Total Gas Volume
(ml)
% Methane
4
A-5 Sample 13 100 50 - 4.6 0.26 25 0.0000
A-6 Sample 14 100 50 - 6.6 5.97 578 9.3930
A-7 Sample 15 100 50 - 7.8 1.08 104 0.0000
a) b)
Figure 4.4: a) Gas Production rate for Experiment 4, b) Gas Production Volume for Experiment 4
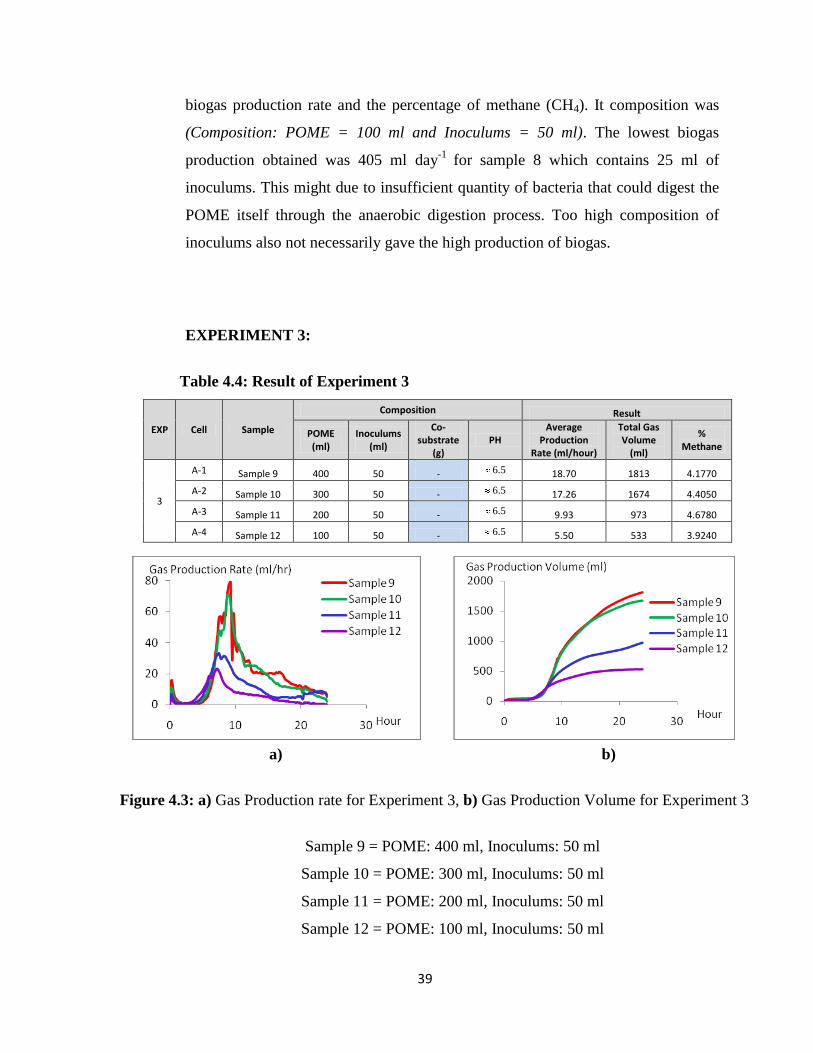
Sample 13 = POME: 100 ml, Inoculums: 50 ml, PH: 4.6
Sample 14 = POME: 100 ml, Inoculums: 50 ml, PH: 6.6
Sample 15 = POME: 100 ml, Inoculums: 50 ml, PH: 7.8
Gas Production Rate (ml/hr)
41
It is known that the pH value plays a crucial role in influencing the biogas
production efficiency for anaerobic degradation of POME. In this study, different
initial pH values (4.8, 6.6 and 7.8) were tested for biogas production. Figure 4.4 b
shows the accumulated biogas profile for different initial pH values in 24 h of
anaerobic fermentation. The result of the biogas profile for sample 13 with initial
pH 4.6 and sample 15 with initial PH 7.8 cannot be plotted and showed in the
graph because the production of the accumulated biogas was very low and zero
production after certain hours. One of the possible reasons for the lower biogas
yield at initial pH 4.6 and PH 7.8 was due to acids and alkaline production in the
system.
Generally, acid accumulation in the system causes a sharp drop of the pH, thus
inhibiting biogas production. The bacteria involved could not sustain its metabolic
activity at pH values less than 6.0 and complete inhibition was reported in the pH
range of 4.0-6.0 (Nazlina, 2009).
The optimal initial pH for biogas production from POME in this study was pH 6.6
which near to PH 7.0. The control of pH could significantly affect biogas
production and stimulate microorganisms to produce biogas. When the initial pH
was higher than 7.5 the culture required more adaptation time for biogas
production.
42
CHAPTER 5
CONCLUSION AND RECOMMENDATIONS
5.1 CONCLUSION
In this study, enhancing biogas production could be achieved under proper
controlled conditions with enrichment of biogas producing bacteria from POME
sludge in mesophilic conditions. The experimental results showed that biogas
production from POME was optimal based on the initial pH 6.6, ratio between co-
substrate to the inoculums volume of 10:3, Volume of POME which is 400 ml
and the ratio of inoculums to POME volume of 1:2. From the experiment it
showed that the Palm Oil Mills Effluent (POME) can be considered as a good
substrate for biogas production under suitable operating conditions.
Co-substrate addition with acceptable ratio to the POME and Inoculums volume
could increase the rate and volume production of biogas as well as percentage of
methane yield. Different volume of POME and Inoculums also will result different
rate and volume production of biogas and the percentage of methane. And last but
not least the best pH condition is neutral within the range of 6-7 for the optimum
process of the anaerobic digestion.
43
5.2 RECOMMENDATIONS
In order to ensure the continuation of the project to become successful, there are
several recommendations are suggested:
i) The range for the operating conditions (PH, POME and Inoculums volume
and the quantity of co-substrate) needed to enlarge for the better result
obtained.
ii) The used of commercial type of microorganisms that available in market to
enhance the biogas production as well as the methane percentage.
iii) The experiment should be carried on in the continuous reactor instead of
batch fermentation system with larger scale of experiment to get more
accurate and reliable result.
iv) Enhancing the equipments required to perform the experiments to ensure
the project is run better and smoothly with the specific task and planning.
44
REFERENCES
Abraham, E. R. (2005). Biogas: Can It Be an Important Source of Energy? Env Sci Pollut
Res , 67-71
Bertoldo, D. (2008). Anaerobic Digestion of Biomass for Biogas Production. Department
of Chemical Engineering Lakehead University
Blika, P. (2007). Anaerobic digestion of olive mill wastewater. 2Institute of Chemical
Engineering and High Temperature Chemical Processes (ICEHT) , 1-8.
Challenge AER-200 Series Aerobic/Anaerobic Respirometer Systems. CES, Inc.
C.C.Onyegbado, J. a. (2007). A Review of Palm Oil Mill Effluent (POME) Water
Treatment. Global Journal of Environment Research , 54-62
Dave Parry, C. C. (January 2004). High Performance Anaerobic Digestion. Bioenergy
Subcommittee , 2-17
Dr. Michael Robinson, P. (2005). Anaerobic Digestion Process Theory. Department of
Civil
E.M.P Barampouti, S. a. (2003). A Mathematical Model for the Estimation of Anaerobic
Sludge Activity. 8th International Conference on Environment Science and
Technology , 72-78
Jaafar, S. T. (2004, February). Waste to Energy: Methane Recovery from Anaerobic
Digestion of Palm Oil Mill Effluent. Energy Smart , p. 4.
Jeongsik Kim, C. P.-H.-W. (November 2002). Effects of various Pretreatments for
Enhanced Anaerobic Digestion with Waste Activated Sludge. Journal of
Bioscience and Bioengineering , 271-275
Kossmann, W. (n.d.). Volume 1: Biogas Basics. Biogas Digest , 1-45.
Koyama, K. (2008, August 14). Renewable Energy Research - Biomass (Anaerobic
Digestion). Retrieved October 2009, 2009, from The California Energy
Commission:
http://www.energy.ca.gov/research/renewable/biomass/anaerobic_digestion/
Llorens, M. T. (2007). Effect of Alkaline Pretreatment on Anaerobic Digestion of Solid
Wastes. National Center for Scientific Researcher (CNIC)
45
Lorestani, A. A. (2006). Biological Treatment of Palm Oil Mill Effluent (POME) Using An
Up-Flow Anaerobic Sludge Fixed Film (UASFF) Bioreactor. Universiti Sains
Malaysia
Ludin, N. (2009). Palm Oil Biomass for Electricity Generation in Malaysia. Retrieved 9
16, 2009, from Pusat Tenaga Malaysia: http://www.ptm.org.my/biogen
Ma A.N, S. a. (1993). Current Status of Palm Oil Processing Wastes Management in Waste
Management in Malaysia. Current Status and Prospects for Bioremendiation,
B.G Yeoh et al. (Eds) , 111-136
M. F. Basri, S. Y. (2009). Improved biogas production from palm oil mill effluent. World J
Microbiol Biotechnol , 505
Mshandete, A. M. (2009). The Anaerobic Digestion of Cattail Weeds to Produce Methane
Using American Cockroach Gut Microorganisms. ARPN Journal of
Agricultural and Biological Science , 45
Monnet, F. (November 2003). An Introduction to Anaerobic Digestion of Organic Wastes.
Scotland: Remade Scotland
Nazlina, H.M.Y., A.R. Nor Aini, F. Ismail, M.Z.M. Yusof and M.A. Hassan, 2009. Effect
of different temperature, initial ph and substrate composition on biohydrogen
production from food waste in batch fermentation. Asian J. Biotechnol., 1: 42-
50.
Pechsuth.M. (2001). High-rate anaerobic treatment of palm oil mill effeluent.
Songklanakarin J. Sci. Technol , 780-787.
P.E. Poh, M. C. (2008). Development of anaerobic digestion methods for palm oil.
Elsivier-Bioresource Technology , 1
P.Prasertsan, S. a. (1996). Biomass Residues From Palm Oil Mills in Thailand:An
Overview on Quantity and Potential Usgae. Pergamon , 388.
R.Mah, R. a. (2006). Hydrolytic Bacteria in Anaerobic digestion of biomass, 15
Residua. (2006). Anaerobic Digestion. Warmer Bulletin
S.Yusoff. (2006). Renewable Energy From Palm Oil-Innovation on Effective Utilization of
Waste. J.Cleaner Prodcut , 87-93
T.Y.Wu, A. J. (2007). Palm Oil Mill Effeluent (POME) Treatment and Bioresources
Recovery Using Ultrafiltration Membrane:Effect of Pressure on Membrane
Fouling. Biochemical Engineering Journal , 309-317.
46
Wooster, OARDC. (2009, April 7). Waste to Energy Workshop: Advances and
Opportunities for Ohio’s Livestock & Food Processing Industries. Ohio, USA
Wikimedia Foundation. (2009). Retrieved 8 15, 2009, from Anaerobic Digestion:
http://en.wikipedia.org/wiki/Anaerobic_digestion
Wu, T. Y. (2009). A holistic approach to managing palm oil mill effluent (POME):
Biotechnological. Elsivier - Biotechnology Advances , 40-52
47
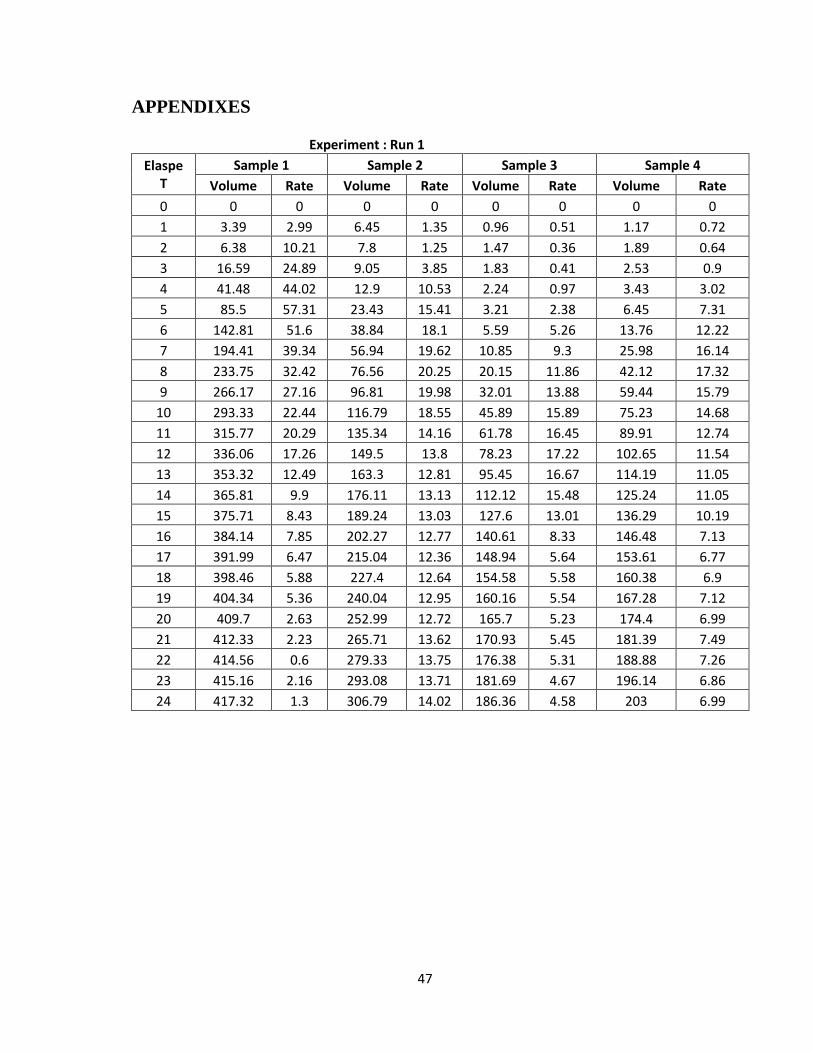
APPENDIXES
Experiment : Run 1
Elaspe T
Sample 1 Sample 2 Sample 3 Sample 4
Volume Rate Volume Rate Volume Rate Volume Rate
0 0 0 0 0 0 0 0 0
1 3.39 2.99 6.45 1.35 0.96 0.51 1.17 0.72
2 6.38 10.21 7.8 1.25 1.47 0.36 1.89 0.64
3 16.59 24.89 9.05 3.85 1.83 0.41 2.53 0.9
4 41.48 44.02 12.9 10.53 2.24 0.97 3.43 3.02
5 85.5 57.31 23.43 15.41 3.21 2.38 6.45 7.31
6 142.81 51.6 38.84 18.1 5.59 5.26 13.76 12.22
7 194.41 39.34 56.94 19.62 10.85 9.3 25.98 16.14
8 233.75 32.42 76.56 20.25 20.15 11.86 42.12 17.32
9 266.17 27.16 96.81 19.98 32.01 13.88 59.44 15.79
10 293.33 22.44 116.79 18.55 45.89 15.89 75.23 14.68
11 315.77 20.29 135.34 14.16 61.78 16.45 89.91 12.74
12 336.06 17.26 149.5 13.8 78.23 17.22 102.65 11.54
13 353.32 12.49 163.3 12.81 95.45 16.67 114.19 11.05
14 365.81 9.9 176.11 13.13 112.12 15.48 125.24 11.05
15 375.71 8.43 189.24 13.03 127.6 13.01 136.29 10.19
16 384.14 7.85 202.27 12.77 140.61 8.33 146.48 7.13
17 391.99 6.47 215.04 12.36 148.94 5.64 153.61 6.77
18 398.46 5.88 227.4 12.64 154.58 5.58 160.38 6.9
19 404.34 5.36 240.04 12.95 160.16 5.54 167.28 7.12
20 409.7 2.63 252.99 12.72 165.7 5.23 174.4 6.99
21 412.33 2.23 265.71 13.62 170.93 5.45 181.39 7.49
22 414.56 0.6 279.33 13.75 176.38 5.31 188.88 7.26
23 415.16 2.16 293.08 13.71 181.69 4.67 196.14 6.86
24 417.32 1.3 306.79 14.02 186.36 4.58 203 6.99
48
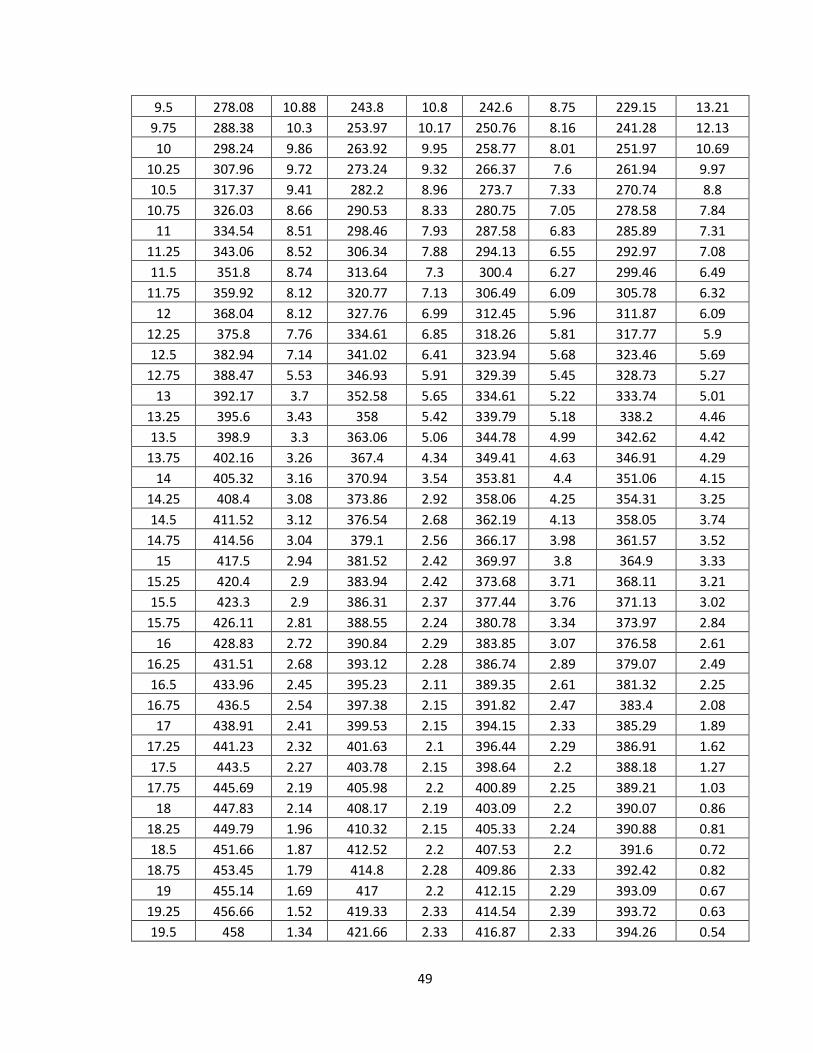
Experiment : Run 2
Elaspe T
Sample 5 Sample 6 Sample 7 Sample 8
Volume Rate Volume Rate Volume Rate Volume Rate
0 0 0 0 0 0 0 0 0
0.25 5.31 5.31 5.42 5.42 5.5 5.5 6.09 6.09
0.5 8.21 2.9 7.88 2.46 8.43 2.93 8.84 2.75
0.75 9.77 1.56 9.14 1.26 9.98 1.55 10.1 1.26
1 10.75 0.98 10.04 0.9 10.95 0.97 10.91 0.81
1.25 11.19 0.44 10.48 0.44 11.59 0.64 11.41 0.5
1.5 11.51 0.32 10.75 0.27 11.91 0.32 11.68 0.27
1.75 11.64 0.13 10.93 0.18 12.14 0.23 11.95 0.27
2 11.73 0.09 11.02 0.09 12.32 0.18 12.13 0.18
2.25 11.91 0.18 11.2 0.18 12.5 0.18 12.4 0.27
2.5 12.35 0.44 11.69 0.49 12.96 0.46 12.58 0.18
2.75 12.76 0.41 12.05 0.36 13.28 0.32 12.85 0.27
3 13.2 0.44 12.41 0.36 13.65 0.37 13.12 0.27
3.25 13.78 0.58 12.86 0.45 14.06 0.41 13.39 0.27
3.5 14.54 0.76 13.4 0.54 14.66 0.6 13.67 0.28
3.75 15.61 1.07 14.16 0.76 15.39 0.73 14.03 0.36
4 17.17 1.56 15.32 1.16 16.49 1.1 14.52 0.49
4.25 19.49 2.32 17.02 1.7 18.23 1.74 15.33 0.81
4.5 22.61 3.12 19.35 2.33 20.61 2.38 16.33 1
4.75 26.67 4.06 22.44 3.09 23.95 3.34 17.63 1.3
5 31.93 5.26 26.57 4.13 28.4 4.45 19.48 1.85
5.25 38.31 6.38 31.85 5.28 34.44 6.04 22.01 2.53
5.5 46.21 7.9 38.44 6.59 42.78 8.34 25.57 3.56
5.75 56.64 10.43 46.41 7.97 53.81 11.03 30.17 4.6
6 68.73 12.09 56.09 9.68 67.65 13.84 36.03 5.86
6.25 82.06 13.33 67.78 11.69 83.95 16.3 43.61 7.58
6.5 96.78 14.72 81.63 13.85 101.17 17.22 52.81 9.2
6.75 113.46 16.68 97.08 15.45 117.39 16.22 63.41 10.6
7 130.01 16.55 112.85 15.77 132.59 15.2 75.68 12.27
7.25 147.63 17.62 128.04 15.19 145.92 13.33 90.25 14.57
7.5 165.73 18.1 143.4 15.36 158.61 12.69 106.53 16.28
7.75 182.06 16.33 157.96 14.56 171.29 12.68 123.48 16.95
8 198.29 16.23 171.63 13.67 183.43 12.14 140.08 16.6
8.25 213.9 15.61 184.89 13.26 194.74 11.31 155.32 15.24
8.5 228.89 14.99 197.75 12.86 205.5 10.76 170.75 15.43
8.75 242.85 13.96 209.98 12.23 215.44 9.94 186.31 15.56
9 255.42 12.57 221.72 11.74 224.79 9.35 201.46 15.15
9.25 267.2 11.78 233 11.28 233.85 9.06 215.94 14.48
49
9.5 278.08 10.88 243.8 10.8 242.6 8.75 229.15 13.21
9.75 288.38 10.3 253.97 10.17 250.76 8.16 241.28 12.13
10 298.24 9.86 263.92 9.95 258.77 8.01 251.97 10.69
10.25 307.96 9.72 273.24 9.32 266.37 7.6 261.94 9.97
10.5 317.37 9.41 282.2 8.96 273.7 7.33 270.74 8.8
10.75 326.03 8.66 290.53 8.33 280.75 7.05 278.58 7.84
11 334.54 8.51 298.46 7.93 287.58 6.83 285.89 7.31
11.25 343.06 8.52 306.34 7.88 294.13 6.55 292.97 7.08
11.5 351.8 8.74 313.64 7.3 300.4 6.27 299.46 6.49
11.75 359.92 8.12 320.77 7.13 306.49 6.09 305.78 6.32
12 368.04 8.12 327.76 6.99 312.45 5.96 311.87 6.09
12.25 375.8 7.76 334.61 6.85 318.26 5.81 317.77 5.9
12.5 382.94 7.14 341.02 6.41 323.94 5.68 323.46 5.69
12.75 388.47 5.53 346.93 5.91 329.39 5.45 328.73 5.27
13 392.17 3.7 352.58 5.65 334.61 5.22 333.74 5.01
13.25 395.6 3.43 358 5.42 339.79 5.18 338.2 4.46
13.5 398.9 3.3 363.06 5.06 344.78 4.99 342.62 4.42
13.75 402.16 3.26 367.4 4.34 349.41 4.63 346.91 4.29
14 405.32 3.16 370.94 3.54 353.81 4.4 351.06 4.15
14.25 408.4 3.08 373.86 2.92 358.06 4.25 354.31 3.25
14.5 411.52 3.12 376.54 2.68 362.19 4.13 358.05 3.74
14.75 414.56 3.04 379.1 2.56 366.17 3.98 361.57 3.52
15 417.5 2.94 381.52 2.42 369.97 3.8 364.9 3.33
15.25 420.4 2.9 383.94 2.42 373.68 3.71 368.11 3.21
15.5 423.3 2.9 386.31 2.37 377.44 3.76 371.13 3.02
15.75 426.11 2.81 388.55 2.24 380.78 3.34 373.97 2.84
16 428.83 2.72 390.84 2.29 383.85 3.07 376.58 2.61
16.25 431.51 2.68 393.12 2.28 386.74 2.89 379.07 2.49
16.5 433.96 2.45 395.23 2.11 389.35 2.61 381.32 2.25
16.75 436.5 2.54 397.38 2.15 391.82 2.47 383.4 2.08
17 438.91 2.41 399.53 2.15 394.15 2.33 385.29 1.89
17.25 441.23 2.32 401.63 2.1 396.44 2.29 386.91 1.62
17.5 443.5 2.27 403.78 2.15 398.64 2.2 388.18 1.27
17.75 445.69 2.19 405.98 2.2 400.89 2.25 389.21 1.03
18 447.83 2.14 408.17 2.19 403.09 2.2 390.07 0.86
18.25 449.79 1.96 410.32 2.15 405.33 2.24 390.88 0.81
18.5 451.66 1.87 412.52 2.2 407.53 2.2 391.6 0.72
18.75 453.45 1.79 414.8 2.28 409.86 2.33 392.42 0.82
19 455.14 1.69 417 2.2 412.15 2.29 393.09 0.67
19.25 456.66 1.52 419.33 2.33 414.54 2.39 393.72 0.63
19.5 458 1.34 421.66 2.33 416.87 2.33 394.26 0.54
50
19.75 459.07 1.07 424.03 2.37 419.3 2.43 394.76 0.5
20 460 0.93 426.41 2.38 421.68 2.38 395.3 0.54
20.25 460.72 0.72 428.78 2.37 424.06 2.38 395.93 0.63
20.5 461.21 0.49 431.24 2.46 426.49 2.43 396.56 0.63
20.75 461.52 0.31 433.75 2.51 428.96 2.47 397.2 0.64
21 461.7 0.18 436.22 2.47 431.44 2.48 397.83 0.63
21.25 461.74 0.04 438.68 2.46 434 2.56 398.59 0.76
21.5 461.74 0 441.1 2.42 436.61 2.61 399.32 0.73
21.75 461.74 0 443.52 2.42 439.31 2.7 399.95 0.63
22 461.74 0 445.8 2.28 442.11 2.8 400.71 0.76
22.25 461.79 0.05 448.04 2.24 444.99 2.88 401.44 0.73
22.5 461.83 0.04 450.06 2.02 447.1 2.11 402.07 0.63
22.75 461.92 0.09 452.12 2.06 450.21 3.11 402.65 0.58
23 461.97 0.05 453.96 1.84 453.15 2.94 403.28 0.63
23.25 462.01 0.04 455.66 1.7 456.12 2.97 403.83 0.55
23.5 462.01 0 457.14 1.48 459.24 3.12 404.41 0.58
23.75 462.01 0 458.57 1.43 462.21 2.97 404.91 0.5
24 462.01 0 459.83 1.26 465.24 3.03 405.45 0.54
Experiment : Run 3
Elaspe T
Sample 9 Sample 10 Sample 11 Sample 12
Volume Rate Volume Rate Volume Rate Volume Rate
0 0 0 0 0 0 0 0 0
0.25 15.48 15.48 11.11 11.11 6.78 6.78 3.79 3.79
0.5 24.62 9.14 16.98 5.87 9.89 3.11 5.73 1.94
0.75 30.1 5.48 20.43 3.45 11.77 1.88 6.86 1.13
1 33.81 3.71 22.8 2.37 13.1 1.33 7.85 0.99
1.25 36.22 2.41 24.37 1.57 14.01 0.91 8.43 0.58
1.5 37.91 1.69 25.63 1.26 14.75 0.74 8.97 0.54
1.75 39.2 1.29 26.66 1.03 15.43 0.68 9.29 0.32
2 40.23 1.03 27.37 0.71 15.94 0.51 9.65 0.36
2.25 41.03 0.8 28 0.63 16.44 0.5 10.28 0.63
2.5 41.7 0.67 28.49 0.49 16.81 0.37 10.96 0.68
2.75 42.37 0.67 29.08 0.59 17.36 0.55 11.95 0.99
3 42.95 0.58 29.66 0.58 18 0.64 13.03 1.08
3.25 43.66 0.71 30.42 0.76 18.87 0.87 14.75 1.72
3.5 44.24 0.58 31.14 0.72 19.74 0.87 16.69 1.94
3.75 44.78 0.54 31.9 0.76 20.79 1.05 19.44 2.75
4 45.58 0.8 33.06 1.16 22.53 1.74 23.36 3.92
4.25 46.52 0.94 34.68 1.62 24.78 2.25 28.77 5.41
4.5 47.54 1.02 36.65 1.97 27.71 2.93 35.22 6.45
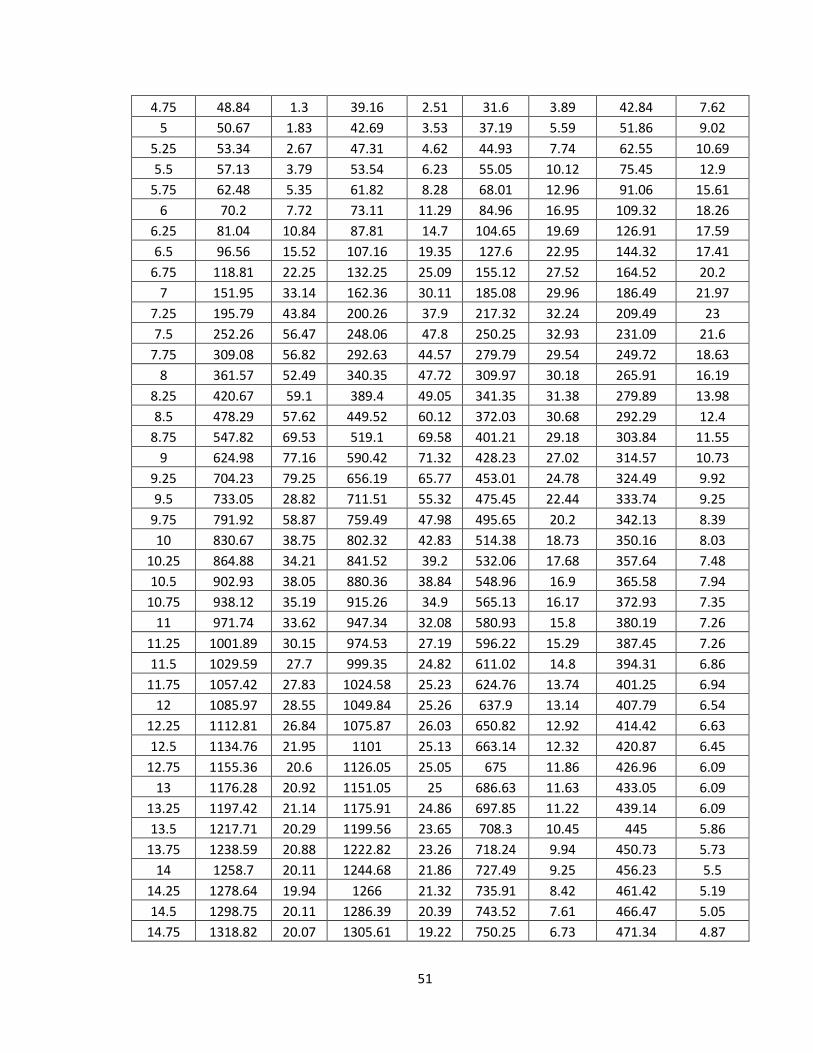
51
4.75 48.84 1.3 39.16 2.51 31.6 3.89 42.84 7.62
5 50.67 1.83 42.69 3.53 37.19 5.59 51.86 9.02
5.25 53.34 2.67 47.31 4.62 44.93 7.74 62.55 10.69
5.5 57.13 3.79 53.54 6.23 55.05 10.12 75.45 12.9
5.75 62.48 5.35 61.82 8.28 68.01 12.96 91.06 15.61
6 70.2 7.72 73.11 11.29 84.96 16.95 109.32 18.26
6.25 81.04 10.84 87.81 14.7 104.65 19.69 126.91 17.59
6.5 96.56 15.52 107.16 19.35 127.6 22.95 144.32 17.41
6.75 118.81 22.25 132.25 25.09 155.12 27.52 164.52 20.2
7 151.95 33.14 162.36 30.11 185.08 29.96 186.49 21.97
7.25 195.79 43.84 200.26 37.9 217.32 32.24 209.49 23
7.5 252.26 56.47 248.06 47.8 250.25 32.93 231.09 21.6
7.75 309.08 56.82 292.63 44.57 279.79 29.54 249.72 18.63
8 361.57 52.49 340.35 47.72 309.97 30.18 265.91 16.19
8.25 420.67 59.1 389.4 49.05 341.35 31.38 279.89 13.98
8.5 478.29 57.62 449.52 60.12 372.03 30.68 292.29 12.4
8.75 547.82 69.53 519.1 69.58 401.21 29.18 303.84 11.55
9 624.98 77.16 590.42 71.32 428.23 27.02 314.57 10.73
9.25 704.23 79.25 656.19 65.77 453.01 24.78 324.49 9.92
9.5 733.05 28.82 711.51 55.32 475.45 22.44 333.74 9.25
9.75 791.92 58.87 759.49 47.98 495.65 20.2 342.13 8.39
10 830.67 38.75 802.32 42.83 514.38 18.73 350.16 8.03
10.25 864.88 34.21 841.52 39.2 532.06 17.68 357.64 7.48
10.5 902.93 38.05 880.36 38.84 548.96 16.9 365.58 7.94
10.75 938.12 35.19 915.26 34.9 565.13 16.17 372.93 7.35
11 971.74 33.62 947.34 32.08 580.93 15.8 380.19 7.26
11.25 1001.89 30.15 974.53 27.19 596.22 15.29 387.45 7.26
11.5 1029.59 27.7 999.35 24.82 611.02 14.8 394.31 6.86
11.75 1057.42 27.83 1024.58 25.23 624.76 13.74 401.25 6.94
12 1085.97 28.55 1049.84 25.26 637.9 13.14 407.79 6.54
12.25 1112.81 26.84 1075.87 26.03 650.82 12.92 414.42 6.63
12.5 1134.76 21.95 1101 25.13 663.14 12.32 420.87 6.45
12.75 1155.36 20.6 1126.05 25.05 675 11.86 426.96 6.09
13 1176.28 20.92 1151.05 25 686.63 11.63 433.05 6.09
13.25 1197.42 21.14 1175.91 24.86 697.85 11.22 439.14 6.09
13.5 1217.71 20.29 1199.56 23.65 708.3 10.45 445 5.86
13.75 1238.59 20.88 1222.82 23.26 718.24 9.94 450.73 5.73
14 1258.7 20.11 1244.68 21.86 727.49 9.25 456.23 5.5
14.25 1278.64 19.94 1266 21.32 735.91 8.42 461.42 5.19
14.5 1298.75 20.11 1286.39 20.39 743.52 7.61 466.47 5.05
14.75 1318.82 20.07 1305.61 19.22 750.25 6.73 471.34 4.87
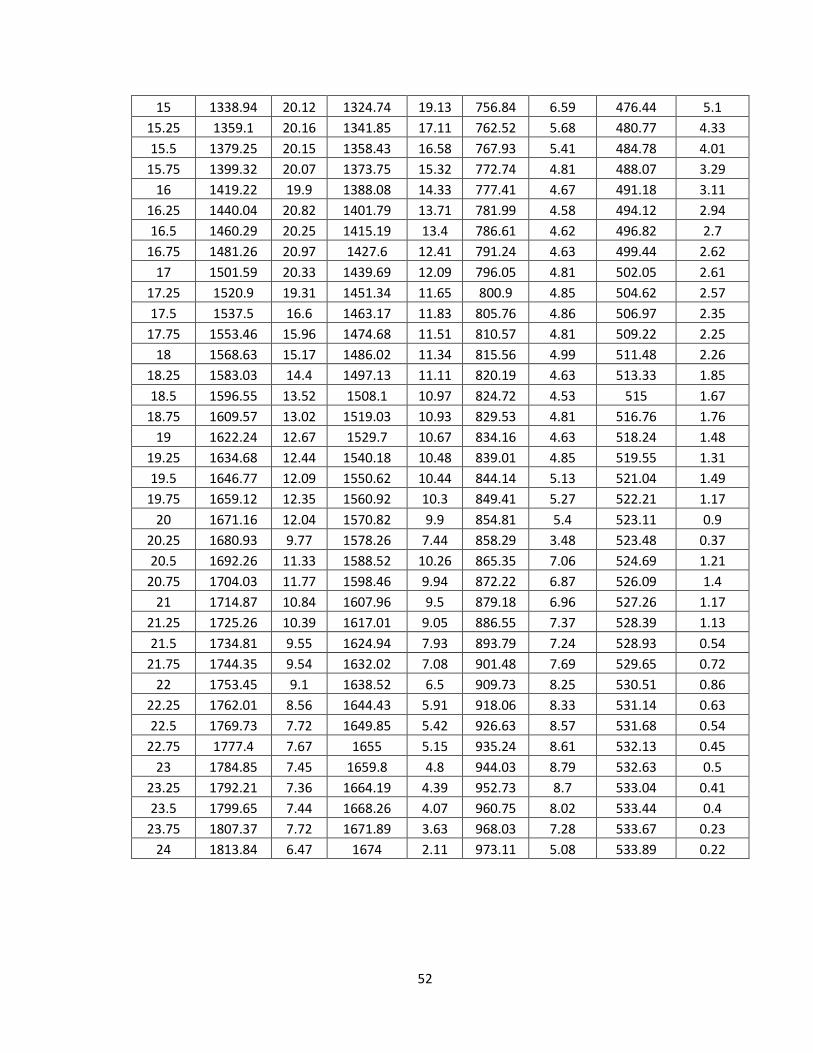
52
15 1338.94 20.12 1324.74 19.13 756.84 6.59 476.44 5.1
15.25 1359.1 20.16 1341.85 17.11 762.52 5.68 480.77 4.33
15.5 1379.25 20.15 1358.43 16.58 767.93 5.41 484.78 4.01
15.75 1399.32 20.07 1373.75 15.32 772.74 4.81 488.07 3.29
16 1419.22 19.9 1388.08 14.33 777.41 4.67 491.18 3.11
16.25 1440.04 20.82 1401.79 13.71 781.99 4.58 494.12 2.94
16.5 1460.29 20.25 1415.19 13.4 786.61 4.62 496.82 2.7
16.75 1481.26 20.97 1427.6 12.41 791.24 4.63 499.44 2.62
17 1501.59 20.33 1439.69 12.09 796.05 4.81 502.05 2.61
17.25 1520.9 19.31 1451.34 11.65 800.9 4.85 504.62 2.57
17.5 1537.5 16.6 1463.17 11.83 805.76 4.86 506.97 2.35
17.75 1553.46 15.96 1474.68 11.51 810.57 4.81 509.22 2.25
18 1568.63 15.17 1486.02 11.34 815.56 4.99 511.48 2.26
18.25 1583.03 14.4 1497.13 11.11 820.19 4.63 513.33 1.85
18.5 1596.55 13.52 1508.1 10.97 824.72 4.53 515 1.67
18.75 1609.57 13.02 1519.03 10.93 829.53 4.81 516.76 1.76
19 1622.24 12.67 1529.7 10.67 834.16 4.63 518.24 1.48
19.25 1634.68 12.44 1540.18 10.48 839.01 4.85 519.55 1.31
19.5 1646.77 12.09 1550.62 10.44 844.14 5.13 521.04 1.49
19.75 1659.12 12.35 1560.92 10.3 849.41 5.27 522.21 1.17
20 1671.16 12.04 1570.82 9.9 854.81 5.4 523.11 0.9
20.25 1680.93 9.77 1578.26 7.44 858.29 3.48 523.48 0.37
20.5 1692.26 11.33 1588.52 10.26 865.35 7.06 524.69 1.21
20.75 1704.03 11.77 1598.46 9.94 872.22 6.87 526.09 1.4
21 1714.87 10.84 1607.96 9.5 879.18 6.96 527.26 1.17
21.25 1725.26 10.39 1617.01 9.05 886.55 7.37 528.39 1.13
21.5 1734.81 9.55 1624.94 7.93 893.79 7.24 528.93 0.54
21.75 1744.35 9.54 1632.02 7.08 901.48 7.69 529.65 0.72
22 1753.45 9.1 1638.52 6.5 909.73 8.25 530.51 0.86
22.25 1762.01 8.56 1644.43 5.91 918.06 8.33 531.14 0.63
22.5 1769.73 7.72 1649.85 5.42 926.63 8.57 531.68 0.54
22.75 1777.4 7.67 1655 5.15 935.24 8.61 532.13 0.45
23 1784.85 7.45 1659.8 4.8 944.03 8.79 532.63 0.5
23.25 1792.21 7.36 1664.19 4.39 952.73 8.7 533.04 0.41
23.5 1799.65 7.44 1668.26 4.07 960.75 8.02 533.44 0.4
23.75 1807.37 7.72 1671.89 3.63 968.03 7.28 533.67 0.23
24 1813.84 6.47 1674 2.11 973.11 5.08 533.89 0.22
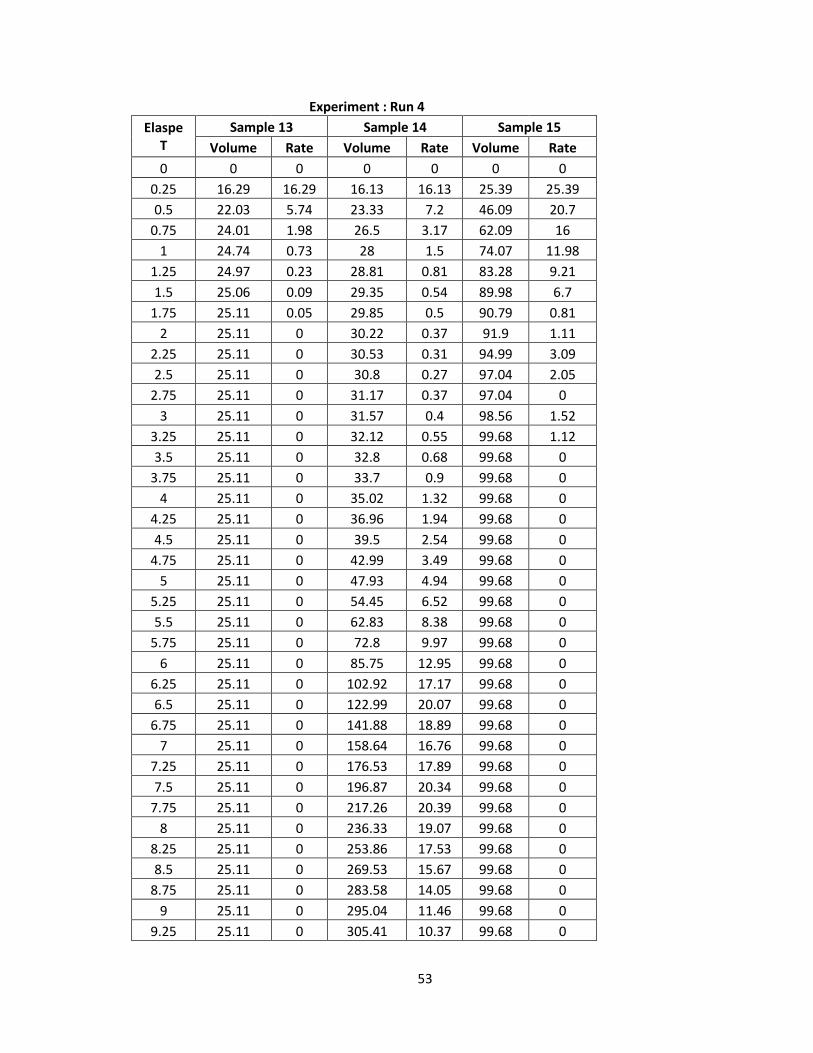
53
Experiment : Run 4
Elaspe T
Sample 13 Sample 14 Sample 15
Volume Rate Volume Rate Volume Rate
0 0 0 0 0 0 0
0.25 16.29 16.29 16.13 16.13 25.39 25.39
0.5 22.03 5.74 23.33 7.2 46.09 20.7
0.75 24.01 1.98 26.5 3.17 62.09 16
1 24.74 0.73 28 1.5 74.07 11.98
1.25 24.97 0.23 28.81 0.81 83.28 9.21
1.5 25.06 0.09 29.35 0.54 89.98 6.7
1.75 25.11 0.05 29.85 0.5 90.79 0.81
2 25.11 0 30.22 0.37 91.9 1.11
2.25 25.11 0 30.53 0.31 94.99 3.09
2.5 25.11 0 30.8 0.27 97.04 2.05
2.75 25.11 0 31.17 0.37 97.04 0
3 25.11 0 31.57 0.4 98.56 1.52
3.25 25.11 0 32.12 0.55 99.68 1.12
3.5 25.11 0 32.8 0.68 99.68 0
3.75 25.11 0 33.7 0.9 99.68 0
4 25.11 0 35.02 1.32 99.68 0
4.25 25.11 0 36.96 1.94 99.68 0
4.5 25.11 0 39.5 2.54 99.68 0
4.75 25.11 0 42.99 3.49 99.68 0
5 25.11 0 47.93 4.94 99.68 0
5.25 25.11 0 54.45 6.52 99.68 0
5.5 25.11 0 62.83 8.38 99.68 0
5.75 25.11 0 72.8 9.97 99.68 0
6 25.11 0 85.75 12.95 99.68 0
6.25 25.11 0 102.92 17.17 99.68 0
6.5 25.11 0 122.99 20.07 99.68 0
6.75 25.11 0 141.88 18.89 99.68 0
7 25.11 0 158.64 16.76 99.68 0
7.25 25.11 0 176.53 17.89 99.68 0
7.5 25.11 0 196.87 20.34 99.68 0
7.75 25.11 0 217.26 20.39 99.68 0
8 25.11 0 236.33 19.07 99.68 0
8.25 25.11 0 253.86 17.53 99.68 0
8.5 25.11 0 269.53 15.67 99.68 0
8.75 25.11 0 283.58 14.05 99.68 0
9 25.11 0 295.04 11.46 99.68 0
9.25 25.11 0 305.41 10.37 99.68 0
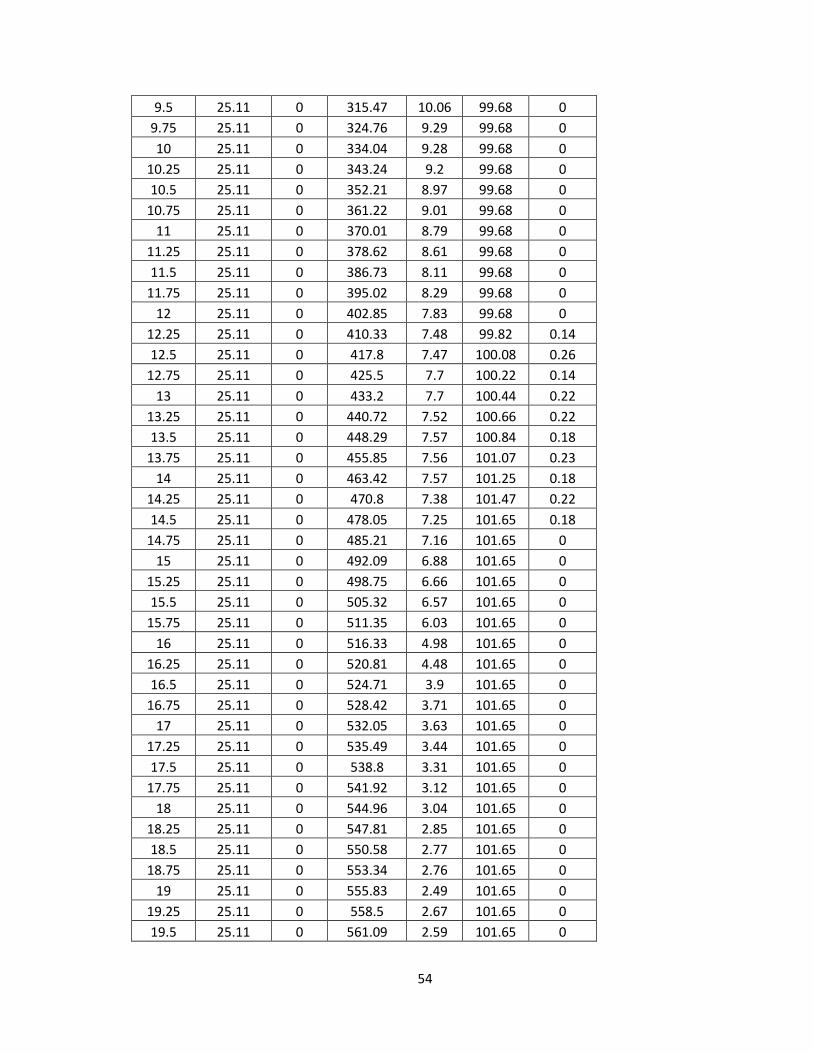
54
9.5 25.11 0 315.47 10.06 99.68 0
9.75 25.11 0 324.76 9.29 99.68 0
10 25.11 0 334.04 9.28 99.68 0
10.25 25.11 0 343.24 9.2 99.68 0
10.5 25.11 0 352.21 8.97 99.68 0
10.75 25.11 0 361.22 9.01 99.68 0
11 25.11 0 370.01 8.79 99.68 0
11.25 25.11 0 378.62 8.61 99.68 0
11.5 25.11 0 386.73 8.11 99.68 0
11.75 25.11 0 395.02 8.29 99.68 0
12 25.11 0 402.85 7.83 99.68 0
12.25 25.11 0 410.33 7.48 99.82 0.14
12.5 25.11 0 417.8 7.47 100.08 0.26
12.75 25.11 0 425.5 7.7 100.22 0.14
13 25.11 0 433.2 7.7 100.44 0.22
13.25 25.11 0 440.72 7.52 100.66 0.22
13.5 25.11 0 448.29 7.57 100.84 0.18
13.75 25.11 0 455.85 7.56 101.07 0.23
14 25.11 0 463.42 7.57 101.25 0.18
14.25 25.11 0 470.8 7.38 101.47 0.22
14.5 25.11 0 478.05 7.25 101.65 0.18
14.75 25.11 0 485.21 7.16 101.65 0
15 25.11 0 492.09 6.88 101.65 0
15.25 25.11 0 498.75 6.66 101.65 0
15.5 25.11 0 505.32 6.57 101.65 0
15.75 25.11 0 511.35 6.03 101.65 0
16 25.11 0 516.33 4.98 101.65 0
16.25 25.11 0 520.81 4.48 101.65 0
16.5 25.11 0 524.71 3.9 101.65 0
16.75 25.11 0 528.42 3.71 101.65 0
17 25.11 0 532.05 3.63 101.65 0
17.25 25.11 0 535.49 3.44 101.65 0
17.5 25.11 0 538.8 3.31 101.65 0
17.75 25.11 0 541.92 3.12 101.65 0
18 25.11 0 544.96 3.04 101.65 0
18.25 25.11 0 547.81 2.85 101.65 0
18.5 25.11 0 550.58 2.77 101.65 0
18.75 25.11 0 553.34 2.76 101.65 0
19 25.11 0 555.83 2.49 101.65 0
19.25 25.11 0 558.5 2.67 101.65 0
19.5 25.11 0 561.09 2.59 101.65 0
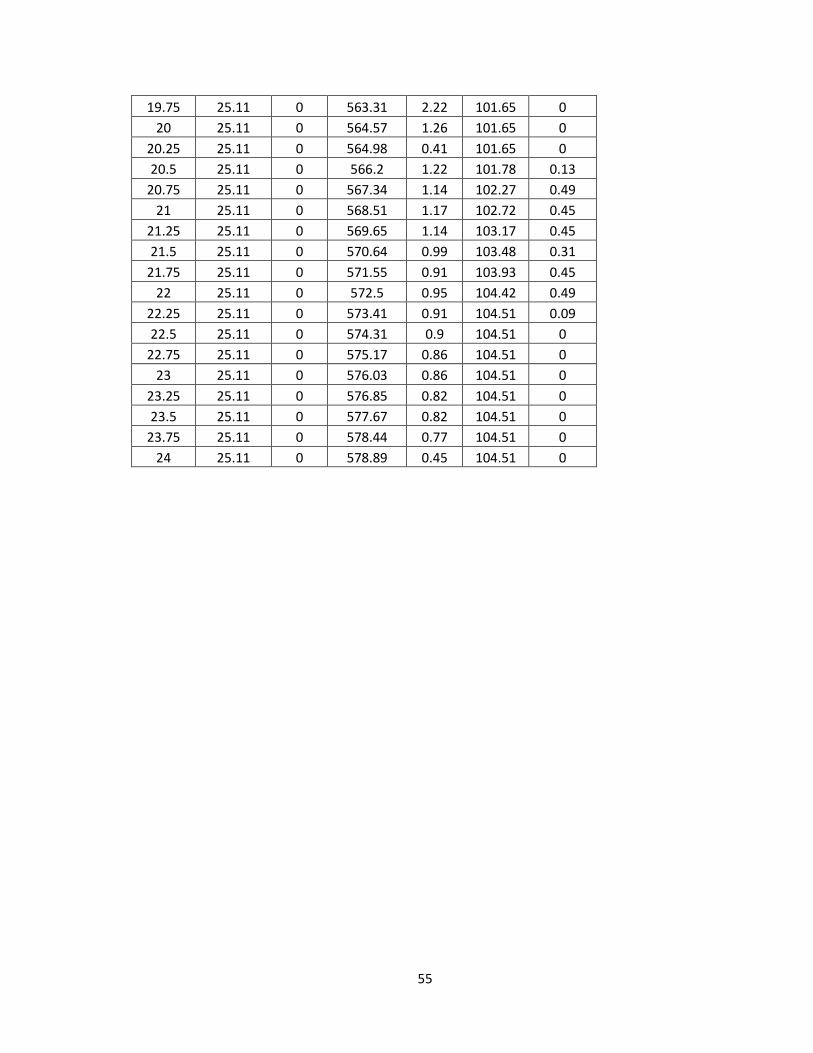
55
19.75 25.11 0 563.31 2.22 101.65 0
20 25.11 0 564.57 1.26 101.65 0
20.25 25.11 0 564.98 0.41 101.65 0
20.5 25.11 0 566.2 1.22 101.78 0.13
20.75 25.11 0 567.34 1.14 102.27 0.49
21 25.11 0 568.51 1.17 102.72 0.45
21.25 25.11 0 569.65 1.14 103.17 0.45
21.5 25.11 0 570.64 0.99 103.48 0.31
21.75 25.11 0 571.55 0.91 103.93 0.45
22 25.11 0 572.5 0.95 104.42 0.49
22.25 25.11 0 573.41 0.91 104.51 0.09
22.5 25.11 0 574.31 0.9 104.51 0
22.75 25.11 0 575.17 0.86 104.51 0
23 25.11 0 576.03 0.86 104.51 0
23.25 25.11 0 576.85 0.82 104.51 0
23.5 25.11 0 577.67 0.82 104.51 0
23.75 25.11 0 578.44 0.77 104.51 0
24 25.11 0 578.89 0.45 104.51 0