Embed Size (px)
Citation preview
Proc. Natl. Acad. Sci. USAVol. 93, pp. 9905-9909, September 1996Neurobiology
Quantal release at a neuronal nicotinic synapse from ratadrenal gland
(chromaffin cell/synaptic current/acetylcholine receptor/patch-clamp/slice)
JEAN-GAEL BARBARA* AND KENNETH TAKEDALaboratoire de Pharmacologie Cellulaire et Moleculaire, Unite de Recherche Associee 600, Centre National de la Recherche Scientifique, Universite LouisPasteur de Strasbourg, B.P. 24, F-67401 Illkirch, France
Communicated by Gerald D. Fischbach, Harvard Medical School, Boston, MA, June 3, 1996 (received for review December 15, 1995)
ABSTRACT The neuronal nicotinic synapse in tissueslices of the adrenal medulla was studied with whole-cellpatch-clamp. Excitatory postsynaptic currents (EPSCs) wereevoked by local field stimulation or occurred spontaneouslyespecially when external [K+l was increased. EPSCs werecarried by channels sharing biophysical and pharmacologicalproperties of neuronal-type nicotinic receptors (nAChRs). Asingle-channel conductance (y) of 43-45 pS was found fromnonstationary variance analysis of EPSCs. SpontaneousEPSCs were tetrodotoxin-insensitive and Ca2+-dependent andoccurred in burst-like clusters. Quantal analysis of sponta-neous EPSCs gave a quantal size of 20 pA and amplitudehistograms were well described by binomial models with lowvalues of quantal content, consistent with a small number ofspontaneously active release sites. However, rare large am-plitude EPSCs suggest that the total number of sites is higherand that extrajunctional receptors are involved. Our estimatesof quantal content and size at the chromaffin cell neuronalnicotinic synapse may be useful in characterizing centralneuronal-type nicotinic receptor-mediated cholinergic synap-tic transmission.
The neuronal nicotinic receptor (nAChR) family displays alarge diversity of a and ,B subunit composition and, corre-spondingly, differences in pharmacological profile, single-channel conductance, and distribution in the central nervoussystem and autonomic ganglia (1, 2). Activation of centralsomatic nAChRs either depolarizes neurons from prefrontalcortex (3), medial habenula (4), and locus coeruleus (5) orhyperpolarizes neurons from dorsolateral septal nucleus (6).As well, nAChRs appear to be involved in presynaptic controlof transmitter release (7, 8). However, apart from the earlydiscovery of nicotinic excitatory synaptic potentials in catRenshaw cells (9), postsynaptic nAChRs have not been shownto be directly involved in central synaptic transmission. Thus,neuronal nicotinic synapses have been mostly studied in ver-tebrate autonomic ganglia (10-13) and recently in the guinea-pig adrenal gland (14, 15). Acetylcholine (ACh) release hasbeen shown to be quantal at ganglionic synapses (16), butdetailed quantal analysis was not done due to the poorresolution associated with intracellular recording. Detection ofthe postsynaptic action of a single quantum is a prerequisite toquantal analysis and determination of quantal parameters(17), thereby allowing study of pre- and postsynaptic factorsinvolved in synaptic transmission (18, 19).
Cholinergic synapses arising from splanchnic nerve termi-nals are present on chromaffin cells (20). These cells are small,rounded, electrically compact and well suited for patch-clampstudies. ACh-induced current in chromaffin cells is due to theactivation of a3 subunit containing nAChRs (21, 22), which arealso expressed in the hippocampus, medial habenula, lateral
geniculate, and granular layer of cerebellum (2, 23). The (32and perhaps also the 134 subunit appear to be coexpressed inchromaffin cells, given the sensitivity to K- but not to a-bun-garotoxin (24). Our experiments were designed to characterizenAChR-mediated excitatory postsynaptic currents (EPSCs) onchromaffin cells in thin tissue slices from rat adrenal gland.Quantal analysis was also made on spontaneous EPSCs. Ourdata represent a clear example of quantal analysis applied toa synapse of small quantal size. They may help to identifyexcitatory cholinergic synaptic transmission in brain regionswhere ACh-containing fibers and neurons expressing nAChRsare known to occur concomitantly.
METHODSAdrenal glands were collected from 12-week-old male Wistarrats killed by cervical dislocation. They were placed in cold(-20C) external solution. After overlying fatty tissue and thecapsule were removed, slices ("300 ,tm thick) were cut with avibroslicer (Campden, Sileby, U.K.). Slices were then main-tained at room temperature in external solution (140 mMNaCl/2 mM KCl/3 mM CaCl2/2 mM MgCl2/26 mMNaHCO3/10 mM glucose, pH 7.4) and gassed with 95%02/5% CO2.Chromaffin cells were visually identified using an upright
microscope and a x40 water-immersion objective (Nikon).The recording chamber was continuously perfused (1-2 ml/min) with external solution at room temperature (22-25°C).Thick-walled borosilicate glass pipettes (1-3 Mfl) were filledwith internal solution (140 mM KCl/2 mM MgCl2/1 mMCaCl2/11 mM EGTA/20 mM Hepes/5 mM MgATP/0.3 mMMgGTP/10 mM phosphocreatine/50 units of phosphohexoki-nase per ml, pH 7.4 with KOH). Whole-cell recordings (25)with a -60 mV holding potential and seal resistances .10-20Gfl were made using an Axopatch 200A (Axon Instruments,Burlingame, CA). As for isolated chromaffin cells (25), cellinput resistances were 5-10 Gfl, consistent with the absence ofelectrical coupling between cells. Uncompensated mean seriesresistance (Rs) and cell capacitance were 8.7 ± 0.8 MfQ and8.6 ± 0.3 pF (n = 30), respectively. Data were discarded whenRs varied by >30%. EPSCs were usually filtered (4-poleBessel) at 1 kHz (-3 dB) and acquired at 3-10 kHz usingpClamp (Axon Instruments). Afferent fiber nerve terminalswere locally field stimulated with 20 ,us voltage pulses (1-50 V;0.01 Hz) from an isolated stimulator using two 1-Mfl tungstenmicroelectrodes glued together (tip separation, =50 ,um; see
Abbreviations: EPSC, excitatory postsynaptic current; nAChR, neu-ronal nicotinic receptor; y, single-channel conductance; ACh, acetyl-choline; p, release probability; n, number of release sites; q, quantalsize; Re, survivor function; Rs, series resistance; B(X = k), binomiallaw; TTX, tetrodotoxin; p.d.f., probability density function; o2, EPSCamplitude variance; oq, quantal variance; o2n, noise variance; T, decaytime constant; v, synaptic frequency; I-V, current-voltage.*To whom reprint requests should be addressed. e-mail:[email protected].
9905
The publication costs of this article were defrayed in part by page chargepayment. This article must therefore be hereby marked "advertisement" inaccordance with 18 U.S.C. §1734 solely to indicate this fact.
Dow
nloa
ded
by g
uest
on
Feb
ruar
y 20
, 202
0

9906 Neurobiology: Barbara and Takeda
Fig. 1A). External solutions containing elevated [KCl] (usually20 mM, substituted for NaCI) or nicotinic antagonists werebath-perfused.
Spontaneous EPSCs were detected and amplitudes weremeasured by using software provided by P. Vincent (EcoleNormale Superieure, Neurobiologie, Paris). Only single eventswere visually selected for construction of amplitude histo-grams. Nonstationary variance analysis (26) was made onensembles of n = 30-80 EPSCs of similar amplitude (decaykinetics were not used to select EPSCs as these were homo-geneous, and the rising phase of EPSCs was omitted from theanalysis). Variance was calculated as Sn-i = 1k=1 (ik +ikp'Imn)2/(n - 1), where ik is the kth EPSC function, ikp the peakEPSC value, and Imn the mean EPSC function normalized to-1. The variance-current relation Sn-1/Im was fitted to Sn-1 =iHIm - I2/N, where Im is the mean EPSC function, i the unitarycurrent amplitude, and N an integral number of channels. AnEPSC reversal potential of -8.2 mV was used in calculating y.
Stochastic properties of release were examined followingBornstein (27). Series of n > 500 consecutively occurringEPSCs were detected and the intervals tk (1 < k < n) betweenEPSCs sorted. The In (Re) function was plotted as In (Re) =
In [1 - k/(n + 1)] against tk (where Re is the survivorfunction). The plot can easily be compared with a stationaryrandom Poisson process where In (Re) = - V'tk with v being themean synaptic frequency.EPSC amplitude histograms were fitted by sums of N
Gaussians with no constraints and 3WN free parameters (stan-dard deviation oa, meanm and area for each Gaussian, 1 <N <6). This fit was used to estimate starting m and a values.Convolution fits (18) were then made in two ways by using Xk= 1B(X = k)-gk, where B(X = k) is a binomial law (with n releasesites and p the release probability), with gk Gaussians associ-ated with N fitted peaks and 3.N + 2 free parameters. Realobserved EPSC frequencies were used in fitting method 1. Asobserved frequencies were dependent on large events that hada large sampling error (due to their very low probability), infitting method 2, the area under all data bins was a freeparameter. The fit was considered satisfactory when the dataprobability density function (p.d.f.) area differed <0.3% fromthe convolution fit area [areas were <1 since large events andB(X = 0), B(X > N) values were excluded from fits]. Thisallowed the sensitivity of the fit to n to be tested. Fitteddistributions were compared using X2-values and Kolmogorov-Smirnov tests applied to cumulative histograms of unbinneddata. Nonlinear least-square fitting procedures were based onthe Marquardt-Levenberg algorithm. Student's unpaired t testwas considered nonsignificant if P > 0.1. Data are given asmean + SEM for n cells.
RESULTSEvoked EPSCs. Recordings were made from visually iden-
tified chromaffin cells in the medulla region of thin slices fromadrenal gland (Fig. L4). Under voltage-clamp, inward Na+ andCa2+ currents and a large outward Ca2+-dependent K+ currentwith a N-shaped I-V relation were typically seen (not shown).The mean resting potential under current-clamp was -60.6 ±2.1 mV (n = 5). As nerve fibers invade the medulla in acentripetal fashion with no well-defined fiber tracts in thegland (20), nerve terminals on chromaffin cells were directlyfield-stimulated using bipolar tungsten electrodes (Fig. 1A).Inward synaptic currents were elicited in an all-or-none fashionas the stimulus intensity was increased (Fig. 1B), with a latencyof 4.0 ± 0.5 ms (n = 5) and no inflexions in the rising phase(10-90% rise time was 1.7 ± 0.2 ms, n = 8), suggesting that asingle fiber was stimulated. In a given cell, evoked EPSCamplitude showed little variation (mean/SEM was <10%; seeFig. 5F) and was on average -733 ± 239 pA (n = 7). EPSCdecay kinetics were well-fitted by a single exponential (Fig. 1C)
A
B
m11 -=- ==ZZA
t::z-.m
J'.~rL'50 un
50pm
10 V1.0-
s i1I. 0.5
0.0-, I8 10 12 14Stimulus intensity (V)
C D nA
-10
-40
/ |200 pA-60 20 ms -1.2
FIG. 1. (A) Schematic drawing of a slice of adrenal gland (c, cortex;m, medulla) and the position of the stimulating and recording elec-trodes. (B) EPSCs were evoked in an all-or-none fashion. (C) EPSCsdecayed as single exponentials; T = 10.3, 9.2, and 4.8 ms at -60, -40,and -10 mV, respectively. (D) EPSC peak current-voltage (I-V)relation.
with a voltage-dependent time constant (r) of 10.6 ± 0.6 ms at-60 mV (n = 10). The EPSC peak I-V relation (Fig. 1D) hadstrong inward rectification and a -8.2 ± 2.2 mV (n = 3)reversal potential. EPSCs were reversibly abolished by thenAChR antagonist hexamethonium (Fig. 2B). Nonstationaryvariance analysis gave y = 43.1 ± 2.8 pS (n = 3; Fig. 2C) for
A Evoked EPSC Spontaneous EPSC
= 13.2
B
C
0.1(
(U
Hexamethonium
200 pA/Wash -
20 msControl
-200 -100 0
[,,
20 pA
20 ms
Control
00 ( _| 200 pAHexamethonium 200ms
Wash
60 y= 37.2 pS
30.. . N=30
30
-60 -30 0
Mean EPSC amplitude (pA)
FIG. 2. Properties of evoked (Left) and spontaneous (Right)EPSCs. (A) EPSC decays were single-exponential; the decay timeconstant T is indicated. (B) Reversible block by 5 tjM hexamethonium.(C) Examples of nonstationary variance analysis of 60 evoked and 30spontaneous EPSCs. N is the number of open channels for an EPSCof mean amplitude, and y is the single-channel conductance.
Proc. Natl. Acad. Sci. USA 93 (1996)
Dow
nloa
ded
by g
uest
on
Feb
ruar
y 20
, 202
0
Proc. Natl. Acad. Sci. USA 93 (1996) 9907
the channels carrying evoked EPSCs, close to the y = 44 pS forsingle nAChR currents in chromaffin cells (25). These dataconfirm that the EPSCs are mediated by nAChRs.
Spontaneous EPSCs. Quantal analysis was not possible onevoked EPSCs due to the very small variations in amplitudewith our stimulation protocol. Instead, we focused on spon-taneously occurring EPSCs. Because in normal solution thesehad a low frequency (v < 0.01 Hz; but in 5 of 100 cells v = 2.7 +2.1 Hz), external [K+] was raised to 20 mM. Spontaneous andevoked EPSCs shared similar properties: the spontaneousEPSC decay T was 13.2 ± 1.4 ms (n = 12, -60 mV; Fig. 2A)and both were reversibly inhibited by 5 ,uM hexamethonium(Fig. 2B). Complete reversible block of spontaneous EPSCswas also obtained with 60 ,uM mecamylamine, 20 ,uM f3-eryth-roidine and 100 p.M hexamethonium (n = 3 for each drug; datanot shown). Nonstationary variance analysis gave a mean y =
45.0 ± 5.0 pS (n = 6; Fig. 2C) for spontaneous EPSCs, whichwas not different from evoked EPSCs.
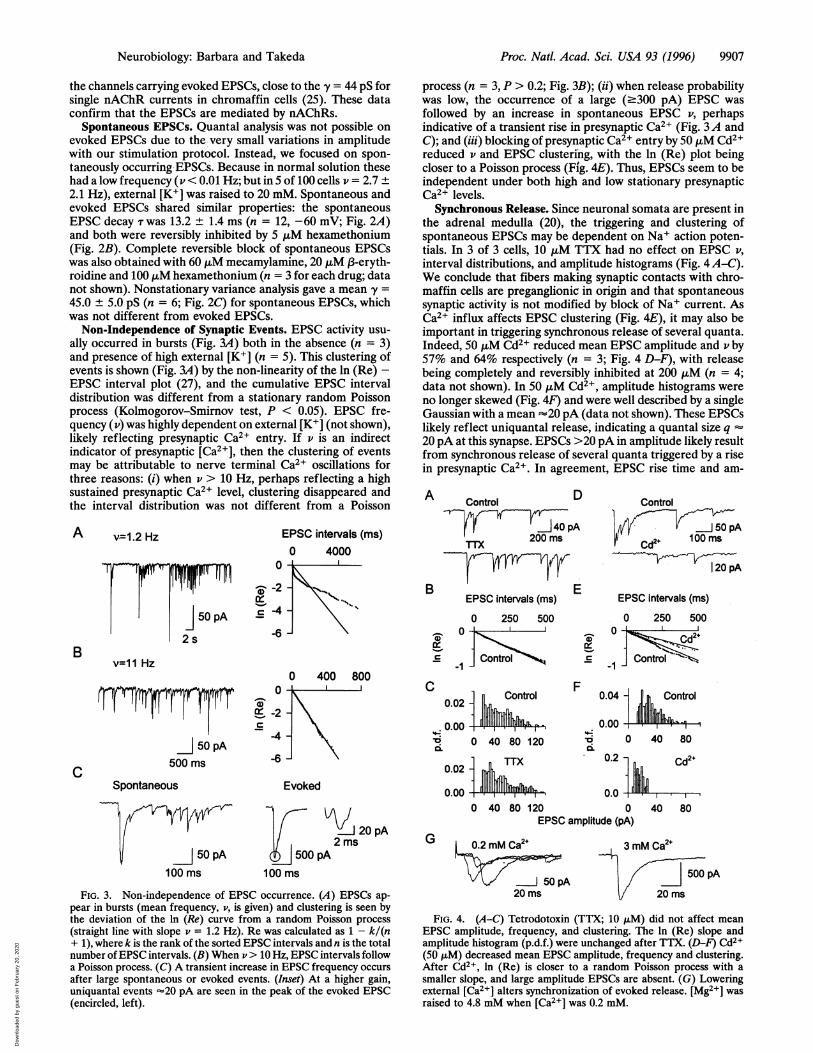
Non-Independence of Synaptic Events. EPSC activity usu-ally occurred in bursts (Fig. 3A) both in the absence (n = 3)and presence of high external [K+] (n = 5). This clustering ofevents is shown (Fig. 3A) by the non-linearity of the ln (Re) -EPSC interval plot (27), and the cumulative EPSC intervaldistribution was different from a stationary random Poissonprocess (Kolmogorov-Smirnov test, P < 0.05). EPSC fre-quency (v) was highly dependent on external [K+] (not shown),likely reflecting presynaptic Ca2+ entry. If v is an indirectindicator of presynaptic [Ca2+], then the clustering of eventsmay be attributable to nerve terminal Ca2+ oscillations forthree reasons: (i) when v > 10 Hz, perhaps reflecting a highsustained presynaptic Ca2+ level, clustering disappeared andthe interval distribution was not different from a Poisson
v=1.2 Hz
0-,U)
C
v=11 Hz
lf50 pA
500 ms
Spontaneous
0
-2
EPSC intervals (ms)0 4000
-4
-6
0
12 -2
-4
-6
0 400 800
Evoked
20 pA2 ms
50 pA 500 pA100 ms 100 ms
FIG. 3. Non-independence of EPSC occurrence. (A) EPSCs ap-pear in bursts (mean frequency, v, is given) and clustering is seen bythe deviation of the ln (Re) curve from a random Poisson process(straight line with slope v = 1.2 Hz). Re was calculated as 1 - k/(n+ 1), where k is the rank of the sorted EPSC intervals and n is the totalnumber of EPSC intervals. (B) When v > 10 Hz, EPSC intervals followa Poisson process. (C) A transient increase in EPSC frequency occursafter large spontaneous or evoked events. (Inset) At a higher gain,uniquantal events =20 pA are seen in the peak of the evoked EPSC(encircled, left).
process (n = 3, P > 0.2; Fig. 3B); (ii) when release probabilitywas low, the occurrence of a large (-300 pA) EPSC wasfollowed by an increase in spontaneous EPSC v, perhapsindicative of a transient rise in presynaptic Ca2+ (Fig. 3A andC); and (iii) blocking of presynaptic Ca2+ entry by 50 ,uM Cd2+reduced v and EPSC clustering, with the ln (Re) plot beingcloser to a Poisson process (Fig. 4E). Thus, EPSCs seem to beindependent under both high and low stationary presynapticCa2+ levels.
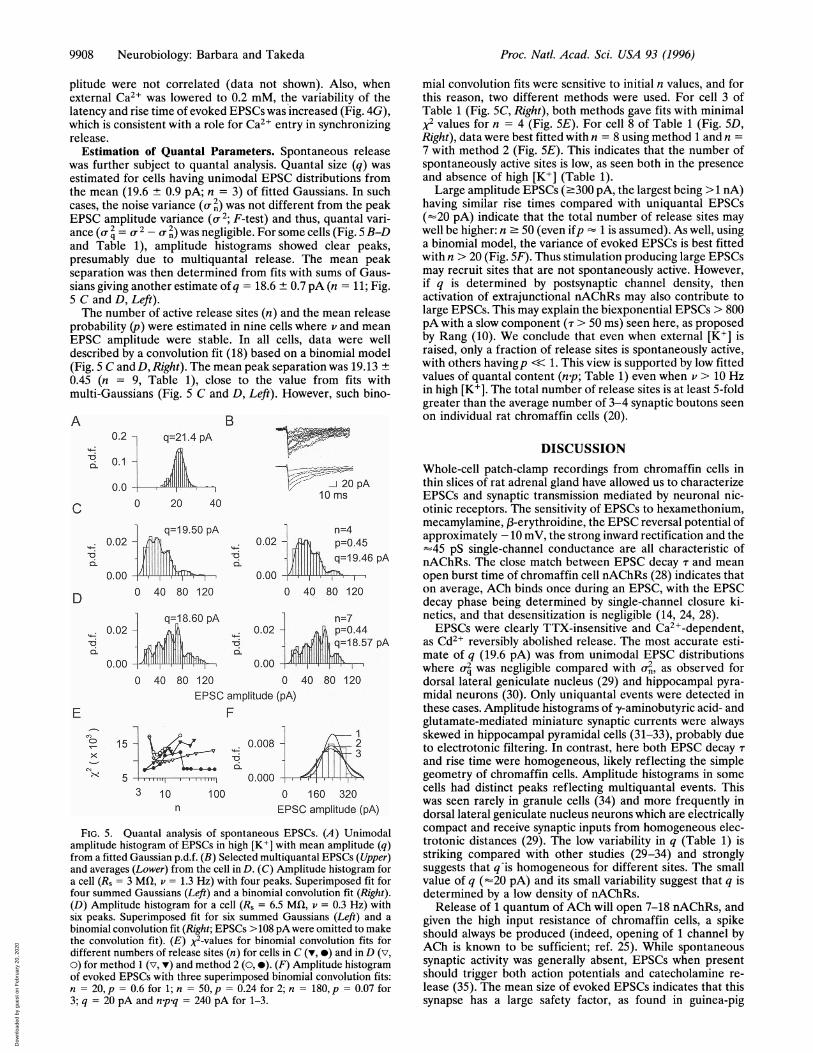
Synchronous Release. Since neuronal somata are present inthe adrenal medulla (20), the triggering and clustering ofspontaneous EP$Cs may be dependent on Na+ action poten-tials. In 3 of 3 cells, 10 ,uM TTX had no effect on EPSC v,interval distributions, and amplitude histograms (Fig. 4 A-C).We conclude that fibers making synaptic contacts with chro-maffin cells are preganglionic in origin and that spontaneoussynaptic activity is not modified by block of Na+ current. AsCa2+ influx affects EPSC clustering (Fig. 4E), it may also beimportant in triggering synchronous release of several quanta.Indeed, 50 ,uM Cd2+ reduced mean EPSC amplitude and v by57% and 64% respectively (n = 3; Fig. 4 D-F), with releasebeing completely and reversibly inhibited at 200 ,uM (n = 4;data not shown). In 50 ,uM Cd2+, amplitude histograms wereno longer skewed (Fig. 4F) and were well described by a singleGaussian with a mean -20 pA (data not shown). These EPSCslikely reflect uniquantal release, indicating a quantal size q20 pA at this synapse. EPSCs >20 pA in amplitude likely resultfrom synchronous release of several quanta triggered by a risein presynaptic Ca2+. In agreement, EPSC rise time and am-
A D''-% Control
140 pA
TTX 200 ms
B ____ . . EEPSC intervals (ms)
0 250 500
c 1jControl
0.02
0.00 I
X 0 40 80 120
0.02 T
0.00 ...I 1
F
Control
50 pACd2+ 100ms
120 pA
EPSC intervals (ms)
0 250 5000
jC ntrol~
0.04 Control
0.00v. 0 40 80
0.2 A Cd2
0.0 W- F-n-
0 40 80 120 0 40 80EPSC amplitude (pA)
G 0.2 mM Ca2+
' 50 pA20 ms
3 mM Ca2+
500 pA
20 ms
FIG. 4. (A-C) Tetrodotoxin (TTX; 10 ,uM) did not affect meanEPSC amplitude, frequency, and clustering. The ln (Re) slope andamplitude histogram (p.d.f.) were unchanged after TTX. (D-F) Cd2+(50 ,uM) decreased mean EPSC amplitude, frequency and clustering.After Cd2+, ln (Re) is closer to a random Poisson process with a
smaller slope, and large amplitude EPSCs are absent. (G) Loweringexternal [Ca2+] alters synchronization of evoked release. [Mg2+] wasraised to 4.8 mM when [Ca2+] was 0.2 mM.
A
B
C
Neurobiology: Barbara and Takeda
Dow
nloa
ded
by g
uest
on
Feb
ruar
y 20
, 202
0
9908 Neurobiology: Barbara and Takeda
plitude were not correlated (data not shown). Also, whenexternal Ca2+ was lowered to 0.2 mM, the variability of thelatency and rise time of evoked EPSCs was increased (Fig. 4G),which is consistent with a role for Ca2+ entry in synchronizingrelease.
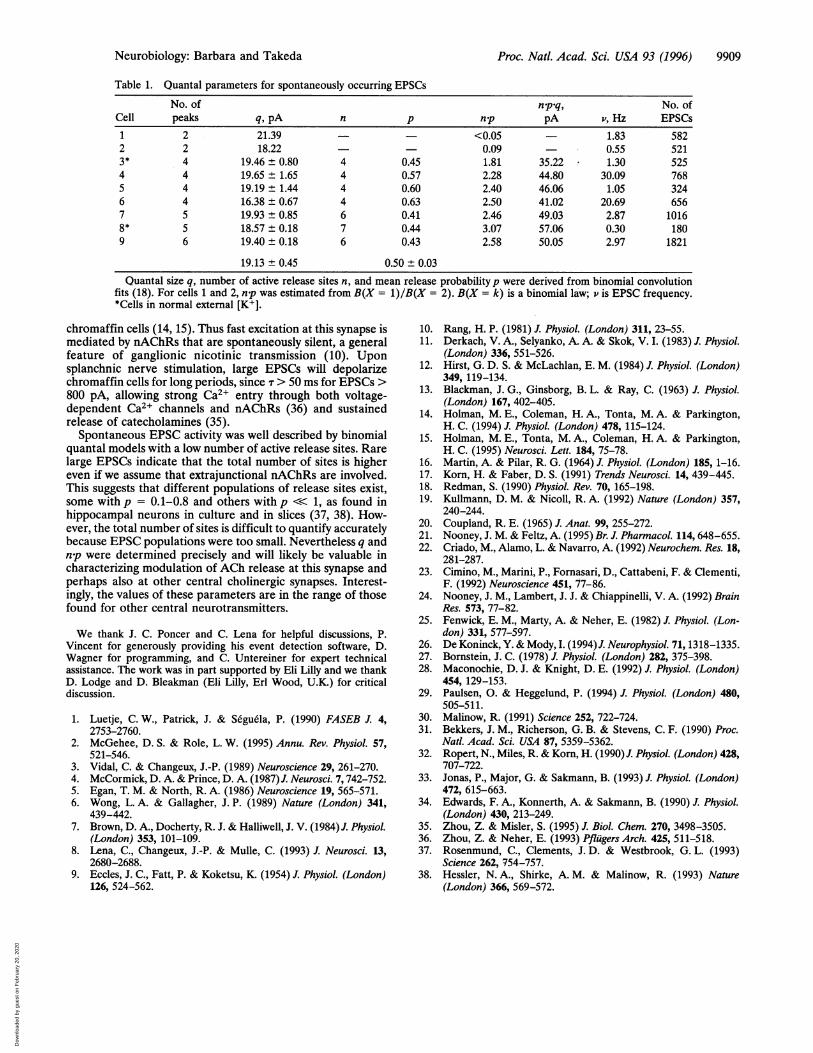
Estimation of Quantal Parameters. Spontaneous releasewas further subject to quantal analysis. Quantal size (q) wasestimated for cells having unimodal EPSC distributions fromthe mean (19.6 ± 0.9 pA; n = 3) of fitted Gaussians. In suchcases, the noise variance (- 2) was not different from the peakEPSC amplitude variance (or2; F-test) and thus, quantal vari-ance (a 2 = 2 - a 2) was negligible. For some cells (Fig. 5 B-Dand Table 1), amplitude histograms showed clear peaks,presumably due to multiquantal release. The mean peakseparation was then determined from fits with sums of Gaus-sians giving another estimate ofq = 18.6 ± 0.7 pA (n = 11; Fig.5 C and D, Left).The number of active release sites (n) and the mean release
probability (p) were estimated in nine cells where v and meanEPSC amplitude were stable. In all cells, data were welldescribed by a convolution fit (18) based on a binomial model(Fig. 5 C andD, Right). The mean peak separation was 19.13 +0.45 (n = 9, Table 1), close to the value from fits withmulti-Gaussians (Fig. 5 C and D, Left). However, such bino-
0.2- q=21.4 pA
0.1
0.0o.o - ,J|1111ki'0 20 40
q=19.50 pA0.02
o.0.00
0 40 80 120
q=1 8.60 pAW 0.02
0.000 40 80 120
B
,jJ 20 pA10 ms
n=40.02 pr=0p=0.4500 '}I 19.46 pA0.00,
0 40 80 120
n=70.02 - p=0.44
0-4Ihq=18.57 pA0.00 t,
0 40 80 120EPSC amplitude (pA)
E Fco 1
15 \ 0.008 2
5 0.0005 .. ,,,. 0.000 ', '. '3 10 100 0 160 320
EPSC amplitude (pA)FIG. 5. Quantal analysis of spontaneous EPSCs. (A) Unimodal
amplitude histogram of EPSCs in high [K+] with mean amplitude (q)from a fitted Gaussian p.d.f. (B) Selected multiquantal EPSCs (Upper)and averages (Lower) from the cell in D. (C) Amplitude histogram fora cell (Rs = 3 Mfl, v = 1.3 Hz) with four peaks. Superimposed fit forfour summed Gaussians (Left) and a binomial convolution fit (Right).(D) Amplitude histogram for a cell (Rs = 6.5 Mfl, v = 0.3 Hz) withsix peaks. Superimposed fit for six summed Gaussians (Left) and a
binomial convolution fit (Right; EPSCs > 108 pAwere omitted to makethe convolution fit). (E) X2-values for binomial convolution fits fordifferent numbers of release sites (n) for cells in C (v, *) and in D (v,o) for method 1 (v, v) and method 2 (0, 0). (F) Amplitude histogramof evoked EPSCs with three superimposed binomial convolution fits:n = 20, p = 0.6 for 1; n = 50, p = 0.24 for 2; n = 180, p = 0.07 for3; q = 20 pA and n.p.q = 240 pA for 1-3.
mial convolution fits were sensitive to initial n values, and forthis reason, two different methods were used. For cell 3 ofTable 1 (Fig. 5C, Right), both methods gave fits with minimalX2 values for n = 4 (Fig. 5E). For cell 8 of Table 1 (Fig. 5D,Right), data were best fitted with n = 8 using method 1 and n =
7 with method 2 (Fig. 5E). This indicates that the number ofspontaneously active sites is low, as seen both in the presenceand absence of high [K+] (Table 1).
Large amplitude EPSCs (.300 pA, the largest being >1 nA)having similar rise times compared with uniquantal EPSCs(=20 pA) indicate that the total number of release sites maywell be higher: n 50 (even ifp - 1 is assumed). As well, usinga binomial model, the variance of evoked EPSCs is best fittedwith n > 20 (Fig. 5F). Thus stimulation producing large EPSCsmay recruit sites that are not spontaneously active. However,if q is determined by postsynaptic channel density, thenactivation of extrajunctional nAChRs may also contribute tolarge EPSCs. This may explain the biexponential EPSCs > 800pA with a slow component (T > 50 ms) seen here, as proposedby Rang (10). We conclude that even when external [K+] israised, only a fraction of release sites is spontaneously active,with others havingp << 1. This view is supported by low fittedvalues of quantal content (n.p; Table 1) even when v > 10 Hzin high [K+]. The total number of release sites is at least 5-foldgreater than the average number of 3-4 synaptic boutons seenon individual rat chromaffin cells (20).
DISCUSSIONWhole-cell patch-clamp recordings from chromaffin cells inthin slices of rat adrenal gland have allowed us to characterizeEPSCs and synaptic transmission mediated by neuronal nic-otinic receptors. The sensitivity of EPSCs to hexamethonium,mecamylamine, 3-erythroidine, the EPSC reversal potential ofapproximately -10 mV, the strong inward rectification and the-45 pS single-channel conductance are all characteristic ofnAChRs. The close match between EPSC decay r and meanopen burst time of chromaffin cell nAChRs (28) indicates thaton average, ACh binds once during an EPSC, with the EPSCdecay phase being determined by single-channel closure ki-netics, and that desensitization is negligible (14, 24, 28).EPSCs were clearly TTX-insensitive and Ca2+-dependent,
as Cd2+ reversibly abolished release. The most accurate esti-mate of q (19.6 pA) was from unimodal EPSC distributionswhere orq was negligible compared with oa, as observed fordorsal lateral geniculate nucleus (29) and hippocampal pyra-midal neurons (30). Only uniquantal events were detected inthese cases. Amplitude histograms of -y-aminobutyric acid- andglutamate-mediated miniature synaptic currents were alwaysskewed in hippocampal pyramidal cells (31-33), probably dueto electrotonic filtering. In contrast, here both EPSC decay T
and rise time were homogeneous, likely reflecting the simplegeometry of chromaffin cells. Amplitude histograms in somecells had distinct peaks reflecting multiquantal events. Thiswas seen rarely in granule cells (34) and more frequently indorsal lateral geniculate nucleus neurons which are electricallycompact and receive synaptic inputs from homogeneous elec-trotonic distances (29). The low variability in q (Table 1) isstriking compared with other studies (29-34) and stronglysuggests that q-is homogeneous for different sites. The smallvalue of q (=20 pA) and its small variability suggest that q isdetermined by a low density of nAChRs.
Release of 1 quantum of ACh will open 7-18 nAChRs, andgiven the high input resistance of chromaffin cells, a spikeshould always be produced (indeed, opening of 1 channel byACh is known to be sufficient; ref. 25). While spontaneoussynaptic activity was generally absent, EPSCs when presentshould trigger both action potentials and catecholamine re-lease (35). The mean size of evoked EPSCs indicates that thissynapse has a large safety factor, as found in guinea-pig
A
C
D
Proc. Natl. Acad. Sci. USA 93 (1996)
Dow
nloa
ded
by g
uest
on
Feb
ruar
y 20
, 202
0
Proc. Natl. Acad. Sci. USA 93 (1996) 9909
Table 1. Quantal parameters for spontaneously occurring EPSCs
No. of npq, No. ofCell peaks q, pA n p np pA v, Hz EPSCs1 2 21.39 <0.05 1.83 5822 2 18.22 0.09 - 0.55 5213* 4 19.46 ± 0.80 4 0.45 1.81 35.22 1.30 5254 4 19.65 ± 1.65 4 0.57 2.28 44.80 30.09 7685 4 19.19 ± 1.44 4 0.60 2.40 46.06 1.05 3246 4 16.38 ± 0.67 4 0.63 2.50 41.02 20.69 6567 5 19.93 ± 0.85 6 0.41 2.46 49.03 2.87 10168* 5 18.57 ± 0.18 7 0.44 3.07 57.06 0.30 1809 6 19.40 ± 0.18 6 0.43 2.58 50.05 2.97 1821
19.13 ± 0.45 0.50 ± 0.03Quantal size q, number of active release sites n, and mean release probability p were derived from binomial convolution
fits (18). For cells 1 and 2, np was estimated from B(X = 1)/B(X = 2). B(X = k) is a binomial law; v is EPSC frequency.*Cells in normal external [K+].
chromaffin cells (14, 15). Thus fast excitation at this synapse ismediated by nAChRs that are spontaneously silent, a generalfeature of ganglionic nicotinic transmission (10). Uponsplanchnic nerve stimulation, large EPSCs will depolarizechromaffin cells for long periods, since XT> 50 ms for EPSCs >800 pA, allowing strong Ca2+ entry through both voltage-dependent Ca2+ channels and nAChRs (36) and sustainedrelease of catecholamines (35).
Spontaneous EPSC activity was well described by binomialquantal models with a low number of active release sites. Rarelarge EPSCs indicate that the total number of sites is highereven if we assume that extrajunctional nAChRs are involved.This suggests that different populations of release sites exist,some with p = 0.1-0.8 and others with p << 1, as found inhippocampal neurons in culture and in slices (37, 38). How-ever, the total number of sites is difficult to quantify accuratelybecause EPSC populations were too small. Nevertheless q andn-p were determined precisely and will likely be valuable incharacterizing modulation of ACh release at this synapse andperhaps also at other central cholinergic synapses. Interest-ingly, the values of these parameters are in the range of thosefound for other central neurotransmitters.
We thank J. C. Poncer and C. Lena for helpful discussions, P.Vincent for generously providing his event detection software, D.Wagner for programming, and C. Untereiner for expert technicalassistance. The work was in part supported by Eli Lilly and we thankD. Lodge and D. Bleakman (Eli Lilly, Erl Wood, U.K.) for criticaldiscussion.
1. Luetje, C. W., Patrick, J. & Seguela, P. (1990) FASEB J. 4,2753-2760.
2. McGehee, D. S. & Role, L. W. (1995) Annu. Rev. Physiol. 57,521-546.
3. Vidal, C. & Changeux, J.-P. (1989) Neuroscience 29, 261-270.4. McCormick, D. A. & Prince, D. A. (1987)J. Neurosci. 7,742-752.5. Egan, T. M. & North, R. A. (1986) Neuroscience 19, 565-571.6. Wong, L. A. & Gallagher, J. P. (1989) Nature (London) 341,
439-442.7. Brown, D. A., Docherty, R. J. & Halliwell, J. V. (1984) J. Physiol.
(London) 353, 101-109.8. Lena, C., Changeux, J.-P. & Mulle, C. (1993) J. Neurosci. 13,
2680-2688.9. Eccles, J. C., Fatt, P. & Koketsu, K. (1954) J. Physiol. (London)
126, 524-562.
10. Rang, H. P. (1981) J. Physiol. (London) 311, 23-55.11. Derkach, V. A., Selyanko, A. A. & Skok, V. I. (1983) J. Physiol.
(London) 336, 551-526.12. Hirst, G. D. S. & McLachlan, E. M. (1984) J. Physiol. (London)
349, 119-134.13. Blackman, J. G., Ginsborg, B. L. & Ray, C. (1963) J. Physiol.
(London) 167, 402-405.14. Holman, M. E., Coleman, H. A., Tonta, M. A. & Parkington,
H. C. (1994) J. Physiol. (London) 478, 115-124.15. Holman, M. E., Tonta, M. A., Coleman, H. A. & Parkington,
H. C. (1995) Neurosci. Lett. 184, 75-78.16. Martin, A. & Pilar, R. G. (1964) J. Physiol. (London) 185, 1-16.17. Korn, H. & Faber, D. S. (1991) Trends Neurosci. 14, 439-445.18. Redman, S. (1990) Physiol. Rev. 70, 165-198.19. Kullmann, D. M. & Nicoll, R. A. (1992) Nature (London) 357,
240-244.20. Coupland, R. E. (1965) J. Anat. 99, 255-272.21. Nooney, J. M. & Feltz, A. (1995) Br. J. Pharmacol. 114,648-655.22. Criado, M., Alamo, L. & Navarro, A. (1992) Neurochem. Res. 18,
281-287.23. Cimino, M., Marini, P., Fornasari, D., Cattabeni, F. & Clementi,
F. (1992) Neuroscience 451, 77-86.24. Nooney, J. M., Lambert, J. J. & Chiappinelli, V. A. (1992) Brain
Res. 573, 77-82.25. Fenwick, E. M., Marty, A. & Neher, E. (1982) J. Physiol. (Lon-
don) 331, 577-597.26. De Koninck, Y. & Mody, I. (1994)J. Neurophysiol. 71,1318-1335.27. Bornstein, J. C. (1978) J. Physiol. (London) 282, 375-398.28. Maconochie, D. J. & Knight, D. E. (1992) J. Physiol. (London)
454, 129-153.29. Paulsen, 0. & Heggelund, P. (1994) J. Physiol. (London) 480,
505-511.30. Malinow, R. (1991) Science 252, 722-724.31. Bekkers, J. M., Richerson, G. B. & Stevens, C. F. (1990) Proc.
Natl. Acad. Sci. USA 87, 5359-5362.32. Ropert, N., Miles, R. & Korn, H. (1990)J. Physiol. (London) 428,
707-722.33. Jonas, P., Major, G. & Sakmann, B. (1993) J. Physiol. (London)
472, 615-663.34. Edwards, F. A., Konnerth, A. & Sakmann, B. (1990) J. Physiol.
(London) 430, 213-249.35. Zhou, Z. & Misler, S. (1995) J. Biol. Chem. 270, 3498-3505.36. Zhou, Z. & Neher, E. (1993) Pflugers Arch. 425, 511-518.37. Rosenmund, C., Clements, J. D. & Westbrook, G. L. (1993)
Science 262, 754-757.38. Hessler, N. A., Shirke, A. M. & Malinow, R. (1993) Nature
(London) 366, 569-572.
Neurobiology: Barbara and Takeda
Dow
nloa
ded
by g
uest
on
Feb
ruar
y 20
, 202
0