Embed Size (px)
Citation preview

RAPPORT D’EVALUATION
DE L’EDUCATION POUR TOUS
EN AFRIQUE SUBSAHARIENNE
2014
vGB – 18 JAN 2014
(page intercalaire
ne pas imprimer)

EDUCATION FOR ALL
IN SUB-SAHARAN AFRICA
ASSESSMENT REPORT
2014

i
Table of Contents
LIST OF TABLES, FIGURES AND BOXES ...................................................................................................... III
ACKNOWLEDGMENTS .......................................................................................................................... IV
ACRONYMS AND ABBREVIATIONS ............................................................................................................ V
INTRODUCTION ................................................................................................................................... 1
SECTION 1. OVERVIEW OF EDUCATION IN SSA IN 2000 – CHALLENGES AND GOALS ......................... 3
1.A- THE DEMOGRAPHIC STATUS OF SSA IN 2000 ..................................................................................... 3
1.B- EDUCATION COVERAGE IN SSA IN 2000 ............................................................................................ 4
1.C- SOME CHARACTERISTICS OF EDUCATION POLICIES IN SSA IN 2000 .......................................................... 5
1.D- SSA EDUCATION SYSTEMS’ DEVELOPMENT GOALS .............................................................................. 8
SECTION 2. THE EFA GOALS – PROGRESS BETWEEN 2000 AND 2012 .............................................. 11
2.A- SOCIOECONOMIC STATUS OF SSA IN 2012 ....................................................................................... 11
2.B- SOME CHARACTERISTICS OF EDUCATION POLICIES IN SSA IN 2012 ........................................................ 13
2.C- THE AFRICAN EFA DEVELOPMENT INDEX ......................................................................................... 16
2.D- GOAL 1: EARLY CHILDHOOD CARE AND EDUCATION ........................................................................... 18
2.E- GOAL 2: UNIVERSAL PRIMARY EDUCATION ....................................................................................... 20
2.F- GOAL 3: THE EDUCATIONAL NEEDS OF YOUTH AND ADULTS ................................................................. 22
2.G- GOAL 4: ADULT LITERACY ............................................................................................................. 29
2.H- GOAL 5: GENDER PARITY IN EDUCATION ......................................................................................... 30
2.I- GOAL 6: EDUCATIONAL QUALITY ..................................................................................................... 33
2.J- KEY FINDINGS ............................................................................................................................. 36
SECTION 3. EFA STRATEGIES– SSA COUNTRIES’ PERSPECTIVES ....................................................... 39
3.A- THE PURSUIT OF EFA GOALS – INITIATIVES, SUCCESSES AND FAILURES ................................................... 40
3.B- ACHIEVING THE EFA GOALS – TRANSVERSAL ISSUES FACED.................................................................. 52
3.C- REFORMS INFLUENCED BY EFA – PROPOSED SOLUTIONS ..................................................................... 55
3.D- KEY FINDINGS ............................................................................................................................ 59
SECTION 4. NATIONAL PERSPECTIVES FOR POST-2015 ................................................................... 61
4.A- THE 2000-15 EFA LEGACY – STAKES AND CHALLENGES ...................................................................... 61
4.B- THE FUTURE OF EDUCATION PROGRAMMES – PRIORITIES AND OUTLOOK ............................................... 63
4.C- A NEW EFA FRAMEWORK - POINTERS ............................................................................................. 68
SUMMARY OF FINDINGS ...................................................................................................................... 74
ii
CASE STUDIES ................................................................................................................................ 81
1: THE APPROACH ADOPTED BY GHANA REGARDING EFA GOAL 1 - EXPERIENCE IN EARLY CHILDHOOD CARE
AND EDUCATION ............................................................................................................................... 81
2: THE APPROACH ADOPTED BY ZAMBIA REGARDING EFA GOAL 2 - EXPERIENCE IN UNIVERSAL PRIMARY
EDUCATION ...................................................................................................................................... 84
3: THE APPROACH ADOPTED BY RWANDA REGARDING EFA GOAL 2 - FAST TRACKING ACCESS TO QUALITY
EDUCATION THROUGH THE 9YBE PROGRAMME ....................................................................................... 87
4: THE APPROACH ADOPTED BY MAINLAND TANZANIA REGARDING EFA GOAL 3 - EXTENDING THE
SCOPE AND COVERAGE OF COMPLEMENTARY BASIC EDUCATION .................................................................. 90
5: THE APPROACH ADOPTED BY ANGOLA REGARDING EFA GOAL 3 - EXPANDING ACCESS TO TVET AND
LIFESKILLS TRAINING........................................................................................................................... 93
6: THE APPROACH ADOPTED BY NIGER REGARDING EFA GOAL 4 - FUNCTIONAL LITERACY FOR WOMEN . 96
7: THE APPROACH ADOPTED BY SENEGAL REGARDING EFA GOAL 5 - THE PRIMARY GENDER PARITY INDEX
AND THE PROMOTION OF GIRLS’ EDUCATION ........................................................................................... 99
8: THE APPROACH ADOPTED BY SWAZILAND REGARDING EFA GOAL 6 - QUALITY PRIMARY EDUCATION IN
SWAZILAND .................................................................................................................................... 102
9: THE PURSUIT OF EFA GOALS IN CABO VERDE – SPECIFIC ISSUES FACED BY A SMALL ISLAND STATE ........ 105
10: EDUCATION FOR ALL IN KENYA - PROMOTING PEACE BUILDING IN AND THROUGH EDUCATION FOR ALL . 108
11: EDUCATION FOR ALL IN ZANZIBAR – THE CHALLENGES OF EDUCATION PROVISION IN A SEMI-
AUTONOMOUS REGION .................................................................................................................... 110
ANNEXES ..................................................................................................................................... 113
ANNEX 1: GLOBAL EFA COORDINATION ............................................................................................... 113
ANNEX 2: COUNTRY DATA TABLES – KEY EFA INDICATORS ....................................................................... 123
ANNEX 3: METHODOLOGICAL CONSIDERATIONS ..................................................................................... 130
ANNEX 4: COUNTRY QUESTIONNAIRE .................................................................................................. 135
ANNEX 5: THE STRUCTURE OF EDUCATION SYSTEMS IN SSA ..................................................................... 144
ANNEX 6: LIST OF SSA COUNTRIES HAVING CONDUCTED CSR-TYPE SECTOR ANALYSIS ................................... 145
iii
List of Tables, Figures and Boxes
TABLE 1: UNESCO’S REGIONAL DIVISIONS FOR SUB-SAHARAN AFRICA ................................................................ 3
TABLE 2: EDUCATION COVERAGE INDICATORS, FOR SSA AND BY REGION, 2000 .................................................... 4
TABLE 3: EDUCATION FINANCING, FOR SSA AND BY REGION, 2000 ..................................................................... 6
TABLE 4: EDUCATION POLICY PARAMETERS, FOR SSA AND BY REGION, 2000 ........................................................ 7
BOX 1: THE SIX EFA GOALS ........................................................................................................................... 8
TABLE 5: SOCIOECONOMIC CHARACTERISTICS, FOR SSA AND BY REGION, 2012 ................................................... 11
TABLE 6: EDUCATION FINANCING, FOR SSA AND BY REGION, 2012 ................................................................... 14
TABLE 7: EDUCATION POLICY PARAMETERS, FOR SSA AND BY REGION, 2012 ...................................................... 15
FIGURE 1: EVOLUTION OF THE EDI, FOR SSA AND BY REGION, 2000-12 ............................................................. 16
FIGURE 2: EVOLUTION OF THE EDI, BY SSA COUNTRY, 2000-12 ....................................................................... 17
FIGURE 3: EVOLUTION OF THE PREPRIMARY GER, FOR SSA AND BY REGION, 2000-12 ......................................... 19
FIGURE 4: PCR TRENDS, FOR SSA AND BY REGION, 2000-12 ........................................................................... 20
BOX 2: RANKING OF SSA COUNTRIES ACCORDING TO THEIR LEVEL OF UPE ATTAINMENT, 2012 ............................ 22
FIGURE 5: LOWER SECONDARY COMPLETION RATE TRENDS, FOR SSA AND BY REGION, 2000-12 ........................... 23
FIGURE 6: AVERAGE TRANSVERSAL SCHOOLING PROFILES, FOR SSA AND BY REGION, 2012 ................................... 24
TABLE 8: PRIMARY AND SECONDARY SURVIVAL AND TRANSITION RATES, FOR SSA AND BY REGION, 2000-12 ......... 25
TABLE 9: TVET ENROLLMENT TRENDS, COMPARED TO TOTAL SECONDARY, FOR SSA AND BY REGION, 2000-12 ...... 26
FIGURE 7: TVET COVERAGE TRENDS, FOR SSA AND BY REGION, 2000-12 ......................................................... 27
FIGURE 8: HIGHER EDUCATION COVERAGE TRENDS, FOR SSA AND BY REGION, 2000-12 ...................................... 28
FIGURE 9: TRENDS IN ADULT LITERACY (15+ YEARS), FOR SSA AND BY REGION, 2000-12 .................................... 29
FIGURE 10: EVOLUTION OF GENDER INEQUALITY AND GPI, PRIMARY, FOR SSA AND BY REGION, 2000-12 .............. 30
BOX 3: RANKING OF SSA COUNTRIES ACCORDING TO THEIR ATTAINMENT OF GENDER PARITY, 2012 ..................... 31
TABLE 10: GENDER ENROLLMENT DISPARITIES, PRIMARY TO HIGHER EDUCATION, FOR SSA AND BY REGION, 2012 .. 32
TABLE 11: SURVIVAL AND TRANSITION RATES, PRIMARY AND SECONDARY, BY GENDER, FOR SSA, 2012 ................. 33
TABLE 12: SHARE OF PRIMARY GRADE 5 PUPILS ACHIEVING THE MINIMUM LEVEL AT PASEC, READING AND MATH,
2004-10 .................................................................................................................................................. 34
TABLE 13: SHARE OF PRIMARY GRADE 6 PUPILS ACHIEVING THE MINIMUM LEVEL AT SACMEQ, READING AND MATH,
2007 ....................................................................................................................................................... 35
FIGURE 11: OVERVIEW OF PROGRESS TOWARDS EFA BY GOAL, SSA, 2000-12 ................................................... 36
FIGURE 12: COMPARATIVE LEVELS OF OWNERSHIP OF EFA GOALS AND THEIR TRENDS, SSA, 2000-14 .................. 40
BOX 4: EFA POLICY FACTORS – A COMPARATIVE ANALYSIS .............................................................................. 50
BOX 5: THE TEACHER CHALLENGE ................................................................................................................. 53
BOX 6: ILLUSTRATIVE SAMPLE OF STRATEGY AND POLICY DOCUMENTS, 4 SSA COUNTRIES .................................... 55
FIGURE 13: NUMBER OF COUNTRIES FOR WHICH A GIVEN POST-2015 PRIORITY IS AMONG THEIR TOP FIVE, AND THEIR
MAIN ONE, SSA ........................................................................................................................................ 64
BOX 7: KEY THEMES IDENTIFIED FOR THE POST-2015 ERA, BY PRIORITY, SSA ...................................................... 66
BOX 8: THE MUSCAT AGREEMENT ................................................................................................................ 69
FIGURE 14: COMPARATIVE APPRAISAL OF THE COMPONENTS OF THE 2000-15 EFA FRAMEWORK ......................... 70
FIGURE 15: PROJECTED TIMEFRAME FOR THE ACHIEVEMENT OF POST-2015 EDUCATION GOALS, BY EDI, 16 SSA
COUNTRIES, 2014 ..................................................................................................................................... 73
iv
Acknowledgments
This publication was prepared by the International Institute for Educational Planning– Pôle de Dakar
under the coordination of UNESCO’s Education for All in Africa office in Dakar.
Under the leadership of Ann Therese Ndong-Jatta (Director, UNESCO’s Dakar office), the coordination
of Zulmira Rodrigues and then Akemi Yonemura (respectively ex-EFA Coordinator for Africa and
Education Programme Specialist, UNESCO Dakar), the supervision of Guillaume Husson (Coordinator,
IIEP/Pôle de Dakar), the drafting team comprised Barnaby Rooke (Consultant), Jean-Pierre Jarousse
(Consultant), Valérie Djioze-Gallet and Hervé Huot-Marchand (Education Programme Specialists,
UNESCO Dakar) and Mohamed Chérif Diarra (Consultant).
The team especially thanks the National UNESCO Commissions and the members of the education
ministries of the countries of Sub-Saharan Africa for the considerable efforts they devoted to the
coordination of the responses to the EFA surveys and the drafting of case studies, two tools that
significant parts of this report are based on.
The report underwent an internal review, whose contributors were Guillaume Husson (Coordinator,
IIEP/Pôle de Dakar), Diane Coury and Beifith Kouak Tiyab (Senior Education Policy Analysts, IIEP/Pôle
de Dakar), Jean-Luc Yameogo, Jean Claude Ndabananiye, Patrick Nkengne, Olivier Pieume and Koffi
Segniagbeto (Education Policy Analysts, IIEP/Pôle de Dakar), Martine Boulanger (Administrator/
Training Focal Point, IIEP/Pôle de Dakar), Nyi Nyi Thaung, (Programme Specialist, UNESCO head
office), Sabine Detzel, (Programme Specialist, EFA and Global Agenda Coordination Team, UNESCO
head office) and Marc Bernal (Africa Regional Advisor, UNESCO Institute for Statistics).
The team also thanks Anne Muller (External Communication and Knowledge Management Officer,
UNESCO Dakar) for her support with the publication process, as well as the company Le Sphinx for
providing the SphinxIQ software at no charge, which helped to process the answers to the afore-
mentioned EFA surveys.
Note
The analyses and policy recommendations presented in this publication are primarily based on the
opinions and perceptions shared by the national education sector teams of Sub-Saharan African
countries, and do not necessarily reflect the views of UNESCO.
v
Acronyms and Abbreviations
ADEA Association for the Development of Education in Africa
ANCEFA African Network Campaign on Education for All
AU African Union
BECE Basic Education Certificate Examination (Ghana)
CCNGO/EFA Collective Consultation of NGOs on EFA
CONFEMEN Conference of Ministers of Education of French-Speaking Countries
CSR Education Country Status Report
ECCE Early Childhood Care and Education
ECD Early Childhood Development
EDI African EFA Development Index
EFA Education for All
EGMA Early Grade Mathematics Assessment
EGRA Early Grade Reading Assessment
EMIS Education Management Information System
FAWE Forum of African Women Educationalists
FTI EFA Fast-Track Initiative
GDP Gross Domestic Product
GER Gross Enrollment Rate
GMR EFA Global Monitoring Report
GPE Global Partnership for Education (previously the FTI)
GPI Gender Parity Index
ICT Information and Communication Technologies
IEC Information, education and communication
IECD Integrated Early Childhood Development
IIEP UNESCO’s International Institute for Educational Planning
INGO International nongovernmental organization
LIC Low Income Country
NEA National Education Assessment (Ghana)
NGO Nongovernmental Organization
OIF Organisation Internationale de la Francophonie
PASEC Programme for the Analysis of the Educational Systems of CONFEMEN Countries
PCR Primary Completion Rate
PIRLS Progress in International Reading Literacy Study
PSLE Primary School Leaving Examination (U. R. of Tanzania)
PTR Pupil-Teacher Ratio
SACMEQ Southern and Eastern Africa Consortium for Monitoring Educational Quality
SSA Sub-Saharan Africa
TFP Technical and Financial Partners
TIMSS Trends in International Mathematics and Science Study
TVET Technical and Vocational Education and Training
vi
UIS UNESCO Institute for Statistics
UNESCO United Nations Educational, Scientific and Cultural Organization
UNFPA United Nations Population Fund
UNICEF United Nations Children’s Fund
UPE Universal Primary Education
WASSCE West African Senior School Certificate Examination (Ghana)
1
Introduction
The organization of the World Education Forum in 2000 opened a new era of international
mobilization for the development of education. After numerous world summits devoted to the
promotion of universal education, the pragmatic debates and recommendations of the Dakar Forum
clarified both the actions to be implemented and the financing offered to support them.
A review of the overall cost of Education for All development support policies, based on a minimal
reformulation of education policies (clear definition of priorities between levels and types of
education, rationalization of spending and management, and so on) gave countries, and the
international community, renewed hope with respect to the prospect of eventually achieving these
goals within a known timeframe (2015), thanks to the respective financial commitments of
governments and their partners.
Six specific goals were set, covering several educational dimensions and targets (formal/nonformal,
general/vocational, youth/adults), explicitly including the commitment to equity and quality. Twelve
strategies were proposed to achieve these goals and ensure Education for All (EFA).
This pragmatism also touched on policy elaboration processes and the relationships between
governments and their partners, sealing an agreement whereby no “credible” EFA plan’s
implementation would be hindered by lack of financing. This adjective, which has been subject to
varied interpretations over the 2000-15 period, refers to the basic rationalization of the policies
mentioned above, with the aim of ensuring the sustainability of the results achieved.
Significant efforts have been deployed to build human, institutional and organizational capacities for
the planning, elaboration and management of national education policies, in particular through the
provision of decision-making tools and the creation of policy dialogue frameworks. This, in order to
guarantee the credibility of the education plans, destined to become referential documents for all
education sector players in each country.
Furthermore, new sources of multinational financing were created to finance them. The birth of the
Fast-Track Initiative (FTI), with funds earmarked for the elaboration of sector plans on the one hand
(capacity building, research and publications), and to co-finance their implementation on the other
(through the Catalytic Fund) epitomizes the spirit of the Forum.
The streamlining of policies and their financing involved the repositioning of donors as technical and
financial partners (TFPs), contributing to limit the detrimental impacts of highly competitive
international aid. The Dakar Framework for Action’s recommendations were adopted by the Paris
Declaration on Aid Effectiveness, leading donor procedures to evolve, aiming for greater coherence,
complementarity and coordination, and gradually facilitating governments’ ownership of the
formulation and management of their education policies. The rebranding of the FTI as the Global
Partnership for Education (GPE) further consolidated this trend.
2
The period initiated by the Dakar Forum has also been fertile in terms of the monitoring and
evaluation of progress, with the publication of annual global and regional reports, the organization of
high level monitoring conferences involving governments and TFPs under UNESCO’s leadership, and
the strengthening of national and international statistical systems, facilitating the multiplication of
reviews and analysis (See Annex 1).
This report shares this approach. It is first and foremost a regional review of Sub-Saharan Africa
(SSA), offering a virtually final evaluation of the level of achievement of the EFA goals, one year short
of the deadline set in 2000.1 The study also includes a sub-regional dimension where data permit (the
distribution of countries reflects that used by UNESCO’s multisectoral regional offices), as well as a
national dimension, through case studies illustrating the experiences of several countries, based on
their efforts to attain given goals, or their specific contexts.
The layout of this report reflects that proposed in UNESCO’s Guidelines for National EFA Reviews.2
The analysis is both quantitative and qualitative, as the report has a participative nature, wishing to
reflect and value the contexts and progress of each country to the greatest possible degree. It
comprises four sections:
- Section 1: The baseline period is reviewed from several angles (demographic, education
system coverage and education policy and financing), to underline the challenges that Sub-
Saharan African countries and regions faced in 2000.
- Section 2: Firstly, the evolution of the socioeconomic context and of education policy and
financing indicators over the 2000-12 period is reviewed. Then, a direct statistical measure of
the EFA goals enables an illustration of their respective levels of achievement, allowing for an
analysis by region. The indicators provided are computed giving preference to data provided
directly by countries, and complemented by those of the UNESCO Institute for Statistics (UIS)
and other institutions.3
- Section 3: A more detailed understanding of the way in which these results have been
achieved, the strengths and weaknesses of national policies and strategies, governments’
perceptions of their successes and failures and the identification of lessons learned and good
practices is provided by the review of country team responses to the EFA surveys, which
include many open questions (See Annex 4).
- Section 4: Governments’ general views of the current EFA framework, its impact on the
execution of national policies and of related institutions and procedures also contributes to
the post-2015 debate, contributing to define countries’ priority goals, the new referential
framework within which they might fit and the procedures and financial and human
resources required to achieve them. These issues are also covered by the questionnaire,
included in Annex 4.
1 This is equivalent to the review of progress towards EFA over the 2000-12 period (See Annex 3 on methodological considerations). 2 “National EFA 2015 Reviews – Guidelines,” (UNESCO, June 2013). 3 See Annex 3.
3
Section 1. Overview of Education in SSA in 2000 – Challenges and
Goals
This first section presents the demographic context that prevailed at the time of the Dakar Forum in
2000 and the most notable factors that characterized education systems over the period (financing
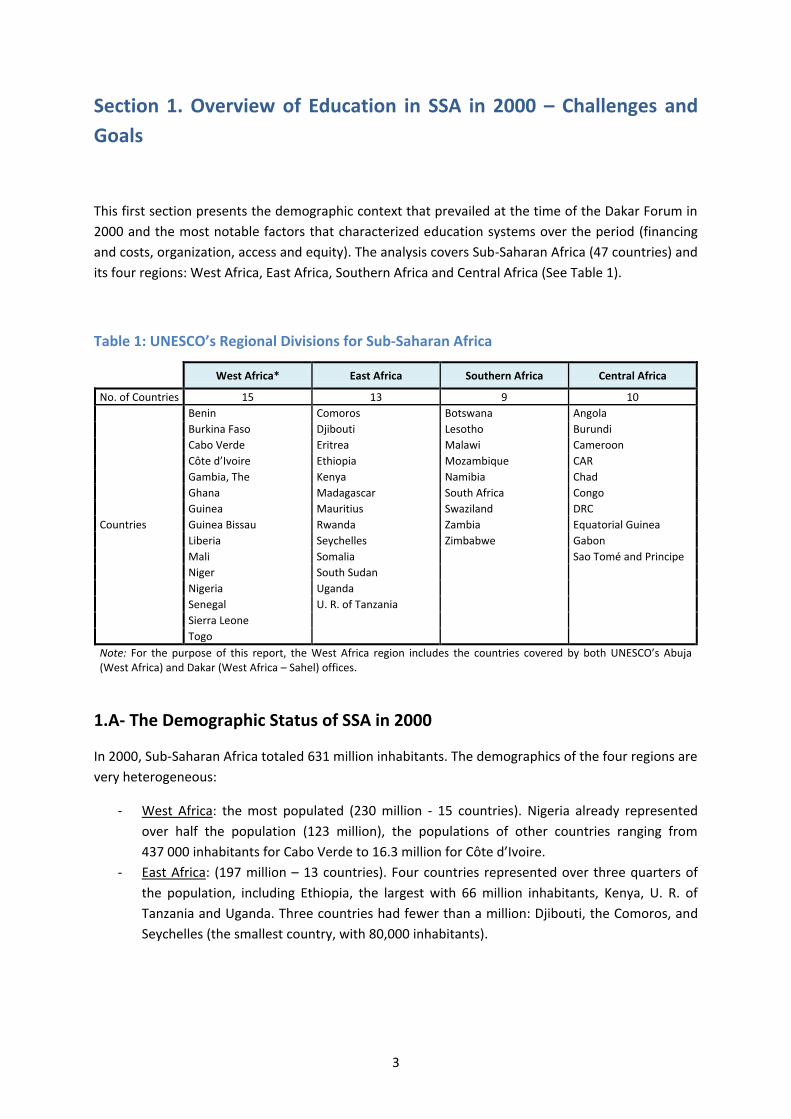
and costs, organization, access and equity). The analysis covers Sub-Saharan Africa (47 countries) and
its four regions: West Africa, East Africa, Southern Africa and Central Africa (See Table 1).
Table 1: UNESCO’s Regional Divisions for Sub-Saharan Africa
West Africa* East Africa Southern Africa Central Africa
No. of Countries 15 13 9 10
Countries
Benin Comoros Botswana Angola
Burkina Faso Djibouti Lesotho Burundi
Cabo Verde Eritrea Malawi Cameroon
Côte d’Ivoire Ethiopia Mozambique CAR
Gambia, The Kenya Namibia Chad
Ghana Madagascar South Africa Congo
Guinea Mauritius Swaziland DRC
Guinea Bissau Rwanda Zambia Equatorial Guinea
Liberia Seychelles Zimbabwe Gabon
Mali Somalia
Sao Tomé and Principe
Niger South Sudan
Nigeria Uganda
Senegal U. R. of Tanzania
Sierra Leone
Togo
Note: For the purpose of this report, the West Africa region includes the countries covered by both UNESCO’s Abuja (West Africa) and Dakar (West Africa – Sahel) offices.
1.A- The Demographic Status of SSA in 2000
In 2000, Sub-Saharan Africa totaled 631 million inhabitants. The demographics of the four regions are
very heterogeneous:
- West Africa: the most populated (230 million - 15 countries). Nigeria already represented
over half the population (123 million), the populations of other countries ranging from
437 000 inhabitants for Cabo Verde to 16.3 million for Côte d’Ivoire.
- East Africa: (197 million – 13 countries). Four countries represented over three quarters of
the population, including Ethiopia, the largest with 66 million inhabitants, Kenya, U. R. of
Tanzania and Uganda. Three countries had fewer than a million: Djibouti, the Comoros, and
Seychelles (the smallest country, with 80,000 inhabitants).
4
- Southern Africa: (104 million - 9 countries). Whereas South Africa’s population was 45
million, Mozambique, Zimbabwe, Malawi and Zambia’s were each between 10 million and 20
million, the remaining countries then having fewer than 2 million inhabitants each.
- Central Africa: (100 million - 10 countries). DRC alone represented 47 percent of the
population, whereas seven countries had fewer than 8 million inhabitants each, including
Equatorial Guinea (518,000) and Sao Tomé and Principe (142,000).
1.B- Education Coverage in SSA in 2000
This section describes the level of development of education in Sub-Saharan Africa and for each of its
regions at the time of the World Education Forum. Table 2 provides a number of education indicators
for 2000 as an illustration. Those offered here are now among the main indicators used to monitor
progress towards the EFA goals over the 2000-15 period, and will later allow for historical
comparisons (See Section 2).
Table 2: Education Coverage Indicators, for SSA and by Region, 2000
West Africa
East Africa
Southern Africa
Central Africa
SSA
Prep. Gross Enrollment Rate (GER) 9% 14% 25% 6% 11%
Pri
mar
y
GER 82% 80% 100% 67% 82%
Access Rate 71% # 110% 114% 71% 94%
Completion Rate 43% # 45% 69% 34% 47%
Seco
nd
ary GER – Lower Secondary 27% 21% 56% 23% 28%
GER – Upper Secondary 17% 15% 38% 11% 19%
Completion Rate – Upper Sec. 9% # 10%# 10% # 12% 10%
TVET TVET Enrollment (Share of General Secondary)
6% # 3% 5% 21% 8%
Literacy Literacy Rate - 15 years + * 39% 72% 74% 60% 58%
Higher Students per 100,000 Inhabitants 338 # 160 203 # 224 217
GPI Gender Parity Index – Primary **
0.77 0.90 0.95 0.84 0.85
Source: IIEP/Pôle de Dakar Indicator Database. Note: * Simple arithmetic means of the country rates, which do not reflect the weight of countries’ population size. ** Computed as the ratio between the GER for girls and the GER for boys. # Figures are indicative, the data being unavailable for some countries (Ethiopia, Nigeria and South Africa) whose relative demographic weight is significant (country data are provided in Annex 2; also, see Annex 3 for methodology considerations).
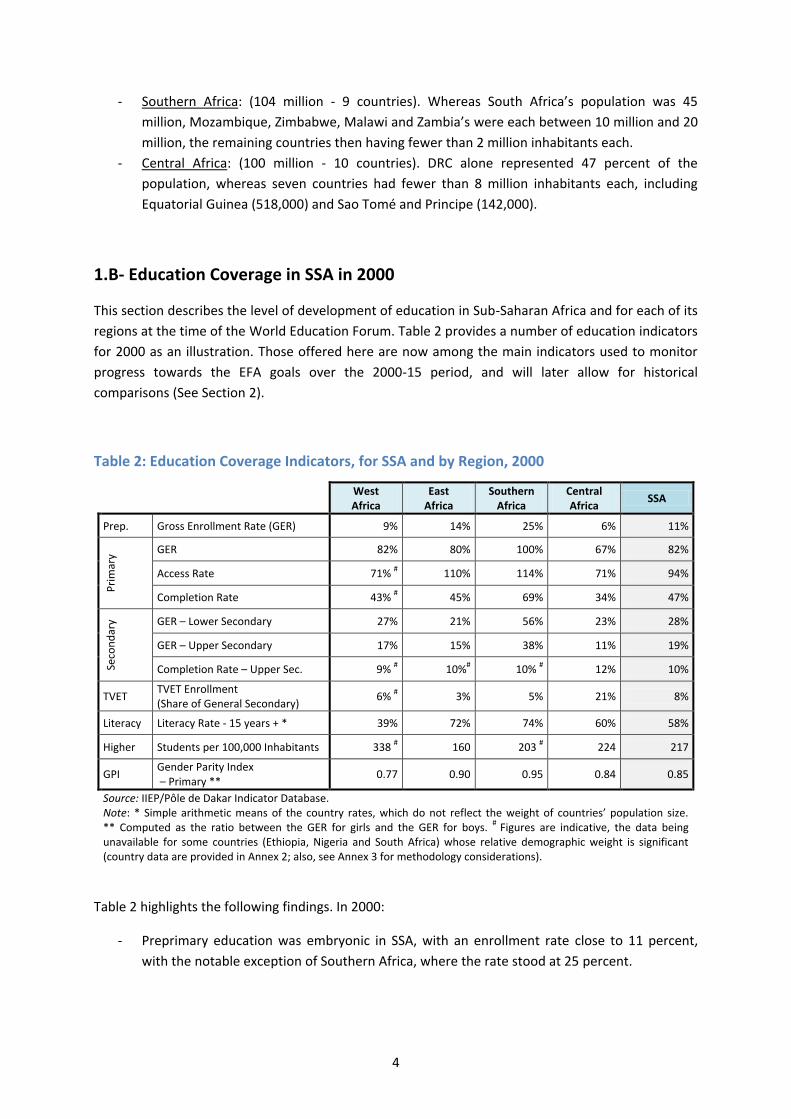
Table 2 highlights the following findings. In 2000:
- Preprimary education was embryonic in SSA, with an enrollment rate close to 11 percent,
with the notable exception of Southern Africa, where the rate stood at 25 percent.
5
- The primary gross enrollment rate (GER) was 82 percent on average for SSA, with significant
gaps between regions (from 67 percent in Central Africa to 100 percent in Southern Africa).
- The primary completion rate was 47 percent for SSA. This low average reflects the low rates
for Central Africa and West Africa, where only 34 percent and 43 percent of children of
primary school age completed the cycle, respectively.
- The GER was only 28 percent for lower secondary and 19 percent for upper secondary
(Southern Africa stood apart with rates twice this high). On average, only 10 percent of a
generation of children completed the full secondary cycle.
- The development of technical and vocational education and training (TVET) was low, its
enrollment representing barely 8 percent of that of total secondary (but 21 percent in
Central Africa).4
- The share of literate adults was 58 percent for SSA, being higher in East Africa (72 percent)
and Southern Africa (74 percent). In West Africa, illiteracy was marked (39 percent).
- The coverage of higher education was still relatively limited overall, with 217 students per
100,000 inhabitants for SSA, although a handful of countries had already invested
considerably in this cycle, such as Nigeria and Mauritius (with close to 1,000 students per
100,000 inhabitants), and Liberia and South Africa (with close to 1,500).
- Enrollment of girls in primary was markedly lower than that of boys, with an average gender
parity index (GPI) of 0.85 (85 girls enrolled for every 100 boys). Southern Africa (GPI of 0.95)
was already close to parity, whereas in West Africa (GPI of 0.77) and Central Africa (GPI of
0.84), gender parity was low.
1.C- Some Characteristics of Education Policies in SSA in 2000
This section reviews the characteristics of education policies in SSA at the beginning of the period,
primarily thanks to financial indicators. The resources available for education are on the one hand a
factor of: (i) national wealth, (ii) governments’ ability to raise a share of it to fund public services, and
(iii) the share of the budget allocated to education (inter-sectoral trade-offs); and on the other, of:
(iv) foreign aid. The education budget is then distributed according to education policy, in particular
the priorities given to each level and type of education (intra-sectoral trade-offs). Table 3 below
provides several relevant data for 2000, which help to identify the levers used by governments in
their EFA development policies (Table 13 in Section 4 provides these same data for 2012, as well as
their evolution over the period).
On average in SSA, countries’ internal resources were equivalent to 19.4 percent of gross domestic
product (GDP), with a maximum for Southern Africa (28.2 percent) and a minimum for West Africa
(14.3 percent). The share of education in national recurrent budgets was 20.6 percent on average in
SSA, although it was significantly lower in Central Africa (15.4 percent) and varied considerably
among countries: from under 10 percent in Angola, Equatorial Guinea and DRC, to close to 30
4 TVET enrollment is compared to that of general secondary plus TVET to illustrate its relative share of education provision for those children and youth leaving primary.
6
percent for Senegal, Togo, Côte d’Ivoire, Botswana, Lesotho, Niger and Uganda. Countries’ financial
commitment to education, measured here by the amount of total education expenditure financed on
internal resources as a share of GDP, varied markedly among countries, from under 2 percent in
Guinea, Guinea Bissau, Equatorial Guinea and CAR, to over 6 percent in Cabo Verde, Congo, Djibouti,
Kenya, Lesotho (11 percent) and Namibia (8 percent).
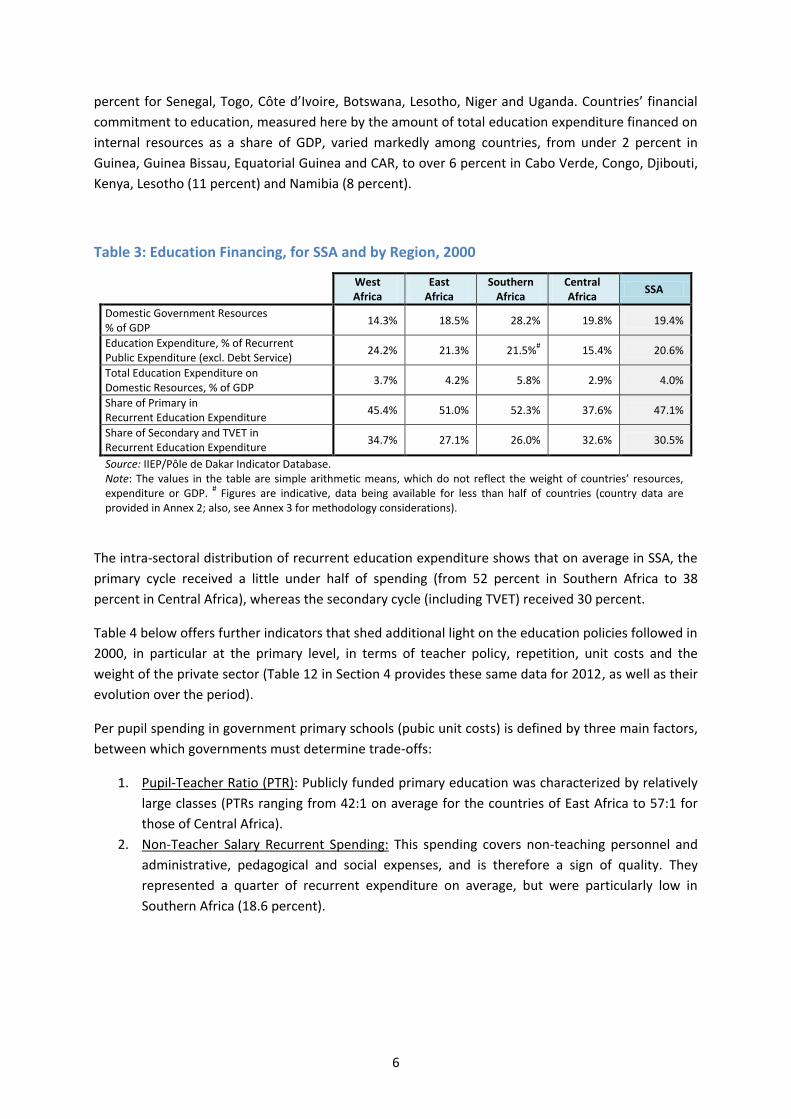
Table 3: Education Financing, for SSA and by Region, 2000
West Africa
East Africa
Southern Africa
Central Africa
SSA
Domestic Government Resources % of GDP
14.3% 18.5% 28.2% 19.8% 19.4%
Education Expenditure, % of Recurrent Public Expenditure (excl. Debt Service)
24.2% 21.3% 21.5%# 15.4% 20.6%
Total Education Expenditure on Domestic Resources, % of GDP
3.7% 4.2% 5.8% 2.9% 4.0%
Share of Primary in Recurrent Education Expenditure
45.4% 51.0% 52.3% 37.6% 47.1%
Share of Secondary and TVET in Recurrent Education Expenditure
34.7% 27.1% 26.0% 32.6% 30.5%
Source: IIEP/Pôle de Dakar Indicator Database. Note: The values in the table are simple arithmetic means, which do not reflect the weight of countries’ resources, expenditure or GDP. # Figures are indicative, data being available for less than half of countries (country data are provided in Annex 2; also, see Annex 3 for methodology considerations).
The intra-sectoral distribution of recurrent education expenditure shows that on average in SSA, the
primary cycle received a little under half of spending (from 52 percent in Southern Africa to 38
percent in Central Africa), whereas the secondary cycle (including TVET) received 30 percent.
Table 4 below offers further indicators that shed additional light on the education policies followed in
2000, in particular at the primary level, in terms of teacher policy, repetition, unit costs and the
weight of the private sector (Table 12 in Section 4 provides these same data for 2012, as well as their
evolution over the period).
Per pupil spending in government primary schools (pubic unit costs) is defined by three main factors,
between which governments must determine trade-offs:
1. Pupil-Teacher Ratio (PTR): Publicly funded primary education was characterized by relatively
large classes (PTRs ranging from 42:1 on average for the countries of East Africa to 57:1 for
those of Central Africa).
2. Non-Teacher Salary Recurrent Spending: This spending covers non-teaching personnel and
administrative, pedagogical and social expenses, and is therefore a sign of quality. They
represented a quarter of recurrent expenditure on average, but were particularly low in
Southern Africa (18.6 percent).
7
3. Average Teacher Remuneration: This was equivalent to 4.2 times GDP per capita (units of
GDP per capita) in SSA.
The public unit cost of primary was equivalent to 11 percent of GDP per capita on average for SSA.
Central Africa, with crowded classes and modest teacher salaries, retained resources for other types
of spending, whereas the countries of Southern Africa bet on higher teacher salaries and better
supervision rates, at the expense of administrative, pedagogical and social spending.
The data available for the secondary level are not sufficient to break down unit costs into their
different components, or to distinguish between the lower and upper cycles and TVET. Table 4 does
however indicate that on average, a secondary pupil cost 2.3 times more than a primary pupil in 2000
(25.6 percent of GDP per capita).
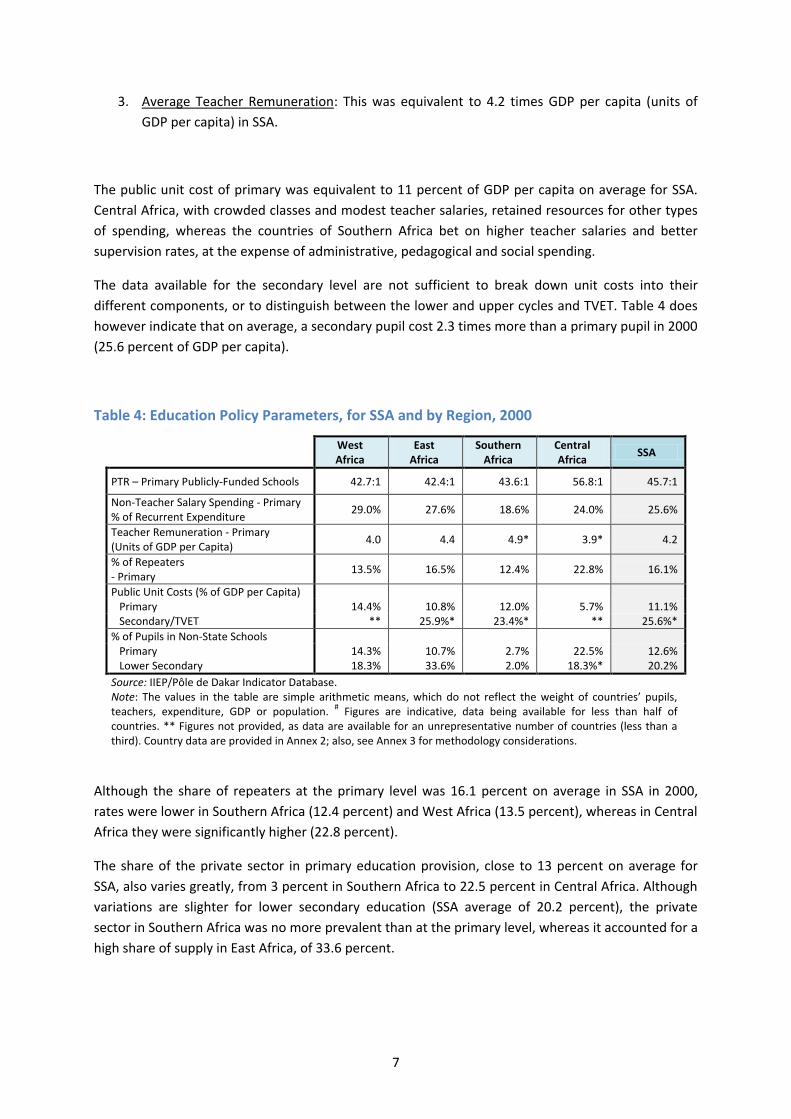
Table 4: Education Policy Parameters, for SSA and by Region, 2000
West Africa
East Africa
Southern Africa
Central Africa
SSA
PTR – Primary Publicly-Funded Schools 42.7:1 42.4:1 43.6:1 56.8:1 45.7:1
Non-Teacher Salary Spending - Primary % of Recurrent Expenditure
29.0% 27.6% 18.6% 24.0% 25.6%
Teacher Remuneration - Primary (Units of GDP per Capita)
4.0 4.4 4.9* 3.9* 4.2
% of Repeaters - Primary
13.5% 16.5% 12.4% 22.8% 16.1%
Public Unit Costs (% of GDP per Capita)
Primary 14.4% 10.8% 12.0% 5.7% 11.1% Secondary/TVET ** 25.9%* 23.4%* ** 25.6%*
% of Pupils in Non-State Schools
Primary 14.3% 10.7% 2.7% 22.5% 12.6% Lower Secondary 18.3% 33.6% 2.0% 18.3%* 20.2%
Source: IIEP/Pôle de Dakar Indicator Database. Note: The values in the table are simple arithmetic means, which do not reflect the weight of countries’ pupils, teachers, expenditure, GDP or population. # Figures are indicative, data being available for less than half of countries. ** Figures not provided, as data are available for an unrepresentative number of countries (less than a third). Country data are provided in Annex 2; also, see Annex 3 for methodology considerations.
Although the share of repeaters at the primary level was 16.1 percent on average in SSA in 2000,
rates were lower in Southern Africa (12.4 percent) and West Africa (13.5 percent), whereas in Central
Africa they were significantly higher (22.8 percent).
The share of the private sector in primary education provision, close to 13 percent on average for
SSA, also varies greatly, from 3 percent in Southern Africa to 22.5 percent in Central Africa. Although
variations are slighter for lower secondary education (SSA average of 20.2 percent), the private
sector in Southern Africa was no more prevalent than at the primary level, whereas it accounted for a
high share of supply in East Africa, of 33.6 percent.
8
1.D- SSA Education Systems’ Development Goals
The overview provided by Parts 1.B and 1.C of the report provides the necessary context to delineate
the education challenges countries faced in 2000, and to appreciate the relevance of the EFA goals
set at the Dakar Forum.
At the turn of the century, literacy was relatively low in Sub-Saharan Africa (only 58 percent of adults
were literate), and all the more fragile that barely one in two children completed primary, which is
recognized today to be the minimum level required to become sustainably literate. The gap between
these two indicators underlines the significant part played by other non-state education providers,
such as Koranic schools and nonformal initiatives (see the percentage of pupils enrolled in non-state
schools in Table 4 above). Although access to primary was on track to becoming universal in 2000,
preprimary enrollment was low and long school careers were rare. This weak development was
further compounded by deep inequalities in individual schooling careers, related to the area of
residence, gender and household income levels.
This situation partly reflected the comparative under-financing of education at the time, due in some
countries to difficulties in raising funds through taxes, and occasionally to budgetary trade-offs that
were unfavorable to education sectors. These financing constraints led to combinations of education
policies that were not conducive to the harmonious development of the sector.
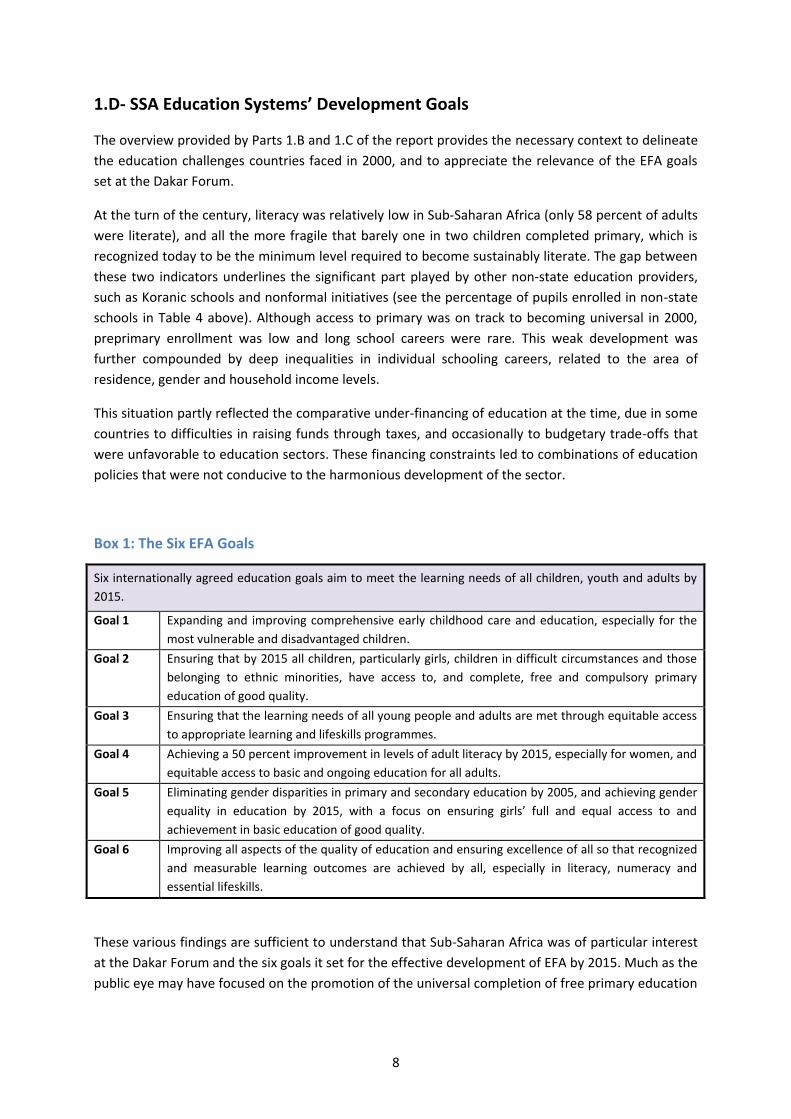
Box 1: The Six EFA Goals
Six internationally agreed education goals aim to meet the learning needs of all children, youth and adults by
2015.
Goal 1 Expanding and improving comprehensive early childhood care and education, especially for the
most vulnerable and disadvantaged children.
Goal 2 Ensuring that by 2015 all children, particularly girls, children in difficult circumstances and those
belonging to ethnic minorities, have access to, and complete, free and compulsory primary
education of good quality.
Goal 3 Ensuring that the learning needs of all young people and adults are met through equitable access
to appropriate learning and lifeskills programmes.
Goal 4 Achieving a 50 percent improvement in levels of adult literacy by 2015, especially for women, and
equitable access to basic and ongoing education for all adults.
Goal 5 Eliminating gender disparities in primary and secondary education by 2005, and achieving gender
equality in education by 2015, with a focus on ensuring girls’ full and equal access to and
achievement in basic education of good quality.
Goal 6 Improving all aspects of the quality of education and ensuring excellence of all so that recognized
and measurable learning outcomes are achieved by all, especially in literacy, numeracy and
essential lifeskills.
These various findings are sufficient to understand that Sub-Saharan Africa was of particular interest
at the Dakar Forum and the six goals it set for the effective development of EFA by 2015. Much as the
public eye may have focused on the promotion of the universal completion of free primary education

9
of good quality (Goal 2), the EFA goals encompass much more, as they relate to the education and
training needs of all children and adults (See Box 1). The will to address all forms of education and
training, and to formalize the fight against any kind of discrimination leads to some overlap between
these different goals, in particular between Goals 2, 5 and 6.

11
Section 2. The EFA Goals – Progress between 2000 and 2012
The operational definition of indicators reflecting education goals is always delicate, but a general
consensus has emerged for the measurement of the six EFA goals over time and through assessments
of progress. After a review of the socioeconomic situation of SSA in 2012 and its evolution since
2000, as well as of education financing and policy indicators in 2012 and their evolution over the
period, this section offers an analysis of the evolution of the main statistical indicators used to
measure progress towards the different EFA goals.5
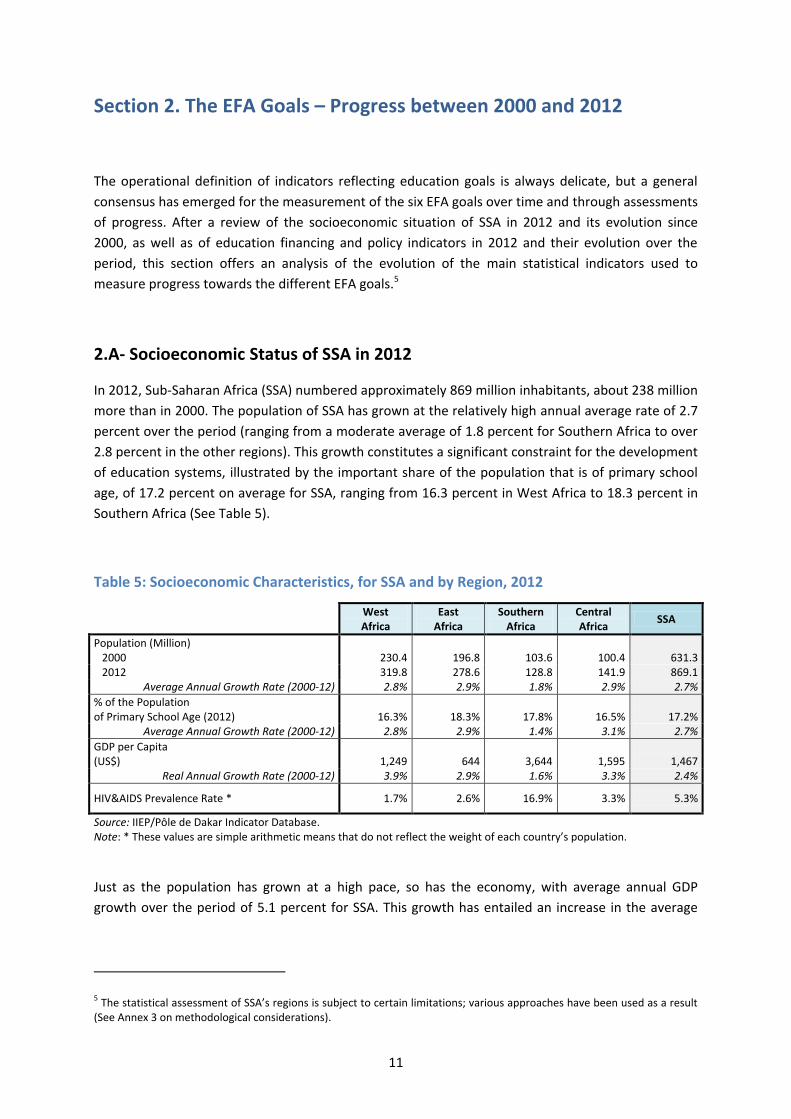
2.A- Socioeconomic Status of SSA in 2012
In 2012, Sub-Saharan Africa (SSA) numbered approximately 869 million inhabitants, about 238 million
more than in 2000. The population of SSA has grown at the relatively high annual average rate of 2.7
percent over the period (ranging from a moderate average of 1.8 percent for Southern Africa to over
2.8 percent in the other regions). This growth constitutes a significant constraint for the development
of education systems, illustrated by the important share of the population that is of primary school
age, of 17.2 percent on average for SSA, ranging from 16.3 percent in West Africa to 18.3 percent in
Southern Africa (See Table 5).
Table 5: Socioeconomic Characteristics, for SSA and by Region, 2012
West Africa
East Africa
Southern Africa
Central Africa
SSA
Population (Million)
2000 230.4 196.8 103.6 100.4 631.3 2012 319.8 278.6 128.8 141.9 869.1
Average Annual Growth Rate (2000-12) 2.8% 2.9% 1.8% 2.9% 2.7%
% of the Population of Primary School Age (2012)
16.3%
18.3%
17.8%
16.5%
17.2%
Average Annual Growth Rate (2000-12) 2.8% 2.9% 1.4% 3.1% 2.7%
GDP per Capita (US$)
1,249
644
3,644
1,595
1,467
Real Annual Growth Rate (2000-12) 3.9% 2.9% 1.6% 3.3% 2.4%
HIV&AIDS Prevalence Rate * 1.7% 2.6% 16.9% 3.3% 5.3%
Source: IIEP/Pôle de Dakar Indicator Database. Note: * These values are simple arithmetic means that do not reflect the weight of each country’s population.
Just as the population has grown at a high pace, so has the economy, with average annual GDP
growth over the period of 5.1 percent for SSA. This growth has entailed an increase in the average
5 The statistical assessment of SSA’s regions is subject to certain limitations; various approaches have been used as a result (See Annex 3 on methodological considerations).
12
real wealth per capita (+2.4 percent per year on average), providing some scope for the financing of
education, both by governments and families. The rise in real GDP per capita has been greatest in
West Africa (3.9 percent per year on average) and lowest in Southern Africa (1.6 percent per year on
average), despite slower population growth. In Southern Africa the level of wealth per capita is
nevertheless the highest by far (US$ 3,644), whereas it is weakest in East Africa (US$ 644).
Nevertheless, despite this progress, the majority of Sub-Saharan African countries are still ranked as
low income countries (LICs). In 2000, they were 39 (all SSA countries except South Africa, Botswana,
Gabon, Equatorial Guinea, Mauritius, Namibia, the Seychelles and Swaziland). Since then, six
countries have left the LIC ranking: Cameroon, Cabo Verde, Congo, Côte d’Ivoire, Ghana and Nigeria.
However, with the incorporation of South Sudan, 34 out of 47 countries are still ranked as LICs.6
Beyond these general issues, the countries of Sub-Saharan Africa face two further specific challenges
that hinder progress towards EFA: HIV and AIDS, and conflict and postconflict situations.
Health
Health plays a determining role in education and learning outcomes. Micronutrient deficiencies,
parasite infections, sight or hearing impairments and unintentional pregnancies are some potential
obstacles to enrollment, attendance, the completion of studies and good results. Appropriate
nutrition for instance, particularly during early childhood, can enhance the intellectual development
and learning outcomes of youth and adolescents. In terms of sexual and reproductive health, early
marriage often dashes all hope of enrollment for girls, and numerous discriminatory measures keep
them away from school in cases of pregnancy.
HIV and AIDS pose a significant threat to the development of education systems, directly and
indirectly, and constitute a particular challenge. In countries where the epidemic is widespread
(prevalence rates above 1 percent) HIV and AIDS increase the teaching staff attrition rate, affect
school attendance, reduce the success rate of pupils that are infected or affected and increase
dropout. Moreover, initiatives aiming to compensate or mitigate the impact of the pandemic
(training new teachers to compensate for attrition, support services for orphans and vulnerable
children) carry an economic cost. Youth aged 15 to 24 years represent 40 percent of new infections.
The fight against HIV and AIDS at the international and national levels is yielding results. Between
2001 and 2009, the rate of new infections receded by over 25 percent in 33 countries, including 22 in
SSA.7 However, the prevalence of HIV is still high on the continent, at about 5.3 percent, and its level
is particularly worrying in Southern Africa, despite the progress achieved (16.9 percent for
6 OECD-DAC: http://www.oecd.org/dac/stats/historyofdaclistsofaidrecipientcountries.htm (viewed on 30 October 2014). A country was ranked as low income in 2000 if its gross national revenue (GNR) per capita was below US$ 760 in 1998, and in 2012 if its GNR per capita was below US$ 1,005 in 2010. 7 “Note technique sur le secteur de l’éducation - Éducation au VIH et à la santé” (UNESCO, 2013).

13
adults on average in 2012). In Central Africa (3.3 percent) and East Africa (2.6 percent) the rates are
more modest, and the pandemic is relatively well controlled in West African countries (1.7 percent).
Additionally, new challenges threaten EFA achievements in some countries, such as the Ebola
epidemic in West Africa, whose multiple consequences have a direct impact on education, leading to
the closure of schools for instance, or an indirect one, by depleting governments and households’
economic resources.
Conflict Situations
Situations of conflict or major crisis also have a direct impact on education indicators as a whole,
exacerbating already fragile contexts. In particular, this impact translates into fragile civil services,
subject to unpredictable foreign aid, low levels of enrollment and schooling and weak institutional
coordination and steering mechanisms, if not the misappropriation of education resources, or
exacerbated income and gender disparities. Furthermore, crises worsen sanitary conditions and a
significant share of the resulting mortality is due not to fighting, but illness and malnutrition.
Of the 30 countries in the world considered to be fragile states in 2014, 17 are in SSA, representing a
third of the region’s countries.8 Moreover, in SSA countries affected by conflict, education indicators
are amongst the weakest worldwide. Education and development in Sub-Saharan Africa are
therefore greatly affected. For instance: (i) the probability that youth living in the DRC province of
North-Kivu be schooled for less than two years is twice as high as the national average; (ii) in
Northern Uganda, violence doubles the risk of girls from the poorest households being out-of-school;
(iii) in SSA countries affected by conflict, only 55 percent of adults are literate, against 85 percent on
average for countries at peace worldwide; and (iv) in Mozambique, the 1977-92 civil war entailed the
loss of 5.3 years of schooling on average.9
2.B- Some Characteristics of Education Policies in SSA in 2012
This section revisits the items that characterize the operation and financing of education systems,
and education policies for 2012, illustrating trends over the 2000-12 period (See Section 1.C for the
situation in 2000).
The global resource mobilization context has improved for education in SSA (See Table 6 below).
Indeed, at the continental level, the tax base has marginally grown. Despite the international context,
domestic resources as a percentage of GDP have gained 8 percent, to reach 21 percent. Southern
Africa remains the region where this rate is the highest (27.4 percent), but the most remarkable
evolution is noted in Central Africa, where domestic resources have risen by 32 percent, from 20
8 World Bank: http://www.worldbank.org/en/topic/fragilityconflictviolence (viewed on 30 October 2014). The 17 countries are Burundi, CAR, Chad, the Comoros, DRC, Congo, Côte d’Ivoire, Eritrea, Guinea Bissau, Liberia, Madagascar, Malawi, Mali, Sierra Leone, Somalia, South Sudan and Togo. 9 “EFA Global Monitoring Report – The Hidden Crisis: Armed Conflict and Education,” (UNESCO, 2011).
14
percent of GDP to 26 percent of GDP. The increase in West Africa (+19 percent) is also worthy of
note, contributing to close the gap with the rest of the continent.
Table 6: Education Financing, for SSA and by Region, 2012
West Africa
East Africa
Southern Africa
Central Africa
SSA
Domestic Government Resources % of GDP
Global Trend 2000-12
17.1%
+19% #
20.0%
+8%
27.4% *
-3% #
26.1% +32%
21.0%
+8%
Education Expenditure, % of Recurrent Public Expenditure (excl. Debt Service)
Global Trend 2000-12
24.5%
+1%
24.0% +13%
19.9% -7% #
21.3% +39%
22.8% +11%
Total Education Expenditure on Domestic Resources, % of GDP
Global Trend 2000-12
4.3%
+15% #
4.3% +3%
5.6%
-4%
4.3%
+48%
4.5%
+13%
Share of Primary in Recurrent Education Expenditure
Global Trend 2000-12
48.6%
+7%
42.0% *
-18% #
40.5%
-23%
41.2%
+10% #
44.2%
-6%
Share of Secondary and TVET in Recurrent Education Expenditure n
Global Trend 2000-12
30.9%
-11%
31.4% *
+16.2% #
29.5% +14%
29.8%
-9%
30.5%
+0%
Source: IIEP/Pôle de Dakar Indicator Database. Note: The 2012 values in the table are simple arithmetic means, which do not reflect the weight of countries’ resources, expenditure or GDP. * Figures are indicative, data being available for less than half of countries. # Trends are indicative, due to a significant variation in the number of countries per region upon which averages are based, between 2000 and 2012 (country data are provided in Annex 2; also, see Annex 3 for methodology considerations).
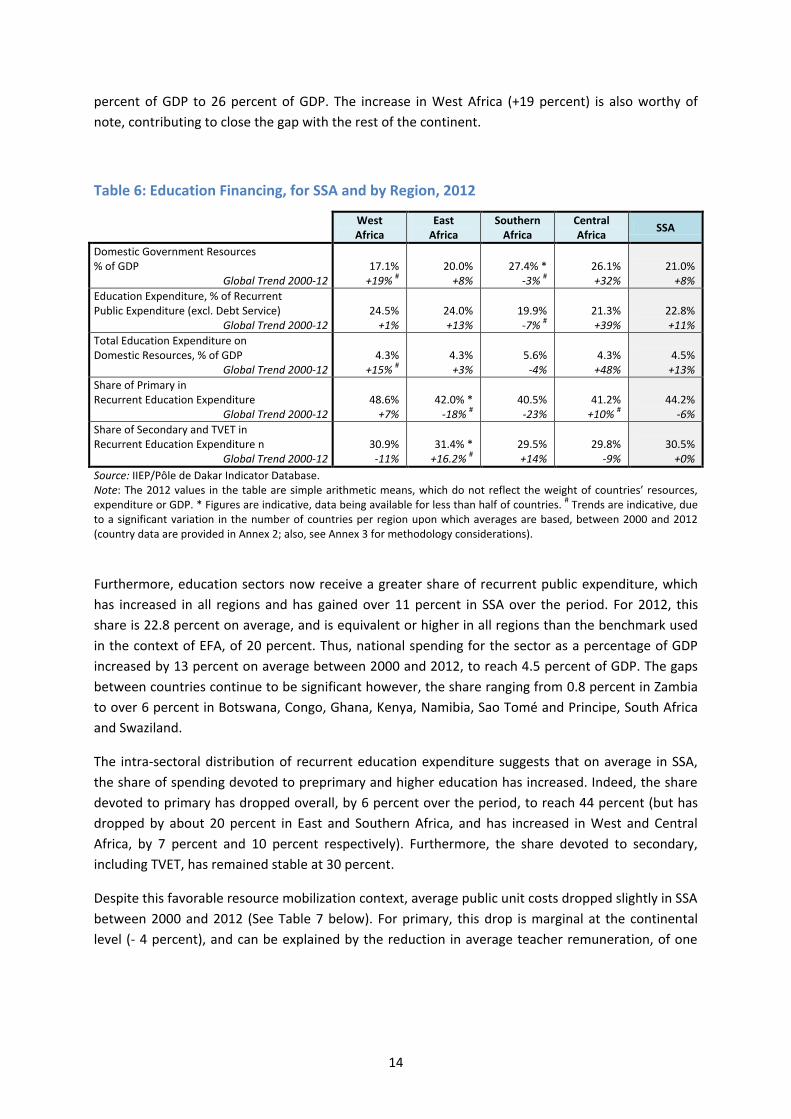
Furthermore, education sectors now receive a greater share of recurrent public expenditure, which
has increased in all regions and has gained over 11 percent in SSA over the period. For 2012, this
share is 22.8 percent on average, and is equivalent or higher in all regions than the benchmark used
in the context of EFA, of 20 percent. Thus, national spending for the sector as a percentage of GDP
increased by 13 percent on average between 2000 and 2012, to reach 4.5 percent of GDP. The gaps
between countries continue to be significant however, the share ranging from 0.8 percent in Zambia
to over 6 percent in Botswana, Congo, Ghana, Kenya, Namibia, Sao Tomé and Principe, South Africa
and Swaziland.
The intra-sectoral distribution of recurrent education expenditure suggests that on average in SSA,
the share of spending devoted to preprimary and higher education has increased. Indeed, the share
devoted to primary has dropped overall, by 6 percent over the period, to reach 44 percent (but has
dropped by about 20 percent in East and Southern Africa, and has increased in West and Central
Africa, by 7 percent and 10 percent respectively). Furthermore, the share devoted to secondary,
including TVET, has remained stable at 30 percent.
Despite this favorable resource mobilization context, average public unit costs dropped slightly in SSA
between 2000 and 2012 (See Table 7 below). For primary, this drop is marginal at the continental
level (- 4 percent), and can be explained by the reduction in average teacher remuneration, of one
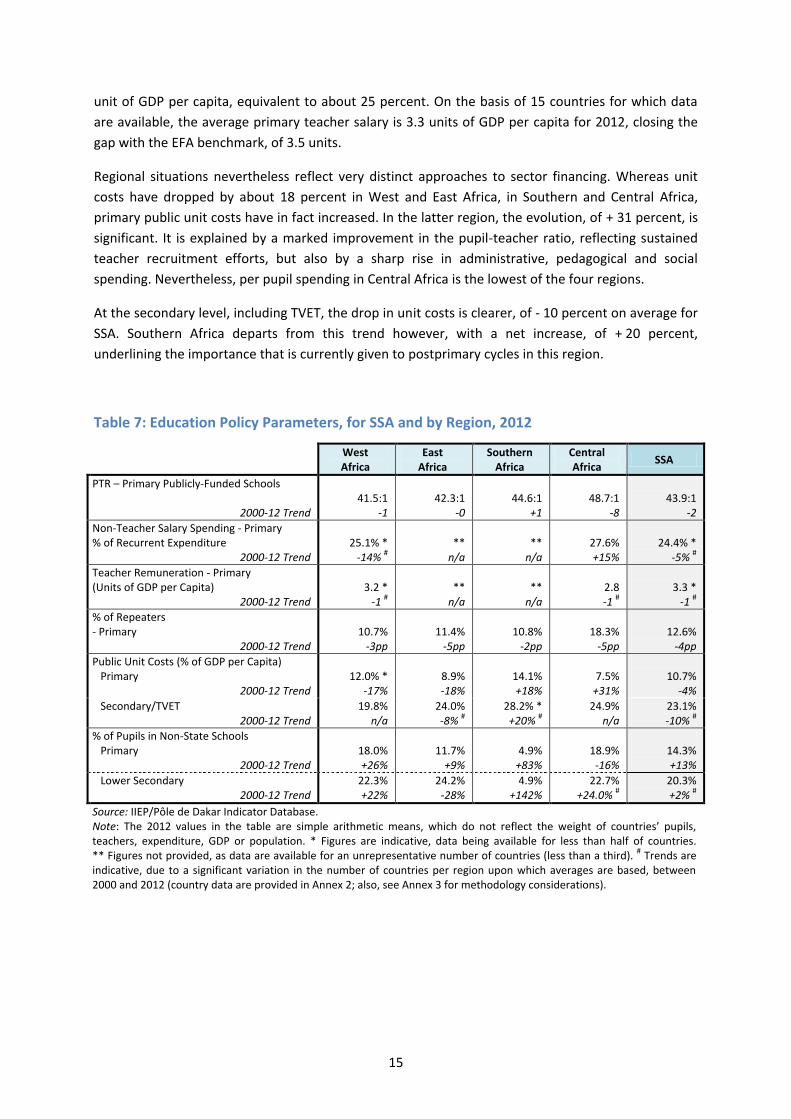
15
unit of GDP per capita, equivalent to about 25 percent. On the basis of 15 countries for which data
are available, the average primary teacher salary is 3.3 units of GDP per capita for 2012, closing the
gap with the EFA benchmark, of 3.5 units.
Regional situations nevertheless reflect very distinct approaches to sector financing. Whereas unit
costs have dropped by about 18 percent in West and East Africa, in Southern and Central Africa,
primary public unit costs have in fact increased. In the latter region, the evolution, of + 31 percent, is
significant. It is explained by a marked improvement in the pupil-teacher ratio, reflecting sustained
teacher recruitment efforts, but also by a sharp rise in administrative, pedagogical and social
spending. Nevertheless, per pupil spending in Central Africa is the lowest of the four regions.
At the secondary level, including TVET, the drop in unit costs is clearer, of - 10 percent on average for
SSA. Southern Africa departs from this trend however, with a net increase, of + 20 percent,
underlining the importance that is currently given to postprimary cycles in this region.
Table 7: Education Policy Parameters, for SSA and by Region, 2012
West Africa
East Africa
Southern Africa
Central Africa
SSA
PTR – Primary Publicly-Funded Schools
2000-12 Trend
41.5:1
-1
42.3:1
-0
44.6:1
+1
48.7:1
-8
43.9:1
-2
Non-Teacher Salary Spending - Primary % of Recurrent Expenditure
2000-12 Trend
25.1% *
-14% #
**
n/a
**
n/a
27.6% +15%
24.4% *
-5% #
Teacher Remuneration - Primary (Units of GDP per Capita)
2000-12 Trend
3.2 *
-1 #
**
n/a
**
n/a
2.8 -1 #
3.3 *
-1 #
% of Repeaters - Primary
2000-12 Trend
10.7%
-3pp
11.4%
-5pp
10.8%
-2pp
18.3%
-5pp
12.6%
-4pp
Public Unit Costs (% of GDP per Capita) Primary
2000-12 Trend
12.0% *
-17%
8.9% -18%
14.1% +18%
7.5%
+31%
10.7%
-4%
Secondary/TVET 2000-12 Trend
19.8% n/a
24.0% -8% #
28.2% * +20% #
24.9% n/a
23.1% -10% #
% of Pupils in Non-State Schools Primary
2000-12 Trend
18.0% +26%
11.7%
+9%
4.9%
+83%
18.9%
-16%
14.3% +13%
Lower Secondary 2000-12 Trend
22.3% +22%
24.2% -28%
4.9% +142%
22.7% +24.0% #
20.3% +2% #
Source: IIEP/Pôle de Dakar Indicator Database. Note: The 2012 values in the table are simple arithmetic means, which do not reflect the weight of countries’ pupils, teachers, expenditure, GDP or population. * Figures are indicative, data being available for less than half of countries. ** Figures not provided, as data are available for an unrepresentative number of countries (less than a third). # Trends are indicative, due to a significant variation in the number of countries per region upon which averages are based, between 2000 and 2012 (country data are provided in Annex 2; also, see Annex 3 for methodology considerations).

16
Table 7 also indicates that repetition has been curbed, the share of repeaters having dropped in all
regions, by 4 percentage points on average. Thus, the rate is close to 11 percent in SSA, excluding
Central Africa, where it remains high (18 percent).
Finally, the share of private education, despite its apparent relative stability for SSA, has varied
considerably within regions. In Southern Africa, where the supply of non-public education was the
lowest in 2000, this sector has doubled in size. Whereas the investment in public education appears
have been reinforced at the primary level in Central Africa and at lower secondary in East Africa over
the period (the share of private education having dropped), for all the other cycles and regions, some
growth in the private sector is noted.
2.C- The African EFA Development Index
The African EFA Development Index (EDI) provides a synthetic perspective of the state of
development of countries’ education systems, and is computed for all of SSA. It is based on the three
most readily available education indicators and for which clear targets have been set for 2015: the
primary completion rate (Goal 2), the literate share of the population aged 15 years and above (Goal
4) and parity between girls and boys in terms of primary enrollment (Goal 5).
Figure 1 illustrates the evolution of the index between 2000 and 2012. Progress has clearly been
made throughout the continent, the value of the index having increased from 38.3 to 57.1 for SSA,
equivalent to a 50 percent gain. There is further scope for improvement however, given that none of
the regions, and even less SSA as a whole, is close to the value of 100 that represents the ideal
situation with respect to the three indicators that the index comprises.
Figure 1: Evolution of the EDI, for SSA and by region, 2000-12
Source: IIEP/Pôle de Dakar Indicator Database.
The ranking of regions with respect to this index has not changed over the period. The weaker the
index in 2000, the greater the progress made. Thus, gaps between regions have decreased. The
[+19p.]
[+23p.]
[+20p.]
[+16p.]
[+08p.]
57.1
49.7
55.6
58.0
71.6
(38.3)
(26.7)
(35.1)
(42.1)
(63.9)
0 20 40 60 80 100 120
SSA
West Africa
Central Africa
East Africa
Southern Africa
African EFA Development Index (EDI)
(2000) 2012 [Evolution]
17
greatest progress is noted in West Africa, where the index was initially the lowest. In 2012, Southern
Africa is still the region with the highest average index (71.6).
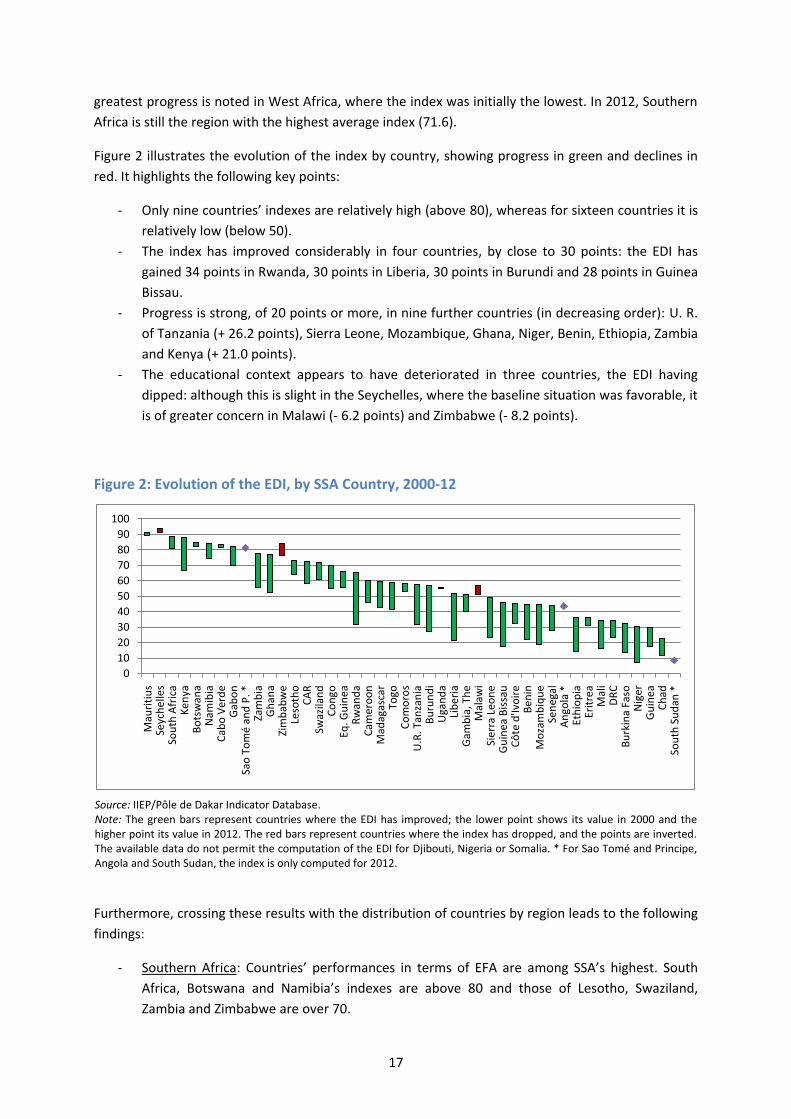
Figure 2 illustrates the evolution of the index by country, showing progress in green and declines in
red. It highlights the following key points:
- Only nine countries’ indexes are relatively high (above 80), whereas for sixteen countries it is
relatively low (below 50).
- The index has improved considerably in four countries, by close to 30 points: the EDI has
gained 34 points in Rwanda, 30 points in Liberia, 30 points in Burundi and 28 points in Guinea
Bissau.
- Progress is strong, of 20 points or more, in nine further countries (in decreasing order): U. R.
of Tanzania (+ 26.2 points), Sierra Leone, Mozambique, Ghana, Niger, Benin, Ethiopia, Zambia
and Kenya (+ 21.0 points).
- The educational context appears to have deteriorated in three countries, the EDI having
dipped: although this is slight in the Seychelles, where the baseline situation was favorable, it
is of greater concern in Malawi (- 6.2 points) and Zimbabwe (- 8.2 points).
Figure 2: Evolution of the EDI, by SSA Country, 2000-12
Source: IIEP/Pôle de Dakar Indicator Database. Note: The green bars represent countries where the EDI has improved; the lower point shows its value in 2000 and the higher point its value in 2012. The red bars represent countries where the index has dropped, and the points are inverted. The available data do not permit the computation of the EDI for Djibouti, Nigeria or Somalia. * For Sao Tomé and Principe, Angola and South Sudan, the index is only computed for 2012.
Furthermore, crossing these results with the distribution of countries by region leads to the following
findings:
- Southern Africa: Countries’ performances in terms of EFA are among SSA’s highest. South
Africa, Botswana and Namibia’s indexes are above 80 and those of Lesotho, Swaziland,
Zambia and Zimbabwe are over 70.
0
10
20
30
40
50
60
70
80
90
100
Mau
riti
us
Seyc
he
lles
Sou
th A
fric
aK
enya
Bo
tsw
ana
Nam
ibia
Cab
o V
erd
eG
abo
nSa
o T
om
é an
d P
. *Za
mb
iaG
han
aZi
mb
abw
eLe
soth
oC
AR
Swaz
ilan
dC
on
goEq
. Gu
ine
aR
wan
da
Cam
ero
on
Mad
agas
car
Togo
Co
mo
ros
U.R
. Tan
zan
iaB
uru
nd
iU
gan
da
Lib
eri
aG
amb
ia, T
he
Mal
awi
Sier
ra L
eon
eG
uin
ea
Bis
sau
Cô
te d
'Ivo
ire
Be
nin
Mo
zam
biq
ue
Sen
egal
An
gola
*Et
hio
pia
Erit
rea
Mal
iD
RC
Bu
rkin
a Fa
soN
iger
Gu
ine
aC
had
Sou
th S
ud
an *
18
- East Africa: Although the indexes for the Seychelles, Mauritius and Kenya are close to 90, for
most countries (the Comoros, Madagascar, Rwanda, Uganda and U. R. of Tanzania) the EDI is
between 55 and 65. In Eritrea it is close to 35, as well as in Ethiopia, where the index has
nevertheless significantly improved (+ 150 percent).
- Central Africa: Gabon is the only country whose index is above 80 in 2012 (82.1). The starkest
progress is noted for Burundi (+ 110 percent) and in Chad the index has considerably
improved in relative terms (+ 90 percent), but remains at a generally low level (22.5).
- West Africa: In many countries (Benin, Burkina Faso, Guinea Bissau, Mali and Niger) the EDI
has increased significantly, but nevertheless remains below the SSA average, due to its low
baseline level. In Niger in particular, the EDI has more than quadrupled (from 6.9 to 30.1).
The most advanced countries in this region are Ghana (77.2 in 2012, after growth of 50
percent) and Cabo Verde (83.6).
The following section will explore the gains achieved by each region in greater detail, reviewing each
of the key EFA goals individually.
2.D- Goal 1: Early Childhood Care and Education
For many countries, early childhood care and education (ECCE) continues to be a complex goal, as it
is multidimensional and requires inter-sectoral coordination that makes its management more
difficult than that of the primary sector, for instance. The idea that preschool unit costs are higher
than those of primary has also limited the development of preschool education in a context of
budgetary constraints. Due to this, the phrasing of Goal 1 as adopted by the Dakar Forum is relatively
modest.
Several research projects have since demonstrated the importance of ECCE.10 In particular, they have
underlined the positive impact preschool education can have on primary schooling, and the EFA GMR
on early childhood has since proposed a consensual definition of this goal:11
“ECCE supports children’s survival, growth, development and learning – including health,
nutrition and hygiene, and cognitive, social, physical and emotional development – from birth
to entry into primary school in formal, informal and non-formal settings.”
The great variety of shapes that ECCE assumes today (parental practices, community care centers,
playschools, formal preschool education, religious education) makes its synthetic measure complex.
10 In particular, see the research of James Heckman (Nobel prizewinner in Economics in 2000). Also, The Lancet series devoted two special series (January 2007 and September 2011) to the ECD issue, including novel studies on the positive externalities of early childhood (http://www.thelancet.com/series/child-development-in-developing-countries). 11 “EFA Global Monitoring Report 2007: Strong Foundations, Early Childhood Care and Education” (UNESCO, 2007).
19
For this reason, the goal is conventionally monitored through the preprimary gross enrollment rate
(GER).12
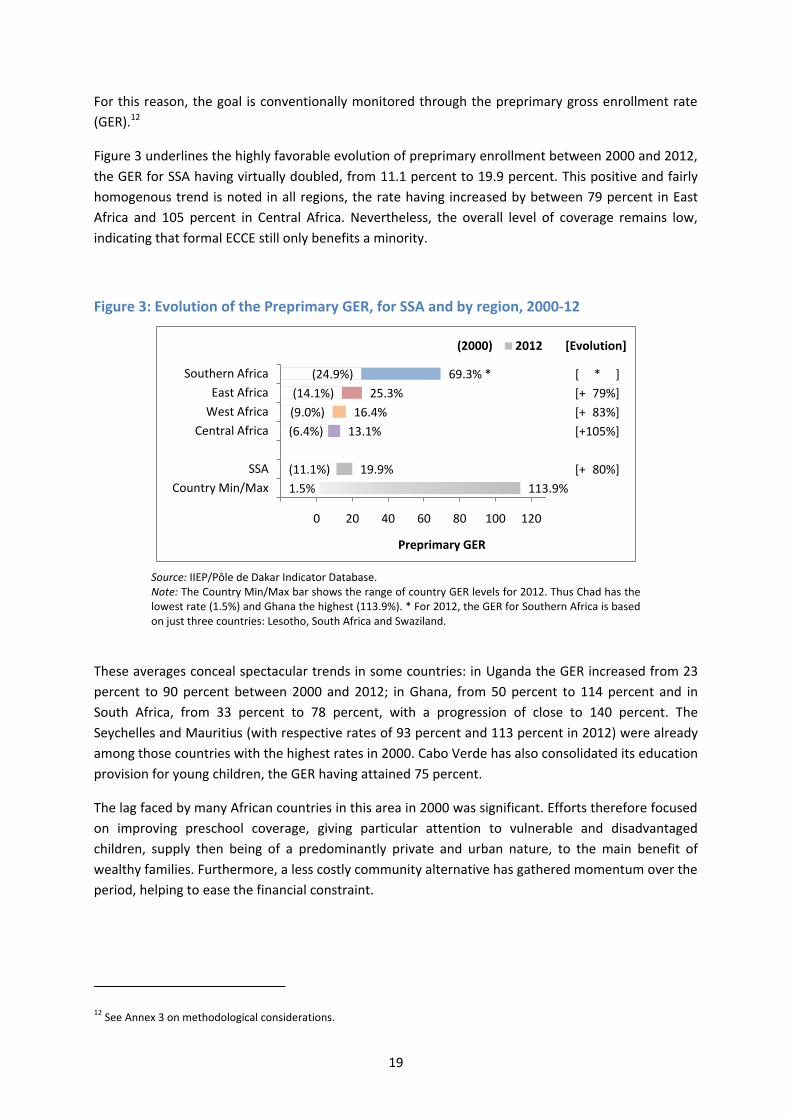
Figure 3 underlines the highly favorable evolution of preprimary enrollment between 2000 and 2012,
the GER for SSA having virtually doubled, from 11.1 percent to 19.9 percent. This positive and fairly
homogenous trend is noted in all regions, the rate having increased by between 79 percent in East
Africa and 105 percent in Central Africa. Nevertheless, the overall level of coverage remains low,
indicating that formal ECCE still only benefits a minority.
Figure 3: Evolution of the Preprimary GER, for SSA and by region, 2000-12
Source: IIEP/Pôle de Dakar Indicator Database. Note: The Country Min/Max bar shows the range of country GER levels for 2012. Thus Chad has the lowest rate (1.5%) and Ghana the highest (113.9%). * For 2012, the GER for Southern Africa is based on just three countries: Lesotho, South Africa and Swaziland.
These averages conceal spectacular trends in some countries: in Uganda the GER increased from 23
percent to 90 percent between 2000 and 2012; in Ghana, from 50 percent to 114 percent and in
South Africa, from 33 percent to 78 percent, with a progression of close to 140 percent. The
Seychelles and Mauritius (with respective rates of 93 percent and 113 percent in 2012) were already
among those countries with the highest rates in 2000. Cabo Verde has also consolidated its education
provision for young children, the GER having attained 75 percent.
The lag faced by many African countries in this area in 2000 was significant. Efforts therefore focused
on improving preschool coverage, giving particular attention to vulnerable and disadvantaged
children, supply then being of a predominantly private and urban nature, to the main benefit of
wealthy families. Furthermore, a less costly community alternative has gathered momentum over the
period, helping to ease the financial constraint.
12 See Annex 3 on methodological considerations.
[+080%]
[+105%]
[+083%]
[+079%]
[ * ]
113.9%
19.9%
13.1%
16.4%
25.3%
69.3% *
1.5%
(11.1%)
(6.4%)
(9.0%)
(14.1%)
(24.9%)
-20 0 20 40 60 80 100 120 140 160
Country Min/Max
SSA
Central Africa
West Africa
East Africa
Southern Africa
Preprimary GER
(2000) 2012 [Evolution]

20
2.E- Goal 2: Universal Primary Education
This goal, set repeatedly in the course of international conferences devoted to education, has
become a beacon goal since the millennium summit, as has the gender parity goal. The Dakar Forum
however reformulated it in terms of universal completion, whereas earlier focus was on access. This
more precise and more demanding definition of universal primary education (UPE) took on board the
results of research having clearly demonstrated that primary completion is an indispensible requisite
to achieve sustainable literacy.
Figure 4: PCR Trends, for SSA and by Region, 2000-12
Source: IIEP/Pôle de Dakar Indicator Database. Note: The Country Min/Max bar shows the range of country PCR rates in 2012. Thus Eritrea has the lowest rate (31.2%) and Sao Tomé and Principe the highest (115.8%). # The regional averages for West Africa do not include Nigeria, due to data constraints.
Figure 4 clearly shows that completion of primary education is still far from universal in SSA, as in all
four regions. For seven Sub-Saharan African countries for which data are available, even access to
primary is not yet universal: Burkina Faso (88.3%), the Comoros (85.5%), Côte d’Ivoire (86.9%),
Eritrea (45.5%), Mali (75.1%) and Nigeria (91.3%). The reasons for failing to achieve UPE are diverse,
of the following types:
- Structural: many countries started the 2000-15 period with very low completion rates;
- Political: leaders have often lacked commitment, as education has not always been a national
development priority;
- Financial: resources have clearly constituted a constraint for the implementation of
education programmes;
- Sociocultural: reticence to enroll children in school, especially girls, remains strong in some
areas, particularly rural; and of course
- Educational: the lack of teachers has often been a bottleneck (according to UIS statistics, SSA
will need approximately a million new teachers by 2015 to lift this constraint), as well as the
lack of school infrastructure, discouraging enrollment because of the distance to school.
[+20pp.]
[+18pp.]
[+30pp.]
[+25pp.]
[+07pp.]
115.8%
66.6%
63.2%
64.0%
67.7% #
76.2%
31.2%
(46.8%)
(45.0%)
(34.1%)
(42.5% #)
(68.8%)
0 40 80 120 160
Country Min/Max
SSA
East Africa
Central Africa
West Africa
Southern Africa
Primary Completion Rate (PCR)
(2000) 2012 [Evolution]
21
Considerable progress has nevertheless been achieved, given that today two thirds of a generation of
Sub-Saharan African children reach the end of the primary cycle (primary completion rate – PCR of 67
percent), against under half in 2000:
- Southern Africa: With an overall gain of 7 percentage points, Southern Africa is the region
having seen least progress over the period, but it was the region with the highest rate in
2000, and still is today. Among others, its average reflects the high completion rates (close to
95 percent) of three countries: South Africa, Botswana and Zambia, as well as a drop in the
PCR in Malawi (from 62.6 percent to 47.6 percent).
- West Africa: Progress in this region between 2000 and 2012 is noteworthy, the PCR having
gained 25 percentage points. The rate has increased most spectacularly in Liberia and Niger,
where it has more than tripled (respectively reaching 65.2 percent and 55.5 percent). It has
also increased by over 80 percent in Benin over the period (to 71.5 percent), Burkina Faso (to
54.9 percent), Guinea (to 61.5 percent), Guinea Bissau (to 62.0 percent) and Mali (to 58.7
percent).
- Central Africa: Central Africa has witnessed most progress, with a gain of 30 percentage
points, aligning itself with East Africa in 2012. The countries whose PCR has improved the
most are Burundi (from 24.2 percent to 62.2 percent) and DRC (from 29.0 percent to 72.8
percent). Gabon, whose PCR was 86.0 percent in 2005, has likely achieved universal primary
education by 2012.
- East Africa: Progress in terms of primary completion has also been momentous (+ 18
percentage points over the period), although this region’s PCR is now marginally lower than
that of Central Africa. The starkest hike occurred in Rwanda, with a gross gain of 54
percentage points and a PCR reaching 75.0 percent in 2012, but the rate virtually tripled in
Djibouti and Kenya, and almost doubled in Madagascar. These advances are however
dampened by rates that have receded in Eritrea (from 38.0 percent to 31.2 percent) and
Uganda (from 61.5 percent to 55.0 percent).
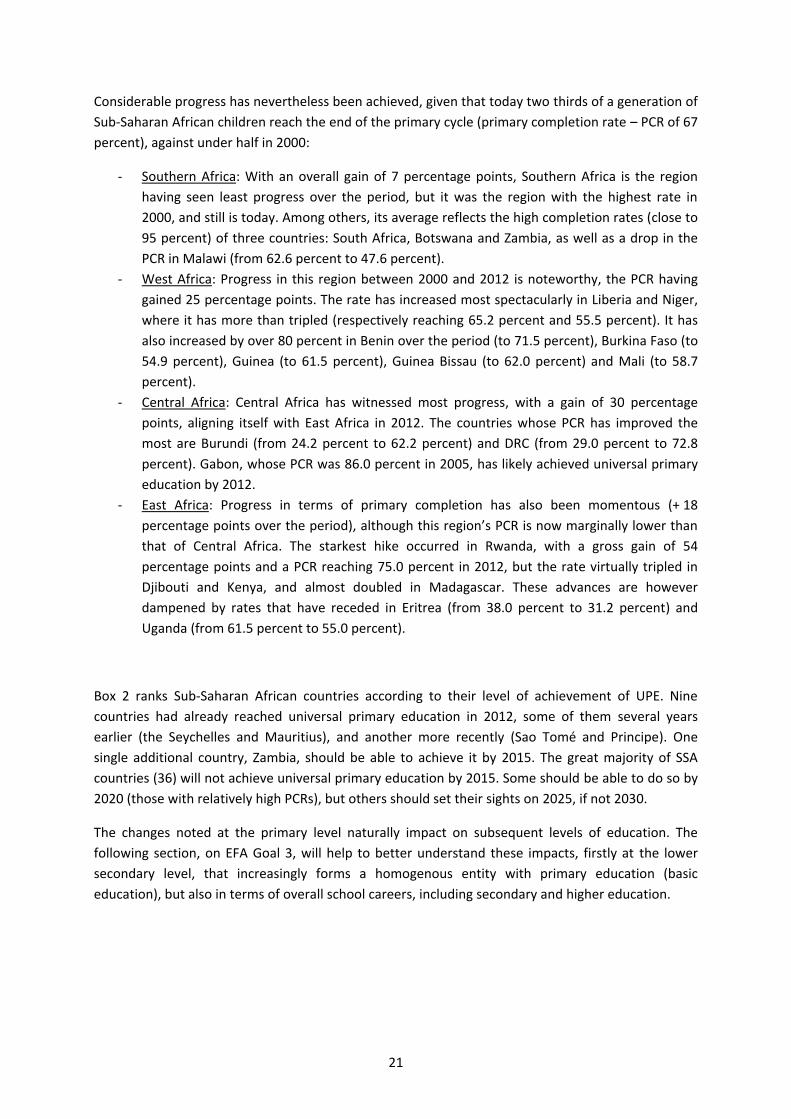
Box 2 ranks Sub-Saharan African countries according to their level of achievement of UPE. Nine
countries had already reached universal primary education in 2012, some of them several years
earlier (the Seychelles and Mauritius), and another more recently (Sao Tomé and Principe). One
single additional country, Zambia, should be able to achieve it by 2015. The great majority of SSA
countries (36) will not achieve universal primary education by 2015. Some should be able to do so by
2020 (those with relatively high PCRs), but others should set their sights on 2025, if not 2030.
The changes noted at the primary level naturally impact on subsequent levels of education. The
following section, on EFA Goal 3, will help to better understand these impacts, firstly at the lower
secondary level, that increasingly forms a homogenous entity with primary education (basic
education), but also in terms of overall school careers, including secondary and higher education.
22
Box 2: Ranking of SSA Countries According to their Level of UPE Attainment, 2012
UPE likely to be achieved after 2015 UPE within
reach for 2015 UPE achieved
6 Countries 14 Countries 16 Countries 1 Country 9 Countries
PCR < 50% 50% ≤ PCR < 70% 70% ≤ PCR < 90% 90% ≤ PCR < 95% PCR ≥ 95%
Angola
CAR
Chad
Eritrea
Malawi
South Sudan
Burkina Faso
Burundi
Comoros
Côte d'Ivoire
Equatorial Guinea
Ethiopia
Guinea Bissau
Guinea
Liberia
Mali
Mozambique
Niger
Senegal
Uganda
Benin
Cameroon
Congo
Djibouti
DRC
Gambia, The
Lesotho
Madagascar
Namibia
Nigeria*
Rwanda
Sierra Leone
Swaziland
Togo
U. R. of Tanzania
Zimbabwe*
Zambia Botswana
Cabo Verde
Gabon*
Ghana
Kenya*
Mauritius
Sao Tomé and Principe
Seychelles*
South Africa
Note: * In the absence of data for 2012, the level of attainment of UPE has been estimated on the basis of historical data and countries’ education contexts. Somalia is not included due to lack of data.
2.F- Goal 3: The Educational Needs of Youth and Adults
The phrasing of EFA Goal 3 refers to the educational needs of all youth and adults, in terms of
acquiring the knowledge and skills required in everyday life. This broad goal relates to the entire
postprimary education system, from lower secondary to higher education, including TVET. It also
covers nonformal education which encompasses other forms of access to learning and provides
“second chance” education to those people who did not receive complete formal basic education.
The indicators selected to evaluate this goal are therefore: (i) the completion rate for lower
secondary, in as much as youth who have finished 8 to 10 years of basic education are considered to
have enough knowledge to learn a job and start an activity; (ii) the transversal schooling profile, from
primary to the end of secondary, to better understand schooling careers, transition and dropout
rates; (iii) the share of TVET enrollment in total secondary education, as a relative measure of the
state and momentum of the development of this stream, as well as the coverage of the subsector in
relation to the total population; and (iv) the number of students per 100,000 inhabitants, as a
measure of higher education enrollment.
23
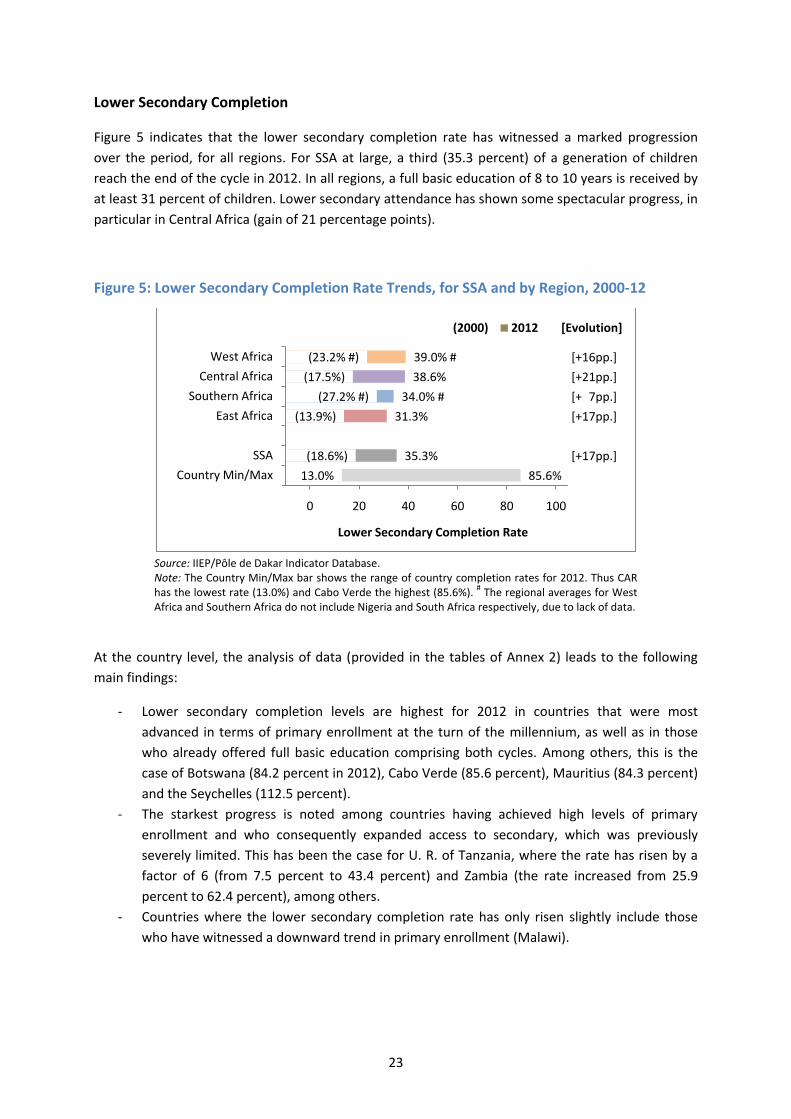
Lower Secondary Completion
Figure 5 indicates that the lower secondary completion rate has witnessed a marked progression
over the period, for all regions. For SSA at large, a third (35.3 percent) of a generation of children
reach the end of the cycle in 2012. In all regions, a full basic education of 8 to 10 years is received by
at least 31 percent of children. Lower secondary attendance has shown some spectacular progress, in
particular in Central Africa (gain of 21 percentage points).
Figure 5: Lower Secondary Completion Rate Trends, for SSA and by Region, 2000-12
Source: IIEP/Pôle de Dakar Indicator Database. Note: The Country Min/Max bar shows the range of country completion rates for 2012. Thus CAR has the lowest rate (13.0%) and Cabo Verde the highest (85.6%). # The regional averages for West Africa and Southern Africa do not include Nigeria and South Africa respectively, due to lack of data.
At the country level, the analysis of data (provided in the tables of Annex 2) leads to the following
main findings:
- Lower secondary completion levels are highest for 2012 in countries that were most
advanced in terms of primary enrollment at the turn of the millennium, as well as in those
who already offered full basic education comprising both cycles. Among others, this is the
case of Botswana (84.2 percent in 2012), Cabo Verde (85.6 percent), Mauritius (84.3 percent)
and the Seychelles (112.5 percent).
- The starkest progress is noted among countries having achieved high levels of primary
enrollment and who consequently expanded access to secondary, which was previously
severely limited. This has been the case for U. R. of Tanzania, where the rate has risen by a
factor of 6 (from 7.5 percent to 43.4 percent) and Zambia (the rate increased from 25.9
percent to 62.4 percent), among others.
- Countries where the lower secondary completion rate has only risen slightly include those
who have witnessed a downward trend in primary enrollment (Malawi).
[+17pp.]
[+17pp.]
[+07pp.]
[+21pp.]
[+16pp.]
85.6%
35.3%
31.3%
34.0% #
38.6%
39.0% #
13.0%
(18.6%)
(13.9%)
(27.2% #)
(17.5%)
(23.2% #)
-20 0 20 40 60 80 100 120
Country Min/Max
SSA
East Africa
Southern Africa
Central Africa
West Africa
Lower Secondary Completion Rate
(2000) 2012 [Evolution]
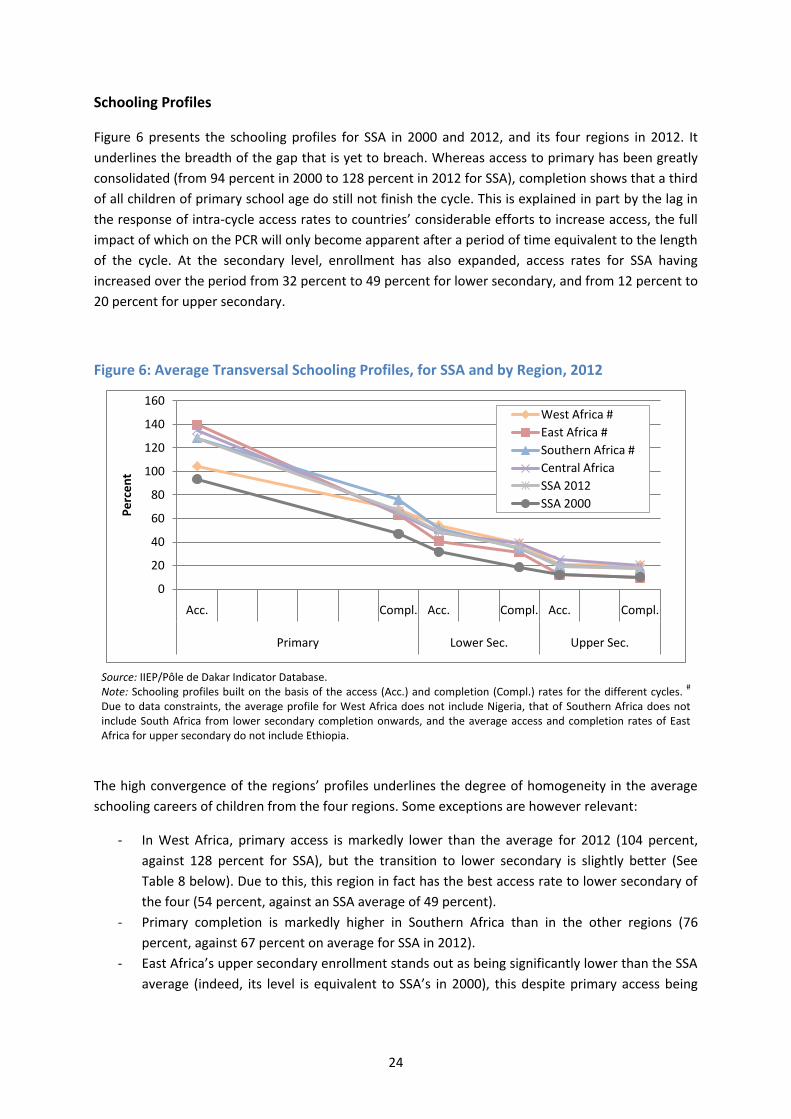
24
Schooling Profiles
Figure 6 presents the schooling profiles for SSA in 2000 and 2012, and its four regions in 2012. It
underlines the breadth of the gap that is yet to breach. Whereas access to primary has been greatly
consolidated (from 94 percent in 2000 to 128 percent in 2012 for SSA), completion shows that a third
of all children of primary school age do still not finish the cycle. This is explained in part by the lag in
the response of intra-cycle access rates to countries’ considerable efforts to increase access, the full
impact of which on the PCR will only become apparent after a period of time equivalent to the length
of the cycle. At the secondary level, enrollment has also expanded, access rates for SSA having
increased over the period from 32 percent to 49 percent for lower secondary, and from 12 percent to
20 percent for upper secondary.
Figure 6: Average Transversal Schooling Profiles, for SSA and by Region, 2012
Source: IIEP/Pôle de Dakar Indicator Database. Note: Schooling profiles built on the basis of the access (Acc.) and completion (Compl.) rates for the different cycles. # Due to data constraints, the average profile for West Africa does not include Nigeria, that of Southern Africa does not include South Africa from lower secondary completion onwards, and the average access and completion rates of East Africa for upper secondary do not include Ethiopia.
The high convergence of the regions’ profiles underlines the degree of homogeneity in the average
schooling careers of children from the four regions. Some exceptions are however relevant:
- In West Africa, primary access is markedly lower than the average for 2012 (104 percent,
against 128 percent for SSA), but the transition to lower secondary is slightly better (See
Table 8 below). Due to this, this region in fact has the best access rate to lower secondary of
the four (54 percent, against an SSA average of 49 percent).
- Primary completion is markedly higher in Southern Africa than in the other regions (76
percent, against 67 percent on average for SSA in 2012).
- East Africa’s upper secondary enrollment stands out as being significantly lower than the SSA
average (indeed, its level is equivalent to SSA’s in 2000), this despite primary access being
0
20
40
60
80
100
120
140
160
Acc. Compl. Acc. Compl. Acc. Compl.
Primary Lower Sec. Upper Sec.
Pe
rce
nt
West Africa #
East Africa #
Southern Africa #
Central Africa
SSA 2012
SSA 2000
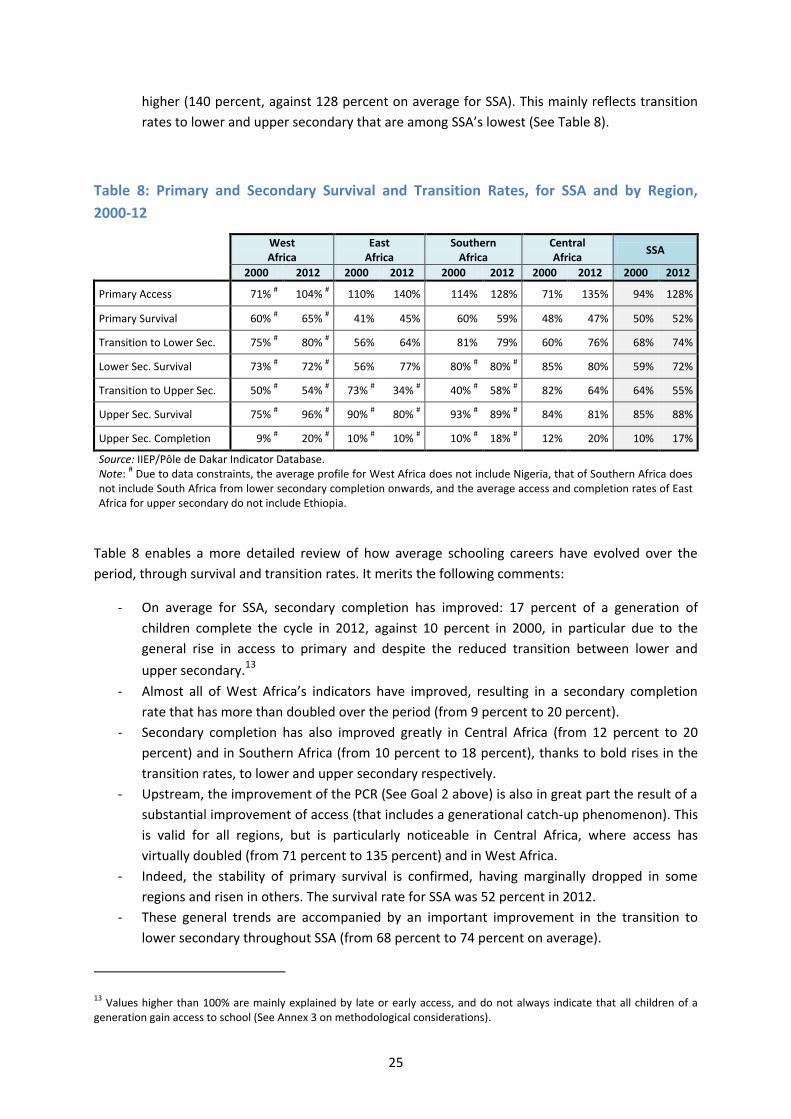
25
higher (140 percent, against 128 percent on average for SSA). This mainly reflects transition
rates to lower and upper secondary that are among SSA’s lowest (See Table 8).
Table 8: Primary and Secondary Survival and Transition Rates, for SSA and by Region,
2000-12
West Africa
East Africa
Southern Africa
Central Africa
SSA
2000 2012 2000 2012 2000 2012 2000 2012 2000 2012
Primary Access 71% # 104% # 110% 140% 114% 128% 71% 135% 94% 128%
Primary Survival 60% # 65% # 41% 45% 60% 59% 48% 47% 50% 52%
Transition to Lower Sec. 75% # 80% # 56% 64% 81% 79% 60% 76% 68% 74%
Lower Sec. Survival 73% # 72% # 56% 77% 80% # 80% # 85% 80% 59% 72%
Transition to Upper Sec. 50% # 54% # 73% # 34% # 40% # 58% # 82% 64% 64% 55%
Upper Sec. Survival 75% # 96% # 90% # 80% # 93% # 89% # 84% 81% 85% 88%
Upper Sec. Completion 9% # 20% # 10% # 10% # 10% # 18% # 12% 20% 10% 17%
Source: IIEP/Pôle de Dakar Indicator Database. Note: # Due to data constraints, the average profile for West Africa does not include Nigeria, that of Southern Africa does not include South Africa from lower secondary completion onwards, and the average access and completion rates of East Africa for upper secondary do not include Ethiopia.
Table 8 enables a more detailed review of how average schooling careers have evolved over the
period, through survival and transition rates. It merits the following comments:
- On average for SSA, secondary completion has improved: 17 percent of a generation of
children complete the cycle in 2012, against 10 percent in 2000, in particular due to the
general rise in access to primary and despite the reduced transition between lower and
upper secondary.13
- Almost all of West Africa’s indicators have improved, resulting in a secondary completion
rate that has more than doubled over the period (from 9 percent to 20 percent).
- Secondary completion has also improved greatly in Central Africa (from 12 percent to 20
percent) and in Southern Africa (from 10 percent to 18 percent), thanks to bold rises in the
transition rates, to lower and upper secondary respectively.
- Upstream, the improvement of the PCR (See Goal 2 above) is also in great part the result of a
substantial improvement of access (that includes a generational catch-up phenomenon). This
is valid for all regions, but is particularly noticeable in Central Africa, where access has
virtually doubled (from 71 percent to 135 percent) and in West Africa.
- Indeed, the stability of primary survival is confirmed, having marginally dropped in some
regions and risen in others. The survival rate for SSA was 52 percent in 2012.
- These general trends are accompanied by an important improvement in the transition to
lower secondary throughout SSA (from 68 percent to 74 percent on average).
13 Values higher than 100% are mainly explained by late or early access, and do not always indicate that all children of a generation gain access to school (See Annex 3 on methodological considerations).
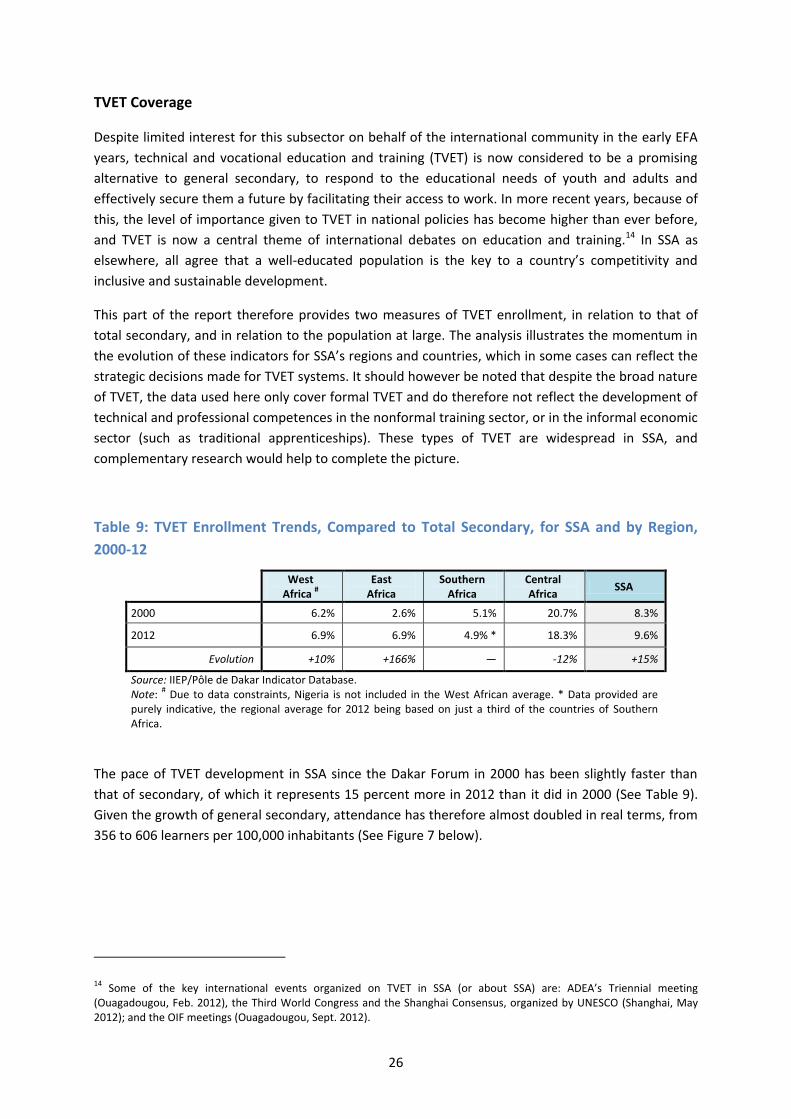
26
TVET Coverage
Despite limited interest for this subsector on behalf of the international community in the early EFA
years, technical and vocational education and training (TVET) is now considered to be a promising
alternative to general secondary, to respond to the educational needs of youth and adults and
effectively secure them a future by facilitating their access to work. In more recent years, because of
this, the level of importance given to TVET in national policies has become higher than ever before,
and TVET is now a central theme of international debates on education and training.14 In SSA as
elsewhere, all agree that a well-educated population is the key to a country’s competitivity and
inclusive and sustainable development.
This part of the report therefore provides two measures of TVET enrollment, in relation to that of
total secondary, and in relation to the population at large. The analysis illustrates the momentum in
the evolution of these indicators for SSA’s regions and countries, which in some cases can reflect the
strategic decisions made for TVET systems. It should however be noted that despite the broad nature
of TVET, the data used here only cover formal TVET and do therefore not reflect the development of
technical and professional competences in the nonformal training sector, or in the informal economic
sector (such as traditional apprenticeships). These types of TVET are widespread in SSA, and
complementary research would help to complete the picture.
Table 9: TVET Enrollment Trends, Compared to Total Secondary, for SSA and by Region,
2000-12
West
Africa # East
Africa Southern
Africa Central Africa
SSA
2000 6.2% 2.6% 5.1% 20.7% 8.3%
2012 6.9% 6.9% 4.9% * 18.3% 9.6%
Evolution +10% +166% ― -12% +15%
Source: IIEP/Pôle de Dakar Indicator Database. Note: # Due to data constraints, Nigeria is not included in the West African average. * Data provided are purely indicative, the regional average for 2012 being based on just a third of the countries of Southern Africa.
The pace of TVET development in SSA since the Dakar Forum in 2000 has been slightly faster than
that of secondary, of which it represents 15 percent more in 2012 than it did in 2000 (See Table 9).
Given the growth of general secondary, attendance has therefore almost doubled in real terms, from
356 to 606 learners per 100,000 inhabitants (See Figure 7 below).
14 Some of the key international events organized on TVET in SSA (or about SSA) are: ADEA’s Triennial meeting (Ouagadougou, Feb. 2012), the Third World Congress and the Shanghai Consensus, organized by UNESCO (Shanghai, May 2012); and the OIF meetings (Ouagadougou, Sept. 2012).
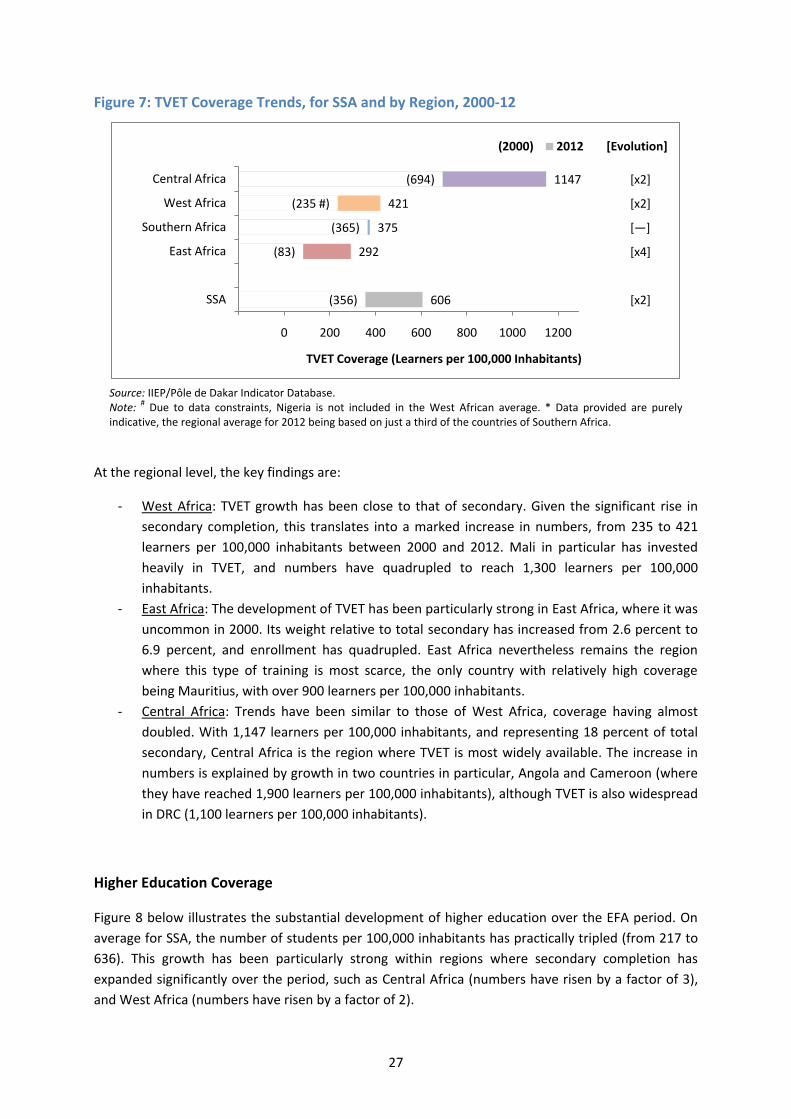
27
Figure 7: TVET Coverage Trends, for SSA and by Region, 2000-12
Source: IIEP/Pôle de Dakar Indicator Database. Note: # Due to data constraints, Nigeria is not included in the West African average. * Data provided are purely indicative, the regional average for 2012 being based on just a third of the countries of Southern Africa.
At the regional level, the key findings are:
- West Africa: TVET growth has been close to that of secondary. Given the significant rise in
secondary completion, this translates into a marked increase in numbers, from 235 to 421
learners per 100,000 inhabitants between 2000 and 2012. Mali in particular has invested
heavily in TVET, and numbers have quadrupled to reach 1,300 learners per 100,000
inhabitants.
- East Africa: The development of TVET has been particularly strong in East Africa, where it was
uncommon in 2000. Its weight relative to total secondary has increased from 2.6 percent to
6.9 percent, and enrollment has quadrupled. East Africa nevertheless remains the region
where this type of training is most scarce, the only country with relatively high coverage
being Mauritius, with over 900 learners per 100,000 inhabitants.
- Central Africa: Trends have been similar to those of West Africa, coverage having almost
doubled. With 1,147 learners per 100,000 inhabitants, and representing 18 percent of total
secondary, Central Africa is the region where TVET is most widely available. The increase in
numbers is explained by growth in two countries in particular, Angola and Cameroon (where
they have reached 1,900 learners per 100,000 inhabitants), although TVET is also widespread
in DRC (1,100 learners per 100,000 inhabitants).
Higher Education Coverage
Figure 8 below illustrates the substantial development of higher education over the EFA period. On
average for SSA, the number of students per 100,000 inhabitants has practically tripled (from 217 to
636). This growth has been particularly strong within regions where secondary completion has
expanded significantly over the period, such as Central Africa (numbers have risen by a factor of 3),
and West Africa (numbers have risen by a factor of 2).
[x2]
[x4]
[―]
[x2]
[x2]
606
292
375
421
1147
(356)
(83)
(365)
(235 #)
(694)
-200 0 200 400 600 800 1000 1200 1400 1600
SSA
East Africa
Southern Africa
West Africa
Central Africa
TVET Coverage (Learners per 100,000 Inhabitants)
(2000) 2012 [Evolution]
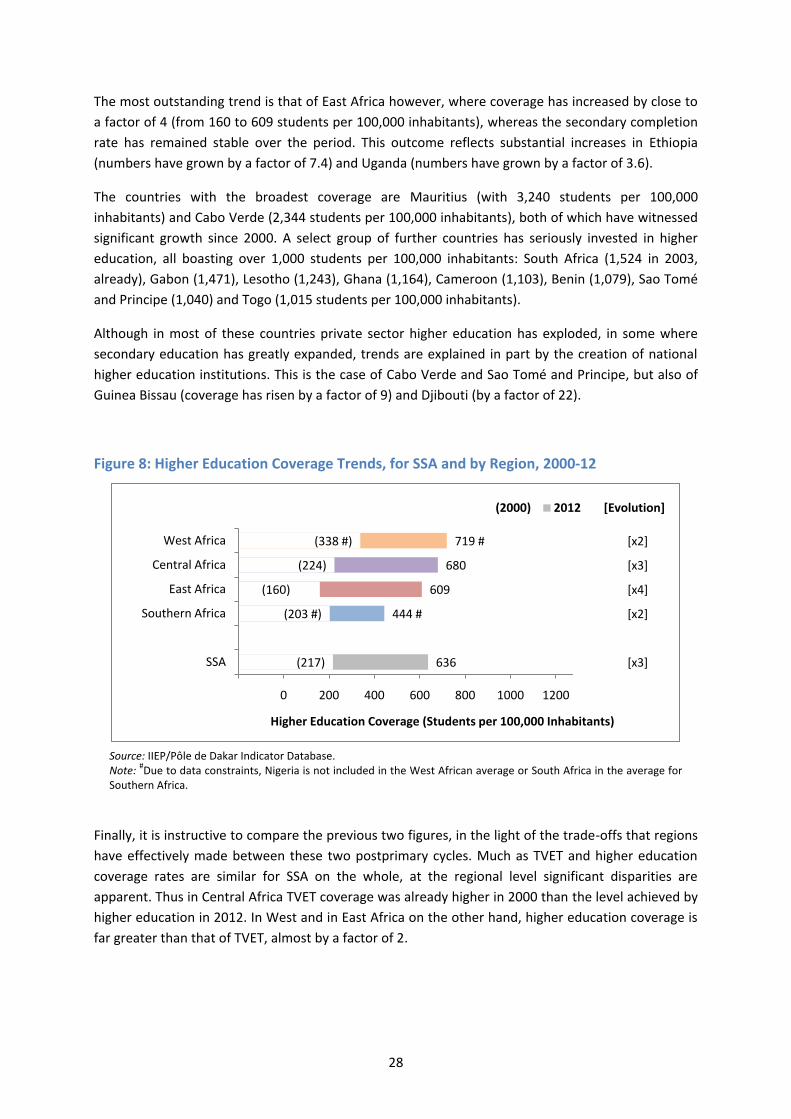
28
The most outstanding trend is that of East Africa however, where coverage has increased by close to
a factor of 4 (from 160 to 609 students per 100,000 inhabitants), whereas the secondary completion
rate has remained stable over the period. This outcome reflects substantial increases in Ethiopia
(numbers have grown by a factor of 7.4) and Uganda (numbers have grown by a factor of 3.6).
The countries with the broadest coverage are Mauritius (with 3,240 students per 100,000
inhabitants) and Cabo Verde (2,344 students per 100,000 inhabitants), both of which have witnessed
significant growth since 2000. A select group of further countries has seriously invested in higher
education, all boasting over 1,000 students per 100,000 inhabitants: South Africa (1,524 in 2003,
already), Gabon (1,471), Lesotho (1,243), Ghana (1,164), Cameroon (1,103), Benin (1,079), Sao Tomé
and Principe (1,040) and Togo (1,015 students per 100,000 inhabitants).
Although in most of these countries private sector higher education has exploded, in some where
secondary education has greatly expanded, trends are explained in part by the creation of national
higher education institutions. This is the case of Cabo Verde and Sao Tomé and Principe, but also of
Guinea Bissau (coverage has risen by a factor of 9) and Djibouti (by a factor of 22).
Figure 8: Higher Education Coverage Trends, for SSA and by Region, 2000-12
Source: IIEP/Pôle de Dakar Indicator Database. Note:
#Due to data constraints, Nigeria is not included in the West African average or South Africa in the average for
Southern Africa.
Finally, it is instructive to compare the previous two figures, in the light of the trade-offs that regions
have effectively made between these two postprimary cycles. Much as TVET and higher education
coverage rates are similar for SSA on the whole, at the regional level significant disparities are
apparent. Thus in Central Africa TVET coverage was already higher in 2000 than the level achieved by
higher education in 2012. In West and in East Africa on the other hand, higher education coverage is
far greater than that of TVET, almost by a factor of 2.
[x3]
[x2]
[x4]
[x3]
[x2]
636
444 #
609
680
719 #
(217)
(203 #)
(160)
(224)
(338 #)
-200 0 200 400 600 800 1000 1200 1400 1600
SSA
Southern Africa
East Africa
Central Africa
West Africa
Higher Education Coverage (Students per 100,000 Inhabitants)
(2000) 2012 [Evolution]

29
2.G- Goal 4: Adult Literacy
EFA Goal 4 relating to adult literacy broadly encompasses access to all formal and nonformal
education programmes that facilitate the social and economic integration of adults. The lag in terms
of formal education in many African countries has favored a rise in the number of illiterate adults,
and of women in particular. This represents a considerable constraint for national development, and
many specific programmes have been implemented to enable those adults who are not, to become
literate.
Figure 9: Trends in Adult Literacy (15+ Years), for SSA and by Region, 2000-12
Source: IIEP/Pôle de Dakar Indicator Database. Note: The regional averages in this figure are simple arithmetic means, which do not reflect the weight of countries’ population of adults aged 15 years and above.
The literacy rate for adults aged 15 years and above has improved by approximately 10 percentage
points in SSA over the period (See Figure 9). The results nevertheless fall short of the target set,
which was an improvement of 50 percent on the 2000 levels. For SSA overall, the rate has increased
from 58 percent to 69 percent, the target being of 87 percent. The scale of progress ranges from 7
percent (for East Africa) to 38 percent (for West Africa):
- West Africa: The adult literacy rate has improved the most in West Africa, where it was
lowest in 2000. However, the rate continues to be among SSA’s weakest in 2012 in several
countries: Benin (42.4 percent), Mali (33.4 percent) and Niger (30.4 percent in 2007). In
Guinea, it has even dropped by 5 percentage points, from 29.5 percent in 2003 to 25.3
percent in 2010. Only two countries’ literacy rates are higher than the SSA average: Cabo
Verde (84.9 percent) and Ghana (71.5 percent).
- Southern Africa: It is in Southern Africa that literacy levels are the highest however (81.1
percent on average). The rate is higher than the SSA average in all countries belonging to this
region but Mozambique (56.1 percent). Furthermore, six out of the nine countries’ rates are
comparably high, above 80 percent for 2012. These are countries where the development of
81.1%77.2%
69.2%
53.6%
68.6%(74.2%)
(71.9%)
(60.4%)
(38.9%)
(57.9%)
30
40
50
60
70
80
90
SouthernAfrica
EastAfrica
CentralAfrica
WestAfrica
SSA
Ad
ult
Lit
era
cy R
ate
(2000) 2012

30
the primary cycle is both mature and substantial: Botswana (85.1 percent), Lesotho (89.6
percent), Namibia (88.8 percent), South Africa (93.0 percent), Swaziland (87.8 percent) and
Zimbabwe (83.6 percent).
- East Africa: The regional average for East Africa (77.2 percent) is currently close to that of
Southern Africa. Although the baseline situation was favorable, some countries have made
considerable progress over the period, such as Eritrea and Kenya, of + 30 percent and + 20
percent respectively. Thus, in 2012, all countries’ rates were above the SSA average, and in
Kenya, Mauritius and the Seychelles, literacy neighbors 90 percent. Only Madagascar stands
out in this general picture, with a literacy rate in 2012 of 64.5 percent, following a drop of
approximately 6 percentage points.
- Central Africa: Progress in adult literacy is equally pronounced in Central Africa, the regional
average being floated by the advances in the three countries whose rates were the lowest in
2000: Chad (+38 percent), CAR (+17 percent) and Burundi (+13 percent). These three
countries’ rates are still lower than the SSA average however, and muffle the high literacy
rates in Gabon (89.0 percent) and Equatorial Guinea (94.1 percent).
2.H- Goal 5: Gender Parity in Education
The analysis of the progress achieved in terms of equity in education is firstly based on the gender
parity index (GPI) for primary. A comparison of the enrollment rates of boys and girls, from primary
to higher education, then broadens the analysis. Finally, a review of the survival rates within cycles
and the transition rates between them, by gender, will highlight the disparities that prevail in
schooling careers.
Figure 10: Evolution of Gender Inequality and GPI, Primary, for SSA and by Region, 2000-12
Source: IIEP/Pôle de Dakar Indicator Database.
(0.95) (0.90) (0.77) (0.84) (0.85)
0.970.95
0.93 0.920.94
0.70
0.75
0.80
0.85
0.90
0.95
1.00
1.05
SouthernAfrica
EastAfrica
WestAfrica
CentralAfrica
SSA
GP
I an
d G
en
de
r P
arit
y G
ap
Parity Area
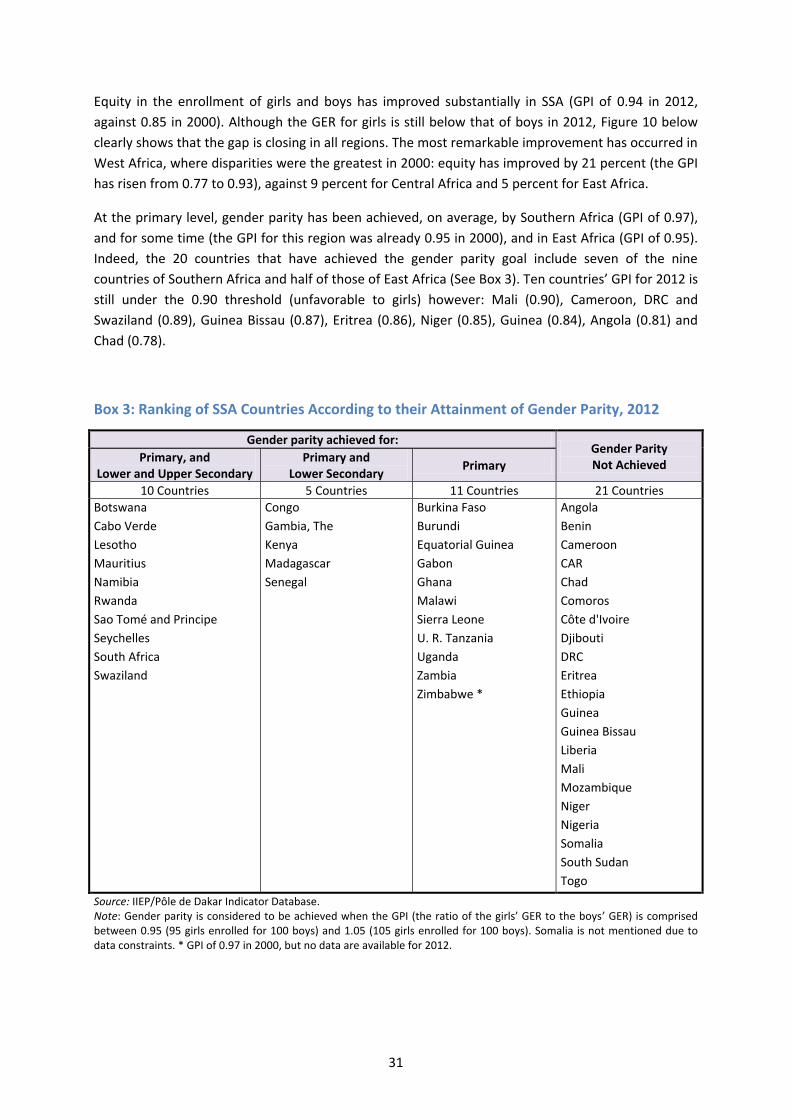
31
Equity in the enrollment of girls and boys has improved substantially in SSA (GPI of 0.94 in 2012,
against 0.85 in 2000). Although the GER for girls is still below that of boys in 2012, Figure 10 below
clearly shows that the gap is closing in all regions. The most remarkable improvement has occurred in
West Africa, where disparities were the greatest in 2000: equity has improved by 21 percent (the GPI
has risen from 0.77 to 0.93), against 9 percent for Central Africa and 5 percent for East Africa.
At the primary level, gender parity has been achieved, on average, by Southern Africa (GPI of 0.97),
and for some time (the GPI for this region was already 0.95 in 2000), and in East Africa (GPI of 0.95).
Indeed, the 20 countries that have achieved the gender parity goal include seven of the nine
countries of Southern Africa and half of those of East Africa (See Box 3). Ten countries’ GPI for 2012 is
still under the 0.90 threshold (unfavorable to girls) however: Mali (0.90), Cameroon, DRC and
Swaziland (0.89), Guinea Bissau (0.87), Eritrea (0.86), Niger (0.85), Guinea (0.84), Angola (0.81) and
Chad (0.78).
Box 3: Ranking of SSA Countries According to their Attainment of Gender Parity, 2012
Gender parity achieved for: Gender Parity Not Achieved
Primary, and Lower and Upper Secondary
Primary and Lower Secondary
Primary
10 Countries 5 Countries 11 Countries 21 Countries
Botswana
Cabo Verde
Lesotho
Mauritius
Namibia
Rwanda
Sao Tomé and Principe
Seychelles
South Africa
Swaziland
Congo
Gambia, The
Kenya
Madagascar
Senegal
Burkina Faso
Burundi
Equatorial Guinea
Gabon
Ghana
Malawi
Sierra Leone
U. R. Tanzania
Uganda
Zambia
Zimbabwe *
Angola
Benin
Cameroon
CAR
Chad
Comoros
Côte d'Ivoire
Djibouti
DRC
Eritrea
Ethiopia
Guinea
Guinea Bissau
Liberia
Mali
Mozambique
Niger
Nigeria
Somalia
South Sudan
Togo
Source: IIEP/Pôle de Dakar Indicator Database. Note: Gender parity is considered to be achieved when the GPI (the ratio of the girls’ GER to the boys’ GER) is comprised between 0.95 (95 girls enrolled for 100 boys) and 1.05 (105 girls enrolled for 100 boys). Somalia is not mentioned due to data constraints. * GPI of 0.97 in 2000, but no data are available for 2012.
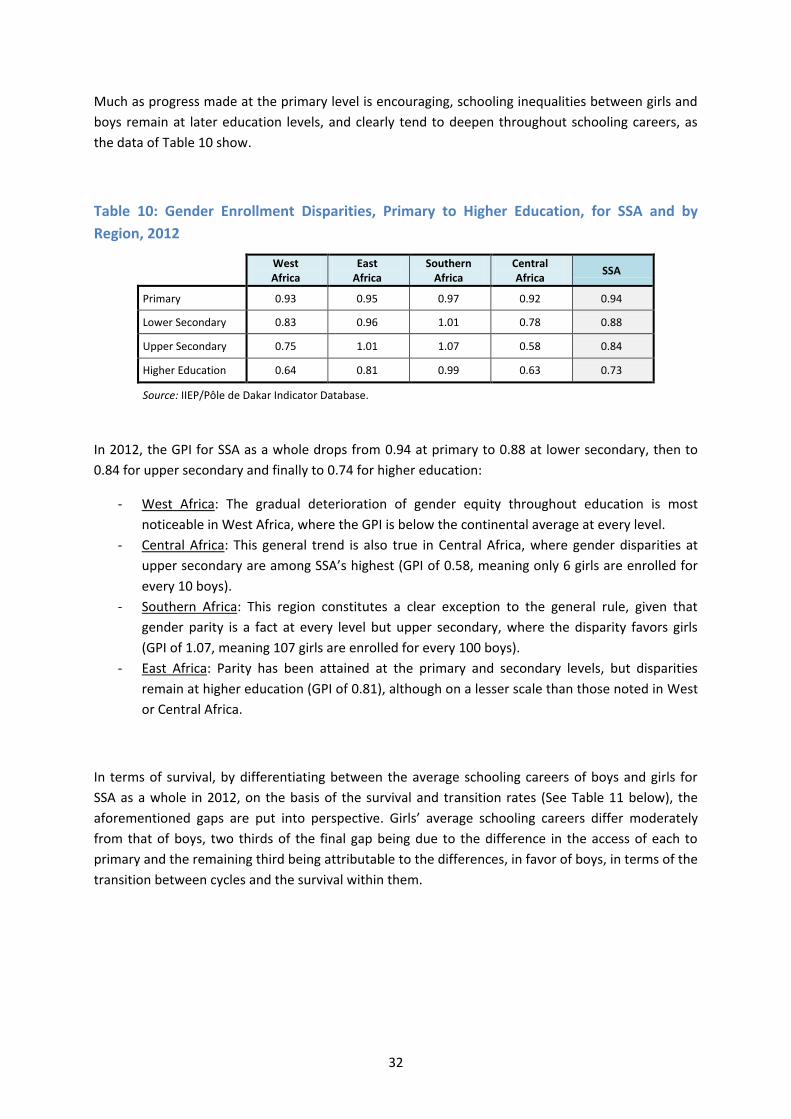
32
Much as progress made at the primary level is encouraging, schooling inequalities between girls and
boys remain at later education levels, and clearly tend to deepen throughout schooling careers, as
the data of Table 10 show.
Table 10: Gender Enrollment Disparities, Primary to Higher Education, for SSA and by
Region, 2012
West Africa
East Africa
Southern Africa
Central Africa
SSA
Primary 0.93 0.95 0.97 0.92 0.94
Lower Secondary 0.83 0.96 1.01 0.78 0.88
Upper Secondary 0.75 1.01 1.07 0.58 0.84
Higher Education 0.64 0.81 0.99 0.63 0.73
Source: IIEP/Pôle de Dakar Indicator Database.
In 2012, the GPI for SSA as a whole drops from 0.94 at primary to 0.88 at lower secondary, then to
0.84 for upper secondary and finally to 0.74 for higher education:
- West Africa: The gradual deterioration of gender equity throughout education is most
noticeable in West Africa, where the GPI is below the continental average at every level.
- Central Africa: This general trend is also true in Central Africa, where gender disparities at
upper secondary are among SSA’s highest (GPI of 0.58, meaning only 6 girls are enrolled for
every 10 boys).
- Southern Africa: This region constitutes a clear exception to the general rule, given that
gender parity is a fact at every level but upper secondary, where the disparity favors girls
(GPI of 1.07, meaning 107 girls are enrolled for every 100 boys).
- East Africa: Parity has been attained at the primary and secondary levels, but disparities
remain at higher education (GPI of 0.81), although on a lesser scale than those noted in West
or Central Africa.
In terms of survival, by differentiating between the average schooling careers of boys and girls for
SSA as a whole in 2012, on the basis of the survival and transition rates (See Table 11 below), the
aforementioned gaps are put into perspective. Girls’ average schooling careers differ moderately
from that of boys, two thirds of the final gap being due to the difference in the access of each to
primary and the remaining third being attributable to the differences, in favor of boys, in terms of the
transition between cycles and the survival within them.
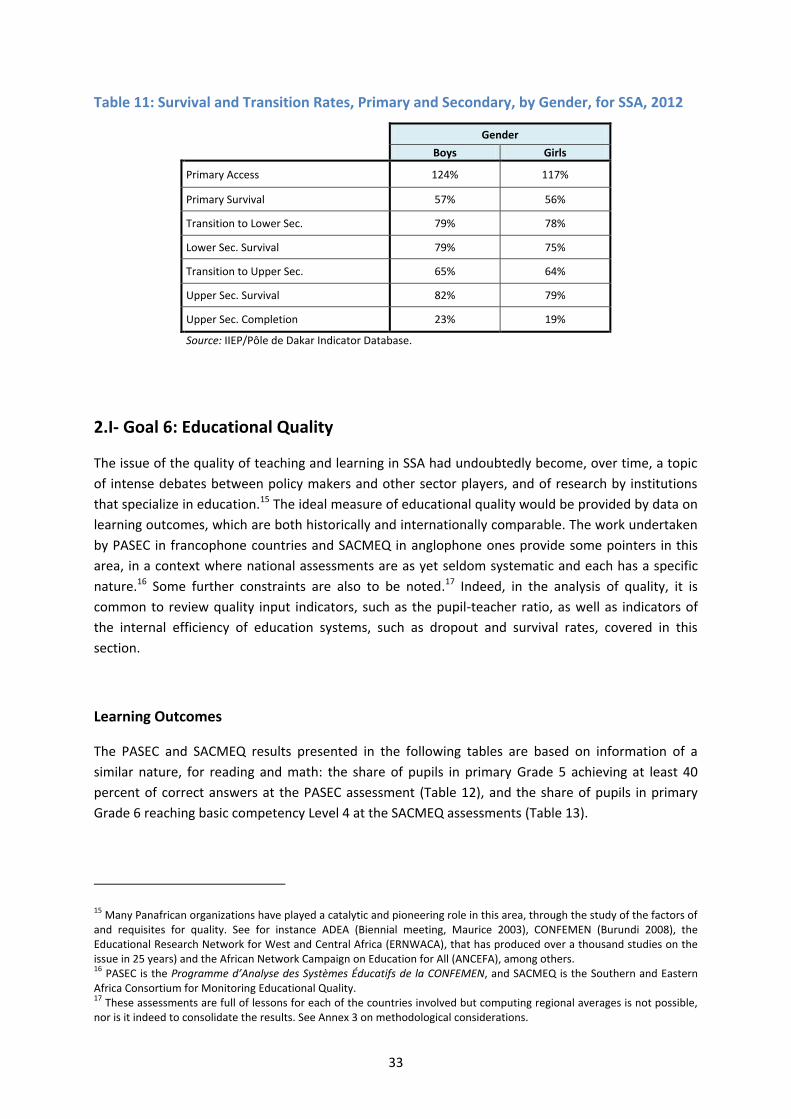
33
Table 11: Survival and Transition Rates, Primary and Secondary, by Gender, for SSA, 2012
Gender
Boys Girls
Primary Access 124% 117%
Primary Survival 57% 56%
Transition to Lower Sec. 79% 78%
Lower Sec. Survival 79% 75%
Transition to Upper Sec. 65% 64%
Upper Sec. Survival 82% 79%
Upper Sec. Completion 23% 19%
Source: IIEP/Pôle de Dakar Indicator Database.
2.I- Goal 6: Educational Quality
The issue of the quality of teaching and learning in SSA had undoubtedly become, over time, a topic
of intense debates between policy makers and other sector players, and of research by institutions
that specialize in education.15 The ideal measure of educational quality would be provided by data on
learning outcomes, which are both historically and internationally comparable. The work undertaken
by PASEC in francophone countries and SACMEQ in anglophone ones provide some pointers in this
area, in a context where national assessments are as yet seldom systematic and each has a specific
nature.16 Some further constraints are also to be noted.17 Indeed, in the analysis of quality, it is
common to review quality input indicators, such as the pupil-teacher ratio, as well as indicators of
the internal efficiency of education systems, such as dropout and survival rates, covered in this
section.
Learning Outcomes
The PASEC and SACMEQ results presented in the following tables are based on information of a
similar nature, for reading and math: the share of pupils in primary Grade 5 achieving at least 40
percent of correct answers at the PASEC assessment (Table 12), and the share of pupils in primary
Grade 6 reaching basic competency Level 4 at the SACMEQ assessments (Table 13).
15 Many Panafrican organizations have played a catalytic and pioneering role in this area, through the study of the factors of and requisites for quality. See for instance ADEA (Biennial meeting, Maurice 2003), CONFEMEN (Burundi 2008), the Educational Research Network for West and Central Africa (ERNWACA), that has produced over a thousand studies on the issue in 25 years) and the African Network Campaign on Education for All (ANCEFA), among others. 16 PASEC is the Programme d’Analyse des Systèmes Éducatifs de la CONFEMEN, and SACMEQ is the Southern and Eastern Africa Consortium for Monitoring Educational Quality. 17 These assessments are full of lessons for each of the countries involved but computing regional averages is not possible, nor is it indeed to consolidate the results. See Annex 3 on methodological considerations.
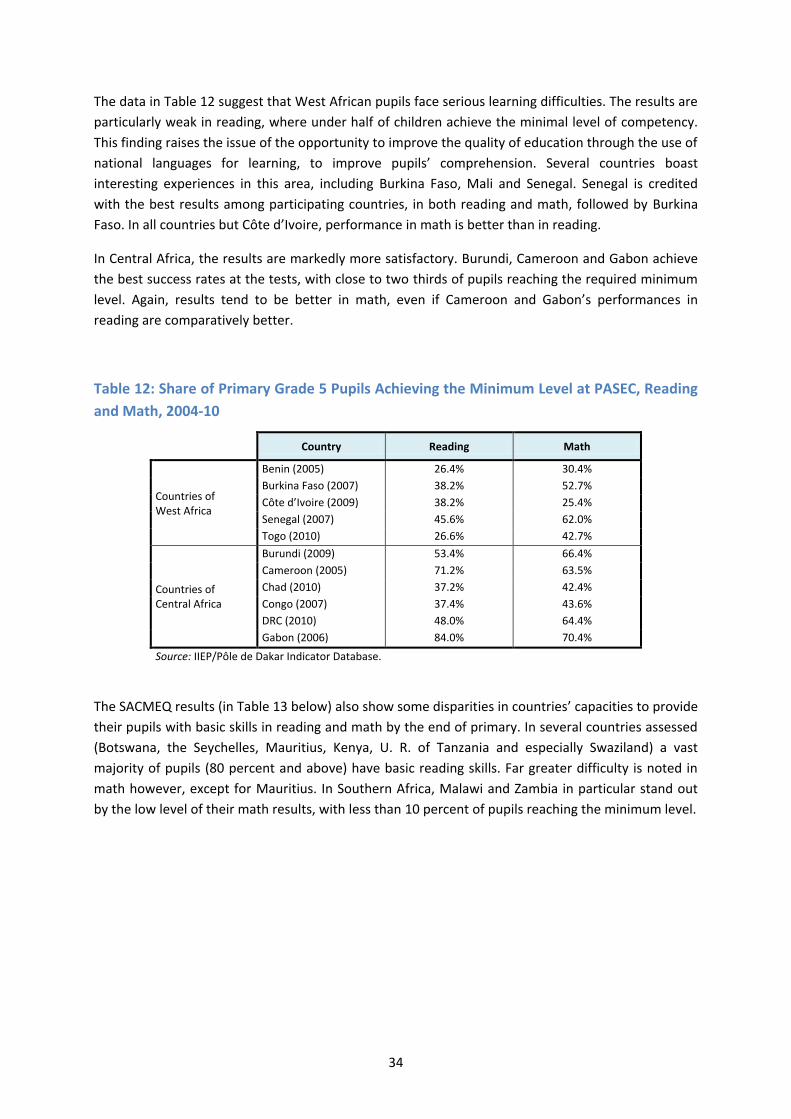
34
The data in Table 12 suggest that West African pupils face serious learning difficulties. The results are
particularly weak in reading, where under half of children achieve the minimal level of competency.
This finding raises the issue of the opportunity to improve the quality of education through the use of
national languages for learning, to improve pupils’ comprehension. Several countries boast
interesting experiences in this area, including Burkina Faso, Mali and Senegal. Senegal is credited
with the best results among participating countries, in both reading and math, followed by Burkina
Faso. In all countries but Côte d’Ivoire, performance in math is better than in reading.
In Central Africa, the results are markedly more satisfactory. Burundi, Cameroon and Gabon achieve
the best success rates at the tests, with close to two thirds of pupils reaching the required minimum
level. Again, results tend to be better in math, even if Cameroon and Gabon’s performances in
reading are comparatively better.
Table 12: Share of Primary Grade 5 Pupils Achieving the Minimum Level at PASEC, Reading
and Math, 2004-10
Country Reading Math
Countries of West Africa
Benin (2005) 26.4% 30.4%
Burkina Faso (2007) 38.2% 52.7%
Côte d’Ivoire (2009) 38.2% 25.4%
Senegal (2007) 45.6% 62.0%
Togo (2010) 26.6% 42.7%
Countries of Central Africa
Burundi (2009) 53.4% 66.4%
Cameroon (2005) 71.2% 63.5%
Chad (2010) 37.2% 42.4%
Congo (2007) 37.4% 43.6%
DRC (2010) 48.0% 64.4%
Gabon (2006) 84.0% 70.4%
Source: IIEP/Pôle de Dakar Indicator Database.
The SACMEQ results (in Table 13 below) also show some disparities in countries’ capacities to provide
their pupils with basic skills in reading and math by the end of primary. In several countries assessed
(Botswana, the Seychelles, Mauritius, Kenya, U. R. of Tanzania and especially Swaziland) a vast
majority of pupils (80 percent and above) have basic reading skills. Far greater difficulty is noted in
math however, except for Mauritius. In Southern Africa, Malawi and Zambia in particular stand out
by the low level of their math results, with less than 10 percent of pupils reaching the minimum level.
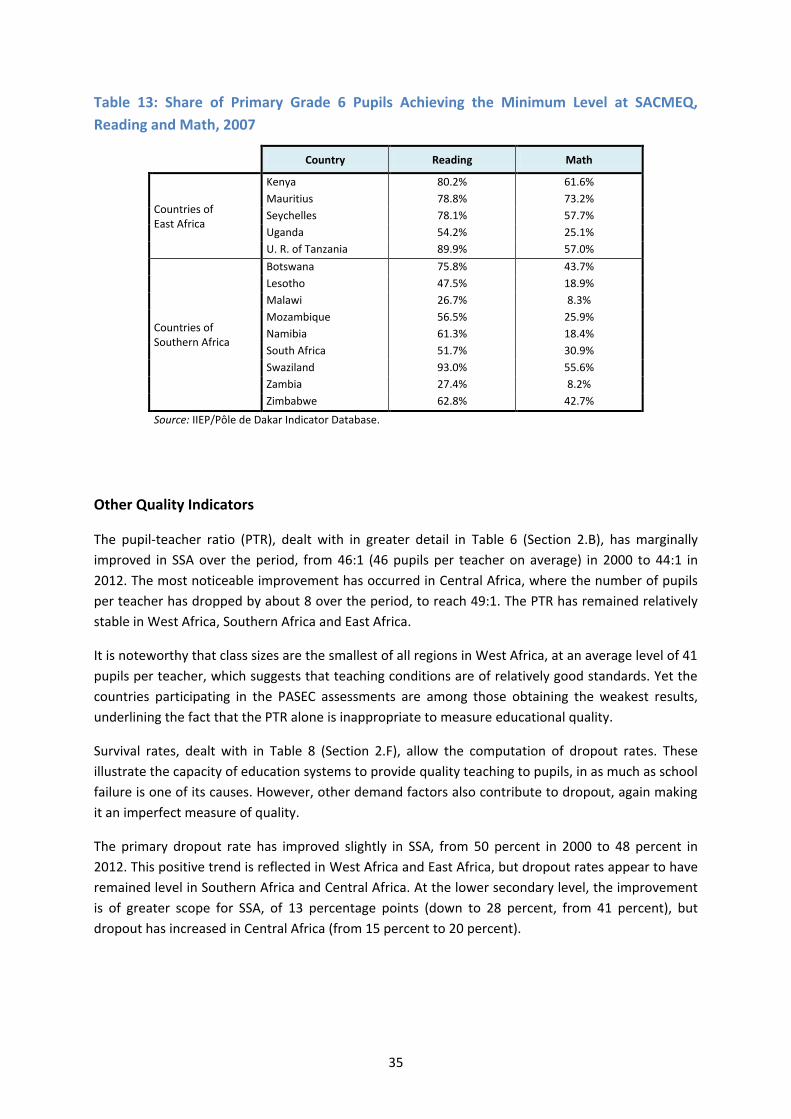
35
Table 13: Share of Primary Grade 6 Pupils Achieving the Minimum Level at SACMEQ,
Reading and Math, 2007
Country Reading Math
Countries of East Africa
Kenya 80.2% 61.6%
Mauritius 78.8% 73.2%
Seychelles 78.1% 57.7%
Uganda 54.2% 25.1%
U. R. of Tanzania 89.9% 57.0%
Countries of Southern Africa
Botswana 75.8% 43.7%
Lesotho 47.5% 18.9%
Malawi 26.7% 8.3%
Mozambique 56.5% 25.9%
Namibia 61.3% 18.4%
South Africa 51.7% 30.9%
Swaziland 93.0% 55.6%
Zambia 27.4% 8.2%
Zimbabwe 62.8% 42.7%
Source: IIEP/Pôle de Dakar Indicator Database.
Other Quality Indicators
The pupil-teacher ratio (PTR), dealt with in greater detail in Table 6 (Section 2.B), has marginally
improved in SSA over the period, from 46:1 (46 pupils per teacher on average) in 2000 to 44:1 in
2012. The most noticeable improvement has occurred in Central Africa, where the number of pupils
per teacher has dropped by about 8 over the period, to reach 49:1. The PTR has remained relatively
stable in West Africa, Southern Africa and East Africa.
It is noteworthy that class sizes are the smallest of all regions in West Africa, at an average level of 41
pupils per teacher, which suggests that teaching conditions are of relatively good standards. Yet the
countries participating in the PASEC assessments are among those obtaining the weakest results,
underlining the fact that the PTR alone is inappropriate to measure educational quality.
Survival rates, dealt with in Table 8 (Section 2.F), allow the computation of dropout rates. These
illustrate the capacity of education systems to provide quality teaching to pupils, in as much as school
failure is one of its causes. However, other demand factors also contribute to dropout, again making
it an imperfect measure of quality.
The primary dropout rate has improved slightly in SSA, from 50 percent in 2000 to 48 percent in
2012. This positive trend is reflected in West Africa and East Africa, but dropout rates appear to have
remained level in Southern Africa and Central Africa. At the lower secondary level, the improvement
is of greater scope for SSA, of 13 percentage points (down to 28 percent, from 41 percent), but
dropout has increased in Central Africa (from 15 percent to 20 percent).
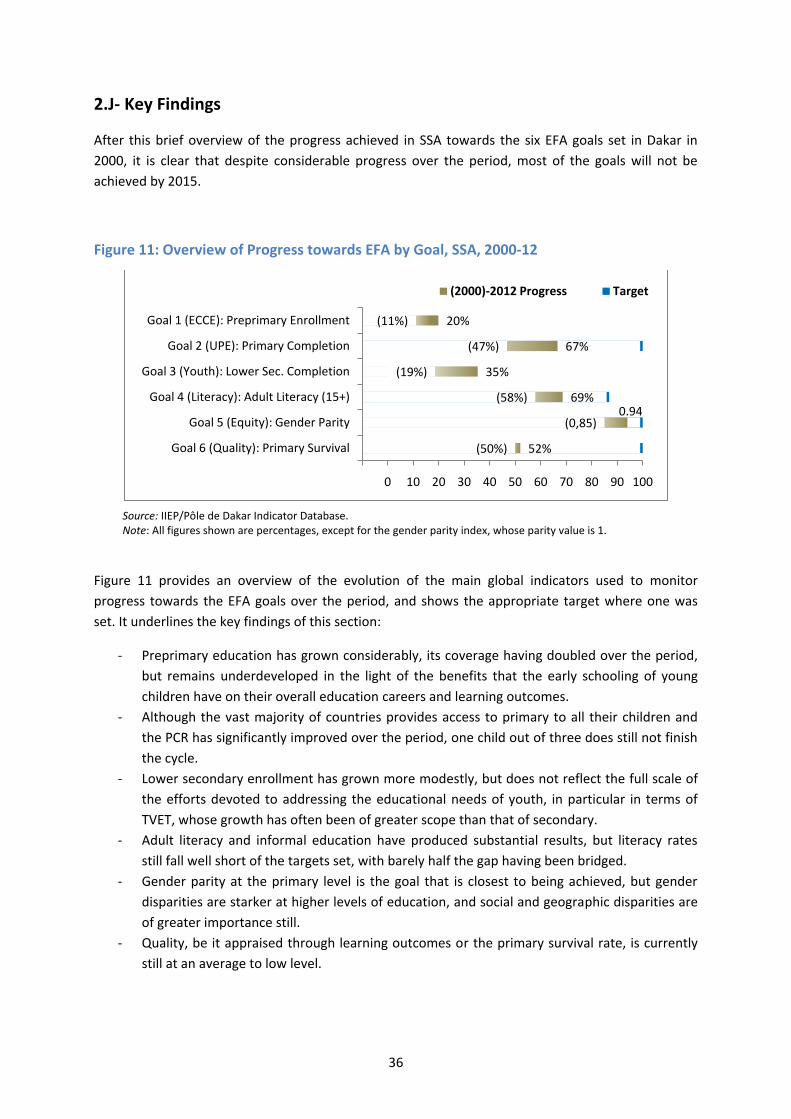
36
2.J- Key Findings
After this brief overview of the progress achieved in SSA towards the six EFA goals set in Dakar in
2000, it is clear that despite considerable progress over the period, most of the goals will not be
achieved by 2015.
Figure 11: Overview of Progress towards EFA by Goal, SSA, 2000-12
Source: IIEP/Pôle de Dakar Indicator Database. Note: All figures shown are percentages, except for the gender parity index, whose parity value is 1.
Figure 11 provides an overview of the evolution of the main global indicators used to monitor
progress towards the EFA goals over the period, and shows the appropriate target where one was
set. It underlines the key findings of this section:
- Preprimary education has grown considerably, its coverage having doubled over the period,
but remains underdeveloped in the light of the benefits that the early schooling of young
children have on their overall education careers and learning outcomes.
- Although the vast majority of countries provides access to primary to all their children and
the PCR has significantly improved over the period, one child out of three does still not finish
the cycle.
- Lower secondary enrollment has grown more modestly, but does not reflect the full scale of
the efforts devoted to addressing the educational needs of youth, in particular in terms of
TVET, whose growth has often been of greater scope than that of secondary.
- Adult literacy and informal education have produced substantial results, but literacy rates
still fall well short of the targets set, with barely half the gap having been bridged.
- Gender parity at the primary level is the goal that is closest to being achieved, but gender
disparities are starker at higher levels of education, and social and geographic disparities are
of greater importance still.
- Quality, be it appraised through learning outcomes or the primary survival rate, is currently
still at an average to low level.
52%
0.9469%
35%
67%
20%
(50%)
(0,85)
(58%)
(19%)
(47%)
(11%)
-10 0 10 20 30 40 50 60 70 80 90 100
Goal 6 (Quality): Primary Survival
Goal 5 (Equity): Gender Parity
Goal 4 (Literacy): Adult Literacy (15+)
Goal 3 (Youth): Lower Sec. Completion
Goal 2 (UPE): Primary Completion
Goal 1 (ECCE): Preprimary Enrollment
(2000)-2012 Progress Target
37
The particular focus on primary in countries’ first EFA and education sector plans, and especially on
its quantitative development, logically led to some mid-term trade-offs to better focus on
postprimary levels and learning quality. Indeed, the expansion of primary coverage generated
demand for further education that spread energetically as far as higher education, and national
education policies, encouraged by governments and development partners, then launched into the
promotion of basic education, usually towards the end of the EFA period. Furthermore, this very
growth of primary often occurred at the expense of educational quality.
Some countries, whose education indicators were particularly weak in 2000, have not managed to
catch-up with their peers, in a timeframe that is in fact fairly short for such structural reforms. Their
situation has nevertheless considerably improved and they have often achieved more than ever
before during this first EFA period. The regional comparisons support these findings, showing
education systems’ general push forward.
It is noteworthy that the relationships between governments and donors on the one hand, and
among donors on the other, have witnessed remarkable changes over the EFA period. Although the
multiplicity of EFA coordination initiatives and mechanisms, at the national, regional and
international levels has contributed to dampen their effectiveness, some of these elements
nevertheless constitute notable EFA achievements (See Annex 1).
The following section will review some of the strategies implemented at the country level to promote
EFA, providing the qualitative perceptions of SSA countries of their progress, successes and failures,
as well as the constraints faced and good practices identified during the implementation of their
chosen education policies.

38
39
Section 3. EFA Strategies– SSA Countries’ Perspectives
This section presents SSA countries’ views of the initiatives launched and strategies implemented at
the national level to achieve the EFA goals over the 2000-14 period. Some actions are goal-specific,
whereas others have a cross-cutting nature.
The views that emanate from this section, for the various EFA goals or policies, represent points of
convergence in the national opinions expressed. These insights will be all the more credible that the
number of countries that share them is great.
The analysis of Section 3 is based on the responses of 36 countries, to (i) the 2012 EFA survey;
and (ii) the 2014 EFA survey (21 of the above, that constitute Sample A).18
Whereas the full sample of 36 countries is used for most of this section, some of the analysis is
based on Sample A responses. These analyses generally cover, for each EFA goal, a selection of
factors that are considered essential for the implementation of education policies in the EFA
framework:
Teacher commitment
Family mobilization
Education sector commitment
Other sectors’ mobilization
Political will
Social mobilization
National financing
External financing
Donor relations
The approach used here compares the relative importance of each factor through scores that
include a quantitative (the number of countries having voiced a favorable or unfavorable
opinion) and a quantitative (the level of approval/disapproval of each country) dimension. The
value of individual scores has no particular meaning.
It is sometimes appropriate to place the opinions formulated in some perspective, on the basis
of regional trends. These Authors’ Notes are clearly differentiated in the text from the views of
the SSA countries.
18 These surveys were carried out by UNESCO’s Dakar office in the context of SSA-level EFA monitoring. The questionnaires offer countries great scope to provide qualitative responses, commenting on their successes, failures, good practices and lessons learned (the questionnaire is provided in Annex 4). The constitution of and use of the various country samples is explained in Annex 3 on methodological considerations.
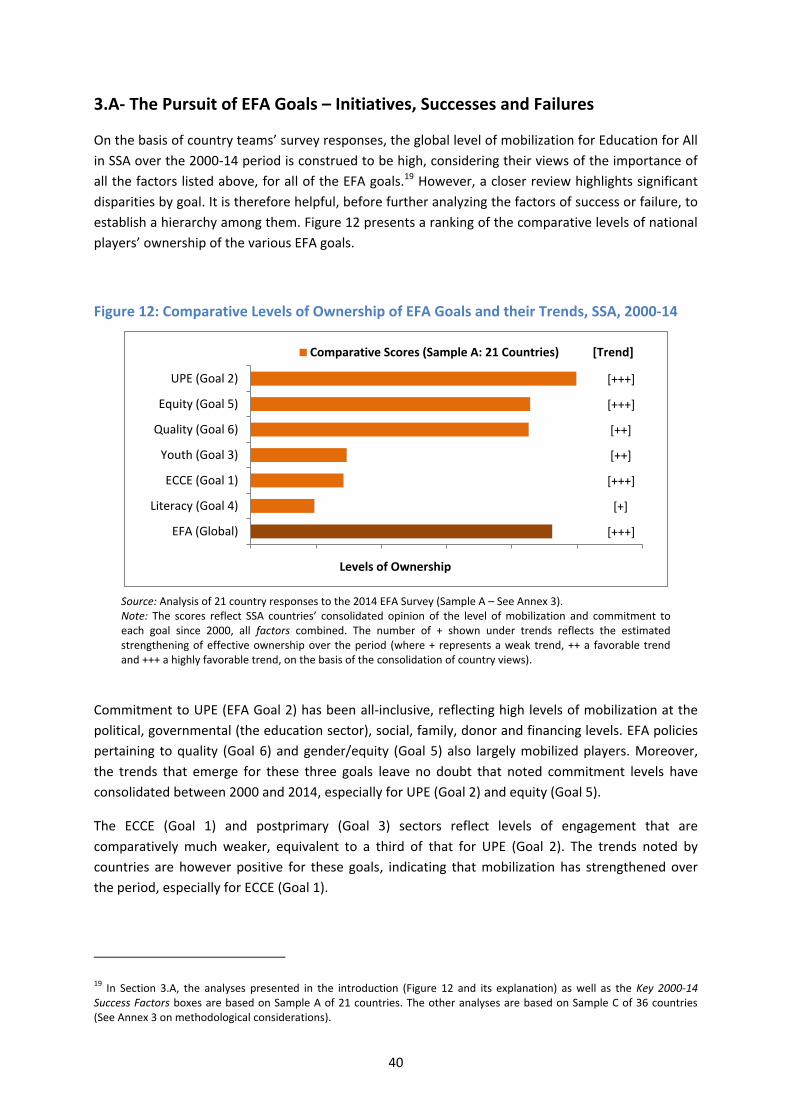
40
3.A- The Pursuit of EFA Goals – Initiatives, Successes and Failures
On the basis of country teams’ survey responses, the global level of mobilization for Education for All
in SSA over the 2000-14 period is construed to be high, considering their views of the importance of
all the factors listed above, for all of the EFA goals.19 However, a closer review highlights significant
disparities by goal. It is therefore helpful, before further analyzing the factors of success or failure, to
establish a hierarchy among them. Figure 12 presents a ranking of the comparative levels of national
players’ ownership of the various EFA goals.
Figure 12: Comparative Levels of Ownership of EFA Goals and their Trends, SSA, 2000-14
Source: Analysis of 21 country responses to the 2014 EFA Survey (Sample A – See Annex 3). Note: The scores reflect SSA countries’ consolidated opinion of the level of mobilization and commitment to each goal since 2000, all factors combined. The number of + shown under trends reflects the estimated strengthening of effective ownership over the period (where + represents a weak trend, ++ a favorable trend and +++ a highly favorable trend, on the basis of the consolidation of country views).
Commitment to UPE (EFA Goal 2) has been all-inclusive, reflecting high levels of mobilization at the
political, governmental (the education sector), social, family, donor and financing levels. EFA policies
pertaining to quality (Goal 6) and gender/equity (Goal 5) also largely mobilized players. Moreover,
the trends that emerge for these three goals leave no doubt that noted commitment levels have
consolidated between 2000 and 2014, especially for UPE (Goal 2) and equity (Goal 5).
The ECCE (Goal 1) and postprimary (Goal 3) sectors reflect levels of engagement that are
comparatively much weaker, equivalent to a third of that for UPE (Goal 2). The trends noted by
countries are however positive for these goals, indicating that mobilization has strengthened over
the period, especially for ECCE (Goal 1).
19 In Section 3.A, the analyses presented in the introduction (Figure 12 and its explanation) as well as the Key 2000-14 Success Factors boxes are based on Sample A of 21 countries. The other analyses are based on Sample C of 36 countries (See Annex 3 on methodological considerations).
[+++]
[+]
[+++]
[++]
[++]
[+++]
[+++]
EFA (Global)
Literacy (Goal 4)
ECCE (Goal 1)
Youth (Goal 3)
Quality (Goal 6)
Equity (Goal 5)
UPE (Goal 2)
Levels of Ownership
Comparative Scores (Sample A: 21 Countries) [Trend]
41
Adult literacy (Goal 4) is the goal with which engagement has clearly been the lightest, equivalent to
just 20 percent of that for UPE. In addition, commitment to this goal appears to have evolved little
over the period (weak trend). This suggests that in a context of policy arbitration between the
different goals, which has almost systematically been required to canalize countries’ efforts, the
priority given to adult literacy has been limited, and continues to be.
Goal 1: Early Childhood Care and Protection
→ See also Ghana’s Case Study on ECCE (Page 83)
The improvements noted in terms of ECCE are clearly the result of a heightened political will to
develop this subsector. This will has translated into the elaboration of specific early childhood
development (ECD) or integrated early childhood development (IECD) policies in many countries,
often coupled with subsector strategies and steering, coordination or management arrangements:
the Pre-School Development Committee in Botswana, the Comité de Coordination Intersectorielle du
Sous-secteur Préscolaire in Côte d’Ivoire, the Bureau of Early Childhood Education in Liberia, or the
National Early Childhood Council in Angola.
Seven countries (out of 36) mention having taken the initiative to provide a preparatory year of
education through primary schools (equivalent to the last year of preprimary), or to annex
preprimary facilities to them (Botswana, Côte d’Ivoire, Gabon, The Gambia, Ghana, Sao Tomé and
Principe and Swaziland). Inter-ministerial mobilization for ECCE is still weak on the other hand, and
where it exists, the health sector is the education sector’s main partner.
Authors’ Note: In the light of the fairly slight results achieved in this area (See Section 2.D), it
should be noted that much as initiatives similar to those mentioned exist, they are often far
from widespread, are not always fully operational. The subsector is underfinanced in many
countries and supply is relatively unstructured, in particular in francophone countries. A
positive trend over recent years is also noted, in particular under the impulse of development
partners.
Key
2000-14
Success
Factors
According to the countries surveyed, the key success factors for Goal 1 on ECCE have been:
Donor relations. This is by far the factor having had the greatest impact, for 19/20
countries;
Strong social mobilization, for 17/21 countries;
Political commitment, that has witnessed the starkest evolution, and is consolidating in
16/17 countries; and
National financing. This factor appears to have been ECCE’s Achilles’ heel. It is
considered to have been a soft point in ECCE growth by 8/20 countries.
Source: Analysis of 21 country responses to the 2014 EFA Survey (Sample A - See Annex 3).

42
In addition, the increase in public investment has been high, and beyond the focus on access, through
infrastructure development, several countries have invested in quality: 9 countries (out of 36) state
that they train or offer qualifications for early childhood carers, and 8 have embarked in the
elaboration of curricula for the ECCE subsector (such as the ECD Learning Framework, developed in
Uganda in 2005) or standards for the accreditation of early childhood services.
Social mobilization is the third strongest point noted. Community participation has been the main
pillar of ECCE development (mentioned by 12/36 countries), often reinforced through sensitization
and parental education campaigns. Partnerships with the private sector have also played an
important part in several countries, including Angola, DRC, Eritrea, South Africa and Zambia.
The main lessons learned are the importance of IEC (information, education and communication) as
well as of parental education, to build greater awareness of the value of ECCE among families.
Governments’ backing of this goal has facilitated the mobilization of other players, especially at the
community level, and has enabled the expansion of ECCE services beyond urban centers so that they
can also benefit rural and vulnerable groups.
Authors’ Note: The scope of parental education reaches well beyond sensitization on the
importance of ECCE, and aims to strengthen parents’ knowledge and competencies to directly
contribute to the development and care of their children. The fact that parental education is
mainly mentioned by countries in the context of awareness building might indicate a
misconception of its potential contribution to ECCE.
Goal 2: Universal Primary Education
→ See also Zambia’s case study on UPE (Page 86) and
Rwanda’s on basic education (Page 89)
Countries claim that the political will to achieve UPE has been very strong, translating, among others,
into significant public investments, to compensate schools’ loss of income following the approval of
laws and decrees in favor of fee-free primary education.
Key
2000-14
Success
Factors
Goal 2, for universal primary education, has harnessed support of an all-embracing
nature in many countries, commitment having been of a very high level in the political,
social, governmental (education ministries) and donor spheres.
All these factors are considered positive by the vast majority of countries (19/21).
Teacher commitment, although high in most countries, was problematic according to
the responses of Burkina Faso, Ghana and Uganda.
Source: Analysis of 21 country responses to the 2014 EFA Survey (Sample A - See Annex 3).
43
The recruitment and training of teachers have been highlighted as key success factors for Goal 2, in
part thanks to the opening of new teacher training facilities, such as in Angola or Burkina Faso. In
some anglophone countries such as Malawi or U. R. of Tanzania, accelerated certification
programmes have been created to face the increased need for qualified teachers. Community
participation has also been fundamental for this cycle, being mentioned as a success factor by over
10 countries (of the 36 respondents).
In terms of failures strictly speaking, countries mention dropout and repetition rates, still considered
too high, the low level of equity in terms of access, in particular for rural and economically
disadvantaged groups, and the persistent challenge that ensuring quality represents. Also, countries
often cite parents’ low literacy levels as an explanation for weak demand for their children’s
education, underlining the complementarity of Goal 4 (literacy) with that of UPE, as well as the need
to strengthen sensitization and IEC activities.
The main constraint noted by countries responding to the survey was the availability of
infrastructure, closely related to that of the resources allocated to this cycle, that also impact the
sufficient availability of pedagogical material, textbooks and equipment.
Although mentioned as success factors by several countries, the recruitment and training of teachers
in sufficient numbers is rather presented as a challenge by many, as well as their weak degree of
motivation, that translates into high levels of absenteeism or wage dissatisfaction. The wide-scale
recruitment of voluntary teachers, with little training but entrusted with classes, is often indicated to
illustrate this issue: it has enabled to address the massive influx of pupils to primary after 2000, but
has not provided these pupils with teaching of acceptable quality.
In terms of lessons learned, numerous countries indicate having gained awareness of the need to
improve sector management to increase access, equity and quality. This wish is expressed, for
instance, in terms of the formulation of real teacher policies, to improve their posting, commitment,
monitoring by the state and assessment. The need to define more balanced school maps is also
noted, as well as options to involve communities in the monitoring of school management and
quality, such as through the creation of school councils.
The power of social mobilization is broadly appreciated, the attainment of UPE being understood as
tributary of the commitment of all players, community, family and school-based, in addition to
central and local authorities. Women’s engagement is noted as an important vector, but the need to
pursue and expand sensitization and IEC efforts is nevertheless underlined.
School environment considerations are perceived as being decisive to build-up education demand
and discourage dropout (latrines, safe water, playgrounds), although not as much as school feeding,
clearly a key factor.
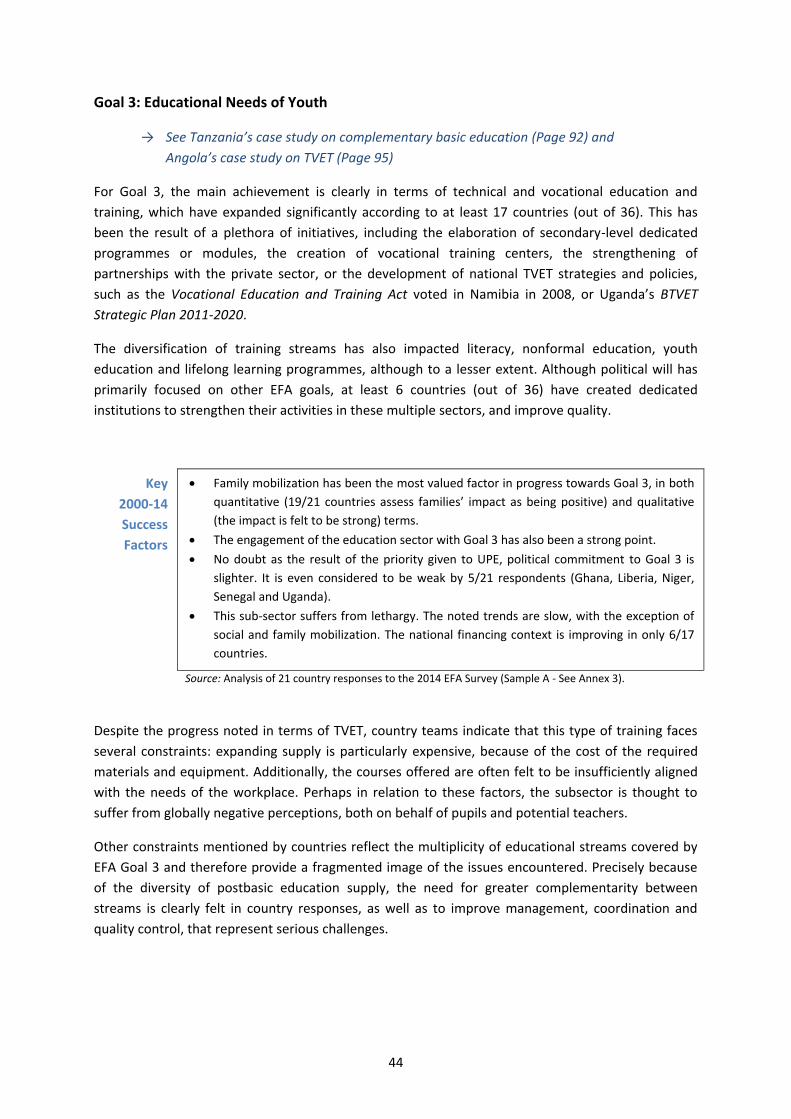
44
Goal 3: Educational Needs of Youth
→ See Tanzania’s case study on complementary basic education (Page 92) and
Angola’s case study on TVET (Page 95)
For Goal 3, the main achievement is clearly in terms of technical and vocational education and
training, which have expanded significantly according to at least 17 countries (out of 36). This has
been the result of a plethora of initiatives, including the elaboration of secondary-level dedicated
programmes or modules, the creation of vocational training centers, the strengthening of
partnerships with the private sector, or the development of national TVET strategies and policies,
such as the Vocational Education and Training Act voted in Namibia in 2008, or Uganda’s BTVET
Strategic Plan 2011-2020.
The diversification of training streams has also impacted literacy, nonformal education, youth
education and lifelong learning programmes, although to a lesser extent. Although political will has
primarily focused on other EFA goals, at least 6 countries (out of 36) have created dedicated
institutions to strengthen their activities in these multiple sectors, and improve quality.
Key
2000-14
Success
Factors
Family mobilization has been the most valued factor in progress towards Goal 3, in both
quantitative (19/21 countries assess families’ impact as being positive) and qualitative
(the impact is felt to be strong) terms.
The engagement of the education sector with Goal 3 has also been a strong point.
No doubt as the result of the priority given to UPE, political commitment to Goal 3 is
slighter. It is even considered to be weak by 5/21 respondents (Ghana, Liberia, Niger,
Senegal and Uganda).
This sub-sector suffers from lethargy. The noted trends are slow, with the exception of
social and family mobilization. The national financing context is improving in only 6/17
countries.
Source: Analysis of 21 country responses to the 2014 EFA Survey (Sample A - See Annex 3).
Despite the progress noted in terms of TVET, country teams indicate that this type of training faces
several constraints: expanding supply is particularly expensive, because of the cost of the required
materials and equipment. Additionally, the courses offered are often felt to be insufficiently aligned
with the needs of the workplace. Perhaps in relation to these factors, the subsector is thought to
suffer from globally negative perceptions, both on behalf of pupils and potential teachers.
Other constraints mentioned by countries reflect the multiplicity of educational streams covered by
EFA Goal 3 and therefore provide a fragmented image of the issues encountered. Precisely because
of the diversity of postbasic education supply, the need for greater complementarity between
streams is clearly felt in country responses, as well as to improve management, coordination and
quality control, that represent serious challenges.

45
Authors’ Note: The fact that country responses for EFA Goal 3 mainly focus on TVET is in itself
highly revealing of their vision of postbasic education, but also conceals many and diverse
efforts in terms of nonformal education, bridging schools, second-chance education,
acceleration programmes and so on. These initiatives are often pilots, or limited to high
priority areas. Nevertheless, many of them are promising, and some should be scaled-up.
The provision of TVET is now accredited with being an effective strategy to reduce youth
unemployment, but is thought to firstly require: revaluing in the public eye through sensitization
campaigns; further investment to ensure it is relevant; commissioning studies on the alignment of
skills acquired/qualifications offered with jobs; training and capacity-building teachers in technical
subjects; and promoting public-private partnerships, to provide better learning conditions and
socioprofessional opportunities to participating youth.
Goal 4: Adult Literacy
→ See Niger’s case study on women’s functional literacy (Page 98)
Although political will in terms of adult literacy is generally considered to be weaker than for general
education in SSA, those countries having made progress in this area have noted the importance of a
certain number of key success factors, including:
- The creation of dedicated institutions (such as Gabon’s Ministère Chargé de l’Éducation
Populaire, Burundi’s Département en Charge de l’Alphabétisation, or Angola’s National
Literacy Commission);
- The elaboration of literacy strategies, whether focused on the creation of specific
programmes or projects, or the integration of literacy in existing development plans, which
has been done in over 10 countries (out of 36);
- Increasing the financing of literacy activities, in particular for the recruitment, training and
professionalization of literacy facilitators;
- Prioritizing functional literacy, to increase its utility for beneficiaries; and
- Strengthening social mobilization, in particular through sensitization activities.
Authors’ Note: The countries whose adult literacy rates have most improved generally
adopted a systematic vision of literacy, making it an integral part of their EFA programmes,
made the necessary trade-offs and negotiated and advocated for the ownership of their
literacy goals.
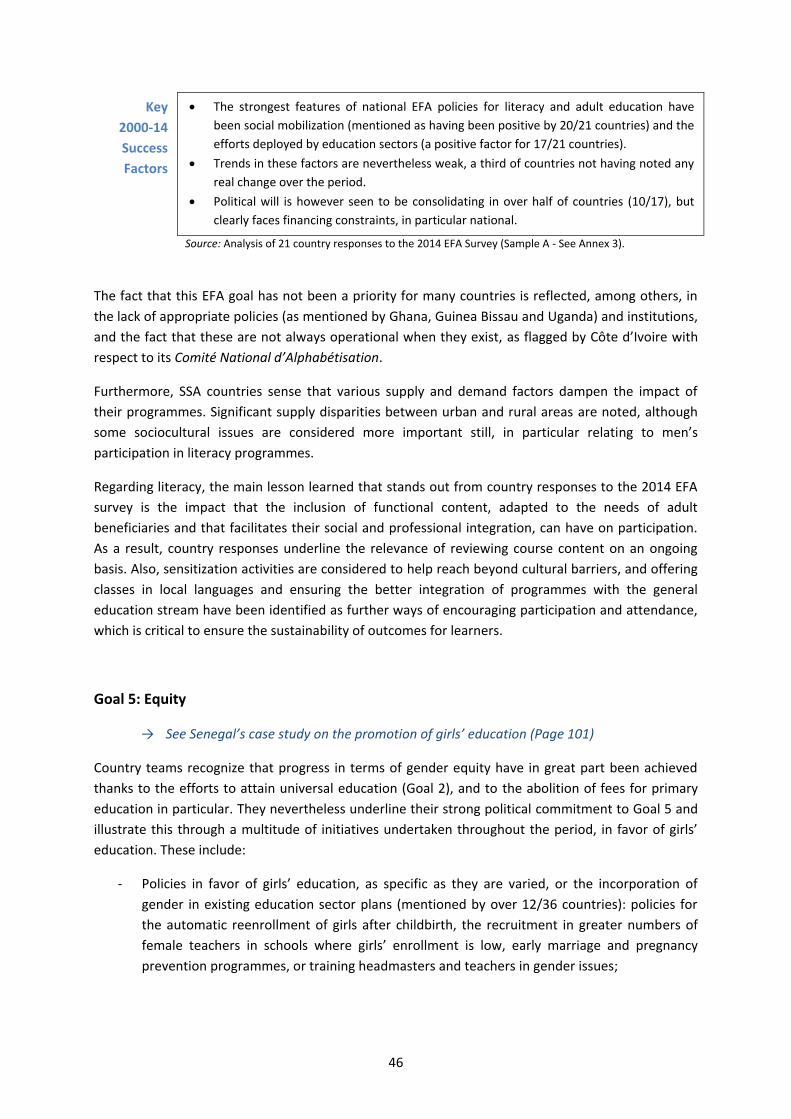
46
Key
2000-14
Success
Factors
The strongest features of national EFA policies for literacy and adult education have
been social mobilization (mentioned as having been positive by 20/21 countries) and the
efforts deployed by education sectors (a positive factor for 17/21 countries).
Trends in these factors are nevertheless weak, a third of countries not having noted any
real change over the period.
Political will is however seen to be consolidating in over half of countries (10/17), but
clearly faces financing constraints, in particular national.
Source: Analysis of 21 country responses to the 2014 EFA Survey (Sample A - See Annex 3).
The fact that this EFA goal has not been a priority for many countries is reflected, among others, in
the lack of appropriate policies (as mentioned by Ghana, Guinea Bissau and Uganda) and institutions,
and the fact that these are not always operational when they exist, as flagged by Côte d’Ivoire with
respect to its Comité National d’Alphabétisation.
Furthermore, SSA countries sense that various supply and demand factors dampen the impact of
their programmes. Significant supply disparities between urban and rural areas are noted, although
some sociocultural issues are considered more important still, in particular relating to men’s
participation in literacy programmes.
Regarding literacy, the main lesson learned that stands out from country responses to the 2014 EFA
survey is the impact that the inclusion of functional content, adapted to the needs of adult
beneficiaries and that facilitates their social and professional integration, can have on participation.
As a result, country responses underline the relevance of reviewing course content on an ongoing
basis. Also, sensitization activities are considered to help reach beyond cultural barriers, and offering
classes in local languages and ensuring the better integration of programmes with the general
education stream have been identified as further ways of encouraging participation and attendance,
which is critical to ensure the sustainability of outcomes for learners.
Goal 5: Equity
→ See Senegal’s case study on the promotion of girls’ education (Page 101)
Country teams recognize that progress in terms of gender equity have in great part been achieved
thanks to the efforts to attain universal education (Goal 2), and to the abolition of fees for primary
education in particular. They nevertheless underline their strong political commitment to Goal 5 and
illustrate this through a multitude of initiatives undertaken throughout the period, in favor of girls’
education. These include:
- Policies in favor of girls’ education, as specific as they are varied, or the incorporation of
gender in existing education sector plans (mentioned by over 12/36 countries): policies for
the automatic reenrollment of girls after childbirth, the recruitment in greater numbers of
female teachers in schools where girls’ enrollment is low, early marriage and pregnancy
prevention programmes, or training headmasters and teachers in gender issues;
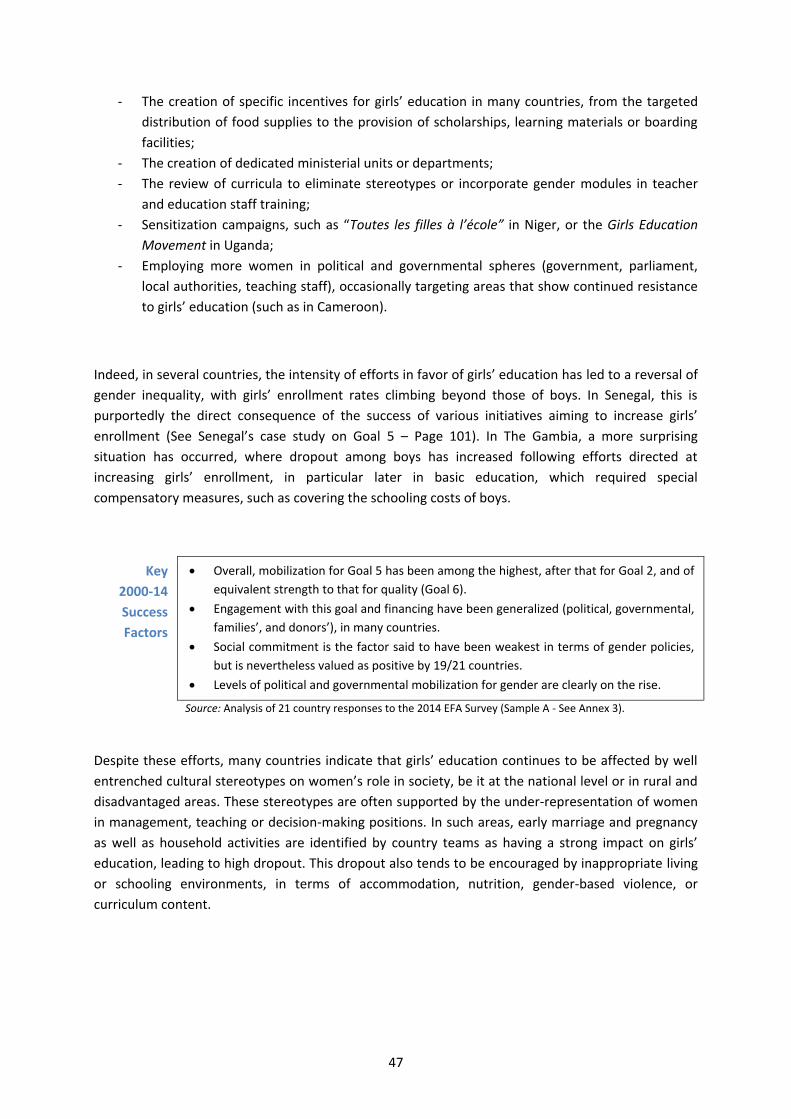
47
- The creation of specific incentives for girls’ education in many countries, from the targeted
distribution of food supplies to the provision of scholarships, learning materials or boarding
facilities;
- The creation of dedicated ministerial units or departments;
- The review of curricula to eliminate stereotypes or incorporate gender modules in teacher
and education staff training;
- Sensitization campaigns, such as “Toutes les filles à l’école” in Niger, or the Girls Education
Movement in Uganda;
- Employing more women in political and governmental spheres (government, parliament,
local authorities, teaching staff), occasionally targeting areas that show continued resistance
to girls’ education (such as in Cameroon).
Indeed, in several countries, the intensity of efforts in favor of girls’ education has led to a reversal of
gender inequality, with girls’ enrollment rates climbing beyond those of boys. In Senegal, this is
purportedly the direct consequence of the success of various initiatives aiming to increase girls’
enrollment (See Senegal’s case study on Goal 5 – Page 101). In The Gambia, a more surprising
situation has occurred, where dropout among boys has increased following efforts directed at
increasing girls’ enrollment, in particular later in basic education, which required special
compensatory measures, such as covering the schooling costs of boys.
Key
2000-14
Success
Factors
Overall, mobilization for Goal 5 has been among the highest, after that for Goal 2, and of
equivalent strength to that for quality (Goal 6).
Engagement with this goal and financing have been generalized (political, governmental,
families’, and donors’), in many countries.
Social commitment is the factor said to have been weakest in terms of gender policies,
but is nevertheless valued as positive by 19/21 countries.
Levels of political and governmental mobilization for gender are clearly on the rise.
Source: Analysis of 21 country responses to the 2014 EFA Survey (Sample A - See Annex 3).
Despite these efforts, many countries indicate that girls’ education continues to be affected by well
entrenched cultural stereotypes on women’s role in society, be it at the national level or in rural and
disadvantaged areas. These stereotypes are often supported by the under-representation of women
in management, teaching or decision-making positions. In such areas, early marriage and pregnancy
as well as household activities are identified by country teams as having a strong impact on girls’
education, leading to high dropout. This dropout also tends to be encouraged by inappropriate living
or schooling environments, in terms of accommodation, nutrition, gender-based violence, or
curriculum content.
48
To better strengthen gender equity in education, social mobilization is deemed instrumental.
Countries’ findings suggest that this tends to be consolidated through increased community
sensitization campaigns in favor of girls’ enrollment and retention in the education system.
Supporting this, some countries have mentioned that popularization of policies pertaining to gender
equity and equality and the commitment of traditional authorities have been effective. The analysis
of country responses to the 2014 EFA survey provides a global vision where this mobilization
supports girls’ education by providing favorable environments, through the creation of mothers’
associations, the promotion of school feeding, the provision of local support services to girls, opening
of community welcome centers, or the development of preventive and remedial gender-based
violence action.
Goal 6: Educational Quality
→ See Swaziland’s case study on quality (Page 104)
Almost every country having participated in UNESCO’s EFA surveys, and specifically addressing
educational quality, underline the importance of the teacher issue, be it with respect to the pupil-
teacher ratio, teachers’ qualification levels, or their basic or ongoing training. On this matter, several
countries relate positive experiences in terms of distance training teachers: Ghana, who offers a
Diploma in Basic Education in this way, Lesotho, with the Distance Teachers Education Programme, as
well as Cabo Verde.
Although the majority of countries state that investments in teaching staff have a favorable impact
on quality, they are just as many, on the other hand, to pinpoint shortcomings in this very area as
being a constraint to the improvement of quality. For almost a quarter of the countries having
responded to the survey, teachers’ weak motivation, related to their status, wage or posting, is
mentioned as a marked factor of failure, affecting levels of absenteeism, effective pupil learning time
and the relevance of teaching.
Indeed, the exponential growth of teaching staff required by the expansion of primary education has
entailed the de-professionalization of teaching in many countries, with the wide-scale recruitment of
contract and community teachers, who are neither monitored nor paid by the government, eroding
quality.
The distribution of textbooks and teaching and learning materials is also noted as having a
meaningful impact on the improvement of learning outcomes, be it positive thanks to its success, or
negative due to certain constraints. Among the latter, the main one cited by countries is that
textbooks and pedagogical material are not always adapted to the new curricula.
Beyond the increase and improvement of school infrastructure and equipment, the other key factors
of progress in terms of quality mentioned by countries are:
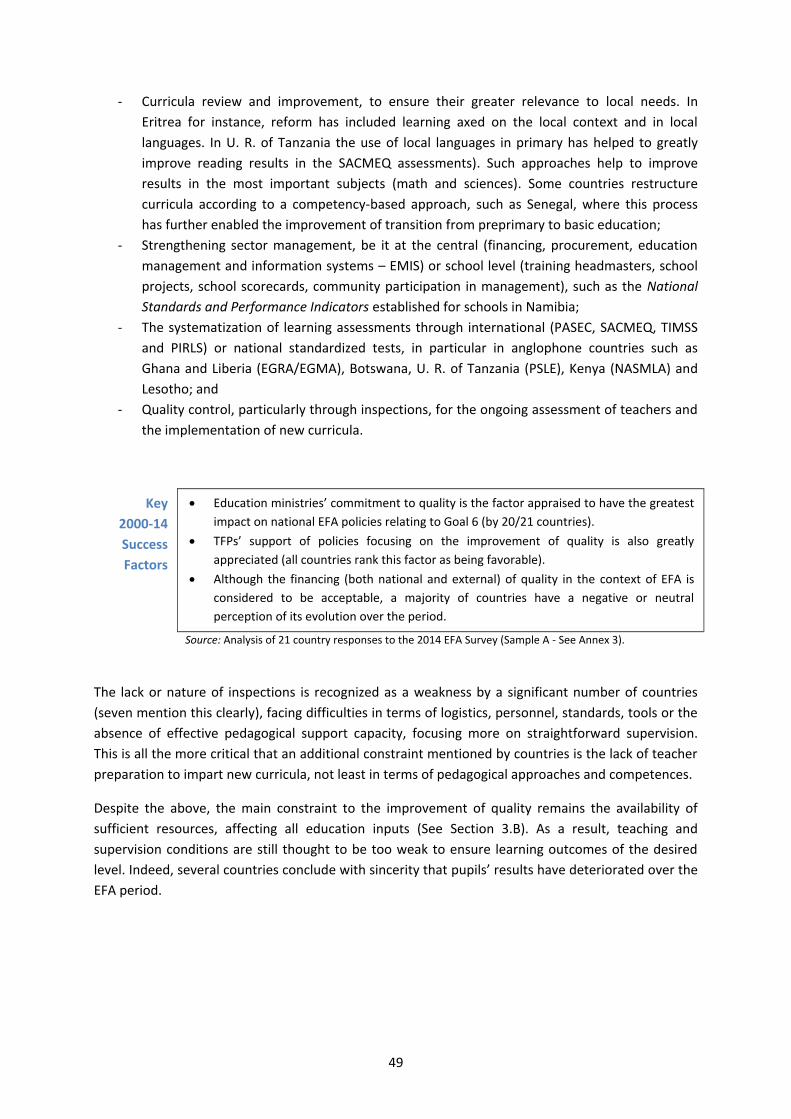
49
- Curricula review and improvement, to ensure their greater relevance to local needs. In
Eritrea for instance, reform has included learning axed on the local context and in local
languages. In U. R. of Tanzania the use of local languages in primary has helped to greatly
improve reading results in the SACMEQ assessments). Such approaches help to improve
results in the most important subjects (math and sciences). Some countries restructure
curricula according to a competency-based approach, such as Senegal, where this process
has further enabled the improvement of transition from preprimary to basic education;
- Strengthening sector management, be it at the central (financing, procurement, education
management and information systems – EMIS) or school level (training headmasters, school
projects, school scorecards, community participation in management), such as the National
Standards and Performance Indicators established for schools in Namibia;
- The systematization of learning assessments through international (PASEC, SACMEQ, TIMSS
and PIRLS) or national standardized tests, in particular in anglophone countries such as
Ghana and Liberia (EGRA/EGMA), Botswana, U. R. of Tanzania (PSLE), Kenya (NASMLA) and
Lesotho; and
- Quality control, particularly through inspections, for the ongoing assessment of teachers and
the implementation of new curricula.
Key
2000-14
Success
Factors
Education ministries’ commitment to quality is the factor appraised to have the greatest
impact on national EFA policies relating to Goal 6 (by 20/21 countries).
TFPs’ support of policies focusing on the improvement of quality is also greatly
appreciated (all countries rank this factor as being favorable).
Although the financing (both national and external) of quality in the context of EFA is
considered to be acceptable, a majority of countries have a negative or neutral
perception of its evolution over the period.
Source: Analysis of 21 country responses to the 2014 EFA Survey (Sample A - See Annex 3).
The lack or nature of inspections is recognized as a weakness by a significant number of countries
(seven mention this clearly), facing difficulties in terms of logistics, personnel, standards, tools or the
absence of effective pedagogical support capacity, focusing more on straightforward supervision.
This is all the more critical that an additional constraint mentioned by countries is the lack of teacher
preparation to impart new curricula, not least in terms of pedagogical approaches and competences.
Despite the above, the main constraint to the improvement of quality remains the availability of
sufficient resources, affecting all education inputs (See Section 3.B). As a result, teaching and
supervision conditions are still thought to be too weak to ensure learning outcomes of the desired
level. Indeed, several countries conclude with sincerity that pupils’ results have deteriorated over the
EFA period.
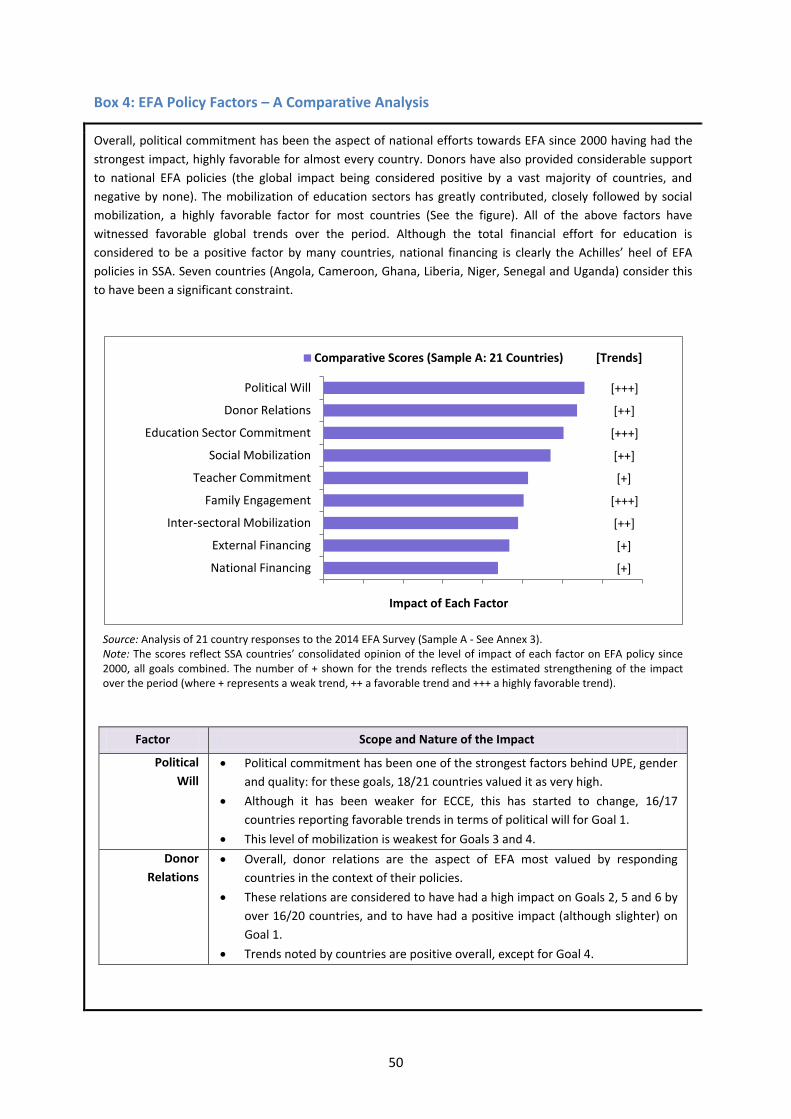
50
Box 4: EFA Policy Factors – A Comparative Analysis
Overall, political commitment has been the aspect of national efforts towards EFA since 2000 having had the
strongest impact, highly favorable for almost every country. Donors have also provided considerable support
to national EFA policies (the global impact being considered positive by a vast majority of countries, and
negative by none). The mobilization of education sectors has greatly contributed, closely followed by social
mobilization, a highly favorable factor for most countries (See the figure). All of the above factors have
witnessed favorable global trends over the period. Although the total financial effort for education is
considered to be a positive factor by many countries, national financing is clearly the Achilles’ heel of EFA
policies in SSA. Seven countries (Angola, Cameroon, Ghana, Liberia, Niger, Senegal and Uganda) consider this
to have been a significant constraint.
Source: Analysis of 21 country responses to the 2014 EFA Survey (Sample A - See Annex 3). Note: The scores reflect SSA countries’ consolidated opinion of the level of impact of each factor on EFA policy since 2000, all goals combined. The number of + shown for the trends reflects the estimated strengthening of the impact over the period (where + represents a weak trend, ++ a favorable trend and +++ a highly favorable trend).
Factor Scope and Nature of the Impact
Political
Will
Political commitment has been one of the strongest factors behind UPE, gender
and quality: for these goals, 18/21 countries valued it as very high.
Although it has been weaker for ECCE, this has started to change, 16/17
countries reporting favorable trends in terms of political will for Goal 1.
This level of mobilization is weakest for Goals 3 and 4.
Donor
Relations
Overall, donor relations are the aspect of EFA most valued by responding
countries in the context of their policies.
These relations are considered to have had a high impact on Goals 2, 5 and 6 by
over 16/20 countries, and to have had a positive impact (although slighter) on
Goal 1.
Trends noted by countries are positive overall, except for Goal 4.
[+]
[+]
[++]
[+++]
[+]
[++]
[+++]
[++]
[+++]
National Financing
External Financing
Inter-sectoral Mobilization
Family Engagement
Teacher Commitment
Social Mobilization
Education Sector Commitment
Donor Relations
Political Will
Impact of Each Factor
Comparative Scores (Sample A: 21 Countries) [Trends]
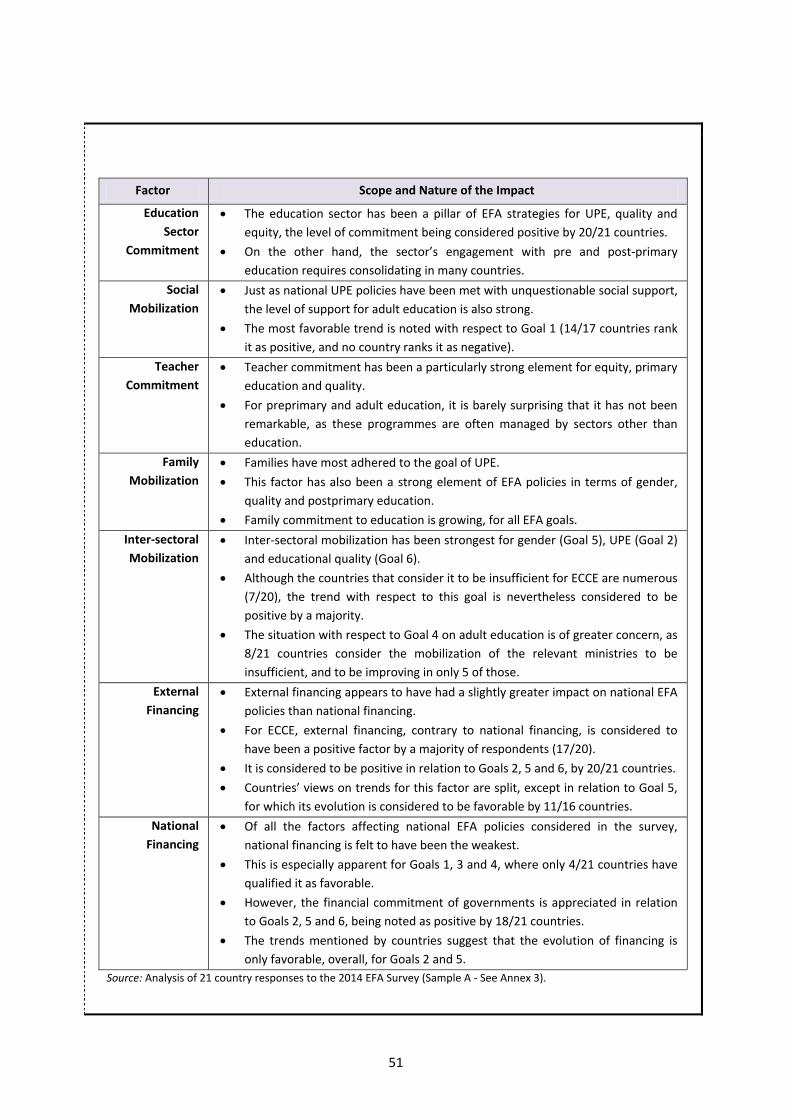
51
Factor Scope and Nature of the Impact
Education
Sector
Commitment
The education sector has been a pillar of EFA strategies for UPE, quality and
equity, the level of commitment being considered positive by 20/21 countries.
On the other hand, the sector’s engagement with pre and post-primary
education requires consolidating in many countries.
Social
Mobilization
Just as national UPE policies have been met with unquestionable social support,
the level of support for adult education is also strong.
The most favorable trend is noted with respect to Goal 1 (14/17 countries rank
it as positive, and no country ranks it as negative).
Teacher
Commitment
Teacher commitment has been a particularly strong element for equity, primary
education and quality.
For preprimary and adult education, it is barely surprising that it has not been
remarkable, as these programmes are often managed by sectors other than
education.
Family
Mobilization
Families have most adhered to the goal of UPE.
This factor has also been a strong element of EFA policies in terms of gender,
quality and postprimary education.
Family commitment to education is growing, for all EFA goals.
Inter-sectoral
Mobilization
Inter-sectoral mobilization has been strongest for gender (Goal 5), UPE (Goal 2)
and educational quality (Goal 6).
Although the countries that consider it to be insufficient for ECCE are numerous
(7/20), the trend with respect to this goal is nevertheless considered to be
positive by a majority.
The situation with respect to Goal 4 on adult education is of greater concern, as
8/21 countries consider the mobilization of the relevant ministries to be
insufficient, and to be improving in only 5 of those.
External
Financing
External financing appears to have had a slightly greater impact on national EFA
policies than national financing.
For ECCE, external financing, contrary to national financing, is considered to
have been a positive factor by a majority of respondents (17/20).
It is considered to be positive in relation to Goals 2, 5 and 6, by 20/21 countries.
Countries’ views on trends for this factor are split, except in relation to Goal 5,
for which its evolution is considered to be favorable by 11/16 countries.
National
Financing
Of all the factors affecting national EFA policies considered in the survey,
national financing is felt to have been the weakest.
This is especially apparent for Goals 1, 3 and 4, where only 4/21 countries have
qualified it as favorable.
However, the financial commitment of governments is appreciated in relation
to Goals 2, 5 and 6, being noted as positive by 18/21 countries.
The trends mentioned by countries suggest that the evolution of financing is
only favorable, overall, for Goals 2 and 5.
Source: Analysis of 21 country responses to the 2014 EFA Survey (Sample A - See Annex 3).

52
This panorama confirms the challenge faced in SSA, to reestablish the balance between access to
education for all and the provision of quality teaching and learning outcomes. The main lesson
learned by countries with respect to Goal 6 is the central and indispensible role of teachers. Their
recruitment in sufficient numbers is necessary, but it is also important to ensure their motivation.
The adaptation of school curricula is also perceived as being fundamental, and all the more effective
that it is focused on the national context, but countries are aware that this will only lead to improved
learning if it is properly coupled with sufficient ongoing teacher training, with pedagogical support
and appropriate textbooks and learning materials.
Much as the updating of textbooks and learning materials carries unquestionable financial and
logistical complexities, several innovative experiences in this area are noteworthy. Nigeria resorted to
public-private partnerships with reputable publishing houses for the design of new textbooks for
general education, whereas Cameroon elaborated and implemented a new policy based on building
local publishing capacities and co-publishing, the liberalization of distribution channels and the
creation of a special fund to create school libraries.
3.B- Achieving the EFA Goals – Transversal Issues Faced
A certain number of transversal constraints and issues affecting the whole education sector in SSA
are underlined by countries in their responses to the surveys, and summarized in this section. Some
of them are indeed far greater than the different limitations indicated in the previous section for
each of the EFA goals. They include, among others, resource mobilization, the teacher issue,
sensitization and IEC, and the management of education systems.
Resource Mobilization
Despite a general improvement of the context of resource mobilization for education in SSA over the
2000-12 period (See Section 2.B, as well as Annex 1), the main constraint to achieving the EFA goals
mentioned by countries is nevertheless the availability of sufficient financial resources. This concern,
accentuated for each of the EFA goals, is expressed just as much in terms of school infrastructure (the
sufficient number of classrooms, but also their condition and maintenance, and the availability of
safe water, latrines and so on) as in terms of teaching staff and their training, or in terms of
pedagogical materials and textbooks.
The lack of resources is particularly acute with respect to Goal 1, being the main constraint noted for
ECCE, in part because this subsector is not an education policy priority. For UPE, the main limitation
mentioned is the availability of infrastructure, but countries also highlight the lack of pedagogical
material, textbooks and equipment, all closely related to the resources allocated. Low budgets are
again the main constraint identified in relation to Goal 3, whether for TVET, secondary education,
nonformal education, teacher training, or lifelong learning. Developing the supply of technical and

53
vocational training is considered to be especially expensive, in particular because of cost of the
required materials and equipment, and due to smaller class sizes. For Goal 4, countries note that this
same financial constraint translates into a lack of literacy centers, qualified literacy facilitators and
materials and books.
This is therefore a question that cross-cuts all education subsectors, and directly impacts the
improvement of quality: country teams having responded to the survey are aware that current
supervision and teaching conditions are still too weak to generate the desired learning outcomes.
Box 5: The Teacher Challenge
“Without a sufficient number of teachers, women in particular, who are professionally qualified, posted to the
right places, correctly remunerated and motivated, adequately supported and who master local languages, we
cannot provide the world’s children with quality education.” (Oslo Declaration, 16-18 December 2008, Oslo).
On the basis of projections carried out by UNESCO’s Institute for Statistics in 2007, it will be necessary to create
1.9 million new teacher posts worldwide to achieve universal primary education by 2015. Almost 1.2 million of
these posts are required in Sub-Saharan Africa. This situation conceals one of greater magnitude still however:
when considering the replacement of existing teaching staff (due to retirement, illness, death and other causes
of attrition), the recruitment effort required is close to double this amount, equivalent to 2.4 million over the
period.
Pupil-teacher ratios in Sub-Saharan Africa have indeed stagnated, and are among the highest worldwide. Of
162 countries for which data were available for 2011, 26 had supervision rates at the primary level that were
above 40 pupils per teacher; 23 of these countries are located in Sub-Saharan Africa.
The challenge is not only quantitative, but also qualitative. Many countries, especially in West Africa, have
responded to the primary and secondary level teacher deficit by recruiting contract teachers, particularly
community teachers. Such staff often work in conditions that are far less advantageous than those of civil
servants, are often recruited directly by communities or schools, and the majority has received only limited
formal training. In West Africa for instance, contract teachers represented half of teaching staff in 2000, and in
2010, reached levels close to 80 percent in Mali and over 60 percent in Benin, Cameroon and Chad.
Although the recruitment of contract teachers helps to compensate the short-term lack of staff, the chances
that it will sustainably improve educational quality are low. Countries that are highly dependent on contract
teachers, such as those in West Africa, rank among those where learning outcomes present most scope for
improvement.
Source: EFA Global Monitoring Report “Teaching and Learning: Achieving Quality for All,” (UNESCO, 2013); “La scolarisation primaire universelle en Afrique: Le défi enseignant,” (Pôle de Dakar/UNESCO-BREDA, 2010).
The Teacher Issue
The recruitment and training of teachers is noted as a success factor by numerous countries in
relation to Goal 2. Recruiting teachers in sufficient numbers is a necessary condition to expand
education coverage, but an insufficient one. Indeed, SSA countries indicate the great difficulties they
54
face in terms of ongoing teacher training, posting, the provision of pedagogical support and in
supplying them with appropriate teaching tools. These questions are all the more important in a
context of curricular review. Finally, a generally weak level of teacher motivation is noted, that
translates into high absenteeism levels or wage dissatisfaction. All of these factors are considered to
potentially have a direct impact on the quality of learning outcomes.
Sensitization and IEC
Many countries express the need to reinforce information, education and communication (IEC)
campaigns and activities, as well as parental education, on account of several EFA goals, to:
(i) Improve communities’ comprehension of the importance of preprimary education, and
thus reinforce demand for ECCE services by mobilizing the appropriate players (Goal 1);
(ii) Sensitize families more broadly on the value of education, for both their children and
society at large, in particular in relation to primary and basic education (Goals 2 and 3);
(iii) Address certain sociocultural disinclinations with respect to men’s participation in
literacy programmes, to encourage attendance and achieve sustainable outcomes (Goal
4); and
(iv) Further mobilize society around the enrollment, education and retention of girls at
school, in particular through the dissemination of equity and gender policies (Goal 5).
Education System Management
Many countries point out deficiencies in terms of education sector management, affecting not only
access, but equity, quality and the internal efficiency of education systems, at different levels:
- Countries are still short of teacher policies, which should include the effective government
monitoring, assessments and more coherent approaches to staff posting.
- At the central level, the desire to strengthen sector management is expressed in terms of the
definition of more equitable school maps, financing, the allocation of resources,
procurement and the production of reliable statistical data, to enable better trade-offs and
decisions, in particular through the use of EMIS.
- At the school level, limitations are felt in terms of the training of headmasters, the
elaboration of school projects, and the definition of indicators and national performance
standards (school dashboards or score cards).
- The involvement of communities in school management is increasingly prescribed to improve
the participatory monitoring of quality, for instance through the creation of school councils.
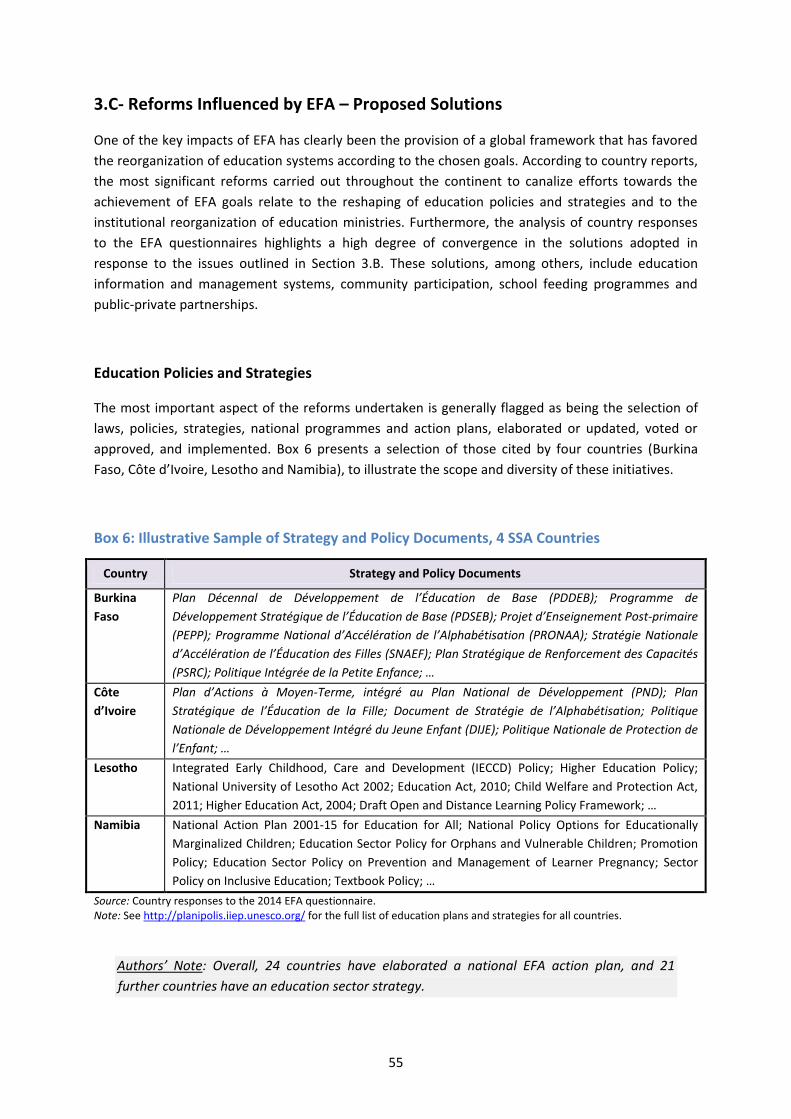
55
3.C- Reforms Influenced by EFA – Proposed Solutions
One of the key impacts of EFA has clearly been the provision of a global framework that has favored
the reorganization of education systems according to the chosen goals. According to country reports,
the most significant reforms carried out throughout the continent to canalize efforts towards the
achievement of EFA goals relate to the reshaping of education policies and strategies and to the
institutional reorganization of education ministries. Furthermore, the analysis of country responses
to the EFA questionnaires highlights a high degree of convergence in the solutions adopted in
response to the issues outlined in Section 3.B. These solutions, among others, include education
information and management systems, community participation, school feeding programmes and
public-private partnerships.
Education Policies and Strategies
The most important aspect of the reforms undertaken is generally flagged as being the selection of
laws, policies, strategies, national programmes and action plans, elaborated or updated, voted or
approved, and implemented. Box 6 presents a selection of those cited by four countries (Burkina
Faso, Côte d’Ivoire, Lesotho and Namibia), to illustrate the scope and diversity of these initiatives.
Box 6: Illustrative Sample of Strategy and Policy Documents, 4 SSA Countries
Country Strategy and Policy Documents
Burkina
Faso
Plan Décennal de Développement de l’Éducation de Base (PDDEB); Programme de
Développement Stratégique de l’Éducation de Base (PDSEB); Projet d’Enseignement Post-primaire
(PEPP); Programme National d’Accélération de l’Alphabétisation (PRONAA); Stratégie Nationale
d’Accélération de l’Éducation des Filles (SNAEF); Plan Stratégique de Renforcement des Capacités
(PSRC); Politique Intégrée de la Petite Enfance; …
Côte
d’Ivoire
Plan d’Actions à Moyen-Terme, intégré au Plan National de Développement (PND); Plan
Stratégique de l’Éducation de la Fille; Document de Stratégie de l’Alphabétisation; Politique
Nationale de Développement Intégré du Jeune Enfant (DIJE); Politique Nationale de Protection de
l’Enfant; …
Lesotho Integrated Early Childhood, Care and Development (IECCD) Policy; Higher Education Policy;
National University of Lesotho Act 2002; Education Act, 2010; Child Welfare and Protection Act,
2011; Higher Education Act, 2004; Draft Open and Distance Learning Policy Framework; …
Namibia National Action Plan 2001-15 for Education for All; National Policy Options for Educationally
Marginalized Children; Education Sector Policy for Orphans and Vulnerable Children; Promotion
Policy; Education Sector Policy on Prevention and Management of Learner Pregnancy; Sector
Policy on Inclusive Education; Textbook Policy; …
Source: Country responses to the 2014 EFA questionnaire. Note: See http://planipolis.iiep.unesco.org/ for the full list of education plans and strategies for all countries.
Authors’ Note: Overall, 24 countries have elaborated a national EFA action plan, and 21
further countries have an education sector strategy.
56
Free primary education has been a beacon policy, implemented in the majority of countries, at any
rate as far as the abolition of school fees is concerned. According to survey respondents, this has
been the single most important factor in increasing access to school, by lightening the burden on
families, and is thus the policy having most contributed to universal primary education.
Authors’ Note: One of the Dakar Forum’s main legacies has been the redefinition of UPE, not
only in terms of universal completion (which automatically encompasses gender parity), but
also by including the promotion, or indeed the improvement, of the quality of learning
outcomes. The pursuit of this broad goal requires relatively precise education policies that are
not limited to developing supply, but simultaneously take demand factors that affect
children’s schooling careers into account. The gratuity of primary education sits well in this
general scheme, through prevention against household wealth-related discrimination, while
constituting a recognition of the right to education, and of the intensity of the positive
individual and collective effects of education. However, free schooling is alone insufficient for
the achievement of UPE, given the related and opportunity costs of education, that go well
beyond school fees. A greater reduction in the education costs supported by parents is
necessary to reduce the financial barrier that families face.
Institutional Reform
These national policies and action plans are often reflected on the institutional level, by the creation
of administrative units devoted to the various priority areas, or if applicable, by their reorganization
(See also Annex 1). Thus, in Cameroon for instance, the old Ministry of National Education has been
split into three ministries, each responsible for different EFA areas: the Ministry of Basic Education,
the Ministry of Secondary Education, and the Ministry of Higher Education, in addition to the
creation of a Ministry of Vocational Training. Most countries have created ministerial departments,
administrative divisions, national commissions and other arrangements, focusing on literacy, gender,
nonformal education, TVET, and many more.
Authors’ Note: The multiplication of administrative divisions is not necessarily a model to
promote. It carries the risk of fragmenting support and of a greater degree of competition
between subsectors that could degrade inter-sectoral coherence as well as intra-sectoral
coordination. It is also a drain on budgets. The efficiency of such institutional reforms is still to
be demonstrated.
Several countries have used decentralization to better face the challenges posed by the broad scale
of reform and service expansion. Burkina Faso indicates that its Programme d’Activités Pluriannuel de
Renforcement des Capacités des Acteurs de la Décentralisation et de la Déconcentration de
l’Éducation (an action plan to build the capacities of education decentralization players) has enabled
the transfer of competencies and resources to local authorities. Niger also considers that its
57
decentralized management of schools is a success, even if it is still to be made sustainable. Malawi
mentions that the decentralization of primary education activities through the Primary School
Improvement Program has reinforced community participation and ownership of school activities
and management.
Authors’ Note: Given the complexities that are inherent to the decentralization of education
services in many countries, this approach nevertheless carries risks in terms of quality and
access to education services.
Finally, several countries mention their appreciation of sector dialogue structures that convene the
government, TFPs, NGOs and civil society (See Annex 1). Often in the shape of theme groups or
education sector groups, these set-ups have occasionally been instrumental in reinforcing
partnerships and mobilizing resources (U. R. of Tanzania), and in other cases have constituted a
highly appreciated sector planning framework (such as in Burundi).
Education Information and Management Systems
Numerous countries indicate that improvements in the monitoring of education policies have been
possible thanks to the strengthening of education information and management systems (EMIS).
Thus Burundi, Cabo Verde, Cameroon, DRC, Eritrea, Gabon, Ghana, Guinea Bissau, Lesotho, Niger and
U. R. of Tanzania are among countries who indicate that their educational statistics systems have
been reinforced, often with the technical support of TFPs, enabling the collection of more reliable
data at the school level and its consolidation at the central level. Beyond the publication of statistical
yearbooks, this in turn has enabled the improvement of service planning, resource allocation,
steering and governance, in addition to sector monitoring and evaluation, having a considerable
impact on the progress achieved.
Community Participation
Communities’ participation in and commitment to education have been particularly appreciated by
country teams in the context of national efforts to achieve EFA. To mention but a few examples:
(i) Their participation in the management of basic schools, through the creation or
activation of school management committees or parent-teacher associations, is
particularly noted by Angola, Burkina Faso, Cameroon and Guinea Bissau;
(ii) Many countries underline their key role in the provision of ECCE services; in The Gambia
these were later annexed to primary schools;

58
(iii) In Burundi and Swaziland their contribution is also noted in terms of school construction;
(iv) Their mobilization has often contributed to encourage girls’ education, by providing girls
with a suitable environment, local support services, welcome centers, or through the
development of gender-based violence prevention and response activities; and
(v) Mothers’ associations have had a marked impact on girls’ education, in particular in
terms of retention, according to Malawi and The Gambia.
Overall, a clear lesson can be drawn from the experiences of Sub-Saharan African countries in this
area: community collaboration facilitates the implementation of education strategies and enables
the strengthening, by different means, of the learning outcomes achieved by pupils.
School Feeding
School feeding programmes are worthy of special mention, considering how conclusive their results
are considered to be, and not only in terms of improving learning outcomes. Indeed, numerous
countries have noted their impact on pupil retention and attendance. Several countries, such as
Guinea Bissau and Lesotho, have used school canteens as positive discrimination tools to iron out
disparities in schooling careers, for instance by providing an additional incentive to the education of
girls or of children of preprimary age, or by targeting grades where dropout is particularly high. In the
case of Cabo Verde, canteens are considered to have been instrumental in achieving UPE.
Authors’ Note: The unit cost of school feeding programmes is sometimes prohibitive, which
could jeopardize their sustainability, especially when TFPs withdraw their support. However,
this is very much related to the adopted strategy. This is an area where community
organization and participation can substantially contribute.
Public-Private Partnerships
In addition to the different EFA policy success factors mentioned for each of the goals above, one
further point stands out from the processing of the country questionnaires as having been favorable
to the achievement of certain education goals: public-private partnerships. Indeed, although overall
these have been seldom mentioned by the countries having responded to the survey, their impact
has nevertheless been considered favorable by Burkina, Burundi, DRC, The Gambia, Guinea Bissau, U.
R. of Tanzania and Senegal. In a context of limited resources and unavoidable intra-sectoral trade-
offs, these partnerships have helped to compensate some weak national capacities in terms of adult
literacy, technical training and ECCE, providing a response to the needs of population groups that do
not benefit from general education.
59
Authors’ Note: At the SSA level, the share of pupils enrolled in non publicly-funded general
education schools has increased between 2000 and 2012, from 9.4 percent to reach 14
percent on average for primary, and from 2.0 percent for lower secondary, where they
represent 20 percent on average (See Table 7 in Section 2.B).
3.D- Key Findings
This Section 3, through the analysis of the perceptions shared by SSA countries of the activity carried
out over the EFA 2000-15 period, helps to provide a general review of the constraints encountered in
the implementation of EFA policies, as well as the degree of intensity of the efforts to overcome
them.
Clearly, the holistic and integral nature of the EFA goals launched SSA countries on the path to revisit
national education goals, to include sectors and beneficiary groups that were not systematically
contemplated beforehand. This has instigated the reorganization of education ministries, and some
intense sector and subsector planning activity.
The massive expansion of existing education coverage, as well as growth in other subsectors and
cycles, has however faced a considerable constraint in terms of resources, particularly national. This
has limited the scope of action to improve education supply, not least in terms of infrastructure and
teacher recruitment and training. A certain number of adjustments were then made to respond to
the needs of these new learners, such as the incorporation of a Class Zero in primary schools, in order
to strengthen preprimary education, or the promotion of private-sector participation in the
acquisition of work skills, to develop the supply of technical and vocational training.
This constraint has also had the unavoidable consequence of graduating national commitment to the
different goals. The priority was first placed on primary education and equity, to later expand to
include basic education and quality.
Furthermore, to stimulate the ongoing improvement of enrollment indicators, awareness has risen
with respect to the importance of demand-side factors and numerous initiatives have seen the light
to strengthen them, particularly beneficiary sensitization campaigns and school feeding programmes.
These initiatives have also provided the opportunity to expand the role of and share responsibility for
education management, in particular with communities, whose contribution over the period has
gradually increased, through multiple initiatives whose cost-benefit ratio has proven to be appealing.
These constraints, coupled to persistent issues of sustained dropout, particularly among girls, and of
often deteriorating quality, have finally created an awareness that to better achieve the EFA goals, it
is many not be necessary to spending more, but to spend better. In this respect, several countries
today wish to improve their education sector management, steering and governance arrangements,
from school inspections to teacher posting, through the deployment of more precise monitoring and
evaluation tools.

60
61
Section 4. National Perspectives for post-2015
This section explores countries’ outlooks for their education sectors for the post-2015 period. It will
review their opinions of the new challenges and stakes in terms of education resulting from the
implementation of EFA strategies over the 2000-14 period, the priorities they have identified in terms
of programme content and subsectors for the future, and their wishes with respect to the nature and
substance of a new EFA framework.
As per Section 3, the views that are outlined here represent points of convergence in the national
opinions shared, and the resulting outlook will have all the more credibility that the number of
countries that share each view is great.
The analysis of Section 4 is based on the responses of 36 countries, to: (i) the 2012 EFA Survey,
and (ii) the 2014 EFA survey (for 21 of the above)20.
Although the full sample of 36 countries is used for most of this section (Sample B), some of the
analyses are based specifically on the responses of the countries of Samples A and C:
- Section 4.B on the future of education programmes: Sample C, of 34 countries
- Section 4.C on the nature of a new EFA framework: Sample A, of 21 countries, for the
parts dealing with the appraisal of the existing framework’s components and the
timeframe envisaged for a new framework.
For Sample A, used in the analysis of the appraisal of the components of the current EFA
framework, the approach compares the relative importance of each component thanks to scores
that incorporate a quantitative dimension (the number of countries having expressed a
favorable or unfavorable view) and a qualitative dimension (the level of approval/disapproval of
each country). The value of each score has no meaning in itself.
It is sometimes appropriate to comment on the views presented, on the basis of regional trends.
These Authors’ Notes are clearly differentiated from countries perceptions’ in the text.
4.A- The 2000-15 EFA Legacy – Stakes and Challenges
The intensity of efforts for EFA over the 2000-15 period and the creation of new mechanisms,
institutions and partnerships (See Annex 1 for further details of the latter), has enabled the
20 These surveys were carried out by UNESCO’s Dakar office in the context of EFA monitoring in SSA. The questionnaires provide countries with great freedom to give qualitative answers, providing information on successes, failures, good practices and lessons learned (the 2014 questionnaire is provided in Annex 4). The constitution and use of the various country samples are explained in Annex 3 on methodological considerations.
62
achievement of significant progress towards some goals. New imbalances in education systems have
also been born, and new challenges have emerged:
- The quality of teaching and learning outcomes is clearly the area most needing redressing at
this stage, after the considerable focus on access over the period.
- Providing educational or economic opportunities to the greater number of primary leavers is
a growing concern.
- Addressing a group of issues relating to efficiency in the use of sector resources also stands
out from country responses as a priority.
- The need to strengthen intersectoral coordination is also underlined.
The scarcer distribution of resources over a greater number of cycles and larger populations (See
Table 7 in Section 2.B on the drop in unit costs), has entailed a reduction of effective teaching time
for some countries, higher pupil-teacher ratios for others, and the recruitment of less qualified or
trained teachers for the majority, impacting the quality and relevance of teaching and even entailing
its deterioration.
Thus, school failure is considered to be still too widespread (on this, Côte d’Ivoire mentions its low
Baccalaureate pass rate), learning outcomes are weak (such as at the NEA, BECE and WASSCE exams
according to Ghana, especially in math and science subjects), a considerable share of pupils fail to
achieve the minimum levels at the PASEC and SACMEQ international assessments, and Niger and
Uganda even point out that pupils’ performance levels are dropping (in both math and language at
the primary level, and particularly in science subjects at the secondary level).
Authors’ Note: This report does not provide all the necessary elements to appreciate the
causes of weak learning outcomes, and countries’ opinions of cause and effect indeed point to
an area where further research is required.
Nevertheless, given the focus on universal primary access and completion over the 2000-15 period,
the stagnating quality of teaching, or even the drop in pupils’ performance mentioned by many
countries, is considered more of a new priority area rather than a failure.
Furthermore, many of the countries having achieved significant progress towards UPE now face a
double issue in relation to the youth who leave primary education:
- For the majority, it is to address considerable levels of demand for postprimary education. In
Zambia for instance, the arrangements to abolish secondary education fees are already
under study, according to a gradual approach, to be accounted for in the expenditure
framework. This demand is set to represent a considerable challenge for secondary
education, and in countries where education systems are more developed, its impact could
even reach the enrollment capacity of higher education.

63
- In the workplace, to provide opportunities for work or activity, through national economic
development. There is some concern regarding the potential social impact that the inactivity
of a significant share of the population, now educated, might have, particularly in the light of
recent developments like the Arab spring.
In this context, the role of TVET has been seriously reconsidered by governments, given its potential
to address both issues.
To address the imperatives of quality and TVET development, resolving the recurrent and widespread
issue of resources is deemed fundamental. However, countries do not only consider this from the
perspective of available financing. Indeed, Senegal for instance notes with sincerity the lack of
efficiency in resource use, brought to light by the high level of loss throughout the spending chains of
the main school inputs, be they salaries, the procurement of textbooks, or the construction of new
classrooms.
Furthermore, national education and training sectors are unable to harness significant proportions of
their budgets, given the complexity of disbursement procedures, of the length and cumbersome
nature of administrative procurement procedures (as noted by Côte d’Ivoire and Burkina Faso,
among others). This delays the implementation of projects and programmes. Several countries are
critical of TFP procedures in particular (addressed in Section 4.C).
Lesotho is not the only country to underline that the other side of this coin, clearly, is the great scope
to improve education systems’ internal efficiency, given that high levels of dropout and repetition
constitute suboptimal use of already limited resources.
Finally, the weakness, or indeed absence, of inter-ministerial coordination is also noted as a
constraint in the implementation of education policy in the framework of EFA. With several ministries
responsible for different subsectors, the need to reinforce the links between them and establish
more effective coordination mechanisms is felt in many countries, including Guinea Bissau, Burundi,
DRC, Eritrea, Gabon and U. R. of Tanzania.
4.B- The Future of Education Programmes – Priorities and Outlook
Through the survey of SSA countries carried out in 2012, respondents were given the opportunity to
outline their education priorities for the future, on the basis of progress achieved and challenges
identified.21 This section of the report summarizes the answers, which were formulated both in terms
of EFA goals, showing country teams’ strong approval of these, and of education subsectors and
levels, as well as of crosscutting issues.
UPE remains the top priority goal mentioned by the greatest number of countries (15/34), reflecting
the fact that over a third of SSA has not yet achieved this beacon goal, but remains determined to do
21 Sample C is used for this analysis, covering 34 countries. Annex 3 on methodological considerations explains the composition of the different country samples used.

64
so (See the purple bars in Figure 13). ECCE is not far behind, now being considered the main priority
of a third of responding countries (11/34). Thirdly, five countries have indicated that their main goal
is improving quality. Finally, two countries single out equity as being at the forefront of their
concerns for the post-2015 period: Sao Tomé and Principe and Gabon.
Figure 13: Number of Countries for which a Given post-2015 Priority is among their Top
Five, and their Main One, SSA
Source: Analysis of 34 country responses to the 20142 EFA survey (Sample C – See Annex 3 on methodological considerations).
However, given the complexity of the development contexts of SSA countries’ education systems,
priorities are always plural. Figure 13 also provides a ranking of priorities according to the number of
countries having mentioned each as one of their top five priorities (the blue bars). It provides
grounds for the following key findings and comments:
- Improving quality is most often mentioned as one of countries’ five top priorities for the
future, and by a significant margin (mentioned by 26/34 countries).
- Educational quality is now considered important by a greater number of countries than
universal primary education (mentioned by 21/34 countries in total).
- ECCE, mentioned by 20/34 countries, is now considered to be a priority by as many countries
as universal primary education.
- The better management of education sectors (and particularly the deployment of EMIS), is of
concern for as many countries as UPE and ECCE (20/34), and constitutes the main priority for
Congo, to make better trade-offs between cycles.
- The development of technical and vocational skills is a fundamental need to encourage youth
employment, a high stake for SSA countries, and was only lightly addressed in earlier policies.
0
5
10
15
20
25
30
Nu
mb
er
of
Co
un
trie
s
Among the Top 5 Priorities
The Main Priority

65
- The focus on the equity imperative is salient. It is now a priority for 15/34 countries. This
comprises vulnerable children, rural populations and children with special education needs,
as well as minorities.
- Adult literacy continues to be a significant concern, mentioned by 12/34 countries.
- Gender is seldom mentioned in its own right, although it is encompassed in the notion of
UPE, considered as part of the equity imperative, or mentioned within the context of quality.
- Finally, although higher education is only cited by a few countries (Sao Tomé and Principe,
Cameroon and Lesotho), its importance for them is considerable.
What stands out less starkly from the figure above relates to the educational opportunities for youth
and adults. The ranking presented tends to understate their importance. Indeed, TVET is often
identified as a priority in its own right (by 17/34 countries). Particular emphasis is placed on the
technical and vocational competences required for entrepreneurship or to start an income
generating activity. However, the 15 countries having identified postprimary or postbasic education
as a priority in a broader sense should also be taken into account in relation to this age group.
Together, these figures underline a growing concern for the educational opportunities for youth.
In addition, two crosscutting issues are mentioned by the majority of countries in the context of the
operational goals identified in terms of sector priorities or quality: the importance of developing
education infrastructure, and the deployment of information and communication technologies (ICT)
throughout education systems, particularly to modernize teaching (Box 7 provides greater detail of
the main themes and strategies envisaged by countries for each of the priorities mentioned).
Outlook
The panorama of countries’ sector priorities for the post-2015 era clearly indicates that the six EFA
goals are still considered relevant. In particular, the renewal of the 2000-15 EFA beacon goal is taken
for granted: there is a real and fundamental concern throughout SSA countries to ensure that UPE is
achieved.
This implies, for many, to invert the enrollment paradigm. The issue is no longer to increase
enrollment, but indeed to reduce out-of-school. Thus equity becomes a priority goal in its own right,
well beyond gender. Children with special educational needs (Lesotho, Angola, Cameroon),
handicapped children (South Africa), children from remote rural areas or those from disadvantaged
social groups, minorities and marginalized groups, refugees (Cameroon) and youth belonging to
religious confessions (Senegal) are just as many new target groups identified by countries, that define
the new educational frontier to reach. For this, a new awareness is emerging, that fine targeting will
be required, as well as the elaboration of learning tools that are appropriate, in their content and
their language, the training of facilitators with specific competencies and the improvement and
reconversion of infrastructure.
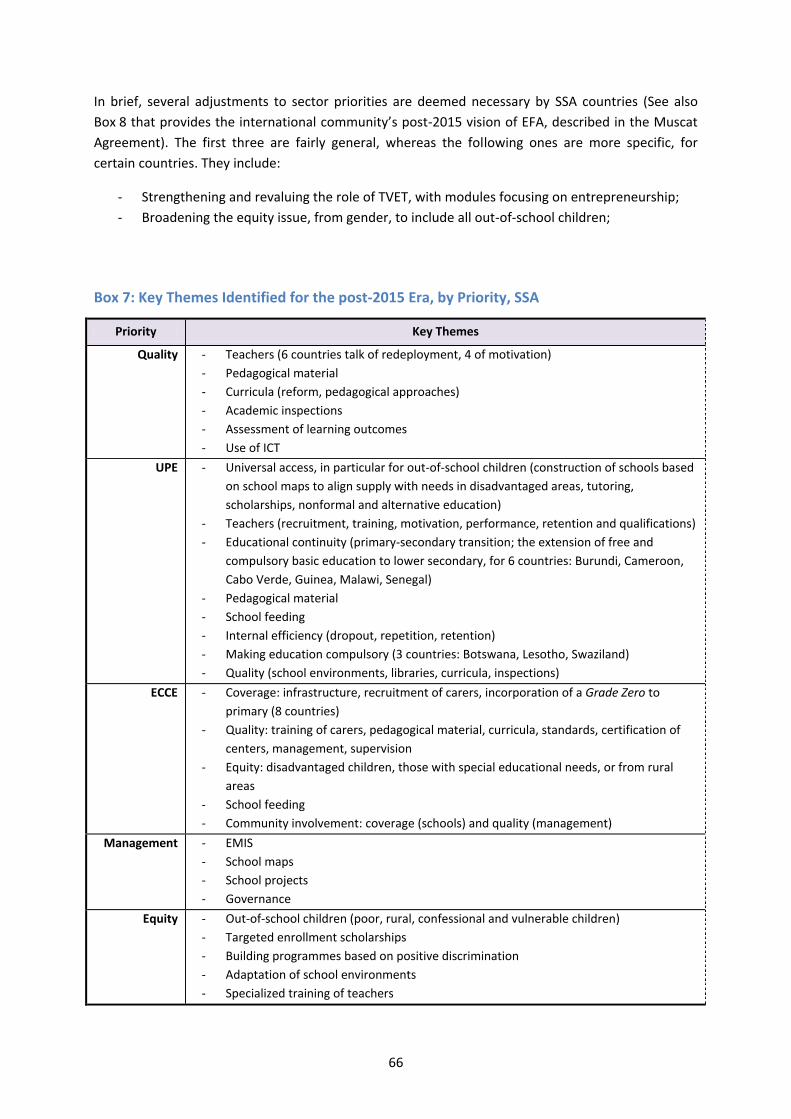
66
In brief, several adjustments to sector priorities are deemed necessary by SSA countries (See also
Box 8 that provides the international community’s post-2015 vision of EFA, described in the Muscat
Agreement). The first three are fairly general, whereas the following ones are more specific, for
certain countries. They include:
- Strengthening and revaluing the role of TVET, with modules focusing on entrepreneurship;
- Broadening the equity issue, from gender, to include all out-of-school children;
Box 7: Key Themes Identified for the post-2015 Era, by Priority, SSA
Priority Key Themes
Quality - Teachers (6 countries talk of redeployment, 4 of motivation)
- Pedagogical material
- Curricula (reform, pedagogical approaches)
- Academic inspections
- Assessment of learning outcomes
- Use of ICT
UPE - Universal access, in particular for out-of-school children (construction of schools based
on school maps to align supply with needs in disadvantaged areas, tutoring,
scholarships, nonformal and alternative education)
- Teachers (recruitment, training, motivation, performance, retention and qualifications)
- Educational continuity (primary-secondary transition; the extension of free and
compulsory basic education to lower secondary, for 6 countries: Burundi, Cameroon,
Cabo Verde, Guinea, Malawi, Senegal)
- Pedagogical material
- School feeding
- Internal efficiency (dropout, repetition, retention)
- Making education compulsory (3 countries: Botswana, Lesotho, Swaziland)
- Quality (school environments, libraries, curricula, inspections)
ECCE - Coverage: infrastructure, recruitment of carers, incorporation of a Grade Zero to
primary (8 countries)
- Quality: training of carers, pedagogical material, curricula, standards, certification of
centers, management, supervision
- Equity: disadvantaged children, those with special educational needs, or from rural
areas
- School feeding
- Community involvement: coverage (schools) and quality (management)
Management - EMIS
- School maps
- School projects
- Governance
Equity - Out-of-school children (poor, rural, confessional and vulnerable children)
- Targeted enrollment scholarships
- Building programmes based on positive discrimination
- Adaptation of school environments
- Specialized training of teachers
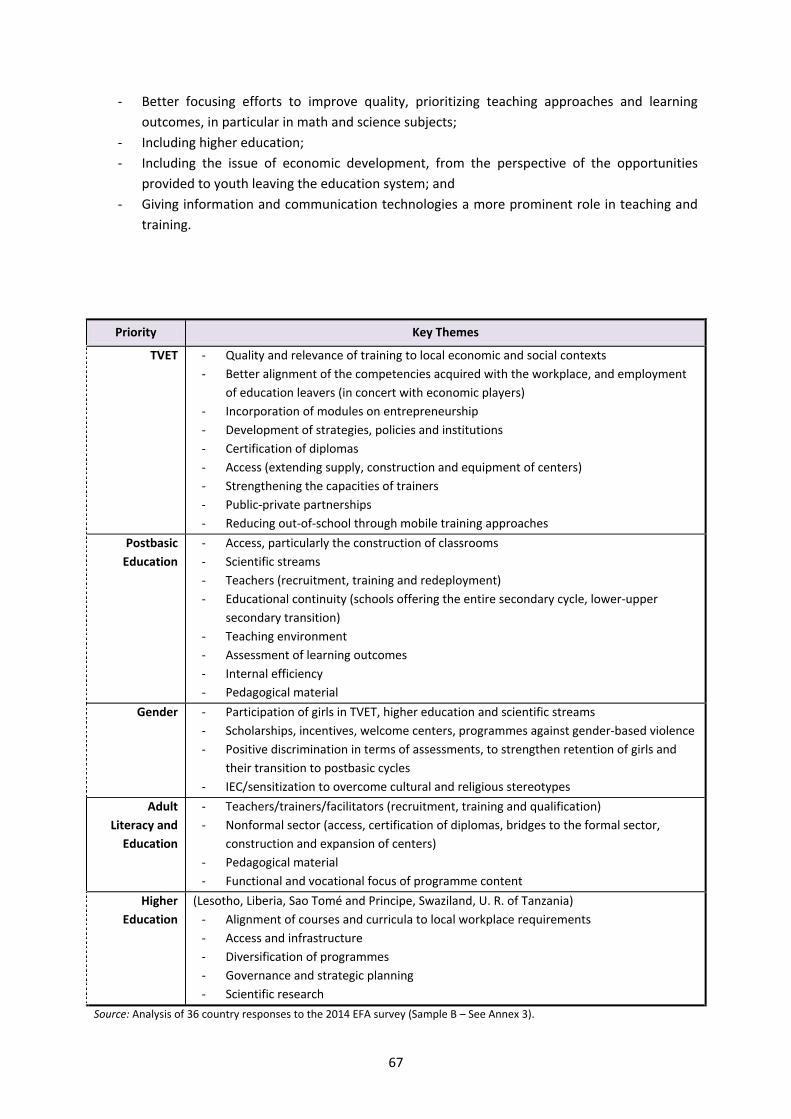
67
- Better focusing efforts to improve quality, prioritizing teaching approaches and learning
outcomes, in particular in math and science subjects;
- Including higher education;
- Including the issue of economic development, from the perspective of the opportunities
provided to youth leaving the education system; and
- Giving information and communication technologies a more prominent role in teaching and
training.
Priority Key Themes
TVET - Quality and relevance of training to local economic and social contexts
- Better alignment of the competencies acquired with the workplace, and employment
of education leavers (in concert with economic players)
- Incorporation of modules on entrepreneurship
- Development of strategies, policies and institutions
- Certification of diplomas
- Access (extending supply, construction and equipment of centers)
- Strengthening the capacities of trainers
- Public-private partnerships
- Reducing out-of-school through mobile training approaches
Postbasic
Education
- Access, particularly the construction of classrooms
- Scientific streams
- Teachers (recruitment, training and redeployment)
- Educational continuity (schools offering the entire secondary cycle, lower-upper
secondary transition)
- Teaching environment
- Assessment of learning outcomes
- Internal efficiency
- Pedagogical material
Gender - Participation of girls in TVET, higher education and scientific streams
- Scholarships, incentives, welcome centers, programmes against gender-based violence
- Positive discrimination in terms of assessments, to strengthen retention of girls and
their transition to postbasic cycles
- IEC/sensitization to overcome cultural and religious stereotypes
Adult
Literacy and
Education
- Teachers/trainers/facilitators (recruitment, training and qualification)
- Nonformal sector (access, certification of diplomas, bridges to the formal sector,
construction and expansion of centers)
- Pedagogical material
- Functional and vocational focus of programme content
Higher
Education
(Lesotho, Liberia, Sao Tomé and Principe, Swaziland, U. R. of Tanzania)
- Alignment of courses and curricula to local workplace requirements
- Access and infrastructure
- Diversification of programmes
- Governance and strategic planning
- Scientific research
Source: Analysis of 36 country responses to the 2014 EFA survey (Sample B – See Annex 3).
68
4.C- A New EFA Framework - Pointers
In the context of the 2014 survey, countries mentioned their wish, or lack of one, for a new
international EFA framework. Although this question was only answered by 16 of the 21 countries
having participated in the survey, equivalent to 35 percent of SSA countries, the results are striking:
all responding countries wish a new EFA framework to be established to guide their post-2015
education policies, but none wants to just see the existing framework extended.
The answers are equally split between those countries that want a new framework to be linked to
their national strategies and that better responds to the particular development issues, challenges
and constraints that they face, and those that want a new framework based on the current one, but
substantially modified.
This section will therefore provide food for thought about a potential new EFA international
framework, and is primarily based on SSA countries’ opinions of the current EFA framework, to draw
certain conclusions, before combining the findings with the finer detail of countries’ wishes for a
future framework.
The 2000-15 EFA Framework – Lessons Learned
On the basis of the opinions of the 36 countries having participated in the surveys, the 2000-15 EFA
framework, defined as the combined actions undertaken to promote and finance EFA, at the national
and international levels, has been a resounding success.22 The core strengths most often pointed out
by SSA countries, that they wish to see extended within a new framework, are to have:
- Offered guidance and encouragement for the elaboration of sector strategies;
- Provided a channel for the financial and technical support of TFPs;
- Enabled the production of diagnoses and studies, as a basis for the planning, targeting,
development and implementation of education programmes (Annex 6 lists the countries
having carried out a CSR – an education sector country status report – over the period);
- Encouraged the commitment and active involvement of social players, as well as synergies in
their activities;
- Reflected the majority of existing national goals, and defined some new ones, also
considered highly relevant; and
- Motivated countries in their efforts to strive towards these ambitious goals.
These findings are strengthened by the assessment of 21 countries’ opinions of the relevance of
several 2000-15 EFA framework components (See Figure 14 below)23. Indeed, the analysis shows that
almost all countries agree that this framework reflected their vision for the development of their
22 Sample B. Annex 3 explains the composition and use of the different country samples. 23 Sample C. Section 2 of the questionnaire provided in Annex 4 provides greater detail of these components.
69
Box 8: The Muscat Agreement
The last global EFA meeting, held in Muscat in May 2014, enabled the international community (Education
ministers, heads of delegation, multilateral and bilateral organizations’ leaders and high-level representatives
of civil society and private sector organizations) to outline an EFA framework for the post-2015 era, known as
the Muscat Agreement. The main components of this agreement are:
Vision: “Education is a fundamental human right for every person. It is an essential condition for human
fulfillment, peace, sustainable development, economic growth, decent work, gender equality and responsible
global citizenship. Furthermore, it contributes to the reduction of inequalities and the eradication of poverty
by bequeathing the conditions and generating the opportunities for just, inclusive and sustainable societies.
Therefore, education must be placed at the heart of the global development agenda.”
Period: 2015 to 2030
Overarching Goal: “Ensure equitable and inclusive quality education and lifelong learning for all by 2030.”
Global Targets: * Minimum global benchmarks and relevant indicators will be identified/developed.
1. At least x% of girls and boys are ready for primary school through participation in quality early
childhood care and education, including at least one year of free and compulsory pre-primary
education, with particular attention to gender equality and the most marginalized.
2. All girls and boys complete free and compulsory quality basic education of at least 9 years and achieve
relevant learning outcomes, with particular attention to gender equality and the most marginalized.
3. All youth and at least x% of adults reach a proficiency level in literacy and numeracy sufficient to fully
participate in society, with particular attention to girls and women and the most marginalized.
4. At least x% of youth and y% of adults have the knowledge and skills for decent work and life through
technical and vocational, upper secondary and tertiary education and training, with particular attention
to gender equality and the most marginalized.
5. All learners acquire knowledge, skills, values and attitudes to establish sustainable and peaceful
societies, including through global citizenship education and education for sustainable development.
6. All governments ensure that all learners are taught by qualified, professionally-trained, motivated and
well-supported teachers.
7. All countries allocate at least 4-6% of their Gross Domestic Product (GDP) or at least 15-20% of their
public expenditure to education, prioritizing groups most in need; and strengthen financial cooperation
for education, prioritizing countries most in need.
Follow-up:
- The Open Working Group on Sustainable Development Goals has elaborated a proposal of goals (New
York, July 2014), where education is given a predominant place, with a dedicated specific goal (Goal 4:
“Ensure inclusive and equitable quality education and promote lifelong learning opportunities for all”)
and seven specific targets similar to those of the Muscat Agreement.
- The global validation of the Muscat Agreement is planned for the 2015 World Education Forum
(Incheon, May 2015), to ensure that it truly reflects the needs of SSA.
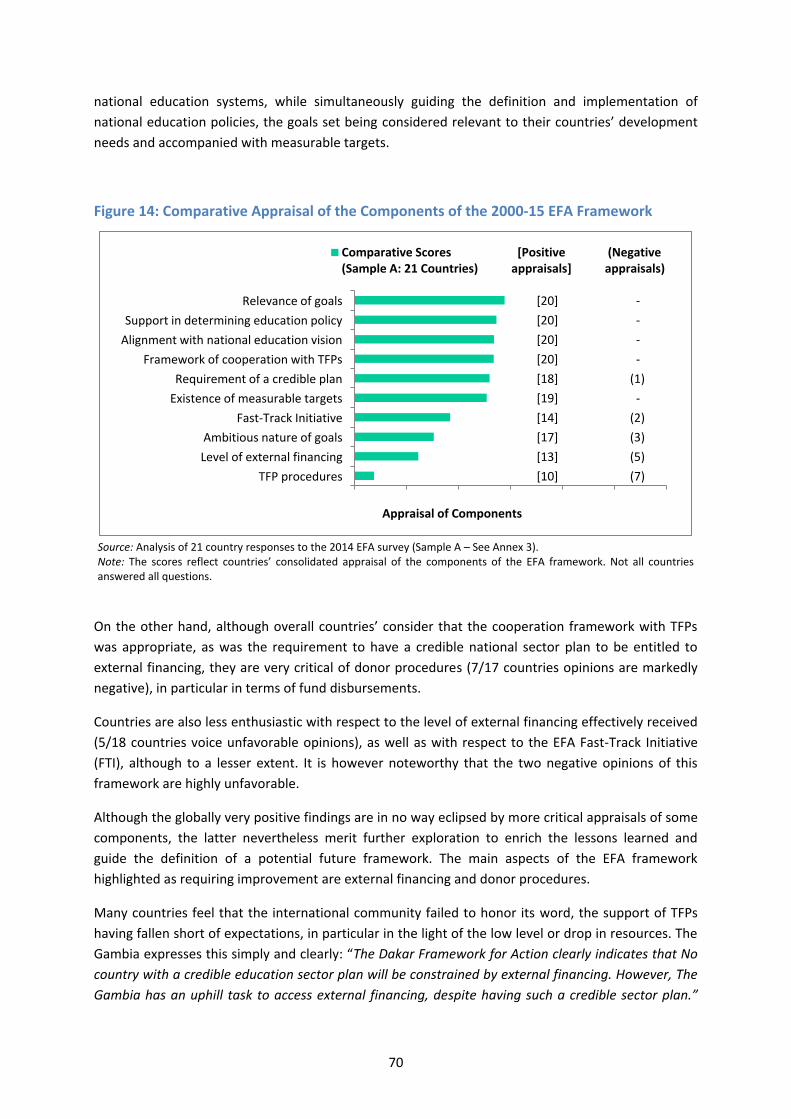
70
national education systems, while simultaneously guiding the definition and implementation of
national education policies, the goals set being considered relevant to their countries’ development
needs and accompanied with measurable targets.
Figure 14: Comparative Appraisal of the Components of the 2000-15 EFA Framework
Source: Analysis of 21 country responses to the 2014 EFA survey (Sample A – See Annex 3). Note: The scores reflect countries’ consolidated appraisal of the components of the EFA framework. Not all countries answered all questions.
On the other hand, although overall countries’ consider that the cooperation framework with TFPs
was appropriate, as was the requirement to have a credible national sector plan to be entitled to
external financing, they are very critical of donor procedures (7/17 countries opinions are markedly
negative), in particular in terms of fund disbursements.
Countries are also less enthusiastic with respect to the level of external financing effectively received
(5/18 countries voice unfavorable opinions), as well as with respect to the EFA Fast-Track Initiative
(FTI), although to a lesser extent. It is however noteworthy that the two negative opinions of this
framework are highly unfavorable.
Although the globally very positive findings are in no way eclipsed by more critical appraisals of some
components, the latter nevertheless merit further exploration to enrich the lessons learned and
guide the definition of a potential future framework. The main aspects of the EFA framework
highlighted as requiring improvement are external financing and donor procedures.
Many countries feel that the international community failed to honor its word, the support of TFPs
having fallen short of expectations, in particular in the light of the low level or drop in resources. The
Gambia expresses this simply and clearly: “The Dakar Framework for Action clearly indicates that No
country with a credible education sector plan will be constrained by external financing. However, The
Gambia has an uphill task to access external financing, despite having such a credible sector plan.”
(7)
(5)
(3)
(2)
-
(1)
-
-
-
-
[10]
[13]
[17]
[14]
[19]
[18]
[20]
[20]
[20]
[20]
TFP procedures
Level of external financing
Ambitious nature of goals
Fast-Track Initiative
Existence of measurable targets
Requirement of a credible plan
Framework of cooperation with TFPs
Alignment with national education vision
Support in determining education policy
Relevance of goals
Appraisal of Components
Comparative Scores(Sample A: 21 Countries)
[Positiveappraisals]
(Negativeappraisals)
71
This opinion, that appears to be shared by Benin, Burkina Faso, Guinea Bissau, Lesotho, Mali,
Namibia, Niger, Swaziland and Uganda, generally reflects the high expectations created by the EFA
framework, and the strong will of countries to align their education goals with it, in extremely
ambitious fashion. Some countries feel that financing has flown towards countries less likely to
achieve the set targets, but without considering the detail of different national contexts on the basis
of disaggregated data.
Donor procedures have also been the source of frustration given the ambitious goals set and adopted
by countries. In particular, country teams note a lack of donor alignment and harmonization, with
multiple procedures. Generally speaking, the bureaucracy required to access external financing is
complex, and responding to the various objections made by TFPs requires considerable time. In some
cases, a further constraint is imposed by the difference between the fiscal years of beneficiary
countries and TFPs (June-July and January-December), which generates further delays.
Thus, the implementation of programmes is made more complex, the execution of planned activities
is delayed, procedures limit the disbursement of amounts committed, and in the worst case
scenarios some programmes are neither financed in time nor implemented.
Authors’ Note: It would indeed appear that some mistakes have been made, and the
international community itself has seen its definition of the credibility of education plans (and
therefore the criteria for the financing of programmes) evolve over the period. The strong
focus on primary in the early plans, and in particular on its quantitative development, logically
gave way in the mid-term to concerns about postprimary cycles and the quality of learning
outcomes. The balanced sector outlook provided during the Dakar Forum’s debates was thus
sometimes forgotten to the benefit of more rapid and spectacular results, but that have
transpired to carry deep imbalances.
These frustrations are nevertheless countered by some more positive perceptions, such as those of
Benin or Burkina Faso, where the common basket called pooled budget support has favored greater
synergies among TFPs’ actions and better alignment with national procedures. In Senegal, this same
synergy and enhanced complementarity of activities is noted thanks to the programme approach
adopted in the context of the pursuit of EFA goals, and has enabled the achievement of better results
than the pre-2000 project approach.
With respect to the EFA Fast-Track Initiative (FTI) and its rebranding in 2011 as the Global Partnership
for Education (GPE), it is worth mentioning countries’ views, even if these are naturally few in
number given the recent rebranding.24 Whereas Kenya considers that the GPE framework has lost
some of the FTI’s responsiveness, Liberia appreciates the greater level of transparency, and the
24 Annex 1 includes a brief presentation of the FTI/GPE and its evolution over the period, among others.
72
increased flexibility provided to the Ministry of education in some activities, such as school
construction, granting scholarships, or the procurement and distribution of pedagogical material.
Authors’ Note: It may be worth further exploring these countries’ opinions, as the procedures
mentioned may be imposed more by supervision agencies than by the GPE itself.
The Potential Content of a post-2015 EFA Framework
The main component that a vast majority of countries wish to see incorporated into a new EFA
framework is strengthened technical and financial support. On the financial side, this support would
contribute to build school complexes, open teacher training institutes, create infirmaries, libraries,
latrines and safe water supplies, implement school feeding programmes, procure school equipment
and supplies and elaborate and publish textbooks and teaching guides.
On the technical side, in addition to the support needed for the aforementioned activities, some
countries wish to receive help in strengthening the technical capacities of national officers through
targeted training, and to establish better national EFA coordination mechanisms, that are formal,
operational and effective.
Many countries also consider that greater national political will for EFA should be harnessed through
the new framework, in particular in terms of resources. It has even been suggested that a minimum
level of national investment should be made a condition to receive external aid, determined
according to the national budget or GDP (See also Box 8).
In those countries where the gap to achieve the 2000-15 EFA goals is greater, there is a marked wish
that any future framework should better address national contexts. Five countries specifically
request that future targets be more realistic and flexible, reflecting their particular economic and
educational contexts, and better reflecting their own challenges, resources and constraints as well as
their domestic needs, rather than focused on international comparability. Their wish is to be
accompanied in the implementation of their national education policies, which would be inspired by
the proposed EFA framework.
Mirroring the previous part of this report, the wish that donor procedures be aligned and
harmonized, in particular in terms of fund disbursement, is also repeatedly voiced.
Three final elements, although more seldom mentioned by country teams, seem relevant: (i) the wish
for strengthened, more regular and local monitoring of EFA policies; (ii) the opportunity to establish
deeper sector consultation processes between TFPs and education ministries, to achieve greater
consensus in policies and implementation strategies; and (iii) the incorporation of a regional
cooperation dimension, in particular with respect to the strategies chosen to improve educational
quality.
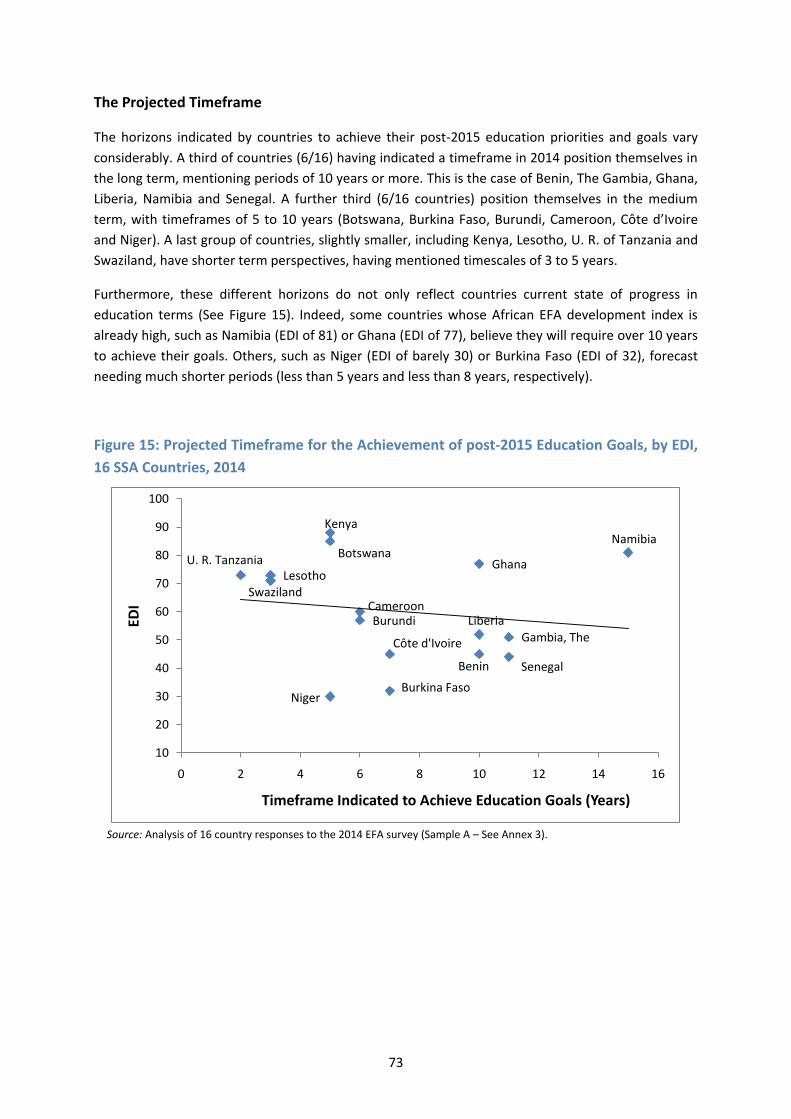
73
The Projected Timeframe
The horizons indicated by countries to achieve their post-2015 education priorities and goals vary
considerably. A third of countries (6/16) having indicated a timeframe in 2014 position themselves in
the long term, mentioning periods of 10 years or more. This is the case of Benin, The Gambia, Ghana,
Liberia, Namibia and Senegal. A further third (6/16 countries) position themselves in the medium
term, with timeframes of 5 to 10 years (Botswana, Burkina Faso, Burundi, Cameroon, Côte d’Ivoire
and Niger). A last group of countries, slightly smaller, including Kenya, Lesotho, U. R. of Tanzania and
Swaziland, have shorter term perspectives, having mentioned timescales of 3 to 5 years.
Furthermore, these different horizons do not only reflect countries current state of progress in
education terms (See Figure 15). Indeed, some countries whose African EFA development index is
already high, such as Namibia (EDI of 81) or Ghana (EDI of 77), believe they will require over 10 years
to achieve their goals. Others, such as Niger (EDI of barely 30) or Burkina Faso (EDI of 32), forecast
needing much shorter periods (less than 5 years and less than 8 years, respectively).
Figure 15: Projected Timeframe for the Achievement of post-2015 Education Goals, by EDI,
16 SSA Countries, 2014
Source: Analysis of 16 country responses to the 2014 EFA survey (Sample A – See Annex 3).
Côte d'Ivoire
Kenya
LesothoSwaziland
Burkina Faso
Cameroon
Niger
SenegalBenin
Ghana
Liberia
Namibia
Gambia, TheBurundi
BotswanaU. R. Tanzania
10
20
30
40
50
60
70
80
90
100
0 2 4 6 8 10 12 14 16
EDI
Timeframe Indicated to Achieve Education Goals (Years)
74
Summary of Findings
At the turn of the millennium, education coverage in Sub-Saharan Africa was weak: preprimary
education was embryonic, with an enrollment rate of approximately 11 percent; the primary gross
enrollment rate (GER) was 82 percent and the completion rate was 47 percent; only 10 percent of a
generation of children completed the full secondary cycle; and TVET learners represented barely 8
percent of total secondary. Moreover, the share of literate adults was only 58 percent. This weak
development was coupled with deep disparities in individual schooling careers, linked to location,
income levels and gender (the enrollment of girls in primary was markedly lower than that of boys,
with a gender parity index of 0.85).
This situation partly reflects a relative under-financing of education at that time. Despite the fact that
education harnessed 20.6 percent of recurrent public expenditure, the financial effort for the sector
(the amount of total education spending financed on domestic resources, as a percentage of GDP)
was under 2 percent in many countries. On average, primary education was allocated just under half
of spending, and secondary (including TVET) received 30 percent. Public primary education was
characterized by fairly crowded classes (PTR of 46:1), and non-teaching salary spending represented
a quarter of recurrent expenditure.
Progress Achieved
Over the EFA period, the resource mobilization context improved, national income reaching 21
percent of GDP, and education sectors’ allocation reaching 22.8 percent of recurrent public
expenditure on average by 2012. Despite this favorable context, public unit costs have dropped,
marginally for primary (- 4 percent), and more significantly for secondary – including TVET (- 10
percent). These reductions are mainly explained by lower average teacher remuneration in units of
GDP per capita, resulting from building a new contract teacher workforce, less well paid than civil
servants, but also from the greater number of children enrolled in school.
The progress made in SSA towards the six goals set at Dakar in 2000 is noteworthy. The value of the
African EFA development index, a synthetic indicator that reflects three key dimensions of EFA,
increased from 38.3 to 57.1, by 50 percent. However, it should also be noted that most goals will not
be achieved by 2015:
- Preprimary education has grown considerably, the GER having virtually doubled, from 11
percent to 20 percent, but remains modest in the light of the proven impact that the
schooling of young children has on their schooling careers and results.
- The majority of countries now provides primary access to all their children, and two thirds of
a generation reach the end of this level (primary completion rate of 67 percent), against
under half in 2000. Nevertheless, only nine countries had achieved UPE in 2012, and a tenth
should achieve it by 2015.
75
- Secondary level enrollment has also been consolidated, although to a lesser degree, access to
the lower cycle having progressed from 32 percent to 49 percent and upper secondary
completion from 10 percent to 17 percent. This progress is partly due to the general rise in
primary access.
- Efforts to respond to the educational needs of youth have translated into the greater
development of TVET. In 2012, the share this subsector represented of total secondary
enrollment was 15 percent higher than in 2000. Given the growth of the latter, TVET
enrollment has virtually doubled in real terms, from 356 to 606 learners per 100,000
inhabitants.
- In addition to the efforts deployed to reach UPE, literacy and nonformal education have
produced significant results in terms of the adult literacy rate, which has progressed by
approximately 10 percentage points over the period, from 58 percent to 69 percent, even if it
still falls short of the set target, of 87 percent.
- Gender parity in primary education is the goal that has come closest to its target (GPI of 0.94
in 2012, against 0.85 in 2000), but in a dozen countries the GPI is still under the 0.90 mark
(unfavorable to girls). Furthermore, gender disparities are more pronounced at higher levels
(GPI of 0.84 for upper secondary and of 0.74 for higher education), and social and
geographical disparities are considerable.
- Higher education has seen strong growth over the period. On average in SSA, the number of
students per 100,000 inhabitants has almost tripled (from 217 to 636).
- Quality, whether assessed by the level of learning outcomes or through the primary survival
rate, is clearly still of an average to low level.
The marked focus on primary in countries’ early EFA sector plans, especially on its quantitative
development, gave way in the mid-term to greater consideration for postprimary cycles and
educational quality. Indeed, the development of primary generated demand for further education
that spread energetically as far as higher education. National education policies then started to
promote basic education, generally towards the end of the period. Furthermore, this very growth of
primary sometimes occurred at the expense of teaching quality.
Some countries, whose education status was weak in 2000, have not managed to close the gap in a
timeframe that is in fact fairly short for structural reforms. Their situation has nevertheless
considerably improved and they have often achieved more than ever before during this first EFA
period.
The analysis by regions has highlighted the following findings:
- West Africa: It is often within this region that progress has been the greatest, in part due to
the low baseline level. This is the case of adult literacy and gender parity among others, and
is reflected in the evolution of the EDI. However, serious learning issues persist, particularly
in reading according to the PASEC.
- East Africa: The development of TVET, whose coverage was limited in 2000, has been
particularly momentous. Gender parity has been achieved at the primary level (GPI of 0.95).
According to the SACMEQ test results, this region boasts the highest level of educational
quality.
76
- Southern Africa: General EFA performance is the highest of all SSA regions. Among others,
literacy levels are the highest (81.1 percent on average) and primary gender parity has been
achieved (GPI of 0.97). However, according to the SACMEQ assessments, results are mixed in
reading, and poor in math.
- Central Africa: It is within this region that TVET is most developed. PASEC results suggest that
educational quality is above average, particularly in math.
Efforts Deployed
These results have been achieved in great part thanks to broad national commitment to EFA, which
countries consider to have been high. Mobilization for UPE has been widespread, reflecting high
levels of engagement at the political, education sector, social, family and donor levels, as well as in
terms of financing. The holistic nature of the EFA goals has led SSA countries to review their national
education goals, to incorporate sectors and beneficiaries that were not systematically covered
previously. Some adjustments were made to respond to the needs of these new learners, such as the
incorporation of a Grade Zero to primary schools, to strengthen preprimary education, or the
promotion of private sector participation in providing apprenticeships, to develop the supply of
technical and vocational training.
This has generated the organizational restructuring of education ministries, and intense sector and
subsector planning activity in most countries, to reshape education policies and strategies. In
addition to the increase and improvement of school infrastructure and equipment, other key factors
of progress mentioned by countries are:
- Curricular reform, to make content more relevant to local needs or incorporate competency-
based approaches;
- The strengthening of sector management, be it at the central or school levels;
- The systemization of the assessment of learning outcomes, through standardized tests;
- Quality control, in particular via academic inspections;
- Education management and information systems, to improve policy elaboration and
monitoring;
- Community participation, through multiple initiatives whose cost-benefit ratio has proven to
be worthwhile; and
- Public-private partnerships.
Furthermore, awareness has been generated with respect to the importance of education demand-
side factors, and numerous initiatives have been born to reinforce them, in particular through
population sensitization activities and school feeding programmes.
Constraints Faced
The broad expansion of education coverage has however faced a considerable constraint in terms of
resources, in particular national ones. This has limited the activities carried out to improve education
supply, not only in terms of infrastructure and the recruitment and training of teachers, but affecting

77
all educational inputs. In addition, new imbalances in education systems have also been created, and
new challenges have emerged:
- The quality of teaching and learning outcomes is clearly the area that most needs redressing
at this point, after the heavy focus on access over the period. This is considered more a new
priority area than a failure.
- Providing educational or economic opportunities to the greater number of primary leavers is
of growing concern.
- A conjunction of issues related to efficient sector resource use also stands out from
countries’ voiced opinions as being a priority. On the one hand, national education and
training sectors are unable to harness significant parts of their budgets due to the complexity
of disbursement procedures. On the other, the internal efficiency of education systems
shows clear scope for improvement, as dropout and repetition levels remain high.
- The low level of teacher motivation, related to status, salary or posting, is highlighted as a
prominent factor of failure, impacting on absenteeism levels, effective learning time and the
relevance of teaching.
- The need to strengthen intersectoral coordination is equally noted.
To lift these constraints, there is real awareness of the need to improve education systems’
management, steering and governance arrangements to increase access, equity and quality. This
wish takes shape along the lines of elaborating effective teacher policies, defining more balanced
school maps, implementing more precise monitoring and evaluation tools, reinforcing academic
inspections and involving communities in the monitoring of quality and the management of schools.
The question is not always about spending more, but spending more effectively. Many countries also
point out the need to develop information, education and communication (IEC) campaigns and
activities, as well as parental education, to support the achievement of several EFA goals.
Future Sector Priorities
In terms of sector priorities, it is clear that the six EFA goals continue to be considered relevant. In
particular, the renewal of the 2000-15 EFA beacon goal of universal primary education is
unquestioned. However, the enrollment paradigm is inverted: the aim is no longer to increase
enrollment, but to reduce out-of-school.
Equity therefore becomes a priority goal in its own right, well beyond the gender parity imperative.
For this, a new awareness is emerging, that more precise targeting approaches will be required, as
well as the elaboration of learning materials that are appropriate, in their content and their language,
as well as the training of facilitators with specific competencies and the adaptation of infrastructure
to cater for children with special educational needs.
Nevertheless, the improvement of quality features most often among countries’ top five priorities for
the future, and by a significant margin, now being considered important by a greater number of
78
countries than universal primary education. It will be necessary to better focus efforts in this
direction, by targeting teaching practices and learning outcomes, in particular in math and science
subjects.
Furthermore, early childhood care and education is now a priority for as many countries as UPE, and
adult literacy remains an ongoing concern. Gender parity, where progress has been most apparent in
recent years, is seldom mentioned specifically, even if it is often included in terms of UPE, equity in a
broader sense, or quality.
SSA countries therefore anticipate several adjustments to sector priorities, which are indeed
reflected in the international community’s vision of post-2015 EFA, consigned in the Muscat
Agreement of 2014:
- To promote youth employment, a great stake for SSA countries. The development of
technical and vocational competences is an considered to be elemental. Countries therefore
wish to strengthen and revalorize the role of TVET, including modules on entrepreneurship,
and ensure greater complementarity between postprimary streams.
- In terms of opportunities for education system leavers, countries also wish to incorporate the
issue of national economic development in any future framework.
- Although higher education is only mentioned by a few of the countries having participated in
the surveys upon which this study is based, the importance of this sector for them is
considerable.
- Finally, there is a tangible interest in the deployment of information and communication
technologies, both for sector management purposes and for the provision of teaching and
training.
The Shape of a New EFA Framework
The 2000-15 EFA framework, defined here as the activities deployed to promote and finance EFA,
both at the national and international levels, has been a resounding success. The great majority of
SSA countries agree that the framework reflected their visions for the development of their national
education systems, while guiding the definition and implementation of education policies, the set
goals being considered relevant to their national development and accompanied by measureable
targets. Furthermore, they consider that EFA has:
- Provided guidance and encouragement for the elaboration of sector strategies;
- Constituted a channel for the technical and financial support of TFPs;
- Enabled the production of research and diagnoses, as a basis for the planning, targeting,
development and implementation of education programmes;
- Favored the commitment and active participation of social players, as well as greater
synergies in their activities; and
- Motivated countries efforts, to make the greatest possible progress towards ambitious
targets.
It is therefore not surprising that all countries having responded to the 2014 EFA survey aspire to the
creation of a new EFA framework to guide their post-2015 education policies. However, no country
79
simply wishes to see the existing framework extended. In addition to the adjustment of goals to
reflect the aforementioned evolution in sector priorities, some of the changes that countries wish to
see in the new framework are:
- Greater flexibility in the formulation of goals and targets, to provide scope to fully reflect
national strategies and better respond to the particular development issues, challenges and
constraints that each country faces;
- Ongoing simplification and harmonization of donor procedures, particularly in terms of fund
disbursements. Indeed, the bureaucracy involved in accessing such funds is unwieldy, and
complicates and delays programme implementation;
- Greater transparency in terms of the conditions to access external financing. Many countries
feel that the international community has not honored its commitments, with donor support
falling short of expectations;
- Greater technical support, particularly in terms of more regular and local monitoring of EFA
policies; and
- Potentially, conditionality in terms of the clear demonstration of national political will,
particularly in terms of resources. It has been suggested that a minimum level of national
investment should be a condition to benefit from external aid.
These wishes, that expose certain frustrations with the 2000-15 EFA framework, generally reflect the
high expectations that it created and countries’ strong will to align their education targets with its
goals, in a very ambitious fashion.
The timeframes mentioned by countries to achieve their post-2015 education priorities and goals
vary vastly. A third of the countries having indicated a timeframe in 2014 position themselves in the
long term, mentioning horizons of 10 years or more; a further third of countries is positioned in the
medium term, with horizons of 5 to 10 years, and a slightly smaller group of countries is banking on
shorter-term results, with timeframes of 3 to 5 years.

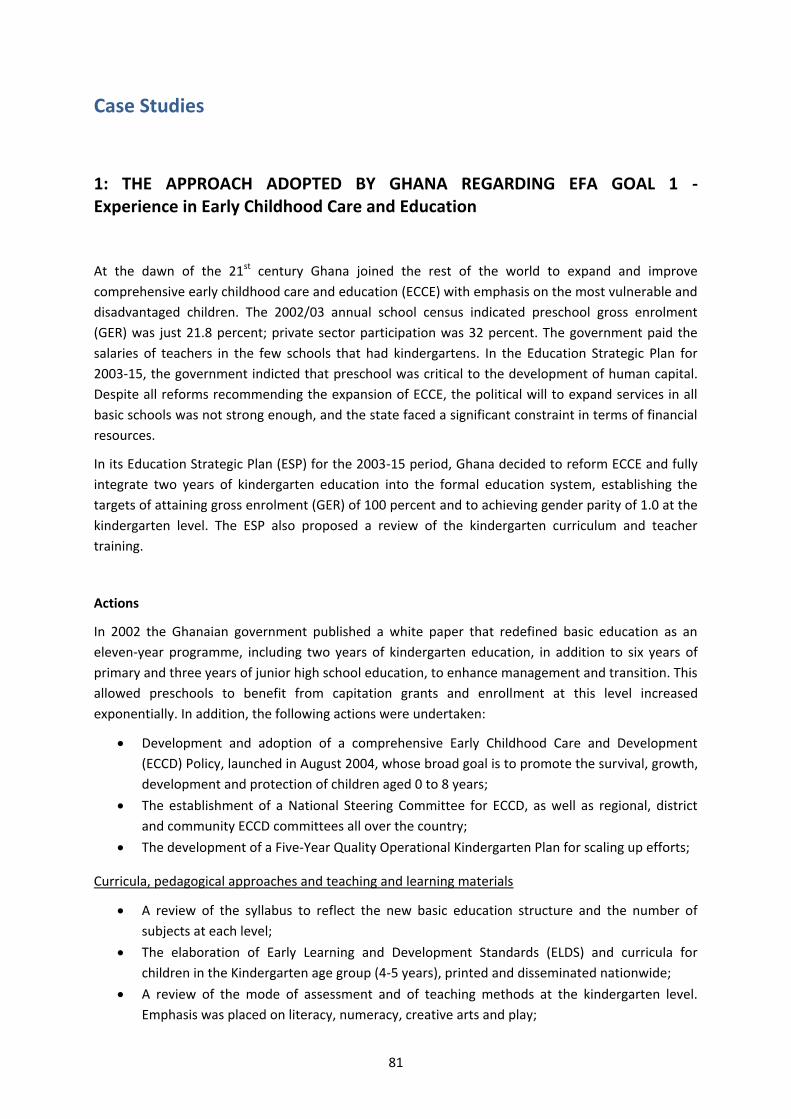
81
Case Studies
1: THE APPROACH ADOPTED BY GHANA REGARDING EFA GOAL 1 - Experience in Early Childhood Care and Education
At the dawn of the 21st century Ghana joined the rest of the world to expand and improve
comprehensive early childhood care and education (ECCE) with emphasis on the most vulnerable and
disadvantaged children. The 2002/03 annual school census indicated preschool gross enrolment
(GER) was just 21.8 percent; private sector participation was 32 percent. The government paid the
salaries of teachers in the few schools that had kindergartens. In the Education Strategic Plan for
2003-15, the government indicted that preschool was critical to the development of human capital.
Despite all reforms recommending the expansion of ECCE, the political will to expand services in all
basic schools was not strong enough, and the state faced a significant constraint in terms of financial
resources.
In its Education Strategic Plan (ESP) for the 2003-15 period, Ghana decided to reform ECCE and fully
integrate two years of kindergarten education into the formal education system, establishing the
targets of attaining gross enrolment (GER) of 100 percent and to achieving gender parity of 1.0 at the
kindergarten level. The ESP also proposed a review of the kindergarten curriculum and teacher
training.
Actions
In 2002 the Ghanaian government published a white paper that redefined basic education as an
eleven-year programme, including two years of kindergarten education, in addition to six years of
primary and three years of junior high school education, to enhance management and transition. This
allowed preschools to benefit from capitation grants and enrollment at this level increased
exponentially. In addition, the following actions were undertaken:
Development and adoption of a comprehensive Early Childhood Care and Development
(ECCD) Policy, launched in August 2004, whose broad goal is to promote the survival, growth,
development and protection of children aged 0 to 8 years;
The establishment of a National Steering Committee for ECCD, as well as regional, district
and community ECCD committees all over the country;
The development of a Five-Year Quality Operational Kindergarten Plan for scaling up efforts;
Curricula, pedagogical approaches and teaching and learning materials
A review of the syllabus to reflect the new basic education structure and the number of
subjects at each level;
The elaboration of Early Learning and Development Standards (ELDS) and curricula for
children in the Kindergarten age group (4-5 years), printed and disseminated nationwide;
A review of the mode of assessment and of teaching methods at the kindergarten level.
Emphasis was placed on literacy, numeracy, creative arts and play;
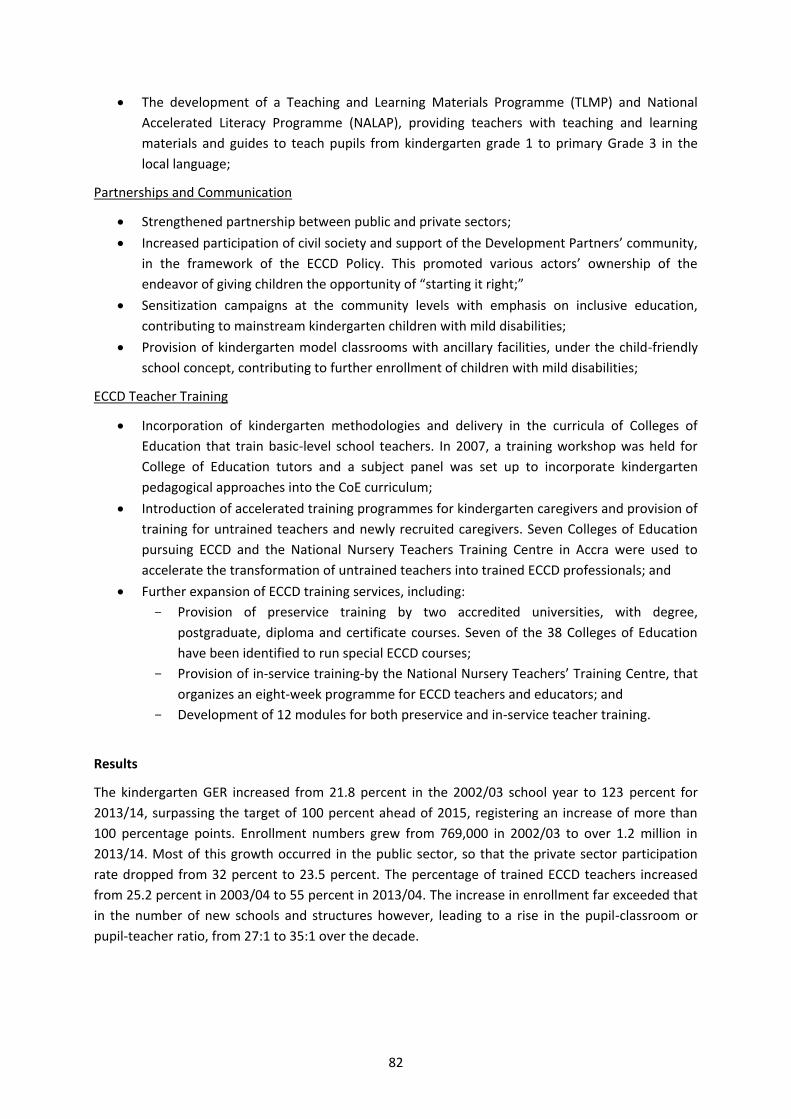
82
The development of a Teaching and Learning Materials Programme (TLMP) and National
Accelerated Literacy Programme (NALAP), providing teachers with teaching and learning
materials and guides to teach pupils from kindergarten grade 1 to primary Grade 3 in the
local language;
Partnerships and Communication
Strengthened partnership between public and private sectors;
Increased participation of civil society and support of the Development Partners’ community,
in the framework of the ECCD Policy. This promoted various actors’ ownership of the
endeavor of giving children the opportunity of “starting it right;”
Sensitization campaigns at the community levels with emphasis on inclusive education,
contributing to mainstream kindergarten children with mild disabilities;
Provision of kindergarten model classrooms with ancillary facilities, under the child-friendly
school concept, contributing to further enrollment of children with mild disabilities;
ECCD Teacher Training
Incorporation of kindergarten methodologies and delivery in the curricula of Colleges of
Education that train basic-level school teachers. In 2007, a training workshop was held for
College of Education tutors and a subject panel was set up to incorporate kindergarten
pedagogical approaches into the CoE curriculum;
Introduction of accelerated training programmes for kindergarten caregivers and provision of
training for untrained teachers and newly recruited caregivers. Seven Colleges of Education
pursuing ECCD and the National Nursery Teachers Training Centre in Accra were used to
accelerate the transformation of untrained teachers into trained ECCD professionals; and
Further expansion of ECCD training services, including:
- Provision of preservice training by two accredited universities, with degree,
postgraduate, diploma and certificate courses. Seven of the 38 Colleges of Education
have been identified to run special ECCD courses;
- Provision of in-service training-by the National Nursery Teachers’ Training Centre, that
organizes an eight-week programme for ECCD teachers and educators; and
- Development of 12 modules for both preservice and in-service teacher training.
Results
The kindergarten GER increased from 21.8 percent in the 2002/03 school year to 123 percent for
2013/14, surpassing the target of 100 percent ahead of 2015, registering an increase of more than
100 percentage points. Enrollment numbers grew from 769,000 in 2002/03 to over 1.2 million in
2013/14. Most of this growth occurred in the public sector, so that the private sector participation
rate dropped from 32 percent to 23.5 percent. The percentage of trained ECCD teachers increased
from 25.2 percent in 2003/04 to 55 percent in 2013/04. The increase in enrollment far exceeded that
in the number of new schools and structures however, leading to a rise in the pupil-classroom or
pupil-teacher ratio, from 27:1 to 35:1 over the decade.
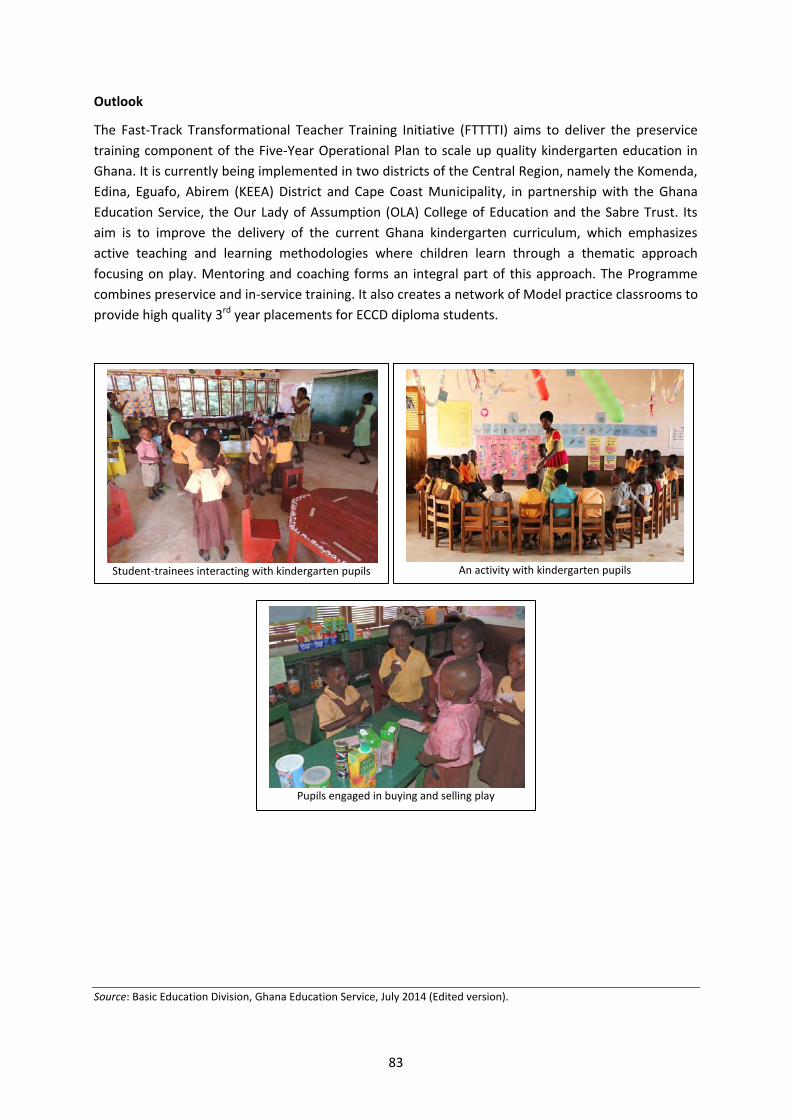
83
Outlook
The Fast-Track Transformational Teacher Training Initiative (FTTTTI) aims to deliver the preservice
training component of the Five-Year Operational Plan to scale up quality kindergarten education in
Ghana. It is currently being implemented in two districts of the Central Region, namely the Komenda,
Edina, Eguafo, Abirem (KEEA) District and Cape Coast Municipality, in partnership with the Ghana
Education Service, the Our Lady of Assumption (OLA) College of Education and the Sabre Trust. Its
aim is to improve the delivery of the current Ghana kindergarten curriculum, which emphasizes
active teaching and learning methodologies where children learn through a thematic approach
focusing on play. Mentoring and coaching forms an integral part of this approach. The Programme
combines preservice and in-service training. It also creates a network of Model practice classrooms to
provide high quality 3rd year placements for ECCD diploma students.
Source: Basic Education Division, Ghana Education Service, July 2014 (Edited version).
Pupils engaged in buying and selling play
An activity with kindergarten pupils Student-trainees interacting with kindergarten pupils
84
2: THE APPROACH ADOPTED BY ZAMBIA REGARDING EFA GOAL 2 - Experience in Universal Primary Education
The 2010 population and housing census set the Republic of Zambia’s population at over 13 million,
with 60.5 percent in rural areas and 42.3 percent living in extreme poverty. More importantly, 45.4
percent were aged under 15 years, with approximately 4 million of primary school age. Close to 0.7
percent of school-aged girls become pregnant each year. Primary enrollment stood at 1.63 million in
2000 and the primary completion rate (PCR) was 63 percent. The national literacy rate for people
over 15 was just 55.3 percent. A host of factors were responsible for these indicators, in particular
extreme poverty, the high cost of education, high pupil-teacher ratios and long distances to school.
To improve primary coverage, a massive increase school infrastructure was required. The
government planned to build 10,000 new classrooms and rehabilitate 4.500 existing ones. To enable
pupils to achieve functional literacy, and provide for greater enrollment levels, teacher training was
to be significantly increased. In both respects, the urban-rural imbalance required redressing. Finally,
school environments needed to be more attractive to reduce dropout rates.
Action and Results
To achieve these goals, the MoE Strategic Plan for 2003-07 was harnessed, and for the 2008-15
period, three successive National Implementation Frameworks were developed and implemented.
Policy Frameworks
A number of initiatives were introduced, such as
Free (although not compulsory) primary education, in 2002;
A re-entry policy for girls to return to school after bearing children;
The provision of alternative modes of education, such the Interactive Radio Instruction, with
the distribution of radio receivers to disadvantaged communities;
The reintroduction of evening classes for adult learners;
The uniform policy, which no longer compelled children to wear uniforms at school; and
The primary school feeding programme, for over 800,000 pupils in disadvantaged areas.
Infrastructure
The government embarked on a massive programme of school construction, particularly in rural
areas, to reduce the distance to school. USS$ 370 million was earmarked for capital expenditure
(2003-07), of which 54 percent was for the primary sub-sector (up from 30 percent in 2001).
An average of 1.500 classrooms were built annually countrywide, based on a community
participation model to ensure cost-effectiveness, effectively cutting the cost to a third of that of
contractors. The District Education Office, working in consultation with the Provincial Education
Office and traditional leaders, would select sites for classroom/school construction, and supervise
civil works through their qualified buildings officer. Communities participated with unskilled labor,
provided locally available building materials such as stones, sand and water, and molded bricks. The
procurement of building materials and skilled labor was assured by a Project Coordinating
Committee, appointed by the local community. New classrooms and teachers’ houses were also built.

85
School environments were improved through the construction of weekly boarding facilities,
ventilated improved pit (VIP) latrines, the sinking of boreholes for clean and safe drinking water, as
well as the introduction of child-friendly corners, among others.
Teacher Provision
Each year, 4,000 qualified primary teachers were recruited on average, to cater for newly created
schools and expand existing establishments, in addition to those recruited to compensate for
attrition. Teacher training colleges embarked on the fast-track Zambia Teacher Education Course
(ZATEC) programme, enabling students to have a year of college tuition and a year of teaching
practice in schools. This internship formula helped to solve challenges related to staff numbers, as
teacher training college enrollment and output doubled.
Community Participation
The introduction of community schools played a fundamental role in the increase in the primary
completion rate. They mainly target disadvantaged and rural areas where families are poor or where
no regular government schools exist. They are run by community members and the teachers (many
of whom are untrained) usually work voluntarily or for small stipends.
Nearly 18 percent of primary pupils are enrolled in community schools. In 2012, 2.642 (or 31.6
percent) of the 8.359 primary schools were community schools, compared to 1,086 in 2003 (of a total
of 5.773). As with government schools, registered community schools are provided with grants, and
some are provided with infrastructure.
Support from Cooperating Partners
Overall, cooperating Partners’ support has enhanced the achievement of universal primary
education, through direct budget support, projects and programmes. In addition, advocacy and
sensitization activities in communities, particularly on the need to keep girls in school, were
conducted with the support of civil society organizations. Development assistance to the education
sector has been relatively low since 2009 however. In 2013, just 1.2 percent of the Ministry of
Education, Science, Vocational Training and Early Education’s total budget of ZMW 5.619 billion (US$
904 million) was externally financed. In 2014, this share rose to approximately 2.7 percent of the
budget, the main sector donors being Irish Aid, UNICEF, JICA and DFID.
In 2013, the Global Partnership for Education approved an application for US$ 35.2 million funding,
for the 2011-15 period, with DFID as the supervising entity, and USAID has also pledged support.
These new contributions will have a further positive effect on the ministry’s programme execution,
such as the roll-out of the new curriculum, the procurement of teaching and learning materials and
teacher training.
Impact
In the period under review, enrollment levels nearly doubled, to over 3 million children in 2012,
representing a 93 percent rise. Consequently, the PCR reached nearly 94 percent in 2012, and the
literacy rate for people over 5 years increased by 15 percentage points to 70.2 percent in 2010.
However, literacy rates in rural areas is still lower (60.5 percent) than in urban areas (83.8 percent).
86
Some unintended results were also noted. The rapid increase in enrollment was not matched by the
adequate supply of teaching and learning materials (in some subjects up to five pupils share a book).
Despite the increase in teacher recruitment, the primary PTR dropped only marginally, from 54:1 in
2001 to 52:1 in 2012, due in part to high teacher HIV&AIDS-related attrition, before retro-viral
therapy became freely available. Overcrowding, mostly in urban schools, resulted in reduced
pupil/teacher contact time, further compromising the quality of education (average contact currently
stands at 3.6 hours per day for Grades 1-4, and 5.1 hours per day for Grades 5-7). Finally, the increase
in the PCR in Zambia was not matched by a concomitant increase in secondary school capacity,
resulting in low transition rates.
Despite the commendable progress in gender parity and in increasing access to primary education
over the past 14 years, more than 400,000 Ghanaian school-aged children are still out of school.
Lessons Learned
The deliberate decision to focus the expansion of education facilities in rural and remote areas has
made the provision of education more equitable, and is expected to have a compounded effect on
national standards of living. However, owing to the harsh conditions of service, teacher deployment
and retention, particularly for women, is an issue in these areas. In this context, community
participation is all the more important, especially as it is noted that schools built by communities
benefit from a greater sense of ownership, and are less vandalized.
When children are provided with food at school, attendance and completion rates increase, not to
mention the improvement of children’s nutrition in a context of widespread poverty.
Although Zambia is close to achieving the MDG and EFA goals in terms of access, this alone is not
adequate unless accompanied by the provision of quality education, which is cause for concern:
The National Assessment Reports (up to 2008) of Grade 5 learners indicate that: i) academic
performance has fallen below 40 percent and is stagnant; and ii) only a minority of learners
reach the minimum literacy and numeracy standards and fewer still attain the desired levels.
The SACMEQ assessments of Grade 6 learners place the performance of Zambian learners
close to the regional minimum. In 2007, the average reading (434) and mathematics scores
(435) were below the average (512 and 510, respectively), with little progress since 2000.
Pass rates at Grade 9 and 12 examinations exhibit a similar trend.
More effort is now being applied in improving reading and numeracy skills of children in the very
early grades, on enhancing teachers’ skills, and in the use of familiar languages for learning, while
maintaining English as the lingua franca for both schools and the nation.
Source: Planning and Information Directorate, Ministry of Education, Science, Vocational Training and Early Education,
September 2014 (Edited version).
87
3: THE APPROACH ADOPTED BY RWANDA REGARDING EFA GOAL 2 - Fast Tracking Access to Quality Education through the 9YBE Programme
Historically, access to education in Rwanda was limited and discriminatory, contributing to deepen
social divisions through ethnic and regional admission policy biases and a curriculum entrenching
stereotypes. This was one of the factors contributing to the 1994 genocide (over one million people
were massacred, over two million fled abroad and one million were internally displaced), which had a
devastating impact on education, in terms of the suffering and psychological impact on pupils,
teachers, and communities, and in the degradation of the education system and its infrastructure.
In 2000, the primary completion rate (PCR) was just 20 percent. In addition to redressing this
alarming situation, post-1994 education set out to be an instrument of peace and reconciliation, to
overcome past ethnic, regional, national and religious prejudices. Universal Primary Education (UPE)
was introduced in 2003, with the abolition of school fees and the provision of capitation grants for
primary schools. By 2008, the success of UPE had created a heightened demand for lower secondary
education and the government considered it a priority to increase fee-free access. However, given
resource constraints, unconventional approaches had to be devised.
Fast-Tracking Access to Quality Basic Education: The 9YBE Programme
The Nine Years Basic Education (9YBE) programme was built on the government's long-term strategic
development plans as per the Economic Development and Poverty Reduction Strategy 2013-18, and
designed to meet EFA Goal 2. Its implementation required broad sector reform:
Between 500 and 1,000 new classrooms (or 50 schools) needed to be built each year
between 2009 and 2015;
The curricula needed reform to reflect the country’s dynamic educational and socio-
economic challenges and provide learning continuity from Grade 1 to 9 in the 9YBE context;
Teachers required training to acquire greater skills (in 2008, only 8.3 percent of secondary
school teachers were qualified) and apply learner-centered teaching methods.
Rapid school infrastructure development
An innovative strategy was developed in 2008 to fast track the school construction programme and
rapidly increase access without compromising quality. Task forces were created, including an inter-
ministerial steering committee at the national level. Rwanda’s decentralized governance system was
a key success factor, with implementing committees created at the local and school levels. Intense
sensitization of the school construction programme was undertaken through meetings involving the
political leadership down to the grassroots levels, the media and parent-teacher committees, which
were key in mobilizing parents and the community.
Community participation was indeed a central pillar in this process. The 9YBE fast-tracking strategies
were discussed within the local community development framework known as Umuganda. The
community-based approach to school construction achieved rapid results, by drawing upon local
88
skills, knowledge and resources, as well as encouraging local ownership. It also ensured the efficient
use of resources: new classrooms cost just 4 million Rwanda francs, cutting the cost by half.
This approach yielded spectacular results: 8,000 new classrooms and 20,000 latrines were built
within three years, four years ahead of schedule. The savings, an estimated US$ 49 million, allowed
for additional investments in teacher training, quality-related inputs and fund transfers to districts to
support the education of children from needy families.
Strategic Realignment of Curricula, Course Content, Textbooks and School Management
Further revisions are underway to the curriculum reform of 1996-98, to respond to the educational
needs of the 9YBE programme, to be completed by December 2014. In the mean time, the
decentralization of the procurement of teaching and learning materials allows schools to choose the
quantity and type of textbooks and materials they require, and for these to be delivered directly,
saving on delivery time and costs.
In 2009, the government switched the medium of instruction to English, from Grade 4 onwards,
having noted the importance of English for business, education, ICT development, and closer
integration with the East African Community (EAC) and Commonwealth countries.
Three combined strategies particularly contributed to improve the quality of education while
expanding access: (i) double shifting, separating the teaching day into morning and afternoon shifts,
with different students attending each; (ii) the reduction of the number of core courses by half (from
about 10 to 5), to increase the number of hours a child spends per subject and allow more in depth
coverage of the syllabus; and (iii) teacher specialization in specific subjects, to rationalize the use of
the existing teaching workforce in the short-run.
The combination of these approaches reduced class sizes by half, improved pupil-teacher ratios, and
impacted on the quality of learning by allowing teachers to concentrate on fewer subjects, with
greater knowledge and confidence, as well as to focus their attention on individual students and
monitor their performance. It also enabled the more efficient use of scarce teachers by increasing
schools' flexibility to create their time tables, in turn allowing them to reduce teacher numbers,
saving on recruitment, recurrent salary spending and ultimately, on classroom construction.
These strategies increased the demands on teachers and entailed some redeployment. To maintain
motivation, an incentive package was introduced: a credit and cooperative savings organization was
established, providing subsidized loans, and a teacher housing programme was launched.
Teacher Training
These strategies had a fundamental impact on teacher training. The capacity of existing pre-service
primary teacher training colleges was increased and two new lower secondary teacher colleges were
opened. A distance learning programme was introduced to impart pedagogical skills to unqualified
primary teachers, and expatriate teacher trainers were recruited from neighboring countries to both
train teachers and mentor local teacher trainers. Course content moved from subject-related training
to subject cluster training, to reflect the specialization policy.
89
Short intensive face-to-face English training courses were organized for all primary and secondary
teachers during their long holidays. Over 700 Rwandan mentors were recruited and given a training
of trainers’ course; they help teachers improve their English language skills throughout the year.
Impact of the 9YBE
The 9YBE programme faced considerable challenges, to develop effective implementation strategies
for the large-scale investment in improved quality, expanded capacity, and managed growth, on the
basis of a nationwide community-based approach, and considering limited capacities in local planning
and implementation.
Nevertheless, the full-scale implementation of the programme was achieved in January 2009, six
years ahead of the 2015 target. In addition to the expansion of school infrastructure, its impact is
reflected in the rapid improvement in primary and lower secondary education indicators: (i) the total
number of primary students increased from 1.48 million in 2000/01 to 2.24 million in 2011, and the
primary net enrolment rate increased from 91.2 percent in 2003 to 96.5 percent in 2012 (98 percent
for girls and 95 percent for boys); (ii) the transition rates to lower and upper secondary reached 94
percent in 2010; (iii) the basic education completion rate rose from 52.5 percent in 2008 to 78.6
percent in 2011; and (iv) both repetition and dropout rates dropped, to 12.7 percent and 10.9
percent respectively, in 2011.
Lessons Learned
The sustainability of the 9YBE programme was largely made possible through the ownership of the
programme by communities, through their role in the design and construction of durable
infrastructure, increased participation in school management and their general involvement in school
affairs. Top leadership commitment, the strong decentralization policy and functional and broadly
participative decentralization structures, sensitization and public awareness, team work, effective
vertical and horizontal communication and extensive preliminary strategy research and studies were
also critical to success. With respect to school management (in particular the double shifting, core
course reduction and teacher specialization strategies), the combination was key for the
achievement of results: double shifting would not save on teachers without specialization, and if
implemented without a reduction of core courses, would have reduced the quality of education.
The continued improvement in quality, access, participation and completion implies the ongoing
prioritisation of the sector and increased investment in education at all levels, despite competing
budget priorities.
Building on its success, the 9YBE programme was extended to 12 years of basic education in 2012. In
2014, the first cohort of students who started UPE in 2003 and progressed through the 9YBE and
12YBE will complete upper secondary school.
Source: Ministry of Education, September 2014 (Edited version).
90
4: THE APPROACH ADOPTED BY MAINLAND TANZANIA REGARDING EFA GOAL 3 - Extending the Scope and Coverage of Complementary Basic Education
Before the turn of the new millennium, an estimated 2.5 million primary school-aged children were
out-of-school in mainland Tanzania. Some of the reasons attributed to this situation include early
pregnancies and marriages, poverty, long distances to school, parents’ negative perception of the
importance of education, nomadic lifestyles and child labor. More importantly, low efficiency in some
primary schools contributed to dropout. Children with disabilities are adversely affected, representing
only 0.3 percent of enrollment in 2012/13.
The education prospects of these out-of-school children were further dashed by a new policy
directive included in the Primary Education Development Programme (PEDP), whereby only children
of official school age (7-10 years) would be entitled to enroll in primary Standard I, as a measure to
encourage timely schooling and combat illiteracy.
Offering a Second Chance of Education to Out-of-School Youth: The COBET Programme
The Complementary Basic Education in Tanzania (COBET) programme was launched in 1999 to
complement formal primary schooling in the delivery of education to out-of-school children aged 11
to 18 years, to ensure the right to basic education was universal, in line with Tanzania’s values and
development goals. It began as a pilot project in five districts (Kisarawe, Masasi, Musoma, Ngara and
Songea). Not only did the programme provide children who had missed out on formal primary
schooling or those who had dropped out with a second chance of education, but it demonstrated an
ability to provide full basic education to children in a reduced timeframe, proving to be very cost-
effective. It was also a spring board for the concept of child-friendly school environments.
The initiative was scaled up countrywide in 2003/04, in the framework of the Medium-Term Strategy
for Adult and Nonformal Education (2003/04 – 2007/08). This was initially planned as a short-term
measure, to clear the backlog of out-of-school children.
The COBET programme caters for two age groups: Cohort One for children aged 11-13 years and
Cohort Two for children aged 14-18 years. Cohort One learners study for two to three years before
sitting the National Standard IV Examination; if successful, they are mainstreamed into a formal
primary school Standard V class. Cohort Two learners study for three years before sitting the Primary
School Leaving Examination (PSLE); if successful, they are mainstreamed into formal secondary
education.
Study sessions are conducted in premises identified and prepared by communities, such as primary
school classrooms, local government offices, or church-owned and community buildings, according to
a flexible time-table. This has contributed to the low capital costs of the programme. Each learning
center provides teaching by two facilitators: a primary school teacher, in addition to her/his formal
teaching duties, and a para-professional facilitator who follows a special two-week training course.
Both are paid a modest motivational stipend by the government.
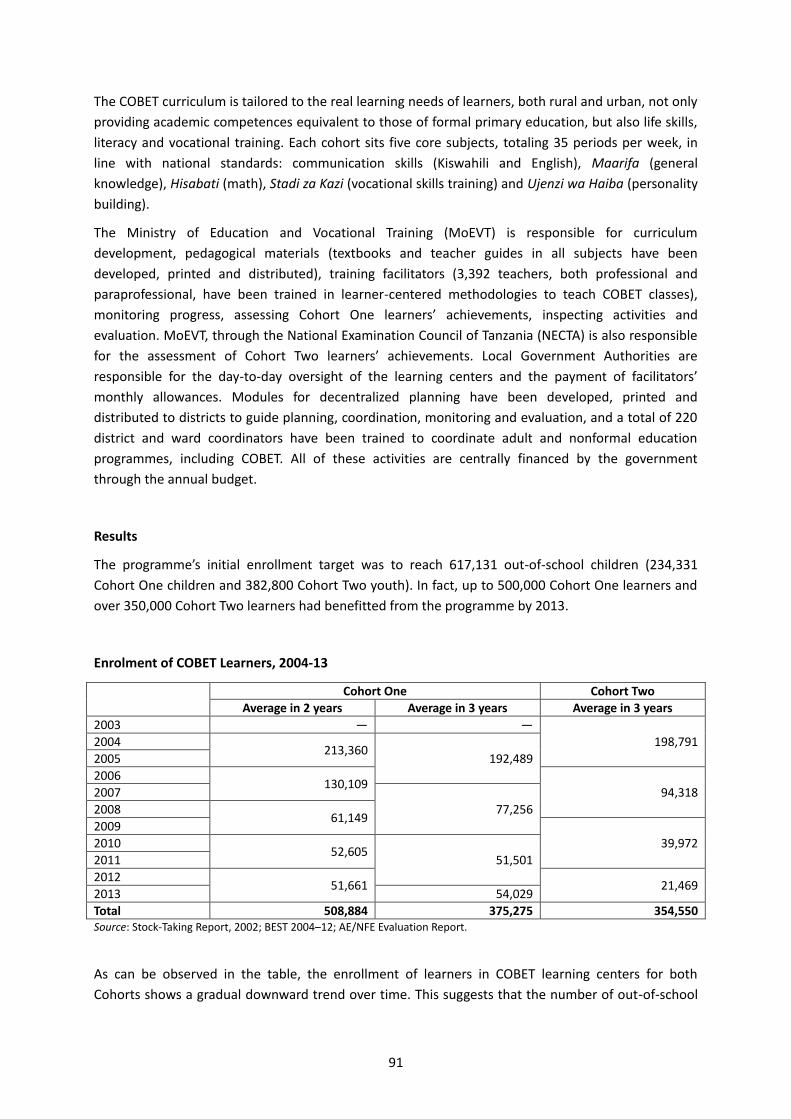
91
The COBET curriculum is tailored to the real learning needs of learners, both rural and urban, not only
providing academic competences equivalent to those of formal primary education, but also life skills,
literacy and vocational training. Each cohort sits five core subjects, totaling 35 periods per week, in
line with national standards: communication skills (Kiswahili and English), Maarifa (general
knowledge), Hisabati (math), Stadi za Kazi (vocational skills training) and Ujenzi wa Haiba (personality
building).
The Ministry of Education and Vocational Training (MoEVT) is responsible for curriculum
development, pedagogical materials (textbooks and teacher guides in all subjects have been
developed, printed and distributed), training facilitators (3,392 teachers, both professional and
paraprofessional, have been trained in learner-centered methodologies to teach COBET classes),
monitoring progress, assessing Cohort One learners’ achievements, inspecting activities and
evaluation. MoEVT, through the National Examination Council of Tanzania (NECTA) is also responsible
for the assessment of Cohort Two learners’ achievements. Local Government Authorities are
responsible for the day-to-day oversight of the learning centers and the payment of facilitators’
monthly allowances. Modules for decentralized planning have been developed, printed and
distributed to districts to guide planning, coordination, monitoring and evaluation, and a total of 220
district and ward coordinators have been trained to coordinate adult and nonformal education
programmes, including COBET. All of these activities are centrally financed by the government
through the annual budget.
Results
The programme’s initial enrollment target was to reach 617,131 out-of-school children (234,331
Cohort One children and 382,800 Cohort Two youth). In fact, up to 500,000 Cohort One learners and
over 350,000 Cohort Two learners had benefitted from the programme by 2013.
Enrolment of COBET Learners, 2004-13
Cohort One Cohort Two
Average in 2 years Average in 3 years Average in 3 years
2003 ― ―
198,791 2004 213,360
192,489 2005
2006 130,109
94,318 2007
77,256 2008 61,149
2009
39,972 2010 52,605
51,501 2011
2012 51,661 21,469
2013 54,029
Total 508,884 375,275 354,550 Source: Stock-Taking Report, 2002; BEST 2004–12; AE/NFE Evaluation Report.
As can be observed in the table, the enrollment of learners in COBET learning centers for both
Cohorts shows a gradual downward trend over time. This suggests that the number of out-of-school

92
children in the communities has diminished as a result of parents sending their children to formal
primary schools. Further successes include:
An average of 86 percent of Cohort One COBET learners are mainstreamed into Standard V;
A total of 5,021 Cohort Two COBET learners passed the PSLE and enrolled in formal
secondary schools. Others joined vocational training centers started work;
Some COBET learning centers have grown into fully fledged primary schools as a result of
enrolling many out-of-school children from their neighborhoods every year;
The implementation of the COBET curriculum influenced the adaptation of the primary
education curriculum in order to become more child-friendly and use participatory teaching
and learning methodologies.
Challenges, Lessons Learned and Outlook
Despite the achievements, the effective and efficient provision of education to all school-aged
children (7-18 years) is still challenged by a significant number of out-of-school children (estimated at
1.7 million). Other related challenges are the improvement of the quality of education in schools and
nonformal education centers; further enhancing community awareness of the importance of
education; financing, to meet the costs of materials, training and teacher allowances to motivate
them and increase their commitment; and follow-up and assessment.
The COBET programme has proven effective in addressing the plight of socially, economically and
culturally disadvantaged children. More than a temporary measure, the programme has become a
permanent intervention to cater for the learning needs of children from disadvantaged environments,
school drop outs and slow learners. This is in part due to its cost-effectiveness: children can acquire
the intended learning in two to three years instead of the seven required by formal primary
education.
In recognition of the importance of COBET and similar interventions, the government of Tanzania has
incorporated the COBET programme in the Literacy and Numeracy Support (LANES) project, for
implementation from 2014/15 to 2016/17. It is expected that through this project, some 50,400 out-
of-school children will benefit countrywide. Furthermore, the Integrated Post Primary Education
(IPPE) programme has been established and is now being piloted in seven districts, integrating pre-
vocational and secondary education, for youth graduating from COBET centers, especially girls. Given
the results, the government must continue to set aside a significant budget for the COBET
programme.
Source: Ministry of Education and Vocational Training, December 2014 (Edited version).
93
5: THE APPROACH ADOPTED BY ANGOLA REGARDING EFA GOAL 3 - Expanding Access to TVET and Lifeskills Training
At the time of the World Education Forum in April 2000, the Republic of Angola continued to face a
widespread situation of political-military instability, which affected overall education system
performance, structurally and transversally, in terms of access, equity and quality. Peace was
consolidated over the 2002-04 period, enabling the definition of plans, programmes and projects for
sustainable development, such as the National Development Plan that set national goals for the
2013-17 period.
In line with the recommendations of the 2nd International Congress on technical and vocational
education held in Seoul in April 1999 and with the Dakar recommendations, this plan includes two
priority and structural axes relating to EFA Goal 3, namely: (i) youth’s access to the workplace; and (ii)
the sustainable promotion and revalorization of human resources. Specific focus has been placed on
expanding the public network of basic and intermediate technical training institutions. Indeed, in
2001 only 3 polytechnic institutes existed (2 in the province of Luanda, and 1 in Benguela).
Several institutions share the responsibility for public policies that address the educational needs of
youth and adults, including (i) the Ministry of Education, which provides intermediate technical
training; and (ii) the Ministry of Public Administration, Work and Social Security, with integrated and
diversified basic vocational training processes, through the National Institute for Employment and
Vocational Training.
Actions
The creation of Labor Force Access Groups (GIVAs) was promoted through the School-Enterprise
Relations Policy, as well as thanks to public and private companies that promote vocational
opportunities. The GIVAs, created within schools at the national and local levels, aim to support,
inform, guide and accompany pupils in their schooling careers and in their transition from education
to the workplace, encouraging their economic integration.
A topic on the art of entrepreneurship has been included in the secondary education curriculum, to
provide pupils with the skills required to develop income generating activities.
Various partnerships have been developed since 2008 by the Ministry of Education, to promote the
training, qualification and employment of youth and adolescents, with CHEVRON, UNDP and UNIDO,
as well with the support of the governments of Portugal and the Republic of Korea. For instance, a
partnership was established with the Angolan Industrial Association for a double training course,
covering theory (in class) and practice (through internships), the association assuming the role of
social partner in learners’ training plans.
These efforts are currently being pursued through a number of initiatives that aim to improve both
course content, and coverage.

94
The Nature of Training
To improve technical and vocational training programmes, the main initiatives have been to:
Elaborate a plan for the design of new courses, aligned with the National Executive Training
Plan and the Vocational Training Plan, with regional coverage that reflects local production
and employment needs, and that tends to redress provincial-level disparities;
Start to revise and update the technical and vocational training (TVT) reform plan; and
Develop general foundations for technical and technological training, that link intermediate
training with higher education and vocational training.
Expanding Training Supply
The implementation of these programmes implies, among others, the annual planning process of the
preparation and launch of new courses, at the national and provincial levels; the planning of required
infrastructure and equipment; and the recruitment and preparation of the required human
resources. Key activities in this area include:
The publication of a TVT Teaching Staff Status, to ensure that different players (teachers,
directors, inspectors, administrators and other managers) receive ongoing training, and to
link their career progression to the assessment of their performance and their professional
and scientific qualifications;
The promotion of specialized TVT officer training, by topic, nationwide, in pedagogical,
didactic, technical and organizational areas;
The assessment and analysis of employment opportunities for TVT leavers and their effective
activities, through an information system and observatory; and
The promotion of the diversification of public and private TVT promoters, in particular with
the launch of new strategic courses.
There is moreover a national vocational training network, under the authority of the National
Institute for Employment and Vocational Training, that comprises 560 centers, 182 of which are
public (3 are rural) and 378 of which are private. They include, among others, Integrated Centers for
Employment and Vocational Training, Rural Schools for Capacity-Building and Crafts, Integrated
Technological Training Centers and Mobile Vocational Training Units.
Results
Despite the recent implementation of these initiatives, some results are already noteworthy:
The number of public technical training institutes has risen from 3 in 2001 (in 2 provinces) to
97 in 2014 (in all 18 provinces), covering polytechnics, administration, management and
services, agrarian sciences and health sciences;
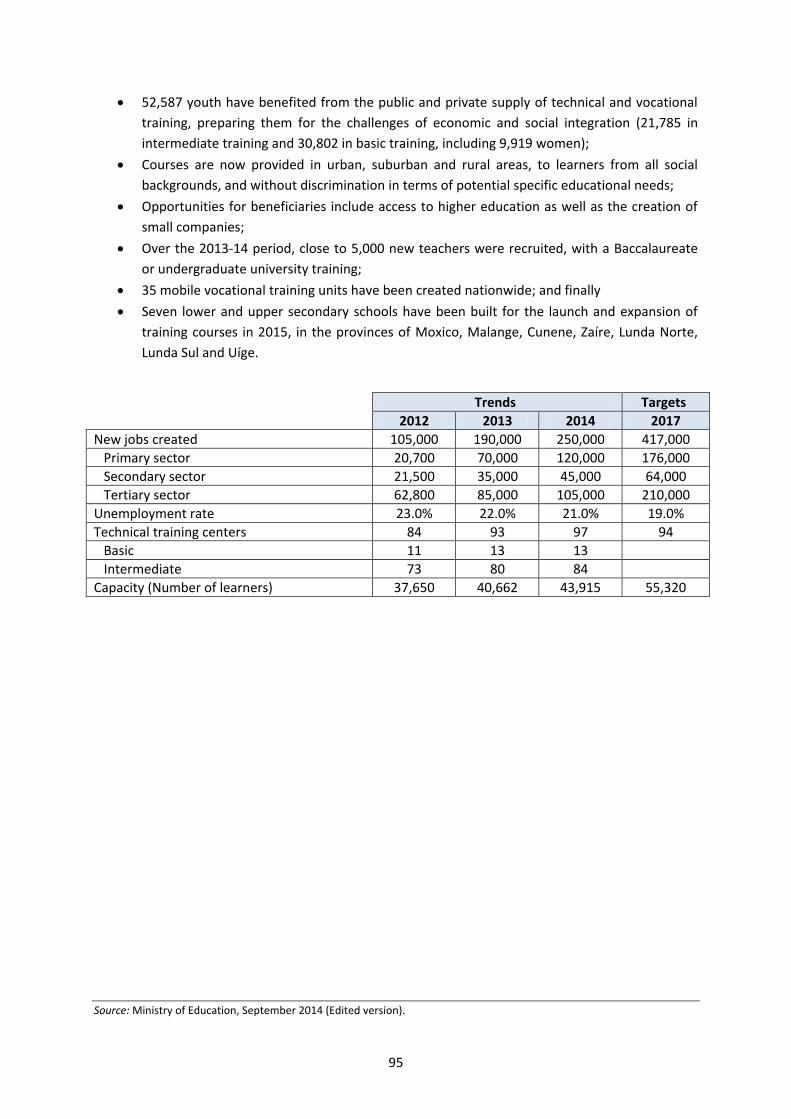
95
52,587 youth have benefited from the public and private supply of technical and vocational
training, preparing them for the challenges of economic and social integration (21,785 in
intermediate training and 30,802 in basic training, including 9,919 women);
Courses are now provided in urban, suburban and rural areas, to learners from all social
backgrounds, and without discrimination in terms of potential specific educational needs;
Opportunities for beneficiaries include access to higher education as well as the creation of
small companies;
Over the 2013-14 period, close to 5,000 new teachers were recruited, with a Baccalaureate
or undergraduate university training;
35 mobile vocational training units have been created nationwide; and finally
Seven lower and upper secondary schools have been built for the launch and expansion of
training courses in 2015, in the provinces of Moxico, Malange, Cunene, Zaíre, Lunda Norte,
Lunda Sul and Uíge.
Trends Targets
2012 2013 2014 2017
New jobs created 105,000 190,000 250,000 417,000
Primary sector 20,700 70,000 120,000 176,000
Secondary sector 21,500 35,000 45,000 64,000
Tertiary sector 62,800 85,000 105,000 210,000
Unemployment rate 23.0% 22.0% 21.0% 19.0%
Technical training centers 84 93 97 94
Basic 11 13 13
Intermediate 73 80 84
Capacity (Number of learners) 37,650 40,662 43,915 55,320
Source: Ministry of Education, September 2014 (Edited version).
96
6: THE APPROACH ADOPTED BY NIGER REGARDING EFA GOAL 4 - Functional Literacy for Women
In Niger, women represent the majority of the illiterate population. Indeed, a 1985 assessment
highlighted the fact that their specific training needs were not covered by literacy programmes. To
rectify this situation, a “Women’s Literacy” office was created in 1986 and a specific functional
literacy programme designed. Despite these arrangements, the situation did not change significantly,
given that in 2000 Niger’s illiteracy rate was 80.1 percent, with marked disparities between women
(85 percent) and men (57 percent).
With a literacy rate of 19.9 percent, Niger was particularly committed, in line with the EFA goals set
in Dakar in 2000, to “improve adult literacy levels, and those of women in particular, by 50 percent by
2015, and provide all adults with equitable access to basic and ongoing education programmes.” The
government therefore adopted the 10-year education development programme (Programme
décennal de développement de l’éducation - PDDE) in 2003. The PDDE’s main goal is to “ensure that a
universal, equitable and quality basic education system is widespread by 2013.”
The PDDE’s literacy and nonformal education (AENF) component includes goals to: increase the
literacy rate, particularly in rural areas and among women; and improve the relevance of courses
offered, in terms of vocational competencies and lifeskills. The achievement of these goals was to
translate into: (i) the inclusion of 65 percent of women within the targets established for AENF
activities; and (ii) the implementation of specific programmes for target beneficiary groups. This
arrangement, coupled with others, was to achieve an improvement of the literacy rate, to reach 38
percent by 2013.
Actions
With the launch of the PDDE, a General Department for Literacy was created, comprising four
technical units, including the Directorate for Literacy and Adult Education Programmes (DPAFA). The
DPAFA reviewed the women’s literacy programme: (i) initially designed for a duration of four months,
the length was extended to six months; (ii) themes relating to associative life and the management of
income-generating activities were incorporated; (iii) in addition to French, programme materials
were translated into five local languages (Hausa, Zarma, Fulfuldé, Kanuri and Tamajeq) to facilitate
the broad adoption of the programme by women in rural areas.
This expansion has occurred in all eight regions, under national financing and with the support of key
partners, including UNICEF and UNESCO. These were joined by the African Development Fund’s
education programme, financed by the African Development Bank (ADB). With the support of this
project, the construction and equipment of Ongoing Education Centers (Foyers d’éducation
permanente - FEP) was launched. These centers provide appropriate frameworks for lifelong learning,
and some guarantee of the sustainability of learning outcomes. The centers have provided
97
beneficiaries with their own facilities, not only to learn literacy, but also to practice their income-
generating activities and improve their living conditions.
Throughout training, beneficiaries are organized into groups, which are formalized with the technical
support of deconcentrated literacy services but on their own funds. They are endowed with legal
documents (internal regulations and statutes) that determine their organization and operations, and
the groups’ management committee members are trained in associative life and management. Each
group pursues the practical and productive activities learned during their training (sewing,
embroidery and knitting) on an ongoing basis, thanks to the financial support received as well as to
other lucrative activities. Minor contributions are levied from learners, which have enabled the
programme to become sustainable.
Over time, the groups have become permanent autonomous, with their own suitable facilities (the
FEPs), within which learning and practice activities are carried out. The teaching/learning activities
are led by earlier beneficiaries, for a stipend or not, depending on whatever arrangement a given
group agrees on.
Between 2001 and 2005, Niger experimented with a new approach that linked communities, the
government and local players in the implementation of literacy programmes. This approach was led
by the Canadian Center for Research and International Cooperation for the implementation of the
Project Supporting Nonformal Education (Projet d’appui à l’éducation non formelle - PADENF),
financed by the Canadian International Development Agency.
The same approach was adopted for the execution of the Development of Nonformal Education
Programme (Programme de développement de l’éducation non formelle - PRODENF) component of
the PDDE during its first phase. For this phase, fairly significant financing was mobilized, with the
World Bank at the forefront. Several partners such as CARE International (through the national NGO
Mata Masu Dubara), Catholic Relief Service and the Swiss Cooperation contributed to support
communities. This enabled a high level of participation of women in literacy activities, from 2003 to
2007.
In 2008, a literacy programme budget line was created to redistribute the funds allocated to basic
education. This initiative helped to better account for the literacy and nonformal education
subsector. In the Education Policy Paper (2013-20) and the 2014-24 Education and Training Sector
Programme (Programme sectoriel de l’éducation et de la formation - PSEF), new measures were
adopted, such as the diversification of supply, considering specific target groups and the
sustainability of outcomes with the construction and equipment of Ongoing Education Centers.
Every year, community sensitization campaigns on women’s literacy and girls’ education are
organized. Facilitators are recruited and trained in line with the number of centers, which are
equipped with teaching and learning materials.
Results
From 2003 to 2007, 128,370 of the 199,668 adults registered in literacy centers were women, or 64.3
percent. Over the 2012-13 period, 1,811 centers were opened, of which 793 are women-only (and
706 are mixed-gender). In 2013-14, 1,897 further centers were opened, of which 835 are women-
only, and the building of 50 ongoing education centers is underway. Thanks to this:
98
131,100 women and young girls have received functional literacy training in the women-only
centers;
2,201 groups have been created;
2,433 management committee members of the women’s groups have been trained in
associative life and the management of income-generating activities; and
149 Ongoing Education Centers (FEPs) have been built and equipped, in addition to the 50
whose construction is underway.
Overall, the adult literacy rate has increased from 9 percent in 2000 to 29 percent in 2007,
representing a 224 percent increase over seven years (ENBC III/2007-08). Although a gender gap
continues to exist, the literacy rate for women has nevertheless increased to 17.1 percent (against
42.8 percent for men), and that of young women (aged 15 to 24 years) has reached 23.2 percent
(against 52.4 percent for young men).
Lessons Learned
Addressing the specific needs of women and involving communities through information and
sensitization sessions have facilitated the ownership of literacy activities at all levels.
The creation of groups has enabled women to become more active and emancipated, no
longer hesitating to raise their voice in public with respect to issues of concern to them, and
participating in development activities and in local-level decision making.
Building Ongoing Education Centers and training their management committee members in
associative life and management has guaranteed the sustainability of results, the set-up of
income-generating activities and women’s greater autonomy.
Nevertheless, some shortcomings have been noted in terms of programme implementation, the
most critical being related to the practice of productive activities, as individual activity is given
priority over collective activities. This represents an obstacle to the development of the associative
spirit and to the management and survival of the groups. To deal with this challenge, the
management is giving sensitization a special role and foresees the reactivation of state monitoring
and evaluation mechanisms.
Source: Ministry of Primary Education, Literacy, Promotion of National Languages and Civic Education, August 2014 (Edited
version).
99
7: THE APPROACH ADOPTED BY SENEGAL REGARDING EFA GOAL 5 - The Primary Gender Parity Index and the Promotion of Girls’ Education
The gender parity index for primary was 0.87 in 2000. Indeed, the gross enrollment rate (GER) for
primary was 62.3 percent for girls, against 71.9 percent for boys. At this time, the constraints noted
in girls’ education included the lack of a policy incentivizing and promoting girls’ education and its
inclusion in national and deconcentrated budgets; the dispersion of activities and the absence of
capitalization of good practices; the persistence of some sociocultural stereotypes; the lack of
consideration of gender-specificity in educational supply, in particular in terms of infrastructure and
the curriculum; as well as poverty and the non-registration of births.
Given this situation, the Senegalese government set the following goals, in collaboration with
technical and financial partners and other players. To:
Define a coherent and proactive girls’ education policy, considering families’ expectations;
Improve synergies between governmental and partners’ activities;
Develop communication and information sharing on girls’ education among all players;
Develop advocacy for girls’ education targeting education community players, local
authorities and school partners;
Organize action-research on the issue of gender parity in education; and
Ensure the monitoring and evaluation of the different initiatives undertaken, creating a girls’
education monitoring mechanism.
Activities
For several years, Senegal has been strongly committed to the elimination of gender disparities, as
well as to the improvement of the effectiveness, efficiency and relevance of equity in the education
system.
Policy and Institutional Framework
A number of key activities have positively contributed to the achievement of results. The execution of
the 10-year Education and Training Programme (Programme décennal de l’éducation et de la
formation - PDEF), from 2000 to 2010, has encouraged gender parity through the efforts focusing on
universal education. In its wake, the 2013-25 Quality, Equity and Transparency Improvement
Programme (Programme d’amélioration de la qualité, de l’équité et de la transparence - PAQUET) has
included the reduction of gender disparities as a strategic axis.
More specifically, the production of a diagnostic study of gender issues, in December 2006, has
helped to better focus efforts and has contributed to guide the elaboration of a policy paper, the
2009-11 Girls’ Education Development Plan (Plan de développement de l’éducation des filles 2009-11)
in December 2008, as well as the elaboration of a reference document on girls’ education in 2011.
On the institutional level, a Framework for the Coordination of Interventions for Girls’ Education
(Cadre de coordination des interventions sur l’éducation des filles - CCIEF) has been developed, with
local gender offices at the deconcentrated level (regions, departments and schools), and a technical
counselor responsible for gender has been appointed.
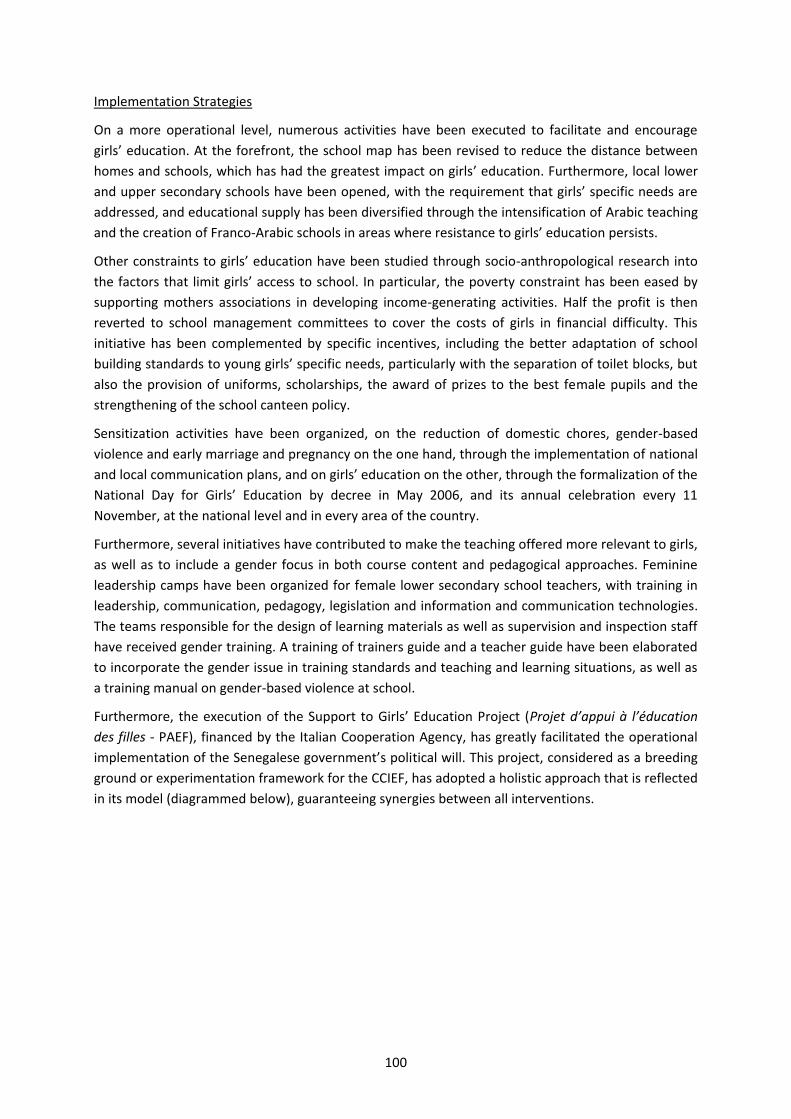
100
Implementation Strategies
On a more operational level, numerous activities have been executed to facilitate and encourage
girls’ education. At the forefront, the school map has been revised to reduce the distance between
homes and schools, which has had the greatest impact on girls’ education. Furthermore, local lower
and upper secondary schools have been opened, with the requirement that girls’ specific needs are
addressed, and educational supply has been diversified through the intensification of Arabic teaching
and the creation of Franco-Arabic schools in areas where resistance to girls’ education persists.
Other constraints to girls’ education have been studied through socio-anthropological research into
the factors that limit girls’ access to school. In particular, the poverty constraint has been eased by
supporting mothers associations in developing income-generating activities. Half the profit is then
reverted to school management committees to cover the costs of girls in financial difficulty. This
initiative has been complemented by specific incentives, including the better adaptation of school
building standards to young girls’ specific needs, particularly with the separation of toilet blocks, but
also the provision of uniforms, scholarships, the award of prizes to the best female pupils and the
strengthening of the school canteen policy.
Sensitization activities have been organized, on the reduction of domestic chores, gender-based
violence and early marriage and pregnancy on the one hand, through the implementation of national
and local communication plans, and on girls’ education on the other, through the formalization of the
National Day for Girls’ Education by decree in May 2006, and its annual celebration every 11
November, at the national level and in every area of the country.
Furthermore, several initiatives have contributed to make the teaching offered more relevant to girls,
as well as to include a gender focus in both course content and pedagogical approaches. Feminine
leadership camps have been organized for female lower secondary school teachers, with training in
leadership, communication, pedagogy, legislation and information and communication technologies.
The teams responsible for the design of learning materials as well as supervision and inspection staff
have received gender training. A training of trainers guide and a teacher guide have been elaborated
to incorporate the gender issue in training standards and teaching and learning situations, as well as
a training manual on gender-based violence at school.
Furthermore, the execution of the Support to Girls’ Education Project (Projet d’appui à l’éducation
des filles - PAEF), financed by the Italian Cooperation Agency, has greatly facilitated the operational
implementation of the Senegalese government’s political will. This project, considered as a breeding
ground or experimentation framework for the CCIEF, has adopted a holistic approach that is reflected
in its model (diagrammed below), guaranteeing synergies between all interventions.
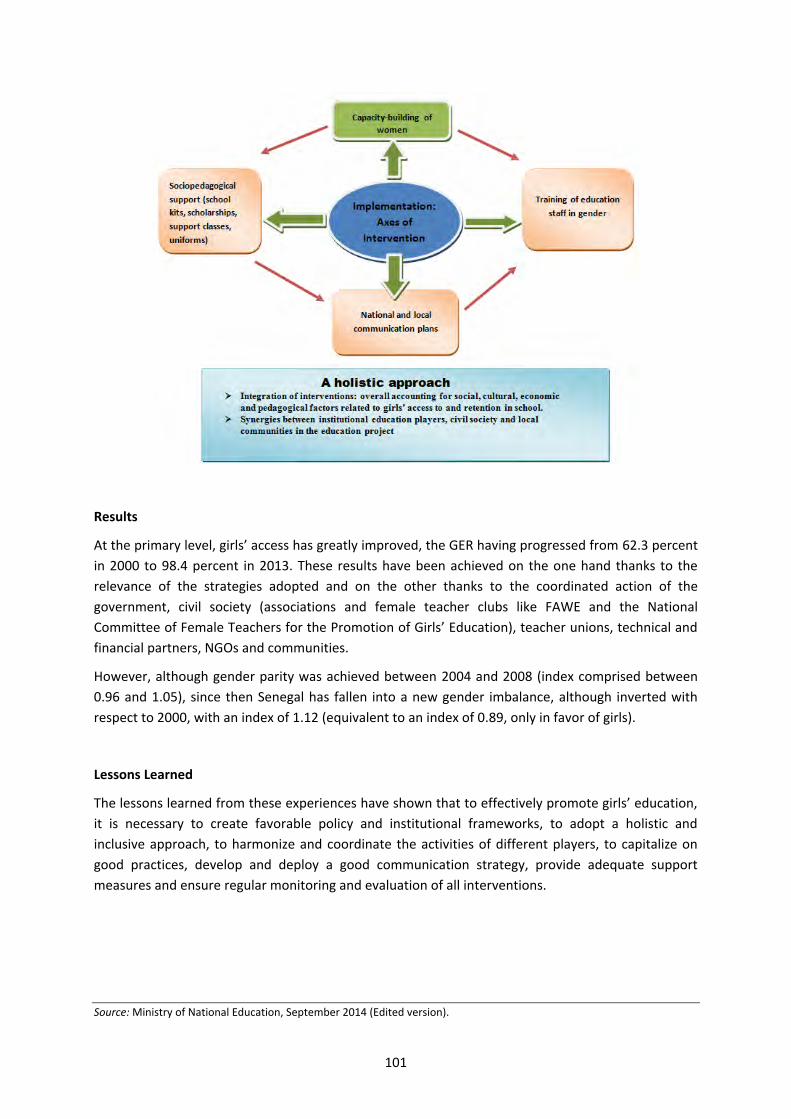
101
Results
At the primary level, girls’ access has greatly improved, the GER having progressed from 62.3 percent
in 2000 to 98.4 percent in 2013. These results have been achieved on the one hand thanks to the
relevance of the strategies adopted and on the other thanks to the coordinated action of the
government, civil society (associations and female teacher clubs like FAWE and the National
Committee of Female Teachers for the Promotion of Girls’ Education), teacher unions, technical and
financial partners, NGOs and communities.
However, although gender parity was achieved between 2004 and 2008 (index comprised between
0.96 and 1.05), since then Senegal has fallen into a new gender imbalance, although inverted with
respect to 2000, with an index of 1.12 (equivalent to an index of 0.89, only in favor of girls).
Lessons Learned
The lessons learned from these experiences have shown that to effectively promote girls’ education,
it is necessary to create favorable policy and institutional frameworks, to adopt a holistic and
inclusive approach, to harmonize and coordinate the activities of different players, to capitalize on
good practices, develop and deploy a good communication strategy, provide adequate support
measures and ensure regular monitoring and evaluation of all interventions.
Source: Ministry of National Education, September 2014 (Edited version).
102
8: THE APPROACH ADOPTED BY SWAZILAND REGARDING EFA GOAL 6 - Quality Primary Education in Swaziland
A number of children in Swaziland fail the end of primary examinations because of English, and even
those who pass do not perform well. English is a failing subject. The nation became concerned about
what were termed “falling standards of education,” referring to low performance in English and
Sciences at all levels. In 2000, the SACMEQ II Research Project also confirmed relatively low levels of
performance in reading (English) and mathematics, with scores of 530 in reading (placing Swaziland
in 5th position among 15 participating countries) and 517 for mathematics (6th position). It was also
noted that a majority of primary school children were not reaching the minimum required levels of
achievement in either subject. Performance in English was a particular concern, as it impacts
children’s learning ability in other subjects.
It was therefore critical improve literacy and numeracy levels to enable children to improve their
performance levels. To achieve this, the overall learning process and experience required review,
including the updating of the curriculum and the appropriate allocation of the required learning and
teaching materials at the primary level.
Subject Panel Reviews of Reading and Math Performance
Subject panels exist in all subject areas in Swaziland. They were created to monitor, evaluate and
manage the content and delivery of the respective subject curriculum. These panels consist of
teachers, inspectors and curriculum designers in each subject area. The Director of Education
instructed the Reading and Mathematics Subject Panels to analyze the SACMEQ II results and identify
all weak areas in the curriculum, based on the Swaziland SACMEQ II report. SACMEQ results had
clearly spelt out areas in which pupils were lacking in both subject content and specified achievement
levels. The panels were then able to focus on those areas that required adjustment. A number of
workshops were held with teachers and the curriculum department to diagnose the issues identified
in each subject. A number of observations were made based on the findings of the SACMEQ II
research:
Although all pupils had textbooks (reading and mathematics) some were not allowed to take
them home as these books belonged to the schools under the Book Rental Scheme at that
time;
Some schools lacked extra reading materials (library books), and those that did have books
provide no time for reading and did not allow pupils to take the books home; and
Homework was given but seldom marked.
The subject panel teams came up with strategies to improve the reading and mathematics levels.
One of the suggestions included the provision of library books and materials to all primary schools
and that pupils should be allowed to take their textbooks and library books home. For this to be a
viable option the government had to ensure that there were enough books in schools.
103
Book Procurement
This demanded procurement of additional books and learning materials. This injection of textbooks
cost about E 17 million (US$ 2 million) in the 2007/2008 school year, equivalent to about 5 percent of
the Ministry budget. For some years the government sustained this budget commitment to ensure
that all pupils had adequate books. This initiative also included the provision of workbooks and
teacher guides to all schools. Initially, books were not taken home for administrative reasons, such
as:
Concerns that books would be lost and not replaced, most children being orphans or
vulnerable children who would not have been able to repay them; and
As audit teams were expected to visit schools, head teachers feared being charged with poor
management if some books were found to be missing.
In some schools these books and materials would be found under lock and key in class cupboards. It
took this initiative and capacity building in managing these resources for schools to begin to allow
books to be taken home. Schools also introduced book-tracking systems; despite the challenge this
represented, there was nevertheless an increase in the number of pupils who took books home.
The government, working with partners, secured additional learning materials and initiated a
programme to supply textbooks in all core subject areas to all primary school-going children in public
schools. Under this initiative the Ministry was supported by a European Union (EU) project, which
provided reading and mathematics materials and cupboards to all primary schools (600 schools) in
the country, from Grade 1 to Grade 4. These materials acted as a good foundation for further
development.
These initiatives gradually led to the institutionalization of the Free Textbook and Stationery
programme, to ensure that every child has a book to him/herself.
Pedagogical Training and Monitoring of Teachers
In service workshops were held for primary school teachers, including professional lesson plans and
the importance of marking homework to track individual pupils’ performance. In addition, school
inspectors visited all low performing schools and offered additional in-service training to teachers as
required.
Results
All primary schools have classroom libraries and children are allowed to borrow books, take them
home and receive learning assistance, even at home. In addition, the government revised its book
rental policy and now procures textbooks for all primary pupils. The current pupil-textbook ratio in
Swaziland at the primary level is 1:1, and every child has all the exercise books needed for school.
The proportion of pupils owning a reading textbook increased from 74.3 percent in 2000 to 99.2
percent in 2007, with roughly the same impact being observed in mathematics where textbook
ownership increased from 74.7 percent in 2000 to 99.8 percent in 2007.
With the further impact of a school feeding programme implemented by the government with
assistance from partners to provide all children with at least one full nutritious meal per day, these
104
changes resulted in increased attendance and reduced drop-out rates, as well as having a positive
impact on children’s performance at school. Indeed, the SACMEQ III evaluation carried out in 2007
showed improved achievement levels for Swaziland in both reading and mathematics: the reading
score increased by 19 points, to 549, and the country’s mathematics average score increased by 34
points, to 549. Thus, 93 percent of primary Grade 6 pupils achieved the minimum level in reading
(making Swaziland the 1st country out of 14 participating in this respect) and 56 percent in math
(placing Swaziland in 5th position, almost on par with the 3rd and 4th countries).
Lessons Learned
Encouraging children to read and practice mathematics during their spare time improves
performance. Providing extra reading materials for children to use in school and also allow them to
take home improves their literacy and numeracy levels. Swaziland considered research in ensuring
that all pupils get a solid foundation in the first four years of their education – this indicates that it is
necessary to always monitor and evaluate education system performance so as to improve its
effectiveness. School feeding is also very important in third world countries, where for some children
it is the only daily meal: it encourages children to stay in school, improving survival rates. Child-
centered approaches also contribute to improve children’s performance.
Source: Ministry of Education and Training, July 2014 (Edited version).

105
9: THE PURSUIT OF EFA GOALS IN CABO VERDE – Specific Issues Faced by a Small Island State
The ten islands of Cabo Verde, an archipelago state off the Western coast of Africa, cover barely
433 km². Its geographic characteristics and highly limited water resources make education system
management particularly costly, given the need for regional delegations, multiple infrastructure and
social equipment, as well as the posting of teachers to all the islands. Furthermore, the country faces
ongoing challenges linked to sustainable food production, nutrition, hygiene, sanitation and the lack
of safe water, factors that all have a negative impact on enrollment and pupils’ results. These
primarily affect agricultural areas where poverty is highly concentrated and where children play a
traditional role in domestic chores, agriculture, cattle-breeding and water collection. Nevertheless, in
2000, when the National EFA Plan was elaborated, universal primary education had already been
achieved (net enrollment rate of 96.2 percent) and only 5 percent of the population aged 15 to 24
years was illiterate.
Paradoxically, the number of qualified teachers was insufficient (33.3 percent) and the better
qualified ones were mainly found in urban areas. School infrastructure was inadequate for the
growth of the education system, with only 420 schools in 2001 and multiple cases of triple classroom
shifts (one classroom for three groups). Furthermore, pro-education socioeconomic compensation
mechanisms failed to eliminate disparities in access to compulsory schooling, especially in peripheral
areas and the more disadvantaged communities. Finally the education system’s sustainable
development also implied the modernization of the administrative and pedagogical management of
schools and the improvement of educational quality.
Actions
To address these issues, Cabo Verde elaborated and approved a National EFA Plan in 2002,
complemented by a 10-year Education Strategic Plan in 2003, with well defined policy options and
measures, including in particular:
The reorganization and intensification of teacher training, as well as the improvement of
their working conditions;
The reconversion of the school social action system, with the adoption of a socioeducational
support policy; and
The elaboration and improvement of pedagogical material and the adaptation of curricula.
Infrastructure
To facilitate access to local education services, significant and gradual efforts were devoted to the
reclassification, enlargement and construction of basic and secondary schools, as well as technical
and vocational training institutes and several universities, including a public one. Overall, 127 schools
were reclassified and 21 enlarged, implying the construction and equipment of 147 classrooms on
the islands of São Vicente, São Nicolau, Maio, Santiago, Fogo and Brava. In addition, nine new basic
106
education schools were built on the islands of Santiago (7), Santo Antão and Fogo. The programme
included sport facilities, toilet blocks, kitchens and access to safe water.
Governance
The adopted strategy relied on good management, rigor and transparency, the recognition of local
skills and the pursuit of strategic partnerships. Governance was reinforced through the training of the
education system’s administrative staff, as well as the definition and approval of a modern regulatory
framework. Thus, the country adopted the School Management Law, the Law for the Recovery of
School Fees and Emoluments in Favor of School Attendance, and implemented a coordination,
supervision and control mechanism, from the grassroots (school delegations) to the highest level
(General Education Inspectorate). Secondary schools were given administrative autonomy and
allowed to raise their own resources, their accounts being audited by the General Education
Inspectorate and the treasury.
The quality of the education system was strengthened in particular through the promotion of
innovation through the use of information and communication technologies, and the facilitation of
math and science subject teaching.
Family Participation
To make access to education more equitable, the definition of socioeducational programmes
targeting the most vulnerable families was fine-tuned. A hot meal is offered to most preprimary
children and to all basic education pupils, through the national school feeding programme. A school
health programme has more recently been coupled to this, in an attempt to enhance educational
inclusion and promote the quality of results.
However, despite the fee-free nature of basic education and government financing the production or
subsidizing textbooks, families’ contributions to the cost of education (for supplies and books, school
uniforms, and through a symbolic participation to school meals) is a policy choice that aims to avoid
generating dependency. Thus, 4 percent of national recurrent basic education spending is covered by
families (CSR, 2011). This reflects the fact that Cape Verdeans generally consider education to be a
sound investment in the social and economic future of their children, and have great faith in
education (88.3 percent of families, according to the 2014 GPS study).
New Technologies
Since 2009, the introduction of the Mundu Novu programme promotes teachers’ knowledge and
creativity while simultaneously making learning more attractive and practical. It consists in the
modernization of teaching and school management processes, through information and
communication technologies. In this context, the Ministry of Education and Sport has already trained
3,593 teachers nationwide thanks to digital media (equivalent to 61 percent of staff), produced
multimedia teaching materials and developed a distance-learning system, with the training of
technicians and facilitators. In terms of equipment, 16 interactive blackboards, 44 computer labs (700
computers) and over 1,000 laptops for teachers and pupils have been distributed, as well as other
equipment (screens, projectors and so on), benefitting over 30,000 pupils.
107
Results
After ten years of implementation of the mentioned policies and strategies, clear changes have
occurred throughout the Cape Verdean education system’s subcycles. Data indicate an overall
improvement of indicators and the achievement of several goals:
For preprimary, the national enrollment rate for the 2012/13 school year was 71 percent (65
percent for children aged 4 to 5 years and 80 percent for the last year of preprimary).
The probability of access to the first year of basic education is 99.8 percent (CSR, 2011).
Only 4 percent of pupils cover more than 3 km to get to school.
The basic education enrollment rate was 93.1 percent in 2013 and the completion rate of
91.3 percent.
The majority of basic education teachers (95.5 percent in 2011/12) are trained, as well as
most secondary school teachers (86.3 percent).
86.3 percent of pupils that complete six years of basic education access the secondary level.
The literacy rate for youth aged 15 to 24 years reached 96.9 percent in 2010, with barely a
1 percent gap between men and women.
Lessons Learned
To achieve these results, Cabo Verde has gone to great pains to mobilize budgetary and extra-
budgetary resources, devoting 23 percent of the government budget to education. Political stability,
the implementation of coherent and sequential education policy measures, good governance and the
co-participation of families in education financing have been other general success factors. In
addition:
To expand the coverage of preprimary, at least for the last two years (4/5 year olds),
strengthening public-private partnerships has been fundamental.
Quality has improved through the supervision and control of the system, in particular thanks
to institutional assessments and assessments of the performance of teachers and
headmasters, as well as through particular focus on school management, providing
appropriate training in this area.
The use of new technologies, for distance learning, education system management and
especially the ongoing training of teachers, has helped to reduce the costs related to
insularity and enhance equity in qualified teacher postings throughout the country’s
townships and islands.
Cabo Verde intends to pursue its investment in curricular innovation at the basic and secondary
education levels, giving priority to competency-based approaches, and strengthening civic education,
artistic education, languages, and practical exercises in math and science subjects.
Source: Ministry of Education and Sport, July 2014 (Edited version).

108
10: EDUCATION FOR ALL IN KENYA - Promoting Peace Building in and through Education for All
Since independence in 1963, Kenya has often experienced sporadic violence in different parts of the
country resulting from cattle rustling, land disputes, ethnic clashes, terrorism and disputed elections.
The worst election-related violence was experienced in December 2007 and early 2008, following
contested presidential results. It has also led to the destruction of schools, the disruption of learning
and the displacement of communities in affected areas. Many of the gains the country had registered
in access, retention and quality were severely eroded.
Acknowledging conflict as a major impediment to the realization of EFA, the Ministry of Education,
Science and Technology determined to promote peace-building through education.
Actions
A Peace Education Programme was initiated in 2008 to strengthen education sector responses to
peace building through policy and programmatic interventions, complementing existing initiatives for
promoting peace in and through education, such as the Life skills Education (LSE) programme of early
2007 (that includes teaching of skills that promote peace and peace education as core living values).
The Ministry of Education, Science and Technology (MOEST) subsequently developed the following
strategies and activities to implement the programme:
Development and dissemination of an Education Sector Policy on Peace education;
Development of peace education materials;
Training of education officials on peace education;
Training of teachers on peace education to strengthen the delivery of existing content in the
curriculum (such as Life skills Education);
Establishment of Peace clubs in schools and provision of management guidelines;
Outreach activities to promote peace among communities and build school /community
relations;
Welfare initiatives to promote care and empathy among learners;
Environmental activities, such as tree nurseries, planting and care within schools and on
community land;
Integration of peace themes into music, drama and sports;
Psycho- social interventions in support of teachers and learners affected by conflict;
Promotion of community dialogue through education;
National Peace Education campaign in schools ahead of the 2013 elections; and
Sharing of experiences and expertise through the Inter-Country quality Node (ICQN).
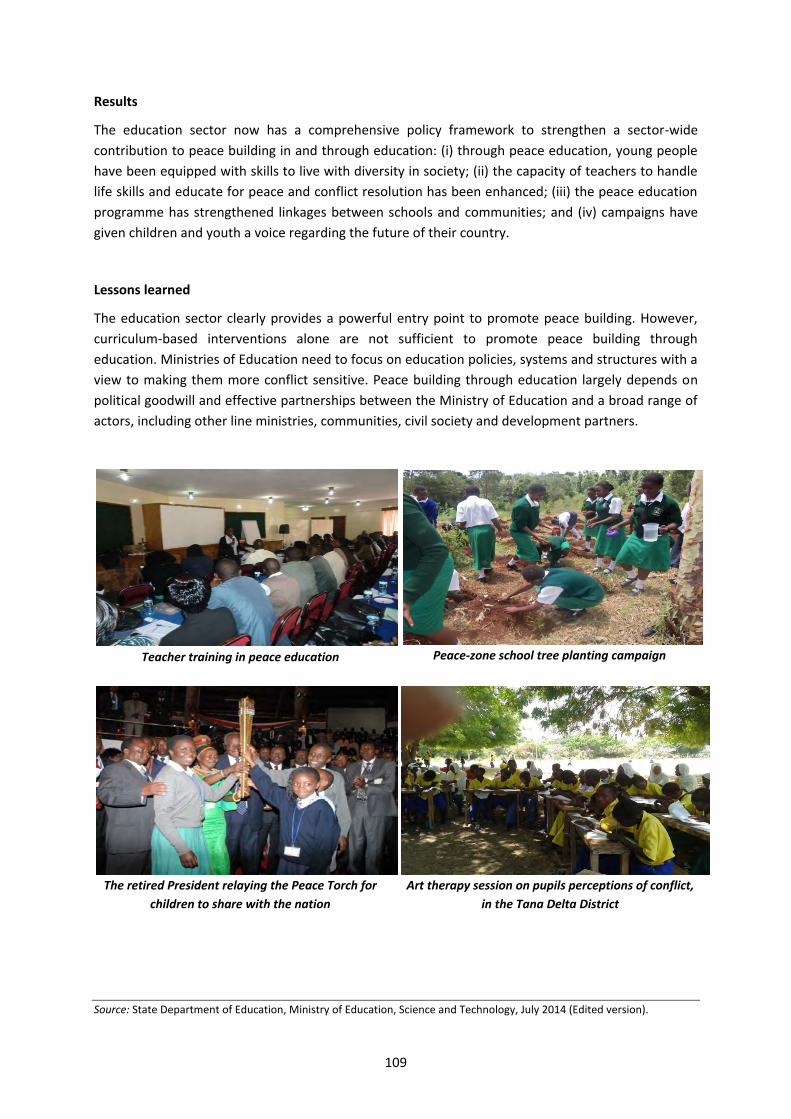
109
Results
The education sector now has a comprehensive policy framework to strengthen a sector-wide
contribution to peace building in and through education: (i) through peace education, young people
have been equipped with skills to live with diversity in society; (ii) the capacity of teachers to handle
life skills and educate for peace and conflict resolution has been enhanced; (iii) the peace education
programme has strengthened linkages between schools and communities; and (iv) campaigns have
given children and youth a voice regarding the future of their country.
Lessons learned
The education sector clearly provides a powerful entry point to promote peace building. However,
curriculum-based interventions alone are not sufficient to promote peace building through
education. Ministries of Education need to focus on education policies, systems and structures with a
view to making them more conflict sensitive. Peace building through education largely depends on
political goodwill and effective partnerships between the Ministry of Education and a broad range of
actors, including other line ministries, communities, civil society and development partners.
Teacher training in peace education
Peace-zone school tree planting campaign
The retired President relaying the Peace Torch for
children to share with the nation
Art therapy session on pupils perceptions of conflict,
in the Tana Delta District
Source: State Department of Education, Ministry of Education, Science and Technology, July 2014 (Edited version).
110
11: EDUCATION FOR ALL IN ZANZIBAR – The Challenges of Education Provision in a Semi-Autonomous Region
The archipelago of Zanzibar, about 40km off the coast of mainland Tanzania, comprises two main
islands (Unguja and Pemba) and a number of other smaller islets, and is divided into 5 regions, 10
districts and 50 constituencies. Population stood at 1.3 million in 2012, growing at 2.8 percent per
year, with 18.6 percent of primary-school age, 51.6 percent of women and 53.7 percent living in rural
areas. Zanzibar joined Tanganyika in 1964 to form the United Republic of Tanzania, but retains
autonomy over all non-union matters, through its own government (the Revolutionary Government
of Zanzibar), parliament (House of Representatives), judiciary and executive (Revolutionary Council).
Zanzibar thus has an independent Ministry of Education and Vocational Training (MoEVT), and
provides 12 years of compulsory basic education (2 years of preprimary, 6 years of primary and 4
years of ordinary secondary). Under the 2006 Education Policy, which aims to expand access and
equity as well as improve the quality and effectiveness of education, several programmes have been
launched and implemented with the collaboration of development partners (World Bank, USAID,
Swedish International Development Agency, UNESCO, UNICEF, BADEA and others).
Action and Results
Goal 1: Since preschool education became compulsory for all children aged 4-5 years, access has
grown rapidly: the gross enrolment rate (GER) increased from 13 percent in 2001 to 33 percent in
2013. In addition to the preprimary classes offered by primary schools, the number of preprimary
centers has grown from 121 in 2001 to 278 in 2014, thanks mainly to private sector investment. The
2010 Health Policy has furthermore contributed to reduce child mortality rates over 2002-10, from
141 to 73 deaths per 1,000 live births, thanks to routine immunization and improved nutrition.
In addition to the inappropriate state of infrastructure and learning environments, especially in
community-based centers, the ECD sector faces a specific challenge in the low qualification of
preprimary teachers, due to the absence of appropriate teacher training. MoEVT plans to create
dedicated ECD training centers, offer ECD training through existing institutions and set minimum
entry requirements, as well as develop in-service upgrading courses for existing teachers.
Goal 2: Primary education has expanded through the construction of new schools and the
rehabilitation of existing classrooms by the government, as well as the completion of classrooms
initiated by communities, and the provision of ‘second chance’ education for out-of-school youth. As
a result, the primary net enrollment rate has increased from 76 percent to 84 percent and the
survival rate to Grade 7 from 74 percent to 80 percent.
Nevertheless, significant challenges remain, impacting on pupil performance, including: (i) class
composition (overcrowding due to the large class teaching approach with several teachers per class,
and double shifts); (ii) a shortage of math and science teachers; (iii) low teaching time due to teacher
absenteeism; (iv) high drop-out and child labor rates in coastal areas; and (v) low coverage of
inclusive education, due to some head teachers perceiving it as an extra burden and the shortage of
learning materials for children with special needs. The building of teacher residential quarters in
111
schools is to be promoted to reduce teachers’ travel time (some live up to 40km away) and improve
effective contact time in class, and parental sensitization campaigns will encourage the timely
enrollment of children in school to ensure UPE is achieved.
Goal 3: For EFA Goal 3, Zanzibar has focused on: (i) life skills education, through the introduction of
different school-based approaches (peer education, Sara communication initiatives, moral ethics and
environmental studies), the development of a single common life skills manual and the deployment
of teacher counselors; and (ii) lifelong learning, to improve technical and vocational training,
especially for out-of-school youth. TVET was promoted through a specific Vocational Training Policy
in 2005, the establishment of a vocational training authority, and the construction of two model
vocational training centers, in 2009.
Various challenges continue to hinder progress however. The absence of a national life skills policy,
of dedicated teaching, and of appropriate school-based extracurricular activities and clubs hinder its
proper development and ownership by teachers. On the other hand, the integrated and coordinated
provision of TVET is weak, as institutions depend on various ministries (Agriculture, Health, Water,
Trade and Tourism), the alignment of training provision with labor market needs is still not sufficient,
due to the incomplete initial assessment and piecemeal implementation of the policy, and training is
predominantly theoretical and classroom-based, due to VET institutions’ very limited resources.
Goal 4: Adult literacy (15 years and above) has improved considerably, from 72 percent in 2002 to 83
percent in 2010 (88 percent for men against 77 percent for women), but is much higher in urban
districts (94 percent) than in rural ones (62 percent in Micheweni and Mkoani districts, despite
remarkable improvements).
The youth literacy rate (15-24 years) has declined however, from 85 percent to 75 percent, due in
particular to high dropout and out-of-school, especially in rural districts. In response to this, the
government has introduced ‘second chance’ education, giving children aged 9-13 years a one-year
course (a condensed version of the primary curriculum for Grades 1-3) to enable their mainstreaming
back into formal education, and children aged 14 years and above three years of skills training in
various areas (tailoring, electrical installation, carpentry, ICT, etc.) before their mainstreaming into
vocational training institutions to acquire further entrepreneurial skills.
Goal 5: Considerable progress has been made in terms of equity in Zanzibar, thanks to policies and
guidelines which all stress equal education rights and opportunities, regardless of sex, ethnicity and
socio-economic status. In particular, several initiatives have targeted girls’ education, including the
provision of girls-only classes in some schools, science camps for girls and the nomination of a gender
focal person within MoEVT, contributing to the achievement of gender parity at all levels from
preprimary to secondary. Furthermore, inclusive education for children with special needs has been
introduced.
Girls are still under-represented in higher education however, and there is a persistent gender gap in
terms of pupils’ performance at O’ and A’ Level Secondary, due to dropout, early marriage, sexual
harassment, the lack of conducive and safe learning environments and inadequate gender policies.

112
Goal 6: Quality has been greatly enhanced thanks to a comprehensive approach: (i) the competency-
based review of curricula, from preprimary to secondary; (ii) the procurement of teaching and
learning materials, including textbooks (every child now has one) and laboratory equipment; (iii) the
introduction of teacher upgrading programmes, the establishment of the State University of Zanzibar
and the effective use of teacher centers to enhance performance; (iv) the development of Basic
Education Standards, to facilitate effective monitoring, strengthen management at all levels and
ensure international standards are met; (v) the ongoing assessment of students’ performance
through examinations; and (vi) the improvement of school facilities to make them safe and learner-
friendly, in particular through the construction of new toilets and the provision of safe water.
Challenges remain however, such as the organization of classes to reduce double shifting, increase
effective learning time and improve curriculum completion, and the further expansion of learning
facilities, especially libraries and laboratories.
Conclusion
A strong political will and commitment coupled with the support and dedication of all education
stakeholders have enabled Zanzibar to expand the provision of early childhood education, strengthen
primary access, improve the transition rate to secondary, create more conducive school learning
environments, institute a quality assurance system through strengthened monitoring under an
autonomous inspectorate body, mainstream gender issues in core MoEVT functions, provide equal
opportunities to children with special needs, and reduce illiteracy.
However, the education system in Zanzibar continues to face some key challenges:
- The elimination of persistent regional and district-level disparities, in particular in ECCE and
literacy;
- The improvement of learning environments to make them more conducive, through the
better provision of latrines, drinking water and adequate learning materials;
- The strengthening of the monitoring and evaluation system, that is still not fully effective or
consistent; and
- The better coordination of education services at the regional and district levels, in particular
to effectively streamline teacher training facilities.
Source: Ministry of Education and Vocational Training Zanzibar, November 2014 (Edited version).
113
Annexes
Annex 1: Global EFA Coordination
Following the Dakar Forum, most SSA countries elaborated 10-year education sector development
plans and EFA plans, often combined in a single document. However, their implementation was
complicated by considerable delays in their elaboration, a notorious lack of financial and quality
human resources, as well as countries’ lack of experience in terms of the conception, implementation
and monitoring and evaluation of the sector plans. To provide countries with complementary
technical support, development partners elaborated and implemented their own sector development
plans.
It was therefore naturally necessary to design coordination and monitoring and evaluation
mechanisms and arrangements, to improve the efficiency and effectiveness of execution, ensure
greater coherence among the different players involved in the process and to harmonize their
interventions. Given the plethora of bodies and players, as well as of their field operational processes
and variable country contexts, this coordination has represented a great challenge. To respond to
this, a number of initiatives have been launched at the international, regional and national levels.
International Coordination
High-Level Group on EFA
UNESCO, in its capacity as education sector lead agency, was given the mandate during the Dakar
Forum to create and lead a High-Level Group on Education for All (HLG-EFA). This group is a decision-
making, guidance and EFA action coordination body at the highest level, including representatives of
governments, development agencies, United Nations, civil society and the private sector. It aims to
strengthen the political will and the technical and financial means for EFA, and accounts for the
international community’s respect of its commitments undertaken in Dakar in 2000.
The group is supported by a technical group, which draws up proposals on the broad direction to
follow as well as recommendations in the areas considered to be of priority for collective action. The
debates within these two bodies have been largely nourished by the EFA Global Monitoring Reports
(GMR), published by an independent unit based in UNESCO’s head office, that present the progress
achieved towards the EFA goals every year.
Over the 2001-11 period, the working group has held ten sessions, three of which have been staged
in SSA: Abuja, Nigeria (2002); Dakar, Senegal (2007); and Addis Ababa, Ethiopia (2010). This last
session recognized some of the deficiencies and dysfunctions that the group is prone to, previously
114
highlighted by par numerous studies, and leading to the Addis Ababa Declaration, that aims for its
revival.25 The main dysfunctions relate to:
- EFA coordination, considered insufficiently receptive to the needs countries express;
- The fragmentation of coordination mechanisms and existing initiatives;
- The lack of clarity in the roles assigned to each partner and lead agency, mainly due to
differences in their respective priorities; and
- The weak links between education goals and countries’ broader development goals.
International Advisory Panel (IAP)
The panel convenes twenty odd representatives of key organizations involved in EFA coordination
activities. It was created in 2007 by UNESCO’s Director General with the objective of holding
consultations throughout the year, preparing and following up on the sessions of the aforementioned
groups and providing UNESCO with advice on EFA coordination.
The E-9 Initiative
The E-9 Initiative was launched by UNESCO in collaboration with other EFA coordination agencies in
New Delhi in 1993, during the Summit of the Leaders of the Nine High-Population Countries. It
provides a framework and network for policy dialogue, information sharing and monitoring for the
nine member countries, which include two SSA countries (Nigeria and Ethiopia).
National and Regional Coordination
National Coordination
At the country level, coordination mechanisms vary according to the challenges imposed by EFA and
the resulting priorities. Typically, these mechanisms include: (i) an EFA coordinator; (ii) a national EFA
forum, including education stakeholders, linked to the regional EFA forum; (iii) a local donor
coordination group (that can be linked to the GPE); (iv) a government-development partners
coordination body; and (v) the United Nations country team. The examples of some countries such as
Kenya and Mozambique show that effective coordination of EFA, or of education more broadly
speaking, has helped to harness support for national efforts, develop education systems and
encourage progress towards the achievement of EFA goals.
25 See for instance: “Reviving the Global Education Compact - Four Options for Global Education Funding,” (D. Bermingham, Center for Global Development, USA, 2010); “Strategies for Financing of Education - A Global View,” (N. Burnett, Results for Development Institute, 2010); and “Enhancing Effectiveness of EFA Coordination,” (UNESCO, 2010).
115
Regional Coordination
The mandate of regional and subregional bodies includes the coordination of appropriate networks,
the definition and monitoring of regional and subregional objectives, advocacy, policy dialogue, the
promotion of partnerships, technical cooperation, sharing best practices and lessons learned,
monitoring and reporting for accountability, as well as the promotion of resource mobilization. These
bodies usually adopt the shape of regional EFA forums, which should not only create networks linking
the national forums and regional and subregional organizations, but also encourage the involvement
of the main EFA players.
Big Push Steering and Coordination Committee
In 2012, on the basis of the Addis Ababa Declaration’s recommendations, a conference was held in
Johannesburg with the aim of reviving the regional coordination of EFA in SSA. Participation was
broad, with representatives of 36 SSA countries, regional economic communities, United Nations
agencies, the African Union, the African parliament, the African Academy of Languages (ACALAN), the
Association for the Development of Education in Africa (ADEA), CONFEMEN, the Forum for African
Women Educationalists (FAWE), the African Network Campaign on Education for All (ANCEFA) and
several international NGOs.
Following this meeting, a small and simple subregional coordination committee was created,
comprising UNESCO Dakar, UNICEF, UNFPA, ADEA, CONFEMEN, FAWE and ANCEFA. Its activities led
to the launch of an initiative called the Big Push. This initiative’s main goal was to support willing
countries in the elaboration and implementation of acceleration frameworks for one or several EFA
goals, selected by the countries, by 2015. The implementation of these acceleration frameworks
required having previously requested the support of UNESCO and its partners. Nine countries
adhered to the initiative: Angola, Côte d’Ivoire, Niger, Senegal, Chad, Lesotho, Swaziland, Zambia and
Uganda. A second wave was planned, covering a dozen further countries, but the initiative was not
pursued.
Technical Support Bodies
The Global Partnership for Education (ex EFA Fast-Track Initiative)26
The Global Partnership for Education (GPE), formerly known as Education for All Fast-Track Initiative
(EFA-FTI) was established in 2002 to accelerate progress towards the goal of universal primary
education by 2015. The Global Partnership for Education has grown from 7 developing country
partners in 2002 to 59 in 2014, 39 of which are in SSA. Its members also include prominent
multilateral partners (UNESCO, UNICEF and the World Bank), donors, foundations, teacher
26 This part is based on http://www.unesco.org/new/en/unesco/partners-donors/the-actions/education/cooperation-with-the-world-bank-in-the-framework-of-gpe-global-partnership-for-education/ and https://www.globalpartnership.org/ about-GPE (seen on 25 October 2014).
116
organizations, civil society organizations, local education groups and the private sector. It is the 4th
largest donor for basic education in low and middle-income countries, providing funding and
technical assistance to support the development and implementation of full-coverage and high-
quality education sector plans.
The GPE helps partners address barriers faced by out-of-school children, helping countries to build
safe and accessible schools where they can learn and reach their potential. The GPE’s approach aims
to empower developing countries so they can assess their education priorities and better invest in
the future of their children, through the development of innovative solutions, communication
practices and knowledge sharing among all partners.
GPE Mission: To galvanize and coordinate a global effort to deliver a good quality
education to all girls and boys, prioritizing the poorest and most vulnerable.
In addition to expanding funding and support to education in GPE countries, the GPE’s areas of focus
include: supporting fragile and conflict-affected states to develop and implement their education
plans; promoting girls’ education; increasing basic numeracy and literacy skills at the primary level;
and improving education quality through teacher effectiveness, by training, recruiting, retaining and
supporting them.
The FTI underwent a mid-term review and its results were considered to be satisfactory overall. The
name change in September 2011, from the EFA-FTI to GPE, reflects the lessons learned by the FTI to
better capitalize on the strengths of the partnership, particularly in terms of country-level
collaboration, harmonization and support mechanisms. Although a paradigm shift has occurred with
the rebranding, the GPE focusing more on targeting the countries in greatest need than the FTI did
on those having elaborated a “credible” sector plan, the GPE Compact explicitly links increased donor
support for education to recipient countries’ policy performance and accountability for results. As
such, the GPE aims to accelerate progress toward the EFA goals by promoting:
Further development effectiveness and more efficient aid for basic education;
Sound sector policies in education;
Adequate and sustainable domestic financing for education;
Sustained increases in aid for basic education; and
Increased accountability for sector results.
The close engagement with the GPE over the EFA 2000-15 period is one of the salient features of
UNESCO’s cooperation with the World Bank, which hosts the GPE.
117
CONFEMEN and SACMEQ
The Programme d’Analyse des Systèmes Éducatifs de la CONFEMEN (PASEC) and the Southern and
Eastern Africa Consortium for Monitoring Educational Quality (SACMEQ) produce technical tools to
monitor the performance of education systems in the francophone and anglophone countries of SSA,
through the assessment of pupils’ learning outcomes. These tools have constituted invaluable
knowledge bases on educational quality, improving knowledge of progress towards the achievement
of EFA goals since 2000, providing grounds to compare the performance of education systems and
helping EFA coordination and implementation bodies to make decisions and define the directions
and reforms that promote the achievement of its goals.
The PASEC programme carries out three types of assessment: (i) diagnostic assessments, that are
based on a sample of primary Grade 2 and Grade 5 pupils; (ii) thematic assessments, that usually
focus on the teacher issue and are based on a sample of teachers; and (iii) the monitoring of the
schooling careers of primary pupils, that review repetition and dropout issues. Since its creation two
decades ago, PASEC has carried out 35 national assessments in almost twenty African countries.
SACMEQ is a consortium of sixteen education ministries of Southern and East African countries. It
was created in 1995, under the impulse of IIEP/UNESCO, as a common framework to measure
educational quality, to strengthen planning capacities and improve education quality monitoring.
Since 2000, the SACMEQ II, III and IV assessments have provided valuable data helping to axe
education reforms on the traditional areas of reading and math, as well as on learning conditions and
their impact on pupils’ results, pupils’ and teachers’ knowledge of HIV&AIDS and on the reduction of
gender disparities in learning outcomes.
Among others, these initiatives have contributed to weave relationships based on trust, cooperation
and partnership between SSA countries’ education system players. Without a doubt, the PASEC and
SACMEQ assessments have often been instrumental in drawing the attention of the various EFA
coordination bodies at the international, regional and national levels to the dysfunctions and gaps
noted in the achievement of the goals, and to enact the required correction measures.
However, although those responsible for these two large programmes have worked towards a
degree of reconciliation in their approaches over the past fifteen years, the inability to produce
relatively common measures of learning outcomes at the continental level, or more simply, to
develop a global learning assessment programme for SSA pupils, represents one of the failures of EFA
over the period.
118
International Development Programmes and Initiatives for EFA27
In addition to the GPE, the Dakar framework for action led to the birth and revival of several other
international development programmes and initiatives, aiming to promote basic education for all.
These initiatives and programmes found fertile ground in Sub-Saharan Africa, playing an important
part over the past fifteen years, both in terms of advocacy and social mobilization, as well as in terms
of policy makers’ and development agencies’ accountability with respect to the commitments made
at the Dakar Forum.
Some of these programmes have developed to the point of becoming inescapable resources for all
players involved in the pursuit of EFA:
- The International Network on Education in Emergencies (INEE), born of the beacon
programme created after the Dakar Forum, has contributed to the development of standard
tools to address education needs in emergency contexts, which have shaken the area.
- The United Nations Girls’ Education Initiative (UNGEI), which has undertaken activities to
promote of girls’ education and document good practices in this area.
- The Interagency Programme on the Impact of HIV&AIDS, which has supported education
systems in the fight against the pandemic in Sub-Saharan Africa.
- Education First, launched in 2012 by the UN Secretary General, aims to accelerate progress
towards the achievement of the EFA goals and the MDG goals relating to education. It also
aims to place education, its quality, relevance and transformational power at the heart of the
post-2015 global development agenda, by mobilizing additional and sufficient resources
through sustained international advocacy.
Advocacy and Policy Dialogue Initiatives
United Nations and African Union Decades
The value of these decades is undoubtedly their potential to sensitize public opinion to a critical
international issue. This in turn helps to focus international action and cooperation on the issue, to
mobilize greater political will and new players, to reinforce the efficiency of the relevant programme
implementation and to mobilize further resources.
During the period since the Dakar Forum, three new decades relating directly to EFA have been
launched:
- The United Nations Literacy Decade (2003-12)
- The United Nations Decade of Education for Sustainable Development (2005-14)
- The Second Decade for Education in Africa (2006-15)
27 See UNESCO’s EFA Global Monitoring Report 2013/2014 “Teaching and Learning: Achieving Quality for All” (UNESCO, 2014).
119
In the course of the Literacy Decade, countries’ perception of literacy has evolved, often departing
from the traditional concept to the benefit of “functional literacy,” with concrete policies and
programmes that respond to various needs imposed by the modern world. Furthermore, the role of
the private sector and civil society has grown, providing innovating services, organizing policy
dialogue and contributing to sensitization and resource mobilization. Universities, research institutes
and members of parliament have also become key partners. The LIFE programme (Literacy for
Empowerment), launched by UNESCO in 2005, has accompanied 18 SSA countries whose literacy rate
was below 50 percent or whose illiterate adult population was greater than 10 million, in carrying out
diagnostic analyses and in formulating national literacy policies and strategies.28
The Decade of Education for Sustainable Development’s goal was to integrate the principles and
approaches to sustainable development in all aspects of education and learning, to promote more
sustainable and fair societies for all. The final assessment carried out in 2014 underlined the fact that
the reorientation of education policies, programmes and plans to integrate sustainable development
is a process well underway in most of the member countries having produced a report, including in
Sub-Saharan Africa. Conversely, education, public awareness and training are now inescapable
strategies for any national sustainable development plan.
The Second Decade for Education in Africa was launched by the African Union according to its vision
whereby every citizen should contribute to building an integrated, prosperous and peaceful
continent, following the First Decade of 1997-2006. The mid-term review indicates that one of the
limitations faced is the fact that the regional economic commissions, which are the main executive
arms of the AU, do not all have functional education units, limiting their potential to support and
monitor the implementation of the Decade.
The Role of NGOs
International nongovernmental organizations (INGOs) have played an important part in campaigns
for education, this since the Dakar Forum where they weighed heavily on the debates and
formulation of the six EFA goals. The participation of INGOs in international efforts for EFA has in
particular translated into the creation of a coherent and independent network of national and
international NGOs with a common EFA agenda, and into the greater visibility and attention paid to
education by the international community, not least during the G7 countries’ debates on the
financing of EFA. INGOs have thus cut out a place for civil society in the planning and monitoring of
national and international education policies, which now represents a considerable force behind EFA.
28 “Implementation of the International Action Plan for the United Nations Literacy Decade and Specific Recommendations for the Period Following the Decade” (UNESCO, 2013).
120
In recognition of their role, UNESCO has created a consultation framework with NGOs, the Collective
Consultation of NGOs on EFA (CCNGO/EFA). This mechanism aims to ensure the commitment and
participation of civil society in the formulation, implementation and monitoring of education
development strategies, and to facilitate reflection, permanent dialogue and joint UNESCO-NGO
actions in the field of EFA. Currently, the network comprises close to 300 member NGOs worldwide.
Its representatives are invited to regional and international EFA meetings, including those of the
Working Group and the High Level Group. Global Campaign for Education is one of the key INGOs,
created in 1999. Its members belong to a wide spectrum of civil society organizations at the national,
regional and international levels, to teacher unions or children’s rights protection movements, and
are devoted to promoting education as a basic human right.
In Sub-Saharan Africa, the most active networks in harnessing support for the EFA goals are the
African Network Campaign on Education for All (ANCEFA) and the Forum for African Women
Educationalists (FAWE). These networks contribute to the work of the EFA Working Group and
participate in the meetings of the CCONG/EPT.
Association for the Development of Education in Africa (ADEA)
ADEA is first and foremost a policy dialogue forum on education and training in Africa. The
association, created in 1988 to strengthen interagency cooperation, has gradually become a
Panafrican institution. In 2008, the office of its minister was fusioned with that of the COMEDAF’s
minister (he AU Conference of Ministers of Education), in line with the decision of the African Union’s
10th summit held in January 2008. After sixteen years spent within UNESCO’s International Institute
for Education Planning (IIEP), ADEA relocated in 2008 to the premises of the African Development
Bank.
ADEA’s stakeholders interact through a network of workgroups for reflection, the sharing of
experiences and action-research into priority education issues. Since the Dakar Forum, ADEA has held
five biennial and triennial meetings in addition to over twenty ministerial meetings on themes such
as contract teachers, educational quality, postprimary education, youth employment, and the
knowledge, competences and qualifications that are required for sustainable development.
These workgroups have published a broad range of documentary resources over the EFA period,
elaborated in collaborative fashion, from retrospective case studies of national experiences to
practical manuals aimed at technicians and policy makers. Five cross-country quality poles, created
more recently, are more focused on capacity-building and knowledge sharing between technical and
policy-making peers, addressing the challenges of early childhood care and education and of the
teaching of math and science subjects, among others.
The assessment of the ADEA programme carried out in 2010 underlines the fact that for the most
part, the workgroups are effective in terms of providing technical assistance and contribute to the
development of their respective thematic areas in Africa. However, the main challenge the institution
121
faces, as is the case of many others working in this area, is the need to more clearly demonstrate the
fundamental role of policy dialogue in achieving sustainable change for education in Africa.
CONFEMEN and SACMEQ
CONFEMEN works towards the promotion of education and technical and vocational training in its 44
member states, 25 of which are located in Sub-Saharan Africa. Based in Africa, CONFEMEN aims to be
a space of shared values, expertise and solidarity between countries from the North and the South
that share a common language. In addition to the PASEC programme (see above), its main missions
are to share information, study issues of common interest and facilitate consultations between
ministers and experts. It seeks to find common ground and to formulate recommendations to
support regional and international education policies.
Over the years, SACMEQ has also become a major forum to share experiences and expertise as well
as of policy dialogue for education, in particular based on the empirical data drawn from its
assessments of education systems’ performance and quality.
Conclusion
The international commitments made in Dakar in 2000 have translated into an unquestionable drive
in Sub-Saharan Africa, in particular through the relay of initiatives and partnerships launched at the
international level. A number of local and concerted actions have also been undertaken, often relying
on existing organizations and institutions, to which the Dakar Forum gave a new lease of life through
common convening goals and the encouragement of greater intellectual and technical collaboration.
One of the key strengths of the mentioned programmes and organizations has been their ability to
captivate the attention of national and regional civil societies and coalesce their efforts around
concerted actions, aiming on the one hand to demand of policy makers that they honor their
commitments in terms of education and literacy, on the other to assess the progress achieved and
that to still be achieved, and finally to share their findings in all EFA monitoring fora.
Unfortunately, few reviews enable the identification of the more effective initiatives and the
measures required to strengthen their impact in SSA. It is indeed difficult to establish relationships
between international initiatives and their impacts at the country level. It is also complex to
determine if and how, during the implementation of EFA, countries have replicated experiences,
good practices and lessons learned, to focus on the achievement of one or several of the EFA goals.
In the same line of thought, it is difficult to convincingly establish if resources have been sufficient, if
they have been well used and what real impact they have had on the coordination and
implementation of actions for the achievement of EFA goals. Of course, coordination has both a
technical and a political dimension, which increases the complexity of the exercise.
122
For SSA, the following findings can however be underlined:
- The recommendations formulated by the EFA High Level Group and Working Group were not
sufficiently communicated to countries, making their incorporation into sector plans difficult,
obviously limiting the scope of their implementation;
- Political will for EFA has lacked strength in many SSA countries;
- Communication deficits between the various coordination levels (global, regional and
national) are noted, obstructing the exchange of ideas, good practices and promising
experiences as well as their adoption at the national level;
- The regional coordination structure has not been fully effective, which has hindered the
dissemination of recommendations at the subregional and national levels;
- At the national level, although national EFA coordination bodies have been created, their
operations have been inadequate;
- Numerous national EFA plans have been elaborated, but their implementation has been
heavily compromised by the lack of financial and human resources;
- The review of sector plans, strategies and programmes has often lacked regularity, and their
results have not been fully utilized; and
- The multiplicity of steering and coordination bodies has been a factor significantly
contributing to their relative ineffectiveness.
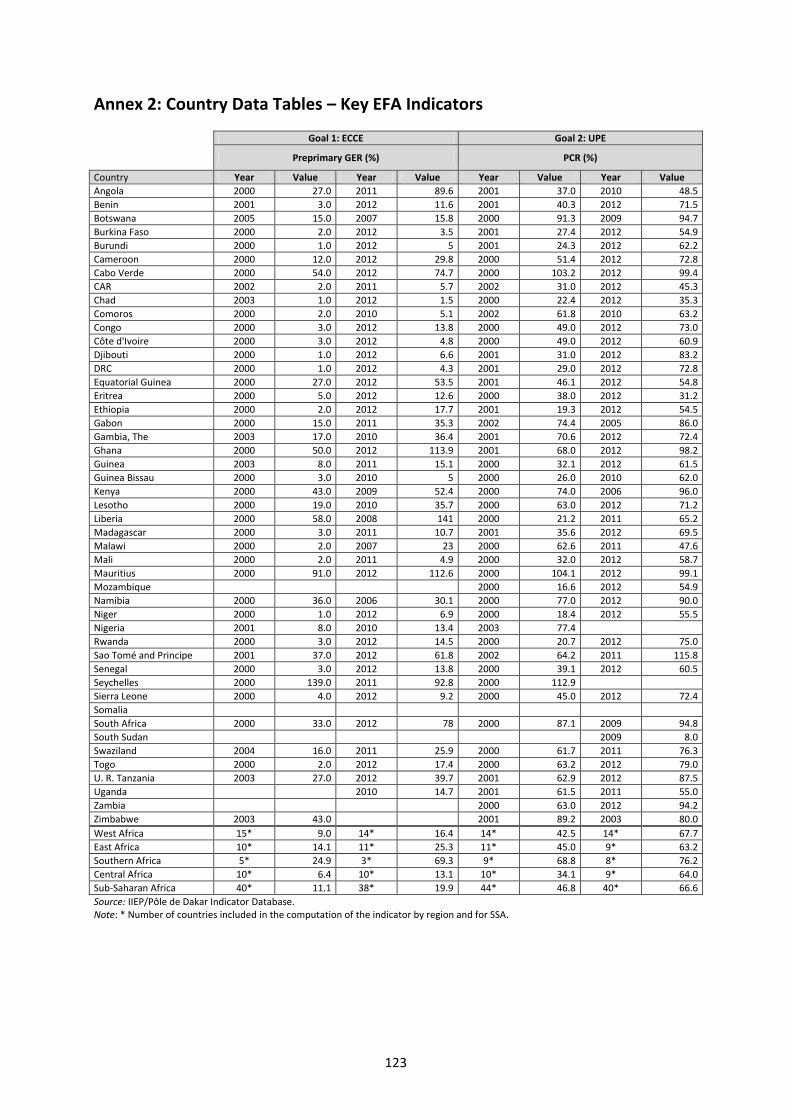
123
Annex 2: Country Data Tables – Key EFA Indicators
Goal 1: ECCE Goal 2: UPE
Preprimary GER (%) PCR (%)
Country Year Value Year Value Year Value Year Value
Angola 2000 27.0 2011 89.6 2001 37.0 2010 48.5
Benin 2001 3.0 2012 11.6 2001 40.3 2012 71.5
Botswana 2005 15.0 2007 15.8 2000 91.3 2009 94.7
Burkina Faso 2000 2.0 2012 3.5 2001 27.4 2012 54.9
Burundi 2000 1.0 2012 5 2001 24.3 2012 62.2
Cameroon 2000 12.0 2012 29.8 2000 51.4 2012 72.8
Cabo Verde 2000 54.0 2012 74.7 2000 103.2 2012 99.4
CAR 2002 2.0 2011 5.7 2002 31.0 2012 45.3
Chad 2003 1.0 2012 1.5 2000 22.4 2012 35.3
Comoros 2000 2.0 2010 5.1 2002 61.8 2010 63.2
Congo 2000 3.0 2012 13.8 2000 49.0 2012 73.0
Côte d'Ivoire 2000 3.0 2012 4.8 2000 49.0 2012 60.9
Djibouti 2000 1.0 2012 6.6 2001 31.0 2012 83.2
DRC 2000 1.0 2012 4.3 2001 29.0 2012 72.8
Equatorial Guinea 2000 27.0 2012 53.5 2001 46.1 2012 54.8
Eritrea 2000 5.0 2012 12.6 2000 38.0 2012 31.2
Ethiopia 2000 2.0 2012 17.7 2001 19.3 2012 54.5
Gabon 2000 15.0 2011 35.3 2002 74.4 2005 86.0
Gambia, The 2003 17.0 2010 36.4 2001 70.6 2012 72.4
Ghana 2000 50.0 2012 113.9 2001 68.0 2012 98.2
Guinea 2003 8.0 2011 15.1 2000 32.1 2012 61.5
Guinea Bissau 2000 3.0 2010 5 2000 26.0 2010 62.0
Kenya 2000 43.0 2009 52.4 2000 74.0 2006 96.0
Lesotho 2000 19.0 2010 35.7 2000 63.0 2012 71.2
Liberia 2000 58.0 2008 141 2000 21.2 2011 65.2
Madagascar 2000 3.0 2011 10.7 2001 35.6 2012 69.5
Malawi 2000 2.0 2007 23 2000 62.6 2011 47.6
Mali 2000 2.0 2011 4.9 2000 32.0 2012 58.7
Mauritius 2000 91.0 2012 112.6 2000 104.1 2012 99.1
Mozambique
2000 16.6 2012 54.9
Namibia 2000 36.0 2006 30.1 2000 77.0 2012 90.0
Niger 2000 1.0 2012 6.9 2000 18.4 2012 55.5
Nigeria 2001 8.0 2010 13.4 2003 77.4
Rwanda 2000 3.0 2012 14.5 2000 20.7 2012 75.0
Sao Tomé and Principe 2001 37.0 2012 61.8 2002 64.2 2011 115.8
Senegal 2000 3.0 2012 13.8 2000 39.1 2012 60.5
Seychelles 2000 139.0 2011 92.8 2000 112.9
Sierra Leone 2000 4.0 2012 9.2 2000 45.0 2012 72.4
Somalia
South Africa 2000 33.0 2012 78 2000 87.1 2009 94.8
South Sudan
2009 8.0
Swaziland 2004 16.0 2011 25.9 2000 61.7 2011 76.3
Togo 2000 2.0 2012 17.4 2000 63.2 2012 79.0
U. R. Tanzania 2003 27.0 2012 39.7 2001 62.9 2012 87.5
Uganda
2010 14.7 2001 61.5 2011 55.0
Zambia
2000 63.0 2012 94.2
Zimbabwe 2003 43.0
2001 89.2 2003 80.0
West Africa 15* 9.0 14* 16.4 14* 42.5 14* 67.7
East Africa 10* 14.1 11* 25.3 11* 45.0 9* 63.2
Southern Africa 5* 24.9 3* 69.3 9* 68.8 8* 76.2
Central Africa 10* 6.4 10* 13.1 10* 34.1 9* 64.0
Sub-Saharan Africa 40* 11.1 38* 19.9 44* 46.8 40* 66.6
Source: IIEP/Pôle de Dakar Indicator Database. Note: * Number of countries included in the computation of the indicator by region and for SSA.
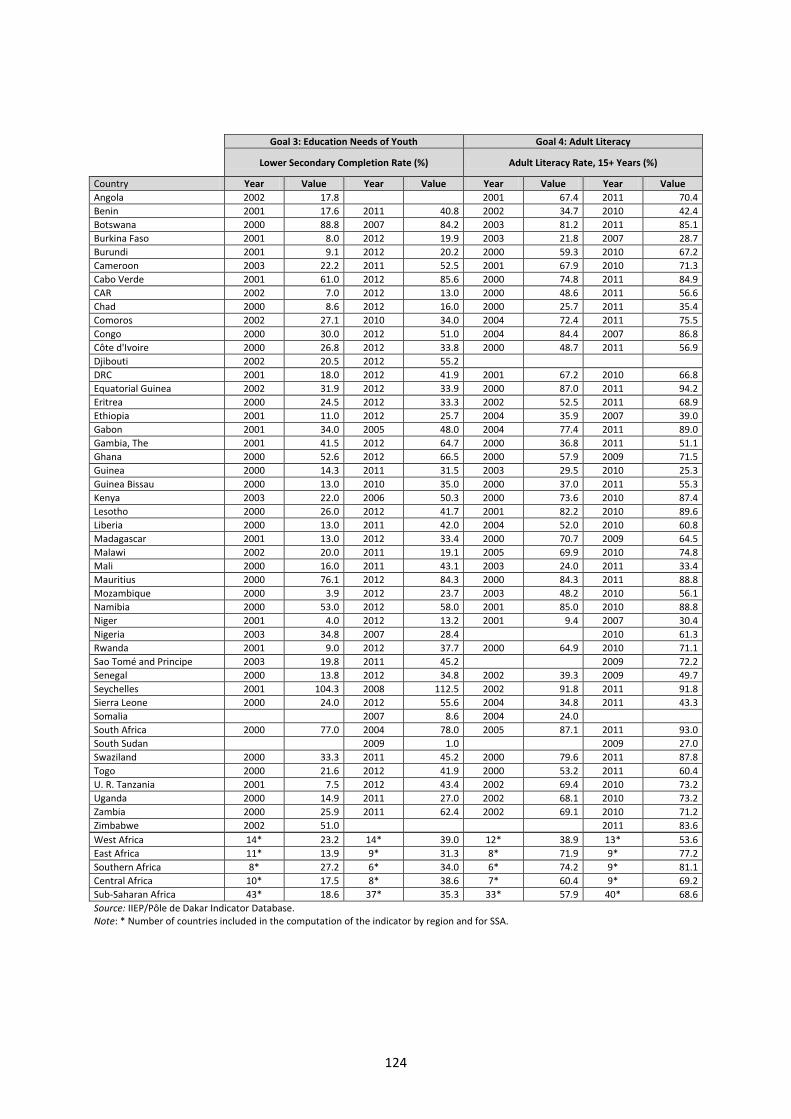
124
Goal 3: Education Needs of Youth Goal 4: Adult Literacy
Lower Secondary Completion Rate (%) Adult Literacy Rate, 15+ Years (%)
Country Year Value Year Value Year Value Year Value
Angola 2002 17.8
2001 67.4 2011 70.4
Benin 2001 17.6 2011 40.8 2002 34.7 2010 42.4
Botswana 2000 88.8 2007 84.2 2003 81.2 2011 85.1
Burkina Faso 2001 8.0 2012 19.9 2003 21.8 2007 28.7
Burundi 2001 9.1 2012 20.2 2000 59.3 2010 67.2
Cameroon 2003 22.2 2011 52.5 2001 67.9 2010 71.3
Cabo Verde 2001 61.0 2012 85.6 2000 74.8 2011 84.9
CAR 2002 7.0 2012 13.0 2000 48.6 2011 56.6
Chad 2000 8.6 2012 16.0 2000 25.7 2011 35.4
Comoros 2002 27.1 2010 34.0 2004 72.4 2011 75.5
Congo 2000 30.0 2012 51.0 2004 84.4 2007 86.8
Côte d'Ivoire 2000 26.8 2012 33.8 2000 48.7 2011 56.9
Djibouti 2002 20.5 2012 55.2
DRC 2001 18.0 2012 41.9 2001 67.2 2010 66.8
Equatorial Guinea 2002 31.9 2012 33.9 2000 87.0 2011 94.2
Eritrea 2000 24.5 2012 33.3 2002 52.5 2011 68.9
Ethiopia 2001 11.0 2012 25.7 2004 35.9 2007 39.0
Gabon 2001 34.0 2005 48.0 2004 77.4 2011 89.0
Gambia, The 2001 41.5 2012 64.7 2000 36.8 2011 51.1
Ghana 2000 52.6 2012 66.5 2000 57.9 2009 71.5
Guinea 2000 14.3 2011 31.5 2003 29.5 2010 25.3
Guinea Bissau 2000 13.0 2010 35.0 2000 37.0 2011 55.3
Kenya 2003 22.0 2006 50.3 2000 73.6 2010 87.4
Lesotho 2000 26.0 2012 41.7 2001 82.2 2010 89.6
Liberia 2000 13.0 2011 42.0 2004 52.0 2010 60.8
Madagascar 2001 13.0 2012 33.4 2000 70.7 2009 64.5
Malawi 2002 20.0 2011 19.1 2005 69.9 2010 74.8
Mali 2000 16.0 2011 43.1 2003 24.0 2011 33.4
Mauritius 2000 76.1 2012 84.3 2000 84.3 2011 88.8
Mozambique 2000 3.9 2012 23.7 2003 48.2 2010 56.1
Namibia 2000 53.0 2012 58.0 2001 85.0 2010 88.8
Niger 2001 4.0 2012 13.2 2001 9.4 2007 30.4
Nigeria 2003 34.8 2007 28.4
2010 61.3
Rwanda 2001 9.0 2012 37.7 2000 64.9 2010 71.1
Sao Tomé and Principe 2003 19.8 2011 45.2
2009 72.2
Senegal 2000 13.8 2012 34.8 2002 39.3 2009 49.7
Seychelles 2001 104.3 2008 112.5 2002 91.8 2011 91.8
Sierra Leone 2000 24.0 2012 55.6 2004 34.8 2011 43.3
Somalia
2007 8.6 2004 24.0
South Africa 2000 77.0 2004 78.0 2005 87.1 2011 93.0
South Sudan
2009 1.0
2009 27.0
Swaziland 2000 33.3 2011 45.2 2000 79.6 2011 87.8
Togo 2000 21.6 2012 41.9 2000 53.2 2011 60.4
U. R. Tanzania 2001 7.5 2012 43.4 2002 69.4 2010 73.2
Uganda 2000 14.9 2011 27.0 2002 68.1 2010 73.2
Zambia 2000 25.9 2011 62.4 2002 69.1 2010 71.2
Zimbabwe 2002 51.0
2011 83.6
West Africa 14* 23.2 14* 39.0 12* 38.9 13* 53.6
East Africa 11* 13.9 9* 31.3 8* 71.9 9* 77.2
Southern Africa 8* 27.2 6* 34.0 6* 74.2 9* 81.1
Central Africa 10* 17.5 8* 38.6 7* 60.4 9* 69.2
Sub-Saharan Africa 43* 18.6 37* 35.3 33* 57.9 40* 68.6
Source: IIEP/Pôle de Dakar Indicator Database. Note: * Number of countries included in the computation of the indicator by region and for SSA.
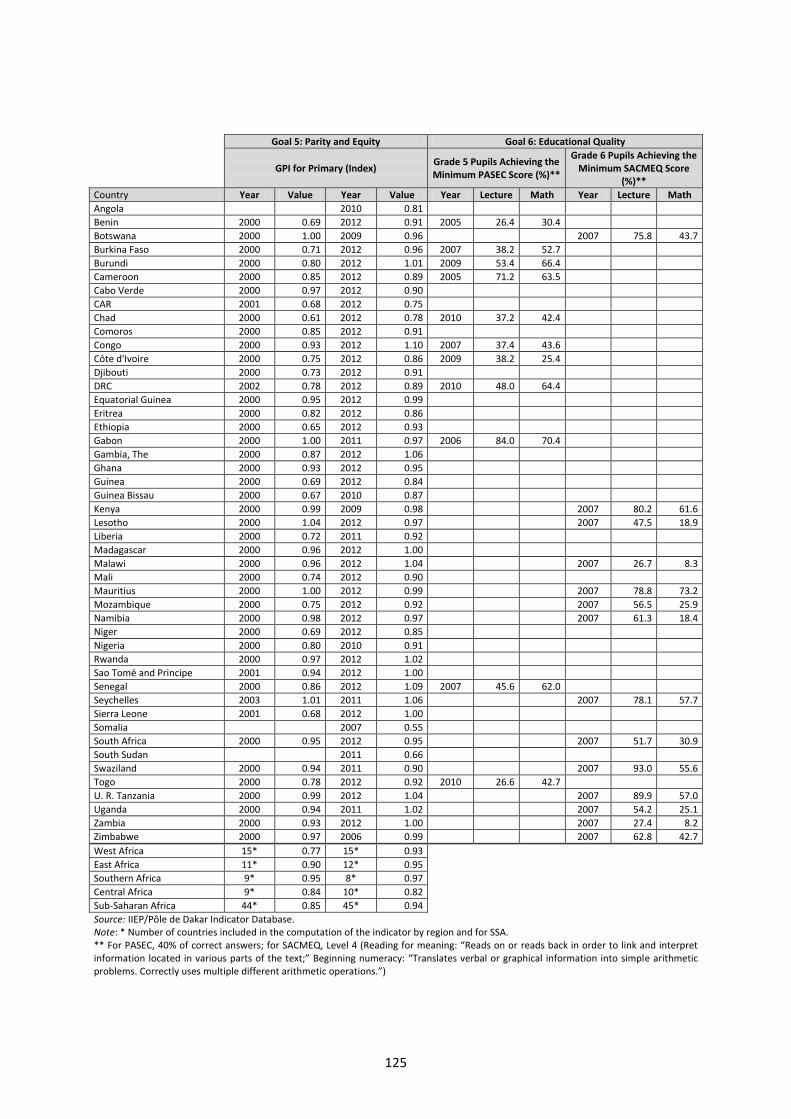
125
Goal 5: Parity and Equity Goal 6: Educational Quality
GPI for Primary (Index)
Grade 5 Pupils Achieving the Minimum PASEC Score (%)**
Grade 6 Pupils Achieving the Minimum SACMEQ Score
(%)**
Country Year Value Year Value Year Lecture Math Year Lecture Math
Angola
2010 0.81
Benin 2000 0.69 2012 0.91 2005 26.4 30.4
Botswana 2000 1.00 2009 0.96
2007 75.8 43.7
Burkina Faso 2000 0.71 2012 0.96 2007 38.2 52.7
Burundi 2000 0.80 2012 1.01 2009 53.4 66.4
Cameroon 2000 0.85 2012 0.89 2005 71.2 63.5
Cabo Verde 2000 0.97 2012 0.90
CAR 2001 0.68 2012 0.75
Chad 2000 0.61 2012 0.78 2010 37.2 42.4
Comoros 2000 0.85 2012 0.91
Congo 2000 0.93 2012 1.10 2007 37.4 43.6
Côte d'Ivoire 2000 0.75 2012 0.86 2009 38.2 25.4
Djibouti 2000 0.73 2012 0.91
DRC 2002 0.78 2012 0.89 2010 48.0 64.4
Equatorial Guinea 2000 0.95 2012 0.99
Eritrea 2000 0.82 2012 0.86
Ethiopia 2000 0.65 2012 0.93
Gabon 2000 1.00 2011 0.97 2006 84.0 70.4
Gambia, The 2000 0.87 2012 1.06
Ghana 2000 0.93 2012 0.95
Guinea 2000 0.69 2012 0.84
Guinea Bissau 2000 0.67 2010 0.87
Kenya 2000 0.99 2009 0.98
2007 80.2 61.6
Lesotho 2000 1.04 2012 0.97
2007 47.5 18.9
Liberia 2000 0.72 2011 0.92
Madagascar 2000 0.96 2012 1.00
Malawi 2000 0.96 2012 1.04
2007 26.7 8.3
Mali 2000 0.74 2012 0.90
Mauritius 2000 1.00 2012 0.99
2007 78.8 73.2
Mozambique 2000 0.75 2012 0.92
2007 56.5 25.9
Namibia 2000 0.98 2012 0.97
2007 61.3 18.4
Niger 2000 0.69 2012 0.85
Nigeria 2000 0.80 2010 0.91
Rwanda 2000 0.97 2012 1.02
Sao Tomé and Principe 2001 0.94 2012 1.00
Senegal 2000 0.86 2012 1.09 2007 45.6 62.0
Seychelles 2003 1.01 2011 1.06
2007 78.1 57.7
Sierra Leone 2001 0.68 2012 1.00
Somalia
2007 0.55
South Africa 2000 0.95 2012 0.95
2007 51.7 30.9
South Sudan
2011 0.66
Swaziland 2000 0.94 2011 0.90
2007 93.0 55.6
Togo 2000 0.78 2012 0.92 2010 26.6 42.7
U. R. Tanzania 2000 0.99 2012 1.04
2007 89.9 57.0
Uganda 2000 0.94 2011 1.02
2007 54.2 25.1
Zambia 2000 0.93 2012 1.00
2007 27.4 8.2
Zimbabwe 2000 0.97 2006 0.99
2007 62.8 42.7
West Africa 15* 0.77 15* 0.93
East Africa 11* 0.90 12* 0.95
Southern Africa 9* 0.95 8* 0.97
Central Africa 9* 0.84 10* 0.82
Sub-Saharan Africa 44* 0.85 45* 0.94
Source: IIEP/Pôle de Dakar Indicator Database. Note: * Number of countries included in the computation of the indicator by region and for SSA. ** For PASEC, 40% of correct answers; for SACMEQ, Level 4 (Reading for meaning: “Reads on or reads back in order to link and interpret information located in various parts of the text;” Beginning numeracy: “Translates verbal or graphical information into simple arithmetic problems. Correctly uses multiple different arithmetic operations.”)
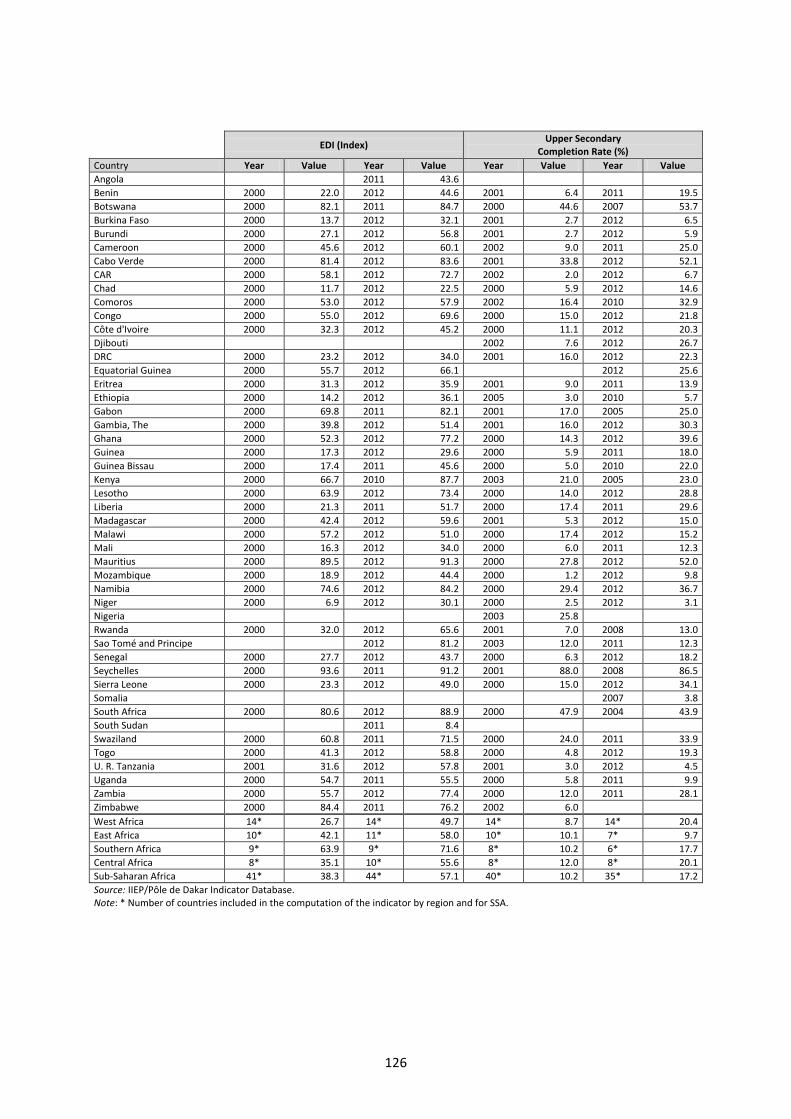
126
EDI (Index) Upper Secondary
Completion Rate (%)
Country Year Value Year Value Year Value Year Value
Angola
2011 43.6
Benin 2000 22.0 2012 44.6 2001 6.4 2011 19.5
Botswana 2000 82.1 2011 84.7 2000 44.6 2007 53.7
Burkina Faso 2000 13.7 2012 32.1 2001 2.7 2012 6.5
Burundi 2000 27.1 2012 56.8 2001 2.7 2012 5.9
Cameroon 2000 45.6 2012 60.1 2002 9.0 2011 25.0
Cabo Verde 2000 81.4 2012 83.6 2001 33.8 2012 52.1
CAR 2000 58.1 2012 72.7 2002 2.0 2012 6.7
Chad 2000 11.7 2012 22.5 2000 5.9 2012 14.6
Comoros 2000 53.0 2012 57.9 2002 16.4 2010 32.9
Congo 2000 55.0 2012 69.6 2000 15.0 2012 21.8
Côte d'Ivoire 2000 32.3 2012 45.2 2000 11.1 2012 20.3
Djibouti
2002 7.6 2012 26.7
DRC 2000 23.2 2012 34.0 2001 16.0 2012 22.3
Equatorial Guinea 2000 55.7 2012 66.1
2012 25.6
Eritrea 2000 31.3 2012 35.9 2001 9.0 2011 13.9
Ethiopia 2000 14.2 2012 36.1 2005 3.0 2010 5.7
Gabon 2000 69.8 2011 82.1 2001 17.0 2005 25.0
Gambia, The 2000 39.8 2012 51.4 2001 16.0 2012 30.3
Ghana 2000 52.3 2012 77.2 2000 14.3 2012 39.6
Guinea 2000 17.3 2012 29.6 2000 5.9 2011 18.0
Guinea Bissau 2000 17.4 2011 45.6 2000 5.0 2010 22.0
Kenya 2000 66.7 2010 87.7 2003 21.0 2005 23.0
Lesotho 2000 63.9 2012 73.4 2000 14.0 2012 28.8
Liberia 2000 21.3 2011 51.7 2000 17.4 2011 29.6
Madagascar 2000 42.4 2012 59.6 2001 5.3 2012 15.0
Malawi 2000 57.2 2012 51.0 2000 17.4 2012 15.2
Mali 2000 16.3 2012 34.0 2000 6.0 2011 12.3
Mauritius 2000 89.5 2012 91.3 2000 27.8 2012 52.0
Mozambique 2000 18.9 2012 44.4 2000 1.2 2012 9.8
Namibia 2000 74.6 2012 84.2 2000 29.4 2012 36.7
Niger 2000 6.9 2012 30.1 2000 2.5 2012 3.1
Nigeria
2003 25.8
Rwanda 2000 32.0 2012 65.6 2001 7.0 2008 13.0
Sao Tomé and Principe
2012 81.2 2003 12.0 2011 12.3
Senegal 2000 27.7 2012 43.7 2000 6.3 2012 18.2
Seychelles 2000 93.6 2011 91.2 2001 88.0 2008 86.5
Sierra Leone 2000 23.3 2012 49.0 2000 15.0 2012 34.1
Somalia
2007 3.8
South Africa 2000 80.6 2012 88.9 2000 47.9 2004 43.9
South Sudan
2011 8.4
Swaziland 2000 60.8 2011 71.5 2000 24.0 2011 33.9
Togo 2000 41.3 2012 58.8 2000 4.8 2012 19.3
U. R. Tanzania 2001 31.6 2012 57.8 2001 3.0 2012 4.5
Uganda 2000 54.7 2011 55.5 2000 5.8 2011 9.9
Zambia 2000 55.7 2012 77.4 2000 12.0 2011 28.1
Zimbabwe 2000 84.4 2011 76.2 2002 6.0
West Africa 14* 26.7 14* 49.7 14* 8.7 14* 20.4
East Africa 10* 42.1 11* 58.0 10* 10.1 7* 9.7
Southern Africa 9* 63.9 9* 71.6 8* 10.2 6* 17.7
Central Africa 8* 35.1 10* 55.6 8* 12.0 8* 20.1
Sub-Saharan Africa 41* 38.3 44* 57.1 40* 10.2 35* 17.2
Source: IIEP/Pôle de Dakar Indicator Database. Note: * Number of countries included in the computation of the indicator by region and for SSA.
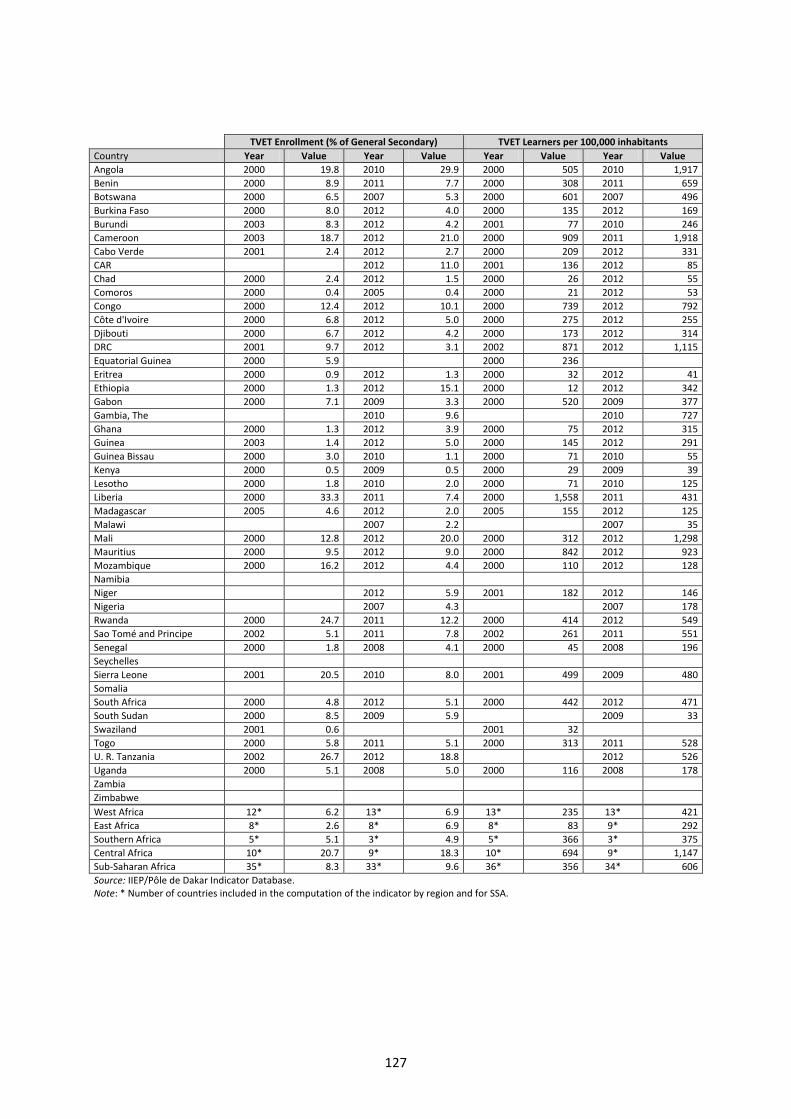
127
TVET Enrollment (% of General Secondary) TVET Learners per 100,000 inhabitants Country Year Value Year Value Year Value Year Value
Angola 2000 19.8 2010 29.9 2000 505 2010 1,917
Benin 2000 8.9 2011 7.7 2000 308 2011 659
Botswana 2000 6.5 2007 5.3 2000 601 2007 496
Burkina Faso 2000 8.0 2012 4.0 2000 135 2012 169
Burundi 2003 8.3 2012 4.2 2001 77 2010 246
Cameroon 2003 18.7 2012 21.0 2000 909 2011 1,918
Cabo Verde 2001 2.4 2012 2.7 2000 209 2012 331
CAR
2012 11.0 2001 136 2012 85
Chad 2000 2.4 2012 1.5 2000 26 2012 55
Comoros 2000 0.4 2005 0.4 2000 21 2012 53
Congo 2000 12.4 2012 10.1 2000 739 2012 792
Côte d'Ivoire 2000 6.8 2012 5.0 2000 275 2012 255
Djibouti 2000 6.7 2012 4.2 2000 173 2012 314
DRC 2001 9.7 2012 3.1 2002 871 2012 1,115
Equatorial Guinea 2000 5.9
2000 236
Eritrea 2000 0.9 2012 1.3 2000 32 2012 41
Ethiopia 2000 1.3 2012 15.1 2000 12 2012 342
Gabon 2000 7.1 2009 3.3 2000 520 2009 377
Gambia, The
2010 9.6
2010 727
Ghana 2000 1.3 2012 3.9 2000 75 2012 315
Guinea 2003 1.4 2012 5.0 2000 145 2012 291
Guinea Bissau 2000 3.0 2010 1.1 2000 71 2010 55
Kenya 2000 0.5 2009 0.5 2000 29 2009 39
Lesotho 2000 1.8 2010 2.0 2000 71 2010 125
Liberia 2000 33.3 2011 7.4 2000 1,558 2011 431
Madagascar 2005 4.6 2012 2.0 2005 155 2012 125
Malawi
2007 2.2
2007 35
Mali 2000 12.8 2012 20.0 2000 312 2012 1,298
Mauritius 2000 9.5 2012 9.0 2000 842 2012 923
Mozambique 2000 16.2 2012 4.4 2000 110 2012 128
Namibia
Niger
2012 5.9 2001 182 2012 146
Nigeria
2007 4.3
2007 178
Rwanda 2000 24.7 2011 12.2 2000 414 2012 549
Sao Tomé and Principe 2002 5.1 2011 7.8 2002 261 2011 551
Senegal 2000 1.8 2008 4.1 2000 45 2008 196
Seychelles
Sierra Leone 2001 20.5 2010 8.0 2001 499 2009 480
Somalia
South Africa 2000 4.8 2012 5.1 2000 442 2012 471
South Sudan 2000 8.5 2009 5.9
2009 33
Swaziland 2001 0.6
2001 32
Togo 2000 5.8 2011 5.1 2000 313 2011 528
U. R. Tanzania 2002 26.7 2012 18.8
2012 526
Uganda 2000 5.1 2008 5.0 2000 116 2008 178
Zambia
Zimbabwe
West Africa 12* 6.2 13* 6.9 13* 235 13* 421
East Africa 8* 2.6 8* 6.9 8* 83 9* 292
Southern Africa 5* 5.1 3* 4.9 5* 366 3* 375
Central Africa 10* 20.7 9* 18.3 10* 694 9* 1,147
Sub-Saharan Africa 35* 8.3 33* 9.6 36* 356 34* 606
Source: IIEP/Pôle de Dakar Indicator Database. Note: * Number of countries included in the computation of the indicator by region and for SSA.

128
Higher Education (Students per 100,000 Inhabitants) Country Year Value Year Value
Angola 2002 84 2010 339
Benin 2000 377 2011 1,079
Botswana 2000 608 2006 857
Burkina Faso 2000 97 2012 411
Burundi 2000 103 2010 355
Cameroon 2000 439 2011 1,103
Cabo Verde 2000 185 2012 2,344
CAR 2000 176 2012 277
Chad 2000 75 2011 202
Comoros 2000 129 2012 975
Congo 2000 458 2012 906
Côte d'Ivoire 2000 676 2009 708
Djibouti 2000 30 2011 653
DRC 2000 214 2012 778
Equatorial Guinea 2000 194
Eritrea 2000 105 2010 210
Ethiopia 2000 103 2012 756
Gabon 2001 622 2009 1,471
Gambia, The 2000 97 2010 447
Ghana 2005 559 2012 1,164
Guinea 2000 153 2012 782
Guinea Bissau 2000 38 2010 351
Kenya 2000 285 2009 422
Lesotho 2000 241 2012 1,243
Liberia 2000 1,525 2008 408
Madagascar 2000 198 2012 405
Malawi 2000 34 2011 79
Mali 2000 192 2012 655
Mauritius 2000 1,024 2012 3,240
Mozambique 2000 64 2011 462
Namibia 2001 691 2008 934
Niger 2001 64 2012 139
Nigeria 2003 931 2005 997
Rwanda 2000 121 2012 673
Sao Tomé and Principe 2002 120 2011 1,040
Senegal 2003 472 2010 711
Seychelles
, 2012 114
Sierra Leone 2000 163 2011 451
Somalia
South Africa 2000 1,420 2006 1,536
South Sudan
2009 283
Swaziland 2000 445 2011 735
Togo 2000 281 2012 1,015
U. R. Tanzania 2001 68 2012 374
Uganda 2000 230 2011 824
Zambia 2000 243 2005 229
Zimbabwe 2000 371 2012 685
West Africa 13* 338 13* 719
East Africa 10* 160 11* 609
Southern Africa 8* 203 5* 444
Central Africa 10* 224 9* 680
Sub-Saharan Africa 41* 217 38* 636
Source: IIEP/Pôle de Dakar Indicator Database. Note: * Number of countries included in the computation of the indicator by region and for SSA.
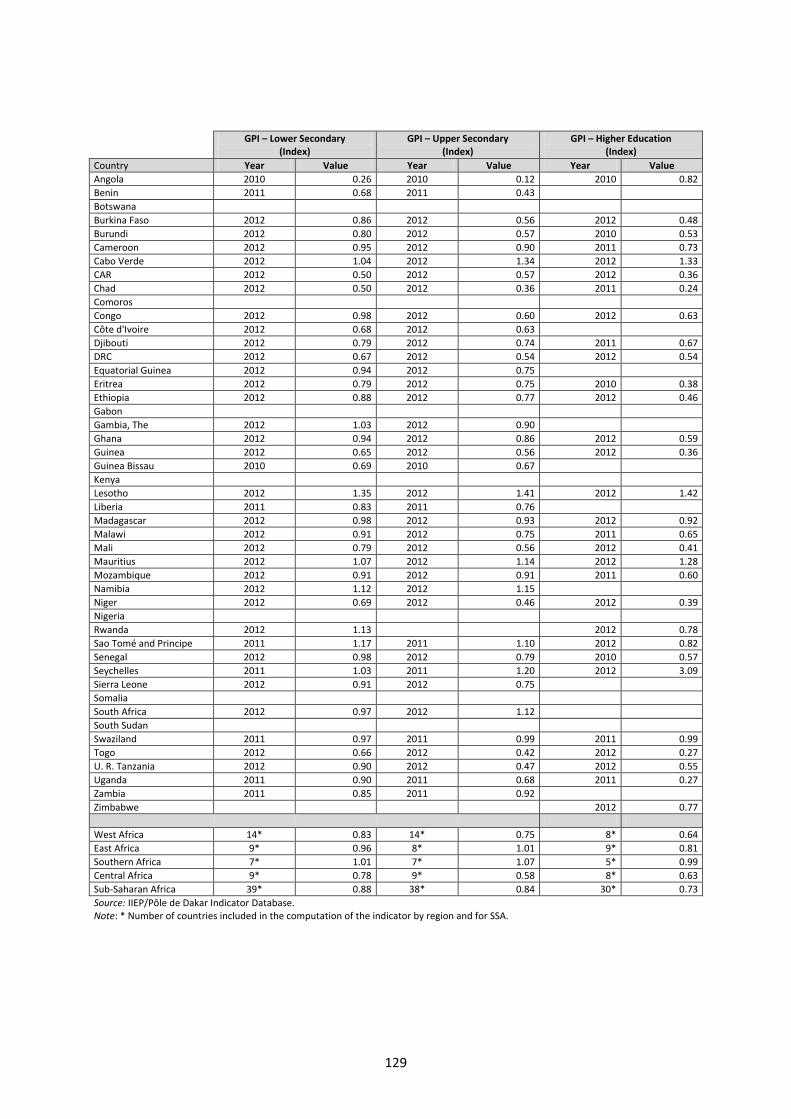
129
GPI – Lower Secondary (Index)
GPI – Upper Secondary (Index)
GPI – Higher Education (Index)
Country Year Value Year Value Year Value
Angola 2010 0.26 2010 0.12 2010 0.82
Benin 2011 0.68 2011 0.43
Botswana
Burkina Faso 2012 0.86 2012 0.56 2012 0.48
Burundi 2012 0.80 2012 0.57 2010 0.53
Cameroon 2012 0.95 2012 0.90 2011 0.73
Cabo Verde 2012 1.04 2012 1.34 2012 1.33
CAR 2012 0.50 2012 0.57 2012 0.36
Chad 2012 0.50 2012 0.36 2011 0.24
Comoros
Congo 2012 0.98 2012 0.60 2012 0.63
Côte d'Ivoire 2012 0.68 2012 0.63
Djibouti 2012 0.79 2012 0.74 2011 0.67
DRC 2012 0.67 2012 0.54 2012 0.54
Equatorial Guinea 2012 0.94 2012 0.75
Eritrea 2012 0.79 2012 0.75 2010 0.38
Ethiopia 2012 0.88 2012 0.77 2012 0.46
Gabon
Gambia, The 2012 1.03 2012 0.90
Ghana 2012 0.94 2012 0.86 2012 0.59
Guinea 2012 0.65 2012 0.56 2012 0.36
Guinea Bissau 2010 0.69 2010 0.67
Kenya
Lesotho 2012 1.35 2012 1.41 2012 1.42
Liberia 2011 0.83 2011 0.76
Madagascar 2012 0.98 2012 0.93 2012 0.92
Malawi 2012 0.91 2012 0.75 2011 0.65
Mali 2012 0.79 2012 0.56 2012 0.41
Mauritius 2012 1.07 2012 1.14 2012 1.28
Mozambique 2012 0.91 2012 0.91 2011 0.60
Namibia 2012 1.12 2012 1.15
Niger 2012 0.69 2012 0.46 2012 0.39
Nigeria
Rwanda 2012 1.13
2012 0.78
Sao Tomé and Principe 2011 1.17 2011 1.10 2012 0.82
Senegal 2012 0.98 2012 0.79 2010 0.57
Seychelles 2011 1.03 2011 1.20 2012 3.09
Sierra Leone 2012 0.91 2012 0.75
Somalia
South Africa 2012 0.97 2012 1.12
South Sudan
Swaziland 2011 0.97 2011 0.99 2011 0.99
Togo 2012 0.66 2012 0.42 2012 0.27
U. R. Tanzania 2012 0.90 2012 0.47 2012 0.55
Uganda 2011 0.90 2011 0.68 2011 0.27
Zambia 2011 0.85 2011 0.92
Zimbabwe
2012 0.77
West Africa 14* 0.83 14* 0.75 8* 0.64
East Africa 9* 0.96 8* 1.01 9* 0.81
Southern Africa 7* 1.01 7* 1.07 5* 0.99
Central Africa 9* 0.78 9* 0.58 8* 0.63
Sub-Saharan Africa 39* 0.88 38* 0.84 30* 0.73
Source: IIEP/Pôle de Dakar Indicator Database. Note: * Number of countries included in the computation of the indicator by region and for SSA.
130
Annex 3: Methodological Considerations
Timeframe Covered by the Report
This assessment report, elaborated from July 2014 onwards, represents an almost final evaluation of
the level of achievement of the EFA goals, one year from the horizon set in 2000, of 2015. However,
considering the time involved in the production and publication of national statistics, the report
effectively reviews progress towards EFA over the period from 2000 to 2012.
Data Sources
The report has a participatory nature, and seeks to best reflect and value each country’s context and
progress. In processing data, priority has been given to national policies. The analysis is based on two
types of sources: national education statistics, that represent the main source of data for Sections 1
and 2 of the report; and country responses to surveys carried out in 2012 and 2014, that are the main
source for Sections 3 and 4.
The indicators offered are therefore computed giving priority to the data provided directly by
countries (such as demographic data), complemented by those of the UNESCO Institute for Statistics
and other institutions. For each country they reflect the effective education system structure (for
instance, the length of the primary cycle retained for the computation of the primary completion rate
might be of 5, 6, 7 or 8 years, depending on the country – See Annex 5).
Analysis by Region
The analysis by region (West Africa, East Africa, Southern Africa and Central Africa) carries several
limitations, such as: (i) countries’ characteristics within a same region are very diverse, which limits
the representativity of the averages; (ii) some analyses performed at the country level cannot be
carried out by region because of the non systematic nature of specific data collection (such as
household surveys, data on learning outcomes or literacy); (iii) where data are not available for all
countries of a given region, or are available for different countries at the start and end of the period,
the averages are even less reliable.
Statistical analysis at the regional level is therefore severely limited in the choice of available
indicators. As a result, in Sections 1 and 2 of this study, the following guidelines have been followed
for the computation of averages:
Dates close to the reference years (the oldest country data from 2000 to 3003 for the
baseline and the most recent country data from 2009 to 2012 for the end of period) are used
to achieve relatively high country coverage and therefore maximize geographical
representativity.
131
Regional indicators that encompass a demographic element have been weighted with
national population data (such as gross enrollment, access and survival rates), whereas
systemic indicators (such as the share of recurrent public expenditure devoted to education)
are simple arithmetic means of the countries for which information is available.
Simple arithmetic means are only computed if data are available for at least a third of a
region’s (or SSA’s) countries, and they are always flagged as being purely indicative when
based on data for under half of countries. Historical comparisons are therefore only provided
when at least a third of countries is considered in both the baseline and end-of-period
averages, and any substantial difference in the number of countries included in each is also
flagged.
Weighted averages only include the data for some countries whose demographic weight
within a region is substantial if data are available for both the start-of-period and the end-of-
period, to avoid any bias in the historical trends: Nigeria for West Africa, Ethiopia for East
Africa, South Africa for Southern Africa and DRC for Central Africa, countries that represent
at least a third of the total population of their respective regions.
It is important to keep these points in mind when reviewing the results presented.
The number of responses to the country questionnaires (see below) did not provide sufficient
representativity at the regional level to enable a disaggregated analysis for Sections 3 and 4, to
conduct meaningful and differentiated analysis, or to identify areas of convergence and trends.
Moreover, all the questions included in the 2014 survey had a purely national focus, offering no
scope for countries to share their views on education performance at the regional level. In these
sections, the analysis is therefore carried out for Sub-Saharan Africa as a whole.
Considerations for Each EFA Goal
Goal 1: The available data for the early childhood care and protection (ECCE) subsector, that covers
children aged 0 to 8 years, are often limited to preprimary education. However, even for this
education level, the scarcity of data does not permit the computation of detailed indicators to
account for the type of institutions created (from basic playschools to real preprimary education) or
even to check the extent to which a given term refers to similar institutions in different countries.
These statistics, and even the work produced on the basis of household surveys, even more rarely
enable the analysis of beneficiary children’s characteristics. Finally, it should also be noted that
families and communities play an important part in terms of informal ECCE, which will not be
reflected in the indicators used here.
Goal 2: In many countries the first measures implemented to support the development of primary
education (abolishing fees or extending the abolition of fees), created situations of late entry (that
are in part related to a generational catch-up phenomenon) or early access that mean that gross

132
enrollment rates mix several cohorts of children. In these circumstances, the indicator can adopt
values higher than 100 percent, but a value of 100 percent does not necessarily mean that all
children of a generation have access to school.
Goal 3: The phrasing of Goal 3 is fairly ambiguous, which makes a precise statistical measurement of
its achievement more complex.
Goal 5: Although gender disparities may be relatively modest compared to those related to area of
residence and household income, it is not possible to detail the evolution of these economic and
geographic disparities due to the absence of data for most countries.
Goal 6: SACMEQ assessments are periodic, including all partner countries at the same time in
common tests that appraise primary Grade 6 pupils’ competency levels in reading and math. The
basic competency level is Level 4 (Reading for meaning: “Reads on or reads back in order to link and
interpret information located in various parts of the text;” Beginning numeracy: “Translates verbal or
graphical information into simple arithmetic problems. Correctly uses multiple different arithmetic
operations.”)
The PASEC assessments are more analytical and focused on research into the factors of quality at the
national level. They nevertheless provide comparability between countries given that some tests are
given in the context of national assessments of primary Grade 2 and Grade 5 pupils. The basic
competency level is set at 40 percent of correct answers, those pupils achieving lower scores being
considered to have failed.
These assessments provide reasonable comparability among countries, but the data are obtained at
different points in time and their representativity for some regions is limited. The SACMEQ III (2007)
data cover the 9 countries of Southern Africa and 5 of the 13 countries of East Africa (two further
countries, Madagascar and the Comoros, participate in the PASEC), whereas the PASEC VII, VIII and IX
(2004-10) programme results provide data for 5 of the 15 countries of West Africa, and 6 of the 10
countries of Central Africa.
Analysis of Country Responses to the EFA Surveys
To enhance the legitimacy of their responses to the questionnaires, countries were encouraged to
form or convene sector teams to prepare their answers, including national education ministry
officers, civil society representatives and members of technical and financial partner agencies.
Given the limited sample of responses to the 2014 survey, the analysis in Sections 3 et 4 is also based
on the responses to the 2012 survey. The full sample therefore includes 36 countries. However, due
to differences in the structure, scope and questions of the two surveys, different country samples are
used for different sections and parts of this report:
A. Sample of 21 countries (close to half of SSA countries), for all the numerical variables (closed
questions with answers given on a scale) of the 2014 survey, or all the countries having
answered these questions.
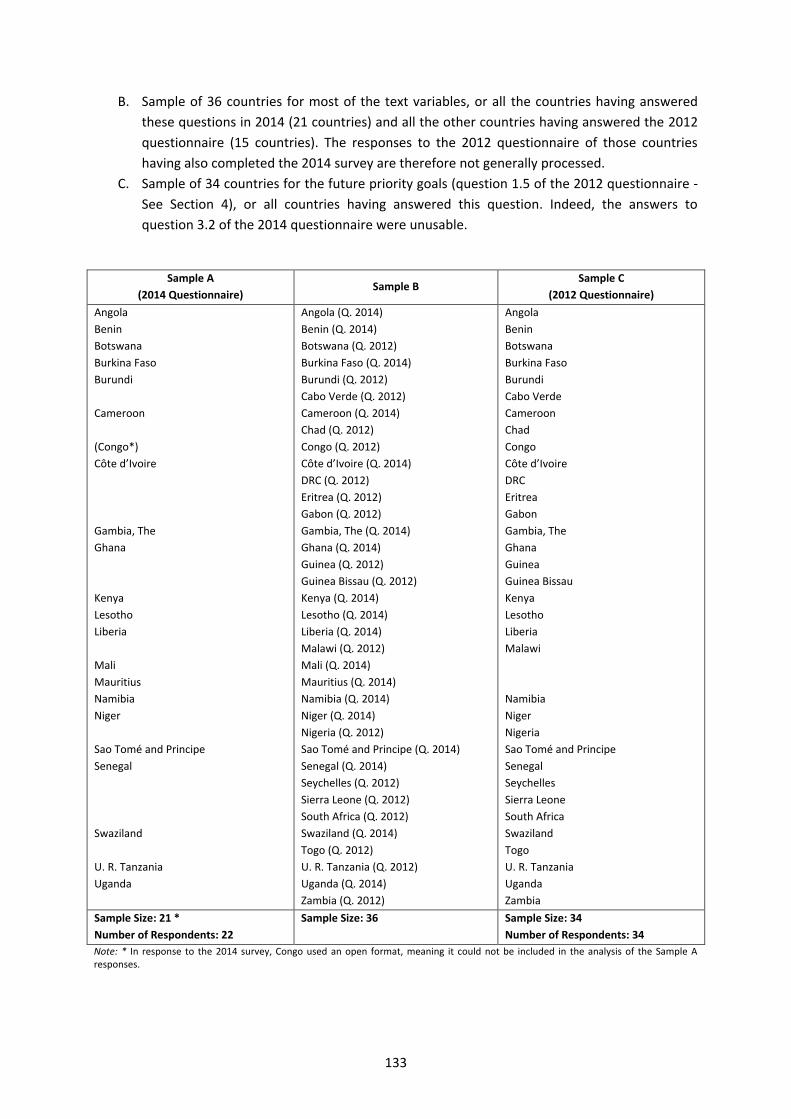
133
B. Sample of 36 countries for most of the text variables, or all the countries having answered
these questions in 2014 (21 countries) and all the other countries having answered the 2012
questionnaire (15 countries). The responses to the 2012 questionnaire of those countries
having also completed the 2014 survey are therefore not generally processed.
C. Sample of 34 countries for the future priority goals (question 1.5 of the 2012 questionnaire -
See Section 4), or all countries having answered this question. Indeed, the answers to
question 3.2 of the 2014 questionnaire were unusable.
Sample A
(2014 Questionnaire) Sample B
Sample C
(2012 Questionnaire)
Angola
Benin
Botswana
Burkina Faso
Burundi
Cameroon
(Congo*)
Côte d’Ivoire
Gambia, The
Ghana
Kenya
Lesotho
Liberia
Mali
Mauritius
Namibia
Niger
Sao Tomé and Principe
Senegal
Swaziland
U. R. Tanzania
Uganda
Angola (Q. 2014)
Benin (Q. 2014)
Botswana (Q. 2012)
Burkina Faso (Q. 2014)
Burundi (Q. 2012)
Cabo Verde (Q. 2012)
Cameroon (Q. 2014)
Chad (Q. 2012)
Congo (Q. 2012)
Côte d’Ivoire (Q. 2014)
DRC (Q. 2012)
Eritrea (Q. 2012)
Gabon (Q. 2012)
Gambia, The (Q. 2014)
Ghana (Q. 2014)
Guinea (Q. 2012)
Guinea Bissau (Q. 2012)
Kenya (Q. 2014)
Lesotho (Q. 2014)
Liberia (Q. 2014)
Malawi (Q. 2012)
Mali (Q. 2014)
Mauritius (Q. 2014)
Namibia (Q. 2014)
Niger (Q. 2014)
Nigeria (Q. 2012)
Sao Tomé and Principe (Q. 2014)
Senegal (Q. 2014)
Seychelles (Q. 2012)
Sierra Leone (Q. 2012)
South Africa (Q. 2012)
Swaziland (Q. 2014)
Togo (Q. 2012)
U. R. Tanzania (Q. 2012)
Uganda (Q. 2014)
Zambia (Q. 2012)
Angola
Benin
Botswana
Burkina Faso
Burundi
Cabo Verde
Cameroon
Chad
Congo
Côte d’Ivoire
DRC
Eritrea
Gabon
Gambia, The
Ghana
Guinea
Guinea Bissau
Kenya
Lesotho
Liberia
Malawi
Namibia
Niger
Nigeria
Sao Tomé and Principe
Senegal
Seychelles
Sierra Leone
South Africa
Swaziland
Togo
U. R. Tanzania
Uganda
Zambia
Sample Size: 21 *
Number of Respondents: 22
Sample Size: 36 Sample Size: 34
Number of Respondents: 34
Note: * In response to the 2014 survey, Congo used an open format, meaning it could not be included in the analysis of the Sample A responses.
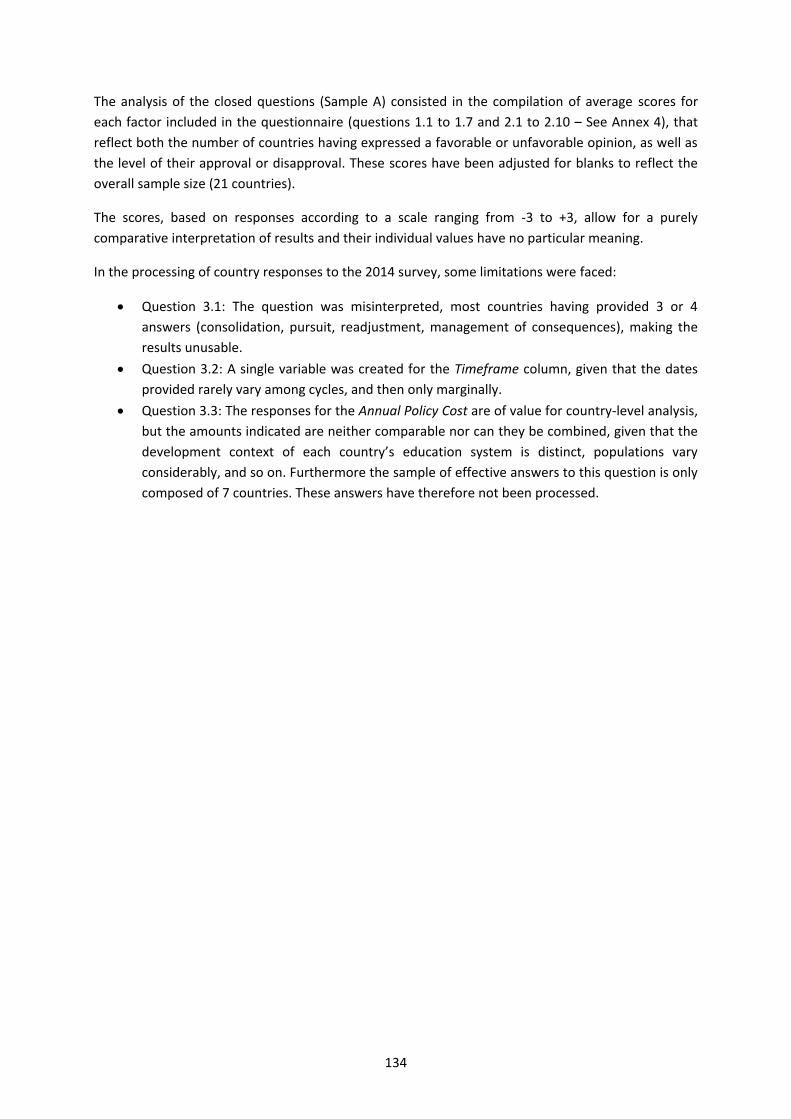
134
The analysis of the closed questions (Sample A) consisted in the compilation of average scores for
each factor included in the questionnaire (questions 1.1 to 1.7 and 2.1 to 2.10 – See Annex 4), that
reflect both the number of countries having expressed a favorable or unfavorable opinion, as well as
the level of their approval or disapproval. These scores have been adjusted for blanks to reflect the
overall sample size (21 countries).
The scores, based on responses according to a scale ranging from -3 to +3, allow for a purely
comparative interpretation of results and their individual values have no particular meaning.
In the processing of country responses to the 2014 survey, some limitations were faced:
Question 3.1: The question was misinterpreted, most countries having provided 3 or 4
answers (consolidation, pursuit, readjustment, management of consequences), making the
results unusable.
Question 3.2: A single variable was created for the Timeframe column, given that the dates
provided rarely vary among cycles, and then only marginally.
Question 3.3: The responses for the Annual Policy Cost are of value for country-level analysis,
but the amounts indicated are neither comparable nor can they be combined, given that the
development context of each country’s education system is distinct, populations vary
considerably, and so on. Furthermore the sample of effective answers to this question is only
composed of 7 countries. These answers have therefore not been processed.

135
Annex 4: Country Questionnaire
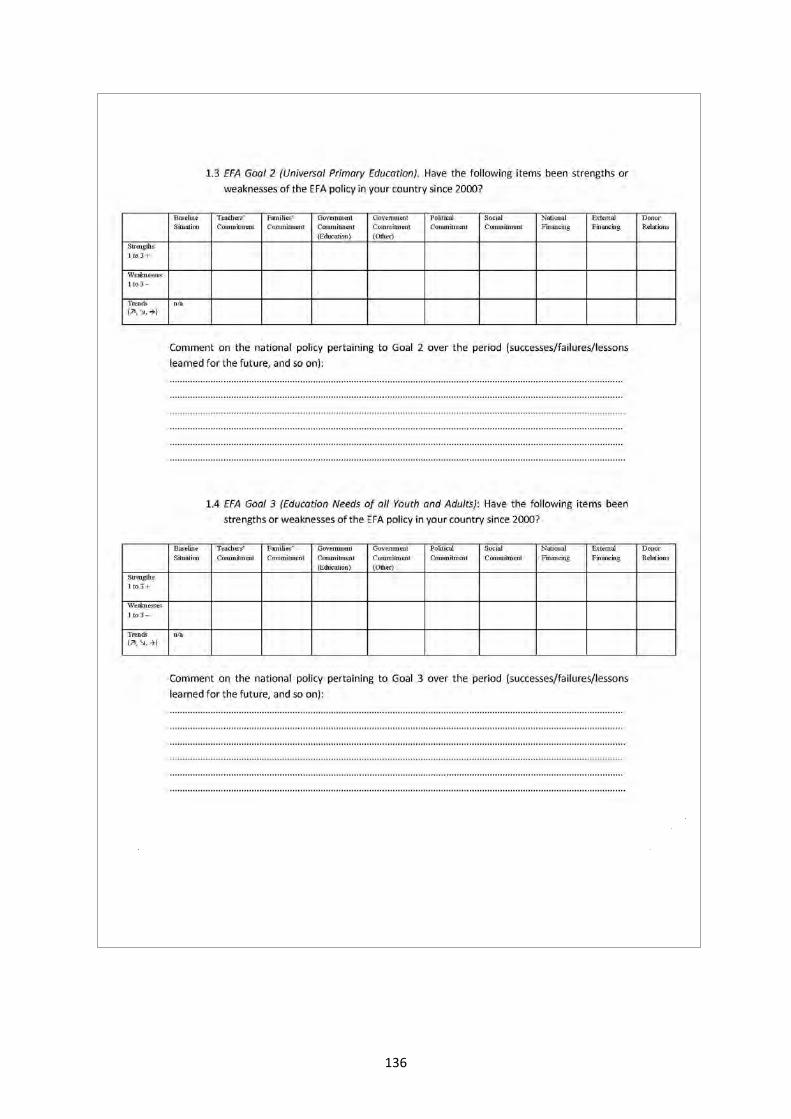
136

137
138
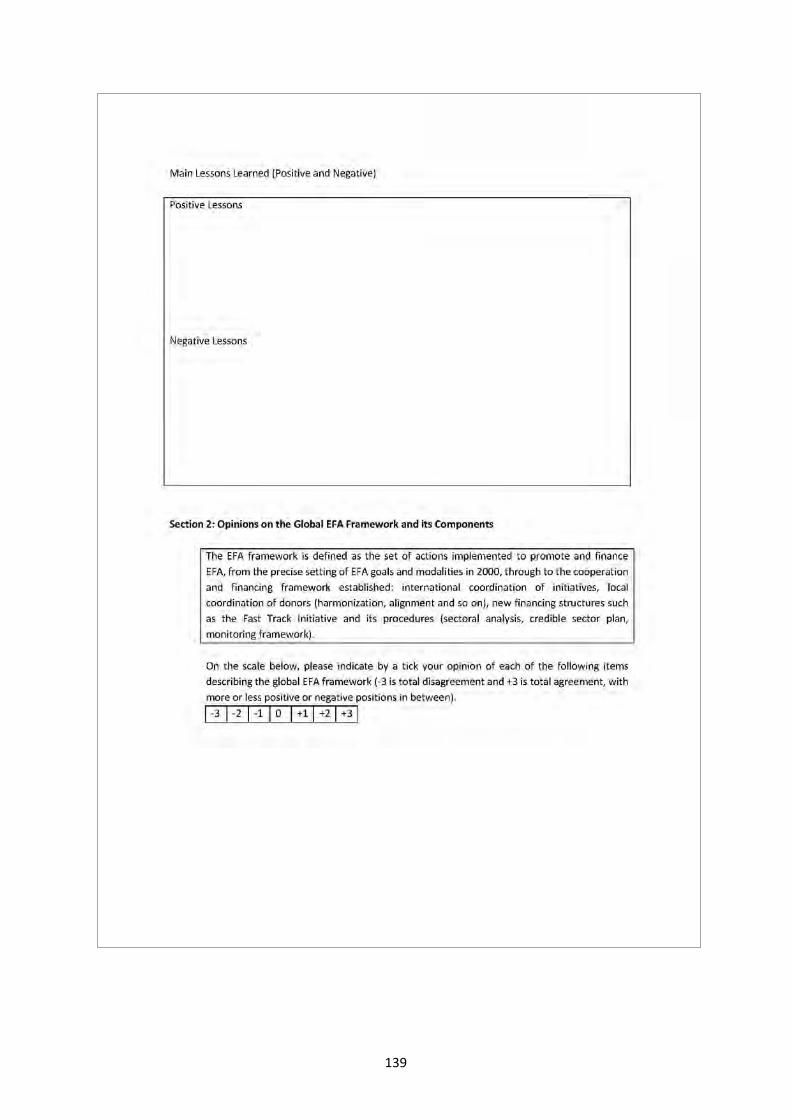
139
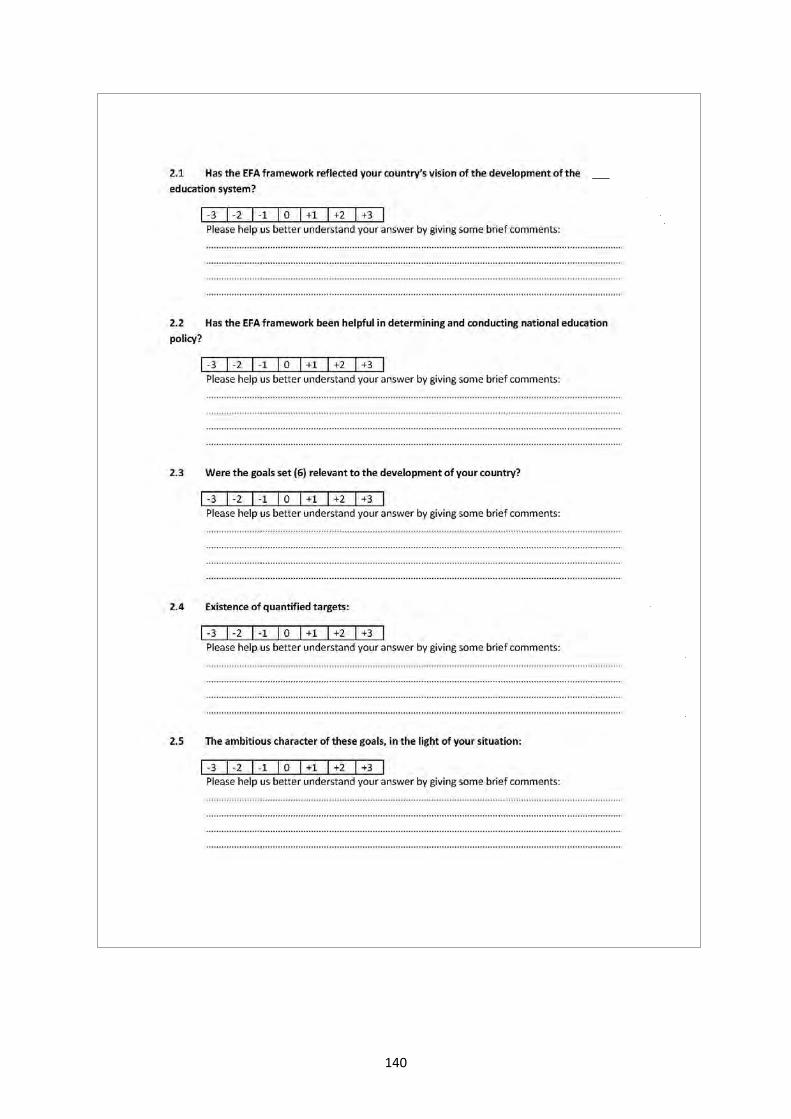
140

141
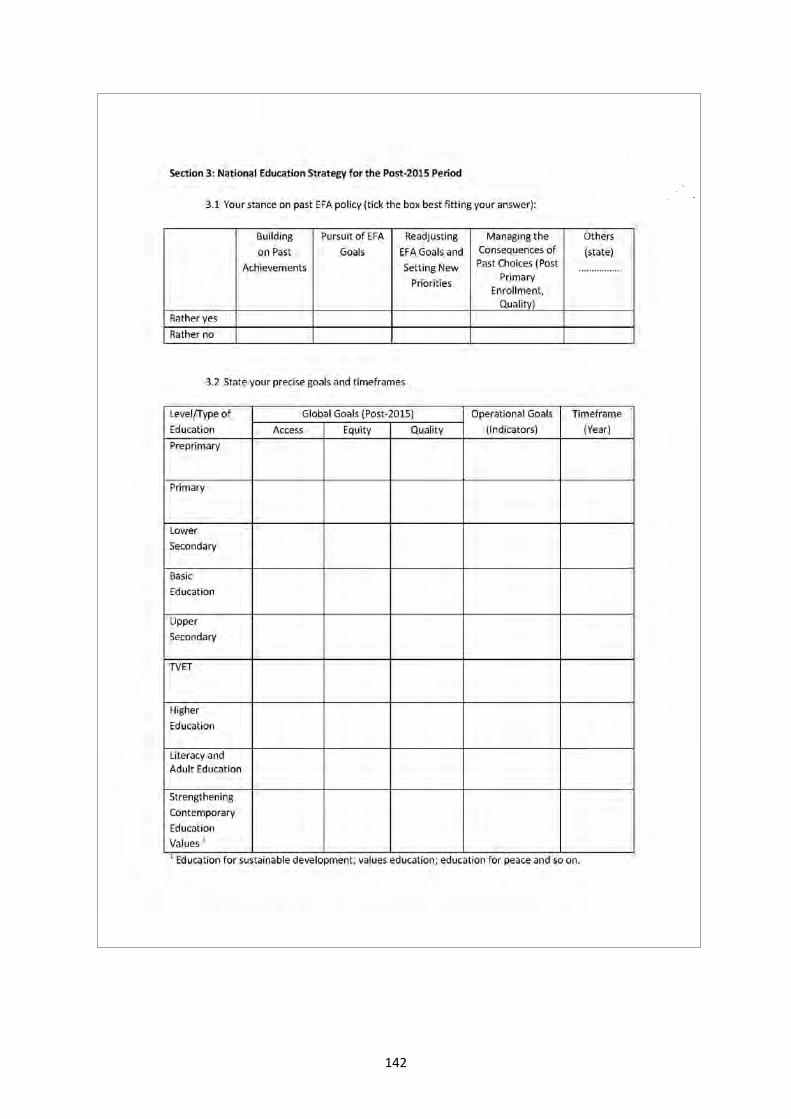
142

143
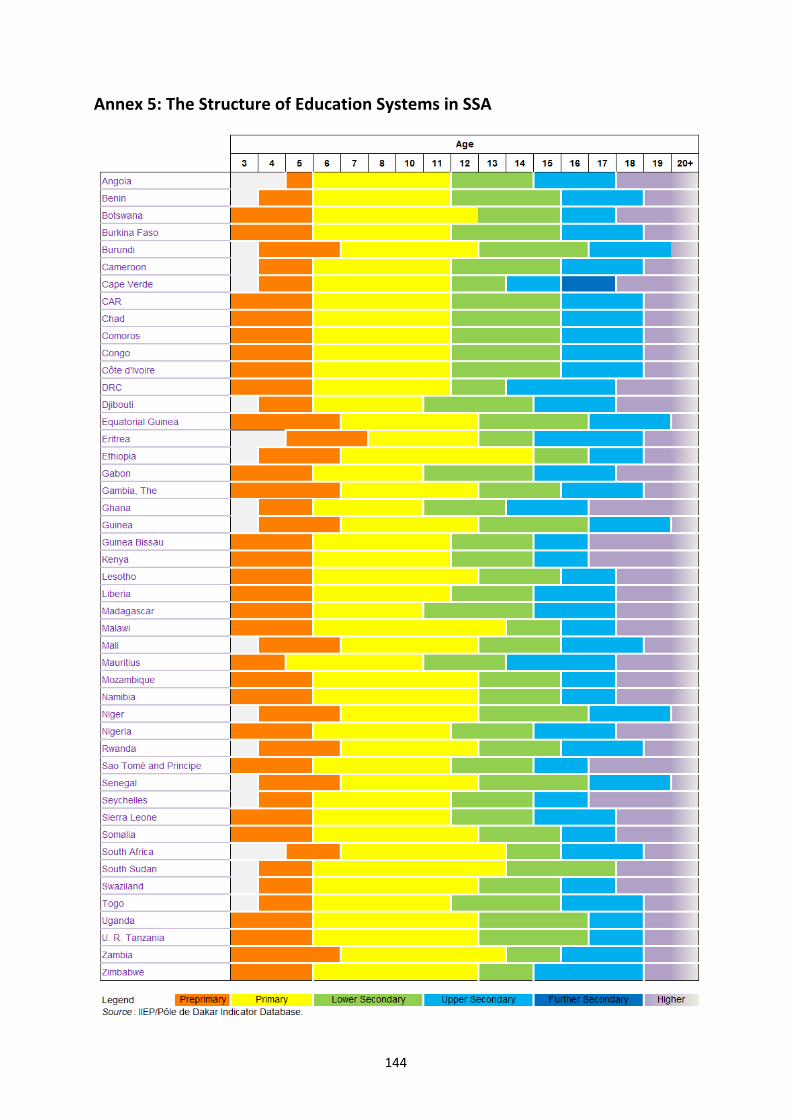
144
Annex 5: The Structure of Education Systems in SSA

145
Annex 6: List of SSA Countries Having Conducted CSR-Type Sector Analysis
Country Year
Benin 2002, 2009 et 2012
Burkina Faso 2000 et 2010
Burundi 2007 et 2012
Cabo Verde 2011
Cameroon 2003 et 2013
Central African Republic 2008
Chad 2007 et 2014
Comoros 2011
Congo 2010
Côte d'Ivoire 2005 et 2011
Democratic Republic of Congo 2005 et 2014
Djibouti 2009
Ethiopia 2005
Gabon 2012
Gambia, The 2011
Ghana 2011
Guinea 2005
Guinea Bissau 2010
Kenya 2004
Lesotho 2005
Liberia 2010
Madagascar 2001 et 2008
Malawi 2004 et 2010
Mali 2007 et 2010
Mozambique 2003
Namibia 2005
Niger 2000, 2004 et 2012
Nigeria 2004
Rwanda 2003, 2011 et 2013
Sao Tomé and Principe 2012
Sierra Leone 2007 et 2012
South Sudan 2012
Swaziland 2006 et 2010
Togo 2003, 2007 et 2013
United Republic of Tanzania 2011
Zambia 2004 Source: World Bank, UNICEF and UNESCO/IIEP/Pôle de Dakar.