Embed Size (px)
Citation preview
Replication in expeRimental economics: a HistoRical and Quantitative appRoacH Focused on public Good Game expeRimentsDocuments de travail GREDEG GREDEG Working Papers Series
Nicolas ValloisDorian Jullien
GREDEG WP No. 2017-21https://ideas.repec.org/s/gre/wpaper.html
Les opinions exprimées dans la série des Documents de travail GREDEG sont celles des auteurs et ne reflèlent pas nécessairement celles de l’institution. Les documents n’ont pas été soumis à un rapport formel et sont donc inclus dans cette série pour obtenir des commentaires et encourager la discussion. Les droits sur les documents appartiennent aux auteurs.
The views expressed in the GREDEG Working Paper Series are those of the author(s) and do not necessarily reflect those of the institution. The Working Papers have not undergone formal review and approval. Such papers are included in this series to elicit feedback and to encourage debate. Copyright belongs to the author(s).
Replication in experimental economics: A historical and
quantitative approach focused on public good game
experiments
Very preliminary version, please do not quote without permission
Nicolas Vallois∗& Dorian Jullien†
GREDEG Working Paper No. 2017–21
Abstract.We propose a historical perspective on replication in experimental economics focused on
public good games. Our intended contribution is twofold: in terms of method and in termsof object. Methodologically, we blend traditional qualitative history of economics with a lesstraditional quantitative approach using basic econometric tools to detect unnoticed historicalpatterns of replication. In terms of our object, we highlight a type of replication that we call“baseline replication”, which is not present in explicit methodological discussions, yet central inthe specificity of experimental economics regarding replication in economics.
Keywords: Experimental Economics, Replication, History of Economic Thought,Methodology, Public Good Experiments.
JEL Codes: B20, C83, A14, C90
∗CRIISEA, Universite Picardie Jules VerneCorresponding author. Email adress: [email protected]†GREDEG, Universite Cote d’Azur
1
Introduction
Replication in science can be broadly defined as the reproduction of empirical results using the
same methods and protocols. According to many authors, replication is the hallmark of science
because it makes research findings more reliable (see the references in Schmidt 2009). Since the
1980’s, seminal publications have pointed out replication difficulties in applied economics and
econometrics (Kane 1984; Dewald et al. 1986; Mirowski and Sklivas 1991; see also Ashenfelter
et al., 1986 for the methodological challenges that replication poses to journal editors). As
Hamermesh puts it “economists treat replication the way teenagers treat chastity - as an ideal
to be professed but not to be practised” (Hamermesh, 2007, p.715). On the other hand, the
experimental method is often praised for the ease of replicability that comes with it compared to
other forms of empirical observations. This belief tends to be held by non-experimentalists (e.g.,
ibid, p.5) and experimentalists alike, e.g., when Plott says bluntly “the heart of the experimental
method is replication” (Plott, 1982, p.1490). The goal of this paper is to provide a historical
perspective on the practice of replication in experimental economics.
This perspective can help better understand the place of economics within the current “repli-
cation crisis” that is impacting several disciplines using controlled experiments (see the references
cited by Camerer et al., 2016, p.1433). The crisis has triggered a renewed interest in replication
within economics at large1, including experimental economics (e.g., Rosenblat, Fatas and Deck
2015. The overall picture is messy. Outside of experimental economics, some argue that most of
empirical economics is not reproducible (e.g Chang, Li et al., 2017), while some others suggest
that the academic market provides sufficient and strong incentives to replicate (Hamermesh,
2016).
Experimental economists seem to be more optimistic: 61,11% (11 out of 18) of experimental
results were successfully replicated in a large collaborative project recently published in the
prestigious journal Science (Camerer et al., 2016). The authors suggest that EE’s results are
relatively more reproducible and robust than in psychology, where a similar study found a repli-
cation rate of 38% (Collaboration et al., 2015). This “relatively good replication success” would
1See Koenker and Zeileis 2009; Glandon 2010; Coffman and Niederle 2015; Clemens 2015; Rosenblat, Fatasand Deck 2015; Hamermesh 2016; Camerer et al. 2016; Mueller-Langer et al. 2017; Chang, Li et al. 2017.Furthermore, a collaborative wiki appeared in 2015 to promote replication studies in economics (replication.uni-goettingen.de/wiki) and the 2017 annual meeting of the AEA in Chicago included a session on replication.
2
be the result of “editorial practices [that] created norms of transparency and made replication
and reanalysis relatively easy” in EE (Camerer et al., 2016, p.1435).
This optimism is questionable. The result of Camerer et al. is indeed hard to interpret:
61,11% is better than 38%, but it still means than more than a third (7 out of 18 studies, i.e.
38,88%) of lab experiments are not reproducible. More importantly, the replicated experiments
are not representative of EE’s “average” literature. Only 18 articles were included in the study
whereas the similar collective project in psychology replicated a hundred experiments. Another
problem is that replicated experiments in economics were published in the American Economic
Review and the Quarterly Journal of Economics between 2011 and 2014, and most papers in
EE are not published in AER or QJE. Last but not least,the three-year time period (2011-2014)
is too short to investigate long-term replication patterns. Low (respectively relatively high)
replication rates could imply that things are really bad (resp. not too bad). An alternative
explanation is that these problems always existed and were probably much worse in the past;
we may not have to be excessively pessimistic because replication failures are due mainly to a
greater awareness of replication issues.
A historical approach is therefore needed in order to evaluate the state of replication in EE
over a longer period. More precisely, our goal is to provide a quantitative approach to highlight
the historical dynamics of replication in experimental economics. Our intended contribution
is twofold: in terms of approach and in terms of object. Our historical approach is to use
basic econometric tools to find unnoticed historical patterns of interests for both historians of
economics and economists. This is meant to facilitate dialog between each academic community
by using the same standard of evidence (as promoted by Backhouse, Middleton and Tribe,
1997) and by indicating long-term tendencies in a given economic research domain (e.g., as with
meta-studies but with time as the main variable of interest). Our historical object, replication
in experimental economics, is in need of two refinements to be empirically meaningful. On the
one hand, we restrict our observations to a specific type of economic experiments: public good
(PG) game experiments. A typical PG game consists in a group of subjects, each of which has
money (experimental tokens) that can be used either to contribute to a PG (yielding returns
to all the subjects in the group) or to invest in a private good (yielding returns only to the
investor). Contributing to the PG can yield better return than investing in a private good only
3
if at least some others are investing in the PG. Using different types of experiments would have
made the results less precise or too long for a single paper. We chose PG game because the
field is relatively well homogeneous, it notably contains mostly contributions from economic
journals (contrary to ultimatum game experiments for instance2. Furthermore, historians and
methodologists of EE consider that PG game played a central role in the long-term development
of the discipline (Guala, 2005; Svorencık, 2015). On the other hand, we have to make explicit
a type of replication in experimental economics, which we will call “baseline replication”, that
seems to be part of experimental economists’ tacit knowledge and common practice, yet absent
from explicit methodological discussion of replication.
The paper is structured as follows. Section 1 exposes the specificity of our historical object,
i.e., baseline replication in PG game experiments. Section 2 discusses the methodological speci-
ficity of our historical approach and describes how we collected our data. Section 3 presents
and interprets the main empirical findings. Section 4 discusses more broadly the meaning of our
results and the specificity of our method. Section 5 summarizes and suggests further work.
1 Baseline replication in EE
“Replication” has different meanings in explicit methodological discussions, and a given meaning
can have different names from author to author. A basic distinction is between what we call
here “pure replication” and “robustness test”3A pure replication tries to find the same results
of a given study by using the same data and the same method. There can be pure econometric
replication: “taking the actual data generated by an experiment and reanalyzing the data to
confirm the original findings”(Levitt and List, 2009, p.14); or pure experimental replication: “to
run an experiment which follows a similar protocol to the first experiment to determine whether
similar results can be generated” (ibid). By contrast, a robustness test tries to find whether a
2We suspected that different disciplines (psychology, political science, anthropology, and so forth) might havedifferent replication practices and might not reflect the culture and method of experimental economists.
3Respectively named“econometric auditing” and “improvisational replication” (Kane, 1984), “replication” and“reproduction” (Mirowski and Sklivas, 1991), “pure replication” and “scientific replication (Hamermesh, 2016).Clemens describes a pure replication as an estimation of parameters “drawn from the same sampling distributionsas those in the original study”, while a robustness test “ estimates parameters drawn from a different samplingdistribution from those in the original study”(Clemens, 2015, p.327).
4
given result holds in a new context (e.g., with different types of subjects, in a new geographical
place, at different times, when other variables are present, etc.). Robustness test can be done
in (non-experimental) econometrics as well as in experimental economics.
We suggest here the existence of a third type of replication, which is specific to experimental
methods. Experimental economists usually report their results as a significant difference between
(at least) two sets of observations: one from a so-called “baseline” condition (or “control group”)
and another from a treatment condition (usually similar to the baseline except for one detail).
For a given type of experiments in economics, e.g., PG game experiments, most experiments
will have a baseline condition that is similar or very close to another baseline condition, so that,
overall, it make sense to check whether the observation in a given baseline condition is close to
the average observation across all baseline conditions. We will call “baseline replication” the
fact that results in baseline conditions of similar experiments are converging toward the same
level.
While absent from explicit methodological discussions (e.g., in the references from the pre-
vious paragraph), baseline replications are pervasive in casual methodological discussions of
experimental economists. Smith is indeed talking about baseline replication when he wrote:
“if I do an experiment similar to yours as a baseline control for comparison with a related
experiment I intend to perform, I am testing the robustness of your original results using my
instructions, subjects and a different experimenter” (Smith, 1994, p.128). In a collective book
on replication in EE, Deck, Fatas and Rosenblat (2015) recognize that pure replication is very
rare in EE but argue that experimental results are reproducible mostly through replication
across papers (i.e., “baseline replication”). Baseline replication can be seen as in-between pure
replication and robustness test and is specific to the use of lab experiments in economics (and
in other social sciences, including psychology). It is not explicit replication in the sense that it
is a mere by-product of finding a possibly new effect in a given domain. This specificity partly
justifies taking baseline replication as our historical object.
The other part of the justification is that pure replications are even less frequent in EE than
in other branches of applied economics. Bibliometric studies such as Mueller-Langer et al. (2017)
show that, among 1,243 published papers from the top-50 economic journals from 1974 to 2014,
less than 0.1% were replications. Hamermesh (2016) analyzes every publication that have cited
5
the 10 most heavily-cited publications in applied labor economics. Only 0,6% of these citing
articles are pure replication and 1,5% are robustness test. Yet out of the 10 most cited articles,
7 were replicated at least 5 times and the remaining 3 replicated 1, 2 and 4 times. Hamermesh
therefore argues that replicability in labor economics is satisfying, at least for most-cited studies.
A closely related result is found by Sukhtankar et al. (2017) who establishe that in development
economics, the stronger predictor of whether a paper is replicated or not is its Google Scholar
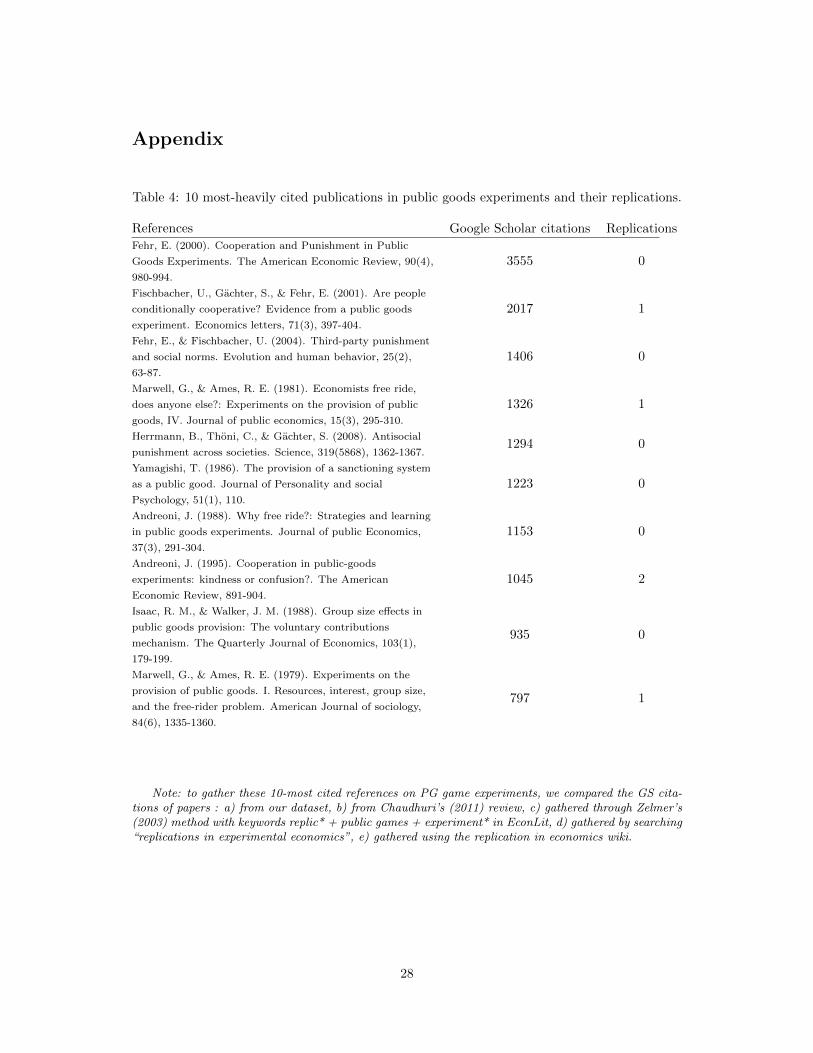
citation count. Using Hamermesh’s method, we selected the 10 most heavily-cited publications
in PG experiments (Table 4 in the Appendix). Only four of these ten publications were replicated
(and only one was replicated two times). In total, we found three pure replications and four
robustness tests (Table 5 in the appendix). Provided that there are thousands of publications in
the field, our result shows that replication (in a large sense, including both pure replication and
robustness tests) is even rarer in EE than what was found in economics by previous bibliometric
studies (Mueller-Langer et al., 2017; Hamermesh, 2016). This result might seem surprising
because incentives for replications are usually considered to be stronger in EE4(Mueller-Langer
et al., 2017). More importantly, as an experimental discipline EE does not face the problems
associated with data sharing in econometrics (see Dewald et al. 1986; Ashenfelter et al. 1986;
Bernanke 2004; Duvendack, Palmer-Jones and Reed 2015). Hamermesh for instance takes for
granted that pure replication are easier to perform in EE than in labor economics: “replication
in the case of labor economics (and presumably of other areas of applied microeconomics) does
not take the form of repetition of a particular protocol on laboratory rats (or their equivalent
in economic research, undergraduate students)” Hamermesh (2016, p.5).
However, the lack of pure replications in our bibliometric data is not surprising for anyone
familiar with experimental science. Even in biological experiments with mice, replications are
never “pure”, since generations of inbreeding have resulted in significant differences between
individuals5 (Richter et al., 2009). Subjects in EE are usually undergraduate students and dis-
parities between human individuals are obviously even more problematic in public good games.
As Clemens argues, most replications in lab economic experiments are not pure replications
4In particular, the journal Experimental Economics is the only top-50 economics journal with an explicitreplication policy : “Lastly, the journal publishes articles with a primary focus on methodology or replicationof controversial findings” (EE’s website). Deck, Fatas and Rosenblat (2015) also point out that the recentlylaunched Journal of the Economic Science Association strives to promote replications.
5Paradoxically, Richter argue that “environmental standardization is a cause of, rather than a cure for, poorreproducibility of experimental outcomes” (Richter, Garner and Wurbel, 2009, p.257)
6
because most original results are understood as being valid in University X (hence, a similar
experiment conducted in University Y is a robustness test; Clemens, 2015, p.330)6But there is
a deeper reason for the lack of replications (not only pure but also robustness test) in our data:
replications in EE are often implicit, in the sense that the explicit purpose of a study where
there is a replication is not to replicate. For instance, Chaudhuri et al. replicate in the initial
part of their experiment the result of Fischbacher and Gachter (2010) that the majority of sub-
jects are “conditional cooperators” and then study the effect of information about conditional
cooperators on contribution to the PG (Chaudhuri, Paichayontvijit et al., 2006). In this article,
replicationis merely a by-product of the main finding, and the paper can not be classified as
replication per se. But of course Chaudhuri et al. really show that Fischbacher et al.’s result is
reproducible and they really have to design a similar experimental condition to compare their
results. This part of the experimental method plays an important role in baseline replication.
In short, Plott’s (1982, p.1490) statement that “the heart of the experimental method is repli-
cation” makes much more sense in terms of baseline replication than replication (both pure and
robustness test).
2 Method
Our paper aims at evaluating the effectiveness of baseline replication in EE, through the case
of public good games. Assessing baseline replication implies that control results in control
conditions can be compared across studies. An additional reason for choosing PG experiments
in this regard is that experimental results in this subfield usually provide a common variable
of interest, the rate of individual contributions to the public good, which allows for easy inter-
studies comparison7. Also, the academic literature in EE is huge and our bibliometric analysis
6Other sources for the lack of pure replications in EE are the same as in (non-experimental) econometrics:computer code is essential to run a replication and do-files are difficult to obtain (McCullough, McGeary andHarrison, 2006); a related problem is that econometric software might be unknown to the researcher planninga replication (Koenker and Zeileis, 2009); some programs might not be available (Mirowski and Sklivas, 1991);understanding differences between the original study and its replication might not be straightforward (Mirowskiand Sklivas, 1991); no sufficient incentives for economists to work on replications since very few journal publishreplication studies.
7In some other areas of EE (e.g., asset experimental markets, auctions experiments), experimental resultsare much harder to compare because there is no general and common variable of interest such as the rate of
7
could not be exhaustive. We had to rely on sampling methods, and another advantage of public
good games is that there already exists meta-studies and surveys that we took as representative
of the whole literature on the topic (Ledyard, 1995; Zelmer, 2003; Chaudhuri, 2011).
Our data set consists of 66 published papers on PG game experiments. We collected single
studies from the references cited in Ledyard (1995) for the pre-1995 period and from Chaudhuri
(2011) for the 1995-2010 period. We obtained a total of 55 studies from 1979 to 2009, i.e.
on average 55/30=1,8 study per year. For the later time period (2009-2015), no survey was
available, so we randomly sampled 11 studies using a method similar to Zelmer (2003): we
conducted a research in EconLit with the keywords “public goods” and “experiment*” (with the
asterisk being a wildcard that can be associated with experiment, experimental, experimentally,
and so forth). This research for the 2009-2015 time period yielded 306 results. To keep the
same average of 1,8 article per year, we had to sample 1,8 x 6 years, which is approximately 11
studies. We displayed 30 articles per page. To avoid alphabetical bias (cf. (Ray and Robson,
2016), we display results by alphabetical order and select the middle-range article (on the 15th
position). If the study did not meet our inclusion criteria, we took the next articles in alternative
ascending/descending order (the 16th, then the 14th, then the 17th, and so forth).
The next (and longer) step was to collect data on “baseline” result for each study. The task
was easy in some cases where the authors explicitly mentioned that one of their conditions was
“control” or “baseline”. But some other studies only contrast various conditions without char-
acterizing one in particular as control (for instance, Marwell and Ames, 1981). Using previous
experiments in which a baseline condition was explicitly identified, we progressively manage to
define several features of what could count as a baseline condition (see Table 2 in the appendix).
For instance, since Andreoni (1988) takes the “stranger condition” as control, we decided that
if a subsequent study included a stranger treatment versus a partner treatment, we should give
priority to the first one to be considered as the control condition. We also collected data on
methodological variables that might explain disparities across baseline results: citations, the
sample size, type of subjects (economic or non-economic students), geographical location of the
individual contribution in public goods games. The discount rate in experiments on intertemporal choices providethis common variable, but a meta-study showed that experimental designs in this subfield are too different toallow for inter-studies comparison (Percoco and Nijkamp, 2009). An alternative candidate was the mean relativechoice in the ultimatum game, but this subfield is much more interdisciplinary and was suspected to be notsufficiently representative of EE, as argued previously (cf. section 1).
8
lab, the marginal per capita return (MPCR) and the group size in the control condition.
The only criterion of restriction that we imposed on single studies is that they have to
provide our “baseline” variable: average group contribution rate to the PG. It requires only
that in the experimental design, subjects are given an initial endowment and have to choose
between a contribution to a private good or a PG. This criterion led mainly to the exclusion of
experiments on social dilemmas that do not give initial endowments to subjects (e.g., Schneider
and Pommerehne, 1981). Unlike Zelmer (2003), we had no restriction criteria on the linearity of
the PG (provision point accepted) or on the MPCR. As detailed in table 6 in the appendix, we
chose however to exclude several studies that brought structural changes to what is considered as
the “classic” PG game, in particular: intergroup competition, revision of decision, contest game,
or coercive institutions. Of course, if these conditions were compared to a baseline condition
without intergroup competition, revision, and so forth, we include the study in our database.
Like Zelmer (2003), we only include studies that report accurate group results; one of the
main reason for exclusion in this regard is when data on contribution rates are only presented
graphically.
Meta-studies such as Zelmer’s collect experimental results on what is usually considered as a
dependent variable in PG games (average level of contribution to the PG) and then run a “meta”
regression of this variable on the different independent variables considered in particular studies
(e.g., MPCR, communication, group composition, use of children as subjects and so forth).
The purpose is to identify which of these independent variables have a significant effect on
contribution to the PG over all studies. A crucial feature of meta-studies is that they need
to include studies that are as homogeneous as possible; ideally, experiments should vary only
regarding independent variables (corresponding to various treatments) and maintain the same
control conditions. In other words, meta-studies take for granted that baseline controls are
indeed replicated across studies. On the contrary, we were interested in the way experimenters
measure contribution in baseline conditions, and if these measurements do converge over time.
Instead of restricting our analysis to a particularly coherent (and recent) subset of the literature,
we were looking for tendency toward coherence in a representative (and not necessarily coherent
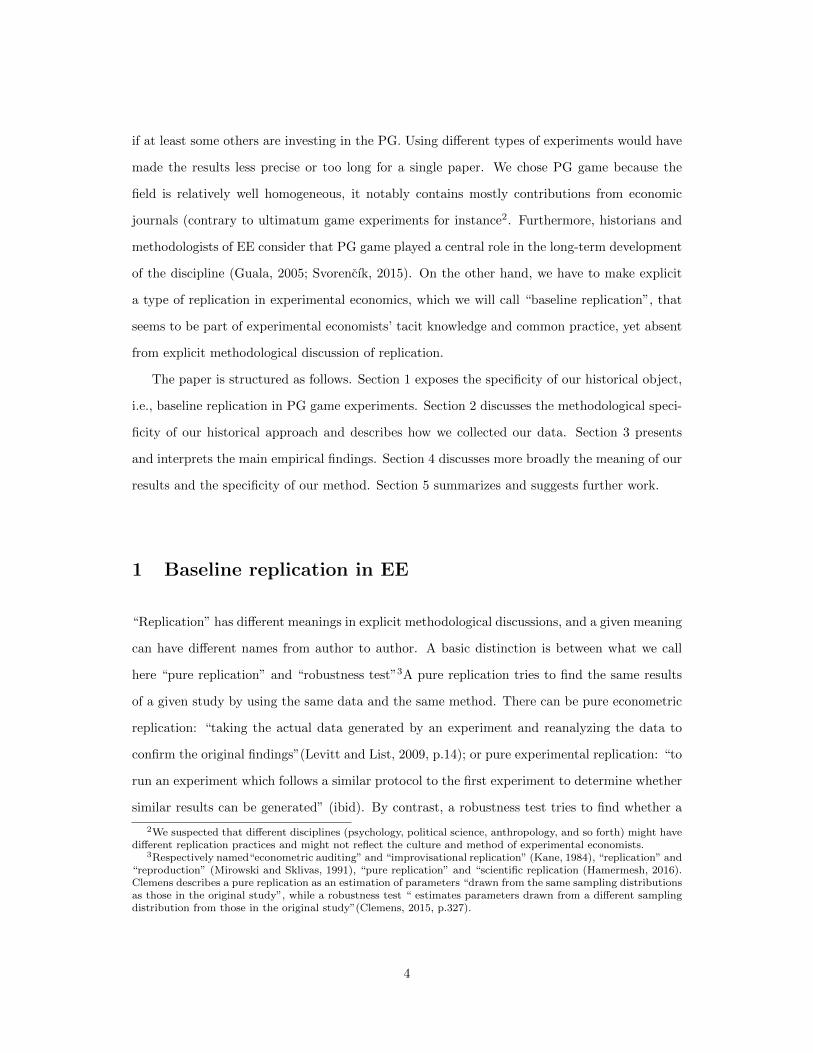
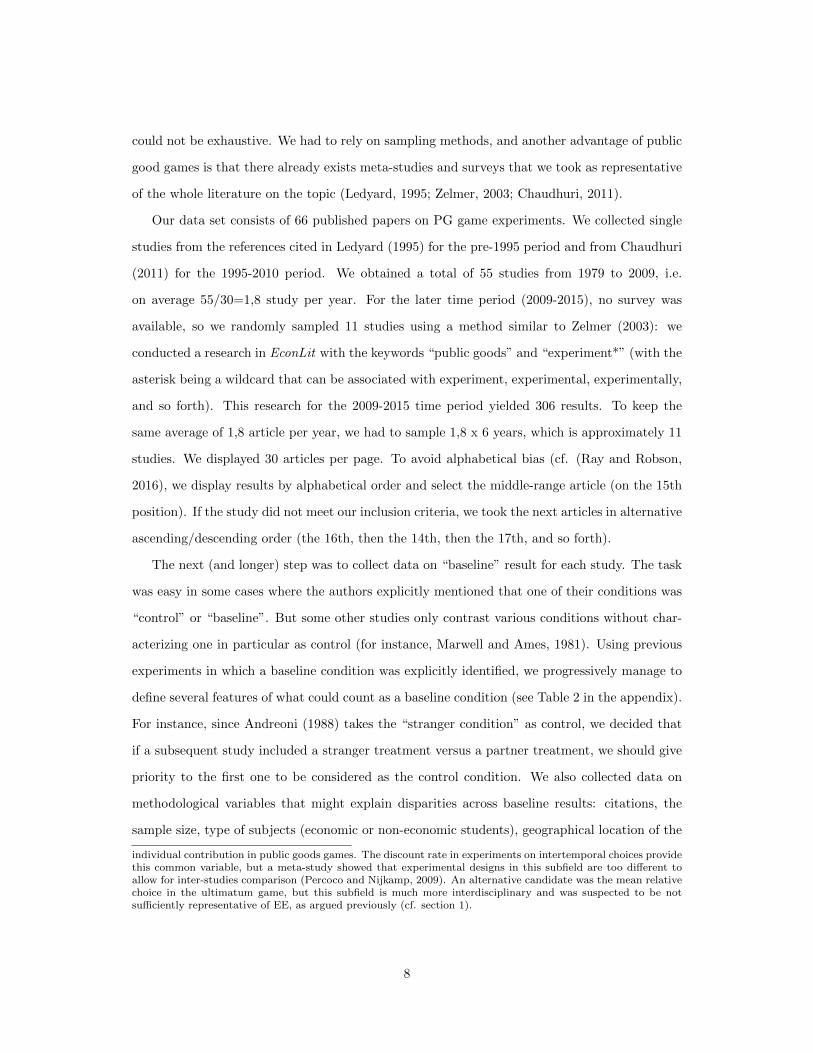
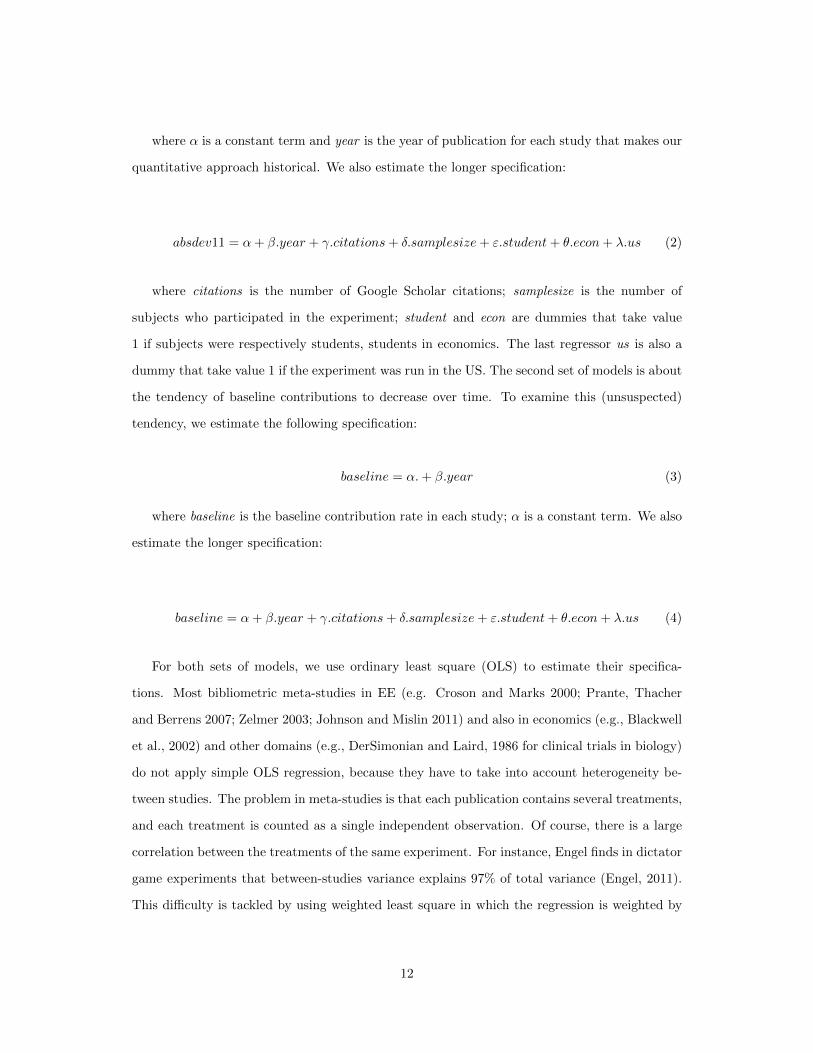
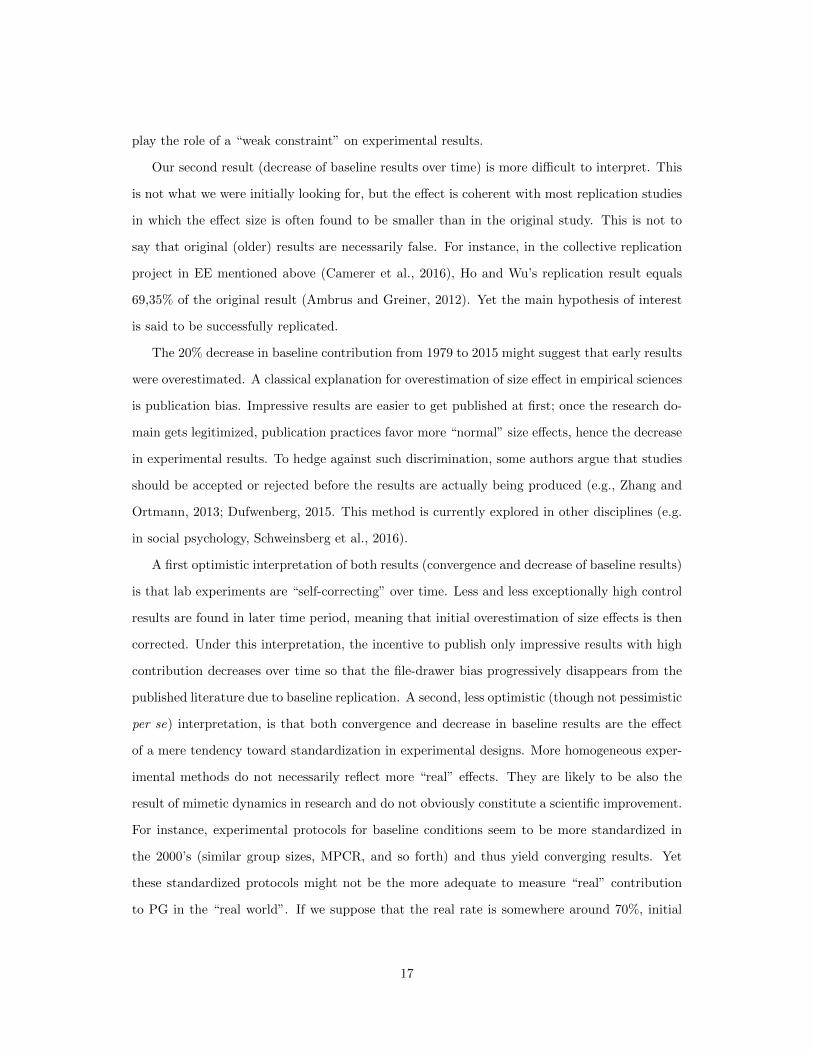
from the beginning) subset. Figure 1 is a graphical representation of our database. It plots the
average baseline result for each study included in our database from 1979 to 2015.
9
Figure 1: Baseline group contribution to PG, 1979-2009
To illustrate how to interpret this figure, take the first point to the left below the trend.
This point means: “in 1980, a PG game experiment was published with a baseline condition
in which the contribution to the PG was on average about 40% of the initial endowment”.
Perfect baseline replications across PG game experiments, i.e., always the same average group
contributions in baseline conditions, would be represented by all the points being very close
to one another (low deviation) and forming a horizontal line (displaying stability over time of
average contribution in baseline conditions). This is obviously not what we observed. However,
there are two blurred historical tendencies. On the one hand, it seems that the points are getting
closer to each other, i.e., baseline contributions seem to converge over time. On the other hand,
the trend line decreases, i.e., baseline contributions seem to decrease over time. The goal of
our historical approach is to go beyond this descriptive use of our data and use econometrics
to check the significance of these two tendencies. To do so, we propose two sets of econometric
models.
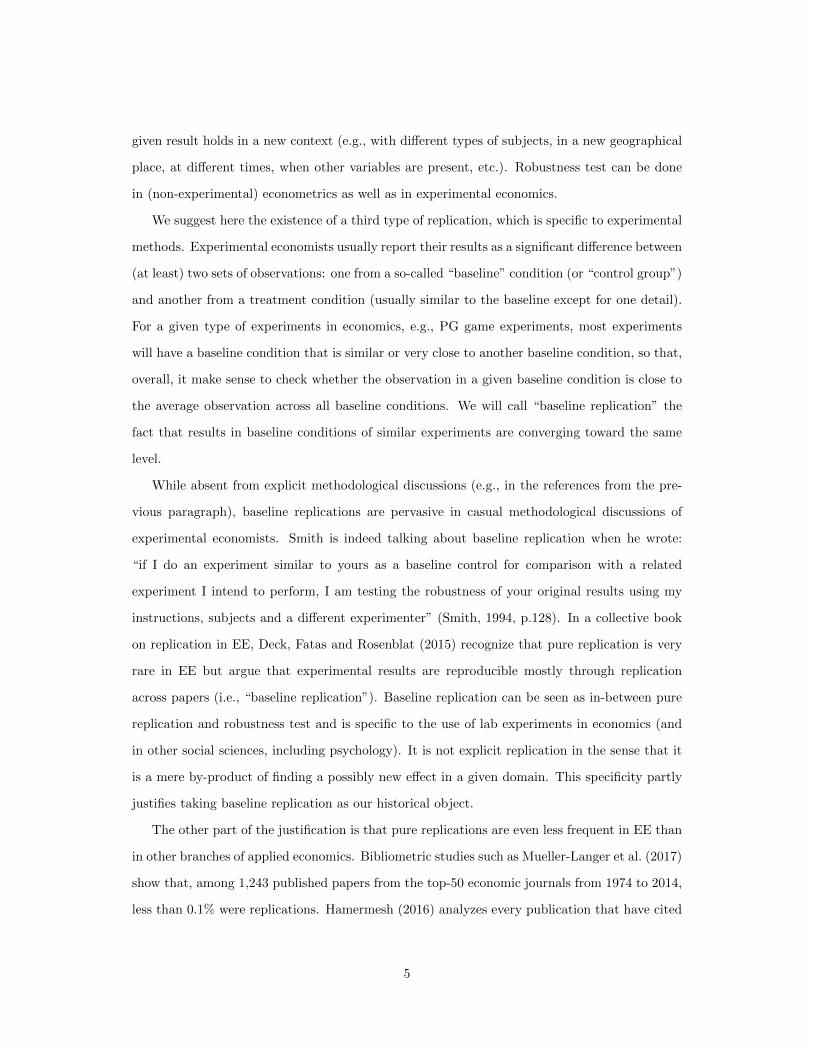
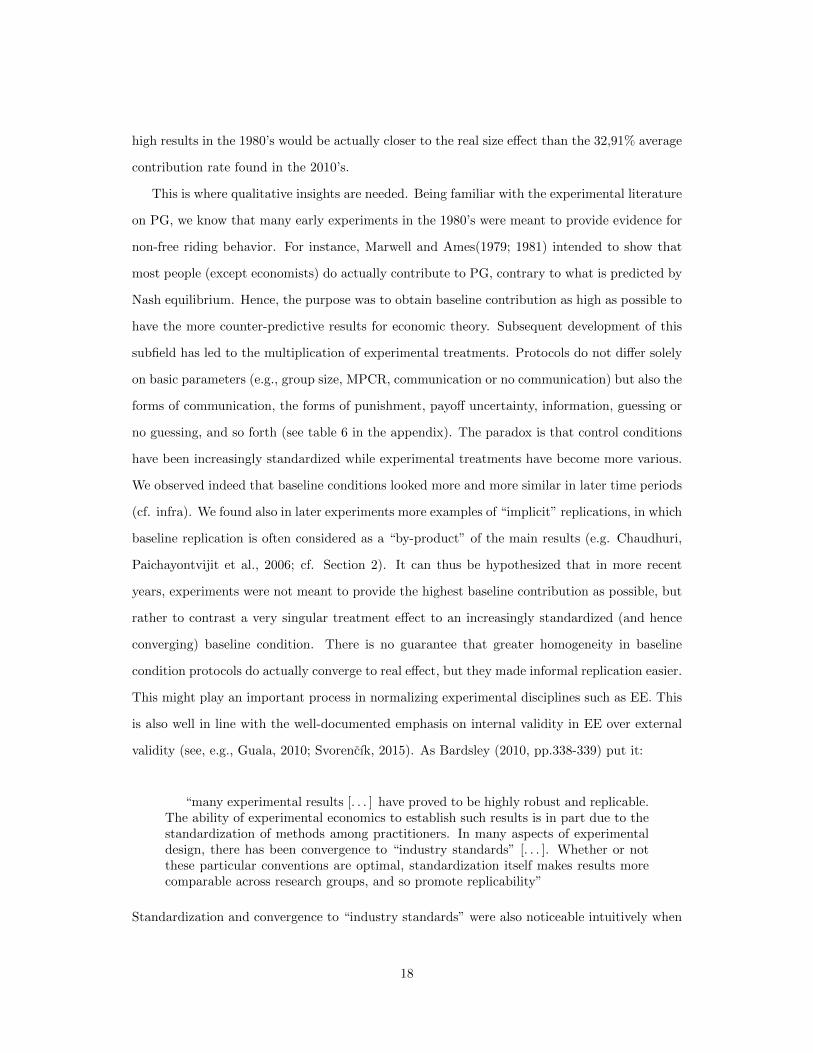
The first set of models is about the tendency of baseline contributions to converge over time.
To do so, we ranked the 66 experiments in chronological order and then we split our database
into 6 subgroups of 11 experiments. Each subgroup corresponds to a time period: 1979-1989,
10
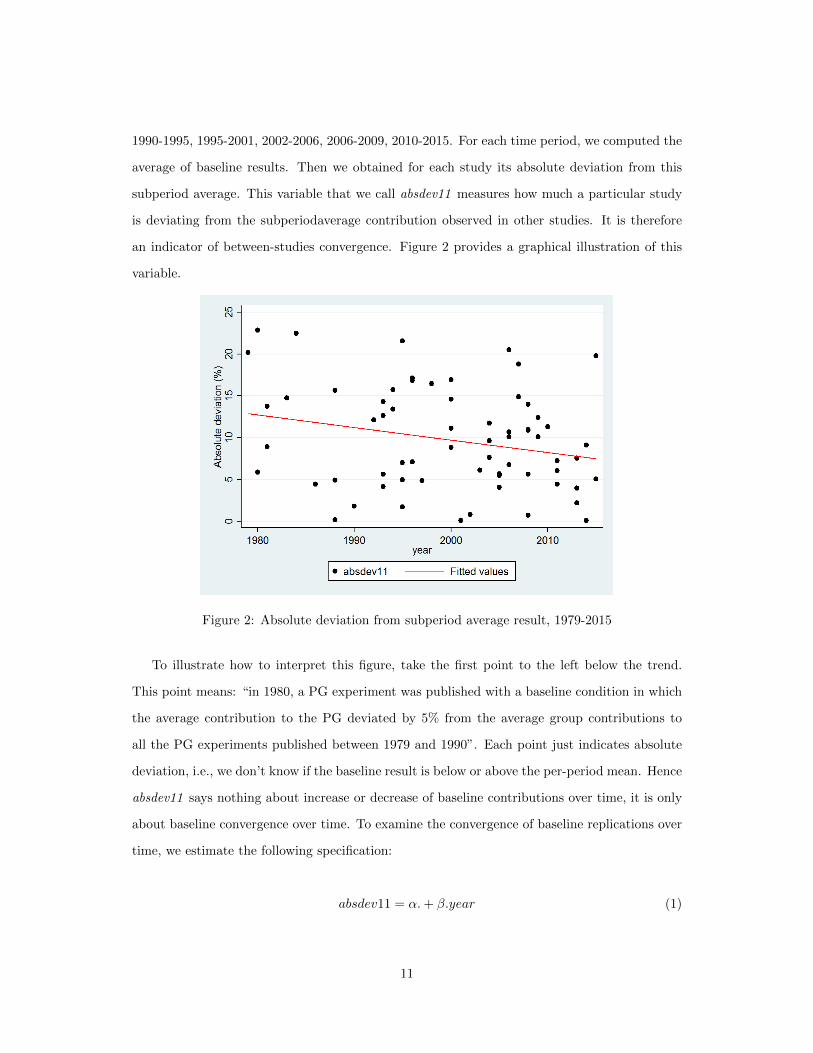
1990-1995, 1995-2001, 2002-2006, 2006-2009, 2010-2015. For each time period, we computed the
average of baseline results. Then we obtained for each study its absolute deviation from this
subperiod average. This variable that we call absdev11 measures how much a particular study
is deviating from the subperiodaverage contribution observed in other studies. It is therefore
an indicator of between-studies convergence. Figure 2 provides a graphical illustration of this
variable.
Figure 2: Absolute deviation from subperiod average result, 1979-2015
To illustrate how to interpret this figure, take the first point to the left below the trend.
This point means: “in 1980, a PG experiment was published with a baseline condition in which
the average contribution to the PG deviated by 5% from the average group contributions to
all the PG experiments published between 1979 and 1990”. Each point just indicates absolute
deviation, i.e., we don’t know if the baseline result is below or above the per-period mean. Hence
absdev11 says nothing about increase or decrease of baseline contributions over time, it is only
about baseline convergence over time. To examine the convergence of baseline replications over
time, we estimate the following specification:
absdev11 = α.+ β.year (1)
11
where α is a constant term and year is the year of publication for each study that makes our
quantitative approach historical. We also estimate the longer specification:
absdev11 = α+ β.year + γ.citations+ δ.samplesize+ ε.student+ θ.econ+ λ.us (2)
where citations is the number of Google Scholar citations; samplesize is the number of
subjects who participated in the experiment; student and econ are dummies that take value
1 if subjects were respectively students, students in economics. The last regressor us is also a
dummy that take value 1 if the experiment was run in the US. The second set of models is about
the tendency of baseline contributions to decrease over time. To examine this (unsuspected)
tendency, we estimate the following specification:
baseline = α.+ β.year (3)
where baseline is the baseline contribution rate in each study; α is a constant term. We also
estimate the longer specification:
baseline = α+ β.year + γ.citations+ δ.samplesize+ ε.student+ θ.econ+ λ.us (4)
For both sets of models, we use ordinary least square (OLS) to estimate their specifica-
tions. Most bibliometric meta-studies in EE (e.g. Croson and Marks 2000; Prante, Thacher
and Berrens 2007; Zelmer 2003; Johnson and Mislin 2011) and also in economics (e.g., Blackwell
et al., 2002) and other domains (e.g., DerSimonian and Laird, 1986 for clinical trials in biology)
do not apply simple OLS regression, because they have to take into account heterogeneity be-
tween studies. The problem in meta-studies is that each publication contains several treatments,
and each treatment is counted as a single independent observation. Of course, there is a large
correlation between the treatments of the same experiment. For instance, Engel finds in dictator
game experiments that between-studies variance explains 97% of total variance (Engel, 2011).
This difficulty is tackled by using weighted least square in which the regression is weighted by
12

the precision of each experiment (usually the inverse number of independent observations). We
do not face this problem here because we have only one observation (i.e. baseline condition) per
experiment and we are not interested in non-control treatments. Yet we suspected that our data
could be clustered around subgroups of labs and researchers that might use similar methods.
We therefore tested for heteroskedasticity for each of our regression using both Breusch-Pagan
test and White test. We never found any significant level of heteroskedasticity. We also esti-
mated the same regressions with heteroskedastic-robust standard errors and that did not change
significantly our results.
3 Results and interpretation
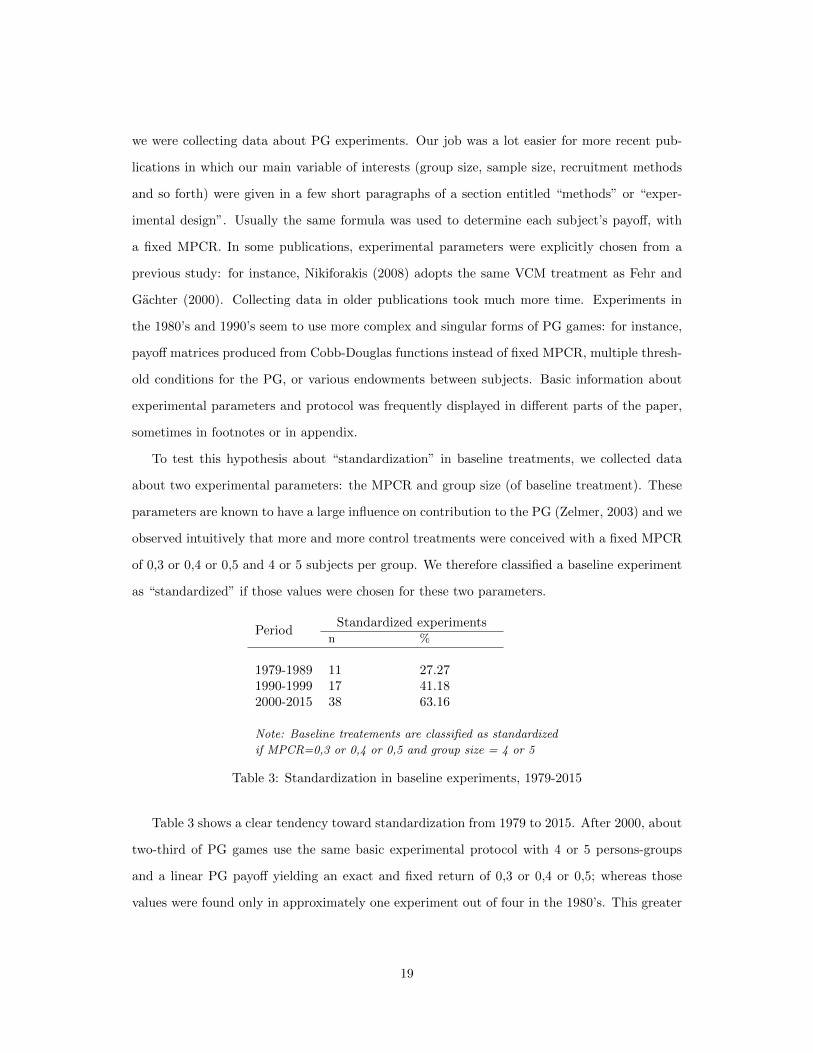
Table 1 shows regression results for the two sets of models. We discuss these results for each set
in separate subsections.
13
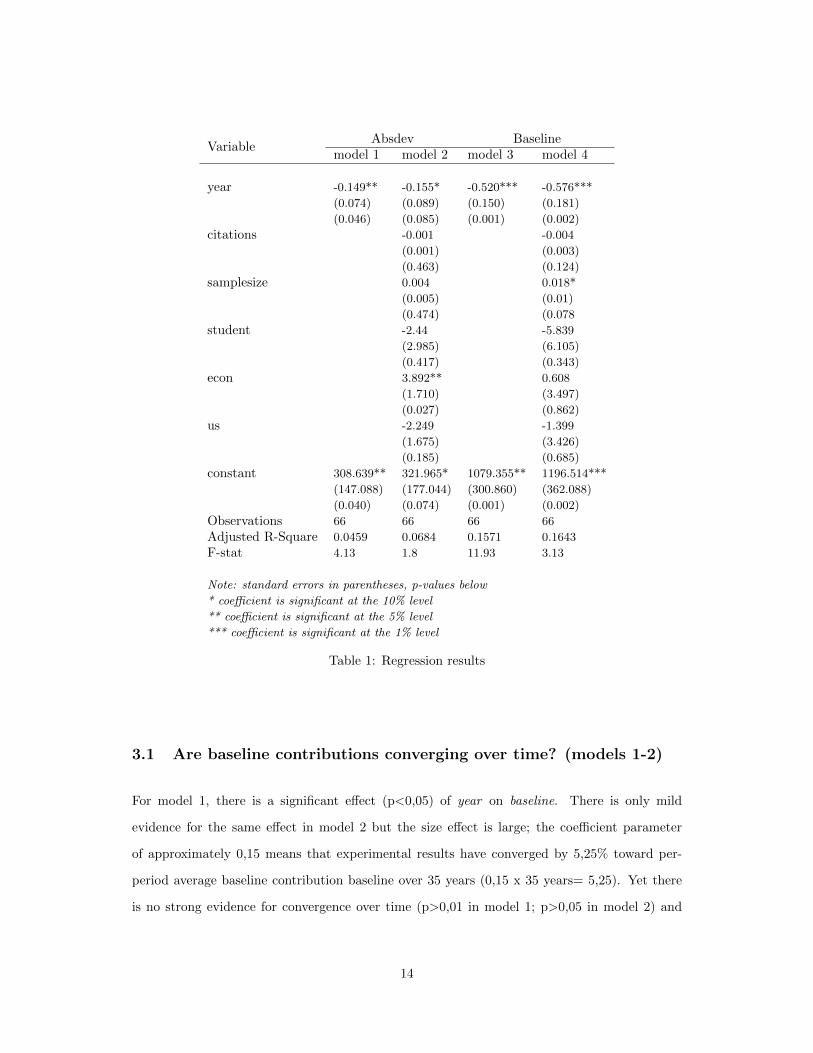
VariableAbsdev Baseline
model 1 model 2 model 3 model 4
year -0.149** -0.155* -0.520*** -0.576***
(0.074) (0.089) (0.150) (0.181)
(0.046) (0.085) (0.001) (0.002)
citations -0.001 -0.004
(0.001) (0.003)
(0.463) (0.124)
samplesize 0.004 0.018*
(0.005) (0.01)
(0.474) (0.078
student -2.44 -5.839
(2.985) (6.105)
(0.417) (0.343)
econ 3.892** 0.608
(1.710) (3.497)
(0.027) (0.862)
us -2.249 -1.399
(1.675) (3.426)
(0.185) (0.685)
constant 308.639** 321.965* 1079.355** 1196.514***
(147.088) (177.044) (300.860) (362.088)
(0.040) (0.074) (0.001) (0.002)
Observations 66 66 66 66
Adjusted R-Square 0.0459 0.0684 0.1571 0.1643
F-stat 4.13 1.8 11.93 3.13
Note: standard errors in parentheses, p-values below
* coefficient is significant at the 10% level
** coefficient is significant at the 5% level
*** coefficient is significant at the 1% level
Table 1: Regression results
3.1 Are baseline contributions converging over time? (models 1-2)
For model 1, there is a significant effect (p<0,05) of year on baseline. There is only mild
evidence for the same effect in model 2 but the size effect is large; the coefficient parameter
of approximately 0,15 means that experimental results have converged by 5,25% toward per-
period average baseline contribution baseline over 35 years (0,15 x 35 years= 5,25). Yet there
is no strong evidence for convergence over time (p>0,01 in model 1; p>0,05 in model 2) and
14
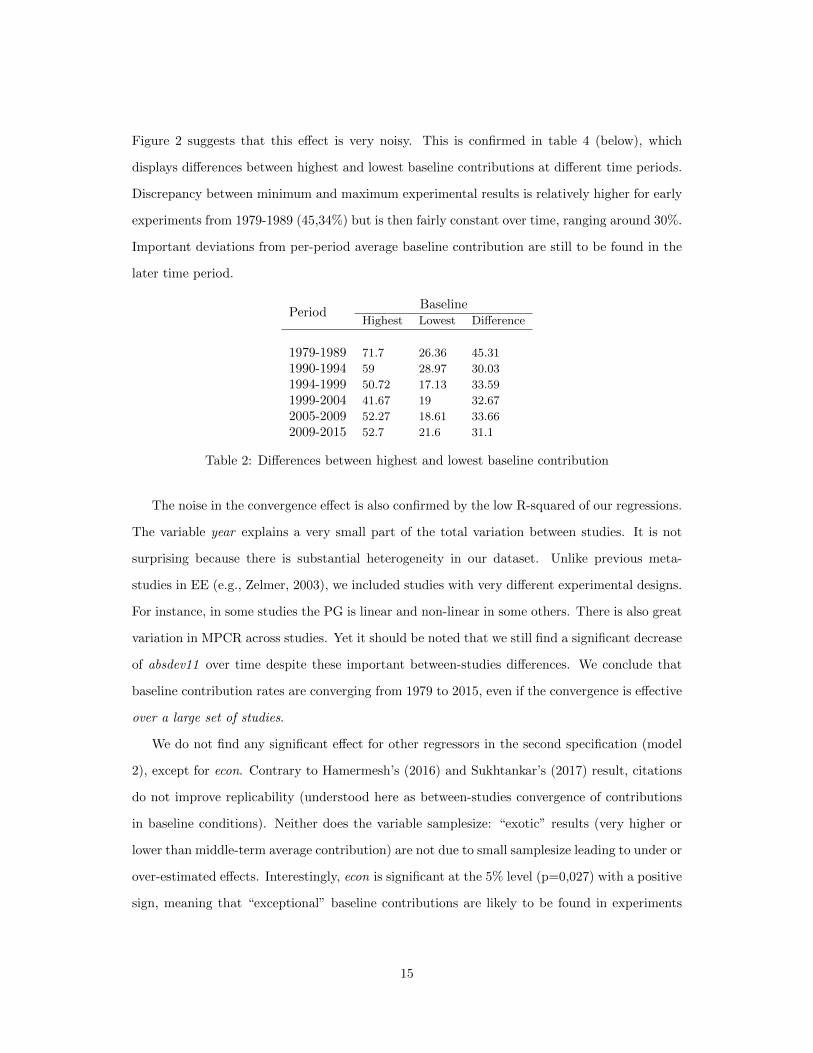
Figure 2 suggests that this effect is very noisy. This is confirmed in table 4 (below), which
displays differences between highest and lowest baseline contributions at different time periods.
Discrepancy between minimum and maximum experimental results is relatively higher for early
experiments from 1979-1989 (45,34%) but is then fairly constant over time, ranging around 30%.
Important deviations from per-period average baseline contribution are still to be found in the
later time period.
PeriodBaseline
Highest Lowest Difference
1979-1989 71.7 26.36 45.31
1990-1994 59 28.97 30.03
1994-1999 50.72 17.13 33.59
1999-2004 41.67 19 32.67
2005-2009 52.27 18.61 33.66
2009-2015 52.7 21.6 31.1
Table 2: Differences between highest and lowest baseline contribution
The noise in the convergence effect is also confirmed by the low R-squared of our regressions.
The variable year explains a very small part of the total variation between studies. It is not
surprising because there is substantial heterogeneity in our dataset. Unlike previous meta-
studies in EE (e.g., Zelmer, 2003), we included studies with very different experimental designs.
For instance, in some studies the PG is linear and non-linear in some others. There is also great
variation in MPCR across studies. Yet it should be noted that we still find a significant decrease
of absdev11 over time despite these important between-studies differences. We conclude that
baseline contribution rates are converging from 1979 to 2015, even if the convergence is effective
over a large set of studies.
We do not find any significant effect for other regressors in the second specification (model
2), except for econ. Contrary to Hamermesh’s (2016) and Sukhtankar’s (2017) result, citations
do not improve replicability (understood here as between-studies convergence of contributions
in baseline conditions). Neither does the variable samplesize: “exotic” results (very higher or
lower than middle-term average contribution) are not due to small samplesize leading to under or
over-estimated effects. Interestingly, econ is significant at the 5% level (p=0,027) with a positive
sign, meaning that “exceptional” baseline contributions are likely to be found in experiments
15
using exclusively students in economics.
3.2 Are baseline contributions declining over time? (models 3-4)
For model 3 and model 4, the variable year has a significant and negative effect on baseline.
Experimental results are therefore decreasing over time. Note that this effect is even more
significant than the previous convergence effect (p<0,01, which is “strongly” significant using
popular terminology). The size effect is also important: the coefficient parameter of 0,576
in model 4 means that results in control conditions have decreased on average by 20% from
1979 to 2015 (0,576x 35 years = 20,16). Yet Figure 1 clearly shows that there is still substantial
variation in contribution rates within each subperiod, as reflected by our low R-squared. Roughly
speaking, experiments in the 1980’s are likely to find baseline contribution around 50 to 55%,
while studies of the 2010’s would yield smaller rates around 30-35%; but there are important
exceptions and baseline contribution rates over 50% are still to be found in the more recent
time period. We do not find any significant effect for additional regressors (citations, econ, us,
student, samplesize) at the 5% level. Higher or lower results are not explained by any of these
methodological variables.
4 Discussion
There is a slight yet significant tendency for baseline results to converge over time in PG game
experiments. But the constant and large fluctuation range (more than 30%) between lowest and
highest baseline results of the same time period (as seen on table 1) still allows for a substantial
amount of between-studies variation. Our data include only published papers, and it can thus
be argued that there are no strong incentives to publish control condition results very close to
the middle-term average. A 50% baseline contribution rate might still seem acceptable in the
2010’s (where average baseline is 32,91%). Yet very high baseline contribution rates (superior
to 60%) are very less likely to be found. Overall, baseline replication over time can be said to
16
play the role of a “weak constraint” on experimental results.
Our second result (decrease of baseline results over time) is more difficult to interpret. This
is not what we were initially looking for, but the effect is coherent with most replication studies
in which the effect size is often found to be smaller than in the original study. This is not to
say that original (older) results are necessarily false. For instance, in the collective replication
project in EE mentioned above (Camerer et al., 2016), Ho and Wu’s replication result equals
69,35% of the original result (Ambrus and Greiner, 2012). Yet the main hypothesis of interest
is said to be successfully replicated.
The 20% decrease in baseline contribution from 1979 to 2015 might suggest that early results
were overestimated. A classical explanation for overestimation of size effect in empirical sciences
is publication bias. Impressive results are easier to get published at first; once the research do-
main gets legitimized, publication practices favor more “normal” size effects, hence the decrease
in experimental results. To hedge against such discrimination, some authors argue that studies
should be accepted or rejected before the results are actually being produced (e.g., Zhang and
Ortmann, 2013; Dufwenberg, 2015. This method is currently explored in other disciplines (e.g.
in social psychology, Schweinsberg et al., 2016).
A first optimistic interpretation of both results (convergence and decrease of baseline results)
is that lab experiments are “self-correcting” over time. Less and less exceptionally high control
results are found in later time period, meaning that initial overestimation of size effects is then
corrected. Under this interpretation, the incentive to publish only impressive results with high
contribution decreases over time so that the file-drawer bias progressively disappears from the
published literature due to baseline replication. A second, less optimistic (though not pessimistic
per se) interpretation, is that both convergence and decrease in baseline results are the effect
of a mere tendency toward standardization in experimental designs. More homogeneous exper-
imental methods do not necessarily reflect more “real” effects. They are likely to be also the
result of mimetic dynamics in research and do not obviously constitute a scientific improvement.
For instance, experimental protocols for baseline conditions seem to be more standardized in
the 2000’s (similar group sizes, MPCR, and so forth) and thus yield converging results. Yet
these standardized protocols might not be the more adequate to measure “real” contribution
to PG in the “real world”. If we suppose that the real rate is somewhere around 70%, initial
17
high results in the 1980’s would be actually closer to the real size effect than the 32,91% average
contribution rate found in the 2010’s.
This is where qualitative insights are needed. Being familiar with the experimental literature
on PG, we know that many early experiments in the 1980’s were meant to provide evidence for
non-free riding behavior. For instance, Marwell and Ames(1979; 1981) intended to show that
most people (except economists) do actually contribute to PG, contrary to what is predicted by
Nash equilibrium. Hence, the purpose was to obtain baseline contribution as high as possible to
have the more counter-predictive results for economic theory. Subsequent development of this
subfield has led to the multiplication of experimental treatments. Protocols do not differ solely
on basic parameters (e.g., group size, MPCR, communication or no communication) but also the
forms of communication, the forms of punishment, payoff uncertainty, information, guessing or
no guessing, and so forth (see table 6 in the appendix). The paradox is that control conditions
have been increasingly standardized while experimental treatments have become more various.
We observed indeed that baseline conditions looked more and more similar in later time periods
(cf. infra). We found also in later experiments more examples of “implicit” replications, in which
baseline replication is often considered as a “by-product” of the main results (e.g. Chaudhuri,
Paichayontvijit et al., 2006; cf. Section 2). It can thus be hypothesized that in more recent
years, experiments were not meant to provide the highest baseline contribution as possible, but
rather to contrast a very singular treatment effect to an increasingly standardized (and hence
converging) baseline condition. There is no guarantee that greater homogeneity in baseline
condition protocols do actually converge to real effect, but they made informal replication easier.
This might play an important process in normalizing experimental disciplines such as EE. This
is also well in line with the well-documented emphasis on internal validity in EE over external
validity (see, e.g., Guala, 2010; Svorencık, 2015). As Bardsley (2010, pp.338-339) put it:
“many experimental results [. . . ] have proved to be highly robust and replicable.The ability of experimental economics to establish such results is in part due to thestandardization of methods among practitioners. In many aspects of experimentaldesign, there has been convergence to “industry standards” [. . . ]. Whether or notthese particular conventions are optimal, standardization itself makes results morecomparable across research groups, and so promote replicability”
Standardization and convergence to “industry standards” were also noticeable intuitively when
18
we were collecting data about PG experiments. Our job was a lot easier for more recent pub-
lications in which our main variable of interests (group size, sample size, recruitment methods
and so forth) were given in a few short paragraphs of a section entitled “methods” or “exper-
imental design”. Usually the same formula was used to determine each subject’s payoff, with
a fixed MPCR. In some publications, experimental parameters were explicitly chosen from a
previous study: for instance, Nikiforakis (2008) adopts the same VCM treatment as Fehr and
Gachter (2000). Collecting data in older publications took much more time. Experiments in
the 1980’s and 1990’s seem to use more complex and singular forms of PG games: for instance,
payoff matrices produced from Cobb-Douglas functions instead of fixed MPCR, multiple thresh-
old conditions for the PG, or various endowments between subjects. Basic information about
experimental parameters and protocol was frequently displayed in different parts of the paper,
sometimes in footnotes or in appendix.
To test this hypothesis about “standardization” in baseline treatments, we collected data
about two experimental parameters: the MPCR and group size (of baseline treatment). These
parameters are known to have a large influence on contribution to the PG (Zelmer, 2003) and we
observed intuitively that more and more control treatments were conceived with a fixed MPCR
of 0,3 or 0,4 or 0,5 and 4 or 5 subjects per group. We therefore classified a baseline experiment
as “standardized” if those values were chosen for these two parameters.
PeriodStandardized experiments
n %
1979-1989 11 27.271990-1999 17 41.182000-2015 38 63.16
Note: Baseline treatements are classified as standardized
if MPCR=0,3 or 0,4 or 0,5 and group size = 4 or 5
Table 3: Standardization in baseline experiments, 1979-2015
Table 3 shows a clear tendency toward standardization from 1979 to 2015. After 2000, about
two-third of PG games use the same basic experimental protocol with 4 or 5 persons-groups
and a linear PG payoff yielding an exact and fixed return of 0,3 or 0,4 or 0,5; whereas those
values were found only in approximately one experiment out of four in the 1980’s. This greater
19
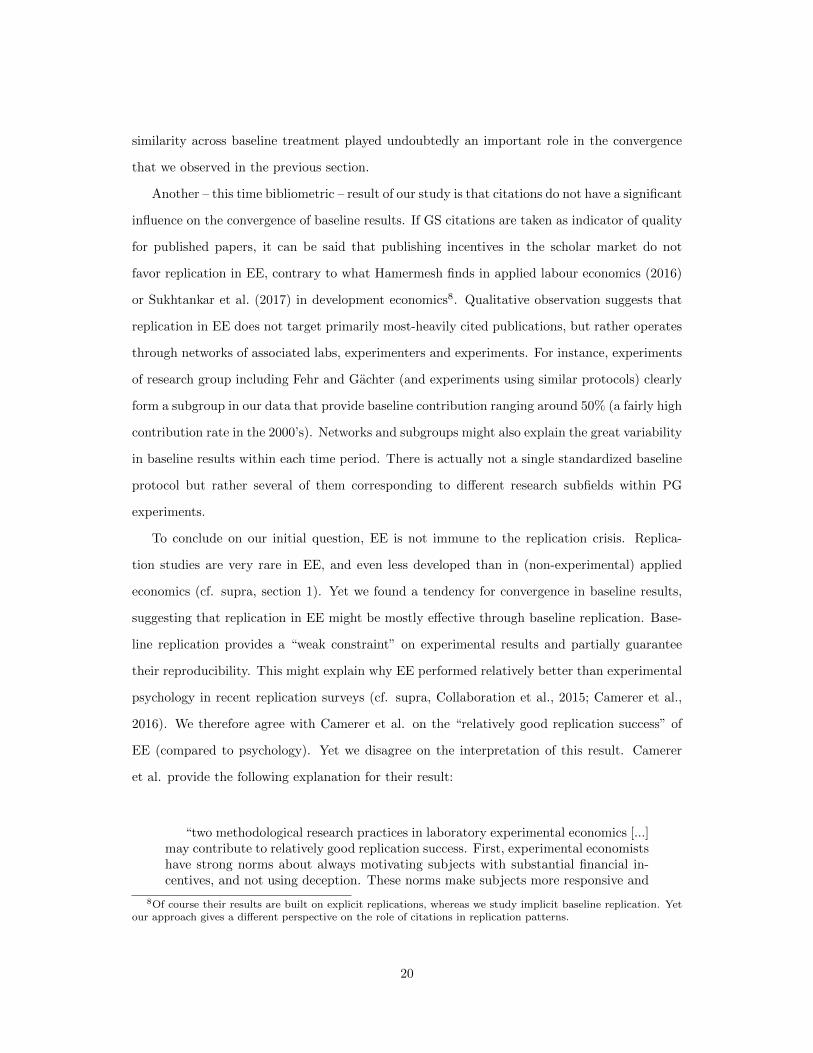
similarity across baseline treatment played undoubtedly an important role in the convergence
that we observed in the previous section.
Another – this time bibliometric – result of our study is that citations do not have a significant
influence on the convergence of baseline results. If GS citations are taken as indicator of quality
for published papers, it can be said that publishing incentives in the scholar market do not
favor replication in EE, contrary to what Hamermesh finds in applied labour economics (2016)
or Sukhtankar et al. (2017) in development economics8. Qualitative observation suggests that
replication in EE does not target primarily most-heavily cited publications, but rather operates
through networks of associated labs, experimenters and experiments. For instance, experiments
of research group including Fehr and Gachter (and experiments using similar protocols) clearly
form a subgroup in our data that provide baseline contribution ranging around 50% (a fairly high
contribution rate in the 2000’s). Networks and subgroups might also explain the great variability
in baseline results within each time period. There is actually not a single standardized baseline
protocol but rather several of them corresponding to different research subfields within PG
experiments.
To conclude on our initial question, EE is not immune to the replication crisis. Replica-
tion studies are very rare in EE, and even less developed than in (non-experimental) applied
economics (cf. supra, section 1). Yet we found a tendency for convergence in baseline results,
suggesting that replication in EE might be mostly effective through baseline replication. Base-
line replication provides a “weak constraint” on experimental results and partially guarantee
their reproducibility. This might explain why EE performed relatively better than experimental
psychology in recent replication surveys (cf. supra, Collaboration et al., 2015; Camerer et al.,
2016). We therefore agree with Camerer et al. on the “relatively good replication success” of
EE (compared to psychology). Yet we disagree on the interpretation of this result. Camerer
et al. provide the following explanation for their result:
“two methodological research practices in laboratory experimental economics [...]may contribute to relatively good replication success. First, experimental economistshave strong norms about always motivating subjects with substantial financial in-centives, and not using deception. These norms make subjects more responsive and
8Of course their results are built on explicit replications, whereas we study implicit baseline replication. Yetour approach gives a different perspective on the role of citations in replication patterns.
20
may reduce variability in how experiments are done across different research teams,thereby improving replicability. Second, pioneering experimental economists wereeager for others to adopt their methods. To this end, they persuaded journals toprint instructions - and even original data - in scarce journal pages. These edito-rial practices created norms of transparency and made replication and reanalysisrelatively easy.” (Camerer et al., 2016, p.1435)
In other words, EE’s results are more robust because they are based on more reliable methods:
paying subjects and transparency in editorial practices. We provided evidence suggesting that
better reproducibility in EE is not the effect of better methods but rather more similar methods.
There are good reasons to believe that the decrease and convergence in baseline results reflect
a tendency to standardize experimental protocols. Such standardization is not equivalent to
pure scientific progress and it does not necessarily imply that EE is relatively more scientifically
advanced than experimental psychology. In this regard, it might be interesting for further
research to compare the state of standardization in EE and experimental psychology.
We propose to reflect on our historical approach to shed some light on the methodology of
quantitative methods in the history of economics (HE). Our previous discussion clearly shows
that qualitative insights are necessary for both the construction of the object, i.e., without
baseline replication one cannot observe patterns of replication in EE, and to interpret our
quantitative results, i.e., convergence and decrease of baseline replication over time do not
have meaning per se. As de Vroey argues, purely bibliometric methods in HE might miss
important features of the economic literature (De Vroey, 2016). Converging baseline results over
time does not mean that EE’s results are more and more “robust”; familiarity with qualitative
aspects of the field are needed to understand research tactics within subgroups and to provide
hypothetical explanations for bibliometric statistics. Nevertheless, it would have been very hard
to get the results of our study by using a purely qualitative approach, as traditional in HE.
Indeed, a purely qualitative approach to the problem of replication in PG experiments would
have probably missed the two effects we found. We might have suspected a general tendency
for decrease and convergence in baseline results, but as these tendencies are very noisy, it is
always possible to find counter-examples (e.g. a 50% contribution rate in the 2010’s) that would
have led us to reject the validity of our hypothesis. Another related problem is that we would
also have focused on heavily-cited publications that are not necessarily representative of the
whole field, in particular the Fehr and Gachter’s experiments that constitute a rather specific
21
subgroup, with relatively high baseline results. As Backhouse, Middleton and Tribe (1997) point
out, an important advantage of quantitative methods in this regard is that they allow to focus
on the “average” contribution to the discipline, rather than the exceptional individual.
We therefore argue in favor of going beyond descriptive statistics by using basic econometric
tools in HE that might indicate unnoticed historical patterns. This brings the method of histori-
ans of economics closer to the methods of economists. One advantage is that historians are thus
submitted to the same standard of evidence than economists (cf. Backhouse, Middleton and
Tribe, 1997), facilitating the dialog between each academic community1. The current state of
quantitative history seems largely unsatisfactory in this regard. Most quantitative contributions
in HE are based on purely descriptive statistics (e.g., Hoover, 2012) or at best network analysis
(e.g., Emmett, 2009). It refers to what Daudin considers as the two most basic uses of quanti-
tative methods in history: “counting things” and “exploring the data”(Daudin, 2011). Network
analysis might be interesting to investigate connections between individuals, but large-scale
publication patterns do not necessarily involve networks.
A more sophisticated use of quantitative methods in history consists in “establishing rela-
tions” (Daudin, 2011). It requires to follow the basic method of hypothesis testing using the
appropriate statistical tools, as we tried to do in this paper. An objection would be that there
are already many applied economists and econometricians using econometric approaches to do
bibliometrics (e.g. Card and DellaVigna, 2013), particularly in the A14 Jel Code which covers
studies in “sociology of economics”, i.e. essentially applied economics of the economic profession.
Historians would thus lose their specificity in becoming “economists of economics” (and could
not become by the way as good in statistics as professional econometricians). Our response
to this objection is twofold. First, statistical tools are not necessarily very sophisticated to
find relevant result in quantitative HE. “Basic” econometric tool (corresponding roughly to an
undergraduate level) are probably sufficient for historians, i.e., in order to highlight patterns of
historical interests. Second, the specificity of quantitative history relatively to the “economics
of economics” subfield is that time remains the main variable of interest. In particular, this is
what distinguished our approach in this paper from previous theoretical meta-studies in EE.
22
Conclusion
The goal of this paper was to propose a historical perspective on the practice of replica-
tion in experimental economics. Explicit methodological discussions of replication in economics
highlight several meanings of “replication”. However none of these meanings correspond to the
most widely practiced type of replication in experimental economics, which we called “baseline
replication”: that similar baseline conditions in different experiments have to yield similar re-
sults. We proposed a quantitative approach to highlight the historical dynamics of replication
in public good games experiments. We found that results in baseline conditions converge over
time, which suggests that baseline replications are effective over time, but they also decline over
time, which suggests a counter-intuitive (i.e., non-stable) notion of replication. We prefer to
interpret our results as a sign of the standardization of experimental practice over time which
favors internal validity, rather than a sign of scientific progress towards a “true” baseline re-
sult in PG games. We hope that our blend of qualitative and quantitative approach to history
of recent economics can motivate discussions with economists, both regarding our econometric
method and our empirical results. In terms of further work, our results suggest that finding
a measure of standardization of experimental protocols can provide an interesting variable to
study long-term patterns in experimental economics.
23
References
Ambrus, Attila, and Ben Greiner. 2012. “Imperfect public monitoring with costly punish-ment: An experimental study.” The American Economic Review, 102(7): 3317–3332.
Andreoni, James. 1988. “Why free ride?: Strategies and learning in public goods experi-ments.” Journal of public Economics, 37(3): 291–304.
Ashenfelter, Orley, Haveman Robert H, Riley John G, and Tay Mccullough John T.1986. “Editorial Statement.” American Economic Review, 76(4).
Backhouse, Roger, Roger Middleton, and Keith Tribe. 1997. “Economics is whatEconomists do, but what do the numbers tell us?” draft, University of Birmingham.
Bardsley, Nick. 2010. Experimental economics: Rethinking the rules. Princeton UniversityPress.
Bernanke, Ben S. 2004. “Editorial Statement.” American Economic Review, 94(1): 404.
Blackwell, Calvin, et al. 2002. “A meta-analysis of tax compliance experiments.”
Camerer, Colin F, Anna Dreber, Eskil Forsell, Teck-Hua Ho, Jurgen Huber, Mag-nus Johannesson, Michael Kirchler, Johan Almenberg, Adam Altmejd, TaizanChan, et al. 2016. “Evaluating replicability of laboratory experiments in economics.” Sci-ence, 351(6280): 1433–1436.
Card, David, and Stefano DellaVigna. 2013. “Nine facts about top journals in economics.”Journal of Economic Literature, 51(1): 144–161.
Chang, Andrew C, Phillip Li, et al. 2017. “A Preanalysis Plan to Replicate Sixty EconomicsResearch Papers That Worked Half of the Time.” American Economic Review, 107(5): 60–64.
Chaudhuri, Ananish. 2011. “Sustaining cooperation in laboratory public goods experiments:a selective survey of the literature.” Experimental Economics, 14(1): 47–83.
Chaudhuri, Ananish, Tirnud Paichayontvijit, et al. 2006. “Conditional cooperation andvoluntary contributions to a public good.” Economics Bulletin, 3(8): 1–14.
Clemens, Michael A. 2015. “The meaning of failed replications: A review and proposal.”Journal of Economic Surveys.
Coffman, Lucas C, and Muriel Niederle. 2015. “Pre-analysis plans have limited upside,especially where replications are feasible.” The Journal of Economic Perspectives, 29(3): 81–97.
Collaboration, Open Science, et al. 2015. “Estimating the reproducibility of psychologicalscience.” Science, 349(6251): aac4716.
Croson, Rachel TA, and Melanie Beth Marks. 2000. “Step returns in threshold publicgoods: A meta-and experimental analysis.” Experimental Economics, 2(3): 239–259.
Daudin, Guillaume. 2011. “Quantitative methods and economic history.” In Where is eco-nomic history going? Methods and prospects from the 13th to the 18th centuries. , ed. FAmmannati. Firenze University Press.
24
Deck, Cary, Enrique Fatas, and Tanya Rosenblat. 2015. “Encouraging Replication ofEconomics Experiments.” In Replication in Experimental Economics. , ed. Cary Deck, EnriqueFatas and Tanya Rosenblat, 3–9. Emerald Group Publishing Limited.
DerSimonian, Rebecca, and Nan Laird. 1986. “Meta-analysis in clinical trials.” Controlledclinical trials, 7(3): 177–188.
De Vroey, Michel. 2016. “Bibliometric versus Inside-Knowledge History? An Assessment ofClaveau and Gingras’s ”Macrodynamics of Economics: A Bibliometric History”.” Universitecatholique de Louvain, Institut de Recherches Economiques et Sociales (IRES).
Dewald, William G, Jerry G Thursby, Richard G Anderson, et al. 1986. “Replicationin Empirical Economics: The Journal of Money, Credit and Banking Project.” AmericanEconomic Review, 76(4): 587–603.
Dufwenberg, Martin. 2015. “Maxims for Experimenters.” In Handbook of experimental eco-nomic methodology. , ed. Guillaume R Frı¿œchette and Andrew Schotter. Oxford UniversityPress.
Duvendack, Maren, Richard W Palmer-Jones, and W Robert Reed. 2015. “Replica-tions in Economics: A progress report.” Econ Journal Watch, 12(2): 164–191.
Emmett, Ross B. 2009. “The Chicago workshop model: normalizing or fragmenting scientificcollaboration?”
Engel, Christoph. 2011. “Dictator games: a meta study.” Experimental Economics,14(4): 583–610.
Fehr, Ernst, and Simon Gachter. 2000. “Fairness and retaliation: The economics of reci-procity.” The journal of economic perspectives, 14(3): 159–181.
Fischbacher, Urs, and Simon Gachter. 2010. “Social preferences, beliefs, and the dynamicsof free riding in public goods experiments.” The American economic review, 100(1): 541–556.
Glandon, Phillip. 2010. “Report on the American economic review data availability compli-ance project.”
Guala, Francesco. 2005. The methodology of experimental economics. Cambridge UniversityPress.
Guala, Francesco. 2010. “History of Experimental Economics.” In Behavioural and Experi-mental Economics. , ed. Steven Durlauf and Lawrence Blume, 99–106. Springer.
Hamermesh, Daniel S. 2007. “Viewpoint: Replication in economics.” Canadian Journal ofEconomics/Revue canadienne d’economique, 40(3): 715–733.
Hamermesh, Daniel S. 2016. “Replication in Labor Economics: Evidence from Data, andWhat It Suggests.”
Hoover, Kevin. 2012. “Microfoundational programs.” In Microfoundations Reconsidered: TheRelationship of Micro and Macroeconomics in Historical Perspective. , ed. Pedro Duarte andGliberto L Tadeu, 19–61. Cheltenham: Edward Elgar.
Johnson, Noel D, and Alexandra A Mislin. 2011. “Trust games: A meta-analysis.” Journalof Economic Psychology, 32(5): 865–889.
25
Kane, Edward J. 1984. “Why journal editors should encourage the replication of appliedeconometric research.” Quarterly Journal of Business and Economics, 3–8.
Koenker, Roger, and Achim Zeileis. 2009. “On reproducible econometric research.” Journalof Applied Econometrics, 24(5): 833–847.
Ledyard, John. 1995. “Public Goods: A Survey of Experimental Research.” In The handbookof experimental economics. , ed. John H Kagel and Alvin E Roth. Princeton university press.
Levitt, Steven D, and John A List. 2009. “Field experiments in economics: The past, thepresent, and the future.” European Economic Review, 53(1): 1–18.
Marwell, Gerald, and Ruth E Ames. 1979. “Experiments on the provision of public goods.I. Resources, interest, group size, and the free-rider problem.” American Journal of sociology,84(6): 1335–1360.
Marwell, Gerald, and Ruth E Ames. 1981. “Economists free ride, does anyone else?:Experiments on the provision of public goods, IV.” Journal of public economics, 15(3): 295–310.
McCullough, Bruce D, Kerry Anne McGeary, and Teresa D Harrison. 2006. “Lessonsfrom the JMCB Archive.” Journal of Money, Credit, and Banking, 38(4): 1093–1107.
Mirowski, Philip, and Steven Sklivas. 1991. “Why econometricians don’t replicate (al-though they do reproduce).” Review of Political Economy, 3(2): 146–163.
Mueller-Langer, Frank, Benedikt Fecher, Dietmar Harhoff, and Gert G Wagner.2017. “The economics of replication.”
Nikiforakis, Nikos. 2008. “Punishment and counter-punishment in public good games: Canwe really govern ourselves?” Journal of Public Economics, 92(1): 91–112.
Percoco, Marco, and Peter Nijkamp. 2009. “Estimating individual rates of discount: ameta-analysis.” Applied Economics Letters, 16(12): 1235–1239.
Plott, Charles R. 1982. “Industrial organization theory and experimental economics.” journalof Economic Literature, 20(4): 1485–1527.
Prante, Tyler, Jennifer A Thacher, and Robert P Berrens. 2007. “Evaluating coaseanbargaining experiments with meta-analysis.” Economics Bulletin, 3(68): 1–7.
Ray, Debraj, and Arthur Robson. 2016. “Certified random co-authors.”
Richter, S Helene, Joseph P Garner, and Hanno Wurbel. 2009. “Environmental stan-dardization: cure or cause of poor reproducibility in animal experiments?” Nature methods,6(4): 257–261.
Rosenblat, Tanya, Enrique Fatas, and Cary A Deck. 2015. Replication in ExperimentalEconomics. Emerald Group Publishing.
Schneider, Friedrich, and Werner W Pommerehne. 1981. “Free riding and collectiveaction: An experiment in public microeconomics.” The Quarterly Journal of Economics,96(4): 689–704.
26
Schweinsberg, Martin, Nikhil Madan, Michelangelo Vianello, S Amy Sommer, Jen-nifer Jordan, Warren Tierney, Eli Awtrey, Luke Lei Zhu, Daniel Diermeier,Justin E Heinze, et al. 2016. “The pipeline project: Pre-publication independent repli-cations of a single laboratory’s research pipeline.” Journal of Experimental Social Psychology,66: 55–67.
Smith, Vernon L. 1994. “Economics in the Laboratory.” The Journal of Economic Perspec-tives, 8(1): 113–131.
Sukhtankar, Sandip, et al. 2017. “Replications in Development Economics.” American Eco-nomic Review, 107(5): 32–36.
Svorencık, Andrej. 2015. “The experimental turn in economics: a history of experimentaleconomics.”
Zelmer, Jennifer. 2003. “Linear public goods experiments: A meta-analysis.” ExperimentalEconomics, 6(3): 299–310.
Zhang, Le, and Andreas Ortmann. 2013. “Exploring the meaning of significance in exper-imental economics.”
27
Appendix
Table 4: 10 most-heavily cited publications in public goods experiments and their replications.
References Google Scholar citations ReplicationsFehr, E. (2000). Cooperation and Punishment in Public
Goods Experiments. The American Economic Review, 90(4),
980-994.
3555 0
Fischbacher, U., Gachter, S., & Fehr, E. (2001). Are people
conditionally cooperative? Evidence from a public goods
experiment. Economics letters, 71(3), 397-404.
2017 1
Fehr, E., & Fischbacher, U. (2004). Third-party punishment
and social norms. Evolution and human behavior, 25(2),
63-87.
1406 0
Marwell, G., & Ames, R. E. (1981). Economists free ride,
does anyone else?: Experiments on the provision of public
goods, IV. Journal of public economics, 15(3), 295-310.
1326 1
Herrmann, B., Thoni, C., & Gachter, S. (2008). Antisocial
punishment across societies. Science, 319(5868), 1362-1367.1294 0
Yamagishi, T. (1986). The provision of a sanctioning system
as a public good. Journal of Personality and social
Psychology, 51(1), 110.
1223 0
Andreoni, J. (1988). Why free ride?: Strategies and learning
in public goods experiments. Journal of public Economics,
37(3), 291-304.
1153 0
Andreoni, J. (1995). Cooperation in public-goods
experiments: kindness or confusion?. The American
Economic Review, 891-904.
1045 2
Isaac, R. M., & Walker, J. M. (1988). Group size effects in
public goods provision: The voluntary contributions
mechanism. The Quarterly Journal of Economics, 103(1),
179-199.
935 0
Marwell, G., & Ames, R. E. (1979). Experiments on the
provision of public goods. I. Resources, interest, group size,
and the free-rider problem. American Journal of sociology,
84(6), 1335-1360.
797 1
Note: to gather these 10-most cited references on PG game experiments, we compared the GS cita-tions of papers : a) from our dataset, b) from Chaudhuri’s (2011) review, c) gathered through Zelmer’s(2003) method with keywords replic* + public games + experiment* in EconLit, d) gathered by searching“replications in experimental economics”, e) gathered using the replication in economics wiki.
28
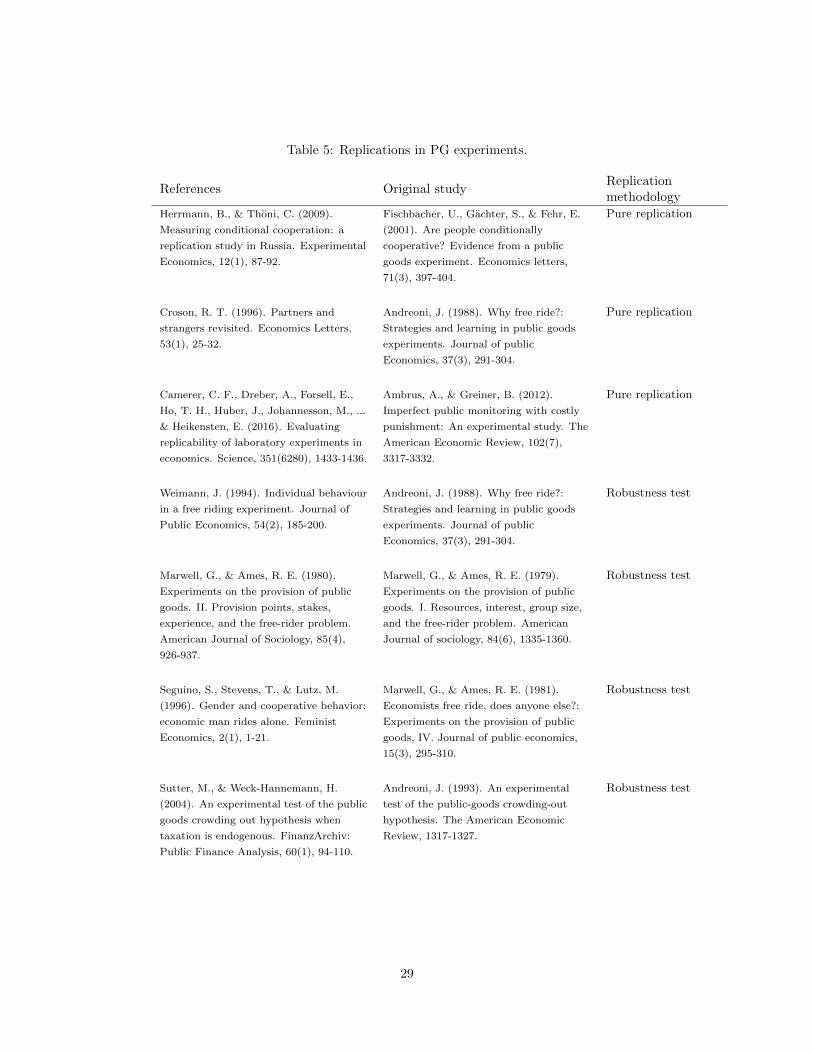
Table 5: Replications in PG experiments.
References Original studyReplicationmethodology
Herrmann, B., & Thoni, C. (2009).
Measuring conditional cooperation: a
replication study in Russia. Experimental
Economics, 12(1), 87-92.
Fischbacher, U., Gachter, S., & Fehr, E.
(2001). Are people conditionally
cooperative? Evidence from a public
goods experiment. Economics letters,
71(3), 397-404.
Pure replication
Croson, R. T. (1996). Partners and
strangers revisited. Economics Letters,
53(1), 25-32.
Andreoni, J. (1988). Why free ride?:
Strategies and learning in public goods
experiments. Journal of public
Economics, 37(3), 291-304.
Pure replication
Camerer, C. F., Dreber, A., Forsell, E.,
Ho, T. H., Huber, J., Johannesson, M., ...
& Heikensten, E. (2016). Evaluating
replicability of laboratory experiments in
economics. Science, 351(6280), 1433-1436.
Ambrus, A., & Greiner, B. (2012).
Imperfect public monitoring with costly
punishment: An experimental study. The
American Economic Review, 102(7),
3317-3332.
Pure replication
Weimann, J. (1994). Individual behaviour
in a free riding experiment. Journal of
Public Economics, 54(2), 185-200.
Andreoni, J. (1988). Why free ride?:
Strategies and learning in public goods
experiments. Journal of public
Economics, 37(3), 291-304.
Robustness test
Marwell, G., & Ames, R. E. (1980).
Experiments on the provision of public
goods. II. Provision points, stakes,
experience, and the free-rider problem.
American Journal of Sociology, 85(4),
926-937.
Marwell, G., & Ames, R. E. (1979).
Experiments on the provision of public
goods. I. Resources, interest, group size,
and the free-rider problem. American
Journal of sociology, 84(6), 1335-1360.
Robustness test
Seguino, S., Stevens, T., & Lutz, M.
(1996). Gender and cooperative behavior:
economic man rides alone. Feminist
Economics, 2(1), 1-21.
Marwell, G., & Ames, R. E. (1981).
Economists free ride, does anyone else?:
Experiments on the provision of public
goods, IV. Journal of public economics,
15(3), 295-310.
Robustness test
Sutter, M., & Weck-Hannemann, H.
(2004). An experimental test of the public
goods crowding out hypothesis when
taxation is endogenous. FinanzArchiv:
Public Finance Analysis, 60(1), 94-110.
Andreoni, J. (1993). An experimental
test of the public-goods crowding-out
hypothesis. The American Economic
Review, 1317-1327.
Robustness test
29
Table 6: Definition of baseline condition
Experimental treatment Inclusion criteria ExamplesIntergroup competition excluded Bornstein and Rapoport 1988
Revision of decisions excluded Dorsey 1992
Contest games excluded
Coercitive institutions If coercitive institutions only, excluded Gerber et al 2013
Group size If group sizes>=3, smallest = usually 4 Marwell and Ames 1979
3 Smith 1980
5 Andreoni 1988
6 Smith 1981
40
If group size = 2 or 4, 4 Goeree et al 2002
Divisibility of public good divisible Alfano and Marwell 1980
Subjects experience inexperienced subjects (assumed if not
mentioned)
Marwell and Ames 1980
Distribution of interest and
resourcesif equal/unequal conditions, equal Marwell and Ames 1979
if only unequal condition, unequal Smith 1980
Repetition between trials if repetition, first block of trials Rapoport 1988
Provision point if linear/provision point, linear Marwell and Ames 1980
if only provision point condition, provision point
if various provision points, average between
various conditions
Suleiman and Rapoport 1992
MPCR Lowest Isaac et al 1984
Communication if communication/no communication conditions,
no communication
Collective decision making if simulaneous/sequential, simultaneous Erev and Rapoport 1990
if auction type/no auction, no auction Smith 1981
Group composition if gender groups, mixed groups Nowell and Tinkler 1994
if homogeneous/heterogeneous, heterogeneous Burlando and Guala 2005
Information if individual/mean contribution information,
individual information only
Weimann 1994
Ranking earning condition No ranking Andreoni 1995
Framing of public good If positive/negative framing, positive Andreoni 1995-b
if associative/non asssociative, non associative
framing
Rege and Telle 2004
Payoff uncertainty if detailed/rough payoff table, detailed payoff Saijo and Nakamura 1995
Information distribution of tokens + return from private and
public investment
Isaac and Walker 1988
Guessing contributions no guessing Croson 2000
Taxes if tax/no tax, no tax condition Falkinger et al 2000
Punishment if punishment/no punishment, no punishment Fehr 2000
Punishment only excluded Anderson and Putterman 2006
Partner/Stranger if Partner/stranger, stranger Keser and van Winden 2000
Subjects classification If subjects classified, average contribution over all
subjects
Yamagishi 1986
Conditional decisions If conditional/unconditional decisions,
unconditional decisions
Fischbacher et al 2001
Approval incentives If approval/no approval, no approval Rege and Telle 2004
30
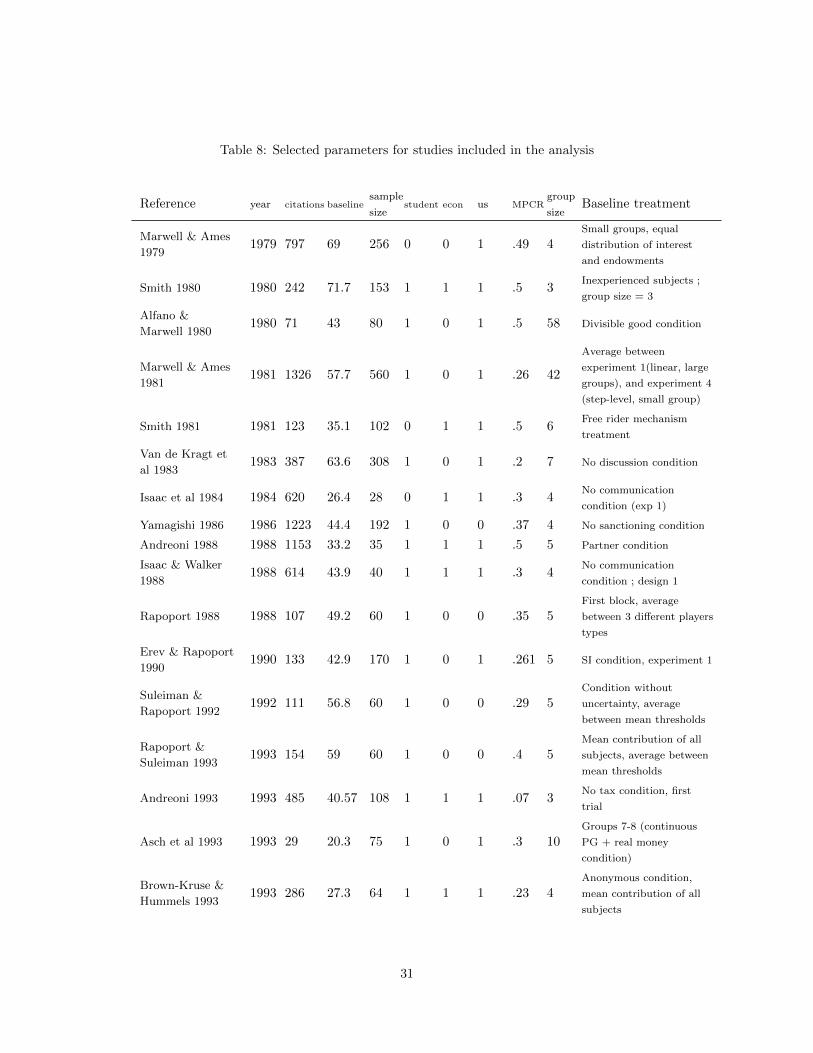
Table 8: Selected parameters for studies included in the analysis
Reference year citations baselinesample
student econ us MPCRgroup
Baseline treatmentsize size
Marwell & Ames
19791979 797 69 256 0 0 1 .49 4
Small groups, equal
distribution of interest
and endowments
Smith 1980 1980 242 71.7 153 1 1 1 .5 3Inexperienced subjects ;
group size = 3
Alfano &
Marwell 19801980 71 43 80 1 0 1 .5 58 Divisible good condition
Marwell & Ames
19811981 1326 57.7 560 1 0 1 .26 42
Average between
experiment 1(linear, large
groups), and experiment 4
(step-level, small group)
Smith 1981 1981 123 35.1 102 0 1 1 .5 6Free rider mechanism
treatment
Van de Kragt et
al 19831983 387 63.6 308 1 0 1 .2 7 No discussion condition
Isaac et al 1984 1984 620 26.4 28 0 1 1 .3 4No communication
condition (exp 1)
Yamagishi 1986 1986 1223 44.4 192 1 0 0 .37 4 No sanctioning condition
Andreoni 1988 1988 1153 33.2 35 1 1 1 .5 5 Partner condition
Isaac & Walker
19881988 614 43.9 40 1 1 1 .3 4
No communication
condition ; design 1
Rapoport 1988 1988 107 49.2 60 1 0 0 .35 5First block, average
between 3 different players
types
Erev & Rapoport
19901990 133 42.9 170 1 0 1 .261 5 SI condition, experiment 1
Suleiman &
Rapoport 19921992 111 56.8 60 1 0 0 .29 5
Condition without
uncertainty, average
between mean thresholds
Rapoport &
Suleiman 19931993 154 59 60 1 0 0 .4 5
Mean contribution of all
subjects, average between
mean thresholds
Andreoni 1993 1993 485 40.57 108 1 1 1 .07 3No tax condition, first
trial
Asch et al 1993 1993 29 20.3 75 1 0 1 .3 10Groups 7-8 (continuous
PG + real money
condition)
Brown-Kruse &
Hummels 19931993 286 27.3 64 1 1 1 .23 4
Anonymous condition,
mean contribution of all
subjects
31
Nowell & Tinkler
19941994 182 28.9 64 1 1 1 .3 4 Mixed gender groups
Weimann 1994 1994 293 58.1 104 1 1 0 .5 5Stranger/no information
condition (exp 4)
Andreoni 1995 1995 718 37.7 80 1 1 1 .5 5Positive treatment, 1st
session
Laury et al 1995 1995 76 43 64 1 1 1 .55 4Control/inexperienced
treatment
Andreoni 1995-b 1995 1045 44.1 120 1 1 1 .5 5 Regular condition
Saijo &
&Nakamura 19951995 210 17.6 112 1 0.5 0 .7 7 DL in DL, DH condition
Offerman et al
19961996 388 50.4 228 1 1 0 .4 5 High 5 condition
Gachter et al
19961996 24 50.7 116 1 0 0 .041 4 Anonymous treatment
McCorkle &
Watts 19961996 5 26.5 60 0 0 0 2.04 49
Mean contribution of all
subjects
Wilson & Sell
19971997 121 28.7 144 1 0 1 .3 6
No information/no
announcement condition
(group D)
Isaac & Walker
19981998 97 17.1 200 1 1 1 .3 4
Nash0+complete
information condition
Falkinger et l
20002000 288 50.5 240 1 0 0 .4 4 Control 1 treatment
Croson 2000 2000 223 42.4 48 1 0 1 .5 4 Control condition
Fehr 2000 2000 3555 22.5 112 1 0 0 1 4No punishment/stranger
treatment, session 3
Keser & van
Winden 20002000 674 19 160 1 0.5 0 .4 4 Stranger condition
Fischbacher et al
20012001 2017 33.5 44 1 0 0 .4 4 Unconditional condition
Goeree et al 2002 2002 280 42.8 32 1 0 1 .5 4 Treatment 1
Brosig et al 2003 2003 309 48.1 140 1 1 0 .5 4 Reference treatment
Andreoni &
Petrie 20042004 554 30.3 200 1 1 1 .2 5 Baseline condition
Walker &
Halloran 20042004 149 51.7 18 1 1 1 .5 4 Baseline treatment
Rege & Telle
20042004 515 34.4 80 1 0 0 .5 10
Non associative/no
framing treatment
Bardsley &
Sausgruber 20052005 147 47.7 456 1 0 0 .4 6 Real game
Burlando &
Guala 20052005 254 47.6 92 1 0 0 .5 4 Session 1
32
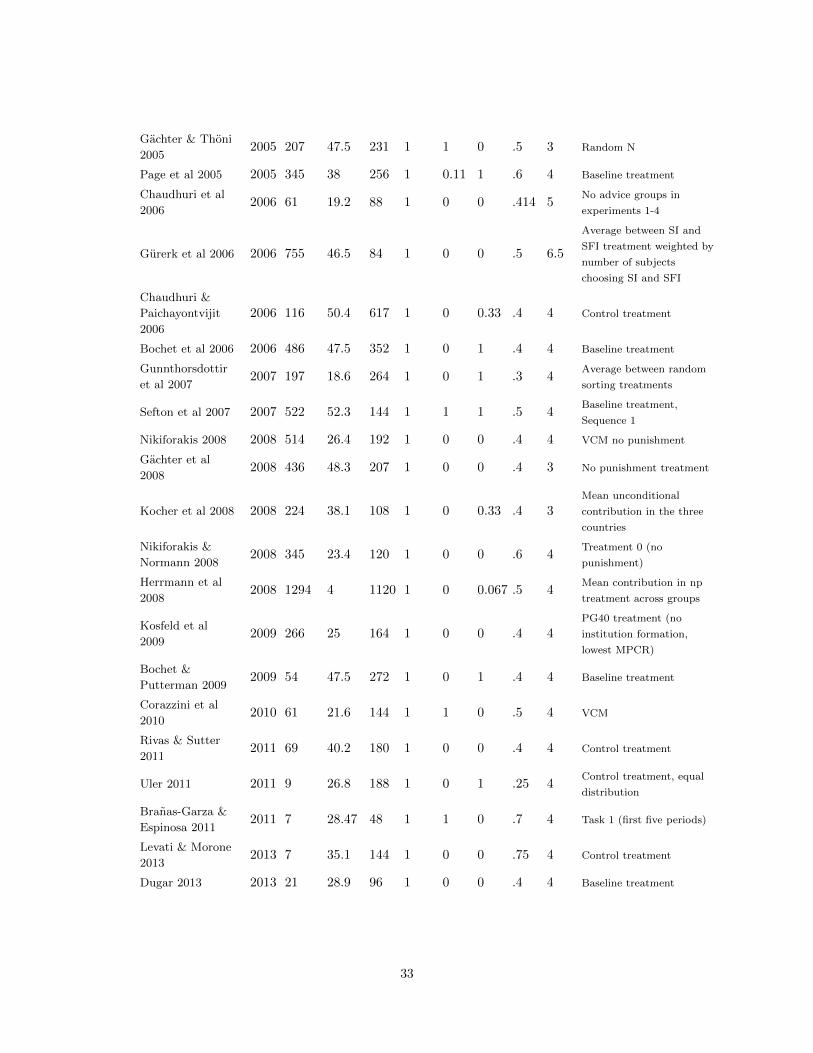
Gachter & Thoni
20052005 207 47.5 231 1 1 0 .5 3 Random N
Page et al 2005 2005 345 38 256 1 0.11 1 .6 4 Baseline treatment
Chaudhuri et al
20062006 61 19.2 88 1 0 0 .414 5
No advice groups in
experiments 1-4
Gurerk et al 2006 2006 755 46.5 84 1 0 0 .5 6.5
Average between SI and
SFI treatment weighted by
number of subjects
choosing SI and SFI
Chaudhuri &
Paichayontvijit
2006
2006 116 50.4 617 1 0 0.33 .4 4 Control treatment
Bochet et al 2006 2006 486 47.5 352 1 0 1 .4 4 Baseline treatment
Gunnthorsdottir
et al 20072007 197 18.6 264 1 0 1 .3 4
Average between random
sorting treatments
Sefton et al 2007 2007 522 52.3 144 1 1 1 .5 4Baseline treatment,
Sequence 1
Nikiforakis 2008 2008 514 26.4 192 1 0 0 .4 4 VCM no punishment
Gachter et al
20082008 436 48.3 207 1 0 0 .4 3 No punishment treatment
Kocher et al 2008 2008 224 38.1 108 1 0 0.33 .4 3Mean unconditional
contribution in the three
countries
Nikiforakis &
Normann 20082008 345 23.4 120 1 0 0 .6 4
Treatment 0 (no
punishment)
Herrmann et al
20082008 1294 4 1120 1 0 0.067 .5 4
Mean contribution in np
treatment across groups
Kosfeld et al
20092009 266 25 164 1 0 0 .4 4
PG40 treatment (no
institution formation,
lowest MPCR)
Bochet &
Putterman 20092009 54 47.5 272 1 0 1 .4 4 Baseline treatment
Corazzini et al
20102010 61 21.6 144 1 1 0 .5 4 VCM
Rivas & Sutter
20112011 69 40.2 180 1 0 0 .4 4 Control treatment
Uler 2011 2011 9 26.8 188 1 0 1 .25 4Control treatment, equal
distribution
Branas-Garza &
Espinosa 20112011 7 28.47 48 1 1 0 .7 4 Task 1 (first five periods)
Levati & Morone
20132013 7 35.1 144 1 0 0 .75 4 Control treatment
Dugar 2013 2013 21 28.9 96 1 0 0 .4 4 Baseline treatment
33
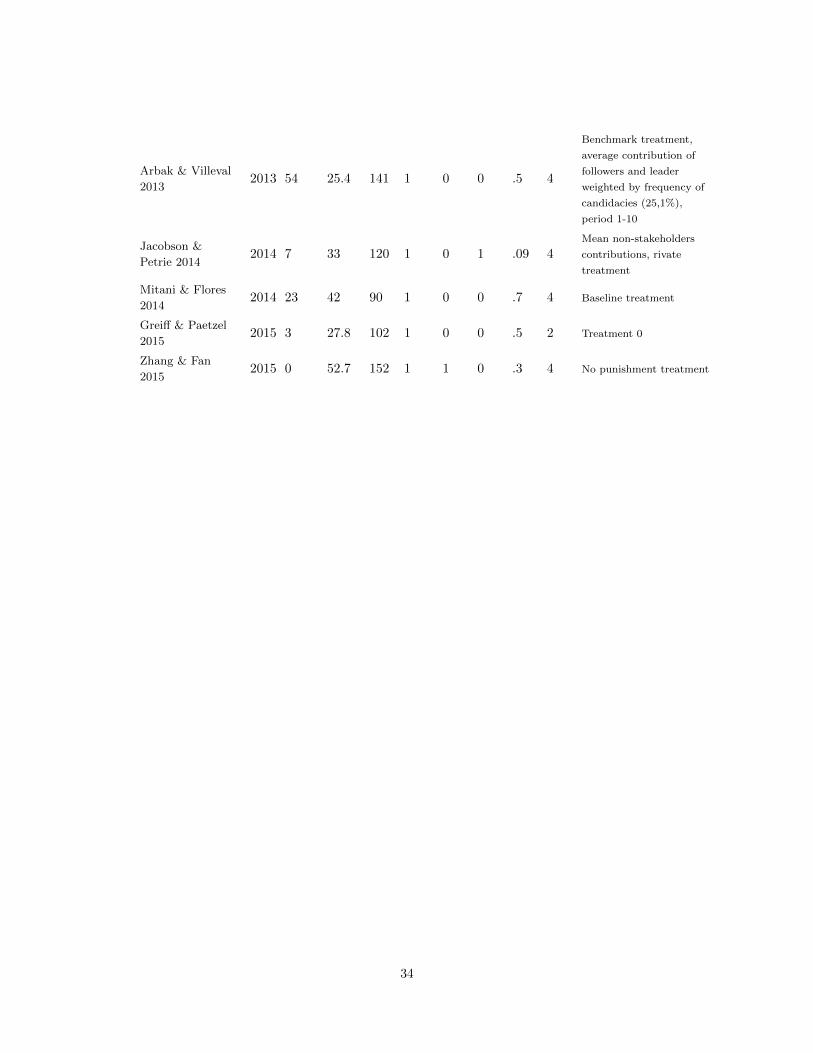
Arbak & Villeval
20132013 54 25.4 141 1 0 0 .5 4
Benchmark treatment,
average contribution of
followers and leader
weighted by frequency of
candidacies (25,1%),
period 1-10
Jacobson &
Petrie 20142014 7 33 120 1 0 1 .09 4
Mean non-stakeholders
contributions, rivate
treatment
Mitani & Flores
20142014 23 42 90 1 0 0 .7 4 Baseline treatment
Greiff & Paetzel
20152015 3 27.8 102 1 0 0 .5 2 Treatment 0
Zhang & Fan
20152015 0 52.7 152 1 1 0 .3 4 No punishment treatment
34
Documents De travail GreDeG parus en 2017GREDEG Working Papers Released in 2017
2017-01 Lauren Larrouy & Guilhem Lecouteux Mindreading and Endogenous Beliefs in Games2017-02 Cilem Selin Hazir, Flora Bellone & Cyrielle Gaglio Local Product Space and Firm Level Churning in Exported Products2017-03 Nicolas Brisset What Do We Learn from Market Design?2017-04 Lise Arena, Nathalie Oriol & Iryna Veryzhenko Exploring Stock Markets Crashes as Socio-Technical Failures2017-05 Iryna Veryzhenko, Etienne Harb, Waël Louhichi & Nathalie Oriol The Impact of the French Financial Transaction Tax on HFT Activities and Market Quality2017-06 Frédéric Marty La régulation du secteur des jeux entre Charybde et Scylla2017-07 Alexandru Monahov & Thomas Jobert Case Study of the Moldovan Bank Fraud: Is Early Intervention the Best Central Bank Strategy to Avoid Financial Crises?2017-08 Nobuyuki Hanaki, Eizo Akiyama, Yukihiko Funaki & Ryuichiro Ishikawa Diversity in Cognitive Ability Enlarges Mispricing in Experimental Asset Markets2017-09 Thierry Blayac & Patrice Bougette Should I Go by Bus? The Liberalization of the Long-Distance Bus Industry in France2017-10 Aymeric Lardon On the Coalitional Stability of Monopoly Power in Differentiated Bertrand and Cournot Oligopolies2017-11 Ismaël Rafaï & Mira Toumi Pay Attention or Be Paid for Attention? Impact of Incentives on Allocation of Attention2017-12 Gérard Mondello Un modèle d’accident unilatéral: incertitude non-radicale et estimations différenciées2017-13 Gérard Mondello Lenders and Risky Activities: Strict Liability or Negligence Rule?2017-14 Frédéric Marty Économie des algorithmes et ordre concurrentiel : réflexions sur les abus d’exploitation et les collusions fondés sur des algorithmes de prix2017-15 Agnès Festré, Pierre Garrouste, Ankinée Kirakozian & Mira Toumi The Pen is Mightier than the Sword: How Third-party Advice or Sanction Impacts on Pro-environmental Behavior2017-16 Edward Lorenz & Sophie Pommet Innovation, Credit Constraints and National Banking Systems: A Comparison of Developing Nations2017-17 Patrice Bougette & Christophe Charlier Antidumping and Feed-In Tariffs as Good Buddies? Modeling the EU-China Solar Panel Dispute2017-18 Nobuyuki Hanaki, Eizo Akiyama & Ryuichiro Ishikawa Behavioral Uncertainty and the Dynamics of Traders’ Confidence in their Price Forecasts

2017-19 Adnane Kendel, Nathalie Lazaric & Kevin Maréchal What Do People ‘Learn By Looking’ at Direct Feedback on their Energy Consumption? Results of a Field Study in Southern France2017-20 Nicolas Vallois & Dorian Jullien Estimating Rationality in Economics: A History of Statistical Methods in Experimental Economics2017-21 Nicolas Vallois & Dorian Jullien Replication in Experimental Economics: A Historical and Quantitative Approach Focused on Public Good Game Experiments


![CYCLING TDF2011 Historical Guide (185p!! in French)[1]](https://img.pdfslide.fr/doc/110x75/5571fb874979599169951cf4/cycling-tdf2011-historical-guide-185p-in-french1.jpg)