Embed Size (px)
Citation preview
Revit Architecture StatisticsHere are the variances in our overall benchmark data, from 2010 to 2016
2010
2011
2012
2013
2014
2015
2016
Average Score: 63%
Average Time: 1 hr 11 mins
Average Score: 65%
Average Time: 1 hr 15 mins
Average Score: 69%
Average Time: 1 hr 5 mins
Average Score: 69%
Average Time: 1 hr 3 mins
Average Score: 70%
Average Time: 1 hr 1 mins
Average Score: 68.5%
Average Time: 1 hr 8 mins
Average Score: 69%
Average Time: 1 hr 12 mins
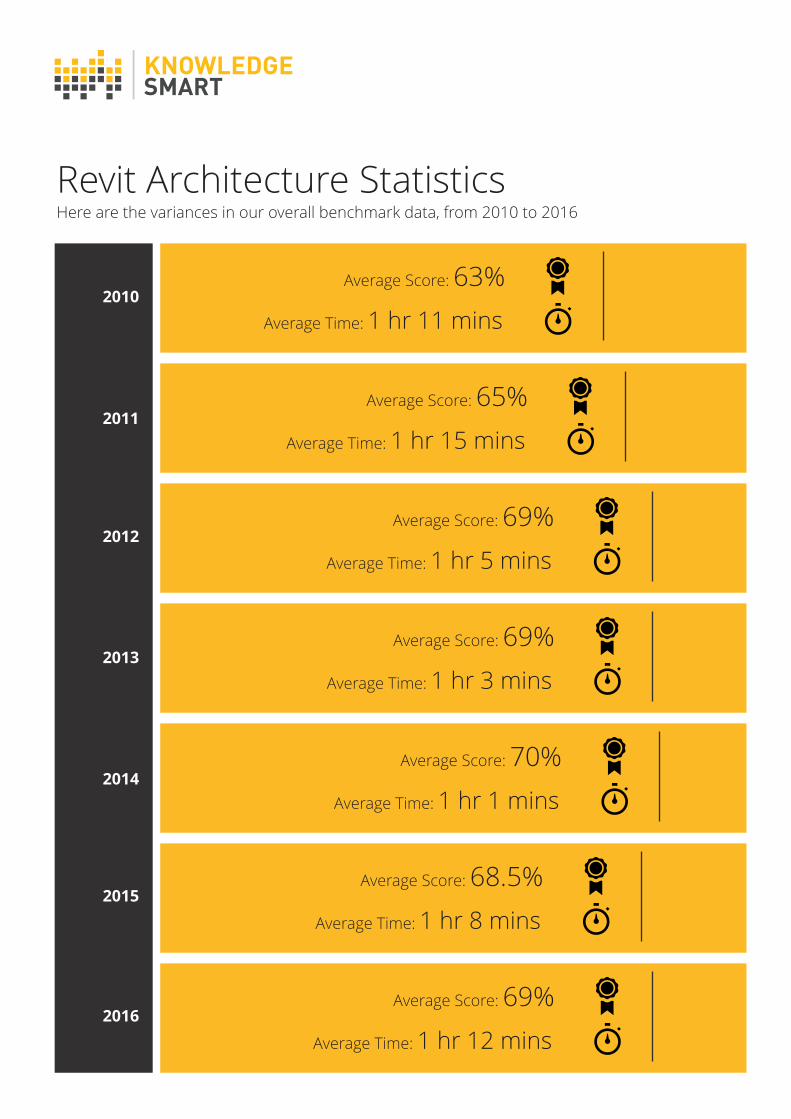
Country Score (%) Time (secs)
Australia 69.4 4736.5
Bahrain 73.2 4493.3
Canada 70.1 4341.4
China 63.5 6178.3
Egypt 68.1 4290.2
Hong Kong 73.5 5096.3
India 48.4 4555.6
Ireland 69.8 4053.8
Italy 73.0 4620.8
Kuwait 73.7 3951.8
New Zealand 74.2 4902.1
Nigeria 71.1 4778.6
Oman 49.3 3660.0
Pakistan 48.0 4459.0
Philippines 53.4 4238.6
Poland 74.0 4305.0
Portugal 67.6 5695.0
Qatar 69.0 4910.8
Saudi Arabia 70.7 4094.4
Singapore 74.5 4788.7
South Africa 66.8 4278.5
South Korea 64.0 4321.3
Spain 65.3 4454.6
Sweden 68.0 4615.0
UAE 66.4 5183.1
UK 73.6 4783.2
USA 72.4 4671.5
Vietnam 71.9 4513.5
Global Average Revit Architecture fundamentals 68.5% 1h 10m
State Score (%) Time (secs)
USA all 72.4 4671.5
Arizona 70.9 3581.7
Arkansas 66.0 3185.0
California 73.6 6101.1
Colorado 66.0 3333.8
District of Columbia 74.9 3995.6
Florida 67.2 4197.8
Georgia 70.3 6449.2
Hawaii 77.5 6622.5
Illinois 77.1 4888.4
Kansas 77.3 3731.7
Maryland 70.8 3986.0
Massachusetts 62.0 4268.3
Michigan 77.8 4113.8
Minnesota 76.2 4648.2
Mississippi 70.1 6366.9
Missouri 74.0 5197.3
New Jersey 76.0 3624.2
New York 75.1 5617.6
North Carolina 69.6 4462.7
Ohio 72.6 5928.0
Oregon 71.0 3861.7
Pennsylvania 75.9 3387.8
South Carolina 64.0 5235.8
Texas 74.3 5242.4
Utah 74.0 5515.1
Virginia 75.0 4322.5
Washington 68.0 4265.8
We also capture data on a per state basis, for our US customers
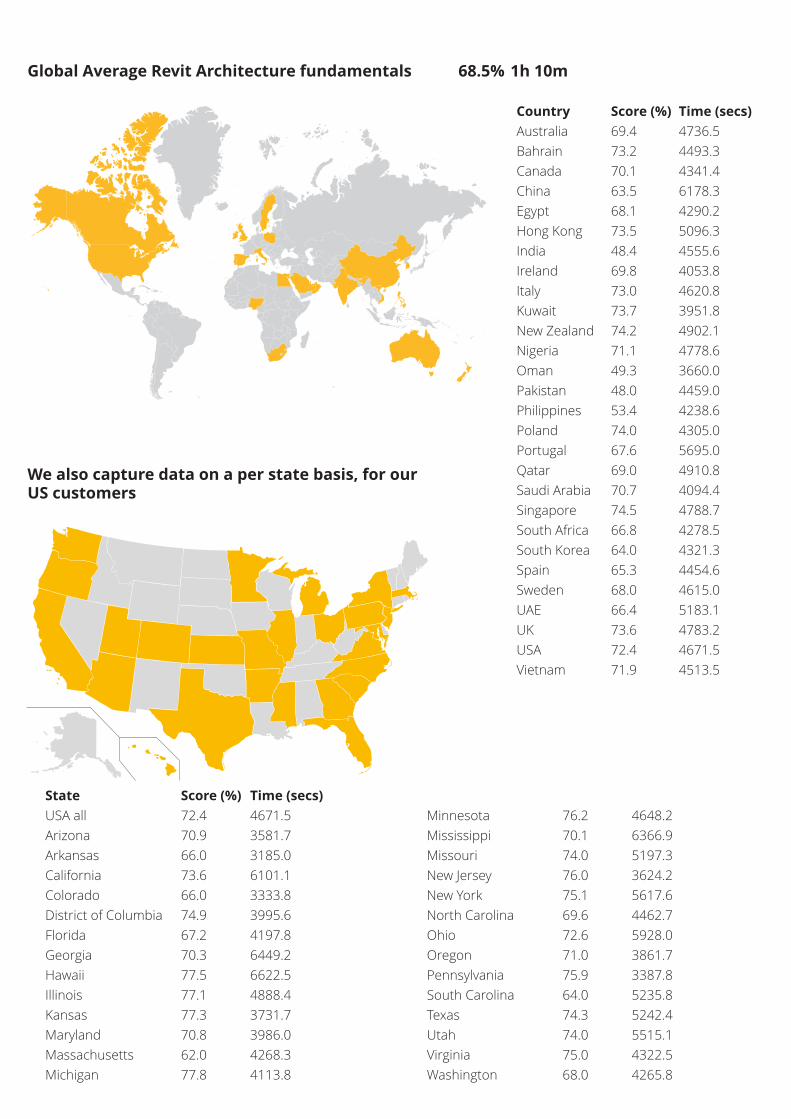
Global Average Revit Architecture Advanced 57.1% 1h 15m
Country Score (%) Time (secs)
Argentina 57.2 5435.0
Australia 61.1 5256.2
Canada 62.3 5404.8
China 48.7 4998.0
Egypt 50.3 6677.5
Hong Kong 57.5 5700.8
India 49.0 4497.7
Ireland 52.2 3995.0
Italy 48.4 4587.0
New Zealand 64.5 4560.0
Nigeria 61.2 4222.5
Philippines 48.1 5904.3
Qatar 61.8 4562.5
Saudi Arabia 63.2 4332.5
Singapore 57.4 4862.6
South Africa 63.0 4034.3
Spain 62.5 5280.0
UAE 61.7 8002.5
UK 60.7 4860.0
USA 62.9 5706.2
Vietnam 58.6 6426.7
Revit Advanced StatisticsHere are the variances in our overall benchmark data, from 2015 to 2016
2015
2016
Average Score: 57.1%
Average Time: 1 hr 24 mins
Average Score: 57%
Average Time: 1 hr 11 mins
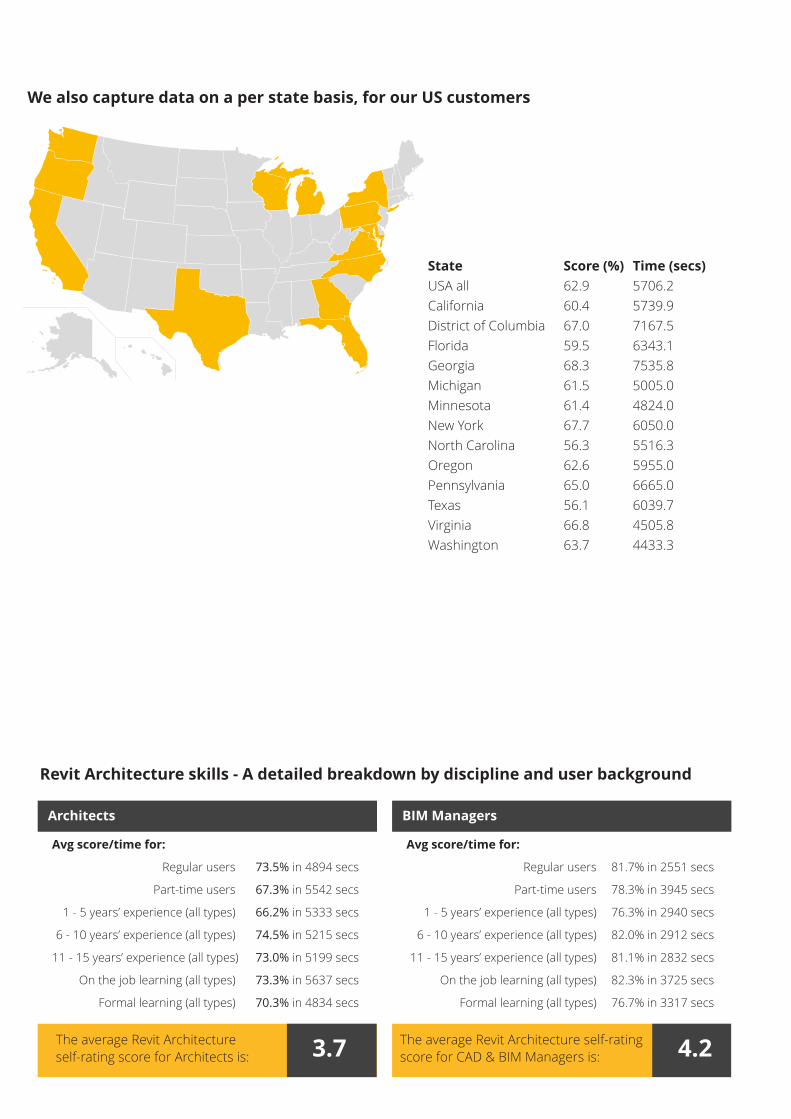
Avg score/time for:
Regular users 73.5% in 4894 secs
Part-time users 67.3% in 5542 secs
1 - 5 years’ experience (all types) 66.2% in 5333 secs
6 - 10 years’ experience (all types) 74.5% in 5215 secs
11 - 15 years’ experience (all types) 73.0% in 5199 secs
On the job learning (all types) 73.3% in 5637 secs
Formal learning (all types) 70.3% in 4834 secs
The average Revit Architecture self-rating score for Architects is:
Architects
3.7
Avg score/time for:
Regular users 81.7% in 2551 secs
Part-time users 78.3% in 3945 secs
1 - 5 years’ experience (all types) 76.3% in 2940 secs
6 - 10 years’ experience (all types) 82.0% in 2912 secs
11 - 15 years’ experience (all types) 81.1% in 2832 secs
On the job learning (all types) 82.3% in 3725 secs
Formal learning (all types) 76.7% in 3317 secs
The average Revit Architecture self-rating score for CAD & BIM Managers is:
BIM Managers
4.2
Revit Architecture skills - A detailed breakdown by discipline and user background
State Score (%) Time (secs)
USA all 62.9 5706.2
California 60.4 5739.9
District of Columbia 67.0 7167.5
Florida 59.5 6343.1
Georgia 68.3 7535.8
Michigan 61.5 5005.0
Minnesota 61.4 4824.0
New York 67.7 6050.0
North Carolina 56.3 5516.3
Oregon 62.6 5955.0
Pennsylvania 65.0 6665.0
Texas 56.1 6039.7
Virginia 66.8 4505.8
Washington 63.7 4433.3
We also capture data on a per state basis, for our US customers
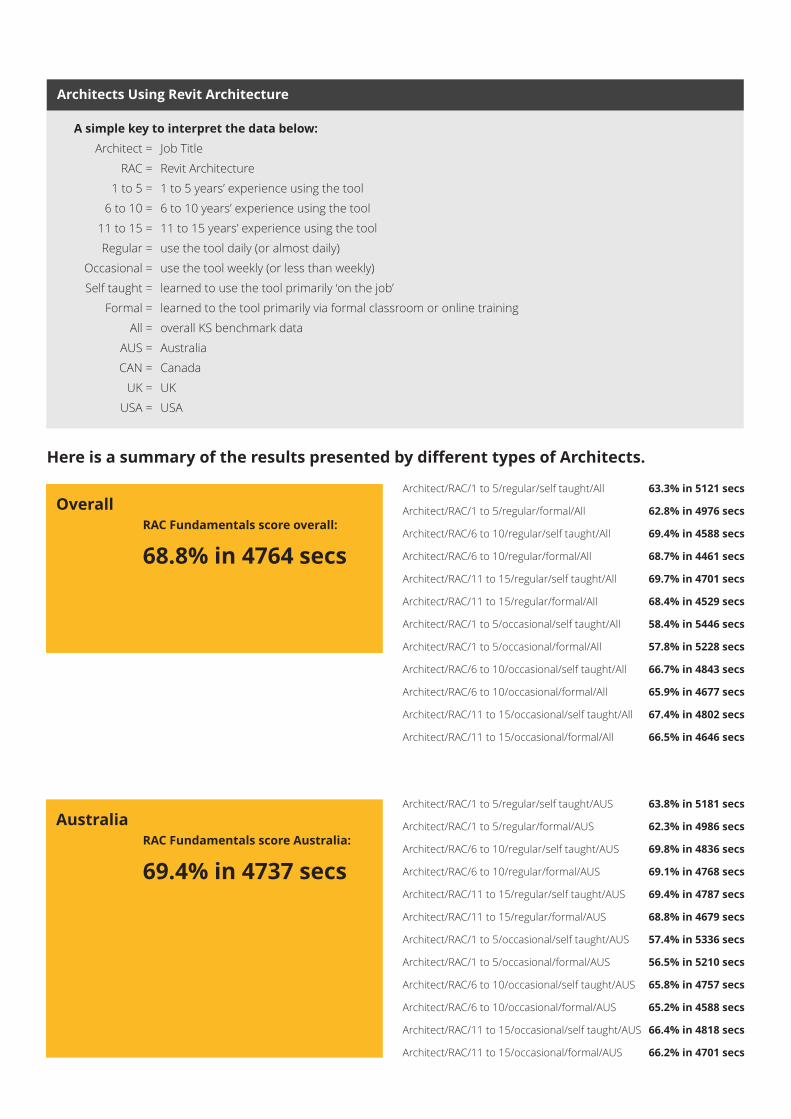
AustraliaArchitect/RAC/1 to 5/regular/self taught/AUS 63.8% in 5181 secs
Architect/RAC/1 to 5/regular/formal/AUS 62.3% in 4986 secs
Architect/RAC/6 to 10/regular/self taught/AUS 69.8% in 4836 secs
Architect/RAC/6 to 10/regular/formal/AUS 69.1% in 4768 secs
Architect/RAC/11 to 15/regular/self taught/AUS 69.4% in 4787 secs
Architect/RAC/11 to 15/regular/formal/AUS 68.8% in 4679 secs
Architect/RAC/1 to 5/occasional/self taught/AUS 57.4% in 5336 secs
Architect/RAC/1 to 5/occasional/formal/AUS 56.5% in 5210 secs
Architect/RAC/6 to 10/occasional/self taught/AUS 65.8% in 4757 secs
Architect/RAC/6 to 10/occasional/formal/AUS 65.2% in 4588 secs
Architect/RAC/11 to 15/occasional/self taught/AUS 66.4% in 4818 secs
Architect/RAC/11 to 15/occasional/formal/AUS 66.2% in 4701 secs
RAC Fundamentals score Australia:
69.4% in 4737 secs
OverallArchitect/RAC/1 to 5/regular/self taught/All 63.3% in 5121 secs
Architect/RAC/1 to 5/regular/formal/All 62.8% in 4976 secs
Architect/RAC/6 to 10/regular/self taught/All 69.4% in 4588 secs
Architect/RAC/6 to 10/regular/formal/All 68.7% in 4461 secs
Architect/RAC/11 to 15/regular/self taught/All 69.7% in 4701 secs
Architect/RAC/11 to 15/regular/formal/All 68.4% in 4529 secs
Architect/RAC/1 to 5/occasional/self taught/All 58.4% in 5446 secs
Architect/RAC/1 to 5/occasional/formal/All 57.8% in 5228 secs
Architect/RAC/6 to 10/occasional/self taught/All 66.7% in 4843 secs
Architect/RAC/6 to 10/occasional/formal/All 65.9% in 4677 secs
Architect/RAC/11 to 15/occasional/self taught/All 67.4% in 4802 secs
Architect/RAC/11 to 15/occasional/formal/All 66.5% in 4646 secs
RAC Fundamentals score overall:
68.8% in 4764 secs
Architects Using Revit Architecture
A simple key to interpret the data below:
Architect = Job Title
RAC = Revit Architecture
1 to 5 = 1 to 5 years’ experience using the tool
6 to 10 = 6 to 10 years’ experience using the tool
11 to 15 = 11 to 15 years’ experience using the tool
Regular = use the tool daily (or almost daily)
Occasional = use the tool weekly (or less than weekly)
Self taught = learned to use the tool primarily ‘on the job’
Formal = learned to the tool primarily via formal classroom or online training
All = overall KS benchmark data
AUS = Australia
CAN = Canada
UK = UK
USA = USA
Here is a summary of the results presented by different types of Architects.
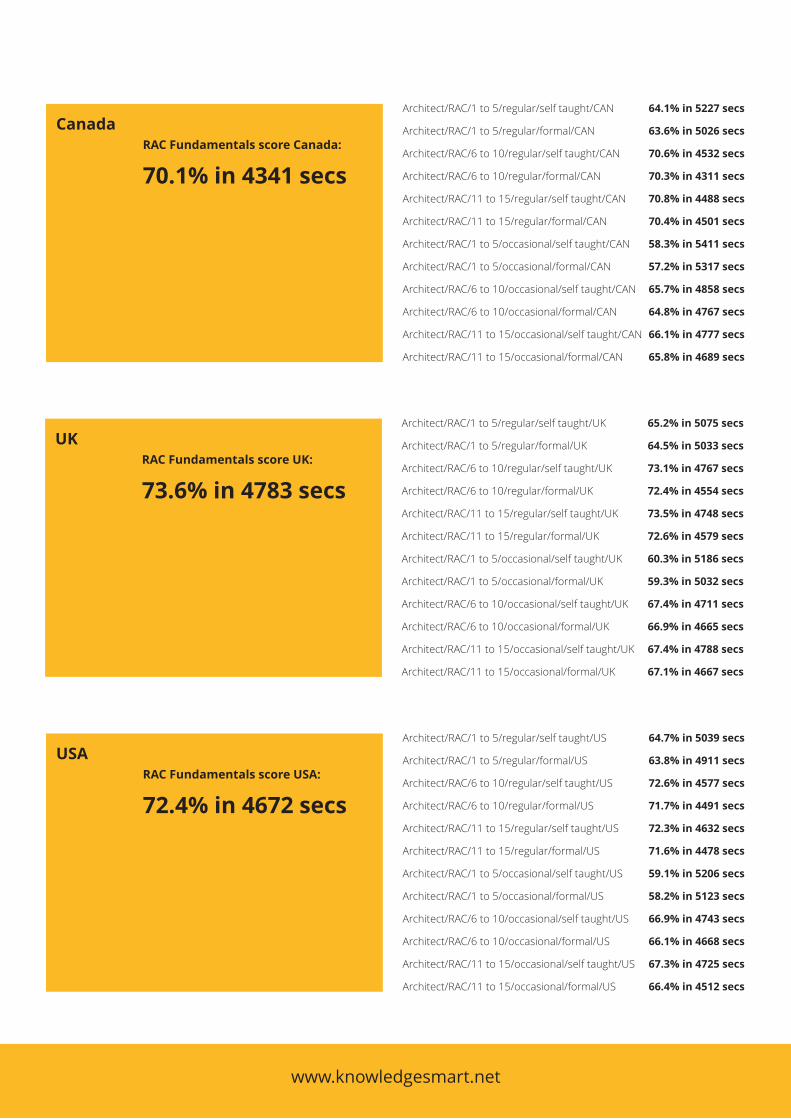
USAArchitect/RAC/1 to 5/regular/self taught/US 64.7% in 5039 secs
Architect/RAC/1 to 5/regular/formal/US 63.8% in 4911 secs
Architect/RAC/6 to 10/regular/self taught/US 72.6% in 4577 secs
Architect/RAC/6 to 10/regular/formal/US 71.7% in 4491 secs
Architect/RAC/11 to 15/regular/self taught/US 72.3% in 4632 secs
Architect/RAC/11 to 15/regular/formal/US 71.6% in 4478 secs
Architect/RAC/1 to 5/occasional/self taught/US 59.1% in 5206 secs
Architect/RAC/1 to 5/occasional/formal/US 58.2% in 5123 secs
Architect/RAC/6 to 10/occasional/self taught/US 66.9% in 4743 secs
Architect/RAC/6 to 10/occasional/formal/US 66.1% in 4668 secs
Architect/RAC/11 to 15/occasional/self taught/US 67.3% in 4725 secs
Architect/RAC/11 to 15/occasional/formal/US 66.4% in 4512 secs
RAC Fundamentals score USA:
72.4% in 4672 secs
UKArchitect/RAC/1 to 5/regular/self taught/UK 65.2% in 5075 secs
Architect/RAC/1 to 5/regular/formal/UK 64.5% in 5033 secs
Architect/RAC/6 to 10/regular/self taught/UK 73.1% in 4767 secs
Architect/RAC/6 to 10/regular/formal/UK 72.4% in 4554 secs
Architect/RAC/11 to 15/regular/self taught/UK 73.5% in 4748 secs
Architect/RAC/11 to 15/regular/formal/UK 72.6% in 4579 secs
Architect/RAC/1 to 5/occasional/self taught/UK 60.3% in 5186 secs
Architect/RAC/1 to 5/occasional/formal/UK 59.3% in 5032 secs
Architect/RAC/6 to 10/occasional/self taught/UK 67.4% in 4711 secs
Architect/RAC/6 to 10/occasional/formal/UK 66.9% in 4665 secs
Architect/RAC/11 to 15/occasional/self taught/UK 67.4% in 4788 secs
Architect/RAC/11 to 15/occasional/formal/UK 67.1% in 4667 secs
RAC Fundamentals score UK:
73.6% in 4783 secs
www.knowledgesmart.net
CanadaArchitect/RAC/1 to 5/regular/self taught/CAN 64.1% in 5227 secs
Architect/RAC/1 to 5/regular/formal/CAN 63.6% in 5026 secs
Architect/RAC/6 to 10/regular/self taught/CAN 70.6% in 4532 secs
Architect/RAC/6 to 10/regular/formal/CAN 70.3% in 4311 secs
Architect/RAC/11 to 15/regular/self taught/CAN 70.8% in 4488 secs
Architect/RAC/11 to 15/regular/formal/CAN 70.4% in 4501 secs
Architect/RAC/1 to 5/occasional/self taught/CAN 58.3% in 5411 secs
Architect/RAC/1 to 5/occasional/formal/CAN 57.2% in 5317 secs
Architect/RAC/6 to 10/occasional/self taught/CAN 65.7% in 4858 secs
Architect/RAC/6 to 10/occasional/formal/CAN 64.8% in 4767 secs
Architect/RAC/11 to 15/occasional/self taught/CAN 66.1% in 4777 secs
Architect/RAC/11 to 15/occasional/formal/CAN 65.8% in 4689 secs
RAC Fundamentals score Canada:
70.1% in 4341 secs