Embed Size (px)
Citation preview
sustainability
Article
Role of Integrated Nutrient Management andAgronomic Fortification of Zinc on Yield, NutrientUptake and Quality of Wheat
Venkatesh Paramesh 1,2,* , Shiva Dhar 1, Anchal Dass 1 , Bipin Kumar 1, Amit Kumar 1,Diaa O. El-Ansary 3 and Hosam O. Elansary 4,5,*
1 Division of Agronomy, ICAR-Indian Agricultural Research Institute, New Delhi 110012, India;[email protected] (S.D.); [email protected] (A.D.); [email protected] (B.K.);[email protected] (A.K.)
2 Natural Resource management Section, ICAR-Central Coastal Agricultural Research Institute, Old Goa,Goa 403402, India
3 Precision Agriculture Laboratory, Department of Pomology, Faculty of Agriculture (El-Shatby),Alexandria University, Alexandria 21545, Egypt; [email protected]
4 Plant Production Department, College of Food and Agricultural Sciences, King Saud University,P.O. Box 2455, Riyadh 11451, Saudi Arabia
5 Floriculture, Ornamental Horticulture, and Garden Design Department, Faculty of Agriculture (El-Shatby),Alexandria University, Alexandria 21545, Egypt
* Correspondence: [email protected] (V.P.); [email protected] (H.O.E.);Tel.: +966-581216322 (H.O.E.)
Received: 9 April 2020; Accepted: 23 April 2020; Published: 25 April 2020�����������������
Abstract: Phosphorus (P) and zinc (Zn) are essential plant nutrients, and their deficiency in soilsand the antagonistic effect of P on Zn are important concerns world-over. Thus, a two-year (2012–13to 2013–14) experimentation was carried out to assess grain yield, nutrient uptake and qualityparameters of wheat by various levels of P and Zn. The results revealed that 50% recommendeddose of P (RDP) through phospho-enriched compost (PEC) + 50% RDP through fertiliser and soilapplication of 12.5 kg ZnSO4.7H2O ha−1 + one foliar spray of 0.5% ZnSO4.7H2O recorded significantlyhigher grain yield (4.81 and 4.61 t ha−1, respectively), straw yield (7.20 and 6.92 t ha−1, respectively)and protein content (11.5% and 11.3%, respectively). The concentrations of Zn in grain (35.6%) andstraw (57.3%) were not affected due to organic P application but 100% P through P fertilizer reducedthe Zn content in the grains. Both soil and foliar application of Zn were found to be more promisingin increasing Zn and Fe concentration in grains (37.5 and 30.9 mg kg−1, respectively) and straw (60.3and 398 mg kg−1, respectively). Overall, the treatment combination of 50% RDP through PEC +
50% RDP through fertiliser and soil applied 12.5 kg ZnSO4.7H2O ha−1 + one spray of 0.5% Zn wasbeneficial in reducing antagonistic effect of P on Zn and increasing Zn and Fe concentration in wheatgrain and, thus, could be used for improving the yield of Zn and Fe enriched wheat grains.
Keywords: nutrient uptake; phospho-enriched compost; phosphorus; wheat; zinc
1. Introduction
Phosphorus (P) is the second most important essential nutrient for crop production after nitrogen [1].This nutrient plays various roles in the plant metabolism including a structural role in molecules,such as nucleic acids and proteins, for energy transfer, respiration, glycolysis, carbohydrate metabolism,redox reactions, enzyme activation/inactivation, membrane synthesis and stability, and in nitrogenfixation [2]. Phosphorus is a component of DNA and RNA, which carries genetic information used to
Sustainability 2020, 12, 3513; doi:10.3390/su12093513 www.mdpi.com/journal/sustainability
Sustainability 2020, 12, 3513 2 of 12
synthesize proteins. Phosphorus is essentially important to human beings also; it is involved in thegrowth and repair of body cells and tissues. Its deficiency in children affects normal bone and teethdevelopment [3]. Thus, there is rising concern over widespread deficiency of P in the agriculturallands of the world. More than 50% soils have been reported to be deficient in P [4]. Application of anadequate amount of P through organic manures and chemical fertilizers sustains crop productivity andenriches the P in the soil, but fixation of P by clay minerals that are rich in acids soils, including variousiron oxides and kaolinite, renders the applied P unavailable for root uptake, and ultimately leading to avery low P-use efficiency (15–20%). Soil pH values below 5.5 and between 7.5 and 8.5 limit phosphateavailability to plants, due to fixation by calcium. Hence, a paramount importance is given to theefficient use of P fertiliser for sustainable crop production [5]. In India, where majority of populationis vegetarian, P deficiency is a major constraint to crop production as 80% of the soils in Indian arelow to medium in P availability, necessitating P additions to obtain optimum plant growth and higherproductivity [6].
Zinc (Zn) deficiency is widespread in the world, particularly in the Asian and African continentsand affecting both human health and crop production [7]. Wheat is more relevant to both of theseconcerns, as wheat is more susceptible to soil Zn deficiency and is a staple food crop for some of theZn-deficient human population [8]. The regions with Zn-deficient soils are also regions of widespreadZn deficiency in human beings, including India, Pakistan, China, Iran and Turkey [9]. Producing staplefood crop grains richer in Zn could certainly help in alleviating Zn deficiencies in both humans andanimals [10]. Low solubility of Zn is the major cause for the extensive occurrence of Zn deficiency incrops [11]. To overcome these challenges, agronomic fortification of Zn could be a possible solution.Pooniya et al. [12] reported that soil and foliar spray of Zn is a effective solution to avoid Zn deficiencyin rice. Foliar application of Zn improves the Zn concentration in grains by about 30%, 25% and 63% inrice, wheat and maize grains, respectively, over soil application [13,14]. Agronomic biofortification ofwheat by Zn fertilization is a promising way to resolve Zn deficiency problems [15]. Likewise, iron isalso an essential micronutrient for plant growth and metabolism, especially in chlorophyll synthesisand for the maintenance of chloroplast structure and function. Iron deficiency in many crop plantsresults in reduced yields with reduction in nutritional quality [16]. Iron can bind directly to the protein,or as haem, an important constituent of blood hemoglobin [17]. Any practice of nutrient management,which either decreases or increases the supply of another nutrient element or its absorption from thesoil by plants or translocation and mobility within the plant, will influence its nutrition and, thereby,the nutrient use efficiency and crop yield [18]. The efficiency of applied P rarely exceeds 30%, while thatof most of the micronutrient cations is more than 10%. Particularly, Zn use efficiency is very low (2%).Therefore, their repeated applications over the years lead to their build up and interactions in soils andplants, affecting agricultural production [19]. The heavy use of P fertilisers may have some adverseor favorable effect on the availability of applied Zn in soils as well as its effect on plants [20]. Hence,the interaction effect between Zn and P is still very much contradictory. Ali et al. [21] reported thatcombined application of P–humate and Zn–humate were more effective in improving grain and strawyield than individually. Keeping the above facts in view, we hypothesised that an organic source of Phas no or less antagonistic effect on Zn concentration and uptake by wheat crop. To test this hypothesis,phospho-enriched compost (PEC) was integrated with chemical fertiliser at different method and levelsof Zn application. The objectives of the study were (i) to assess the effect of integrated P managementand Zn application on wheat yield, concentration and uptake of P, Zn and Fe in wheat grain and strawand (ii) to analyse the effect of P and Zn on protein and amino acid concentration in the wheat grainunder neutral to alkaline soil.
2. Material and Methods
The experimental site was situated in ICAR-Indian Agricultural Research Institute, New Delhi,India (28◦40′ N and 77◦12′ E). It has a semiarid, sub-tropical climate; the mean maximum temperatureduring July is about 40 ◦C, while the mean minimum temperature in the January is as low as 6 ◦C.
Sustainability 2020, 12, 3513 3 of 12
The annual average temperature is 25.6 ◦C. The normal onset period of monsoon is in the third weekof June. The mean annual rainfall is 614 mm, received during July–January. Soil belongs to orderInceptisol, Mahauli series. Texture of the soil is loamy in nature, leveled, percolating and fine drained,hypothermic family of the Typic Ustochrept (old alluvium). The initial chemical properties of the soilare shown in Table 1.
Table 1. Initial soil parameter (0–15 cm) of the experimental field.
Parameters Values
pH 7.3Organic carbon 0.51%
Available nitrogen 168.3 kg ha−1
Available phosphorus 11.9 kg ha−1
Available potassium 241.5 kg ha−1
Available Zn 0.68 mg kg−1
The wheat straw was air dried and shredded to 8–10 cm pieces. Chopped straw was mixedwith cow dung, soil and farmyard manure (FYM) in a ratio of 8:1:0.5:0.5. The rock phosphate(32% P2O5) was mixed with substrate mixture. To activate the microbial action, 1% urea was addedto the substrate mixture. Treated straw mixture was put in 1 m3 concrete pits. The moisture wasmaintained initially at 100% (w/w) and later at 65%. After 30 days of decomposition when thethermophilic temperature subsided, the bio-inoculant Aspergillus awamori was applied at 300 g myceliat−1 of substrate. The fortnightly turnings were given to ensure thorough mixing and decomposition.The compost samples were drawn after four months of substrate decomposition. The samples wereair-dried and homogenized by grinding. The compost so prepared was used for soil application.
The two-year field experiment on wheat was conducted during winter season (November–April)of 2012–13 and 2013–14. The treatments of the experiment included five phosphorus (P) managementpractices, including control (without P), 100% recommended dose of phosphorus (RDP) throughchemical fertilizers (P100-F), 100% RDP through phosphor-enriched compost (P100-PEC), 50% RDPthrough PEC + 50% RDP through fertilizer (P50-PEC + P100-F) and 75% RDP through PEC + vesiculararbuscular mycorrhiza (VAM) + phosphate solubilizing bacteria (PSB) (P75-PEC + VAM + PSB) andfour levels of zinc, including control (without Zn), soil application of 25 kg ZnSO4.7H2O ha−1 (25 kgsoil), two foliar spray of 0.5% ZnSO4.7H2O at anthesis and one week after anthesis in wheat (two foliarspray), soil application of 12.5 kg ZnSO4.7H2O ha−1 + one foliar spray of 0.5% ZnSO4.7H2O at one weekafter anthesis in wheat (soil + foliar spray). Thus, there were 20 treatment combinations of phosphorusand zinc applications. The treatments were set in a split plot design with three replications in fixedplots of size 4.2 m × 5 m each. A dose of 60 kg N and 40 kg K2O ha−1 was applied as basal dose duringsowing. Subsequently, 60 kg N was applied in two equal splits as top dressing at first and secondirrigation. Phosphorus was applied to the respective plots as per treatment through diammoniumphosphate (DAP). Zinc was applied basally at the time of sowing as per treatment through zincsulphate (ZnSO4.7H2O) that contained 21% zinc and 10% S. The amount of sulphur was adjustedthrough elemental sulphur in all the plots and applied one week before sowing of crop. The inoculumspecies used for PSB and VAM were Pseudomonas striata and Glomus fasciculatum, respectively.
For estimation of P, plant samples were digested with di-acid mixture (HNO3:HClO4 in 9:4).The P content in the extracts was determined by stannous chloride method [22]. This extract wassubsequently used for Zn and Fe estimation. Zinc and iron (Fe) in plant extracts were determined byatomic absorption spectrophotometer from the extract prepared for the estimation of phosphorus asoutlined above and expressed in mg kg−1. The P, Zn and Fe uptakes in grain or straw were worked outby multiplying their respective nutrient concentrations with the corresponding yield. The total uptakesof nutrients were determined by adding up their respective uptake in grain and straw. Protein contentin wheat grain was calculated by multiplying N content by the factor 5.85 [23]. The amino acid
Sustainability 2020, 12, 3513 4 of 12
composition, such as tryptophan content, lysine and methionine contents were determined by usingthe protocols developed by Horn et al. [24]; Spies and Chambers [25]; and Felker et al. [26].
Data collected from different treatments with three replications were subjected to the analysis ofvariance in split-plot design. Statistical analysis of the data was performed using SPSS software (version11.0). Test of significance of the treatment differences was done on the basis of ‘T’ test. The significantdifferences between treatments were compared with the Duncan’s multiple range test at 5% level ofsignificance. Correlation and regression were performed to know the effect of yield attributes, and Pconcentration on wheat grain yield.
3. Results and Discussion
3.1. Yield and Yield Parameters
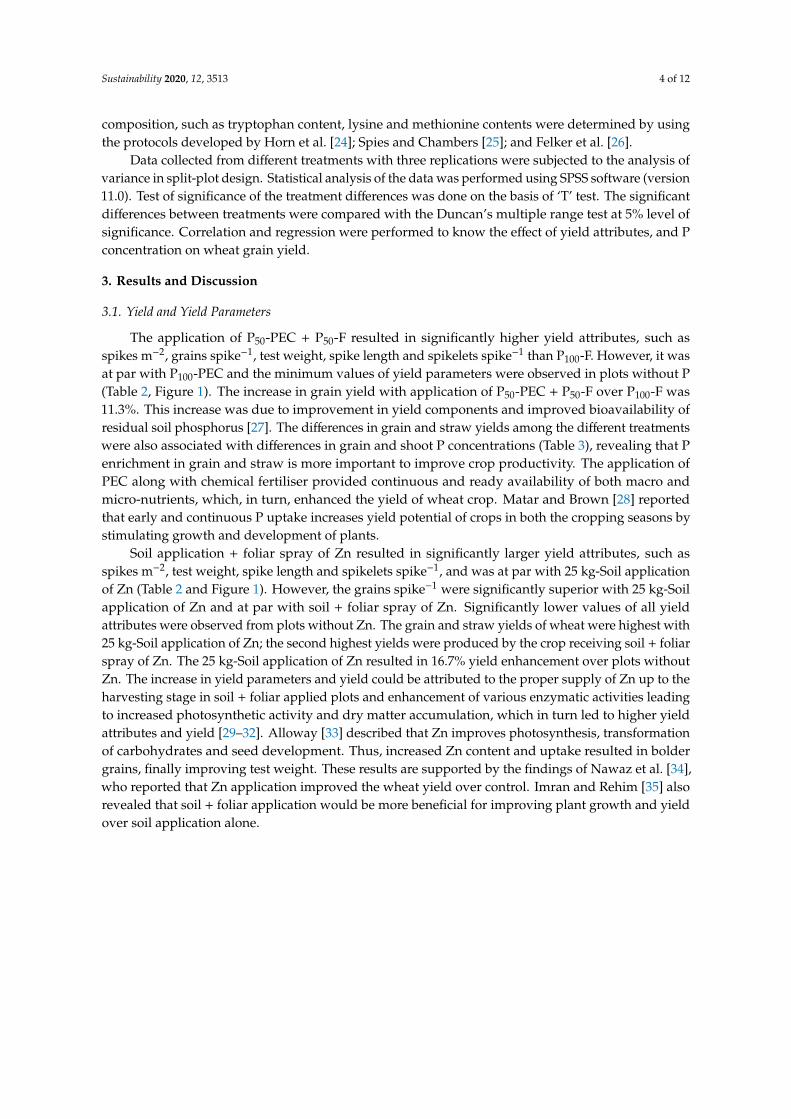
The application of P50-PEC + P50-F resulted in significantly higher yield attributes, such asspikes m−2, grains spike−1, test weight, spike length and spikelets spike−1 than P100-F. However, it wasat par with P100-PEC and the minimum values of yield parameters were observed in plots without P(Table 2, Figure 1). The increase in grain yield with application of P50-PEC + P50-F over P100-F was11.3%. This increase was due to improvement in yield components and improved bioavailability ofresidual soil phosphorus [27]. The differences in grain and straw yields among the different treatmentswere also associated with differences in grain and shoot P concentrations (Table 3), revealing that Penrichment in grain and straw is more important to improve crop productivity. The application ofPEC along with chemical fertiliser provided continuous and ready availability of both macro andmicro-nutrients, which, in turn, enhanced the yield of wheat crop. Matar and Brown [28] reportedthat early and continuous P uptake increases yield potential of crops in both the cropping seasons bystimulating growth and development of plants.
Soil application + foliar spray of Zn resulted in significantly larger yield attributes, such asspikes m−2, test weight, spike length and spikelets spike−1, and was at par with 25 kg-Soil applicationof Zn (Table 2 and Figure 1). However, the grains spike−1 were significantly superior with 25 kg-Soilapplication of Zn and at par with soil + foliar spray of Zn. Significantly lower values of all yieldattributes were observed from plots without Zn. The grain and straw yields of wheat were highest with25 kg-Soil application of Zn; the second highest yields were produced by the crop receiving soil + foliarspray of Zn. The 25 kg-Soil application of Zn resulted in 16.7% yield enhancement over plots withoutZn. The increase in yield parameters and yield could be attributed to the proper supply of Zn up to theharvesting stage in soil + foliar applied plots and enhancement of various enzymatic activities leadingto increased photosynthetic activity and dry matter accumulation, which in turn led to higher yieldattributes and yield [29–32]. Alloway [33] described that Zn improves photosynthesis, transformationof carbohydrates and seed development. Thus, increased Zn content and uptake resulted in boldergrains, finally improving test weight. These results are supported by the findings of Nawaz et al. [34],who reported that Zn application improved the wheat yield over control. Imran and Rehim [35] alsorevealed that soil + foliar application would be more beneficial for improving plant growth and yieldover soil application alone.
Sustainability 2020, 12, 3513 5 of 12
Table 2. Influence of integrated P management and Zn application on yield, yield attributes and proteinpercent in wheat grain (average of 2 years).
Treatments Spikesm−2
GrainsSpike−1
TestWeight
(g)
SpikeLength
(cm)
SpikeletsSpike−1
GrainYield
(t ha−1)
StrawYield
(t ha−1)
Protein(%)
Phosphorus levels
Without P 302 d 31.6 d 35.9 c 9.4 d 26.8 d 3.65 d 5.90 d 9.5 d
P100-F 327 c 36.8 c 36.1 c 10.3 c 29.7 c 4.03 c 6.19 c 10.0 c
P100-PEC 353 a 44.3 b 40.4 a 11.7 a 33.7 a 4.77 a 7.09 a 11.3 ab
P50-PEC + P50-F 358 a 46.4 a 40.6 a 11.8 a 34.7 a 4.81 a 7.20 a 11.5 a
P75-PEC + VAM + PSB 341 b 42.5 b 39.2 b 11.1 b 32.0 b 4.58 b 6.68 b 11.2 b
Application of ZnSO4.7H2O
Without Zn 316 c 36.1 b 36.6 b 10.1 b 29.1 b 4.08 c 6.16 c 10.1 b
25 kg-Soil 352 a 44.7 a 40.2 a 11.5 a 33.4 a 4.61 a 7.01 a 11.3 a
Two foliar ** 325 b 36.3 b 36.3 b 10.1 b 29.5 b 4.19 b 6.36 b 10.2 b
Soil + Foliar * 352 a 44.1 a 40.7 a 11.6 a 33.6 a 4.59 a 6.92 a 11.2 a
**—Two foliar spray at anthesis and one week after anthesis stage; *—one foliar spray at one week after anthesisstage. Similar letter in a column indicates non-significance difference between treatments.
Sustainability 2020, 12, x FOR PEER REVIEW 5 of 12
5
Table 2. Influence of integrated P management and Zn application on yield, yield attributes and protein percent in wheat grain (average of 2 years).
Treatments Spikes m-2 Grains spike-1 Test weight (g)
Spike length (cm) Spikelets spike-1 Grain yield
(t ha-1) Straw yield
(t ha-1) Protein
(%) Phosphorus levels
Without P 302d 31.6d 35.9c 9.4d 26.8d 3.65d 5.90d 9.5d P100-F 327c 36.8c 36.1c 10.3c 29.7c 4.03c 6.19c 10.0c
P100-PEC 353a 44.3b 40.4a 11.7a 33.7a 4.77a 7.09a 11.3ab P50-PEC+ P50-F 358a 46.4a 40.6a 11.8a 34.7a 4.81a 7.20a 11.5a
P75-PEC+VAM+PSB
341b 42.5b 39.2b 11.1b 32.0b 4.58b 6.68b 11.2b
Application of ZnSO4.7H2O Without Zn 316c 36.1b 36.6b 10.1b 29.1b 4.08c 6.16c 10.1b 25 kg-Soil 352a 44.7a 40.2a 11.5a 33.4a 4.61a 7.01a 11.3a
Two foliar** 325b 36.3b 36.3b 10.1b 29.5b 4.19b 6.36b 10.2b Soil + Foliar* 352a 44.1a 40.7a 11.6a 33.6a 4.59a 6.92a 11.2a
**- Two foliar spray at anthesis and one week after anthesis stage; *- one foliar spray at one week after anthesis stage. Similar letter in a row indicates non-significance difference between treatments.
(a) (b)
(c)
Figure 1. Relationship between grain yield and yield parameters. (a) Grains spike−1, (b) spikelets spike−1 and (c) spikes m−2.
3.2. Phosphorus Concentration and Uptake
The P concentration in grain as well as in straw was highest with P100-PEC followed by P50-PEC + P50-F and P75-PEC + VAM + PSB (Table 3). The P uptake in grain was found highest with P100-PEC and the uptake of P in straw and total P uptake were highest with P50-PEC + P50-F. The percent increase in wheat grain P concentration due to P100-PEC over without P was 39.2%. This might be due to better availability and consistent supply of P from PEC and chemical fertiliser up to harvest and also increased microbial activity in soil helping to increase the P uptake and leading to increased
Figure 1. Relationship between grain yield and yield parameters. (a) Grains spike−1, (b) spikeletsspike−1 and (c) spikes m−2.
3.2. Phosphorus Concentration and Uptake
The P concentration in grain as well as in straw was highest with P100-PEC followed by P50-PEC +
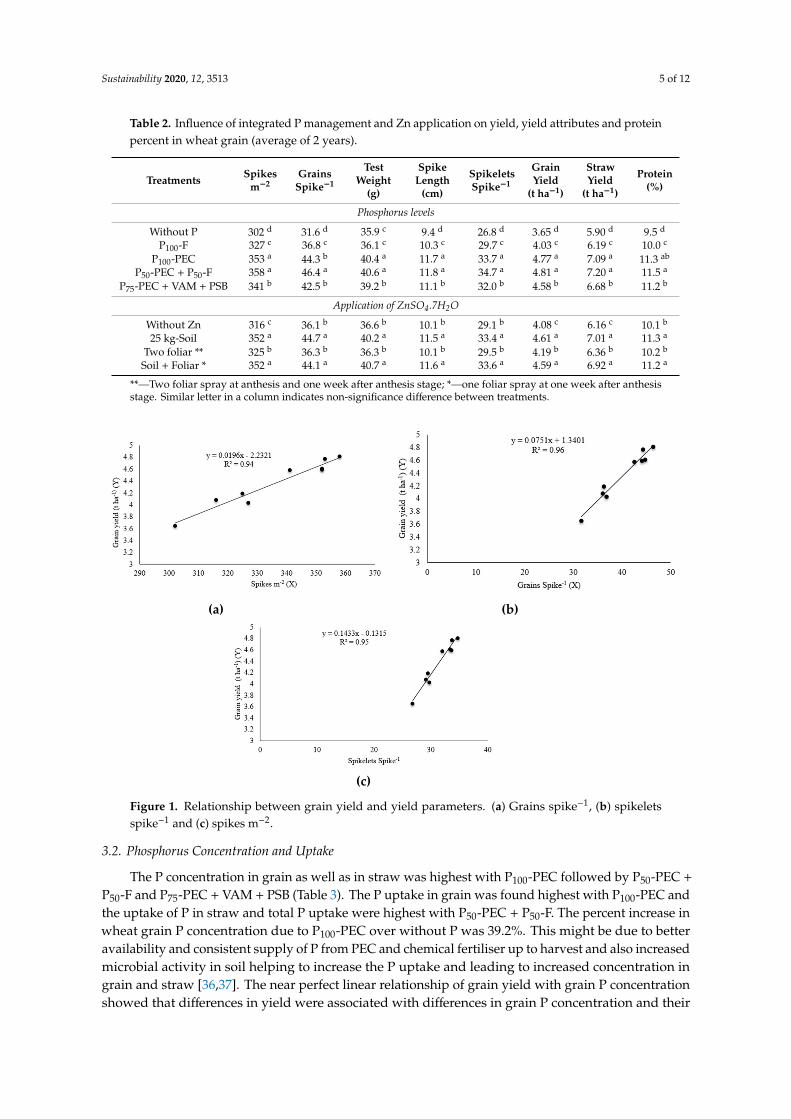
P50-F and P75-PEC + VAM + PSB (Table 3). The P uptake in grain was found highest with P100-PEC andthe uptake of P in straw and total P uptake were highest with P50-PEC + P50-F. The percent increase inwheat grain P concentration due to P100-PEC over without P was 39.2%. This might be due to betteravailability and consistent supply of P from PEC and chemical fertiliser up to harvest and also increasedmicrobial activity in soil helping to increase the P uptake and leading to increased concentration ingrain and straw [36,37]. The near perfect linear relationship of grain yield with grain P concentrationshowed that differences in yield were associated with differences in grain P concentration and their
Sustainability 2020, 12, 3513 6 of 12
corresponding uptake (Figure 2). These results firmly revealed that P uptake is of greater significancein enhancing crop productivity. Zaki and Radwan [38] reported that application of P fertilizer and PSBenhanced P and micronutrients availability and concentration in plants. Shivay et al. [39] reportedthat minute quantity of fertilizer P is bioavailable for plant uptake. The bioavailable P in the soil wasfound to be higher whenever an organic source of P was applied externally. The increased P levelsproportionately increased the bioavailable P in the soil, which caused the increased P concentrationand uptake in wheat parts.
The P concentration in grain and straw was highest with two foliar sprays of Zn followed bysoil + foliar spray of Zn. However, the highest P uptake was noticed with soil + foliar spray of Zn.The increase in grain P concentration with two foliar sprays of Zn over 25 kg-Soil application of Znwas 9%. This trend could likely be due the antagonistic effect of excessive Zn on P-absorption andfurther translocation from roots to other parts of the plants. However, the Zn application by foliarspray increased P-absorption from the soil by plants [11]. Soil Zn application increased the N and Pconcentration but at higher dose reduced the P concentration [40].
Table 3. Influence of integrated P management and Zn application on P concentration and uptake bywheat (average of 2 years).
TreatmentsGrain P
Concentration(%)
Straw PConcentration
(%)
Grain P(kg ha−1)
Straw P(kg ha−1)
Total P(kg ha−1)
Phosphorus levels
Without P 0.28 c 0.13 b 10.4 c 7.6 c 17.9 d
P100-F 0.3 b 0.13 b 13.5 b 8.2 c 21.7 c
P100-PEC 0.38 a 0.15 a 18.1 a 10.5 b 28.6 a
P50-PEC + P50-F 0.37 a 0.15 a 18.0 a 11.0 a 29.0 a
P75-PEC + VAM + PSB 0.38 a 0.15 a 17.3 a 10.2 b 27.4 b
Application of ZnSO4.7H2O
Without Zn 0.34 b 0.15 a 13.9 c 9.1 b 23.0 d
25 kg-Soil 0.33 b 0.13 c 15.6 b 9.1 b 24.7 c
Two foliar ** 0.36 a 0.15 a 15.4 b 9.8 a 25.2 b
Soil + Foliar * 0.36 a 0.14 b 16.9 a 10.0 a 26.9 a
**—Two foliar spray at anthesis and one week after anthesis stage; *—one foliar spray at one week after anthesisstage. Similar letter in a column indicates non-significance difference between treatments.
Sustainability 2020, 12, x FOR PEER REVIEW 6 of 12
6
concentration in grain and straw [36,37]. The near perfect linear relationship of grain yield with grain P concentration showed that differences in yield were associated with differences in grain P concentration and their corresponding uptake (Figure 2). These results firmly revealed that P uptake is of greater significance in enhancing crop productivity. Zaki and Radwan [38] reported that application of P fertilizer and PSB enhanced P and micronutrients availability and concentration in plants. Shivay et al. [39] reported that minute quantity of fertilizer P is bioavailable for plant uptake. The bioavailable P in the soil was found to be higher whenever an organic source of P was applied externally. The increased P levels proportionately increased the bioavailable P in the soil, which caused the increased P concentration and uptake in wheat parts.
The P concentration in grain and straw was highest with two foliar sprays of Zn followed by soil + foliar spray of Zn. However, the highest P uptake was noticed with soil + foliar spray of Zn. The increase in grain P concentration with two foliar sprays of Zn over 25 kg - Soil application of Zn was 9%. This trend could likely be due the antagonistic effect of excessive Zn on P-absorption and further translocation from roots to other parts of the plants. However, the Zn application by foliar spray increased P-absorption from the soil by plants [11]. Soil Zn application increased the N and P concentration but at higher dose reduced the P concentration [40].
Table 3. Influence of integrated P management and Zn application on P concentration and uptake by wheat (average of 2 years).
Treatments Grain P
concentration (%) Straw P
concentration (%) Grain P (kg ha−1)
Straw P (kg ha−1)
Total P (kg ha−1)
Phosphorus levels Without P 0.28c 0.13b 10.4c 7.6c 17.9d
P100-F 0.3b 0.13b 13.5b 8.2c 21.7c P100-PEC 0.38a 0.15a 18.1a 10.5b 28.6a
P50-PEC + P50-F 0.37a 0.15a 18.0a 11.0a 29.0a P75-PEC + VAM + PSB 0.38a 0.15a 17.3a 10.2b 27.4b
Application of ZnSO4.7H2O Without Zn 0.34b 0.15a 13.9c 9.1b 23.0d 25 kg-Soil 0.33b 0.13c 15.6b 9.1b 24.7c
Two foliar** 0.36a 0.15a 15.4b 9.8a 25.2b Soil + Foliar* 0.36a 0.14b 16.9a 10.0a 26.9a
**- Two foliar spray at anthesis and one week after anthesis stage; *- one foliar spray at one week after anthesis stage. Similar letter in a row indicates non-significance difference between treatments
Y = 151.3X + 2029.4; R² = 0.92
3000
3200
3400
3600
3800
4000
4200
4400
4600
4800
5000
0 5 10 15 20
Gra
in Y
ield
(t h
a-1) (
Y)
Grain P concentration (g kg-1) (X)
Figure 2. Response of grain P uptake to grain yield of wheat (grain P uptake with grain yield of wheatunder different P and Zn levels were taken for this response calculation).
Sustainability 2020, 12, 3513 7 of 12
3.3. Zinc Concentration and Uptake
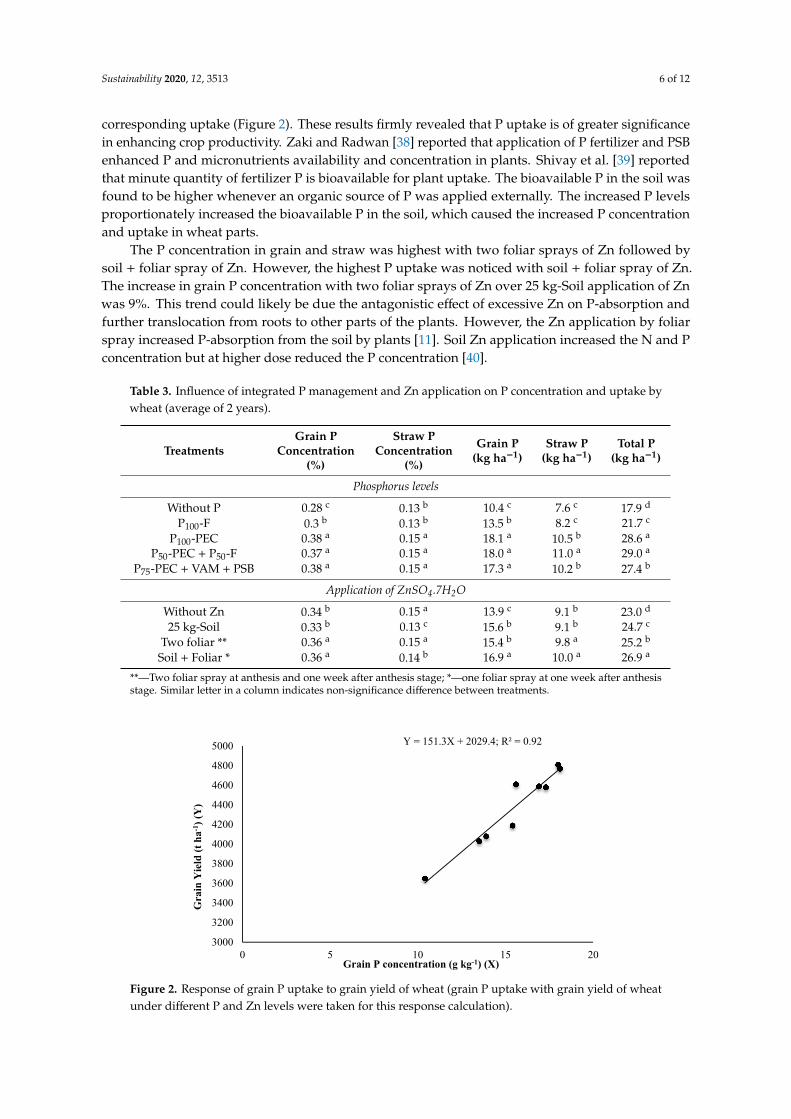
There were significant differences among treatments for Zn concentration and uptake in wheat(Table 4). The Zn concentration and uptake in wheat were significantly higher with P50-PEC+ P50-Ffollowed by P100-PEC; the lowest Zn concentration in grain and straw was noticed with P100-F.The increase in grain Zn concentration with P50-PEC + P50-F over P100-F was 13.3%. The increased Znconcentration with integrated P management resulted from the reduction in antagonistic effect of Pon Zn when organic P was applied [41]. The decreased Zn concentration in grain and straw seen inP100-F plots might be due to dilution effect [42,43]. Ryan et al. [5] described that higher applicationof P fertilizers induces Zn deficiency in plants due to dilution effect. The Zn concentration in grainand straw was highest with two foliar sprays of Zn and it was at par with soil + foliar spray of Zn.The Zn uptake in grain, straw and total uptake of Zn were highest with soil + foliar spray of Zn.The increase in grain Zn concentration with two foliar sprays of Zn over 25 kg-Soil application of Znwas 10.4%. The results revealed that soil and foliar application of Zn are efficient in improving theZn concentration in grains as nutrients are absorbed quickly through leaves as compared to uptakefrom the plant roots [35,44]. Similar results were obtained by Ghasal et al. [45]; they reported thatsoil + foliar application of Zn increased Zn uptake by 4–7% over soil application alone. Habib [46]found that the concentration of Zn in wheat increased by three times by foliar application of Zn atthe reproductive stage of the crop. Ghasal et al. [47] reported that Zn concentration in grain increasessignificantly with an increase in Zn level in soil.
Table 4. Influence of integrated P management and Zn application on Zn concentration and uptake bywheat (pooled data of two years).
TreatmentsGrain Zn
Concentration(%)
Straw ZnConcentration
(%)
Grain Zn(mg−1 kg)
Straw Zn(mg−1 kg)
Total Zn(mg kg−1)
Phosphorus levels
Without P 34.9 b 56.5 a 127.7 c 335 c 463 d
P100-F 31.5 c 50.6 c 127.0 c 313 d 440 d
P100-PEC 35.6 a 57.2 a 170.5 a 407 a 578 a
P50-PEC + P50-F 35.6 a 57.3 a 171.9 a 414 a 586 a
P75-PEC + VAM + PSB 34.6 b 55.5 b 158.9 b 371 b 530 b
Application of ZnSO4.7H2O
Without Zn 28.7 c 46.2 c 117.8 c 285 c 403 c
25 kg-Soil 34.2 b 54.8 b 158.2 b 385 b 544 b
Two foliar ** 37.2 a 60.3 a 156.3 b 384 b 540 b
Soil + Foliar* 37.5 a 60.3 a 172.6 a 419 a 591 a
**—Two foliar sprays at anthesis and one week after anthesis stage; *—one foliar spray at one week after anthesisstage. Similar letter in a column indicates non-significance difference between treatments.
3.4. Iron Concentration and Uptake
There was a significant increase in Fe concentration and uptake due to the application of P50-PEC+ P50-F followed by P100-PEC over without P and P100-F (Table 5). The increase in wheat grain Feconcentration over P100-F was 13.4%. The lowest Fe concentration and uptake were noticed in plotswithout P. As the P also exhibited a negative effect on absorption and translocation of Fe, the applicationof P100-F recorded lower Fe concentration over all other treatments. The application of PEC mighthave improved the chelation of Fe compounds and helped in absorption of Fe from soil. Two foliarsprays of Zn and soil + foliar spray of Zn improved Fe concentration and uptakes in grain and straw ofwheat significantly compared to without Zn treatment. However, soil + foliar spray of Zn resulted inthe highest grain, straw and total uptake of Fe because of higher dry matter production. This studyindicated that soil application of Zn reduced the Fe absorption from soil. These results are in agreement
Sustainability 2020, 12, 3513 8 of 12
with the findings of Abbas et al. [48]. Haldar and Mandal [49] reported that Fe may get accumulated inthe roots, and higher root Zn might reduce the Fe translocation from root to shoot or may reduce theuptake from soil itself.
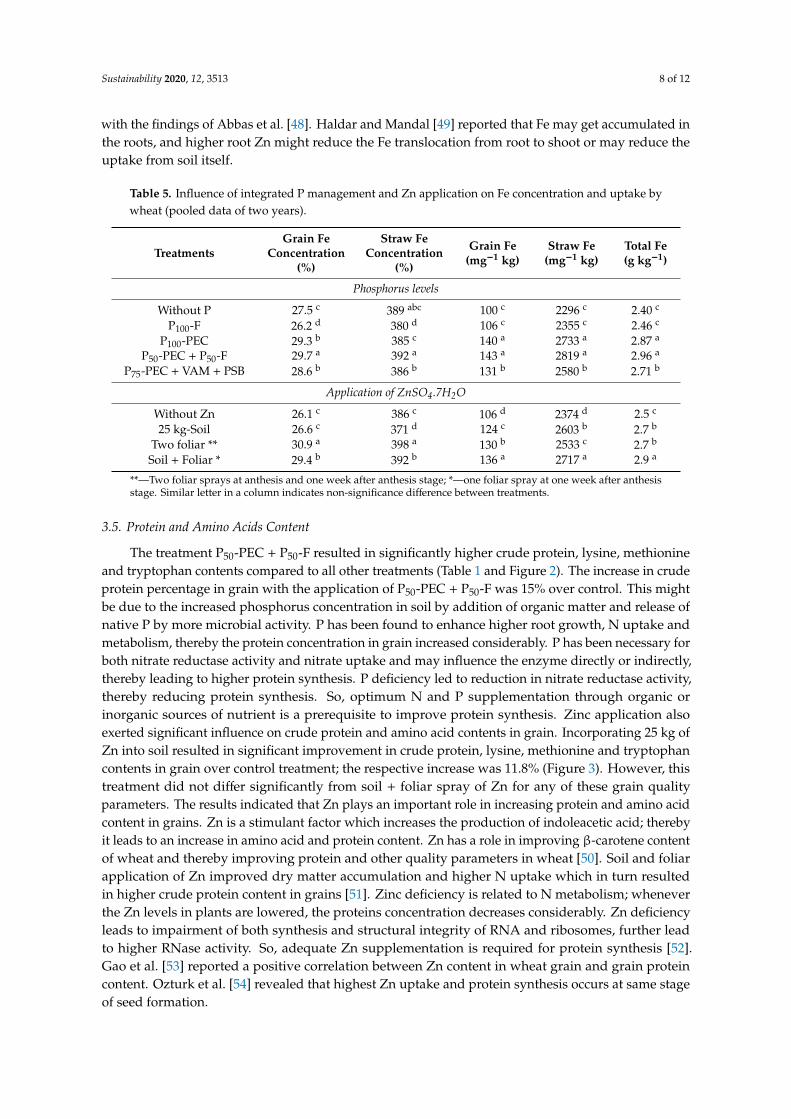
Table 5. Influence of integrated P management and Zn application on Fe concentration and uptake bywheat (pooled data of two years).
TreatmentsGrain Fe
Concentration(%)
Straw FeConcentration
(%)
Grain Fe(mg−1 kg)
Straw Fe(mg−1 kg)
Total Fe(g kg−1)
Phosphorus levels
Without P 27.5 c 389 abc 100 c 2296 c 2.40 c
P100-F 26.2 d 380 d 106 c 2355 c 2.46 c
P100-PEC 29.3 b 385 c 140 a 2733 a 2.87 a
P50-PEC + P50-F 29.7 a 392 a 143 a 2819 a 2.96 a
P75-PEC + VAM + PSB 28.6 b 386 b 131 b 2580 b 2.71 b
Application of ZnSO4.7H2O
Without Zn 26.1 c 386 c 106 d 2374 d 2.5 c
25 kg-Soil 26.6 c 371 d 124 c 2603 b 2.7 b
Two foliar ** 30.9 a 398 a 130 b 2533 c 2.7 b
Soil + Foliar * 29.4 b 392 b 136 a 2717 a 2.9 a
**—Two foliar sprays at anthesis and one week after anthesis stage; *—one foliar spray at one week after anthesisstage. Similar letter in a column indicates non-significance difference between treatments.
3.5. Protein and Amino Acids Content
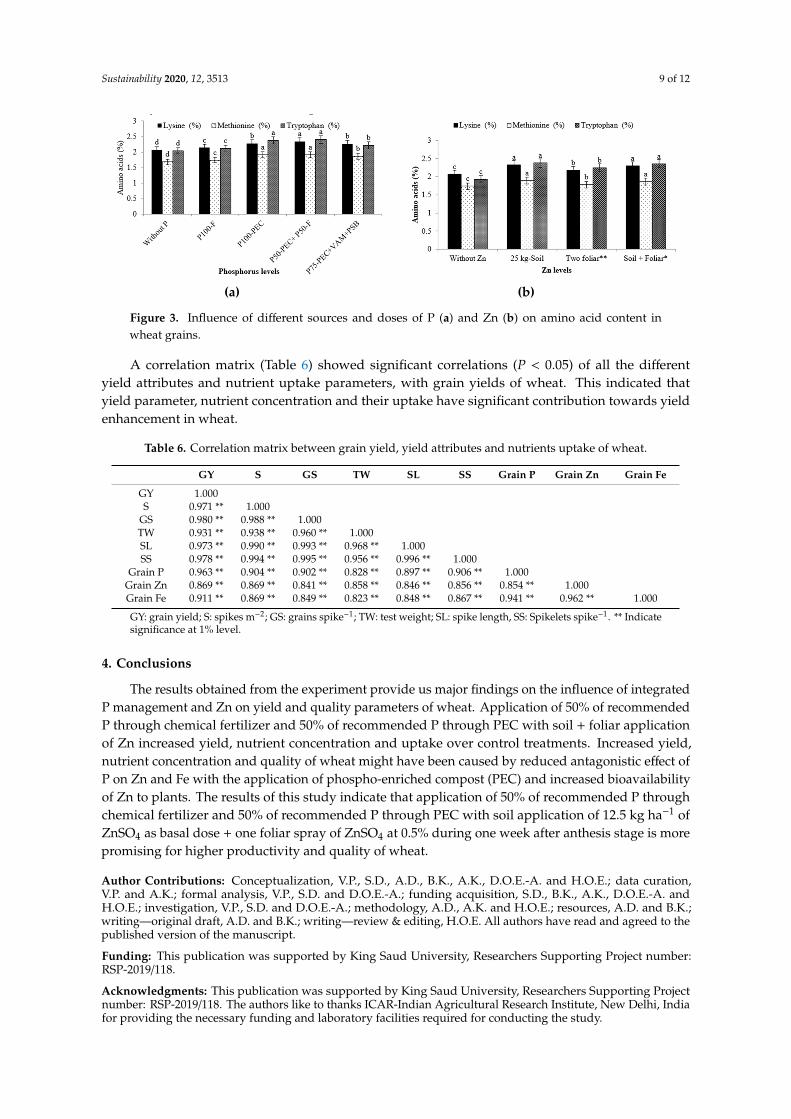
The treatment P50-PEC + P50-F resulted in significantly higher crude protein, lysine, methionineand tryptophan contents compared to all other treatments (Table 1 and Figure 2). The increase in crudeprotein percentage in grain with the application of P50-PEC + P50-F was 15% over control. This mightbe due to the increased phosphorus concentration in soil by addition of organic matter and release ofnative P by more microbial activity. P has been found to enhance higher root growth, N uptake andmetabolism, thereby the protein concentration in grain increased considerably. P has been necessary forboth nitrate reductase activity and nitrate uptake and may influence the enzyme directly or indirectly,thereby leading to higher protein synthesis. P deficiency led to reduction in nitrate reductase activity,thereby reducing protein synthesis. So, optimum N and P supplementation through organic orinorganic sources of nutrient is a prerequisite to improve protein synthesis. Zinc application alsoexerted significant influence on crude protein and amino acid contents in grain. Incorporating 25 kg ofZn into soil resulted in significant improvement in crude protein, lysine, methionine and tryptophancontents in grain over control treatment; the respective increase was 11.8% (Figure 3). However, thistreatment did not differ significantly from soil + foliar spray of Zn for any of these grain qualityparameters. The results indicated that Zn plays an important role in increasing protein and amino acidcontent in grains. Zn is a stimulant factor which increases the production of indoleacetic acid; therebyit leads to an increase in amino acid and protein content. Zn has a role in improving β-carotene contentof wheat and thereby improving protein and other quality parameters in wheat [50]. Soil and foliarapplication of Zn improved dry matter accumulation and higher N uptake which in turn resultedin higher crude protein content in grains [51]. Zinc deficiency is related to N metabolism; wheneverthe Zn levels in plants are lowered, the proteins concentration decreases considerably. Zn deficiencyleads to impairment of both synthesis and structural integrity of RNA and ribosomes, further leadto higher RNase activity. So, adequate Zn supplementation is required for protein synthesis [52].Gao et al. [53] reported a positive correlation between Zn content in wheat grain and grain proteincontent. Ozturk et al. [54] revealed that highest Zn uptake and protein synthesis occurs at same stageof seed formation.
Sustainability 2020, 12, 3513 9 of 12
Sustainability 2020, 12, x FOR PEER REVIEW 9 of 12
9
in wheat grain and grain protein content. Ozturk et al. [54] revealed that highest Zn uptake and protein synthesis occurs at same stage of seed formation.
(a) (b)
Figure 3. Influence of different sources and doses of P (a) and Zn (b) on amino acid content in wheat grains.
A correlation matrix (Table 6) showed significant correlations (P < 0.05) of all the different yield attributes and nutrient uptake parameters, with grain yields of wheat. This indicated that yield parameter, nutrient concentration and their uptake have significant contribution towards yield enhancement in wheat.
Table 6. Correlation matrix between grain yield, yield attributes and nutrients uptake of wheat.
GY S GS TW SL SS Grain P Grain Zn Grain Fe GY 1.000 S 0.971** 1.000
GS 0.980** 0.988** 1.000 TW 0.931** 0.938** 0.960** 1.000 SL 0.973** 0.990** 0.993** 0.968** 1.000 SS 0.978** 0.994** 0.995** 0.956** 0.996** 1.000
Grain P 0.963** 0.904** 0.902** 0.828** 0.897** 0.906** 1.000 Grain Zn 0.869** 0.869** 0.841** 0.858** 0.846** 0.856** 0.854** 1.000 Grain Fe 0.911** 0.869** 0.849** 0.823** 0.848** 0.867** 0.941** 0.962** 1.000
GY: grain yield; S: spikes m-2; GS: grains spike-1; TW: test weight; SL: spike length, SS: Spikelets spike-
1. * Indicate significance at 5% level. ** Indicate significance at 1% level. *** Indicate significance at 0.1% level.
4. Conclusions
The results obtained from the experiment provide us major findings on the influence of integrated P management and Zn on yield and quality parameters of wheat. Application of 50% of recommended P through chemical fertilizer and 50% of recommended P through PEC with soil + foliar application of Zn increased yield, nutrient concentration and uptake over control treatments. Increased yield, nutrient concentration and quality of wheat might have been caused by reduced antagonistic effect of P on Zn and Fe with the application of phospho-enriched compost (PEC) and increased bioavailability of Zn to plants. The results of this study indicate that application of 50% of recommended P through chemical fertilizer and 50% of recommended P through PEC with soil application of 12.5 kg ha-1 of ZnSO4 as basal dose + one foliar spray of ZnSO4 at 0.5% during one week after anthesis stage is more promising for higher productivity and quality of wheat.
Author Contributions: Conceptualization, V. P., S. D., A. D., B. K., A. K., D. O. E. and H. O. E.; data curation, V. P. and A. K.; formal analysis, V. P., S. D. and D. O. E.; funding acquisition, S. D., B. K., A. K., D. O. El and H. O.
Figure 3. Influence of different sources and doses of P (a) and Zn (b) on amino acid content inwheat grains.
A correlation matrix (Table 6) showed significant correlations (P < 0.05) of all the differentyield attributes and nutrient uptake parameters, with grain yields of wheat. This indicated thatyield parameter, nutrient concentration and their uptake have significant contribution towards yieldenhancement in wheat.
Table 6. Correlation matrix between grain yield, yield attributes and nutrients uptake of wheat.
GY S GS TW SL SS Grain P Grain Zn Grain Fe
GY 1.000S 0.971 ** 1.000
GS 0.980 ** 0.988 ** 1.000TW 0.931 ** 0.938 ** 0.960 ** 1.000SL 0.973 ** 0.990 ** 0.993 ** 0.968 ** 1.000SS 0.978 ** 0.994 ** 0.995 ** 0.956 ** 0.996 ** 1.000
Grain P 0.963 ** 0.904 ** 0.902 ** 0.828 ** 0.897 ** 0.906 ** 1.000Grain Zn 0.869 ** 0.869 ** 0.841 ** 0.858 ** 0.846 ** 0.856 ** 0.854 ** 1.000Grain Fe 0.911 ** 0.869 ** 0.849 ** 0.823 ** 0.848 ** 0.867 ** 0.941 ** 0.962 ** 1.000
GY: grain yield; S: spikes m−2; GS: grains spike−1; TW: test weight; SL: spike length, SS: Spikelets spike−1. ** Indicatesignificance at 1% level.
4. Conclusions
The results obtained from the experiment provide us major findings on the influence of integratedP management and Zn on yield and quality parameters of wheat. Application of 50% of recommendedP through chemical fertilizer and 50% of recommended P through PEC with soil + foliar applicationof Zn increased yield, nutrient concentration and uptake over control treatments. Increased yield,nutrient concentration and quality of wheat might have been caused by reduced antagonistic effect ofP on Zn and Fe with the application of phospho-enriched compost (PEC) and increased bioavailabilityof Zn to plants. The results of this study indicate that application of 50% of recommended P throughchemical fertilizer and 50% of recommended P through PEC with soil application of 12.5 kg ha−1 ofZnSO4 as basal dose + one foliar spray of ZnSO4 at 0.5% during one week after anthesis stage is morepromising for higher productivity and quality of wheat.
Author Contributions: Conceptualization, V.P., S.D., A.D., B.K., A.K., D.O.E.-A. and H.O.E.; data curation,V.P. and A.K.; formal analysis, V.P., S.D. and D.O.E.-A.; funding acquisition, S.D., B.K., A.K., D.O.E.-A. andH.O.E.; investigation, V.P., S.D. and D.O.E.-A.; methodology, A.D., A.K. and H.O.E.; resources, A.D. and B.K.;writing—original draft, A.D. and B.K.; writing—review & editing, H.O.E. All authors have read and agreed to thepublished version of the manuscript.
Funding: This publication was supported by King Saud University, Researchers Supporting Project number:RSP-2019/118.
Acknowledgments: This publication was supported by King Saud University, Researchers Supporting Projectnumber: RSP-2019/118. The authors like to thanks ICAR-Indian Agricultural Research Institute, New Delhi, Indiafor providing the necessary funding and laboratory facilities required for conducting the study.
Sustainability 2020, 12, 3513 10 of 12
Conflicts of Interest: The authors declare no conflict of interest.
References
1. Moustakas, N.K.; Akoumianaki-Ioannidou, A.; Barouchas, P.E. The effects of cadmium and zinc interactionson the concentration of cadmium and zinc in pot marigold (Calendula officinalis L.). Aust. J. Crop Sci. 2011,5, 277.
2. Yousuf, P.Y.; Abd-Allah, E.F.; Nauman, M.; Asif, A.; Hashem, A.; Alqarawi, A.A.; Ahmad, A. ResponsiveProteins in Wheat Cultivars with Contrasting Nitrogen Efficiencies under the Combined Stress of HighTemperature and Low Nitrogen. Genes (Basel) 2017, 8, 356. [CrossRef]
3. Sheetal, A. Malnutrition and its Oral Outcome-A Review. J. Clin. Diagn. Res. 2013, 7, 178–180. [CrossRef][PubMed]
4. Ågren, G.I.; Wetterstedt, J.Å.M.; Billberger, M.F.K. Nutrient limitation on terrestrial plant growth-modelingthe interaction between nitrogen and phosphorus. New Phytol. 2012, 194, 953–960. [CrossRef] [PubMed]
5. Ryan, M.H.; McInerney, J.K.; Record, I.R.; Angus, J.F. Zinc bioavailability in wheat grain in relation tophosphorus fertiliser, crop sequence and mycorrhizal fungi. J. Sci. Food Agric. 2008, 88, 1208–1216. [CrossRef]
6. Cakmak, I. Enrichment of cereal grains with zinc: Agronomic or genetic biofortification? Plant Soil 2008, 302,1–17. [CrossRef]
7. Cakmak, I. Plant nutrition research: Priorities to meet human needs for food in sustainable ways. Plant Soil2002, 247, 3–24. [CrossRef]
8. Impa, S.M.; Johnson-Beebout, S.E. Mitigating zinc deficiency and achieving high grain Zn in rice throughintegration of soil chemistry and plant physiology research. Plant Soil 2012, 361, 3–41. [CrossRef]
9. Brown, K.H.; Rivera, J.A.; Bhutta, Z.; Gibson, R.S.; King, J.C.; Lönnerdal, B.; Ruel, M.T.; Sandtröm, B.;Wasantwisut, E.; Hotz, C. Assessment of the risk of zinc deficiency in populations and options for its control.Food Nutr. Bull. 2004, 25, S203.
10. Dass, A.; Chandra, S.; Uphoff, N.; Choudhary, A.K.; Bhattacharyya, R.; Rana, K.S. Agronomic fortification ofrice grains with secondary and micronutrients under differing crop management and soil moisture regimesin the north Indian Plains. Paddy Water Environ. 2017, 15, 745–760. [CrossRef]
11. Bukvic, G.; Antunovic, M.; Popovic, S.; Rastija, M. Effect of P and Zn fertilization on biomass yield and itsuptake by maize lines Zea mays L. J. Plant Soil Environ. 2003, 49, 505–510. [CrossRef]
12. Pooniya, V.; Shivay, Y.S.; Rana, A.; Nain, L.; Prasanna, R. Enhancing soil nutrient dynamics and productivityof Basmati rice through residue incorporation and zinc fertilization. Eur. J. Agron. 2012, 41, 28–37. [CrossRef]
13. Wei, Y.; Shohag, M.J.I.; Yang, X. Biofortification and bioavailability of rice grain zinc as affected by differentforms of foliar zinc fertilization. PLoS ONE 2012, 7, e45428. [CrossRef] [PubMed]
14. Yerokun, O.A.; Chirwa, M. Soil and foliar application of Zinc to maize and wheat grown on a ZambianAlfisol. Afr. J. Agric. Res. 2014, 9, 963–970.
15. Bouis, H.E.; Welch, R.M. Biofortification-a sustainable agricultural strategy for reducing micronutrientmalnutrition in the global south. Crop. Sci. 2010, 50, S20. [CrossRef]
16. Rout, G.R.; Sahoo, S. Role of iron in plant growth and metabolism. Rev. Agric. Sci. 2015, 3, 1–24. [CrossRef]17. Balk, J.; Connorton, J.M.; Wan, Y.; Lovegrove, A.; Moore, K.L.; Uauy, C.; Sharp, P.A.; Shewry, P.R. Improving
wheat as a source of iron and zinc for global nutrition. Nutr. Bull. 2019, 44, 53–59. [CrossRef]18. Rehim, A.; Zafar-ul-Hye, M.; Imran, M.; Ali, M.A.; Hussain, M. Phosphorus and zinc application improves
rice productivity. Pak. J. Sci. 2014, 66, 134–139.19. Shivay, Y.S.; Prasad, R. Zinc-coated urea improves productivity and quality of basmati rice (Oryza sativa L.)
under zinc stress condition. J. Plant Nutr. 2012, 35, 928–951. [CrossRef]20. Das, D.K.; Mandal, L.N. Micronutrients: Their Behaviour in Soils and Plants; Das, D.K., Ed.; Kalyani: New Delhi,
India, 1986.21. Ali, L.K.M.; Mohamed, N.A.; El-Maghraby, T.A. Effect of P and Zn fertilization on wheat yield and nutrient
uptake in calcareous soil. J. Soil Sci. Agric. Eng. 2011, 2, 555–569. [CrossRef]22. Watanabe, F.S.; Olsen, S.R. Test of an Ascorbic Acid Method for Determining Phosphorus in Water and
NaHCO3 Extracts from Soil1. Soil Sci. Soc. Am. J. 1965, 29, 677. [CrossRef]
Sustainability 2020, 12, 3513 11 of 12
23. Wrolstad, R.E. Current Protocols in Food Analytical Chemistry; Wrolstad, R.E., Acree, T.E., Decker, E.A.,Penner, M.H., Reid, D.S., Schwartz, S.J., Shoemaker, C.F., Smith, D., Sporns, P., Eds.; John Wiley & Sons, Inc.:Hoboken, NJ, USA, 2001; ISBN 0471142913.
24. Horn, M.J.; Jones, D.B.; Blum, A.E. Colorimetric determination of methionine in proteins and foods. J. Biol.Chem. 1946, 166, 313–320. [PubMed]
25. Spies, J.R.; Chambers, D.C. Chemical Determination of Tryptophan in Proteins. Anal. Chem. 1949, 21,1249–1266. [CrossRef]
26. Felker, C.; Libanauskas, C.K.; Wainer, G. Estimation of lysine in foods. Crop. Sci. 1978, 18, 480–490.27. Garg, S.; Bahl, G.S. Phosphorus availability to maize as influenced by organic manures and fertilizer P
associated phosphatase activity in soils. Bioresour. Technol. 2008, 99, 5773–5777. [CrossRef] [PubMed]28. Matar, A.E.; Brown, S.C. Effect of rate and method of phosphate placement on productivity of durum wheat
in mediterranean environments. Fertil. Res. 1989, 20, 75–82. [CrossRef]29. Hussain, F.; Yasin, M. Soil Fertility Monitoring and Management in Rice-Wheat; LRRP NARC: Islamabad,
Pakistan, 2004.30. Jakhar, S.R.; Singh, M.; Balai, C.M. Effect offarmyard manure, phosphorus and zinc levels on growth, yield,
quality and economics of pearl millet (Pennisetum glauculn). Indian J. Agric. Sci. 2006, 76, 388–391.31. Yin, G.; Gu, J.; Zhang, F.; Hao, L.; Cong, P.; Liu, Z. Maize Yield Response to Water Supply and Fertilizer Input
in a Semi-Arid Environment of Northeast China. PLoS ONE 2014, 9, e86099. [CrossRef]32. Paramesh, V.; Dhar, S.; Vyas, A.K.; Dass, A. Studies on impact of phosphoenriched compost, chemical
fertilizer and method of zinc application on yield, uptake and quality of maize (Zea mays). Indian J. Agron.2014, 59, 613–618.
33. Alloway, B.J. Zinc in Soils and Crop Nutrition; International Zinc Association: Brussels, Belgium, 2008.34. Nawaz, H.; Hussain, N.; Yasmeen, A.; Arif, M.; Hussain, M.; Rehmani, M.I.A.; Chattha, M.B.; Ahmad, A. Soil
applied zinc ensures high production and net returns of divergent wheat cultivars. J. Environ. Agric. Sci.2015, 2, 1–7.
35. Imran, M.; Rehim, A. Zinc fertilization approaches for agronomic biofortification and estimated humanbioavailability of zinc in maize grain. Arch. Agron. Soil Sci. 2017, 63, 106–116. [CrossRef]
36. Xu, M.; Li, D.; Li, J.; Qin, D.; Kazuyuki, Y.; Hosen, Y. Effects of Organic Manure Application with ChemicalFertilizers on Nutrient Absorption and Yield of Rice in Hunan of Southern China. Agric. Sci. China 2008, 7,1245–1252. [CrossRef]
37. Chen, Y.; Zhou, T.; Zhang, C.; Wang, K.; Liu, J.; Lu, J.; Xu, K. Rational Phosphorus Application Facilitates theSustainability of the Wheat/Maize/Soybean Relay Strip Intercropping System. PLoS ONE 2015, 10, e0141725.[CrossRef]
38. Zaki, R.N.; Radwan, T.E.E. Impact of microorganisms activity on phosphorus availability and its uptake byfaba bean plants grown on some newly reclaimed soils in Egypt. Int. J. Agric. Biol. 2006, 8, 221–225.
39. Shivay, Y.S.; Kumar, D.; Prasad, R. Relative Efficiency of Zinc Sulfate and Zinc Oxide-Coated Urea inRice-Wheat Cropping System. Commun. Soil Sci. Plant. Anal. 2008, 39, 1154–1167. [CrossRef]
40. Khan, N.H.; Raja, M.I.; Tahir, G.R. Interaction studies on nitrogen, phosphorus, and zinc application to cornunder field conditions. Pak. J. Agric. Res. 1980, 1, 119–124.
41. Nayak, A.K.; Gupta, M.L. Phosphorus, Zinc and Organic matter interaction in relation to uptake, tissueconcentration and absorption rate of Phosphorus in wheat. J. Ind. Soc. Soil Sci. 1995, 43, 633–636.
42. Verma, T.S.; Minhas, R.S. Zinc and phosphorus interaction in a wheat-maize cropping system. Fertil. Res.1987, 13, 77–86. [CrossRef]
43. Goh, T.B.; Banerjee, M.R.; Tu, S.; Burton, D.L. Vesicular arbuscular mycorrhizae-mediated uptake andtranslocation of P and Zn by wheat in a calcareous soil. Can. J. Plant Sci. 1997, 77, 339–346. [CrossRef]
44. Helfenstein, J.; Müller, I.; Grüter, R.; Bhullar, G.; Mandloi, L.; Papritz, A.; Siegrist, M.; Schulin, R.; Frossard, E.Organic Wheat Farming Improves Grain Zinc Concentration. PLoS ONE 2016, 11, e0160729. [CrossRef]
45. Ghasal, P.C.; Shivay, Y.S.; Pooniya, V.; Choudhary, M.; Verma, R.K. Zinc partitioning in basmati rice varietiesas influenced by Zn fertilization. Crop. J. 2017, 6, 136–147. [CrossRef]
46. Habib, M. Effect of foliar application of Zn and Fe on wheat yield and quality. Afr. J. Biotechnol. 2009, 8,6795–6798.
Sustainability 2020, 12, 3513 12 of 12
47. Gissel-Nielsen, G.; Jensen, A. Plant. Nutrition—Molecular Biology and Genetics: Proceedings of the SixthInternational Symposium on Genetics and Molecular Biology of Plant. Nutrition; Springer Science & BusinessMedia Press: Elsinore, Denmark, 2013; ISBN 940172685X.
48. Abbas, G.; Khan, M.Q.; Jamil, M.; Tahir, M.; Hussain, F. Nutrient uptake, growth and yield of wheat (Triticumaestivum) as affected by zinc application rates. Int. J. Agric. Biol. 2009, 11, 389–396.
49. Haldar, M.; Mandal, L.N. Effect of phosphorus and zinc on the growth and phosphorus, zinc, copper, ironand manganese nutrition of rice. Plant Soil 1981, 59, 415–425. [CrossRef]
50. Kharub, A.S.; Gupta, S.P. Quality traits in durum and aestnum wheat genotypes as influenced by Znapplication. Indian J. Agric. Res. 2003, 37, 48–51.
51. Barunawati, N.; Hettwer Giehl, R.F.; Bauer, B.; Von Wirén, N. The influence of inorganic nitrogen fertilizerforms on micronutrient retranslocation and accumulation in grains of winter wheat. Front. Plant Sci. 2013, 4,320. [CrossRef]
52. Patel, K.; Kumar, A.; Durani, S. Analysis of the structural consensus of the zinc coordination centers ofmetalloprotein structures. Biochim. Biophys. Acta-Proteins Proteom. 2007, 1774, 1247–1253. [CrossRef]
53. Gao, X.; Lukow, O.M.; Grant, C.A. Grain concentrations of protein, iron and zinc and bread making qualityin spring wheat as affected by seeding date and nitrogen fertilizer management. J. Geochem. Explor. 2012,121, 36–44. [CrossRef]
54. Ozturk, L.; Yazici, M.A.; Yucel, C.; Torun, A.; Cekic, C.; Bagci, A.; Ozkan, H.; Braun, H.; Sayers, Z.; Cakmak, I.Concentration and localization of zinc during seed development and germination in wheat. Physiol. Plant.2006, 128, 144–152. [CrossRef]
© 2020 by the authors. Licensee MDPI, Basel, Switzerland. This article is an open accessarticle distributed under the terms and conditions of the Creative Commons Attribution(CC BY) license (http://creativecommons.org/licenses/by/4.0/).