Embed Size (px)
Citation preview
* Corresponding author: S. Slouma, Université de Tunis El Manar, Ecole Nationale d'Ingénieurs de Tunis, LR11ES15 Laboratoire de Systèmes Electriques, 1002, Tunis, Tunisie, E-mail: [email protected] 1 Université de Tunis El Manar, Ecole Nationale d'Ingénieurs de Tunis, LR11ES15 Laboratoire de Systèmes
Electriques, 1002, Tunis, Tunisia 2 Université de Carthage, Ecole Nationale d'Architecture et d'Urbanisme, 2026, Sidi Bou Said, Tunisia 3Technopôle Borj Cédria, Centre de Recherche et de Technologie de l'Energie, LR10CRTEn01 Laboratoire
Photovoltaique, 2050, Tunisia 4APEARC, Dept. of Electrical Engineering, Faculty of Engineering in Aswan , South-Valley University , Egypt
Copyright © JES 2015 on-line : journal/esrgroups.org/jes
S. Slouma1,3,
*
S. Skander
Mustapha1,2
,
I. Slama
Belkhodja1,
M.Orabi4
J. Electrical Systems 11-2 (2015): 145-159
Regular paper
An improved simple Fuel Cell model for
Energy Management in residential
buildings
JES
Journal of Journal of Journal of Journal of Electrical Electrical Electrical Electrical SystemsSystemsSystemsSystems
This paper deals with a fuel cell (FC) model to be integrated into the energy management algorithm for a stand-alone residential photovoltaic (PV) power system. The FC system is added to guarantee continuous power supply taking account of the photovoltaic intermittent nature. FC models are generally relatively complex especially when they should be introduced in a complete hybrid system model. This paper investigates a simple FC model derived from the FC electrical circuit model. Analytic expression of each element of this simple circuit is established. Experimental tests are conducted to identify the model parameters. FC model is simulated using PSIM software and validated with corresponding experimental polarization curves. To verify FC model effectiveness for energy management algorithm, simulations are carried out with specific load shape and a hybrid system (FC and PV systems with storage batteries). Several scenarios are performed under various meteorological conditions and in case of non-availability generation.
Keywords: Fuel Cell model; Hybrid system; Photovoltaic; Energy management; control.
Article history: Received 10 October 2014, Received in revised form 11 January 2015, Accepted 24 April 2015
1. Introduction
Over the past years, there has been a real increase in the use of DC supply specially, for
residential applications. This is due to the increased energy saving and the improved
reliability [1], and the significant portion of the used residential load operating with DC
current, such as lighting applications, multimedia, computers and all devices operating
internally on DC.
Hence, DC power sources as photovoltaic system (PVS) directly coupled to DC loads
seem to be a reasonable solution for residential buildings. However, several factors should
be considered: First, PVS are highly depending on daily and seasonally climatic conditions
variations. In addition, a large part of domestic loads has minor coincidence with PVS
output. Furthermore, the load shape is less foreseeable due to residential appliances and
users behaviours.
In order to overcome these problems and to improve hybrid system reliability, PVS can
be associated with other alternate power sources, like fuel cell system (FCS) as described in
[1]- [4]. When there is a deficit in PV power generation, the FCS will intervene to produce
energy. In fact, associating PVS with fuel cells for residential applications leads to a non-
polluting and reliable energy source. In addition, FC systems are in their advanced
developmental stage, they present a promising electrical power source for applications such
as electric vehicles, emergency power systems and domestic devices [5]- [7]. Amongst the
various available fuel cells, Proton Exchange Membrane Fuel Cells (PEMFC) are regarded
S. SLOUMA et al: An improved simple Fuel Cell model for Energy Management...
146
as one of the most suitable for residential applications due to their low operating
temperature, high efficiency, quick response, and zero emission of gases [5]- [7].
Different FCS models are reported in literature [8]- [12]. These models are relatively
complex due to the FC non-linear electrochemical and mechanical characteristics [8]- [10].
These complexities are especially due to the analytic equations related to each of membrane
resistance equation and activation voltage drop. For example, in [1], [10] , the membrane
resistance equation contains a relatively complicated resistivity numeric expression. In the
same way in [9], [10], [11], [13] , the activation voltage drop is calculated by a relatively
complex expression using parametric coefficients. Those coefficients are also themselves
based on theoretical equations, including a complex term of oxygen concentration.
In this paper, authors focus on the design of a simple FC model, to be used for the stand-
alone residential energy management system. The overall power management strategy is
designed to ensure continuous supply whatever specific residential load shape and
meteorological conditions fluctuations. The developed FC model is integrated in a whole
hybrid system and validated experimentally.
This paper is organized as follows: firstly a description of the overall system is
completed; then, model and detailed control process of each component are performed.
Simulations are carried out to verify the effectiveness of the proposed system. Next,
experimental validation of FC model is presented. Finally a power management algorithm
for the residential application and a hybrid system (FC and PV systems with storage
batteries) is achieved using the developed FC model. Several scenarios are performed under
various meteorological conditions and in case of non-availability generation.
2. System description and modelling
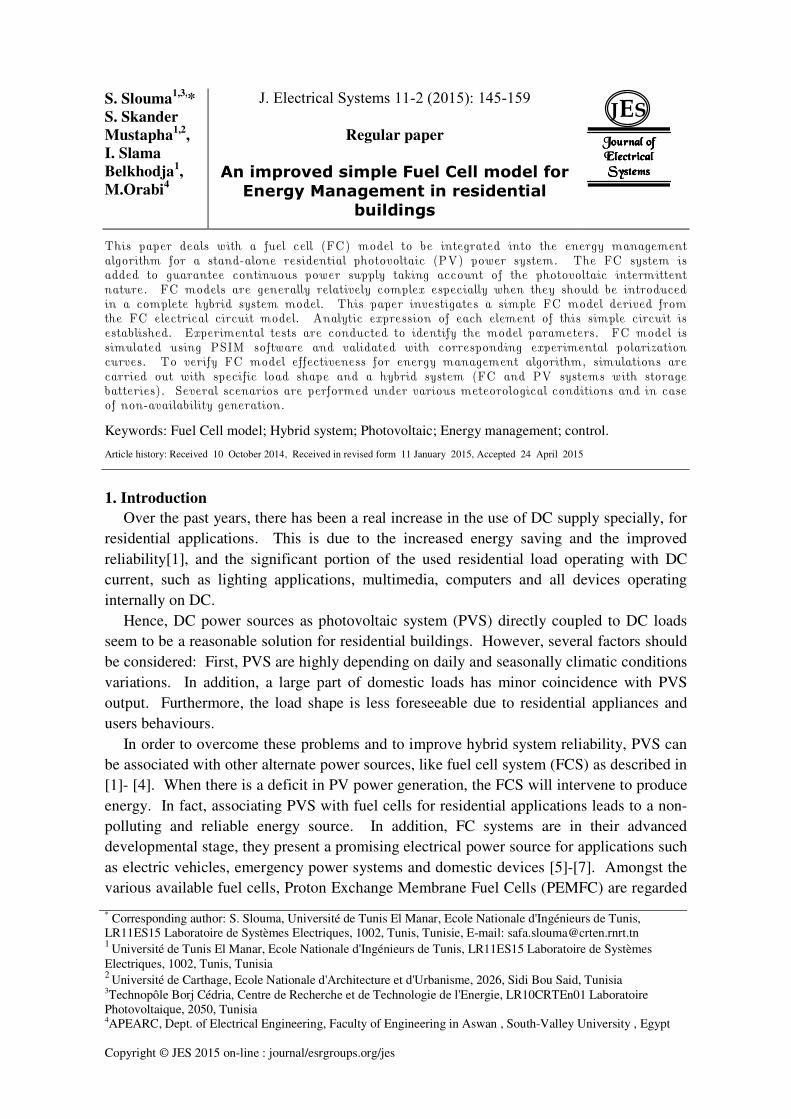
The proposed hybrid system (Fig. 1) is composed of PVS associated to a FCS supplied by a
hydrogen storage tanks. A supplementary battery storage system is introduced.
Fig. 1.Overall hybrid system.
J. Electrical Systems 11-2 (2015): 145-159
147
A supervision unit including the energy management algorithm is performed to achieve
continuous supply of load demand. Each component is detailed as follows:
2.1. Photovoltaic system
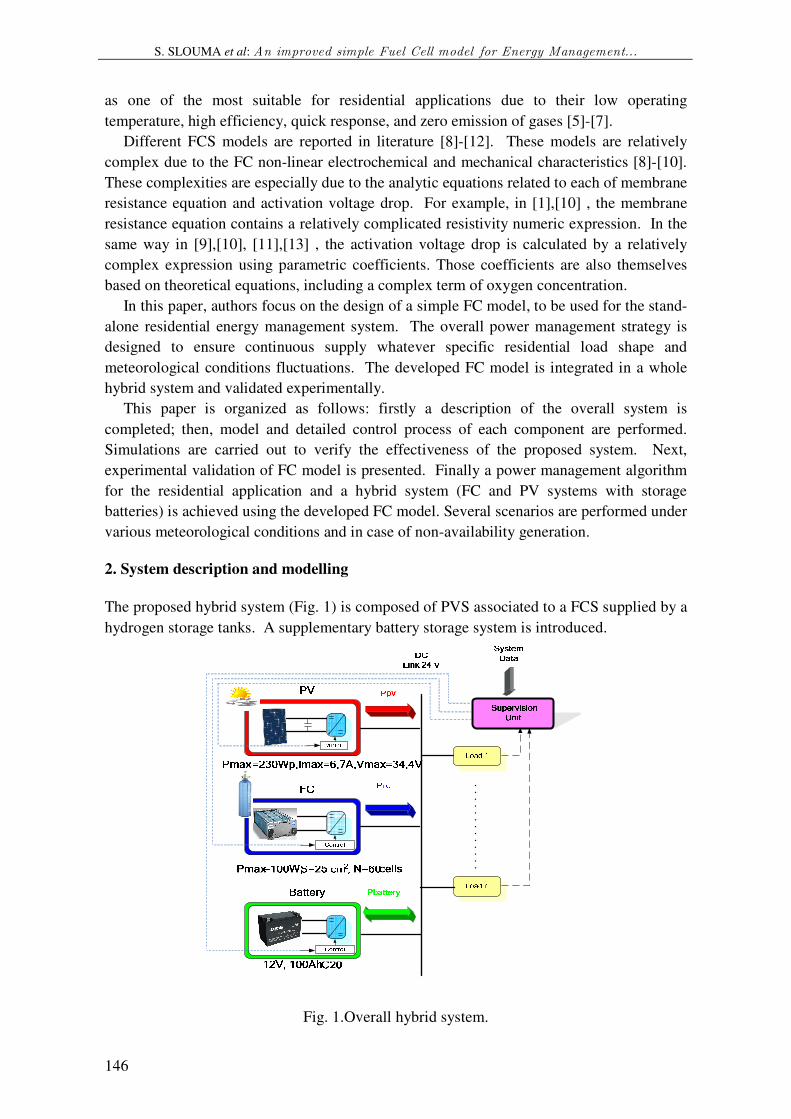
The system incorporates a photovoltaic array delivering 230Wp associated to a buck
converter (Fig. 2). The PV output characteristic depends on the temperature (T) and the
solar radiation (G) [14]. For these nonlinear PV characteristics, it is necessary to design a
Maximum Power Point Tacking (MPPT).
2.1.1. Buck converter sizing
Before integrating MPPT controller, it is essential to properly size the capacitors (Cpv, Cout)
and the inductor (Lpv) as shown in Fig. 2 [15].
The converter components sizing (Cout, Lpv) are based on the following criteria [15]:
- The ripple output current (∆) must be bigger than 1% of the inductance current (IL).
- The ripple output voltage (∆) is required of about 1% of the output voltage ().
Thus Lpv and Cpv are written as follows:
( )1pv
pv
L
D D VL
f I
−=
∆ ( 1)
( )2
1
8
pv
out
pv bus
D D VC
f L V∆
−= ( 2)
Where f is the pulse width modulation (PWM) frequency equal to 10 kHz, D is the buck
converter duty cycle equal to / and is the PV output voltage.
Taking account of the ripple PV output voltage to be less than 2% of its average value, the
input capacitor value Cpv can be calculated by the following equation [15]:
( )1
0.02
s
pv
pv
D D IC
V f
−= ( 3)
Where I is the converter output current.
On the basis of the previous conditions and equations, inductance and capacities values are
as follows:
Lpv = 330µH, Cpv= 400µF and Cout=50 µF.
Vpv
Cpv
IpvBuck converter
Vpv
IsIL
Fig. 2. PVS connected to a dc–dc converter.
S. SLOUMA et al: An improved simple Fuel Cell model for Energy Management...
148
2.1.2. MPPT control
The MPPT controller allows the buck converter to track the maximum power as quickly
as possible, irrespective of solar radiation.
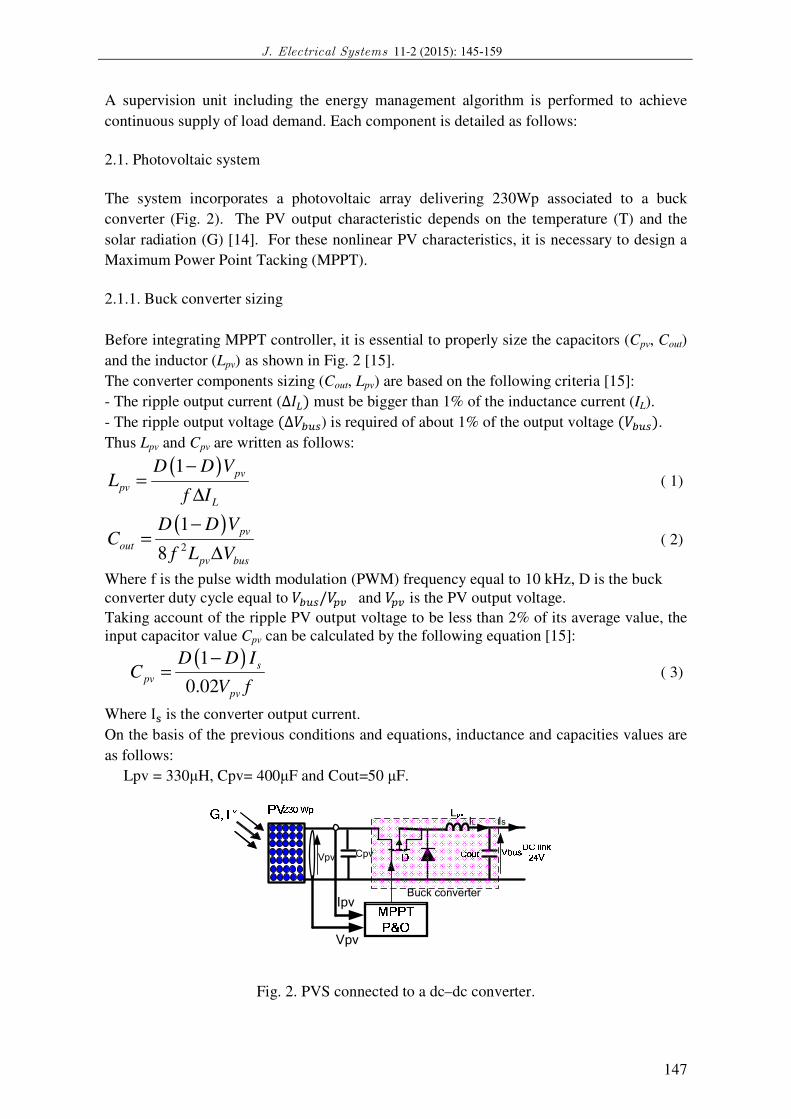
Several techniques of MPPT have been considered in PV power applications. The
Perturbation and Observation (P&O) method is adopted for its simplicity and its fast
response time as shown in Fig. 3 [11], [14], [15], [16] .
Fig. 3. Perturbation and Observation algorithm flowchart.
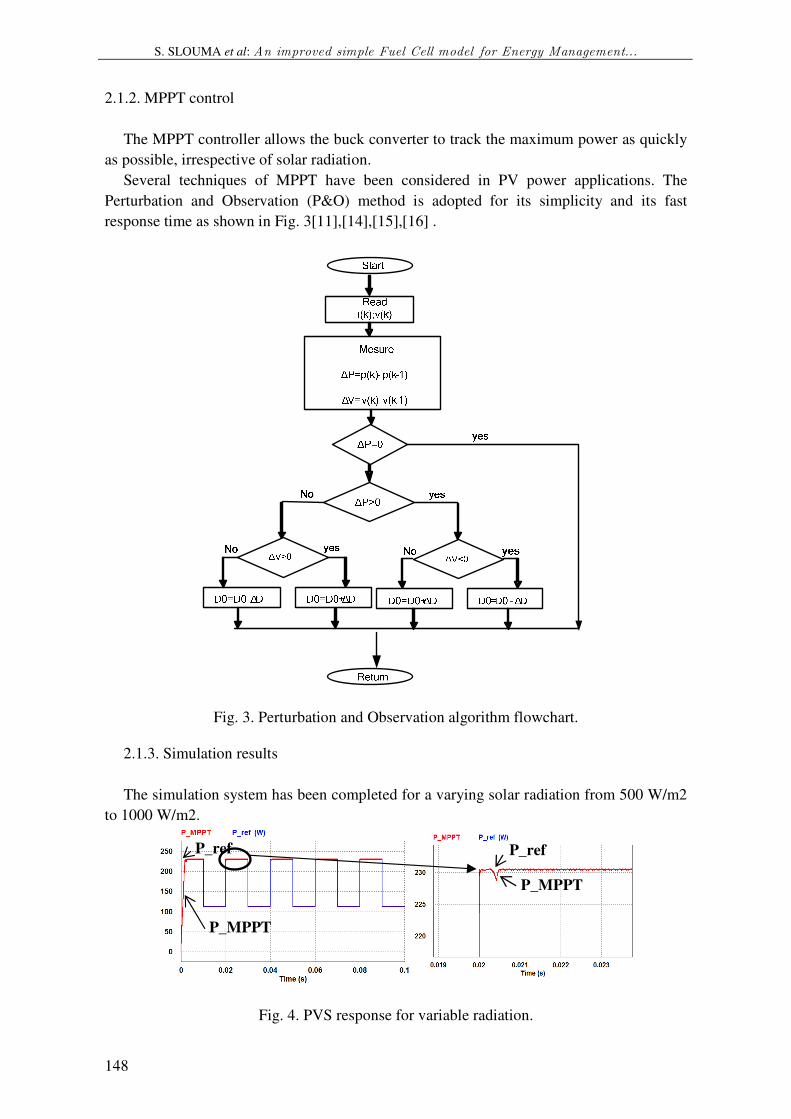
2.1.3. Simulation results
The simulation system has been completed for a varying solar radiation from 500 W/m2
to 1000 W/m2.
Fig. 4. PVS response for variable radiation.
P_ref
P_MPPT
P_MPPT
P_ref
J. Electrical Systems 11-2 (2015): 145-159
149
Erreur ! Source du renvoi introuvable. 4 shows the power output curve of the P&O-
MPPT compared to the reference power P_ref. These results confirm the performance and
the robustness of the P&O algorithm to radiation variations: Power follows the reference
value (P_ref) with fast response time (0.5ms).
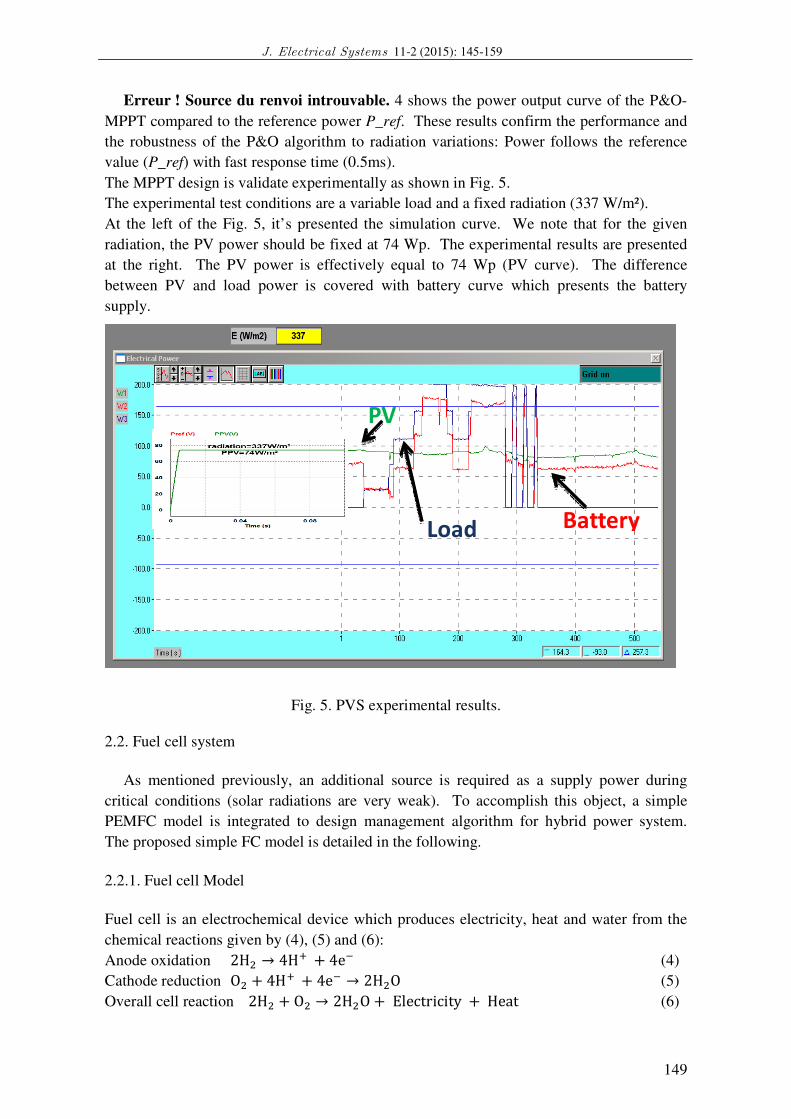
The MPPT design is validate experimentally as shown in Fig. 5.
The experimental test conditions are a variable load and a fixed radiation (337 W/m²).
At the left of the Fig. 5, it’s presented the simulation curve. We note that for the given
radiation, the PV power should be fixed at 74 Wp. The experimental results are presented
at the right. The PV power is effectively equal to 74 Wp (PV curve). The difference
between PV and load power is covered with battery curve which presents the battery
supply.
Fig. 5. PVS experimental results.
2.2. Fuel cell system
As mentioned previously, an additional source is required as a supply power during
critical conditions (solar radiations are very weak). To accomplish this object, a simple
PEMFC model is integrated to design management algorithm for hybrid power system.
The proposed simple FC model is detailed in the following.
2.2.1. Fuel cell Model
Fuel cell is an electrochemical device which produces electricity, heat and water from the
chemical reactions given by (4), (5) and (6):
Anode oxidation 2H 4H 4e (4)
Cathode reduction O 4H 4e 2HO (5)
Overall cell reaction 2H O 2HO Electricity Heat (6)
PV
Battery Load
S. SLOUMA et al: An improved simple Fuel Cell model for Energy Management...
150
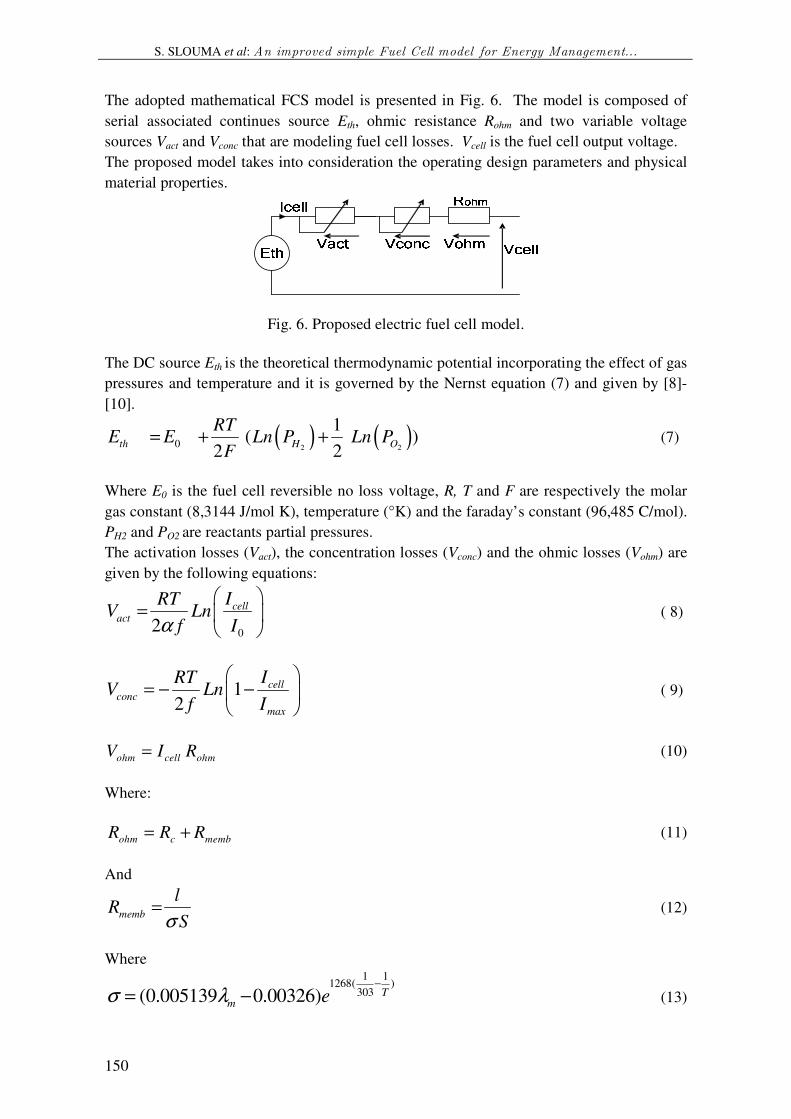
The adopted mathematical FCS model is presented in Fig. 6. The model is composed of
serial associated continues source Eth, ohmic resistance Rohm and two variable voltage
sources Vact and Vconc that are modeling fuel cell losses. Vcell is the fuel cell output voltage.
The proposed model takes into consideration the operating design parameters and physical
material properties.
Fig. 6. Proposed electric fuel cell model.
The DC source Eth is the theoretical thermodynamic potential incorporating the effect of gas
pressures and temperature and it is governed by the Nernst equation (7) and given by [8]-
[10].
( ) ( )2 2 0
1 ( )
2 2th H O
RTE E Ln P Ln P
F= + + (7)
Where E0 is the fuel cell reversible no loss voltage, R, T and F are respectively the molar
gas constant (8,3144 J/mol K), temperature (°K) and the faraday’s constant (96,485 C/mol).
PH2 and PO2 are reactants partial pressures.
The activation losses (Vact), the concentration losses (Vconc) and the ohmic losses (Vohm) are
given by the following equations:
0
2
cellact
IRTV Ln
f Iα
=
( 8)
12
cellconc
max
IRTV Ln
f I
= − −
( 9)
ohm cell ohmV I R= (10)
Where:
ohm c membR R R= + (11)
And
memb
lR
Sσ= (12)
Where 1 1
1268( )303(0.005139 0.00326) T
m eσ λ−
= − (13)
J. Electrical Systems 11-2 (2015): 145-159
151
where α is the transfer coefficient, Icell the current, I0 the exchange current, Imax the limit
current, Rmemb the resistance of the membrane, Rc the contact resistance, l the membrane
thickness and S the fuel cell area.
Also, the Nafion 117 conductivity σ is presented in (13), where λm the hydration level
considered as constant and the membrane resistance is given by (12).
The different parameters of the proposed model (I0, Imax, Rc, E0, α) are extracted from
experimental measurements detailed in 2.2.3.
The cell voltage output (Vcell) is presented by:
cell th conc act ohmV E V V V= − − − (14)
The global FC is composed of N cells, thus Vfc is given as follows:
( )fc th conc act ohmV N E V V V= − − − (15)
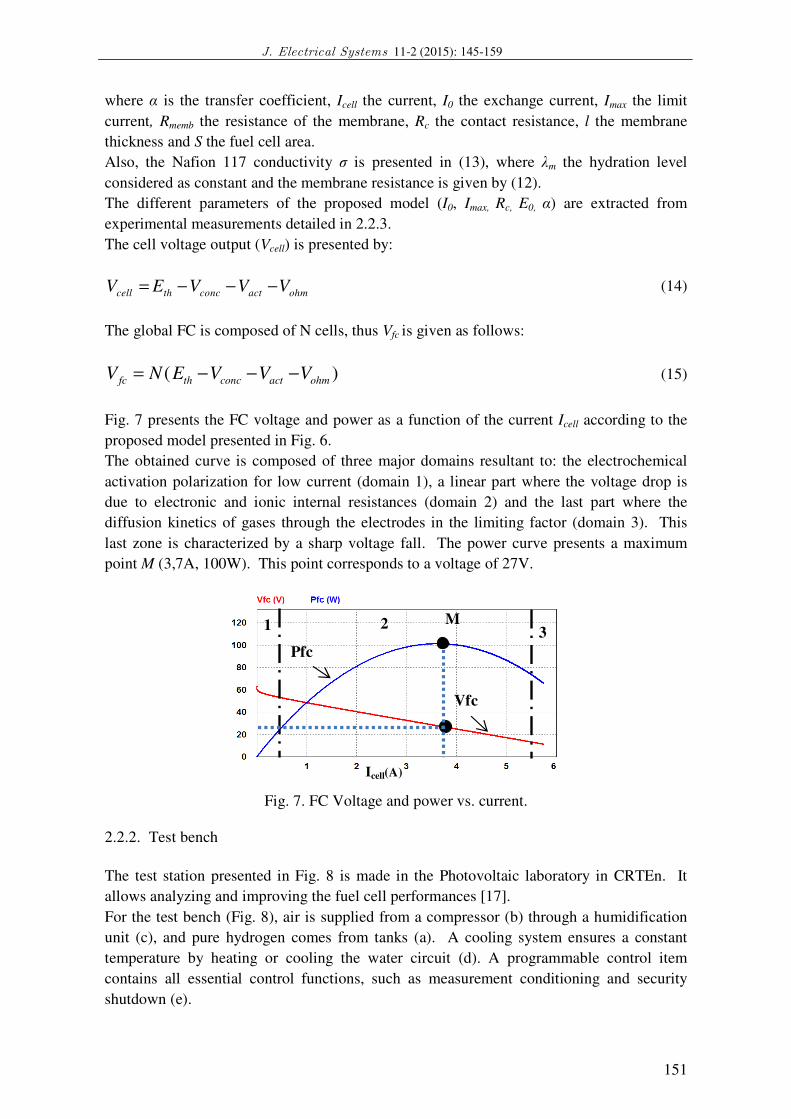
Fig. 7 presents the FC voltage and power as a function of the current Icell according to the
proposed model presented in Fig. 6.
The obtained curve is composed of three major domains resultant to: the electrochemical
activation polarization for low current (domain 1), a linear part where the voltage drop is
due to electronic and ionic internal resistances (domain 2) and the last part where the
diffusion kinetics of gases through the electrodes in the limiting factor (domain 3). This
last zone is characterized by a sharp voltage fall. The power curve presents a maximum
point M (3,7A, 100W). This point corresponds to a voltage of 27V.
Fig. 7. FC Voltage and power vs. current.
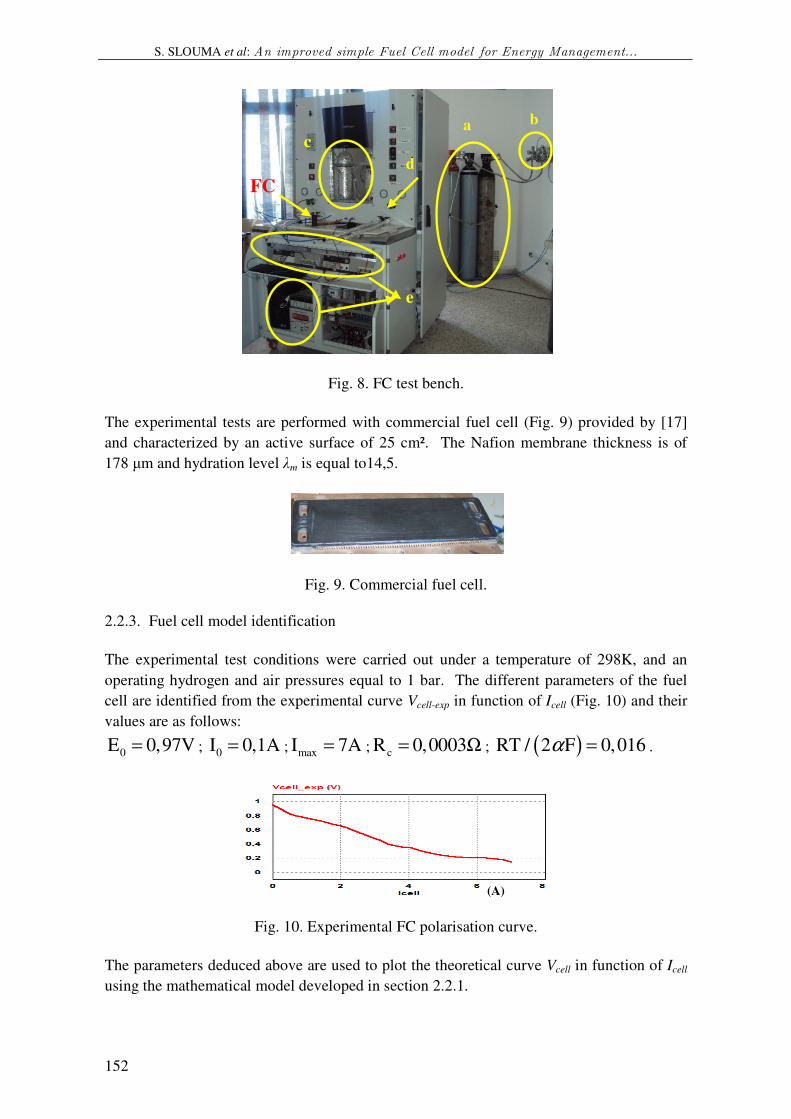
2.2.2. Test bench
The test station presented in Fig. 8 is made in the Photovoltaic laboratory in CRTEn. It
allows analyzing and improving the fuel cell performances [17].
For the test bench (Fig. 8), air is supplied from a compressor (b) through a humidification
unit (c), and pure hydrogen comes from tanks (a). A cooling system ensures a constant
temperature by heating or cooling the water circuit (d). A programmable control item
contains all essential control functions, such as measurement conditioning and security
shutdown (e).
1 2 3
M
Icell(A)
Pfc
Vfc
S. SLOUMA et al: An improved simple Fuel Cell model for Energy Management...
152
Fig. 8. FC test bench.
The experimental tests are performed with commercial fuel cell (Fig. 9) provided by [17]
and characterized by an active surface of 25 cm². The Nafion membrane thickness is of
178 µm and hydration level λm is equal to14,5.
Fig. 9. Commercial fuel cell.
2.2.3. Fuel cell model identification
The experimental test conditions were carried out under a temperature of 298K, and an
operating hydrogen and air pressures equal to 1 bar. The different parameters of the fuel
cell are identified from the experimental curve Vcell-exp in function of Icell (Fig. 10) and their
values are as follows:
0E 0,97V= ; 0I 0,1A= ; maxI 7A= ; cR 0,0003= Ω ; ( )RT / 2 F 0,016α = .
Fig. 10. Experimental FC polarisation curve.
The parameters deduced above are used to plot the theoretical curve Vcell in function of Icell
using the mathematical model developed in section 2.2.1.
a b
FC
d
e
c
(A)
J. Electrical Systems 11-2 (2015): 145-159
153
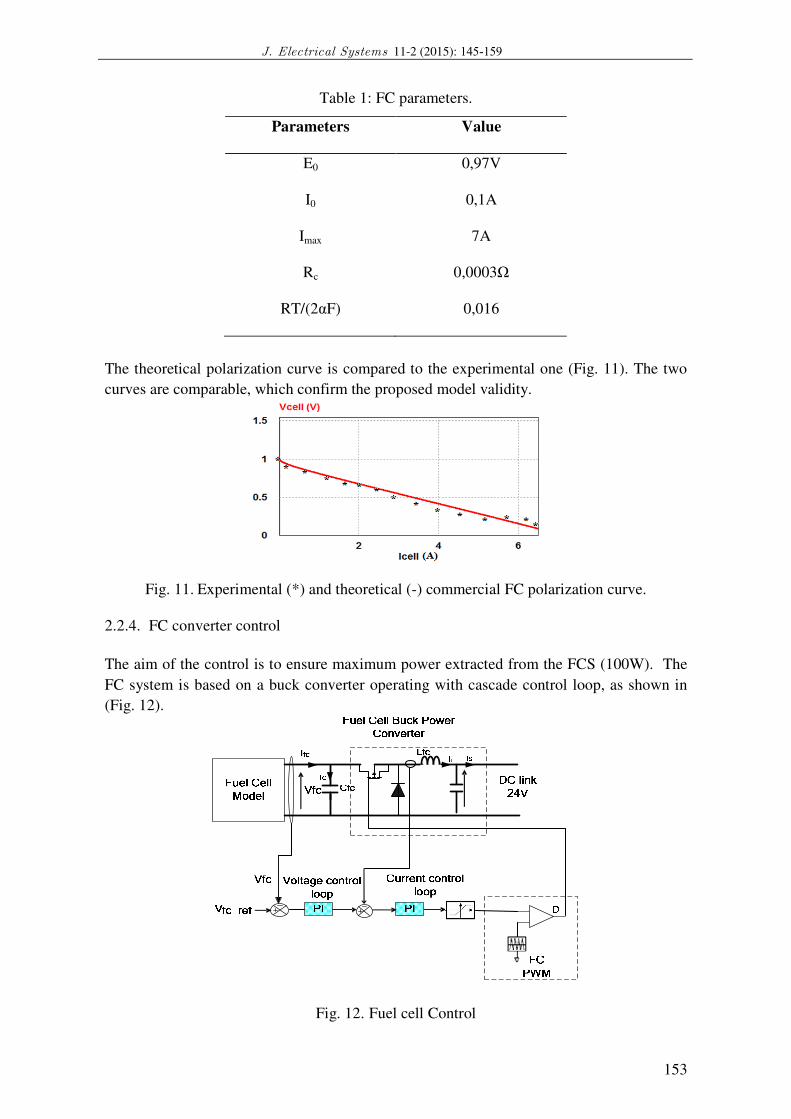
Table 1: FC parameters.
Parameters Value
E0 0,97V
I0 0,1A
Imax 7A
Rc 0,0003Ω
RT/(2αF) 0,016
The theoretical polarization curve is compared to the experimental one (Fig. 11). The two
curves are comparable, which confirm the proposed model validity.
Fig. 11. Experimental (*) and theoretical (-) commercial FC polarization curve.
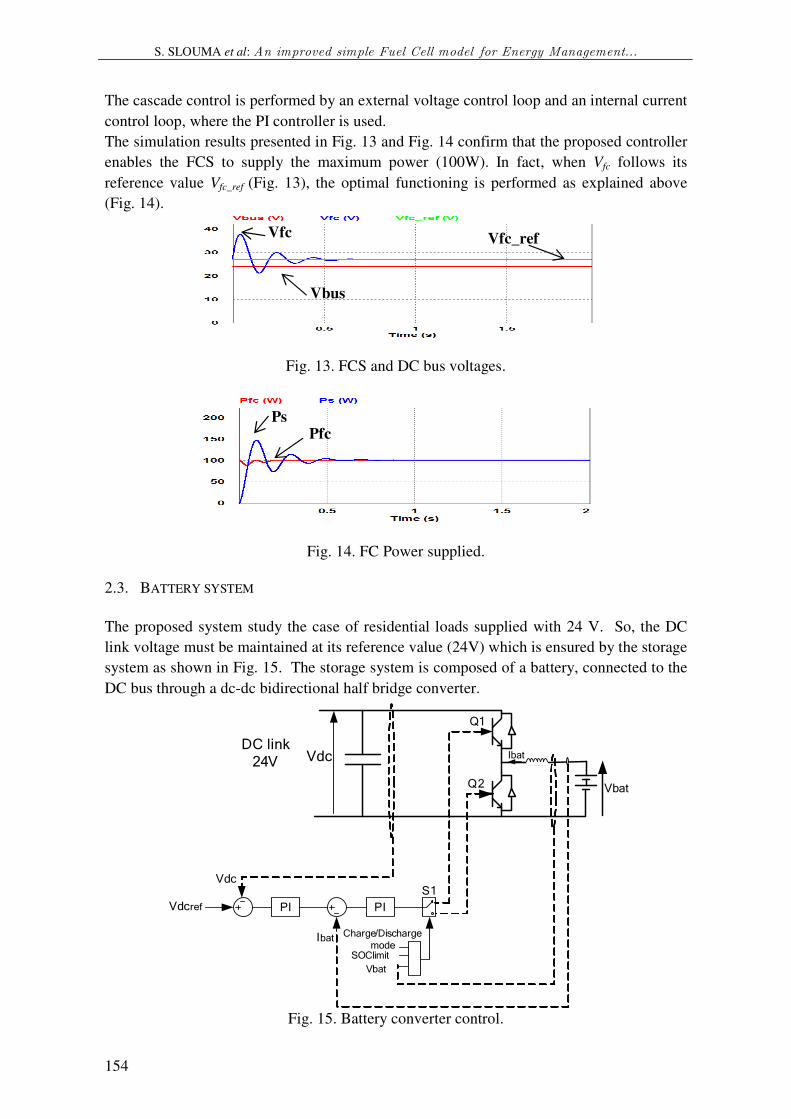
2.2.4. FC converter control
The aim of the control is to ensure maximum power extracted from the FCS (100W). The
FC system is based on a buck converter operating with cascade control loop, as shown in
(Fig. 12).
Fig. 12. Fuel cell Control
S. SLOUMA et al: An improved simple Fuel Cell model for Energy Management...
154
The cascade control is performed by an external voltage control loop and an internal current
control loop, where the PI controller is used.
The simulation results presented in Fig. 13 and Fig. 14 confirm that the proposed controller
enables the FCS to supply the maximum power (100W). In fact, when Vfc follows its
reference value Vfc_ref (Fig. 13), the optimal functioning is performed as explained above
(Fig. 14).
Fig. 13. FCS and DC bus voltages.
Fig. 14. FC Power supplied.
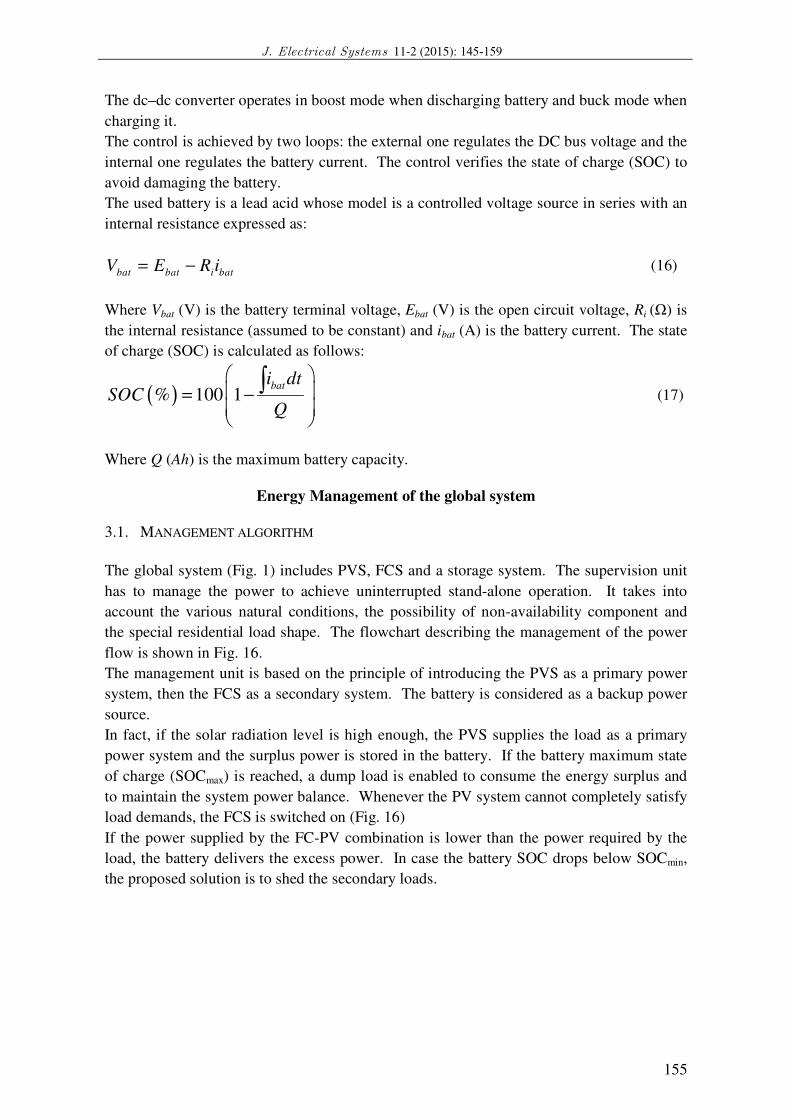
2.3. BATTERY SYSTEM
The proposed system study the case of residential loads supplied with 24 V. So, the DC
link voltage must be maintained at its reference value (24V) which is ensured by the storage
system as shown in Fig. 15. The storage system is composed of a battery, connected to the
DC bus through a dc-dc bidirectional half bridge converter.
PI PI
Charge/Discharge mode
Vdcref
Vdc
Ibat
Q1
Q2
IbatVdc
Vbat
S1
SOClimit
DC link 24V
Vbat
Fig. 15. Battery converter control.
Pfc Ps
Vfc
Vbus
Vfc_ref
J. Electrical Systems 11-2 (2015): 145-159
155
The dc–dc converter operates in boost mode when discharging battery and buck mode when
charging it.
The control is achieved by two loops: the external one regulates the DC bus voltage and the
internal one regulates the battery current. The control verifies the state of charge (SOC) to
avoid damaging the battery.
The used battery is a lead acid whose model is a controlled voltage source in series with an
internal resistance expressed as:
bat bat i batV E R i= − (16)
Where Vbat (V) is the battery terminal voltage, Ebat (V) is the open circuit voltage, Ri (Ω) is
the internal resistance (assumed to be constant) and ibat (A) is the battery current. The state
of charge (SOC) is calculated as follows:
( )% 100 1bati dt
SOCQ
= −
∫ (17)
Where Q (Ah) is the maximum battery capacity.
Energy Management of the global system
3.1. MANAGEMENT ALGORITHM
The global system (Fig. 1) includes PVS, FCS and a storage system. The supervision unit
has to manage the power to achieve uninterrupted stand-alone operation. It takes into
account the various natural conditions, the possibility of non-availability component and
the special residential load shape. The flowchart describing the management of the power
flow is shown in Fig. 16.
The management unit is based on the principle of introducing the PVS as a primary power
system, then the FCS as a secondary system. The battery is considered as a backup power
source.
In fact, if the solar radiation level is high enough, the PVS supplies the load as a primary
power system and the surplus power is stored in the battery. If the battery maximum state
of charge (SOCmax) is reached, a dump load is enabled to consume the energy surplus and
to maintain the system power balance. Whenever the PV system cannot completely satisfy
load demands, the FCS is switched on (Fig. 16)
If the power supplied by the FC-PV combination is lower than the power required by the
load, the battery delivers the excess power. In case the battery SOC drops below SOCmin,
the proposed solution is to shed the secondary loads.
S. SLOUMA et al: An improved simple Fuel Cell model for Energy Management...
156
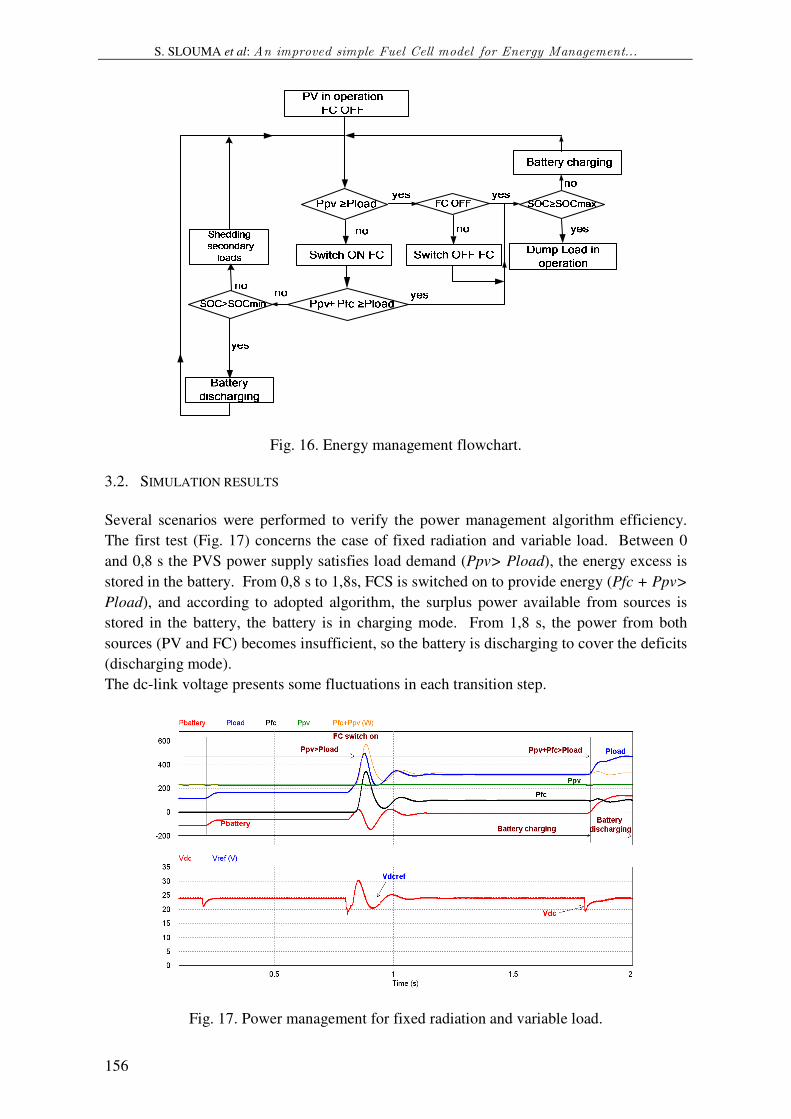
Fig. 16. Energy management flowchart.
3.2. SIMULATION RESULTS
Several scenarios were performed to verify the power management algorithm efficiency.
The first test (Fig. 17) concerns the case of fixed radiation and variable load. Between 0
and 0,8 s the PVS power supply satisfies load demand (Ppv> Pload), the energy excess is
stored in the battery. From 0,8 s to 1,8s, FCS is switched on to provide energy (Pfc + Ppv>
Pload), and according to adopted algorithm, the surplus power available from sources is
stored in the battery, the battery is in charging mode. From 1,8 s, the power from both
sources (PV and FC) becomes insufficient, so the battery is discharging to cover the deficits
(discharging mode).
The dc-link voltage presents some fluctuations in each transition step.
Fig. 17. Power management for fixed radiation and variable load.
J. Electrical Systems 11-2 (2015): 145-159
157
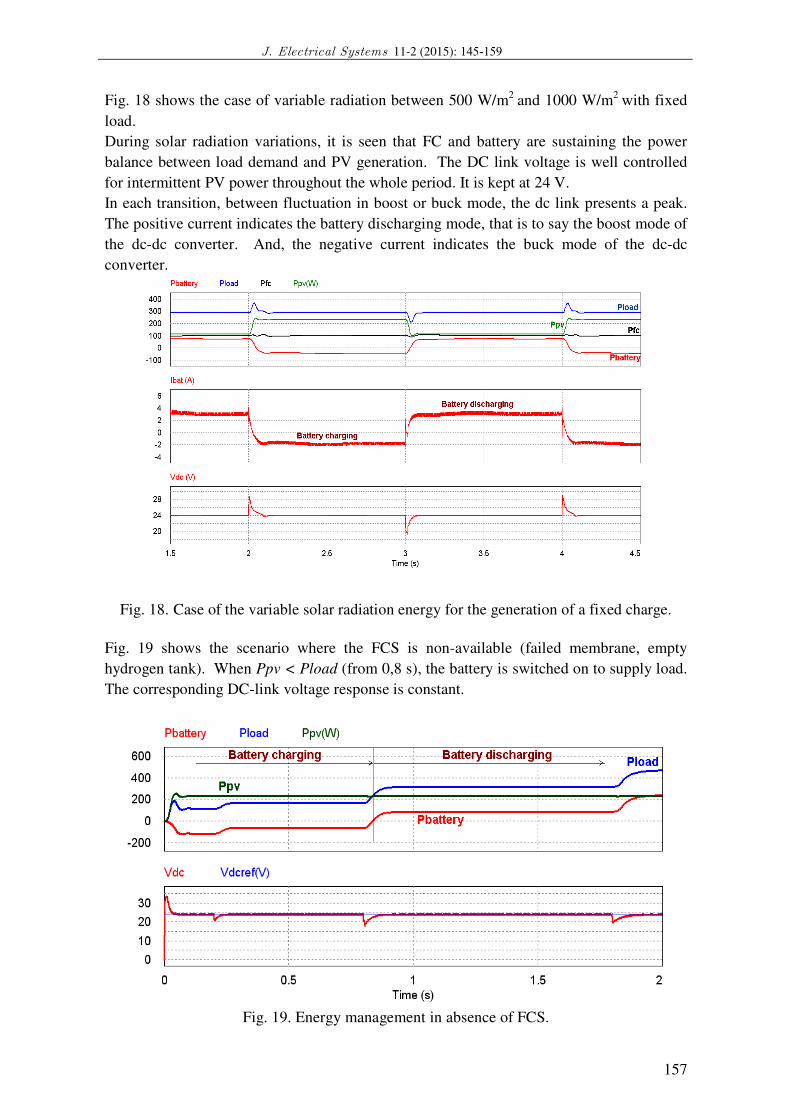
Fig. 18 shows the case of variable radiation between 500 W/m2
and 1000 W/m2
with fixed
load.
During solar radiation variations, it is seen that FC and battery are sustaining the power
balance between load demand and PV generation. The DC link voltage is well controlled
for intermittent PV power throughout the whole period. It is kept at 24 V.
In each transition, between fluctuation in boost or buck mode, the dc link presents a peak.
The positive current indicates the battery discharging mode, that is to say the boost mode of
the dc-dc converter. And, the negative current indicates the buck mode of the dc-dc
converter.
Fig. 18. Case of the variable solar radiation energy for the generation of a fixed charge.
Fig. 19 shows the scenario where the FCS is non-available (failed membrane, empty
hydrogen tank). When Ppv < Pload (from 0,8 s), the battery is switched on to supply load.
The corresponding DC-link voltage response is constant.
Fig. 19. Energy management in absence of FCS.
S. SLOUMA et al: An improved simple Fuel Cell model for Energy Management...
158
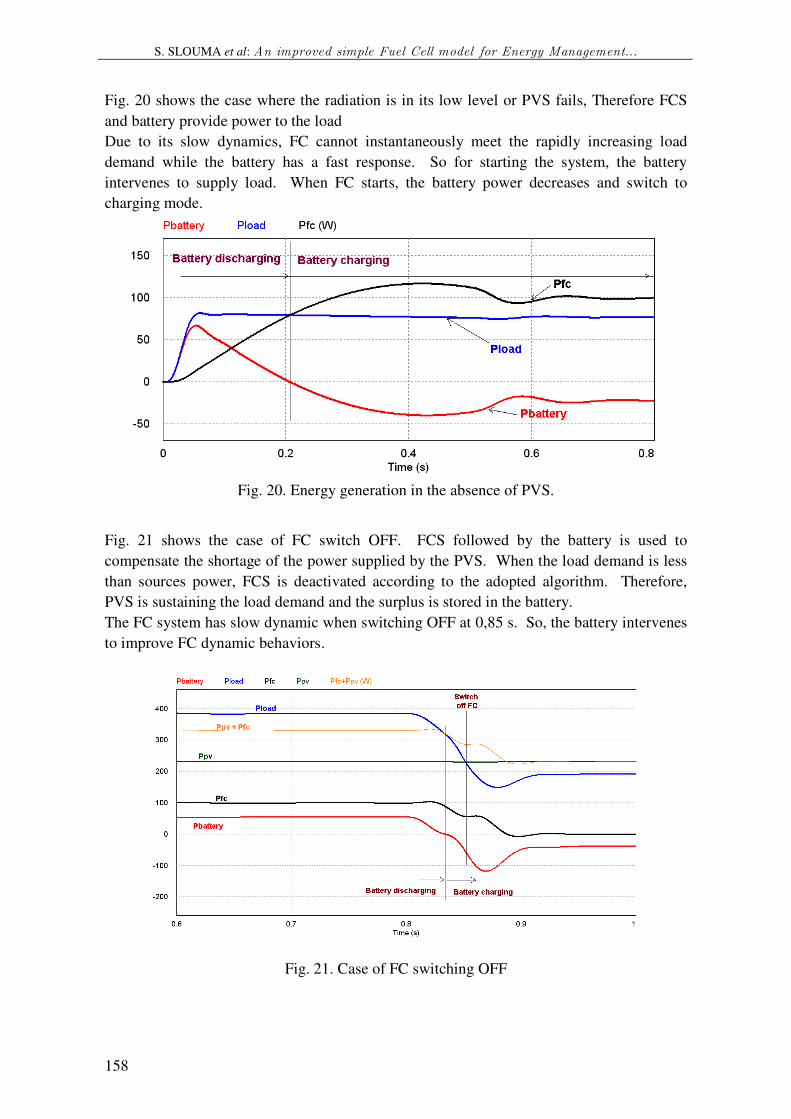
Fig. 20 shows the case where the radiation is in its low level or PVS fails, Therefore FCS
and battery provide power to the load
Due to its slow dynamics, FC cannot instantaneously meet the rapidly increasing load
demand while the battery has a fast response. So for starting the system, the battery
intervenes to supply load. When FC starts, the battery power decreases and switch to
charging mode.
Fig. 20. Energy generation in the absence of PVS.
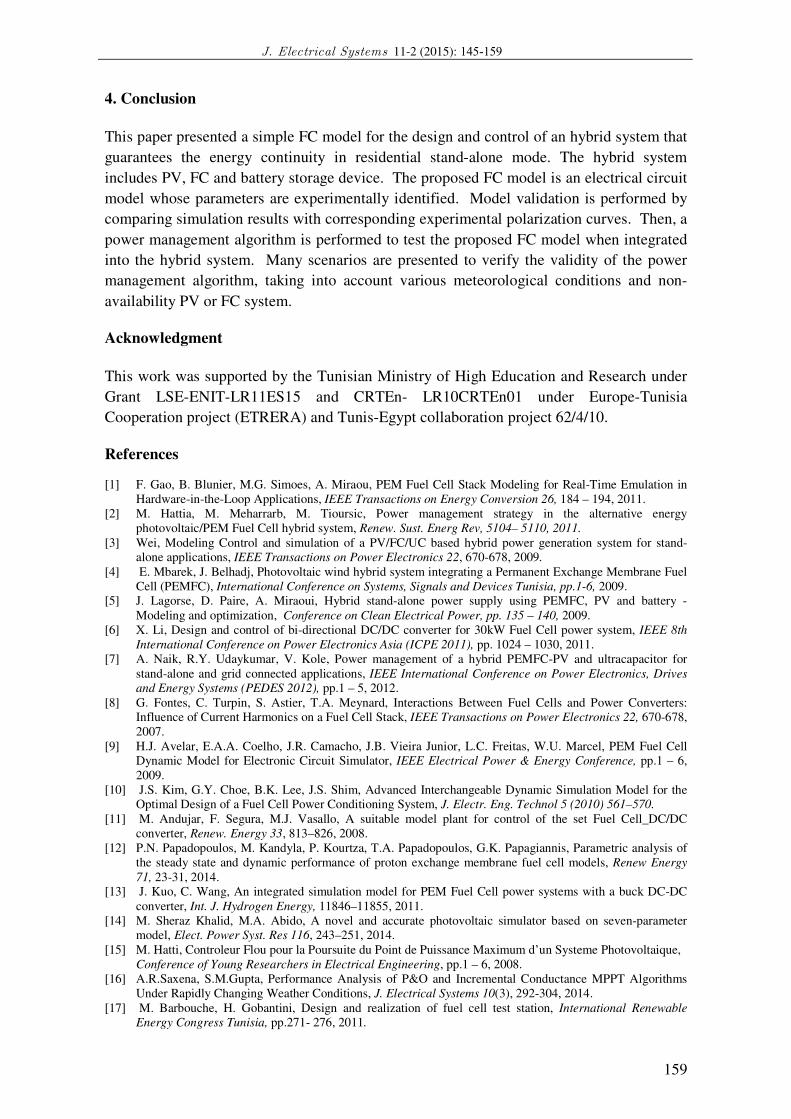
Fig. 21 shows the case of FC switch OFF. FCS followed by the battery is used to
compensate the shortage of the power supplied by the PVS. When the load demand is less
than sources power, FCS is deactivated according to the adopted algorithm. Therefore,
PVS is sustaining the load demand and the surplus is stored in the battery.
The FC system has slow dynamic when switching OFF at 0,85 s. So, the battery intervenes
to improve FC dynamic behaviors.
Fig. 21. Case of FC switching OFF
J. Electrical Systems 11-2 (2015): 145-159
159
4. Conclusion
This paper presented a simple FC model for the design and control of an hybrid system that
guarantees the energy continuity in residential stand-alone mode. The hybrid system
includes PV, FC and battery storage device. The proposed FC model is an electrical circuit
model whose parameters are experimentally identified. Model validation is performed by
comparing simulation results with corresponding experimental polarization curves. Then, a
power management algorithm is performed to test the proposed FC model when integrated
into the hybrid system. Many scenarios are presented to verify the validity of the power
management algorithm, taking into account various meteorological conditions and non-
availability PV or FC system.
Acknowledgment
This work was supported by the Tunisian Ministry of High Education and Research under
Grant LSE-ENIT-LR11ES15 and CRTEn- LR10CRTEn01 under Europe-Tunisia
Cooperation project (ETRERA) and Tunis-Egypt collaboration project 62/4/10.
References
[1] F. Gao, B. Blunier, M.G. Simoes, A. Miraou, PEM Fuel Cell Stack Modeling for Real-Time Emulation in
Hardware-in-the-Loop Applications, IEEE Transactions on Energy Conversion 26, 184 – 194, 2011.
[2] M. Hattia, M. Meharrarb, M. Tioursic, Power management strategy in the alternative energy
photovoltaic/PEM Fuel Cell hybrid system, Renew. Sust. Energ Rev, 5104– 5110, 2011.
[3] Wei, Modeling Control and simulation of a PV/FC/UC based hybrid power generation system for stand-alone applications, IEEE Transactions on Power Electronics 22, 670-678, 2009.
[4] E. Mbarek, J. Belhadj, Photovoltaic wind hybrid system integrating a Permanent Exchange Membrane Fuel
Cell (PEMFC), International Conference on Systems, Signals and Devices Tunisia, pp.1-6, 2009. [5] J. Lagorse, D. Paire, A. Miraoui, Hybrid stand-alone power supply using PEMFC, PV and battery -
Modeling and optimization, Conference on Clean Electrical Power, pp. 135 – 140, 2009.
[6] X. Li, Design and control of bi-directional DC/DC converter for 30kW Fuel Cell power system, IEEE 8th
International Conference on Power Electronics Asia (ICPE 2011), pp. 1024 – 1030, 2011.
[7] A. Naik, R.Y. Udaykumar, V. Kole, Power management of a hybrid PEMFC-PV and ultracapacitor for
stand-alone and grid connected applications, IEEE International Conference on Power Electronics, Drives
and Energy Systems (PEDES 2012), pp.1 – 5, 2012.
[8] G. Fontes, C. Turpin, S. Astier, T.A. Meynard, Interactions Between Fuel Cells and Power Converters: Influence of Current Harmonics on a Fuel Cell Stack, IEEE Transactions on Power Electronics 22, 670-678,
2007.
[9] H.J. Avelar, E.A.A. Coelho, J.R. Camacho, J.B. Vieira Junior, L.C. Freitas, W.U. Marcel, PEM Fuel Cell Dynamic Model for Electronic Circuit Simulator, IEEE Electrical Power & Energy Conference, pp.1 – 6,
2009.
[10] J.S. Kim, G.Y. Choe, B.K. Lee, J.S. Shim, Advanced Interchangeable Dynamic Simulation Model for the Optimal Design of a Fuel Cell Power Conditioning System, J. Electr. Eng. Technol 5 (2010) 561–570.
[11] M. Andujar, F. Segura, M.J. Vasallo, A suitable model plant for control of the set Fuel Cell_DC/DC
converter, Renew. Energy 33, 813–826, 2008.
[12] P.N. Papadopoulos, M. Kandyla, P. Kourtza, T.A. Papadopoulos, G.K. Papagiannis, Parametric analysis of
the steady state and dynamic performance of proton exchange membrane fuel cell models, Renew Energy
71, 23-31, 2014. [13] J. Kuo, C. Wang, An integrated simulation model for PEM Fuel Cell power systems with a buck DC-DC
converter, Int. J. Hydrogen Energy, 11846–11855, 2011.
[14] M. Sheraz Khalid, M.A. Abido, A novel and accurate photovoltaic simulator based on seven-parameter model, Elect. Power Syst. Res 116, 243–251, 2014.
[15] M. Hatti, Controleur Flou pour la Poursuite du Point de Puissance Maximum d’un Systeme Photovoltaique,
Conference of Young Researchers in Electrical Engineering, pp.1 – 6, 2008.
[16] A.R.Saxena, S.M.Gupta, Performance Analysis of P&O and Incremental Conductance MPPT Algorithms
Under Rapidly Changing Weather Conditions, J. Electrical Systems 10(3), 292-304, 2014.
[17] M. Barbouche, H. Gobantini, Design and realization of fuel cell test station, International Renewable
Energy Congress Tunisia, pp.271- 276, 2011.