Embed Size (px)
Citation preview
Nat ional Environment CommissionRoyal Government of Bhutan
Kingdom of Bhutan
Second Nat ional Communicat ionto the UNFCCC
༄ ། །དཔལ་ལ ན་འབ ག་པ་ཕ གས་ལས་ར
མ་ར ལ།།
༄ །
།ར ལ་ཡ
ངས་མཐའ་འཁ ར་གནས་ས ངས་ལ ན་ཚ གས།
N
ational Environment Commissio
n
Kingdom of Bhutan - Second N
at ional Com
municat
ion to the UN
FCCC
Nat ional Environment CommissionRoyal Government of Bhutan
P.O. Box 466, Thimphu, Bhutanwww.nec.gov.bt
ISBN : 978-99936-865-0-7
༄ །
།ར ལ་ཡ
ངས་མཐའ་འཁ ར་གནས་ས ངས་ལ ན་ཚ གས།
N
ational Environment Commissio
n

Kingdom of Bhutan
Second National Communication
to the UNFCCC
National Environment CommissionRoyal Government of Bhutan
This report is the Second National Communication from the Kingdom of Bhutan to the United Nations Framework Convention on Climate Change (UNFCCC).The report was prepared as an Enabling Activity funded by the Global Environment Facility through UNDP-Bhutan. A soft copy of this report and other supporting documents are available online at www.nec.gov.bt/climate/snc/
༄ ། །དཔལ་ལ ན་འབ ག་པ་ཕ གས་ལས་ར
མ་ར ལ།།
༄ །
།ར ལ་ཡ
ངས་མཐའ་འཁ ར་གནས་ས ངས་ལ ན་ཚ གས།
N
ational Environment Commissio
n
Second National Communication from Bhutan to the UNFCCC
Coordinated and Edited by:Thinley Namgyel, SNC Coordinator, EMD, NECSSonam Dagay,CCU, EMD, NECSTshering Tashi, EMD, NECS Sonam Lhaden Khandu, CCU, EMD, NECSKarma Tshering, PCS, NECS
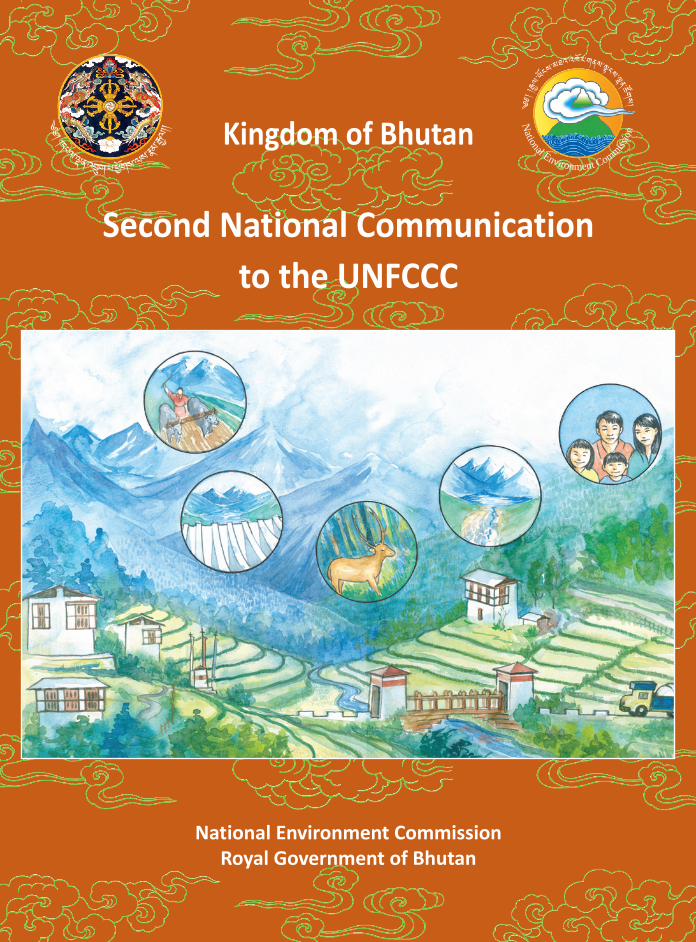
Cover Illustration:Rajesh, VAST Bhutan
Published by:National Environment CommissionRoyal Government of BhutanPO Box 466, Thimphu, BHUTANTel: +975-2-323384/324323 Fax: +975-2-323385www.nec.gov.bt
ISBN #: 978-99936-865-0-7
Thimphu, BHUTAN, November 2011
© National Environment Commission
Printed @ Phama Printers and Publishers
The publication may be reproduced in whole or part in any form for education and non-profit use without permission from the copyright holder, provided acknowledgement of the source is made
ContentsGlossary of Acronyms ............................................................................................................................. 1
Executive Summary ................................................................................................................................ 5
Chapter1: National Circumstances ....................................................................................................... 13
1.1 Geographic profile ...................................................................................................................... 15
1.2 Climate ....................................................................................................................................... 15
1.3 Biodiversity ................................................................................................................................. 15
1.4 Demography ............................................................................................................................... 17
1.5 Socio-economy ........................................................................................................................... 18
1.6 Governance ................................................................................................................................ 20
1.7 National Coordination Mechanism on Climate Change .............................................................. 21
Chapter 2: National Greenhouse Gas Inventory ................................................................................... 23
2.1 Introduction ................................................................................................................................ 25
2.2 Methodology .............................................................................................................................. 25
2.3 Total GHG Emissions ................................................................................................................... 25
2.4 GHG Emission Trends.................................................................................................................. 26
2.5 Energy ......................................................................................................................................... 27
2.6 Industrial Processes and Other Product Use .............................................................................. 28
2.7 Agriculture .................................................................................................................................. 29
2.8 Land-Use Change and Forestry ................................................................................................... 30
2.9 Waste .......................................................................................................................................... 30
2.10 Emissions of PFCs, HFCs, and SF6 .............................................................................................. 31
2.11 Uncertainty Assessment ........................................................................................................... 31
Chapter 3: Mitigation Measures ........................................................................................................... 35
3.1 Introduction ................................................................................................................................ 37
3.2 Current Mitigation measures ...................................................................................................... 37
3.3 Energy ......................................................................................................................................... 40
3.4 Industrial Processes .................................................................................................................... 51
3.5 Agriculture .................................................................................................................................. 53
3.6 Land Use Change and Forestry ................................................................................................... 59
3.7 Waste Management ................................................................................................................... 62
3.8 Priorities for International Support in Mitigation ....................................................................... 63
Chapter 4: Vulnerability and Adaptation .............................................................................................. 65
4.1 Introduction ................................................................................................................................ 67
4.2 Climate Baseline and Scenarios .................................................................................................. 67
4.3 Water Resources ......................................................................................................................... 78
4.4 Agriculture .................................................................................................................................. 80
4.5. Forests and Biodiversity............................................................................................................. 84
4.6 Energy (Hydropower) ................................................................................................................. 91
4.7 Human Health ............................................................................................................................ 96
4.8 Glaciers and GLOFs ..................................................................................................................... 99
4.9 Cross-cutting Issues .................................................................................................................. 105
4.10 Adaptation Plan ...................................................................................................................... 106
Chapter 5: Other Information ............................................................................................................. 125
5.1 Climate Change Awareness ...................................................................................................... 127
5.2 Education and Capacity Building for Climate Change ...............................................................128
5.3 Technology Needs Assessment ................................................................................................. 129
5.4 Recommendations to improve Climate Change Actions in Bhutan ..........................................129
Annexures ........................................................................................................................................... 133
Annex I: Climate Change Committees, Task Forces & Workshop Participants................................135
Annex II: References ....................................................................................................................... 145
As a small least developed and land locked country in the Eastern Himalayas, Bhutan already faces signifi cant challenges for development but climate change threaten the achievements in development made thus far. Recognising the seriousness of such challenges, Bhutan has committ ed to taking all necessary measures to address climate change. In 2009 at COP 15, the Royal Government delivered a declarati on ti tled, “Declarati on of the Kingdom of Bhutan- The Land of Gross Nati onal Happiness to Save our Planet” wherein we committ ed to “keep absorbing more carbon than we emit – and to maintain our country’s status as a net sink for Green House Gases”.
While adaptati on to the adverse impacts of climate change remains a top priority, acti ons on miti gati on have been taken to not only ensure that development choices are in line with our development philosophy of Gross Nati onal Happiness, but also to encourage others that bold acti ons are needed to combat climate change. To support our carbon neutral declarati on our Economic Development Policy aims for “green growth” and a strategy for Bhutan to remain carbon neutral will be soon in place. With regards to adaptati on, Bhutan is implementi ng one of the fi rst projects under the Nati onal Adaptati on Program of Acti on to reduce the risk of glacial lake outburst fl ood from one of 25 dangerous glacial lakes. Furthermore, considering the extreme vulnerability of mountainous areas, Bhutan will be hosti ng the “Climate Summit for a Living Himalayas- Bhutan 2011”, between Bangladesh, Bhutan, India and Nepal in November 2011 to promote regional cooperati on in adaptati on to climate change in the Eastern Himalayas.
The Second Nati onal Communicati on from Bhutan to the UNFCCC elaborates the acti ons taken, and needed, to address emissions and adverse impacts of climate change in Bhutan. Greenhouse gas emissions from Bhutan are sti ll a third of what our forests sequester, but emissions are growing due to progress in socio-economic development and a growing populati on. Miti gati on measures that are already in place and opti ons for further acti on are presented in this report. Vulnerability and adaptati on assessment in the key sectors of water, agriculture, energy (hydropower), human health, and glaciers, highlight the high degree of vulnerability of the people of Bhutan to climate change. The adaptati on acti ons needed to address the vulnerabiliti es and impacts have been identi fi ed but will require the support of the internati onal community to ensure their implementati on.
While the Second Nati onal Communicati on from Bhutan to the UN Framework Conventi on on Climate Change is being submitt ed as an obligati on, the informati on contained herein will also inform all Bhutanese and our development partners. This report is the outcome of a long process of collaborati on, capacity building and consultati on led by the Nati onal Environment Commission among key stakeholder groups including line agencies, civil society organisati ons, the private sector, and experts from outside Bhutan. In this regard, I would like to thank all the individuals and organisati ons that have contributed to this important document and also all our partners who have been supporti ng Bhutan in its development eff orts and in combati ng climate change.
Jigmi Y. Thinley
Prime Minister of the Kingdom of Bhutan Chairman of Nati onal Environment Commission
Foreword
Jigmi Y. Thinley
Mi i f h Ki d f Bh

1
ABI Associati on of Bhutanese Industries
ABTO Associati on of Bhutanese Tour Operators
ANOVA Analysis of variance
A-OGCM Atmosphere-Ocean General Circulati on Model
ATF Aviati on Turbine Fuel
AWS Automati c Weather Stati on
BAFRA Bhutan Agriculture and Food Regulatory Authority
BaO Barium Oxide
BAP Biodiversity Acti on Plan
BAU Business-as-Usual
BCCI Bhutan Chamber of Commerce and Industry
BHU Basic Health Unit
BPC Bhutan Power Corporati on
BRT Bus Rapid Transit
BT Biotemperature
BTC Bhutan Tourism Corporati on
BTFEC Bhutan Trust Fund for Environment and Conservati on
CAB Constructi on Associati on of Bhutan
CAN Calcium Ammonium Nitrate
CaO Calcium Oxide
CC Climate Change
CCD Climate Change Division
CCU Climate Change Unit
CDM Clean Development Mechanism
CFL Compact Fluorescent Lamp
CH4 Methane
CLSH Climate Summit for a Living Himalayas
CNG Compressed Natural Gas
CNR College of Natural Resource
CO Carbon Monoxide
CO2 Carbon Dioxide
CoRRB Council of Renewable Natural Resource Research of Bhutan
CSLH Climate Summit for Living Himalaya
CSO Central Stati sti cal Organizati on
CTEM Cleaner Technology and Environmental Management
DAMC Department of Agriculture Marketi ng Cooperati ves
DDM Department of Disaster Management
DGM Department of Geology and Mines
DGPC Druk Green Power Corporati on
DLG Department of Local Governance
DoA Department of Agriculture
DoE Department of Energy
DOFPS Department of Forests and Park Services
DoI Department of Industry
DoL Department of Livestock
DoPH Department of Public Health
DoT Department of Trade
DRE Department of Renewable Energy
DSSAT Decision Support System for Agrotechnology Transfer
EA Environment Assessmnet
ECHAM European Center Hamburg Model
ECP Environment Climate change and Poverty
EE Energy-effi cient
EIA Environment Impact Assessment
EMD Environment Monitoring Division
ESD Environment Service Division
EU European Union
FAO Food and Agriculture Organizati on
Glossary of Acronyms
2
FeMn Ferro Manganese
FMU Forest Management Unit
FYM Farmyard Manure
GCMs General Circulati on Models
GDP Gross Domesti c Product
GEF Global Environment Facility
Gg Gigagram
GHG Greenhouse Gas
GLOF Glacial Lake Outburst Flood
GLS Gray Leaf spot
GNH Gross Nati onal Happiness
GNHC Gross Nati onal Happiness Commission
GWh Giga Watt Hour
Ha Hectare
HadCM Hadley Centre Coupled Model
HCFC Hydrochlorofl urocarbons
HFCs Hydrofuorocarbons
HIG High growth
HIGEE High growth coupled with energy effi ciency
HLZS Holdridge Life Zone system
HMSD Hydro Metrological Service Division
HST Hydraulic Siphon Technique
ICIMOD Internati onal Center for Integrated Mountain Development
ICS Informati on Communicati on and Services
IEMMP Integrated Energy Management Plan
INC Initi al Nati onal Communicati on
IPCC Inter-governmental Panel on Climate Change
IWRM Integrated Water Resources Management
JDWNRH Jigme Dorji Wangchuck Nati onal Referral Hospital
JSP Joint Support Program
kV Kilovolt
kWh Kilowatt -hour
kWh/m2 Kilowatt -hour meter square
LCMP Land Cover Mapping Project
LDO Light Diesel Oil
LEAP Long-range Energy Assessment Plan
LED Light Emitti ng Diodes
LPG Liquefi ed Petroleum Gas
LRT Light Rail Transit
LUCF Land Use Change and Forestry
m.a.s.l Meter Above Sea Level
m3/s Cubic Meter per Second
MoAF Ministry of Agriculture and Forests
MoE Ministry of Educati on
MoEA Ministry of Economic Aff airs
MoHCA Ministry of Home and Cultural Aff airs
MoIC Ministry of Informati on and Communicati on
MOP Muriate of Potash
MoWHS Ministry of Works and Human Sett lement
MPIOM Max Planck Insti tute for Meteorology
MSTCCC Multi Sectoral Technical Committ ee on Climate Change
MSW Municipal Solid Waste
MT Metric Tonnes
MU Mega Units
MW Megawatt s
N2O Nitrous Oxide
NAMAs Nati onally Appropriate Miti gati on Acti ons
NAPA Nati onal Adaptati on Program of Acti on
NBC Nati onal Biodiversity Center
NBS Net Basin Supply
NCCC Nati onal Climate Change Committ ee
NCD Nature Conservati on Division
Glossary of Acronyms
3
NDRMF Nati onal Disaster Risk Management Framework
NEC Nati onal Environment Commission
NECS Nati onal Environment Commission Secretariat
NGO Non Governmental Organizati on
NLC Nati onal Land Commission
NMVOC Non Methane Volati le Organic Compound
NRDCL Natural Resources Development Corporati on Limited
NSB Nati onal Stati sti cal Bureau
NSSC Nati onal Soil Service Center
NTG Nati onal Themati c Group
ORC Outreach Clinics
PFCs Perfl uorocarbons
PFM Plasmodium Falciparum
PHED Public Health Engineering Division
PPD Policy Planning Division
PRECIS Providing Regional Climates for Impact Studies
PV Photo Voltaic
R&D Research and Development
RDTC Rural Development Training Center
REDD+ Reducing Emission from Deforestati on and Forest Degradati on
REMP Rural Electrifi cati on Master Plan
REP Renewable Energy Policy
RGoB Royal Government of Bhutan
Rn Rain
RNR Renewable Natural Resources
RNR-RC Renewable Natural Resource Research Center
RSPN Royal Society for Protecti on of Nature
RSTA Road Safety and Transport Authority
SF6 Sulphur hexafl uoride
SFC SAARC Forestry Center
SFD Social Forestry Division
SLM Sustainable Land Management
SLMP Sustainable Land Management Programme
SNC Second Nati onal Communicati on
SNV Sti chti ng Nederlandse Vrijwilligers (Netherland Development Organizati on)
SRES Special Report on Emission Scenarios
SSP Single Super Phosphate
START-SEA System for Analysis Research and Training - South East Asia
SVO Straight Vegetable Oils
TCB Tourism Council of Bhutan
tCO2e Tonnes of Carbon Dioxide Equivalent
TERI The Energy and Resources Insti tute
TLB Turcicum Leaf Blight
Tn Minimum Temperature
TOE Tonnes of Oil Equivalent
Tx Maximum Temperature
UNCBD United Nati ons Conventi on on Biological Diversity
UNDP United Nati ons Development Program
UNEP United Nati ons Environment Program
UNFCCC United Nati ons Framework Conventi on on Climate Change
UWICE Ugyen Wangchuck Insti tute for Conservati on and Environment
V&A Vulnerability and Adaptati on
W/m2 Watt per meter square
WB World Bank
WCD Wildlife Conservati on Division
WCP Wangchuck Centennial Park
WEAP Water Evaluati on and Planning
WHO World Health Organizati on
WR Water Resources
WWF World Wildlife Fund
Glossary of Acronyms

5
Nati onal Circumstances
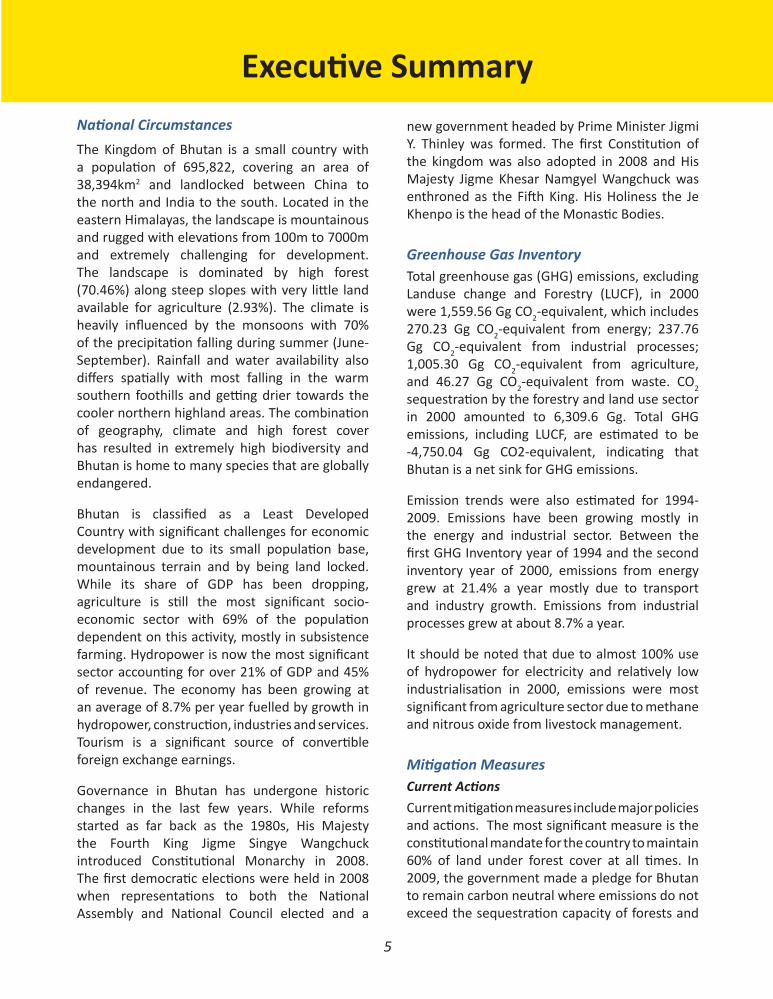
The Kingdom of Bhutan is a small country with a populati on of 695,822, covering an area of 38,394km2 and landlocked between China to the north and India to the south. Located in the eastern Himalayas, the landscape is mountainous and rugged with elevati ons from 100m to 7000m and extremely challenging for development. The landscape is dominated by high forest (70.46%) along steep slopes with very litt le land available for agriculture (2.93%). The climate is heavily infl uenced by the monsoons with 70% of the precipitati on falling during summer (June-September). Rainfall and water availability also diff ers spati ally with most falling in the warm southern foothills and getti ng drier towards the cooler northern highland areas. The combinati on of geography, climate and high forest cover has resulted in extremely high biodiversity and Bhutan is home to many species that are globally endangered.
Bhutan is classifi ed as a Least Developed Country with signifi cant challenges for economic development due to its small populati on base, mountainous terrain and by being land locked. While its share of GDP has been dropping, agriculture is sti ll the most signifi cant socio-economic sector with 69% of the populati on dependent on this acti vity, mostly in subsistence farming. Hydropower is now the most signifi cant sector accounti ng for over 21% of GDP and 45% of revenue. The economy has been growing at an average of 8.7% per year fuelled by growth in hydropower, constructi on, industries and services. Tourism is a signifi cant source of converti ble foreign exchange earnings.
Governance in Bhutan has undergone historic changes in the last few years. While reforms started as far back as the 1980s, His Majesty the Fourth King Jigme Singye Wangchuck introduced Consti tuti onal Monarchy in 2008. The fi rst democrati c electi ons were held in 2008 when representati ons to both the Nati onal Assembly and Nati onal Council elected and a
new government headed by Prime Minister Jigmi Y. Thinley was formed. The fi rst Consti tuti on of the kingdom was also adopted in 2008 and His Majesty Jigme Khesar Namgyel Wangchuck was enthroned as the Fift h King. His Holiness the Je Khenpo is the head of the Monasti c Bodies.
Greenhouse Gas InventoryTotal greenhouse gas (GHG) emissions, excluding Landuse change and Forestry (LUCF), in 2000 were 1,559.56 Gg CO2-equivalent, which includes 270.23 Gg CO2-equivalent from energy; 237.76 Gg CO2-equivalent from industrial processes; 1,005.30 Gg CO2-equivalent from agriculture, and 46.27 Gg CO2-equivalent from waste. CO2 sequestrati on by the forestry and land use sector in 2000 amounted to 6,309.6 Gg. Total GHG emissions, including LUCF, are esti mated to be -4,750.04 Gg CO2-equivalent, indicati ng that Bhutan is a net sink for GHG emissions.
Emission trends were also esti mated for 1994-2009. Emissions have been growing mostly in the energy and industrial sector. Between the fi rst GHG Inventory year of 1994 and the second inventory year of 2000, emissions from energy grew at 21.4% a year mostly due to transport and industry growth. Emissions from industrial processes grew at about 8.7% a year.
It should be noted that due to almost 100% use of hydropower for electricity and relati vely low industrialisati on in 2000, emissions were most signifi cant from agriculture sector due to methane and nitrous oxide from livestock management.
Miti gati on MeasuresCurrent Acti ons
Current miti gati on measures include major policies and acti ons. The most signifi cant measure is the consti tuti onal mandate for the country to maintain 60% of land under forest cover at all ti mes. In 2009, the government made a pledge for Bhutan to remain carbon neutral where emissions do not exceed the sequestrati on capacity of forests and
Executi ve Summary
6
called on the internati onal community to support this pledge. Current policy measures for miti gati on include; expansion of installed hydropower capacity to 10,000 MW by 2020, electricity for all by 2013, incenti ves for energy saving devices and low emission vehicles, and various legislati on for environmental protecti on. Programs in agriculture like sustainable land management, reducti on of improved livestock management and promoti on of organic agriculture also provide miti gati on benefi ts. Forest policy and management acti ons through sustainable forest management, reforestati on plans and eff orts to reduce fuel wood consumpti on are signifi cant acti ons in the LUCF sector. The Economic Development Policy 2010 also provides several measures to promote “green growth” in response to the government’s commitment to carbon neutrality. A strategy for Bhutan to maintain carbon neutral status is under development and is expected by end of 2011.
Opti ons for Energy
While hydroelectricity is an important energy source for industry, increasing energy effi ciency in industry and adopti on of cleaner technology and process opti misati on are important measures that need support for miti gati ng further emissions. Opti ons for the transport sector include promoti on of alternati ve fuels, electric and hybrid technologies and mass transport opti ons. Transport demand management including proper design of urban areas and promoti on of non-motorised transport are also seen as important miti gati on measures for transport sector. The residenti al sector can benefi t from improved building designs, promoti on of more effi cient appliances, and switching to cleaner fuels and electricity. Promoti on of renewable energy will be important not only for miti gati on but also from energy security and adaptati on perspecti ves because of the country’s dependence on climate vulnerable hydropower and imported fossil fuels.
Opti ons for Industry
Miti gati on in industry is linked to measures discussed in energy effi ciency and also in process opti misati on. Diff erent effi ciency improvement
technologies through promoti on of cleaner technologies and management will be important to both increase effi ciency and reduce emissions. Other possible measures include substi tuti on of input materials where feasible. Carbon capture and off sets are other opti ons but costs may be an issue.
Opti ons for Agriculture
Opti ons for livestock include improvements in livestock and grazing management to reduce enteric fermentati on such as reducti on of surplus populati on and improvement of breeds, pasture and fodder. Manure management and biogas producti on are measures that could result in improved farmer income and emission reducti on, and could provide other benefi ts like reduced human wildlife confl ict and improved forest regenerati on. Improved soil ferti lity management through promoti on of farm yard manure, upscaling of sustainable land management practi ces, increasing cropping intensity, and increasing the area under organic farming are feasible measures for the cropping sector. Changes in techniques for rice farming could provide miti gati on benefi ts but threats from urban expansion and limited area available for culti vati on may aff ect paddy culti vati on and food security in Bhutan. Several measures such as sustainable land management and livestock management will increase resilience of communiti es through bett er land husbandry and forest conservati on.
Opti ons for LUCF
In the landuse change and forestry sector, implementati on of measures to support existi ng policies will be required. Opportuniti es like REDD+ need to be aligned with the Nati onal Forest Inventory to make opti mum use of limited resources of manpower and fi nancing. Review of FMUs and implementati on of interventi ons to improve management will be crucial to maintain sustainable producti on of ti mber. Expansion and promoti on of community forestry which is already picking up rapidly will provide both miti gati on and socio-economic benefi ts to local communiti es. Preventi on and control of forest fi res will become
Executi ve Summary
7
more important under a future climate of drier and warmer winters. Reforestati on of degraded areas and plantati on acti viti es should conti nue to both promote carbon sequestrati on and control of soil erosion and land degradati on. It should be noted that measure for miti gati on in LUCF sector also interface with adaptati on and biodiversity conservati on through ecosystem resilience.
Opti ons for Waste
With increasing populati on and affl uence, waste management will be an important miti gati on measure. Emissions from wastes can be reduced through promoti on of the 3Rs (reduce, reuse and recycle), promoti ng of composti ng the high organic content in municipal waste, methane capture and incinerati on for energy. Measures in waste management will require promoti on of public private partnership and provision of incenti ves as per existi ng policies and legislati on.
Vulnerability and Adaptati on Assessment
The challenge for development and vulnerability of mountainous countries to climate change is well established and recognised in both the Conventi on and IPCC Assessment Reports. The adapti ve capacity of mountainous countries like Bhutan is also very low due the fragility of the ecosystem and high costs of delivering services in a rugged terrain.
Climate Scenarios
Data is extremely limited in Bhutan in terms of historical record or spati al coverage to provide adequate baseline assessment of climate. However an analysis of observed data from 2000-2009 shows an increasing trend for both maximum and minimum temperatures but no apparent trends in precipitati on patt ern.
Future periods were modelled using ECHAM5 and HadCM3Q0 A1B scenarios in PRECIS. As compared to the 1980-2009 period mean annual temperature is projected to increase by 0.80C to 1.00C in 2010-2039 and by 2.00C – 2.40C by 2040-2069. Summer temperatures may increase by up to 0.80C in 2010-2039 and by 2.10C in 2040-2069.
Winter temperatures will see higher increases with projected increase of 1.20C by 2010-2039 and 2.80C by 2040-2069. Changes in mean annual precipitati on is projected to increase 10% by 2010-2039, and 20% by 2040-2069 but with conditi ons getti ng wett er in the monsoon season and slightly drier in the winter season. These more extreme precipitati on changes between seasons conform to the fi ndings of the IPCC (2007) report for the Himalayan region of South-east Asia. The change in the amount and seasonality of precipitati on will aff ect not only the energy/hydropower and domesti c water sector of Bhutan, but also the water used for irrigati on.
Extreme climate events are also becoming more frequent with episodes of high rainfall over short periods such as cyclone Aila in May 2009 which brought record rains and rivers to fl ood levels throughout the country so much so that fl ows in Punatsangchhu were higher than during the 1994 GLOF. In additi on to fl ash fl oods and landslides, windstorms are also increasingly damaging property and crops.
Water resources
While at a gross level, Bhutan has one of the highest per capita availability of water, the distributi on of this resource over the seasons and area is an issue. WEAP modelling also shows that water availability in the future under climate change will be adequate at a gross level (main rivers) in the Wang Chhu Basin despite increasing demand and evapo-transpirati on. However, this provides a false sense of availability as all major rivers are at valley bott oms while sett lements and agriculture depends on rain, springs or smaller streams and tributaries. There are increasing reports of drying water sources throughout the country which is already a current vulnerability and may get worse with drier and warmer winters in the future.
Agriculture
Agriculture is a signifi cant contributor to GDP in Bhutan, accounti ng for more than 18.5 % of GDP in 2008 and with 69% of the populati on dependent on this sector. Agriculture is already vulnerable due to increasing episodes of extreme events like
Executi ve Summary
8
fl ash fl oods, hailstorms, windstorms, droughts, pests and diseases. The mountainous terrain and limited land availability also aff ect food security. For the regions used as case studies, namely Kanglung for maize, Bhur for rice and Phobjikha for potatoes, both the HadCM3Q0/AIB and ECHAM5/A1B climate models, when coupled with the DSSAT crop model, show slight to moderate decreases in maize and rice yields, but signifi cant increases in potato yields in the future (2010-2039 and 2040-2069).
Forests and Biodiversity
Current threats to forests and biodiversity include direct pressures like urbanisati on, industrialisati on and other development and human acti viti es, and indirect pressures like populati on growth, changing consumpti on patt erns and climate change. For the forestry and biodiversity sector, both the HadCM3Q0/AIB and ECHAM5/A1B climate models, when coupled with the Holdridge Forest Classifi cati on System, show a general northward migrati on of the major forest classes of Bhutan in the future (2010-2039 and 2040-2069), with subtropical species invading the southern margins and alpine species decreasing on the northern margins. Climate change will accelerate and exacerbate threats to biodiversity through loss of species, spread of invasive, pests and diseases, increased risk of forest fi re, loss of agro diversity and loss of livelihood, traditi onal knowledge and practi ces.
Energy
Hydropower is important for Bhutan as it is the major source of government’s revenue and contributes 19% of GDP mainly through exports to India. Almost 100% of electricity consumed is from hydropower with biomass as the major source of primary energy in Bhutan. Fossil fuels are the energy sources for transport and industries. Threats to hydropower include glacial lake outburst fl oods, increased sedimentati on from increased precipitati on, disrupti on in fl ows from changing precipitati on and deteriorati on of watersheds. Using Net Basin Supply (NBS) assessment with the HadCM3Q0/AIB and ECHAM5/A1B climate models
show generally slightly increased potenti al fl ows (NBS) and hydropower producti on in the wet monsoon season and slightly decreased fl ows and hydropower producti on in the dry winter season.
Health
The health sector will be vulnerable to future (2010-2039 and 2040-2069) climate change. However, the analysis for the health sector is greatly compromised by the lack of suffi cient observed data. However health of climate change on impacts will be determined by both climate change and non-climati c factors such as health care and the health conditi on of the populati on. Strengthening of public health systems is necessary with or without climate change; climate change makes this need even more criti cal and urgent. The threat to human health from climate change includes potenti al changes in water and vector borne diseases.
Glaciers and GLOF
Bhutan has 677 glaciers and 2674 glacial lakes. Glaciers in Bhutan are retreati ng rapidly by 8-10m/year for debris free glaciers and 30-40m/year for debris covered glaciers. Due to the rapid melti ng, 25 glacial lakes are considered potenti ally dangerous with the threat of glacial lake outburst fl oods (GLOFs). Based on rates of glacial retreat, temperature trends in the area and trends in GLOF in the region, threats from GLOF are expected to increase in the future. Bhutan has implemented GLOF risk miti gati on measures at a couple of lakes but and opti ons for adaptati on will depend on site conditi ons.
Adaptati on prioriti es
Bhutan lacks the resources for meeti ng most of its development needs let alone adaptati on measures required to address the additi onal burdens to address the impacts of climate change. Adaptati on prioriti es were prepared based on the V&A assessment in the SNC and has been aligned with the nati onal process under the Climate Summit for a Living Himalayas – Bhutan 2011. Priority adaptati on acti ons have been
Executi ve Summary
9
prepared for the sectors of Water and Climate Related Disasters, Agriculture, Energy, Forest and Biodiversity, Human Health, and for Glaciers and GLOF. Cross cutti ng issues among the sectors and stakeholder groups, esti mated costs, ti me frames and implementati on measures have also been considered in the preparati on of the Adaptati on Prioriti es for Bhutan. The major objecti ves of the adaptati on acti ons are as follows;
Water Sector and Climate related disasters
Conduct comprehensive water resources assessment to improve understanding of water resource availability, the eff ects of climate change to develop appropriate adaptati on measures
Increase resilience to the impacts of climate change on water resources
Water Resources Management through adopti on and implementati on of IWRM and eco-effi ciency by using river basin framework for planning
Strengthening Climate observati on and network for early warning and forecasti ng of extreme events understanding climate change
Mainstream CC & WR into nati onal plans and programmes.
Agriculture
To identi fy and map highly vulnerable farming communiti es across the country
To strengthen insti tuti onal capacity of research/extension of DoA and at district and geog levels
To increase access to improved geneti c resources resistant to a-bioti c and bioti c stresses
To identi fy and promote potenti al crops for agriculture/farming diversifi cati on to reduce crop failures
Increase access to improved irrigati on systems
Improve postharvest faciliti es to increase shelf life of food products
Improve informati on management system of the sector.
Energy
Measures to ensure energy security during lean season (due to projected shortf all of hydropower producti on in winter as a result of climate change)
Diversify the energy supply mix to reduce dependence on hydropower which is threatened by climate change
Measures to address demand side management especially for projected lean season power shortf all under climate change.
Forests and Biodiversity
Establishing the baseline, understanding and monitoring the impacts of CC on the species and ecosystems in Bhutan
Increase ecosystem resilience against climate change disrupti on through re-evaluati on and strengthening of protected areas, and sustainable management of biodiversity use
Address risk of species loss from climate change by strengthening species conservati on and management program by taking into considerati on climate change
Measures to address increased threat from invasive species, pests and diseases under changing climate
Develop and implement a comprehensive forest fi re management program, taking into account drier and warmer winters
Conserve agro-biodiversity to promote adaptati on of crops and livestock to changing climati c conditi ons
Measures to ensure sustainable use and management of biodiversity by local communiti es by taking into account threats from changing climate
Executi ve Summary
10
Develop sustainable local conservati on fi nancing mechanisms to reduce vulnerability and build adapti ve of ecosystems and habitats
Capacity Building for Biodiversity and Climate Change Resilience by strengthening relevant insti tuti ons, public awareness, and insti tuti onal arrangements and mainstreaming.
Health
Ensure adequate drinking water during the dry period
Control and reduce spread of vector borne diseases
Build disaster response management preparedness
To educate and enhance the level of awareness to cope with health risks of climate change
Strengthening the surveillance, research, monitoring, review and supervisory system and feedback mechanism for climate related diseases
Build and improve program and research capacity to monitor climate change impacts on human health
Reduce nutriti onal impacts of climate change.
Glaciers and GLOF
1. Enhancing preparedness and understanding for GLOFs triggered by Climate Change
2. Implementati on of risk reducti on measures in potenti ally dangerous glacial lakes.
Other Informati on
Climate Change Awareness
A survey of various stakeholders including policy makers revealed a high level of awareness about climate change and most believe that the cause of climate change is human acti viti es. There was agreement that climate change will negati vely aff ect development acti viti es in Bhutan and that proper adaptati on measures are necessary.
While there is general awareness, in depth knowledge about the subject is lacking especially on informati on specifi c to Bhutan. This gap in informati on on climate change, att ributed to lack of funds and resources and the general lack of research in Bhutan, is identi fi ed as a barrier to eff ecti ve adaptati on planning.
Educati on and Capacity Building
An assessment of existi ng educati onal insti tutes revealed that some insti tuti onal capacity exist in terms of programmati c structures that is conducive to mainstreaming environment, poverty and climate change (ECP) in to training programmes. However systemati c constraints include uncertainti es about demand for such trainings, lack of recogniti on of programs and courses, lack of resources for teaching and knowledge, insuffi cient number of faculty members and inadequate coverage of relevant issues in existi ng curricula and modules. Several recommendati ons to address these concerns and to mainstream ECP have also been made through the Joint Sector Program in Bhutan, but implementati on is yet to be funded.
Technology Needs Assessments
While several technologies have been identi fi ed within the miti gati on and adaptati on measures, a full assessment is now underway and is to be completed in 2012. The fi rst technology needs assessment conducted in 2002 (agriculture, industries and meteorology) was limited by lack of guidelines and methodologies and has become out dated.
Recommendati ons for future work to address climate change
A comprehensive nati onal climate change strategy should be developed by taking into account, adaptati on needs, miti gati on measures and other related crosscutti ng issues.
Climate change mainstreaming should be promoted in development plans and policies at all levels.
Executi ve Summary
11
Addressing climate change requires additi onal eff orts on top of ongoing development acti viti es, so fi nancial support required should be emphasized as support needed for the additi onal burden of climate change.
There needs to be bett er coordinati on among stakeholders led by NEC in cooperati on with GNHC.
Increased support is needed to promote research and capacity development for climate change to bett er inform preparati on of adaptati on and miti gati on measures.
The media and relevant NGOs, and government should educate the citi zens and policy makers
about climate change and acti ons required to address the impacts and causes.
Climate change must be incorporated in to the educati on curriculum as the youth of today will have to face a future with a diff erent climate.
NEC should be given more authority to monitor bett er implementati on of environment and climate policies.
Future assessment of climate change should address human sett lements (urban areas and infrastructure) and conduct mapping of vulnerable populati on.
Executi ve Summary


Chapter One
Nati onalCircumstances

15
1.1 Geographic profi le
The Kingdom of Bhutan with an area of 38,394km2
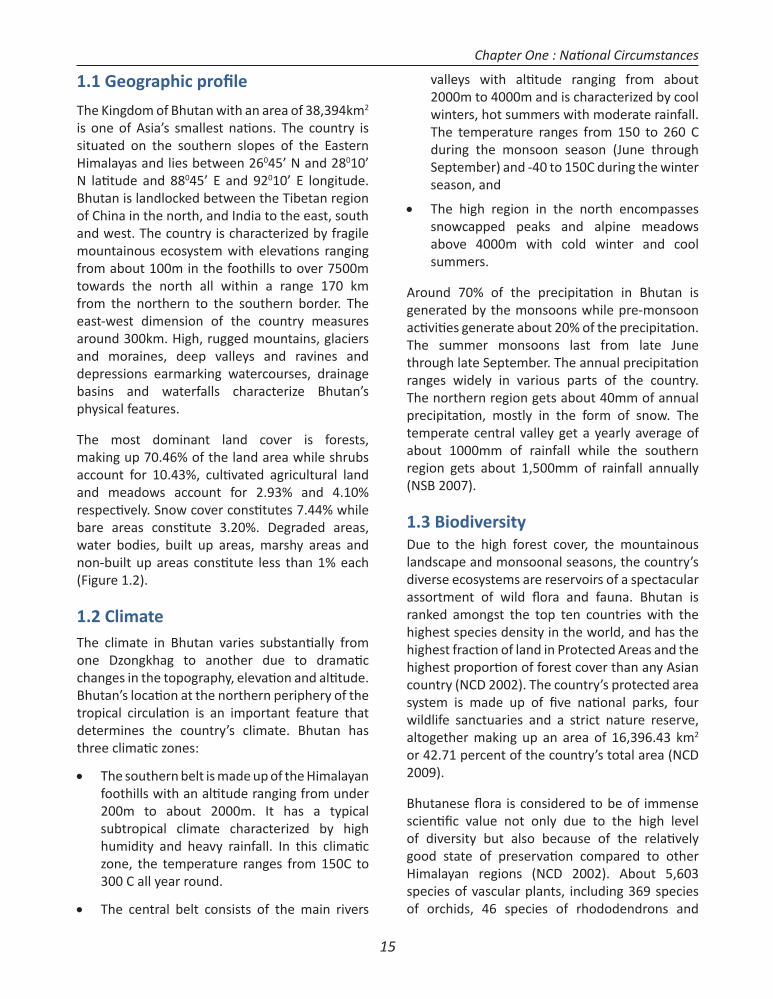
is one of Asia’s smallest nati ons. The country is situated on the southern slopes of the Eastern Himalayas and lies between 26045’ N and 28010’ N lati tude and 88045’ E and 92010’ E longitude. Bhutan is landlocked between the Tibetan region of China in the north, and India to the east, south and west. The country is characterized by fragile mountainous ecosystem with elevati ons ranging from about 100m in the foothills to over 7500m towards the north all within a range 170 km from the northern to the southern border. The east-west dimension of the country measures around 300km. High, rugged mountains, glaciers and moraines, deep valleys and ravines and depressions earmarking watercourses, drainage basins and waterfalls characterize Bhutan’s physical features.
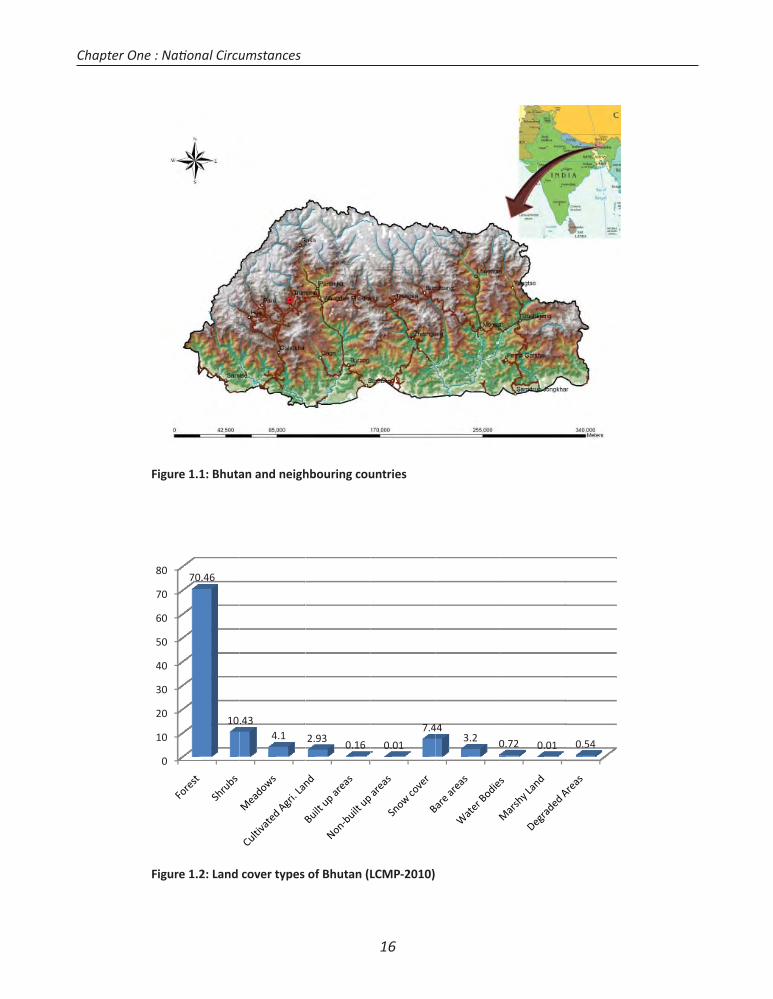
The most dominant land cover is forests, making up 70.46% of the land area while shrubs account for 10.43%, culti vated agricultural land and meadows account for 2.93% and 4.10% respecti vely. Snow cover consti tutes 7.44% while bare areas consti tute 3.20%. Degraded areas, water bodies, built up areas, marshy areas and non-built up areas consti tute less than 1% each (Figure 1.2).
1.2 ClimateThe climate in Bhutan varies substanti ally from one Dzongkhag to another due to dramati c changes in the topography, elevati on and alti tude. Bhutan’s locati on at the northern periphery of the tropical circulati on is an important feature that determines the country’s climate. Bhutan has three climati c zones:
The southern belt is made up of the Himalayan foothills with an alti tude ranging from under 200m to about 2000m. It has a typical subtropical climate characterized by high humidity and heavy rainfall. In this climati c zone, the temperature ranges from 150C to 300 C all year round.
The central belt consists of the main rivers
valleys with alti tude ranging from about 2000m to 4000m and is characterized by cool winters, hot summers with moderate rainfall. The temperature ranges from 150 to 260 C during the monsoon season (June through September) and -40 to 150C during the winter season, and
The high region in the north encompasses snowcapped peaks and alpine meadows above 4000m with cold winter and cool summers.
Around 70% of the precipitati on in Bhutan is generated by the monsoons while pre-monsoon acti viti es generate about 20% of the precipitati on. The summer monsoons last from late June through late September. The annual precipitati on ranges widely in various parts of the country. The northern region gets about 40mm of annual precipitati on, mostly in the form of snow. The temperate central valley get a yearly average of about 1000mm of rainfall while the southern region gets about 1,500mm of rainfall annually (NSB 2007).
1.3 BiodiversityDue to the high forest cover, the mountainous landscape and monsoonal seasons, the country’s diverse ecosystems are reservoirs of a spectacular assortment of wild fl ora and fauna. Bhutan is ranked amongst the top ten countries with the highest species density in the world, and has the highest fracti on of land in Protected Areas and the highest proporti on of forest cover than any Asian country (NCD 2002). The country’s protected area system is made up of fi ve nati onal parks, four wildlife sanctuaries and a strict nature reserve, altogether making up an area of 16,396.43 km2 or 42.71 percent of the country’s total area (NCD 2009).
Bhutanese fl ora is considered to be of immense scienti fi c value not only due to the high level of diversity but also because of the relati vely good state of preservati on compared to other Himalayan regions (NCD 2002). About 5,603 species of vascular plants, including 369 species of orchids, 46 species of rhododendrons and
Chapter One : Nati onal Circumstances
16
Figure 1.1: Bhutan and neighbouring countries
Figure 1.2: Land cover types of Bhutan (LCMP-2010)
0
10
20
30
40
50
60
70
8070.46
10..434.1 2.93 0.16 0.01
7.4443.2 00.72 0.01 0.54
Chapter One : Nati onal Circumstances
17
105 endemics plant species have been recorded in Bhutan (NCD 2009). Close to 200 species of mammal are known to occur in Bhutan of which 27 are globally threatened species like the Royal Bengal ti ger, Snow leopard,Red panda, Bhutan Takin and Golden langur among others (NCD 2009). 677 species of birds, of which 14 are globally threatened and ten restricted range bird species are found in the country. Other types of fauna are less studied but some 50 freshwater fi sh species are recorded in the country, 23 species of repti les and amphibians were recorded in the Manas Nati onal Park and about 800 to 900 species of butt erfl y are expected to exist in Bhutan (NCD 2009).
In terms of domesti c biodiversity, about 80 species of agricultural crops is grown in Bhutan including cereals such as rice, maize, barley, millet, wheat and buckwheat; fruits such as apple, orange, and pear; vegetables such as potato, bean, and cabbage; and spices such as chilli, cardamom, garlic, and ginger (NCD 2009). Several of the crop varieti es represent adaptati ons to some of the highest agricultural lands in the world, with culti vati on in the alpine agro-ecological zone extending up to 4,600 masl.
For example, while wheat is not an indigenous crop, varieti es grown around Laya are adapted
to higher alti tudes and colder climati c conditi ons than wheat varieti es in other parts of the world (NCD 2009). Livestock diversity in Bhutan basically consists of bovines, caprines, ovines, equines, avians, swines, canines and felines (NCD 2009).
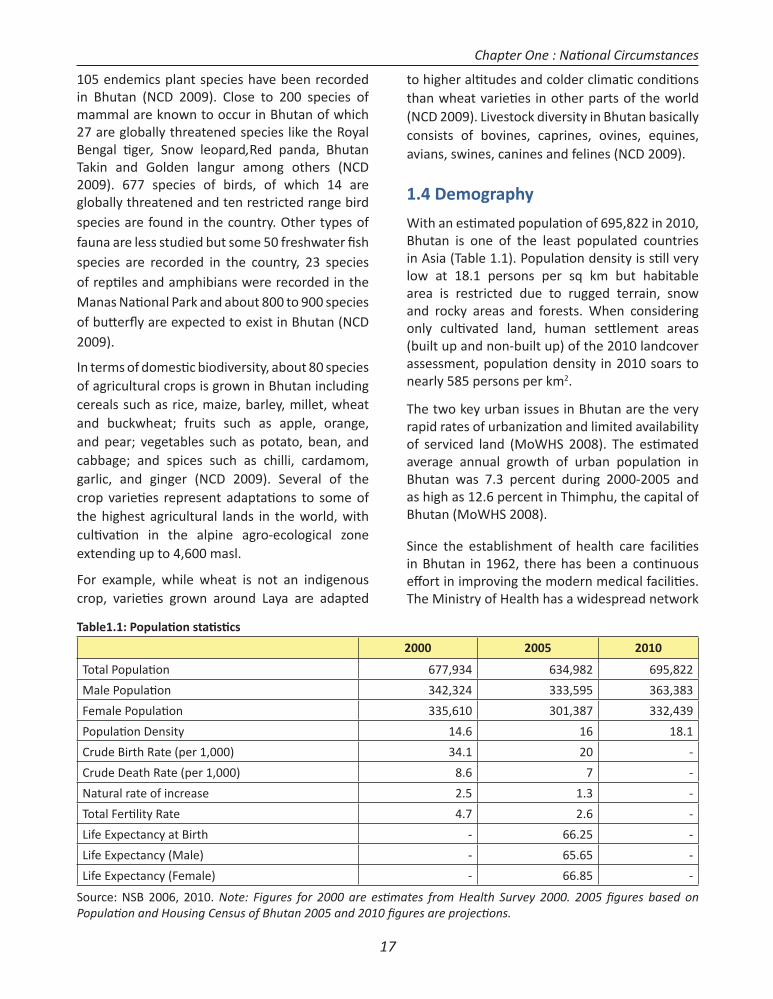
1.4 Demography
With an esti mated populati on of 695,822 in 2010, Bhutan is one of the least populated countries in Asia (Table 1.1). Populati on density is sti ll very low at 18.1 persons per sq km but habitable area is restricted due to rugged terrain, snow and rocky areas and forests. When considering only culti vated land, human sett lement areas (built up and non-built up) of the 2010 landcover assessment, populati on density in 2010 soars to nearly 585 persons per km2.
The two key urban issues in Bhutan are the very rapid rates of urbanizati on and limited availability of serviced land (MoWHS 2008). The esti mated average annual growth of urban populati on in Bhutan was 7.3 percent during 2000-2005 and as high as 12.6 percent in Thimphu, the capital of Bhutan (MoWHS 2008).
Since the establishment of health care faciliti es in Bhutan in 1962, there has been a conti nuous eff ort in improving the modern medical faciliti es. The Ministry of Health has a widespread network
2000 2005 2010
Total Populati on 677,934 634,982 695,822
Male Populati on 342,324 333,595 363,383
Female Populati on 335,610 301,387 332,439
Populati on Density 14.6 16 18.1
Crude Birth Rate (per 1,000) 34.1 20 -
Crude Death Rate (per 1,000) 8.6 7 -
Natural rate of increase 2.5 1.3 -
Total Ferti lity Rate 4.7 2.6 -
Life Expectancy at Birth - 66.25 -
Life Expectancy (Male) - 65.65 -
Life Expectancy (Female) - 66.85 -
Source: NSB 2006, 2010. Note: Figures for 2000 are esti mates from Health Survey 2000. 2005 fi gures based on Populati on and Housing Census of Bhutan 2005 and 2010 fi gures are projecti ons.
Table1.1: Populati on stati sti cs
Chapter One : Nati onal Circumstances
18
of health faciliti es, covering around 90% of the total populati on (NSB 2010). As of 2009, there are 31 hospitals, 181 Basic Health Units (BHU) and over 15 Extended Health Centers/Out Reach Clinics (ORC) providing health care services. General Health conditi ons in Bhutan are aff ected by low nutriti on, poor sanitati on, high prevalence of parasiti c infecti ons and contagious diseases. Acute Respiratory Infecti on conti nues to dominate enti re morbidity situati on (NSB 2007).
1.5 Socio-economy
Bhutan is categorised as a least developed country and its small populati on base, geographic size and being land locked pose signifi cant challenges for development. Agriculture is sti ll the dominant sector providing livelihood, income and employment to more than 69% percent of the total populati on. Bhutan is also rich in hydropower resources and the majority of electricity is exported to India. Fuelled by the development of hydropower, the industrial sector is developing rapidly. Tourism acti viti es are also on the rise.
Socio-economic development in Bhutan is guided by the philosophy of Gross Nati onal Happiness (GNH) promulgated by His Majesty King Jigme Singye Wangchuck. In recent years, the philosophy of GNH has gained acceptance amongst global economists, academicians, social scienti sts and planners who are developing methods to use GNH as a development indicator to measure how sustainable and equitable development is. The
GNH philosophy advocates that socio-economic development will lead to the prosperity and happiness of the general populace only if there is an equitable balance between the four pillars of: i) Good governance, ii) a pristi ne environment, iii) economic self-reliance and iv) the preservati on and promoti on of Bhutan’s culture. To emphasize the importance of using GNH as the guiding philosophy for all plans and programs of the country, a GNH Commission was established in 2008 as the apex body for planning in Bhutan.
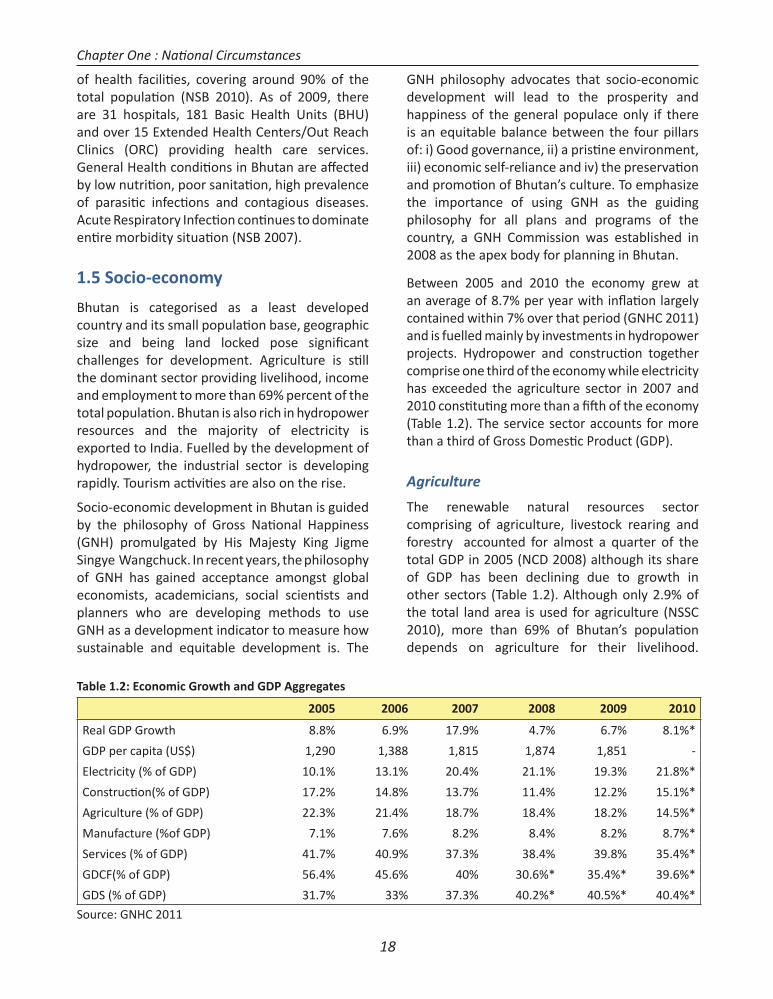
Between 2005 and 2010 the economy grew at an average of 8.7% per year with infl ati on largely contained within 7% over that period (GNHC 2011) and is fuelled mainly by investments in hydropower projects. Hydropower and constructi on together comprise one third of the economy while electricity has exceeded the agriculture sector in 2007 and 2010 consti tuti ng more than a fi ft h of the economy (Table 1.2). The service sector accounts for more than a third of Gross Domesti c Product (GDP).
Agriculture
The renewable natural resources sector comprising of agriculture, livestock rearing and forestry accounted for almost a quarter of the total GDP in 2005 (NCD 2008) although its share of GDP has been declining due to growth in other sectors (Table 1.2). Although only 2.9% of the total land area is used for agriculture (NSSC 2010), more than 69% of Bhutan’s populati on depends on agriculture for their livelihood.
2005 2006 2007 2008 2009 2010
Real GDP Growth 8.8% 6.9% 17.9% 4.7% 6.7% 8.1%*
GDP per capita (US$) 1,290 1,388 1,815 1,874 1,851 -
Electricity (% of GDP) 10.1% 13.1% 20.4% 21.1% 19.3% 21.8%*
Constructi on(% of GDP) 17.2% 14.8% 13.7% 11.4% 12.2% 15.1%*
Agriculture (% of GDP) 22.3% 21.4% 18.7% 18.4% 18.2% 14.5%*
Manufacture (%of GDP) 7.1% 7.6% 8.2% 8.4% 8.2% 8.7%*
Services (% of GDP) 41.7% 40.9% 37.3% 38.4% 39.8% 35.4%*
GDCF(% of GDP) 56.4% 45.6% 40% 30.6%* 35.4%* 39.6%*
GDS (% of GDP) 31.7% 33% 37.3% 40.2%* 40.5%* 40.4%*
Source: GNHC 2011
Table 1.2: Economic Growth and GDP Aggregates
Chapter One : Nati onal Circumstances
19
Therefore, a signifi cant segment of the Bhutanese populati on is vulnerable to the impacts of climate change as crop irrigati on is highly dependent on perennial streams and the monsoons. In additi on, the rugged and steep terrain makes it diffi cult to both expand producti ons and market any surplus that may be produced. The main cash crops of the farmers (rice, potatoes, chillies, apples, maize and oranges) are all highly sensiti ve to water and temperature variati ons (DoA 2005). Dry land crops such as wheat, buckwheat, maize and barley are the major food source for the farmers; both for family consumpti on and for rearing livestock. Dry land crops are however enti rely dependent on rainfall thus making the farmers even more vulnerable to climate hazards.
EnergyBhutan’s main export earnings are from hydropower generati on and accounts for about 45% of the country’s revenue. It is esti mated that the country has the potenti al to generate up to 30,000MW of electricity, and the total installed capacity as of December 2010 was 1505.32 MW (NTG-Energy 2011). Much of the electricity is exported to India to generate income to fi nance development acti viti es in the other sectors. In 2005, 1775MU3 (approximately 67% of the total electricity generated) was exported to India. During the lean season (winter months), power is also imported from India. In 2005, 18.39MU was imported from India (DoE, 2005). Other sources of energy consti tute coal, biomass, fossil fuels and other renewable energy sources. According to the Department of Geology and Mines, Bhutan has 1.96 million tonnes of coal reserves in the eastern part of the country in SamdrupJongkhar (DoE 2005). Biomass fuels from forests are the main energy source for a majority of households in both urban and rural areas of the country.
TransportThe transport system is a criti cal infrastructure for development. The transport system in Bhutan consists mainly of road and air transport services. Bhutan has a total length of 6920.14 Km (as of June 2010) of roads. This includes nati onal highways, district roads, feeder roads, farm roads, urban
roads, expressway, power ti ller tracks, access road and forest roads (DOR, 2010). As of August 2011, there are 59,483 registered vehicles in Bhutan (RSTA2011). According to the Road Safety and Transport Authority (RSTA), the number of vehicles that is being registered in Bhutan is increasing at an average of 10% annually. Air transport was introduced in the beginning of the 1980s with links to neighbouring countries provided by the only nati onal airline (Druk Air) with a fl eet of two aircraft . Limited domesti c air services are expected to begin in 2012.
Industries
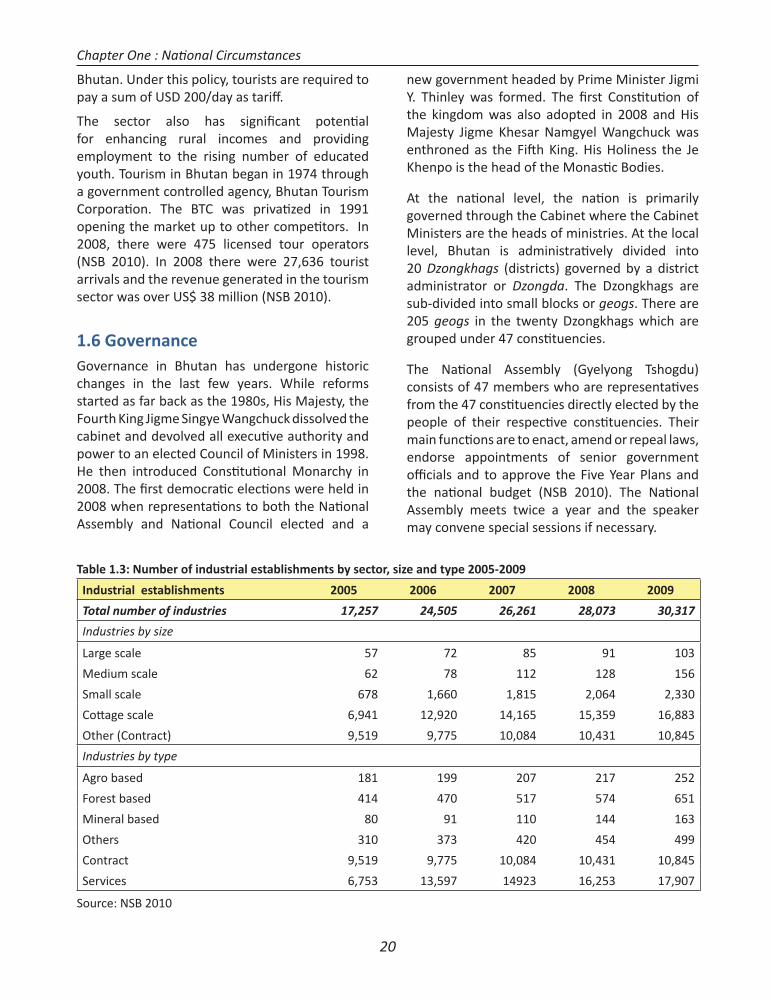
Industrial development in Bhutan is constrained by many factors, including supply and access to raw materials, high transportati on costs, small domesti c market, lack of space and infrastructure, and shortage of skilled and semi-skilled human resources. The number of industrial license holders has increased steadily over the last decade, however most of the industrial establishments are small scale or cott age industries (Table 1.3). The mineral based industries are calcium carbide, ferro alloys and cement producti on. There are several units that mine dolomite, gypsum, limestone and coal. Wood-based industries comprise mainly of small sawmills, furniture making units, small traditi onal paper units, one parti cleboard factory, wood veneering and resin and turpenti ne harvesti ng. Agro-based industries consist of fruit processing and alcoholic beverage producti on units. Other manufacturing units produce local handicraft s and texti les.
Tourism
The tourism industry plays an important role in Bhutan’s socio-economic development as the largest commercial source of converti ble currency earnings. Bhutan’s locati on, terrain and relati ve isolati on have provided a strong comparati ve advantage for Bhutan as a special desti nati on. Furthermore, the kingdom’s reputati on for conservati on and its developmental philosophy of Gross Nati onal Happiness have all added to Bhutan’s mysti que, luring more and more tourists to Bhutan every year. The “High value, Low impact” policy has always guided tourism in
Chapter One : Nati onal Circumstances
20
Bhutan. Under this policy, tourists are required to pay a sum of USD 200/day as tariff .
The sector also has signifi cant potenti al for enhancing rural incomes and providing employment to the rising number of educated youth. Tourism in Bhutan began in 1974 through a government controlled agency, Bhutan Tourism Corporati on. The BTC was privati zed in 1991 opening the market up to other competi tors. In 2008, there were 475 licensed tour operators (NSB 2010). In 2008 there were 27,636 tourist arrivals and the revenue generated in the tourism sector was over US$ 38 million (NSB 2010).
1.6 GovernanceGovernance in Bhutan has undergone historic changes in the last few years. While reforms started as far back as the 1980s, His Majesty, the Fourth King Jigme Singye Wangchuck dissolved the cabinet and devolved all executi ve authority and power to an elected Council of Ministers in 1998. He then introduced Consti tuti onal Monarchy in 2008. The fi rst democrati c electi ons were held in 2008 when representati ons to both the Nati onal Assembly and Nati onal Council elected and a
new government headed by Prime Minister Jigmi Y. Thinley was formed. The fi rst Consti tuti on of the kingdom was also adopted in 2008 and His Majesty Jigme Khesar Namgyel Wangchuck was enthroned as the Fift h King. His Holiness the Je Khenpo is the head of the Monasti c Bodies.
At the nati onal level, the nati on is primarily governed through the Cabinet where the Cabinet Ministers are the heads of ministries. At the local level, Bhutan is administrati vely divided into 20 Dzongkhags (districts) governed by a district administrator or Dzongda. The Dzongkhags are sub-divided into small blocks or geogs. There are 205 geogs in the twenty Dzongkhags which are grouped under 47 consti tuencies.
The Nati onal Assembly (Gyelyong Tshogdu) consists of 47 members who are representati ves from the 47 consti tuencies directly elected by the people of their respecti ve consti tuencies. Their main functi ons are to enact, amend or repeal laws, endorse appointments of senior government offi cials and to approve the Five Year Plans and the nati onal budget (NSB 2010). The Nati onal Assembly meets twice a year and the speaker may convene special sessions if necessary.
Industrial establishments 2005 2006 2007 2008 2009
Total number of industries 17,257 24,505 26,261 28,073 30,317
Industries by size
Large scale 57 72 85 91 103
Medium scale 62 78 112 128 156
Small scale 678 1,660 1,815 2,064 2,330
Cott age scale 6,941 12,920 14,165 15,359 16,883
Other (Contract) 9,519 9,775 10,084 10,431 10,845
Industries by type
Agro based 181 199 207 217 252
Forest based 414 470 517 574 651
Mineral based 80 91 110 144 163
Others 310 373 420 454 499
Contract 9,519 9,775 10,084 10,431 10,845
Services 6,753 13,597 14923 16,253 17,907
Source: NSB 2010
Table 1.3: Number of industrial establishments by sector, size and type 2005-2009
Chapter One : Nati onal Circumstances
21
The Nati onal Council has 25 members, of which 20 are directly elected by the people from the 20 Dzongkhags and the other 5 are nominated by His Majesty the King of Bhutan. Their main functi ons are to review matt ers aff ecti ng the security and sovereignty of the country and to ensure that the government safeguards the interest of the nati on and fulfi lls the aspirati ons of the people (NSB 2010). The Nati onal Council also meets twice a year and special sessions can be convened depending on the needs.
The Monasti c Body comprises of the Central Monasti c Body and the Rabdeys (District Monasti c Bodies). The Monasti c Body is the sole arbiter on religious matt ers and His Holiness the Je Khenpo is the head of the Monasti c Body. The current strength of the Monasti c Body is over 5000 registered gelongs (monks) and is fi nanced by an annual subsidy from the Royal Government (NSB 2010).
1.7 Nati onal Coordinati on Mechanism on Climate ChangeAft er Bhutan rati fi ed the United Nati ons Framework Conventi on on Climate Change (UNFCCC) on 15 August 1995, the Nati onal Environment Commission Secretariat (NECS) became the nati onal focal agency for climate change acti viti es in the country. The Nati onal Environment Commission (NEC) chaired by the Prime Minister is designated as the Nati onal Climate Change Committ ee (NCCC).
In 2009, the NEC at its 27th Commission Meeti ng approved the formati on of a nati onal level task force, the Multi Sectoral Technical Committ ee on Climate Change (MSTCCC) to serve as a forum for coordinati ng all climate change related acti viti es/issues in the country. The meeti ng also approved the formati on of a Climate Change Unit (CCU) at the NECS. Furthermore, in June 2011 the 32nd NEC approved the up-gradati on of the CCU to a Climate Change Division at the NECS.
Chapter One : Nati onal Circumstances

Chapter Two
Nati onal Greenhouse Gas Inventory

25
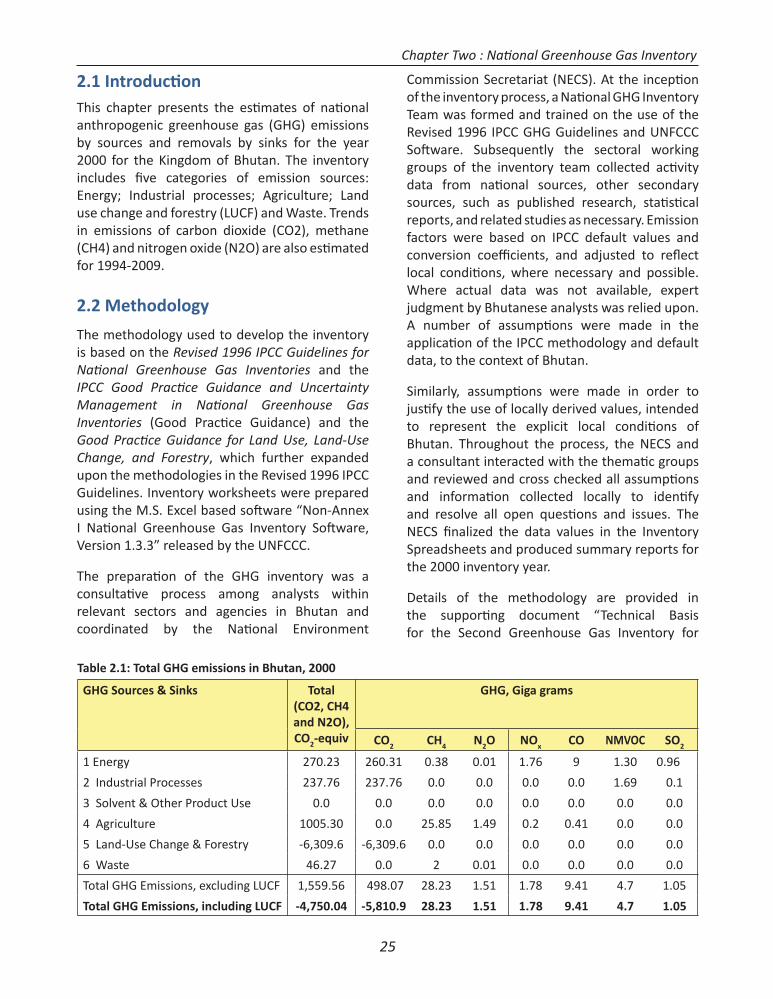
2.1 Introducti onThis chapter presents the esti mates of nati onal anthropogenic greenhouse gas (GHG) emissions by sources and removals by sinks for the year 2000 for the Kingdom of Bhutan. The inventory includes fi ve categories of emission sources: Energy; Industrial processes; Agriculture; Land use change and forestry (LUCF) and Waste. Trends in emissions of carbon dioxide (CO2), methane (CH4) and nitrogen oxide (N2O) are also esti mated for 1994-2009.
2.2 Methodology
The methodology used to develop the inventory is based on the Revised 1996 IPCC Guidelines for Nati onal Greenhouse Gas Inventories and the IPCC Good Practi ce Guidance and Uncertainty Management in Nati onal Greenhouse Gas Inventories (Good Practi ce Guidance) and the Good Practi ce Guidance for Land Use, Land-Use Change, and Forestry, which further expanded upon the methodologies in the Revised 1996 IPCC Guidelines. Inventory worksheets were prepared using the M.S. Excel based soft ware “Non-Annex I Nati onal Greenhouse Gas Inventory Soft ware, Version 1.3.3” released by the UNFCCC.
The preparati on of the GHG inventory was a consultati ve process among analysts within relevant sectors and agencies in Bhutan and coordinated by the Nati onal Environment
Commission Secretariat (NECS). At the incepti on of the inventory process, a Nati onal GHG Inventory Team was formed and trained on the use of the Revised 1996 IPCC GHG Guidelines and UNFCCC Soft ware. Subsequently the sectoral working groups of the inventory team collected acti vity data from nati onal sources, other secondary sources, such as published research, stati sti cal reports, and related studies as necessary. Emission factors were based on IPCC default values and conversion coeffi cients, and adjusted to refl ect local conditi ons, where necessary and possible. Where actual data was not available, expert judgment by Bhutanese analysts was relied upon. A number of assumpti ons were made in the applicati on of the IPCC methodology and default data, to the context of Bhutan.
Similarly, assumpti ons were made in order to justi fy the use of locally derived values, intended to represent the explicit local conditi ons of Bhutan. Throughout the process, the NECS and a consultant interacted with the themati c groups and reviewed and cross checked all assumpti ons and informati on collected locally to identi fy and resolve all open questi ons and issues. The NECS fi nalized the data values in the Inventory Spreadsheets and produced summary reports for the 2000 inventory year.
Details of the methodology are provided in the supporti ng document “Technical Basis for the Second Greenhouse Gas Inventory for
Chapter Two : Nati onal Greenhouse Gas Inventory
GHG Sources & Sinks Total (CO2, CH4 and N2O),CO2-equiv
GHG, Giga grams
CO2 CH4 N2O NOx CO NMVOC SO2
1 Energy 270.23 260.31 0.38 0.01 1.76 9 1.30 0.96
2 Industrial Processes 237.76 237.76 0.0 0.0 0.0 0.0 1.69 0.1
3 Solvent & Other Product Use 0.0 0.0 0.0 0.0 0.0 0.0 0.0 0.0
4 Agriculture 1005.30 0.0 25.85 1.49 0.2 0.41 0.0 0.0
5 Land-Use Change & Forestry -6,309.6 -6,309.6 0.0 0.0 0.0 0.0 0.0 0.0
6 Waste 46.27 0.0 2 0.01 0.0 0.0 0.0 0.0
Total GHG Emissions, excluding LUCF 1,559.56 498.07 28.23 1.51 1.78 9.41 4.7 1.05
Total GHG Emissions, including LUCF -4,750.04 -5,810.9 28.23 1.51 1.78 9.41 4.7 1.05
Table 2.1: Total GHG emissions in Bhutan, 2000
26
Bhutan”, Volume 1 (Technical notes on methods, assumpti ons and data sources) and Volume 2 (Spreadsheets of the inventory for year 2000)1.
2.3 Total GHG EmissionsTable 2.1 presents total GHG emissions by sources and removals by sinks for the year 2000. Total GHG emissions, excluding LUCF, in 2000 were 1559.56Gg CO2-equivalent, which includes 270.23 Gg CO2-equivalent from energy; 237.76 Gg CO2-equivalent from industrial processes; 1005.30 Gg CO2-equivalent from agriculture, and 46.27 Gg CO2-equivalent from waste. Emissions from perfl uorocarbons (PFCs), hydrofl uorocarbons (HFCs) and sulfurs hexafl uoride (SF6) in Bhutan are negligible as the products containing these gases are not produced in the country. CO2 sequestrati on by the forestry and land use sector in 2000 amounted to 6,309.6 Gg. Total GHG emissions, including LUCF, are esti mated to be -4,750.04 Gg CO2-equivalent, indicati ng that Bhutan is a net sink for GHG emissions.
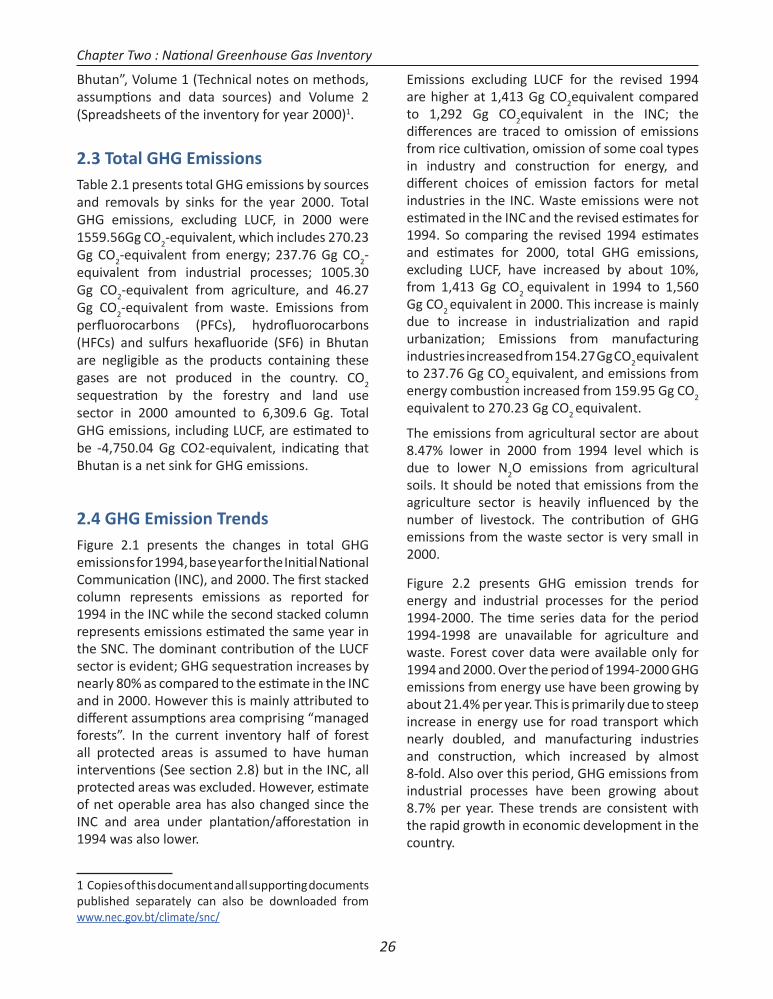
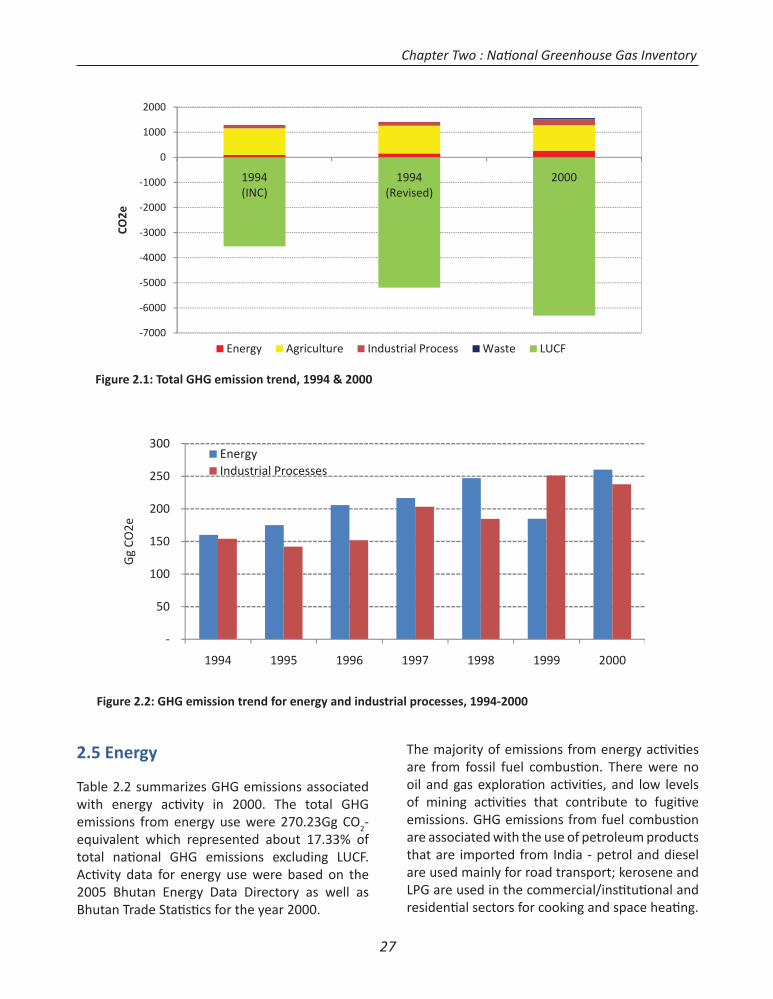
2.4 GHG Emission TrendsFigure 2.1 presents the changes in total GHG emissions for 1994, base year for the Initi al Nati onal Communicati on (INC), and 2000. The fi rst stacked column represents emissions as reported for 1994 in the INC while the second stacked column represents emissions esti mated the same year in the SNC. The dominant contributi on of the LUCF sector is evident; GHG sequestrati on increases by nearly 80% as compared to the esti mate in the INC and in 2000. However this is mainly att ributed to diff erent assumpti ons area comprising “managed forests”. In the current inventory half of forest all protected areas is assumed to have human interventi ons (See secti on 2.8) but in the INC, all protected areas was excluded. However, esti mate of net operable area has also changed since the INC and area under plantati on/aff orestati on in 1994 was also lower.
1 Copies of this document and all supporti ng documents published separately can also be downloaded from www.nec.gov.bt/climate/snc/
Emissions excluding LUCF for the revised 1994 are higher at 1,413 Gg CO2equivalent compared to 1,292 Gg CO2equivalent in the INC; the diff erences are traced to omission of emissions from rice culti vati on, omission of some coal types in industry and constructi on for energy, and diff erent choices of emission factors for metal industries in the INC. Waste emissions were not esti mated in the INC and the revised esti mates for 1994. So comparing the revised 1994 esti mates and esti mates for 2000, total GHG emissions, excluding LUCF, have increased by about 10%, from 1,413 Gg CO2 equivalent in 1994 to 1,560 Gg CO2 equivalent in 2000. This increase is mainly due to increase in industrializati on and rapid urbanizati on; Emissions from manufacturing industries increased from 154.27 Gg CO2 equivalent to 237.76 Gg CO2 equivalent, and emissions from energy combusti on increased from 159.95 Gg CO2
equivalent to 270.23 Gg CO2 equivalent.
The emissions from agricultural sector are about 8.47% lower in 2000 from 1994 level which is due to lower N2O emissions from agricultural soils. It should be noted that emissions from the agriculture sector is heavily infl uenced by the number of livestock. The contributi on of GHG emissions from the waste sector is very small in 2000.
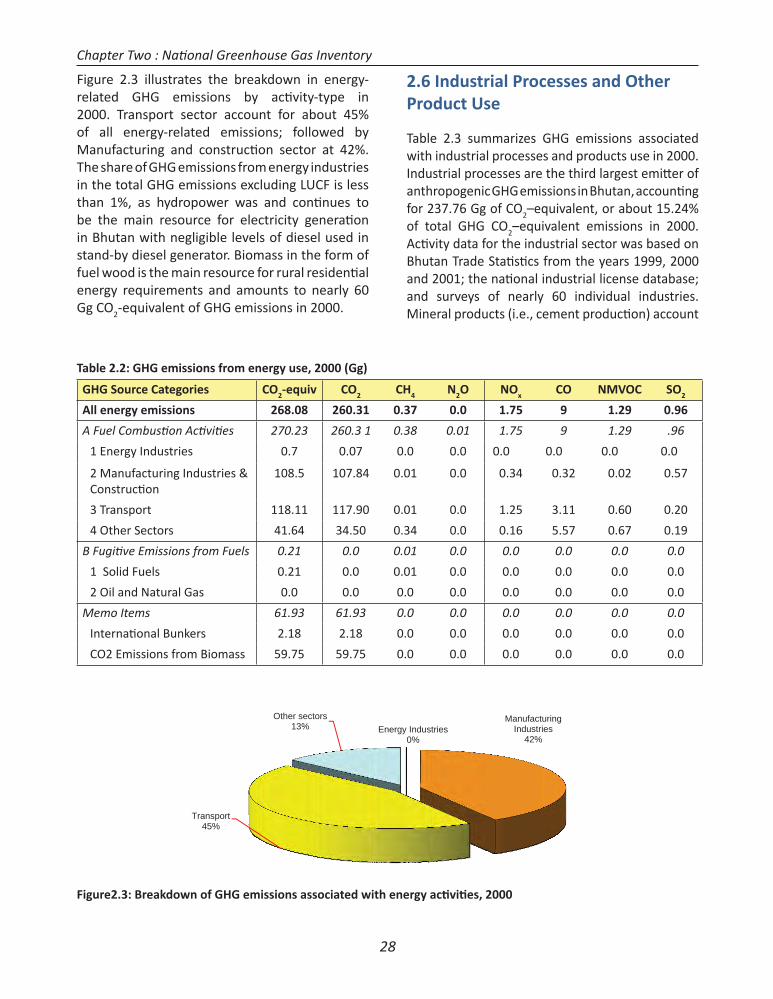
Figure 2.2 presents GHG emission trends for energy and industrial processes for the period 1994-2000. The ti me series data for the period 1994-1998 are unavailable for agriculture and waste. Forest cover data were available only for 1994 and 2000. Over the period of 1994-2000 GHG emissions from energy use have been growing by about 21.4% per year. This is primarily due to steep increase in energy use for road transport which nearly doubled, and manufacturing industries and constructi on, which increased by almost 8-fold. Also over this period, GHG emissions from industrial processes have been growing about 8.7% per year. These trends are consistent with the rapid growth in economic development in the country.
Chapter Two : Nati onal Greenhouse Gas Inventory
27
2.5 Energy
Table 2.2 summarizes GHG emissions associated with energy acti vity in 2000. The total GHG emissions from energy use were 270.23Gg CO2-equivalent which represented about 17.33% of total nati onal GHG emissions excluding LUCF. Acti vity data for energy use were based on the 2005 Bhutan Energy Data Directory as well as Bhutan Trade Stati sti cs for the year 2000.
The majority of emissions from energy acti viti es are from fossil fuel combusti on. There were no oil and gas explorati on acti viti es, and low levels of mining acti viti es that contribute to fugiti ve emissions. GHG emissions from fuel combusti on are associated with the use of petroleum products that are imported from India - petrol and diesel are used mainly for road transport; kerosene and LPG are used in the commercial/insti tuti onal and residenti al sectors for cooking and space heati ng.
7000
6000
5000
4000
3000
2000
1000
0
1000
2000
1994(INC)
1994(Revised)
2000
CO2e
Energy Agriculture Industrial Process Waste LUCF
50
100
150
200
250
300
1994 1995 1996 1997 1998 1999 2000
Gg
CO2e
EnergyIndustrial Processes
Figure 2.1: Total GHG emission trend, 1994 & 2000
Figure 2.2: GHG emission trend for energy and industrial processes, 1994-2000
Chapter Two : Nati onal Greenhouse Gas Inventory
28
Figure 2.3 illustrates the breakdown in energy-related GHG emissions by acti vity-type in 2000. Transport sector account for about 45% of all energy-related emissions; followed by Manufacturing and constructi on sector at 42%. The share of GHG emissions from energy industries in the total GHG emissions excluding LUCF is less than 1%, as hydropower was and conti nues to be the main resource for electricity generati on in Bhutan with negligible levels of diesel used in stand-by diesel generator. Biomass in the form of fuel wood is the main resource for rural residenti al energy requirements and amounts to nearly 60 Gg CO2-equivalent of GHG emissions in 2000.
2.6 Industrial Processes and Other Product Use
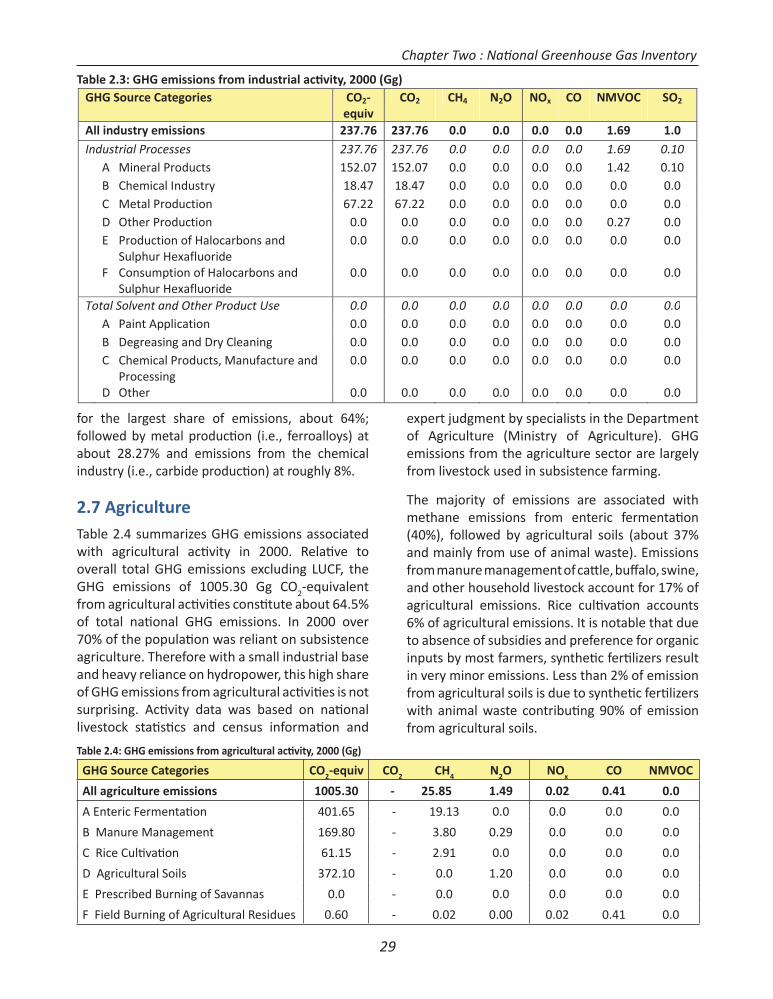
Table 2.3 summarizes GHG emissions associated with industrial processes and products use in 2000. Industrial processes are the third largest emitt er of anthropogenic GHG emissions in Bhutan, accounti ng for 237.76 Gg of CO2–equivalent, or about 15.24% of total GHG CO2–equivalent emissions in 2000. Acti vity data for the industrial sector was based on Bhutan Trade Stati sti cs from the years 1999, 2000 and 2001; the nati onal industrial license database; and surveys of nearly 60 individual industries. Mineral products (i.e., cement producti on) account
GHG Source Categories CO2-equiv CO2 CH4 N2O NOx CO NMVOC SO2
All energy emissions 268.08 260.31 0.37 0.0 1.75 9 1.29 0.96
A Fuel Combusti on Acti viti es 270.23 260.3 1 0.38 0.01 1.75 9 1.29 .96
1 Energy Industries 0.7 0.07 0.0 0.0 0.0 0.0 0.0 0.0
2 Manufacturing Industries & Constructi on
108.5 107.84 0.01 0.0 0.34 0.32 0.02 0.57
3 Transport 118.11 117.90 0.01 0.0 1.25 3.11 0.60 0.20
4 Other Sectors 41.64 34.50 0.34 0.0 0.16 5.57 0.67 0.19
B Fugiti ve Emissions from Fuels 0.21 0.0 0.01 0.0 0.0 0.0 0.0 0.0
1 Solid Fuels 0.21 0.0 0.01 0.0 0.0 0.0 0.0 0.0
2 Oil and Natural Gas 0.0 0.0 0.0 0.0 0.0 0.0 0.0 0.0
Memo Items 61.93 61.93 0.0 0.0 0.0 0.0 0.0 0.0
Internati onal Bunkers 2.18 2.18 0.0 0.0 0.0 0.0 0.0 0.0
CO2 Emissions from Biomass 59.75 59.75 0.0 0.0 0.0 0.0 0.0 0.0
Trransport45%
Other sect13%
torsEnergy Indus
0%stries
ManufactuIndustri
42%
uringies
Figure2.3: Breakdown of GHG emissions associated with energy acti viti es, 2000
Table 2.2: GHG emissions from energy use, 2000 (Gg)
Chapter Two : Nati onal Greenhouse Gas Inventory
29
for the largest share of emissions, about 64%; followed by metal producti on (i.e., ferroalloys) at about 28.27% and emissions from the chemical industry (i.e., carbide producti on) at roughly 8%.
2.7 AgricultureTable 2.4 summarizes GHG emissions associated with agricultural acti vity in 2000. Relati ve to overall total GHG emissions excluding LUCF, the GHG emissions of 1005.30 Gg CO2-equivalent from agricultural acti viti es consti tute about 64.5% of total nati onal GHG emissions. In 2000 over 70% of the populati on was reliant on subsistence agriculture. Therefore with a small industrial base and heavy reliance on hydropower, this high share of GHG emissions from agricultural acti viti es is not surprising. Acti vity data was based on nati onal livestock stati sti cs and census informati on and
expert judgment by specialists in the Department of Agriculture (Ministry of Agriculture). GHG emissions from the agriculture sector are largely from livestock used in subsistence farming.
The majority of emissions are associated with methane emissions from enteric fermentati on (40%), followed by agricultural soils (about 37% and mainly from use of animal waste). Emissions from manure management of catt le, buff alo, swine, and other household livestock account for 17% of agricultural emissions. Rice culti vati on accounts 6% of agricultural emissions. It is notable that due to absence of subsidies and preference for organic inputs by most farmers, syntheti c ferti lizers result in very minor emissions. Less than 2% of emission from agricultural soils is due to syntheti c ferti lizers with animal waste contributi ng 90% of emission from agricultural soils.
GHG Source Categories CO2-equiv CO2 CH4 N2O NOx CO NMVOC
All agriculture emissions 1005.30 - 25.85 1.49 0.02 0.41 0.0
A Enteric Fermentati on 401.65 - 19.13 0.0 0.0 0.0 0.0
B Manure Management 169.80 - 3.80 0.29 0.0 0.0 0.0
C Rice Culti vati on 61.15 - 2.91 0.0 0.0 0.0 0.0
D Agricultural Soils 372.10 - 0.0 1.20 0.0 0.0 0.0
E Prescribed Burning of Savannas 0.0 - 0.0 0.0 0.0 0.0 0.0
F Field Burning of Agricultural Residues 0.60 - 0.02 0.00 0.02 0.41 0.0
Table 2.3: GHG emissions from industrial acti vity, 2000 (Gg)GHG Source Categories CO2
equivCO2 CH4 N2O NOx CO NMVOC SO2
All industry emissions 237.76 237.76 0.0 0.0 0.0 0.0 1.69 1.0Industrial Processes 237.76 237.76 0.0 0.0 0.0 0.0 1.69 0.10
A Mineral Products 152.07 152.07 0.0 0.0 0.0 0.0 1.42 0.10B Chemical Industry 18.47 18.47 0.0 0.0 0.0 0.0 0.0 0.0C Metal Production 67.22 67.22 0.0 0.0 0.0 0.0 0.0 0.0D Other Production 0.0 0.0 0.0 0.0 0.0 0.0 0.27 0.0E Production of Halocarbons and
Sulphur Hexafluoride0.0 0.0 0.0 0.0 0.0 0.0 0.0 0.0
F Consumption of Halocarbons andSulphur Hexafluoride
0.0 0.0 0.0 0.0 0.0 0.0 0.0 0.0
Total Solvent and Other Product Use 0.0 0.0 0.0 0.0 0.0 0.0 0.0 0.0A Paint Application 0.0 0.0 0.0 0.0 0.0 0.0 0.0 0.0B Degreasing and Dry Cleaning 0.0 0.0 0.0 0.0 0.0 0.0 0.0 0.0C Chemical Products, Manufacture and
Processing0.0 0.0 0.0 0.0 0.0 0.0 0.0 0.0
D Other 0.0 0.0 0.0 0.0 0.0 0.0 0.0 0.0
Table 2.4: GHG emissions from agricultural acti vity, 2000 (Gg)
Chapter Two : Nati onal Greenhouse Gas Inventory
30
such as wood, food, fodder and traditi onal remedies. The Consti tuti on of the Kingdom of Bhutan also mandates that 60% of the country remain under forest cover for all ti mes to come. Total managed forests accounted for about 14,054 square kilometres in Bhutan in 20002. This total managed forest area is comprised of 8,124 square kilometers (58%) reserved for potenti al commercial management; 4,231 square kilometers (30%) of protected forests (representi ng 50% of total protected forest land); and 1,700 square kilometers (12%) of areas already being managed as forest management units (fi gure 2.4). It is important to note that virtually all forests in Bhutan have some form of
2. The area esti mated as “managed forests” for this inventory is much more conservati ve when compared to the Forest Resources Assessment for Bhutan (FAO 2005) which esti mated managed forests in Bhutan at 2,933,500 ha (modifi ed natural + semi-natural + 50% of Primary or 2,543,000 + 184,000 + 0.5x413,000 ha).
Figure 2.4: Forest management units and working schemes in Bhutan.
2.8 Land-Use Change and Forestry
Table 2.5 summarizes GHG emissions associated with land use, land-use change and forestry in 2000. The managed forests, forest plantati ons and the abandonment of managed lands sequestered 6,309.63 Gg CO2-equivalent and is roughly four ti mes the level of Bhutan’s total GHG emissions excluding LUCF. Annual acti vity data were compiled from nati onal forest reports which used a mixture of sources including annual forest resource and land cover assessments, GIS-based and RS-based land use/land cover mapping using Landsat satellite images from 1999-2000.
The prominence of carbon sequestrati on in the nati onal GHG inventory refl ects nati onal policy that regards forests as crucial for the well-being of the Bhutanese populati on through its natural regulati on of climati c, water, and fl ora/fauna resources to furnish essenti al needs
GHG Source Categories CO2-equiv CO2 CH4 N2O NOx CO
All LUCF emissions -6,309.6 -6309.6 0.0 0.0 0.0 0.0
A Changes in Forest and Other Woody Biomass Stocks -5,988.0 -5,988.0 0.0 0.0 0.0 0.0
B Forest and Grassland Conversion 0.0 0.0 0.0 0.0 0.0 0.0
C Abandonment of Managed Lands -321.63 -321.63 0.0 0.0 0.0 0.0
D CO2 Emissions and Removals from Soil 0.0 0.0 0.0 0.0 0.0 0.0
E Other 0.0 0.0 0.0 0.0 0.0 0.0
Table 2.5: GHG emissions from LUCF acti vity, 2000 (Gg)
Chapter Two : Nati onal Greenhouse Gas Inventory
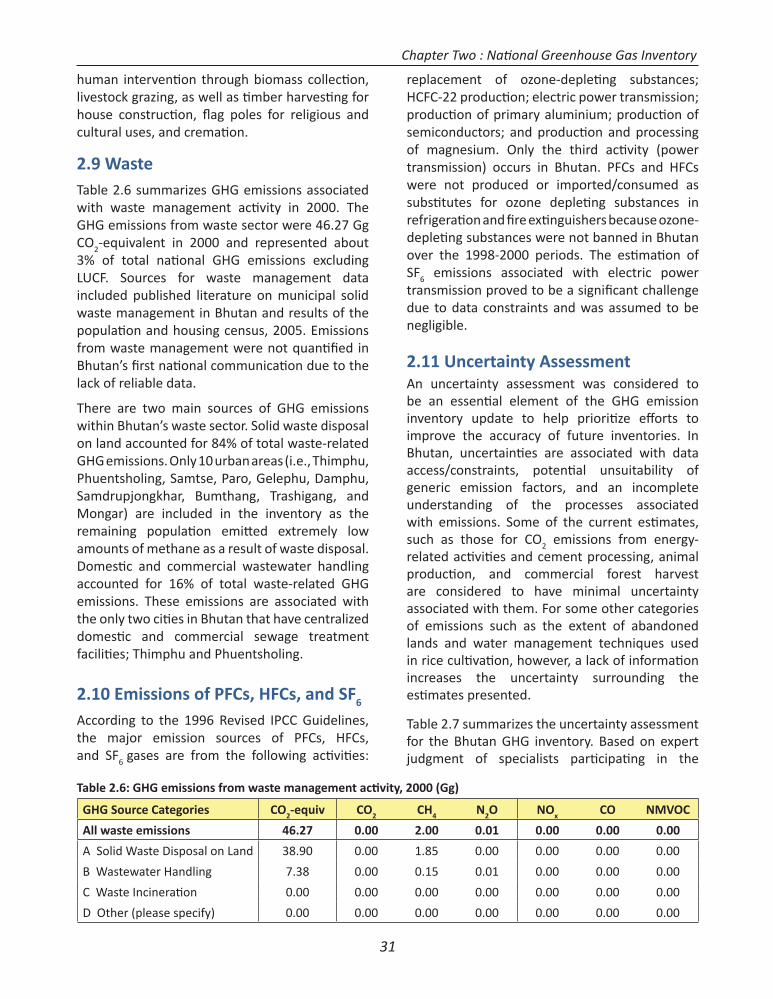
31
human interventi on through biomass collecti on, livestock grazing, as well as ti mber harvesti ng for house constructi on, fl ag poles for religious and cultural uses, and cremati on.
2.9 WasteTable 2.6 summarizes GHG emissions associated with waste management acti vity in 2000. The GHG emissions from waste sector were 46.27 Gg CO2-equivalent in 2000 and represented about 3% of total nati onal GHG emissions excluding LUCF. Sources for waste management data included published literature on municipal solid waste management in Bhutan and results of the populati on and housing census, 2005. Emissions from waste management were not quanti fi ed in Bhutan’s fi rst nati onal communicati on due to the lack of reliable data.
There are two main sources of GHG emissions within Bhutan’s waste sector. Solid waste disposal on land accounted for 84% of total waste-related GHG emissions. Only 10 urban areas (i.e., Thimphu, Phuentsholing, Samtse, Paro, Gelephu, Damphu, Samdrupjongkhar, Bumthang, Trashigang, and Mongar) are included in the inventory as the remaining populati on emitt ed extremely low amounts of methane as a result of waste disposal. Domesti c and commercial wastewater handling accounted for 16% of total waste-related GHG emissions. These emissions are associated with the only two citi es in Bhutan that have centralized domesti c and commercial sewage treatment faciliti es; Thimphu and Phuentsholing.
2.10 Emissions of PFCs, HFCs, and SF6
According to the 1996 Revised IPCC Guidelines, the major emission sources of PFCs, HFCs, and SF6 gases are from the following acti viti es:
replacement of ozone-depleti ng substances; HCFC-22 producti on; electric power transmission; producti on of primary aluminium; producti on of semiconductors; and producti on and processing of magnesium. Only the third acti vity (power transmission) occurs in Bhutan. PFCs and HFCs were not produced or imported/consumed as substi tutes for ozone depleti ng substances in refrigerati on and fi re exti nguishers because ozone-depleti ng substances were not banned in Bhutan over the 1998-2000 periods. The esti mati on of SF6 emissions associated with electric power transmission proved to be a signifi cant challenge due to data constraints and was assumed to be negligible.
2.11 Uncertainty AssessmentAn uncertainty assessment was considered to be an essenti al element of the GHG emission inventory update to help prioriti ze eff orts to improve the accuracy of future inventories. In Bhutan, uncertainti es are associated with data access/constraints, potenti al unsuitability of generic emission factors, and an incomplete understanding of the processes associated with emissions. Some of the current esti mates, such as those for CO2 emissions from energy-related acti viti es and cement processing, animal producti on, and commercial forest harvest are considered to have minimal uncertainty associated with them. For some other categories of emissions such as the extent of abandoned lands and water management techniques used in rice culti vati on, however, a lack of informati on increases the uncertainty surrounding the esti mates presented.
Table 2.7 summarizes the uncertainty assessment for the Bhutan GHG inventory. Based on expert judgment of specialists parti cipati ng in the
GHG Source Categories CO2-equiv CO2 CH4 N2O NOx CO NMVOC
All waste emissions 46.27 0.00 2.00 0.01 0.00 0.00 0.00
A Solid Waste Disposal on Land 38.90 0.00 1.85 0.00 0.00 0.00 0.00
B Wastewater Handling 7.38 0.00 0.15 0.01 0.00 0.00 0.00
C Waste Incinerati on 0.00 0.00 0.00 0.00 0.00 0.00 0.00
D Other (please specify) 0.00 0.00 0.00 0.00 0.00 0.00 0.00
Table 2.6: GHG emissions from waste management acti vity, 2000 (Gg)
Chapter Two : Nati onal Greenhouse Gas Inventory
32
development of the inventory, the confi dence in the results for each source/sink category was evaluated relati ve to the uncertainty associated with data quality and emission factor suitability. Less than 10% uncertainty was considered to be low; uncertainty between 10% and 50% was considered medium; and uncertainty greater than 50% was considered high.
Att enti on to two areas could help reduce uncertainty in Bhutan’s GHG inventory. First, improving the accuracy of some emission factors to calculate emissions from a variety of sources is vital. Most of the emission factors correspond to IPCC default factors. However, as noted in the above table, there are numerous emission factor categories, parti cularly for agriculture LUCF, and waste, that
are classifi ed as having medium uncertainty (i.e., uncertainty between 10% and 50%). For example, the accuracy of current emission factors for enteric fermentati on by animals at high alti tude remains uncertain in the absence of local sampling and testi ng acti viti es. Secondly, the availability of detailed acti vity data will support refi nement of inventory esti mates. Although methodologies have been used to esti mate emissions for some sources, problems arose in obtaining acti vity data at a level of detail in which aggregate emission factors can be applied. Addressing these areas through additi onal capacity strengthening and development of dedicated observati on networks will enhance the quality and accuracy of future emission inventories.
Chapter Two : Nati onal Greenhouse Gas Inventory
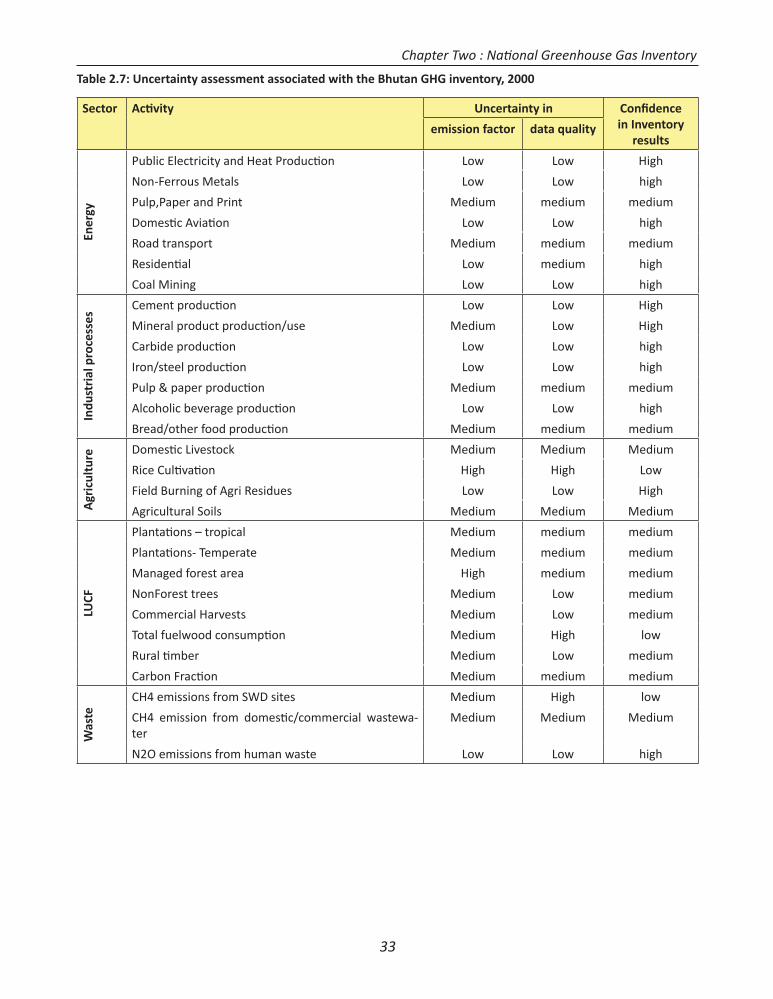
33
Table 2.7: Uncertainty assessment associated with the Bhutan GHG inventory, 2000
Sector Acti vity Uncertainty in Confi dence in Inventory
resultsemission factor data quality
Ener
gy
Public Electricity and Heat Producti on Low Low High
Non-Ferrous Metals Low Low high
Pulp,Paper and Print Medium medium medium
Domesti c Aviati on Low Low high
Road transport Medium medium medium
Residenti al Low medium high
Coal Mining Low Low high
Indu
stri
al p
roce
sses
Cement producti on Low Low High
Mineral product producti on/use Medium Low High
Carbide producti on Low Low high
Iron/steel producti on Low Low high
Pulp & paper producti on Medium medium medium
Alcoholic beverage producti on Low Low high
Bread/other food producti on Medium medium medium
Agr
icul
ture Domesti c Livestock Medium Medium Medium
Rice Culti vati on High High Low
Field Burning of Agri Residues Low Low High
Agricultural Soils Medium Medium Medium
LUCF
Plantati ons – tropical Medium medium medium
Plantati ons- Temperate Medium medium medium
Managed forest area High medium medium
NonForest trees Medium Low medium
Commercial Harvests Medium Low medium
Total fuelwood consumpti on Medium High low
Rural ti mber Medium Low medium
Carbon Fracti on Medium medium medium
Was
te
CH4 emissions from SWD sites Medium High low
CH4 emission from domesti c/commercial wastewa-ter
Medium Medium Medium
N2O emissions from human waste Low Low high
Chapter Two : Nati onal Greenhouse Gas Inventory

Chapter Three
Miti gati on Measures

37
3.1 Introducti on
3.1.1 MethodologyHaving consulted with the various key stakeholders in public and private sectors, this chapter summarises the miti gati on policies and measures that are being taken and can be taken in Bhutan to reduce GHG emissions. The current and future GHG trends along with the technical, fi nancial, regulatory and insti tuti onal barriers and challenges are discussed.
Future trends from energy and industry sectors, the two sectors with growing emissions, are based on results of energy demand simulati ons using Long-range Energy Assessment Plan (LEAP) model as detailed in the Integrated Energy Management Plan (IEEMP) developed by the Department of Energy and TERI in 2010. The emission factors for each fuel types were used to convert the energy intensity data into potenti al GHG emissions. In the IEEMP the scenarios for the various sub-sectors were simulated for the base year of 2005 and projected for 2010, 2015 and 2020 under four scenarios (although in this chapter only 2020 data are considered):
Business-as-Usual scenario (BAU) - In the absence of any technological or policy interventi on, this scenario is termed as the most likely path of development. This scenario incorporates existi ng government plans and policies, an average real gross domesti c product (GDP) growth rate of 7.7%
Energy-effi cient scenario (EE) - This scenario takes into account the specifi c energy effi ciency measures spanning across all sectors. Effi ciency improvements in existi ng devices and shift s to modern effi cient technologies are basic characteristi cs and sectoral variables are assumed to grow as per the BAU rates.
High growth scenario (HIG) - This scenario assumes a high GDP growth rate of 10% (uniform over the modeling ti me frame, 2005–20). The HIG scenario is characterized
by a shift of the economy towards growth led by the industrial and service sector, with the latt er dominati ng in terms of its contributi on to GDP.
High growth coupled with energy effi ciency (HIGEE) - Finally, the HIGEE scenario combines a high GDP growth rate of 10% with high energy effi ciency measures. This scenario is representati ve of the most opti misti c scenario in terms of both economic growth and technological interventi ons.
3.1.2 GHG Emission Trends
The GHG emission trends for the energy, industrial process, agriculture and waste sectors are shown in Figure 3.1. As is evident, emissions from Bhutan are currently dominated by the agriculture sector but without clear trends in emission. However, with rapid economic development over the last few decades, there has been steady growth in emissions from energy consumpti on and industrial processes. Emissions from industrial processes increased from 142.14 Gg CO2 to 237.76 GgCO2 in 2000 to 505.03 GgCO2 in 2009. Emissions from energy have also steadily increased from 175.22 Gg CO2e in 1995 to 270.23 Gg CO2e in 2000 to 500.87 Gg CO2e in 2009.
3.2 Current Miti gati on measuresIn 2009, the government of Bhutan issued a declarati on ti tled “Declarati on of the Kingdom of Bhutan- The Land of Gross Nati onal Happiness to Save our Planet” Bhutan committ ed to “keep absorbing more carbon than we emit – and to maintain our country’s status as a net sink for Green House Gasses”. Keeping in line with this bold declarati on, the Economic Development Policy of 2010 also states that “green growth” will be encouraged in promoti ng industrial and private sector development. The declarati on also calls for the internati onal community to support Bhutan in fulfi lling this commitment. A strategy for Bhutan to maintain Carbon Neutrality is also under preparati on and will be completed by end of 2011.
Chapter Three : Miti gati on Measures
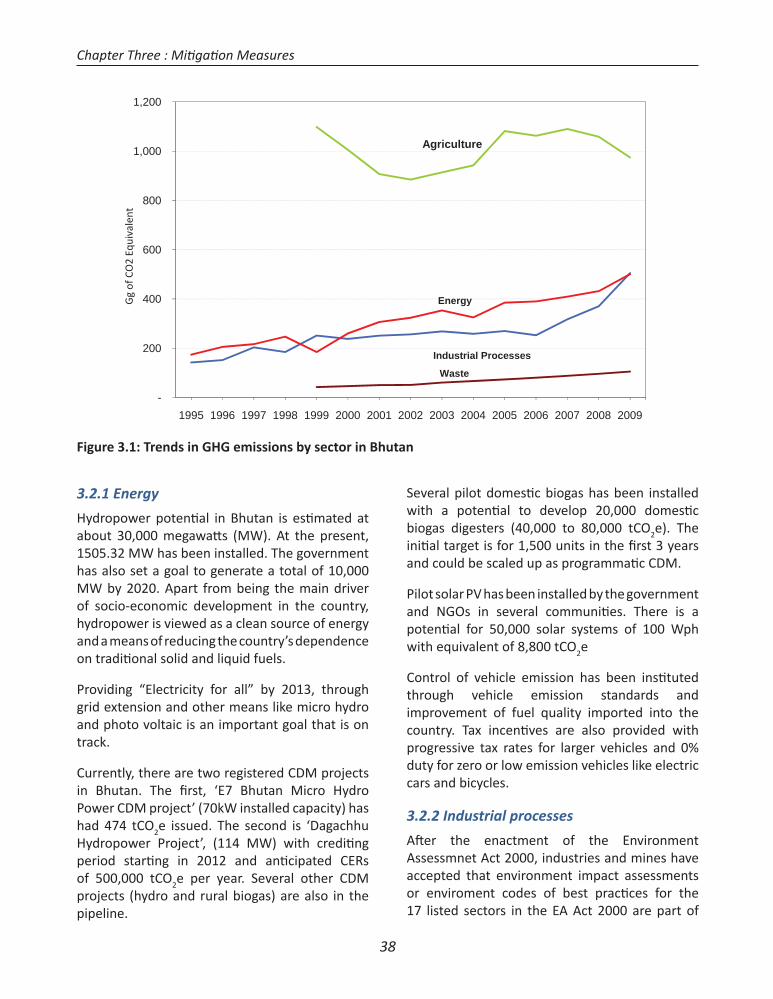
38
3.2.1 Energy
Hydropower potenti al in Bhutan is esti mated at about 30,000 megawatt s (MW). At the present, 1505.32 MW has been installed. The government has also set a goal to generate a total of 10,000 MW by 2020. Apart from being the main driver of socio-economic development in the country, hydropower is viewed as a clean source of energy and a means of reducing the country’s dependence on traditi onal solid and liquid fuels.
Providing “Electricity for all” by 2013, through grid extension and other means like micro hydro and photo voltaic is an important goal that is on track.
Currently, there are two registered CDM projects in Bhutan. The fi rst, ‘E7 Bhutan Micro Hydro Power CDM project’ (70kW installed capacity) has had 474 tCO2e issued. The second is ‘Dagachhu Hydropower Project’, (114 MW) with crediti ng period starti ng in 2012 and anti cipated CERs of 500,000 tCO2e per year. Several other CDM projects (hydro and rural biogas) are also in the pipeline.
Several pilot domesti c biogas has been installed with a potenti al to develop 20,000 domesti c biogas digesters (40,000 to 80,000 tCO2e). The initi al target is for 1,500 units in the fi rst 3 years and could be scaled up as programmati c CDM.
Pilot solar PV has been installed by the government and NGOs in several communiti es. There is a potenti al for 50,000 solar systems of 100 Wph with equivalent of 8,800 tCO2e
Control of vehicle emission has been insti tuted through vehicle emission standards and improvement of fuel quality imported into the country. Tax incenti ves are also provided with progressive tax rates for larger vehicles and 0% duty for zero or low emission vehicles like electric cars and bicycles.
3.2.2 Industrial processes
Aft er the enactment of the Environment Assessmnet Act 2000, industries and mines have accepted that environment impact assessments or enviroment codes of best practi ces for the 17 listed sectors in the EA Act 2000 are part of
Industrial Processes
Agriculture
Energy
Waste
-
200
400
600
800
1,000
1,200
1995 1996 1997 1998 1999 2000 2001 2002 2003 2004 2005 2006 2007 2008 2009
Gg
ofCO
2Eq
uiva
lent
Figure 3.1: Trends in GHG emissions by sector in Bhutan
Chapter Three : Miti gati on Measures
39
overall business planning and management. Two phases of Cleaner Technology and Environmental Management (CTEM) support were provided to industries in the last decade. The fi rst phase covered awareness, capacity building and piloti ng of CTEM projects. The second phase from 2004 focused on cleaner producti on guidelines for the steel, ferro-silicon, cement, food, wood industries and the mining sector and also an environmental management plan for Pasakha industrial estate. These industries representi ng the largest number of industrial acti viti es in the country are taking measures to insti tuti onalise CTEM and also understand that reduced waste improves bott omline.
The Associati on of Bhutanese Industries has established an informati on cell to disseminate CTEM informati on to members. However, industries also face challenges in terms of resources for wider adopti on of CTEM.
3.2.3 Agriculture
The government is promoti ng “Zero Grazing Policy” to make the best use of animal waste. This shall be complemented with biogas project to generate energy and reduce dependence on fossil fuels, electricity, and forest in small homesteads. The feed and fodder program shall ensure the provision of bett er feeds that will have reduced GHG emission from animals and improved producti vity.
Under the GEF-WB funded Sustainable Land Management Programme (SLMP) parti cipatory Sustainable Land Management is currently acti ve in Trashigang, Chukha and Zhemgang and provides support to nine geogs in these three Dzongkhags. Acti viti es are also underway for mainstreaming socio-economy and preventi on of rangeland degradati on by nomads of Haa in Western Bhutan. The SLM practi ces being developed in the following three sectors are:
Agriculture - support for land management through demonstrati on of vegetati ve and non-vegetati ve on-farm soil conservati on measures. Measures include hedgerow using
fodder species, which serve as important source of fodder for livestock. Farm soil conservati on, creati ons of plantati on crops is also supported.
Livestock – Improved breed and livestock management practi ces are promoted and supported to reduce the number of stray and unproducti ve catt le in order to ulti mately reduce number of livestock populati on grazing free in the forest.
Forestry - the project supports establishment of community and private forestry and reforestati on program that are of direct benefi ts to the farmers.
The UNDP/GEF supported Sustainable Land Management Programme is helping various communiti es in Dagana Dzongkhag to combat land degradati on and secure sustainable farmland for future generati ons. This is part of a bigger project promoti ng SLM practi ces in Dagana, Sarpang, Samtse, Bumthang and Trongsa. A community group comprised of members from all households has been formed to initi ate this joint eff ort in combati ng land degradati on and securing sustainable farmland for future generati ons. Apart from terracing, contour bunding and building check dams to control soil erosion, sustainable agricultural practi ces through parti cipatory SLM approaches is also promoted. To meet the demand for fuel wood, fodder and fruit trees, the project supported a nursery on private land voluntarily contributed by the community leaders.
GEF Small Grants Program in the area of climate change miti gati on, projects include promoti on of renewable energy technologies by removing barriers and reducing implementati on costs.
3.2.4 Land Use Change and Forestry
The consti tuti on of Bhutan mandates that 60% of the country shall remain under forest cover. In line with this the Nati onal Forest Policy (2008) states its goal that “Bhutan’s forest resources and biodiversity are managed sustainably and
Chapter Three : Miti gati on Measures
40
equitably to produce a wide range of social, economic and environmental goods and services for the opti mal benefi t of all citi zens while sti ll maintaining 60% of the land under forest, thereby contributi ng to Gross Nati onal Happiness”. Currently 74.46% of the land or 27,052.9km2 is forested. The 2nd GHG Inventory esti mates that 6309Gg of CO2 was sequestered in 2000.
Bhutan has one of the highest proporti ons of area under protected areas in the world with fi ve nati onal parks, four wildlife sanctuaries and a strict nature reserve, altogether making up an area of 16,396.43 km2 or 42.71 percent of the country’s total area(NCD 2009).
The forest policy mandates that ti mber producti on is for domesti c demand only and commercial logging is limited to forest management units and very small concession areas, rural ti mber demand is met through ti mber marking. There are a total of 18 FMUs in operati on with scienti fi c silvicultural management plans. The operati onal and planned FMUs collecti vely cover a total forest area of 238,633 hectares. This fi gure translates to roughly eight percent of the total forest area and 48 percent of the total forest area manageable for ti mber producti on.
Shift ing culti vati on (tseri) which was practi ced in the eastern region of the country is now illegal and other farming methods are promoted.
As a nati onal programme, reforestati on of degraded and barren forest lands was the earliest conservati on initi ati ve in Bhutan. As early as 1947, the fi rst forest plantati on was established, 11 years prior to the DoF coming into being. Since then, reforestati on has been carried out on more than 21,500 ha. Reforestati on has been a regular feature in all the Five Year Plans and has been carried out at the rate of about 2,400 ha per Five Year Plan.
Since the reiniti ati on of a program on community forestry from 2001, 313 community forest
units covering 36,649 ha of forest land were established (as of June 2011) (SFD 2011).
3.2.5 Waste
Waste Preventi on and Management Act 2009 came into force with the principles of Reduce, Reuse and Recycle and allows for penalti es and incenti ves. Public Private Partnership models for waste management including recycling and composti ng has also been initi ated.
3.3 EnergyDue to rapid economic growth over the last few decades, GHG emissions in the energy sector increased signifi cantly from 175Gg CO2e in 1995 to 260.31 Gg CO2e in 2000 and 500.87 Gg CO2ein 2009. This large increase was mainly due to increasing energy emissions from transportati on and industries (Figure 3.2). Emissions from the residenti al sector are fairly constant. As almost all energy produced in Bhutan is from fuelwood or hydropower, and GHG emissions from energy industries (backup generators) are less than 1% of the nati onal emissions.
3.3.1 Energy situati on in BhutanThe energy needs of the Bhutanese economy can be categorized in the following manner: resources for electricity generati on; fuels and resources for transport which is dependent on import of petrol and diesel and jet fuel; and fuels to meet heat and mechanical energy demand of the industrial, commercial, and residenti al sectors (excluding electricity). Bhutan is endowed with rich water resources, along with abundant biomass reserves. Both these resources are being exploited in a sustainable manner to fulfi l the energy needs of the people whilst making sure that GHG emissions are managed sustainably.
Recognizing the importance of energy for poverty alleviati on, the Royal Government has been taking several measures to accomplish its ambiti ous goal of ‘electricity for all by 2020’
Chapter Three : Miti gati on Measures
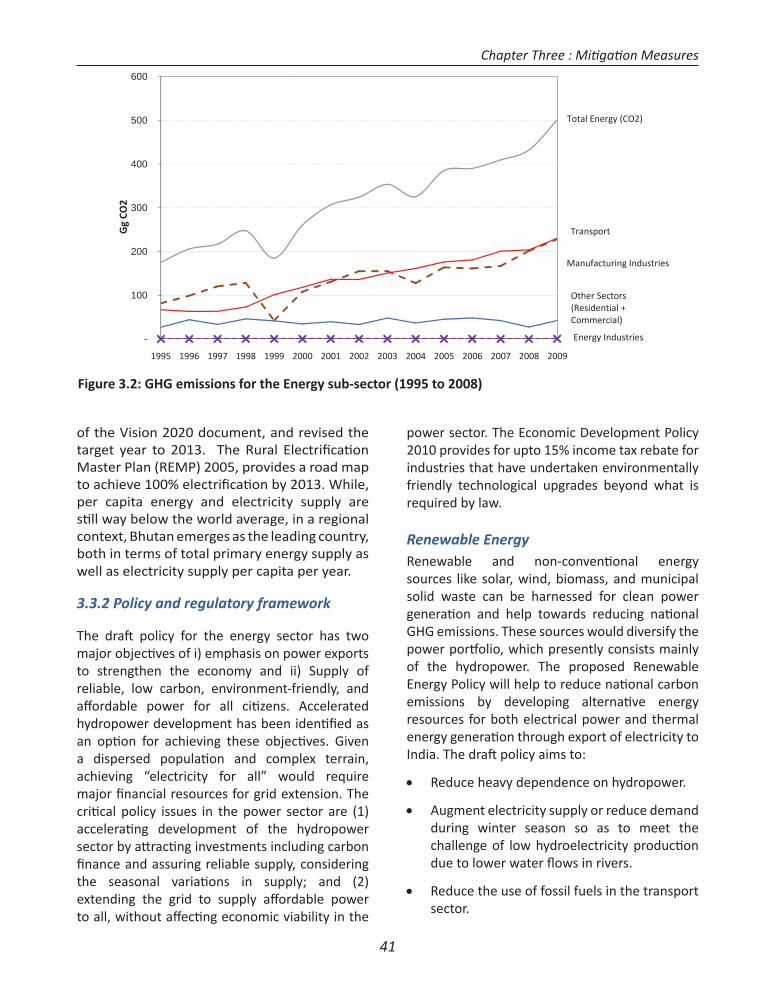
41
of the Vision 2020 document, and revised the target year to 2013. The Rural Electrifi cati on Master Plan (REMP) 2005, provides a road map to achieve 100% electrifi cati on by 2013. While, per capita energy and electricity supply are sti ll way below the world average, in a regional context, Bhutan emerges as the leading country, both in terms of total primary energy supply as well as electricity supply per capita per year.
3.3.2 Policy and regulatory framework
The draft policy for the energy sector has two major objecti ves of i) emphasis on power exports to strengthen the economy and ii) Supply of reliable, low carbon, environment-friendly, and aff ordable power for all citi zens. Accelerated hydropower development has been identi fi ed as an opti on for achieving these objecti ves. Given a dispersed populati on and complex terrain, achieving “electricity for all” would require major fi nancial resources for grid extension. The criti cal policy issues in the power sector are (1) accelerati ng development of the hydropower sector by att racti ng investments including carbon fi nance and assuring reliable supply, considering the seasonal variati ons in supply; and (2) extending the grid to supply aff ordable power to all, without aff ecti ng economic viability in the
power sector. The Economic Development Policy 2010 provides for upto 15% income tax rebate for industries that have undertaken environmentally friendly technological upgrades beyond what is required by law.
Renewable EnergyRenewable and non-conventi onal energy sources like solar, wind, biomass, and municipal solid waste can be harnessed for clean power generati on and help towards reducing nati onal GHG emissions. These sources would diversify the power portf olio, which presently consists mainly of the hydropower. The proposed Renewable Energy Policy will help to reduce nati onal carbon emissions by developing alternati ve energy resources for both electrical power and thermal energy generati on through export of electricity to India. The draft policy aims to:
Reduce heavy dependence on hydropower.
Augment electricity supply or reduce demand during winter season so as to meet the challenge of low hydroelectricity producti on due to lower water fl ows in rivers.
Reduce the use of fossil fuels in the transport sector.
Energy Industries
Manufacturing Industries
Transport
Other Sectors(Residential +Commercial)
Total Energy (CO2)
-
100
200
300
400
500
600
1995 1996 1997 1998 1999 2000 2001 2002 2003 2004 2005 2006 2007 2008 2009
Gg
CO2
Figure 3.2: GHG emissions for the Energy sub-sector (1995 to 2008)
Chapter Three : Miti gati on Measures
42
Introduce environment-friendly and locally available fuels/energy resources to meet demand for energy, especially in remote and dispersed locati ons.
Diversifi cati on of the energy mix through renewable energy is both a miti gati on and adaptati on measure as the existi ng seasonal shortage of hydropower in the winter is projected to get worse under future climate change (see Chapter 4). Diversifi cati on of energy supply can be uti lized to both avoid use of fossil fuels for energy generati on and also for energy security under climate change. Such measures could include storage type hydro plants that can also increase water supply rather than just relying on run-of-river hydropower schemes. Such multi -purpose hydropower plants can also prevent fl ooding and provide water for drinking and irrigati on. An overview of some of the potenti al renewable energy (other than hydro) is presented below.
a. Bioenergy
Biomass largely consists of unrefi ned fuels that are used in a traditi onal way, such as solid biomass used in traditi onal cook stoves for cooking, water heati ng, and space heati ng. “Modern bioenergy” is used aft er their conversion into more effi cient energy carriers with higher calorifi c value (such as pellets, briquett es, bio-diesel, and biogas) and/ or are used in the effi cient equipment (such as improved cook stoves and gasifi ers). Liquid biofuels such as straight vegetable oils (SVO) and bio-diesel are currently being explored as alternati ves to petroleum fuels, especially for the transport sector. In Bhutan, these fuels will have limited role due to limited land available for culti vati on.
b. Biomass-based power generati on
Biomass-based power generati on – either through direct combusti on or through gasifi cati on– is an established technology worldwide. Biomass-based power generati on can supplement the power generati on capacity for conti nuous power generati on: i) Off -grid power generati on using biomass - Locally available biomass in decentralized power generati on using biomass gasifi ers where producer gas is used for various
applicati ons, including power generati on. ii) Thermal applicati ons of biomass - Current biomass appliance/technology used for heati ng and cooking in residenti al and insti tuti onal sectors can be upgraded to modern effi cient biomass technologies like gasifi er and briquetti ng for thermal applicati ons. and iii) Pelleti zati on - Pellets produced from various raw materials like agro-waste, sawdust, and pine needles are easy to handle and transport, and advanced automati c pellet stoves and space heaters have made pellets simple and effi cient to use.
c. Wind energy
While Bhutan has good wind potenti al, the development of wind farms is constrained by various issues, as outlined in the IEMMP: i) Infrastructure development - Typically, wind machines of large capaciti es are installed on 50–80m towers, and wind generator blades are typically 20–30m long but current road infrastructure may not be adequate to transport such blades and heavy machinery; ii) Public opinion - There is concern that large wind machines may spoil the aestheti c and natural beauty of the landscape, and that they may also be harmful for endangered birds such as White bellied herons especially in Punakha and Wangdi valley and other areas where black necked cranes are found and iii) Small wind machines and water pumping wind mills - Small wind machines (less than 100 kW) and mechanical wind pumps to generate electricity or water pumping for irrigati on and drinking could be installed in isolated locati ons for scatt ered households, and could be coupled with solar photovoltaic power plants in hybrid mode to generate electricity for small villages.
d. Solar energy
The solar energy resource in the southern part of the country is about 4.0 kWh/m2 and about 5.0 kWh/m2 per day at high alti tudes in the northern part of Bhutan (NREL, 2009). Some suitable areas are located near transmission lines and have potenti al for on grid connecti on. Assessments using satellite imaging show some areas with moderate (300-400 W/m2) to excellent (500-600 W/m2) potenti al in several valleys throughout the
Chapter Three : Miti gati on Measures
43
country but these data will need further ground data validati on. Solar photovoltaic technologies are expensive but can be considered as an alternati ve for electricity producti on.
Grid-connected solar photovoltaic plants of few hundred kilowatt capaciti es are generally cheaper. Currently, solar photovoltaic power generati on costs are in the range Nu 15–30/ kWh, depending on the site, technology, and size of the plant. These costs are, thus, very high compared to hydropower unless the cost of grid extension as well as low capacity uti lizati on of this infrastructure is also taken into account.
e. Geothermal energy
Geothermal energy is the heat energy available in the core of the earth. Several hot springs (tsachhus) are known to exist in Bhutan in northern Bhutan at Gasa, Punakha, upper Trongsa, Bumthang, and Lhunetse dzongkhags and in southern Bhutan at Rongkhola and Bhurkhola. These are traditi onally used for bathing, as the water is believed to have medicinal and healing properti es.
3.3.3 Energy demand in the manufacturing and constructi on sector
Spurred by the lowest electricity tariff s in the region there has been a rapid growth in industrial acti viti es in the past few decades (see Chapter 1). The industrial sector as a whole consumed about 25.5% of total energy in the country and 64.7% of total electricity (DoE 2005). Other fuels that are used in the sector include coal, furnace oil, kerosene, light diesel oil (LDO), and fuelwood. Though the industrial sector in Bhutan has many small and medium scale industries, energy consumpti on in the industrial sector is dominated by few large energy-intensive industries. Electricity consumers are categorized in three groups: (i) Low voltage consumers (230 volts and 415 volts) are mostly the residenti al and commercial sectors and a number of small-scale industries; (ii) Medium voltage consumers (6.6 kV, 11 kV, and 33 kV) are medium-scale and some small-scale industries, and (iii) High voltage consumers (66 kV and above) are heavy, power-
intensive industries.
For energy projecti ons, analysis has been done separately for both energy intensive and non-energy-intensive industries under the IEMMP. However, detailed data was available only for six major operati ng units which are classifi ed as energy intensive industries (Bhutan Ferro Alloys Ltd, Bhutan Calcium Carbide Ltd, Penden Cement Authority Ltd, Druk Cement Company Ltd, Druk Iron and Steel Ltd, and Bhutan Steels Ltd). All other remaining industries are classifi ed as non-energy intensive industries. In 2005, these six energy intensive industries consumed close to 90% of the total sectoral energy consumpti on and 62% of the country’s electricity consumpti on. Being powered by hydropower, the GHG emissions are relati vely low and the products are for export with India as the main internati onal market. Energy equivalent of petroleum products use is 9,000 tonnes of oil equivalent (TOE), while that of electricity is 33,000 TOE. In the following secti ons, the existi ng energy consumpti on patt erns (energy intensiti es), technologies used in energy-intensive units, and the potenti al for energy conservati on are discussed.
Emissions from energy use in manufacturing industries grew by from 81.42 Gg CO2 in 1995 to 107.84GgCO2e in 2000 to 228.10 GgCO2e in 2009 (Figure 3.2). Potenti al future GHG emissions trends were simulated using data generated through LEAP assessment in the IEMMP (DoE 2010). Each fuel was converted to potenti al GHG emissions with appropriate emission factor. The energy supply and demand scenarios for the various sub-sectors from 2005 to 2020 were simulated under four scenarios as described in secti on 3.1.1. As menti oned earlier, these energy-intensive industries mostly consume electricity and coal and future demand for these inputs by energy-intensive industries is presented in Figures 3.3.
a. Electricity
The 2005 total electricity consumpti on by energy-intensive industries is 377 million kWh (GWh) and is expected to reach 2,192 million kWh by 2020 under the BAU scenario. Being of hydro source,
Chapter Three : Miti gati on Measures
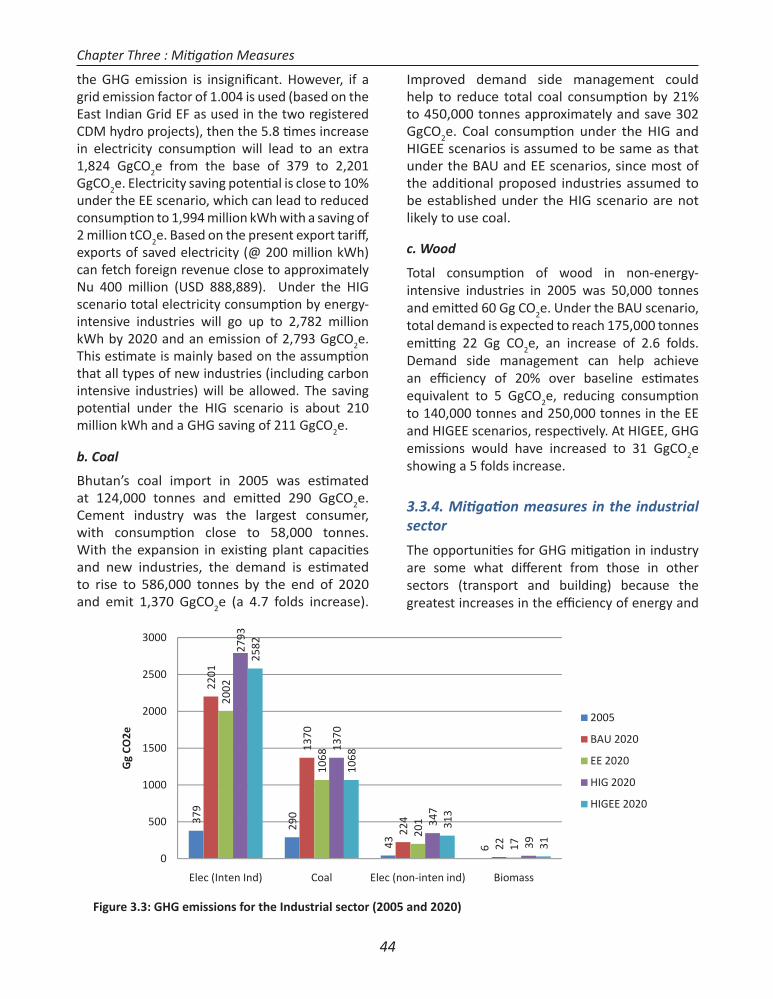
44
the GHG emission is insignifi cant. However, if a grid emission factor of 1.004 is used (based on the East Indian Grid EF as used in the two registered CDM hydro projects), then the 5.8 ti mes increase in electricity consumpti on will lead to an extra 1,824 GgCO2e from the base of 379 to 2,201 GgCO2e. Electricity saving potenti al is close to 10% under the EE scenario, which can lead to reduced consumpti on to 1,994 million kWh with a saving of 2 million tCO2e. Based on the present export tariff , exports of saved electricity (@ 200 million kWh) can fetch foreign revenue close to approximately Nu 400 million (USD 888,889). Under the HIG scenario total electricity consumpti on by energy-intensive industries will go up to 2,782 million kWh by 2020 and an emission of 2,793 GgCO2e. This esti mate is mainly based on the assumpti on that all types of new industries (including carbon intensive industries) will be allowed. The saving potenti al under the HIG scenario is about 210 million kWh and a GHG saving of 211 GgCO2e.
b. Coal
Bhutan’s coal import in 2005 was esti mated at 124,000 tonnes and emitt ed 290 GgCO2e. Cement industry was the largest consumer, with consumpti on close to 58,000 tonnes. With the expansion in existi ng plant capaciti es and new industries, the demand is esti mated to rise to 586,000 tonnes by the end of 2020 and emit 1,370 GgCO2e (a 4.7 folds increase).
Improved demand side management could help to reduce total coal consumpti on by 21% to 450,000 tonnes approximately and save 302 GgCO2e. Coal consumpti on under the HIG and HIGEE scenarios is assumed to be same as that under the BAU and EE scenarios, since most of the additi onal proposed industries assumed to be established under the HIG scenario are not likely to use coal.
c. Wood
Total consumpti on of wood in non-energy-intensive industries in 2005 was 50,000 tonnes and emitt ed 60 Gg CO2e. Under the BAU scenario, total demand is expected to reach 175,000 tonnes emitti ng 22 Gg CO2e, an increase of 2.6 folds. Demand side management can help achieve an effi ciency of 20% over baseline esti mates equivalent to 5 GgCO2e, reducing consumpti on to 140,000 tonnes and 250,000 tonnes in the EE and HIGEE scenarios, respecti vely. At HIGEE, GHG emissions would have increased to 31 GgCO2e showing a 5 folds increase.
3.3.4. Miti gati on measures in the industrial sector
The opportuniti es for GHG miti gati on in industry are some what diff erent from those in other sectors (transport and building) because the greatest increases in the effi ciency of energy and
379
290
43 6
2201
1370
224
22
2002
1068
201
17
2793
1370
347
39
2582
1068
313
31
0
500
1000
1500
2000
2500
3000
Elec (Inten Ind) Coal Elec (non inten ind) Biomass
Gg
CO2e
2005
BAU 2020
EE 2020
HIG 2020
HIGEE 2020
Figure 3.3: GHG emissions for the Industrial sector (2005 and 2020)
Chapter Three : Miti gati on Measures
45
materials use oft en come not from direct eff orts to reduce consumpti on, but rather from pursuing other goals such as improved product quality and lower producti on costs. Industry is also diff erent in that, fi rms usually have an incenti ve to improve effi ciency in order to reduce costs and maintain their profi tability. Furthermore, the Economic Development Policy 2010 provides upto 15% income tax rebate for industries that implement environmentally friendly technological upgrades beyond what is required by law. Some of the recommended opti ons for energy effi ciency in industries are discussed below.
a. Small- and medium-scale industries
The main aim of this strategy is to improve energy effi ciency and reduce energy consumpti on as well as polluti on and GHG emissions in the small and medium-scale industries. The LEAP analysis has shown that implementi ng these measures will save approximately 10% of electricity in future. The DoE has established an energy laboratory under the IEMMP project. The laboratory faciliti es and the infrastructure available with the Department of Industry on Training and Capacity Building can be used to develop training and energy audit programmes for small-scale industries.
b. Ferro alloy industry
In 2000, 17237.02 tons of Ferro alloys producti on emitt ed 67.22 GgCO2. It is observed that the ferro alloy industry is one of the most energy intensive industries in Bhutan and accounts for more than one-third of the domesti c electric consumpti on. So, even a small saving can indeed make a signifi cant diff erence to total electricity scenario for Bhutan. In 2005, the largest ferro alloy plant in Bhutan is the Bhutan Ferro Alloys Ltd (BFAL). However, as large number of applicati ons for establishment of such units have been received and is presently only limited by power availability in the winter. Energy-effi cient technologies would need to be used extensively.
c. Cement industry
In additi on to being a heavy user of electricity, the cement industry is also the biggest consumer of coal in Bhutan. In 2000, 293994.67 tons of clinkers
producti on emitt ed 152.07 Gg CO2. Dungsam Cement Project is expected to be operati onal by end of 2011 and will produce 1 million tons of clinker annually adding three ti mes more CO2 emissions annually from this industry.
Process opti mizati on, load management, and operati onal improvement can lead to signifi cant energy saving, and although it involves marginal fi nancial investment, it is found to have encouraging results in energy saving. These include the following: Plugging of leakages in kiln and pre-heater circuit, raw mill, and coal mill circuits; Reducing idle running; Installing improved insulati ng bricks/blocks in kilns and pre-heaters; Uti lizing hot exit gases in an effi cient manner; Opti mizing cooler operati on; Opti mum loading of grinding media/grinding mill opti mizati on; Rati onalizing compressed air uti lizati on; Redesigning of raw mix; Installing capacitor banks for power factor improvement; Replacing over-rated motors with opti mally rated motors; Opti mizing kiln operati on; Changing from fl at belt to V-belt.
d. Iron and steel industry
As of 2009 there were 7 iron and steel industries in Bhutan with some specializing in iron re-rolling, while others in the iron and steel making. Emissions from iron and steel industry along with ferro alloys have increased signifi cantly since 2006 and surpassed emissions from cement industry (Figure 3.6).
Demand side management in industries is eff ecti vely done by adopti ng energy effi ciency measures and promoti ng energy-effi cient technologies. The energy audits carried out during the IEMMP project have shown that the industries have the potenti al to save energy and reducti on in GHG emissions.
3.3.5 Energy Demand in Transport Sector
The transport sector in Bhutan is characterized by the dominance of road and air transport. Being a mountainous country, rivers generally do not run very deep, and use of waterways for transport is non-existent. In some places, ropeways are being
Chapter Three : Miti gati on Measures
46
used for the transportati on of logs and other materials. However, foot trails, ponies and yaks are sti ll widely used in Bhutan and especially where road connecti vity is lacking.
Internati onal aviati on from Bhutan is limited to the Druk Air, the nati onal carrier, which operates two Airbus A319s, and supplemented by one turboprop aircraft on lease. Limited domesti c air services with turboprop planes is planned to begin by 2011. Nevertheless the transport sector is one of the signifi cant sectors with emissions in Bhutan. Emissions from transport have grown consistently from 66.81Gg CO2in 1995 to 230.36 Gg CO2 in 2009 (Figure 3.2).
Diesel, gasoline, and ATF are the main fuels consumed in the transport sector. Alternati ve fuels like compressed natural gas (CNG) and LPG are not used for transportati on in Bhutan. Of the three major transportati on fuels imported in Bhutan, diesel has the largest share.
The import of petrol has gone up more than three ti mes over the period 1995–2005, while that of diesel has risen 2.5 ti mes during the same period. The number of vehicles is growing at 9-10% per annum and the consumpti on of petroleum products for surface transport is likely to grow 3 ti mes the current level of petroleum product consumpti on by 2020 (RSTA 2007). Besides the rising cost of petrol and diesel, complete dependence of the transport sector on imported fuels is a concern from the energy security perspecti ve.
Diesel
In the IEMPP, diesel consumpti on in 2005 is reported to be 53878 kilolitres (equivalent of 144.46 Gg CO2) and is expected to reach 191,100 kilolitres in the BAU scenario (3.7 folds increase to 507 Gg CO2) and 284,000 kilolitres in the HIG scenario (751 GgoCO2e). Energy-effi cient diesel engines can reduce the consumpti on of diesel by about 10% to 171,694 kilolitres and 256,178 kilolitres under the EE and HIGEE scenarios, respecti vely (Figure 3.4). This will provide a saving of between 50 to 76 GgCO2 for both scenarios.
Aviati on turbine fuel
In the BAU scenario, it is predicted that a total import of 3,495 kilolitres of ATF will be required and emit 9 GgCO2e, while in the HIG, the import demand can reach as high as 5,074 kilolitres by 2020 to give an emission of 13 GgCO2e.
Petrol
Volume of petrol imports is esti mated at 13,775 kilolitres and an emission of 31.96 GgCO2 in 2005. Projecti ons from LEAP peg the total import demand at 51,673 kilolitres in the BAU scenario and emit 120 GgCO2 in 2020, while in the HIG scenario, the total demand is expected to be 78,402 kilolitres with an emission of 183 GgCO2. Effi ciency improvement of 14% for petrol-driven engines can reduce the consumpti on to 44,439 kilolitres and 67,426 kilolitres, respecti vely, in the EE and HIGEE scenarios, respecti vely. This will give a saving of between 17 and 23 GgCO2e with improved effi cient petrol vehicles.
3.3.6 Miti gati on opti ons for transport sector
Some of the management strategies explored in the Surface Transport Master Plan for Bhutan also provide opti ons for miti gati on opti ons for the transport sector and are discussed below.
a. Improving effi ciency of petrol and diesel vehicles through standards
The import of old and second hand cars is prohibited in Bhutan and so far prevented the dumping of old and ineffi cient vehicles in the country which can increase GHG emissions. Vehicle emission standards have also been established and import duti es removed for spare parts that are essenti al in engine exhaust control. Other measure taken include the check on quality of fuel imported aft er vehicle emissions monitoring revealed that fuel quality was one of the major causes of vehicular polluti on in Bhutan. Vehicle emissions standard and type standards (Euro and Bharat Standards) are to be reviewed periodically and made more stringent to encourage effi ciency and reduce local air polluti on. Increasing capacity of workshops and mechanics in vehicle maintenance and drivers will also be essenti al as improved eco-driving methods
Chapter Three : Miti gati on Measures
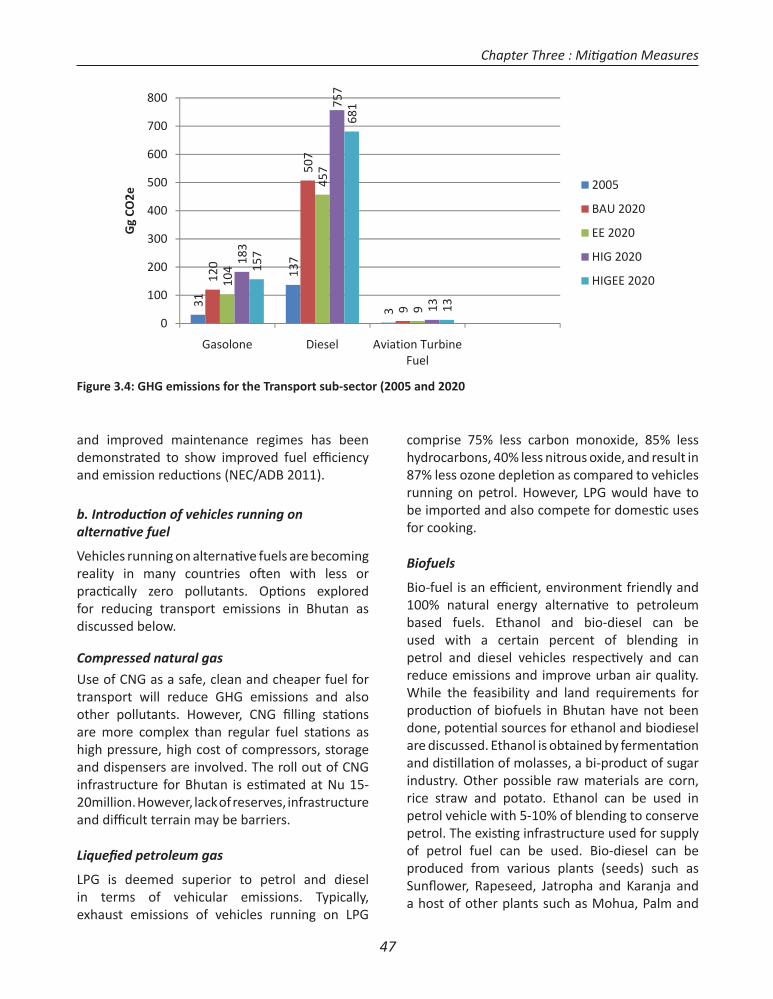
47
and improved maintenance regimes has been demonstrated to show improved fuel effi ciency and emission reducti ons (NEC/ADB 2011).
b. Introducti on of vehicles running on alternati ve fuel
Vehicles running on alternati ve fuels are becoming reality in many countries oft en with less or practi cally zero pollutants. Opti ons explored for reducing transport emissions in Bhutan as discussed below.
Compressed natural gas
Use of CNG as a safe, clean and cheaper fuel for transport will reduce GHG emissions and also other pollutants. However, CNG fi lling stati ons are more complex than regular fuel stati ons as high pressure, high cost of compressors, storage and dispensers are involved. The roll out of CNG infrastructure for Bhutan is esti mated at Nu 15-20million. However, lack of reserves, infrastructure and diffi cult terrain may be barriers.
Liquefi ed petroleum gas
LPG is deemed superior to petrol and diesel in terms of vehicular emissions. Typically, exhaust emissions of vehicles running on LPG
comprise 75% less carbon monoxide, 85% less hydrocarbons, 40% less nitrous oxide, and result in 87% less ozone depleti on as compared to vehicles running on petrol. However, LPG would have to be imported and also compete for domesti c uses for cooking.
Biofuels
Bio-fuel is an effi cient, environment friendly and 100% natural energy alternati ve to petroleum based fuels. Ethanol and bio-diesel can be used with a certain percent of blending in petrol and diesel vehicles respecti vely and can reduce emissions and improve urban air quality. While the feasibility and land requirements for producti on of biofuels in Bhutan have not been done, potenti al sources for ethanol and biodiesel are discussed. Ethanol is obtained by fermentati on and disti llati on of molasses, a bi-product of sugar industry. Other possible raw materials are corn, rice straw and potato. Ethanol can be used in petrol vehicle with 5-10% of blending to conserve petrol. The existi ng infrastructure used for supply of petrol fuel can be used. Bio-diesel can be produced from various plants (seeds) such as Sunfl ower, Rapeseed, Jatropha and Karanja and a host of other plants such as Mohua, Palm and
31
137
3
120
507
9
104
457
9
183
757
13
157
681
13
0
100
200
300
400
500
600
700
800
Gasolone Diesel Aviation TurbineFuel
Gg
CO2e
2005
BAU 2020
EE 2020
HIG 2020
HIGEE 2020
Figure 3.4: GHG emissions for the Transport sub-sector (2005 and 2020
Chapter Three : Miti gati on Measures
48
Soyabean. Jatropha appears to be most suitable for plantati on on under stocked forestlands, farmer’s fi eld boundaries to provide protecti ve hedge, fallow lands, public lands along highways, etc.
c. Electric vehicles
With abundant and cheap hydroelectricity, use of electricity for mass transport and electric/hybrid vehicles for personal transport are viable opti ons for Bhutan in medium term. Hybrid and electric vehicles are now being developed by many major automobile manufacturers worldwide. Tax incenti ves are already provided for purchase of electric vehicles. Further policy measures could be explored to encourage greater use through small scale assembly of electric cars, batt ery swaps and maintenance in the country.
d. Mass transit opti ons
Opti ons for mass transit such as electric trolley busses and light rail transit are also being explored through the Bhutan Urban Transport Systems Project as alternati ve transport systems. Mass transportati on systems must be promoted to tackle congesti on and air polluti on in the major urban areas of Bhutan.
Electric Trolley Bus
Electric trolley buses with motors powered by electricity from overhead wires and rubber-tyres, are more energy effi cient, quieter, operate bett er on hills, require less maintenance, and longer lasti ng than motor buses. Cheap hydropower in Bhutan is an advantage for this type of transport. However, trolley buses will be restricted to lines with a high-enough frequency of service as infrastructure costs are high.
Light RailTransit
Light Rail Transit (LRT) as Urban Rail Transit typically uses less massive equipments and infrastructure than rapid transit systems. LRTs can either run along the streets or share space with road traffi c or along their own right-of-way separated from road traffi c. Light rail may not be feasible due to high infrastructure costs and limited space for dedicated lines.
Bus Rapid Transits
Among the transport opti ons considered, Bus Rapid Transit (BRT) is the most viable and fl exible opti on. These buses running on dedicated lanes or by providing priority on roads could be powered by electricity and the need to create an electric bus trolley line will not be necessary. The management of batt eries by establishing a nati onal infrastructure network for charging and loading batt eries will have to be built.
e. Transport Demand Management
Transport Demand Management is seen as a new paradigm in transport management. Demand management measures could reduce GHG emissions and at the same ti me reduce congesti on and provide other local benefi ts. Some of the opti ons are discussed as follows:
Promoti on of Non Motorized Transport
Cycling has zero emissions and is a healthy practi ce and is growing among urban dwellers parti cularly in Thimphu. Adequate and user friendly infrastructure must be created for bicyclists. Walking is another very healthy opti on. Many people in the urban as well as rural Bhutan sti ll walk long distances. Yet, pedestrians remain invisible in the maze of motorized traffi c that choke the roads and walk in extremely unsafe and hosti le conditi ons. Citi es must build pedestrian friendly infrastructure instead of building more roads. Some porti on of road space must be dedicated for pedestrians.
Integrati on of Land Use and Transport Planning
While land use and transport are intricately linked to each other, land use planning has been done in isolati on without considering transport and travel needs of city dwellers. Urban planners need to disti nguish between moving people and goods from moving vehicles. Providing easy access to educati on, employment, and shopping and entertainment opportuniti es is what transport systems must provide. Predicti ng traffi c growth and providing infrastructure has been proven unsuccessful in many citi es worldwide
Chapter Three : Miti gati on Measures
49
and Bhutan must learn from the mistakes. Co-ordinati on issues between various agencies involved in transport must be addressed through restructuring insti tuti onal set ups and other reforms. All these measures should focus on the need to reduce travel.
Car pooling and car sharing practi ces
A growing trend of single occupancy driving is observed in almost all the urban centres. Such habits are highly unsustainable and un-economical. Car pooling and car sharing practi ces will help improve energy effi ciency, ease traffi c congesti ons and reduce GHG emissions.
Parking Management
Car ownership is growing at a very high rate (9-10% per annum) but without enough space for parking. This leads to reduced accessibility and mobility especially in city centres. Proper parking management policies impacts share of transport mode, supports local economic development, earns revenue, improves road safety and infl uences car ownership. Limited parking space should be bett er managed through pricing.
Road Pricing and Congesti on charging
Road pricing would not only re-orient travel to off -peak periods but would also reduce total demand for travel itself.
3.3.6 Residenti al sector energy demands
Biomass in the form of fuel wood is the main resource for rural residenti al energy requirements and emitt ed about 41.64Gg CO2-equivalent in 2000. The residenti al sector accounts for 48.7% of the total energy consumpti on, making it a highest energy consumer. The sector’s 91% demand is met by biomass, and the remaining 9% is accounted for by fuels like LPG, electricity, and kerosene. In the residenti al sector, energy is mainly used for cooking (66% of the total residenti al energy share) and fodder cooking (26%). There is a signifi cant diff erence in the energy consumpti on patt erns between the rural and urban areas. While rural
households primarily depend on fi rewood, the urban households rely more on electricity and petroleum fuels.
Electricity
Demand for electricity during 2005 in the residenti al sector was 80.2 million kWh and is expected to reach 175 million kWh by 2020, under the BAU scenario, whereas in the HIG scenario, the demand can be as high as 253 million kWh (Figure 3.5). Energy-saving measures can help reduce electricity consumpti on by 27%. No signifi cant GHG emissions are expected from the use of hydro-electricity.
Fuelwood
The demand in 2005 for fuelwood is 490,000 tonnes which emitt ed 59 Gg CO2and is highly skewed towards rural households that account for 95% of the total residenti al usage. Fuel switching is expected, and as a result, fuelwood usage will come down to 294,000 tonnes in the BAU scenario (Figure 3.5) to give a saving of 24 Gg CO2 (60% saving). In the HIG scenario, due to the faster switching to cleaner fuels like LPG and electricity, the consumpti on could come down to 150,000 tonnes and a further saving of 41 Gg CO2 (70%) from 2005 baseline. Demand side management, parti cularly in household cooking, can help achieve an effi ciency level of 30% (saving of 10 Gg CO2e).
Liquefi ed petroleum gas
The consumpti on of LPG is found to be on the lower side compared to other fuels but is expected to increase by 2.4 ti mes the present consumpti on of 2,900 tonnes to give an increase in emissions of 11 Gg CO2 (2.76 tCO2/t LPG). In the HIG scenario, consumpti on could reach 9,000 tonnes and emit an extra 17 Gg CO2 over the base year of 2005 (Figure 3.5). Achievable effi ciency improvement is 5%, as the devices in use do not have a scope for improvement, which can lead to reducti on in consumpti on, with the fi gures in the EE and HIGEE scenarios being 6,200 and 8,800 tonnes, respecti vely. The savings are less signifi cant at 1 Gg CO2.
Chapter Three : Miti gati on Measures
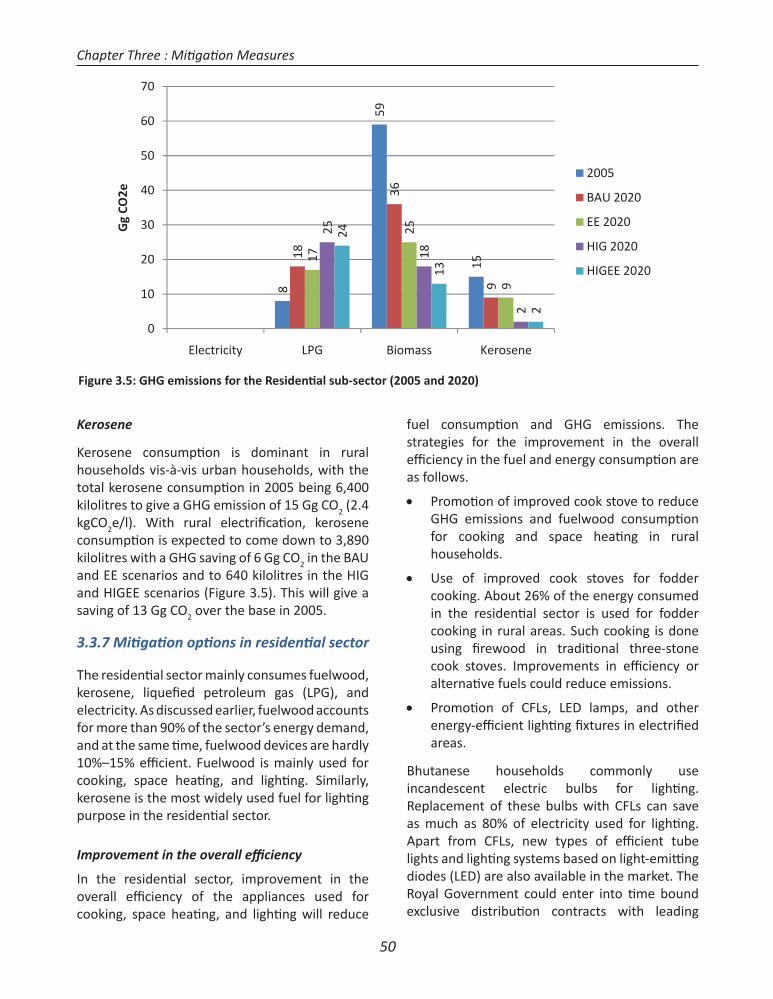
50
Kerosene
Kerosene consumpti on is dominant in rural households vis-à-vis urban households, with the total kerosene consumpti on in 2005 being 6,400 kilolitres to give a GHG emission of 15 Gg CO2 (2.4 kgCO2e/l). With rural electrifi cati on, kerosene consumpti on is expected to come down to 3,890 kilolitres with a GHG saving of 6 Gg CO2 in the BAU and EE scenarios and to 640 kilolitres in the HIG and HIGEE scenarios (Figure 3.5). This will give a saving of 13 Gg CO2 over the base in 2005.
3.3.7 Miti gati on opti ons in residenti al sector
The residenti al sector mainly consumes fuelwood, kerosene, liquefi ed petroleum gas (LPG), and electricity. As discussed earlier, fuelwood accounts for more than 90% of the sector’s energy demand, and at the same ti me, fuelwood devices are hardly 10%–15% effi cient. Fuelwood is mainly used for cooking, space heati ng, and lighti ng. Similarly, kerosene is the most widely used fuel for lighti ng purpose in the residenti al sector.
Improvement in the overall effi ciency
In the residenti al sector, improvement in the overall effi ciency of the appliances used for cooking, space heati ng, and lighti ng will reduce
fuel consumpti on and GHG emissions. The strategies for the improvement in the overall effi ciency in the fuel and energy consumpti on are as follows.
Promoti on of improved cook stove to reduce GHG emissions and fuelwood consumpti on for cooking and space heati ng in rural households.
Use of improved cook stoves for fodder cooking. About 26% of the energy consumed in the residenti al sector is used for fodder cooking in rural areas. Such cooking is done using fi rewood in traditi onal three-stone cook stoves. Improvements in effi ciency or alternati ve fuels could reduce emissions.
Promoti on of CFLs, LED lamps, and other energy-effi cient lighti ng fi xtures in electrifi ed areas.
Bhutanese households commonly use incandescent electric bulbs for lighti ng. Replacement of these bulbs with CFLs can save as much as 80% of electricity used for lighti ng. Apart from CFLs, new types of effi cient tube lights and lighti ng systems based on light-emitti ng diodes (LED) are also available in the market. The Royal Government could enter into ti me bound exclusive distributi on contracts with leading
8
59
15
18
36
9
17
25
9
25
18
2
24
13
2
0
10
20
30
40
50
60
70
Electricity LPG Biomass Kerosene
Gg
CO2e
2005
BAU 2020
EE 2020
HIG 2020
HIGEE 2020
Figure 3.5: GHG emissions for the Residenti al sub-sector (2005 and 2020)
Chapter Three : Miti gati on Measures
51
lighti ng companies to switch the nati on from incandescent electric bulbs to use of CFL and LED. Exclusivity should allow for procurement at lower cost CFL/LED lights by consumers and free use by the company of its collaborati on with the country in its adverti sements for a greener planet.
Use of modern fuel and renewable energy sources
Promoti on of effi cient LPG stoves- Use of LPG as cooking fuel is common in urban areas. However, in rural areas, LPG is sti ll not a preferred fuel due to: (i) High cost mainly from transportati on cost; (ii) limited availability and (iii) diffi culty in transporti ng it to the households. Replacing fuelwood with LPG and effi cient use ofLPG by introducing effi cient LPG cook stoves can help to reduce local GHG emissions.
Use of briquett es and pellets for space heati ng- Briquett es made from saw dusts are now available in Thimphu region, and mainly supplied through briquetti ng plant set up by the Natural Resources Development Corporati on Ltd. (NRDCL). Promoti ng such plants at other places can reduce both wood waste and emissions.
Promoti on of solar lanterns and home lighti ng systems in un-electrifi ed areas-Reducing the use of imported kerosene will reduce emissions along with indoor polluti on and provide improved lighti ng to rural unelectrifi ed households. Though all households will eventually be covered under accelerated rural electrifi cati on programme, an immediate and intermediate soluti on can be providing solar lighti ng systems and solar lanterns.
Promoti on of solar water heati ng systems - Water heati ng is another end use applicati on in Bhutan, which consumes a lot of energy. Water is heated mostly in kitchen or by using bukharis. Solar water heati ng systems have proved their eff ecti veness in saving electricity and other fuels that are used for heati ng water.
Promoti on of use of electricity for cooking- Use of LPG or kerosene incurs an outf low of money, as it has to be imported. A viable means is to
promote the use of electricity for cooking by families. Reliable electricity supply is essenti al to encourage switch over and low lifeline rates to cover basic cost of running such appliances.
Development of energy effi cient housings/buildings
Energy consumpti on for lighti ng and space heati ng and GHG emissions can be reduced by using suitably designed houses and buildings. Eco-friendly housing designed to reduce heat loss and use daylight for internal lighti ng is eff ecti ve in reducing the energy consumpti on for space heati ng and lighti ng. Energy-effi cient building designs can be introduced initi ally for new housing complexes being developed by government agencies. Initi ally external expert agencies can be involved in developing designs and simultaneously followed by organizing capacity building training courses for architects and builders. An industry manufacturing insulati on materials, windows, doors and other constructi on materials and products for improving energy effi ciency in homes must be promoted through a preferenti al public procurement policy. The Royal Government must lead by mandati ng that all its constructi on must be green and energy effi cient and any space it plans to rent must be energy effi cient.
3.4 Industrial Processes
The industrial sector is dominated by a small number of cements, chemical, ferro alloys, steel rolling mills, carbide, agro processing and forest and wood based plants like furniture, medium density fi bre board and ply wood. As shown in Figure 3.6, the GHG emissions in the industrial sector increased from 142.14 Gg CO2 in 1995 to GgCO2 to 505.03 GgCO2 in 2009. Emissions from the mineral sub-sector, dominated by cement producti on increased from 75 GgCO2 in 1995 to 189 GgCO2 in 2009. The chemical sub-sector accounted by one plant has been steady at around 20 Gg of CO2 over the same periods. The metal industry showed the most growth in GHG emissions in the last several years from 46 GgCO2 in 1995 to 297 GgCO2 in 2009.
Chapter Three : Miti gati on Measures
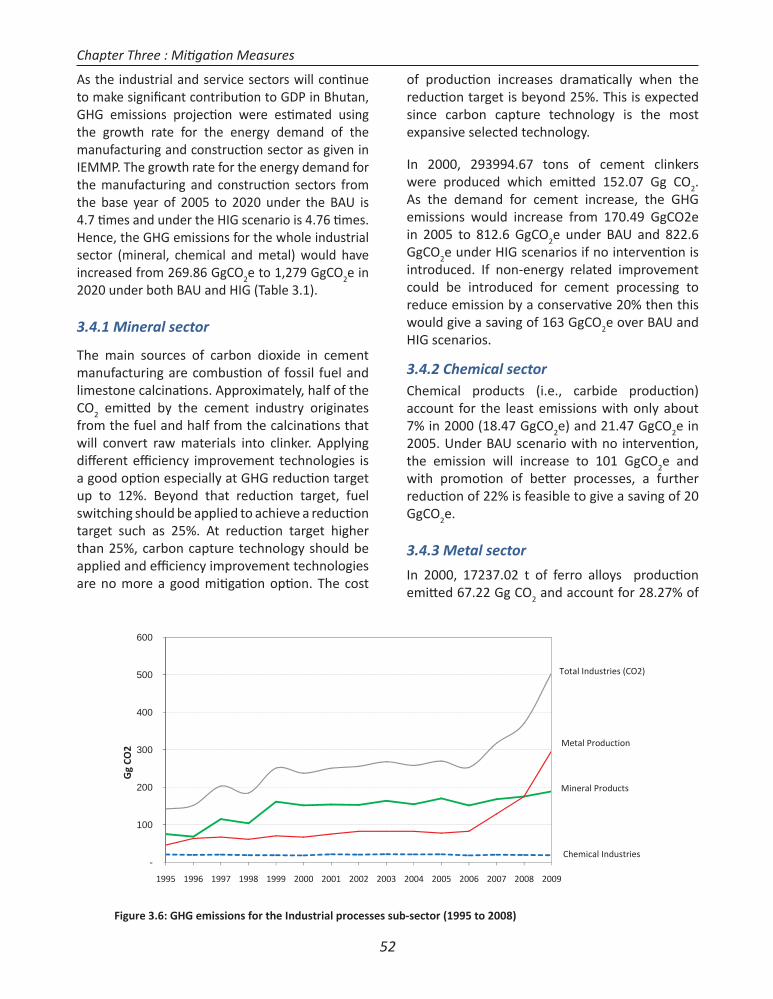
52
As the industrial and service sectors will conti nue to make signifi cant contributi on to GDP in Bhutan, GHG emissions projecti on were esti mated using the growth rate for the energy demand of the manufacturing and constructi on sector as given in IEMMP. The growth rate for the energy demand for the manufacturing and constructi on sectors from the base year of 2005 to 2020 under the BAU is 4.7 ti mes and under the HIG scenario is 4.76 ti mes. Hence, the GHG emissions for the whole industrial sector (mineral, chemical and metal) would have increased from 269.86 GgCO2e to 1,279 GgCO2e in 2020 under both BAU and HIG (Table 3.1).
3.4.1 Mineral sector
The main sources of carbon dioxide in cement manufacturing are combusti on of fossil fuel and limestone calcinati ons. Approximately, half of the CO2 emitt ed by the cement industry originates from the fuel and half from the calcinati ons that will convert raw materials into clinker. Applying diff erent effi ciency improvement technologies is a good opti on especially at GHG reducti on target up to 12%. Beyond that reducti on target, fuel switching should be applied to achieve a reducti on target such as 25%. At reducti on target higher than 25%, carbon capture technology should be applied and effi ciency improvement technologies are no more a good miti gati on opti on. The cost
of producti on increases dramati cally when the reducti on target is beyond 25%. This is expected since carbon capture technology is the most expansive selected technology.
In 2000, 293994.67 tons of cement clinkers were produced which emitt ed 152.07 Gg CO2. As the demand for cement increase, the GHG emissions would increase from 170.49 GgCO2e in 2005 to 812.6 GgCO2e under BAU and 822.6 GgCO2e under HIG scenarios if no interventi on is introduced. If non-energy related improvement could be introduced for cement processing to reduce emission by a conservati ve 20% then this would give a saving of 163 GgCO2e over BAU and HIG scenarios.
3.4.2 Chemical sectorChemical products (i.e., carbide producti on) account for the least emissions with only about 7% in 2000 (18.47 GgCO2e) and 21.47 GgCO2e in 2005. Under BAU scenario with no interventi on, the emission will increase to 101 GgCO2e and with promoti on of bett er processes, a further reducti on of 22% is feasible to give a saving of 20 GgCO2e.
3.4.3 Metal sector
In 2000, 17237.02 t of ferro alloys producti on emitt ed 67.22 Gg CO2 and account for 28.27% of
Figure 3.6: GHG emissions for the Industrial processes sub sector (1995 to 2008)
Mineral Products
Chemical Industries
Metal Production
Total Industries (CO2)
-
100
200
300
400
500
600
1995 1996 1997 1998 1999 2000 2001 2002 2003 2004 2005 2006 2007 2008 2009
Gg
CO2
Chapter Three : Miti gati on Measures
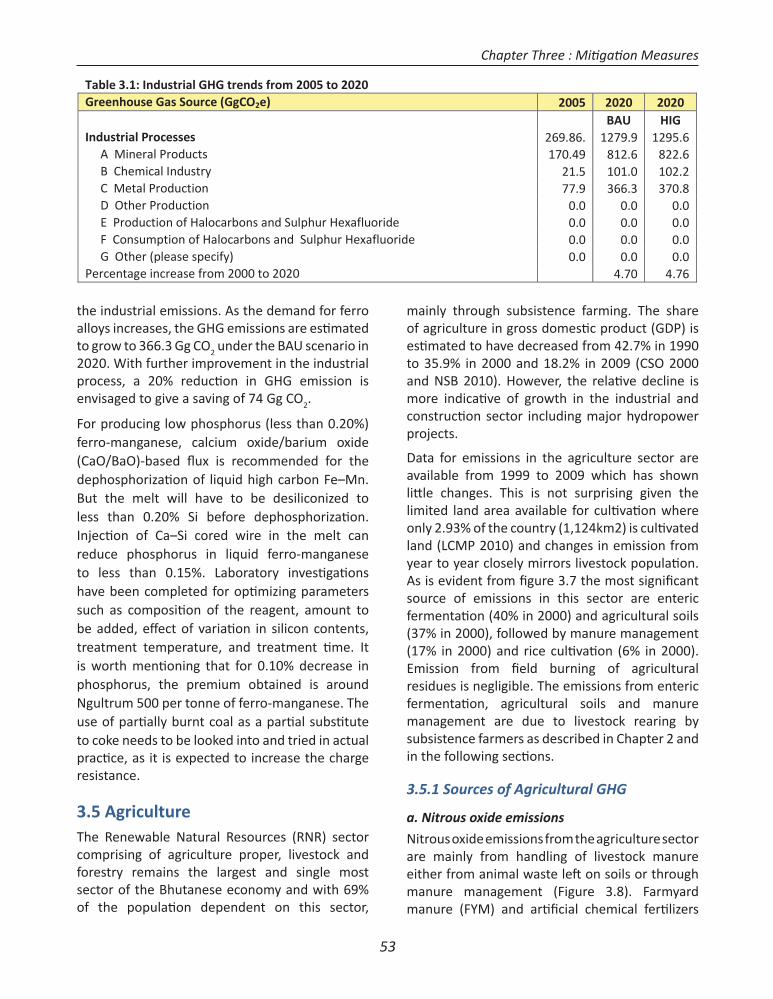
53
the industrial emissions. As the demand for ferro alloys increases, the GHG emissions are esti mated to grow to 366.3 Gg CO2 under the BAU scenario in 2020. With further improvement in the industrial process, a 20% reducti on in GHG emission is envisaged to give a saving of 74 Gg CO2.
For producing low phosphorus (less than 0.20%) ferro-manganese, calcium oxide/barium oxide (CaO/BaO)-based fl ux is recommended for the dephosphorizati on of liquid high carbon Fe–Mn. But the melt will have to be desiliconized to less than 0.20% Si before dephosphorizati on. Injecti on of Ca–Si cored wire in the melt can reduce phosphorus in liquid ferro-manganese to less than 0.15%. Laboratory investi gati ons have been completed for opti mizing parameters such as compositi on of the reagent, amount to be added, eff ect of variati on in silicon contents, treatment temperature, and treatment ti me. It is worth menti oning that for 0.10% decrease in phosphorus, the premium obtained is around Ngultrum 500 per tonne of ferro-manganese. The use of parti ally burnt coal as a parti al substi tute to coke needs to be looked into and tried in actual practi ce, as it is expected to increase the charge resistance.
3.5 AgricultureThe Renewable Natural Resources (RNR) sector comprising of agriculture proper, livestock and forestry remains the largest and single most sector of the Bhutanese economy and with 69% of the populati on dependent on this sector,
mainly through subsistence farming. The share of agriculture in gross domesti c product (GDP) is esti mated to have decreased from 42.7% in 1990 to 35.9% in 2000 and 18.2% in 2009 (CSO 2000 and NSB 2010). However, the relati ve decline is more indicati ve of growth in the industrial and constructi on sector including major hydropower projects.
Data for emissions in the agriculture sector are available from 1999 to 2009 which has shown litt le changes. This is not surprising given the limited land area available for culti vati on where only 2.93% of the country (1,124km2) is culti vated land (LCMP 2010) and changes in emission from year to year closely mirrors livestock populati on. As is evident from fi gure 3.7 the most signifi cant source of emissions in this sector are enteric fermentati on (40% in 2000) and agricultural soils (37% in 2000), followed by manure management (17% in 2000) and rice culti vati on (6% in 2000). Emission from fi eld burning of agricultural residues is negligible. The emissions from enteric fermentati on, agricultural soils and manure management are due to livestock rearing by subsistence farmers as described in Chapter 2 and in the following secti ons.
3.5.1 Sources of Agricultural GHG
a. Nitrous oxide emissions
Nitrous oxide emissions from the agriculture sector are mainly from handling of livestock manure either from animal waste left on soils or through manure management (Figure 3.8). Farmyard manure (FYM) and arti fi cial chemical ferti lizers
Table 3.1: Industrial GHG trends from 2005 to 2020Greenhouse Gas Source (GgCO2e) 2005 2020 2020
BAU HIGIndustrial Processes 269.86. 1279.9 1295.6
A Mineral Products 170.49 812.6 822.6B Chemical Industry 21.5 101.0 102.2C Metal Production 77.9 366.3 370.8D Other Production 0.0 0.0 0.0E Production of Halocarbons and Sulphur Hexafluoride 0.0 0.0 0.0F Consumption of Halocarbons and Sulphur Hexafluoride 0.0 0.0 0.0G Other (please specify) 0.0 0.0 0.0
Percentage increase from 2000 to 2020 4.70 4.76
Chapter Three : Miti gati on Measures
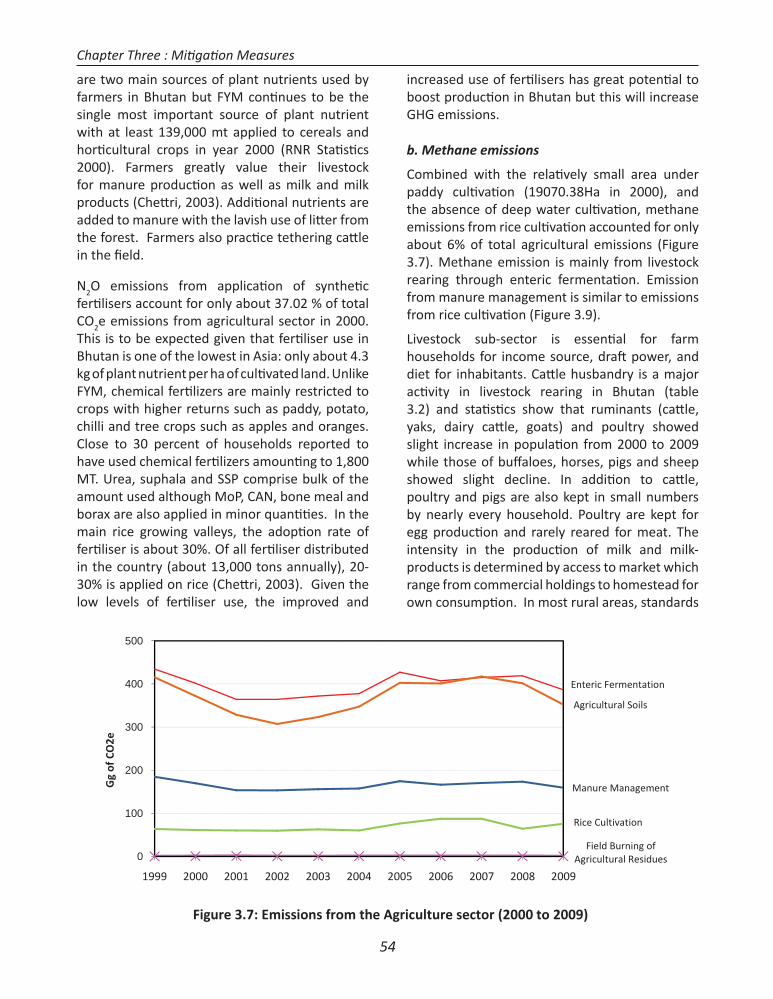
54
are two main sources of plant nutrients used by farmers in Bhutan but FYM conti nues to be the single most important source of plant nutrient with at least 139,000 mt applied to cereals and horti cultural crops in year 2000 (RNR Stati sti cs 2000). Farmers greatly value their livestock for manure producti on as well as milk and milk products (Chett ri, 2003). Additi onal nutrients are added to manure with the lavish use of litt er from the forest. Farmers also practi ce tethering catt le in the fi eld.
N2O emissions from applicati on of syntheti c ferti lisers account for only about 37.02 % of total CO2e emissions from agricultural sector in 2000. This is to be expected given that ferti liser use in Bhutan is one of the lowest in Asia: only about 4.3 kg of plant nutrient per ha of culti vated land. Unlike FYM, chemical ferti lizers are mainly restricted to crops with higher returns such as paddy, potato, chilli and tree crops such as apples and oranges. Close to 30 percent of households reported to have used chemical ferti lizers amounti ng to 1,800 MT. Urea, suphala and SSP comprise bulk of the amount used although MoP, CAN, bone meal and borax are also applied in minor quanti ti es. In the main rice growing valleys, the adopti on rate of ferti liser is about 30%. Of all ferti liser distributed in the country (about 13,000 tons annually), 20-30% is applied on rice (Chett ri, 2003). Given the low levels of ferti liser use, the improved and
increased use of ferti lisers has great potenti al to boost producti on in Bhutan but this will increase GHG emissions.
b. Methane emissions
Combined with the relati vely small area under paddy culti vati on (19070.38Ha in 2000), and the absence of deep water culti vati on, methane emissions from rice culti vati on accounted for only about 6% of total agricultural emissions (Figure 3.7). Methane emission is mainly from livestock rearing through enteric fermentati on. Emission from manure management is similar to emissions from rice culti vati on (Figure 3.9).
Livestock sub-sector is essenti al for farm households for income source, draft power, and diet for inhabitants. Catt le husbandry is a major acti vity in livestock rearing in Bhutan (table 3.2) and stati sti cs show that ruminants (catt le, yaks, dairy catt le, goats) and poultry showed slight increase in populati on from 2000 to 2009 while those of buff aloes, horses, pigs and sheep showed slight decline. In additi on to catt le, poultry and pigs are also kept in small numbers by nearly every household. Poultry are kept for egg producti on and rarely reared for meat. The intensity in the producti on of milk and milk-products is determined by access to market which range from commercial holdings to homestead for own consumpti on. In most rural areas, standards
Figure 3.7: Emissions from the Agriculture sector (2000 to 2009)
Enteric Fermentation
Manure Management
Rice Cultivation
Agricultural Soils
Field Burning ofAgricultural Residues0
100
200
300
400
500
1999 2000 2001 2002 2003 2004 2005 2006 2007 2008 2009
Gg
ofCO
2e
Chapter Three : Miti gati on Measures
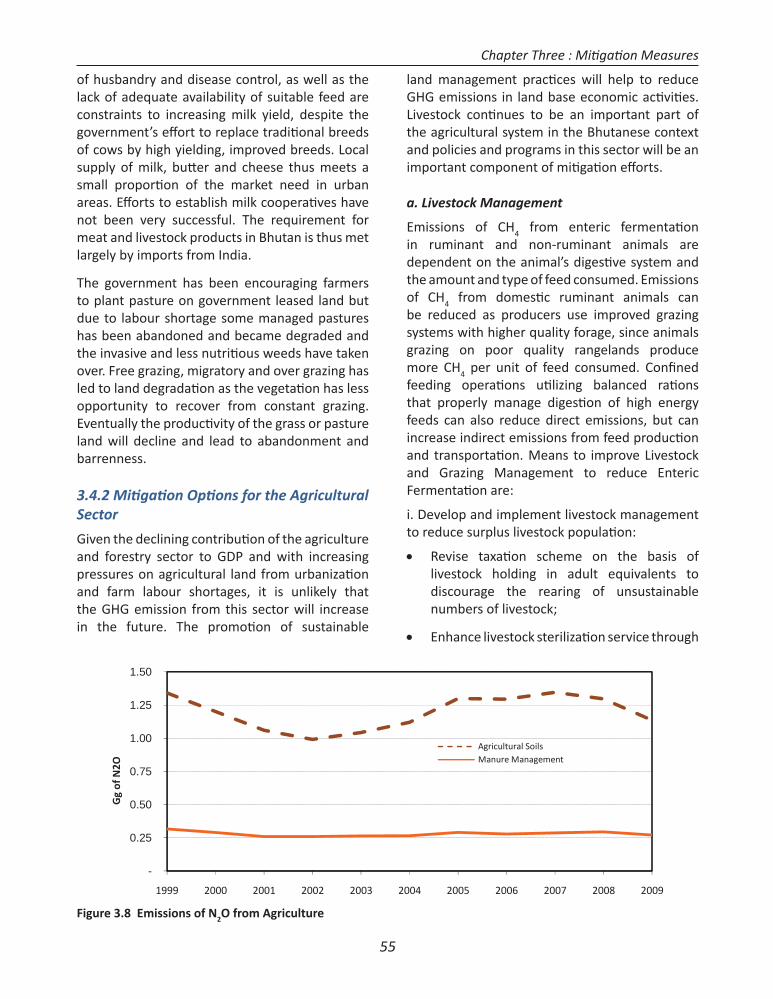
55
of husbandry and disease control, as well as the lack of adequate availability of suitable feed are constraints to increasing milk yield, despite the government’s eff ort to replace traditi onal breeds of cows by high yielding, improved breeds. Local supply of milk, butt er and cheese thus meets a small proporti on of the market need in urban areas. Eff orts to establish milk cooperati ves have not been very successful. The requirement for meat and livestock products in Bhutan is thus met largely by imports from India.
The government has been encouraging farmers to plant pasture on government leased land but due to labour shortage some managed pastures has been abandoned and became degraded and the invasive and less nutriti ous weeds have taken over. Free grazing, migratory and over grazing has led to land degradati on as the vegetati on has less opportunity to recover from constant grazing. Eventually the producti vity of the grass or pasture land will decline and lead to abandonment and barrenness.
3.4.2 Miti gati on Opti ons for the Agricultural Sector
Given the declining contributi on of the agriculture and forestry sector to GDP and with increasing pressures on agricultural land from urbanizati on and farm labour shortages, it is unlikely that the GHG emission from this sector will increase in the future. The promoti on of sustainable
land management practi ces will help to reduce GHG emissions in land base economic acti viti es. Livestock conti nues to be an important part of the agricultural system in the Bhutanese context and policies and programs in this sector will be an important component of miti gati on eff orts.
a. Livestock Management
Emissions of CH4 from enteric fermentati on in ruminant and non-ruminant animals are dependent on the animal’s digesti ve system and the amount and type of feed consumed. Emissions of CH4 from domesti c ruminant animals can be reduced as producers use improved grazing systems with higher quality forage, since animals grazing on poor quality rangelands produce more CH4 per unit of feed consumed. Confi ned feeding operati ons uti lizing balanced rati ons that properly manage digesti on of high energy feeds can also reduce direct emissions, but can increase indirect emissions from feed producti on and transportati on. Means to improve Livestock and Grazing Management to reduce Enteric Fermentati on are:
i. Develop and implement livestock management to reduce surplus livestock populati on:
Revise taxati on scheme on the basis of livestock holding in adult equivalents to discourage the rearing of unsustainable numbers of livestock;
Enhance livestock sterilizati on service through
-
0.25
0.50
0.75
1.00
1.25
1.50
1999 2000 2001 2002 2003 2004 2005 2006 2007 2008 2009
Gg
ofN
2O
Agricultural SoilsManure Management
Figure 3.8 Emissions of N2O from Agriculture
Chapter Three : Miti gati on Measures
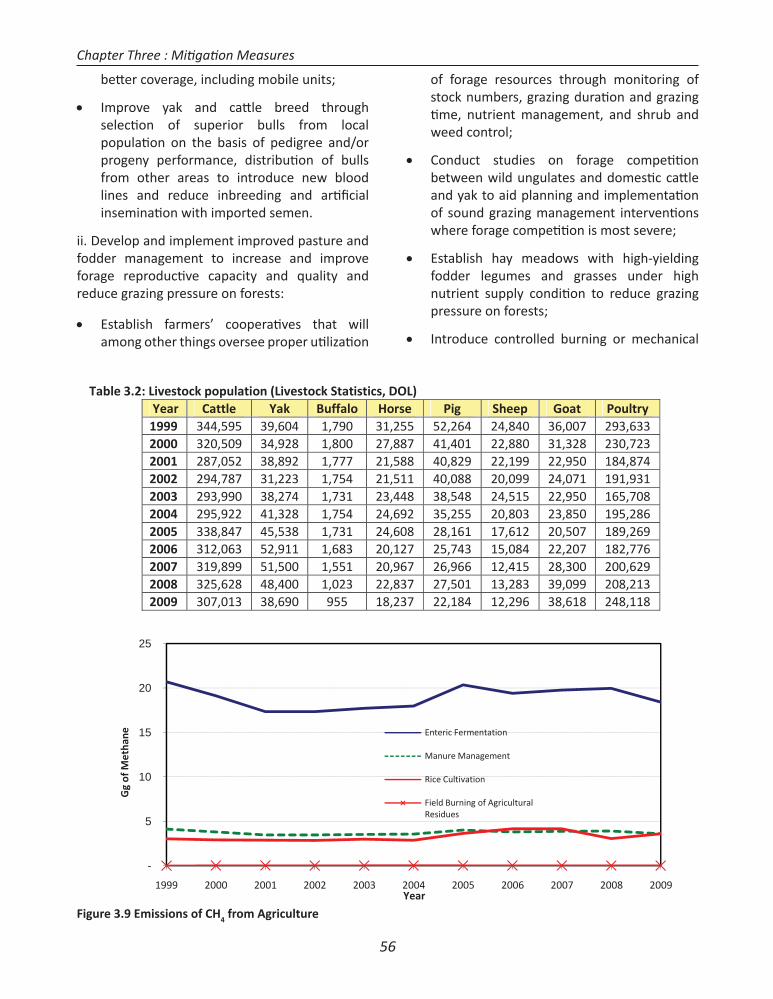
56
bett er coverage, including mobile units;
Improve yak and catt le breed through selecti on of superior bulls from local populati on on the basis of pedigree and/or progeny performance, distributi on of bulls from other areas to introduce new blood lines and reduce inbreeding and arti fi cial inseminati on with imported semen.
ii. Develop and implement improved pasture and fodder management to increase and improve forage reproducti ve capacity and quality and reduce grazing pressure on forests:
Establish farmers’ cooperati ves that will among other things oversee proper uti lizati on
of forage resources through monitoring of stock numbers, grazing durati on and grazing ti me, nutrient management, and shrub and weed control;
Conduct studies on forage competi ti on between wild ungulates and domesti c catt le and yak to aid planning and implementati on of sound grazing management interventi ons where forage competi ti on is most severe;
Establish hay meadows with high-yielding fodder legumes and grasses under high nutrient supply conditi on to reduce grazing pressure on forests;
Introduce controlled burning or mechanical
-
5
10
15
20
25
1999 2000 2001 2002 2003 2004 2005 2006 2007 2008 2009
Gg
ofM
etha
ne
Year
Enteric Fermentation
Manure Management
Rice Cultivation
Field Burning of AgriculturalResidues
Table 3.2: Livestock population (Livestock Statistics, DOL)Year Cattle Yak Buffalo Horse Pig Sheep Goat Poultry
1999 344,595 39,604 1,790 31,255 52,264 24,840 36,007 293,6332000 320,509 34,928 1,800 27,887 41,401 22,880 31,328 230,7232001 287,052 38,892 1,777 21,588 40,829 22,199 22,950 184,8742002 294,787 31,223 1,754 21,511 40,088 20,099 24,071 191,9312003 293,990 38,274 1,731 23,448 38,548 24,515 22,950 165,7082004 295,922 41,328 1,754 24,692 35,255 20,803 23,850 195,2862005 338,847 45,538 1,731 24,608 28,161 17,612 20,507 189,2692006 312,063 52,911 1,683 20,127 25,743 15,084 22,207 182,7762007 319,899 51,500 1,551 20,967 26,966 12,415 28,300 200,6292008 325,628 48,400 1,023 22,837 27,501 13,283 39,099 208,2132009 307,013 38,690 955 18,237 22,184 12,296 38,618 248,118
Figure 3.9 Emissions of CH4 from Agriculture
Chapter Three : Miti gati on Measures
57
clearing of shrubs followed by reseeding with selected species and protecti on from grazing based on applied research and extension;
Establish community and homestead forests of species with high forage and soil conservati on values, and preferably with other ethno-botanical values using parti cipatory strategies with local people. This will necessitate establishment of forest nurseries, where such nurseries do not exist.
iii. Develop and implement pasture management on leased forest lands:
Identi fy barren and/or degraded forest lands that can be potenti ally leased for pasture management as per the provision of the Land Act of Bhutan 2007;
Prepare and implement management plans for pasture development on leased barren/ degraded forest lands on a pilot scale, starti ng with 1-2 sites in each dzongkhag.
b. Manure and Biogas
The keeping of livestock in pen or stall as a cut and carry system for integrati on into a cropping farm system will provide protein, milk and food crop security. The livestock provides farm security and the manure from the livestock could be converted into clean biogas through anaerobic digester for cooking and lighti ng. Furthermore the digested organic sludge and slurry are a good source of organic ferti lizer which can be used in rice, cereal or fruit tree. Human wastes could also be connected to the digester to provide extra biogas and clean sanitati on. Biogas feasibility assessments (SNV 2010) found that up to 20,000 potenti al domesti c digesters could be developed in the warmer parts of Bhutan and each digester could reduce 2 to 4 tCO2e per annum depending on whether non renewable biomass is used in the baseline calculati on. During fi rst 3 years, around 1,500 plants could be installed, leading to maximally 3,000 tCO2e per year aft er 3 years. A program to identi fy and to miti gate the technical, fi nancial and regulatory barriers for the scaling up of domesti c biogas is currently being developed
by the Department of Livestock in collaborati on with the Department of Energy.
Other measures that can reduce fugiti ve emissions include:
Increasing the digesti bility of forage and feeds;
Adopti ng a good manure nutrient management plan;
Understanding of crop ferti lizer needs;
Soil testi ng to establish nutrient requirement;
Use of organic manure as a nutrient source;
Timing of manure applicati on: Controlled- release ferti lizers, nitrifi cati on inhibitors, the ti ming of nitrogen applicati on, and water management should lead to improvements in nitrogen use effi ciency and further limit N2O formati on;
Determine amount of manure produced;
Applicati on of compost;
Mineral additi ons to compost and Improve Moisture and aerati on.
c. Agriculture Sector (Crops): Miti gati on Measures
Agriculture is an important sector in Bhutan that engages over 69 % of the populati on and provides employment to over 55 % of the total populati on (see – Bhutan Climate Summit on Food Security and Climate Change). The arable land suited for farming is around 2.93 % of the total geographical area, and more than 60 % of arable land is under dry land culti vati on (NSSC, 2010). The main source of plant nutrients to produce food comes from the applicati on of 3 to 5 tons of farmyard manure, and around 9 kg of plant nutrients from chemical ferti lizersper hectare of land (Norbu, 2008). The use of plant protecti on chemicals such as insecti cides and fungicides has decreased over the years while use of the herbicides in paddy and potato fi elds increased. The distributi on of chemicals for crop producti on recorded during the 2007-2008 report of the department of agriculture
Chapter Three : Miti gati on Measures
58
showed 3057.8 t of inorganic ferti lizers and around 16 t of plant protecti on chemicals (DoA, 2009). Through intensifi cati on and diversifi cati on of farming systems, the sector intends to achieve more than 50 to 60 % self suffi ciency in rice, increase annual income of farming households to Nu 35,000, and encourage more farming households to practi ce organic farming (10th plan document, 2008). The key to meet these targets, and help to miti gate climate change is through a number of interventi ons highlighted: Promoti on of integrated Soil Ferti lity Management; Sustainable land Management (SLM); Increasing Cropping Intensity; and Organic Farming.
d. Promoti on of Integrated Soil Ferti lity Management
Farmers in Bhutan use crop residues, forest litt er and animal manures to produce farm yard manure (FYM). FYM is a mixture of these organic materials and serves as the main source of plant nutrients for all types of crop producti on. The applicati on rates reported varied from 3 -5 t/ha, and the percent of N, P and K in FYM dry matt er was 1.6 %, 0.8 % and 2.9 % respecti vely in one of the studies conducted ( RNR-RC, Bajo, 2000). Because of the year in and year out applicati on of this input, the soil organic matt er build up in most of the culti vated soils ranges between 2 to 4 %. This traditi onal practi ce of FYM applicati on to farm land has been helping to store carbon in soils in the form of soil organic matt er for generati ons. This traditi onal process also helps to reduce emissions of methane or nitrogenous oxide gas from manure since FYM is not in slurry form and is being collected and piled on regular intervals. With increasing farm labor shortage to produce FYM coupled with the introducti on of chemical ferti lizers is likely to reduce soil organic matt er content in the long run. There is, however, a huge potenti al to promote integrated soil ferti lity management principles (combinati on of improved management of organic residues, chemical ferti lizers and use green legumes) to reduce GHG emissions from these sources - manures and chemical ferti lizers.
e. Up Scaling Sustainable Land Management (SLM) Technologies
Sustainable land management is one of the best measures available to miti gate climate change in the Bhutanese farming landscape. The nati onal land management campaign in 2005 promoted SLM technologies across the diverse farming systems (DoA, 2005). Hedge rows of grasses and tree species were introduced along the sloping farming land to reduce soil erosion, diversify income sources and sequester carbon. Through GEF, UNDP and World Bank support, these acti viti es were promoted from wet humid tropics to cool temperate pilot sites. The farmers have taken up these technologies on their farms as well as on the community lands. Most of these degraded forest or grazing land was brought under improved management systems. The SLM/WB_GEF project reported that about 2400 ha of degraded/vulnerable lands are brought under improved land management practi ces; and another 2563 tseri (shift ing culti vati on) lands are brought under permanent culti vati on. Although SLM benefi ts are long term, with conti nued advocacy and educati ons, more farmers are coming forward to take up these technologies. This is also a promising area where land degradati on, biodiversity and climate change focal area acti viti es potenti ally converge.
f. Increasing Cropping Intensity
There is no scope to expand arable land to increase food producti on. The only possible way out is through intensifi cati on and diversifi cati on. For example, farmers living around wet sub-tropical to dry sub-tropical zones can harvest three crops in a season: potato- maize followed by buckwheat or millets/wheat. Growing more crops in a year would mean capturing more carbon dioxide from atmosphere. There is a potenti al to increase cropping intensity from around 120 to over 200 % in some of the selected agro-ecological zones there by reducing fallow period. Shift ing culti vati on or tseri is another form of land use to grow cereal crops, but now it has been discouraged since crop yield per unit area appeared to be very low, and damage to environment is
Chapter Three : Miti gati on Measures
59
high through removal of vegetati on cover and burning. Incenti ves are provided to farmers to convert them into permanent culti vati on such as orchards or agro-forestry systems. Promoti on of enabling environment to grow more crops in a year, and bring barren areas under permanent culti vati on is another potenti al to increase food producti on, reduce emission of GHG, and carbon sequestrati on.
g. Increasing Area under Organic Farming
Farming in Bhutan revolves around recycling of organic residues for plant nutrients and crop rotati on practi ces to reduce pest and disease infestati ons. The land holding is small (less than 1.5 ha) and because of economic reasons, many farmers do not invest in inputs like chemicals to increase producti on. In many ways, there is scope to increase producti on guided by organic farming principles if right sites and crops are selected. For these reasons the government is seeking to expand Bhutan’s total area under organic culti vati on to create “Brand Bhutan” envisioned under the Economic Development Policy. The organic farming framework is in place and currently the master plan/strategic plans are being developed. But there is always tension between the desire to promote low carbon organic farming and the need to increase food producti on and food security using high input intensive systems.
The spread of pest and diseases are low in most of these farming communiti es because of geographical isolati on of one farming community from another. The buildup of soil organic matt er is going to be high since plant nutrients are supplied through recycling of organic residues. Biological control of pest and diseases, crop rotati on practi ces and the use of local resistant land races are going to demand less energy to produce organic food. There is also a high demand for organic produce in the local tourism industry and neighbouring citi es of India. For environment, economic and health reasons, organic farming has drawn a lot att enti on from politi cians, planners and researchers. They know that this farming practi ce can reduce emission of green house gases, sequester carbon and increase income for small holders.
h. Reducing methane emission from rice fi elds
Feasible miti gati on strategies that have been verifi ed to signifi cantly reduce methane emission from rice fi elds are temporary midseason aerati on of the soil, using fermented instead of fresh organic manure, applying sulfate containing ferti lizer, and planti ng/breeding rice culti vars with low emission capacity (Chett ri, 2003). Developing direct seeding techniques to augment transplanti ng are potenti al future opti ons that could help to reduce methane emissions. However with increasing threats to paddy fi elds from increasing urban sprawl and farm labour shortage, unless there are major changes in policy and incenti ves, increase in rice culti vati on is not expected.
3.6 Land Use Change and Forestry
The prominence of carbon sequestrati on in the nati onal GHG inventory refl ects nati onal policy that regards forests as crucial for the well-being of the Bhutanese populati on. The great foresight and leadership has allowed much of Bhutan’s natural environment and biodiversity to be in pristi ne state. Bhutan has been dubbed as a conservati on centrepiece of the Eastern Himalayas, a region known to be one of the global biodiversity hotspots. The 6,309.6 Gg of CO2 sequestered through managed forests, forest plantati ons and the abandonment of managed lands is roughly four ti mes the level of Bhutan’s overall anthropogenic GHG emissions (see Chapter 2).
3.6.1 Forest Resources and threats
According to the Land Cover Assessment 2010, 70.46% of Bhutan is forested. Of this, 12.9%, roughly 413,000 hectares, is classifi ed as primary forest. There are 10 formally protected areas covering nearly 43% of the land area. An additi onal nearly 9% of the land area has been declared as biological corridors connecti ng the protected areas. With the additi on of conservati on areas, about 51% of the country’s area is under some form of conservati on management.
It is esti mated that 236,700 ha of forests are degraded; the annual rate of degradati on is
Chapter Three : Miti gati on Measures
60
esti mated to be 0.5 per cent and the main causes are:
Shift ing culti vati on (tseri) is prevalent in the eastern region of the country. Shift ing culti vati on, if properly carried out, does not cause major degradati on. However, shortened fallow periods, clearing land on steep gradients and forest fi res resulti ng from slash-and-burn culti vati on are among the factors contributi ng to degradati on. Slash-and-burn culti vati on is now illegal as per the forest and nature conservati on legislati on.
Fire is one of the biggest threats to the forests in Bhutan. The amount and distributi on patt ern of rain aff ects the fi re situati on to a great extent in Bhutan. The peak season for forest fi res in Bhutan is from January to March. The causes are; (I) burning of agricultural debris (40%), (II) burning of trees to prepare grazing areas for livestock (30%), (III) camps, picnics and cooking fi res (25%), and (IV) discarded cigarett es (5%).
Rapid urbanizati on is also placing increased demands on the forests for ti mber and fuelwood. Despite the fact that logging is not allowed without an approved management plan, tree marking for bona fi de house constructi on is practi ced in most of the government reserved forests.
3.6.2 Legal and insti tuti onal setti ng
The Consti tuti on of the Kingdom of Bhutan adopted in 2008 is one of the key legal mandates for forest management in the country as it mandates that 60% of the country remain under forest cover for all ti mes to come. The Consti tuti on also mandates the responsibiliti es of all citi zens to safeguard the natural environment for the benefi t of present and future generati ons.
The key legislati on governing forest management is the “Forest and Nature Conservati on Act, 1995” with the following objecti ves: i) To ensure an adequate supply of basic forest products to meet the needs of the populati on with due recogniti on of the multi ple responsibiliti es for forest resources
and their sustainable management and use; ii) To provide for the special legal protecti on from fi res; and protecti on of fl ora and fauna, listi ng twenty-three wild animals and seven plants as totally protected species and iii) To lay down regulati ons for the extracti on of fi rewood.
The Land Act of Bhutan 2007 is another important legislati on with major implicati ons for forest management. In the context of REDD+, one of the important implicati ons is Chapter 6 which confi rms that trees, either naturally grown or planted, in registered land shall belong to the landowner.
A revised Nati onal Forest Policy is now in the fi nal stages of Government endorsement. Its goal explicitly states that, “Bhutan’s forest resources and biodiversity are managed sustainably and equitably to produce a wide range of social, economic and environmental goods and services for the opti mal benefi t of all citi zens while sti ll maintaining 60% of the land under forest, thereby contributi ng to Gross Nati onal Happiness.” The Policy establishes six broad objecti ves that must be pursued within a planning framework that integrates environmental and economic/commercial outcomes. These are:
Sustainably produce economic and environmental goods and services to meet the long term needs of society through acti ve and sustainable management of Bhutan’s forests;
Maintain species persistence and ensure long term sustainability of Bhutan’s biodiversity, ecosystem services and natural habitats through a network of protected areas;
Bhutan’s forested watersheds acti vely managed to achieve sustainable rural livelihoods and to produce a reliable supply of high quality water for domesti c use, irrigati on and hydro power producti on;
Rural communiti es able to meet the majority of their ti mber demands from their own community forests, and derive economic benefi ts from the sustainable management of their forests through sale of forest products
Chapter Three : Miti gati on Measures
61
and services;
An economically viable and effi cient forest based industry and
Organizati onal and insti tuti onal reforms carried out and managerial, technical and administrati ve capacity developed to implement strategies and achieve all policy objecti ves.
3.6.3. Miti gati on Opti ons for LUCF
a. Reducti on Emission from Deforestati on and Forest Degradati on (REDD +)
Bhutan will need support to address the various capacity gaps in becoming ready to implement REDD+. The government in collaborati on with WWF Living Himalayas Initi ati ve and other partners has initi ated REDD+ capacity building and aim to further integrate nati onal level baseline carbon esti mati on within the current nati onal forest inventory. Ensuring that the design of the Nati onal Forest Inventory is suitable for biomass and carbon assessment would allow substanti al capacity to be developed. A coordinated implementati on of the forest inventory and monitoring would be essenti al to make effi cient use of limited resources of manpower and fi nancing.
b. Sustainable Forest Management
Strengthening the protecti on and management of forests to enhance carbon sinks for sustainable producti on and uti lizati on of forest resources will be crucial in ensuring the maintenance of Bhutan’s carbon sink. Some recommendati ons in the Bhutan Biodiversity Plan (NBC 2009) include the following acti ons:
Assessment of old FMUs, parti cularly in wood defi cit dzongkhags, for sustainable producti on and uti lizati on of forest resources with some protecti on and enrichment planti ng;
Develop capacity of territorial forestry divisions to eff ecti vely implement planning guidelines for management of forest areas outside the FMU system;
Implement the planning guidelines in at least one forest area in each territorial forestry division and evaluate the applicability and eff ecti veness of the guidelines;
Evaluati on of the eff ecti veness of FMUs in the context of environmental sustainability and socio-economic development for enhancing FMU planning and management.
c. Expansion of Community Forests
The primary objecti ve of Community Forestry is to improve local forest conditi ons through community management whilst enhancing socio-economic benefi ts to the local communiti es in terms of increased access to ti mber, fuelwood, fodder and non-wood forest products. As of June 2011, 313 community forest unit covering 36,649 ha of forest land was established.
Preventi on and Control of Forest Fires
In spite of stringent legislati on and regular public awareness programmes, forest fi res are a recurrent and widespread phenomenon. 526 incidents of forest fi re, aff ecti ng nearly 70,000 hectares of forest was recorded, between 1999/2000 and 2007/08 (NCD 2009). Preventi on and control of forest fi re, like forest management, is both an adaptati on and miti gati on measure. The risk of forest fi re is expected to increase with drier winters under a future climate (See chapter 4) and is also identi fi ed as a priority acti vity in Bhutan’s NAPA. The approaches for forest fi re management will require both, research, awareness campaigns and capacity building for both government agencies and community organizati ons.
e. Reforestati on
As a nati onal programme, reforestati on of degraded and barren forest lands was the earliest conservati on initi ati ve in Bhutan. As early as 1947, the fi rst forest plantati on was established, 11 years prior to the DoF coming into being. Since then, reforestati on has been carried out on more than 21,500 ha as. The end of 9th FYP. (Table 3.3). Conti nued reforestati on of degraded and burnt forest lands will be essenti al for management of forests for both reducing risk of erosion and
Chapter Three : Miti gati on Measures
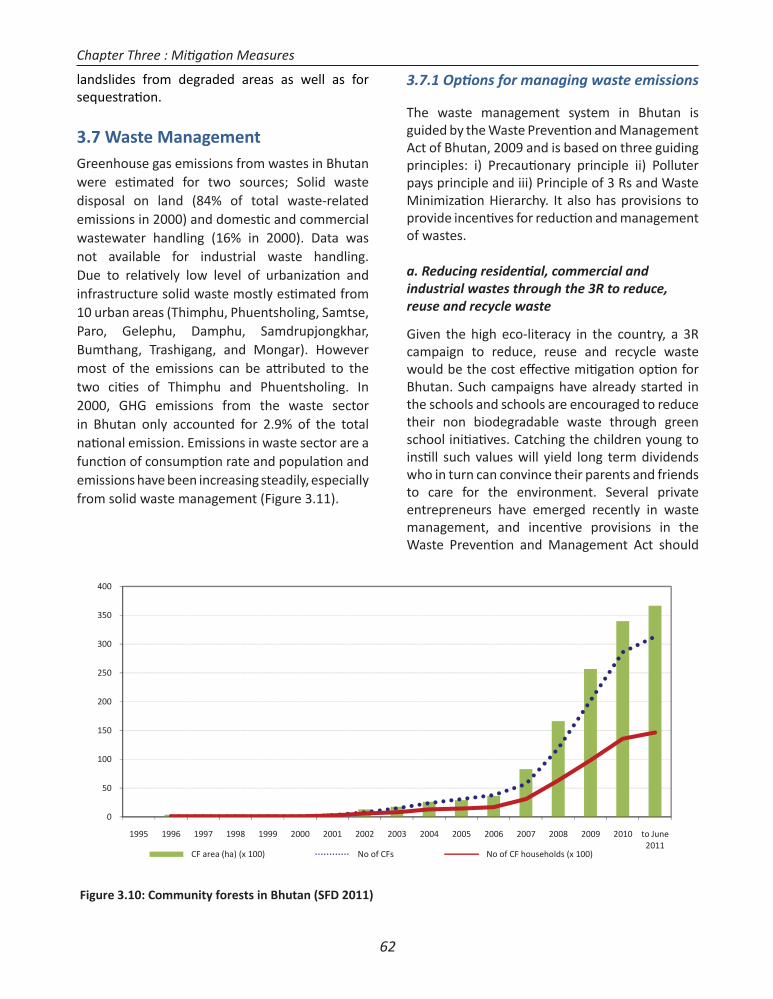
62
landslides from degraded areas as well as for sequestrati on.
3.7 Waste ManagementGreenhouse gas emissions from wastes in Bhutan were esti mated for two sources; Solid waste disposal on land (84% of total waste-related emissions in 2000) and domesti c and commercial wastewater handling (16% in 2000). Data was not available for industrial waste handling. Due to relati vely low level of urbanizati on and infrastructure solid waste mostly esti mated from 10 urban areas (Thimphu, Phuentsholing, Samtse, Paro, Gelephu, Damphu, Samdrupjongkhar, Bumthang, Trashigang, and Mongar). However most of the emissions can be att ributed to the two citi es of Thimphu and Phuentsholing. In 2000, GHG emissions from the waste sector in Bhutan only accounted for 2.9% of the total nati onal emission. Emissions in waste sector are a functi on of consumpti on rate and populati on and emissions have been increasing steadily, especially from solid waste management (Figure 3.11).
3.7.1 Opti ons for managing waste emissions
The waste management system in Bhutan is guided by the Waste Preventi on and Management Act of Bhutan, 2009 and is based on three guiding principles: i) Precauti onary principle ii) Polluter pays principle and iii) Principle of 3 Rs and Waste Minimizati on Hierarchy. It also has provisions to provide incenti ves for reducti on and management of wastes.
a. Reducing residenti al, commercial and industrial wastes through the 3R to reduce, reuse and recycle waste
Given the high eco-literacy in the country, a 3R campaign to reduce, reuse and recycle waste would be the cost eff ecti ve miti gati on opti on for Bhutan. Such campaigns have already started in the schools and schools are encouraged to reduce their non biodegradable waste through green school initi ati ves. Catching the children young to insti ll such values will yield long term dividends who in turn can convince their parents and friends to care for the environment. Several private entrepreneurs have emerged recently in waste management, and incenti ve provisions in the Waste Preventi on and Management Act should
Figure 3.10: Community forests in Bhutan (SFD 2011)
0
50
100
150
200
250
300
350
400
1995 1996 1997 1998 1999 2000 2001 2002 2003 2004 2005 2006 2007 2008 2009 2010 to June2011
CF area (ha) (x 100) No of CFs No of CF households (x 100)
Chapter Three : Miti gati on Measures
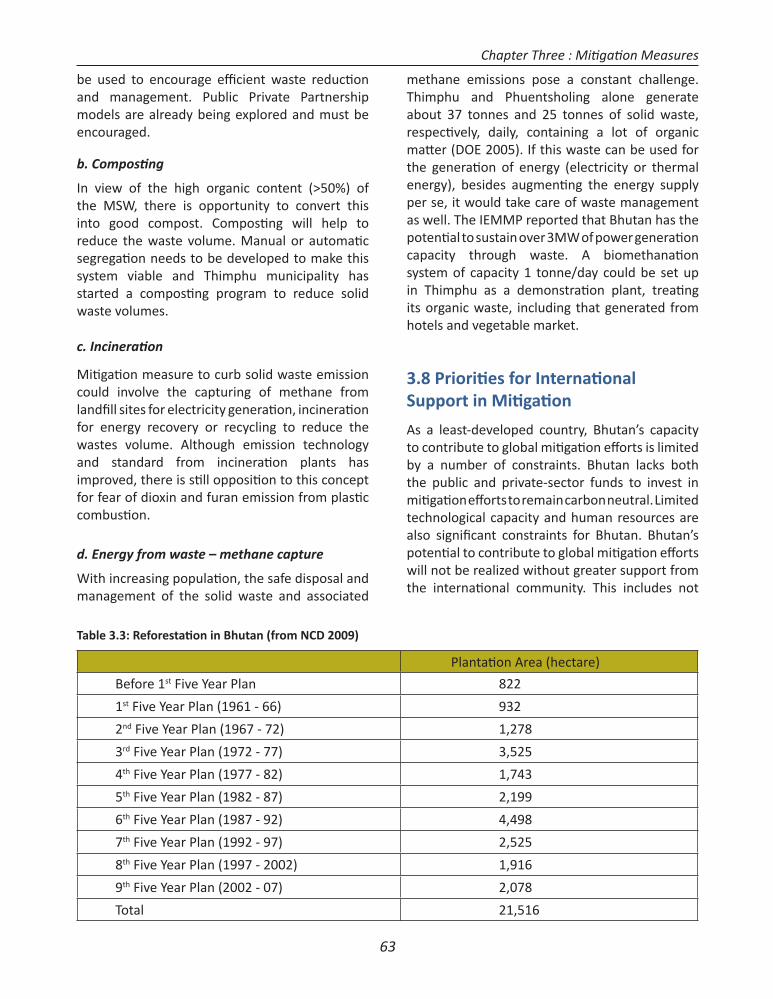
63
be used to encourage effi cient waste reducti on and management. Public Private Partnership models are already being explored and must be encouraged.
b. Composti ng
In view of the high organic content (>50%) of the MSW, there is opportunity to convert this into good compost. Composti ng will help to reduce the waste volume. Manual or automati c segregati on needs to be developed to make this system viable and Thimphu municipality has started a composti ng program to reduce solid waste volumes.
c. Incinerati on
Miti gati on measure to curb solid waste emission could involve the capturing of methane from landfi ll sites for electricity generati on, incinerati on for energy recovery or recycling to reduce the wastes volume. Although emission technology and standard from incinerati on plants has improved, there is sti ll oppositi on to this concept for fear of dioxin and furan emission from plasti c combusti on.
d. Energy from waste – methane capture
With increasing populati on, the safe disposal and management of the solid waste and associated
methane emissions pose a constant challenge. Thimphu and Phuentsholing alone generate about 37 tonnes and 25 tonnes of solid waste, respecti vely, daily, containing a lot of organic matt er (DOE 2005). If this waste can be used for the generati on of energy (electricity or thermal energy), besides augmenti ng the energy supply per se, it would take care of waste management as well. The IEMMP reported that Bhutan has the potenti al to sustain over 3MW of power generati on capacity through waste. A biomethanati on system of capacity 1 tonne/day could be set up in Thimphu as a demonstrati on plant, treati ng its organic waste, including that generated from hotels and vegetable market.
3.8 Prioriti es for Internati onal Support in Miti gati on
As a least-developed country, Bhutan’s capacity to contribute to global miti gati on eff orts is limited by a number of constraints. Bhutan lacks both the public and private-sector funds to invest in miti gati on eff orts to remain carbon neutral. Limited technological capacity and human resources are also signifi cant constraints for Bhutan. Bhutan’s potenti al to contribute to global miti gati on eff orts will not be realized without greater support from the internati onal community. This includes not
Plantati on Area (hectare)
Before 1st Five Year Plan 822
1st Five Year Plan (1961 - 66) 932
2nd Five Year Plan (1967 - 72) 1,278
3rd Five Year Plan (1972 - 77) 3,525
4th Five Year Plan (1977 - 82) 1,743
5th Five Year Plan (1982 - 87) 2,199
6th Five Year Plan (1987 - 92) 4,498
7th Five Year Plan (1992 - 97) 2,525
8th Five Year Plan (1997 - 2002) 1,916
9th Five Year Plan (2002 - 07) 2,078
Total 21,516
Table 3.3: Reforestati on in Bhutan (from NCD 2009)
Chapter Three : Miti gati on Measures
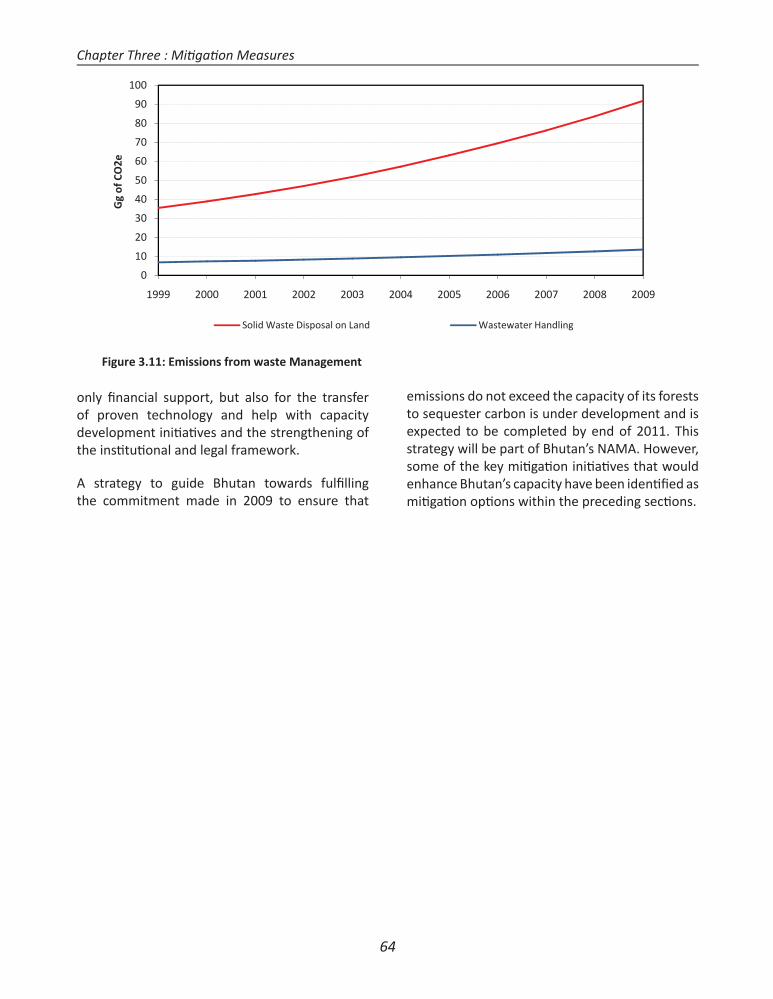
64
only fi nancial support, but also for the transfer of proven technology and help with capacity development initi ati ves and the strengthening of the insti tuti onal and legal framework.
A strategy to guide Bhutan towards fulfi lling the commitment made in 2009 to ensure that
emissions do not exceed the capacity of its forests to sequester carbon is under development and is expected to be completed by end of 2011. This strategy will be part of Bhutan’s NAMA. However, some of the key miti gati on initi ati ves that would enhance Bhutan’s capacity have been identi fi ed as miti gati on opti ons within the preceding secti ons.
Figure 3.11: Emissions from waste Management
0
10
20
30
40
50
60
70
80
90
100
1999 2000 2001 2002 2003 2004 2005 2006 2007 2008 2009
Gg
ofCO
2e
Solid Waste Disposal on Land Wastewater Handling
Chapter Three : Miti gati on Measures
Chapter Four
Vulnerability and Adaptati on

67
4.1 Introducti on
The vulnerability of countries with mountainous ecosystems to the adverse eff ects of climate change is well recognised. The UNFCCC identi fi es countries with mountainous ecosystems as among the most vulnerable in Arti cle 4.8 and also its preamble. The Intergovernmental Panel on Climate Change (IPCC) in its Second, Third and Fourth Assessment Reports indicate that mountainous countries such as Bhutan are likely to be among the most vulnerable to the adverse impacts of climate change. The IPCC and other similar reports point to a number of vulnerabiliti es that mountainous countries face in regards to climate change and variability, including their size and limited resource base, vulnerability to existi ng weather events such as heavy monsoonal rainfall, dry-season drought, tropical storms such as cyclones, and restricted economic opportuniti es that are being exacerbated by globalizati on and trade barriers. Though, relati vely small in size (38,394 km2) and populati on (projected populati on of 708,265 people in 2011), there is more than ample space but rugged terrain, limited economic resources and poor soils and limited land for culti vati on (1,124km2) make for diffi cult economic and living conditi ons. In fact, the various IPCC reports claim that adapti ve capacity of human systems is generally limited in mountainous developing countries, such as in Bhutan, and vulnerability high. Furthermore, one of the most important consequences of climate change, especially mountainous countries with glaciers, is climate-driven glacial melt and Glacial Lake Outburst Floods (GLOF), which in turn can severely impact upon inland waters and ecosystems and infrastructure well into the future.
In this chapter, the key vulnerabiliti es and adaptati on needs for Bhutan are presented for the following sectors: water resources, forests and biodiversity, agriculture, energy, human health and glaciers. Cross-linkages between sectors where overlap occurs are also addressed. Furthermore, policy frameworks, plans, policies and insti tuti onal frameworks and resources
for developing and implementi ng adaptati on strategies and measures in response to climate change are also addressed.
This chapter was prepared through a process involving a combinati on of technical assessments by several teams of experts (refer Annex I) specifi cally for the Second Nati onal Communicati on, outputs of other ongoing assessments in Bhutan, and several rounds of consultati ons with stakeholders and experts to provide inputs for the assessments and review the fi ndings. The general methodology used in the V&A is provided in the following secti ons but the main technical assessment is fully presented in a separate document “V&A Assessment for Bhutan’s Second Nati onal Communicati on: Technical Report” published separately3. The V&A process for the SNC also built upon a separate process, namely, the preparati on of nati onal themati c papers for the “Climate Summit for a Living Himalayas-Bhutan 20114” and used the same members in the V&A Task force to ensure synergy in developing the adaptati on prioriti es for Bhutan.
4.2 Climate Baseline and ScenariosBhutan has very limited meteorological records both in terms of area and historical coverage. A limited data set of reliable observed data at the Dzongkhag (district) level is available from 23 Class A and Class C stati ons for maximum and minimum temperature and rainfall, from 1996-2008 for most stati ons (13 years) and a few stati ons cover the
3 Soft copies of this report and the full technical V&A assessment, supporti ng maps and data are available online at www.nec.gov.bt/climate/snc/4 The Climate Summit for a Living Himalayas-Bhutan 2011 is a sub-regional eff ort for common adaptati on needs of the nati ons and communiti es around the southern slopes of the Eastern Himalayas, namely; Bangladesh, Bhutan, India and Nepal. The Summit is scheduled for 19 November 2011 in Thimphu, Bhutan and will culminate in a regional roadmap to address adaptati on along the themes of Biodiversity, Energy Security, Food Security and Water Resources. More informati on is available at www.bhutanclimatesummit.org.bt
Chapter Four : Vulnerability and Adaptati on
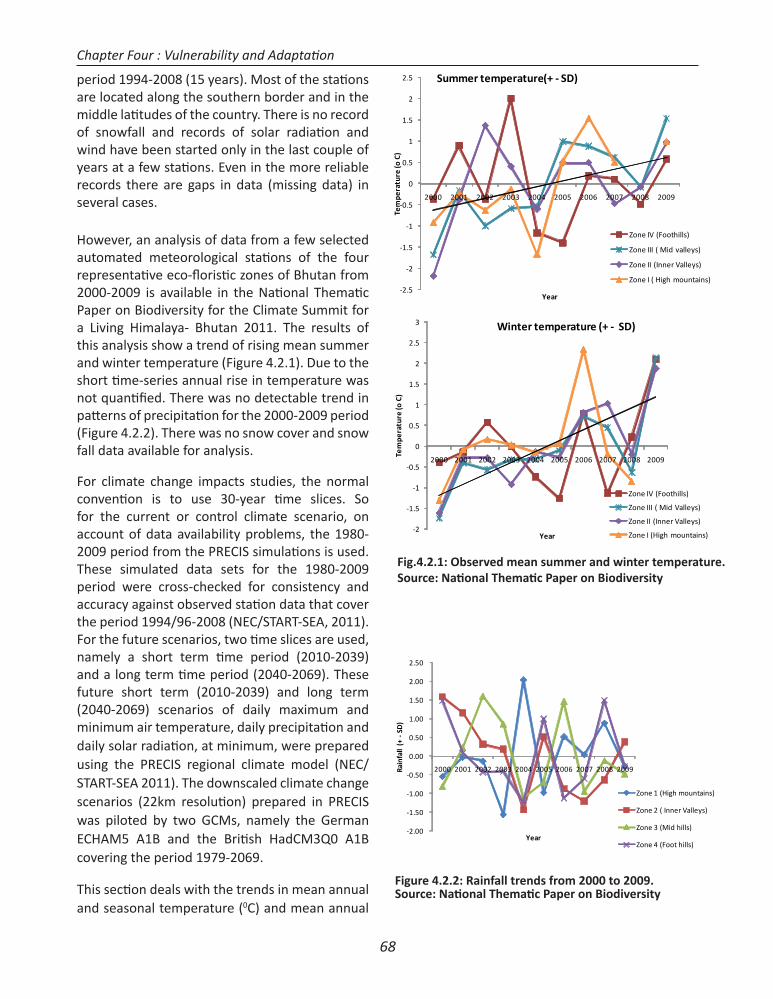
68
Figure 4.2.2: Rainfall trends from 2000 to 2009. Source: Nati onal Themati c Paper on Biodiversity
period 1994-2008 (15 years). Most of the stati ons are located along the southern border and in the middle lati tudes of the country. There is no record of snowfall and records of solar radiati on and wind have been started only in the last couple of years at a few stati ons. Even in the more reliable records there are gaps in data (missing data) in several cases.
However, an analysis of data from a few selected automated meteorological stati ons of the four representati ve eco-fl oristi c zones of Bhutan from 2000-2009 is available in the Nati onal Themati c Paper on Biodiversity for the Climate Summit for a Living Himalaya- Bhutan 2011. The results of this analysis show a trend of rising mean summer and winter temperature (Figure 4.2.1). Due to the short ti me-series annual rise in temperature was not quanti fi ed. There was no detectable trend in patt erns of precipitati on for the 2000-2009 period (Figure 4.2.2). There was no snow cover and snow fall data available for analysis.
For climate change impacts studies, the normal conventi on is to use 30-year ti me slices. So for the current or control climate scenario, on account of data availability problems, the 1980-2009 period from the PRECIS simulati ons is used. These simulated data sets for the 1980-2009 period were cross-checked for consistency and accuracy against observed stati on data that cover the period 1994/96-2008 (NEC/START-SEA, 2011). For the future scenarios, two ti me slices are used, namely a short term ti me period (2010-2039) and a long term ti me period (2040-2069). These future short term (2010-2039) and long term (2040-2069) scenarios of daily maximum and minimum air temperature, daily precipitati on and daily solar radiati on, at minimum, were prepared using the PRECIS regional climate model (NEC/START-SEA 2011). The downscaled climate change scenarios (22km resoluti on) prepared in PRECIS was piloted by two GCMs, namely the German ECHAM5 A1B and the Briti sh HadCM3Q0 A1B covering the period 1979-2069.
This secti on deals with the trends in mean annual and seasonal temperature (0C) and mean annual
-2.00
-1.50
-1.00
-0.50
0.00
0.50
1.00
1.50
2.00
2.50
2000 2001 2002 2003 2004 2005 2006 2007 2008 2009Rain
fall
(+ -
SD)
Year
Zone 1 (High mountains)
Zone 2 ( Inner Valleys)
Zone 3 (Mid hills)
Zone 4 (Foot hills)
-2.5
-2
-1.5
-1
-0.5
0
0.5
1
1.5
2
2.5
2000 2001 2002 2003 2004 2005 2006 2007 2008 2009
Tem
pera
ture
(o C
)
Year
Summer temperature(+ - SD)
Zone IV (Foothills)
Zone III ( Mid valleys)
Zone II (Inner Valleys)
Zone I ( High mountains)
-2
-1.5
-1
-0.5
0
0.5
1
1.5
2
2.5
3
2000 2001 2002 2003 2004 2005 2006 2007 2008 2009
Tem
pera
ture
(o C
)
Year
Winter temperature (+ - SD)
Zone IV (Foothills)
Zone III ( Mid Valleys)
Zone II (Inner Valleys)
Zone I (High mountains)
Fig.4.2.1: Observed mean summer and winter temperature. Source: Nati onal Themati c Paper on Biodiversity
Chapter Four : Vulnerability and Adaptati on
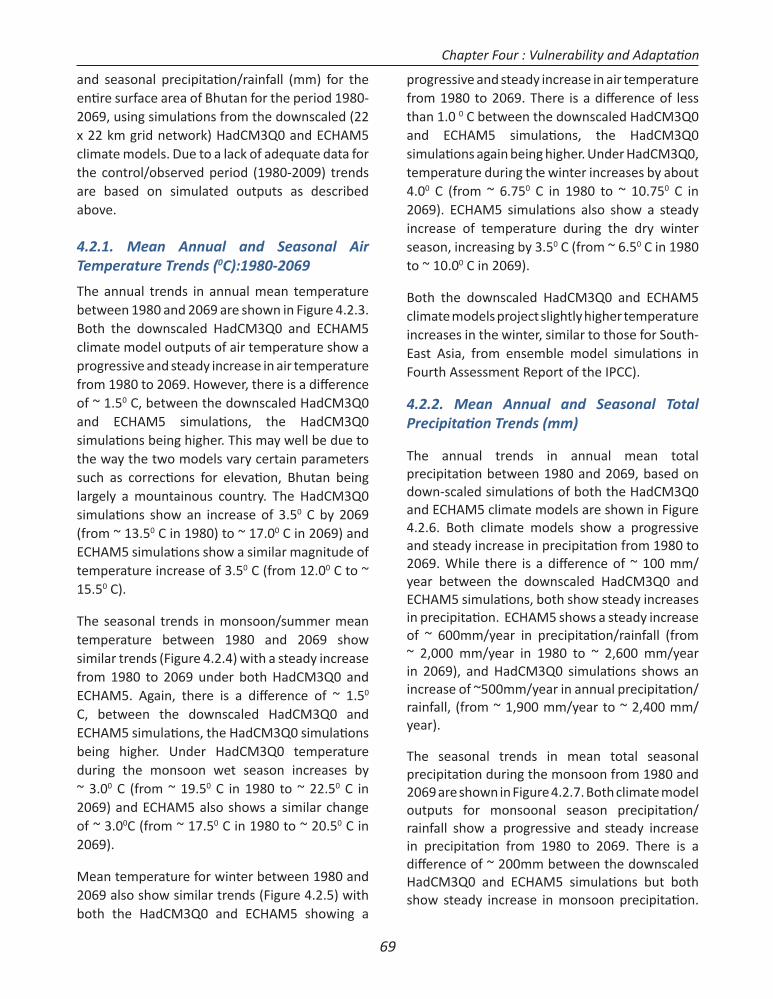
69
and seasonal precipitati on/rainfall (mm) for the enti re surface area of Bhutan for the period 1980-2069, using simulati ons from the downscaled (22 x 22 km grid network) HadCM3Q0 and ECHAM5 climate models. Due to a lack of adequate data for the control/observed period (1980-2009) trends are based on simulated outputs as described above.
4.2.1. Mean Annual and Seasonal Air Temperature Trends (0C):1980-2069
The annual trends in annual mean temperature between 1980 and 2069 are shown in Figure 4.2.3. Both the downscaled HadCM3Q0 and ECHAM5 climate model outputs of air temperature show a progressive and steady increase in air temperature from 1980 to 2069. However, there is a diff erence of ~ 1.50 C, between the downscaled HadCM3Q0 and ECHAM5 simulati ons, the HadCM3Q0 simulati ons being higher. This may well be due to the way the two models vary certain parameters such as correcti ons for elevati on, Bhutan being largely a mountainous country. The HadCM3Q0 simulati ons show an increase of 3.50 C by 2069 (from ~ 13.50 C in 1980) to ~ 17.00 C in 2069) and ECHAM5 simulati ons show a similar magnitude of temperature increase of 3.50 C (from 12.00 C to ~ 15.50 C).
The seasonal trends in monsoon/summer mean temperature between 1980 and 2069 show similar trends (Figure 4.2.4) with a steady increase from 1980 to 2069 under both HadCM3Q0 and ECHAM5. Again, there is a diff erence of ~ 1.50 C, between the downscaled HadCM3Q0 and ECHAM5 simulati ons, the HadCM3Q0 simulati ons being higher. Under HadCM3Q0 temperature during the monsoon wet season increases by ~ 3.00 C (from ~ 19.50 C in 1980 to ~ 22.50 C in 2069) and ECHAM5 also shows a similar change of ~ 3.00C (from ~ 17.50 C in 1980 to ~ 20.50 C in 2069).
Mean temperature for winter between 1980 and 2069 also show similar trends (Figure 4.2.5) with both the HadCM3Q0 and ECHAM5 showing a
progressive and steady increase in air temperature from 1980 to 2069. There is a diff erence of less than 1.0 0 C between the downscaled HadCM3Q0 and ECHAM5 simulati ons, the HadCM3Q0 simulati ons again being higher. Under HadCM3Q0, temperature during the winter increases by about 4.00 C (from ~ 6.750 C in 1980 to ~ 10.750 C in 2069). ECHAM5 simulati ons also show a steady increase of temperature during the dry winter season, increasing by 3.50 C (from ~ 6.50 C in 1980 to ~ 10.00 C in 2069).
Both the downscaled HadCM3Q0 and ECHAM5 climate models project slightly higher temperature increases in the winter, similar to those for South-East Asia, from ensemble model simulati ons in Fourth Assessment Report of the IPCC).
4.2.2. Mean Annual and Seasonal Total Precipitati on Trends (mm)
The annual trends in annual mean total precipitati on between 1980 and 2069, based on down-scaled simulati ons of both the HadCM3Q0 and ECHAM5 climate models are shown in Figure 4.2.6. Both climate models show a progressive and steady increase in precipitati on from 1980 to 2069. While there is a diff erence of ~ 100 mm/year between the downscaled HadCM3Q0 and ECHAM5 simulati ons, both show steady increases in precipitati on. ECHAM5 shows a steady increase of ~ 600mm/year in precipitati on/rainfall (from ~ 2,000 mm/year in 1980 to ~ 2,600 mm/year in 2069), and HadCM3Q0 simulati ons shows an increase of ~500mm/year in annual precipitati on/rainfall, (from ~ 1,900 mm/year to ~ 2,400 mm/year).
The seasonal trends in mean total seasonal precipitati on during the monsoon from 1980 and 2069 are shown in Figure 4.2.7. Both climate model outputs for monsoonal season precipitati on/rainfall show a progressive and steady increase in precipitati on from 1980 to 2069. There is a diff erence of ~ 200mm between the downscaled HadCM3Q0 and ECHAM5 simulati ons but both show steady increase in monsoon precipitati on.
Chapter Four : Vulnerability and Adaptati on
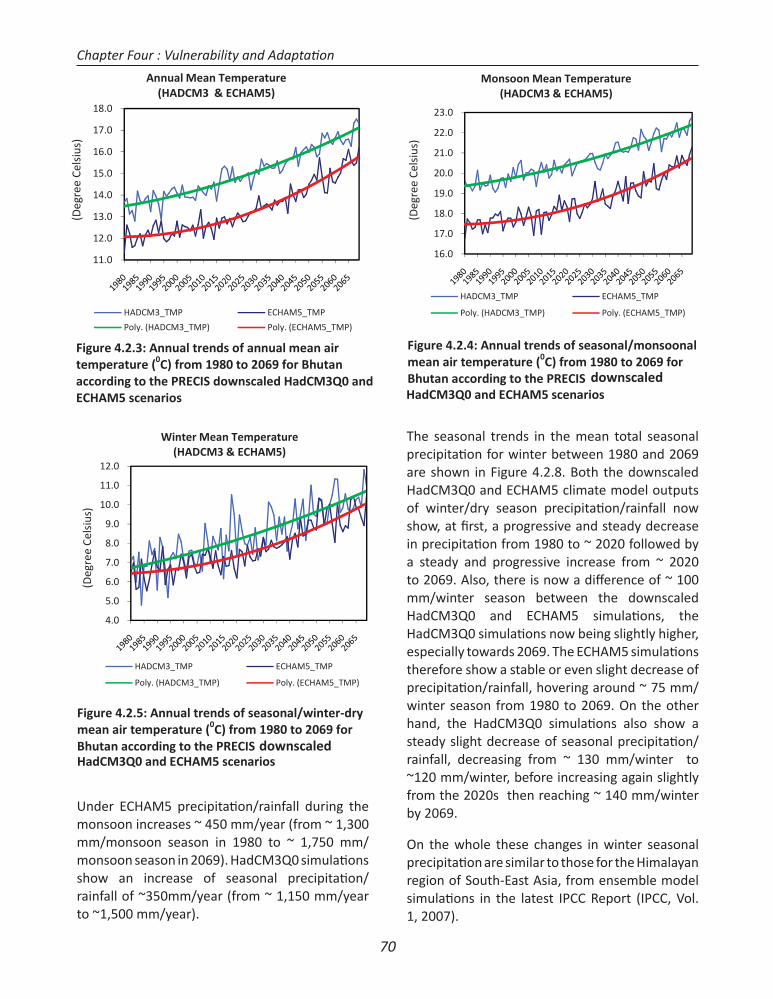
70
Under ECHAM5 precipitati on/rainfall during the monsoon increases ~ 450 mm/year (from ~ 1,300 mm/monsoon season in 1980 to ~ 1,750 mm/monsoon season in 2069). HadCM3Q0 simulati ons show an increase of seasonal precipitati on/rainfall of ~350mm/year (from ~ 1,150 mm/year to ~1,500 mm/year).
The seasonal trends in the mean total seasonal precipitati on for winter between 1980 and 2069 are shown in Figure 4.2.8. Both the downscaled HadCM3Q0 and ECHAM5 climate model outputs of winter/dry season precipitati on/rainfall now show, at fi rst, a progressive and steady decrease in precipitati on from 1980 to ~ 2020 followed by a steady and progressive increase from ~ 2020 to 2069. Also, there is now a diff erence of ~ 100 mm/winter season between the downscaled HadCM3Q0 and ECHAM5 simulati ons, the HadCM3Q0 simulati ons now being slightly higher, especially towards 2069. The ECHAM5 simulati ons therefore show a stable or even slight decrease of precipitati on/rainfall, hovering around ~ 75 mm/winter season from 1980 to 2069. On the other hand, the HadCM3Q0 simulati ons also show a steady slight decrease of seasonal precipitati on/rainfall, decreasing from ~ 130 mm/winter to ~120 mm/winter, before increasing again slightly from the 2020s then reaching ~ 140 mm/winter by 2069.
On the whole these changes in winter seasonal precipitati on are similar to those for the Himalayan region of South-East Asia, from ensemble model simulati ons in the latest IPCC Report (IPCC, Vol. 1, 2007).
Figure 4.2.5: Annual trends of seasonal/winter drymean air temperature (0C) from 1980 to 2069 forBhutan according to the PRECIS
4.0
5.0
6.0
7.0
8.0
9.0
10.0
11.0
12.0
(Deg
ree
Cels
ius)
Winter Mean Temperature(HADCM3 & ECHAM5)
HADCM3_TMP ECHAM5_TMP
Poly. (HADCM3_TMP) Poly. (ECHAM5_TMP)
HadCM3Q0 and ECHAM5 scenarios
Figure 4.2.4: Annual trends of seasonal/monsoonalmean air temperature (0C) from 1980 to 2069 forBhutan according to the PRECISdownscaledHadCM3Q0 and ECHAM5 scenarios
16.0
17.0
18.0
19.0
20.0
21.0
22.0
23.0
(Deg
ree
Cels
ius)
Monsoon Mean Temperature(HADCM3 & ECHAM5)
HADCM3_TMP ECHAM5_TMP
Poly. (HADCM3_TMP) Poly. (ECHAM5_TMP)
HadCM3Q0 and ECHAM5 scenarios
11.0
12.0
13.0
14.0
15.0
16.0
17.0
18.0
(Deg
ree
Cels
ius)
Annual Mean Temperature(HADCM3 & ECHAM5)
HADCM3_TMP ECHAM5_TMP
Poly. (HADCM3_TMP) Poly. (ECHAM5_TMP)
Figure 4.2.3: Annual trends of annual mean airtemperature (0C) from 1980 to 2069 for Bhutanaccording to the PRECIS downscaledHadCM3Q0 andECHAM5 scenarios (Top Left).
HadCM3Q0 and downscaled
downscaled
Chapter Four : Vulnerability and Adaptati on
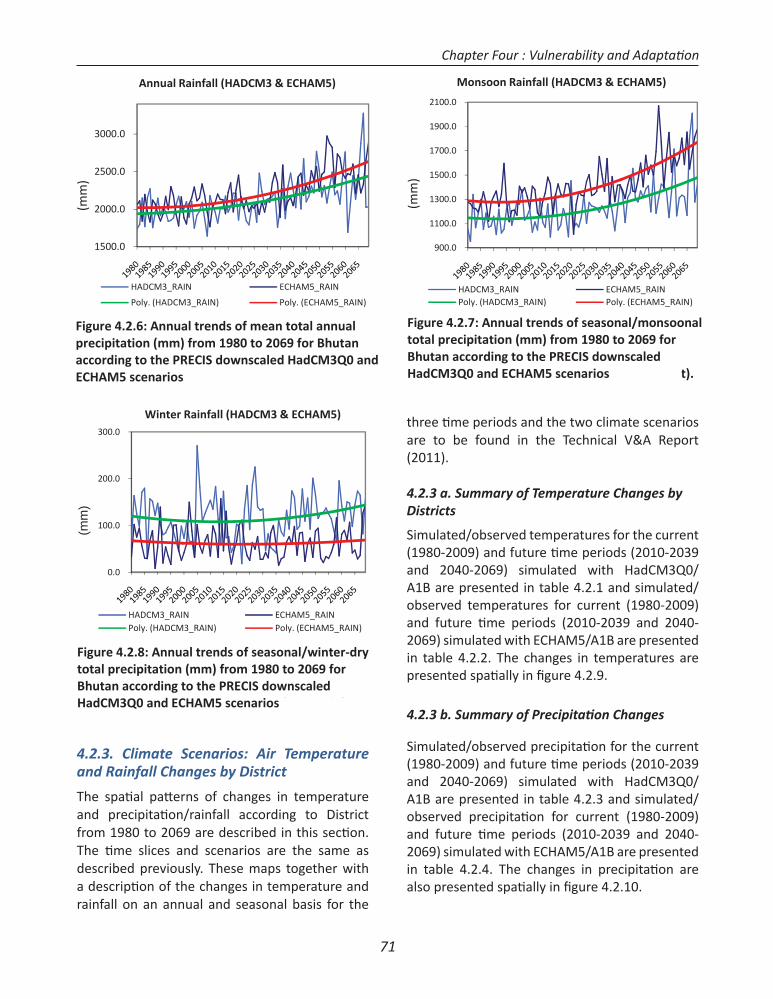
71
4.2.3. Climate Scenarios: Air Temperature and Rainfall Changes by District
The spati al patt erns of changes in temperature and precipitati on/rainfall according to District from 1980 to 2069 are described in this secti on. The ti me slices and scenarios are the same as described previously. These maps together with a descripti on of the changes in temperature and rainfall on an annual and seasonal basis for the
three ti me periods and the two climate scenarios are to be found in the Technical V&A Report (2011).
4.2.3 a. Summary of Temperature Changes by Districts
Simulated/observed temperatures for the current (1980-2009) and future ti me periods (2010-2039 and 2040-2069) simulated with HadCM3Q0/A1B are presented in table 4.2.1 and simulated/observed temperatures for current (1980-2009) and future ti me periods (2010-2039 and 2040-2069) simulated with ECHAM5/A1B are presented in table 4.2.2. The changes in temperatures are presented spati ally in fi gure 4.2.9.
4.2.3 b. Summary of Precipitati on Changes
Simulated/observed precipitati on for the current (1980-2009) and future ti me periods (2010-2039 and 2040-2069) simulated with HadCM3Q0/A1B are presented in table 4.2.3 and simulated/observed precipitati on for current (1980-2009) and future ti me periods (2010-2039 and 2040-2069) simulated with ECHAM5/A1B are presented in table 4.2.4. The changes in precipitati on are also presented spati ally in fi gure 4.2.10.
1500.0
2000.0
2500.0
3000.0
(mm
)Annual Rainfall (HADCM3 & ECHAM5)
HADCM3_RAIN ECHAM5_RAIN
Poly. (HADCM3_RAIN) Poly. (ECHAM5_RAIN)
900.0
1100.0
1300.0
1500.0
1700.0
1900.0
2100.0
(mm
)
Monsoon Rainfall (HADCM3 & ECHAM5)
HADCM3_RAIN ECHAM5_RAINPoly. (HADCM3_RAIN) Poly. (ECHAM5_RAIN)
0.0
100.0
200.0
300.0
(mm
)
Winter Rainfall (HADCM3 & ECHAM5)
HADCM3_RAIN ECHAM5_RAINPoly. (HADCM3_RAIN) Poly. (ECHAM5_RAIN)
Figure 4.2.8: Annual trends of seasonal/winter drytotal precipitation (mm) from 1980 to 2069 forBhutan according to the PRECIS downscaledHadCM3Q0 and ECHAM5 scenarios (Top Right).
Figure 4.2.6: Annual trends of mean total annualprecipitation (mm) from 1980 to 2069 for Bhutanaccording to the PRECIS downscaled HadCM3Q0 andECHAM5 scenarios (Top Left).
Figure 4.2.7: Annual trends of seasonal/monsoonaltotal precipitation (mm) from 1980 to 2069 forBhutan according to the PRECIS downscaledHadCM3Q0 and ECHAM5 scenarios (Bottom Left).
Chapter Four : Vulnerability and Adaptati on
72
4.2.4. Summary of Climate Scenarios
It transpires from the preceding secti ons that, compared to the current (1980-2009) climate, by 2010-2039 the mean annual temperature will increase by ~ 0.8 0C (ECHAM5/A1B scenario) to ~ 1.0 0C (HadCM3Q0/A1B scenario). Also, HadCM3Q0/A1B scenario projects a slightly higher increase in mean winter seasonal temperature (~ 1.2 0C) and a slightly lower increase in mean monsoon seasonal temperature (~ 0.8 0C) for the period 2010-2039. On the other hand, there is litt le or no diff erence between the annual and seasonal (monsoon and winter) temperature changes for the period 2010-2039, according to the ECHAM5/A1B scenario.
On the other hand, by 2040-2069 mean annual temperature will increase by ~ 2.0 0C (ECHAM5/A1B) to ~ 2.4 0C (HadCM3Q0/A1B). Again, the HadCM3Q0/A1B scenario projects a slightly higher increase in mean winter seasonal temperature (~ 2.8 0C) and a slightly lower increase in mean monsoon seasonal temperature (~ 2.1 0C) for the period 2040-2069. But there is litt le or no diff erence between the annual and seasonal (monsoon and winter) temperature changes for the period 2040-2069, according to the ECHAM5/A1B scenario.
As for changes in mean annual precipitati on
both the HadCM3Q0/A1B and ECHAM5/A1B project a slight increase in mean total annual precipitati on of ~ 6% in the 2010-2039 period. On a seasonal basis there is a slight decrease in winter precipitati on (~2%) and increase between 4-8% in the monsoon season for the period 2010-2039.
Finally, for the 2040-2069 period, the HadCM3Q0/A1B projects a moderate increase in mean total annual precipitati on of ~ 21 %, but with generally higher increases in the monsoon season compared to the winter season for Bhutan on the whole (11%). Similarly, the ECHAM5/A1B scenario also projects an increase in mean total annual precipitati on of ~ 25 % for the 2040-2069 period, also with generally higher increases in the monsoon season compared to the winter season for all Dzongkhags together.
Therefore, for changes in precipitati on both the HadCM3Q0/A1B and ECHAM5/A1B scenarios project moderate increases in mean total annual rainfall for the 2040-2069 period, but with conditi ons getti ng wett er in the wet monsoon season and drier in the dry winter season. These more extreme precipitati on changes between seasons conform to the fi ndings of the IPCC (2007) report for the Himalayan region of South-east Asia.
Chapter Four : Vulnerability and Adaptati on
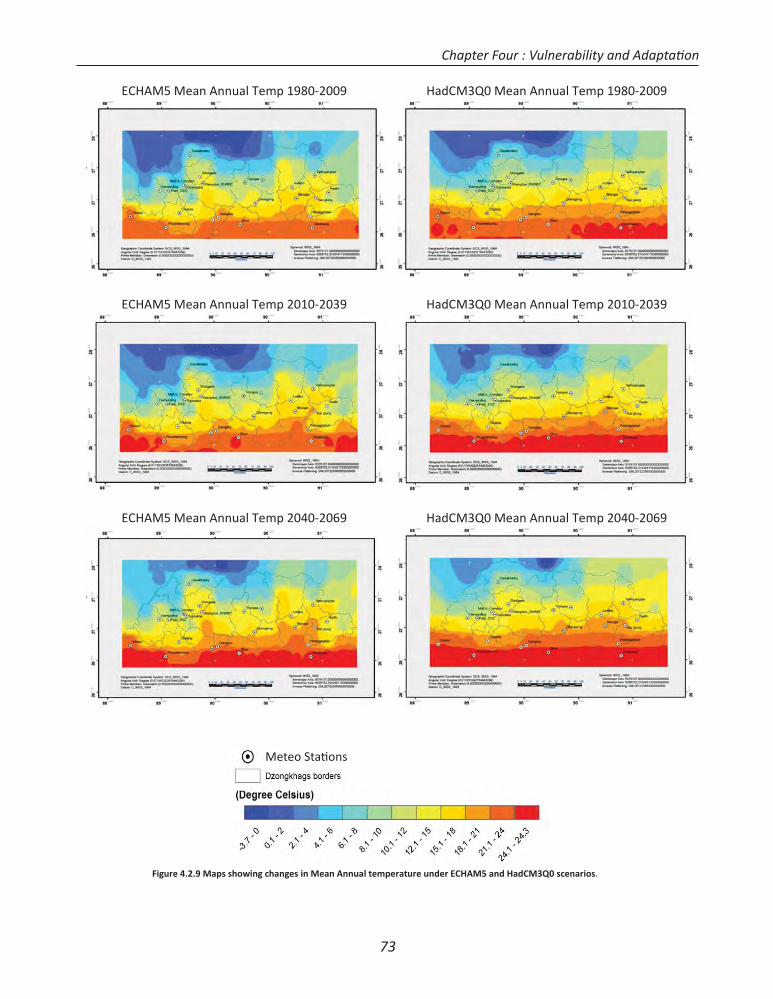
73
Figure 4.2.9 Maps showing changes in Mean Annual temperature under ECHAM5 and HadCM3Q0 scenarios.
ECHAM5 Mean Annual Temp 1980 2009 HadCM3Q0 Mean Annual Temp 1980 2009
ECHAM5 Mean Annual Temp 2010 2039 HadCM3Q0 Mean Annual Temp 2010 2039
ECHAM5 Mean Annual Temp 2040 2069 HadCM3Q0 Mean Annual Temp 2040 2069
Meteo Stati ons
Chapter Four : Vulnerability and Adaptati on
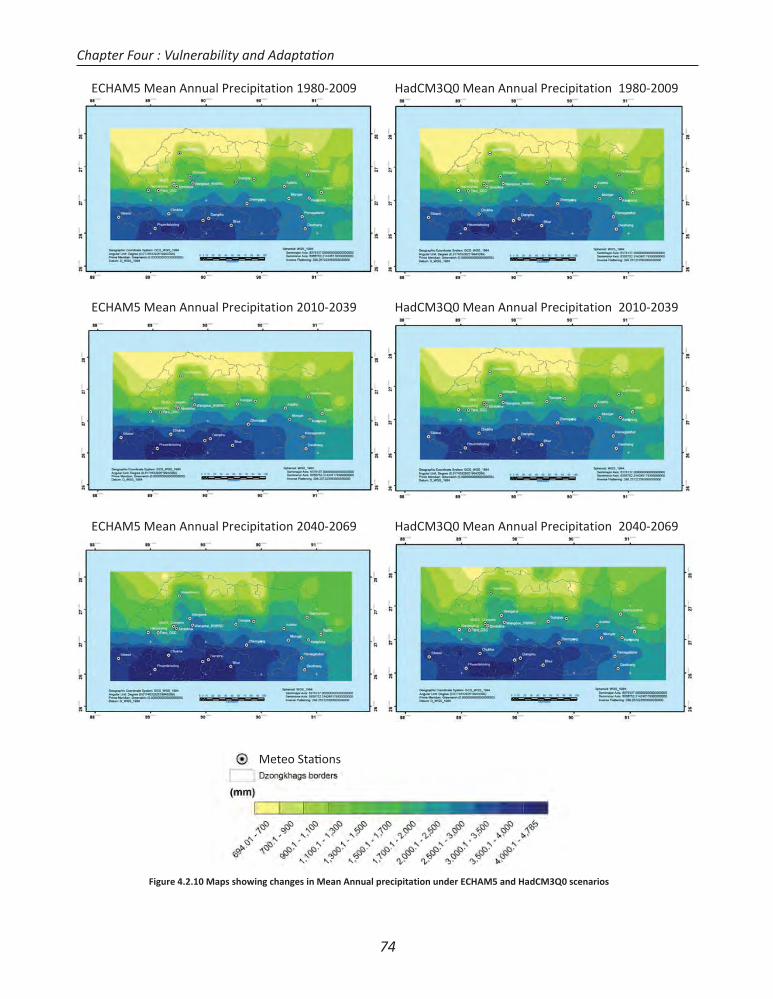
74
ECHAM5 Mean Annual Precipitation 1980 2009 HadCM3Q0 Mean Annual Precipitation 1980 2009
ECHAM5 Mean Annual Precipitation 2010 2039 HadCM3Q0 Mean Annual Precipitation 2010 2039
ECHAM5 Mean Annual Precipitation 2040 2069 HadCM3Q0 Mean Annual Precipitation 2040 2069
Figure 4.2.10 Maps showing changes in Mean Annual precipitation under ECHAM5 and HadCM3Q0 scenarios
Meteo Stati ons
Chapter Four : Vulnerability and Adaptati on
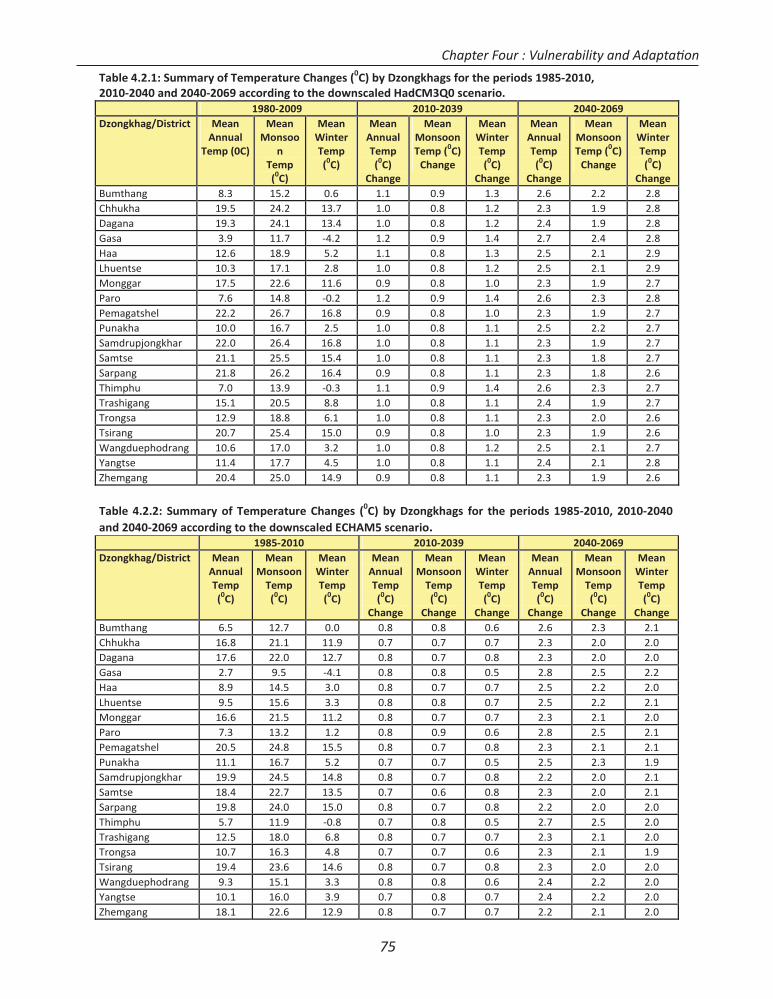
75
Table 4.2.1: Summary of Temperature Changes (0C) by Dzongkhags for the periods 1985 2010,2010 2040 and 2040 2069 according to the downscaled HadCM3Q0 scenario.
1980 2009 2010 2039 2040 2069Dzongkhag/District Mean
AnnualTemp (0C)
MeanMonsoo
nTemp(0C)
MeanWinterTemp(0C)
MeanAnnualTemp(0C)
Change
MeanMonsoonTemp (0C)
Change
MeanWinterTemp(0C)
Change
MeanAnnualTemp(0C)
Change
MeanMonsoonTemp (0C)
Change
MeanWinterTemp(0C)
ChangeBumthang 8.3 15.2 0.6 1.1 0.9 1.3 2.6 2.2 2.8Chhukha 19.5 24.2 13.7 1.0 0.8 1.2 2.3 1.9 2.8Dagana 19.3 24.1 13.4 1.0 0.8 1.2 2.4 1.9 2.8Gasa 3.9 11.7 4.2 1.2 0.9 1.4 2.7 2.4 2.8Haa 12.6 18.9 5.2 1.1 0.8 1.3 2.5 2.1 2.9Lhuentse 10.3 17.1 2.8 1.0 0.8 1.2 2.5 2.1 2.9Monggar 17.5 22.6 11.6 0.9 0.8 1.0 2.3 1.9 2.7Paro 7.6 14.8 0.2 1.2 0.9 1.4 2.6 2.3 2.8Pemagatshel 22.2 26.7 16.8 0.9 0.8 1.0 2.3 1.9 2.7Punakha 10.0 16.7 2.5 1.0 0.8 1.1 2.5 2.2 2.7Samdrupjongkhar 22.0 26.4 16.8 1.0 0.8 1.1 2.3 1.9 2.7Samtse 21.1 25.5 15.4 1.0 0.8 1.1 2.3 1.8 2.7Sarpang 21.8 26.2 16.4 0.9 0.8 1.1 2.3 1.8 2.6Thimphu 7.0 13.9 0.3 1.1 0.9 1.4 2.6 2.3 2.7Trashigang 15.1 20.5 8.8 1.0 0.8 1.1 2.4 1.9 2.7Trongsa 12.9 18.8 6.1 1.0 0.8 1.1 2.3 2.0 2.6Tsirang 20.7 25.4 15.0 0.9 0.8 1.0 2.3 1.9 2.6Wangduephodrang 10.6 17.0 3.2 1.0 0.8 1.2 2.5 2.1 2.7Yangtse 11.4 17.7 4.5 1.0 0.8 1.1 2.4 2.1 2.8Zhemgang 20.4 25.0 14.9 0.9 0.8 1.1 2.3 1.9 2.6
Table 4.2.2: Summary of Temperature Changes (0C) by Dzongkhags for the periods 1985 2010, 2010 2040and 2040 2069 according to the downscaled ECHAM5 scenario.
1985 2010 2010 2039 2040 2069Dzongkhag/District Mean
AnnualTemp(0C)
MeanMonsoon
Temp(0C)
MeanWinterTemp(0C)
MeanAnnualTemp(0C)
Change
MeanMonsoon
Temp(0C)
Change
MeanWinterTemp(0C)
Change
MeanAnnualTemp(0C)
Change
MeanMonsoon
Temp(0C)
Change
MeanWinterTemp(0C)
ChangeBumthang 6.5 12.7 0.0 0.8 0.8 0.6 2.6 2.3 2.1Chhukha 16.8 21.1 11.9 0.7 0.7 0.7 2.3 2.0 2.0Dagana 17.6 22.0 12.7 0.8 0.7 0.8 2.3 2.0 2.0Gasa 2.7 9.5 4.1 0.8 0.8 0.5 2.8 2.5 2.2Haa 8.9 14.5 3.0 0.8 0.7 0.7 2.5 2.2 2.0Lhuentse 9.5 15.6 3.3 0.8 0.8 0.7 2.5 2.2 2.1Monggar 16.6 21.5 11.2 0.8 0.7 0.7 2.3 2.1 2.0Paro 7.3 13.2 1.2 0.8 0.9 0.6 2.8 2.5 2.1Pemagatshel 20.5 24.8 15.5 0.8 0.7 0.8 2.3 2.1 2.1Punakha 11.1 16.7 5.2 0.7 0.7 0.5 2.5 2.3 1.9Samdrupjongkhar 19.9 24.5 14.8 0.8 0.7 0.8 2.2 2.0 2.1Samtse 18.4 22.7 13.5 0.7 0.6 0.8 2.3 2.0 2.1Sarpang 19.8 24.0 15.0 0.8 0.7 0.8 2.2 2.0 2.0Thimphu 5.7 11.9 0.8 0.7 0.8 0.5 2.7 2.5 2.0Trashigang 12.5 18.0 6.8 0.8 0.7 0.7 2.3 2.1 2.0Trongsa 10.7 16.3 4.8 0.7 0.7 0.6 2.3 2.1 1.9Tsirang 19.4 23.6 14.6 0.8 0.7 0.8 2.3 2.0 2.0Wangduephodrang 9.3 15.1 3.3 0.8 0.8 0.6 2.4 2.2 2.0Yangtse 10.1 16.0 3.9 0.7 0.8 0.7 2.4 2.2 2.0Zhemgang 18.1 22.6 12.9 0.8 0.7 0.7 2.2 2.1 2.0
Chapter Four : Vulnerability and Adaptati on
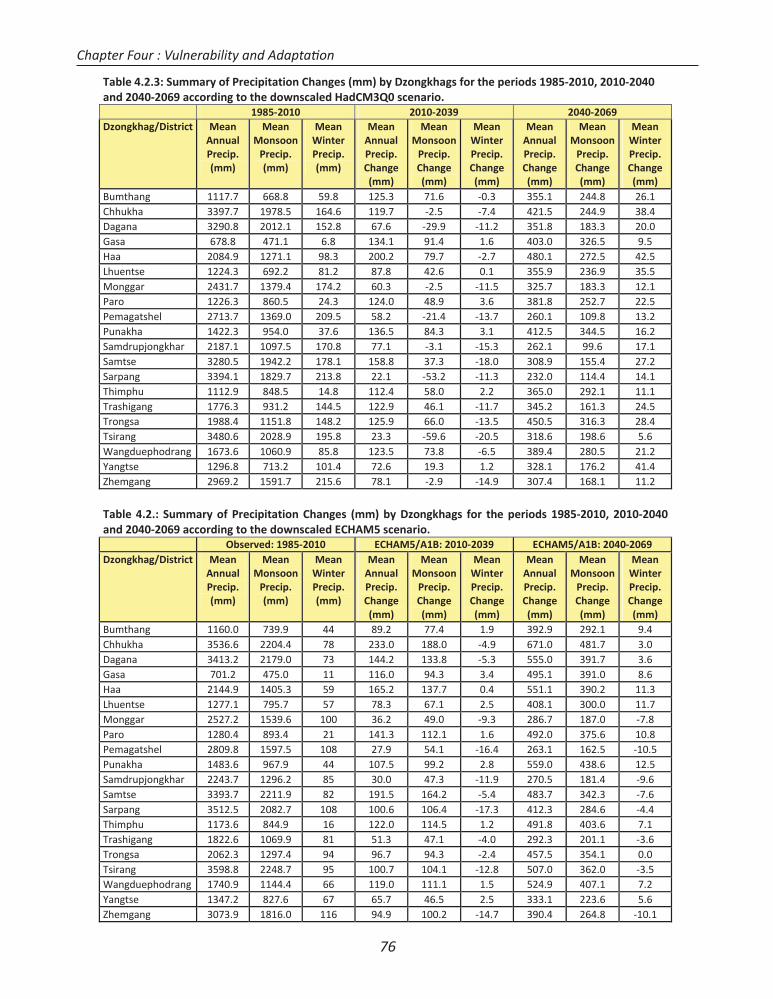
76
Table 4.2.3: Summary of Precipitation Changes (mm) by Dzongkhags for the periods 1985 2010, 2010 2040and 2040 2069 according to the downscaled HadCM3Q0 scenario.
1985 2010 2010 2039 2040 2069Dzongkhag/District Mean
AnnualPrecip.(mm)
MeanMonsoon
Precip.(mm)
MeanWinterPrecip.(mm)
MeanAnnualPrecip.Change(mm)
MeanMonsoon
Precip.Change(mm)
MeanWinterPrecip.Change(mm)
MeanAnnualPrecip.Change(mm)
MeanMonsoon
Precip.Change(mm)
MeanWinterPrecip.Change(mm)
Bumthang 1117.7 668.8 59.8 125.3 71.6 0.3 355.1 244.8 26.1Chhukha 3397.7 1978.5 164.6 119.7 2.5 7.4 421.5 244.9 38.4Dagana 3290.8 2012.1 152.8 67.6 29.9 11.2 351.8 183.3 20.0Gasa 678.8 471.1 6.8 134.1 91.4 1.6 403.0 326.5 9.5Haa 2084.9 1271.1 98.3 200.2 79.7 2.7 480.1 272.5 42.5Lhuentse 1224.3 692.2 81.2 87.8 42.6 0.1 355.9 236.9 35.5Monggar 2431.7 1379.4 174.2 60.3 2.5 11.5 325.7 183.3 12.1Paro 1226.3 860.5 24.3 124.0 48.9 3.6 381.8 252.7 22.5Pemagatshel 2713.7 1369.0 209.5 58.2 21.4 13.7 260.1 109.8 13.2Punakha 1422.3 954.0 37.6 136.5 84.3 3.1 412.5 344.5 16.2Samdrupjongkhar 2187.1 1097.5 170.8 77.1 3.1 15.3 262.1 99.6 17.1Samtse 3280.5 1942.2 178.1 158.8 37.3 18.0 308.9 155.4 27.2Sarpang 3394.1 1829.7 213.8 22.1 53.2 11.3 232.0 114.4 14.1Thimphu 1112.9 848.5 14.8 112.4 58.0 2.2 365.0 292.1 11.1Trashigang 1776.3 931.2 144.5 122.9 46.1 11.7 345.2 161.3 24.5Trongsa 1988.4 1151.8 148.2 125.9 66.0 13.5 450.5 316.3 28.4Tsirang 3480.6 2028.9 195.8 23.3 59.6 20.5 318.6 198.6 5.6Wangduephodrang 1673.6 1060.9 85.8 123.5 73.8 6.5 389.4 280.5 21.2Yangtse 1296.8 713.2 101.4 72.6 19.3 1.2 328.1 176.2 41.4Zhemgang 2969.2 1591.7 215.6 78.1 2.9 14.9 307.4 168.1 11.2
Table 4.2.: Summary of Precipitation Changes (mm) by Dzongkhags for the periods 1985 2010, 2010 2040and 2040 2069 according to the downscaled ECHAM5 scenario.
Observed: 1985 2010 ECHAM5/A1B: 2010 2039 ECHAM5/A1B: 2040 2069Dzongkhag/District Mean
AnnualPrecip.(mm)
MeanMonsoon
Precip.(mm)
MeanWinterPrecip.(mm)
MeanAnnualPrecip.Change(mm)
MeanMonsoon
Precip.Change(mm)
MeanWinterPrecip.Change(mm)
MeanAnnualPrecip.Change(mm)
MeanMonsoon
Precip.Change(mm)
MeanWinterPrecip.Change(mm)
Bumthang 1160.0 739.9 44 89.2 77.4 1.9 392.9 292.1 9.4Chhukha 3536.6 2204.4 78 233.0 188.0 4.9 671.0 481.7 3.0Dagana 3413.2 2179.0 73 144.2 133.8 5.3 555.0 391.7 3.6Gasa 701.2 475.0 11 116.0 94.3 3.4 495.1 391.0 8.6Haa 2144.9 1405.3 59 165.2 137.7 0.4 551.1 390.2 11.3Lhuentse 1277.1 795.7 57 78.3 67.1 2.5 408.1 300.0 11.7Monggar 2527.2 1539.6 100 36.2 49.0 9.3 286.7 187.0 7.8Paro 1280.4 893.4 21 141.3 112.1 1.6 492.0 375.6 10.8Pemagatshel 2809.8 1597.5 108 27.9 54.1 16.4 263.1 162.5 10.5Punakha 1483.6 967.9 44 107.5 99.2 2.8 559.0 438.6 12.5Samdrupjongkhar 2243.7 1296.2 85 30.0 47.3 11.9 270.5 181.4 9.6Samtse 3393.7 2211.9 82 191.5 164.2 5.4 483.7 342.3 7.6Sarpang 3512.5 2082.7 108 100.6 106.4 17.3 412.3 284.6 4.4Thimphu 1173.6 844.9 16 122.0 114.5 1.2 491.8 403.6 7.1Trashigang 1822.6 1069.9 81 51.3 47.1 4.0 292.3 201.1 3.6Trongsa 2062.3 1297.4 94 96.7 94.3 2.4 457.5 354.1 0.0Tsirang 3598.8 2248.7 95 100.7 104.1 12.8 507.0 362.0 3.5Wangduephodrang 1740.9 1144.4 66 119.0 111.1 1.5 524.9 407.1 7.2Yangtse 1347.2 827.6 67 65.7 46.5 2.5 333.1 223.6 5.6Zhemgang 3073.9 1816.0 116 94.9 100.2 14.7 390.4 264.8 10.1
Chapter Four : Vulnerability and Adaptati on
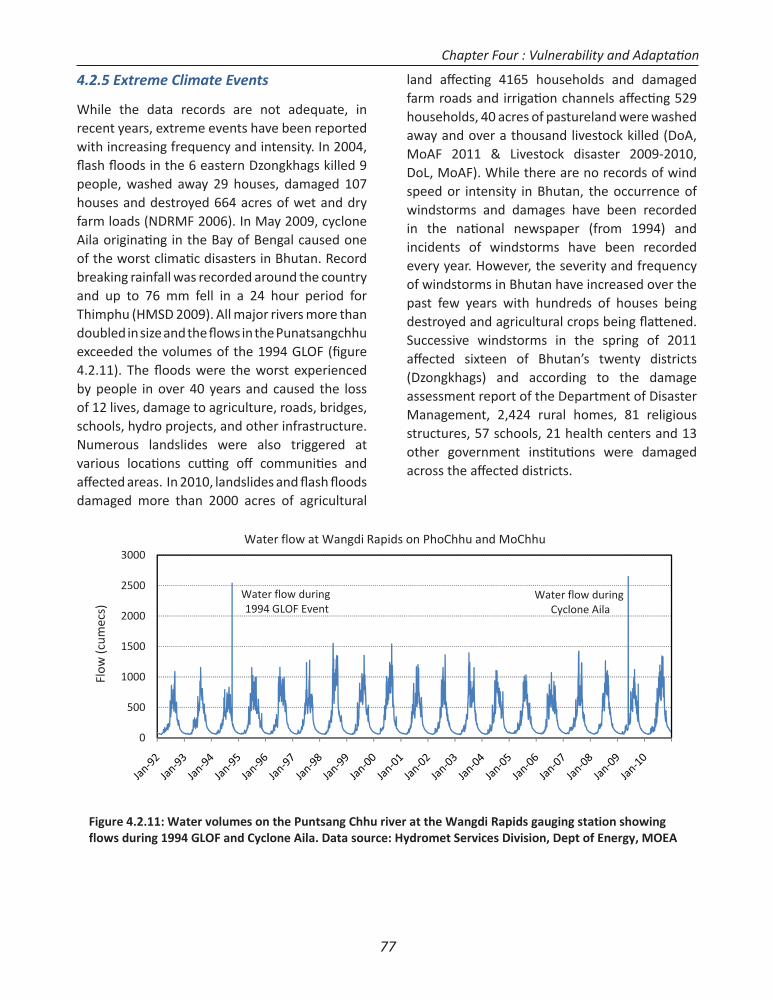
77
4.2.5 Extreme Climate Events
While the data records are not adequate, in recent years, extreme events have been reported with increasing frequency and intensity. In 2004, fl ash fl oods in the 6 eastern Dzongkhags killed 9 people, washed away 29 houses, damaged 107 houses and destroyed 664 acres of wet and dry farm loads (NDRMF 2006). In May 2009, cyclone Aila originati ng in the Bay of Bengal caused one of the worst climati c disasters in Bhutan. Record breaking rainfall was recorded around the country and up to 76 mm fell in a 24 hour period for Thimphu (HMSD 2009). All major rivers more than doubled in size and the fl ows in the Punatsangchhu exceeded the volumes of the 1994 GLOF (fi gure 4.2.11). The fl oods were the worst experienced by people in over 40 years and caused the loss of 12 lives, damage to agriculture, roads, bridges, schools, hydro projects, and other infrastructure. Numerous landslides were also triggered at various locati ons cutti ng off communiti es and aff ected areas. In 2010, landslides and fl ash fl oods damaged more than 2000 acres of agricultural
land aff ecti ng 4165 households and damaged farm roads and irrigati on channels aff ecti ng 529 households, 40 acres of pastureland were washed away and over a thousand livestock killed (DoA, MoAF 2011 & Livestock disaster 2009-2010, DoL, MoAF). While there are no records of wind speed or intensity in Bhutan, the occurrence of windstorms and damages have been recorded in the nati onal newspaper (from 1994) and incidents of windstorms have been recorded every year. However, the severity and frequency of windstorms in Bhutan have increased over the past few years with hundreds of houses being destroyed and agricultural crops being fl att ened. Successive windstorms in the spring of 2011 aff ected sixteen of Bhutan’s twenty districts (Dzongkhags) and according to the damage assessment report of the Department of Disaster Management, 2,424 rural homes, 81 religious structures, 57 schools, 21 health centers and 13 other government insti tuti ons were damaged across the aff ected districts.
Figure 4.2.11: Water volumes on the Puntsang Chhu river at the Wangdi Rapids gauging station showingflows during 1994 GLOF and Cyclone Aila. Data source: Hydromet Services Division, Dept of Energy, MOEA
0
500
1000
1500
2000
2500
3000
Flow
(cum
ecs)
Water flow at Wangdi Rapids on PhoChhu and MoChhu
Water flow during1994 GLOF Event
Water flow duringCyclone Aila
Chapter Four : Vulnerability and Adaptati on
78
4.3 Water Resources
Bhutan has four major river systems with numerous tributaries streams and natural lakes which are dependent mainly on glaciers, snow, forests and seasonal rainfall. The Amo Chhu (Toorsa), the Wang Chhu (Raidak), the Punatsang Chhu (Sunkosh) and the Drangme Chhu (Manas) are Bhutan’s four major rivers all of which drain into the Brahmaputra River in India. Nyera Ama Chu, Jomotshangkha Chhu and Shaar Chhu form smaller river basins. All the river systems originate within the country except three rivers viz. Amo Chhu, Gongri and Kuri Chhu all of which originate in the southern part of the Tibetan Plateau.
Water is of vital importance to the economy and people of Bhutan. Water has always been vital to agriculture but with economic growth, other sectors, mainly hydro power, industry and tourism are leaning more heavily on water resources. While the rivers provide potenti al for hydropower, the main rivers are generally at the bott om of valleys, irrigated agriculture is limited to areas adjacent to small perennial streams above the main rivers. On a macro scale the availability of water seems very high (109,000 m3 per capita) but this provides a false sense of water security as the major sources for drinking and irrigati on are mainly from local springs, streams and minor east-west tributaries. The main rivers are generally located at the bott om of valleys or deep gorges and ravines where accessibility remains a daunti ng challenge. Water fl ow measuring stati ons are also located only on main rivers for hydro power planning purposes and measurements do not exist for the smaller springs, streams and tributaries on which the majority of populati on depends.
Although Bhutan has not experienced severe water shortages in the past, reports of dwindling water sources are increasing and climate change may render the country much more vulnerable (NTG Water, 2011). Surveys of local percepti ons have reported that people have observed winter
fl ows to be lower than normal in the past 10-20 years (NTG Biodiversity 2011, WWF & WCP 2011). Furthermore, during the mid-term review consultati on of the 10th Five Year Plan (March-May 2011), representati ves of almost all Dzongkhags raised the issue of acute water shortages for drinking and att ributed such recent issues as increasing fallowing of agricultural land in the rural communiti es to the drying of water sources.
4.3.1 WEAP Assessment of Water Resources
For the V&A Assessment of water, WEAP (Water Evaluati on and Planning) soft ware package was selected. Due to ti me and scope of the project, the case study approach was used within the Wang Chhu River Basin. The area covered includes, Thimphu District/Dzongkhag, (Thimphu Chhu River) Haa Dzongkhag (Haa Chhu), Paro District (Paro Chhu) in the upper part of the basin and Chukha District/Dzongkhag in the lower part of the Basin (Figure 4.3.1). The climate scenarios are the same as described in the previous secti on for the baseline (1980-2009) and future periods (2010-2039 and 2040-2069). The water demand and supply scenarios were based on the Water Resources Management Plan (DoE 2003) with 2002 as current accounts year (the most recent year with reliable data) and 2003-2009 as the reference period. Water Demand sites were considered for Thimphu (Municipal and Industry), Paro (Rural and Livestock), Irrigated Land (Agriculture Land). Stream fl ow data for Paro and Chimakothi were used. For the 2 future periods, water demand was modifi ed by applying a populati on growth rate for both Thimphu (7.0% and Paro regions (1.3%) and an increase in the amount of irrigated areas. The water year method was used to integrate climate scenarios in the model. The full assessment is described in the Technical Report for the V&A available separately as described before.
Chapter Four : Vulnerability and Adaptati on
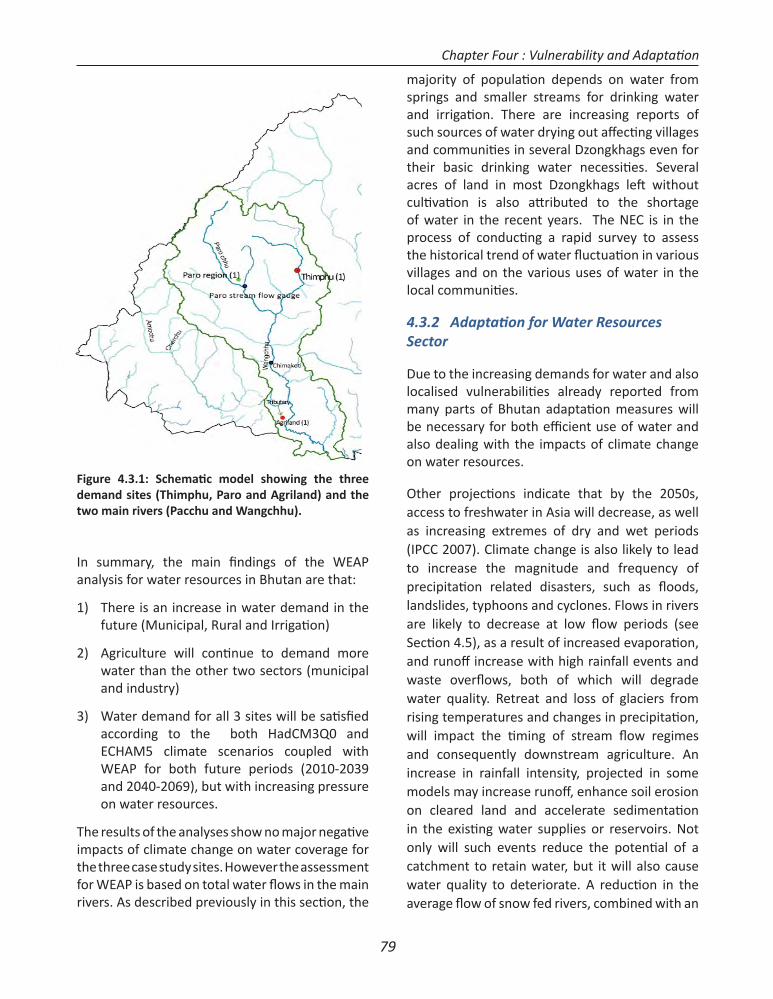
79
In summary, the main fi ndings of the WEAP analysis for water resources in Bhutan are that:
1) There is an increase in water demand in the future (Municipal, Rural and Irrigati on)
2) Agriculture will conti nue to demand more water than the other two sectors (municipal and industry)
3) Water demand for all 3 sites will be sati sfi ed according to the both HadCM3Q0 and ECHAM5 climate scenarios coupled with WEAP for both future periods (2010-2039 and 2040-2069), but with increasing pressure on water resources.
The results of the analyses show no major negati ve impacts of climate change on water coverage for the three case study sites. However the assessment for WEAP is based on total water fl ows in the main rivers. As described previously in this secti on, the
majority of populati on depends on water from springs and smaller streams for drinking water and irrigati on. There are increasing reports of such sources of water drying out aff ecti ng villages and communiti es in several Dzongkhags even for their basic drinking water necessiti es. Several acres of land in most Dzongkhags left without culti vati on is also att ributed to the shortage of water in the recent years. The NEC is in the process of conducti ng a rapid survey to assess the historical trend of water fl uctuati on in various villages and on the various uses of water in the local communiti es.
4.3.2 Adaptati on for Water Resources Sector
Due to the increasing demands for water and also localised vulnerabiliti es already reported from many parts of Bhutan adaptati on measures will be necessary for both effi cient use of water and also dealing with the impacts of climate change on water resources.
Other projecti ons indicate that by the 2050s, access to freshwater in Asia will decrease, as well as increasing extremes of dry and wet periods (IPCC 2007). Climate change is also likely to lead to increase the magnitude and frequency of precipitati on related disasters, such as fl oods, landslides, typhoons and cyclones. Flows in rivers are likely to decrease at low fl ow periods (see Secti on 4.5), as a result of increased evaporati on, and runoff increase with high rainfall events and waste overfl ows, both of which will degrade water quality. Retreat and loss of glaciers from rising temperatures and changes in precipitati on, will impact the ti ming of stream fl ow regimes and consequently downstream agriculture. An increase in rainfall intensity, projected in some models may increase runoff , enhance soil erosion on cleared land and accelerate sedimentati on in the existi ng water supplies or reservoirs. Not only will such events reduce the potenti al of a catchment to retain water, but it will also cause water quality to deteriorate. A reducti on in the average fl ow of snow fed rivers, combined with an
Figure 4.3.1: Schemati c model showing the three demand sites (Thimphu, Paro and Agriland) and the two main rivers (Pacchu and Wangchhu).
Chapter Four : Vulnerability and Adaptati on
80
increase in peak fl ows and sediment yield, would have major impacts on hydropower generati on, urban water supply and agriculture.
In light of such projected impacts and lack of informati on in the country on the status of water security, one of the urgent acti viti es needed for both resource management and adaptati on to climate change is baseline assessment of water resources. In Bhutan there has been no comprehensive study of the water sources, their historical trend, and inventory on the use of the water for various purposes. Such assessments and other adaptati on prioriti es and issues for water security in Bhutan are described in the secti on on the Adaptati on Plan (Secti on 4.9).
4.4 Agriculture
Traditi onally agriculture has been the mainstay of the Bhutanese economy. In 2008, the agricultural sector contributed 18.5 percent to Bhutan’s GDP. Its share has been gradually declining over the years as energy (hydro power), industry and tourism have recently become more important. However, 69% of the Bhutanese populati on sti ll depends on the agriculture sector which is mostly subsistence in nature and farmers engage in both land and animal husbandry. Due to the mountainous terrain, land available for culti vati on is limited and only 2.93% of the country (1,124km2) is culti vated. Furthermore, farming is a challenge because of low soil ferti lity, poor infrastructure, small landholding size and occurrence of natural disasters like fl oods, and the mountainous terrain, all of which make the acti vity labour-intensive. Despite the limited area, Bhutan’s agricultural diversity in the agro-ecological zones is quite varied and covers a range of climati c zones (Table 4.4.1).
The main crops in Bhutan are rice, maize, wheat, potatoes, buckwheat, barley and millet. Socioeconomically, rice, maize and potato are the three most important crops in Bhutan. Rice is the staple food of the Bhutanese people, closely followed by maize. Potato is an important cash
crop of communiti es living at higher elevati ons. Rice is grown mainly in the western region, in Thimphu, Paro, Punakha and Wangdue districts and the Southern districts of Samdrupjongkhar, Sarpang, Tsirang and Samtse followed by notable areas in Lhuentse, Trashiyangtse and Trashigang in the East. Total culti vated rice area is esti mated at 19,410 hectares and represents 74 percent of all farming households. Producti on of rice on a commercial scale is limited – total paddy culti vati on is limited to 19,410 hectares – due largely to a shortage of arable land and farm labor, low cropping intensity, inadequate irrigati on and crop losses to pests and especially, wild animals.
Maize is grown all over the country, but is more popular in the Eastern region. About 45 percent of the total maize producti on comes from the six eastern districts of Trashigang, Samdrupjhongkhar, Pemagatshel, Trashiyangtse, Monggar and Lhuntse. Ma ize consti tutes 49 percent of the nati onal food basket and represents 42 percent of the culti vated area. Potato is the most important cash crop in Bhutan. Around 27,745 households, located mostly at mid and high elevati ons such as Phobjekha in the Wangdue Phodrang district, are dependent on potato producti on for a signifi cant porti on of their livelihood. While self-suffi cient in maize, barley, millet, and buckwheat, Bhutan is only 50 percent self-suffi cient in rice and 30 percent in wheat. In total the country is around 60 percent self-suffi cient in cereals. Other key crops which are exported are potatoes, spices (mainly cardamom), and fruits such as oranges and apples. However, exports of vegetables are gaining importance especially during the summer months.
4.4.1 Current vulnerability of agriculture sector
Some of the observed symptoms of climate change impacts on agriculture in Bhutan are loss of crops to unusual outbreaks of pests and diseases, errati c rainfalls, windstorms, droughts and fl ash fl oods/landslides that are increasing annually. In 1996, farmers in the high alti tude areas lost between 80% to 90% of rice to rice blast epidemic. In 2007,
Chapter Four : Vulnerability and Adaptati on
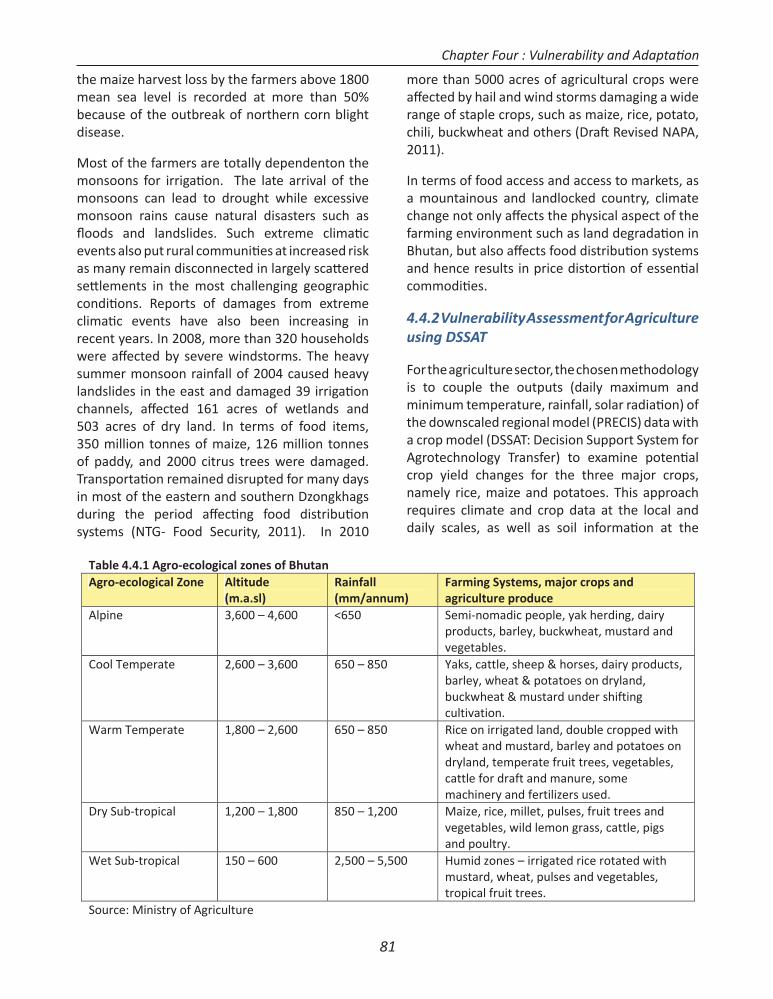
81
the maize harvest loss by the farmers above 1800 mean sea level is recorded at more than 50% because of the outbreak of northern corn blight disease.
Most of the farmers are totally dependenton the monsoons for irrigati on. The late arrival of the monsoons can lead to drought while excessive monsoon rains cause natural disasters such as fl oods and landslides. Such extreme climati c events also put rural communiti es at increased risk as many remain disconnected in largely scatt ered sett lements in the most challenging geographic conditi ons. Reports of damages from extreme climati c events have also been increasing in recent years. In 2008, more than 320 households were aff ected by severe windstorms. The heavy summer monsoon rainfall of 2004 caused heavy landslides in the east and damaged 39 irrigati on channels, aff ected 161 acres of wetlands and 503 acres of dry land. In terms of food items, 350 million tonnes of maize, 126 million tonnes of paddy, and 2000 citrus trees were damaged. Transportati on remained disrupted for many days in most of the eastern and southern Dzongkhags during the period aff ecti ng food distributi on systems (NTG- Food Security, 2011). In 2010
more than 5000 acres of agricultural crops were aff ected by hail and wind storms damaging a wide range of staple crops, such as maize, rice, potato, chili, buckwheat and others (Draft Revised NAPA, 2011).
In terms of food access and access to markets, as a mountainous and landlocked country, climate change not only aff ects the physical aspect of the farming environment such as land degradati on in Bhutan, but also aff ects food distributi on systems and hence results in price distorti on of essenti al commoditi es.
4.4.2 Vulnerability Assessment for Agriculture using DSSAT
For the agriculture sector, the chosen methodology is to couple the outputs (daily maximum and minimum temperature, rainfall, solar radiati on) of the downscaled regional model (PRECIS) data with a crop model (DSSAT: Decision Support System for Agrotechnology Transfer) to examine potenti al crop yield changes for the three major crops, namely rice, maize and potatoes. This approach requires climate and crop data at the local and daily scales, as well as soil informati on at the
Table 4.4.1 Agro ecological zones of BhutanAgro ecological Zone Altitude
(m.a.sl)Rainfall(mm/annum)
Farming Systems, major crops andagriculture produce
Alpine 3,600 – 4,600 <650 Semi nomadic people, yak herding, dairyproducts, barley, buckwheat, mustard andvegetables.
Cool Temperate 2,600 – 3,600 650 – 850 Yaks, cattle, sheep & horses, dairy products,barley, wheat & potatoes on dryland,buckwheat & mustard under shiftingcultivation.
Warm Temperate 1,800 – 2,600 650 – 850 Rice on irrigated land, double cropped withwheat and mustard, barley and potatoes ondryland, temperate fruit trees, vegetables,cattle for draft and manure, somemachinery and fertilizers used.
Dry Sub tropical 1,200 – 1,800 850 – 1,200 Maize, rice, millet, pulses, fruit trees andvegetables, wild lemon grass, cattle, pigsand poultry.
Wet Sub tropical 150 – 600 2,500 – 5,500 Humid zones – irrigated rice rotated withmustard, wheat, pulses and vegetables,tropical fruit trees.
Source: Ministry of Agriculture
Chapter Four : Vulnerability and Adaptati on
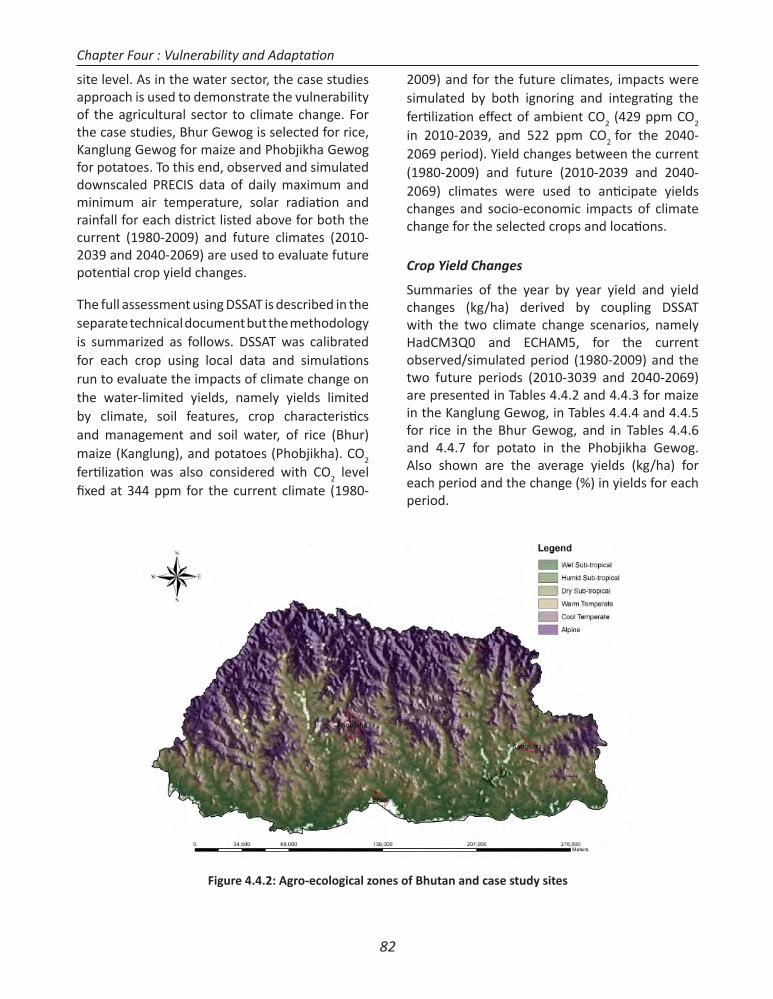
82
site level. As in the water sector, the case studies approach is used to demonstrate the vulnerability of the agricultural sector to climate change. For the case studies, Bhur Gewog is selected for rice, Kanglung Gewog for maize and Phobjikha Gewog for potatoes. To this end, observed and simulated downscaled PRECIS data of daily maximum and minimum air temperature, solar radiati on and rainfall for each district listed above for both the current (1980-2009) and future climates (2010-2039 and 2040-2069) are used to evaluate future potenti al crop yield changes.
The full assessment using DSSAT is described in the separate technical document but the methodology is summarized as follows. DSSAT was calibrated for each crop using local data and simulati ons run to evaluate the impacts of climate change on the water-limited yields, namely yields limited by climate, soil features, crop characteristi cs and management and soil water, of rice (Bhur) maize (Kanglung), and potatoes (Phobjikha). CO2
ferti lizati on was also considered with CO2 level fi xed at 344 ppm for the current climate (1980-
2009) and for the future climates, impacts were simulated by both ignoring and integrati ng the ferti lizati on eff ect of ambient CO2 (429 ppm CO2
in 2010-2039, and 522 ppm CO2 for the 2040-2069 period). Yield changes between the current (1980-2009) and future (2010-2039 and 2040-2069) climates were used to anti cipate yields changes and socio-economic impacts of climate change for the selected crops and locati ons.
Crop Yield Changes
Summaries of the year by year yield and yield changes (kg/ha) derived by coupling DSSAT with the two climate change scenarios, namely HadCM3Q0 and ECHAM5, for the current observed/simulated period (1980-2009) and the two future periods (2010-3039 and 2040-2069) are presented in Tables 4.4.2 and 4.4.3 for maize in the Kanglung Gewog, in Tables 4.4.4 and 4.4.5 for rice in the Bhur Gewog, and in Tables 4.4.6 and 4.4.7 for potato in the Phobjikha Gewog. Also shown are the average yields (kg/ha) for each period and the change (%) in yields for each period.
Figure 4.4.2: Agro-ecological zones of Bhutan and case study sites
Chapter Four : Vulnerability and Adaptati on
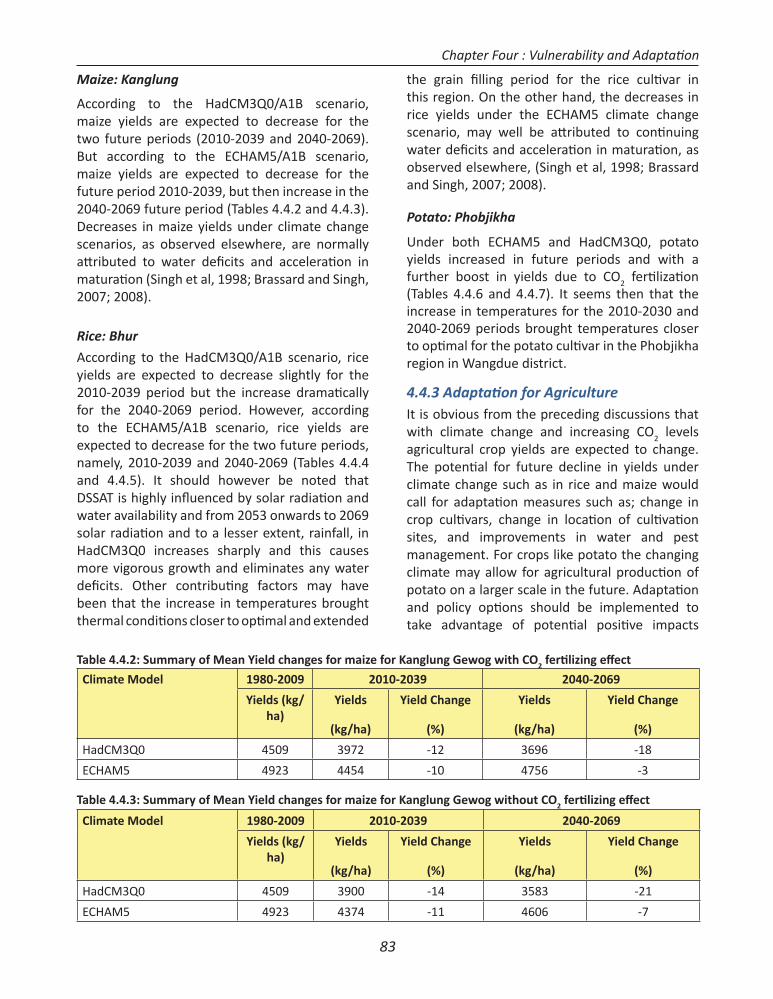
83
Maize: Kanglung
According to the HadCM3Q0/A1B scenario, maize yields are expected to decrease for the two future periods (2010-2039 and 2040-2069). But according to the ECHAM5/A1B scenario, maize yields are expected to decrease for the future period 2010-2039, but then increase in the 2040-2069 future period (Tables 4.4.2 and 4.4.3). Decreases in maize yields under climate change scenarios, as observed elsewhere, are normally att ributed to water defi cits and accelerati on in maturati on (Singh et al, 1998; Brassard and Singh, 2007; 2008).
Rice: Bhur
According to the HadCM3Q0/A1B scenario, rice yields are expected to decrease slightly for the 2010-2039 period but the increase dramati cally for the 2040-2069 period. However, according to the ECHAM5/A1B scenario, rice yields are expected to decrease for the two future periods, namely, 2010-2039 and 2040-2069 (Tables 4.4.4 and 4.4.5). It should however be noted that DSSAT is highly infl uenced by solar radiati on and water availability and from 2053 onwards to 2069 solar radiati on and to a lesser extent, rainfall, in HadCM3Q0 increases sharply and this causes more vigorous growth and eliminates any water defi cits. Other contributi ng factors may have been that the increase in temperatures brought thermal conditi ons closer to opti mal and extended
the grain fi lling period for the rice culti var in this region. On the other hand, the decreases in rice yields under the ECHAM5 climate change scenario, may well be att ributed to conti nuing water defi cits and accelerati on in maturati on, as observed elsewhere, (Singh et al, 1998; Brassard and Singh, 2007; 2008).
Potato: Phobjikha
Under both ECHAM5 and HadCM3Q0, potato yields increased in future periods and with a further boost in yields due to CO2 ferti lizati on (Tables 4.4.6 and 4.4.7). It seems then that the increase in temperatures for the 2010-2030 and 2040-2069 periods brought temperatures closer to opti mal for the potato culti var in the Phobjikha region in Wangdue district.
4.4.3 Adaptati on for AgricultureIt is obvious from the preceding discussions that with climate change and increasing CO2 levels agricultural crop yields are expected to change. The potenti al for future decline in yields under climate change such as in rice and maize would call for adaptati on measures such as; change in crop culti vars, change in locati on of culti vati on sites, and improvements in water and pest management. For crops like potato the changing climate may allow for agricultural producti on of potato on a larger scale in the future. Adaptati on and policy opti ons should be implemented to take advantage of potenti al positi ve impacts
Climate Model 1980-2009 2010-2039 2040-2069
Yields (kg/ha)
Yields
(kg/ha)
Yield Change
(%)
Yields
(kg/ha)
Yield Change
(%)
HadCM3Q0 4509 3972 -12 3696 -18
ECHAM5 4923 4454 -10 4756 -3
Climate Model 1980-2009 2010-2039 2040-2069
Yields (kg/ha)
Yields
(kg/ha)
Yield Change
(%)
Yields
(kg/ha)
Yield Change
(%)
HadCM3Q0 4509 3900 -14 3583 -21
ECHAM5 4923 4374 -11 4606 -7
Table 4.4.2: Summary of Mean Yield changes for maize for Kanglung Gewog with CO2 ferti lizing eff ect
Table 4.4.3: Summary of Mean Yield changes for maize for Kanglung Gewog without CO2 ferti lizing eff ect
Chapter Four : Vulnerability and Adaptati on
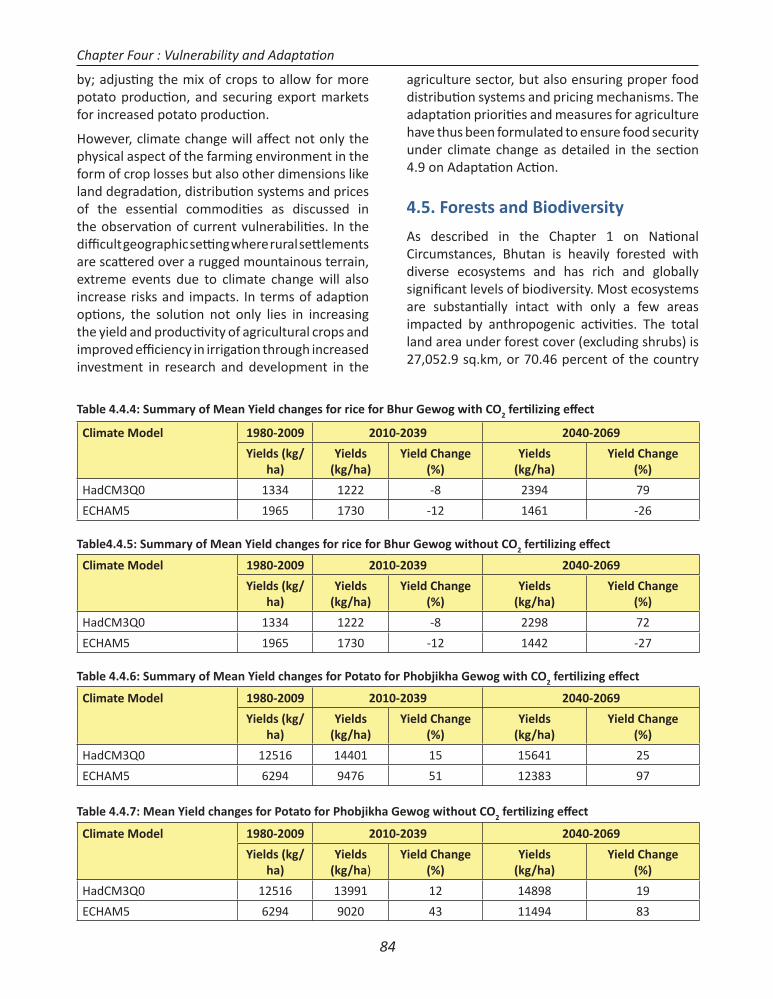
84
by; adjusti ng the mix of crops to allow for more potato producti on, and securing export markets for increased potato producti on.
However, climate change will aff ect not only the physical aspect of the farming environment in the form of crop losses but also other dimensions like land degradati on, distributi on systems and prices of the essenti al commoditi es as discussed in the observati on of current vulnerabiliti es. In the diffi cult geographic setti ng where rural sett lements are scatt ered over a rugged mountainous terrain, extreme events due to climate change will also increase risks and impacts. In terms of adapti on opti ons, the soluti on not only lies in increasing the yield and producti vity of agricultural crops and improved effi ciency in irrigati on through increased investment in research and development in the
agriculture sector, but also ensuring proper food distributi on systems and pricing mechanisms. The adaptati on prioriti es and measures for agriculture have thus been formulated to ensure food security under climate change as detailed in the secti on 4.9 on Adaptati on Acti on.
4.5. Forests and Biodiversity
As described in the Chapter 1 on Nati onal Circumstances, Bhutan is heavily forested with diverse ecosystems and has rich and globally signifi cant levels of biodiversity. Most ecosystems are substanti ally intact with only a few areas impacted by anthropogenic acti viti es. The total land area under forest cover (excluding shrubs) is 27,052.9 sq.km, or 70.46 percent of the country
Climate Model 1980-2009 2010-2039 2040-2069
Yields (kg/ha)
Yields(kg/ha)
Yield Change(%)
Yields(kg/ha)
Yield Change(%)
HadCM3Q0 1334 1222 -8 2394 79
ECHAM5 1965 1730 -12 1461 -26
Climate Model 1980-2009 2010-2039 2040-2069
Yields (kg/ha)
Yields(kg/ha)
Yield Change(%)
Yields(kg/ha)
Yield Change(%)
HadCM3Q0 1334 1222 -8 2298 72
ECHAM5 1965 1730 -12 1442 -27
Climate Model 1980-2009 2010-2039 2040-2069
Yields (kg/ha)
Yields(kg/ha)
Yield Change(%)
Yields(kg/ha)
Yield Change(%)
HadCM3Q0 12516 14401 15 15641 25
ECHAM5 6294 9476 51 12383 97
Climate Model 1980-2009 2010-2039 2040-2069
Yields (kg/ha)
Yields(kg/ha)
Yield Change(%)
Yields(kg/ha)
Yield Change(%)
HadCM3Q0 12516 13991 12 14898 19
ECHAM5 6294 9020 43 11494 83
Table 4.4.4: Summary of Mean Yield changes for rice for Bhur Gewog with CO2 ferti lizing eff ect
Table4.4.5: Summary of Mean Yield changes for rice for Bhur Gewog without CO2 ferti lizing eff ect
Table 4.4.6: Summary of Mean Yield changes for Potato for Phobjikha Gewog with CO2 ferti lizing eff ect
Table 4.4.7: Mean Yield changes for Potato for Phobjikha Gewog without CO2 ferti lizing eff ect
Chapter Four : Vulnerability and Adaptati on
85
(NSSC, LCMP, 2010). The interacti on of topography, climate and human use has resulted in a complex patt ern of vegetati on and habitat types. The three major vegetati on zones of Bhutan are: the Alpine zone (above 4000m); Temperate zone (2000 to 4000m), which includes the major conifer/broadleaf forests; and the Subtropical Zone (150 to 2000m), characterized by tropical/subtropical vegetati on.
The broadleaf forests (62.43 %) and the mixed conifer forest (22.69%) form the dominant forest types (Figure 4.5.1).These diverse ecosystems harbour a spectacular assortment biodiversity with a recorded total of 5,603 species of angiosperms and gymnosperms, close to 200 species of mammals and 678 species of birds, recorded to date (see Chapter 1 and the Technical V&A document for more details).
In Bhutan, the importance of biodiversity is highlighted by the country’s unique social, cultural, economic and physiographic conditi ons. Reverence for nature and all beings is fundamental to Buddhism, which plays a predominant role in the lives and culture of the Bhutanese people. From the ecological standpoint, the country’s inherently fragile geologic conditi ons, rugged mountain terrain and high precipitati on levels necessitate conservati on and sustainable use of natural resources to miti gate natural disasters such as landslides and fl ash fl oods. Furthermore, the forests of Bhutan have an immensely important role in carbon sequestrati on and alleviati ng the impacts of climate change (Ministry of Agriculture, RGOB, 2009).
Due to such traditi onal and ecological reasons, biodiversity and forest conservati on is embedded in the policies of the Royal Government. The Consti tuti on of Bhutan mandates the maintenance of at least 60% of the land under forest cover and ensures the rights and responsibiliti es for every Bhutanese as a “trustee of the Kingdom’s natural resources for the benefi t of present and future generati on” (See Chapter 1 for details). Environmental conservati on is also one of the four pillars of the development philosophy of “Gross Nati onal Happiness” that guides development
planning in Bhutan. Bhutan also became a party to the United Nati ons Conventi on on Biological Diversity) in 1995.
4.5.1 Current Threats to Biodiversity
Conservati on and sustainable use of biodiversity are becoming increasingly challenging in Bhutan as the country opens up to meet new development needs of a growing and modernizing populati on. There are both direct and indirect causes aff ecti ng biodiversity in Bhutan.
The direct causes aff ecti ng biodiversity in Bhutan are forest harvesti ng for housing and constructi on and fuelwood; wood-based industries; infrastructure development; livestock grazing of pastures and forests, forest fi res, human-wildlife confl icts and poaching, land use change and conversion, urbanizati on, mining and quarrying, infrastructure development, invasive species, hydropower and industrial development (BAP, 2009).
The indirect causes aff ecti ng biodiversity in Bhutan are a growing populati on, poverty, changing consumpti on trends and market forces. The new threat is from climate change It is already known from global experiences that climate change leads to ecosystem changes such as, phenological shift s, alti tudinal and lati tudinal range shift s and upward migrati on of species, colonizati on by new species, exti ncti on of certain species, epidermis burning of vegetati on, shift s in species occurrence and habitat changes for plants, birds and mammals and upward shift of culti vati on and grazing acti viti es (Herzog et al., 2011).
While there is a general lack of resources and capacity to conduct studies on climate change and biodiversity in Bhutan, a survey of people’s observati ons and percepti ons in 2010 is one of the fi rst att empts in this regard (NTG Biodiversity, 2011). The survey conducted across four broad eco-fl oristi c zones in the country showed people’s understanding of climate change and its impacts on biodiversity was poor in general, highlighti ng their vulnerability to the impacts of climate change. However, the survey reported changes in a number of animal species across all the eco-fl oristi c zones with an observed increase in the
Chapter Four : Vulnerability and Adaptati on
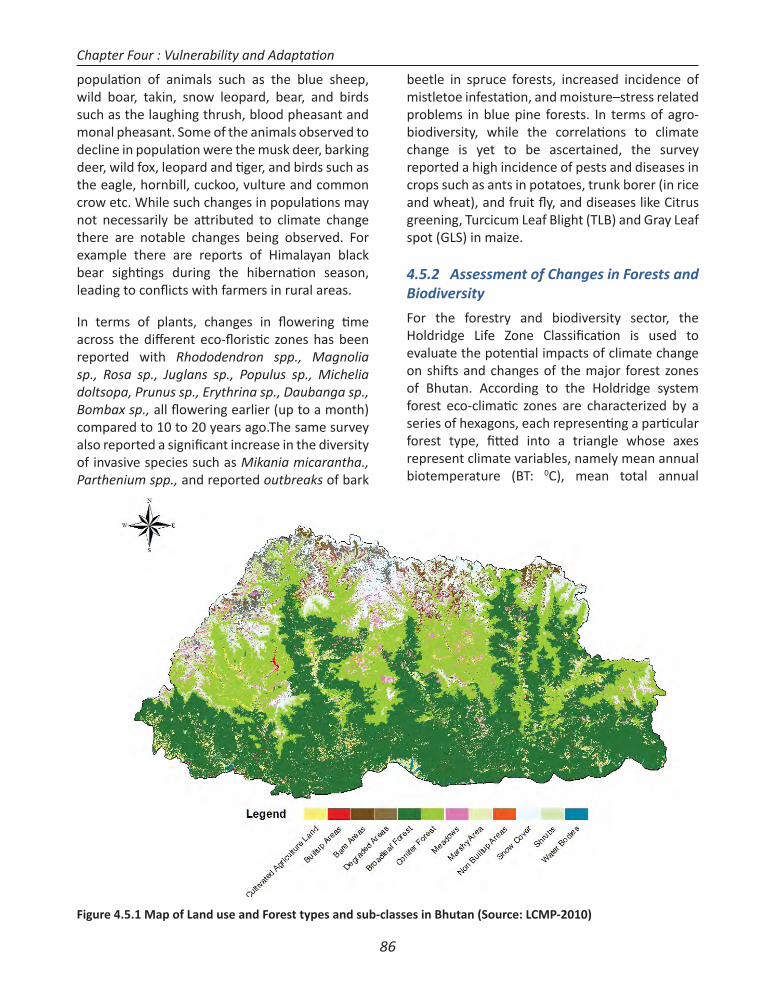
86
populati on of animals such as the blue sheep, wild boar, takin, snow leopard, bear, and birds such as the laughing thrush, blood pheasant and monal pheasant. Some of the animals observed to decline in populati on were the musk deer, barking deer, wild fox, leopard and ti ger, and birds such as the eagle, hornbill, cuckoo, vulture and common crow etc. While such changes in populati ons may not necessarily be att ributed to climate change there are notable changes being observed. For example there are reports of Himalayan black bear sighti ngs during the hibernati on season, leading to confl icts with farmers in rural areas.
In terms of plants, changes in fl owering ti me across the diff erent eco-fl oristi c zones has been reported with Rhododendron spp., Magnolia sp., Rosa sp., Juglans sp., Populus sp., Michelia doltsopa, Prunus sp., Erythrina sp., Daubanga sp., Bombax sp., all fl owering earlier (up to a month) compared to 10 to 20 years ago.The same survey also reported a signifi cant increase in the diversity of invasive species such as Mikania micarantha., Parthenium spp., and reported outbreaks of bark
beetle in spruce forests, increased incidence of mistletoe infestati on, and moisture–stress related problems in blue pine forests. In terms of agro-biodiversity, while the correlati ons to climate change is yet to be ascertained, the survey reported a high incidence of pests and diseases in crops such as ants in potatoes, trunk borer (in rice and wheat), and fruit fl y, and diseases like Citrus greening, Turcicum Leaf Blight (TLB) and Gray Leaf spot (GLS) in maize.
4.5.2 Assessment of Changes in Forests and Biodiversity
For the forestry and biodiversity sector, the Holdridge Life Zone Classifi cati on is used to evaluate the potenti al impacts of climate change on shift s and changes of the major forest zones of Bhutan. According to the Holdridge system forest eco-climati c zones are characterized by a series of hexagons, each representi ng a parti cular forest type, fi tt ed into a triangle whose axes represent climate variables, namely mean annual biotemperature (BT: 0C), mean total annual
Figure 4.5.1 Map of Land use and Forest types and sub-classes in Bhutan (Source: LCMP-2010)
Chapter Four : Vulnerability and Adaptati on
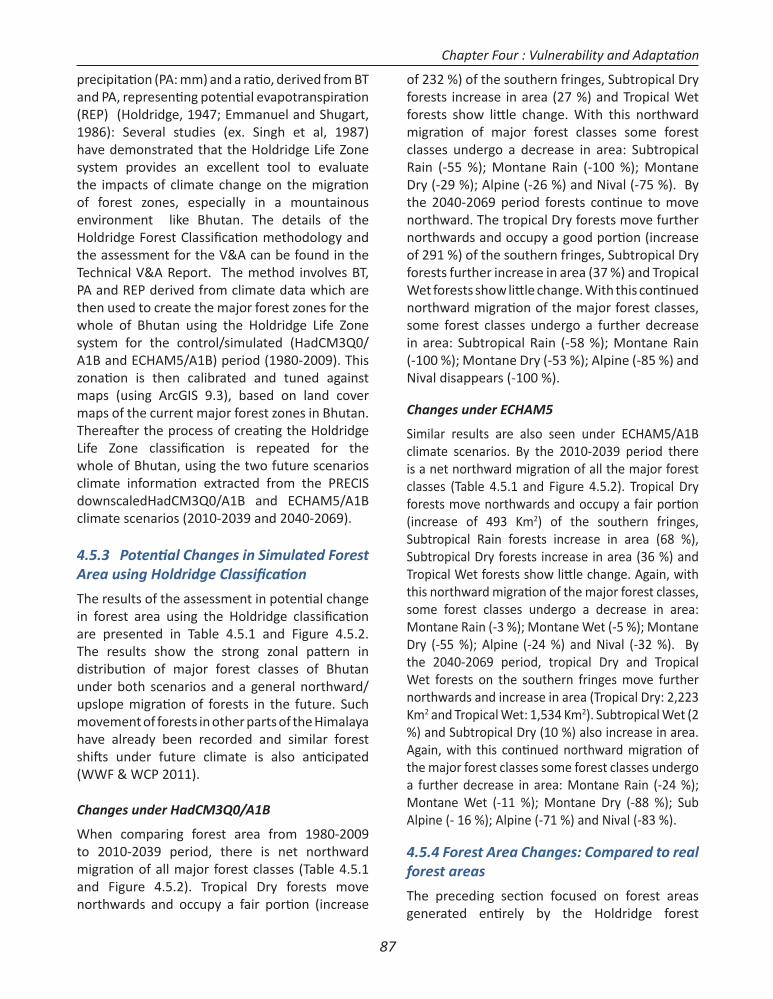
87
precipitati on (PA: mm) and a rati o, derived from BT and PA, representi ng potenti al evapotranspirati on (REP) (Holdridge, 1947; Emmanuel and Shugart, 1986): Several studies (ex. Singh et al, 1987) have demonstrated that the Holdridge Life Zone system provides an excellent tool to evaluate the impacts of climate change on the migrati on of forest zones, especially in a mountainous environment like Bhutan. The details of the Holdridge Forest Classifi cati on methodology and the assessment for the V&A can be found in the Technical V&A Report. The method involves BT, PA and REP derived from climate data which are then used to create the major forest zones for the whole of Bhutan using the Holdridge Life Zone system for the control/simulated (HadCM3Q0/A1B and ECHAM5/A1B) period (1980-2009). This zonati on is then calibrated and tuned against maps (using ArcGIS 9.3), based on land cover maps of the current major forest zones in Bhutan. Thereaft er the process of creati ng the Holdridge Life Zone classifi cati on is repeated for the whole of Bhutan, using the two future scenarios climate informati on extracted from the PRECIS downscaledHadCM3Q0/A1B and ECHAM5/A1B climate scenarios (2010-2039 and 2040-2069).
4.5.3 Potenti al Changes in Simulated Forest Area using Holdridge Classifi cati on
The results of the assessment in potenti al change in forest area using the Holdridge classifi cati on are presented in Table 4.5.1 and Figure 4.5.2. The results show the strong zonal patt ern in distributi on of major forest classes of Bhutan under both scenarios and a general northward/upslope migrati on of forests in the future. Such movement of forests in other parts of the Himalaya have already been recorded and similar forest shift s under future climate is also anti cipated (WWF & WCP 2011).
Changes under HadCM3Q0/A1B
When comparing forest area from 1980-2009 to 2010-2039 period, there is net northward migrati on of all major forest classes (Table 4.5.1 and Figure 4.5.2). Tropical Dry forests move northwards and occupy a fair porti on (increase
of 232 %) of the southern fringes, Subtropical Dry forests increase in area (27 %) and Tropical Wet forests show litt le change. With this northward migrati on of major forest classes some forest classes undergo a decrease in area: Subtropical Rain (-55 %); Montane Rain (-100 %); Montane Dry (-29 %); Alpine (-26 %) and Nival (-75 %). By the 2040-2069 period forests conti nue to move northward. The tropical Dry forests move further northwards and occupy a good porti on (increase of 291 %) of the southern fringes, Subtropical Dry forests further increase in area (37 %) and Tropical Wet forests show litt le change. With this conti nued northward migrati on of the major forest classes, some forest classes undergo a further decrease in area: Subtropical Rain (-58 %); Montane Rain (-100 %); Montane Dry (-53 %); Alpine (-85 %) and Nival disappears (-100 %).
Changes under ECHAM5
Similar results are also seen under ECHAM5/A1B climate scenarios. By the 2010-2039 period there is a net northward migrati on of all the major forest classes (Table 4.5.1 and Figure 4.5.2). Tropical Dry forests move northwards and occupy a fair porti on (increase of 493 Km2) of the southern fringes, Subtropical Rain forests increase in area (68 %), Subtropical Dry forests increase in area (36 %) and Tropical Wet forests show litt le change. Again, with this northward migrati on of the major forest classes, some forest classes undergo a decrease in area: Montane Rain (-3 %); Montane Wet (-5 %); Montane Dry (-55 %); Alpine (-24 %) and Nival (-32 %). By the 2040-2069 period, tropical Dry and Tropical Wet forests on the southern fringes move further northwards and increase in area (Tropical Dry: 2,223 Km2 and Tropical Wet: 1,534 Km2). Subtropical Wet (2 %) and Subtropical Dry (10 %) also increase in area. Again, with this conti nued northward migrati on of the major forest classes some forest classes undergo a further decrease in area: Montane Rain (-24 %); Montane Wet (-11 %); Montane Dry (-88 %); Sub Alpine (- 16 %); Alpine (-71 %) and Nival (-83 %).
4.5.4 Forest Area Changes: Compared to real forest areas
The preceding secti on focused on forest areas generated enti rely by the Holdridge forest
Chapter Four : Vulnerability and Adaptati on
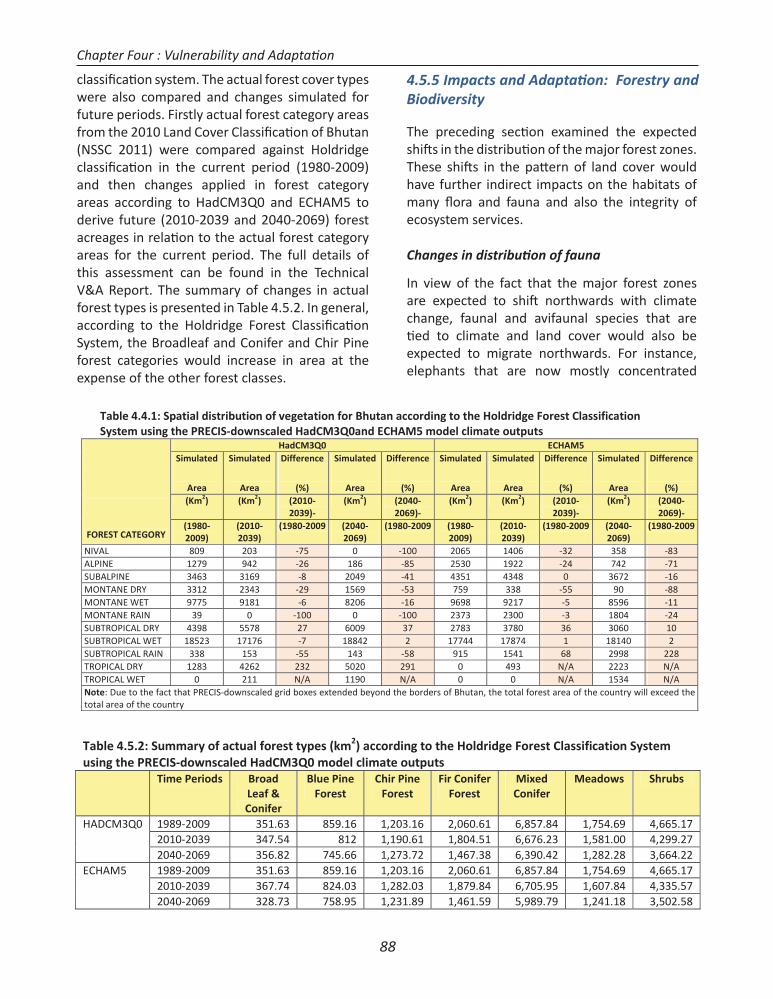
88
classifi cati on system. The actual forest cover types were also compared and changes simulated for future periods. Firstly actual forest category areas from the 2010 Land Cover Classifi cati on of Bhutan (NSSC 2011) were compared against Holdridge classifi cati on in the current period (1980-2009) and then changes applied in forest category areas according to HadCM3Q0 and ECHAM5 to derive future (2010-2039 and 2040-2069) forest acreages in relati on to the actual forest category areas for the current period. The full details of this assessment can be found in the Technical V&A Report. The summary of changes in actual forest types is presented in Table 4.5.2. In general, according to the Holdridge Forest Classifi cati on System, the Broadleaf and Conifer and Chir Pine forest categories would increase in area at the expense of the other forest classes.
4.5.5 Impacts and Adaptati on: Forestry and Biodiversity
The preceding secti on examined the expected shift s in the distributi on of the major forest zones. These shift s in the patt ern of land cover would have further indirect impacts on the habitats of many fl ora and fauna and also the integrity of ecosystem services.
Changes in distributi on of fauna
In view of the fact that the major forest zones are expected to shift northwards with climate change, faunal and avifaunal species that are ti ed to climate and land cover would also be expected to migrate northwards. For instance, elephants that are now mostly concentrated
Table 4.4.1: Spatial distribution of vegetation for Bhutan according to the Holdridge Forest ClassificationSystem using the PRECIS downscaled HadCM3Q0and ECHAM5 model climate outputs
FOREST CATEGORY
HadCM3Q0 ECHAM5Simulated
Area
Simulated
Area
Difference
(%)
Simulated
Area
Difference
(%)
Simulated
Area
Simulated
Area
Difference
(%)
Simulated
Area
Difference
(%)(Km2) (Km2) (2010
2039)(Km2) (2040
2069)(Km2) (Km2) (2010
2039)(Km2) (2040
2069)(19802009)
(20102039)
(1980 2009 (20402069)
(1980 2009 (19802009)
(20102039)
(1980 2009 (20402069)
(1980 2009
NIVAL 809 203 75 0 100 2065 1406 32 358 83ALPINE 1279 942 26 186 85 2530 1922 24 742 71SUBALPINE 3463 3169 8 2049 41 4351 4348 0 3672 16MONTANE DRY 3312 2343 29 1569 53 759 338 55 90 88MONTANE WET 9775 9181 6 8206 16 9698 9217 5 8596 11MONTANE RAIN 39 0 100 0 100 2373 2300 3 1804 24SUBTROPICAL DRY 4398 5578 27 6009 37 2783 3780 36 3060 10SUBTROPICAL WET 18523 17176 7 18842 2 17744 17874 1 18140 2SUBTROPICAL RAIN 338 153 55 143 58 915 1541 68 2998 228TROPICAL DRY 1283 4262 232 5020 291 0 493 N/A 2223 N/ATROPICAL WET 0 211 N/A 1190 N/A 0 0 N/A 1534 N/ANote: Due to the fact that PRECIS downscaled grid boxes extended beyond the borders of Bhutan, the total forest area of the country will exceed thetotal area of the country
Table 4.5.2: Summary of actual forest types (km2) according to the Holdridge Forest Classification Systemusing the PRECIS downscaled HadCM3Q0 model climate outputs
Time Periods BroadLeaf &Conifer
Blue PineForest
Chir PineForest
Fir ConiferForest
MixedConifer
Meadows Shrubs
HADCM3Q0 1989 2009 351.63 859.16 1,203.16 2,060.61 6,857.84 1,754.69 4,665.172010 2039 347.54 812 1,190.61 1,804.51 6,676.23 1,581.00 4,299.272040 2069 356.82 745.66 1,273.72 1,467.38 6,390.42 1,282.28 3,664.22
ECHAM5 1989 2009 351.63 859.16 1,203.16 2,060.61 6,857.84 1,754.69 4,665.172010 2039 367.74 824.03 1,282.03 1,879.84 6,705.95 1,607.84 4,335.572040 2069 328.73 758.95 1,231.89 1,461.59 5,989.79 1,241.18 3,502.58
Chapter Four : Vulnerability and Adaptati on
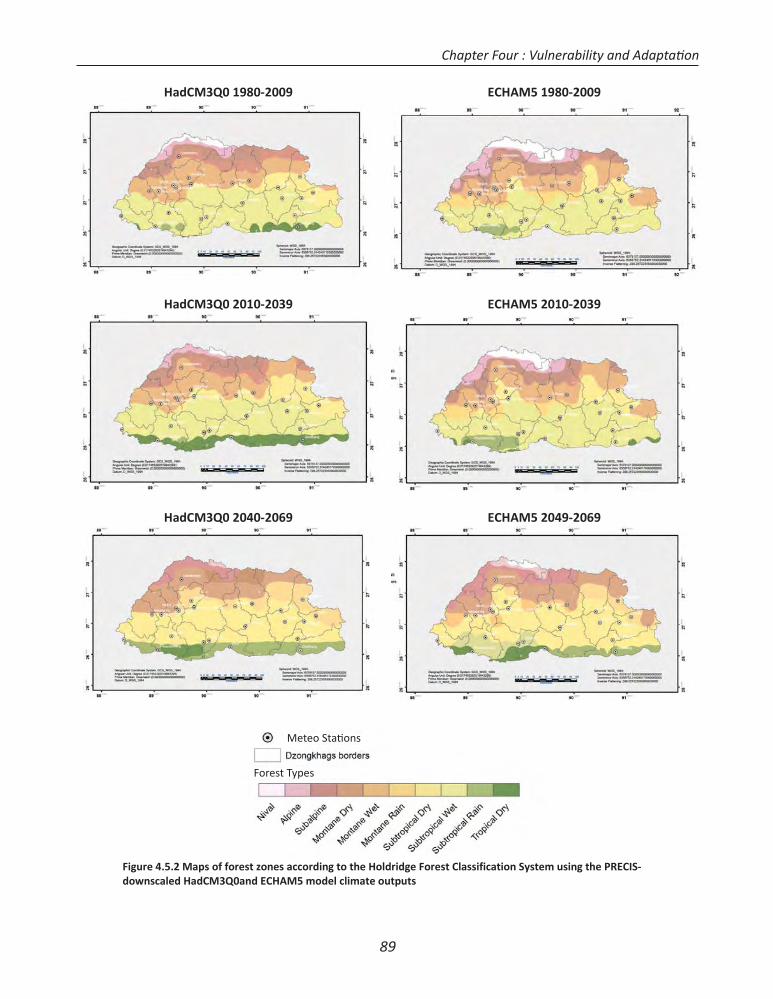
89
HadCM3Q0 1980 2009 ECHAM5 1980 2009
HadCM3Q0 2010 2039 ECHAM5 2010 2039
HadCM3Q0 2040 2069 ECHAM5 2049 2069
Figure 4.5.2 Maps of forest zones according to the Holdridge Forest Classification System using the PRECISdownscaled HadCM3Q0and ECHAM5 model climate outputs
Meteo Stati ons
Forest Types
Chapter Four : Vulnerability and Adaptati on
90
in the Subtropical Rain and Tropical Dry forests on the southern fringes of Bhutan may migrate northwards towards the interior. Tigers that are today mostly found in the southern two thirds of Bhutan may in the future be found in riverine habitats spread across Bhutan. Birds commonly found in southern and central parts of Bhutan under the current climate (e.g. migratory water birds, and hornbills), are likely to move to higher alti tudes in the future.
Loss of species
Many of the species in Bhutan are already at risk of exti ncti on due to pressures arising from natural processes and human acti viti es. Climate change will further exacerbate these pressures especially for threatened and vulnerable species (Gitay et al, 2002). According to the IPCC AR4 (2007), up to 30 percent of the higher plant and animal species are likely to be at an increased risk of exti ncti on if global average temperature increase exceeds 1.5 to 2.5 degree Celsius over the present temperature (Campbell et al, 2009, NTG - Biodiversity, 2011). The further changes from northward migrati on of habitats especially threaten mountain-top and locati on restricted species. A study by WWF and Wangchuck Centennial Park (2011) on the vulnerability in Wangchuck Centennial Park indicates considerable loss of habitats for the snow leopard (an endangered top predator of alpine areas) under future climate. Endangered and globally signifi cant birds with restricted habitats like Black Necked Crane and White bellied Heron would likely be at additi onal risk.
Increased establishment of invasive species
The threat to biodiversity due to alien invasive species is considered only second to that of habitat loss. Climate change will expedite the colonizati on of some areas by invasive species in both terrestrial as well as fresh water ecosystems, which will have severe ramifi cati ons on nati ve species (Campbell et al, 2009, CBD, 2009 Nati onal Paper on Biodiversity, 2011). In Bhutan, Survey 2010 reported a signifi cant increase in the diversity of invasive species such as Mikania micarantha., Parthenium spp., Opunti a spp.,
Eupatorium ordoratum, Lantana camara, Commelina, Galinsoga and Phyllanthus (NTG - Biodiversity, 2011). The northward migrati on of such species can also be expected in light of the northward migrati on of forest types in the future under a changing climate.
Increased risk of forest fi re
Forest fi res are considered to be one of the key threats to coniferous forests in the country with 526 incidents of forest fi re, aff ecti ng over 70,000 ha of forest between 1999/2000 to 2007/2008 (BAP, 2009). While most fi res in Bhutan are caused by human acti vity, the rising temperature and long spells of drought due to climate change are likely to increase the risk of forest fi res resulti ng in further reducti on and degradati on of forest resources. Such examples include the fi res in the winter of 1998/99 which was characterized by a prolonged spell of dry (snow-less) weather with forest fi re incidents even in places without a known history of forest fi res (BAP, 2009 and NTG - Biodiversity, 2011). Forest fi res in Bhutan mostly occur in Blue pine and Chir pine zones, and the results of the Holdridge classifi cati on indicate that it is these forest types that are likely to increase in area.
Loss of agro-biodiversity
Agricultural biodiversity plays a crucial role for adapti ng to altered climati c conditi ons through geneti c variability of crops and livestock species which can be bred to bett er adapt to climate change impacts. It is widely accepted that geneti c diversity is important both in its own right and in determining resilience of species to impacts of climate change and other pressures. The introducti on of modern crop varieti es and breeds has led to the erosion of geneti c diversity (Fowler and Mooney, 1990) with esti mates that 75% of the geneti c diversity of agricultural crops has been lost since the beginning of the twenti eth century (FAO, 1997). Now climate change poses additi onal threat to agricultural biodiversity by increasing geneti c erosion of landraces and threatening wild species, including crop wild
Chapter Four : Vulnerability and Adaptati on
91
relati ves (Jarvis et al., 2008). Climate change will also bring new and enhanced demand for geneti c resources. Nati onal and internati onal breeding programmes are already targeti ng new varieti es of crops for adaptati on to future climati c stresses (NTG - Biodiversity, 2011).
Increased incidences of pests and diseases
Recent moderate warming has been linked to improved forests producti vity, but these gains are expected to be off set by the eff ects of increasing drought, fi re and insect outbreaks as a result of further warming (Campbell et al, 2009). Survey 2010 results showed that the producti vity of Abies densa, Pinus wallichiana, Quercus glauca and Quercus griffi thii forests suff ered set-backs due to periodic diebacks and insect att acks (NTG-Biodiversity, 2011) and that pests and diseases in forests and agriculture had increased over the years in general. There were outbreaks of bark beetle in spruce forests, increased incidence of mistletoe infestati on, and moisture–stress related problems in blue pine forests. It is likely that with rising temperature and errati c dry and moist periods, intensity and incidences of diseases and pests will increase. In less than 16 years (1992-2008), fi ve incidences of pine die-backs were observed (1994, 1999, 2001, 2003 & 2008) along the Paachu-Wangchu valley. Research indicates that pine die-back was strongly correlated with higher temperature and lower rainfall during the die-back incidences in the area (Wangda et al. 2009 and NTG - Biodiversity, 2011).
Loss of livelihood, traditi onal knowledge and practi ces (“Biocultural” loss)
The Bhutanese have always lived in harmony with nature and have used biodiversity for many purposes such as fuel-wood, food, fi bre, shelter, medicine, household implements, and handicraft s among others. Traditi onal practi ces are also closely linked to biodiversity. For example, the use of “Dru Na Gu” (nine important food crops) in off erings and rituals signifi es the sacred role of biodiversity in culture and traditi ons. If climate and land-use change lead to losses in biodiversity, including loss of habitats, the livelihoods of local communiti es will be adversely aff ected.
Destructi on of vegetati on as a result of heavy grazing or exposure of soil could encourage the establishment of southerly weedy species under a warmer climate leading to adverse impacts on nati ve biodiversity and local livelihoods (Gitay et al, 2002). Loss of alpine habitat from encroachment could lead to the loss of Ophiocordyceps sinensis and other high value medicinal plants which will have signifi cant impacts on the livelihoods of high alti tude pastoral communiti es (NTG - Biodiversity, 2011).
4.5.6 Adaptati on Opti ons
The Adaptati on measures for the Forest and Biodiversity Sector are presented in Secti on 4.9. The measures have been prepared considering the global signifi cance of the biodiversity in Bhutan, the potenti al impacts from climate change, gaps in baseline informati on and the lack of capacity and resources in monitoring impacts from climate change.
4.6 Energy (Hydropower)
The primary energy resource in Bhutan is biomass (wood) followed by hydropower. Fuel wood dominates the primary energy at 56.8% of total primary energy supply with electricity at 15.7%, 19% from petroleum fuels and coal at 8% (DoE 2010). Fossil fuels used in Bhutan and which are imported include petrol, diesel, LPG, kerosene and aviati on turbine fuel. Small deposits of sub-bituminous coal are found in south eastern Bhutan. Solar energy is harnessed as a part of the rural electrifi cati on programme for lighti ng homes, as a source for powering telecommunicati on equipment and in heati ng water for some insti tuti ons. The feasibility of tapping wind energy is being explored and presently data are being collected.
However, hydropower is considered the backbone of the Bhutanese economy and contributes about 45% of the nati onal revenue and consti tutes about 19% of the country’s GDP. The rugged mountainous terrain and swift fl owing rivers have made Bhutan a natural haven for hydro power with an esti mated potenti al for 30,000
Chapter Four : Vulnerability and Adaptati on
92
MW out of which 23,765 MW has been found to be techno-economically feasible. The total installed capacity as of December 2010 was 1505.32 MW. The government has also set an ambiti ous programme to install a minimum of 10,000 MW generati ng capacity by 2020 through 10 hydropower projects under the “accelerated hydropower development programme”. Of these 10 projects, Punatsangchhu-I (1200 MW), Punatsangchhu-II (990 MW) and Mangdechhu (720 MW) are under constructi on while the rest are in the various stages of detailed feasibility studies, and implementati on.
With almost total dependency on hydropower for electricity and hopes for the sector to be the major source of economic growth and future source of revenues for development acti viti es, Bhutan has become most vulnerable to climate change. While the country is endowed with abundant water resources, any change in fl ow regimes will have a direct impact on ensuring energy security. The issues of concern in the hydropower sector are 1) predicti ng future fl ows, 2) managing hydropower systems for potenti al future fl ows, 3) reservoir sedimentati on, 4) fl oods including fl ash fl oods and GLOFs, 5) increasing glacier retreat and less snow cover, 6) errati c rainfall patt erns (NTG- Energy, 2011).
On the other hand, as biomass is the primary energy source of energy with almost 91% of residenti al consumpti on being met by biomass (DoE 2010). The biomass reserves (forests) are impacted by frequent rains and fl ood resulti ng in heavy erosion and landslides which in turn reduces the capacity of the catchment to retain water and aff ects the growth of vegetati on.
Current vulnerabiliti es in the energy/hydropower sector as identi fi ed in Bhutan’s NAPA (NEC 2006 & 2011 draft ) include:
Threats to hydropower systems from Glacial Lake Outburst Floods
Temporal & spati al variati on in fl ow, aff ecti ng electricity producti on/exports due to disrupti on of average fl ows for opti mum hydropower generati on
Increased sedimentati on of rivers, water reservoirs and distributi on network
Reduced ability of catchment areas to retain water/increased runoff s with enhanced soil erosion (deteriorati on of environment).
4.6.1 Vulnerability Assessment of Energy Sector
Given the socio-economic signifi cance of hydropower, the vulnerability assessment of the energy sector focused on hydropower. It is well known that the hydro generati ng capaciti es of drainage basins are closely linked to the discharge rates (m3/s) of the river systems so the Net Basin Supply (NBS) concept is used for this assessment (see Singh 1987). NBS essenti ally represents the potenti al fl ow or discharge taking into account the supply of moisture by precipitati on and the loss of moisture via evapotranspirati on on a monthly basis. Details on the NBS methodology and the full assessment are available in the Technical Report. The case study approach is uti lized for the assessment for Chukha (336 MW)and Tala Hydro-electric (1020 MW) projects on the Wangchhu River (Figure 4.6.1) and the Puna Tsang Chhu I & II hydro-electric projects (1200 MW & 990 MW respecti vely) which are currently under constructi on along the Punatsangchhu river (Figure 4.6.2). NBS (m3/s) and potenti al hydro-generati ng capacity for the chosen river basins are calculated for the control period (1980-2009) and for the two future ti me slices (2010-2039 and 2040-2069), using outputs from the HadCM3Q0/A1B and ECHAM5/A1B in order to evaluate the vulnerability of the energy sector of Bhutan to climate change.
4.6.2 Summary of NBS (Potenti al Discharge/Flow) Changes
The results of the changes in NBS (potenti al fl ow) for the Wangchu and Punatsangchhu basins for the future periods (2010-2039 and 2040-2069) according to the HadCM3Q0/A1B and ECHAM5/A1B downscaled scenarios are presented below and summarised in fi gures 3.5.3 and 4.6.4.
Chapter Four : Vulnerability and Adaptati on
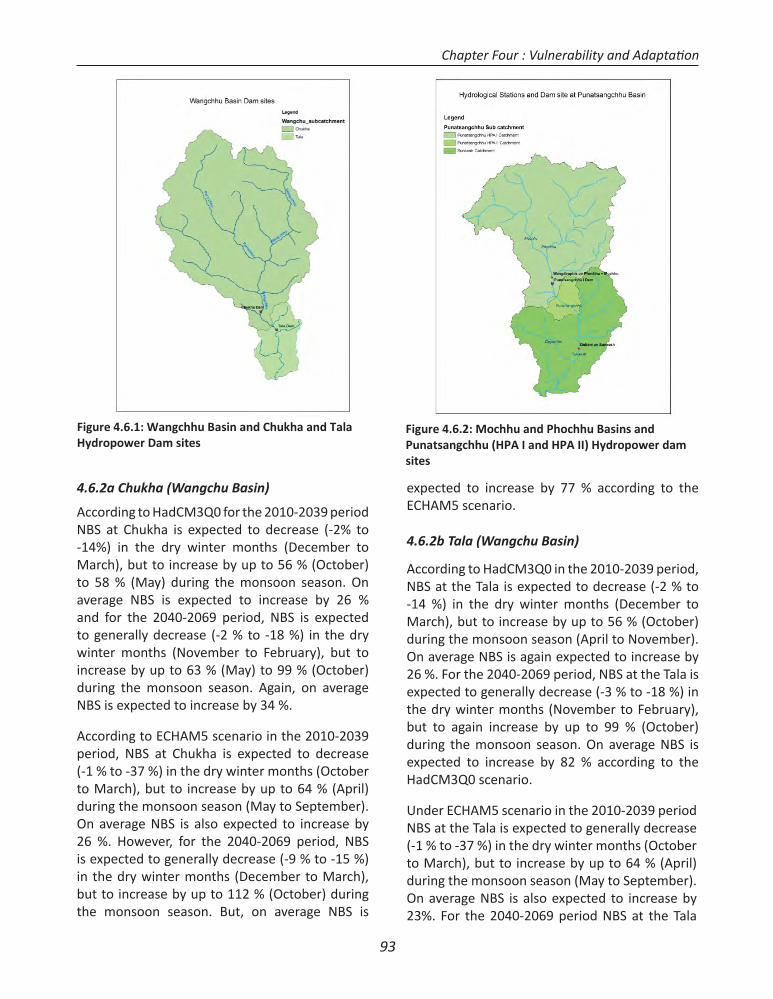
93
4.6.2a Chukha (Wangchu Basin)
According to HadCM3Q0 for the 2010-2039 period NBS at Chukha is expected to decrease (-2% to -14%) in the dry winter months (December to March), but to increase by up to 56 % (October) to 58 % (May) during the monsoon season. On average NBS is expected to increase by 26 % and for the 2040-2069 period, NBS is expected to generally decrease (-2 % to -18 %) in the dry winter months (November to February), but to increase by up to 63 % (May) to 99 % (October) during the monsoon season. Again, on average NBS is expected to increase by 34 %.
According to ECHAM5 scenario in the 2010-2039 period, NBS at Chukha is expected to decrease (-1 % to -37 %) in the dry winter months (October to March), but to increase by up to 64 % (April) during the monsoon season (May to September). On average NBS is also expected to increase by 26 %. However, for the 2040-2069 period, NBS is expected to generally decrease (-9 % to -15 %) in the dry winter months (December to March), but to increase by up to 112 % (October) during the monsoon season. But, on average NBS is
expected to increase by 77 % according to the ECHAM5 scenario.
4.6.2b Tala (Wangchu Basin)
According to HadCM3Q0 in the 2010-2039 period, NBS at the Tala is expected to decrease (-2 % to -14 %) in the dry winter months (December to March), but to increase by up to 56 % (October) during the monsoon season (April to November). On average NBS is again expected to increase by 26 %. For the 2040-2069 period, NBS at the Tala is expected to generally decrease (-3 % to -18 %) in the dry winter months (November to February), but to again increase by up to 99 % (October) during the monsoon season. On average NBS is expected to increase by 82 % according to the HadCM3Q0 scenario.
Under ECHAM5 scenario in the 2010-2039 period NBS at the Tala is expected to generally decrease (-1 % to -37 %) in the dry winter months (October to March), but to increase by up to 64 % (April) during the monsoon season (May to September). On average NBS is also expected to increase by 23%. For the 2040-2069 period NBS at the Tala
Figure 4.6.2: Mochhu and Phochhu Basins andPunatsangchhu (HPA I and HPA II) Hydropower damsites
Figure 4.6.1: Wangchhu Basin and Chukha and TalaHydropower Dam sites
Chapter Four : Vulnerability and Adaptati on
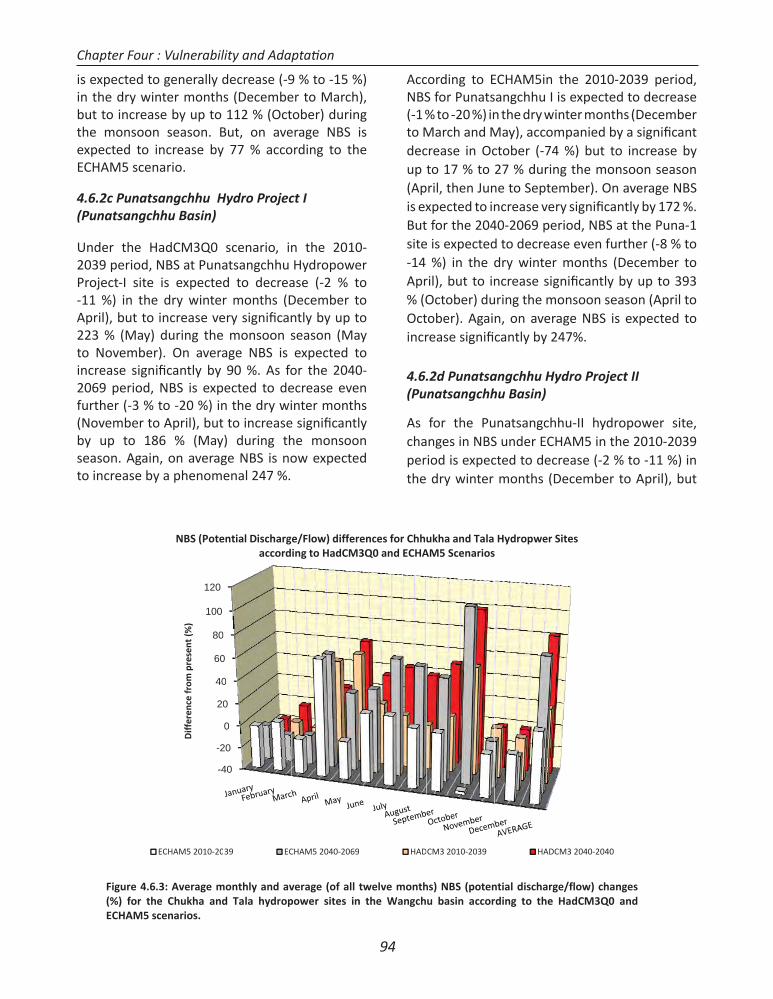
94
is expected to generally decrease (-9 % to -15 %) in the dry winter months (December to March), but to increase by up to 112 % (October) during the monsoon season. But, on average NBS is expected to increase by 77 % according to the ECHAM5 scenario.
4.6.2c Punatsangchhu Hydro Project I (Punatsangchhu Basin)
Under the HadCM3Q0 scenario, in the 2010-2039 period, NBS at Punatsangchhu Hydropower Project-I site is expected to decrease (-2 % to -11 %) in the dry winter months (December to April), but to increase very signifi cantly by up to 223 % (May) during the monsoon season (May to November). On average NBS is expected to increase signifi cantly by 90 %. As for the 2040-2069 period, NBS is expected to decrease even further (-3 % to -20 %) in the dry winter months (November to April), but to increase signifi cantly by up to 186 % (May) during the monsoon season. Again, on average NBS is now expected to increase by a phenomenal 247 %.
According to ECHAM5in the 2010-2039 period, NBS for Punatsangchhu I is expected to decrease (-1 % to -20 %) in the dry winter months (December to March and May), accompanied by a signifi cant decrease in October (-74 %) but to increase by up to 17 % to 27 % during the monsoon season (April, then June to September). On average NBS is expected to increase very signifi cantly by 172 %. But for the 2040-2069 period, NBS at the Puna-1 site is expected to decrease even further (-8 % to -14 %) in the dry winter months (December to April), but to increase signifi cantly by up to 393 % (October) during the monsoon season (April to October). Again, on average NBS is expected to increase signifi cantly by 247%.
4.6.2d Punatsangchhu Hydro Project II (Punatsangchhu Basin)
As for the Punatsangchhu-II hydropower site, changes in NBS under ECHAM5 in the 2010-2039 period is expected to decrease (-2 % to -11 %) in the dry winter months (December to April), but
Figure 4.6(%) for thECHAM5 s
.3: Average me Chukha andcenarios.
-4
-2
20
40
60
80
100
120
Diff
eren
cefr
ompr
esen
t(%
)
NBS (Pote
ECHAM5 2010 20
monthly and avd Tala hydrop
40
20
0
0
0
0
ential Dischargaccord
39 EC
verage (of all tpower sites in
e/Flow) differing to HadCM3
CHAM5 2040 2069
twelve monthn the Wangch
rences for Chhu3Q0 and ECHA
9 HAD
hs) NBS (potenu basin accor
ukha and TalaAM5 Scenarios
CM3 2010 2039
ntial dischargerding to the H
Hydropwer Sis
HADCM
e/flow) changeHadCM3Q0 an
ites
M3 2040 2040
esnd
Chapter Four : Vulnerability and Adaptati on
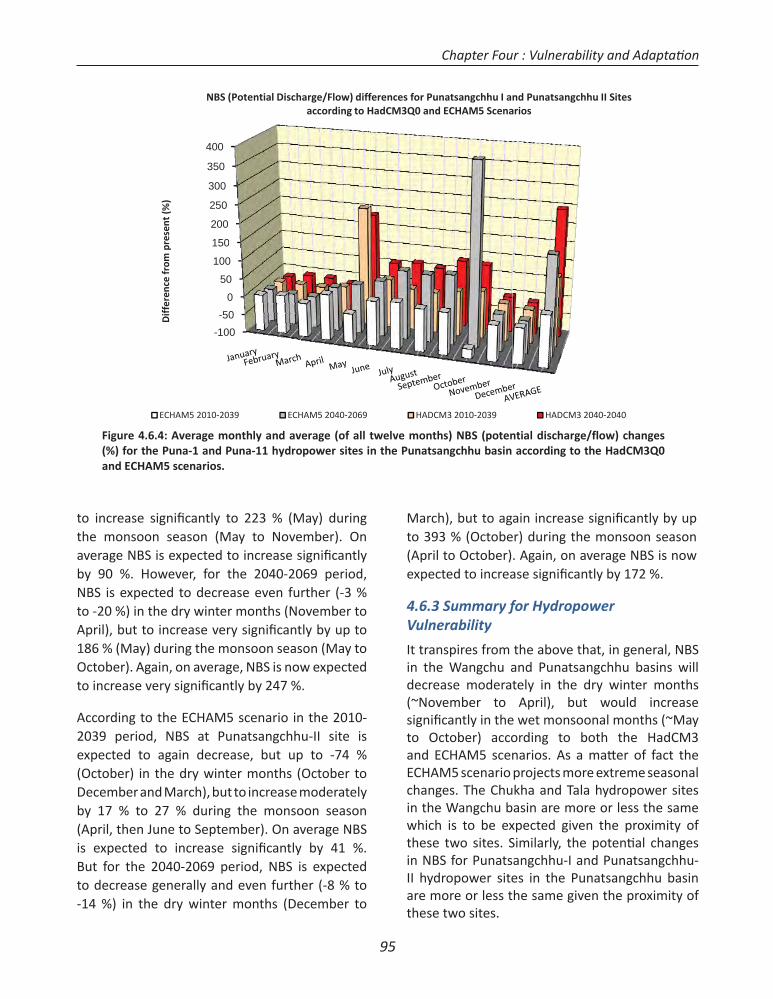
95
to increase signifi cantly to 223 % (May) during the monsoon season (May to November). On average NBS is expected to increase signifi cantly by 90 %. However, for the 2040-2069 period, NBS is expected to decrease even further (-3 % to -20 %) in the dry winter months (November to April), but to increase very signifi cantly by up to 186 % (May) during the monsoon season (May to October). Again, on average, NBS is now expected to increase very signifi cantly by 247 %.
According to the ECHAM5 scenario in the 2010-2039 period, NBS at Punatsangchhu-II site is expected to again decrease, but up to -74 % (October) in the dry winter months (October to December and March), but to increase moderately by 17 % to 27 % during the monsoon season (April, then June to September). On average NBS is expected to increase signifi cantly by 41 %. But for the 2040-2069 period, NBS is expected to decrease generally and even further (-8 % to -14 %) in the dry winter months (December to
March), but to again increase signifi cantly by up to 393 % (October) during the monsoon season (April to October). Again, on average NBS is now expected to increase signifi cantly by 172 %.
4.6.3 Summary for Hydropower Vulnerability
It transpires from the above that, in general, NBS in the Wangchu and Punatsangchhu basins will decrease moderately in the dry winter months (~November to April), but would increase signifi cantly in the wet monsoonal months (~May to October) according to both the HadCM3 and ECHAM5 scenarios. As a matt er of fact the ECHAM5 scenario projects more extreme seasonal changes. The Chukha and Tala hydropower sites in the Wangchu basin are more or less the same which is to be expected given the proximity of these two sites. Similarly, the potenti al changes in NBS for Punatsangchhu-I and Punatsangchhu-II hydropower sites in the Punatsangchhu basin are more or less the same given the proximity of these two sites.
Figure 4.6(%) for theand ECHAM
.4: Average me Puna 1 and PM5 scenarios.
-10-5
50
100
150
200
250
300
350
400D
iffer
ence
from
pres
ent
(%)
NBS
ECHAM5 2010 20
monthly and avPuna 11 hydro
00500
0
0
0
0
0
(Potential Disch
039 EC
verage (of all topower sites i
harge/Flow) diffaccording to H
HAM5 2040 2069
twelve monthn the Punatsa
ferences for PunHadCM3Q0 and
HADCM
hs) NBS (potenangchhu basin
natsangchhu I anECHAM5 Scena
M3 2010 2039
ntial dischargeaccording to
nd Punatsangcharios
HADCM3 2
e/flow) changethe HadCM3Q
hhu II Sites
2040 2040
esQ0
Chapter Four : Vulnerability and Adaptati on
96
Furthermore, a recent study on: ‘Climate change impacts on the fl ow regimes of rivers in Bhutan and possible consequences for hydropower development’ using the ECHAM5/MPIOM A-OGCM, forced by the SRES A2 and B1 GHG scenarios and downscaled to a 0.5 degree grid for the Hindu Kush-Himalayan region and coupled to a spati ally distributed hydrological model was conducted by the Norwegian Water Resources and Energy Directorate for describing hydrological processes including glacier mass balance, snow storage, subsurface water storage and streamfl ow and their impacts on hydropower generati on (Beldring, S. (Editor) 2011). Historical or present climate was represented by a control period 1981-2010, while future climate for the projecti on periods 2021-2050 and 2071-2100 were considered.
The results of this study, which corroborates with this study, showed that the change in mean annual discharge available for hydropower producti on from 1981-2010 to 2021-2050 varies between 13 % decrease and 7 % increase for all catchments and both climate scenarios. The change in mean annual discharge available for hydropower producti on from 1981-2010 to 2071-2100 is infl uenced by reduced contributi on to streamfl ow from glacier ice melt (Beldring, S. (Editor) 2011).
Since, there is the possibility of reduced river fl ows there is the risk of reduced hydropower potenti al and loss of revenues, especially during the dry winter months.
4.6.4 Adaptati on for Energy Sector
Given the heavy dependence of Bhutan on the hydropower sector, the fi ndings of the vulnerability assessment necessitate major adaptati on measures for the energy sector. Such measures would need to consider the current run-of-river hydropower schemes to capture water for the lean season, diversifi cati on of energy sources and other policies to increase energy effi ciency. Furthermore, given the fact that emissions from Bhutan are almost negligible due to dependence on hydropower and forest biomass (See Chapters 2 and 3), measures to promote energy effi ciency and diversifi cati on in Bhutan will have to be
considered as adaptati on rather than miti gati on measures. The adaptati on prioriti es for energy security are presented in Secti on 4.9.
4.7 Human Health
The health of millions of people is impacted upon each year by the acute and long-term eff ects of climate. Climate change is expected to exacerbate this conditi on. The basic requirements for good health are clean air and water, suffi cient food and adequate shelter and each of these conditi ons are very likely to be aff ected by future climate changes.Climate change also brings new challenges to the control of infecti ous diseases. Many of the major killers are highly sensiti ve to temperature and rainfall, including cholera and diarrhoeal diseases, as well as vector borne diseases including malaria, dengue and schistosomiasis (WHO, 2010). Malaria and dengue fever, two diseases linked to climate change, have become major public health problems in countries such as Bhutan in the recent past. Plasmodium falciparum (PFM), one of the species that causes malaria, is the main infecti ous agent transmitt ed.
4.7.1 Stati sti cal Analysis of Climate Sensiti ve Diseases
For the health sector, the case study approach is uti lized on the two most populous municipaliti es, namely the capital city of Thimphu and the border town of Phuentsholing to the south, adjacent to India. In order to evaluate the impacts of climate change on human health in Bhutan, epidemiological data on the types of diseases and mortality rates is uti lized. The data for the Thimphu region consisted of an agglomerati on of data from a number of Hospitals and Public Health Centers, including JDWNR hospital, Gidakom hospital, Lungtenphu Army hospital, Dechhencholing BHU I, Moti thang Sat. Clinic, Jungshina Sat. Clinic, RBP Clinic and Chamgang. In the case of Phuntsholing, data was obtained for only the Phuntsholing hospital. Because of data limitati on, dengue was treated for the whole of Bhutan. However, it must be cauti oned that people from the surrounding rural populati ons of both Thimphu and Phuntsholing visit the health
Chapter Four : Vulnerability and Adaptati on
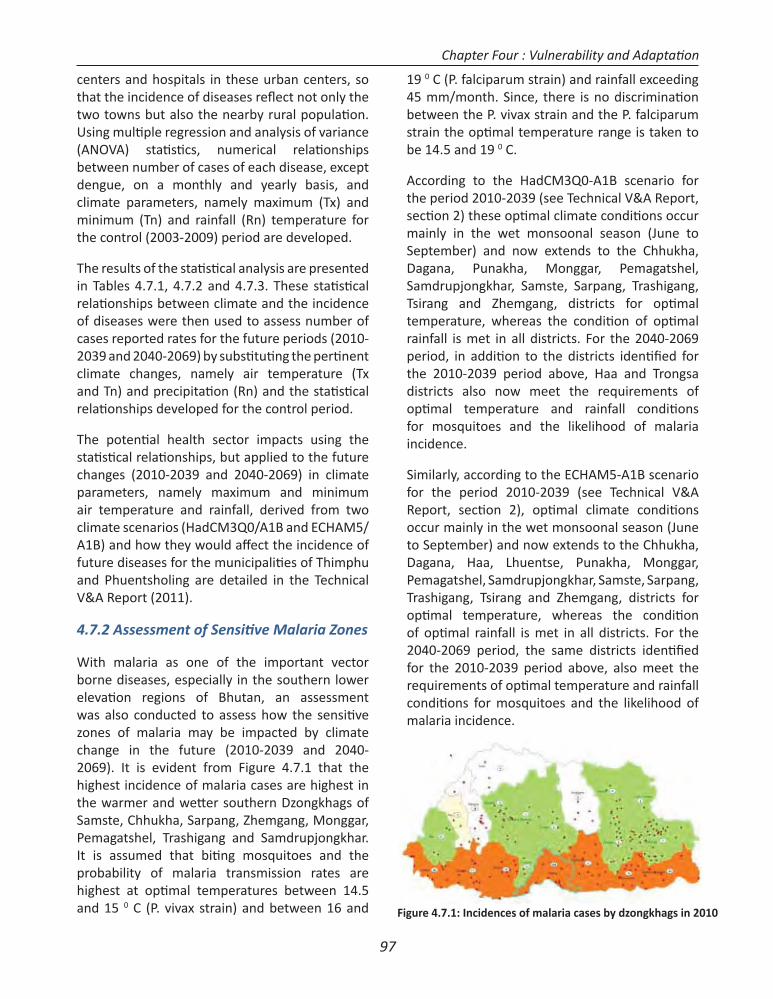
97
centers and hospitals in these urban centers, so that the incidence of diseases refl ect not only the two towns but also the nearby rural populati on. Using multi ple regression and analysis of variance (ANOVA) stati sti cs, numerical relati onships between number of cases of each disease, except dengue, on a monthly and yearly basis, and climate parameters, namely maximum (Tx) and minimum (Tn) and rainfall (Rn) temperature for the control (2003-2009) period are developed.
The results of the stati sti cal analysis are presented in Tables 4.7.1, 4.7.2 and 4.7.3. These stati sti cal relati onships between climate and the incidence of diseases were then used to assess number of cases reported rates for the future periods (2010-2039 and 2040-2069) by substi tuti ng the perti nent climate changes, namely air temperature (Tx and Tn) and precipitati on (Rn) and the stati sti cal relati onships developed for the control period.
The potenti al health sector impacts using the stati sti cal relati onships, but applied to the future changes (2010-2039 and 2040-2069) in climate parameters, namely maximum and minimum air temperature and rainfall, derived from two climate scenarios (HadCM3Q0/A1B and ECHAM5/A1B) and how they would aff ect the incidence of future diseases for the municipaliti es of Thimphu and Phuentsholing are detailed in the Technical V&A Report (2011).
4.7.2 Assessment of Sensiti ve Malaria Zones
With malaria as one of the important vector borne diseases, especially in the southern lower elevati on regions of Bhutan, an assessment was also conducted to assess how the sensiti ve zones of malaria may be impacted by climate change in the future (2010-2039 and 2040-2069). It is evident from Figure 4.7.1 that the highest incidence of malaria cases are highest in the warmer and wett er southern Dzongkhags of Samste, Chhukha, Sarpang, Zhemgang, Monggar, Pemagatshel, Trashigang and Samdrupjongkhar. It is assumed that biti ng mosquitoes and the probability of malaria transmission rates are highest at opti mal temperatures between 14.5 and 15 0 C (P. vivax strain) and between 16 and
19 0 C (P. falciparum strain) and rainfall exceeding 45 mm/month. Since, there is no discriminati on between the P. vivax strain and the P. falciparum strain the opti mal temperature range is taken to be 14.5 and 19 0 C.
According to the HadCM3Q0-A1B scenario for the period 2010-2039 (see Technical V&A Report, secti on 2) these opti mal climate conditi ons occur mainly in the wet monsoonal season (June to September) and now extends to the Chhukha, Dagana, Punakha, Monggar, Pemagatshel, Samdrupjongkhar, Samste, Sarpang, Trashigang, Tsirang and Zhemgang, districts for opti mal temperature, whereas the conditi on of opti mal rainfall is met in all districts. For the 2040-2069 period, in additi on to the districts identi fi ed for the 2010-2039 period above, Haa and Trongsa districts also now meet the requirements of opti mal temperature and rainfall conditi ons for mosquitoes and the likelihood of malaria incidence.
Similarly, according to the ECHAM5-A1B scenario for the period 2010-2039 (see Technical V&A Report, secti on 2), opti mal climate conditi ons occur mainly in the wet monsoonal season (June to September) and now extends to the Chhukha, Dagana, Haa, Lhuentse, Punakha, Monggar, Pemagatshel, Samdrupjongkhar, Samste, Sarpang, Trashigang, Tsirang and Zhemgang, districts for opti mal temperature, whereas the conditi on of opti mal rainfall is met in all districts. For the 2040-2069 period, the same districts identi fi ed for the 2010-2039 period above, also meet the requirements of opti mal temperature and rainfall conditi ons for mosquitoes and the likelihood of malaria incidence.
Figure 4.7.1: Incidences of malaria cases by dzongkhags in 2010
Chapter Four : Vulnerability and Adaptati on
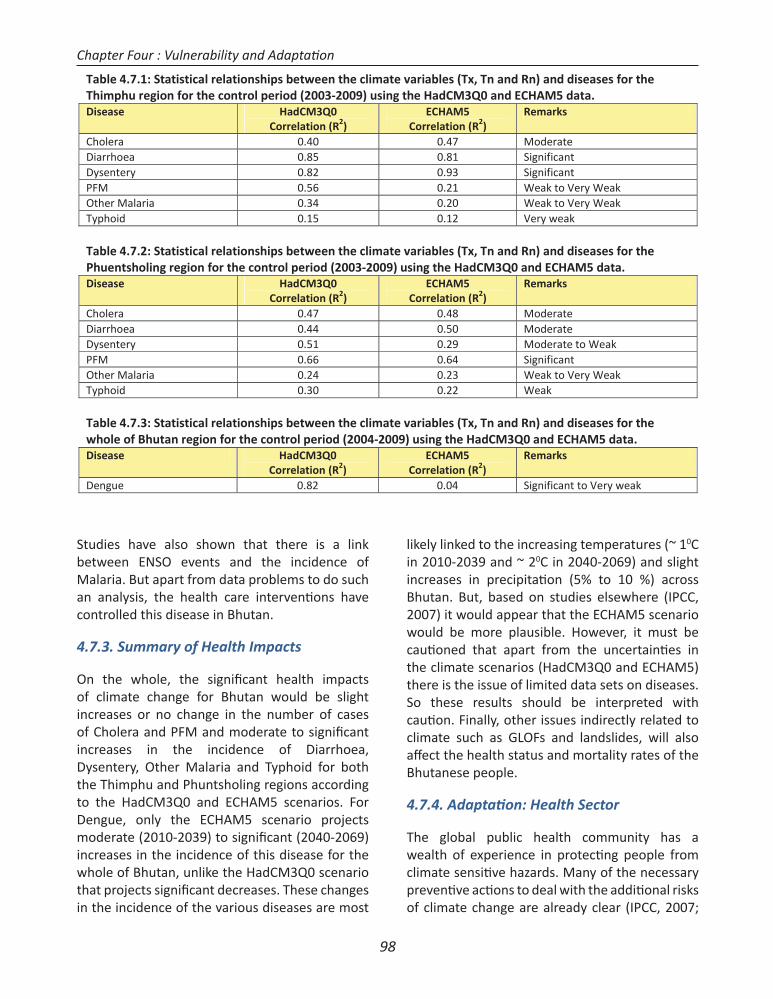
98
Studies have also shown that there is a link between ENSO events and the incidence of Malaria. But apart from data problems to do such an analysis, the health care interventi ons have controlled this disease in Bhutan.
4.7.3. Summary of Health Impacts
On the whole, the signifi cant health impacts of climate change for Bhutan would be slight increases or no change in the number of cases of Cholera and PFM and moderate to signifi cant increases in the incidence of Diarrhoea, Dysentery, Other Malaria and Typhoid for both the Thimphu and Phuntsholing regions according to the HadCM3Q0 and ECHAM5 scenarios. For Dengue, only the ECHAM5 scenario projects moderate (2010-2039) to signifi cant (2040-2069) increases in the incidence of this disease for the whole of Bhutan, unlike the HadCM3Q0 scenario that projects signifi cant decreases. These changes in the incidence of the various diseases are most
likely linked to the increasing temperatures (~ 10C in 2010-2039 and ~ 20C in 2040-2069) and slight increases in precipitati on (5% to 10 %) across Bhutan. But, based on studies elsewhere (IPCC, 2007) it would appear that the ECHAM5 scenario would be more plausible. However, it must be cauti oned that apart from the uncertainti es in the climate scenarios (HadCM3Q0 and ECHAM5) there is the issue of limited data sets on diseases. So these results should be interpreted with cauti on. Finally, other issues indirectly related to climate such as GLOFs and landslides, will also aff ect the health status and mortality rates of the Bhutanese people.
4.7.4. Adaptati on: Health Sector
The global public health community has a wealth of experience in protecti ng people from climate sensiti ve hazards. Many of the necessary preventi ve acti ons to deal with the additi onal risks of climate change are already clear (IPCC, 2007;
Table 4.7.1: Statistical relationships between the climate variables (Tx, Tn and Rn) and diseases for theThimphu region for the control period (2003 2009) using the HadCM3Q0 and ECHAM5 data.Disease HadCM3Q0
Correlation (R2)ECHAM5
Correlation (R2)Remarks
Cholera 0.40 0.47 ModerateDiarrhoea 0.85 0.81 SignificantDysentery 0.82 0.93 SignificantPFM 0.56 0.21 Weak to Very WeakOther Malaria 0.34 0.20 Weak to Very WeakTyphoid 0.15 0.12 Very weak
Table 4.7.2: Statistical relationships between the climate variables (Tx, Tn and Rn) and diseases for thePhuentsholing region for the control period (2003 2009) using the HadCM3Q0 and ECHAM5 data.Disease HadCM3Q0
Correlation (R2)ECHAM5
Correlation (R2)Remarks
Cholera 0.47 0.48 ModerateDiarrhoea 0.44 0.50 ModerateDysentery 0.51 0.29 Moderate to WeakPFM 0.66 0.64 SignificantOther Malaria 0.24 0.23 Weak to Very WeakTyphoid 0.30 0.22 Weak
Table 4.7.3: Statistical relationships between the climate variables (Tx, Tn and Rn) and diseases for thewhole of Bhutan region for the control period (2004 2009) using the HadCM3Q0 and ECHAM5 data.Disease HadCM3Q0
Correlation (R2)ECHAM5
Correlation (R2)Remarks
Dengue 0.82 0.04 Significant to Very weak
Chapter Four : Vulnerability and Adaptati on
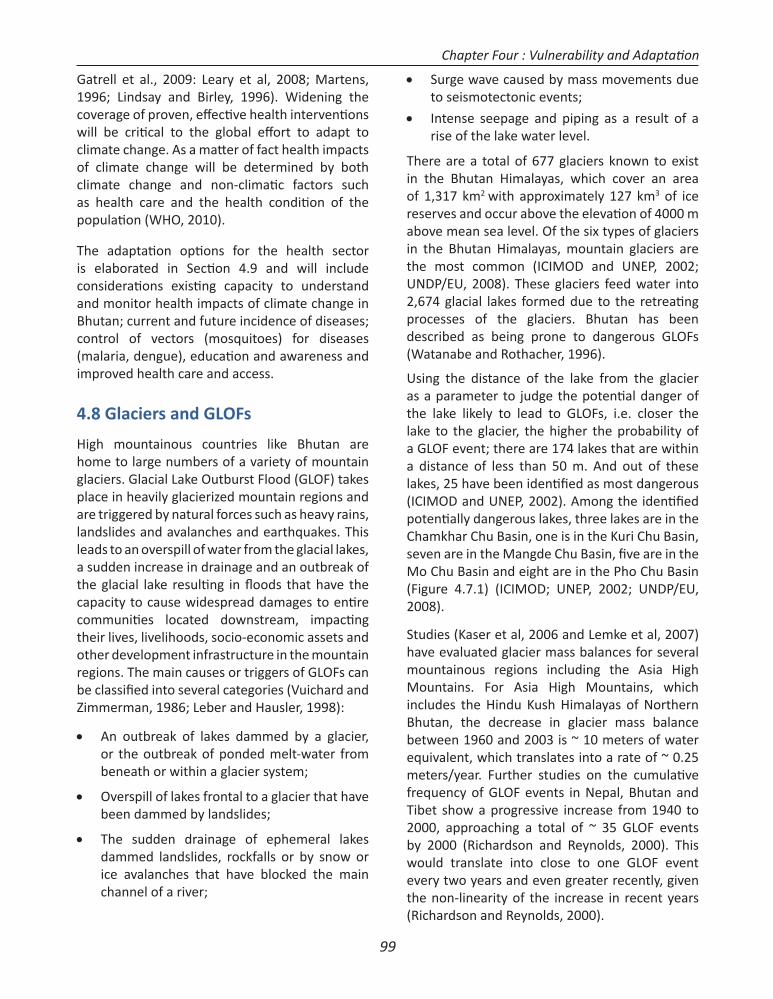
99
Gatrell et al., 2009: Leary et al, 2008; Martens, 1996; Lindsay and Birley, 1996). Widening the coverage of proven, eff ecti ve health interventi ons will be criti cal to the global eff ort to adapt to climate change. As a matt er of fact health impacts of climate change will be determined by both climate change and non-climati c factors such as health care and the health conditi on of the populati on (WHO, 2010).
The adaptati on opti ons for the health sector is elaborated in Secti on 4.9 and will include considerati ons existi ng capacity to understand and monitor health impacts of climate change in Bhutan; current and future incidence of diseases; control of vectors (mosquitoes) for diseases (malaria, dengue), educati on and awareness and improved health care and access.
4.8 Glaciers and GLOFs
High mountainous countries like Bhutan are home to large numbers of a variety of mountain glaciers. Glacial Lake Outburst Flood (GLOF) takes place in heavily glacierized mountain regions and are triggered by natural forces such as heavy rains, landslides and avalanches and earthquakes. This leads to an overspill of water from the glacial lakes, a sudden increase in drainage and an outbreak of the glacial lake resulti ng in fl oods that have the capacity to cause widespread damages to enti re communiti es located downstream, impacti ng their lives, livelihoods, socio-economic assets and other development infrastructure in the mountain regions. The main causes or triggers of GLOFs can be classifi ed into several categories (Vuichard and Zimmerman, 1986; Leber and Hausler, 1998):
An outbreak of lakes dammed by a glacier, or the outbreak of ponded melt-water from beneath or within a glacier system;
Overspill of lakes frontal to a glacier that have been dammed by landslides;
The sudden drainage of ephemeral lakes dammed landslides, rockfalls or by snow or ice avalanches that have blocked the main channel of a river;
Surge wave caused by mass movements due to seismotectonic events;
Intense seepage and piping as a result of a rise of the lake water level.
There are a total of 677 glaciers known to exist in the Bhutan Himalayas, which cover an area of 1,317 km2 with approximately 127 km3 of ice reserves and occur above the elevati on of 4000 m above mean sea level. Of the six types of glaciers in the Bhutan Himalayas, mountain glaciers are the most common (ICIMOD and UNEP, 2002; UNDP/EU, 2008). These glaciers feed water into 2,674 glacial lakes formed due to the retreati ng processes of the glaciers. Bhutan has been described as being prone to dangerous GLOFs (Watanabe and Rothacher, 1996).
Using the distance of the lake from the glacier as a parameter to judge the potenti al danger of the lake likely to lead to GLOFs, i.e. closer the lake to the glacier, the higher the probability of a GLOF event; there are 174 lakes that are within a distance of less than 50 m. And out of these lakes, 25 have been identi fi ed as most dangerous (ICIMOD and UNEP, 2002). Among the identi fi ed potenti ally dangerous lakes, three lakes are in the Chamkhar Chu Basin, one is in the Kuri Chu Basin, seven are in the Mangde Chu Basin, fi ve are in the Mo Chu Basin and eight are in the Pho Chu Basin (Figure 4.7.1) (ICIMOD; UNEP, 2002; UNDP/EU, 2008).
Studies (Kaser et al, 2006 and Lemke et al, 2007) have evaluated glacier mass balances for several mountainous regions including the Asia High Mountains. For Asia High Mountains, which includes the Hindu Kush Himalayas of Northern Bhutan, the decrease in glacier mass balance between 1960 and 2003 is ~ 10 meters of water equivalent, which translates into a rate of ~ 0.25 meters/year. Further studies on the cumulati ve frequency of GLOF events in Nepal, Bhutan and Tibet show a progressive increase from 1940 to 2000, approaching a total of ~ 35 GLOF events by 2000 (Richardson and Reynolds, 2000). This would translate into close to one GLOF event every two years and even greater recently, given the non-linearity of the increase in recent years (Richardson and Reynolds, 2000).
Chapter Four : Vulnerability and Adaptati on
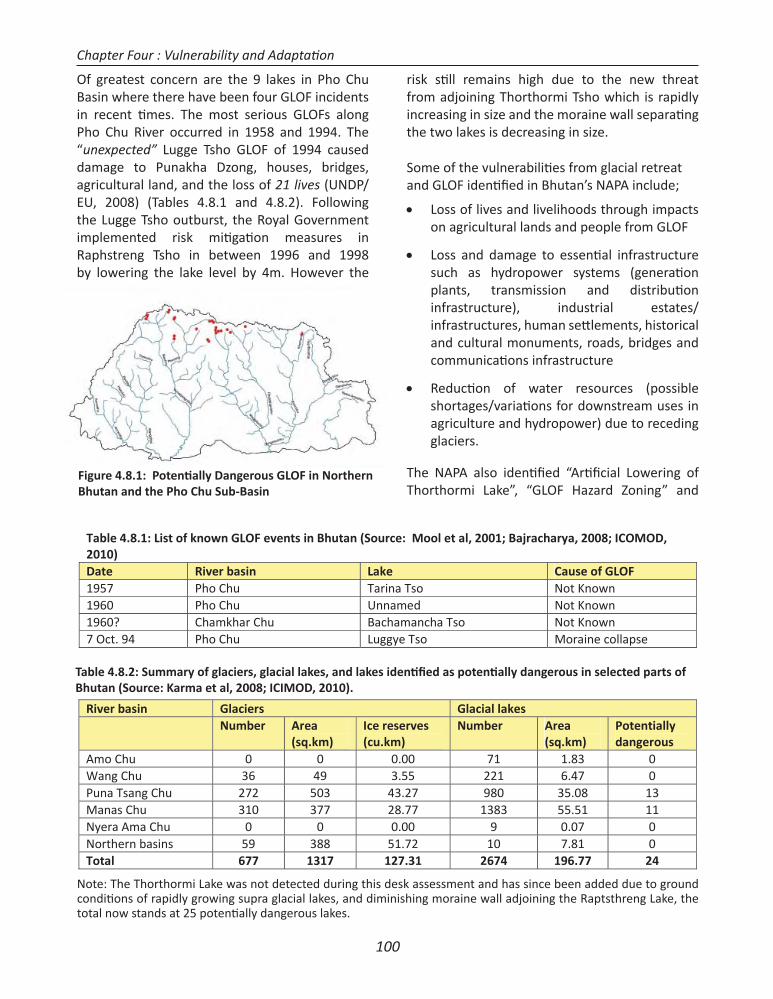
100
River basin Glaciers Glacial lakesNumber Area
(sq.km)Ice reserves(cu.km)
Number Area(sq.km)
Potentiallydangerous
Amo Chu 0 0 0.00 71 1.83 0Wang Chu 36 49 3.55 221 6.47 0Puna Tsang Chu 272 503 43.27 980 35.08 13Manas Chu 310 377 28.77 1383 55.51 11Nyera Ama Chu 0 0 0.00 9 0.07 0Northern basins 59 388 51.72 10 7.81 0Total 677 1317 127.31 2674 196.77 24
Table 4.8.1: List of known GLOF events in Bhutan (Source: Mool et al, 2001; Bajracharya, 2008; ICOMOD,2010)Date River basin Lake Cause of GLOF1957 Pho Chu Tarina Tso Not Known1960 Pho Chu Unnamed Not Known1960? Chamkhar Chu Bachamancha Tso Not Known7 Oct. 94 Pho Chu Luggye Tso Moraine collapse
Of greatest concern are the 9 lakes in Pho Chu Basin where there have been four GLOF incidents in recent ti mes. The most serious GLOFs along Pho Chu River occurred in 1958 and 1994. The “unexpected” Lugge Tsho GLOF of 1994 caused damage to Punakha Dzong, houses, bridges, agricultural land, and the loss of 21 lives (UNDP/EU, 2008) (Tables 4.8.1 and 4.8.2). Following the Lugge Tsho outburst, the Royal Government implemented risk miti gati on measures in Raphstreng Tsho in between 1996 and 1998 by lowering the lake level by 4m. However the
risk sti ll remains high due to the new threat from adjoining Thorthormi Tsho which is rapidly increasing in size and the moraine wall separati ng the two lakes is decreasing in size.
Some of the vulnerabiliti es from glacial retreat and GLOF identi fi ed in Bhutan’s NAPA include;
Loss of lives and livelihoods through impacts on agricultural lands and people from GLOF
Loss and damage to essenti al infrastructure such as hydropower systems (generati on plants, transmission and distributi on infrastructure), industrial estates/infrastructures, human sett lements, historical and cultural monuments, roads, bridges and communicati ons infrastructure
Reducti on of water resources (possible shortages/variati ons for downstream uses in agriculture and hydropower) due to receding glaciers.
The NAPA also identi fi ed “Arti fi cial Lowering of Thorthormi Lake”, “GLOF Hazard Zoning” and
Table 4.8.2: Summary of glaciers, glacial lakes, and lakes identi fi ed as potenti ally dangerous in selected parts of Bhutan (Source: Karma et al, 2008; ICIMOD, 2010).
Note: The Thorthormi Lake was not detected during this desk assessment and has since been added due to ground conditi ons of rapidly growing supra glacial lakes, and diminishing moraine wall adjoining the Raptsthreng Lake, the total now stands at 25 potenti ally dangerous lakes.
Figure 4.8.1: Potenti ally Dangerous GLOF in Northern Bhutan and the Pho Chu Sub-Basin
Chapter Four : Vulnerability and Adaptati on
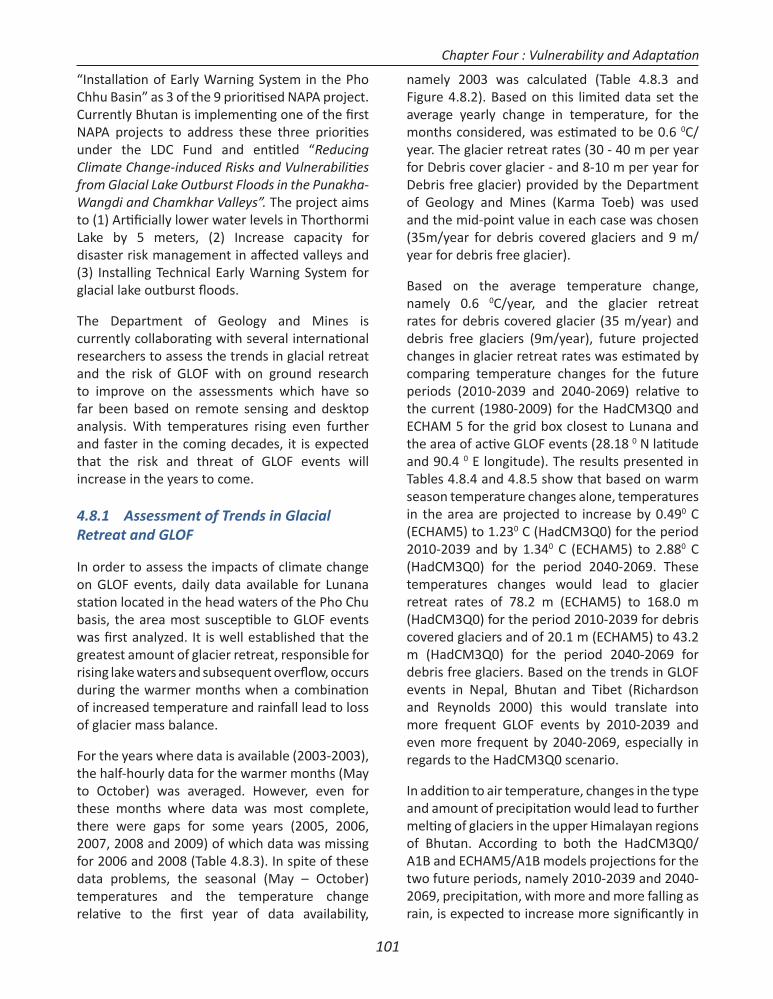
101
“Installati on of Early Warning System in the Pho Chhu Basin” as 3 of the 9 prioriti sed NAPA project. Currently Bhutan is implementi ng one of the fi rst NAPA projects to address these three prioriti es under the LDC Fund and enti tled “Reducing Climate Change-induced Risks and Vulnerabiliti es from Glacial Lake Outburst Floods in the Punakha-Wangdi and Chamkhar Valleys”. The project aims to (1) Arti fi cially lower water levels in Thorthormi Lake by 5 meters, (2) Increase capacity for disaster risk management in aff ected valleys and (3) Installing Technical Early Warning System for glacial lake outburst fl oods.
The Department of Geology and Mines is currently collaborati ng with several internati onal researchers to assess the trends in glacial retreat and the risk of GLOF with on ground research to improve on the assessments which have so far been based on remote sensing and desktop analysis. With temperatures rising even further and faster in the coming decades, it is expected that the risk and threat of GLOF events will increase in the years to come.
4.8.1 Assessment of Trends in Glacial Retreat and GLOF
In order to assess the impacts of climate change on GLOF events, daily data available for Lunana stati on located in the head waters of the Pho Chu basis, the area most suscepti ble to GLOF events was fi rst analyzed. It is well established that the greatest amount of glacier retreat, responsible for rising lake waters and subsequent overfl ow, occurs during the warmer months when a combinati on of increased temperature and rainfall lead to loss of glacier mass balance.
For the years where data is available (2003-2003), the half-hourly data for the warmer months (May to October) was averaged. However, even for these months where data was most complete, there were gaps for some years (2005, 2006, 2007, 2008 and 2009) of which data was missing for 2006 and 2008 (Table 4.8.3). In spite of these data problems, the seasonal (May – October) temperatures and the temperature change relati ve to the fi rst year of data availability,
namely 2003 was calculated (Table 4.8.3 and Figure 4.8.2). Based on this limited data set the average yearly change in temperature, for the months considered, was esti mated to be 0.6 0C/year. The glacier retreat rates (30 - 40 m per year for Debris cover glacier - and 8-10 m per year for Debris free glacier) provided by the Department of Geology and Mines (Karma Toeb) was used and the mid-point value in each case was chosen (35m/year for debris covered glaciers and 9 m/year for debris free glacier).
Based on the average temperature change, namely 0.6 0C/year, and the glacier retreat rates for debris covered glacier (35 m/year) and debris free glaciers (9m/year), future projected changes in glacier retreat rates was esti mated by comparing temperature changes for the future periods (2010-2039 and 2040-2069) relati ve to the current (1980-2009) for the HadCM3Q0 and ECHAM 5 for the grid box closest to Lunana and the area of acti ve GLOF events (28.18 0 N lati tude and 90.4 0 E longitude). The results presented in Tables 4.8.4 and 4.8.5 show that based on warm season temperature changes alone, temperatures in the area are projected to increase by 0.490 C (ECHAM5) to 1.230 C (HadCM3Q0) for the period 2010-2039 and by 1.340 C (ECHAM5) to 2.880 C (HadCM3Q0) for the period 2040-2069. These temperatures changes would lead to glacier retreat rates of 78.2 m (ECHAM5) to 168.0 m (HadCM3Q0) for the period 2010-2039 for debris covered glaciers and of 20.1 m (ECHAM5) to 43.2 m (HadCM3Q0) for the period 2040-2069 for debris free glaciers. Based on the trends in GLOF events in Nepal, Bhutan and Tibet (Richardson and Reynolds 2000) this would translate into more frequent GLOF events by 2010-2039 and even more frequent by 2040-2069, especially in regards to the HadCM3Q0 scenario.
In additi on to air temperature, changes in the type and amount of precipitati on would lead to further melti ng of glaciers in the upper Himalayan regions of Bhutan. According to both the HadCM3Q0/A1B and ECHAM5/A1B models projecti ons for the two future periods, namely 2010-2039 and 2040-2069, precipitati on, with more and more falling as rain, is expected to increase more signifi cantly in
Chapter Four : Vulnerability and Adaptati on
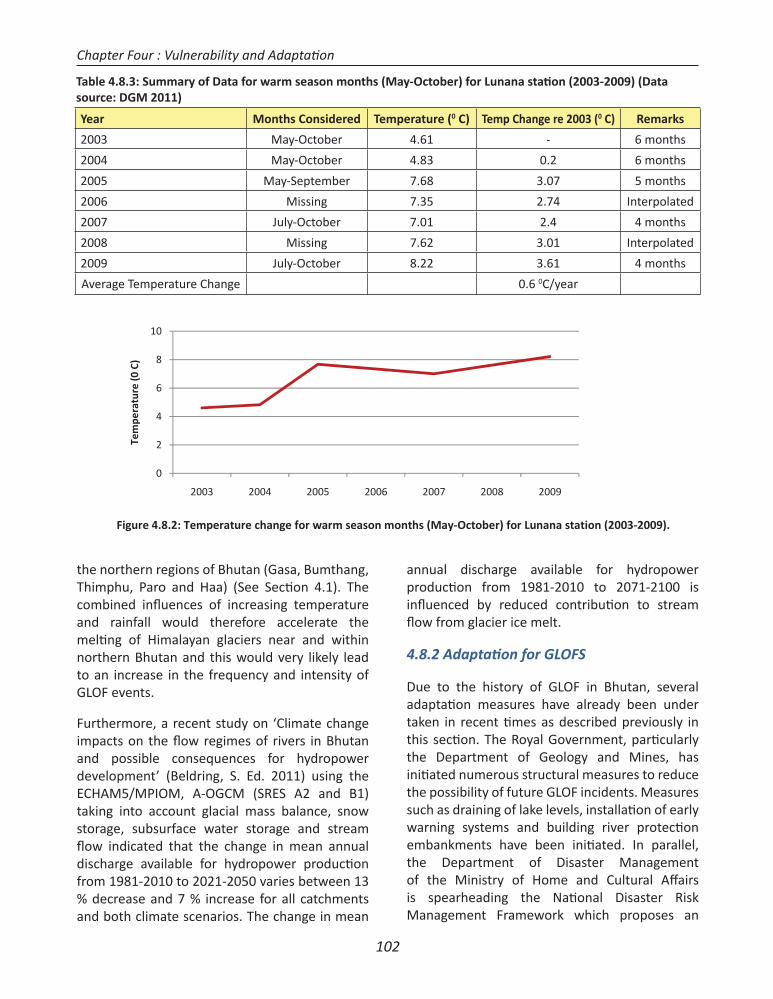
102
Year Months Considered Temperature (0 C) Temp Change re 2003 (0 C) Remarks
2003 May-October 4.61 - 6 months
2004 May-October 4.83 0.2 6 months
2005 May-September 7.68 3.07 5 months
2006 Missing 7.35 2.74 Interpolated
2007 July-October 7.01 2.4 4 months
2008 Missing 7.62 3.01 Interpolated
2009 July-October 8.22 3.61 4 months
Average Temperature Change 0.6 0C/year
Table 4.8.3: Summary of Data for warm season months (May-October) for Lunana stati on (2003-2009) (Data source: DGM 2011)
Figure 4.8.2: Temperature change for warm season months (May October) for Lunana station (2003 2009).
0
2
4
6
8
10
2003 2004 2005 2006 2007 2008 2009
Tem
pera
ture
(0C)
the northern regions of Bhutan (Gasa, Bumthang, Thimphu, Paro and Haa) (See Secti on 4.1). The combined infl uences of increasing temperature and rainfall would therefore accelerate the melti ng of Himalayan glaciers near and within northern Bhutan and this would very likely lead to an increase in the frequency and intensity of GLOF events.
Furthermore, a recent study on ‘Climate change impacts on the fl ow regimes of rivers in Bhutan and possible consequences for hydropower development’ (Beldring, S. Ed. 2011) using the ECHAM5/MPIOM, A-OGCM (SRES A2 and B1) taking into account glacial mass balance, snow storage, subsurface water storage and stream fl ow indicated that the change in mean annual discharge available for hydropower producti on from 1981-2010 to 2021-2050 varies between 13 % decrease and 7 % increase for all catchments and both climate scenarios. The change in mean
annual discharge available for hydropower producti on from 1981-2010 to 2071-2100 is infl uenced by reduced contributi on to stream fl ow from glacier ice melt.
4.8.2 Adaptati on for GLOFS
Due to the history of GLOF in Bhutan, several adaptati on measures have already been under taken in recent ti mes as described previously in this secti on. The Royal Government, parti cularly the Department of Geology and Mines, has initi ated numerous structural measures to reduce the possibility of future GLOF incidents. Measures such as draining of lake levels, installati on of early warning systems and building river protecti on embankments have been initi ated. In parallel, the Department of Disaster Management of the Ministry of Home and Cultural Aff airs is spearheading the Nati onal Disaster Risk Management Framework which proposes an
Chapter Four : Vulnerability and Adaptati on
103
insti tuti onal framework at three diff erent levels - nati onal, Dzongkhag (district) and Dungkhag/Gewog/Thromde (local administrati on) levels -to discharge responsibiliti es in both pre-disaster as well as the post-disaster phases.Following the 1994 Lugge Tsho GLOF the Government of Bhutan promptly started further structural GLOF miti gati on initi ati ves and response measures to avoid similar catastrophic incidents in the future. Following up on preliminary studies of the dangerous glacial lakes in Pho Chu, a series of short-term and long-term measures were recommended (ICIMOD and UNEP, 2002; Watanabe and Rothacher, 1996 and Hausler and Leber, 1998).
While the priority acti ons for adaptati on to GLOF and glacial retreat is presented in secti on 4.9 a discussion on the various adaptati on measures to GLOF is warranted since the chosen methods will depend on parti cular conditi ons at site, costs and other informati on that will arise during detailed assessments. A brief discussion of various recommended measures is presented below:
The Short-term Measures recommended were:
Unloading the crown of the landslide near the Tshopda Tsho outlet and constructi ng gabiontoe walls on either banks of Pho Chu;
Lowering the outlet of Thorthormi Tsho by 10 m in stages to reduce the hydrostati c pressure;
Restoring the original secti on of the morainic barrier of Raphstreng Tsho washed away by the 1994 fl ood; and
Lowering the level of Raphstreng Tsho by 20m to reduce the volume by 38%.
The Long-Term Measures recommended were:
Constructi on of check dams, river draining dykes and other energy dissipati on measures downstream;
Stabilizati on of slopes by plantati ons;
Detailed monitoring of glacial lakes;
Establishment of seismic stati ons to record earthquakes in the Lunana area; and
Establishment of meteorological stati on in the lake area to record micro-climati c variati ons.
Furthermore, Grabs and Hanisch (1993) prescribed a series of structural methods to lower the water level in the glacier lakes to prevent the outburst of GLOF-prone lakes, and the most common techniques recommended were:
Arti fi cial deepening of the natural spillway;
Blasti ng the moraine dam;
Inclined drilling through the moraine dam; and
Driving a tunnel from an adjacent deeper lying valley.
Grabs and Hanisch (1993), however, cauti oned that the above methods and techniques “suff er from unpredictable risks” and suggested that the Hydraulic Siphon Technique (HST) as best suited for the harsh Himalayan conditi ons in additi on to being aff ordable. Basically HST, which can be adapted to the specifi c conditi ons of the Himalayas, can lower lake water levels in the magnitude of 5 m by taking advantage of the diff erence of a hydraulic potenti al between the inlet and the outlet water fi lled pipe to a deeper lying outlet.
The non-structural miti gati on measures include (UNDP/EU, 2008):
At a Nati onal level:
Strengthen legislati ve and insti tuti onal frameworks;
Devising of simpler response mechanisms;
Allocati on of suffi cient funds; and
Build disaster risk management capacity.
Community and local levels:
Strengthen awareness and preparedness measures;
Initi ate an eff ecti ve fl ood insurance scheme;
Build a disaster resilient community;
Strengthen community bond;
Chapter Four : Vulnerability and Adaptati on
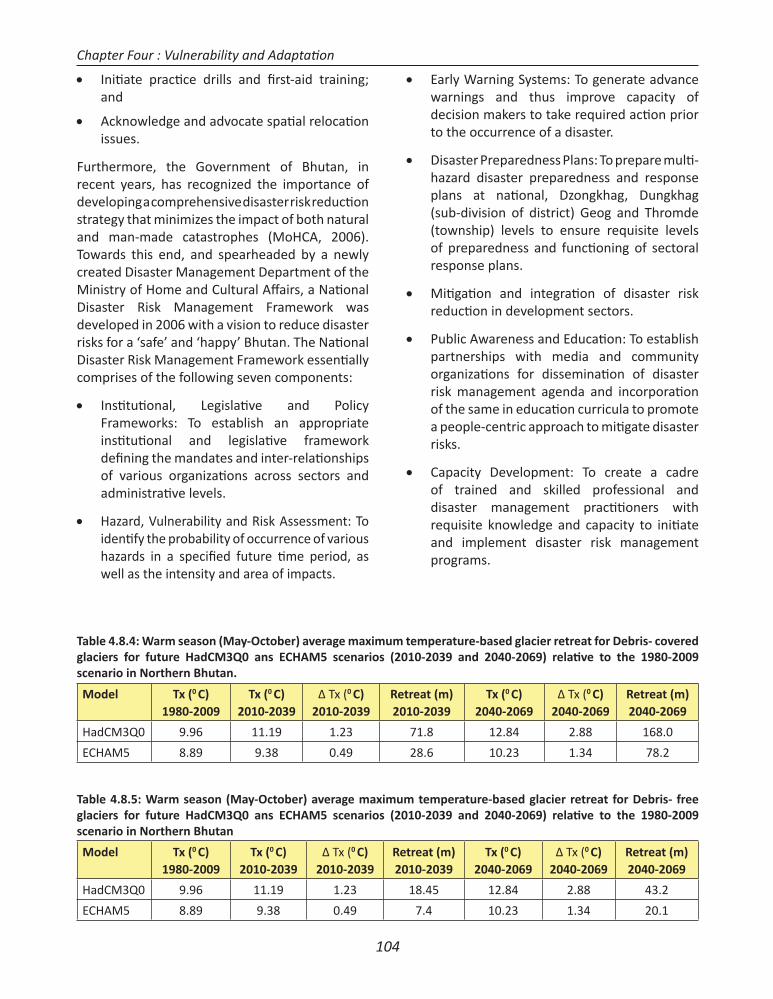
104
Initi ate practi ce drills and fi rst-aid training; and
Acknowledge and advocate spati al relocati on issues.
Furthermore, the Government of Bhutan, in recent years, has recognized the importance of developing a comprehensive disaster risk reducti on strategy that minimizes the impact of both natural and man-made catastrophes (MoHCA, 2006). Towards this end, and spearheaded by a newly created Disaster Management Department of the Ministry of Home and Cultural Aff airs, a Nati onal Disaster Risk Management Framework was developed in 2006 with a vision to reduce disaster risks for a ‘safe’ and ‘happy’ Bhutan. The Nati onal Disaster Risk Management Framework essenti ally comprises of the following seven components:
Insti tuti onal, Legislati ve and Policy Frameworks: To establish an appropriate insti tuti onal and legislati ve framework defi ning the mandates and inter-relati onships of various organizati ons across sectors and administrati ve levels.
Hazard, Vulnerability and Risk Assessment: To identi fy the probability of occurrence of various hazards in a specifi ed future ti me period, as well as the intensity and area of impacts.
Early Warning Systems: To generate advance warnings and thus improve capacity of decision makers to take required acti on prior to the occurrence of a disaster.
Disaster Preparedness Plans: To prepare multi -hazard disaster preparedness and response plans at nati onal, Dzongkhag, Dungkhag (sub-division of district) Geog and Thromde (township) levels to ensure requisite levels of preparedness and functi oning of sectoral response plans.
Miti gati on and integrati on of disaster risk reducti on in development sectors.
Public Awareness and Educati on: To establish partnerships with media and community organizati ons for disseminati on of disaster risk management agenda and incorporati on of the same in educati on curricula to promote a people-centric approach to miti gate disaster risks.
Capacity Development: To create a cadre of trained and skilled professional and disaster management practi ti oners with requisite knowledge and capacity to initi ate and implement disaster risk management programs.
Model Tx (0 C)1980-2009
Tx (0 C)2010-2039
Δ Tx (0 C)2010-2039
Retreat (m)2010-2039
Tx (0 C)2040-2069
Δ Tx (0 C)2040-2069
Retreat (m)2040-2069
HadCM3Q0 9.96 11.19 1.23 71.8 12.84 2.88 168.0
ECHAM5 8.89 9.38 0.49 28.6 10.23 1.34 78.2
Model Tx (0 C)1980-2009
Tx (0 C)2010-2039
Δ Tx (0 C)2010-2039
Retreat (m)2010-2039
Tx (0 C)2040-2069
Δ Tx (0 C)2040-2069
Retreat (m)2040-2069
HadCM3Q0 9.96 11.19 1.23 18.45 12.84 2.88 43.2
ECHAM5 8.89 9.38 0.49 7.4 10.23 1.34 20.1
Table 4.8.4: Warm season (May-October) average maximum temperature-based glacier retreat for Debris- covered glaciers for future HadCM3Q0 ans ECHAM5 scenarios (2010-2039 and 2040-2069) relati ve to the 1980-2009 scenario in Northern Bhutan.
Table 4.8.5: Warm season (May-October) average maximum temperature-based glacier retreat for Debris- free glaciers for future HadCM3Q0 ans ECHAM5 scenarios (2010-2039 and 2040-2069) relati ve to the 1980-2009 scenario in Northern Bhutan
Chapter Four : Vulnerability and Adaptati on
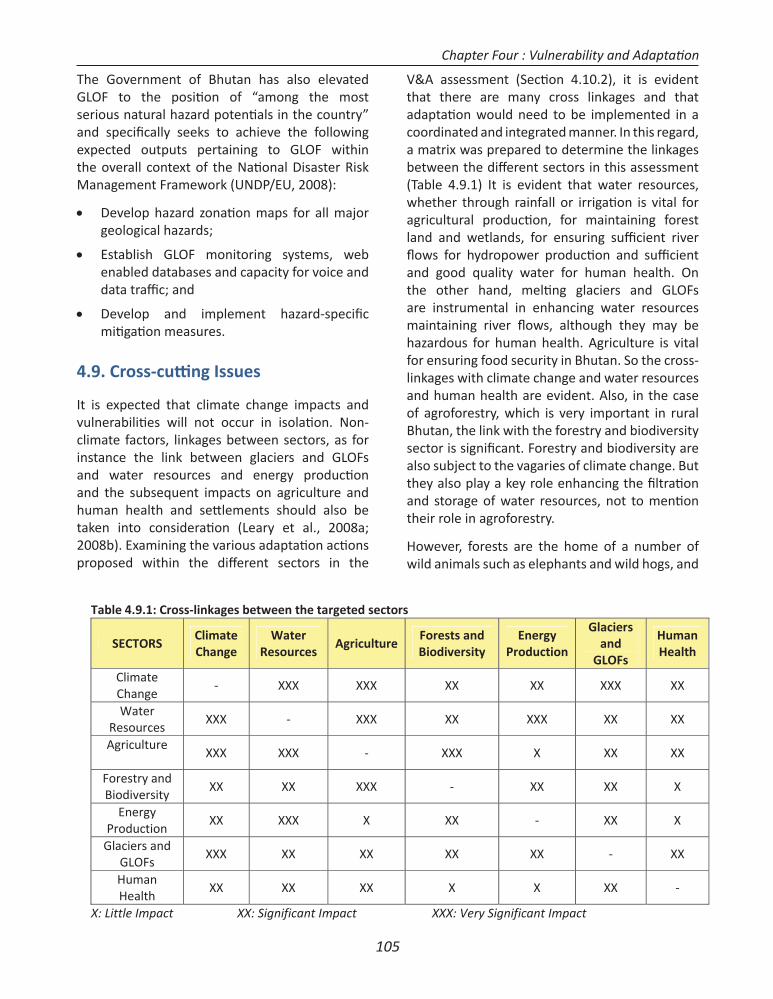
105
The Government of Bhutan has also elevated GLOF to the positi on of “among the most serious natural hazard potenti als in the country” and specifi cally seeks to achieve the following expected outputs pertaining to GLOF within the overall context of the Nati onal Disaster Risk Management Framework (UNDP/EU, 2008):
Develop hazard zonati on maps for all major geological hazards;
Establish GLOF monitoring systems, web enabled databases and capacity for voice and data traffi c; and
Develop and implement hazard-specifi c miti gati on measures.
4.9. Cross-cutti ng Issues
It is expected that climate change impacts and vulnerabiliti es will not occur in isolati on. Non-climate factors, linkages between sectors, as for instance the link between glaciers and GLOFs and water resources and energy producti on and the subsequent impacts on agriculture and human health and sett lements should also be taken into considerati on (Leary et al., 2008a; 2008b). Examining the various adaptati on acti ons proposed within the diff erent sectors in the
V&A assessment (Secti on 4.10.2), it is evident that there are many cross linkages and that adaptati on would need to be implemented in a coordinated and integrated manner. In this regard, a matrix was prepared to determine the linkages between the diff erent sectors in this assessment (Table 4.9.1) It is evident that water resources, whether through rainfall or irrigati on is vital for agricultural producti on, for maintaining forest land and wetlands, for ensuring suffi cient river fl ows for hydropower producti on and suffi cient and good quality water for human health. On the other hand, melti ng glaciers and GLOFs are instrumental in enhancing water resources maintaining river fl ows, although they may be hazardous for human health. Agriculture is vital for ensuring food security in Bhutan. So the cross-linkages with climate change and water resources and human health are evident. Also, in the case of agroforestry, which is very important in rural Bhutan, the link with the forestry and biodiversity sector is signifi cant. Forestry and biodiversity are also subject to the vagaries of climate change. But they also play a key role enhancing the fi ltrati on and storage of water resources, not to menti on their role in agroforestry.
However, forests are the home of a number of wild animals such as elephants and wild hogs, and
Table 4.9.1: Cross linkages between the targeted sectors
SECTORSClimateChange
WaterResources
AgricultureForests andBiodiversity
EnergyProduction
Glaciersand
GLOFs
HumanHealth
ClimateChange
XXX XXX XX XX XXX XX
WaterResources
XXX XXX XX XXX XX XX
AgricultureXXX XXX XXX X XX XX
Forestry andBiodiversity
XX XX XXX XX XX X
EnergyProduction
XX XXX X XX XX X
Glaciers andGLOFs
XXX XX XX XX XX XX
HumanHealth
XX XX XX X X XX
X: Little Impact XX: Significant Impact XXX: Very Significant Impact
Chapter Four : Vulnerability and Adaptati on
106
these are very disastrous to agriculture in Bhutan: the human-wildlife confl ict. Finally glaciers and GLOFs, although they contribute to maintaining river fl ows for energy producti on via hydropower and to irrigati on water for agriculture in Bhutan, they can someti mes be detrimental to human health, causing loss of life through excessive fl ooding. It is therefore very evident that climate change would intricately cross-link with other key sectors of Bhutan, namely the water resources, agriculture, forestry and biodiversity, energy, glaciers and GLOF and human health.
4.10 Adaptati on Plan
The adaptati on prioriti es are presented by sector in this secti on along with objecti ves, indicati ve ti me frame, scope of coverage, lead agencies and other cross-cutti ng sectors and issues. Costs of some of the adaptati on acti viti es have also been roughly esti mated. The adaptati on measures were prepared in a consultati ve manner, over several rounds of discussions, taking into considerati on the outcomes of the Vulnerability and Adaptati on Assessment as described in this chapter, the nati onal themati c papers prepared for the Climate Summit for a Living Himalayas-Bhutan 2011 (CSLH) and outcomes of other assessments and projects, and also the adaptati on opti ons identi fi ed in Bhutan’s Nati onal Adaptati on Programme of Acti on.
Since the CSLH -Bhutan 2011 will result in a nati onal adaptati on road map as a part of the Regional Framework of Acti on for Climate Adaptati on in the Eastern Himalayas (Bangladesh, Bhutan, India and Nepal) to be adopted in November 2011, it was essenti al to ensure synergies with that process. Towards this end, members of the four Themati c Group for the CLSH (Biodiversity, Energy Security, Food Security and Water Resources), upon completi on of their task of preparing the nati onal themati c papers conti nued as members of the SNC V&A Task Force. Human Health and Glaciers & GLOF were two additi onal sectors for the SNC V&A Task Force. Consequently the adaptati on acti ons identi fi ed in this secti on is aligned with the acti viti es within the CLSH process.
4.10.1 Implementati on Arrangements for Adaptati on
Currently Bhutan lacks fi nancing and capacity even for regular baseline development acti viti es and research on climate observati on and vulnerability assessment, let along additi onal adaptati on acti viti es. Therefore the implementati on of adaptati on prioriti es will be heavily dependent on availability of fi nancing.
With regards to implementati on arrangements, it is recommended that at a nati onal level the NEC as the nati onal focal agency for climate change, in consultati on with the GNHC as the nati onal planning agency, shall coordinate nati onal V&A and adaptati on planning including monitoring the progress in implementati on of adaptati on acti viti es. However sectors and stakeholders shall implement adaptati on prioriti es and acti ons within their own sectoral plans and programs. The role of local communiti es, local governance and civil society organisati ons will also be crucial to ensure that adaptati on measures are implemented to benefi t the most vulnerable communiti es
Coordinati on of crosscutti ng and overlapping issues can be facilitated through the Multi sectoral Technical Committ ee on Climate Change (MSTCCC). Such an arrangement can also facilitate synergies with other relevant acti viti es. It will also be essenti al to maintain close consultati on between NEC and the Secretariat for the Climate Summit for a Living Himalayas – Bhutan 2011 to ensure synergy in building nati onal resilience to climate change from two diff erent but related processes.
With regards to implementati on within sectors, several sector specifi c recommendati ons are identi fi ed as follows:
Water
Set-up of present insti tuti ons are adequate
Bett er collaborati ons are required both within agencies and with the local governments/gewogs, and water user associati ons
Need to establish Independent Water
Chapter Four : Vulnerability and Adaptati on
107
Authority as per Water Act
Capacity building required.
Energy
Each sectoral adaptati on acti on will be implemented by the identi fi ed agency in the sectoral plan.
For Energy issues, there is a need for either an independent Ministry to address the overall energy issues or an Energy Board comprising members from diff erent relevant agencies.
Forest and Biodiversity
MoAF will be the main implementi ng agency for adaptati on in the forestry and biodiversity sector.
Relevant insti tuti ons will be mandated by MoAF to implement priority acti ons under the nati onal acti on plan.
A nodal agency should be identi fi ed to coordinate and monitor the implementati on of adaptati on acti viti es within the agriculture and forestry sector. The nodal agency shall also link with relevant agencies/NGOs within and outside Bhutan.
Health
Research insti tutes should be encouraged to conduct more research on health and climate change.
A Nati onal Integrated Database bank to cover all aspects of climate related data should be established to facilitate health sector concerns.
Agriculture
Insti tuti onally, food security needs to be addressed across all sectors and not just the Ministry of Agriculture and Forest
Increase investment on SLM technologies to combat land degradati on arising due to climate change
Increase investment on Research insti tuti ons to increase the capacity to develop climate resilient technologies
Insti tute pest and disease surveillance system
Strengthen and improve informati on management system.
Glaciers and GLOF
Nati onal Environment Commission and other major stakeholders shall coordinate at the nati onal level
Dzongkhags and communiti es implement and coordinate at the local level.
Chapter Four : Vulnerability and Adaptati on
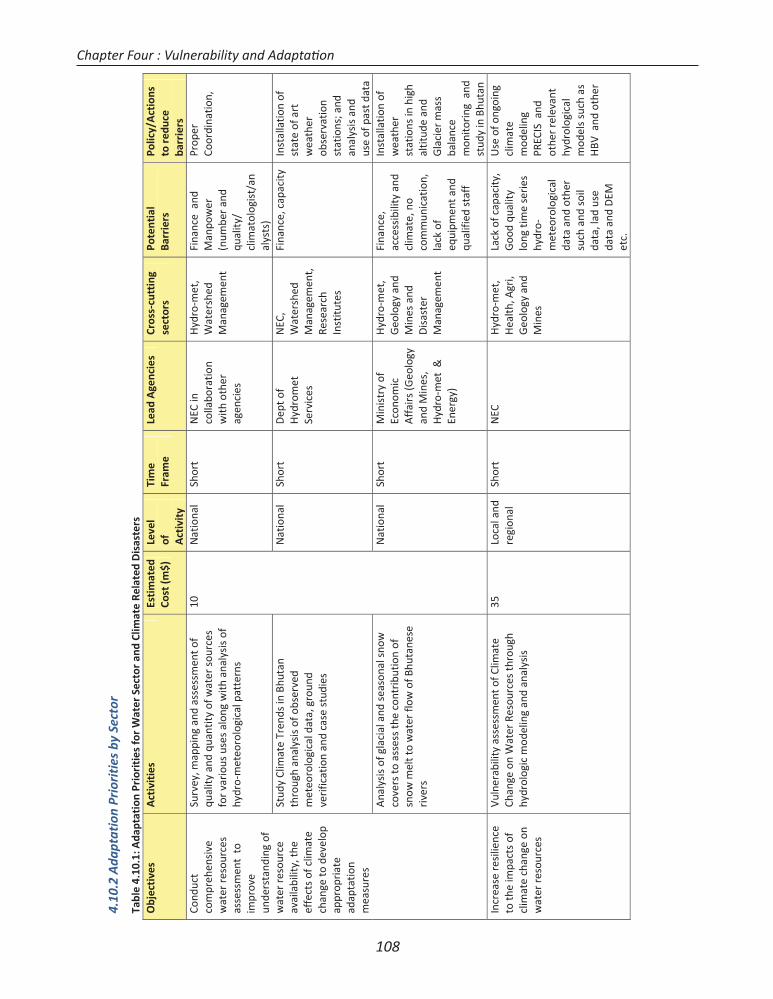
108
Chapter Four : Vulnerability and Adaptati on
4.10
.2A
dapt
atio
nPr
iori
ties
bySe
ctor
Tabl
e4.
10.1
:Ada
ptat
ion
Prio
riti
esfo
rW
ater
Sect
oran
dCl
imat
eRe
late
dD
isas
ters
Obj
ecti
ves
Act
ivit
ies
Esti
mat
edCo
st(m
$)Le
vel
of Act
ivit
y
Tim
eFr
ame
Lead
Age
ncie
sCr
oss
cutt
ing
sect
ors
Pote
ntia
lBa
rrie
rsPo
licy/
Act
ions
tore
duce
barr
iers
Cond
uct
com
preh
ensi
vew
ater
reso
urce
sas
sess
men
tto
impr
ove
unde
rsta
ndin
gof
wat
erre
sour
ceav
aila
bilit
y,th
eef
fect
sof
clim
ate
chan
geto
deve
lop
appr
opri
ate
adap
tatio
nm
easu
res
Surv
ey,m
appi
ngan
das
sess
men
tof
qual
ityan
dqu
antit
yof
wat
erso
urce
sfo
rva
riou
sus
esal
ong
with
anal
ysis
ofhy
dro
met
eoro
logi
calp
atte
rns
10N
atio
nal
Shor
tN
ECin
colla
bora
tion
with
othe
rag
enci
es
Hyd
rom
et,
Wat
ersh
edM
anag
emen
t
Fina
nce
and
Man
pow
er(n
umbe
ran
dqu
ality
/cl
imat
olog
ist/
anal
ysts
)
Prop
erCo
ordi
natio
n,
Stud
yCl
imat
eTr
ends
inBh
utan
thro
ugh
anal
ysis
ofob
serv
edm
eteo
rolo
gica
ldat
a,gr
ound
verif
icat
ion
and
case
stud
ies
Nat
iona
lSh
ort
Dep
tof
Hyd
rom
etSe
rvic
es
NEC
,W
ater
shed
Man
agem
ent,
Rese
arch
Inst
itute
s
Fina
nce,
capa
city
Inst
alla
tion
ofst
ate
ofar
tw
eath
erob
serv
atio
nst
atio
ns;a
ndan
alys
isan
dus
eof
past
data
Ana
lysi
sof
glac
iala
ndse
ason
alsn
owco
vers
toas
sess
the
cont
ribu
tion
ofsn
owm
eltt
ow
ater
flow
ofBh
utan
ese
rive
rs
Nat
iona
lSh
ort
Min
istr
yof
Econ
omic
Aff
airs
(Geo
logy
and
Min
es,
Hyd
rom
et&
Ener
gy)
Hyd
rom
et,
Geo
logy
and
Min
esan
dD
isas
ter
Man
agem
ent
Fina
nce,
acce
ssib
ility
and
clim
ate,
noco
mm
unic
atio
n,la
ckof
equi
pmen
tand
qual
ified
staf
f
Inst
alla
tion
ofw
eath
erst
atio
nsin
high
altit
ude
and
Gla
cier
mas
sba
lanc
em
onito
ring
and
stud
yin
Bhut
anIn
crea
sere
silie
nce
toth
eim
pact
sof
clim
ate
chan
geon
wat
erre
sour
ces
Vuln
erab
ility
asse
ssm
ento
fClim
ate
Chan
geon
Wat
erRe
sour
ces
thro
ugh
hydr
olog
icm
odel
ing
and
anal
ysis
35Lo
cala
ndre
gion
alSh
ort
NEC
Hyd
rom
et,
Hea
lth,A
gri,
Geo
logy
and
Min
es
Lack
ofca
paci
ty,
Goo
dqu
ality
long
time
seri
eshy
dro
met
eoro
logi
cal
data
and
othe
rsu
chan
dso
ilda
ta,l
adus
eda
taan
dD
EMet
c.
Use
ofon
goin
gcl
imat
em
odel
ing
PREC
ISan
dot
her
rele
vant
hydr
olog
ical
mod
els
such
asH
BVan
dot
her
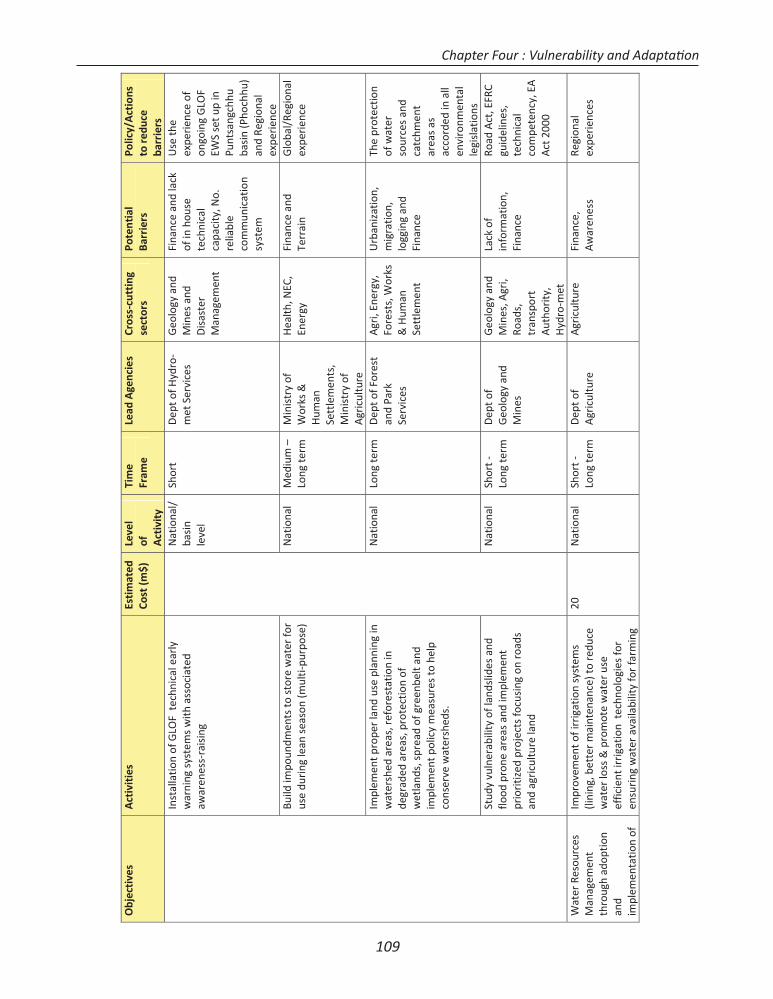
109
Chapter Four : Vulnerability and Adaptati on
Obj
ecti
ves
Act
ivit
ies
Esti
mat
edCo
st(m
$)Le
vel
of Act
ivit
y
Tim
eFr
ame
Lead
Age
ncie
sCr
oss
cutt
ing
sect
ors
Pote
ntia
lBa
rrie
rsPo
licy/
Act
ions
tore
duce
barr
iers
Inst
alla
tion
ofG
LOF
tech
nica
lear
lyw
arni
ngsy
stem
sw
ithas
soci
ated
awar
enes
sra
isin
g
Nat
iona
l/ba
sin
leve
l
Shor
tD
epto
fHyd
rom
etSe
rvic
esG
eolo
gyan
dM
ines
and
Dis
aste
rM
anag
emen
t
Fina
nce
and
lack
ofin
hous
ete
chni
cal
capa
city
,No.
relia
ble
com
mun
icat
ion
syst
em
Use
the
expe
rien
ceof
ongo
ing
GLO
FEW
Sse
tup
inPu
ntsa
ngch
huba
sin
(Pho
chhu
)an
dRe
gion
alex
peri
ence
Build
impo
undm
ents
tost
ore
wat
erfo
rus
edu
ring
lean
seas
on(m
ulti
purp
ose)
Nat
iona
lM
ediu
m–
Long
term
Min
istr
yof
Wor
ks&
Hum
anSe
ttle
men
ts,
Min
istr
yof
Agr
icul
ture
Hea
lth,N
EC,
Ener
gyFi
nanc
ean
dTe
rrai
nG
loba
l/Re
gion
alex
peri
ence
Impl
emen
tpro
perl
and
use
plan
ning
inw
ater
shed
area
s,re
fore
stat
ion
inde
grad
edar
eas,
prot
ectio
nof
wet
land
s,sp
read
ofgr
eenb
elta
ndim
plem
entp
olic
ym
easu
res
tohe
lpco
nser
vew
ater
shed
s.
Nat
iona
lLo
ngte
rmD
epto
fFor
est
and
Park
Serv
ices
Agr
i,En
ergy
,Fo
rest
s,W
orks
&H
uman
Sett
lem
ent
Urb
aniz
atio
n,m
igra
tion,
logg
ing
and
Fina
nce
The
prot
ectio
nof
wat
erso
urce
san
dca
tchm
ent
area
sas
acco
rded
inal
len
viro
nmen
tal
legi
slat
ions
Stud
yvu
lner
abili
tyof
land
slid
esan
dflo
odpr
one
area
san
dim
plem
ent
prio
ritiz
edpr
ojec
tsfo
cusi
ngon
road
san
dag
ricu
lture
land
Nat
iona
lSh
ort
Long
term
Dep
tof
Geo
logy
and
Min
es
Geo
logy
and
Min
es,A
gri,
Road
s,tr
ansp
ort
Aut
hori
ty,
Hyd
rom
et
Lack
ofin
form
atio
n,Fi
nanc
e
Road
Act
,EFR
Cgu
idel
ines
,te
chni
cal
com
pete
ncy,
EAA
ct20
00
Wat
erRe
sour
ces
Man
agem
ent
thro
ugh
adop
tion
and
impl
emen
tatio
nof
Impr
ovem
ento
firr
igat
ion
syst
ems
(lini
ng,b
ette
rm
aint
enan
ce)t
ore
duce
wat
erlo
ss&
prom
ote
wat
erus
eef
ficie
ntir
riga
tion
tech
nolo
gies
for
ensu
ring
wat
erav
aila
bilit
yfo
rfa
rmin
g
20N
atio
nal
Shor
tLo
ngte
rmD
epto
fA
gric
ultu
reA
gric
ultu
reFi
nanc
e,A
war
enes
sRe
gion
alex
peri
ence
s
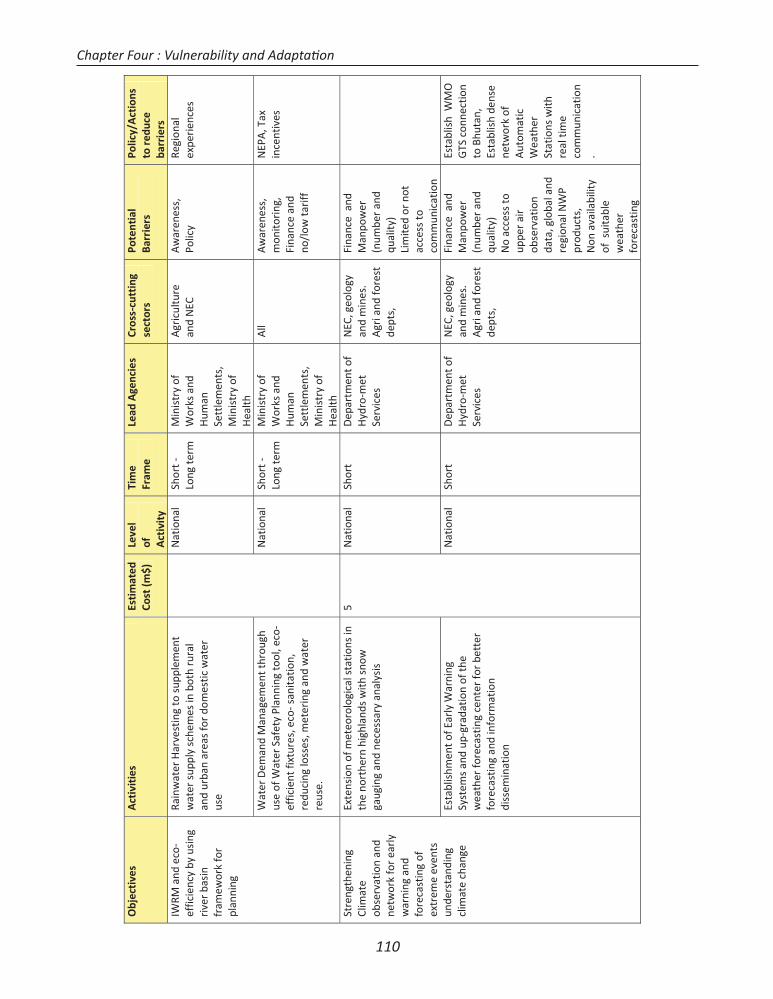
110
Chapter Four : Vulnerability and Adaptati on
Obj
ecti
ves
Act
ivit
ies
Esti
mat
edCo
st(m
$)Le
vel
of Act
ivit
y
Tim
eFr
ame
Lead
Age
ncie
sCr
oss
cutt
ing
sect
ors
Pote
ntia
lBa
rrie
rsPo
licy/
Act
ions
tore
duce
barr
iers
IWRM
and
eco
effic
ienc
yby
usin
griv
erba
sin
fram
ewor
kfo
rpl
anni
ng
Rain
wat
erH
arve
stin
gto
supp
lem
ent
wat
ersu
pply
sche
mes
inbo
thru
ral
and
urba
nar
eas
for
dom
estic
wat
erus
e
Nat
iona
lSh
ort
Long
term
Min
istr
yof
Wor
ksan
dH
uman
Sett
lem
ents
,M
inis
try
ofH
ealth
Agr
icul
ture
and
NEC
Aw
aren
ess,
Polic
yRe
gion
alex
peri
ence
s
Wat
erD
eman
dM
anag
emen
tthr
ough
use
ofW
ater
Safe
tyPl
anni
ngto
ol,e
coef
ficie
ntfix
ture
s,ec
osa
nita
tion,
redu
cing
loss
es,m
eter
ing
and
wat
erre
use.
Nat
iona
lSh
ort
Long
term
Min
istr
yof
Wor
ksan
dH
uman
Sett
lem
ents
,M
inis
try
ofH
ealth
All
Aw
aren
ess,
mon
itorin
g,Fi
nanc
ean
dno
/low
tarif
f
NEP
A,T
axin
cent
ives
Stre
ngth
enin
gCl
imat
eob
serv
atio
nan
dne
twor
kfo
rea
rly
war
ning
and
fore
cast
ing
ofex
trem
eev
ents
unde
rsta
ndin
gcl
imat
ech
ange
Exte
nsio
nof
met
eoro
logi
cals
tatio
nsin
the
nort
hern
high
land
sw
ithsn
owga
ugin
gan
dne
cess
ary
anal
ysis
5N
atio
nal
Shor
tD
epar
tmen
tof
Hyd
rom
etSe
rvic
es
NEC
,geo
logy
and
min
es.
Agr
iand
fore
stde
pts,
Fina
nce
and
Man
pow
er(n
umbe
ran
dqu
ality
)Li
mite
dor
not
acce
ssto
com
mun
icat
ion
Esta
blis
hmen
tofE
arly
War
ning
Syst
ems
and
upgr
adat
ion
ofth
ew
eath
erfo
reca
stin
gce
nter
for
bett
erfo
reca
stin
gan
din
form
atio
ndi
ssem
inat
ion
Nat
iona
lSh
ort
Dep
artm
ento
fH
ydro
met
Serv
ices
NEC
,geo
logy
and
min
es.
Agr
iand
fore
stde
pts,
Fina
nce
and
Man
pow
er(n
umbe
ran
dqu
ality
)N
oac
cess
toup
per
air
obse
rvat
ion
data
,glo
bala
ndre
gion
alN
WP
prod
ucts
,N
onav
aila
bilit
yof
suita
ble
wea
ther
fore
cast
ing
Esta
blis
hW
MO
GTS
conn
ectio
nto
Bhut
an,
Esta
blis
hde
nse
netw
ork
ofA
utom
atic
Wea
ther
Stat
ions
with
real
time
com
mun
icat
ion
.
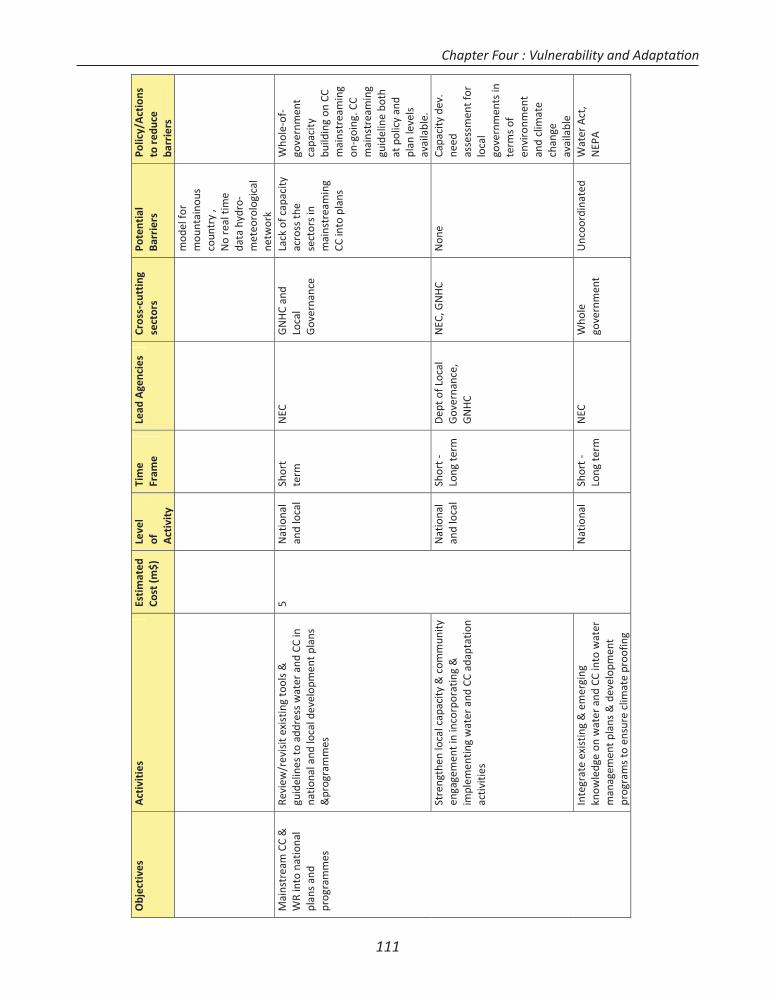
111
Chapter Four : Vulnerability and Adaptati on
Obj
ecti
ves
Act
ivit
ies
Esti
mat
edCo
st(m
$)Le
vel
of Act
ivit
y
Tim
eFr
ame
Lead
Age
ncie
sCr
oss
cutt
ing
sect
ors
Pote
ntia
lBa
rrie
rsPo
licy/
Act
ions
tore
duce
barr
iers
mod
elfo
rm
ount
aino
usco
untr
y,
No
real
time
data
hydr
om
eteo
rolo
gica
lne
twor
kM
ains
trea
mCC
&W
Rin
tona
tiona
lpl
ans
and
prog
ram
mes
Revi
ew/r
evis
itex
istin
gto
ols
&gu
idel
ines
toad
dres
sw
ater
and
CCin
natio
nala
ndlo
cald
evel
opm
entp
lans
&pr
ogra
mm
es
5N
atio
nal
and
loca
lSh
ort
term
NEC
GN
HC
and
Loca
lG
over
nanc
e
Lack
ofca
paci
tyac
ross
the
sect
ors
inm
ains
trea
min
gCC
into
plan
s
Who
leof
gove
rnm
ent
capa
city
build
i ng
onCC
mai
nstr
eam
ing
ongo
ing.
CCm
ains
trea
min
ggu
idel
ine
both
atpo
licy
and
plan
leve
lsav
aila
ble.
Stre
ngth
enlo
calc
apac
ity&
com
mun
ityen
gage
men
tin
inco
rpor
atin
g&
impl
emen
ting
wat
eran
dCC
adap
tatio
nac
tiviti
es
Nat
iona
lan
dlo
cal
Shor
tLo
ngte
rmD
epto
fLoc
alG
over
nanc
e,G
NH
C
NEC
,GN
HC
Non
eCa
paci
tyde
v.ne
edas
sess
men
tfor
loca
lgo
vern
men
tsin
term
sof
envi
ronm
ent
and
clim
ate
chan
geav
aila
ble
Inte
grat
eex
istin
g&
emer
ging
know
ledg
eon
wat
eran
dCC
into
wat
erm
anag
emen
tpla
ns&
deve
lopm
ent
prog
ram
sto
ensu
recl
imat
epr
oofin
g
Nat
iona
lSh
ort
Long
term
NEC
Who
lego
vern
men
tU
ncoo
rdin
ated
Wat
erA
ct,
NEP
A
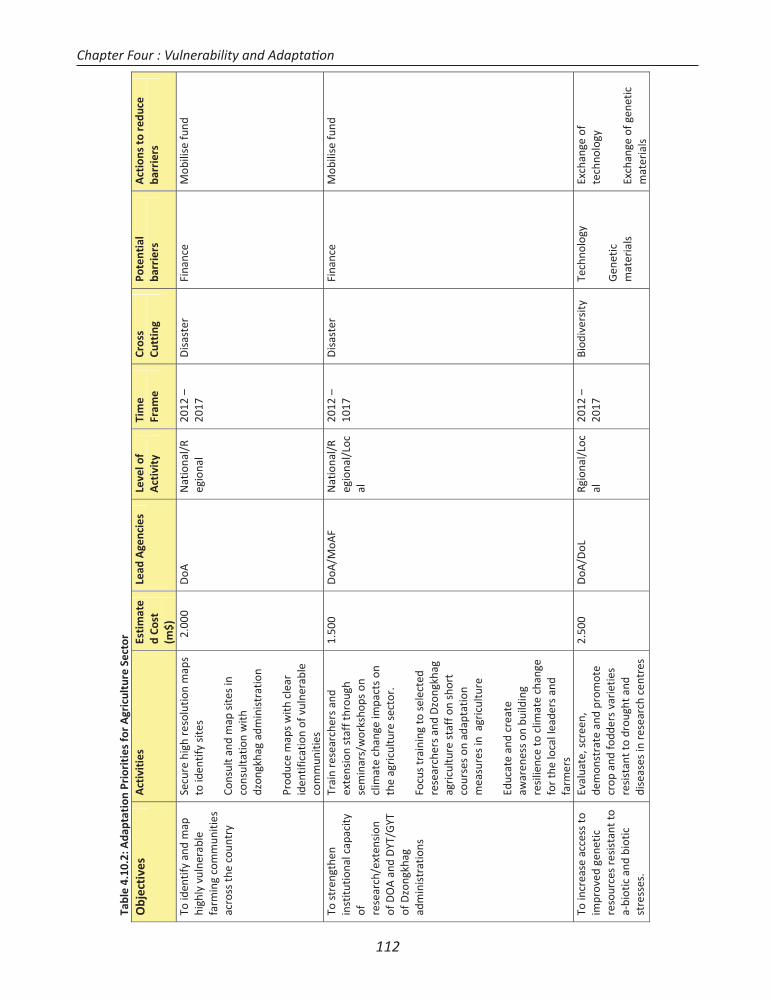
112
Tabl
e4.
10.2
:Ada
ptat
ion
Prio
riti
esfo
rA
gric
ultu
reSe
ctor
Obj
ecti
ves
Act
ivit
ies
Esti
mat
ed
Cost
(m$)
Lead
Age
ncie
sLe
velo
fA
ctiv
ity
Tim
eFr
ame
Cros
sCu
ttin
gPo
tent
ial
barr
iers
Act
ions
tore
duce
barr
iers
Toid
entif
yan
dm
aphi
ghly
vuln
erab
lefa
rmin
gco
mm
uniti
esac
ross
the
coun
try
Secu
rehi
ghre
solu
tion
map
sto
iden
tify
site
s
Cons
ulta
ndm
apsi
tes
inco
nsul
tatio
nw
ithdz
ongk
hag
adm
inis
trat
ion
Prod
uce
map
sw
ithcl
ear
iden
tific
atio
nof
vuln
erab
leco
mm
uniti
es
2.00
0D
oAN
atio
nal/
Reg
iona
l20
12–
2017
Dis
aste
rFi
nanc
eM
obili
sefu
nd
Tost
reng
then
inst
itutio
nalc
apac
ityof re
sear
ch/e
xten
sion
ofD
OA
and
DYT
/GYT
ofD
zong
khag
adm
inis
trat
ions
Trai
nre
sear
cher
san
dex
tens
ion
staf
fthr
ough
sem
inar
s/w
orks
hops
oncl
imat
ech
ange
impa
cts
onth
eag
ricul
ture
sect
or.
Focu
str
aini
ngto
sele
cted
rese
arch
ers
and
Dzo
ngkh
agag
ricu
lture
staf
fon
shor
tco
urse
son
adap
tatio
nm
easu
res
inag
ricu
lture
Educ
ate
and
crea
teaw
aren
ess
onbu
ildin
gre
silie
nce
tocl
imat
ech
ange
for
the
loca
llea
ders
and
farm
ers
1.50
0D
oA/M
oAF
Nat
iona
l/R
egio
nal/
Loc
al
2012
–10
17D
isas
ter
Fina
nce
Mob
ilise
fund
Toin
crea
seac
cess
toim
prov
edge
netic
reso
urce
sre
sist
antt
oa
biot
ican
dbi
otic
stre
sses
.
Eval
uate
,scr
een,
dem
onst
rate
and
prom
ote
crop
and
fodd
ers
vari
etie
sre
sist
antt
odr
ough
tand
dise
ases
inre
sear
chce
ntre
s
2.50
0D
oA/D
oLRg
iona
l/Lo
cal
2012
–20
17Bi
odiv
ersi
tyTe
chno
logy
Gen
etic
mat
eria
ls
Exch
ange
ofte
chno
logy
Exch
ange
ofge
netic
mat
eria
ls
Chapter Four : Vulnerability and Adaptati on
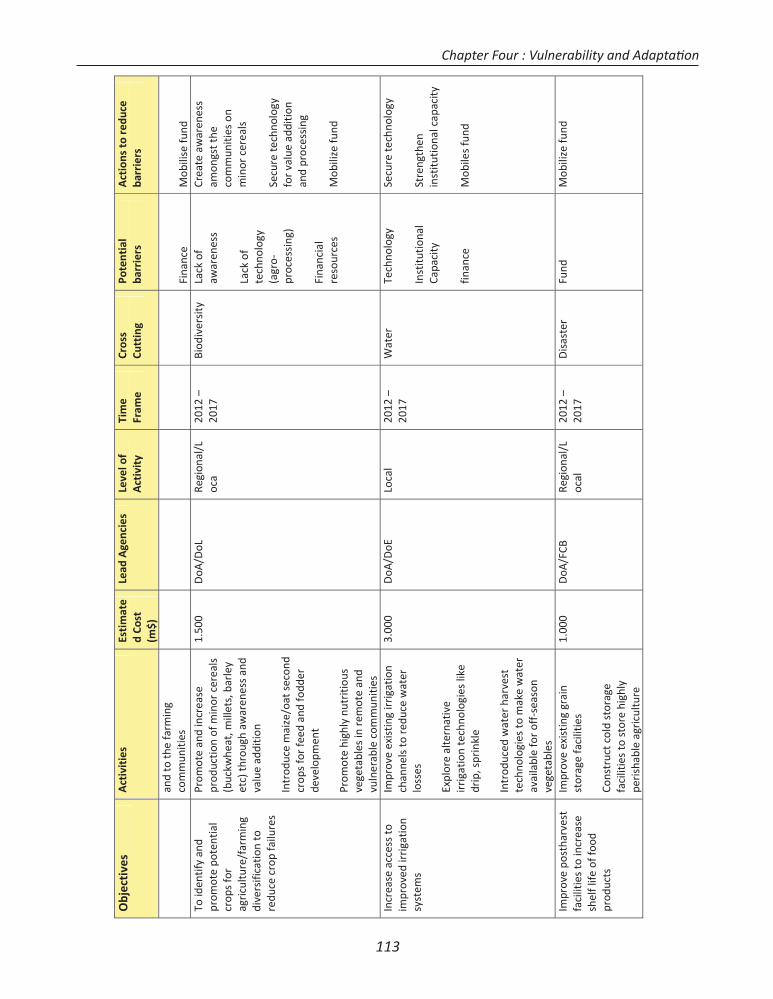
113
Obj
ecti
ves
Act
ivit
ies
Esti
mat
ed
Cost
(m$)
Lead
Age
ncie
sLe
velo
fA
ctiv
ity
Tim
eFr
ame
Cros
sCu
ttin
gPo
tent
ial
barr
iers
Act
ions
tore
duce
barr
iers
and
toth
efa
rmin
gco
mm
uniti
esFi
nanc
eM
obili
sefu
ndTo
iden
tify
and
prom
ote
pote
ntia
lcr
ops
for
agric
ultu
re/f
arm
ing
dive
rsifi
catio
nto
redu
cecr
opfa
ilure
s
Prom
ote
and
incr
ease
prod
uctio
nof
min
orce
real
s(b
uckw
heat
,mill
ets,
barl
eyet
c)th
roug
haw
aren
ess
and
valu
ead
ditio
n
Intr
oduc
em
aize
/oat
seco
ndcr
ops
for
feed
and
fodd
erde
velo
pmen
t
Prom
ote
high
lynu
triti
ous
vege
tabl
esin
rem
ote
and
vuln
erab
leco
mm
uniti
es
1.50
0D
oA/D
oLRe
gion
al/L
oca
2012
–20
17Bi
odiv
ersi
tyLa
ckof
awar
enes
s
Lack
ofte
chno
logy
(agr
opr
oces
sing
)
Fina
ncia
lre
sour
ces
Crea
teaw
aren
ess
amon
gstt
heco
mm
uniti
eson
min
orce
real
s
Secu
rete
chno
logy
for
valu
ead
ditio
nan
dpr
oces
sing
Mob
ilize
fund
Incr
ease
acce
ssto
impr
oved
irri
gatio
nsy
stem
s
Impr
ove
exis
ting
irrig
atio
nch
anne
lsto
redu
cew
ater
loss
es
Expl
ore
alte
rnat
ive
irrig
atio
nte
chno
logi
eslik
edr
ip,s
prin
kle
Intr
oduc
edw
ater
harv
est
tech
nolo
gies
tom
ake
wat
erav
aila
ble
for
off
seas
onve
geta
bles
3.00
0D
oA/D
oELo
cal
2012
–20
17W
ater
Tech
nolo
gy
Inst
itutio
nal
Capa
city
finan
ce
Secu
rete
chno
logy
Stre
ngth
enin
stitu
tiona
lcap
acity
Mob
iles
fund
Impr
ove
post
harv
est
faci
litie
sto
incr
ease
shel
flife
offo
odpr
oduc
ts
Impr
ove
exis
ting
grai
nst
orag
efa
cilit
ies
Cons
truc
tcol
dst
orag
efa
cilit
ies
tost
ore
high
lype
rish
able
agric
ultu
re
1.00
0D
oA/F
CBRe
gion
al/L
ocal
2012
–20
17D
isas
ter
Fund
Mob
ilize
fund
Chapter Four : Vulnerability and Adaptati on
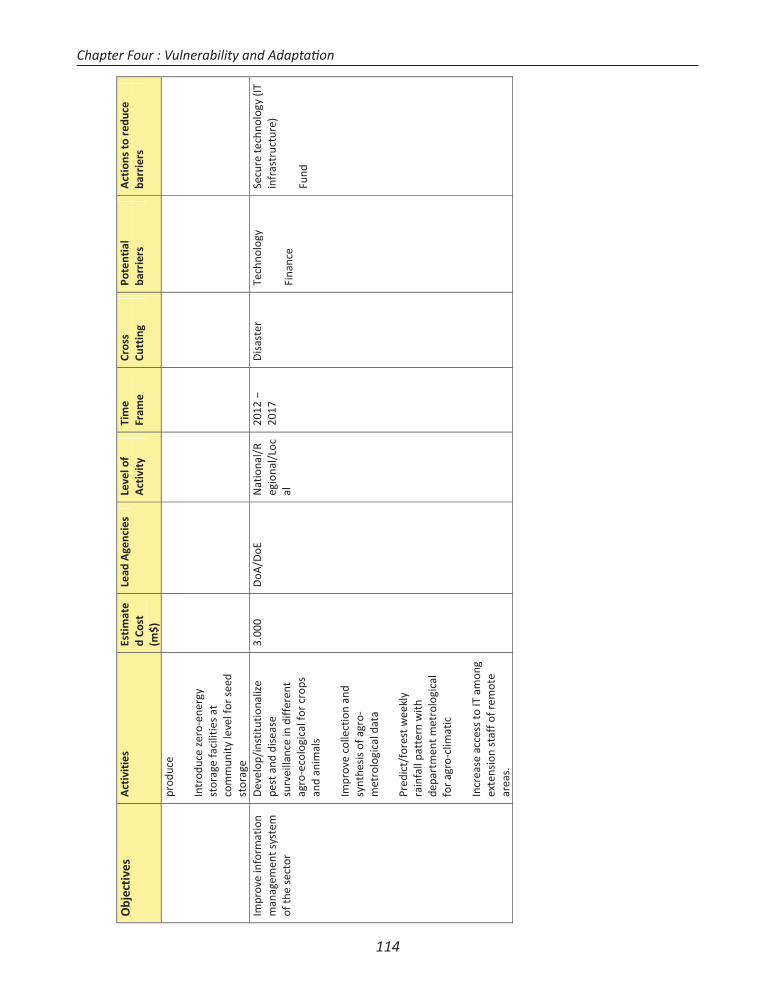
114
Obj
ecti
ves
Act
ivit
ies
Esti
mat
ed
Cost
(m$)
Lead
Age
ncie
sLe
velo
fA
ctiv
ity
Tim
eFr
ame
Cros
sCu
ttin
gPo
tent
ial
barr
iers
Act
ions
tore
duce
barr
iers
prod
uce
Intr
oduc
eze
roen
ergy
stor
age
faci
litie
sat
com
mun
ityle
velf
orse
edst
orag
eIm
prov
ein
form
atio
nm
anag
emen
tsys
tem
ofth
ese
ctor
Dev
elop
/ins
titut
iona
lize
pest
and
dise
ase
surv
eilla
nce
indi
ffer
ent
agro
ecol
ogic
alfo
rcr
ops
and
anim
als
Impr
ove
colle
ctio
nan
dsy
nthe
sis
ofag
rom
etro
logi
cald
ata
Pred
ict/
fore
stw
eekl
yra
infa
llpa
tter
nw
ithde
part
men
tmet
rolo
gica
lfo
rag
rocl
imat
ic
Incr
ease
acce
ssto
ITam
ong
exte
nsio
nst
affo
frem
ote
area
s.
3.00
0D
oA/D
oEN
atio
nal/
Reg
iona
l/Lo
cal
2012
–20
17D
isas
ter
Tech
nolo
gy
Fina
nce
Secu
rete
chno
logy
(ITin
fras
truc
ture
)
Fund
Chapter Four : Vulnerability and Adaptati on
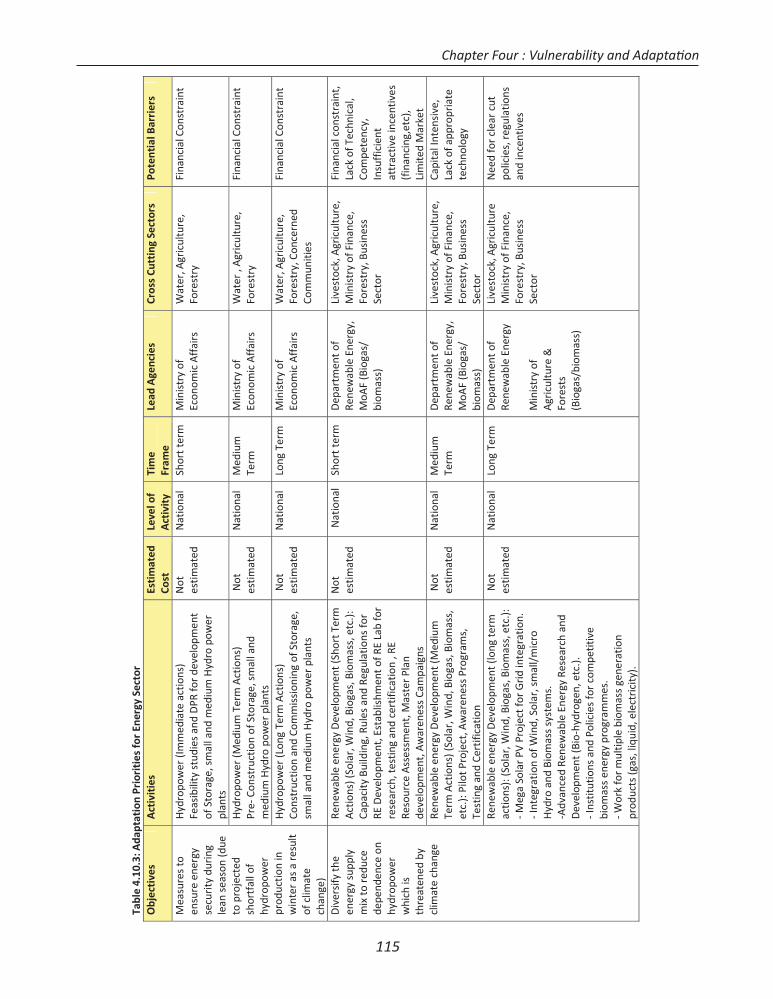
115
Tabl
e4.
10.3
:Ada
ptat
ion
Prio
riti
esfo
rEn
ergy
Sect
orO
bjec
tive
sA
ctiv
itie
sEs
tim
ated
Cost
Leve
lof
Act
ivit
yTi
me
Fram
eLe
adA
genc
ies
Cros
sCu
ttin
gSe
ctor
sPo
tent
ialB
arri
ers
Mea
sure
sto
ensu
reen
ergy
secu
rity
durin
gle
anse
ason
(due
topr
ojec
ted
shor
tfal
lof
hydr
opow
erpr
oduc
tion
inw
inte
ras
are
sult
ofcl
imat
ech
ange
)
Hyd
ropo
wer
(Imm
edia
teac
tions
)Fe
asib
ility
stud
ies
and
DPR
for
deve
lopm
ent
ofSt
orag
e,sm
alla
ndm
ediu
mH
ydro
pow
erpl
ants
Not
estim
ated
Nat
iona
lSh
ortt
erm
Min
istr
yof
Econ
omic
Aff
airs
Wat
er,A
gric
ultu
re,
Fore
stry
Fina
ncia
lCon
stra
int
Hyd
ropo
wer
(Med
ium
Term
Act
ions
)Pr
eCo
nstr
uctio
nof
Stor
age,
smal
land
med
ium
Hyd
ropo
wer
plan
ts
Not
estim
ated
Nat
iona
lM
ediu
mTe
rmM
inis
try
ofEc
onom
icA
ffai
rsW
ater
,Agr
icul
ture
,Fo
rest
ryFi
nanc
ialC
onst
rain
t
Hyd
ropo
wer
(Lon
gTe
rmA
ctio
ns)
Cons
truc
tion
and
Com
mis
sion
ing
ofSt
orag
e,sm
alla
ndm
ediu
mH
ydro
pow
erpl
ants
Not
estim
ated
Nat
iona
lLo
ngTe
rmM
inis
try
ofEc
onom
icA
ffai
rsW
ater
,Agr
icul
ture
,Fo
rest
ry,C
once
rned
Com
mun
ities
Fina
ncia
lCon
stra
int
Div
ersi
fyth
een
ergy
supp
lym
ixto
redu
cede
pend
ence
onhy
drop
ower
whi
chis
thre
aten
edby
clim
ate
chan
ge
Rene
wab
leen
ergy
Dev
elop
men
t(Sh
ortT
erm
Act
ions
)(So
lar,
Win
d,Bi
ogas
,Bio
mas
s,et
c.):
Capa
city
Build
ing,
Rule
san
dRe
gula
tions
for
RED
evel
opm
ent,
Esta
blis
hmen
tofR
ELa
bfo
rre
sear
ch,t
estin
gan
dce
rtifi
catio
n,R
ERe
sour
ceA
sses
smen
t,M
aste
rPla
nde
velo
pmen
t,A
war
enes
sCa
mpa
igns
Not
estim
ated
Nat
iona
lSh
ortt
erm
Dep
artm
ento
fRe
new
able
Ener
gy,
MoA
F(B
ioga
s/bi
omas
s)
Live
stoc
k,A
gric
ultu
re,
Min
istr
yof
Fina
nce,
Fore
stry
,Bus
ines
sSe
ctor
Fina
ncia
lcon
stra
int,
Lack
ofTe
chni
cal,
Com
pete
ncy,
Insu
ffic
ient
attr
activ
ein
cent
ives
(fin
anci
ng,e
tc),
Lim
ited
Mar
ket
Rene
wab
leen
ergy
Dev
elop
men
t(M
ediu
mTe
rmA
ctio
ns)(
Sola
r,W
ind,
Biog
as,B
iom
ass,
etc.
):Pi
lotP
roje
ct,A
war
enes
sPr
ogra
ms,
Test
ing
and
Cert
ifica
tion
Not
estim
ated
Nat
iona
lM
ediu
mTe
rmD
epar
tmen
tof
Rene
wab
leEn
ergy
,M
oAF
(Bio
gas/
biom
ass)
Live
stoc
k,A
gric
ultu
re,
Min
istr
yof
Fina
nce,
Fore
stry
,Bus
ines
sSe
ctor
Capi
talI
nten
sive
,La
ckof
appr
opria
tete
chno
logy
Rene
wab
leen
ergy
Dev
elop
men
t(lo
ngte
rmac
tions
):(S
olar
,Win
d,Bi
ogas
,Bio
mas
s,et
c.):
Meg
aSo
lar
PVPr
ojec
tfor
Grid
inte
grat
ion.
Inte
grat
ion
ofW
ind,
Sola
r,sm
all/
mic
roH
ydro
and
Biom
ass
syst
ems.
Adv
ance
dRe
new
able
Ener
gyRe
sear
chan
dD
evel
opm
ent(
Bio
hydr
ogen
,etc
.).In
stitu
tions
and
Polic
ies
for
com
petit
ive
biom
ass
ener
gypr
ogra
mm
es.
Wor
kfo
rm
ultip
lebi
omas
sge
nera
tion
prod
uct s
(gas
,liq
uid,
elec
tric
ity).
Not
estim
ated
Nat
iona
lLo
ngTe
rmD
epar
tmen
tof
Rene
wab
leEn
ergy
Min
istr
yof
Agr
icul
ture
&Fo
rest
s(B
ioga
s/bi
omas
s)
Live
stoc
k,A
gric
ultu
reM
inis
try
ofFi
nanc
e,Fo
rest
ry,B
usin
ess
Sect
or
Nee
dfo
rcl
ear
cut
polic
ies,
regu
latio
nsan
din
cent
ives
Chapter Four : Vulnerability and Adaptati on
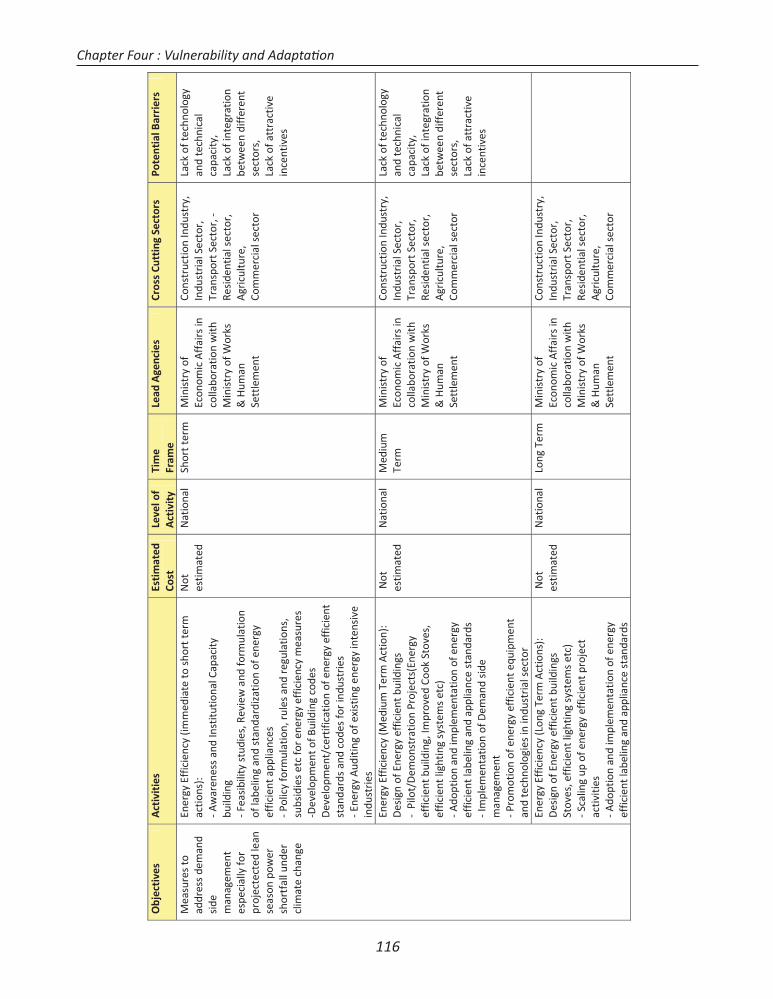
116
Obj
ecti
ves
Act
ivit
ies
Esti
mat
edCo
stLe
velo
fA
ctiv
ity
Tim
eFr
ame
Lead
Age
ncie
sCr
oss
Cutt
ing
Sect
ors
Pote
ntia
lBar
rier
s
Mea
sure
sto
addr
ess
dem
and
side
man
agem
ent
espe
cial
lyfo
rpr
ojec
tect
edle
anse
ason
pow
ersh
ortf
allu
nder
clim
ate
chan
ge
Ener
gyEf
ficie
ncy
(imm
edia
teto
shor
tter
mac
tions
):A
war
enes
san
dIn
stitu
tiona
lCap
acity
build
ing
Feas
ibili
tyst
udie
s,Re
view
and
form
ulat
ion
ofla
belin
gan
dst
anda
rdiz
atio
nof
ener
gyef
ficie
ntap
plia
nces
Polic
yfo
rmul
atio
n,ru
les
and
regu
latio
ns,
subs
idie
set
cfo
ren
ergy
effic
ienc
ym
easu
res
Dev
elo p
men
tofB
uild
ing
code
sD
evel
opm
ent/
cert
ifica
tion
ofen
ergy
effic
ient
stan
dard
san
dco
des
for
indu
stri
esEn
ergy
Aud
iting
ofex
istin
gen
ergy
inte
nsiv
ein
dust
ries
Not
estim
ated
Nat
iona
lSh
ortt
erm
Min
istr
yof
Econ
omic
Aff
airs
inco
llabo
ratio
nw
ithM
inis
try
ofW
orks
&H
uman
Sett
lem
ent
Cons
truc
tion
Indu
stry
,In
dust
rialS
ecto
r,Tr
ansp
ortS
ecto
r,Re
side
ntia
lsec
tor,
Agr
icul
ture
,Co
mm
erci
alse
ctor
Lack
ofte
chno
logy
and
tech
nica
lca
paci
ty,
Lack
ofin
tegr
atio
nbe
twee
ndi
ffer
ent
sect
ors,
Lack
ofat
trac
tive
ince
ntiv
es
Ener
gyEf
ficie
ncy
(Med
ium
Term
Act
ion)
:D
esig
nof
Ener
gyef
ficie
ntbu
ildin
gsPi
lot/
Dem
onst
ratio
nPr
ojec
ts(E
nerg
yef
ficie
ntbu
ildin
g,Im
prov
edCo
okSt
oves
,ef
ficie
ntlig
htin
gsy
stem
set
c)A
dopt
ion
and
impl
emen
tatio
nof
ener
gyef
ficie
ntla
belin
gan
dap
plia
nce
stan
dard
sIm
plem
enta
tion
ofD
eman
dsi
dem
anag
emen
tPr
omot
ion
ofen
ergy
effic
ient
equi
pmen
tan
dte
chno
logi
esin
indu
stri
alse
ctor
Not
estim
ated
Nat
iona
lM
ediu
mTe
rmM
inis
try
ofEc
onom
icA
ffai
rsin
colla
bora
tion
with
Min
istr
yof
Wor
ks&
Hum
anSe
ttle
men
t
Cons
truc
tion
Indu
stry
,In
dust
rialS
ecto
r,Tr
ansp
ortS
ecto
r,Re
side
ntia
lsec
tor,
Agr
icul
ture
,Co
mm
erci
alse
ctor
Lack
ofte
chno
logy
and
tech
nica
lca
paci
ty,
Lack
ofin
tegr
atio
nbe
twee
ndi
ffer
ent
sect
ors,
Lack
ofat
trac
tive
ince
ntiv
es
Ener
gyEf
ficie
ncy
(Lon
gTe
rmA
ctio
ns):
Des
ign
ofEn
ergy
effic
ient
build
ings
Stov
es,e
ffic
ient
light
ing
syst
ems
etc)
Scal
ing
upof
ener
gyef
ficie
ntpr
ojec
tac
tiviti
esA
dopt
ion
and
impl
emen
tatio
nof
ener
gyef
ficie
ntla
belin
gan
dap
plia
nce
stan
dard
s
Not
estim
ated
Nat
iona
lLo
ngTe
rmM
inis
try
ofEc
onom
icA
ffai
rsin
colla
bora
tion
with
Min
istr
yof
Wor
ks&
Hum
anSe
ttle
men
t
Cons
truc
tion
Indu
stry
,In
dust
rialS
ecto
r,Tr
ansp
ortS
ecto
r,Re
side
ntia
lsec
tor,
Agr
icul
ture
,Co
mm
erci
alse
ctor
Chapter Four : Vulnerability and Adaptati on
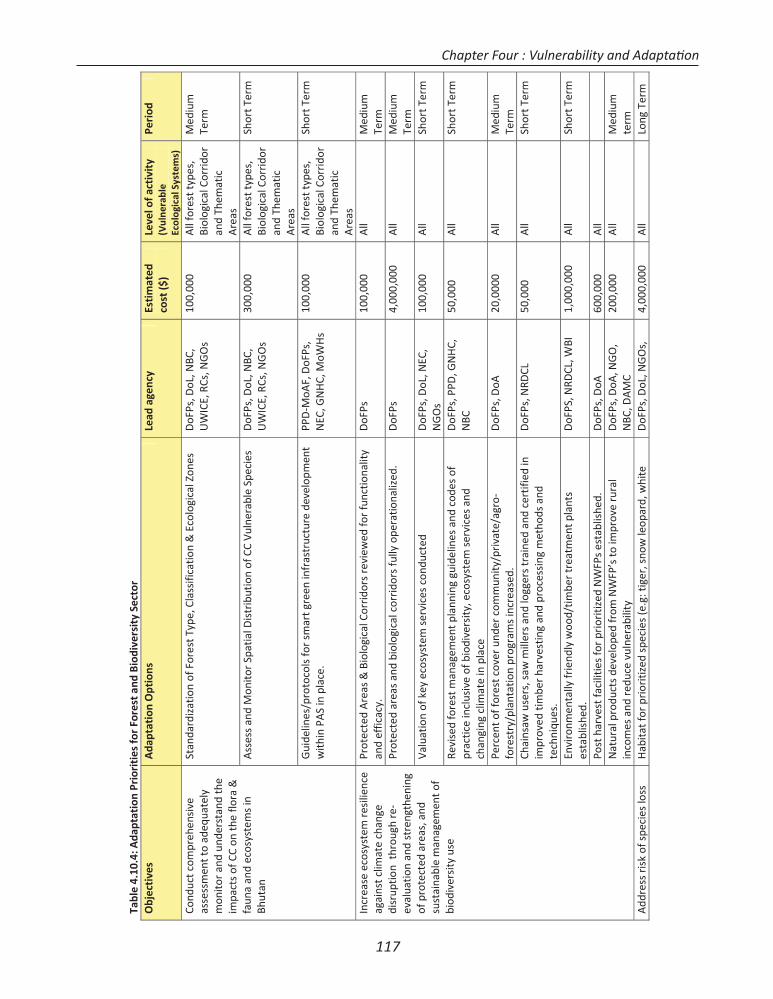
117
Tabl
e4.
10.4
:Ada
ptat
ion
Prio
riti
esfo
rFo
rest
and
Biod
iver
sity
Sect
orO
bjec
tive
sA
dapt
atio
nO
ptio
nsLe
adag
ency
Esti
mat
edco
st($
)Le
velo
fact
ivit
y(V
ulne
rabl
eEc
olog
ical
Syst
ems)
Peri
od
Cond
uctc
ompr
ehen
sive
asse
ssm
entt
oad
equa
tely
mon
itor
and
unde
rsta
ndth
eim
pact
sof
CCon
the
flora
&fa
una
and
ecos
yste
ms
inBh
utan
Stan
dard
izat
ion
ofFo
rest
Type
,Cla
ssifi
catio
n&
Ecol
ogic
alZo
nes
DoF
Ps,D
oL,N
BC,
UW
ICE,
RCs,
NG
Os
100,
000
All
fore
stty
pes,
Biol
ogic
alCo
rrid
oran
dTh
emat
icA
reas
Med
ium
Term
Ass
ess
and
Mon
itor
Spat
ialD
istr
ibut
ion
ofCC
Vuln
erab
leSp
ecie
sD
oFPs
,DoL
,NBC
,U
WIC
E,RC
s,N
GO
s30
0,00
0A
llfo
rest
type
s,Bi
olog
ical
Corr
idor
and
Them
atic
Are
as
Shor
tTer
m
Gui
delin
es/p
roto
cols
for
smar
tgre
enin
fras
truc
ture
deve
lopm
ent
with
inPA
Sin
plac
e.PP
DM
oAF,
DoF
Ps,
NEC
,GN
HC,
MoW
Hs
100,
000
All
fore
stty
pes,
Biol
ogic
alCo
rrid
oran
dTh
emat
icA
reas
Shor
tTer
m
Incr
ease
ecos
yste
mre
silie
nce
agai
nstc
limat
ech
ange
disr
uptio
nth
roug
hre
eval
uatio
nan
dst
reng
then
ing
ofpr
otec
ted
area
s,an
dsu
stai
nabl
em
anag
emen
tof
biod
iver
sity
use
Prot
ecte
dA
reas
&Bi
olog
ical
Corr
idor
sre
view
edfo
rfu
nctio
nalit
yan
def
ficac
y.D
oFPs
100,
000
All
Med
ium
Term
Prot
ecte
dar
eas
and
biol
ogic
alco
rrid
ors
fully
oper
atio
naliz
ed.
DoF
Ps4,
000,
000
All
Med
ium
Term
Valu
atio
nof
key
ecos
yste
mse
rvic
esco
nduc
ted
DoF
Ps,D
oL,N
EC,
NG
Os
100,
000
All
Shor
tTer
m
Revi
sed
fore
stm
anag
emen
tpla
nnin
ggu
idel
ines
and
code
sof
prac
tice
incl
usiv
eof
biod
iver
sity
,eco
syst
emse
rvic
esan
dch
angi
ngcl
imat
ein
plac
e
DoF
Ps,P
PD,G
NH
C,N
BC50
,000
All
Shor
tTer
m
Perc
ento
ffor
estc
over
unde
rco
mm
unity
/pri
vate
/agr
ofo
rest
ry/p
lant
atio
npr
ogra
ms
incr
ease
d.D
oFPs
,DoA
20,0
000
All
Med
ium
Term
Chai
nsaw
user
s,sa
wm
iller
san
dlo
gger
str
aine
dan
dce
rtifi
edin
impr
oved
timbe
rha
rves
ting
and
proc
essi
ngm
etho
dsan
dte
chni
ques
.
DoF
Ps,N
RDCL
50,0
00A
llSh
ortT
erm
Envi
ronm
enta
llyfr
iend
lyw
ood/
timbe
rtr
eatm
entp
lant
ses
tabl
ishe
d.D
oFPS
,NRD
CL,W
BI1,
000,
000
All
Shor
tTer
m
Post
harv
estf
acili
ties
for
prio
ritiz
edN
WFP
ses
tabl
ishe
d.D
oFPs
,DoA
600,
000
All
Nat
ural
prod
ucts
deve
lope
dfr
omN
WFP
’sto
impr
ove
rura
lin
com
esan
dre
duce
vuln
erab
ility
DoF
Ps,D
oA,N
GO
,N
BC,D
AM
C20
0,00
0A
llM
ediu
mte
rmA
ddre
ssris
kof
spec
ies
loss
Hab
itatf
orpr
iori
tized
spec
ies
(e.g
:tig
er,s
now
leop
ard,
whi
teD
oFPs
,DoL
,NG
Os,
4,00
0,00
0A
llLo
ngTe
rm
Chapter Four : Vulnerability and Adaptati on
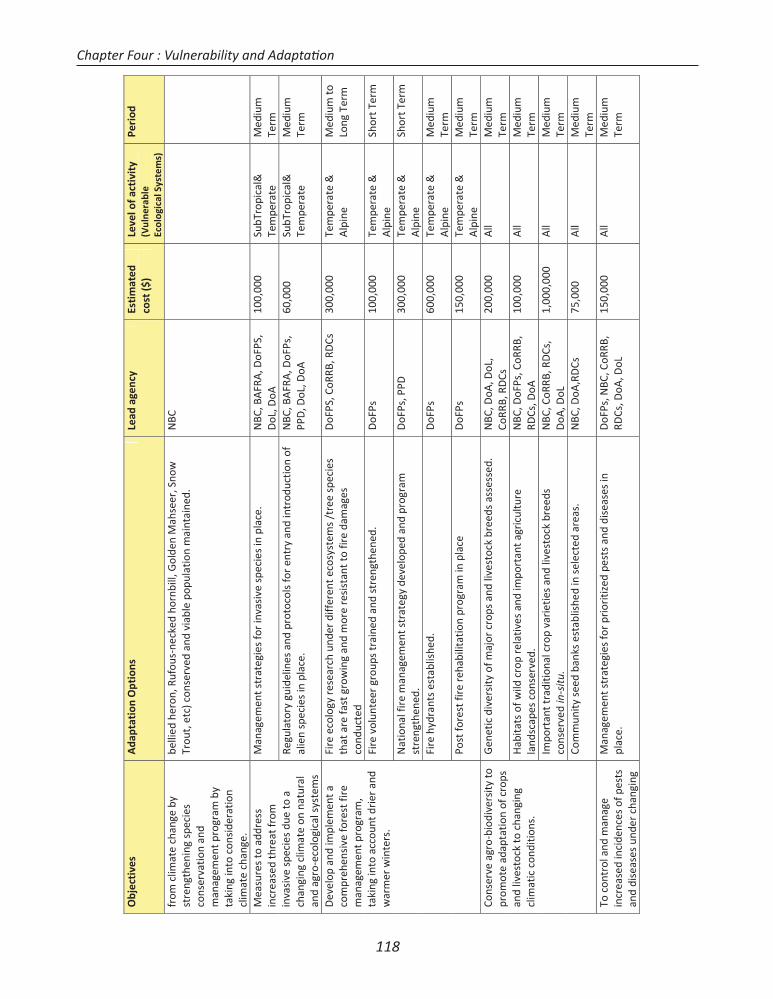
118
Obj
ecti
ves
Ada
ptat
ion
Opt
ions
Lead
agen
cyEs
tim
ated
cost
($)
Leve
lofa
ctiv
ity
(Vul
nera
ble
Ecol
ogic
alSy
stem
s)
Peri
od
from
clim
ate
chan
geby
stre
ngth
enin
gsp
ecie
sco
nser
vatio
nan
dm
anag
emen
tpro
gram
byta
king
into
cons
ider
atio
ncl
imat
ech
ange
.
belli
edhe
ron,
Rufo
usne
cked
horn
bill,
Gol
den
Mah
seer
,Sno
wTr
out,
etc)
cons
erve
dan
dvi
able
popu
latio
nm
aint
aine
d.N
BC
Mea
sure
sto
addr
ess
incr
ease
dth
reat
from
inva
sive
spec
ies
due
toa
chan
ging
clim
ate
onna
tura
lan
dag
roec
olog
ical
syst
ems
Man
agem
ents
trat
egie
sfo
rin
vasi
vesp
ecie
sin
plac
e.N
BC,B
AFR
A,D
oFPS
,D
oL,D
oA10
0,00
0Su
bTro
pica
l&Te
mpe
rate
Med
ium
Term
Regu
lato
rygu
idel
ines
and
prot
ocol
sfo
ren
try
and
intr
oduc
tion
ofal
ien
spec
ies
inpl
ace.
NBC
,BA
FRA
,DoF
Ps,
PPD
,DoL
,DoA
60,0
00Su
bTro
pica
l&Te
mpe
rate
Med
ium
Term
Dev
elop
and
impl
emen
taco
mpr
ehen
sive
fore
stfir
em
anag
emen
tpro
gram
,ta
king
into
acco
untd
rier
and
war
mer
win
ters
.
Fire
ecol
ogy
rese
arch
unde
rdi
ffer
ente
cosy
stem
s/t
ree
spec
ies
that
are
fast
grow
ing
and
mor
ere
sist
antt
ofir
eda
mag
esco
nduc
ted
DoF
PS,C
oRRB
,RD
Cs30
0,00
0Te
mpe
rate
&A
lpin
eM
ediu
mto
Long
Term
Fire
volu
ntee
rgr
oups
trai
ned
and
stre
ngth
ened
.D
oFPs
100,
000
Tem
pera
te&
Alp
ine
Shor
tTer
m
Nat
iona
lfir
em
anag
emen
tstr
ateg
yde
velo
ped
and
prog
ram
stre
ngth
ened
.D
oFPs
,PPD
300,
000
Tem
pera
te&
Alp
ine
Shor
tTer
m
Fire
hydr
ants
esta
blis
hed.
DoF
Ps60
0,00
0Te
mpe
rate
&A
lpin
eM
ediu
mTe
rmPo
stfo
rest
fire
reha
bilit
atio
npr
ogra
min
plac
eD
oFPs
150,
000
Tem
pera
te&
Alp
ine
Med
ium
Term
Cons
erve
agro
biod
iver
sity
topr
omot
ead
apta
tion
ofcr
ops
and
lives
tock
toch
angi
ngcl
imat
icco
nditi
ons.
Gen
etic
dive
rsity
ofm
ajor
crop
san
dliv
esto
ckbr
eeds
asse
ssed
.N
BC,D
oA,D
oL,
CoRR
B,RD
Cs20
0,00
0A
llM
ediu
mTe
rmH
abita
tsof
wild
crop
rela
tives
and
impo
rtan
tagr
icul
ture
land
scap
esco
nser
ved.
NBC
,DoF
Ps,C
oRRB
,RD
Cs,D
oA10
0,00
0A
llM
ediu
mTe
rmIm
port
antt
radi
tiona
lcro
pva
rietie
san
dliv
esto
ckbr
eeds
cons
erve
din
situ
.N
BC,C
oRRB
,RD
Cs,
DoA
,DoL
1,00
0,00
0A
llM
ediu
mTe
rmCo
mm
unity
seed
bank
ses
tabl
ishe
din
sele
cted
area
s.N
BC,D
oA,R
DCs
75,0
00A
llM
ediu
mTe
rmTo
cont
rola
ndm
anag
ein
crea
sed
inci
denc
esof
pest
san
ddi
seas
esun
der
chan
ging
Man
agem
ents
trat
egie
sfo
rpr
iorit
ized
pest
san
ddi
seas
esin
plac
e.D
oFPs
,NBC
,CoR
RB,
RDCs
,DoA
,DoL
150,
000
All
Med
ium
Term
Chapter Four : Vulnerability and Adaptati on
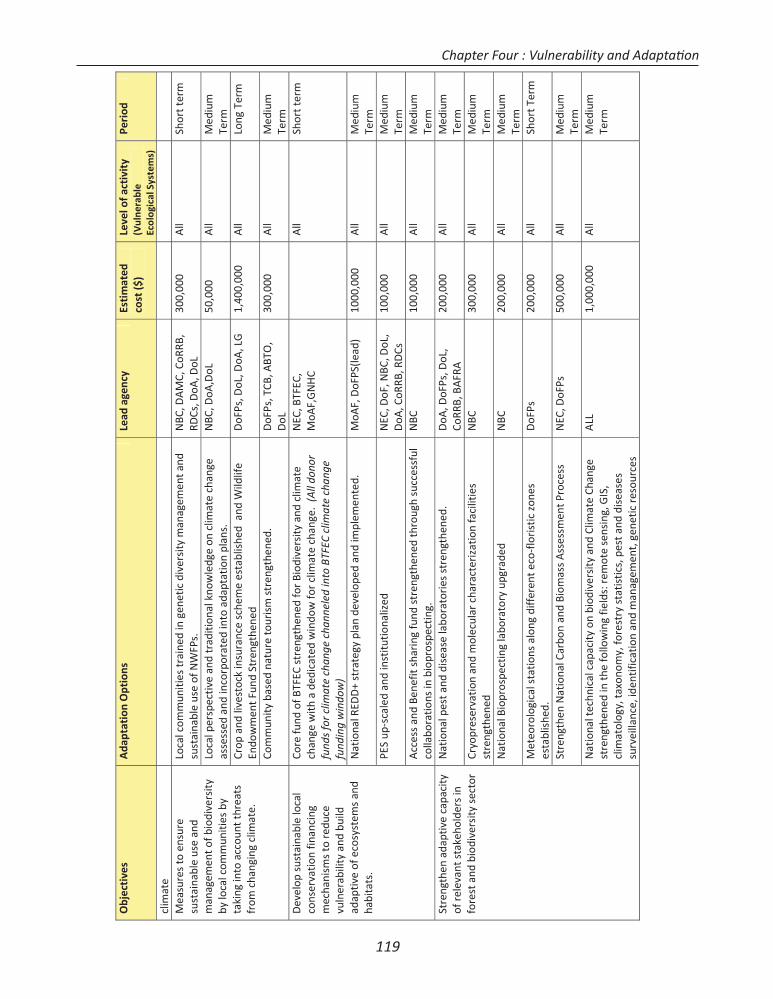
119
128
Obj
ecti
ves
Ada
ptat
ion
Opt
ions
Lead
agen
cyEs
tim
ated
cost
($)
Leve
lofa
ctiv
ity
(Vul
nera
ble
Ecol
ogic
alSy
stem
s)
Peri
od
clim
ate
Mea
sure
sto
ensu
resu
stai
nabl
eus
ean
dm
anag
emen
tofb
iodi
vers
ityby
loca
lcom
mun
ities
byta
king
into
acco
untt
hrea
tsfr
omch
angi
ngcl
imat
e.
Loca
lcom
mun
ities
trai
ned
inge
netic
dive
rsity
man
agem
enta
ndsu
stai
nabl
eus
eof
NW
FPs.
NBC
,DA
MC,
CoRR
B,RD
Cs,D
oA,D
oL30
0,00
0A
llSh
ortt
erm
Loca
lper
spec
tive
and
trad
ition
alkn
owle
dge
oncl
imat
ech
ange
asse
ssed
and
inco
rpor
ated
into
adap
tatio
npl
ans.
NBC
,DoA
,DoL
50,0
00A
llM
ediu
mTe
rmCr
opan
dliv
esto
ckin
sura
nce
sche
me
esta
blis
hed
and
Wild
life
Endo
wm
entF
und
Stre
ngth
ened
DoF
Ps,D
oL,D
oA,L
G1,
400,
000
All
Long
Term
Com
mun
ityba
sed
natu
reto
uris
mst
reng
then
ed.
DoF
Ps,T
CB,A
BTO
,D
oL30
0,00
0A
llM
ediu
mTe
rmD
evel
opsu
stai
nabl
elo
cal
cons
erva
tion
finan
cing
mec
hani
sms
tore
duce
vuln
erab
ility
and
build
adap
tive
ofec
osys
tem
san
dha
bita
ts.
Core
fund
ofBT
FEC
stre
ngth
ened
for
Biod
iver
sity
and
clim
ate
chan
gew
itha
dedi
cate
dw
indo
wfo
rcl
imat
ech
ange
.(A
lldo
nor
fund
sfo
rclim
ate
chan
gech
anne
led
into
BTFE
Ccl
imat
ech
ange
fund
ing
win
dow
)
NEC
,BTF
EC,
MoA
F,G
NH
CA
llSh
ortt
erm
Nat
iona
lRED
D+
stra
tegy
plan
deve
lope
dan
dim
plem
ente
d.M
oAF,
DoF
PS(le
ad)
1000
,000
All
Med
ium
Term
PES
upsc
aled
and
inst
itutio
naliz
edN
EC,D
oF,N
BC,D
oL,
DoA
,CoR
RB,R
DCs
100,
000
All
Med
ium
Term
Acc
ess
and
Bene
fitsh
arin
gfu
ndst
reng
then
edth
roug
hsu
cces
sful
colla
bora
tions
inbi
opro
spec
ting.
NBC
100,
000
All
Med
ium
Term
Stre
ngth
enad
aptiv
eca
paci
tyof
rele
vant
stak
ehol
ders
info
rest
and
biod
iver
sity
sect
or
Nat
iona
lpes
tand
dise
ase
labo
rato
ries
stre
ngth
ened
.D
oA,D
oFPs
,DoL
,Co
RRB,
BAFR
A20
0,00
0A
llM
ediu
mTe
rmCr
yopr
eser
vatio
nan
dm
olec
ular
char
acte
riza
tion
faci
litie
sst
reng
then
edN
BC30
0,00
0A
llM
ediu
mTe
rmN
atio
nalB
iopr
ospe
ctin
gla
bora
tory
upgr
aded
NBC
200,
000
All
Med
ium
Term
Met
eoro
logi
cals
tatio
nsal
ong
diff
eren
teco
floris
ticzo
nes
esta
blis
hed.
DoF
Ps20
0,00
0A
llSh
ortT
erm
Stre
ngth
enN
atio
nalC
arbo
nan
dBi
omas
sA
sses
smen
tPro
cess
NEC
,DoF
Ps50
0,00
0A
llM
ediu
mTe
rmN
atio
nalt
echn
ical
capa
city
onbi
odiv
ersi
tyan
dCl
imat
eCh
ange
stre
ngth
ened
inth
efo
llow
ing
field
s:re
mot
ese
nsin
g,G
IS,
clim
atol
ogy,
taxo
nom
y,fo
rest
ryst
atis
tics,
pest
and
dise
ases
surv
eilla
nce,
iden
tific
atio
nan
dm
anag
emen
t,ge
netic
reso
urce
s
ALL
1,00
0,00
0A
llM
ediu
mTe
rm
Chapter Four : Vulnerability and Adaptati on
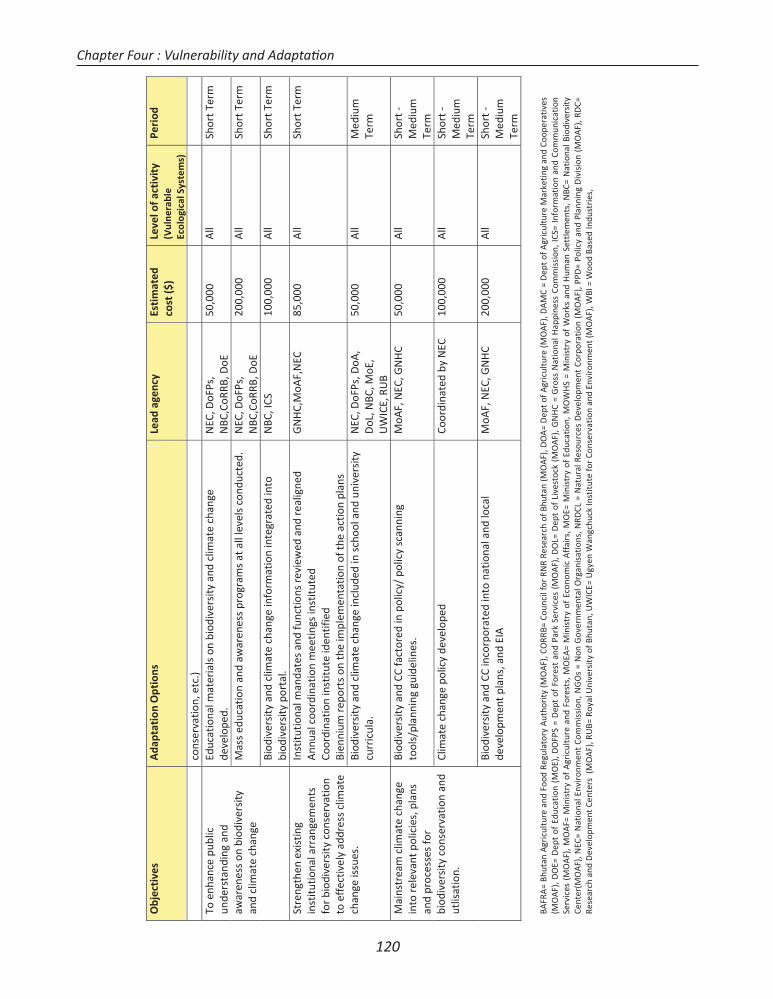
120
Obj
ecti
ves
Ada
ptat
ion
Opt
ions
Lead
agen
cyEs
tim
ated
cost
($)
Leve
lofa
ctiv
ity
(Vul
nera
ble
Ecol
ogic
alSy
stem
s)
Peri
od
cons
erva
tion,
etc.
)To
enha
nce
publ
icun
ders
tand
ing
and
awar
enes
son
biod
iver
sity
and
clim
ate
chan
ge
Educ
atio
nalm
ater
ials
onbi
odiv
ersi
tyan
dcl
imat
ech
ange
deve
lope
d.N
EC,D
oFPs
,N
BC,C
oRRB
,DoE
50,0
00A
llSh
ortT
erm
Mas
sed
ucat
ion
and
awar
enes
spr
ogra
ms
atal
llev
els
cond
ucte
d.N
EC,D
oFPs
,N
BC,C
oRRB
,DoE
200,
000
All
Shor
tTer
m
Biod
iver
sity
and
clim
ate
chan
gein
form
atio
nin
tegr
ated
into
biod
iver
sity
port
al.
NBC
,ICS
100,
000
All
Shor
tTer
m
Stre
ngth
enex
istin
gin
stitu
tiona
larr
ange
men
tsfo
rbi
odiv
ersi
tyco
nser
vatio
nto
effe
ctiv
ely
addr
ess
clim
ate
chan
geis
sues
.
Inst
itutio
nalm
anda
tes
and
func
tions
revi
ewed
and
real
igne
dA
nnua
lcoo
rdin
atio
nm
eetin
gsin
stitu
ted
Coor
dina
tion
inst
itute
iden
tifie
dBi
enni
umre
port
son
the
impl
emen
tatio
nof
the
actio
npl
ans
GN
HC,
MoA
F,N
EC85
,000
All
Shor
tTer
m
Biod
iver
sity
and
clim
ate
chan
gein
clud
edin
scho
olan
dun
iver
sity
curr
icul
a.N
EC,D
oFPs
,DoA
,D
oL,N
BC,M
oE,
UW
ICE,
RUB
50,0
00A
llM
ediu
mTe
rm
Mai
nstr
eam
clim
ate
chan
gein
tore
leva
ntpo
licie
s,pl
ans
and
proc
esse
sfo
rbi
odiv
ersi
tyco
nser
vatio
nan
dut
lisat
ion.
Biod
iver
sity
and
CCfa
ctor
edin
polic
y/po
licy
scan
ning
tool
s/pl
anni
nggu
idel
ines
.M
oAF,
NEC
,GN
HC
50,0
00A
llSh
ort
Med
ium
Term
Clim
ate
chan
gepo
licy
deve
lope
dCo
ordi
nate
dby
NEC
100,
000
All
Shor
tM
ediu
mTe
rmBi
odiv
ersi
tyan
dCC
inco
rpor
ated
into
natio
nala
ndlo
cal
deve
lopm
entp
lans
,and
EIA
MoA
F,N
EC,G
NH
C20
0,00
0A
llSh
ort
Med
ium
Term
BAFR
A=
Bhut
anA
gric
ultu
rean
dFo
odRe
gula
tory
Aut
hori
ty(M
OA
F),C
ORR
B=Co
unci
lfor
RNR
Rese
arch
ofBh
utan
(MO
AF)
,DO
A=
Dep
tof
Agr
icul
ture
(MO
AF)
,DA
MC
=D
ept
ofA
gric
ultu
reM
arke
ting
and
Coop
erat
ives
(MO
AF)
,DO
E=D
ept
ofEd
ucat
ion
(MO
E),D
OFP
S=
Dep
tof
Fore
stan
dPa
rkSe
rvic
es(M
OA
F),D
OL=
Dep
tof
Live
stoc
k(M
OA
F),G
NH
C=
Gro
ssN
atio
nalH
appi
ness
Com
mis
sion
,ICS
=In
form
atio
nan
dCo
mm
unic
atio
nSe
rvic
es(M
OA
F),M
OA
F=M
inis
try
ofA
gric
ultu
rean
dFo
rest
s,M
OEA
=M
inis
try
ofEc
onom
icA
ffai
rs,M
OE=
Min
istr
yof
Educ
atio
n,M
OW
HS
=M
inis
try
ofW
orks
and
Hum
anSe
ttle
men
ts,N
BC=
Nat
iona
lBio
dive
rsity
Cent
er(M
OA
F),N
EC=
Nat
iona
lEnv
iron
men
tCo
mm
issi
on,N
GO
s=
Non
Gov
ernm
enta
lOrg
anis
atio
ns,N
RDCL
=N
atur
alRe
sour
ces
Dev
elop
men
tCo
rpor
atio
n(M
OA
F),P
PD=
Polic
yan
dPl
anni
ngD
ivis
ion
(MO
AF)
,RD
C=Re
sear
chan
dD
evel
opm
entC
ente
rs(M
OA
F),R
UB=
Roya
lUni
vers
ityof
Bhut
an,U
WIC
E=U
gyen
Wan
gchu
ckIn
stitu
tefo
rCo
nser
vati
onan
dEn
viro
nmen
t(M
OA
F),W
BI=
Woo
dBa
sed
Indu
stri
es,
Chapter Four : Vulnerability and Adaptati on
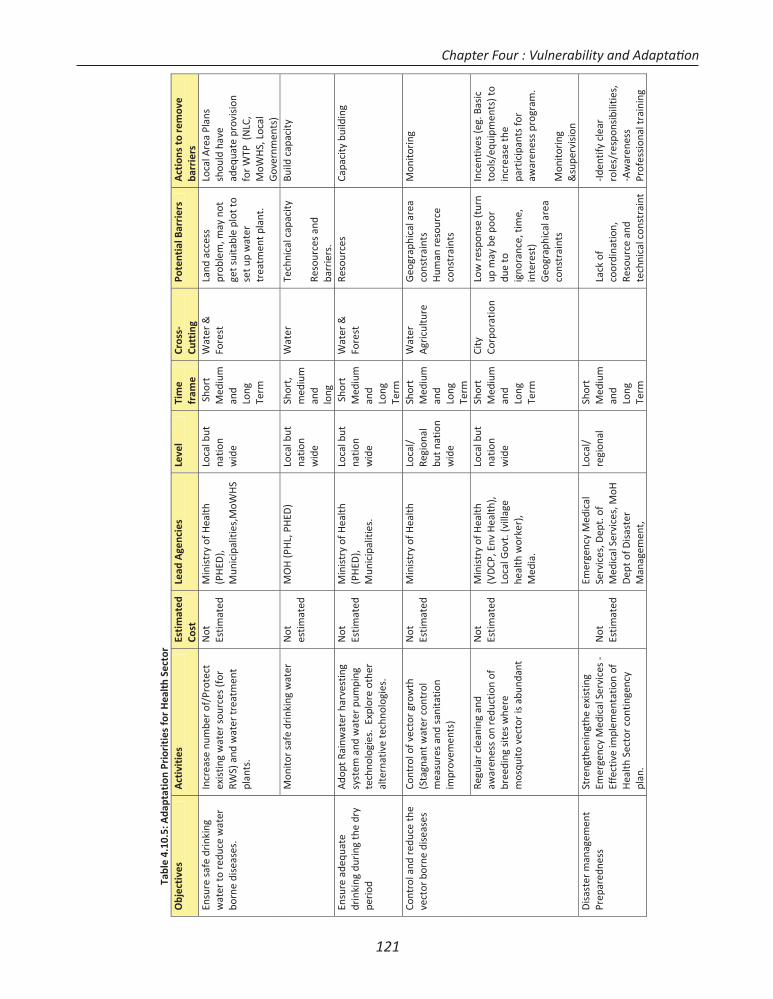
121
Tabl
e4.
10.5
:Ada
ptat
ion
Prio
riti
esfo
rH
ealt
hSe
ctor
Obj
ecti
ves
Act
ivit
ies
Esti
mat
edCo
stLe
adA
genc
ies
Leve
lTi
me
fram
eCr
oss
Cutt
ing
Pote
ntia
lBar
rier
sA
ctio
nsto
rem
ove
barr
iers
Ensu
resa
fedr
inki
ngw
ater
tore
duce
wat
erbo
rne
dise
ases
.
Incr
ease
num
ber
of/P
rote
ctex
istin
gw
ater
sour
ces
(for
RWS)
and
wat
ertr
eatm
ent
plan
ts.
Not
Estim
ated
Min
istr
yof
Hea
lth(P
HED
),M
unic
ipal
ities
,MoW
HS
Loca
lbut
natio
nw
ide
Shor
tM
ediu
man
dLo
ngTe
rm
Wat
er&
Fore
stLa
ndac
cess
prob
lem
,may
not
gets
uita
ble
plot
tose
tup
wat
ertr
eatm
entp
lant
.
Loca
lAre
aPl
ans
shou
ldha
vead
equa
tepr
ovis
ion
for
WTP
(NLC
,M
oWH
S,Lo
cal
Gov
ernm
ents
)M
onito
rsa
fedr
inki
ngw
ater
Not
estim
ated
MO
H(P
HL,
PHED
)Lo
calb
utna
tion
wid
e
Shor
t,m
ediu
man
dlo
ng
Wat
erTe
chni
calc
apac
ity
Reso
urce
san
dba
rrie
rs.
Build
capa
city
Ensu
read
equa
tedr
inki
ngdu
ring
the
dry
peri
od
Ado
ptRa
inw
ater
harv
estin
gsy
stem
and
wat
erpu
mpi
ngte
chno
logi
es.
Expl
ore
othe
ral
tern
ativ
ete
chno
logi
es.
Not
Estim
ated
Min
istr
yof
Hea
lth(P
HED
),M
unic
ipal
ities
.
Loca
lbut
natio
nw
ide
Shor
tM
ediu
man
dLo
ngTe
rm
Wat
er&
Fore
stRe
sour
ces
Capa
city
build
ing
Cont
rola
ndre
duce
the
vect
orbo
rne
dise
ases
Cont
rolo
fvec
torg
row
th(S
tagn
antw
ater
cont
rol
mea
sure
san
dsa
nita
tion
impr
ovem
ents
)
Not
Estim
ated
Min
istr
yof
Hea
lthLo
cal/
Regi
onal
butn
atio
nw
ide
Shor
tM
ediu
man
dLo
ngTe
rm
Wat
erA
gric
ultu
reG
eogr
aphi
cala
rea
cons
trai
nts
Hum
anre
sour
ceco
nstr
aint
s
Mon
itori
ng
Regu
larc
lean
ing
and
awar
enes
son
redu
ctio
nof
bree
ding
site
sw
here
mos
quito
vect
oris
abun
dant
Not
Estim
ated
Min
istr
yof
Hea
lth(V
DCP
,Env
Hea
lth),
Loca
lGov
t.(v
illag
ehe
alth
wor
ker)
,M
edia
.
Loca
lbut
natio
nw
ide
Shor
tM
ediu
man
dLo
ngTe
rm
City
Corp
orat
ion
Low
resp
onse
(tur
nup
may
bepo
ordu
eto
igno
ranc
e,tim
e,in
tere
st)
Geo
grap
hica
lare
aco
nstr
aint
s
Ince
ntiv
es(e
g.Ba
sic
tool
s/eq
uipm
ents
)to
incr
ease
the
part
icip
ants
for
awar
enes
spr
ogra
m.
Mon
itori
ng&
supe
rvis
ion
Dis
aste
rm
anag
emen
tPr
epar
edne
ssSt
reng
then
ingt
heex
istin
gEm
erge
ncy
Med
ical
Serv
ices
Effe
ctiv
eim
plem
enta
tion
ofH
ealth
Sect
orco
ntin
genc
ypl
an.
Not
Estim
ated
Emer
genc
yM
edic
alSe
rvic
es,D
ept.
ofM
edic
alSe
rvic
es,M
oHD
epto
fDis
aste
rM
anag
emen
t,
Loca
l/re
gion
alSh
ort
Med
ium
and
Long
Term
Lack
ofco
ordi
natio
n,Re
sour
cean
dte
chni
calc
onst
rain
t
Iden
tify
clea
rro
les/
resp
onsi
bilit
ies,
Aw
aren
ess
Prof
essi
onal
trai
ning
Chapter Four : Vulnerability and Adaptati on
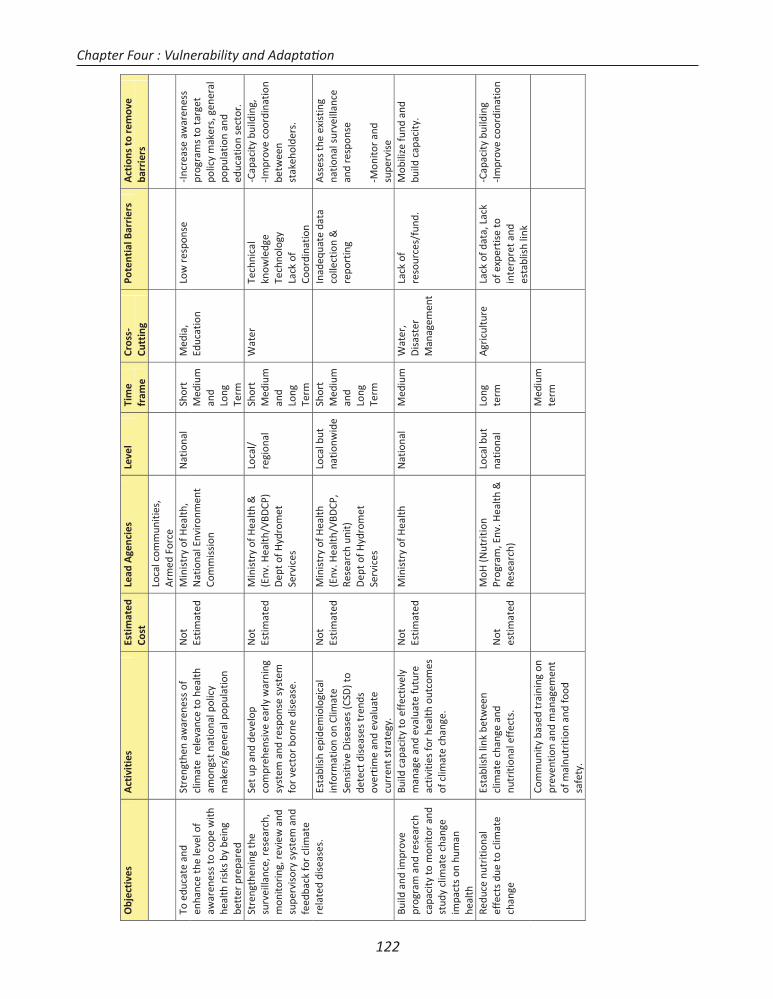
122
Obj
ecti
ves
Act
ivit
ies
Esti
mat
edCo
stLe
adA
genc
ies
Leve
lTi
me
fram
eCr
oss
Cutt
ing
Pote
ntia
lBar
rier
sA
ctio
nsto
rem
ove
barr
iers
Loca
lcom
mun
ities
,A
rmed
Forc
eTo
educ
ate
and
enha
nce
the
leve
lof
awar
enes
sto
cope
with
heal
thris
ksby
bein
gbe
tter
prep
ared
Stre
ngth
enaw
aren
ess
ofcl
imat
ere
leva
nce
tohe
alth
amon
gstn
atio
nalp
olic
ym
aker
s/ge
nera
lpop
ulat
ion
Not
Estim
ated
Min
istr
yof
Hea
lth,
Nat
iona
lEnv
iron
men
tCo
mm
issi
on
Nat
iona
lSh
ort
Med
ium
and
Long
Term
Med
ia,
Educ
atio
nLo
wre
spon
seIn
crea
seaw
aren
ess
prog
ram
sto
targ
etpo
licy
mak
ers,
gene
ral
popu
latio
nan
ded
ucat
ion
sect
or.
Stre
ngth
enin
gth
esu
rvei
llanc
e,re
sear
ch,
mon
itori
ng,r
evie
wan
dsu
perv
isor
ysy
stem
and
feed
back
for
clim
ate
rela
ted
dise
ases
.
Setu
pan
dde
velo
pco
mpr
ehen
sive
earl
yw
arni
ngsy
stem
and
resp
onse
syst
emfo
rve
ctor
born
edi
seas
e.
Not
Estim
ated
Min
istr
yof
Hea
lth&
(Env
.Hea
lth/V
BDCP
)D
epto
fHyd
rom
etSe
rvic
es
Loca
l/re
gion
alSh
ort
Med
ium
and
Long
Term
Wat
erTe
chni
cal
know
ledg
eTe
c hno
logy
Lack
ofCo
ordi
natio
n
Capa
city
build
ing,
Impr
ove
coor
dina
tion
betw
een
stak
ehol
ders
.
Esta
blis
hep
idem
iolo
gica
lin
form
atio
non
Clim
ate
Sens
itive
Dis
ease
s(C
SD)t
ode
tect
dise
ases
tren
dsov
ertim
ean
dev
alua
tecu
rren
tstr
ateg
y.
Not
Estim
ated
Min
istr
yof
Hea
lth(E
nv.H
ealth
/VBD
CP,
Rese
arch
unit)
Dep
tofH
ydro
met
Serv
ices
Loca
lbut
natio
nwid
eSh
ort
Med
ium
and
Long
Term
Inad
equa
teda
taco
llect
ion
&re
port
ing
Ass
ess
the
exis
ting
natio
nals
urve
illan
cean
dre
spon
se
Mon
itor
and
supe
rvis
eBu
ildan
dim
prov
epr
ogra
man
dre
sear
chca
paci
tyto
mon
itor
and
stud
ycl
imat
ech
ange
impa
cts
onhu
man
heal
th
Build
capa
city
toef
fect
ivel
ym
anag
ean
dev
alua
tefu
ture
activ
ities
for
heal
thou
tcom
esof
clim
ate
chan
ge.
Not
Estim
ated
Min
istr
yof
Hea
lthN
atio
nal
Med
ium
Wat
er,
Dis
aste
rM
anag
emen
t
Lack
ofre
sour
ces/
fund
.M
obili
zefu
ndan
dbu
ildca
paci
ty.
Redu
cenu
triti
onal
effe
cts
due
tocl
imat
ech
ange
Esta
blis
hlin
kbe
twee
ncl
imat
ech
ange
and
nutr
ition
alef
fect
s.N
otes
timat
ed
MoH
(Nut
ritio
nPr
ogra
m,E
nv.H
ealth
&Re
sear
ch)
Loca
lbut
natio
nal
Long
term
Agr
icul
ture
Lack
ofda
ta,L
ack
ofex
pert
ise
toin
terp
reta
ndes
tabl
ish
link
Capa
city
build
ing
Impr
ove
coor
dina
tion
Com
mun
ityba
sed
trai
ning
onpr
even
tion
and
man
agem
ent
ofm
alnu
triti
onan
dfo
odsa
fety
.
Med
ium
term
Chapter Four : Vulnerability and Adaptati on
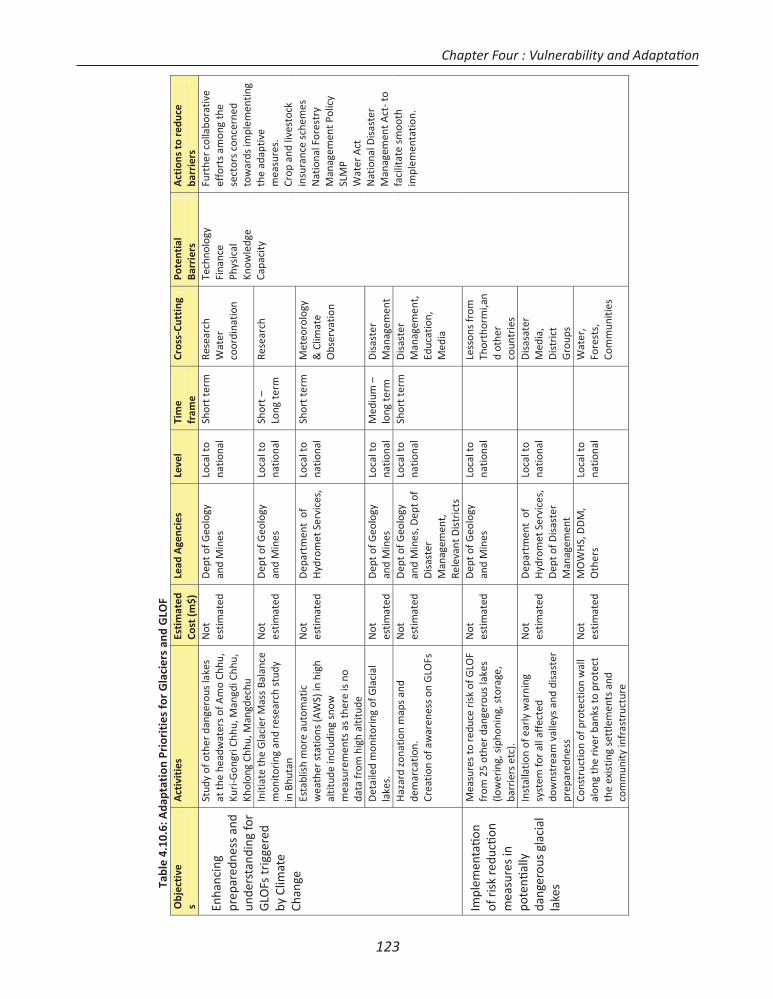
123
Tabl
e4.
10.6
:Ada
ptat
ion
Prio
riti
esfo
rG
laci
ers
and
GLO
FO
bjec
tive
sA
ctiv
itie
sEs
tim
ated
Cost
(m$)
Lead
Age
ncie
sLe
vel
Tim
efr
ame
Cros
sCu
ttin
gPo
tent
ial
Barr
iers
Act
ions
tore
duce
barr
iers
Enha
ncin
g prep
ared
ness
and
unde
rsta
ndin
gfo
rG
LOFs
trig
gere
dby Cl
imat
eCh
ange
Stud
yof
othe
rda
nger
ous
lake
sat
the
head
wat
ers
ofA
mo
Chhu
,Ku
riG
ongr
iChh
u,M
angd
iChh
u,Kh
olon
gCh
hu,M
angd
echu
Not
estim
ated
Dep
tofG
eolo
gyan
dM
ines
Loca
lto
natio
nal
Shor
tter
mRe
sear
chW
ater
coor
dina
tion
Tech
nolo
gyFi
nanc
ePh
ysic
alKn
owle
dge
Capa
city
Furt
her
colla
bora
tive
effo
rts
amon
gth
ese
ctor
sco
ncer
ned
tow
ards
impl
emen
ting
the
adap
tive
mea
sure
s.Cr
opan
dliv
esto
ckin
sura
nce
sche
mes
Nat
iona
lFor
estr
yM
anag
emen
tPol
icy
SLM
PW
ater
Act
Nat
iona
lDis
aste
rM
anag
emen
tAct
tofa
cilit
ate
smoo
thim
plem
enta
tion.
Initi
ate
the
Gla
cier
Mas
sBa
lanc
em
onito
ring
and
rese
arch
stud
yin
Bhut
an
Not
estim
ated
Dep
tofG
eolo
gyan
dM
ines
Loca
lto
natio
nal
Shor
t–Lo
ngte
rmRe
sear
ch
Esta
blis
hm
ore
auto
mat
icw
eath
erst
atio
ns(A
WS)
inhi
ghal
titud
ein
clud
ing
snow
mea
sure
men
tsas
ther
eis
noda
tafr
omhi
ghal
titud
e
Not
estim
ated
Dep
artm
ent
ofH
ydro
met
Serv
ices
,Lo
calt
ona
tiona
lSh
ortt
erm
Met
eoro
logy
&Cl
imat
eO
bser
vatio
n
Det
aile
dm
onito
ring
ofG
laci
alla
kes.
Not
estim
ated
Dep
tofG
eolo
gyan
dM
ines
Loca
lto
natio
nal
Med
ium
–lo
ngte
rmD
isas
ter
Man
agem
ent
Haz
ard
zona
tion
map
san
dde
mar
catio
n.Cr
eatio
nof
awar
enes
son
GLO
Fs
Not
estim
ated
Dep
tofG
eolo
gyan
dM
ines
,Dep
tof
Dis
aste
rM
anag
emen
t,Re
leva
ntD
istr
icts
Loca
lto
natio
nal
Shor
tter
mD
isas
ter
Man
agem
ent,
Educ
atio
n,M
edia
Impl
eme
ntat
ion
ofri
skre
duct
ion
mea
sure
sin po
tent
iall
y dang
erou
sgl
acia
lla
kes
Mea
sure
sto
redu
ceri
skof
GLO
Ffr
om25
othe
rdan
gero
usla
kes
(low
erin
g,si
phon
ing,
stor
age,
barr
iers
etc)
.
Not
estim
ated
Dep
tofG
eolo
gyan
dM
ines
Loca
lto
natio
nal
Less
ons
from
Thor
thor
mi,a
nd
othe
rco
untr
ies
Inst
alla
tion
ofea
rly
war
ning
syst
emfo
ral
laff
ecte
ddo
wns
trea
mva
lleys
and
disa
ster
prep
ared
ness
Not
estim
ated
Dep
artm
ent
ofH
ydro
met
Serv
ices
,D
epto
fDis
aste
rM
anag
emen
t
Loca
lto
natio
nal
Dis
asat
erM
edia
,D
istr
ict
Gro
ups
Cons
truc
tion
ofpr
otec
tion
wal
lal
ong
the
river
bank
sto
prot
ect
the
exis
ting
sett
lem
ents
and
com
mun
ityin
fras
truc
ture
Not
estim
ated
MO
WH
S,D
DM
,O
ther
sLo
calt
ona
tiona
lW
ater
,Fo
rest
s,Co
mm
uniti
es
Chapter Four : Vulnerability and Adaptati on
Enha
ncin
g pr
epar
edne
ss a
nd
unde
rsta
ndin
g fo
r G
LOFs
trig
gere
d by
Clim
ate
Chan
ge
Impl
emen
tati o
n of
ris
k re
ducti
on
mea
sure
s in
po
tenti
ally
da
nger
ous
glac
ial
lake
s


Chapter Five
Other Informati on

127
5.1 Climate Change Awareness
A study was undertaken to access the level of climate change awareness of the policy makers and other stakeholders and to provide necessary recommendati ons for the policy makers related to planning and climate change. In this process, many policy documents and reports related to completed and ongoing climate change acti viti es were reviewed. The full report of this study is published separately5. Most of the reports reviewed highlighted the need for climate change awareness and capacity building. The NAPA and the acti ons identi fi ed for miti gati on (chapter 3) and adaptati on (Chapter 4) also identi fy several needs for increasing awareness and capacity building.
A survey was also conducted as part of the study to assess the awareness of the various stakeholders, at the insti tuti onal and policy making levels (See full report for details). The key fi ndings were as follows:
The majority of the policy makers are aware of climate change issues. A majority (94.6 % of respondents) agreed that climate change was important and must be considered while developing any kind of plans and policies. They also felt that they should be accountable for any plans and policies executed under their leadership if there were any resulti ng negati ve environmental impacts contributi ng to climate change.
The survey showed that all the respondents have heard of ‘climate change’ before the interview. Similarly, all respondents believe that the climate change is a reality (with 70.9% strongly agreeing). The respondents felt that climate change is aff ecti ng the lives of Bhutanese people and they don’t believe that climate change is a natural phenomenon.
The Bhutanese planners and policy makers are aware about climate change. They believe
5 The full report including review of reports of other projects and assessments and the survey on awareness on climate change in Bhutan is available online at www.nec.gov.bt/snc/
that climate change has impacts on people’s health and feel that Bhutan must have climate change adaptati on programmes.
Respondents suggested the need of awareness programmes on climate change in schools, insti tutes, and public. 92.7% agreed on the need for awareness programmes, 94.5% agreed that Bhutan should initi ate adaptati on programmes, and 85.4% disagreed that ‘climate change has no impacts on health’, meaning they know that it has impacts on human health.
81.8 % of the respondents disagree with the statement, ‘climate change will not have any eff ects on our developmental projects/acti viti es’ and that adopt proper plans and policies should be adopted to minimize the impacts.
The respondents have greater concerns regarding future eff ects of climate change in Bhutan. A majority of 70.9% of the respondents was of the view that it was important to worry and think about future climate change impacts. The majority of respondents rated ‘glacial lake outburst fl ood’ as the possible future impact of climate change.
The study summarized that currently, planners and policy makers of Bhutan are aware of what climate change means in general. Almost all the respondents have an idea and basic knowledge of what climate change is indicati ng that the numerous awareness acti viti es in the country and media have helped create climate change awareness. They were able to broadly identi fy the main causes of climate change, the possible future impacts on Bhutan, and what they should do to minimize its impacts. They are also aware of the impacts of developmental acti viti es and projects.
However, while planners and policy makers are aware about climate change issues in general there seems to be a lack of in-depth technical knowledge on climate change. This can be att ributed to the lack of research and informati on
Chapter Five : Other Informati on
128
regarding climate change in Bhutan ti ll recently. The lack of funds and technological resources for a small developing country like Bhutan is another problem since it limits the extent of research carried out in climate change. However, there are few people like environmental offi cers and planners in the technical divisions of government ministries and agencies who have technical capacity about climate change issues. However, lack of technical capacity or in-depth knowledge in dealing with climate change and its eff ects can act as barriers to actually develop appropriate adaptati on programmes and implementi ng them.
5.2 Educati on and Capacity Building for Climate ChangeA report commissioned by the NEC for the Joint Support Program on Capacity Development for Mainstreaming Environment, Climate Change and Poverty Concerns in Policies, Plans and Programs (JSP, 2011) assessed the existi ng capacity situati on and various proposed capacity development acti ons for strengthening capacity for in-country training in the area of Environment Climate and Poverty (ECP) mainstreaming. The assessment covered eleven insti tutes, namely the College of Natural Resources, College of Science and Technology, Gaeddu College of Business Studies, Insti tute for Management studies, Paro College of Educati on, Royal Insti tute of Management, Royal Thimphu College, Sherubtse College, Ugyen Wangchuck Insti tute for Conservati on and Environment, Jigme Namgyal Polytechnic and Samtse College of Educati on.
The assessment found that insti tuti onal capaciti es exist in the form of favorable programmati c structures of the environmental insti tutes to infuse ECP mainstreaming training, good insti tuti onal partnerships with internati onal insti tutes, existence of courses and modules that off er substanti al scope to embed ECP mainstreaming elements, very good training infrastructure and faciliti es, and good locati on of the insti tutes in relati on to their training/ educati onal programs.
However, systemic capacity constraints include market uncertainti es for training courses customized for ECP mainstreaming especially if similar courses are off ered by a number of insti tutes, lack of recogniti on of short training courses in career advancement, and lack of mechanism for coordinati on between in-country training insti tutes. Capacity constraints at the insti tuti onal level include inadequate coverage and focus on ECP mainstreaming in existi ng curricula and modules, lack of teaching and knowledge resources for ECP mainstreaming, insuffi cient number of Bhutanese faculty members for teaching ECP mainstreaming, intermitt ent staff turnover, and lack of insti tuti onal partnerships with reputed overseas insti tutes in the area of ECP mainstreaming. A few insti tutes currently lack recognized accreditati on/ certi fi cati on system. At the individual level, existi ng faculty members have very limited specializati on training in subjects related to ECP mainstreaming.
As a result of the assessment several capacity building prioriti es to address ECP were proposed as follow:
Development of coordinati on mechanism to foster inter-insti tuti onal collaborati on and synergy for training in the area of ECP mainstreaming;
Advocacy of ECP mainstreaming in the context of the policy for GNH-infused learning;
Review and enhancement of existi ng curricula/ modules to build in or enhance ECP mainstreaming elements;
Development of new courses, such as those been envisioned by insti tutes such as the College of Natural Resources and College of Science and Technology, with special att enti on to ECP mainstreaming topics;
Development of teaching aids/materials and knowledge for ECP mainstreaming training depending upon the design of revised/ newly developed curricula and modules;
Development and conduct of customized
Chapter Five : Other Informati on
129
short training courses addressing specifi c ECP mainstreaming topics on a pilot basis with the dual objecti ves of providing hands-on training experience to faculty members and of developing knowledge and skills on specifi c ECP mainstreaming approaches and tools among certain target groups;
Development of partnerships with overseas insti tutes with experti se in ECP mainstreaming;
Development of knowledge and skills of the faculty members in the various insti tutes, through an in-country training workshop on ECP mainstreaming in the short-term for orientati on and general understanding about the subject followed by specializati on courses (short-term intensive courses and Postgraduate diploma or Masters degree courses) in the medium-term for advanced knowledge and skills in ECP mainstreaming topics.
5.3 Technology Needs Assessment
Aft er the completi on of the Initi al Nati onal Communicati on in 2000, a Technology Needs Assessment was undertaken with top up funding from GEF/UNDP. The assessment at that ti me was conducted without any guidance on methodologies or adequate informati on, and without any follow up for implementati on. The needs assessment was conducted for Agriculture, Cleaner Producti on in Industries and Strengthening of Meteorological Network. A new Technology Needs Assessment is currently being implemented by NEC with support from UNEP and GEF Funding. This assessment will build on the work in the second nati onal communicati on, the NAPA, Carbon Neutral Strategy (expected end of 2011) and will also prepare prioriti zed projects for both adaptati on and miti gati on along with an implementati on plan by June 2012.
5.4 Recommendati ons to improve Climate Change Acti ons in Bhutan
During the survey, consultati ons and review of reports on climate change programs and acti viti es, several recommendati ons to enhance awareness, capacity building and mainstreaming of climate change in Bhutan were suggested. The key recommendati ons are summarized below.
a. Comprehensive climate change strategy should be developed
While several separate assessments and acti on plans like the SNC, NAPA, Nati onal Road Map for the Climate Summit, Technology Needs Assessment and Carbon Neutral Strategy are ready or being prepared there is a need for a comprehensive and cohesive nati onal climate change strategy. The separate assessments menti oned now provide a sound grounding to inform the development of a nati onal climate change strategy that targets both Adaptati on and Miti gati on. The strategy should also cover related acti ons required such as, policies and acti ons, incenti ves and measures, capacity building, research, awareness and educati on, technology needs etc. Such a strategy can inform policy and decision makers, implementers at nati onal and local levels and also potenti al donor partners engaged in climate change acti viti es in Bhutan.
b. Research and capacity development on climate change
NEC can coordinate support for research and capacity development, with all relevant insti tuti ons including developing capacity of technical staff and awareness at the local government level as well as the terti ary educati on and civil society. Research proposals and small studies on climate change in Bhutan should be funded. Technical staff and decision makers in the most relevant line ministries, commissions and governing bodies can be trained further. The networking of educati onal insti tutes should be promoted, especially the higher educati on sector, to share research and data related to climate change and its impacts.
Chapter Five : Other Informati on
130
c. Bett er coordinati on among stakeholders and donors
A drawback is the weak coordinati on and linkages amongst stakeholders within the country as well as within the donor agencies. In the area of climate change, NEC could take a lead role for donor coordinati on, in cooperati on with the GNHC. This would be in-line with the recommendati ons of the “2005 Good Governance Plus” exercise to establish inter-agency coordinati on mechanisms to minimise duplicati ons. While the MSTCCC has been established for this purpose, support is needed to increase capacity to bett er understand climate change and mainstreaming issues for eff ecti ve coordinati on.
d. Mainstreaming Climate Change
Climate Change mainstreaming should be promoted in development plans and policies at all levels. This is important to ensure that development acti viti es are implemented keeping in mind potenti al impacts of climate change or potenti al impact on the nati onal policy to remain carbon neutral. Such mainstreaming eff orts should be no-regret opti ons that provide local benefi ts and additi onal costs should be supported by climate change fi nancing. However, greater support for understanding mainstreaming of climate change, along with other issues of environment, poverty and gender needs to be provided through capacity building and demonstrati on projects.
e. Climate Financing Opti ons
It is a given that acti ons to address climate change will require additi onal fi nancing on top of regular development acti viti es that are already being pursued. It is recommended that opti ons of securing climate change fi nance from the various emerging funding sources be explored. The fi nancing opti ons and strategy should be aligned with a nati onal climate change strategy and the comparati ve advantages of the sources and local needs and prioriti es should be considered as the emerging funds will be a mix of public and market based mechanisms, grants or loans and may be channelled through multi lateral or bilateral sources.
f. Media and Awareness
The media and conservati onists should educate citi zens on climate change and hold policymakers accountable for policies that have a negati ve impact on the environment. There must be more climate change related reports and informati on made available to the public. Policy makers should be informed on climate change issues and be accountable for the environmental impact of any initi ati ves executed under their leadership, be it hydropower projects, large scale farming, or industrial development.
g. Climate Change in Educati on Curriculum
Climate change can be incorporated as a subject at the earliest possible. The youth of today will become the policy makers of tomorrow and need to be informed adequately about the science and issues surrounding climate change. NEC should take a lead role in creati ng awareness in schools. RSPN in collaborati on with NEC can develop environmental educati on programs for the general public and school children. NEC and RSPN can develop a curriculum with the Ministry of Educati on to create awareness at the school level.
h. NEC should be given more authority
NEC is the apex environmental agency in Bhutan but it does not have the power or authority to override decisions made by the ministries or government as a whole. NEC should have authority to be able to ensure bett er implementati on of all policies and to ensure that defaulters are punished.
i. More investment towards R&D in climate change
There is a need to reorient research plans and programs to seek policy and fi nancial support to prepare for the changing local environment. There is a need to increase budget allocati on, improve research faciliti es and equip researchers with technical know-how to address issues of food, water, and energy security and climate change and impacts on local resources like forests and biodiversity. A research fund can be created
Chapter Five : Other Informati on
131
for fi nancing long term climate change research and development.
j. Vulnerability and Adaptati on of Human sett lements and infrastructure
Given the changes in demography and growth in urban areas and investments in public infrastructure, it is recommended that future V&A assessments should cover human sett lements, criti cal infrastructure and mapping of vulnerable populati ons and areas. This may be taken up in the third nati onal communicati on
or other acti viti es. Mapping vulnerable areas and populati ons will help mainstream climate change by providing informati on to planners at diff erent levels including local levels for making appropriate plans and programs and prioriti sing interventi ons. This exercise should build another eff orts including assessment of the state of the environment reports at nati onal and local levels, and other vulnerability mapping exercises such as the diff erent hazard mappings under the NAPA implementati on program.
Chapter Five : Other Informati on


Annexures

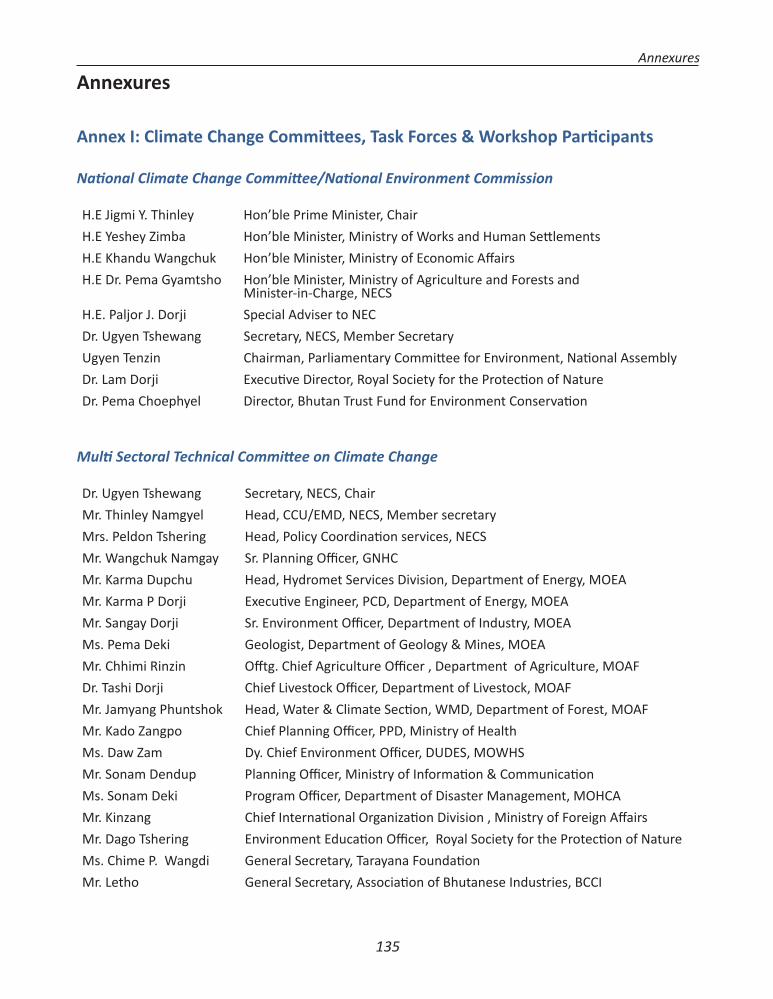
135
Annexures
Annex I: Climate Change Committ ees, Task Forces & Workshop Parti cipants
Nati onal Climate Change Committ ee/Nati onal Environment Commission
H.E Jigmi Y. Thinley Hon’ble Prime Minister, Chair
H.E Yeshey Zimba Hon’ble Minister, Ministry of Works and Human Sett lements
H.E Khandu Wangchuk Hon’ble Minister, Ministry of Economic Aff airs
H.E Dr. Pema Gyamtsho Hon’ble Minister, Ministry of Agriculture and Forests and Minister-in-Charge, NECS
H.E. Paljor J. Dorji Special Adviser to NEC
Dr. Ugyen Tshewang Secretary, NECS, Member Secretary
Ugyen Tenzin Chairman, Parliamentary Committ ee for Environment, Nati onal Assembly
Dr. Lam Dorji Executi ve Director, Royal Society for the Protecti on of Nature
Dr. Pema Choephyel Director, Bhutan Trust Fund for Environment Conservati on
Multi Sectoral Technical Committ ee on Climate Change
Dr. Ugyen Tshewang Secretary, NECS, Chair
Mr. Thinley Namgyel Head, CCU/EMD, NECS, Member secretary
Mrs. Peldon Tshering Head, Policy Coordinati on services, NECS
Mr. Wangchuk Namgay Sr. Planning Offi cer, GNHC
Mr. Karma Dupchu Head, Hydromet Services Division, Department of Energy, MOEA
Mr. Karma P Dorji Executi ve Engineer, PCD, Department of Energy, MOEA
Mr. Sangay Dorji Sr. Environment Offi cer, Department of Industry, MOEA
Ms. Pema Deki Geologist, Department of Geology & Mines, MOEA
Mr. Chhimi Rinzin Off tg. Chief Agriculture Offi cer , Department of Agriculture, MOAF
Dr. Tashi Dorji Chief Livestock Offi cer, Department of Livestock, MOAF
Mr. Jamyang Phuntshok Head, Water & Climate Secti on, WMD, Department of Forest, MOAF
Mr. Kado Zangpo Chief Planning Offi cer, PPD, Ministry of Health
Ms. Daw Zam Dy. Chief Environment Offi cer, DUDES, MOWHS
Mr. Sonam Dendup Planning Offi cer, Ministry of Informati on & Communicati on
Ms. Sonam Deki Program Offi cer, Department of Disaster Management, MOHCA
Mr. Kinzang Chief Internati onal Organizati on Division , Ministry of Foreign Aff airs
Mr. Dago Tshering Environment Educati on Offi cer, Royal Society for the Protecti on of Nature
Ms. Chime P. Wangdi General Secretary, Tarayana Foundati on
Mr. Letho General Secretary, Associati on of Bhutanese Industries, BCCI
Annexures
136
Nati onal Greenhouse Gas Inventory Team
Energy
Mr. Karma Pemba RSTA, MOIC (Working group Leader)
Mr. Sonam Gyeltshen Nati onal Stati sti cal Bureau
Mr. Karma Dupchu Department of Energy, MoEA
Ms. Tashi Chuki Wangdi Environment Unit, MOEA
Mr. Karma Tshewang Dept of Energy, MoEA
Industrial Processes
Mr. Karchen Dorji Environment Unit, MoEA
Mr. Chandra B. Chett ri BCCI
Ms. Tashi Chuki Wangdi Environment Unit, MoEA
Ms. Deki Gyamtsho RRCO, MoF, Paro
Ms. Choden Dept. of Roads, MoWHS
Ms. Peldon Tshering NEC (Working group Leader)
Mr. Karma L. Rapten UNDP-Bhutan
Mr. Tshewang Dorji NEC
Agriculture
Mr. Isaac Lepcha NFFP, Bumthang, MoA
Ms. Sonam Deki DMD, MoHCA
Ms. Kinley Dem Agromet Secti on, CORRB, MoA
Ms. Yeshey Dema NSSC, MoA (Working group Leader)
LUCF
Mr. Sonam Dhargay Nati onal Land Commission
Mr. Karma Jigme DoF, MoA
Mr. Krishna B. Rai Bhutan Power Corporati on
Mr. Chukey Wangchuk BTFEC (Working group Leader)
Mr. Ngawang Gyeltshen Nati onal Biodiversity Center
Mr. Langa Tshering Tala Hydroelectric Project
Mr. Dungkar Dukpa PPD, MoWHS
Waste
Mr. Yeshey Penjor NEC (Working group Leader)
Mr. Dago Tshering RSPN
Mr. Gyembo Dorji Dept. of Public Health, Ministry of Health
Annexures
137
Mr. Gyaltshen Dukpa Thimphu City Corporati on
Mr. Pema Gyelpo Tarayana Foundati on
Ms. Dawa Zangmo CDB, MoWHS
Mr. Thinley Namgyel NEC
Mr. Rinzin Namgay NEC
Nati onal Vulnerability and Adaptati on Task Force for SNC
Agriculture
Dr. Thinlay Plant Protecti on Specialist, NPPC, MoAF
Ganesh B Chett ri Agri.specialist- DoA
Mahesh Ghimirey Rice specialist, RDC-Bajo (Germplasm)
Tirtha Katwal Principal Research Offi cer, RDC- Wengkhar
Dr. Tashi Dorji CLO, Dept of Livestock Livestock, MoAF
Chhimi Rinzin CAO, DoA, MoA
Glaciers & GLOF
Karma Toep Chief Glaciologist, Department of Geology and Mines, MoEA
Tshering Wangchuk Asst. Program Offi cer, Department of Disaster Management, MoHCA
Sonam Dagay Asst. Environment Offi cer, Climate Change Unit NEC
Sonam Dagay Nati onal Land Commission
Mr. Wangchuk Namgay Sr. Planning Offi cer, GNHC
Mr. Letho General Secretary, Associati on of Bhutanese Industries
Energy
Tashi Dorji, Chief Engineer, Planning and Coordinati on Division, DoE, MoEA
Karma P. Dorji EE, Planning and Coordinati on Division, DoE, MoEA
Mewang Gyeltshen Head, Renewable Energy Division, Department of Energy, MoEA
Karma Pemba Head, Transport Development Division, RSTA, MoIC
Tashi Pem Dy. Executi ve Engineer, Dept of Energy
Thinley Asst. manager (CDM), Druk Green Power Corporati on
Forests & Biodiversity
Kinley Tshering, CFO, Forest Resources Development Division, DoFPS, MoAF
Chado Tshering SAARC Forestry Center
Dr. Pema Wangda RNR-Research and Development Center-Yusipang
Dr. Lungten Council for RNR Research of Bhutan, MoAF
Sangay Dema Nati onal Biodiversity Center
Annexures
138
Ugen Dorji MAP& Spices Program, Horti culture Division, DoA, MoAF
Sherab Ugen Wangchuck Insti tute for Conservati on and Environment
Karma Jigme Nature Conservati on Division, DoFPS, MoAF
Dorji Program Offi cer, BTFEC
Human Health
Sonam Chophel Sr. Program Offi cer, Ministry of Health
Rada Dukpa Asst. Program Offi cer, Ministry of Health
Dr Meenakshi Rai Head, Community Outreach Unit, RENEW
Dago Tshering RSPN
Sonam Lhaden Khandu NEC
Water
G Karma Chhopel Head, Water resources Coordinati on Division, NEC
Kunzang Legal Services, NEC
Ichharam Dulal UISD, DUDES, MoWHS
Karma Tshering Watershed Management Division, DoFS, MoAF
Ugyen Rinzin PHED, DoPH, MoH
Karma Tshethar DoA, MoAF
Karma Dupchu Hydromet Services Division, DoE, MoEA
Chukey Wangchuk Sr. Program Offi cer, BTFEC
Annexures
139
Parti cipants for GHG Miti gati on Assessment Workshop
Anne Erica Larsen, Project Analyst, UNDP, Bhutan
Bikash Tirwa, Chemist, Lhaki Cement
Chimi Zangmo, Druk Holding and Investments
Choden, Assistant Engineer, DoR, MoWHS
Chukey Wangchuk, Chief Program Offi cer, BTFEC
Dago Tshering, Environment Educati on Offi cer, RSPN
Daw Zam, Dy. Chief Environment Offi cer, MoWHS
Dr. Karma Tenzin, Country Coordinator, GEF Small Grant Program,UNDP, Bhutan
G K. Chhopel, Head, WRCD, NEC
Janchub Dema, EQS Technician , NEC
K. N. Ghimeray, Social Forestry DoFPS, MoAF,
Kamal Ghalley, USD Enterprise, Thimphu
Karchung Dukpa, Chemist, KK Steel
Karma C. Nyedrup, Environmental Analyst, NEC
Karma Dupchu, Head, HMSD, DOE, MOEA
Karma L. Rapten, Head, Energy Environment and Disaster Management Unit, UNDP, Bhutan
Kezang Yangden, Forest Offi cer, FRDD, DoFPS, MOAF
Kinley Dem, Forest Offi cer, DoFPS, MoAF
Kinzang, Chief, Internati onal Organizati on Division, Ministry of Foreign Aff airs
Krishna B. Rai, Environment Offi cer, BPC
M. Ghimiray, RNR Research Center, Bajo
Matt Addison, TA, ADB, NEC
N. K. Sharma, ADB-TA Project NEC
Narayan Pradhan, General Manager, NRDCL.
Pema Gyalpo, Finance Offi cer, Tarayana Foundati on
Phurba Lhendup, Program Offi cer, WWF
S R. Gurung, Focal Person, Ugyen Ferro Alloy Ltd.
Samdrup, Environment Focal Person, PCAL
Sangay Dorji, Head, Environment Unit, MoEA
Sherab Wangchuk, Asst Program Offi cer, MoAF
Sonam Choden, Forest Offi cer, WMD, DoFPS, MoAF
Sonam Dargay, Asst. Environment Offi cer, NEC
Sonam Dendup, Sr. Program Offi cer, MoIC
Sonam Dhargay, Dy. Chief ICT Offi cer, NLC
Sonam Tobgay, RSTA, MoIC
Tandi Dolma, Focal Person, Druk Iron and Steel
Tashi Wangdi, Manager, Bhutan Ferro and Alloy Ltd.
Thinley Namgyel, Head, EMD, NEC
Tshering Dorji, Stati sti cal Offi cer, PPD, Ministry of Finance
Tshering Tashi, Communicati on Offi ce, NEC
Tshering Zam, Department of Agriculture, MoAF
Tshewang Dorji, Environment Offi cer, NEC
Ugyen Dorji, Proprietor, Yangki Automobile
Yeshey Penjor, Head, ESD, NEC
Yeshi Dorji, Program Offi cer, BCCI
Annexures
140
Parti cipants for Vulnerability & Adaptati on Training and Consultati on WorkshopAnne E. Larsen, Project Analyst, UNDP Bhutan
Chencho G. Dorjee, Program Analyst, UNCDF, Bhutan
Chhimi Rinzin, Chief Agriculture Offi cer, Department of Agriculture, MoAF
Chukey Wangchuk, Chief Program Offi cer, BTFEC
Dago Tshering, Environment Educati on Offi cer, RSPN
Dechen Lham, EQS Technician, Nati onal Environment Commission
Thinley, Druk Green Power Corporati on ,
Dorji, Program Offi cer, BTFEC
G. K. Chhopel, Head, Water Resource Coordinati on Division, NEC
Ichharam Dulal, Chief Engineer, Department of Urban Development and Engineering Service, MoWHS
Karl Schultz, Climate Change Economist, NEC/ADB Capacity Building Project, NEC
Karma Dupchu, Head, Hydromet Service Division, Department of Energy, MoEA
Karma Jigme, Forest Offi cer, Department of Forest and Park Services, MoAF
Karma P. Dorji, Executi ve Engineer, Department of Energy, MoEA
Karma Tenzin, Livestock Offi cer, Department of Livestock, MoAF
Karma Toeb, Chief Glaciologist, Department of Geology and Mines, MoEA
Karma Tshering, Chief HMO, Watershed Management Division, MoAF
Karma Tshethar, Executi ve Engineer, Department of Agriculture, MoAF
Kunzang, Legal Offi cer, NEC
Letho, General Secretary, Associati on of Bhutanese Industries
Nim Dem, Civil Engineer, Rural Electrifi cati on Division, Department of Energy, MoEA
Passang Dema, EQS Technician, NEC
Phuntsho, GIS Offi cer, Forest Resource Development Division, Department of Forests and Park Services, MoAF
Rada Dukpa, Asst. Program Offi cer, Department of Public Health, Ministry of Health
Sangay Dema, Dy. Chief Biodiversity Offi cer, Nati onal Biodiversity Center, MoAF
Sonam Dagay, Asst. Environment Offi cer, Nati onal Environment Commission
Sonam Dhargay, Dy. Chief Informati on Offi cer, Nati onal Land Commission
Sonam L. Khandu, Environment Offi cer, NEC
Tashi Dorji, Chief Engineer, Policy Coordinati on Division, Department of Energy, MoEA
Tashi Pem, Engineer, Department of Energy, MoEA
Thinley Namgyel, Head, EMD, NEC
Tshering Tashi, Communicati on Offi cer, NEC
Tshering Wangchuk, Program Offi cer, Department of Disaster Management, MoHCA
Tshewang Dorji, Sr. Environment Offi cer, NEC
Tshewang Lhamo, Program Offi cer, NEC
Ugyen Dorji, Sr. Horti culture Division, Horti culture Division, Department of Agriculture and Forests, MoAF
Ugyen Rinzin, Executi ve Engineer, Public Health Engineering Division, Ministry of Health
Yeshey Penjor, Climate Change Policy Specialist, UNDP, Bhutan
Annexures
141
Parti cipants for 2nd Consultati on Workshop on Vulnerability and Adaptati on
Chado Tshering, CEO, SFC, DOFPS, MoAF
Cheku Dukpa, General Secretary, CAB
Chhimi Dorji, Dy. Executi ve Engineer, HMSD, MOEA
Chhimi Dorji, Executi ve Engineer , HMSD, MoEA
Chukey Wangchuk, CPO, BTFEC
Dr. Tashi Dorji, Chief Livestock Offi cer, DoL, MoAF
Dr. Tashi Yangzom, Prog. Director, NSB, MoAF
G. Karma Chhopel, Head, WRCD, NEC
Ichharam Dulal, Specialist, DUDES, MoWHS
Jigme Nidup, Sr. Environment Offi cer, NEC
Jigme Zangmo, AQS Technician, NEC
Karma Jigme, Forest Offi cer, Wildlife Conservati on Division, MoAF
Karma Pembak, Dy. Chief Transport Offi cer, RSTA, MoIC
Karma Tenzin, Livestock Offi cer, DoL, MoAF
Karma Tshering, Program Offi cer , NEC
Karma Tshethar, Executi ve Engineer , DoA, MOAF
Kinley Tshering, Chief Forest Offi cer , FRDD, MoAF
Krishna B. Rai, Environment Offi cer, BPC
Kriti ka Neopaney, Environment Offi cer , Druk Holding Investment Infra
Kunzang Choden, Sr. Research Offi cer , CORRB, MoAF
Kunzang, Legal Offi cer,NEC
Letho, General Secretary,ABI
Lobzang Dorji, Chief Environment Offi cer, PHPA
M B Monger, Chief Engineer , DoR, MOWHS
Mewang Gyeltshen, Chief Engineer,DOE, MoEA
Mewang Gyeltshen, Chief Engineer, DOE, MoEA
Pema Gyelpo, Finance Offi cer , Tarayana Foundati on
Pema Thinley, Program Offi cer, PPD, MoAF
Pema Wangda, RDC, Yusipang
Rada Dukpa, Asst. Program Offi cer, MoH
Riamsara Kuyakana, UWICE
Rinchen Namgyel, Asst. Engineer, DGPC
Sangay Dorji, Sr. Environment Offi cer, PHPA
Sangay Dorji, Sr. Lecturer, Sherubtse College
Sanjay Gurung, Environment Focal Person, Druk Ferro and Alloy
Sonam Dagay, Asst. Environment Offi cer , NEC
Sonam Dendup, Sr. Program Offi cer, MoIC
Sonam Dhargay, Dy. Chief ICT Offi cer, Nati onal Land Commission
Sonam L. Khandu, Sr. Environment Offi cer, NEC
Tashi Pem, DY. Executi ve Engineer, DoE, MoEA
Tashi Wangdi, Manager, Bhutan Ferro and Alloy Ltd.
Thinley Namgyel, Head, EMD, NEC
Thinley Pelden, Asst. program Offi cer, DDM, MOHCA
Thinley Wangdi, UWICE
Tshering Tashi, Communicati on Offi cer, NEC
Tshering Tashi (sr), Environment Specialist, NEC
Ugyen Rinzin, Executi ve Engineer, Public Health Engineering Division, Ministry of Health
Ugyen Wangda, Head, Geological Survey of Bhutan, DGM, MoEA
Annexures
142
Sangay Khandu, Secretary, Nati onal Land Commis-sion
Dr, Ugyen Tshewang, Secretary, Nati onal Environ-ment Commission
Tshewang Tandin, Director General, Department of School Educati on, Ministry of Educati on
Dr. Ugeyn Dophu, Director, Department of Public Health, Ministry of Health
Chencho Norbu, Director, Department of Agricul-ture, Ministry of Agriculture and Forests
Chime P. Wangdi, Secretary General, Tarayana
Dr. Tashi Dorji, Chief Livestock Offi cer, Department of Livestock, , Ministry of Agriculture and Forests
Karma Dupchu, Head, Hydromet Service Division, Department of Energy, Ministry of Economic Aff airs
Peldon Tshering, Chief, Policy Planning Services, Nati onal Environment Commission
Thinley Namgyel, Head, Climate Change Division, Nati onal Environment Commission
Ichharam Dulal, Specialist, Department of Urban Development and Engineering Services, Ministry of Works and Human Sett lement
Yeshey Penjor, Climate change Policy Specialist, UNDP, Bhutan
Thinley Namgay, Chief Engineer, Road Safety and Transport Authority, Ministry of Informati on and Communicati on
Dago Tshering, Educati on Offi cer, Royal Society for Protecti on of Nature
Thuji Pem, Program Offi cer, Tourism Council of Bhutan
M B Monger, Department of Roads, Ministry of Works and Human Sett lement
Chhimi Rinzin, Department of Agriculture, Minis-try of Agriculture and Forests
Karma P. Dorji, Executi ve Engineer, Department of Energy, Ministry of Economic Aff airs
Karchen Dorji, Environment Unit, Ministry of Economic Aff airs
Sonam Tashi, Off tg, Chief Progaram Offi cer, PPD, Ministry of Economic Aff airs
Tshering Tashi, Communicati on Offi cer, Nati onal Environment Commission
Sonam Dagay, Asst. Environment Offi cer, Nati onal Environment Commission
Wangchu Namgay, Sr. Program Offi cer, Gross Nati onal Happiness Commission
Tashi Wangmo, Department of Urban Develop-ment and Engineering Services, Ministry of Works and Human Sett lement
Karma Tshering, Program Offi cer, Nati onal Envi-ronment Commission
Samten Wangdi, Engg. Geologist, Department of Geology and Mines, Ministry of Economic Aff airs
Annexures
Parti cipants for Final Consultati on of Second Nati onal Communicati on
143
Experts and Reviewers
Climate Modeling for Bhutan using PRECISSTART-SEA TeamDr. Annond Snidvongs, Director, START Regional Offi ce, SEA, Bangkok
Mr. Viriya Laung Aram,START Regional Offi ce, SEA, Bangkok
Mr. Suppakon Chinvanno, Affi liated Researcher, START Regional Offi ce, SEA, Bangkok
Mr. Watcharapong Noimuni, Asst. Researcher, START Regional Offi ce, SEA, Bangkok
Bhutan Team
Mr. Thinley Namgyel, Head, EMD/CCD, SNC Project Manager
Mr. Tshering Tashi, Communicati on Offi cer, EMD
Mr. Sonam Dagay, SNC Project Asst.
Ms. Dechen Wangmo, Asst. Engineer I, GIS Unit, DoE, MoEA
Ms. Wangmo, Asst. Engineer I, GIS Unit, DoE, MoEA
Nati onal Circumstances (Chapter 1)
Consultant
Nedup Tshering, Sonam Consultancy, Thimphu,
Reviewers
Tshewang Lhamo, Environment Offi cer, NEC
Kezang Wangmo, Intern, NEC
Sonam Lhaden Khandu, Sr. Program Offi cer, NEC
Thinley Namgyel, Head, EMD, NEC
Sonam Dagay, Asst. Environment Offi cer, NEC
Tshering Tashi, Communicati on Offi cer, NEC
Greenhouse Gas Inventory (Chapter 2)
GHG Inventory Consultant & Trainer
Bill Dougherty, SEI-US Boston, USA
Reviewers
Thinley Namgyel, Head, EMD, NEC
Sonam Dagay, Asst. Environment Offi cer, NEC
Rinzin Namgay, Data Manager, NEC
Jigme, Bonn, UNFCCC, Germany
Miti gati on Assessment (Chapter 3)
Miti gati on Consultant
Dr. Jason Yapp, Caleb Group, UK, Miti gati on Consultant
Emission trends team
Thinley Namgyel, Head, EMD, NEC
Sonam Dagay, Asst. Environment Offi cer, NEC
Rinzin Namgay, Data Manager, NEC
Reviewers
NCSP, UNDP, New York
MSTCCC Members
Thinley Namgyel, Head, EMD, NEC
Sonam Dagay, Asst. Environment Offi cer, NEC
Tshering Tashi, Communicati on Offi cer, NEC
Chencho Norbu, Director, DoA, MoAF
Sonam Tashi, PPD, MoEA
Vulnerability and Adaptati on (Chapter 4)
V&A Assessment Consultants
Mr. Bhawan Singh, Climate Change, Internati onal Soluti ons, Canada, Lead V&A Consultant
Dr. Abderrahman El Fouladi,Consultant (Climate, Forestry and Energy)
Dr. Kénel Délusca,Consultant (Water Resources and Agriculture)
Mr. Robert Cissokho,Consultant (Human Health)
Reviewers
V&A Task Force
Multi Sectoral Technical Committ ee on Climate Change
Nati onal Communicati on Support Program, UNDP, New York
Thinley Namgyel, Head, EMD, NEC,
Tshering Tashi, Communicati on Offi cer, NEC
Sonam Dagay, Asst. Environment Offi cer, NEC
Annexures
144
Other informati on (Chapter 5)
Climate change awareness surveyors
Phuntsho Wangmo, RIM Trainee
Dorji Nidup, RIM Trainee
Reviewers
Thinley Namgyel, NEC
Mr. Karma Tshering, NEC
Tshering Tashi, CO NEC
Second Nati onal Communicati on Project Board
Dr. Ugyen Tshewang, Secretary, NEC, Chairman
Bakhodir Burkhanov, Dy. RR, UNDP,
Wangchuk Namgay, Sr. PO, GNHC
Peldon Tshering, Head, PPS, NEC
Karma Chhopel, Head, HMSD, MoEA
Karma Dupchu, Head, HMSD, MoEA
Karma L. Rapten, Unit Head, EEDM, UNDP
Rinzin Dorji, Sr. PO, MoAF
Thinley Namgyel, SNC Project Coordinator, Member Secretary
Karma Tshering, P.O. NEC Alternate SNC Project Coordinator
Second Nati onal Communicati on Project Management Team
Thinley Namgyel, Project Manager, Second Nati onal Communicati on
Karma Tshering, Alternate Project Manager and V&A Coordinator, SNC
Sonam Dagay, Project Assistant, SNC
Kunzang Dema, SNC Project Accountant
Tshewang Rinchen, Administrati on
Tshering Tashi, GIS and Workshop Coordinator
Sonam L. Khandu, Project Manager, Nati onal Adaptati on Program of Acti on
Maps
Dr. Abderrahman EI Fouladi, Canada
Tshering Tashi, Communicati on Offi cer NEC
Annexures
145
Annex II: References
Chapter 1: Nati onal Circumstances
Ageta, Y.; Naito, N.; Nakawo, M.; Fujita, K.; Shakar, K.; Pokhrel, A.P.; Wangda, D. (2001) ‘Study Project on the Recent Rapid Shrinkage of Summer Accumulati on Type Glaciers in the Himalayas, 1997-1999’. In Bull. Glacial. Research, vol.18 pp.45-49.
Department of Agriculture 2005, Agriculture Stati sti cs 2005 – Volume 1, Ministry of Agriculture 2005, Royal Government of Bhutan, Thimphu
Department of Agriculture 2005, Agriculture Stati sti cs 2005 – Volume 2, Ministry of Agriculture, Royal Government of Bhutan, Thimphu
Department of Energy 2005, Bhutan – Energy Data Directory 2005, Ministry of Trade & Industry, Royal Government of Bhutan, Thimphu
Department of Roads 2011, Informati on on Road Network (Spread sheet provided by DoR on September 2011), Ministry of Works and Human Sett lement, Royal Government of Bhutan
Gross Nati onal Happiness Commission 2011, Eleventh Round Table Meeti ng- Turning Vision into Reality: The Development Challenges Confronti ng Bhutan, GNHC, Royal Government of Bhutan, Thimphu
Karma, Ageta, Y., Naito, N., Iwata, S.&Yabuki, H. 2003, ‘Glacier distributi on in the Himalaya and glacier shrinkage from 1963 to 1993 in Bhutan Himalayas’,Bulleti n of Glaciological Research, v.20, p.29-40.
Ministry of Health 2007, Annual Health Bulleti n 2007 – A window to Health Sector Programme – Safer Water=Safer Health, MoH, Royal Government of Bhutan, Thimphu
Ministry of Home and Cultural Aff airs 2006, Nati onal Disaster Risk Management Framework – Reducing disaster risks for a safe and happy Bhutan, Disaster Management Division (DMD), Department of Local Governance, MoHCA, Royal Government of Bhutan, Thimphu
Ministry of Works and Human Sett lement 2008, Bhutan Nati onal Urbanizati on Strategy (BNUS) , MoWHS, Royal Government of Bhutan, Thimphu
Nati onal Environment Commission Secretariat, September 2000, REPORT – Bhutan’s Nati onal Capacity Self Assessment for Global Environmental management and Acti on Plan, NEC, Thimphu
Nati onal Environment Commission Secretariat 2000, Initi al Nati onal Communicati on, NECS, Thimphu
Nati onal Environment Commission Secretariat 2008, Bhutan Environment Outlook, NECS, Thimphu
Nati onal Soil Service Center (NSSC) & Policy and Planning Division 2010, Bhutan Land Cover Assessment (LCMP 2010), Ministry of Agriculture and Forest, Royal Government of Bhutan, Thimphu
Nati onal Stati sti cs Bureau December 2005, Stati sti cal Yearbook of Bhutan 2005, NSB, Royal Government of Bhutan, Thimphu
Nati onal Stati sti cs Bureau December 2007, Stati sti cal Yearbook of Bhutan 2007, NSB, Royal Government of Bhutan, Thimphu
Nati onal Stati sti cs Bureau December 2010, Stati sti cal Yearbook of Bhutan 2006, NSB, Royal Government of Bhutan, Thimphu
Nature Conservati on Division 2002, Biodiversity Acti on Plan for Bhutan 2002, Ministry of Agriculture, Royal Government of Bhutan, Thimphu
Nature Conservati on Division 2009, Biodiversity Acti on Plan for Bhutan 2009, NCD, Ministry of Agriculture, Royal Government of Bhutan, Thimphu
NTG-Energy 2011, Nati onal Themati c Group for Energy, Nati onal Road Map for Energy Security 2012-2021- Bhutan, Nati onal Themati c Paper
Annexures
146
for the Climate Summit for a Living Himalayas- Bhutan 2011
Chapter 2: GHG Inventory
Agricultural stati sti cs, 2000; MoA
Bhutan Energy Data Directory 2005
Bhutan Trade Stati sti cs (1998,1999,2000)
Conference Proceedings of the Nati onal Conference on Solid Waste Management (DUDES, 2008) Ministry of Work & Human Sett lement
Department of Forestry, MoA, RGoB, Annual Report – 2007.
Dhitt al, D.B., Forest Resources Assessment (FRA), RGOB/FAO 2005
FAO, 1990- FRA 2000, Forest Resources of Bhutan- Country Reports.
Ferti lizer data from Druk Seed Corporati on, Paro Bhutan.
Industrial License Database, Ministry of Economic Aff airs as of July 2008
IPCC Good Practi ce Guidelines for LULUCF.
K.J. Temphel & H.J.J. Beukeboom, June 2006, Community Forestry Contributes to the Nati onal and Millennium Development Goals without Compromising the Forestry Policy,
Livestock Stati sti cs 2007
MoA, RGoB, Master Plan for Forestry Development, 30 November 1991.
MoA, RGoB. Renewable-Natural Resources (RNR) Journal 2000,
Natural Resources Development Corporati on Limited, Informati on Booklet – 2007.
Penjor, Y., (2007). Enhancing Municipal Solid Waste Management with 3Rs Opti on in Thimphu, Bhutan.
POL Secti on, Department of Trade, Ministry of
Economic Aff airs
PPD, MoA, RGoB, Bhutan Land Cover Assessment 2005 – Summary.
PPD, MoA, RGoB, Land Use and Land Cover Atlas of Bhutan – 1997.
Rice in Bhutan – A Source Book, 2008, CoRRB, MoA (Pp. 19).
RNR Census 2000
RNR Census 2002
Stati sti cal Yearbook of Bhutan 2000, CSO, Planning Commission
Survey data from individual industries
Survey of Energy Usage in Industries by Energy Working Group, GHG Inventory Task Force of the Second Nati onal Communicati on Project, December 2008.
Ugen P. Norbu, Report on Fuelwood consumpti on in Bhutan – 2000, A study for Bhutan Trust Fund for Environmental Conservati on
W. Schindele, Altusried, Forest Resources Potenti al Assessment (FRPA) for Bhutan. RGOB/FAO March 2004
Chapter 3: Miti gati on Assessment
Chett ri,G.B. 2003. Climate Change Adaptati on Technology Needs Assessment: Agriculture Sector.
DOE 2005, Energy Data Directory, Department of Energy,Ministry of Economic Aff airs and The Energy Research Insti tute
DOE 2010, Integrated Energy Management Master Plan for Bhutan, Department of Energy,Ministry of Economic Aff airs and The Energy Research Insti tute
Dhitt al, D.B., Forest Resources Assessment (FRA), RGOB/FAO 2005
DOA, 2005, Field Report # 2006/01- Land Management Campaign.
Annexures
147
DOA, 2009. Highlights from 2007 to 2008, Department of Agriculture, June 2009.
Ferti lizer data from Druk Seed Corporati on, Paro Bhutan.
DOL 2007, Livestock Stati sti cs 2007, Department of Livestock, Ministry of Agriculture and Forests
MoA, RGoB, Master Plan for Forestry Development, 30 November 1991.
MoA, RGoB, Renewable-Natural Resources (RNR) Journal 2000,
Natural Resources Development Corporati on Limited, Informati on Booklet – 2007
Nature Conservati on Division 2009, Biodiversity Acti on Plan for Bhutan 2009, NCD, Ministry of Agriculture, Royal Government of Bhutan, Thimphu
NEC/ADB, 2011, NEC ADB TA to Build Capacity of NEC in Climate Change – Transport Miti gati on Report
Norbu, C. 2008. Inorganic Ferti lizer Distributi on trend in Bhutan-Aft er Privati zati on. In Journal of RNR Bhutan,Vol 4. No.1.
LCMP 2010, Bhutan Land Cover Assessment 2010, Land Cover Mapping Project, Nati onal Soil Services Center and Policy and Planning Division, Ministry of Agriculture and Forests,
PPD, MoA, RGoB, Bhutan Land Cover Assessment 2005 – Summary
RGOB 10thFive Year Plan Document, 2008
Rice in Bhutan – A Source Book, 2008, CoRRB, MoA
RNR Census 2000, Ministry of Agriculture and Forests, Royal Government of Bhutan
RNR Census 2002, Ministry of Agriculture and Forests, Royal Government of Bhutan
RNR-RC,Bajo. 2000. Eff ects of farm yard manure, ferti lizers and green manuring in rice-wheat system in Bhutan- results from a long term experiment. Technical Paper. 34pp.
Road Safety and Transport authority, Surface Transport Master Plan for Bhutan 2007
W. Schindele, Altusried, Forest Resources Potenti al Assessment (FRPA) for Bhutan. RGOB/FAO March 2004
Chapter 4: Vulnerability and Adaptati on
Climate Scenarios
B. Singh, A. El Fouladi, K. Délusca and R. Cissokho (2011). Technical Report on the V&A Chapter of the Second Nati onal Communicati ons of Bhutan. Vol. 1, 262 p.
IPCC (1990). First Assessment Report (FAR): Working Group Reports – Vol. 1; Vol. 2 and Vol. 3.
IPCC (1995). Second Assessment Report (SAR): Working Group Reports – Vol. 1; Vol. 2 and Vol. 3.
IPCC (2001). Third Assessment Report (TAR): Working Group Reports – Vol. 1; Vol. 2 and Vol. 3.
IPCC (2007). Climate Change 2007: Working Group Reports – Vol. 1; Vol. 2 and Vol. 3.
NTG-Biodiversity 2011, Nati onal Themati c Group for Biodiversity, Nati onal Road Map for Biodiversity Persistence and Climate Change 2012-2021- Bhutan, Nati onal Themati c Paper for the Climate Summit for a Living Himalayas- Bhutan 2011
Pope, V., M.L. Gallani, P.R. Rowntree, R.A. Stratt on, (2000). The impact of new physical parameterizati ons in the Hadley Centre climate model: HadAM3. Clim. Dyn., 16, 123-146.
Roeckner, E., R. Brokopf, M. Esch, M. Giorgett a, S. Hagemann, L. Kornblueh, E. Manzini, U. Schlese, and U. Schulzweida, Sensiti vity of simulated climate to horizontal and verti cal resoluti on in the ECHAM5 atmosphere model, J. Climate, 19, 3771-3791, 2006.
Water Resources
NEC 2006, Nati onal Adaptati on Programme of Acti on for Bhutan
NTG-Water 2011, Nati onal Themati c Group Water,
Annexures
148
Nati onal Themati c Paper for Securing the Natural Freshwater Systems of the Bhutan Himalayas - Climate Change and Adaptati on measures on Water Resources in Bhutan 2012-2021- Bhutan 2011
IPCC, Climate Change 2007—Impacts, Adaptati on and Vulnerability, Contributi on of Working Group II to the FAR of the IPCC. (Cambridge University Press, New York, 2007)
Palmer, M. A., Reidy Liermann, C. A., Nilsson, C., Florke, M., Alcamo, J., et al. (2008). Climate change and the world’s river basins: anti cipati ng management opti ons. Fronti ers in Ecology and the Environment 6, 81–89. doi:10.1890/060148
Securing the Natural Freshwater Systems of the Bhutan Himalayas (November, 2011). Climate Change and Adaptati on measures on Water Resources in Bhutan, 45 p.
Water Resources Management Plan (WRMP) (2003) Final Report. Volumes A to D4.
Agriculture
NEC 2006, Nati onal Adaptati on Programme of Acti on for Bhutan
NTG-Food Security 2011, Nati onal Themati c Group for Food Security, Nati onal Road Map for Energy Security 2012-2021- Bhutan, Nati onal Themati c Paper for the Climate Summit for a Living Himalayas- Bhutan 2011
Hoogenboom G, Wilkens PW, Thornton PK, Jones JW, Hunt LA, Imamura DT (1999) Decision support system for agrotechnology transfer V3.5. p. 1-36. In Hoogenboom G, Wilkens PW, Tsuji GY (eds.) DSSAT version 4, University of Hawaii, Honolulu, HI (ISBN 1-886684-04-9).
Forests and Biodiversity
Biodiversity Acti on Plan (BAP), 2009. Ministry of Agriculture, Royal Government of Bhutan.
Campbell, A., Kapos, V., Scharlemann, J.P.W., Bubb, P., Chenery, A., Coad,L., Dickson, B., Doswald, N., Khan, M.S.I., Kershaw, F., and Rashid, M., 2009. Review of literature on the Links between
Biodiversity and Climate Change: Impacts, Adaptati on and Miti gati on. Secretariat of the Conventi on on Biological Diversity, Montreal. Technical Series No.42.
NTG-Biodiversity 2011, Nati onal Themati c Group for Biodiversity, Nati onal Road Map for Biodiversity Persistence and Climate Change 2012-2021- Bhutan, Nati onal Themati c Paper for the Climate Summit for a Living Himalayas- Bhutan 2011
Conventi on on Biological Diversity (CBD) Secretariat, 2009. Connecti ng Biodiversity and Climate change miti gati on and adaptati on; Report of the 2nd Adhoc Technical Expert Group on Biodiversity and Climate change, Montreal, Technical Series No. 41.
Emmanuel. W.R. and H.H. Shugart (1986). The Holdridge life-zone classifi cati on: climate change and the distributi on of terrestrial ecosystems. Climati c Change.
FAO. 1997. The state of the World’s Plant Geneti c Resources for Food and Agriculture, Rome, Italy, FAO.510 pp.
Fowler, C & Mooney, P., 1990. The threatened Gene: Food politi cs and the loss of geneti c diversity. Cambridge, UK. Lutworth Press.
Gitay, H., Suarez A., Watson, R.T., Dokken, D.J., (eds.), 2002. Intergovernmental Panel on Climate Change, Technical paper V.
Herzog, Sebasti an K., Rodney Martí nez, Peter M. Jørgensen, Holm Tiessen (Eds.) (2011). Climate Change and Biodiversity in the Tropical Andes .Inter-American Insti tute for Global Change Research (IAI) and Scienti fi cCommitt ee on Problems of the Environment (SCOPE), 348 pp.
Holdridge, L.R. (1947). Determinati on of world plant formati ons from simple climati c data. Science, Vol. 105: 367-368.
IPCC 2007. Climate Change 2007: Synthesis Report.
Jarvis, A., Lane,A., & Hijmans, R., 2008. The eff ect of climate change on crop wild relati ves. Agr.
Annexures
149
Ecosyst. Environ., 126; 13-23.
Ministry of Agriculture, Royal Government of Bhutan (2009). Bhutan-Biodiversity Acti on Plan 2009, 95 pp.
Nati onal Paper on Biodiversity Persistence and Climate Change (2011). RGOB, 49 p.
Wangda, P. & Ohsawa, M. 2010.Temperature and humidity as determinants of thetransiti on from dry pine to humid cloud forests in the Bhutan Himalaya. In L. A. Bruijnzeel et al. ed. Tropical Montane Cloud Forests: Internati onal Hydrology Series, Cambridge University Press. 156-163.
WWF & WCP, 2011, Climate Change Vulnerability Assessment of Wangchuck Centennial Park, Bhutan, WWF Bhutan and Wangchuck Centennial Park Bhutan
Energy
NEC 2006, Nati onal Adaptati on Programme of Acti on for Bhutan
NTG-Energy 2011, Nati onal Themati c Group for Energy, Nati onal Road Map for Energy Security 2012-2021- Bhutan, Nati onal Themati c Paper for the Climate Summit for a Living Himalayas- Bhutan 2011
SINGH, B. and R. TAILLEFER (1986). The eff ect of synopti c-scale advecti on on the performance of the Priestley-Taylor evaporati on formula. Boundary Layer Meteorology, Vol. 36, p. 267-282.
SINGH, B. (1987). The impacts of CO2-induced climate change on hydro-electric generati on potenti al in the James Bay Territory of Québec. IAHS Publicati on, No 168, p. 403-418.
Health
Climate Change and Adaptati on. Earthscan, London, UK, 384 p.
Gatrell, Anthony C. and Elliot, Susan J. (2009). Geographies of Health: an introducti on, 2nd Ed., Wiley-Blackwell, Chichester, West Sussex, UK, 282 p.
Haines, A., McMichael A.J. and Epstein P.R. (2000). Environment and health: 2. Global change and
health. Canadian Medical Associati on Journal, 163, 729-734.
Heslop-Thomas, C., Baily, W., Amarakoon, D., Chen, A., Rawlins, S., Chadee, D.D., Crosbourne, R., Owino, A., Polson, K., Rhoden, C., Stennet, R. and Taylor, M. (2008). Vulnerability to Dengue Fever in Jamaica. In: Leary N., Conde, C., Kulkarni J., Nyong, A. and Pulhin, J. (Eds.) (2009). Climate Change and Vulnerability. Earthscan, UK, 431 p.
Initi al Nati onal Communicati on (2002) of Bhutan (INC), 175 p.
IPCC (2007). Climate Change 2007: Working Group Reports – Vol. 1; Vol. 2 and Vol. 3.
Leary N., Adejuwon A., Barros V., Burton I., Kulkarni J. and Lasco R. (Eds.) (2008b). Climate Change and Adaptati on. Earthscan, London, UK, 384 p.
Leary N., Conde C., Kulkarni J., Nyong A. and Pulhin J. (Eds.) (2008a). Climate Change and Vulnerability. Earthscan, London, UK, 431 p.
Lindsay S. W. Birley, M.H. (1996). Climate change and malaria transmission. Annals of Tropical medicine and Parasitology, 90, 573-588.
Martens, P. (1996). Health and Climate Change; modeling the impacts of global warming and ozone depleti on, Earthscan Publicati on, London, UK.
World Health Organizati on (2010) www.who.int.
Glaciers and GLOF
Bajracharya, S.R., P.K. Mool and B.R. Shrestha (2008). Global Climate Change and Melti ng of Himalayan Glaciers. In: Ranade, P.S. (Ed.). Melti ng Glaciers and Rising Sea Levels: impacts and implicati ons, Hyderabad: ICFAI University Press, pp 28-46.
Beldring, Stein (Editor) (2011). Climate change impacts on the fl ow regimes of rivers in Bhutan and possible consequences for hydropower development. Norwegian Water Resources and Energy Directorate, Report no. 4 – 2011, 156 p.
ICIMOD and UNEP (2002). Inventory of Glaciers,
Annexures
150
Glacial Lakes and Glacial Lake Outburst Floods Monitoring and Early Warning Systems in the Hindu Kush - Himalayan Region: Bhutan.
Ives, J.D.,R. B. Shrestha and P. K. Mool (2010).Formati on of Glacial Lakes in the Hindu Kush-Himalayas and GLOF Risk Assessment. ICIMOD Report, 66 p.
Ministry of Home and Cultural Aff airs (MOHCA) (2006). Nati onal Disaster Risk Management
Framework: Reducing Disaster Risks for a Safe and Happy Bhutan, Royal Government of Bhutan.
Grabs, W. E. and J. Hanisch (1992). Objecti ves and Preventi on Methods for Glacier Lake Outburst Snow and Glacier Hydrology (Proceedings of the Kathmandu Symposium). Kathmandu, Nepal, IAHS.
Kaltenborn, B.P., C. Nellemann and I. I. Vistnes (Eds.) (2010). High Mountain Glaciers and Climate Change: challenges to human livelihoods and adaptati on. UNEP Report, 56 p.
Hausler, H. and D. Leber (1998). Raphstreng Tsho Outburst Flood Miti gatory Project (Lunana,
Northwestern Bhutan): Phase I. Vienna, Austria, Insti tute of Geology, University of Vienna: 33.
ICIMOD and EU (2007). The Snake and the River Don’t Run Straight: Local Knowledge on Disaster Preparedness in the Eastern Terai of Nepal.
Karma, T, K.S. Ghalley and U. Thinley (2008). Hazard zonati on for glacier lake outburst fl ood along Punatshang Chu from Khuruthang to Thamoyzinkha. (Y. Dorgi, Ed), DGM-NCAP Project (Oct 2006- May 2008).
Leber, D., H. Hauesler, et al. (2002). GLOF Miti gati on Project.
Richardson, S.D. and Reynolds, J.M. 2000. An overview of glacial hazards in the Himalayas. Quaternary Internati onal, 65-66, 31-47.
UNDP and EU (2008). An Analysis of Socio-economic Impact and risk Miti gati on and Preparedness Measures of GLOF Events in Bhutan:
a Case Study of Samdingkha, 62 p.
Vuichard, D. and M. Zimmerman (1986). The Langmoche Flash-Flood, Khumbu Himal, Nepal.
Mountain Research and Development 6(1): 5.
Watanabe, T., J. D. Ives, et al. (1994). “Rapid Growth of a Glacial Lake in Khumbu Himal, Himalaya: Prospects for a Catastrophic Flood.” Mountain Research and Development 14(4): 11.
Watanabe, T. and D. Rothacher (1996). Lugge Tsho Glacial Lake Outburst Flood, Bhutan Himalaya. Mountain Research and Development 16(1): 5.
Cross-cutti ng Issues
Gatrell, Anthony C. and Elliot, Susan J. (2009). Geographies of Health: an introducti on, 2nd Ed., Wiley-Blackwell, Chichester, West Sussex, UK, 282 p.
Haines, A., McMichael A.J. and Epstein P.R. (2000). Environment and health: 2. Global change and health. Canadian Medical Associati on Journal, 163, 729-734.
IPCC (2007). Climate Change 2007: Working Group Reports – Vol. 1; Vol. 2 and Vol. 3.
IPCC (2001). Third Assessment Report (TAR): Working Group Reports – Vol. 1; Vol. 2 and Vol. 3.
IPCC (1995). Second Assessment Report (SAR): Working Group Reports – Vol. 1; Vol. 2 and Vol. 3.
IPCC (1990). First Assessment Report (FAR): Working Group Reports – Vol. 1; Vol. 2 and Vol. 3.
Leary N., Conde C., Kulkarni J., Nyong A. and Pulhin J. (Eds.) (2008a). Climate Change and Vulnerability. Earthscan, London, UK, 431 p.
Leary N., Adejuwon A., Barros V., Burton I., Kulkarni J. and Lasco R. (Eds.) (2008b). Climate Change and Adaptati on. Earthscan, London, UK, 384 p.
Lindsay S. W. Birley, M.H. (1996). Climate change and malaria transmission. Annals of Tropical medicine and Parasitology, 90, 573-588.
Martens, P. (1996). Health and Climate Change;
Annexures
151
modeling the impacts of global warming and ozone depleti on, Earthscan Publicati on, London, UK.
World Health Organizati on (2010). htt p://www.who.int.
Chapter 5: Other Informati on
Capacity Development for Gross Nati onal Happiness, A Vision for Local Government in Bhutan. Discussion Paper – June 2010
Capacity Development Technical Assistance (CDTA) December 2009. Kingdom of Bhutan: Capacity Building of the Nati onal Environment Commission in Climate Change
Climate Change Screening of Danish Development Cooperati on with Bhutan Danida, June 2008
GHG Inventory 2000, Bhutan Nati onal Greenhouse Gas Project
JSP 2011, “Capacity Development Assessment of Training and Educati onal Insti tutes in the Area of Environment-Climate Change-Poverty Mainstreaming”, Joint Support Program on Capacity Development for Mainstreaming Environment, Climate Change and Poverty Concerns in Policies, Plans and Programs,
NTG-Biodiversity 2011, Nati onal Themati c Group for Biodiversity, Nati onal Road Map for Biodiversity Persistence and Climate Change 2012-2021- Bhutan, Nati onal Themati c Paper for the Climate Summit for a Living Himalayas- Bhutan 2011
NTG-Energy 2011, Nati onal Themati c Group for Energy, Nati onal Road Map for Energy Security 2012-2021- Bhutan, Nati onal Themati c Paper for the Climate Summit for a Living Himalayas- Bhutan 2011
NTG-Food Security 2011, Nati onal Themati c Group for Food Security, Nati onal Road Map for Energy Security 2012-2021- Bhutan, Nati onal Themati c Paper for the Climate Summit for a Living Himalayas- Bhutan 2011 (draft )
NTG-Water 2011,Nati onal Themati c Group Water, Nati onal Themati c Paper for Securing the Natural Freshwater Systems of the Bhutan Himalayas- Climate Change and Adaptati on measures on Water Resources in Bhutan 2012-2021- Bhutan 2011
Royal Government of Bhutan, 2000 Initi al Nati onal Communicati on under the UNFCC, November 2000
Annexures
Nat ional Environment CommissionRoyal Government of Bhutan
Kingdom of Bhutan
Second Nat ional Communicat ionto the UNFCCC
༄ ། །དཔལ་ལ ན་འབ ག་པ་ཕ གས་ལས་ར
མ་ར ལ།།
༄ །
།ར ལ་ཡ
ངས་མཐའ་འཁ ར་གནས་ས ངས་ལ ན་ཚ གས།
N
ational Environment Commissio
n
Kingdom of Bhutan - Second N
at ional Com
municat
ion to the UN
FCCC
Nat ional Environment CommissionRoyal Government of Bhutan
P.O. Box 466, Thimphu, Bhutanwww.nec.gov.bt
ISBN : 978-99936-865-0-7
༄ །
།ར ལ་ཡ
ངས་མཐའ་འཁ ར་གནས་ས ངས་ལ ན་ཚ གས།
N
ational Environment Commissio
n