Embed Size (px)
Citation preview
Use of freshwater resources in Europe(Supplementary document to the draft indicator sheet CSI018)
Draft ETC/ICM Technical Report
Prepared/compiled by: Nihat Zal
EEA
and
George Bariamis, Alexandros Zachos,Dimitris Panagos, Ioannis Konstantinou,
Evangelos Baltas, Maria Mimikou Organisation:
ETC/ICM-NTUA
EEA project manager:Nihat Zal

Cover photo: © Lake Plastiras Greece, George Bariamis, NTUA
Important note
This draft Technical Report is a supplementary document to the draft indicator sheet of CSI 018, which is the main formal document for the EIONET consultation. The countries are expected to provide the comments only on the draft indicator sheet, but not necessarily to this report. This report should be regarded as documentation on all the results along with the databases and tools in a way to enable the consultation for the updating CSI 018 in order to be more transparent with the relevant data providers and cooperation partners, i.e. Member States and EU level Partners DG ENV, Eurostat and the European Commission Joint Research Centre (JRC). By the end of EIONET consultation, the report will take stock from the EIONET consultation feedback and will be published as ETC/ICM Technical Report in 2016.
This is the third version of the EEA report on the outcomes of the analyses of the Use of Freshwater Resources (Water Exploitation Index-WEI) and Water Assets Accounts. The first version of the report was circulated to the EEA Member Countries on 6th of March 20151 with the purpose of updating the EEA indicator on the Use of Freshwater Resources (CSI 018/WAT01). Furthermore, the results have been presented to and discussed with the members of the CIS WG WA in Brussels in March 2015 WG Water Statistics in Luxembourg, in April 2015. Following the WG Water Statistics Meeting held by Eurostat, the report had been revised and the second version was made available by Eurostat to the National Statistical Offices2. Since then, EEA has received written comments from Estonian and Maltese Statistical and Environmental organizations including individual expert comments from Jürgen Förster (Eurostat) and Rudy Vannevel (Belgium).
Meanwhile, the EEA has updated the water accounts production database by means of better integration of the SoE water quantity data and new streamflow data provisions from the European Commission Joint Research Centre. Water use data has also been updated via the various Eurostat datasets for industry, population and tourism.
The third version of the report is the final version revised based on the new results, as well as, on comments received. The purpose of this report is to provide detailed information on all data sources, method and procedures implemented in the computation of the Water Exploitation Index. This document is providing the transparency and traceability between source data and the final production.
The report is attached to the draft indicator sheet as a supplementary of the data sources and methodology for updating the CSI 018. It is expected that the EEA member countries and cooperative countries would provide comments to the “Draft CSI 018 Indicator Sheet” and may use this report in the case further clarifications would be needed, but not necessarily comment to this report.
Some key points relevant to the respective chapters are also provided as text box throughout the report for those who may want only to see the fundamental approaches in data acquisition, processing and methodological implementation. Two annexes are incorporated into the report. Annex-I clarifies all technical procedures on the data used in the estimating of the renewable water resources. Annex-II is for the water use data processing. If readers would like to see all clarifications on data processing, it is recommended that they read Annex-I and II.
1 European Water Assets Accounts and updating the use of freshwater resources indicator (CSI018)2 Eurostat’s Working Group on Water Statistics (23-24 April 2015)
Contents1 Introduction..........................................................................................11
1.1 Updating the Use of Freshwater Resources Indicator (CSI 018).....121.2 Overview on the conceptual understanding of renewable water
resources and water consumption.....................................................121.2.1 Regionalized Water Exploitation Index (WEI+)......................................121.2.2 Pressure analysis and UN SEEA – Water accounting framework.........141.2.3 Thresholds for the Water Exploitation Index..........................................16
2 Data and uncertainties.........................................................................182.1 EEA Water Accounts Production Database......................................182.2 Data and methodology uncertainties.................................................20
3 Water availability and consumption...................................................223.1 Renewable water resources of Europe..............................................223.2 Water use in Europe............................................................................233.3 Pressures on the renewable water resources...................................26
4 Water Exploitation Index across Europe...........................................29
5 Conclusions.........................................................................................395.1 Water resources and use in Europe...................................................395.2 Issues to resolve in future EEA water accounting work..................39
5.2.1 Uncertainties with the implementation of WEI+ formulas.......................395.2.2 Data Uncertainties.................................................................................405.2.3 Tools, applications and further data improvements...............................40
6 Annex I – Data for renewable water resources..................................416.1.1 Spatial Data...........................................................................................416.1.2 Data for water availability.......................................................................41
7 Annex II – Data for water use..............................................................497.1.1 Update of data on the population of Large Cities...................................497.1.2 Update of tourism data...........................................................................507.1.3 Industrial data updates...........................................................................517.1.4 UWWTP database updates....................................................................527.1.5 Updating Water Use Coefficients...........................................................537.1.6 Modulation Coefficients Update.............................................................60
8 References............................................................................................66
4 Use of Freshwater Resources in Europe
List of Acronyms
BAT Best available techniquesBREF BAT reference documentCIS Common Implementation StrategyCSI Core Set of Indicators (EEA’s indicators system)CTY Country (spatial scale)DG ENV Directorate-General for Environment (European Commission department)ECRINS European Catchments and Rivers Network SystemEEA European Environment AgencyE-PRTR European Pollutant Release and Transfer RegisterETC/ICM European Topic Centre on Inland, Coastal and Marine watersEU European UnionFD Floods DirectiveFEC Functional Elementary Catchment (ECRINS spatial reference scale)FRBD Functional River Basin District (ECRINS spatial reference scale)IRWS International Recommendations for Water StatisticsISIC International Standard Industrial ClassificationJRC Joint Research Centre LISFLOOD GIS based distributed model for river basin scale water balance & flood
simulation developed by JRCNACE Nomenclature Générale des Activités Économiques dans les Communautés
Européennes (EU classification system)Nopolu Water accounts application developed by NaldeoNUTS Nomenclature of Territorial Units for Statistics (Eurostat’s geocode standard)Q1-Q4 The four quarters of the calendar yearRBD River Basin District (Water Framework Directive)SB Sub-basin (ECRINS spatial reference scale)SEEA-CF System of Environmental Economic Accounting – Central FrameworkSEEA-W System of Environmental Economic Accounting – Water SoE State of Environment dataflowTWG Technical working groupUMZ Urban Morphological ZonesUWWTP Urban waste water treatment plantWA Water AccountsWAT EEA’s water indicatorsWEI(+) Water Exploitation Index (plus)WFD Water Framework DirectiveWG Working Group
Use of Freshwater Resources in Europe 5
AcknowledgementsThe Report on the European Water Assets Accounts was supervised by Beate Werner, Head of Water Group (EEA);
It was written and compiled by European Environment Agency (EEA):
Nihat Zal
European Topic Centre – Inland Coastal and Marine Waters (ETC/ICM):
George Bariamis, Alexandros Zachos, Dimitris Panagos, Ioannis Konstantinou, Evangelos Baltas, Maria Mimikou
Further contributions were received from;
Guillaume Le Gall (Naldeo), Philippe Crouzet (Naldeo), Blaz Kurnik (EEA), Daniel Desaulty (EEA) and Wouter Vanneuville (EEA)
6 Use of Freshwater Resources in Europe
SummaryUse of freshwater resources (CSI 018 alternatively Water Exploitation Index plus, WEI+) is one of the core indicators implemented by EEA for identifying water stress prone areas and the water use pressures over the renewable water resources. This indicator is regularly updated by means of data deliveries under the SoE data flows from the EEA member countries and cooperation countries together with several data sets obtained from cooperation partners i.e. DG ENV, Eurostat and the European Commission Joint Research Centre (JRC). The latest update of the CSI 018 was in 2010 comparing country scale of multi-annual average of water exploitation index for the 1990s and 2007. The current update of CSI 018 has developed a baseline as a building block to the previous EEA works (European Environment Agency, 2012b, 2012a, 2013) covering almost all functional river basin districts - FRBDs (namely without political boundaries of the countries, FRBDs) and sub-basins (SB) of EEA member countries for the years 2002-2012 on monthly resolution.
This report is a supplementary document to the CSI 018 indicator sheet, which is the main formal document to be communicated in EIONET for consultation. The countries are expected to provide the comments only on the indicator sheet, but not necessarily to this report. This report should be regarded as a documentation on all the results along with the databases and tools in a way to enable the consultation for the updating of CSI 018 to be more transparent with the relevant data providers and cooperation partners, i.e. Member States and EU level Partners DG ENV, Eurostat and the European Commission Joint Research Centre (JRC).
The report has been organized into five main chapters. The first chapter is about the conceptual issues while the second chapter outlines data related topics. The third and fourth chapters are mainly discussing the results of water stress and pressures over the water resources. The last chapter provides information on the future directions. In addition to these main chapters, two annexes have been introduced for detailed clarifications on data integration and updates.
Renewable water resources, which is the denominator of the Water Exploitation Index, can be calculated with two different formulas endorsed by the water directors in 2012. The first formula is containing climatic and hydrological parameters which are mainly applicable for pristine areas, while the second formula searching for relations between human intervention and output from the hydrological territory. The report introduces the results of formula 2 as it is adopted of a non-existence of pristine sub-basins (SBs) or functional river basin districts (FRBDs). Meanwhile, the results of formula 1 have also been produced only for the comparison purposes between those two formulas.
As the data sources and the details of the methodology are subject for consultation now, these are the following interpretations of the obtained results:
Assessment of WEI+ at ECRINS sub-basin (SB) scale on monthly/seasonal resolutions revealed that the freshwater systems are under pressure especially in the Mediterranean region due to high irrigation water abstraction in summer months, while the rest of Europe experiences lower water stress by other economic sectors, such as water collection treatment and supply, energy and industries. In addition to the Mediterranean region, particularly those
Use of Freshwater Resources in Europe 7
sub-basins having a high population density illustrate also prone conditions to the water stress.
From the environmental perspective, high water abstractions overlap with low renewal of water resources particularly in summer months, which create partly additional stress over the freshwater resources.
As water availability is a regional phenomenon, spatial aggregation of the parameters involved with water stress (e.g. from sub-basin to country scale) is prone to hide the real conditions in the respective less aggregated areas. In this sense, the report also verifies the findings in the previous studies on regionalized WEI. Sectorial share of water abstraction and use is very crucial information for the policy makers and stakeholders in assessing water resources efficiency and implementing the measures to tackle environmental concerns including the role of water resources as part of our total natural capital.
The share of total water abstraction between surface and ground water resources is respectively 65% and 35% across Europe. Rivers are meeting around 46% of total water demand followed by the groundwater resources (35%). Water abstraction is doubled during the 3rd quarter compared to 1st quarter of this year. Reservoirs play quite a signifcant role in meeting the water demand during the summer months. Water is abstracted from the reservoirs 300 % more in summer compared to winter.
In Europe, almost 70% of total water is used by agriculture, forestry and fishing (36 %), water collection, treatment and supply (32 %), followed by electricity3, gas and steam and air conditioning supply (17%). Water used for hydropower production is regarded as non-consumptive in-situ use and current water accounts database do not have such kinds of information. But abstracting water for electricity production alters the hydrological regime in rivers and lakes, increases also the water temperature during the cooling process.
Water use by agriculture, forestry and fishing. Almost 36% of total water use goes to agricultural activities across Europe. Mediterranean region consumes solely almost 75% of that volume of water in irrigation. This rate reaches up 94% in winter and 70% in summer seasons as the total share of agricultural activities across the biogeographical regions change in the summer season. Mediterranean region is followed by Continental (14%) and Atlantic (5%) biogeographical regions.
Water use in irrigation shows also great seasonal variations. Around 94% of total water use for irrigation is abstracted during spring (33%) and summer (61%). Despite 22 % decrease occurred in water abstraction for agriculture since 1990s, still agriculture is the highest water demanding sector.
Abstraction for water collection, treatment and supply. According to the NACE classification water collection, treatment and supply represents volume of water used for public water supply. Public water supply is the second largest sector (32%) after agriculture. Public water supply illustrates water stressed conditions driven mainly by population density and economic activities.
3 ISIC Rev.4:This section includes the operation of electric and gas utilities, which generate, controland distribute electric power or gas. Also included is the provision of steam and air-conditioningsupply. This section excludes the operation of water and sewerage utilities. This section alsoexcludes the (typically long-distance) transport of gas through pipelines.”
8 Use of Freshwater Resources in Europe
Atlantic (31%) and Continental (30%) biogeographic regions use almost 60% of total water collection treatment and supply in Europe. Mediterranean region is the third region (26%) following those regions. There is more or less a steady condition in terms of water use by public water supply throughout the year with a slight increase (3%) in summer compared to winter. Water supply sector presents a -5% decrease in total water consumption through the period of analysis.
An average European citizen uses 36 m3 of water from the renewable freshwater resources within a year. This corresponds approximately 98 litre of water per-capita/day. This volume excludes recycled, reused and desalinated water.
The highest water use per capita for the water collection treatment and supply is estimated for the Mediterranean region with 133 litre/capita/day. Alpine (123 litre/capita/day) and Atlantic (120 litre/capita/day) just followed by the Mediterranean. Less water use per capita are estimated 72 litre/day for Continental and 34 litre/day Pannonian region.
Water use per-capita fluctuates little throughout the year with slight increase in summer and decrease in winter.
The annual net water use per capita is estimated at about 114 m3/year which corresponds to approximately 310 liters net water consumption per capita/day across Europe. This amount of water is used for all economic sectors, in hygien and social activities. Thus, it doesn’t mean the actual amount of water consumed by each person of the European inhabitants.
Water use for the service industry. According to the NACE codes for the service industry represented by “Category I” where water is used for accommodation, food and other similar services. The share of water use for the service sector is estimated approximately at 11% in Europe. Due to a high number of visitors in tourism activities across Europe, water use by tourism has a significant impact on the general overview of water use by the service sector. Around 85% of total water use by the service sector is occurring in the Atlantic (38%), Continental (29%) and in the Mediterranean (19 %) regions.
Seasonal water use by the service sector indicates winter share as the highest proportion of water (28%) compared to summer (23%). Apart from this general overview, tourism particularly in the Mediterranean islands has a great impact over water use by the service sector. The average number of tourists received in the Mediterranean islands is almost 17 times more tourists than their local residents. Almost 27% of total water use by the service sector is consumed in the summer months in the Mediterranean islands followed by 26% in the winter.
Water abstraction for energy production. Water abstraction for electricy production (hydropower or cooling) is not regareded as consumptive use of water resources. Approximately 17% of total freshwater water abstraction is Europe is accounted for electricty production. Almost 65% of total water abstraction for electricty production is used in the Continental region followed by Atlantic (15%) and Mediterrannean (13%). Winter months record the highest water abstraction rate (28%) for electricty production compared while in summer this rate decreases to 21%.
Use of Freshwater Resources in Europe 9
Water is not only abstracted from the freshwater resources for producing the electricty. Coastal and transitional water resources are also used for cooling purposes. Around 25% of total water abstraction for electricity production is met from brakish and salt water.
Water use for mining, quarrying, manufacturing and construction. Total water use by mining, quarrying, manufacturing and construction counts for 4% of total freshwater use in Europe. Continental region consumes 35% of water used for mining and quarrying. This region is followed by the Mediterranean (28%), Boreal (17%) and Atlantic (14%) biogeographical regions. Seasonal conditions in water use by these sectors are showing quite steady trends between summer and winter.
Change in water abstraction. For comparability reasons, a check has been made with annual freshwater abstractions in country scale from Eurostat data4. There is a tendency of decreasing in water abstraction for some economic sectors across Europe since 1990s. Based on current available datasets, the industry sector has improved resource efficiency and registered the most significant decrease (28 %) in water abstractions since 1990s. This sector is followed by Agriculture where a 17 % decrease occurred since 1990s; still agriculture is the highest water demanding sector.
A significant increase with water abstraction for agriculture has been observed in Turkey between 1990s and 2013. During that time the water abstraction for agriculture increased around 140 % in Turkey. Water abstraction for electricity has been decreased by 14 % since 1990s and indicate more or less constant trend as of 2000s.
Little improvement has been obtained in water abstraction for public supply. Only 5 % decrease happened since 1990s. Significant decrease in public water supply occur in the eastern and western part of Europe, while public water supply has increased in the south, West Balkans and Turkey. This might be related to the improvements in the water supply network.
During 2002-2012 the number of tourists has increased around 30% across Europe. Water use for the service sector has steadily increased (7%) between 2002 and 2008. However during the last 3 years (2010-2012) a decrease (1.5%) is observed in water use for the service sector.
It has to be also underlined that the results obtained by this study should be treated as an estimation of the regional statuses and not as a replacement to the local authorities/institutions and more detailed ones. The main target of having the WEI+ at the European scale is to provide information on state of the art and trend at the European scale in the context of water scarcity and pressures. Last but not least, it also has to be mentioned that, Water Exploitation Index highly depends on data quality and availability. Future developments towards a robust common knowledge base can only be possible in the case spatial and temporal coverage of water quantity data would be further improved.
4 Annual freshwater abstraction by source and sector, [env_wat_abs] dataset; Last update: 08-10-2015
10 Use of Freshwater Resources in Europe
1 Introduction
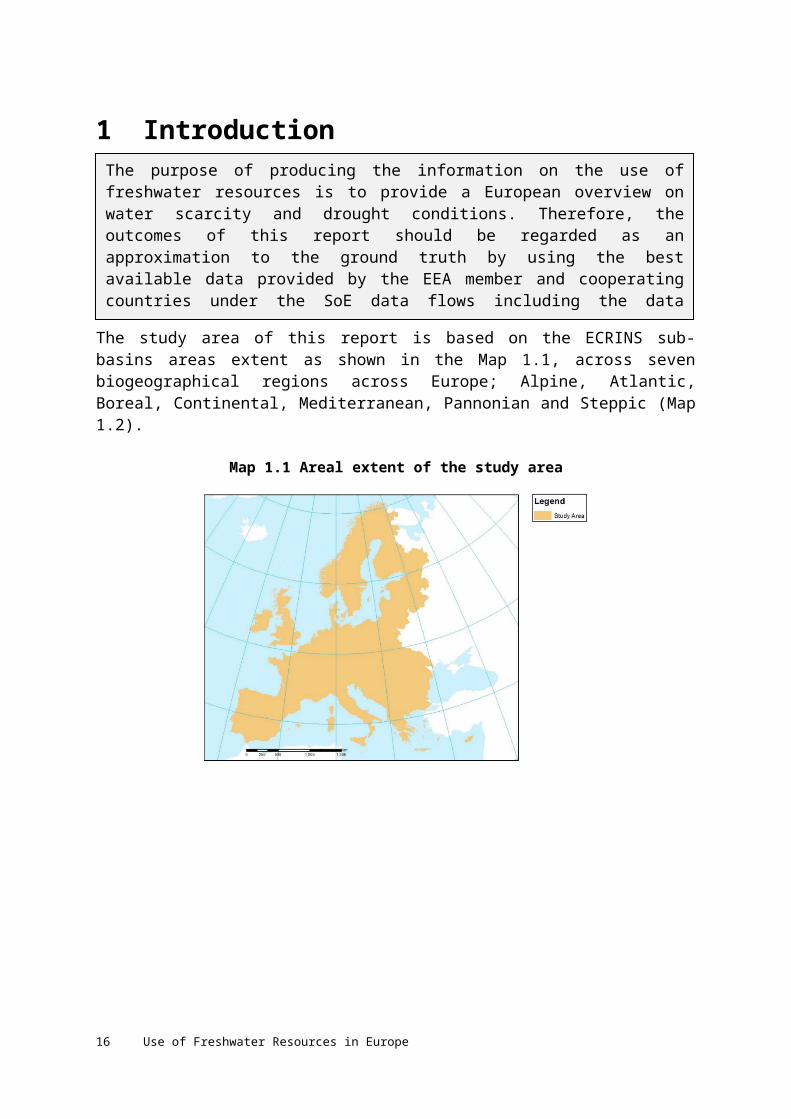
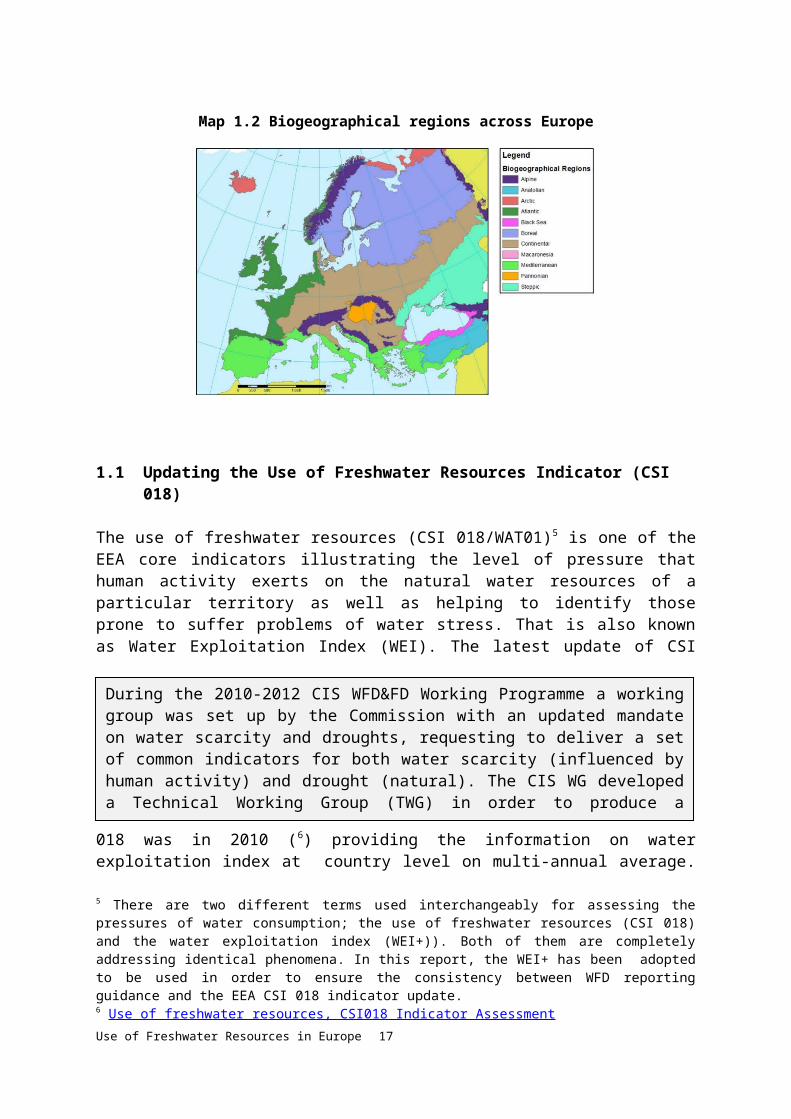
The study area of this report is based on the ECRINS sub-basins areas extent as shown in the Map 1.1, across seven biogeographical regions across Europe; Alpine, Atlantic, Boreal, Continental, Mediterranean, Pannonian and Steppic (Map 1.2).
Map 1.1 Areal extent of the study area
Map 1.2 Biogeographical regions across Europe
The purpose of producing the information on the use of freshwater resources is to provide a European overview on water scarcity and drought conditions. Therefore, the outcomes of this report should be regarded as an approximation to the ground truth by using the best available data provided by the EEA member and cooperating countries under the SoE data flows including the data provisions from the cooperating partners i.e. the European Commission, Eurostat and the EC Joint Research Centre. The report does not aim at producing the information with such scope and content on water scarcity and drought conditions that can directly be translated into the implementation at the local scale.
Use of Freshwater Resources in Europe 11
1.1 Updating the Use of Freshwater Resources Indicator (CSI 018)
The use of freshwater resources (CSI 018/WAT01)5 is one of the EEA core indicators illustrating the level of pressure that human activity exerts on the natural water resources of a particular territory as well as helping to identify those prone to suffer problems of water stress. That is also known as Water Exploitation Index (WEI). The latest update of CSI 018 was in 2010 (6) providing the information on water exploitation index at country level on multi-annual average. The new update aims to provide a consistent baseline among the EEA member countries for the years 2002-2012.
The previous works of the EEA since 2008 (Kossida M. et al., 2009; EEA ETC/ICM, 2012; European Environment Agency, 2012b, 2013; Agence européenne pour l’environnement, 2012) as well as the outcomes of the CIS WG Water Scarcity and Drought have strongly recommended that the WEI should be developed at finer scales than at country level on seasonal or monthly time resolution in order to better represent the problem of water scarcity. The new EEA Water Exploitation Index calculation has been formed according to these recommendations and provides the results at the sub-basin scale on monthly resolution with aggregation to the functional river basin on seasonal or annual resolution. With that structure and content, the new WEI is known as the “Regionalized Water Exploitation Index” or WEI+.
1.2 Overview on the conceptual understanding of renewable water resources and water consumption
1.2.1 Regionalized Water Exploitation Index (WEI+)
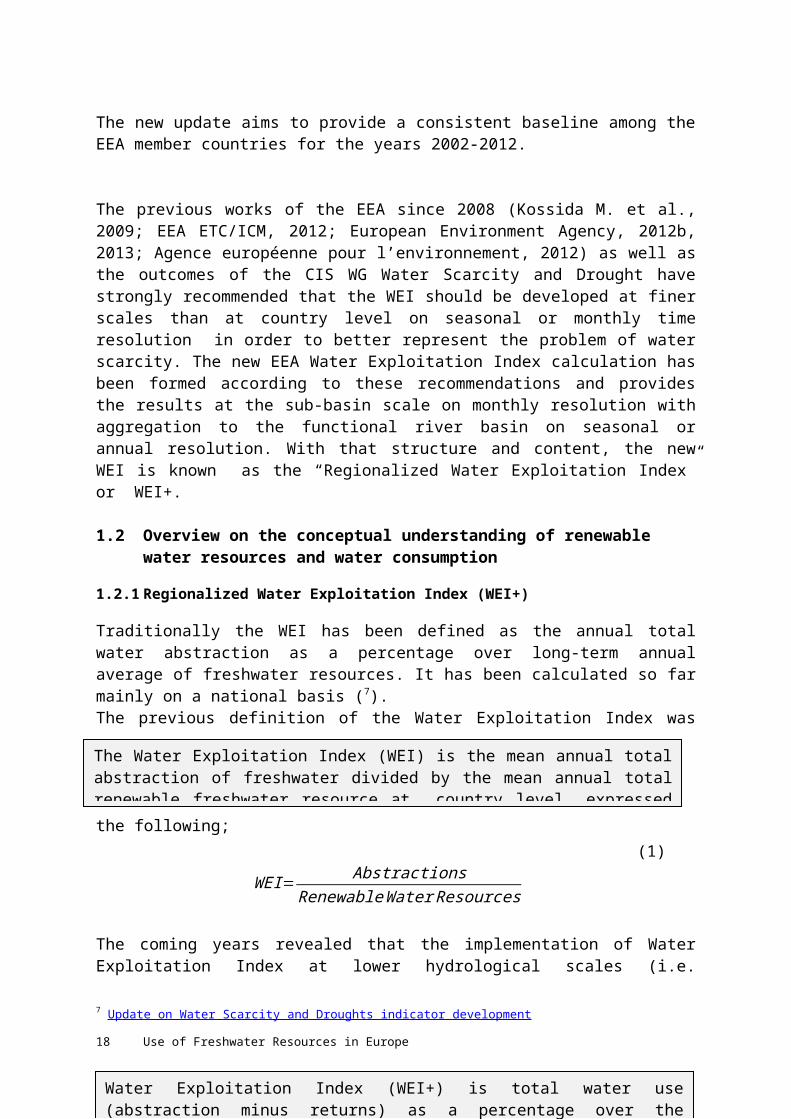
Traditionally the WEI has been defined as the annual total water abstraction as a percentage over long-term annual average of freshwater resources. It has been calculated so far mainly on a national basis (7). The previous definition of the Water Exploitation Index was the following;
(1)
5 There are two different terms used interchangeably for assessing the pressures of water consumption; the use of freshwater resources (CSI 018) and the water exploitation index (WEI+)). Both of them are completely addressing identical phenomena. In this report, the WEI+ has been adopted to be used in order to ensure the consistency between WFD reporting guidance and the EEA CSI 018 indicator update. 6 Use of freshwater resources, CSI018 Indicator Assessment 7 Update on Water Scarcity and Droughts indicator development
The Water Exploitation Index (WEI) is the mean annual total abstraction of freshwater divided by the mean annual total renewable freshwater resource at country level, expressed in percentage terms.
During the 2010-2012 CIS WFD&FD Working Programme a working group was set up by the Commission with an updated mandate on water scarcity and droughts, requesting to deliver a set of common indicators for both water scarcity (influenced by human activity) and drought (natural). The CIS WG developed a Technical Working Group (TWG) in order to produce a proposal on implementing the WEI. The TWG has proposed two different formulas for estimating the Renewable Water Resources. Later that proposal was endorsed by the Water Directors in 2012.
12 Use of Freshwater Resources in Europe
WEI= AbstractionsRenewable Water Resources
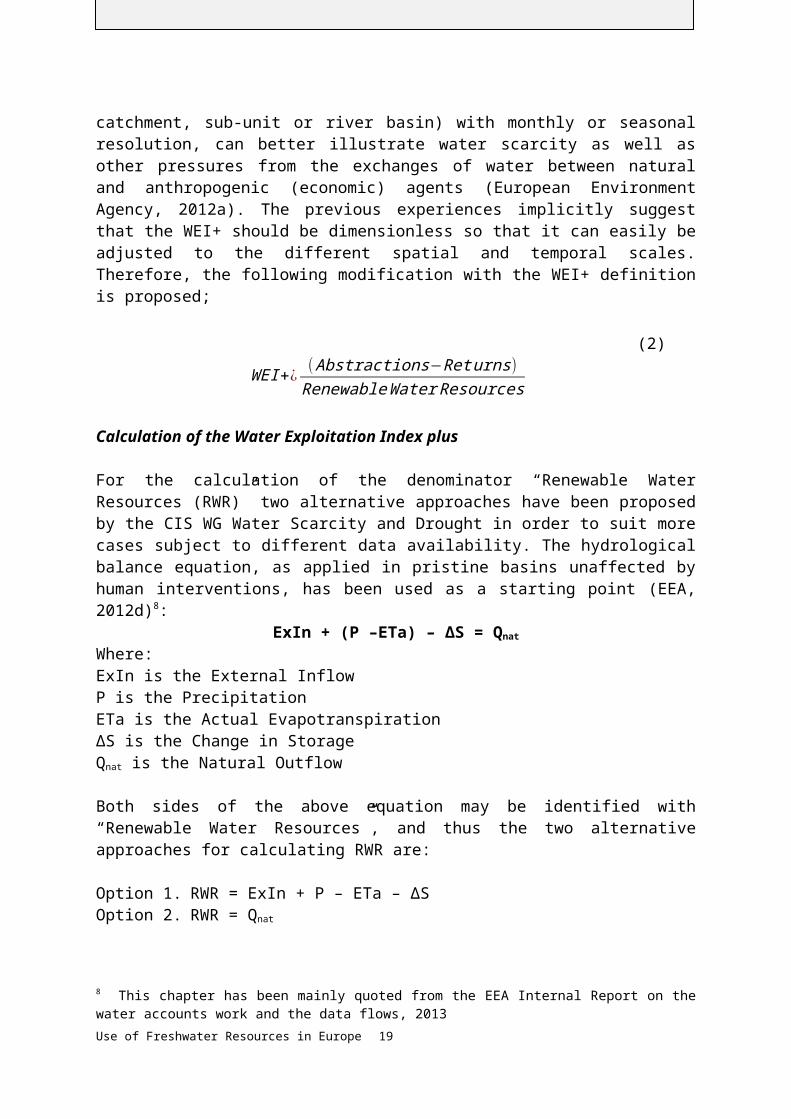
The coming years revealed that the implementation of Water Exploitation Index at lower hydrological scales (i.e. catchment, sub-unit or river basin) with monthly or seasonal resolution, can better illustrate water scarcity as well as other pressures from the exchanges of water between natural and anthropogenic (economic) agents (European Environment Agency, 2012a). The previous experiences implicitly suggest that the WEI+ should be dimensionless so that it can easily be adjusted to the different spatial and temporal scales. Therefore, the following modification with the WEI+ definition is proposed;
WEI +¿( Abstractions−Ret urns)
Renewable Water Resources
(2)
Calculation of the Water Exploitation Index plus
For the calculation of the denominator “Renewable Water Resources (RWR)” two alternative approaches have been proposed by the CIS WG Water Scarcity and Drought in order to suit more cases subject to different data availability. The hydrological balance equation, as applied in pristine basins unaffected by human interventions, has been used as a starting point (EEA, 2012d)8:
ExIn + (P –ETa) – ΔS = Qnat
Where: ExIn is the External InflowP is the PrecipitationETa is the Actual EvapotranspirationΔS is the Change in StorageQnat is the Natural Outflow
Both sides of the above equation may be identified with “Renewable Water Resources”, and thus the two alternative approaches for calculating RWR are:
Option 1. RWR = ExIn + P – ETa – ΔSOption 2. RWR = Qnat
Consequently, when applied in basins with human alterations, the observed outflow does not in fact equal RWR. For option 2, a flow re-naturalization is thus necessary. This correction can be made by restoring the consumption (abstractions – returns) and flow alteration linked with management, which may be approached by adding the variation in artificial storage:
Option 1. RWR = ExIn + P – ETa – ΔSnat
Option 2. RWR = Outflow + (Abstraction – Return) – ΔSart
8 This chapter has been mainly quoted from the EEA Internal Report on the water accounts work and the data flows, 2013
Water Exploitation Index (WEI+) is total water use (abstraction minus returns) as a percentage over the renewable freshwater resources in a given territory and time scale.
Use of Freshwater Resources in Europe 13
It has been identified by the CIS TWG that both approaches present certain limitations. There are practical difficulties in incorporating the variation of natural storage (ΔSnat) in option 1. In case this is neglected, the (P-ETa) at the monthly scale can render negative values. The calculation of the ΔSnat most often requires hydrological modeling and is not a parameter to be obtained for measurements as such. With regards to option 2, the outflow should consider both surface and groundwater. In case of systems that are not groundwater dominated, one could assume that the surface outflow (i.e. streamflow at the outlet), which in fact includes base flow, is representative enough. Yet, it is to be emphasized that in the case of non-pristine sites, where water abstraction is influencing the system, the observed streamflow does not represent the RWR. The necessary in these cases “naturalization” of the streamflow is a challenging process, especially in complex water systems on a monthly basis. In case that a part of the water stored in the artificial reservoirs comes from a transfer (as opposed to generated within the territory of reference) or from a desalination plant, then the ΔSart needs to be carefully considered and corrected for the effect of these alternative water resources (i.e. water transfers, desalination). Water uses analysis in this study excludes sea water due to lack of information whether the water is used for cooling or desalination purposes.
Water use can be calculated by extracting returns from the water abstractions (Abstractions-Returns). Despite quite straight forward definition, there would be a time lag between water abstractions and returns on a monthly scale that may cause returns that would be greater than abstractions.
1.2.2 Pressure analysis and UN SEEA – Water accounting framework
While the Water Exploitation Index is an indicator for analyzing the water scarcity and drought conditions, further supplementary information is needed for better illustrating pressures of water consumption by economic sectors. Water accounts is a way of organizing economic and hydrological information, enabling a consistent analysis of the contribution of water to the economy and of the impact of the economy on water resources (United Nations, 2012). Thus, Water Exploitation Index and Water Accounts are strongly interlinked and can be regarded as two building blocks of information which are helping in a better understanding of the water exchange between environment and economy.
The United Nations System of Environmental-Economic Accounting for Water (UN SEEA-W) is about estimating natural water assets and depletion in them due to human interventions for different purposes i.e. water consumption modifying the System of National Accounts (United Nations, 2012). Within this framework the water account is understood as a balance
The EEA Water Exploitation Index calculation involves only freshwater resources in estimating the renewable water resources, but excludes water transfers among the river basins and also desalinated water from the sea.
The current study arbitrary adopts that a one month time length is sufficiently enough to close the time lag between water abstractions and return regardless the spatial scale of the analysis.
The current study is following the UN SEEA Water Accounting Framework for assessing the water asset accounts and covering physical supply and use tables of the Flow accounts. Physical supply and use tables provide information for the pressure analysis.
14 Use of Freshwater Resources in Europe
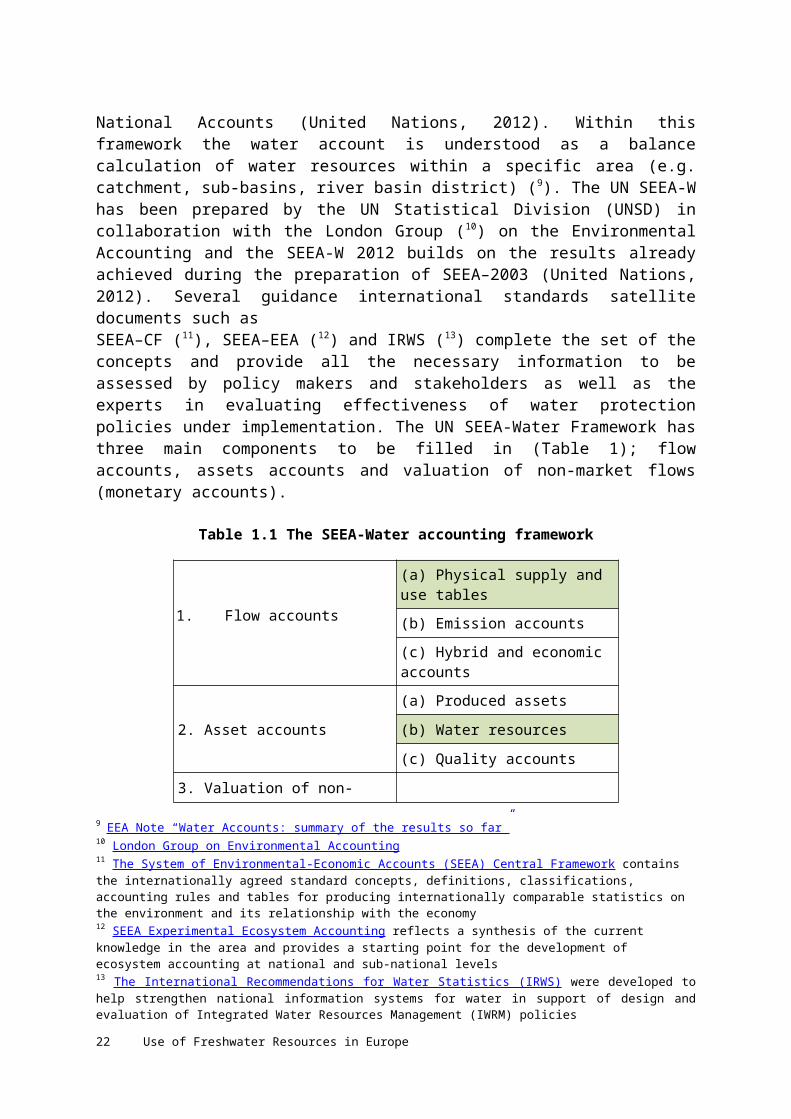
calculation of water resources within a specific area (e.g. catchment, sub-basins, river basin district) (9). The UN SEEA-W has been prepared by the UN Statistical Division (UNSD) in collaboration with the London Group (10) on the Environmental Accounting and the SEEA-W 2012 builds on the results already achieved during the preparation of SEEA–2003 (United Nations, 2012). Several guidance international standards satellite documents such as SEEA–CF (11), SEEA–EEA (12) and IRWS (13) complete the set of the concepts and provide all the necessary information to be assessed by policy makers and stakeholders as well as the experts in evaluating effectiveness of water protection policies under implementation. The UN SEEA-Water Framework has three main components to be filled in (Table 1); flow accounts, assets accounts and valuation of non-market flows (monetary accounts).
Table 1.1 The SEEA-Water accounting framework
1.Flow accounts(a) Physical supply and use tables
(b) Emission accounts
(c) Hybrid and economic accounts
2. Asset accounts
(a) Produced assets
(b) Water resources
(c) Quality accounts
3. Valuation of non-market flowsNote: Green cells indicate the developed SEEA-W components in this study
The components of the UN SEEA-W covered in this study represent all water assets in the territory of reference for surface water, groundwater, soil water and natural flows among them including water exchange within the whole economy and its components (within the administrative and hydrological boundaries of accounting) at catchment scale further aggregated to sub-basin, river basin and country scales.
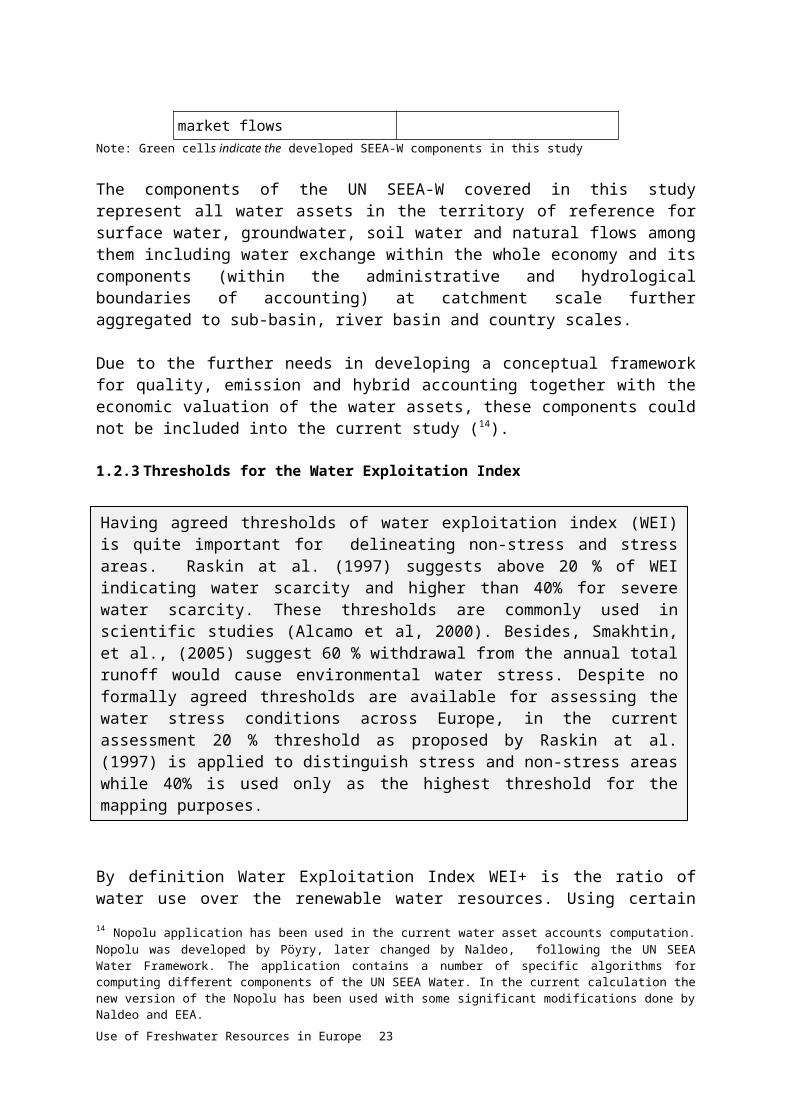
Due to the further needs in developing a conceptual framework for quality, emission and hybrid accounting together with the economic valuation of the water assets, these components could not be included into the current study (14).
9 EEA Note “Water Accounts: summary of the results so far”10 London Group on Environmental Accounting 11 The System of Environmental-Economic Accounts (SEEA) Central Framework contains the internationally agreed standard concepts, definitions, classifications, accounting rules and tables for producing internationally comparable statistics on the environment and its relationship with the economy 12 SEEA Experimental Ecosystem Accounting reflects a synthesis of the current knowledge in the area and provides a starting point for the development of ecosystem accounting at national and sub-national levels 13 The International Recommendations for Water Statistics (IRWS) were developed to help strengthen national information systems for water in support of design and evaluation of Integrated Water Resources Management (IWRM) policies 14 Nopolu application has been used in the current water asset accounts computation. Nopolu was developed by Pöyry, later changed by Naldeo, following the UN SEEA Water Framework. The application contains a number of specific algorithms for computing different components of the UN SEEA Water. In the current calculation the new version of the Nopolu has been used with some significant modifications done by Naldeo and EEA.
Use of Freshwater Resources in Europe 15
1.2.3 Thresholds for the Water Exploitation Index
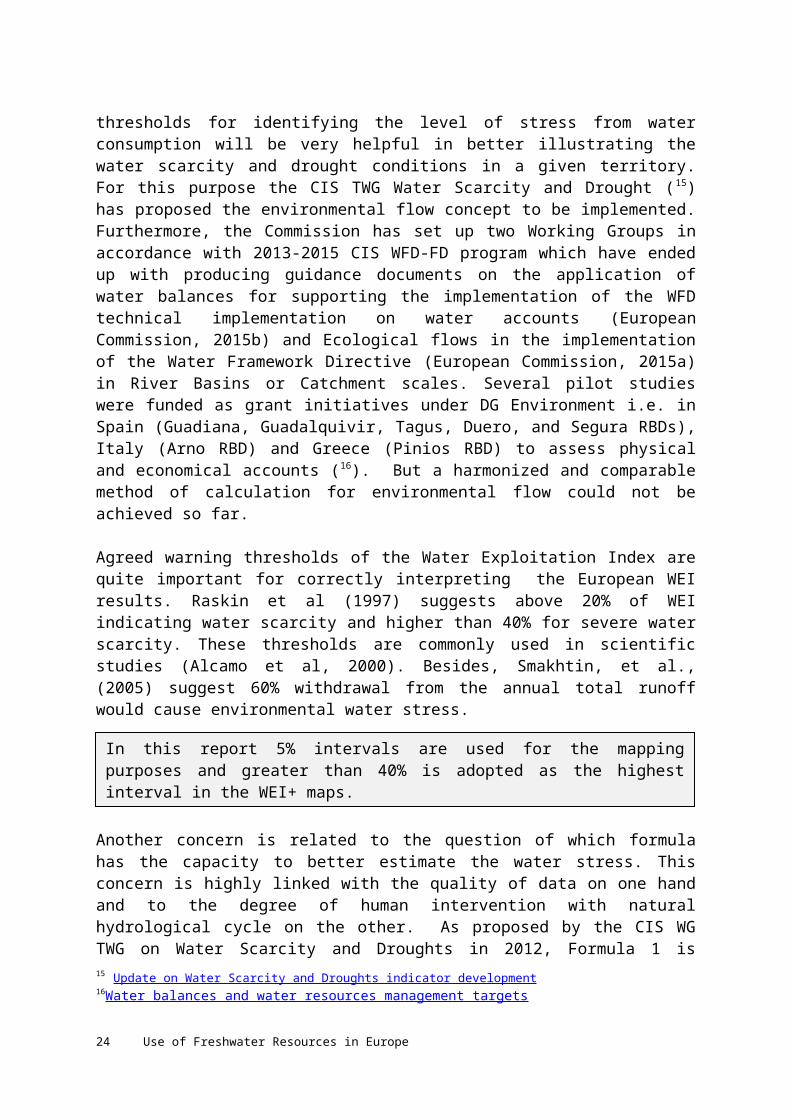
By definition Water Exploitation Index WEI+ is the ratio of water use over the renewable water resources. Using certain thresholds for identifying the level of stress from water consumption will be very helpful in better illustrating the water scarcity and drought conditions in a given territory. For this purpose the CIS TWG Water Scarcity and Drought (15) has proposed the environmental flow concept to be implemented. Furthermore, the Commission has set up two Working Groups in accordance with 2013-2015 CIS WFD-FD program which have ended up with producing guidance documents on the application of water balances for supporting the implementation of the WFD technical implementation on water accounts (European Commission, 2015b) and Ecological flows in the implementation of the Water Framework Directive (European Commission, 2015a) in River Basins or Catchment scales. Several pilot studies were funded as grant initiatives under DG Environment i.e. in Spain (Guadiana, Guadalquivir, Tagus, Duero, and Segura RBDs), Italy (Arno RBD) and Greece (Pinios RBD) to assess physical and economical accounts (16). But a harmonized and comparable method of calculation for environmental flow could not be achieved so far.
Agreed warning thresholds of the Water Exploitation Index are quite important for correctly interpreting the European WEI results. Raskin et al (1997) suggests above 20% of WEI indicating water scarcity and higher than 40% for severe water scarcity. These thresholds are commonly used in scientific studies (Alcamo et al, 2000). Besides, Smakhtin, et al., (2005) suggest 60% withdrawal from the annual total runoff would cause environmental water stress.
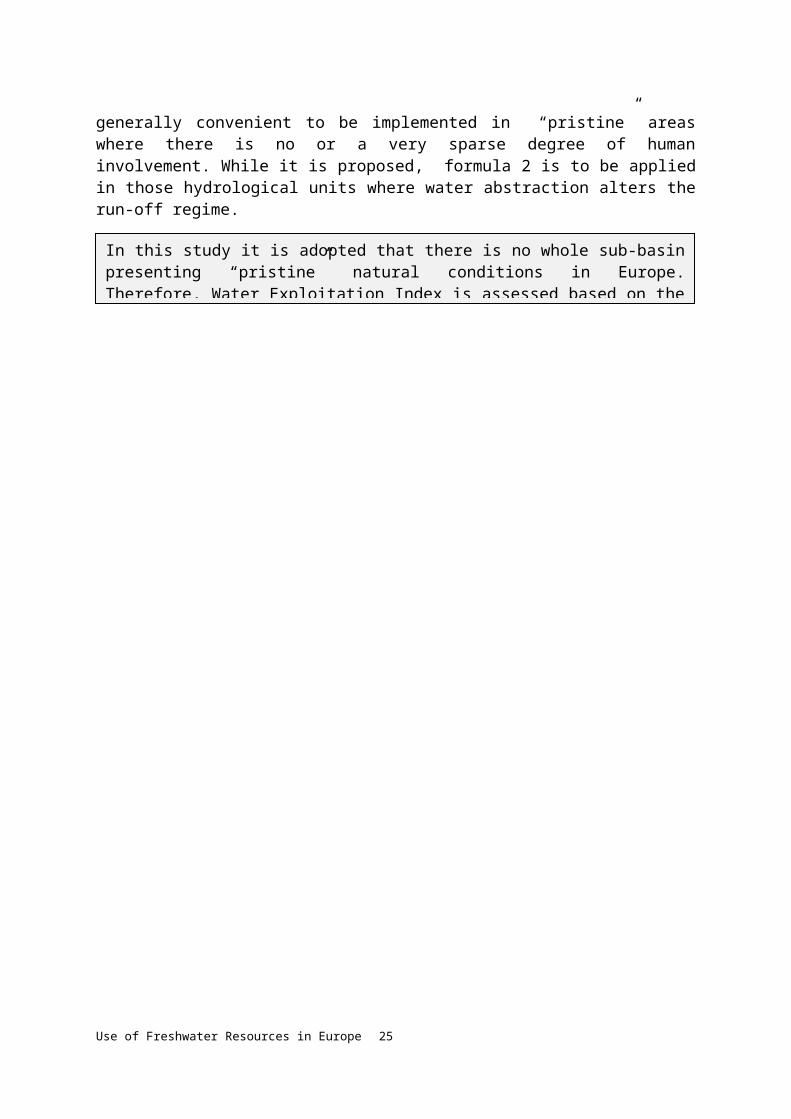
Another concern is related to the question of which formula has the capacity to better estimate the water stress. This concern is highly linked with the quality of data on one hand and to the degree of human intervention with natural hydrological cycle on the other. As proposed by the CIS WG TWG on Water Scarcity and Droughts in 2012, Formula 1 is generally convenient to be implemented in “pristine” areas where there is no or a very sparse
15 Update on Water Scarcity and Droughts indicator development16Water balances and water resources management targets
Having agreed thresholds of water exploitation index (WEI) is quite important for delineating non-stress and stress areas. Raskin at al. (1997) suggests above 20 % of WEI indicating water scarcity and higher than 40% for severe water scarcity. These thresholds are commonly used in scientific studies (Alcamo et al, 2000). Besides, Smakhtin, et al., (2005) suggest 60 % withdrawal from the annual total runoff would cause environmental water stress. Despite no formally agreed thresholds are available for assessing the water stress conditions across Europe, in the current assessment 20 % threshold as proposed by Raskin at al. (1997) is applied to distinguish stress and non-stress areas while 40% is used only as the highest threshold for the mapping purposes.
In this report 5% intervals are used for the mapping purposes and greater than 40% is adopted as the highest interval in the WEI+ maps.
16 Use of Freshwater Resources in Europe
degree of human involvement. While it is proposed, formula 2 is to be applied in those hydrological units where water abstraction alters the run-off regime.
In this study it is adopted that there is no whole sub-basin presenting “pristine” natural conditions in Europe. Therefore, Water Exploitation Index is assessed based on the formula 2 results.
Use of Freshwater Resources in Europe 17
2 Data and uncertainties2.1 EEA Water Accounts Production Database
Exploring the routes of water between environment and economy requires various heterogenic environmental and economic data sets to be involved and integrated. The EEA Water Accounts Database is a warehouse of data harvested from SoE and other data sources enabling quantification of the European scale of WEI and Water Asset Accounts.
In practice, Water Exploitation Index is exploring input/output relationship in a given hydrological territory. In hydrological terms, inputs refer to external inflows from upstream territories (either surface or groundwater) and to precipitation . Output from the hydrological entity is possible after volumes of water used either by the environment (actual evapotranspiration, outflow to downstream territories/to the sea) or by economic activities. For estimating the climatic variables in renewable water resources; climatic data were obtained from the EEA Climatic Database developed based on ENSEMBLES Observation Dataset (E-OBS) (Haylock et al., 2008). E-OBS data are further processed to disaggregate the climatic parameters to the catchment scale (see clarifications on the climatic parameters at Kurnik et al., 2014). The current climatic data available in the EEA Water Accounts Production Database consists of precipitation, actual evapotranspiration, surface stream flow, soil water and temperature for the years 2002-2013. SoE water quantity climatic data has been used for validating the E-OBS data before running the computation for the renewable water resources. As for the estimation external inflow and outflow, the main source is the SoE water quantity streamflow data reported by the EEA member countries. This database doesn’t have full spatial and temporal coverage for all of Europe yet. Previously, ad-hoc streamflow data compilation had been carried out by Pöyry under the contract with the DG ENV in 2012 (17). This data has been kept. Furthermore, in order to fill the gaps in spatial and temporal coverage, JRC LISFLOOD data has been integrated into the Water Accounts Production Database (18). By means of the JRC LISFLOOD data the current EEA Water Accounts Production Database has enabled to cover all EEA countries for the years 2002-2012 at catchment scale.
The second input/output relation is the subject between water abstraction and return. Water is abstracted for different purposes to meet the demand of societal and economic needs and is returned back to the environment after its use. SoE Water Quantity Database hosts information about water abstraction, but with insufficient temporal and spatial coverage. Therefore, some proxies and modelling had been developed by Pöyry in the previous 17 Service Contract to contribute to the building of Water and Ecosystem accounts at EU level, Final Report 1, Reference system and Ressouces datasets 18 LISFLOOD data is providing information on stream flow at 5 km grid covering all of Europe with daily resolution. Thanks to the JRC provision of the stream flow data to EEA, this data has been integrated into the EEA WADP and used for gap filling. See further clarifications on the stream flow database structure and methodology implemented in integrating LISFLOOD data in Annex-I of this report.
Detailed clarifications on data processing for the renewable water resources can be found in Annex –I; and for the water use component in Annex – II
18 Use of Freshwater Resources in Europe
European Water Assets Accounts implemented by the DG ENV (19). The model has been maintained in the new calculation of the WEI with the updating water use time series via inserting SoE and Eurostat data.
To compile water use information across Europe, Pöyry had used in 2012 the Landscan 2010 (20) for the distribution of population across Europe, Urban Morphological Zone (21) for distinguishing urban and rural population and Urban Waste Water Treatment Plants (UWWTP) database (22) for estimating the proportional distribution of population connected to Urban Waste Water Treatment Plants. Landscan and UMZ have not been updated in this study as there is no significant changes in both databases. However, UWWTP database has been updated via the new data deliveries under that reporting cycle.
For water abstraction by industry, The European Pollutant Release and Transfer Register (E-PRTR) database (23) was used for distribution of industrial installations (24). E-PRTR database has been updated in the new computation. Water use coefficient per industrial installation had been obtained from BREF (25) without information on production level at the instalment scale. Cooling water database has been developed by the European Commission General Directorate of Environment in 2014 (26).
As for water return, this information is mainly harvested from the UWWTP database. The population equivalent capacity of each UWWTP is taken into consideration while estimating the water abstraction and return. It is assumed that all urban population is connected to UWWTPs while the remained capacity of the UWWTP installations are used for the rural population (22).
Water use by agriculture had been harvested from the JRC database on water requirements per crop (Gunter Wiedt et al., 2008) (27) by Pöyry under the contract with the DG-ENV in 2012. No further update has been done in the database except the coefficient per crop type has been expanded until 2012 based on the results of the previous period of time.
All components of the water abstraction and return are validated at sub-unit or river basin district or country scale with the data reported by member countries to the SoE Water Quantity database or to Eurostat where available.
The spatial reference data is the European Catchments and Rivers Network System (Ecrins). Ecrins is a seamless spatial data set produced by the EEA containing necessary spatial information on catchments and drainage networks (EEA, 2012). Ecrins makes possible further aggregations between different hydrological administrative units i.e. catchment, sub-basin, river basin, NUTS2 and country scale.
19 Service Contract to contribute to the building of Water and Ecosystem accounts at EU level, Final Report 2,Uses & Supply 20 LandScan™ 21Urban morphological zones changes 1990-2000 22 Waterbase - UWWTD23The European Pollutant Release and Transfer Register (E-PRTR) 24 See for further clarifications on the water use data modelling in Annex –II of this Report. 25 Reference documents under the IPPC Directive and the IED26 This database is treated as confidential27 Water Requirements for Irrigation in the European Union
Use of Freshwater Resources in Europe 19
2.2 Data and methodology uncertainties
The complete calculation of renewable water resources can only be done when actual total volume of water stored in lakes and reservoirs together with the information on external inflow and outflow would be available. The current SoE Water Quantity Database hosts information for these parameters only for 147 entities from 10 EEA member countries, despite Ecrins has 70 000 lakes and reservoirs while the WFD reporting in 2010 provides information on the existence of 372 000 entities across Europe but without storage information. The possibility for involving the change in storage into the calculation is only possible to include relative changes of storage as possible water demand. But this approach is a very rough approximation and creates uncertainty around the actual volume of water
abstraction from the reservoirs. Due to the complex nature of relationships between environment and economy, the water abstraction and return calculation is highly demanding on data. Data required for a complete analysis of water abstraction and return are not available for all European regions. Therefore, population, industrial plants and their installation capacities as well as crop water demand for irrigation are used as the main proxies in calculating the water abstraction by economic sectors further compared with the renewable water resources. This algorithm had been already developed within the Nopolu by the Naldeo for the DG ENV contract. The same algorithm has been used in the new calculation as well. For the variation of the water use on monthly scale, tourism data (28) and production in industry (29) have been additionally used in the new calculation. Further validation of the water abstraction and return have been made with SoE and Eurostat data at sub-basin or river basin scales where reported data is available.
Dealing with the impact of tourism over the water consumption certainly causes double counting due the lack of information on the origin of the travel. On the other hand, the impact of tourism on local water resources is quite important to know particularly in those areas prone to water scarcity and drought i.e. in small Mediterranean islands and in some popular tourist destinations of Europe.
Double counting aspect of tourism in WEI has been partially counterweighted in the current study by the assumption, that tourism water consumption equals the respective residents’ consumption. However, scientific literatures suggest that one tourist generally uses 2-3 times
28 Eurostat tourism (tour) dataset 29 Eurostat Production in industry (sts_inpr_m) dataset
Due to insufficient data availability, opening and closing stock of the reservoirs can’t be quantified. Instead, change in reservoirs is provided.
Double counting of water consumption by tourism
Water abstraction and returns calculation is a hybrid calculation of reported data together with the modelling.
20 Use of Freshwater Resources in Europe
more water per capita/day compared to the local inhabitants (Essex et al. 2004; Gössling et al., 2012).
Water Exploitation Index calculation sometimes can render negative results as some months provide water return greater than water abstraction due to the time lag between water abstraction and return or insufficient data quality. Similar situations would also be encountered particularly in summer months when actual evapotranspiration would be greater than precipitation. In both cases, the WEI+ results would be negative. For proper interpretation with this type of result the following approaches were adopted;
Return greater than abstractionFor a month where the volume of returned water is greater than water abstraction, from the water assets accounts point of view, it means that there is no net water consumption from the environment. On the contrary, the residual water returning back to the environment can be calculated as surplus. In order to avoid from effect of “0” value in the division “1 m3” of water is adopted as the positive difference between water abstraction and return.
Actual evapotranspiration greater than precipitationDuring the summer months in many locations particularly in the Mediterranean region actual evapotranspiration could be greater than precipitation. As there is no clear conceptual solution for the deficit between ETa and P in both proposed renewable water resources formulas, this deficit is met from the water storage i.e. from reservoirs. This causes the water balance in reservoirs to be always negative until the next period where P would be greater than ETa. This situation is certainly related to the lack of data on reference volume of water in reservoirs and lakes. On the other hand, this type of negative WEI+ value points out the pressure over the renewable water resources. Therefore, it is adopted that such negative WEI+ values have to be converted into the positive.
Both nominator and denominator are negative As mentioned earlier, sometimes water consumption and renewable water resource components of the WEI+ formula would be negative for the same time period. In such cases, even water is returned back to the environment more than water abstracted, still there is significant pressures over the renewable water resources due to less available water in the environment. Therefore, whenever negative values would be on the both sides of the WEI formula, the result is also converted into the positive.
In order to avoid from such cases to possible extent, seasonal Water Exploitation Index assessments have been conducted at river basin district scale despite the upper scale of WEI assessment in spatial and temporal terms, may hinder the appropriate analysis of water scarcity and drought conditions.
Water Exploitation Index results are not always positive value. Because of the limitations in WEI formulas, sometimes the monthly scale of WEI can render negative values.
Use of Freshwater Resources in Europe 21
3 Water availability and consumption
3.1 Renewable water resources of Europe
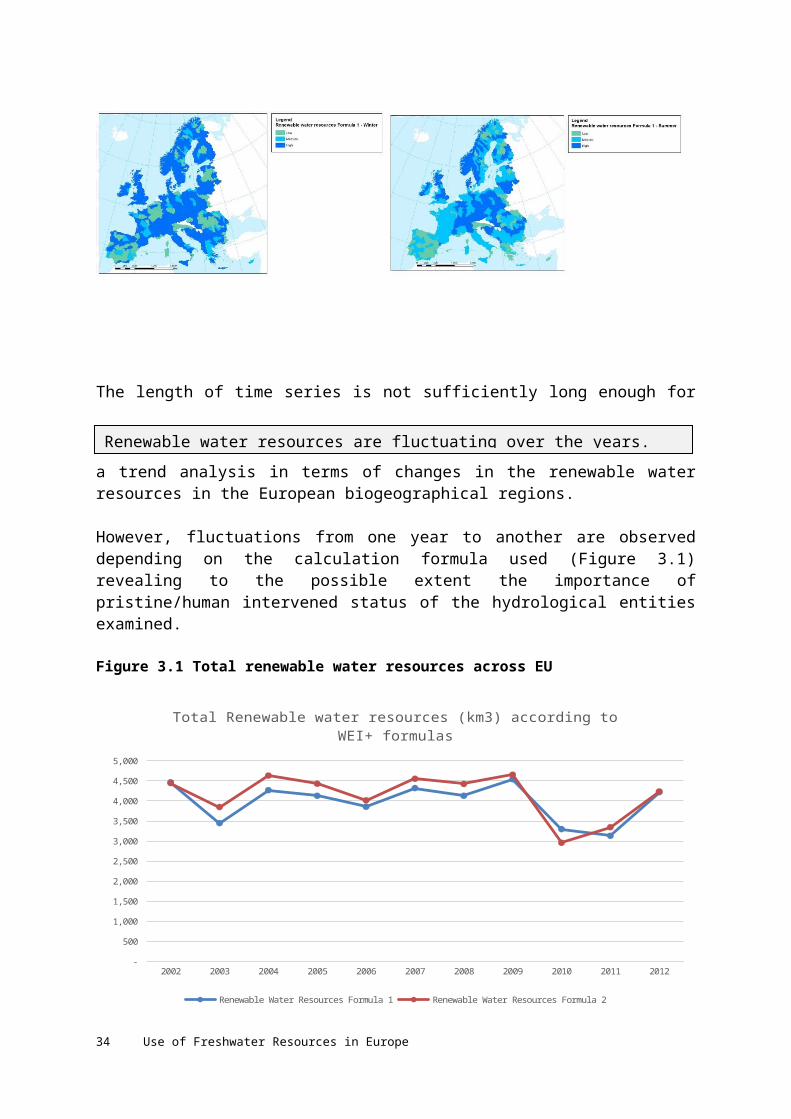
Europe (30) receives approximately 3.7 x 10⁶ hm3 of water from precipitation on an annual scale (average for the years 2002-2012). More than half of that amount (55%) returns back to the atmosphere by actual evapotranspiration. Renewable water resources (estimated according to Formula 1) significantly varies among the regions31 and seasons (Map 3.1) across Europe. Mostly mountainous areas and lowlands of the western part of Europe and Baltic region have comparatively higher renewable water resources compared to the Mediterranean region. Seasonal variations indicate lower water availability during the winter particularly in those areas receiving precipitation, while in summer high water availability can be observed in the Alpines and Atlantic. The Mediterranean region experiences a significant low level of water availability during summer and winter months.
Map 3.3 Renewable water resources seasonal (winter & summer) distribution across Europe calculated by formula 1
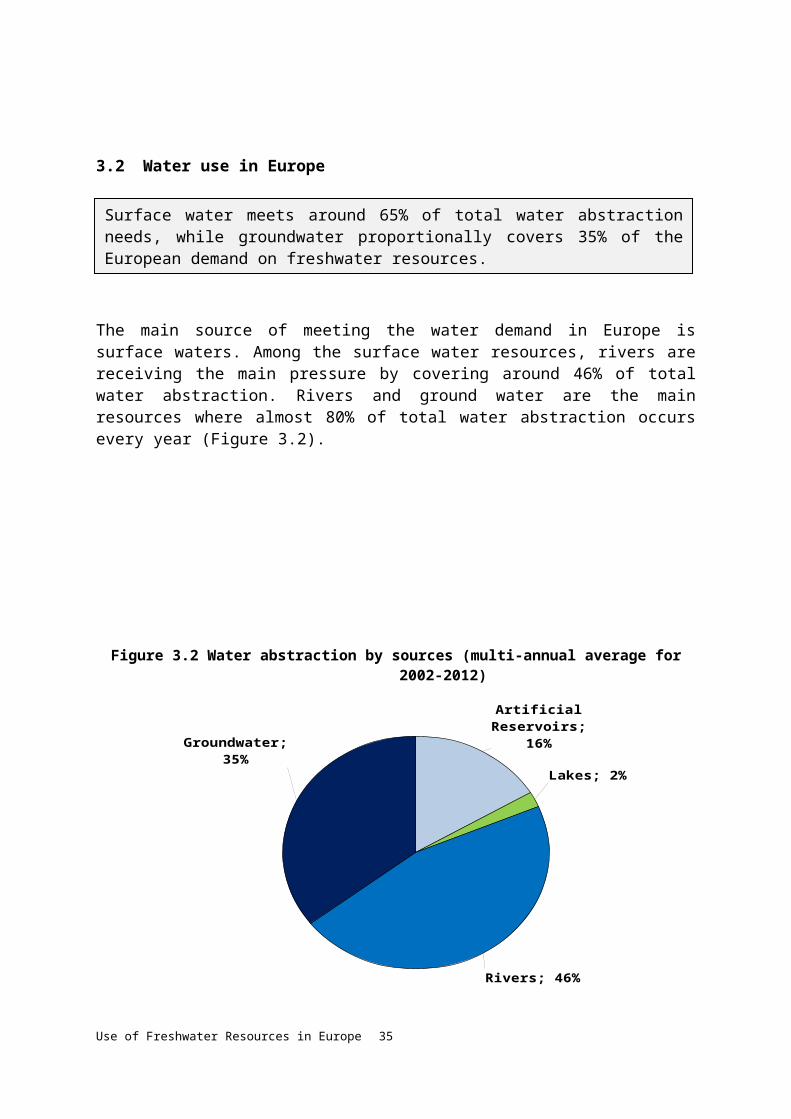
The length of time series is not sufficiently long enough for a trend analysis in terms of changes in the renewable water resources in the European biogeographical regions. 30 Spatial coverage of this study are the EEA member countries including cooperating countries of the West Balkans excluding Turkey and Iceland due to the lack of available data.
31 Biogeographical region is used in this indicator as one of the assessment scales. Delineation of the biogeographical regions are taken from the official delineations used in the Habitats Directive (92/43/EEC) and for the EMERALD Network set up under the Convention on the Conservation of European Wildlife and Natural Habitats (Bern Convention).
The Mediterranean region experiences less renewable water resources throughout the year compared to other biogeographical regions of Europe.
Renewable water resources are fluctuating over the years.
22 Use of Freshwater Resources in Europe
However, fluctuations from one year to another are observed depending on the calculation formula used (Figure 3.1) revealing to the possible extent the importance of pristine/human intervened status of the hydrological entities examined.
Figure 3.1 Total renewable water resources across EU
2002 2003 2004 2005 2006 2007 2008 2009 2010 2011 2012 -
500
1,000
1,500
2,000
2,500
3,000
3,500
4,000
4,500
5,000
Total Renewable water resources (km3) according to WEI+ formulas
Renewable Water Resources Formula 1 Renewable Water Resources Formula 2
3.2 Water use in Europe
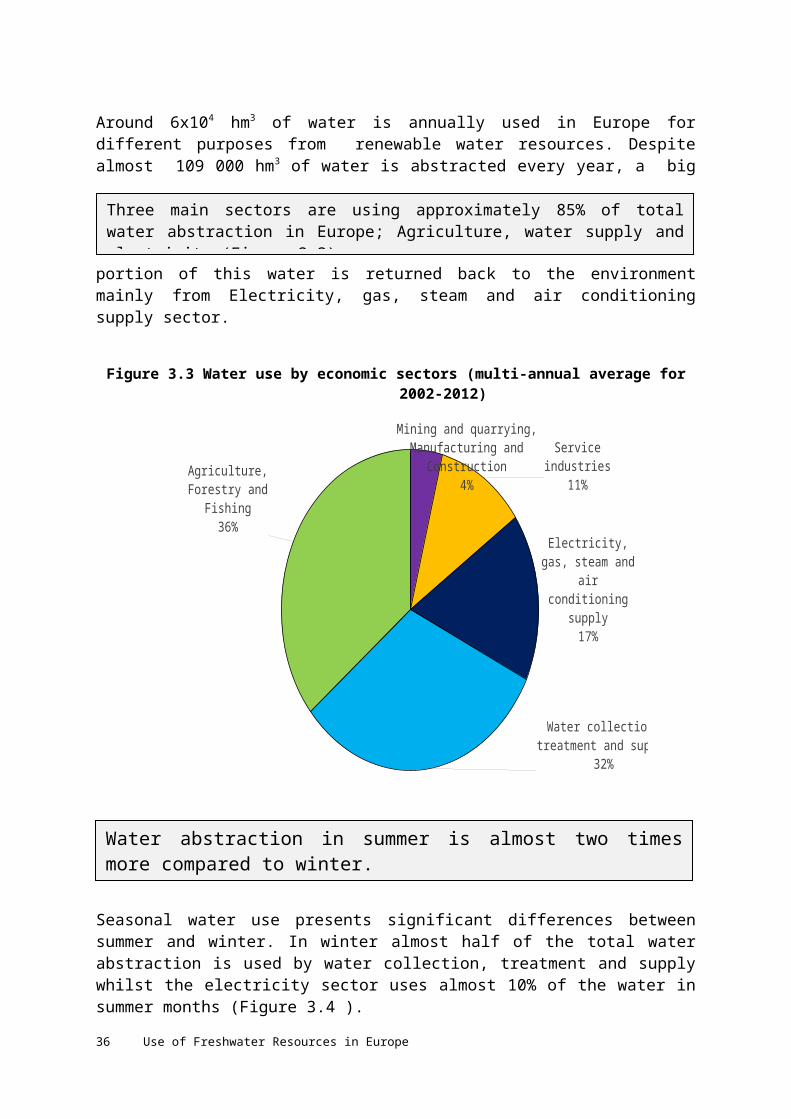
The main source of meeting the water demand in Europe is surface waters. Among the surface water resources, rivers are receiving the main pressure by covering around 46% of total water abstraction. Rivers and ground water are the main resources where almost 80% of total water abstraction occurs every year (Figure 3.2).
Figure 3.2 Water abstraction by sources (multi-annual average for 2002-2012)
Surface water meets around 65% of total water abstraction needs, while groundwater proportionally covers 35% of the European demand on freshwater resources.
Use of Freshwater Resources in Europe 23
Artificial Reservoirs;
16%
Lakes; 2%
Rivers; 46%
Groundwater; 35%
Around 6x10⁴ hm3 of water is annually used in Europe for different purposes from renewable water resources. Despite almost 109 000 hm3 of water is abstracted every year, a big portion of this water is returned back to the environment mainly from Electricity, gas, steam and air conditioning supply sector.
Figure 3.3 Water use by economic sectors (multi-annual average for 2002-2012)
Mining and quarrying, Manufacturing and Construction
4%Service industries
11%
Electricity, gas, steam and air conditioning
supply17%
Water collection, treatment and supply
32%
Agriculture, Forestry and Fishing
36%
Three main sectors are using approximately 85% of total water abstraction in Europe; Agriculture, water supply and electricity (Figure 3.3).
24 Use of Freshwater Resources in Europe
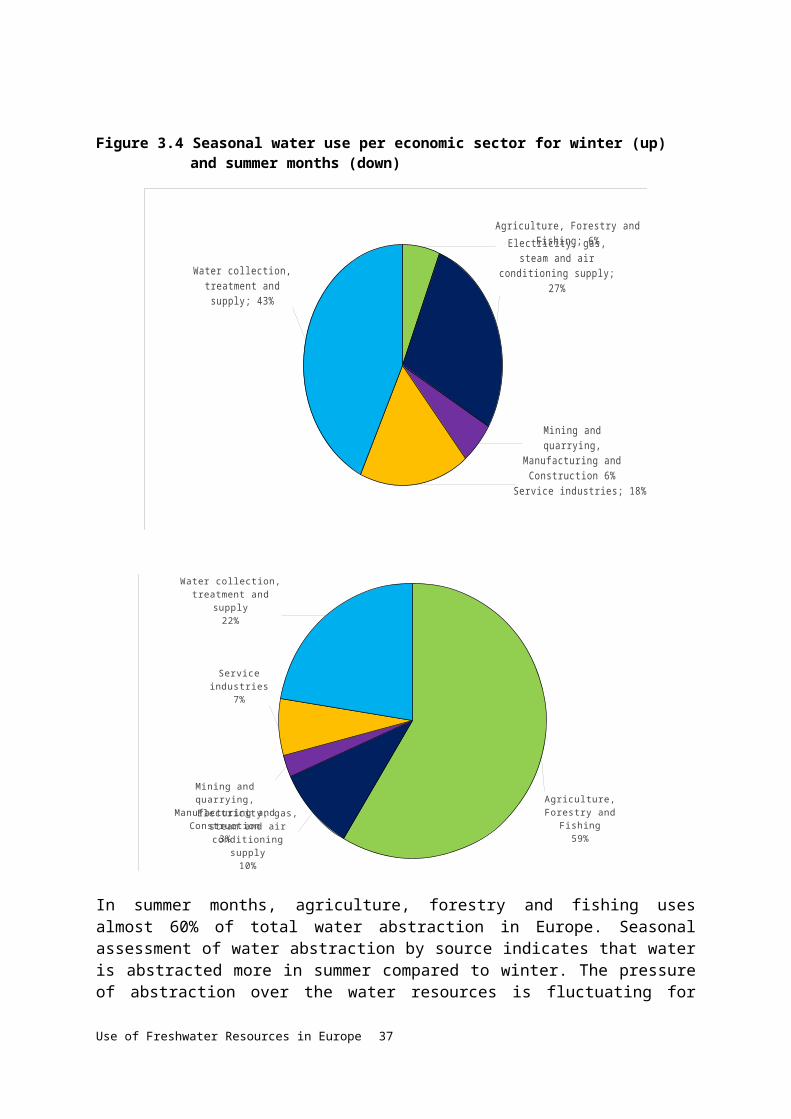
Seasonal water use presents significant differences between summer and winter. In winter almost half of the total water abstraction is used by water collection, treatment and supply whilst the electricity sector uses almost 10% of the water in summer months (Figure 3.4 ).
Figure 3.4 Seasonal water use per economic sector for winter (up) and summer months (down)
Agriculture, Forestry and Fishing; 6%
Electricity, gas, steam and air conditioning supply; 27%
Mining and quarrying, Manu-facturing and Construction 6%
Service industries; 18%
Water collection, treatment and supply; 43%
Agriculture, Forestry and Fishing
59%
Electricity, gas, steam and air conditioning supply
10%
Mining and quarrying, Manufacturing and
Construction3%
Service industries7%
Water collection, treatment and supply
22%
In summer months, agriculture, forestry and fishing uses almost 60% of total water abstraction in Europe. Seasonal assessment of water abstraction by source indicates that
Water abstraction in summer is almost two times more compared to winter.
Use of Freshwater Resources in Europe 25
water is abstracted more in summer compared to winter. The pressure of abstraction over the water resources is fluctuating for rivers and groundwater resources throughout the year. Water is stored in reservoirs mainly during the winter months and used in summer (Figure 3.5).
Figure 3.5 Seasonal abstractions in hm3 by water sources (based on annual average
values)
Q1 Q2 Q3 Q4 -
5,000.00
10,000.00
15,000.00
20,000.00
25,000.00
30,000.00
35,000.00
40,000.00
45,000.00
Artificial Reservoirs Lakes Rivers Groundwater
Note: Q1-Q4: Quarters (3 month intervals) of the calendar year
3.3 Pressures on the renewable water resources
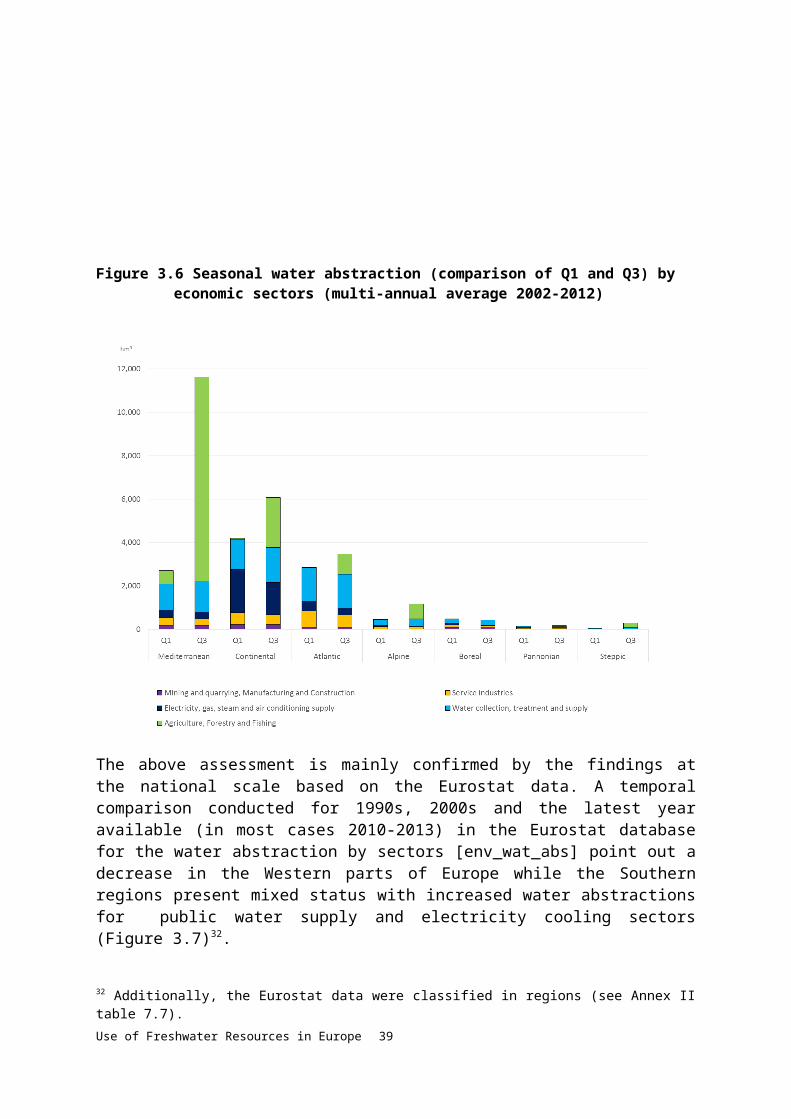
Water is abstracted from the environment for meeting social and economic needs. Following the trace of water cycling within the economy exposes information on the source of pressures over the water resources. Based on the ISIC (NACE) classification, analysis of water consumption per sector indicates that agriculture and water supply in Europe (Figure 3.6) are still remaining the main pressures on the water resources.
26 Use of Freshwater Resources in Europe
Figure 3.6 Seasonal water abstraction (comparison of Q1 and Q3) by economic sectors (multi-annual average 2002-2012)
The above assessment is mainly confirmed by the findings at the national scale based on the Eurostat data. A temporal comparison conducted for 1990s, 2000s and the latest year available (in most cases 2010-2013) in the Eurostat database for the water abstraction by sectors [env_wat_abs] point out a decrease in the Western parts of Europe while the Southern regions present mixed status with increased water abstractions for public water supply and electricity cooling sectors (Figure 3.7)32.
32 Additionally, the Eurostat data were classified in regions (see Annex II table 7.7).
Use of Freshwater Resources in Europe 27
Figure 3.7 Freshwater abstractions trend analysis based on annual country Eurostat data [env_wat_abs] dataset.
28 Use of Freshwater Resources in Europe
4 Water Exploitation Index across EuropeThe Mediterranean region experiences the highest water stress than most other regions in Europe (Figure 4.1). Mostly Mediterranean countries e.g. Malta, Cyprus33, Spain, Greece and slightly Italy and Albania in summer months live under water stress conditions. But it is also known that particularly in Malta and Cyprus desalinated water gains more role in meeting the water demand throughout the year.
Figure 4.8 Quarterly average of Water Exploitation Index per Biogeographic region for
Formula 1 (up) and Formula 2 (down)
ALP ATL BOR CON MED PAN STE0%
5%
10%
15%
20%
25%
30%
35%
40%
Q1 Q2 Q3 Q4
ALP ATL BOR CON MED PAN STE0%
5%
10%
15%
20%
25%
30%
35%
40%
Q1 Q2 Q3 Q4
Regarding sectorial pressures emerged from the biogeographical regions, Figure 4.2 illustrates the total share of water use in Biogeographical regions per economic sector. According to this analysis almost 65% of total water use in agriculture forestry and fishing
33 Water Exploitation Index for Cyprus is over estimated due to the ill-reported coordinates of the gauging stations under the SoE data flow. Thus it is not possible to integrate the streamflow data from Cyprus into the assessment.
During the winter months about 30 million inhabitants live under water stress conditions while in summer this number increases up to 70 million which corresponds to 14% of the total population of Europe.
Use of Freshwater Resources in Europe 29
occurs in the Mediterranean region. Similarly the highest share of water use in electricity sector happens in the Continental region (36%).
Figure 4.9 Total share of water use (%) per economic sector in biogeographical regions
ALP
ATL
BOR
CON
MED
PAN
STE
0% 10% 20% 30% 40% 50% 60% 70% 80% 90% 100%Agriculture, Forestry and Fishing Electricity, gas, steam and air conditioning supply Mining and quarrying, Manufacturing and Construction
Service industries Water collection, treatment and supply
Note: This graph depicts the percentages of water use across the area of study. Water accounts data availability differ from one biogeographical region to another, therefore total spatial coverage is not succeeded for all the regions
Scaling down the analysis of water stress to the River Basin Districts scale indicate that 20 river basin districts are experiencing water stress with higher than 20% of Water Exploitation Index (Figure 4.3). Mostly those river basin districts are islands and are located in the Mediterranean (86%) and in the Atlantic (14%) regions. The total population living under water stress in winter is about 30 million. In summer this number increases up to 70 million. When summer comes, the high Water Exploitation Index expands its coverage almost all over the Mediterranean islands including Spanish and partly Portuguese river basin districts (Map 4.1).
30 Use of Freshwater Resources in Europe
Figure 4.10 FRBDs where average WEI+ is greater than 20% (period 2002-2012)
Andalusia Mediterranean BasinsNorth West
DouroCrete
Tagus and Western BasinsSicily
Western Sterea ElladaWestern MacedoniaEastern Sterea Ellada
EbroAttica
North EasternJucar
Balearic IslandsThessalia
Andalusia Atlantic BasinsGuadiana
Aegean IslandsSeguraCyprus
0 10 20 30 40 50 60 70 80 90 100
Summer Winter
WEI Formula 2 (%)
Map 4.4 River Basin Districts (Ecrins FRBD) with WEI+ greater than 20%
Seasonal conditions between summer and winter provide a significantly different pattern than annual scale in the detailed SB spatial resolution (Figure 4.4).
Use of Freshwater Resources in Europe 31
Text box: Water balance and Water Exploitation Index in the United Kingdom (Kowalski et al., 2011)
Based on the assessment for the years 2006-2007 which has been carried out by WRAP covering the United Kingdom, indicates that the total annual water abstraction in the UK is about 65 000 hm3. The country scale of WEI is estimated 10% for UK. But regional differences in the UK indicate that in south eastern and eastern England the WEI increases up to 22%. Analyzing the proportional distribution of water abstraction per economic sector reveals that half of the water is abstracted for public water supply followed by electricity production (30%) and the remaining for other non-household uses, including agriculture and aquaculture.
Water use is classified by the UK Environment Agency as consumptive use and non-consumptive use. Based on this classification, water for consumptive use is mostly abstracted by manufacturing, electricity and agricultural sectors followed by accommodation and support services.
32 Use of Freshwater Resources in Europe
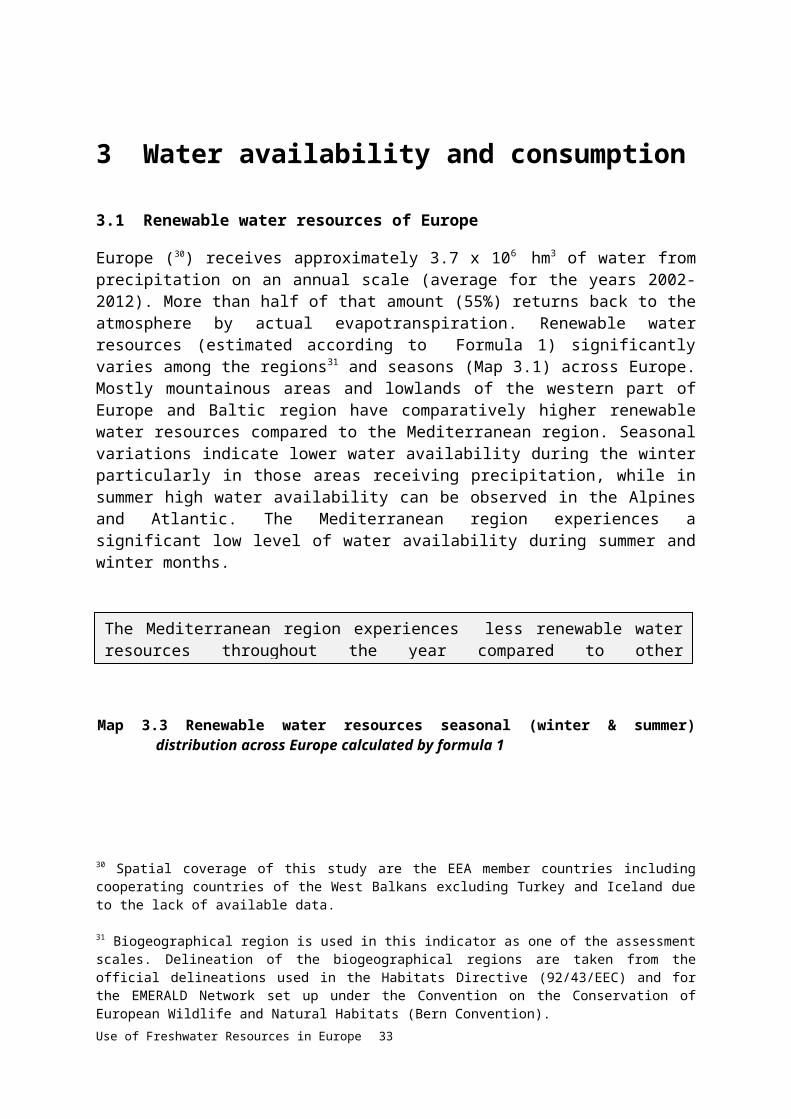
Figure 4.11 Water Exploitation Index at the Sub-basin scale in winter and summer
North West Southern Appenines coastal: Ofanto, Fortore, Tri*
EslaCrete
Duero main - Medium - Tormes Southern Appenines coastal: Sele
SicilyDanube Region Basin District
Ebro main - Upper - AragonSegre
Eastern Sterea ElladaAttica
Maritsa coastal catchmentsWestern Macedonia
Skellefte coastal catchmentsIijoki coastal catchments
NeretvaEman coastal: 4
SemanTajo coastal: 1
Ebro coastal catchmentsCrni Drim / Drin,Drini i Zi
Eman coastal: 5Weser coastal catchments
Guadalquivir main - Upper - Guadiana menorAdriatic Sea coastal catchments and small basins
Rhine coastal: 2
0 10 20 30 40 50 60 70 80 90 100
Summer WinterNote: The names of the SB entities are referring to the database coding fields
Use of Freshwater Resources in Europe 33
The main sectors creating pressures over the water resources in the Mediterranean islands are public water supply (55%) and agriculture (32%). There is very limited information available on the services sector in the Mediterranean islands. Mainly water abstracted for tourism is embedded into the public water supply. On the other hand, in order to better analyze the impacts of tourism over renewable water resources, a proxy for quantifying water use by tourism as separate information from the public water supply has been developed in this study. Further clarification on the methodology on tourism data processing can be found in Annex-II. Nevertheless, the findings indicate high pressures from tourism in the Mediterranean islands as well as in some large cities like London, Paris etc. as they attract mass tourism.
Map 4.5 Seasonal (Q1, Q3) WEI+ at FRBD scale of Formula 2
First Quarter (Q1: January – March)Third Quarter (Q3: July – September)
Text box: Water Exploitation Index in Italian BasinsPo Basin Implementation of drought policy in the Po River Basin (Source; Checcucci, 2011)Po River Basin is one of the largest basins in Italy with 70.000 km2 of basin area. The area of the basin is occupied as 58% by mountains and 42 % by alluvial plain. Approximately 17 million inhabitants are living in more than 3000 settlement areas including 3 metropolitan cities; Milano, Bologna and Torino.
The annual average of surface flow from the Po River is 45 000 hm3 per year. The total renewable water resources estimated for the Po Basin is about 87.000 hm3, of which 89 % is surface water while ground water is consisting of 11%. 1289 hm3 of water is subject to being stored in reservoirs on an annual scale.
The total water consumption is approximately 20,500 hm3 which indicates that the annual Water Exploitation Index in the Po basin is about 0.24. This is an indication that corresponds to 24% of total renewable water resources used in the Po basin to meet water demand. Regarding sectorial water use, irrigation is the major pressure over the renewable water resources followed by water supply.
Water supply12%
Indus-try7%
Irri-gatio
n80%
34 Use of Freshwater Resources in Europe
Sub-basin scale provides very detailed information on WEI distribution pattern across Europe. Seasonal variations indicate the dominance of climatic conditions in spring and summer (Map 4.3). On the other hand, water abstraction for irrigation and population create water stress conditions diverting from the climatic zonal distribution as well as from seasonal variations. For example, even in winter months some sub-basins from the Mediterranean region still show a high Water Exploitation Index because of water abstraction, irrigation and tourism as well.
Map 4.6 Seasonal (Q1-Q4) WEI+ for formula 2 at Ecrins SB scale
Note : First Quarter (Q1: January – March); Second Quarter (Q2: April – June)Third Quarter (Q3: July – September); Fourth Quarter (Q4: October – December)
In fact, the results obtained from both WEI formulas testify more or less the same distribution pattern of WEI values across Europe but the amplitude of the results are completely different between them.
Text box: Water Exploitation Index in Italian BasinsPo Basin Implementation of drought policy in the Po River Basin (Source; Checcucci, 2011)Po River Basin is one of the largest basins in Italy with 70.000 km2 of basin area. The area of the basin is occupied as 58% by mountains and 42 % by alluvial plain. Approximately 17 million inhabitants are living in more than 3000 settlement areas including 3 metropolitan cities; Milano, Bologna and Torino.
The annual average of surface flow from the Po River is 45 000 hm3 per year. The total renewable water resources estimated for the Po Basin is about 87.000 hm3, of which 89 % is surface water while ground water is consisting of 11%. 1289 hm3 of water is subject to being stored in reservoirs on an annual scale.
The total water consumption is approximately 20,500 hm3 which indicates that the annual Water Exploitation Index in the Po basin is about 0.24. This is an indication that corresponds to 24% of total renewable water resources used in the Po basin to meet water demand. Regarding sectorial water use, irrigation is the major pressure over the renewable water resources followed by water supply.
Water supply12%
Indus-try7%
Irri-gatio
n80%
Use of Freshwater Resources in Europe 35
Water Balance in Mallorca (source; Donta et al., 2005)
Mallorca is the main island of the Balearic archipelago located to the north-west of the Mediterranean. The area of the island is 3640 km2 hosting approximately 600.000 permanent residents. During the high season of tourism the total population of the island can increase up to one million.
The annual total renewable water resources estimated for the island is approximately 494 million m3.
Groundwater73%
Surface water23%
Desalinated water4%
Total water supply is estimated approximately at 246 hm3 per year. Water losses are estimated at 12 hm3. Based on annual water balance the net water consumption is about 234 hm3. Regarding the source of water abstraction, about 90% of water abstraction is from groundwater, while surface water meets 10% of water demand. The annual Water Exploitation Index is 0.47 (47%). WEI per source indicates that Groundwater Exploitation Index is 0.59; Surface Water Exploitation Index is 0.20. It can be concluded that groundwater resources on the island are under heavy pressure from water consumption.
Sectorial water consumption indicates that water demand for agriculture is approximately 61% of the total water demand of the island.
Industry Other Water supply-including tourism Irrigation0
10
20
30
40
50
60
70
80
90
0.2 2
36.7
61.05
6.6 8.5
83.4
1.5
Water Use GDP
Based on the assessments it has been revealed that while agriculture is using 61% of total water supply, it contributes only 1.5% to the Gross Domestic Product of the Island.
36 Use of Freshwater Resources in Europe
Trends in Water Exploitation Index Analyzing the monthly time series of the WEI+ across Europe (an average values approach) in an attempt to reveal any general tendency during the last 11 years of this study, a minor decreasing is presented as formula 2 (Figure 4.5).
Figure 4.12 Trend analysis of the average values of the WEI+ across Europe
JuneJune December June December December June December June December June December June December June December June December June December June December2002 2003 2004 2005 2006 2007 2008 2009 2010 2011 2012
0%
2%
4%
6%
8%
10%
12%
14%
Average Monthly WEI+ Formula 2 Linear (Average Monthly WEI+ Formula 2)
Use of Freshwater Resources in Europe 37

5 Conclusions5.1 Water resources and use in Europe
While water is generally abundant in much of Europe, water scarcity and droughts continue to affect some areas. Mediterranean region and most of densely populated river basins from different parts of Europe are hot spots for the water stress conditions.
About 30 million inhabitants in winter and 70 million in summer live under water stress conditions that corresponding to 14% of total population of Europe.
Around 20% of total population of the Mediterranean region live permanently under water stress condition. Water stress effects more than half (53 %) of Mediterranean inhabitants during summer.
Rivers and groundwater resources meet 80 % of total water demand in Europe. Agriculture and public water supply accounts for 68 % total water use in Europe and put higher pressures on renewable water resources compared to other economic sectors.
From an environmental perspective, groundwater bodies and rivers are under pressure especially in summer, while reservoirs are a very crucial link in the chain of supporting seasonal water demands in summer by tripling their water supply to the economy.
Defining the most appropriate spatial and temporal scale for evaluating water scarcity phenomena across Europe is very important. That fact has been pointed out in several studies (EEA 2012; 2012a; 2012b; 2012c and 2013). In coarser spatial scales such as country and RBD (which also depends on the size of the area and the range of social and economic activities) water stress could not be captured due to highly spatial aggregation of both water assets and water consumption. However, when scaling down the analysis, these issues are magnified due to the environmental pressures and water scarcity becomes visible over the regional water assets as well as which economic sectors create the pressure. This information is very helpful for policymakers and stakeholders to assess the environmental status of the regional interest and further infrastructure or economic measures that may be put into force to protect the water capital.
5.2 Issues to resolve in future EEA water accounting work
5.2.1 Uncertainties with the implementation of WEI+ formulas
Implementing WEI+ formulas at a monthly scale across Europe with so many diverse climatic, hydrologic and land cover conditions by itself is quite a challenging task. Source quality and validated hydrological information arises as one of the top issues to be addressed.
Quality of the index depends on the quality of the data series used in the WEI estimation. In reality, the data to populate the indicators are seldom systematically or reliably available regardless the spatial scale due to heterogeneity of the phenomena i.e. relation between environment and economy. For instance, total water abstraction is not always well known,
38 Use of Freshwater Resources in Europe
particularly if non-authorized uses are important. The rate (quantity) of water abstraction is often estimated rather than measured. Estimates are subject to large uncertainties, particularly for water abstractions in agriculture (Winpenny, 2012).
Water abstraction to satisfy human needs is the most important quantitative pressure on freshwater resources. Excessive growth of demands in a territory in relation to the availability water resources can result in a chronic shortages situation in the medium-long term. Besides, returned water also includes a variety of components which are not easy to measure. It comprises estimation of water abstraction particularly for irrigation, where water efficiency is of quite high concern.
The WEI+ indicator is very helpful in identifying the rate of water abstraction per sector on a comparable basis and thus supporting the assessment on whether water consumption is sustainable or not and its possible impacts on freshwater resources (Faergemann, 2012). Despite identifying the thresholds for WEI+ dealing with environmental flow which are not yet finalized, thresholds are so crucial in order to provide a certain range of values for a robust indicator result. Having well-identified warning thresholds for the WEI+ will support answers to key questions related to water scarcity and resource efficiency.
Due to high actual evapotranspiration values as well as a lack of data on the total volume of water stored in lakes and reservoirs, negative WEI+ values have been encountered . Normally, that can easily be understood as pressure over the renewable water resources. But still further development is required by experts to assess and provide useful information about the monthly step implementation of the formulas as well as with the extreme and negative seasonal values (e.g. summer months).
Another problem is dealt with the difference between water abstraction and return. In some cases, return would be greater than water abstraction either due the time delay between the exact time of water abstraction and the exact time of water returned back to the environment or due to the data quality. The current data availability didn’t allow for further investigation of this issue.
5.2.2 Data Uncertainties
One of the basic sources of uncertainty during this exercise was the data availability (in terms of spatial and temporal coverage) in the respective area of reference. Data quality is so crucial that affects not only the water asset account tables filling up, but also the interpretation of the indicator results. To this end, several statistical and hydrological oriented techniques had to be applied in order to provide to the maximum possible extent, a reliable and continuous time series for the water assets accounts before the implementation of the indicator’s formulas. This causes a chain reaction of data manipulation from source (extrapolation techniques) for avoidance from outliers or extreme values, especially in entities where data coverage (spatial and temporal) was insufficient on which further clarifications can be found in Annex-I and Annex-II.
Use of Freshwater Resources in Europe 39
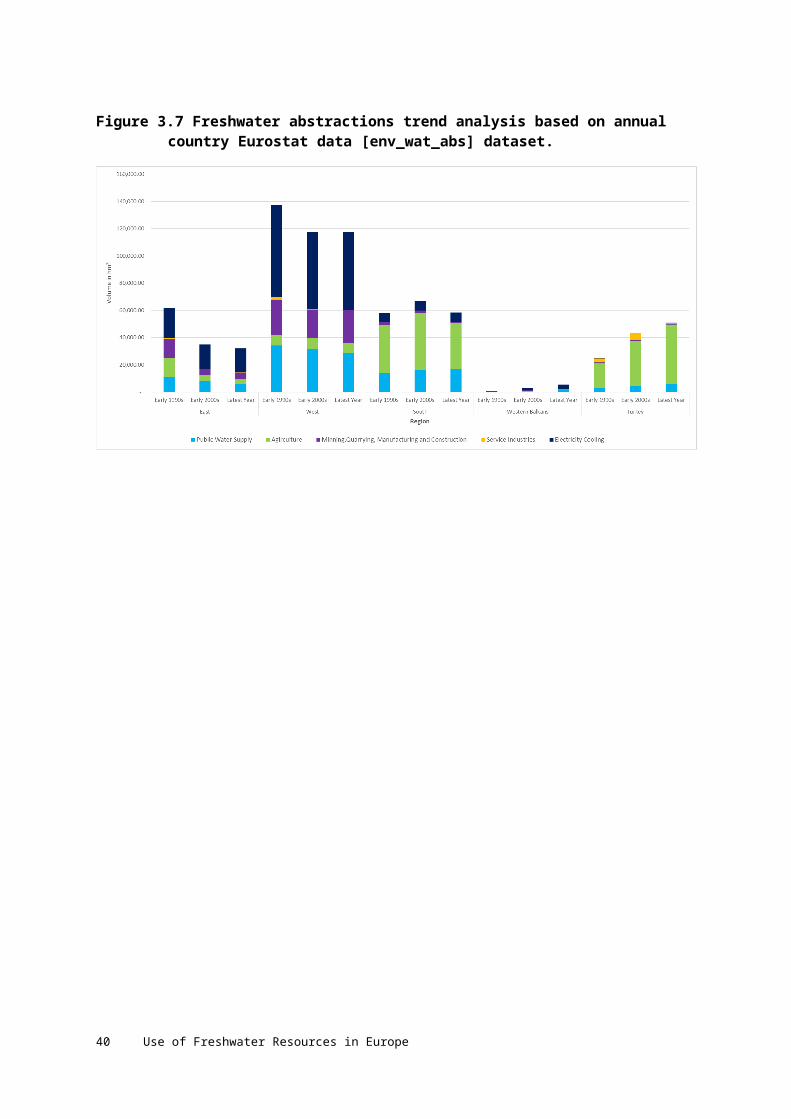
5.2.3 Tools, applications and further data improvements
The water assets accounts exercise is a highly demanding process on data and IT tools. It requires ensuring horizontal and vertical consistencies between statistical and spatial data by means of a chain-wise iterative procedure to be implemented in an application. This is not usually a very straightforward computation procedure.
6 Annex I – Data for renewable water resources
Water accounts and WEI assessment require very heterogenic data involvements for estimating both renewable water resources and water consumption by source and sector. The following paragraphs clarify data structure, data sources and processing for each component of the Water Exploitation Index including the water asset accounts.
6.1.1 Spatial Data
Spatial data is the information of reference entities and station coordinates. ECRINS is a spatial reference system used in the EEA water accounts work that allows carrying out spatial operations in data integration and assimilation, as well as, displaying the results at the different scales (e.g. catchment, sub-basin, river basin district and country scale (34). It includes - among other data - the European Catchments and Drainage Network.
In addition to ECRINS spatial data sets, other spatial data such as river stream flow stations reported under SoE Water Quantity dataflow and water use entities i.e. industries and waste water treatment plants reported for UWWT Directive and cities have been included into the assessment. The Landscan 2010 version has been kept in the database for cities which was updated previously under the DG-ENV contract with Pöyry (35). SoE stream flow stations and the UWWTP database have been updated with the latest delivery from the year 2013.
It should be mentioned that ECRINS is quite far from being the perfect spatial reference data due to some inconsistencies in terms of topological relations among the catchments (FEC-Functional Elementary Catchment) and hosts also topological faults, having a wrong connection in some river segments. This has not had drastically significant impacts over the general results but still needs to be fixed (36).
6.1.2 Data for water availability
Water availability consists of climatic and hydrological time series data. In order to ensure the consistency among different components of water cycle, the 2002-2012 period was selected as temporal scale.
34 Definition of hydrological units in this study i.e. catchment, sub-basin, river basin district are quite different from those defined under the WFD Article 5. As Ecrins is used as a spatial reference in this report, the hydrological units in Ecrins are purely hydrological without considering the country boundaries. 35 ENV.D.1/SER/2011/0036 - http://ec.europa.eu/environment/archives/funding/pdf/calls2011/specifications_en_11036.pdf 36 Ecrins is currently being upgraded with the purpose of eliminating such errors from the spatial reference dataset. When EuHydro is available, Ecrins will be replaced with the EuHydro
40 Use of Freshwater Resources in Europe
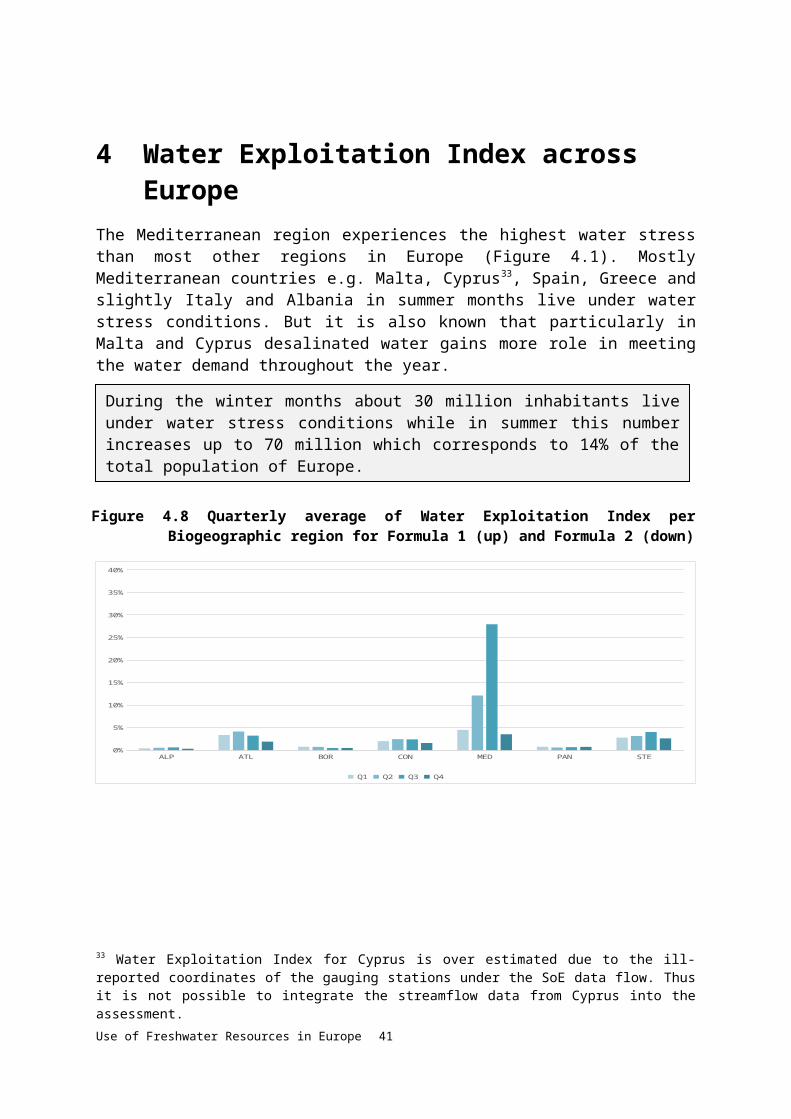
Climatic DataThe climatic data is of paramount importance in estimating robust water assets accounts in a given territory. Relation between precipitation and actual evaporation has significant impacts over the general water balance, particularly for the proposed estimation of renewable water resources in Formula 1. Therefore, the full spatial and temporal coverage of climatic parameters across Europe, was one of the main objectives in the context of database acquisition and updates. The current climatic data sets contain the results of modelled interpretation with E-OBS data sets prepared originally in 25 km2 grids by the EEA for the 2002-2012 period. It hosts precipitation (Rain), actual evapotranspiration (ETReal), potential evapotranspiration (ETPot), soil water balance (SWaBa),water deficit (Defic),Surface run-off (SurRof) and temperature (Tmean, Tlow, Tmax) as the main climatic parameters. Modelling and interpolation of data in some parameters are dictated by the nature of water accounts regardless of the spatial or temporal scales of the analysis. That is also the case for some climatic parameters i.e. evaporation, soil-water balance etc. As mentioned in the previous paragraph, the EEA climatic dataset is prepared as raster at a 25 km resolution which requires disaggregation to the Ecrins catchment scale (250 m vector). The integration procedure is to intersect the 25 km2 raster with the Ecrins Catchment and calculate average precipitation and actual evapotranspiration in lt/m2 per catchment. In the second phase the averaged value of precipitation and evapotranspiration are to be converted into million m3 per catchment and aggregated to the any other upper scale subject to the water accounts calculation. The Map 2.1 illustrates the distribution of the multi-annual average of precipitation aggregated to sub-basin scale before and after the updates. The updates in precipitation is compared with the previous EEA water accounts production database and the current one which has been used in this study.
The precipitation pattern across Europe indicates that mostly mountainous areas receive more rain compared to other lowland areas.
Map 6.7 Precipitation per SB area (lt/m2) across Europe before (left) and after (right) the climatic data update
Note: Values introduced on maps have been calculated over multi-annual average (2002-2012).
The relationship between precipitation and actual evapotranspiration is becoming more critical, since the renewable water resources are calculated on a monthly scale. From the
Use of Freshwater Resources in Europe 41
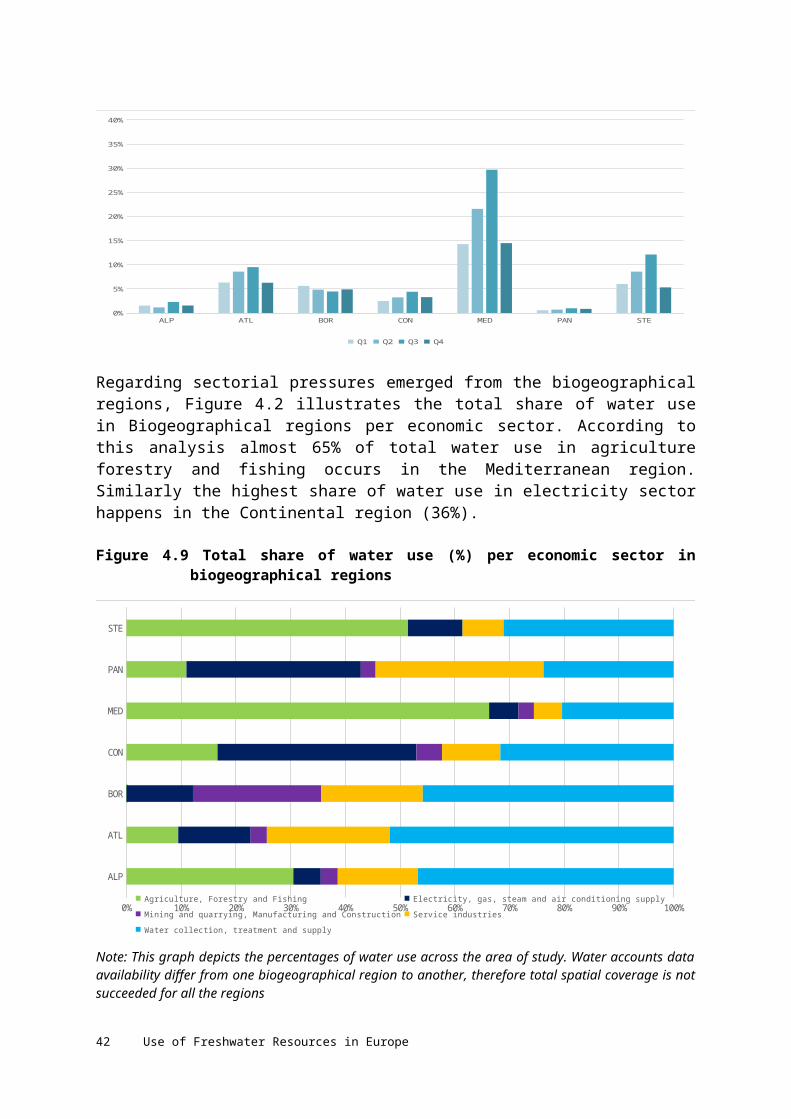
water accounts perspective, higher evapotranspiration values than precipitation is just an environmental deficit for the respective month, which can be recovered in the annual closing stock. Indeed, some summer months are characterized with higher ETa values compared to precipitation particularly for the southern parts of Europe. But, this has a large impact on estimating monthly Water Exploitation Index resulting in negative WEI values, due to a deficit in water balance for the respective month particularly in the case that b WEI is calculated using Formula 1. The EEA’s modelled data for climatic parameters had higher ETa values than precipitation particularly for winter months in Northern Europe. As the ETa is modeled data and the model itself involves a number of different parameters, such as solar radiation in estimating the ETa values in a given territory, sometimes the model provides negative values for those locations in winter months which are quite unrealistic to the ground truth. This situation has a number of impacts over the Water Accounts and WEI+. In the case of having higher ETa values for winter months combined with a constant trend during the summer months causes a negative water balance over the entire hydrological or calendar year. In order to overcome that uncertainty around the ETa values, in agreement with the content expert developing the EEA climatic data, those ETa values higher than precipitation for December and January in Northern Europe have been converted into zero values. After this modification in ETa, the distribution pattern of annual ETa values has been significantly changed particularly over Northern Europe and Mountainous areas in Central Europe (Map 2.2).
Map 6.8 Actual Evapotranspiration per SB area (lt/m2) across Europe before (left) and after (right) the update
Note: Values introduced on maps have been calculated over multi-annual average (2002-2012).
The modification done with the ETa is very rough and needs to be further calibrated and validated with the country data. The SoE WQ climatic data such as areal precipitation and evaporation have been used in validating the climatic data base of this report.
As a result of the validation procedure37 it has to be noted that there is the lack of an extensive time series, especially monthly for both climatic parameters (precipitation and actual evapotranspiration). However, areal precipitation both in monthly and annual scales presents high correlation and high efficiency coefficient values, which means that modelled data by the WA application are sufficiently expressing the observed/reported values under the SoE dataset for the cases tested.37 http://forum.eionet.europa.eu/etc-icm-consortium/library/subvention-2015/tasks-and-milestones-2015/1.5.4.-water-accounts-and-indicators-resource-efficiency/milestone-1-csi-0018-updating/technical-report-climatic-data-validation
42 Use of Freshwater Resources in Europe
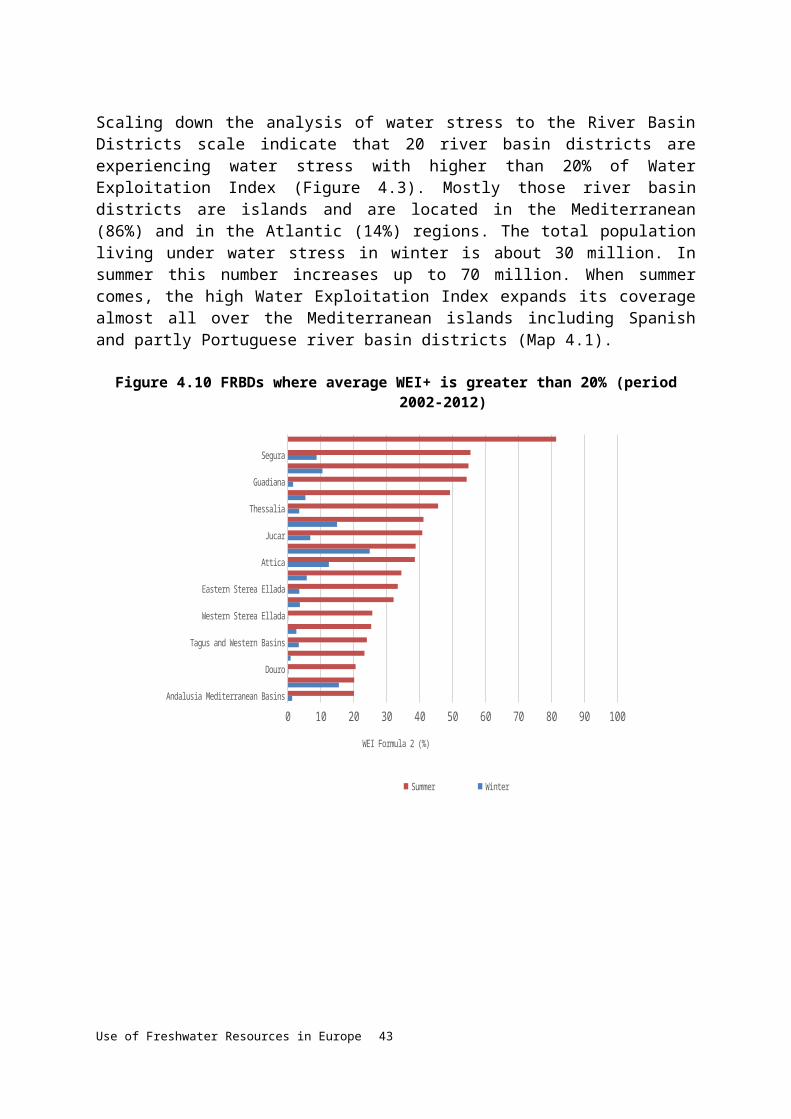
Map 6.9 WFD RBD areas used for validation of the precipitation parameter
On the contrary, it was found that this is not the case with actual evapotranspiration modelled values both in monthly and annual scales. Due to this reason, it is proposed that whenever the SoE dataset will be enriched with ETa values, at RBD scale this validation procedure should be repeated.
Map 6.10 WFD RBD areas used for validation of the ETa parameter
Use of Freshwater Resources in Europe 43
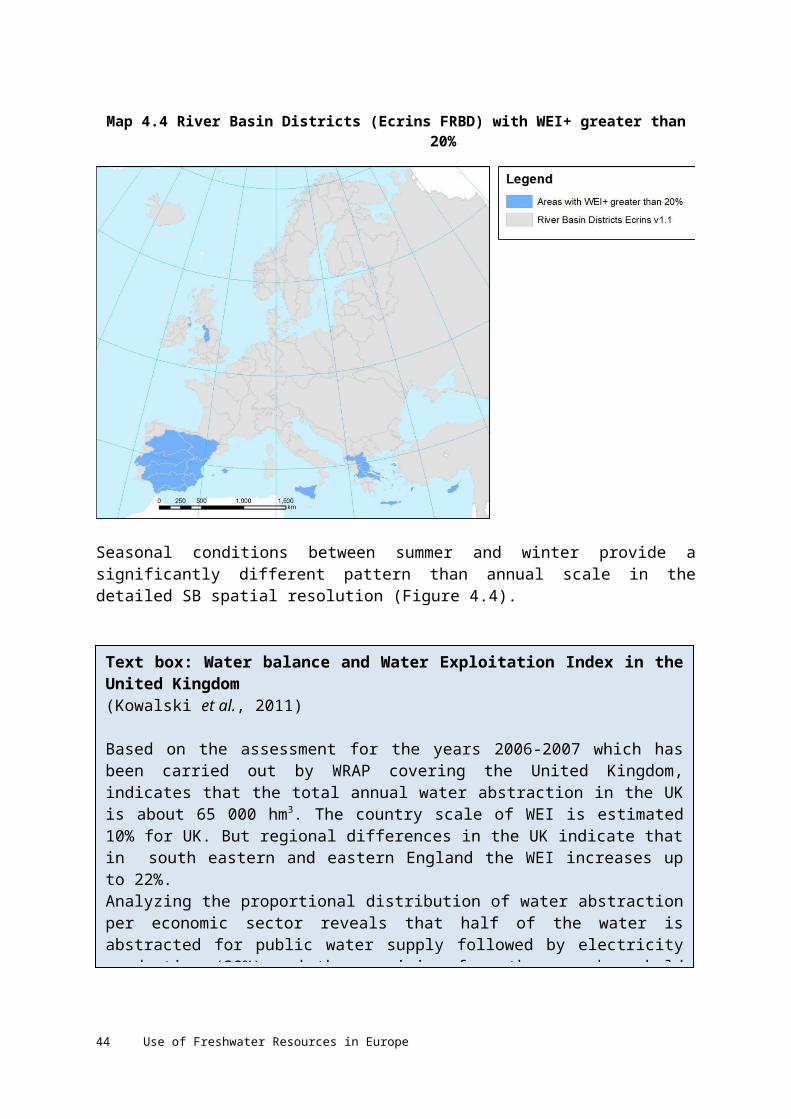
The outcome of this process indicate that modelled climatic input data are not without meaning, since they are a condensed product of data collected and statistically checked and they are reliable for the WA application.
Based on the above mentioned modification, the updated climatic data contains approximately 70 000 km3 of precipitation in grand total compared to 35 000 km3 of ETa for the 2002–2012 period covering spatial territory of this study as presented below in Figure 2.1.
Figure 6.13 Precipitation and actual Evapotranspiration volumes in million m3 across Europe (2002–2012)
Precipitation Act. Evapotranspiration0
10000
20000
30000
40000
50000
60000
70000
80000
90000
Before update After update
Volu
me
in m
illio
n km
3
Stream Flow DataThe stream flow data contains information about stream flow stations and river discharge time series. The stations data includes information about the coordinates, river catchment, FEC assignment and other hydrological and spatial information.
In this study, daily and monthly stream flow data that are reported on monitoring stations under the SoE reporting stream has been used including some ad-hoc data compilation done in the previous EEA and DG-ENV water accounts work. In addition to that, LISFLOOD data provided by JRC for the years 2002-2012 has also been integrated into the streamflow data of the EEA WA production database.
It should be mentioned that the number of stations reported under the SoE WQ is increasing over the years and that is very ambitious development in terms of data provision, as well as, future work with the water accounts and Water Exploitation Index at European scale. Figure 6.2 illustrates this positive trend in the stream flow data provision in SoE. Comparing 2007 with 2012, which indicates that 10 times more data are provided by member countries.
44 Use of Freshwater Resources in Europe
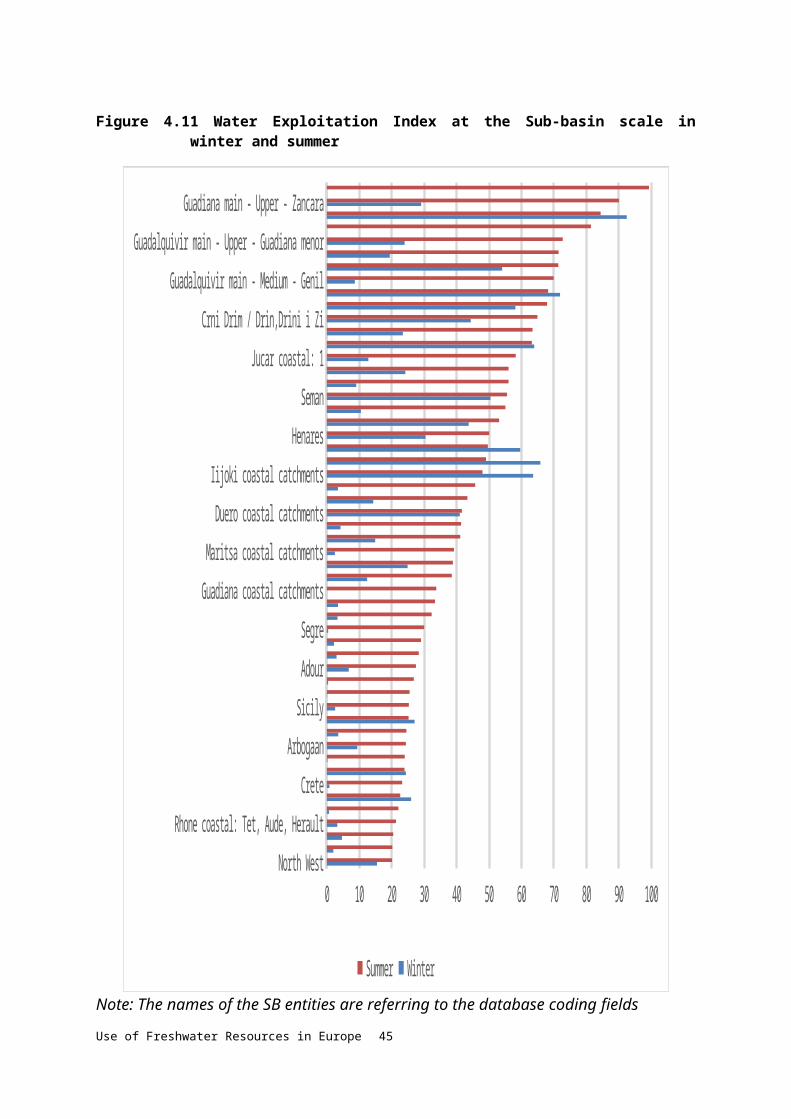
Figure 6.14 Stream flow data provisions under the SoE data flows (2007–2012)
2002
2003
2004
2005
2006
2007
2008
2009
2010
2011
2012
0
200
400
600
800
1000
1200
1400
Figure 6.15 Stream flow gauging stations after update
2002 2003 2004 2005 2006 2007 2008 2009 2010 2011 20120
2000
4000
6000
8000
10000
12000
14000
JRC Fictitious Stations SOE Stations WA Application Stations v2014
Num
ber o
f Sta
tions
The previous version of the EEA Water Accounts Database was hosting 5 472 stream flow stations (with at least one discharge value) outpouring in grand total approximately 25 000 km3 discharge for the 2002–2012 period.
Figure 6.3 indicates that initially ad-hoc data compilation was the building block for Water accounts and WEI. But the latest years as can be seen from Figure 6.2, clearly indicates this by means of SoE Water Quantity data flows, the updates are getting more stable and institutionalized. Besides that, the spatial and temporal coverage of SoE WQ data have to be
Use of Freshwater Resources in Europe 45
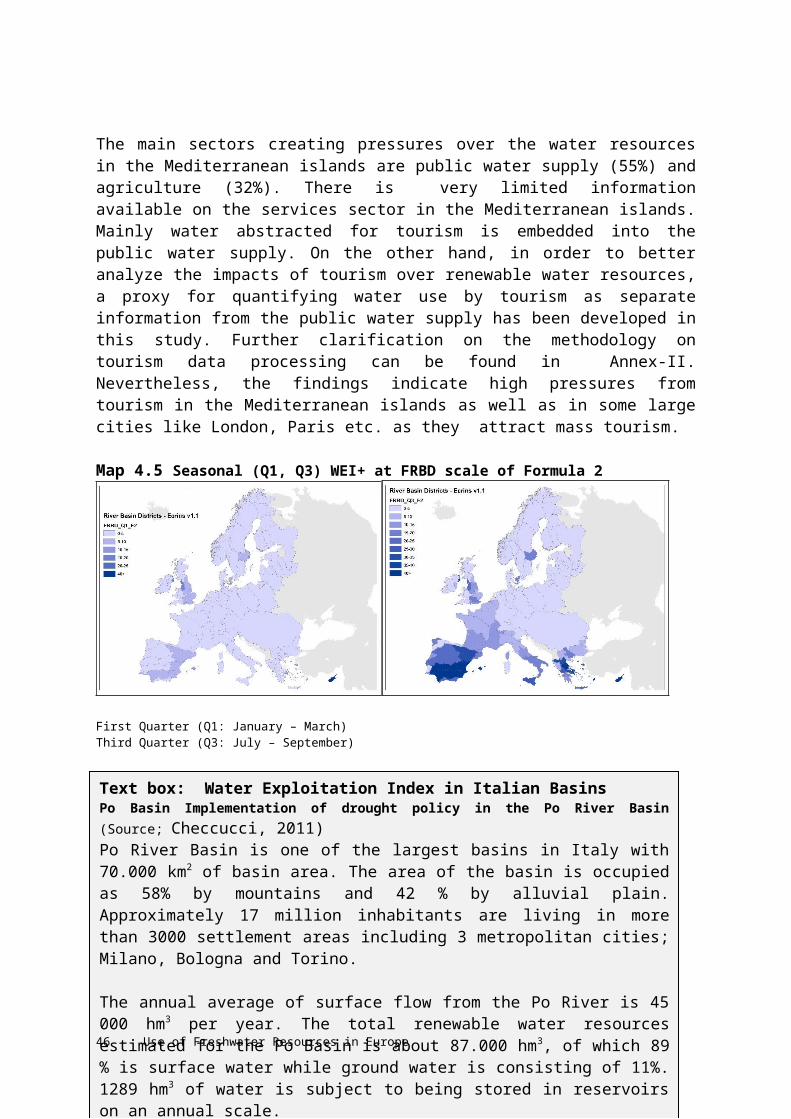
improved in the coming years, otherwise, the European scale of water accounts assessment will be quite difficult to be accomplished.
In order to provide a compiled overview covering all parts of Europe, as mentioned earlier the JRC LISFLOOD data has been integrated into the streamflow data. The integration has supported to fill gaps in both spatial coverage and the time series. Further clarifications on the stream flow data integration can be found in the Technical Report38. The final number of stations integrated in the WA database are 20 133, where 16 000 of them were used in the production of the Asset Account tables under SEEA-W covering the EEA as shown in Map 6.5 below.
Stream flow data is crucially important in calculating renewable water resources. The lack of stream flow data causes either having water deficit in water accounts and thus indicates higher WEI values for the territories concerned or has to be taken out from the assessment because of high uncertainties in the calculation.
Map 6.11 Stream flow stations coverage before LISFLOOD data integration (up) and after LISFLOOD data integration (down) update
Streamflow data is also important for quantifying external inflow from the upstream territories to the reference territory and outflow to the downstream or to the sea that are main components in the UN-SEEA-W framework. These are very important in estimating water exchange between different water agents within the same territory. In addition to that, these two parameters are also used in estimating Water Exploitation Index.
Calculating external inflow from upstream to the territory of reference to some extent requires implementing a calculation method in the case there is no observed data available. Water comes from upstream and joins renewable water resources in the reference territory
38 ETC/ICM - Technical Report on JRC runoff data integration
46 Use of Freshwater Resources in Europe
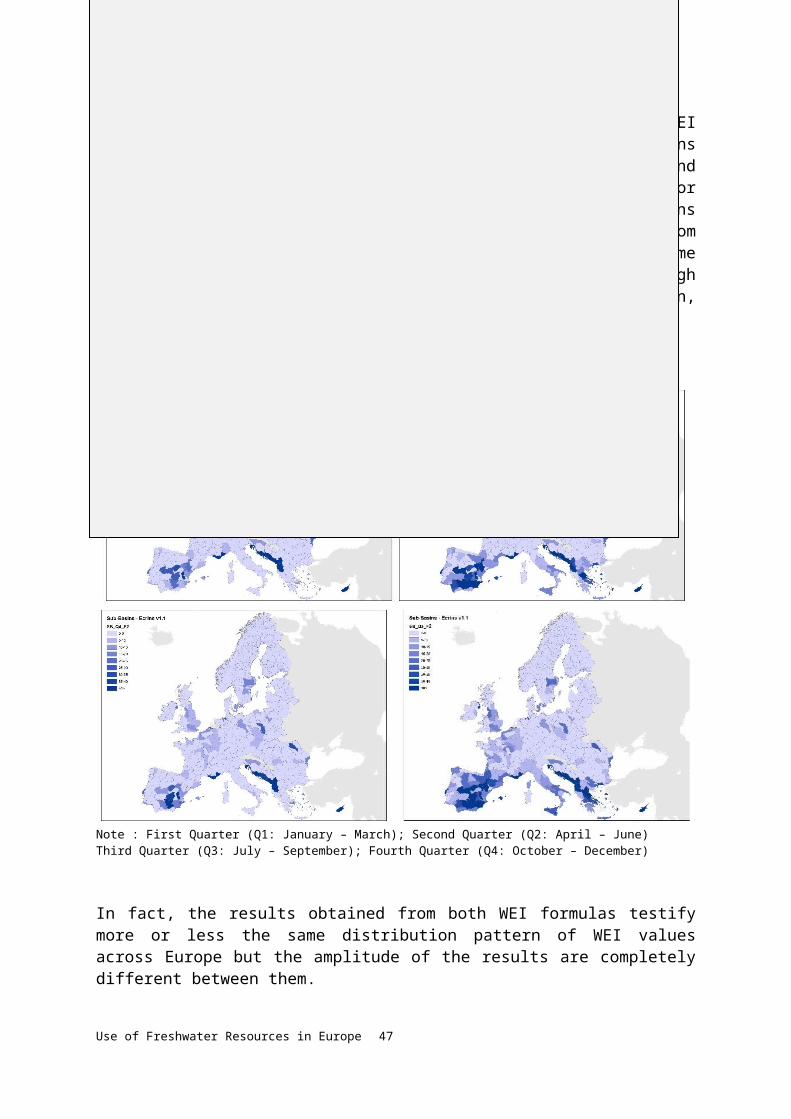
and further also contributes to outflow to the downstream areas. This travel of water should be accurately calculated without causing any double counting. This component of the EEA Water Accounts calculation is called “flow linearization or linearized flow”. Discharge data (daily and monthly) reported by member countries under the SoE WQ dataflow is extrapolated between stations along the main drains of the Ecrins drainage network to populate each and every one of the river segments presented in Ecrins with a monthly value. Therefore, the Ecrins segment represents the statistical unit of the accounts for rivers. By doing so, discharge is extended up to the source of the river and considers the affluent and reservoirs as well. Calculating Standard River Unit (river length (km) x discharge (m3) is the fundamental part of the flow linearization (39).
Change in StorageChange in storage is presented in both formulas and it has an significant impact over the WEI results. The lack of data on reference volume of water stored in lakes and reservoirs at a certain time causes a chain effect in computing the opening and closing stocks. Without knowing how much water is stored and available in the natural or man-made water reserves, estimating the change in reservoirs remains completely relative. Unfortunately, these data are not available for all reservoirs and lakes in the SoE database. The current algorithm of estimating change in reservoirs as a component of renewable water resources is based on water deficit resulted from a relationship between other agents in the renewable water resources. Whenever water deficit occurs, the theoretical volume of water is taken from the reservoirs and registered as “changes in reservoirs” in the accounting period. The impacts of this approach by applying the same change in storage for both formulas, due to the lack of data, cannot not be fully checked over the Water Exploitation Index, and it does not make possible to close the stock in the Assets Account Table, and thus creates some uncertainties over the actual water abstraction from the reservoirs.
The EEA water accounts production database covers approximately 71 000 lake entities. In the SoE water quantity database only 105 reservoirs are presented with information on the reference volume of water. The WaterBase Lakes database has also around 1 860 lake water bodies presented with the information on either area together with mean, max and min. depth or total volume of water which can be used as a proxy in estimating the reference volume of water stored in lakes and reservoirs. But on the other hand, still that the numbers of lakes with available information is far from good enough to include reference volume of water stored in the reservoirs for closing the stock calculation in the Asset Accounts.
39 See the POYRY report for further clarifications on the method and algorithm used for the interpolation and extrapolation in stream flow data
Use of Freshwater Resources in Europe 47

7 Annex II – Data for water useThe current SoE WQ database has limited temporal and spatial coverage across Europe with a very heterogeneous composition of reported scales. Therefore, dealing with the water use assessment in the water accounting framework, requires modeling and proxies to be implemented in the case the reported data is not available. The modelling in the EEA water accounts work with the water use component generally takes information into account on the population of urban and rural areas for estimating the water supply; technical specifications of industrial installations for estimating water consumption by economic sector and information on crop area distribution and crop water demand for estimating water abstraction by the agricultural sector. In addition to that, UWWTPs capacities and the EPRTR database are also included into the estimating of water use and returns. Final validation is carried out by Eurostat data which is reported by the member countries at RBD or SU scale on an annual resolution. Detailed information on the method for calculating water abstraction, water use and return can be found in previous reports on the Water Accounts Tool (40).
The following paragraphs outline the content of the data updates in different domains of the Water Use database and the technical procedure followed in data integration and assimilation.
7.1.1 Update of data on the population of Large Cities
Population is one of the main drivers on water abstraction and use. Particularly water consumption for household and public supply, which is estimated via the population data together with the UWWTPs database. In the EEA water accounts exercise population is classified as rural and urban population in order to estimate the water abstraction and return via the UWWTPs database. UMZ is used as a proxy in distinguishing the boundaries of urban and rural areas while the spatial distribution of population across Europe is identified in the Landscan 2010 database. Furthermore, cities are classified as Large, Medium and Small based on population size. Large cities have significant impacts over the water abstraction and consumption.
In order to update the population of large cities, the Eurostat Urban Audit dataset (41) has been used. The Urban Audit data collection of Eurostat provides information and comparable measurements on various aspects of the urban life of European cities. The Urban Audit Table includes population data for European Large cities up to 2013.
Population data for medium and small cities including the rural areas could not be updated due to lack of publicly available data sources particularly in the Landscan database.
7.1.2 Update of tourism data
The Eurostat Tourism Database (42) has been used for the purpose of disaggregating the number of tourists at catchment scale to better reflect the impacts of tourism over the renewable water resources. 40 Service Contract to contribute to the building of Water and Ecosystem accounts at EU level, Final Report 2 Uses & Supply 41 Eurostat- Urban Audit 42 Eurostat tourism (tour) dataset
48 Use of Freshwater Resources in Europe
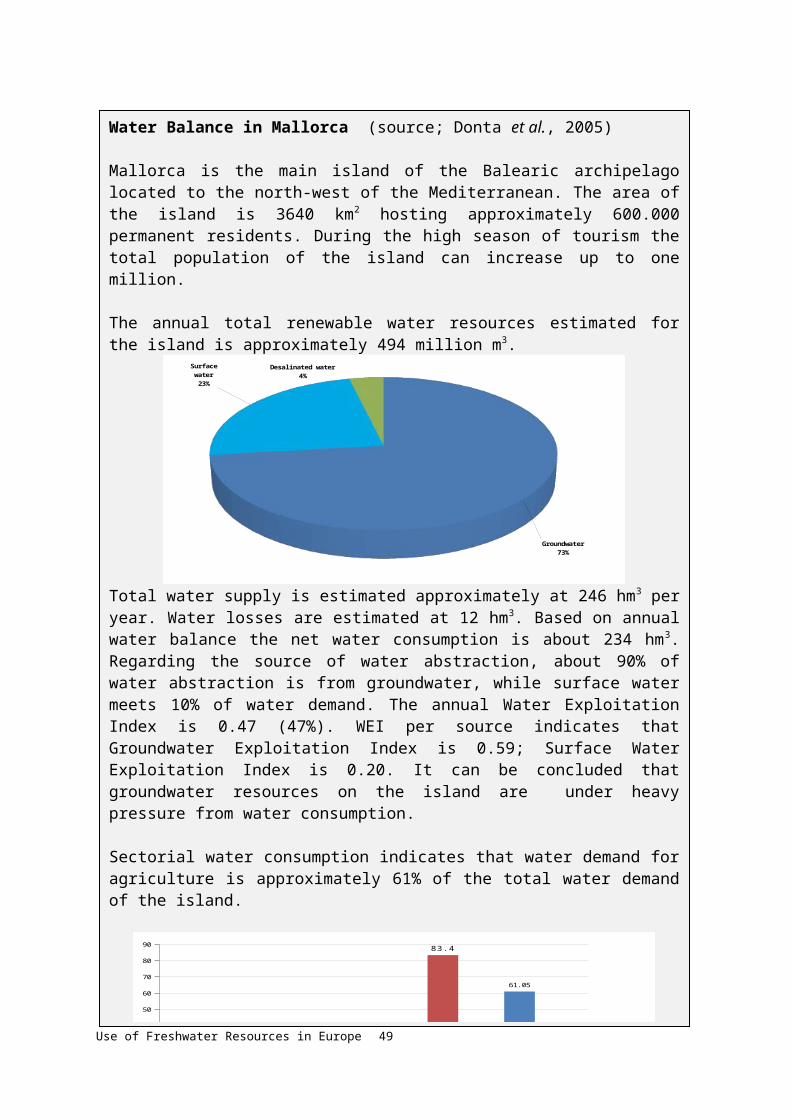
In order to disaggregate the total number of tourists over the catchment, two Eurostat datasets were used, namely:
“Nights spent at tourist accommodation establishments by NUTS2 regions” and “Nights spent at tourist accommodation establishments - monthly data”
A disaggregation procedure of the tourism data in finer temporal and spatial scales had to be implemented. Eurostat monthly data of the latter dataset were disaggregated to NUTS2 level based on the annual data of the former dataset. Then the disaggregation procedure was extended, in order to estimate the tourist presence at FEC scale.
The first step was to calculate NUTS2 tourism ratios for each country. These ratios were defined by the number of tourists on a particular region to the total number of tourists arriving in the country. Then each ratio was multiplied by the respective monthly “Country nights spent” data, in order to produce monthly information per NUTS2 level. The next step was to spatially disaggregate from NUTS2 level to FEC level. In order to perform this task, an assumption was made, that tourists are proportionally distributed in each FEC based on the respective resident population size. Following this assumption, monthly tourism population data were multiplied by the population ratio of each FEC in every NUTS2 region. On the water abstraction and returns calculation the monthly tourism nights translated to population were multiplied by the respective water domestic coefficients in order to produce water volumes. The Figure 7.1 for Spanish NUTS2, indicates that the Canarias and Balearic islands seem to have the highest tourism presence over the months of spring and summer.Figure 7.16 Nights Spent by non-Residents in Spain
Jan-02 Oct-02 Jul-03 Apr-04 Jan-05 Oct-05 Jul-06 Apr-07 Jan-08 Oct-08 Jul-09 Apr-10 Jan-11 Oct-11 Jul-12 Apr-13 Jan-14 Oct-140
2000000
4000000
6000000
8000000
10000000
12000000
Nights Spent by Non Residents, Spain NUTS2 (2002-2014)
Andalucía Aragón Canarias Cantabria Castilla y León Castilla-La Mancha
Cataluña Ciudad Autónoma de Ceuta Ciudad Autónoma de Melilla Comunidad de Madrid Comunidad Foral de Navarra Comunidad Valenciana
Extremadura Galicia Illes Balears La Rioja País Vasco Principado de Asturias
Región de Murcia
Nig
hts
7.1.3 Industrial data updates
For updating the industry related entities and their water use in the database, three main source data have been encountered; UWWTP, European Pollutant Release and Transfer Register (E–PRTR) and the Cooling Water Database developed under a Commission contract
Use of Freshwater Resources in Europe 49
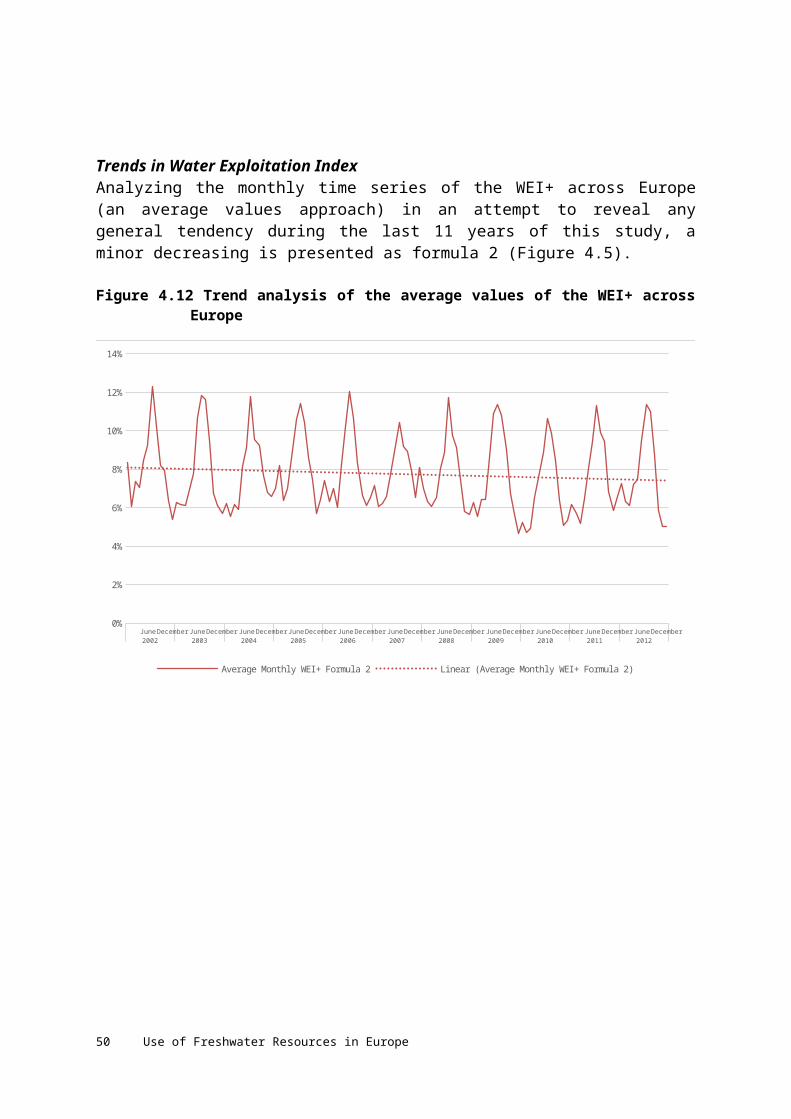
in 2014. The Map 7.1 illustrates the status of industries spatial coverage before and after the update.Industries across Europe as updated from the E-PRTR database before (red) and after (green) update.
Map 7.12 Industries across Europe as updated from E-PRTR database before (red) and after (green) update
By means of the cooling water database developed by the DG-ENV it could be possible to better capture the water abstraction and water use by industrial plants across Europe.
7.1.4 UWWTP database updates
The capacity of UWWTP is one of the main data sources in estimating water abstraction and return in the EEA WA assessment. It is designed to use waste water treatment plants in order to calculate water abstractions and returns. A procedure has been followed for the update of corresponding database tables with the latest delivery (2012) initially covered 2007–2011 time periods. The update enriched the database with 1 359 more UWWTPs increasing the total capacity by 175 466 522 equivalent population (p.e.) based on the last version of the Urban Waste Water Treatment Plants Directive (Map 7.2).
50 Use of Freshwater Resources in Europe

Map 7.13 Urban waste water treatment plants across Europe, before (red) and after (green) update
7.1.5 Updating Water Use Coefficients
Water consumption for domestic and services purposes are estimated by water use coefficients. The source for those coefficients is statistical data from country and European statistical authorities like Eurostat. Based on the available data from the countries as well as from Eurostat (43) the previous coefficient per country per sector have been further updated. Table 7.1 illustrates the updated coefficients in the current water accounts study.
Table 7.2 Water use coefficient per country
Country code
Households’ consumption/total public
water supplied (%)
Year of update Households consumption ratio
(m3/inhab/day)
Connected services consumption ratio
(m3/inhab/day)
AT 86.97 2010 (Germany data) 0.12 0.02BE 56.57 2009 0.10 0.08BG 71.89 2011 0.10 0.04CY 61.65 2010 0.28 0.17CZ 66.06 2011 0.09 0.04DE 86.97 2010 0.12 0.02DK 65.23 2004 0.13 0.07EE 58.00 2011 (Lithuania data) 0.06 0.04ES 74.59 2010 0.16 0.05FI 58.82 2011 0.10 0.07FR 87.28 2008 (estimated by Poyry) 0.16 0.02GR 63.10 2007 0.10 0.06HR 63.10 2011 0.12 0.07HU 73.75 2011 0.09 0.03IE 71.87 2011 (UK data) 0.29 0.11IT 74.59 2010 (Spain data) 0.19 0.07IS 44.78 2004 0.28 0.35LT 58.00 2011 0.05 0.04LU 56.57 2009 (Belgium data) 0.10 0.08LV 58.00 2011 (Lithuania data) 0.18 0.13
43 Annual freshwater abstraction by source and sector (env_wat_abs table) - http://appsso.eurostat.ec.europa.eu/nui/show.do?dataset=env_wat_abs&lang=en
Use of Freshwater Resources in Europe 51
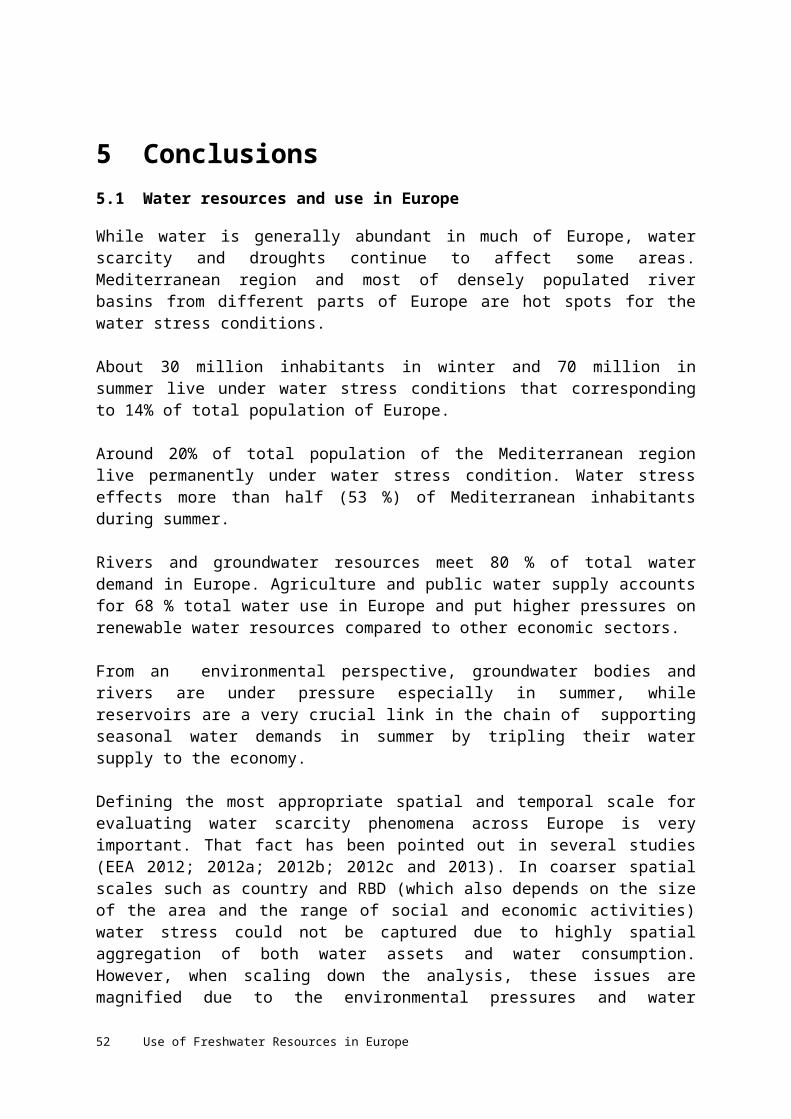
Country code
Households’ consumption/total public
water supplied (%)
Year of update Households consumption ratio
(m3/inhab/day)
Connected services consumption ratio
(m3/inhab/day)
MK 57.32 2009 0.13 0.09MT 36.67 2011 0.07 0.12NL 72.18 2010 0.13 0.05NO 58.82 2011 (Finland data) 0.10 0.07PO 77.80 2011 0.09 0.02PT 86.21 2009 0.16 0.03RO 64.82 2011 0.07 0.04RS 70.02 2009 0.12 0.05SE 70.91 2010 0.14 0.06SI 71.55 2011 0.11 0.04SK 45.39 2011 0.07 0.08TR 0.00 2010 0.00 0.12UK 71.87 2011 0.14 0.05CH 57.97 2011 0.19 0.14
The abstraction volumes depending on the water resources’ type are presented on the following table:
Table 7.3 - Water resources abstracted by the public sector
country code
Surface water
abstraction for public
activities by EUROSTAT Mm3/year
Year Surface water
abstraction/total abstracti
on (%)
Groundwater abstraction for public activities by EUROSTAT
Mm3/year
Year Groundwater abstraction/t
otal abstraction
(%)
Sea water abstraction for public
activities by EUROSTAT Mm3/year
Year Sea water abstraction/total abstraction
(%)
Total Abstractio
n Mm3/yea
r
AT 1 2008 0 607 2008 100 0 608
BE 249 2009 35 458 2009 65 0 707
BG 480 2011 52 436 2011 48 0 916
CY 26 2011 25 27 2011 26 49 2011 48 102
CZ 327 2011 51 311 2011 49 0 638
DE 1546 2010 30 3535 2010 70 0 5081
DK 0 2010 0 387 2010 100 0 387
EE 28 2011 27 34 2011 55 0 61
ES 3760 2010 65 1590 2010 28 425 2006 7 5775
FI 160 2011 40 240 2011 60 0 400
FR 1616 2010 29 3875 2010 71 0 5491
GR 604 2011 47 689 2011 53 0 1293
HR 62 2011 12 461 2011 88 0 523
HU 255 2011 42 346 2011 58 0 601
IE 489 2007 80 120 2007 20 0 609
IT 1366 2008 15 7729 2008 85 0 9095
IS 3 2005 4 76 2005 96 0 79
LT 0 2011 0 124 2011 100 0 124
LU 24 2011 53 21 2011 47 0 45
LV 35 2010 16 187 2010 84 0 222
MT 0 2011 0 13 2011 43 17 2011 57 30
MK 227 2009 83 47 2009 17 0 274
52 Use of Freshwater Resources in Europe
country code
Surface water
abstraction for public
activities by EUROSTAT Mm3/year
Year Surface water
abstraction/total abstracti
on (%)
Groundwater abstraction for public activities by EUROSTAT
Mm3/year
Year Groundwater abstraction/t
otal abstraction
(%)
Sea water abstraction for public
activities by EUROSTAT Mm3/year
Year Sea water abstraction/total abstraction
(%)
Total Abstractio
n Mm3/yea
r
NL 456 2010 37 761 2010 63 0 1217
NO 740 2011 90 79 2011 10 0 819
PO 611 2011 30 1423 2011 70 0 2034
PT 611 2009 65 323 2009 35 0 934
RO 622 2011 62 378 2011 38 0 1000
RS 200 2011 30 473 2011 70 0 673
SE 708 2010 78 200 2010 22 0 908
SI 4 2011 2 165 2011 98 0 169
SK 49 2011 16 254 2011 84 0 303
TR 2559 2010 44 3233 2010 56 0 5792
UK 4614 2011 73 1719 2011 27 0 6333
CH 191 2011 20 763 2011 80 0 954
Table 7.2 is an update of the former work performed under the construction of the water accounts tool for the EEA44 in 2012. The table columns are referring to:
Surface water abstraction for public activities Groundwater abstraction for public activities Sea water abstraction for public activities
For the update, Eurostat dataset “env_wat_abs”(45) has been used. Table 7.2 adds seven more countries in comparison to the 2012 work. These countries are Croatia, Iceland, FYROM, Norway, Serbia, Turkey and Switzerland. The total number of countries with data on this Table has risen to 34. The latest year covering this update is 2011.The next Table 7.3 indicates the water volumes supplied by the public sector that have been derived by Eurostat data, in comparison with the respective abstracted volumes.
In the same way with Table 7.2, Table 7.3 is correlated to the former work on the water accounts tool (46) in 2012. It is referring to:• Total Abstraction• Total Public water Supply• % of water lost (system water losses)In Table 7.3, also 7 countries have been inserted in comparison to the older Table(45). For the initial update, Eurostat data has been used. The relevant datasets are “env_wat_abs” and “env_wat_cat”(47) . In order to calculate losses of the public water supply system, an estimation methodology was performed; total water supply volume was divided by the respective total abstraction volume, in order to find the efficiency “e” of the supply system. Then losses, “L” were calculated as L=1-e. The implementation of this methodology gave unrealistic results in 11 cases. In these latter cases abstractions were lower or equal to water supply leading to negative losses or close to zero. For that reason a research has been used in order to find the water supply system losses. More particularly for Austria, losses have been reported in the range of 7-11%
44 http://ec.europa.eu/environment/water/blueprint/pdf/WaterEcosystemAccount2.pdf45 Eurostat, http://appsso.eurostat.ec.europa.eu/nui/show.do?dataset=env_wat_abs&lang=en
Use of Freshwater Resources in Europe 53
(46). In Belgium losses are 13%(47), in Cyprus the respective losses are reported as 17-23%(48) , while in Malta are 23%(49). Finally in Switzerland losses have been reported as 11% (50). European countries' water supply system losses have been also gathered by various official organizations and the EU(51). These sources of actual data were preferred than the derived data based on the estimation methodology. Finally some assumptions, based on spatial proximity of some countries, were inevitable in the case of existing data gaps.
Table 7.4 - Public water supplied and comparison with abstraction
country code
Total Abstraction by
EUROSTAT Mm3/year
Year
Total Public water Supply by EUROSTAT
Mm3/year
Year % of water lost
% of water lost using EUROSTAT and data from
neighboring countries
% of water lost from extra
sources
PROPOSED FINAL
AT 608 2008 608 2008 0 7-11 11
BE 707 2009 700 2009 1 13 13
BG 916 2011 370 2011 60 60 50 50
CY 102 2011 - 17-23 20
CZ 638 2011 492 2011 23 23 32 32
DE 5081 2010 4113 2010 19 19 7 7
DK 660 2009 386 2009 42 42 10 10
46 Experiences with Water Loss PIs in the Austrian Benchmarking Project, J. Kölbl, H. Theuretzbacher-Fritz, R. Neunteufel, R. Perfler, G. Gangl, H. Kainz & R. Haberl 47 Secteur Public Fédéral - Economie, PME, Classes moyennes et Energie:Ressources et utilisations de l'ea, PME, 200948 Auditor General of the Republic of Cyprus, 2008. Republic of Cyprus Annual Report 2006 -2007, http://www.audit.gov.cy/audit/audit.nsf/annualrpt_en/annualrpt_en?OpenDocument 49 Water Loss Control Management by the water services corporation in Malta, NAO, 200850 The cost structure of water utilities in Switzerland, Andrea Baranzini and Anne-Kathrin Faust, 200951http://www.bdew.de/bdew.nsf/id/DE_Profile_of_the_German_Water_Industry/$file/ Profile_German_Water_Industry_2008.pdf
54 Use of Freshwater Resources in Europe
EE 103 2011 48 2011 53 53 53
ES 5775 2010 3621 2010 37 37 22 22
FI 400 2011 340 2011 15 15 15 15
FR 5491 2010 - 26 26
GR 846 2007 626 2007 26 26 26
HR 523 2011 290 2011 45 45 45
HU 601 2011 461 2011 23 23 35 35
IE 609 2007 609 2007 0 34 34
IT 9095 2008 5533 2008 39 39 28 28
IS 79 2005 67 2005 15 15 15
LT 124 2011 100 2011 19 19 19
LU 45 2011 - 13 (Belgium) 13
LV 211 2007 249 2007 -18 19 (Lithuania) 19
MT 30 2011 30 2011 0 23 23
MK 274 2009 164 2009 40 40 40
NL 1217 2010 1089 2010 11 11 11
NO 819 2011 - 15 (Finland) 15
PO 2034 2011 1545 2011 24 24 24
PT 934 2009 718 2009 23 23 23
RO 1000 2011 830 2011 17 17 31 31
RS 673 2011 457 2011 32 32 32
SE 908 2010 671 2010 26 26 17 17
SI 169 2011 116 2011 31 31 40 40
SK 303 2011 304 2011 0 27 27
TR 5792 2010 3013 2010 48 48 48
UK 6333 2011 4487 2011 29 29 22 22
CH 954 2011 954 2011 0 11 11
Following the procedure of the former work of 2012, Table 7.4 has been derived. This Table contains:
Initial total public water supply ratios per inhabitant and day Final total public water supply ratio per inhabitant and day
Also the same 7 countries, mentioned previously, have been added. For the update of this table, data from Eurostat and OFWAT (Water services regulation authority in England and Wales) 52 were used. More particularly the Eurostat dataset “env_wat_cat”, has been used for the update of “initial total public water supply” in m3/inhab/day. In order to calculate the final consumptions, including water lost in the distribution network through leakage, the percentage of losses estimated in the previous table was added in the initial total public supply ratios, giving the “final public supply” consumptions in m3/inhab./day. OFWAT’s
52 https://www.ofwat.gov.uk/
Use of Freshwater Resources in Europe 55
data, were used as a consistency check of the derived results, although in case of deviations, the calculated results were preferred instead of these data.
By means of updates made with the above tables, the final abstractions are presented in the Table 7.4:
Table 7.5 - Final ratios used for abstracted water and supplied water (m3/ inhabitant/day)
Country code Total public water supply
ratio per inhabitant
(m3/inhab/day)
year of update and also estimation on neighboring countries for public
water supply ratio (EUROSTAT)
% of water lost using
EUROSTAT and data from
neighboring countries
% of water lost
from extra
sources
PROPOSED
FINAL
Total abstraction ratio
per inhabitant (m3/inhab/day)
AT 0.14 Estimation with German data 7-11 11 0.20
BE 0.18 2009 13 13 0.18
BG 0.14 2011 60 50 50 0.34
CY 0.45 2010 17-23 20 0.17
CZ 0.13 2011 23 32 32 0.17
DE 0.14 2010 19 7 7 0.17
DK 0.19 2009 42 10 10 0.19
EE 0.10 2011 53 53 0.21
ES 0.21 2010 37 22 22 0.32
FI 0.17 2011 15 15 15 0.20
FR 0.18 Estimation with Netherlands data 26 26 0.23
GR 0.15 2007 26 26 0.32
HR 0.19 2011 45 45 0.33
HU 0.13 2011 23 35 35 0.16
IE 0.40 2011 34 34 0.38
IT 0.26 2008 39 28 28 0.42
IS 0.63 2005 15 15 0.74
LT 0.09 2011 19 19 0.11
LU 0.18 Estimation with Belgium data 13 (Belgium) 11 0.24
LV 0.31 2007 19 (Lithuania) 19 0.28
MK 0.22 2009 40 40 0.37
MT 0.20 2011 23 23 0.09
NL 0.18 2010 11 11 0.20
NO 0.17 Estimation with Finland data 15 (Finland) 15 0.45
PO 0.11 2011 24 24 0.15
PT 0.19 2009 23 23 0.24
RO 0.11 2011 17 31 31 0.14
RS 0.17 2011 32 32 0.25
SE 0.20 2010 26 17 17 0.27
SI 0.16 2011 31 40 40 0.22
SK 0.15 2011 27 27 0.16
TR 0.12 2010 48 48 0.22
56 Use of Freshwater Resources in Europe
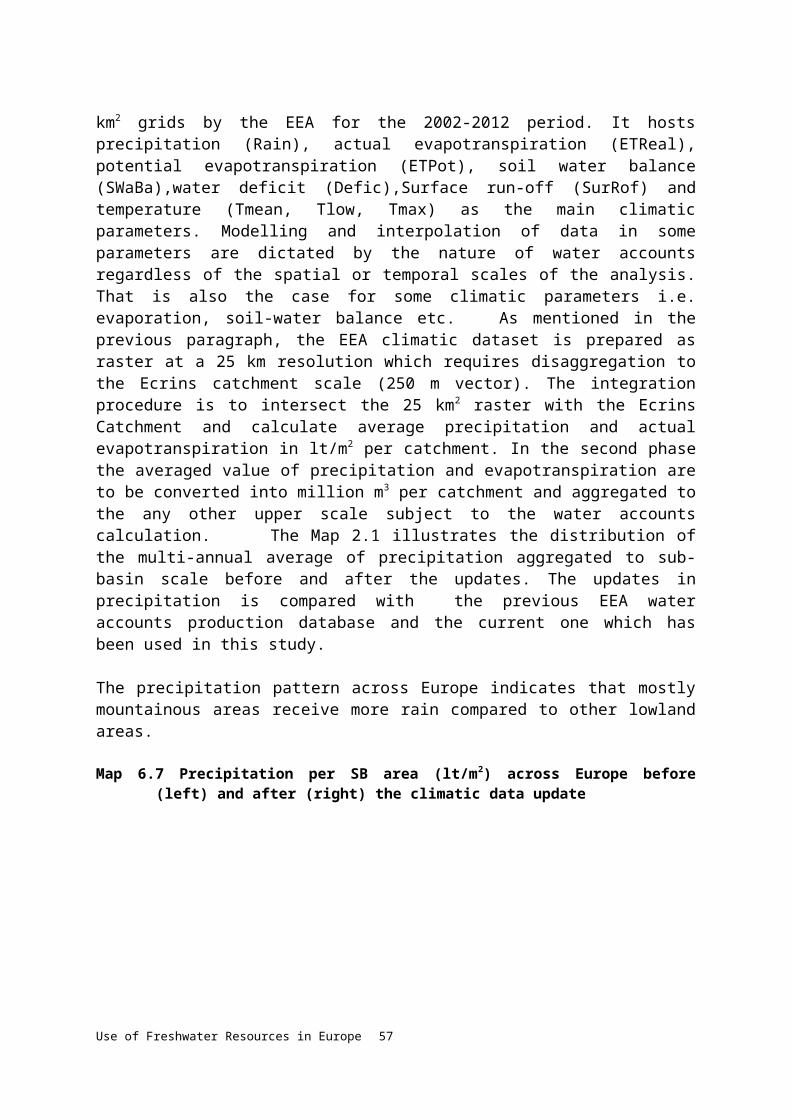
Country code Total public water supply
ratio per inhabitant
(m3/inhab/day)
year of update and also estimation on neighboring countries for public
water supply ratio (EUROSTAT)
% of water lost using
EUROSTAT and data from
neighboring countries
% of water lost
from extra
sources
PROPOSED
FINAL
Total abstraction ratio
per inhabitant (m3/inhab/day)
UK 0.20 2011 29 22 22 0.27
CH 0.33 2011 11 11 0.33
Finally Table 7.5 was updated in relation with the 2012 work. This table splits the total public supply consumption into two parts: Households and the connected services in the economy. Units are in m3/inhab/day. As mentioned earlier, seven countries have been additionally inserted. The households’ consumptions have been found in Eurostat, while the connected services’ consumptions were estimated by the abstraction of households’ consumptions from the overall public supply consumptions.
All the updates of data coefficients mentioned above affected the Tp_act_domes table (stored into EU_Uses.mdb) of the EEA WA Production Database.
Table 7.6 - Ratios used for households and connected services supplied watercountry code Households
consumption/total public water supplied (%)
Year of update Households consumption ratio
(m3/inhab/day)
Connected services
consumption ratio (m3/inhab/day)
AT 86.97 German data 0.12 0.02BE 56.57 2009 0.10 0.08BG 71.89 2011 0.10 0.04CY 61.65 2010 0.28 0.17CZ 66.06 2011 0.09 0.04DE 86.97 2010 0.12 0.02DK 65.23 2004 0.13 0.07EE 58.00 Lithuania data 0.06 0.04ES 74.59 2010 0.16 0.05FI 58.82 2011 0.10 0.07FR 87.28 POYRY 0.16 0.02GR 63.10 2007 0.10 0.06HR 63.10 2011 0.12 0.07HU 73.75 2011 0.09 0.03
Use of Freshwater Resources in Europe 57
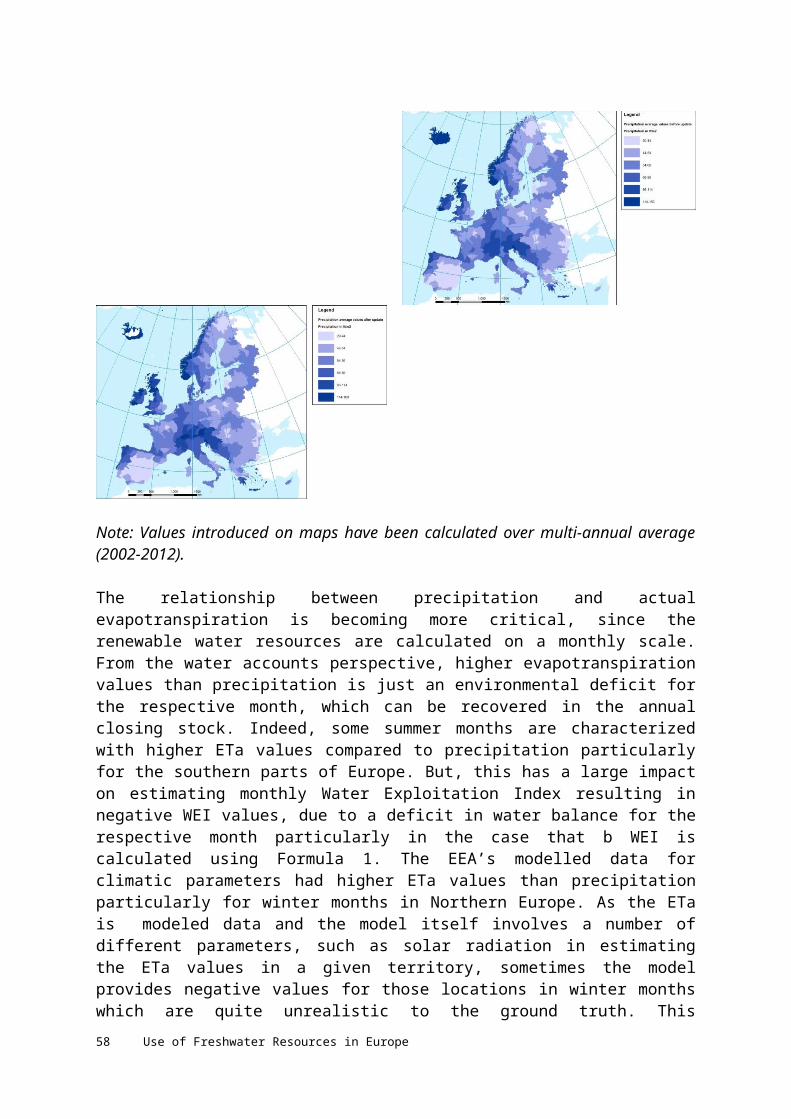
IE 71.87 UK data 0.29 0.11IT 74.59 Spain data 0.19 0.07IS 44.78 2004 0.28 0.35LT 58.00 2011 0.05 0.04LU 56.57 Belgium data 0.10 0.08LV 58.00 Lithuania data 0.18 0.13MK 57.32 2009 0.13 0.09MT 36.67 2011 0.07 0.12NL 72.18 2010 0.13 0.05NO 58.82 Finland data 0.10 0.07PO 77.80 2011 0.09 0.02PT 86.21 2009 0.16 0.03RO 64.82 2011 0.07 0.04RS 70.02 2009 0.12 0.05SE 70.91 2010 0.14 0.06SI 71.55 2011 0.11 0.04SK 45.39 2011 0.07 0.08TR 0.00 2010 0.00 0.12UK 71.87 2011 0.14 0.05CH 57.97 2011 0.19 0.14
7.1.6 Modulation Coefficients Update
Water use volumes per sector are calculated by the use of monthly modulation coefficients. The economic sectors follow the ISIC classification under UN SEEA. Main sectors of the application are:
A (Agriculture, forestry and fishing)
B (Mining and quarrying)
C (Manufacturing)
D 35 (Electricity, gas, steam and air conditioning supply) and
E 36 (Water collection, treatment and supply).
Eurostat provides monthly data for “Production in industry”53 with the year 2010 as a reference. This was the proxy to identify the water use modulation coefficients at country scale and monthly level. Such coefficients were multiplied by the water volume of each catchment (industrial and domestic use) in order to provide a monthly variation of water abstraction and use.
The analysis is based on sectors B – C, D35 and E36. Figures 7.2 to 7.4 indicate the variation of water uses considering the reference year of 2010.
53 Production in industry - monthly data - http://appsso.eurostat.ec.europa.eu/nui/show.do?dataset=STS_INPR_M&lang=en
58 Use of Freshwater Resources in Europe
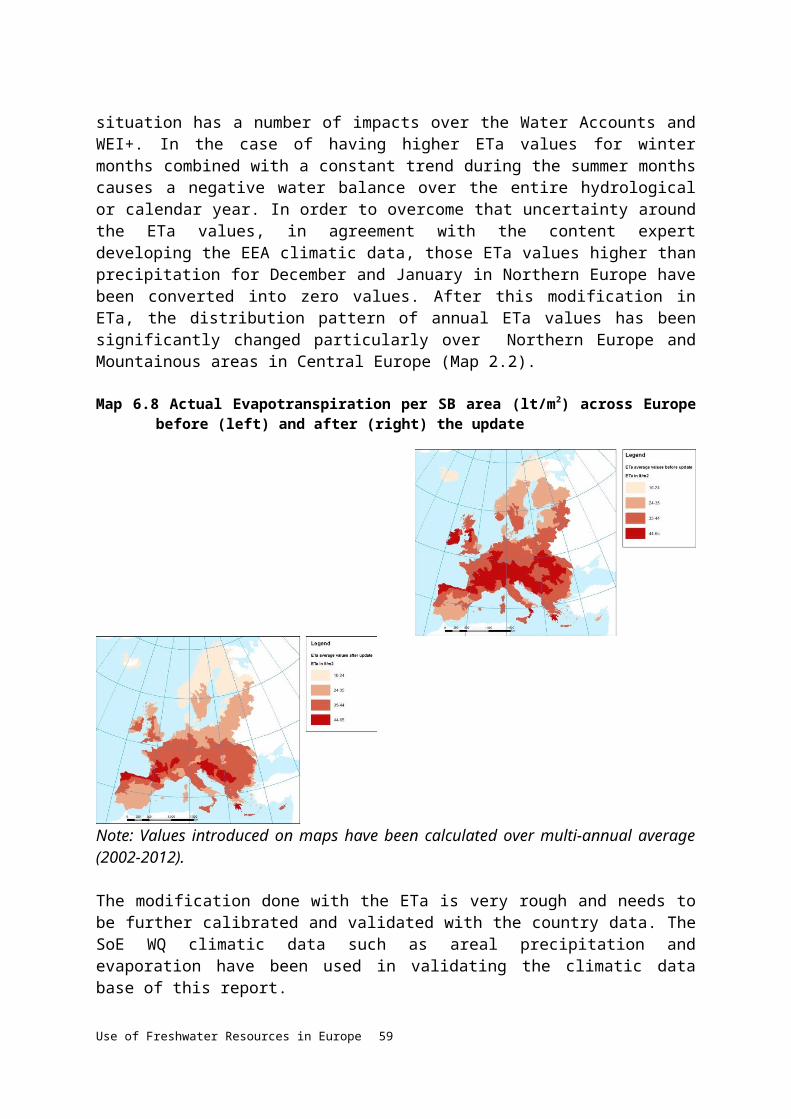
Figure 7.17 Production in Industry sectors B - C (2010)
Janu
ary
Febr
uary
Mar
ch
April
May
June July
Augu
st
Sept
embe
r
Octo
ber
Nove
mbe
r
Dece
mbe
r
2010
0
20
40
60
80
100
120
140
Albania Belgium Bulgaria Czech Denmark GermanyEstonia Ireland Greece Spain France CroatiaItaly Cyprus Latvia Liechtenstein Lithuania LuxembourgHungary Iceland Malta Netherlands Austria PolandPortugal Romania Slovenia Slovakia Finland SwedenSwitzerland UK Norway Montenegro FYROM SerbiaTurkey Bosnia Kosovo
Figure 7.18 Production in Industry sector D35 (2010)
January February March April May June July August September October November December2010
020406080
100120140160180200
Albania Belgium Bulgaria Czech Denmark Germany Estonia
Ireland Greece Spain France Croatia Italy Cyprus
Latvia Liechtenstein Lithuania Luxembourg Hungary Iceland Malta
Netherlands Austria Poland Portugal Romania Slovenia Slovakia
Finland Sweden Switzerland UK Norway Montenegro FYROM
Serbia Turkey Bosnia Kosovo
Use of Freshwater Resources in Europe 59
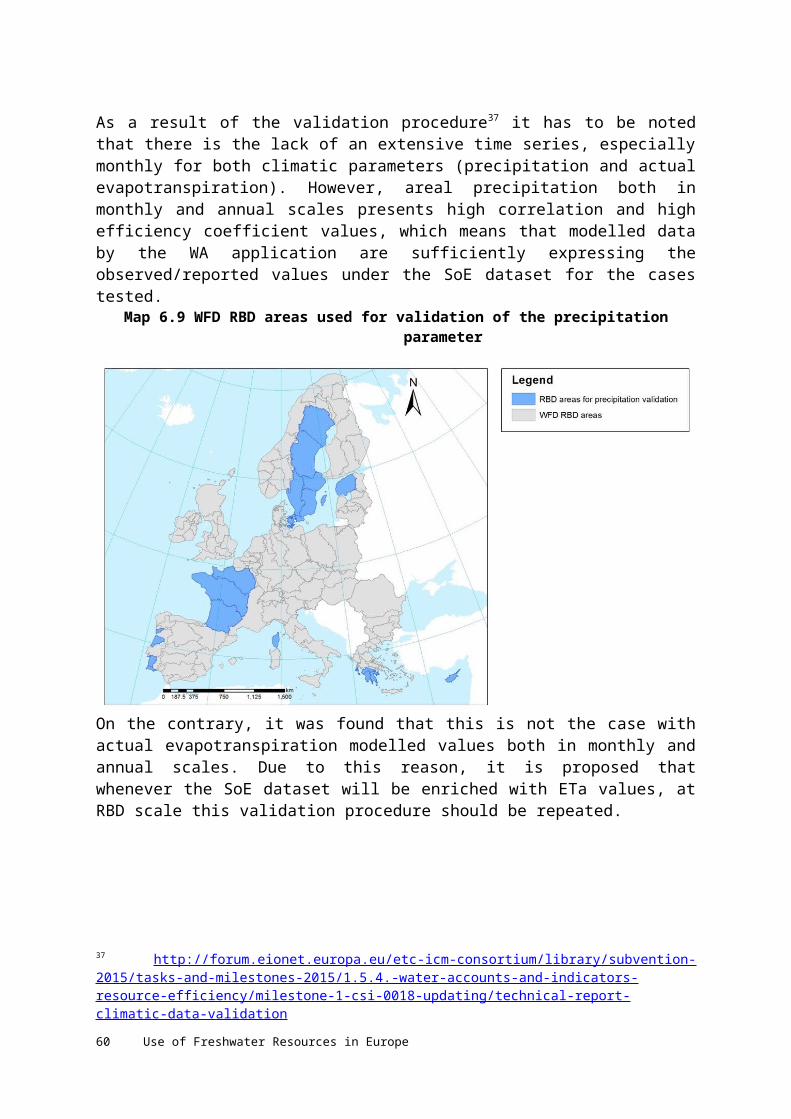
Figure 7.19 Production in Industry sector E36 (2010)
January February March April May June July August September October November December2010
0
20
40
60
80
100
120
140
Albania Belgium Bulgaria Czech Denmark GermanyEstonia Ireland Greece Spain France CroatiaItaly Cyprus Latvia Liechtenstein Lithuania LuxembourgHungary Iceland Malta Netherlands Austria PolandPortugal Romania Slovenia Slovakia Finland SwedenSwitzerland UK Norway Montenegro FYROM SerbiaTurkey Bosnia Kosovo
For countries with no data on Eurostat “Production in industry” dataset, the gap filling was made by other countries based on the closest GDP. Table 7.6 illustrates the gap filling assumptions.
Table 7.7 Gap filling in Industry Coefficients
COUNTRY SECTOR B,C SECTOR D35 SECTOR E36
Belgium OK OK OK
Bulgaria OK OK OK
Czech Republic OK OK Poland
Denmark OK OK Netherlands
Germany (until 1990 former territory of the FRG)
OK OK Average of Belgium, Netherlands
Estonia OK OK Lithuania
Ireland OK United Kingdom Average of Belgium, Netherlands
Greece OK OK OK
Spain OK OK Greece
France OK OK Belgium
Croatia OK OK Bulgaria
Italy OK OK Greece
Cyprus OK OK Greece
Latvia OK OK Poland
Lithuania OK OK OK
60 Use of Freshwater Resources in Europe
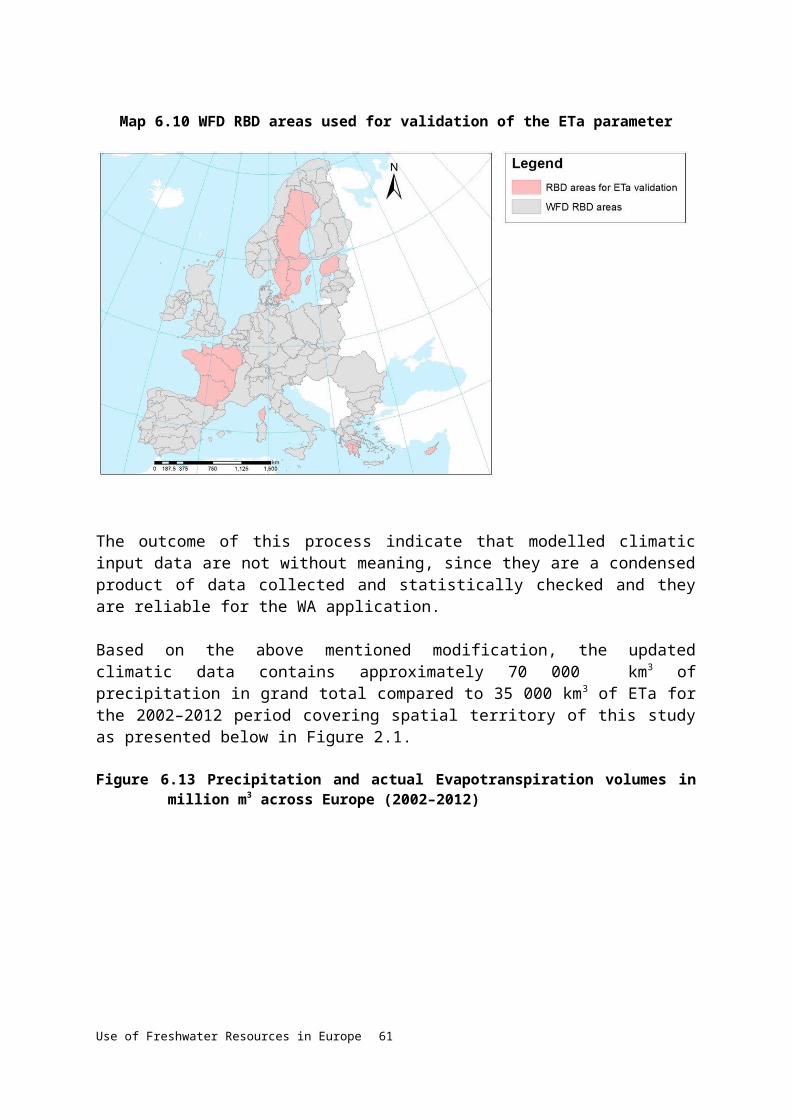
COUNTRY SECTOR B,C SECTOR D35 SECTOR E36
Luxembourg OK OK Average of Belgium, Netherlands
Hungary OK OK Poland
Malta OK OK Poland
Netherlands Average of Belgium, Luxembourg
OK OK
Austria OK OK Netherlands
Poland OK OK OK
Portugal OK OK Poland
Romania OK OK Bulgaria
Slovenia OK OK Poland
Slovakia OK OK Poland
Finland OK OK OK
Sweden OK OK Finland
United Kingdom OK OK Finland
Norway Average of Finland, Sweden OK Netherlands
Montenegro Croatia Croatia Bulgaria
Former Yugoslav Republic of Macedonia, the
Average of Bulgaria, Greece, Croatia
OK Bulgaria
Serbia Average of Bulgaria, Croatia, Hungary, Romania
Bulgaria Bulgaria
Turkey Average of Bulgaria, Greece Romania Bulgaria
Bosnia and Herzegovina Croatia Bulgaria Bulgaria
Kosovo Average of Bulgaria, Croatia Average of Bulgaria, Croatia
Bulgaria
The aforementioned industrial sectors affected the modulation coefficients and the water distribution at monthly scale for the period 2002-2012.
Table 7.8 Region assignment for annual abstraction Eurostat data analysis
Region Country Region Country
East Bulgaria West Balkans
Albania
East Czech Republic West Balkans
Serbia
East Estonia West Balkans
Bosnia and Herzegovina
East Latvia West Balkans
Kosovo (under United Nations Security Council Resolution 1244/99)
East Lithuania West Belgium
East Hungary West Denmark
East Poland West Germany (until 1990 former territory of the FRG)
East Romania West Ireland
Use of Freshwater Resources in Europe 61
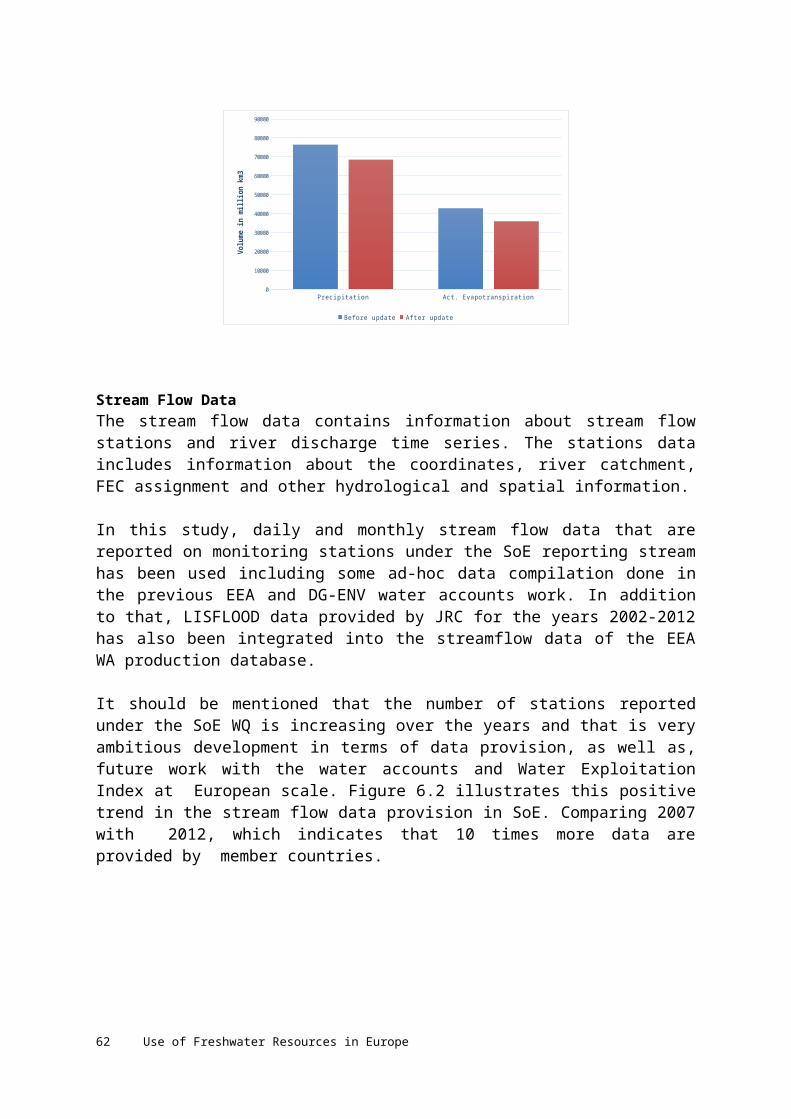
Region Country Region Country
East Slovenia West France
East Slovakia West Luxembourg
South Greece West Netherlands
South Spain West Austria
South Italy West Finland
South Cyprus West Sweden
South Malta West United Kingdom
South Portugal West England and Wales
Turkey Turkey West Iceland
West Balkans
Croatia West Norway
West Balkans
Former Yugoslav Republic of Macedonia, the
West Switzerland
62 Use of Freshwater Resources in Europe
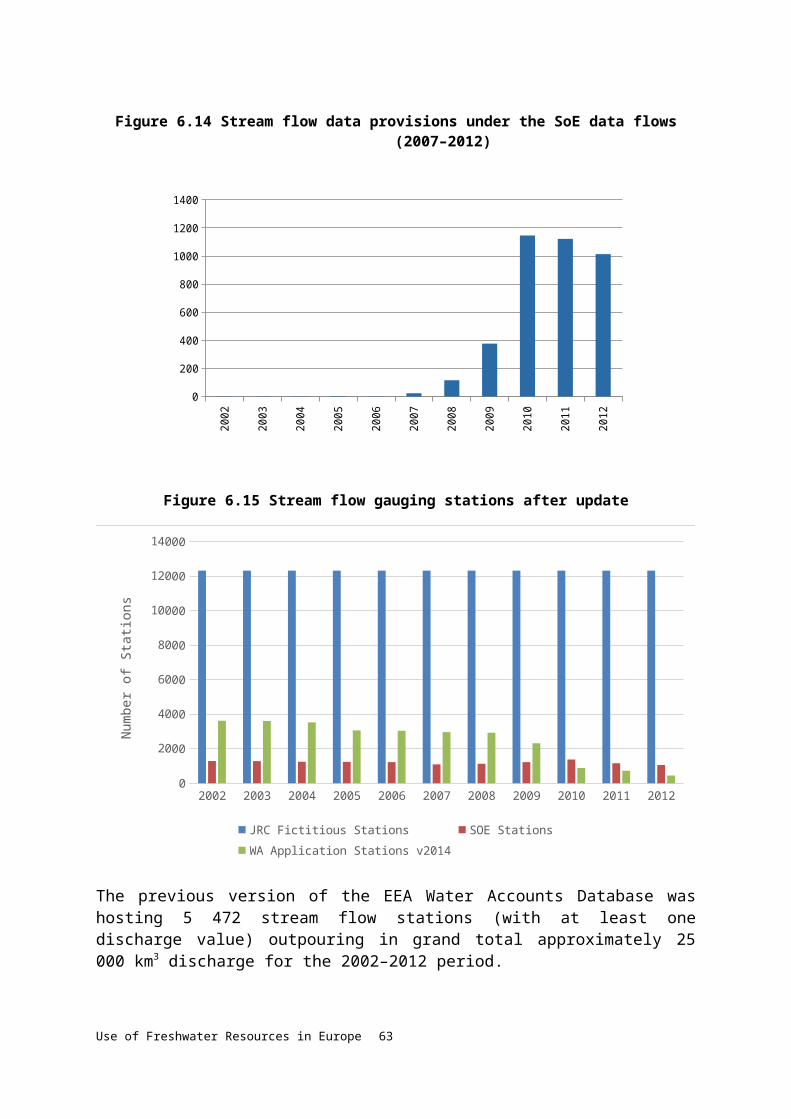
ReferencesAgence européenne pour l’environnement, 2012, Water ressources in Europe in the context of vulnerability EEA 2012 state of water assessment, European Environment Agency ; Publications Office of the European Communities, Copenhagen; Luxembourg.
Burek, P.A., J. Van Der Knijff, A.P.J. de Roo (2013): LISFLOOD - Distributed Water Balance and Flood Simulation Model - Revised User Manual 2013.EUR - Scientific and Technical Research Reports JRC78917. Publications Office of the European Union. DOI: 10.2788/24982 (print) / 10.2788/24719 (online).
EEA, 2012, EEA Catchments and Rivers Network System ECRINS v1.1, Rationales, building and improving for widening uses to Water Accounts and WISE application,
EEA ETC/ICM, 2012, Thematic Assessment on Vulnerability to Water Scarcity and Drought, Background report, Report from the EEA European Topic Centre on Inland, Coastal and Marine Waters and European Topic Centre on Climate Change impacts, vulnerability and Adaptation.European Commission, 2015a, Ecological flows in the implementation of the Water Framework Directive, Technical Report, 2015-086, European Commission.
European Commission, 2015b, Guidance document on the application of water balances for supporting the implementation of the WFD, Guidance Dcoument, v6.1, EC, Brussels.
European Environment Agency, ed., 2012a, European waters: current status and future challenges ; synthesis, European Environment Agency [u.a.], Copenhagen.
European Environment Agency, ed., 2012b, Water resources in Europe in the context of vulnerability: EEA 2012 state of water assessment, European Environment Agency [u.a.], Copenhagen.
European Environment Agency, 2013, Results and lessons from implementing the water assets accounts in the EEA area from concept to production., Publications Office, Luxembourg.
Faergemann, H., 2012, 'Update on Water Scarcity and Droughts indicator development',
Gössling, S., Peeters, P., Michael Hall, C.M., Ceron, J.P., Dubois, G., Lehmann, L.V., Scott, D., 2012. Tourism and water use: Supply, demand, and security. An international review. Tourism Management. Volume 33, Issue 1, February 2012, Pages 1-15.
Gunter Wiedt, Marijn Van der Velde, Alberto Aloe and Fayçal Bouraoui, 2008, Water Requirements for Irrigation in the European Union a model based assessment of irrigation water requirements and regional water demands in Europe, JRC 46748, European Commission Joint Research Centre Institute for Environment and Sustainability, Ispra (VA)/Italy.
Haylock, M. R., Hofstra, N., Klein Tank, A. M. G., Klok, E. J., Jones, P. D. and New, M., 2008, 'A European daily high-resolution gridded data set of surface temperature and
Use of Freshwater Resources in Europe 63
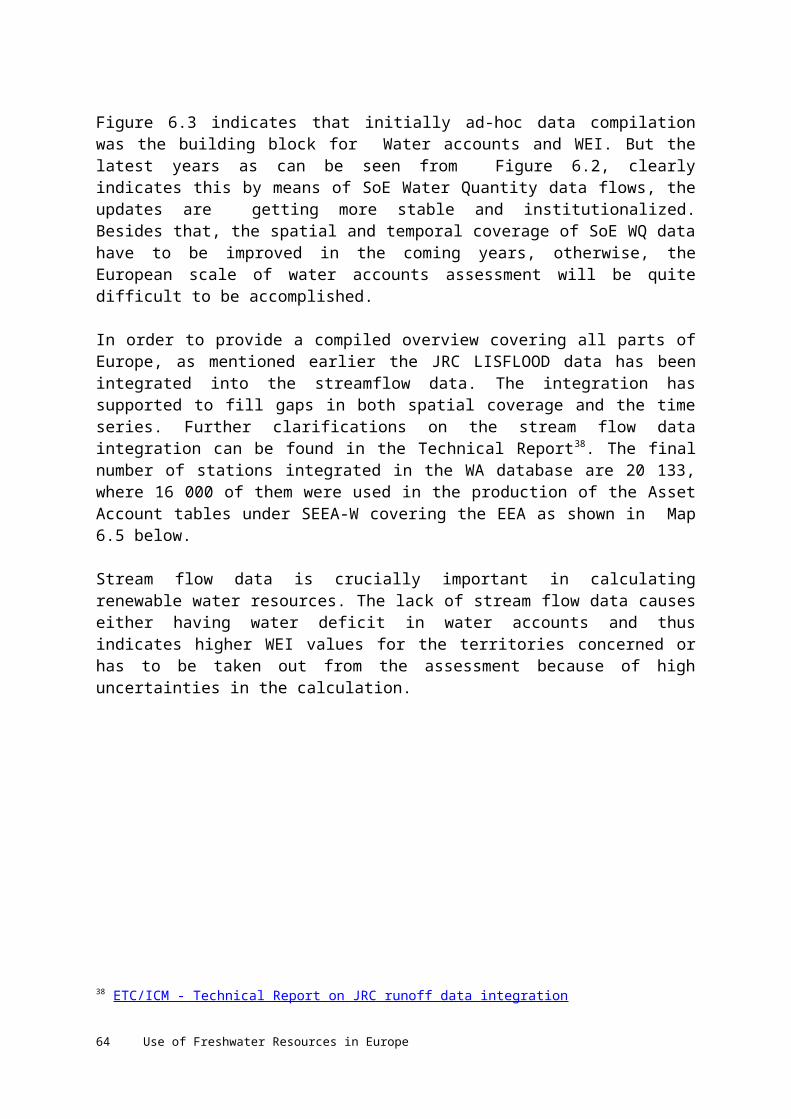
precipitation for 1950–2006', Journal of Geophysical Research 113(D20) (http://doi.wiley.com/10.1029/2008JD010201) accessed May 18, 2015.
Kurnik, B., Louwagie, G., Erhard, M., Ceglar, A. and Bogataj Kajfež, L., 2014, 'Analysing Seasonal Differences between a Soil Water Balance Model and In-Situ Soil Moisture Measurements at Nine Locations Across Europe', Environmental Modeling & Assessment 19(1), pp. 19–34.
Kossida M., K., Koutiva, I., Makropoulos, C., Monokrousou, K., Mimikou, M., Fons-Esteve, J. and Iglesias, A., 2009, Water Scarcity and Drought: towards a European Water Scarcity and Drought Network (WSDN), ETC/ICM.
United Nations, 2012, System of environmental-economic accounting for water, United Nations, New York.
Winpenny, J., 2012, Green Accounting and Data Improvement for Water Resources, United Nations.
64 Use of Freshwater Resources in Europe