Embed Size (px)
Citation preview
Sketch-Based Attack Detection on Programmable Networks
João Francisco Romeiras da Costa Amado
Thesis to obtain the Master of Science Degree in
Computer Science and Engineering
Supervisors: Prof. Miguel Nuno Dias Alves Pupo CorreiaProf. Fernando Manuel Valente Ramos
Examination Committee
Chairperson: Prof. João António Madeiras PereiraSupervisor: Prof. Miguel Nuno Dias Alves Pupo Correia
Member of the Committee: Prof. Nuno Fuentecilla Maia Ferreira Neves
November 2018

ii

Acknowledgments
First of all, I would like to sincerely thank my advisors, Professor Miguel Pupo Correia and
Professor Fernando Ramos, for their precious guidance, support, and availability over the course
of this work.
I also thank all my friends and colleagues for their permanent support and cheerful motiva-
tion. In particular, Andre, Joana, Filipa, Tomas, Bruno, Dharu and Pedro, for all the wonderful
moments and memories during this journey we made together.
To my family, a word of gratitude for their unconditional support and dedication. A special
thank you to my dear uncle P., for his patient and precious revision of this thesis, and to my
cousins, Ines and Nuno, for our many unforgettable cooking adventures during study breaks.
Finally, I warmly thank my mom and dad, Maria Romeiras Amado and Joao Paulo Amado,
for making this journey possible, for all their love and dedication, and particularly for helping
me develop a continuous love for knowledge and discovery. This thesis is only possible thanks
to you.
iii

iv

Resumo
A implementacao de um sistema de detecao de intrusoes lida com dois problemas. Em primeiro
lugar, a necessidade de obtencao de estatısticas atualizadas que cubram diversas metricas rel-
evantes, desde informacao acerca de trafego de rede (e.g., volume de trafego ou latencia), a
alertas de seguranca. Em segundo lugar, a necessidade de extrair conclusoes relevantes a partir
destes dados. O primeiro problema e geralmente abordado atraves de monitorizacao de redes em
tempo real usando tecnicas de baixa precisao como sampling de pacotes, que requerem o posi-
cionamento de dispendiosos componentes de hardware em pontos-chave da rede para conseguir
uma maior exatidao. Nesta tese, exploramos a primeira questao utilizando redes programaveis,
uma nova abordagem as redes computacionais que separa o plano de dados do plano de controlo,
permitindo assim a sua centralizacao. Este corre aplicacoes programadas pelo operador que per-
mitem a configuracao automatica de equipamento de encaminhamento. Este novo paradigma
inclui a capacidade de programacao do plano de dados, possibilitando pela primeira vez o uso
de algoritmos de sketching nos proprios switches, que providenciam estatısticas resumidas ac-
erca de flows de rede e permitem uma monitorizacao mais efetiva. Para o segundo problema,
recorremos a tecnicas de unsupervised machine learning, que possuem a capacidade de identificar
comportamentos especıficos sem qualquer conhecimento previo ou fases de treino, servindo deste
modo como um mecanismo eficaz na detecao de padroes de trafego suspeitos. Este trabalho ap-
resenta entao o desenho, implementacao e avaliacao de um sistema de monitorizacao baseado
em switches programaveis que recorre a algoritmos de machine learning para realizar detecao
de ataques na rede.
Palavras-chave: Redes Definidas por Software, Switches Programaveis, Aprendizagem
Automatica.
v

vi

Abstract
The implementation of an intrusion detection system deals with two problems. First, the need to
obtain up-to-date statistics encompassing various metrics of interest that can range from network
traffic information (e.g., network load or latency) to security alerts. Second, the ability to extract
relevant knowledge from the aforementioned data. The first problem is usually tackled through
real-time network monitoring using low accuracy techniques such as packet sampling, requiring
the placement of expensive hardware components in crucial network points in order to improve
accuracy. In this thesis we plan to approach this challenge with programmable networking,
a new approach to computer networks that separates the data plane from the control plane,
enabling the centralization of network control and the execution of applications that direct
the configuration of forwarding devices. This new paradigm includes the programmability of
forwarding devices, such as switches, and enables the use of sketching algorithms directly in
the data plane, that provide summary statistics about packet flows, allowing a more effective
network monitoring. We tackle the second problem through unsupervised machine learning
techniques that possess the ability to identify a specific behavior without any prior knowledge
or training phase, serving as a powerful instrument to detect suspicious patterns. This work
will, therefore, propose the design, implementation, and evaluation of a monitoring system using
programmable switches that leverages machine learning algorithms to perform network attack
detection.
Keywords: Software-Defined Networks, Programmable Switches, Sketching, Machine
Learning.
vii

viii

Contents
Acknowledgments . . . . . . . . . . . . . . . . . . . . . . . . . . . . . . . . . . . . . . . iii
Resumo . . . . . . . . . . . . . . . . . . . . . . . . . . . . . . . . . . . . . . . . . . . . v
Abstract . . . . . . . . . . . . . . . . . . . . . . . . . . . . . . . . . . . . . . . . . . . . vii
List of Tables . . . . . . . . . . . . . . . . . . . . . . . . . . . . . . . . . . . . . . . . . xi
List of Figures . . . . . . . . . . . . . . . . . . . . . . . . . . . . . . . . . . . . . . . . xiii
Acronyms . . . . . . . . . . . . . . . . . . . . . . . . . . . . . . . . . . . . . . . . . . . xv
1 Introduction 1
1.1 Motivation . . . . . . . . . . . . . . . . . . . . . . . . . . . . . . . . . . . . . . . 1
1.2 Proposed Solution . . . . . . . . . . . . . . . . . . . . . . . . . . . . . . . . . . . 2
1.3 Thesis Outline . . . . . . . . . . . . . . . . . . . . . . . . . . . . . . . . . . . . . 3
2 Related Work 5
2.1 Programmable Networks . . . . . . . . . . . . . . . . . . . . . . . . . . . . . . . . 5
2.2 Network Monitoring . . . . . . . . . . . . . . . . . . . . . . . . . . . . . . . . . . 9
2.3 Intrusion Detection Based on Machine Learning . . . . . . . . . . . . . . . . . . . 11
2.3.1 Machine Learning Techniques . . . . . . . . . . . . . . . . . . . . . . . . . 11
2.3.2 Intrusion Detection on Traditional Networks . . . . . . . . . . . . . . . . 14
2.3.3 SDN-Based Intrusion Detection . . . . . . . . . . . . . . . . . . . . . . . . 18
2.4 Network Monitoring with Streaming . . . . . . . . . . . . . . . . . . . . . . . . . 20
2.5 Network Monitoring Using Sketches . . . . . . . . . . . . . . . . . . . . . . . . . 22
2.6 Summary . . . . . . . . . . . . . . . . . . . . . . . . . . . . . . . . . . . . . . . . 25
3 Design 27
3.1 Overview . . . . . . . . . . . . . . . . . . . . . . . . . . . . . . . . . . . . . . . . 27
3.2 Network Flow Statistics Collection . . . . . . . . . . . . . . . . . . . . . . . . . . 29
3.2.1 Count-Min and Bitmap Sketches . . . . . . . . . . . . . . . . . . . . . . . 31
3.3 Data Normalization . . . . . . . . . . . . . . . . . . . . . . . . . . . . . . . . . . 32
ix

3.4 Clustering and Classification . . . . . . . . . . . . . . . . . . . . . . . . . . . . . 33
3.5 Summary . . . . . . . . . . . . . . . . . . . . . . . . . . . . . . . . . . . . . . . . 34
4 Implementation 35
4.1 P4 Sketches . . . . . . . . . . . . . . . . . . . . . . . . . . . . . . . . . . . . . . . 35
4.2 ONOS . . . . . . . . . . . . . . . . . . . . . . . . . . . . . . . . . . . . . . . . . . 37
4.3 Unsupervised Learning . . . . . . . . . . . . . . . . . . . . . . . . . . . . . . . . . 39
4.4 Summary . . . . . . . . . . . . . . . . . . . . . . . . . . . . . . . . . . . . . . . . 40
5 Evaluation 43
5.1 Dataset and Experimental Setup . . . . . . . . . . . . . . . . . . . . . . . . . . . 43
5.2 P4 Sketch Collection . . . . . . . . . . . . . . . . . . . . . . . . . . . . . . . . . . 44
5.3 Clustering Evaluation using the CAIDA Dataset . . . . . . . . . . . . . . . . . . 46
5.3.1 Bitmap Sketch . . . . . . . . . . . . . . . . . . . . . . . . . . . . . . . . . 46
5.3.2 Count-min and Bitmap Sketch on a Modified Dataset . . . . . . . . . . . 48
5.3.3 Netflow . . . . . . . . . . . . . . . . . . . . . . . . . . . . . . . . . . . . . 49
5.4 Performance . . . . . . . . . . . . . . . . . . . . . . . . . . . . . . . . . . . . . . . 54
6 Conclusion and Future Work 57
6.1 Conclusion . . . . . . . . . . . . . . . . . . . . . . . . . . . . . . . . . . . . . . . 57
6.2 Future Work . . . . . . . . . . . . . . . . . . . . . . . . . . . . . . . . . . . . . . 58
Bibliography 59
x

List of Tables
2.1 Comparison of network monitoring systems. . . . . . . . . . . . . . . . . . . . . . 25
2.2 Comparison of IDS using machine learning techniques. . . . . . . . . . . . . . . . 26
3.1 Flow statistics features. . . . . . . . . . . . . . . . . . . . . . . . . . . . . . . . . 30
3.2 Original and normalized flow statistics. . . . . . . . . . . . . . . . . . . . . . . . . 33
5.1 Count-min sketch collection comparison. . . . . . . . . . . . . . . . . . . . . . . . 45
5.2 Bitmap sketch collection comparison. . . . . . . . . . . . . . . . . . . . . . . . . . 45
5.3 Bitmap sketch cluster centroids. . . . . . . . . . . . . . . . . . . . . . . . . . . . . 47
5.4 Source addresses with highest bitmap sketch values and respective cluster. . . . . 48
5.5 Flows with highest count-min sketch values and respective cluster. . . . . . . . . 49
5.6 Flows with highest bitmap sketch values and respective cluster. . . . . . . . . . . 49
5.7 Netflow-based cluster centroids. . . . . . . . . . . . . . . . . . . . . . . . . . . . . 51
5.8 Comparison of cluster allocation between bitmap sketch and netflow values. . . . 52
5.9 Comparison of cluster allocation between count-min sketch and netflow values. . 53
5.10 ONOS resource usage with various network speed simulations. . . . . . . . . . . . 54
5.11 Resource usage for the data normalization and machine learning components. . . 55
xi

xii

List of Figures
2.1 Overview of traditional vs. software-defined networks. . . . . . . . . . . . . . . . 6
2.2 The P4 forwarding model. [BDG+14] . . . . . . . . . . . . . . . . . . . . . . . . . 8
3.1 General architecture of our solution. . . . . . . . . . . . . . . . . . . . . . . . . . 28
3.2 Execution flowchart. . . . . . . . . . . . . . . . . . . . . . . . . . . . . . . . . . . 29
4.1 Example of an ONOS flow table. . . . . . . . . . . . . . . . . . . . . . . . . . . . 38
4.2 Elbow method plot. . . . . . . . . . . . . . . . . . . . . . . . . . . . . . . . . . . 39
4.3 PCA reduction example. . . . . . . . . . . . . . . . . . . . . . . . . . . . . . . . . 40
5.1 Bitmap sketch clustering. . . . . . . . . . . . . . . . . . . . . . . . . . . . . . . . 47
5.2 Count-min and bitmap sketch clustering. . . . . . . . . . . . . . . . . . . . . . . . 48
5.3 Netflow-based clustering. . . . . . . . . . . . . . . . . . . . . . . . . . . . . . . . . 50
xiii

xiv

Acronyms
ANN Artificial Neural Networks.
BM Bitmap.
C&C Command and Control.
CM Count-Min.
DDoS Distributed Denial-of-Service.
EM Expectation-Maximization.
HMM Hidden Markov Model.
NAE Network Application Effectiveness.
NIDS Network Intrusion Detection Systems.
ONOS Open Network Operating System.
PCA Principal Component Analysis.
PFE Programmable Forwarding Engines.
SDN Software-Defined Networking.
SSE Sum of Squared Errors.
UNIDS Unsupervised Network Intrusion Detection System.
xv

xvi

Chapter 1
Introduction
This chapter starts by presenting the various problems investigated in this thesis, along with
the approach followed to address them. Additionally, it also describes the structure of this
document.
1.1 Motivation
Network security, in particular, the capability to perform intrusion detection or to identify
instances of malicious activity in an infrastructure, entails two fundamental problems. First, the
need to possess statistics encompassing various metrics of interest that can range from network
traffic management information (e.g., network load or latency) to security alerts. Second, the
ability to extract relevant knowledge from the aforementioned data – in this case, to detect
anomalous activities. Such a task can be particularly difficult when an attack is new, and when
depending only on the knowledge obtained from previous attacks is not enough.
To address the first problem, operators perform real-time monitoring using sampling-based
approaches such as NetFlow [Cla04]. This data collection process can be a daunting task on
large-scale traditional computer networks, where for scalability reasons the sampling rate is
typically low (1 in 1000 packets, or less, typically [SNR+17]), affecting the accuracy of network
monitoring tasks. As a result, a hardware monitoring infrastructure has to be placed at key
network points in order to perform a more precise data collection to effectively increase the
detection accuracy, which tends to be a costly solution.
A recent approach to computer networks, Software-Defined Networking (SDN), improves on
traditional networks by separating the network control plane from the data plane [RKV15]. This
separation allows the centralization of network control, enabling network-wide abstractions, with
administration policies being defined through applications that run on the control plane, direct-
1

ing the configuration of forwarding devices. Moreover, network monitoring tasks are facilitated
through this decoupling, since it avoids the need for an expensive monitoring infrastructure.
However, the problem of low resolution in sample-based monitoring persists.
An alternative to packet sampling is the use of sketching algorithms, a class of streaming
algorithms that provide summary statistics about packet flows [YJM13]. This technique allows
the processing of all packets, providing a more effective network monitoring and increased ac-
curacy in threat detection mechanisms. This approach achieves an effective tradeoff between
memory usage and accuracy, with variations depending on the specific sketch function used.
Despite the advantages of sketching algorithms, they introduce feasibility issues, since current
switching hardware does not yet enable the sort of data plane computation required by sketching
solutions. This situation is now changing, with the emergence of programmable switches. Recent
switch designs [BGK+13] demonstrate the ability to reprogram hardware using a high-level
language such as P4 [BDG+14][p4w17]. Production hardware, such as Barefoot Tofino [bar17],
is already available; many compilers also exist for a variety of hardware (e.g., P4FPGA [p4f17],
Tofino) and software targets (e.g., Pisces [pis17]). The availability of programmable switch
components enables sketching to be performed at line rate, as demonstrated in the UnivMon
[LMV+16] and HashPipe [SNR+17] projects.
The second challenge consists of the extraction of relevant knowledge about security events
from the collected monitoring data. Recent solutions have shown that intrusion detection sys-
tems can apply machine learning algorithms to extend their capabilities by analyzing the col-
lected monitoring information [LKS+17]. More specifically, unsupervised machine learning tech-
niques have the ability to identify a specific behavior without any prior knowledge or training
steps, thereby reinforcing a monitoring system’s capacity to detect common threats and also to
identify new ones.
1.2 Proposed Solution
In this work, we propose a monitoring system using programmable switches that leverages
machine learning algorithms to perform network attack detection. Our hypothesis is that it is
possible to improve attack detection by improving the quality of the input measurement data,
leveraging programmable hardware for this purpose.
Our solution runs on an SDN infrastructure, using the Open Network Operating System
(ONOS) [BGH+14] controller. At the data plane level, a network of programmable switches
collects basic flow statistics (based on a 5-tuple structure) and executes sketching algorithms
developed in the P4 language. Specifically, we include two sketches in our solution. First,
2

the Count-Min (CM) sketch, which relies on hash functions to map events to frequencies, is
used for the detection of heavy-hitters, a class of flows that are larger than a specific fraction
of the total packets observed. Second, the Bitmap (BM) sketch, which uses an array of bits
to count the number of specified unique elements and can be used to identify superspreaders,
a type of network flow that contacts more than k distinct addresses during a specified time
interval. The use of these two sketches together enables us to detect possible DDoS attacks and
malware spreading. The employment of sketching algorithms in our solution allows real-time
collection of flow statistics that process all packets, differing from a netflow-based approach,
based on packet sampling. While the switches process the streaming of network packets, the
SDN controller manages the active flows at any given moment, retrieves sketch data from the
switch, and periodically exports all flow statistics.
The collected data is then processed through various normalization steps, as preparation for
the subsequent unsupervised machine learning phase. We use the K-Means clustering algorithm
to group similar entities according to their characteristics, using a predefined number k of
clusters. Through various iterations using a combination of basic flow statistics and sketching
algorithms, the resulting clusters group both regular traffic and the outliers, which represent
possible network attacks. Subsequently, a manual analysis of all processed data obtains the final
detection results.
1.3 Thesis Outline
This thesis is structured as follows:
• Section 2 explores some relevant studies on this field;
• Section 3 outlines the design of our proposed solution, detailing its various components;
• Section 4 details the project’s implementation process;
• Section 5 describes the evaluation process used to validate the solution;
• Section 6 presents some conclusions and a discussion of future work.
3

4

Chapter 2
Related Work
The following chapter describes previous work related to the subject of this thesis. As a starting
point, Section 2.1 presents the concept of SDN, its distinction from traditional networks, and
the concept of programmable networks. Section 2.2 describes network monitoring techniques,
providing a definition of a network flow and describing various flow-based monitoring solutions.
Section 2.3 provides an overview of network intrusion detection systems that use machine learn-
ing techniques, showing the more relevant machine learning methods and how they can be used
to perform monitoring. Section 2.4 presents various streaming-based network monitoring so-
lutions, and in Section 2.5 the concept of sketching is presented, along with various network
streaming techniques that rely on this structure to obtain data monitoring information. Finally,
in Section 2.6, we summarize the present chapter.
2.1 Programmable Networks
Traditional computer networks have intrinsic properties that make them very complicated to
manage on a large scale. In terms of infrastructure, the control plane (which manages network
traffic) and the data plane (that executes traffic forwarding according to the control plane’s
instructions) are bundled together in each networking device. As a result, performing network
policy modifications, such as changing security rules or load-balancing data, is highly complex
due to the need for an administrator to configure each network device, without the ability to
resort to global, network-wide abstractions. This legacy paradigm in network implementations
has led to substantial inertia in the process of innovation.
Software-Defined Networking is an approach to computer networks in which the control
logic is separated from the forwarding elements, such as routers and switches. By separating
the control plane from the data plane, an SDN infrastructure provides increased flexibility and
5
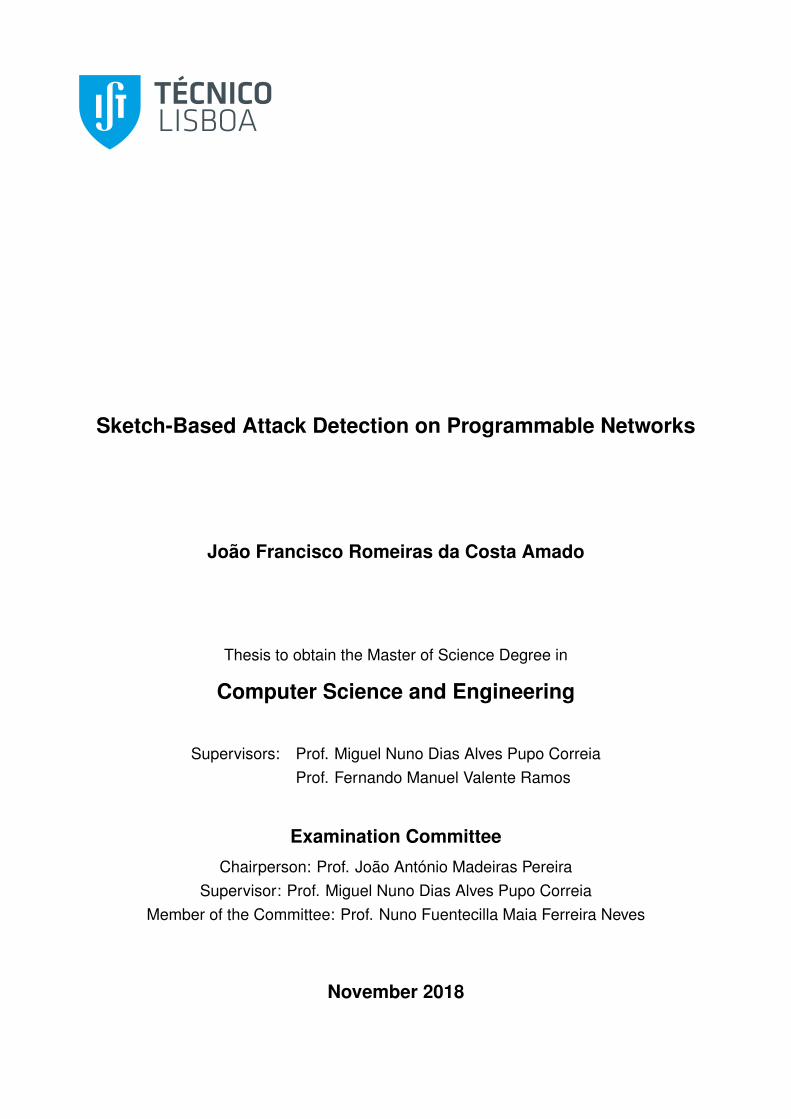
decentralization of the decision process. Network applications are programmed and executed in
the controller, thus abstracting the lower-level interaction with the network routers and switches,
which become simple forwarding devices. Hence, an SDN infrastructure is more apt to manage
enterprise-grade networks that require both scalability and flexibility.
Figure 2.1: Overview of traditional vs. software-defined networks.
An SDN architecture is composed of multiple layers, from the low-level forwarding elements
to the high-level network applications, as shown in Figure 2.1.
• Network Infrastructure: data plane environment. Physical devices (e.g., switches, routers)
that follow a set of instructions, defined by southbound interfaces, to forward traffic ac-
cording to the centralized control system;
• Southbound Interface: communication channel between the physical devices and the SDN
controller, effectively separating the control and data planes. Contains the instruction set
API that defines the forwarding rules chosen by the controller and executed by the data
plane devices;
• SDN Controller: element that interacts with the forwarding devices according to the
network applications and policies defined at a given time, while abstracting the lower-level
details of the network;
• Northbound Interface: serving a similar function as the southbound interface, provides a
6
communication channel between the SDN Controller and the higher-level network appli-
cations. Contains the instruction set API used by network applications to communicate
with the SDN controller;
• Network Applications: implementations of specific network behavior. These can perform
functions such as routing (B4 [JKM+13]), load balancing (SWAN [LLW+14]) or man-
agement strategies such as reducing power consumption (ElasticTree [HSM+10]). These
applications define a behavior to be configured into network commands by the SDN con-
troller and executed by the data plane elements.
The OpenFlow protocol [MAB+08] was a crucial enabler of SDN, as it offered controllers
a southbound path with direct access to the forwarding plane and allowed the definition of
packet-handling rules from a remote, logically centralized location. Most commercial switches
that used proprietary interfaces and scripting languages could also implement the OpenFlow
protocol without requiring hardware changes.
An SDN controller is a logically centralized element responsible for relaying the network con-
figuration instructions from the network applications to the forwarding devices. In a sense, each
controller functions as a traditional operating system, abstracting the lower-level details of each
specific network implementation. The control plane infrastructure runs on commodity server
technology and can either be a fully centralized system (e.g., the NOX controller [GKP+08]) or
be physically distributed, providing the abstraction of a centralized network view instead. Such
an example is Onix [KCG+10], the first distributed SDN controller, which provided developers
with a new paradigm by avoiding the need for specific application distribution mechanisms.
Some of the more relevant controller implementations include ONOS [BGH+14], which pro-
vides a set of high-level abstractions and modules (extensible at run-time) to be used by network
applications, and the OpenDaylight project [MVTG14], a Linux Foundation initiative supported
by a large community of developers and companies that promotes the development of an open
SDN framework.
By leveraging open northbound APIs, an SDN infrastructure allows administrators to pro-
gram applications that manage the control plane. Additionally, the forwarding devices in the
data plane maintain a set of flow rules that define actions on incoming packets, based on con-
troller specifications. The emergence of programmable switches gives the ability to reprogram
network hardware, with languages such as P4 [BDG+14][p4w17], thus increasing the expressive-
ness of the control flow abstraction, allowing the direct control of packet processing.
This high-level language, P4, is specifically tailored for reconfigurable switches, allowing
the definition of new protocol headers and providing protocol-independent packet processing. It
7
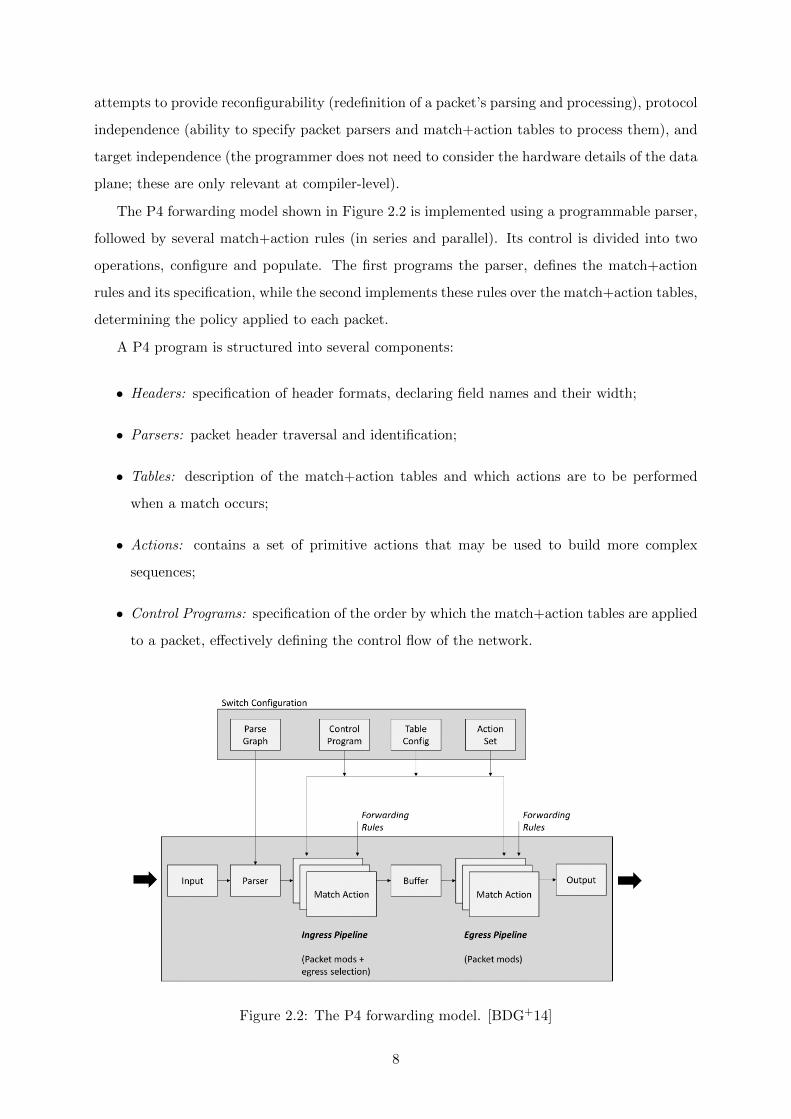
attempts to provide reconfigurability (redefinition of a packet’s parsing and processing), protocol
independence (ability to specify packet parsers and match+action tables to process them), and
target independence (the programmer does not need to consider the hardware details of the data
plane; these are only relevant at compiler-level).
The P4 forwarding model shown in Figure 2.2 is implemented using a programmable parser,
followed by several match+action rules (in series and parallel). Its control is divided into two
operations, configure and populate. The first programs the parser, defines the match+action
rules and its specification, while the second implements these rules over the match+action tables,
determining the policy applied to each packet.
A P4 program is structured into several components:
• Headers: specification of header formats, declaring field names and their width;
• Parsers: packet header traversal and identification;
• Tables: description of the match+action tables and which actions are to be performed
when a match occurs;
• Actions: contains a set of primitive actions that may be used to build more complex
sequences;
• Control Programs: specification of the order by which the match+action tables are applied
to a packet, effectively defining the control flow of the network.
Figure 2.2: The P4 forwarding model. [BDG+14]
8

An execution sequence starts with the arriving packets being processed by the parser, which
extracts each header and identifies the protocols supported by a given switch. Afterwards, the
processed header fields are sent through the match+action tables, which are separated by ingress
and egress. The former determines the egress ports and queue order, while the latter defines the
destination ports and number of instances to be sent.
2.2 Network Monitoring
Network management requires accurate statistics encompassing various metrics of interest through
real-time monitoring, in order to perform adjustments, that can range from network traffic
management (e.g., load balancing) to security mechanisms such as intrusion detection and its
subsequent resolution.
One class of monitoring algorithms is based on flow monitoring. A flow is defined as a
sequence of packets satisfying a set of common features in a given time period. A flow is
typically composed of a 5-tuple containing Source IP address, Destination IP address, Source
Port, Destination Port, and Transport Protocol. Flow identification is managed using matching
rules that can have various degrees of granularity (a coarse-grained rule will match a broader
set of flows).
Depending on the desired operation, the number of collected flow-counts may need to be
controlled with specific sampling rates (e.g., to perform heavy hitter detection). Flow monitoring
algorithms usually rely on packet sampling due to resource limitations on the switches (each
packet has a very limited processing time), which results in lower accuracy when dealing with
more fine-grained metrics.
NetFlow [Cla04] is a monitoring tool introduced by Cisco that provides generic support for
different measuring tasks. It supports network monitoring inside routers by using a hash table
to keep a working set of flows supporting for instance, flow insertion/removal and collision res-
olution. NetFlow records both flow information (e.g., source/destination IP, source/destination
port and protocol) and flow properties (e.g., packet counts, flow start/finish times), exporting
said data to a remote collector.
Several NetFlow implementations have been tried over the years [LMKY16], each dealing
with a number of key challenges, such as handling of hash collisions during flow insertion, removal
of an old flow, or limited packet processing time when dealing with merchant silicon hardware.
Better results can be achieved by using custom silicon hardware to process NetFlow; however,
this solution only works for small-scale implementations due to hardware/resource costs. In
large-scale implementations, such as data centers, a sampling process is required to deal with
9
bandwidth and resource limitations.
A monitoring algorithm built on the concept of NetFlow, but exploring programmable
switches, is FlowRadar [LMKY16]. By encoding flows and their respective counters into a
small fixed-size memory space with constant flow insertion time, and by performing network-
wide decoding and the more complex temporal/flow-space analysis using the remote collector’s
computing power, FlowRadar manages to keep both memory use and switch processing time
at a minimum. During the encoding process, the same flow is hashed to multiple locations to
decrease the probability of a collision. Additionally, flow storage in the same cell is performed
through an XOR function to achieve fixed-size memory space.
This system shows better performance concerning two fundamental properties:
• Flow coverage: by using fewer resources, FlowRadar manages to process every single flow
without performing sampling;
• Temporal coverage: the encoded results are exported to a remote collector in short time
slots (e.g., 10ms).
The relevant information is stored in an encoded flowset using a flow filter, namely a bloom
filter that tests if a packet belongs to a new flow or not, and a counting table that stores the
necessary flow counters (including XOR data). Following the arrival of a packet, the respective
flow fields are extracted and checked against the flow filter. In case the packet belongs to a flow
that is not present in the table, the XOR data is updated, and the flow/packet counters are
incremented. Otherwise, if the packet belongs to an existing flow, the only action is to increment
the packet counters in all respective locations.
The decoding process is network-wide, reducing by 5.6% the amount of memory that would
be used in an ideal NetFlow implementation. Since many of the observed flows follow a path
with multiple switches, FlowRadar also performs a redundancy check to remove duplicate flows
(e.g., start by finding any common subset of flows between A1 and A2, check the ones that can
be decoded in A1 but not A2, and remove them from A2).
While FlowRadar requires a server for later decoding, a different approach is followed by
TurboFlow [SAKS18], a flow record generator that runs on programmable switches and does
not require any processing support from external entities. The authors divided the various
implementation parts between two processing resources available on programmable switches:
Programmable Forwarding Engines (PFE), such as P4 hardware, and standard CPUs.
Each processor type has specific limitations on its own, such as insufficient memory and
restrictive computational models (that prevent complex data structures) for PFEs, and a low
10

throughput for per-packet key-value operations for standard CPUs. TurboFlow was designed
to counter these limitations and maximize performance, with each processor running the tasks
more suited to it.
The P4-programmed PFE is responsible for the generation of microflow records (flow records
which only account for the most recent packets in each flow), using a data structure similar to a
hash table. In the event of a flow collision, the older microflow record is sent to the switch CPU,
and the newer record replaces it. The CPU then groups the microflow records into regular flow
records using an optimized hash table.
By splitting the workload between the two processing units through a design that exploits
their strong points, combined with a series of software optimizations, TurboFlow achieves high
performance on a TB/s scale network.
In conclusion, traditional techniques’ lack of accuracy (such as NetFlow) can be circumvented
with the use of programmable switches, an aspect we plan to explore in this work.
2.3 Intrusion Detection Based on Machine Learning
The extraction of useful information from large datasets can be a time and resource consuming
operation. Machine learning techniques, which allow knowledge extraction through the obser-
vation of patterns in specific environments, are useful to process, normalize and classify many
different types of information sets. Machine learning schemes can be broadly classified in un-
supervised learning algorithms, which receive unlabeled input data and identify correlations in
order to classify the information, and supervised learning algorithms, which require a training
phase in which labeled input data is used to train the system, as preparation to receive further
sets of information.
Network intrusion detection systems can be implemented with machine learning methods
that augment their capabilities. Using a combination of regular network data and various
anomalies as a training set, they reinforce their ability to both detect common threats and to
identify new ones.
2.3.1 Machine Learning Techniques
Nowadays, there is a wide range of machine learning techniques that are directly applied on
network security systems as intrusion detection mechanisms. Buczak et al. performed a survey
[BG16] on research methods and practical applications concerning this topic, of which the more
relevant are presented in this subsection.
11
Artificial Neural Networks (ANN): ANNs are inspired by human and animal neurons. Con-
sisting of several layers of artificial neurons, in an ANN the input arrives at the first layer to be
processed and passed on to the next layer; this process is repeated until the last layer returns
the output. These neurons generally have an internal state and may possess a weight value that
varies as the learning process advances, and can modify the strength of a signal they send. An
IDS employing ANNs is described by Bivens et al. [BPS+02], in which the use of unsupervised
Self-Organizing Maps followed by a Multilayer Perceptron managed to achieve relevant results
in short duration predictions.
Association Rules and Fuzzy Association Rules: Association rule learning describes relation-
ship rules between variables using metrics such as support, the frequency of specific data in the
complete dataset, and confidence, the conditional probability that a given transaction X will
generate Y. Traditional association rules are limited since they only work on binary properties,
which is unfeasible for many real-world applications. Fuzzy association rules provide an improve-
ment by allowing numerical and categorical properties. The NETMINE framework [ABCD09]
performs generalized association rule extraction and classification using NetFlow data streams,
implementing the Genio algorithm for that effect. Afterwards, each rule is organized according
to its semantic interpretation, serving as a basis for future pattern analysis.
Bayesian Networks: A probabilistic graphical model that represents sets of variables and
their corresponding interconnections. Bayesian networks are modeled via directed acyclic graphs
where the nodes represent the variables, and the edges represent the respective connections.
Possible applications of this relationship scheme between sets of variables include a detailed
analysis of variable interplay or the calculation of a given output for a target state. Jemili et al.
presented an IDS framework that uses Bayesian Network classifiers [JZA07]. On a first phase,
a junction tree inference module describes a situation using normal or attack categories. The
following phase uses the previous inferences to detect possible attacks, achieving good results
with a large number of training instances.
Clustering: A set of unsupervised machine learning techniques that group entities related
through a set of features, forming several clusters of information. By adjusting the desired
parameters, similar data points are grouped together; the ones that don’t share the chosen set
of characteristics are dispersed as outliers and also identified. The proximity between different
clusters can also be a relevant factor to discover relations between datasets. Several models
may be used to perform clustering, such as centroid, distribution, density, or graph models.
An example of clustering applied to anomaly detection is the work developed by Blowers and
Williams [BW14], in which the DBSCAN method is used to form a correlation analysis on select
12

features of the KDD dataset.
Decision Trees: Structure modeled after a flowchart where each path represents a classifica-
tion model. The nodes refer to a test, for example a coin flip, and the edges (branches) define all
its possible outcomes. The leaf nodes represent class labels, or decisions made after considering
all attributes. A study by Kruegel and Toth [KT03] applied clustering techniques on sets of
rules used by Snort 2.0 and from it derived a decision tree. The resulting performance surpassed
Snort since this approach allows for the parallel evaluation of every feature.
Ensemble Learning: A set of methods that combine multiple model strategies to achieve a
more accurate result than the one obtained through an individual model. This strategy is based
on the generation of a strong learner system resulting from the composition of several weak
learners, or systems in which the results obtained are only slightly better than random guesses.
The DISCLOSURE system [BBR+12], developed by Bilge et al., relies on Random Forests to
process and classify metadata from NetFlow datasets, achieving a true-positive detection rate
of 65% when applied to real-world networks.
Evolutionary Computation: This term refers to a family of algorithms applying concepts of
artificial intelligence based on biological evolution. A population, or a case of candidate solutions,
is initially generated and updated over a series of iterations. Operations such as selection,
crossover, and mutation are used to control and evolve the various generations, choosing the
best candidates for reproduction according to a given fitness value. An implementation that
relies on evolutionary computation using three genetic programming techniques is shown by
Abraham et al. [AGMV07], who evolved simple programs to classify attacks and tested them
with the DARPA 1998 intrusion detection dataset.
Hidden Markov Model (HMM): A Markov process is a set of states interconnected through
various transition probabilities. Hidden Markov Models are a specific type of Markov process
in which the state is only partially observable, hence the specific state sequence used by the
model is unknown. The hidden elements have to be determined from the observable state and
the fully visible output. Joshi and Phoha used this approach to perform intrusion detection
[JP05] by constructing an HMM with five states and six observation symbols per state, with
an interconnection system allowing any state to be reachable from any other state, with the
parameters estimated through the Baum-Welch method.
Inductive Learning: A classifying system built following the logical process known as induc-
tive reasoning and applying it to machine learning techniques. Using a bottom-up approach,
the first processing step builds a base of concrete observations and measures. Following a series
of analysis processes, where similar patterns are identified, the algorithm presents several hy-
13
potheses and forms general conclusions/theories. An intrusion detection framework developed
by Lee et al. [LSM99] combines various machine learning techniques, relying on the inductive
learning system RIPPER to perform rule generation.
Naive Bayes: A probabilistic classifier that applies the Bayes’ theorem with the assumption
that the input feature sets are independent. If this property is preserved, which may prove to be
an extremely difficult task in real settings, this type of classifier can be trained very efficiently.
The Naive Bayes classifier from the Weka package was used by Panda and Patra [PP07] to
process the KDD 1999 dataset and tested on four different attack types, managing to achieve a
testing accuracy above 90% on all categories.
Sequential Pattern Mining: An approach that processes datasets in search of relevant pat-
terns of information. The values contained in these datasets are presented sequentially, with a
specific order to be followed. This order is commonly preserved through the use of a time ID.
Typical applications of this powerful data mining technique are the apriori algorithm and the
FP-growth technique. Li et al. applied sequential pattern mining to reduce alert redundancies
[LZLW07]. The AprioriAll algorithm is used to detect multi-stage attack patterns, where the
previously discovered attacks formed the sequences. Using a support threshold of 40%, the
system was able to detect 93% of the attacks in 20 seconds, on the first set of experiments.
Support Vector Machine: This classifier works by finding a specific hyperplane in the feature
space between two classes, in such a way that the distance between the hyperplane and the
closest data points of each class is maximized. The support vectors are the data points nearest
to the hyperplane, representing the critical points of a dataset that, if removed, would alter the
position of the dividing hyperplane. Points that are farthest from the dataset are the ones whose
classification accuracy is more confident. An example implementation is the work by Wagner et
al. [WFE+11], in which a one-class SVM classifier is applied on NetFlow data using a window
kernel that searched for anomalies based on the time position inside the datasets.
2.3.2 Intrusion Detection on Traditional Networks
Network Intrusion Detection Systems (NIDS) detect various types of attacks, such as port-
scanning, Distributed Denial-of-Service (DDoS) attacks or botnets, by monitoring traffic within
a network. There are two main classes of NIDS: misuse detection and anomaly detection.
The first approach uses previously acquired knowledge about attack detection (referred to as
signatures) to identify patterns of malicious activity. A glaring flaw in a misuse detection NIDS
is the inability to detect new attacks, which will not match against any signature in its database.
The second approach feeds on normal operation traffic to build a profile, so that any network
14

behavior that deviates from it is considered an attack. Both classes can be considered reactive
countermeasures, since they are dependent on knowledge provided through a third-party. An
ideal approach would instead be more proactive, without requiring a feeding channel of third-
party information.
An example of a NIDS that does not belong in any of the aforementioned classes is the
Unsupervised Network Intrusion Detection System (UNIDS) [CMO12], which is able to detect
network attacks without any signature database, training or labeled instances. This solution
relies on unsupervised machine learning through various clustering techniques such as sub-space
clustering, density-based clustering, and evidence accumulation.
By clustering network instances, UNIDS identifies the large chunks as regular network ac-
tivity and pinpoints any deviating behavior by focusing on the outliers. UNIDS behavior is
distributed in three phases:
• Phase 1: the captured packets are first aggregated in IP flows, with a second such process
dividing various flow-resolution levels using aggregation keys Li: traffic per time slot (L1),
source network prefixes (L2, L3, L4), destination network prefixes (L5, L6, L7), source IP
(L8), destination IP (L9). Different time-series are constructed for simple traffic metrics
(e.g., number of bytes, packets, and IP flows per time slot). Subsequently, a change-
detection algorithm traverses the various levels, and all anomalous time-slots are flagged;
• Phase 2: all the flows in the previously flagged time-slots are processed through a multi-
clustering algorithm, in which several clusters will be identified, along with a number of
outliers. These are grouped in two classes: 1-to-n anomalies and n-to-1 anomalies. The
first class represents a source infecting n target hosts, for example, a network scan or the
spreading of a virus/worm. In the second class, the IP flows show n sources targeting a
single destination, a classic example being a DDoS attack or a flash crowd. This outlier
classification will result in a ranking representing the degree of abnormality;
• Phase 3: the top-ranked outlying flows are flagged as anomalies, according to a predeter-
mined threshold mechanism, and through the Evidence Accumulation for Ranking Outliers
algorithm, that will highlight the flows which are farthest from the normal operation traffic.
Supervised machine learning techniques can be used on a NIDS by feeding network data as
a training set. One example of a system that uses such an approach is presented by Winter
et al., using a One-Class Support Vector Machine algorithm [WHZ11]. In the case presented,
the dataset used to train the algorithm contained only malicious data, so the system focused
its detection on what would be considered deviating behavior, with the regular network activity
15
relegated to the outliers. The authors present several reasons for this decision, such as the higher
difficulty of using a training set from benign activity due to a different understanding of what
characterizes said behavior depending on each computer network; an incomplete benign training
set would trigger a large number of false alarms, while a malicious one would have a higher miss
rate, considered less fatal for the effects of this study.
Network data captured by this system goes through a path with various processing phases.
When a flow is captured, it goes through a preprocessing step (feature selection, normalization),
followed by a first classification pass on a one-class SVM. If the flow is identified as ’not malicious’
then it is dropped from the system. Otherwise, a second classification path follows, in which a
two-class SVM is used for network traffic classification (designed to determine the protocol to
which the malicious flow belongs, HTTP or SSH).
As shown in the previous examples, current network security mechanisms rely increasingly on
machine learning to process large quantities of information, classifying it according to determined
metrics or identifying data outliers to detect possible threats. A particular characteristic that
makes these algorithms so enticing is the refinement of the data classifying process with each
iteration. As the mechanism is fed more information, its capacity to identify possible threats
becomes more stable and accurate.
A good example is the application of machine learning to process large logs in an enterprise
or data center environment. The extraction and analysis of relevant information from these files
can be extremely complex, since they often contain repetitive data, are filled with noise, and have
a convoluted structure. Goncalves et al. used a combination of unsupervised and supervised
machine learning algorithms on logs provided by Vodafone PT with the aim of identifying
instances of host misbehavior [GBC15].
Their approach is divided into two phases: configuration and runtime. The first phase de-
fines several properties of the detection mechanism, such as data normalization (specifying the
relevant data from the logs), feature selection (what characteristics will separate well-behaved
entities from misbehaving ones), and feature extraction definition (how to extract the previously
defined sets of information from the logs). Afterwards, the normalization and feature extrac-
tion processes are executed, and the result is clustered and analyzed. The final output is a
classification model that will be applied in the second phase.
The initial clustering process requires a manual intervention to obtain a classification model
that can serve as a base for the following iterations. Subsequently, the process is automated,
only requiring human intervention when the obtained results are wrong, in which case the
classification model is manually updated.
16

The runtime phase consists of a sequence of steps which are executed during a user-defined
time period. The input logs go through a process of normalization and feature extraction, after
which they are clustered. The resulting clusters are then processed by the classification model
mentioned above. If the results are positive (meaning that the classification is successful), the
model is updated; if any errors are encountered, the respective clusters need to be manually
analyzed, which will also result in a classification model update.
In this study, the assumption is made that the larger clusters contain well-behaved entities,
so the focus of the analysis is on the smaller ones. The clustering process uses various features
from the logs, and its values can be very different. As such, a normalization process is applied
so that all values are between [0, 1] (which is achieved by dividing all features by the maximum
value, with some saturation accepted).
The specific clustering algorithm used is Expectation-Maximization (EM), that functions
over a series of iterations, starting with parameter guesses that will be used to calculate the
probability of each entity belonging to a cluster. These results will be used to re-estimate the
parameters on each iteration.
Many network attacks are facilitated through the dissemination of botnet instances, defined
as a group of compromised machines infected with malware code. These are controlled by Com-
mand and Control (C&C) structures known as botmasters, that issue commands for purposes
such as DDoS attacks or spam and phishing activities. Botnet architectures can be centralized,
in which the infected machines receive commands from a single botmaster, or decentralized,
through the use of peer-to-peer communication (thus avoiding a single point of failure).
BotMiner [GPZL08] is a botnet detection system that does not require any prior knowledge
of specific botnets and is independent of C&C protocols and structures. Its approach consists on
two monitoring frameworks, one searching for similar communication patterns among different
hosts, and another looking for similar activity patterns:
• C-plane monitor: this monitoring framework captures network flows for later analysis of
communication patterns, recording the time, duration, source/destination IP, source/des-
tination port, and the number of packets/bytes transferred in both directions;
• A-plane monitor: monitors outbound traffic in order to detect an internal host’s malicious
activities, such as scanning, spamming or exploit attempts.
These are first analyzed independently using clustering techniques, such as the X-Means
algorithm, followed by a combined analysis through cross-cluster correlation, in order to identify
hosts sharing both similar communication patterns and similar malicious activity patterns.
17

Viegas et al. recently implemented a network traffic measurement system using resilient
analysis for stream learning intrusion detection [VSN+17]. Employing a distributed stream
processing approach that collects and groups network events at runtime, the resulting data
flows are analyzed through semi-supervised classification.
The streaming network events are determined as host-based (communication between two
hosts) or service-based (communication between two or more services within two hosts), with
this distinction affecting the obtained features. The specific feature values are captured using
time intervals, referred to as tumbling windows. After a time interval expires, its values are
exported for classification.
The intrusion detection method employs multi-view stream learning decision trees (referred
to also as a random forest). The initial classifier pool is obtained through a supervised dataset,
from which different classifiers are trained with different feature subsets. After the initial train-
ing, the classification process uses unsupervised learning. Each classifier determines if a network
flow is normal or an attack. The flow is then sent to a pool class assigner module, which relies
on a majority voting system to determine its final classification. In the event that the assigned
class is not unanimous, the classifier pool is updated, and the new classification model is used
for new, incoming flows.
In this subsection we reviewed traditional network IDS based on machine learning. The
following subsection will describe detection systems in the context of programmable networks.
2.3.3 SDN-Based Intrusion Detection
As referred in the previous section, machine learning techniques can be used in IDS to process
and classify network flows. Traditional networks lack the centralized controller abstraction
that SDN offers, so any monitoring task depends on specific hardware components deployed
in strategic network points. However, an SDN-based IDS can build on such an abstraction to
sidestep network infrastructure and distribution details, focusing all monitoring operations on
the control plane. In this subsection, we present various network detection approaches based on
SDN.
An attempt to leverage traditional anomaly detection techniques and adapt them to an SDN
scenario is explored by Mehdi et al., using OpenFlow’s monitoring capabilities and NOX as a
controller [MKK11]. This work focused on home/small office networks and managed to achieve
a highly accurate line rate detection of anomalies, without incurring a relevant performance
penalty on the regular network operations.
In order to implement a lightweight DDoS attack detection system, Braga et al. combined
18
OpenFlow with NOX to collect flow table statistics and used the resulting dataset to train a
neural network [BMP10]. This method is easily adaptable, since the detection algorithms can be
modified in order to detect new kinds of attacks. Additionally, the use of NOX as a controller
platform allows new switches to be introduced and configured in the detection system in a
simple, effortless process.
As revealed in the previous system, IDS can prove to be invaluable for the discovery and
prevention of new attacks, such as ransomware. These attacks are a type of malware in which
a user’s information is encrypted, and the original files only returned after a ransom is paid. A
recent growing threat, ransomware attacks can present a challenge concerning network detection
due to its shift from HTTP to HTTPS, preventing techniques such as deep packet inspection.
Cusack et al. leverage PFEs to perform a fast and accurate network monitoring [CMK18], sub-
mitting the obtained flow records through a random forest classifier for an effective ransomware
detection.
The implemented detection system collects flow records with the typical 5-tuple and performs
feature extraction to obtain statistics such as packet interarrival times or the ratio of outgoing
to incoming packets. On the subsequent classification stage, since there was a need to balance
classification performance with learning time, the random forest ensemble classifier was tested
with multiple combinations, and the optimal result was 40 trees containing a depth of 15. This
implementation was tested with the crypto-based Cerber ransomware, obtaining a false negative
rate of 0.0% and a false positive rate of 12.5%.
Another related approach is Athena by Lee et al. [LKS+17], a framework for distributed
anomaly detection in software-defined networks, with an emphasis on scalability and ease of
implementation. No hardware modifications on the original network infrastructure are required,
apart from the need for OpenFlow support. This project exports an API that allows developers
to program new network anomaly detection applications while abstracting low-level details and
data management. Since a primary concern with SDN management is the issue of scalability,
Athena employs a distributed database, a computing cluster, and a distributed controller, to
achieve a scalable application deployment system in high volume environments. Additionally,
the anomaly detection algorithms deployed are augmented by a machine learning library in order
to speed up the runtime detection model generation.
Athena is implemented over ONOS, functioning as a subsystem that provides services to
an application layer. Being a fully distributed framework, each instance is hosted on an SDN
controller. All components perform monitoring functions, retrieving information associated with
their hosted network controller and respective data plane, and share said information and state
19

through the distributed database and clusters, connecting all instances and ensuring a scalable
environment.
Various scenarios were tested against the Athena framework, using anomaly detection appli-
cations:
• Large-Scale DDoS Attack Detection: implementing the framework’s network feature col-
lection and scalability capacities, the developed application used machine learning tasks
(in this specific case, the K-Means algorithm) distributed across several worker nodes, re-
ceiving as a result the detection model. This test achieved a detection rate of 99.23% and
a false alarm rate of 4.46%;
• Link Flooding Attacks Mitigation: in this type of attack, a specific network area is satu-
rated by an adversary. The authors compared a link flooding attack detector application
using Athena with the Spiffy system [KGS16], that analyzes the transmission rate con-
trol mechanism in the TCP protocol to mitigate these attacks. The Athena framework
does not require any SDN system modifications, while Spiffy must be deployed in an
OpenSketch-enabled environment;
• Network Application Effectiveness (NAE): this concept is described as a consequence of
concurrent SDN applications attempting to define flow rules in the same controller. A pos-
sible example is the simultaneous execution of a load-balancing application and a security
analyzer that directs FTP-related traffic, where both attempt to direct network traffic and
create flow rule conflicts. Using Athena, the authors developed an NAE problem detector
that manages any given application’s priority, according to the current network state.
The use of ONOS as an SDN controller is a promising approach we use in our implementation,
due to its high-level abstractions that facilitate the development of applications, such as the
desired streaming collection and machine learning processing solutions.
2.4 Network Monitoring with Streaming
A stream is a continuous sequence of data, made available over time. Data streaming in a
network monitoring scenario allows for a different approach to perform intrusion detection in
real-time when compared to a general batch analysis of network data. However, this technique
has several constraints with respect to processing time, since a network setting may experience
flow bursts and the resulting high number of packets require an analysis in an extremely short
20
time frame; additionally, network monitoring based on streaming techniques tends to focus on
a single point of interest, failing to provide a broad spectrum of relevant metrics.
Various streaming-based security analytics techniques are emerging due to the necessity of
detecting network attacks on a timely basis, such as network flow analysis [JJP16] and intrusion
detection logs [CDCP17]. Runtime system/application event logs, which provide a powerful
resource in security analytics, aren’t used nearly as often as the aforementioned techniques due
to a lack of standard design and implementation practices. Instead, custom-made filters are
commonly required to dig through a massive amount of unstructured text logs in order to find
log entries that might reveal interesting activity.
A possible technique to process this mass of information is a term-weighting scheme named
logarithmic entropy (log.entropy) [CDCP17], which computes the entropy of runtime log streams
with respect to a specific system behavioral baseline (making no assumptions on the structure
of the processed entries). This method does not require any background knowledge or labeled
dataset and is fully automatic, making it a viable choice for execution in critical information
systems.
The detailed process involves two phases: sampling and collecting. The first computes the
entropy of all new entries generated during a predefined time frame. This involves applying
some data preparation steps to every entry, extracting the relevant information and counting
each term occurrence; afterwards, the log.entropy is calculated (weighting step) using the count
results. The second phase collects the most recent log.entropy measurements for all the logs in
the system.
In a distributed log stream, any activity can be tracked by more than one event log. Instead
of an individual analysis, the study of different relationships between logs may reveal information
that could remain unnoticed. The authors tested this implementation on real-world datasets,
and the resulting output statistics revealed promising results, with the log.entropy measurements
deviating from the system behavioral baseline in the occurrence of interesting network activity.
Jain et al. implemented streaming algorithms while researching previously unidentified client
tracking mechanisms on website usage [JJP16]. In order to detect persistent strings (client-
unique data), the collected dataset goes through a processing pipeline consisting of preprocessing,
connection-based filtering, slicing, sorting, string-based filtering, and lastly context building and
analysis. The final output is a set of candidate identifier strings for each user, for which the
subsequent analysis is a manual process. Using an enterprise network environment as a source
to retrieve raw network traces, a dataset of 3.5 TB was assembled, encompassing 790 distinct
devices. The entire process depends on streaming techniques, with the exception of the sorting
21

stage.
Data streaming in a network monitoring scenario can suffer from scalability issues, due to
the limitations on data plane hardware and the subsequent short time frame available to process
each packet in real-time. The following section describes several approaches that tackle this
issue, in order to process network traffic without relying on packet sampling.
2.5 Network Monitoring Using Sketches
Recent monitoring algorithms leverage specific instances of streaming algorithms called sketching
techniques [YJM13][LMV+16]. A sketch is a data structure that stores summary information
about packet states captured through streaming, using a combination of hashing, counting and
filtering techniques. Sketch-based algorithms observe all packets, instead of relying on sampling.
Sketches offer various improvements over generic flow-based counters, such as:
• Low memory usage: since a sketch is a data structure that stores summary information,
the output will be significantly smaller in terms of size than the input data;
• Balance between memory usage and accuracy: most sketches are implemented with prov-
able tradeoffs concerning memory and accuracy, depending on the specific sketch function.
An example of a sketch-based algorithm is count-min, which can be applied to various tasks
(e.g., anomaly detection, heavy-hitter detection). This sketch summarizes information by ana-
lyzing the frequency of each item in a large stream of data.
Sketching algorithms are a powerful and efficient way to monitor a network, with recent
advances starting to provide a more general monitoring approach, instead of focusing on a
single feature. By streaming and processing all packets in a given network, instead of relying
on packet sampling, threat detection mechanisms are able to function with a higher degree of
precision and prevent attacks that could otherwise be unnoticed. The development of the P4
language made possible the execution of sketching algorithms on the data plane, by directly
programming the hardware switches. Table 2.1 presents the various solutions described in this
section.
OpenSketch [YJM13] is a sketch-based traffic measurement architecture designed to operate
in commodity switch hardware that provides a more generic and efficient solution by separating
the network measurement control and data plane functions. The measurement functions present
in a generic data plane are the selection of which packet to measure, and storing/exporting the
measurement data.
22

In this particular instance, various combinations of hashing and classification rules are used
in the selection process. For the data storage and export task, OpenSketch uses a table with
complex indexing, which reduces the memory overhead and can be easily exported to the con-
troller. Hence, the OpenSketch data plane is composed by three elements: a hashing stage,
that summarizes and reduces the measurement data, a classification stage, that performs flow
selection, and a counting stage, that accumulates traffic statistics.
Using the aforementioned techniques, a vast number of specific sketches can be implemented
(e.g., bit checking, picking packets with a given probability). On a higher level, the OpenSketch
controller provides two main components:
• Sketch Manager: provides automatic sketch configuration to achieve the best memory-
accuracy trade off;
• Resource Allocator: allocates the available switch memory resources across the various
measurement tasks.
A wide variety of measurement tasks are allowed on OpenSketch, many of which can be
executed using the sketches directly; in the case of more complex data analysis requirements,
the system uses a combination of simple sketches with specialized software running on the
controller.
Flow monitoring algorithms feed on network streaming data and can be particularly powerful
when dealing with specific cases like heavy-hitter detection, or the detection of any flow that is
larger than a fraction t of the total packets observed on a link (may also be referred to as one of
the top k flows in terms of size). Identifying packets belonging to heavy flows is a difficult task,
since the data plane has several technical constraints, e.g., small processing time allocated to
each packet, and limited memory in switching hardware. The ideal scenario would be to identify
these heavy flows as they are being processed in the switch and treat them as a special case.
HashPipe [SNR+17] is an algorithm implemented with the P4 programming language that
tracks heavy flows within a network with high accuracy. By using a pipeline of hash tables,
HashPipe retains the identifiers belonging to the heaviest flows while discarding the lighter
ones. Each incoming packet hash is checked against the values already on the first stage of the
pipeline. If there is a hit, then that counter is updated. In case there is a miss, the key with
the smallest counter is sent down the pipeline, following the same process. This ensures that in
the end, the identifiers retained in the hash tables are those with the larger counts, representing
the heaviest flows.
Many common sketching algorithms are designed to be operated on networks where the
23

available resources are extremely limited, since each packet has a very short time window in
order to be processed by the switch. These monitoring algorithms minimize time and space
requirements, and as a result neglect security. Work developed by Pereira et al., implements
a secure version of the aforementioned count-min sketch, intended for P4-enabled forwarding
devices [PNR17].
An ideal monitoring framework will offer a general-purpose approach while achieving high-
fidelity. UnivMon [LMV+16] is a P4 framework implementation that proposes such an approach
using universal streaming, a single universal sketch abstraction which allows network-wide mon-
itoring without focusing only on a specific feature. The authors test the system’s versatility
through applications of heavy-hitter detection, DDoS victim detection, change detection, en-
tropy estimation, and global iceberg detection.
The UnivMon data plane processes the incoming stream using general-purpose monitoring
primitives, also maintaining several data structures associated with it. These sketching primi-
tives do not require any prior knowledge about the metrics that will be estimated. The system
relies on a single universal switch abstraction that guarantees the successful measuring of dif-
ferent dimensions of traffic (e.g., source IPs, destination ports), making it seem like the traffic
entering the network is monitored by a unique switch.
As a means to avoid the repetition of incoming packets and the associated resource-use
penalties, UnivMon’s control flow is sequential. Every packet follows sequentially through sam-
pling, sketching and storage processes; this progression occurs across various substream levels,
stopping either when each packet reaches the last level or is not sampled.
Regarding implementation, the UnivMon framework consists of four key stages:
• Sampling stage: runs through incoming packets and samples them with respect to a specific
substream;
• Sketching stage: receives the input substreams, calculates sketch counters and populates
the respective sketch counter arrays;
• Top-k computation stage: receives the input stream and identifies the k heaviest elements;
• Estimation stage: collects the heavy element frequencies and outputs the desired metrics;
The control plane is responsible for assigning the monitoring responsibilities across the var-
ious nodes and collecting statistics from the data plane. This mechanism is implemented em-
ploying a sketch manifest, provided periodically by the controller to each switch, which contains
the set of actions to be applied when a specific packet arrives.
24
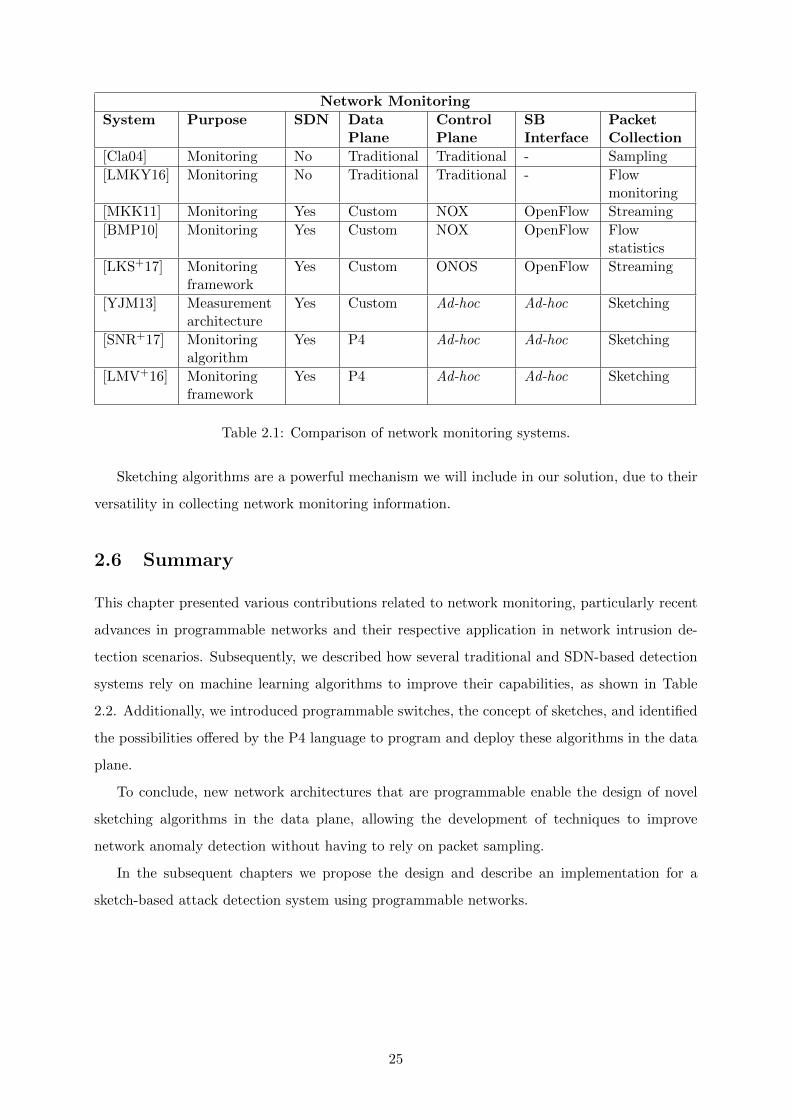
Network Monitoring
System Purpose SDN DataPlane
ControlPlane
SBInterface
PacketCollection
[Cla04] Monitoring No Traditional Traditional - Sampling
[LMKY16] Monitoring No Traditional Traditional - Flowmonitoring
[MKK11] Monitoring Yes Custom NOX OpenFlow Streaming
[BMP10] Monitoring Yes Custom NOX OpenFlow Flowstatistics
[LKS+17] Monitoringframework
Yes Custom ONOS OpenFlow Streaming
[YJM13] Measurementarchitecture
Yes Custom Ad-hoc Ad-hoc Sketching
[SNR+17] Monitoringalgorithm
Yes P4 Ad-hoc Ad-hoc Sketching
[LMV+16] Monitoringframework
Yes P4 Ad-hoc Ad-hoc Sketching
Table 2.1: Comparison of network monitoring systems.
Sketching algorithms are a powerful mechanism we will include in our solution, due to their
versatility in collecting network monitoring information.
2.6 Summary
This chapter presented various contributions related to network monitoring, particularly recent
advances in programmable networks and their respective application in network intrusion de-
tection scenarios. Subsequently, we described how several traditional and SDN-based detection
systems rely on machine learning algorithms to improve their capabilities, as shown in Table
2.2. Additionally, we introduced programmable switches, the concept of sketches, and identified
the possibilities offered by the P4 language to program and deploy these algorithms in the data
plane.
To conclude, new network architectures that are programmable enable the design of novel
sketching algorithms in the data plane, allowing the development of techniques to improve
network anomaly detection without having to rely on packet sampling.
In the subsequent chapters we propose the design and describe an implementation for a
sketch-based attack detection system using programmable networks.
25

System Purpose SDN ML Process ML Algorithms
[GBC15] Intrusion Detection No Unsupervised &Supervised Learning
Clustering (EM)
[CMO12] Anomaly detection No UnsupervisedLearning
Clustering, EA
[WHZ11] Anomaly detection No Supervised Learning Support VectorMachines
[BMP10] Monitoring Yes UnsupervisedLearning
Self Organizing Maps
[LKS+17] Monitoring framework Yes Ad-hoc Ad-hoc
Table 2.2: Comparison of IDS using machine learning techniques.
26

Chapter 3
Design
In this chapter, we describe a network monitoring system using programmable switches that
leverages machine learning techniques to perform attack detection. We start with a general
overview of the architecture, followed by a more detailed analysis of its various components.
Our work intends to address two fundamental problems related to network intrusion detec-
tion:
• The need to obtain statistics encompassing various metrics of interest that can range from
network traffic management information (e.g., network load or latency) to security alerts;
• The ability to extract relevant knowledge from the aforementioned data – in this case, to
detect anomalous activities.
To address the first problem, we use sketching algorithms running on programmable switches.
The second challenge is approached with unsupervised machine learning techniques, in order to
analyze the collected monitoring information.
3.1 Overview
The scheme in Figure 3.1 presents an overview of the architecture of our solution. The data plane
is composed of a set of programmable switches managed by an SDN controller. Periodically, the
controller collects basic flow statistics and sketch values from the data plane. These statistics are
then sent to the data processing component, where we apply data normalization and machine
learning algorithms. Following this process, we perform a human analysis on the processed data,
in order to obtain the final detection results.
A flowchart displaying an example execution of the implemented approach is shown in Figure
3.2. On the data plane, a set of programmable switches apply the active forwarding model at any
27
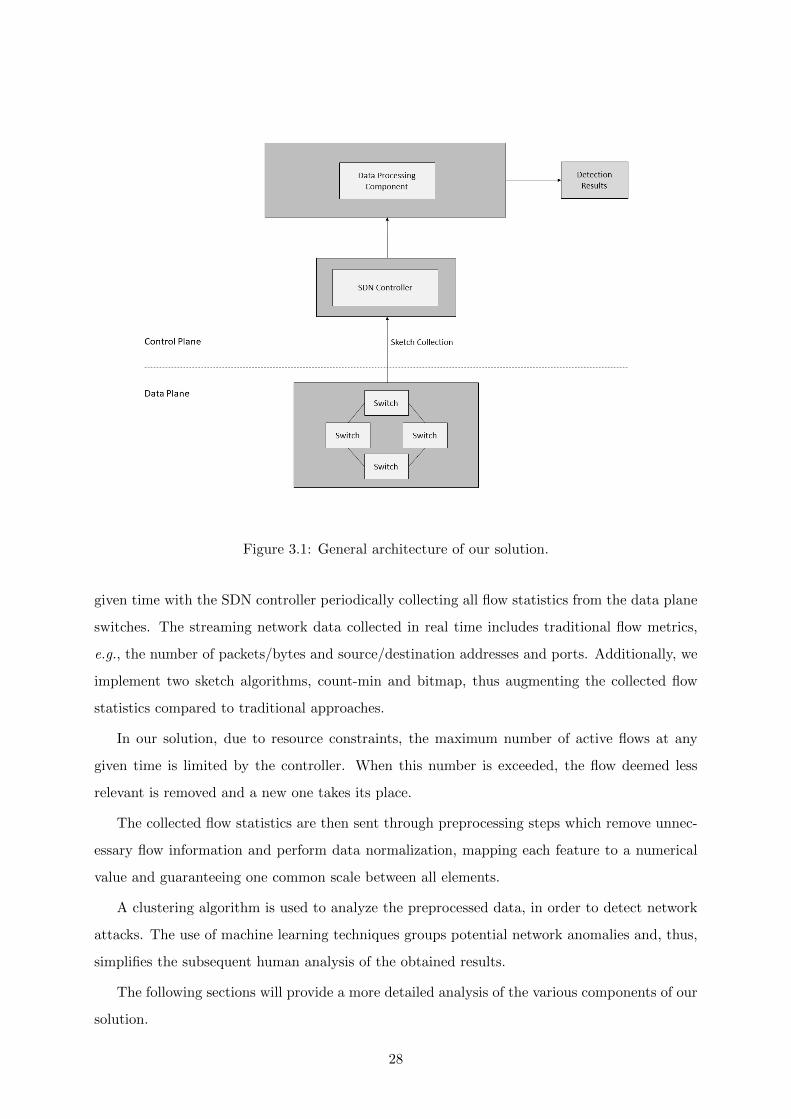
Figure 3.1: General architecture of our solution.
given time with the SDN controller periodically collecting all flow statistics from the data plane
switches. The streaming network data collected in real time includes traditional flow metrics,
e.g., the number of packets/bytes and source/destination addresses and ports. Additionally, we
implement two sketch algorithms, count-min and bitmap, thus augmenting the collected flow
statistics compared to traditional approaches.
In our solution, due to resource constraints, the maximum number of active flows at any
given time is limited by the controller. When this number is exceeded, the flow deemed less
relevant is removed and a new one takes its place.
The collected flow statistics are then sent through preprocessing steps which remove unnec-
essary flow information and perform data normalization, mapping each feature to a numerical
value and guaranteeing one common scale between all elements.
A clustering algorithm is used to analyze the preprocessed data, in order to detect network
attacks. The use of machine learning techniques groups potential network anomalies and, thus,
simplifies the subsequent human analysis of the obtained results.
The following sections will provide a more detailed analysis of the various components of our
solution.
28
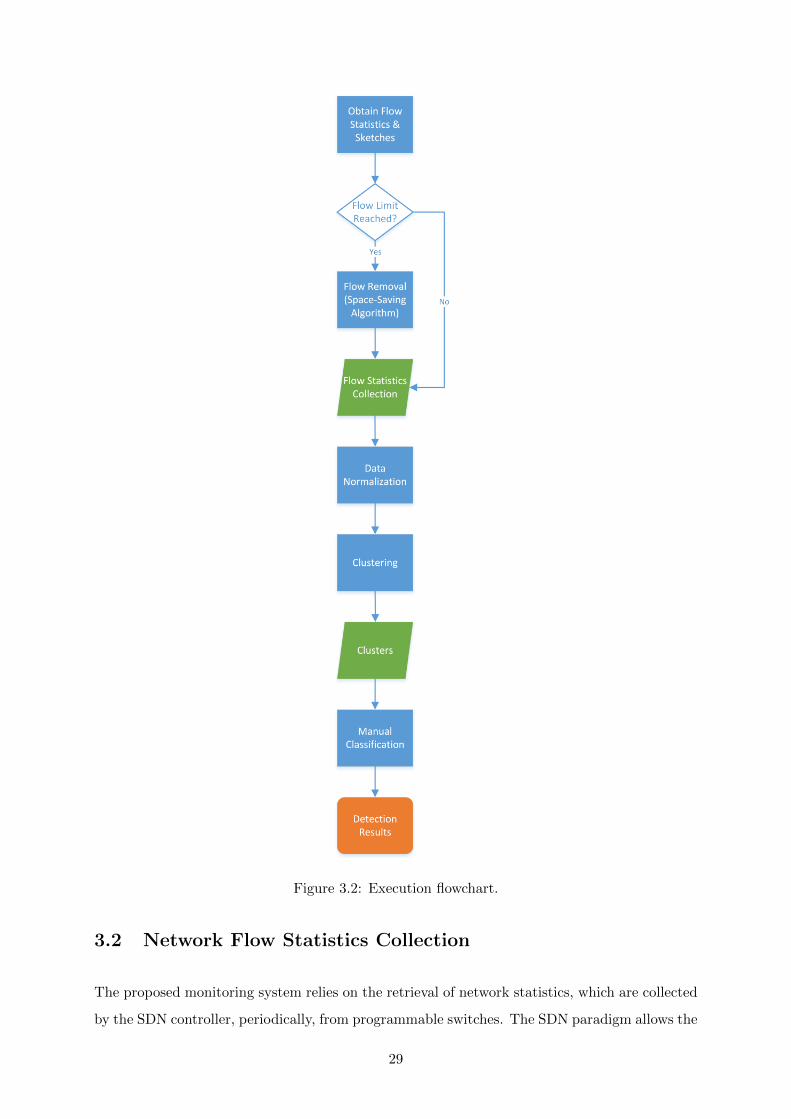
Figure 3.2: Execution flowchart.
3.2 Network Flow Statistics Collection
The proposed monitoring system relies on the retrieval of network statistics, which are collected
by the SDN controller, periodically, from programmable switches. The SDN paradigm allows the
29

Features
Number of packets
Number of bytes
Source and destination IP address
IP protocol
UDP/TCP source and destination port
Count-min sketch
Bitmap sketch
Table 3.1: Flow statistics features.
configuration of diverse statistics collection strategies by introducing programmable forwarding
devices.
The SDN controller manages the data plane composed of programmable switches, that ex-
ecute the active forwarding model at any given moment, and several network applications that
provide services to end hosts and neighboring networks. Additionally, these programmable
switches perform the sketch algorithm calculations in real-time. The collected flow statistics are
presented in Table 3.1.
Traditionally, active flows in the control plane are discarded after a specific time period of
inactivity: any flow that is not updated within a certain time interval (e.g., the controller has
not received any packet matching that flow) is removed from the active flow table. Since we
aim to collect flow statistics spanning a large number of packets, we do not set this time limit.
In this way, we remove the need to keep a record of past flows and their respective statistics
that would have to be constantly compared to the active flow table, which allows us to track all
statistics pertaining to a specific flow with a higher degree of accuracy.
Algorithm 1 Pseudo Code for the Space-Saving Algorithm
1: // Table T with m slots, each containing (key,val) corresponding to a specific flow.2: // Incoming packet has key iKey.3: procedure Update4: if ∃ slot j in T with iKey = keyj then5: valj ← valj + 16: else7: if ∃ empty slot j in T then8: (keyj , valj)← (iKey, 1)9: else
10: r← argminj∈{1,...,m}(valj)11: (keyr, valr)← (iKey, valr + 1)
However, maintaining a limitless flow table is impractical due to memory constraints. For
that reason, we developed an adaptation of the space-saving algorithm [SNR+17], that uses O(k)
counters to count k flows: when a packet arrives, if it does not match an active flow and if the
counter table is not full, the algorithm inserts the new flow with a count of 1. If the packet
30

matches an active flow, the algorithm increases the corresponding flow counter. However, if the
packet does not match any active flow and if the counter table is full, the algorithm replaces the
flow entry that has the minimum counter value v in the table with the packet’s respective flow
and increments the counter. The pseudo code for this procedure is presented in Algorithm 1.
3.2.1 Count-Min and Bitmap Sketches
The two sketching algorithms included in our solution, the count-min sketch and the bitmap
sketch, are presented next. These particular sketches were chosen due to their ability to be used
in the detection of several network anomalies, particularly DDoS attacks and malware spreading.
The count–min sketch is a probabilistic data structure that serves as a frequency table of
events in a stream of data. It uses hash functions to map elements, such as specific network
flows, to frequencies, making it useful in packet monitoring scenarios for heavy-hitter detection:
the identification of large flows that occupy more than a fraction k of the network link capacity
during a time interval.
As presented in Algorithm 2, the count-min sketch’s structure consists of an array of counters,
each accessed through a specific hash function. When an event i arrives, the sketch is updated
by calculating all hash values of i and subsequently incrementing each respective counter on the
array. When the current count for a certain event j is requested, the estimated value is obtained
by comparing all counters in order to find the minimum stored value.
The bitmap sketch maintains an array of bits to count the number of unique elements (e.g.,
IP destination addresses). Each item in a stream of elements is hashed to one of the b bits in
the array, with the respective bit changed from 0 to 1. The bitmap sketch value is obtained by
the sum of all values from the bitmap array.
A possible use case for the bitmap sketch is the detection of superspreaders: hosts that
contact more than k distinct destinations during a time interval, for purposes such as mal-
ware spreading, for instance. The reverse situation, where a large number of distinct addresses
contacts a single host, may be evidence of a DDoS attack.
The bitmap sketch can be used, for instance, to easily count the number of accesses to
distinct destinations by a single source address. As the packets arrive, the first step consists
of calculating a hash for every destination address. Subsequently, a filtering process selects all
the packets matching the intended source address. If a certain packet matches, then the bitmap
array is updated at the index given by the hash value of the destination address, with its value
modified from 0 to 1. By summing all values in the bitmap array, we obtain the number of
unique destinations. Algorithm 3 presents our modified version of the bitmap sketch, in which a
31

Algorithm 2 Pseudo Code for the Count-Min Sketch
1: // P4 Registers contain (hash,val). Each register hash receives different input features.2: // registerFinal saves the min value, after comparing all registers.3: // register0 hash: IP src addr, IP dst addr, Ethernet src addr, Ethernet dst addr, IP proto.4: // register1 hash: IP src addr, IP dst addr, IP proto.5: // register2 hash: IP src addr, IP dst addr.6: // registerFinal hash: IP src addr, IP dst addr.7: procedure Cmsketch(PACKET)8: hashV al0← hash0(PACKET )9: hashV al1← hash1(PACKET )
10: hashV al2← hash2(PACKET )11: register0[hashV al0]← register0[hashV al0] + 112: register1[hashV al1]← register1[hashV al1] + 113: register2[hashV al2]← register2[hashV al2] + 114: cmValue← register0[hashV al0]15: cmHash← hashVal016: if cmValue > register1[hashV al1] then17: cmValue← register1[hashV al1]18: cmHash← hashVal119: if cmValue > register2[hashV al2] then20: cmValue← register2[hashV al2]21: cmHash← hashVal222: registerFinal[cmHash]← cmValue
second array (implemented as a P4 register) saves the number of unique destinations for every
source address.
Algorithm 3 Pseudo Code for the Bitmap Sketch
1: // Two P4 registers are used to save (hash,val).2: // register0 is used to determine if the flow’s src/dst address pair is new, in which case we
increment the value of register1. If not, we do nothing.3: // register1 saves the bitmap value for every src address.4: // register0 hash: IP src addr, IP dst addr.5: // register1 hash: IP src addr.6: procedure Bmsketch(PACKET)7: hashV al0← hash0(PACKET )8: hashV al1← hash1(PACKET )9: if register0[hashV al0] == 0 then
10: register0[hashV al0]← 111: register1[hashV al1]← register1[hashV al1] + 1
3.3 Data Normalization
The collected flow statistics are composed of various features, of which many contain numerical
values. As such, we need to perform data normalization, in order to prepare the statistics for
analysis.
32

Original Normalized
Number of packets 11 0.010111
Number of bytes 840 0.010261
Source IP address 186.75.212.235 0.320849
Destination IP address 48.88.140.173 0.603558
IP protocol 6 0.0
UDP/TCP source port 80 0.000412
UDP/TCP destination port 42396 0.647283
Count-min sketch 16 0.015167
Bitmap sketch 40 0.634921
Table 3.2: Original and normalized flow statistics.
Since our flow statistics contain non-numerical features, the first step is the conversion of
any of these, such as IP addresses, to numerical values. The second step consists of mapping
all values to a specific range, in this case, the interval [0,1], with 0 being the minimum and 1
the maximum. Considering a feature X = (x1, . . . ,xn), a normalized value zi will be obtained
as described in Equation 3.1.
zi =xi −min(x)
max(x)−min(x), xi ∈ [0, 1] (3.1)
An example of the resulting flow statistics can be seen in Table 3.2.
3.4 Clustering and Classification
As referred in Section 2.3, machine learning techniques are usually classified into two categories:
unsupervised and supervised learning. For this project, we rely on an unsupervised clustering
algorithm that allows us to group similar network behaviors. In this way, we do not require any
training phases to provide our system with prior knowledge about similar situations, enabling
us to detect new attacks.
Clustering algorithms group related entities according to their characteristics. The input data
is fed to the algorithm, after which, by adjusting specific parameters, similar data points are
grouped together; data entities containing different and more uncommon features are considered
outliers and also identified.
In this project, we use K-Means, a widely used clustering algorithm that provides reliable
results in a reasonable execution time. Algorithm 4 shows the pseudo code for this algorithm.
Requiring a predefined number k of clusters as input, K-Means starts by randomly choosing a
centroid value for each cluster, after which it iteratively performs three steps:
33

1. Find the Euclidean distance given by d(x, y) =√∑n
i=1(xi − yi)2, between each data entity
and each cluster’s centroid.
2. According to the previous results, assign each data entity to its closest cluster.
3. From the mean value of all entities belonging to a cluster, update the respective centroid
values.
The iterations continue until the centroid values no longer change significantly.
Algorithm 4 Pseudo Code for the K-Means Algorithm
1: procedure K-Means(X,k)2: randomC ← (c1, ..., ck), ck ∈ Rd
3: for ∀xi ∈ X do4: Find closest centroid using euclidean distance argminp d(xi, cp)5: xi is associated with cluster p
6: for ∀ci ∈ C do7: while ∆ci > ε do8: ci ← 1
ni
∑xj∈X xj
return C
By applying a clustering algorithm such as K-Means on the obtained flow statistics, we
expect the regular traffic representing the bulk of the dataset to be grouped in several large
clusters, and the scarcer network anomalies to be clustered together as outliers and subject to
a manual analysis in search of network attacks.
3.5 Summary
In this chapter we presented the design of our solution, describing its various components and
their respective functions. Starting with a general overview of the proposed system, we detailed
the data plane processing. Subsequently, we described the data normalization and machine
learning components that process the monitored data, before a human analysis phase delivers
the final detection results.
The following chapters will describe the implementation process for our solution, followed
by an evaluation, intended to validate the obtained results.
34
Chapter 4
Implementation
This chapter describes the implementation of our solution. We used the P4 language to program
the network switches, ONOS as the SDN controller, and the Python library Scikit-Learn to
implement the data normalization and machine learning algorithms. Next, we detail the P4
programs compiled on the switches, how ONOS retrieves network statistics from the switches,
and finally the data preprocessing and clustering algorithms responsible for the analysis of the
measurement data.
4.1 P4 Sketches
In order to implement new flow statistics, including sketches, we rely on P4 programs running
on the data plane topology, i.e., the switches. Our implementation uses Mininet, a virtual
network emulator, to emulate the desired host and switch configuration. This virtual data plane
is controlled by ONOS, effectively functioning as an SDN infrastructure.
The P4 language provides direct control over data plane behavior, allowing the definition
of custom packet parsers and match+action tables. As such, we defined a table matching the
following type of flow:
• Ethernet source and destination address;
• Ethernet type protocol;
• IPv4 source and destination address;
• IPv4 type protocol;
• UDP/TCP source and destination port.
35
This procedure allows the extraction of flows with a fine granularity. In our solution, all
packets are sent to a specific switch in the emulated network. When a new packet arrives, it
matches the table, and its respective flow is added to the ONOS flow table. Follow-up packets
from this flow just increment the required counters. We show examples in section 4.2.
The deployed P4 program we developed includes the implementation of the two sketches
used in our solution, the count-min sketch and the bitmap sketch, that perform their respective
functions after a packet is matched with the table referred above. Both sketches rely extensively
on hashing functions, P4 metadata, and register arrays. Metadata is data associated with a
single packet, whereas registers allow the storage of persistent data across packets.
The count-min sketch performs three different hash function calculations, which are used to
access their respective register’s position and increment its value by 1. A comparison is then
performed between the three values, in order to determine the minimum. The final count-min
value is stored in a fourth register for later retrieval by the SDN controller.
An example of a P4 hash used in the count-min sketch is shown below:
action action_get_count_min_hash_1_val() {
hash(packet_count_min_hash1,
HashAlgorithm.crc32,
(bit<32>)0,
{hdr.ipv4.src_addr, hdr.ipv4.dst_addr, hdr.ipv4.protocol},
(bit<32>)65536);
meta.my_metadata.count_min_hash_val1 = packet_count_min_hash1;
}
The bitmap sketch implementation in P4 relies on two registers: The first is accessed using
a hash composed of the packet’s source and destination IP address, and determines if that pair
is new (the register’s value is 0 in case of a new combination, and 1 otherwise). The second
register is accessed using a hash composed of the packet’s source address, only if the previous
pair was new. In this case, the respective value is incremented by 1. Since the objective of the
bitmap sketch is to count the number of unique elements for a given set of features, we use this
implementation to store the number of unique destination accesses for a given source address.
The SDN controller accesses the second register for the bitmap sketch values.
The P4 implementation of the two possible actions according to the previous knowledge of
a certain pair is shown below:
36
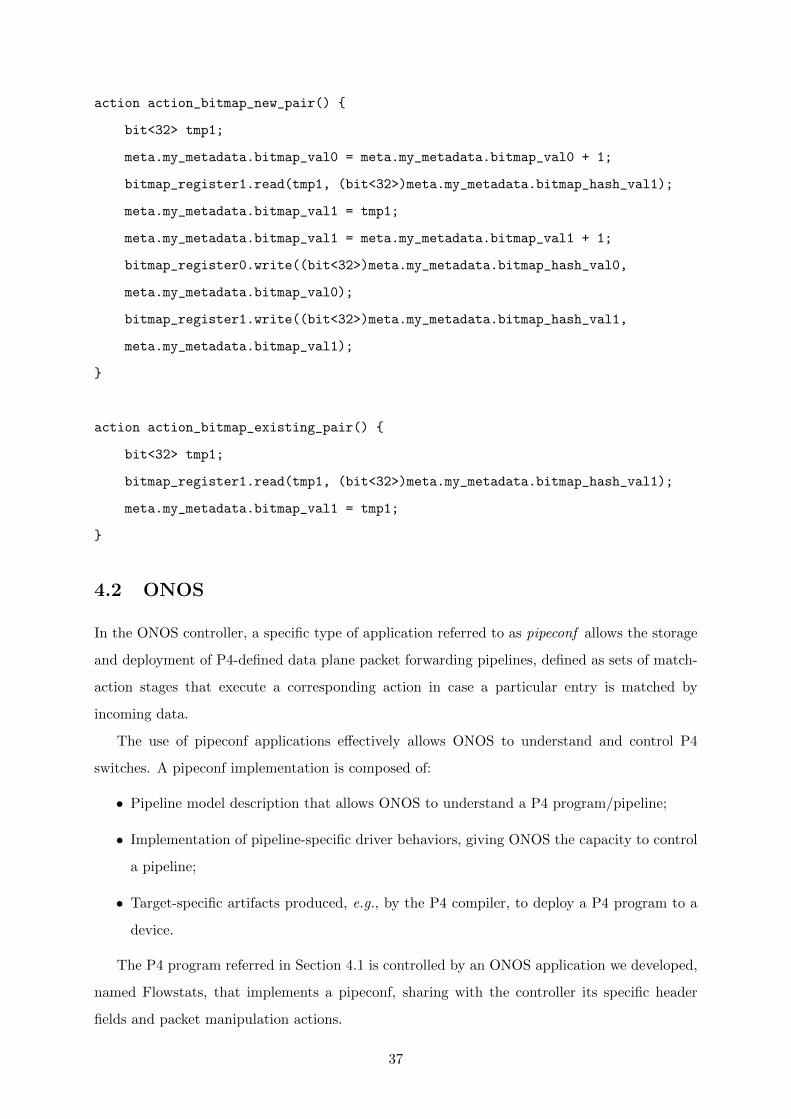
action action_bitmap_new_pair() {
bit<32> tmp1;
meta.my_metadata.bitmap_val0 = meta.my_metadata.bitmap_val0 + 1;
bitmap_register1.read(tmp1, (bit<32>)meta.my_metadata.bitmap_hash_val1);
meta.my_metadata.bitmap_val1 = tmp1;
meta.my_metadata.bitmap_val1 = meta.my_metadata.bitmap_val1 + 1;
bitmap_register0.write((bit<32>)meta.my_metadata.bitmap_hash_val0,
meta.my_metadata.bitmap_val0);
bitmap_register1.write((bit<32>)meta.my_metadata.bitmap_hash_val1,
meta.my_metadata.bitmap_val1);
}
action action_bitmap_existing_pair() {
bit<32> tmp1;
bitmap_register1.read(tmp1, (bit<32>)meta.my_metadata.bitmap_hash_val1);
meta.my_metadata.bitmap_val1 = tmp1;
}
4.2 ONOS
In the ONOS controller, a specific type of application referred to as pipeconf allows the storage
and deployment of P4-defined data plane packet forwarding pipelines, defined as sets of match-
action stages that execute a corresponding action in case a particular entry is matched by
incoming data.
The use of pipeconf applications effectively allows ONOS to understand and control P4
switches. A pipeconf implementation is composed of:
• Pipeline model description that allows ONOS to understand a P4 program/pipeline;
• Implementation of pipeline-specific driver behaviors, giving ONOS the capacity to control
a pipeline;
• Target-specific artifacts produced, e.g., by the P4 compiler, to deploy a P4 program to a
device.
The P4 program referred in Section 4.1 is controlled by an ONOS application we developed,
named Flowstats, that implements a pipeconf, sharing with the controller its specific header
fields and packet manipulation actions.
37
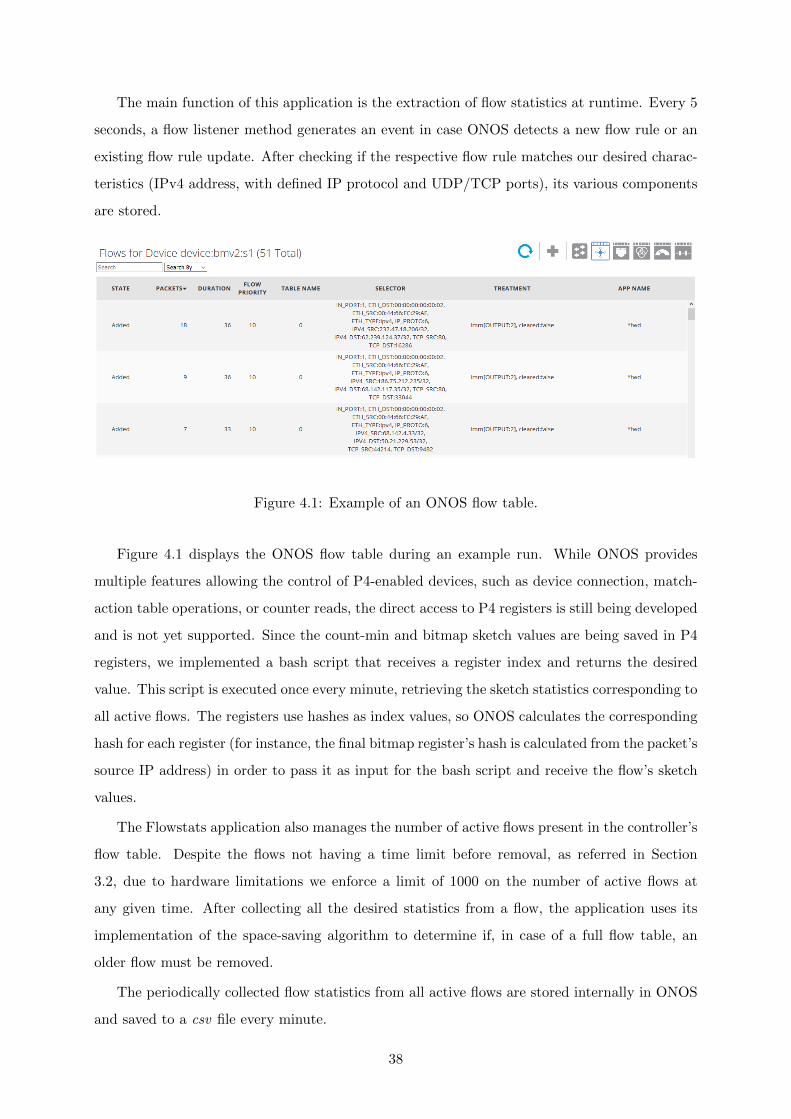
The main function of this application is the extraction of flow statistics at runtime. Every 5
seconds, a flow listener method generates an event in case ONOS detects a new flow rule or an
existing flow rule update. After checking if the respective flow rule matches our desired charac-
teristics (IPv4 address, with defined IP protocol and UDP/TCP ports), its various components
are stored.
Figure 4.1: Example of an ONOS flow table.
Figure 4.1 displays the ONOS flow table during an example run. While ONOS provides
multiple features allowing the control of P4-enabled devices, such as device connection, match-
action table operations, or counter reads, the direct access to P4 registers is still being developed
and is not yet supported. Since the count-min and bitmap sketch values are being saved in P4
registers, we implemented a bash script that receives a register index and returns the desired
value. This script is executed once every minute, retrieving the sketch statistics corresponding to
all active flows. The registers use hashes as index values, so ONOS calculates the corresponding
hash for each register (for instance, the final bitmap register’s hash is calculated from the packet’s
source IP address) in order to pass it as input for the bash script and receive the flow’s sketch
values.
The Flowstats application also manages the number of active flows present in the controller’s
flow table. Despite the flows not having a time limit before removal, as referred in Section
3.2, due to hardware limitations we enforce a limit of 1000 on the number of active flows at
any given time. After collecting all the desired statistics from a flow, the application uses its
implementation of the space-saving algorithm to determine if, in case of a full flow table, an
older flow must be removed.
The periodically collected flow statistics from all active flows are stored internally in ONOS
and saved to a csv file every minute.
38
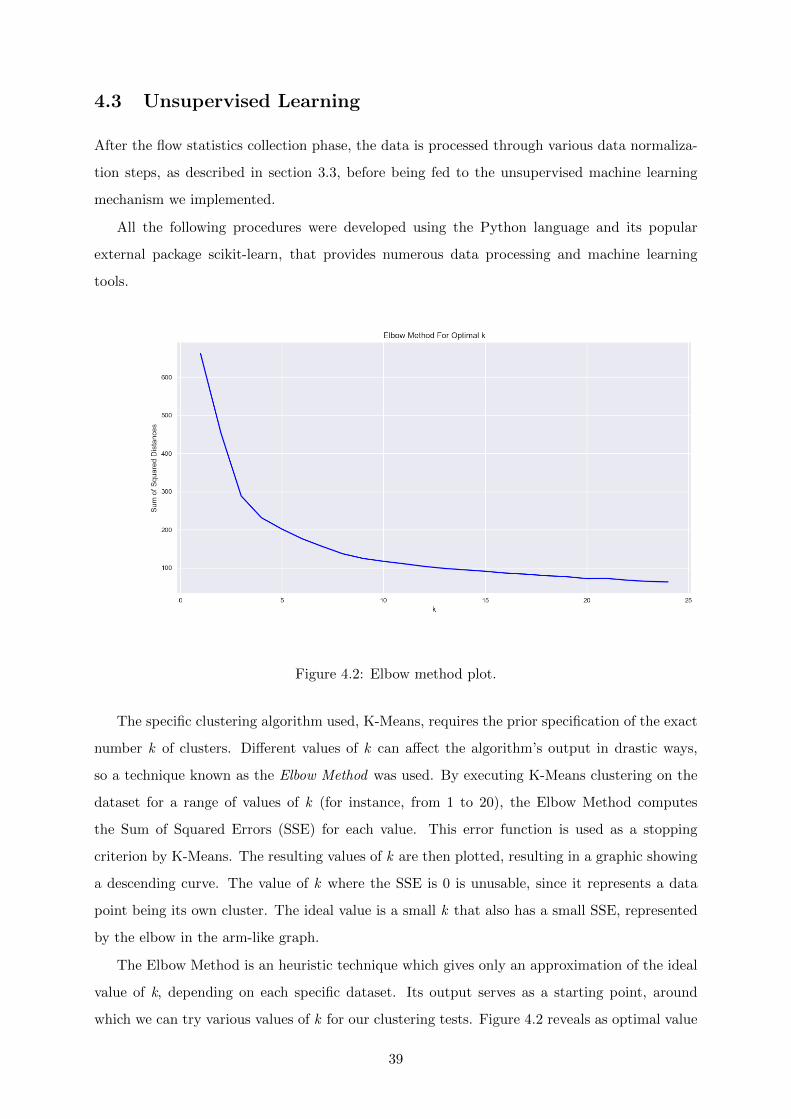
4.3 Unsupervised Learning
After the flow statistics collection phase, the data is processed through various data normaliza-
tion steps, as described in section 3.3, before being fed to the unsupervised machine learning
mechanism we implemented.
All the following procedures were developed using the Python language and its popular
external package scikit-learn, that provides numerous data processing and machine learning
tools.
Figure 4.2: Elbow method plot.
The specific clustering algorithm used, K-Means, requires the prior specification of the exact
number k of clusters. Different values of k can affect the algorithm’s output in drastic ways,
so a technique known as the Elbow Method was used. By executing K-Means clustering on the
dataset for a range of values of k (for instance, from 1 to 20), the Elbow Method computes
the Sum of Squared Errors (SSE) for each value. This error function is used as a stopping
criterion by K-Means. The resulting values of k are then plotted, resulting in a graphic showing
a descending curve. The value of k where the SSE is 0 is unusable, since it represents a data
point being its own cluster. The ideal value is a small k that also has a small SSE, represented
by the elbow in the arm-like graph.
The Elbow Method is an heuristic technique which gives only an approximation of the ideal
value of k, depending on each specific dataset. Its output serves as a starting point, around
which we can try various values of k for our clustering tests. Figure 4.2 reveals as optimal value
39
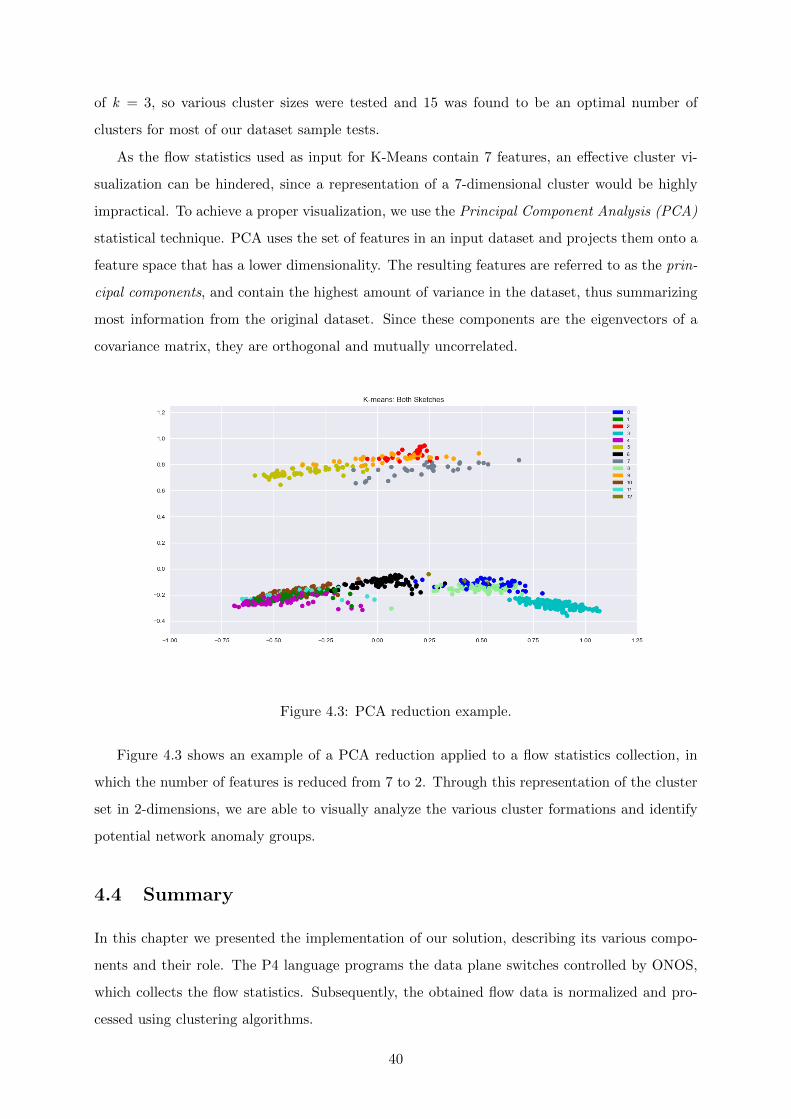
of k = 3, so various cluster sizes were tested and 15 was found to be an optimal number of
clusters for most of our dataset sample tests.
As the flow statistics used as input for K-Means contain 7 features, an effective cluster vi-
sualization can be hindered, since a representation of a 7-dimensional cluster would be highly
impractical. To achieve a proper visualization, we use the Principal Component Analysis (PCA)
statistical technique. PCA uses the set of features in an input dataset and projects them onto a
feature space that has a lower dimensionality. The resulting features are referred to as the prin-
cipal components, and contain the highest amount of variance in the dataset, thus summarizing
most information from the original dataset. Since these components are the eigenvectors of a
covariance matrix, they are orthogonal and mutually uncorrelated.
Figure 4.3: PCA reduction example.
Figure 4.3 shows an example of a PCA reduction applied to a flow statistics collection, in
which the number of features is reduced from 7 to 2. Through this representation of the cluster
set in 2-dimensions, we are able to visually analyze the various cluster formations and identify
potential network anomaly groups.
4.4 Summary
In this chapter we presented the implementation of our solution, describing its various compo-
nents and their role. The P4 language programs the data plane switches controlled by ONOS,
which collects the flow statistics. Subsequently, the obtained flow data is normalized and pro-
cessed using clustering algorithms.
40

The next chapter will present the evaluation method used to validate the performance of our
solution.
41

42

Chapter 5
Evaluation
This chapter describes the evaluation method used to validate the performance of our imple-
mentation. In the following sections we analyze:
• Our system’s ability to collect reliable and accurate flow sketches from a P4 switch infras-
tructure;
• Network anomaly detection using clustering algorithms receiving as input a combination
of regular flow statistics collected through ONOS, and the P4 sketches, with a comparison
between both netflow-based statistics and our solution;
• The performance of our solution, in terms of processing time and resource consumption.
5.1 Dataset and Experimental Setup
The CAIDA dataset [cai18], collected by the Center for Applied Internet Data Analysis, contains
anonymized passive bidirectional traffic traces from various monitors on high-speed internet
backbone links. The traces provided are available as pcap files containing timestamped packet
data. 30 samples from this dataset were used as input for our evaluation tests, specifically from
CAIDA’s 2014 Chicago monitor.
The SDN components, such as the ONOS controller and the P4-programmed switches run-
ning on mininet, were implemented and tested on an Ubuntu 16.04 virtual machine with 4
virtual processor cores and 6 GB of RAM. The data normalization and clustering phases were
implemented using Python libraries and tested on a Windows 10 system with a dual-core i7
processor and 16 GB of RAM.
43

5.2 P4 Sketch Collection
In this section, we evaluate the ability of our P4-sketching approach to provide accurate network
flow statistics in real-time. To perform an accurate comparison, the obtained pcap files from
the CAIDA dataset were analyzed, in order to determine a ground truth corresponding to the
original captured network traffic.
In our implementation, the count-min sketch maintains statistics about flows with the same
source-destination pair of IP addresses, as a means for heavy-hitter detection. Hence, the ground
truth was obtained by analyzing the pcap files and counting the occurrence number of all source-
destination address pairs.
The bitmap sketch is used to determine the existence of superspreader sources, by counting
the number of distinct destinations for each source address. The same logic was applied to
obtain the ground truth: All source addresses in the pcap file were sorted, and each distinct
destination was counted.
As referred in Chapters 3 and 4, the space-saving algorithm is used to limit the number
of active flows. This approach reduces the accuracy of the result, as an old flow with relevant
sketch statistics might be replaced if the algorithm deems it dispensable, a not uncommon case
in superspreader sources. Bitmap values are commonly obtained through a combination of many
single accesses from a particular source to many destinations, resulting in multiple flows that
may have a high bitmap value, but are considered less relevant by the space-saving algorithm
and removed.
However, our tests revealed that both the count-min and bitmap sketch values obtained are
accurate when compared with the ground truth, as can be observed in Tables 5.1 and 5.2. Both
table’s sketch statistics were generated from a batch of 100k packets from the 2014 CAIDA
Chicago monitor, containing 11943 distinct source-destination IP address pairs.
Table 5.1 shows the 15 source-destination IP address pairs with the highest count-min sketch
values, hence the most likely candidates for heavy-hitters. As can be observed, the obtained
sketch statistics are accurate when compared with the ground truth values, with only a few
captured values differing by a small amount, e.g., rows 8 and 11.
The 15 most relevant bitmap sketch values are displayed in Table 5.2, revealing the IP source
addresses that are connected to the highest number of distinct destinations. The obtained bitmap
statistics contain more differences when compared to the ground truth values than the count-min
statistics, but the more relevant source addresses are still identified in a consistent manner. In
this example, we can observe that the more relevant source addresses appear to belong to the
same subnet, a possible indication of various infected hosts in the same infrastructure attempting
44
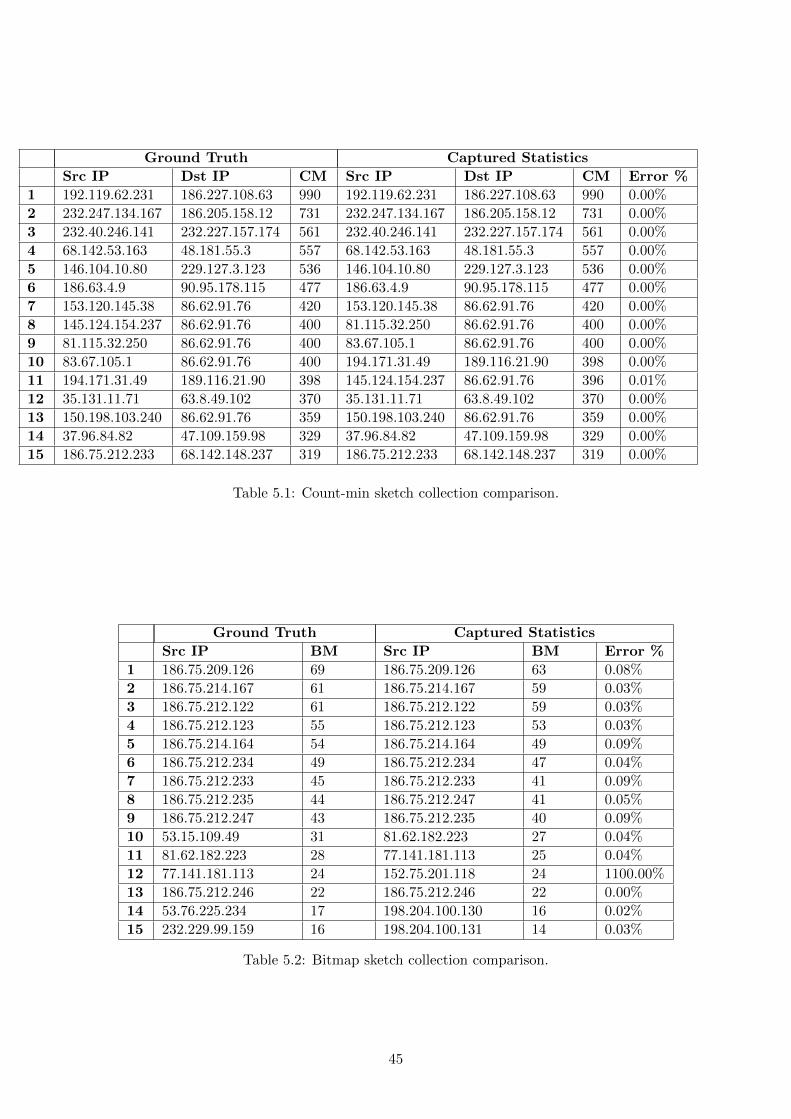
Ground Truth Captured Statistics
Src IP Dst IP CM Src IP Dst IP CM Error %
1 192.119.62.231 186.227.108.63 990 192.119.62.231 186.227.108.63 990 0.00%
2 232.247.134.167 186.205.158.12 731 232.247.134.167 186.205.158.12 731 0.00%
3 232.40.246.141 232.227.157.174 561 232.40.246.141 232.227.157.174 561 0.00%
4 68.142.53.163 48.181.55.3 557 68.142.53.163 48.181.55.3 557 0.00%
5 146.104.10.80 229.127.3.123 536 146.104.10.80 229.127.3.123 536 0.00%
6 186.63.4.9 90.95.178.115 477 186.63.4.9 90.95.178.115 477 0.00%
7 153.120.145.38 86.62.91.76 420 153.120.145.38 86.62.91.76 420 0.00%
8 145.124.154.237 86.62.91.76 400 81.115.32.250 86.62.91.76 400 0.00%
9 81.115.32.250 86.62.91.76 400 83.67.105.1 86.62.91.76 400 0.00%
10 83.67.105.1 86.62.91.76 400 194.171.31.49 189.116.21.90 398 0.00%
11 194.171.31.49 189.116.21.90 398 145.124.154.237 86.62.91.76 396 0.01%
12 35.131.11.71 63.8.49.102 370 35.131.11.71 63.8.49.102 370 0.00%
13 150.198.103.240 86.62.91.76 359 150.198.103.240 86.62.91.76 359 0.00%
14 37.96.84.82 47.109.159.98 329 37.96.84.82 47.109.159.98 329 0.00%
15 186.75.212.233 68.142.148.237 319 186.75.212.233 68.142.148.237 319 0.00%
Table 5.1: Count-min sketch collection comparison.
Ground Truth Captured Statistics
Src IP BM Src IP BM Error %
1 186.75.209.126 69 186.75.209.126 63 0.08%
2 186.75.214.167 61 186.75.214.167 59 0.03%
3 186.75.212.122 61 186.75.212.122 59 0.03%
4 186.75.212.123 55 186.75.212.123 53 0.03%
5 186.75.214.164 54 186.75.214.164 49 0.09%
6 186.75.212.234 49 186.75.212.234 47 0.04%
7 186.75.212.233 45 186.75.212.233 41 0.09%
8 186.75.212.235 44 186.75.212.247 41 0.05%
9 186.75.212.247 43 186.75.212.235 40 0.09%
10 53.15.109.49 31 81.62.182.223 27 0.04%
11 81.62.182.223 28 77.141.181.113 25 0.04%
12 77.141.181.113 24 152.75.201.118 24 1100.00%
13 186.75.212.246 22 186.75.212.246 22 0.00%
14 53.76.225.234 17 198.204.100.130 16 0.02%
15 232.229.99.159 16 198.204.100.131 14 0.03%
Table 5.2: Bitmap sketch collection comparison.
45

to spread malware to multiple destinations.
The source address on the right side of row 12 on Table 5.2, 152.75.201.118, is an example
of a capture anomaly, since the ground truth shows a corresponding value of only 2 instead of
24. A subsequent analysis of the pcap file revealed that 152.75.201.118 made 31 connections to
2 distinct values: 189.116.21.80 and 189.116.21.89. However, 24 of those connections displayed
a TCP Dup ACK error, indicating a gap flagged by the receiver. This particular error made the
P4 bitmap implementation consider these connections as distinct flows and increase the sketch
value.
As shown in this section, the obtained flow sketch statistics are accurate, displaying very
similar values when compared with the ground truth. This factor is essential so that the sub-
sequent clustering and analysis process can accurately reveal network anomalies and potential
attacks.
5.3 Clustering Evaluation using the CAIDA Dataset
In this section, we evaluate various clustering experiments using the obtained flow statistics
and compare a traditional netflow-based monitoring approach with our solution using sketching
algorithms.
All network flow statistics collected from the SDN infrastructure are normalized, in order
to serve as input for the K-Means clustering algorithm. We used the elbow method referred
in Section 4.3, to determine the optimal number of clusters for each case. Furthermore, the
centroid values representing the mean value of each feature were analyzed for all clusters, as a
means to identify the more relevant components of each, with special consideration to sketching
centroid values.
5.3.1 Bitmap Sketch
An example run of the K-Means algorithm with 15 clusters is presented in Figure 5.1. By
analyzing both the image and the cluster distribution for each flow, the results are revealed to
be positive, as the flows containing the highest bitmap values are concentrated on cluster 0,
displayed in the lower-right corner, and well separated from the remaining flows. In Table 5.3,
we can compare each cluster’s corresponding centroid values for each feature. The bitmap value
(identified as BM) for cluster 0 is indeed high, and looking at the remaining bitmap centroid
column values, it is possible to observe that cluster 0 is the only one containing a relevant value,
with all others well below 0.1.
By looking at the cluster column in table 5.4, that shows the top 10 flows ordered by bitmap
46
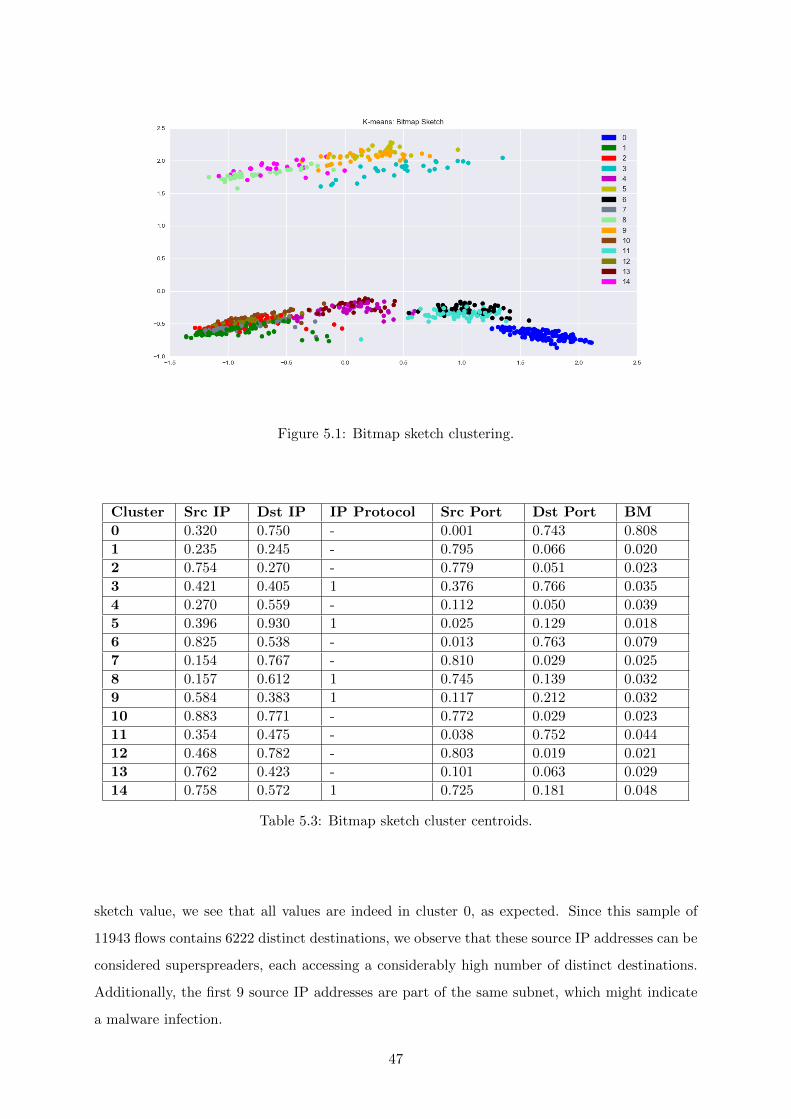
Figure 5.1: Bitmap sketch clustering.
Cluster Src IP Dst IP IP Protocol Src Port Dst Port BM
0 0.320 0.750 - 0.001 0.743 0.808
1 0.235 0.245 - 0.795 0.066 0.020
2 0.754 0.270 - 0.779 0.051 0.023
3 0.421 0.405 1 0.376 0.766 0.035
4 0.270 0.559 - 0.112 0.050 0.039
5 0.396 0.930 1 0.025 0.129 0.018
6 0.825 0.538 - 0.013 0.763 0.079
7 0.154 0.767 - 0.810 0.029 0.025
8 0.157 0.612 1 0.745 0.139 0.032
9 0.584 0.383 1 0.117 0.212 0.032
10 0.883 0.771 - 0.772 0.029 0.023
11 0.354 0.475 - 0.038 0.752 0.044
12 0.468 0.782 - 0.803 0.019 0.021
13 0.762 0.423 - 0.101 0.063 0.029
14 0.758 0.572 1 0.725 0.181 0.048
Table 5.3: Bitmap sketch cluster centroids.
sketch value, we see that all values are indeed in cluster 0, as expected. Since this sample of
11943 flows contains 6222 distinct destinations, we observe that these source IP addresses can be
considered superspreaders, each accessing a considerably high number of distinct destinations.
Additionally, the first 9 source IP addresses are part of the same subnet, which might indicate
a malware infection.
47
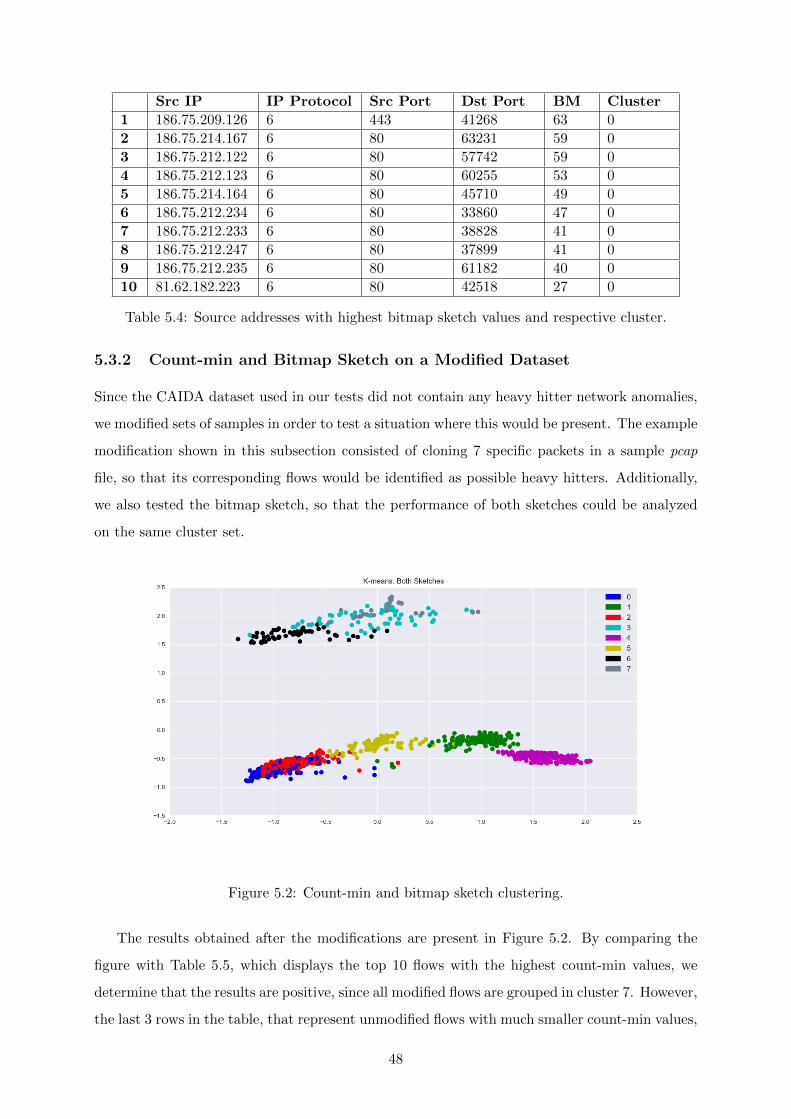
Src IP IP Protocol Src Port Dst Port BM Cluster
1 186.75.209.126 6 443 41268 63 0
2 186.75.214.167 6 80 63231 59 0
3 186.75.212.122 6 80 57742 59 0
4 186.75.212.123 6 80 60255 53 0
5 186.75.214.164 6 80 45710 49 0
6 186.75.212.234 6 80 33860 47 0
7 186.75.212.233 6 80 38828 41 0
8 186.75.212.247 6 80 37899 41 0
9 186.75.212.235 6 80 61182 40 0
10 81.62.182.223 6 80 42518 27 0
Table 5.4: Source addresses with highest bitmap sketch values and respective cluster.
5.3.2 Count-min and Bitmap Sketch on a Modified Dataset
Since the CAIDA dataset used in our tests did not contain any heavy hitter network anomalies,
we modified sets of samples in order to test a situation where this would be present. The example
modification shown in this subsection consisted of cloning 7 specific packets in a sample pcap
file, so that its corresponding flows would be identified as possible heavy hitters. Additionally,
we also tested the bitmap sketch, so that the performance of both sketches could be analyzed
on the same cluster set.
Figure 5.2: Count-min and bitmap sketch clustering.
The results obtained after the modifications are present in Figure 5.2. By comparing the
figure with Table 5.5, which displays the top 10 flows with the highest count-min values, we
determine that the results are positive, since all modified flows are grouped in cluster 7. However,
the last 3 rows in the table, that represent unmodified flows with much smaller count-min values,
48
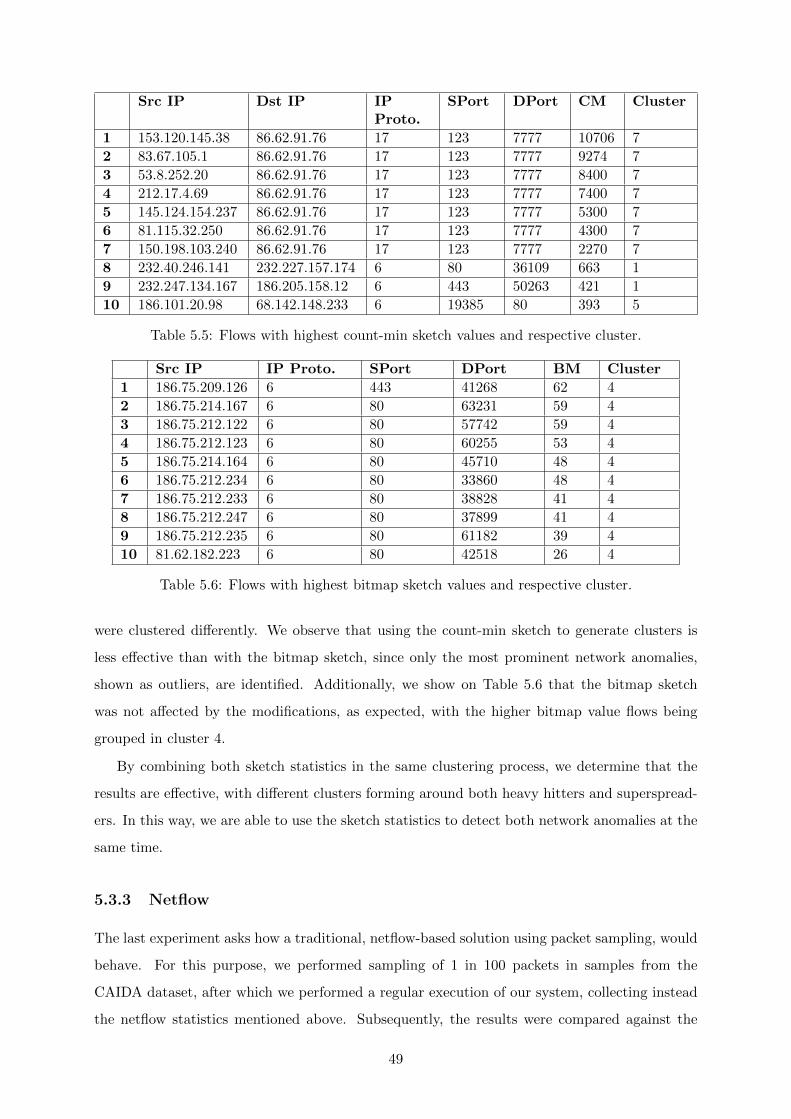
Src IP Dst IP IPProto.
SPort DPort CM Cluster
1 153.120.145.38 86.62.91.76 17 123 7777 10706 7
2 83.67.105.1 86.62.91.76 17 123 7777 9274 7
3 53.8.252.20 86.62.91.76 17 123 7777 8400 7
4 212.17.4.69 86.62.91.76 17 123 7777 7400 7
5 145.124.154.237 86.62.91.76 17 123 7777 5300 7
6 81.115.32.250 86.62.91.76 17 123 7777 4300 7
7 150.198.103.240 86.62.91.76 17 123 7777 2270 7
8 232.40.246.141 232.227.157.174 6 80 36109 663 1
9 232.247.134.167 186.205.158.12 6 443 50263 421 1
10 186.101.20.98 68.142.148.233 6 19385 80 393 5
Table 5.5: Flows with highest count-min sketch values and respective cluster.
Src IP IP Proto. SPort DPort BM Cluster
1 186.75.209.126 6 443 41268 62 4
2 186.75.214.167 6 80 63231 59 4
3 186.75.212.122 6 80 57742 59 4
4 186.75.212.123 6 80 60255 53 4
5 186.75.214.164 6 80 45710 48 4
6 186.75.212.234 6 80 33860 48 4
7 186.75.212.233 6 80 38828 41 4
8 186.75.212.247 6 80 37899 41 4
9 186.75.212.235 6 80 61182 39 4
10 81.62.182.223 6 80 42518 26 4
Table 5.6: Flows with highest bitmap sketch values and respective cluster.
were clustered differently. We observe that using the count-min sketch to generate clusters is
less effective than with the bitmap sketch, since only the most prominent network anomalies,
shown as outliers, are identified. Additionally, we show on Table 5.6 that the bitmap sketch
was not affected by the modifications, as expected, with the higher bitmap value flows being
grouped in cluster 4.
By combining both sketch statistics in the same clustering process, we determine that the
results are effective, with different clusters forming around both heavy hitters and superspread-
ers. In this way, we are able to use the sketch statistics to detect both network anomalies at the
same time.
5.3.3 Netflow
The last experiment asks how a traditional, netflow-based solution using packet sampling, would
behave. For this purpose, we performed sampling of 1 in 100 packets in samples from the
CAIDA dataset, after which we performed a regular execution of our system, collecting instead
the netflow statistics mentioned above. Subsequently, the results were compared against the
49
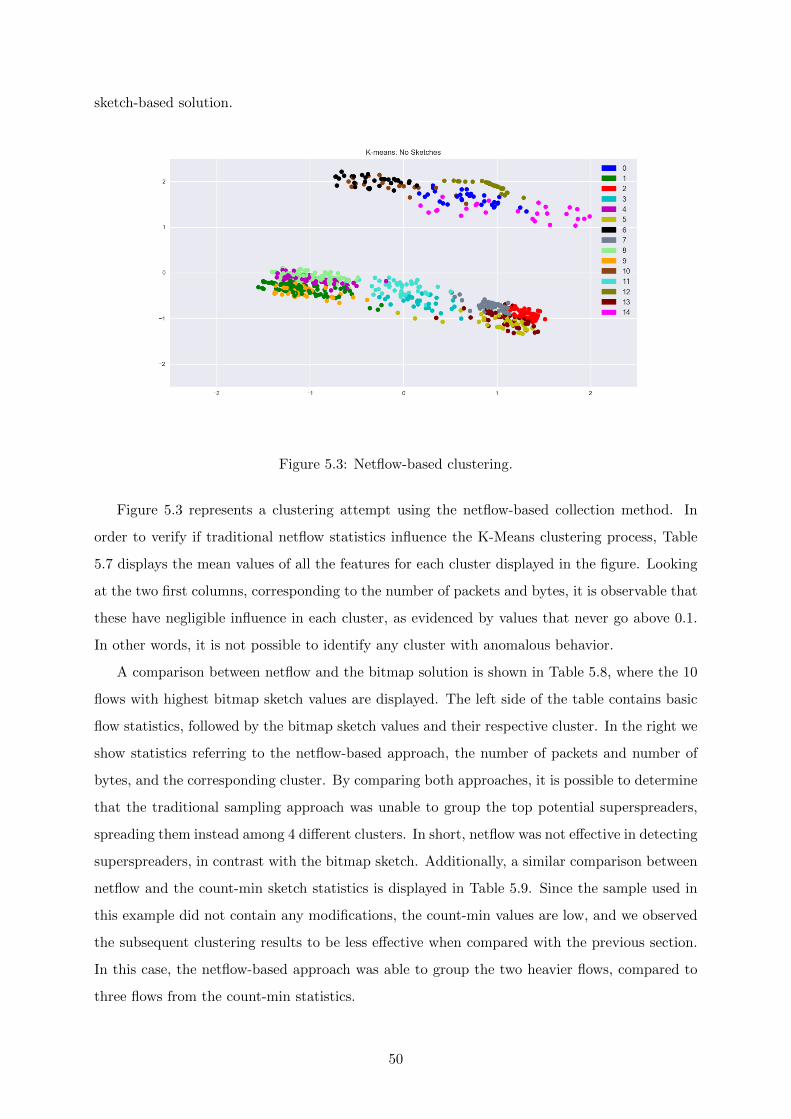
sketch-based solution.
Figure 5.3: Netflow-based clustering.
Figure 5.3 represents a clustering attempt using the netflow-based collection method. In
order to verify if traditional netflow statistics influence the K-Means clustering process, Table
5.7 displays the mean values of all the features for each cluster displayed in the figure. Looking
at the two first columns, corresponding to the number of packets and bytes, it is observable that
these have negligible influence in each cluster, as evidenced by values that never go above 0.1.
In other words, it is not possible to identify any cluster with anomalous behavior.
A comparison between netflow and the bitmap solution is shown in Table 5.8, where the 10
flows with highest bitmap sketch values are displayed. The left side of the table contains basic
flow statistics, followed by the bitmap sketch values and their respective cluster. In the right we
show statistics referring to the netflow-based approach, the number of packets and number of
bytes, and the corresponding cluster. By comparing both approaches, it is possible to determine
that the traditional sampling approach was unable to group the top potential superspreaders,
spreading them instead among 4 different clusters. In short, netflow was not effective in detecting
superspreaders, in contrast with the bitmap sketch. Additionally, a similar comparison between
netflow and the count-min sketch statistics is displayed in Table 5.9. Since the sample used in
this example did not contain any modifications, the count-min values are low, and we observed
the subsequent clustering results to be less effective when compared with the previous section.
In this case, the netflow-based approach was able to group the two heavier flows, compared to
three flows from the count-min statistics.
50

Cluster Packets Bytes Src IP Dst IP IPProto.
Src Port Dst Port
0 - - 0.512 0.377 1 0.134 0.180
1 0.014 0.028 0.281 0.254 - 0.793 0.047
2 0.009 0.025 0.350 0.762 - 0.793 0.047
3 0.019 0.033 0.667 0.261 - 0.054 0.094
4 0.016 0.030 0.657 0.759 - 0.817 0.016
5 0.060 0.073 0.404 0.248 - 0.072 0.823
6 0.030 0.019 0.116 0.636 1 0.743 0.131
7 0.032 0.047 0.333 0.742 - 0.008 0.604
8 0.015 0.029 0.190 0.773 - 0.778 0.028
9 0.020 0.034 0.821 0.255 - 0.823 0.032
10 0.011 0.007 0.821 0.721 1 0.759 0.215
11 0.004 0.020 0.278 0.649 - 0.156 0.030
12 0.073 0.046 0.452 0.948 1 0.028 0.132
13 0.022 0.038 0.877 0.443 - 0.029 0.722
14 0.007 0.004 0.441 0.540 1 0.360 0.824
Table 5.7: Netflow-based cluster centroids.
51
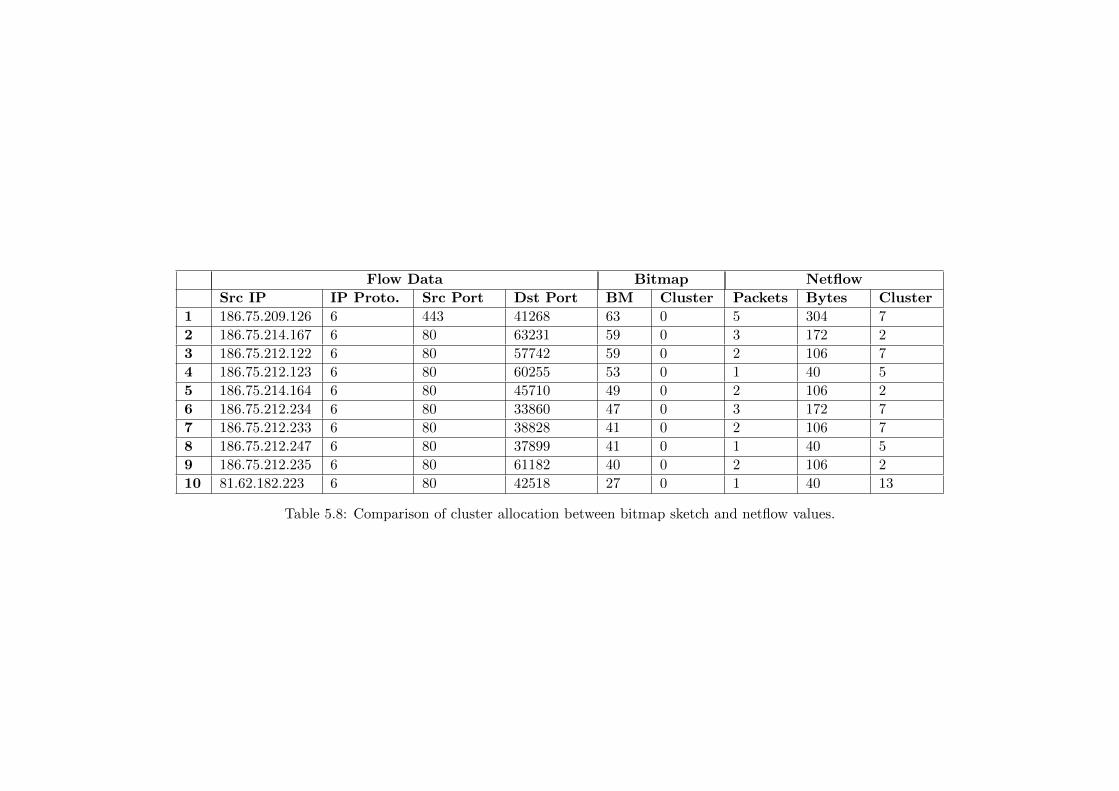
Flow Data Bitmap Netflow
Src IP IP Proto. Src Port Dst Port BM Cluster Packets Bytes Cluster
1 186.75.209.126 6 443 41268 63 0 5 304 7
2 186.75.214.167 6 80 63231 59 0 3 172 2
3 186.75.212.122 6 80 57742 59 0 2 106 7
4 186.75.212.123 6 80 60255 53 0 1 40 5
5 186.75.214.164 6 80 45710 49 0 2 106 2
6 186.75.212.234 6 80 33860 47 0 3 172 7
7 186.75.212.233 6 80 38828 41 0 2 106 7
8 186.75.212.247 6 80 37899 41 0 1 40 5
9 186.75.212.235 6 80 61182 40 0 2 106 2
10 81.62.182.223 6 80 42518 27 0 1 40 13
Table 5.8: Comparison of cluster allocation between bitmap sketch and netflow values.
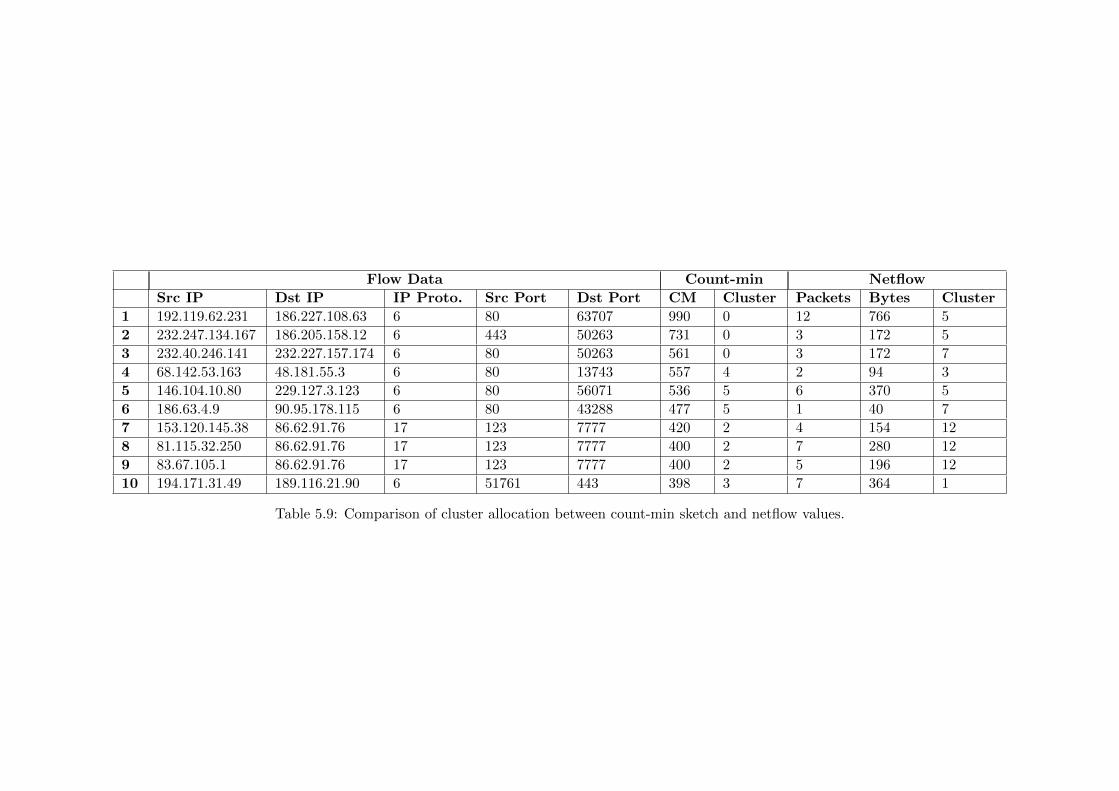
Flow Data Count-min Netflow
Src IP Dst IP IP Proto. Src Port Dst Port CM Cluster Packets Bytes Cluster
1 192.119.62.231 186.227.108.63 6 80 63707 990 0 12 766 5
2 232.247.134.167 186.205.158.12 6 443 50263 731 0 3 172 5
3 232.40.246.141 232.227.157.174 6 80 50263 561 0 3 172 7
4 68.142.53.163 48.181.55.3 6 80 13743 557 4 2 94 3
5 146.104.10.80 229.127.3.123 6 80 56071 536 5 6 370 5
6 186.63.4.9 90.95.178.115 6 80 43288 477 5 1 40 7
7 153.120.145.38 86.62.91.76 17 123 7777 420 2 4 154 12
8 81.115.32.250 86.62.91.76 17 123 7777 400 2 7 280 12
9 83.67.105.1 86.62.91.76 17 123 7777 400 2 5 196 12
10 194.171.31.49 189.116.21.90 6 51761 443 398 3 7 364 1
Table 5.9: Comparison of cluster allocation between count-min sketch and netflow values.
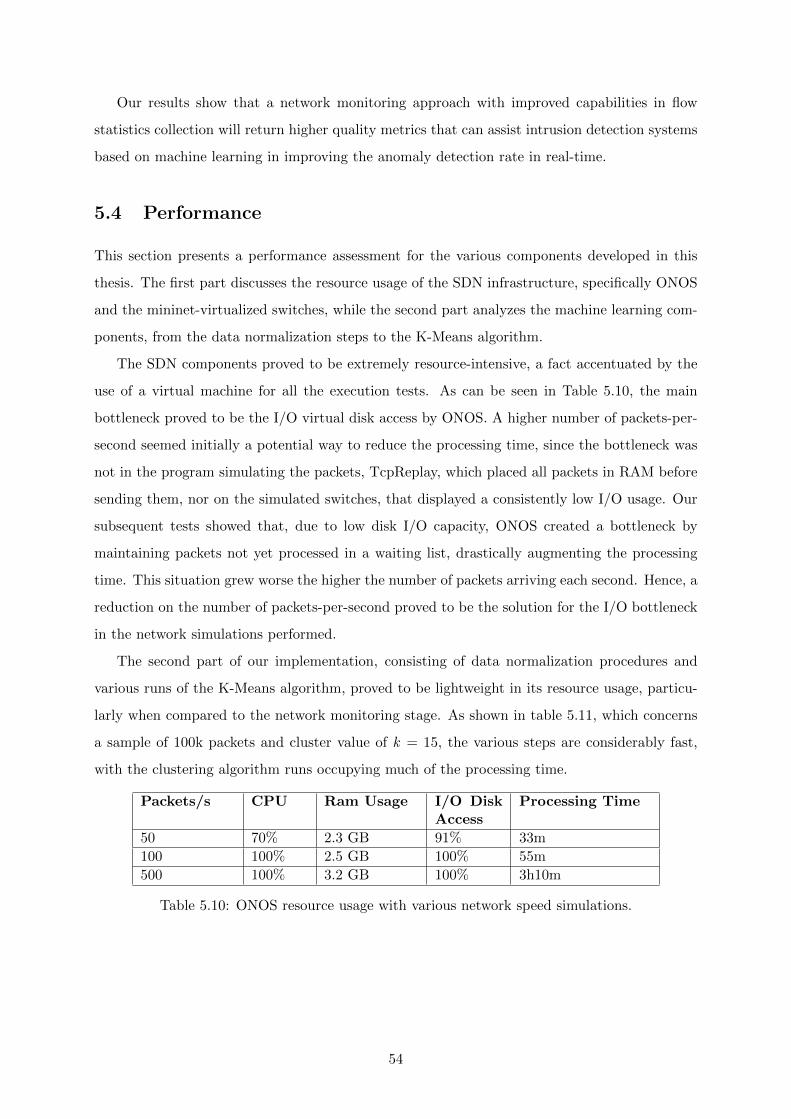
Our results show that a network monitoring approach with improved capabilities in flow
statistics collection will return higher quality metrics that can assist intrusion detection systems
based on machine learning in improving the anomaly detection rate in real-time.
5.4 Performance
This section presents a performance assessment for the various components developed in this
thesis. The first part discusses the resource usage of the SDN infrastructure, specifically ONOS
and the mininet-virtualized switches, while the second part analyzes the machine learning com-
ponents, from the data normalization steps to the K-Means algorithm.
The SDN components proved to be extremely resource-intensive, a fact accentuated by the
use of a virtual machine for all the execution tests. As can be seen in Table 5.10, the main
bottleneck proved to be the I/O virtual disk access by ONOS. A higher number of packets-per-
second seemed initially a potential way to reduce the processing time, since the bottleneck was
not in the program simulating the packets, TcpReplay, which placed all packets in RAM before
sending them, nor on the simulated switches, that displayed a consistently low I/O usage. Our
subsequent tests showed that, due to low disk I/O capacity, ONOS created a bottleneck by
maintaining packets not yet processed in a waiting list, drastically augmenting the processing
time. This situation grew worse the higher the number of packets arriving each second. Hence, a
reduction on the number of packets-per-second proved to be the solution for the I/O bottleneck
in the network simulations performed.
The second part of our implementation, consisting of data normalization procedures and
various runs of the K-Means algorithm, proved to be lightweight in its resource usage, particu-
larly when compared to the network monitoring stage. As shown in table 5.11, which concerns
a sample of 100k packets and cluster value of k = 15, the various steps are considerably fast,
with the clustering algorithm runs occupying much of the processing time.
Packets/s CPU Ram Usage I/O DiskAccess
Processing Time
50 70% 2.3 GB 91% 33m
100 100% 2.5 GB 100% 55m
500 100% 3.2 GB 100% 3h10m
Table 5.10: ONOS resource usage with various network speed simulations.
54
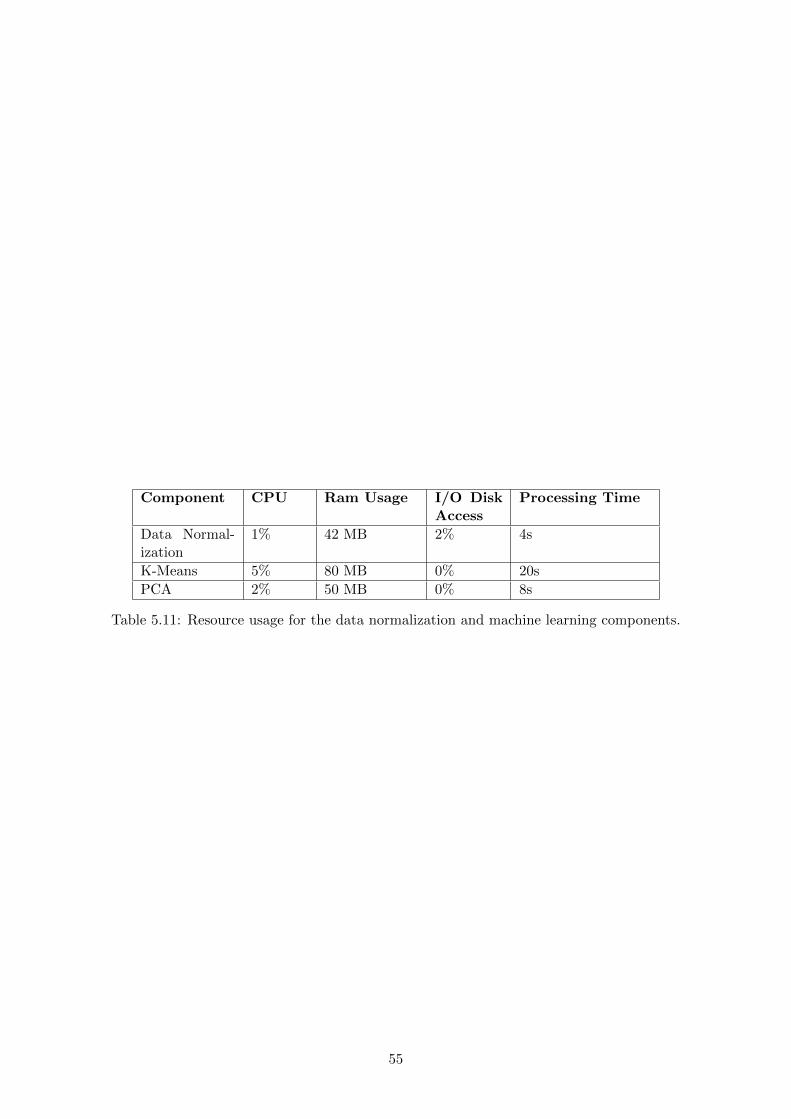
Component CPU Ram Usage I/O DiskAccess
Processing Time
Data Normal-ization
1% 42 MB 2% 4s
K-Means 5% 80 MB 0% 20s
PCA 2% 50 MB 0% 8s
Table 5.11: Resource usage for the data normalization and machine learning components.
55

56
Chapter 6
Conclusion and Future Work
6.1 Conclusion
In this thesis, we presented a detection system for attacks in software-defined networking infras-
tructures that relies on the collection of basic packet flow statistics and network sketches from
programmable switches. Additionally, our solution leverages unsupervised machine learning al-
gorithms to process the obtained data and identify potential anomalies. After the various data
collection and processing stages, a subsequent manual classification phase verifies the obtained
results and determines the existence of network attacks.
As use cases of our solution, we studied heavy-hitter flows and superspreaders, since these
occurrences are commonly linked to DDoS attacks and malware spreading, respectively. To
accurately detect these particular traffic behaviors, we implemented two sketching algorithms
in the P4 language, count-min and bitmap. The combination of regular, 5-tuple flow statistics,
and flow sketch values proved effective in the latter processing stages. Following several data
normalization steps, the collected flow statistics were clustered using the K-Means clustering
algorithm. In order to obtain reliable evaluation results concerning network traffic behavior,
we used a real dataset. For this purpose, samples from the CAIDA dataset were used for our
evaluation tests, with the obtained flow statistics primarily analyzed for network anomalies.
The resulting cluster separation showed a division between regular network traffic and specific
outlier cases, as initially expected. Subsequent analysis between flow statistics and cluster
division results revealed that flows with higher sketch values, representing possible network
attacks, tended to be grouped in the same cluster. Furthermore, an important factor is the
similarity between our obtained flow sketch statistics and the corresponding ground-truth data.
Various comparisons between both datasets revealed the high accuracy of the implemented flow
statistics collection process.
57

Additional comparisons were also performed between the proposed approach and a more tra-
ditional netflow-based collection that relies on packet sampling. An analysis of both techniques
proved that our sketch-based implementation is more effective in identifying network anomalies.
Our results show both the effectiveness of sketching algorithms for network anomaly detection
approaches and its potential when working in tandem with unsupervised learning approaches.
6.2 Future Work
The use of sketching algorithms allied with machine learning analysis for network attack de-
tection and prevention is a new and promising approach to network security. Some topics that
could augment the work presented in this thesis include:
• Automatic Classification: using unsupervised learning as a baseline, the application of
supervised machine learning algorithms to this approach would allow the automatic clas-
sification of flow statistics and subsequently reveal more relevant results, without the need
for human intervention;
• Additional Sketches: this thesis implemented the count-min and bitmap sketches, specifi-
cally for the detection of two types of network anomalies, heavy-hitters and superspreaders,
respectively. Different sketch implementations focusing on other potential attacks could
reinforce detection efforts;
• Automatic Flow Blocking or Removal: an infrastructure relying on a highly trained super-
vised machine learning classification mechanism could implement an automatic block or
removal of suspect flows, therefore preventing possible network attacks.
58

Bibliography
[ABCD09] Daniele Apiletti, Elena Baralis, Tania Cerquitelli, and Vincenzo D’Elia. Charac-
terizing network traffic by means of the netmine framework. Computer Networks,
53(6):774–789, 2009.
[AGMV07] Ajith Abraham, Crina Grosan, and Carlos Martin-Vide. Evolutionary design of
intrusion detection programs. IJ Network Security, 4(3):328–339, 2007.
[bar17] Barefoot tofino, 2017. URL: https://barefootnetworks.com/products/
brief-tofino/.
[BBR+12] Leyla Bilge, Davide Balzarotti, William Robertson, Engin Kirda, and Christopher
Kruegel. Disclosure: detecting botnet command and control servers through large-
scale analysis. In Proceedings of the 28th Annual Computer Security Applications
Conference, pages 129–138. ACM, 2012.
[BDG+14] Pat Bosshart, Dan Daly, Glen Gibb, Martin Izzard, Nick McKeown, Jennifer Rex-
ford, Cole Schlesinger, Dan Talayco, Amin Vahdat, George Varghese, et al. P4:
Programming protocol-independent packet processors. ACM SIGCOMM Computer
Communication Review, 44(3):87–95, 2014.
[BG16] Anna L Buczak and Erhan Guven. A survey of data mining and machine learning
methods for cyber security intrusion detection. IEEE Communications Surveys &
Tutorials, 18(2):1153–1176, 2016.
[BGH+14] Pankaj Berde, Matteo Gerola, Jonathan Hart, Yuta Higuchi, Masayoshi Kobayashi,
Toshio Koide, Bob Lantz, Brian O’Connor, Pavlin Radoslavov, William Snow, et al.
Onos: towards an open, distributed sdn os. In Proceedings of the third workshop on
Hot topics in software defined networking, pages 1–6. ACM, 2014.
[BGK+13] Pat Bosshart, Glen Gibb, Hun-Seok Kim, George Varghese, Nick McKeown, Martin
Izzard, Fernando Mujica, and Mark Horowitz. Forwarding metamorphosis: Fast
59

programmable match-action processing in hardware for sdn. In ACM SIGCOMM
Computer Communication Review, volume 43, pages 99–110. ACM, 2013.
[BMP10] Rodrigo Braga, Edjard Mota, and Alexandre Passito. Lightweight ddos flooding
attack detection using nox/openflow. In Local Computer Networks (LCN), 2010
IEEE 35th Conference on, pages 408–415. IEEE, 2010.
[BPS+02] Alan Bivens, Chandrika Palagiri, Rasheda Smith, Boleslaw Szymanski, Mark Em-
brechts, et al. Network-based intrusion detection using neural networks. Intelligent
Engineering Systems through Artificial Neural Networks, 12(1):579–584, 2002.
[BW14] Misty Blowers and Jonathan Williams. Machine learning applied to cyber opera-
tions. In Network Science and Cybersecurity, pages 155–175. Springer, 2014.
[cai18] The caida ucsd anonymized internet traces - 2014, 2018. URL: http://www.caida.
org/data/passive/passive_dataset.xml.
[CDCP17] Marcello Cinque, Raffaele Della Corte, and Antonio Pecchia. Entropy-based security
analytics: Measurements from a critical information system. In Dependable Systems
and Networks (DSN), 2017 47th Annual IEEE/IFIP International Conference on,
pages 379–390. IEEE, 2017.
[Cla04] Benoit Claise. Cisco systems netflow services export version 9, 2004. URL: https:
//tools.ietf.org/html/rfc3954.
[CMK18] Greg Cusack, Oliver Michel, and Eric Keller. Machine learning-based detection of
ransomware using sdn. In Proceedings of the 2018 ACM International Workshop on
Security in Software Defined Networks & Network Function Virtualization, pages
1–6. ACM, 2018.
[CMO12] Pedro Casas, Johan Mazel, and Philippe Owezarski. Unsupervised network intrusion
detection systems: Detecting the unknown without knowledge. Computer Commu-
nications, 35(7):772–783, 2012.
[GBC15] Daniel Goncalves, Joao Bota, and Miguel Correia. Big data analytics for detecting
host misbehavior in large logs. In Trustcom/BigDataSE/ISPA, 2015 IEEE, vol-
ume 1, pages 238–245. IEEE, 2015.
[GKP+08] Natasha Gude, Teemu Koponen, Justin Pettit, Ben Pfaff, Martın Casado, Nick
McKeown, and Scott Shenker. Nox: towards an operating system for networks.
ACM SIGCOMM Computer Communication Review, 38(3):105–110, 2008.
60

[GPZL08] Guofei Gu, Roberto Perdisci, Junjie Zhang, and Wenke Lee. Botminer: Clustering
analysis of network traffic for protocol-and structure-independent botnet detection.
2008.
[HSM+10] Brandon Heller, Srinivasan Seetharaman, Priya Mahadevan, Yiannis Yiakoumis,
Puneet Sharma, Sujata Banerjee, and Nick McKeown. Elastictree: Saving energy in
data center networks. In Networked Systems Design and Implementation, volume 10,
pages 249–264, 2010.
[JJP16] Sakshi Jain, Mobin Javed, and Vern Paxson. Towards mining latent client identifiers
from network traffic. Proceedings on Privacy Enhancing Technologies, 2016(2):100–
114, 2016.
[JKM+13] Sushant Jain, Alok Kumar, Subhasree Mandal, Joon Ong, Leon Poutievski, Arjun
Singh, Subbaiah Venkata, Jim Wanderer, Junlan Zhou, Min Zhu, et al. B4: Expe-
rience with a globally-deployed software defined wan. ACM SIGCOMM Computer
Communication Review, 43(4):3–14, 2013.
[JP05] Shrijit S Joshi and Vir V Phoha. Investigating hidden markov models capabilities in
anomaly detection. In Proceedings of the 43rd annual Southeast regional conference-
Volume 1, pages 98–103. ACM, 2005.
[JZA07] Farah Jemili, Montaceur Zaghdoud, and Mohamed Ben Ahmed. A framework for
an adaptive intrusion detection system using bayesian network. In Intelligence and
Security Informatics, 2007 IEEE, pages 66–70. IEEE, 2007.
[KCG+10] Teemu Koponen, Martin Casado, Natasha Gude, Jeremy Stribling, Leon Poutievski,
Min Zhu, Rajiv Ramanathan, Yuichiro Iwata, Hiroaki Inoue, Takayuki Hama, et al.
Onix: A distributed control platform for large-scale production networks. In Oper-
ating Systems Design and Implementation, volume 10, pages 1–6, 2010.
[KGS16] Min Suk Kang, Virgil D Gligor, and Vyas Sekar. Spiffy: Inducing cost-detectability
tradeoffs for persistent link-flooding attacks. In NDSS, 2016.
[KT03] Christopher Kruegel and Thomas Toth. Using decision trees to improve signature-
based intrusion detection. In Recent Advances in Intrusion Detection, pages 173–191.
Springer, 2003.
[LKS+17] Seunghyeon Lee, Jinwoo Kim, Seungwon Shin, Phillip Porras, and Vinod Yeg-
neswaran. Athena: A framework for scalable anomaly detection in software-defined
61

networks. In Dependable Systems and Networks (DSN), 2017 47th Annual IEEE/I-
FIP International Conference on, pages 249–260. IEEE, 2017.
[LLW+14] Tao Lei, Zhaoming Lu, Xiangming Wen, Xing Zhao, and Luhan Wang. Swan: An
sdn based campus wlan framework. In Wireless Communications, Vehicular Tech-
nology, Information Theory and Aerospace & Electronic Systems (VITAE), 2014
4th International Conference on, pages 1–5. IEEE, 2014.
[LMKY16] Yuliang Li, Rui Miao, Changhoon Kim, and Minlan Yu. Flowradar: A better netflow
for data centers. In Networked Systems Design and Implementation, pages 311–324,
2016.
[LMV+16] Zaoxing Liu, Antonis Manousis, Gregory Vorsanger, Vyas Sekar, and Vladimir
Braverman. One sketch to rule them all: Rethinking network flow monitoring with
univmon. In Proceedings of the 2016 conference on ACM SIGCOMM 2016 Confer-
ence, pages 101–114. ACM, 2016.
[LSM99] Wenke Lee, Salvatore J Stolfo, and Kui W Mok. A data mining framework for
building intrusion detection models. In Security and Privacy, 1999. Proceedings of
the 1999 IEEE Symposium on, pages 120–132. IEEE, 1999.
[LZLW07] Zhitang Li, Aifang Zhang, Jie Lei, and Li Wang. Real-time correlation of network
security alerts. In e-Business Engineering, 2007. ICEBE 2007. IEEE International
Conference on, pages 73–80. IEEE, 2007.
[MAB+08] Nick McKeown, Tom Anderson, Hari Balakrishnan, Guru Parulkar, Larry Peterson,
Jennifer Rexford, Scott Shenker, and Jonathan Turner. Openflow: enabling inno-
vation in campus networks. ACM SIGCOMM Computer Communication Review,
38(2):69–74, 2008.
[MKK11] Syed Akbar Mehdi, Junaid Khalid, and Syed Ali Khayam. Revisiting traffic anomaly
detection using software defined networking. In International Workshop on Recent
Advances in Intrusion Detection, pages 161–180. Springer, 2011.
[MVTG14] Jan Medved, Robert Varga, Anton Tkacik, and Ken Gray. Opendaylight: Towards a
model-driven sdn controller architecture. In World of Wireless, Mobile and Multime-
dia Networks (WoWMoM), 2014 IEEE 15th International Symposium on a, pages
1–6. IEEE, 2014.
[p4f17] P4fpga website, 2017. URL: https://p4fpga.github.io/.
62

[p4w17] P4 website, 2017. URL: https://p4.org/.
[pis17] Pisces website, 2017. URL: http://pisces.cs.princeton.edu/.
[PNR17] Fabio Pereira, Nuno Ferreira Neves, and Fernando Ramos. Secure network monitor-
ing using programmable data planes. In Third International Workshop on Security
in NFV-SDN (IEEE NFV-SDN 2017), October 2017.
[PP07] Mrutyunjaya Panda and Manas Ranjan Patra. Network intrusion detection us-
ing naive bayes. International journal of computer science and network security,
7(12):258–263, 2007.
[RKV15] Fernando MV Ramos, Diego Kreutz, and Paulo Verissimo. Software-defined net-
works: On the road to the softwarization of networking. Cutter IT journal, 2015.
[SAKS18] John Sonchack, Adam J Aviv, Eric Keller, and Jonathan M Smith. Turboflow:
information rich flow record generation on commodity switches. In Proceedings of
the Thirteenth EuroSys Conference, page 11. ACM, 2018.
[SNR+17] Vibhaalakshmi Sivaraman, Srinivas Narayana, Ori Rottenstreich, S Muthukrishnan,
and Jennifer Rexford. Heavy-hitter detection entirely in the data plane. In Proceed-
ings of the Symposium on SDN Research, pages 164–176. ACM, 2017.
[VSN+17] Eduardo Viegas, Altair Santin, Nuno Neves, Alysson Bessani, and Vilmar Abreu. A
resilient stream learning intrusion detection mechanism for real-time analysis of net-
work traffic. In GLOBECOM 2017-2017 IEEE Global Communications Conference,
pages 1–6. IEEE, 2017.
[WFE+11] Cynthia Wagner, Jerome Francois, Thomas Engel, et al. Machine learning approach
for ip-flow record anomaly detection. In International Conference on Research in
Networking, pages 28–39. Springer, 2011.
[WHZ11] Philipp Winter, Eckehard Hermann, and Markus Zeilinger. Inductive intrusion de-
tection in flow-based network data using one-class support vector machines. In New
Technologies, Mobility and Security (NTMS), 2011 4th IFIP International Confer-
ence on, pages 1–5. IEEE, 2011.
[YJM13] Minlan Yu, Lavanya Jose, and Rui Miao. Software defined traffic measurement with
opensketch. In NSDI, volume 13, pages 29–42, 2013.
63

64