Embed Size (px)
Citation preview
Délivré par l’Université de Montpellier
Préparée au sein de l’école doctorale
Science Chimique Balard Ed459
Et de l’unité de recherche
UMR5253 ICGM -AIME
Spécialité : Chimie des Matériaux
Présentée par Yannick Nabil-Moreau
Soutenue le 18 Décembre 2015 devant le jury composé de
Mme Déborah JONES, Directeur de Recherche,
CNRS
Directrice de thèse
M. Francisco ALCAIDE, Directeur de Recherche,
Cidetec
Rapporteur
M. Enrico TRAVERSA, Professeur,
King Abdullah University of Science and Technology
Rapporteur
Mme Sara CAVALIERE, Maître de Conférences,
Université de Montpellier
Co-encadrante de thèse
M. JACQUES ROZIERE, Professeur,
Université de Montpellier
Examinateur
M. Jonathan SHARMAN, Directeur de Recherche,
Johnson Matthey Fuel Cells
M. Ian HARKNESS, Directeur de Recherche,
Johnson Matthey Fuel Cells
Examinateur
Examinateur
Supports De Catalyseur Nanostructurés
Pour Pile À Combustible À Membrane
Échangeuse De Protons

Delivred by the University of Montpellier
Prepared within the doctoral school
Science Chimique Balard Ed459
And the research unit
UMR5253 ICGM -AIME
Specialty: Chemistry and Physicochemistry of
Materials
Presented by Yannick Nabil-Moreau
18 December 2015
Mme Déborah JONES, Research Director,
CNRS
Supervisor
M. Francisco ALCAIDE, Research Director,
Cidetec
Reviewer
M. Enrico TRAVERSA, Professor,
King Abdullah University of Science and Technology
Reviewer
Mme Sara CAVALIERE, Lecturer,
University of Montpellier
Co-Supervisor
M. JACQUES ROZIERE, Professeur,
University of Montpellier
Examiner
M. Jonathan SHARMAN, Research Director,
Johnson Matthey Fuel Cells
M. Ian HARKNESS, Research Director,
Johnson Matthey Fuel Cells
Examiner
Examiner
Novel Structured Catalyst Supports
For PEM Fuel Cells


Firstly I would like to express my sincere gratitude to Dr. Deborah Jones, Prof. Jacques Rozière and
Dr. Sara Cavaliere who entrusted me to work freely and independently on my research and helped
me to improve scientifically and personally. Their guidance has been very beneficial to me. Owing to
their vast scientific knowledge and experience in the field, I had the opportunity to develop novel,
interesting strategies for this challenging project. I really appreciate that they have ensured that I
have received a high level of training and that they encouraged me to attend international
conferences and workshops.
I am very thankful to all the members of the examination jury for taking the time to evaluate my
work. I would like to thank the 2 “rapporteurs” Prof Enrico Traversa and Francisco Alcaide for their
positive reports, but also my co-supervisors from Johnson Matthey: Ian Harkness, Jonathan Sharman
and Graham Hards, who supported me efficiently and constantly during this project. I would like to
reiterate my thanks to the members of my research committee: Dr. Deborah Jones without whose
supervision the completion of this thesis would not have been possible, Prof. Jacques Rozière for
assuming the role of president of the jury and for his persistent help concerning the scientific aspect
of the thesis and Dr. Sara Cavaliere for her advice and the encouragement she has given me day to
day throughout my PhD. As a mentor but also as a friend, she was essential in keeping me
stimulated.
I would also like to acknowledge….
…Giorgio Ecolano for his constant support and for providing me with key advice related to both
practical and theoretical issues. His help was very precious and the time we spent together as lab
mates or as friends, in France or abroad will never be forgotten.
…Julien Bernard d’Arbigny for helping me during the crucial steps of the beginning of the project.
…Nicolas Donzel and Marc Dupont for the helpful discussions on PEM Fuel cell.
…Yannig Nedelec for the training and for helping me to setup the experiments that were necessary
for this project.
…Cathy Andreux and Tatyana Pary for their help with all the administrative issues.
…Romain Berthelot, Bernard Fraisse / Julien Fullenwarth for the practical help and useful discussion
on X-Ray fluorescence and X-Ray diffraction.
…Frederique Jaouen and Frederique Favier for the valuable discussions on electrochemistry.
…Geoffrey spikes, Benedict Prelot and Gilles Taillades for taking the time to share their scientific
knowledge and help.
…Didier Cot, Frederic Fernandez, Franck Godiard and Erwan Oliviero for the TEM and SEM-EDX work.

I am also grateful for having been received warmly into the group in the Laboratory ICG-AIME in
Montpellier, as well as in the Johnson Matthey Technical Center in Sonning Coomon during my stays.
I would like to thank all my colleagues at these two institutes. Among them, Aurélien Kreisz,
Laura Coustan, Alvaro Reyes, Julien Bernard d’Arbigny and Giorgio Ecolano deserve special
consideration for sharing the office with me and for contributing to the great atmosphere that made
these 3 years so pleasant.
I owe deep gratitude to Julie Delagenière, for her love and her inexhaustible support. Despite
geographic distances, she has always been by my side, inspiring me to do my best and accompanying
me with her dynamism in my determination to undertake personal and professional projects.
To my little brother Salem Nabil, thank you for your enthusiasm and good mood that helped me to
keep smiling whenever I was facing difficult situations. I am highly indebted to Charles B., Florian D.,
Claire R., Marc D., Geoffrey B., Aziz C., David C., Tariel L., Micha B., Yeelen P., Said D., Francois Gerald
F., Alexis C. … representing a long list of friends who give me the strength to stay motivated and to
achieve my goals.
And last but not least, I would like to express my genuine gratitude to my mother for her generosity
and for the affection with which she looked after me over the past 3 decades.
Table of contents Table of contents …………………………………………………………………………………………………………………............. 5
General Introduction ………………………………………………………………………………………………………………………11
Chapter I: Context and motivation .………………………………………………………………………………………………… 13
A. Introduction ...................................................................................................................................... 14
1.Fuel cells ..................................................................................................................................... 14
2.Proton exchange membrane fuel cells (PEMFC) ........................................................................ 16
i.Thermodynamics ...................................................................................................................... 17
ii.Kinetics ..................................................................................................................................... 19
3.Components of membrane electrode assemblies of PEMFC ..................................................... 24
i.Electrodes ................................................................................................................................. 25
ii.Membrane ............................................................................................................................... 26
4.Challenges and motivation ......................................................................................................... 27
i.High surface area and suitable porosity ................................................................................... 28
ii.High electrical conductivity ...................................................................................................... 29
iii.Electrochemical stability and durability .................................................................................. 29
B.Alternative electrocatalyst support for PEMFC cathodes .................................................................. 31
1.Metal oxides ............................................................................................................................... 31
2.Metal nitrides ............................................................................................................................. 31
3.Metal carbides ............................................................................................................................ 32
i.Electrocatalysts ......................................................................................................................... 32
ii.Co-catalysts .............................................................................................................................. 32
iii.Electrocatalyst supports.......................................................................................................... 33
4.Electrospun materials as electrocatalyst supports .................................................................... 38
i.History and principle of electrospinning ................................................................................... 38
ii.Electrospun materials in PEMFC cathodes .............................................................................. 39
C.Synthesis and deposition of Pt electrocatalysts ................................................................................. 41
1.Pt nanoparticles .......................................................................................................................... 41
i.Impregnation method ............................................................................................................... 41
ii.Colloid methods ....................................................................................................................... 41
iii.Microwave-assisted polyol method ........................................................................................ 42
2.Pt thin layers ............................................................................................................................... 43
i.Physical vapour deposition and chemical vapour deposition .................................................. 43
ii.Atomic layer deposition ........................................................................................................... 43
iii.Electrodeposition .................................................................................................................... 44
iV.Exchange reactions ................................................................................................................. 44
D.Conclusion .......................................................................................................................................... 45
E.References .......................................................................................................................................... 46
F.Table of Figures .................................................................................................................................. 58
Chapter II: Niobium carbide nanostructures as electrocatalyst support……………………………………………59
A.Introduction ....................................................................................................................................... 60
B.Synthesis and characterisation .......................................................................................................... 61
1.Synthesis of niobium carbide nanostructures ............................................................................ 61
2.Morphological characterisation of niobium carbide nanostructures ........................................ 64
3.Characterisation of the chemical and structural composition of niobium carbide
nanostructures ......................................................................................................................................69
4.Electrical characterisation of niobium carbide nanostructures ................................................. 77
C.Synthesis and characterisation of Pt supported on NbC nanostructures .......................................... 78
1.Synthesis of Pt supported on NbC nanostructures .................................................................... 78
2.Physico-chemical characterisation of Pt supported on NbC nanostructures............................. 79

D.Electrochemical characterisation of NbC nanostructures supported Pt on rotating disc electrode
……………………………………………………………………………………………………………………………………………….. 83
1.Electrochemical surface area ..................................................................................................... 83
2.Stability over time ...................................................................................................................... 87
3.Activity towards the oxygen reduction reaction ........................................................................ 90
E.Conclusion and perspectives .............................................................................................................. 94
1.Approach and method................................................................................................................ 94
2.A suitable composition and morphology to improve ................................................................. 94
F.References .......................................................................................................................................... 95
G.Table of Figures .................................................................................................................................. 97
Chapter III: Niobium carbide nanofibres as electrocatalyst support.................................................. 99
A.Introduction ..................................................................................................................................... 100
B.Synthesis and characterisation ........................................................................................................ 101
1.Synthesis of niobium carbide nanofibres ................................................................................. 101
2.Structural, chemical and morphological characterisation of niobium carbide nanofibres ...... 102
3.Morphological characterisation of niobium carbide nanofibres.............................................. 106
C.Synthesis and characterisation of Pt supported on NbC nanofibres ............................................... 110
1.Synthesis of Pt supported on NbC nanofibres.......................................................................... 110
2.Physico-chemical characterisation of Pt supported on NbC nanofibres .................................. 110
D.Electrochemical characterisation of NbC nanofibres supported Pt on rotating disk electrode ...... 112
1.Electrochemical surface area ................................................................................................... 112
2.Stability in time ......................................................................................................................... 112
3.Activity towards the oxygen reduction reaction ...................................................................... 114
E.In situ characterisation of Pt supported on NbC nanofibres ........................................................... 115
1.MEA Preparation ...................................................................................................................... 115
2.Performance/Characterisation ................................................................................................. 115
F.Alternative electrocatalyst morphology: Pt film deposition ............................................................ 118
1.Introduction .............................................................................................................................. 118
2.Copper underpotential deposition and Cu - Pt exchange by galvanic displacement............... 119
3.Direct Pt electrodeposition ...................................................................................................... 124
i.Synthesis ................................................................................................................................. 124
ii.Morphological characterisation ............................................................................................. 124
iii.Electrochemical characterisation .......................................................................................... 129
G.Conclusion and perspectives ........................................................................................................... 134
H.References ....................................................................................................................................... 135
I.Table of Figures ................................................................................................................................. 137
Chapter IV: Niobium carbide nanotubes as electrocatalyst support.................................................. 141
A.Introduction ..................................................................................................................................... 142
B.Synthesis and characterisation ........................................................................................................ 143
1.Synthesis of niobium carbide nanotubes ................................................................................. 143
2.Characterisation of the chemical and structural composition of niobium carbide 1D
nanostructured material ..................................................................................................................... 147
3.Morphological characterisation of niobium carbide nanotubes .............................................. 153
C.Preparation and characterisation of Pt supported on NbC nanotubes ........................................... 157
1.Synthesis of Pt supported NbC nanotubes ............................................................................... 157
2.Physico-chemical characterisation of Pt supported NbC nanotubes ....................................... 157
D.Electrochemical characterisation of NbC nanotubes supported Pt on rotating disc electrode ...... 160
1.Electrochemical surface area ................................................................................................... 160
2.Stability over time .................................................................................................................... 161
3.Activity towards the oxygen reduction reaction ...................................................................... 163
E.In situ characterisation of Pt supported on NbC nanotubes ............................................................ 165
1.MEA Preparation ...................................................................................................................... 165
2.Performance/Characterisation ................................................................................................. 165
F.Conclusion and perspectives ............................................................................................................ 167
G.References ....................................................................................................................................... 168
H.Table of Figures ................................................................................................................................ 169
General Conclusion ............................................................................................................................171
Experimental Annex ...........................................................................................................................173
A.Material preparation ........................................................................................................................ 174
1.NbC nanostructures synthesis .................................................................................................. 174
2.NbC nanofibres synthesis ......................................................................................................... 174
3.NbC nanotubes synthesis ......................................................................................................... 175
B.Electrocatalyst synthesis and deposition ......................................................................................... 175
1.Microwave assisted Polyol method1........................................................................................ 175
2.Electrodeposition ..................................................................................................................... 176
3.Galvanic displacement ............................................................................................................. 176
C.Characterisation ............................................................................................................................... 177
4.Morphological characterisation ............................................................................................... 177
i.Electron microscopies ............................................................................................................ 177
ii.Nitrogen adsorption/desorption ........................................................................................... 177
5.Compositional and structural characterisation ........................................................................ 178
i.X-Ray Diffraction ..................................................................................................................... 178
ii.Thermogravimetric analysis ................................................................................................... 178
iii.Elemental analysis ................................................................................................................. 178
iv.X-ray photoelectron spectroscopy ....................................................................................... 178
v.X-ray fluorescence................................................................................................................. 179
6.Electrochemical characterisation ............................................................................................. 179

vi.Ex situ characterisation ......................................................................................................... 179
vii.In situ characterisation ......................................................................................................... 180
7.Electrical conductivity .............................................................................................................. 181
8.Chemical stability in acid .......................................................................................................... 181
Glossary ............................................................................................................................................ 183
General introduction 11
General introduction A third of oil reserves, half of gas reserves and over 80 % of current coal reserves globally should
remain in the ground so that the average global temperature does not exceed the 2°C above pre-
industrial levels target agreed by policy makers1. In 2014, the Lima climate talks represented a highly
significant shift towards renewable energy sources such as solar and wind. Consequently the
declining production from existing oil and gas fields and the replacement of power plants or other
assets that reach the end of their productive life set a major investment challenge for policy makers
and the industry. The International Energy Agency wrote on the occasion of the world energy
investment outlook 2014 that these declines and retirements represent “a real opportunity to
change the nature of the energy system by switching fuels and by deploying more efficient
technologies”2.
The energy produced by renewable technologies needs to be stored. In this context, fuel cells
combined with water electrolysers provide the opportunity to use hydrogen as energy carrier by
converting solar or wind energy to chemical energy and chemical energy to electricity in the so-called
"hydrogen cycle"3. Associated with a clean source of hydrogen, proton exchange membrane fuel cells
(PEMFC) produce electricity without consuming fossil fuels4. The energy loss implied by the
conversion of mechanical or thermal energy to electricity results in additional costs compared to fuel
cells that grant a better efficiency5. Moreover fuel cells produce only water as a by-product and their
use could substantially reduce greenhouse gas emissions6.
Although first fuel cell products for off-grid power supply or automotive applications7 are already
commercially available, several issues remain to facilitate their wide spread adoption such as costs
and durability. Platinum used as catalyst at the electrodes is the most expensive component in this
technology8. Much effort has been made to develop adapted carbon based supports to reduce the
amount of platinum in a PEMFC. In some PEMFC operating conditions, electrocatalyst supports based
on conventional carbon suffer from corrosion, leading to aggregation, migration, detachment or
isolation of platinum nanoparticles resulting in a loss of performance6. To overcome this limitation,
the strategy adopted in the work described in this thesis is to associate an alternative composition
with different morphologies and elaborate novel catalyst supports for PEMFC cathodes.
Three different synthesis routes for the elaboration of niobium carbide electrocatalyst supports
leading to three different morphologies have been developed: nanostructured powders, nanofibres
and nanotubes. After a presentation of the principle of fuel cells, and remaining challenges related to

General introduction 12
PEMFC, the state of the art concerning metal electrocatalyst supports will be described. Special
attention is given to 1D nanostructured supports. The three following chapters will be dedicated to a
description of the synthesis and characterisation of the catalysed supports prepared in this work.
Experimental techniques recurrent within the different chapters will be detailed in the Experimental
Annex.
The research described in this thesis received financial support from Johnson Matthey Fuel Cells and
the CNRS (CNRS Bourse de Doctorat pour Ingénieur). It was carried out at ICGM-AIME (Institute
Charles Gerhardt of Montpellier; research group: Aggregates, Interfaces and Materials for Energy).
Part of the characterisation was performed in the Technical Centre of Johnson Matthey Fuel Cells at
Sonning Common, UK.

13 Chapter I: Context and Motivation
Chapter 1: Context and motivation
14 Chapter I: Context and Motivation
A. Introduction
1. Fuel cells
Fuel cells are energy converters generating electricity through electrochemical processes. Supported
by the work of Christian Friedrich Schönbein (1799 – 1868) related to water electrolysis, William
Robert Grove (1811 – 1896) demonstrated the fuel cell principle in 18399: this device converted the
chemical energy provided by the inverse reaction of water electrolysis (1) into electrical energy.
𝐻2 +1
2 𝑂2 → 𝐻2𝑂 + Heat and energy (1)
This system used pure gaseous hydrogen and oxygen and sulphuric acid as electrolyte. The reactions
were catalysed by a porous platinum electrode. The interest for fuel cells dwindled and was renewed
only in the early 1960s, when Bacon and al. substituted the acidic electrolyte by potassium hydroxide
and built the first Alkaline Fuel Cell (AFC) that was then improved by Pratt and al. by reducing the
weight and enhancing the durability. This technology was used by the NASA in the GEMINI (1963)
and APOLLO programmes (1968)10. In 2015 the first commercially available hybrid hydrogen fuel cell
car, the Toyota Mirai, is being sold in Japan and the USA11.
In a fuel cell, chemical energy is converted into electricity without any combustion process. Thus its
efficiency is not thermodynamically limited by the Carnot cycle. Moreover the theoretical efficiency
of a fuel cell can be up to 90 % if the heat produced is captured and used in a cogeneration system.
Fuel cells are generally between 40–60 % energy efficient which is far above the maximum thermal
efficiency (25 % to 30 %) of a combustion engine12,13. As long as they are supplied with fuel, fuel cells
can, in principle, deliver electricity continuously, unlike batteries where the number of charge
carriers at the negative electrode, for example, is finite.
Despite these advantages, fuel cell technology suffers some limitations that need to be overcome,
mainly their high cost and poor durability. Much effort has been devoted to decrease the amount of
precious metal electrocatalyst for the oxygen reduction reaction (ORR) and to extend fuel cell
durability by understanding the mechanisms by which materials components age prematurely, and
the fuel cell operation conditions under which different ageing mechanisms predominate. The
research described in this thesis is aligned with this momentum.
There are several fuel cell types, including proton exchange membrane fuel cells (PEMFC), alkaline
fuel cells (AFC), direct alcohol fuel cells (DAFC) including direct methanol and direct ethanol fuel cells
15 Chapter I: Context and Motivation
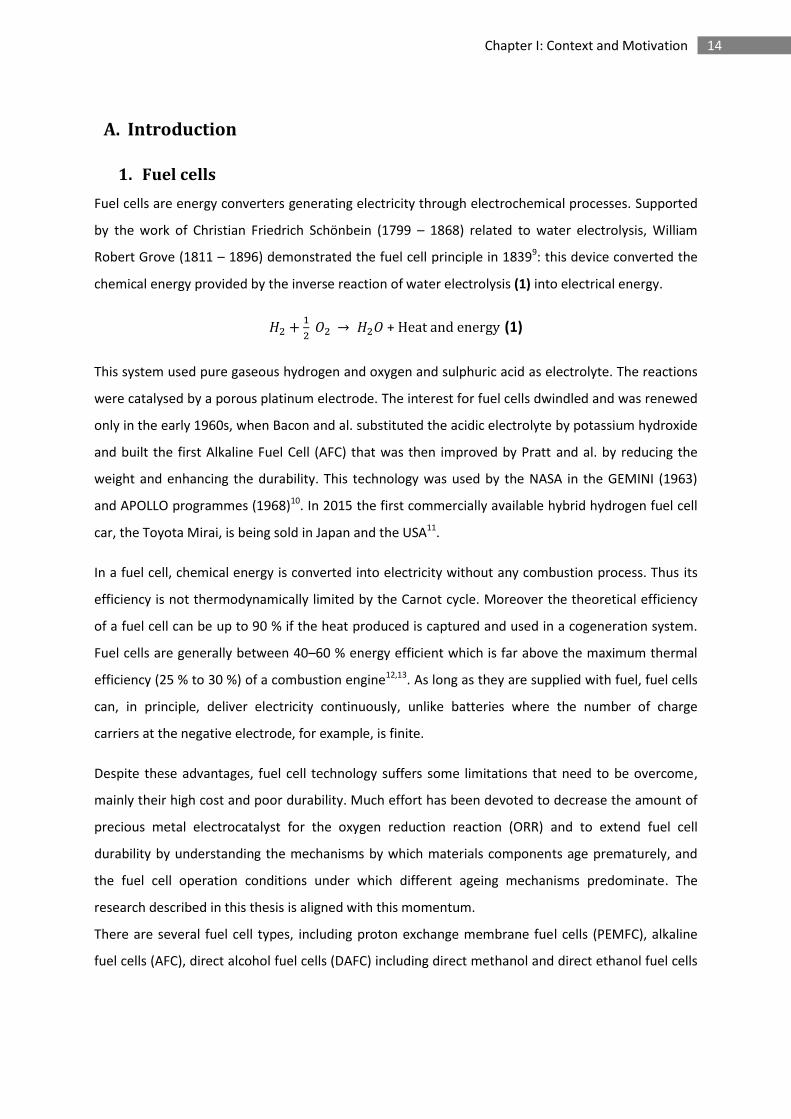
(DMFC, DEFC), phosphoric acid fuel cells (PAFC), high temperature PEMFC (HT-PEMFC), molten
carbonate fuel cells (MCFC), proton ceramic fuel cells (PCFC) and solid oxide fuel cells (SOFC). They
are commonly classified according to the type of electrolyte, which to a large extent defines the
temperature range of operation and thus fuel type and electrocatalysts14,15. Figure 1 and 2
schematically depict the operating conditions for the various types of fuel cell16.
Figure 1. Specifications of the different fuel cells types
(electrolyte, fuel and operating temperature range)17.
-
16 Chapter I: Context and Motivation
Typical
applications
Portable
electronics
equipment
Cars, Boats,
and domestic CHP
Distributed power
generation, CHP,
Buses
Power (Watt) 1 - 100 1 k - 10 k 1 M - 10 M
Main
Advantages
Higher energy density
than batteries and
faster recharging
Potential for zero
emissions
High efficiency
High efficiency
less pollution
quiet
Range of
application
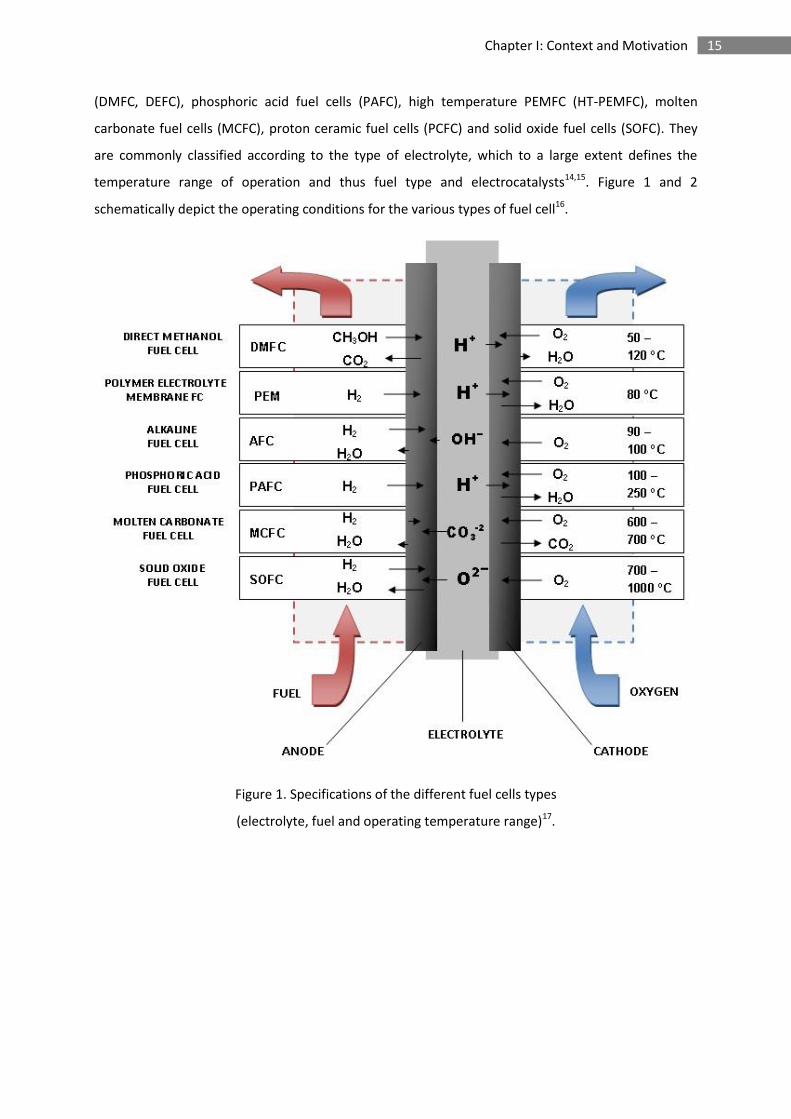
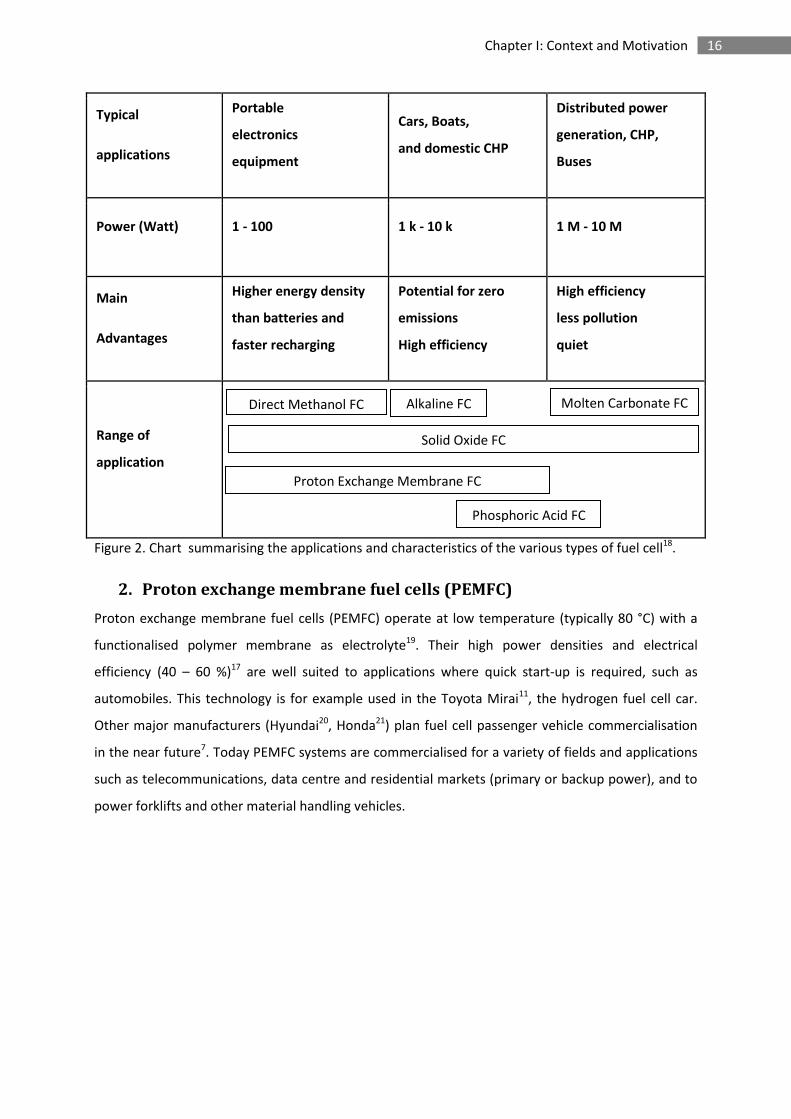
Figure 2. Chart summarising the applications and characteristics of the various types of fuel cell18.
2. Proton exchange membrane fuel cells (PEMFC)
Proton exchange membrane fuel cells (PEMFC) operate at low temperature (typically 80 °C) with a
functionalised polymer membrane as electrolyte19. Their high power densities and electrical
efficiency (40 – 60 %)17 are well suited to applications where quick start-up is required, such as
automobiles. This technology is for example used in the Toyota Mirai11, the hydrogen fuel cell car.
Other major manufacturers (Hyundai20, Honda21) plan fuel cell passenger vehicle commercialisation
in the near future7. Today PEMFC systems are commercialised for a variety of fields and applications
such as telecommunications, data centre and residential markets (primary or backup power), and to
power forklifts and other material handling vehicles.
Direct Methanol FC
Alkaline FC Molten Carbonate FC
Solid Oxide FC
Proton Exchange Membrane FC
Phosphoric Acid FC
17 Chapter I: Context and Motivation
i. Thermodynamics
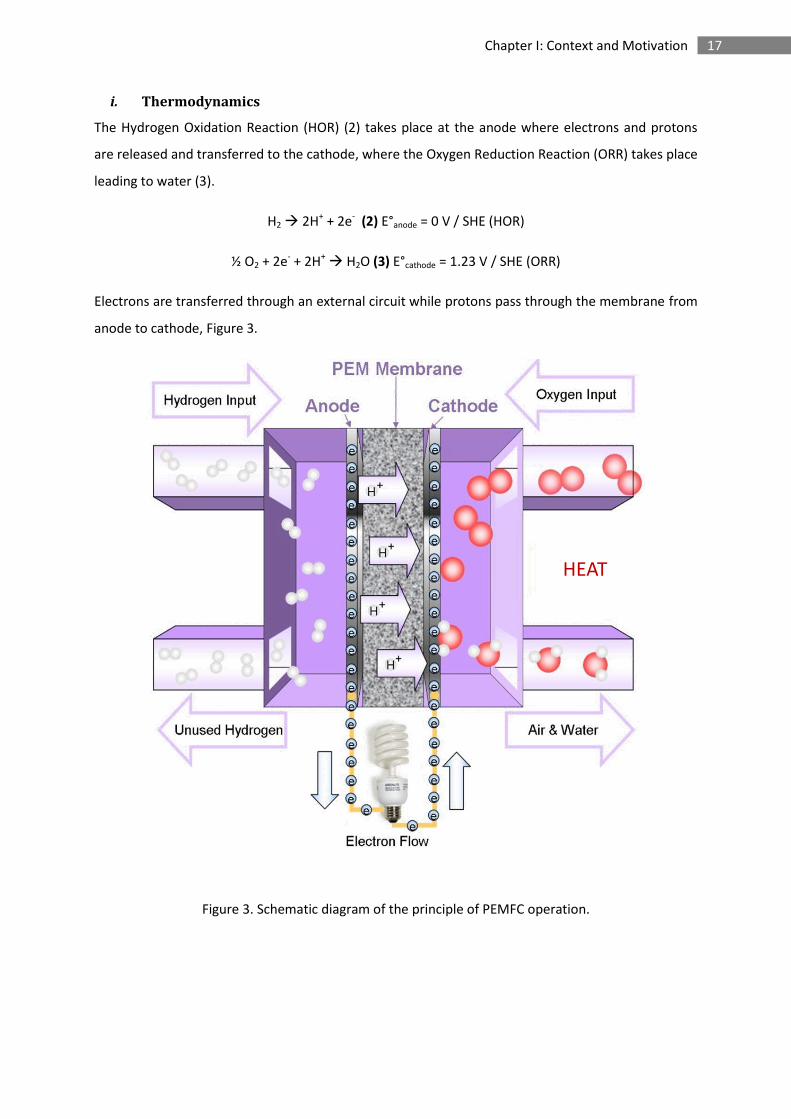
The Hydrogen Oxidation Reaction (HOR) (2) takes place at the anode where electrons and protons
are released and transferred to the cathode, where the Oxygen Reduction Reaction (ORR) takes place
leading to water (3).
H2 2H+ + 2e- (2) E°anode = 0 V / SHE (HOR)
½ O2 + 2e- + 2H+ H2O (3) E°cathode = 1.23 V / SHE (ORR)
Electrons are transferred through an external circuit while protons pass through the membrane from
anode to cathode, Figure 3.
Figure 3. Schematic diagram of the principle of PEMFC operation.
HEATt
18 Chapter I: Context and Motivation
Therefore the balanced overall reaction that occurs between fuel and oxidant (1) in a fuel cell is the
reaction of formation of water from oxygen and hydrogen. Thermodynamically this reaction is
exothermic which implies a production of heat by the system. The electrical energy released by the
reactions and that can potentially be developed by the proton exchange membrane fuel cell can be
quantified by the Gibbs free energy (ΔG°) of the global chemical reaction (1). This energy is expressed
per mole, and matches the formation of one mole of liquid water (4).
𝛥𝐺𝐻2𝑂 (𝑙)0 = −228.2 𝑘𝐽 . 𝑚𝑜𝑙−1 𝑎𝑡 80 °𝐶 (4)
The Gibbs free energy under standard conditions for thermodynamic equilibrium allows defining the
electromotive force or reversible open circuit voltage (5): 𝛥𝐸𝑒𝑞0 .
This voltage would be ideally obtained if all the chemical energy were converted to electrical energy.
𝛥𝐸𝑒𝑞0 = −
𝛥𝐺𝐻2𝑂 (𝑙)0
𝑛 𝐹 (5)
F is the Faraday constant (96,485 C . mol-1)
n is the number of exchanged electrons during the reaction
At 25 °C the calculated open circuit voltage (OCV) of PEMFC is 1.23 V (1.18 V at 80 °C ).
Practically, the balance of the process includes the heat and the electricity produced during the
reaction (1).
H2 + ½ O2 H2O + Heat + Electricity (1)
And the maximum efficiency allowed by thermodynamic laws ξ𝑓𝑢𝑒𝑙 𝑐𝑒𝑙𝑙 is the ratio of the maximum
available work energy over the total chemical available energy within the fuel cell:
ξ𝑓𝑢𝑒𝑙 𝑐𝑒𝑙𝑙 = 𝛥𝐺𝐻2𝑂 (𝑙)
𝑅1
𝛥𝐻𝐻2𝑂 (𝑙)𝑅1 (7)
For a PEMFC at 25 °C, at atmospheric pressure (PO2 and PH2 = 1 bar), the thermodynamic fuel cell
maximum efficiency, ξ, is 83 %.
19 Chapter I: Context and Motivation
ii. Kinetics
Despite the thermodynamic forecasts, some remaining energy barrier needs to be overcome. In
PEMFC operating temperature (80 °C) this activation energy is required to increase the rates of
hydrogen oxidation and oxygen reduction reactions taking place at the anode and the cathode sides,
respectively. Thus for both reactions the use of a suitable electrocatalyst is essential.
Hydrogen Oxidation Reaction
H2 → 2H+ + 2e- (2)
The mechanism of hydrogen oxidation at the PEMFC anode (2) involves different steps matching the
adsorption of hydrogen onto a catalyst surface such as platinum with the hydrogen molecule
dissociation into single atoms (Tafel reaction, 8) and the release of one proton and one electron
(Volmer reaction, 9)22.
Tafel reaction: H2 → Had + Had (8)
Volmer reaction: Had → H+ + e- (9)
There is a contribution of an alternative pathway at high overpotential. For this mechanism, the
dissociation of the H2 molecule takes place during the first step producing a proton and an electron
(Heyrovski reaction), 10. The remaining absorbed hydrogen is released as one proton and one
electron in a second step via the Volmer reaction(11)23.
Heyrovsky reaction: H2 → Had + H+ + e- (10)
Volmer reaction: Had → H+ + e- (11)
Oxygen Reduction Reaction
The ORR is kinetically limiting (106 slower than HOR)24 and understanding its mechanism is essential.
The one usually described in literature25 is a direct 4-electron reduction of oxygen to water in acidic
medium (3).
O2 + 4H+ + 4e-→ 2H2O E0 = 1.23 V (3b)
A second pathway via the formation of hydrogen peroxide in a 2-step mechanism is also possible:
hydrogen peroxide formed during the first step by the 2-electron reduction of oxygen (12a) is
consumed in a second 2-electron step leading to the formation of water (12b).
O2 + 2H+ + 2e- → 2 H2O2 E0 = 0.67 V (12a)
20 Chapter I: Context and Motivation
2H2O2 + 2H+ + 2e- →H2O (12b)
The presence of H2O2 was revealed by rotating ring disk electrode (RRDE) as a proof of a
contribution/competition of the 2 step pathway26. Currently platinum nanoparticles supported on
carbon (Pt/C) are the most commonly used ORR electrocatalysts. In this case, the measured
hydrogen peroxide amount is negligible in operating fuel cell voltage (0.6 – 1.0 vs RHE)24, indicating
that the main mechanism on platinum is the direct 4-electron path. Any presence of hydrogen
peroxide is important since it can lead to the formation of hydroxyl radicals (HO.) that can lead to
membrane and carbon support degradation. Moreover, the direct 4-electron mechanism is more
energetically efficient and is preferable in the case of PEMFC.
According to experimental and theoretical studies such as Density Functional Theory (DFT), two more
detailed mechanisms in the presence of platinum were proposed27.
The dissociative mechanism (13) leads to the 4e- pathways. Oxygen is first adsorbed onto the
platinum active sites and reduced by reacting with the proton coming from the anode through the
membrane in a second step. Water is finally released out of the active sites in the last step.
½ O2 + * → O* (13a)
O* + H+ + e- → OH* (13b)
OH* + H+ + e- → H2O (13c)
At higher current density the associative mechanism may occur, leading to the 2e- pathway. In this
mechanism, the oxygen bound may not be broken resulting in the formation of hydrogen peroxide
(14d).
O2 + * → O2* (14a)
O2* + H+ + e- → HO2*(14b)
HO2* + H+ + e- → H2O + O* (14c)
(or HO2* + H+ + e- → H2O2 + *) (14d)
O* + H+ + e- → OH* (14e)
OH* + H+ + e → H2O + * (14f)
Several models have been suggested for the oxygen adsorption onto platinum active sites such as
Griffiths (15a), Yeager (15b) or Pauling models (15c)28 (Figure 4). In the first model (15a) the O2
molecule interacts with two bonds on a single platinum active site. In (15c) the O2 molecule as a

21 Chapter I: Context and Motivation
bridge between two different platinum active sites is absorbed with two bonds. In (15b) O2 is
adsorbed on a single platinum active site with a single bond.
Figure 4. Griffiths (15a), Yeager (15b) and Pauling (15c) adsorption models.
Given the theoretical calculations, the Yeager model benefits more stable adsorption conditions than
the two other models. In contrast to the Griffiths and Yeager model that lead to the formation of
water only, the Pauling model explains the possible presence of hydrogen peroxide.
The high efficiency of platinum as electrocatalyst for the ORR in comparison to other precious metals
can be explained by the Sabatier principle. The platinum - oxygen binding energy must be strong
enough to promote the adsorption of oxygen onto the metal surface, and weak enough to allow the
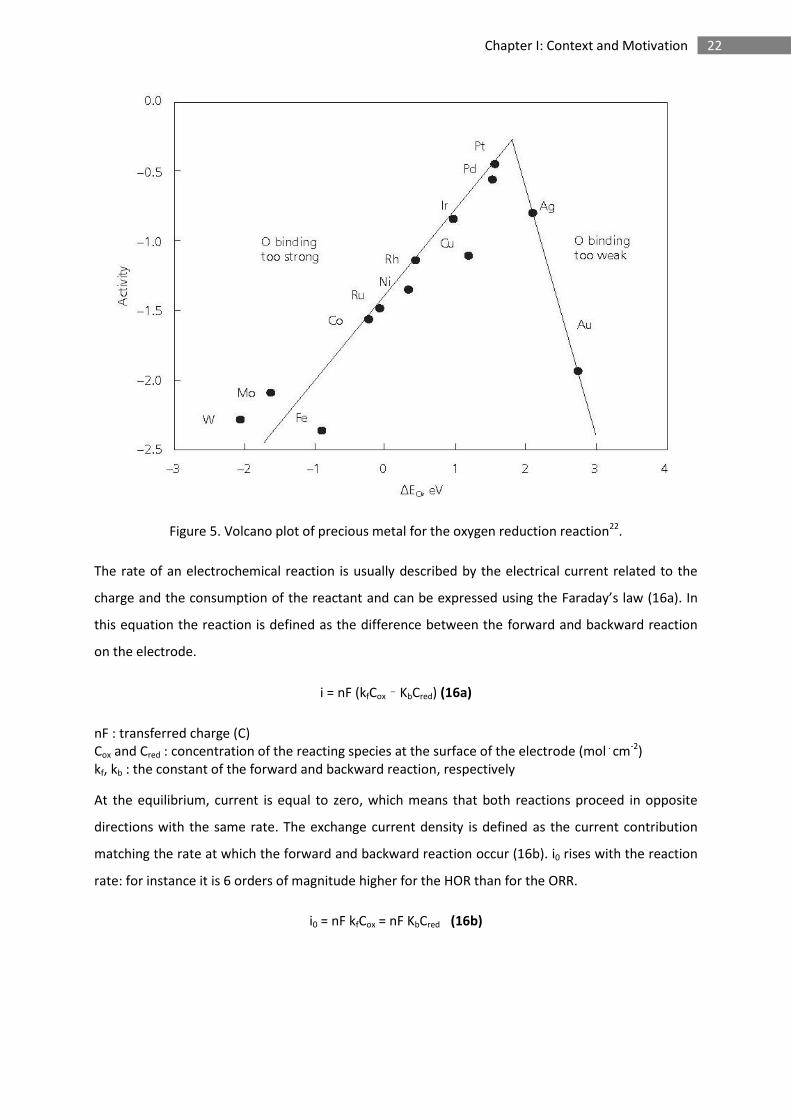
release of a water molecule and free an active site at the same time. This argument can be illustrated
by the volcano plot in Figure 5, that displays the activities of different transition metals as a function
of the oxygen binding energy (calculated by DFT)29,30. For species located on the right hand side of
the diagram such as Ag or Au the binding energy with oxygen would be too weak and the adsorption
would become too slow to maximise the reaction rate. Species located on the left hand side such as
Ni or Pd would be adsorbed too strongly resulting in electrocatalyst active site blockage.
15a 15b 15c
22 Chapter I: Context and Motivation
Figure 5. Volcano plot of precious metal for the oxygen reduction reaction22.
The rate of an electrochemical reaction is usually described by the electrical current related to the
charge and the consumption of the reactant and can be expressed using the Faraday’s law (16a). In
this equation the reaction is defined as the difference between the forward and backward reaction
on the electrode.
i = nF (kfCox – KbCred) (16a)
nF : transferred charge (C) Cox and Cred : concentration of the reacting species at the surface of the electrode (mol . cm-2) kf, kb : the constant of the forward and backward reaction, respectively
At the equilibrium, current is equal to zero, which means that both reactions proceed in opposite
directions with the same rate. The exchange current density is defined as the current contribution
matching the rate at which the forward and backward reaction occur (16b). i0 rises with the reaction
rate: for instance it is 6 orders of magnitude higher for the HOR than for the ORR.
i0 = nF kfCox = nF KbCred (16b)
23 Chapter I: Context and Motivation
Given the Arrhenius equation, the rate constants can be expressed as a function of the temperature
and the activation energy, that the charge must overcome to move from the electrolyte to the
electrode (16c).
k= A exp(-Ea/RT) (16c)
The electrochemical term of the energy activation is proportional to the voltage E (V), the transferred
charge nF (C) and the transfer coefficient α (theoretically between 0 and 1 and usually equal to 0.5)
(16d).
k= k0 exp(-αnFE/RT) (16d)
The equation (16e) obtained from equation (16a), (16b) and (16d) is called the Butler-Volmer
equation and delineates the relationship between current and potential.
i = i0 [exp(-αnFη/RT) - exp(-(1-α)nFη/RT) ] (16e)
i: effective current (A)
i0: exchange current (A)
α: transfer coefficient
n: number of transferred electron
F: Faraday’s constant = 96,485 C . mol-1
η: overpotential (V) is the difference between the potential of the cathode and the equilibrium potential of the reaction
R: universal gas constant = 8.31 J . K-1 . mol-1
T: temperature (K)
In the case of PEMFC at high overpotential, the term corresponding to the anodic reaction is
negligible in comparison with the term corresponding to the cathodic reaction and the equation
(16e) can be simplified to (17) and furthermore to the so-called Tafel equation (17b).
i = i0 [exp(−αnF
RTη)] (17)
log(𝑖) = log(𝑖0) + (−αnF
2.3RTη) (17a)
24 Chapter I: Context and Motivation
η = (2.3RT
αnF) log(𝑖0) + (
2.3RT
αnF) log(𝑖) = 𝑎 + 𝑏 log (𝑖) (17b)
The Tafel plot displays the overpotential as a linear function of log(i). In the case of the ORR at the
PEMFC cathode, two Tafel slopes are often reported in the literature depending on the current
density31. The change in Tafel slope is attributed to the change in the nature of the adsorbed oxygen-
containing species with potential, a transition that strongly affects the ORR32. In acidic media, typical
slopes around 60 mV dec-1 for low overpotential and 120 mV . dec-1 for high overpotential are
reported for Pt29. Tafel slope values highlight information on ORR electrocatalysis mechanism. In the
case of platinum, the Tafel curve can be affected by several parameters such as a change in the
physical structure of Pt (Pt–Pt bond distance and coordination number), adsorption of oxygen-
containing species from the electrolyte onto the Pt, redox type processes33.
3. Components of membrane electrode assemblies of PEMFC
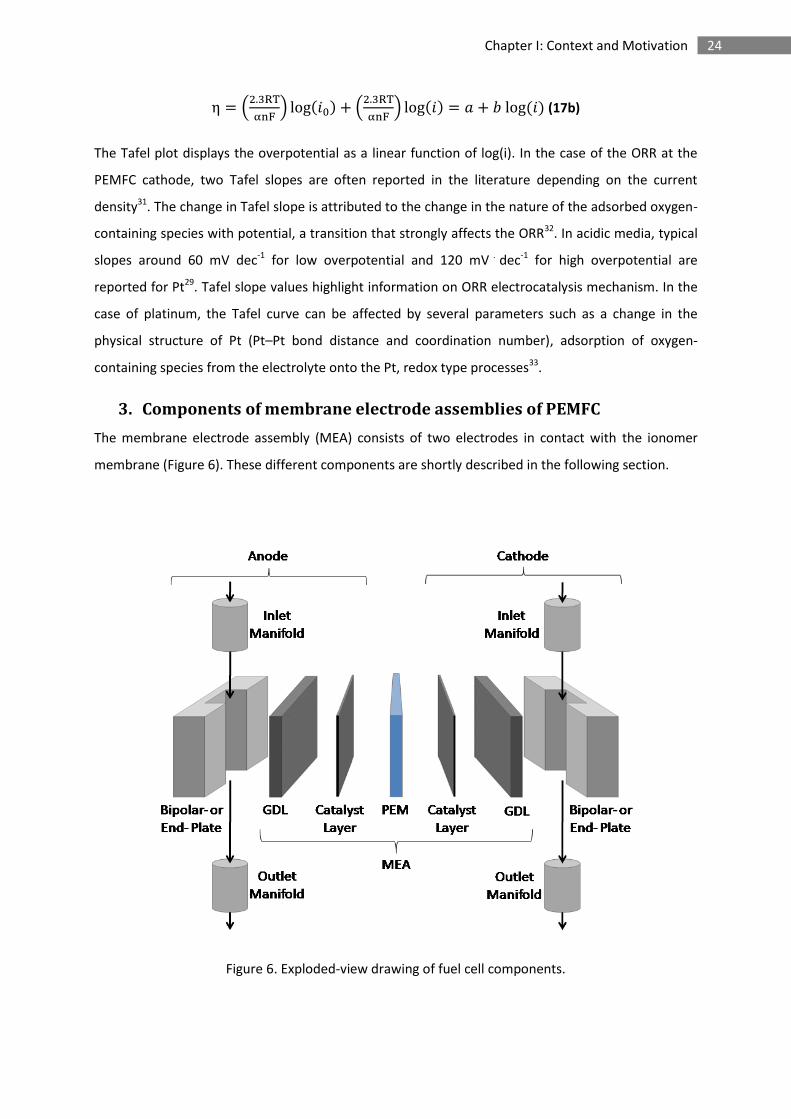
The membrane electrode assembly (MEA) consists of two electrodes in contact with the ionomer
membrane (Figure 6). These different components are shortly described in the following section.
Figure 6. Exploded-view drawing of fuel cell components.
25 Chapter I: Context and Motivation
i. Electrodes
The two electrodes include the same components, a gas diffusion layer (GDL), a catalyst layer and an
optional microporous layer. Concerning the preparation, the catalyst layer can be deposited on the
GDL and form a gas diffusion electrode (GDE) or directly applied to the membrane (catalyst coated
membrane, CCM). The MEA is usually hot pressed to develop appropriate interface between catalyst
layer and membrane.
Gas diffusion layer
The gas diffusion layer stands at the interface between catalytic layer and the bipolar plate and
allows distribution of the gas to the catalyst layer by diffusion. It is usually made of carbon cloth or
carbon fibre papers. Its main role is to provide the gas accessibility to the catalytic layer, but its
design and composition34 optimisation also improve the water management in the electrode which is
vital to ensure the high performance and long life of the fuel cell35.
Catalyst layer
In a conventional PEMFC, the catalyst layer is made of platinum (or platinum alloy) particles
supported on carbon black, the high surface area and suitable porosity of which allow a good
dispersion of the electrocatalyst. Catalysed carbon black set a reference as electrocatalyst however
insufficient electrochemical stability at high potential results in poor durability that justifies the
development of alternative supports. The elaboration of alternative to carbon-based supports is the
main objective of the work described in this PhD thesis, and their required properties will be detailed
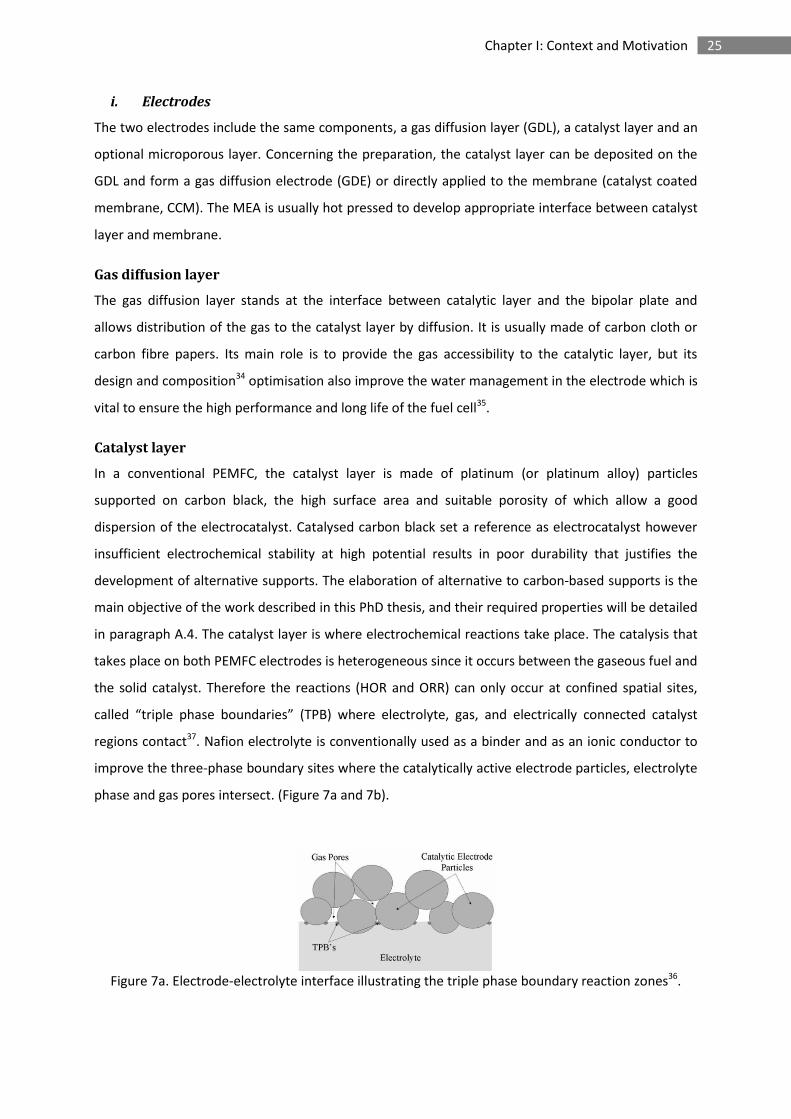
in paragraph A.4. The catalyst layer is where electrochemical reactions take place. The catalysis that
takes place on both PEMFC electrodes is heterogeneous since it occurs between the gaseous fuel and
the solid catalyst. Therefore the reactions (HOR and ORR) can only occur at confined spatial sites,
called “triple phase boundaries” (TPB) where electrolyte, gas, and electrically connected catalyst
regions contact37. Nafion electrolyte is conventionally used as a binder and as an ionic conductor to
improve the three-phase boundary sites where the catalytically active electrode particles, electrolyte
phase and gas pores intersect. (Figure 7a and 7b).
Figure 7a. Electrode-electrolyte interface illustrating the triple phase boundary reaction zones36.
26 Chapter I: Context and Motivation
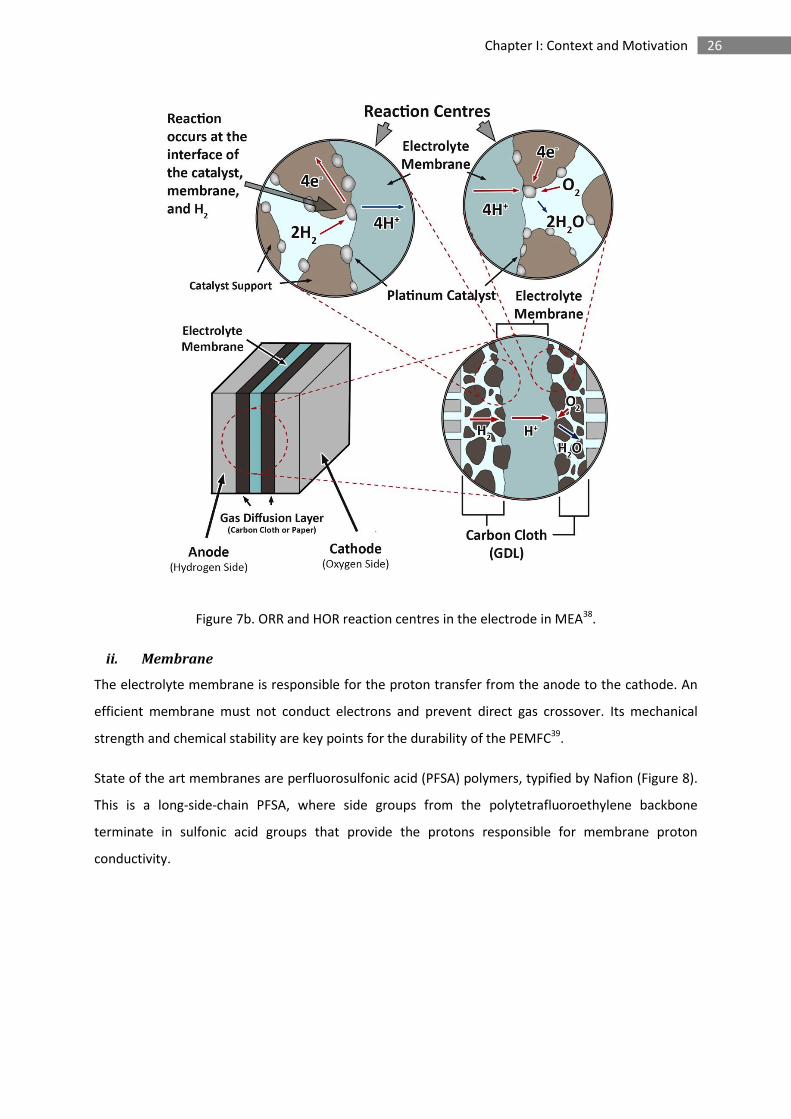
Figure 7b. ORR and HOR reaction centres in the electrode in MEA38.
ii. Membrane
The electrolyte membrane is responsible for the proton transfer from the anode to the cathode. An
efficient membrane must not conduct electrons and prevent direct gas crossover. Its mechanical
strength and chemical stability are key points for the durability of the PEMFC39.
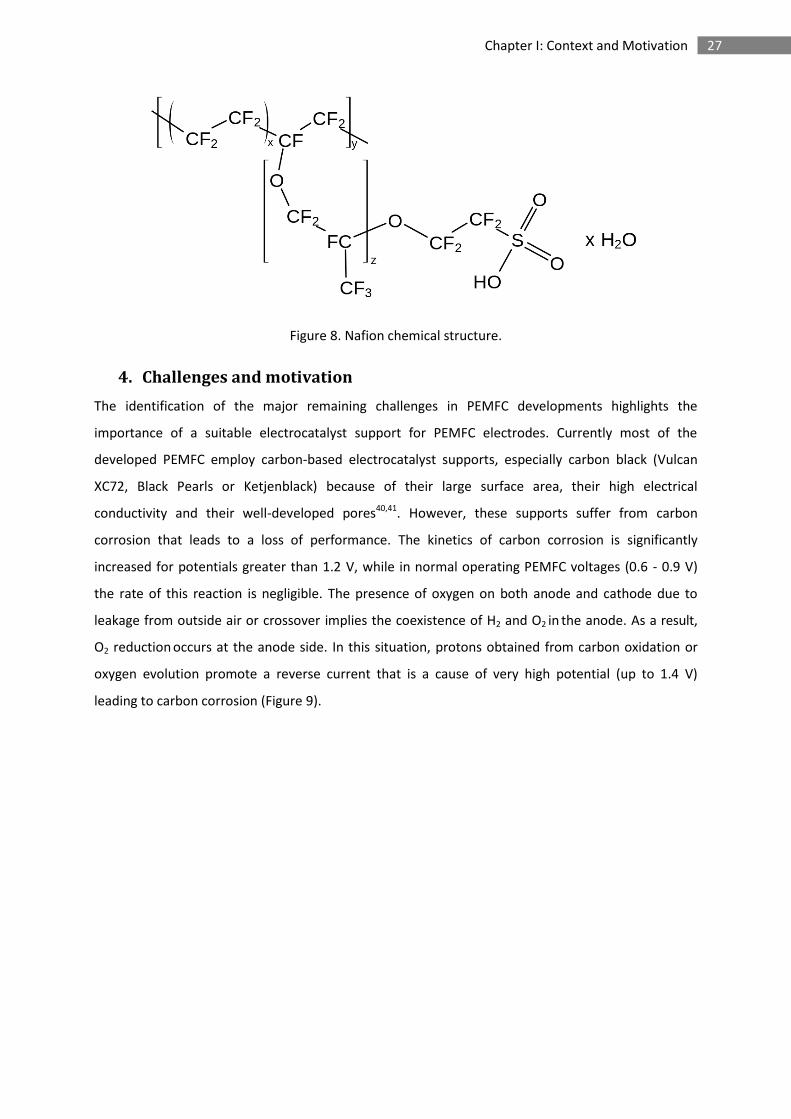
State of the art membranes are perfluorosulfonic acid (PFSA) polymers, typified by Nafion (Figure 8).
This is a long-side-chain PFSA, where side groups from the polytetrafluoroethylene backbone
terminate in sulfonic acid groups that provide the protons responsible for membrane proton
conductivity.
27 Chapter I: Context and Motivation
Figure 8. Nafion chemical structure.
4. Challenges and motivation
The identification of the major remaining challenges in PEMFC developments highlights the
importance of a suitable electrocatalyst support for PEMFC electrodes. Currently most of the
developed PEMFC employ carbon-based electrocatalyst supports, especially carbon black (Vulcan
XC72, Black Pearls or Ketjenblack) because of their large surface area, their high electrical
conductivity and their well-developed pores40,41. However, these supports suffer from carbon
corrosion that leads to a loss of performance. The kinetics of carbon corrosion is significantly
increased for potentials greater than 1.2 V, while in normal operating PEMFC voltages (0.6 - 0.9 V)
the rate of this reaction is negligible. The presence of oxygen on both anode and cathode due to
leakage from outside air or crossover implies the coexistence of H2 and O2 in the anode. As a result,
O2 reduction occurs at the anode side. In this situation, protons obtained from carbon oxidation or
oxygen evolution promote a reverse current that is a cause of very high potential (up to 1.4 V)
leading to carbon corrosion (Figure 9).
28 Chapter I: Context and Motivation
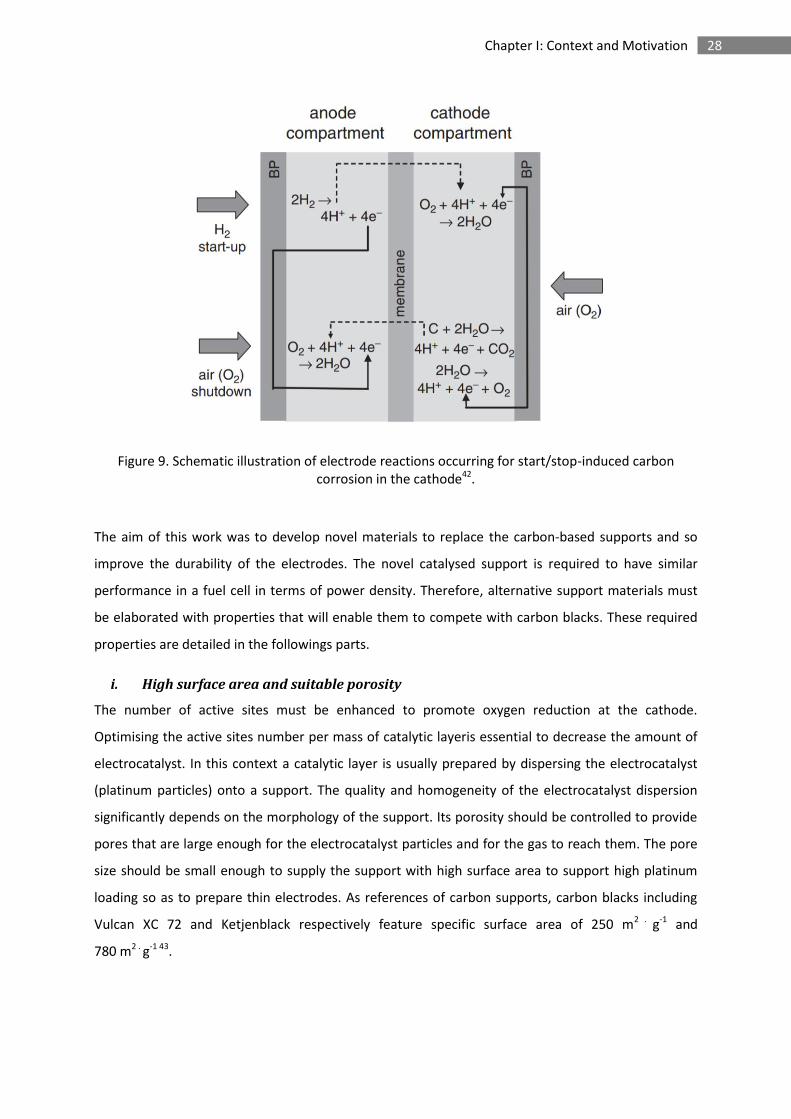
Figure 9. Schematic illustration of electrode reactions occurring for start/stop-induced carbon corrosion in the cathode42.
The aim of this work was to develop novel materials to replace the carbon-based supports and so
improve the durability of the electrodes. The novel catalysed support is required to have similar
performance in a fuel cell in terms of power density. Therefore, alternative support materials must
be elaborated with properties that will enable them to compete with carbon blacks. These required
properties are detailed in the followings parts.
i. High surface area and suitable porosity
The number of active sites must be enhanced to promote oxygen reduction at the cathode.
Optimising the active sites number per mass of catalytic layeris essential to decrease the amount of
electrocatalyst. In this context a catalytic layer is usually prepared by dispersing the electrocatalyst
(platinum particles) onto a support. The quality and homogeneity of the electrocatalyst dispersion
significantly depends on the morphology of the support. Its porosity should be controlled to provide
pores that are large enough for the electrocatalyst particles and for the gas to reach them. The pore
size should be small enough to supply the support with high surface area to support high platinum
loading so as to prepare thin electrodes. As references of carbon supports, carbon blacks including
Vulcan XC 72 and Ketjenblack respectively feature specific surface area of 250 m2 . g-1 and
780 m2 . g-1 43.
29 Chapter I: Context and Motivation
ii. High electrical conductivity
The electron transfer within the electrodes is directly related to the electronic conductivity of the
support. This is consequently a pivotal requirement so that the electron transfer does not become
the limiting step for the ORR kinetics. Depending on their crystal structures carbon based materials
present a wide range of electrical conductivity. The highest value was measured for graphene (10 –
102 S . cm-1)44,45, while that of carbon Vulcan is 0.1 – 10 S . cm-1 46. It is interesting to note that the
electrical conductivity is also related to the grain size and the morphology of the electrocatalyst
support.
iii. Electrochemical stability and durability
The benefit of a novel electrocatalyst support will be found in the insufficiency of the currently used
carbon blacks in fuel cell operating conditions47. One crucial requirement is a high chemical and
electrochemical stability to prevent the degradation of the catalyst layer overtime and improve the
electrode durability. The cause of the performance loss has been the subject of studies in the past
three decades. One remaining issue is the degradation of the carbon-based electrocatalyst support
conventionally used in PEMFC electrodes. The corrosion reaction is generalised48 as (18):
C + 2H2O CO2 + 4 H+ + 4e- E° = 0.207 V (18)
This reaction is reported as a 3-step mechanism that consists of the oxidation of a carbon lattice
(19a), the hydrolysis of the formed cation (19b) and the release of carbon dioxide (19c)49.
C → C+ + e- (19a)
C + ½ H2O → CO + H+ (19b)
CO + H2O → CO2 + 2H+ + 2e- (19c)
This reaction is thermodynamically allowable at the potentials at which the fuel cell cathode
operates50, but it is believed to be almost negligibly slow in the operating condition of PEMFC51.
However, even if it proceeds very slowly, it can affect the long-term durability of PEMFCs.
Furthermore in particular conditions in which hydrogen-rich regions and hydrogen-starved regions
coexist in the anode chamber of a single cell, the reverse-current mechanism (previously detailed in
paragraph A.4.) has been proposed52–55, which creates higher potential (up to 1.5 V vs RHE56) than
the open circuit voltage (OCV) of ca. 1 V usually encountered as the maximum potential. This
mechanism is frequent at start-up of the system or during shut-down of the anode chamber57
(Figure 9). When carbon corrosion occurs (18), the morphology of the support is damaged promoting
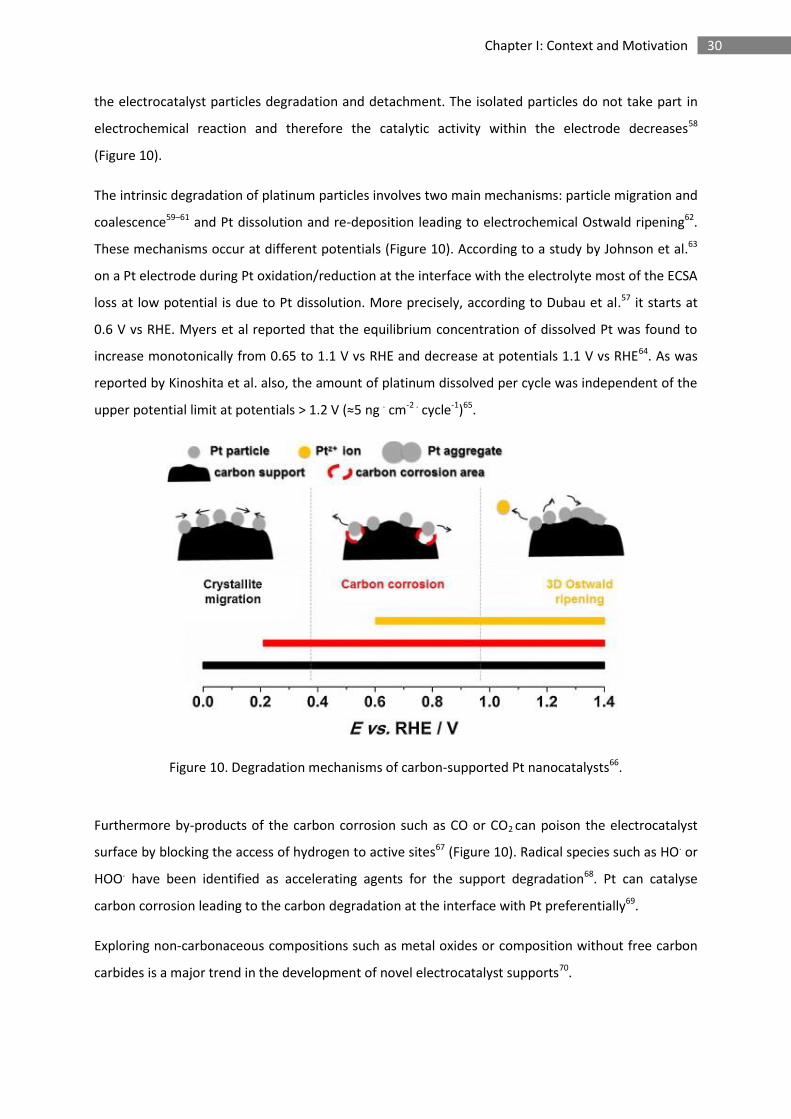
30 Chapter I: Context and Motivation
the electrocatalyst particles degradation and detachment. The isolated particles do not take part in
electrochemical reaction and therefore the catalytic activity within the electrode decreases58
(Figure 10).
The intrinsic degradation of platinum particles involves two main mechanisms: particle migration and
coalescence59–61 and Pt dissolution and re-deposition leading to electrochemical Ostwald ripening62.
These mechanisms occur at different potentials (Figure 10). According to a study by Johnson et al.63
on a Pt electrode during Pt oxidation/reduction at the interface with the electrolyte most of the ECSA
loss at low potential is due to Pt dissolution. More precisely, according to Dubau et al.57 it starts at
0.6 V vs RHE. Myers et al reported that the equilibrium concentration of dissolved Pt was found to
increase monotonically from 0.65 to 1.1 V vs RHE and decrease at potentials 1.1 V vs RHE64. As was
reported by Kinoshita et al. also, the amount of platinum dissolved per cycle was independent of the
upper potential limit at potentials > 1.2 V (≈5 ng . cm-2 . cycle-1)65.
Figure 10. Degradation mechanisms of carbon-supported Pt nanocatalysts66.
Furthermore by-products of the carbon corrosion such as CO or CO2 can poison the electrocatalyst
surface by blocking the access of hydrogen to active sites67 (Figure 10). Radical species such as HO. or
HOO. have been identified as accelerating agents for the support degradation68. Pt can catalyse
carbon corrosion leading to the carbon degradation at the interface with Pt preferentially69.
Exploring non-carbonaceous compositions such as metal oxides or composition without free carbon
carbides is a major trend in the development of novel electrocatalyst supports70.

31 Chapter I: Context and Motivation
B. Alternative electrocatalyst support for PEMFC cathodes
A multitude of materials have been investigated for a partial or total replacement of carbon blacks as
electrocatalyst support for fuel cells electrodes69. This strategy was followed mainly to improve the
electrode durability but also to possibly benefit from a promotion of the ORR activity.
1. Metal oxides
Inorganic oxides such as SnO2, TiO2, Nb2O5, Ta2O5, WO3, and Sb2O3 are being considered as
alternatives to carbon supports due to their inertness in strong oxidative conditions69. Theoretical71
and experimental studies72,73 have described their high electrochemical stability in fuel cell operating
conditions. Furthermore, metal oxides are known to promote Pt electrocatalysis e.g. by the so-called
strong metal support interaction (SMSI). For instance in the case of Pt/TiO2 the Pt 4f binding energy
was decreased compared to Pt/C74,75. This SMSI interbonding effect affects the cleavages of
intermediates involved in the ORR leading to higher reaction rates.
So far, Pt supported on TiO276–78, WO3
79,80 and SnO281 showed to be efficient catalysts for the ORR and
methanol oxidation reaction (MOR). Nevertheless metal oxides are generally semi-conducting. One
of the strategies used to increase their conductivity is the use of doping agents including ionic Nb82,
Ta83 and Sb84. Depending on the oxide, the doping agent is used to add electrons (resulting in a n-
type semiconductor) or to increase the number of “holes” (resulting in a p-type semiconductor). The
limitation induced by the low electronic conductivity has also been circumvented by increasing the Pt
loading on the support so as to decrease the thickness of the catalyst layer85. Associated with carbon,
the use of metal oxides such as TiO2 or SnO2 resulted in further electrical conductivity improvement86
leading to an ORR activity increase compared to pure oxide support and an enhanced durability
compared to carbon based supports.
2. Metal nitrides
Since they are characterised by high electronic conductivity, excellent mechanical stability and
corrosion resistance in acidic media, transition metal carbides (TMCs) and nitrides (TMNs) are
considered as suitable candidates as electrocatalyst supports. Furthermore some of them show
intrinsic electrocatalytic behaviour 70,87. TiN displays a high MOR activity as well as high CO resistance
that was attributed to the synergistic effect between Pt and TiN88. Mo2N, investigated as ORR
electrocatalyst, provided a maximum power density of 65 mW . cm-2 in single fuel cell89. Also ZrN and
ZrON have shown electrocatalytic activity featuring a ORR onset potential of 0.7 V vs RHE 90.
32 Chapter I: Context and Motivation
3. Metal carbides
Since the use of TMCs is reported not only as supports but also as electrocatalysts themselves, this
section is organised into three parts corresponding to the role played by the material in the
electrode: Electrocatalyst, Co-catalyst and Electrocatalyst support. Key examples are also
summarised in Table 1.
i. Electrocatalysts
In 1963, Mazza and Trasatti first reported that TMCs including WC, TiC, and TaC were active towards
the ORR in sulfuric acid91. In particular, tungsten carbide featured superior activity than other
carbides92,93 that can be explained by the relation between the catalytic activity and the electronic
structure. Indeed, Pt-like behaviour of WC is due to a change in electron distribution of W by the
presence of C. Consequently, WC and Pt display a similar valence band structure94. This was proven
by XPS, showing that the electronic density of WC at the Fermi level is very similar to that of the
noble metal70. With the development of DFT, the energy of a complex multi-electron system can be
determined as a function of the electron density. Using this theory, Norskov et al. have correlated
the electronic structure of metal surfaces to their catalytic activity95, confirming the similarity of
tungsten carbide to platinum94.
In order to benefit from the electrocatalytic activity of carbides, carbide/carbon composites such as
SiC/carbide derived carbon or WC with amorphous carbon have been elaborated without further
precious metal. In the first example, carbon was formed during the synthesis route96, whereas in the
latter it was used as carbon source to form the carbide97. The effect of the addition of carbon on the
stability of these composites was not reported.
Research on metal carbides as electrocatalysts has been often extended to nitrides and oxynitrides
including TaON and TaN that display an enhanced catalytic activity toward ORR and are obtained by
slight modifications of the synthesis parameters98.
ii. Co-catalysts
Due to their electrocatalytic activity TMCs have also been associated with noble metals, and their
promoting effect leads to a similar ORR activity, but with lower Pt loadings99. For instance, the ORR
electrocatalytic activity of a Pt monolayer deposited by ALD on WC was reported to be similar to that
of Pt bulk100. This result was explained by the oxygen binding energy on WC that was initially almost
twice high as on Pt, but that was decreased to that of Pt (111) once one Pt monolayer was added100.
Following the same strategy, a platinum modified dimolybdenum carbide (Pt/Mo2C) thin film
prepared by a co-impregnation method, demonstrated similar hydrogen evolution reaction activity
33 Chapter I: Context and Motivation
as bulk Pt101. Another strategy has been the addition of metal carbides to conventional Pt/C
supported electrocatalysts to improve their ORR activity. For instance, ZrC was added to Pt/C in order
to take advantage of carbon to ensure high specific surface area and of ZrC to promote the ORR
catalysis102. This example highlights the recurrent need of controlled morphology and porosity to
increase the surface area of carbides.
A similar strategy was used on titanium dioxide that was catalysed by a carbide based electrocatalyst
(Pt-WC-TiO2) supported on a bamboo charcoal based support103,104. In this case, WC and TiO2 were
both used to protect carbon from corrosion and to assist the electrocatalytic activity of Pt. A double
synergistic effect was reported either between Pt and WC (as described above) and Pt and TiO2 due
to strong metal support interaction.
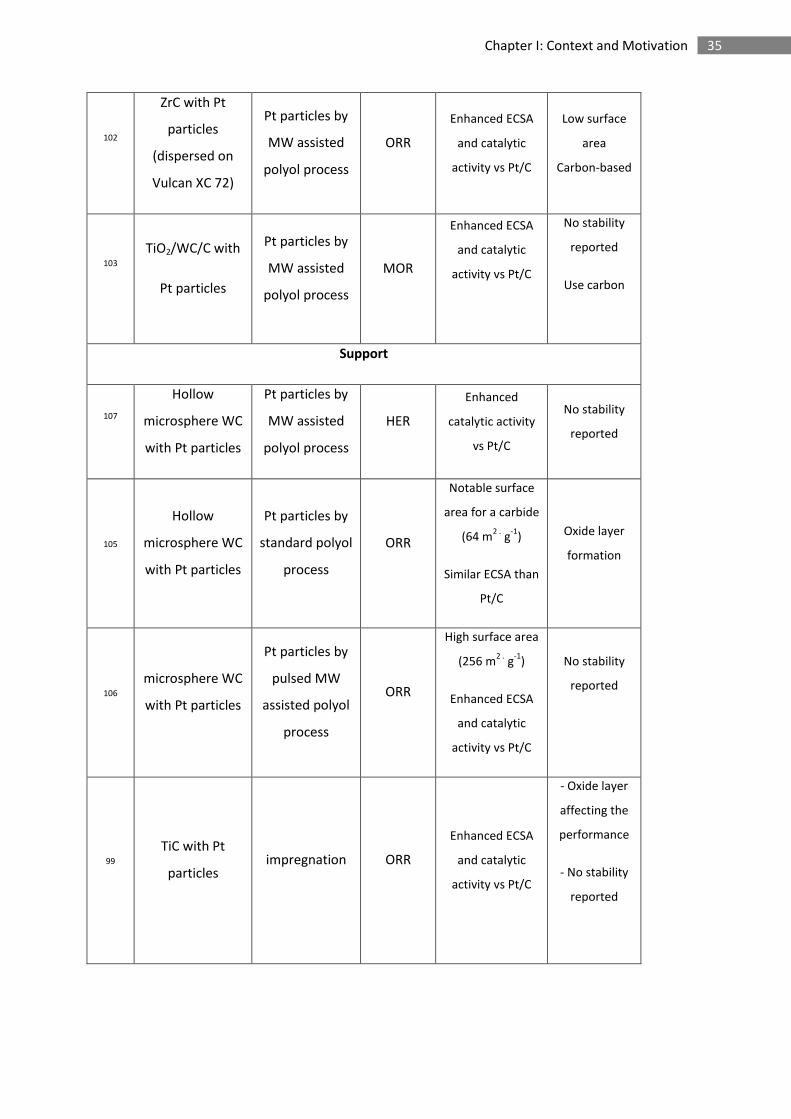
iii. Electrocatalyst supports
As it is the most studied carbide and because of its similar electronic structure to platinum, WC was
the earliest carbide to be investigated among alternative electrocatalyst supports69. Tungsten carbide
hollow microspheres as supports for Pt show enhanced electrocatalytic activity towards the
ORR105106, the HER107, and the MOR108. This approach was then extended to other metal carbides.
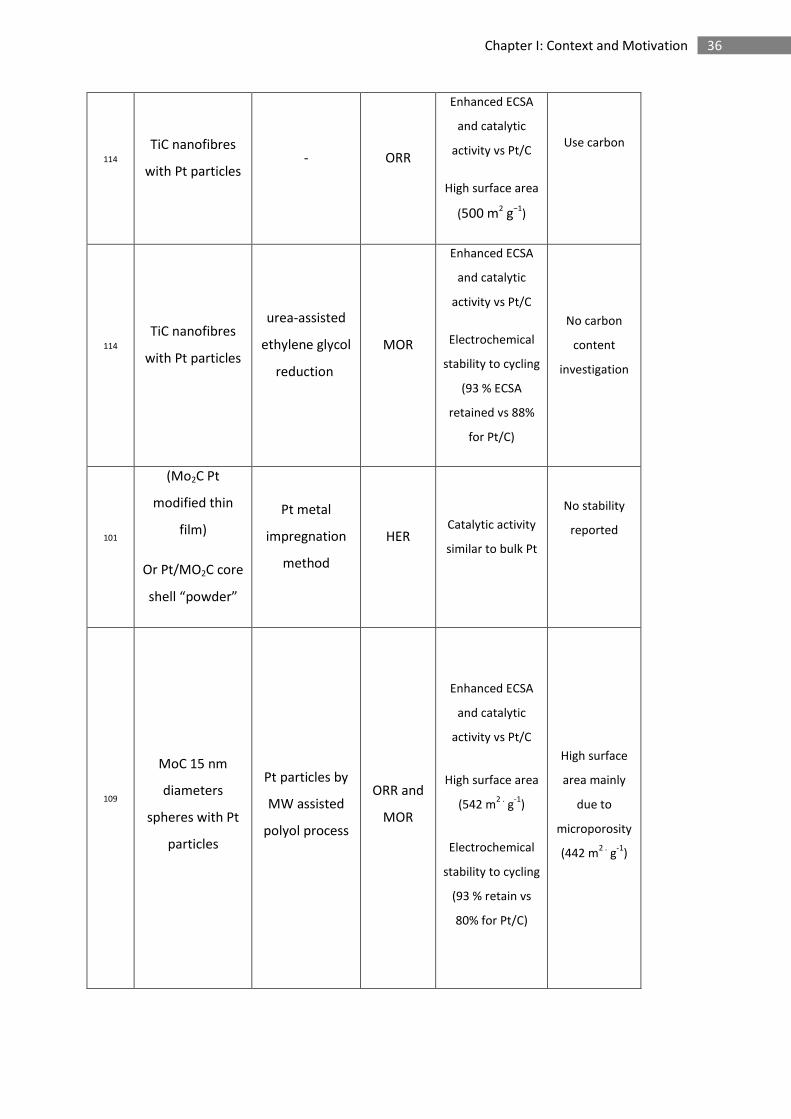
MoC porous nanospheres have been catalysed with Pt particles resulting in high ECSA and MOR and
ORR catalytic activity109. An enhanced electrochemical stability was reported for this material
compared to Pt/C. This support features a high surface area (542 m2 . g-1) mainly due to microporosity
(80 %)109. Titanium carbide associated with different precious metals (Pt by impregnation99 or Pt-Ir by
a thermal reduction process110) shows high ECSA and ORR activity. However, a treatment under
hydrogen was required to obtain improved ORR activity compared to Pt/C. Indeed, the formation of a
surface oxide layer (reported for instance also for WC) led to a reduction in its electronic conductivity
which could affect the catalytic activity of catalysed carbide111. The durability over prolonged
electrochemical cycles was not investigated for this material. This was a pivotal aspect, however, of
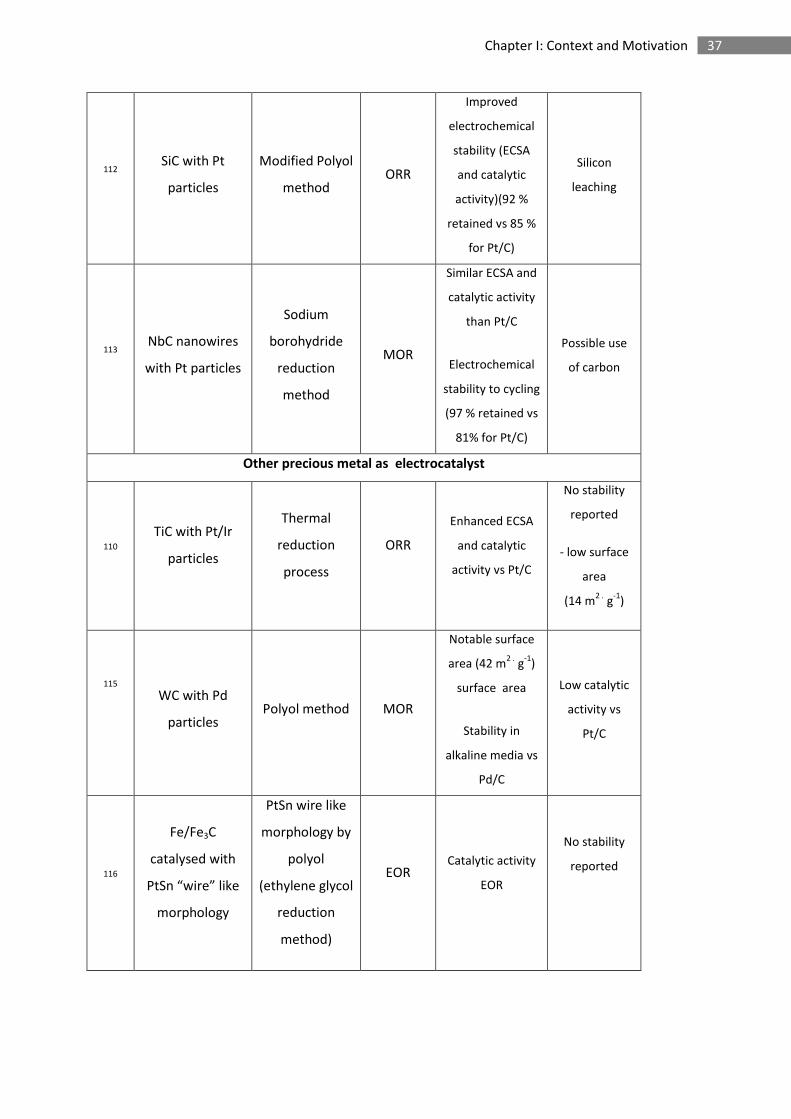
the study of Pt/SiC prepared by an impregnation technique using a wood material as carbon source.
Accelerated durability tests including cycling (0.6 – 1 V vs RHE) and start/stop testing
(1 - 1.5 V vs RHE) showed improved chemical stability compared to a commercial Pt/C but also led to
Si leaching112.
Niobium carbide nanowires synthesised by a carbon thermal method on bamboo, and catalysed with
platinum particles, showed high electrochemical stability in accelerated stress tests resulting in 20 %
more retained catalyst active surface area than Pt/C, for a comparable initial ECSA (71 m2 . g-1 vs 73
m2 . g-1) and enhanced MOR mass activity (766 A . g-1 vs 222 A . g-1)113. This NbC nanowire support
34 Chapter I: Context and Motivation
showed a high electrical conductivity (5.02 mΩ . cm-1) that was attributed to the composition and to
the 1D nanostructured morphology. Since continuous morphologies such as fibres imply a decrease
of the interface between grains, they are expected to feature a higher electrical conductivity than a
less organised material with the same porosity. This illustrates that nanowires are promising
supports in terms of electrical conductivity, durability and catalytic activity93,113.
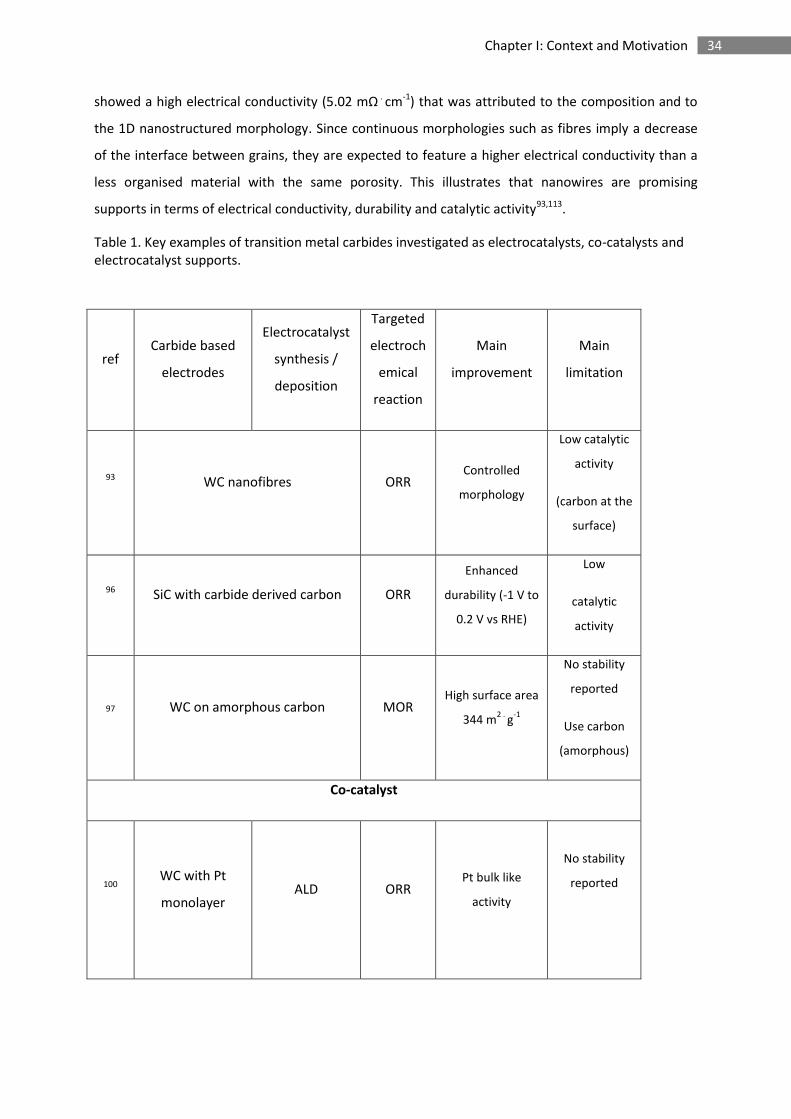
Table 1. Key examples of transition metal carbides investigated as electrocatalysts, co-catalysts and electrocatalyst supports.
ref Carbide based
electrodes
Electrocatalyst
synthesis /
deposition
Targeted
electroch
emical
reaction
Main
improvement
Main
limitation
93 WC nanofibres ORR Controlled
morphology
Low catalytic
activity
(carbon at the
surface)
96 SiC with carbide derived carbon ORR
Enhanced
durability (-1 V to
0.2 V vs RHE)
Low
catalytic
activity
97 WC on amorphous carbon MOR High surface area
344 m2 .
g-1
No stability
reported
Use carbon
(amorphous)
Co-catalyst
100 WC with Pt
monolayer ALD ORR
Pt bulk like
activity
No stability
reported
35 Chapter I: Context and Motivation
102
ZrC with Pt
particles
(dispersed on
Vulcan XC 72)
Pt particles by
MW assisted
polyol process
ORR
Enhanced ECSA
and catalytic
activity vs Pt/C
Low surface
area
Carbon-based
103
TiO2/WC/C with
Pt particles
Pt particles by
MW assisted
polyol process
MOR
Enhanced ECSA
and catalytic
activity vs Pt/C
No stability
reported
Use carbon
Support
107
Hollow
microsphere WC
with Pt particles
Pt particles by
MW assisted
polyol process
HER
Enhanced
catalytic activity
vs Pt/C
No stability
reported
105
Hollow
microsphere WC
with Pt particles
Pt particles by
standard polyol
process
ORR
Notable surface
area for a carbide
(64 m2 .
g-1
)
Similar ECSA than
Pt/C
Oxide layer
formation
106
microsphere WC
with Pt particles
Pt particles by
pulsed MW
assisted polyol
process
ORR
High surface area
(256 m2 .
g-1
)
Enhanced ECSA
and catalytic
activity vs Pt/C
No stability
reported
99
TiC with Pt
particles impregnation ORR
Enhanced ECSA
and catalytic
activity vs Pt/C
- Oxide layer
affecting the
performance
- No stability
reported
36 Chapter I: Context and Motivation
114
TiC nanofibres
with Pt particles - ORR
Enhanced ECSA
and catalytic
activity vs Pt/C
High surface area
(500 m2 g−1)
Use carbon
114
TiC nanofibres
with Pt particles
urea-assisted
ethylene glycol
reduction
MOR
Enhanced ECSA
and catalytic
activity vs Pt/C
Electrochemical
stability to cycling
(93 % ECSA
retained vs 88%
for Pt/C)
No carbon
content
investigation
101
(Mo2C Pt
modified thin
film)
Or Pt/MO2C core
shell “powder”
Pt metal
impregnation
method
HER Catalytic activity
similar to bulk Pt
No stability
reported
109
MoC 15 nm
diameters
spheres with Pt
particles
Pt particles by
MW assisted
polyol process
ORR and
MOR
Enhanced ECSA
and catalytic
activity vs Pt/C
High surface area
(542 m2 .
g-1
)
Electrochemical
stability to cycling
(93 % retain vs
80% for Pt/C)
High surface
area mainly
due to
microporosity
(442 m2 .
g-1
)
37 Chapter I: Context and Motivation
112 SiC with Pt
particles
Modified Polyol
method ORR
Improved
electrochemical
stability (ECSA
and catalytic
activity)(92 %
retained vs 85 %
for Pt/C)
Silicon
leaching
113 NbC nanowires
with Pt particles
Sodium
borohydride
reduction
method
MOR
Similar ECSA and
catalytic activity
than Pt/C
Electrochemical
stability to cycling
(97 % retained vs
81% for Pt/C)
Possible use
of carbon
Other precious metal as electrocatalyst
110
TiC with Pt/Ir
particles
Thermal
reduction
process
ORR
Enhanced ECSA
and catalytic
activity vs Pt/C
No stability
reported
- low surface
area
(14 m2 .
g-1
)
115
WC with Pd
particles Polyol method MOR
Notable surface
area (42 m2 .
g-1
)
surface area
Stability in
alkaline media vs
Pd/C
Low catalytic
activity vs
Pt/C
116
Fe/Fe3C
catalysed with
PtSn “wire” like
morphology
PtSn wire like
morphology by
polyol
(ethylene glycol
reduction
method)
EOR Catalytic activity
EOR
No stability
reported
38 Chapter I: Context and Motivation
4. Electrospun materials as electrocatalyst supports
In the context of the preparation of 1D nanostructured materials, electrospinning allows the
elaboration of continuous fibres with homogeneous diameters down to the nanoscale opening the
way to new properties and consequent applications117. This technique is described in further details
in the following paragraph.
i. History and principle of electrospinning
The history of electrospinning started in 1902 with the patent of Cooley118. Continuous advances in
the electrospinning process such as the patent of A. Formhals119 and comprehension of the involved
mechanism reflected by the fundamental work of G. Taylor on electrohydrodynamics120 led to
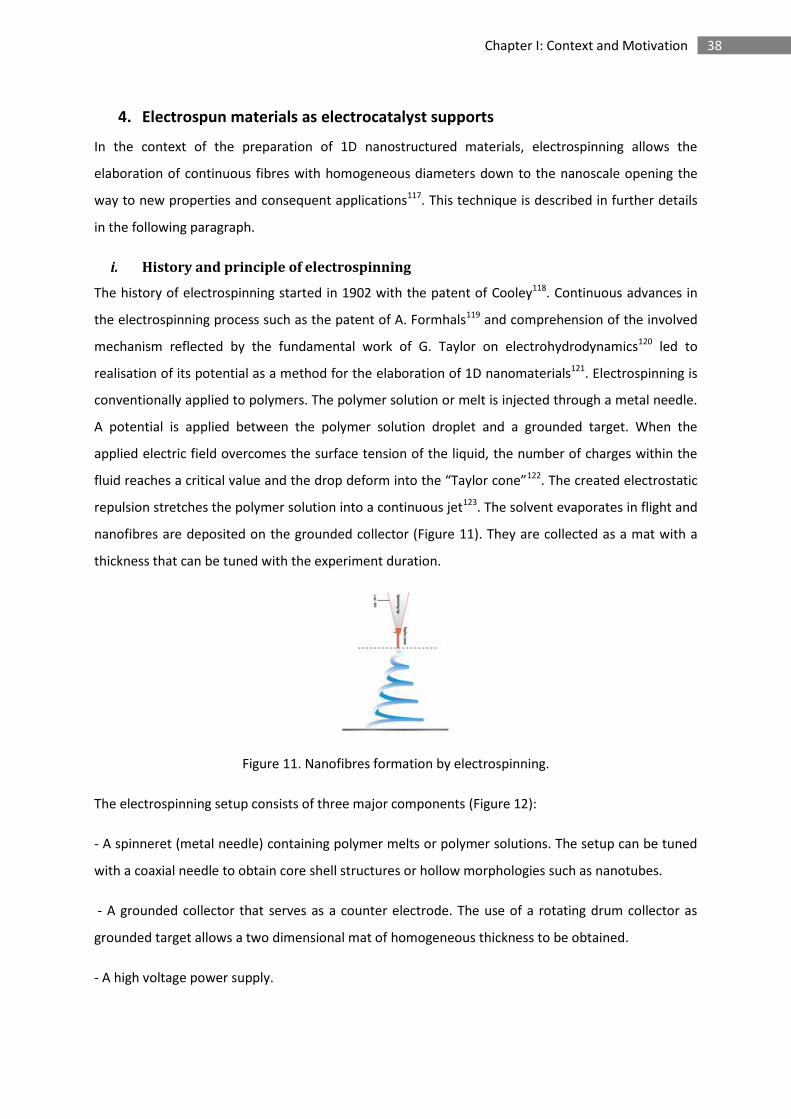
realisation of its potential as a method for the elaboration of 1D nanomaterials121. Electrospinning is
conventionally applied to polymers. The polymer solution or melt is injected through a metal needle.
A potential is applied between the polymer solution droplet and a grounded target. When the
applied electric field overcomes the surface tension of the liquid, the number of charges within the
fluid reaches a critical value and the drop deform into the “Taylor cone”122. The created electrostatic
repulsion stretches the polymer solution into a continuous jet123. The solvent evaporates in flight and
nanofibres are deposited on the grounded collector (Figure 11). They are collected as a mat with a
thickness that can be tuned with the experiment duration.
Figure 11. Nanofibres formation by electrospinning.
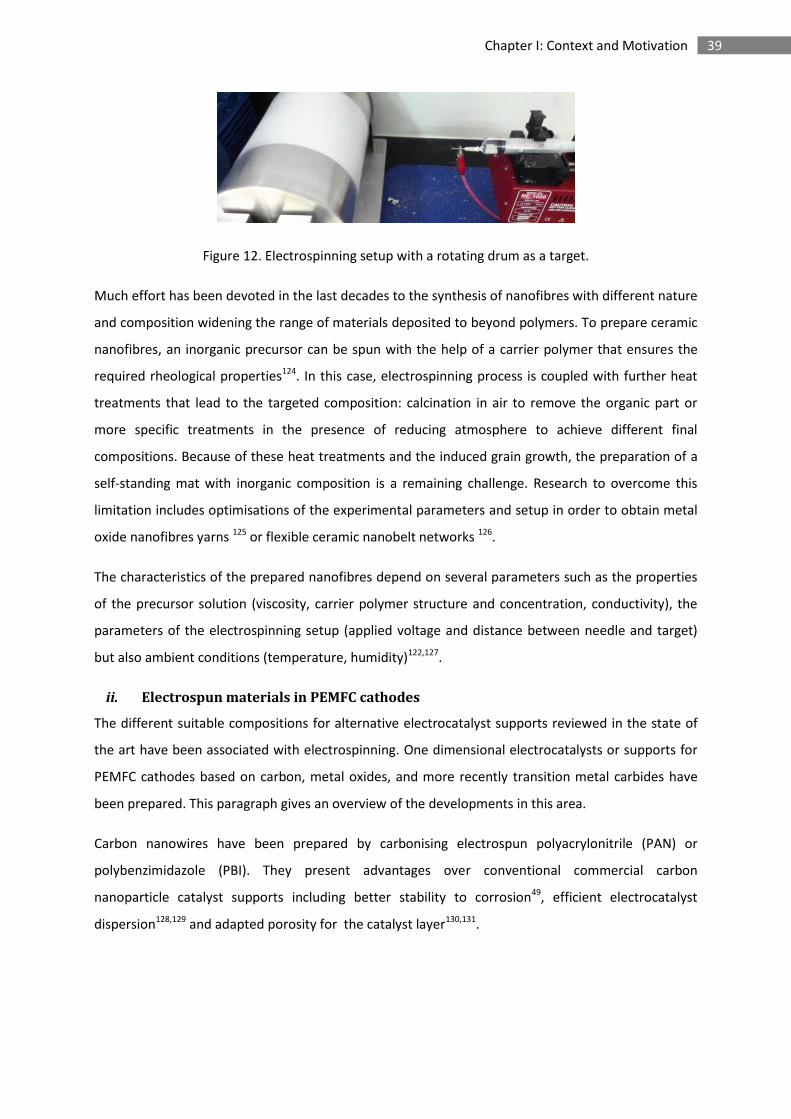
The electrospinning setup consists of three major components (Figure 12):
- A spinneret (metal needle) containing polymer melts or polymer solutions. The setup can be tuned
with a coaxial needle to obtain core shell structures or hollow morphologies such as nanotubes.
- A grounded collector that serves as a counter electrode. The use of a rotating drum collector as
grounded target allows a two dimensional mat of homogeneous thickness to be obtained.
- A high voltage power supply.
39 Chapter I: Context and Motivation
Figure 12. Electrospinning setup with a rotating drum as a target.
Much effort has been devoted in the last decades to the synthesis of nanofibres with different nature
and composition widening the range of materials deposited to beyond polymers. To prepare ceramic
nanofibres, an inorganic precursor can be spun with the help of a carrier polymer that ensures the
required rheological properties124. In this case, electrospinning process is coupled with further heat
treatments that lead to the targeted composition: calcination in air to remove the organic part or
more specific treatments in the presence of reducing atmosphere to achieve different final
compositions. Because of these heat treatments and the induced grain growth, the preparation of a
self-standing mat with inorganic composition is a remaining challenge. Research to overcome this
limitation includes optimisations of the experimental parameters and setup in order to obtain metal
oxide nanofibres yarns 125 or flexible ceramic nanobelt networks 126.
The characteristics of the prepared nanofibres depend on several parameters such as the properties
of the precursor solution (viscosity, carrier polymer structure and concentration, conductivity), the
parameters of the electrospinning setup (applied voltage and distance between needle and target)
but also ambient conditions (temperature, humidity)122,127.
ii. Electrospun materials in PEMFC cathodes
The different suitable compositions for alternative electrocatalyst supports reviewed in the state of
the art have been associated with electrospinning. One dimensional electrocatalysts or supports for
PEMFC cathodes based on carbon, metal oxides, and more recently transition metal carbides have
been prepared. This paragraph gives an overview of the developments in this area.
Carbon nanowires have been prepared by carbonising electrospun polyacrylonitrile (PAN) or
polybenzimidazole (PBI). They present advantages over conventional commercial carbon
nanoparticle catalyst supports including better stability to corrosion49, efficient electrocatalyst
dispersion128,129 and adapted porosity for the catalyst layer130,131.
40 Chapter I: Context and Motivation
Electrospinning of metal oxides has also been explored for fuel cell cathode applications132. For
instance, TiO2 doped with niobium or treated under reducing atmosphere and catalysed with
platinum particles showed high stability and ORR electrocatalytic activity78,133,134. Electrospun SnO2
nanofibres also showed good durability and displayed excellent performance as anode for the HOR135
or as cathode when doped with Nb82 and Sb84.
Few studies report the preparation of non-supported electrocatalysts as pure or alloyed noble metal
nanowires136. In terms of durability, Pt/Fe nanowires were reported to display enhanced
electrochemical stability compared to Pt/C in addition to high catalytic activity towards the ORR137.
Other bimetallic alloys have been developed for anodic reactions such as Pt/Rh and Pt/Ru for MOR
featuring better performance than Pt/C138. The difficulty in elaborating fibres with very thin
diameters is a challenge for the preparation of 1D nanostructured electrocatalysts with an optimised
ECSA.
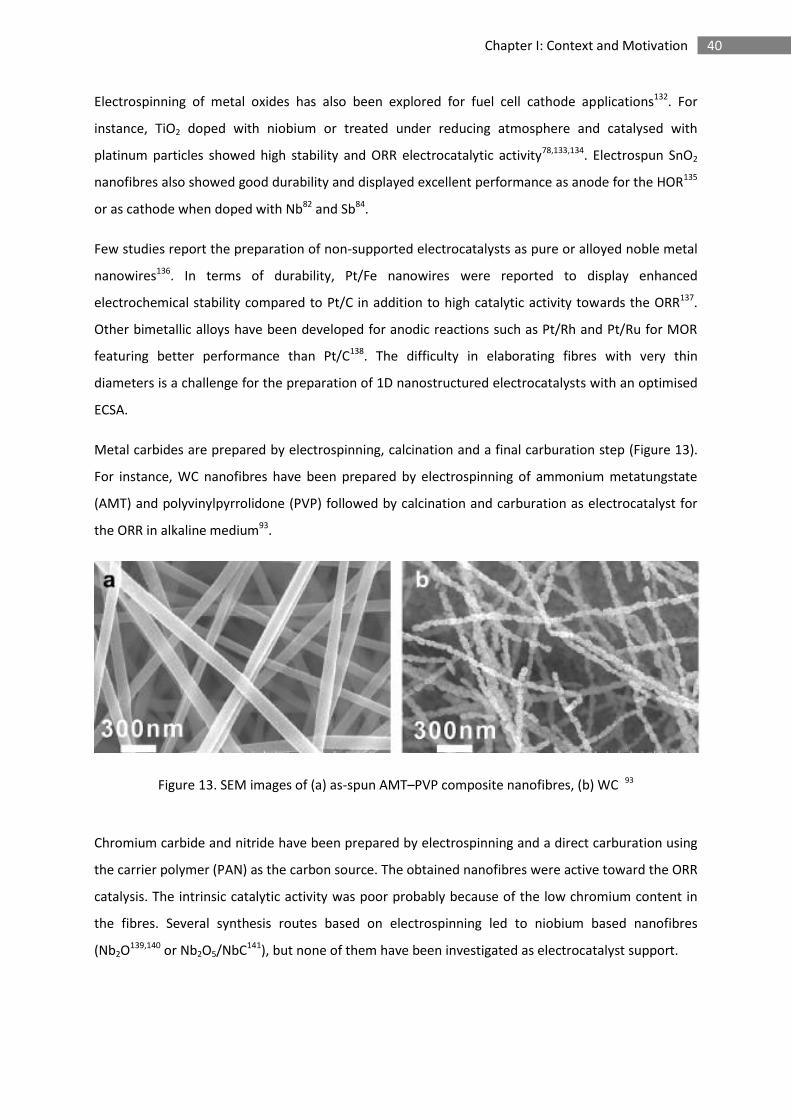
Metal carbides are prepared by electrospinning, calcination and a final carburation step (Figure 13).
For instance, WC nanofibres have been prepared by electrospinning of ammonium metatungstate
(AMT) and polyvinylpyrrolidone (PVP) followed by calcination and carburation as electrocatalyst for
the ORR in alkaline medium93.
Figure 13. SEM images of (a) as-spun AMT–PVP composite nanofibres, (b) WC 93
Chromium carbide and nitride have been prepared by electrospinning and a direct carburation using
the carrier polymer (PAN) as the carbon source. The obtained nanofibres were active toward the ORR
catalysis. The intrinsic catalytic activity was poor probably because of the low chromium content in
the fibres. Several synthesis routes based on electrospinning led to niobium based nanofibres
(Nb2O139,140 or Nb2O5/NbC141), but none of them have been investigated as electrocatalyst support.
41 Chapter I: Context and Motivation
C. Synthesis and deposition of Pt electrocatalysts
Several chemical and electrochemical methods can be used for the synthesis and deposition
of a metal catalyst on the support. The most common are described here, including impregnation,
colloid methods ("Bönnemann" method, microemulsion and polyol)142 and electrodeposition.
1. Pt nanoparticles
i. Impregnation method
In the impregnation method, the Pt salt (for example H2PtCl6) is reduced directly onto the support
either under a flow of H2 at around 300 °C or by using a reducing agent143. It is a very simple method,
which allows obtaining a good dispersion on the support with very small Pt nanoparticle size of
around 2 nm. One of the advantages of this method is the deposition of the Pt nanoparticles within
the pore structure of the support. The disadvantage of this method is the very poor Pt loading,
between 1 and 10 %wt, which is too low for PEMFC cathode application. The attempt to increase the
metal loading on the carbon support leads to a less homogeneous distribution of the particle size.
ii. Colloid methods
Since the impregnation method does not provide the control of Pt particle size and distribution
colloid methods were developed144. They consist on the reduction of platinum salt in solution,
followed by the adsorption of the Pt ions onto the support. Stabilising agents and surfactants allow
an efficient control of the metal nanoparticle size and prevent their agglomeration145. Ethylene glycol
is a suitable stabilising agent because it can be easily removed from the catalyst surface by a heat
treatment at 160 °C146. However regarding the low concentration of the metal particles, the colloidal
method requires a large amount of solvent that would be a disadvantage for up-scaled production.
In the so-called Bönnemann method, tetraalkylammonium salt acts as both the reducing agent and
the stabilising agent. It was used for the elaboration of Pt and Pt alloys particles in
tetrahydrofuran (THF). For example, PtRu and Pt3Sn particles were obtained with a very narrow
particle size distribution (2 nm diameter). Unlike ethylene glycol, this surfactant needs to be removed
by calcination at 300 °C which can damage the catalyst structure147.
42 Chapter I: Context and Motivation
The use of nanoreactors in a microemulsion is another possibility to control nucleation and growth
of metallic nanoparticles in order to obtain narrow size distributions. The surfactant acts as a
separator between the non-polar solvent and the water droplets in which the reduction of the metal
salt occurs148.
In the polyol method149,150 ethylene glycol plays the role of solvent, reducing agent and stabilising
agent. The latter is oxidized to aldehydes, carboxylic acid and CO2 and the platinum salt reduced to
metallic platinum. At high pH the glycolic acid groups dissociate into glycolate groups which stabilise
the platinum colloid by forming chelate-type complexes151. This mechanism of stabilisation allows
controlling the particles size with the concentration of glycolate and thus with the pH of the solution.
The higher is the pH the higher the concentration of glycolate and the smaller is the Pt particle size.
Other parameters such as precursor salt concentration, temperature and time of the reaction have
also major influence on the particles diameter. The usual reflux at 160 ° C for 3 h leads to 2 – 4 nm
particles for an initial pH set above 11152. This platinum particle diameter is close to the optimal size
for the ORR catalysis in acidic medium. Sattler and Ross153 and Peuckert154 have found a maximum
efficiency for 3.5 nm particles diameter (matching a mass activity of 40 A . g-1 at 0.9 V vs RHE for an
ECSA of 80 m2 . g-1Pt in phosphoric acid)153. They attributed it to the surface structure of smaller
particles155. However, other investigations performed by Takasu156 highlighted a plateau in
electrocatalytic activity in the range of particles with a diameter between 2 and 4.5 nm. Watanabe157,
Bregoli158 and Bett159 showed that the activity increases as the particles size decreases (with a mass
activity and ECSA maxima of respectively 160 A . g-1 at 0.85 V vs RHE and 200 m2 . g-1Pt obtained for
1.4 nm crystallite in sulphuric acid)157, but that diameters lower than 2 nm resulted in poor durability
due to spontaneous agglomeration and sintering49.
iii. Microwave-assisted polyol method
Polyol method was recently improved by the microwave assistance that shortens the conventional
3-hour reaction to 6 minutes78,160. Other advantages are also crucial, including homogeneous heating
and activation, high reaction rate and chemical yield. These assets result in a uniform nucleation and
growth suitable for the synthesis of nanoparticles with a narrow size distribution. Moreover given its
dielectric constant (ε = 41.2), ethylene glycol is appropriate for the rapid heating provided by the
microwave160.
43 Chapter I: Context and Motivation
2. Pt thin layers
Covering the support with a thin, contiguous and conformal platinum film is a beneficial alternative
to catalyse the support161. Such extended Pt surface will enhance the catalyst performance by
minimising the contribution of edge and corner usually composing the Pt particulate catalyst
resulting in much higher surface specific area activity towards the ORR162,163. By achieving sufficiently
thin coating, such structure will significantly increase the ORR mass activity compared to
conventional Pt particles164. This approach is also expected to improve the durability of the catalysed
support by protecting the support with a highly stable noble metal coverage that will be less
energetically subject to sintering and dissolution165,166 .
i. Physical vapour deposition and chemical vapour deposition
Physical vapour deposition (PVD) describes a family of coating processes that involve vacuum
evaporation and the subsequent condensation or the bombardment of the substrate to be coated
with energetic positively charged ions. The result of these physical processes is a very strong
adhesion between the coating and the tooling substrate and tailored physical, structural and
tribological properties of the film167. Chemical vapour deposition (CVD) is a chemical process that
uses a controlled atmosphere at high temperatures (1000 °C) to achieve reactions between various
gaseous phases and the heated surface of substrates within the reactor168,169. As different gases are
transported through the reactor, distinct coating layers are formed on the substrate. Films deposited
by CVD usually have better conformity than films deposited by PVD and therefore CVD is preferred
when conformal platinum films are needed.
ii. Atomic layer deposition
Atomic layer deposition (ALD) is a thin film deposition technique that can be considered as a special
modification of CVD. On the contrary to the conventional CVD, the precursors are introduced to the
reactor in alternate pulses that are separated by inert gas purging170. The film grows in a layer-by-
layer manner by precursor chemisorption on the substrate surface making the process self-limiting.
The thickness of the deposited films can be controlled accurately simply by the number of applied
growth cycles. It has a large variety of application such as microelectronics and catalysis. Few Pt ALD
processes have been reported for the elaboration of PEMFC electrode100,171,172. Among them, the
thermal ALD process using a platinum precursor and O2 gas has become the most widely used173.
44 Chapter I: Context and Motivation
iii. Electrodeposition
Electrodeposition consists on the surface modification of a conductive support by the reduction of a
metal salt in solution174. The challenge is to determine the conditions that lead preferentially to the
2D growth of a Pt monolayer than to 3D multilayer growth. Smooth Pt monolayer can be deposited
on Au substrates175, but practically it is only possible to obtain a partial Pt monolayer coverage. The
formation of a saturated adsorbed hydrogen layer is used to inhibit the 3D growth by quenching the
Pt deposition in order to cover the support with Pt islands176. Repeating this procedure through cyclic
pulses at the suitable potential allow achieving thin continuous platinum film.
iv. Exchange reactions
Surface exchange reactions177 are also being explored to prepare thin Pt films. Galvanic displacement
of Cu monolayer results in a monolayer coverage of the noble metal178. Using this technique on
previously prepared Cu nanowires, Pt coated copper nanowires have been synthesised as
electrocatalyst for the ORR resulting in an ECSA of 31 m2 . g-1 and high ORR catalytic activity179. This
method can be extended to various conductive supports with the deposition of a Cu monolayer
performed by under potential deposition (UPD)180 and galvanic displacement181. It represents a
convenient alternative strategy to direct platinum deposition since the copper film can be easily
removed making the electrodeposition easy to study182. However, various substrates would present
different amount and types of active sites towards the UPD that should be studied to optimise the
parameter of the deposition.
45 Chapter I: Context and Motivation
D. Conclusion
Proton exchange membrane fuel cells provide electricity with zero emissions at the point of use. The
technology has advanced to the point of commercialisation of a fuel cell vehicle in 2015 (Toyota) and
installation of thousands of domestic CHP systems in Japan. Pt particles supported on particulate
carbon blacks are the state of the art PEMFC electrocatalyst. However, insufficient electrochemical
stability of carbon at high potential excursions results in poor durability performance that requires
the development of alternative supports. The literature survey on non-carbon supports highlights the
suitability of transition metal carbides in terms of electrochemical stability and electronic
conductivity. Some of them are also intrinsically active towards the ORR, demonstrating the
possibility of synergic effects to promote electrocatalysis.
In this context, the work described in this manuscript aims at the development of transition metal
carbides with adapted properties and tuned morphologies to meet the requirements of PEMFC
electrocatalyst supports. Starting from a material already designed and investigated in the
laboratory, tungsten carbide porous microspheres105, we developed various chemical and physical
synthesis routes to niobium carbide nanomaterials and characterised them as electrocatalyst
supports. Particular attention was devoted to the control of surface area and porosity that are key
parameters for the support materials.
This manuscript describes a range of synthesis routes leading to the association of the chosen
carbide composition with different morphologies and dimensionalities leading to nanostructured
materials with high surface areas. These supports have been catalysed by deposition of platinum
nanoparticles synthesised by a microwave-assisted polyol method. They have been characterised by
their structural and morphological properties, and evaluated as electrocatalyst supports for the
oxygen reduction reaction. The results have been compared to a commercial carbon based catalysed
support in order to study the feasibility of a replacement of carbon black with a more stable material.
After the ex situ electrochemical characterisation by rotating disk electrode, membrane electrode
assemblies were prepared with the most promising catalysed supports in order to investigate them
in a single fuel cell.
46 Chapter I: Context and Motivation
E. References
1. J. Hansen, P. Kharecha, M. Sato, V. Masson-Delmotte, F. Ackerman, D. J. Beerling, P. J. Hearty, O. Hoegh-Guldberg, S.-L. Hsu, C. Parmesan, J. Rockstrom, E. J. Rohling, J. Sachs, P. Smith, K. Steffen, L. Van Susteren, K. von Schuckmann and J. C. Zachos, PLoS One, 2013, 8, 81648.
2. F. Birol, Paris Int. Energy Agency, 2008.
3. M. Specht, Int. J. Hydrogen Energy, 1998, 23, 387–396.
4. Danish Energy Agency, Danish Clim. Energy Policy, 2012. (http://www.ens.dk/en/policy/danish-climate-energy-policy)
5. F. Barbir, Int. J. Hydrogen Energy, 1996, 21, 891–901.
6. S. Maass, F. Finsterwalder, G. Frank, R. Hartmann and C. Merten, J. Power Sources, 2008, 176, 444–451.
7. U. Eberle, B. Müller and R. von Helmolt, Energy Environ. Sci., 2012, 5, 8780.
8. C. Sealy, Mater. Today, 2008, 11, 65–68.
9. L. Blomen and M. Mugerwa, Fuel cell systems, ch. 1 The first century, Springer Science & Business Media, 2013, 19-24.
10. G. Acres, J. Power Sources, 2001, 100, 60–66.
11. J. Lippert, Toyota plans mirai fuel-cell car traveling 300 miles per tank, 2014. (http://www.bloomberg.com/news/articles/2014-11-17)
12. M. C. Williams, J. P. Strakey and W. A. Surdoval, J. Power Sources, 2005, 143, 191–196.
13. N. Behling, Fuel cells: current technology challenges and future research needs, Ch. 1 Introduction, Newness, 2012, 1-6.
14. F. Alcaide, P.-L. Cabot and E. Brillas, J. Power Sources, 2006, 153, 47–60.
47 Chapter I: Context and Motivation
15. S. Basu, Fuel Cell Science and Technology, Ch. 1 Introduction, Springer, 2007 1-10.
16. B. C. Steele and A. Heinzel, Nature, 2001, 414, 345–52.
17. Breakthrough Technologies Institute, fuel cell 2000, 2015. (http://www.fuelcells.org/base.cgim?template=types_of_fuel_cells)
18. J. Larminie, A. Dicks and M. McDonald, Fuel cell systems explained, Ch. 1 Introduction, 2003, 1-24.
19. D. Wilkinson, J. Zhang, R. Hui, J. Fergus and X. Li, Proton exchange membrane fuel cells:
materials properties and performance, 2009.
20. W. Sung, Y. Song, K. Yu and T. Lim, Recent Advances in the Development of Hyundai· Kia’s Fuel Cell Electric Vehicles, 2010. (http://papers.sae.org/2010-01-1089)
21. T. Nakajima, Fuel cells & hydrogen for sustainable transport, 2009.
(http://hydrogenlink.net/download/pictures/h2cop15/2_honda-fuelcell-vehicles-copenhagen.pdf)
22. N. M. Markovic, B. N. Grgur and P. N. Ross, J. Phys. Chem. B, Mater. surfaces, interfaces
Biophys., 101, 5405–5413.
23. P. M. Quaino, J. L. Fernández, M. R. Gennero de Chialvo and A. C. Chialvo, J. Mol. Catal. A Chem., 2006, 252, 156–162.
24. L. Su, W. Jia, C.-M. Li and Y. Lei, ChemSusChem, 2014, 7, 361–78.
25. M. Winter and R. J. Brodd, Chem. Rev., 2004, 104, 4245–4269.
26. C. Sanchez and A. Bard, Anal. Chem., 2009, 81, 8094–8100.
27. L. Zhang and Z. Xia, J. Phys. Chem. C, 2011, 115, 11170–11176.
28. E. Yeager, J. Mol. Catal., 1986, 38, 5–25.
48 Chapter I: Context and Motivation
29. J. Zhang, PEM Fuel Cell Electrocatalysts and Catalyst Layers: Fundamentals and Applications, ch. 1 PEM Fuel Cell Fundamentals, Springer, 2008, 1-79.
30. V. Zhdanov and B. Kasemo, Electrochem. commun., 2006, 8, 1132–1136.
31. J. X. Wang, F. A. Uribe, T. E. Springer, J. Zhang and R. R. Adzic, Faraday Discuss., 2008, 140, 347–62; discussion 417–37.
32. V. Stamenković, T. J. Schmidt, P. N. Ross and N. M. Marković, J. Electroanal. Chem., 2003, 554-555, 191–199.
33. D. A. Walsh, A. Ejigu, J. Smith and P. Licence, Phys. Chem. Chem. Phys., 2013, 15, 7548–54.
34. L. Giorgi, E. Antolini, A. Pozio and E. Passalacqua, Electrochim. Acta, 1998, 43, 3675–3680.
35. J. Chen, T. Matsuura and M. Hori, J. Power Sources, 2004, 131, 155–161.
36. R. O’Hayre, D. Barnett and F. Prinz, Electrochemical proceedings : Proton Conducting Membrane fuel cells IV, 2006, 2004-21, 23-37.
37. R. O’Hayre, D. Barnett and F. Prinz, J. Electrochem. Soc., 2005, 152, A439–A444.
38. D. J. Jones, in Global Change, Energy Issues and Regulation Policies, vol. 2, Ch. 8 Introduction
to hydrogen and fuel cell technologies and their contribution to a sustainable energy future, Springer Netherlands, 2013, 161–178.
39. S. Subianto, M. Pica, M. Casciola, P. Cojocaru, L. Merlo, G. Hards and D. J. Jones, J. Power Sources, 2013, 233, 216–230.
40. L. Li, L. Hu, J. Li and Z. Wei, Nano Res., 2015, 8, 418–440.
41. Y. Shao, G. Yin, Y. Gao and P. Shi, J. Electrochem. Soc., 2006, 153, A1093.
42. F. Büchi, M. Inaba and T. Schmidt, in Polymer electrolyte fuel cell durability, Ch. 1 stack component-catalyst-dissolution and stabilization of platinum in oxygen cathod, Springer, 2009, 7–29.
43. J. Speder, A. Zana, I. Spanos, J. J. K. Kirkensgaard, K. Mortensen, M. Hanzlik and M. Arenz, J. Power Sources, 2014, 261, 14–22.
49 Chapter I: Context and Motivation
44. S. Guo and S. Sun, J. Am. Chem. Soc., 2012, 134, 2492–5.
45. X. Zhou, J. Qiao, L. Yang and J. Zhang, Adv. Energy Mater., 2014, 4, 1-25. 46. A.-F. Che, V. Germain, M. Cretin, D. Cornu, C. Innocent and S. Tingry, New J. Chem., 2011, 35,
2848–2853.
47. R. Makharia, S. Kocha, P. Yu, M. A. Sweikart, W. Gu, F. Wagner and H. A. Gasteiger, ECS Trans., 2006, 1, 3–18.
48. K. Kinoshita, Carbon: electrochemical and physicochemical properties, John Wiley Sons, 1988.
49. Y. Shao, G. Yin and Y. Gao, J. Power Sources, 2007, 171, 558–566.
50. F. N. Büchi, M. Inanba and T. J. Schmidt, Eds., Polymer Electrolyte Fuel Cell Durability, Springer-Verlag, New York, 2009.
51. M. Mathias, R. Makharia and H. Gasteiger, electrocheical Soc. Interface, 2005, 14, 24–35.
52. M. Oszcipok, M. Zedda, D. Riemann and D. Geckeler, J. Power Sources, 2006, 154, 404–411.
53. T. F. Fuller, J. Electrochem. Soc., 1993, 140, 1218.
54. T. W. Patterson and R. M. Darling, Electrochem. Solid-State Lett., 2006, 9, A183.
55. H. Tang, Z. Qi, M. Ramani and J. F. Elter, J. Power Sources, 2006, 158, 1306–1312.
56. C. Reiser, L. Bregoli and T. Patterson, Electrochem. Solid-State Lett., 2005, 8, A273.
57. L. Dubau, L. Castanheira, F. Maillard, M. Chatenet, O. Lottin, G. Maranzana, J. Dillet, A. Lamibrac, J.-C. Perrin, E. Moukheiber, A. ElKaddouri, G. De Moor, C. Bas, L. Flandin and N. Caqué, Wiley Interdiscip. Rev. Energy Environ., 2014, 3, 540–560.
58. D. Rohendi, E. H. Majlan, A. B. Mohamad, W. R. W. Daud, A. A. H. Kadhum and L. K. Shyuan, Int. J. Hydrogen Energy, 2015, 40, 10960–10968.
59. H. Gasteiger, W. Gu and R. Makharia, in Handbook Of Fuel Cell: Fundamentals Technology And Application, effisciency loss contributions, Wiley & sons, 2003.
50 Chapter I: Context and Motivation
60. A. Honji, J. Electrochem. Soc., 1988, 135, 355.
61. G. A. Gruver, J. Electrochem. Soc., 1980, 127, 1219.
62. V. Komanicky, K. C. Chang, A. Menzel, N. M. Markovic, H. You, X. Wang and D. Myers, J. Electrochem. Soc., 2006, 153, B446.
63. D. C. Johnson, D. T. Napp and S. Bruckenstein, Electrochim. Acta, 1970, 15, 1493–1509.
64. X. Wang, R. Kumar and D. J. Myers, Electrochem. Solid-State Lett., 2006, 9, A225.
65. K. Kinoshita, J. T. Lundquist and P. Stonehart, J. Electroanal. Chem. Interfacial Electrochem., 1973, 48, 157–166.
66. Y. Shao-Horn, W. C. Sheng, S. Chen, P. J. Ferreira, E. F. Holby and D. Morgan, Top. Catal., 2007, 46, 285–305.
67. Q. Li, R. He, J.-A. Gao, J. O. Jensen and N. J. Bjerrum, J. Electrochem. Soc., 2003, 150, A1599.
68. M. Cai, M. S. Ruthkosky, B. Merzougui, S. Swathirajan, M. P. Balogh and S. H. Oh, J. Power Sources, 2006, 160, 977–986.
69. Y. Yu, H. Li, H. Wang, X-Z. Yuan, G. Wang and M. Pan, 2012, Journal of Power Sources, 205, 10–23.
70. S. Sharma and B. G. Pollet, J. Power Sources, 2012, 208, 96–119.
71. K. Sasaki, F. Takasaki and Z. Noda, ECS Trans., 2010, 33, 473–482.
72. F. Takasaki, S. Matsuie, Y. Takabatake, Z. Noda, a. Hayashi, Y. Shiratori, K. Ito and K. Sasaki, J. Electrochem. Soc., 2011, 158, B1270.
73. K. Kanda, Z. Noda, Y. Nagamatsu, T. Higashi, S. Taniguchi, S. M. Lyth, A. Hayashi and K. Sasaki, ECS Electrochem. Lett., 2014, 3, F15–F18.
74. S. J. Tauster, Acc. Chem. Res., 1987, 20, 389–394.
51 Chapter I: Context and Motivation
75. J. Shim, C.-R. Lee, H.-K. Lee, J.-S. Lee and E. J. Cairns, J. Power Sources, 2001, 102, 172–177.
76. S. H. S. Kang, Y. Y.-E. Sung and W. W. H. Smyrl, J. Electrochem. Soc., 2008, 155, B1128.
77. Z. Zhang, J. Liu, J. Gu, L. Su and L. Cheng, Energy Environ. Sci., 2014, 7, 2535-2558.
78. I. Savych, J. Bernard d’Arbigny, S. Subianto, S. Cavaliere, D. J. Jones and J. Rozière, J. Power Sources, 2014, 257, 147–155.
79. P. J. Kulesza, J. Electrochem. Soc., 1989, 136, 707.
80. P. J. Kulesza, B. Grzybowska, M. A. Malik, M. Chojak and K. Miecznikowski, J. Electroanal. Chem., 2001, 512, 110–118.
81. M. Watanabe, S. Venkatesan and H. Laitinen, J. Electrochem. Soc., 1983, 130, 59–64.
82. I. Savych, S. Subianto, Y. Nabil, S. Cavaliere, D. Jones and J. Rozière, Phys. Chem. Chem. Phys.,
2015, 17, 16970–16976.
83. Y. Wang, T. Brezesinski, M. Antonietti and B. Smarsly, ACS Nano, 2009, 3, 1373–1378.
84. S. Cavaliere, I. Jiménez-Morales, G. Ercolano, I. Savych, D. Jones and J. Rozière, ChemElectroChem, 2015, n/a–n/a.
85. S.-Y. Huang, P. Ganesan and B. N. Popov, Appl. Catal. B Environ., 2011, 102, 71–77.
86. J. Ma, A. Habrioux and N. Alonso-Vante, ChemElectroChem, 2014, 1, 37–46.
87. Y. Liu, T. G. Kelly, J. G. Chen and W. E. Mustain, ACS Catal., 2013, 3, 1184–1194.
88. O. T. M. Musthafa, S. Sampath and O. Muhammedá, Chem. Commun., 2008, 1, 67–69.
89. H. Zhong, H. Zhang, G. Liu, Y. Liang, J. Hu and B. Yi, Electrochem. commun., 2006, 8, 707–712.
90. G. Liu, H. M. Zhang, M. R. Wang, H. X. Zhong and J. Chen, J. Power Sources, 2007, 172, 503–510.
91. F. Mazza and S. Trassatti, J. Electrochem. Soc., 1963, 110, 847.
52 Chapter I: Context and Motivation
92. M. Voïnov, D. Bühler and H. Tannenberger, J. Electrochem. Soc., 1971.
93. X. S. Zhou, Y. J. Qiu, J. Yu, J. Yin and S. Gao, Int. J. Hydrogen Energy, 2011, 36, 7398–7404.
94. R. Levy and M. Boudart, Science, 181, 1973, 54773c9.
95. B. Hammer and J. K. Nørskov, Impact of Surface Science on Catalysis, Elsevier, 2000, vol. 45.
96. H. Pan, J. Zang, X. Li and Y. Wang, Carbon N. Y., 2014, 69, 630–633.
97. H. Zheng, Z. Chen, Y. Li and C. Ma, Electrochim. Acta, 2013, 108, 486–490.
98. Y. Ohgi, A. Ishihara, K. Matsuzawa, S. Mitsushima, K. Ota, M. Matsumoto and H. Imai, Electrochim. Acta, 2012, 68, 192–197.
99. L. Yang, Y. C. Kimmel, Q. Lu and J. G. Chen, J. Power Sources, 2015, 287, 196–202.
100. I. J. Hsu, D. A. Hansgen, B. E. McCandless, B. G. Willis and J. G. Chen, J. Phys. Chem. C, 2011, 115, 3709–3715.
101. T. G. Kelly, K. X. Lee and J. G. Chen, J. Power Sources, 2014, 271, 76–81.
102. P. Justin, P. H. K. Charan and G. R. Rao, Appl. Catal. B Environ., 2014, 144, 767–774.
103. G.-H. Song, M.-Q. Shi, Y.-Q. Chu and C.-A. Ma, Electrochim. Acta, 2013, 112, 53–58.
104. C. Xu, M. Shi, L. Kang and C. Ma, Mater. Lett., 2013, 91, 183–186.
105. J. Bernard D’Arbigny, G. Taillades, M. Marrony, D. J. Jones and J. Rozière, Chem. Commun., 2011, 47, 7950–7952.
106. Y. Wang, S. Q. Song, V. Maragou, P. K. Shen and P. Tsiakaras, Appl. Catal. B-Environmental, 2009, 89, 223–228.
107. C. Tang, D. Wang, Z. Wu and B. Duan, Int. J. Hydrogen Energy, 2015, 40, 3229–3237.
108. G. Cui, P. K. Shen, H. Meng, J. Zhao and G. Wu, J. Power Sources, 2011, 196, 6125–6130.
53 Chapter I: Context and Motivation
109. Z. Yan, J. Xie and P. K. Shen, J. Power Sources, 2015, 286, 239–246.
110. S. Sui, L. Ma and Y. Zhai, J. Power Sources, 2011, 196, 5416–5422.
111. Y. Liu and W. E. Mustain, ACS Catal., 2011, 1, 212–220.
112. S. N. Stamatin, J. Speder, R. Dhiman, M. Arenz and E. M. Skou, ACS Appl. Mater. Interfaces, 2015, 7, 6153–6161.
113. Z. Qiu, H. Huang, J. Du, T. Feng, W. Zhang, Y. Gan and X. Tao, J. Phys. Chem. C, 2013, 117, 13770–13775.
114. H. Liu, F. Wang, Y. Zhao and H. Fong, Nanoscale, 2013, 5, 3643–3647.
115. J.-S. Moon, Y.-W. Lee, S.-B. Han and K.-W. Park, Int. J. Hydrogen Energy, 2014, 39, 7798–7804.
116. H. Wang, Y. Ma, W. Lv, S. Ji, J. Key and R. Wang, J. Electrochem. Soc., 2015, 162, H79–H85.
117. S. Subianto, S. Giancola, G. Ercolano, Y. Nabil, D. Jones, J. Rozière, and S. Cavaliere, Electrospinning for Advanced Energy and Environmental Applications, ch. 2 Electrospun Nanofibers for Low-Temperature Proton Exchange Membrane Fuel Cells, CRCPress, 29-61, 2015.
118. J. Cooley, US Pat. 692,631, 1902. 119. D. S. E. Anthony and L. Andrady, US Pat. 7297305 B2, 2007.
120. G. Taylor, Proc. R. Soc. A Math. Phys. Eng. Sci., 1969, 313, 453–475.
121. W. E. Teo and S. Ramakrishna, Nanotechnology, 2006, 17, R89–R106.
122. D. H. Reneker and A. L. Yarin, Polymer (Guildf)., 2008, 49, 2387–2425.
123. G. Taylor, Proc. R. Soc. London. Ser. A. Math. Phys. Sci. , 1964, 280 , 383–397.
124. R. Ramaseshan, S. Sundarrajan, R. Jose and S. Ramakrishna, J. Appl. Phys., 2007, 102, 111101.
125. a. F. Lotus, E. T. Bender, E. a. Evans, R. D. Ramsier, D. H. Reneker and G. G. Chase, J. Appl. Phys., 2008, 103, 024910.

54 Chapter I: Context and Motivation
126. S. Huang, H. Wu, M. Zhou, C. Zhao, Z. Yu, Z. Ruan and W. Pan, NPG Asia Mater., 2014, 6, e86.
127. C. Mit-uppatham, M. Nithitanakul and P. Supaphol, Macromol. Chem. Phys., 2004, 205, 2327–2338.
128. F. Coloma, A. Sepulvedaescribano and F. Rodriguezreinoso, J. Catal., 1995, 154, 299–305.
129. J. J.-H. Park, Y.-W. Y. Ju, S.-H. S. Park, H. H.-R. Jung, K.-S. Yang and W.-J. Lee, J. Appl. Electrochem., 2009, 39, 1229–1236.
130. C. A. Bessel, K. Laubernds, N. M. Rodriguez and R. T. K. Baker, J. Phys. Chem. B, 2001, 105, 1115–1118.
131. I.-S. Park, K.-W. Park, J.-H. Choi, C. R. Park and Y.-E. Sung, Carbon N. Y., 2007, 45, 28–33.
132. Y.-J. Wang, D. P. Wilkinson and J. Zhang, Chem. Rev., 2011, 111, 7625–51.
133. A. Bauer, L. Chevallier, R. Hui, S. Cavaliere, J. Zhang, D. Jones and J. Rozière, Electrochim. Acta, 2012, 77, 1–7.
134. S. Cavaliere, S. Subianto, L. Chevallier, D. J. Jones and J. Rozière, Chem. Commun. (Camb)., 2011, 47, 6834–6836.
135. A. A. B. Suryamas, G. M. G. Anilkumar, S. Sago, T. Ogi and K. Okuyama, Catal. Commun., 2013, 33, 11–14.
136. H. J. Kim, Y. S. Kim, M. H. Seo, S. M. Choi, J. Cho, G. W. Huber and W. B. Kim, Electrochem. commun., 2010, 12, 32–35.
137. J. Shui, C. Chen and J. C. M. Li, Adv. Funct. Mater., 2011, 21, 3357–3362.
138. Y. S. Kim, S. H. Nam, H.-S. Shim, H.-J. Ahn, M. Anand and W. B. Kim, Electrochem. commun., 2008, 10, 1016–1019.
139. A. Le Viet, M. V. Reddy, R. Jose, B. V. R. Chowdari and S. Ramakrishna, J. Phys. Chem. C, 2010, 114, 664–671.
140. J. Rajan, P. S. Archana, A. Le Viet, Q. L. Bao, K. P. Loh, M. Muhammad Yusoff, G. N. M. A.
55 Chapter I: Context and Motivation
Kumar and S. Ramakrishna, Adv. Mater. Res., 2012, 545, 21–26.
141. K. Nakane, M. Morinaga and N. Ogata, J. Mater. Sci., 2013, 48, 7774–7779.
142. K.-Y. Chan, J. Ding, J. Ren, S. Cheng and K. Y. Tsang, J. Mater. Chem., 2004, 14, 505.
143. E. Antolini, J. Mater. Sci., 38, 2995–3005.
144. C. Coutanceau, S. Brimaud, C. Lamy, J.-M. Léger, L. Dubau, S. Rousseau and F. Vigier, Electrochim. Acta, 2008, 53, 6865–6880.
145. A. Esmaeilifar, S. Rowshanzamir, M. H. Eikani and E. Ghazanfari, Energy, 2010, 35, 3941–3957.
146. E. Lebègue, S. Baranton and C. Coutanceau, J. Power Sources, 2011, 196, 920–927.
147. H. Bönnemann and R. Brinkmann, J. New Mater. Electrochem. Syst., 2000, 3, 199–206.
148. M. Boutonnet, J. Kizling, P. Stenius and G. Maire, Colloids and Surfaces, 1982, 5, 209–225.
149. F. Fievet, J. Lagier, B. Blin, B. Beaudoin and M. Figlarz, Solid State Ionics, 1989, 33, 198–205.
150. G. Viau, P. Toneguzzo and A. Pierrard, Scr. Mater., 2001, 44, 2263–2267.
151. C. Bock, C. Paquet, M. Couillard, G. A. Botton and B. R. MacDougall, J. Am. Chem. Soc., 2004, 126, 8028–37.
152. H.-S. Oh, J.-G. Oh, Y.-G. Hong and H. Kim, Electrochim. Acta, 2007, 52, 7278–7285.
153. M. L. Sattler and P. N. Ross, Ultramicroscopy, 1986, 20, 21–28.
154. M. Peuckert, J. Electrochem. Soc., 1986, 133, 944.
155. N. Markovic, H. Gasteiger and P. N. Ross, J. Electrochem. Soc., 1997, 144, 1591–1597.
156. Y. Takasu, N. Ohashi, X.-G. Zhang, Y. Murakami, H. Minagawa, S. Sato and K. Yahikozawa, Electrochim. Acta, 1996, 41, 2595–2600.
157. M. Watanabe, S. Saegusa and P. Stonehart, Chem. Lett., 1988, 9, 1487–1490.
56 Chapter I: Context and Motivation
158. L. J. Bregoli, Electrochim. Acta, 1978, 23, 489–492.
159. J. Bett, J. Lundquist, E. Washington and P. Stonehart, Electrochim. Acta, 1973, 18, 343–348.
160. M. Tsuji, M. Hashimoto, Y. Nishizawa, M. Kubokawa and T. Tsuji, Chemistry, 2005, 11, 440–52.
161. C. T. Campbell, Surf. Sci. Rep., 1997, 27, 1–111.
162. N. M. Marković, T. J. Schmidt, V. Stamenković and P. N. Ross, Fuel Cells, 2001, 1, 105–116.
163. N. Kristian and X. Wang, Electrochem. commun., 2008, 10, 12–15.
164. V. Stamenkovic, B. S. Mun, K. J. J. Mayrhofer, P. N. Ross, N. M. Markovic, J. Rossmeisl, J. Greeley and J. K. Nørskov, Angew. Chemie, 2006, 118, 2963–2967.
165. R. R. Adzic, J. Zhang, K. Sasaki, M. B. Vukmirovic, M. Shao, J. X. Wang, a. U. Nilekar, M. Mavrikakis, J. a. Valerio and F. Uribe, Top. Catal., 2007, 46, 249–262.
166. K. Sasaki, J. . Wang, M. Balasubramanian, J. McBreen, F. Uribe and R. . Adzic, Electrochim. Acta, 2004, 49, 3873–3877.
167. R. F. Bunshah, J. Vac. Sci. Technol. A Vacuum, Surfaces, Film., 1985, 3, 553.
168. S. Yamazaki, US Pat. 4,869,923, 1989.
169. J. Crawley and V. Saywell, US Pat. 5,871,586, 1999.
170. M. Leskelä and M. Ritala, Thin Solid Films, 2002, 409, 138–146.
171. C. Liu, C.-C. Wang, C.-C. Kei, Y.-C. Hsueh and T.-P. Perng, Small, 2009, 5, 1535–8.
172. M. Lashdaf, J. Lahtinen, M. Lindblad, T. Venäläinen and A. O. I. Krause, Appl. Catal. A Gen., 2004, 276, 129–137.
173. H. C. M. Knoops, a. J. M. Mackus, M. E. Donders, M. C. M. van de Sanden, P. H. L. Notten and W. M. M. Kessels, Electrochem. Solid-State Lett., 2009, 12, G34.
57 Chapter I: Context and Motivation
174. A. Arvia, J. New Mater. Electrochem. Syst., 2004, 7, 133–144.
175. T. Kondo, M. Shibata, N. Hayashi, H. Fukumitsu, T. Masuda, S. Takakusagi and K. Uosaki, Electrochim. Acta, 2010, 55, 8302–8306.
176. Y. Liu, D. Gokcen, U. Bertocci and T. P. Moffat, Science, 2012, 338, 1327–30.
177. D. Gokcen, S.-E. Bae and S. R. Brankovic, Electrochim. Acta, 2011, 56, 5545–5553.
178. S. R. Brankovic, J. X. Wang and R. R. Adžić, Surf. Sci., 2001, 474, L173–L179.
179. S. M. Alia, K. Jensen, C. Contreras, F. Garzon, B. Pivovar and Y. Yan, ACS Catal., 2013, 3, 358–362.
180. V. Sudha and M. Sangaranarayanan, J. Phys. Chem. B, 2002, 106, 2699–2707.
181. H. Tang, J. H. Chen, M. Y. Wang, L. H. Nie, Y. F. Kuang and S. Z. Yao, Appl. Catal. A Gen., 2004, 275, 43–48.
182. M. Khosravi and M. K. Amini, Int. J. Hydrogen Energy, 2010, 35, 10527–10538.
58 Chapter I: Context and Motivation
F. Table of Figures
Figure 1. Specifications of the different fuel cells types (electrolyte, fuel and operating temperature
range)17. ................................................................................................................................................. 13
Figure 2. Chart summarising the applications and characteristics of the various types of fuel cell18. 14
Figure 3. Schematic diagram of the principle of PEMFC operation ...................................................... 15
Figure 4. Griffiths (17a), Yeager (17b) and Pauling (17c) adsorption models. ...................................... 19
Figure 5. Volcano plot of precious metal for the oxygen reduction reaction22. ................................... 20
Figure 6. Exploded-view drawing of fuel cell components. .................................................................. 23
Figure 7. ORR and HOR reaction centres in the electrode in MEA ....................................................... 25
Figure 8. Nafion chemical structure. ..................................................................................................... 26
Figure 9. Schematic illustration of electrode reactions occurring for start/stop-induced carbon
corrosion in the cathode42 ……………………………………………………………………………………………………………27
Figure 10. Degradation mechanisms of carbon-supported Pt nanocatalysts66 .................................... 30
Figure 11. Nanofibres formation by electrospinning. ........................................................................... 37
Figure 12. Electrospinning setup with a rotating drum as a target. ...................................................... 38
Figure 13. SEM images of (a) as-spun AMT–PVP composite nanofibres, (b) WC (pristine) 95 .............. 39

59 Chapter II : Niobium Carbide Nanostructures as Electrocatalyst Support
Chapter II: Niobium carbide nanostructures as electrocatalyst support
60 Chapter II : Niobium Carbide Nanostructures as Electrocatalyst Support
A. Introduction
This chapter describes the synthesis and characterisation of nanostructured NbC based
electrocatalyst supports. The choice of niobium carbide has been justified by a preliminary
investigation of the stability and electrical conduction properties of commercial bulk NbC. This study
showed a suitable chemical stability in sulphuric acid at 80 °C, a BET surface area of 1 m2 . g-1
calculated from the N2 adsorption/desorption and an electrical conductivity of 18 S . m-1 at 20 °C. This
value is 2 orders of magnitude lower than that obtained for carbon Vulcan XC 72 (5 – 14 102 S . m-1 at
20° C) but makes it a better candidate as electrocatalyst support than other carbides e.g. tantalum
carbide (6 S . m-1). (Conductivities were measured with an in house device using the Van der Pauw
method. Further details concerning this characterisation are reported in the Experimental Annex).
The expected low surface area of bulk niobium carbide justifies the synthesis of a NbC based
nanomaterial with a controlled morphology that will provide the required porosity. The
characterisation of this material sets up the characterisation protocol that will be applied to the
other synthesised materials presented in chapters III and IV.
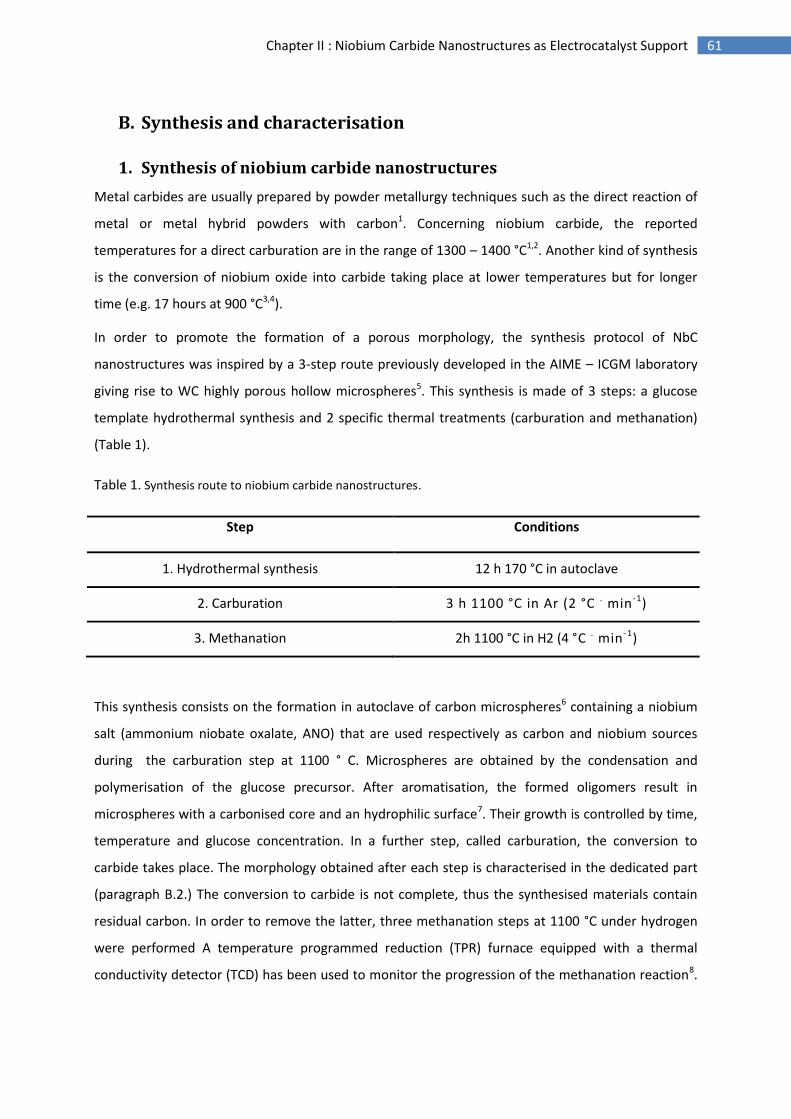
61 Chapter II : Niobium Carbide Nanostructures as Electrocatalyst Support
B. Synthesis and characterisation
1. Synthesis of niobium carbide nanostructures
Metal carbides are usually prepared by powder metallurgy techniques such as the direct reaction of
metal or metal hybrid powders with carbon1. Concerning niobium carbide, the reported
temperatures for a direct carburation are in the range of 1300 – 1400 °C1,2. Another kind of synthesis
is the conversion of niobium oxide into carbide taking place at lower temperatures but for longer
time (e.g. 17 hours at 900 °C3,4).
In order to promote the formation of a porous morphology, the synthesis protocol of NbC
nanostructures was inspired by a 3-step route previously developed in the AIME – ICGM laboratory
giving rise to WC highly porous hollow microspheres5. This synthesis is made of 3 steps: a glucose
template hydrothermal synthesis and 2 specific thermal treatments (carburation and methanation)
(Table 1).
Table 1. Synthesis route to niobium carbide nanostructures.
Step Conditions
1. Hydrothermal synthesis 12 h 170 °C in autoclave
2. Carburation 3 h 1100 °C in Ar (2 °C . min-1)
3. Methanation 2h 1100 °C in H2 (4 °C . min-1)
This synthesis consists on the formation in autoclave of carbon microspheres6 containing a niobium
salt (ammonium niobate oxalate, ANO) that are used respectively as carbon and niobium sources
during the carburation step at 1100 ° C. Microspheres are obtained by the condensation and
polymerisation of the glucose precursor. After aromatisation, the formed oligomers result in
microspheres with a carbonised core and an hydrophilic surface7. Their growth is controlled by time,
temperature and glucose concentration. In a further step, called carburation, the conversion to
carbide takes place. The morphology obtained after each step is characterised in the dedicated part
(paragraph B.2.) The conversion to carbide is not complete, thus the synthesised materials contain
residual carbon. In order to remove the latter, three methanation steps at 1100 °C under hydrogen
were performed A temperature programmed reduction (TPR) furnace equipped with a thermal
conductivity detector (TCD) has been used to monitor the progression of the methanation reaction8.
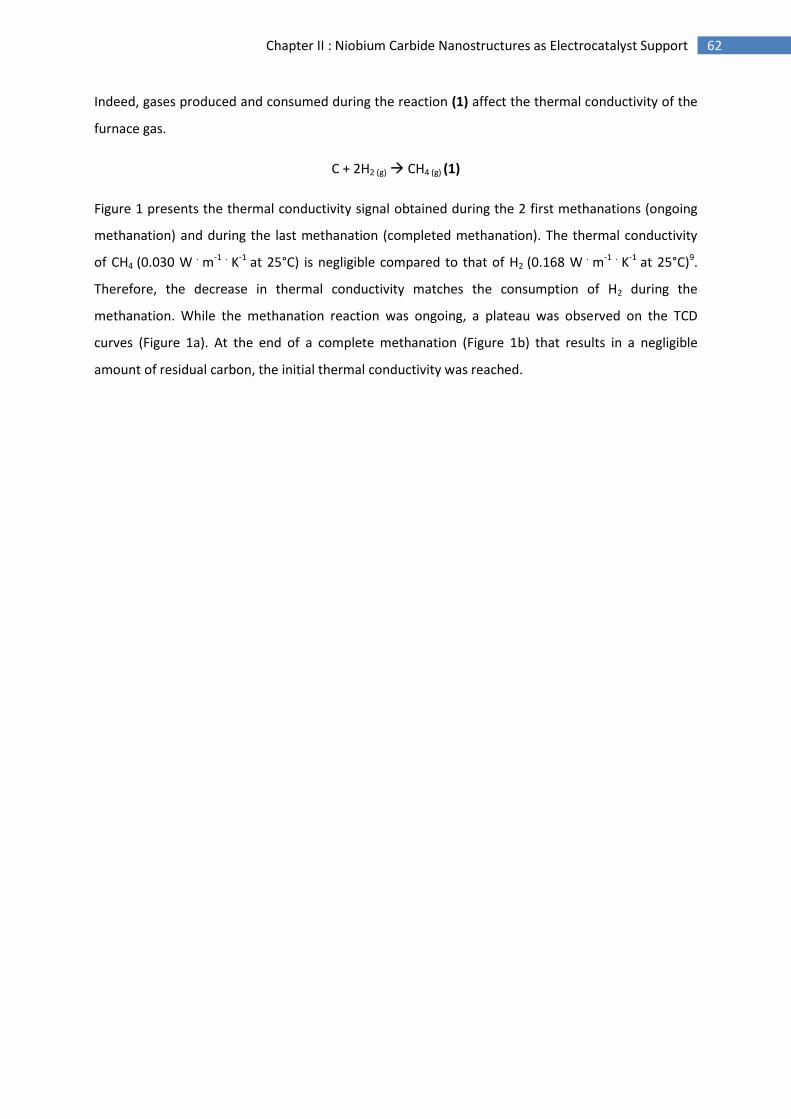
62 Chapter II : Niobium Carbide Nanostructures as Electrocatalyst Support
Indeed, gases produced and consumed during the reaction (1) affect the thermal conductivity of the
furnace gas.
C + 2H2 (g) CH4 (g) (1)
Figure 1 presents the thermal conductivity signal obtained during the 2 first methanations (ongoing
methanation) and during the last methanation (completed methanation). The thermal conductivity
of CH4 (0.030 W . m-1 . K-1 at 25°C) is negligible compared to that of H2 (0.168 W . m-1 . K-1 at 25°C)9.
Therefore, the decrease in thermal conductivity matches the consumption of H2 during the
methanation. While the methanation reaction was ongoing, a plateau was observed on the TCD
curves (Figure 1a). At the end of a complete methanation (Figure 1b) that results in a negligible
amount of residual carbon, the initial thermal conductivity was reached.
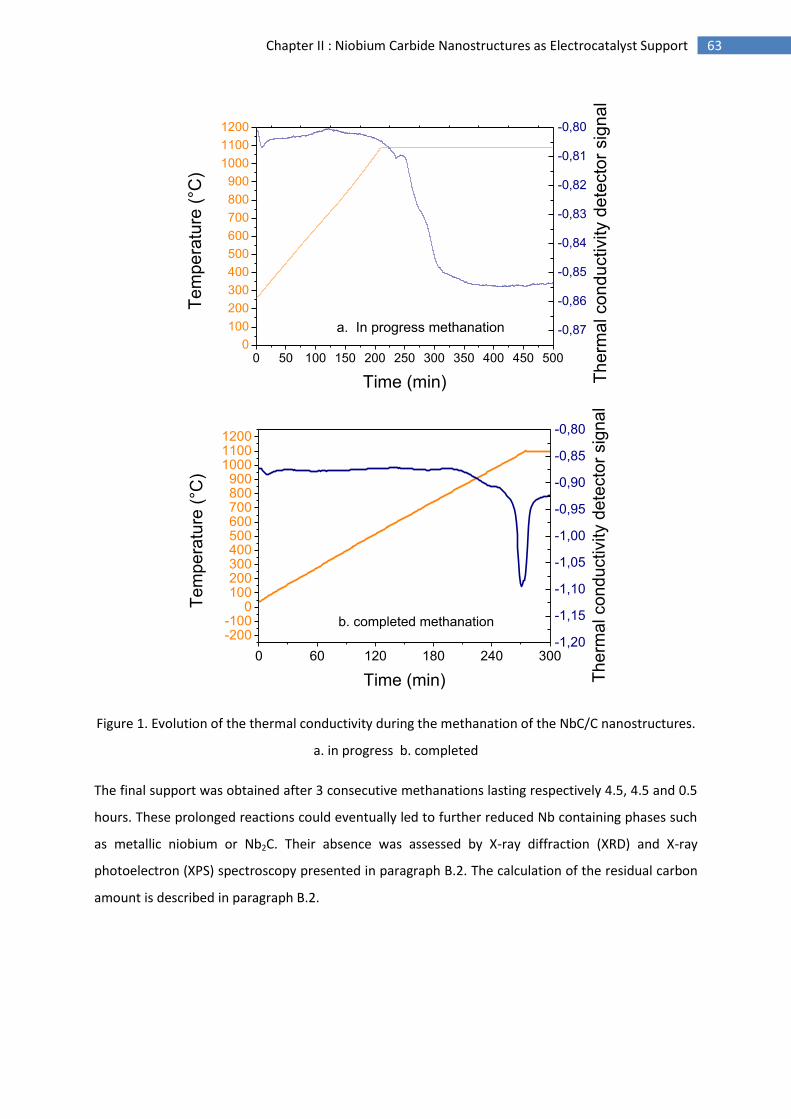
63 Chapter II : Niobium Carbide Nanostructures as Electrocatalyst Support
0 50 100 150 200 250 300 350 400 450 5000
100
200
300
400
500
600
700
800
900
1000
1100
1200
Tem
pe
ratu
re (
°C)
Time (min)
-0,87
-0,86
-0,85
-0,84
-0,83
-0,82
-0,81
-0,80
T
herm
al con
du
ctivity d
ete
cto
r sig
na
l
a. In progress methanation
0 60 120 180 240 300
-200-100
0100200300400500600700800900
100011001200
Tem
pe
ratu
re (
°C)
Time (min)
b. completed methanation
-1,20
-1,15
-1,10
-1,05
-1,00
-0,95
-0,90
-0,85
-0,80
The
rmal cond
uctivity d
ete
cto
r sig
na
l
Figure 1. Evolution of the thermal conductivity during the methanation of the NbC/C nanostructures.
a. in progress b. completed
The final support was obtained after 3 consecutive methanations lasting respectively 4.5, 4.5 and 0.5
hours. These prolonged reactions could eventually led to further reduced Nb containing phases such
as metallic niobium or Nb2C. Their absence was assessed by X-ray diffraction (XRD) and X-ray
photoelectron (XPS) spectroscopy presented in paragraph B.2. The calculation of the residual carbon
amount is described in paragraph B.2.
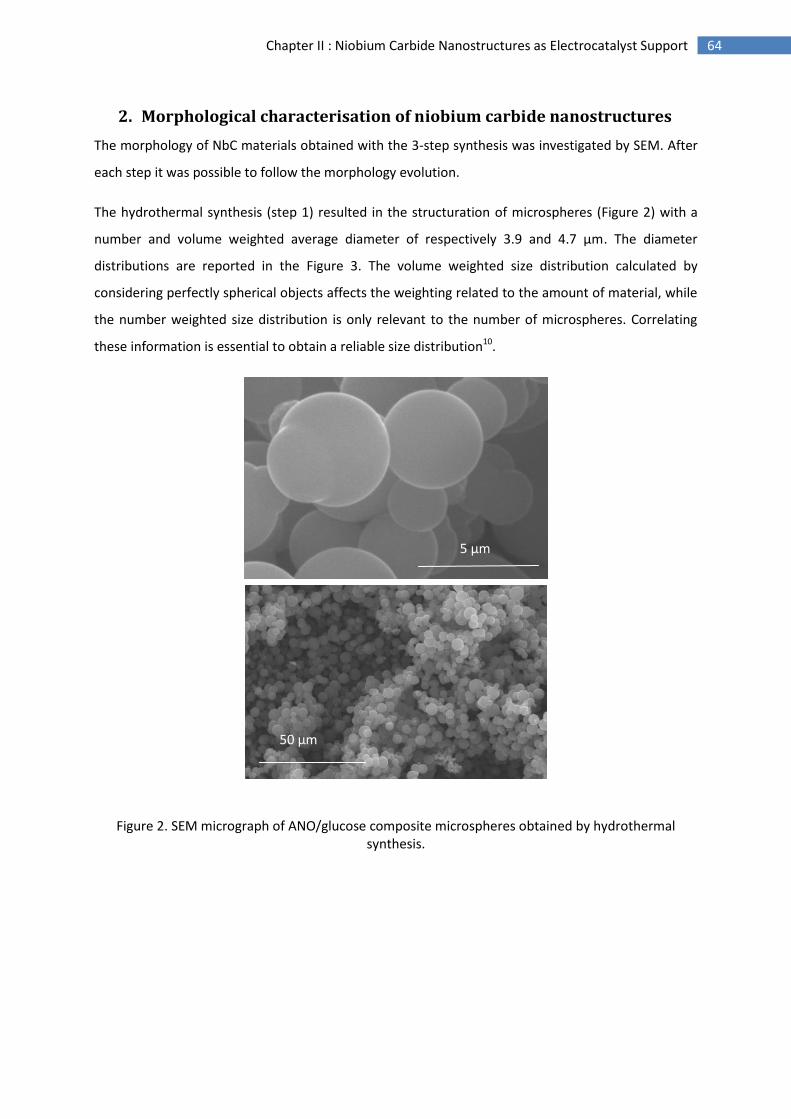
64 Chapter II : Niobium Carbide Nanostructures as Electrocatalyst Support
2. Morphological characterisation of niobium carbide nanostructures
The morphology of NbC materials obtained with the 3-step synthesis was investigated by SEM. After
each step it was possible to follow the morphology evolution.
The hydrothermal synthesis (step 1) resulted in the structuration of microspheres (Figure 2) with a
number and volume weighted average diameter of respectively 3.9 and 4.7 µm. The diameter
distributions are reported in the Figure 3. The volume weighted size distribution calculated by
considering perfectly spherical objects affects the weighting related to the amount of material, while
the number weighted size distribution is only relevant to the number of microspheres. Correlating
these information is essential to obtain a reliable size distribution10.
Figure 2. SEM micrograph of ANO/glucose composite microspheres obtained by hydrothermal synthesis.
5 µm
50 µm
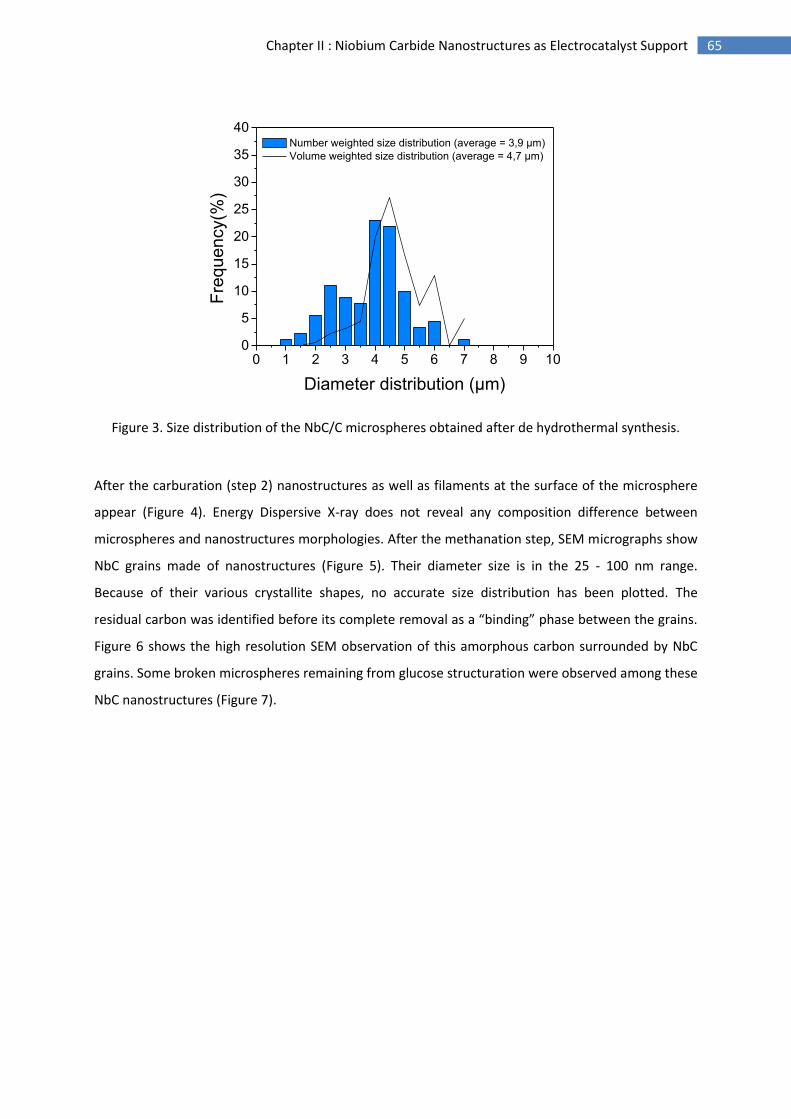
65 Chapter II : Niobium Carbide Nanostructures as Electrocatalyst Support
0 1 2 3 4 5 6 7 8 9 100
5
10
15
20
25
30
35
40 Number weighted size distribution (average = 3,9 µm)
Volume weighted size distribution (average = 4,7 µm)
Fre
qu
en
cy(%
)
Diameter distribution (µm)
Figure 3. Size distribution of the NbC/C microspheres obtained after de hydrothermal synthesis.
After the carburation (step 2) nanostructures as well as filaments at the surface of the microsphere
appear (Figure 4). Energy Dispersive X-ray does not reveal any composition difference between
microspheres and nanostructures morphologies. After the methanation step, SEM micrographs show
NbC grains made of nanostructures (Figure 5). Their diameter size is in the 25 - 100 nm range.
Because of their various crystallite shapes, no accurate size distribution has been plotted. The
residual carbon was identified before its complete removal as a “binding” phase between the grains.
Figure 6 shows the high resolution SEM observation of this amorphous carbon surrounded by NbC
grains. Some broken microspheres remaining from glucose structuration were observed among these
NbC nanostructures (Figure 7).
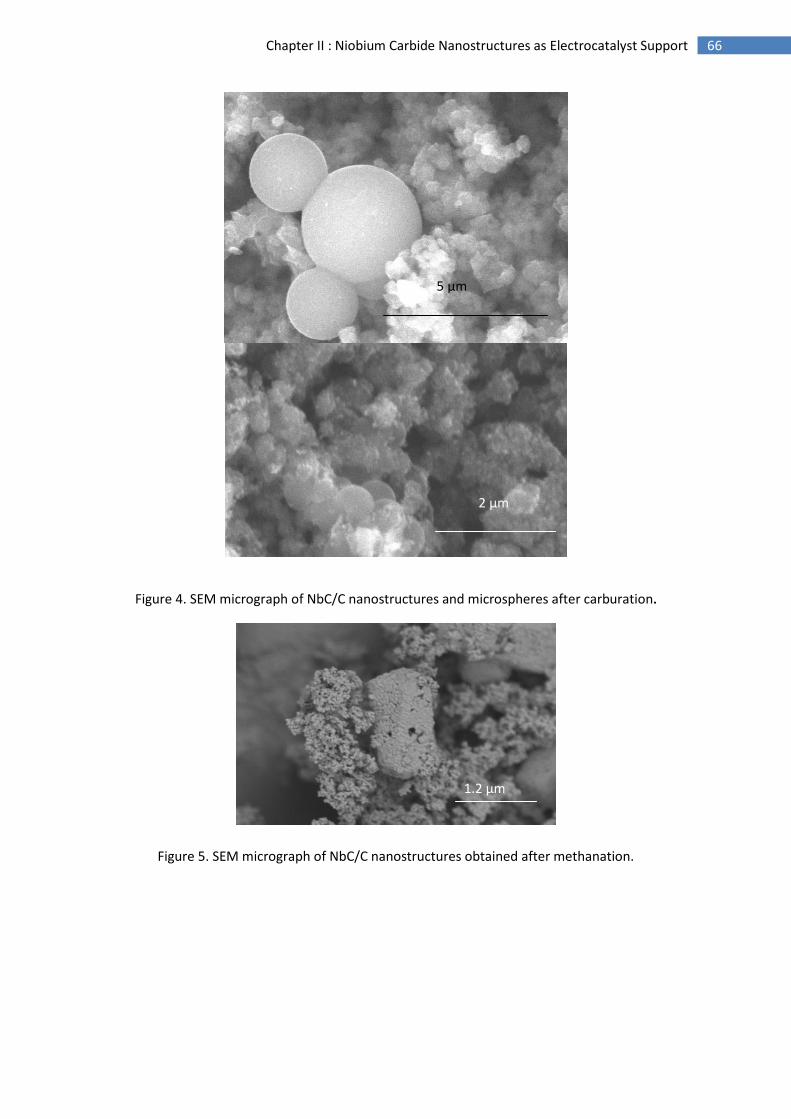
66 Chapter II : Niobium Carbide Nanostructures as Electrocatalyst Support
Figure 4. SEM micrograph of NbC/C nanostructures and microspheres after carburation.
Figure 5. SEM micrograph of NbC/C nanostructures obtained after methanation.
5 µm
2 µm
1.2 µm
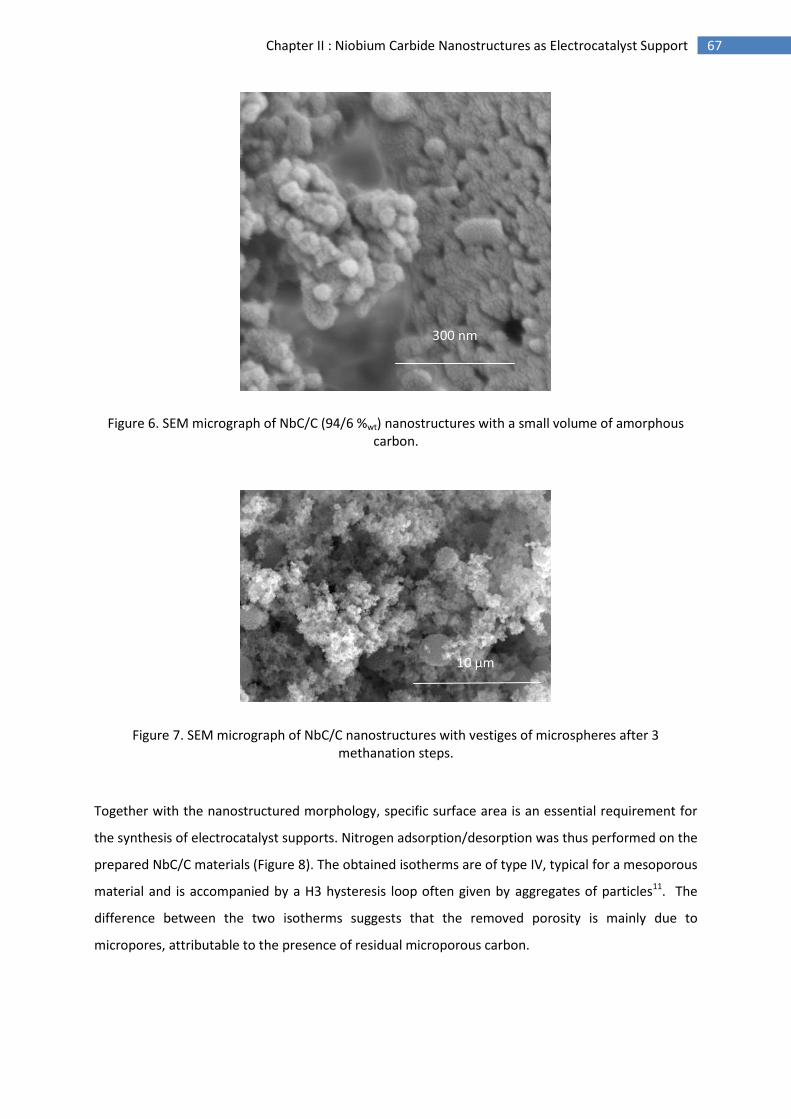
67 Chapter II : Niobium Carbide Nanostructures as Electrocatalyst Support
Figure 6. SEM micrograph of NbC/C (94/6 %wt) nanostructures with a small volume of amorphous carbon.
Figure 7. SEM micrograph of NbC/C nanostructures with vestiges of microspheres after 3 methanation steps.
Together with the nanostructured morphology, specific surface area is an essential requirement for
the synthesis of electrocatalyst supports. Nitrogen adsorption/desorption was thus performed on the
prepared NbC/C materials (Figure 8). The obtained isotherms are of type IV, typical for a mesoporous
material and is accompanied by a H3 hysteresis loop often given by aggregates of particles11. The
difference between the two isotherms suggests that the removed porosity is mainly due to
micropores, attributable to the presence of residual microporous carbon.
300 nm
10 µm
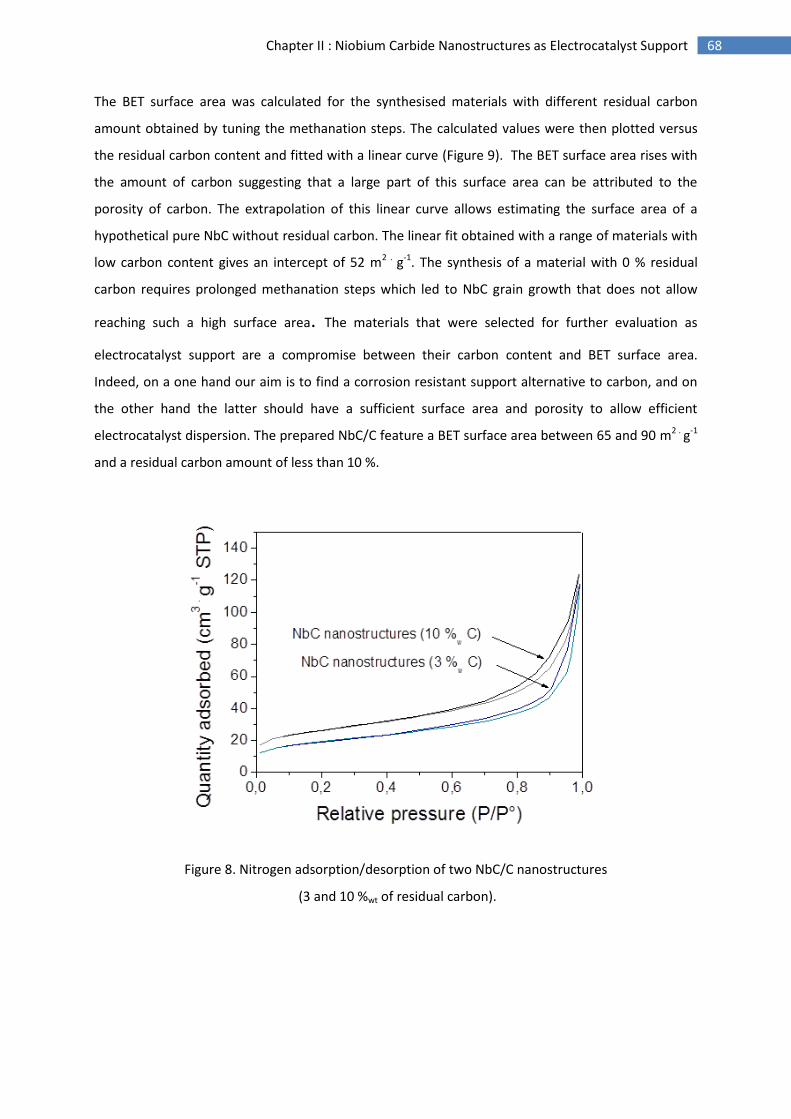
68 Chapter II : Niobium Carbide Nanostructures as Electrocatalyst Support
The BET surface area was calculated for the synthesised materials with different residual carbon
amount obtained by tuning the methanation steps. The calculated values were then plotted versus
the residual carbon content and fitted with a linear curve (Figure 9). The BET surface area rises with
the amount of carbon suggesting that a large part of this surface area can be attributed to the
porosity of carbon. The extrapolation of this linear curve allows estimating the surface area of a
hypothetical pure NbC without residual carbon. The linear fit obtained with a range of materials with
low carbon content gives an intercept of 52 m2 . g-1. The synthesis of a material with 0 % residual
carbon requires prolonged methanation steps which led to NbC grain growth that does not allow
reaching such a high surface area. The materials that were selected for further evaluation as
electrocatalyst support are a compromise between their carbon content and BET surface area.
Indeed, on a one hand our aim is to find a corrosion resistant support alternative to carbon, and on
the other hand the latter should have a sufficient surface area and porosity to allow efficient
electrocatalyst dispersion. The prepared NbC/C feature a BET surface area between 65 and 90 m2 . g-1
and a residual carbon amount of less than 10 %.
Figure 8. Nitrogen adsorption/desorption of two NbC/C nanostructures
(3 and 10 %wt of residual carbon).
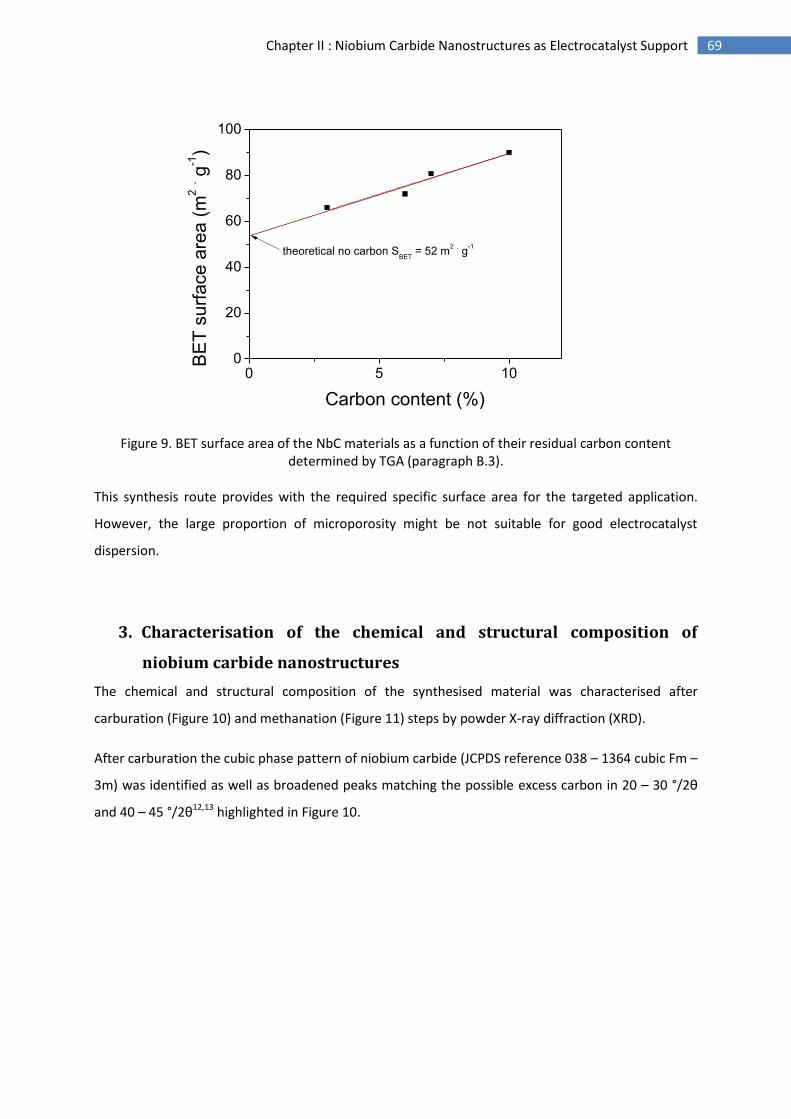
69 Chapter II : Niobium Carbide Nanostructures as Electrocatalyst Support
0 5 100
20
40
60
80
100
BE
T s
urf
ace
are
a (
m2 . g
-1)
Carbon content (%)
theoretical no carbon SBET
= 52 m2 . g
-1
Figure 9. BET surface area of the NbC materials as a function of their residual carbon content determined by TGA (paragraph B.3).
This synthesis route provides with the required specific surface area for the targeted application.
However, the large proportion of microporosity might be not suitable for good electrocatalyst
dispersion.
3. Characterisation of the chemical and structural composition of
niobium carbide nanostructures
The chemical and structural composition of the synthesised material was characterised after
carburation (Figure 10) and methanation (Figure 11) steps by powder X-ray diffraction (XRD).
After carburation the cubic phase pattern of niobium carbide (JCPDS reference 038 – 1364 cubic Fm –
3m) was identified as well as broadened peaks matching the possible excess carbon in 20 – 30 °/2θ
and 40 – 45 °/2θ12,13 highlighted in Figure 10.
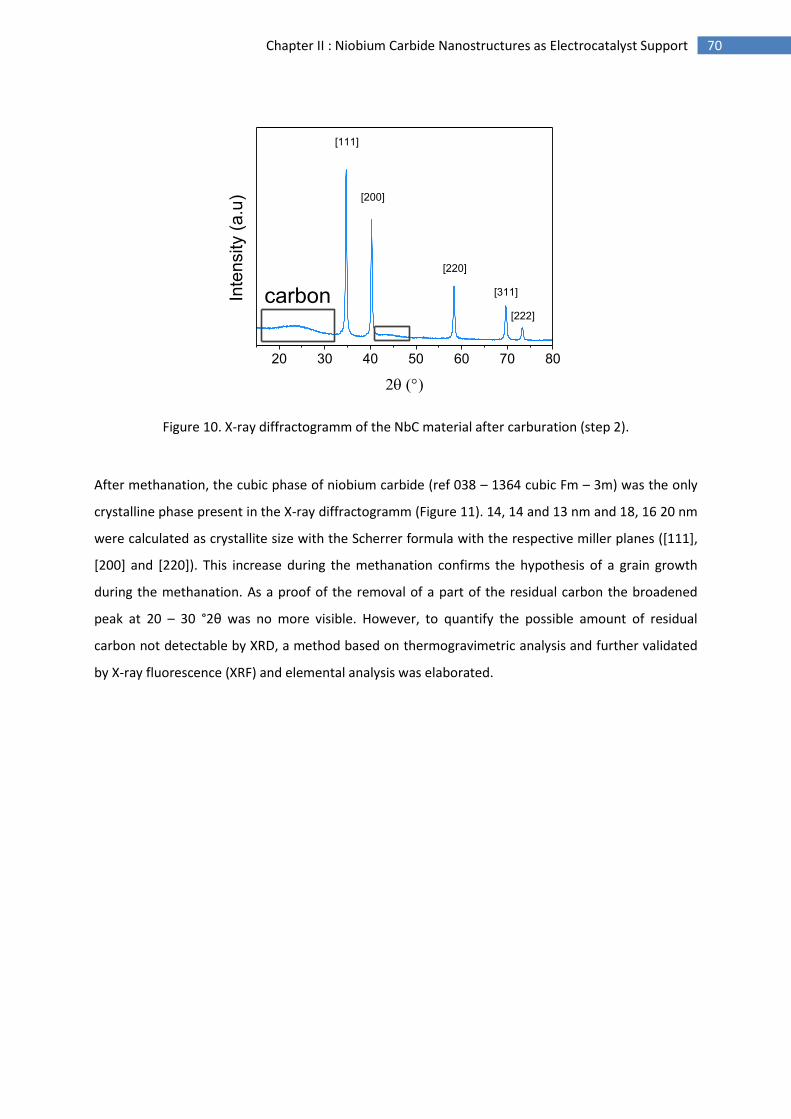
70 Chapter II : Niobium Carbide Nanostructures as Electrocatalyst Support
20 30 40 50 60 70 80
Inte
nsity (
a.u
)
[111]
[200]
[220]
[311]
[222]
carbon
Figure 10. X-ray diffractogramm of the NbC material after carburation (step 2).
After methanation, the cubic phase of niobium carbide (ref 038 – 1364 cubic Fm – 3m) was the only
crystalline phase present in the X-ray diffractogramm (Figure 11). 14, 14 and 13 nm and 18, 16 20 nm
were calculated as crystallite size with the Scherrer formula with the respective miller planes ([111],
[200] and [220]). This increase during the methanation confirms the hypothesis of a grain growth
during the methanation. As a proof of the removal of a part of the residual carbon the broadened
peak at 20 – 30 °2θ was no more visible. However, to quantify the possible amount of residual
carbon not detectable by XRD, a method based on thermogravimetric analysis and further validated
by X-ray fluorescence (XRF) and elemental analysis was elaborated.
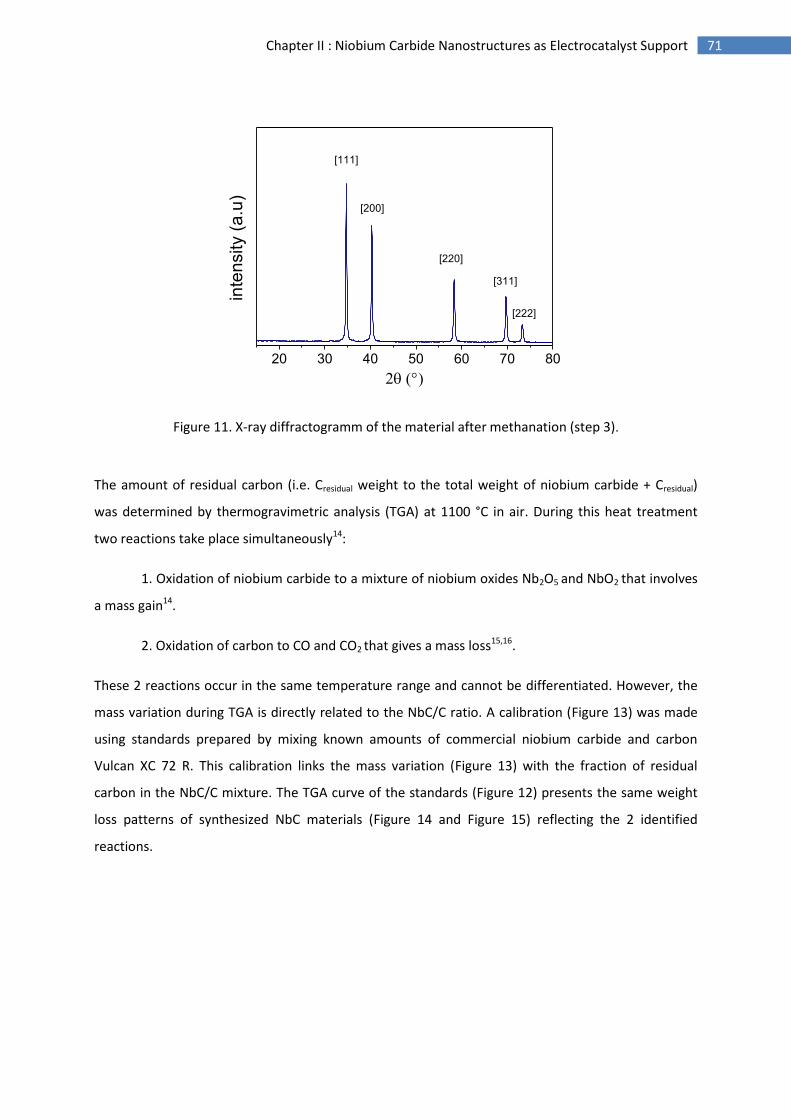
71 Chapter II : Niobium Carbide Nanostructures as Electrocatalyst Support
20 30 40 50 60 70 80
inte
nsity (
a.u
)
[111]
[200]
[220]
[311]
[222]
Figure 11. X-ray diffractogramm of the material after methanation (step 3).
The amount of residual carbon (i.e. Cresidual weight to the total weight of niobium carbide + Cresidual)
was determined by thermogravimetric analysis (TGA) at 1100 °C in air. During this heat treatment
two reactions take place simultaneously14:
1. Oxidation of niobium carbide to a mixture of niobium oxides Nb2O5 and NbO2 that involves
a mass gain14.
2. Oxidation of carbon to CO and CO2 that gives a mass loss15,16.
These 2 reactions occur in the same temperature range and cannot be differentiated. However, the
mass variation during TGA is directly related to the NbC/C ratio. A calibration (Figure 13) was made
using standards prepared by mixing known amounts of commercial niobium carbide and carbon
Vulcan XC 72 R. This calibration links the mass variation (Figure 13) with the fraction of residual
carbon in the NbC/C mixture. The TGA curve of the standards (Figure 12) presents the same weight
loss patterns of synthesized NbC materials (Figure 14 and Figure 15) reflecting the 2 identified
reactions.

72 Chapter II : Niobium Carbide Nanostructures as Electrocatalyst Support
200 400 600 800 10000
20
40
60
80
100
120
140
Mass (
%)
Temperature (°C)
Figure 12. Thermogravimetric analyses of NbC/C standards (mixture of commercial NbC (Alfa Assar) and Vulcan XC 72 R (Cabot).
-100 -80 -60 -40 -20 0 20 400
20
40
60
80
100
% N
bC
mass gain/loss (%)
Figure 13. Calibration curve for the determination of NbC and carbon content obtained by TGA.
The TGA of NbC nanostructures before methanation displays an overall mass gain that corresponds
to NbC/C = 50/50 (Figure 14).
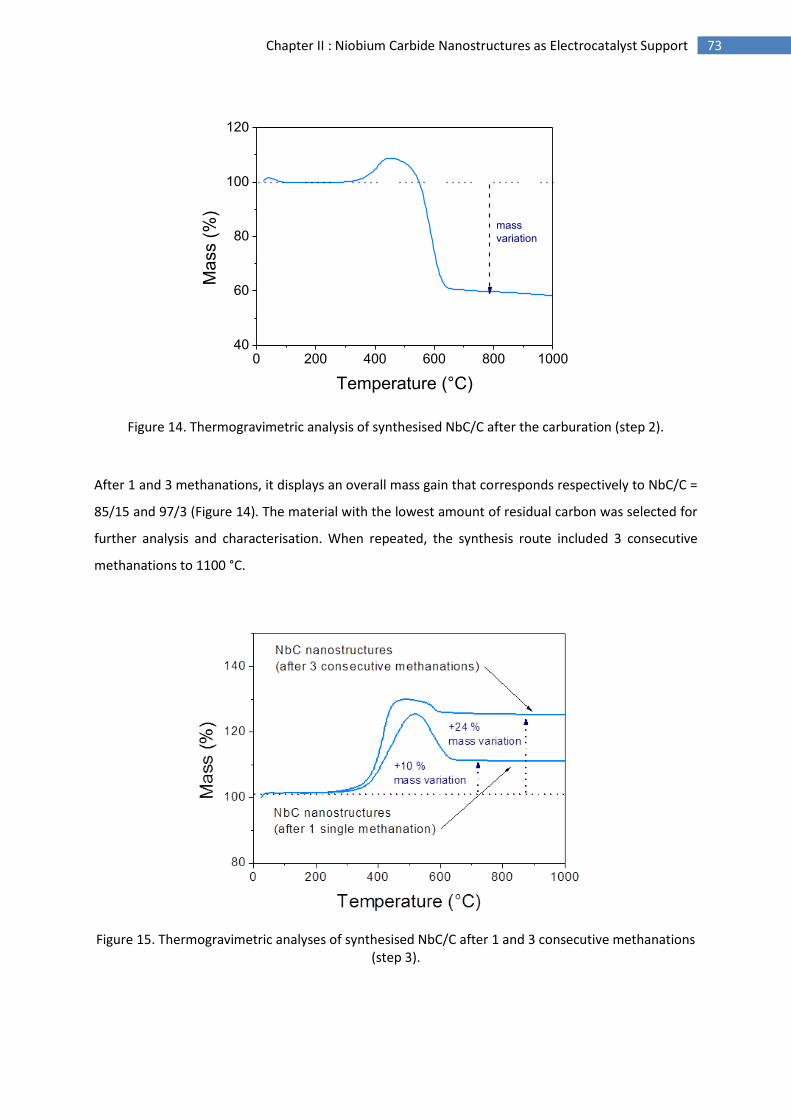
73 Chapter II : Niobium Carbide Nanostructures as Electrocatalyst Support
0 200 400 600 800 100040
60
80
100
120
Mass (
%)
Temperature (°C)
mass
variation
Figure 14. Thermogravimetric analysis of synthesised NbC/C after the carburation (step 2).
After 1 and 3 methanations, it displays an overall mass gain that corresponds respectively to NbC/C =
85/15 and 97/3 (Figure 14). The material with the lowest amount of residual carbon was selected for
further analysis and characterisation. When repeated, the synthesis route included 3 consecutive
methanations to 1100 °C.
Figure 15. Thermogravimetric analyses of synthesised NbC/C after 1 and 3 consecutive methanations
(step 3).
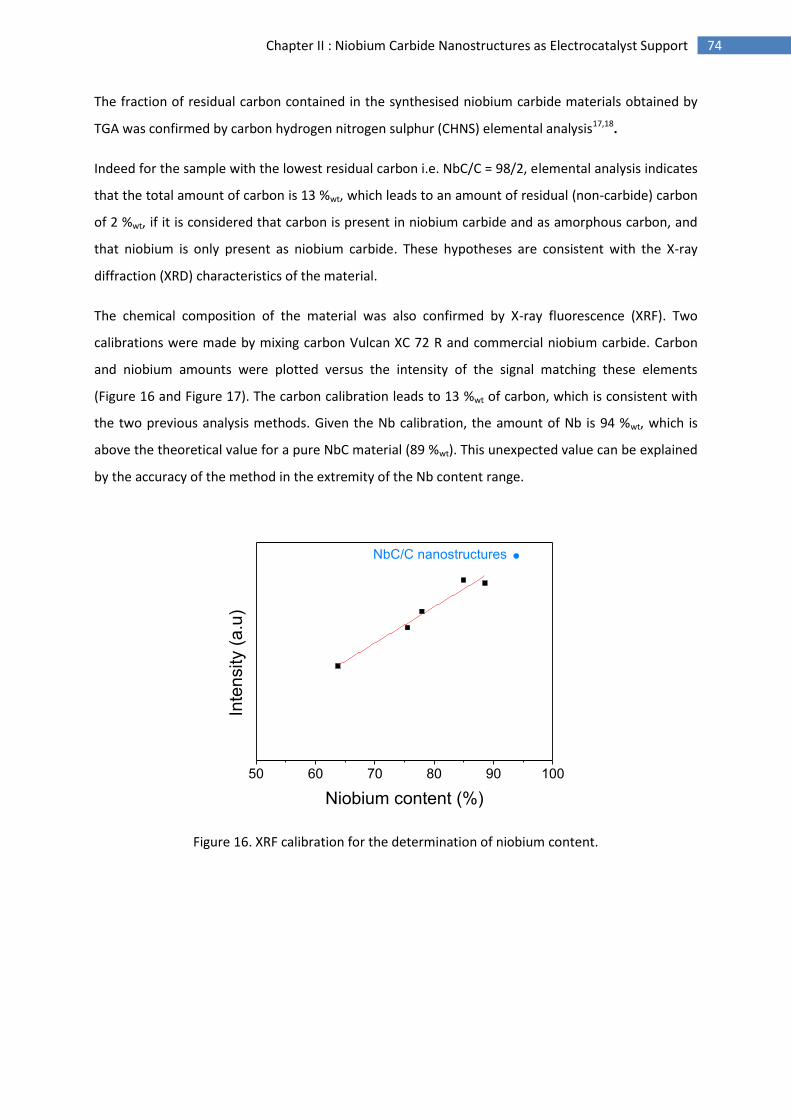
74 Chapter II : Niobium Carbide Nanostructures as Electrocatalyst Support
The fraction of residual carbon contained in the synthesised niobium carbide materials obtained by
TGA was confirmed by carbon hydrogen nitrogen sulphur (CHNS) elemental analysis17,18.
Indeed for the sample with the lowest residual carbon i.e. NbC/C = 98/2, elemental analysis indicates
that the total amount of carbon is 13 %wt, which leads to an amount of residual (non-carbide) carbon
of 2 %wt, if it is considered that carbon is present in niobium carbide and as amorphous carbon, and
that niobium is only present as niobium carbide. These hypotheses are consistent with the X-ray
diffraction (XRD) characteristics of the material.
The chemical composition of the material was also confirmed by X-ray fluorescence (XRF). Two
calibrations were made by mixing carbon Vulcan XC 72 R and commercial niobium carbide. Carbon
and niobium amounts were plotted versus the intensity of the signal matching these elements
(Figure 16 and Figure 17). The carbon calibration leads to 13 %wt of carbon, which is consistent with
the two previous analysis methods. Given the Nb calibration, the amount of Nb is 94 %wt, which is
above the theoretical value for a pure NbC material (89 %wt). This unexpected value can be explained
by the accuracy of the method in the extremity of the Nb content range.
50 60 70 80 90 100
Inte
nsity (
a.u
)
Niobium content (%)
NbC/C nanostructures
Figure 16. XRF calibration for the determination of niobium content.
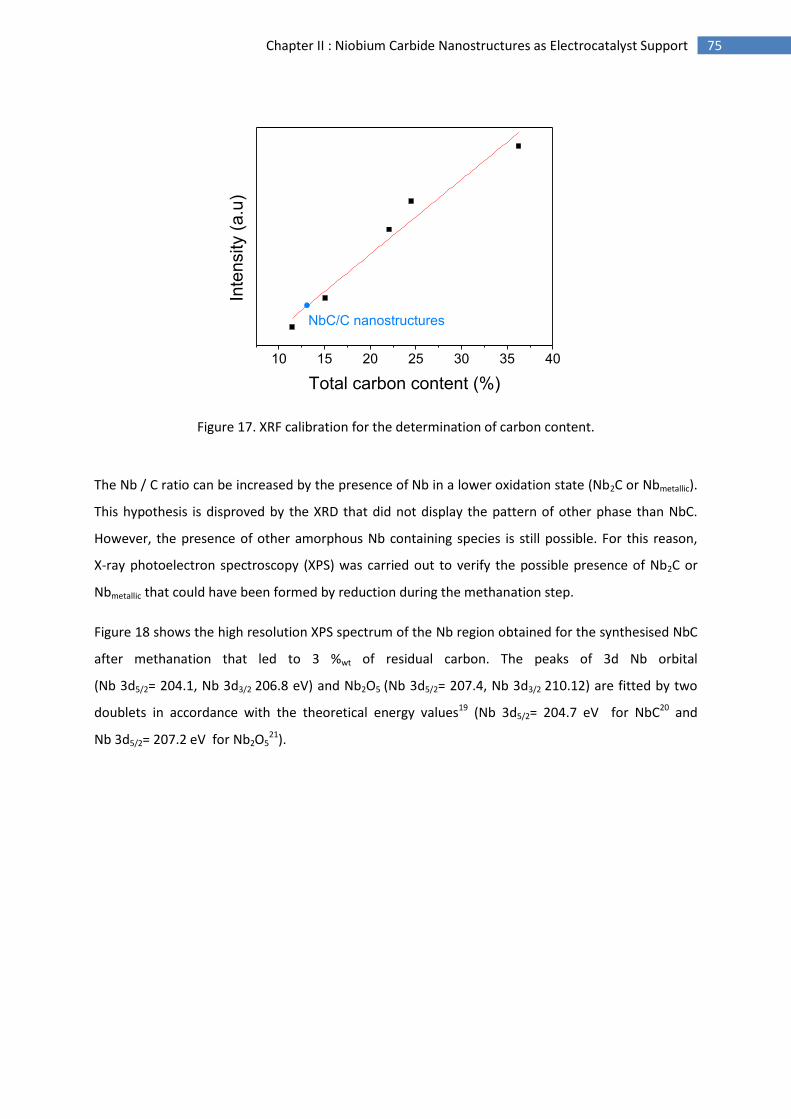
75 Chapter II : Niobium Carbide Nanostructures as Electrocatalyst Support
10 15 20 25 30 35 40
Inte
nsity (
a.u
)
Total carbon content (%)
NbC/C nanostructures
Figure 17. XRF calibration for the determination of carbon content.
The Nb / C ratio can be increased by the presence of Nb in a lower oxidation state (Nb2C or Nbmetallic).
This hypothesis is disproved by the XRD that did not display the pattern of other phase than NbC.
However, the presence of other amorphous Nb containing species is still possible. For this reason,
X-ray photoelectron spectroscopy (XPS) was carried out to verify the possible presence of Nb2C or
Nbmetallic that could have been formed by reduction during the methanation step.
Figure 18 shows the high resolution XPS spectrum of the Nb region obtained for the synthesised NbC
after methanation that led to 3 %wt of residual carbon. The peaks of 3d Nb orbital
(Nb 3d5/2= 204.1, Nb 3d3/2 206.8 eV) and Nb2O5 (Nb 3d5/2= 207.4, Nb 3d3/2 210.12) are fitted by two
doublets in accordance with the theoretical energy values19 (Nb 3d5/2= 204.7 eV for NbC20 and
Nb 3d5/2= 207.2 eV for Nb2O521).

76 Chapter II : Niobium Carbide Nanostructures as Electrocatalyst Support
By integrating the Nb 3d5/2 peaks of NbC and Nb2O5, 36 %at of oxide was calculated. Since this
significant amount of niobium pentoxide was not visible on XRD it can be concluded that this
compound is concentrated at the surface of the NbC materials as a thin amorphous layer. This
surface passivation has been already reported for NbC particles20. A particular attention will be paid
to the resistivity of such a layer as it could insulate the electrocatalyst from the conductive NbC core
of the support22. The evolution of this niobium oxide layer and its progression to the core of the
material could be an issue regarding the long-term stability. Any traces of metallic niobium or
diniobium carbide Nb2C have been detected by XPS, proving that the reaction was stopped before
further reduction of niobium carbide.
Figure 18. XPS high resolution spectrum of the Nb 3d region for NbC/C nanostructures.
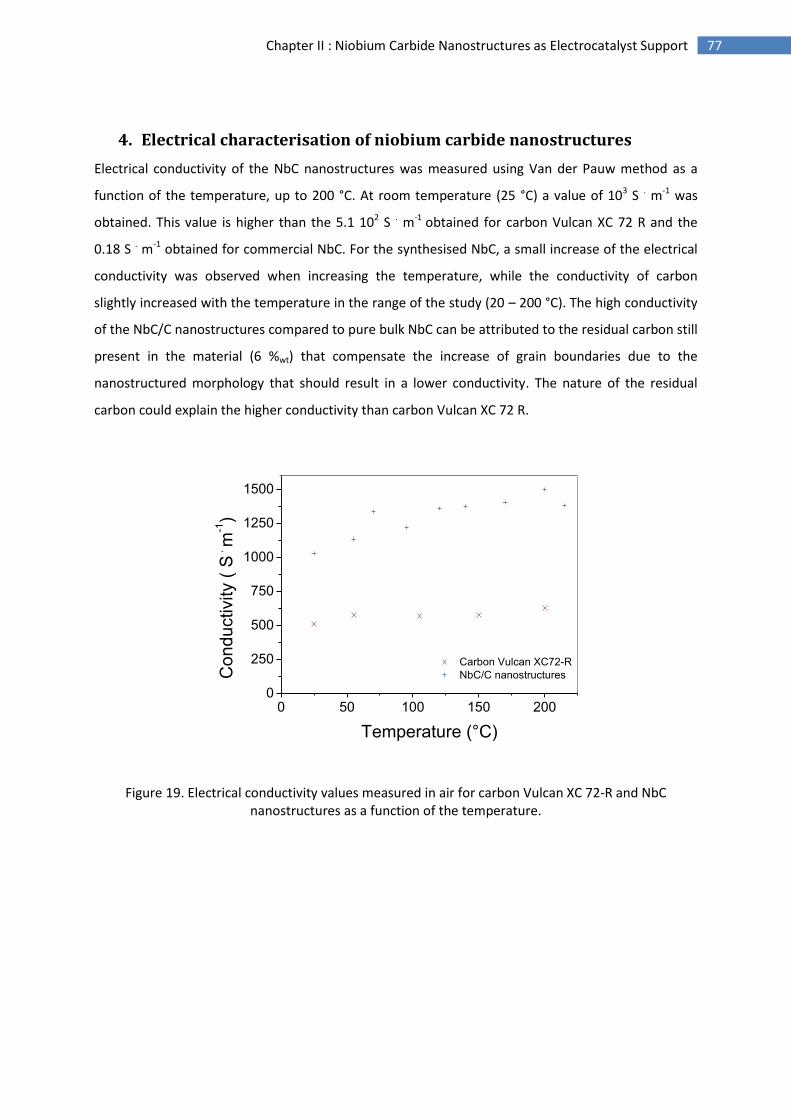
77 Chapter II : Niobium Carbide Nanostructures as Electrocatalyst Support
4. Electrical characterisation of niobium carbide nanostructures
Electrical conductivity of the NbC nanostructures was measured using Van der Pauw method as a
function of the temperature, up to 200 °C. At room temperature (25 °C) a value of 103 S . m-1 was
obtained. This value is higher than the 5.1 102 S . m-1 obtained for carbon Vulcan XC 72 R and the
0.18 S . m-1 obtained for commercial NbC. For the synthesised NbC, a small increase of the electrical
conductivity was observed when increasing the temperature, while the conductivity of carbon
slightly increased with the temperature in the range of the study (20 – 200 °C). The high conductivity
of the NbC/C nanostructures compared to pure bulk NbC can be attributed to the residual carbon still
present in the material (6 %wt) that compensate the increase of grain boundaries due to the
nanostructured morphology that should result in a lower conductivity. The nature of the residual
carbon could explain the higher conductivity than carbon Vulcan XC 72 R.
0 50 100 150 2000
250
500
750
1000
1250
1500
Carbon Vulcan XC72-R
NbC/C nanostructuresCo
nd
uctivity (
S .
m-1)
Temperature (°C)
Figure 19. Electrical conductivity values measured in air for carbon Vulcan XC 72-R and NbC nanostructures as a function of the temperature.
78 Chapter II : Niobium Carbide Nanostructures as Electrocatalyst Support
C. Synthesis and characterisation of Pt supported on NbC
nanostructures
1. Synthesis of Pt supported on NbC nanostructures
To be investigated as electrocatalyst support, the material was loaded with a platinum based
electrocatalyst. Thus the preparation of the catalysed support consists of two consecutive steps: the
synthesis of platinum particles and their deposition onto the NbC nanostructures.
Platinum particles have been prepared by the polyol method that is presented in the chapter 1 in the
paragraph D.3. This synthesis route, developed by Fievet et al23, was improved by microwave
assistance. The standard 2 hours long reflux at 160 °C have been replaced by a 6 minutes microwave
treatment that produces platinum nanoparticles with a narrow size distribution24,25. The latter will be
used as well to catalyse the supports investigated in the third and fourth chapter in order to compare
their performance as electrocatalyst support for PEMFC cathodes.
Zeta potential measurements were performed on platinum particles and NbC nanostructures to
study the influence of the pH on the surface charge in order to improve the adhesion of the
nanocatalyst. At acidic pH (5 – 2) the surface charges of the electrocatalyst is positive while that of
the support is negative. Therefore, in this pH range the electrostatic interaction is favourable for the
electrocatalyst deposition26. After the Pt nanoparticle preparation, the pH of their colloidal
suspension was adjusted to 4. A suspension containing the NbC nanostructures was then added to it
and let reacting. After filtration and rinsing, the catalysed was activated with a short heat treatment
at 160 °C in air27 to remove eventual traces of ethylene glycol on its surface.
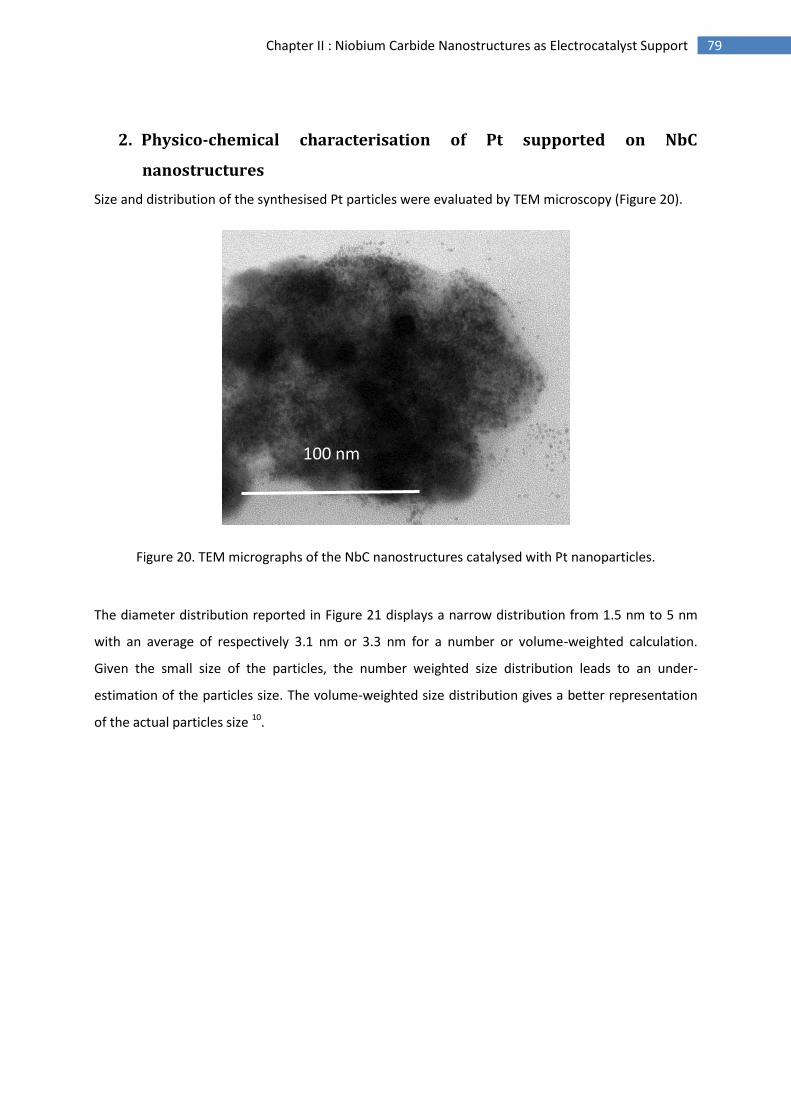
79 Chapter II : Niobium Carbide Nanostructures as Electrocatalyst Support
2. Physico-chemical characterisation of Pt supported on NbC
nanostructures
Size and distribution of the synthesised Pt particles were evaluated by TEM microscopy (Figure 20).
Figure 20. TEM micrographs of the NbC nanostructures catalysed with Pt nanoparticles.
The diameter distribution reported in Figure 21 displays a narrow distribution from 1.5 nm to 5 nm
with an average of respectively 3.1 nm or 3.3 nm for a number or volume-weighted calculation.
Given the small size of the particles, the number weighted size distribution leads to an under-
estimation of the particles size. The volume-weighted size distribution gives a better representation
of the actual particles size 10.
100 nm
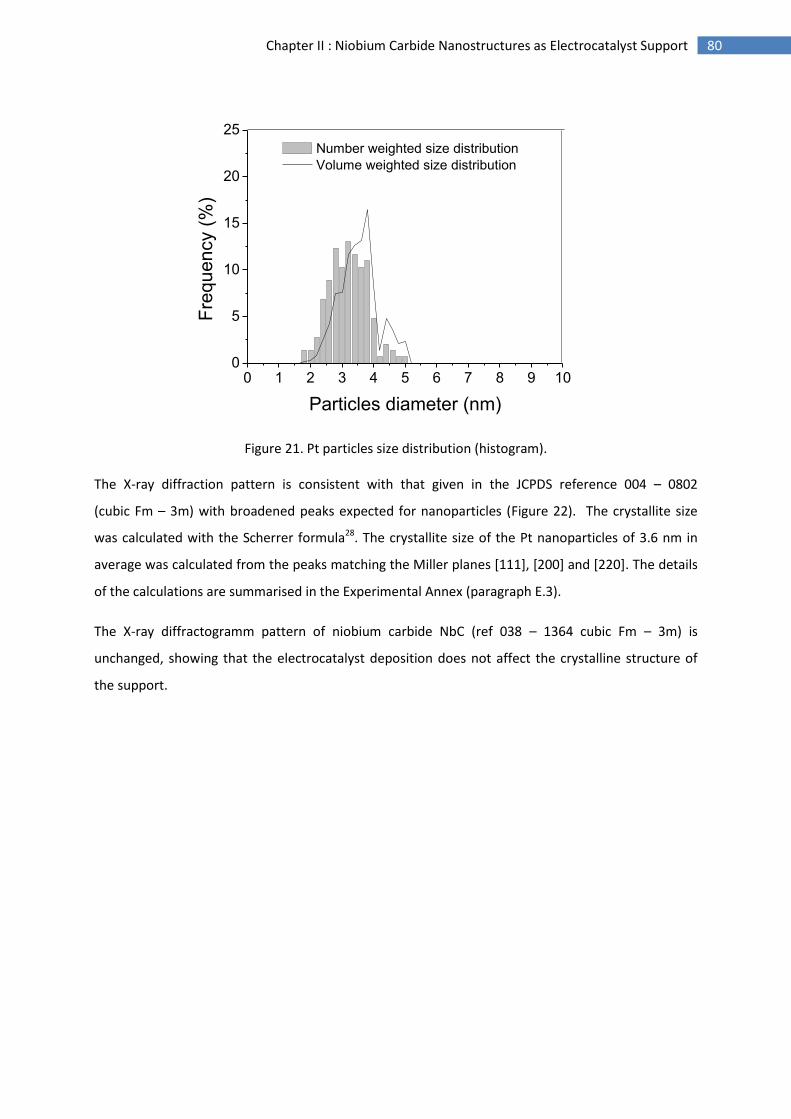
80 Chapter II : Niobium Carbide Nanostructures as Electrocatalyst Support
0 1 2 3 4 5 6 7 8 9 100
5
10
15
20
25
Number weighted size distribution
Volume weighted size distribution
Fre
qu
en
cy (
%)
Particles diameter (nm)
Figure 21. Pt particles size distribution (histogram).
The X-ray diffraction pattern is consistent with that given in the JCPDS reference 004 – 0802
(cubic Fm – 3m) with broadened peaks expected for nanoparticles (Figure 22). The crystallite size
was calculated with the Scherrer formula28. The crystallite size of the Pt nanoparticles of 3.6 nm in
average was calculated from the peaks matching the Miller planes [111], [200] and [220]. The details
of the calculations are summarised in the Experimental Annex (paragraph E.3).
The X-ray diffractogramm pattern of niobium carbide NbC (ref 038 – 1364 cubic Fm – 3m) is
unchanged, showing that the electrocatalyst deposition does not affect the crystalline structure of
the support.
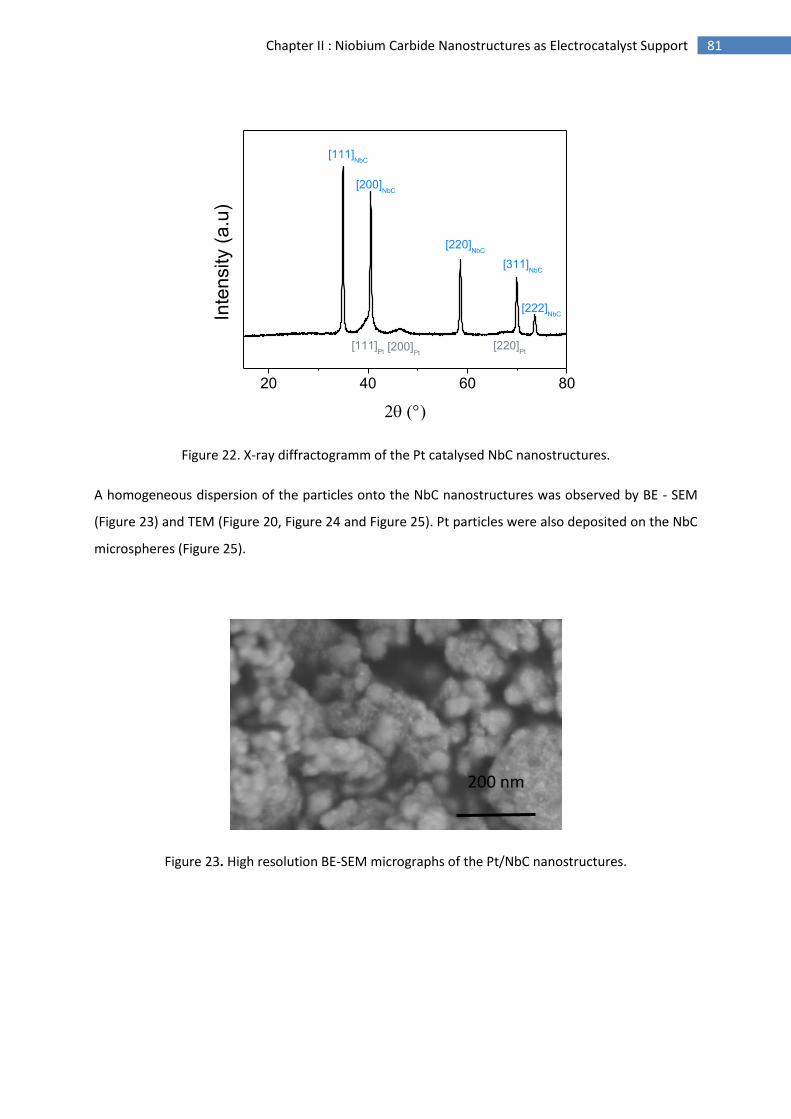
81 Chapter II : Niobium Carbide Nanostructures as Electrocatalyst Support
20 40 60 80
[220]Pt
[200]Pt
[111]Pt
[222]NbC
[311]NbC
[220]NbC
[200]NbC
Inte
nsity (
a.u
)
[111]NbC
Figure 22. X-ray diffractogramm of the Pt catalysed NbC nanostructures.
A homogeneous dispersion of the particles onto the NbC nanostructures was observed by BE - SEM
(Figure 23) and TEM (Figure 20, Figure 24 and Figure 25). Pt particles were also deposited on the NbC
microspheres (Figure 25).
Figure 23. High resolution BE-SEM micrographs of the Pt/NbC nanostructures.
200 nm
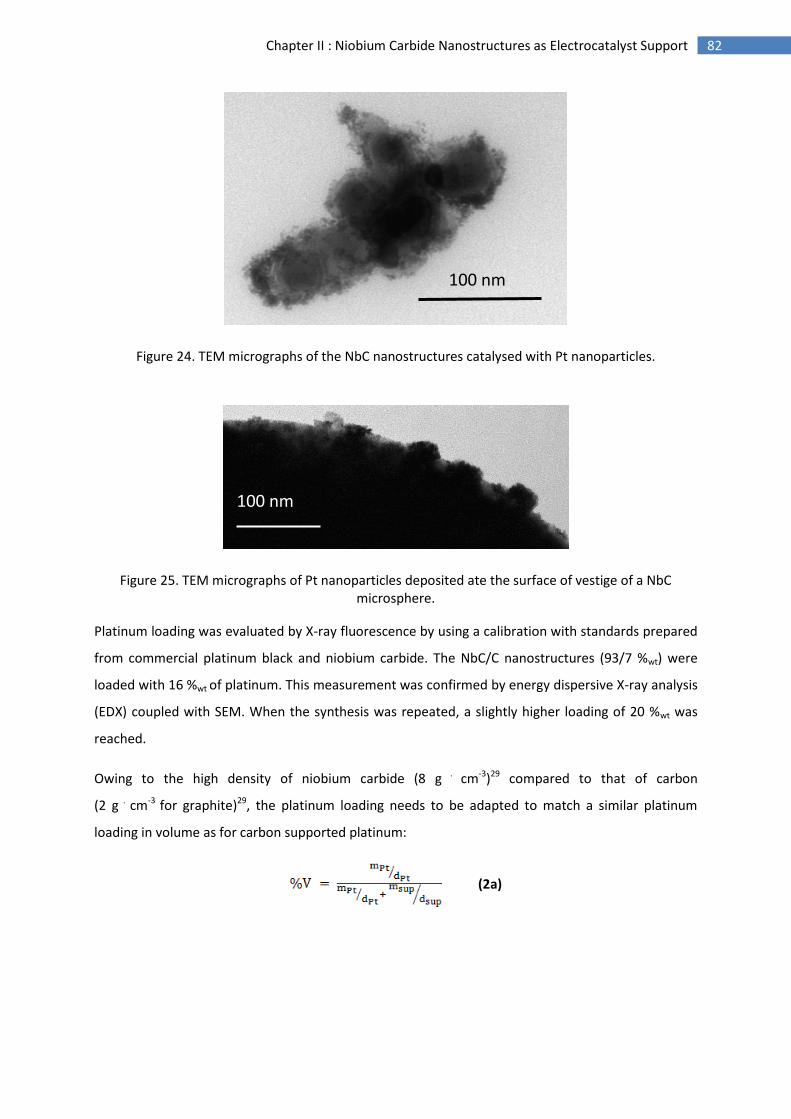
82 Chapter II : Niobium Carbide Nanostructures as Electrocatalyst Support
Figure 24. TEM micrographs of the NbC nanostructures catalysed with Pt nanoparticles.
Figure 25. TEM micrographs of Pt nanoparticles deposited ate the surface of vestige of a NbC microsphere.
Platinum loading was evaluated by X-ray fluorescence by using a calibration with standards prepared
from commercial platinum black and niobium carbide. The NbC/C nanostructures (93/7 %wt) were
loaded with 16 %wt of platinum. This measurement was confirmed by energy dispersive X-ray analysis
(EDX) coupled with SEM. When the synthesis was repeated, a slightly higher loading of 20 %wt was
reached.
Owing to the high density of niobium carbide (8 g . cm-3)29 compared to that of carbon
(2 g . cm-3 for graphite)29, the platinum loading needs to be adapted to match a similar platinum
loading in volume as for carbon supported platinum:
(2a)
100 nm
100 nm
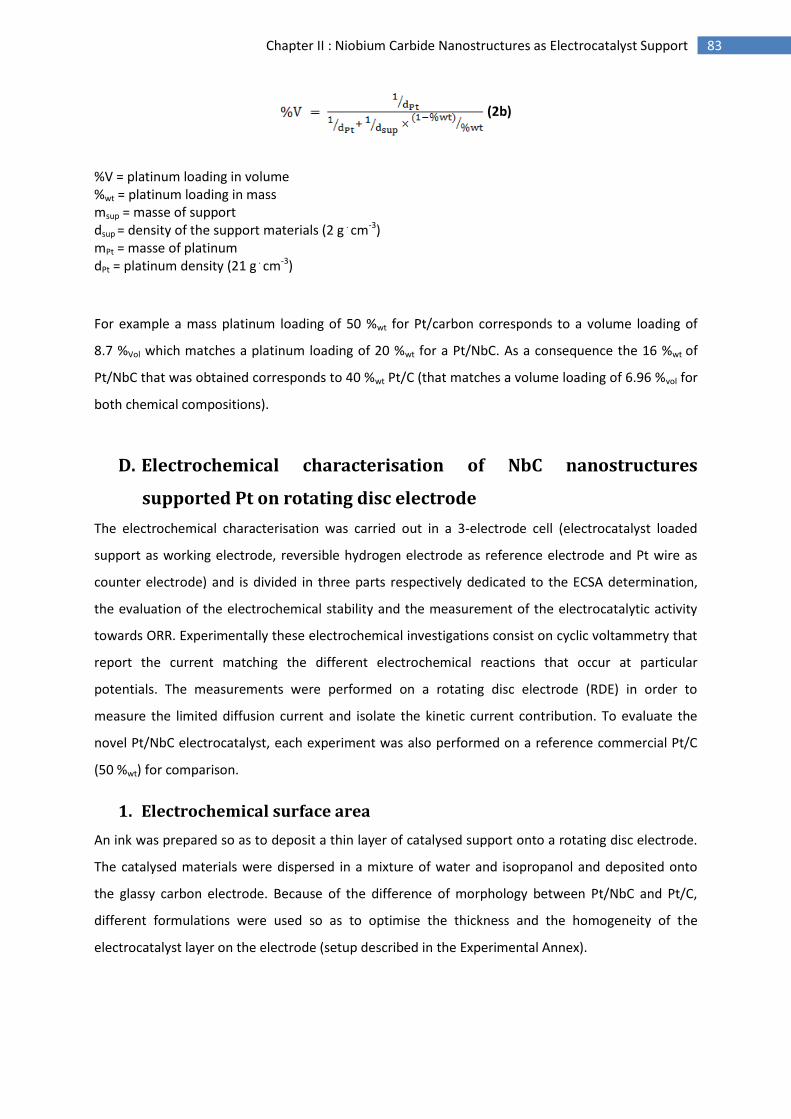
83 Chapter II : Niobium Carbide Nanostructures as Electrocatalyst Support
(2b)
%V = platinum loading in volume %wt = platinum loading in mass msup = masse of support dsup = density of the support materials (2 g . cm-3) mPt = masse of platinum dPt = platinum density (21 g . cm-3)
For example a mass platinum loading of 50 %wt for Pt/carbon corresponds to a volume loading of
8.7 %Vol which matches a platinum loading of 20 %wt for a Pt/NbC. As a consequence the 16 %wt of
Pt/NbC that was obtained corresponds to 40 %wt Pt/C (that matches a volume loading of 6.96 %vol for
both chemical compositions).
D. Electrochemical characterisation of NbC nanostructures
supported Pt on rotating disc electrode
The electrochemical characterisation was carried out in a 3-electrode cell (electrocatalyst loaded
support as working electrode, reversible hydrogen electrode as reference electrode and Pt wire as
counter electrode) and is divided in three parts respectively dedicated to the ECSA determination,
the evaluation of the electrochemical stability and the measurement of the electrocatalytic activity
towards ORR. Experimentally these electrochemical investigations consist on cyclic voltammetry that
report the current matching the different electrochemical reactions that occur at particular
potentials. The measurements were performed on a rotating disc electrode (RDE) in order to
measure the limited diffusion current and isolate the kinetic current contribution. To evaluate the
novel Pt/NbC electrocatalyst, each experiment was also performed on a reference commercial Pt/C
(50 %wt) for comparison.
1. Electrochemical surface area
An ink was prepared so as to deposit a thin layer of catalysed support onto a rotating disc electrode.
The catalysed materials were dispersed in a mixture of water and isopropanol and deposited onto
the glassy carbon electrode. Because of the difference of morphology between Pt/NbC and Pt/C,
different formulations were used so as to optimise the thickness and the homogeneity of the
electrocatalyst layer on the electrode (setup described in the Experimental Annex).
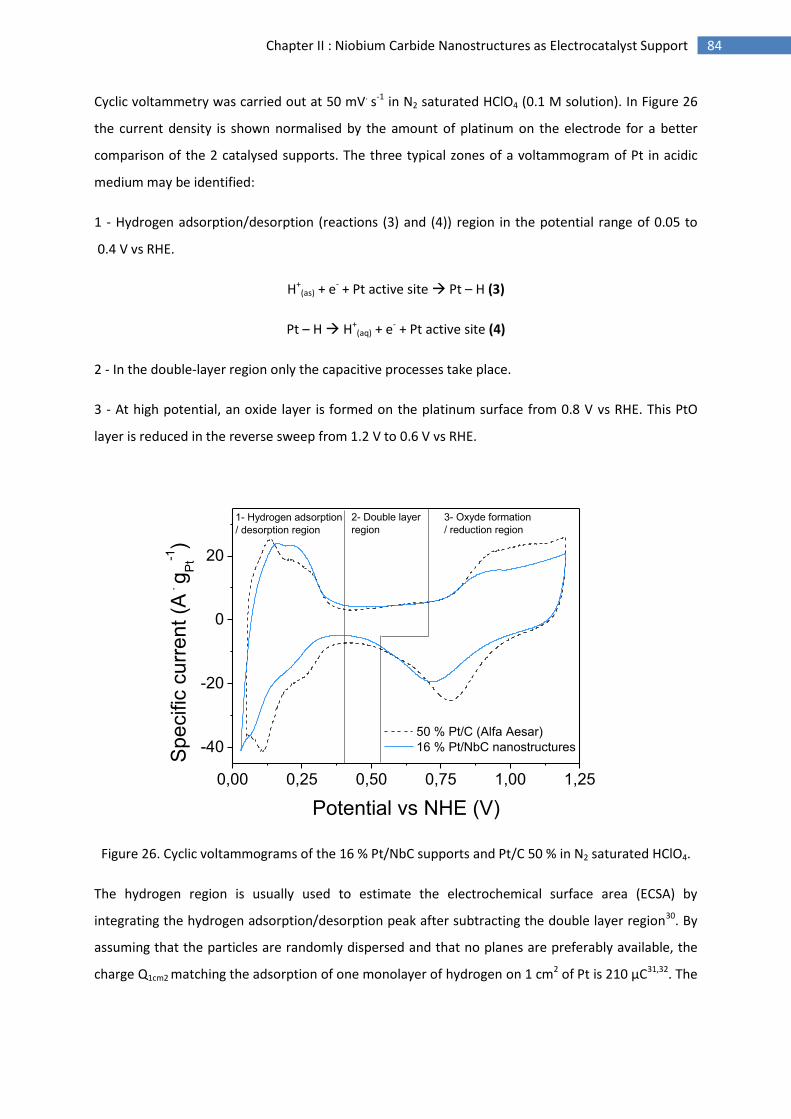
84 Chapter II : Niobium Carbide Nanostructures as Electrocatalyst Support
Cyclic voltammetry was carried out at 50 mV. s-1 in N2 saturated HClO4 (0.1 M solution). In Figure 26
the current density is shown normalised by the amount of platinum on the electrode for a better
comparison of the 2 catalysed supports. The three typical zones of a voltammogram of Pt in acidic
medium may be identified:
1 - Hydrogen adsorption/desorption (reactions (3) and (4)) region in the potential range of 0.05 to
0.4 V vs RHE.
H+(as) + e- + Pt active site Pt – H (3)
Pt – H H+(aq) + e- + Pt active site (4)
2 - In the double-layer region only the capacitive processes take place.
3 - At high potential, an oxide layer is formed on the platinum surface from 0.8 V vs RHE. This PtO
layer is reduced in the reverse sweep from 1.2 V to 0.6 V vs RHE.
0,00 0,25 0,50 0,75 1,00 1,25
-40
-20
0
20
2- Double layer
region
3- Oxyde formation
/ reduction region
50 % Pt/C (Alfa Aesar)
16 % Pt/NbC nanostructures
Sp
ecific
cu
rre
nt (A
. g
Pt-1
)
Potential vs NHE (V)
1- Hydrogen adsorption
/ desorption region
Figure 26. Cyclic voltammograms of the 16 % Pt/NbC supports and Pt/C 50 % in N2 saturated HClO4.
The hydrogen region is usually used to estimate the electrochemical surface area (ECSA) by
integrating the hydrogen adsorption/desorption peak after subtracting the double layer region30. By
assuming that the particles are randomly dispersed and that no planes are preferably available, the
charge Q1cm2 matching the adsorption of one monolayer of hydrogen on 1 cm2 of Pt is 210 µC31,32. The
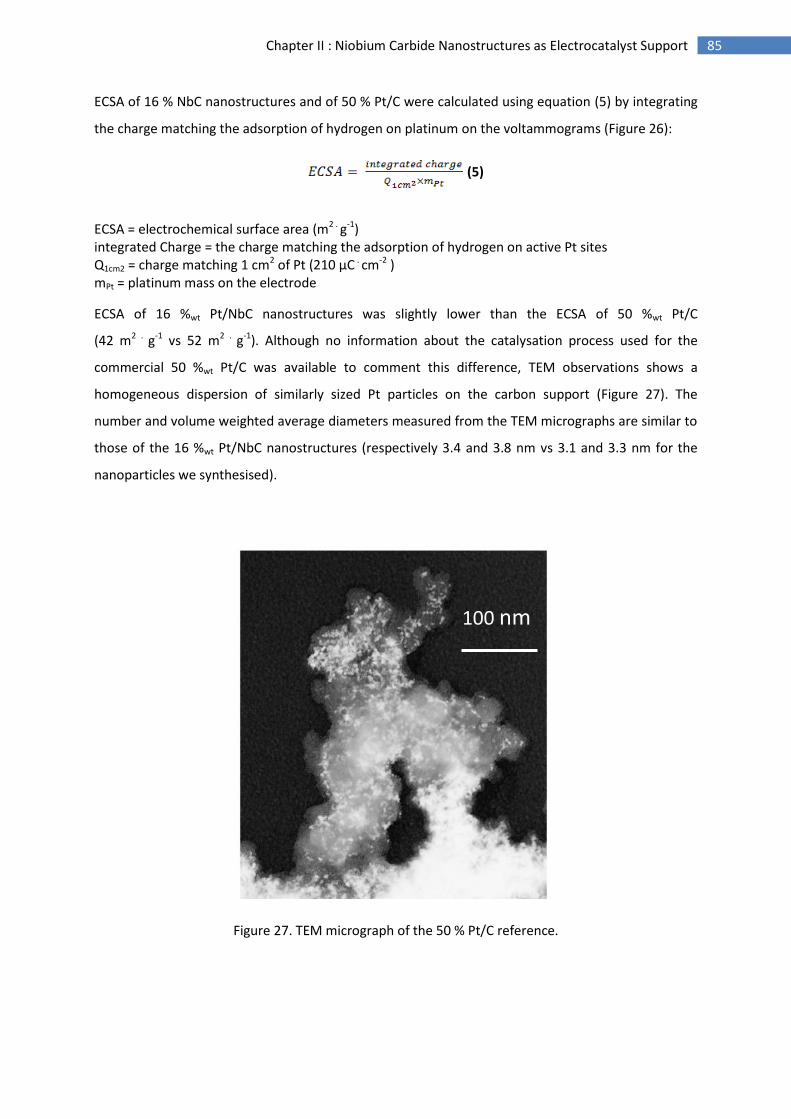
85 Chapter II : Niobium Carbide Nanostructures as Electrocatalyst Support
ECSA of 16 % NbC nanostructures and of 50 % Pt/C were calculated using equation (5) by integrating
the charge matching the adsorption of hydrogen on platinum on the voltammograms (Figure 26):
(5)
ECSA = electrochemical surface area (m2 . g-1) integrated Charge = the charge matching the adsorption of hydrogen on active Pt sites Q1cm2 = charge matching 1 cm2 of Pt (210 µC . cm-2 ) mPt = platinum mass on the electrode
ECSA of 16 %wt Pt/NbC nanostructures was slightly lower than the ECSA of 50 %wt Pt/C
(42 m2 . g-1 vs 52 m2 . g-1). Although no information about the catalysation process used for the
commercial 50 %wt Pt/C was available to comment this difference, TEM observations shows a
homogeneous dispersion of similarly sized Pt particles on the carbon support (Figure 27). The
number and volume weighted average diameters measured from the TEM micrographs are similar to
those of the 16 %wt Pt/NbC nanostructures (respectively 3.4 and 3.8 nm vs 3.1 and 3.3 nm for the
nanoparticles we synthesised).
Figure 27. TEM micrograph of the 50 % Pt/C reference.
100 nm

86 Chapter II : Niobium Carbide Nanostructures as Electrocatalyst Support
Considering the average diameter of the Pt particles in both cases, the expected ECSA should be
higher. Indeed, if we approximate the cuboctahedral shape33 of Pt particle as spherical we can
calculate their surface area (SAtheoretical) using equation (6). With an average diameter of 3.3 nm, the
theoretical electrochemical surface area for the Pt nanostructures would be 86 m2 . g-1 while it would
be 75 m2 . g-1 for the 3.8 nm Pt particles of the reference Pt/C..
(6)
Since the particles are supported, this calculation overestimates the ECSA. Morphological properties
such as an unadapted microporosity could also explain the significant difference between the
theoretical and experimental ECSA values.
87 Chapter II : Niobium Carbide Nanostructures as Electrocatalyst Support
2. Stability over time
During the past 10 years, numerous accelerated stress tests (AST) that have been developed to
assess the durability of a fuel cell or its components34. They have been proven to be a valuable tool
that significantly reduced the duration of experiments compared to steady state lifetime tests. They
can be performed in situ or ex situ and provide with reliable results on lifetime evaluation and
degradation mechanism35.
This PhD work focuses on the PEMFC cathode. Therefore an AST has been conceived to corrode the
electrocatalyst support ex situ so as to evaluate the durability of the Pt/NbC and compare it with
Pt/C. In this AST, the ECSA is monitored during potential cycles as an indicator of the stability of the
electrocatalyst on the support. Its degradation causes an ECSA loss that is reported as a proportion of
the initial one. The AST consists on 10,000 electrochemical cycles between 0.6 V and 1.4 V vs RHE
at 500 mV . s-1 (Figure 28). Every 100 cycles, two cycles were carried out at a slower rate of 50 mV . s-1
for ECSA monitoring. The ECSA loss is due to the degradation of the electrocatalyst support leading
to particle detachment but also to the degradation of the electrocatalyst himself caused by the
platinum particles evolution36. These mechanisms have been depicted in further details in the
chapter I in the paragraph B.4.iii. The chosen potential is in agreement with the potentials
recommended by the department of energy for similar electrochemical stability investigations. They
recommend two different AST, targeting the specific investigation of the catalyst durability
(0.6 to 1 V vs RHE) or the support durability (1-1.5 V vs RHE)37. The AST developed for this project
combines them in order to reach the carbon corrosion, assess the electrocatalyst durability and
highlight the electrostability of the synthesised alternative supports38 compared to carbon based
supports. Concerning the chosen scan rate of the AST, A report of several AST shows close agreement
of dissolution rates per potential cycle with widely varying scan rates, indicating that the dissolution
reaction is more dependent on the number of oxidation-reduction cycles rather than on the length of
the cycle or time at oxidising potentials35.
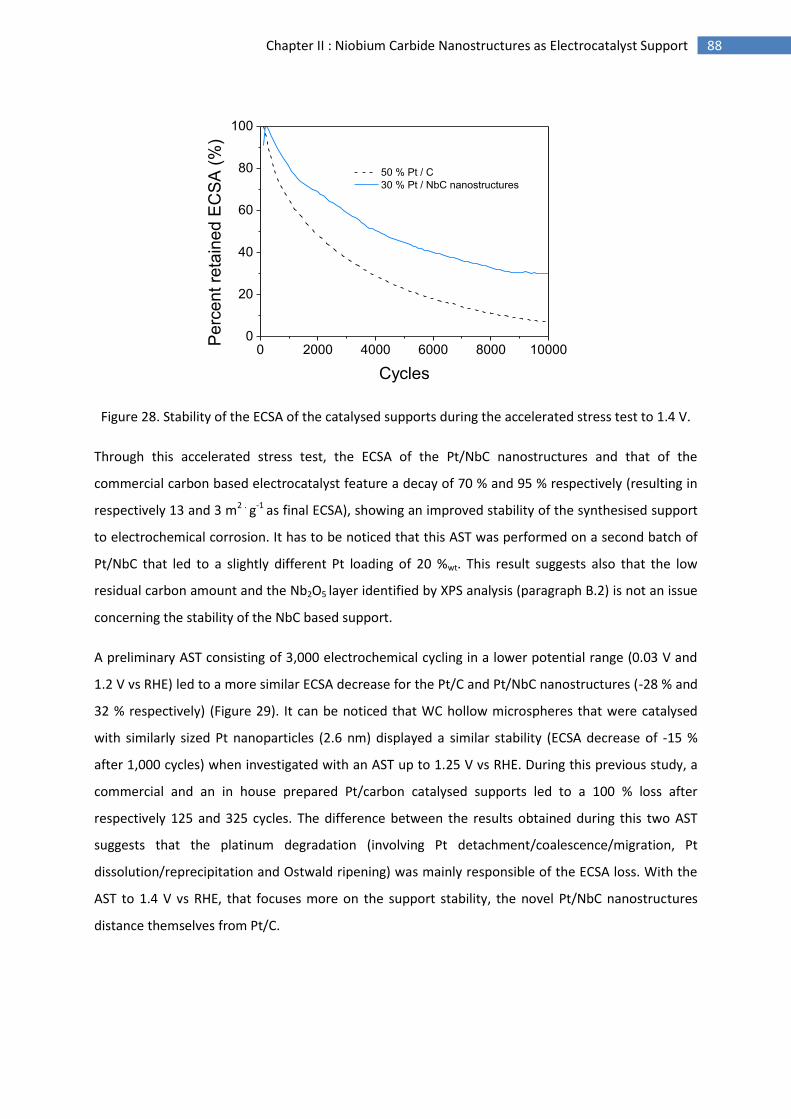
88 Chapter II : Niobium Carbide Nanostructures as Electrocatalyst Support
0 2000 4000 6000 8000 100000
20
40
60
80
100
50 % Pt / C
30 % Pt / NbC nanostructures
Pe
rce
nt re
tain
ed
EC
SA
(%
)
Cycles
Figure 28. Stability of the ECSA of the catalysed supports during the accelerated stress test to 1.4 V.
Through this accelerated stress test, the ECSA of the Pt/NbC nanostructures and that of the
commercial carbon based electrocatalyst feature a decay of 70 % and 95 % respectively (resulting in
respectively 13 and 3 m2 . g-1 as final ECSA), showing an improved stability of the synthesised support
to electrochemical corrosion. It has to be noticed that this AST was performed on a second batch of
Pt/NbC that led to a slightly different Pt loading of 20 %wt. This result suggests also that the low
residual carbon amount and the Nb2O5 layer identified by XPS analysis (paragraph B.2) is not an issue
concerning the stability of the NbC based support.
A preliminary AST consisting of 3,000 electrochemical cycling in a lower potential range (0.03 V and
1.2 V vs RHE) led to a more similar ECSA decrease for the Pt/C and Pt/NbC nanostructures (-28 % and
32 % respectively) (Figure 29). It can be noticed that WC hollow microspheres that were catalysed
with similarly sized Pt nanoparticles (2.6 nm) displayed a similar stability (ECSA decrease of -15 %
after 1,000 cycles) when investigated with an AST up to 1.25 V vs RHE. During this previous study, a
commercial and an in house prepared Pt/carbon catalysed supports led to a 100 % loss after
respectively 125 and 325 cycles. The difference between the results obtained during this two AST
suggests that the platinum degradation (involving Pt detachment/coalescence/migration, Pt
dissolution/reprecipitation and Ostwald ripening) was mainly responsible of the ECSA loss. With the
AST to 1.4 V vs RHE, that focuses more on the support stability, the novel Pt/NbC nanostructures
distance themselves from Pt/C.
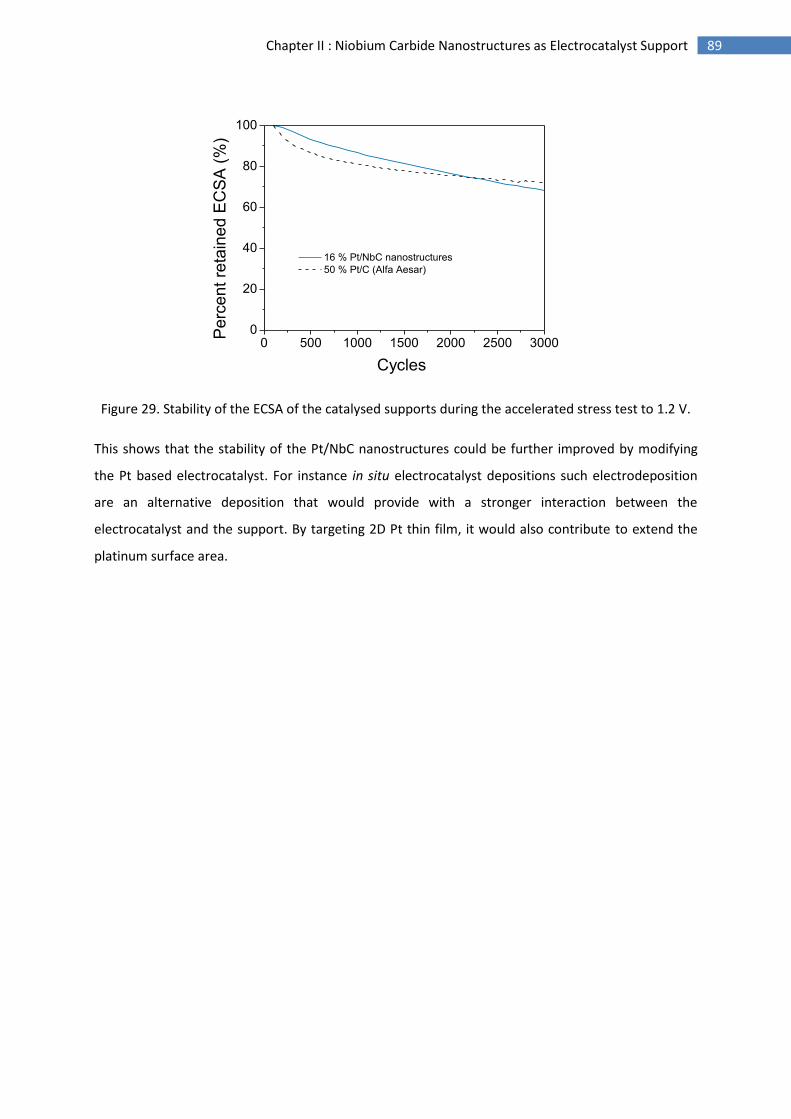
89 Chapter II : Niobium Carbide Nanostructures as Electrocatalyst Support
0 500 1000 1500 2000 2500 30000
20
40
60
80
100
16 % Pt/NbC nanostructures
50 % Pt/C (Alfa Aesar)
Pe
rce
nt re
tain
ed
EC
SA
(%
)
Cycles
Figure 29. Stability of the ECSA of the catalysed supports during the accelerated stress test to 1.2 V.
This shows that the stability of the Pt/NbC nanostructures could be further improved by modifying
the Pt based electrocatalyst. For instance in situ electrocatalyst depositions such electrodeposition
are an alternative deposition that would provide with a stronger interaction between the
electrocatalyst and the support. By targeting 2D Pt thin film, it would also contribute to extend the
platinum surface area.
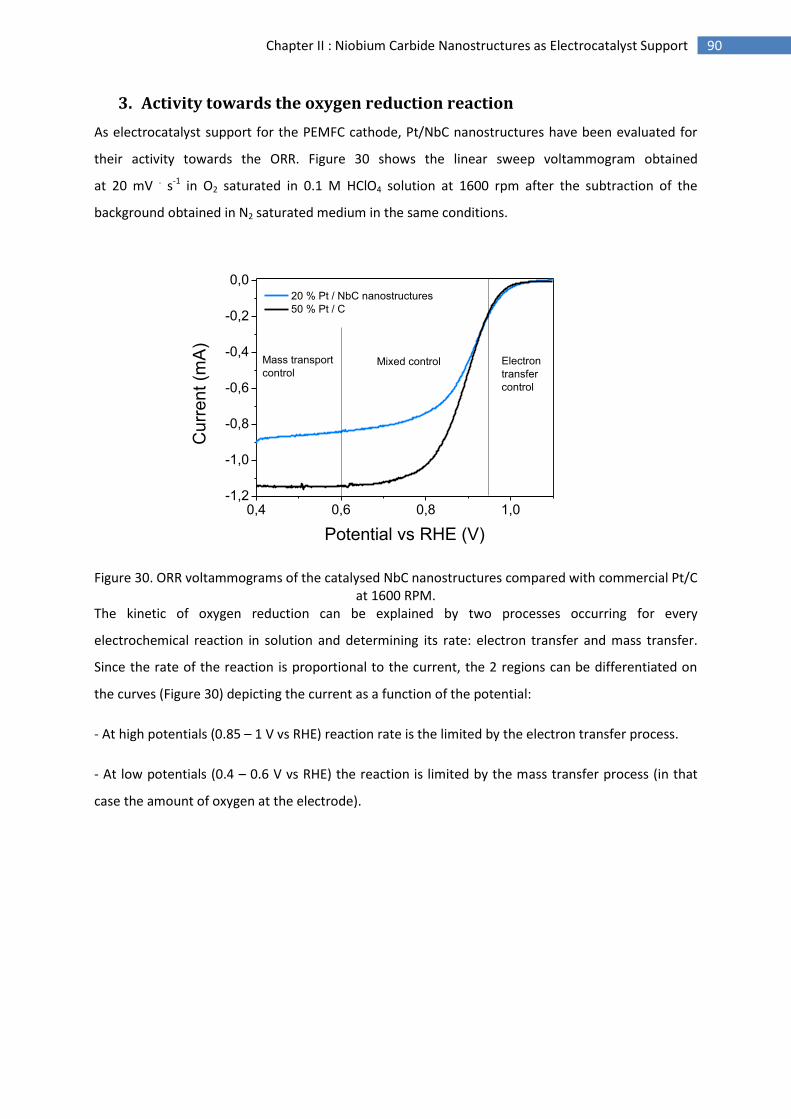
90 Chapter II : Niobium Carbide Nanostructures as Electrocatalyst Support
3. Activity towards the oxygen reduction reaction
As electrocatalyst support for the PEMFC cathode, Pt/NbC nanostructures have been evaluated for
their activity towards the ORR. Figure 30 shows the linear sweep voltammogram obtained
at 20 mV . s-1 in O2 saturated in 0.1 M HClO4 solution at 1600 rpm after the subtraction of the
background obtained in N2 saturated medium in the same conditions.
0,4 0,6 0,8 1,0-1,2
-1,0
-0,8
-0,6
-0,4
-0,2
0,0
Electron
transfer
control
Mixed control
20 % Pt / NbC nanostructures
50 % Pt / C
Cu
rre
nt (m
A)
Potential vs RHE (V)
Mass transport
control
Figure 30. ORR voltammograms of the catalysed NbC nanostructures compared with commercial Pt/C at 1600 RPM.
The kinetic of oxygen reduction can be explained by two processes occurring for every
electrochemical reaction in solution and determining its rate: electron transfer and mass transfer.
Since the rate of the reaction is proportional to the current, the 2 regions can be differentiated on
the curves (Figure 30) depicting the current as a function of the potential:
- At high potentials (0.85 – 1 V vs RHE) reaction rate is the limited by the electron transfer process.
- At low potentials (0.4 – 0.6 V vs RHE) the reaction is limited by the mass transfer process (in that
case the amount of oxygen at the electrode).
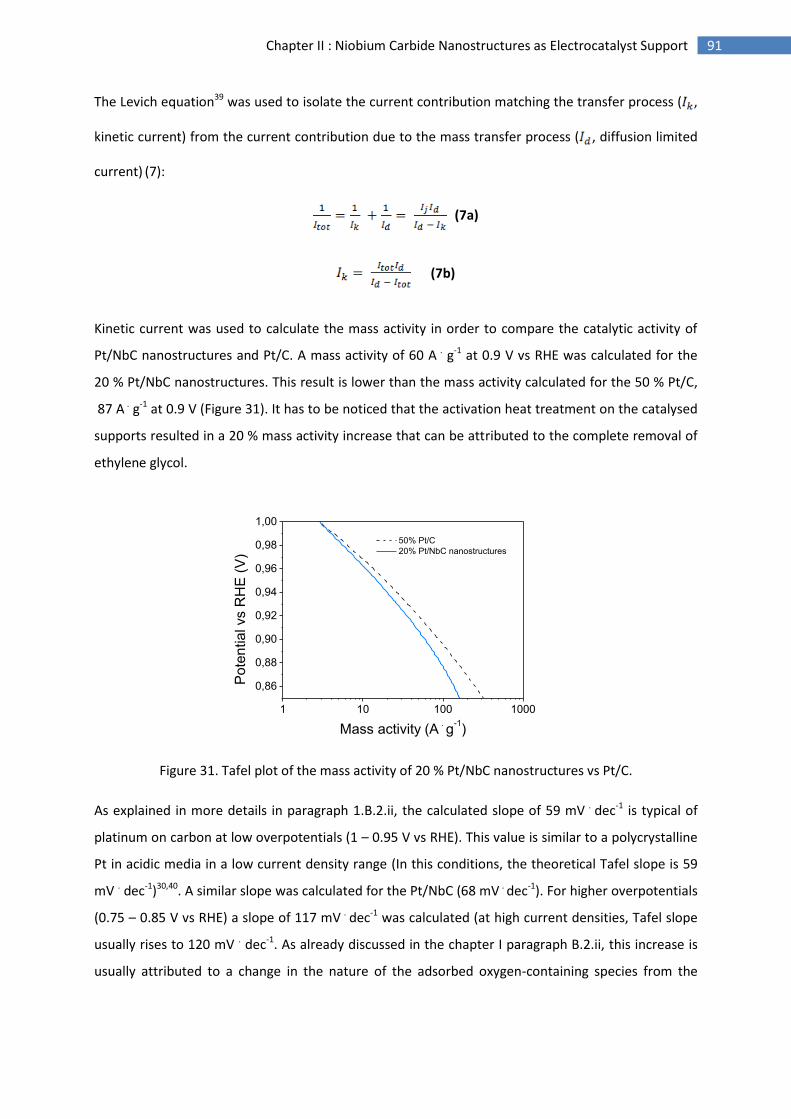
91 Chapter II : Niobium Carbide Nanostructures as Electrocatalyst Support
The Levich equation39 was used to isolate the current contribution matching the transfer process ( ,
kinetic current) from the current contribution due to the mass transfer process ( , diffusion limited
current) (7):
(7a)
(7b)
Kinetic current was used to calculate the mass activity in order to compare the catalytic activity of
Pt/NbC nanostructures and Pt/C. A mass activity of 60 A . g-1 at 0.9 V vs RHE was calculated for the
20 % Pt/NbC nanostructures. This result is lower than the mass activity calculated for the 50 % Pt/C,
87 A . g-1 at 0.9 V (Figure 31). It has to be noticed that the activation heat treatment on the catalysed
supports resulted in a 20 % mass activity increase that can be attributed to the complete removal of
ethylene glycol.
1 10 100 1000
0,86
0,88
0,90
0,92
0,94
0,96
0,98
1,00
50% Pt/C
20% Pt/NbC nanostructures
Pote
ntia
l vs R
HE
(V
)
Mass activity (A . g
-1)
Figure 31. Tafel plot of the mass activity of 20 % Pt/NbC nanostructures vs Pt/C.
As explained in more details in paragraph 1.B.2.ii, the calculated slope of 59 mV . dec-1 is typical of
platinum on carbon at low overpotentials (1 – 0.95 V vs RHE). This value is similar to a polycrystalline
Pt in acidic media in a low current density range (In this conditions, the theoretical Tafel slope is 59
mV . dec-1)30,40. A similar slope was calculated for the Pt/NbC (68 mV . dec-1). For higher overpotentials
(0.75 – 0.85 V vs RHE) a slope of 117 mV . dec-1 was calculated (at high current densities, Tafel slope
usually rises to 120 mV . dec-1. As already discussed in the chapter I paragraph B.2.ii, this increase is
usually attributed to a change in the nature of the adsorbed oxygen-containing species from the
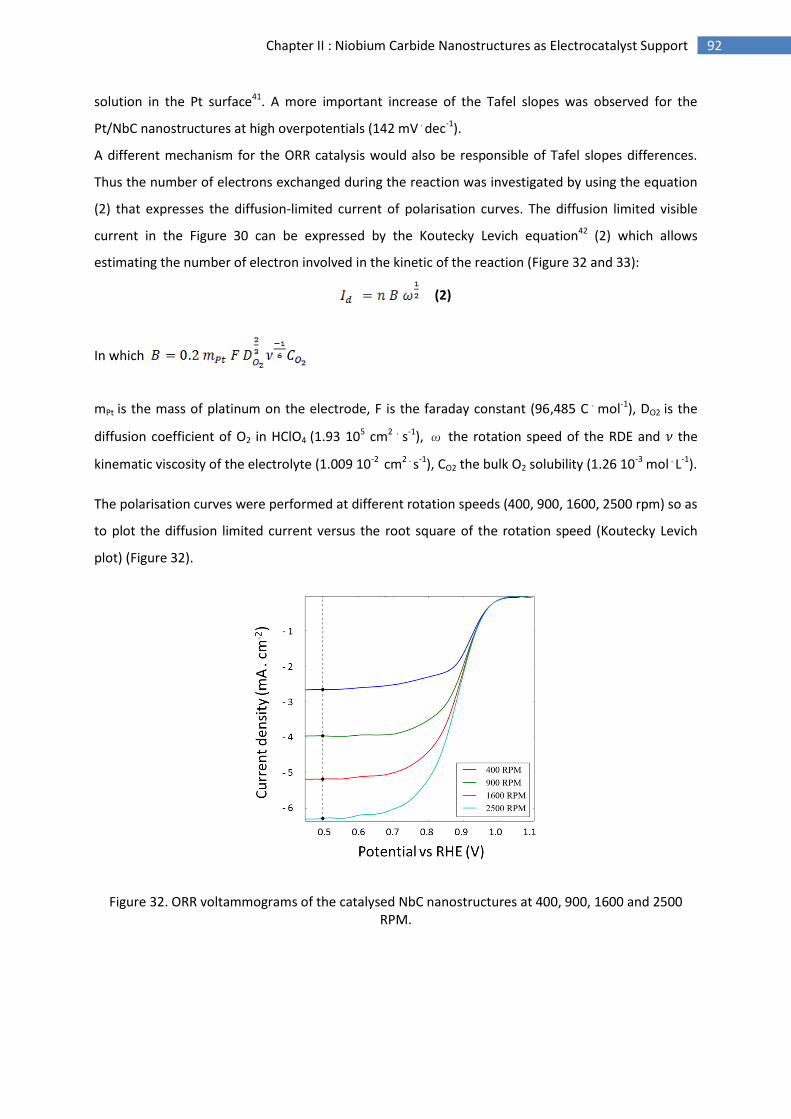
92 Chapter II : Niobium Carbide Nanostructures as Electrocatalyst Support
solution in the Pt surface41. A more important increase of the Tafel slopes was observed for the
Pt/NbC nanostructures at high overpotentials (142 mV . dec-1).
A different mechanism for the ORR catalysis would also be responsible of Tafel slopes differences.
Thus the number of electrons exchanged during the reaction was investigated by using the equation
(2) that expresses the diffusion-limited current of polarisation curves. The diffusion limited visible
current in the Figure 30 can be expressed by the Koutecky Levich equation42 (2) which allows
estimating the number of electron involved in the kinetic of the reaction (Figure 32 and 33):
(2)
In which
mPt is the mass of platinum on the electrode, F is the faraday constant (96,485 C . mol-1), DO2 is the
diffusion coefficient of O2 in HClO4 (1.93 105 cm2 . s-1), ω the rotation speed of the RDE and 𝜈 the
kinematic viscosity of the electrolyte (1.009 10-2 cm2 . s-1), CO2 the bulk O2 solubility (1.26 10-3 mol . L-1).
The polarisation curves were performed at different rotation speeds (400, 900, 1600, 2500 rpm) so as
to plot the diffusion limited current versus the root square of the rotation speed (Koutecky Levich
plot) (Figure 32).
Figure 32. ORR voltammograms of the catalysed NbC nanostructures at 400, 900, 1600 and 2500 RPM.
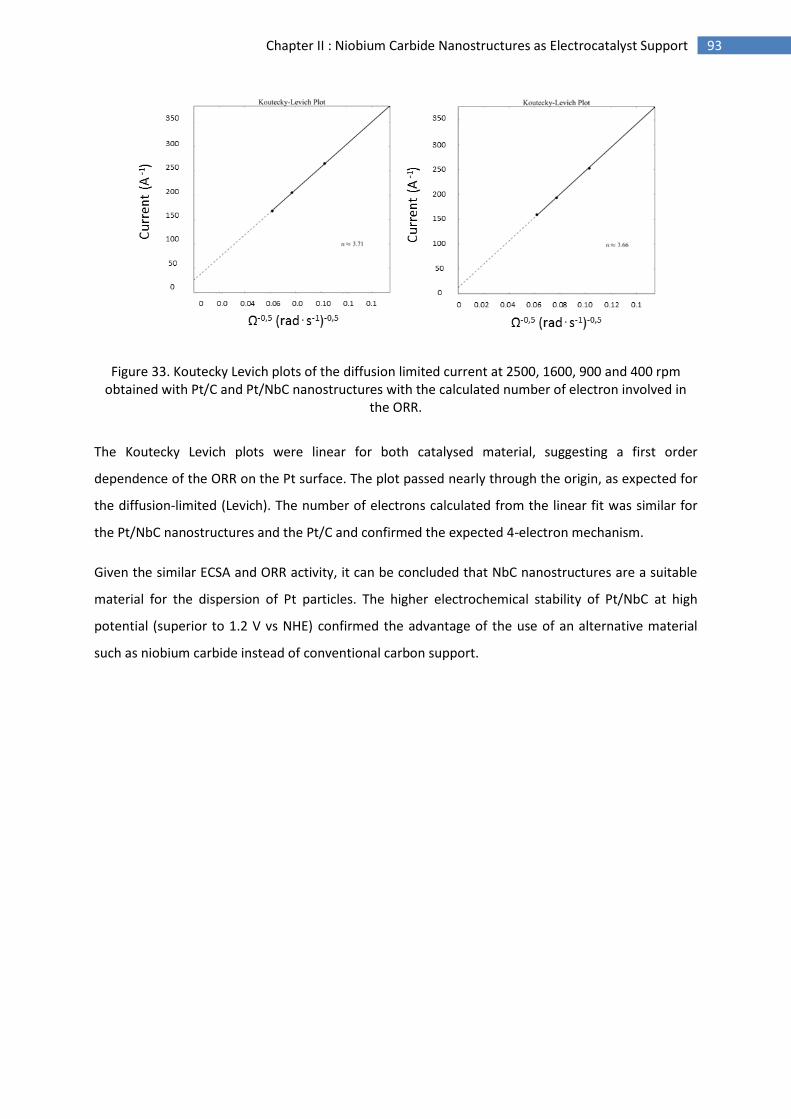
93 Chapter II : Niobium Carbide Nanostructures as Electrocatalyst Support
Figure 33. Koutecky Levich plots of the diffusion limited current at 2500, 1600, 900 and 400 rpm obtained with Pt/C and Pt/NbC nanostructures with the calculated number of electron involved in
the ORR.
The Koutecky Levich plots were linear for both catalysed material, suggesting a first order
dependence of the ORR on the Pt surface. The plot passed nearly through the origin, as expected for
the diffusion-limited (Levich). The number of electrons calculated from the linear fit was similar for
the Pt/NbC nanostructures and the Pt/C and confirmed the expected 4-electron mechanism.
Given the similar ECSA and ORR activity, it can be concluded that NbC nanostructures are a suitable
material for the dispersion of Pt particles. The higher electrochemical stability of Pt/NbC at high
potential (superior to 1.2 V vs NHE) confirmed the advantage of the use of an alternative material
such as niobium carbide instead of conventional carbon support.

94 Chapter II : Niobium Carbide Nanostructures as Electrocatalyst Support
E. Conclusion and perspectives
1. Approach and method
The comparison of the synthesised catalysed Pt/NbC support with a commercial Pt/C confirms the
approach that will be followed during this project. This synthesis route set the standard techniques
for the characterisation of a NbC based material as electrocatalyst support (SEM, TEM, XRD, XPS,
XRF, TGA, cyclic voltammetry). The developed microwave assisted polyol method led to Pt particles
with a suitable diameter that will be used to catalyse all the supports synthesised during this PhD
project. Furthermore the various physicochemical and electrochemical techniques that were carried
out for the characterisation of the Pt/NbC nanostructures will be also performed on the other NbC
based materials discussed in the following chapters. The electrochemical accelerated stress tests
were well adapted to characterise the stability of the electrocatalysts, and the monitoring of the
ECSA of the supported platinum particles.
2. A suitable composition and morphology to improve
A novel electrocatalyst support was successfully synthesised by associating a NbC composition with a
low amount of residual carbon with a controlled morphology. This material gave an opportunity to
confirm that the niobium carbide was suitable for the targeted application. Its electrical conductivity
competes with that of carbon. The controlled morphology provides with specific surface area that
can be tuned in the range of 60 – 80 m2 . g-1 by adjusting the residual carbon amount. However, the
obtained porosity was still mainly due to the microporosity of residual carbon and therefore is less
favourable to obtain a suitable electrocatalyst dispersion.
The material was easily catalysed through Pt nanoparticles prepared by a microwave assisted polyol
method. The same electrocatalysts were used for all the supports prepared in this PhD work so as to
better compare them. Pt/NbC nanostructures feature a catalytic activity towards ORR that is only
slightly lower than that of commercial Pt/C. Their stability through AST up to 1.4 V vs RHE was higher
compared to Pt/C, suggesting that the low residual carbon amount or the Nb2O5 layer identified by
XPS analysis do not affect negatively the stability of the catalysed NbC nanostructure.
To further study the influence of the morphology on the support properties, 1D nanostructured NbC
have been prepared by electrospinning. These alternative morphologies together with new
electrocatalyst deposition methods have been explored to further improve the stability of the PEMFC
cathodes, and are reported in the following chapters.
95 Chapter II : Niobium Carbide Nanostructures as Electrocatalyst Support
F. References
1 L. Toth, Transition metal carbides and nitrides volume 7, 2014.
2 O. Dernovsek and J. Bressiani, J. Mater. Sci., 2000, 35, 2201–2207.
3 H. S. Kim, G. Bugli and G. Djéga-Mariadassou, J. Solid State Chem., 1999, 142, 100–107.
4 V. L. S. Teixeira da Silva, E. I. Ko, M. Schmal and S. T. Oyama, Chem. Mater., 1995, 7, 179–184.
5 J. Bernard D’Arbigny, G. Taillades, M. Marrony, D. J. Jones and J. Rozière, Chem. Commun., 2011, 47, 7950–7952.
6 Q. Wang, H. Li, L. Q. Chen and X. J. Huang, Carbon N. Y., 2001, 39, 2211–2214.
7 X. M. Sun and Y. D. Li, Angew. Chemie-International Ed., 2004, 43, 597–601.
8 V. L. S. Teixeira da Silva, M. Schmal and S. T. Oyama, J. Solid State Chem., 1996, 123, 168–182.
9 Engineers Edge, thermal conductivity of gases chart, 2015. (http://www.engineersedge.com/heat_transfer/thermal-conductivity-gases.htm)
10 H. G. Merkus, Particle Size Measurements: Fundamentals, Practice, Quality, Springer Science & Business Media, 2009.
11 J. Rouquerol, F. Rouquerol, P. Llewellyn, G. Maurin and K. S. W. Sing, Adsorption by Powders and Porous Solids: Principles, Methodology and Applications, 2013.
12 L. Ci, B. Wei, C. Xu, J. Liang, D. Wu, S. Xie, W. Zhou, Y. Li, Z. Liu and D. Tang, J. Cryst. Growth, 2001, 233, 823–828.
13 G. G. Tibbetts, G. L. Doll, D. W. Gorkiewicz, J. J. Moleski, T. A. Perry, C. J. Dasch and M. J. Balogh, Carbon N. Y., 1993, 31, 1039–1047.
14 C. F. Miller, G. W. Simmons and R. P. Wei, Scr. Mater., 2000, 42, 227–232.
15 Z. Du, A. F. Sarofim, J. P. Longwell and C. A. Mims, Energy & Fuels, 1991, 5, 214–221.
16 L. S. K. Pang, J. D. Saxby and S. P. Chatfield, J. Phys. Chem., 1993, 97, 6941–6942.
17 E. Puello-Polo and J. L. Brito, J. Mol. Catal. A Chem., 2008, 281, 85–92.
18 V. Schwartz and S. T. Oyama, Chem. Mater., 1997, 9, 3052–3059.
96 Chapter II : Niobium Carbide Nanostructures as Electrocatalyst Support
19 J. Moulder, W. Stickle, P. Sobol, K. Bomben, P. E. S. J. F. M. W.F. Stickle, J. Moulder, W. Stickle, P. Sobol, K. Bomben and K. D. B. J. F. M. W. F. S. P.E. Sobol, Handbook of X-ray photoelectron spectroscopy, Perkin Elmer Corporation, 1992.
20 M. T. Marques, A. M. Ferraria, J. B. Correia, A. M. B. do Rego and R. Vilar, Mater. Chem. Phys., 2008, 109, 174–180.
21 G. McGuire, G. Schweitzer and T. Carlson, Inorg. Chem., 1973, 12, 2450–2453.
22 E. H. Greener, D. H. Whitmore and M. E. Fine, J. Chem. Phys., 1961, 34, 1017.
23 F. Fievet, J. P. Lagier, B. Blin, B. Beaudoin and M. Figlarz, Solid State Ionics, 1989, 32, 198–205.
24 I. Savych, J. Bernard d’Arbigny, S. Subianto, S. Cavaliere, D. J. Jones and J. Rozière, J. Power Sources, 2014, 257, 147–155.
25 K. Wang, Z. Pan, F. Tzorbatzoglou, Y. Zhang, Y. Wang, T. Panagiotis and S. Song, Appl. Catal. B Environ., 2015, 166, 224–230.
26 H.-S. S. Oh, J.-G. G. Oh and H. Kim, J. Power Sources, 2008, 183, 600–603.
27 E. Lebègue, S. Baranton and C. Coutanceau, J. Power Sources, 2011, 196, 920–927.
28 A. Patterson, Phys. Rev., 1939, 56, 978.
29 J. Shackelford and W. Alexander, CRC materials science and engineering handbook, 2000.
30 S. Gojković, S. Zečević and R. Savinell, J. Electrochem., 1998, 145, 3716–3720.
31 H. Angerstein-Kozlowska, B. E. Conway and W. B. A. Sharp, J. Electroanal. Chem. Interfacial Electrochem., 1973, 43, 9–36.
32 B. E. Conway and H. Angerstein-Kozlowska, Acc. Chem. Res., 1981, 14, 49–56.
33 K. Kinoshita, J. Electrochem. Soc., 1990, 137, 845.
34 S. Zhang, X.-Z. Yuan, H. Wang, W. Merida, H. Zhu, J. SHEN, S. Wu and J. Zhang, Int. J. Hydrogen Energy, 2009, 34, 388–404.
35 R. Borup, J. Meyers and B. Pivovar, Chem. Rev., 2007, 107, 3904–3951.
36 Y. Shao, G. Yin and Y. Gao, J. Power Sources, 2007, 171, 558–566.
37 S. Kocha, Y. Garsany and D. Myers, Testing Oxygen Reduction Reaction Activity with the Rotating Disc Electrode Technique, 2013.
38 J. Wu, X. Z. Yuan, J. J. Martin, H. Wang, J. Zhang, J. Shen, S. Wu and W. Merida, J. Power Sources, 2008, 184, 104–119.
97 Chapter II : Niobium Carbide Nanostructures as Electrocatalyst Support
39 A. Bard and L. Faulkner, Electrochemical methods: Theory and applications, John Wilney and Sons, 1980.
40 E. Gileadi and E. Kirowa-Eisner, Corros. Sci., 2005, 47, 3068–3085.
41 D. Walsh, A. Ejigu, J. Smith and P. Licence, Phys. Chem. Chem. Phys., 2013, 15, 7548–7554.
42 K. Kakinuma, Y. Wakasugi, M. Uchida, T. Kamino, H. Uchida, S. Deki and M. Watanabe, Electrochim. Acta, 2012, 77, 279–284.
G. Table of Figures
Figure 1. Evolution of the thermal conductivity during the methanation of the NbC/C nanostructures.
a. in progress b. completed ……………………………………………………………………………………………………………61
Figure 2. SEM micrograph of ANO/glucose composite microspheres obtained by hydrothermal
synthesis………………………………………………………………………………………………………………………………………... 62
Figure 3. Size distribution of the NbC/C microspheres obtained after de hydrothermal synthesis..63
Figure 4. SEM micrograph of NbC/C nanostructures and microspheres after carburation……….. 64
Figure 5. SEM micrograph of NbC/C nanostructures obtained after methanation………………….64
Figure 6. SEM micrograph of NbC/C (94/6 %wt) nanostructures with a small volume of amorphous
carbon. …………………………………………………………………………………………………………………………………………… 65
Figure 7. SEM micrograph of NbC/C nanostructures with vestiges of microspheres after 3
methanation steps ………………………………………………………………………………………………………………………… 65
Figure 8. BET surface area as a function of residual carbon content in NbC materials……….66
Figure 9. Nitrogen adsorption/desorption of 2 NbC/C nanostructures (3 and 10 % of residual
carbon)……………………………………………………………………………………………………………………………………………. 67
Figure 10. X-ray diffractogramm of the NbC material after carburation (step 2)……………….. 68
Figure 11. X-ray diffractogramm of the material after methanation (step 3)……………………. 69
Figure 12. Thermogravimetric analyses of NbC/C standards (mixture of commercial NC (Alfa Assar)
and Vulcan XC 72 R (Cabot)…………………………………………………………………………………………………………… 70
Figure 13. Calibration curve for the determination of NbC and carbon content obtained by TGA.. 70
Figure 14. Thermogravimetric analysis of synthesised NbC/C after the carburation (step 2)…………… 71
Figure 15. Thermogravimetric analyses of synthesised NbC/C after 1 and 3 consecutive methanations
(step 3)……………………………………………………………………………………………………………………………………………71
Figure 16. XRF calibration for the determination of niobium content…………………………………………. 72
Figure 17. XRF calibration for the determination of carbon content……………………………………. 73
Figure 18. XPS high resolution spectrum of the Nb 3d region for NbC/C nanostructures……………… 74
98 Chapter II : Niobium Carbide Nanostructures as Electrocatalyst Support
Figure 19. Electrical conductivity values for carbon Vulcan XC 72-R and NbC nanostructures as a
function of the temperature................................................................................................ 75
Figure 20. TEM micrographs of the NbC nanostructures catalysed with Pt nanoparticles……………… 77
Figure 21. Pt particles size distribution (histogram).………………………………………………………………… 78
Figure 22. X-ray diffractogramm of the Pt catalysed NbC nanostructures................................ 79
Figure 23. High resolution BE-SEM micrographs of the Pt/NbC nanostructures...............................79
Figure 24. TEM micrographs of the NbC nanostructures catalysed with Pt nanoparticles.………. 80
Figure 25. TEM micrographs of Pt nanoparticles deposited ate the surface of vestige of a NbC
microsphere……………………………………………………………………………………………………………………………………. 80
Figure 26. Cyclic voltammograms of the 16 % Pt/NbC supports and Pt/C 50 % in N2 saturated
HClO4………………………………………………………………………………………………………………………………………..…… 83
Figure 27. TEM micrograph of the 50 % Pt/C reference. ………………………………………………………………… 84
Figure 28. Stability of the ECSA of the catalysed supports during the accelerated stress test
to 1.4 V....................................................................................................................................... 86
Figure 29. Stability of the ECSA of the catalysed supports during the accelerated stress test to 1.2
V.................................................................................................................................................. 87
Figure 30. ORR voltammograms of the catalysed NbC nanostructures compared with commercial Pt/C
at 1600 RPM……………………………………………………………………………………………………………………………. 88
Figure 31. Tafel plot of the mass activity of 20 % Pt/NbC nanostructures vs Pt/C……………………... 89
Figure 32. ORR voltammograms of the catalysed NbC nanostructures at 400, 900, 1600 and 2500
RPM………………………………………………………………………………………………………………………………………………… 90
Figure 33. Koutecky Levich plots of the diffusion limited current at 2500, 1600, 900 and 400 rpm
obtained with Pt/C and Pt/NbC nanostructures with the calculated number of electron involved in
the ORR…………………………………………………………………………………………………………………………………………… 91

99 Chapter III : Niobium Carbide Nanofibres as Electrocatalyst Support
Chapter III: Niobium carbide nanofibres as electrocatalyst support
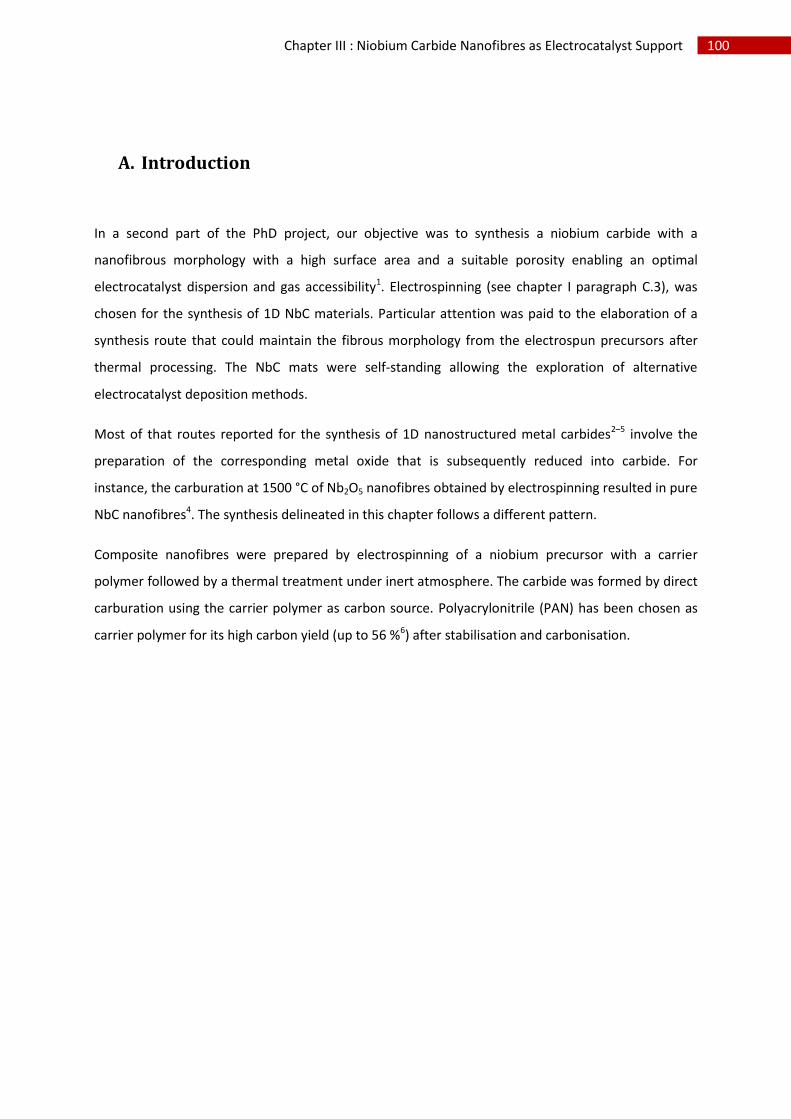
100 Chapter III : Niobium Carbide Nanofibres as Electrocatalyst Support
A. Introduction
In a second part of the PhD project, our objective was to synthesis a niobium carbide with a
nanofibrous morphology with a high surface area and a suitable porosity enabling an optimal
electrocatalyst dispersion and gas accessibility1. Electrospinning (see chapter I paragraph C.3), was
chosen for the synthesis of 1D NbC materials. Particular attention was paid to the elaboration of a
synthesis route that could maintain the fibrous morphology from the electrospun precursors after
thermal processing. The NbC mats were self-standing allowing the exploration of alternative
electrocatalyst deposition methods.
Most of that routes reported for the synthesis of 1D nanostructured metal carbides2–5 involve the
preparation of the corresponding metal oxide that is subsequently reduced into carbide. For
instance, the carburation at 1500 °C of Nb2O5 nanofibres obtained by electrospinning resulted in pure
NbC nanofibres4. The synthesis delineated in this chapter follows a different pattern.
Composite nanofibres were prepared by electrospinning of a niobium precursor with a carrier
polymer followed by a thermal treatment under inert atmosphere. The carbide was formed by direct
carburation using the carrier polymer as carbon source. Polyacrylonitrile (PAN) has been chosen as
carrier polymer for its high carbon yield (up to 56 %6) after stabilisation and carbonisation.
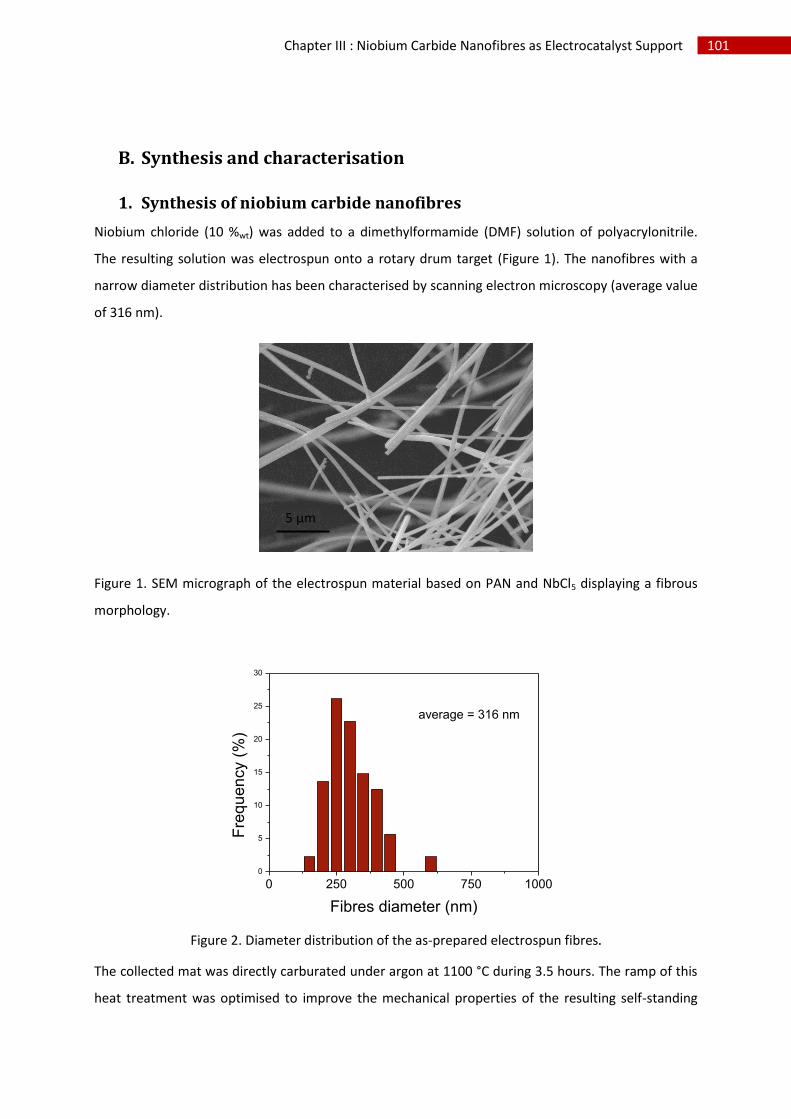
101 Chapter III : Niobium Carbide Nanofibres as Electrocatalyst Support
B. Synthesis and characterisation
1. Synthesis of niobium carbide nanofibres
Niobium chloride (10 %wt) was added to a dimethylformamide (DMF) solution of polyacrylonitrile.
The resulting solution was electrospun onto a rotary drum target (Figure 1). The nanofibres with a
narrow diameter distribution has been characterised by scanning electron microscopy (average value
of 316 nm).
Figure 1. SEM micrograph of the electrospun material based on PAN and NbCl5 displaying a fibrous
morphology.
0 250 500 750 10000
5
10
15
20
25
30
Fre
qu
en
cy (
%)
Fibres diameter (nm)
average = 316 nm
Figure 2. Diameter distribution of the as-prepared electrospun fibres.
The collected mat was directly carburated under argon at 1100 °C during 3.5 hours. The ramp of this
heat treatment was optimised to improve the mechanical properties of the resulting self-standing
5 µm
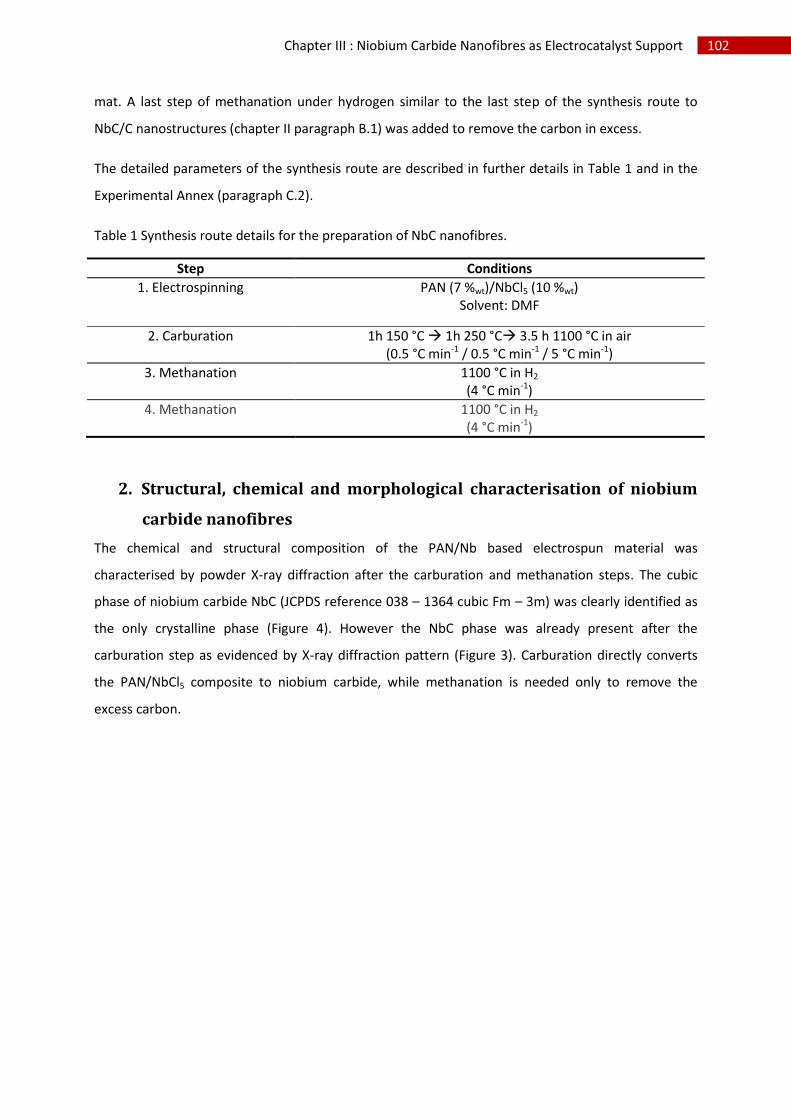
102 Chapter III : Niobium Carbide Nanofibres as Electrocatalyst Support
mat. A last step of methanation under hydrogen similar to the last step of the synthesis route to
NbC/C nanostructures (chapter II paragraph B.1) was added to remove the carbon in excess.
The detailed parameters of the synthesis route are described in further details in Table 1 and in the
Experimental Annex (paragraph C.2).
Table 1 Synthesis route details for the preparation of NbC nanofibres.
Step Conditions
1. Electrospinning PAN (7 %wt)/NbCl5 (10 %wt) Solvent: DMF
2. Carburation 1h 150 °C 1h 250 °C 3.5 h 1100 °C in air (0.5 °C min-1 / 0.5 °C min-1 / 5 °C min-1)
3. Methanation 1100 °C in H2 (4 °C min-1)
4. Methanation 1100 °C in H2 (4 °C min-1)
2. Structural, chemical and morphological characterisation of niobium
carbide nanofibres
The chemical and structural composition of the PAN/Nb based electrospun material was
characterised by powder X-ray diffraction after the carburation and methanation steps. The cubic
phase of niobium carbide NbC (JCPDS reference 038 – 1364 cubic Fm – 3m) was clearly identified as
the only crystalline phase (Figure 4). However the NbC phase was already present after the
carburation step as evidenced by X-ray diffraction pattern (Figure 3). Carburation directly converts
the PAN/NbCl5 composite to niobium carbide, while methanation is needed only to remove the
excess carbon.

103 Chapter III : Niobium Carbide Nanofibres as Electrocatalyst Support
20 30 40 50 60 70 80
[222]
[311]
[220]
[200]
Inte
nsity (
a.u
)
2
[111]
Figure 3. X-ray diffractogramm of the NbC nanofibres after carburation.
Figure 4. X-ray diffractogramm of the NbC nanofibres after methanation.
The crystallite sizes were calculated using the Scherrer formula for the Miller planes ([111], [200] and
[220]) leading to respectively 12 nm, 12 nm and 19 nm for the nanofibres after carburation and 28,
24 and 25 nm for the nanofibres after methanation. This crystallite size increase is consistent with
the grain growth caused by prolonged heat treatments.
PAN used as carbon source lead to residual carbon. The latter gave no visible X-ray diffraction pattern
but needed to be quantified. Thermogravimetric analysis was used as discussed in chapter II
paragraph B.2 (Figure 5) to determine the residual carbon content.
20 30 40 50 60 70 80
Inte
nsity (
a.u
)
2 (°)
[111]
[200]
[220]
[311]
[222]
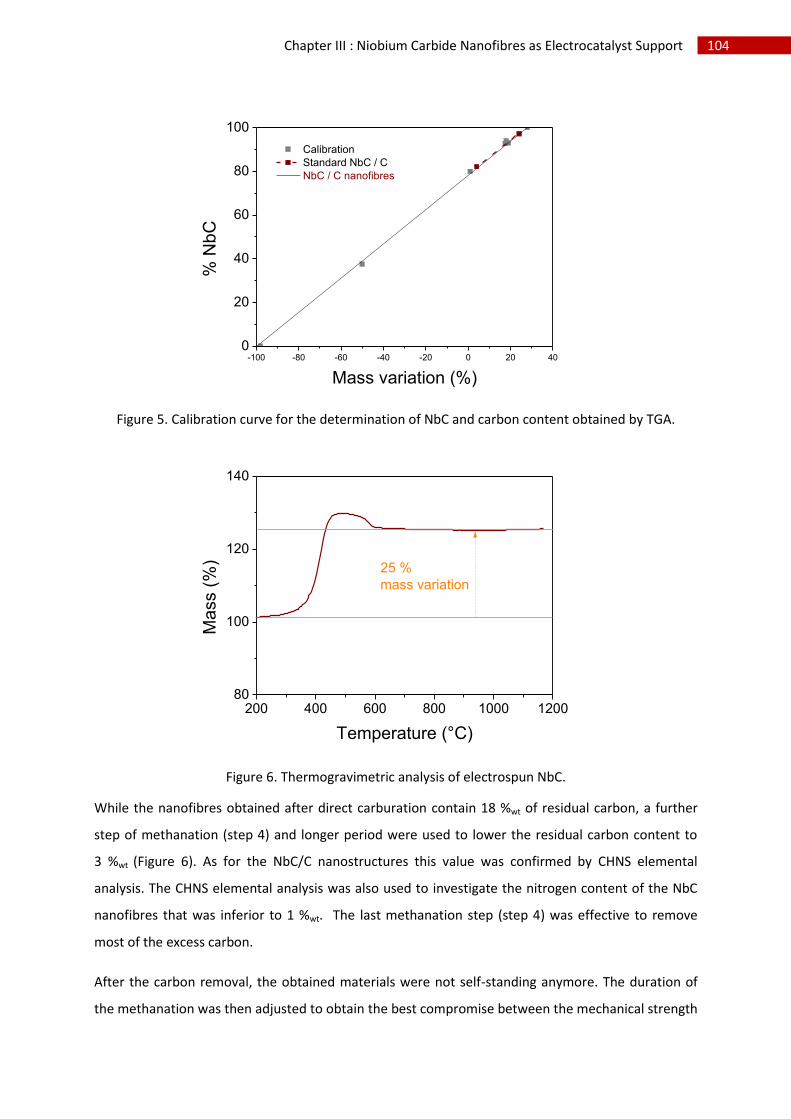
104 Chapter III : Niobium Carbide Nanofibres as Electrocatalyst Support
-100 -80 -60 -40 -20 0 20 400
20
40
60
80
100
Calibration
Standard NbC / C
NbC / C nanofibres
% N
bC
Mass variation (%)
Figure 5. Calibration curve for the determination of NbC and carbon content obtained by TGA.
200 400 600 800 1000 120080
100
120
140
Mass (
%)
Temperature (°C)
25 %
mass variation
Figure 6. Thermogravimetric analysis of electrospun NbC.
While the nanofibres obtained after direct carburation contain 18 %wt of residual carbon, a further
step of methanation (step 4) and longer period were used to lower the residual carbon content to
3 %wt (Figure 6). As for the NbC/C nanostructures this value was confirmed by CHNS elemental
analysis. The CHNS elemental analysis was also used to investigate the nitrogen content of the NbC
nanofibres that was inferior to 1 %wt. The last methanation step (step 4) was effective to remove
most of the excess carbon.
After the carbon removal, the obtained materials were not self-standing anymore. The duration of
the methanation was then adjusted to obtain the best compromise between the mechanical strength
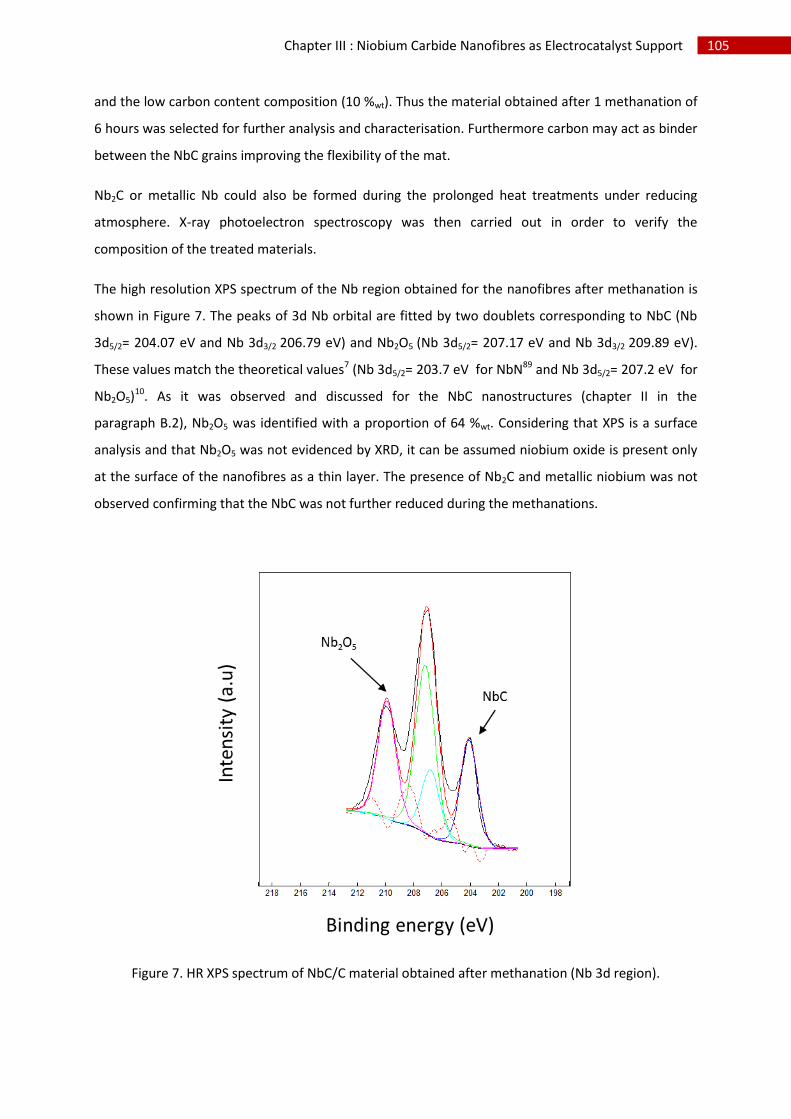
105 Chapter III : Niobium Carbide Nanofibres as Electrocatalyst Support
and the low carbon content composition (10 %wt). Thus the material obtained after 1 methanation of
6 hours was selected for further analysis and characterisation. Furthermore carbon may act as binder
between the NbC grains improving the flexibility of the mat.
Nb2C or metallic Nb could also be formed during the prolonged heat treatments under reducing
atmosphere. X-ray photoelectron spectroscopy was then carried out in order to verify the
composition of the treated materials.
The high resolution XPS spectrum of the Nb region obtained for the nanofibres after methanation is
shown in Figure 7. The peaks of 3d Nb orbital are fitted by two doublets corresponding to NbC (Nb
3d5/2= 204.07 eV and Nb 3d3/2 206.79 eV) and Nb2O5 (Nb 3d5/2= 207.17 eV and Nb 3d3/2 209.89 eV).
These values match the theoretical values7 (Nb 3d5/2= 203.7 eV for NbN89 and Nb 3d5/2= 207.2 eV for
Nb2O5)10. As it was observed and discussed for the NbC nanostructures (chapter II in the
paragraph B.2), Nb2O5 was identified with a proportion of 64 %wt. Considering that XPS is a surface
analysis and that Nb2O5 was not evidenced by XRD, it can be assumed niobium oxide is present only
at the surface of the nanofibres as a thin layer. The presence of Nb2C and metallic niobium was not
observed confirming that the NbC was not further reduced during the methanations.
Figure 7. HR XPS spectrum of NbC/C material obtained after methanation (Nb 3d region).
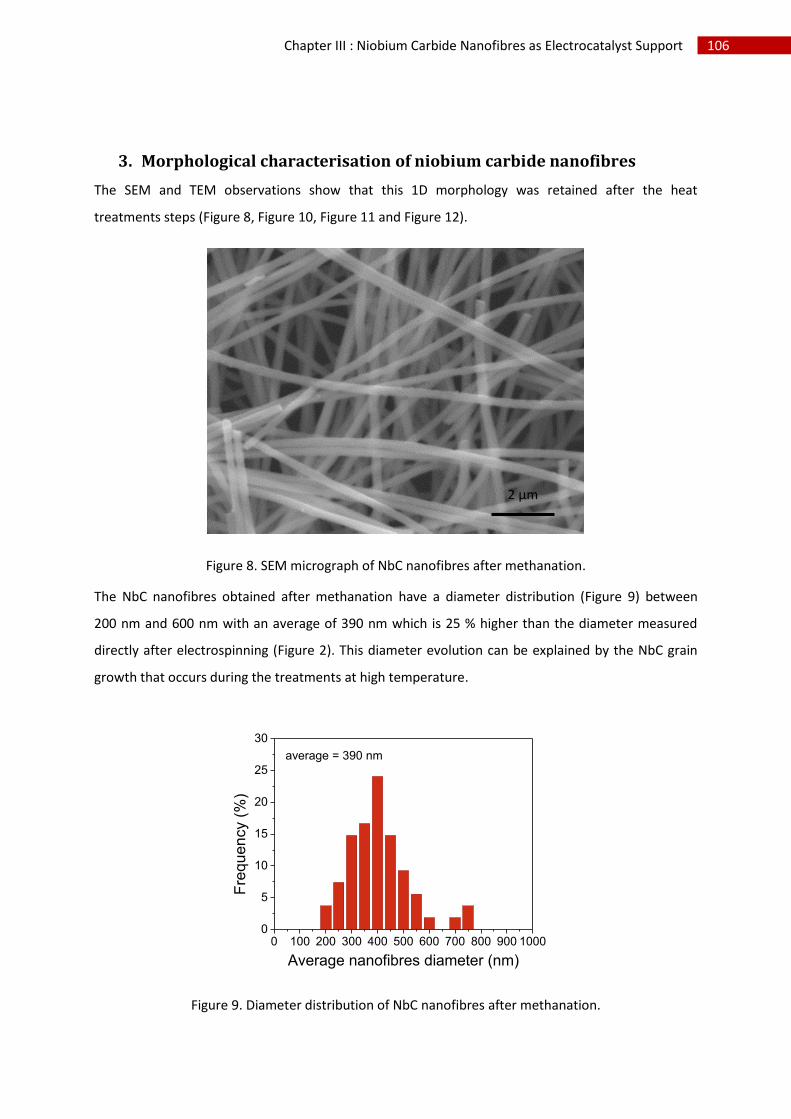
106 Chapter III : Niobium Carbide Nanofibres as Electrocatalyst Support
3. Morphological characterisation of niobium carbide nanofibres
The SEM and TEM observations show that this 1D morphology was retained after the heat
treatments steps (Figure 8, Figure 10, Figure 11 and Figure 12).
Figure 8. SEM micrograph of NbC nanofibres after methanation.
The NbC nanofibres obtained after methanation have a diameter distribution (Figure 9) between
200 nm and 600 nm with an average of 390 nm which is 25 % higher than the diameter measured
directly after electrospinning (Figure 2). This diameter evolution can be explained by the NbC grain
growth that occurs during the treatments at high temperature.
0 100 200 300 400 500 600 700 800 900 10000
5
10
15
20
25
30
Fre
qu
en
cy (
%)
Average nanofibres diameter (nm)
average = 390 nm
Figure 9. Diameter distribution of NbC nanofibres after methanation.
2 µm

107 Chapter III : Niobium Carbide Nanofibres as Electrocatalyst Support
Figure 10. SEM micrograph of the NbC nanofibres displaying the NbC grains in NbC/C matrix
(secondary electron (right) vs backscattered electron (left)).
Some fibres with a double or more sized diameter suggest that the heat treatment can result in the
welding of nanofibres (Figure 12).
Figure 11. SEM micrograph of merged NbC fibres.
TEM observations highlight the structure of the nanofibres. Niobium carbide grains seem to be
encapsulated in a carbon matrix (Figure 12). The size distribution of the niobium carbide grains
composing the nanofibres is wide (Figure 13) (with an average of 23 nm). This value is in the range of
the crystallite size calculated with the Scherrer formula (paragraph B.2).
Figure 12. TEM micrographs of the NbC nanofibres.
2 µm 2 µm
2.5 µm
1.1 µm 2.2 µm
560 nm
200 nm 2 µm
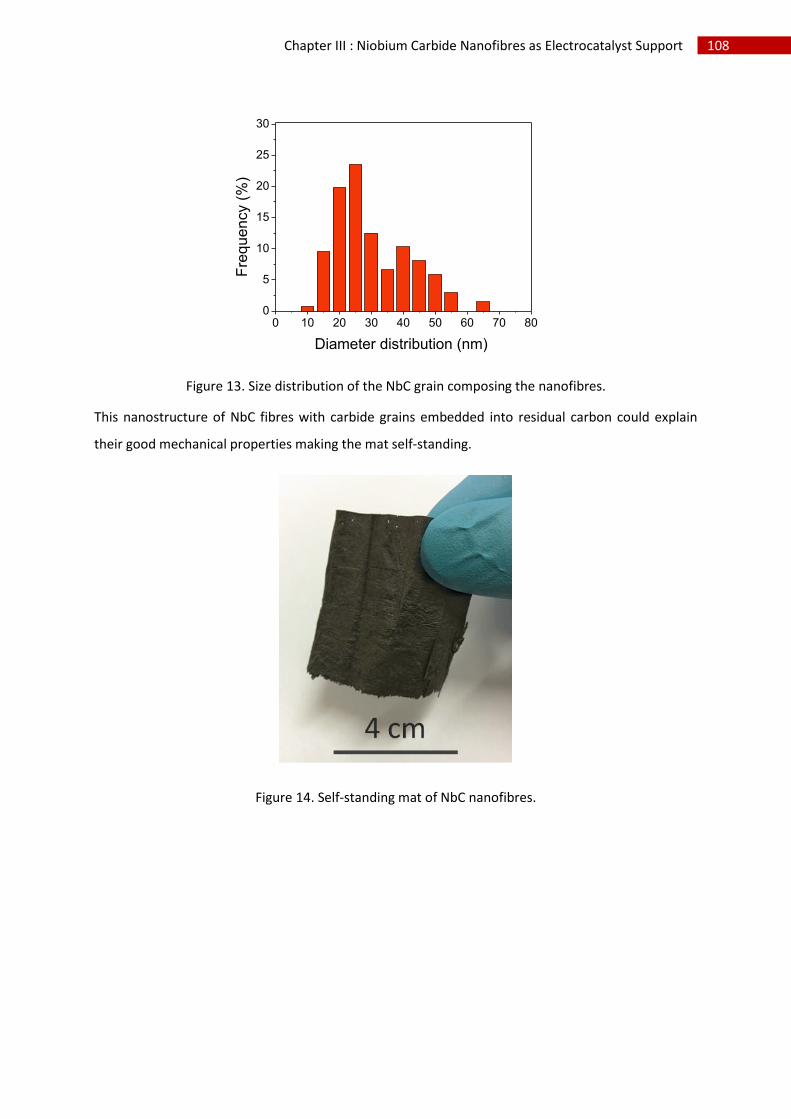
108 Chapter III : Niobium Carbide Nanofibres as Electrocatalyst Support
0 10 20 30 40 50 60 70 800
5
10
15
20
25
30
Fre
qu
en
cy (
%)
Diameter distribution (nm)
Figure 13. Size distribution of the NbC grain composing the nanofibres.
This nanostructure of NbC fibres with carbide grains embedded into residual carbon could explain
their good mechanical properties making the mat self-standing.
Figure 14. Self-standing mat of NbC nanofibres.
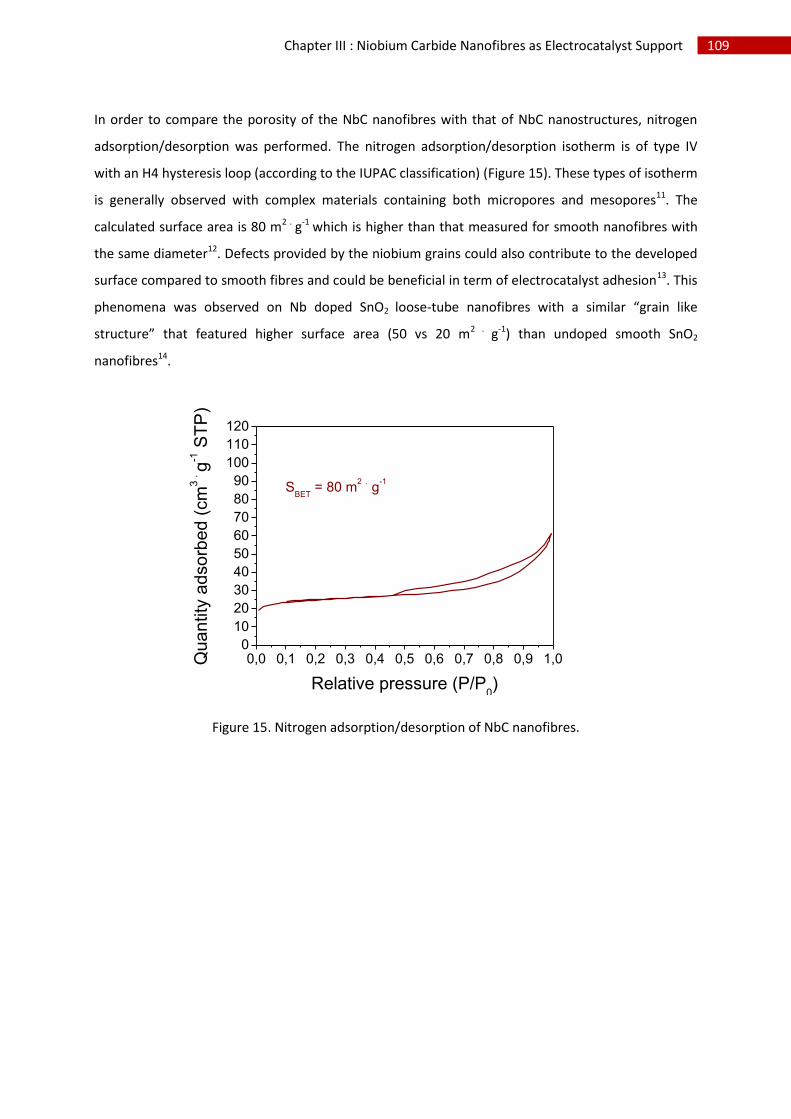
109 Chapter III : Niobium Carbide Nanofibres as Electrocatalyst Support
In order to compare the porosity of the NbC nanofibres with that of NbC nanostructures, nitrogen
adsorption/desorption was performed. The nitrogen adsorption/desorption isotherm is of type IV
with an H4 hysteresis loop (according to the IUPAC classification) (Figure 15). These types of isotherm
is generally observed with complex materials containing both micropores and mesopores11. The
calculated surface area is 80 m2 . g-1 which is higher than that measured for smooth nanofibres with
the same diameter12. Defects provided by the niobium grains could also contribute to the developed
surface compared to smooth fibres and could be beneficial in term of electrocatalyst adhesion13. This
phenomena was observed on Nb doped SnO2 loose-tube nanofibres with a similar “grain like
structure” that featured higher surface area (50 vs 20 m2 . g-1) than undoped smooth SnO2
nanofibres14.
0,0 0,1 0,2 0,3 0,4 0,5 0,6 0,7 0,8 0,9 1,00
10
20
30
40
50
60
70
80
90
100
110
120
Qu
an
tity
ad
so
rbe
d (
cm
3 .
g-1 S
TP
)
Relative pressure (P/P0)
SBET
= 80 m2 . g
-1
Figure 15. Nitrogen adsorption/desorption of NbC nanofibres.
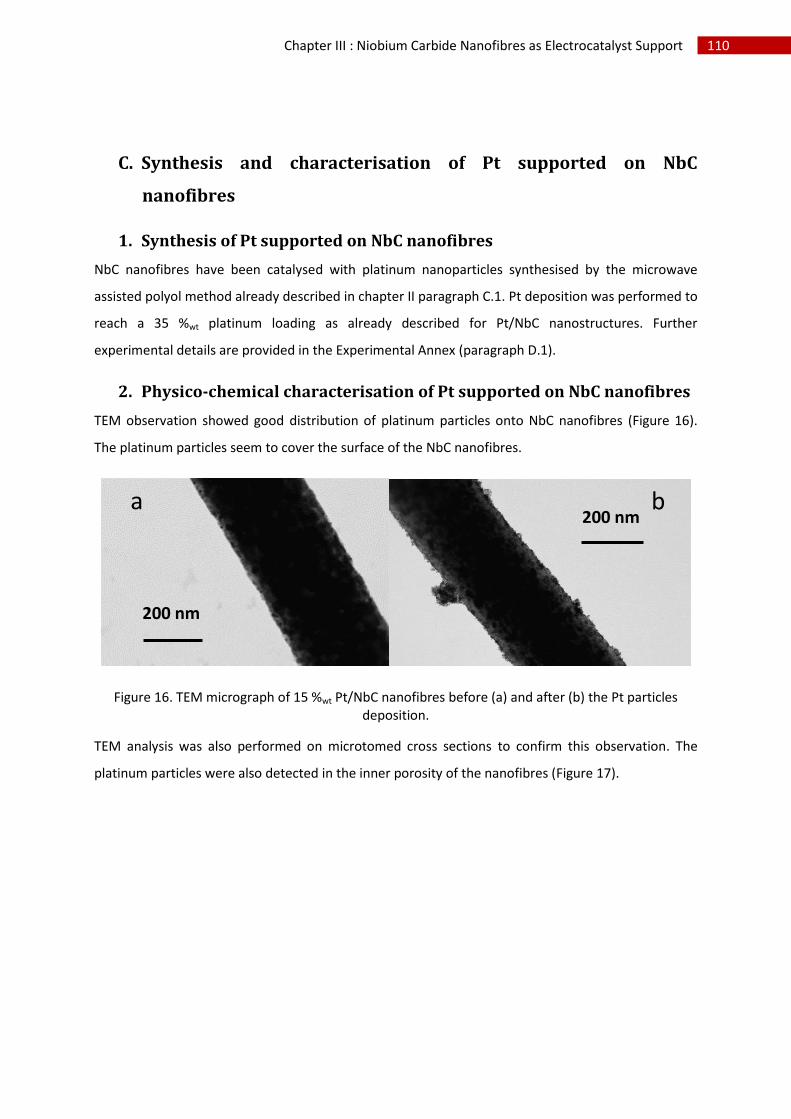
110 Chapter III : Niobium Carbide Nanofibres as Electrocatalyst Support
C. Synthesis and characterisation of Pt supported on NbC
nanofibres
1. Synthesis of Pt supported on NbC nanofibres
NbC nanofibres have been catalysed with platinum nanoparticles synthesised by the microwave
assisted polyol method already described in chapter II paragraph C.1. Pt deposition was performed to
reach a 35 %wt platinum loading as already described for Pt/NbC nanostructures. Further
experimental details are provided in the Experimental Annex (paragraph D.1).
2. Physico-chemical characterisation of Pt supported on NbC nanofibres
TEM observation showed good distribution of platinum particles onto NbC nanofibres (Figure 16).
The platinum particles seem to cover the surface of the NbC nanofibres.
Figure 16. TEM micrograph of 15 %wt Pt/NbC nanofibres before (a) and after (b) the Pt particles deposition.
TEM analysis was also performed on microtomed cross sections to confirm this observation. The
platinum particles were also detected in the inner porosity of the nanofibres (Figure 17).
200 nm
200 nm a b
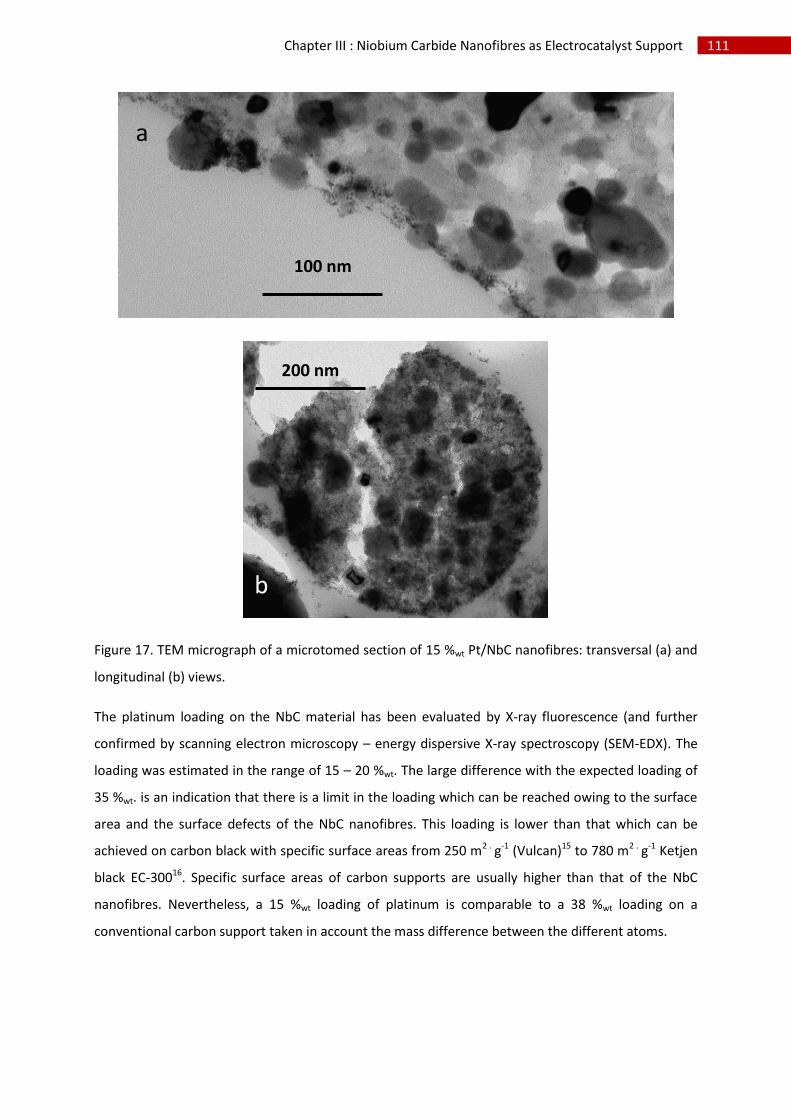
111 Chapter III : Niobium Carbide Nanofibres as Electrocatalyst Support
Figure 17. TEM micrograph of a microtomed section of 15 %wt Pt/NbC nanofibres: transversal (a) and
longitudinal (b) views.
The platinum loading on the NbC material has been evaluated by X-ray fluorescence (and further
confirmed by scanning electron microscopy – energy dispersive X-ray spectroscopy (SEM-EDX). The
loading was estimated in the range of 15 – 20 %wt. The large difference with the expected loading of
35 %wt. is an indication that there is a limit in the loading which can be reached owing to the surface
area and the surface defects of the NbC nanofibres. This loading is lower than that which can be
achieved on carbon black with specific surface areas from 250 m2 . g-1 (Vulcan)15 to 780 m2 . g-1 Ketjen
black EC-30016. Specific surface areas of carbon supports are usually higher than that of the NbC
nanofibres. Nevertheless, a 15 %wt loading of platinum is comparable to a 38 %wt loading on a
conventional carbon support taken in account the mass difference between the different atoms.
100 nm
200 nm
a
b

112 Chapter III : Niobium Carbide Nanofibres as Electrocatalyst Support
D. Electrochemical characterisation of NbC nanofibres supported Pt
on rotating disk electrode
1. Electrochemical surface area
The ex situ electrochemical characterisation was performed on rotating disk electrode on the 15 %wt
Pt/NbC nanofibres and commercial 50 %wt Pt/C (Alfa Aesar) for comparison. The ink formulations for
the RDE as well as the procedure of the electrode preparation are described in the Experimental
Annex (paragraph E.8). For comparison with a Pt/C reference electrode, the results were normalised
by dividing by the platinum mass per electrode (A . g-1Pt).
0,00 0,25 0,50 0,75 1,00 1,25
-40
-30
-20
-10
0
10
20
30
a
b
Spe
cific
curr
ent (A
. g
-1)
Potential vs RHE (V)
Figure 18. Cyclic voltammograms of 15 % Pt/NbC nanofibres (a) and 50 % Pt/C (b) in N2 saturated HClO4 (Alfa Aesar).
Cyclic voltammetry in N2 saturated HClO4 performed on the Pt/NbC electrode (Figure 18), shows the
typical features of Pt surface (see chapter II paragraph D.1).
Platinum electrochemical surface area (ECSA) calculated by integrating the hydrogen adsorption peak
was 26 m2 . g-1. This value is significantly lower than the ECSA of 52 m2 . g-1 obtained for the 50 %wt
Pt/C (Alfa Aesar) suggesting that a part of the platinum was isolated from the electrolyte. It can be
assumed that the platinum particles deposited on the inner porosity of the NbC nanofibres are not
active because non accessible.
2. Stability in time
The stability in time of the catalysed nanofibres was investigated by monitoring their ECSA every
100 cycles during the two accelerated stress tests previously described:
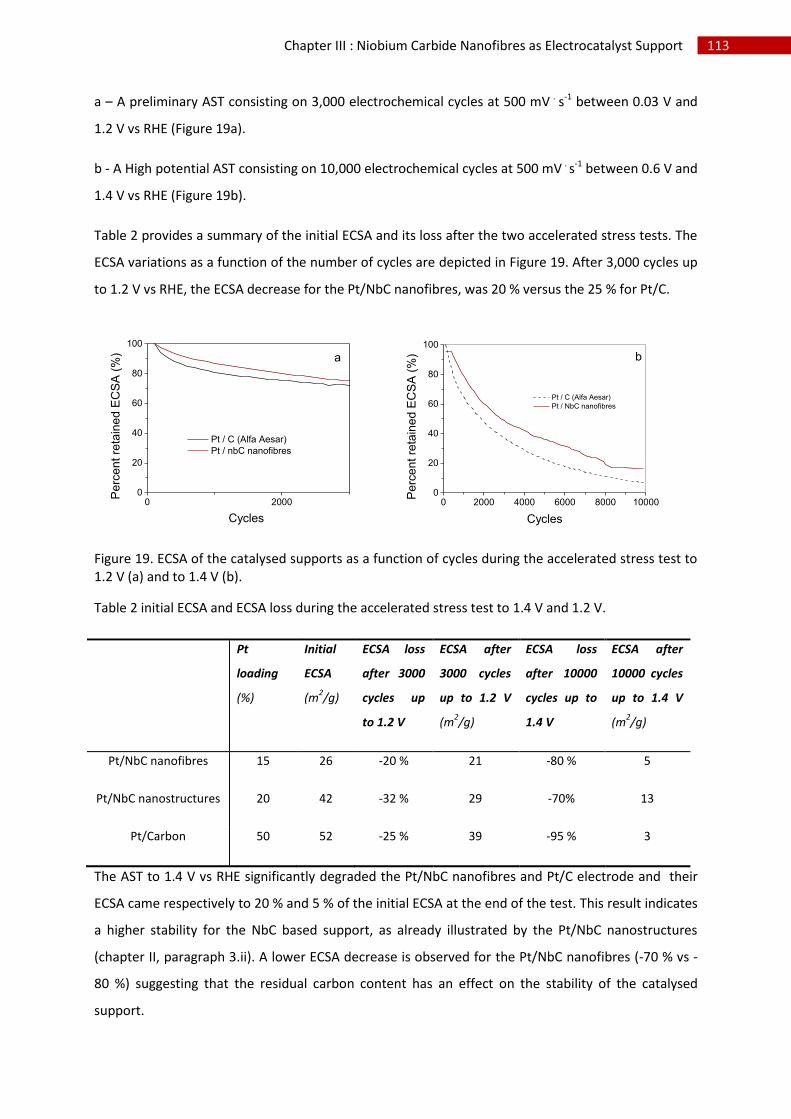
113 Chapter III : Niobium Carbide Nanofibres as Electrocatalyst Support
a – A preliminary AST consisting on 3,000 electrochemical cycles at 500 mV . s-1 between 0.03 V and
1.2 V vs RHE (Figure 19a).
b - A High potential AST consisting on 10,000 electrochemical cycles at 500 mV . s-1 between 0.6 V and
1.4 V vs RHE (Figure 19b).
Table 2 provides a summary of the initial ECSA and its loss after the two accelerated stress tests. The
ECSA variations as a function of the number of cycles are depicted in Figure 19. After 3,000 cycles up
to 1.2 V vs RHE, the ECSA decrease for the Pt/NbC nanofibres, was 20 % versus the 25 % for Pt/C.
0 20000
20
40
60
80
100
Pt / C (Alfa Aesar)
Pt / nbC nanofibres
Pe
rce
nt re
tain
ed
EC
SA
(%
)
Cycles
a
0 2000 4000 6000 8000 100000
20
40
60
80
100
Pt / C (Alfa Aesar)
Pt / NbC nanofibresP
erc
ent re
tain
ed E
CS
A (
%)
Cycles
b
Figure 19. ECSA of the catalysed supports as a function of cycles during the accelerated stress test to 1.2 V (a) and to 1.4 V (b).
Table 2 initial ECSA and ECSA loss during the accelerated stress test to 1.4 V and 1.2 V.
Pt
loading
(%)
Initial
ECSA
(m2/g)
ECSA loss
after 3000
cycles up
to 1.2 V
ECSA after
3000 cycles
up to 1.2 V
(m2/g)
ECSA loss
after 10000
cycles up to
1.4 V
ECSA after
10000 cycles
up to 1.4 V
(m2/g)
Pt/NbC nanofibres 15 26 -20 % 21 -80 % 5
Pt/NbC nanostructures 20 42 -32 % 29 -70% 13
Pt/Carbon 50 52 -25 % 39 -95 % 3
The AST to 1.4 V vs RHE significantly degraded the Pt/NbC nanofibres and Pt/C electrode and their
ECSA came respectively to 20 % and 5 % of the initial ECSA at the end of the test. This result indicates
a higher stability for the NbC based support, as already illustrated by the Pt/NbC nanostructures
(chapter II, paragraph 3.ii). A lower ECSA decrease is observed for the Pt/NbC nanofibres (-70 % vs -
80 %) suggesting that the residual carbon content has an effect on the stability of the catalysed
support.
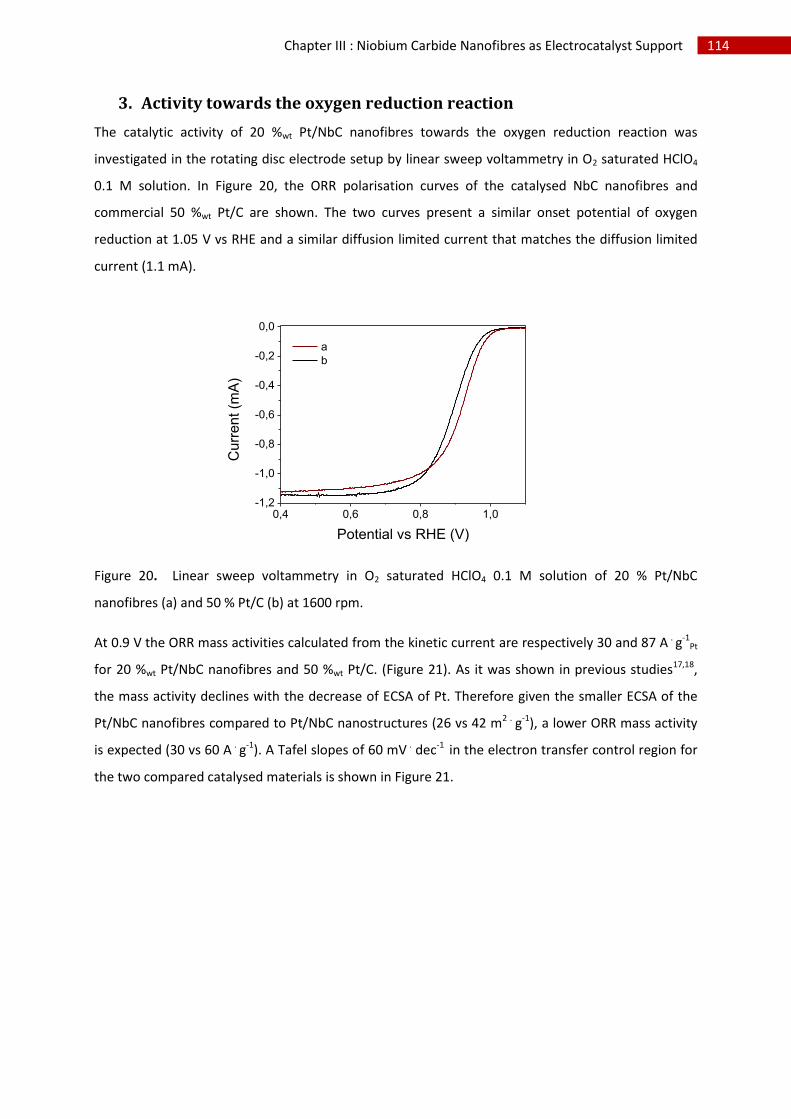
114 Chapter III : Niobium Carbide Nanofibres as Electrocatalyst Support
3. Activity towards the oxygen reduction reaction
The catalytic activity of 20 %wt Pt/NbC nanofibres towards the oxygen reduction reaction was
investigated in the rotating disc electrode setup by linear sweep voltammetry in O2 saturated HClO4
0.1 M solution. In Figure 20, the ORR polarisation curves of the catalysed NbC nanofibres and
commercial 50 %wt Pt/C are shown. The two curves present a similar onset potential of oxygen
reduction at 1.05 V vs RHE and a similar diffusion limited current that matches the diffusion limited
current (1.1 mA).
0,4 0,6 0,8 1,0-1,2
-1,0
-0,8
-0,6
-0,4
-0,2
0,0
a
b
Cu
rren
t (m
A)
Potential vs RHE (V)
Figure 20. Linear sweep voltammetry in O2 saturated HClO4 0.1 M solution of 20 % Pt/NbC
nanofibres (a) and 50 % Pt/C (b) at 1600 rpm.
At 0.9 V the ORR mass activities calculated from the kinetic current are respectively 30 and 87 A . g-1Pt
for 20 %wt Pt/NbC nanofibres and 50 %wt Pt/C. (Figure 21). As it was shown in previous studies17,18,
the mass activity declines with the decrease of ECSA of Pt. Therefore given the smaller ECSA of the
Pt/NbC nanofibres compared to Pt/NbC nanostructures (26 vs 42 m2 . g-1), a lower ORR mass activity
is expected (30 vs 60 A . g-1). A Tafel slopes of 60 mV . dec-1 in the electron transfer control region for
the two compared catalysed materials is shown in Figure 21.
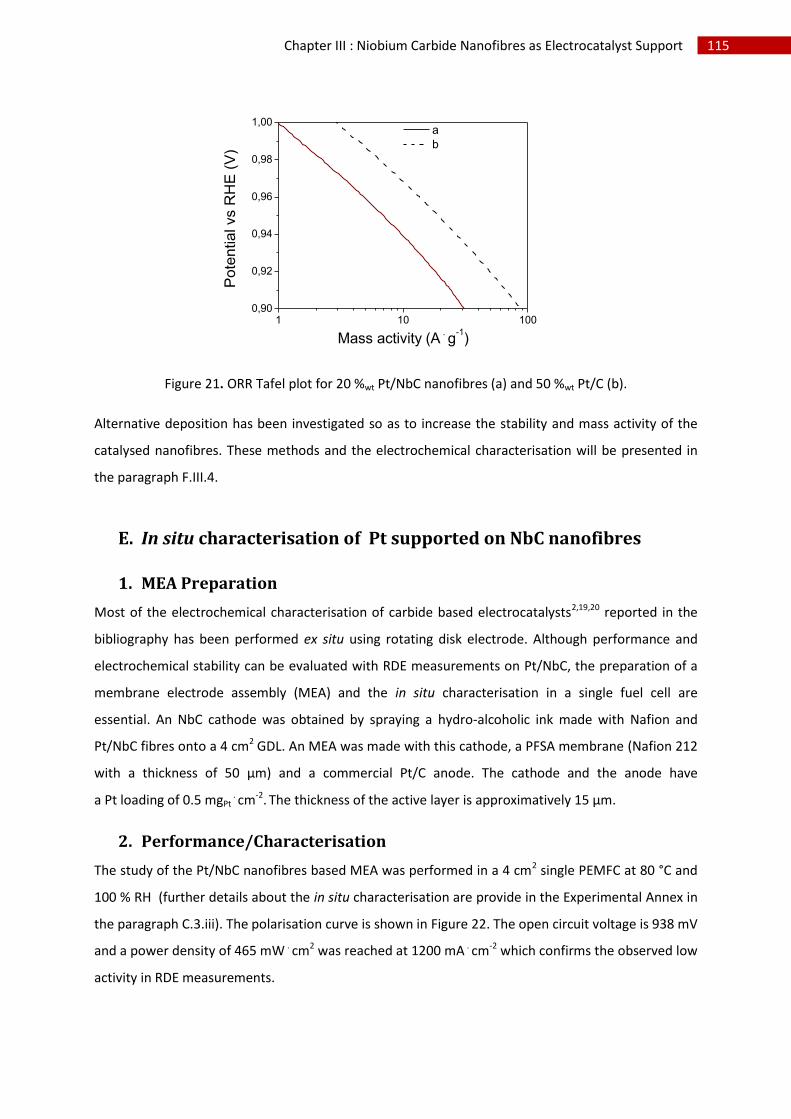
115 Chapter III : Niobium Carbide Nanofibres as Electrocatalyst Support
1 10 1000,90
0,92
0,94
0,96
0,98
1,00 a
b
Pote
ntia
l vs R
HE
(V
)
Mass activity (A . g
-1)
Figure 21. ORR Tafel plot for 20 %wt Pt/NbC nanofibres (a) and 50 %wt Pt/C (b).
Alternative deposition has been investigated so as to increase the stability and mass activity of the
catalysed nanofibres. These methods and the electrochemical characterisation will be presented in
the paragraph F.III.4.
E. In situ characterisation of Pt supported on NbC nanofibres
1. MEA Preparation
Most of the electrochemical characterisation of carbide based electrocatalysts2,19,20 reported in the
bibliography has been performed ex situ using rotating disk electrode. Although performance and
electrochemical stability can be evaluated with RDE measurements on Pt/NbC, the preparation of a
membrane electrode assembly (MEA) and the in situ characterisation in a single fuel cell are
essential. An NbC cathode was obtained by spraying a hydro-alcoholic ink made with Nafion and
Pt/NbC fibres onto a 4 cm2 GDL. An MEA was made with this cathode, a PFSA membrane (Nafion 212
with a thickness of 50 µm) and a commercial Pt/C anode. The cathode and the anode have
a Pt loading of 0.5 mgPt . cm-2. The thickness of the active layer is approximatively 15 µm.
2. Performance/Characterisation
The study of the Pt/NbC nanofibres based MEA was performed in a 4 cm2 single PEMFC at 80 °C and
100 % RH (further details about the in situ characterisation are provide in the Experimental Annex in
the paragraph C.3.iii). The polarisation curve is shown in Figure 22. The open circuit voltage is 938 mV
and a power density of 465 mW . cm2 was reached at 1200 mA . cm-2 which confirms the observed low
activity in RDE measurements.
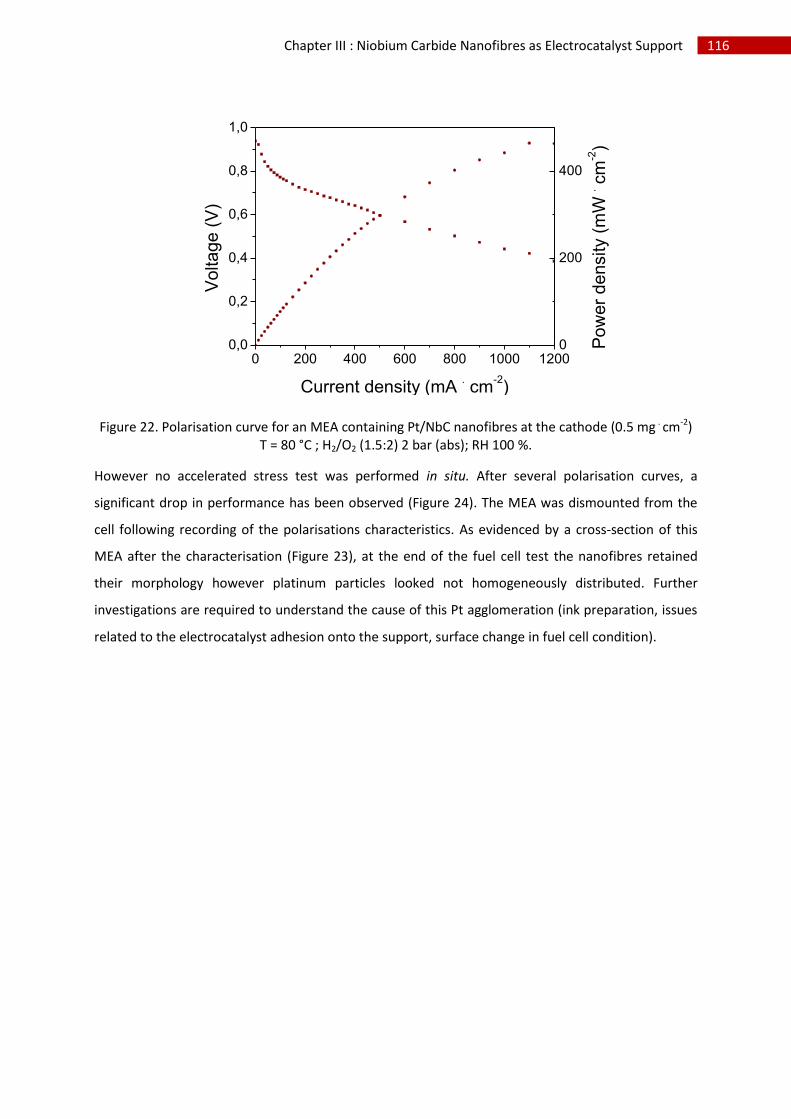
116 Chapter III : Niobium Carbide Nanofibres as Electrocatalyst Support
0 200 400 600 800 1000 12000,0
0,2
0,4
0,6
0,8
1,0
Voltage
(V
)
Current density (mA . cm
-2)
0
200
400
Pow
er
de
nsity (
mW
. cm
-2)
Figure 22. Polarisation curve for an MEA containing Pt/NbC nanofibres at the cathode (0.5 mg . cm-2) T = 80 °C ; H2/O2 (1.5:2) 2 bar (abs); RH 100 %.
However no accelerated stress test was performed in situ. After several polarisation curves, a
significant drop in performance has been observed (Figure 24). The MEA was dismounted from the
cell following recording of the polarisations characteristics. As evidenced by a cross-section of this
MEA after the characterisation (Figure 23), at the end of the fuel cell test the nanofibres retained
their morphology however platinum particles looked not homogeneously distributed. Further
investigations are required to understand the cause of this Pt agglomeration (ink preparation, issues
related to the electrocatalyst adhesion onto the support, surface change in fuel cell condition).
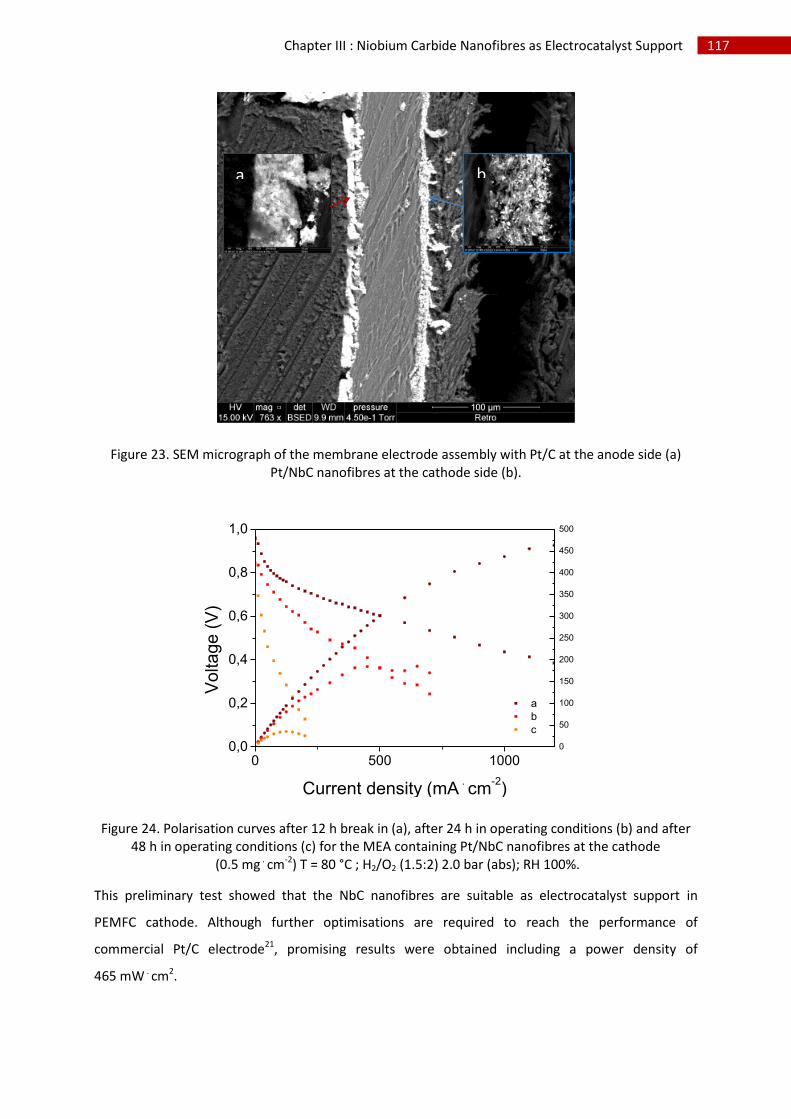
117 Chapter III : Niobium Carbide Nanofibres as Electrocatalyst Support
Figure 23. SEM micrograph of the membrane electrode assembly with Pt/C at the anode side (a) Pt/NbC nanofibres at the cathode side (b).
0 500 10000,0
0,2
0,4
0,6
0,8
1,0
a
b
c
Voltage
(V
)
Current density (mA . cm
-2)
0
50
100
150
200
250
300
350
400
450
500
Figure 24. Polarisation curves after 12 h break in (a), after 24 h in operating conditions (b) and after 48 h in operating conditions (c) for the MEA containing Pt/NbC nanofibres at the cathode
(0.5 mg . cm-2) T = 80 °C ; H2/O2 (1.5:2) 2.0 bar (abs); RH 100%.
This preliminary test showed that the NbC nanofibres are suitable as electrocatalyst support in
PEMFC cathode. Although further optimisations are required to reach the performance of
commercial Pt/C electrode21, promising results were obtained including a power density of
465 mW . cm2.
a b
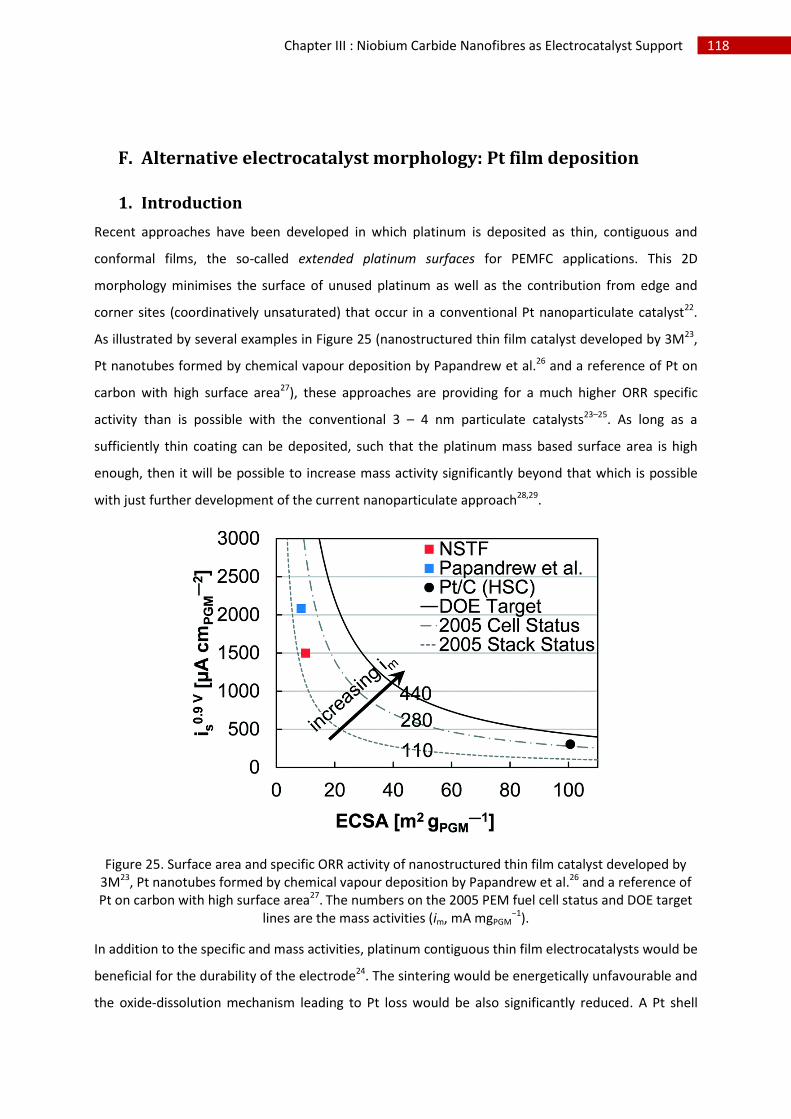
118 Chapter III : Niobium Carbide Nanofibres as Electrocatalyst Support
F. Alternative electrocatalyst morphology: Pt film deposition
1. Introduction
Recent approaches have been developed in which platinum is deposited as thin, contiguous and
conformal films, the so-called extended platinum surfaces for PEMFC applications. This 2D
morphology minimises the surface of unused platinum as well as the contribution from edge and
corner sites (coordinatively unsaturated) that occur in a conventional Pt nanoparticulate catalyst22.
As illustrated by several examples in Figure 25 (nanostructured thin film catalyst developed by 3M23,
Pt nanotubes formed by chemical vapour deposition by Papandrew et al.26 and a reference of Pt on
carbon with high surface area27), these approaches are providing for a much higher ORR specific
activity than is possible with the conventional 3 – 4 nm particulate catalysts23–25. As long as a
sufficiently thin coating can be deposited, such that the platinum mass based surface area is high
enough, then it will be possible to increase mass activity significantly beyond that which is possible
with just further development of the current nanoparticulate approach28,29.
Figure 25. Surface area and specific ORR activity of nanostructured thin film catalyst developed by 3M23, Pt nanotubes formed by chemical vapour deposition by Papandrew et al.26 and a reference of Pt on carbon with high surface area27. The numbers on the 2005 PEM fuel cell status and DOE target
lines are the mass activities (im, mA mgPGM−1).
In addition to the specific and mass activities, platinum contiguous thin film electrocatalysts would be
beneficial for the durability of the electrode24. The sintering would be energetically unfavourable and
the oxide-dissolution mechanism leading to Pt loss would be also significantly reduced. A Pt shell
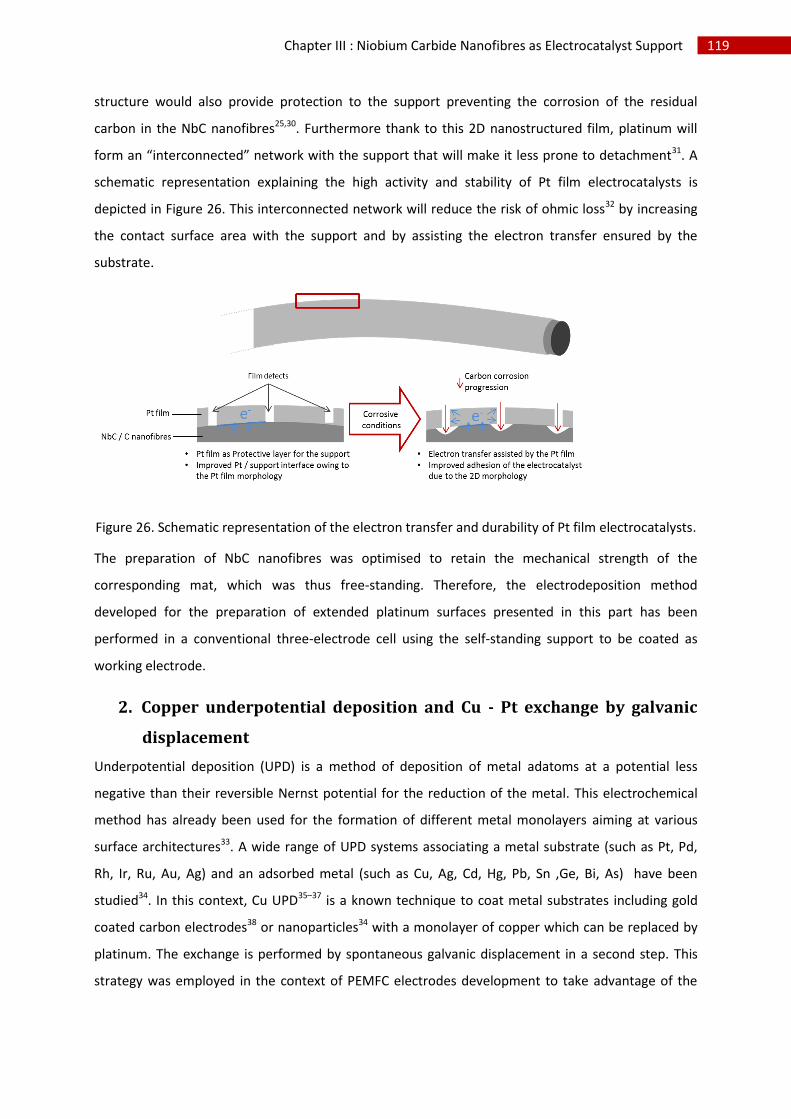
119 Chapter III : Niobium Carbide Nanofibres as Electrocatalyst Support
structure would also provide protection to the support preventing the corrosion of the residual
carbon in the NbC nanofibres25,30. Furthermore thank to this 2D nanostructured film, platinum will
form an “interconnected” network with the support that will make it less prone to detachment31. A
schematic representation explaining the high activity and stability of Pt film electrocatalysts is
depicted in Figure 26. This interconnected network will reduce the risk of ohmic loss32 by increasing
the contact surface area with the support and by assisting the electron transfer ensured by the
substrate.
Figure 26. Schematic representation of the electron transfer and durability of Pt film electrocatalysts.
The preparation of NbC nanofibres was optimised to retain the mechanical strength of the
corresponding mat, which was thus free-standing. Therefore, the electrodeposition method
developed for the preparation of extended platinum surfaces presented in this part has been
performed in a conventional three-electrode cell using the self-standing support to be coated as
working electrode.
2. Copper underpotential deposition and Cu - Pt exchange by galvanic
displacement
Underpotential deposition (UPD) is a method of deposition of metal adatoms at a potential less
negative than their reversible Nernst potential for the reduction of the metal. This electrochemical
method has already been used for the formation of different metal monolayers aiming at various
surface architectures33. A wide range of UPD systems associating a metal substrate (such as Pt, Pd,
Rh, Ir, Ru, Au, Ag) and an adsorbed metal (such as Cu, Ag, Cd, Hg, Pb, Sn ,Ge, Bi, As) have been
studied34. In this context, Cu UPD35–37 is a known technique to coat metal substrates including gold
coated carbon electrodes38 or nanoparticles34 with a monolayer of copper which can be replaced by
platinum. The exchange is performed by spontaneous galvanic displacement in a second step. This
strategy was employed in the context of PEMFC electrodes development to take advantage of the
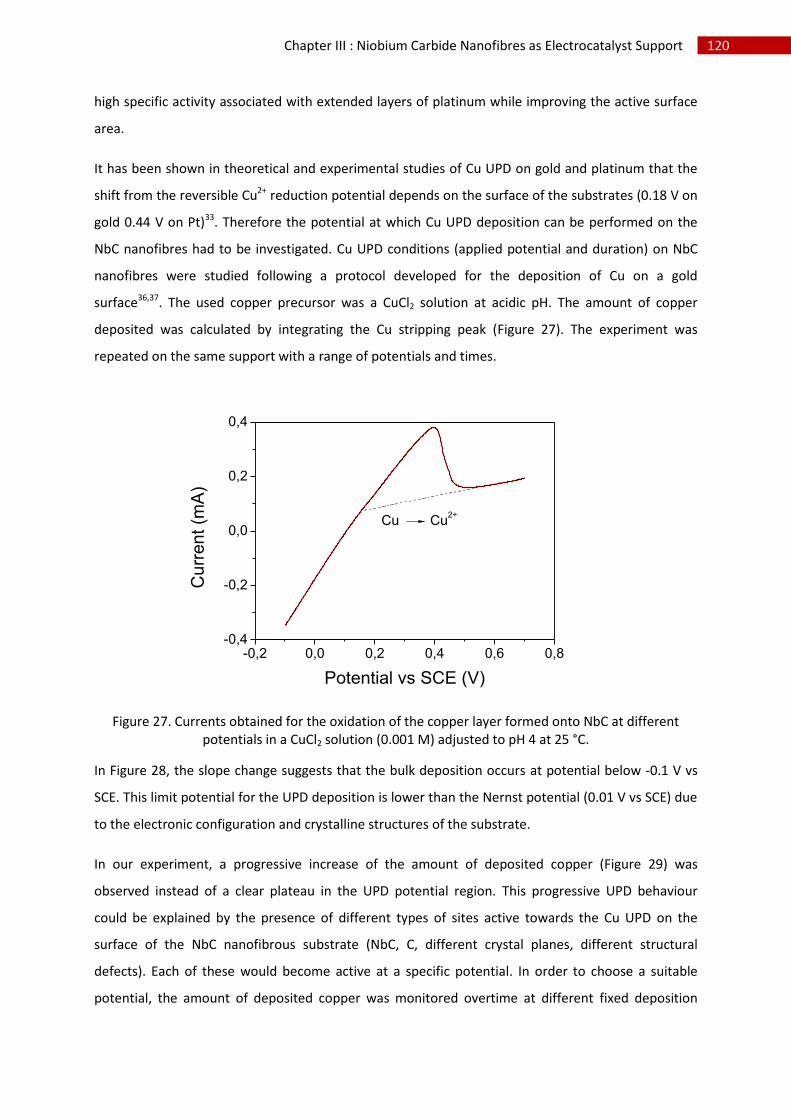
120 Chapter III : Niobium Carbide Nanofibres as Electrocatalyst Support
high specific activity associated with extended layers of platinum while improving the active surface
area.
It has been shown in theoretical and experimental studies of Cu UPD on gold and platinum that the
shift from the reversible Cu2+ reduction potential depends on the surface of the substrates (0.18 V on
gold 0.44 V on Pt)33. Therefore the potential at which Cu UPD deposition can be performed on the
NbC nanofibres had to be investigated. Cu UPD conditions (applied potential and duration) on NbC
nanofibres were studied following a protocol developed for the deposition of Cu on a gold
surface36,37. The used copper precursor was a CuCl2 solution at acidic pH. The amount of copper
deposited was calculated by integrating the Cu stripping peak (Figure 27). The experiment was
repeated on the same support with a range of potentials and times.
-0,2 0,0 0,2 0,4 0,6 0,8-0,4
-0,2
0,0
0,2
0,4
Cu
rre
nt (m
A)
Potential vs SCE (V)
Cu Cu2+
Figure 27. Currents obtained for the oxidation of the copper layer formed onto NbC at different potentials in a CuCl2 solution (0.001 M) adjusted to pH 4 at 25 °C.
In Figure 28, the slope change suggests that the bulk deposition occurs at potential below -0.1 V vs
SCE. This limit potential for the UPD deposition is lower than the Nernst potential (0.01 V vs SCE) due
to the electronic configuration and crystalline structures of the substrate.
In our experiment, a progressive increase of the amount of deposited copper (Figure 29) was
observed instead of a clear plateau in the UPD potential region. This progressive UPD behaviour
could be explained by the presence of different types of sites active towards the Cu UPD on the
surface of the NbC nanofibrous substrate (NbC, C, different crystal planes, different structural
defects). Each of these would become active at a specific potential. In order to choose a suitable
potential, the amount of deposited copper was monitored overtime at different fixed deposition
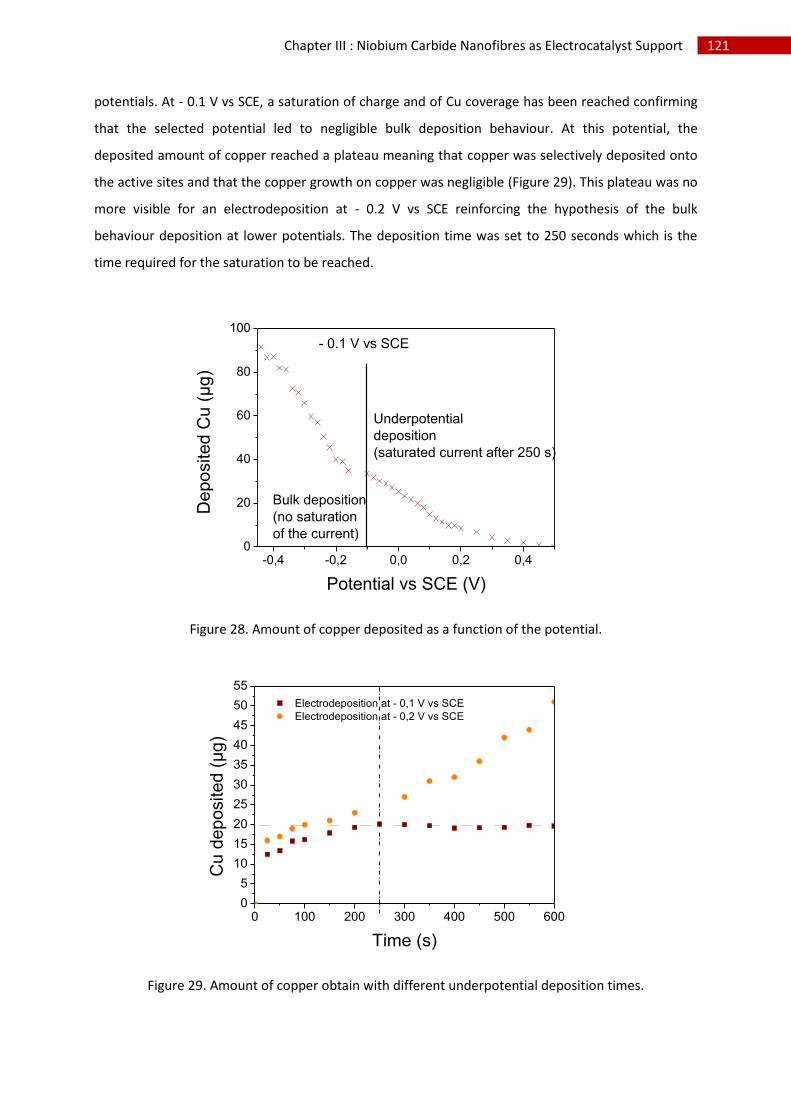
121 Chapter III : Niobium Carbide Nanofibres as Electrocatalyst Support
potentials. At - 0.1 V vs SCE, a saturation of charge and of Cu coverage has been reached confirming
that the selected potential led to negligible bulk deposition behaviour. At this potential, the
deposited amount of copper reached a plateau meaning that copper was selectively deposited onto
the active sites and that the copper growth on copper was negligible (Figure 29). This plateau was no
more visible for an electrodeposition at - 0.2 V vs SCE reinforcing the hypothesis of the bulk
behaviour deposition at lower potentials. The deposition time was set to 250 seconds which is the
time required for the saturation to be reached.
-0,4 -0,2 0,0 0,2 0,40
20
40
60
80
100
- 0.1 V vs SCE
Underpotential
deposition
(saturated current after 250 s)
De
po
site
d C
u (
µg
)
Potential vs SCE (V)
Bulk deposition
(no saturation
of the current)
Figure 28. Amount of copper deposited as a function of the potential.
0 100 200 300 400 500 6000
5
10
15
20
25
30
35
40
45
50
55
Electrodeposition at - 0,1 V vs SCE
Electrodeposition at - 0,2 V vs SCE
Cu
dep
osited (
µg)
Time (s)
Figure 29. Amount of copper obtain with different underpotential deposition times.
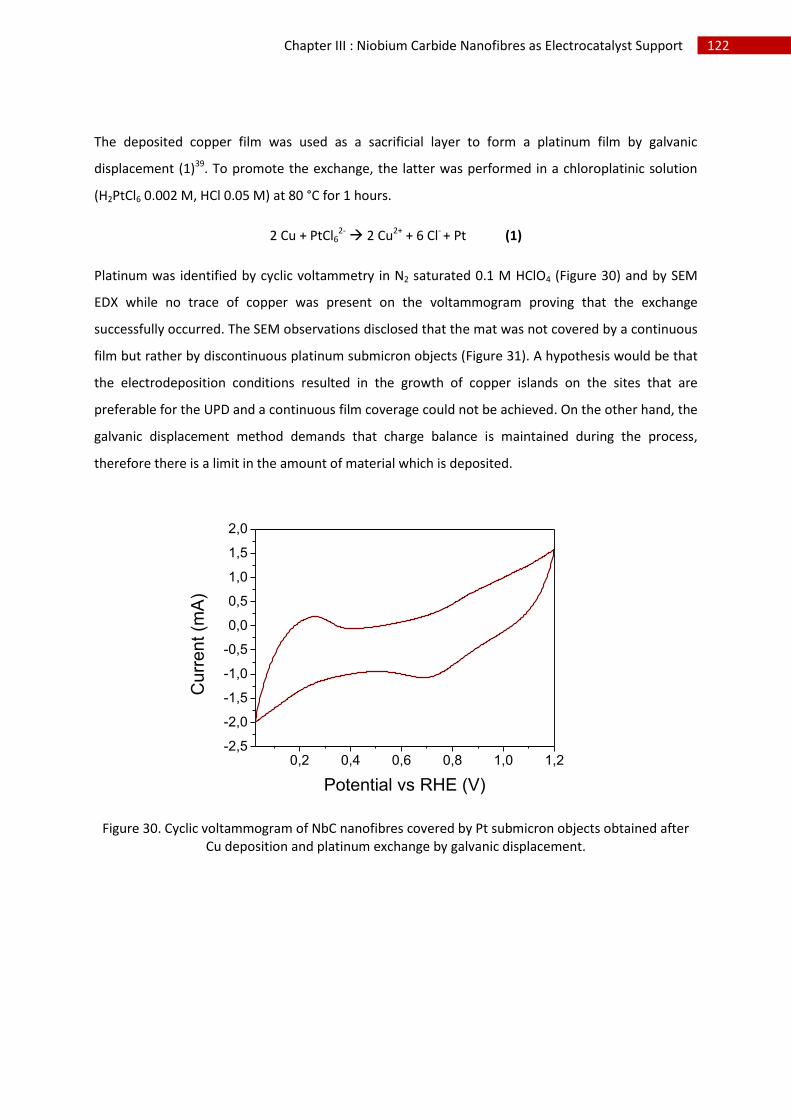
122 Chapter III : Niobium Carbide Nanofibres as Electrocatalyst Support
The deposited copper film was used as a sacrificial layer to form a platinum film by galvanic
displacement (1)39. To promote the exchange, the latter was performed in a chloroplatinic solution
(H2PtCl6 0.002 M, HCl 0.05 M) at 80 °C for 1 hours.
2 Cu + PtCl62- 2 Cu2+ + 6 Cl- + Pt (1)
Platinum was identified by cyclic voltammetry in N2 saturated 0.1 M HClO4 (Figure 30) and by SEM
EDX while no trace of copper was present on the voltammogram proving that the exchange
successfully occurred. The SEM observations disclosed that the mat was not covered by a continuous
film but rather by discontinuous platinum submicron objects (Figure 31). A hypothesis would be that
the electrodeposition conditions resulted in the growth of copper islands on the sites that are
preferable for the UPD and a continuous film coverage could not be achieved. On the other hand, the
galvanic displacement method demands that charge balance is maintained during the process,
therefore there is a limit in the amount of material which is deposited.
0,2 0,4 0,6 0,8 1,0 1,2-2,5
-2,0
-1,5
-1,0
-0,5
0,0
0,5
1,0
1,5
2,0
Cu
rre
nt (m
A)
Potential vs RHE (V)
Figure 30. Cyclic voltammogram of NbC nanofibres covered by Pt submicron objects obtained after Cu deposition and platinum exchange by galvanic displacement.
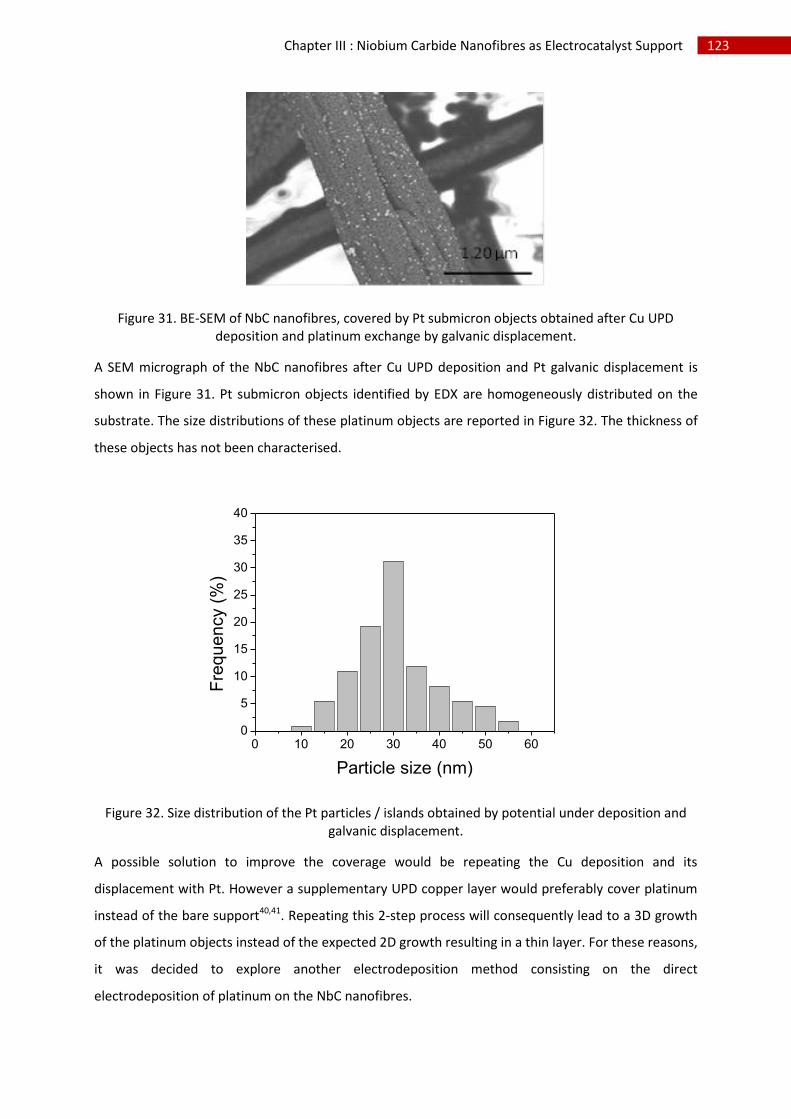
123 Chapter III : Niobium Carbide Nanofibres as Electrocatalyst Support
Figure 31. BE-SEM of NbC nanofibres, covered by Pt submicron objects obtained after Cu UPD deposition and platinum exchange by galvanic displacement.
A SEM micrograph of the NbC nanofibres after Cu UPD deposition and Pt galvanic displacement is
shown in Figure 31. Pt submicron objects identified by EDX are homogeneously distributed on the
substrate. The size distributions of these platinum objects are reported in Figure 32. The thickness of
these objects has not been characterised.
0 10 20 30 40 50 600
5
10
15
20
25
30
35
40
Fre
qu
en
cy (
%)
Particle size (nm)
Figure 32. Size distribution of the Pt particles / islands obtained by potential under deposition and galvanic displacement.
A possible solution to improve the coverage would be repeating the Cu deposition and its
displacement with Pt. However a supplementary UPD copper layer would preferably cover platinum
instead of the bare support40,41. Repeating this 2-step process will consequently lead to a 3D growth
of the platinum objects instead of the expected 2D growth resulting in a thin layer. For these reasons,
it was decided to explore another electrodeposition method consisting on the direct
electrodeposition of platinum on the NbC nanofibres.
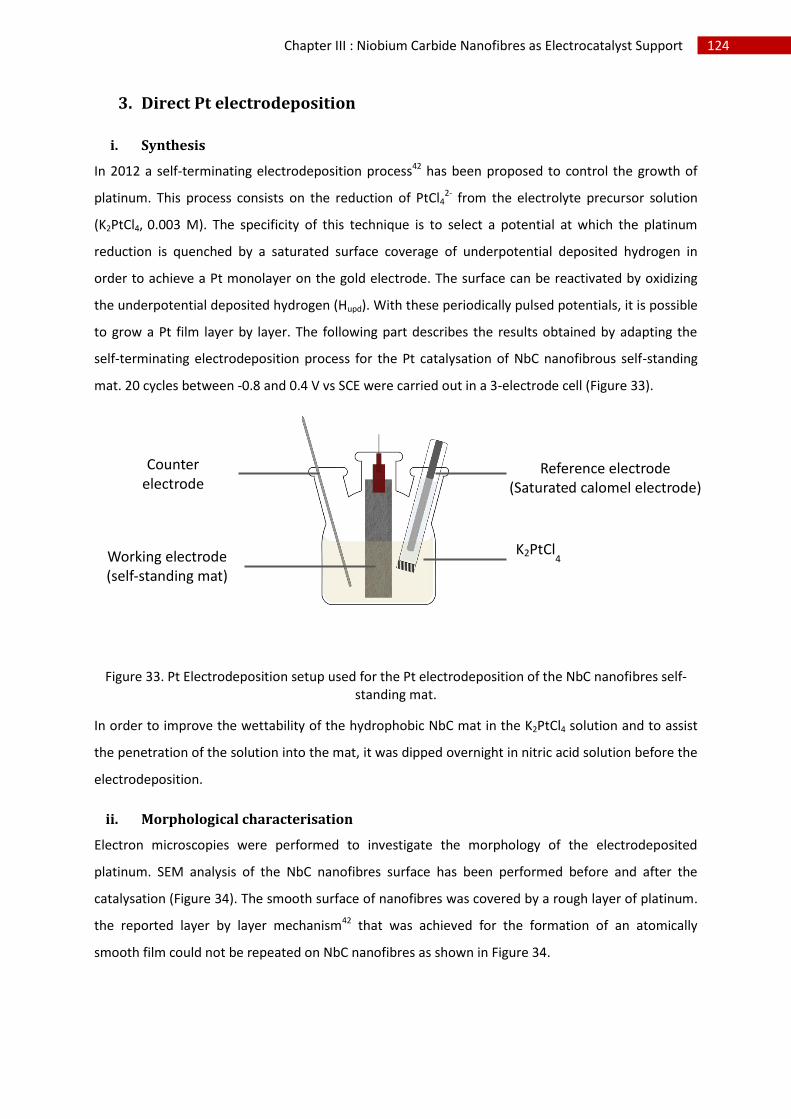
124 Chapter III : Niobium Carbide Nanofibres as Electrocatalyst Support
3. Direct Pt electrodeposition
i. Synthesis
In 2012 a self-terminating electrodeposition process42 has been proposed to control the growth of
platinum. This process consists on the reduction of PtCl42- from the electrolyte precursor solution
(K2PtCl4, 0.003 M). The specificity of this technique is to select a potential at which the platinum
reduction is quenched by a saturated surface coverage of underpotential deposited hydrogen in
order to achieve a Pt monolayer on the gold electrode. The surface can be reactivated by oxidizing
the underpotential deposited hydrogen (Hupd). With these periodically pulsed potentials, it is possible
to grow a Pt film layer by layer. The following part describes the results obtained by adapting the
self-terminating electrodeposition process for the Pt catalysation of NbC nanofibrous self-standing
mat. 20 cycles between -0.8 and 0.4 V vs SCE were carried out in a 3-electrode cell (Figure 33).
Figure 33. Pt Electrodeposition setup used for the Pt electrodeposition of the NbC nanofibres self-standing mat.
In order to improve the wettability of the hydrophobic NbC mat in the K2PtCl4 solution and to assist
the penetration of the solution into the mat, it was dipped overnight in nitric acid solution before the
electrodeposition.
ii. Morphological characterisation
Electron microscopies were performed to investigate the morphology of the electrodeposited
platinum. SEM analysis of the NbC nanofibres surface has been performed before and after the
catalysation (Figure 34). The smooth surface of nanofibres was covered by a rough layer of platinum.
the reported layer by layer mechanism42 that was achieved for the formation of an atomically
smooth film could not be repeated on NbC nanofibres as shown in Figure 34.
Counter electrode (Pt wire)
Working electrode (self-standing mat)
Reference electrode (Saturated calomel electrode)
K2PtCl4
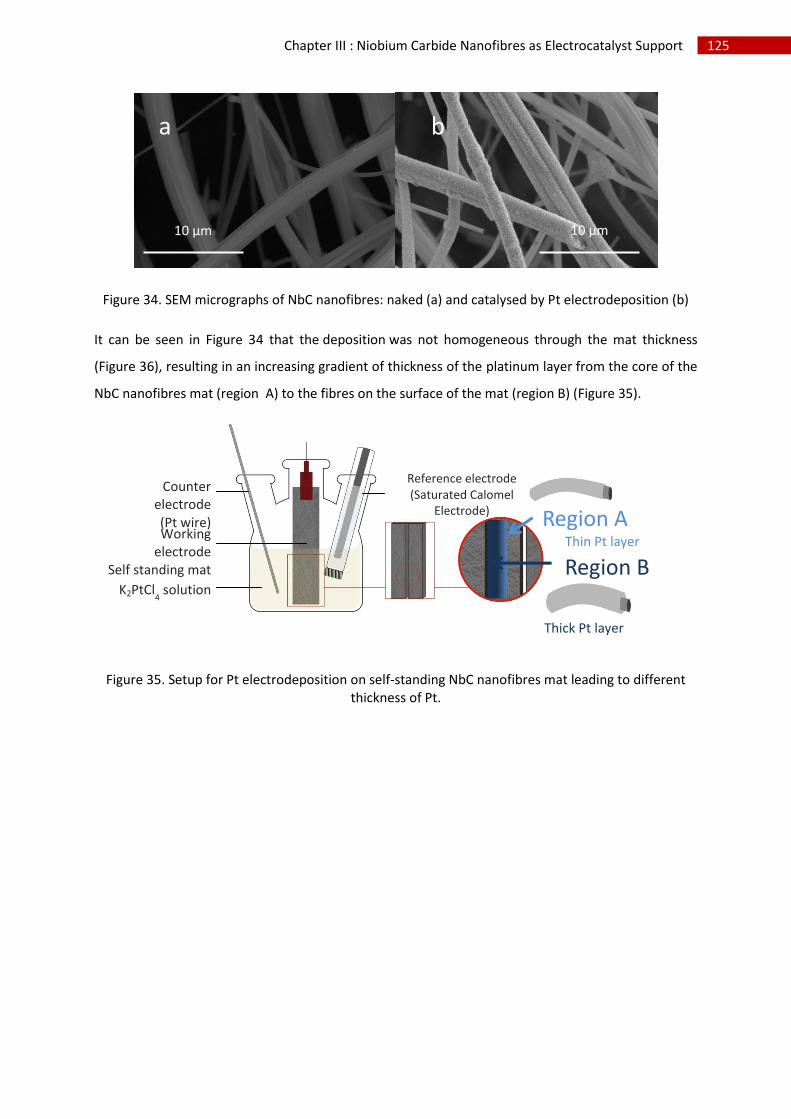
125 Chapter III : Niobium Carbide Nanofibres as Electrocatalyst Support
Figure 34. SEM micrographs of NbC nanofibres: naked (a) and catalysed by Pt electrodeposition (b)
It can be seen in Figure 34 that the deposition was not homogeneous through the mat thickness
(Figure 36), resulting in an increasing gradient of thickness of the platinum layer from the core of the
NbC nanofibres mat (region A) to the fibres on the surface of the mat (region B) (Figure 35).
Figure 35. Setup for Pt electrodeposition on self-standing NbC nanofibres mat leading to different thickness of Pt.
10 µm 10 µm
Working electrode
Self standing mat
Thick Pt layer
K2PtCl4 solution
Counter electrode
(Pt wire)
Region A Thin Pt layer
Region B
Reference electrode (Saturated Calomel
Electrode)
b a
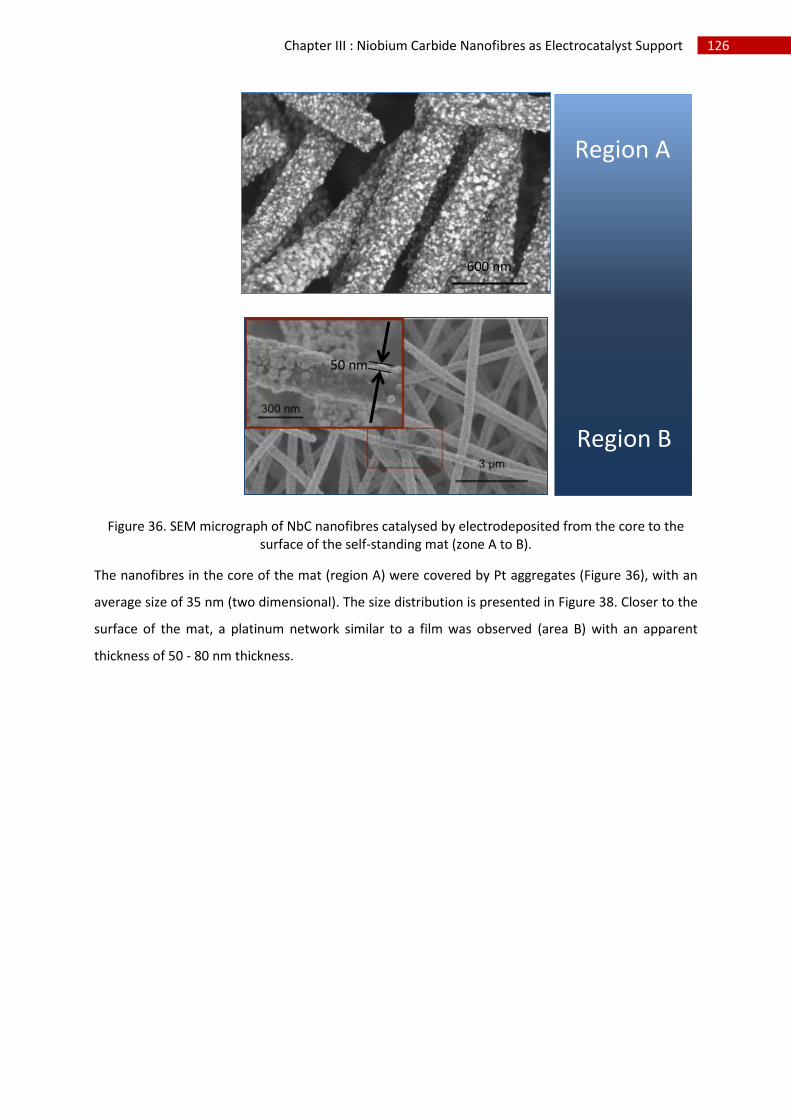
126 Chapter III : Niobium Carbide Nanofibres as Electrocatalyst Support
Figure 36. SEM micrograph of NbC nanofibres catalysed by electrodeposited from the core to the surface of the self-standing mat (zone A to B).
The nanofibres in the core of the mat (region A) were covered by Pt aggregates (Figure 36), with an
average size of 35 nm (two dimensional). The size distribution is presented in Figure 38. Closer to the
surface of the mat, a platinum network similar to a film was observed (area B) with an apparent
thickness of 50 - 80 nm thickness.
600 nm
50 nm
Region A
Region B
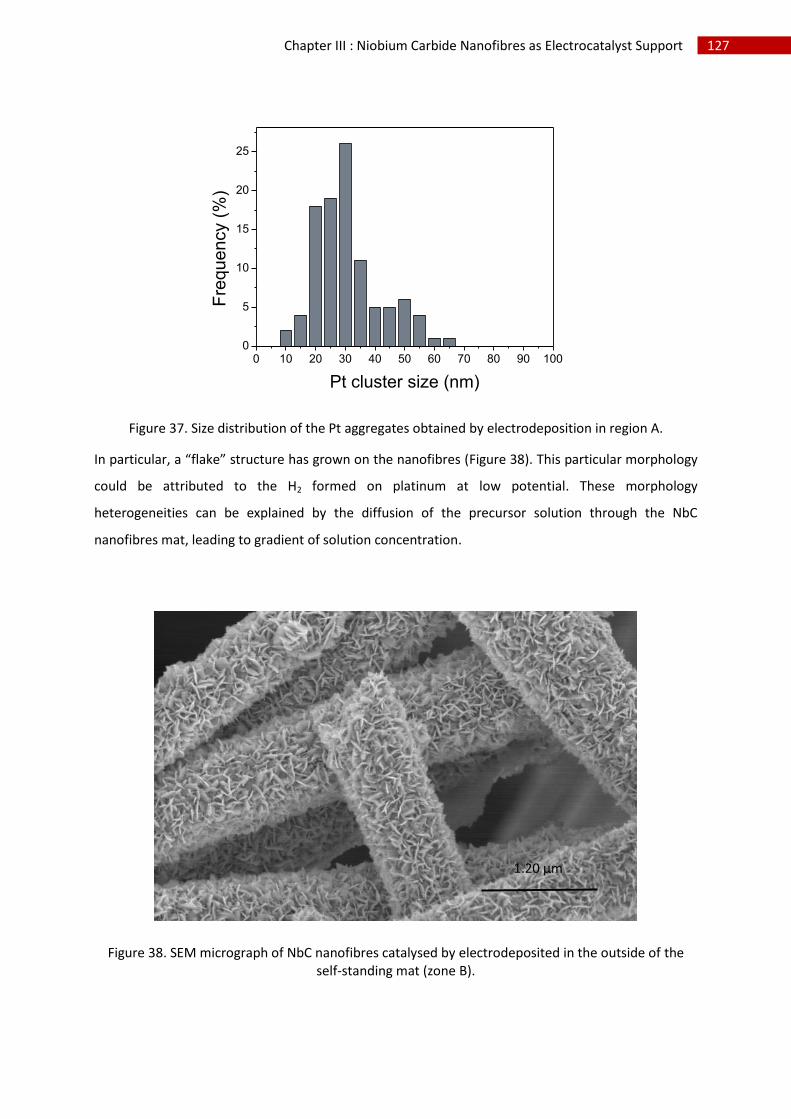
127 Chapter III : Niobium Carbide Nanofibres as Electrocatalyst Support
0 10 20 30 40 50 60 70 80 90 1000
5
10
15
20
25
Fre
qu
en
cy (
%)
Pt cluster size (nm)
Figure 37. Size distribution of the Pt aggregates obtained by electrodeposition in region A.
In particular, a “flake” structure has grown on the nanofibres (Figure 38). This particular morphology
could be attributed to the H2 formed on platinum at low potential. These morphology
heterogeneities can be explained by the diffusion of the precursor solution through the NbC
nanofibres mat, leading to gradient of solution concentration.
Figure 38. SEM micrograph of NbC nanofibres catalysed by electrodeposited in the outside of the self-standing mat (zone B).
1.20 µm
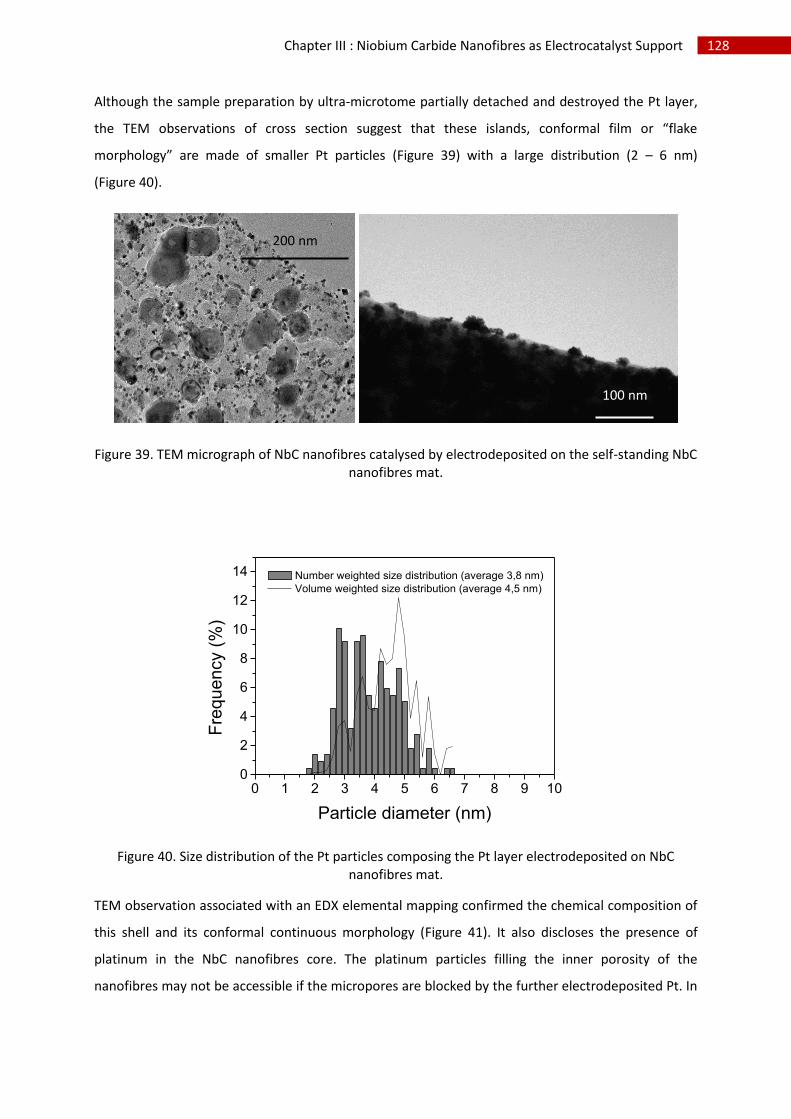
128 Chapter III : Niobium Carbide Nanofibres as Electrocatalyst Support
Although the sample preparation by ultra-microtome partially detached and destroyed the Pt layer,
the TEM observations of cross section suggest that these islands, conformal film or “flake
morphology” are made of smaller Pt particles (Figure 39) with a large distribution (2 – 6 nm)
(Figure 40).
Figure 39. TEM micrograph of NbC nanofibres catalysed by electrodeposited on the self-standing NbC nanofibres mat.
0 1 2 3 4 5 6 7 8 9 100
2
4
6
8
10
12
14 Number weighted size distribution (average 3,8 nm)
Volume weighted size distribution (average 4,5 nm)
Fre
qu
en
cy (
%)
Particle diameter (nm)
Figure 40. Size distribution of the Pt particles composing the Pt layer electrodeposited on NbC nanofibres mat.
TEM observation associated with an EDX elemental mapping confirmed the chemical composition of
this shell and its conformal continuous morphology (Figure 41). It also discloses the presence of
platinum in the NbC nanofibres core. The platinum particles filling the inner porosity of the
nanofibres may not be accessible if the micropores are blocked by the further electrodeposited Pt. In
100 nm
200 nm
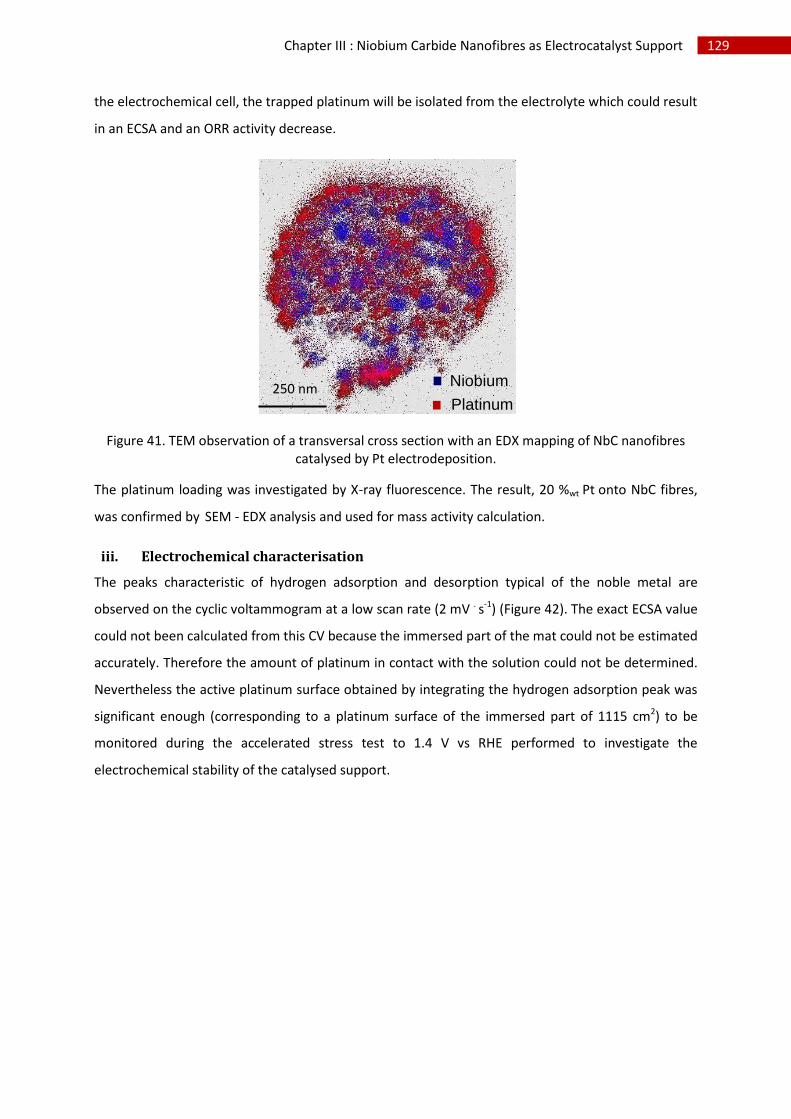
129 Chapter III : Niobium Carbide Nanofibres as Electrocatalyst Support
the electrochemical cell, the trapped platinum will be isolated from the electrolyte which could result
in an ECSA and an ORR activity decrease.
Figure 41. TEM observation of a transversal cross section with an EDX mapping of NbC nanofibres catalysed by Pt electrodeposition.
The platinum loading was investigated by X-ray fluorescence. The result, 20 %wt Pt onto NbC fibres,
was confirmed by SEM - EDX analysis and used for mass activity calculation.
iii. Electrochemical characterisation
The peaks characteristic of hydrogen adsorption and desorption typical of the noble metal are
observed on the cyclic voltammogram at a low scan rate (2 mV . s-1) (Figure 42). The exact ECSA value
could not been calculated from this CV because the immersed part of the mat could not be estimated
accurately. Therefore the amount of platinum in contact with the solution could not be determined.
Nevertheless the active platinum surface obtained by integrating the hydrogen adsorption peak was
significant enough (corresponding to a platinum surface of the immersed part of 1115 cm2) to be
monitored during the accelerated stress test to 1.4 V vs RHE performed to investigate the
electrochemical stability of the catalysed support.
250 nm Niobium
Platinum
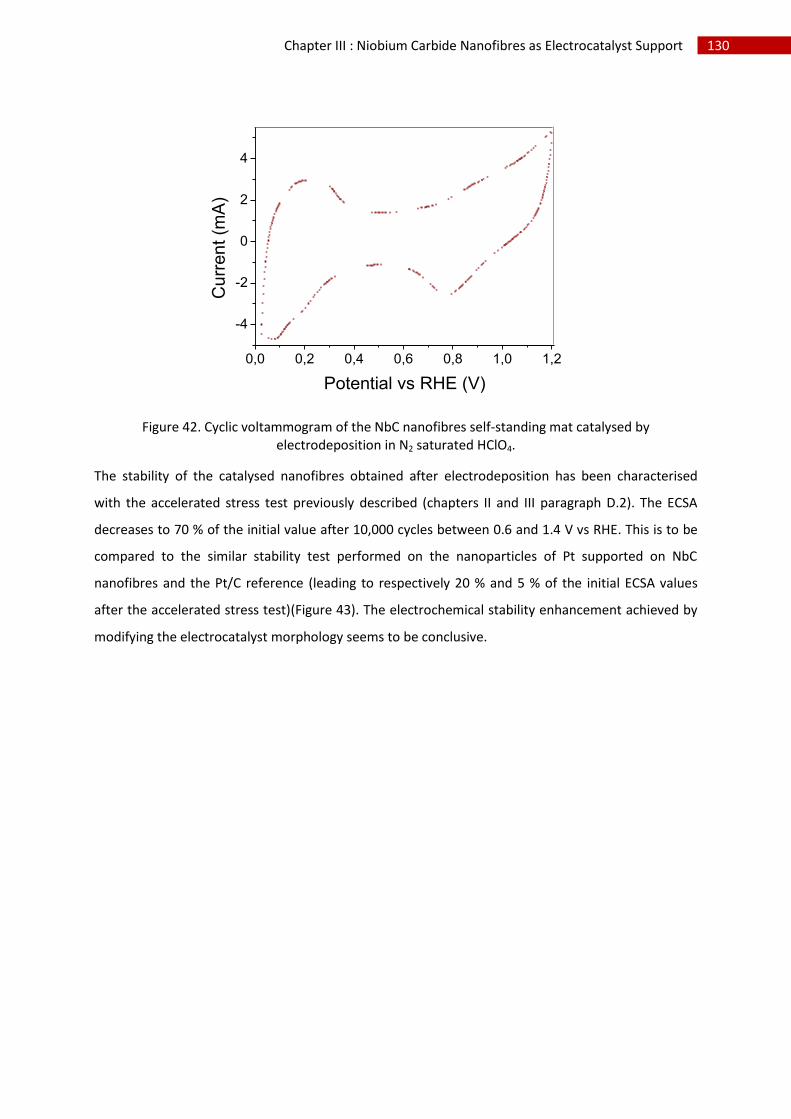
130 Chapter III : Niobium Carbide Nanofibres as Electrocatalyst Support
0,0 0,2 0,4 0,6 0,8 1,0 1,2
-4
-2
0
2
4
Cu
rren
t (m
A)
Potential vs RHE (V)
Figure 42. Cyclic voltammogram of the NbC nanofibres self-standing mat catalysed by electrodeposition in N2 saturated HClO4.
The stability of the catalysed nanofibres obtained after electrodeposition has been characterised
with the accelerated stress test previously described (chapters II and III paragraph D.2). The ECSA
decreases to 70 % of the initial value after 10,000 cycles between 0.6 and 1.4 V vs RHE. This is to be
compared to the similar stability test performed on the nanoparticles of Pt supported on NbC
nanofibres and the Pt/C reference (leading to respectively 20 % and 5 % of the initial ECSA values
after the accelerated stress test)(Figure 43). The electrochemical stability enhancement achieved by
modifying the electrocatalyst morphology seems to be conclusive.
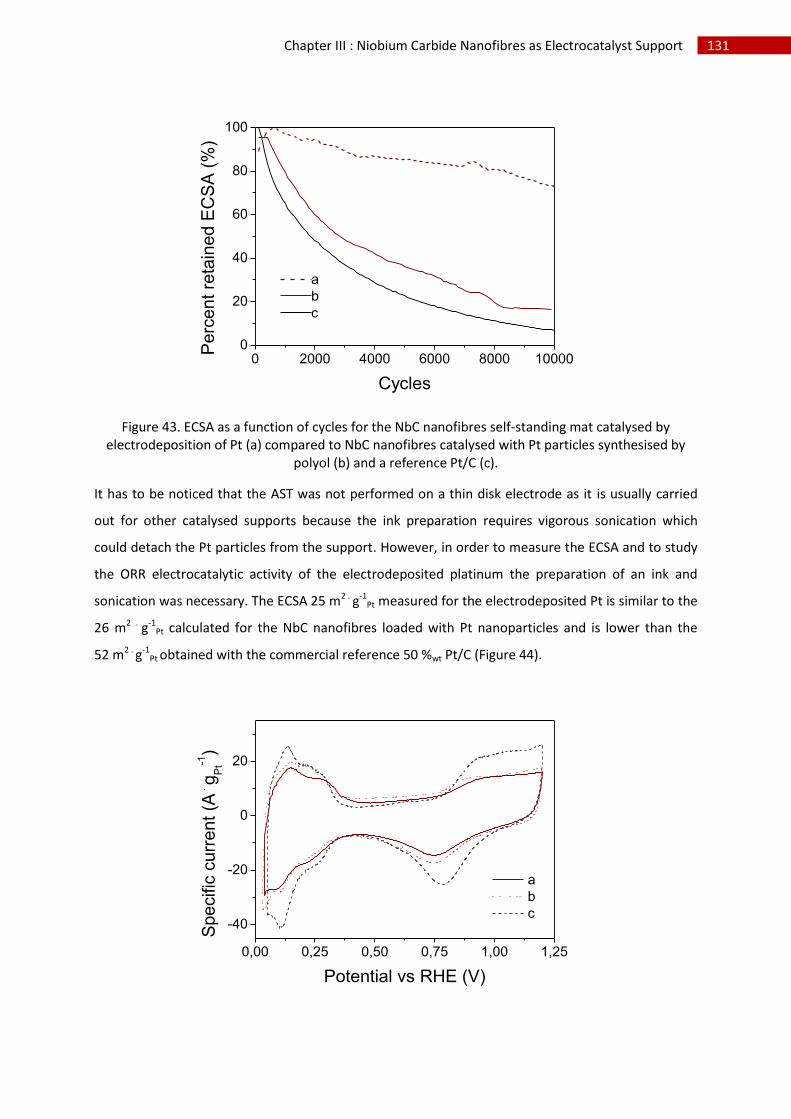
131 Chapter III : Niobium Carbide Nanofibres as Electrocatalyst Support
0 2000 4000 6000 8000 100000
20
40
60
80
100
a
b
c
Perc
ent re
tain
ed E
CS
A (
%)
Cycles
Figure 43. ECSA as a function of cycles for the NbC nanofibres self-standing mat catalysed by electrodeposition of Pt (a) compared to NbC nanofibres catalysed with Pt particles synthesised by
polyol (b) and a reference Pt/C (c).
It has to be noticed that the AST was not performed on a thin disk electrode as it is usually carried
out for other catalysed supports because the ink preparation requires vigorous sonication which
could detach the Pt particles from the support. However, in order to measure the ECSA and to study
the ORR electrocatalytic activity of the electrodeposited platinum the preparation of an ink and
sonication was necessary. The ECSA 25 m2 . g-1Pt measured for the electrodeposited Pt is similar to the
26 m2 . g-1Pt calculated for the NbC nanofibres loaded with Pt nanoparticles and is lower than the
52 m2 . g-1Pt obtained with the commercial reference 50 %wt Pt/C (Figure 44).
0,00 0,25 0,50 0,75 1,00 1,25
-40
-20
0
20
a
b
c
Spe
cific
curr
ent (A
. g
Pt-1
)
Potential vs RHE (V)
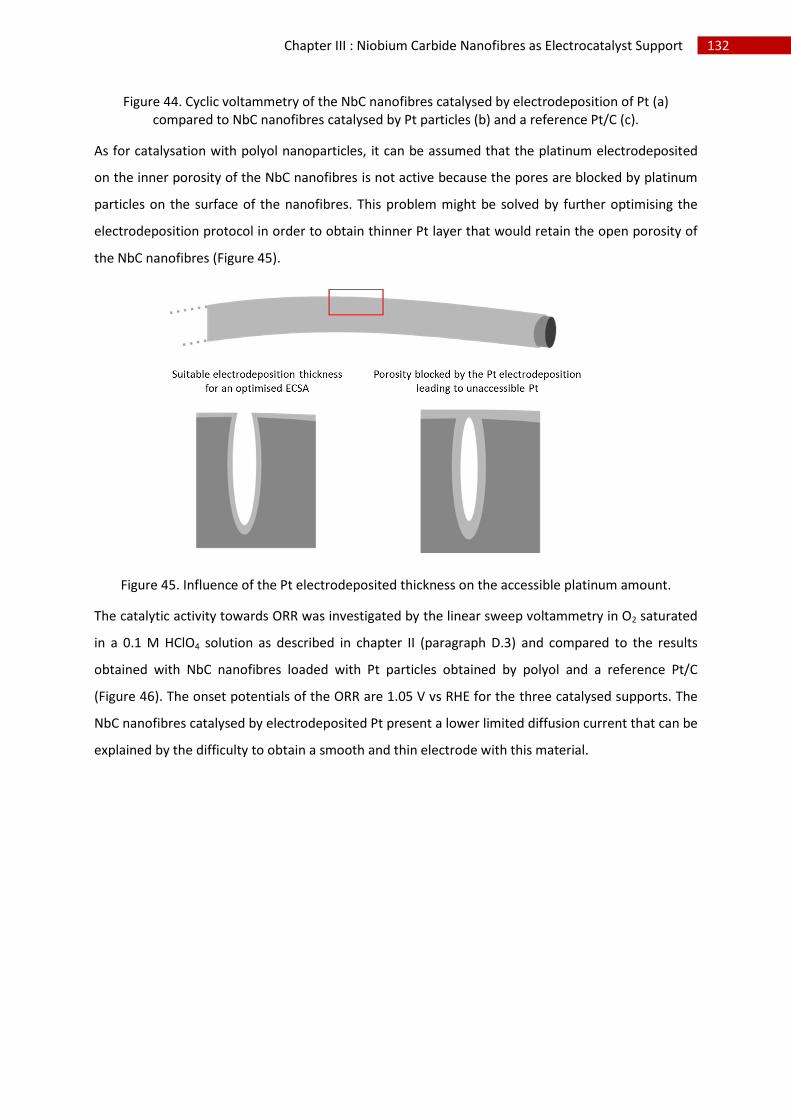
132 Chapter III : Niobium Carbide Nanofibres as Electrocatalyst Support
Figure 44. Cyclic voltammetry of the NbC nanofibres catalysed by electrodeposition of Pt (a) compared to NbC nanofibres catalysed by Pt particles (b) and a reference Pt/C (c).
As for catalysation with polyol nanoparticles, it can be assumed that the platinum electrodeposited
on the inner porosity of the NbC nanofibres is not active because the pores are blocked by platinum
particles on the surface of the nanofibres. This problem might be solved by further optimising the
electrodeposition protocol in order to obtain thinner Pt layer that would retain the open porosity of
the NbC nanofibres (Figure 45).
Figure 45. Influence of the Pt electrodeposited thickness on the accessible platinum amount.
The catalytic activity towards ORR was investigated by the linear sweep voltammetry in O2 saturated
in a 0.1 M HClO4 solution as described in chapter II (paragraph D.3) and compared to the results
obtained with NbC nanofibres loaded with Pt particles obtained by polyol and a reference Pt/C
(Figure 46). The onset potentials of the ORR are 1.05 V vs RHE for the three catalysed supports. The
NbC nanofibres catalysed by electrodeposited Pt present a lower limited diffusion current that can be
explained by the difficulty to obtain a smooth and thin electrode with this material.
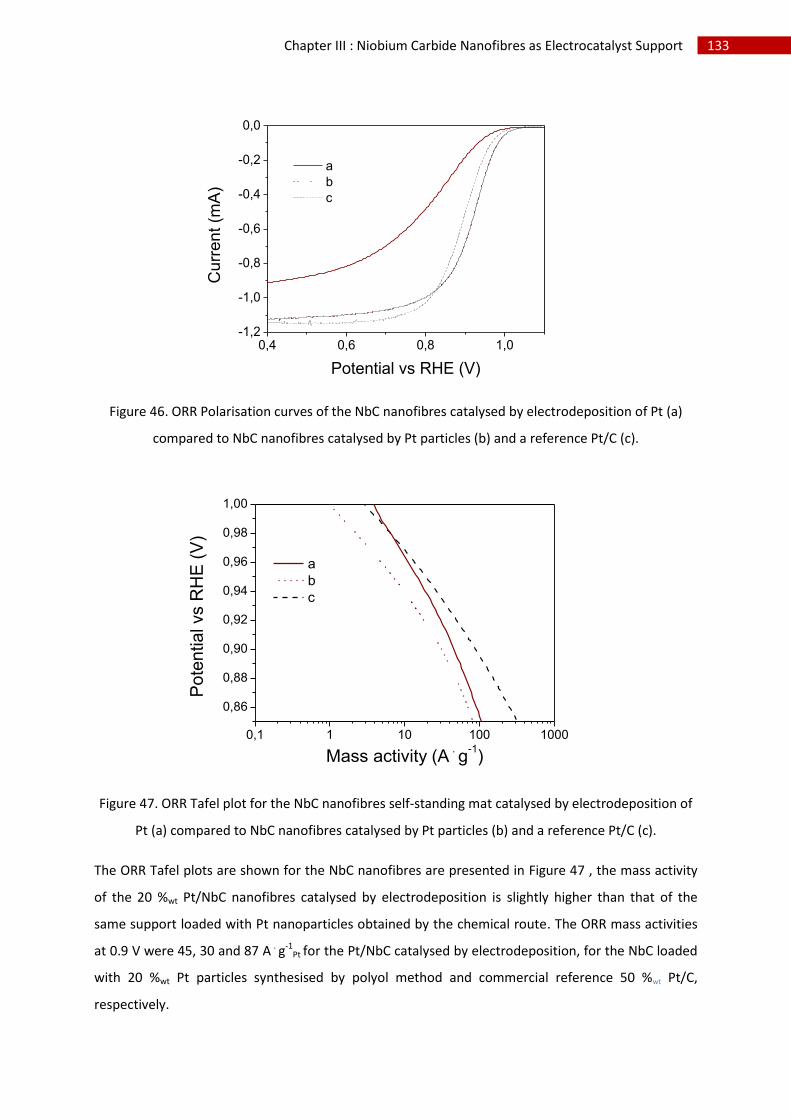
133 Chapter III : Niobium Carbide Nanofibres as Electrocatalyst Support
0,4 0,6 0,8 1,0-1,2
-1,0
-0,8
-0,6
-0,4
-0,2
0,0
a
b
c
Cu
rren
t (m
A)
Potential vs RHE (V)
Figure 46. ORR Polarisation curves of the NbC nanofibres catalysed by electrodeposition of Pt (a)
compared to NbC nanofibres catalysed by Pt particles (b) and a reference Pt/C (c).
0,1 1 10 100 1000
0,86
0,88
0,90
0,92
0,94
0,96
0,98
1,00
a
b
c
Pote
ntia
l vs R
HE
(V
)
Mass activity (A . g
-1)
Figure 47. ORR Tafel plot for the NbC nanofibres self-standing mat catalysed by electrodeposition of
Pt (a) compared to NbC nanofibres catalysed by Pt particles (b) and a reference Pt/C (c).
The ORR Tafel plots are shown for the NbC nanofibres are presented in Figure 47 , the mass activity
of the 20 %wt Pt/NbC nanofibres catalysed by electrodeposition is slightly higher than that of the
same support loaded with Pt nanoparticles obtained by the chemical route. The ORR mass activities
at 0.9 V were 45, 30 and 87 A . g-1Pt for the Pt/NbC catalysed by electrodeposition, for the NbC loaded
with 20 %wt Pt particles synthesised by polyol method and commercial reference 50 %wt Pt/C,
respectively.
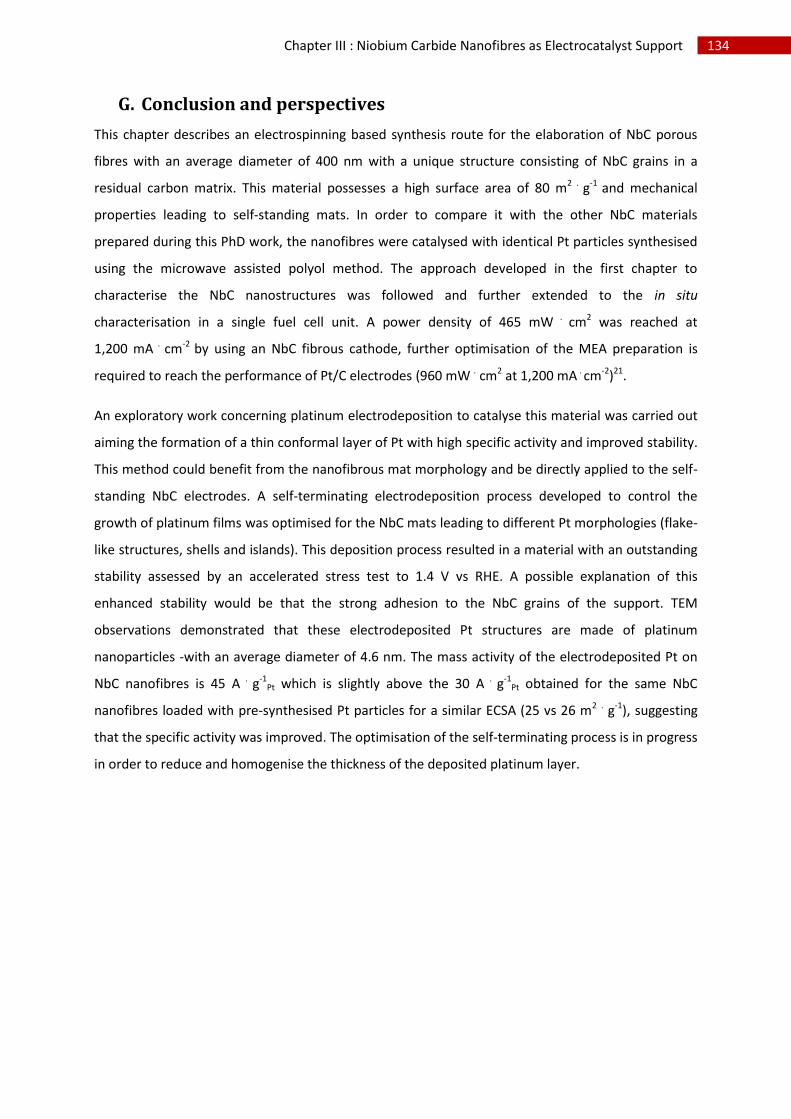
134 Chapter III : Niobium Carbide Nanofibres as Electrocatalyst Support
G. Conclusion and perspectives
This chapter describes an electrospinning based synthesis route for the elaboration of NbC porous
fibres with an average diameter of 400 nm with a unique structure consisting of NbC grains in a
residual carbon matrix. This material possesses a high surface area of 80 m2 . g-1 and mechanical
properties leading to self-standing mats. In order to compare it with the other NbC materials
prepared during this PhD work, the nanofibres were catalysed with identical Pt particles synthesised
using the microwave assisted polyol method. The approach developed in the first chapter to
characterise the NbC nanostructures was followed and further extended to the in situ
characterisation in a single fuel cell unit. A power density of 465 mW . cm2 was reached at
1,200 mA . cm-2 by using an NbC fibrous cathode, further optimisation of the MEA preparation is
required to reach the performance of Pt/C electrodes (960 mW . cm2 at 1,200 mA . cm-2)21.
An exploratory work concerning platinum electrodeposition to catalyse this material was carried out
aiming the formation of a thin conformal layer of Pt with high specific activity and improved stability.
This method could benefit from the nanofibrous mat morphology and be directly applied to the self-
standing NbC electrodes. A self-terminating electrodeposition process developed to control the
growth of platinum films was optimised for the NbC mats leading to different Pt morphologies (flake-
like structures, shells and islands). This deposition process resulted in a material with an outstanding
stability assessed by an accelerated stress test to 1.4 V vs RHE. A possible explanation of this
enhanced stability would be that the strong adhesion to the NbC grains of the support. TEM
observations demonstrated that these electrodeposited Pt structures are made of platinum
nanoparticles -with an average diameter of 4.6 nm. The mass activity of the electrodeposited Pt on
NbC nanofibres is 45 A . g-1Pt which is slightly above the 30 A . g-1
Pt obtained for the same NbC
nanofibres loaded with pre-synthesised Pt particles for a similar ECSA (25 vs 26 m2 . g-1), suggesting
that the specific activity was improved. The optimisation of the self-terminating process is in progress
in order to reduce and homogenise the thickness of the deposited platinum layer.
135 Chapter III : Niobium Carbide Nanofibres as Electrocatalyst Support
H. References
1 K. Lee, J. Zhang, H. Wang and D. P. Wilkinson, J. Appl. Electrochem., 2006, 36, 507–522.
2 X. S. Zhou, Y. J. Qiu, J. Yu, J. Yin and S. Gao, Int. J. Hydrogen Energy, 2011, 36, 7398–7404.
3 H. S. Kim, G. Bugli and G. Djéga-Mariadassou, J. Solid State Chem., 1999, 142, 100–107.
4 K. Nakane, M. Morinaga and N. Ogata, J. Mater. Sci., 2013, 48, 7774–7779.
5 Y. Xia, P. Yang, Y. Sun, Y. Wu and B. Mayers, Adv. Mater., 2003, 15, 353–389.
6 S. K. Nataraj, K. S. Yang and T. M. Aminabhavi, Prog. Polym. Sci., 2012, 37, 487–513.
7 K. D. B. J. F. M. W. F. S. P.E. Sobol, Handbook of X-ray Photoelectron Spectroscopy, Perkin Elmer Corporation, 1992.
8 M. T. Marques, A. M. Ferraria, J. B. Correia, A. M. B. do Rego and R. Vilar, Mater. Chem. Phys., 2008, 109, 174–180.
9 C. Wagner, A. Naumkin and A. Kraut-Vass, in NIST Standard Reference Database, 2003, vol. 3.3.
10 G. McGuire, G. Schweitzer and T. Carlson, Inorg. Chem., 1973, 12, 2450–2453.
11 J. Rouquerol, F. Rouquerol, P. Llewellyn, G. Maurin and K. S. W. Sing, Adsorption by Powders and Porous Solids: Principles, Methodology and Applications, 2013.
12 B. Ding, H. Kim, C. Kim, M. Khil and S. Park, Nanotechnology, 2003, 14, 532–537.
13 Y. Shao, J. Liu, Y. Wang and Y. H. Lin, J. Mater. Chem., 2009, 19, 46–59.
14 S. Cavaliere, S. Subianto, I. Savych, M. Tillard, D. J. Jones and J. Rozière, J. Phys. Chem. C, 2013, 117, 18298–18307.
15 E. Antolini, Appl. Catal. B Environ., 2009, 88, 1–24.
16 J. Speder, A. Zana, I. Spanos, J. J. K. Kirkensgaard, K. Mortensen, M. Hanzlik and M. Arenz, J. Power Sources, 2014, 261, 14–22.
17 M. Nesselberger, S. Ashton, J. C. Meier, I. Katsounaros, K. J. J. Mayrhofer and M. Arenz, J. Am. Chem. Soc., 2011, 133, 17428–33.
18 H. A. Gasteiger, S. S. Kocha, B. Sompalli and F. T. Wagner, Appl. Catal. B Environ., 2005, 56, 9–35.
136 Chapter III : Niobium Carbide Nanofibres as Electrocatalyst Support
19 Y. Wang, S. Q. Song, V. Maragou, P. K. Shen and P. Tsiakaras, Appl. Catal. B-Environmental, 2009, 89, 223–228.
20 Y. Zhao, Y. Wang, X. Cheng, L. Dong, Y. Zhang and J. Zang, Carbon N. Y., 2014, 67, 409–416.
21 I. Savych, S. Subianto, Y. Nabil, S. Cavaliere, D. Jones and J. Rozière, Phys. Chem. Chem. Phys., 2015, 17, 16970 – 16976.
22 S. M. Alia, Y. S. Yan and B. S. Pivovar, Catal. Sci. Technol., 2014, 4, 3589–3600.
23 E. E. Parsonage and M. K. Debe US pat. 5,338,430 A, 1994.
24 N. Kristian and X. Wang, Electrochem. commun., 2008, 10, 12–15.
25 S. M. Alia, S. Pylypenko, K. C. Neyerlin, D. A. Cullen, S. S. Kocha and B. S. Pivovar, ACS Catal., 2014, 4, 2680–2686.
26 A. B. Papandrew, R. W. Atkinson, G. A. Goenaga, D. L. Wilson, S. S. Kocha, K. C. Neyerlin, J. W. Zack, B. S. Pivovar and T. A. Zawodzinski, ECS Trans., 2013, 50, 1397–1403.
27 S. S. Kocha, J. W. Zack, S. M. Alia, K. C. Neyerlin and B. S. Pivovar, ECS Trans., 2013, 50, 1475–1485.
28 R. M. Darling and J. P. Meyers, J. Electrochem. Soc., 2003, 150, A1523A1527.
29 R. Borup, J. Meyers, B. Pivovar, Y. S. Kim, R. Mukundan, N. Garland, D. Myers, M. Wilson, F. Garzon, D. Wood, P. Zelenay, K. More, K. Stroh, T. Zawodzinski, J. Boncella, J. E. McGrath, M. Inaba, K. Miyatake, M. Hori, K. Ota, Z. Ogumi, S. Miyata, A. Nishikata, Z. Siroma, Y. Uchimoto, K. Yasuda, K.-I. Kimijima and N. Iwashita, Chem. Rev., 2007, 107, 3904–51.
30 S. Chen, Z. Wei, X. Qi, L. Dong, Y.-G. Guo, L. Wan, Z. Shao and L. Li, J. Am. Chem. Soc., 2012, 134, 13252–5.
31 C. T. Campbell, Surf. Sci. Rep., 1997, 27, 1–111.
32 R. R. Adzic, J. Zhang, K. Sasaki, M. B. Vukmirovic, M. Shao, J. X. Wang, A. U. Nilekar, M. Mavrikakis, J. A. Valerio and F. Uribe, Top. Catal., 2007, 46, 249–262.
33 V. Sudha and M. Sangaranarayanan, J. Phys. Chem. B, 2002, 106, 2699–2707.
34 H. Tang, J. H. Chen, M. Y. Wang, L. H. Nie, Y. F. Kuang and S. Z. Yao, Appl. Catal. A Gen., 2004, 275, 43–48.
35 D. Zhao and B.-Q. Xu, Angew. Chemie, 2006, 118, 5077–5081.
36 Y. Yu, Y. Hu, X. Liu, W. Deng and X. Wang, Electrochim. Acta, 2009, 54, 3092–3097.
37 M. H. Hölzle, U. Retter and D. M. Kolb, J. Electroanal. Chem., 1994, 371, 101–109.
38 M. Khosravi and M. K. Amini, Int. J. Hydrogen Energy, 2010, 35, 10527–10538.
137 Chapter III : Niobium Carbide Nanofibres as Electrocatalyst Support
39 S. R. Brankovic, J. X. Wang and R. R. Adžić, Surf. Sci., 2001, 474, L173–L179.
40 I. Bakos, S. Szabó and T. Pajkossy, J. Solid State Electrochem., 2011, 15, 2453–2459.
41 E. Herrero, L. Buller and H. Abruna, Chem. Rev., 2001, 101, 1897 – 1930.
42 Y. Liu, D. Gokcen, U. Bertocci and T. P. Moffat, Science, 2012, 338, 1327–30.
I. Table of Figures
Figure 1. SEM micrograph of the electrospun material based on PAN and NbCl5 displaying a fibrous
morphology. ........................................................................................................................................ 101
Figure 2. Diameter distribution of the as-prepared electrospun fibres. ............................................. 101
Figure 3. X-ray diffractogramm of the NbC nanofibres after carburation. ......................................... 103
Figure 4. X-ray diffractogramm of the NbC nanofibres after methanation. ....................................... 103
Figure 5. Calibration curve for the determination of NbC and carbon content obtained by TGA. ..... 104
Figure 6. Thermogravimetric analysis of electrospun NbC. ................................................................ 104
Figure 7. HR XPS spectrum of NbC/C material obtained after methanation (Nb 3d region). ............. 105
Figure 8. SEM micrograph of NbC nanofibres after methanation. ..................................................... 106
Figure 9. Diameter distribution of NbC nanofibres after methanation. ............................................. 106
Figure 10. SEM micrograph of the NbC nanofibres displaying the NbC grains in NbC/C matrix
(secondary electron (right) vs backscattered electron (left)). ............................................................ 107
Figure 11. SEM micrograph of merged NbC fibres. ............................................................................. 107
Figure 12. TEM micrographs of the NbC nanofibres. .......................................................................... 107
Figure 13. size distribution of the NbC grain composing the nanofibres. ........................................... 108
Figure 14. Self-standing mat of NbC nanofibres. ................................................................................ 108
Figure 15. Nitrogen adsorption/desorption of NbC nanofibres. ......................................................... 109
Figure 16. TEM micrograph of 15 %wt NbC nanofibres before (a) and after (b) the Pt particles
deposition. ........................................................................................................................................... 110
Figure 17. TEM micrograph of a microtomed section of a 15 %wt Pt/NbC nanofibres: transversal (a)
and longitudinal (b) views. .................................................................................................................. 111
Figure 18. Cyclic voltammograms of 15 % Pt/NbC nanofibres (a) and 50 % Pt/C (b) in N2 saturated
HClO4 (Alfa Aesar). ............................................................................................................................... 112
Figure 19. ECSA of the catalysed supports as a function of cycles during the accelerated stress test to
1.2 V (a) and to 1.4 V (b). ..................................................................................................................... 113
Figure 20. Linear sweep voltammetry in O2 saturated HClO4 0.1 M solution of 20 % Pt/NbC
nanofibres (a) and 50 % Pt/C (b) at 1600 rpm..................................................................................... 114
138 Chapter III : Niobium Carbide Nanofibres as Electrocatalyst Support
Figure 21. ORR tafel plot for 20 % Pt/NbC nanofibres (a) and 50 % Pt/C (b). ..................................... 115
Figure 22. Polarisation curve for an MEA containing Pt/NbC nanofibres at the cathode (0.5 mg . cm-2)
T = 80 °C ; H2/O2 (1.5:2) 2 bar (abs); RH 100 %. ................................................................................... 116
Figure 23. SEM micrograph of the membrane electrode assembly with Pt/C at the anode side (a)
Pt/NbC nanofibres at the cathode side (b). ........................................................................................ 117
Figure 24. Polarisation curves after 12 h break in (a), after 24 h in operating conditions (b) and after
48 h in operating conditions (c) for the MEA containing Pt/NbC nanofibres at the cathode (0.5 mg .
cm-2) T = 80 °C ; H2/O2 (1.5:2) 2.0 bar (abs); RH 100%. ........................................................................ 117
Figure 25. Surface area and specific ORR activity of nanostructured thin film catalyst developed by
3M23, Pt nanotubes formed by chemical vapour deposition by Papandrew et al.26 and a reference of
Pt on carbon with high surface area27. The numbers on the 2005 PEM fuel cell status and DOE target
lines are the mass activities (im, mA mgPGM−1). .................................................................................... 118
Figure 26. Schematic representation of the electron transfer and durability of Pt film electrocatalysts.
............................................................................................................................................................. 119
Figure 27. Currents obtained for the oxidation of the copper layer formed onto NbC at different
potentials in a CuCl2 solution (0.001 M) adjusted to pH 4 at 25 °C. .................................................... 120
Figure 28. Amount of copper deposited as a function of the potential. ............................................. 121
Figure 29. Amount of copper obtain with different underpotential deposition times. ...................... 121
Figure 30. Cyclic voltammogram of NbC nanofibres covered by Pt submicron objects obtained after
Cu deposition and platinum exchange by galvanic displacement. ..................................................... 122
Figure 31. BE-SEM of NbC nanofibres, covered by Pt submicron objects obtained after Cu UPD
deposition and platinum exchange by galvanic displacement............................................................ 123
Figure 32. Size distribution of the Pt particles / islands obtained by potential under deposition and
galvanic displacement. ........................................................................................................................ 123
Figure 33. Pt Electrodeposition setup used for the Pt electrodeposition of the NbC nanofibres self-
standing mat. ....................................................................................................................................... 124
Figure 34. SEM micrographs of NbC nanofibres: naked (a) and catalysed by Pt electrodeposition (b)
............................................................................................................................................................. 125
Figure 35. Setup for Pt electroseposition on self-standing NbC nanofibres mat leading to different
thickness of Pt. .................................................................................................................................... 125
Figure 36. SEM micrograph of NbC nanofibres catalysed by electrodeposited from the core to the
surface of the self-standing mat (zone A to B). ................................................................................... 126
Figure 37. Size distribution of the Pt aggregates obtained by electrodeposition in region A. ........... 127
Figure 38. SEM micrograph of NbC nanofibres catalysed by electrodeposited in the outside of the
self-standing mat (zone B). .................................................................................................................. 127
139 Chapter III : Niobium Carbide Nanofibres as Electrocatalyst Support
Figure 39. TEM micrograph of NbC nanofibres catalysed by electrodeposited on the self-standing NbC
nanofibres mat. ................................................................................................................................... 128
Figure 40. Size distribution of the Pt particles composing the Pt layer electrodeposited on NbC
nanofibres mat. ................................................................................................................................... 128
Figure 41. TEM observation of a transversal cross section with an EDX mapping of NbC nanofibres
catalysed by Pt electrodeposition. ...................................................................................................... 129
Figure 42. Cyclic voltammogram of the NbC nanofibres self-standing mat catalysed by
electrodeposition in N2 saturated HClO4. ............................................................................................ 130
Figure 43. ECSA as a function of cylces for the NbC nanofibres self-standing mat catalysed by
electrodeposition of Pt compared to NbC nanofibres catalysed with Pt particles synthesised by polyol
and a reference Pt/C. .......................................................................................................................... 131
Figure 44. Cyclic voltammetry of the NbC nanofibres catalysed by electrodeposition of Pt (a)
compared to NbC nanofibres catalysed by Pt particles (b) and a reference Pt/C (c). ........................ 132
Figure 45. Influence of the Pt electrodeposited thickness on the accessible platinum amount. ....... 132
Figure 46. ORR Polarisation curves of the NbC nanofibres catalysed by electrodeposition of Pt (a)
compared to NbC nanofibres catalysed by Pt particles (b) and a reference Pt/C (c). ........................ 133
Figure 47. ORR Tafel plot for the NbC nanofibres self-standing mat catalysed by electrodeposition of
Pt (a) compared to NbC nanofibres catalysed by Pt particles (b) and a reference Pt/C (c). ............... 133

140 Chapter III : Niobium Carbide Nanofibres as Electrocatalyst Support

141 Chapter IV: Niobium Carbide Nanotubes as Electrocatalyst Support
Chapter IV: Niobium carbide nanotubes as electrocatalyst support
142 Chapter IV: Niobium Carbide Nanotubes as Electrocatalyst Support
A. Introduction
The results described in chapter III on NbC nanofibres functionalisation show that 1 D nanostructured
materials are valuable in terms of their specific surface area and adapted porosity. However residual
amorphous carbon cloaks the niobium carbide grains in NbC nanofibres as in the NbC nanostructures
(chapter II), and this residual carbon is oxidized under high voltage conditions, leading to degradation
of the material. Further, the microporous character of this residual carbon might not provide the
required accessibility of the gas to the catalyst. We are convinced that an NbC material with less
residual carbon would lead to a more durable support.
This chapter presents the development of a 1 D nanostructured material with internal porosity that is
expected to increase the electrocatalyst dispersion and improve gas accessibility to the platinum
active sites. These features would be beneficial for the elaboration of efficient catalyst layers and
allowing decrease of the platinum loading in an MEA without sacrificing cell performance1.
Over the past 25 years, nanotubes have become something of a symbol in nanomaterials and
nanotechnology research, with the advent in particular of carbon nanotubes in 1991 by Iijima2 et al.
and of inorganic (WS2) nanotubes by Tenne3. This has led to intense experimental and theoretical
research on hollow 1 D nanostructures4. In 2000 Mishra et al. indicated in their study of optical
limiting behaviour of a carbon nanotube suspension that the high electrochemically accessible
surface area of porous nanotube arrays, combined with their mechanical properties and high
electronic conductivity, makes them attractive as electrodes for energy conversion devices5.
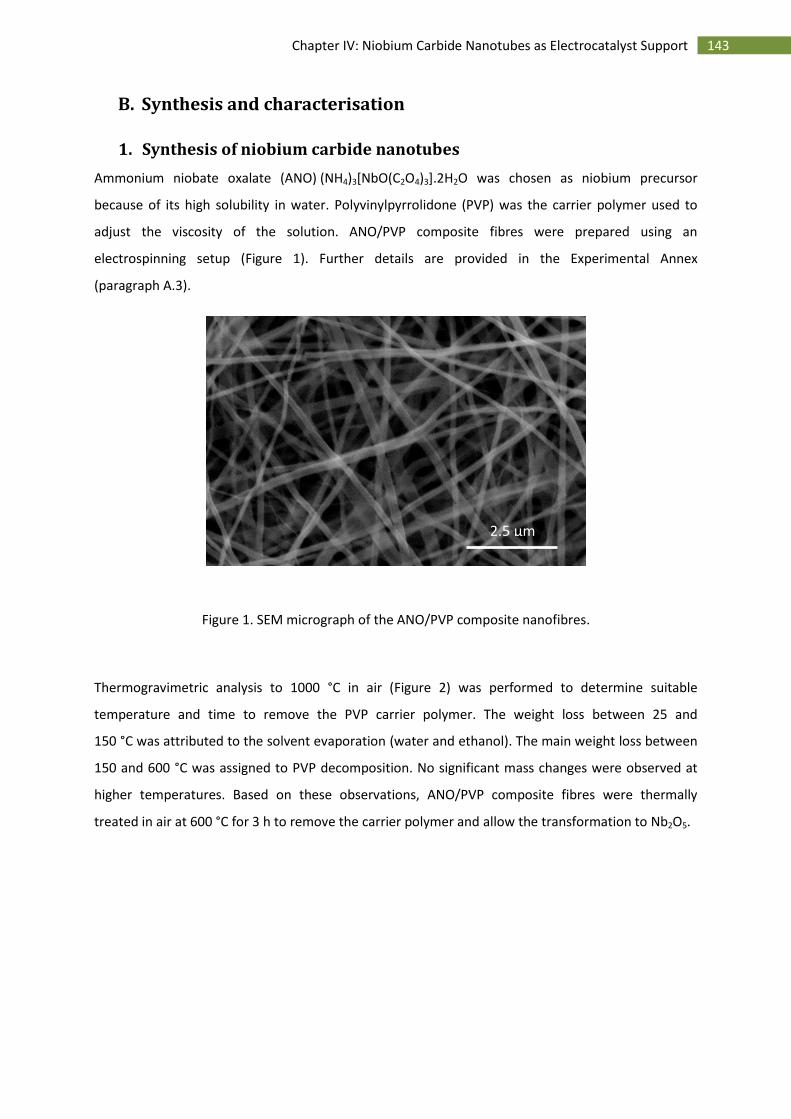
143 Chapter IV: Niobium Carbide Nanotubes as Electrocatalyst Support
B. Synthesis and characterisation
1. Synthesis of niobium carbide nanotubes
Ammonium niobate oxalate (ANO) (NH4)3[NbO(C2O4)3].2H2O was chosen as niobium precursor
because of its high solubility in water. Polyvinylpyrrolidone (PVP) was the carrier polymer used to
adjust the viscosity of the solution. ANO/PVP composite fibres were prepared using an
electrospinning setup (Figure 1). Further details are provided in the Experimental Annex
(paragraph A.3).
Figure 1. SEM micrograph of the ANO/PVP composite nanofibres.
Thermogravimetric analysis to 1000 °C in air (Figure 2) was performed to determine suitable
temperature and time to remove the PVP carrier polymer. The weight loss between 25 and
150 °C was attributed to the solvent evaporation (water and ethanol). The main weight loss between
150 and 600 °C was assigned to PVP decomposition. No significant mass changes were observed at
higher temperatures. Based on these observations, ANO/PVP composite fibres were thermally
treated in air at 600 °C for 3 h to remove the carrier polymer and allow the transformation to Nb2O5.
2.5 µm
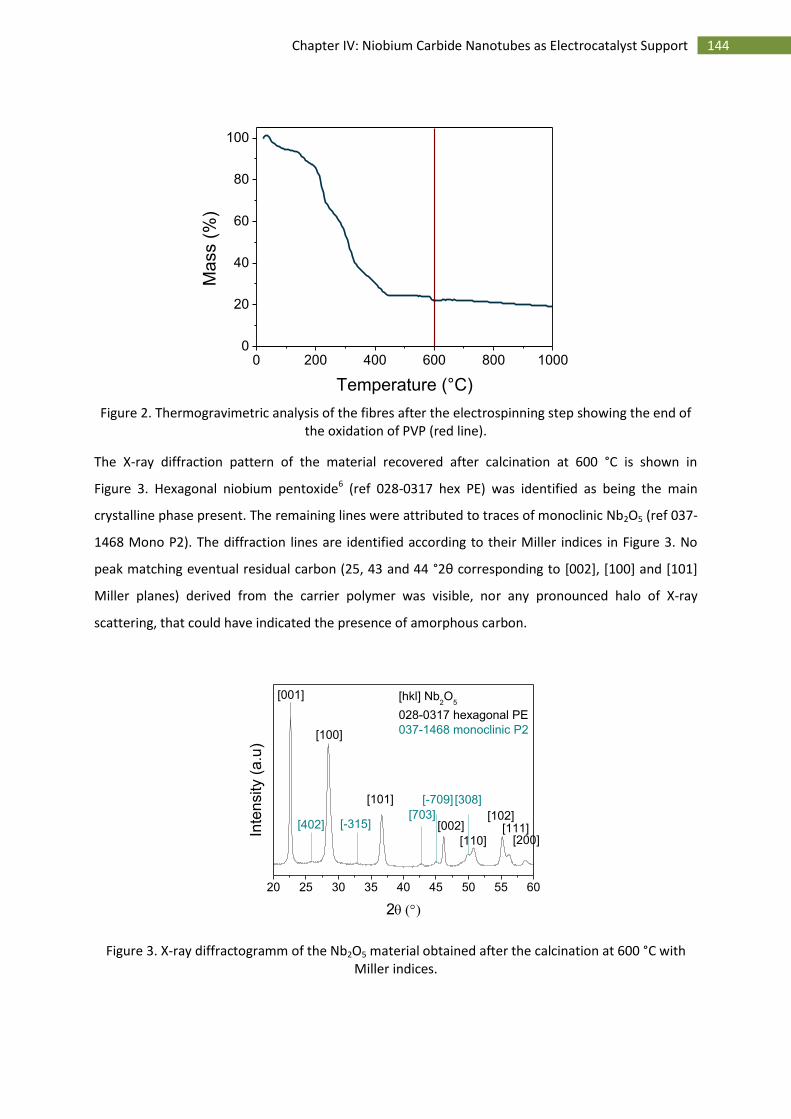
144 Chapter IV: Niobium Carbide Nanotubes as Electrocatalyst Support
0 200 400 600 800 10000
20
40
60
80
100
Mass (
%)
Temperature (°C)
Figure 2. Thermogravimetric analysis of the fibres after the electrospinning step showing the end of the oxidation of PVP (red line).
The X-ray diffraction pattern of the material recovered after calcination at 600 °C is shown in
Figure 3. Hexagonal niobium pentoxide6 (ref 028-0317 hex PE) was identified as being the main
crystalline phase present. The remaining lines were attributed to traces of monoclinic Nb2O5 (ref 037-
1468 Mono P2). The diffraction lines are identified according to their Miller indices in Figure 3. No
peak matching eventual residual carbon (25, 43 and 44 °2θ corresponding to [002], [100] and [101]
Miller planes) derived from the carrier polymer was visible, nor any pronounced halo of X-ray
scattering, that could have indicated the presence of amorphous carbon.
20 25 30 35 40 45 50 55 60
[402]
[-709] [308]
[703]
[200][111]
[102][002]
[110]
[101]
[100]
Inte
nsity (
a.u
)
2
[001] [hkl] Nb2O
5
028-0317 hexagonal PE
037-1468 monoclinic P2
[-315]
Figure 3. X-ray diffractogramm of the Nb2O5 material obtained after the calcination at 600 °C with Miller indices.
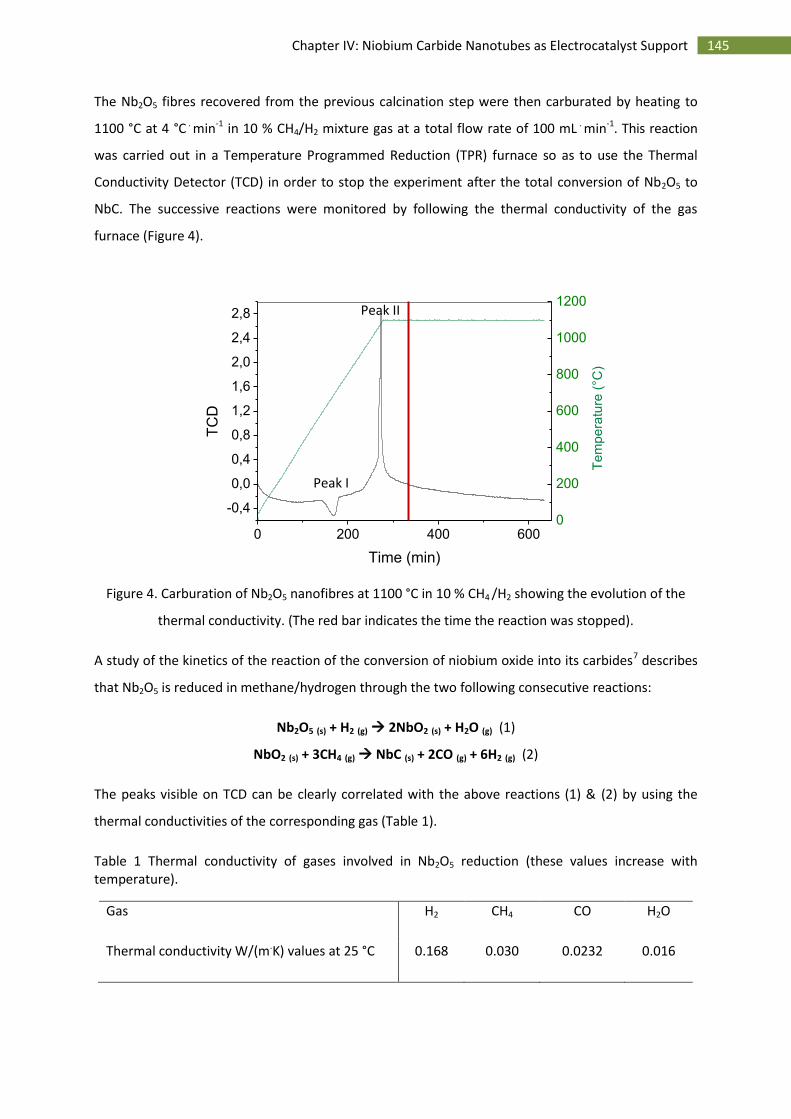
145 Chapter IV: Niobium Carbide Nanotubes as Electrocatalyst Support
The Nb2O5 fibres recovered from the previous calcination step were then carburated by heating to
1100 °C at 4 °C . min-1 in 10 % CH4/H2 mixture gas at a total flow rate of 100 mL . min-1. This reaction
was carried out in a Temperature Programmed Reduction (TPR) furnace so as to use the Thermal
Conductivity Detector (TCD) in order to stop the experiment after the total conversion of Nb2O5 to
NbC. The successive reactions were monitored by following the thermal conductivity of the gas
furnace (Figure 4).
0 200 400 600
-0,4
0,0
0,4
0,8
1,2
1,6
2,0
2,4
2,8
TC
D
Time (min)
0
200
400
600
800
1000
1200
Te
mp
era
ture
(°C
)
Figure 4. Carburation of Nb2O5 nanofibres at 1100 °C in 10 % CH4 /H2 showing the evolution of the
thermal conductivity. (The red bar indicates the time the reaction was stopped).
A study of the kinetics of the reaction of the conversion of niobium oxide into its carbides7 describes
that Nb2O5 is reduced in methane/hydrogen through the two following consecutive reactions:
Nb2O5 (s) + H2 (g) 2NbO2 (s) + H2O (g) (1)
NbO2 (s) + 3CH4 (g) NbC (s) + 2CO (g) + 6H2 (g) (2)
The peaks visible on TCD can be clearly correlated with the above reactions (1) & (2) by using the
thermal conductivities of the corresponding gas (Table 1).
Table 1 Thermal conductivity of gases involved in Nb2O5 reduction (these values increase with temperature).
Gas H2 CH4 CO H2O
Thermal conductivity W/(m.K) values at 25 °C 0.168 0.030 0.0232 0.016
Peak I 2.5 µm
Peak II
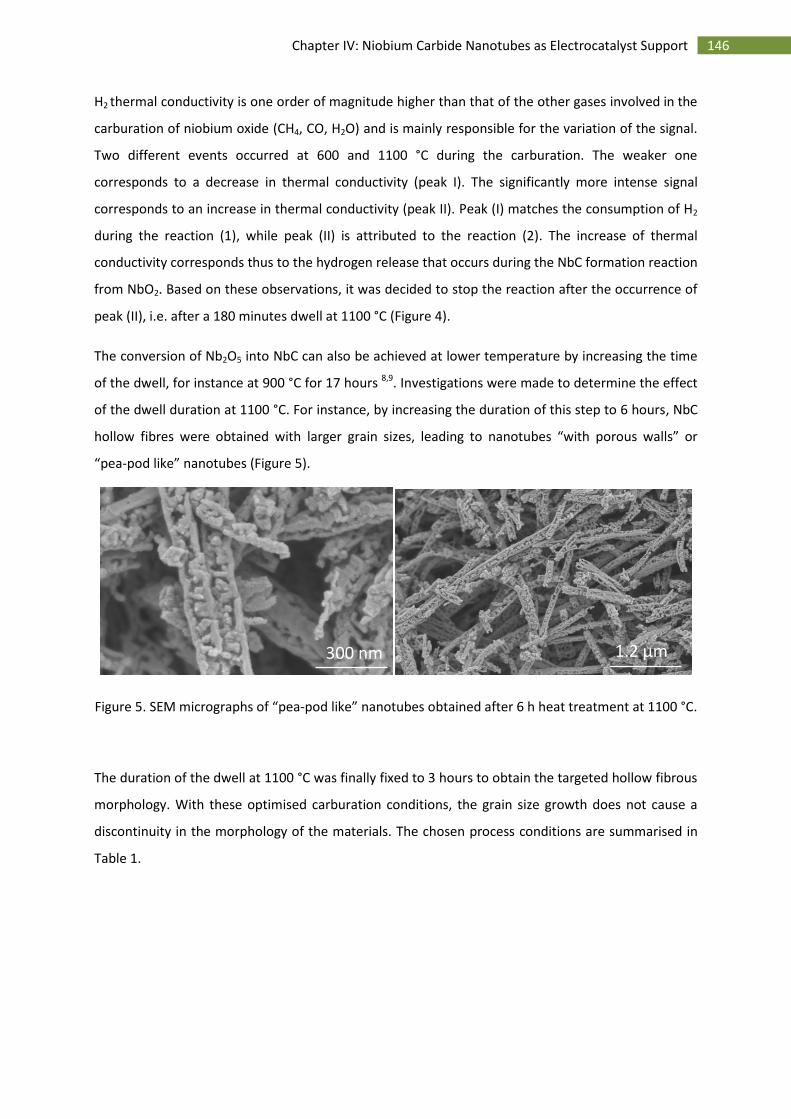
146 Chapter IV: Niobium Carbide Nanotubes as Electrocatalyst Support
H2 thermal conductivity is one order of magnitude higher than that of the other gases involved in the
carburation of niobium oxide (CH4, CO, H2O) and is mainly responsible for the variation of the signal.
Two different events occurred at 600 and 1100 °C during the carburation. The weaker one
corresponds to a decrease in thermal conductivity (peak I). The significantly more intense signal
corresponds to an increase in thermal conductivity (peak II). Peak (I) matches the consumption of H2
during the reaction (1), while peak (II) is attributed to the reaction (2). The increase of thermal
conductivity corresponds thus to the hydrogen release that occurs during the NbC formation reaction
from NbO2. Based on these observations, it was decided to stop the reaction after the occurrence of
peak (II), i.e. after a 180 minutes dwell at 1100 °C (Figure 4).
The conversion of Nb2O5 into NbC can also be achieved at lower temperature by increasing the time
of the dwell, for instance at 900 °C for 17 hours 8,9. Investigations were made to determine the effect
of the dwell duration at 1100 °C. For instance, by increasing the duration of this step to 6 hours, NbC
hollow fibres were obtained with larger grain sizes, leading to nanotubes “with porous walls” or
“pea-pod like” nanotubes (Figure 5).
Figure 5. SEM micrographs of “pea-pod like” nanotubes obtained after 6 h heat treatment at 1100 °C.
The duration of the dwell at 1100 °C was finally fixed to 3 hours to obtain the targeted hollow fibrous
morphology. With these optimised carburation conditions, the grain size growth does not cause a
discontinuity in the morphology of the materials. The chosen process conditions are summarised in
Table 1.
300 nm 1.2 µm

147 Chapter IV: Niobium Carbide Nanotubes as Electrocatalyst Support
Table 1. NbC nanotubes synthesis route details.
Step Conditions
Electrospinning PVP (13 %)/ANO (19.5 %)
Solvent: H2O/EtOH (50/50 volume)
Voltage 15 kV; flow rate 0.2 mL . h-1; drum rotation 300 rpm
Calcination 1h 150 °C 1h 250 °C 3 h 600 °C in air
(ramp up 0.5 °C min-1 / 0.5 °C min-1 / 5 °C min-1)
Carburation 180 min at 1100 °C in CH4/H2
(ramp up 4 °C min-1)
2. Characterisation of the chemical and structural composition of
niobium carbide 1D nanostructured material
The structure of the material recovered after carburation was characterised by powder X-ray
diffraction, Figure 6. Niobium carbide NbC (ref 038 – 1364 cubic Fm – 3m) was identified as the only
crystalline phase, with no other non-assigned diffraction lines that could have corresponded to
unreacted Nb2O5, other niobium carbide compositions (Nb2C) or niobium metal.
The crystallite sizes were calculated with the Scherrer formula with the [111], [200] and [220] Miller
plans leading to respectively 12 nm, 12 nm and 13 nm. Considering that a grain composing the wall
can contain several crystallites, this calculation is consistent with the TEM observations of 19 nm
average sized grains (paragraph B.3).

148 Chapter IV: Niobium Carbide Nanotubes as Electrocatalyst Support
10 20 30 40 50 60 70 80
[hkl] NbC ref: 038-1364
Cubic Fm-3m
[222]
[311]
[220]
[200]
Inte
nsity (
a.u
)
2
[111]
Figure 6. X-ray diffractogramm of the NbC material obtained after the carburation step.
Although the carbon of the carrier polymer is completely removed by calcination in step 2, carbon
could also be formed during the carburation step by decomposition of CH4 at high temperature as
previously described by Teixeira da Silva et al. in their study of the conversion of niobium oxide to
niobium carbide in methane9.
The quantification of any residual carbon was investigated by thermogravimetric analysis (Figure 7).
The same calibration relation was used as previously for the characterisation of NbC nanostructures
and NbC nanofibres that correlates the mass variation with the NbC/C ratio. The TGA of electrospun
NbC materials displays an overall mass gain that corresponds to NbC/C = 96/4 (Figure 7 and Figure 8).
0 200 400 600 800 100080
100
120
140
Mass (
%)
Temperature (°C)
22 %
mass variation
Figure 7. Thermogravimetric analysis of synthesised NbC/C 1D nanostructured material after carburation (step 3).
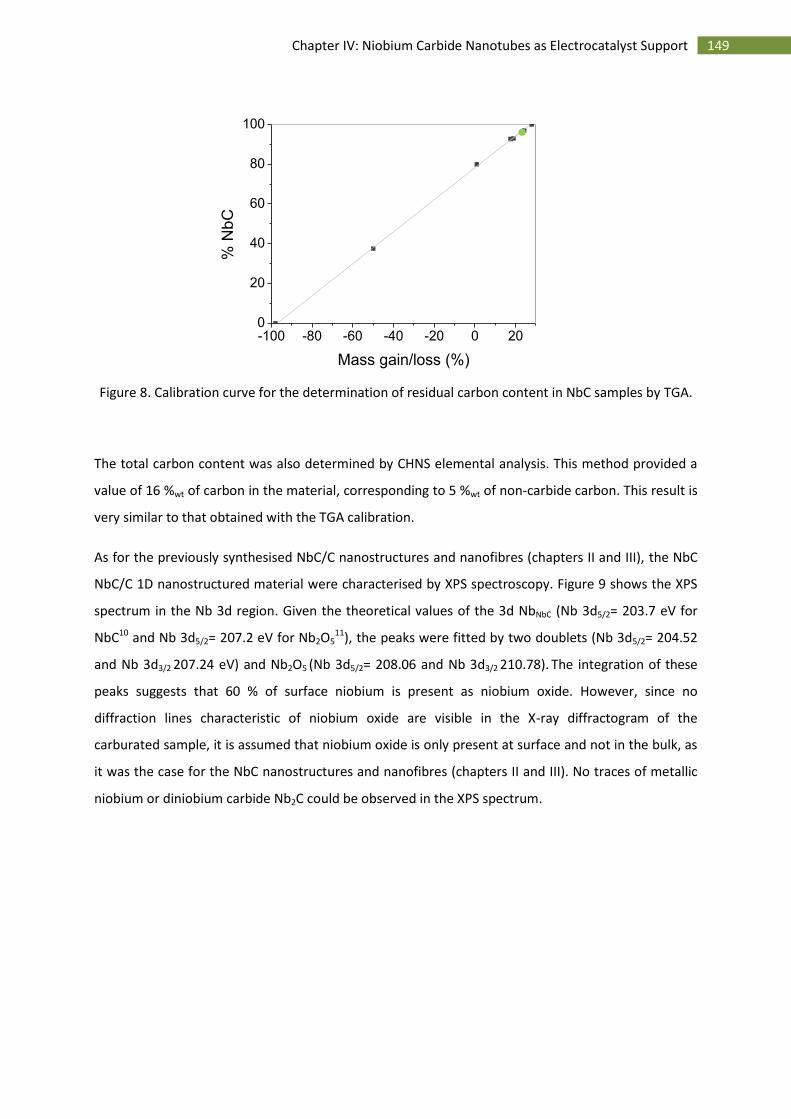
149 Chapter IV: Niobium Carbide Nanotubes as Electrocatalyst Support
Figure 8. Calibration curve for the determination of residual carbon content in NbC samples by TGA.
The total carbon content was also determined by CHNS elemental analysis. This method provided a
value of 16 %wt of carbon in the material, corresponding to 5 %wt of non-carbide carbon. This result is
very similar to that obtained with the TGA calibration.
As for the previously synthesised NbC/C nanostructures and nanofibres (chapters II and III), the NbC
NbC/C 1D nanostructured material were characterised by XPS spectroscopy. Figure 9 shows the XPS
spectrum in the Nb 3d region. Given the theoretical values of the 3d NbNbC (Nb 3d5/2= 203.7 eV for
NbC10 and Nb 3d5/2= 207.2 eV for Nb2O511), the peaks were fitted by two doublets (Nb 3d5/2= 204.52
and Nb 3d3/2 207.24 eV) and Nb2O5 (Nb 3d5/2= 208.06 and Nb 3d3/2 210.78). The integration of these
peaks suggests that 60 % of surface niobium is present as niobium oxide. However, since no
diffraction lines characteristic of niobium oxide are visible in the X-ray diffractogram of the
carburated sample, it is assumed that niobium oxide is only present at surface and not in the bulk, as
it was the case for the NbC nanostructures and nanofibres (chapters II and III). No traces of metallic
niobium or diniobium carbide Nb2C could be observed in the XPS spectrum.
-100 -80 -60 -40 -20 0 200
20
40
60
80
100
% N
bC
Mass gain/loss (%)
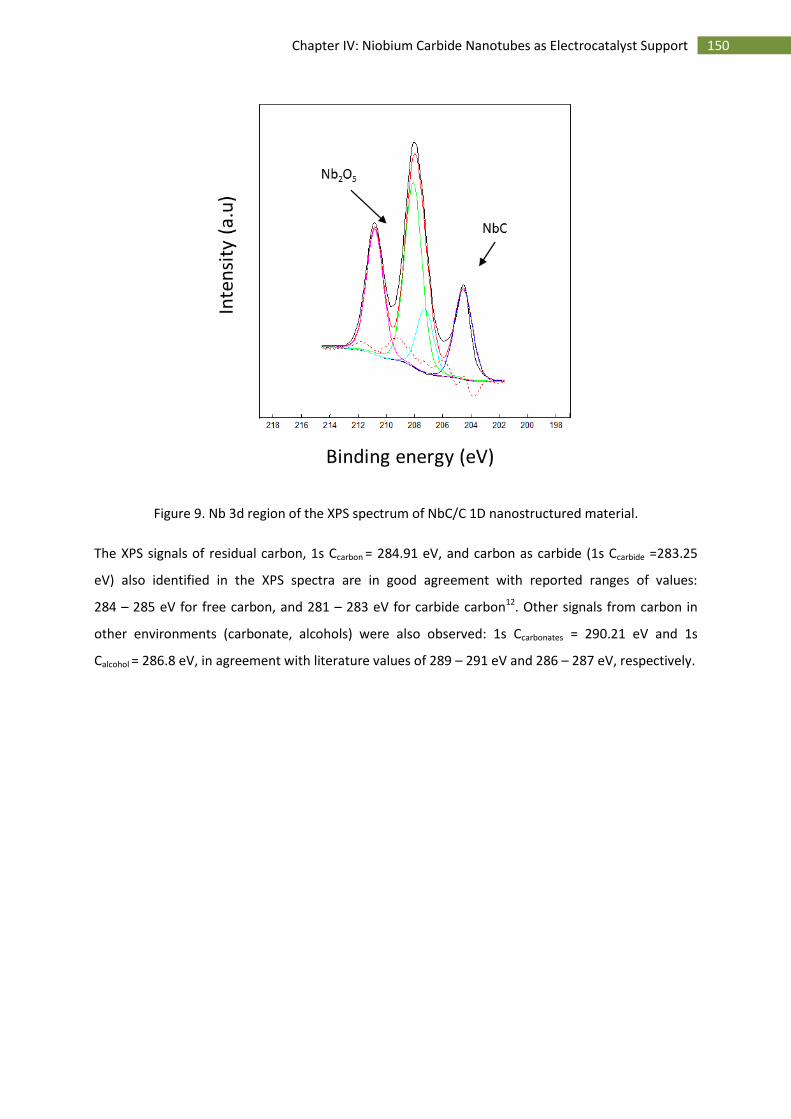
150 Chapter IV: Niobium Carbide Nanotubes as Electrocatalyst Support
Figure 9. Nb 3d region of the XPS spectrum of NbC/C 1D nanostructured material.
The XPS signals of residual carbon, 1s Ccarbon = 284.91 eV, and carbon as carbide (1s Ccarbide =283.25
eV) also identified in the XPS spectra are in good agreement with reported ranges of values:
284 – 285 eV for free carbon, and 281 – 283 eV for carbide carbon12. Other signals from carbon in
other environments (carbonate, alcohols) were also observed: 1s Ccarbonates = 290.21 eV and 1s
Calcohol = 286.8 eV, in agreement with literature values of 289 – 291 eV and 286 – 287 eV, respectively.
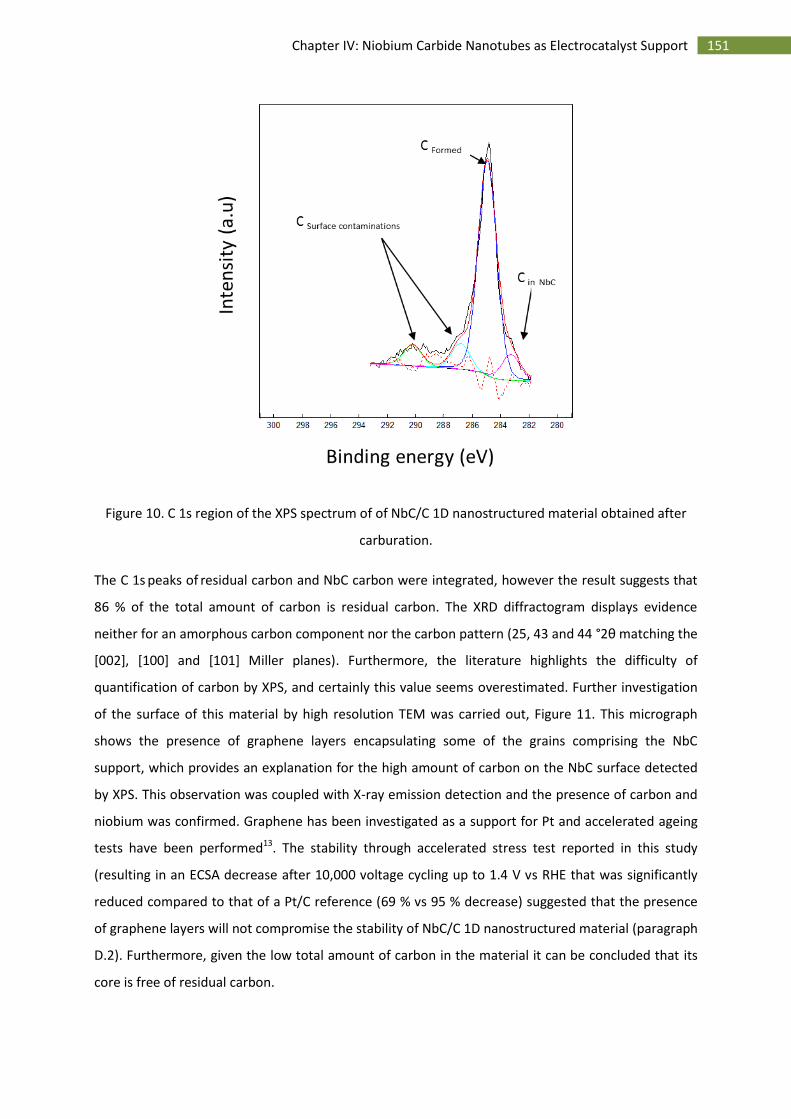
151 Chapter IV: Niobium Carbide Nanotubes as Electrocatalyst Support
Figure 10. C 1s region of the XPS spectrum of of NbC/C 1D nanostructured material obtained after
carburation.
The C 1s peaks of residual carbon and NbC carbon were integrated, however the result suggests that
86 % of the total amount of carbon is residual carbon. The XRD diffractogram displays evidence
neither for an amorphous carbon component nor the carbon pattern (25, 43 and 44 °2θ matching the
[002], [100] and [101] Miller planes). Furthermore, the literature highlights the difficulty of
quantification of carbon by XPS, and certainly this value seems overestimated. Further investigation
of the surface of this material by high resolution TEM was carried out, Figure 11. This micrograph
shows the presence of graphene layers encapsulating some of the grains comprising the NbC
support, which provides an explanation for the high amount of carbon on the NbC surface detected
by XPS. This observation was coupled with X-ray emission detection and the presence of carbon and
niobium was confirmed. Graphene has been investigated as a support for Pt and accelerated ageing
tests have been performed13. The stability through accelerated stress test reported in this study
(resulting in an ECSA decrease after 10,000 voltage cycling up to 1.4 V vs RHE that was significantly
reduced compared to that of a Pt/C reference (69 % vs 95 % decrease) suggested that the presence
of graphene layers will not compromise the stability of NbC/C 1D nanostructured material (paragraph
D.2). Furthermore, given the low total amount of carbon in the material it can be concluded that its
core is free of residual carbon.
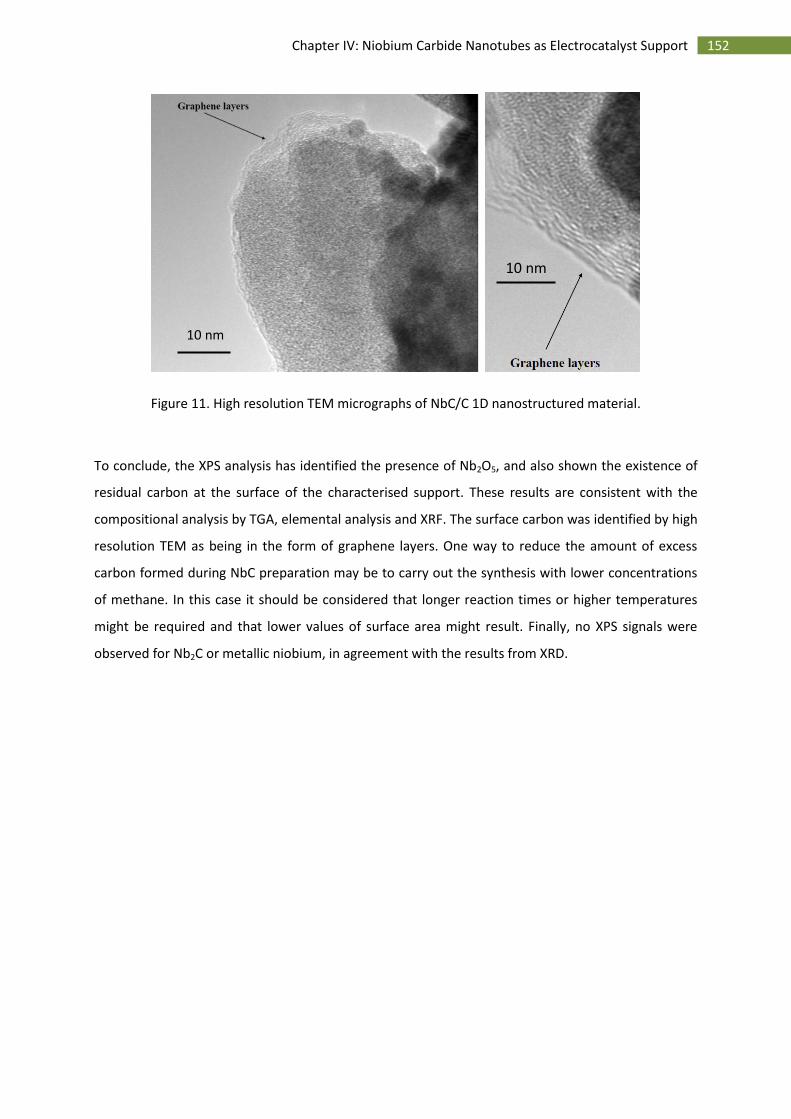
152 Chapter IV: Niobium Carbide Nanotubes as Electrocatalyst Support
Figure 11. High resolution TEM micrographs of NbC/C 1D nanostructured material.
To conclude, the XPS analysis has identified the presence of Nb2O5, and also shown the existence of
residual carbon at the surface of the characterised support. These results are consistent with the
compositional analysis by TGA, elemental analysis and XRF. The surface carbon was identified by high
resolution TEM as being in the form of graphene layers. One way to reduce the amount of excess
carbon formed during NbC preparation may be to carry out the synthesis with lower concentrations
of methane. In this case it should be considered that longer reaction times or higher temperatures
might be required and that lower values of surface area might result. Finally, no XPS signals were
observed for Nb2C or metallic niobium, in agreement with the results from XRD.
10 nm
10 nm
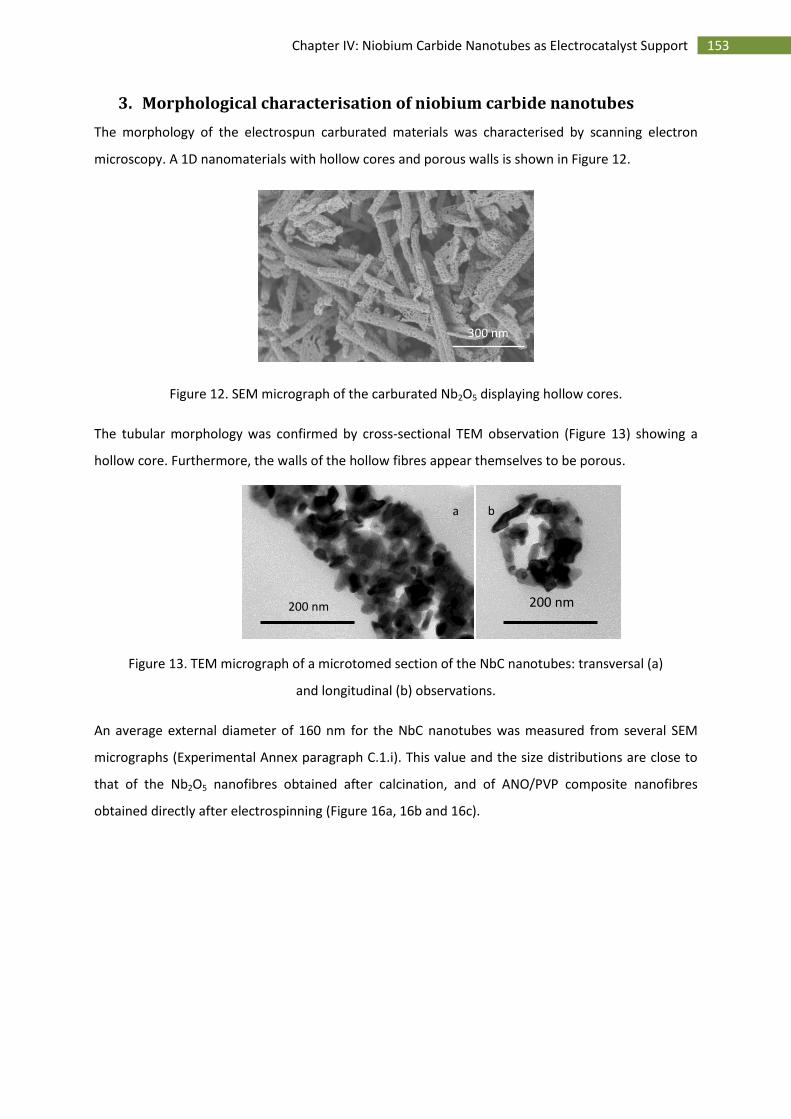
153 Chapter IV: Niobium Carbide Nanotubes as Electrocatalyst Support
3. Morphological characterisation of niobium carbide nanotubes
The morphology of the electrospun carburated materials was characterised by scanning electron
microscopy. A 1D nanomaterials with hollow cores and porous walls is shown in Figure 12.
Figure 12. SEM micrograph of the carburated Nb2O5 displaying hollow cores.
The tubular morphology was confirmed by cross-sectional TEM observation (Figure 13) showing a
hollow core. Furthermore, the walls of the hollow fibres appear themselves to be porous.
Figure 13. TEM micrograph of a microtomed section of the NbC nanotubes: transversal (a)
and longitudinal (b) observations.
An average external diameter of 160 nm for the NbC nanotubes was measured from several SEM
micrographs (Experimental Annex paragraph C.1.i). This value and the size distributions are close to
that of the Nb2O5 nanofibres obtained after calcination, and of ANO/PVP composite nanofibres
obtained directly after electrospinning (Figure 16a, 16b and 16c).
300 nm
200 nm
a
200 nm
b
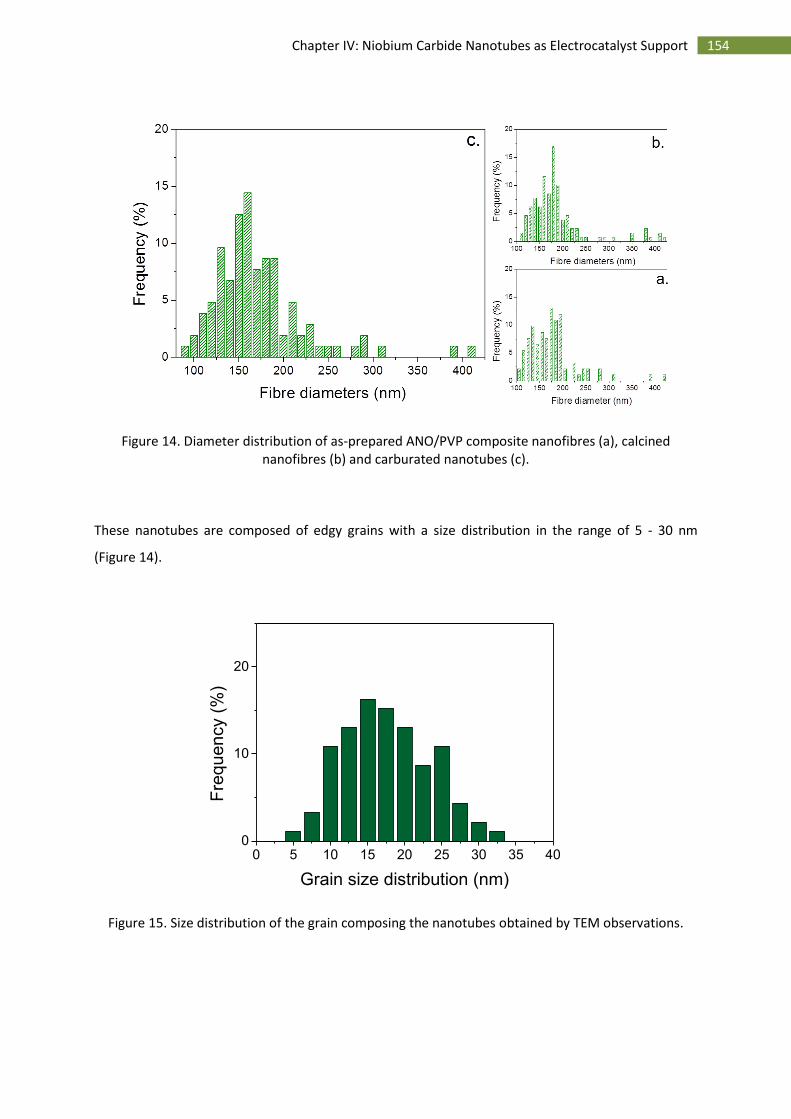
154 Chapter IV: Niobium Carbide Nanotubes as Electrocatalyst Support
Figure 14. Diameter distribution of as-prepared ANO/PVP composite nanofibres (a), calcined nanofibres (b) and carburated nanotubes (c).
These nanotubes are composed of edgy grains with a size distribution in the range of 5 - 30 nm
(Figure 14).
0 5 10 15 20 25 30 35 400
10
20
Fre
qu
en
cy (
%)
Grain size distribution (nm)
Figure 15. Size distribution of the grain composing the nanotubes obtained by TEM observations.
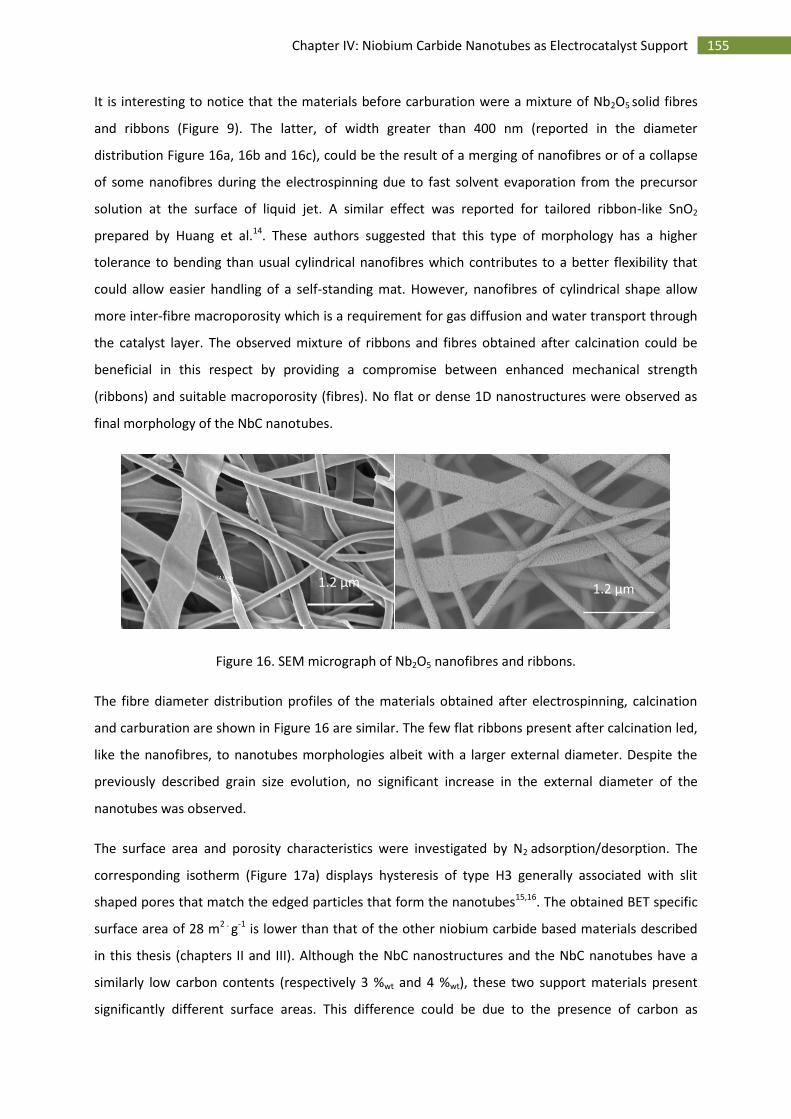
155 Chapter IV: Niobium Carbide Nanotubes as Electrocatalyst Support
It is interesting to notice that the materials before carburation were a mixture of Nb2O5 solid fibres
and ribbons (Figure 9). The latter, of width greater than 400 nm (reported in the diameter
distribution Figure 16a, 16b and 16c), could be the result of a merging of nanofibres or of a collapse
of some nanofibres during the electrospinning due to fast solvent evaporation from the precursor
solution at the surface of liquid jet. A similar effect was reported for tailored ribbon-like SnO2
prepared by Huang et al.14. These authors suggested that this type of morphology has a higher
tolerance to bending than usual cylindrical nanofibres which contributes to a better flexibility that
could allow easier handling of a self-standing mat. However, nanofibres of cylindrical shape allow
more inter-fibre macroporosity which is a requirement for gas diffusion and water transport through
the catalyst layer. The observed mixture of ribbons and fibres obtained after calcination could be
beneficial in this respect by providing a compromise between enhanced mechanical strength
(ribbons) and suitable macroporosity (fibres). No flat or dense 1D nanostructures were observed as
final morphology of the NbC nanotubes.
Figure 16. SEM micrograph of Nb2O5 nanofibres and ribbons.
The fibre diameter distribution profiles of the materials obtained after electrospinning, calcination
and carburation are shown in Figure 16 are similar. The few flat ribbons present after calcination led,
like the nanofibres, to nanotubes morphologies albeit with a larger external diameter. Despite the
previously described grain size evolution, no significant increase in the external diameter of the
nanotubes was observed.
The surface area and porosity characteristics were investigated by N2 adsorption/desorption. The
corresponding isotherm (Figure 17a) displays hysteresis of type H3 generally associated with slit
shaped pores that match the edged particles that form the nanotubes15,16. The obtained BET specific
surface area of 28 m2 . g-1 is lower than that of the other niobium carbide based materials described
in this thesis (chapters II and III). Although the NbC nanostructures and the NbC nanotubes have a
similarly low carbon contents (respectively 3 %wt and 4 %wt), these two support materials present
significantly different surface areas. This difference could be due to the presence of carbon as
1.2 µm 1.2 µm
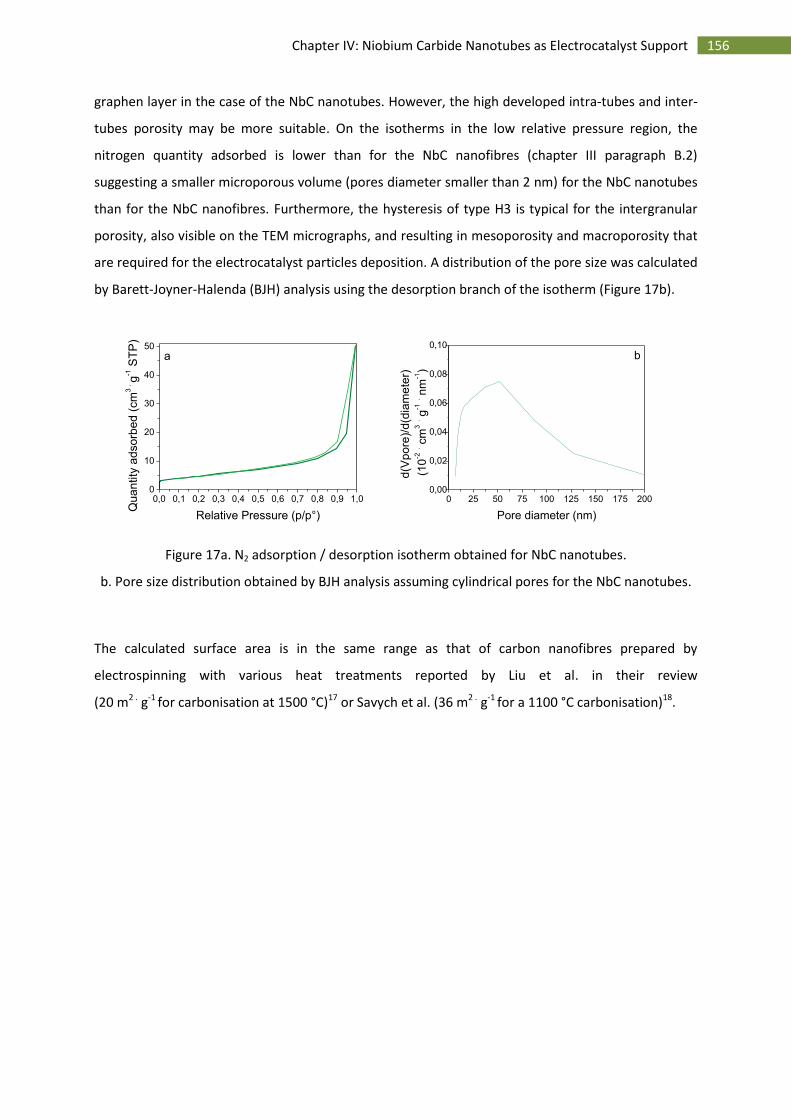
156 Chapter IV: Niobium Carbide Nanotubes as Electrocatalyst Support
graphen layer in the case of the NbC nanotubes. However, the high developed intra-tubes and inter-
tubes porosity may be more suitable. On the isotherms in the low relative pressure region, the
nitrogen quantity adsorbed is lower than for the NbC nanofibres (chapter III paragraph B.2)
suggesting a smaller microporous volume (pores diameter smaller than 2 nm) for the NbC nanotubes
than for the NbC nanofibres. Furthermore, the hysteresis of type H3 is typical for the intergranular
porosity, also visible on the TEM micrographs, and resulting in mesoporosity and macroporosity that
are required for the electrocatalyst particles deposition. A distribution of the pore size was calculated
by Barett-Joyner-Halenda (BJH) analysis using the desorption branch of the isotherm (Figure 17b).
0,0 0,1 0,2 0,3 0,4 0,5 0,6 0,7 0,8 0,9 1,00
10
20
30
40
50
Quan
tity
ad
sorb
ed
(cm
3 .
g-1 S
TP
)
Relative Pressure (p/p°)
a
0 25 50 75 100 125 150 175 2000,00
0,02
0,04
0,06
0,08
0,10
d(V
po
re)/
d(d
iam
ete
r)
(10
-2 . c
m3 . g
-1 . n
m-1)
Pore diameter (nm)
b
Figure 17a. N2 adsorption / desorption isotherm obtained for NbC nanotubes.
b. Pore size distribution obtained by BJH analysis assuming cylindrical pores for the NbC nanotubes.
The calculated surface area is in the same range as that of carbon nanofibres prepared by
electrospinning with various heat treatments reported by Liu et al. in their review
(20 m2 . g-1 for carbonisation at 1500 °C)17 or Savych et al. (36 m2 . g-1 for a 1100 °C carbonisation)18.
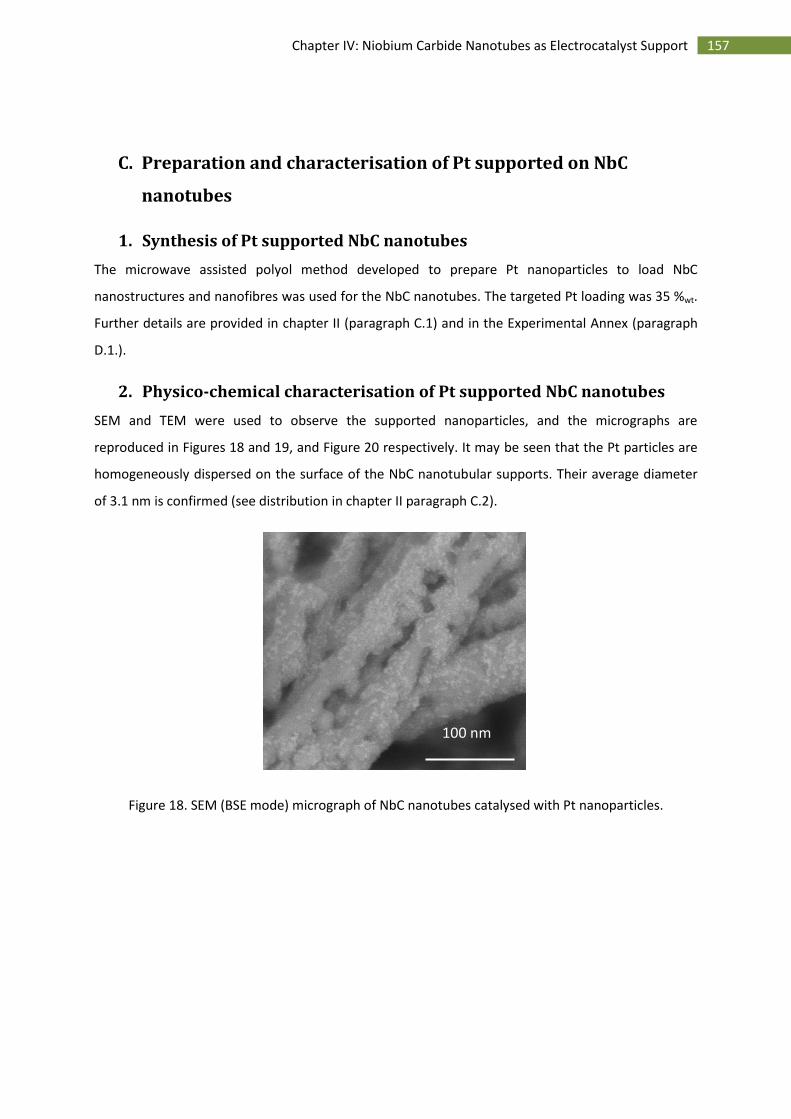
157 Chapter IV: Niobium Carbide Nanotubes as Electrocatalyst Support
C. Preparation and characterisation of Pt supported on NbC
nanotubes
1. Synthesis of Pt supported NbC nanotubes
The microwave assisted polyol method developed to prepare Pt nanoparticles to load NbC
nanostructures and nanofibres was used for the NbC nanotubes. The targeted Pt loading was 35 %wt.
Further details are provided in chapter II (paragraph C.1) and in the Experimental Annex (paragraph
D.1.).
2. Physico-chemical characterisation of Pt supported NbC nanotubes
SEM and TEM were used to observe the supported nanoparticles, and the micrographs are
reproduced in Figures 18 and 19, and Figure 20 respectively. It may be seen that the Pt particles are
homogeneously dispersed on the surface of the NbC nanotubular supports. Their average diameter
of 3.1 nm is confirmed (see distribution in chapter II paragraph C.2).
Figure 18. SEM (BSE mode) micrograph of NbC nanotubes catalysed with Pt nanoparticles.
100 nm

158 Chapter IV: Niobium Carbide Nanotubes as Electrocatalyst Support
Figure 19. SEM (BSE mode) micrographs of the NbC nanotubes catalysed with Pt nanoparticles.
Platinum and niobium carbide were discriminated one from the other by using SEM in the back
scattered electron (BSE) mode (Figure 18), which shows a good distribution of the platinum
nanoparticles (brighter due to their higher electron density compared to the support) onto the
internal and external surface of the NbC nanotubes. This observation is confirmed by the TEM
micrographs (Figure 20), showing the complete and homogeneous coverage of the tubes by the
nanocatalysts.
Figure 20. TEM micrograph of 30 %wt Pt/NbC nanotubes catalysed with Pt nanoparticles.
Figure 21. TEM micrographs of 50 %wt Pt/NbC nanotubes nanoparticles.
200 nm 300 nm
200 nm
100 nm
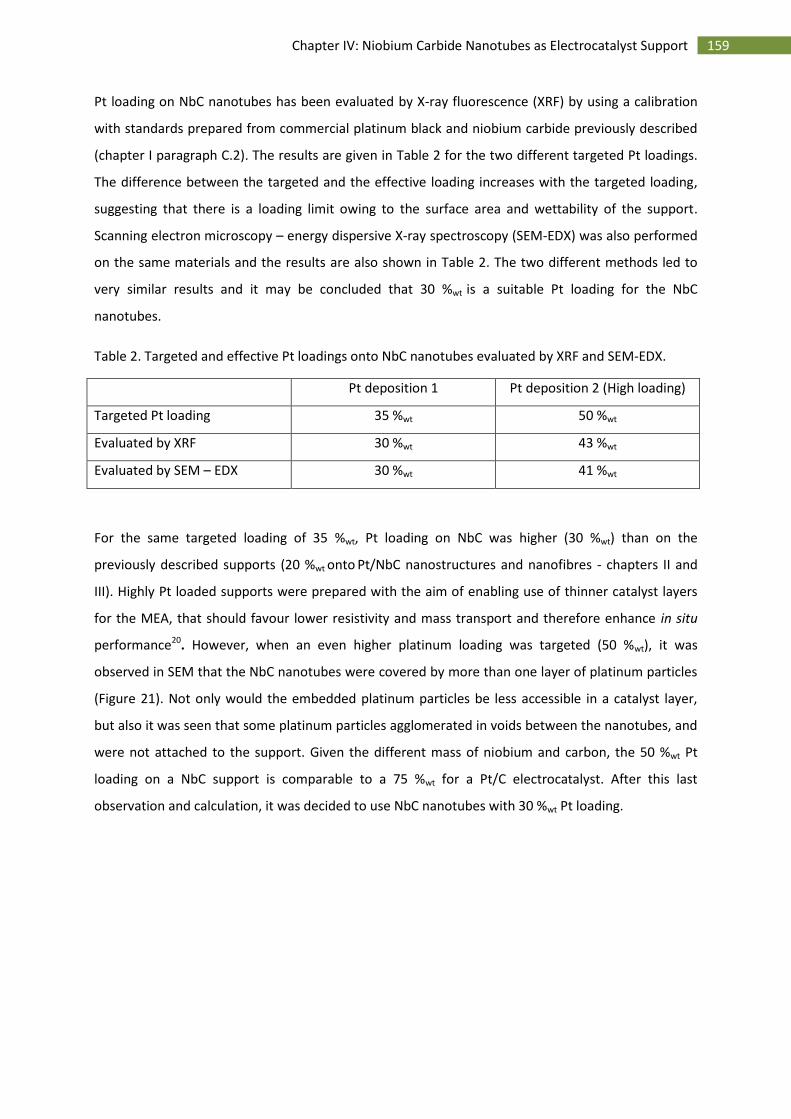
159 Chapter IV: Niobium Carbide Nanotubes as Electrocatalyst Support
Pt loading on NbC nanotubes has been evaluated by X-ray fluorescence (XRF) by using a calibration
with standards prepared from commercial platinum black and niobium carbide previously described
(chapter I paragraph C.2). The results are given in Table 2 for the two different targeted Pt loadings.
The difference between the targeted and the effective loading increases with the targeted loading,
suggesting that there is a loading limit owing to the surface area and wettability of the support.
Scanning electron microscopy – energy dispersive X-ray spectroscopy (SEM-EDX) was also performed
on the same materials and the results are also shown in Table 2. The two different methods led to
very similar results and it may be concluded that 30 %wt is a suitable Pt loading for the NbC
nanotubes.
Table 2. Targeted and effective Pt loadings onto NbC nanotubes evaluated by XRF and SEM-EDX.
Pt deposition 1 Pt deposition 2 (High loading)
Targeted Pt loading 35 %wt 50 %wt
Evaluated by XRF 30 %wt 43 %wt
Evaluated by SEM – EDX 30 %wt 41 %wt
For the same targeted loading of 35 %wt, Pt loading on NbC was higher (30 %wt) than on the
previously described supports (20 %wt onto Pt/NbC nanostructures and nanofibres - chapters II and
III). Highly Pt loaded supports were prepared with the aim of enabling use of thinner catalyst layers
for the MEA, that should favour lower resistivity and mass transport and therefore enhance in situ
performance20. However, when an even higher platinum loading was targeted (50 %wt), it was
observed in SEM that the NbC nanotubes were covered by more than one layer of platinum particles
(Figure 21). Not only would the embedded platinum particles be less accessible in a catalyst layer,
but also it was seen that some platinum particles agglomerated in voids between the nanotubes, and
were not attached to the support. Given the different mass of niobium and carbon, the 50 %wt Pt
loading on a NbC support is comparable to a 75 %wt for a Pt/C electrocatalyst. After this last
observation and calculation, it was decided to use NbC nanotubes with 30 %wt Pt loading.
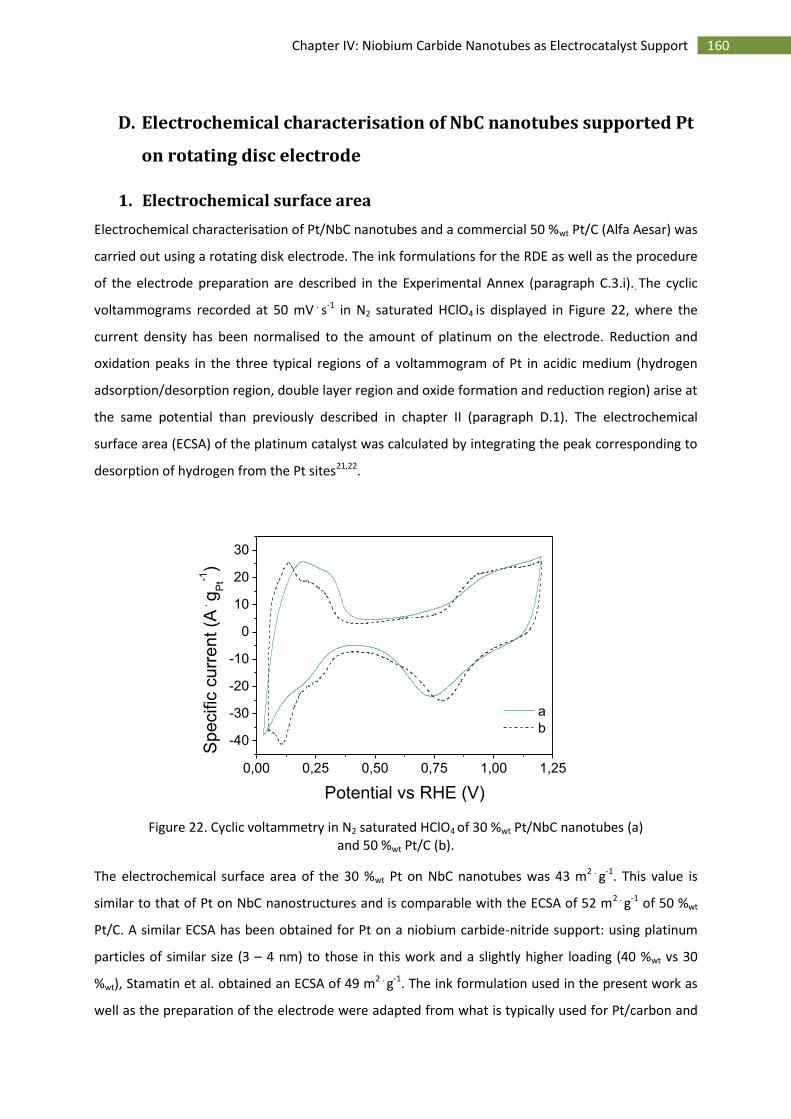
160 Chapter IV: Niobium Carbide Nanotubes as Electrocatalyst Support
D. Electrochemical characterisation of NbC nanotubes supported Pt
on rotating disc electrode
1. Electrochemical surface area
Electrochemical characterisation of Pt/NbC nanotubes and a commercial 50 %wt Pt/C (Alfa Aesar) was
carried out using a rotating disk electrode. The ink formulations for the RDE as well as the procedure
of the electrode preparation are described in the Experimental Annex (paragraph C.3.i).. The cyclic
voltammograms recorded at 50 mV . s-1 in N2 saturated HClO4 is displayed in Figure 22, where the
current density has been normalised to the amount of platinum on the electrode. Reduction and
oxidation peaks in the three typical regions of a voltammogram of Pt in acidic medium (hydrogen
adsorption/desorption region, double layer region and oxide formation and reduction region) arise at
the same potential than previously described in chapter II (paragraph D.1). The electrochemical
surface area (ECSA) of the platinum catalyst was calculated by integrating the peak corresponding to
desorption of hydrogen from the Pt sites21,22.
0,00 0,25 0,50 0,75 1,00 1,25
-40
-30
-20
-10
0
10
20
30
a
b
Spe
cific
curr
en
t (A
. g
Pt-1
)
Potential vs RHE (V)
Figure 22. Cyclic voltammetry in N2 saturated HClO4 of 30 %wt Pt/NbC nanotubes (a) and 50 %wt Pt/C (b).
The electrochemical surface area of the 30 %wt Pt on NbC nanotubes was 43 m2 . g-1. This value is
similar to that of Pt on NbC nanostructures and is comparable with the ECSA of 52 m2 . g-1 of 50 %wt
Pt/C. A similar ECSA has been obtained for Pt on a niobium carbide-nitride support: using platinum
particles of similar size (3 – 4 nm) to those in this work and a slightly higher loading (40 %wt vs 30
%wt), Stamatin et al. obtained an ECSA of 49 m2 . g-1. The ink formulation used in the present work as
well as the preparation of the electrode were adapted from what is typically used for Pt/carbon and
161 Chapter IV: Niobium Carbide Nanotubes as Electrocatalyst Support
care was taken to obtain a uniform and thin layer. However, it is difficult to prepare a suspension
with catalysed nanofibrous materials because the energy required during the sonication process can
lead to Pt particles detachment23. Therefore, a compromise between the uniformity of the thin film
used as electrode and a soft ink preparation process was required.
2. Stability over time
The stability of the Pt/NbC nanotubes was investigated by applying the two accelerated stress tests
to 1.2 V and 1.4 V vs RHE described previously in chapters II and III paragraph D.2:
a – A preliminary AST consisting on 3,000 electrochemical cycles at 500 mV . s-1 between 0.03 V and
1.2 V vs RHE (Figure 23a).
b - A High potential AST consisting on 10,000 electrochemical cycles at 500 mV . s-1 between 0.6 V and
1.4 V vs RHE (Figure 23b).
0 20000
20
40
60
80
100
Pt/NbC nanotubes
Pt/Carbon
Pe
rce
nt
reta
ine
d E
CS
A (
%)
Cycles
a
0 2000 4000 6000 8000 100000
20
40
60
80
100
Pt/NbC nanotubes
Pt/Carbon
Perc
ent re
tain
ed E
CS
A (
%)
Cycles
b
Figure 23. ECSA evolution for Pt/C and Pt/NbC nanotubes as a function of voltage cycling to 1.2 V (a)
and to 1.4 V (b).
Table 3 provides a summary of the initial ECSA and its loss after voltage cycling. It may be seen that
after 3,000 cycles up to 1.2 V the ECSA decreased by 12 % for the Pt/NbC nanotubes, while for the
Pt/C material it decreased by 25 %. After voltage cycling, the ECSA of Pt/NbC nanotubes is the same
of Pt/carbon (38 m2 . g-1) after cycling.
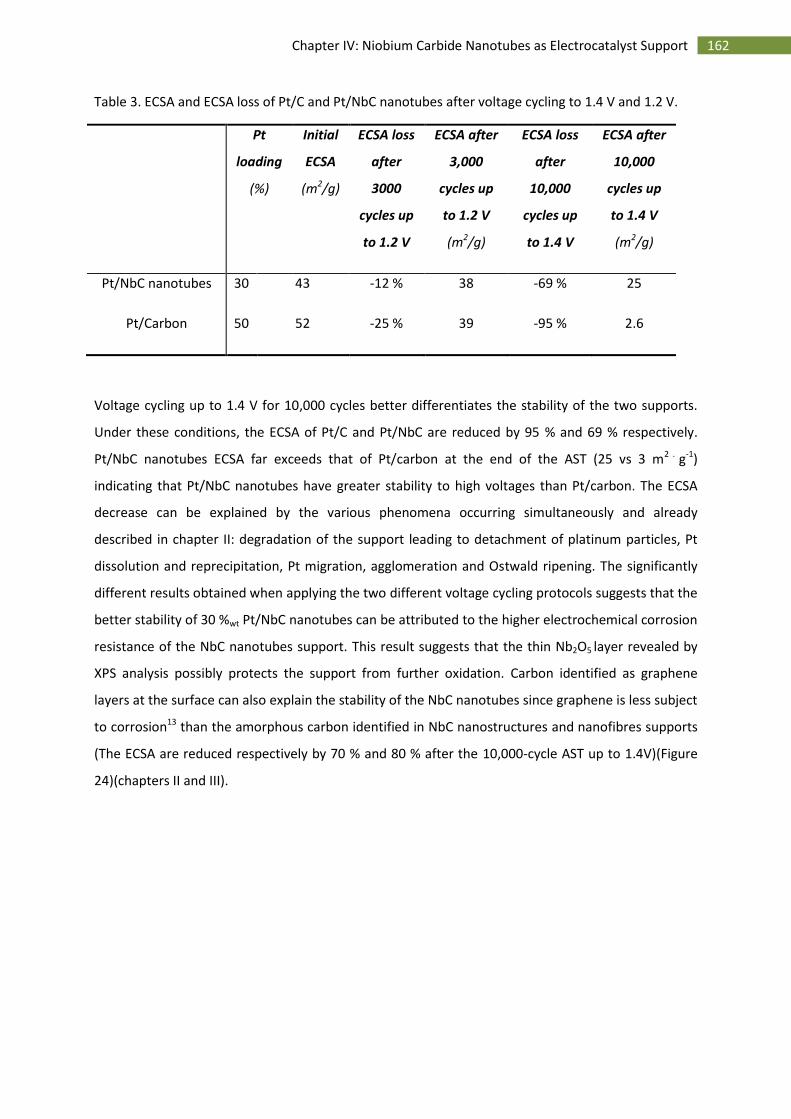
162 Chapter IV: Niobium Carbide Nanotubes as Electrocatalyst Support
Table 3. ECSA and ECSA loss of Pt/C and Pt/NbC nanotubes after voltage cycling to 1.4 V and 1.2 V.
Pt
loading
(%)
Initial
ECSA
(m2/g)
ECSA loss
after
3000
cycles up
to 1.2 V
ECSA after
3,000
cycles up
to 1.2 V
(m2/g)
ECSA loss
after
10,000
cycles up
to 1.4 V
ECSA after
10,000
cycles up
to 1.4 V
(m2/g)
Pt/NbC nanotubes 30 43 -12 % 38 -69 % 25
Pt/Carbon 50 52 -25 % 39 -95 % 2.6
Voltage cycling up to 1.4 V for 10,000 cycles better differentiates the stability of the two supports.
Under these conditions, the ECSA of Pt/C and Pt/NbC are reduced by 95 % and 69 % respectively.
Pt/NbC nanotubes ECSA far exceeds that of Pt/carbon at the end of the AST (25 vs 3 m2 . g-1)
indicating that Pt/NbC nanotubes have greater stability to high voltages than Pt/carbon. The ECSA
decrease can be explained by the various phenomena occurring simultaneously and already
described in chapter II: degradation of the support leading to detachment of platinum particles, Pt
dissolution and reprecipitation, Pt migration, agglomeration and Ostwald ripening. The significantly
different results obtained when applying the two different voltage cycling protocols suggests that the
better stability of 30 %wt Pt/NbC nanotubes can be attributed to the higher electrochemical corrosion
resistance of the NbC nanotubes support. This result suggests that the thin Nb2O5 layer revealed by
XPS analysis possibly protects the support from further oxidation. Carbon identified as graphene
layers at the surface can also explain the stability of the NbC nanotubes since graphene is less subject
to corrosion13 than the amorphous carbon identified in NbC nanostructures and nanofibres supports
(The ECSA are reduced respectively by 70 % and 80 % after the 10,000-cycle AST up to 1.4V)(Figure
24)(chapters II and III).
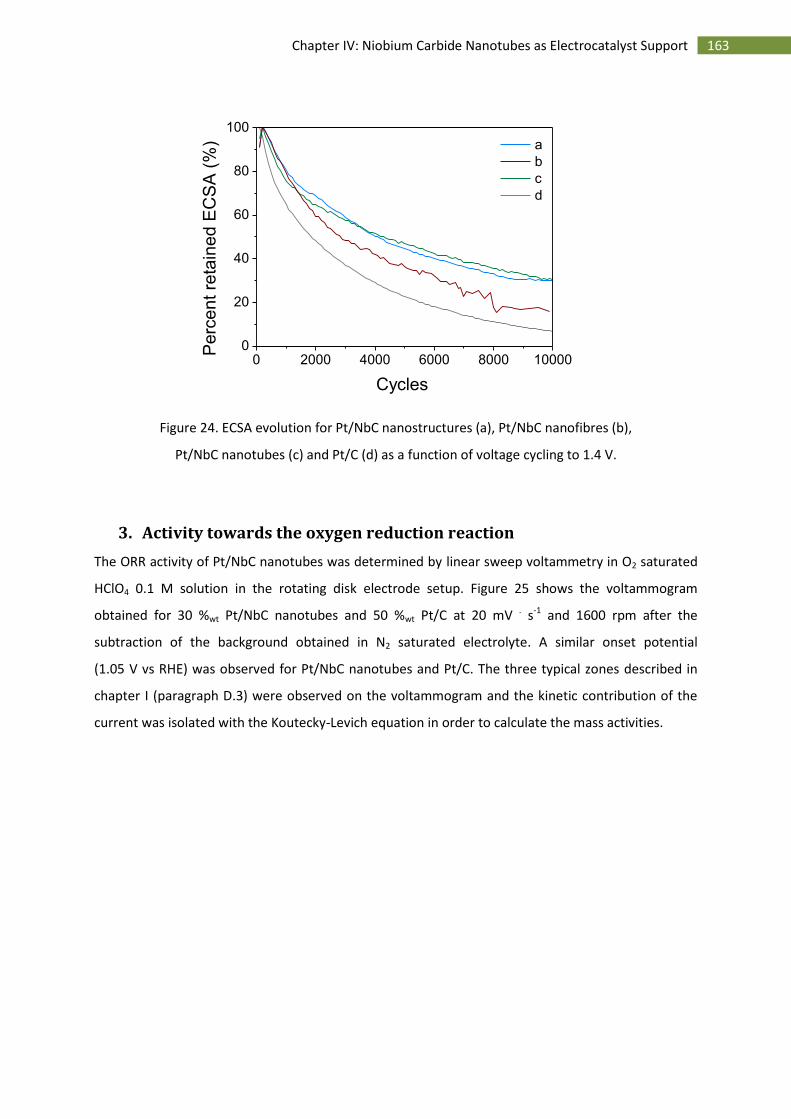
163 Chapter IV: Niobium Carbide Nanotubes as Electrocatalyst Support
0 2000 4000 6000 8000 100000
20
40
60
80
100
a
b
c
d
Pe
rce
nt re
tain
ed
EC
SA
(%
)
Cycles
Figure 24. ECSA evolution for Pt/NbC nanostructures (a), Pt/NbC nanofibres (b),
Pt/NbC nanotubes (c) and Pt/C (d) as a function of voltage cycling to 1.4 V.
3. Activity towards the oxygen reduction reaction
The ORR activity of Pt/NbC nanotubes was determined by linear sweep voltammetry in O2 saturated
HClO4 0.1 M solution in the rotating disk electrode setup. Figure 25 shows the voltammogram
obtained for 30 %wt Pt/NbC nanotubes and 50 %wt Pt/C at 20 mV . s-1 and 1600 rpm after the
subtraction of the background obtained in N2 saturated electrolyte. A similar onset potential
(1.05 V vs RHE) was observed for Pt/NbC nanotubes and Pt/C. The three typical zones described in
chapter I (paragraph D.3) were observed on the voltammogram and the kinetic contribution of the
current was isolated with the Koutecky-Levich equation in order to calculate the mass activities.
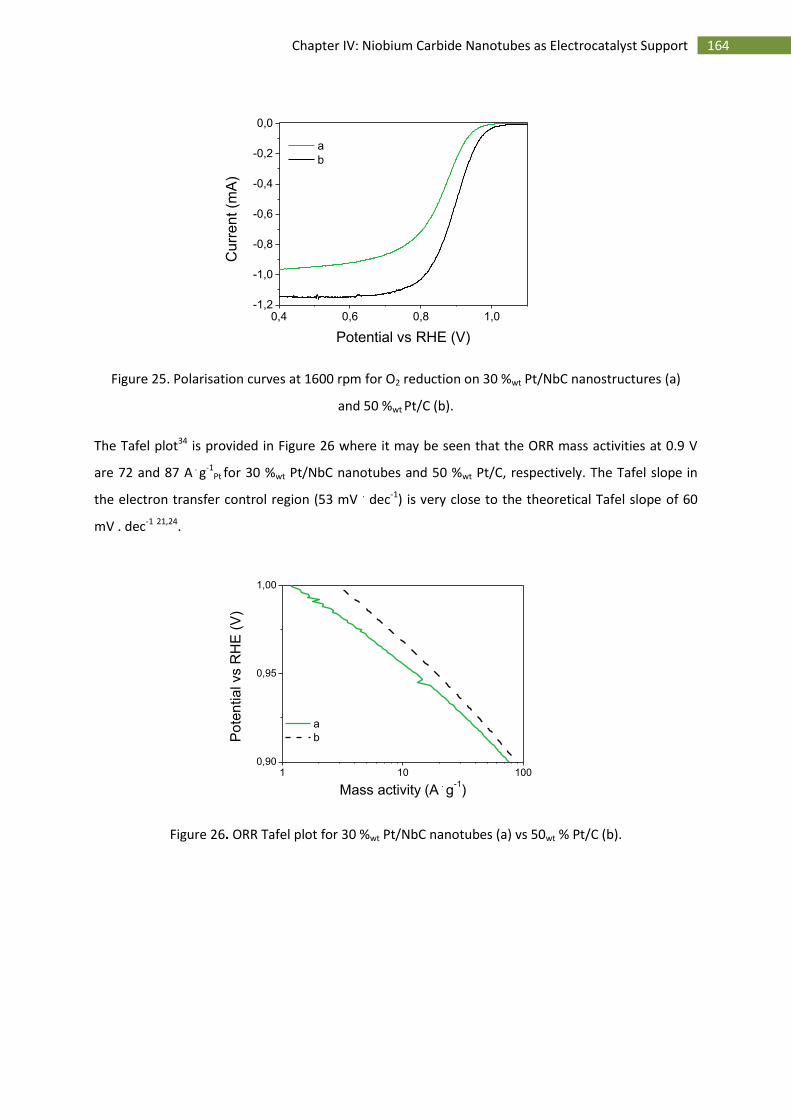
164 Chapter IV: Niobium Carbide Nanotubes as Electrocatalyst Support
0,4 0,6 0,8 1,0-1,2
-1,0
-0,8
-0,6
-0,4
-0,2
0,0
a
b
Cu
rre
nt (m
A)
Potential vs RHE (V)
Figure 25. Polarisation curves at 1600 rpm for O2 reduction on 30 %wt Pt/NbC nanostructures (a)
and 50 %wt Pt/C (b).
The Tafel plot34 is provided in Figure 26 where it may be seen that the ORR mass activities at 0.9 V
are 72 and 87 A . g-1Pt for 30 %wt Pt/NbC nanotubes and 50 %wt Pt/C, respectively. The Tafel slope in
the electron transfer control region (53 mV . dec-1) is very close to the theoretical Tafel slope of 60
mV . dec-1 21,24.
1 10 1000,90
0,95
1,00
a
b
Po
ten
tia
l vs R
HE
(V
)
Mass activity (A . g
-1)
Figure 26. ORR Tafel plot for 30 %wt Pt/NbC nanotubes (a) vs 50wt % Pt/C (b).
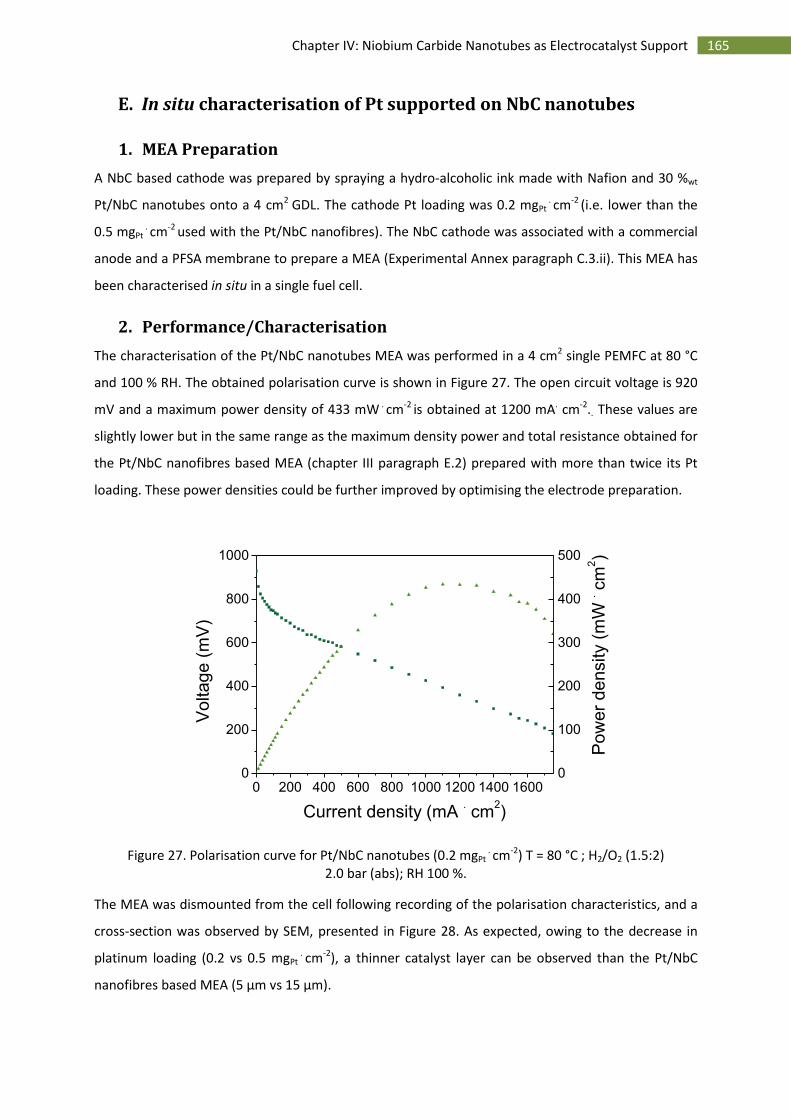
165 Chapter IV: Niobium Carbide Nanotubes as Electrocatalyst Support
E. In situ characterisation of Pt supported on NbC nanotubes
1. MEA Preparation
A NbC based cathode was prepared by spraying a hydro-alcoholic ink made with Nafion and 30 %wt
Pt/NbC nanotubes onto a 4 cm2 GDL. The cathode Pt loading was 0.2 mgPt . cm-2 (i.e. lower than the
0.5 mgPt . cm-2 used with the Pt/NbC nanofibres). The NbC cathode was associated with a commercial
anode and a PFSA membrane to prepare a MEA (Experimental Annex paragraph C.3.ii). This MEA has
been characterised in situ in a single fuel cell.
2. Performance/Characterisation
The characterisation of the Pt/NbC nanotubes MEA was performed in a 4 cm2 single PEMFC at 80 °C
and 100 % RH. The obtained polarisation curve is shown in Figure 27. The open circuit voltage is 920
mV and a maximum power density of 433 mW . cm-2 is obtained at 1200 mA. cm-2.. These values are
slightly lower but in the same range as the maximum density power and total resistance obtained for
the Pt/NbC nanofibres based MEA (chapter III paragraph E.2) prepared with more than twice its Pt
loading. These power densities could be further improved by optimising the electrode preparation.
0 200 400 600 800 1000 1200 1400 16000
200
400
600
800
1000
Volta
ge
(m
V)
Current density (mA . cm
2)
0
100
200
300
400
500
Pow
er
de
nsity (
mW
. cm
2)
Figure 27. Polarisation curve for Pt/NbC nanotubes (0.2 mgPt . cm-2) T = 80 °C ; H2/O2 (1.5:2)
2.0 bar (abs); RH 100 %.
The MEA was dismounted from the cell following recording of the polarisation characteristics, and a
cross-section was observed by SEM, presented in Figure 28. As expected, owing to the decrease in
platinum loading (0.2 vs 0.5 mgPt . cm-2), a thinner catalyst layer can be observed than the Pt/NbC
nanofibres based MEA (5 µm vs 15 µm).
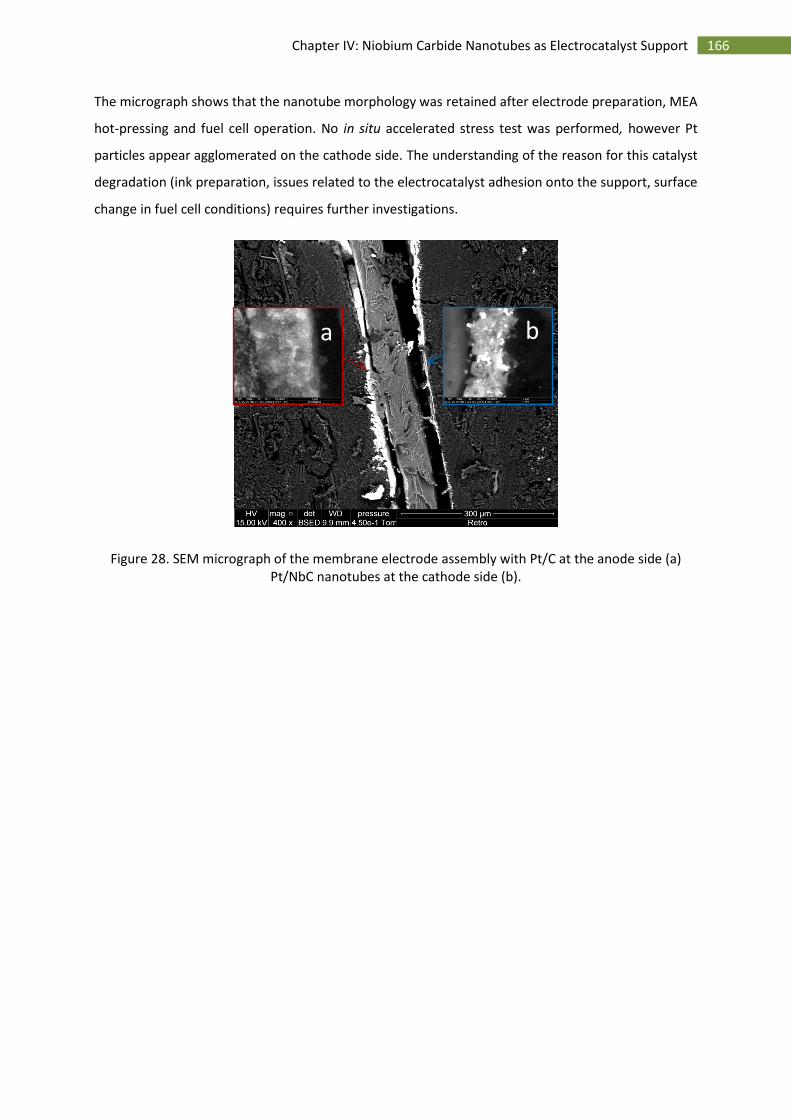
166 Chapter IV: Niobium Carbide Nanotubes as Electrocatalyst Support
The micrograph shows that the nanotube morphology was retained after electrode preparation, MEA
hot-pressing and fuel cell operation. No in situ accelerated stress test was performed, however Pt
particles appear agglomerated on the cathode side. The understanding of the reason for this catalyst
degradation (ink preparation, issues related to the electrocatalyst adhesion onto the support, surface
change in fuel cell conditions) requires further investigations.
Figure 28. SEM micrograph of the membrane electrode assembly with Pt/C at the anode side (a) Pt/NbC nanotubes at the cathode side (b).
a b
167 Chapter IV: Niobium Carbide Nanotubes as Electrocatalyst Support
F. Conclusion and perspectives
A synthesis route for the elaboration of niobium carbide nanotubes with porous walls has
been developed. It consists of three steps: electrospinning of ammonium niobate oxalate (as niobium
precursor) and PVP (as carrier polymer) composite, calcination in air to remove the carrier polymer
and form niobium oxide fibres, and carburation to convert niobium oxide to carbide. The fibre
morphology evolves during the carburation step probably due to the grain growth, and nanotubular
NbC is recovered having a residual carbon amount of 5 %wt. Pt nanoparticles were prepared using the
microwave-assisted polyol method and deposited on nanotubular NbC. Electrochemical
characterisation indicated that the ECSA of Pt on NbC is slightly lower, but similar to that of
commercial Pt on carbon. Following voltage cycling the ECSA of Pt on NbC undergoes less reduction
than that of Pt/C, and the final ECSA values are also significantly higher than that of Pt/C, which
indicates that the NbC support material is more stable and corrosion resistant. A preliminary fuel cell
measurement on a membrane electrode assembly comprising a cathode incorporating Pt/NbC (no
added carbon) has shown that electrocatalysts of this type, incorporating supports of novel
composition and morphology, are suitable. However, much work remains to optimise the ink
composition in order to show the real potential of Pt/NbC cathode electrocatalysts. The stability of
the NbC based MEA must also been assessed in situ, especially with accelerated stress tests
mimicking the PEMFC operating conditions leading to higher cathode degradation (e.g. start-up/shut-
down cycles).
Electrospinning provides the possibility to obtain self-standing mats as demonstrated in chapter IV.
Further optimisation of the NbC nanotubes synthesis is required to obtain the suitable mechanical
strength for them to be handled as a self-standing film. The exploratory work on electrodeposition
carried out with NbC nanofibres as well as other thin layer deposition techniques (e.g. ALD) could be
transposed to such self-standing NbC nanotubes mat electrodes.
The achieved morphology providing with hierarchical intra-tubes and inter-tubes porosity is also a
driving force to adapt this synthesis route for the development of other transition metal carbides. For
instance, the preparation of 1 D nanostructured tungsten carbide is envisaged, due to a possible
synergistic effect towards the ORR catalysis (chapter I). Work for the development of catalysed WC
nanofibrous materials is in progress.
168 Chapter IV: Niobium Carbide Nanotubes as Electrocatalyst Support
G. References
1 X. Leimin, L. Shijun, Y. Lijun and L. Zhenxing, Fuel Cells, 2009, 9, 101–105.
2 S. Iijima, Nature, 1991, 354, 56–58.
3 R. Tenne, L. Margulis, M. Genut and G. Hodes, Nature, 1992, 360, 444–446.
4 C. N. R. Rao, A. Govindaraj, G. Gundiah and S. R. C. Vivekchand, Chem. Eng. Sci., 2004, 59, 4665–4671.
5 S. R. Mishra, H. S. Rawat, S. C. Mehendale, K. C. Rustagi, A. K. Sood, R. Bandyopadhyay, A. Govindaraj and C. N. R. Rao, Chem. Phys. Lett., 2000, 317, 510–514.
6 L. K. frevel and H. W. Rinn, Anal. Chem., 1955, 27, 1329–1330.
7 F. A. O. Fontes, J. F. De Sousa, C. P. Souza, M. B. D. Bezerra and M. Benachour, Chem. Eng. J., 175, 534–538.
8 H. S. Kim, G. Bugli and G. Djéga-Mariadassou, J. Solid State Chem., 1999, 142, 100–107.
9 V. L. S. Teixeira da Silva, E. I. Ko, M. Schmal and S. T. Oyama, Chem. Mater., 1995, 7, 179–184.
10 M. T. Marques, A. M. Ferraria, J. B. Correia, A. M. B. do Rego and R. Vilar, Mater. Chem. Phys., 2008, 109, 174–180.
11 G. McGuire, G. Schweitzer and T. Carlson, Inorg. Chem., 1973, 12, 2450–2453.
12 V. L. S. Teixeira da Silva, M. Schmal and S. T. Oyama, J. Solid State Chem., 1996, 123, 168–182.
13 Y. Shao, S. Zhang, C. Wang, Z. Nie, J. Liu, Y. Wang and Y. Lin, J. Power Sources, 2010, 195, 4600–4605.
14 S. Huang, H. Wu, M. Zhou, C. Zhao, Z. Yu, Z. Ruan and W. Pan, NPG Asia Mater., 2014, 6, e86.
15 M. Thommes, Chem. Ing. Tech, 2010, 82, 1059.
16 G. Leofanti, M. Padovan, G. Tozzola and B. Venturelli, Catal. Today, 1998, 41, 207–219.
17 C.-K. Liu, K. Lai, W. Liu, M. Yao and R.-J. Sun, Polym. Int., 2009, 58, 1341–1349.
18 I. Savych, J. Bernard d’Arbigny, S. Subianto, S. Cavaliere, D. J. Jones and J. Rozière, J. Power Sources, 2014, 257, 147–155.
19 K. Wang, Z. Pan, F. Tzorbatzoglou, Y. Zhang, Y. Wang, T. Panagiotis and S. Song, Appl. Catal. B Environ., 2015, 166, 224–230.
20 L. Xiong and A. Manthiram, Electrochim. Acta, 2005, 50, 3200–3204.
21 S. Gojković, S. Zečević and R. Savinell, J. Electrochem., 1998, 145, 3716–3720.
169 Chapter IV: Niobium Carbide Nanotubes as Electrocatalyst Support
22 D. A. J. Rand and R. Woods, J. Electroanal. Chem. Interfacial Electrochem., 1972, 36, 57–69.
23 R. A. Caruso, M. Ashokkumar and F. Grieser, Colloids Surfaces A Physicochem. Eng. Asp., 2000, 169, 219–225.
24 E. Gileadi and E. Kirowa-Eisner, Corros. Sci., 2005, 47, 3068–3085.
H. Table of Figures
Figure 1. SEM micrograph of the ANO/PVP composite nanofibres. ................................................... 143
Figure 2. Thermogravimetric analysis of the fibres after the electrospinning step showing the end of
the oxidation of PVP (red line). ........................................................................................................... 144
Figure 3. X-ray diffractogramm of the Nb2O5 material obtained after the calcination at 600 °C with
Miller indices. ...................................................................................................................................... 144
Figure 4. Carburation of Nb2O5 nanofibres at 1100 °C in 10 % CH4 /H2 showing the evolution of the
thermal conductivity. (The red bar indicates the time the reaction was stopped). ........................... 145
Figure 5. SEM micrographs of “pea-pod like” nanotubes obtained after 6 h heat treatment at 1100 °C.
............................................................................................................................................................. 146
Figure 6. X-ray diffractogramm of the NbC material obtained after the carburation step. ............... 148
Figure 7. Thermogravimetric analysis of synthesised NbC/C 1D nanostructured material after
carburation (step 3). ............................................................................................................................ 148
Figure 8. Calibration curve for the determination of residual carbon content in NbC samples by TGA.
............................................................................................................................................................. 149
Figure 9. Nb 3d region of the XPS spectrum of NbC/C 1D nanostructured material. ......................... 150
Figure 10. C 1s region of the XPS spectrum of of NbC/C 1D nanostructured material obtained after
carburation. ......................................................................................................................................... 151
Figure 11. High resolution TEM micrographs of NbC/C 1D nanostructured material. ....................... 152
Figure 12. SEM micrograph of the carburated Nb2O5 displaying hollow cores. .................................. 153
Figure 13. TEM micrograph of a microtomed section of the NbC nanotubes: transversal (a) and
longitudinal (b) observations. ............................................................................................................. 153
Figure 14. Diameter distribution of as-prepared ANO/PVP composite nanofibres (a), calcined
nanofibres (b) and carburated nanotubes (c). .................................................................................... 154
Figure 15. Size distribution of the grain composing the nanotubes obtained by TEM observations. 154
Figure 16. SEM micrograph of Nb2O5 nanofibres and ribbons. ........................................................... 155
Figure 17a. N2 adsorption / desorption isotherm obtained for NbC nanotubes. b. Pore size
distribution obtained by BJH analysis assuming cylindrical pores for the NbC nanotubes. ............... 156
Figure 18. SEM (BSE mode) micrograph of NbC nanotubes catalysed with Pt nanoparticles. ........... 157
170 Chapter IV: Niobium Carbide Nanotubes as Electrocatalyst Support
Figure 19. SEM (BSE mode) micrographs of the NbC nanotubes catalysed with Pt nanoparticles. ... 158
Figure 20. TEM micrograph of 30 %wt Pt/NbC nanotubes catalysed with Pt nanoparticles. .............. 158
Figure 21. TEM micrographs of 50 %wt Pt/NbC nanotubes nanoparticles. ......................................... 158
Figure 22. Cyclic voltammetry in N2 saturated HClO4 of 30 %wt Pt/NbC nanotubes (a) and 50 %wt Pt/C
(b). ....................................................................................................................................................... 160
Figure 23. ECSA evolution for Pt/C and Pt/NbC nanotubes as a function of voltage cycling to 1.2 V (a)
and to 1.4 V (b). ................................................................................................................................... 161
Figure 24. ECSA evolution for Pt/NbC nanostructures (a), Pt/NbC nanofibres (b), Pt/NbC nanotubes
(c) and Pt/C (d) as a function of voltage cycling to 1.4 V. ................................................................... 163
Figure 25. Polarisation curves at 1600 rpm for O2 reduction on 30 %wt Pt/NbC nanostructures (a) and
50 %wt Pt/C (b). .................................................................................................................................... 164
Figure 26. ORR Tafel plot for 30 % Pt/NbC nanotubes (a) vs 50 % Pt/C (b). ....................................... 164
Figure 27. Polarisation curve for Pt/NbC nanotubes (0.2 mgPt . cm-2) T = 80 °C ; H2/O2 (1.5:2) 2.0 bar
(abs); RH 100 %. ................................................................................................................................... 165
Figure 28. SEM micrograph of the membrane electrode assembly with Pt/C at the anode side (a)
Pt/NbC nanotubes at the cathode side (b).......................................................................................... 166
171 General Conclusion
General Conclusion The objective of this thesis was to develop corrosion resistant support materials that can potentially
replace carbon and improve the durability of the PEMFC cathodes. Among alternative electrocatalyst
supports, niobium carbide was selected for its high electronic conductivity, and high chemical and
electrochemical stability. Three different synthesis routes were developed leading to different
morphologies. NbC nanostructured powder were synthesised from a hydrothermal synthesis route
resulting in the structuration of microspheres. This synthesis method allowed tuning the porosity of
the material leading to high specific surface area (65 m2 . g-1). 1D nanostructured materials were
elaborated by associating the electrospinning technique with different heat treatments. NbC
nanotubes with porous walls were obtained by carburation under methane of niobium oxide
nanofibres, while NbC nanofibres were obtained by direct carburation of a niobium salt/carrier
polymer composite. The latter were obtained as self-standing nanofibrous mats.
The obtained materials were characterised using various techniques including SEM, TEM, XRD, XPS,
N2 adsorption/desorption and electric conductivity measurements. Particular attention was focused
on determination of NbC materials. The presence of Nb2O5 on the surface was identified by X-ray
photoelectron spectroscopy. The presence and amount of residual carbon was determined and
confirmed by combining different analytical methods. When required, the syntheses were adapted in
order to minimise the amount of residual carbon. Platinum particles of average diameter 3.3 nm
were synthesised by a microwave-assisted polyol method and deposited onto each type of NbC
support. The electrochemical properties of the catalysed supports including their electrochemical
surface area, their electrochemical stability through voltage cycling accelerated stress tests and their
ORR electrocatalytic activities were determined ex situ on rotating disk electrodes and compared to
those of a commercial Pt/C based electrocatalyst. It was concluded that the most promising materials
are the catalysed NbC nanofibres and nanotubes and they were also characterised in situ in a single
fuel cell unit.
The stability of the ECSA to voltage cycling of the NbC materials is higher to different degrees
compared to the Pt/C reference. This indicates that the chosen composition is a good candidate and
demonstrates the influence of the composition morphology on the electrocatalytic properties.
Among the different types of NbC morphology, NbC nanotubes presented the lowest ECSA decrease
on voltage cycling to 1.4 V (70 % for the NbC nanotube; 95 % for the Pt/C reference) with an ORR
mass activity close to that of Pt/C (72 A . g-1 at 0.9 V vs RHE for NbC; 87 A . g-1 at 0.9 V vs RHE for the
Pt/C reference). The advantage of following a two-step process (previous synthesis of the
nanoparticles and subsequent deposition onto the supports) as described in this thesis allows use of
172 General Conclusion
the exact same type of particles in order to compare the supports. The investigation of a “one pot”
synthesis and deposition of the Pt particles is a single step process planned which may allow a better
electrocatalyst adhesion onto the support resulting in further stability improvement.
To fully take advantage of the self-standing mat morphology of electrospun NbC fibres, exploratory
investigation was undertaken on direct electrodeposition onto these mats used as electrodes. This
led to the deposition of a network of platinum which is characterised by outstanding electrochemical
stability. One remaining objective is to obtain NbC nanotubes also in self-standing form in order to
transpose this work to the most promising materials synthesised. Catalyst ink preparation with
nanofibres is challenging, not the least because of the amount of energy required to obtain a
suspension that can affect the electrocatalyst/support adhesion. This limitation is relevant to the RDE
measurements as well as the in situ characterisation in a single fuel cell unit. In this respect, a
catalysed self-standing support with the appropriate thickness and porosity would provide adapted
morphology for their direct in situ characterisation in an MEA. Although much further work is
required on MEA preparation the preliminary in situ characterisation carried out in this work
constitutes proof of concept of the use of NbC 1D nanostructured materials as electrocatalyst
supports for PEMFC cathodes. Future in situ characterisation must also include accelerated stress
tests to assess the stability of the catalysed support in PEMFC operating conditions. A study of any
evolution of Nb2O5 (observed by XPS in the as prepared sample surface) during the in situ
characterisation is planned which will further provide information on the chemical and
electrochemical stability of the NbC composition.
Further investigation with larger material amounts featuring industrial catalysation processes and
MEA preparation (Johnson Matthey Fuel Cells) are on-going. The development of carbide supports
was recently extended to self-standing mats of WC 1D nanofibres by adapting the synthesis used for
NbC nanotubes. The study of this material and its catalysation by atomic layer deposition of platinum
is in progress.

173 Experimental Annex
Experimental Annex

174 Experimental Annex
A. Material preparation
1. NbC nanostructures synthesis
1 g of ammonium niobate oxalate (ANO) (NH4)3[NbO(C2O4)3].2H2O purchased by Sigma Aldrich
(99.99 %) previously dissolved in 1.4 mL of milli-Q water (18 MΩ . cm) was mixed with a solution of
0.666 g of glucose (Fluka, 99.5%) in 2 mL of ethanol. ANO and glucose blend was sealed in an
autoclave for 12 hours at 170 °C. The sample was dried overnight at 80 °C. The resulting powder was
heated at 1100 ° C in argon for 3 hours. The residual carbon was then removed by methanation
through three heat treatments to 1100 °C under hydrogen in a temperature programmed reduction
(TPR) furnace so as to monitor the amount of carbon removed with the TCD signal of a Micromeritics
ASAP 2010 Chemi system)
Table 1. Synthesis route to NbC/C.
Step Conditions
Hydrothermal synthesis 12 h 170 °C in autoclave
Carburation 3 h 1100 °C in Ar (2 °C/min)
Methanation 2h 1100 °C in H2 (4 °C/min)
2. NbC nanofibres synthesis
0.450 g of polyacrylonitrile (PAN, Mw 150, 000, Sigma Aldrich) were dissolved in 6 g of anhydrous
dimethylformamide (Sigma Aldrich, 99.8 %) (DMF) (7%wt). 0.760 g of niobium chloride (Sigma Aldrich,
99 %) (10 %wt) were then added and the mixture was stirred overnight to obtain a clear solution.
Fibres were prepared from the prepared solution by a conventional electrospinning setup (Spraybase
setup), which consists of a high voltage power supply and a syringe with a stainless steel needle. A
drum rotating at 300 rpm was used as the target. The electrospinning process was carried out at a
fixed voltage of 14 kV, at a distance of 10 cm between the drum and the needle and at a flow rate of
0.25 mL . h-1. Fibres were collected from the rotary drum target and carburated under argon at
1100 °C during 3.5 h in a tubular furnace. This heat treatment features 2 dwells of 1 hour at 150 °C
and at 250 °C. The last step of this synthesis route consisted in a methanation to remove the excess
carbon and was performed with a heating ramp up to 1100 °C under hydrogen in the TPR furnace.
The synthesis parameters are summarised in Table 2.
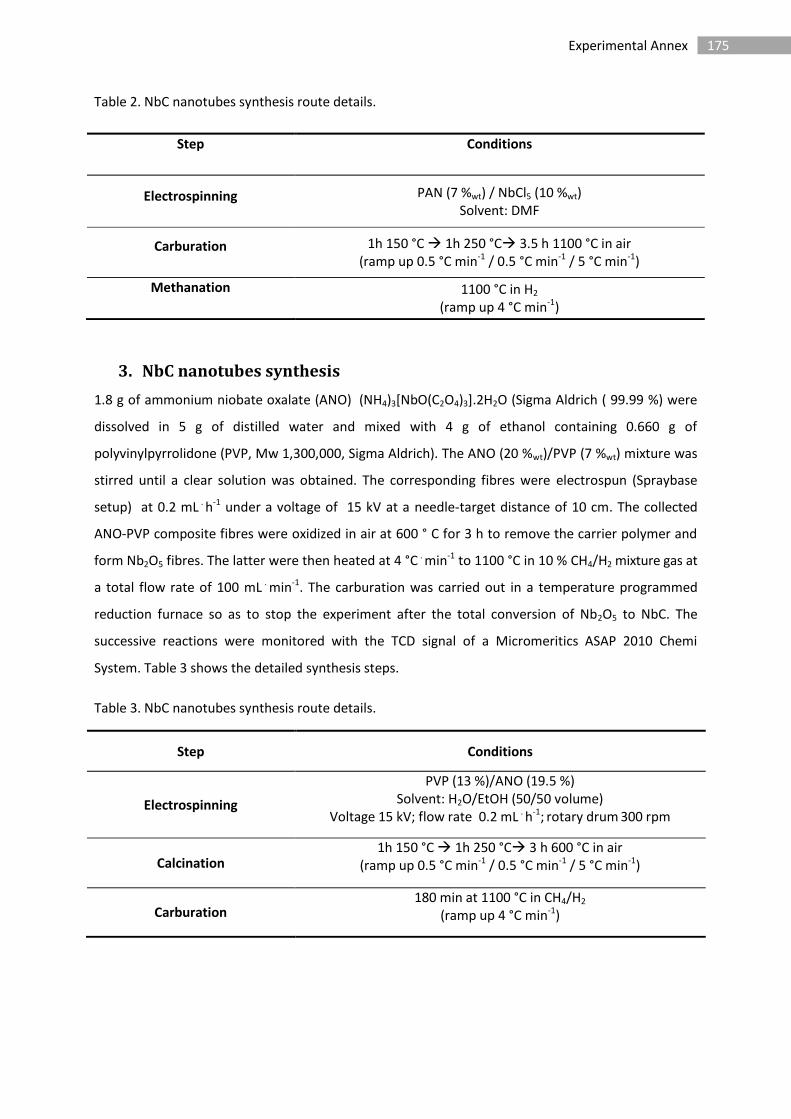
175 Experimental Annex
Table 2. NbC nanotubes synthesis route details.
Step Conditions
Electrospinning PAN (7 %wt) / NbCl5 (10 %wt) Solvent: DMF
Carburation 1h 150 °C 1h 250 °C 3.5 h 1100 °C in air (ramp up 0.5 °C min-1 / 0.5 °C min-1 / 5 °C min-1)
Methanation 1100 °C in H2 (ramp up 4 °C min-1)
3. NbC nanotubes synthesis
1.8 g of ammonium niobate oxalate (ANO) (NH4)3[NbO(C2O4)3].2H2O (Sigma Aldrich ( 99.99 %) were
dissolved in 5 g of distilled water and mixed with 4 g of ethanol containing 0.660 g of
polyvinylpyrrolidone (PVP, Mw 1,300,000, Sigma Aldrich). The ANO (20 %wt)/PVP (7 %wt) mixture was
stirred until a clear solution was obtained. The corresponding fibres were electrospun (Spraybase
setup) at 0.2 mL . h-1 under a voltage of 15 kV at a needle-target distance of 10 cm. The collected
ANO-PVP composite fibres were oxidized in air at 600 ° C for 3 h to remove the carrier polymer and
form Nb2O5 fibres. The latter were then heated at 4 °C . min-1 to 1100 °C in 10 % CH4/H2 mixture gas at
a total flow rate of 100 mL . min-1. The carburation was carried out in a temperature programmed
reduction furnace so as to stop the experiment after the total conversion of Nb2O5 to NbC. The
successive reactions were monitored with the TCD signal of a Micromeritics ASAP 2010 Chemi
System. Table 3 shows the detailed synthesis steps.
Table 3. NbC nanotubes synthesis route details.
Step Conditions
Electrospinning
PVP (13 %)/ANO (19.5 %) Solvent: H2O/EtOH (50/50 volume)
Voltage 15 kV; flow rate 0.2 mL . h-1; rotary drum 300 rpm
Calcination 1h 150 °C 1h 250 °C 3 h 600 °C in air
(ramp up 0.5 °C min-1 / 0.5 °C min-1 / 5 °C min-1)
Carburation 180 min at 1100 °C in CH4/H2
(ramp up 4 °C min-1)
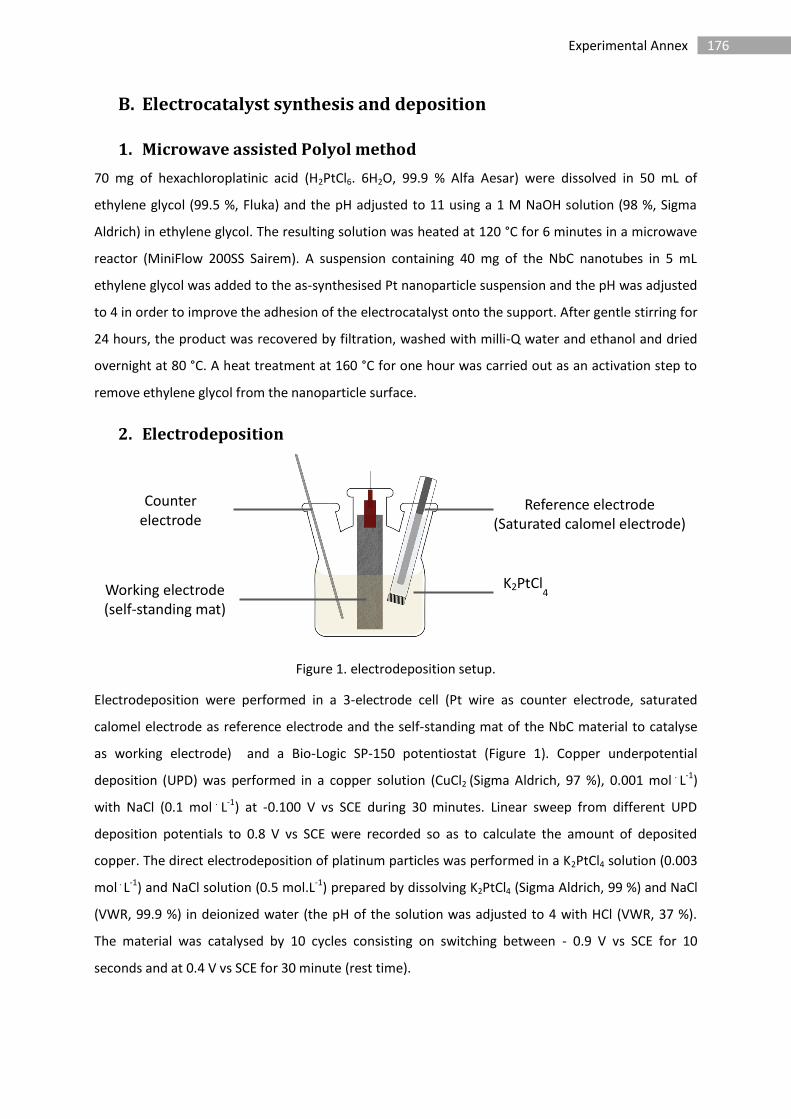
176 Experimental Annex
B. Electrocatalyst synthesis and deposition
1. Microwave assisted Polyol method
70 mg of hexachloroplatinic acid (H2PtCl6. 6H2O, 99.9 % Alfa Aesar) were dissolved in 50 mL of
ethylene glycol (99.5 %, Fluka) and the pH adjusted to 11 using a 1 M NaOH solution (98 %, Sigma
Aldrich) in ethylene glycol. The resulting solution was heated at 120 °C for 6 minutes in a microwave
reactor (MiniFlow 200SS Sairem). A suspension containing 40 mg of the NbC nanotubes in 5 mL
ethylene glycol was added to the as-synthesised Pt nanoparticle suspension and the pH was adjusted
to 4 in order to improve the adhesion of the electrocatalyst onto the support. After gentle stirring for
24 hours, the product was recovered by filtration, washed with milli-Q water and ethanol and dried
overnight at 80 °C. A heat treatment at 160 °C for one hour was carried out as an activation step to
remove ethylene glycol from the nanoparticle surface.
2. Electrodeposition
Figure 1. electrodeposition setup.
Electrodeposition were performed in a 3-electrode cell (Pt wire as counter electrode, saturated
calomel electrode as reference electrode and the self-standing mat of the NbC material to catalyse
as working electrode) and a Bio-Logic SP-150 potentiostat (Figure 1). Copper underpotential
deposition (UPD) was performed in a copper solution (CuCl2 (Sigma Aldrich, 97 %), 0.001 mol . L-1)
with NaCl (0.1 mol . L-1) at -0.100 V vs SCE during 30 minutes. Linear sweep from different UPD
deposition potentials to 0.8 V vs SCE were recorded so as to calculate the amount of deposited
copper. The direct electrodeposition of platinum particles was performed in a K2PtCl4 solution (0.003
mol . L-1) and NaCl solution (0.5 mol.L-1) prepared by dissolving K2PtCl4 (Sigma Aldrich, 99 %) and NaCl
(VWR, 99.9 %) in deionized water (the pH of the solution was adjusted to 4 with HCl (VWR, 37 %).
The material was catalysed by 10 cycles consisting on switching between - 0.9 V vs SCE for 10
seconds and at 0.4 V vs SCE for 30 minute (rest time).
Counter electrode (Pt wire)
Working electrode (self-standing mat)
Reference electrode (Saturated calomel electrode)
K2PtCl4
177 Experimental Annex
3. Galvanic displacement
Galvanic displacement was used to exchange copper that was deposited by UPD onto niobium
carbide with platinum. In that case, the previously copper coated self-standing mat was soaked in a
chloroplatinic solution (H2PtCl6 0.002 mol . L-1, HCl 0.05 mol . L-1) at 80 °C for 1 hour. Afterwards, the
sample was rinsed 4 times in deionised water.
C. Characterisation
1. Morphological characterisation
i. Electron microscopies
The morphology of the material was observed using a Hitachi S-4800 Scanning electron microscope
(SEM), FEI Quanta FEG 200 and equipped with energy-dispersive spectroscopy analysis (EDX) and
JEOL 1200 EXII transmission electron microscope (TEM) operating at 120 kV, equipped with a CCD
camera SIS Olympus Quemesa (11 million pixels). For SEM observation, samples were prepared by
dusting the SEM stub with the material to analyse. For TEM analyses, samples were suspended in
isopropanol and sonicated before deposition onto carbon-coated copper grids. The diameters of the
Pt nanoparticles, diameters of the fibres and diameters of the grains were determined by measuring
at least 100 selected particles using the Image J software.
For a more accurate identification of the composition of nanostructured material, an elemental
mapping was achieved using Tecnai F20 Transmission Electron Microscope operating at 200 kV with a
30 and 50 µm and a bright-field imaging mode using CCD high magnification lattice resolution
imaging mode and CCD dark-field (Z-contrast) imaging in scanning mode using an off-axis annular
detector compositional analysis by X-ray emission detection in the scanning mode.
ii. Nitrogen adsorption/desorption
With the purpose of calculate the main textural parameters of a porous material, such as specific
surface area, nitrogen adsorption and desorption at -196 °C (77 K) were measured using a
Micromeritics ASAP 2020 apparatus after outgassing overnight at 130 °C. The specific surface area
was calculated using the Brunauer-Emmett-Teller (BET) equation2, taking 0.162 nm2 as the cross-
sectional area of one N2 molecule.
178 Experimental Annex
2. Compositional and structural characterisation
i. X-Ray Diffraction
Patterns of the synthesised support were recorded at room temperature in Bragg-Brentano
configuration using a PANAlytical X’pert diffractometer, equipped with a hybrid monochromator,
operating with CuKα radiation (λ = 1.541 Å), and using a step size of 0.1° 2θ within the 2θ domain
from 10 to 80 °.
The crystallite size composing the platinum particles and the NbC support were calculated with the
Scherrer formula (1) applied on the broadened peaks matching the plans [111], [200] and [220] of Pt
nanoparticles or of the NbC supports.
L = K λ / (βobs –βinstr) cos(θ) (1)
L = Cristallite size (nm) l = wavelength of the radiation (nm) K = Scherrer constant 0.94 βobs = observed FWHM (radian) βinstr = instrumental broadening (radian)
ii. Thermogravimetric analysis
Thermogravimetric analysis, (TGA) measures of the mass variation of a sample when is exposed to
temperature changes in a controlled atmosphere. This variation can be either positive or negative
(mass gain or loss). Registration of these changes will provide with information about the sample
decomposition with temperature. In this work, TGA (Netzsch STA 409 PC apparatus) was used to
determine the amount of residual carbon (i.e. Cresidual weight to the total weight of
niobium carbide + Cresidual) by heating up to 1100 °C in air at 4 °C.min-1 . TGA was also performed in air
up to 1000 °C at 10 °C . min-1 on composite ANO/PVP electrospun nanofibres in order to determine
characteristic weight loss profiles and polymer decomposition temperature.
iii. Elemental analysis
Carbon contents in the support have been confirmed by an elemental analyser Thermo FLASH EA
1112. This equipment works by high temperature flash combustion in continuous flow, which allows
to quantify with precision the amount of carbon, hydrogen, nitrogen and sulphur (CHNS) present in
the samples.
iv. X-ray photoelectron spectroscopy
X-ray photoelectron spectroscopy was performed using a Physical Electronics PHI 5700 spectrometer
with a non-monochromatic Mg Kα radiation (300 W, 15 kV, hν = 1253.6 eV) as excitation source.
Spectra were recorded at a 45° take-off angle by a concentric hemispherical analyser operating in the
179 Experimental Annex
constant pass energy mode at 25.9 eV, using a 720 μm diameter analysis area. Powdered solids were
mounted on a sample holder without adhesive tape and kept overnight in a high vacuum chamber
before they were transferred inside the analysis chamber of the spectrometer. Each region was
scanned with several sweeps until a good signal to noise ratio was observed. The pressure in the
analysis chamber was maintained below 10−7 Pa. PHI ACCESS ESCA-V6.0 F and Multipak 8.2b software
packages were used for acquisition and data analysis. A Shirley type background was subtracted from
the signals. Recorded spectra were always fitted using Gauss–Lorentz curves in order to determine
the binding energy of the different element core levels more accurately. The accuracy of the binding
energy (BE) values was within ±0.1 eV.
v. X-ray fluorescence
X-ray fluorescence (XRF) analysis performed with a PANalytical Axios Max spectrometer fitted with a
Rh (4kW) tube in order to investigate the NbC/C and Pt/NbC ratios. Omnian software and LiF200
crystal have been used for these analyses. The samples were prepared by grinding 50 mg of the
support with 25 mg of H3BO3 to facilitate the formatting of the pellet. The recovered powder was
then placed in a cavity in the H3BO3 matrix subsequently pressed, in order to obtain a pellet of 32 mm
diameter with scanned surface of circa 12 mm. The same protocol was followed to prepare five
standard samples using commercial NbC (Alfa Aesar) and carbon Vulcan XC 72 R to obtain a
calibration lines. This protocol was also used to prepare five standard samples with Pt black
(Alfa Aesar) and commercial NbC (Alfa Aesar) in order to investigate the Pt loading obtain after the Pt
particles synthesized by polyol. Pt/Nb ratio was determined by X-ray fluorescence using two
calibrations with standards made by mixing carbon Vulcan XC 72 R and commercial niobium carbide.
3. Electrochemical characterisation
i. Ex situ characterisation
The electrochemical analyses were carried out in a three-electrode cell comprising a glassy carbon
disk electrode with surface area of 0.196 cm2 (working electrode), a reversible hydrogen electrode
(RHE, reference electrode), a platinum wire (counter electrode), and a Bio-Logic SP-150 potentiostat
(Figure 2).
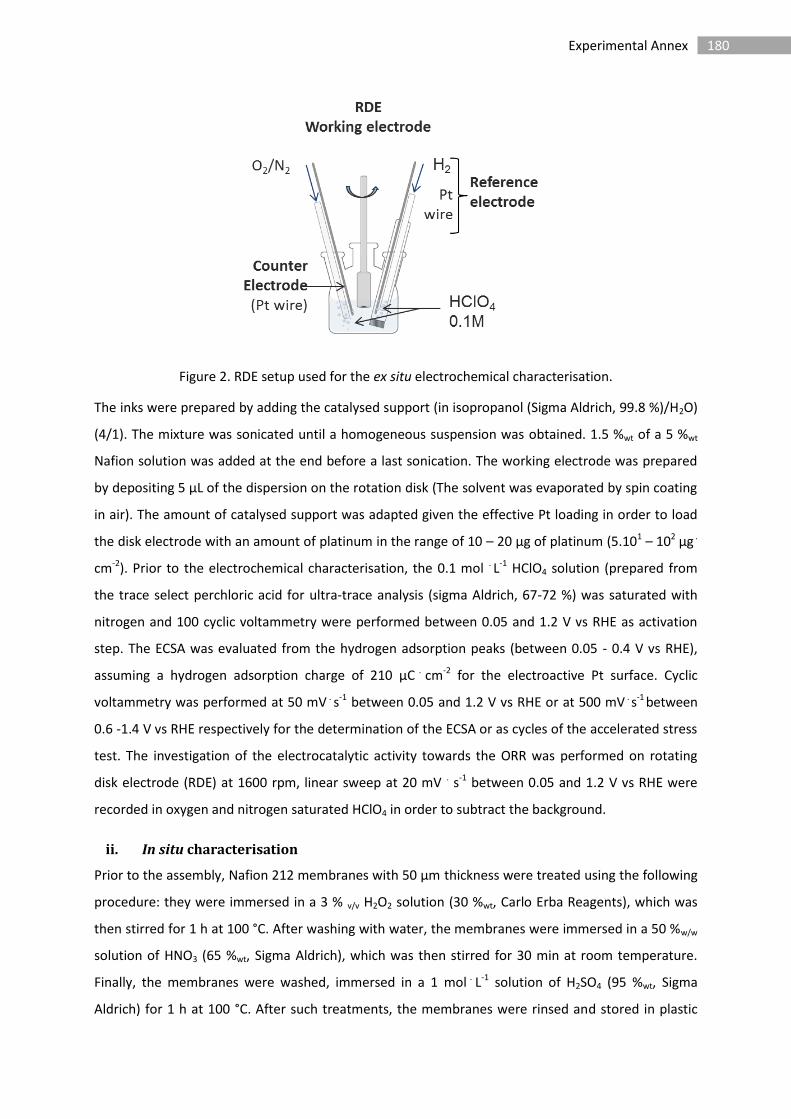
180 Experimental Annex
Figure 2. RDE setup used for the ex situ electrochemical characterisation.
The inks were prepared by adding the catalysed support (in isopropanol (Sigma Aldrich, 99.8 %)/H2O)
(4/1). The mixture was sonicated until a homogeneous suspension was obtained. 1.5 %wt of a 5 %wt
Nafion solution was added at the end before a last sonication. The working electrode was prepared
by depositing 5 µL of the dispersion on the rotation disk (The solvent was evaporated by spin coating
in air). The amount of catalysed support was adapted given the effective Pt loading in order to load
the disk electrode with an amount of platinum in the range of 10 – 20 µg of platinum (5.101 – 102 µg .
cm-2). Prior to the electrochemical characterisation, the 0.1 mol . L-1 HClO4 solution (prepared from
the trace select perchloric acid for ultra-trace analysis (sigma Aldrich, 67-72 %) was saturated with
nitrogen and 100 cyclic voltammetry were performed between 0.05 and 1.2 V vs RHE as activation
step. The ECSA was evaluated from the hydrogen adsorption peaks (between 0.05 - 0.4 V vs RHE),
assuming a hydrogen adsorption charge of 210 μC . cm-2 for the electroactive Pt surface. Cyclic
voltammetry was performed at 50 mV . s-1 between 0.05 and 1.2 V vs RHE or at 500 mV . s-1 between
0.6 -1.4 V vs RHE respectively for the determination of the ECSA or as cycles of the accelerated stress
test. The investigation of the electrocatalytic activity towards the ORR was performed on rotating
disk electrode (RDE) at 1600 rpm, linear sweep at 20 mV . s-1 between 0.05 and 1.2 V vs RHE were
recorded in oxygen and nitrogen saturated HClO4 in order to subtract the background.
ii. In situ characterisation
Prior to the assembly, Nafion 212 membranes with 50 μm thickness were treated using the following
procedure: they were immersed in a 3 % v/v H2O2 solution (30 %wt, Carlo Erba Reagents), which was
then stirred for 1 h at 100 °C. After washing with water, the membranes were immersed in a 50 %w/w
solution of HNO3 (65 %wt, Sigma Aldrich), which was then stirred for 30 min at room temperature.
Finally, the membranes were washed, immersed in a 1 mol . L-1 solution of H2SO4 (95 %wt, Sigma
Aldrich) for 1 h at 100 °C. After such treatments, the membranes were rinsed and stored in plastic
181 Experimental Annex
bags. A hydro-alcoolic ink with 15 % of Nafion and 85 % of the catalysed support previously sonicated
for at least 1 hour was sprayed on a 4 cm2 gas diffusion layer (GDL) (Sigracet S10 BC) targeting
platinum loadings of 0.5 mgPt . cm-2 for the nanofibres and 0.2 mgPt
. cm-2 for the nanotubes and a
Nafion loading of 0.5 mg . cm-2 (loadings were controlled by weight). This cathode was associated with
a commercial Pt/C sigracet S10 BC (0.5 mgPt . cm-2) on the anode side. MEA was assembled by
pressing the electrodes and membrane at 140 °C for 2 min at 6.8 107 Pa. The MEA was then
incorporated in the fuel cell setup using fluorinated ethylene propylene (FEP) gaskets at 10 - 15 %
compression in order to prevent leakage of the reactants. The MEA break-in step was performed
prior to the actual tests at 0.5 A . cm-2 overnight at 80 °C. H2 and O2 were bubbled through milli-Q
water, which was heated at 80 °C. The humidity of the reactant gases was maintained at 100 % RH
for both cathode and anode sides for all MEAs. Polarisation curves and impedance measurements
were carried out under H2/O2 (using a 1.5/2 stoichiometry) by setting the current density and
measuring the cell potential. Tests were performed under the pressure of 1 bar (2 bar absolute
pressure).
4. Electrical conductivity
Pellets of 12 mm in diameter and of 250 - 600 μm thick were obtained by using a cylindrical die and
then compressed using a manual hydraulic press during 5 minutes at 3.4 108 Pa. The thickness of the
pellet was measured using a micrometer caliper. The electrical conductivity of the obtained pellets
was measured using Van der Pauw method with an in-house developed conductivity cell. In order to
achieve a suitable cohesion of the pellet, 20 % of Nafion (5 %wt dispersion Aldrich) was added as a
binder to the sample was added. The obtained mixture was oven dried at 80 °C overnight.
5. Chemical stability in acid
The chemical stability was investigated by measuring the mass loss of the material after 24 hours at
80 °C in acid (1 M H2SO4). A sample of 1 g was added to 100 mL of 1 M sulphuric acid. The mixture
was heated up to 80 °C in a round bottomed flask fitted with a reflux condenser. After 24 hours the
acid was diluted in water and centrifuged. The washing water was removed and deionized water was
added to clean the sample. This washing procedure was repeated 4 times until a neutral pH was
obtained. The solid was then dried overnight at 100 °C and the resulting solid sample was weighted.
X-ray diffraction was also performed before and after the test to confirm that no structural change
occurred during the acid treatment.

182 Experimental Annex
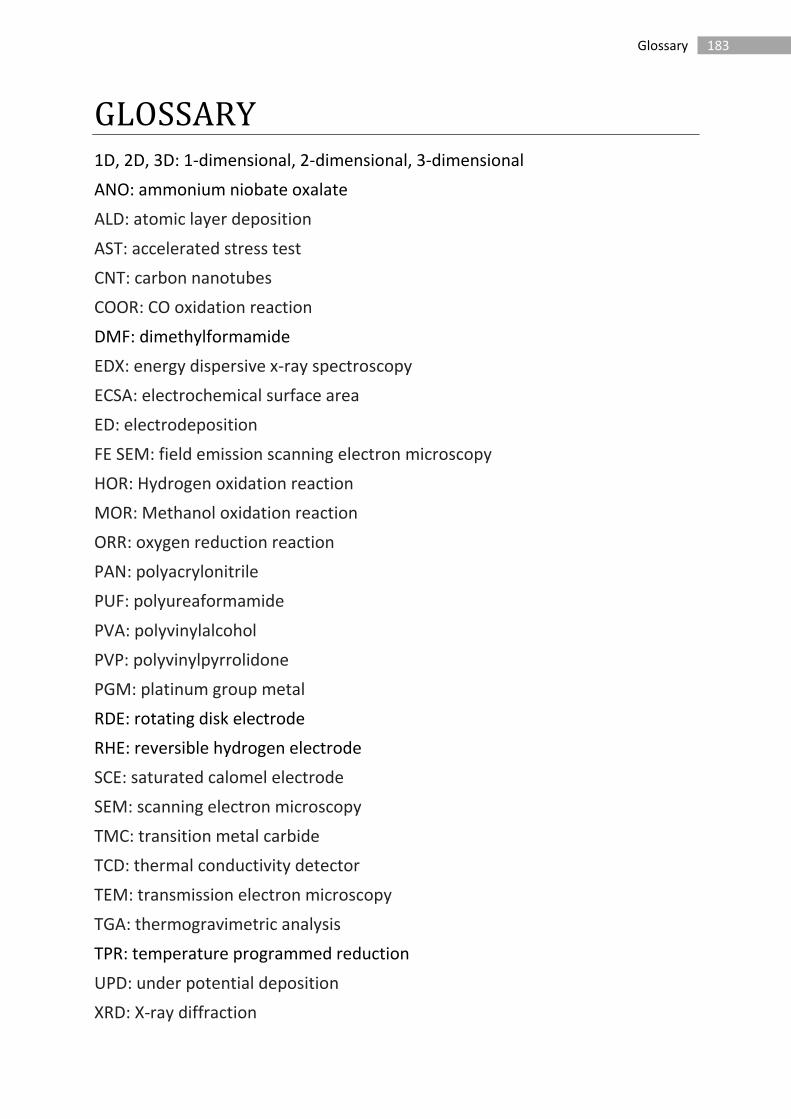
183 Glossary
GLOSSARY 1D, 2D, 3D: 1-dimensional, 2-dimensional, 3-dimensional
ANO: ammonium niobate oxalate
ALD: atomic layer deposition
AST: accelerated stress test
CNT: carbon nanotubes
COOR: CO oxidation reaction
DMF: dimethylformamide
EDX: energy dispersive x-ray spectroscopy
ECSA: electrochemical surface area
ED: electrodeposition
FE SEM: field emission scanning electron microscopy
HOR: Hydrogen oxidation reaction
MOR: Methanol oxidation reaction
ORR: oxygen reduction reaction
PAN: polyacrylonitrile
PUF: polyureaformamide
PVA: polyvinylalcohol
PVP: polyvinylpyrrolidone
PGM: platinum group metal
RDE: rotating disk electrode
RHE: reversible hydrogen electrode
SCE: saturated calomel electrode
SEM: scanning electron microscopy
TMC: transition metal carbide
TCD: thermal conductivity detector
TEM: transmission electron microscopy
TGA: thermogravimetric analysis
TPR: temperature programmed reduction
UPD: under potential deposition
XRD: X-ray diffraction

184

185
Laboratoire Agregats, Interfaces et Matériaux pour l’Energie UMR5253 – CC1502 Université de Montpellier,Place Eugène Bataillon – 34095 Montpellier Cedex 5
Abstract
One pivotal issue to be overcome for the widespread adoption of Proton exchange membrane fuel
cells (PEMFC) is the stability overtime. In this context, This PhD project focuses on the elaboration of
niobium carbide based electrocatalyst supports for the PEMFC cathode to replace the conventional
carbon based supports that notoriously suffer from corrosion in fuel cell operating conditions. The
approach is to associate this alternative chemical composition with controlled morphologies in order
to design electronically conductive and chemically stable materials with the appropriate porosity.
Three different syntheses involving hydrothermal template synthesis or electrospinning have been
developed leading to three different morphologies: nanostructured powders with high surface area,
self-standing nanofibrous mats, and nanotubes with porous walls. These various supports have been
catalysed by deposition of platinum nanoparticles synthesised by a microwave-assisted polyol
method, and they have been characterised for their chemical and structural composition,
morphology, and electrochemical properties. This work demonstrates that the Pt loaded NbC
supports feature a greater electrochemical stability than a commercial Pt/C reference and similar
electrocatalytic activities towards the oxygen reduction reaction.
Keywords: Niobium carbide; electrocatalyst support; oxygen reduction reaction; electrospinning; energy conversion devices; controlled morphology; nanotubes; nanofibres.
Résumé
La durabilité des piles à combustible à membrane échangeuse de proton (PEMFC) est un des verrous
technologiques majeurs qui freinent leurs implantations sur le marché. Ces travaux de thèse
s’inscrivent dans ce contexte en proposant l’élaboration de matériaux en carbure de niobium comme
support de catalyseur pour remplacer les supports carbonés actuellement utilisés dans les cathodes
de PEMFC. Notre démarche est d’associer cette composition à différentes morphologies contrôlées
pour développer des matériaux conducteurs, présentant une porosité adaptée et chimiquement plus
stable que le carbone qui se corrode dans les conditions de fonctionnement des PEMFC. Ainsi trois
voies de synthèse basées sur des techniques variées (filage électrostatique, synthèse hydrothermal
avec agent structurant) ont été étudiées aboutissant à trois types de morphologie : des poudres
nanostructurées, des tissus nanofibreux et des nanotubes aux parois poreuses. Après leurs
caractérisations structurales et morphologiques approfondies, ces supports ont été catalysés avec
des nanoparticules de platine synthétisées par une méthode polyol assisté par micro-onde. La finalité
de ce projet est d’évaluer les performances électrochimiques relatives à la réaction de réduction de
l’oxygène de ces supports catalysés pour mettre en avant leurs exceptionnelles stabilités comparées
à un support catalysé de référence (Pt/C) sans perte significative d’activité catalytique.
Mots clefs : Carbure de niobium ; Support de catalyseur ; Réduction de l’oxygène ; électrofilage
électrostatique ; conversion d’énergie ; morphologie contrôlée ; nanotubes ; nanofibres.