Embed Size (px)
Citation preview
FOOD SECURITY RESEARCH PROJECT
Technical Compendium: Descriptive Agricultural Statistics and Analysis for Zambia
in Support of the USAID Mission’s Feed the Future Strategic Review
by
Nicholas J. Sitko, Antony Chapoto, Steven Kabwe,
Solomon Tembo, Munguzwe Hichaambwa, Rebecca Lubinda, Harrison Chiwawa, Mebelo Mataa, Simon
Heck, and Dorothy Nthani
WORKING PAPER No. 52 FOOD SECURITY RESEARCH PROJECT LUSAKA, ZAMBIA April 2011 (Downloadable at: http://www.aec.msu.edu/agecon/fs2/zambia/index.htm )
ii
Technical Compendium: Descriptive Agricultural Statistics and Analysis for Zambia in Support of the USAID Mission’s Feed the
Future Strategic Review
by
Nicholas J. Sitko, Antony Chapoto, Steven Kabwe, Solomon Tembo, Munguzwe Hichaambwa, Rebecca Lubinda, Harrison Chiwawa, Mebelo Mataa, Simon Heck,
and Dorothy Nthani
April 2011 Nicholas Sitko is research fellow at the Food Security Research Project, Lusaka. Antony Chapoto is research coordinator at the Food Security Research Project. Steven Kabwe, Solomon Tembo, and Munguzwe Hichaambwa are research associates at the Food Security Research Project. Rebecca Lubinda is lecturer at the University of Zambia, Department of Agricultural Economics and Extension Education. Harrison Chiwawa is director of Vet-Crop Farming Services, Zambia. Mebelo Mataa is a horticulturalist at the University of Zambia, Department of Crop Sciences. Simon Heck is senior policy advisor and country manager for the World Fish Center, Zambia. Dorothy Nthani is lecturer at the Natural Resources Development College, Lusaka.
iii
ACKNOWLEDGMENTS The Food Security Research Project is a collaborative program of research, outreach, and local capacity building, between the Agricultural Consultative Forum, the Ministry of Agriculture and Cooperatives, and Michigan State University's Department of Agricultural Economics. This technical compendium was compiled with support from researchers at the University of Zambia (UNZA) and the Natural Resources Development College. We wish to acknowledge the financial and substantive support of the Swedish International Development Agency (SIDA) and the United States Agency for International Development (USAID) in Lusaka. Research support from the Global Bureau, Office of Agriculture and Food Security, and the Africa Bureau, Office of Sustainable Development at USAID/Washington also made it possible for MSU researchers to contribute to this work. The authors also wish to thank Patricia Johannes for her assistance in editing and formatting this document. Any views expressed or remaining errors are solely the responsibility of the authors. Comments and questions should be directed to the Food Security Research Project Director, 26A Middleway, kabulonga, Lusaka: tel +260 (21)1 234539; fax +260 (21)1 234559; email: [email protected]
iv
FOOD SECURITY RESEARCH PROJECT TEAM MEMBERS The Zambia Food Security Research Project (FSRP) field research team is comprised of Chance Kabaghe, Antony Chapoto, T.S. Jayne, William Burke, Munguzwe Hichaambwa, Solomon Tembo, Stephen Kabwe, Auckland Kuteya, Nicholas Sitko, Mary Lumumbu, and Arthur Shipekesa. MSU-based researchers in the Food Security Research Project are Steve Haggblade, Nicole Mason, James Shaffer, Margaret Beaver, and David Tschirley.
v
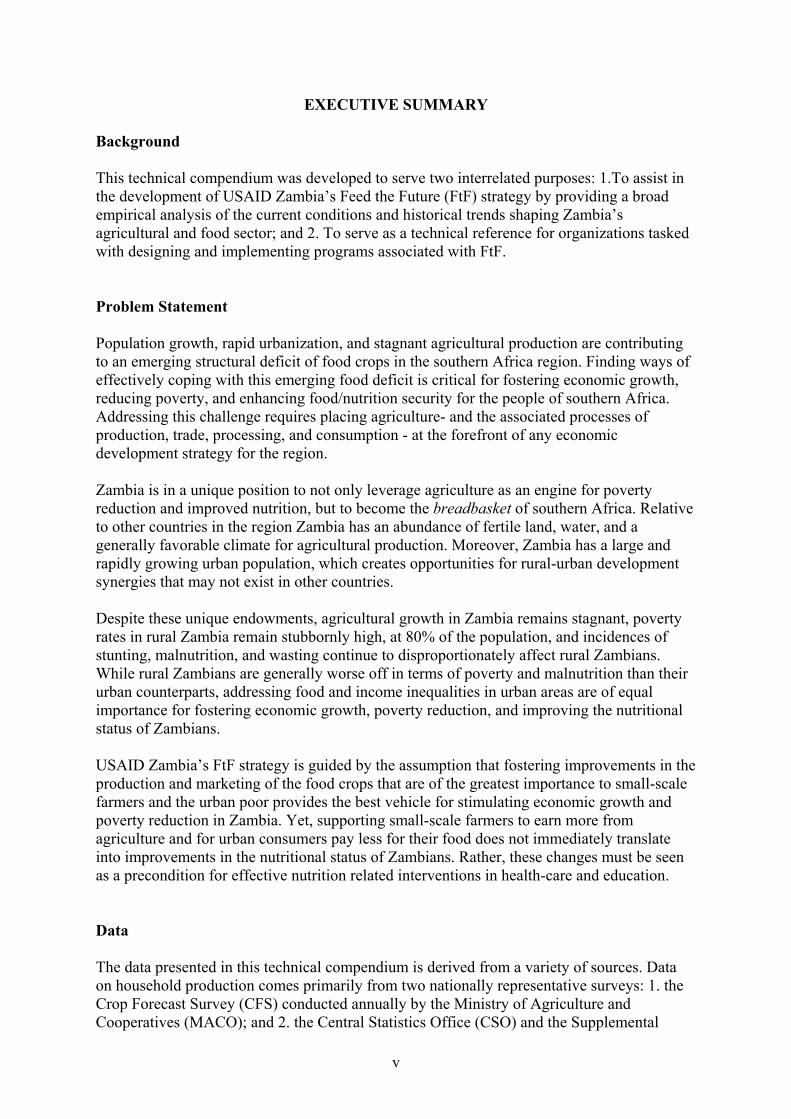
EXECUTIVE SUMMARY Background This technical compendium was developed to serve two interrelated purposes: 1.To assist in the development of USAID Zambia’s Feed the Future (FtF) strategy by providing a broad empirical analysis of the current conditions and historical trends shaping Zambia’s agricultural and food sector; and 2. To serve as a technical reference for organizations tasked with designing and implementing programs associated with FtF. Problem Statement Population growth, rapid urbanization, and stagnant agricultural production are contributing to an emerging structural deficit of food crops in the southern Africa region. Finding ways of effectively coping with this emerging food deficit is critical for fostering economic growth, reducing poverty, and enhancing food/nutrition security for the people of southern Africa. Addressing this challenge requires placing agriculture- and the associated processes of production, trade, processing, and consumption - at the forefront of any economic development strategy for the region. Zambia is in a unique position to not only leverage agriculture as an engine for poverty reduction and improved nutrition, but to become the breadbasket of southern Africa. Relative to other countries in the region Zambia has an abundance of fertile land, water, and a generally favorable climate for agricultural production. Moreover, Zambia has a large and rapidly growing urban population, which creates opportunities for rural-urban development synergies that may not exist in other countries. Despite these unique endowments, agricultural growth in Zambia remains stagnant, poverty rates in rural Zambia remain stubbornly high, at 80% of the population, and incidences of stunting, malnutrition, and wasting continue to disproportionately affect rural Zambians. While rural Zambians are generally worse off in terms of poverty and malnutrition than their urban counterparts, addressing food and income inequalities in urban areas are of equal importance for fostering economic growth, poverty reduction, and improving the nutritional status of Zambians. USAID Zambia’s FtF strategy is guided by the assumption that fostering improvements in the production and marketing of the food crops that are of the greatest importance to small-scale farmers and the urban poor provides the best vehicle for stimulating economic growth and poverty reduction in Zambia. Yet, supporting small-scale farmers to earn more from agriculture and for urban consumers pay less for their food does not immediately translate into improvements in the nutritional status of Zambians. Rather, these changes must be seen as a precondition for effective nutrition related interventions in health-care and education. Data The data presented in this technical compendium is derived from a variety of sources. Data on household production comes primarily from two nationally representative surveys: 1. the Crop Forecast Survey (CFS) conducted annually by the Ministry of Agriculture and Cooperatives (MACO); and 2. the Central Statistics Office (CSO) and the Supplemental
vi
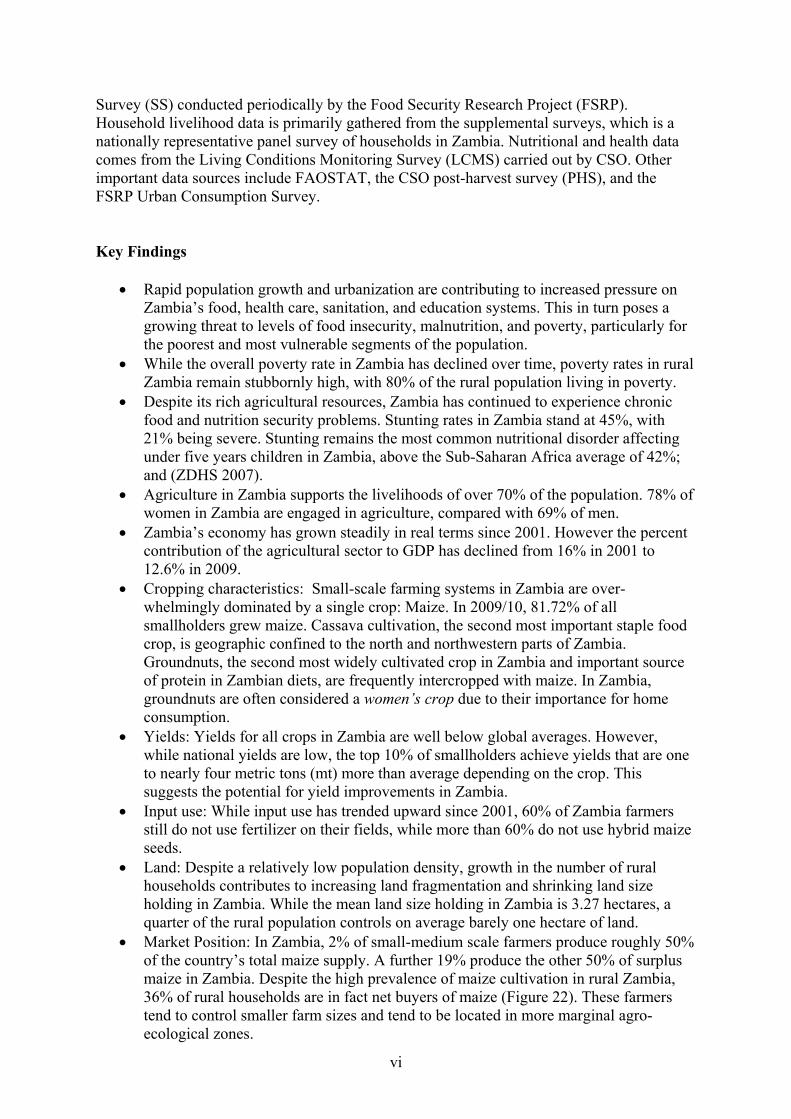
Survey (SS) conducted periodically by the Food Security Research Project (FSRP). Household livelihood data is primarily gathered from the supplemental surveys, which is a nationally representative panel survey of households in Zambia. Nutritional and health data comes from the Living Conditions Monitoring Survey (LCMS) carried out by CSO. Other important data sources include FAOSTAT, the CSO post-harvest survey (PHS), and the FSRP Urban Consumption Survey. Key Findings
• Rapid population growth and urbanization are contributing to increased pressure on Zambia’s food, health care, sanitation, and education systems. This in turn poses a growing threat to levels of food insecurity, malnutrition, and poverty, particularly for the poorest and most vulnerable segments of the population.
• While the overall poverty rate in Zambia has declined over time, poverty rates in rural Zambia remain stubbornly high, with 80% of the rural population living in poverty.
• Despite its rich agricultural resources, Zambia has continued to experience chronic food and nutrition security problems. Stunting rates in Zambia stand at 45%, with 21% being severe. Stunting remains the most common nutritional disorder affecting under five years children in Zambia, above the Sub-Saharan Africa average of 42%; and (ZDHS 2007).
• Agriculture in Zambia supports the livelihoods of over 70% of the population. 78% of women in Zambia are engaged in agriculture, compared with 69% of men.
• Zambia’s economy has grown steadily in real terms since 2001. However the percent contribution of the agricultural sector to GDP has declined from 16% in 2001 to 12.6% in 2009.
• Cropping characteristics: Small-scale farming systems in Zambia are over-whelmingly dominated by a single crop: Maize. In 2009/10, 81.72% of all smallholders grew maize. Cassava cultivation, the second most important staple food crop, is geographic confined to the north and northwestern parts of Zambia. Groundnuts, the second most widely cultivated crop in Zambia and important source of protein in Zambian diets, are frequently intercropped with maize. In Zambia, groundnuts are often considered a women’s crop due to their importance for home consumption.
• Yields: Yields for all crops in Zambia are well below global averages. However, while national yields are low, the top 10% of smallholders achieve yields that are one to nearly four metric tons (mt) more than average depending on the crop. This suggests the potential for yield improvements in Zambia.
• Input use: While input use has trended upward since 2001, 60% of Zambia farmers still do not use fertilizer on their fields, while more than 60% do not use hybrid maize seeds.
• Land: Despite a relatively low population density, growth in the number of rural households contributes to increasing land fragmentation and shrinking land size holding in Zambia. While the mean land size holding in Zambia is 3.27 hectares, a quarter of the rural population controls on average barely one hectare of land.
• Market Position: In Zambia, 2% of small-medium scale farmers produce roughly 50% of the country’s total maize supply. A further 19% produce the other 50% of surplus maize in Zambia. Despite the high prevalence of maize cultivation in rural Zambia, 36% of rural households are in fact net buyers of maize (Figure 22). These farmers tend to control smaller farm sizes and tend to be located in more marginal agro-ecological zones.
vii
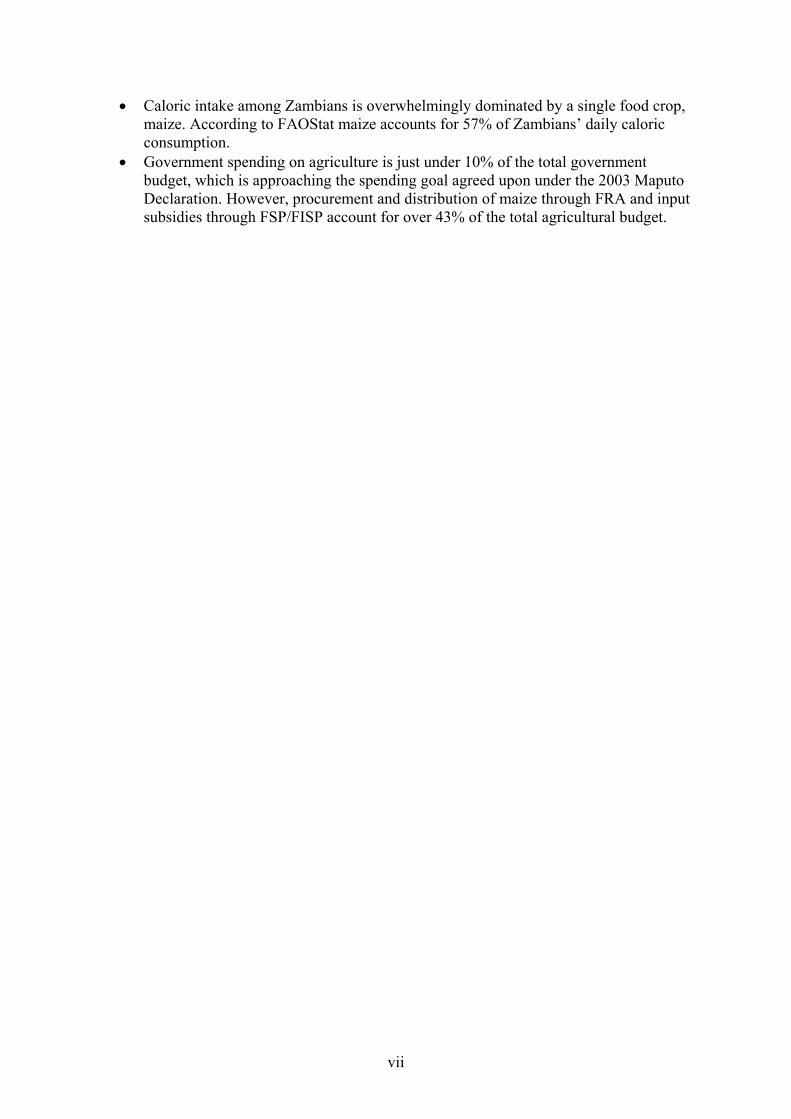
• Caloric intake among Zambians is overwhelmingly dominated by a single food crop, maize. According to FAOStat maize accounts for 57% of Zambians’ daily caloric consumption.
• Government spending on agriculture is just under 10% of the total government budget, which is approaching the spending goal agreed upon under the 2003 Maputo Declaration. However, procurement and distribution of maize through FRA and input subsidies through FSP/FISP account for over 43% of the total agricultural budget.

ix
CONTENTS
ACKNOWLEDGMENTS ....................................................................................................... iii FOOD SECURITY RESEARCH PROJECT TEAM MEMBERS ..........................................iv EXECUTIVE SUMMARY .......................................................................................................v LIST OF TABLES...................................................................................................................xii LIST OF FIGURES ............................................................................................................... xiii LIST OF MAPS ......................................................................................................................xiv ACRONYMS..........................................................................................................................xvi I. STATEMENT OF THE PROBLEM.............................................................................1 II. CONTEXT.....................................................................................................................2
2.1. Population .............................................................................................................2 2.2. Poverty and Malnutrition ......................................................................................4 2.3. Nutrition Analysis for Zambia ............................................................................7
2.3.1. Underlying Causes of Malnutrition in Zambia by Region......................7 2.3.2. Selected Food Value Chains ....................................................................12 2.3.3. The Role of Women in the Value Chains and Household and Child
Nutrition..................................................................................................21 2.3.4. Major Policy Environments, Current Initiatives, and Enabling
Environments ..........................................................................................21 2.4. GDP and the Role of Agriculture in Zambia’s Economy ...................................22 2.5. Challenge of Integrating Women into Commercial Agriculture ........................25
III. AGRICULTURAL SECTOR IN ZAMBIA: WHY IS AGRICULTURE A CRITICAL
PART OF THE SOLUTION TO FOOD INSECURITY, MALNUTRITION, AND POVERTY IN ZAMBIA? ...........................................................................................26 3.1. Agro-Ecological Zones .......................................................................................26 3.2. Cropping Characteristics.....................................................................................27 3.3. Agricultural Productivity Trends ........................................................................28 3.4. Input Use and Access..........................................................................................31 3.5. Farm Structure and Land Sizes ...........................................................................32 3.6. Crop Marketing Behaviors, Market Positions, and Farm Incomes.....................35
IV. DEMAND CHARACTERISTICS IN URBAN ZAMBIA..........................................38 V. PUBLIC SPENDING ON AGRICULTURAL SECTOR ...........................................42 VI. STAPLE FOOD VALUE CHAINS.............................................................................45
6.1. Maize Value Chain .............................................................................................45
x
6.1.1. Production: Among All Food Crops Grown by Smallholders in Zambia, Maize Is the Most Important...................................................................45
6.1.2. Marketing................................................................................................49 6.1.3. Consumption/Demand ............................................................................51 6.1.4. Research and Development in the Maize Sector ....................................54 6.1.5. Interventions and Investment Opportunities within the Maize Value
Chain .......................................................................................................55 6.1.6. Policy Challenges in the Maize Value Chain .........................................58 6.1.7. Gender Issues in the Maize Value Chain................................................59
6.2. Horticulture Value Chain.....................................................................................59
6.2.1. Production...............................................................................................59 6.2.2. Marketing................................................................................................62 6.2.3. Consumption/Demand ............................................................................65 6.2.4. Research and Development within the Horticulture Sector....................68 6.2.5. Interventions and Investments in the Horticulture Sector.......................69 6.2.6. Role of Women in FFV Production and Marketing................................69
6.3. Groundnut Value Chain ......................................................................................73
6.3.1. Production...............................................................................................73 6.3.2. Marketing................................................................................................75 6.3.3. Consumption and Demand......................................................................76 6.3.4. Research and Development in the Groundnut Sector .............................76 6.3.5. Women’s Roles in Groundnut Value Chain ...........................................76 6.3.6. Investments and Intervention Opportunities in the Groundnut Sector ...78
6.4. Cassava Value Chain ...........................................................................................78
6.4.1. Production..............................................................................................78 6.4.2. Marketing................................................................................................80 6.4.3. Consumption and Demand......................................................................81 6.4.4. Research and Development.....................................................................81 6.4.5. Women’s Roles in the Cassava Value Chain..........................................81 6.4.6. Intervention and Investment Opportunities in the Cassava Sector .........81
6.5. Beans Value Chain...............................................................................................82
6.5.1. Production...............................................................................................82 6.5.2. Marketing................................................................................................84 6.5.3. Consumption and Demand......................................................................85 6.5.4. Research and Development.....................................................................86 6.5.5. Role of Women in Bean Value Chain.....................................................86 6.5.6. Investment and Inervention Opportunities..............................................87
6.6. Village Poultry Value Chain................................................................................87
6.6.1. Production...............................................................................................87 6.6.2. Marketing.................................................................................................88 6.6.3. Consumption/ Demand ............................................................................89 6.6.4. Consumption/Demand .............................................................................89 6.6.5. Research and development ......................................................................89 6.6.6. Role of Women in Village Poultry Value Chain .....................................90 6.6.7. Investment and Intervention Opportunities ............................................90
xi
VII. ADDITIONAL VALUE CHAINS ..............................................................................92
7.1. Aquaculture Value Chain, from World Fish........................................................92 7.1.1. Rationale: Why Invest in Aquaculture?..................................................92 7.1.2. Opportunities for Investing in Aquaculture in Zambia...........................94 7.1.3. Challenges and Constraints and How they Can Be Addressed...............94
7.2. Rice Value Chain .................................................................................................96 7.2.1. Background..............................................................................................96
7.3. Cotton Value Chain..............................................................................................99 7.3.1. Background..............................................................................................99
VIII. EASTERN PROVINCE DATA ................................................................................101
8.1. Population .........................................................................................................101 8.2. Poverty and Nutrition Data ...............................................................................101 8.3. Cropping and Production Data..........................................................................102 8.4. Farm Structure and Size....................................................................................106 8.5. Input Use and Access........................................................................................107 8.6. Crop Sales Data.................................................................................................108
IX. COUNTRY READINESS .........................................................................................110
9.1. Zambia’s Long-Term Development Agenda Is Outlined in the Vision 2030
Document..........................................................................................................110 9.2. Current National Development Plan: Fifth National Development Plan...........110
9.2.1. The Sixth National Development Plan ..................................................110 9.3. Several Supporting Policies Have Been Promulgated in Order to Support the
Functioning of Zambia’s Agricultural Markets ................................................112 9.3.1. Agricultural Credit Act ..........................................................................112 9.3.2. Agricultural Marketing Act, Which Seeks to: .......................................112
ADDITIONAL TABLES FOR REFERENCE......................................................................113 REFERENCES ......................................................................................................................155
xii
LIST OF TABLES Table Page 1. Rates of Stunting, Underweight, and Wasting among Children under 5 Years of Age; Low Body Mass Index among Women of Reproductive Age, by Province..............8 2. Average Number of Meals per Day by Sex of Head, Rural/Urban, and Province 2006 ..12 3. Zambia - Household Maize Market Participation Status by Agro-Ecological Zone, 2008...................................................................................................................................27 4. Crop Yields (MT/ha), 2003- Zambia vs. Global...............................................................30 5. Ratio of Cultivated Land by Rural Population .................................................................33 6. Smallholder Landholding Size per Household in Zambia and Alternative Farm Size Definition, 1999/2000 ...............................................................................................33 7. Characteristics of Smallholder Farmers, Zambia 2006/07 ...............................................36 8. Zambia - Household Shares of Components in Total Crop Sales Income by Landholding Quintiles, National, 2008.............................................................................36 9. Zambia - Household Share of Components in Total Gross Farm Income by Landholding Quintiles, National, 2008.............................................................................36 10. Food Shares of Total Value of Consumption, Food Item Shares of Total Value of Food
Consumption among Staple Carbohydrates, February 1, 2007 to January 30, 2008........40 11. Food Consumption Shares during the Last 30 Days, July/August 2007 and
January/February 2008 (Percentage of Total Value of Food Consumption over the Two 30-Day Periods) ................................................................................................................41
12. Distribution of Households Producing 1 Mt/Ha or Less over Time.................................46 13. Zambia - Household Shares of Components in Total Crop Sales Income by Landholding Quintiles, National, 2008.............................................................................49 14. Zambia - Household Share of Components in Total Gross Farm Income by Landholding
Quintiles, National, 2008 ..................................................................................................50 15. Distribution of Sales Points 2008/09 Marketing Season ..................................................50 16. Food Consumption Shares during the Last 30 Days, July/August 2007 and
January/February 2008 (Percentage of Total Value of Food Consumption over the Two 30-Day Periods) ................................................................................................................53
17. The Five Most Valuable FFV Items Sold by Smallholder Farmers in 2004 (SS 2004) and 2008 (SS 2008) in Lusaka Markets............................................................................61
18. Comparison of Yields of Common Vegetables Obtained by Small Scale Growers Compared to Recommended Optimum Yield....................................................61 19. Share of National Sales by Province for Key Vegetables, 2004 and 2008.......................63 20. Urban Household Expenditure Shares on Food by Urban Area .......................................65 21. Percent Shares of Total Food Expenditure of Different FFV Items .................................66 22. Major Public Horticultural Research in Zambia...............................................................68 23. Fresh Vegetable Research Being Done in Zambia ...........................................................68 24. Groundnut Varieties in Zambia ........................................................................................77 25. Cassava Yields in Zambia (Mt/Ha)...................................................................................79 26. Overview of Aquaculture Production Systems in Zambia ...............................................95 27. Basic Aquaculture Statistics for Zambia...........................................................................96 28. Percent of Small and Medium Scale Farmers Growing Rice by Province .......................97 29. Rice: Area Cultivated by Small and Medium Scale Farmers by Province ......................97 30. Percent of Small and Medium Scale Farmers Growing Cotton by Province ...................99 31. Cotton: Area Cultivated by Small and Medium Scale Farmers by Province ..................99 32. Population Distribution by Province Rural and Urban Areas Zambia ...........................101 33. Distribution of Households by Province, Rural and Urban areas, Zambia.....................101
xiii
34. Incidence and Number of Children under 5 Exhibiting Signs of Stunting, Underweight, and Wasting ....................................................................................................................102
35. Incidence and Number of People Living in Poverty.......................................................102 36. Percent of Farmers in Eastern Province Growing Crops, 2009/10.................................103 37. Number of Farmers Growing Crops, 2009/10 ................................................................103 38. Area Cultivated 2009/10 .................................................................................................104 39. Production in Metric Tons, 2009/10 ...............................................................................105 40. Yield (Kg/ha), 2009/10 ...................................................................................................106 41. Number of Large Scale Farmers by Province.................................................................107 42. Percent Smallholders Using Fertilizer ............................................................................108 43. Percent of Farmers Using Hybrid Maize Seed ...............................................................108 44. Expected Sales (Including Large-scale Farming Sector)................................................108
LIST OF FIGURES Figure Page 1. Population Projections, 2000- 2010....................................................................................2 2. Urban and Rural Population, Zambia .................................................................................3 3. Number of Small and Medium Scale Farming Households, Zambia1 ...............................3 4. Poverty Levels in Zambia, 1991 to 2006............................................................................4 5. Conceptual Framework for the Determinants of Nutritional Status ...................................9 6. Nutritional Status of Children by Age ..............................................................................10 7. Percentage Distribution of Currently Employed Persons Aged 15 years and above by
Industry .............................................................................................................................23 8. Percent of Men and Women in Zambia Employed in Agriculture ...................................23 9. Zambia GDP at Constant 1994 Prices (K' Billion) ...........................................................24 10. Contribution of Selected Sectors to GDP (%), 2008 ........................................................24 11. Contribution of the Agricultural Sector to GDP...............................................................24 12. Percent of Small-Scale Farmers Growing Crop by Year..................................................27 13. Yield (MT/ha) Trends for Selected Crops in Zambia.......................................................28 13.a. Five-Year Yield Average: National versus Top 10%, 2005-2010....................................29 14. Yield Response to Fertilizer Use over Time.....................................................................29 15. National Production Trends for Selected Crops ...............................................................30 16. National Production Trends for Maize .............................................................................30 17. Maize Production: Area Cultivated and Average Yields..................................................31 18. Trends in % of Smallholders Using Fertilizer Nationwide...............................................31 19. Maize Yields (MT per Hectare of Area Planted), Fertilizer Users versus Non-users ......32 20. Trends in Hybrid Maize Seed Use, % of Smallholder Households..................................32 21.a. Cumulative Distribution of Landholding Size (Cultivated and Fallow), 2004.................34 21.b. Cumulative Distribution of Cultivated Land, 2004 ..........................................................34 22. Distribution of the Small-Scale Farmer Population According to their Position in the
Staple Grain Market, Zambia............................................................................................35 23. Zambia’s Kcal/Capita/Day by Crop, 2008........................................................................38 24. Net Exports of Maize and Maize Meal in Southern Africa ..............................................39 25. Lusaka Retail Maize Prices versus c.i.f. Prices South Africa...........................................39 26. Public Spending on Agriculture, 2000-09 ........................................................................42 27. Agriculture’s Share of Zambia’s National Budget 2000-09 .............................................43 28. 2010 Allocation of Public Budget to Agriculture .............................................................43 29. Share of Spending on Agriculture Sector by Government versus Cooperating Partners .44 30. Cumulative Distribution of Household Yield per Planted ha (2006-2010) ......................45
xiv
31. Percent of Smallholder Maize Farmers using Fertilizer over Time..................................48 32. Percent of Smallholder Maize Farmers Using Hybrid Seeds over Time..........................48 33. Maize Yield Response to Fertilizer Use ...........................................................................49 34. Distribution of the Small-Scale Farmer Population According to Their Position in the
Staple Grain Market, Zambia............................................................................................51 35. Price Trends for Retail Breakfast Meal and Wholesale Maize Grain, Lusaka, Zambia ...52 36. Percentage of Urban Consumers Indicating That Maize Grain Is Unavailable to Buy in
Local Markets, Four Cities in Zambia, 2007/08 ...............................................................54 37. Annual Food Calendar ......................................................................................................65 38. Projected Maize Production and Demand to 2015/16 with 0% Annual Yield Increase...57 39. Households Growing FFV with HH Income Less than $2 per Day, 2009/10 ..................60 40. Market Channels for Fresh Produce by Urban Center......................................................62 41. Seasonal Price Volatility in Soweto Market, Lusaka........................................................66 42. Proportion of Female Headed Households Producing and Selling FFV by Province ......70 43. Different Roles Played by Women and Children in Horticultural Production: Male
Headed Households (The Size of the Arrow Denotes Scale of Involvement)..................71 44. Different Roles Played by Women and Children in Horticultural Production: Female
Headed Households (The Size of the Arrow Denotes Scale of Involvement)..................72 45. Groundnut Yields (mt/ha) in Southern Africa, 2000-2008...............................................73 46. Import and Export Trends for Groundnuts (mt), 2000-2008 ............................................76 47. Female-headed Household Participation in Groundnut Cultivation.................................77 48. Trends in Cassava Production 1965-2005 ........................................................................79 49. Female-Headed Household Participation in Cassava Production.....................................82 50. National Bean Production, Export, Import, and Consumption Trends.............................84 51. Average Bean Yields by Province for 2009/10 Cropping Cycle......................................84 52. Role of Women in Bean Value Chain...............................................................................87 53. Number of Farmers Growing Crops, 2009/10 and Eastern Province's Share of Total ...103 54. Area Cultivated (ha) 2009/10..........................................................................................104 55. Production in Metric Tons, 2009/10 ...............................................................................105 56. Yields (kg/ha) 2009/10 ...................................................................................................106
LIST OF MAPS Map Page 1. Population Distribution in Zambia......................................................................................3 2. Incidence of Poverty in Zambia..........................................................................................5 3. Numbers of People Living in Extreme Poverty by Province..............................................5 4. Number of Under 5 Children Exhibiting Signs of Growth Stunting by Province ..............6 5. Number of Underweight Children by Province ..................................................................6 6. Number of Wasting Children by Province..........................................................................7 7. Zambia’s Agro-ecological Zones......................................................................................26 8. Staple Food Zones.............................................................................................................28 9. Number of Households with One Hectare of Land or Less..............................................32 10. Number of Households Growing Maize by Province 2009/10.........................................46 11. Kilograms of Maize Produced by Province 2009/10........................................................47 12. Kilograms of Maize Sold by Province 2009/10................................................................47 13. Grain Marketing Sheds in Eastern and Southern Africa...................................................58 14. Number of Households Growing Fruits and Vegetables...................................................60 15. Value of Fruit and Vegetable Sales by Province, 2009/10 ...............................................63 16. District Shares of Tomato, Rape, and Onion Supplied to Soweto Market, Lusaka..........64 17. Number of Households Growing Groundnuts by Province, 2009/10...............................74
xv
18. Kilograms of Groundnuts Produced by Province, 2009/10 ..............................................74 19. Kilograms of Groundnuts Sold by Province 2009/10.......................................................75 20. Number of Households Growing Cassava by Province, 2009/10.....................................78 21. Kilograms of Cassava Chips Produced by Province 2009/10 ..........................................80 22. Kilograms of Cassava Chips Sold by Province 2009/10 ..................................................80 23. Number of Households Growing Beans by Province 2009/10.........................................83 24. Kilograms of Beans Produced by Province 2009/10 ........................................................83 25. Kilograms of Beans Sold by Province 2009/10................................................................85 26. Number of Households Raising Chickens by Household.................................................88 27. Value of Chicken and Eggs Sales by Province, 2007/08 ..................................................88 28. Rice production – Hectares 2009/10.................................................................................98 29. Rice Production, % Smallholders by District 2009/10 .....................................................98 30. Cotton Cultivation – Hectares 2009/10...........................................................................100 31. Cotton Cultivation % Small-scale Farmer 2009/10 ........................................................100 32. Number of Households with One Hectare of Land or Less............................................107
xvi
ACRONYMS ARMD Age Related Macular Disease BMI Body Mass Index CAADP Comprehensive Africa Agriculture Development Programme CFS Crop Forecast Survey CSO Central Statistics Office DRC Democratic Republic of Congo EPCMU Easter Province Cooperative Marketing Union FAOSTAT Food and Agricultural Organization Online Statistical Database FINNIDA Finnish International Development Agency FRA Food Reserve Agency FSP/FISP Fertilizer Support Program/Farmer Input Support Program FSRP Food Security Research Project FtF Feed the Future GART Golden Valley Research Trust GDP Gross Domestic Product GIDD Gender in Development Division HH House Hold IAA Integrated Agriculture Aquaculture IFAD International Fund for Agricultural Development LCMS Living Conditions Monitoring Survey MACO Ministry of Agriculture and Cooperatives MSU Michigan State University MT Metric Ton OFSP Orange-fleshed Sweet Potato PABRN Pan African Bean Research Network PHS Post-harvest Survey QDS Quality Declared Seed RBCs Red Blood Corpuscles RTIP Root and Tuber Improvement Programme SABRN Southern African Bean Research Network SADC Southern African Development Community SME Small-Medium Enterprise SNDP Sixth National Development Plan SS Supplemental Survey UNICEF The United Nations Children's Fund UNZA University of Zambia USAID United States Agency for International Development WFP World Food Program WRS Warehouse Receipt System ZABRN Zambia Bean Research Network ZAMACE Zambian Agricultural Commodity Exchange ZARI Zambia Agricultural Research Institute ZDHS Zambia District Health Surveys ZEGA Zambia Export Growers Association
1
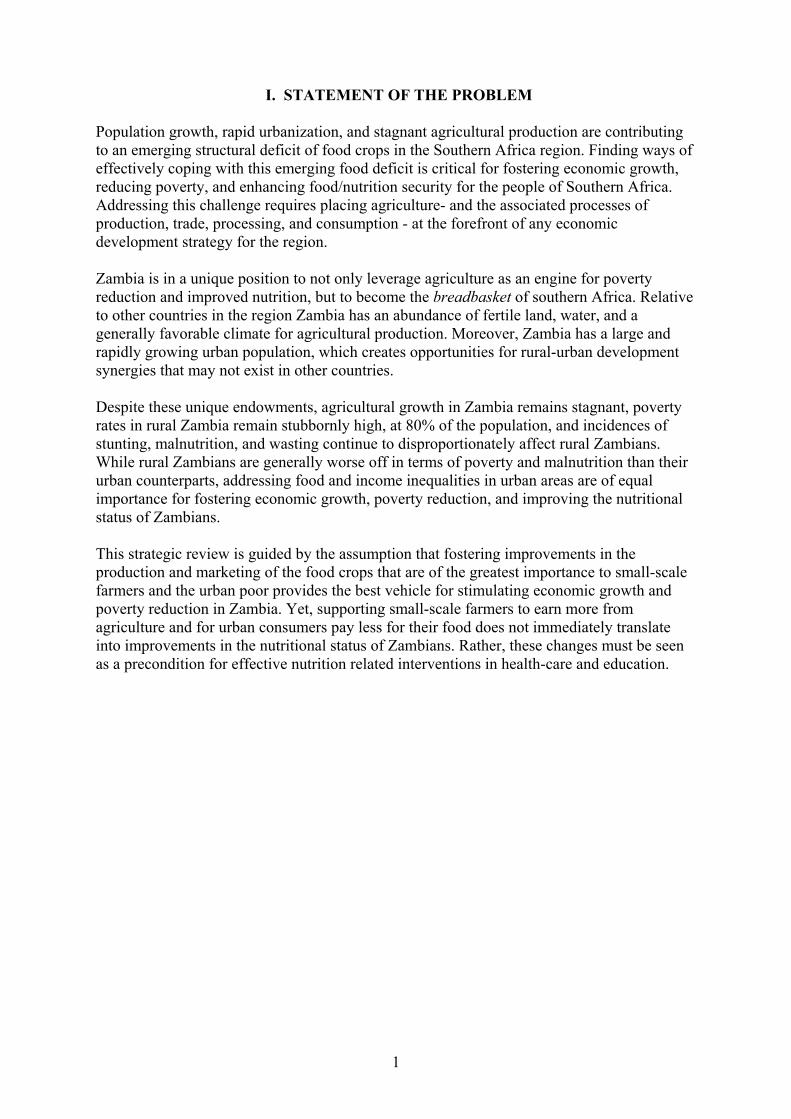
I. STATEMENT OF THE PROBLEM Population growth, rapid urbanization, and stagnant agricultural production are contributing to an emerging structural deficit of food crops in the Southern Africa region. Finding ways of effectively coping with this emerging food deficit is critical for fostering economic growth, reducing poverty, and enhancing food/nutrition security for the people of Southern Africa. Addressing this challenge requires placing agriculture- and the associated processes of production, trade, processing, and consumption - at the forefront of any economic development strategy for the region. Zambia is in a unique position to not only leverage agriculture as an engine for poverty reduction and improved nutrition, but to become the breadbasket of southern Africa. Relative to other countries in the region Zambia has an abundance of fertile land, water, and a generally favorable climate for agricultural production. Moreover, Zambia has a large and rapidly growing urban population, which creates opportunities for rural-urban development synergies that may not exist in other countries. Despite these unique endowments, agricultural growth in Zambia remains stagnant, poverty rates in rural Zambia remain stubbornly high, at 80% of the population, and incidences of stunting, malnutrition, and wasting continue to disproportionately affect rural Zambians. While rural Zambians are generally worse off in terms of poverty and malnutrition than their urban counterparts, addressing food and income inequalities in urban areas are of equal importance for fostering economic growth, poverty reduction, and improving the nutritional status of Zambians. This strategic review is guided by the assumption that fostering improvements in the production and marketing of the food crops that are of the greatest importance to small-scale farmers and the urban poor provides the best vehicle for stimulating economic growth and poverty reduction in Zambia. Yet, supporting small-scale farmers to earn more from agriculture and for urban consumers pay less for their food does not immediately translate into improvements in the nutritional status of Zambians. Rather, these changes must be seen as a precondition for effective nutrition related interventions in health-care and education.
2
II. CONTEXT
2.1. Population
Rapid population growth and urbanization are contributing to increased pressure on Zambia’s food, health care, sanitation, and education systems. This in turn poses a growing threat to levels of food insecurity, malnutrition, and poverty, particularly for the poorest and most vulnerable segments of the population.
a. The last population census for which data are available was conducted in 2000. Data have been collected for the 2010 census, but are not yet available.
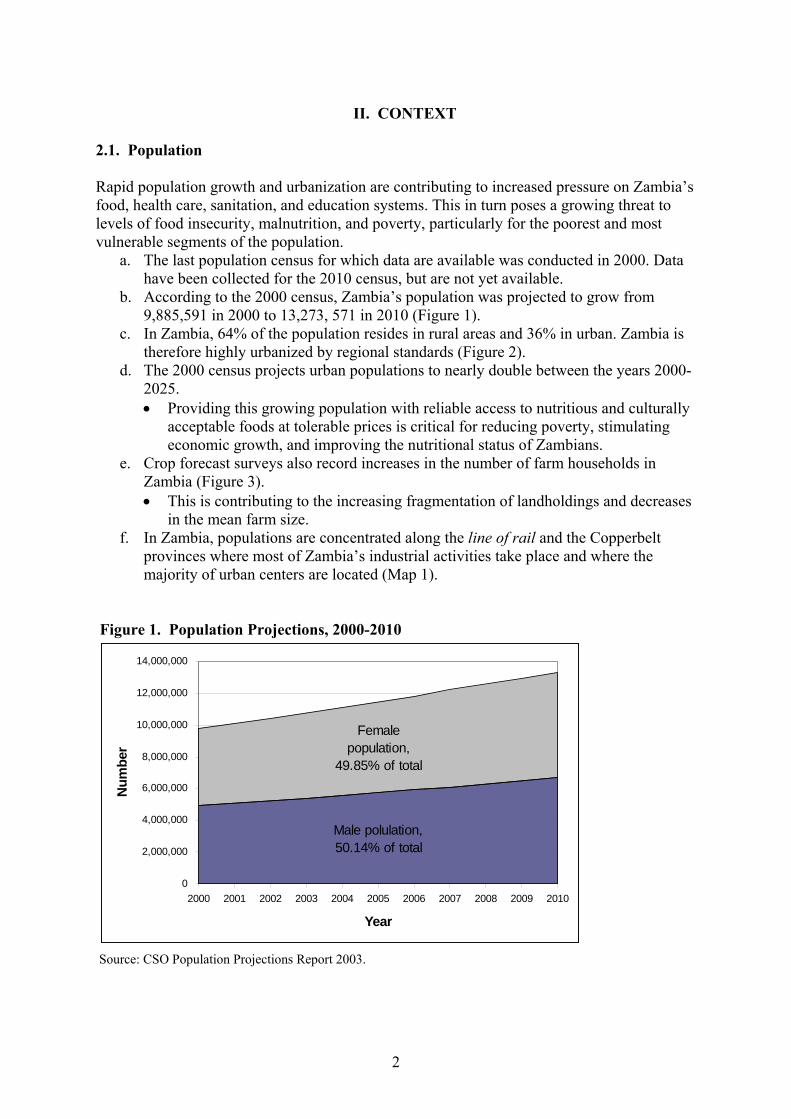
b. According to the 2000 census, Zambia’s population was projected to grow from 9,885,591 in 2000 to 13,273, 571 in 2010 (Figure 1).
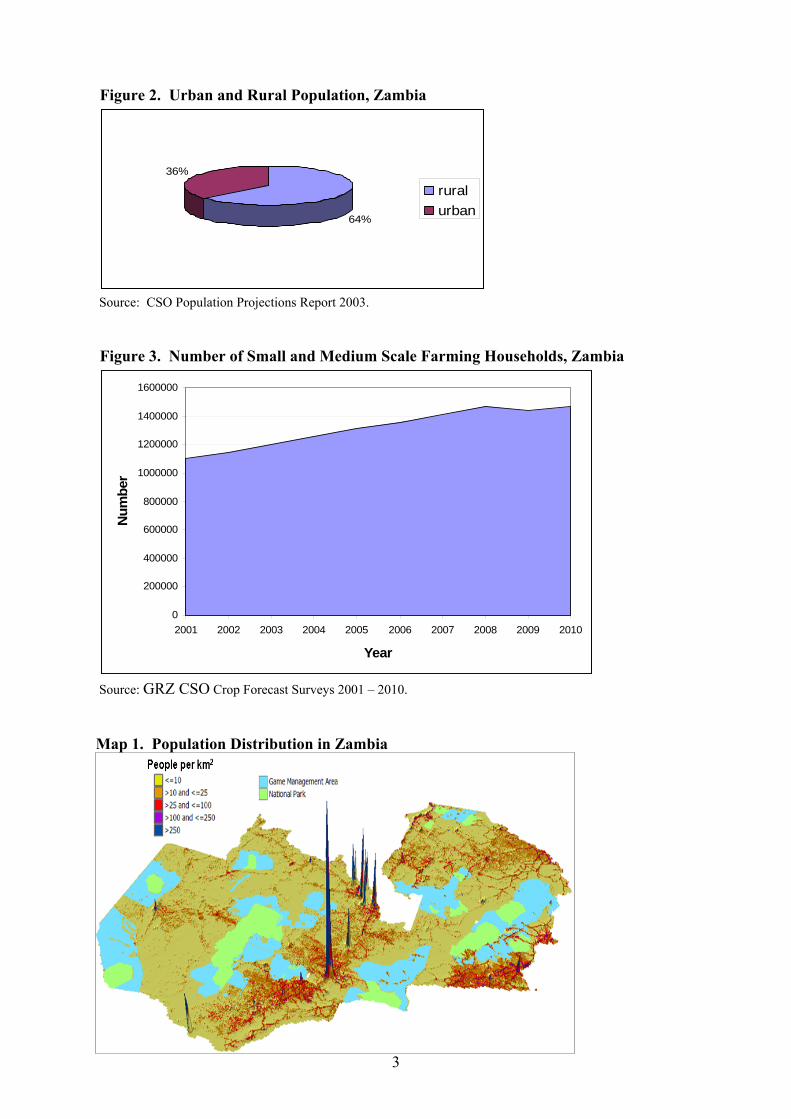
c. In Zambia, 64% of the population resides in rural areas and 36% in urban. Zambia is therefore highly urbanized by regional standards (Figure 2).
d. The 2000 census projects urban populations to nearly double between the years 2000-2025. • Providing this growing population with reliable access to nutritious and culturally
acceptable foods at tolerable prices is critical for reducing poverty, stimulating economic growth, and improving the nutritional status of Zambians.
e. Crop forecast surveys also record increases in the number of farm households in Zambia (Figure 3). • This is contributing to the increasing fragmentation of landholdings and decreases
in the mean farm size. f. In Zambia, populations are concentrated along the line of rail and the Copperbelt
provinces where most of Zambia’s industrial activities take place and where the majority of urban centers are located (Map 1).
Figure 1. Population Projections, 2000-2010
Male polulation, 50.14% of total
Female population,
49.85% of total
0
2,000,000
4,000,000
6,000,000
8,000,000
10,000,000
12,000,000
14,000,000
2000 2001 2002 2003 2004 2005 2006 2007 2008 2009 2010
Year
Num
ber
Source: CSO Population Projections Report 2003.
3
Figure 2. Urban and Rural Population, Zambia
64%
36%
ruralurban
Source: CSO Population Projections Report 2003. Figure 3. Number of Small and Medium Scale Farming Households, Zambia
0
200000
400000
600000
800000
1000000
1200000
1400000
1600000
2001 2002 2003 2004 2005 2006 2007 2008 2009 2010
Year
Num
ber
Source: GRZ CSO Crop Forecast Surveys 2001 – 2010. Map 1. Population Distribution in Zambia
4
2.2. Poverty and Malnutrition While the overall poverty rate in Zambia has declined over time, poverty rates in rural Zambia remain stubbornly high, with 80% of the rural population living in poverty. Furthermore, children living in rural areas of Zambia disproportionately exhibit signs of stunting, underweight, and wasting than their urban counterparts.
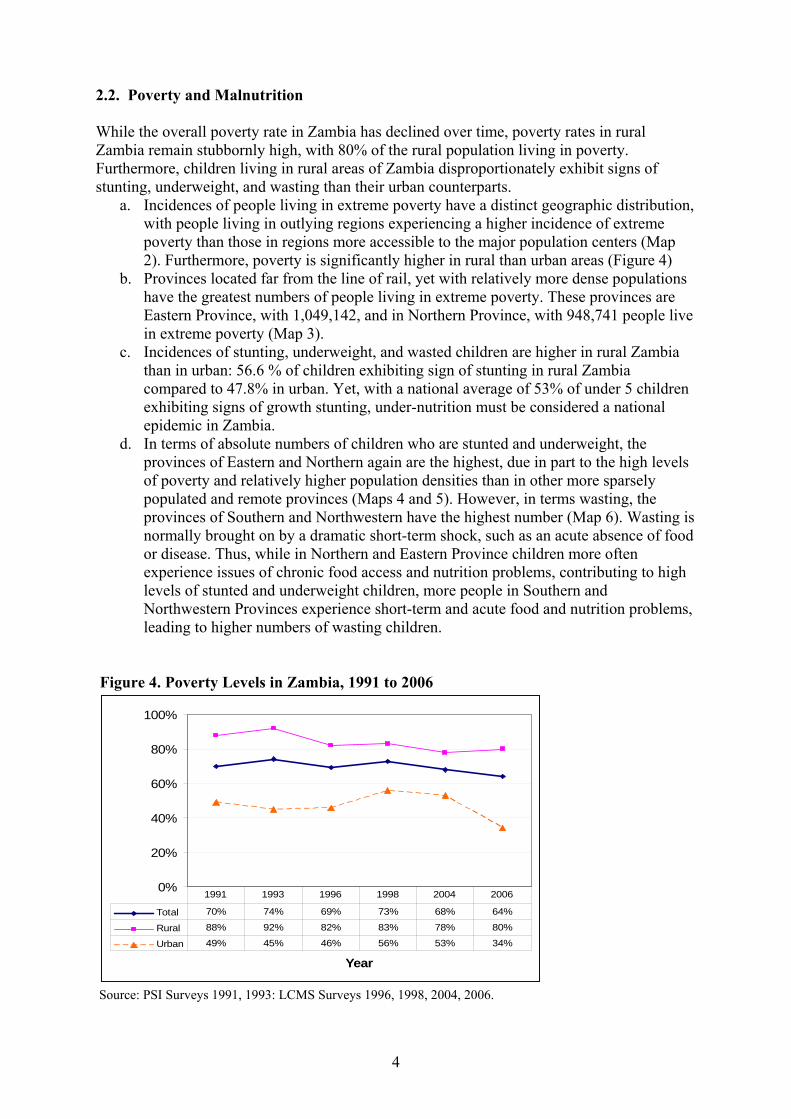
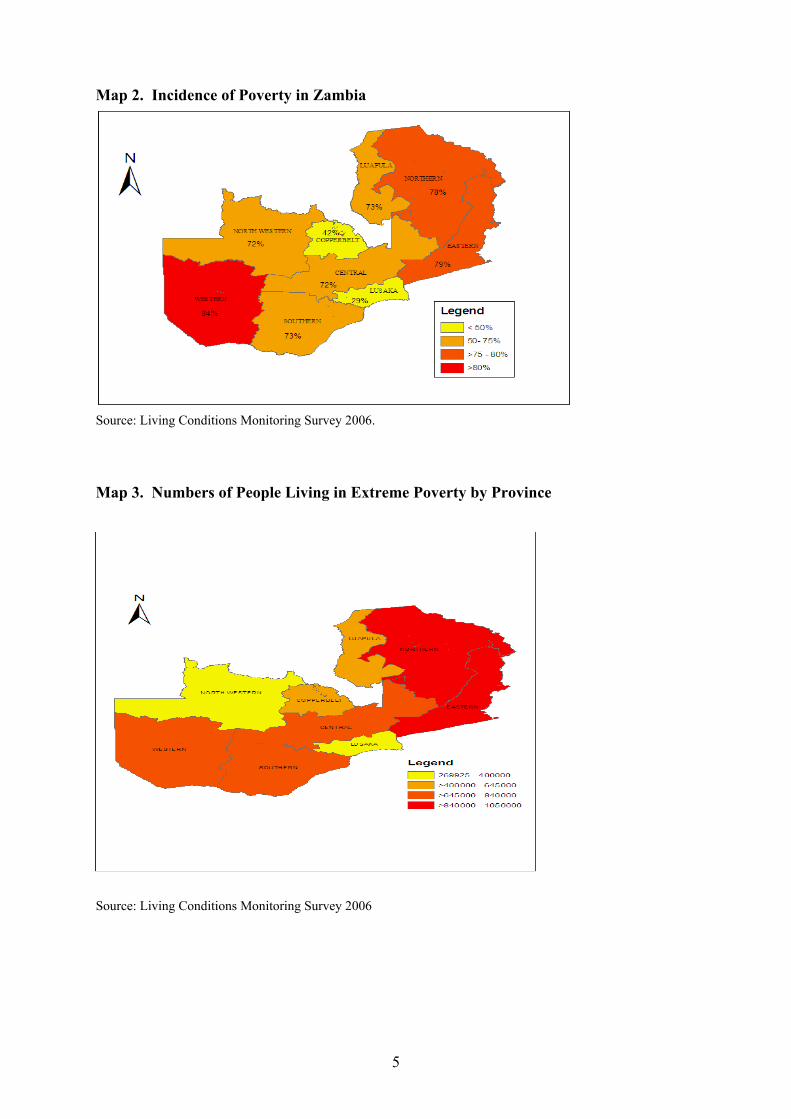
a. Incidences of people living in extreme poverty have a distinct geographic distribution, with people living in outlying regions experiencing a higher incidence of extreme poverty than those in regions more accessible to the major population centers (Map 2). Furthermore, poverty is significantly higher in rural than urban areas (Figure 4)
b. Provinces located far from the line of rail, yet with relatively more dense populations have the greatest numbers of people living in extreme poverty. These provinces are Eastern Province, with 1,049,142, and in Northern Province, with 948,741 people live in extreme poverty (Map 3).
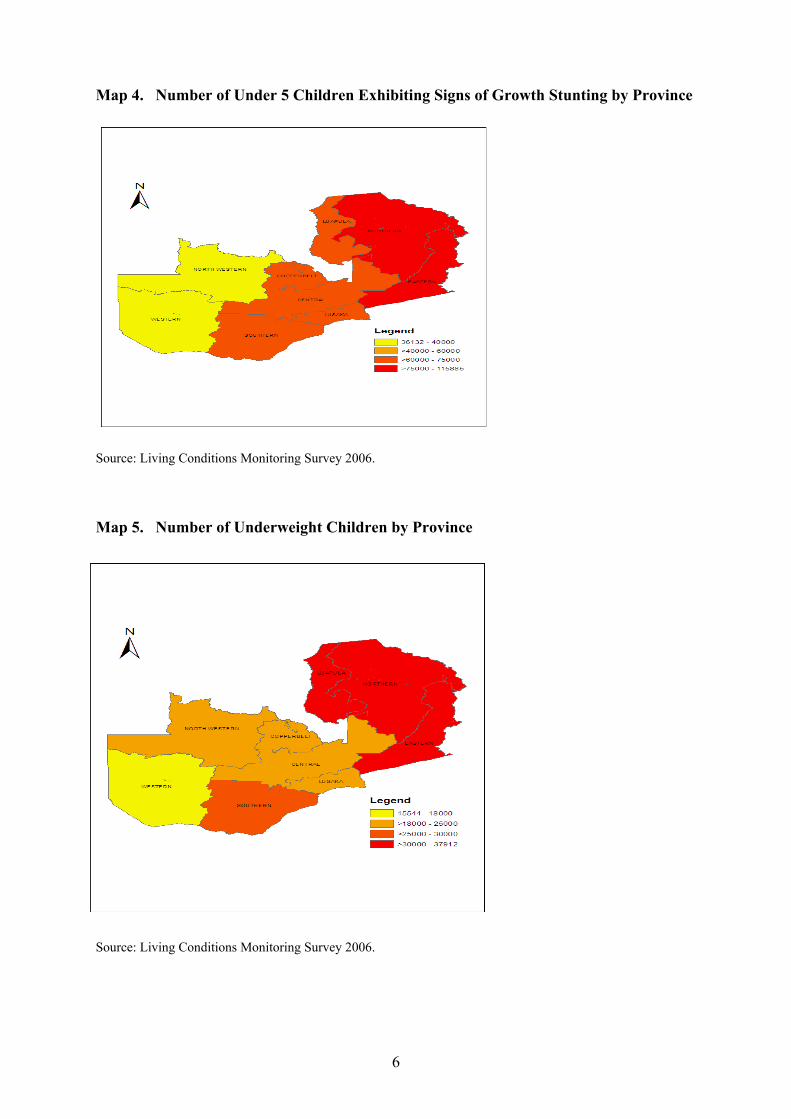
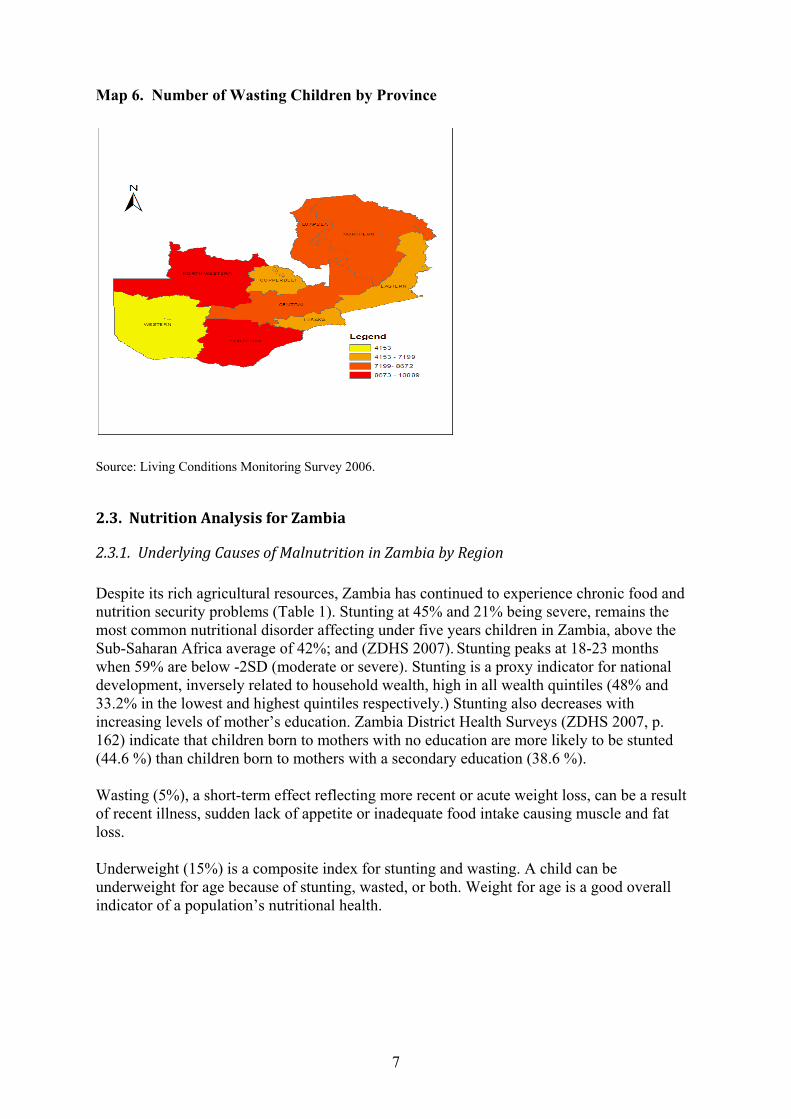
c. Incidences of stunting, underweight, and wasted children are higher in rural Zambia than in urban: 56.6 % of children exhibiting sign of stunting in rural Zambia compared to 47.8% in urban. Yet, with a national average of 53% of under 5 children exhibiting signs of growth stunting, under-nutrition must be considered a national epidemic in Zambia.
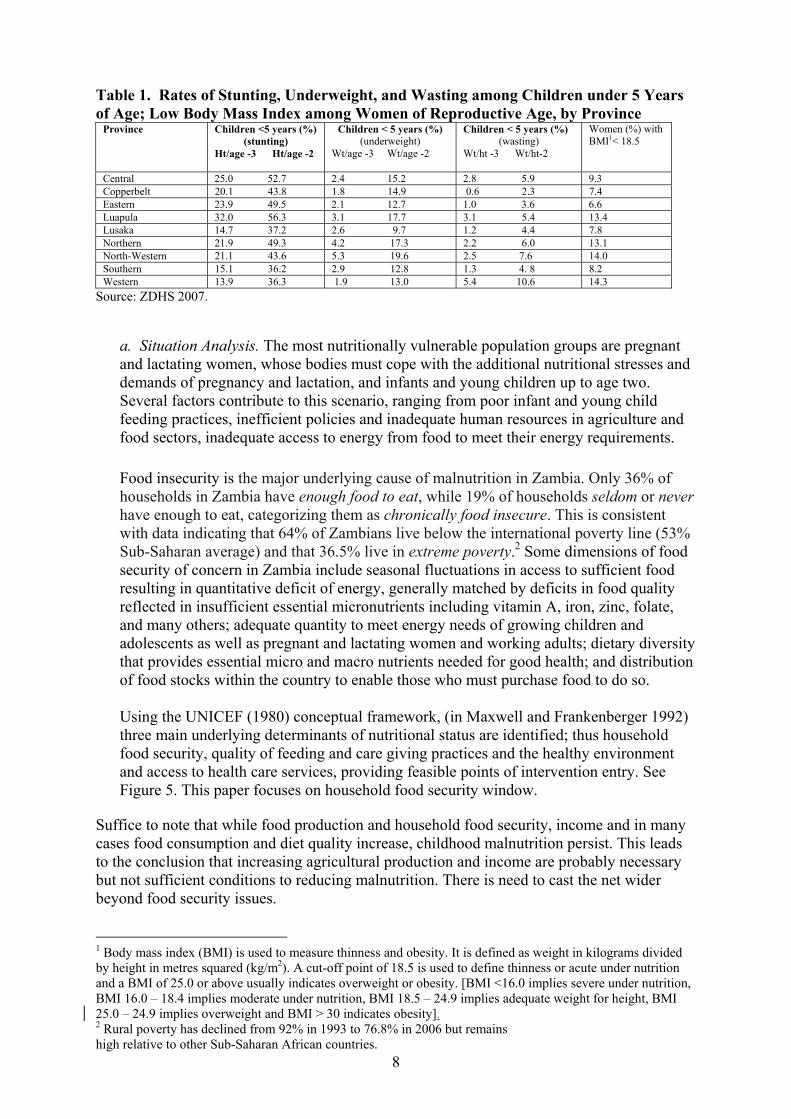
d. In terms of absolute numbers of children who are stunted and underweight, the provinces of Eastern and Northern again are the highest, due in part to the high levels of poverty and relatively higher population densities than in other more sparsely populated and remote provinces (Maps 4 and 5). However, in terms wasting, the provinces of Southern and Northwestern have the highest number (Map 6). Wasting is normally brought on by a dramatic short-term shock, such as an acute absence of food or disease. Thus, while in Northern and Eastern Province children more often experience issues of chronic food access and nutrition problems, contributing to high levels of stunted and underweight children, more people in Southern and Northwestern Provinces experience short-term and acute food and nutrition problems, leading to higher numbers of wasting children.
Figure 4. Poverty Levels in Zambia, 1991 to 2006
0%
20%
40%
60%
80%
100%
Year
Total 70% 74% 69% 73% 68% 64%
Rural 88% 92% 82% 83% 78% 80%
Urban 49% 45% 46% 56% 53% 34%
1991 1993 1996 1998 2004 2006
Source: PSI Surveys 1991, 1993: LCMS Surveys 1996, 1998, 2004, 2006.
5
Map 2. Incidence of Poverty in Zambia
Source: Living Conditions Monitoring Survey 2006. Map 3. Numbers of People Living in Extreme Poverty by Province
Source: Living Conditions Monitoring Survey 2006
6
Map 4. Number of Under 5 Children Exhibiting Signs of Growth Stunting by Province
Source: Living Conditions Monitoring Survey 2006. Map 5. Number of Underweight Children by Province
Source: Living Conditions Monitoring Survey 2006.
7
Map 6. Number of Wasting Children by Province
Source: Living Conditions Monitoring Survey 2006. 2.3. Nutrition Analysis for Zambia
2.3.1. Underlying Causes of Malnutrition in Zambia by Region Despite its rich agricultural resources, Zambia has continued to experience chronic food and nutrition security problems (Table 1). Stunting at 45% and 21% being severe, remains the most common nutritional disorder affecting under five years children in Zambia, above the Sub-Saharan Africa average of 42%; and (ZDHS 2007). Stunting peaks at 18-23 months when 59% are below -2SD (moderate or severe). Stunting is a proxy indicator for national development, inversely related to household wealth, high in all wealth quintiles (48% and 33.2% in the lowest and highest quintiles respectively.) Stunting also decreases with increasing levels of mother’s education. Zambia District Health Surveys (ZDHS 2007, p. 162) indicate that children born to mothers with no education are more likely to be stunted (44.6 %) than children born to mothers with a secondary education (38.6 %). Wasting (5%), a short-term effect reflecting more recent or acute weight loss, can be a result of recent illness, sudden lack of appetite or inadequate food intake causing muscle and fat loss. Underweight (15%) is a composite index for stunting and wasting. A child can be underweight for age because of stunting, wasted, or both. Weight for age is a good overall indicator of a population’s nutritional health.
8
Table 1. Rates of Stunting, Underweight, and Wasting among Children under 5 Years of Age; Low Body Mass Index among Women of Reproductive Age, by Province
Province Children <5 years (%) (stunting)
Ht/age -3 Ht/age -2
Children < 5 years (%) (underweight)
Wt/age -3 Wt/age -2
Children < 5 years (%) (wasting)
Wt/ht -3 Wt/ht-2
Women (%) with BMI1< 18.5
Central 25.0 52.7 2.4 15.2 2.8 5.9 9.3 Copperbelt 20.1 43.8 1.8 14.9 0.6 2.3 7.4 Eastern 23.9 49.5 2.1 12.7 1.0 3.6 6.6 Luapula 32.0 56.3 3.1 17.7 3.1 5.4 13.4 Lusaka 14.7 37.2 2.6 9.7 1.2 4.4 7.8 Northern 21.9 49.3 4.2 17.3 2.2 6.0 13.1 North-Western 21.1 43.6 5.3 19.6 2.5 7.6 14.0 Southern 15.1 36.2 2.9 12.8 1.3 4. 8 8.2 Western 13.9 36.3 1.9 13.0 5.4 10.6 14.3
Source: ZDHS 2007.
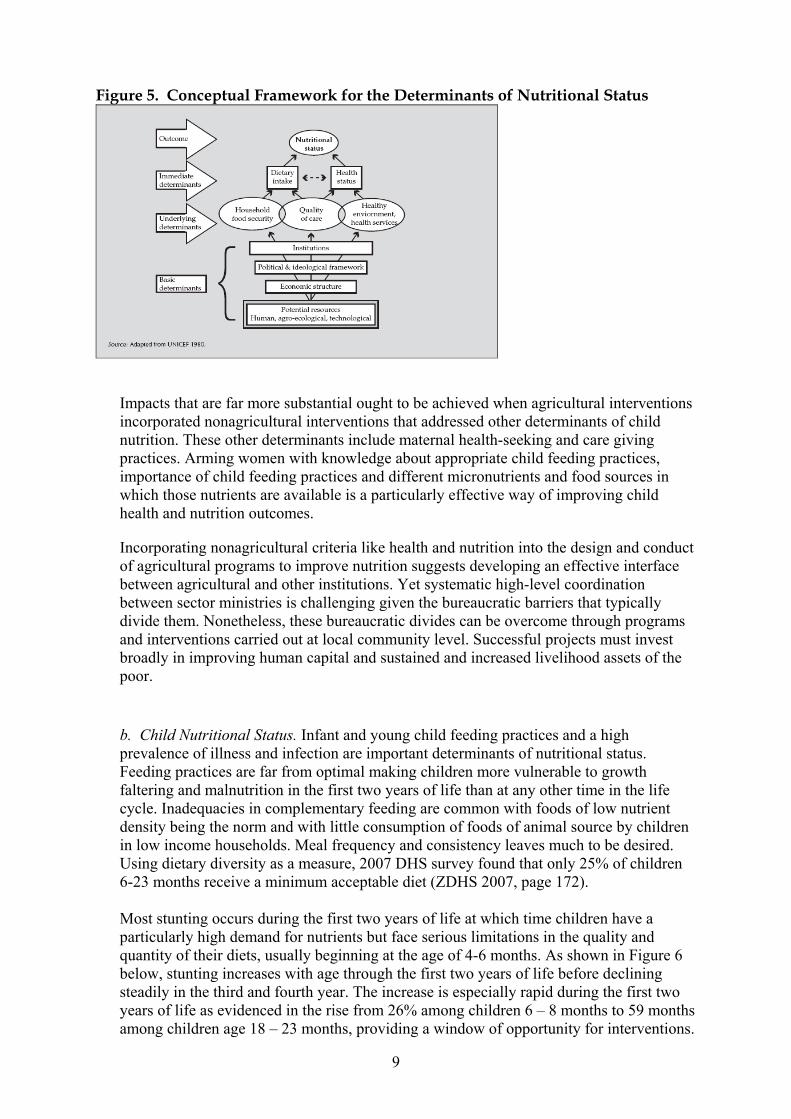
a. Situation Analysis. The most nutritionally vulnerable population groups are pregnant and lactating women, whose bodies must cope with the additional nutritional stresses and demands of pregnancy and lactation, and infants and young children up to age two. Several factors contribute to this scenario, ranging from poor infant and young child feeding practices, inefficient policies and inadequate human resources in agriculture and food sectors, inadequate access to energy from food to meet their energy requirements. Food insecurity is the major underlying cause of malnutrition in Zambia. Only 36% of households in Zambia have enough food to eat, while 19% of households seldom or never have enough to eat, categorizing them as chronically food insecure. This is consistent with data indicating that 64% of Zambians live below the international poverty line (53% Sub-Saharan average) and that 36.5% live in extreme poverty.2 Some dimensions of food security of concern in Zambia include seasonal fluctuations in access to sufficient food resulting in quantitative deficit of energy, generally matched by deficits in food quality reflected in insufficient essential micronutrients including vitamin A, iron, zinc, folate, and many others; adequate quantity to meet energy needs of growing children and adolescents as well as pregnant and lactating women and working adults; dietary diversity that provides essential micro and macro nutrients needed for good health; and distribution of food stocks within the country to enable those who must purchase food to do so. Using the UNICEF (1980) conceptual framework, (in Maxwell and Frankenberger 1992) three main underlying determinants of nutritional status are identified; thus household food security, quality of feeding and care giving practices and the healthy environment and access to health care services, providing feasible points of intervention entry. See Figure 5. This paper focuses on household food security window.
Suffice to note that while food production and household food security, income and in many cases food consumption and diet quality increase, childhood malnutrition persist. This leads to the conclusion that increasing agricultural production and income are probably necessary but not sufficient conditions to reducing malnutrition. There is need to cast the net wider beyond food security issues.
1 Body mass index (BMI) is used to measure thinness and obesity. It is defined as weight in kilograms divided by height in metres squared (kg/m2). A cut-off point of 18.5 is used to define thinness or acute under nutrition and a BMI of 25.0 or above usually indicates overweight or obesity. [BMI <16.0 implies severe under nutrition, BMI 16.0 – 18.4 implies moderate under nutrition, BMI 18.5 – 24.9 implies adequate weight for height, BMI 25.0 – 24.9 implies overweight and BMI > 30 indicates obesity]. 2 Rural poverty has declined from 92% in 1993 to 76.8% in 2006 but remains high relative to other Sub-Saharan African countries.
9
Figure 5. Conceptual Framework for the Determinants of Nutritional Status
Impacts that are far more substantial ought to be achieved when agricultural interventions incorporated nonagricultural interventions that addressed other determinants of child nutrition. These other determinants include maternal health-seeking and care giving practices. Arming women with knowledge about appropriate child feeding practices, importance of child feeding practices and different micronutrients and food sources in which those nutrients are available is a particularly effective way of improving child health and nutrition outcomes.
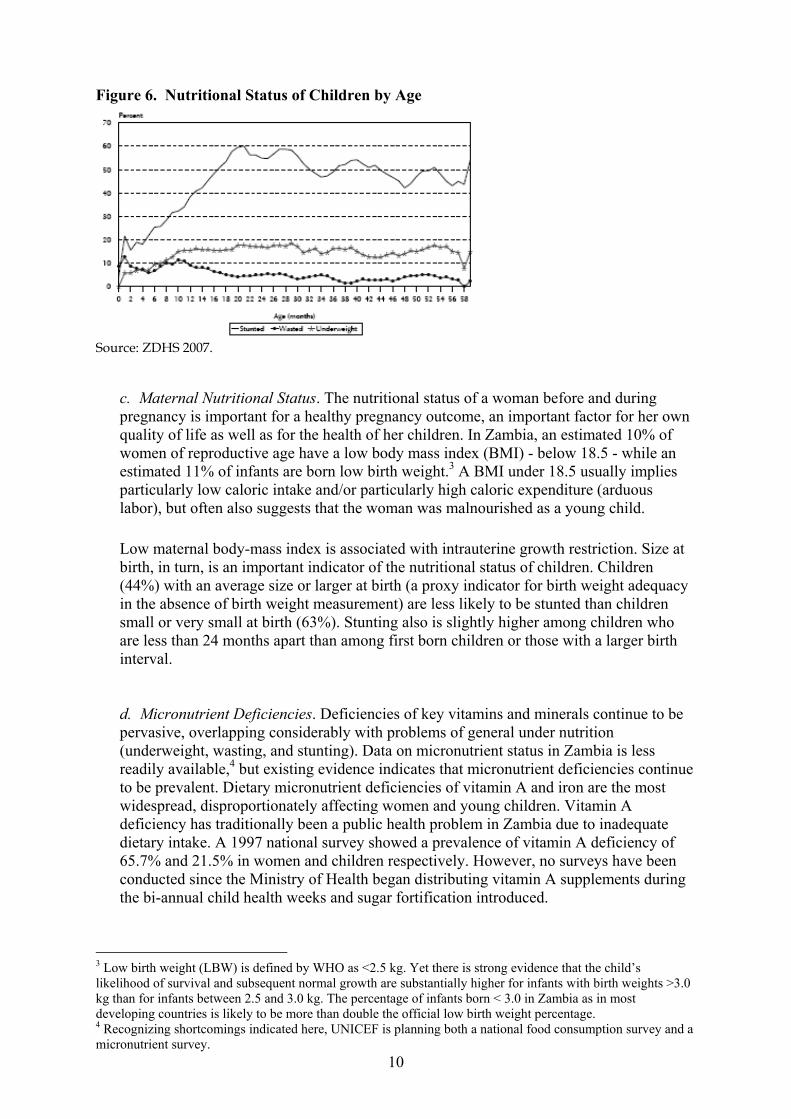
Incorporating nonagricultural criteria like health and nutrition into the design and conduct of agricultural programs to improve nutrition suggests developing an effective interface between agricultural and other institutions. Yet systematic high-level coordination between sector ministries is challenging given the bureaucratic barriers that typically divide them. Nonetheless, these bureaucratic divides can be overcome through programs and interventions carried out at local community level. Successful projects must invest broadly in improving human capital and sustained and increased livelihood assets of the poor. b. Child Nutritional Status. Infant and young child feeding practices and a high prevalence of illness and infection are important determinants of nutritional status. Feeding practices are far from optimal making children more vulnerable to growth faltering and malnutrition in the first two years of life than at any other time in the life cycle. Inadequacies in complementary feeding are common with foods of low nutrient density being the norm and with little consumption of foods of animal source by children in low income households. Meal frequency and consistency leaves much to be desired. Using dietary diversity as a measure, 2007 DHS survey found that only 25% of children 6-23 months receive a minimum acceptable diet (ZDHS 2007, page 172). Most stunting occurs during the first two years of life at which time children have a particularly high demand for nutrients but face serious limitations in the quality and quantity of their diets, usually beginning at the age of 4-6 months. As shown in Figure 6 below, stunting increases with age through the first two years of life before declining steadily in the third and fourth year. The increase is especially rapid during the first two years of life as evidenced in the rise from 26% among children 6 – 8 months to 59 months among children age 18 – 23 months, providing a window of opportunity for interventions.
10
Figure 6. Nutritional Status of Children by Age
Source: ZDHS 2007.
c. Maternal Nutritional Status. The nutritional status of a woman before and during pregnancy is important for a healthy pregnancy outcome, an important factor for her own quality of life as well as for the health of her children. In Zambia, an estimated 10% of women of reproductive age have a low body mass index (BMI) - below 18.5 - while an estimated 11% of infants are born low birth weight.3 A BMI under 18.5 usually implies particularly low caloric intake and/or particularly high caloric expenditure (arduous labor), but often also suggests that the woman was malnourished as a young child. Low maternal body-mass index is associated with intrauterine growth restriction. Size at birth, in turn, is an important indicator of the nutritional status of children. Children (44%) with an average size or larger at birth (a proxy indicator for birth weight adequacy in the absence of birth weight measurement) are less likely to be stunted than children small or very small at birth (63%). Stunting also is slightly higher among children who are less than 24 months apart than among first born children or those with a larger birth interval. d. Micronutrient Deficiencies. Deficiencies of key vitamins and minerals continue to be pervasive, overlapping considerably with problems of general under nutrition (underweight, wasting, and stunting). Data on micronutrient status in Zambia is less readily available,4 but existing evidence indicates that micronutrient deficiencies continue to be prevalent. Dietary micronutrient deficiencies of vitamin A and iron are the most widespread, disproportionately affecting women and young children. Vitamin A deficiency has traditionally been a public health problem in Zambia due to inadequate dietary intake. A 1997 national survey showed a prevalence of vitamin A deficiency of 65.7% and 21.5% in women and children respectively. However, no surveys have been conducted since the Ministry of Health began distributing vitamin A supplements during the bi-annual child health weeks and sugar fortification introduced.
3 Low birth weight (LBW) is defined by WHO as <2.5 kg. Yet there is strong evidence that the child’s likelihood of survival and subsequent normal growth are substantially higher for infants with birth weights >3.0 kg than for infants between 2.5 and 3.0 kg. The percentage of infants born < 3.0 in Zambia as in most developing countries is likely to be more than double the official low birth weight percentage. 4 Recognizing shortcomings indicated here, UNICEF is planning both a national food consumption survey and a micronutrient survey.
11
Shortage of nutrients in diets limit growth, weaken immunity, cause xerophthalmia (an irreversible eye disorder leading to blindness), and increase mortality. Iron deficiency is estimated to be the most prevalent nutritional deficiency. Anemia prevalence is 53% (2003) among children 6 – 59 months and 46.9% (1999) among pregnant women: as many as 50% of women attending antennal clinics are affected. At least 50% of anemia is caused by inadequate iron intake, the major cause being low consumption of animal source foods, particularly in low income households. In young children, iron deficiency impairs growth, cognitive development, and immune function. In school-age children, it affects school performance, and in adults, it lowers work capacity. Iron deficiency anemia is responsible for tens of thousands of maternal deaths each year. Although no studies have been conducted on zinc deficiency in Zambia, there is evidence internationally of an association between levels of absorbable zinc in food supply (usually from animal sources) and stunting prevalence. Zinc is an essential nutrient for normal growth in children and is vital for the immune system; even mild deficiency may increase the risk of infection. Zinc deficiency may be an important contributing factor to stunting given evidence of low animal-source food consumption especially for young children, reliance on maize and other staples from which zinc is poorly absorbed, and frequent infections such as pneumonia and diarrhea which cause significant zinc losses. Other micronutrients of concern in maternal and child health include calcium, folic acid, and vitamin B12.
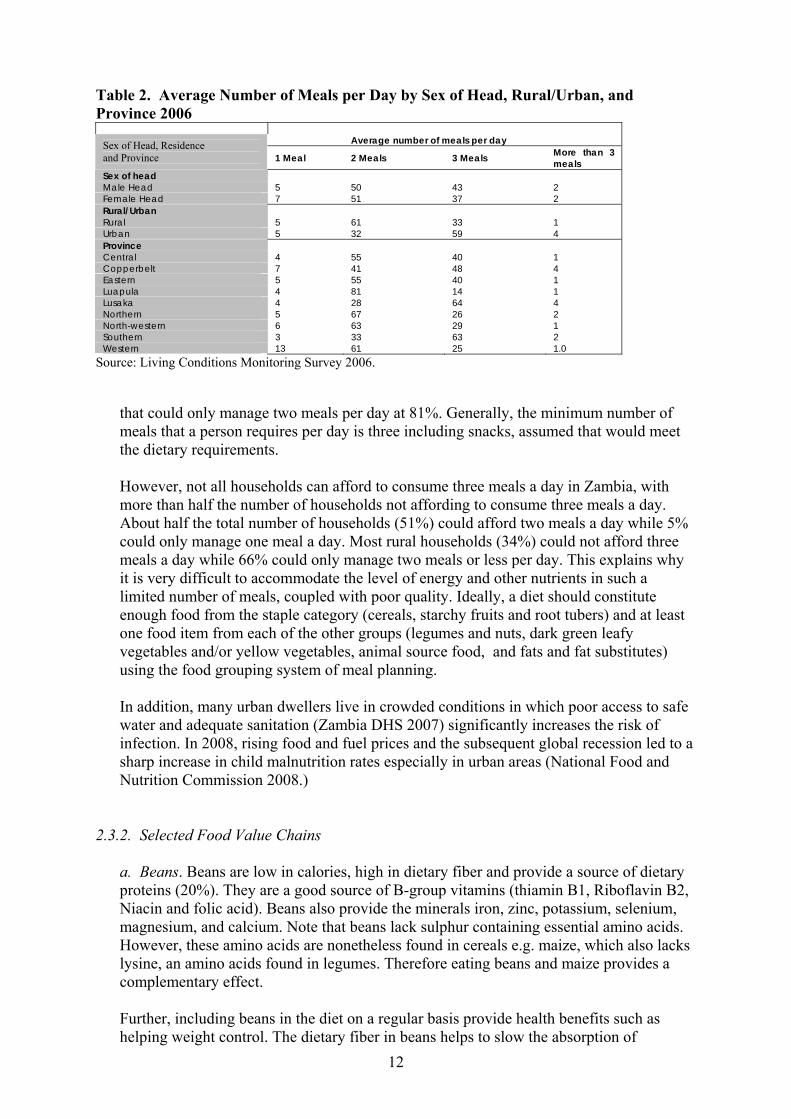
e. Food Consumption Patterns. Food consumption patterns in Zambia are generally poor, exhibited in monotonous low daily meal frequency and dietary diversity. The best available direct measure of food insecurity is an estimate of daily energy intake manifesting in high stunting rates for children and low BMI for adults. Nearly half of the country’s rural population, 45% have daily caloric intakes below 1,750 (an average for individuals of all age groups) per day (FAO5 food balance sheet calculation) while their families spend nearly 80% of their incomes on food. Calorie consumption ranges from 1,185 in Luapula province and 2,103 in Lusaka compared with an estimated average daily requirement of 2, 750 and 2, 600 for men and women respectively. The FAO food balance sheet calculation also indicates that, on average, only two percent of calories consumed by Zambians are from pulses, vegetables, and nuts highlighting the dire need for dietary diversity. While extreme poverty is more common in rural areas of Zambia, evidence indicates that the poor in urban and peri-urban areas also have challenges obtaining sufficient food as shown in Table 2 below. At Provincial Level, Lusaka Province had the highest percentage of households that could afford three meals a day at 64%. Luapula province had the lowest proportion of households that could afford three meals at 14% and the highest proportion of households
5 FAO food balance sheet reflects calories and protein averages per capita food availability calculated by dividing total food production by population figures. Evidently, results do not reflect inequitable access to the food, storage and cooking losses or intra-household distribution.
12
Table 2. Average Number of Meals per Day by Sex of Head, Rural/Urban, and Province 2006
Average number of meals per day Sex of Head, Residence
and Province 1 Meal 2 Meals 3 Meals More than 3 meals
Sex of head Male Head 5 50 43 2 Female Head 7 51 37 2 Rural/Urban Rural 5 61 33 1 Urban 5 32 59 4 Province Central 4 55 40 1 Copperbelt 7 41 48 4 Eastern 5 55 40 1 Luapula 4 81 14 1 Lusaka 4 28 64 4 Northern 5 67 26 2 North-western 6 63 29 1 Southern 3 33 63 2 Western 13 61 25 1.0
Source: Living Conditions Monitoring Survey 2006.
that could only manage two meals per day at 81%. Generally, the minimum number of meals that a person requires per day is three including snacks, assumed that would meet the dietary requirements. However, not all households can afford to consume three meals a day in Zambia, with more than half the number of households not affording to consume three meals a day. About half the total number of households (51%) could afford two meals a day while 5% could only manage one meal a day. Most rural households (34%) could not afford three meals a day while 66% could only manage two meals or less per day. This explains why it is very difficult to accommodate the level of energy and other nutrients in such a limited number of meals, coupled with poor quality. Ideally, a diet should constitute enough food from the staple category (cereals, starchy fruits and root tubers) and at least one food item from each of the other groups (legumes and nuts, dark green leafy vegetables and/or yellow vegetables, animal source food, and fats and fat substitutes) using the food grouping system of meal planning. In addition, many urban dwellers live in crowded conditions in which poor access to safe water and adequate sanitation (Zambia DHS 2007) significantly increases the risk of infection. In 2008, rising food and fuel prices and the subsequent global recession led to a sharp increase in child malnutrition rates especially in urban areas (National Food and Nutrition Commission 2008.)
2.3.2. Selected Food Value Chains
a. Beans. Beans are low in calories, high in dietary fiber and provide a source of dietary proteins (20%). They are a good source of B-group vitamins (thiamin B1, Riboflavin B2, Niacin and folic acid). Beans also provide the minerals iron, zinc, potassium, selenium, magnesium, and calcium. Note that beans lack sulphur containing essential amino acids. However, these amino acids are nonetheless found in cereals e.g. maize, which also lacks lysine, an amino acids found in legumes. Therefore eating beans and maize provides a complementary effect. Further, including beans in the diet on a regular basis provide health benefits such as helping weight control. The dietary fiber in beans helps to slow the absorption of
13
carbohydrates, which may prevent hunger from occurring soon. The high content of dietary fiber in bean especially soluble fiber helps slow the absorption rate of carbohydrate, a factor which moderates blood sugar peaking related to food intake, a positive attribute in diabetes. Further beans are a very good source of resistant starch, which play a role in reducing the risk of colon cancer. The nutrition profile of beans contributes to heart health. It is low in total fat, saturated fat, and sodium while it is high in dietary fiber, especially soluble fiber, folate (B-group vitamin), potassium, and a host of other minerals. Finally, beans help to maintain normal ranges for several risk factors for heart diseases including blood cholesterol, blood pressure, and blood cysteine levels. Despite the positive attributes highlighted above, beans however suffer some challenges. Anti-nutrient factors in beans reduce amounts of nutrients absorbed by the body. The proportion of iron and zinc that can be absorbed from legumes including beans is typically low due to anti-nutrients such as phytates and polyphenols, which normally bind to the iron and zinc making them unavailable for absorption and therefore body use. Flatulence factors caused by the presence of sugars and polysaccharides that are not digested by the human enzymes pass undigested and get fermented in the large intestines by microorganisms thus producing gas, a factor that may be deemed uncomfortable for some people. Most beans varieties take a long time to cook. Nonetheless, varieties that are being developed now combine a number of agronomic and consumer acceptance characteristics including low phytate levels and short cooking time. Opportunities available for beans include processing and cooking methods being available that reduce anti-nutrients factors, including germination, fermentation, and dehulling. Eating beans with vitamin C rich foods enables vitamin C to bind with iron thus making it unavailable for phytate binding, preventing it from being attached to the iron absorption inhibitors thereby increasing its bioavailability. This means that eating beans together with vegetables and fruits enhance iron and zinc absorption.
b. Sweet Potatoes. Sweet potato, not only is it sweet to taste buds but also good for cardiovascular health. This starchy root vegetable is a rich source of antioxidants, vitamins, minerals and dietary fiber that are essential for optimal health. Sweet potatoes are not always orange-fleshed on the inside but can also be a spectacular purple color. The orange fleshed sweet potato intervention not only improved gains in production, incomes, and household food security in Mozambique, but also showed significantly greater nutrition impacts of vitamin A intake when combined with interventions involving women’s empowerment, education, and behavior change. The study that measured biochemical indicators also showed reductions in Vitamin A deficiency. Sweet potatoes are low in calories (provide just 90 cal/100 g, on comparison with starch rich cereals) and contains no saturated fats and cholesterol; but are a rich source of dietary fiber, anti-oxidants, vitamins (provides 40% of the RDA for vitamin C) and minerals like iron, calcium, magnesium, manganese and potassium which are very essential for body metabolism • Sweet potatoes are a store-house of starch, a complex carbohydrate, which raises
blood sugar levels slowly on comparison to simple sugars; therefore, recommended as a healthy food supplement even in diabetes. It is an excellent source of flavonoids like beta carotene and vitamin A (provides 14187 IU of vitamin A and 8509 mcg of β-carotene). Vitamin A is also required by the body to maintain integrity of healthy
14
mucus membranes and skin. It is also vital nutrient for vision. Consumption of natural vegetables and fruits rich in flavonoids helps to protect from lung and oral cavity cancers. Sweet potato is packed with many essential vitamins such as pantothenic acid (vitamin B5), pyridoxine (vitamin B-6) and thiamin (vitamin B-1), niacin and riboflavin. These vitamins are essential in the sense that the body requires them from external sources to replenish. These vitamins function as co-factors for various enzymes during metabolism. There are surprisingly a number of nutrient categories responsible for the health benefits of this underappreciated tuber, among which categories are antioxidants, anti-inflammatory nutrients, and blood sugar-regulating nutrients. Each category brings with it valuable health benefits.
• Antioxidants: Sweet potatoes contain a wealth of orange-hued carotenoid
pigments. They have a highly effective way of providing school age children with sizable amounts of their daily vitamin A. In some studies, sweet potatoes have been shown to be a better source of bioavailable beta-carotene than green leafy vegetables. Because sweet potatoes are available in on a virtual year-round basis, their ability to provide beta-carotene antioxidant makes them a standout antioxidant food. Particularly in purple-fleshed sweet potato, antioxidant anthocyanin pigments are abundant. Recent research has shown that particularly when passing through our digestive tract, sweet potato cyanidins and peonidins and other color-related phytonutrients may be able to lower the potential health risk posed by heavy metals and oxygen radicals. Storage proteins (sporamins) in sweet potato also have important antioxidant properties. Orange-fleshed sweet potatoes may be one of nature's unsurpassed sources of beta-carotene. Several studies have shown the superior ability of sweet potatoes to raise the blood levels of vitamin A. In several studies from Africa, sweet potatoes were found to contain between 100-1,600 micrograms to meet 35% of all vitamin A needs, and in many cases enough to meet over 90% of vitamin A needs (from this single food alone).
Biofortified orange-fleshed sweet potato (OFSP) has heightened potential. Unlike most staple crops, even unimproved OFSP is rich in vitamin A and is promising for a number of reasons. It contains very high levels of carotenoids; it is well accepted by young children proving a good source of energy. It is easy to cultivate, is vegetatively propagated, and fairly drought-resistant once established, qualities making it an excellent food security crop. It is also less labor-intensive than most other staple crops, and this is particularly helpful to labor-constrained households, such as those affected by HIV/AIDS. It can be planted over a broad range of time without considerable yield loss and can fill some seasonal gaps in energy and vitamin A intakes. Finally, prices are generally low enough that families will choose to keep some OFSP for home consumption, rather than selling all they produce.
• Anti-Inflammatory Nutrients: Anthocyanin and other color-related pigments in
sweet potato are equally valuable for their anti-inflammatory health benefits. Their phytonutrients have a profound impact effect on fibrinogen, a key glycoproteins in the body that is required for successful blood clotting. With the help of a coagulation factor called thrombin, fibronogen gets converted into fibrin during the blood clotting process. Balanced amounts of fibrinogen, thrombin, and fibrin are a key part of the body's health.
• Blood Sugar Benefits: Many people think that this starchy root crop could not
possibly be helpful for controlling their blood sugar, realizing that food starches
15
can be converted by the digestive tract into simple sugars. If foods are especially concentrated in starch, there can often be a risk of too much simple sugar release in the digestive tract and too much pressure upon the bloodstream to uptake more sugar, a situation resulting in an overly quick elevation of the blood sugar level. However, what is fascinating about sweet potatoes is their ability to actually improve blood sugar regulation-even in persons with type 2 diabetes. While sweet potatoes contain a valuable amount of dietary fiber, (just over 3 grams per medium sweet potato) if boiled or steamed can carry a very reasonable glycemic index (GI) rating of approximately 50.
Recent research has shown that extracts from sweet potatoes can significantly increase blood levels of adiponectin in persons with type 2 diabetes. Adiponectin is a protein hormone produced by fat cells, and serves as an important modifier of insulin metabolism. Persons with poorly-regulated insulin metabolism and insulin insensitivity tend to have lower levels of adiponectin; those with healthier insulin metabolism tend to have higher levels. While more research on much larger groups of individuals to further evaluate and confirm these blood sugar regulating benefits, this area of health research is an especially exciting one for anyone who loves sweet potatoes.
• Other Health Benefits: One of the more intriguing nutrient groups provided by sweet potatoes are resin glycosides. These nutrients are sugar-related and starch-related molecules that are unusual in their arrangement of carbohydrate-related components, and in their inclusion of some non-carbohydrate molecules. Sweet potatoes contain one group of resin glycosides called batatins (including batatin I and batatin II). Recently researchers discovered a related group of glycosides in sweet potato called batatosides (including batatodide III, batatoside IV, and batatoside V). In laboratory studies, most of these sweet potato glycosides have been shown to have antibacterial and antifungal properties. To what extent these carbohydrate-related molecules in sweet potatoes can provide us with health benefits in these same antibacterial and antifungal areas is not yet clear.
c. Horticulture. Agricultural interventions promoting increased production of fruit and vegetable carry considerable potential to effectively address micronutrient deficiencies. A significant body of evidence documenting the success of homestead gardens in raising production, income, household consumption and the intake of targeted fruit and vegetable by vulnerable population groups exist. Several programs also show significant impacts on dietary and biochemical indicators of micronutrient deficiencies, and especially so when they include components designed to change behavior through education and to empower women. It is hoped that households will earn incomes by selling the fruits and vegetables. The main use of this income should be for food and also to invest in seeds, seedlings, saplings or other income-generating activities as well as save income. Households with improved homestead gardens should consume micronutrient-rich, non-cereal foods more frequently. In turn, foods, such as beans and animal products, may not actually be produced in the garden, but purchased using income generated from the selling of garden produce. Chicken liver is a particularly rich source of vitamin A and other essential micronutrients. Egg consumption should be encouraged to increase disproportionately among women and children. Nutrition education should emphasize both intra-household distribution issues and micronutrient consumption and focus on the special needs of women and young
16
children. Horticultural crops under consideration include tomato, rape, onion and indigenous vegetables (sweet potato leaves, pumpkin leaves, cassava leaves), mangoes, bananas and oranges. These will be considered in turn below:
• Tomato: Tomato can be considered either a fruit or vegetable. Though technically
a fruit, tomato is used as a vegetable for cooking purposes. Tomatoes have a number of important nutrients and are believed to accord a number of nutritional benefits to their users. Tomato is a good source of calcium and iron. It also contains some phosphorus, sulphur, potassium and some vitamin A. It is rich in vitamin C which increases as the vegetable ripens. 100 g of tomato contains only 20 calories, which are easy to absorb by the body. The low calorie content of tomato makes it a favourite for obese people as it fills the stomach and does not add calories.
The presence of antioxidants in tomatoes helps in cleansing toxic compounds from the body. Lycopene, present in tomatoes, neutralize free radicals in the body, reducing the risk of prostate cancer and heart attack. Eating raw tomatoes reduces the risk of developing rectal, colon or stomach cancer. Tomatoes block the effects of nitrosamines and thus, reduce the risk of lung cancer. Vitamin K present in tomatoes helps in keeping the bones strong and healthy. It also helps prevent hemorrhages. Consuming raw tomato on a regular basis helps improve the skin texture, making it glow. Tomatoes are known to have blood purifying properties protecting the liver from cirrhosis and dissolves gallstones as well. Being a natural antiseptic, tomatoes help to protect the body against various common infections. Nicotinic acid in tomatoes is credited with reducing blood cholesterol, which in turn helps keep heart diseases at bay. Studies have shown that consumption of tomatoes and tomato based products prevents serum lipid oxidation and reduces the risk of macular degenerative disease. When applied topically, tomato pulp helps heal wounds and sores.
• Onion: Onion is a vegetable cultivated in almost all countries of the world and
consumed across the globe used for cooking purposes. Not only does the vegetable lend an excellent taste to dishes, but is also associated with imparting a number of health benefits to its users. Onions have therapeutic, antibacterial, antifungal and load of other beneficial properties. Fresh as well as cooked onions have anti-platelet adhesiveness, which helps in preventing thrombosis. Onion is very good for those suffering from high blood pressure, helps reduce inflammation and is therefore, beneficial for those suffering from Neuritis, Vertigo, and Bronchitis. Onion, being a diuretic, increases the secretion of urine. It is rich in flavonoids and thus, provides protection against cardiovascular disease.
Onions contain a number of sulfides that help in lowering blood lipids; have anti-allergy properties, apart from being slightly laxative. They help drain out mucus from the cavities and loosen phlegm, in turn alleviating symptoms of sinus. They also help the body in destroying worms and other parasites. They have a property of helping lower blood sugar, hence are good for people suffering from diabetes. Extracts of onion, being rich in a variety of sulfides, provide some protection against tumor growth. In addition, onions have been found to be helpful in the alleviation of the following ailments: asthma, bacterial infections, cough, colds,
17
influenza, insomnia, obesity, pneumonia, tuberculosis, neuritis, vertigo, and bronchitis.
• Rape: Rape, classified as group A vegetable are rich in vitamins B1, B2, C,
carotene, and a variety of inorganic salts and large amounts of water, usually 70% to 90%. Being a dark green vegetable, rape is a rich content of nutrition, right from protein, vitamins, potassium, phosphorus, magnesium, calcium to selenium, iron, manganese, copper, and zinc. A high vegetable diet assures a relief from all the major and minor problems of the body. People consuming greater amounts of vegetables in their diet are high on energy and feel less lethargic or stressed out. The nutrition provided, helps body perform all the activities, by providing the body cells and organisms, all the necessary requisites for supporting life.
• Sweet Potato Leaves: Sweet potatoes leaves are not only delicious, nutritious and
exceptionally easy to prepare – they are also versatile, having great nutritional profile. Sweet potato leaves are edible; containing more nutrients and dietary fiber than some green leafy vegetables like spinach (e.g. 100 g sweet potato leaves provide 1028 IU of vitamin A). They can also be dried and preserved for use to add culinary taste and in the lean periods. High consumption of vegetables and fruits has been linked epidemiologically to decreased risk of cancer and cardiovascular disease, beneficial effects attributed partly to the presence of numerous polyphenolic compounds, which display antioxidant and free radical scavenging properties. Polyphenols are the major phytochemicals in fruits and vegetables. A variety of in vitro studies have shown that polyphenols such as flavonoids are antioxidants, immunomodulators, and exhibit antigenotoxic effects. Sweet potato leaves are easily grown and have the highest polyphenolic content, in particular, flavonoids, of all the commonly grown vegetables, therefore supplementation of diets with sweet potato leaves would be prudent. As with many vegetables and fruits, sweet potato leaves are rich in carotenoids, whose immunomodulatory activity in animals and human beings is well known.
• Pumpkin Leaves: Pumpkin leaves and flowers can be cooked as vegetables, an incredibly rich source of vital anti-oxidants and vitamins. This humble vegetable is very low in calories yet good source of vitamin A, flavonoid poly-phenolic antioxidants like leutin, xanthins, and carotenes. It is one of the vegetables which is very low in calories; providing 26cal per 100g and contains no saturated fats or cholesterol; but is a rich source of dietary fiber, anti-oxidants, minerals, vitamins such as A, C and E, recommended in cholesterol controlling and weight reduction programs. With 7384 mg per 100 g, it is one of the vegetable in the cucurbitaceae family with highest levels of vitamin-A, providing about 246% of RDA. Vitamin A is a powerful natural anti-oxidant and is required by body for maintaining the integrity of skin and mucus membranes. It is also an essential vitamin for vision. Pumpkin leaves are also an excellent source of many natural poly-phenolic flavonoid compounds like alpha and beta carotenes, cryptoxanthin, leutin and zeaxanthin. Zea-xanthin is a natural anti-oxidant, which has UV (ultra-violet) rays filtering actions in the macula lutea in the retina of the eyes; thus, helping protect from age related macular disease (ARMD) in the elderly. Pumpkin leaves are also rich in B-complex group of vitamins like folates, niacin, vitamin B-6 (pyridoxine), thiamin, and pantothenic acid and a rich source of minerals like copper, calcium, potassium, and phosphorus.
• Cassava Leaves: Young cassava leaves are a popular vegetable due to the high content of protein, minerals, and vitamins. According to studies, consumption of
18
400g cassava leaves is equivalent to protein intake of 45 to 50 grams. It contains vitamin A, vitamin B1 vitamin C, calcium, calories, phosphorus, protein, fat, carbohydrate, and iron. Cassava leaves contain 15 to 20 times cyanide compared to roots. But this is easily degraded during cooking.
d. Chickens. Program and interventions involving animal source foods have even greater potential to tackle micronutrient deficiencies, especially vitamin A, Iron and Zinc deficiencies. These micronutrients are more readily bio-available in animal source foods than plan foods. Chicken makes a delicious, flavorful, and nutritious meal. It is no wonder chicken is the world's primary source of animal protein and a healthy alternative to red meat. It is available to enjoy throughout the year.
Chicken is rated as a very good source of protein, providing 67.6% of the daily value for protein in 4 ounces. Chicken provides an alternative source of meat for people who wish to reduce the amount of fat in their meals. The leanest part of the chicken is the chicken breast, which has less than half the fat of a trimmed Choice grade T-bone steak. The fat in chicken is also less saturated than beef fat. However, eating the chicken with the skin doubles the amount of fat and saturated fat in the food. Chicken is a very good source of the cancer-protective B vitamin, niacin. Components of DNA require niacin, and a deficiency of niacin (as well as other B-complex vitamins) has been directly linked to genetic (DNA) damage. A four-ounce serving of chicken provides 72.0% of the daily value for niacin. Chicken is also a good source of the trace mineral, selenium, of fundamental importance to human health. It is an essential component of several major metabolic pathways, including thyroid hormone metabolism, antioxidant defense systems, and immune function. Chicken is not only a very good source of niacin, but is also a good source of vitamin B6. This particular mix of B-complex vitamins makes chicken a helpful food in supporting energy metabolism throughout the body, because these B vitamins are involved as cofactors that help enzymes throughout the body guide metabolic reactions. Both of these B vitamins are important for energy production. In addition to its DNA actions, niacin is essential for the conversion of the body's proteins, fats, and carbohydrates into usable energy. Niacin helps optimize blood sugar regulation via its actions as a component of a molecule called glucose tolerance factor, which optimizes insulin activity. Vitamin B6 is essential for the body's processing of carbohydrate (sugar and starch), especially the breakdown of glycogen, the form in which sugar is stored in muscle cells and to a lesser extent in our liver. In addition to its role in energy metabolism, vitamin B6 plays a pivotal role as a methyl donor in the basic cellular process of methylation, through which methyl groups are transferred from one molecule to another, resulting in the formation of a wide variety of very important active molecules. When levels of B6 are inadequate, the availability of methyl groups is also lessened. One result of the lack of methyl groups is that molecules that would normally be quickly changed into other types of molecules not only do not change, but accumulate. One such molecule, homocysteine, is so damaging to blood vessel walls that high levels are considered a significant risk factor for cardiovascular disease.
19
e. Free Range Eggs. Free range eggs means the chicken was allowed to roam, picking what it wanted to eat. Research has shown that cage-free hens have produce eggs higher in various vitamins. Chickens packaged tightly in cages undergo stress, lowering their immune systems and raising their likelihood of infection. Many times, chickens are given regular antibiotics to help keep down infection rates. These antibiotics may lead to stronger, more resistant bacteria in the feces of the chicken and even in that of the farmer who raises them. This presents two big potential problems for the consumer: 1) antibiotics like sulfa in the chicken that could aggravate drug allergies, and 2) super resistant bugs. Free-range eggs actually show greater resistance to bugs like salmonella. On this account free range eggs offer the best alternative. Eggs are probably one of the most nutritious foods that easily find space on every supermarket shelf round the world. Apart from being inexpensive, they are delicious and packed with a wealth of essential components required by the body. Eggs are a rich source of high-quality protein and amino acids that are indispensable for a healthy body. Eggs are a great source of protein and numerous vitamins, including vitamin A, potassium, and many B vitamins like folic acid, choline, and biotin, are also packed into this oval-shaped staple. In fact, very few foods share the same diverse nutrient makeup available in a single egg. Many of these are specifically needed for the health of the nerves and the brain. Due to the presence of carotenoids like lutein and zeaxanthin, eggs check macular degeneration caused by ageing. Eggs also defend and improve eyesight by preventing diseases like cataract. Due to high vitamin D content, consuming eggs gives rise to strong and healthy bones. Eggs are also rich sources of vitamin E that is important for combating free radicals and ensuring cell protection. Eggs also contain phosphorus that helps in the development of healthy teeth and bones. Iron present in eggs helps in the formation of red blood corpuscles (RBC’s) in the body. Zinc present in eggs aids in normal functioning of the immune system. Consuming eggs prevents different types of cancers, including breast cancer. Due to high sulphur content and presence of many vitamins and minerals, eating eggs helps in the promotion of healthy hair and nails. Chlorine that forms an essential component of eggs, boosts memory power and brain functioning. An important antioxidant called selenium is also found in eggs that curbs damages caused by unrestrained oxidation in the body, and thus prevents blood clots, strokes, and heart attacks. f. Maize. Maize is the most important grain crop in Zambia, being both the major feed grain and the staple food for the majority of the population. Maize has a wide variety of uses that ranges from both human to industrial. Maize meal is a staple food and high volumes are traded monthly. Maize is a rich source of carbohydrates, Vitamin B1, Vitamin B5, and Vitamin C, dietary fibers, proteins, and minerals. Presence of thiamin in maize helps in keeping memory power intact; thereby prevent the dreaded Alzheimer's disease. Folate, a good source of niacin, helps in preventing birth defects and helps in lowering the level of Homocysteine that has the potential of damaging the blood vessels. Humans eat maize or corn in the form of popcorn, porridge, beverage, etc. In terms of industrial usage, the grains of the maize are used in the transformation of plastics and fabrics. Ethanol, produced from maize, is being used as an additive in gas to prevent pollution levels and reduce the use of petroleum. Consumption of corn also prevents the occurrence of lung cancer, as it is rich in beta-cryptoxanthin, an orange-red carotenoid found in corn in large proportion.
g. Groundnuts. Groundnuts are an important source of cheap protein, more than meat and two and half times more protein than that obtainable from eggs. They suffer the
20
misconception of being a fatty food because of the oil content. However, research has shown that its oil is actually nutritious, packed with mono-unsaturated fats. They are also not lacking in antioxidants that help reduce the risk of cancer and heart disease as well as have anti-aging properties contributing to a younger look. Groundnuts provide five main nutrients required by the body in good quantity to maintain and repair the tissues namely food energy, protein, phosphorous, thiamin, and niacin. Groundnuts are also rich vitamins and contain at least 13 different types of vitamins that include Vitamin A, B, C and E. along with this, groundnuts are also rich in 26 essential minerals like calcium, iron, zinc, boron, etc. these help in brain function and development and also help to maintain strong bones. Groundnuts possess healing properties, are easily digested, and serve as a mild laxative. They are also known to boost the immune system. Groundnuts build resistance against such diseases as hepatitis and tuberculosis. In addition, groundnuts and their products are very beneficial in the treatment of hemophilia and other such inherited blood disorders. People suffering from nose bleeding also benefit from eating groundnuts and they are also helpful in reducing excessive menstrual bleeding in women. They have also proven effective in the treatment of obesity. Roasted groundnuts could be taken before lunch. They do a good job in lowering appetite, which could contribute to weight loss. Diabetics should consider groundnuts as a boon because it addresses niacin deficiency. It also minimizes the risk of vascular complications. In the absence of dairy milk or avoiding it for health reasons, groundnut milk can serve as an alternative that is as nutritious as dairy milk. As beneficial as groundnuts are, moderation should be exercised in consumption because in excess could give rise to acidity in the stomach. Excessive should be avoided by asthmatics, much in the same way as in those with gastritis and jaundice as it could lead to indigestion and heartburn. It is recommended that growing children, expecting women and nursing mothers consume roasted groundnuts with. It is said to provide resistance and immunity against dangerous infections like hepatitis and tuberculosis. Groundnuts are rich in anti-oxidants and a chemical called resveratrol. These help in reducing the risk of contracting cardiovascular diseases, cancer risk and help in anti-ageing, thus keeping the body young and fit.
h. Cassava Value Chain. In Luapula and Northern provinces, cassava is the staple food. The major advantage of cassava is that both tubers and leaves are consumed. In addition many products can be made from chips, flour and starch commercial purposes. With the increase in food prices and population trends towards urbanization, many products can be made from cassava, offer interesting nutritious and palatable options for consumers. Low levels of cassava utilization in Zambia clearly show that many households are not aware of the wide range of possible products available for domestic consumption and input into the food industry. Under-utilization of cassava is therefore a limiting factor to increased and sustained production. Cassava is mainly composed of starch (carbohydrates) as the source of energy, fiber, minerals, and vitamins. The tubers have very low protein levels (though of high quality) in comparison with cereals and this forms the common criticism of cassava crop. However, the leaves are richer in protein. Some varieties that have yellow fleshed roots contain β-carotene. In cassava-based farming systems where cassava is the staple food, if the diet is not balanced people, especially children under five years of age are at greater risk of malnutrition. Use of protein rich foods such as groundnuts, soya beans, beans,
21
cowpea, cassava leaves, and kapenta etc. in combination with cassava products overcomes the protein inadequacy. The major challenge for cassava is that of high cyanide content in bitter varieties. The danger of having high levels of cyanide in consumed cassava is that most animal protein is diverted to detoxify cyanide resulting in growth retardation. It is for this reason that cassava should be properly processed to remove the toxins. Despite the low utilization levels, cassava root is utilized in many food preparations in Zambia. The most commonly consumed cassava products include nshima, boiled roots, roasted chips, and leaves. In addition, many other products can be made for household consumption and for sale to increase household income. Eating places such as restaurants and hotels should be encouraged to promote cassava products. Constraints for cassava are manifold, including inadequate accessibility to drying equipment and tools increases post harvest losses, especially during the rainy season and the inability to benefit from higher prices during this period. Low adaptability of improved processing technology due to high capital investments result in low quality cassava chips and loss of value addition. Further, inadequate access to (reliable) water may constrain small scale farmers to explore high value adding processing like starch production and hence limit their income generating opportunities. Inadequate access to capital limits farmers to invest in appropriate processing technology, as a result they are only able to produce low to medium quality chips for local markets. Lastly, cassava is generally perceived a poor man food and hence not sought for by the middle and high income earners (with exception of those who were born in cassava growing areas). Regardless of the constraints, opportunities do abound. These include the promotion of innovative saving and credit systems facilitating access to loans making it possible for farmers to store their cassava instead of being forced to sell immediate after harvesting at low prices. Additionally, the possibility of harvesting the whole year around enables farmers to benefit from seasonal price increases, especially when maize is scarce, resulting in higher returns. Lastly, the deficits in neighbouring countries like the Congo DRC provide ample opportunities for cross border trade and outlets for the farmers’ surpluses.
2.3.3. The Role of Women in the Value Chains and Household and Child Nutrition Women play multiple roles in both agricultural production and nutrition, and interventions that consider trade-offs between their respective roles and their time and labor constraints are more likely to lead to positive outcomes. Successful interventions are more likely to take into account the range of factors that differentially enable or constrain men and women in terms of access to resources like land and services like credit. These influence and often determine their roles as decision makers in the household or community. The significance of gender equity is particularly critical because women’s status and decision-making power directly affect the nutritional status of their children.
2.3.4. Major Policy Environments, Current Initiatives, and Enabling Environments
To achieve the policy objective of reducing poverty and improving income distribution, Zambia has employed a number of policy measures embraced in several documents. In the
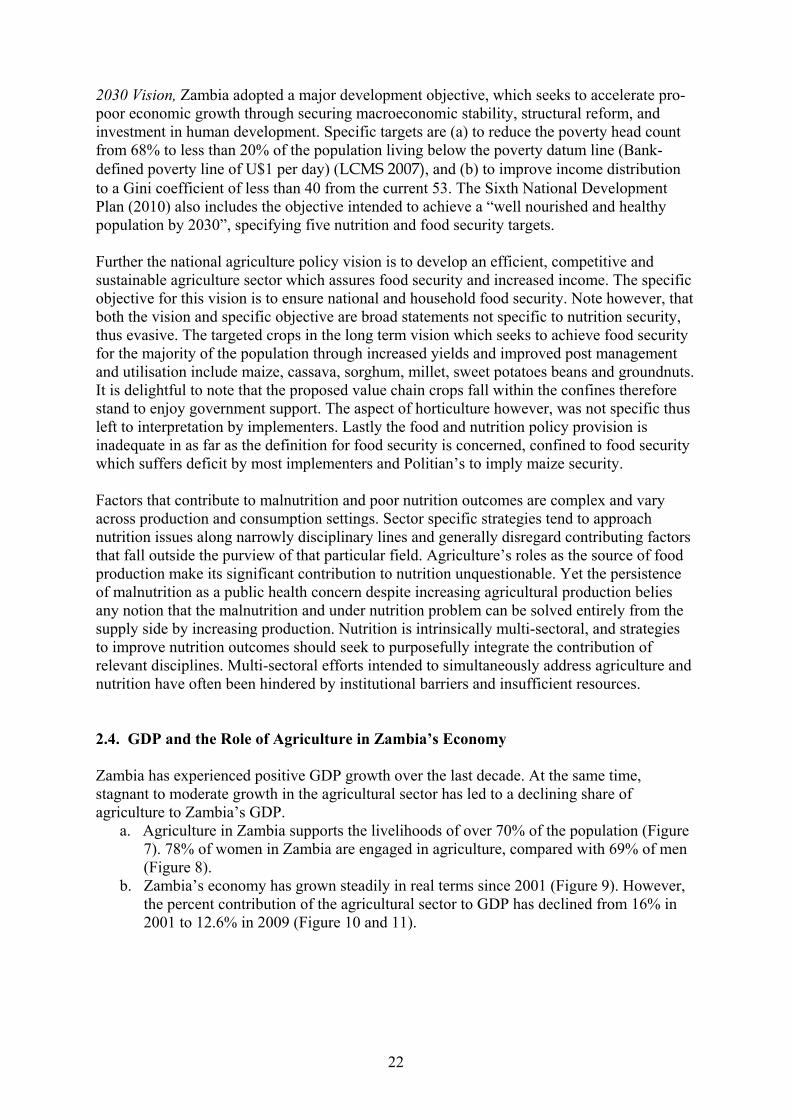
22
2030 Vision, Zambia adopted a major development objective, which seeks to accelerate pro-poor economic growth through securing macroeconomic stability, structural reform, and investment in human development. Specific targets are (a) to reduce the poverty head count from 68% to less than 20% of the population living below the poverty datum line (Bank-defined poverty line of U$1 per day) (LCMS 2007), and (b) to improve income distribution to a Gini coefficient of less than 40 from the current 53. The Sixth National Development Plan (2010) also includes the objective intended to achieve a “well nourished and healthy population by 2030”, specifying five nutrition and food security targets. Further the national agriculture policy vision is to develop an efficient, competitive and sustainable agriculture sector which assures food security and increased income. The specific objective for this vision is to ensure national and household food security. Note however, that both the vision and specific objective are broad statements not specific to nutrition security, thus evasive. The targeted crops in the long term vision which seeks to achieve food security for the majority of the population through increased yields and improved post management and utilisation include maize, cassava, sorghum, millet, sweet potatoes beans and groundnuts. It is delightful to note that the proposed value chain crops fall within the confines therefore stand to enjoy government support. The aspect of horticulture however, was not specific thus left to interpretation by implementers. Lastly the food and nutrition policy provision is inadequate in as far as the definition for food security is concerned, confined to food security which suffers deficit by most implementers and Politian’s to imply maize security. Factors that contribute to malnutrition and poor nutrition outcomes are complex and vary across production and consumption settings. Sector specific strategies tend to approach nutrition issues along narrowly disciplinary lines and generally disregard contributing factors that fall outside the purview of that particular field. Agriculture’s roles as the source of food production make its significant contribution to nutrition unquestionable. Yet the persistence of malnutrition as a public health concern despite increasing agricultural production belies any notion that the malnutrition and under nutrition problem can be solved entirely from the supply side by increasing production. Nutrition is intrinsically multi-sectoral, and strategies to improve nutrition outcomes should seek to purposefully integrate the contribution of relevant disciplines. Multi-sectoral efforts intended to simultaneously address agriculture and nutrition have often been hindered by institutional barriers and insufficient resources. 2.4. GDP and the Role of Agriculture in Zambia’s Economy Zambia has experienced positive GDP growth over the last decade. At the same time, stagnant to moderate growth in the agricultural sector has led to a declining share of agriculture to Zambia’s GDP.
a. Agriculture in Zambia supports the livelihoods of over 70% of the population (Figure 7). 78% of women in Zambia are engaged in agriculture, compared with 69% of men (Figure 8).
b. Zambia’s economy has grown steadily in real terms since 2001 (Figure 9). However, the percent contribution of the agricultural sector to GDP has declined from 16% in 2001 to 12.6% in 2009 (Figure 10 and 11).
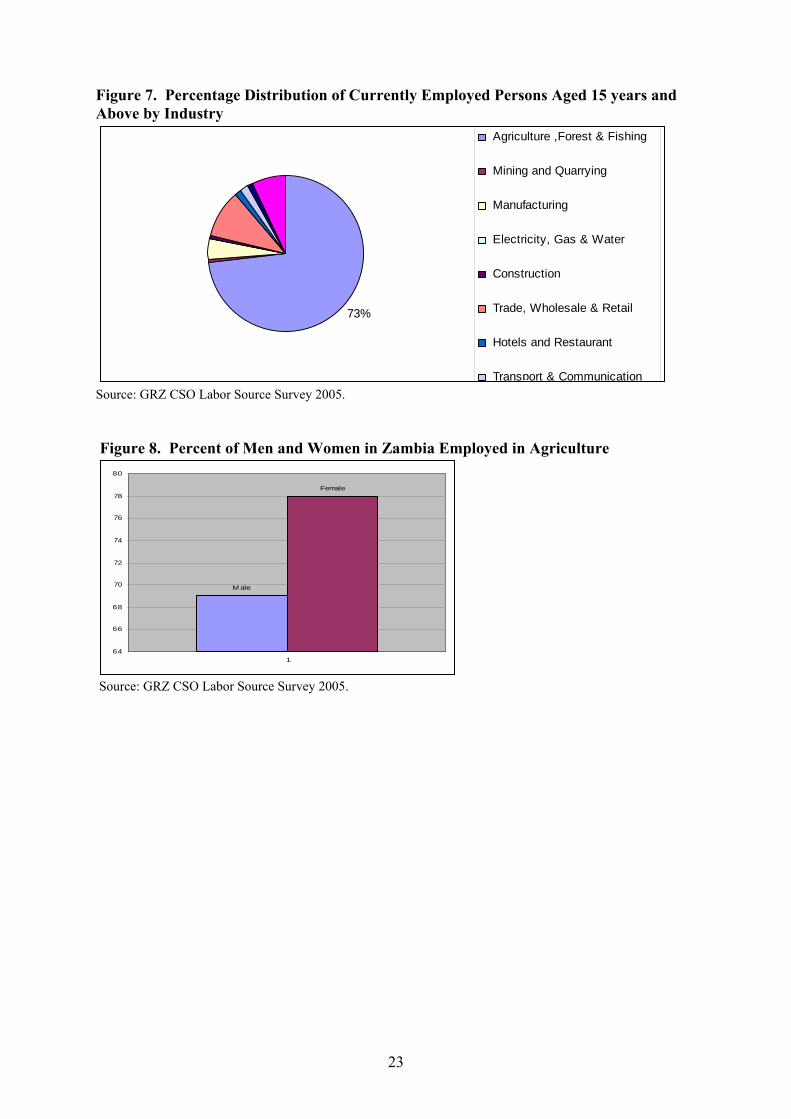
23
Figure 7. Percentage Distribution of Currently Employed Persons Aged 15 years and Above by Industry
73%
Agriculture ,Forest & Fishing
Mining and Quarrying
Manufacturing
Electricity, Gas & Water
Construction
Trade, Wholesale & Retail
Hotels and Restaurant
Transport & Communication Source: GRZ CSO Labor Source Survey 2005. Figure 8. Percent of Men and Women in Zambia Employed in Agriculture
M ale
Female
64
66
68
70
72
74
76
78
80
1
Source: GRZ CSO Labor Source Survey 2005.
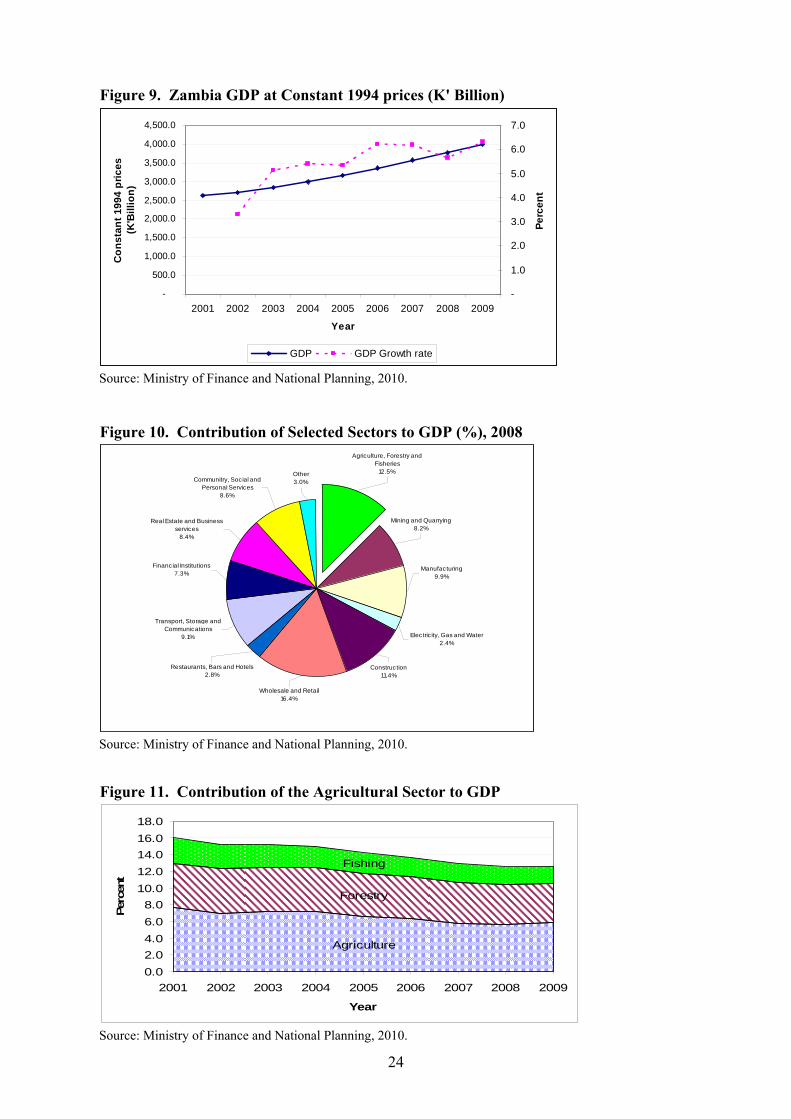
24
Figure 9. Zambia GDP at Constant 1994 prices (K' Billion)
-
500.0
1,000.0
1,500.0
2,000.0
2,500.0
3,000.0
3,500.0
4,000.0
4,500.0
2001 2002 2003 2004 2005 2006 2007 2008 2009
Year
Con
stan
t 199
4 pr
ices
(K
'Bill
ion)
-
1.0
2.0
3.0
4.0
5.0
6.0
7.0
Perc
ent
GDP GDP Growth rate
Source: Ministry of Finance and National Planning, 2010. Figure 10. Contribution of Selected Sectors to GDP (%), 2008
Agriculture, Forestry and Fisheries
12.5%
Mining and Quarrying8.2%
Manufacturing9.9%
Electric ity, Gas and Water2.4%
Construction11.4%
Wholesale and Retail16.4%
Restaurants, Bars and Hotels2.8%
Transport, Storage and Communications
9.1%
Financial Institutions7.3%
Real Estate and Business services
8.4%
Communitry, Social and Personal Services
8.6%
Other3.0%
Source: Ministry of Finance and National Planning, 2010. Figure 11. Contribution of the Agricultural Sector to GDP
Agriculture
Forestry
Fishing
0.02.04.06.08.0
10.012.014.016.018.0
2001 2002 2003 2004 2005 2006 2007 2008 2009
Year
Perc
ent
Source: Ministry of Finance and National Planning, 2010.
25
2.5. Challenge of Integrating Women into Commercial Agriculture Empirical evidence from Zambia suggests that gender inequalities can slow down economic growth and poverty reduction (GTZ 2008).
a. According to the World Bank Strategic Country Gender Assessment for Zambia, women provide 70% of the country’s agricultural labor (World Bank 2004).
b. Women are often disproportionately excluded from resource access, decision-making processes, and are less privileged beneficiaries of public service, such as extension services.
c. Women farmers more often than men produce agricultural products to meet household consumption needs, which limits their ability to generate an income from agricultural production and marketing.
d. According to the World Bank: if women enjoyed the same overall degree of capital investment in agricultural inputs, including land, output in Zambia could increase up to 15%
e. Zambia has generated a National Gender Policy, created a Gender in Development Division (GIDD), and assigned a Gender Focal Point within the Ministry of Agriculture and Cooperatives. However, these policies and positions have very little visibility, financing, or training to make meaningful changes on the ground.
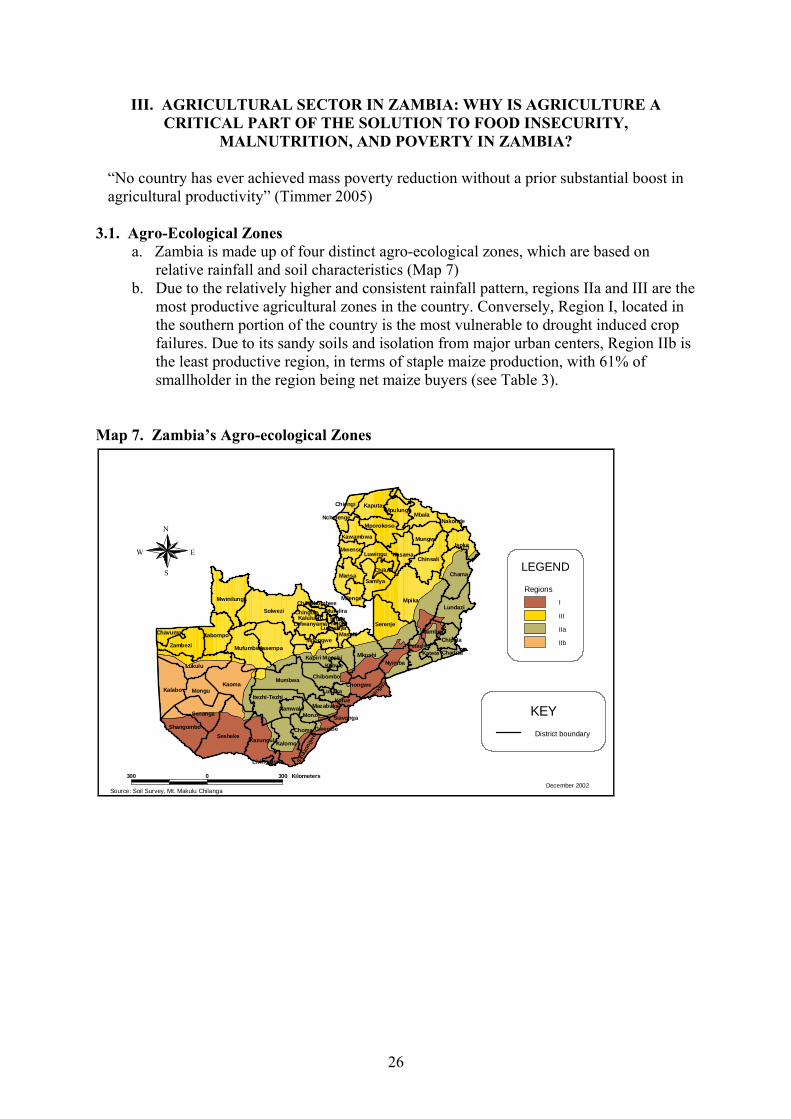
26
III. AGRICULTURAL SECTOR IN ZAMBIA: WHY IS AGRICULTURE A CRITICAL PART OF THE SOLUTION TO FOOD INSECURITY,
MALNUTRITION, AND POVERTY IN ZAMBIA? “No country has ever achieved mass poverty reduction without a prior substantial boost in agricultural productivity” (Timmer 2005)
3.1. Agro-Ecological Zones
a. Zambia is made up of four distinct agro-ecological zones, which are based on relative rainfall and soil characteristics (Map 7)
b. Due to the relatively higher and consistent rainfall pattern, regions IIa and III are the most productive agricultural zones in the country. Conversely, Region I, located in the southern portion of the country is the most vulnerable to drought induced crop failures. Due to its sandy soils and isolation from major urban centers, Region IIb is the least productive region, in terms of staple maize production, with 61% of smallholder in the region being net maize buyers (see Table 3).
Map 7. Zambia’s Agro-ecological Zones
KaputaChiengiMpulungu
MbalaNakondeNchelenge
Mporokoso
Kawambwa MungwiIsoka
ChinsaliKasama
MwenseLuwingu
ChamaMansaChilubi
Samfya
MpikaMwinilunga MilengeLundaziSolwezi
Serenje
ChililabombweChingola Mufulira
Lufwanyama
Kabompo
Kalulushi KitweNdola
Masaiti Mambwe
Kasempa
Luanshya
MufumbweChipata
Zambezi
Chavuma
Mkushi
MpongwePetauke
Kapiri MposhiKatete Chadiza
NyimbaLukulu
KaomaMumbwa
Kalabo
Kabwe
ChibomboChongwe
MonguLua
ngwa
KafueLusaka
Itezhi-Tezhi
SenangaMazabuka
Sesheke
NamwalaMonze Siavonga
Shangombo
Kazungula
Choma
Kalomo
Gwembe
Sina
zong
we
Livingstone
300 0 300 Kilometers
N
EW
S
RegionsI
III
IIa
IIb
LEGEND
District boundary
KEY
Source: Soil Survey, Mt. Makulu ChilangaDecember 2002
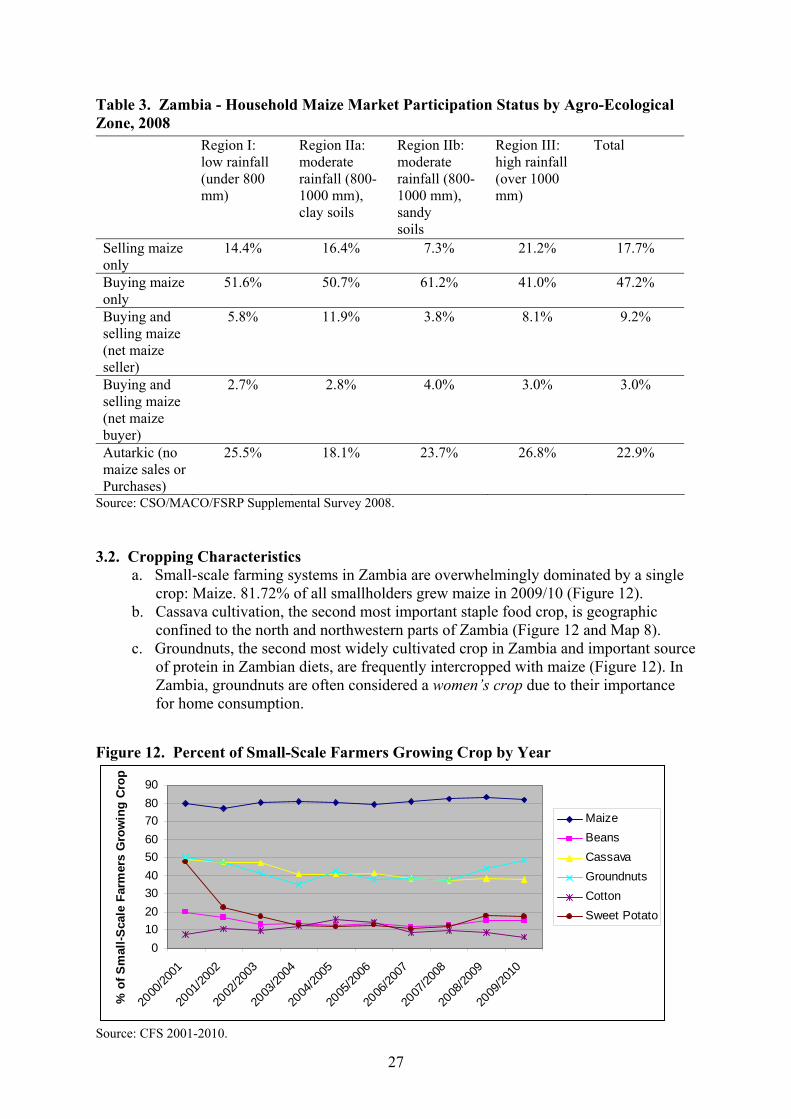
27
Table 3. Zambia - Household Maize Market Participation Status by Agro-Ecological Zone, 2008 Region I:
low rainfall (under 800 mm)
Region IIa: moderate rainfall (800- 1000 mm), clay soils
Region IIb: moderate rainfall (800- 1000 mm), sandy soils
Region III: high rainfall (over 1000 mm)
Total
Selling maize only
14.4%
16.4% 7.3% 21.2% 17.7%
Buying maize only
51.6% 50.7% 61.2% 41.0% 47.2%
Buying and selling maize (net maize seller)
5.8% 11.9% 3.8% 8.1% 9.2%
Buying and selling maize (net maize buyer)
2.7% 2.8% 4.0% 3.0% 3.0%
Autarkic (no maize sales or Purchases)
25.5% 18.1% 23.7% 26.8% 22.9%
Source: CSO/MACO/FSRP Supplemental Survey 2008. 3.2. Cropping Characteristics
a. Small-scale farming systems in Zambia are overwhelmingly dominated by a single crop: Maize. 81.72% of all smallholders grew maize in 2009/10 (Figure 12).
b. Cassava cultivation, the second most important staple food crop, is geographic confined to the north and northwestern parts of Zambia (Figure 12 and Map 8).
c. Groundnuts, the second most widely cultivated crop in Zambia and important source of protein in Zambian diets, are frequently intercropped with maize (Figure 12). In Zambia, groundnuts are often considered a women’s crop due to their importance for home consumption.
Figure 12. Percent of Small-Scale Farmers Growing Crop by Year
0102030405060708090
2000
/2001
2001
/2002
2002
/2003
2003
/2004
2004
/2005
2005
/2006
2006
/2007
2007
/2008
2008
/2009
2009
/2010
% o
f Sm
all-S
cale
Far
mer
s G
row
ing
Cro
p
MaizeBeansCassavaGroundnutsCottonSweet Potato
Source: CFS 2001-2010.
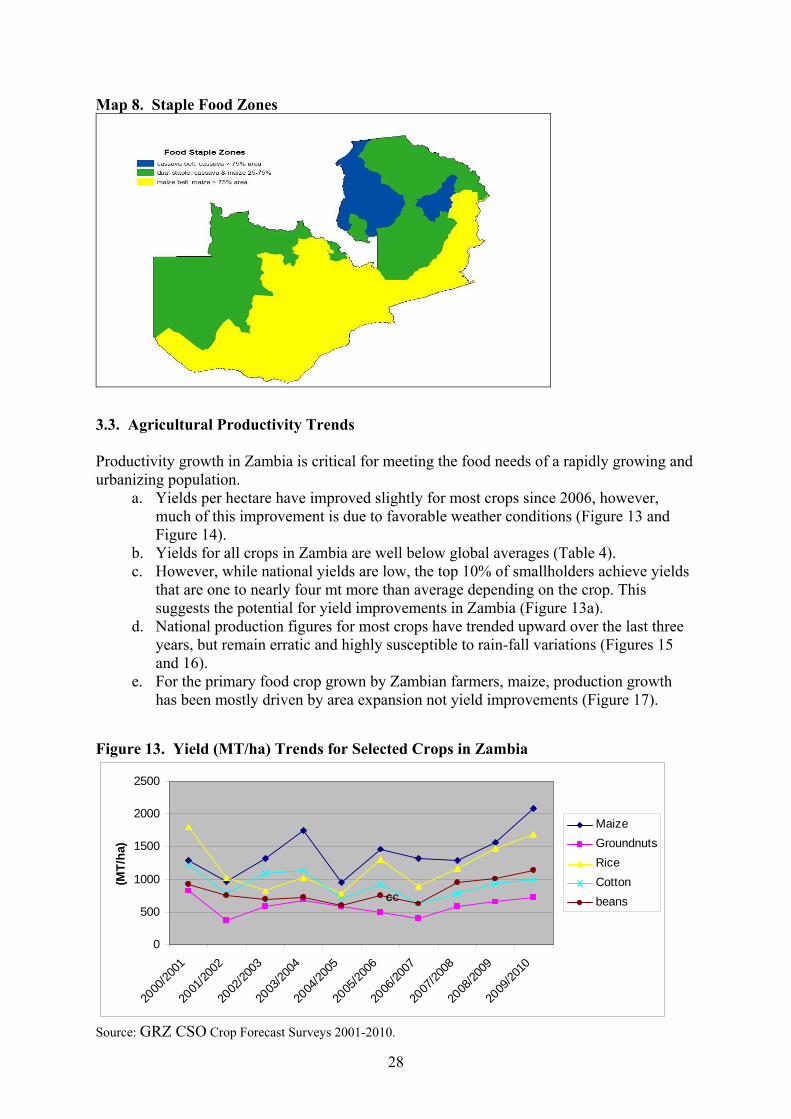
28
Map 8. Staple Food Zones
3.3. Agricultural Productivity Trends Productivity growth in Zambia is critical for meeting the food needs of a rapidly growing and urbanizing population.
a. Yields per hectare have improved slightly for most crops since 2006, however, much of this improvement is due to favorable weather conditions (Figure 13 and Figure 14).
b. Yields for all crops in Zambia are well below global averages (Table 4). c. However, while national yields are low, the top 10% of smallholders achieve yields
that are one to nearly four mt more than average depending on the crop. This suggests the potential for yield improvements in Zambia (Figure 13a).
d. National production figures for most crops have trended upward over the last three years, but remain erratic and highly susceptible to rain-fall variations (Figures 15 and 16).
e. For the primary food crop grown by Zambian farmers, maize, production growth has been mostly driven by area expansion not yield improvements (Figure 17).
Figure 13. Yield (MT/ha) Trends for Selected Crops in Zambia
0
500
1000
1500
2000
2500
2000
/2001
2001
/2002
2002
/2003
2003
/2004
2004
/2005
2005
/2006
2006
/2007
2007
/2008
2008
/2009
2009
/2010
(MT/
ha)
MaizeGroundnutsRiceCottonbeansccc
Source: GRZ CSO Crop Forecast Surveys 2001-2010.
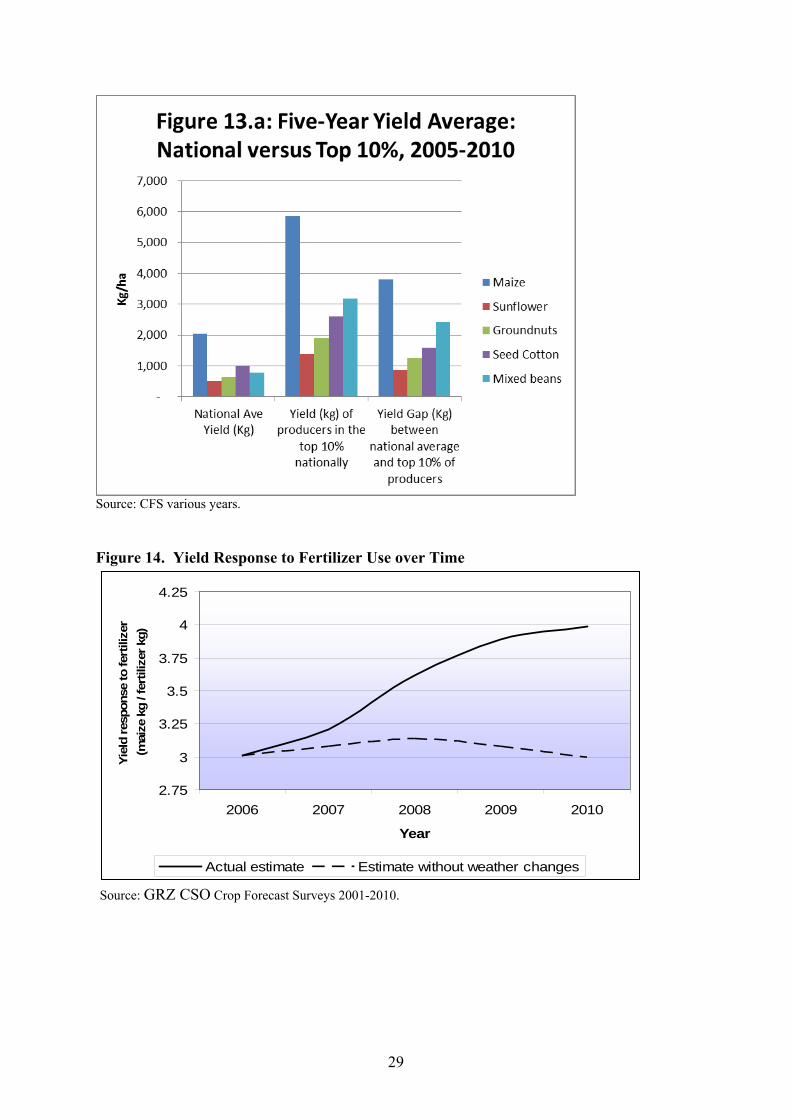
29
Source: CFS various years. Figure 14. Yield Response to Fertilizer Use over Time
Source: GRZ CSO Crop Forecast Surveys 2001-2010.
2.75
3
3.25
3.5
3.75
4
4.25
2006 2007 2008 2009 2010
Year
Yiel
d re
spon
se to
fert
ilize
r (m
aize
kg
/ fer
tiliz
er k
g)
Actual estimate Estimate without weather changes
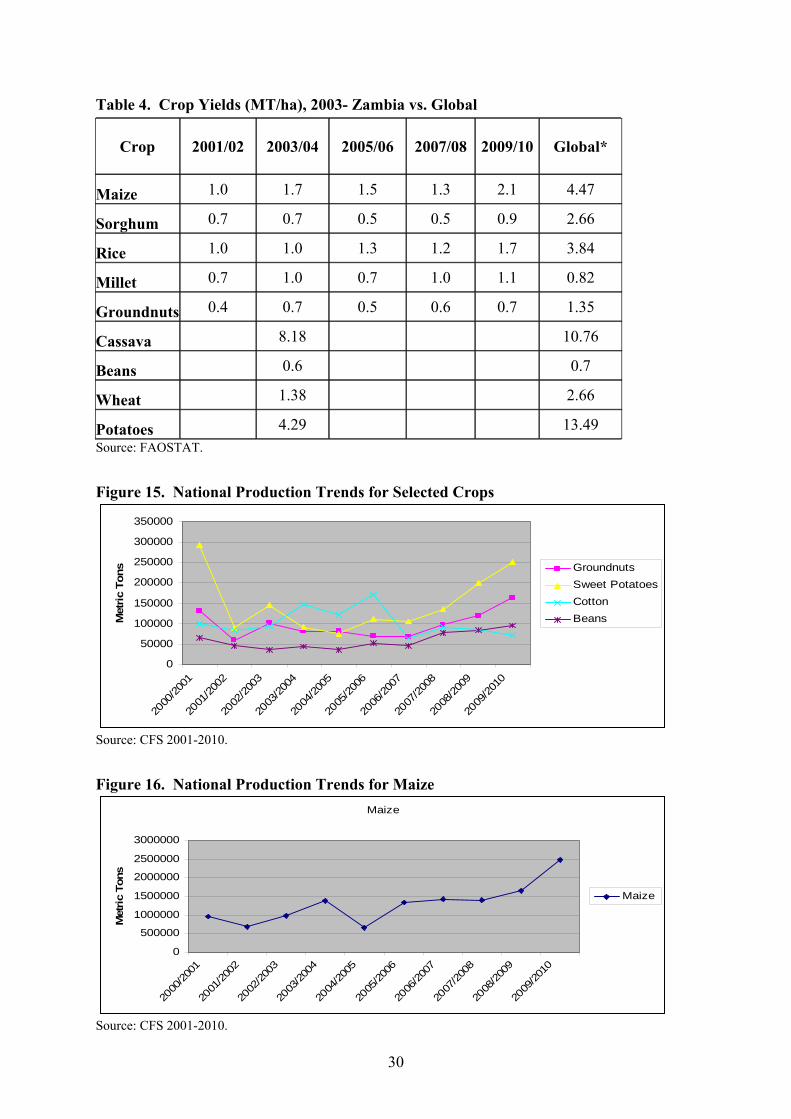
30
Table 4. Crop Yields (MT/ha), 2003- Zambia vs. Global
Crop
2001/02
2003/04
2005/06
2007/08
2009/10
Global*
Maize 1.0 1.7 1.5 1.3 2.1 4.47
Sorghum 0.7 0.7 0.5 0.5 0.9 2.66
Rice 1.0 1.0 1.3 1.2 1.7 3.84
Millet 0.7 1.0 0.7 1.0 1.1 0.82
Groundnuts 0.4 0.7 0.5 0.6 0.7 1.35
Cassava 8.18 10.76
Beans 0.6 0.7
Wheat 1.38 2.66
Potatoes 4.29 13.49 Source: FAOSTAT. Figure 15. National Production Trends for Selected Crops
0
50000
100000
150000
200000
250000
300000
350000
2000
/2001
2001
/2002
2002
/2003
2003
/2004
2004
/2005
2005
/2006
2006
/2007
2007
/2008
2008
/2009
2009
/2010
Met
ric T
ons Groundnuts
Sweet PotatoesCottonBeans
Source: CFS 2001-2010. Figure 16. National Production Trends for Maize
Maize
0
500000
1000000
1500000
2000000
2500000
3000000
2000
/2001
2001
/2002
2002
/2003
2003
/2004
2004
/2005
2005
/2006
2006
/2007
2007
/2008
2008
/2009
2009
/2010
Met
ric
Tons
Maize
Source: CFS 2001-2010.
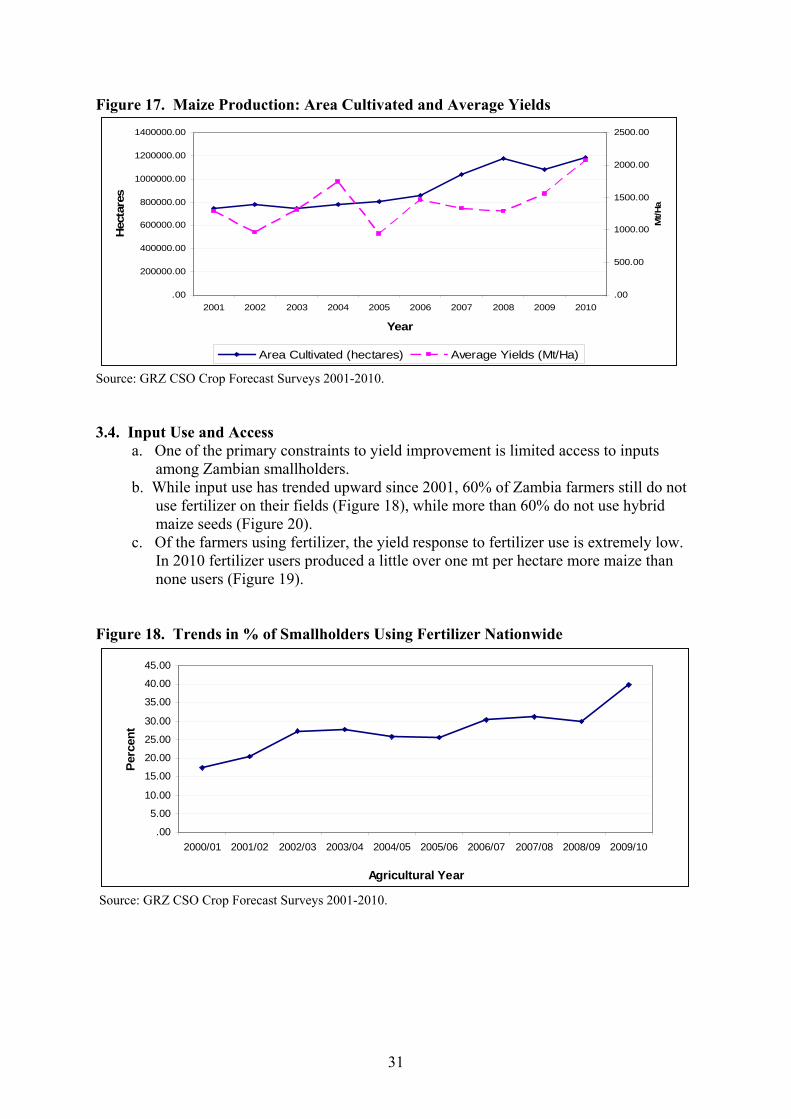
31
Figure 17. Maize Production: Area Cultivated and Average Yields
.00
200000.00
400000.00
600000.00
800000.00
1000000.00
1200000.00
1400000.00
2001 2002 2003 2004 2005 2006 2007 2008 2009 2010
Year
Hec
tare
s
.00
500.00
1000.00
1500.00
2000.00
2500.00
Mt/H
a
Area Cultivated (hectares) Average Yields (Mt/Ha)
Source: GRZ CSO Crop Forecast Surveys 2001-2010. 3.4. Input Use and Access
a. One of the primary constraints to yield improvement is limited access to inputs among Zambian smallholders.
b. While input use has trended upward since 2001, 60% of Zambia farmers still do not use fertilizer on their fields (Figure 18), while more than 60% do not use hybrid maize seeds (Figure 20).
c. Of the farmers using fertilizer, the yield response to fertilizer use is extremely low. In 2010 fertilizer users produced a little over one mt per hectare more maize than none users (Figure 19).
Figure 18. Trends in % of Smallholders Using Fertilizer Nationwide
.00
5.00
10.00
15.00
20.00
25.00
30.00
35.00
40.00
45.00
2000/01 2001/02 2002/03 2003/04 2004/05 2005/06 2006/07 2007/08 2008/09 2009/10
Agricultural Year
Perc
ent
Source: GRZ CSO Crop Forecast Surveys 2001-2010.
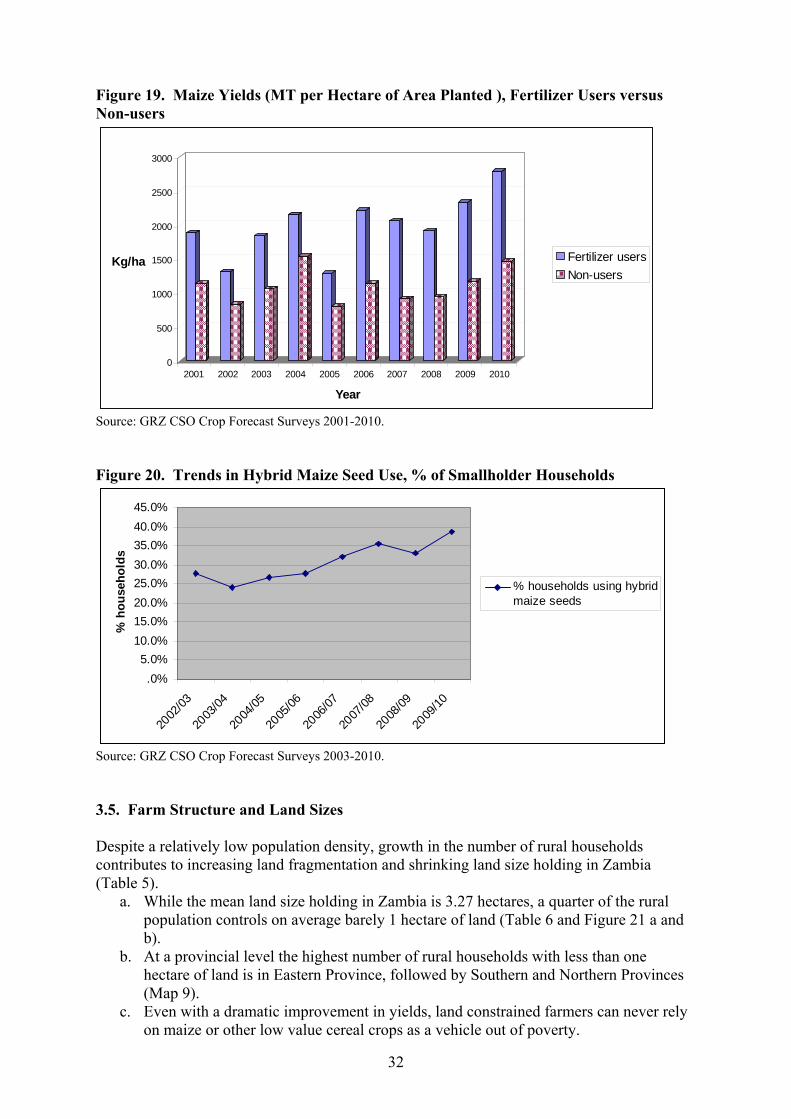
32
Figure 19. Maize Yields (MT per Hectare of Area Planted ), Fertilizer Users versus Non-users
0
500
1000
1500
2000
2500
3000
Kg/ha
2001 2002 2003 2004 2005 2006 2007 2008 2009 2010
Year
Fertilizer usersNon-users
Source: GRZ CSO Crop Forecast Surveys 2001-2010. Figure 20. Trends in Hybrid Maize Seed Use, % of Smallholder Households
.0%5.0%
10.0%15.0%20.0%25.0%30.0%35.0%40.0%45.0%
2002
/03
2003
/04
2004
/05
2005
/06
2006
/07
2007
/08
2008
/09
2009
/10
% h
ouse
hold
s
% households using hybridmaize seeds
Source: GRZ CSO Crop Forecast Surveys 2003-2010.
3.5. Farm Structure and Land Sizes Despite a relatively low population density, growth in the number of rural households contributes to increasing land fragmentation and shrinking land size holding in Zambia (Table 5).
a. While the mean land size holding in Zambia is 3.27 hectares, a quarter of the rural population controls on average barely 1 hectare of land (Table 6 and Figure 21 a and b).
b. At a provincial level the highest number of rural households with less than one hectare of land is in Eastern Province, followed by Southern and Northern Provinces (Map 9).
c. Even with a dramatic improvement in yields, land constrained farmers can never rely on maize or other low value cereal crops as a vehicle out of poverty.
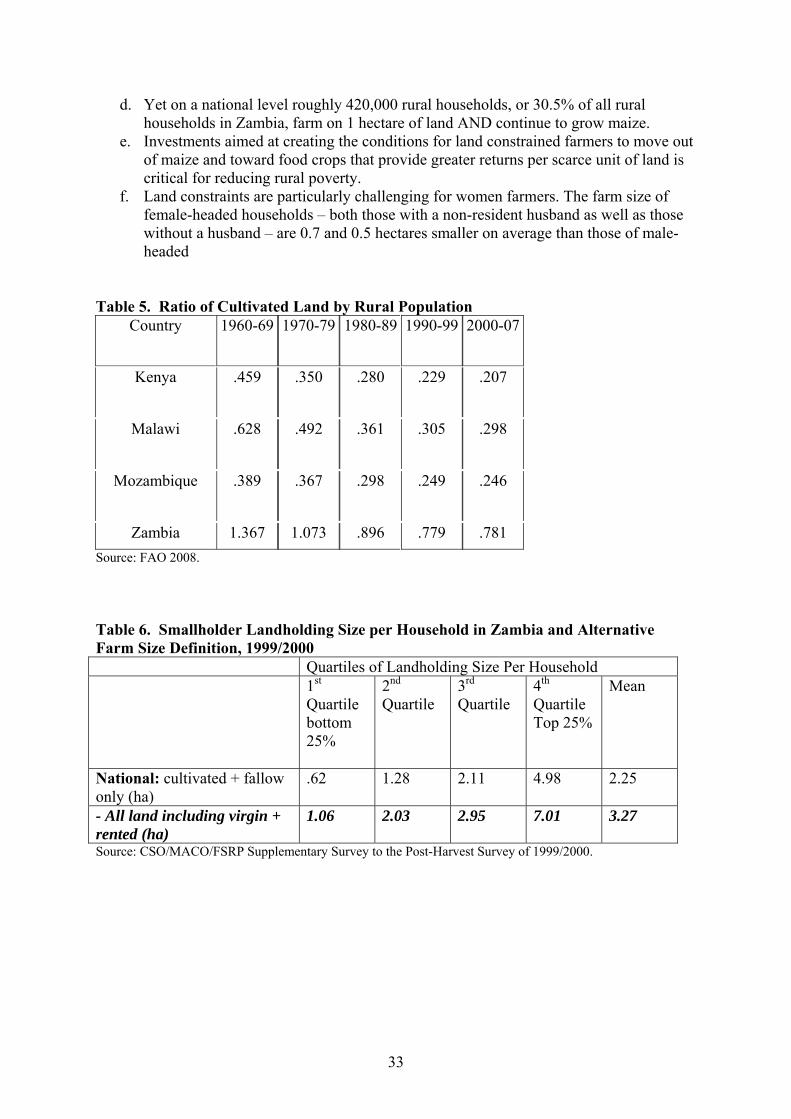
33
d. Yet on a national level roughly 420,000 rural households, or 30.5% of all rural households in Zambia, farm on 1 hectare of land AND continue to grow maize.
e. Investments aimed at creating the conditions for land constrained farmers to move out of maize and toward food crops that provide greater returns per scarce unit of land is critical for reducing rural poverty.
f. Land constraints are particularly challenging for women farmers. The farm size of female-headed households – both those with a non-resident husband as well as those without a husband – are 0.7 and 0.5 hectares smaller on average than those of male-headed
Table 5. Ratio of Cultivated Land by Rural Population Country 1960-69 1970-79 1980-89 1990-99 2000-07
Kenya .459 .350 .280 .229 .207
Malawi .628 .492 .361 .305 .298
Mozambique .389 .367 .298 .249 .246
Zambia 1.367 1.073 .896 .779 .781 Source: FAO 2008. Table 6. Smallholder Landholding Size per Household in Zambia and Alternative Farm Size Definition, 1999/2000 Quartiles of Landholding Size Per Household 1st
Quartile bottom 25%
2nd Quartile
3rd Quartile
4th Quartile Top 25%
Mean
National: cultivated + fallow only (ha)
.62 1.28 2.11 4.98 2.25
- All land including virgin + rented (ha)
1.06 2.03 2.95 7.01 3.27
Source: CSO/MACO/FSRP Supplementary Survey to the Post-Harvest Survey of 1999/2000.
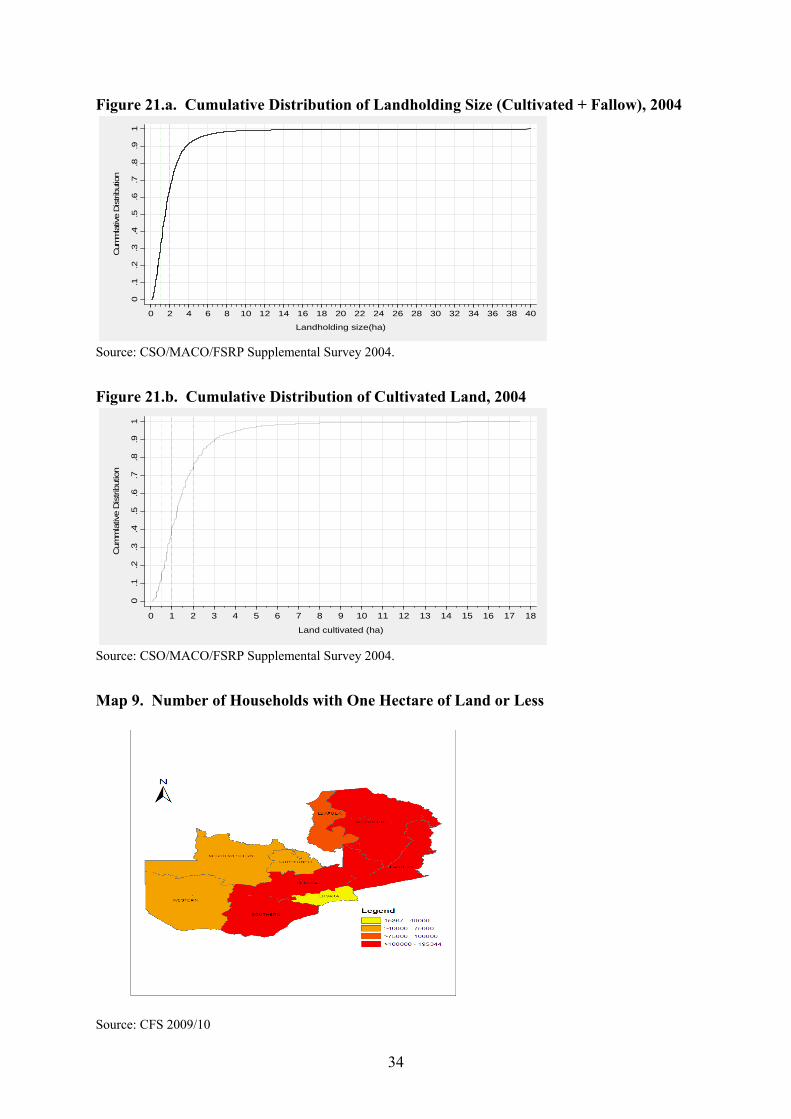
34
Figure 21.a. Cumulative Distribution of Landholding Size (Cultivated + Fallow), 2004
0.1
.2.3
.4.5
.6.7
.8.9
1
Cum
mla
tive
Dis
tribu
tion
0 2 4 6 8 10 12 14 16 18 20 22 24 26 28 30 32 34 36 38 40
Landholding size(ha)
Source: CSO/MACO/FSRP Supplemental Survey 2004. Figure 21.b. Cumulative Distribution of Cultivated Land, 2004
0.1
.2.3
.4.5
.6.7
.8.9
1
Cum
mla
tive
Dis
tribu
tion
0 1 2 3 4 5 6 7 8 9 10 11 12 13 14 15 16 17 18
Land cultivated (ha)
Source: CSO/MACO/FSRP Supplemental Survey 2004. Map 9. Number of Households with One Hectare of Land or Less
Source: CFS 2009/10
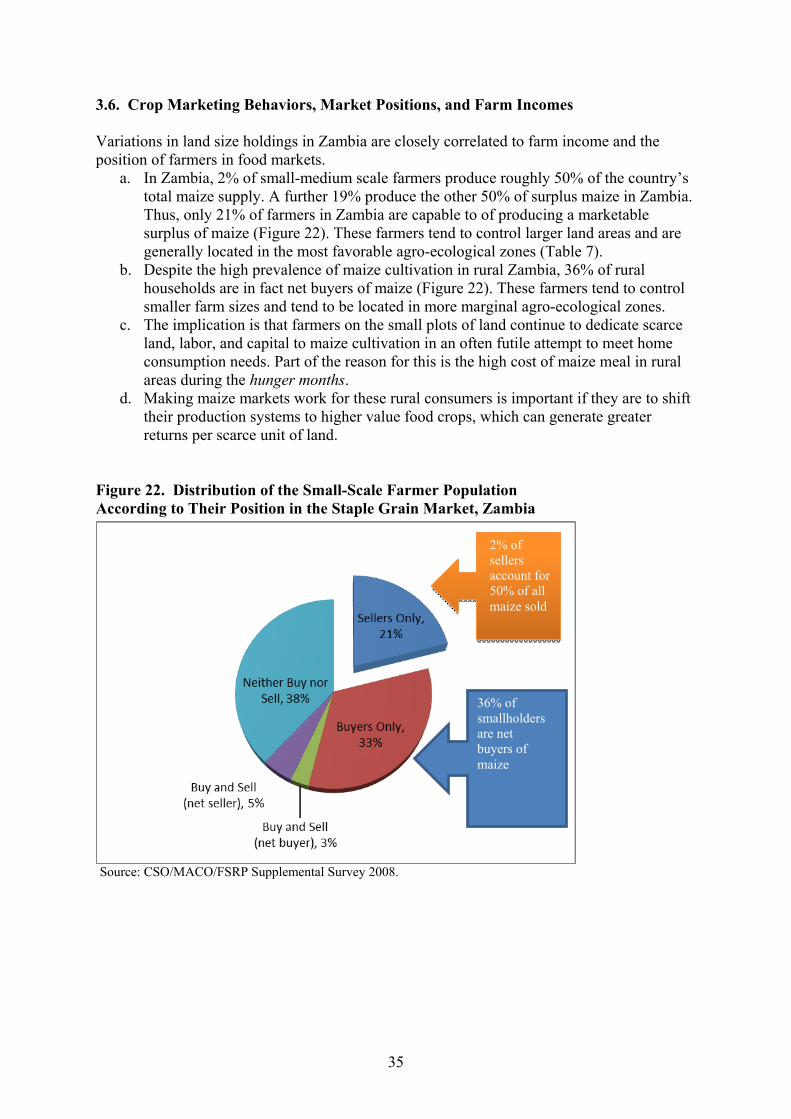
35
3.6. Crop Marketing Behaviors, Market Positions, and Farm Incomes Variations in land size holdings in Zambia are closely correlated to farm income and the position of farmers in food markets.
a. In Zambia, 2% of small-medium scale farmers produce roughly 50% of the country’s total maize supply. A further 19% produce the other 50% of surplus maize in Zambia. Thus, only 21% of farmers in Zambia are capable to of producing a marketable surplus of maize (Figure 22). These farmers tend to control larger land areas and are generally located in the most favorable agro-ecological zones (Table 7).
b. Despite the high prevalence of maize cultivation in rural Zambia, 36% of rural households are in fact net buyers of maize (Figure 22). These farmers tend to control smaller farm sizes and tend to be located in more marginal agro-ecological zones.
c. The implication is that farmers on the small plots of land continue to dedicate scarce land, labor, and capital to maize cultivation in an often futile attempt to meet home consumption needs. Part of the reason for this is the high cost of maize meal in rural areas during the hunger months.
d. Making maize markets work for these rural consumers is important if they are to shift their production systems to higher value food crops, which can generate greater returns per scarce unit of land.
Figure 22. Distribution of the Small-Scale Farmer Population According to Their Position in the Staple Grain Market, Zambia
Source: CSO/MACO/FSRP Supplemental Survey 2008.
2% of sellers account for 50% of all maize sold
36% of smallholders are net buyers of maize
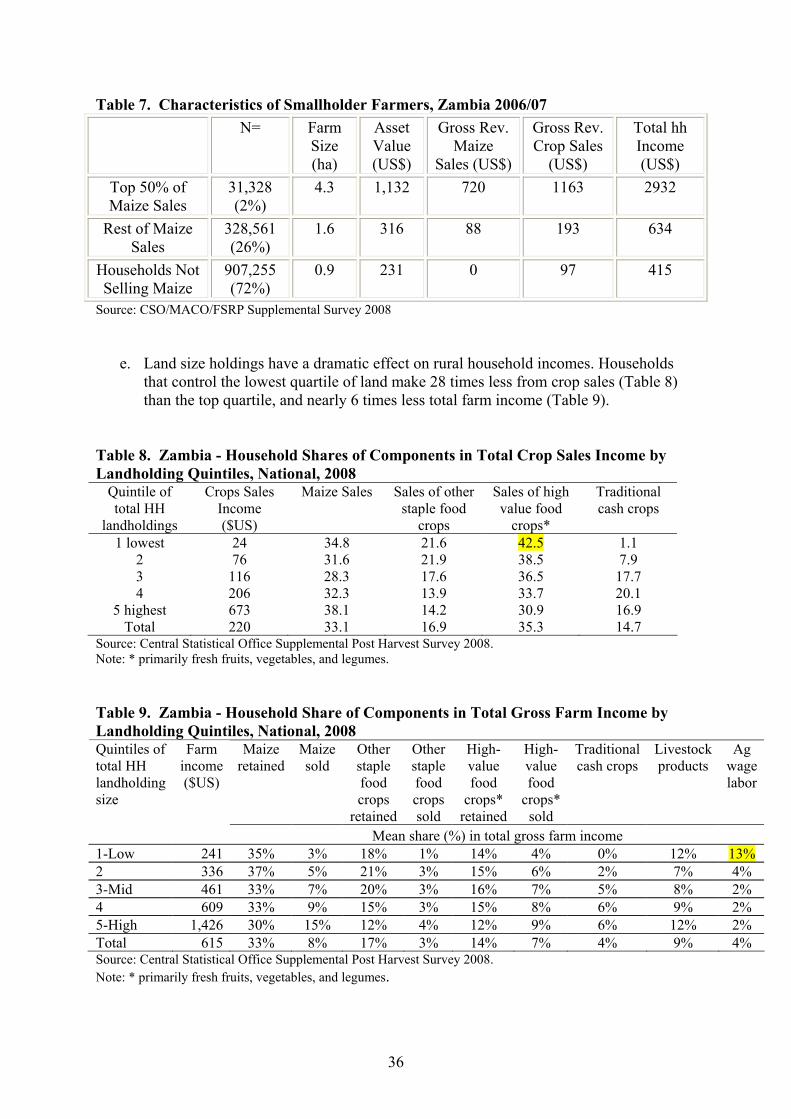
36
Table 7. Characteristics of Smallholder Farmers, Zambia 2006/07 N= Farm
Size (ha)
Asset Value (US$)
Gross Rev. Maize
Sales (US$)
Gross Rev. Crop Sales
(US$)
Total hh Income (US$)
Top 50% of Maize Sales
31,328 (2%)
4.3 1,132 720 1163 2932
Rest of Maize Sales
328,561 (26%)
1.6 316 88 193 634
Households Not Selling Maize
907,255 (72%)
0.9 231 0 97 415
Source: CSO/MACO/FSRP Supplemental Survey 2008
e. Land size holdings have a dramatic effect on rural household incomes. Households that control the lowest quartile of land make 28 times less from crop sales (Table 8) than the top quartile, and nearly 6 times less total farm income (Table 9).
Table 8. Zambia - Household Shares of Components in Total Crop Sales Income by Landholding Quintiles, National, 2008
Quintile of total HH
landholdings
Crops Sales Income ($US)
Maize Sales Sales of other staple food
crops
Sales of high value food
crops*
Traditional cash crops
1 lowest 24 34.8 21.6 42.5 1.1 2 76 31.6 21.9 38.5 7.9 3 116 28.3 17.6 36.5 17.7 4 206 32.3 13.9 33.7 20.1
5 highest 673 38.1 14.2 30.9 16.9 Total 220 33.1 16.9 35.3 14.7
Source: Central Statistical Office Supplemental Post Harvest Survey 2008. Note: * primarily fresh fruits, vegetables, and legumes. Table 9. Zambia - Household Share of Components in Total Gross Farm Income by Landholding Quintiles, National, 2008
Maize retained
Maize sold
Other staple food crops
retained
Other staple food crops sold
High-value food
crops* retained
High-value food
crops* sold
Traditional cash crops
Livestock products
Ag wage labor
Quintiles of total HH landholding size
Farm income ($US)
Mean share (%) in total gross farm income 1-Low 241 35% 3% 18% 1% 14% 4% 0% 12% 13% 2 336 37% 5% 21% 3% 15% 6% 2% 7% 4% 3-Mid 461 33% 7% 20% 3% 16% 7% 5% 8% 2% 4 609 33% 9% 15% 3% 15% 8% 6% 9% 2% 5-High 1,426 30% 15% 12% 4% 12% 9% 6% 12% 2% Total 615 33% 8% 17% 3% 14% 7% 4% 9% 4% Source: Central Statistical Office Supplemental Post Harvest Survey 2008. Note: * primarily fresh fruits, vegetables, and legumes.
37
f. The highest share of the income from crop sales generated by the most land poor is from high value food cops, particularly fruits and vegetables (Table 8). Thus improving the productivity of vegetable cultivation and the market linkages between land constrained farmers and urban consumers is a critical intervention area for lowering and stabilizing the cost of vegetables for urban consumer, while raising returns for the poorest farmers.
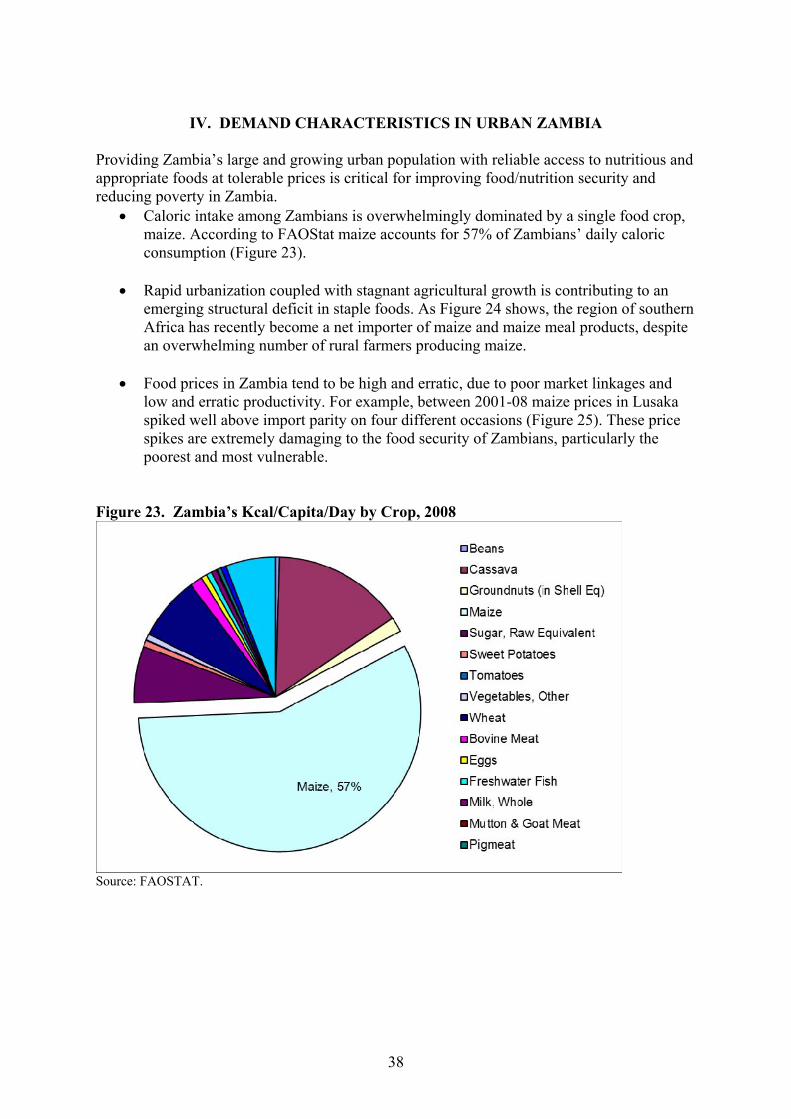
38
IV. DEMAND CHARACTERISTICS IN URBAN ZAMBIA
Providing Zambia’s large and growing urban population with reliable access to nutritious and appropriate foods at tolerable prices is critical for improving food/nutrition security and reducing poverty in Zambia.
• Caloric intake among Zambians is overwhelmingly dominated by a single food crop, maize. According to FAOStat maize accounts for 57% of Zambians’ daily caloric consumption (Figure 23).
• Rapid urbanization coupled with stagnant agricultural growth is contributing to an
emerging structural deficit in staple foods. As Figure 24 shows, the region of southern Africa has recently become a net importer of maize and maize meal products, despite an overwhelming number of rural farmers producing maize.
• Food prices in Zambia tend to be high and erratic, due to poor market linkages and
low and erratic productivity. For example, between 2001-08 maize prices in Lusaka spiked well above import parity on four different occasions (Figure 25). These price spikes are extremely damaging to the food security of Zambians, particularly the poorest and most vulnerable.
Figure 23. Zambia’s Kcal/Capita/Day by Crop, 2008
Source: FAOSTAT.
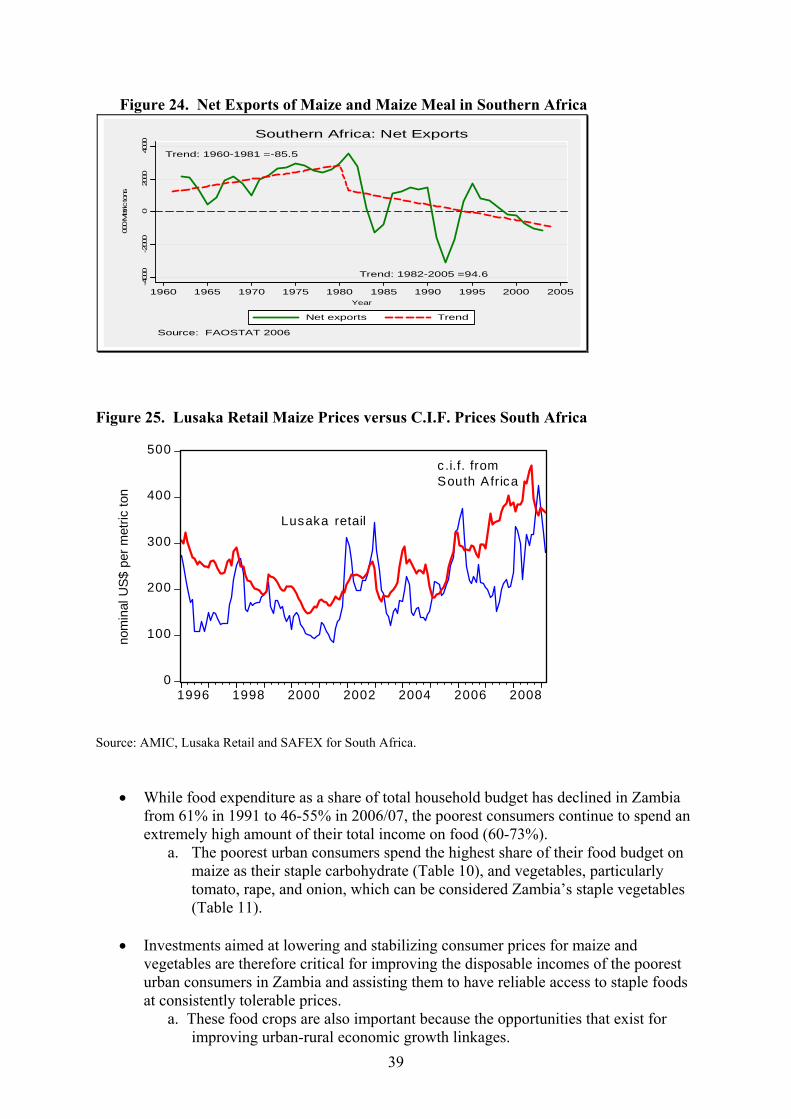
39
Figure 24. Net Exports of Maize and Maize Meal in Southern Africa
Trend: 1960-1981 =-85.5
Trend: 1982-2005 =94.6
-400
0-2
000
020
0040
00
000 M
etric
tons
1960 1965 1970 1975 1980 1985 1990 1995 2000 2005Year
Net exports Trend
Source: FAOSTAT 2006
Southern Africa: Net Exports
Figure 25. Lusaka Retail Maize Prices versus C.I.F. Prices South Africa
S Source: AMIC, Lusaka Retail and SAFEX for South Africa.
• While food expenditure as a share of total household budget has declined in Zambia from 61% in 1991 to 46-55% in 2006/07, the poorest consumers continue to spend an extremely high amount of their total income on food (60-73%).
a. The poorest urban consumers spend the highest share of their food budget on maize as their staple carbohydrate (Table 10), and vegetables, particularly tomato, rape, and onion, which can be considered Zambia’s staple vegetables (Table 11).
• Investments aimed at lowering and stabilizing consumer prices for maize and
vegetables are therefore critical for improving the disposable incomes of the poorest urban consumers in Zambia and assisting them to have reliable access to staple foods at consistently tolerable prices.
a. These food crops are also important because the opportunities that exist for improving urban-rural economic growth linkages.
0
100
200
300
400
500
1996 1998 2000 2002 2004 2006 2008
Lusaka retail
c .i.f. fromSouth Africa
nom
inal
US$
per
met
ric to
n
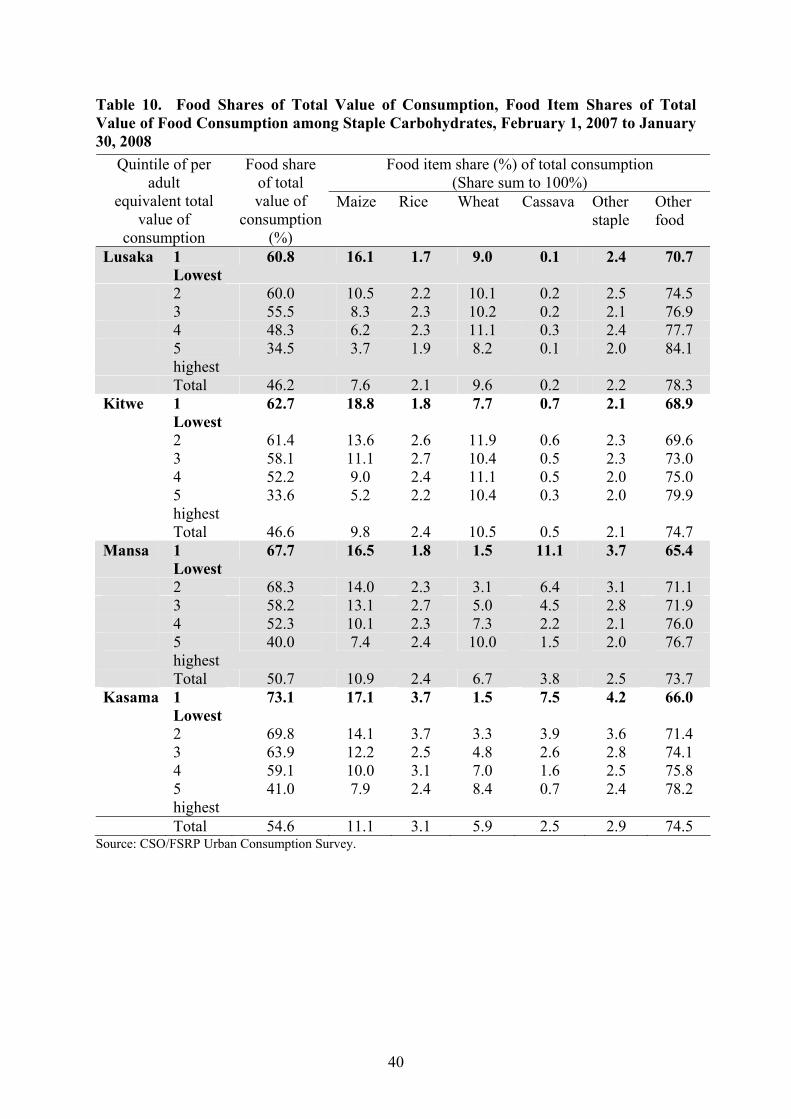
40
Table 10. Food Shares of Total Value of Consumption, Food Item Shares of Total Value of Food Consumption among Staple Carbohydrates, February 1, 2007 to January 30, 2008
Food item share (%) of total consumption (Share sum to 100%)
Quintile of per adult
equivalent total value of
consumption
Food share of total value of
consumption (%)
Maize Rice Wheat Cassava Other staple
Other food
Lusaka 1 Lowest
60.8 16.1 1.7 9.0 0.1 2.4 70.7
2 60.0 10.5 2.2 10.1 0.2 2.5 74.5 3 55.5 8.3 2.3 10.2 0.2 2.1 76.9 4 48.3 6.2 2.3 11.1 0.3 2.4 77.7 5
highest 34.5 3.7 1.9 8.2 0.1 2.0 84.1
Total 46.2 7.6 2.1 9.6 0.2 2.2 78.3 Kitwe 1
Lowest 62.7 18.8 1.8 7.7 0.7 2.1 68.9
2 61.4 13.6 2.6 11.9 0.6 2.3 69.6 3 58.1 11.1 2.7 10.4 0.5 2.3 73.0 4 52.2 9.0 2.4 11.1 0.5 2.0 75.0 5
highest 33.6 5.2 2.2 10.4 0.3 2.0 79.9
Total 46.6 9.8 2.4 10.5 0.5 2.1 74.7 Mansa 1
Lowest 67.7 16.5 1.8 1.5 11.1 3.7 65.4
2 68.3 14.0 2.3 3.1 6.4 3.1 71.1 3 58.2 13.1 2.7 5.0 4.5 2.8 71.9 4 52.3 10.1 2.3 7.3 2.2 2.1 76.0 5
highest 40.0 7.4 2.4 10.0 1.5 2.0 76.7
Total 50.7 10.9 2.4 6.7 3.8 2.5 73.7 Kasama 1
Lowest 73.1 17.1 3.7 1.5 7.5 4.2 66.0
2 69.8 14.1 3.7 3.3 3.9 3.6 71.4 3 63.9 12.2 2.5 4.8 2.6 2.8 74.1 4 59.1 10.0 3.1 7.0 1.6 2.5 75.8 5
highest 41.0 7.9 2.4 8.4 0.7 2.4 78.2
Total 54.6 11.1 3.1 5.9 2.5 2.9 74.5 Source: CSO/FSRP Urban Consumption Survey.

41
Table 11. Food Consumption Shares during the Last 30 Days, July/August 2007 and January/February 2008 (Percentage of Total Value of Food Consumption over the Two 30-Day Periods)
Consumption quintile Maize Rice Wheat Cassava Other staples
Sugar and oil
Dairy Meat and eggs
Fish Vege-tables Fruit Legumes
Other food
prepared at home
Food away from home
Lusaka 1 lowest 16.1 1.7 9.0 0.1 2.4 10.6 3.7 11.6 8.3 18.3 2.2 4.5 5.3 6.2 2 10.5 2.2 10.1 0.2 2.5 8.2 4.1 17.7 8.7 14.5 4.2 4.5 7.1 5.4 3 8.3 2.3 10.2 0.2 2.1 7.2 5.8 18.4 7.0 12.2 3.3 3.3 10.5 9.1 4 6.2 2.3 11.1 0.3 2.4 6.4 6.2 18.4 7.6 10.8 4.6 3.1 10.3 10.4 5 highest 3.7 1.9 8.2 0.1 2.0 4.5 6.5 18.7 5.5 8.4 3.9 2.4 13.2 21.0 Total 7.6 2.1 9.6 0.2 2.2 6.7 5.6 17.6 7.1 11.7 3.8 3.3 10.2 12.3
Kitwe 1 lowest 18.8 1.8 7.7 0.7 2.1 9.9 1.5 11.4 9.1 19.7 3.2 3.7 7.0 3.2 2 13.0 2.6 11.9 0.6 2.3 9.3 3.0 14.7 8.8 14.8 3.7 3.2 7.9 4.2 3 11.1 2.7 10.4 0.5 2.3 8.6 3.9 17.0 9.2 13.8 3.4 3.0 7.9 6.2 4 9.0 2.4 11.1 0.5 2.0 8.0 4.3 18.0 7.7 12.1 4.9 3.0 10.2 6.8 5 highest 5.2 2.2 10.4 0.3 2.0 6.1 6.0 19.8 7.0 8.9 4.9 2.6 12.7 11.9 Total 9.8 2.4 10.5 0.5 2.1 7.9 4.3 17.2 8.1 12.6 4.2 3.0 9.8 7.6
Mansa 1 lowest 16.5 1.8 1.5 11.1 3.7 7.8 0.2 7.2 14.4 12.4 4.9 4.2 7.1 7.3 2 14.0 2.3 3.1 6.4 3.1 8.3 0.5 10.2 13.1 12.2 3.8 4.2 8.6 10.2 3 13.1 2.7 5.0 4.5 2.8 8.7 1.5 14.7 13.6 11.3 2.9 3.5 8.4 7.1 4 10.1 2.3 7.3 2.2 2.1 8.4 2.8 16.6 10.7 9.3 2.7 2.9 11.4 11.2 5 highest 7.4 2.4 10.0 1.5 2.0 8.1 4.0 17.0 9.5 8.5 3.5 2.7 12.2 11.2 Total 10.9 2.4 6.7 3.8 2.5 8.3 2.4 14.6 11.5 10.1 3.3 3.3 10.3 9.9
Kasama 1 lowest 17.1 3.7 1.5 7.5 4.2 8.6 0.3 10.7 12.4 16.6 4.6 4.7 7.0 1.2 2 14.1 3.7 3.3 3.9 3.6 8.5 1.0 13.5 13.5 14.5 4.3 4.1 8.2 3.6 3 12.2 3.5 4.8 2.6 2.8 8.6 1.9 15.9 11.8 13.7 4.0 3.9 8.9 5.4 4 10.0 3.1 7.0 1.6 2.5 8.6 3.1 18.2 12.4 12.0 3.5 3.0 10.0 5.1 5 highest 7.9 2.4 8.4 0.7 2.4 8.0 4.6 18.7 9.8 10.0 4.0 2.5 12.1 8.5 Total 11.1 3.1 5.9 2.5 2.9 8.4 2.7 16.5 11.6 12.5 4.0 3.3 9.9 5.6
Source: CSO/FSRP Urban Consumption Survey 2007/2008.
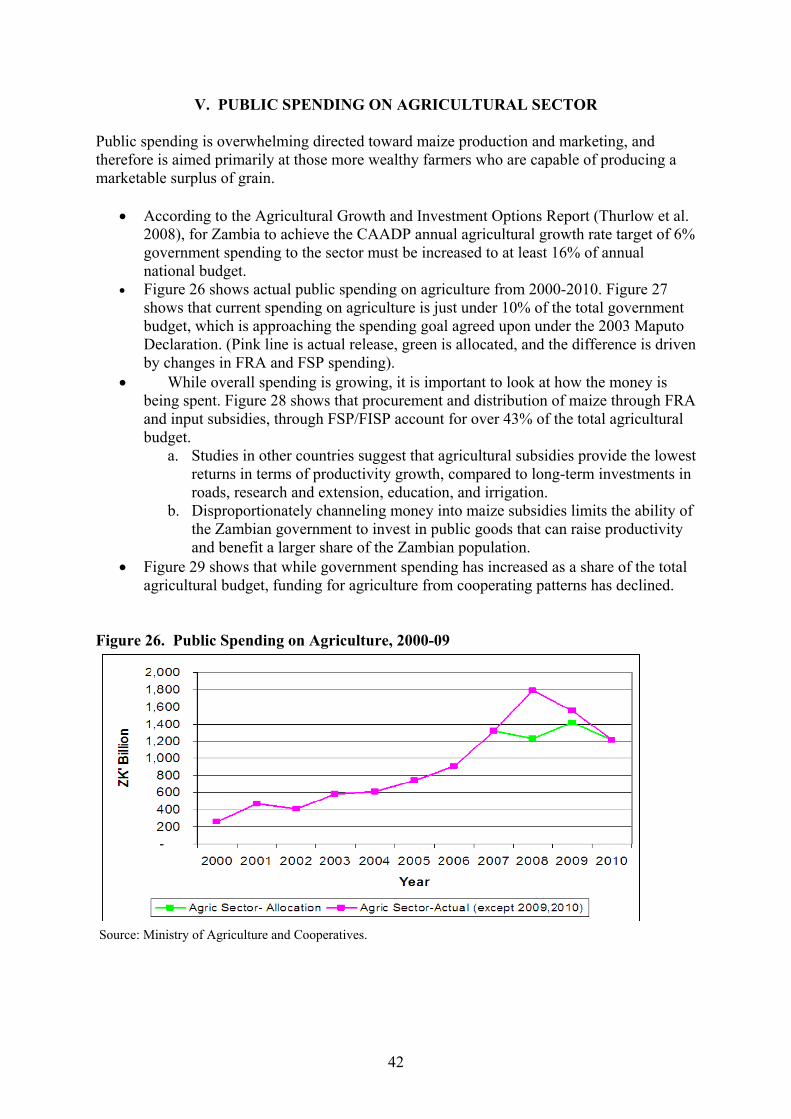
42
V. PUBLIC SPENDING ON AGRICULTURAL SECTOR Public spending is overwhelming directed toward maize production and marketing, and therefore is aimed primarily at those more wealthy farmers who are capable of producing a marketable surplus of grain.
• According to the Agricultural Growth and Investment Options Report (Thurlow et al. 2008), for Zambia to achieve the CAADP annual agricultural growth rate target of 6% government spending to the sector must be increased to at least 16% of annual national budget.
• Figure 26 shows actual public spending on agriculture from 2000-2010. Figure 27 shows that current spending on agriculture is just under 10% of the total government budget, which is approaching the spending goal agreed upon under the 2003 Maputo Declaration. (Pink line is actual release, green is allocated, and the difference is driven by changes in FRA and FSP spending).
• While overall spending is growing, it is important to look at how the money is being spent. Figure 28 shows that procurement and distribution of maize through FRA and input subsidies, through FSP/FISP account for over 43% of the total agricultural budget.
a. Studies in other countries suggest that agricultural subsidies provide the lowest returns in terms of productivity growth, compared to long-term investments in roads, research and extension, education, and irrigation.
b. Disproportionately channeling money into maize subsidies limits the ability of the Zambian government to invest in public goods that can raise productivity and benefit a larger share of the Zambian population.
• Figure 29 shows that while government spending has increased as a share of the total agricultural budget, funding for agriculture from cooperating patterns has declined.
Figure 26. Public Spending on Agriculture, 2000-09
Source: Ministry of Agriculture and Cooperatives.
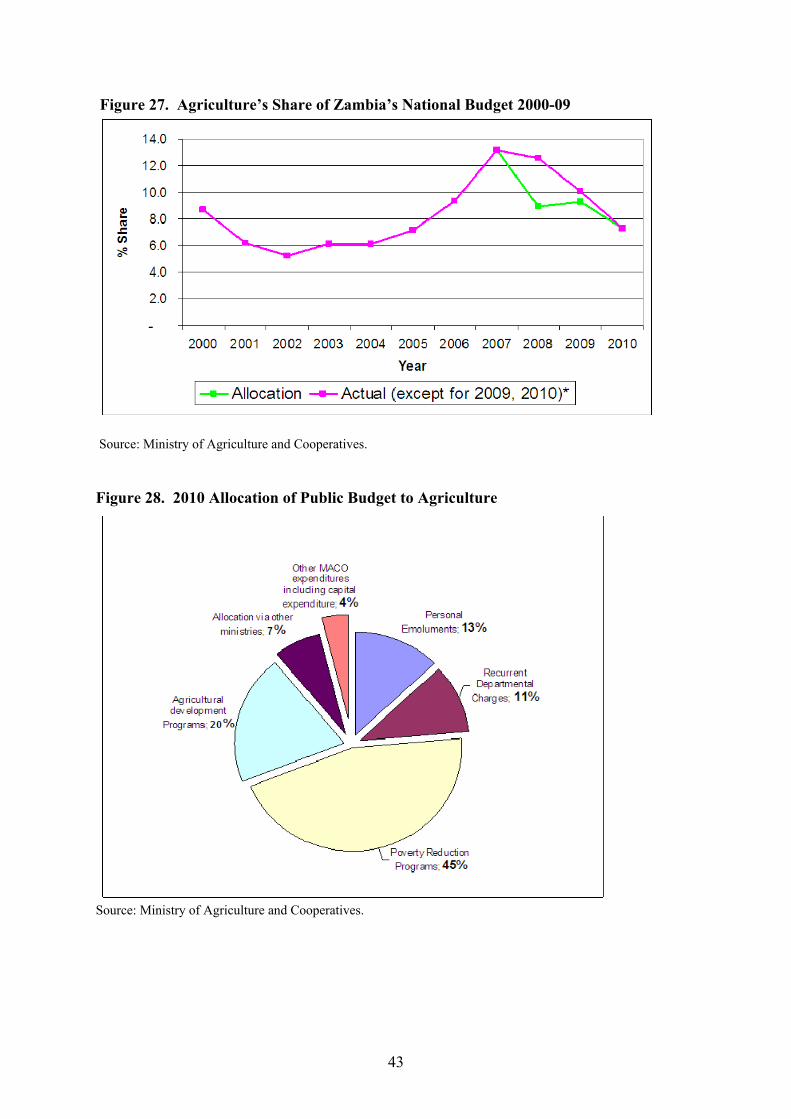
43
Figure 27. Agriculture’s Share of Zambia’s National Budget 2000-09
Source: Ministry of Agriculture and Cooperatives. Figure 28. 2010 Allocation of Public Budget to Agriculture
Source: Ministry of Agriculture and Cooperatives.
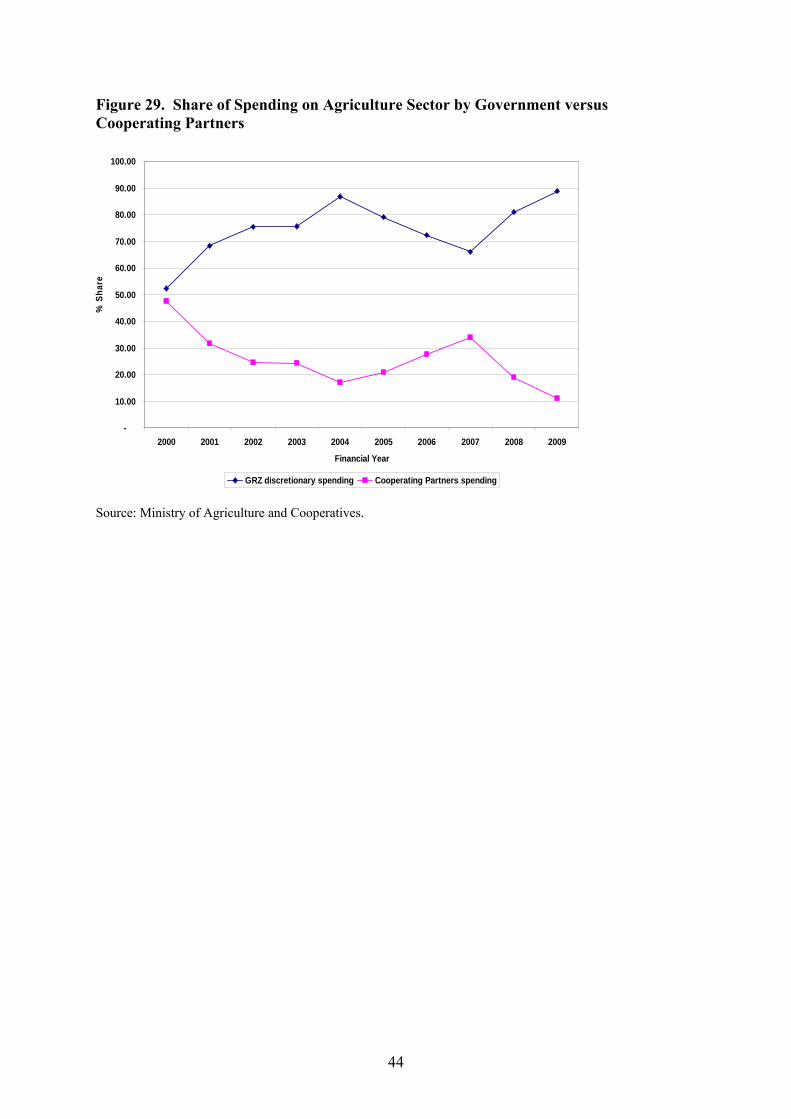
44
Figure 29. Share of Spending on Agriculture Sector by Government versus Cooperating Partners
Source: Ministry of Agriculture and Cooperatives.
-
10.00
20.00
30.00
40.00
50.00
60.00
70.00
80.00
90.00
100.00
2000 2001 2002 2003 2004 2005 2006 2007 2008 2009
Financial Year
% S
hare
GRZ discretionary spending Cooperating Partners spending
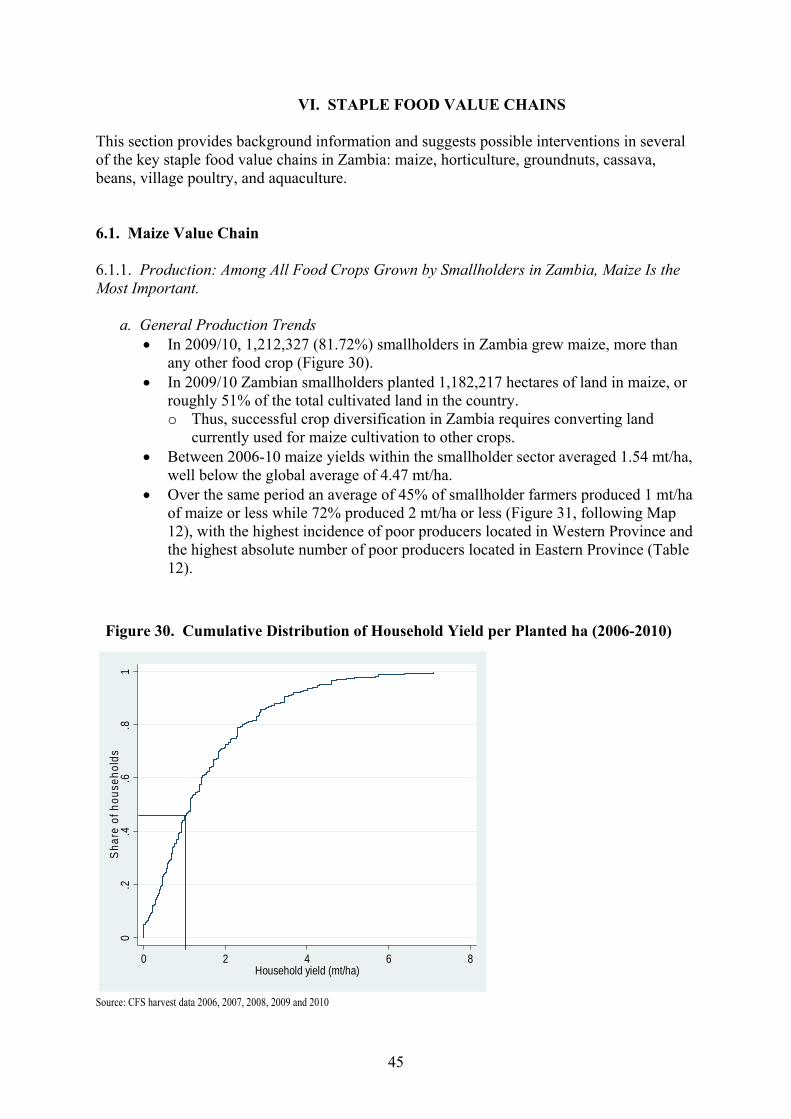
45
VI. STAPLE FOOD VALUE CHAINS
This section provides background information and suggests possible interventions in several of the key staple food value chains in Zambia: maize, horticulture, groundnuts, cassava, beans, village poultry, and aquaculture. 6.1. Maize Value Chain
6.1.1. Production: Among All Food Crops Grown by Smallholders in Zambia, Maize Is the Most Important.
a. General Production Trends • In 2009/10, 1,212,327 (81.72%) smallholders in Zambia grew maize, more than
any other food crop (Figure 30). • In 2009/10 Zambian smallholders planted 1,182,217 hectares of land in maize, or
roughly 51% of the total cultivated land in the country. o Thus, successful crop diversification in Zambia requires converting land
currently used for maize cultivation to other crops. • Between 2006-10 maize yields within the smallholder sector averaged 1.54 mt/ha,
well below the global average of 4.47 mt/ha. • Over the same period an average of 45% of smallholder farmers produced 1 mt/ha
of maize or less while 72% produced 2 mt/ha or less (Figure 31, following Map 12), with the highest incidence of poor producers located in Western Province and the highest absolute number of poor producers located in Eastern Province (Table 12).
Figure 1: Cumulative distribution of household yield per planted ha (2006-2010)
0.2
.4.6
.81
Shar
e of
hou
seho
lds
0 2 4 6 8Household yield (mt/ha)
Source: CFS harvest data 2006, 2007, 2008, 2009 and 2010
Figure 30. Cumulative Distribution of Household Yield per Planted ha (2006-2010)
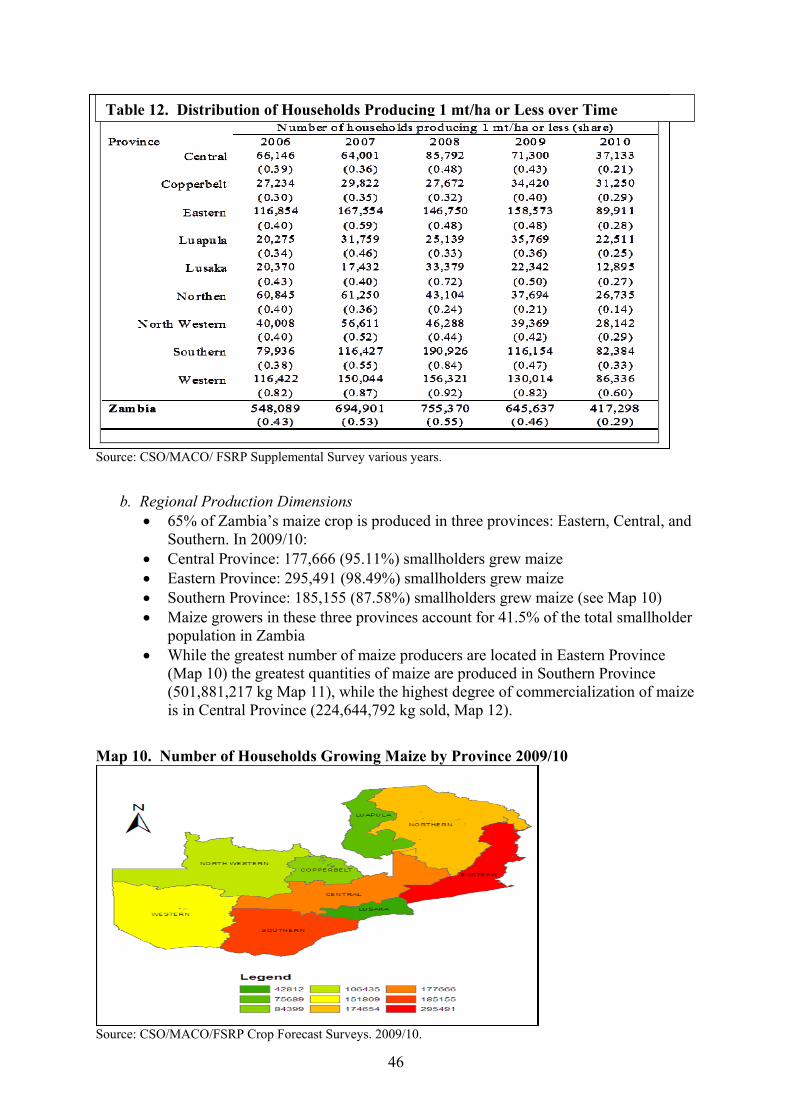
46
Source: CSO/MACO/ FSRP Supplemental Survey various years.
b. Regional Production Dimensions • 65% of Zambia’s maize crop is produced in three provinces: Eastern, Central, and
Southern. In 2009/10: • Central Province: 177,666 (95.11%) smallholders grew maize • Eastern Province: 295,491 (98.49%) smallholders grew maize • Southern Province: 185,155 (87.58%) smallholders grew maize (see Map 10) • Maize growers in these three provinces account for 41.5% of the total smallholder
population in Zambia • While the greatest number of maize producers are located in Eastern Province
(Map 10) the greatest quantities of maize are produced in Southern Province (501,881,217 kg Map 11), while the highest degree of commercialization of maize is in Central Province (224,644,792 kg sold, Map 12).
Map 10. Number of Households Growing Maize by Province 2009/10
Source: CSO/MACO/FSRP Crop Forecast Surveys. 2009/10.
Table 12. Distribution of Households Producing 1 mt/ha or Less over Time
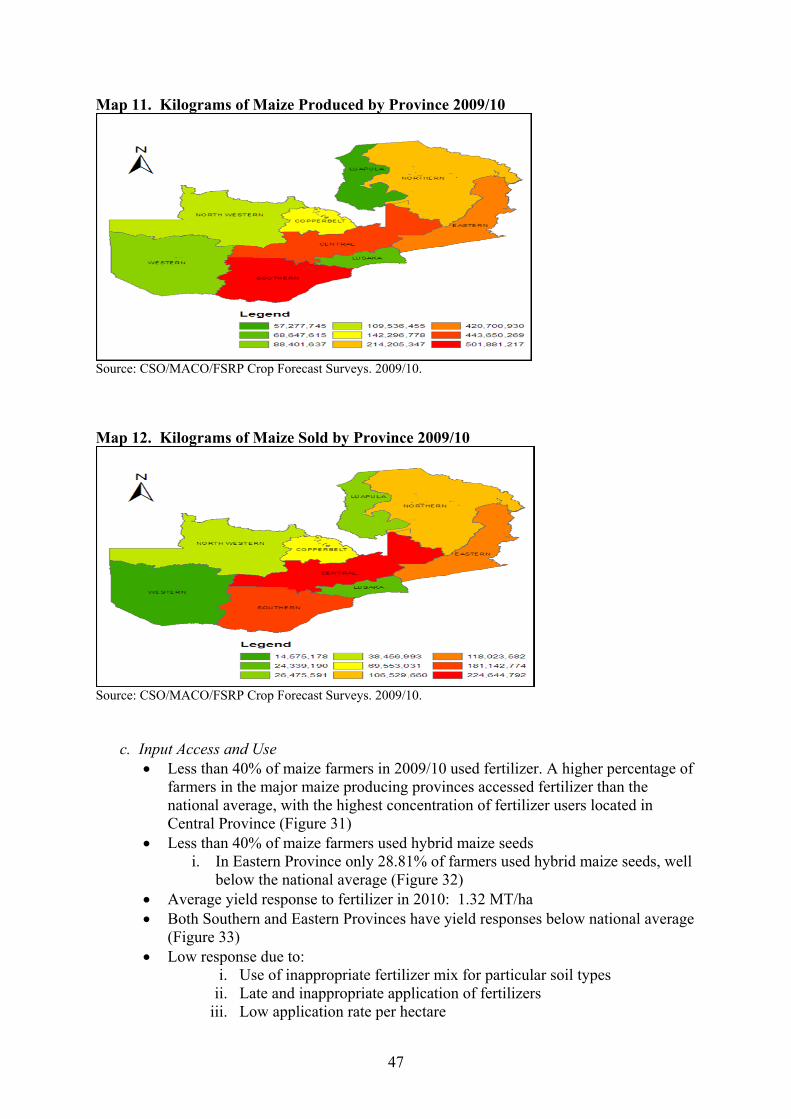
47
Map 11. Kilograms of Maize Produced by Province 2009/10
Source: CSO/MACO/FSRP Crop Forecast Surveys. 2009/10. Map 12. Kilograms of Maize Sold by Province 2009/10
Source: CSO/MACO/FSRP Crop Forecast Surveys. 2009/10.
c. Input Access and Use • Less than 40% of maize farmers in 2009/10 used fertilizer. A higher percentage of
farmers in the major maize producing provinces accessed fertilizer than the national average, with the highest concentration of fertilizer users located in Central Province (Figure 31)
• Less than 40% of maize farmers used hybrid maize seeds i. In Eastern Province only 28.81% of farmers used hybrid maize seeds, well
below the national average (Figure 32) • Average yield response to fertilizer in 2010: 1.32 MT/ha • Both Southern and Eastern Provinces have yield responses below national average
(Figure 33) • Low response due to:
i. Use of inappropriate fertilizer mix for particular soil types ii. Late and inappropriate application of fertilizers
iii. Low application rate per hectare
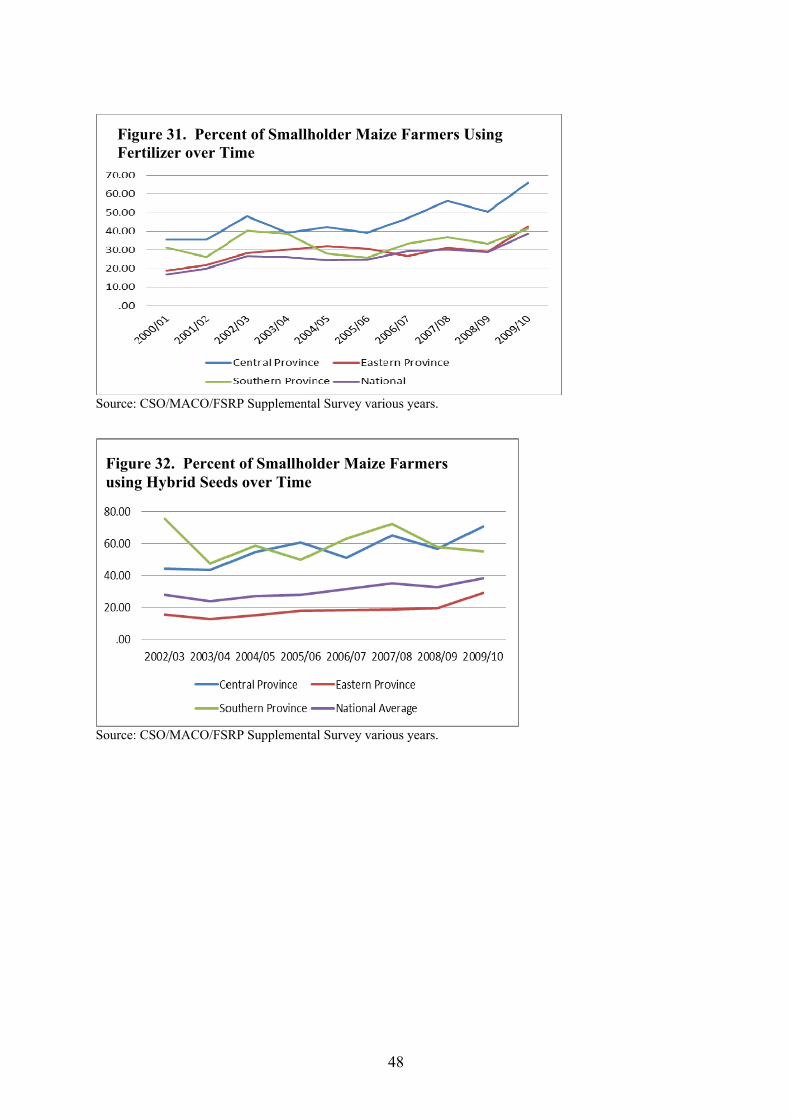
48
Source: CSO/MACO/FSRP Supplemental Survey various years.
Source: CSO/MACO/FSRP Supplemental Survey various years.
Figure 31. Percent of Smallholder Maize Farmers Using Fertilizer over Time
Figure 32. Percent of Smallholder Maize Farmers using Hybrid Seeds over Time
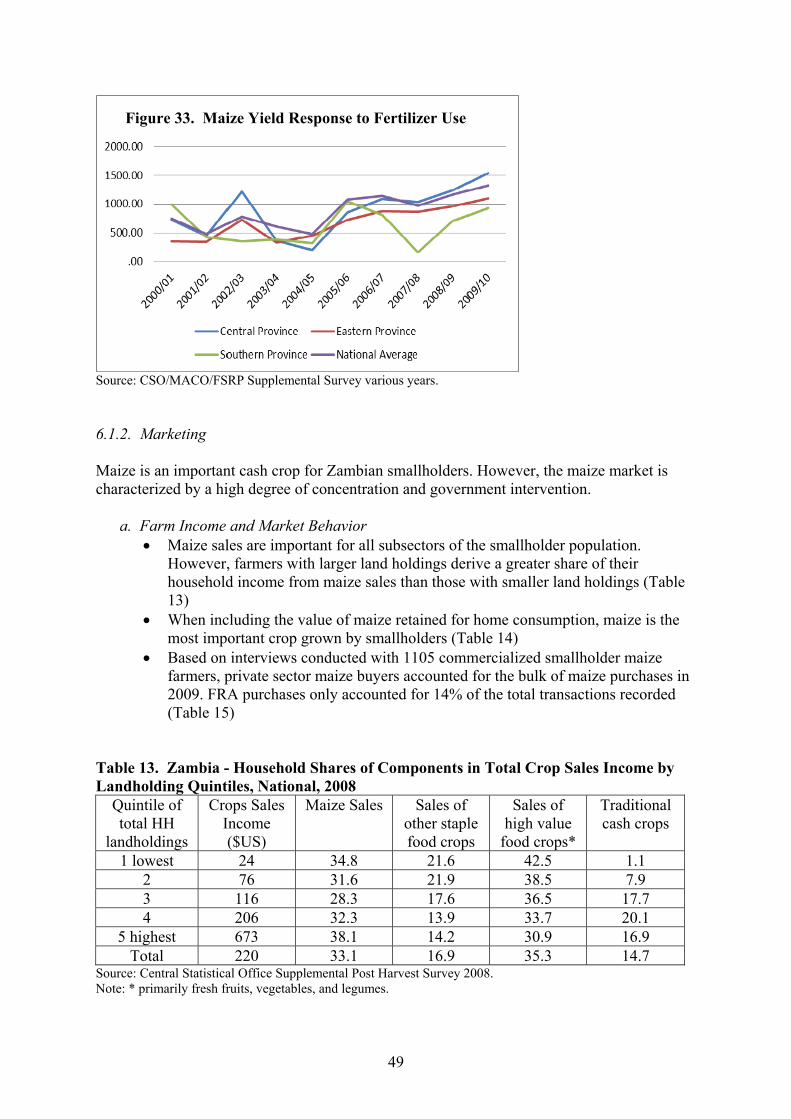
49
Source: CSO/MACO/FSRP Supplemental Survey various years. 6.1.2. Marketing Maize is an important cash crop for Zambian smallholders. However, the maize market is characterized by a high degree of concentration and government intervention.
a. Farm Income and Market Behavior • Maize sales are important for all subsectors of the smallholder population.
However, farmers with larger land holdings derive a greater share of their household income from maize sales than those with smaller land holdings (Table 13)
• When including the value of maize retained for home consumption, maize is the most important crop grown by smallholders (Table 14)
• Based on interviews conducted with 1105 commercialized smallholder maize farmers, private sector maize buyers accounted for the bulk of maize purchases in 2009. FRA purchases only accounted for 14% of the total transactions recorded (Table 15)
Table 13. Zambia - Household Shares of Components in Total Crop Sales Income by Landholding Quintiles, National, 2008
Quintile of total HH
landholdings
Crops Sales Income ($US)
Maize Sales Sales of other staple food crops
Sales of high value
food crops*
Traditional cash crops
1 lowest 24 34.8 21.6 42.5 1.1 2 76 31.6 21.9 38.5 7.9 3 116 28.3 17.6 36.5 17.7 4 206 32.3 13.9 33.7 20.1
5 highest 673 38.1 14.2 30.9 16.9 Total 220 33.1 16.9 35.3 14.7
Source: Central Statistical Office Supplemental Post Harvest Survey 2008. Note: * primarily fresh fruits, vegetables, and legumes.
Figure 33. Maize Yield Response to Fertilizer Use
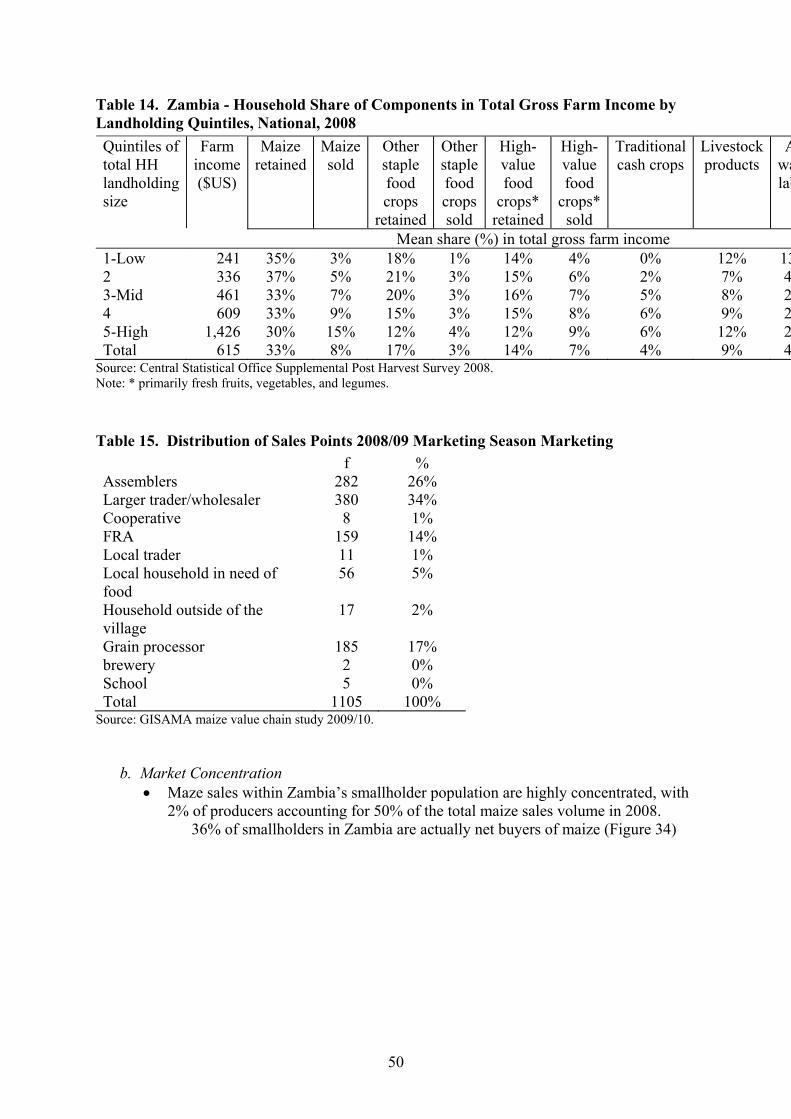
50
Table 14. Zambia - Household Share of Components in Total Gross Farm Income by Landholding Quintiles, National, 2008
Maize retained
Maize sold
Other staple food crops
retained
Other staple food crops sold
High-value food
crops* retained
High-value food
crops* sold
Traditional cash crops
Livestock products
Awalab
Quintiles of total HH landholding size
Farm income ($US)
Mean share (%) in total gross farm income 1-Low 241 35% 3% 18% 1% 14% 4% 0% 12% 132 336 37% 5% 21% 3% 15% 6% 2% 7% 43-Mid 461 33% 7% 20% 3% 16% 7% 5% 8% 24 609 33% 9% 15% 3% 15% 8% 6% 9% 25-High 1,426 30% 15% 12% 4% 12% 9% 6% 12% 2Total 615 33% 8% 17% 3% 14% 7% 4% 9% 4
Source: Central Statistical Office Supplemental Post Harvest Survey 2008. Note: * primarily fresh fruits, vegetables, and legumes. Table 15. Distribution of Sales Points 2008/09 Marketing Season Marketing
f % Assemblers 282 26% Larger trader/wholesaler 380 34% Cooperative 8 1% FRA 159 14% Local trader 11 1% Local household in need of food
56 5%
Household outside of the village
17 2%
Grain processor 185 17% brewery 2 0% School 5 0% Total 1105 100%
Source: GISAMA maize value chain study 2009/10.
b. Market Concentration • Maze sales within Zambia’s smallholder population are highly concentrated, with
2% of producers accounting for 50% of the total maize sales volume in 2008. 36% of smallholders in Zambia are actually net buyers of maize (Figure 34)
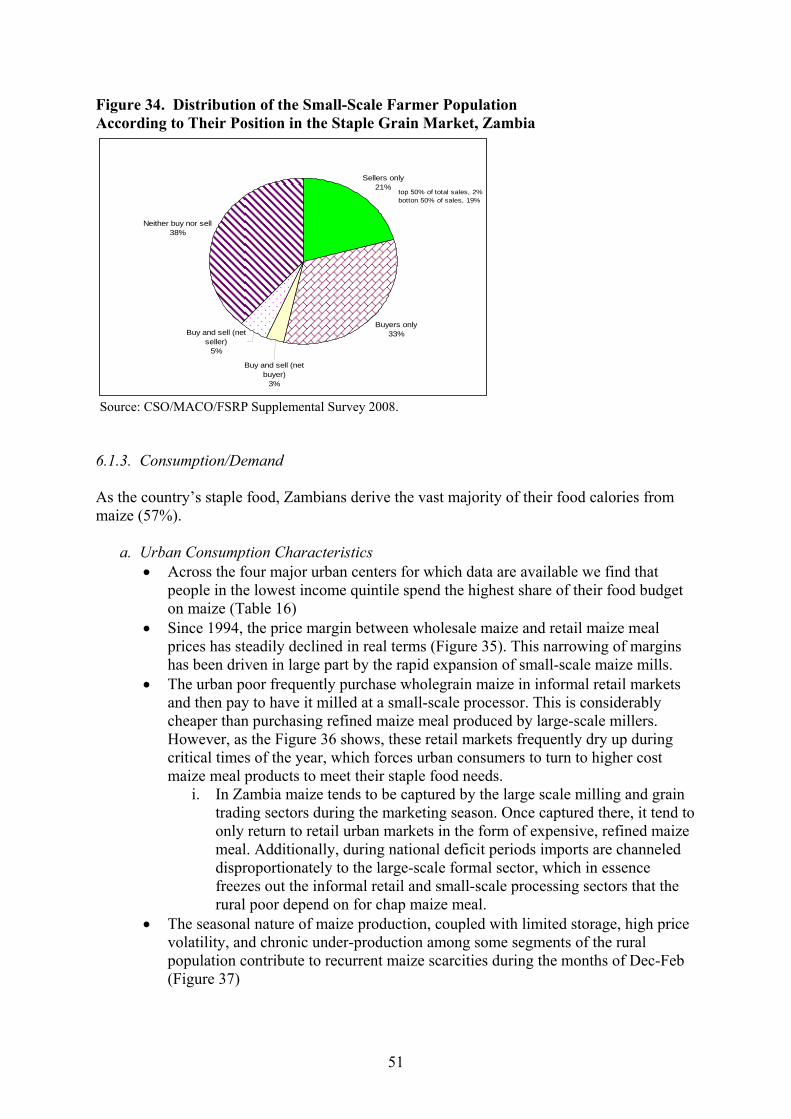
51
Figure 34. Distribution of the Small-Scale Farmer Population According to Their Position in the Staple Grain Market, Zambia
Sellers only21%
Neither buy nor sell 38%
Buyers only33%Buy and sell (net
seller) 5%
Buy and sell (net buyer)
3%
top 50% of total sales, 2%botton 50% of sales, 19%
Source: CSO/MACO/FSRP Supplemental Survey 2008. 6.1.3. Consumption/Demand As the country’s staple food, Zambians derive the vast majority of their food calories from maize (57%).
a. Urban Consumption Characteristics • Across the four major urban centers for which data are available we find that
people in the lowest income quintile spend the highest share of their food budget on maize (Table 16)
• Since 1994, the price margin between wholesale maize and retail maize meal prices has steadily declined in real terms (Figure 35). This narrowing of margins has been driven in large part by the rapid expansion of small-scale maize mills.
• The urban poor frequently purchase wholegrain maize in informal retail markets and then pay to have it milled at a small-scale processor. This is considerably cheaper than purchasing refined maize meal produced by large-scale millers. However, as the Figure 36 shows, these retail markets frequently dry up during critical times of the year, which forces urban consumers to turn to higher cost maize meal products to meet their staple food needs.
i. In Zambia maize tends to be captured by the large scale milling and grain trading sectors during the marketing season. Once captured there, it tend to only return to retail urban markets in the form of expensive, refined maize meal. Additionally, during national deficit periods imports are channeled disproportionately to the large-scale formal sector, which in essence freezes out the informal retail and small-scale processing sectors that the rural poor depend on for chap maize meal.
• The seasonal nature of maize production, coupled with limited storage, high price volatility, and chronic under-production among some segments of the rural population contribute to recurrent maize scarcities during the months of Dec-Feb (Figure 37)
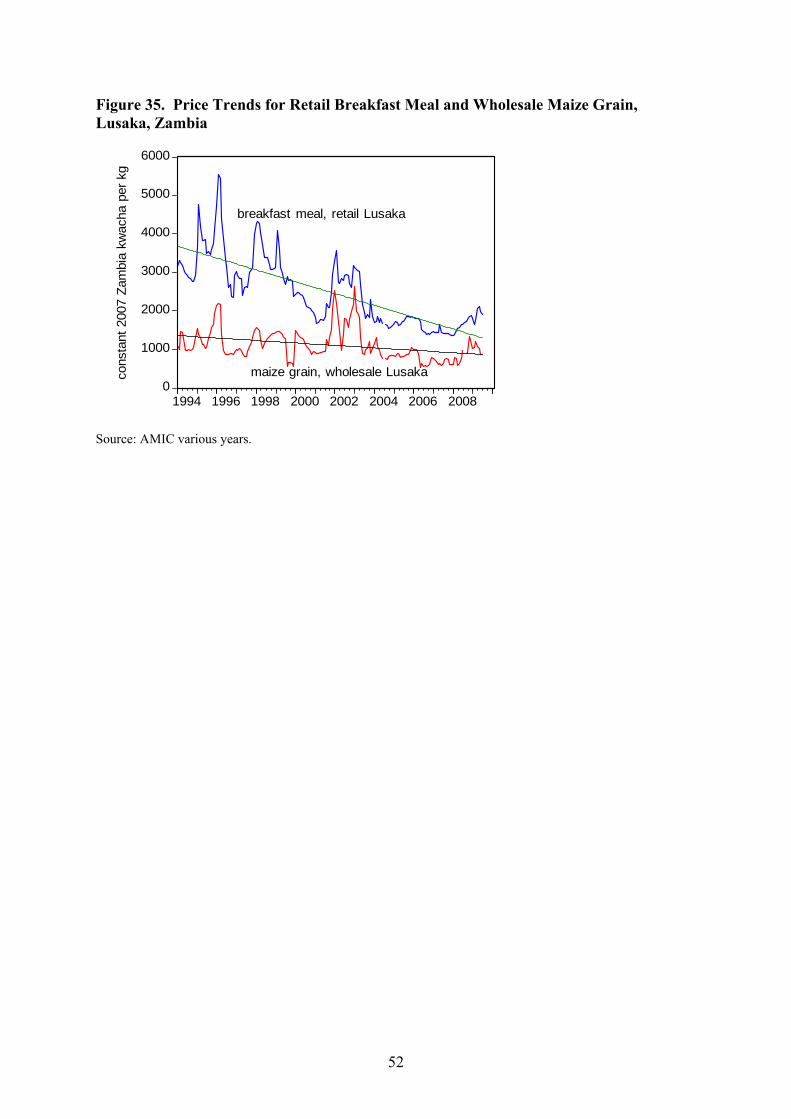
52
Figure 35. Price Trends for Retail Breakfast Meal and Wholesale Maize Grain, Lusaka, Zambia
Source: AMIC various years.
0
1000
2000
3000
4000
5000
6000
1994 1996 1998 2000 2002 2004 2006 2008
cons
tant
200
7 Za
mbi
a kw
acha
per
kg
breakfast meal, retail Lusaka
maize grain, wholesale Lusaka
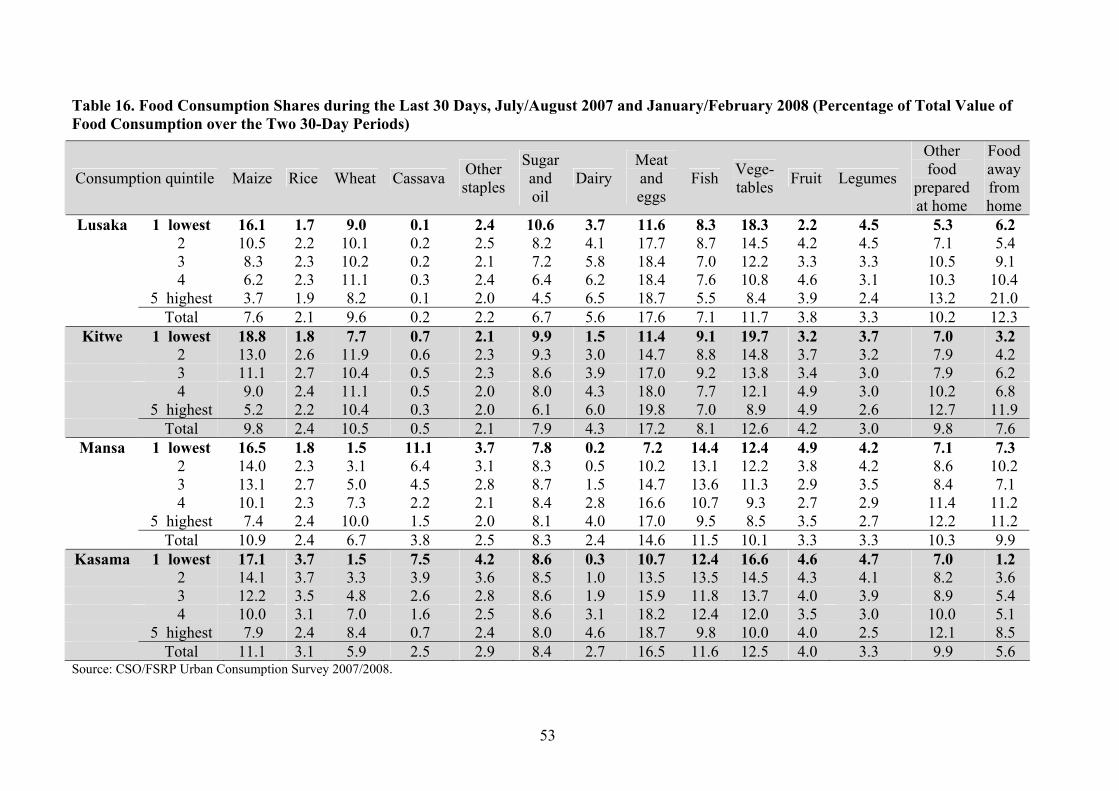
53
Table 16. Food Consumption Shares during the Last 30 Days, July/August 2007 and January/February 2008 (Percentage of Total Value of Food Consumption over the Two 30-Day Periods)
Consumption quintile Maize Rice Wheat Cassava Other staples
Sugar and oil
Dairy Meat and eggs
Fish Vege-tables Fruit Legumes
Other food
prepared at home
Food away from home
Lusaka 1 lowest 16.1 1.7 9.0 0.1 2.4 10.6 3.7 11.6 8.3 18.3 2.2 4.5 5.3 6.2 2 10.5 2.2 10.1 0.2 2.5 8.2 4.1 17.7 8.7 14.5 4.2 4.5 7.1 5.4 3 8.3 2.3 10.2 0.2 2.1 7.2 5.8 18.4 7.0 12.2 3.3 3.3 10.5 9.1 4 6.2 2.3 11.1 0.3 2.4 6.4 6.2 18.4 7.6 10.8 4.6 3.1 10.3 10.4 5 highest 3.7 1.9 8.2 0.1 2.0 4.5 6.5 18.7 5.5 8.4 3.9 2.4 13.2 21.0 Total 7.6 2.1 9.6 0.2 2.2 6.7 5.6 17.6 7.1 11.7 3.8 3.3 10.2 12.3
Kitwe 1 lowest 18.8 1.8 7.7 0.7 2.1 9.9 1.5 11.4 9.1 19.7 3.2 3.7 7.0 3.2 2 13.0 2.6 11.9 0.6 2.3 9.3 3.0 14.7 8.8 14.8 3.7 3.2 7.9 4.2 3 11.1 2.7 10.4 0.5 2.3 8.6 3.9 17.0 9.2 13.8 3.4 3.0 7.9 6.2 4 9.0 2.4 11.1 0.5 2.0 8.0 4.3 18.0 7.7 12.1 4.9 3.0 10.2 6.8 5 highest 5.2 2.2 10.4 0.3 2.0 6.1 6.0 19.8 7.0 8.9 4.9 2.6 12.7 11.9 Total 9.8 2.4 10.5 0.5 2.1 7.9 4.3 17.2 8.1 12.6 4.2 3.0 9.8 7.6
Mansa 1 lowest 16.5 1.8 1.5 11.1 3.7 7.8 0.2 7.2 14.4 12.4 4.9 4.2 7.1 7.3 2 14.0 2.3 3.1 6.4 3.1 8.3 0.5 10.2 13.1 12.2 3.8 4.2 8.6 10.2 3 13.1 2.7 5.0 4.5 2.8 8.7 1.5 14.7 13.6 11.3 2.9 3.5 8.4 7.1 4 10.1 2.3 7.3 2.2 2.1 8.4 2.8 16.6 10.7 9.3 2.7 2.9 11.4 11.2 5 highest 7.4 2.4 10.0 1.5 2.0 8.1 4.0 17.0 9.5 8.5 3.5 2.7 12.2 11.2 Total 10.9 2.4 6.7 3.8 2.5 8.3 2.4 14.6 11.5 10.1 3.3 3.3 10.3 9.9
Kasama 1 lowest 17.1 3.7 1.5 7.5 4.2 8.6 0.3 10.7 12.4 16.6 4.6 4.7 7.0 1.2 2 14.1 3.7 3.3 3.9 3.6 8.5 1.0 13.5 13.5 14.5 4.3 4.1 8.2 3.6 3 12.2 3.5 4.8 2.6 2.8 8.6 1.9 15.9 11.8 13.7 4.0 3.9 8.9 5.4 4 10.0 3.1 7.0 1.6 2.5 8.6 3.1 18.2 12.4 12.0 3.5 3.0 10.0 5.1 5 highest 7.9 2.4 8.4 0.7 2.4 8.0 4.6 18.7 9.8 10.0 4.0 2.5 12.1 8.5 Total 11.1 3.1 5.9 2.5 2.9 8.4 2.7 16.5 11.6 12.5 4.0 3.3 9.9 5.6
Source: CSO/FSRP Urban Consumption Survey 2007/2008.
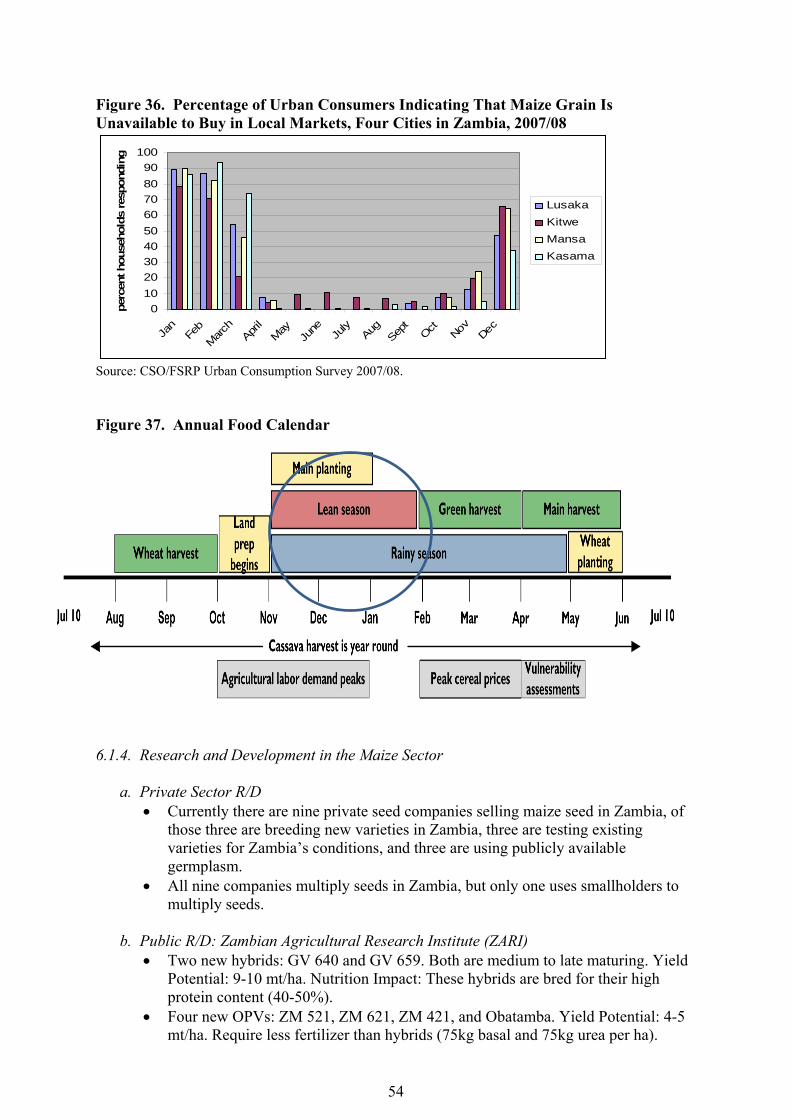
54
Figure 36. Percentage of Urban Consumers Indicating That Maize Grain Is Unavailable to Buy in Local Markets, Four Cities in Zambia, 2007/08
0102030405060708090
100
Jan
Feb
March
April
MayJu
ne July
AugSep
tOct Nov Dec
perc
ent h
ouse
hold
s re
spon
ding
LusakaKitwe Mansa Kasama
Source: CSO/FSRP Urban Consumption Survey 2007/08. Figure 37. Annual Food Calendar
6.1.4. Research and Development in the Maize Sector
a. Private Sector R/D • Currently there are nine private seed companies selling maize seed in Zambia, of
those three are breeding new varieties in Zambia, three are testing existing varieties for Zambia’s conditions, and three are using publicly available germplasm.
• All nine companies multiply seeds in Zambia, but only one uses smallholders to multiply seeds.
b. Public R/D: Zambian Agricultural Research Institute (ZARI)
• Two new hybrids: GV 640 and GV 659. Both are medium to late maturing. Yield Potential: 9-10 mt/ha. Nutrition Impact: These hybrids are bred for their high protein content (40-50%).
• Four new OPVs: ZM 521, ZM 621, ZM 421, and Obatamba. Yield Potential: 4-5 mt/ha. Require less fertilizer than hybrids (75kg basal and 75kg urea per ha).
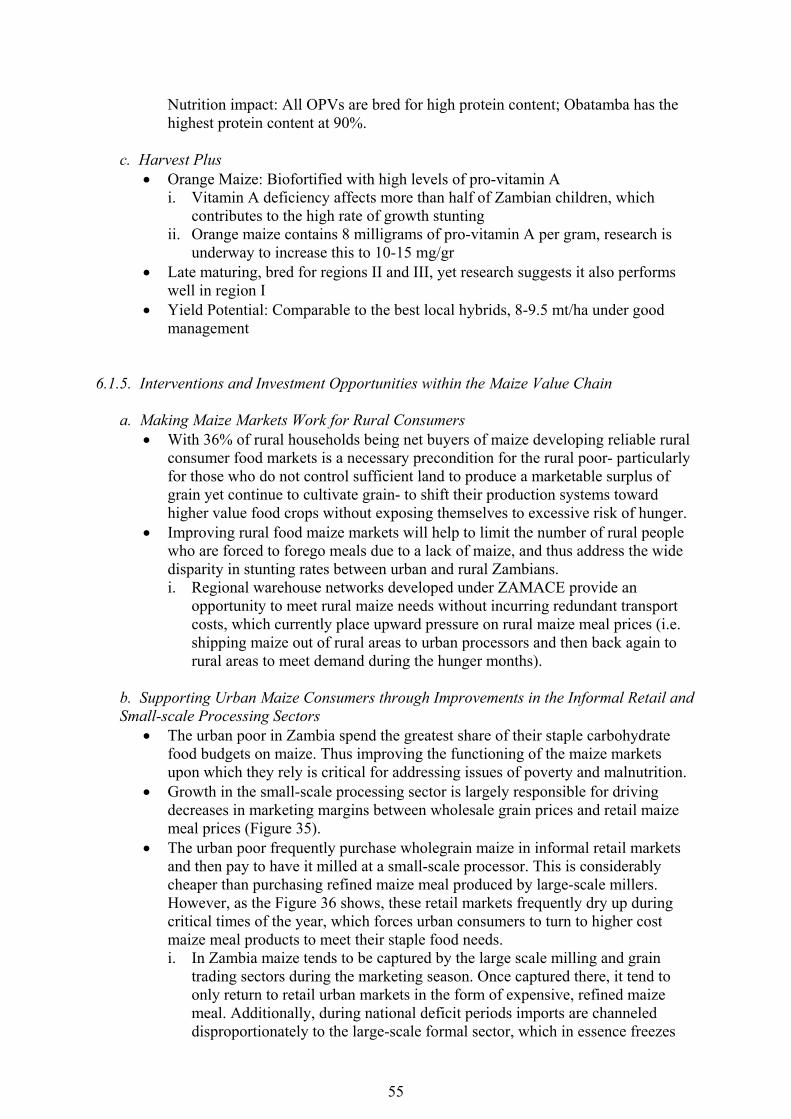
55
Nutrition impact: All OPVs are bred for high protein content; Obatamba has the highest protein content at 90%.
c. Harvest Plus
• Orange Maize: Biofortified with high levels of pro-vitamin A i. Vitamin A deficiency affects more than half of Zambian children, which
contributes to the high rate of growth stunting ii. Orange maize contains 8 milligrams of pro-vitamin A per gram, research is
underway to increase this to 10-15 mg/gr • Late maturing, bred for regions II and III, yet research suggests it also performs
well in region I • Yield Potential: Comparable to the best local hybrids, 8-9.5 mt/ha under good
management
6.1.5. Interventions and Investment Opportunities within the Maize Value Chain
a. Making Maize Markets Work for Rural Consumers • With 36% of rural households being net buyers of maize developing reliable rural
consumer food markets is a necessary precondition for the rural poor- particularly for those who do not control sufficient land to produce a marketable surplus of grain yet continue to cultivate grain- to shift their production systems toward higher value food crops without exposing themselves to excessive risk of hunger.
• Improving rural food maize markets will help to limit the number of rural people who are forced to forego meals due to a lack of maize, and thus address the wide disparity in stunting rates between urban and rural Zambians. i. Regional warehouse networks developed under ZAMACE provide an
opportunity to meet rural maize needs without incurring redundant transport costs, which currently place upward pressure on rural maize meal prices (i.e. shipping maize out of rural areas to urban processors and then back again to rural areas to meet demand during the hunger months).
b. Supporting Urban Maize Consumers through Improvements in the Informal Retail and Small-scale Processing Sectors
• The urban poor in Zambia spend the greatest share of their staple carbohydrate food budgets on maize. Thus improving the functioning of the maize markets upon which they rely is critical for addressing issues of poverty and malnutrition.
• Growth in the small-scale processing sector is largely responsible for driving decreases in marketing margins between wholesale grain prices and retail maize meal prices (Figure 35).
• The urban poor frequently purchase wholegrain maize in informal retail markets and then pay to have it milled at a small-scale processor. This is considerably cheaper than purchasing refined maize meal produced by large-scale millers. However, as the Figure 36 shows, these retail markets frequently dry up during critical times of the year, which forces urban consumers to turn to higher cost maize meal products to meet their staple food needs. i. In Zambia maize tends to be captured by the large scale milling and grain
trading sectors during the marketing season. Once captured there, it tend to only return to retail urban markets in the form of expensive, refined maize meal. Additionally, during national deficit periods imports are channeled disproportionately to the large-scale formal sector, which in essence freezes
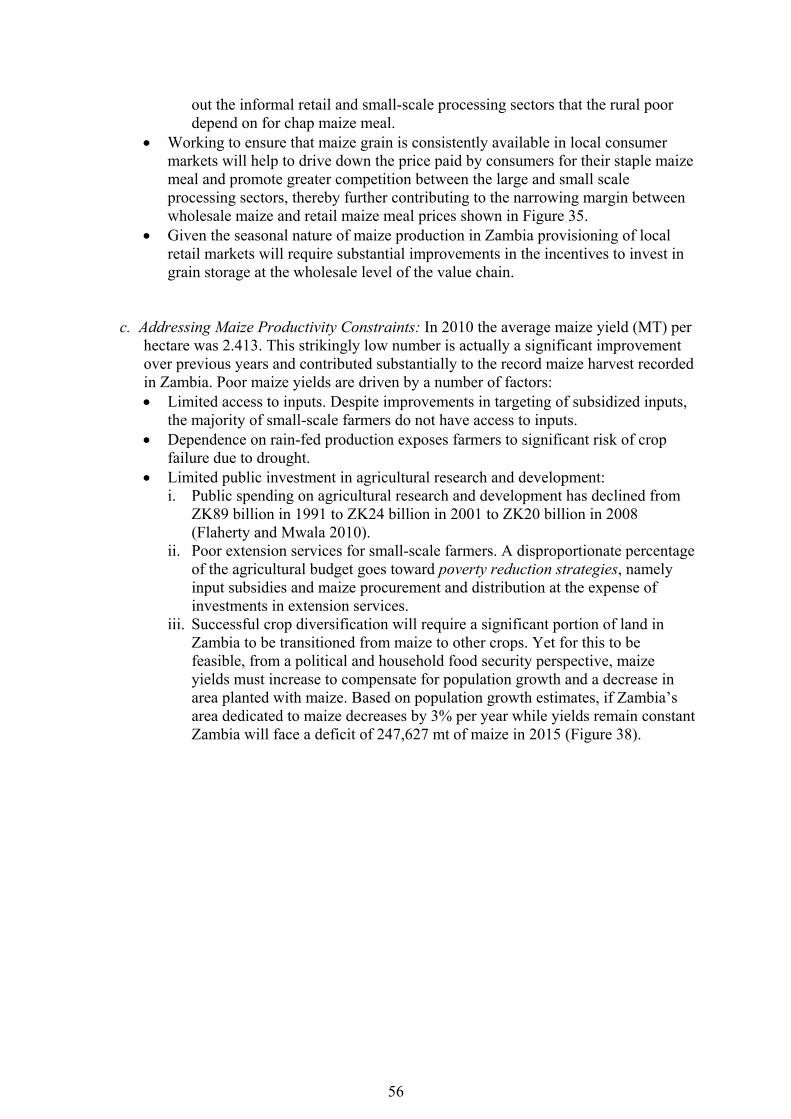
56
out the informal retail and small-scale processing sectors that the rural poor depend on for chap maize meal.
• Working to ensure that maize grain is consistently available in local consumer markets will help to drive down the price paid by consumers for their staple maize meal and promote greater competition between the large and small scale processing sectors, thereby further contributing to the narrowing margin between wholesale maize and retail maize meal prices shown in Figure 35.
• Given the seasonal nature of maize production in Zambia provisioning of local retail markets will require substantial improvements in the incentives to invest in grain storage at the wholesale level of the value chain.
c. Addressing Maize Productivity Constraints: In 2010 the average maize yield (MT) per
hectare was 2.413. This strikingly low number is actually a significant improvement over previous years and contributed substantially to the record maize harvest recorded in Zambia. Poor maize yields are driven by a number of factors: • Limited access to inputs. Despite improvements in targeting of subsidized inputs,
the majority of small-scale farmers do not have access to inputs. • Dependence on rain-fed production exposes farmers to significant risk of crop
failure due to drought. • Limited public investment in agricultural research and development:
i. Public spending on agricultural research and development has declined from ZK89 billion in 1991 to ZK24 billion in 2001 to ZK20 billion in 2008 (Flaherty and Mwala 2010). ii. Poor extension services for small-scale farmers. A disproportionate percentage
of the agricultural budget goes toward poverty reduction strategies, namely input subsidies and maize procurement and distribution at the expense of investments in extension services.
iii. Successful crop diversification will require a significant portion of land in Zambia to be transitioned from maize to other crops. Yet for this to be feasible, from a political and household food security perspective, maize yields must increase to compensate for population growth and a decrease in area planted with maize. Based on population growth estimates, if Zambia’s area dedicated to maize decreases by 3% per year while yields remain constant Zambia will face a deficit of 247,627 mt of maize in 2015 (Figure 38).
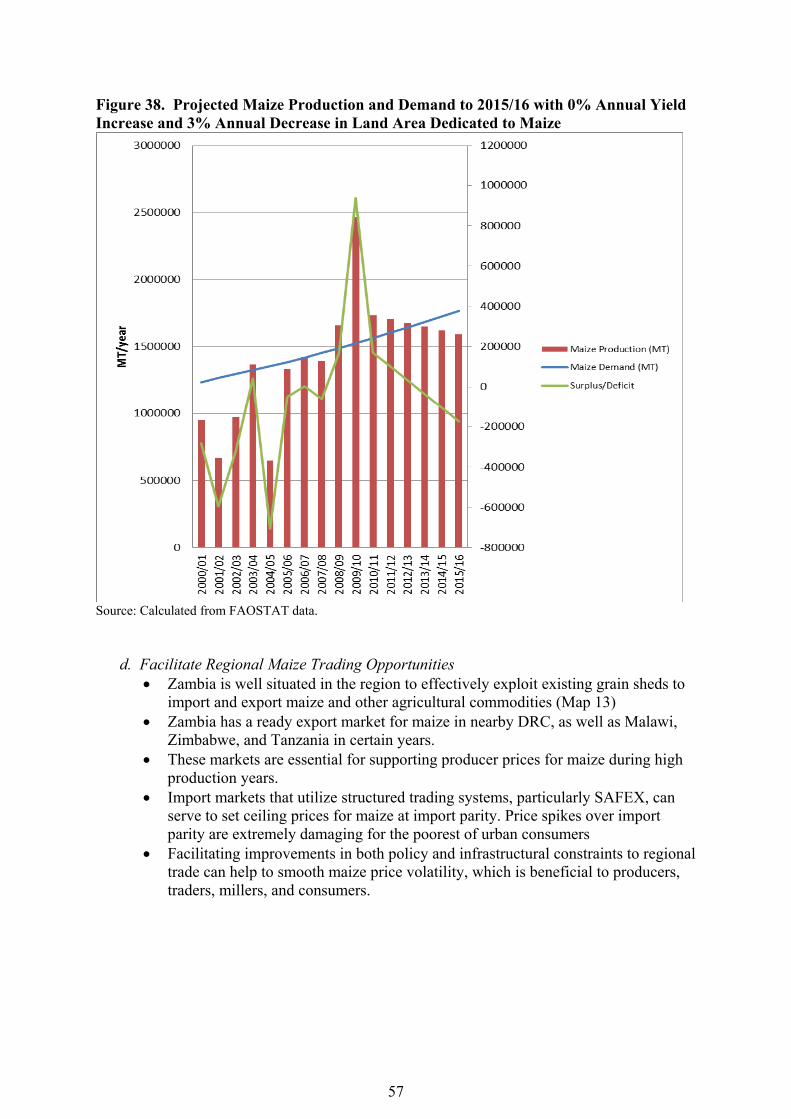
57
Figure 38. Projected Maize Production and Demand to 2015/16 with 0% Annual Yield Increase and 3% Annual Decrease in Land Area Dedicated to Maize
Source: Calculated from FAOSTAT data.
d. Facilitate Regional Maize Trading Opportunities • Zambia is well situated in the region to effectively exploit existing grain sheds to
import and export maize and other agricultural commodities (Map 13) • Zambia has a ready export market for maize in nearby DRC, as well as Malawi,
Zimbabwe, and Tanzania in certain years. • These markets are essential for supporting producer prices for maize during high
production years. • Import markets that utilize structured trading systems, particularly SAFEX, can
serve to set ceiling prices for maize at import parity. Price spikes over import parity are extremely damaging for the poorest of urban consumers
• Facilitating improvements in both policy and infrastructural constraints to regional trade can help to smooth maize price volatility, which is beneficial to producers, traders, millers, and consumers.
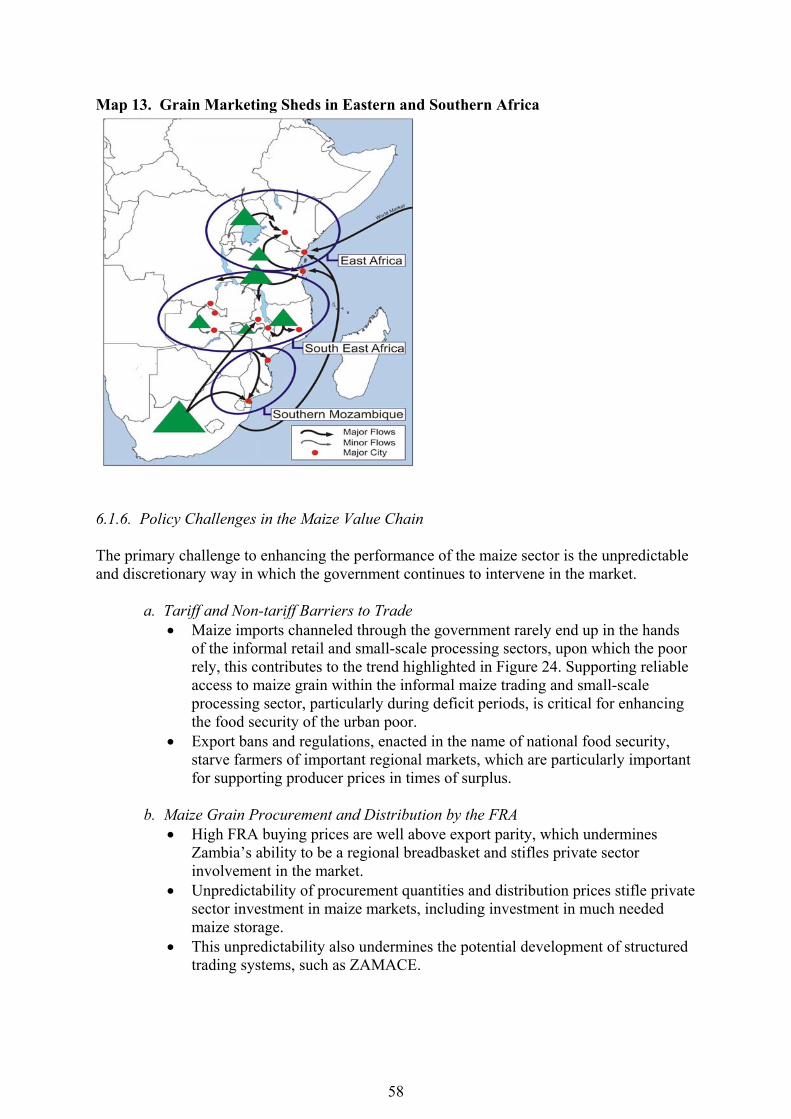
58
Map 13. Grain Marketing Sheds in Eastern and Southern Africa
6.1.6. Policy Challenges in the Maize Value Chain The primary challenge to enhancing the performance of the maize sector is the unpredictable and discretionary way in which the government continues to intervene in the market.
a. Tariff and Non-tariff Barriers to Trade • Maize imports channeled through the government rarely end up in the hands
of the informal retail and small-scale processing sectors, upon which the poor rely, this contributes to the trend highlighted in Figure 24. Supporting reliable access to maize grain within the informal maize trading and small-scale processing sector, particularly during deficit periods, is critical for enhancing the food security of the urban poor.
• Export bans and regulations, enacted in the name of national food security, starve farmers of important regional markets, which are particularly important for supporting producer prices in times of surplus.
b. Maize Grain Procurement and Distribution by the FRA
• High FRA buying prices are well above export parity, which undermines Zambia’s ability to be a regional breadbasket and stifles private sector involvement in the market.
• Unpredictability of procurement quantities and distribution prices stifle private sector investment in maize markets, including investment in much needed maize storage.
• This unpredictability also undermines the potential development of structured trading systems, such as ZAMACE.
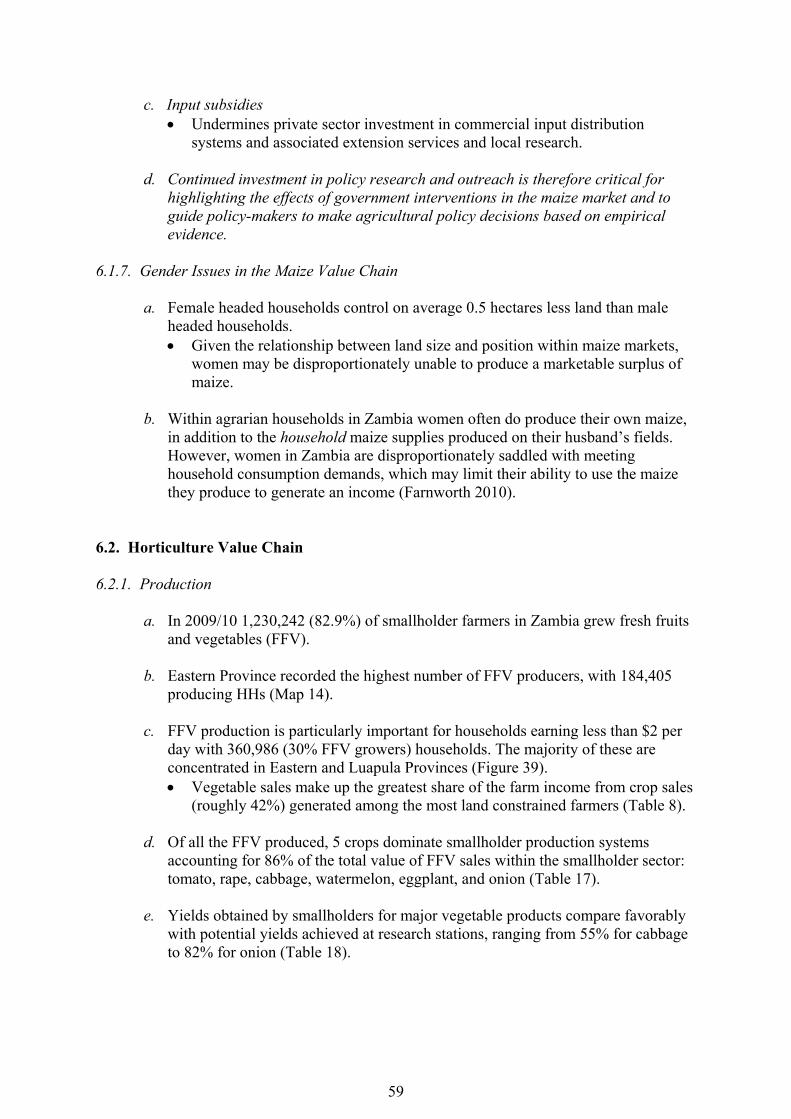
59
c. Input subsidies • Undermines private sector investment in commercial input distribution
systems and associated extension services and local research.
d. Continued investment in policy research and outreach is therefore critical for highlighting the effects of government interventions in the maize market and to guide policy-makers to make agricultural policy decisions based on empirical evidence.
6.1.7. Gender Issues in the Maize Value Chain
a. Female headed households control on average 0.5 hectares less land than male headed households. • Given the relationship between land size and position within maize markets,
women may be disproportionately unable to produce a marketable surplus of maize.
b. Within agrarian households in Zambia women often do produce their own maize,
in addition to the household maize supplies produced on their husband’s fields. However, women in Zambia are disproportionately saddled with meeting household consumption demands, which may limit their ability to use the maize they produce to generate an income (Farnworth 2010).
6.2. Horticulture Value Chain 6.2.1. Production
a. In 2009/10 1,230,242 (82.9%) of smallholder farmers in Zambia grew fresh fruits and vegetables (FFV).
b. Eastern Province recorded the highest number of FFV producers, with 184,405
producing HHs (Map 14). c. FFV production is particularly important for households earning less than $2 per
day with 360,986 (30% FFV growers) households. The majority of these are concentrated in Eastern and Luapula Provinces (Figure 39). • Vegetable sales make up the greatest share of the farm income from crop sales
(roughly 42%) generated among the most land constrained farmers (Table 8).
d. Of all the FFV produced, 5 crops dominate smallholder production systems accounting for 86% of the total value of FFV sales within the smallholder sector: tomato, rape, cabbage, watermelon, eggplant, and onion (Table 17).
e. Yields obtained by smallholders for major vegetable products compare favorably
with potential yields achieved at research stations, ranging from 55% for cabbage to 82% for onion (Table 18).
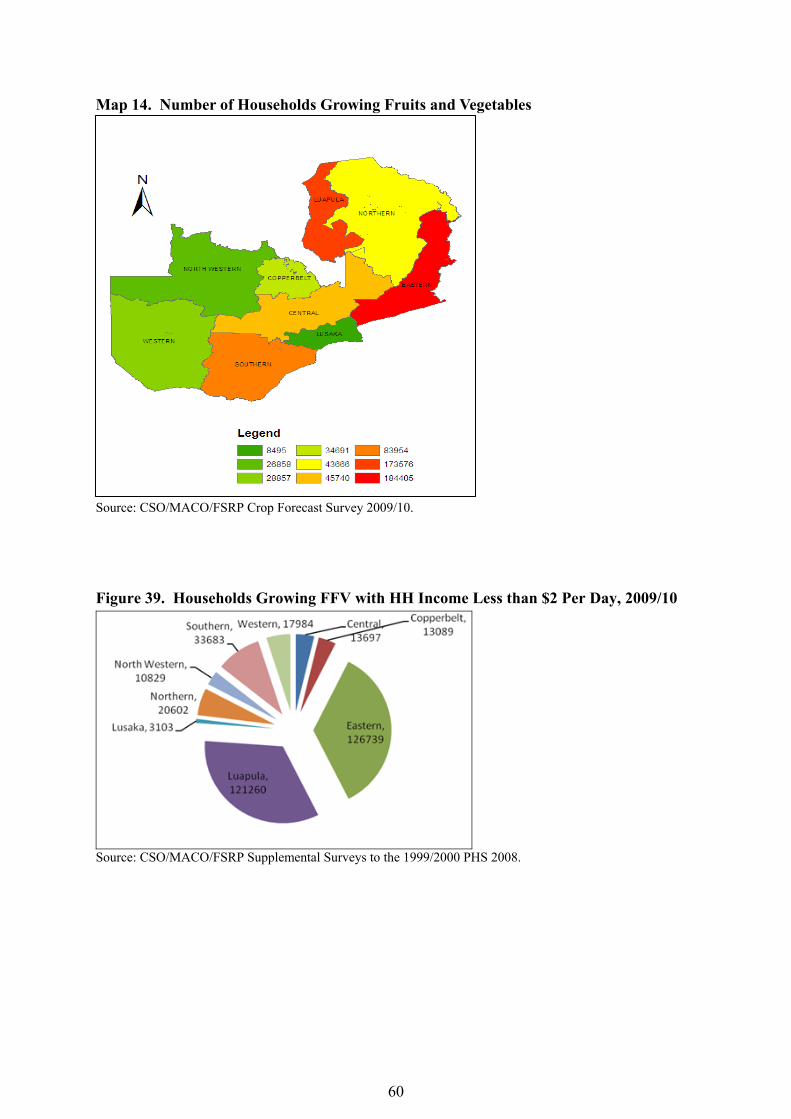
60
Map 14. Number of Households Growing Fruits and Vegetables Source: FSRP/CSO CFS, 2009/10 Source: CSO/MACO/FSRP Crop Forecast Survey 2009/10. Figure 39. Households Growing FFV with HH Income Less than $2 Per Day, 2009/10
Source: CSO/MACO/FSRP Supplemental Surveys to the 1999/2000 PHS 2008.
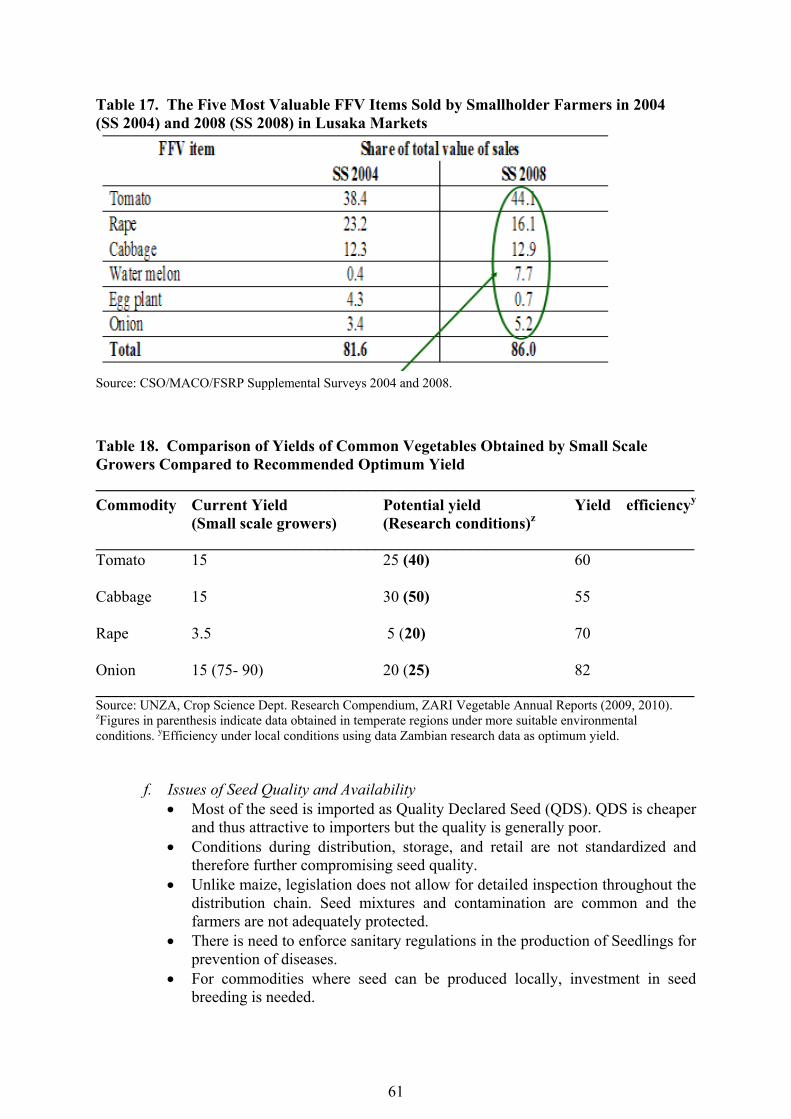
61
Table 17. The Five Most Valuable FFV Items Sold by Smallholder Farmers in 2004 (SS 2004) and 2008 (SS 2008) in Lusaka Markets
Source: CSO/MACO/FSRP Supplemental Surveys 2004 and 2008. Table 18. Comparison of Yields of Common Vegetables Obtained by Small Scale Growers Compared to Recommended Optimum Yield ___________________________________________________________________________ Commodity Current Yield Potential yield Yield efficiencyy
(Small scale growers) (Research conditions)z ___________________________________________________________________________ Tomato 15 25 (40) 60 Cabbage 15 30 (50) 55 Rape 3.5 5 (20) 70 Onion 15 (75- 90) 20 (25) 82 ___________________________________________________________________________ Source: UNZA, Crop Science Dept. Research Compendium, ZARI Vegetable Annual Reports (2009, 2010). zFigures in parenthesis indicate data obtained in temperate regions under more suitable environmental conditions. yEfficiency under local conditions using data Zambian research data as optimum yield.
f. Issues of Seed Quality and Availability • Most of the seed is imported as Quality Declared Seed (QDS). QDS is cheaper
and thus attractive to importers but the quality is generally poor. • Conditions during distribution, storage, and retail are not standardized and
therefore further compromising seed quality. • Unlike maize, legislation does not allow for detailed inspection throughout the
distribution chain. Seed mixtures and contamination are common and the farmers are not adequately protected.
• There is need to enforce sanitary regulations in the production of Seedlings for prevention of diseases.
• For commodities where seed can be produced locally, investment in seed breeding is needed.
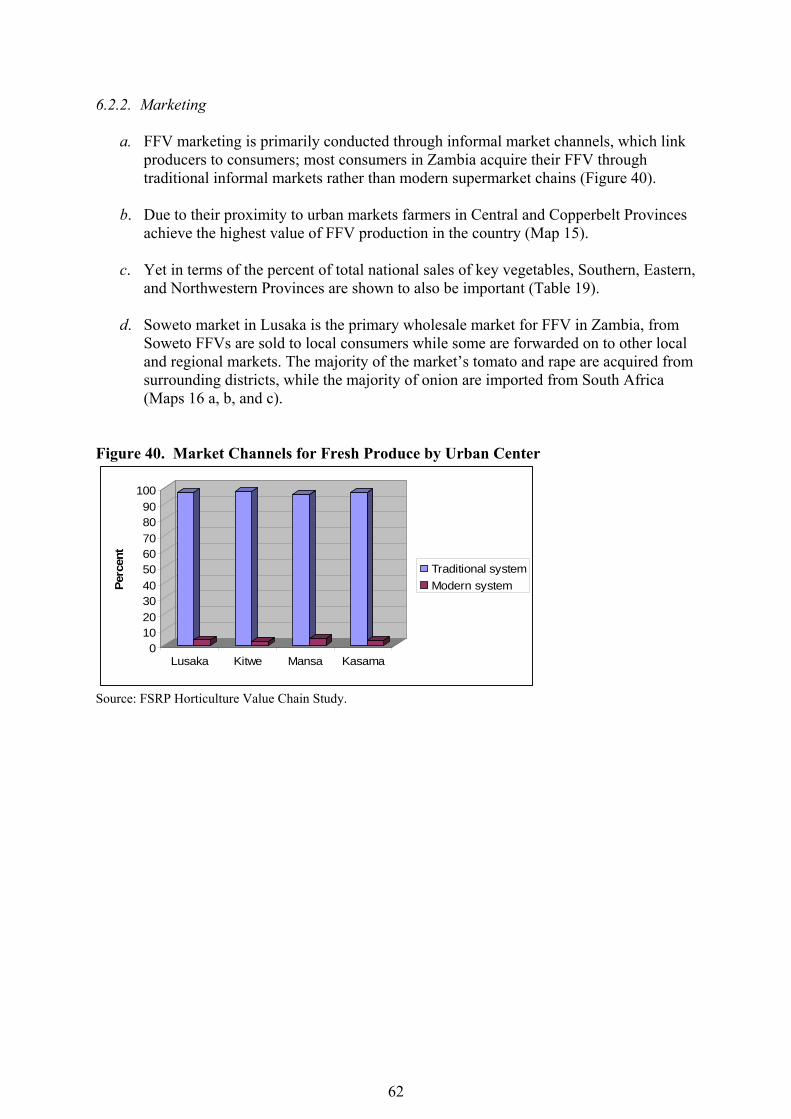
62
6.2.2. Marketing
a. FFV marketing is primarily conducted through informal market channels, which link producers to consumers; most consumers in Zambia acquire their FFV through traditional informal markets rather than modern supermarket chains (Figure 40).
b. Due to their proximity to urban markets farmers in Central and Copperbelt Provinces
achieve the highest value of FFV production in the country (Map 15). c. Yet in terms of the percent of total national sales of key vegetables, Southern, Eastern,
and Northwestern Provinces are shown to also be important (Table 19). d. Soweto market in Lusaka is the primary wholesale market for FFV in Zambia, from
Soweto FFVs are sold to local consumers while some are forwarded on to other local and regional markets. The majority of the market’s tomato and rape are acquired from surrounding districts, while the majority of onion are imported from South Africa (Maps 16 a, b, and c).
Figure 40. Market Channels for Fresh Produce by Urban Center
0102030405060708090
100
Perc
ent
Lusaka Kitwe Mansa Kasama
Traditional systemModern system
Source: FSRP Horticulture Value Chain Study.
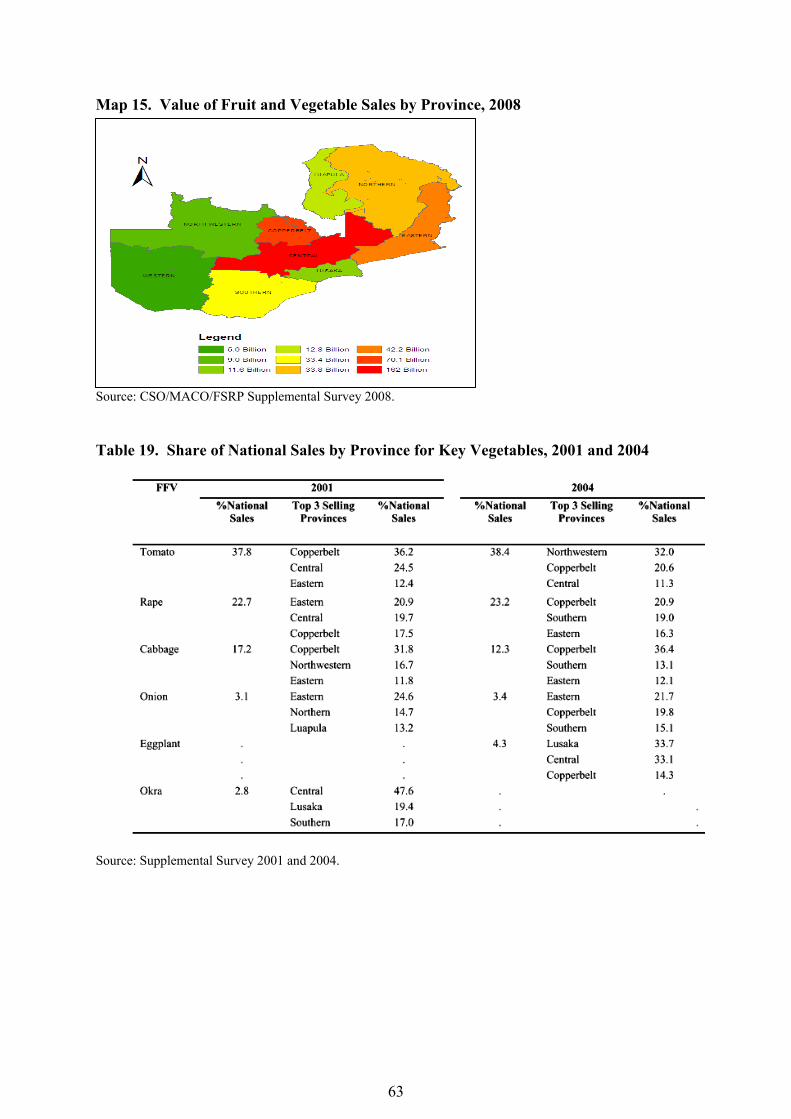
63
Map 15. Value of Fruit and Vegetable Sales by Province, 2008
Source: CSO/MACO/FSRP Supplemental Survey 2008. Table 19. Share of National Sales by Province for Key Vegetables, 2001 and 2004
Source: Supplemental Survey 2001 and 2004.
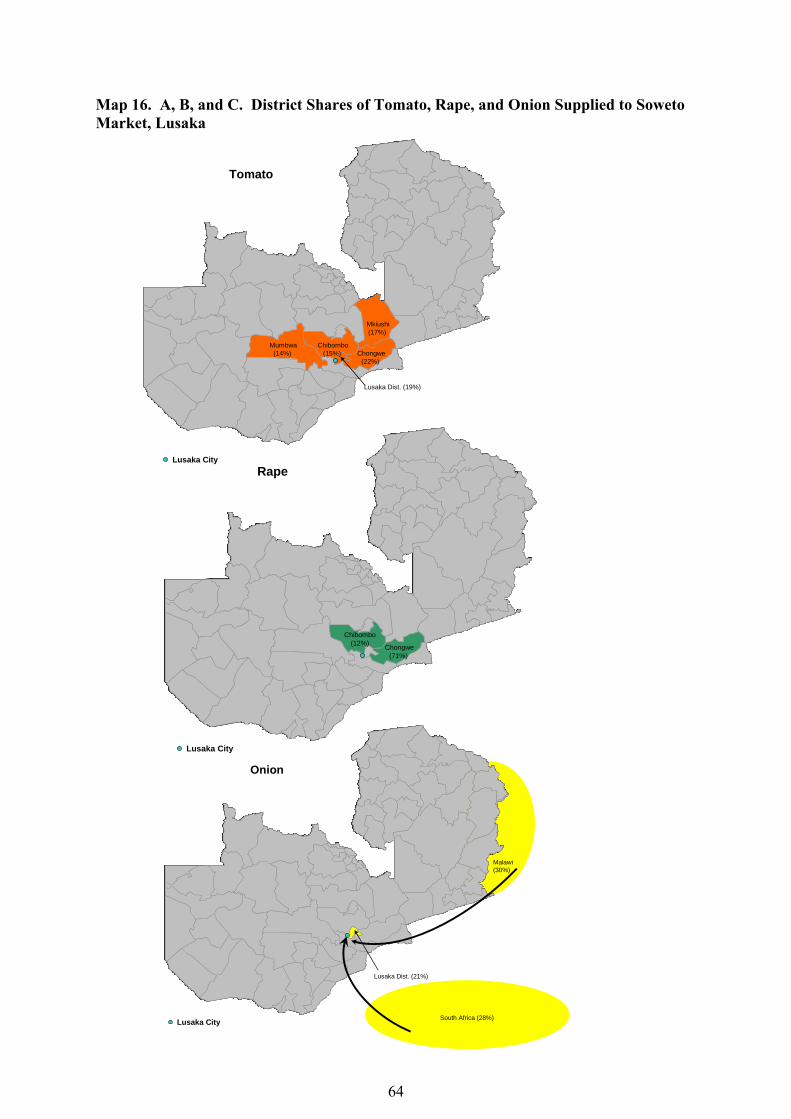
64
Map 16. A, B, and C. District Shares of Tomato, Rape, and Onion Supplied to Soweto Market, Lusaka
Mumbwa(14%)
Chibombo(15%)
Mkiushi(17%)
Chongwe(22%)
Lusaka Dist. (19%)
Tomato
Lusaka City
Chibombo(12%) Chongwe
(71%)
Rape
Lusaka City
Lusaka City
Lusaka Dist. (21%)
Malawi(30%)
South Africa (28%)
Onion
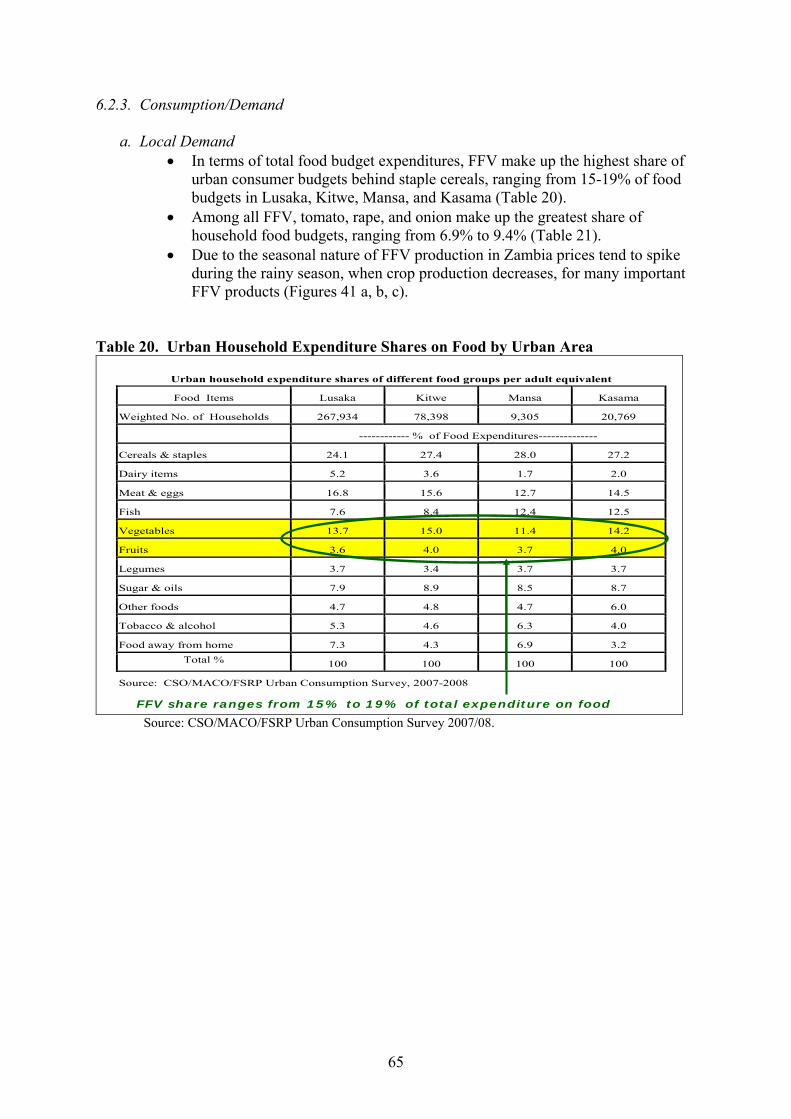
65
6.2.3. Consumption/Demand
a. Local Demand • In terms of total food budget expenditures, FFV make up the highest share of
urban consumer budgets behind staple cereals, ranging from 15-19% of food budgets in Lusaka, Kitwe, Mansa, and Kasama (Table 20).
• Among all FFV, tomato, rape, and onion make up the greatest share of household food budgets, ranging from 6.9% to 9.4% (Table 21).
• Due to the seasonal nature of FFV production in Zambia prices tend to spike during the rainy season, when crop production decreases, for many important FFV products (Figures 41 a, b, c).
Table 20. Urban Household Expenditure Shares on Food by Urban Area
Urban household expenditure shares of different food groups per adult equivalent
Food Items Lusaka Kitwe Mansa Kasama
Weighted No. of Households 267,934 78,398 9,305 20,769
------------ % of Food Expenditures--------------
Cereals & staples 24.1 27.4 28.0 27.2
Dairy items 5.2 3.6 1.7 2.0
Meat & eggs 16.8 15.6 12.7 14.5
Fish 7.6 8.4 12.4 12.5
Vegetables 13.7 15.0 11.4 14.2
Fruits 3.6 4.0 3.7 4.0
Legumes 3.7 3.4 3.7 3.7
Sugar & oils 7.9 8.9 8.5 8.7
Other foods 4.7 4.8 4.7 6.0
Tobacco & alcohol 5.3 4.6 6.3 4.0
Food away from home 7.3 4.3 6.9 3.2 Total % 100 100 100 100
Source: CSO/MACO/FSRP Urban Consumption Survey, 2007-2008
FFV share ranges from 15% to 19% of total expenditure on food Source: CSO/MACO/FSRP Urban Consumption Survey 2007/08.
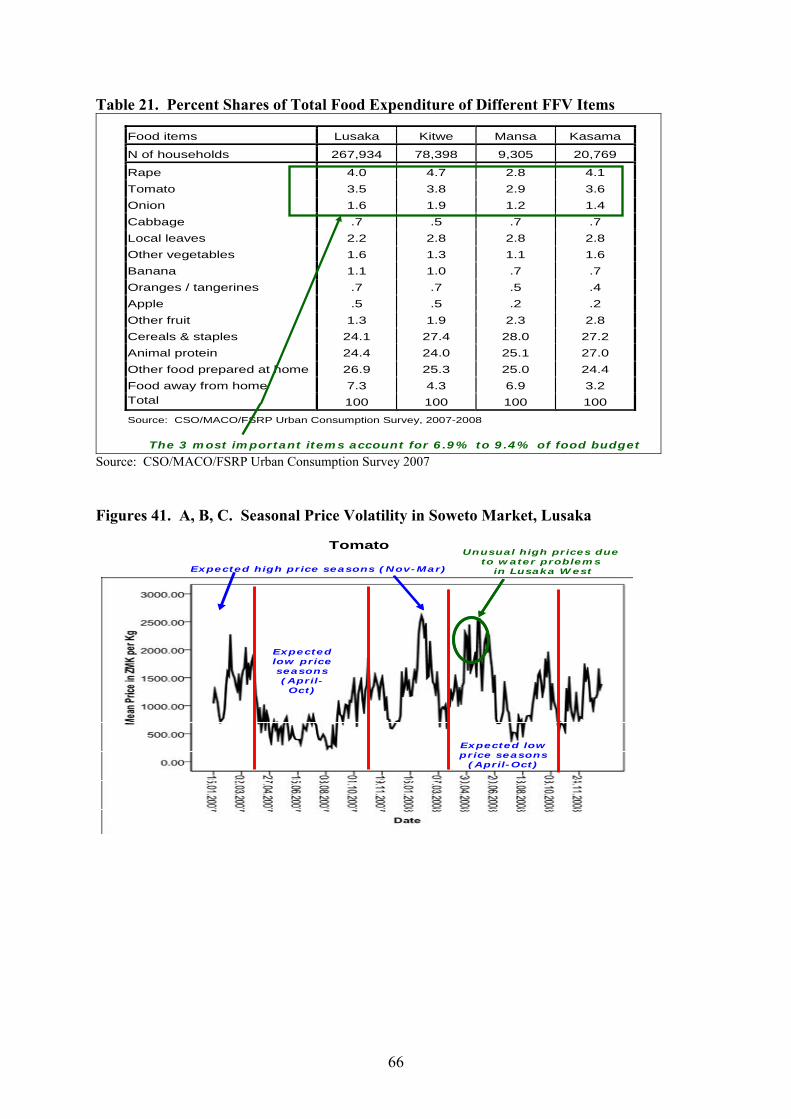
66
Table 21. Percent Shares of Total Food Expenditure of Different FFV Items
Food items Lusaka Kitwe Mansa Kasama
N of households 267,934 78,398 9,305 20,769
Rape 4.0 4.7 2.8 4.1 Tomato 3.5 3.8 2.9 3.6 Onion 1.6 1.9 1.2 1.4 Cabbage .7 .5 .7 .7 Local leaves 2.2 2.8 2.8 2.8 Other vegetables 1.6 1.3 1.1 1.6 Banana 1.1 1.0 .7 .7 Oranges / tangerines .7 .7 .5 .4 Apple .5 .5 .2 .2 Other fruit 1.3 1.9 2.3 2.8 Cereals & staples 24.1 27.4 28.0 27.2 Animal protein 24.4 24.0 25.1 27.0 Other food prepared at home 26.9 25.3 25.0 24.4 Food away from home 7.3 4.3 6.9 3.2 Total 100 100 100 100
Source: CSO/MACO/FSRP Urban Consumption Survey, 2007-2008
The 3 most important items account for 6.9% to 9.4% of food budget Source: CSO/MACO/FSRP Urban Consumption Survey 2007 Figures 41. A, B, C. Seasonal Price Volatility in Soweto Market, Lusaka
TomatoUnusual high prices due
to water problemsin Lusaka West
Expected low price seasons (April-Oct)
Expected low price seasons
(April-Oct)
Expected high price seasons (Nov-Mar)
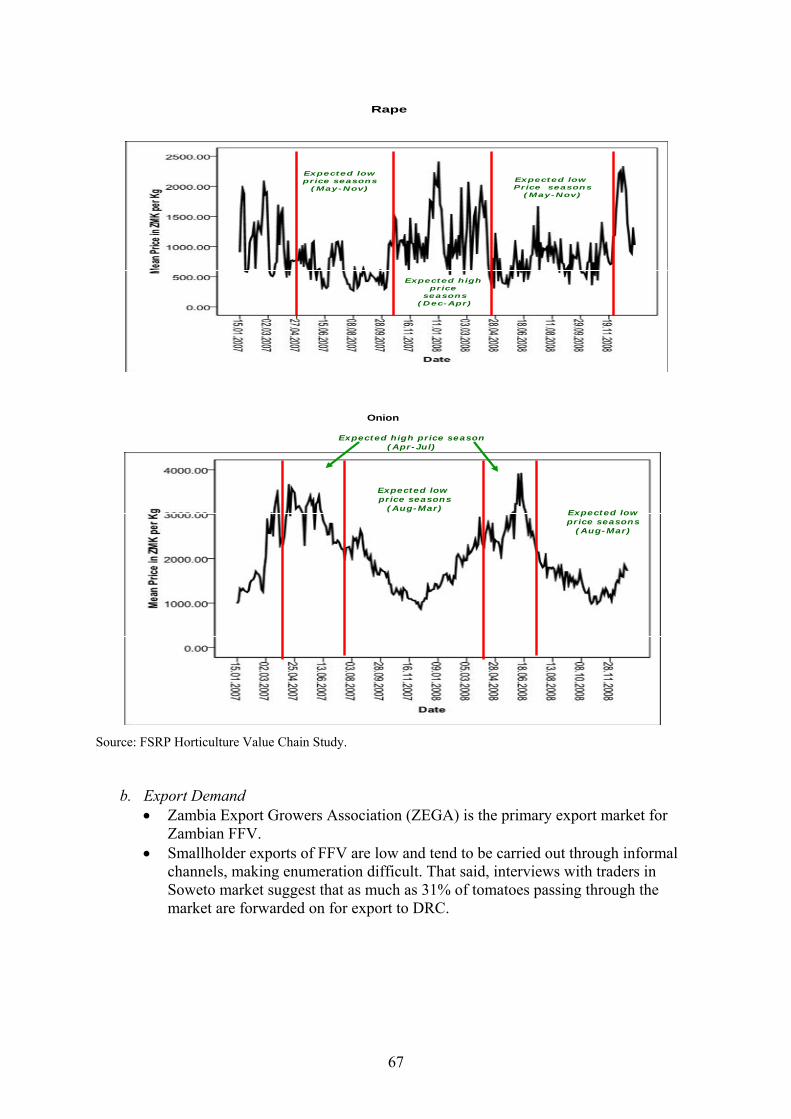
67
Rape
Expected low price seasons
(May-Nov)
Expected high price
seasons(Dec-Apr)
Expected low Price seasons
(May-Nov)
Onion
Expected low price seasons
(Aug-Mar) Expected low price seasons
(Aug-Mar)
Expected high price season (Apr-Jul)
Source: FSRP Horticulture Value Chain Study.
b. Export Demand
• Zambia Export Growers Association (ZEGA) is the primary export market for Zambian FFV.
• Smallholder exports of FFV are low and tend to be carried out through informal channels, making enumeration difficult. That said, interviews with traders in Soweto market suggest that as much as 31% of tomatoes passing through the market are forwarded on for export to DRC.
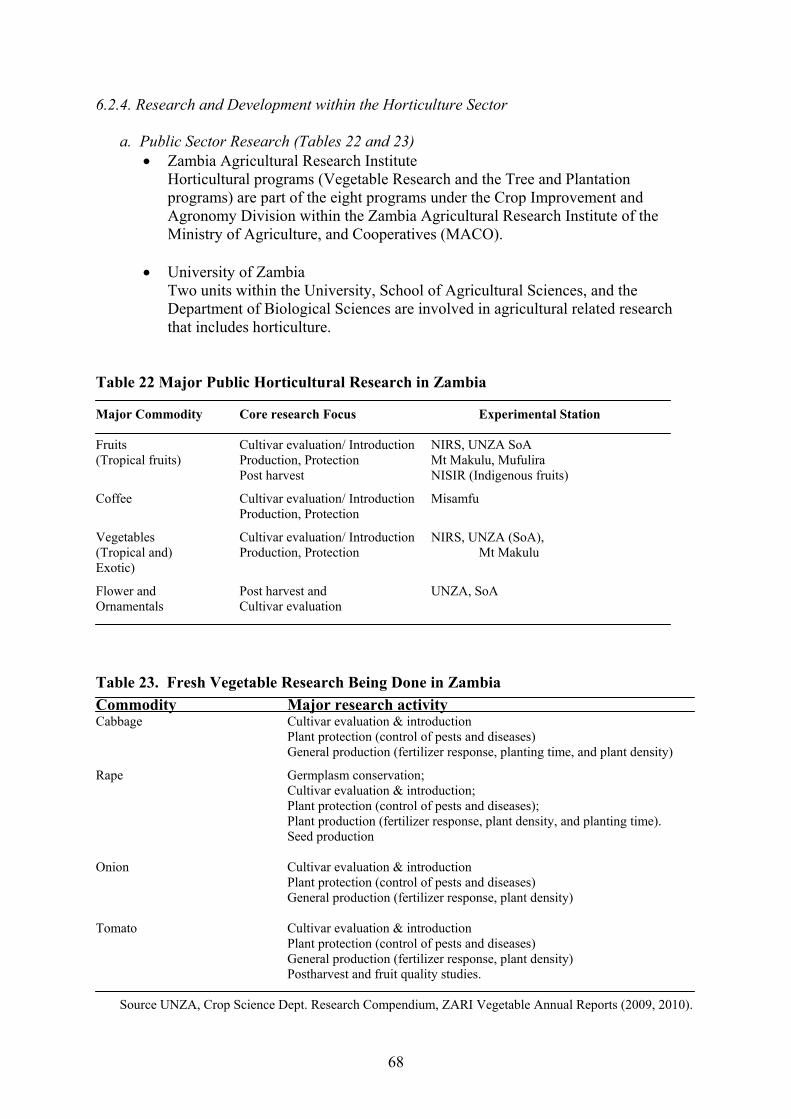
68
6.2.4. Research and Development within the Horticulture Sector
a. Public Sector Research (Tables 22 and 23) • Zambia Agricultural Research Institute
Horticultural programs (Vegetable Research and the Tree and Plantation programs) are part of the eight programs under the Crop Improvement and Agronomy Division within the Zambia Agricultural Research Institute of the Ministry of Agriculture, and Cooperatives (MACO).
• University of Zambia
Two units within the University, School of Agricultural Sciences, and the Department of Biological Sciences are involved in agricultural related research that includes horticulture.
Table 22 Major Public Horticultural Research in Zambia Major Commodity Core research Focus Experimental Station Fruits Cultivar evaluation/ Introduction NIRS, UNZA SoA (Tropical fruits) Production, Protection Mt Makulu, Mufulira Post harvest NISIR (Indigenous fruits)
Coffee Cultivar evaluation/ Introduction Misamfu Production, Protection
Vegetables Cultivar evaluation/ Introduction NIRS, UNZA (SoA), (Tropical and) Production, Protection Mt Makulu Exotic)
Flower and Post harvest and UNZA, SoA Ornamentals Cultivar evaluation
Table 23. Fresh Vegetable Research Being Done in Zambia Commodity Major research activity Cabbage Cultivar evaluation & introduction
Plant protection (control of pests and diseases) General production (fertilizer response, planting time, and plant density)
Rape Germplasm conservation; Cultivar evaluation & introduction;
Plant protection (control of pests and diseases); Plant production (fertilizer response, plant density, and planting time). Seed production
Onion Cultivar evaluation & introduction
Plant protection (control of pests and diseases) General production (fertilizer response, plant density)
Tomato Cultivar evaluation & introduction
Plant protection (control of pests and diseases) General production (fertilizer response, plant density) Postharvest and fruit quality studies.
Source UNZA, Crop Science Dept. Research Compendium, ZARI Vegetable Annual Reports (2009, 2010).
69
b. Private Sector Research • Seed Companies
The major private sector players in research are Seed companies. However, the majority of seeds are developed and tested overseas.
6.2.5. Interventions and Investments in the Horticulture Sector
a. Addressing the Needs of Small-scale, Informal FFV Producers This sector comprises the bulk of the small scale horticulture producers. The system is largely informal and disorganized, with production levels generally suboptimal; for most FFV crops smallholder productivity is less than 50 % of the optimum. Furthermore the quality of the produce is of sub standard and not able to be marketed to formal sector processors. For example, tomato total soluble solid content is less than the 4 % that demanded by processors. Critical interventions that are needed to improve include:
• Organizing farmers into groups so that their limitations can be assessed much easily and the assistance can be delivered to large number in a concentrated manner.
• Re organizing the research system to ensure that it is driven by the agenda of the real problems of the growers. This can be done by adopting participatory research and extension methods.
• Facilitating information dissemination system to ensure that the technology development outputs reach the end-users. The recommendations are for other areas and not necessarily based on prevailing socio economic and soil/ climatic conditions.
b. Investments
• Support to extension system recurrent expenditure. • Optimizing information/ technology delivery.
i. Intensive targeted training system (defining training needs and training of trainers); and
ii. Logistical support such as transport and other top up remunerations.
6.2.6. Role of Women in FFV Production and Marketing Women play a major role in the production and marketing of FFV. This is both as a source of labor and as owners of fields. Survey data available, however, does not indicate the gender of the person involved in management or ownership of each of the fields in households. This notwithstanding, women are quite often more involved in the production of vegetables such as okra, African egg plants and the leafy ones such as rape, Chinese cabbage, spinach, and the local traditional leaves. Analysis of the vegetables trade flows and pricing dynamics data of the FSRP shows that 13% of the rape first sellers at Lusaka Soweto market (the main FFV wholesale market) are women compared to 8% and 6% for tomato and onion respectively. At the wider national level, about 19% of the smallholder farmers that produce FFV and 17% of those that sell are female headed (Figure 42). Women participation in these activities is higher in Lusaka, Western, Northwestern, and Luapula provinces.
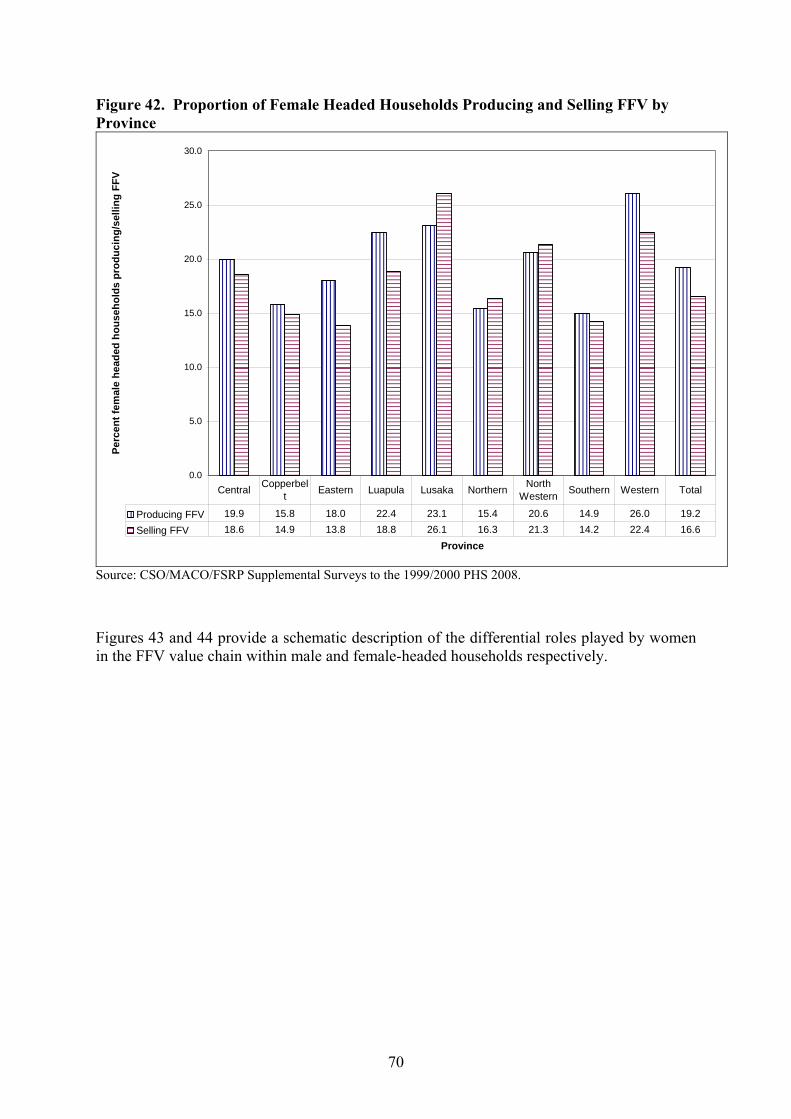
70
Figure 42. Proportion of Female Headed Households Producing and Selling FFV by Province
0.0
5.0
10.0
15.0
20.0
25.0
30.0
Province
Perc
ent f
emal
e he
aded
hou
seho
lds
prod
ucin
g/se
lling
FFV
Producing FFV 19.9 15.8 18.0 22.4 23.1 15.4 20.6 14.9 26.0 19.2Selling FFV 18.6 14.9 13.8 18.8 26.1 16.3 21.3 14.2 22.4 16.6
Central Copperbelt Eastern Luapula Lusaka Northern North
Western Southern Western Total
Source: CSO/MACO/FSRP Supplemental Surveys to the 1999/2000 PHS 2008. Figures 43 and 44 provide a schematic description of the differential roles played by women in the FFV value chain within male and female-headed households respectively.
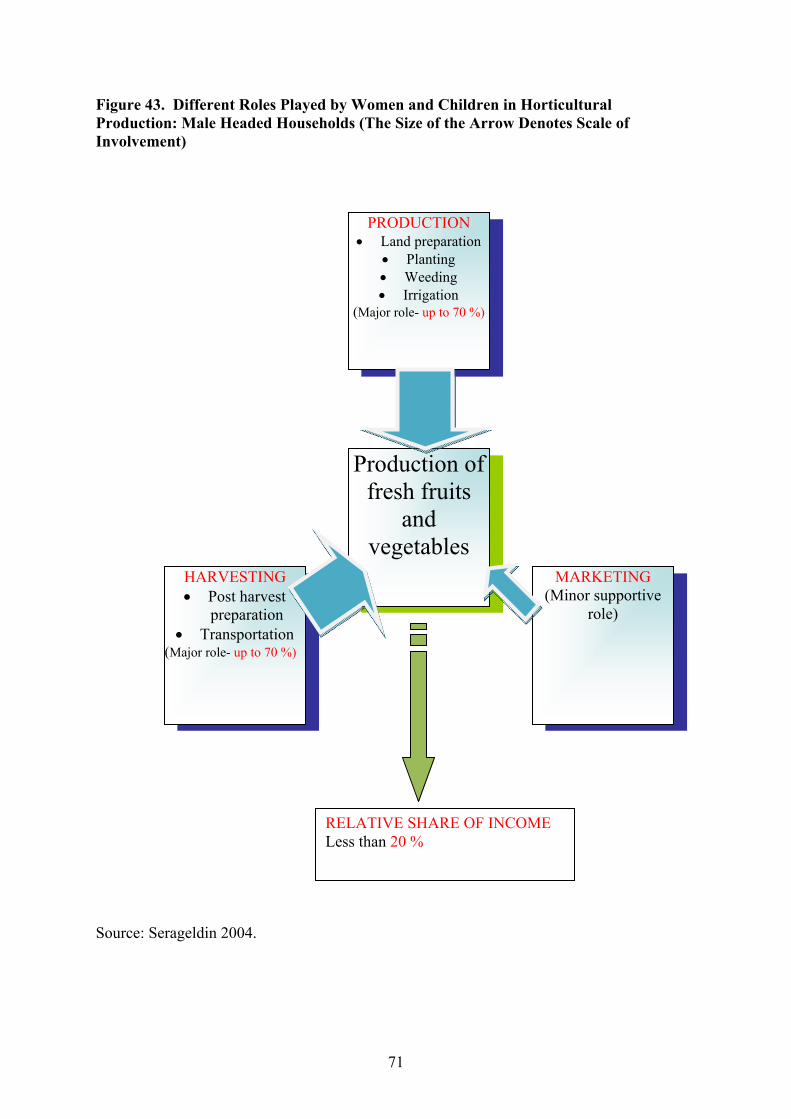
71
Figure 43. Different Roles Played by Women and Children in Horticultural Production: Male Headed Households (The Size of the Arrow Denotes Scale of Involvement)
Source: Serageldin 2004.
HARVESTING • Post harvest
preparation • Transportation
(Major role- up to 70 %)
MARKETING (Minor supportive
role)
PRODUCTION • Land preparation
• Planting • Weeding • Irrigation
(Major role- up to 70 %)
Production of fresh fruits
and vegetables
RELATIVE SHARE OF INCOME Less than 20 %
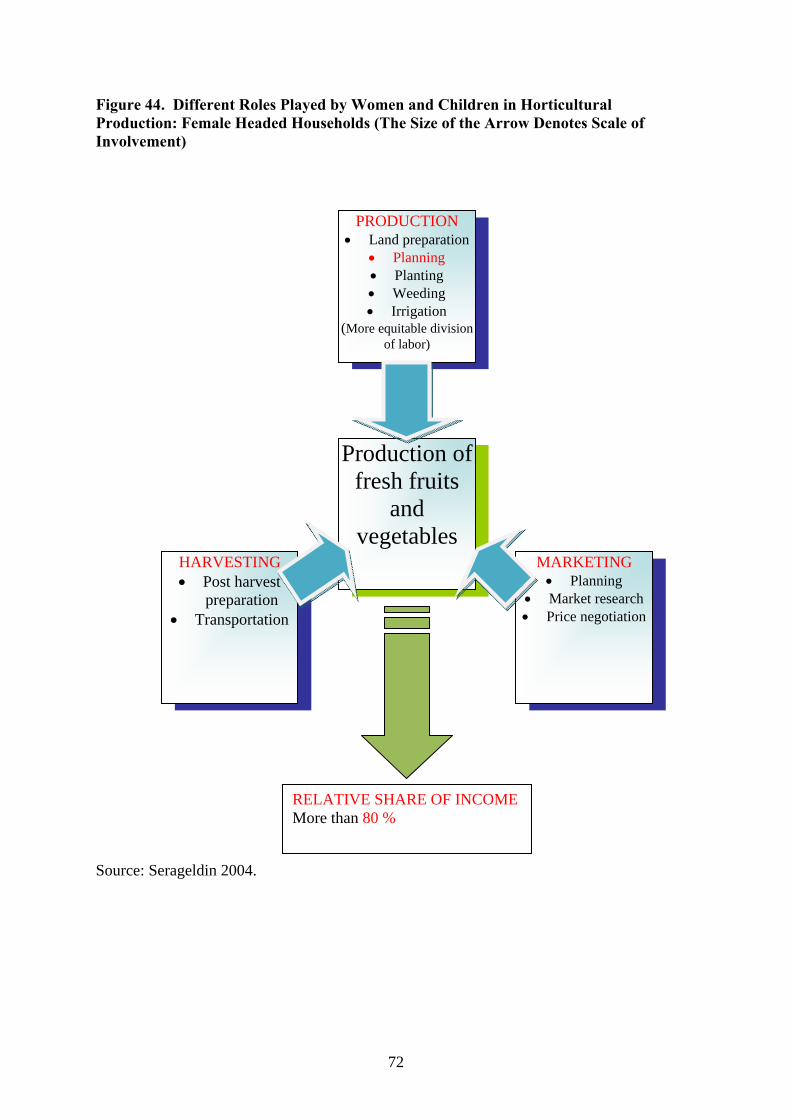
72
Figure 44. Different Roles Played by Women and Children in Horticultural Production: Female Headed Households (The Size of the Arrow Denotes Scale of Involvement)
Source: Serageldin 2004.
HARVESTING • Post harvest
preparation • Transportation
MARKETING • Planning
• Market research • Price negotiation
PRODUCTION • Land preparation
• Planning • Planting • Weeding • Irrigation
(More equitable division of labor)
Production of fresh fruits
and vegetables
RELATIVE SHARE OF INCOME More than 80 %
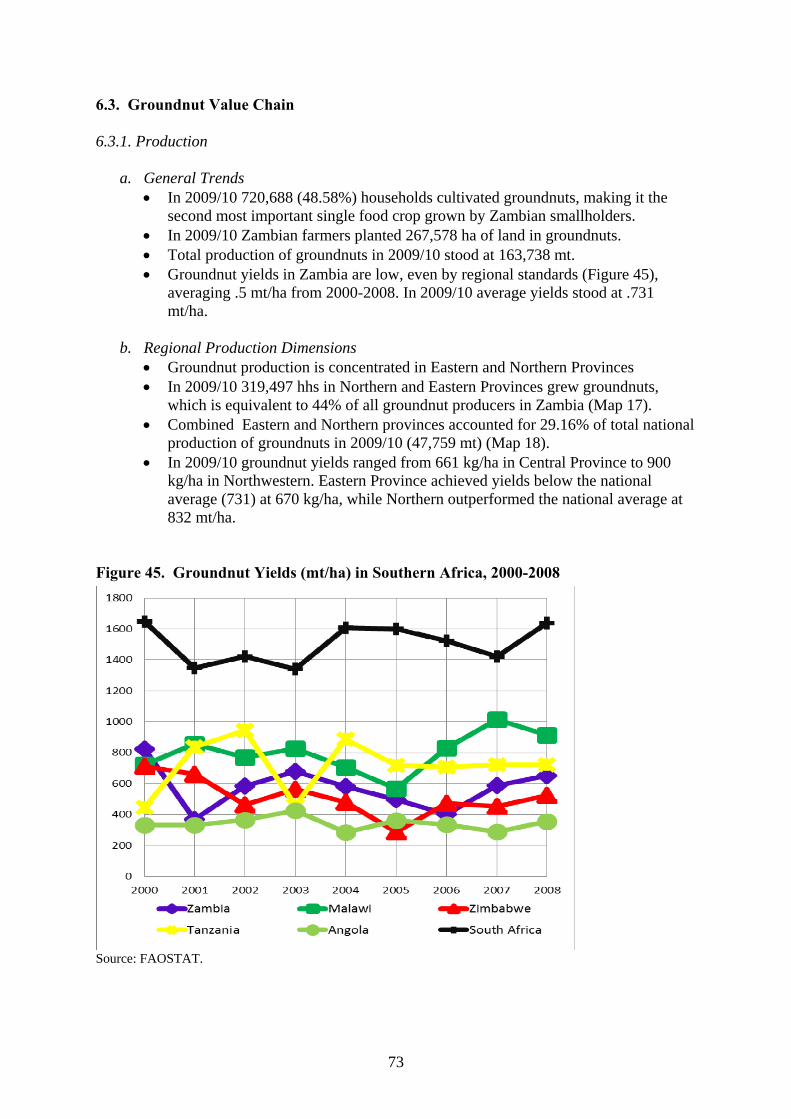
73
6.3. Groundnut Value Chain 6.3.1. Production
a. General Trends
• In 2009/10 720,688 (48.58%) households cultivated groundnuts, making it the second most important single food crop grown by Zambian smallholders.
• In 2009/10 Zambian farmers planted 267,578 ha of land in groundnuts. • Total production of groundnuts in 2009/10 stood at 163,738 mt. • Groundnut yields in Zambia are low, even by regional standards (Figure 45),
averaging .5 mt/ha from 2000-2008. In 2009/10 average yields stood at .731 mt/ha.
b. Regional Production Dimensions
• Groundnut production is concentrated in Eastern and Northern Provinces • In 2009/10 319,497 hhs in Northern and Eastern Provinces grew groundnuts,
which is equivalent to 44% of all groundnut producers in Zambia (Map 17). • Combined Eastern and Northern provinces accounted for 29.16% of total national
production of groundnuts in 2009/10 (47,759 mt) (Map 18). • In 2009/10 groundnut yields ranged from 661 kg/ha in Central Province to 900
kg/ha in Northwestern. Eastern Province achieved yields below the national average (731) at 670 kg/ha, while Northern outperformed the national average at 832 mt/ha.
Figure 45. Groundnut Yields (mt/ha) in Southern Africa, 2000-2008
Source: FAOSTAT.
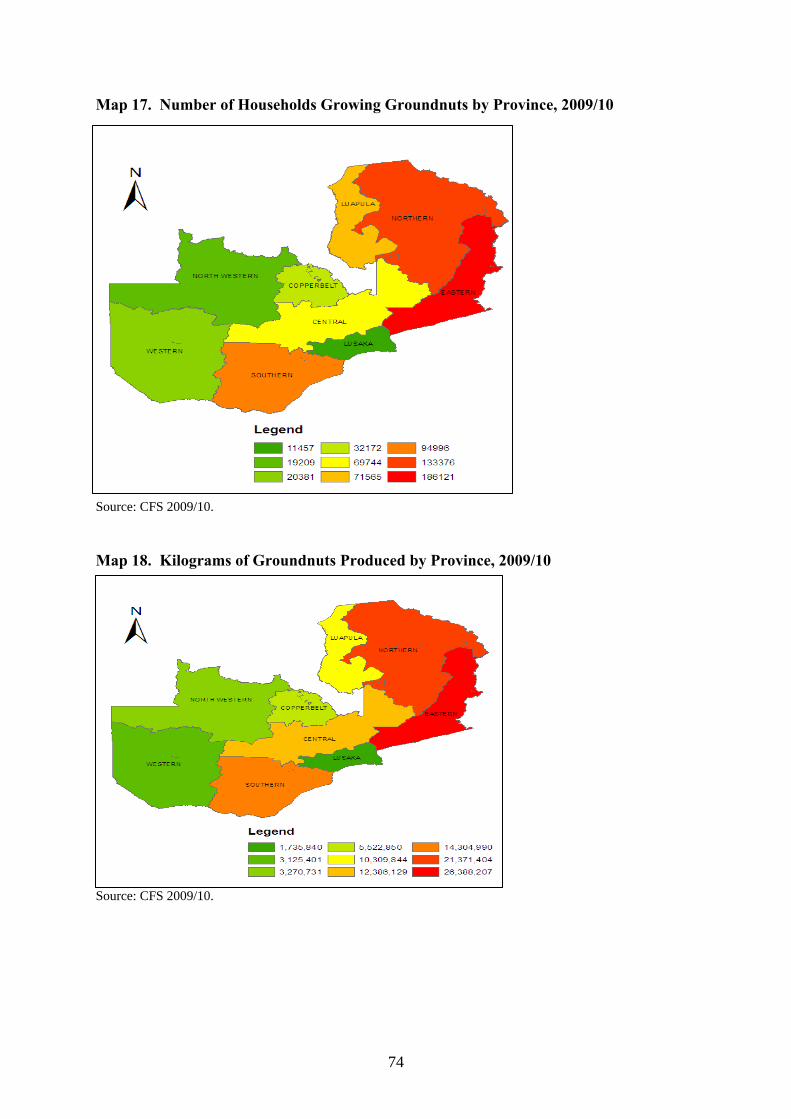
74
Map 17. Number of Households Growing Groundnuts by Province, 2009/10
Source: CFS 2009/10. Map 18. Kilograms of Groundnuts Produced by Province, 2009/10
Source: CFS 2009/10.
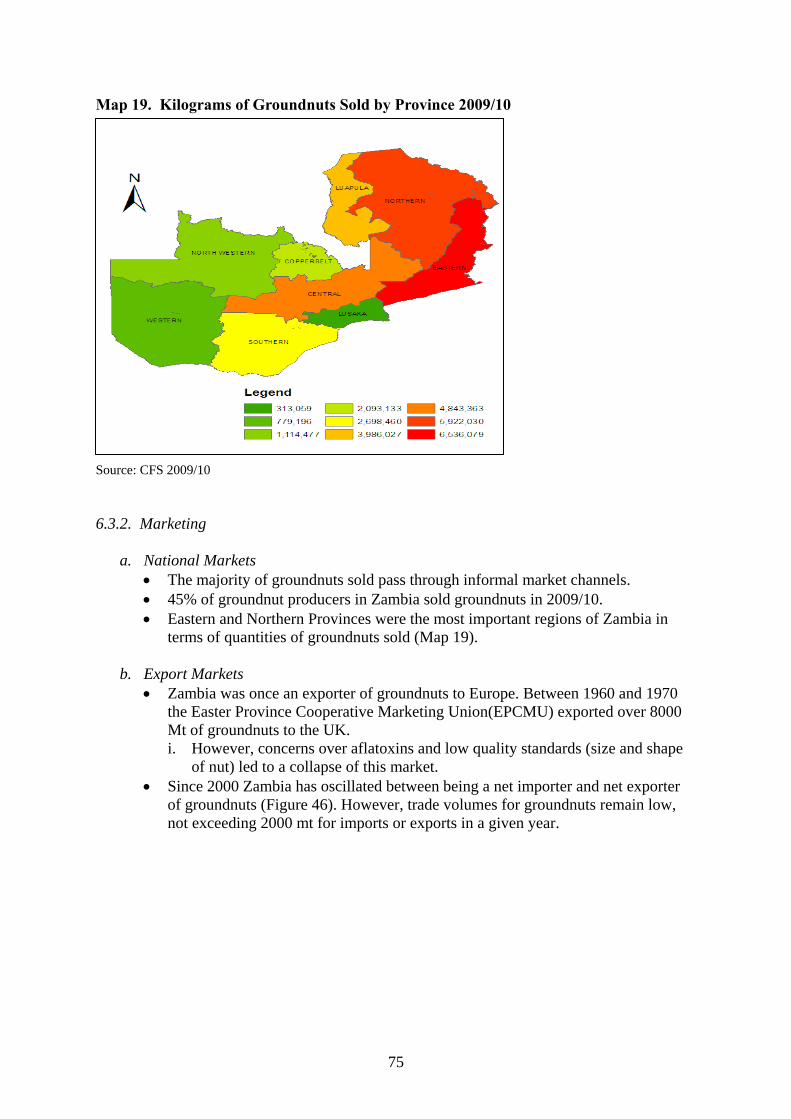
75
Map 19. Kilograms of Groundnuts Sold by Province 2009/10
Source: CFS 2009/10 6.3.2. Marketing
a. National Markets • The majority of groundnuts sold pass through informal market channels. • 45% of groundnut producers in Zambia sold groundnuts in 2009/10. • Eastern and Northern Provinces were the most important regions of Zambia in
terms of quantities of groundnuts sold (Map 19).
b. Export Markets • Zambia was once an exporter of groundnuts to Europe. Between 1960 and 1970
the Easter Province Cooperative Marketing Union(EPCMU) exported over 8000 Mt of groundnuts to the UK. i. However, concerns over aflatoxins and low quality standards (size and shape
of nut) led to a collapse of this market. • Since 2000 Zambia has oscillated between being a net importer and net exporter
of groundnuts (Figure 46). However, trade volumes for groundnuts remain low, not exceeding 2000 mt for imports or exports in a given year.
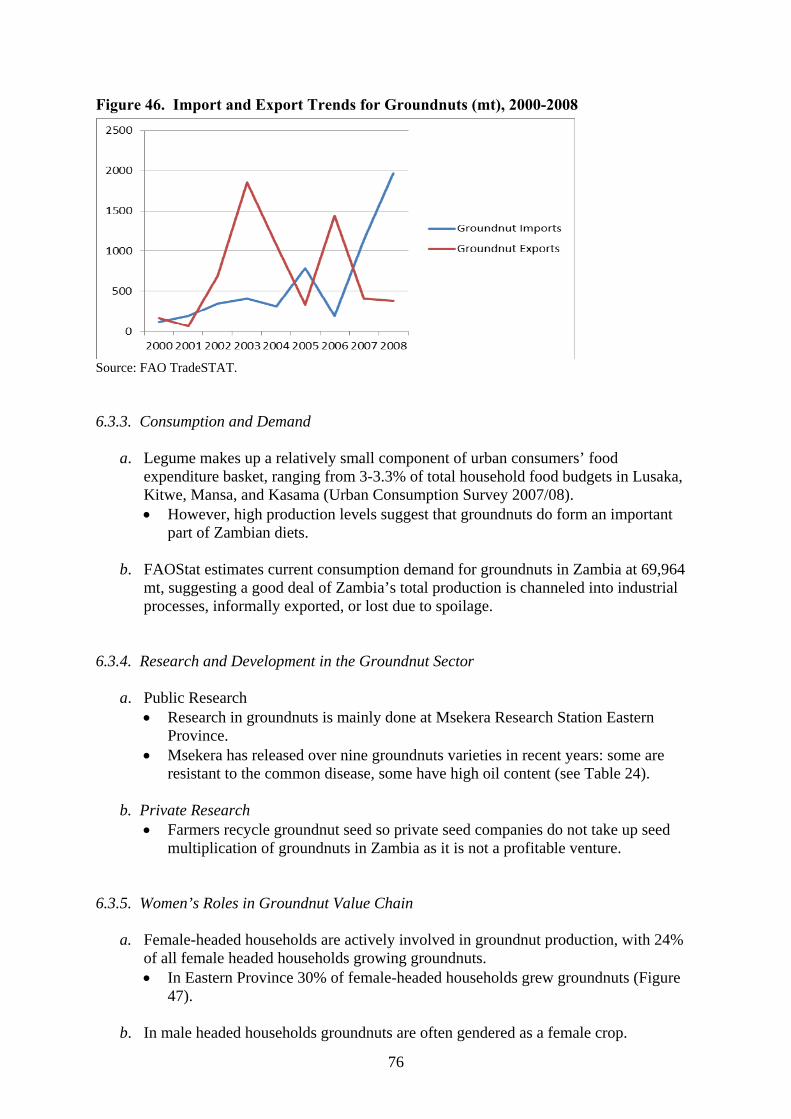
76
Figure 46. Import and Export Trends for Groundnuts (mt), 2000-2008
Source: FAO TradeSTAT. 6.3.3. Consumption and Demand
a. Legume makes up a relatively small component of urban consumers’ food expenditure basket, ranging from 3-3.3% of total household food budgets in Lusaka, Kitwe, Mansa, and Kasama (Urban Consumption Survey 2007/08). • However, high production levels suggest that groundnuts do form an important
part of Zambian diets.
b. FAOStat estimates current consumption demand for groundnuts in Zambia at 69,964 mt, suggesting a good deal of Zambia’s total production is channeled into industrial processes, informally exported, or lost due to spoilage.
6.3.4. Research and Development in the Groundnut Sector
a. Public Research • Research in groundnuts is mainly done at Msekera Research Station Eastern
Province. • Msekera has released over nine groundnuts varieties in recent years: some are
resistant to the common disease, some have high oil content (see Table 24).
b. Private Research • Farmers recycle groundnut seed so private seed companies do not take up seed
multiplication of groundnuts in Zambia as it is not a profitable venture. 6.3.5. Women’s Roles in Groundnut Value Chain
a. Female-headed households are actively involved in groundnut production, with 24% of all female headed households growing groundnuts. • In Eastern Province 30% of female-headed households grew groundnuts (Figure
47).
b. In male headed households groundnuts are often gendered as a female crop.
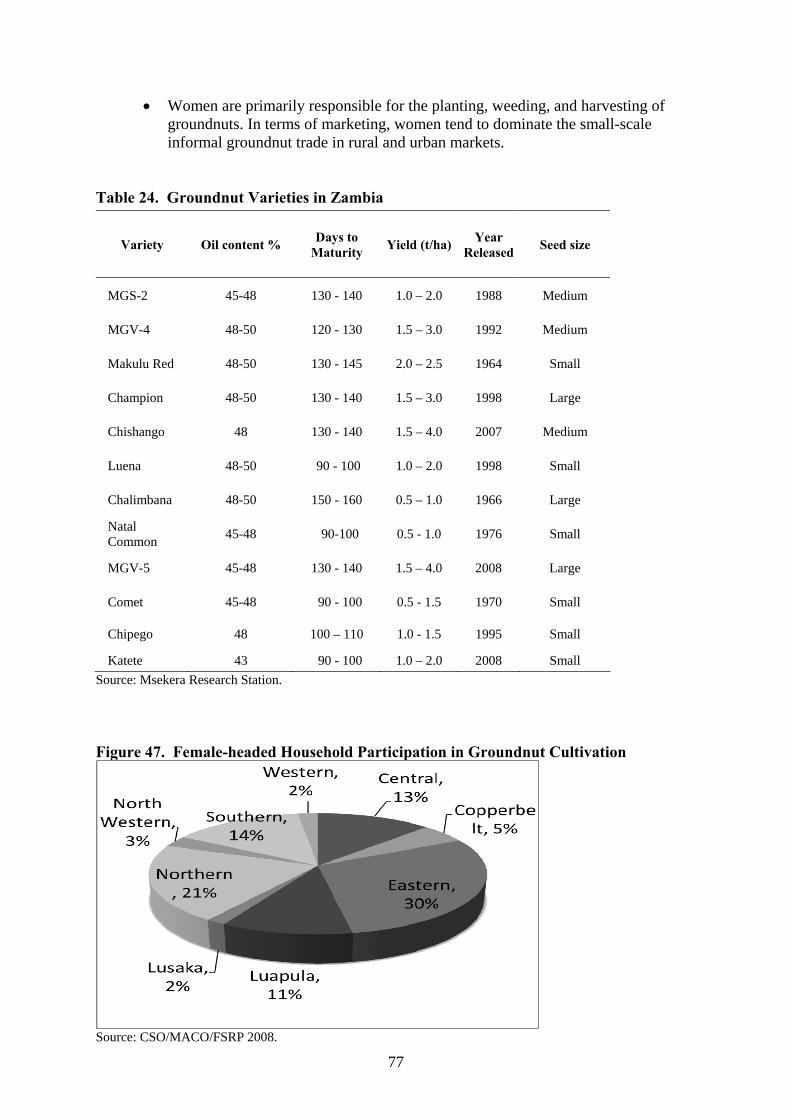
77
• Women are primarily responsible for the planting, weeding, and harvesting of groundnuts. In terms of marketing, women tend to dominate the small-scale informal groundnut trade in rural and urban markets.
Table 24. Groundnut Varieties in Zambia
Variety Oil content % Days to Maturity Yield (t/ha) Year
Released Seed size
MGS-2 45-48 130 - 140 1.0 – 2.0 1988 Medium
MGV-4 48-50 120 - 130 1.5 – 3.0 1992 Medium
Makulu Red 48-50 130 - 145 2.0 – 2.5 1964 Small
Champion 48-50 130 - 140 1.5 – 3.0 1998 Large
Chishango 48 130 - 140 1.5 – 4.0 2007 Medium
Luena 48-50 90 - 100 1.0 – 2.0 1998 Small
Chalimbana 48-50 150 - 160 0.5 – 1.0 1966 Large
Natal Common 45-48 90-100 0.5 - 1.0 1976 Small
MGV-5 45-48 130 - 140 1.5 – 4.0 2008 Large
Comet 45-48 90 - 100 0.5 - 1.5 1970 Small
Chipego 48 100 – 110 1.0 - 1.5 1995 Small
Katete 43 90 - 100 1.0 – 2.0 2008 Small Source: Msekera Research Station. Figure 47. Female-headed Household Participation in Groundnut Cultivation
Source: CSO/MACO/FSRP 2008.
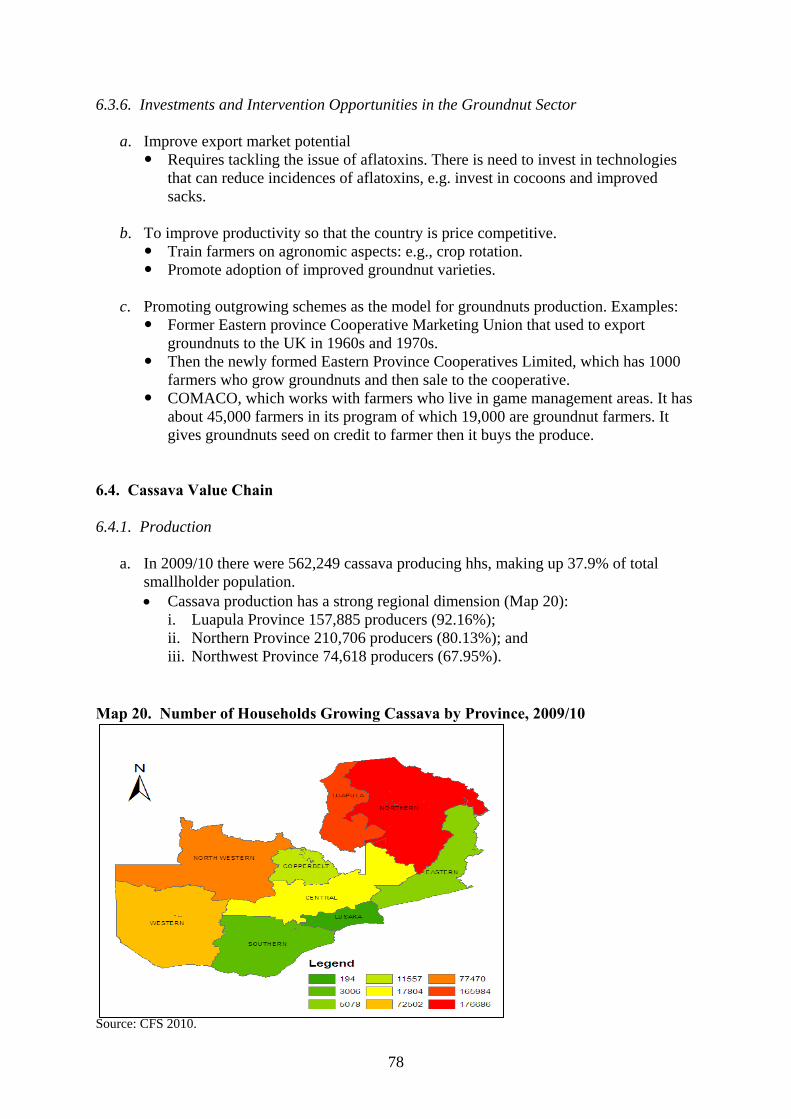
78
6.3.6. Investments and Intervention Opportunities in the Groundnut Sector a. Improve export market potential
Requires tackling the issue of aflatoxins. There is need to invest in technologies that can reduce incidences of aflatoxins, e.g. invest in cocoons and improved sacks.
b. To improve productivity so that the country is price competitive.
Train farmers on agronomic aspects: e.g., crop rotation. Promote adoption of improved groundnut varieties.
c. Promoting outgrowing schemes as the model for groundnuts production. Examples:
Former Eastern province Cooperative Marketing Union that used to export groundnuts to the UK in 1960s and 1970s.
Then the newly formed Eastern Province Cooperatives Limited, which has 1000 farmers who grow groundnuts and then sale to the cooperative.
COMACO, which works with farmers who live in game management areas. It has about 45,000 farmers in its program of which 19,000 are groundnut farmers. It gives groundnuts seed on credit to farmer then it buys the produce.
6.4. Cassava Value Chain 6.4.1. Production
a. In 2009/10 there were 562,249 cassava producing hhs, making up 37.9% of total smallholder population. • Cassava production has a strong regional dimension (Map 20):
i. Luapula Province 157,885 producers (92.16%); ii. Northern Province 210,706 producers (80.13%); and iii. Northwest Province 74,618 producers (67.95%).
Map 20. Number of Households Growing Cassava by Province, 2009/10
Source: CFS 2010.
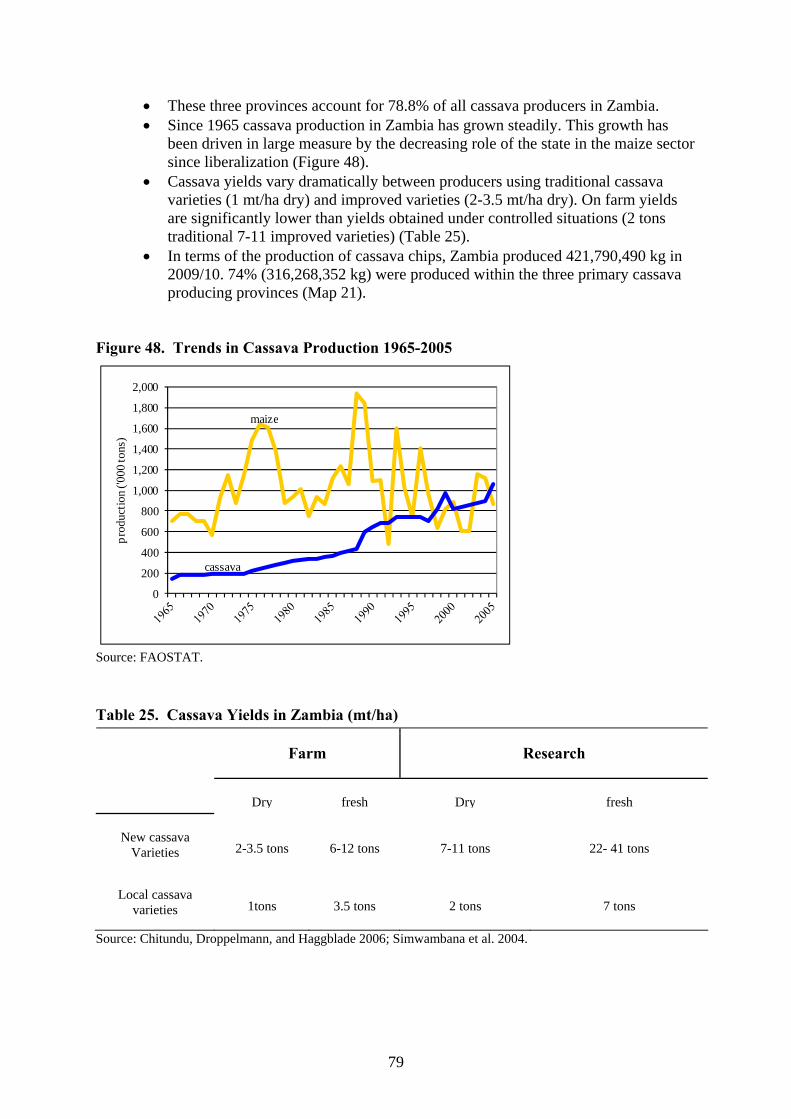
79
• These three provinces account for 78.8% of all cassava producers in Zambia. • Since 1965 cassava production in Zambia has grown steadily. This growth has
been driven in large measure by the decreasing role of the state in the maize sector since liberalization (Figure 48).
• Cassava yields vary dramatically between producers using traditional cassava varieties (1 mt/ha dry) and improved varieties (2-3.5 mt/ha dry). On farm yields are significantly lower than yields obtained under controlled situations (2 tons traditional 7-11 improved varieties) (Table 25).
• In terms of the production of cassava chips, Zambia produced 421,790,490 kg in 2009/10. 74% (316,268,352 kg) were produced within the three primary cassava producing provinces (Map 21).
Figure 48. Trends in Cassava Production 1965-2005
Source: FAOSTAT. Table 25. Cassava Yields in Zambia (mt/ha)
Farm Research
Dry fresh Dry fresh
New cassava Varieties 2-3.5 tons 6-12 tons 7-11 tons 22- 41 tons
Local cassava varieties 1tons 3.5 tons 2 tons 7 tons
Source: Chitundu, Droppelmann, and Haggblade 2006; Simwambana et al. 2004.
0
200
400
600
800
1,000
1,200
1,400
1,600
1,800
2,000
prod
uctio
n ('0
00 to
ns)
maize
cassava
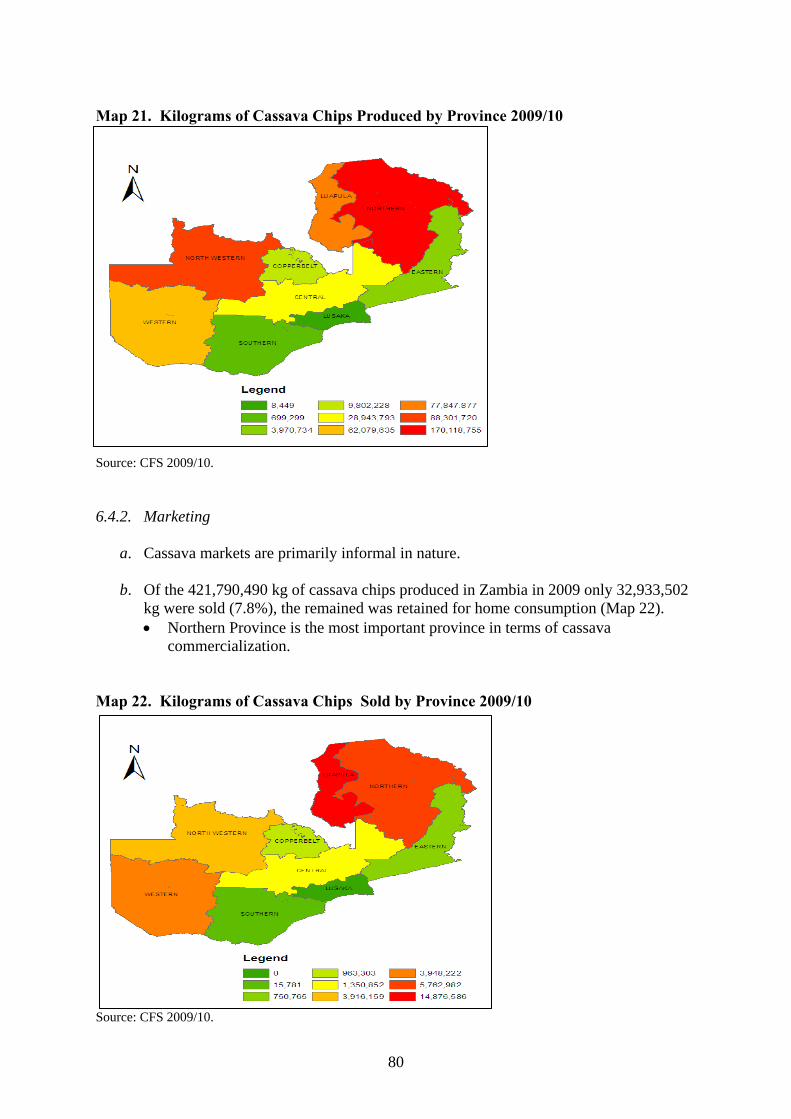
80
Map 21. Kilograms of Cassava Chips Produced by Province 2009/10
Source: CFS 2009/10. 6.4.2. Marketing
a. Cassava markets are primarily informal in nature. b. Of the 421,790,490 kg of cassava chips produced in Zambia in 2009 only 32,933,502
kg were sold (7.8%), the remained was retained for home consumption (Map 22). • Northern Province is the most important province in terms of cassava
commercialization. Map 22. Kilograms of Cassava Chips Sold by Province 2009/10
Source: CFS 2009/10.
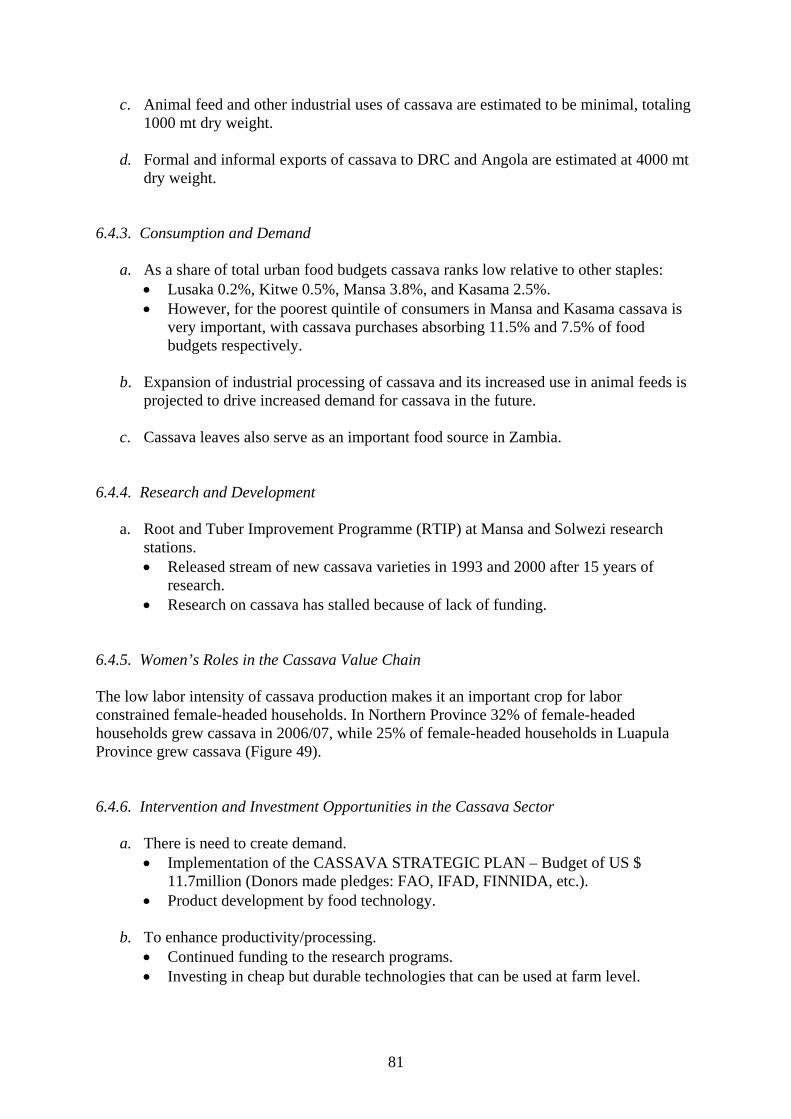
81
c. Animal feed and other industrial uses of cassava are estimated to be minimal, totaling 1000 mt dry weight.
d. Formal and informal exports of cassava to DRC and Angola are estimated at 4000 mt
dry weight. 6.4.3. Consumption and Demand
a. As a share of total urban food budgets cassava ranks low relative to other staples: • Lusaka 0.2%, Kitwe 0.5%, Mansa 3.8%, and Kasama 2.5%. • However, for the poorest quintile of consumers in Mansa and Kasama cassava is
very important, with cassava purchases absorbing 11.5% and 7.5% of food budgets respectively.
b. Expansion of industrial processing of cassava and its increased use in animal feeds is projected to drive increased demand for cassava in the future.
c. Cassava leaves also serve as an important food source in Zambia.
6.4.4. Research and Development
a. Root and Tuber Improvement Programme (RTIP) at Mansa and Solwezi research stations. • Released stream of new cassava varieties in 1993 and 2000 after 15 years of
research. • Research on cassava has stalled because of lack of funding.
6.4.5. Women’s Roles in the Cassava Value Chain The low labor intensity of cassava production makes it an important crop for labor constrained female-headed households. In Northern Province 32% of female-headed households grew cassava in 2006/07, while 25% of female-headed households in Luapula Province grew cassava (Figure 49). 6.4.6. Intervention and Investment Opportunities in the Cassava Sector
a. There is need to create demand. • Implementation of the CASSAVA STRATEGIC PLAN – Budget of US $
11.7million (Donors made pledges: FAO, IFAD, FINNIDA, etc.). • Product development by food technology.
b. To enhance productivity/processing.
• Continued funding to the research programs. • Investing in cheap but durable technologies that can be used at farm level.
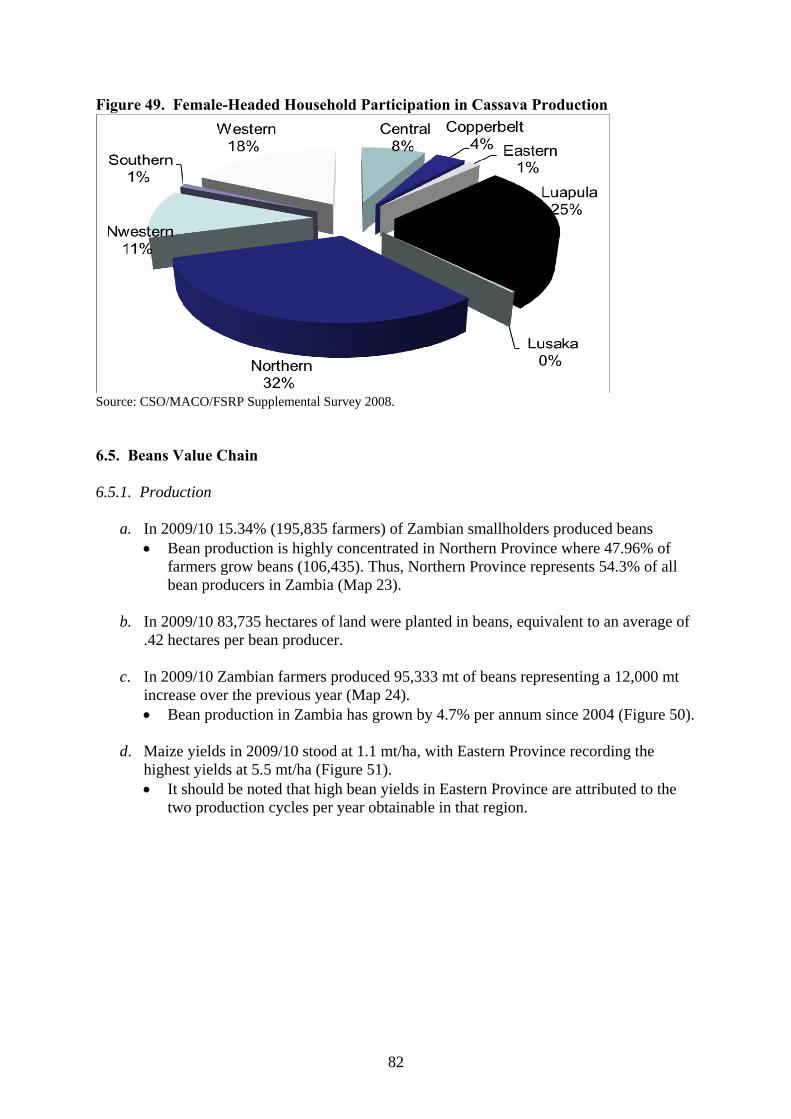
82
Figure 49. Female-Headed Household Participation in Cassava Production
Source: CSO/MACO/FSRP Supplemental Survey 2008. 6.5. Beans Value Chain 6.5.1. Production
a. In 2009/10 15.34% (195,835 farmers) of Zambian smallholders produced beans • Bean production is highly concentrated in Northern Province where 47.96% of
farmers grow beans (106,435). Thus, Northern Province represents 54.3% of all bean producers in Zambia (Map 23).
b. In 2009/10 83,735 hectares of land were planted in beans, equivalent to an average of
.42 hectares per bean producer. c. In 2009/10 Zambian farmers produced 95,333 mt of beans representing a 12,000 mt
increase over the previous year (Map 24). • Bean production in Zambia has grown by 4.7% per annum since 2004 (Figure 50).
d. Maize yields in 2009/10 stood at 1.1 mt/ha, with Eastern Province recording the highest yields at 5.5 mt/ha (Figure 51). • It should be noted that high bean yields in Eastern Province are attributed to the
two production cycles per year obtainable in that region.
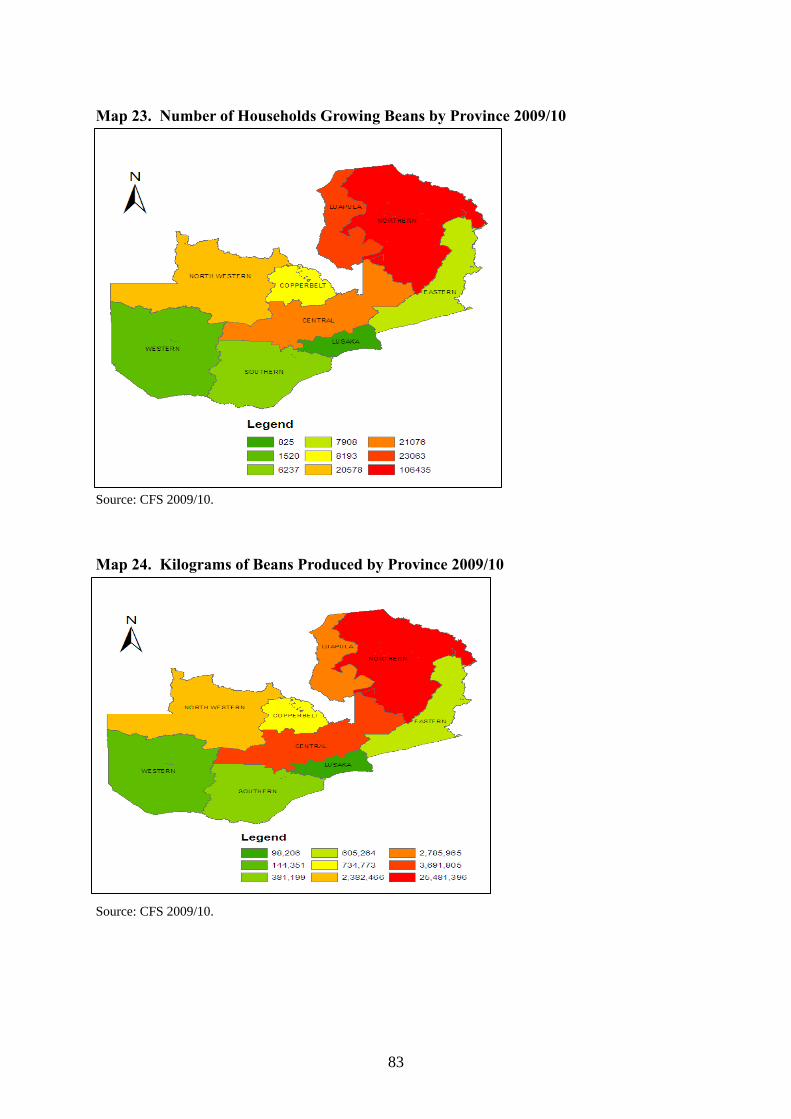
83
Map 23. Number of Households Growing Beans by Province 2009/10 Source: CFS 2009/10.
Map 24. Kilograms of Beans Produced by Province 2009/10 Source: CFS 2009/10.
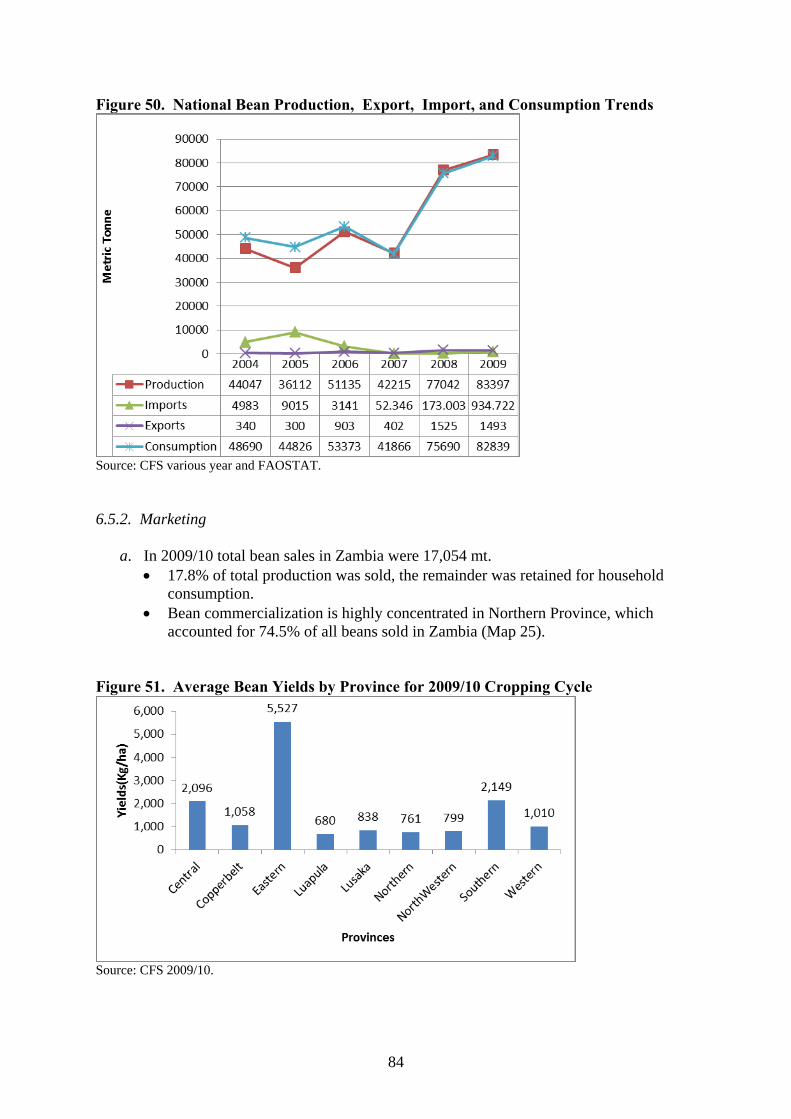
84
Figure 50. National Bean Production, Export, Import, and Consumption Trends
Source: CFS various year and FAOSTAT. 6.5.2. Marketing
a. In 2009/10 total bean sales in Zambia were 17,054 mt. • 17.8% of total production was sold, the remainder was retained for household
consumption. • Bean commercialization is highly concentrated in Northern Province, which
accounted for 74.5% of all beans sold in Zambia (Map 25). Figure 51. Average Bean Yields by Province for 2009/10 Cropping Cycle
Source: CFS 2009/10.
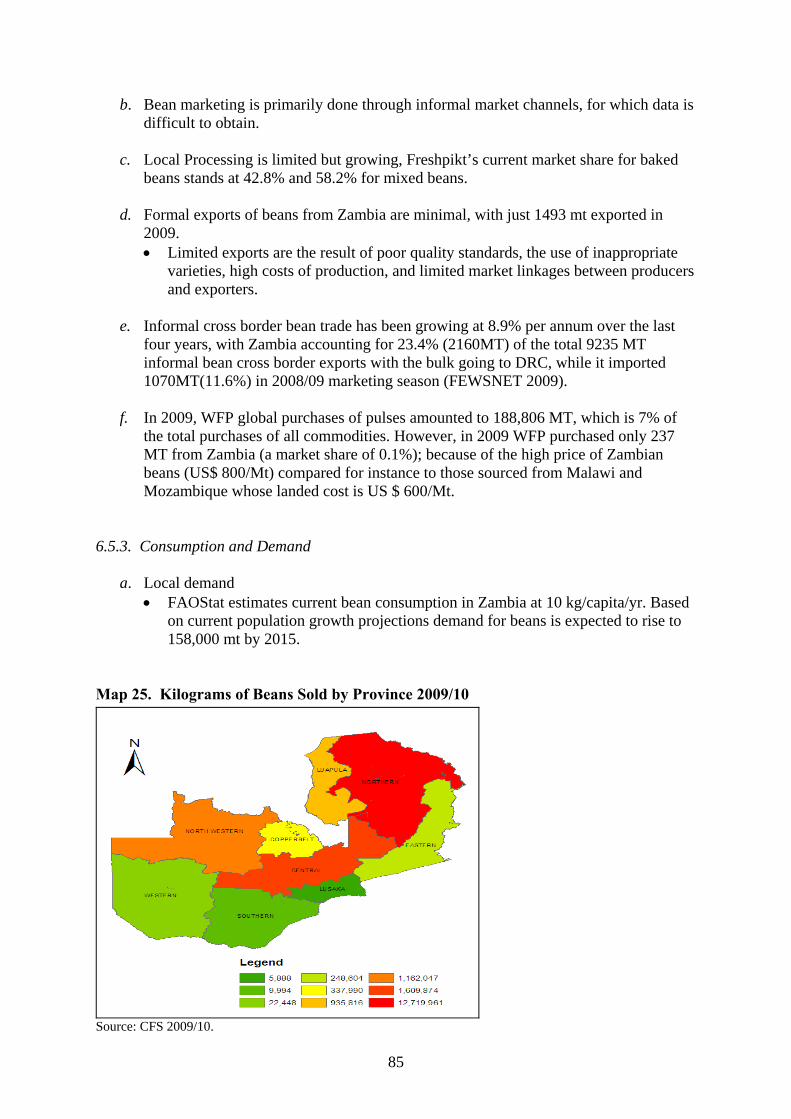
85
b. Bean marketing is primarily done through informal market channels, for which data is difficult to obtain.
c. Local Processing is limited but growing, Freshpikt’s current market share for baked
beans stands at 42.8% and 58.2% for mixed beans. d. Formal exports of beans from Zambia are minimal, with just 1493 mt exported in
2009. • Limited exports are the result of poor quality standards, the use of inappropriate
varieties, high costs of production, and limited market linkages between producers and exporters.
e. Informal cross border bean trade has been growing at 8.9% per annum over the last
four years, with Zambia accounting for 23.4% (2160MT) of the total 9235 MT informal bean cross border exports with the bulk going to DRC, while it imported 1070MT(11.6%) in 2008/09 marketing season (FEWSNET 2009).
f. In 2009, WFP global purchases of pulses amounted to 188,806 MT, which is 7% of
the total purchases of all commodities. However, in 2009 WFP purchased only 237 MT from Zambia (a market share of 0.1%); because of the high price of Zambian beans (US$ 800/Mt) compared for instance to those sourced from Malawi and Mozambique whose landed cost is US $ 600/Mt.
6.5.3. Consumption and Demand
a. Local demand • FAOStat estimates current bean consumption in Zambia at 10 kg/capita/yr. Based
on current population growth projections demand for beans is expected to rise to 158,000 mt by 2015.
Map 25. Kilograms of Beans Sold by Province 2009/10
Source: CFS 2009/10.
86
• Freshpitk has put together an ambitious plan to expand its local procurement of beans by 43 % p.a. to 46,000 mt by 2015.
b. Export Demand • Regional trade statistics indicate 88, 830 Mt of kidney beans being imported in
2008 by five selected countries (South Africa, Zimbabwe, Zambia, Botswana, and Angola) in the region; showing a 31% increase in import volumes from 2004 to 2008.
• South Africa offers an great market opportunity as imports of kidney and navy beans stood at 64,378Mt and 18,000Mt respectively by 2008 (ECIAfrica 2010).
• The majority of current imports come from China, though Zambia could compete favorably given the 10% duty preference it enjoys as a SADC member.
6.5.4. Research and Development
a. Public Sector • Zambia Agricultural Research Institute (ZARI) • Golden Valley Research Trust (GART) • University of Zambia (UNZA)
b. Private Sector: seed companies c. Bean Research Networks
• National: Zambia Bean Research Network (ZABRN) • Regional: Southern African Bean Research Network (SABRN) • Continental: Pan African Bean Research Network (PABRN)
d. New Varieties • From 1998 to 2009, 15 bean varieties that are resilient to multiple stresses have
been released some of which include: Chambeshi (A197), Lukupa (PEF 14), Lyambai (CAL 143), Kalungu (SPS2-4P24), Kabale (KID 31), Kabulangeti, Kapisha (C30 – P20), Lwangeni (OPS-KW1), Bounty, Cardinal, Speckled ice, PAN 148, PAN 116, PAN 128 and SR3(SCCI,2009).
6.5.5. Role of Women in Bean Value Chain
Although national statistics of the number of bean farmers disaggregated by gender is lacking, it is widely accepted that women play a critical role in bean production and marketing (See Figure 52). Women are actively involved in on farm activities and retailing. The on farm activities are labor intensive yet the share of the total value from the bean value chain that women get is relatively small compared to other key players that perform marketing functions such as bulking, processing, transportation and wholesaling. Therefore it is important to develop and disseminate labor saving technologies that would have an impact on the wellbeing and incomes of women such as conservation farming techniques. It has been suggested that conservation farming could reduce labor for land preparation by 30% and when using herbicides decreases labor demand for weeding by 70%. It is also important that women are linked to supply chains that would increase their share of the total value added to
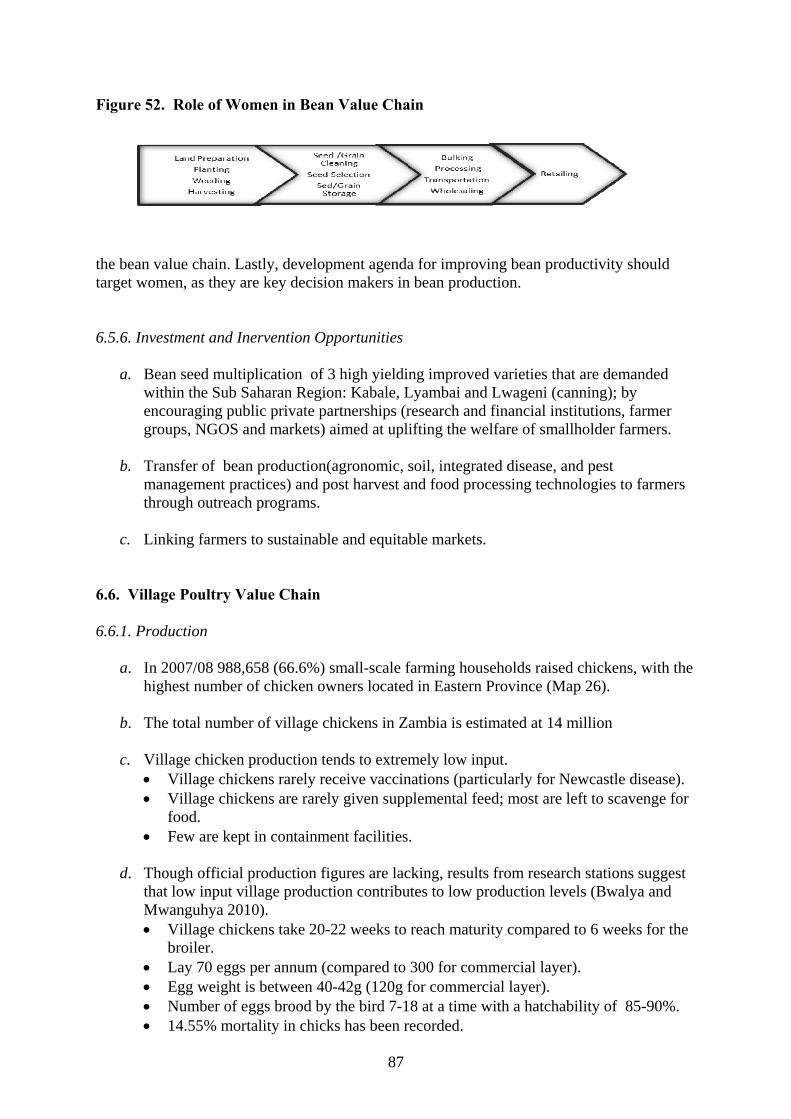
87
Figure 52. Role of Women in Bean Value Chain
the bean value chain. Lastly, development agenda for improving bean productivity should target women, as they are key decision makers in bean production. 6.5.6. Investment and Inervention Opportunities
a. Bean seed multiplication of 3 high yielding improved varieties that are demanded within the Sub Saharan Region: Kabale, Lyambai and Lwageni (canning); by encouraging public private partnerships (research and financial institutions, farmer groups, NGOS and markets) aimed at uplifting the welfare of smallholder farmers.
b. Transfer of bean production(agronomic, soil, integrated disease, and pest
management practices) and post harvest and food processing technologies to farmers through outreach programs.
c. Linking farmers to sustainable and equitable markets.
6.6. Village Poultry Value Chain 6.6.1. Production
a. In 2007/08 988,658 (66.6%) small-scale farming households raised chickens, with the
highest number of chicken owners located in Eastern Province (Map 26). b. The total number of village chickens in Zambia is estimated at 14 million c. Village chicken production tends to extremely low input.
• Village chickens rarely receive vaccinations (particularly for Newcastle disease). • Village chickens are rarely given supplemental feed; most are left to scavenge for
food. • Few are kept in containment facilities.
d. Though official production figures are lacking, results from research stations suggest
that low input village production contributes to low production levels (Bwalya and Mwanguhya 2010). • Village chickens take 20-22 weeks to reach maturity compared to 6 weeks for the
broiler. • Lay 70 eggs per annum (compared to 300 for commercial layer). • Egg weight is between 40-42g (120g for commercial layer). • Number of eggs brood by the bird 7-18 at a time with a hatchability of 85-90%. • 14.55% mortality in chicks has been recorded.
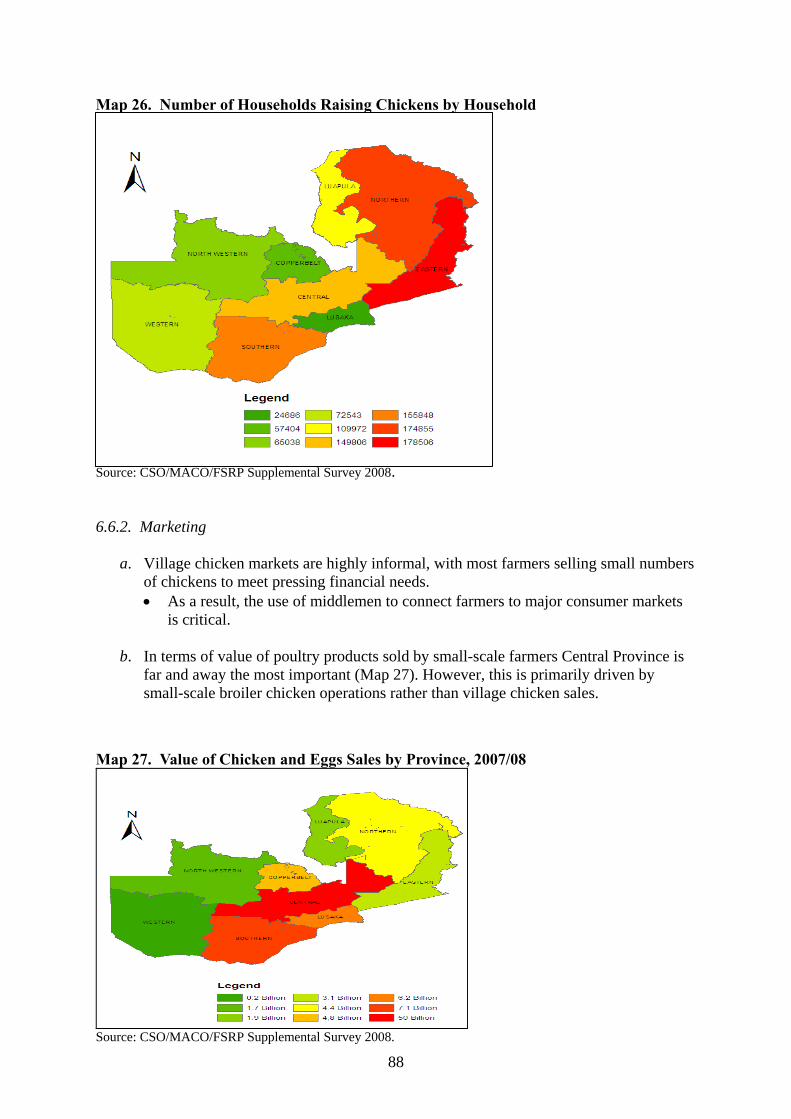
88
Map 26. Number of Households Raising Chickens by Household Source: CSO/MACO/FSRP Supplemental Survey 2008. 6.6.2. Marketing
a. Village chicken markets are highly informal, with most farmers selling small numbers of chickens to meet pressing financial needs. • As a result, the use of middlemen to connect farmers to major consumer markets
is critical.
b. In terms of value of poultry products sold by small-scale farmers Central Province is far and away the most important (Map 27). However, this is primarily driven by small-scale broiler chicken operations rather than village chicken sales.
Map 27. Value of Chicken and Eggs Sales by Province, 2007/08
Source: CSO/MACO/FSRP Supplemental Survey 2008.
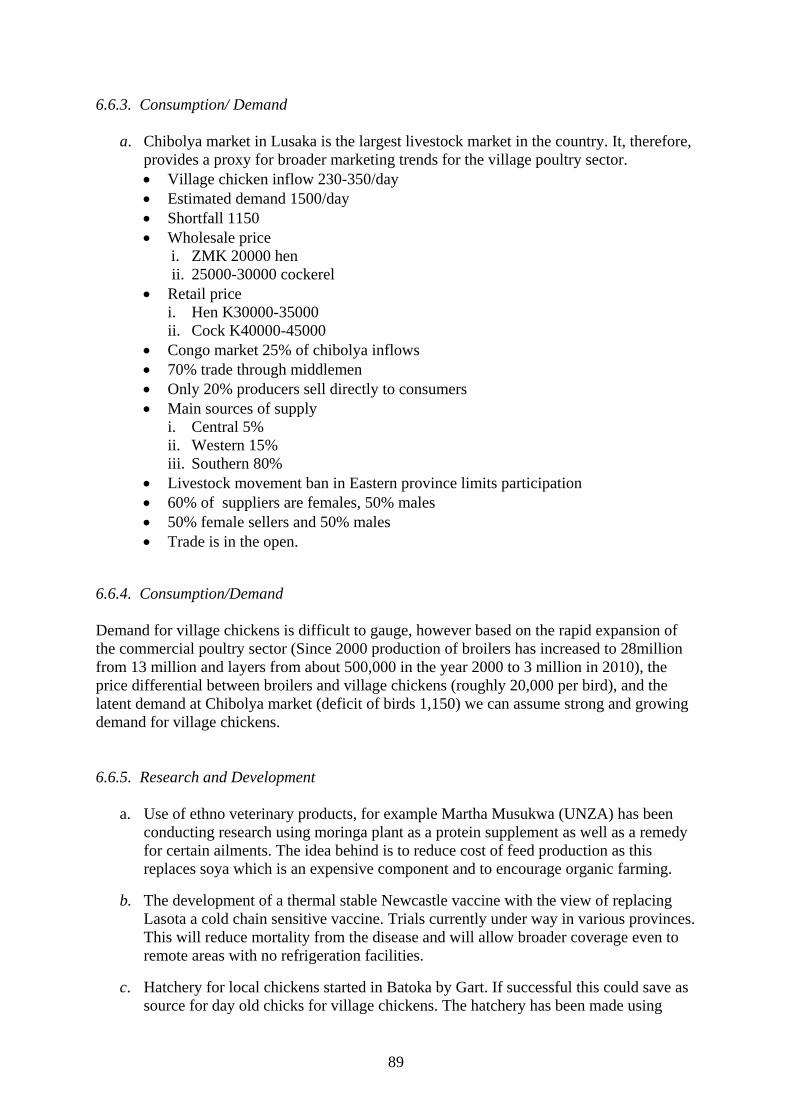
89
6.6.3. Consumption/ Demand
a. Chibolya market in Lusaka is the largest livestock market in the country. It, therefore, provides a proxy for broader marketing trends for the village poultry sector. • Village chicken inflow 230-350/day • Estimated demand 1500/day • Shortfall 1150 • Wholesale price
i. ZMK 20000 hen ii. 25000-30000 cockerel
• Retail price i. Hen K30000-35000 ii. Cock K40000-45000
• Congo market 25% of chibolya inflows • 70% trade through middlemen • Only 20% producers sell directly to consumers • Main sources of supply
i. Central 5% ii. Western 15% iii. Southern 80%
• Livestock movement ban in Eastern province limits participation • 60% of suppliers are females, 50% males • 50% female sellers and 50% males • Trade is in the open.
6.6.4. Consumption/Demand Demand for village chickens is difficult to gauge, however based on the rapid expansion of the commercial poultry sector (Since 2000 production of broilers has increased to 28million from 13 million and layers from about 500,000 in the year 2000 to 3 million in 2010), the price differential between broilers and village chickens (roughly 20,000 per bird), and the latent demand at Chibolya market (deficit of birds 1,150) we can assume strong and growing demand for village chickens. 6.6.5. Research and Development
a. Use of ethno veterinary products, for example Martha Musukwa (UNZA) has been conducting research using moringa plant as a protein supplement as well as a remedy for certain ailments. The idea behind is to reduce cost of feed production as this replaces soya which is an expensive component and to encourage organic farming.
b. The development of a thermal stable Newcastle vaccine with the view of replacing Lasota a cold chain sensitive vaccine. Trials currently under way in various provinces. This will reduce mortality from the disease and will allow broader coverage even to remote areas with no refrigeration facilities.
c. Hatchery for local chickens started in Batoka by Gart. If successful this could save as source for day old chicks for village chickens. The hatchery has been made using
90
local materials to make it sustainable. This in itself will address all the productivity shortfalls addressed earlier.
d. Research to assess the socioeconomic impact of village chickens done in western province by Dr. Banda and Dr. Simainga as a well of mitigating HIV/AIDS, alleviating poverty, income generation, and nutritional enhancement. This is important in shifting perceptions that cover this noble industry as an inferior venture when compared to the broiler.
e. Provision of improved layer housing units by some NGOs that are environmentally acceptable and cheaper than the battery cages. Advantage is that the work well for village setup layer production units. This leads to increased production of eggs and allows for easy handling for interventions such as vaccinations.
f. The Government has set up a number of facilities for research in the Livestock Industry. These include a Ministry of Livestock and Veterinary departments. In addition, agriculture research stations (Mount Makulu, GART, Msekera, etc) are available in most provincial centers and include research in Poultry.
g. Establishment of VETLAB through the efforts of PAZ with assistance from USAID and other stakeholders (Ross, Hybrid, Zambeef, Agrivet, Golan Poultry Solutions, Nutri Feeds, Olympic Milling, and Bokomo). These laboratory services cover all sectors of livestock and are charged at commercial rates. Feed testing is also done on request from clients.
h. Infrastructure has expanded by 100% for hatcheries and feed making companies. Broiler production has reached a staggering 28million per year and is expected to rise. The capacity of production is estimated at 1.8million per week but it’s yet to be attained. If this is attained it will give 1.8million per week.
i. The local market is so huge that companies are only allowed to export 10% of their production to avoid shortages.
6.6.6. Role of Women in Village Poultry Value Chain
a. Women feature prominently in village chicken rearing and marketing. Evidence from Chibolya market suggests that 60% of producers and 50% of retailers are women.
6.6.7. Investment and Intervention Opportunities
a. Establishment of Village Chicken Breeding/ Multiplication Centers: The establishment of such centers would facilitate bulk production of the local chicken and its marketing. The system can use Women’s groups for labor as well as marketing. This would result in selection of good breeding stock in the required ratio of cockerel to hen as opposed to current trends where farmers use spent cockerels with a long history of inbreeding.
b. Women Capacity Building: Women need to be empowered with training in management skills, bookkeeping, and value addition activities if the value chain is to be of any significance. This would help them interpret business trends and hedge against risks. They would act from an informed view. In terms of village chickens,
91
women must be made to appreciate the use of ethno-veterinary products and feed supplementation if the chicken is to be considered organic. Focus should also be attached to veterinary interventions so that loses due to viral diseases are minimized.
c. Poultry Certification Systems: This system would ensure that Poultry products are certified for quality and source. This would also facilitate tracking in case of diseases and other eventualities. This would involve establishment of testing centers and provision of certificates. If many small scale farmers register on the program, their bargaining power for the prime markets such as Shoprite, spar would be strengthened. Intermediate buyers could be organized to provide warehousing facilities for the farmers. This would mean the small scale farmer would stick to his program of all in all out production without incurring extra costs for storage or further feeding. Under this certification system small scale farmers are to be requested and taught how to meet certain minimum standards such as branding and other processes if they are to compete favorably on the market.
d. Policy Streamlining: The introduction of poultry-specific policy would facilitate regulation, training, monitoring as well as general control of the sector. The currently situation where the veterinary department is very strong at HQ and weakest at camp level requires urgent redress. If women farmers in the villages are to be promoted, the camp staff must be equipped with modalities to execute his programs.
e. Poultry Support Programs: The establishment of a program to support small-holder poultry producers would be good. This could include loan facilitating, a sub-contracting arrangement with a guaranteed market which would include a package of chicks, medication, training, and basic management skills. Under this program there should be creation of women friendly markets and not the rough markets they are subjected to now. The infrastructure should have descent facilities like trade area, ablution, etc.
92
VII. ADDITIONAL VALUE CHAINS 7.1. Aquaculture Value Chain, from World Fish 7.1.1. Rationale: Why Invest in Aquaculture?
a. There is strong and growing demand for fish in Zambia and the region – and aquaculture is the main means to meet this demand. Market demand for fish and fish products is strongly increasing in Zambia and neighboring countries and is projected to increase further with growing populations, urbanization, and economic development in the region. Market prices for fish in Zambia have increased sharply over the past years. While they vary seasonally, in most months these increases have been above average food price increases and have ranged from 4% to over 13% per month in 2008.
Per capita supply of fish in Zambia has fallen from over 11kg p.a. in the 1970s to 6.5kg today. The ‘supply gap’ for maintaining the current level will require a further 10,000mt p.a. by 2015; bringing it back to 10kg will require an additional annual increase of at least 50,000mt by 2015.
Markets for fish are particularly strong in the expanding urban areas in Zambia including Lusaka and the Copperbelt towns, as well as in neighboring Katanga province, DRC and other regional centers. In addition, demand among rural populations is growing, if more scattered.
Capture fisheries, while still providing the bulk of fish supply in the country, have on the whole reached their productive capacity and may decline due to external factors stemming from infrastructure development (dams), land use changes, pollution and climate change.
Aquaculture will be the main means to narrow the ‘supply gap’ of fish in Zambia and the region. While aquaculture currently provides about 8,000mt p.a. (roughly 10% of officially recorded national fish production), there is great scope for broad and rapid growth to meet production targets of at least 50,000mt by 2015 and 100,000mt by 2020. To enable sustainable increases in production and productivity, targeted investments in the aquaculture value chain are required. Initial focus is required on improving input markets (seed, feed), strengthening services to the sector (finance, business development, research/information), and rationalizing the regulatory and policy environment.
b. Fish is an important source of high-quality nutrition for the poor in Zambia. Fish is an important source of high quality nutrition for the poor in Zambia. In addition to providing over 30% of protein, it is often a main source of vital micronutrients. Surveys suggest that fish consumption is particular important among the poor who can access small and easily divisible quantities of fish. Within households, fish is more equally shared by women, men, children, and the elderly than most other animal-based food.
These benefits can make significant contributions to addressing major malnutrition challenges in Zambia including protein, vitamin, and mineral deficiencies.
Aquaculture can meet the strong demand for fish among the poor very efficiently. Several tilapia species are being farmed in Zambia that are generally well suited for aquaculture expansion and intensification. Managing tilapia production for small size
93
food fish allows two or three harvests a year in most parts of Zambia and can regularly yield large quantities of fresh fish products for the poor.
There are basically two avenues for delivering food and nutrition security benefits through aquaculture that are relevant in Zambia:
• Smallholder aquaculture among the rural poor for on-farm consumption and local markets, and
• Commercial aquaculture through small and medium scale enterprises that target urban and regional markets.
c. Smallholder aquaculture increases incomes and farm productivity and improves
nutrition security among the rural poor. Aquaculture on smallholder farms can be an efficient way to produce highly nutritious food from locally available resources. Fish production levels will be modest but will make significant contributions to household food security and will generate limited surpluses for local marketing.
Integrated Agriculture Aquaculture (IAA) technologies have been shown to improve farm productivity, nutrition security, and incomes among smallholders in Southern Africa. In addition to fish production, fish ponds strengthen productivity and nutrition impacts of mixed farming systems at smallholder level. Water is used for small-scale irrigation during the dry season, allowing continued production of vegetables as well as staple crops. In view of likely climatic changes in Zambia and the region, improved on-farm water management will become increasingly important for securing viable smallholder livelihoods.
Smallholder aquaculture can also provides significant opportunities for households headed by women or children and for families affected by HIV/AIDS. Labor requirements are limited beyond the initial construction and harvesting for food or sale is flexible and can be timed and apportioned to meet specific household needs.
d. SME aquaculture generates rural economic growth and provides affordable, highly
nutritious food for national and regional markets. Commercial private investments in aquaculture are growing in Zambia. Currently, about 20-30 aquaculture enterprises in the SME sector are producing fish from ponds and/or cages. These are clustered mainly to supply urban markets in Lusaka and the Copperbelt towns. The number of commercial farms is growing and their scale of operation is expanding (average of 20-30 ponds per enterprise). Government estimates put productivity of these systems to about 5-6 tons (tilapia) per hectare, which suggests semi-intensive production using purchased fingerlings and supplementary feed. Experience from similar production systems elsewhere shows that productivity can be significantly increased (by over 100%) with access to improved seed, feed and production methods.
The high degree of urbanization in Zambia and its position in relation to regional markets provide an accessible, solid, and growing consumer base for SME aquaculture. Specific additional opportunities exist in targeting significant demand among mining populations. Mining companies are starting to invest in aquaculture production through outgrower schemes, which could be profitably managed by SMEs.
Aquaculture SMEs are often the drivers of sector development, stimulating investments in improved input markets and service sectors, which in turn increases productivity and lowers costs of inputs and triggers further investment in fish production. This momentum is starting to show also in Zambia with private sector hatcheries and feed mills increasing their investments. With further targeted support
94
to critical points in the value chain, Zambia could enter a similar growth curve as is currently witnessed in Uganda (from 5,000mt in 2002 to 51,000mt in 2007) or Nigeria (30,000mt to 85,000mt over the same 5-year period).
Benefits from SME aquaculture include large quantities of highly nutritious food at affordable prices for major population centers, employment opportunities for rural and urban poor through the value chain, and investment opportunities in input value chains, service industry, transport, and marketing.
7.1.2. Opportunities for Investing in Aquaculture in Zambia
Opportunities for investing in aquaculture in Zambia have improved strongly. Driven by increasing demand for fish, also by the poor, the economic context of the sector is strong today. In response, private investments are growing.
The policy and regulatory environment is improving and Government of Zambia has further prioritized aquaculture as a growth sector in the SNDP. Capitalizing on this momentum for change, support can be targeted at updating the institutional framework and specifying policies and regulations to meet the demand of increased investments in sustainable aquaculture production.
Broadly speaking, a two-pronged approach to investing in aquaculture in Zambia is recommended:
a. Strengthening the aquaculture value chain through SMEs to generate local economic growth and increase fish supply to expanding national and regional markets; and
b. Enhancing and scaling-up smallholder aquaculture to improve incomes and food and nutrition security among the rural poor and increase productivity and climate resilience of smallholder farming.
This approach responds to specific and complementary opportunities in different socio-economic settings in Zambia and would result in a diversified aquaculture sector contributing to meet the needs of the poor as producers, consumers, and stakeholders in wider agricultural development.
7.1.3. Challenges and Constraints and How they Can Be Addressed
a. What are the barriers to adopting aquaculture, why are so few farmers doing it? What sorts of market barriers are there? What sorts of investments could best address these challenges. Poor smallholders- defined here as those with less than 1 ha land-holdings – are generally only able to build small ponds, not least because transforming substantial areas of crops to fish production can increase vulnerability (markets; weather; etc.). A lack of assets – land, education, money – means that pond productivity must be driven by on-farm wastes, which are usually of poor quality and available only in small quantities. As a result, production is rarely more than a few tens of kg per year. Such smallholders are also are poorly connected to markets, both input (seed, feed, affordable credit, technical information) and output (access to areas where fish demand and prices are high). Among other things, for example, this results in partial harvests of bigger fish in order to leave the smaller fish behind, which then breed and generate the seed for the next season. Over several generations this strategy serves to select for poor growing fish, with the result that the strains grown in such
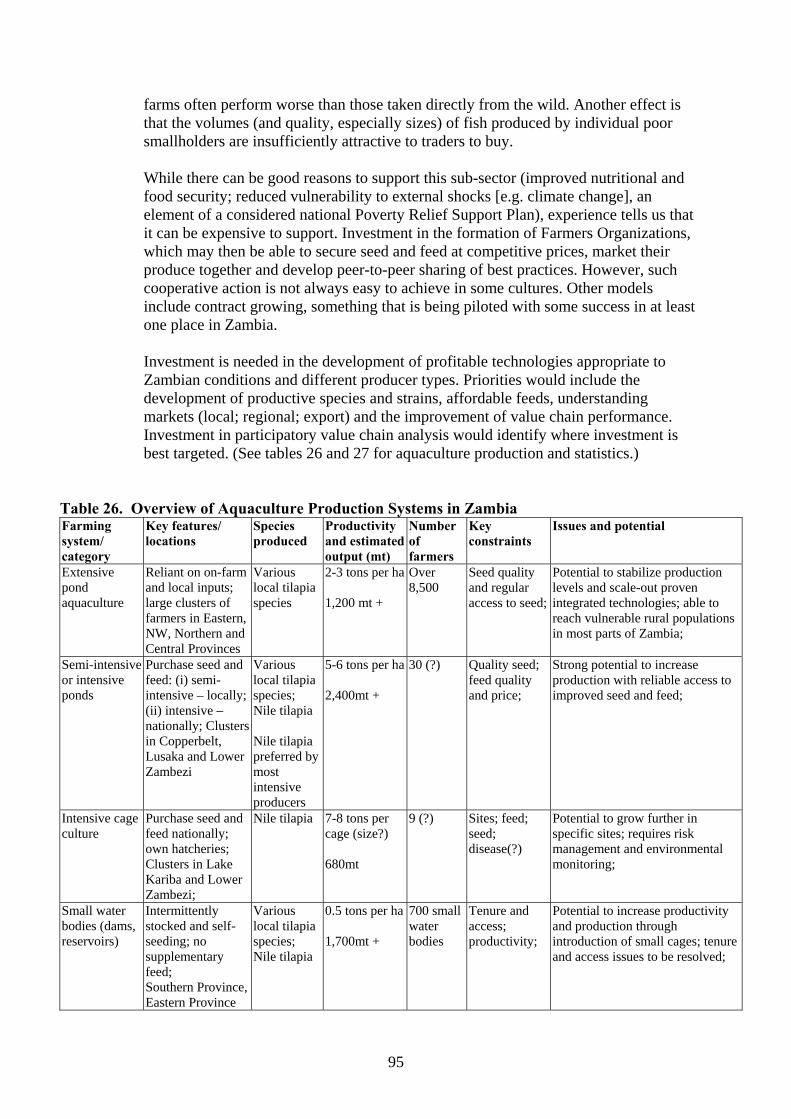
95
farms often perform worse than those taken directly from the wild. Another effect is that the volumes (and quality, especially sizes) of fish produced by individual poor smallholders are insufficiently attractive to traders to buy.
While there can be good reasons to support this sub-sector (improved nutritional and food security; reduced vulnerability to external shocks [e.g. climate change], an element of a considered national Poverty Relief Support Plan), experience tells us that it can be expensive to support. Investment in the formation of Farmers Organizations, which may then be able to secure seed and feed at competitive prices, market their produce together and develop peer-to-peer sharing of best practices. However, such cooperative action is not always easy to achieve in some cultures. Other models include contract growing, something that is being piloted with some success in at least one place in Zambia. Investment is needed in the development of profitable technologies appropriate to Zambian conditions and different producer types. Priorities would include the development of productive species and strains, affordable feeds, understanding markets (local; regional; export) and the improvement of value chain performance. Investment in participatory value chain analysis would identify where investment is best targeted. (See tables 26 and 27 for aquaculture production and statistics.)
Table 26. Overview of Aquaculture Production Systems in Zambia Farming system/ category
Key features/ locations
Species produced
Productivity and estimated output (mt)
Number of farmers
Key constraints
Issues and potential
Extensive pond aquaculture
Reliant on on-farm and local inputs; large clusters of farmers in Eastern, NW, Northern and Central Provinces
Various local tilapia species
2-3 tons per ha 1,200 mt +
Over 8,500
Seed quality and regular access to seed;
Potential to stabilize production levels and scale-out proven integrated technologies; able to reach vulnerable rural populations in most parts of Zambia;
Semi-intensive or intensive ponds
Purchase seed and feed: (i) semi-intensive – locally; (ii) intensive – nationally; Clusters in Copperbelt, Lusaka and Lower Zambezi
Various local tilapia species; Nile tilapia Nile tilapia preferred by most intensive producers
5-6 tons per ha 2,400mt +
30 (?) Quality seed; feed quality and price;
Strong potential to increase production with reliable access to improved seed and feed;
Intensive cage culture
Purchase seed and feed nationally; own hatcheries; Clusters in Lake Kariba and Lower Zambezi;
Nile tilapia 7-8 tons per cage (size?) 680mt
9 (?) Sites; feed; seed; disease(?)
Potential to grow further in specific sites; requires risk management and environmental monitoring;
Small water bodies (dams, reservoirs)
Intermittently stocked and self-seeding; no supplementary feed; Southern Province, Eastern Province
Various local tilapia species; Nile tilapia
0.5 tons per ha 1,700mt +
700 small water bodies
Tenure and access; productivity;
Potential to increase productivity and production through introduction of small cages; tenure and access issues to be resolved;
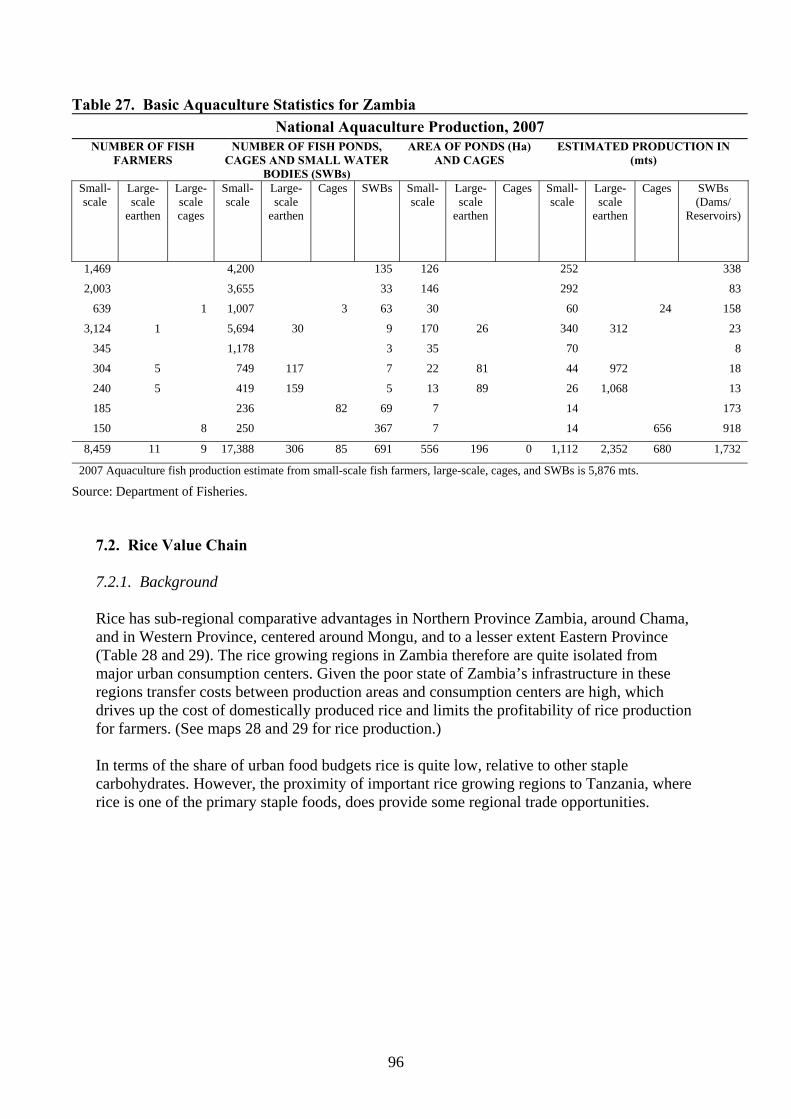
96
Table 27. Basic Aquaculture Statistics for Zambia National Aquaculture Production, 2007
NUMBER OF FISH FARMERS
NUMBER OF FISH PONDS, CAGES AND SMALL WATER
BODIES (SWBs)
AREA OF PONDS (Ha) AND CAGES
ESTIMATED PRODUCTION IN (mts)
Small-scale
Large-scale
earthen
Large-scale cages
Small-scale
Large-scale
earthen
Cages SWBs Small-scale
Large-scale
earthen
Cages Small-scale
Large-scale
earthen
Cages SWBs (Dams/
Reservoirs)
1,469 4,200 135 126 252 338
2,003 3,655 33 146 292 83
639 1 1,007 3 63 30 60 24 158
3,124 1 5,694 30 9 170 26 340 312 23
345 1,178 3 35 70 8
304 5 749 117 7 22 81 44 972 18
240 5 419 159 5 13 89 26 1,068 13
185 236 82 69 7 14 173
150 8 250 367 7 14 656 918
8,459 11 9 17,388 306 85 691 556 196 0 1,112 2,352 680 1,732
2007 Aquaculture fish production estimate from small-scale fish farmers, large-scale, cages, and SWBs is 5,876 mts.
Source: Department of Fisheries. 7.2. Rice Value Chain 7.2.1. Background Rice has sub-regional comparative advantages in Northern Province Zambia, around Chama, and in Western Province, centered around Mongu, and to a lesser extent Eastern Province (Table 28 and 29). The rice growing regions in Zambia therefore are quite isolated from major urban consumption centers. Given the poor state of Zambia’s infrastructure in these regions transfer costs between production areas and consumption centers are high, which drives up the cost of domestically produced rice and limits the profitability of rice production for farmers. (See maps 28 and 29 for rice production.) In terms of the share of urban food budgets rice is quite low, relative to other staple carbohydrates. However, the proximity of important rice growing regions to Tanzania, where rice is one of the primary staple foods, does provide some regional trade opportunities.
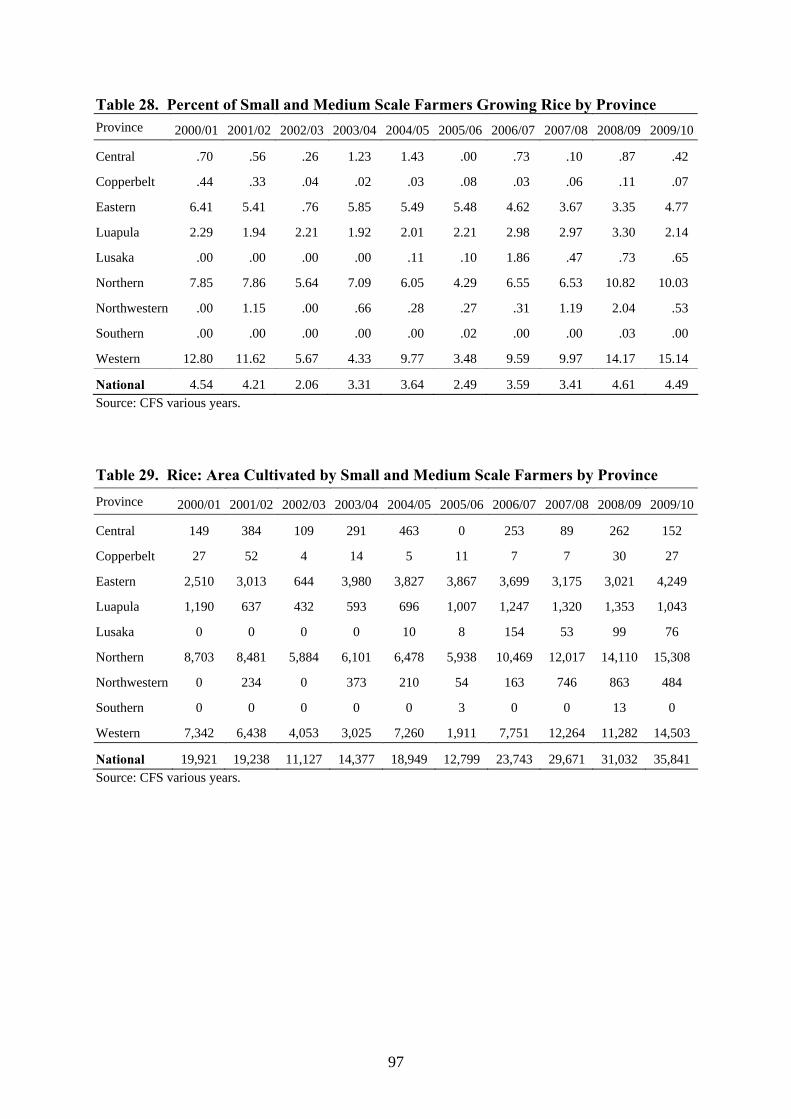
97
Table 28. Percent of Small and Medium Scale Farmers Growing Rice by Province Province 2000/01 2001/02 2002/03 2003/04 2004/05 2005/06 2006/07 2007/08 2008/09 2009/10
Central .70 .56 .26 1.23 1.43 .00 .73 .10 .87 .42
Copperbelt .44 .33 .04 .02 .03 .08 .03 .06 .11 .07
Eastern 6.41 5.41 .76 5.85 5.49 5.48 4.62 3.67 3.35 4.77
Luapula 2.29 1.94 2.21 1.92 2.01 2.21 2.98 2.97 3.30 2.14
Lusaka .00 .00 .00 .00 .11 .10 1.86 .47 .73 .65
Northern 7.85 7.86 5.64 7.09 6.05 4.29 6.55 6.53 10.82 10.03
Northwestern .00 1.15 .00 .66 .28 .27 .31 1.19 2.04 .53
Southern .00 .00 .00 .00 .00 .02 .00 .00 .03 .00
Western 12.80 11.62 5.67 4.33 9.77 3.48 9.59 9.97 14.17 15.14
National 4.54 4.21 2.06 3.31 3.64 2.49 3.59 3.41 4.61 4.49 Source: CFS various years. Table 29. Rice: Area Cultivated by Small and Medium Scale Farmers by Province Province 2000/01 2001/02 2002/03 2003/04 2004/05 2005/06 2006/07 2007/08 2008/09 2009/10
Central 149 384 109 291 463 0 253 89 262 152
Copperbelt 27 52 4 14 5 11 7 7 30 27
Eastern 2,510 3,013 644 3,980 3,827 3,867 3,699 3,175 3,021 4,249
Luapula 1,190 637 432 593 696 1,007 1,247 1,320 1,353 1,043
Lusaka 0 0 0 0 10 8 154 53 99 76
Northern 8,703 8,481 5,884 6,101 6,478 5,938 10,469 12,017 14,110 15,308
Northwestern 0 234 0 373 210 54 163 746 863 484
Southern 0 0 0 0 0 3 0 0 13 0
Western 7,342 6,438 4,053 3,025 7,260 1,911 7,751 12,264 11,282 14,503
National 19,921 19,238 11,127 14,377 18,949 12,799 23,743 29,671 31,032 35,841 Source: CFS various years.
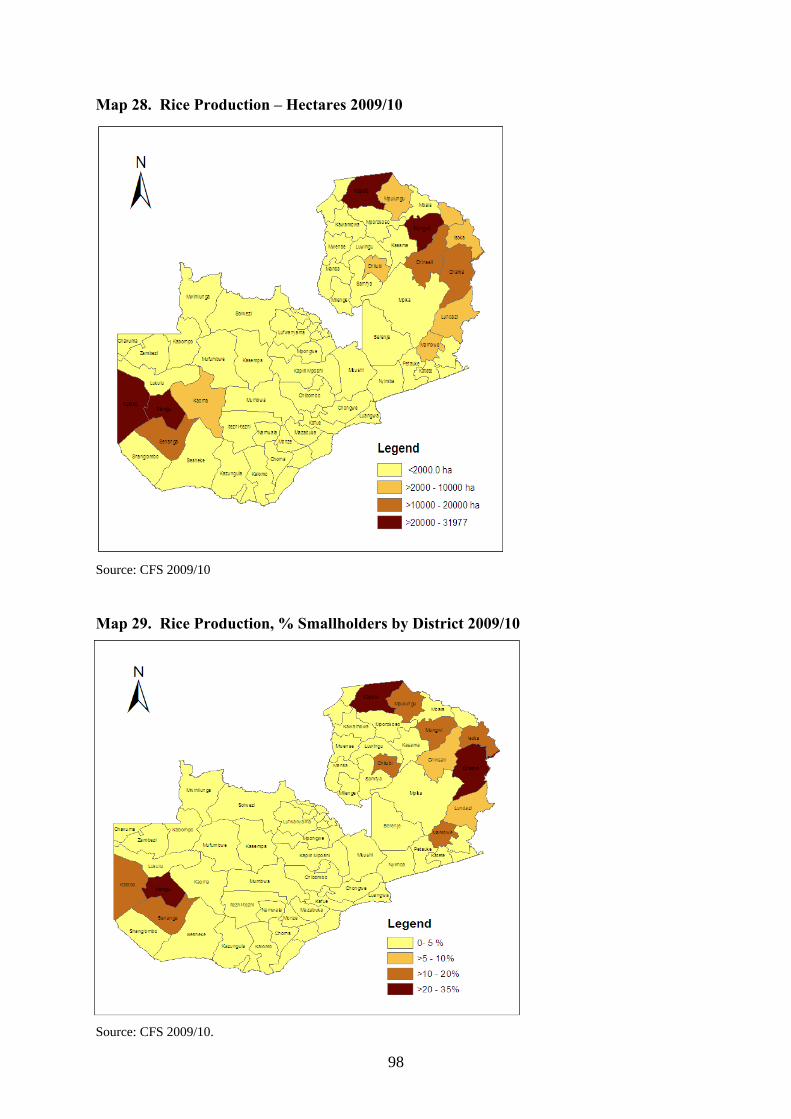
98
Map 28. Rice Production – Hectares 2009/10
Source: CFS 2009/10 Map 29. Rice Production, % Smallholders by District 2009/10
Source: CFS 2009/10.
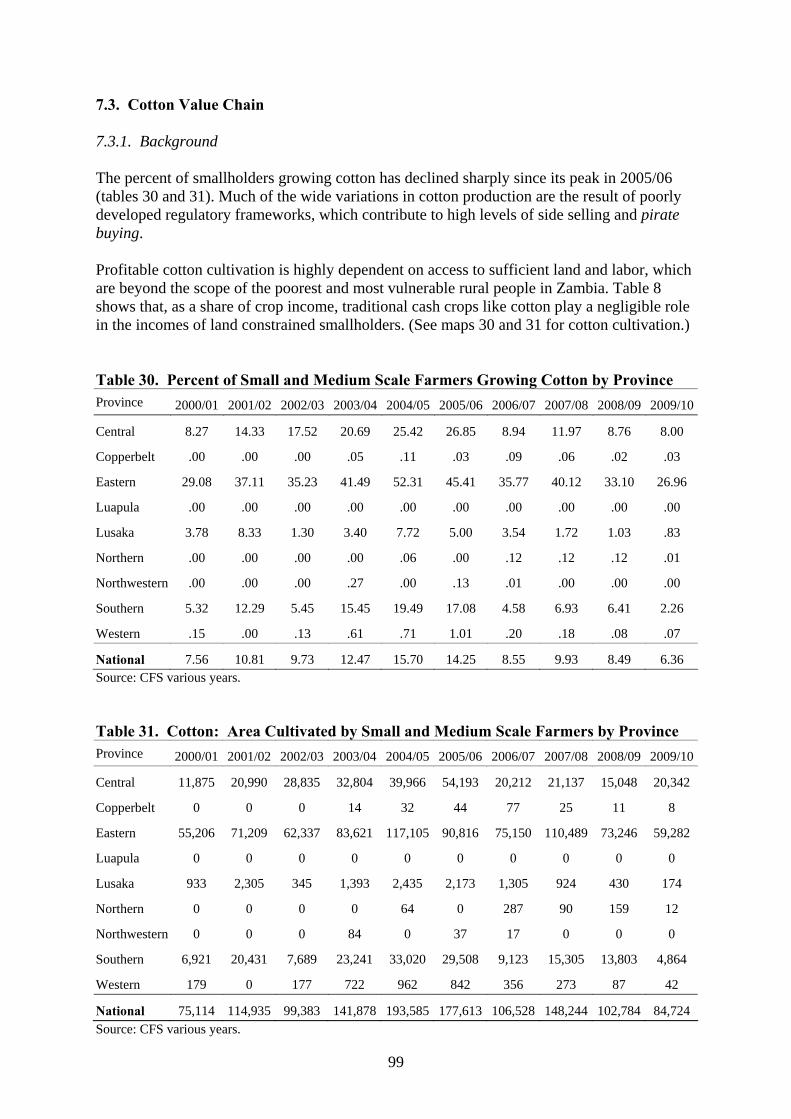
99
7.3. Cotton Value Chain 7.3.1. Background The percent of smallholders growing cotton has declined sharply since its peak in 2005/06 (tables 30 and 31). Much of the wide variations in cotton production are the result of poorly developed regulatory frameworks, which contribute to high levels of side selling and pirate buying. Profitable cotton cultivation is highly dependent on access to sufficient land and labor, which are beyond the scope of the poorest and most vulnerable rural people in Zambia. Table 8 shows that, as a share of crop income, traditional cash crops like cotton play a negligible role in the incomes of land constrained smallholders. (See maps 30 and 31 for cotton cultivation.) Table 30. Percent of Small and Medium Scale Farmers Growing Cotton by Province Province 2000/01 2001/02 2002/03 2003/04 2004/05 2005/06 2006/07 2007/08 2008/09 2009/10
Central 8.27 14.33 17.52 20.69 25.42 26.85 8.94 11.97 8.76 8.00
Copperbelt .00 .00 .00 .05 .11 .03 .09 .06 .02 .03
Eastern 29.08 37.11 35.23 41.49 52.31 45.41 35.77 40.12 33.10 26.96
Luapula .00 .00 .00 .00 .00 .00 .00 .00 .00 .00
Lusaka 3.78 8.33 1.30 3.40 7.72 5.00 3.54 1.72 1.03 .83
Northern .00 .00 .00 .00 .06 .00 .12 .12 .12 .01
Northwestern .00 .00 .00 .27 .00 .13 .01 .00 .00 .00
Southern 5.32 12.29 5.45 15.45 19.49 17.08 4.58 6.93 6.41 2.26
Western .15 .00 .13 .61 .71 1.01 .20 .18 .08 .07
National 7.56 10.81 9.73 12.47 15.70 14.25 8.55 9.93 8.49 6.36 Source: CFS various years. Table 31. Cotton: Area Cultivated by Small and Medium Scale Farmers by Province Province 2000/01 2001/02 2002/03 2003/04 2004/05 2005/06 2006/07 2007/08 2008/09 2009/10
Central 11,875 20,990 28,835 32,804 39,966 54,193 20,212 21,137 15,048 20,342
Copperbelt 0 0 0 14 32 44 77 25 11 8
Eastern 55,206 71,209 62,337 83,621 117,105 90,816 75,150 110,489 73,246 59,282
Luapula 0 0 0 0 0 0 0 0 0 0
Lusaka 933 2,305 345 1,393 2,435 2,173 1,305 924 430 174
Northern 0 0 0 0 64 0 287 90 159 12
Northwestern 0 0 0 84 0 37 17 0 0 0
Southern 6,921 20,431 7,689 23,241 33,020 29,508 9,123 15,305 13,803 4,864
Western 179 0 177 722 962 842 356 273 87 42
National 75,114 114,935 99,383 141,878 193,585 177,613 106,528 148,244 102,784 84,724 Source: CFS various years.
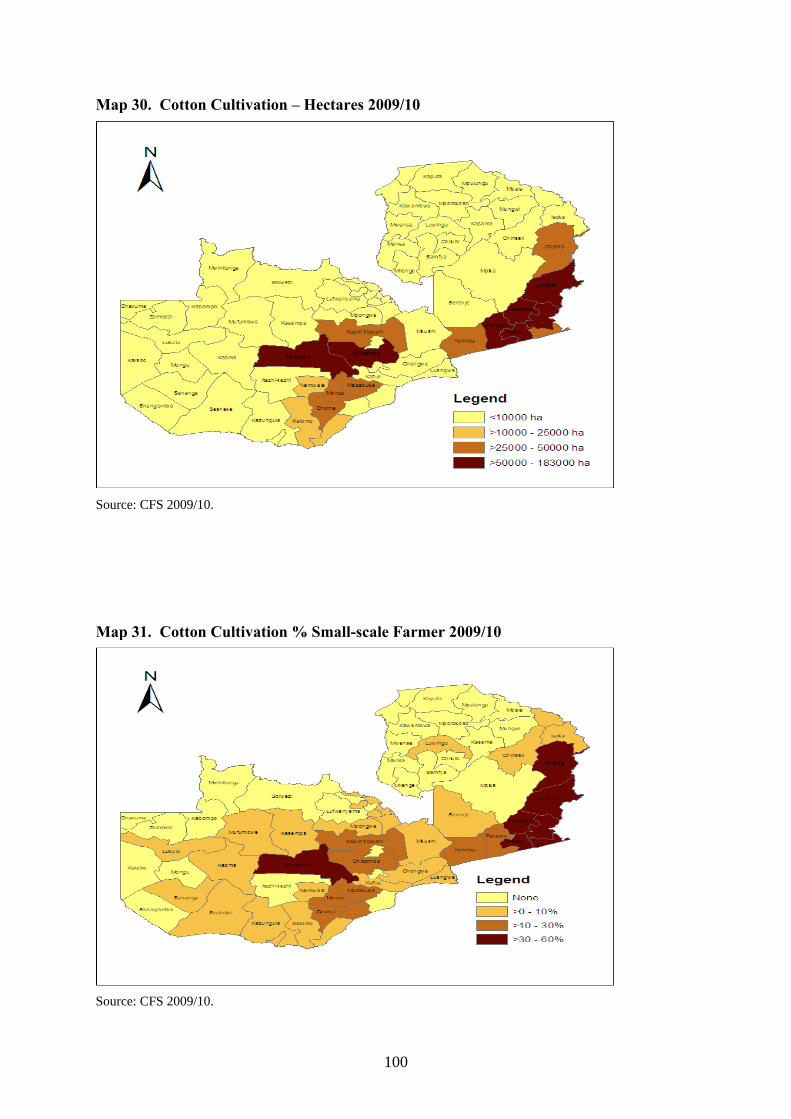
100
Map 30. Cotton Cultivation – Hectares 2009/10
Source: CFS 2009/10. Map 31. Cotton Cultivation % Small-scale Farmer 2009/10
Source: CFS 2009/10.
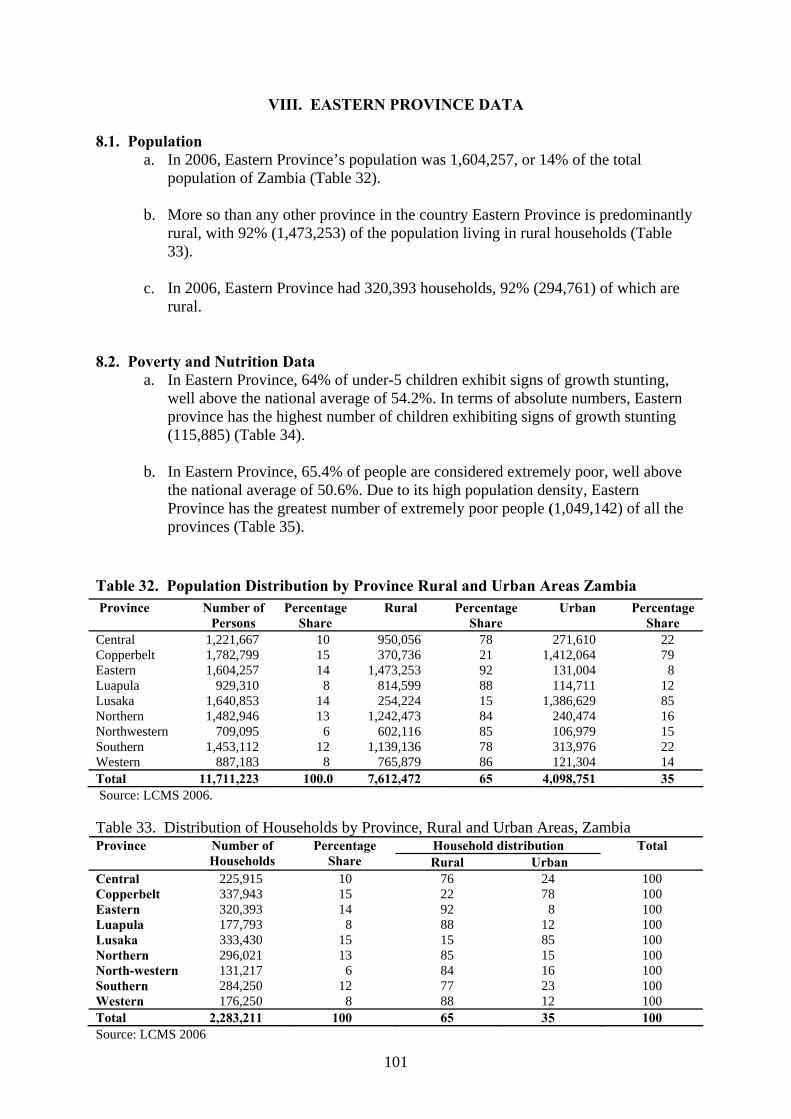
101
VIII. EASTERN PROVINCE DATA
8.1. Population a. In 2006, Eastern Province’s population was 1,604,257, or 14% of the total
population of Zambia (Table 32). b. More so than any other province in the country Eastern Province is predominantly
rural, with 92% (1,473,253) of the population living in rural households (Table 33).
c. In 2006, Eastern Province had 320,393 households, 92% (294,761) of which are
rural.
8.2. Poverty and Nutrition Data a. In Eastern Province, 64% of under-5 children exhibit signs of growth stunting,
well above the national average of 54.2%. In terms of absolute numbers, Eastern province has the highest number of children exhibiting signs of growth stunting (115,885) (Table 34).
b. In Eastern Province, 65.4% of people are considered extremely poor, well above
the national average of 50.6%. Due to its high population density, Eastern Province has the greatest number of extremely poor people (1,049,142) of all the provinces (Table 35).
Table 32. Population Distribution by Province Rural and Urban Areas Zambia Province Number of
Persons Percentage
Share Rural Percentage
Share Urban Percentage
Share Central 1,221,667 10 950,056 78 271,610 22 Copperbelt 1,782,799 15 370,736 21 1,412,064 79 Eastern 1,604,257 14 1,473,253 92 131,004 8 Luapula 929,310 8 814,599 88 114,711 12 Lusaka 1,640,853 14 254,224 15 1,386,629 85 Northern 1,482,946 13 1,242,473 84 240,474 16 Northwestern 709,095 6 602,116 85 106,979 15 Southern 1,453,112 12 1,139,136 78 313,976 22 Western 887,183 8 765,879 86 121,304 14 Total 11,711,223 100.0 7,612,472 65 4,098,751 35 Source: LCMS 2006. Table 33. Distribution of Households by Province, Rural and Urban Areas, Zambia
Household distribution Province Number of Households
Percentage Share Rural Urban
Total
Central 225,915 10 76 24 100 Copperbelt 337,943 15 22 78 100 Eastern 320,393 14 92 8 100 Luapula 177,793 8 88 12 100 Lusaka 333,430 15 15 85 100 Northern 296,021 13 85 15 100 North-western 131,217 6 84 16 100 Southern 284,250 12 77 23 100 Western 176,250 8 88 12 100 Total 2,283,211 100 65 35 100 Source: LCMS 2006
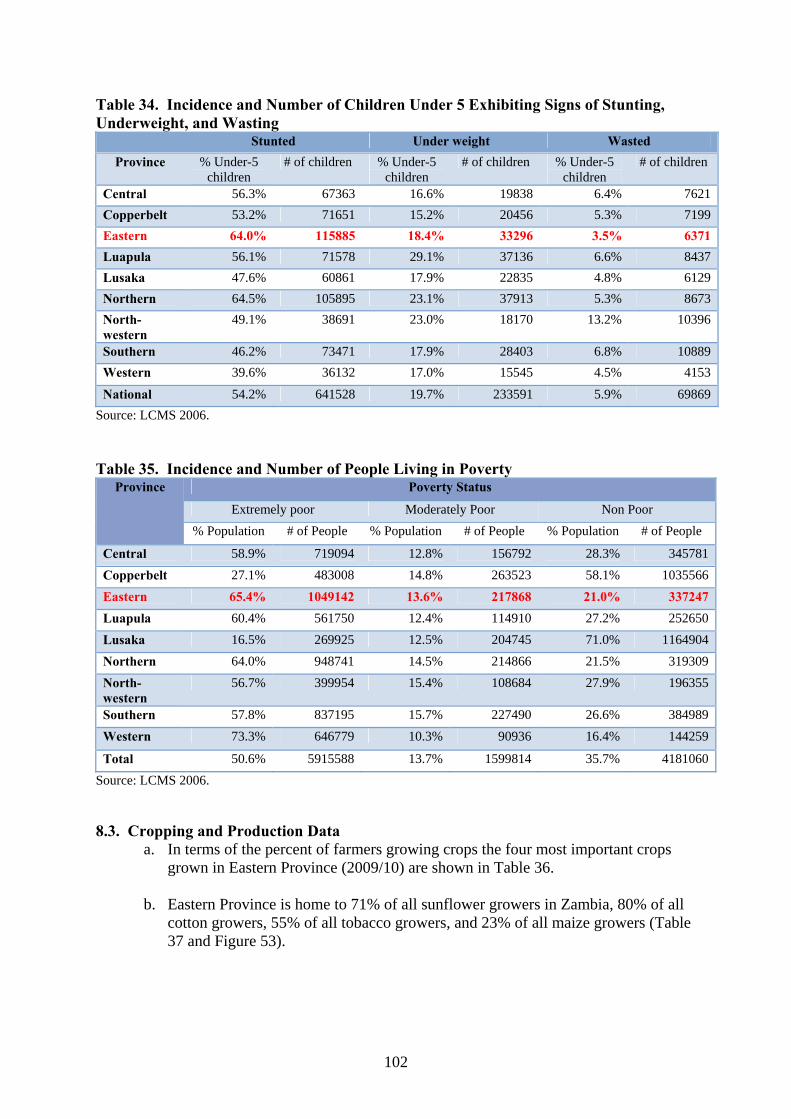
102
Table 34. Incidence and Number of Children Under 5 Exhibiting Signs of Stunting, Underweight, and Wasting
Stunted Under weight Wasted Province % Under-5
children # of children % Under-5
children # of children % Under-5
children # of children
Central 56.3% 67363 16.6% 19838 6.4% 7621Copperbelt 53.2% 71651 15.2% 20456 5.3% 7199Eastern 64.0% 115885 18.4% 33296 3.5% 6371Luapula 56.1% 71578 29.1% 37136 6.6% 8437Lusaka 47.6% 60861 17.9% 22835 4.8% 6129Northern 64.5% 105895 23.1% 37913 5.3% 8673North-western
49.1% 38691 23.0% 18170 13.2% 10396
Southern 46.2% 73471 17.9% 28403 6.8% 10889Western 39.6% 36132 17.0% 15545 4.5% 4153
National 54.2% 641528 19.7% 233591 5.9% 69869Source: LCMS 2006. Table 35. Incidence and Number of People Living in Poverty
Poverty Status
Extremely poor Moderately Poor Non Poor
Province
% Population # of People % Population # of People % Population # of People
Central 58.9% 719094 12.8% 156792 28.3% 345781Copperbelt 27.1% 483008 14.8% 263523 58.1% 1035566Eastern 65.4% 1049142 13.6% 217868 21.0% 337247Luapula 60.4% 561750 12.4% 114910 27.2% 252650Lusaka 16.5% 269925 12.5% 204745 71.0% 1164904Northern 64.0% 948741 14.5% 214866 21.5% 319309North-western
56.7% 399954 15.4% 108684 27.9% 196355
Southern 57.8% 837195 15.7% 227490 26.6% 384989Western 73.3% 646779 10.3% 90936 16.4% 144259
Total 50.6% 5915588 13.7% 1599814 35.7% 4181060Source: LCMS 2006. 8.3. Cropping and Production Data
a. In terms of the percent of farmers growing crops the four most important crops grown in Eastern Province (2009/10) are shown in Table 36.
b. Eastern Province is home to 71% of all sunflower growers in Zambia, 80% of all
cotton growers, 55% of all tobacco growers, and 23% of all maize growers (Table 37 and Figure 53).
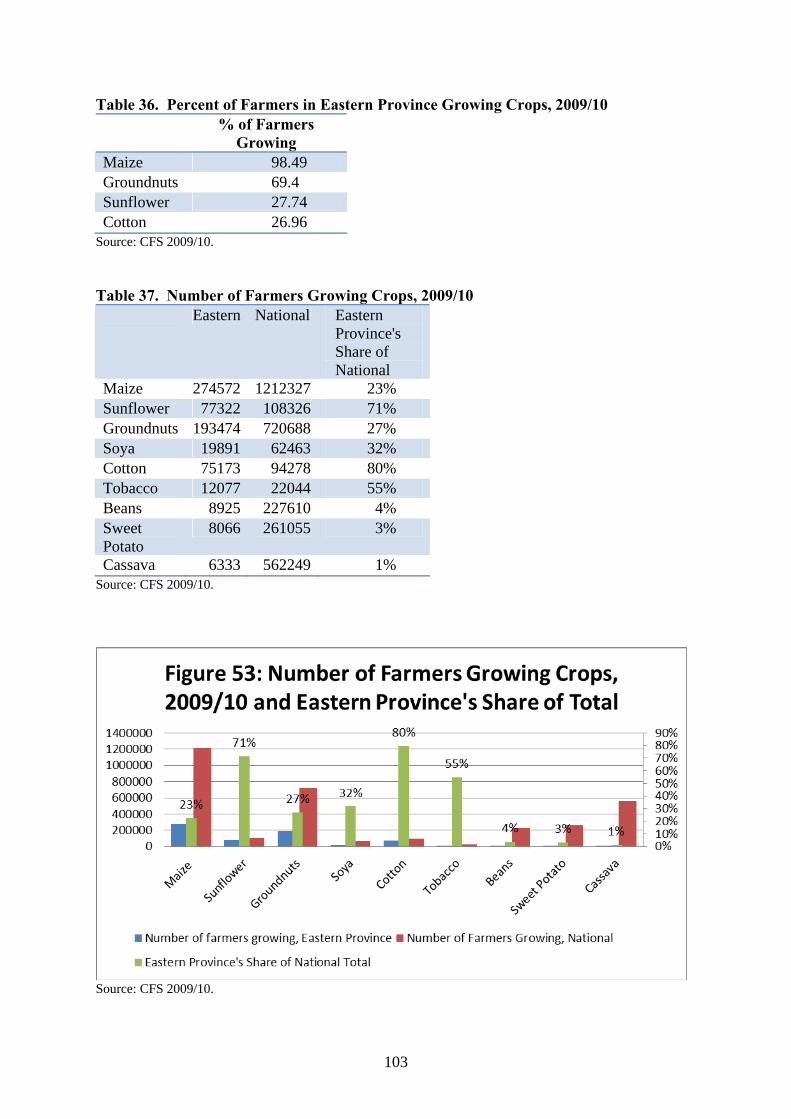
103
Table 36. Percent of Farmers in Eastern Province Growing Crops, 2009/10 % of Farmers
Growing Maize 98.49 Groundnuts 69.4 Sunflower 27.74 Cotton 26.96
Source: CFS 2009/10. Table 37. Number of Farmers Growing Crops, 2009/10 Eastern National Eastern
Province's Share of National
Maize 274572 1212327 23% Sunflower 77322 108326 71% Groundnuts 193474 720688 27% Soya 19891 62463 32% Cotton 75173 94278 80% Tobacco 12077 22044 55% Beans 8925 227610 4% Sweet Potato
8066 261055 3%
Cassava 6333 562249 1% Source: CFS 2009/10.
Source: CFS 2009/10.
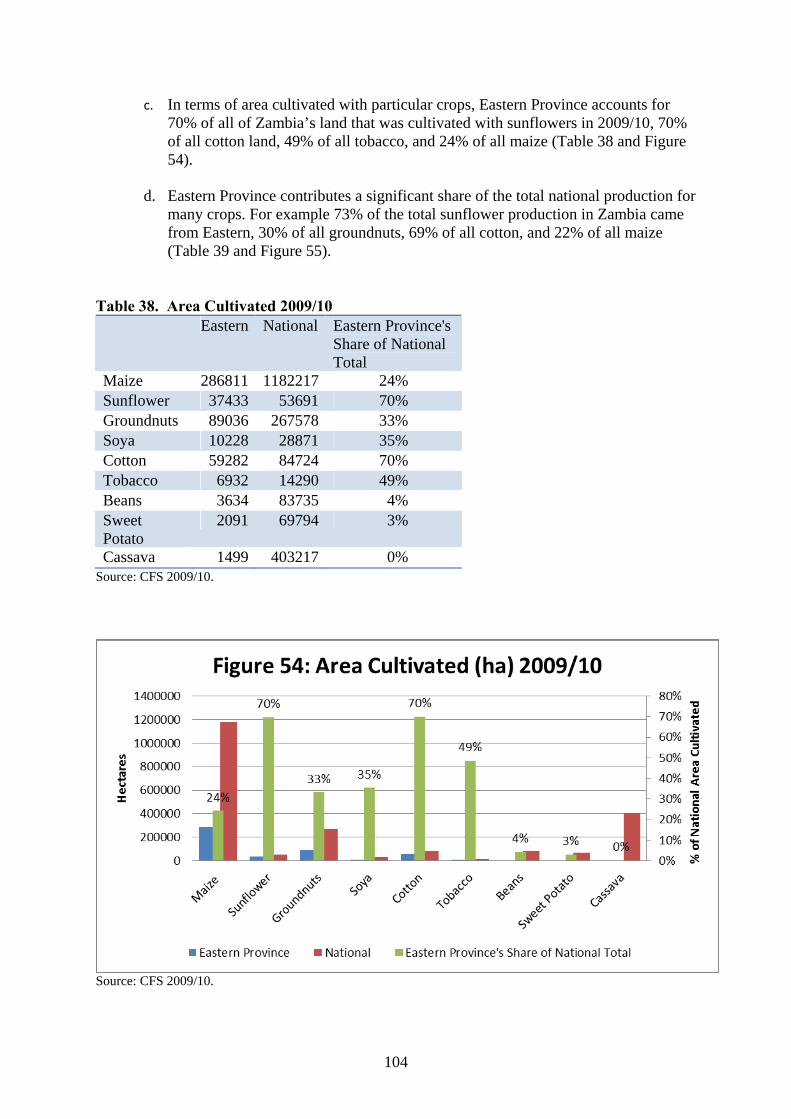
104
c. In terms of area cultivated with particular crops, Eastern Province accounts for 70% of all of Zambia’s land that was cultivated with sunflowers in 2009/10, 70% of all cotton land, 49% of all tobacco, and 24% of all maize (Table 38 and Figure 54).
d. Eastern Province contributes a significant share of the total national production for
many crops. For example 73% of the total sunflower production in Zambia came from Eastern, 30% of all groundnuts, 69% of all cotton, and 22% of all maize (Table 39 and Figure 55).
Table 38. Area Cultivated 2009/10 Eastern National Eastern Province's
Share of National Total
Maize 286811 1182217 24% Sunflower 37433 53691 70% Groundnuts 89036 267578 33% Soya 10228 28871 35% Cotton 59282 84724 70% Tobacco 6932 14290 49% Beans 3634 83735 4% Sweet Potato
2091 69794 3%
Cassava 1499 403217 0% Source: CFS 2009/10.
Source: CFS 2009/10.
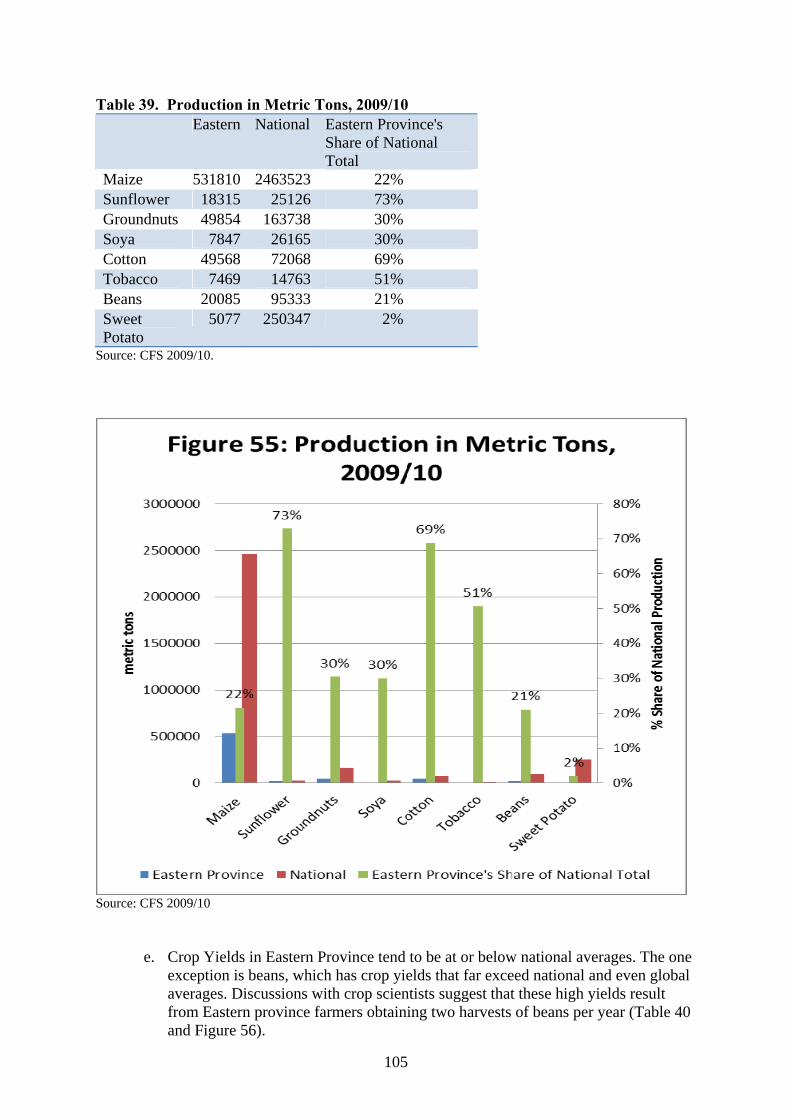
105
Table 39. Production in Metric Tons, 2009/10 Eastern National Eastern Province's
Share of National Total
Maize 531810 2463523 22% Sunflower 18315 25126 73% Groundnuts 49854 163738 30% Soya 7847 26165 30% Cotton 49568 72068 69% Tobacco 7469 14763 51% Beans 20085 95333 21% Sweet Potato
5077 250347 2%
Source: CFS 2009/10.
Source: CFS 2009/10
e. Crop Yields in Eastern Province tend to be at or below national averages. The one exception is beans, which has crop yields that far exceed national and even global averages. Discussions with crop scientists suggest that these high yields result from Eastern province farmers obtaining two harvests of beans per year (Table 40 and Figure 56).
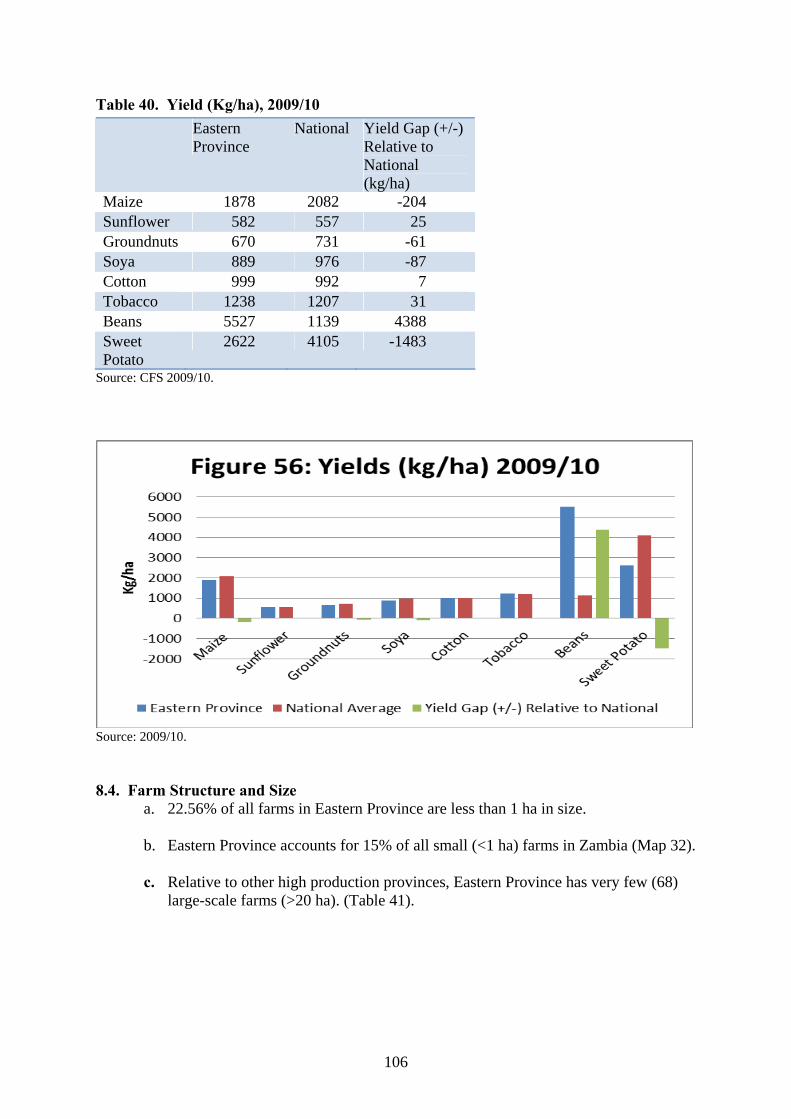
106
Table 40. Yield (Kg/ha), 2009/10 Eastern
Province National Yield Gap (+/-)
Relative to National (kg/ha)
Maize 1878 2082 -204 Sunflower 582 557 25 Groundnuts 670 731 -61 Soya 889 976 -87 Cotton 999 992 7 Tobacco 1238 1207 31 Beans 5527 1139 4388 Sweet Potato
2622 4105 -1483
Source: CFS 2009/10.
Source: 2009/10. 8.4. Farm Structure and Size
a. 22.56% of all farms in Eastern Province are less than 1 ha in size. b. Eastern Province accounts for 15% of all small (<1 ha) farms in Zambia (Map 32). c. Relative to other high production provinces, Eastern Province has very few (68)
large-scale farms (>20 ha). (Table 41).
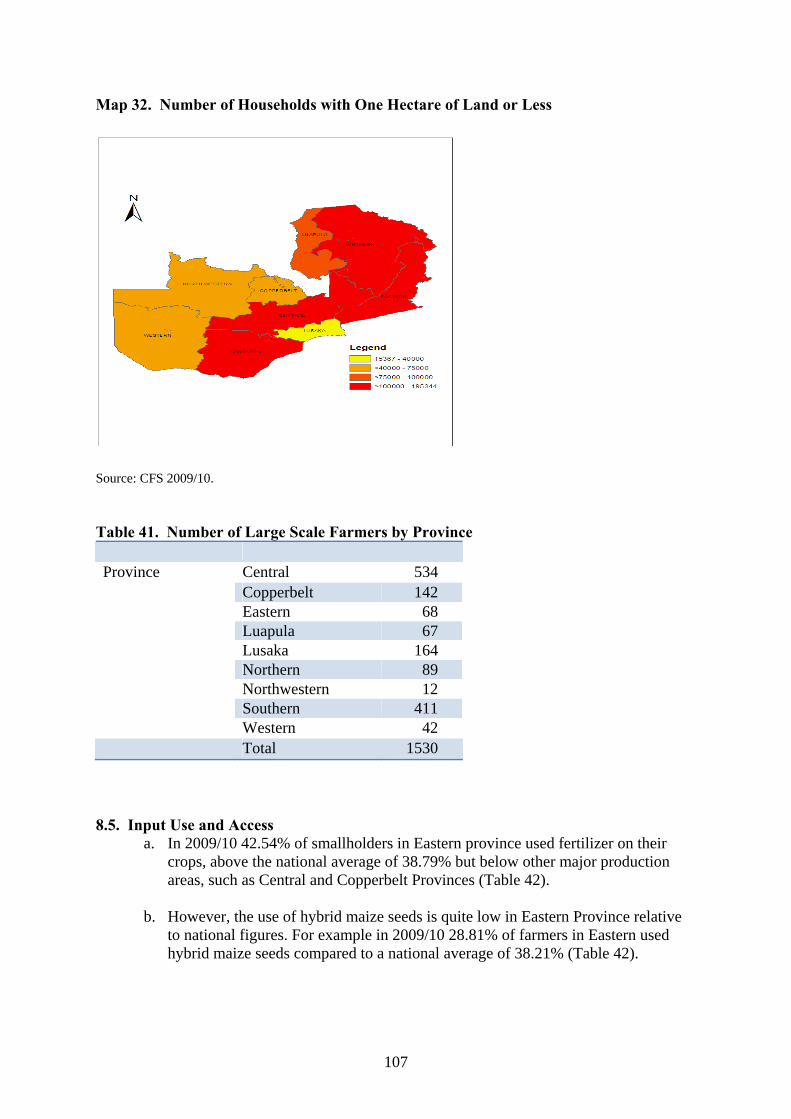
107
Map 32. Number of Households with One Hectare of Land or Less
Source: CFS 2009/10. Table 41. Number of Large Scale Farmers by Province
Central 534 Copperbelt 142 Eastern 68 Luapula 67 Lusaka 164 Northern 89 Northwestern 12 Southern 411
Province
Western 42 Total 1530
8.5. Input Use and Access
a. In 2009/10 42.54% of smallholders in Eastern province used fertilizer on their crops, above the national average of 38.79% but below other major production areas, such as Central and Copperbelt Provinces (Table 42).
b. However, the use of hybrid maize seeds is quite low in Eastern Province relative
to national figures. For example in 2009/10 28.81% of farmers in Eastern used hybrid maize seeds compared to a national average of 38.21% (Table 42).
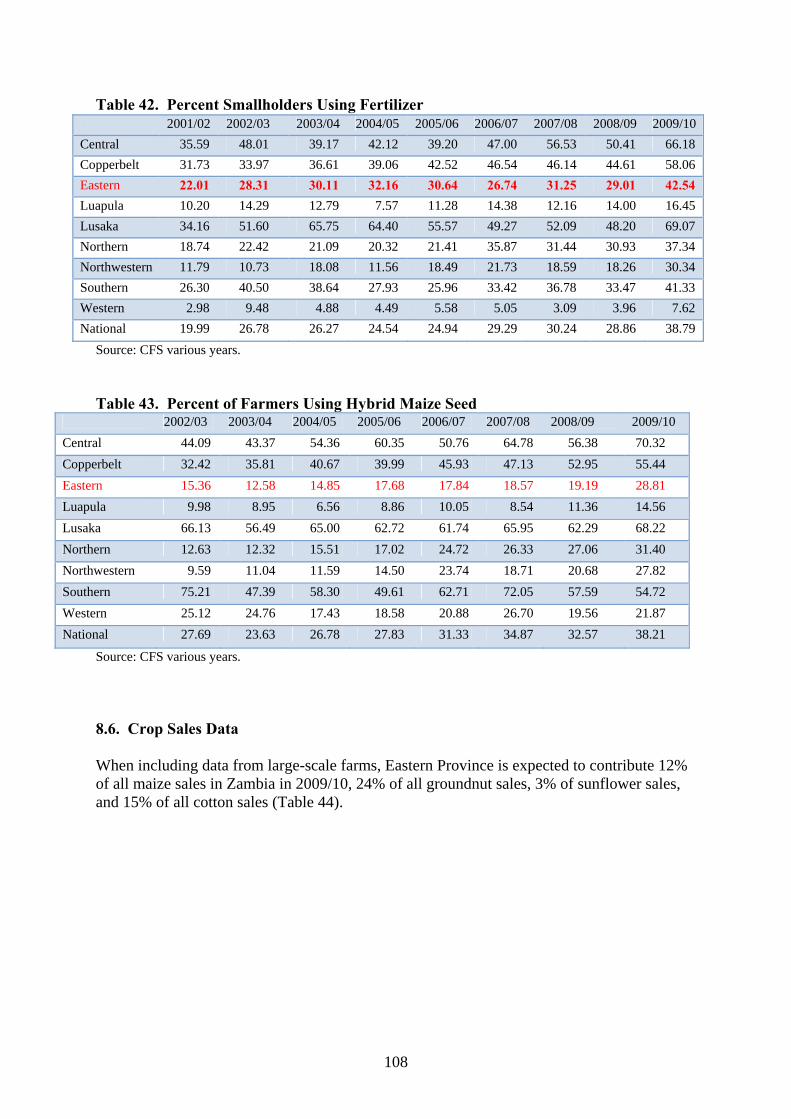
108
Table 42. Percent Smallholders Using Fertilizer
Source: CFS various years. Table 43. Percent of Farmers Using Hybrid Maize Seed
2002/03 2003/04 2004/05 2005/06 2006/07 2007/08 2008/09 2009/10 Central 44.09 43.37 54.36 60.35 50.76 64.78 56.38 70.32 Copperbelt 32.42 35.81 40.67 39.99 45.93 47.13 52.95 55.44 Eastern 15.36 12.58 14.85 17.68 17.84 18.57 19.19 28.81 Luapula 9.98 8.95 6.56 8.86 10.05 8.54 11.36 14.56 Lusaka 66.13 56.49 65.00 62.72 61.74 65.95 62.29 68.22 Northern 12.63 12.32 15.51 17.02 24.72 26.33 27.06 31.40 Northwestern 9.59 11.04 11.59 14.50 23.74 18.71 20.68 27.82 Southern 75.21 47.39 58.30 49.61 62.71 72.05 57.59 54.72 Western 25.12 24.76 17.43 18.58 20.88 26.70 19.56 21.87 National 27.69 23.63 26.78 27.83 31.33 34.87 32.57 38.21
Source: CFS various years. 8.6. Crop Sales Data When including data from large-scale farms, Eastern Province is expected to contribute 12% of all maize sales in Zambia in 2009/10, 24% of all groundnut sales, 3% of sunflower sales, and 15% of all cotton sales (Table 44).
2001/02 2002/03 2003/04 2004/05 2005/06 2006/07 2007/08 2008/09 2009/10Central 35.59 48.01 39.17 42.12 39.20 47.00 56.53 50.41 66.18 Copperbelt 31.73 33.97 36.61 39.06 42.52 46.54 46.14 44.61 58.06 Eastern 22.01 28.31 30.11 32.16 30.64 26.74 31.25 29.01 42.54 Luapula 10.20 14.29 12.79 7.57 11.28 14.38 12.16 14.00 16.45 Lusaka 34.16 51.60 65.75 64.40 55.57 49.27 52.09 48.20 69.07 Northern 18.74 22.42 21.09 20.32 21.41 35.87 31.44 30.93 37.34 Northwestern 11.79 10.73 18.08 11.56 18.49 21.73 18.59 18.26 30.34 Southern 26.30 40.50 38.64 27.93 25.96 33.42 36.78 33.47 41.33 Western 2.98 9.48 4.88 4.49 5.58 5.05 3.09 3.96 7.62 National 19.99 26.78 26.27 24.54 24.94 29.29 30.24 28.86 38.79
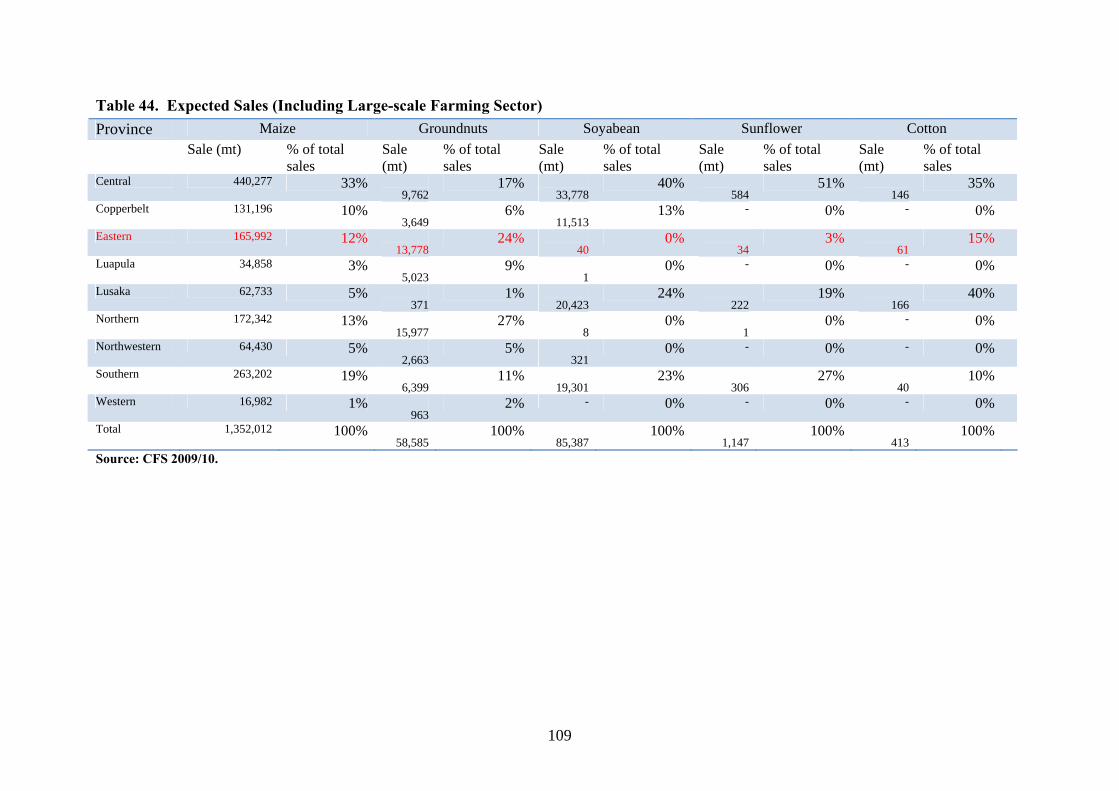
109
Table 44. Expected Sales (Including Large-scale Farming Sector) Province Maize Groundnuts Soyabean Sunflower Cotton Sale (mt) % of total
sales Sale (mt)
% of total sales
Sale (mt)
% of total sales
Sale (mt)
% of total sales
Sale (mt)
% of total sales
Central 440,277 33% 9,762
17% 33,778
40% 584
51% 146
35%
Copperbelt 131,196 10% 3,649
6% 11,513
13% - 0% - 0%
Eastern 165,992 12% 13,778
24% 40
0% 34
3% 61
15%
Luapula 34,858 3% 5,023
9% 1
0% - 0% - 0%
Lusaka 62,733 5% 371
1% 20,423
24% 222
19% 166
40%
Northern 172,342 13% 15,977
27% 8
0% 1
0% - 0%
Northwestern 64,430 5% 2,663
5% 321
0% - 0% - 0%
Southern 263,202 19% 6,399
11% 19,301
23% 306
27% 40
10%
Western 16,982 1% 963
2% - 0% - 0% - 0%
Total 1,352,012 100% 58,585
100% 85,387
100% 1,147
100% 413
100%
Source: CFS 2009/10.
110
IX. COUNTRY READINESS This section outlines the medium and long-term policy goals and frameworks guiding agricultural investments in Zambia 9.1. Zambia’s Long-Term Development Agenda Is Outlined in the Vision 2030 Document
a. Vision 2030 is a long-term economic development strategy, which is operationalized through medium term five year National Development Plans.
b. The Vision highlights three scenarios outlining development options, namely the
baseline, the preferred, and the optimistic. The socio-economic development objectives enshrined in the Preferred Scenario are: to attain and sustain annual real growth of 6% (2006-2010), 8% (2011-2015), 9% (2016-2020), and 10% between 2021 and 2030; to attain and maintain a moderate inflation rate of 5%; to reduce national poverty head count to less than 20% of the population; to reduce income inequalities measured by a Gini coefficient of less than 40; to provide secure access to safe potable water sources and improved sanitation facilities to 100% of the population in both urban and rural areas; to attain education for all; and, to provide equitable access to quality health care to all by 2030.
c. Given that the majority of Zambians depend on the agricultural sector for their
livelihoods, GRZ, through the Vision 2030, has identified the agricultural sector as key in leading the country’s overall economic development strategy.
9.2. Current National Development Plan: Fifth National Development Plan
a. Agriculture Sector Goals: i. Attain 90% HH food security by 2015; ii. Increase agriculture’s contribution to FOREX earnings from 3-5% to 10-20%; iii. Increase agricultural export output at an annual rate of 20%; iv. Grow agriculture from 1% to 7-10% per annum from 2006 onwards; v. Increase agriculture’s contribution to GDP from 18-20% to 25%; vi. Facilitate the role of private sector; and vii. Increase incomes for those in agriculture.
9.2.1. The Sixth National Development Plan The Sixth National Development Plan (SNDP) is currently being formulated and will take effect in December 2010. The SNDP’s agricultural section will enshrine the CAADP principles outlined in the National CAADP compact (which has been formulated but not yet signed).
In Zambia’s CAADP Compact, three challenges to agriculture as an engine of economic and social development are identified:
• Low investment in the agricultural sector by government and the private sector, despite the sector’s support to the livelihoods of over 60% of the population;
• Low production and productivity, especially among smallholder farmers due to low input use and low levels of technology; and
111
• Failure to fully recognize that chronic hunger and malnutrition are a critical threat to Zambia’s long-term development and its 2030 vision.
To address these challenges, the GRZ has outlined specific investment programs, which fall under the four CAADP pillars.
Pillar 1: Extending the area under sustainable land management and reliable water control systems through:
a) Agricultural Productivity Improvement Programme. • Crop and soil productivity enhancement; • Irrigation; • Livestock production; and • Agricultural finance innovations – i.e. leasing, futures markets, insurance, etc.
Pillar 2: Improving rural infrastructure and trade-related capacities for market access:
a) Agricultural Marketing Development Program. • Agricultural market information; • Agricultural marketing and trade - Promote structured markets, price
discovery and transparency through support to ZAMACE; • Private sector capacity building; • Rural market infrastructure development - feeder roads, private sector, public
access storage; • Private sector agro-dealer promotion; and • Restructuring of Fertilizer Support Program - E-voucher pilot and build out,
more effective targeting. b) Agricultural Investment Promotion Program:
• Electronic voucher for farm input subsidy programs; • Investment identification and promotion (including value chain analysis); • Investment fund (public/private capital investment); • Farm block development; • Irrigation development; • Out-grower promotion; and • Agro-processing promotion.
Pillar 3: Increasing food supply, reducing hunger, and improving responses to food emergency crises:
a) Food and Nutrition Security Program. • Social protection and safety nets - investigate and implement alternative
delivery mechanisms that crowd in private sector; • Food security pack; • Early warning; • Agricultural information and statistics; • Nutrition research and education; • Livestock; and • Fisheries.
Pillar 4: Improving agricultural research, technology dissemination, and adoption: a) Research and Extension Enhancement Program.
• Consultation-based research and extension agenda; • Research and extension infrastructure improvements; • Human resources development;
112
• Support to private sector research; and • Information communication technology.
9.3. Several Supporting Policies Have Been Promulgated in Order to Support the Functioning of Zambia’s Agricultural Markets 9.3.1. Agricultural Credit Act
• Appoint agency to regulate warehouse receipt system (WRS). • Improve inventory credit by issuing transferable receipts.
9.3.2. Agricultural Marketing Act, Which Seeks to:
• Provide for a comprehensive & trade enhancing agricultural marketing legislation; • Realign Government regulatory and market support functions; • Identify new strategic roles of the FRA; • Harmonize and consolidate existing agricultural marketing related Acts; • Provide for a comprehensive & trade enhancing agricultural marketing legislation; • Realign Government regulatory and market support functions; • Identify new strategic roles of the FRA; and • Harmonize and consolidate existing agricultural marketing related Acts.

113
ADDITIONAL TABLES FOR REFERENCE
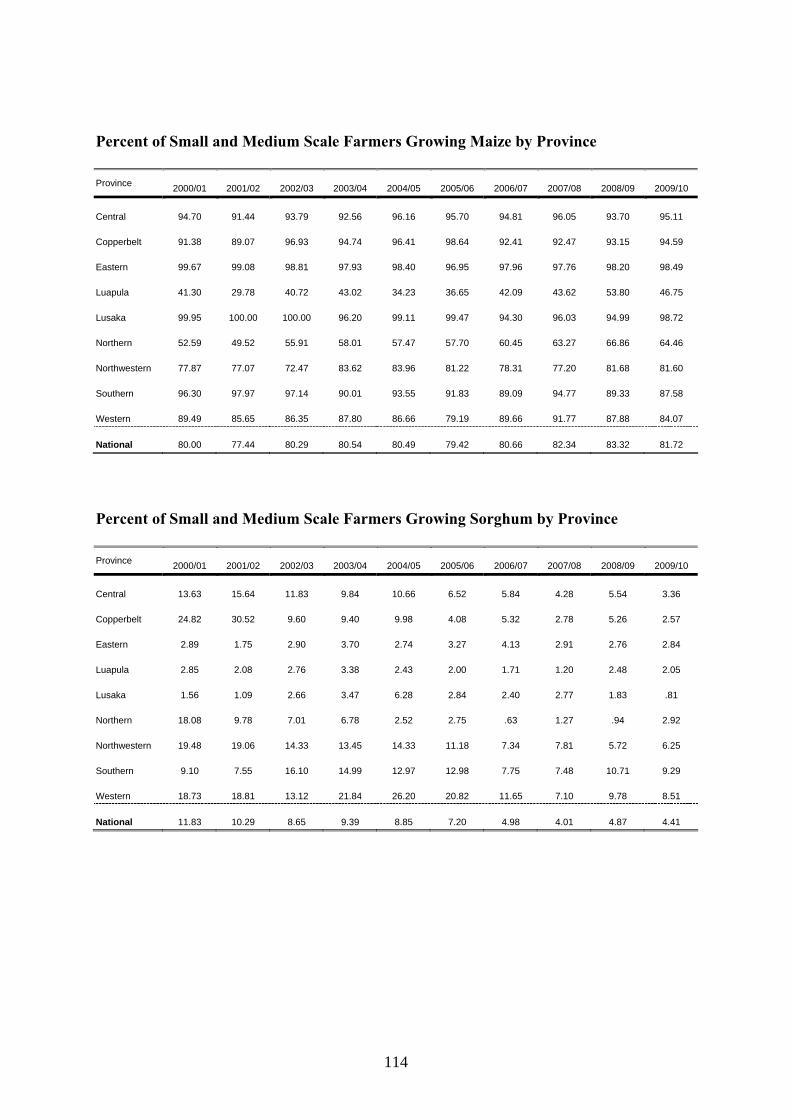
114
Percent of Small and Medium Scale Farmers Growing Maize by Province Province 2000/01 2001/02 2002/03 2003/04 2004/05 2005/06 2006/07 2007/08 2008/09 2009/10
Central 94.70 91.44 93.79 92.56 96.16 95.70 94.81 96.05 93.70 95.11
Copperbelt 91.38 89.07 96.93 94.74 96.41 98.64 92.41 92.47 93.15 94.59
Eastern 99.67 99.08 98.81 97.93 98.40 96.95 97.96 97.76 98.20 98.49
Luapula 41.30 29.78 40.72 43.02 34.23 36.65 42.09 43.62 53.80 46.75
Lusaka 99.95 100.00 100.00 96.20 99.11 99.47 94.30 96.03 94.99 98.72
Northern 52.59 49.52 55.91 58.01 57.47 57.70 60.45 63.27 66.86 64.46
Northwestern 77.87 77.07 72.47 83.62 83.96 81.22 78.31 77.20 81.68 81.60
Southern 96.30 97.97 97.14 90.01 93.55 91.83 89.09 94.77 89.33 87.58
Western 89.49 85.65 86.35 87.80 86.66 79.19 89.66 91.77 87.88 84.07
National 80.00 77.44 80.29 80.54 80.49 79.42 80.66 82.34 83.32 81.72
Percent of Small and Medium Scale Farmers Growing Sorghum by Province Province 2000/01 2001/02 2002/03 2003/04 2004/05 2005/06 2006/07 2007/08 2008/09 2009/10
Central 13.63 15.64 11.83 9.84 10.66 6.52 5.84 4.28 5.54 3.36
Copperbelt 24.82 30.52 9.60 9.40 9.98 4.08 5.32 2.78 5.26 2.57
Eastern 2.89 1.75 2.90 3.70 2.74 3.27 4.13 2.91 2.76 2.84
Luapula 2.85 2.08 2.76 3.38 2.43 2.00 1.71 1.20 2.48 2.05
Lusaka 1.56 1.09 2.66 3.47 6.28 2.84 2.40 2.77 1.83 .81
Northern 18.08 9.78 7.01 6.78 2.52 2.75 .63 1.27 .94 2.92
Northwestern 19.48 19.06 14.33 13.45 14.33 11.18 7.34 7.81 5.72 6.25
Southern 9.10 7.55 16.10 14.99 12.97 12.98 7.75 7.48 10.71 9.29
Western 18.73 18.81 13.12 21.84 26.20 20.82 11.65 7.10 9.78 8.51
National 11.83 10.29 8.65 9.39 8.85 7.20 4.98 4.01 4.87 4.41
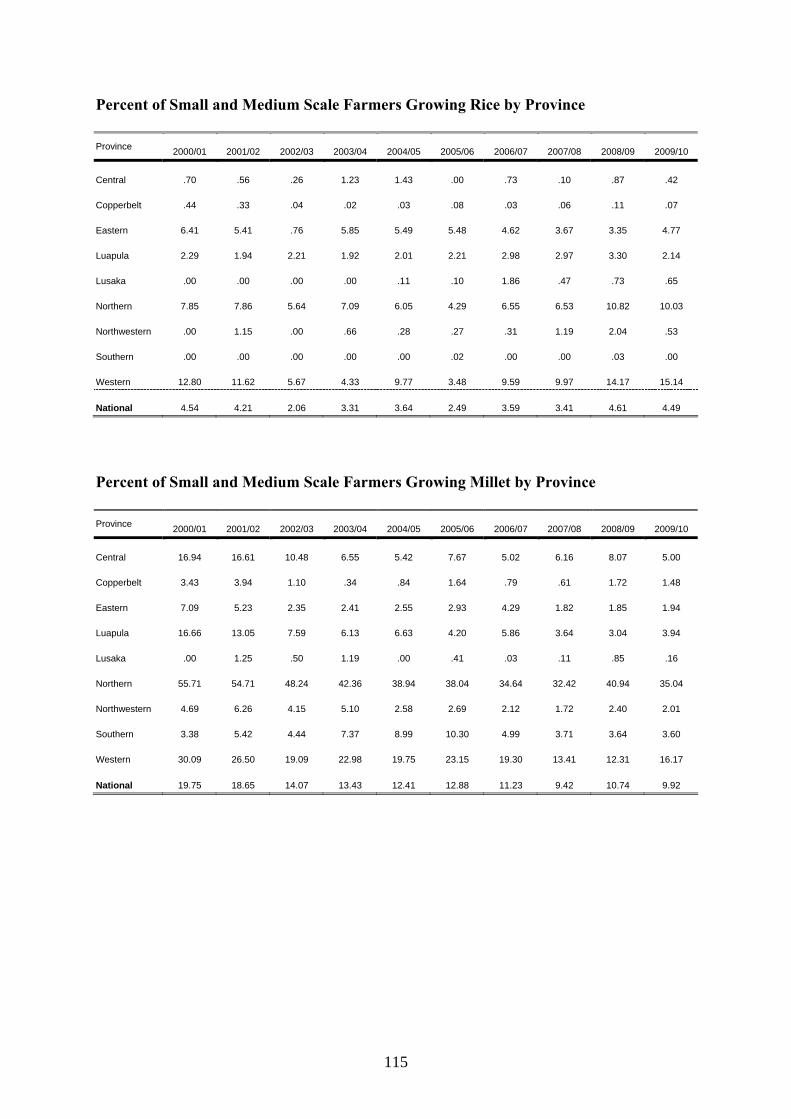
115
Percent of Small and Medium Scale Farmers Growing Rice by Province Province 2000/01 2001/02 2002/03 2003/04 2004/05 2005/06 2006/07 2007/08 2008/09 2009/10
Central .70 .56 .26 1.23 1.43 .00 .73 .10 .87 .42
Copperbelt .44 .33 .04 .02 .03 .08 .03 .06 .11 .07
Eastern 6.41 5.41 .76 5.85 5.49 5.48 4.62 3.67 3.35 4.77
Luapula 2.29 1.94 2.21 1.92 2.01 2.21 2.98 2.97 3.30 2.14
Lusaka .00 .00 .00 .00 .11 .10 1.86 .47 .73 .65
Northern 7.85 7.86 5.64 7.09 6.05 4.29 6.55 6.53 10.82 10.03
Northwestern .00 1.15 .00 .66 .28 .27 .31 1.19 2.04 .53
Southern .00 .00 .00 .00 .00 .02 .00 .00 .03 .00
Western 12.80 11.62 5.67 4.33 9.77 3.48 9.59 9.97 14.17 15.14
National 4.54 4.21 2.06 3.31 3.64 2.49 3.59 3.41 4.61 4.49
Percent of Small and Medium Scale Farmers Growing Millet by Province Province 2000/01 2001/02 2002/03 2003/04 2004/05 2005/06 2006/07 2007/08 2008/09 2009/10
Central 16.94 16.61 10.48 6.55 5.42 7.67 5.02 6.16 8.07 5.00
Copperbelt 3.43 3.94 1.10 .34 .84 1.64 .79 .61 1.72 1.48
Eastern 7.09 5.23 2.35 2.41 2.55 2.93 4.29 1.82 1.85 1.94
Luapula 16.66 13.05 7.59 6.13 6.63 4.20 5.86 3.64 3.04 3.94
Lusaka .00 1.25 .50 1.19 .00 .41 .03 .11 .85 .16
Northern 55.71 54.71 48.24 42.36 38.94 38.04 34.64 32.42 40.94 35.04
Northwestern 4.69 6.26 4.15 5.10 2.58 2.69 2.12 1.72 2.40 2.01
Southern 3.38 5.42 4.44 7.37 8.99 10.30 4.99 3.71 3.64 3.60
Western 30.09 26.50 19.09 22.98 19.75 23.15 19.30 13.41 12.31 16.17
National 19.75 18.65 14.07 13.43 12.41 12.88 11.23 9.42 10.74 9.92
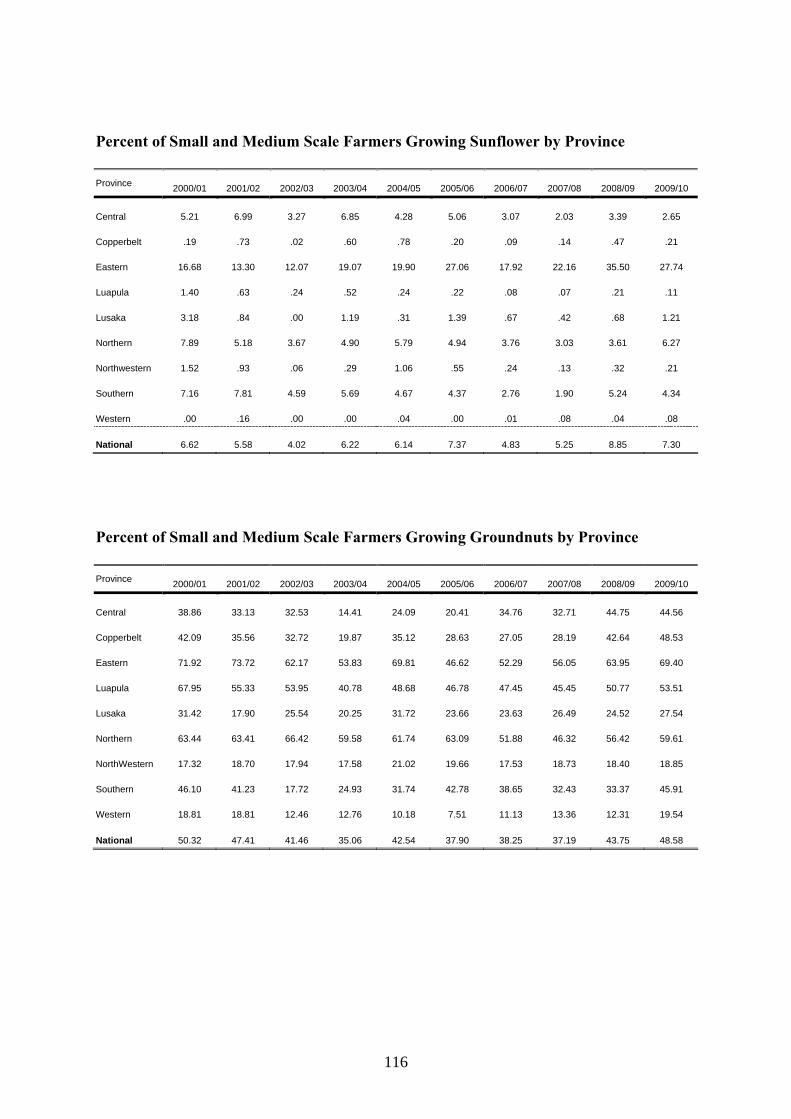
116
Percent of Small and Medium Scale Farmers Growing Sunflower by Province Province 2000/01 2001/02 2002/03 2003/04 2004/05 2005/06 2006/07 2007/08 2008/09 2009/10
Central 5.21 6.99 3.27 6.85 4.28 5.06 3.07 2.03 3.39 2.65
Copperbelt .19 .73 .02 .60 .78 .20 .09 .14 .47 .21
Eastern 16.68 13.30 12.07 19.07 19.90 27.06 17.92 22.16 35.50 27.74
Luapula 1.40 .63 .24 .52 .24 .22 .08 .07 .21 .11
Lusaka 3.18 .84 .00 1.19 .31 1.39 .67 .42 .68 1.21
Northern 7.89 5.18 3.67 4.90 5.79 4.94 3.76 3.03 3.61 6.27
Northwestern 1.52 .93 .06 .29 1.06 .55 .24 .13 .32 .21
Southern 7.16 7.81 4.59 5.69 4.67 4.37 2.76 1.90 5.24 4.34
Western .00 .16 .00 .00 .04 .00 .01 .08 .04 .08
National 6.62 5.58 4.02 6.22 6.14 7.37 4.83 5.25 8.85 7.30
Percent of Small and Medium Scale Farmers Growing Groundnuts by Province Province 2000/01 2001/02 2002/03 2003/04 2004/05 2005/06 2006/07 2007/08 2008/09 2009/10
Central 38.86 33.13 32.53 14.41 24.09 20.41 34.76 32.71 44.75 44.56
Copperbelt 42.09 35.56 32.72 19.87 35.12 28.63 27.05 28.19 42.64 48.53
Eastern 71.92 73.72 62.17 53.83 69.81 46.62 52.29 56.05 63.95 69.40
Luapula 67.95 55.33 53.95 40.78 48.68 46.78 47.45 45.45 50.77 53.51
Lusaka 31.42 17.90 25.54 20.25 31.72 23.66 23.63 26.49 24.52 27.54
Northern 63.44 63.41 66.42 59.58 61.74 63.09 51.88 46.32 56.42 59.61
NorthWestern 17.32 18.70 17.94 17.58 21.02 19.66 17.53 18.73 18.40 18.85
Southern 46.10 41.23 17.72 24.93 31.74 42.78 38.65 32.43 33.37 45.91
Western 18.81 18.81 12.46 12.76 10.18 7.51 11.13 13.36 12.31 19.54
National 50.32 47.41 41.46 35.06 42.54 37.90 38.25 37.19 43.75 48.58
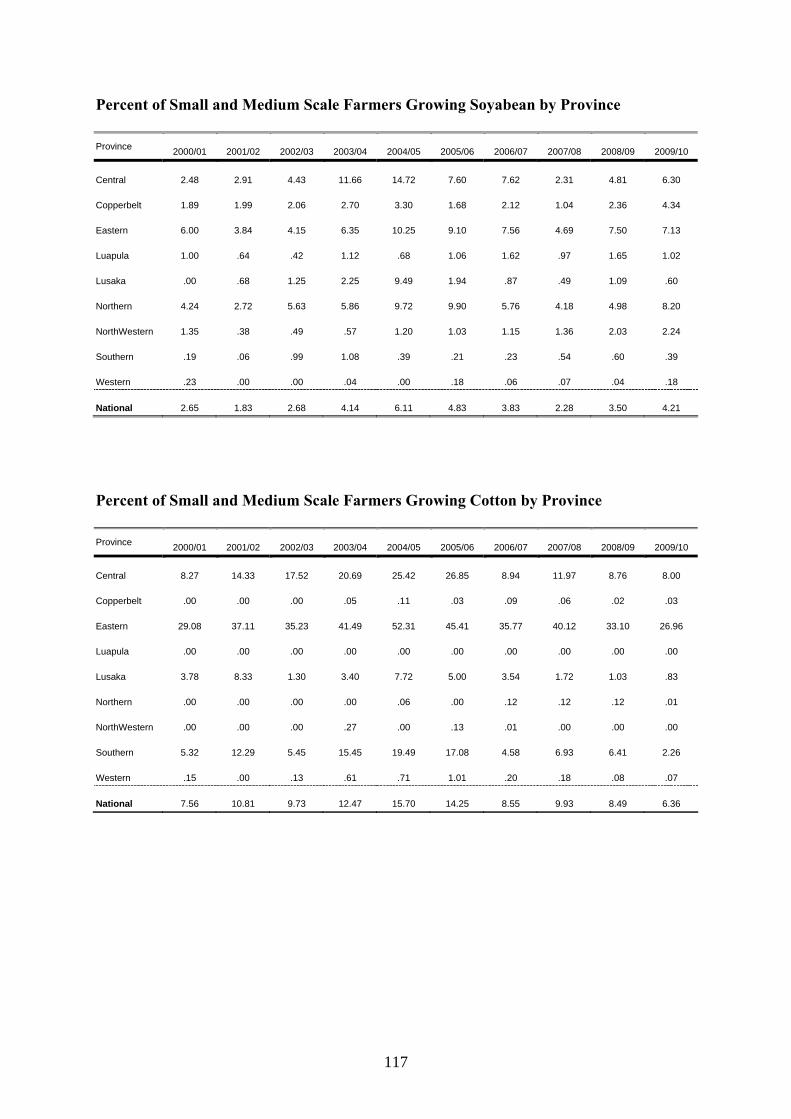
117
Percent of Small and Medium Scale Farmers Growing Soyabean by Province Province 2000/01 2001/02 2002/03 2003/04 2004/05 2005/06 2006/07 2007/08 2008/09 2009/10
Central 2.48 2.91 4.43 11.66 14.72 7.60 7.62 2.31 4.81 6.30
Copperbelt 1.89 1.99 2.06 2.70 3.30 1.68 2.12 1.04 2.36 4.34
Eastern 6.00 3.84 4.15 6.35 10.25 9.10 7.56 4.69 7.50 7.13
Luapula 1.00 .64 .42 1.12 .68 1.06 1.62 .97 1.65 1.02
Lusaka .00 .68 1.25 2.25 9.49 1.94 .87 .49 1.09 .60
Northern 4.24 2.72 5.63 5.86 9.72 9.90 5.76 4.18 4.98 8.20
NorthWestern 1.35 .38 .49 .57 1.20 1.03 1.15 1.36 2.03 2.24
Southern .19 .06 .99 1.08 .39 .21 .23 .54 .60 .39
Western .23 .00 .00 .04 .00 .18 .06 .07 .04 .18
National 2.65 1.83 2.68 4.14 6.11 4.83 3.83 2.28 3.50 4.21
Percent of Small and Medium Scale Farmers Growing Cotton by Province Province 2000/01 2001/02 2002/03 2003/04 2004/05 2005/06 2006/07 2007/08 2008/09 2009/10
Central 8.27 14.33 17.52 20.69 25.42 26.85 8.94 11.97 8.76 8.00
Copperbelt .00 .00 .00 .05 .11 .03 .09 .06 .02 .03
Eastern 29.08 37.11 35.23 41.49 52.31 45.41 35.77 40.12 33.10 26.96
Luapula .00 .00 .00 .00 .00 .00 .00 .00 .00 .00
Lusaka 3.78 8.33 1.30 3.40 7.72 5.00 3.54 1.72 1.03 .83
Northern .00 .00 .00 .00 .06 .00 .12 .12 .12 .01
NorthWestern .00 .00 .00 .27 .00 .13 .01 .00 .00 .00
Southern 5.32 12.29 5.45 15.45 19.49 17.08 4.58 6.93 6.41 2.26
Western .15 .00 .13 .61 .71 1.01 .20 .18 .08 .07
National 7.56 10.81 9.73 12.47 15.70 14.25 8.55 9.93 8.49 6.36
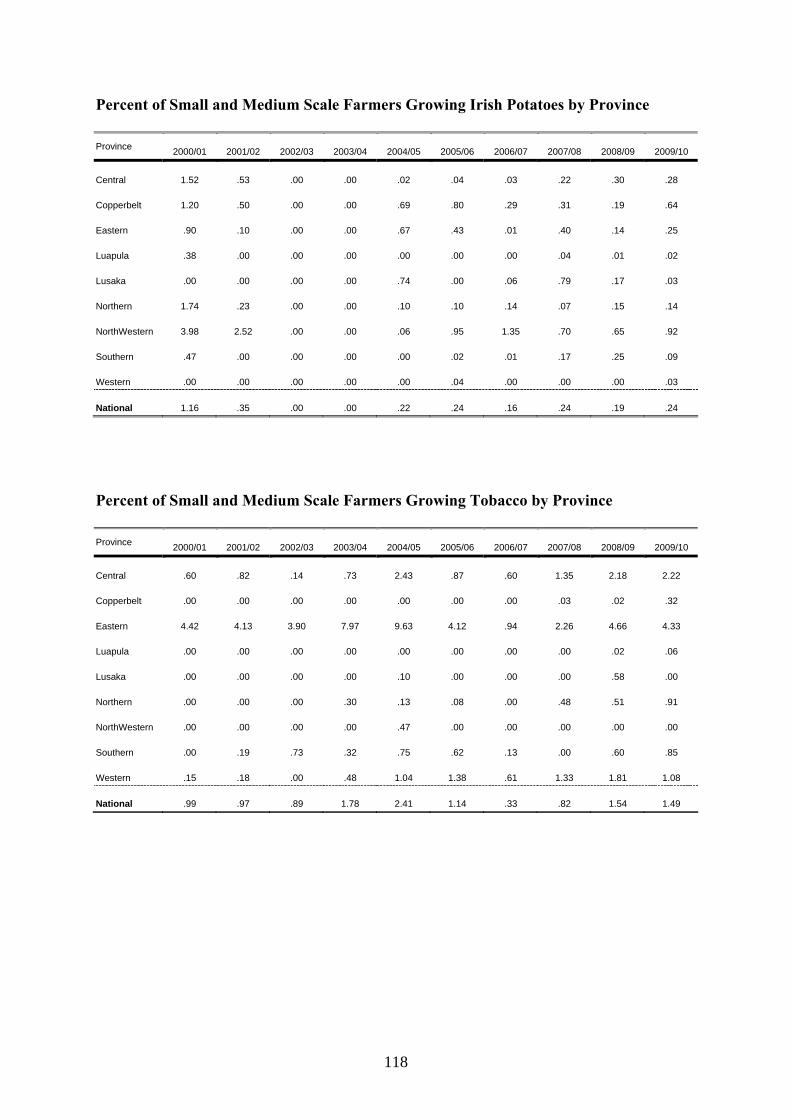
118
Percent of Small and Medium Scale Farmers Growing Irish Potatoes by Province Province 2000/01 2001/02 2002/03 2003/04 2004/05 2005/06 2006/07 2007/08 2008/09 2009/10
Central 1.52 .53 .00 .00 .02 .04 .03 .22 .30 .28
Copperbelt 1.20 .50 .00 .00 .69 .80 .29 .31 .19 .64
Eastern .90 .10 .00 .00 .67 .43 .01 .40 .14 .25
Luapula .38 .00 .00 .00 .00 .00 .00 .04 .01 .02
Lusaka .00 .00 .00 .00 .74 .00 .06 .79 .17 .03
Northern 1.74 .23 .00 .00 .10 .10 .14 .07 .15 .14
NorthWestern 3.98 2.52 .00 .00 .06 .95 1.35 .70 .65 .92
Southern .47 .00 .00 .00 .00 .02 .01 .17 .25 .09
Western .00 .00 .00 .00 .00 .04 .00 .00 .00 .03
National 1.16 .35 .00 .00 .22 .24 .16 .24 .19 .24
Percent of Small and Medium Scale Farmers Growing Tobacco by Province Province 2000/01 2001/02 2002/03 2003/04 2004/05 2005/06 2006/07 2007/08 2008/09 2009/10
Central .60 .82 .14 .73 2.43 .87 .60 1.35 2.18 2.22
Copperbelt .00 .00 .00 .00 .00 .00 .00 .03 .02 .32
Eastern 4.42 4.13 3.90 7.97 9.63 4.12 .94 2.26 4.66 4.33
Luapula .00 .00 .00 .00 .00 .00 .00 .00 .02 .06
Lusaka .00 .00 .00 .00 .10 .00 .00 .00 .58 .00
Northern .00 .00 .00 .30 .13 .08 .00 .48 .51 .91
NorthWestern .00 .00 .00 .00 .47 .00 .00 .00 .00 .00
Southern .00 .19 .73 .32 .75 .62 .13 .00 .60 .85
Western .15 .18 .00 .48 1.04 1.38 .61 1.33 1.81 1.08
National .99 .97 .89 1.78 2.41 1.14 .33 .82 1.54 1.49
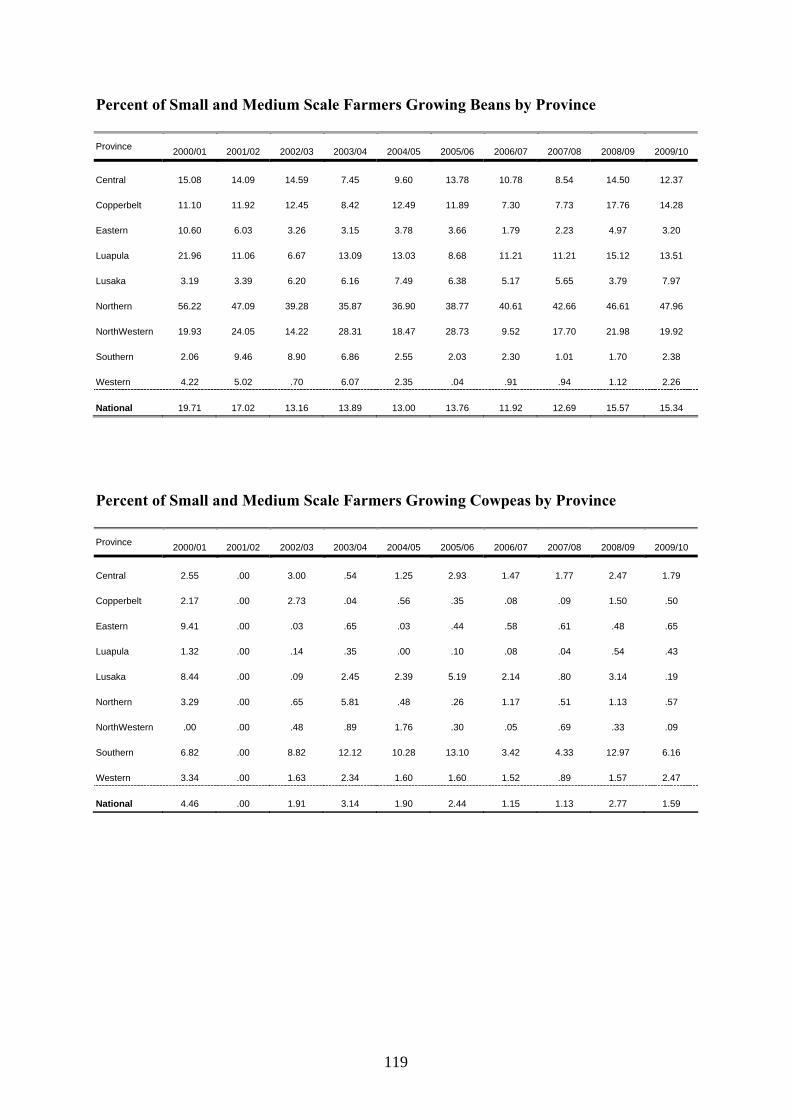
119
Percent of Small and Medium Scale Farmers Growing Beans by Province Province 2000/01 2001/02 2002/03 2003/04 2004/05 2005/06 2006/07 2007/08 2008/09 2009/10
Central 15.08 14.09 14.59 7.45 9.60 13.78 10.78 8.54 14.50 12.37
Copperbelt 11.10 11.92 12.45 8.42 12.49 11.89 7.30 7.73 17.76 14.28
Eastern 10.60 6.03 3.26 3.15 3.78 3.66 1.79 2.23 4.97 3.20
Luapula 21.96 11.06 6.67 13.09 13.03 8.68 11.21 11.21 15.12 13.51
Lusaka 3.19 3.39 6.20 6.16 7.49 6.38 5.17 5.65 3.79 7.97
Northern 56.22 47.09 39.28 35.87 36.90 38.77 40.61 42.66 46.61 47.96
NorthWestern 19.93 24.05 14.22 28.31 18.47 28.73 9.52 17.70 21.98 19.92
Southern 2.06 9.46 8.90 6.86 2.55 2.03 2.30 1.01 1.70 2.38
Western 4.22 5.02 .70 6.07 2.35 .04 .91 .94 1.12 2.26
National 19.71 17.02 13.16 13.89 13.00 13.76 11.92 12.69 15.57 15.34
Percent of Small and Medium Scale Farmers Growing Cowpeas by Province Province 2000/01 2001/02 2002/03 2003/04 2004/05 2005/06 2006/07 2007/08 2008/09 2009/10
Central 2.55 .00 3.00 .54 1.25 2.93 1.47 1.77 2.47 1.79
Copperbelt 2.17 .00 2.73 .04 .56 .35 .08 .09 1.50 .50
Eastern 9.41 .00 .03 .65 .03 .44 .58 .61 .48 .65
Luapula 1.32 .00 .14 .35 .00 .10 .08 .04 .54 .43
Lusaka 8.44 .00 .09 2.45 2.39 5.19 2.14 .80 3.14 .19
Northern 3.29 .00 .65 5.81 .48 .26 1.17 .51 1.13 .57
NorthWestern .00 .00 .48 .89 1.76 .30 .05 .69 .33 .09
Southern 6.82 .00 8.82 12.12 10.28 13.10 3.42 4.33 12.97 6.16
Western 3.34 .00 1.63 2.34 1.60 1.60 1.52 .89 1.57 2.47
National 4.46 .00 1.91 3.14 1.90 2.44 1.15 1.13 2.77 1.59
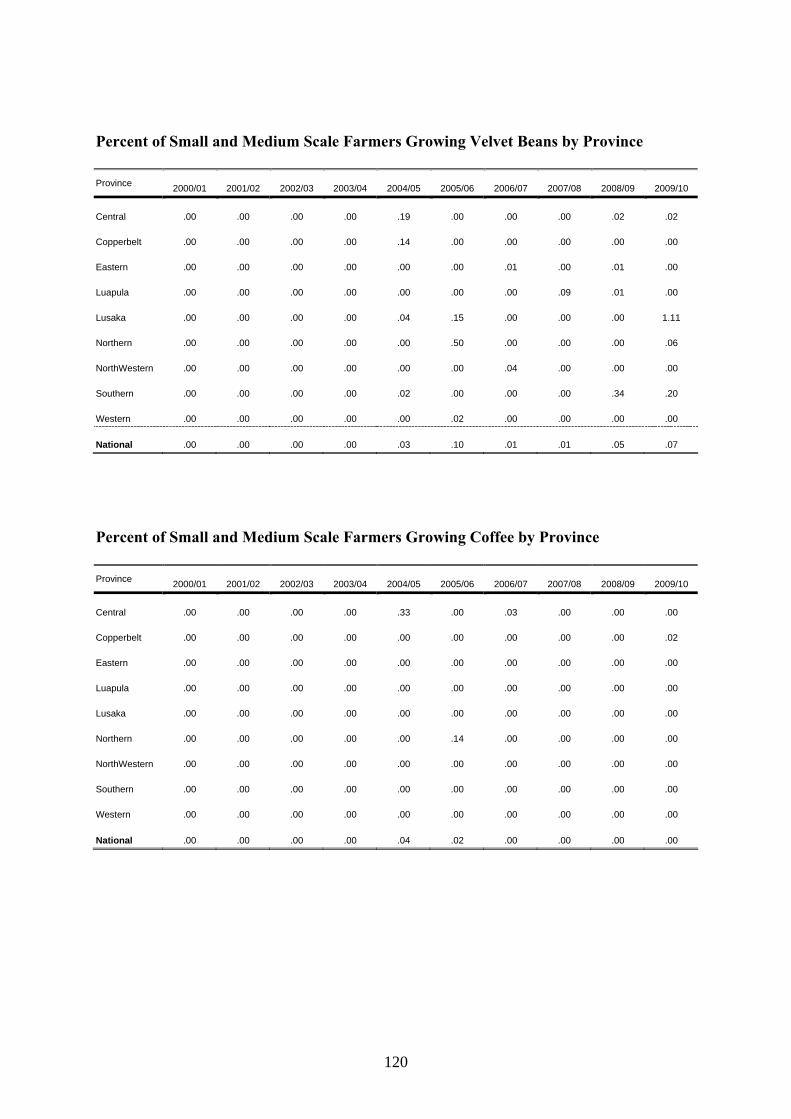
120
Percent of Small and Medium Scale Farmers Growing Velvet Beans by Province Province 2000/01 2001/02 2002/03 2003/04 2004/05 2005/06 2006/07 2007/08 2008/09 2009/10
Central .00 .00 .00 .00 .19 .00 .00 .00 .02 .02
Copperbelt .00 .00 .00 .00 .14 .00 .00 .00 .00 .00
Eastern .00 .00 .00 .00 .00 .00 .01 .00 .01 .00
Luapula .00 .00 .00 .00 .00 .00 .00 .09 .01 .00
Lusaka .00 .00 .00 .00 .04 .15 .00 .00 .00 1.11
Northern .00 .00 .00 .00 .00 .50 .00 .00 .00 .06
NorthWestern .00 .00 .00 .00 .00 .00 .04 .00 .00 .00
Southern .00 .00 .00 .00 .02 .00 .00 .00 .34 .20
Western .00 .00 .00 .00 .00 .02 .00 .00 .00 .00
National .00 .00 .00 .00 .03 .10 .01 .01 .05 .07
Percent of Small and Medium Scale Farmers Growing Coffee by Province Province 2000/01 2001/02 2002/03 2003/04 2004/05 2005/06 2006/07 2007/08 2008/09 2009/10
Central .00 .00 .00 .00 .33 .00 .03 .00 .00 .00
Copperbelt .00 .00 .00 .00 .00 .00 .00 .00 .00 .02
Eastern .00 .00 .00 .00 .00 .00 .00 .00 .00 .00
Luapula .00 .00 .00 .00 .00 .00 .00 .00 .00 .00
Lusaka .00 .00 .00 .00 .00 .00 .00 .00 .00 .00
Northern .00 .00 .00 .00 .00 .14 .00 .00 .00 .00
NorthWestern .00 .00 .00 .00 .00 .00 .00 .00 .00 .00
Southern .00 .00 .00 .00 .00 .00 .00 .00 .00 .00
Western .00 .00 .00 .00 .00 .00 .00 .00 .00 .00
National .00 .00 .00 .00 .04 .02 .00 .00 .00 .00
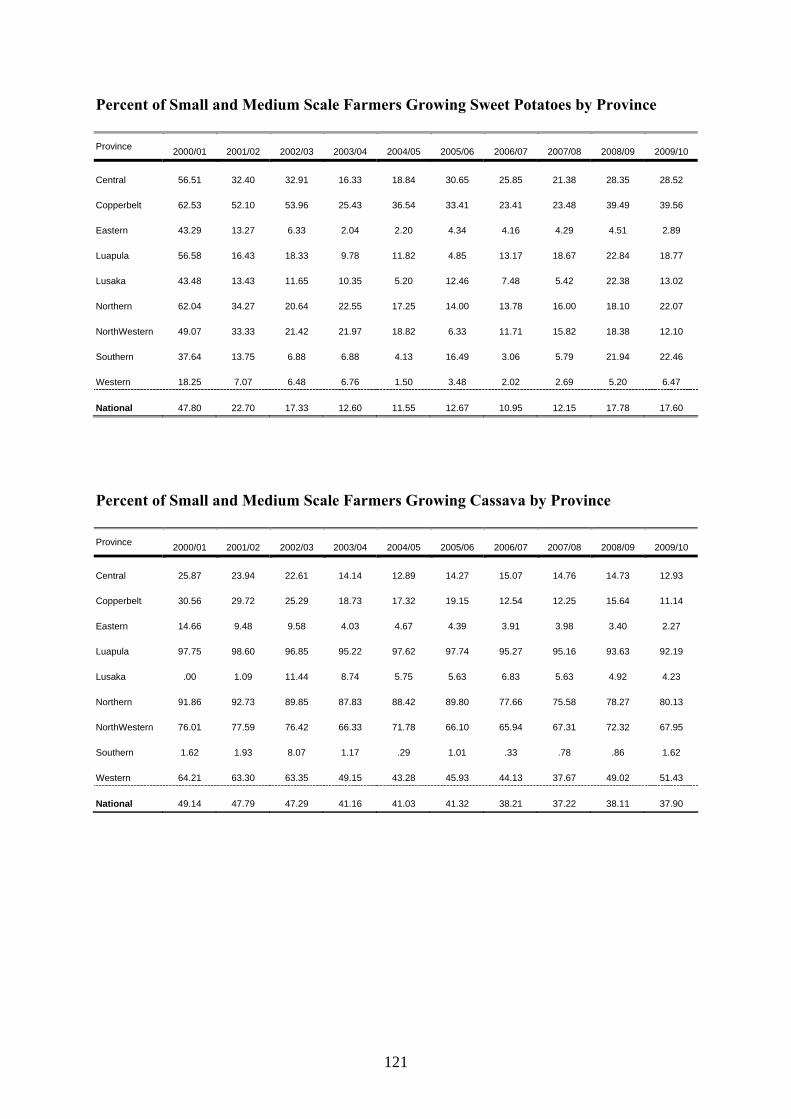
121
Percent of Small and Medium Scale Farmers Growing Sweet Potatoes by Province Province 2000/01 2001/02 2002/03 2003/04 2004/05 2005/06 2006/07 2007/08 2008/09 2009/10
Central 56.51 32.40 32.91 16.33 18.84 30.65 25.85 21.38 28.35 28.52
Copperbelt 62.53 52.10 53.96 25.43 36.54 33.41 23.41 23.48 39.49 39.56
Eastern 43.29 13.27 6.33 2.04 2.20 4.34 4.16 4.29 4.51 2.89
Luapula 56.58 16.43 18.33 9.78 11.82 4.85 13.17 18.67 22.84 18.77
Lusaka 43.48 13.43 11.65 10.35 5.20 12.46 7.48 5.42 22.38 13.02
Northern 62.04 34.27 20.64 22.55 17.25 14.00 13.78 16.00 18.10 22.07
NorthWestern 49.07 33.33 21.42 21.97 18.82 6.33 11.71 15.82 18.38 12.10
Southern 37.64 13.75 6.88 6.88 4.13 16.49 3.06 5.79 21.94 22.46
Western 18.25 7.07 6.48 6.76 1.50 3.48 2.02 2.69 5.20 6.47
National 47.80 22.70 17.33 12.60 11.55 12.67 10.95 12.15 17.78 17.60
Percent of Small and Medium Scale Farmers Growing Cassava by Province Province 2000/01 2001/02 2002/03 2003/04 2004/05 2005/06 2006/07 2007/08 2008/09 2009/10
Central 25.87 23.94 22.61 14.14 12.89 14.27 15.07 14.76 14.73 12.93
Copperbelt 30.56 29.72 25.29 18.73 17.32 19.15 12.54 12.25 15.64 11.14
Eastern 14.66 9.48 9.58 4.03 4.67 4.39 3.91 3.98 3.40 2.27
Luapula 97.75 98.60 96.85 95.22 97.62 97.74 95.27 95.16 93.63 92.19
Lusaka .00 1.09 11.44 8.74 5.75 5.63 6.83 5.63 4.92 4.23
Northern 91.86 92.73 89.85 87.83 88.42 89.80 77.66 75.58 78.27 80.13
NorthWestern 76.01 77.59 76.42 66.33 71.78 66.10 65.94 67.31 72.32 67.95
Southern 1.62 1.93 8.07 1.17 .29 1.01 .33 .78 .86 1.62
Western 64.21 63.30 63.35 49.15 43.28 45.93 44.13 37.67 49.02 51.43
National 49.14 47.79 47.29 41.16 41.03 41.32 38.21 37.22 38.11 37.90
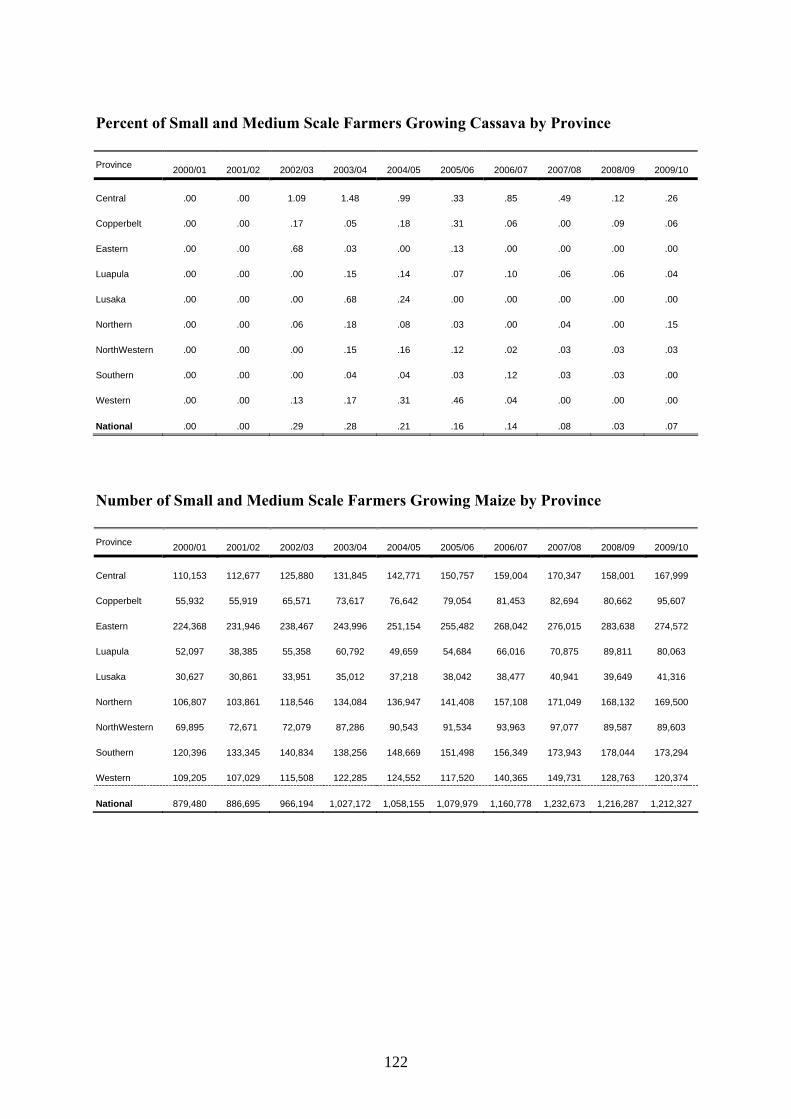
122
Percent of Small and Medium Scale Farmers Growing Cassava by Province Province 2000/01 2001/02 2002/03 2003/04 2004/05 2005/06 2006/07 2007/08 2008/09 2009/10
Central .00 .00 1.09 1.48 .99 .33 .85 .49 .12 .26
Copperbelt .00 .00 .17 .05 .18 .31 .06 .00 .09 .06
Eastern .00 .00 .68 .03 .00 .13 .00 .00 .00 .00
Luapula .00 .00 .00 .15 .14 .07 .10 .06 .06 .04
Lusaka .00 .00 .00 .68 .24 .00 .00 .00 .00 .00
Northern .00 .00 .06 .18 .08 .03 .00 .04 .00 .15
NorthWestern .00 .00 .00 .15 .16 .12 .02 .03 .03 .03
Southern .00 .00 .00 .04 .04 .03 .12 .03 .03 .00
Western .00 .00 .13 .17 .31 .46 .04 .00 .00 .00
National .00 .00 .29 .28 .21 .16 .14 .08 .03 .07
Number of Small and Medium Scale Farmers Growing Maize by Province Province 2000/01 2001/02 2002/03 2003/04 2004/05 2005/06 2006/07 2007/08 2008/09 2009/10
Central 110,153 112,677 125,880 131,845 142,771 150,757 159,004 170,347 158,001 167,999
Copperbelt 55,932 55,919 65,571 73,617 76,642 79,054 81,453 82,694 80,662 95,607
Eastern 224,368 231,946 238,467 243,996 251,154 255,482 268,042 276,015 283,638 274,572
Luapula 52,097 38,385 55,358 60,792 49,659 54,684 66,016 70,875 89,811 80,063
Lusaka 30,627 30,861 33,951 35,012 37,218 38,042 38,477 40,941 39,649 41,316
Northern 106,807 103,861 118,546 134,084 136,947 141,408 157,108 171,049 168,132 169,500
NorthWestern 69,895 72,671 72,079 87,286 90,543 91,534 93,963 97,077 89,587 89,603
Southern 120,396 133,345 140,834 138,256 148,669 151,498 156,349 173,943 178,044 173,294
Western 109,205 107,029 115,508 122,285 124,552 117,520 140,365 149,731 128,763 120,374
National 879,480 886,695 966,194 1,027,172 1,058,155 1,079,979 1,160,778 1,232,673 1,216,287 1,212,327
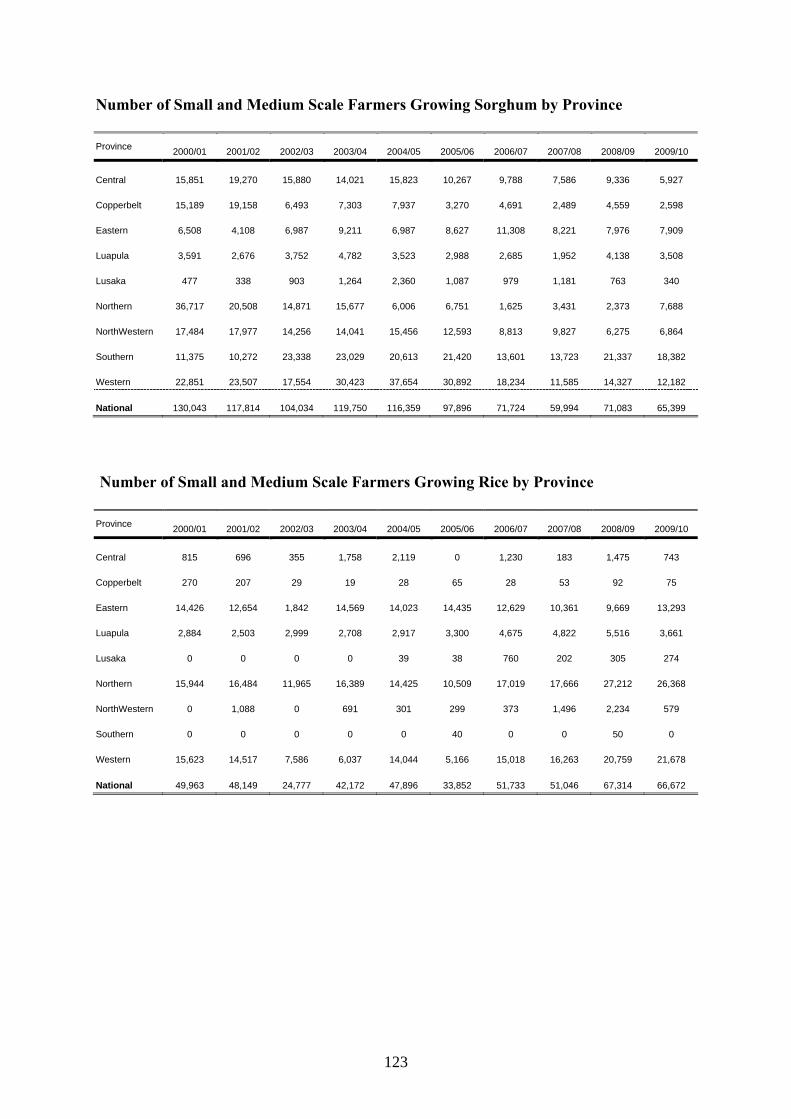
123
Number of Small and Medium Scale Farmers Growing Sorghum by Province Province 2000/01 2001/02 2002/03 2003/04 2004/05 2005/06 2006/07 2007/08 2008/09 2009/10
Central 15,851 19,270 15,880 14,021 15,823 10,267 9,788 7,586 9,336 5,927
Copperbelt 15,189 19,158 6,493 7,303 7,937 3,270 4,691 2,489 4,559 2,598
Eastern 6,508 4,108 6,987 9,211 6,987 8,627 11,308 8,221 7,976 7,909
Luapula 3,591 2,676 3,752 4,782 3,523 2,988 2,685 1,952 4,138 3,508
Lusaka 477 338 903 1,264 2,360 1,087 979 1,181 763 340
Northern 36,717 20,508 14,871 15,677 6,006 6,751 1,625 3,431 2,373 7,688
NorthWestern 17,484 17,977 14,256 14,041 15,456 12,593 8,813 9,827 6,275 6,864
Southern 11,375 10,272 23,338 23,029 20,613 21,420 13,601 13,723 21,337 18,382
Western 22,851 23,507 17,554 30,423 37,654 30,892 18,234 11,585 14,327 12,182
National 130,043 117,814 104,034 119,750 116,359 97,896 71,724 59,994 71,083 65,399
Number of Small and Medium Scale Farmers Growing Rice by Province Province 2000/01 2001/02 2002/03 2003/04 2004/05 2005/06 2006/07 2007/08 2008/09 2009/10
Central 815 696 355 1,758 2,119 0 1,230 183 1,475 743
Copperbelt 270 207 29 19 28 65 28 53 92 75
Eastern 14,426 12,654 1,842 14,569 14,023 14,435 12,629 10,361 9,669 13,293
Luapula 2,884 2,503 2,999 2,708 2,917 3,300 4,675 4,822 5,516 3,661
Lusaka 0 0 0 0 39 38 760 202 305 274
Northern 15,944 16,484 11,965 16,389 14,425 10,509 17,019 17,666 27,212 26,368
NorthWestern 0 1,088 0 691 301 299 373 1,496 2,234 579
Southern 0 0 0 0 0 40 0 0 50 0
Western 15,623 14,517 7,586 6,037 14,044 5,166 15,018 16,263 20,759 21,678
National 49,963 48,149 24,777 42,172 47,896 33,852 51,733 51,046 67,314 66,672
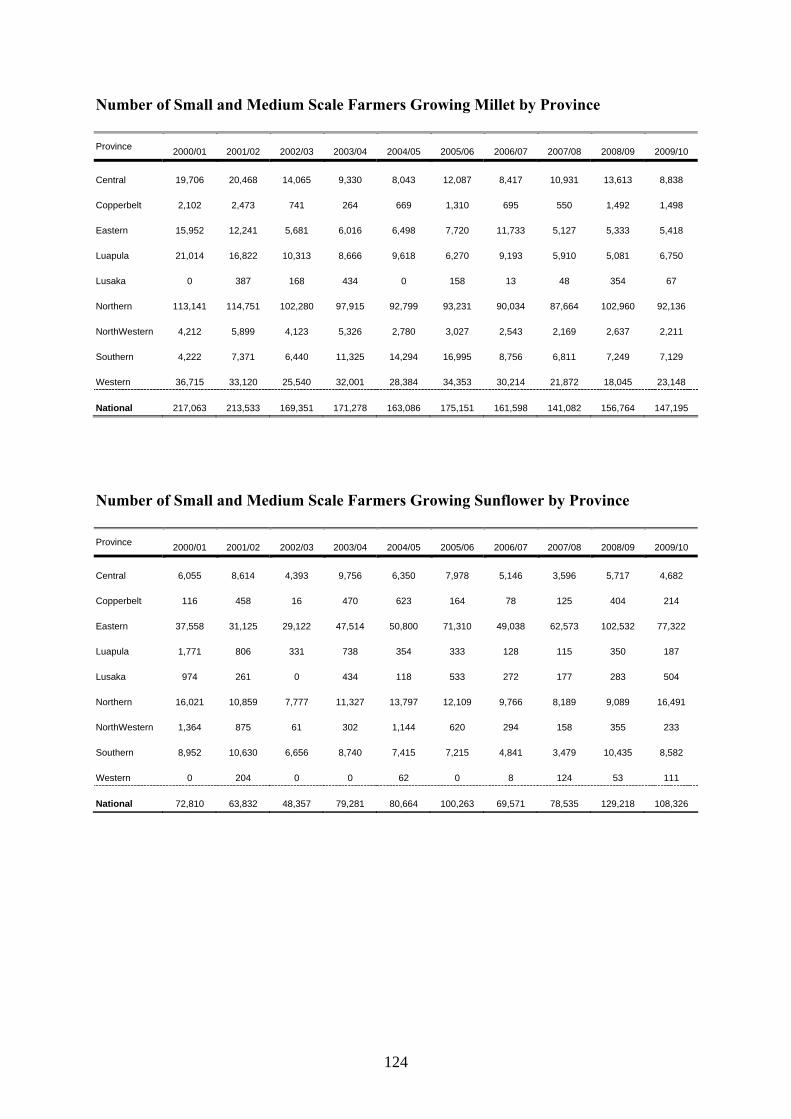
124
Number of Small and Medium Scale Farmers Growing Millet by Province Province 2000/01 2001/02 2002/03 2003/04 2004/05 2005/06 2006/07 2007/08 2008/09 2009/10
Central 19,706 20,468 14,065 9,330 8,043 12,087 8,417 10,931 13,613 8,838
Copperbelt 2,102 2,473 741 264 669 1,310 695 550 1,492 1,498
Eastern 15,952 12,241 5,681 6,016 6,498 7,720 11,733 5,127 5,333 5,418
Luapula 21,014 16,822 10,313 8,666 9,618 6,270 9,193 5,910 5,081 6,750
Lusaka 0 387 168 434 0 158 13 48 354 67
Northern 113,141 114,751 102,280 97,915 92,799 93,231 90,034 87,664 102,960 92,136
NorthWestern 4,212 5,899 4,123 5,326 2,780 3,027 2,543 2,169 2,637 2,211
Southern 4,222 7,371 6,440 11,325 14,294 16,995 8,756 6,811 7,249 7,129
Western 36,715 33,120 25,540 32,001 28,384 34,353 30,214 21,872 18,045 23,148
National 217,063 213,533 169,351 171,278 163,086 175,151 161,598 141,082 156,764 147,195
Number of Small and Medium Scale Farmers Growing Sunflower by Province Province 2000/01 2001/02 2002/03 2003/04 2004/05 2005/06 2006/07 2007/08 2008/09 2009/10
Central 6,055 8,614 4,393 9,756 6,350 7,978 5,146 3,596 5,717 4,682
Copperbelt 116 458 16 470 623 164 78 125 404 214
Eastern 37,558 31,125 29,122 47,514 50,800 71,310 49,038 62,573 102,532 77,322
Luapula 1,771 806 331 738 354 333 128 115 350 187
Lusaka 974 261 0 434 118 533 272 177 283 504
Northern 16,021 10,859 7,777 11,327 13,797 12,109 9,766 8,189 9,089 16,491
NorthWestern 1,364 875 61 302 1,144 620 294 158 355 233
Southern 8,952 10,630 6,656 8,740 7,415 7,215 4,841 3,479 10,435 8,582
Western 0 204 0 0 62 0 8 124 53 111
National 72,810 63,832 48,357 79,281 80,664 100,263 69,571 78,535 129,218 108,326
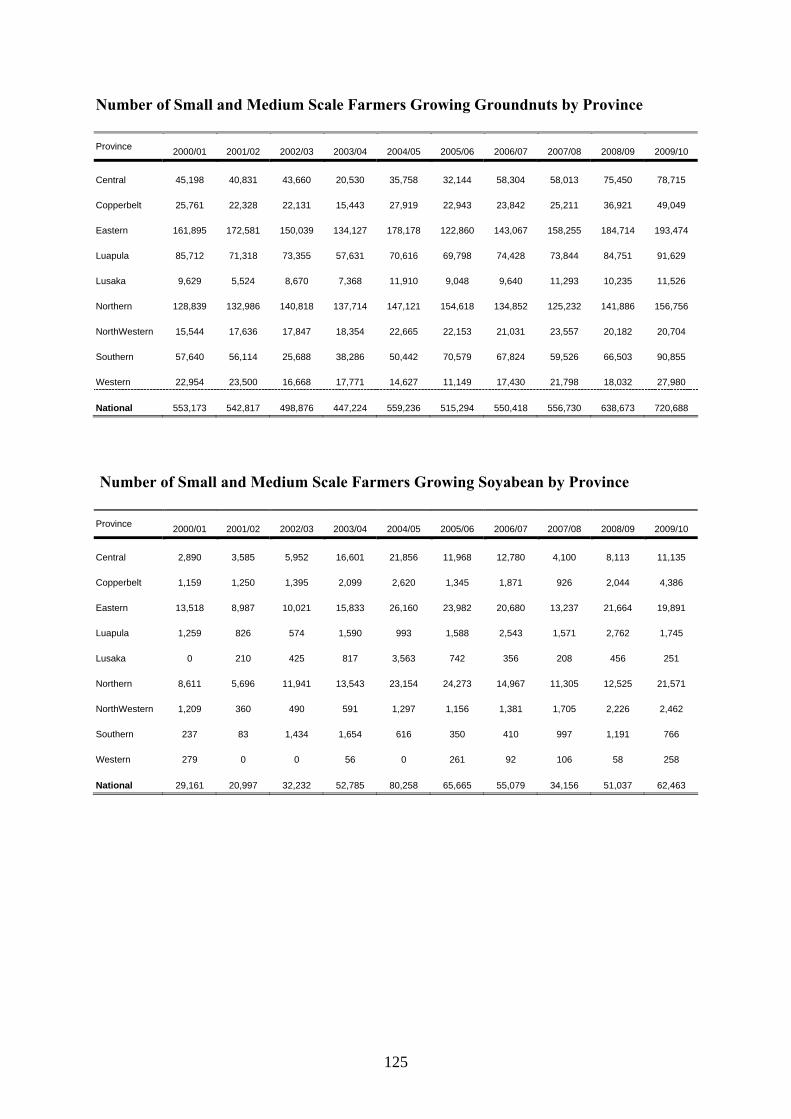
125
Number of Small and Medium Scale Farmers Growing Groundnuts by Province Province 2000/01 2001/02 2002/03 2003/04 2004/05 2005/06 2006/07 2007/08 2008/09 2009/10
Central 45,198 40,831 43,660 20,530 35,758 32,144 58,304 58,013 75,450 78,715
Copperbelt 25,761 22,328 22,131 15,443 27,919 22,943 23,842 25,211 36,921 49,049
Eastern 161,895 172,581 150,039 134,127 178,178 122,860 143,067 158,255 184,714 193,474
Luapula 85,712 71,318 73,355 57,631 70,616 69,798 74,428 73,844 84,751 91,629
Lusaka 9,629 5,524 8,670 7,368 11,910 9,048 9,640 11,293 10,235 11,526
Northern 128,839 132,986 140,818 137,714 147,121 154,618 134,852 125,232 141,886 156,756
NorthWestern 15,544 17,636 17,847 18,354 22,665 22,153 21,031 23,557 20,182 20,704
Southern 57,640 56,114 25,688 38,286 50,442 70,579 67,824 59,526 66,503 90,855
Western 22,954 23,500 16,668 17,771 14,627 11,149 17,430 21,798 18,032 27,980
National 553,173 542,817 498,876 447,224 559,236 515,294 550,418 556,730 638,673 720,688
Number of Small and Medium Scale Farmers Growing Soyabean by Province Province 2000/01 2001/02 2002/03 2003/04 2004/05 2005/06 2006/07 2007/08 2008/09 2009/10
Central 2,890 3,585 5,952 16,601 21,856 11,968 12,780 4,100 8,113 11,135
Copperbelt 1,159 1,250 1,395 2,099 2,620 1,345 1,871 926 2,044 4,386
Eastern 13,518 8,987 10,021 15,833 26,160 23,982 20,680 13,237 21,664 19,891
Luapula 1,259 826 574 1,590 993 1,588 2,543 1,571 2,762 1,745
Lusaka 0 210 425 817 3,563 742 356 208 456 251
Northern 8,611 5,696 11,941 13,543 23,154 24,273 14,967 11,305 12,525 21,571
NorthWestern 1,209 360 490 591 1,297 1,156 1,381 1,705 2,226 2,462
Southern 237 83 1,434 1,654 616 350 410 997 1,191 766
Western 279 0 0 56 0 261 92 106 58 258
National 29,161 20,997 32,232 52,785 80,258 65,665 55,079 34,156 51,037 62,463
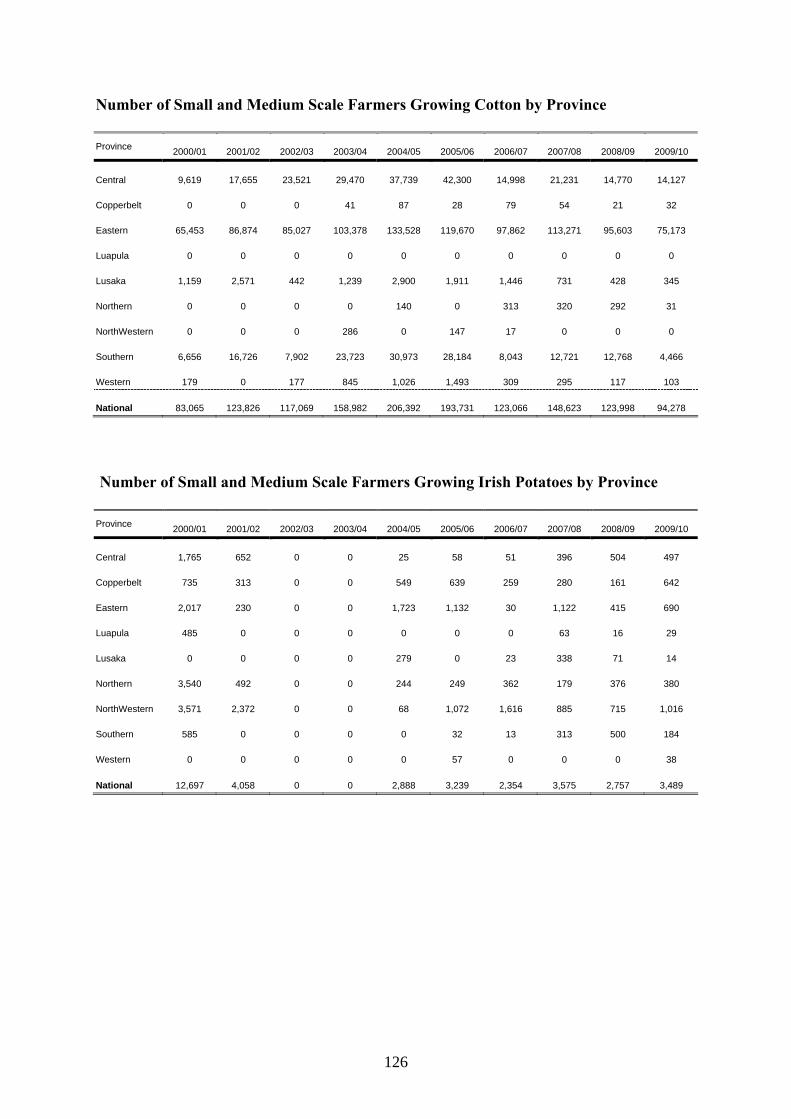
126
Number of Small and Medium Scale Farmers Growing Cotton by Province Province 2000/01 2001/02 2002/03 2003/04 2004/05 2005/06 2006/07 2007/08 2008/09 2009/10
Central 9,619 17,655 23,521 29,470 37,739 42,300 14,998 21,231 14,770 14,127
Copperbelt 0 0 0 41 87 28 79 54 21 32
Eastern 65,453 86,874 85,027 103,378 133,528 119,670 97,862 113,271 95,603 75,173
Luapula 0 0 0 0 0 0 0 0 0 0
Lusaka 1,159 2,571 442 1,239 2,900 1,911 1,446 731 428 345
Northern 0 0 0 0 140 0 313 320 292 31
NorthWestern 0 0 0 286 0 147 17 0 0 0
Southern 6,656 16,726 7,902 23,723 30,973 28,184 8,043 12,721 12,768 4,466
Western 179 0 177 845 1,026 1,493 309 295 117 103
National 83,065 123,826 117,069 158,982 206,392 193,731 123,066 148,623 123,998 94,278
Number of Small and Medium Scale Farmers Growing Irish Potatoes by Province Province 2000/01 2001/02 2002/03 2003/04 2004/05 2005/06 2006/07 2007/08 2008/09 2009/10
Central 1,765 652 0 0 25 58 51 396 504 497
Copperbelt 735 313 0 0 549 639 259 280 161 642
Eastern 2,017 230 0 0 1,723 1,132 30 1,122 415 690
Luapula 485 0 0 0 0 0 0 63 16 29
Lusaka 0 0 0 0 279 0 23 338 71 14
Northern 3,540 492 0 0 244 249 362 179 376 380
NorthWestern 3,571 2,372 0 0 68 1,072 1,616 885 715 1,016
Southern 585 0 0 0 0 32 13 313 500 184
Western 0 0 0 0 0 57 0 0 0 38
National 12,697 4,058 0 0 2,888 3,239 2,354 3,575 2,757 3,489
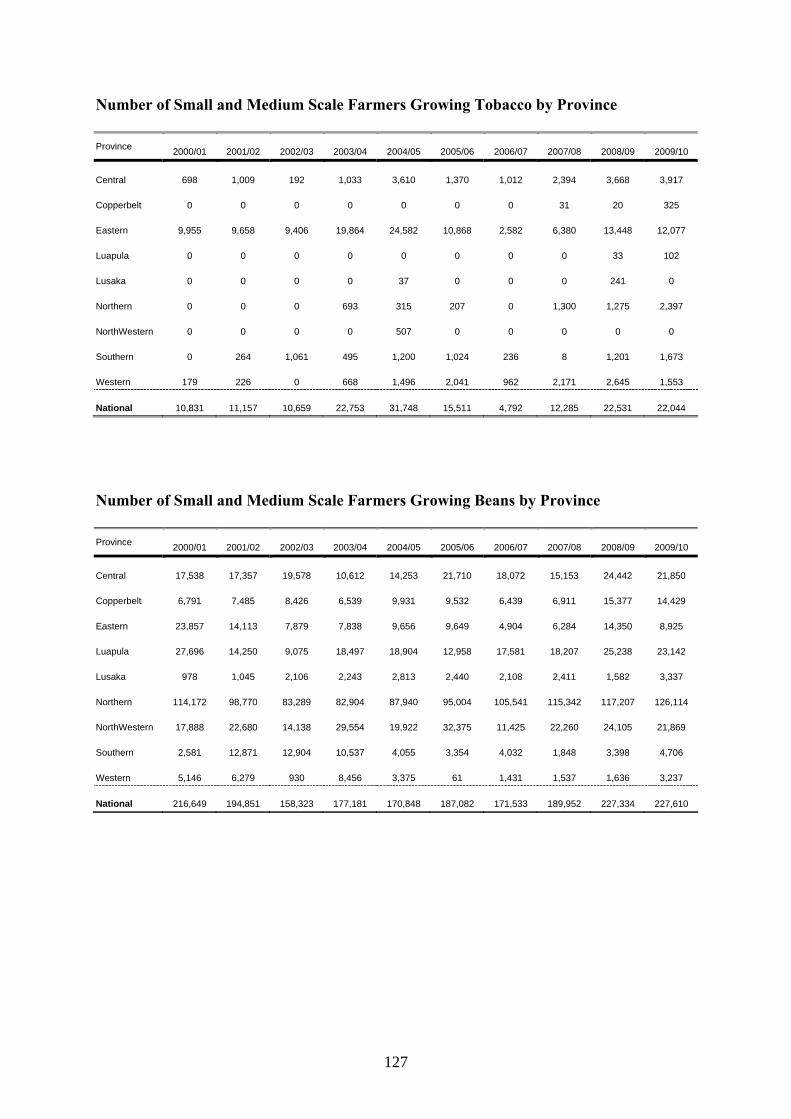
127
Number of Small and Medium Scale Farmers Growing Tobacco by Province Province 2000/01 2001/02 2002/03 2003/04 2004/05 2005/06 2006/07 2007/08 2008/09 2009/10
Central 698 1,009 192 1,033 3,610 1,370 1,012 2,394 3,668 3,917
Copperbelt 0 0 0 0 0 0 0 31 20 325
Eastern 9,955 9,658 9,406 19,864 24,582 10,868 2,582 6,380 13,448 12,077
Luapula 0 0 0 0 0 0 0 0 33 102
Lusaka 0 0 0 0 37 0 0 0 241 0
Northern 0 0 0 693 315 207 0 1,300 1,275 2,397
NorthWestern 0 0 0 0 507 0 0 0 0 0
Southern 0 264 1,061 495 1,200 1,024 236 8 1,201 1,673
Western 179 226 0 668 1,496 2,041 962 2,171 2,645 1,553
National 10,831 11,157 10,659 22,753 31,748 15,511 4,792 12,285 22,531 22,044
Number of Small and Medium Scale Farmers Growing Beans by Province Province 2000/01 2001/02 2002/03 2003/04 2004/05 2005/06 2006/07 2007/08 2008/09 2009/10
Central 17,538 17,357 19,578 10,612 14,253 21,710 18,072 15,153 24,442 21,850
Copperbelt 6,791 7,485 8,426 6,539 9,931 9,532 6,439 6,911 15,377 14,429
Eastern 23,857 14,113 7,879 7,838 9,656 9,649 4,904 6,284 14,350 8,925
Luapula 27,696 14,250 9,075 18,497 18,904 12,958 17,581 18,207 25,238 23,142
Lusaka 978 1,045 2,106 2,243 2,813 2,440 2,108 2,411 1,582 3,337
Northern 114,172 98,770 83,289 82,904 87,940 95,004 105,541 115,342 117,207 126,114
NorthWestern 17,888 22,680 14,138 29,554 19,922 32,375 11,425 22,260 24,105 21,869
Southern 2,581 12,871 12,904 10,537 4,055 3,354 4,032 1,848 3,398 4,706
Western 5,146 6,279 930 8,456 3,375 61 1,431 1,537 1,636 3,237
National 216,649 194,851 158,323 177,181 170,848 187,082 171,533 189,952 227,334 227,610
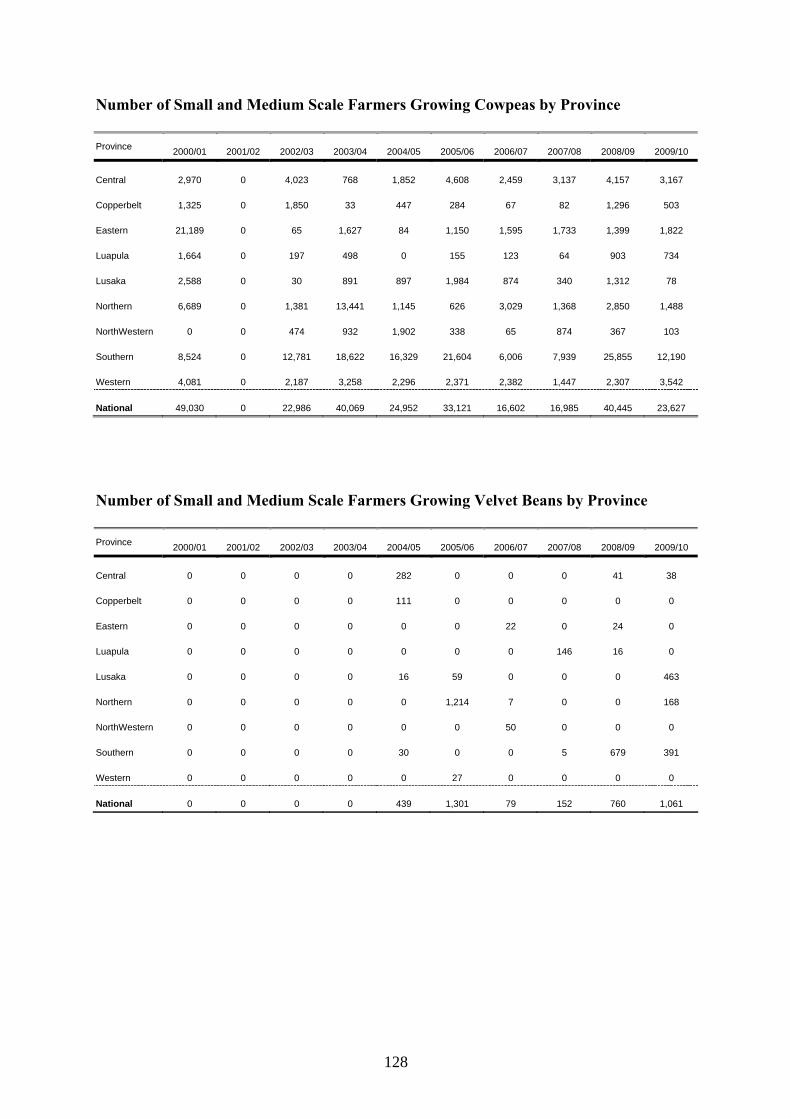
128
Number of Small and Medium Scale Farmers Growing Cowpeas by Province Province 2000/01 2001/02 2002/03 2003/04 2004/05 2005/06 2006/07 2007/08 2008/09 2009/10
Central 2,970 0 4,023 768 1,852 4,608 2,459 3,137 4,157 3,167
Copperbelt 1,325 0 1,850 33 447 284 67 82 1,296 503
Eastern 21,189 0 65 1,627 84 1,150 1,595 1,733 1,399 1,822
Luapula 1,664 0 197 498 0 155 123 64 903 734
Lusaka 2,588 0 30 891 897 1,984 874 340 1,312 78
Northern 6,689 0 1,381 13,441 1,145 626 3,029 1,368 2,850 1,488
NorthWestern 0 0 474 932 1,902 338 65 874 367 103
Southern 8,524 0 12,781 18,622 16,329 21,604 6,006 7,939 25,855 12,190
Western 4,081 0 2,187 3,258 2,296 2,371 2,382 1,447 2,307 3,542
National 49,030 0 22,986 40,069 24,952 33,121 16,602 16,985 40,445 23,627
Number of Small and Medium Scale Farmers Growing Velvet Beans by Province Province 2000/01 2001/02 2002/03 2003/04 2004/05 2005/06 2006/07 2007/08 2008/09 2009/10
Central 0 0 0 0 282 0 0 0 41 38
Copperbelt 0 0 0 0 111 0 0 0 0 0
Eastern 0 0 0 0 0 0 22 0 24 0
Luapula 0 0 0 0 0 0 0 146 16 0
Lusaka 0 0 0 0 16 59 0 0 0 463
Northern 0 0 0 0 0 1,214 7 0 0 168
NorthWestern 0 0 0 0 0 0 50 0 0 0
Southern 0 0 0 0 30 0 0 5 679 391
Western 0 0 0 0 0 27 0 0 0 0
National 0 0 0 0 439 1,301 79 152 760 1,061
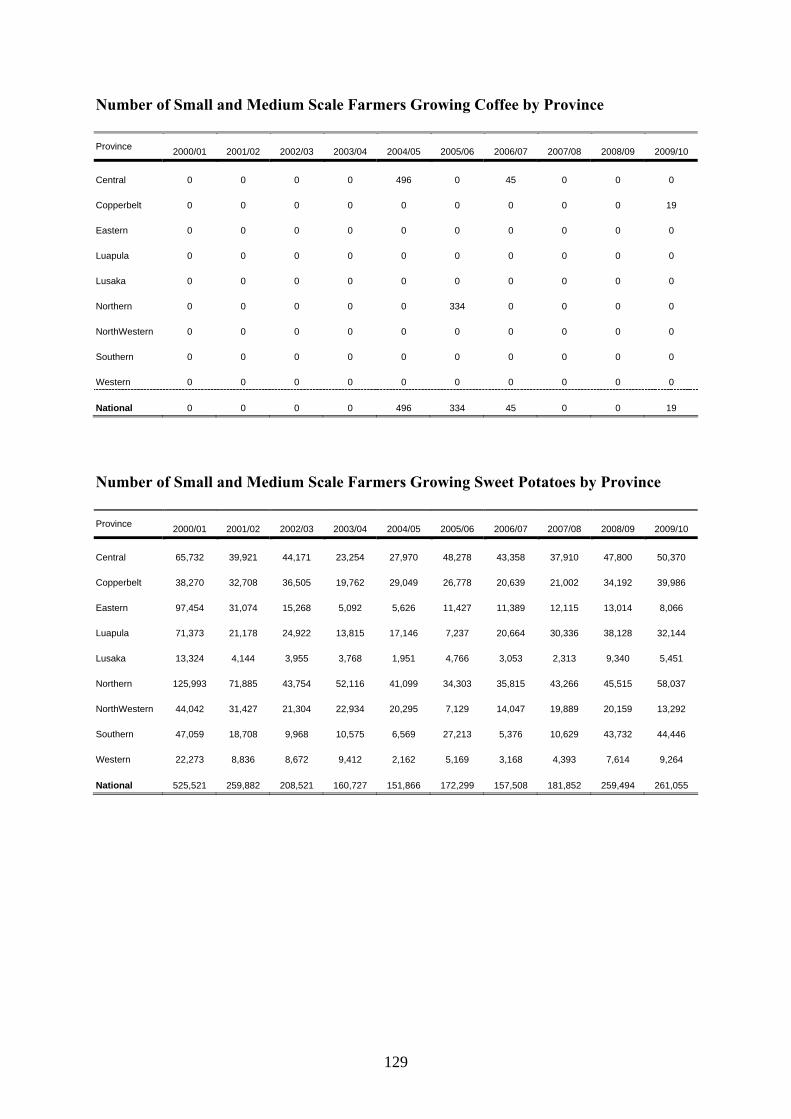
129
Number of Small and Medium Scale Farmers Growing Coffee by Province Province 2000/01 2001/02 2002/03 2003/04 2004/05 2005/06 2006/07 2007/08 2008/09 2009/10
Central 0 0 0 0 496 0 45 0 0 0
Copperbelt 0 0 0 0 0 0 0 0 0 19
Eastern 0 0 0 0 0 0 0 0 0 0
Luapula 0 0 0 0 0 0 0 0 0 0
Lusaka 0 0 0 0 0 0 0 0 0 0
Northern 0 0 0 0 0 334 0 0 0 0
NorthWestern 0 0 0 0 0 0 0 0 0 0
Southern 0 0 0 0 0 0 0 0 0 0
Western 0 0 0 0 0 0 0 0 0 0
National 0 0 0 0 496 334 45 0 0 19
Number of Small and Medium Scale Farmers Growing Sweet Potatoes by Province Province 2000/01 2001/02 2002/03 2003/04 2004/05 2005/06 2006/07 2007/08 2008/09 2009/10
Central 65,732 39,921 44,171 23,254 27,970 48,278 43,358 37,910 47,800 50,370
Copperbelt 38,270 32,708 36,505 19,762 29,049 26,778 20,639 21,002 34,192 39,986
Eastern 97,454 31,074 15,268 5,092 5,626 11,427 11,389 12,115 13,014 8,066
Luapula 71,373 21,178 24,922 13,815 17,146 7,237 20,664 30,336 38,128 32,144
Lusaka 13,324 4,144 3,955 3,768 1,951 4,766 3,053 2,313 9,340 5,451
Northern 125,993 71,885 43,754 52,116 41,099 34,303 35,815 43,266 45,515 58,037
NorthWestern 44,042 31,427 21,304 22,934 20,295 7,129 14,047 19,889 20,159 13,292
Southern 47,059 18,708 9,968 10,575 6,569 27,213 5,376 10,629 43,732 44,446
Western 22,273 8,836 8,672 9,412 2,162 5,169 3,168 4,393 7,614 9,264
National 525,521 259,882 208,521 160,727 151,866 172,299 157,508 181,852 259,494 261,055
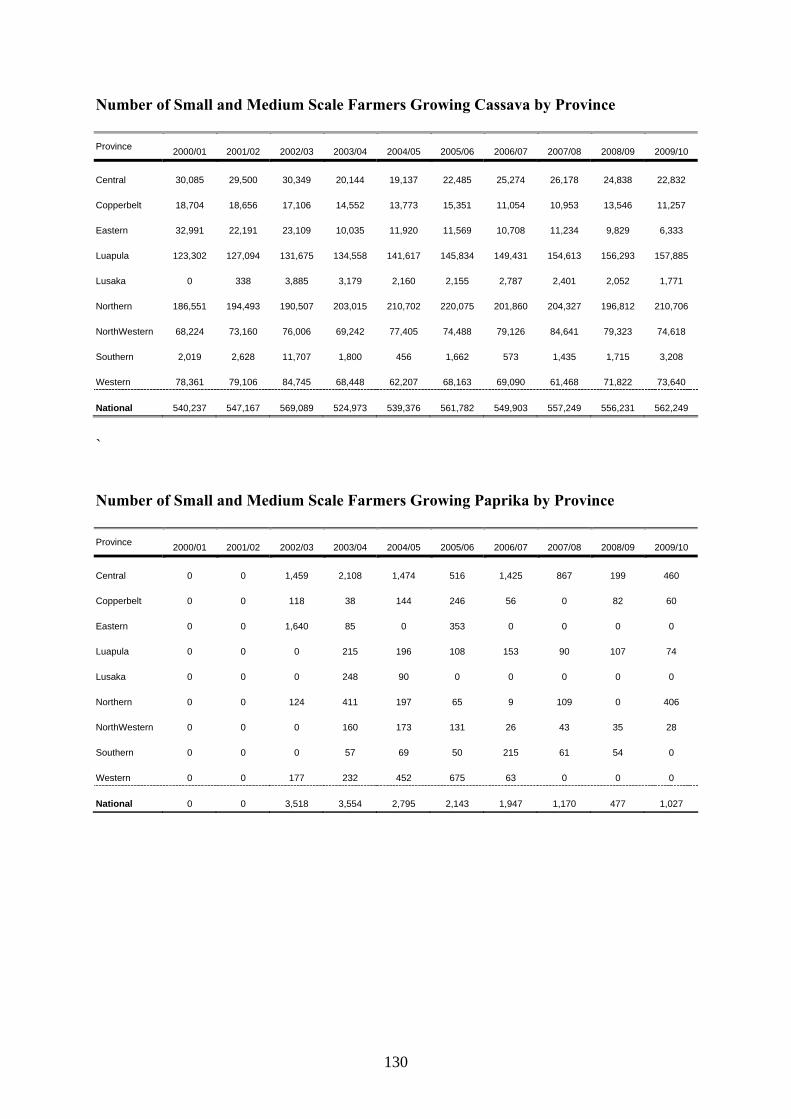
130
Number of Small and Medium Scale Farmers Growing Cassava by Province Province 2000/01 2001/02 2002/03 2003/04 2004/05 2005/06 2006/07 2007/08 2008/09 2009/10
Central 30,085 29,500 30,349 20,144 19,137 22,485 25,274 26,178 24,838 22,832
Copperbelt 18,704 18,656 17,106 14,552 13,773 15,351 11,054 10,953 13,546 11,257
Eastern 32,991 22,191 23,109 10,035 11,920 11,569 10,708 11,234 9,829 6,333
Luapula 123,302 127,094 131,675 134,558 141,617 145,834 149,431 154,613 156,293 157,885
Lusaka 0 338 3,885 3,179 2,160 2,155 2,787 2,401 2,052 1,771
Northern 186,551 194,493 190,507 203,015 210,702 220,075 201,860 204,327 196,812 210,706
NorthWestern 68,224 73,160 76,006 69,242 77,405 74,488 79,126 84,641 79,323 74,618
Southern 2,019 2,628 11,707 1,800 456 1,662 573 1,435 1,715 3,208
Western 78,361 79,106 84,745 68,448 62,207 68,163 69,090 61,468 71,822 73,640
National 540,237 547,167 569,089 524,973 539,376 561,782 549,903 557,249 556,231 562,249
` Number of Small and Medium Scale Farmers Growing Paprika by Province Province 2000/01 2001/02 2002/03 2003/04 2004/05 2005/06 2006/07 2007/08 2008/09 2009/10
Central 0 0 1,459 2,108 1,474 516 1,425 867 199 460
Copperbelt 0 0 118 38 144 246 56 0 82 60
Eastern 0 0 1,640 85 0 353 0 0 0 0
Luapula 0 0 0 215 196 108 153 90 107 74
Lusaka 0 0 0 248 90 0 0 0 0 0
Northern 0 0 124 411 197 65 9 109 0 406
NorthWestern 0 0 0 160 173 131 26 43 35 28
Southern 0 0 0 57 69 50 215 61 54 0
Western 0 0 177 232 452 675 63 0 0 0
National 0 0 3,518 3,554 2,795 2,143 1,947 1,170 477 1,027
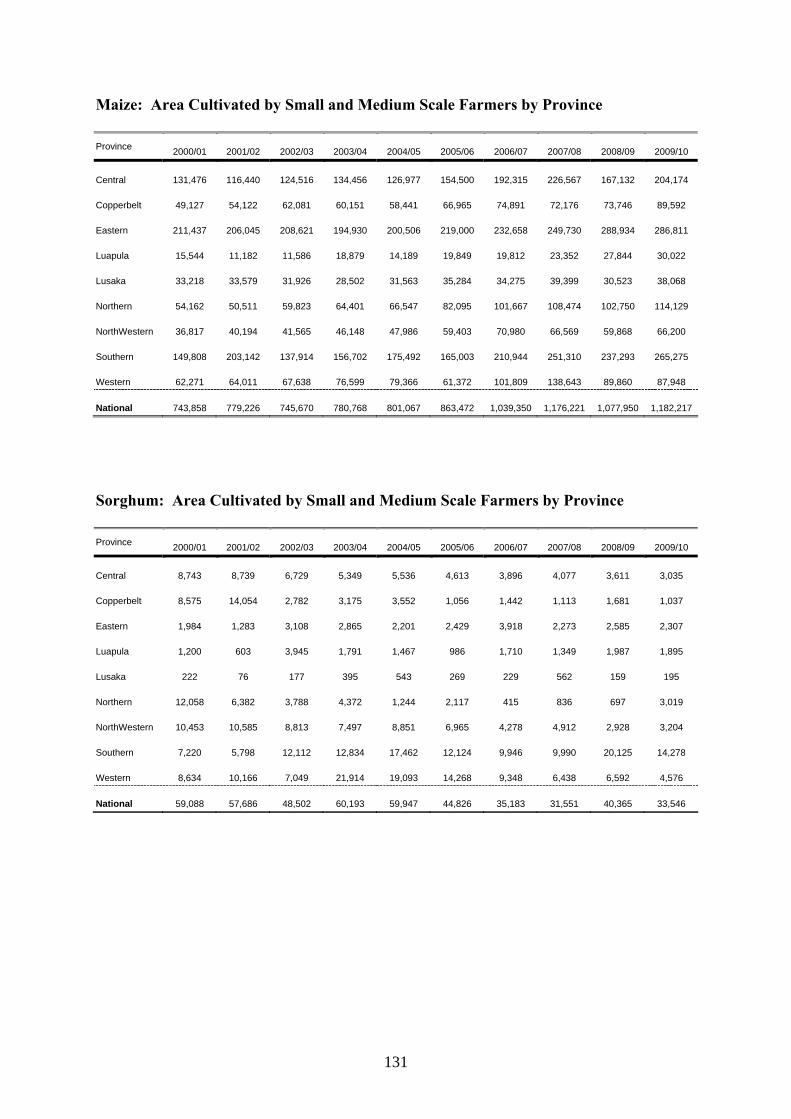
131
Maize: Area Cultivated by Small and Medium Scale Farmers by Province Province 2000/01 2001/02 2002/03 2003/04 2004/05 2005/06 2006/07 2007/08 2008/09 2009/10
Central 131,476 116,440 124,516 134,456 126,977 154,500 192,315 226,567 167,132 204,174
Copperbelt 49,127 54,122 62,081 60,151 58,441 66,965 74,891 72,176 73,746 89,592
Eastern 211,437 206,045 208,621 194,930 200,506 219,000 232,658 249,730 288,934 286,811
Luapula 15,544 11,182 11,586 18,879 14,189 19,849 19,812 23,352 27,844 30,022
Lusaka 33,218 33,579 31,926 28,502 31,563 35,284 34,275 39,399 30,523 38,068
Northern 54,162 50,511 59,823 64,401 66,547 82,095 101,667 108,474 102,750 114,129
NorthWestern 36,817 40,194 41,565 46,148 47,986 59,403 70,980 66,569 59,868 66,200
Southern 149,808 203,142 137,914 156,702 175,492 165,003 210,944 251,310 237,293 265,275
Western 62,271 64,011 67,638 76,599 79,366 61,372 101,809 138,643 89,860 87,948
National 743,858 779,226 745,670 780,768 801,067 863,472 1,039,350 1,176,221 1,077,950 1,182,217
Sorghum: Area Cultivated by Small and Medium Scale Farmers by Province Province 2000/01 2001/02 2002/03 2003/04 2004/05 2005/06 2006/07 2007/08 2008/09 2009/10
Central 8,743 8,739 6,729 5,349 5,536 4,613 3,896 4,077 3,611 3,035
Copperbelt 8,575 14,054 2,782 3,175 3,552 1,056 1,442 1,113 1,681 1,037
Eastern 1,984 1,283 3,108 2,865 2,201 2,429 3,918 2,273 2,585 2,307
Luapula 1,200 603 3,945 1,791 1,467 986 1,710 1,349 1,987 1,895
Lusaka 222 76 177 395 543 269 229 562 159 195
Northern 12,058 6,382 3,788 4,372 1,244 2,117 415 836 697 3,019
NorthWestern 10,453 10,585 8,813 7,497 8,851 6,965 4,278 4,912 2,928 3,204
Southern 7,220 5,798 12,112 12,834 17,462 12,124 9,946 9,990 20,125 14,278
Western 8,634 10,166 7,049 21,914 19,093 14,268 9,348 6,438 6,592 4,576
National 59,088 57,686 48,502 60,193 59,947 44,826 35,183 31,551 40,365 33,546
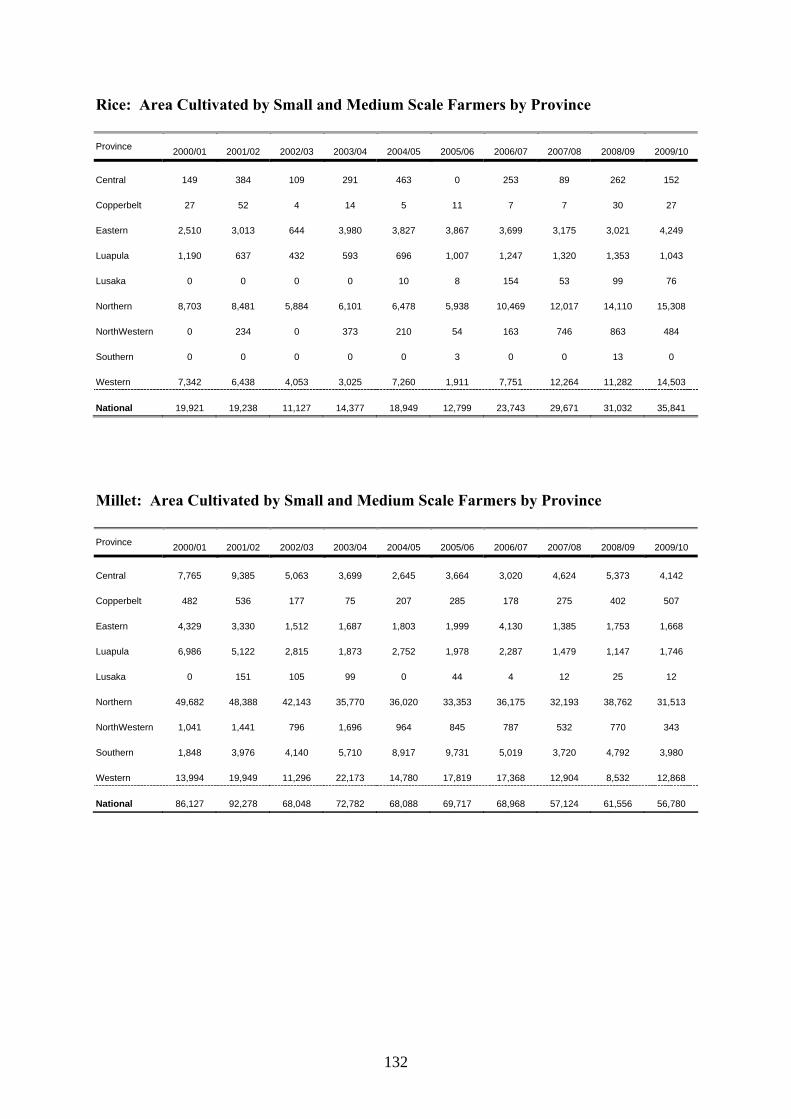
132
Rice: Area Cultivated by Small and Medium Scale Farmers by Province Province 2000/01 2001/02 2002/03 2003/04 2004/05 2005/06 2006/07 2007/08 2008/09 2009/10
Central 149 384 109 291 463 0 253 89 262 152
Copperbelt 27 52 4 14 5 11 7 7 30 27
Eastern 2,510 3,013 644 3,980 3,827 3,867 3,699 3,175 3,021 4,249
Luapula 1,190 637 432 593 696 1,007 1,247 1,320 1,353 1,043
Lusaka 0 0 0 0 10 8 154 53 99 76
Northern 8,703 8,481 5,884 6,101 6,478 5,938 10,469 12,017 14,110 15,308
NorthWestern 0 234 0 373 210 54 163 746 863 484
Southern 0 0 0 0 0 3 0 0 13 0
Western 7,342 6,438 4,053 3,025 7,260 1,911 7,751 12,264 11,282 14,503
National 19,921 19,238 11,127 14,377 18,949 12,799 23,743 29,671 31,032 35,841
Millet: Area Cultivated by Small and Medium Scale Farmers by Province Province 2000/01 2001/02 2002/03 2003/04 2004/05 2005/06 2006/07 2007/08 2008/09 2009/10
Central 7,765 9,385 5,063 3,699 2,645 3,664 3,020 4,624 5,373 4,142
Copperbelt 482 536 177 75 207 285 178 275 402 507
Eastern 4,329 3,330 1,512 1,687 1,803 1,999 4,130 1,385 1,753 1,668
Luapula 6,986 5,122 2,815 1,873 2,752 1,978 2,287 1,479 1,147 1,746
Lusaka 0 151 105 99 0 44 4 12 25 12
Northern 49,682 48,388 42,143 35,770 36,020 33,353 36,175 32,193 38,762 31,513
NorthWestern 1,041 1,441 796 1,696 964 845 787 532 770 343
Southern 1,848 3,976 4,140 5,710 8,917 9,731 5,019 3,720 4,792 3,980
Western 13,994 19,949 11,296 22,173 14,780 17,819 17,368 12,904 8,532 12,868
National 86,127 92,278 68,048 72,782 68,088 69,717 68,968 57,124 61,556 56,780
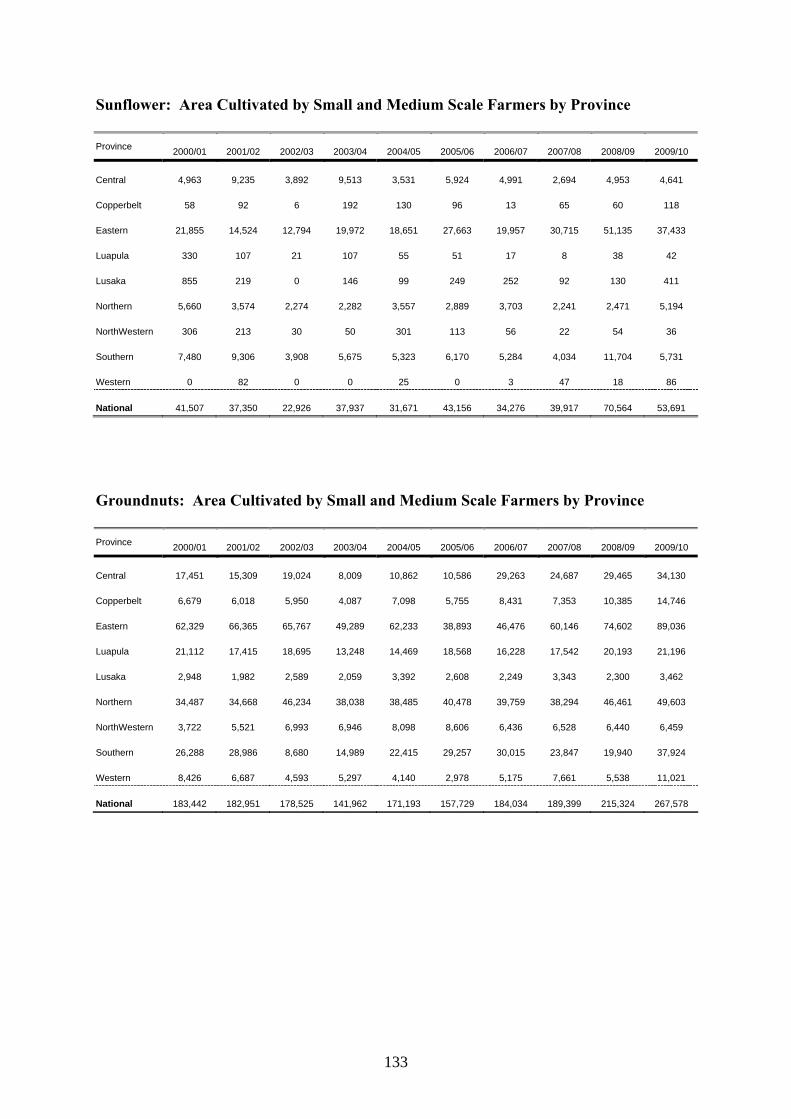
133
Sunflower: Area Cultivated by Small and Medium Scale Farmers by Province Province 2000/01 2001/02 2002/03 2003/04 2004/05 2005/06 2006/07 2007/08 2008/09 2009/10
Central 4,963 9,235 3,892 9,513 3,531 5,924 4,991 2,694 4,953 4,641
Copperbelt 58 92 6 192 130 96 13 65 60 118
Eastern 21,855 14,524 12,794 19,972 18,651 27,663 19,957 30,715 51,135 37,433
Luapula 330 107 21 107 55 51 17 8 38 42
Lusaka 855 219 0 146 99 249 252 92 130 411
Northern 5,660 3,574 2,274 2,282 3,557 2,889 3,703 2,241 2,471 5,194
NorthWestern 306 213 30 50 301 113 56 22 54 36
Southern 7,480 9,306 3,908 5,675 5,323 6,170 5,284 4,034 11,704 5,731
Western 0 82 0 0 25 0 3 47 18 86
National 41,507 37,350 22,926 37,937 31,671 43,156 34,276 39,917 70,564 53,691
Groundnuts: Area Cultivated by Small and Medium Scale Farmers by Province Province 2000/01 2001/02 2002/03 2003/04 2004/05 2005/06 2006/07 2007/08 2008/09 2009/10
Central 17,451 15,309 19,024 8,009 10,862 10,586 29,263 24,687 29,465 34,130
Copperbelt 6,679 6,018 5,950 4,087 7,098 5,755 8,431 7,353 10,385 14,746
Eastern 62,329 66,365 65,767 49,289 62,233 38,893 46,476 60,146 74,602 89,036
Luapula 21,112 17,415 18,695 13,248 14,469 18,568 16,228 17,542 20,193 21,196
Lusaka 2,948 1,982 2,589 2,059 3,392 2,608 2,249 3,343 2,300 3,462
Northern 34,487 34,668 46,234 38,038 38,485 40,478 39,759 38,294 46,461 49,603
NorthWestern 3,722 5,521 6,993 6,946 8,098 8,606 6,436 6,528 6,440 6,459
Southern 26,288 28,986 8,680 14,989 22,415 29,257 30,015 23,847 19,940 37,924
Western 8,426 6,687 4,593 5,297 4,140 2,978 5,175 7,661 5,538 11,021
National 183,442 182,951 178,525 141,962 171,193 157,729 184,034 189,399 215,324 267,578
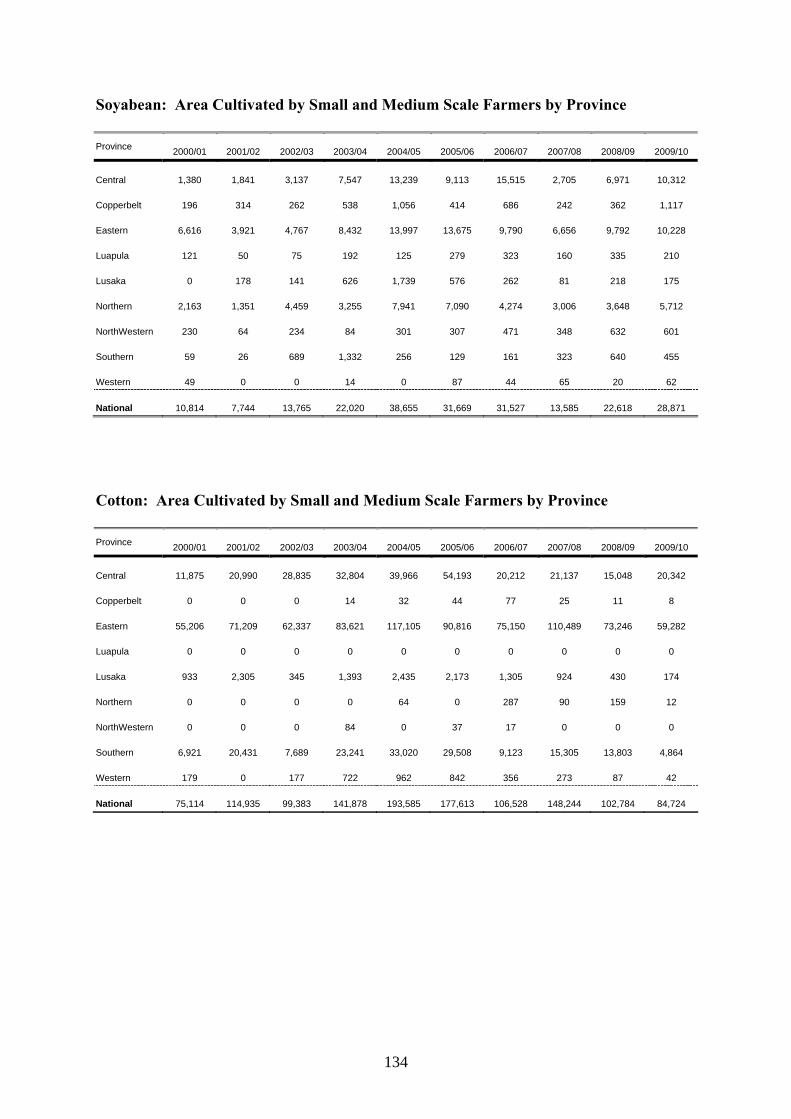
134
Soyabean: Area Cultivated by Small and Medium Scale Farmers by Province Province 2000/01 2001/02 2002/03 2003/04 2004/05 2005/06 2006/07 2007/08 2008/09 2009/10
Central 1,380 1,841 3,137 7,547 13,239 9,113 15,515 2,705 6,971 10,312
Copperbelt 196 314 262 538 1,056 414 686 242 362 1,117
Eastern 6,616 3,921 4,767 8,432 13,997 13,675 9,790 6,656 9,792 10,228
Luapula 121 50 75 192 125 279 323 160 335 210
Lusaka 0 178 141 626 1,739 576 262 81 218 175
Northern 2,163 1,351 4,459 3,255 7,941 7,090 4,274 3,006 3,648 5,712
NorthWestern 230 64 234 84 301 307 471 348 632 601
Southern 59 26 689 1,332 256 129 161 323 640 455
Western 49 0 0 14 0 87 44 65 20 62
National 10,814 7,744 13,765 22,020 38,655 31,669 31,527 13,585 22,618 28,871
Cotton: Area Cultivated by Small and Medium Scale Farmers by Province Province 2000/01 2001/02 2002/03 2003/04 2004/05 2005/06 2006/07 2007/08 2008/09 2009/10
Central 11,875 20,990 28,835 32,804 39,966 54,193 20,212 21,137 15,048 20,342
Copperbelt 0 0 0 14 32 44 77 25 11 8
Eastern 55,206 71,209 62,337 83,621 117,105 90,816 75,150 110,489 73,246 59,282
Luapula 0 0 0 0 0 0 0 0 0 0
Lusaka 933 2,305 345 1,393 2,435 2,173 1,305 924 430 174
Northern 0 0 0 0 64 0 287 90 159 12
NorthWestern 0 0 0 84 0 37 17 0 0 0
Southern 6,921 20,431 7,689 23,241 33,020 29,508 9,123 15,305 13,803 4,864
Western 179 0 177 722 962 842 356 273 87 42
National 75,114 114,935 99,383 141,878 193,585 177,613 106,528 148,244 102,784 84,724
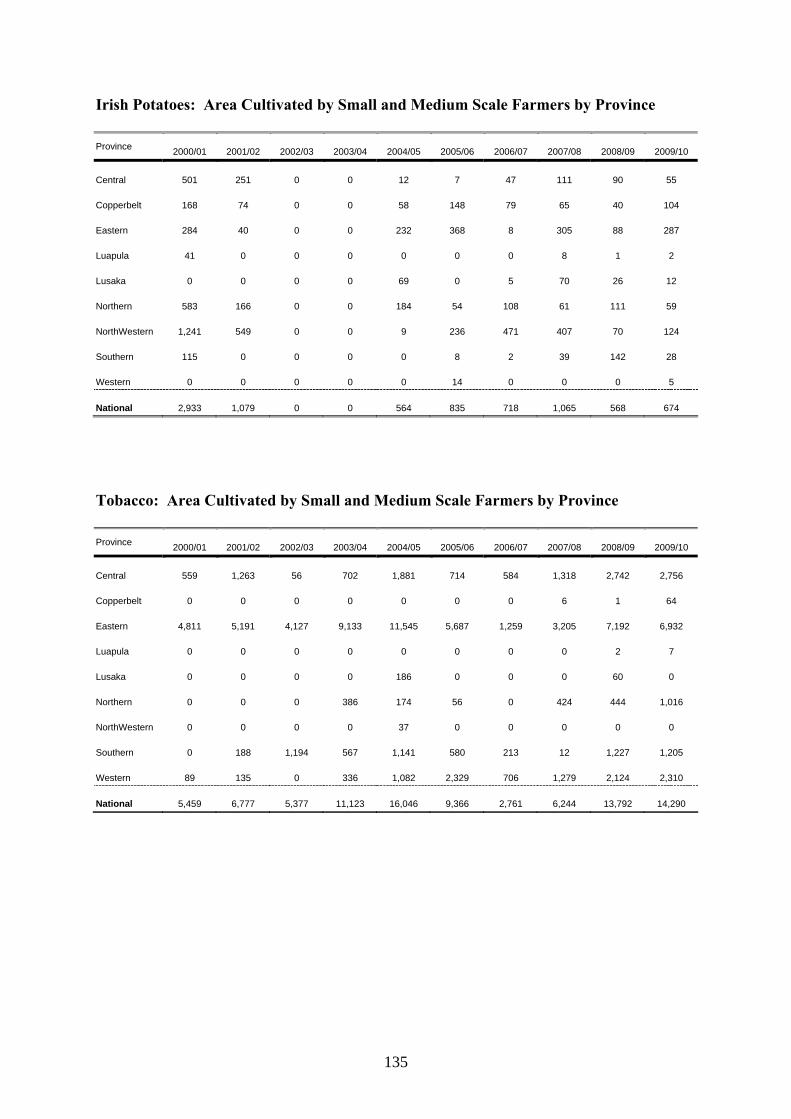
135
Irish Potatoes: Area Cultivated by Small and Medium Scale Farmers by Province Province 2000/01 2001/02 2002/03 2003/04 2004/05 2005/06 2006/07 2007/08 2008/09 2009/10
Central 501 251 0 0 12 7 47 111 90 55
Copperbelt 168 74 0 0 58 148 79 65 40 104
Eastern 284 40 0 0 232 368 8 305 88 287
Luapula 41 0 0 0 0 0 0 8 1 2
Lusaka 0 0 0 0 69 0 5 70 26 12
Northern 583 166 0 0 184 54 108 61 111 59
NorthWestern 1,241 549 0 0 9 236 471 407 70 124
Southern 115 0 0 0 0 8 2 39 142 28
Western 0 0 0 0 0 14 0 0 0 5
National 2,933 1,079 0 0 564 835 718 1,065 568 674
Tobacco: Area Cultivated by Small and Medium Scale Farmers by Province Province 2000/01 2001/02 2002/03 2003/04 2004/05 2005/06 2006/07 2007/08 2008/09 2009/10
Central 559 1,263 56 702 1,881 714 584 1,318 2,742 2,756
Copperbelt 0 0 0 0 0 0 0 6 1 64
Eastern 4,811 5,191 4,127 9,133 11,545 5,687 1,259 3,205 7,192 6,932
Luapula 0 0 0 0 0 0 0 0 2 7
Lusaka 0 0 0 0 186 0 0 0 60 0
Northern 0 0 0 386 174 56 0 424 444 1,016
NorthWestern 0 0 0 0 37 0 0 0 0 0
Southern 0 188 1,194 567 1,141 580 213 12 1,227 1,205
Western 89 135 0 336 1,082 2,329 706 1,279 2,124 2,310
National 5,459 6,777 5,377 11,123 16,046 9,366 2,761 6,244 13,792 14,290
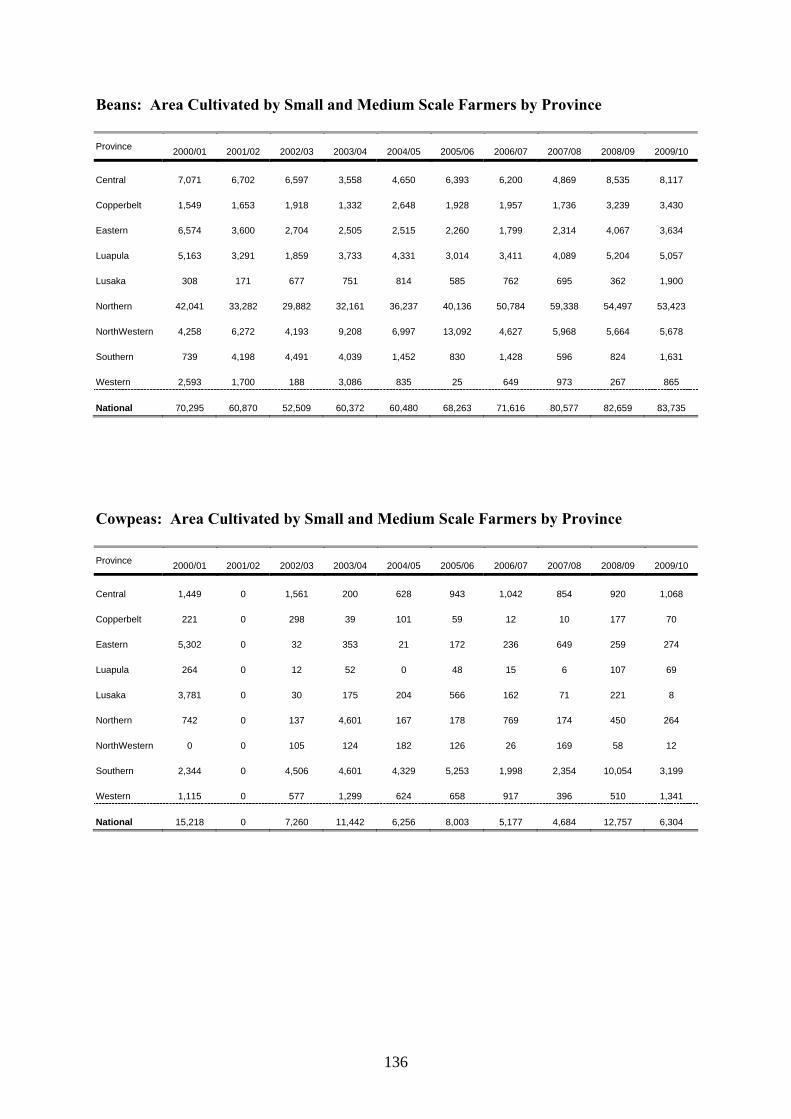
136
Beans: Area Cultivated by Small and Medium Scale Farmers by Province Province 2000/01 2001/02 2002/03 2003/04 2004/05 2005/06 2006/07 2007/08 2008/09 2009/10
Central 7,071 6,702 6,597 3,558 4,650 6,393 6,200 4,869 8,535 8,117
Copperbelt 1,549 1,653 1,918 1,332 2,648 1,928 1,957 1,736 3,239 3,430
Eastern 6,574 3,600 2,704 2,505 2,515 2,260 1,799 2,314 4,067 3,634
Luapula 5,163 3,291 1,859 3,733 4,331 3,014 3,411 4,089 5,204 5,057
Lusaka 308 171 677 751 814 585 762 695 362 1,900
Northern 42,041 33,282 29,882 32,161 36,237 40,136 50,784 59,338 54,497 53,423
NorthWestern 4,258 6,272 4,193 9,208 6,997 13,092 4,627 5,968 5,664 5,678
Southern 739 4,198 4,491 4,039 1,452 830 1,428 596 824 1,631
Western 2,593 1,700 188 3,086 835 25 649 973 267 865
National 70,295 60,870 52,509 60,372 60,480 68,263 71,616 80,577 82,659 83,735
Cowpeas: Area Cultivated by Small and Medium Scale Farmers by Province Province 2000/01 2001/02 2002/03 2003/04 2004/05 2005/06 2006/07 2007/08 2008/09 2009/10
Central 1,449 0 1,561 200 628 943 1,042 854 920 1,068
Copperbelt 221 0 298 39 101 59 12 10 177 70
Eastern 5,302 0 32 353 21 172 236 649 259 274
Luapula 264 0 12 52 0 48 15 6 107 69
Lusaka 3,781 0 30 175 204 566 162 71 221 8
Northern 742 0 137 4,601 167 178 769 174 450 264
NorthWestern 0 0 105 124 182 126 26 169 58 12
Southern 2,344 0 4,506 4,601 4,329 5,253 1,998 2,354 10,054 3,199
Western 1,115 0 577 1,299 624 658 917 396 510 1,341
National 15,218 0 7,260 11,442 6,256 8,003 5,177 4,684 12,757 6,304
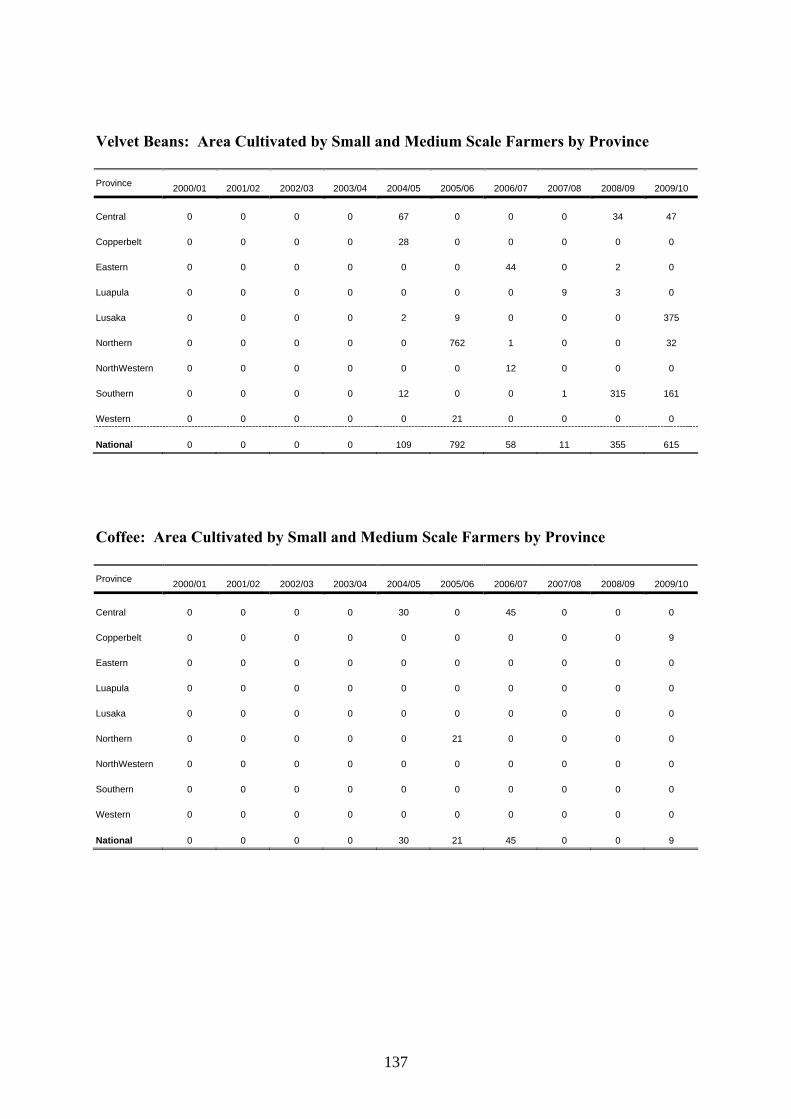
137
Velvet Beans: Area Cultivated by Small and Medium Scale Farmers by Province Province 2000/01 2001/02 2002/03 2003/04 2004/05 2005/06 2006/07 2007/08 2008/09 2009/10
Central 0 0 0 0 67 0 0 0 34 47
Copperbelt 0 0 0 0 28 0 0 0 0 0
Eastern 0 0 0 0 0 0 44 0 2 0
Luapula 0 0 0 0 0 0 0 9 3 0
Lusaka 0 0 0 0 2 9 0 0 0 375
Northern 0 0 0 0 0 762 1 0 0 32
NorthWestern 0 0 0 0 0 0 12 0 0 0
Southern 0 0 0 0 12 0 0 1 315 161
Western 0 0 0 0 0 21 0 0 0 0
National 0 0 0 0 109 792 58 11 355 615
Coffee: Area Cultivated by Small and Medium Scale Farmers by Province Province 2000/01 2001/02 2002/03 2003/04 2004/05 2005/06 2006/07 2007/08 2008/09 2009/10
Central 0 0 0 0 30 0 45 0 0 0
Copperbelt 0 0 0 0 0 0 0 0 0 9
Eastern 0 0 0 0 0 0 0 0 0 0
Luapula 0 0 0 0 0 0 0 0 0 0
Lusaka 0 0 0 0 0 0 0 0 0 0
Northern 0 0 0 0 0 21 0 0 0 0
NorthWestern 0 0 0 0 0 0 0 0 0 0
Southern 0 0 0 0 0 0 0 0 0 0
Western 0 0 0 0 0 0 0 0 0 0
National 0 0 0 0 30 21 45 0 0 9
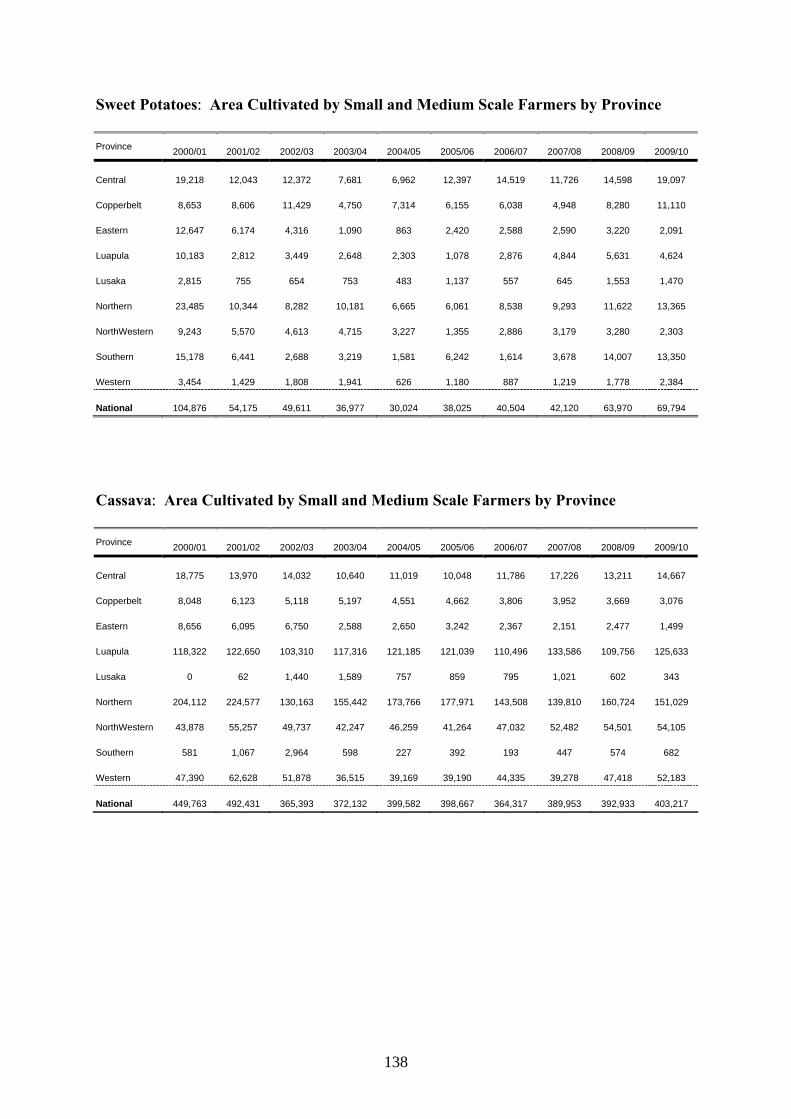
138
Sweet Potatoes: Area Cultivated by Small and Medium Scale Farmers by Province Province 2000/01 2001/02 2002/03 2003/04 2004/05 2005/06 2006/07 2007/08 2008/09 2009/10
Central 19,218 12,043 12,372 7,681 6,962 12,397 14,519 11,726 14,598 19,097
Copperbelt 8,653 8,606 11,429 4,750 7,314 6,155 6,038 4,948 8,280 11,110
Eastern 12,647 6,174 4,316 1,090 863 2,420 2,588 2,590 3,220 2,091
Luapula 10,183 2,812 3,449 2,648 2,303 1,078 2,876 4,844 5,631 4,624
Lusaka 2,815 755 654 753 483 1,137 557 645 1,553 1,470
Northern 23,485 10,344 8,282 10,181 6,665 6,061 8,538 9,293 11,622 13,365
NorthWestern 9,243 5,570 4,613 4,715 3,227 1,355 2,886 3,179 3,280 2,303
Southern 15,178 6,441 2,688 3,219 1,581 6,242 1,614 3,678 14,007 13,350
Western 3,454 1,429 1,808 1,941 626 1,180 887 1,219 1,778 2,384
National 104,876 54,175 49,611 36,977 30,024 38,025 40,504 42,120 63,970 69,794
Cassava: Area Cultivated by Small and Medium Scale Farmers by Province Province 2000/01 2001/02 2002/03 2003/04 2004/05 2005/06 2006/07 2007/08 2008/09 2009/10
Central 18,775 13,970 14,032 10,640 11,019 10,048 11,786 17,226 13,211 14,667
Copperbelt 8,048 6,123 5,118 5,197 4,551 4,662 3,806 3,952 3,669 3,076
Eastern 8,656 6,095 6,750 2,588 2,650 3,242 2,367 2,151 2,477 1,499
Luapula 118,322 122,650 103,310 117,316 121,185 121,039 110,496 133,586 109,756 125,633
Lusaka 0 62 1,440 1,589 757 859 795 1,021 602 343
Northern 204,112 224,577 130,163 155,442 173,766 177,971 143,508 139,810 160,724 151,029
NorthWestern 43,878 55,257 49,737 42,247 46,259 41,264 47,032 52,482 54,501 54,105
Southern 581 1,067 2,964 598 227 392 193 447 574 682
Western 47,390 62,628 51,878 36,515 39,169 39,190 44,335 39,278 47,418 52,183
National 449,763 492,431 365,393 372,132 399,582 398,667 364,317 389,953 392,933 403,217
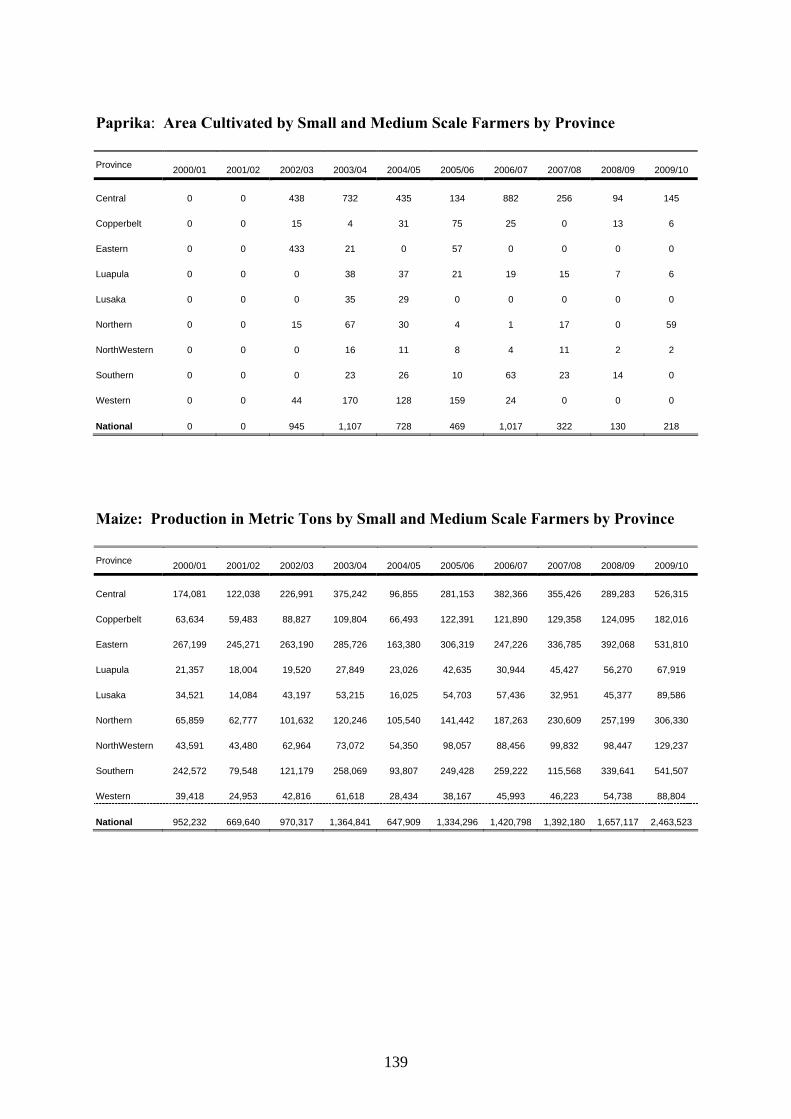
139
Paprika: Area Cultivated by Small and Medium Scale Farmers by Province Province 2000/01 2001/02 2002/03 2003/04 2004/05 2005/06 2006/07 2007/08 2008/09 2009/10
Central 0 0 438 732 435 134 882 256 94 145
Copperbelt 0 0 15 4 31 75 25 0 13 6
Eastern 0 0 433 21 0 57 0 0 0 0
Luapula 0 0 0 38 37 21 19 15 7 6
Lusaka 0 0 0 35 29 0 0 0 0 0
Northern 0 0 15 67 30 4 1 17 0 59
NorthWestern 0 0 0 16 11 8 4 11 2 2
Southern 0 0 0 23 26 10 63 23 14 0
Western 0 0 44 170 128 159 24 0 0 0
National 0 0 945 1,107 728 469 1,017 322 130 218
Maize: Production in Metric Tons by Small and Medium Scale Farmers by Province Province 2000/01 2001/02 2002/03 2003/04 2004/05 2005/06 2006/07 2007/08 2008/09 2009/10
Central 174,081 122,038 226,991 375,242 96,855 281,153 382,366 355,426 289,283 526,315
Copperbelt 63,634 59,483 88,827 109,804 66,493 122,391 121,890 129,358 124,095 182,016
Eastern 267,199 245,271 263,190 285,726 163,380 306,319 247,226 336,785 392,068 531,810
Luapula 21,357 18,004 19,520 27,849 23,026 42,635 30,944 45,427 56,270 67,919
Lusaka 34,521 14,084 43,197 53,215 16,025 54,703 57,436 32,951 45,377 89,586
Northern 65,859 62,777 101,632 120,246 105,540 141,442 187,263 230,609 257,199 306,330
NorthWestern 43,591 43,480 62,964 73,072 54,350 98,057 88,456 99,832 98,447 129,237
Southern 242,572 79,548 121,179 258,069 93,807 249,428 259,222 115,568 339,641 541,507
Western 39,418 24,953 42,816 61,618 28,434 38,167 45,993 46,223 54,738 88,804
National 952,232 669,640 970,317 1,364,841 647,909 1,334,296 1,420,798 1,392,180 1,657,117 2,463,523
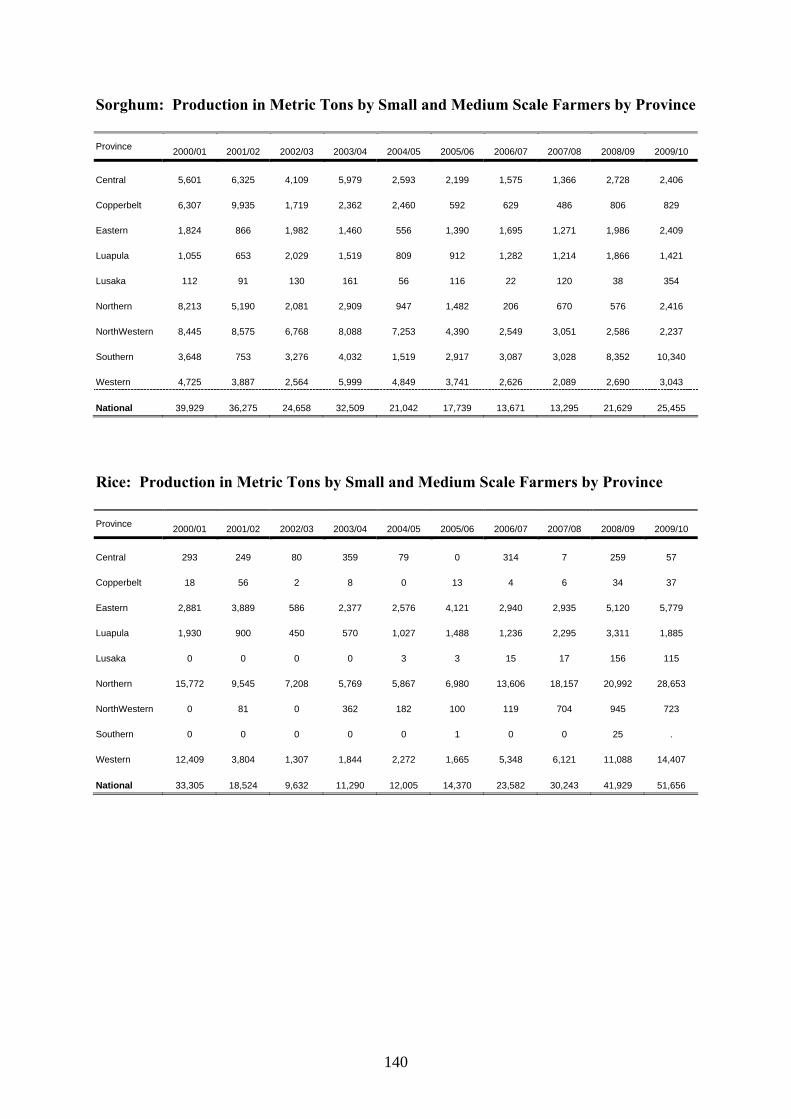
140
Sorghum: Production in Metric Tons by Small and Medium Scale Farmers by Province Province 2000/01 2001/02 2002/03 2003/04 2004/05 2005/06 2006/07 2007/08 2008/09 2009/10
Central 5,601 6,325 4,109 5,979 2,593 2,199 1,575 1,366 2,728 2,406
Copperbelt 6,307 9,935 1,719 2,362 2,460 592 629 486 806 829
Eastern 1,824 866 1,982 1,460 556 1,390 1,695 1,271 1,986 2,409
Luapula 1,055 653 2,029 1,519 809 912 1,282 1,214 1,866 1,421
Lusaka 112 91 130 161 56 116 22 120 38 354
Northern 8,213 5,190 2,081 2,909 947 1,482 206 670 576 2,416
NorthWestern 8,445 8,575 6,768 8,088 7,253 4,390 2,549 3,051 2,586 2,237
Southern 3,648 753 3,276 4,032 1,519 2,917 3,087 3,028 8,352 10,340
Western 4,725 3,887 2,564 5,999 4,849 3,741 2,626 2,089 2,690 3,043
National 39,929 36,275 24,658 32,509 21,042 17,739 13,671 13,295 21,629 25,455
Rice: Production in Metric Tons by Small and Medium Scale Farmers by Province Province 2000/01 2001/02 2002/03 2003/04 2004/05 2005/06 2006/07 2007/08 2008/09 2009/10
Central 293 249 80 359 79 0 314 7 259 57
Copperbelt 18 56 2 8 0 13 4 6 34 37
Eastern 2,881 3,889 586 2,377 2,576 4,121 2,940 2,935 5,120 5,779
Luapula 1,930 900 450 570 1,027 1,488 1,236 2,295 3,311 1,885
Lusaka 0 0 0 0 3 3 15 17 156 115
Northern 15,772 9,545 7,208 5,769 5,867 6,980 13,606 18,157 20,992 28,653
NorthWestern 0 81 0 362 182 100 119 704 945 723
Southern 0 0 0 0 0 1 0 0 25 .
Western 12,409 3,804 1,307 1,844 2,272 1,665 5,348 6,121 11,088 14,407
National 33,305 18,524 9,632 11,290 12,005 14,370 23,582 30,243 41,929 51,656
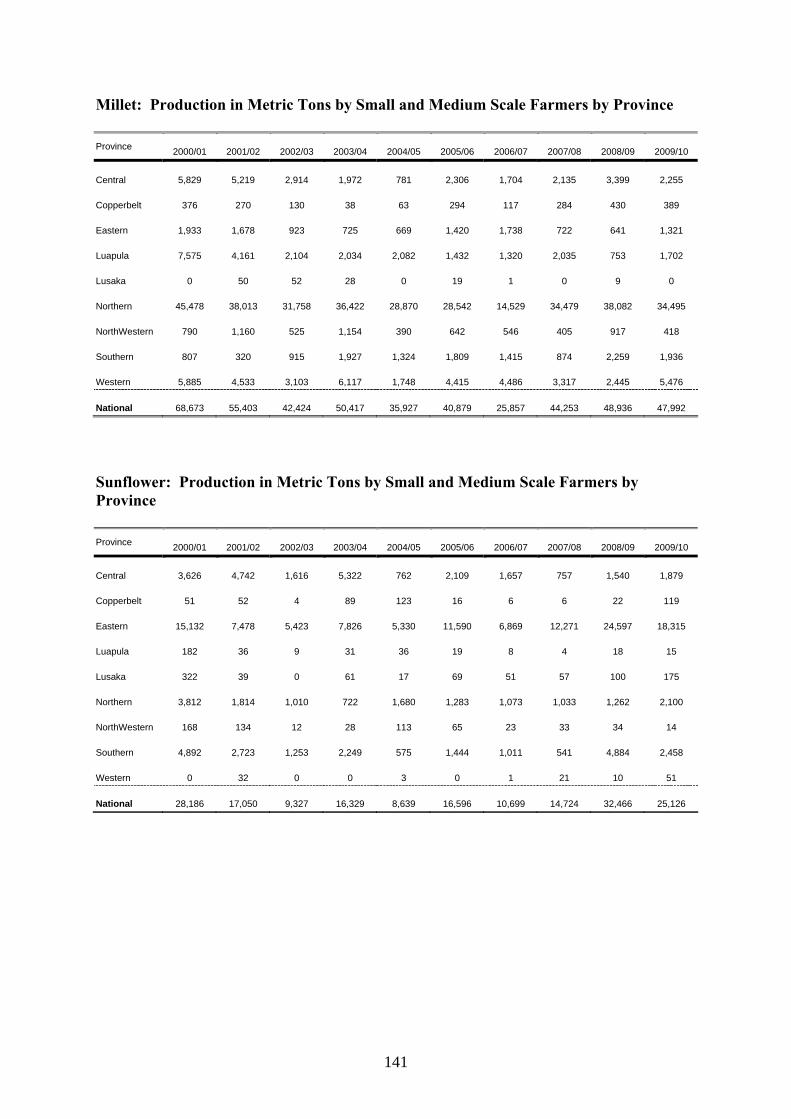
141
Millet: Production in Metric Tons by Small and Medium Scale Farmers by Province Province 2000/01 2001/02 2002/03 2003/04 2004/05 2005/06 2006/07 2007/08 2008/09 2009/10
Central 5,829 5,219 2,914 1,972 781 2,306 1,704 2,135 3,399 2,255
Copperbelt 376 270 130 38 63 294 117 284 430 389
Eastern 1,933 1,678 923 725 669 1,420 1,738 722 641 1,321
Luapula 7,575 4,161 2,104 2,034 2,082 1,432 1,320 2,035 753 1,702
Lusaka 0 50 52 28 0 19 1 0 9 0
Northern 45,478 38,013 31,758 36,422 28,870 28,542 14,529 34,479 38,082 34,495
NorthWestern 790 1,160 525 1,154 390 642 546 405 917 418
Southern 807 320 915 1,927 1,324 1,809 1,415 874 2,259 1,936
Western 5,885 4,533 3,103 6,117 1,748 4,415 4,486 3,317 2,445 5,476
National 68,673 55,403 42,424 50,417 35,927 40,879 25,857 44,253 48,936 47,992
Sunflower: Production in Metric Tons by Small and Medium Scale Farmers by Province Province 2000/01 2001/02 2002/03 2003/04 2004/05 2005/06 2006/07 2007/08 2008/09 2009/10
Central 3,626 4,742 1,616 5,322 762 2,109 1,657 757 1,540 1,879
Copperbelt 51 52 4 89 123 16 6 6 22 119
Eastern 15,132 7,478 5,423 7,826 5,330 11,590 6,869 12,271 24,597 18,315
Luapula 182 36 9 31 36 19 8 4 18 15
Lusaka 322 39 0 61 17 69 51 57 100 175
Northern 3,812 1,814 1,010 722 1,680 1,283 1,073 1,033 1,262 2,100
NorthWestern 168 134 12 28 113 65 23 33 34 14
Southern 4,892 2,723 1,253 2,249 575 1,444 1,011 541 4,884 2,458
Western 0 32 0 0 3 0 1 21 10 51
National 28,186 17,050 9,327 16,329 8,639 16,596 10,699 14,724 32,466 25,126
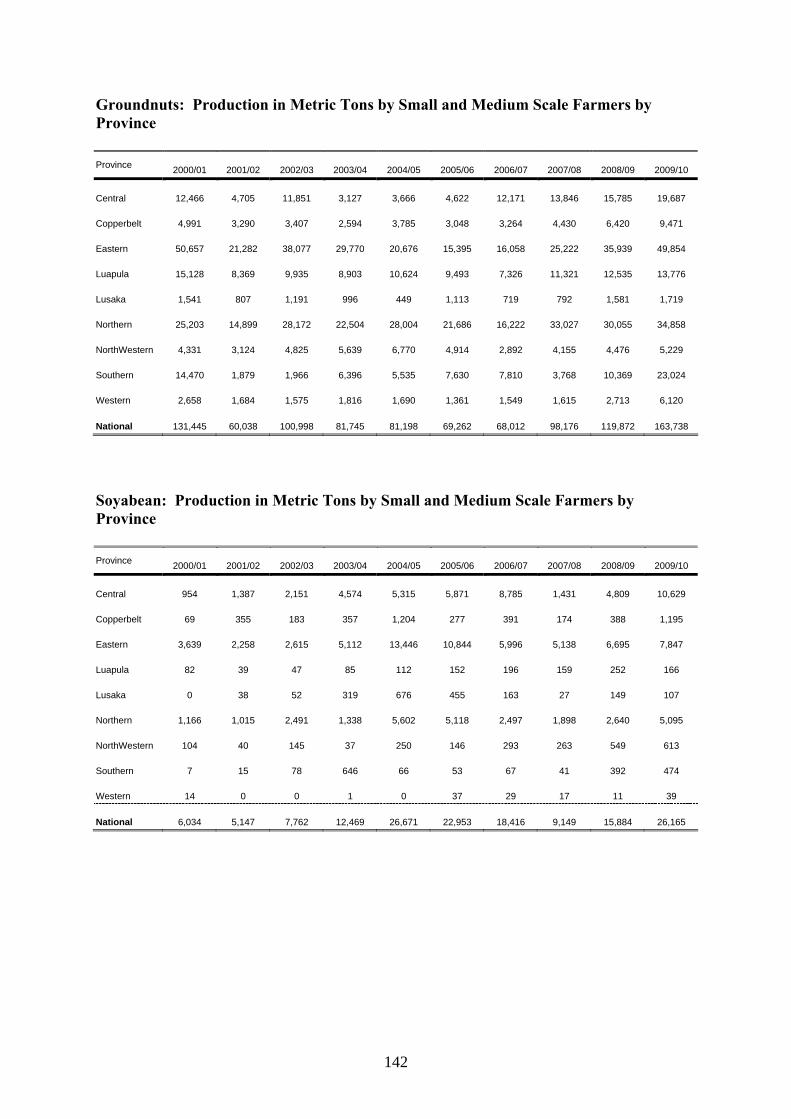
142
Groundnuts: Production in Metric Tons by Small and Medium Scale Farmers by Province Province 2000/01 2001/02 2002/03 2003/04 2004/05 2005/06 2006/07 2007/08 2008/09 2009/10
Central 12,466 4,705 11,851 3,127 3,666 4,622 12,171 13,846 15,785 19,687
Copperbelt 4,991 3,290 3,407 2,594 3,785 3,048 3,264 4,430 6,420 9,471
Eastern 50,657 21,282 38,077 29,770 20,676 15,395 16,058 25,222 35,939 49,854
Luapula 15,128 8,369 9,935 8,903 10,624 9,493 7,326 11,321 12,535 13,776
Lusaka 1,541 807 1,191 996 449 1,113 719 792 1,581 1,719
Northern 25,203 14,899 28,172 22,504 28,004 21,686 16,222 33,027 30,055 34,858
NorthWestern 4,331 3,124 4,825 5,639 6,770 4,914 2,892 4,155 4,476 5,229
Southern 14,470 1,879 1,966 6,396 5,535 7,630 7,810 3,768 10,369 23,024
Western 2,658 1,684 1,575 1,816 1,690 1,361 1,549 1,615 2,713 6,120
National 131,445 60,038 100,998 81,745 81,198 69,262 68,012 98,176 119,872 163,738
Soyabean: Production in Metric Tons by Small and Medium Scale Farmers by Province Province 2000/01 2001/02 2002/03 2003/04 2004/05 2005/06 2006/07 2007/08 2008/09 2009/10
Central 954 1,387 2,151 4,574 5,315 5,871 8,785 1,431 4,809 10,629
Copperbelt 69 355 183 357 1,204 277 391 174 388 1,195
Eastern 3,639 2,258 2,615 5,112 13,446 10,844 5,996 5,138 6,695 7,847
Luapula 82 39 47 85 112 152 196 159 252 166
Lusaka 0 38 52 319 676 455 163 27 149 107
Northern 1,166 1,015 2,491 1,338 5,602 5,118 2,497 1,898 2,640 5,095
NorthWestern 104 40 145 37 250 146 293 263 549 613
Southern 7 15 78 646 66 53 67 41 392 474
Western 14 0 0 1 0 37 29 17 11 39
National 6,034 5,147 7,762 12,469 26,671 22,953 18,416 9,149 15,884 26,165
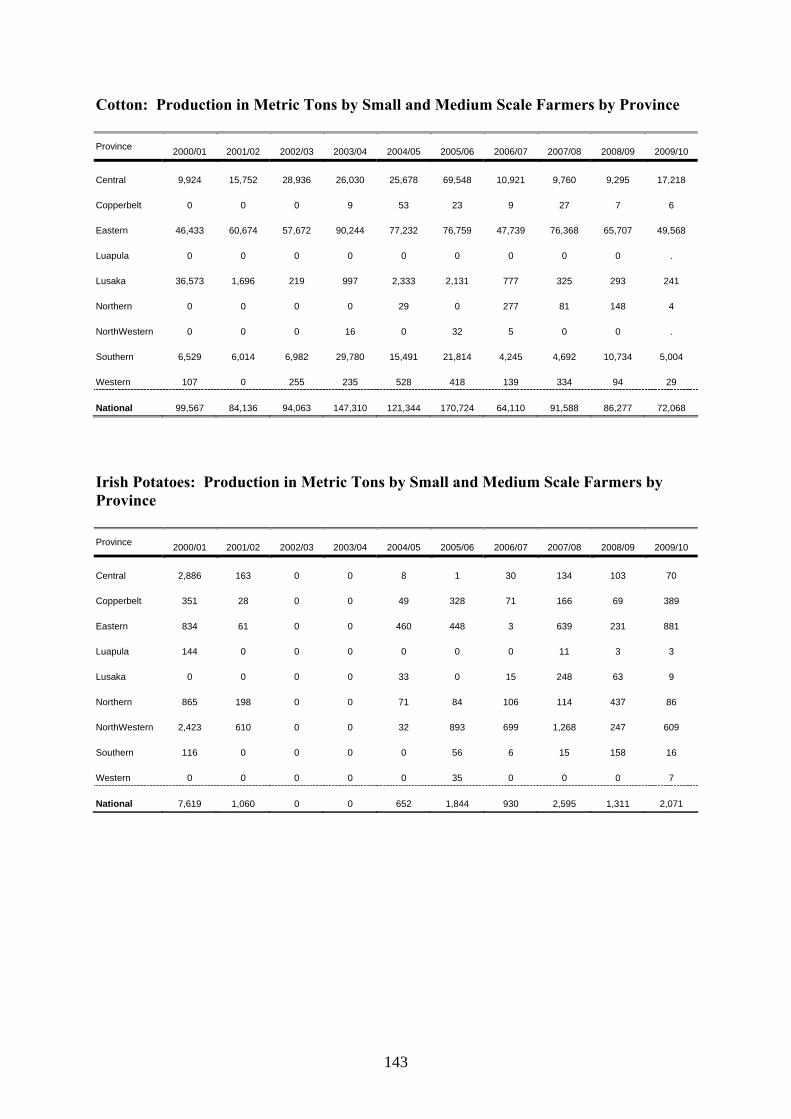
143
Cotton: Production in Metric Tons by Small and Medium Scale Farmers by Province Province 2000/01 2001/02 2002/03 2003/04 2004/05 2005/06 2006/07 2007/08 2008/09 2009/10
Central 9,924 15,752 28,936 26,030 25,678 69,548 10,921 9,760 9,295 17,218
Copperbelt 0 0 0 9 53 23 9 27 7 6
Eastern 46,433 60,674 57,672 90,244 77,232 76,759 47,739 76,368 65,707 49,568
Luapula 0 0 0 0 0 0 0 0 0 .
Lusaka 36,573 1,696 219 997 2,333 2,131 777 325 293 241
Northern 0 0 0 0 29 0 277 81 148 4
NorthWestern 0 0 0 16 0 32 5 0 0 .
Southern 6,529 6,014 6,982 29,780 15,491 21,814 4,245 4,692 10,734 5,004
Western 107 0 255 235 528 418 139 334 94 29
National 99,567 84,136 94,063 147,310 121,344 170,724 64,110 91,588 86,277 72,068
Irish Potatoes: Production in Metric Tons by Small and Medium Scale Farmers by Province Province 2000/01 2001/02 2002/03 2003/04 2004/05 2005/06 2006/07 2007/08 2008/09 2009/10
Central 2,886 163 0 0 8 1 30 134 103 70
Copperbelt 351 28 0 0 49 328 71 166 69 389
Eastern 834 61 0 0 460 448 3 639 231 881
Luapula 144 0 0 0 0 0 0 11 3 3
Lusaka 0 0 0 0 33 0 15 248 63 9
Northern 865 198 0 0 71 84 106 114 437 86
NorthWestern 2,423 610 0 0 32 893 699 1,268 247 609
Southern 116 0 0 0 0 56 6 15 158 16
Western 0 0 0 0 0 35 0 0 0 7
National 7,619 1,060 0 0 652 1,844 930 2,595 1,311 2,071
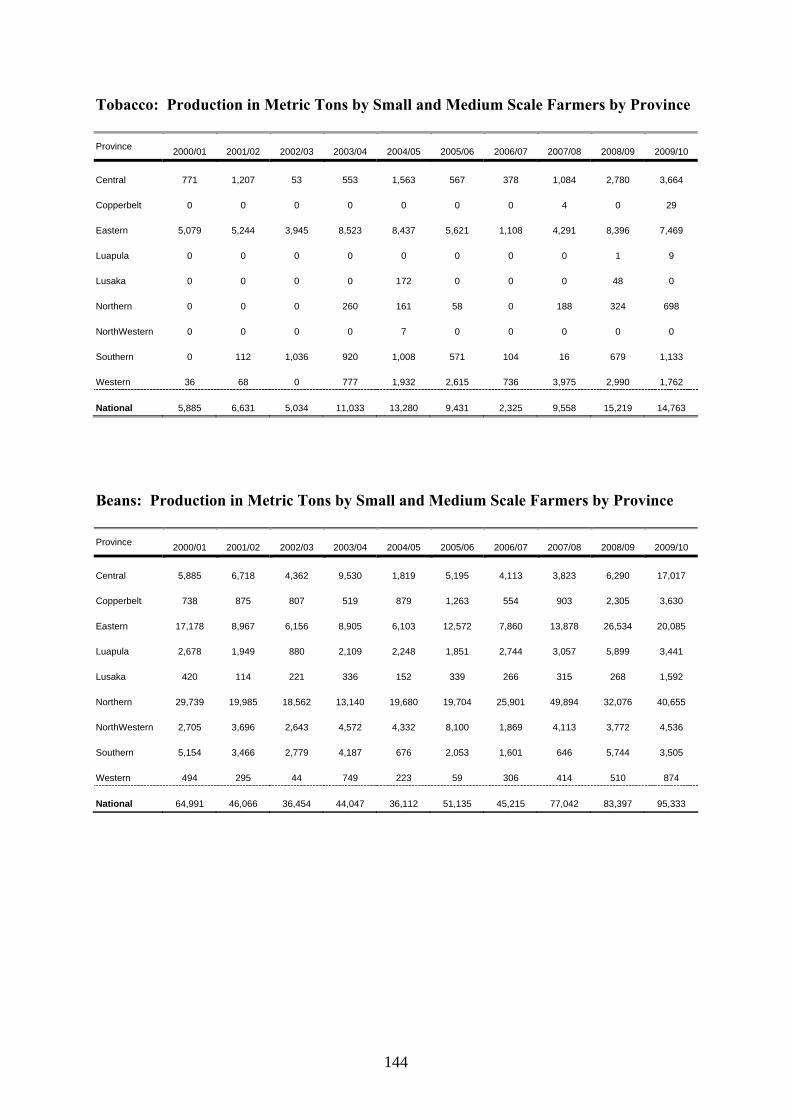
144
Tobacco: Production in Metric Tons by Small and Medium Scale Farmers by Province Province 2000/01 2001/02 2002/03 2003/04 2004/05 2005/06 2006/07 2007/08 2008/09 2009/10
Central 771 1,207 53 553 1,563 567 378 1,084 2,780 3,664
Copperbelt 0 0 0 0 0 0 0 4 0 29
Eastern 5,079 5,244 3,945 8,523 8,437 5,621 1,108 4,291 8,396 7,469
Luapula 0 0 0 0 0 0 0 0 1 9
Lusaka 0 0 0 0 172 0 0 0 48 0
Northern 0 0 0 260 161 58 0 188 324 698
NorthWestern 0 0 0 0 7 0 0 0 0 0
Southern 0 112 1,036 920 1,008 571 104 16 679 1,133
Western 36 68 0 777 1,932 2,615 736 3,975 2,990 1,762
National 5,885 6,631 5,034 11,033 13,280 9,431 2,325 9,558 15,219 14,763
Beans: Production in Metric Tons by Small and Medium Scale Farmers by Province Province 2000/01 2001/02 2002/03 2003/04 2004/05 2005/06 2006/07 2007/08 2008/09 2009/10
Central 5,885 6,718 4,362 9,530 1,819 5,195 4,113 3,823 6,290 17,017
Copperbelt 738 875 807 519 879 1,263 554 903 2,305 3,630
Eastern 17,178 8,967 6,156 8,905 6,103 12,572 7,860 13,878 26,534 20,085
Luapula 2,678 1,949 880 2,109 2,248 1,851 2,744 3,057 5,899 3,441
Lusaka 420 114 221 336 152 339 266 315 268 1,592
Northern 29,739 19,985 18,562 13,140 19,680 19,704 25,901 49,894 32,076 40,655
NorthWestern 2,705 3,696 2,643 4,572 4,332 8,100 1,869 4,113 3,772 4,536
Southern 5,154 3,466 2,779 4,187 676 2,053 1,601 646 5,744 3,505
Western 494 295 44 749 223 59 306 414 510 874
National 64,991 46,066 36,454 44,047 36,112 51,135 45,215 77,042 83,397 95,333
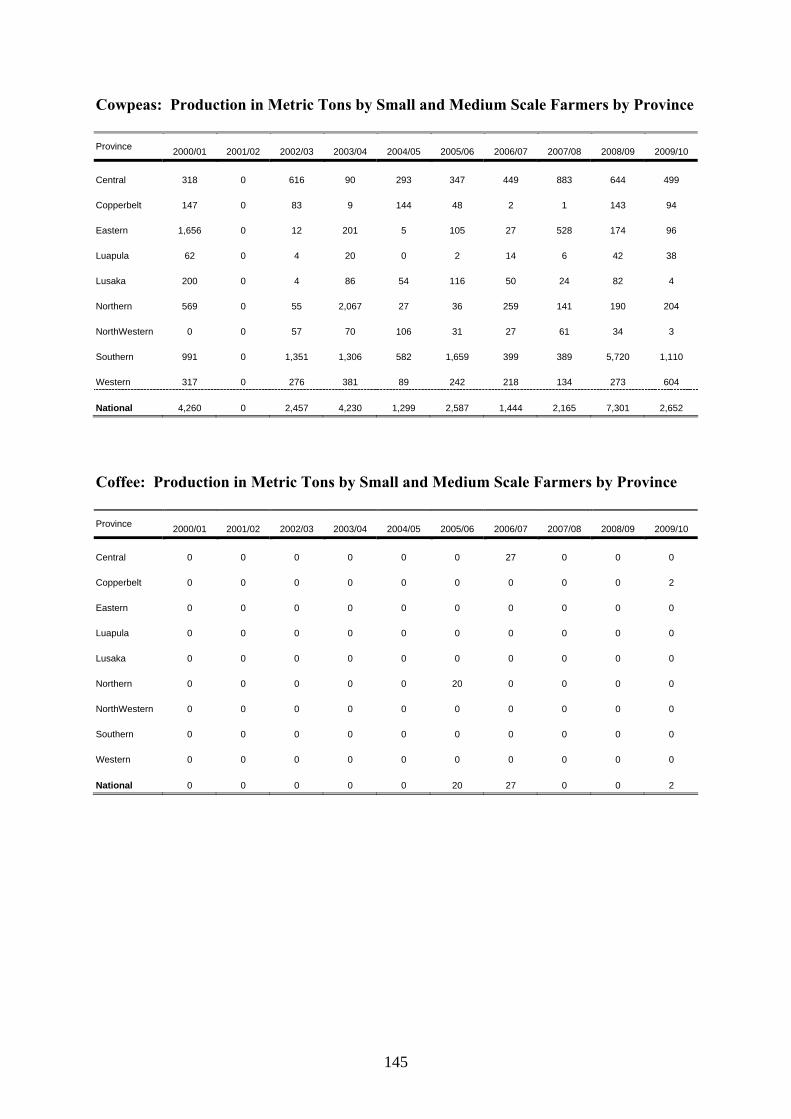
145
Cowpeas: Production in Metric Tons by Small and Medium Scale Farmers by Province Province 2000/01 2001/02 2002/03 2003/04 2004/05 2005/06 2006/07 2007/08 2008/09 2009/10
Central 318 0 616 90 293 347 449 883 644 499
Copperbelt 147 0 83 9 144 48 2 1 143 94
Eastern 1,656 0 12 201 5 105 27 528 174 96
Luapula 62 0 4 20 0 2 14 6 42 38
Lusaka 200 0 4 86 54 116 50 24 82 4
Northern 569 0 55 2,067 27 36 259 141 190 204
NorthWestern 0 0 57 70 106 31 27 61 34 3
Southern 991 0 1,351 1,306 582 1,659 399 389 5,720 1,110
Western 317 0 276 381 89 242 218 134 273 604
National 4,260 0 2,457 4,230 1,299 2,587 1,444 2,165 7,301 2,652
Coffee: Production in Metric Tons by Small and Medium Scale Farmers by Province Province 2000/01 2001/02 2002/03 2003/04 2004/05 2005/06 2006/07 2007/08 2008/09 2009/10
Central 0 0 0 0 0 0 27 0 0 0
Copperbelt 0 0 0 0 0 0 0 0 0 2
Eastern 0 0 0 0 0 0 0 0 0 0
Luapula 0 0 0 0 0 0 0 0 0 0
Lusaka 0 0 0 0 0 0 0 0 0 0
Northern 0 0 0 0 0 20 0 0 0 0
NorthWestern 0 0 0 0 0 0 0 0 0 0
Southern 0 0 0 0 0 0 0 0 0 0
Western 0 0 0 0 0 0 0 0 0 0
National 0 0 0 0 0 20 27 0 0 2
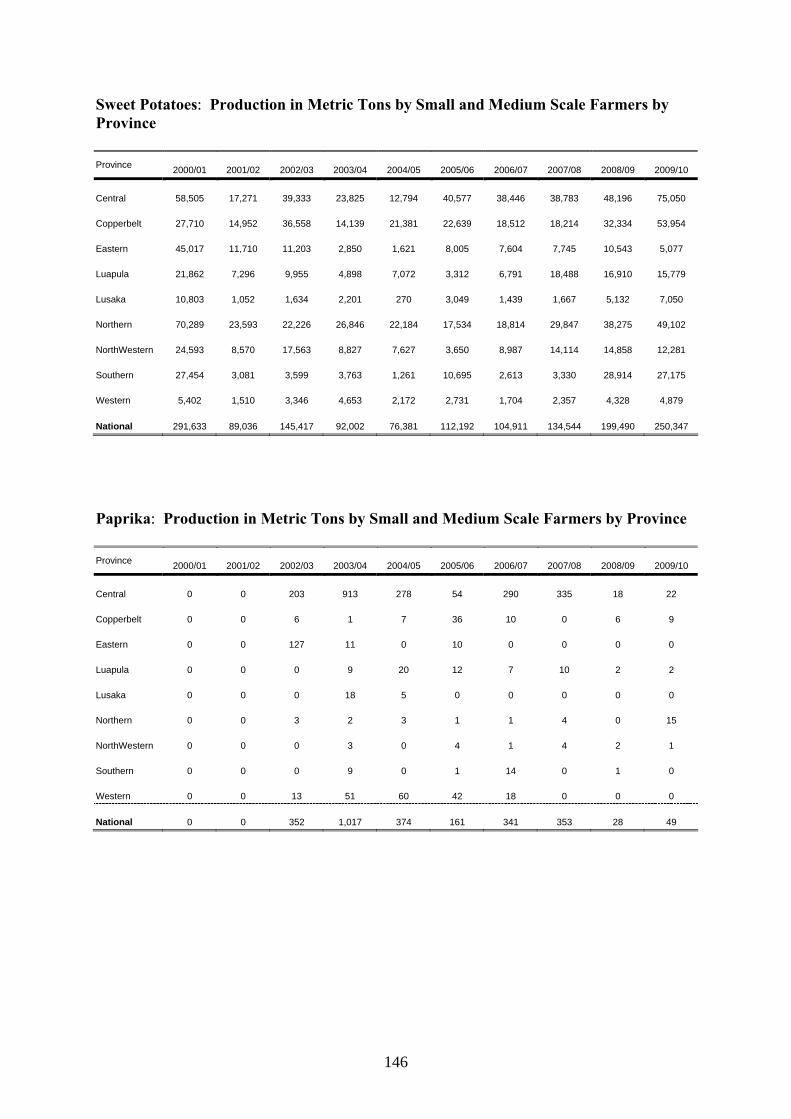
146
Sweet Potatoes: Production in Metric Tons by Small and Medium Scale Farmers by Province Province 2000/01 2001/02 2002/03 2003/04 2004/05 2005/06 2006/07 2007/08 2008/09 2009/10
Central 58,505 17,271 39,333 23,825 12,794 40,577 38,446 38,783 48,196 75,050
Copperbelt 27,710 14,952 36,558 14,139 21,381 22,639 18,512 18,214 32,334 53,954
Eastern 45,017 11,710 11,203 2,850 1,621 8,005 7,604 7,745 10,543 5,077
Luapula 21,862 7,296 9,955 4,898 7,072 3,312 6,791 18,488 16,910 15,779
Lusaka 10,803 1,052 1,634 2,201 270 3,049 1,439 1,667 5,132 7,050
Northern 70,289 23,593 22,226 26,846 22,184 17,534 18,814 29,847 38,275 49,102
NorthWestern 24,593 8,570 17,563 8,827 7,627 3,650 8,987 14,114 14,858 12,281
Southern 27,454 3,081 3,599 3,763 1,261 10,695 2,613 3,330 28,914 27,175
Western 5,402 1,510 3,346 4,653 2,172 2,731 1,704 2,357 4,328 4,879
National 291,633 89,036 145,417 92,002 76,381 112,192 104,911 134,544 199,490 250,347
Paprika: Production in Metric Tons by Small and Medium Scale Farmers by Province Province 2000/01 2001/02 2002/03 2003/04 2004/05 2005/06 2006/07 2007/08 2008/09 2009/10
Central 0 0 203 913 278 54 290 335 18 22
Copperbelt 0 0 6 1 7 36 10 0 6 9
Eastern 0 0 127 11 0 10 0 0 0 0
Luapula 0 0 0 9 20 12 7 10 2 2
Lusaka 0 0 0 18 5 0 0 0 0 0
Northern 0 0 3 2 3 1 1 4 0 15
NorthWestern 0 0 0 3 0 4 1 4 2 1
Southern 0 0 0 9 0 1 14 0 1 0
Western 0 0 13 51 60 42 18 0 0 0
National 0 0 352 1,017 374 161 341 353 28 49
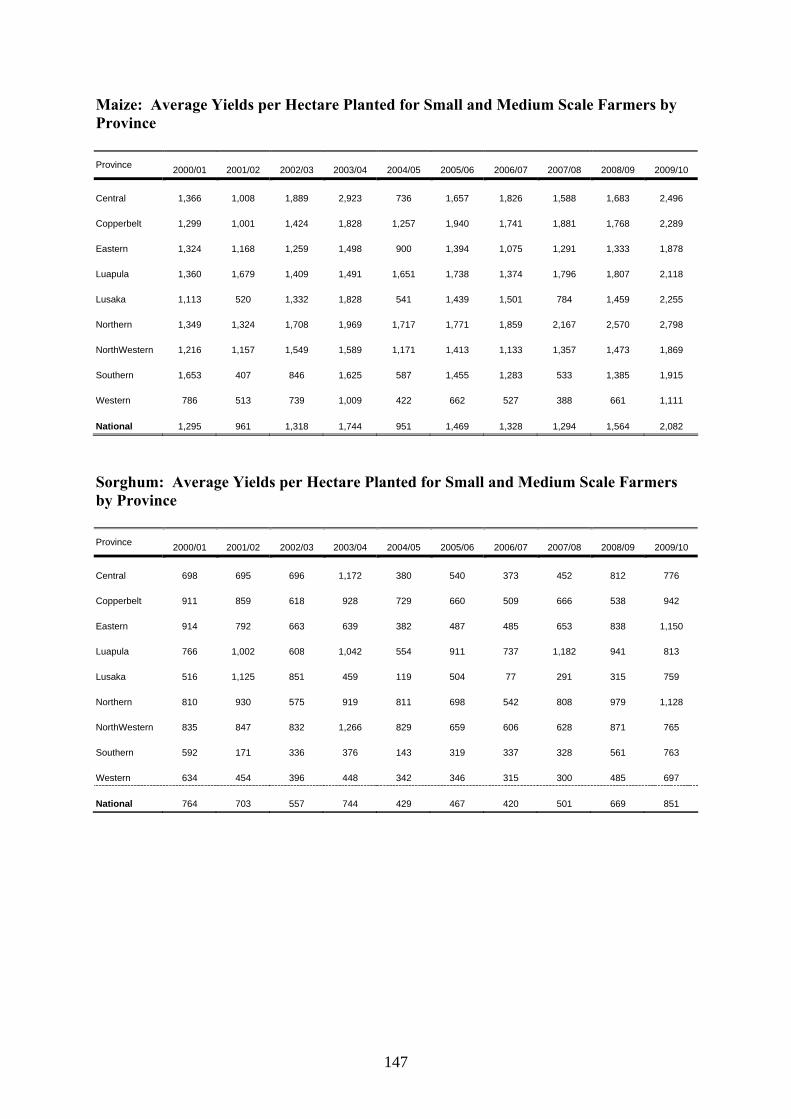
147
Maize: Average Yields per Hectare Planted for Small and Medium Scale Farmers by Province Province 2000/01 2001/02 2002/03 2003/04 2004/05 2005/06 2006/07 2007/08 2008/09 2009/10
Central 1,366 1,008 1,889 2,923 736 1,657 1,826 1,588 1,683 2,496
Copperbelt 1,299 1,001 1,424 1,828 1,257 1,940 1,741 1,881 1,768 2,289
Eastern 1,324 1,168 1,259 1,498 900 1,394 1,075 1,291 1,333 1,878
Luapula 1,360 1,679 1,409 1,491 1,651 1,738 1,374 1,796 1,807 2,118
Lusaka 1,113 520 1,332 1,828 541 1,439 1,501 784 1,459 2,255
Northern 1,349 1,324 1,708 1,969 1,717 1,771 1,859 2,167 2,570 2,798
NorthWestern 1,216 1,157 1,549 1,589 1,171 1,413 1,133 1,357 1,473 1,869
Southern 1,653 407 846 1,625 587 1,455 1,283 533 1,385 1,915
Western 786 513 739 1,009 422 662 527 388 661 1,111
National 1,295 961 1,318 1,744 951 1,469 1,328 1,294 1,564 2,082
Sorghum: Average Yields per Hectare Planted for Small and Medium Scale Farmers by Province Province 2000/01 2001/02 2002/03 2003/04 2004/05 2005/06 2006/07 2007/08 2008/09 2009/10
Central 698 695 696 1,172 380 540 373 452 812 776
Copperbelt 911 859 618 928 729 660 509 666 538 942
Eastern 914 792 663 639 382 487 485 653 838 1,150
Luapula 766 1,002 608 1,042 554 911 737 1,182 941 813
Lusaka 516 1,125 851 459 119 504 77 291 315 759
Northern 810 930 575 919 811 698 542 808 979 1,128
NorthWestern 835 847 832 1,266 829 659 606 628 871 765
Southern 592 171 336 376 143 319 337 328 561 763
Western 634 454 396 448 342 346 315 300 485 697
National 764 703 557 744 429 467 420 501 669 851
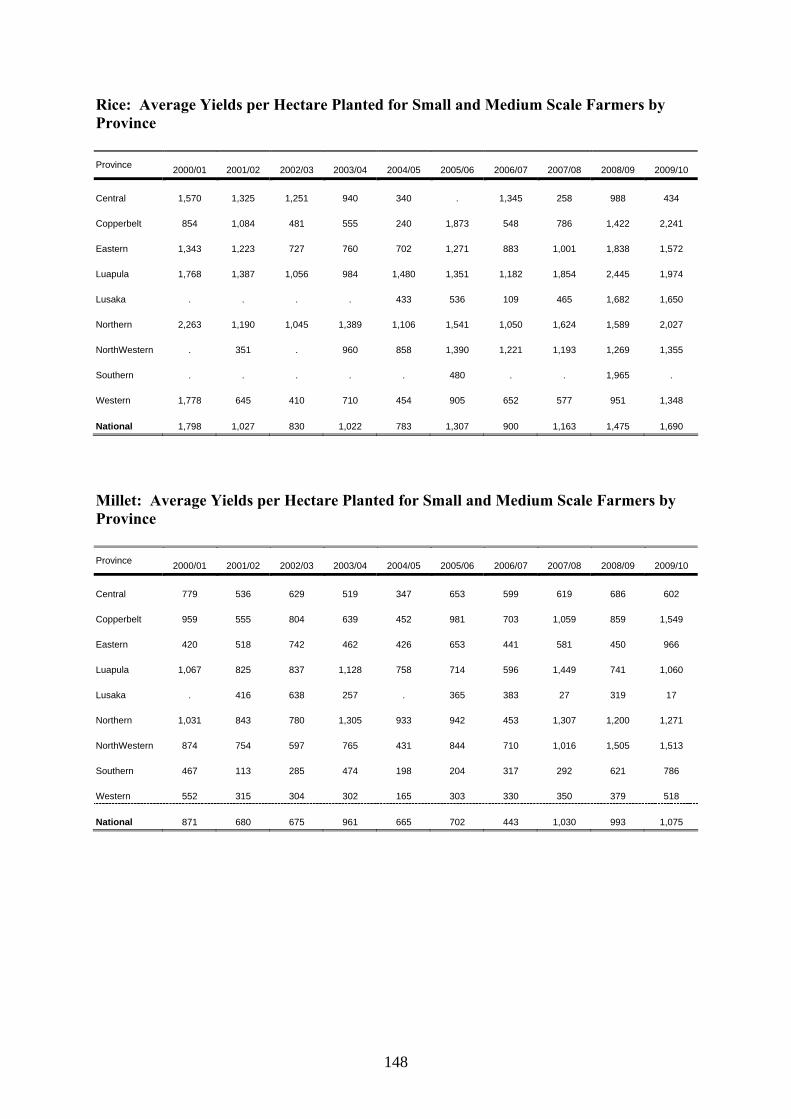
148
Rice: Average Yields per Hectare Planted for Small and Medium Scale Farmers by Province Province 2000/01 2001/02 2002/03 2003/04 2004/05 2005/06 2006/07 2007/08 2008/09 2009/10
Central 1,570 1,325 1,251 940 340 . 1,345 258 988 434
Copperbelt 854 1,084 481 555 240 1,873 548 786 1,422 2,241
Eastern 1,343 1,223 727 760 702 1,271 883 1,001 1,838 1,572
Luapula 1,768 1,387 1,056 984 1,480 1,351 1,182 1,854 2,445 1,974
Lusaka . . . . 433 536 109 465 1,682 1,650
Northern 2,263 1,190 1,045 1,389 1,106 1,541 1,050 1,624 1,589 2,027
NorthWestern . 351 . 960 858 1,390 1,221 1,193 1,269 1,355
Southern . . . . . 480 . . 1,965 .
Western 1,778 645 410 710 454 905 652 577 951 1,348
National 1,798 1,027 830 1,022 783 1,307 900 1,163 1,475 1,690
Millet: Average Yields per Hectare Planted for Small and Medium Scale Farmers by Province Province 2000/01 2001/02 2002/03 2003/04 2004/05 2005/06 2006/07 2007/08 2008/09 2009/10
Central 779 536 629 519 347 653 599 619 686 602
Copperbelt 959 555 804 639 452 981 703 1,059 859 1,549
Eastern 420 518 742 462 426 653 441 581 450 966
Luapula 1,067 825 837 1,128 758 714 596 1,449 741 1,060
Lusaka . 416 638 257 . 365 383 27 319 17
Northern 1,031 843 780 1,305 933 942 453 1,307 1,200 1,271
NorthWestern 874 754 597 765 431 844 710 1,016 1,505 1,513
Southern 467 113 285 474 198 204 317 292 621 786
Western 552 315 304 302 165 303 330 350 379 518
National 871 680 675 961 665 702 443 1,030 993 1,075
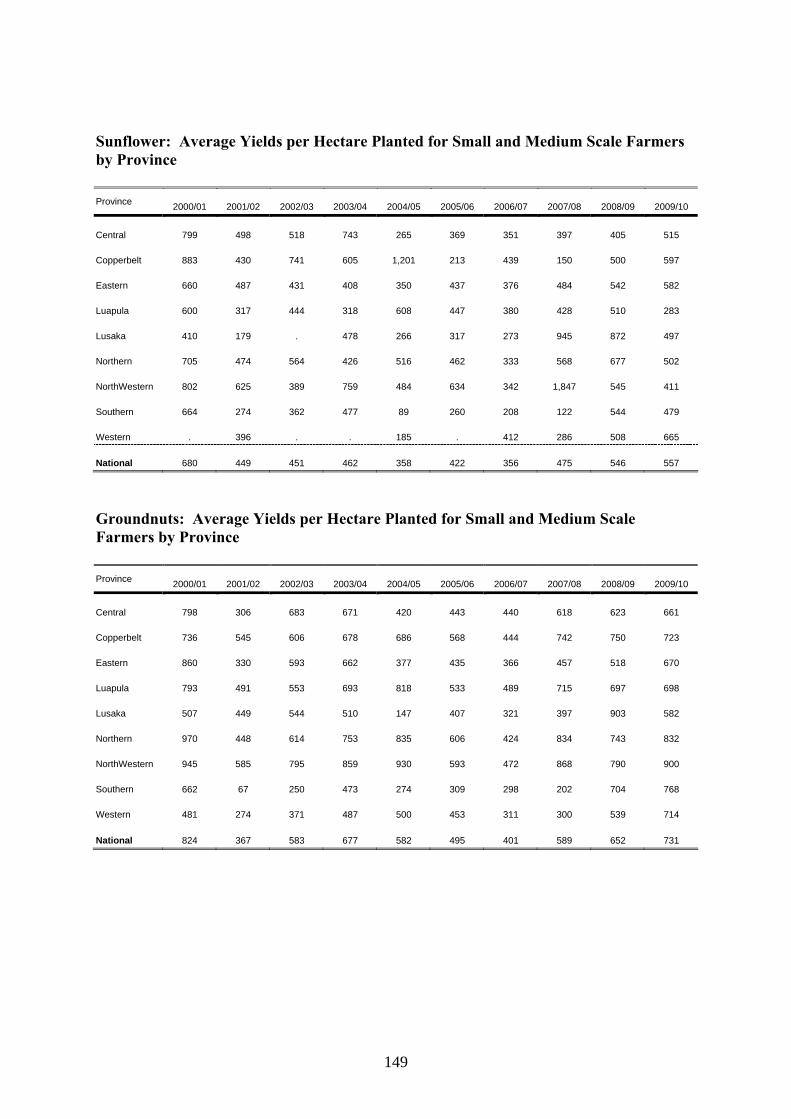
149
Sunflower: Average Yields per Hectare Planted for Small and Medium Scale Farmers by Province Province 2000/01 2001/02 2002/03 2003/04 2004/05 2005/06 2006/07 2007/08 2008/09 2009/10
Central 799 498 518 743 265 369 351 397 405 515
Copperbelt 883 430 741 605 1,201 213 439 150 500 597
Eastern 660 487 431 408 350 437 376 484 542 582
Luapula 600 317 444 318 608 447 380 428 510 283
Lusaka 410 179 . 478 266 317 273 945 872 497
Northern 705 474 564 426 516 462 333 568 677 502
NorthWestern 802 625 389 759 484 634 342 1,847 545 411
Southern 664 274 362 477 89 260 208 122 544 479
Western . 396 . . 185 . 412 286 508 665
National 680 449 451 462 358 422 356 475 546 557
Groundnuts: Average Yields per Hectare Planted for Small and Medium Scale Farmers by Province Province 2000/01 2001/02 2002/03 2003/04 2004/05 2005/06 2006/07 2007/08 2008/09 2009/10
Central 798 306 683 671 420 443 440 618 623 661
Copperbelt 736 545 606 678 686 568 444 742 750 723
Eastern 860 330 593 662 377 435 366 457 518 670
Luapula 793 491 553 693 818 533 489 715 697 698
Lusaka 507 449 544 510 147 407 321 397 903 582
Northern 970 448 614 753 835 606 424 834 743 832
NorthWestern 945 585 795 859 930 593 472 868 790 900
Southern 662 67 250 473 274 309 298 202 704 768
Western 481 274 371 487 500 453 311 300 539 714
National 824 367 583 677 582 495 401 589 652 731
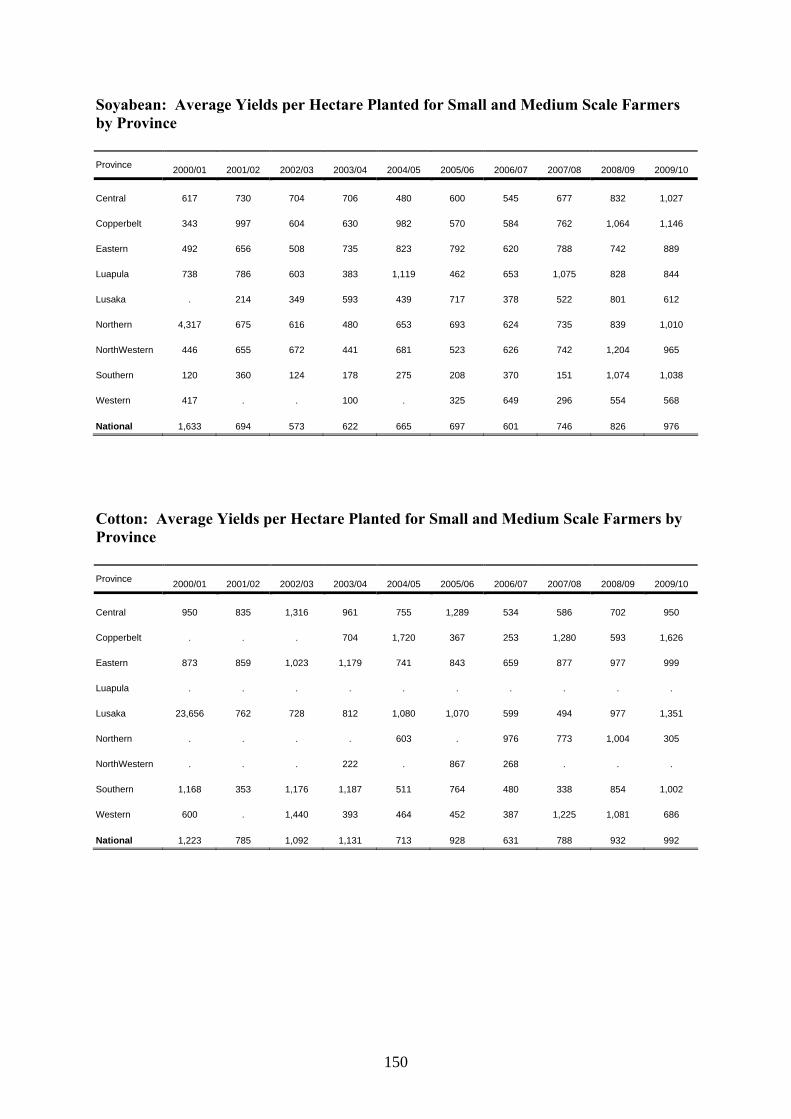
150
Soyabean: Average Yields per Hectare Planted for Small and Medium Scale Farmers by Province Province 2000/01 2001/02 2002/03 2003/04 2004/05 2005/06 2006/07 2007/08 2008/09 2009/10
Central 617 730 704 706 480 600 545 677 832 1,027
Copperbelt 343 997 604 630 982 570 584 762 1,064 1,146
Eastern 492 656 508 735 823 792 620 788 742 889
Luapula 738 786 603 383 1,119 462 653 1,075 828 844
Lusaka . 214 349 593 439 717 378 522 801 612
Northern 4,317 675 616 480 653 693 624 735 839 1,010
NorthWestern 446 655 672 441 681 523 626 742 1,204 965
Southern 120 360 124 178 275 208 370 151 1,074 1,038
Western 417 . . 100 . 325 649 296 554 568
National 1,633 694 573 622 665 697 601 746 826 976
Cotton: Average Yields per Hectare Planted for Small and Medium Scale Farmers by Province Province 2000/01 2001/02 2002/03 2003/04 2004/05 2005/06 2006/07 2007/08 2008/09 2009/10
Central 950 835 1,316 961 755 1,289 534 586 702 950
Copperbelt . . . 704 1,720 367 253 1,280 593 1,626
Eastern 873 859 1,023 1,179 741 843 659 877 977 999
Luapula . . . . . . . . . .
Lusaka 23,656 762 728 812 1,080 1,070 599 494 977 1,351
Northern . . . . 603 . 976 773 1,004 305
NorthWestern . . . 222 . 867 268 . . .
Southern 1,168 353 1,176 1,187 511 764 480 338 854 1,002
Western 600 . 1,440 393 464 452 387 1,225 1,081 686
National 1,223 785 1,092 1,131 713 928 631 788 932 992
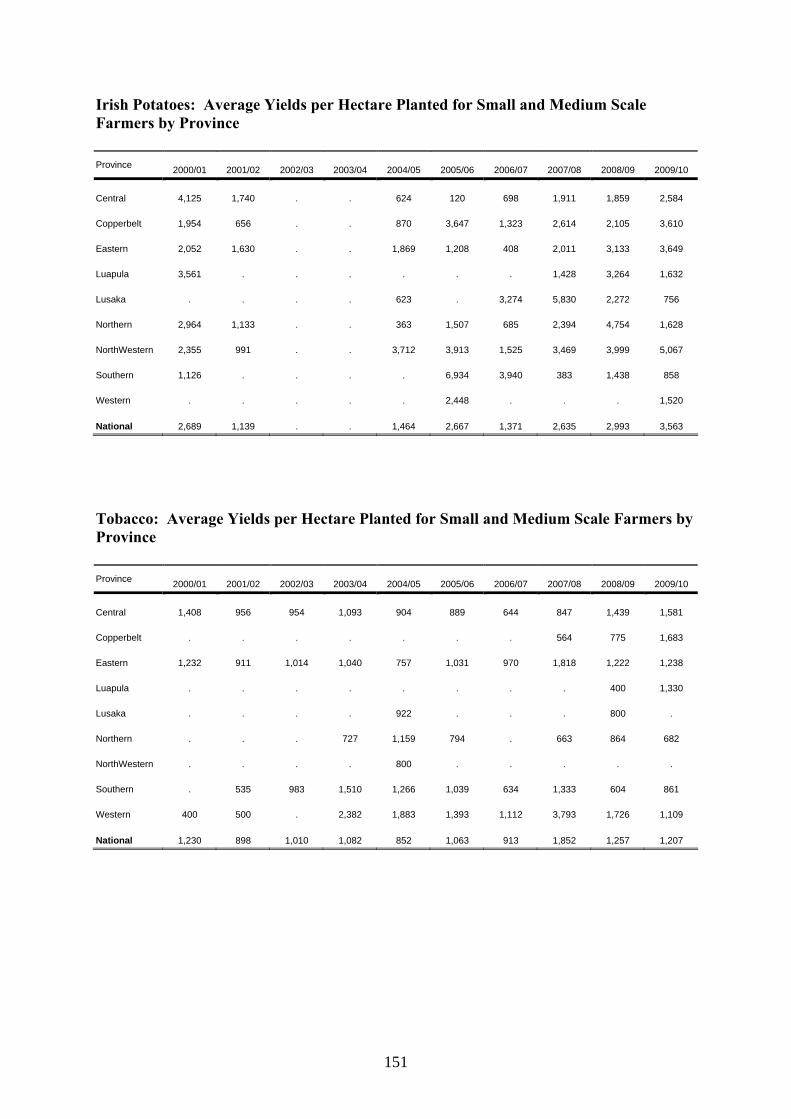
151
Irish Potatoes: Average Yields per Hectare Planted for Small and Medium Scale Farmers by Province Province 2000/01 2001/02 2002/03 2003/04 2004/05 2005/06 2006/07 2007/08 2008/09 2009/10
Central 4,125 1,740 . . 624 120 698 1,911 1,859 2,584
Copperbelt 1,954 656 . . 870 3,647 1,323 2,614 2,105 3,610
Eastern 2,052 1,630 . . 1,869 1,208 408 2,011 3,133 3,649
Luapula 3,561 . . . . . . 1,428 3,264 1,632
Lusaka . . . . 623 . 3,274 5,830 2,272 756
Northern 2,964 1,133 . . 363 1,507 685 2,394 4,754 1,628
NorthWestern 2,355 991 . . 3,712 3,913 1,525 3,469 3,999 5,067
Southern 1,126 . . . . 6,934 3,940 383 1,438 858
Western . . . . . 2,448 . . . 1,520
National 2,689 1,139 . . 1,464 2,667 1,371 2,635 2,993 3,563
Tobacco: Average Yields per Hectare Planted for Small and Medium Scale Farmers by Province Province 2000/01 2001/02 2002/03 2003/04 2004/05 2005/06 2006/07 2007/08 2008/09 2009/10
Central 1,408 956 954 1,093 904 889 644 847 1,439 1,581
Copperbelt . . . . . . . 564 775 1,683
Eastern 1,232 911 1,014 1,040 757 1,031 970 1,818 1,222 1,238
Luapula . . . . . . . . 400 1,330
Lusaka . . . . 922 . . . 800 .
Northern . . . 727 1,159 794 . 663 864 682
NorthWestern . . . . 800 . . . . .
Southern . 535 983 1,510 1,266 1,039 634 1,333 604 861
Western 400 500 . 2,382 1,883 1,393 1,112 3,793 1,726 1,109
National 1,230 898 1,010 1,082 852 1,063 913 1,852 1,257 1,207
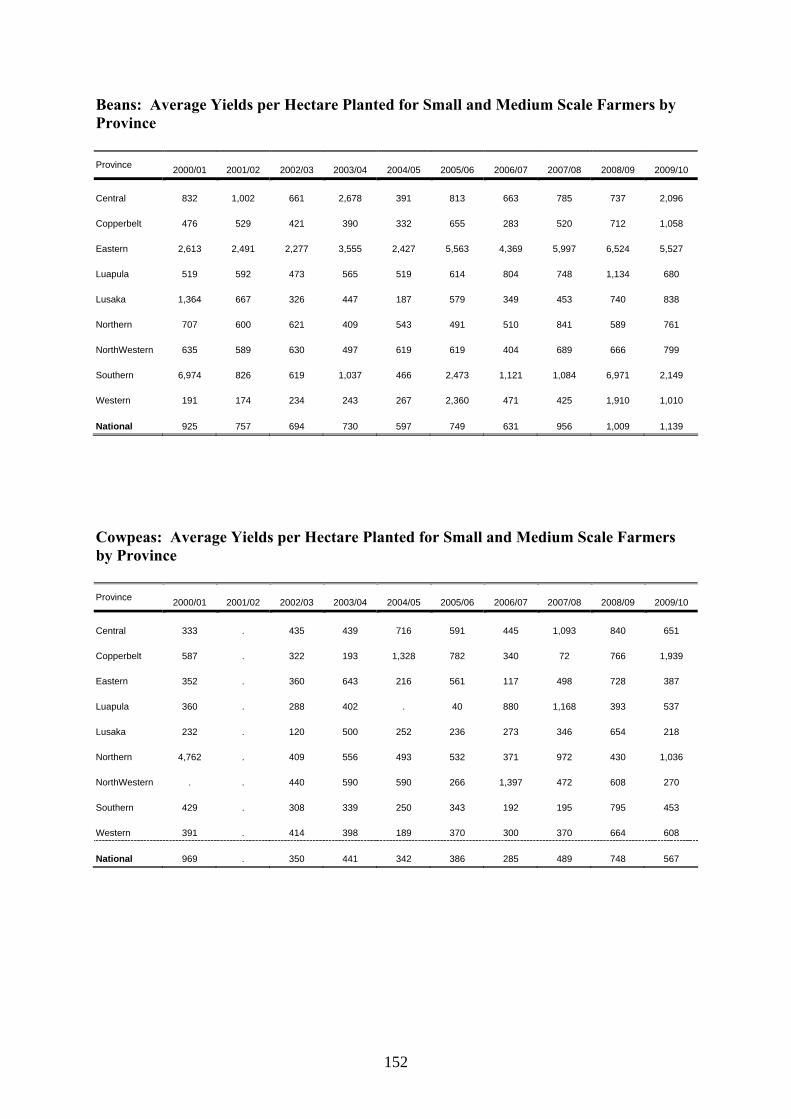
152
Beans: Average Yields per Hectare Planted for Small and Medium Scale Farmers by Province Province 2000/01 2001/02 2002/03 2003/04 2004/05 2005/06 2006/07 2007/08 2008/09 2009/10
Central 832 1,002 661 2,678 391 813 663 785 737 2,096
Copperbelt 476 529 421 390 332 655 283 520 712 1,058
Eastern 2,613 2,491 2,277 3,555 2,427 5,563 4,369 5,997 6,524 5,527
Luapula 519 592 473 565 519 614 804 748 1,134 680
Lusaka 1,364 667 326 447 187 579 349 453 740 838
Northern 707 600 621 409 543 491 510 841 589 761
NorthWestern 635 589 630 497 619 619 404 689 666 799
Southern 6,974 826 619 1,037 466 2,473 1,121 1,084 6,971 2,149
Western 191 174 234 243 267 2,360 471 425 1,910 1,010
National 925 757 694 730 597 749 631 956 1,009 1,139
Cowpeas: Average Yields per Hectare Planted for Small and Medium Scale Farmers by Province Province 2000/01 2001/02 2002/03 2003/04 2004/05 2005/06 2006/07 2007/08 2008/09 2009/10
Central 333 . 435 439 716 591 445 1,093 840 651
Copperbelt 587 . 322 193 1,328 782 340 72 766 1,939
Eastern 352 . 360 643 216 561 117 498 728 387
Luapula 360 . 288 402 . 40 880 1,168 393 537
Lusaka 232 . 120 500 252 236 273 346 654 218
Northern 4,762 . 409 556 493 532 371 972 430 1,036
NorthWestern . . 440 590 590 266 1,397 472 608 270
Southern 429 . 308 339 250 343 192 195 795 453
Western 391 . 414 398 189 370 300 370 664 608
National 969 . 350 441 342 386 285 489 748 567
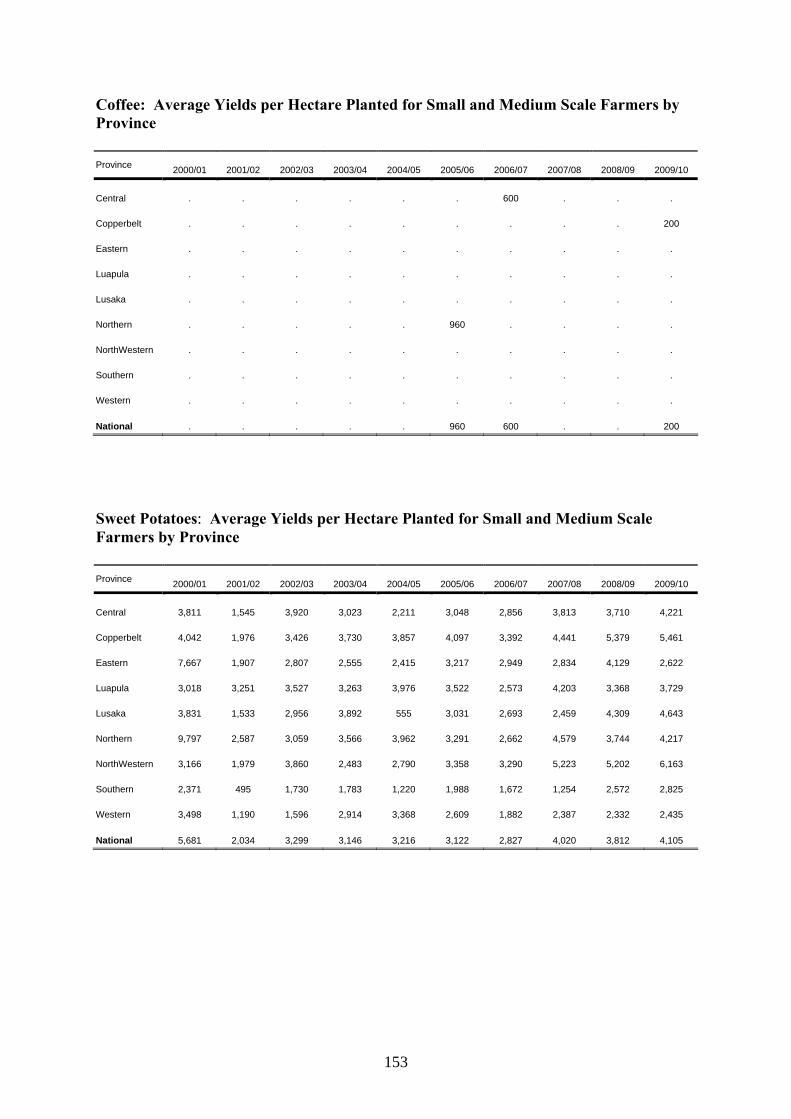
153
Coffee: Average Yields per Hectare Planted for Small and Medium Scale Farmers by Province Province 2000/01 2001/02 2002/03 2003/04 2004/05 2005/06 2006/07 2007/08 2008/09 2009/10
Central . . . . . . 600 . . .
Copperbelt . . . . . . . . . 200
Eastern . . . . . . . . . .
Luapula . . . . . . . . . .
Lusaka . . . . . . . . . .
Northern . . . . . 960 . . . .
NorthWestern . . . . . . . . . .
Southern . . . . . . . . . .
Western . . . . . . . . . .
National . . . . . 960 600 . . 200
Sweet Potatoes: Average Yields per Hectare Planted for Small and Medium Scale Farmers by Province Province 2000/01 2001/02 2002/03 2003/04 2004/05 2005/06 2006/07 2007/08 2008/09 2009/10
Central 3,811 1,545 3,920 3,023 2,211 3,048 2,856 3,813 3,710 4,221
Copperbelt 4,042 1,976 3,426 3,730 3,857 4,097 3,392 4,441 5,379 5,461
Eastern 7,667 1,907 2,807 2,555 2,415 3,217 2,949 2,834 4,129 2,622
Luapula 3,018 3,251 3,527 3,263 3,976 3,522 2,573 4,203 3,368 3,729
Lusaka 3,831 1,533 2,956 3,892 555 3,031 2,693 2,459 4,309 4,643
Northern 9,797 2,587 3,059 3,566 3,962 3,291 2,662 4,579 3,744 4,217
NorthWestern 3,166 1,979 3,860 2,483 2,790 3,358 3,290 5,223 5,202 6,163
Southern 2,371 495 1,730 1,783 1,220 1,988 1,672 1,254 2,572 2,825
Western 3,498 1,190 1,596 2,914 3,368 2,609 1,882 2,387 2,332 2,435
National 5,681 2,034 3,299 3,146 3,216 3,122 2,827 4,020 3,812 4,105
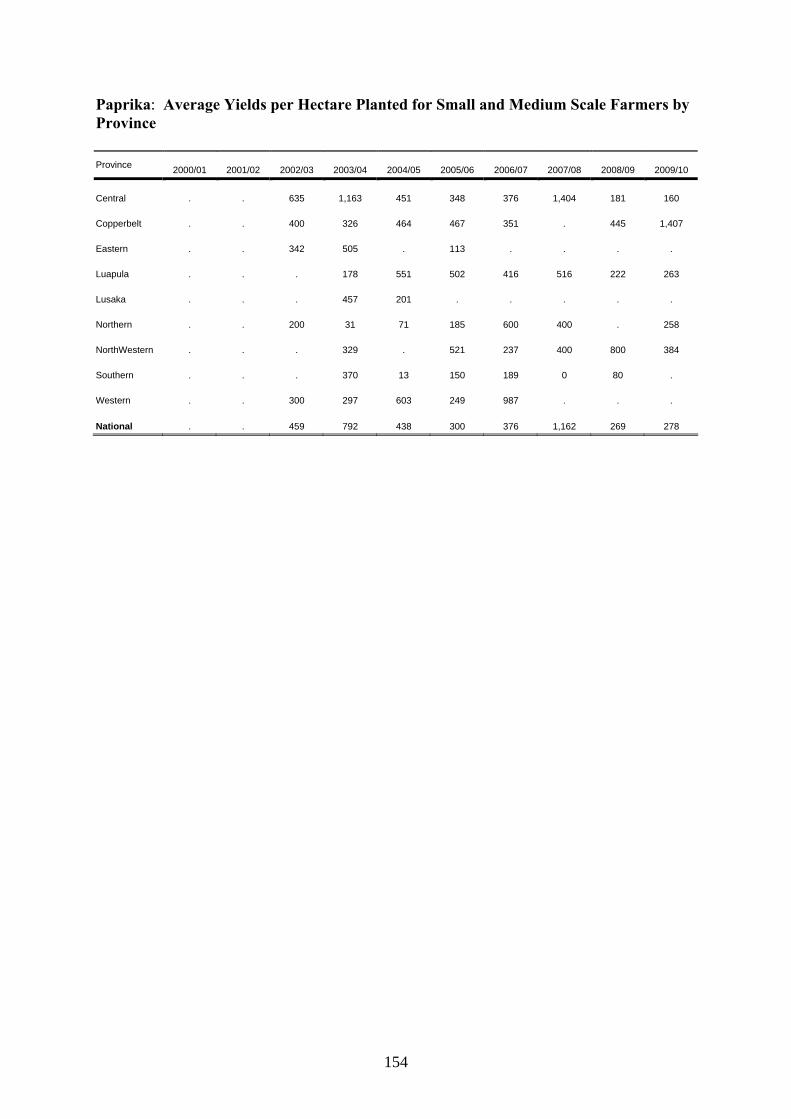
154
Paprika: Average Yields per Hectare Planted for Small and Medium Scale Farmers by Province Province 2000/01 2001/02 2002/03 2003/04 2004/05 2005/06 2006/07 2007/08 2008/09 2009/10
Central . . 635 1,163 451 348 376 1,404 181 160
Copperbelt . . 400 326 464 467 351 . 445 1,407
Eastern . . 342 505 . 113 . . . .
Luapula . . . 178 551 502 416 516 222 263
Lusaka . . . 457 201 . . . . .
Northern . . 200 31 71 185 600 400 . 258
NorthWestern . . . 329 . 521 237 400 800 384
Southern . . . 370 13 150 189 0 80 .
Western . . 300 297 603 249 987 . . .
National . . 459 792 438 300 376 1,162 269 278
155
REFERENCES
Bwalya, R. and J. Mwanguhya. 2010. Value Chain Analysis for Free Range Poultry Sub-Sector in Chongwe and Lusaka Districts-Zambia. Lusaka: Ministry of Livestock and Fisheries, GRZ.
Central Statistics Office. 2003. Population Projections Report. Lusaka: GRZ. CSO/FSRP. YEAR? Urban Consumption Survey. Lusaka: GRZ. CSO/MACO/FSRP Crop Forecast Surveys. Various years. Lusaka: GRZ. CSO/MACO/FSRP. 2008. Supplemental Survey to the 1999/2000 Post-Harvest Survey
Dataset. Lusaka: FSRP. Chitundu, M., C. Droppelmann, and S. Haggblade. 2006. A Value Chain Task Force
Approach for Managing Private-Public Partnership: Zambia Task Force on Acceleration of Cassava Utilization. FSRP Working Paper No. 21. Lusaka, Zambia: FSRP.
ECI Africa Consulting Ltd. 2010. Market Access, Trade and Enabling Policies Program-
Regional Trade Analysis on Dried Legumes and Groundnuts. Draft Report, submitted to the United States Agency for International Development.
FAOSTAT. Rome: FAO. www.FAOSTAT.org. Farnworth, C.R. 2010. Gender Aware Approaches in Agricultural Programmes: A Study of
SIDA-Supported Agricultural Programmes. Report commissioned by SIDA, Department for Economic Opportunities, Team for Agriculture, Forestry and Food Security in cooperation with the Secretariat for Evaluation.
FEWSNET. 2009. Food Security Update. Available at
http://www.fews.net/docs/Publications/Zambia_FSU_August_2009_final.pdf Flaherty, K. and Mwala, N. 2010. Zambia: Recent Developments in Agricultural Research.
Agriculture and Technology Indicators. Washington, D.C.: IFPRI. Available at http://www.ifpri.org/sites/default/files/publications/zambia-note.pdf
GRZ. Various years. CSO/MACO/FSRP Crops Forecast Surveys. Lusaka: GRZ. GRZ. Various years. CSO Living Conditions Monitoring Survey Results. Lusaka: GRZ. GRZ. Various years. CSO Priority Survey I. Lusaka: GRZ. GRZ. 2005. CSO Labor Survey. Lusaka: GRZ. GRZ. 2010. National Budget for 2010. Lusaka: Ministry of Finance. GTZ. 2008. Study on Gender-disaggregated Data for the Zambian Ministry of Finance and
National Planning (MoFNP). Lusaka: MoFNP.
156
Maxwell S. and T. Frankenberger. 1992. Household Food Security: Concepts, Indicators, Measurements: A Technical Review. Rome, Italy: IFAD/UNICEF. Serageldin, I. 2004. Nurturing and Nourishing the World’s Poor: Important Roles for
Horticulture in Sustainable Development. In Proceedings XXVI IHC, Acta Horticulturae, 642, ed. N.E. Looney. Leuven, Belgium: ISHS. Online at www.actahort.org.
Simwambana, Moses S.C., Martin Chiona, Able Chalwe, and Stanley Mutuna, 2004. Basic
Cultural Practices of Cassava Crop Production in Zambia. Solwezi: MACO. Thurlow, J., S. Benin, X. Diao, H. Kalinda, and T. Kalinda. 2008. Agricultural Growth and
Investment Options Report for Poverty Reduction in Zambia. IFPRI Discussion Paper No. 00791. Washington, D.C.: IFPRI.
Timmer, P. 2005. Food Security and Economic Growth: An Asian Perspective. Asian-Pacific
Economic Literature 19.1: 1-17. World Bank. 2004. Zambia: Strategic Country Gender Assessment. Washington, D.C.: The
World Bank. ZDHS. 2007. Zambia District Health Survey. Lusaka: GRZ.