Embed Size (px)
Citation preview
TELECOM INFRASTRUCTURE INDUSTRY IN INDIA
Contact:
Anjan Ghosh
+91-22-30470006
Vikas Aggarwal
+91-124-4545300
Nidhi Marwaha
+91-124-4545337
Website:
www.icra.in
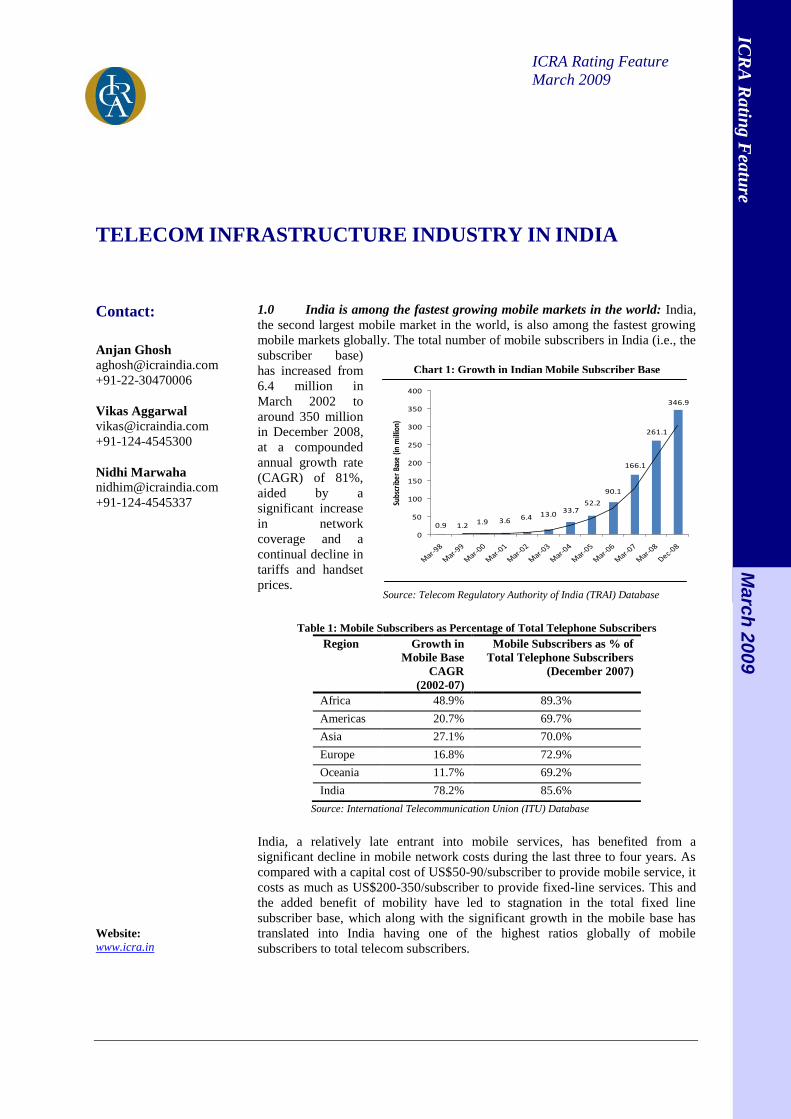
1.0 India is among the fastest growing mobile markets in the world: India,
the second largest mobile market in the world, is also among the fastest growing
mobile markets globally. The total number of mobile subscribers in India (i.e., the
subscriber base)
has increased from
6.4 million in
March 2002 to
around 350 million
in December 2008,
at a compounded
annual growth rate
(CAGR) of 81%,
aided by a
significant increase
in network
coverage and a
continual decline in
tariffs and handset
prices.
Table 1: Mobile Subscribers as Percentage of Total Telephone Subscribers
India, a relatively late entrant into mobile services, has benefited from a
significant decline in mobile network costs during the last three to four years. As
compared with a capital cost of US$50-90/subscriber to provide mobile service, it
costs as much as US$200-350/subscriber to provide fixed-line services. This and
the added benefit of mobility have led to stagnation in the total fixed line
subscriber base, which along with the significant growth in the mobile base has
translated into India having one of the highest ratios globally of mobile
subscribers to total telecom subscribers.
Region Growth in
Mobile Base
CAGR
(2002-07)
Mobile Subscribers as % of
Total Telephone Subscribers
(December 2007)
Africa 48.9% 89.3%
Americas 20.7% 69.7%
Asia 27.1% 70.0%
Europe 16.8% 72.9%
Oceania 11.7% 69.2%
India 78.2% 85.6%
Source: International Telecommunication Union (ITU) Database
ICR
IC
RA
Ra
ting
Fea
ture
ICR
M
arc
h 2
00
9
ICRA Rating Feature
March 2009
Chart 1: Growth in Indian Mobile Subscriber Base
Source: Telecom Regulatory Authority of India (TRAI) Database
0.9 1.21.9 3.6 6.4 13.0
33.752.2
90.1
166.1
261.1
346.9
0
50
100
150
200
250
300
350
400Su
bscr
iber
Bas
e (in
mill
ion)
Telecom Infrastructure Industry in India March 2009
ICRA Rating Services www.icra.in Page 2
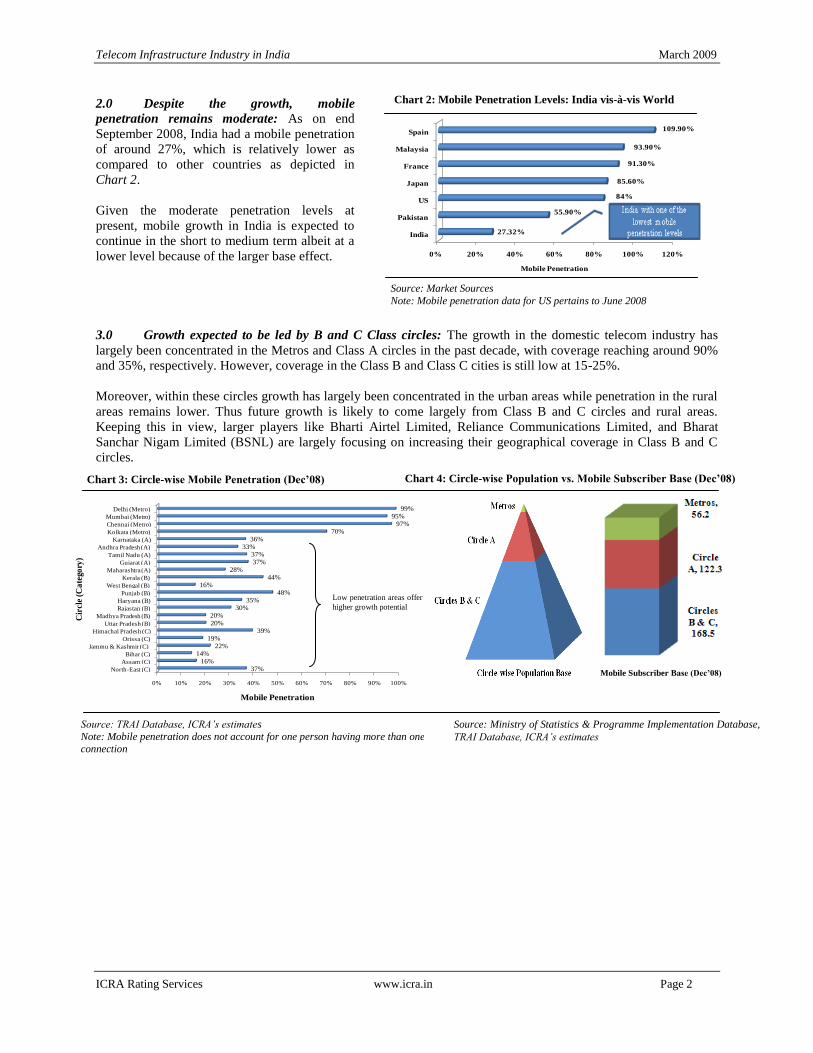
2.0 Despite the growth, mobile
penetration remains moderate: As on end
September 2008, India had a mobile penetration
of around 27%, which is relatively lower as
compared to other countries as depicted in
Chart 2.
Given the moderate penetration levels at
present, mobile growth in India is expected to
continue in the short to medium term albeit at a
lower level because of the larger base effect.
3.0 Growth expected to be led by B and C Class circles: The growth in the domestic telecom industry has
largely been concentrated in the Metros and Class A circles in the past decade, with coverage reaching around 90%
and 35%, respectively. However, coverage in the Class B and Class C cities is still low at 15-25%.
Moreover, within these circles growth has largely been concentrated in the urban areas while penetration in the rural
areas remains lower. Thus future growth is likely to come largely from Class B and C circles and rural areas.
Keeping this in view, larger players like Bharti Airtel Limited, Reliance Communications Limited, and Bharat
Sanchar Nigam Limited (BSNL) are largely focusing on increasing their geographical coverage in Class B and C
circles.
0% 10% 20% 30% 40% 50% 60% 70% 80% 90% 100%
North-East (C)
Assam (C)
Bihar (C)
Jammu & Kashmir (C)
Orissa (C)
Himachal Pradesh (C)
Uttar Pradesh (B)
Madhya Pradesh (B)
Rajastan (B)
Haryana (B)
Punjab (B)
West Bengal (B)
Kerala (B)
Maharashtra (A)
Gujarat (A)
Tamil Nadu (A)
Andhra Pradesh (A)
Karnataka (A)
Kolkata (Metro)
Chennai (Metro)
Mumbai (Metro)
Delhi (Metro)
37%
16%14%
22%
19%39%
20%20%
30%
35%48%
16%44%
28%
37%37%
33%
36%70%
97%95%
99%
Mobile Penetration
Cir
cle
(Ca
tego
ry)
Low penetration areas offer
higher growth potential
Source: TRAI Database, ICRA’s estimates
Note: Mobile penetration does not account for one person having more than one
connection
Chart 4: Circle-wise Population vs. Mobile Subscriber Base (Dec’08)
Source: Ministry of Statistics & Programme Implementation Database,
TRAI Database, ICRA’s estimates
Mobile Subscriber Base (Dec’08)
Chart 3: Circle-wise Mobile Penetration (Dec’08)
Chart 2: Mobile Penetration Levels: India vis-à-vis World
Source: Market Sources
Note: Mobile penetration data for US pertains to June 2008
0% 20% 40% 60% 80% 100% 120%
India
Pakistan
US
Japan
France
Malaysia
Spain
27.32%
55.90%
84%
85.60%
91.30%
93.90%
109.90%
Mobile Penetration
Telecom Infrastructure Industry in India March 2009
ICRA Rating Services www.icra.in Page 3
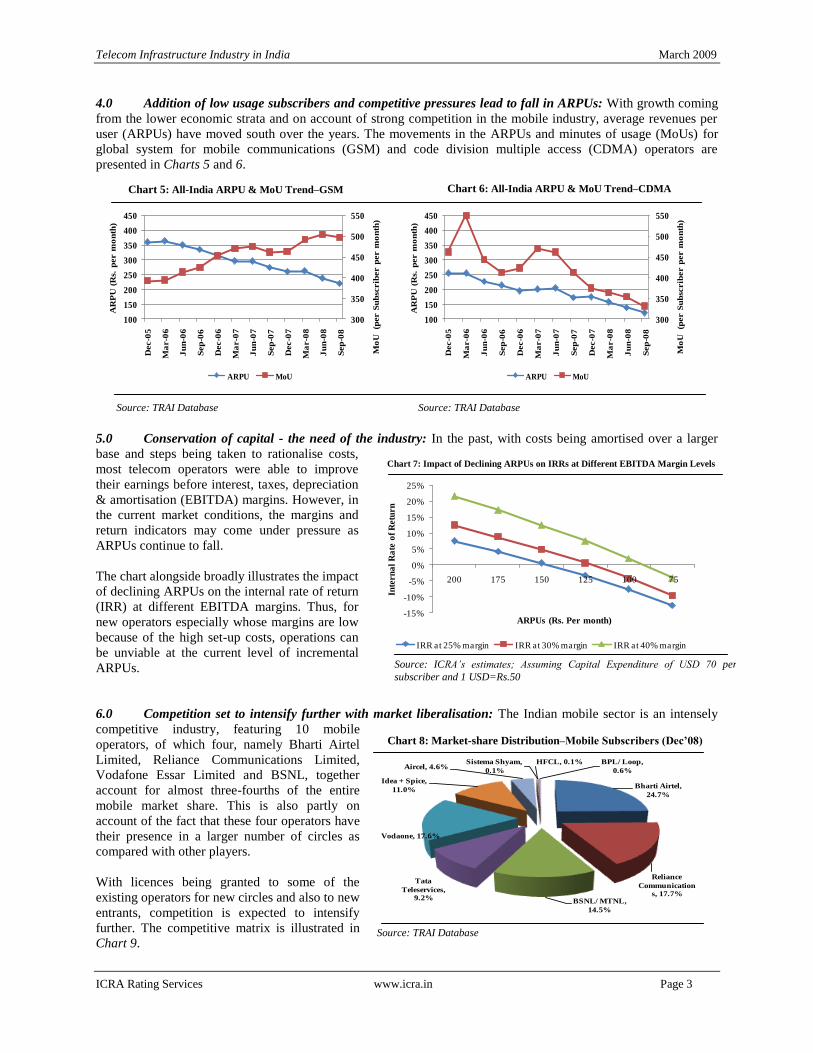
4.0 Addition of low usage subscribers and competitive pressures lead to fall in ARPUs: With growth coming
from the lower economic strata and on account of strong competition in the mobile industry, average revenues per
user (ARPUs) have moved south over the years. The movements in the ARPUs and minutes of usage (MoUs) for
global system for mobile communications (GSM) and code division multiple access (CDMA) operators are
presented in Charts 5 and 6.
5.0 Conservation of capital - the need of the industry: In the past, with costs being amortised over a larger
base and steps being taken to rationalise costs,
most telecom operators were able to improve
their earnings before interest, taxes, depreciation
& amortisation (EBITDA) margins. However, in
the current market conditions, the margins and
return indicators may come under pressure as
ARPUs continue to fall.
The chart alongside broadly illustrates the impact
of declining ARPUs on the internal rate of return
(IRR) at different EBITDA margins. Thus, for
new operators especially whose margins are low
because of the high set-up costs, operations can
be unviable at the current level of incremental
ARPUs.
6.0 Competition set to intensify further with market liberalisation: The Indian mobile sector is an intensely
competitive industry, featuring 10 mobile
operators, of which four, namely Bharti Airtel
Limited, Reliance Communications Limited,
Vodafone Essar Limited and BSNL, together
account for almost three-fourths of the entire
mobile market share. This is also partly on
account of the fact that these four operators have
their presence in a larger number of circles as
compared with other players.
With licences being granted to some of the
existing operators for new circles and also to new
entrants, competition is expected to intensify
further. The competitive matrix is illustrated in
Chart 9.
Chart 5: All-India ARPU & MoU Trend–GSM Chart 6: All-India ARPU & MoU Trend–CDMA
Source: TRAI Database Source: TRAI Database
300
350
400
450
500
550
100
150
200
250
300
350
400
450
Dec-0
5
Ma
r-0
6
Ju
n-0
6
Sep
-06
Dec-0
6
Ma
r-0
7
Ju
n-0
7
Sep
-07
Dec-0
7
Ma
r-0
8
Ju
n-0
8
Sep
-08
Mo
U
(per S
ub
scrib
er p
er m
on
th)
AR
PU
(R
s. p
er m
on
th)
ARPU MoU
300
350
400
450
500
550
100
150
200
250
300
350
400
450
Dec-0
5
Ma
r-0
6
Ju
n-0
6
Sep
-06
Dec-0
6
Ma
r-0
7
Ju
n-0
7
Sep
-07
Dec-0
7
Ma
r-0
8
Ju
n-0
8
Sep
-08
Mo
U
(per S
ub
scrib
er p
er m
on
th)
AR
PU
(R
s. p
er m
on
th)
ARPU MoU
Chart 7: Impact of Declining ARPUs on IRRs at Different EBITDA Margin Levels
Source: ICRA’s estimates; Assuming Capital Expenditure of USD 70 per
subscriber and 1 USD=Rs.50
-15%
-10%
-5%
0%
5%
10%
15%
20%
25%
200 175 150 125 100 75
Inte
rn
al
Ra
te o
f R
etu
rn
ARPUs (Rs. Per month)
IRR at 25% margin IRR at 30% margin IRR at 40% margin
Chart 8: Market-share Distribution–Mobile Subscribers (Dec’08)
Source: TRAI Database
Bharti Airtel,
24.7%
Reliance
Communications, 17.7%
BSNL/ MTNL,
14.5%
Tata
Teleservices, 9.2%
Vodaone, 17.6%
Idea + Spice,
11.0%
Aircel, 4.6%HFCL, 0.1%Sistema Shyam,
0.1%
BPL/ Loop,
0.6%
Telecom Infrastructure Industry in India March 2009
ICRA Rating Services www.icra.in Page 4
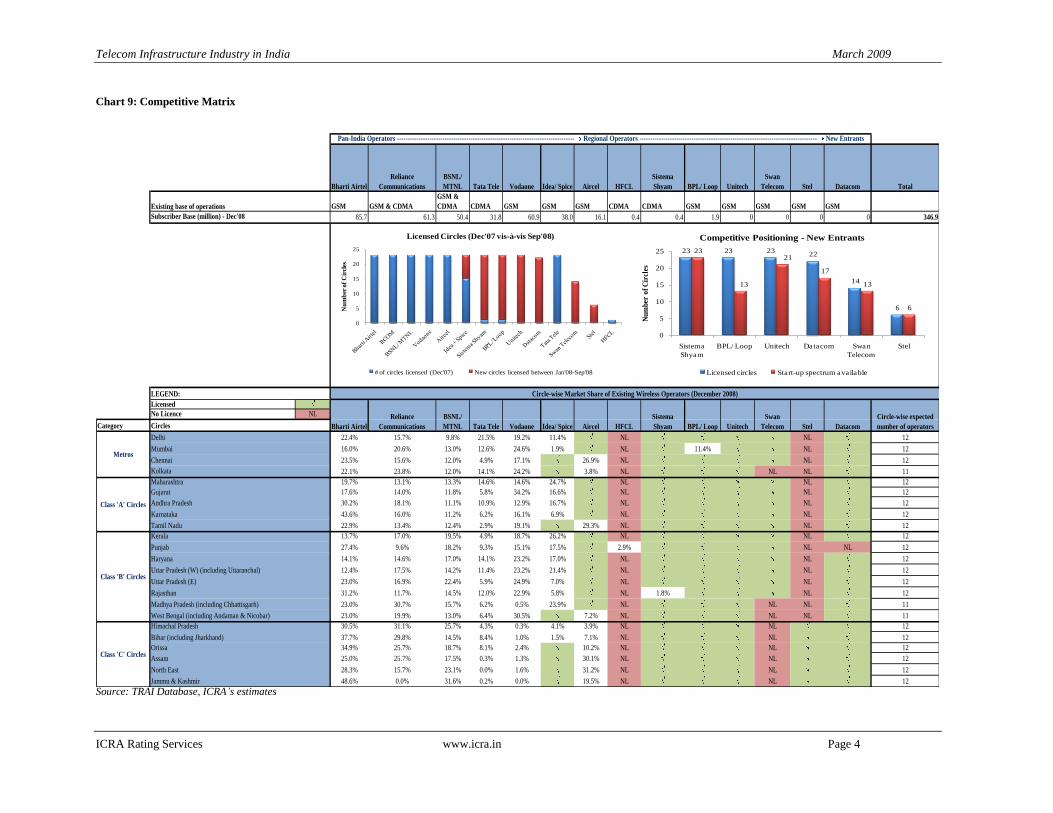
Chart 9: Competitive Matrix
Source: TRAI Database, ICRA’s estimates
23 23 2322
14
6
23
13
21
17
13
6
0
5
10
15
20
25
Sistema
Shyam
BPL/ Loop Unitech Datacom Swan
Telecom
Stel
Nu
mb
er o
f C
ircl
es
Competitive Positioning - New Entrants
Licensed circles Start-up spectrum available
0
5
10
15
20
25
Nu
mb
er o
f C
ircl
es
Licensed Circles (Dec'07 vis-à-vis Sep'08)
# of circles licensed (Dec'07) New circles licensed between Jan'08-Sep'08
GSM GSM & CDMA
GSM &
CDMA CDMA GSM GSM GSM CDMA CDMA GSM GSM GSM GSM GSM
85.7 61.3 50.4 31.8 60.9 38.0 16.1 0.4 0.4 1.9 0 0 0 0 346.9
LEGEND:
Licensed
No Licence NL
Category
22.4% 15.7% 9.8% 21.5% 19.2% 11.4% NL NL 12
16.0% 20.6% 13.0% 12.6% 24.6% 1.9% NL 11.4% NL 12
23.5% 15.6% 12.0% 4.9% 17.1% 26.9% NL NL 12
22.1% 23.8% 12.0% 14.1% 24.2% 3.8% NL NL NL 11
19.7% 13.1% 13.3% 14.6% 14.6% 24.7% NL NL 12
17.6% 14.0% 11.8% 5.8% 34.2% 16.6% NL NL 12
30.2% 18.1% 11.1% 10.9% 12.9% 16.7% NL NL 12
43.6% 16.0% 11.2% 6.2% 16.1% 6.9% NL NL 12
22.9% 13.4% 12.4% 2.9% 19.1% 29.3% NL NL 12
13.7% 17.0% 19.5% 4.9% 18.7% 26.2% NL NL 12
27.4% 9.6% 18.2% 9.3% 15.1% 17.5% 2.9% NL NL 12
14.1% 14.6% 17.0% 14.1% 23.2% 17.0% NL NL 12
12.4% 17.5% 14.2% 11.4% 23.2% 21.4% NL NL 12
23.0% 16.9% 22.4% 5.9% 24.9% 7.0% NL NL 12
31.2% 11.7% 14.5% 12.0% 22.9% 5.8% NL 1.8% NL 12
23.0% 30.7% 15.7% 6.2% 0.5% 23.9% NL NL NL 11
23.0% 19.9% 13.0% 6.4% 30.5% 7.2% NL NL NL 11
30.5% 31.1% 25.7% 4.3% 0.3% 4.1% 3.9% NL NL 12
37.7% 29.8% 14.5% 8.4% 1.0% 1.5% 7.1% NL NL 12
34.9% 25.7% 18.7% 8.1% 2.4% 10.2% NL NL 12
25.0% 25.7% 17.5% 0.3% 1.3% 30.1% NL NL 12
28.3% 15.7% 23.1% 0.0% 1.6% 31.2% NL NL 12
48.6% 0.0% 31.6% 0.2% 0.0% 19.5% NL NL 12
Idea/ Spice Aircel HFCL
Sistema
Shyam Unitech
Swan
Telecom Stel Datacom
Pan-India Operators ---------------------------------------------------------------------------------- Regional Operators ---------------------------------------------------------------------------------- New Entrants
Bharti Airtel
Reliance
Communications
BSNL/
MTNL Tata Tele Vodaone Total
Circle-wise Market Share of Existing Wireless Operators (December 2008)
Bharti Airtel
Reliance
Communications
BSNL/
MTNL Tata Tele Vodaone Idea/ Spice
BPL/ Loop
Aircel HFCL
Sistema
Shyam BPL/ Loop Unitech
Swan
Telecom Stel Datacom
Circle-wise expected
number of operators
Metros
Class 'A' Circles
Class 'B' Circles
Gujarat
Andhra Pradesh
Karnataka
Tamil Nadu
Existing base of operations
Subscriber Base (million) - Dec'08
Delhi
Mumbai
Chennai
Kolkata
Maharashtra
Punjab
Rajasthan
Class 'C' Circles
North East
Jammu & Kashmir
Assam
Circles
Madhya Pradesh (including Chhattisgarh)
West Bengal (including Andaman & Nicobar)
Himachal Pradesh
Bihar (including Jharkhand)
Orissa
Kerala
Haryana
Uttar Pradesh (W) (including Uttaranchal)
Uttar Pradesh (E)
Telecom Infrastructure Industry in India March 2009
ICRA Rating Services www.icra.in Page 5
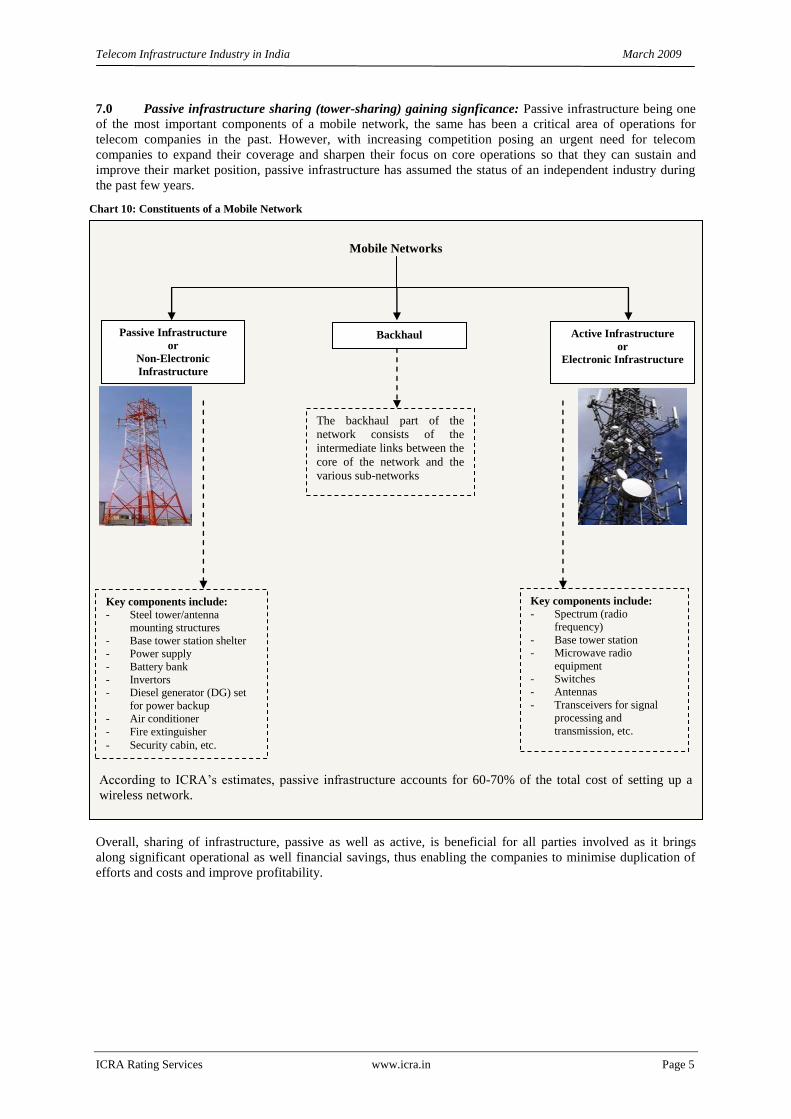
7.0 Passive infrastructure sharing (tower-sharing) gaining signficance: Passive infrastructure being one
of the most important components of a mobile network, the same has been a critical area of operations for
telecom companies in the past. However, with increasing competition posing an urgent need for telecom
companies to expand their coverage and sharpen their focus on core operations so that they can sustain and
improve their market position, passive infrastructure has assumed the status of an independent industry during
the past few years.
Overall, sharing of infrastructure, passive as well as active, is beneficial for all parties involved as it brings
along significant operational as well financial savings, thus enabling the companies to minimise duplication of
efforts and costs and improve profitability.
Chart 10: Constituents of a Mobile Network
Mobile Networks
According to ICRA’s estimates, passive infrastructure accounts for 60-70% of the total cost of setting up a
wireless network.
Passive Infrastructure
or
Non-Electronic
Infrastructure
Active Infrastructure
or
Electronic Infrastructure
Backhaul
Key components include:
- Steel tower/antenna
mounting structures
- Base tower station shelter
- Power supply
- Battery bank
- Invertors
- Diesel generator (DG) set
for power backup
- Air conditioner
- Fire extinguisher
- Security cabin, etc.
Key components include:
- Spectrum (radio
frequency)
- Base tower station
- Microwave radio
equipment
- Switches
- Antennas
- Transceivers for signal
processing and
transmission, etc.
The backhaul part of the
network consists of the
intermediate links between the
core of the network and the
various sub-networks
Telecom Infrastructure Industry in India March 2009
ICRA Rating Services www.icra.in Page 6
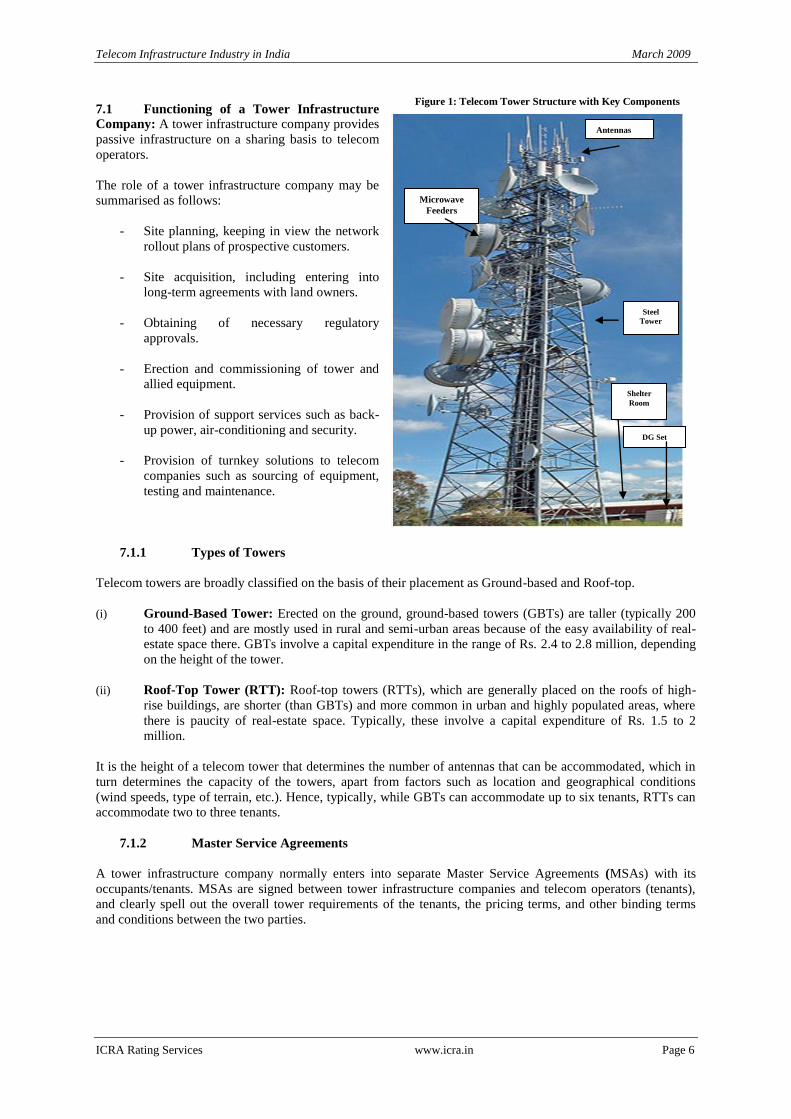
7.1 Functioning of a Tower Infrastructure
Company: A tower infrastructure company provides
passive infrastructure on a sharing basis to telecom
operators.
The role of a tower infrastructure company may be
summarised as follows:
- Site planning, keeping in view the network
rollout plans of prospective customers.
- Site acquisition, including entering into
long-term agreements with land owners.
- Obtaining of necessary regulatory
approvals.
- Erection and commissioning of tower and
allied equipment.
- Provision of support services such as back-
up power, air-conditioning and security.
- Provision of turnkey solutions to telecom
companies such as sourcing of equipment,
testing and maintenance.
7.1.1 Types of Towers
Telecom towers are broadly classified on the basis of their placement as Ground-based and Roof-top.
(i) Ground-Based Tower: Erected on the ground, ground-based towers (GBTs) are taller (typically 200
to 400 feet) and are mostly used in rural and semi-urban areas because of the easy availability of real-
estate space there. GBTs involve a capital expenditure in the range of Rs. 2.4 to 2.8 million, depending
on the height of the tower.
(ii) Roof-Top Tower (RTT): Roof-top towers (RTTs), which are generally placed on the roofs of high-
rise buildings, are shorter (than GBTs) and more common in urban and highly populated areas, where
there is paucity of real-estate space. Typically, these involve a capital expenditure of Rs. 1.5 to 2
million.
It is the height of a telecom tower that determines the number of antennas that can be accommodated, which in
turn determines the capacity of the towers, apart from factors such as location and geographical conditions
(wind speeds, type of terrain, etc.). Hence, typically, while GBTs can accommodate up to six tenants, RTTs can
accommodate two to three tenants.
7.1.2 Master Service Agreements
A tower infrastructure company normally enters into separate Master Service Agreements (MSAs) with its
occupants/tenants. MSAs are signed between tower infrastructure companies and telecom operators (tenants),
and clearly spell out the overall tower requirements of the tenants, the pricing terms, and other binding terms
and conditions between the two parties.
Figure 1: Telecom Tower Structure with Key Components
Antennas
Microwave
Feeders
Shelter
Room
DG Set
Steel
Tower
Telecom Infrastructure Industry in India March 2009
ICRA Rating Services www.icra.in Page 7
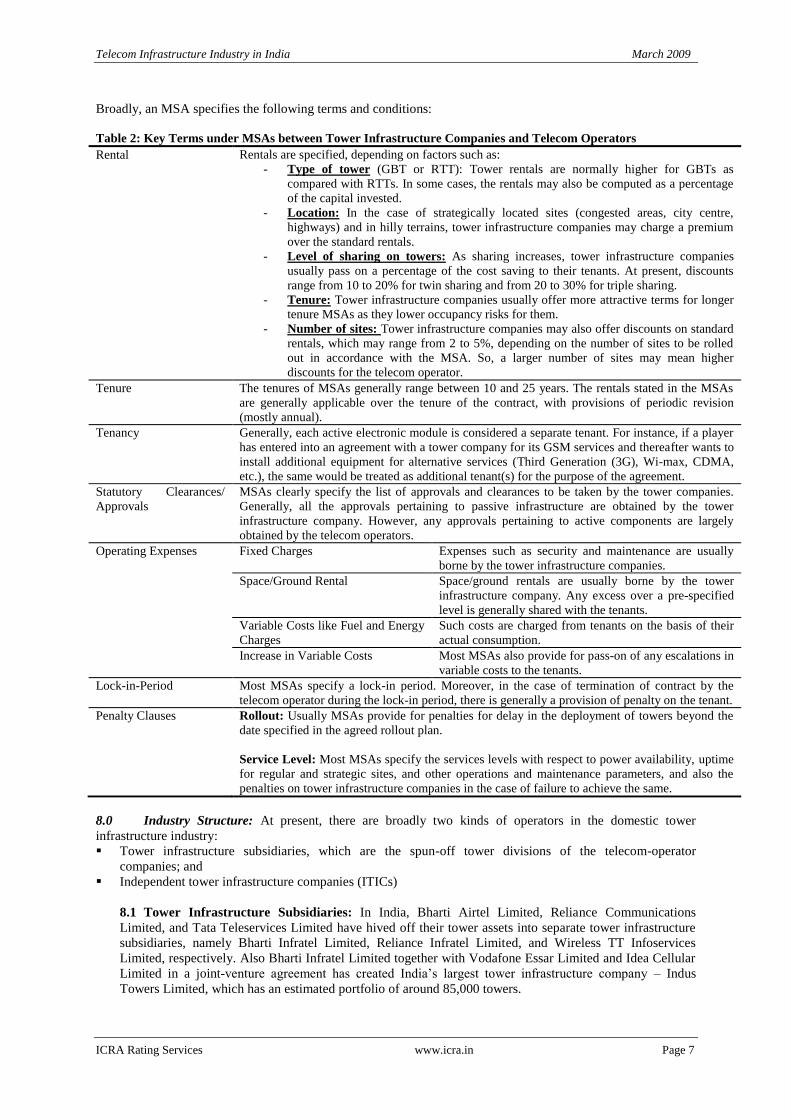
Broadly, an MSA specifies the following terms and conditions:
Table 2: Key Terms under MSAs between Tower Infrastructure Companies and Telecom Operators
Rental Rentals are specified, depending on factors such as:
- Type of tower (GBT or RTT): Tower rentals are normally higher for GBTs as
compared with RTTs. In some cases, the rentals may also be computed as a percentage
of the capital invested.
- Location: In the case of strategically located sites (congested areas, city centre,
highways) and in hilly terrains, tower infrastructure companies may charge a premium
over the standard rentals.
- Level of sharing on towers: As sharing increases, tower infrastructure companies
usually pass on a percentage of the cost saving to their tenants. At present, discounts
range from 10 to 20% for twin sharing and from 20 to 30% for triple sharing.
- Tenure: Tower infrastructure companies usually offer more attractive terms for longer
tenure MSAs as they lower occupancy risks for them.
- Number of sites: Tower infrastructure companies may also offer discounts on standard
rentals, which may range from 2 to 5%, depending on the number of sites to be rolled
out in accordance with the MSA. So, a larger number of sites may mean higher
discounts for the telecom operator.
Tenure The tenures of MSAs generally range between 10 and 25 years. The rentals stated in the MSAs
are generally applicable over the tenure of the contract, with provisions of periodic revision
(mostly annual).
Tenancy Generally, each active electronic module is considered a separate tenant. For instance, if a player
has entered into an agreement with a tower company for its GSM services and thereafter wants to
install additional equipment for alternative services (Third Generation (3G), Wi-max, CDMA,
etc.), the same would be treated as additional tenant(s) for the purpose of the agreement.
Statutory Clearances/
Approvals
MSAs clearly specify the list of approvals and clearances to be taken by the tower companies.
Generally, all the approvals pertaining to passive infrastructure are obtained by the tower
infrastructure company. However, any approvals pertaining to active components are largely
obtained by the telecom operators.
Operating Expenses Fixed Charges Expenses such as security and maintenance are usually
borne by the tower infrastructure companies.
Space/Ground Rental Space/ground rentals are usually borne by the tower
infrastructure company. Any excess over a pre-specified
level is generally shared with the tenants.
Variable Costs like Fuel and Energy
Charges
Such costs are charged from tenants on the basis of their
actual consumption.
Increase in Variable Costs Most MSAs also provide for pass-on of any escalations in
variable costs to the tenants.
Lock-in-Period Most MSAs specify a lock-in period. Moreover, in the case of termination of contract by the
telecom operator during the lock-in period, there is generally a provision of penalty on the tenant.
Penalty Clauses Rollout: Usually MSAs provide for penalties for delay in the deployment of towers beyond the
date specified in the agreed rollout plan.
Service Level: Most MSAs specify the services levels with respect to power availability, uptime
for regular and strategic sites, and other operations and maintenance parameters, and also the
penalties on tower infrastructure companies in the case of failure to achieve the same.
8.0 Industry Structure: At present, there are broadly two kinds of operators in the domestic tower
infrastructure industry:
Tower infrastructure subsidiaries, which are the spun-off tower divisions of the telecom-operator
companies; and
Independent tower infrastructure companies (ITICs)
8.1 Tower Infrastructure Subsidiaries: In India, Bharti Airtel Limited, Reliance Communications
Limited, and Tata Teleservices Limited have hived off their tower assets into separate tower infrastructure
subsidiaries, namely Bharti Infratel Limited, Reliance Infratel Limited, and Wireless TT Infoservices
Limited, respectively. Also Bharti Infratel Limited together with Vodafone Essar Limited and Idea Cellular
Limited in a joint-venture agreement has created India’s largest tower infrastructure company – Indus
Towers Limited, which has an estimated portfolio of around 85,000 towers.
Telecom Infrastructure Industry in India March 2009
ICRA Rating Services www.icra.in Page 8
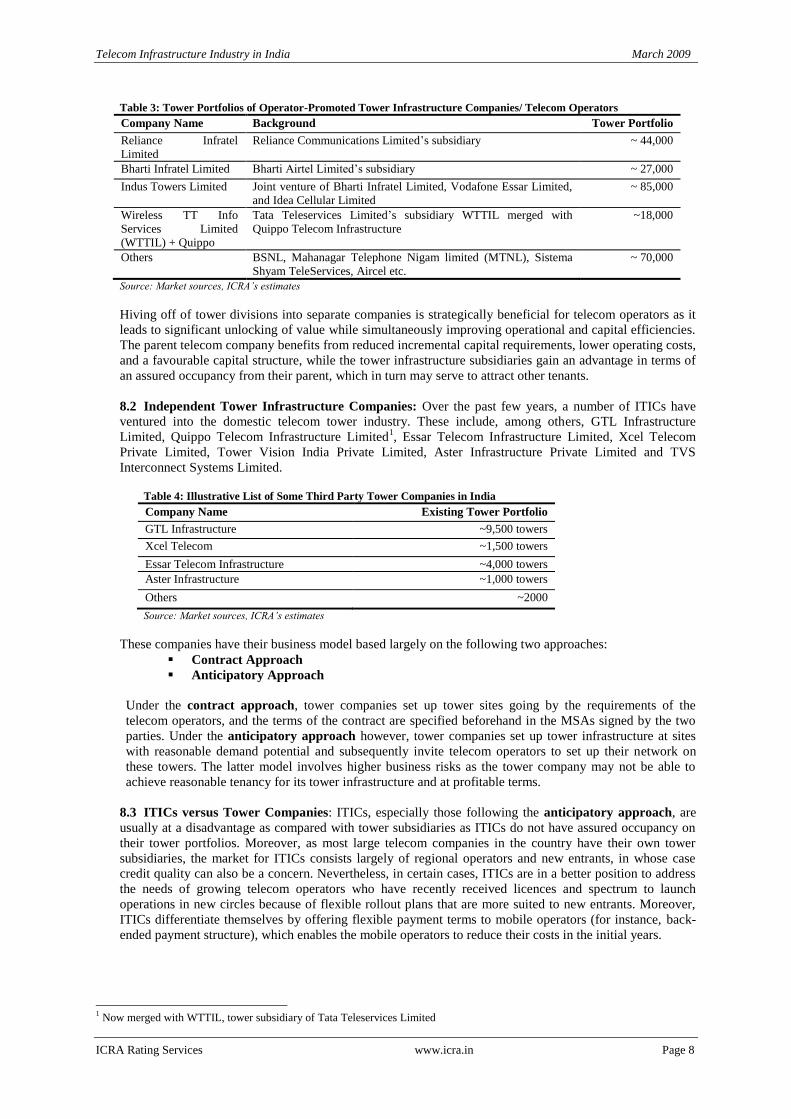
Table 3: Tower Portfolios of Operator-Promoted Tower Infrastructure Companies/ Telecom Operators
Company Name Background Tower Portfolio
Reliance Infratel
Limited
Reliance Communications Limited’s subsidiary ~ 44,000
Bharti Infratel Limited Bharti Airtel Limited’s subsidiary ~ 27,000
Indus Towers Limited Joint venture of Bharti Infratel Limited, Vodafone Essar Limited,
and Idea Cellular Limited
~ 85,000
Wireless TT Info
Services Limited
(WTTIL) + Quippo
Tata Teleservices Limited’s subsidiary WTTIL merged with
Quippo Telecom Infrastructure
~18,000
Others BSNL, Mahanagar Telephone Nigam limited (MTNL), Sistema
Shyam TeleServices, Aircel etc.
~ 70,000
Source: Market sources, ICRA’s estimates
Hiving off of tower divisions into separate companies is strategically beneficial for telecom operators as it
leads to significant unlocking of value while simultaneously improving operational and capital efficiencies.
The parent telecom company benefits from reduced incremental capital requirements, lower operating costs,
and a favourable capital structure, while the tower infrastructure subsidiaries gain an advantage in terms of
an assured occupancy from their parent, which in turn may serve to attract other tenants.
8.2 Independent Tower Infrastructure Companies: Over the past few years, a number of ITICs have
ventured into the domestic telecom tower industry. These include, among others, GTL Infrastructure
Limited, Quippo Telecom Infrastructure Limited1, Essar Telecom Infrastructure Limited, Xcel Telecom
Private Limited, Tower Vision India Private Limited, Aster Infrastructure Private Limited and TVS
Interconnect Systems Limited. Table 4: Illustrative List of Some Third Party Tower Companies in India
Company Name Existing Tower Portfolio
GTL Infrastructure ~9,500 towers
Xcel Telecom ~1,500 towers
Essar Telecom Infrastructure ~4,000 towers
Aster Infrastructure ~1,000 towers
Others ~2000
Source: Market sources, ICRA’s estimates
These companies have their business model based largely on the following two approaches:
Contract Approach
Anticipatory Approach
Under the contract approach, tower companies set up tower sites going by the requirements of the
telecom operators, and the terms of the contract are specified beforehand in the MSAs signed by the two
parties. Under the anticipatory approach however, tower companies set up tower infrastructure at sites
with reasonable demand potential and subsequently invite telecom operators to set up their network on
these towers. The latter model involves higher business risks as the tower company may not be able to
achieve reasonable tenancy for its tower infrastructure and at profitable terms.
8.3 ITICs versus Tower Companies: ITICs, especially those following the anticipatory approach, are
usually at a disadvantage as compared with tower subsidiaries as ITICs do not have assured occupancy on
their tower portfolios. Moreover, as most large telecom companies in the country have their own tower
subsidiaries, the market for ITICs consists largely of regional operators and new entrants, in whose case
credit quality can also be a concern. Nevertheless, in certain cases, ITICs are in a better position to address
the needs of growing telecom operators who have recently received licences and spectrum to launch
operations in new circles because of flexible rollout plans that are more suited to new entrants. Moreover,
ITICs differentiate themselves by offering flexible payment terms to mobile operators (for instance, back-
ended payment structure), which enables the mobile operators to reduce their costs in the initial years.
1 Now merged with WTTIL, tower subsidiary of Tata Teleservices Limited
Telecom Infrastructure Industry in India March 2009
ICRA Rating Services www.icra.in Page 9
9.0 Economics of the Model—Tower Infrastructure Companies
The key points relating to the working of tower infrastructure companies are discussed in following bullet list.
- High initial capital investments: On an average, while a roof-top tower involves a capital expenditure
of Rs. 1.5 to 2 million; a ground-based tower requires a capital expenditure of Rs. 2.4 to 2.8 million.
Given the high capital investments required in the business, tower companies are generally highly
leveraged.
- Stable and predictable cash flow business: Once a tower asset is rented out, it usually generates a
stable and predictable cash flow in the form of tower rentals from occupants over the term of the MSA
between the two parties.
- Low working capital requirement: The tower business is also characterised by low working capital
requirements, as most of the operating expenses (such as electricity and fuel and other variable
operating expenses) are reimbursable by the tenants on actual basis. Moreover, the larger companies
with a bigger and geographically spread out portfolio of networks may be able to get rentals for the
towers in advance and also obtain better credit terms from their suppliers, thus further improving their
working capital cycle.
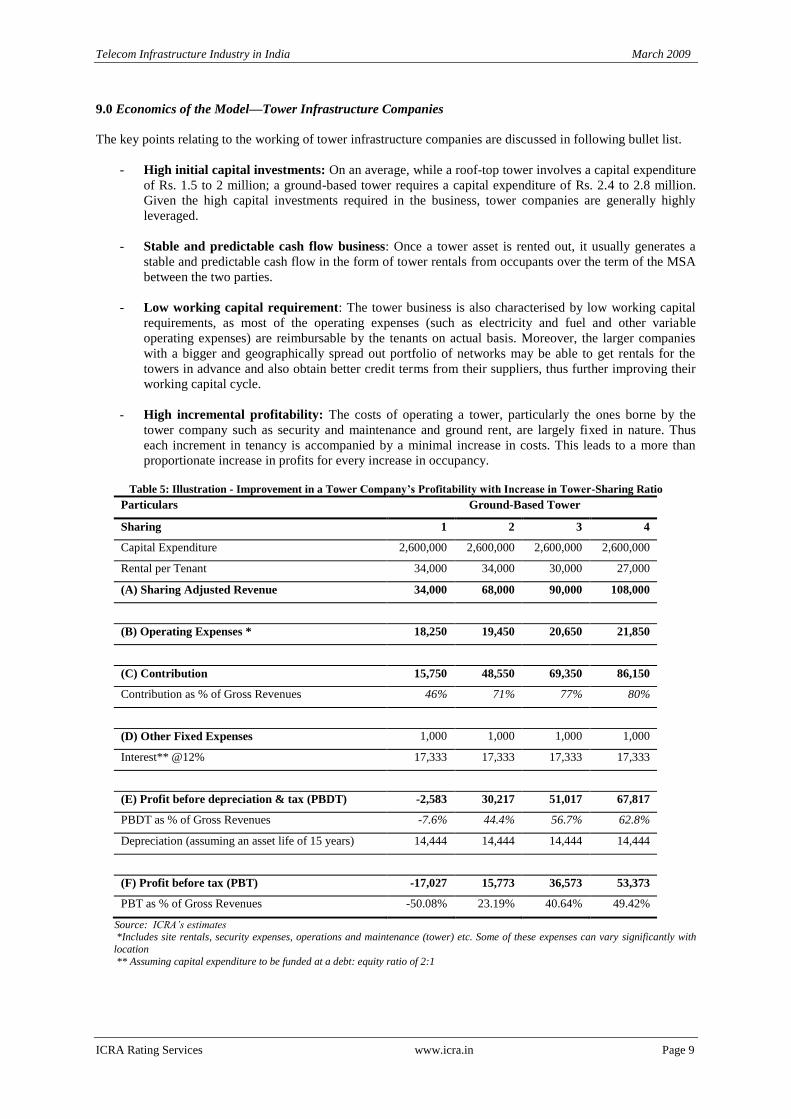
- High incremental profitability: The costs of operating a tower, particularly the ones borne by the
tower company such as security and maintenance and ground rent, are largely fixed in nature. Thus
each increment in tenancy is accompanied by a minimal increase in costs. This leads to a more than
proportionate increase in profits for every increase in occupancy.
Table 5: Illustration - Improvement in a Tower Company’s Profitability with Increase in Tower-Sharing Ratio
Particulars Ground-Based Tower
Sharing 1 2 3 4
Capital Expenditure 2,600,000 2,600,000 2,600,000 2,600,000
Rental per Tenant 34,000 34,000 30,000 27,000
(A) Sharing Adjusted Revenue 34,000 68,000 90,000 108,000
(B) Operating Expenses * 18,250 19,450 20,650 21,850
(C) Contribution 15,750 48,550 69,350 86,150
Contribution as % of Gross Revenues 46% 71% 77% 80%
(D) Other Fixed Expenses 1,000 1,000 1,000 1,000
Interest** @12% 17,333 17,333 17,333 17,333
(E) Profit before depreciation & tax (PBDT) -2,583 30,217 51,017 67,817
PBDT as % of Gross Revenues -7.6% 44.4% 56.7% 62.8%
Depreciation (assuming an asset life of 15 years) 14,444 14,444 14,444 14,444
(F) Profit before tax (PBT) -17,027 15,773 36,573 53,373
PBT as % of Gross Revenues -50.08% 23.19% 40.64% 49.42%
Source: ICRA’s estimates *Includes site rentals, security expenses, operations and maintenance (tower) etc. Some of these expenses can vary significantly with
location
** Assuming capital expenditure to be funded at a debt: equity ratio of 2:1
Telecom Infrastructure Industry in India March 2009
ICRA Rating Services www.icra.in Page 10
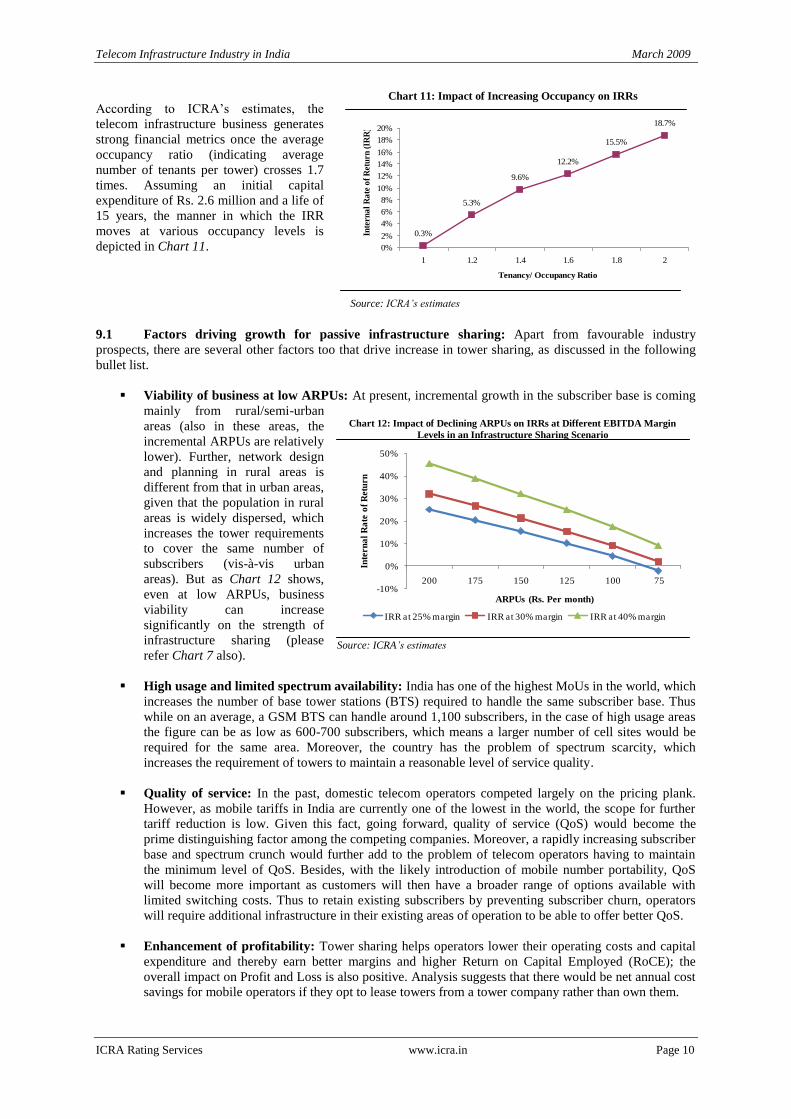
According to ICRA’s estimates, the
telecom infrastructure business generates
strong financial metrics once the average
occupancy ratio (indicating average
number of tenants per tower) crosses 1.7
times. Assuming an initial capital
expenditure of Rs. 2.6 million and a life of
15 years, the manner in which the IRR
moves at various occupancy levels is
depicted in Chart 11.
9.1 Factors driving growth for passive infrastructure sharing: Apart from favourable industry
prospects, there are several other factors too that drive increase in tower sharing, as discussed in the following
bullet list.
Viability of business at low ARPUs: At present, incremental growth in the subscriber base is coming
mainly from rural/semi-urban
areas (also in these areas, the
incremental ARPUs are relatively
lower). Further, network design
and planning in rural areas is
different from that in urban areas,
given that the population in rural
areas is widely dispersed, which
increases the tower requirements
to cover the same number of
subscribers (vis-à-vis urban
areas). But as Chart 12 shows,
even at low ARPUs, business
viability can increase
significantly on the strength of
infrastructure sharing (please
refer Chart 7 also).
High usage and limited spectrum availability: India has one of the highest MoUs in the world, which
increases the number of base tower stations (BTS) required to handle the same subscriber base. Thus
while on an average, a GSM BTS can handle around 1,100 subscribers, in the case of high usage areas
the figure can be as low as 600-700 subscribers, which means a larger number of cell sites would be
required for the same area. Moreover, the country has the problem of spectrum scarcity, which
increases the requirement of towers to maintain a reasonable level of service quality.
Quality of service: In the past, domestic telecom operators competed largely on the pricing plank.
However, as mobile tariffs in India are currently one of the lowest in the world, the scope for further
tariff reduction is low. Given this fact, going forward, quality of service (QoS) would become the
prime distinguishing factor among the competing companies. Moreover, a rapidly increasing subscriber
base and spectrum crunch would further add to the problem of telecom operators having to maintain
the minimum level of QoS. Besides, with the likely introduction of mobile number portability, QoS
will become more important as customers will then have a broader range of options available with
limited switching costs. Thus to retain existing subscribers by preventing subscriber churn, operators
will require additional infrastructure in their existing areas of operation to be able to offer better QoS.
Enhancement of profitability: Tower sharing helps operators lower their operating costs and capital
expenditure and thereby earn better margins and higher Return on Capital Employed (RoCE); the
overall impact on Profit and Loss is also positive. Analysis suggests that there would be net annual cost
savings for mobile operators if they opt to lease towers from a tower company rather than own them.
ICRA’s estimates
Chart 12: Impact of Declining ARPUs on IRRs at Different EBITDA Margin
Levels in an Infrastructure Sharing Scenario
Source: ICRA’s estimates
-10%
0%
10%
20%
30%
40%
50%
200 175 150 125 100 75
Inte
rn
al
Ra
te o
f R
etu
rn
ARPUs (Rs. Per month)
IRR at 25% margin IRR at 30% margin IRR at 40% margin
Chart 11: Impact of Increasing Occupancy on IRRs
Source: ICRA’s estimates
0.3%
5.3%
9.6%
12.2%
15.5%
18.7%
0%
2%
4%
6%
8%
10%
12%
14%
16%
18%
20%
1 1.2 1.4 1.6 1.8 2
Tenancy/ Occupancy Ratio
Inte
rna
l R
ate
of
Ret
urn
(IR
R)
Telecom Infrastructure Industry in India March 2009
ICRA Rating Services www.icra.in Page 11
Table 6: Incremental Costs in Owning vs. Leasing a Tower
Amounts in Rs. Owned Leased Difference
Operating Expenses 543,000 312,000 231,000
Tower Rentals 0 408,000 -408,000
Depreciation 173,333 0 173,333
Cost of Capital 312,000 0 312,000
Overall Saving 308,333
Source: ICRA’s estimates Note: Calculations assume a tower cost of Rs. 2.6 million, life of
asset of 15 years and 12% cost of capital. The operating expenses
are indicative.
Entry of new players and expansion plans of existing operators: Recently, several regional
operators such as Vodafone Essar Limited, Idea Cellular Limited, Aircel Cellular Limited and Shyam
Telelink Limited (now Sistema Shyam Teleservices Limited) have received licences as well spectrum
in new circles, which would enable them to become pan-India operators in the next one-two years.
Also, new licences have been issued to players such as Unitech, Swan Telecom, and S Tel Limited.
Given the significant expansion plans of new entrants over the medium term and the need for them to
optimise investments in order to maintain returns, demand for towers is expected to report a sharp
increase.
Shorter rollout time, a key necessity: As the domestic telecom industry is highly competitive, doing
business may not be easy for the new entrants. Moreover, given that the incumbents already have the
competitive advantages of widespread distribution networks, established brand names and strong
subscriber base, shorter network-rollout time would be a critical success factor for the new entrants; a
longer rollout time could mean loss of substantial market share to other operators. Tower companies
allow players to start operations in a particular region just by installing their electronics on the ready-
to-use towers, thereby significantly shortening the rollout time.
New technologies to further stimulate demand: 3G services are expected to be launched in the
country in 2009-10. Moreover, in order to augment their services, various operators plan to launch Wi-
Max services as soon as they receive additional spectrum from Government. This would further
increase the demand for sharing of passive infrastructure.
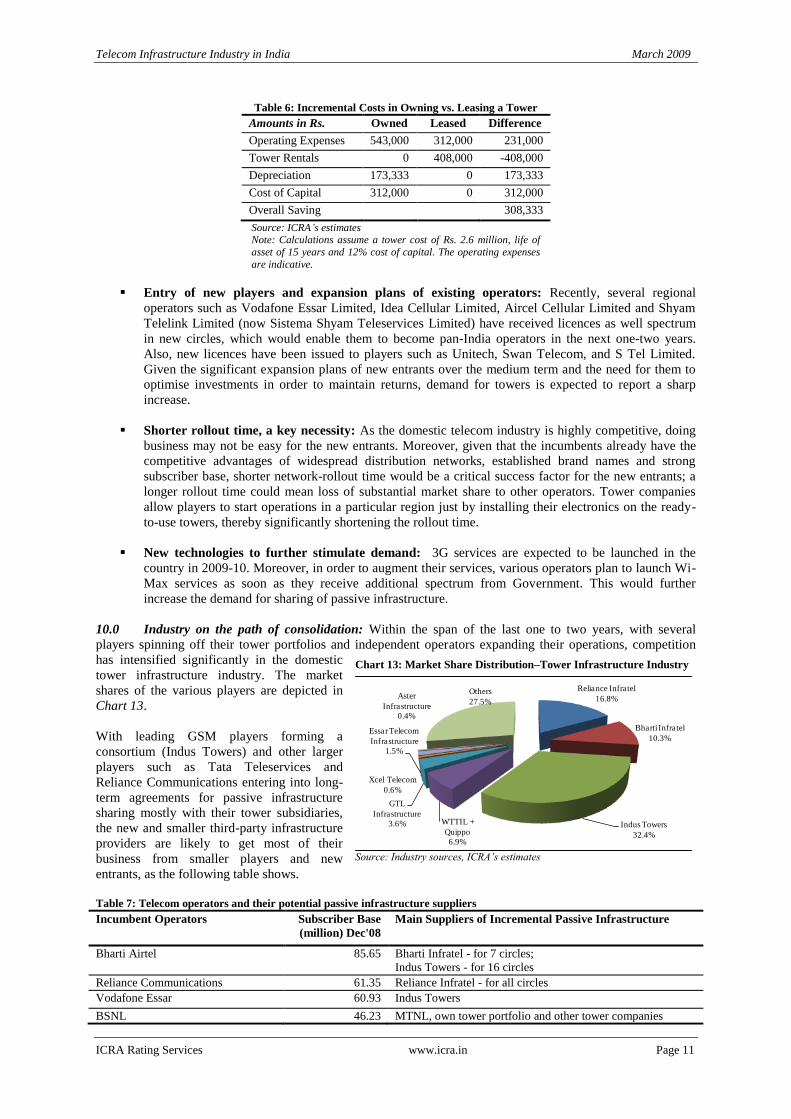
10.0 Industry on the path of consolidation: Within the span of the last one to two years, with several
players spinning off their tower portfolios and independent operators expanding their operations, competition
has intensified significantly in the domestic
tower infrastructure industry. The market
shares of the various players are depicted in
Chart 13.
With leading GSM players forming a
consortium (Indus Towers) and other larger
players such as Tata Teleservices and
Reliance Communications entering into long-
term agreements for passive infrastructure
sharing mostly with their tower subsidiaries,
the new and smaller third-party infrastructure
providers are likely to get most of their
business from smaller players and new
entrants, as the following table shows.
Table 7: Telecom operators and their potential passive infrastructure suppliers
Incumbent Operators Subscriber Base
(million) Dec'08
Main Suppliers of Incremental Passive Infrastructure
Bharti Airtel 85.65 Bharti Infratel - for 7 circles;
Indus Towers - for 16 circles
Reliance Communications 61.35 Reliance Infratel - for all circles
Vodafone Essar 60.93 Indus Towers
BSNL 46.23 MTNL, own tower portfolio and other tower companies
Chart 13: Market Share Distribution–Tower Infrastructure Industry
Source: Industry sources, ICRA’s estimates
Reliance Infratel
16.8%
Bharti Infratel
10.3%
Indus Towers
32.4%
WTTIL +
Quippo
6.9%
GTL
Infrastructure
3.6%
Xcel Telecom
0.6%
Essar Telecom
Infrastructure
1.5%
Aster
Infrastructure
0.4%
Others
27.5%
Telecom Infrastructure Industry in India March 2009
ICRA Rating Services www.icra.in Page 12
Incumbent Operators Subscriber Base
(million) Dec'08
Main Suppliers of Incremental Passive Infrastructure
Idea Cellular/ Spice 38.01 Indus Towers
Tata Teleservices 31.76 WTTIL
Aircel Cellular 16.08 Own and other tower companies
MTNL 4.19 BSNL, own tower portfolio and other tower companies
BPL Mobile Communications 1.95 Own and other tower companies
HFCL Infotel 0.38 Own and other tower companies
Sistema Shyam TeleServices 0.37 Own and other tower companies
Overall, the domestic telecom infrastructure industry is expected to see consolidation in the near future given the
rapidly increasing number of independent tower infrastructure companies and following the entry of several
large telecom companies in the infrastructure business.
Summary: ICRA is of the view that demand for passive telecom infrastructure in India would continue to grow
at a healthy rate, at least over the medium term, and that this increased demand would be accompanied by
greater sharing of infrastructure by the existing as well as new telecom players. The need for such sharing, in
ICRA’s view, would be dictated by the imperative of remaining profitable in an increasingly competitive
market.
Telecom Infrastructure Industry in India March 2009
ICRA Rating Services www.icra.in Page 13
ICRA Limited An Associate of Moody’s Investors Service
CORPORATE OFFICE
Building No. 8, 2nd
Floor, Tower A, DLF Cyber City, Phase II, Gurgaon 122 002
Tel: +91 124 4545300 Fax: +91 124 4545350
Email: [email protected], Website:www.icra.in
REGISTERED OFFICE
1105, Kailash Building, 11th Floor, 26 Kasturba Gandhi Marg, New Delhi 110001
Tel: +91 11 23357940-50 Fax: +91 11 23357014
Branches: Mumbai: Tel.: + (91 22) 24331046/53/62/74/86/87, Fax: + (91 22) 2433 1390 Chennai: Tel + (91 44) 2434
0043/9659/8080, 2433 0724/ 3293/3294, Fax + (91 44) 2434 3663 Kolkata: Tel + (91 33) 2287 8839 /2287 6617/ 2283
1411/ 2280 0008, Fax + (91 33) 2287 0728 Bangalore: Tel + (91 80) 2559 7401/4049 Fax + (91 80) 559 4065
Ahmedabad: Tel + (91 79) 2658 4924/5049/2008, Fax + (91 79) 2658 4924 Hyderabad: Tel +(91 40) 2373 5061/7251,
Fax + (91 40) 2373 5152 Pune: Tel + (91 20) 2552 0194/95/96, Fax + (91 20) 553 9231
© Copyright, 2009, ICRA Limited. All Rights Reserved.
Contents may be used freely with due acknowledgement to ICRA.
All information contained herein has been obtained by ICRA from sources believed by it to be accurate and reliable.
Although reasonable care has been taken to ensure that the information herein is true, such information is provided ‘as
is’ without any warranty of any kind, and ICRA in particular, makes no representation or warranty, express or
implied, as to the accuracy, timeliness or completeness of any such information. All information contained herein
must be construed solely as statements of opinion and ICRA shall not be liable for any losses incurred by users from
any use of this publication or its contents.


![[XLS] · Web viewQuality Tools- Acceptance Sampling by Variables- Accept/Reject Camera.MTW BulbDefect.MTW Control Charts- Attributes Chart- P Chart Telephone.MTW Control Charts- Attributes](https://img.pdfslide.fr/doc/110x75/5aebc09f7f8b9ad73f8edd21/xls-viewquality-tools-acceptance-sampling-by-variables-acceptreject-cameramtw.jpg)