Embed Size (px)
Citation preview
www.ccsenet.org/jsd Journal of Sustainable Development Vol. 5, No. 2; February 2012
ISSN 1913-9063 E-ISSN 1913-9071 2
Temporal Variability of Heavy Metals Concentration in Rural Groundwater of Benue State, Middle Belt, Nigeria
Ocheri Maxwell Idoko
Department of Geography, Benue State University
Makurdi PMB102119, Nigeria
E-mail: [email protected]
Temi E. Ologunorisa
Centre for Climate Change and Environmental Research
Osun State University, Osogbo, Nigeria
E-mail: [email protected]
Aderonke A. Okoya
Institute of Ecology and Environmental Studies
Obafemi Awolowo University, Ile-Ife, Nigeria
E-mail: [email protected]
Received: October 19, 2011 Accepted: January 5, 2012 Published: February 1, 2012
doi:10.5539/jsd.v5n2p2 URL: http://dx.doi.org/10.5539/jsd.v5n2p2
Abstract
The influence of changes in season on heavy metal concentrations in rural groundwater of Benue State is investigated in this study. Water samples were collected from 26 rural community boreholes and analyzed for heavy metal concentrations as they affect the quality of drinking water based on the WHO standard and their variability for both wet and dry seasons. The analyses were carried out as prescribed in the standard methods for examination of water. The results of analyses show the mean values and CV% as follows: pH 7.55; 6.21% for wet season and 8.89; 4.24% for dry season. 414 µS/cm; 137.58% for wet season and 272.13 µS/cm; 94.92% for dry season; Fe 0.82 mg/L; 81.71% for wet season and 0.03 mg/L; 324% for dry season; Mn 0.73 mg/L; 52.05% for wet season and 0.14 mg/L; 92% for dry season; Zn 0.10 mg/L; 140% for wet season and 0.13 mg/L; 130.76% for dry season; Pb 0.74 mg/L; 75.68% for wet season and 0.04 mg/L; 170% for dry season; Cu 0.88 mg/L; 64.77% for wet season and 0.00 mg/L; 60% for dry season. Apart from pH and Zn whose values were higher in the dry season, other metals investigated had higher concentrations in the wet season. This implies that as climate becomes either wetter or drier due to phenomenal changes concentrations of heavy metals are likely to respond appropriately.
Keywords: Groundwater, Boreholes, Heavy metals, Concentrations, Seasons
1. Introduction
Heavy metals constitute a natural component of the earth’s crust. They are biodegradable, hence persist in the environment. Heavy metals may come from natural sources, leached from rocks and soils according to the geochemical mobility or from anthropogenic sources (Abolude et al., 2009; Okoya et al., 2011). Generally trace metals are always present in freshwaters from the weathering of rocks and soils. In addition industrial wastewaters discharges and mining are major sources of metals in freshwaters. Through precipitation and atmospheric deposition, significant amounts also enter the hydrological cycle through surface water (Merian, 1991; Robinson, 1996). The ability of water body to support aquatic life as well as its suitability for other uses depends on trace metals. Some metals such as manganese, zinc, copper, iron and nickel, when present in trace concentrations are important for the physiological functions of living tissue and regulate many biochemical processes (Rainbow & White, 1989; Sanders, 1997). Trace metals like manganese, zinc etc are essential at low
www.ccsenet.org/jsd Journal of Sustainable Development Vol. 5, No. 2; February 2012
Published by Canadian Center of Science and Education 3
concentrations, while others like arsenic, lead and cadmium etc are toxic even at a relatively low concentrations (Adriano, 2001).
In Nigeria, studies on heavy metal pollution have concentrated on urban environment (Mombreshora et al., 1983; Adeniyi & Mbagwu, 1990; Okoye et al., 1991; Ikem et al., 2004; Aiyesanmi, 2006; Emoyan et al., 2006; Orisakwe, 2007; Ngange et al., 2007; Elaigwu et al., 2007; Jatau et al., 2008; Odukoya & Abimbola, 2010; Oyeku & Eludoyin, 2010). This is probably due to high rate of urbanization with all its attendant problems of over concentration of socio-economic activities leading to huge generation and improperly disposed wastes both solid and liquid polluting both surface and groundwater sources (Adebayo & Rowland, 1973; Okafor, 1983; Mabogunje, 1986; Olade, 1987; Onokerhoraye, 1995). However, the results of the metal contents of the soils of Ife- Ijesa area reinforced other findings that some Pb, Mn, Zn and Cu containing fertilizer and pesticides contaminate the soils and the environment at large (Okoya et al., 2010; Okoya et al., 2011). There is little work done on heavy metal pollution of rural groundwater except in mining communities (Adaikpor et al., 2006; Ololade et al., 2008; Olubunmi & Olorunsola, 2010). They found that mining of minerals like oil petroleum, coal and bitumen pollute groundwater sources.
Groundwater includes all water found beneath the earth’s surface in the saturated zone of the aquifer. They are formations that contains sufficient saturated permeable materials to yield sufficient quantities of water to wells and spring (Loham, 1972; Todd, 1980). Groundwater development is generally believed to be the only realistic option in rural water supply (MacDonald et al., 2005). It is accessible anywhere; it is relatively cheaper to develop and maintain; it is not so prone to pollution and seasonal fluctuation as surface water, and is of good natural quality (Carter & Howsam, 1994; Calow et al., 1977; Habila, 2005). Effort of governments and non-governmental organizations has resulted in several communities having boreholes. Although a welcome development, water from some of the boreholes are of doubtful quality due to presence of colour, odour and taste which are indications of pollution. According to Appelo and Postma (1993) the importance of groundwater for human consumption and changes in quality with subsequence contamination affect human health. The chemical composition of groundwater is a measure of its suitability as source of water for human consumption and for other purposes, and also influences ecosystem health and function.
However, groundwater has come under threats from indiscriminate drilling of boreholes, increasing demand and withdrawals, geology and geochemical conditions, climate change, mineral exploitation, industrialization and agricultural land use (Mackey, 1990; Edmunds & Smedley, 1996; Adelana, 1986; MacDonald et al., 2005). According to Villholth (2006) the present and predicted increase in groundwater withdrawal for human activities globally, and the emerging threats from escalated and unplanned use and degradation, especially in the developing countries, point to the need for intensified efforts to cope with the imbalances. There is therefore the need to assess the concentration level of heavy metals and their seasonal variability in groundwater in rural communities of Benue State.
In this study, attempt is made to investigate heavy metal pollution status of rural groundwater from boreholes with respect to seasonal influence in Benue State.
2. Materials and Methods
2.1 Study Area
The study area is the rural communities of Benue State. Benue State is located within the middle belt geopolitical zone of Northern Nigeria (Figure 1). The state has a landmass of about 33,955 Sq Km and population of 4,219,244 (NPC, 2006). The State is inhabited indigenously by Tiv, Idoma, Igede, Etulo, Jukun and Hausa tribes. They are mostly farmers, fishermen and traders.
The geology of the area is predominantly sedimentary believed to have developed structurally during interglacial of the quaternary glaciation. The geology and hydrogeology of the study area fall within regional Benue Trough basin (Kogbe et al., 1978; Nyagba, 2000; Offodile, 2002). MacDonald et al. (2005) classified the geology into three groups with their characteristic hydrogeology. They are Eze Aku, Awgu and Basement complex. Awgu group comprises Awgu shale and Agbani sandstone. Awgu shale is highly carbonaceous and interbedded with muddy shelly limestone and sandstone. There are occasional layers of fine to moderately sorted sandstones known as Agbani. Hydrogeologically, little usable groundwater exists within the formation and is only found within the sandstone layers and dolerite intrusions. Agbani sandstone comprises fine to medium grained silt to sandstone interbedded with thin limestone. Groundwater tapping is more successful because of better yield. Generally, groundwater within the Awgu ground has high total hardness and total dissolved solids (Ocheri, 2010). Eze Aku group is of two formations. Namely, Eze Aku shale and Makurdi sandstone. Eze Aku shale is dominated by mudstones with occasional layers of limestones, siltstones and sandstones (Peter, 1978; Nwajide,
www.ccsenet.org/jsd Journal of Sustainable Development Vol. 5, No. 2; February 2012
ISSN 1913-9063 E-ISSN 1913-9071 4
1990). Makurdi sandstone occurs where sandstone dominate. Sandstones are usually believed to best aquifers in terms of groundwater yield. Basement complex rocks of ancient igneous and metamorphic occurs in parts of Gboko, Vandeikya and Oju LGAs of the study area. These dominated by porphyritic granites, migmatites and gneiss. Basement complex are generally poor aquifers except fractured and weathered. Groundwater here have low total dissolved solids and of good quality (Ocheri, 2010).
Fersiallitic soil (Lateritic) formed under tropical climate dominate the study area. The soil consists of a red iron rich soil of several meters thick, overlying a mottled clay horizon. The concentration of iron oxides in the upper zone is partly related to the iron content of the parent rock. Groundwater flows mainly within the iron crust and at reduced rate within the mottled clay horizons, redistributing iron, alumimium and silica. The nature of tropical soil cover impact upon the hydrogeology of the area especially as it relate to the quality of groundwater.
The study area has a high drainage density with many streams that are seasonal in nature. Permanent water table in many parts of the state is very low as consequence of the thick overlying permeable meta-sediments and the great depth to which weathering has reached. Hence there is acute shortage of water during dry season in LGAs like Guma, Okpokwu, Ogbadibo, Gwer-West and Oju. The relief of the study area generally low-lying averaging 100m-250m with occasional laterite capped hills, mesas and buttes, inselbergs.
The climate of the area is a tropical sub-humid type with two seasons, wet and dry seasons. The wet season lasts for 7 months from April to October marking the onset and cessation of rainfall. A short dry spell locally known as ‘August break’ is often experienced. The rainfall is generally convective characterized by occasional heavy downpour at times resulting to run offs and flash floods. The annual rainfall total ranges from 1,200-1,500mm and 200 rain days is often experienced in the study area. The rainfall distribution is controlled by the annual movement and prevalence of Inter-Tropical Discontinuity (ITD) (Tyubee, 2009). During the wet season, there is general rise in the water table due groundwater recharge. Soil water is also abundant which is very useful for rain fed agriculture. There is a lot interaction in soil water and groundwater resulting to mineralization and dissolution of mineral into water sources. This exerts strong influence on the quality of water. Dry season lasts from November to March characterized by dry cold wind known as harmattan and hot period. During this period, there is high evaporation resulting in some water sources drying up, others are sustained by seepages. This also can lead to depletion of water table making some boreholes and hand dug wells to dry up. Water scarcity is generally common during this period causing untold hardship. Temperatures are generally high during the day particularly in the month of March and April with a maximum and minimum temperature of 35oC and 21oC. Economic activities especially farming is controlled by these seasons. During wet season, as farmers practice rain fed agriculture they depend heavy on the onset of rain for land preparation and planting of crops such as yams, cassava, rice, maize, ground nut , corn etc. Harvesting of these crops and storage is generally carried out during the dry season. This period farmer often markets their produce.
2.2 Sampling
This study relied on primary data obtained from the analyses of water samples collected from rural community boreholes in Benue State. Two sets of water samples were collected from 26 boreholes in sterilized plastic containers during the wet and dry seasons. For wet season sampling, water samples were collected in the month of October when rainfall was highest and vulnerability to pollution is often expected. In the dry season, water samples were collected in the month of February with extreme dryness often characterized with high evaporation. Water samples were collected after pumping twice from a borehole to ensure consistency. The samples taken from the field were preserved with ice blocks in cooler containers. They were later stored in the refrigerator before laboratory analyses. Water samples were collected and preserved with 1ml of analytically graded concentrated HCl. pH and electrical conductivity were determined using Gallenkamp pH meters.
2.3 Determination of Metals
Nitric acid digestion method described in the standard methods for the examination for water and wastewater (APHA-AWWA-WPCF, 1995) was followed to digest the water samples and reported based on the WHO (2006) guide limit for drinking water. Portions of the digested samples were used directly for the metals (Fe, Ca, Mn, Zn, Pb and Cu) determinations in Atomic Absorption Spectrophotometric (AAS) technique ( AS UNICAM Solaar 32 model).
3. Results and Discussion
Digestion of water samples was carried out to detach the metals from organic matrix in the sample. The AAS analyses of heavy metal concentrations in rural groundwater of Benue State are presented in Table 1 and 2.
www.ccsenet.org/jsd Journal of Sustainable Development Vol. 5, No. 2; February 2012
Published by Canadian Center of Science and Education 5
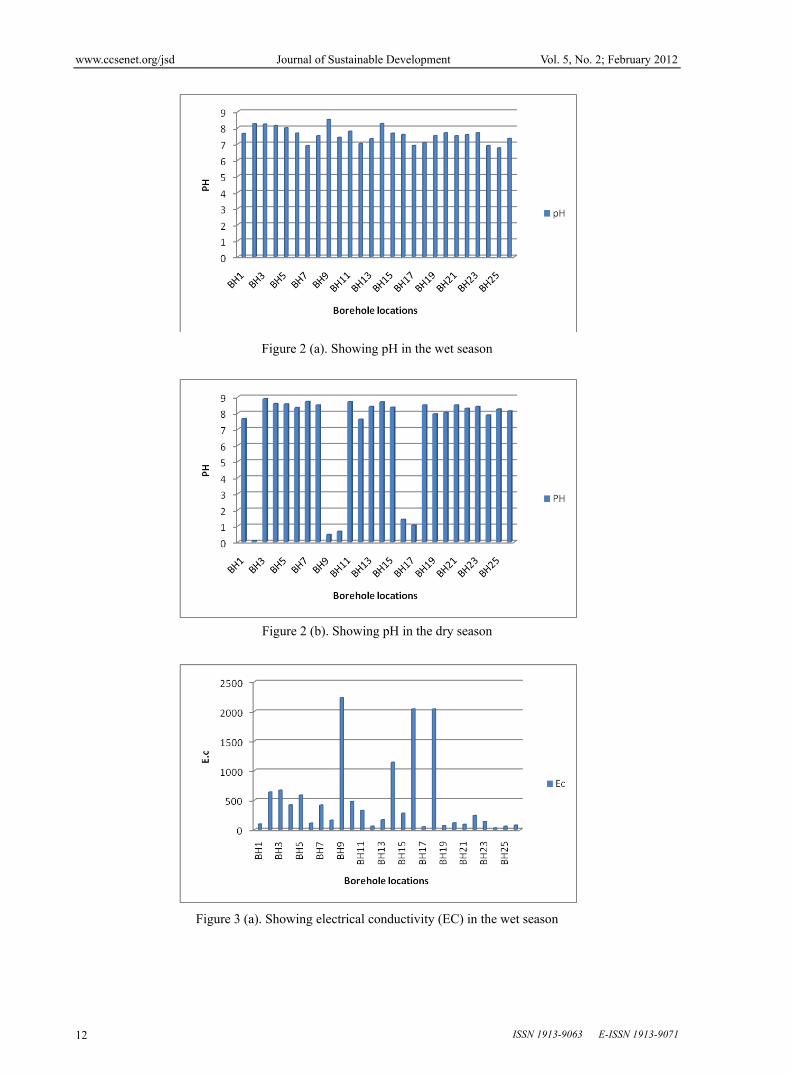
The pH of water body is very important in that it may affect the solubility and toxicity of metals in aquatic system (Efe et al., 2005). The pH of water samples from rural boreholes has a mean and coefficient of variation of 7.77 and 6.21% for wet season as against 8.26 and 4.24% for the dry season respectively. From the mean value, pH of groundwater was lower in the wet season when compared to that of the dry season. This may be due to possible reaction of rainwater with atmospheric carbon dioxide to produce acidic runoff water which eventually percolate the groundwater and hence a lower pH of wet season water samples (Figure 2).
The results from pH determination indicates that the groundwater in the area is alkaline. The water is suitable for drinking except in localized area where for other elements pre sent make the water not fit for drinking. The pH of all the water samples examined are within the WHO prescribed limit of 7-9.2 for drinking water.
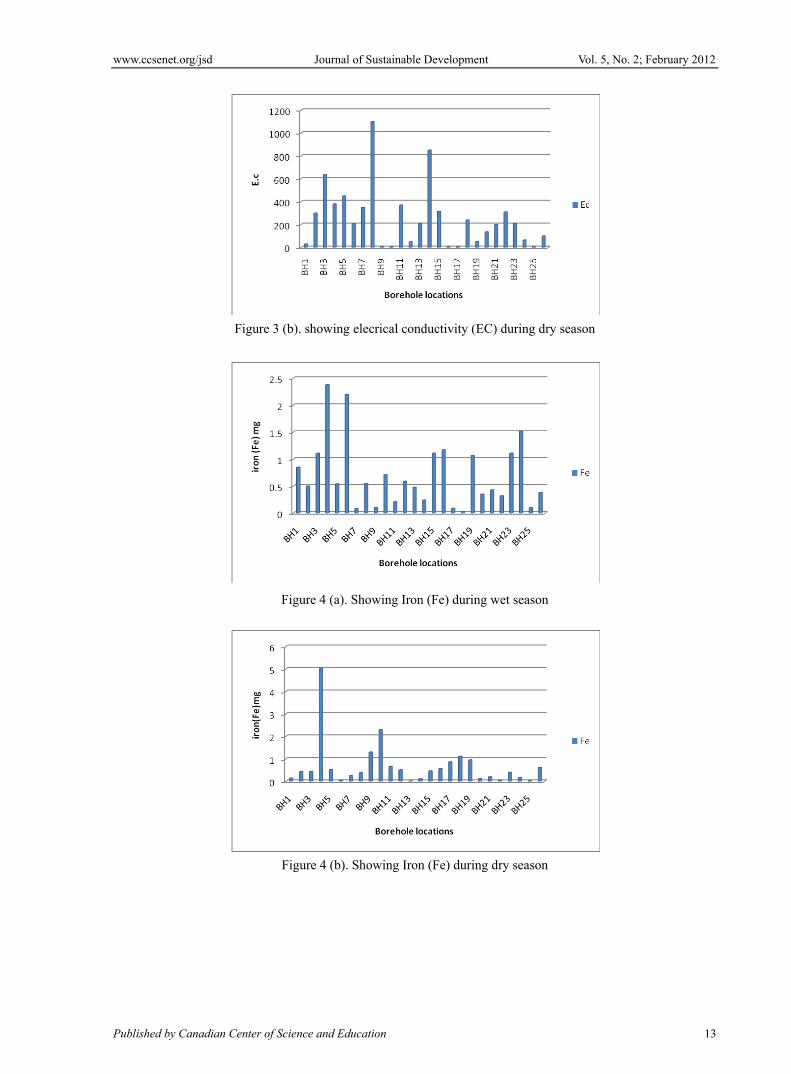
Electrical conductivity is viewed as a valuable indicator of the amount of dissolved materials in water (Olajire & Imeokparia, 2001). Potable water should not have high electrical conductivity (Hutton, 1983) and that is why WHO set guide limit of 750-2,500 µS/cm for drinking water. The electrical conductivity of water samples analyzed have a mean and coefficient of variation of 414.27 µS/cm and 137.58% for the wet season as against 272.13 µS/cm and 94.92% for the dry season. The electrical conductivity in groundwater is higher in the wet season than in the dry season. This may be attributed to the solvent action of rainwater when in contact with soluble mineral content of soils and rocks (Figure 3). This is consistent with the findings of Bowell et al. (1996) and Efe et al. (2005). Very high electrical conductivity nearing the WHO maximum limit of 2,500 µS/cm for drinking water was noted in some of the boreholes both in the wet and dry seasons. This is however attributed to the local environment of the environment coupled with anthropogenic activities.
Tables 1 and 2 showed the results for the determination of heavy metal concentrations and their variability in the study area.
The results of analyses show iron concentrations in groundwater have a mean and coefficient of variation of 0.82 mg/L, 81.71% for wet season as against 0.33 mg/L and 324.24% for dry season (Table 2). From the mean values of iron concentrations in the boreholes, the concentration is higher in wet season than in the dry season. This may be due to the contact of rainwater with soil and rocks which releases ferrous iron into groundwater sources. This seasonal trend is consistent with the findings of Bowell et al. (1996) and Abolude et al. (2009). The analyses has also shown that 35% and 8% of the boreholes had iron concentrations above the WHO prescribed limit of 0.1-1.0 mg/L for drinking water both for the wet and dry seasons respectively. High iron concentrations in groundwater are widespread and sometimes underrated constraints in rural water supply. Although, iron in water has no direct health consequences, but problem may arise if communities decide not to use this water and return to old polluted sources (MacDonald et al., 2005). However, excessive iron concentration can cause damage to the cells of gastrointestinal tract and may also damage the cells in the heart and liver (Adraino, 2001).
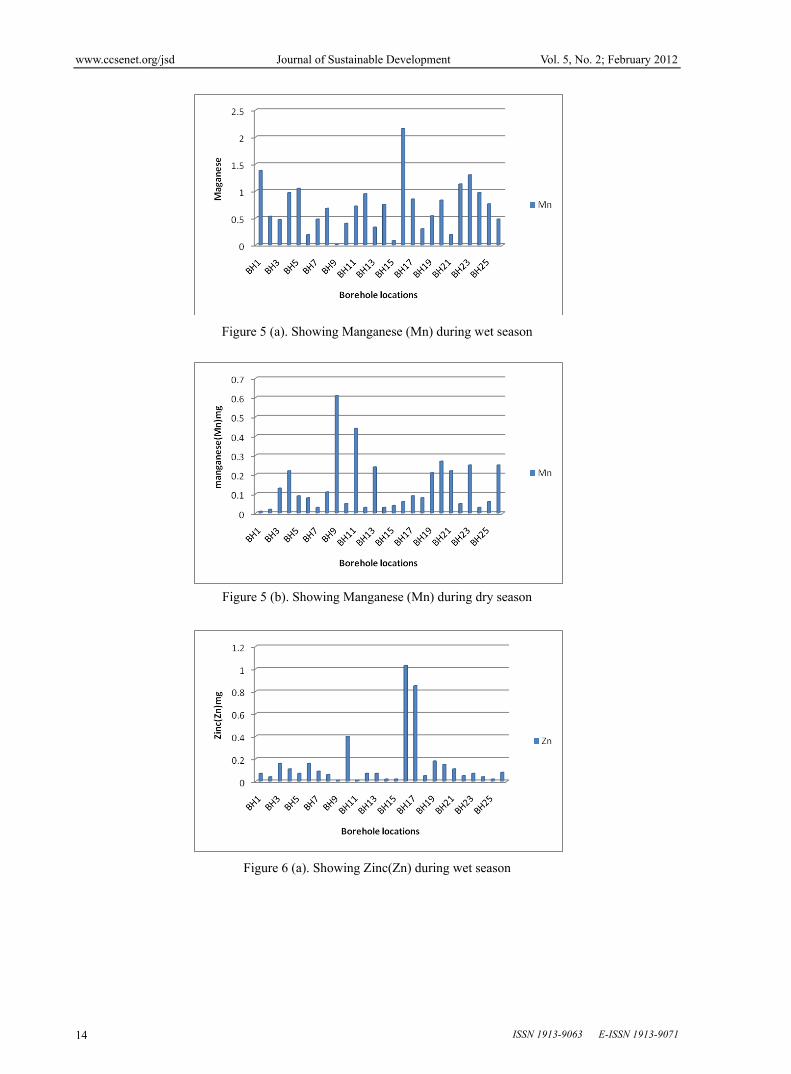
Manganese in water sample analyzed have a mean and coefficient of variation of 0.73 mg/L and 52.05% for the wet season, as against 0.14 mg/L and 92.86% in the dry season. From the mean concentrations manganese level is higher in the wet season when compared to that of the dry season. The results of analyses also show 65% of the boreholes had manganese concentrations above WHO allowable range for drinking water in the wet season while all were within the range in the dry season. The high concentration of manganese is of concern because it generally dissolves under mild reducing conditions to produce the mobile divalent manganese iron which when exposed to air is oxidized to hydrated oxide that form black colouration and can stain plumbing and cloths (Hem, 1992; Hounslow, 1995).
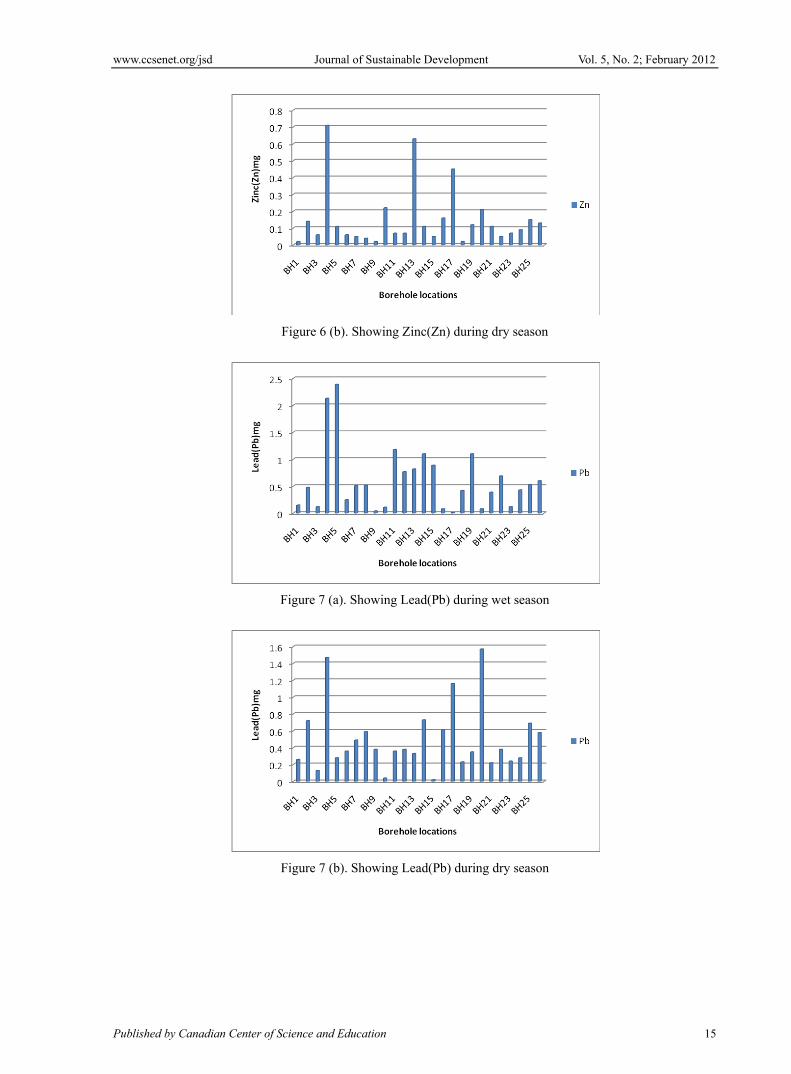
Zinc concentrations in the water samples for both the wet and dry seasons respectively have a mean and coefficient of variation as follows: 0.10 mg/L, 140%; 0.13 mg/L, 130.76%. From the analyses zinc concentrations in the boreholes are lower in the wet season when compared to that of dry season. This is at variance with the findings of Bowell et al. (1996). The study by Okereke et al. (2007) showed consistency in concentrations in water for both wet and the dry seasons. These discrepancies in research results may be due to variation in the geology of the different study areas as well as dissimilar anthropogenic activities occurring in the areas. However, zinc concentrations in all the boreholes are all within the WHO acceptable limit for drinking water for the wet and dry seasons. Zinc is essential to plant and animal physiology, however excessive level in water can cause problem of bitter, astringent taste and opalescent appearance (ALPHA, 1980).
High lead concentration in drinking water may result in metallic poisoning that manifests in symptoms such as tiredness, lassitude, slight abdominal discomfort, irritation, anaemia and, in the case of children, behavioral changes (WHO, 1980). It is cumulative poison and a possible human carcinogen (Bakare & Odunola, 2005). The results of analyses of water samples for heavy metals show lead concentrations to have a mean and coefficient of variation of 0.74 mg/L, 75% for the wet season as against 0.04 mg/L 170% for the dry season analysis. From the
www.ccsenet.org/jsd Journal of Sustainable Development Vol. 5, No. 2; February 2012
ISSN 1913-9063 E-ISSN 1913-9071 6
mean values, lead concentrations in groundwater is higher in the wet season when compared to that of the dry season. This is consistent with the findings of Okereke et al. (2007) and Adekunle et al. (2007). The study also revealed 96% and 8% of the boreholes had lead concentrations above the WHO prescribed limit for drinking both in the wet and dry seasons respectively. The possible causes of high lead concentration in these boreholes are rather very surprising being a rural environment. Nonetheless, increased use of chemical fertilizer due to rapidly declining soil fertility in the study may have accounted for high lead contamination of the groundwater.
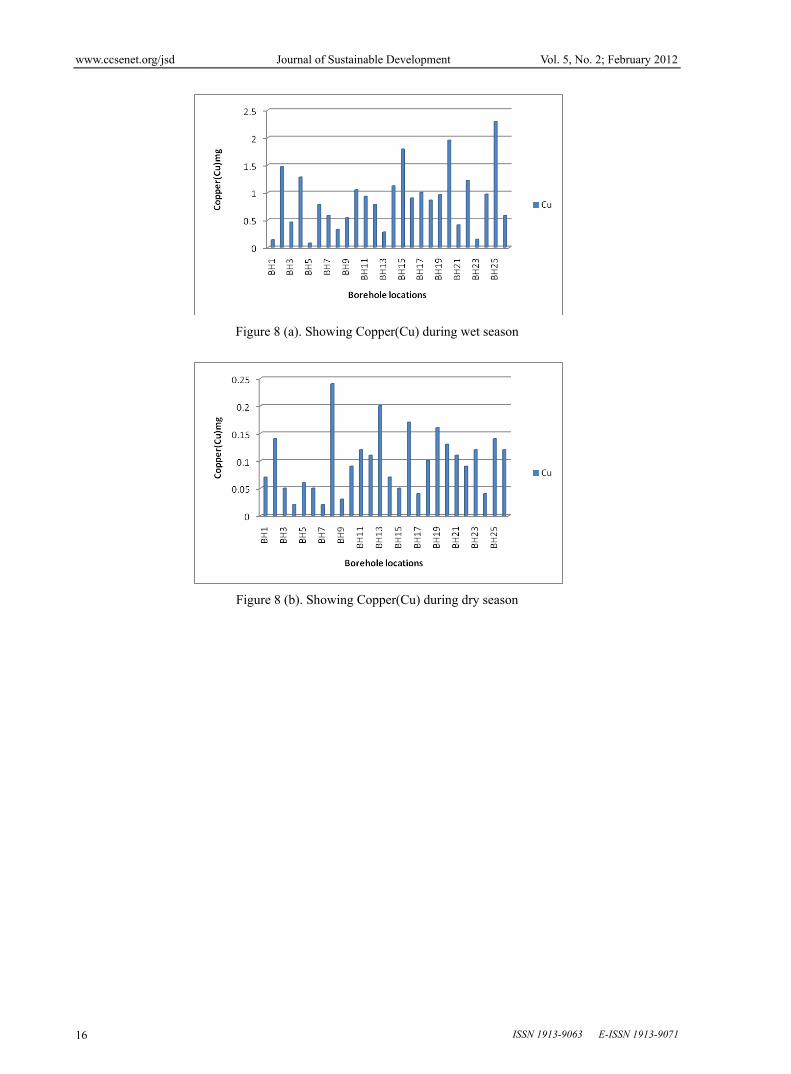
Copper concentrations in boreholes have a mean of 0.88 mg/L and coefficient of variation of 64.77% for the wet season as against a mean and coefficient of 0.00 mg/L and 60% for the dry season. Copper concentrations are noted to be higher in the wet season than in the dry season. Common sources of copper in drinking water may come from corrosion of household plumbing systems and erosion of natural deposits. Long term exposure may lead to liver or kidney damage.
Apart from zinc whose concentration was higher in the dry season, other metals like iron, manganese, lead and copper recorded have higher concentration in the wet season. This implies that as the climate becomes either wetter or drier concentration level of heavy metals in water are appropriately affected. Also, elements such as turbidity, iron, manganese, and lead concentrations in these borehole water exceeded the WHO prescribed limit for drinking water. This implies that prolonged consumption of water polluted with these elements will be of health risks overtime.
High concentrations of some of the metals observed in the wet season samples could be an indication that the soluble forms of the metals are either present in the environment or produced after chemical reaction have occurred.
4. Conclusion
This study has shown that heavy metal pollution of groundwater source is not only an urban affair; rural areas also contribute their own quota. The concentration levels of heavy metal in groundwater were noted to be affected by change in season. The results from this study could serve as guide for rural water supply developers, who often drill boreholes for rural use without any information on the chemistry of the groundwater. Consequently, water provided may not be safe for human consumption. Rural water supply providers should make the safety of the water a top priority not just mere provision as that will be counter-productive. Frequent monitoring of the quality of groundwater will be necessary to know the changes in the chemistry and possibly to put remedial measures in place.
References
Abolude, D. S., Davies, O. A., & Chia, A. M. (2009). Distribution and concentration of trace Elements in Kubanni reservoir in Northern Nigeria. Research Journal of Environmental and Earth Sciences, 1 (2), 39-44.
Adaikpor, E. O., Nwajei, G. E., & Olada, J. E. (2005). Heavy metal concentration in coal and Sediments from River Ekulu in Enugu, Coal City of Nigeria. Journal of Applied Science and Environmental Management, 9 (3), 5-8.
Adebayo, A., & Rowland. (1973). Management of problems of rapid urbanization in Nigeria (pp. 27). University of Ife Press.
Adekunle, I. M., Adetunji, M. T., Gbadebo, A. M., & Banjoko, O. B. (2007). Assessment of Groundwater quality in a typical rural settlement in the southwest Nigeria. International Journal Environmental Research and Public Health, 4 (4), 307-318. http://dx.doi.org/10.3390/ijerph200704040007
Adeniyi, H. A., & Mbagwu, I. G. (1990). Study of some physico-chemical factors and heavy metals in Jakarta reservoir, Kano State, Nigeria National Institute of Fresh Water Fisher Research. (NFFR) Annual report, 136-140.
Adriano, D. C. (2001). Trace metals in terrestrial environment. Biogeochemical, Bioavailability and Risks of metals, 3, 133.
Aiyesanmi, A. F. (2006). Baseline concentration of heavy metals in water samples from Rivers within Okitipupa Southeast belt of the Nigeria bitumen field. Journal Chemical Society of Nigeria, 31 (1&2), 30-37.
Appelo, C. A. J., & Postma, R. (1993). Geochemistry of groundwater and pollution. Balkama, Rotterdam
Appelo, C. A. J., & Postma, R. (1999). Chemical analysis of groundwater in: Geochemistry groundwater and pollution. A. A Balkema/Rotterdam/Bookfield.
www.ccsenet.org/jsd Journal of Sustainable Development Vol. 5, No. 2; February 2012
Published by Canadian Center of Science and Education 7
APHA. (1980). Standard Methods for the Examination of Water and Wastewater. American Public Health Association.
APHA-AWWA-WPCF. (1995). American Public Health Association-America American Waterworks Association-Water Pollution Control Federation, Standard Methods for Examination of Water and Wastewaters N.Y, U.S.A, 19th Edition.
Bakare-Odunola, M. T. (2005). Determination of some metallic impurities present in soft drinks marketed in Nigeria. The Nigerian Journal of Pharmaceutical Research, 4 (1), 51-54.
Biney, A. T., Amuza, A. T., Calamari, D., Kaba, N., Mbomwe, T. L., Naeve, H., Ochumba, P. B. O., Osibanjo, O., Randegonde, Vand Saad, MAH. (1994). Review of heavy Metals CIFA Technical paper 25.
Calow, R. C., Robin, N. S., MacDonald, Gribbs, B. R., Orpen., N. R. G., Mitembezeka, A., Andrews, A. J., & Appiah, S. O. (1997). Groundwater management in drought prone areas of Africa. International Journal of Water Resources Development, 13 (2), 241-261.
Carter, R. C., & Howsam, P. (1994). Sustainable use of groundwater for small irrigation with reference to sub-Saharan. Landuse policy, 11 (4), 275-285. http://dx.doi.org/10.1016/0264-8377(94)90053-1
Edmunds, W. M., & Smedley, P. (1996). Groundwater geochemistry and health: An overview in Appleton, JD, Fuge, R and McCall, GJH (eds) Environ. Geochem. and hlth, British Geological Society, Special publication, No113.91-105.
Efe, S. I., Ogban, F. E., Horsfall, M., & Akporhonor, E. E. (2005). Seasonal variation of Physico-chemical characteristics of water resources quality in western Niger Delta region, Nigeria. Journal of Applied Science and Environmental Management, 191-195.
Emoyan, O. O., Ogban, F. E., & Akarah, E. (2006). Evaluation of heavy metals loading of River Ijana in Ekpan-Warri, Nigeria. Journal of Applied Science and Environmental Management, 10 (2), 121-127.
Habila, O. (2005). Groundwater and Millennium Goals, Proceedings Groundwater and Poverty reduction in Africa. International Association. Hydrogeol, London.
Hem, J. D. (1992). Study and interpretation of the chemical characteristics of natural waters (pp. 2254). US Geological Survey Water Supply.
Hounslow, A. W. (1995). Water quality data analysis and interpretation. Boca Raton, New York: Lewis Publishers.
Hutton, L. G. (1983). Field Testing of Water in development Countries. Water Research Center. Unwin Brothers Limited, Britain.
Ikem, A., Osibanjo, O., Sridhar, M. H. C., & Sobande, A. (2004). Evaluation of groundwater quality characteristics near two waste sites in Ibadan and Lagos, Nigeria. Water Air and Soil Pollution. 140 (1-4), 307-333.
Jatau, B. S., Bajeh, T., & Innocent, S. (2008). Trace metal in surface and subsurface water in Kaduna South Industrial Area North-Central Nigeria. Research Journal of Applied Sciences, 3 (1), 81-87.
Kabir, G., & Madugu, A. I. (2010). Assessment of environmental impact on air quality by Cement industry and mitigating measures: A case study. Environmental Monitoring and Assessment, 160 (1-4), 91-99. http://dx.doi.org/10.1007/s10661-008-0660-4
Kogbe, C. A., Torkaeshi, A., Osijuk, D., & Wozney, D. E. (1978). Geology of Makurdi Sheet 257 in the middle valley, Nigeria, Occasional publications 5, Department of Geology, Ahmadu Bello University, Zaria, Nigeria.
Loham, S. W. (1972). Groundwater hydraulic, U.S Geological Survey, Professional Paper. Mabogunje, AK (1986) Urbanization in Nigeria, University of London Press.
MacDonald, A., Davies, J., Calow, R., & Chilton. (2005). Developing groundwater: A guide to rural water supply. UK: ITDG publishing.
Mackey, R. (1990). Groundwater quality in Thannah, NC and Biswas. AK (eds). Environmentally sound water management. Oxford University Press.
Merian, E. (1991). Metals and their compounds in the environmental occurrence. Analysis and biological Relevance UCH. Weintrein, New York.
www.ccsenet.org/jsd Journal of Sustainable Development Vol. 5, No. 2; February 2012
ISSN 1913-9063 E-ISSN 1913-9071 8
Mombreshora, C., Osibanjo, O., & Ajayi, S. O. (1983). Pollution studies on Nigeria rivers: the onset of lead pollution of surface waters in Ibadan. Environment International, 9, 81-84. http://dx.doi.org/10.1016/0160-4120(83)90057-0
Ngange, T. N., Edet, A. E., & Ekwere, S. J. (2007). Concentration of heavy metals and Hydrocarbons in groundwater near petrol station and mechanic workshop in Calabar metropolis, southeast Nigeria. Environment Geosciences, 14, 15-29. http://dx.doi.org/10.1306/eg.08230505005
NPC. (2006). National Population Commission. The Nigeria Census, Federal Government of Nigeria.
Nwachukwu, S. O. (1972). The tectonic evolution of southern portion of the Benue Trough, Nigeria. Geological Magazine, 109, 411-419. http://dx.doi.org/10.1017/S0016756800039790
Nwajide, C. S. (1990). Cretaceous sedimentation and palaegeography of the Central Benue Trough, in: Ofoegbu, CO (ed). The Benue Trough structure and evolution Series, Viewing 19-38.
Nyagba, J. L. (2000). Benue State in: Mamman, A. B., Oyebanyi, J. D and Peters, SW (eds). Nigeria: A People United, A Future Assured, Survey of States, Millennium Edition Vol.2.
Ocheri, M. I. (2010). Assessment of groundwater quality for rural water supply in Benue State, Nigeria. Unpubl. M.Sc Thesis, Department of Geography, University of Nigeria, Nsukka.
Odukoya, A. M., & Abimbola, A. F. (2010). Contamination assessment of surface and groundwater within and around two dumpsites. International Journal Environment Science and Technology, 7 (2), 367-376.
Offodile, M. E. (2002). Groundwater study and development in Nigeria, Mecon Engineering services Ltd.
Okafor, F. C. (1983). Urban Development and Environmental pollution in urban of Nigeria Cities, Paper presented at the National Conference on Development and Environment, NISER, Ibadan.
Okereke, S. C., Eze, C. O., Iloegbunam, R. O., & Nwachukwu, N. C. (2007). Seasonal variation of toxic/heavy metals of bilante rock mining pit water, Ishagu, Ebonyi State. Int. J. Biotech. and Allied Sc, 2 (3), 297- 299.
Okoya, A. A., Asubiojo, O. I., & Amusan, A. A. (2010). Extractable metals and physicochemical properties of some Southwestern Nigerian Soils. In: Biotechnology Development and threat of Climate Change in Africa: The case of Nigeria, Cuvillier Verlag Gottingen German, 2, 166-176.
Okoya, A. A., Asubiojo, O. I., & Amusan, A. A. (2011). Trace element concentrations of soils of Ife-Ijesa area. Journal of Environmental Chemistry and Ecotoxicology, 3 (7), 173-179.
Okoye, R. S., Obakin, C. E., & Tongo, P. S. (1991). Heavy metal and organism in Lagos Lagoon. International Journal Environmental Studies, 37, 285-292. http://dx.doi.org/10.1080/00207239108710641
Olajire, A. A., & Imepeokparia, F. E. (2001). Water quality assessment of Osun River, studies on inorganic nutrients. Environmental Monitoring and Assessment, 69, 17-28. http://dx.doi.org/10.1023/A:1010796410829
Ololade, I. A., Lajide, L., & Amoo, I. A. (2007). The distribution of heavy metals in streambed Sediments from oil-producing region of Nigeria. Journal of Applied Science and Environmental Management, 12 (14), 11-18.
Olubunmi, F. E., & Olorunsola, O. E. (2010). Evaluation of the status of heavy metal of sediment of Agbabu bitumen deposit area, Nigeria. European Journal Scientific Research, 41 (3), 373-382.
Onokerhoraye, A. G. (1995). Urbanization and Environment in Nigeria. The Benin Social Series for Africa, Benin.
Orisakwe, N. (2007). Heavy metal level and physico-chemical quality of potable water supply in Warri, Nigeria. Analytical Chemistry, 97 (9), 867-874.
Oyeku, O. T., & Eludoyin, A. O. (2010). Heavy metal contamination of groundwater resources in a Nigerian urban settlement. African Journal Environmental Science and Technology, 4 (4), 201-214.
Peters, S. W. (1978). Stratigraphic evolution of the Benue trough and its implications for pper cretaceous palaogeography of West Africa. J. Geol, 86, 311-322. http://dx.doi.org/10.1086/649693
Rainbow, P. S., & White, S. C. (1995). Comparative strategies of heavy metal accumulation by crustaceans: zinc, copper and cadmium in a decapodan Amphipod and a barnade, Hydrobiol. 174, 245-262. http://dx.doi.org/10.1007/BF00008164
Robinson, J. (1996). Evaluation of health assessment index with reference to bioaccumulation of metals oreochromis (paper1882) and in aspect of morphology of lernacea cypinacea. LinnaeusThesis, Rand Africaans University, South Africa.
www.ccsenet.org/jsd Journal of Sustainable Development Vol. 5, No. 2; February 2012
Published by Canadian Center of Science and Education 9
Sanders, M. J. (1977). A field evaluation of freshwater river crab, potamonantes warrein as a bioaccumulative indicators of metal pollution. Thesis, Rand Afrikaans University, South Africa.
Todd, D. K. (1980). Groundwater Hydrology. John Wiley and Sons, New York.
Tyubee, B. T. (2009). The influence of ENSO and North Atlantic Sea surface anomaly (SSTA) on extreme rainfall events in Makurdi, Nigeria. Journal of Meteorology Climate Science, 7, 28-33.
Villholth, K. G. (2006). Groundwater assessment and management: Implications and opportunities of globalization. Hydrogeology Journal, 14, 330-339. http://dx.doi.org/10.1007/s10040-005-0476-z
WHO. (2006). Guidelines for Drinking water. 1st Addendum to 3rd edition. Recommendations, Geneva.
www.ccsenet.org/jsd Journal of Sustainable Development Vol. 5, No. 2; February 2012
ISSN 1913-9063 E-ISSN 1913-9071 10
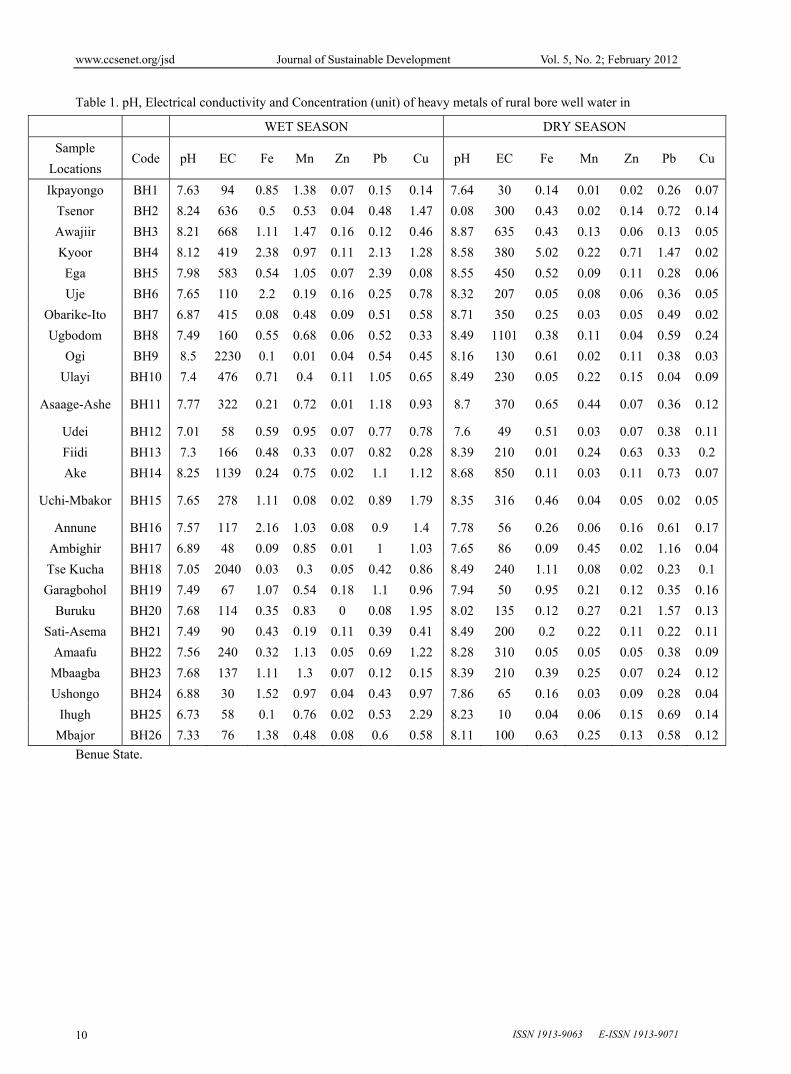
Table 1. pH, Electrical conductivity and Concentration (unit) of heavy metals of rural bore well water in
WET SEASON DRY SEASON
Sample
Locations Code pH EC Fe Mn Zn Pb Cu pH EC Fe Mn Zn Pb Cu
Ikpayongo BH1 7.63 94 0.85 1.38 0.07 0.15 0.14 7.64 30 0.14 0.01 0.02 0.26 0.07
Tsenor BH2 8.24 636 0.5 0.53 0.04 0.48 1.47 0.08 300 0.43 0.02 0.14 0.72 0.14
Awajiir BH3 8.21 668 1.11 1.47 0.16 0.12 0.46 8.87 635 0.43 0.13 0.06 0.13 0.05
Kyoor BH4 8.12 419 2.38 0.97 0.11 2.13 1.28 8.58 380 5.02 0.22 0.71 1.47 0.02
Ega BH5 7.98 583 0.54 1.05 0.07 2.39 0.08 8.55 450 0.52 0.09 0.11 0.28 0.06
Uje BH6 7.65 110 2.2 0.19 0.16 0.25 0.78 8.32 207 0.05 0.08 0.06 0.36 0.05
Obarike-Ito BH7 6.87 415 0.08 0.48 0.09 0.51 0.58 8.71 350 0.25 0.03 0.05 0.49 0.02
Ugbodom BH8 7.49 160 0.55 0.68 0.06 0.52 0.33 8.49 1101 0.38 0.11 0.04 0.59 0.24
Ogi BH9 8.5 2230 0.1 0.01 0.04 0.54 0.45 8.16 130 0.61 0.02 0.11 0.38 0.03
Ulayi BH10 7.4 476 0.71 0.4 0.11 1.05 0.65 8.49 230 0.05 0.22 0.15 0.04 0.09
Asaage-Ashe BH11 7.77 322 0.21 0.72 0.01 1.18 0.93 8.7 370 0.65 0.44 0.07 0.36 0.12
Udei BH12 7.01 58 0.59 0.95 0.07 0.77 0.78 7.6 49 0.51 0.03 0.07 0.38 0.11
Fiidi BH13 7.3 166 0.48 0.33 0.07 0.82 0.28 8.39 210 0.01 0.24 0.63 0.33 0.2
Ake BH14 8.25 1139 0.24 0.75 0.02 1.1 1.12 8.68 850 0.11 0.03 0.11 0.73 0.07
Uchi-Mbakor BH15 7.65 278 1.11 0.08 0.02 0.89 1.79 8.35 316 0.46 0.04 0.05 0.02 0.05
Annune BH16 7.57 117 2.16 1.03 0.08 0.9 1.4 7.78 56 0.26 0.06 0.16 0.61 0.17
Ambighir BH17 6.89 48 0.09 0.85 0.01 1 1.03 7.65 86 0.09 0.45 0.02 1.16 0.04
Tse Kucha BH18 7.05 2040 0.03 0.3 0.05 0.42 0.86 8.49 240 1.11 0.08 0.02 0.23 0.1
Garagbohol BH19 7.49 67 1.07 0.54 0.18 1.1 0.96 7.94 50 0.95 0.21 0.12 0.35 0.16
Buruku BH20 7.68 114 0.35 0.83 0 0.08 1.95 8.02 135 0.12 0.27 0.21 1.57 0.13
Sati-Asema BH21 7.49 90 0.43 0.19 0.11 0.39 0.41 8.49 200 0.2 0.22 0.11 0.22 0.11
Amaafu BH22 7.56 240 0.32 1.13 0.05 0.69 1.22 8.28 310 0.05 0.05 0.05 0.38 0.09
Mbaagba BH23 7.68 137 1.11 1.3 0.07 0.12 0.15 8.39 210 0.39 0.25 0.07 0.24 0.12
Ushongo BH24 6.88 30 1.52 0.97 0.04 0.43 0.97 7.86 65 0.16 0.03 0.09 0.28 0.04
Ihugh BH25 6.73 58 0.1 0.76 0.02 0.53 2.29 8.23 10 0.04 0.06 0.15 0.69 0.14
Mbajor BH26 7.33 76 1.38 0.48 0.08 0.6 0.58 8.11 100 0.63 0.25 0.13 0.58 0.12
Benue State.
www.ccsenet.org/jsd Journal of Sustainable Development Vol. 5, No. 2; February 2012
Published by Canadian Center of Science and Education 11
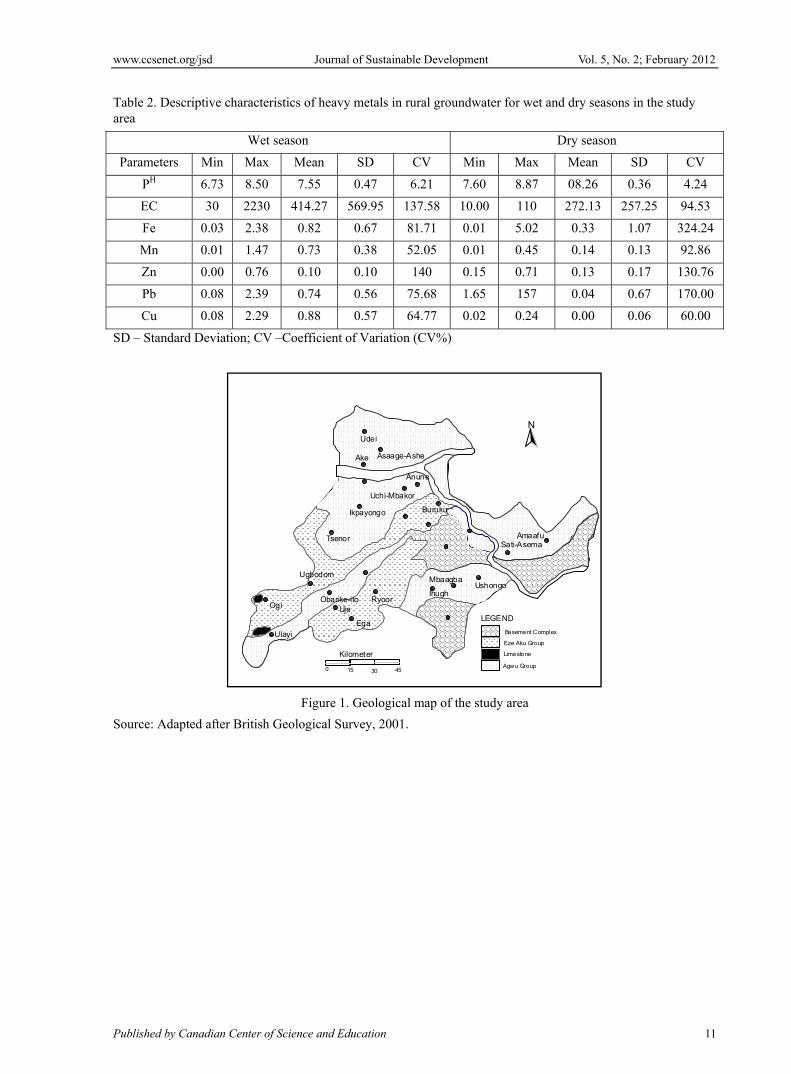
Table 2. Descriptive characteristics of heavy metals in rural groundwater for wet and dry seasons in the study area
Wet season Dry season
Parameters Min Max Mean SD CV Min Max Mean SD CV
PH 6.73 8.50 7.55 0.47 6.21 7.60 8.87 08.26 0.36 4.24
EC 30 2230 414.27 569.95 137.58 10.00 110 272.13 257.25 94.53
Fe 0.03 2.38 0.82 0.67 81.71 0.01 5.02 0.33 1.07 324.24
Mn 0.01 1.47 0.73 0.38 52.05 0.01 0.45 0.14 0.13 92.86
Zn 0.00 0.76 0.10 0.10 140 0.15 0.71 0.13 0.17 130.76
Pb 0.08 2.39 0.74 0.56 75.68 1.65 157 0.04 0.67 170.00
Cu 0.08 2.29 0.88 0.57 64.77 0.02 0.24 0.00 0.06 60.00
SD – Standard Deviation; CV –Coefficient of Variation (CV%)
Figure 1. Geological map of the study area
Source: Adapted after British Geological Survey, 2001.
Udei
Ake Asaage-Ashe
Anune
Uchi-Mbakor
BurukuIkpayongo
Tsenor
Ugbodom
Ogi
UlayiEga
UjeObarike-ito Ryoor
Ihugh
MbaagbaUshongo
AmaafuSati-Asema
0 15 30 45
Kilometer
Basement Complex
Eze Aku Group
Limestone
Agwu Group
LEGEND
N
www.ccsenet.org/jsd Journal of Sustainable Development Vol. 5, No. 2; February 2012
ISSN 1913-9063 E-ISSN 1913-9071 12
Figure 2 (a). Showing pH in the wet season
Figure 2 (b). Showing pH in the dry season
Figure 3 (a). Showing electrical conductivity (EC) in the wet season
www.ccsenet.org/jsd Journal of Sustainable Development Vol. 5, No. 2; February 2012
Published by Canadian Center of Science and Education 13
Figure 3 (b). showing elecrical conductivity (EC) during dry season
Figure 4 (a). Showing Iron (Fe) during wet season
Figure 4 (b). Showing Iron (Fe) during dry season
www.ccsenet.org/jsd Journal of Sustainable Development Vol. 5, No. 2; February 2012
ISSN 1913-9063 E-ISSN 1913-9071 14
Figure 5 (a). Showing Manganese (Mn) during wet season
Figure 5 (b). Showing Manganese (Mn) during dry season
Figure 6 (a). Showing Zinc(Zn) during wet season
www.ccsenet.org/jsd Journal of Sustainable Development Vol. 5, No. 2; February 2012
Published by Canadian Center of Science and Education 15
Figure 6 (b). Showing Zinc(Zn) during dry season
Figure 7 (a). Showing Lead(Pb) during wet season
Figure 7 (b). Showing Lead(Pb) during dry season
www.ccsenet.org/jsd Journal of Sustainable Development Vol. 5, No. 2; February 2012
ISSN 1913-9063 E-ISSN 1913-9071 16
Figure 8 (a). Showing Copper(Cu) during wet season
Figure 8 (b). Showing Copper(Cu) during dry season


![Bioaccumulation of Some Heavy Metals: Analysis …downloads.hindawi.com/journals/bmri/2017/5801432.pdf4 BioMedResearchInternational [3] N. Dirilgen, Accumulation of Heavy Metals in](https://img.pdfslide.fr/doc/110x75/5f751ed2d05a56711121b960/bioaccumulation-of-some-heavy-metals-analysis-4-biomedresearchinternational-3.jpg)