Embed Size (px)
Citation preview
Rev. Écol. (Terre Vie), vol. 65, 2010.
– 163 –
PoPulation ecology of small rodents in sown wild flower areas in western switzerland
raphael ElmigEr1, michaela ramsEiEr1, wolfgang NENtwig1* & Jean-Pierre airoldi1*2
résumé. — Écologie des populations de petits rongeurs dans des jachères florales dans l’ouest de la Suisse. — Des communautés de petits mammifères ont été étudiées dans des jachères florales en Suisse romande du printemps à l’automne 2005 au moyen du piégeage par capture et recapture. au total, 666 individus ont été capturés, appartenant aux espèces suivantes : Microtus arvalis, Apodemus sylvaticus, Apo-demus flavicollis et Crocidura russula. M. arvalis, l’espèce la plus abondante, a atteint un maximum de 581 animaux/ha (mna : minimum number alive) sur une parcelle en septembre. au printemps, les populations de M. arvalis furent très basses sur toutes les parcelles. une étude préliminaire en 2003-2004 a montré que le nombre d’animaux était très bas en hiver et ne s’accroissait qu’à la fin du printemps. Le renouvellement (turnover) des populations fut généralement élevé, dépassant 80 % en une semaine en août. sur toutes les parcelles, un surplus de femelles de M. arvalis fut observé. en août et septembre, la différence par rapport à un sex-ratio de 1 : 1 fut statistiquement significative, due probablement à des taux de survie différents entre mâles et femelles. Aucune différence significative entre les poids des mâles et femelles adultes ne fut observée. la deuxième espèce la plus fréquente, A. sylvaticus, atteignit une densité de 225 individus/ha sur une parcelle, mais seulement 60-100 individus/ha sur les trois autres sites.
summary. — Small mammal communities on four sown wild flower areas in western Switzerland were studied from spring to autumn 2005 using the capture-recapture method. we trapped 666 animals belong-ing to Microtus arvalis, Apodemus sylvaticus, Apodemus flavicollis and Crocidura russula. M. arvalis, the most abundant species, reached a peak of 581 animals/ha known to be alive (mna) on one area in late september. spring populations of M. arvalis were very low on all fields. A preliminary study in 2003-2004 showed a very low number of animals known to be alive during the winter months and a similar population growth in spring. Population turnover was generally high with up to 81 % of the population renewed in a one-week period (August). On all fields, there was a surplus of female M. arvalis. in august and september, the difference from 1 : 1 ratio was significant in one field, apparently a result of differential survival rate and recruitment between sexes. There was no significant difference in body mass between adult females and adult males. the second most frequent species, A. sylvaticus reached densities of up to 225 animals/ha on one area, but only 60-100 animals/ha, on the other three sites.
The continuous intensification of agricultural production during the last century has caused a severe reduction in natural habitats and structural diversity in swiss agro-ecosystems. therefore, ecological compensation areas (eca), such as extensively used meadows, hedges or fallow land, were established and associated with direct payments to the farmers. the design of these areas aims at enhancing and preserving biodiversity in agro-ecosystems.
1 University of Bern, Institute of Ecology and Evolution, Baltzerstrasse 6, CH - 3012 Bern, Switzerland* corresponding authors. e-mails : [email protected] and [email protected]
– 164 –
Among these ECA, sown wild flower areas have been progressively introduced into the swiss agricultural landscape during the last decade (nentwig, 2000). according to the direct payment decree by the Swiss Federal Office for Agriculture, these fields or strips need to be at least three meters wide and have to persist for a minimum of two years. Fertilizers and chemi-cal plant protection agents are prohibited.
Some work has been done in Switzerland showing positive effects of these sown wild flower areas by enhancing arthropod density (Frank & Nentwig, 1995). As well, a positive effect in pest control was suggested, as these areas attract hoverflies (Weiss & Stettmer, 1991; Salveter & Nentwig, 1993).
It is conceivable that sown wild flower fields could also serve as a habitat for small mam-mals. More diversified vegetation might provide more variable food resources than cultivated fields. Sown wild flower areas and other set-aside plots could also function as spatial refuges for potential pest species such as voles, after cultivated fields were ploughed or when food is limited in winter and spring (Skrivan & Andera, 1987; Maisonneuve & Rioux, 2001). When reaching large enough population sizes, voles could disperse again to surrounding crop fields.
Because of intense cropping and a decrease in perennial grassland in the last decades, voles have become less of a pest in Switzerland. With the establishment of ECA, however, farmers fear that considerable crop damage by voles may reoccur.
few studies have been made of small mammal communities and population dynamics in ECA such as sown wild flower areas. Baumann (1996) and Briner et al. (2005) suggested that sown wild flower areas provide a suitable habitat for the common vole (Microtus arvalis). M. arvalis is nowadays among the predominant small mammal species in central and eastern europe’s agro-ecosystems. Briner et al. (2005, 2007) worked on weed strips 3 m wide and about 100 m long. the present study took place in an agricultural landscape of several km2 interspersed with sown wildflower areas usually over 1 ha each. Contrary to similar studies carried out in western france (millan de la Peña et al., 2003; Butet et al., 2006; Michel et al., 2006, 2007) there were no hedgerows near our trapping grids, only a few isolated small wood-lots and forests on the boundaries, usually at distances of more than hundred meters.
considering its high reproductive capability and its exclusive herbivorous diet, M. arvalis is a potential agricultural pest species (Myllymäki, 1979). Population densities of more than 3000 voles/ha have been reported (Truszkowski, 1982) and damages up to 90 % of the potential harvest can occur (Tertil, 1977). Small mammals, on the other hand, also provide an important food source for predators such as the common buzzard, kestrel, fox, weasel or stoat (Nietham-mer & Krapp, 1982). For Michel et al. (2007), small mammals play a major role in ecosystems due to their function as prey; they constitute an important food source for predatory animals.
a preliminary study in the same area, carried out from fall 2003 to early summer 2004, using the same trapping design as in the present study showed that populations of small mam-mals were very low in winter and increased from spring to summer. we were therefore inter-ested in the fate of such populations from spring to autumn.
the aim of the present study was to describe population dynamics of small mammals liv-ing on sown wild flower areas. With the mark-recapture method, we were able to estimate the population densities and describe the population structure. our main focus was on the most abundant species M. arvalis. we determined population turnover rates, to estimate how fast the populations renewed themselves. Population densities and structure were also studied for the second most frequent species, the wood mouse, Apodemus sylvaticus.
MATERIAL AND METHODS
study area
The study was carried out in the Broye valley in western Switzerland. Four sown wild flower fields were chosen in this area. The first two were situated in Bellerive (552 m asl) and Salavaux (486 m als), on the western border of Lake Murten. The third field was on the municipal area of Chevroux (454 m asl) while the fourth was near Sévaz, (488 m asl). In the preliminary study, two sampling areas per field were trapped in Salavaux, Chevroux and Sévaz.
– 165 –
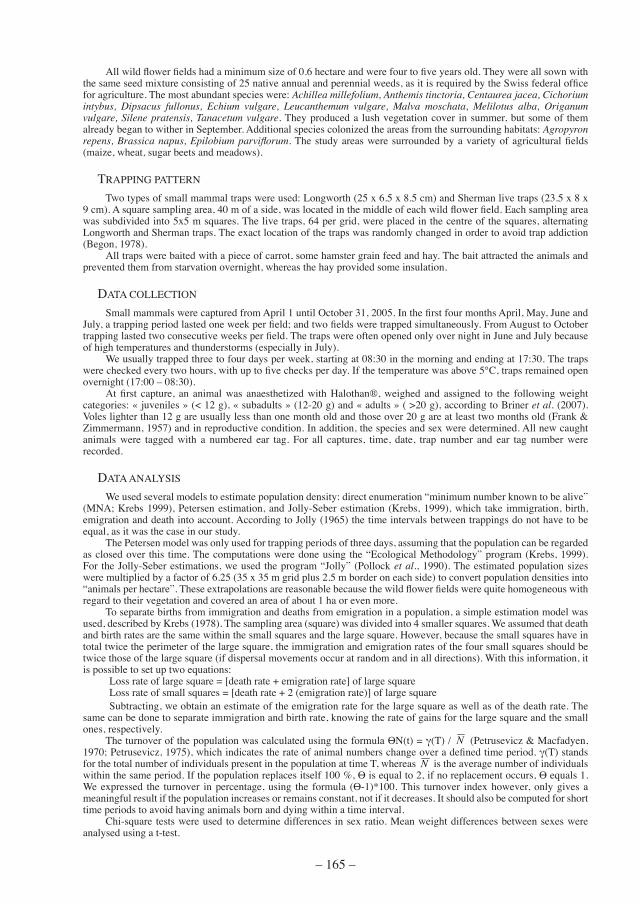
All wild flower fields had a minimum size of 0.6 hectare and were four to five years old. They were all sown with the same seed mixture consisting of 25 native annual and perennial weeds, as it is required by the Swiss federal office for agriculture. the most abundant species were: Achillea millefolium, Anthemis tinctoria, Centaurea jacea, Cichorium intybus, Dipsacus fullonus, Echium vulgare, Leucanthemum vulgare, Malva moschata, Melilotus alba, Origanum vulgare, Silene pratensis, Tanacetum vulgare. they produced a lush vegetation cover in summer, but some of them already began to wither in September. Additional species colonized the areas from the surrounding habitats: Agropyron repens, Brassica napus, Epilobium parviflorum. The study areas were surrounded by a variety of agricultural fields (maize, wheat, sugar beets and meadows).
traPPing Pattern
two types of small mammal traps were used: longworth (25 x 6.5 x 8.5 cm) and sherman live traps (23.5 x 8 x 9 cm). A square sampling area, 40 m of a side, was located in the middle of each wild flower field. Each sampling area was subdivided into 5x5 m squares. the live traps, 64 per grid, were placed in the centre of the squares, alternating longworth and sherman traps. the exact location of the traps was randomly changed in order to avoid trap addiction (Begon, 1978).
all traps were baited with a piece of carrot, some hamster grain feed and hay. the bait attracted the animals and prevented them from starvation overnight, whereas the hay provided some insulation.
data collection
Small mammals were captured from April 1 until October 31, 2005. In the first four months April, May, June and July, a trapping period lasted one week per field; and two fields were trapped simultaneously. From August to October trapping lasted two consecutive weeks per field. The traps were often opened only over night in June and July because of high temperatures and thunderstorms (especially in July).
We usually trapped three to four days per week, starting at 08:30 in the morning and ending at 17:30. The traps were checked every two hours, with up to five checks per day. If the temperature was above 5°C, traps remained open overnight (17:00 – 08:30).
At first capture, an animal was anaesthetized with Halothan®, weighed and assigned to the following weight categories: « juveniles » (< 12 g), « subadults » (12-20 g) and « adults » ( >20 g), according to Briner et al. (2007). Voles lighter than 12 g are usually less than one month old and those over 20 g are at least two months old (frank & Zimmermann, 1957) and in reproductive condition. In addition, the species and sex were determined. All new caught animals were tagged with a numbered ear tag. for all captures, time, date, trap number and ear tag number were recorded.
data analysis
we used several models to estimate population density: direct enumeration “minimum number known to be alive” (MNA; Krebs 1999), Petersen estimation, and Jolly-Seber estimation (Krebs, 1999), which take immigration, birth, emigration and death into account. According to Jolly (1965) the time intervals between trappings do not have to be equal, as it was the case in our study.
the Petersen model was only used for trapping periods of three days, assuming that the population can be regarded as closed over this time. The computations were done using the “Ecological Methodology” program (Krebs, 1999). for the Jolly-seber estimations, we used the program “Jolly” (Pollock et al., 1990). The estimated population sizes were multiplied by a factor of 6.25 (35 x 35 m grid plus 2.5 m border on each side) to convert population densities into “animals per hectare”. These extrapolations are reasonable because the wild flower fields were quite homogeneous with regard to their vegetation and covered an area of about 1 ha or even more.
to separate births from immigration and deaths from emigration in a population, a simple estimation model was used, described by Krebs (1978). The sampling area (square) was divided into 4 smaller squares. We assumed that death and birth rates are the same within the small squares and the large square. However, because the small squares have in total twice the perimeter of the large square, the immigration and emigration rates of the four small squares should be twice those of the large square (if dispersal movements occur at random and in all directions). with this information, it is possible to set up two equations:
loss rate of large square = [death rate + emigration rate] of large squareloss rate of small squares = [death rate + 2 (emigration rate)] of large squaresubtracting, we obtain an estimate of the emigration rate for the large square as well as of the death rate. the
same can be done to separate immigration and birth rate, knowing the rate of gains for the large square and the small ones, respectively.
the turnover of the population was calculated using the formula ӨN(t) = γ(T) / N (Petrusevicz & Macfadyen, 1970; Petrusevicz, 1975), which indicates the rate of animal numbers change over a defined time period. γ(T) stands for the total number of individuals present in the population at time t, whereas N is the average number of individuals within the same period. If the population replaces itself 100 %, Ө is equal to 2, if no replacement occurs, Ө equals 1. We expressed the turnover in percentage, using the formula (Ө-1)*100. This turnover index however, only gives a meaningful result if the population increases or remains constant, not if it decreases. it should also be computed for short time periods to avoid having animals born and dying within a time interval.
chi-square tests were used to determine differences in sex ratio. mean weight differences between sexes were analysed using a t-test.
– 166 –
results
caPtured sPecies
In total, 666 animals were marked. Altogether, we obtained 1447 captures of which 781 were recaptures. M. arvalis was the most abundant species on all fields, followed by A. sylvati-cus (tab. i). we also trapped a few individuals of the yellow-necked mouse (A. flavicollis) in salavaux and chevroux. the greater white toothed shrew (Crocidura russula) was captured on all four areas but in very low numbers. it is possible that the bait used was not appropriate for insectivores. Because of the small sample sizes, the latter two species were excluded from all analyses.
taBle i
Summary of all captured species. Nr. of captures includes recaptures
nr. of animals
nr. of captures
Microtus arvalis
Apodemus sylvaticus
Apodemus flavicollis
Crocidura russula
salavaux 107 228 74 30 2 1
Bellerive 238 486 196 39 0 3
chevroux 124 329 60 59 2 3
Sévaz 197 404 174 20 0 3
total 666 1447 504 148 4 10
in the preliminary study, 220 animals were captured, belonging to the same species mentioned above. the common vole was the most abundant species, with 180 individuals trapped.
PoPulation structure
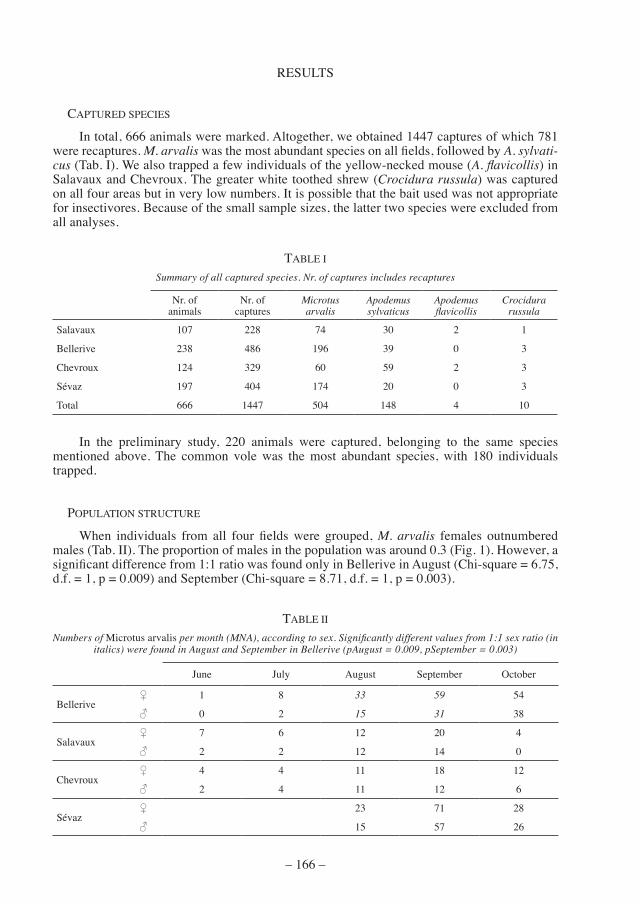
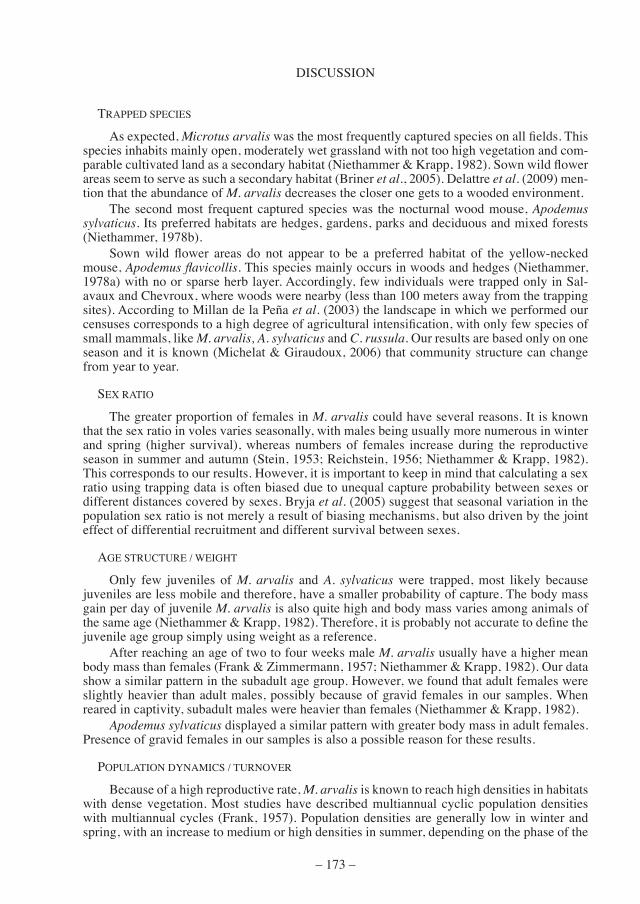
When individuals from all four fields were grouped, M. arvalis females outnumbered males (Tab. II). The proportion of males in the population was around 0.3 (Fig. 1). However, a significant difference from 1:1 ratio was found only in Bellerive in August (Chi-square = 6.75, d.f. = 1, p = 0.009) and September (Chi-square = 8.71, d.f. = 1, p = 0.003).
taBle ii
Numbers of microtus arvalis per month (MNA), according to sex. Significantly different values from 1:1 sex ratio (in italics) were found in August and September in Bellerive (pAugust = 0.009, pSeptember = 0.003)
June July august september october
Bellerive♀ 1 8 33 59 54
♂ 0 2 15 31 38
salavaux♀ 7 6 12 20 4
♂ 2 2 12 14 0
chevroux♀ 4 4 11 18 12
♂ 2 4 11 12 6
Sévaz♀ 23 71 28
♂ 15 57 26
– 167 –
0
0.1
0.2
0.3
0.4
0.5
0.6
0.7
0.8
0.9
1
June July August September October
pro
po
rtio
n o
f m
ales
Bellerive
Salavaux
Chevroux
Sévaz
figure 1. — the proportion of male Microtus arvalis in the population (mna).
Apodemus sylvaticus displayed a similar greater proportion of females in Bellerive, sal-avaux and chevroux (tab. iii). slightly more male A. sylvaticus were caught in Sévaz but the total number of animals was low there. We found, however, no significant differences from 1:1 ratio on all sites.
taBle iii
Numbers of apodemus sylvaticus per month (MNA), according to sex
June July august september october
Bellerive♀ 3 5 8 6 6
♂ 2 4 6 3 2
salavaux♀ 0 0 4 9 13
♂ 0 0 5 6 5
chevroux♀ 0 2 19 26 12
♂ 0 2 10 10 13
Sévaz♀ 0 0 1 4 4
♂ 0 0 0 6 7
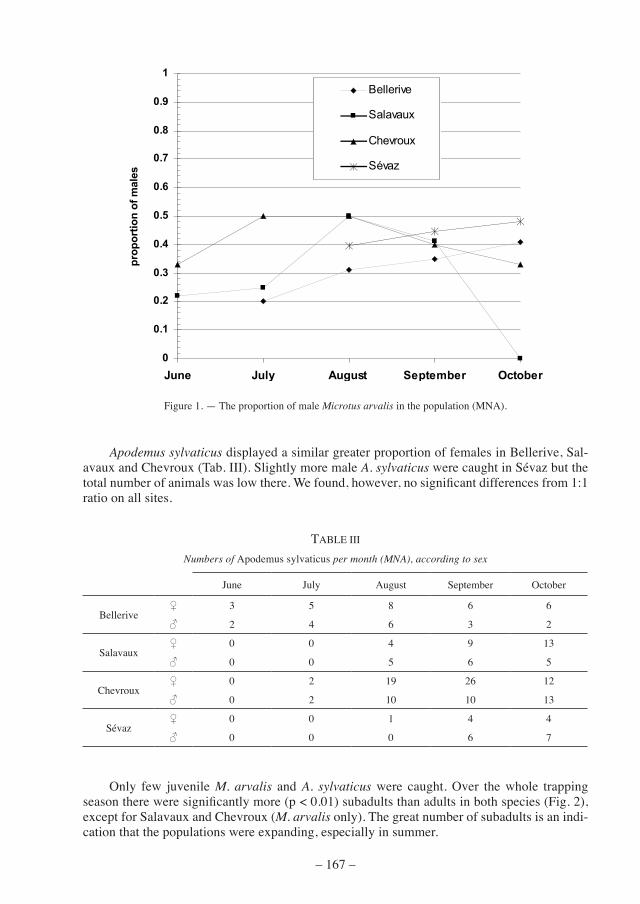
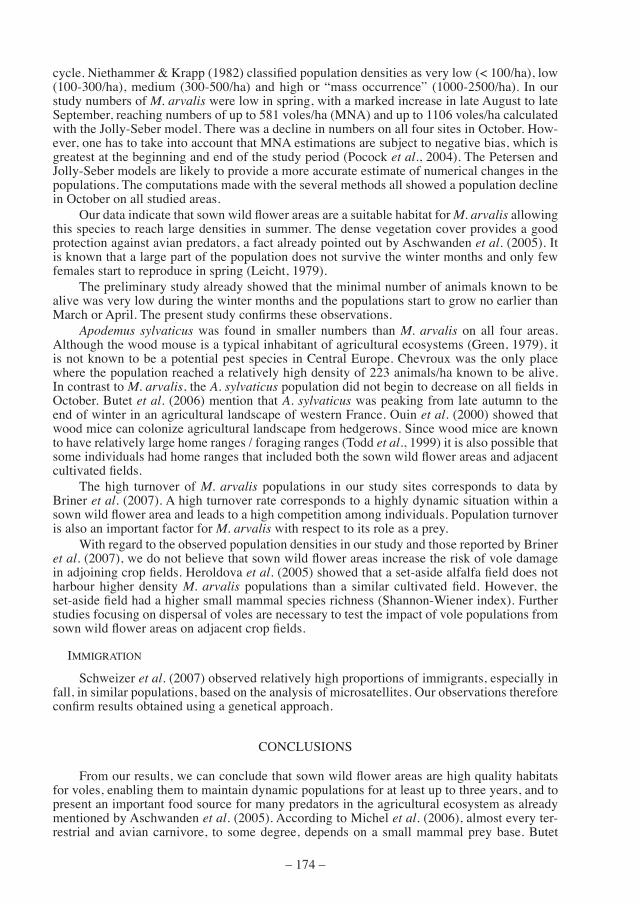
only few juvenile M. arvalis and A. sylvaticus were caught. over the whole trapping season there were significantly more (p < 0.01) subadults than adults in both species (Fig. 2), except for salavaux and chevroux (M. arvalis only). the great number of subadults is an indi-cation that the populations were expanding, especially in summer.
– 168 –
14
0
20
40
60
80
100
120
140
160
180
200
Ma As Ma As Ma As Ma As
Nu
mb
er o
f ca
ptu
res
adults>20 g
subadults12-20 g
juveniles<12 g
Salavaux Bellerive Chevroux Sévaz
figure 2. — age structure of all captured Microtus arvalis (ma) and Apodemus sylvaticus (As). Significant differences from 1:1 ratio between adults and subadults were found in Bellerive (Ma: p < 0.01; As: 0.05 > p > 0.01), Chevroux
(As: p < 0.01) and Sévaz (Ma: p < 0.01; As: p < 0.01).
Body mass of adult male M. arvalis (26.87 g; SD = 5.24, N = 67) did not differ from that of adult females (27.33 g; SD = 5.03, N = 129; t = 0.604, d.f. = 194, 2-tail, equal variances assumed, p = 0.55). the heaviest male weighted 38 g and the heaviest female 48 g. Body mass of subadult male M. arvalis (15.52 g; SD = 1.49, N = 122) was greater than that of subadult females (15.06 g (SD = 1.53, N = 134; t = 2.431, d.f. = 254, 2-tail, equal variances assumed, p = 0.016).
Body mass of adult female A. sylvaticus (23.45 g, sd = 4.20, n = 22) was slightly greater than that of adult males (23.17, SE = 3.52, N = 21). Subadults displayed an opposite pattern (15.10 g, SD = 1.75, N = 53 and 15.82 g, SD = 1.77, N = 35, for females and males, respec-tively). These differences were not significant though. The heaviest A. sylvaticus was a female with a body mass of 32 g.
PoPulation densities
Microtus arvalis
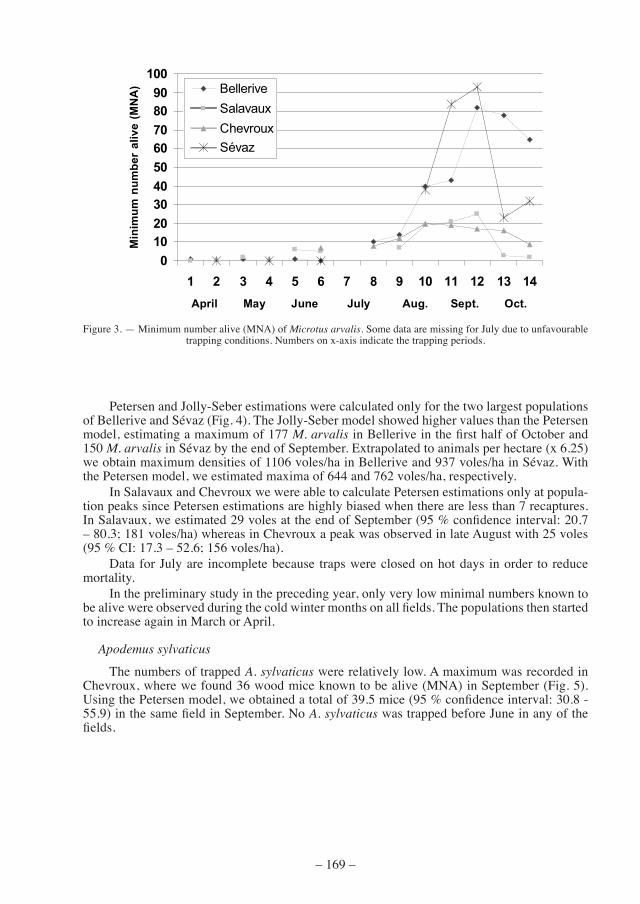
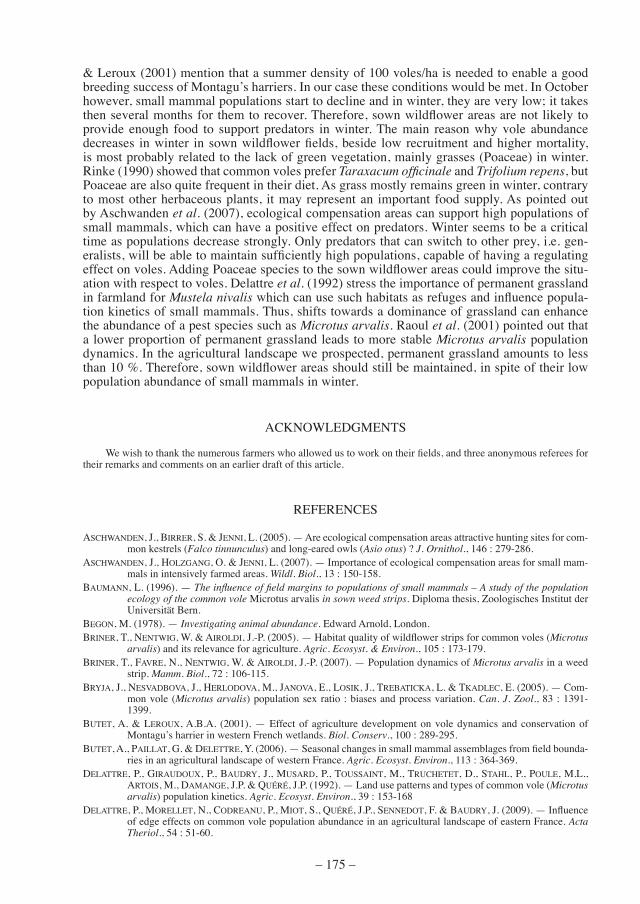
in april, may and June captures of M. arvalis were very low on all fields. In Bellerive we captured a total of 3 voles known to be alive (MNA) in April, whereas in Sévaz we trapped 1 vole in April and none in May. The population sizes began to increase in early August and reached their maximum in late september (fig. 3). the highest numbers were recorded in the second trapping week of September in Bellerive (MNA = 82) and in Sévaz (MNA = 93). in salavaux and chevroux, numbers remained relatively low with a maximum of 25 and 20 mna, respectively.
– 169 –
0
1020
3040
50
6070
8090
100
1 2 3 4 5 6 7 8 9 10 11 12 13 14
Min
imu
m n
um
be
r a
liv
e (
MN
A) Bellerive
Salavaux
Chevroux
Sévaz
April May June July Aug. Sept. Oct.
figure 3. — minimum number alive (mna) of Microtus arvalis. some data are missing for July due to unfavourable trapping conditions. numbers on x-axis indicate the trapping periods.
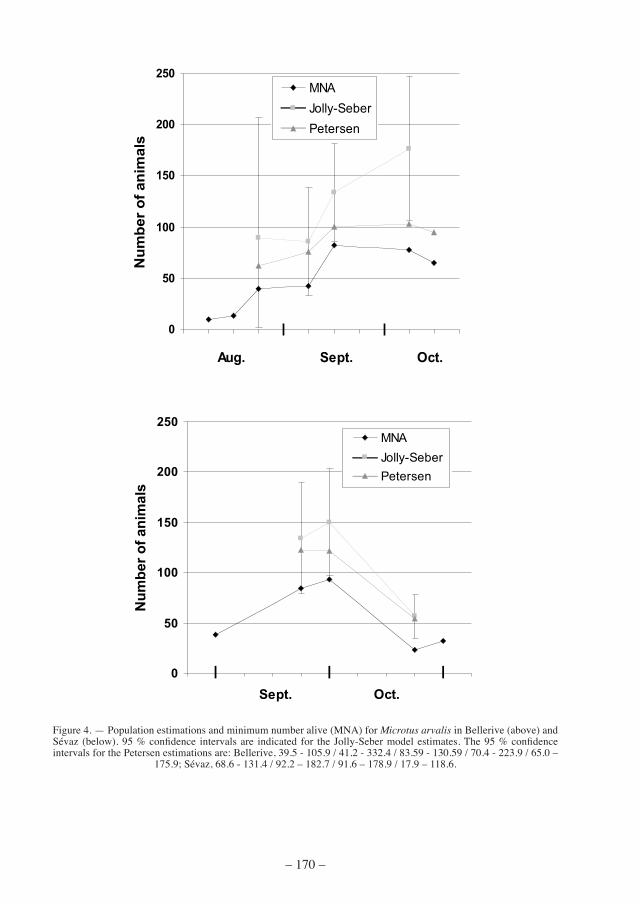
Petersen and Jolly-seber estimations were calculated only for the two largest populations of Bellerive and Sévaz (Fig. 4). The Jolly-Seber model showed higher values than the Petersen model, estimating a maximum of 177 M. arvalis in Bellerive in the first half of October and 150 M. arvalis in Sévaz by the end of September. Extrapolated to animals per hectare (x 6.25) we obtain maximum densities of 1106 voles/ha in Bellerive and 937 voles/ha in Sévaz. With the Petersen model, we estimated maxima of 644 and 762 voles/ha, respectively.
in salavaux and chevroux we were able to calculate Petersen estimations only at popula-tion peaks since Petersen estimations are highly biased when there are less than 7 recaptures. In Salavaux, we estimated 29 voles at the end of September (95 % confidence interval: 20.7 – 80.3; 181 voles/ha) whereas in Chevroux a peak was observed in late August with 25 voles (95 % CI: 17.3 – 52.6; 156 voles/ha).
data for July are incomplete because traps were closed on hot days in order to reduce mortality.
in the preliminary study in the preceding year, only very low minimal numbers known to be alive were observed during the cold winter months on all fields. The populations then started to increase again in march or april.
Apodemus sylvaticus
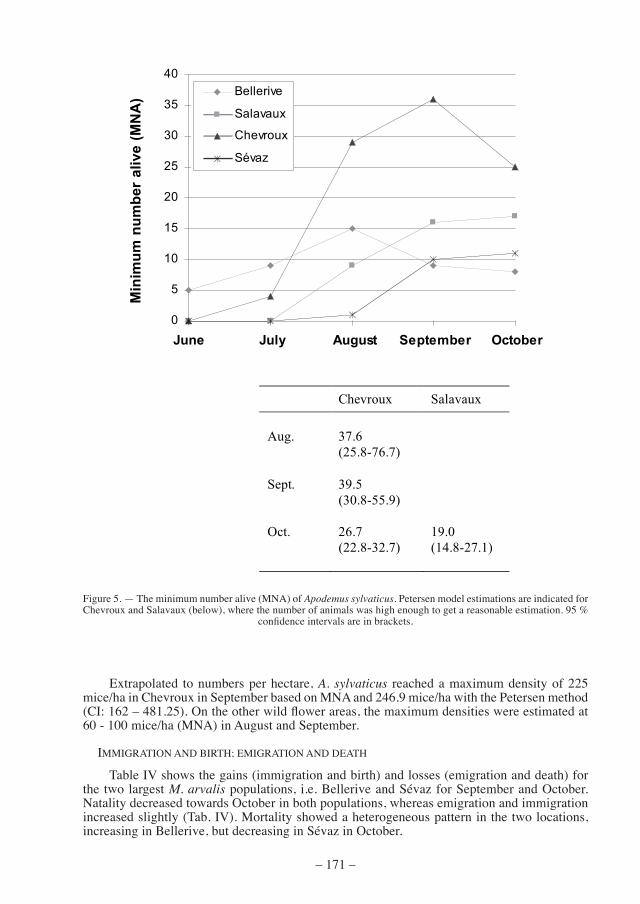
the numbers of trapped A. sylvaticus were relatively low. a maximum was recorded in chevroux, where we found 36 wood mice known to be alive (mna) in september (fig. 5). Using the Petersen model, we obtained a total of 39.5 mice (95 % confidence interval: 30.8 - 55.9) in the same field in September. No A. sylvaticus was trapped before June in any of the fields.
– 170 –
0
50
100
150
200
250
0 1 2 3 4 5 6 7 8 9 10
Nu
mb
er o
f an
imal
s
MNA
Jolly-Seber
Petersen
Sept. Oct.
0
50
100
150
200
250
0 1 2 3 4 5 6 7 8 9 10 11
Nu
mb
er
of
an
imals
MNA
Jolly-Seber
Petersen
Aug. Sept. Oct.
figure 4. — Population estimations and minimum number alive (mna) for Microtus arvalis in Bellerive (above) and Sévaz (below). 95 % confidence intervals are indicated for the Jolly-Seber model estimates. The 95 % confidence intervals for the Petersen estimations are: Bellerive, 39.5 - 105.9 / 41.2 - 332.4 / 83.59 - 130.59 / 70.4 - 223.9 / 65.0 –
175.9; Sévaz, 68.6 - 131.4 / 92.2 – 182.7 / 91.6 – 178.9 / 17.9 – 118.6.
– 171 –
0
5
10
15
20
25
30
35
40
June July August September October
Min
imu
m n
um
be
r a
liv
e (
MN
A) Bellerive
Salavaux
Chevroux
Sévaz
Chevroux Salavaux
Aug. 37.6
(25.8-76.7)
Sept. 39.5 (30.8-55.9)
Oct. 26.7 (22.8-32.7)
19.0 (14.8-27.1)
figure 5. — the minimum number alive (mna) of Apodemus sylvaticus. Petersen model estimations are indicated for Chevroux and Salavaux (below), where the number of animals was high enough to get a reasonable estimation. 95 %
confidence intervals are in brackets.
extrapolated to numbers per hectare, A. sylvaticus reached a maximum density of 225 mice/ha in Chevroux in September based on MNA and 246.9 mice/ha with the Petersen method (CI: 162 – 481.25). On the other wild flower areas, the maximum densities were estimated at 60 - 100 mice/ha (mna) in august and september.
iMMIgRATION AND BIRTH; EMIgRATION AND DEATH
table iV shows the gains (immigration and birth) and losses (emigration and death) for the two largest M. arvalis populations, i.e. Bellerive and Sévaz for September and October. natality decreased towards october in both populations, whereas emigration and immigration increased slightly (tab. iV). mortality showed a heterogeneous pattern in the two locations, increasing in Bellerive, but decreasing in Sévaz in October.
– 172 –
taBle iV
Immigration, natality, emigration and mortality (number of individuals) in Bellerive and Sévaz. For each month, the first week of the trapping period was compared with the second one
Belleriveseptember
Belleriveoctober
Sévazseptember
Sévazoctober
immigration 6 12 9 11
natality 48 6 35 0
emigration 6 12 9 11
mortality 7 24 29 9
total gains 54 18 44 11
total losses 13 36 38 20
turNovEr
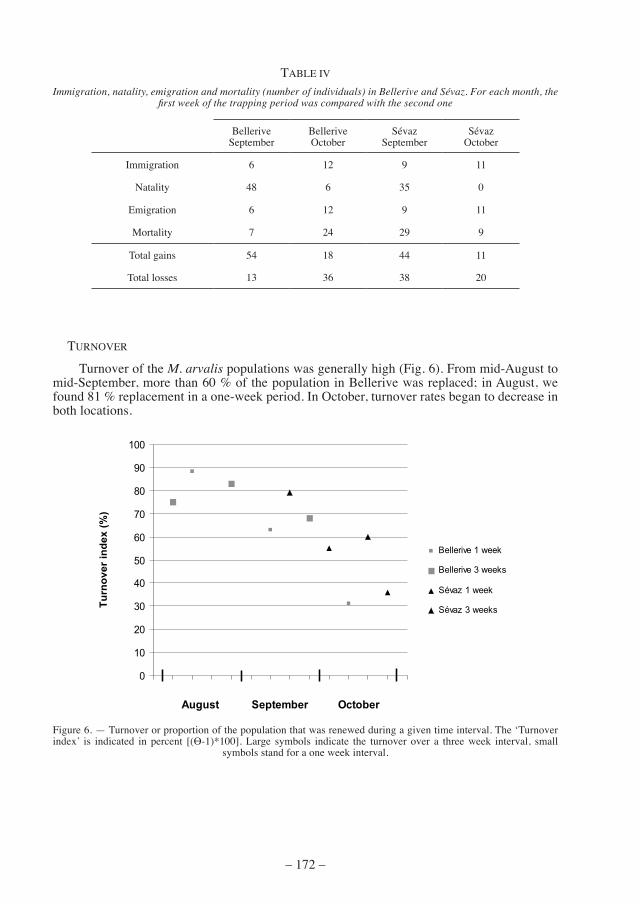
turnover of the M. arvalis populations was generally high (fig. 6). from mid-august to mid-September, more than 60 % of the population in Bellerive was replaced; in August, we found 81 % replacement in a one-week period. in october, turnover rates began to decrease in both locations.
0
10
20
30
40
50
60
70
80
90
100
2 3 4 5 6 7 8 9 10 11 12 13 14 15
Tu
rno
ve
r in
de
x (
%)
Bellerive 1 week
Bellerive 3 weeks
Sévaz 1 week
Sévaz 3 weeks
August September October
figure 6. — turnover or proportion of the population that was renewed during a given time interval. the ‘turnover index’ is indicated in percent [(Ө-1)*100]. Large symbols indicate the turnover over a three week interval, small
symbols stand for a one week interval.
– 173 –
discussion
traPPed sPecies
as expected, Microtus arvalis was the most frequently captured species on all fields. This species inhabits mainly open, moderately wet grassland with not too high vegetation and com-parable cultivated land as a secondary habitat (Niethammer & Krapp, 1982). Sown wild flower areas seem to serve as such a secondary habitat (Briner et al., 2005). delattre et al. (2009) men-tion that the abundance of M. arvalis decreases the closer one gets to a wooded environment.
the second most frequent captured species was the nocturnal wood mouse, Apodemus sylvaticus. its preferred habitats are hedges, gardens, parks and deciduous and mixed forests (Niethammer, 1978b).
Sown wild flower areas do not appear to be a preferred habitat of the yellow-necked mouse, Apodemus flavicollis. this species mainly occurs in woods and hedges (niethammer, 1978a) with no or sparse herb layer. Accordingly, few individuals were trapped only in Sal-avaux and chevroux, where woods were nearby (less than 100 meters away from the trapping sites). according to millan de la Peña et al. (2003) the landscape in which we performed our censuses corresponds to a high degree of agricultural intensification, with only few species of small mammals, like M. arvalis, A. sylvaticus and C. russula. our results are based only on one season and it is known (michelat & giraudoux, 2006) that community structure can change from year to year.
sex ratio
the greater proportion of females in M. arvalis could have several reasons. it is known that the sex ratio in voles varies seasonally, with males being usually more numerous in winter and spring (higher survival), whereas numbers of females increase during the reproductive season in summer and autumn (Stein, 1953; Reichstein, 1956; Niethammer & Krapp, 1982). This corresponds to our results. However, it is important to keep in mind that calculating a sex ratio using trapping data is often biased due to unequal capture probability between sexes or different distances covered by sexes. Bryja et al. (2005) suggest that seasonal variation in the population sex ratio is not merely a result of biasing mechanisms, but also driven by the joint effect of differential recruitment and different survival between sexes.
agE STRUCTURE / WEIgHT
only few juveniles of M. arvalis and A. sylvaticus were trapped, most likely because juveniles are less mobile and therefore, have a smaller probability of capture. the body mass gain per day of juvenile M. arvalis is also quite high and body mass varies among animals of the same age (Niethammer & Krapp, 1982). Therefore, it is probably not accurate to define the juvenile age group simply using weight as a reference.
after reaching an age of two to four weeks male M. arvalis usually have a higher mean body mass than females (Frank & Zimmermann, 1957; Niethammer & Krapp, 1982). Our data show a similar pattern in the subadult age group. However, we found that adult females were slightly heavier than adult males, possibly because of gravid females in our samples. when reared in captivity, subadult males were heavier than females (Niethammer & Krapp, 1982).
Apodemus sylvaticus displayed a similar pattern with greater body mass in adult females. Presence of gravid females in our samples is also a possible reason for these results.
PoPulation dynamics / turnoVer
Because of a high reproductive rate, M. arvalis is known to reach high densities in habitats with dense vegetation. most studies have described multiannual cyclic population densities with multiannual cycles (Frank, 1957). Population densities are generally low in winter and spring, with an increase to medium or high densities in summer, depending on the phase of the
– 174 –
cycle. Niethammer & Krapp (1982) classified population densities as very low (< 100/ha), low (100-300/ha), medium (300-500/ha) and high or “mass occurrence” (1000-2500/ha). in our study numbers of M. arvalis were low in spring, with a marked increase in late august to late september, reaching numbers of up to 581 voles/ha (mna) and up to 1106 voles/ha calculated with the Jolly-Seber model. There was a decline in numbers on all four sites in October. How-ever, one has to take into account that mna estimations are subject to negative bias, which is greatest at the beginning and end of the study period (Pocock et al., 2004). the Petersen and Jolly-seber models are likely to provide a more accurate estimate of numerical changes in the populations. the computations made with the several methods all showed a population decline in october on all studied areas.
Our data indicate that sown wild flower areas are a suitable habitat for M. arvalis allowing this species to reach large densities in summer. the dense vegetation cover provides a good protection against avian predators, a fact already pointed out by aschwanden et al. (2005). it is known that a large part of the population does not survive the winter months and only few females start to reproduce in spring (Leicht, 1979).
the preliminary study already showed that the minimal number of animals known to be alive was very low during the winter months and the populations start to grow no earlier than March or April. The present study confirms these observations.
Apodemus sylvaticus was found in smaller numbers than M. arvalis on all four areas. Although the wood mouse is a typical inhabitant of agricultural ecosystems (green, 1979), it is not known to be a potential pest species in central europe. chevroux was the only place where the population reached a relatively high density of 223 animals/ha known to be alive. in contrast to M. arvalis, the A. sylvaticus population did not begin to decrease on all fields in october. Butet et al. (2006) mention that A. sylvaticus was peaking from late autumn to the end of winter in an agricultural landscape of western france. ouin et al. (2000) showed that wood mice can colonize agricultural landscape from hedgerows. Since wood mice are known to have relatively large home ranges / foraging ranges (todd et al., 1999) it is also possible that some individuals had home ranges that included both the sown wild flower areas and adjacent cultivated fields.
the high turnover of M. arvalis populations in our study sites corresponds to data by Briner et al. (2007). A high turnover rate corresponds to a highly dynamic situation within a sown wild flower area and leads to a high competition among individuals. Population turnover is also an important factor for M. arvalis with respect to its role as a prey.
with regard to the observed population densities in our study and those reported by Briner et al. (2007), we do not believe that sown wild flower areas increase the risk of vole damage in adjoining crop fields. Heroldova et al. (2005) showed that a set-aside alfalfa field does not harbour higher density M. arvalis populations than a similar cultivated field. However, the set-aside field had a higher small mammal species richness (Shannon-Wiener index). Further studies focusing on dispersal of voles are necessary to test the impact of vole populations from sown wild flower areas on adjacent crop fields.
immigration
Schweizer et al. (2007) observed relatively high proportions of immigrants, especially in fall, in similar populations, based on the analysis of microsatellites. our observations therefore confirm results obtained using a genetical approach.
conclusions
From our results, we can conclude that sown wild flower areas are high quality habitats for voles, enabling them to maintain dynamic populations for at least up to three years, and to present an important food source for many predators in the agricultural ecosystem as already mentioned by aschwanden et al. (2005). according to michel et al. (2006), almost every ter-restrial and avian carnivore, to some degree, depends on a small mammal prey base. Butet
– 175 –
& leroux (2001) mention that a summer density of 100 voles/ha is needed to enable a good breeding success of montagu’s harriers. in our case these conditions would be met. in october however, small mammal populations start to decline and in winter, they are very low; it takes then several months for them to recover. Therefore, sown wildflower areas are not likely to provide enough food to support predators in winter. the main reason why vole abundance decreases in winter in sown wildflower fields, beside low recruitment and higher mortality, is most probably related to the lack of green vegetation, mainly grasses (Poaceae) in winter. Rinke (1990) showed that common voles prefer Taraxacum officinale and Trifolium repens, but Poaceae are also quite frequent in their diet. as grass mostly remains green in winter, contrary to most other herbaceous plants, it may represent an important food supply. as pointed out by aschwanden et al. (2007), ecological compensation areas can support high populations of small mammals, which can have a positive effect on predators. winter seems to be a critical time as populations decrease strongly. only predators that can switch to other prey, i.e. gen-eralists, will be able to maintain sufficiently high populations, capable of having a regulating effect on voles. Adding Poaceae species to the sown wildflower areas could improve the situ-ation with respect to voles. delattre et al. (1992) stress the importance of permanent grassland in farmland for Mustela nivalis which can use such habitats as refuges and influence popula-tion kinetics of small mammals. thus, shifts towards a dominance of grassland can enhance the abundance of a pest species such as Microtus arvalis. raoul et al. (2001) pointed out that a lower proportion of permanent grassland leads to more stable Microtus arvalis population dynamics. in the agricultural landscape we prospected, permanent grassland amounts to less than 10 %. Therefore, sown wildflower areas should still be maintained, in spite of their low population abundance of small mammals in winter.
acknowledgments
We wish to thank the numerous farmers who allowed us to work on their fields, and three anonymous referees for their remarks and comments on an earlier draft of this article.
references
aschwaNdEN, J., BirrEr, s. & JENNi, l. (2005). — are ecological compensation areas attractive hunting sites for com-mon kestrels (Falco tinnunculus) and long-eared owls (Asio otus) ? J. Ornithol., 146 : 279-286.
aschwaNdEN, J., holzgaNg, o. & JENNi, l. (2007). — Importance of ecological compensation areas for small mam-mals in intensively farmed areas. Wildl. Biol., 13 : 150-158.
BaumaNN, L. (1996). — The influence of field margins to populations of small mammals – A study of the population ecology of the common vole microtus arvalis in sown weed strips. diploma thesis, zoologisches institut der universität Bern.
BEgoN, M. (1978). — Investigating animal abundance. edward arnold, london.BriNEr, t., NENtwig, w. & airoldi, J.-P. (2005). — Habitat quality of wildflower strips for common voles (Microtus
arvalis) and its relevance for agriculture. Agric. Ecosyst. & Environ., 105 : 173-179.BriNEr, t., FavrE, N., NENtwig, w. & airoldi, J.-P. (2007). — Population dynamics of Microtus arvalis in a weed
strip. Mamm. Biol., 72 : 106-115.BryJa, J., NEsvadBova, J., hErlodova, m., JaNova, E., losik, J., trEBaticka, l. & tkadlEc, E. (2005). — com-
mon vole (Microtus arvalis) population sex ratio : biases and process variation. Can. J. Zool., 83 : 1391-1399.
ButEt, a. & lEroux, a.B.a. (2001). — effect of agriculture development on vole dynamics and conservation of montagu’s harrier in western french wetlands. Biol. Conserv., 100 : 289-295.
ButEt, a., Paillat, g. & dElEttrE, y. (2006). — Seasonal changes in small mammal assemblages from field bounda-ries in an agricultural landscape of western france. Agric. Ecosyst. Environ., 113 : 364-369.
dElattrE, P., giraudoux, P., Baudry, J., musard, P., toussaiNt, m., truchEtEt, d., stahl, P., PoulE, m.l., artois, m., damaNgE, J.P. & Quéré, J.P. (1992). — Land use patterns and types of common vole (Microtus arvalis) population kinetics. Agric. Ecosyst. Environ., 39 : 153-168
dElattrE, P., morEllEt, N., codrEaNu, P., miot, s., Quéré, J.P., sENNEdot, F. & Baudry, J. (2009). — Influence of edge effects on common vole population abundance in an agricultural landscape of eastern france. Acta Theriol., 54 : 51-60.
– 176 –
FraNk, F. (1957). — Das Fortpflanzungspotential der Feldmaus Microtus arvalis (Pallas) – eine Spitzenleistung unter den säugetieren. Z. Säugetierk., 21 : 176-181.
FraNk, F. & zimmErmaNN, k. (1957). — Über die Beziehungen zwischen Lebensalter und morphologischen Merk-malen bei der feldmaus, Microtus arvalis (Pallas). Zool. Jb., Abt. Syst., Ökol. Geogr. Tiere, 85 : 283-300.
FraNk, t. & NENtwig, w. (1995). — ground dwelling spiders (Araneae) in sown weed strips and adjacent fields. Acta Oecol., 16 : 179-193.
grEEN, R.E. (1979). — The ecology of wood mice (Apodemus sylvaticus) on arable farmland. J. Zool., 188 : 357-377.hEroldova, m., JaNova, E., BryJa, J. & tkadlEc, E. (2005). — Set-aside plots – source of small mammal pests ?
Folia Zool., 54 : 337-350.Jolly, g.M. (1965). — Explicit estimates from capture-recapture data with both death and immigration-stochastic
model. Biometrika, 52 : 225-247.krEBs, C.J. (1978). — Ecology : The experimental analysis of distribution and abundance. 2nd Edition. Harper & Row,
Publishers, New York, Hagerstwon, San Francisco, London.krEBs, C.J. (1999). — Ecological methodology. 2nd edition. Benjamin cummings, menlo Park, california.lEicht, W.H. (1979). — Tiere der offenen Kulturlandschaft. Teil 2. Feldhamster. Feldmaus. Quelle & meyer.
Heidelberg.maisoNNEuvE, c. & rioux, s. (2001). — importance of riparian habitats for small mammal and herpetofaunal com-
munities in agricultural landscapes of southern Québec. Agric. Ecosyst. Environ., 83 : 165-175.michEl, N., BurEl, F. & ButEt, a. (2006). — How does landscape use influence small mammals diversity, abundance
and biomass in hedgerow networks of framing landscapes ? Acta Oecol., 30 : 11-20.michEl, N., BurEl, F., lEgENdrE, P. & ButEt, a. (2007). — Role of habitat and landscape in structuring small mam-
mal assemblages in hedgerow networks of contrasted farming landscapes in Brittany, france. Landscape Ecol., 22 : 1241-1253.
michElat, d. & giraudoux, P. (2006). — synchrony between small mammal population dynamics in marshes and adjacent grassland in a landscape of the Jura plateau, france : a ten year investigation. Acta Theriol., 51 : 155-162.
millaN dE la PEña, N., ButEt, a., dElEttrE, y., Paillat, g., moraNt, P., lE du, l. & BurEl, F. (2003). — response of the small mammal community to changes in western french agricultural landscapes. Landscape Ecol., 18 : 265-278.
myllymäki, A. (1979). — Importance of small mammals as pests in agriculture and stored products. Pp 239-279 in : d.m. stoddart (ed.). Ecology of small mammals. Chapman and Hall, London.
NENtwig, w. (2000). — die Bedeutung von streifenförmigen strukturen in der kulturlandschaft. Pp 1-40 in : w. nen-twig (ed.). Streifenförmige ökologische Ausgleichsflächen in der Kulturlandschaft : Ackerkrautstreifen, Bunt-brache, Feldränder. Verlag Agrarökologie, Bern und Hannover.
NiEthammEr, J. (1978a). — Apodemus flavicollis (Melchior, 1834) – gelbhalsmaus. Pp. 325-336 in : J. niethammer & f. krapp (eds). Handbuch der Säugetiere Europas, Band 1 : Rodentia I. akademische Verlagsgesellschaft, wiesbaden.
NiEthammEr, J. (1978b). — Apodemus sylvaticus (Linnaeus, 1758) – Waldmaus. Pp 337-358 in : J. niethammer & f. krapp (eds). Handbuch der Säugetiere Europas, Band 1 : Rodentia I. akademische Verlagsgesellschaft, wiesbaden.
NiEthammEr, J. & kraPP, F. (1982). — Microtus arvalis (Pallas, 1779) – Feldmaus. Pp 284-318 in : J. niethammer & f. krapp (eds). Handbuch der Säugetiere Europas, Band 2/I, Rodentia II. akademische Verlagsgesellschaft, wiesbaden.
ouiN, a., Paillat, g., ButEt, a. & BurEl, F. (2000). — spatial dynamics of wood mouse (Apodemus sylvaticus) in an agricultural landscape under intensive use in the mont saint michel Bay (france). Agric. Ecosyst. Environ., 78 : 159-165.
PEtrusEwicz, K. (1975). — Productivity investigation in ecology. Pp 9-23 in : F. golley, K. Petrusewicz, & L. Rysz-kowski (eds). Small mammals : their productivity and population dynamics. cambridge university Press.
PEtrusEwicz, k. & macFadyEN, a. (1970). — Productivity of terrestrial animals, principles and methods. IBP Hand-book No. 13. Blackwell Scientific Publications, Oxford and Edinburgh : 1-26.
Pocock, m.J.o., FraNtz, a.c., cowaN, d.P., whitE, P.c.l. & sEarlE, J.B. (2004). — tapering bias inherent in minimum number alive (mna) population indices. J. Mammal., 85 : 959-962.
Pollock, k.h., Nichols, J.d., BrowNiE, c. & hiNEs, J.E. (1990). — Statistical inference for capture-recapture exper-iments. Wildl. Monogr., 107 : 1-97.
raoul, F., dEFaut, r., michElat, d., moNtadErt, m., PéPiN, d., Quéré, J.P., tissot, B., dElattrE, P. & girau-doux, P. (2001). — landscape effects on the population dynamics of small mammals communities : a pre-liminary analysis of prey-resource variations. Rev. Ecol. (Terre Vie), 56 : 339-352.
rEichstEiN, H. (1956). — zur dynamik der sexualproportion bei der feldmaus. Z. Säugetierk., 21 : 184-191.riNkE, T. (1990). — Nutrition ecology of Microtus arvalis (Pallas, 1779) on permanent meadows. 1. general food
preferences. Z. Säugetierk., 55 : 106-114.salvEtEr r. & NENtwig, W. (1993). — Schwebefliegen (Diptera, Syrphidae) in der Agrarlandschaft : Phänologie,
Abundanz und Markierungsversuche. Mitt. NatForsch. Ges. Bern N. F., 50 : 147-191.

– 177 –
schwEizEr, m., ExcoFFiEr, l. & hEckEl, g. (2007). — Fine scale genetic structure and dispersal in the common vole (Microtus arvalis). Mol. Ecol., 16 : 2463-2473.
skrivaN, P. & aNdEra, m. (1987). — Small mammal communities of the stream corridors in agrocenosis. Ekológia (CSSR), 6 : 129-146.
stEiN, g.H.W. (1953). — Über das Zahlenverhältnis der geschlechter bei der Feldmaus, Microtus arvalis. Zool. Jb., Abt. Syst., Ökol. Geogr. Tiere, 82 : 137-156.
tErtil, R. (1977). — Impact of the common vole, Microtus arvalis (Pallas) on winter wheat and alfalfa crops. EPPO Bull., 7 : 317-339.
todd, i.a., tEw, t.E. & macdoNald, d.w. (1999). — Arable habitat use by wood mice (Apodemus sylvaticus). 1. macrohabitat. J. Zool., 250 : 299-303.
truszkowski, J. (1982). — The impact of the common vole on the vegetation of agroecosystems. Acta Theriol., 27 : 305-345.
wEiss, E. & stEttmEr, c. (1991). — Unkräuter in der Agrarlandschaft locken blütenbesuchende Nutzinsekten an. Agrarökol., 1 : 1-104.

![[eng] AGRICULTURAL PRICES : Price indices and absolute ... · agricultural production Eurostat publications on agricultural price statistics Page 5 Signes et abréviations employés](https://img.pdfslide.fr/doc/110x75/5f82febcf143ec7a1a0d0d02/eng-agricultural-prices-price-indices-and-absolute-agricultural-production.jpg)