Embed Size (px)
Citation preview
Treball de fi de màster Acadèmic
The Effect of EFL learners' Attitudes towards Native English Accents on Listening
Comprehension and Comprehensibility
Nom i Cognoms Jarna van Gelder
Màster: Lingüística Teòrica i Aplicada
Edició: 2018-2019
Directors: Dr. Carmen Perez Vidal Dr. Joan Carles Mora
Any de defensa: 2019
Col⋅lecció: Treballs de fi de màster
Departament de Traducció i Ciències del Llenguatge

Acknowledgments
Undertaking this master’s degree has been an amazing opportunity that would not have
been possible without the support of others. Thank you all for your support doing it all!
I am eternally grateful to the VSB-fund for granting me a scholarship to do complete my
master’s degree abroad. This extraordinary chance was only made possible because of
your generosity.
Without my supervisors, I would have been nowhere. I am extremely grateful to Carmen
Perez Vidal for her time, advice and guidance in creating, structuring, clarifying and
analysing my thesis every step of the way. I will be forever thankful to her and co-
supervisor Joan Carlos Mora, who gave his invaluable feedback, lent his expertise on
experimental research design and helped me through the statistical analysis.
Furthermore, I am extremely appreciative to him for helping me to record all audio
samples in the lab, even when due to a scheduling conflict I was already in the
Netherlands during the last recordings to conduct part of this study. I really would not
have managed without either of them. Additionally, I would like to thank Joan Costa, for
his insightfulness and help, and especially for the boost in enthusiasm that I sorely
needed about the field that I love most: sociolinguistics.
Without my speakers I would have been nowhere, thank you so more for lending
me your accents! I would additionally like to thank the Deltion College in the
Netherlands, its teachers, and its students for aiding me in conducting this study there.
Furthermore want to thank my supporting family and friends. Kristyn Johnson,
you were my partner in crime during this whole process from co-developing Task 1 and
coming with me to the Netherlands, to lending me your IT- hero (thanks Tiago!) and
aiding me in countless invaluable ways. More than that, I want to thank you for being
my sounding board and rock during the most frustrating and trying times.
‘Bedankedank’, from the bottom of my heart!
Finally, to my fiancé Jasper de Vries, I will simply never be able to express how
much this year has meant to me. I would not have even started if it weren’t for your
support, let alone finished. You were there for me during this whole crazy adventure.
Always, and in every possible way. To many more.
4
Abstract
This study sought to contribute to all of the research done on the crossroads of language
attitudes and second language acquisition, by examining attitudes towards the two most
well-known accents of English: Standard British English (RP) and Standard American
English, and the effects of those attitudes, as well as exposure on the constructs Listening
Comprehension, Comprehensibility and perceived Teach Ability. This was done in a two
part mixed test design. Forty-one EFL learners from the Netherlands were asked to rate
two male native speakers, on their native British and American accents, using 11 attitude
dimension Likert-scales. Part two consisted of a standard listening test in the two accents,
which was used to objectively rate performance in those accents, followed by the
subjective comprehensibility and perceived teach ability measures. 41 Dutch EFL
participants showed an overall higher attitude score for the General American accent, in
spite of a higher status attitude score for Received pronunciation. The effects of the
attitudes on Listening Comprehension and Comprehensibility are as diverse and
inconsistent as previous studies have been. An effect of attitude towards an accent on
perceived Teach Ability is one of the most conclusive results.
Keywords: Attitudes, Attitudes towards Accents, Varieties of English, Language
Acquisition, Formal instruction, L2 EFL, L1 Dutch, Comprehensibility, Listening
Comprehension, Exposure, Teach Ability, Perception.
5
Index
1. Introduction 7
2. Literature Review ................................................................................................................ 9
2.1 Attitudes to Accents __________________________________________________ 9
2.2 Listening Comprehension, Comprehensibility, Accent and Exposure __________ 12
2.3 Effect of Attitude on Listening Comprehension, Comprehensibility & Teach ability15
2.4 This Study ________________________________________________________ 18
2.5 The Research Question and Hypotheses: ________________________________ 19
3. Methods ........................................................................................................................ 21
3.1 Design ___________________________________________________________ 21
3.2 Speakers __________________________________________________________ 23
3.3 Participants _______________________________________________________ 25
3.4 Materials and Procedure _____________________________________________ 27
2.4.1 Part 1 .................................................................................................................... 28
2.4.2 Part 2 ................................................................................................................... 31
4. Results .............................................................................................................................. 36
4.1 Attitude towards an accent: ___________________________________________ 37
4.2 Attitude, Listening Comprehension, Comprehensibility and Teach Ability ______ 39
4.3 Exposure, Listening Comprehension, Comprehensibility and Teach Ability _____ 42
5. Discussion ......................................................................................................................... 45
6. Conclusion ........................................................................................................................ 50
6
7. Bibliography ..................................................................................................................... 54
8. Table of Figures ................................................................................................................ 59
9. Appendices ....................................................................................................................... 61
Appendix A - Speaker Background Questionnaire ____________________________ 61
Appendix B - Speaker Consent Form_______________________________________ 62
Appendix C - Speaker Debriefing Letter ____________________________________ 64
Appendix D - Table 5: Speaker Demographics _______________________________ 66
Appendix E - Questionnaire: Participant Information _________________________ 68
Appendix F - Task 1: Texts for Attitude and Exposure Measure __________________ 72
Appendix G - Task 1: Attitude and Exposure Measure _________________________ 77
Appendix H - Task 2: Texts for Listening Comprehension Test __________________ 83
Appendix I - Task 2: Comprehension Test & Comprehensibility/ Teach-ability measures91
Appendix J – Table 6: Table of participant’s attitude scores ___________________ 112
Appendix K: Correlation Matrixes _______________________________________ 114
Appendix L: Table 12 – Raw data file SPSS ________________________________ 116
7
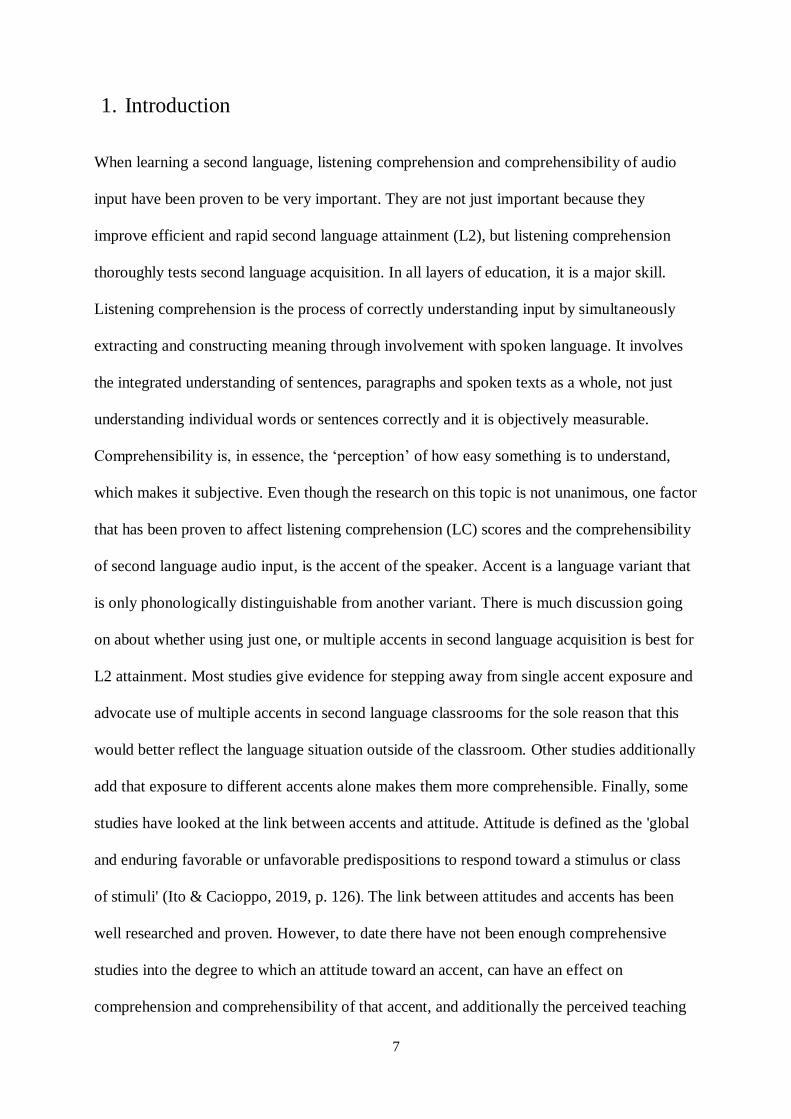
1. Introduction
When learning a second language, listening comprehension and comprehensibility of audio
input have been proven to be very important. They are not just important because they
improve efficient and rapid second language attainment (L2), but listening comprehension
thoroughly tests second language acquisition. In all layers of education, it is a major skill.
Listening comprehension is the process of correctly understanding input by simultaneously
extracting and constructing meaning through involvement with spoken language. It involves
the integrated understanding of sentences, paragraphs and spoken texts as a whole, not just
understanding individual words or sentences correctly and it is objectively measurable.
Comprehensibility is, in essence, the ‘perception’ of how easy something is to understand,
which makes it subjective. Even though the research on this topic is not unanimous, one factor
that has been proven to affect listening comprehension (LC) scores and the comprehensibility
of second language audio input, is the accent of the speaker. Accent is a language variant that
is only phonologically distinguishable from another variant. There is much discussion going
on about whether using just one, or multiple accents in second language acquisition is best for
L2 attainment. Most studies give evidence for stepping away from single accent exposure and
advocate use of multiple accents in second language classrooms for the sole reason that this
would better reflect the language situation outside of the classroom. Other studies additionally
add that exposure to different accents alone makes them more comprehensible. Finally, some
studies have looked at the link between accents and attitude. Attitude is defined as the 'global
and enduring favorable or unfavorable predispositions to respond toward a stimulus or class
of stimuli' (Ito & Cacioppo, 2019, p. 126). The link between attitudes and accents has been
well researched and proven. However, to date there have not been enough comprehensive
studies into the degree to which an attitude toward an accent, can have an effect on
comprehension and comprehensibility of that accent, and additionally the perceived teaching
8
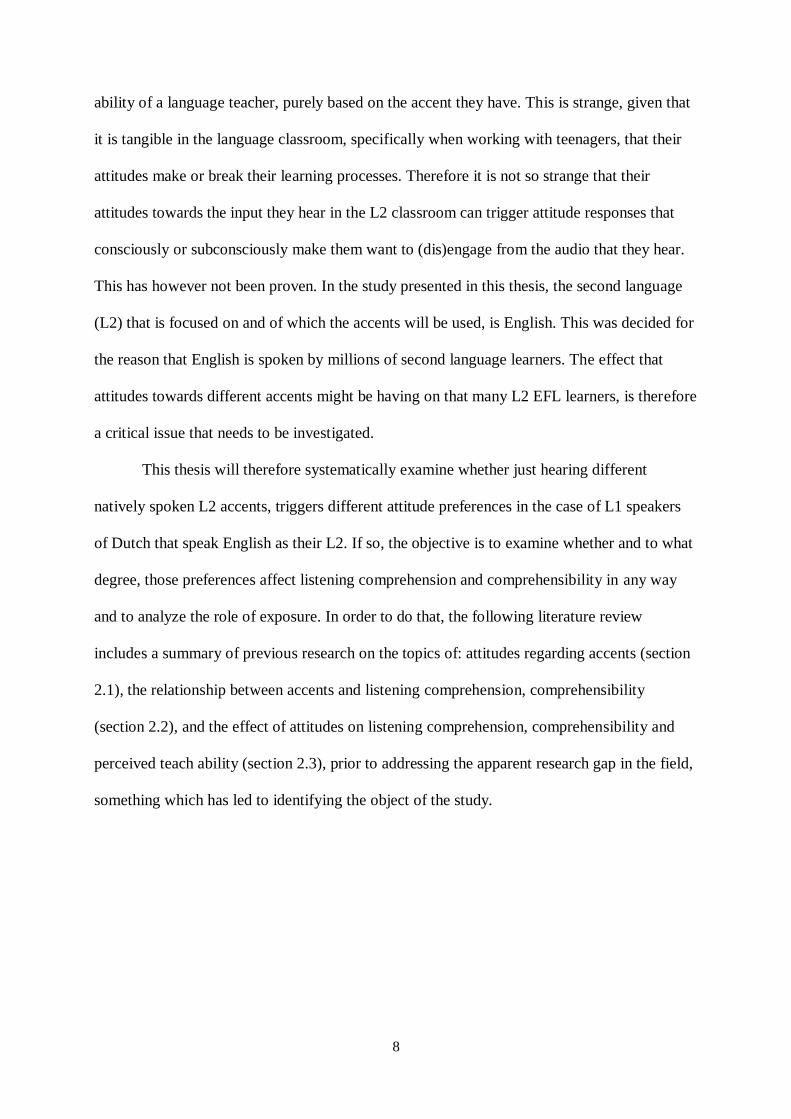
ability of a language teacher, purely based on the accent they have. This is strange, given that
it is tangible in the language classroom, specifically when working with teenagers, that their
attitudes make or break their learning processes. Therefore it is not so strange that their
attitudes towards the input they hear in the L2 classroom can trigger attitude responses that
consciously or subconsciously make them want to (dis)engage from the audio that they hear.
This has however not been proven. In the study presented in this thesis, the second language
(L2) that is focused on and of which the accents will be used, is English. This was decided for
the reason that English is spoken by millions of second language learners. The effect that
attitudes towards different accents might be having on that many L2 EFL learners, is therefore
a critical issue that needs to be investigated.
This thesis will therefore systematically examine whether just hearing different
natively spoken L2 accents, triggers different attitude preferences in the case of L1 speakers
of Dutch that speak English as their L2. If so, the objective is to examine whether and to what
degree, those preferences affect listening comprehension and comprehensibility in any way
and to analyze the role of exposure. In order to do that, the following literature review
includes a summary of previous research on the topics of: attitudes regarding accents (section
2.1), the relationship between accents and listening comprehension, comprehensibility
(section 2.2), and the effect of attitudes on listening comprehension, comprehensibility and
perceived teach ability (section 2.3), prior to addressing the apparent research gap in the field,
something which has led to identifying the object of the study.
9
2. Literature Review
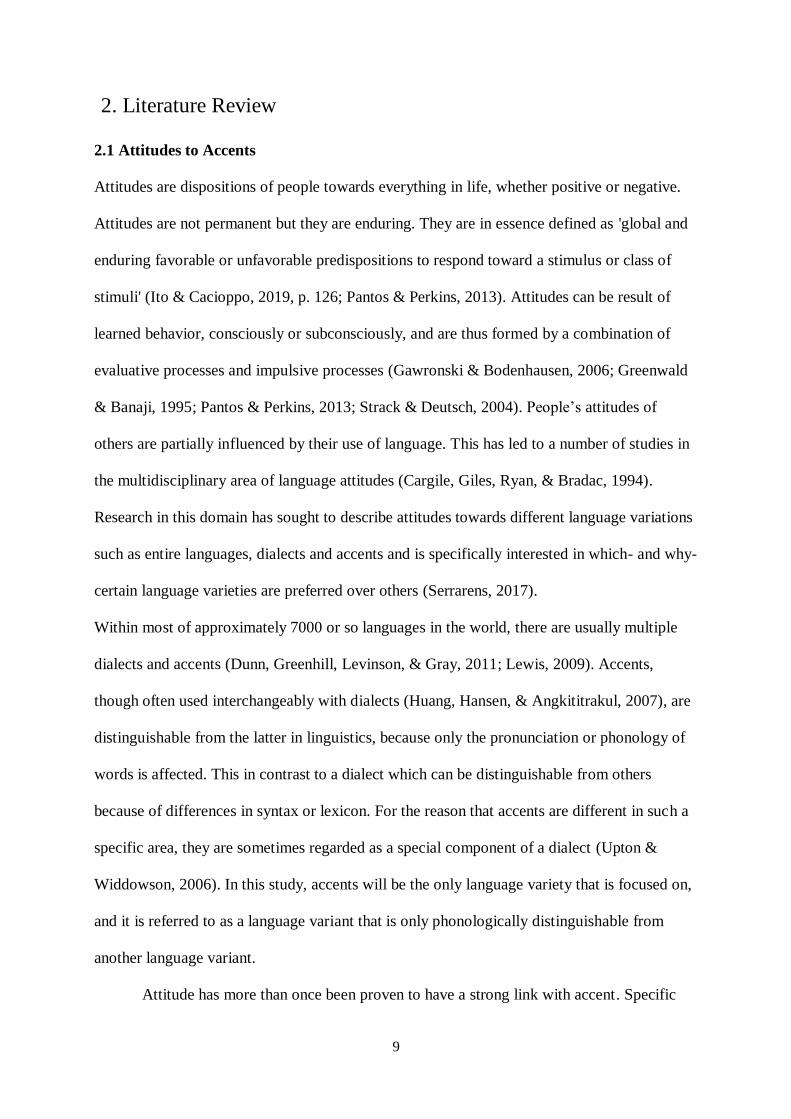
2.1 Attitudes to Accents
Attitudes are dispositions of people towards everything in life, whether positive or negative.
Attitudes are not permanent but they are enduring. They are in essence defined as 'global and
enduring favorable or unfavorable predispositions to respond toward a stimulus or class of
stimuli' (Ito & Cacioppo, 2019, p. 126; Pantos & Perkins, 2013). Attitudes can be result of
learned behavior, consciously or subconsciously, and are thus formed by a combination of
evaluative processes and impulsive processes (Gawronski & Bodenhausen, 2006; Greenwald
& Banaji, 1995; Pantos & Perkins, 2013; Strack & Deutsch, 2004). People’s attitudes of
others are partially influenced by their use of language. This has led to a number of studies in
the multidisciplinary area of language attitudes (Cargile, Giles, Ryan, & Bradac, 1994).
Research in this domain has sought to describe attitudes towards different language variations
such as entire languages, dialects and accents and is specifically interested in which- and why-
certain language varieties are preferred over others (Serrarens, 2017).
Within most of approximately 7000 or so languages in the world, there are usually multiple
dialects and accents (Dunn, Greenhill, Levinson, & Gray, 2011; Lewis, 2009). Accents,
though often used interchangeably with dialects (Huang, Hansen, & Angkititrakul, 2007), are
distinguishable from the latter in linguistics, because only the pronunciation or phonology of
words is affected. This in contrast to a dialect which can be distinguishable from others
because of differences in syntax or lexicon. For the reason that accents are different in such a
specific area, they are sometimes regarded as a special component of a dialect (Upton &
Widdowson, 2006). In this study, accents will be the only language variety that is focused on,
and it is referred to as a language variant that is only phonologically distinguishable from
another language variant.
Attitude has more than once been proven to have a strong link with accent. Specific
10
research into the link of attitudes and language attitudes has proven that a speaker’s social
identity is determined by the listener, purely based on their accent (Giles, 1970). Accents have
also influenced behavior in even young children, making them less eager to make certain
friends, depending on the accent another child has. It appears that ‘variations in accent are
sufficient to evoke these social preferences’ (Kinzler, Dupoux, & Spelke, 2007). This is the
case, because language attitudes are based on a combination of cognitions, behaviors from the
past, intentions for the future and affective reactions and they in turn impact cognitions,
intentions and behavior for the future (Zimbardo & Leippe, 1991). This is substantiated by
Eagly & Mlandinic (1989), who also mention the cognitive, affective and behavioral
categories as having an effect on the generation of an attitude. The affective category includes
the sentiments that people have, the cognitive category encompasses their thoughts, and the
behavioral category influences actual behavior towards the item or person that the attitude is
about (Eagly & Mladinic, 1989). These language attitudes are formed on a spectrum, and can
range anywhere between extremes of negative and positive (Watson, Watson, & Tay, 2018).
Where each individual sits between the extremes, whether more on the positive or negative
end, can even be formed without a correct mental representation (Zimbardo & Leippe, 1991).
Stereotyping has also been shown to play a role in the attitudes that people have towards
accents, because this attitude is often connected to whatever stereotype someone has about the
social group of those speaking with a certain accent (Serrarens, 2017). Taifel’s (1982)
previous views fall in line with this, as he views language attitudes specifically as based on
social preferences that are valued subjectively by society in a stratifying way. Similarly
Edwards (1982) more generally states that all attitudes to language variations are created
based on stereotypes. Additional previous language research has also suggested that these
evaluation patterns to accents are often based on the evaluations and stereotypes about the
nation that the speaker is from (e.g., Ryan, 1983). One hypothesis, which is known as the
11
‘imposed norm hypothesis’, states that language attitudes are based on evaluative patterns
innate in cultural norms and patterns (Giles, Bourhis, & Davies, 1974; Giles, Bourhis, Lewis,
& Trudgill, 1974). It can thus be concluded from previous language research that cultures
within countries form attitudes about other accents based on specific stereotypes and views of
the country where the speaker is from. It is also not necessarily a bad thing to have these
stereotypes, though it is often viewed this way. Categorizing based on cultural norms and
patterns that the stereotypes are based on, is needed in order to categorize the world around us
(Lippmann, 1922). It is a human way of being able to place speakers into a social hierarchy
because when they are categorized they are more easily dealt with (e.g., Labov, 1966;
Lambert, 1967; Pantos & Perkins, 2013; Preston, 1989). Stereotyping has therefore also been
be defined as ‘a mental concept, picture in our heads which governs the process of perception’
(Ladegaard, 1998b, p251).
Some authors consider attitudes to be the result of a more negative process. Tajfel
(1982) for example, describes attitudes as being formed by an ‘us vs. them’ mentality that is
triggered by enhancing the status of a group that we feel we are most closely related to. These
subjective status perceptions are connected to factors such as a higher level of education, a
certain kind of occupation, respectable behavior, being more well-spoken etc. They are also
known as status traits (Ito & Cacioppo, 2019). Aside from status, there are other traits
included in attitude judgements, which include characteristics such as kindness and humor
(Ito & Cacioppo, 2019). These are referred to as solidarity traits (Ito & Cacioppo, 2019), or
social attractiveness items (Carrier, 1999; Zahn & Hopper, 1985). Both types of traits
combined condition an attitude to language, and they are both shaped subjectively (Ash,
2013). There is a wealth of research looking into what these different attitudes are, in different
parts of the world, towards different accents. The status attributes specifically are often
attributed to the standard variety of the language, which is the variety that is considered to be
12
spoken by the educated members of society, in academia, the media etc. (Edwards, 1982).The
non-standard accent are generally disfavored by listeners (Gluszek & Dovidio, 2010;
Lambert, 1967; Ryan, 1982). Results from diverse research studies have shown that many
attitudes are in fact uniform across cultures (Bradac, 1990; Giles & Coupland, 1991;
Ladegaard, 1998a; Ladegaard, 1998b). Though there is conflicting research to be found on the
subject as well.
2.2 Listening Comprehension, Comprehensibility, Accent and Exposure
Being able to correctly understand spoken language from an L2 language is crucial in learning
that language, as this greatly improves L2 development (Moyer, 2009). Correctly
understanding verbal input is also known as listening comprehension (LC). It is the process of
simultaneously extracting and constructing meaning through involvement with spoken
language (Snow, 2002). Speech is comprehended by processing information that can be
gathered from visual and auditory clues by the listener, so that it can be understood what the
speaker is trying to express (Rubin J., 1990). It involves the integrated understanding of
sentences, paragraphs, and spoken texts as a whole, not just understanding individual words
or sentences correctly, and it is objectively measurable (Snow, 2002).
Barlow (as cited in Kagitci, 2017) and Kagitci (2017) looked at an additional construct
rather than at just the objective construct of LC. They added a measure of perception to their
experiments in which they asked the participants to indicate which accents they perceived
easier to understand. This measure of perception, is comprehensibility, and it is closely related
to listening comprehension, yet still a separate factor. It is, in essence, the ‘perception’ of how
easy something is to understand (Derwing & Munro, 1997). So, while listening
comprehension is objectively measured, comprehensibility is someone’s personal judgement
of what they hear and therefore subjective.
It needs to be pointed out, for the sake of clarification, that LC, as well as
13
comprehensibility, are different from another well-known construct in second language
acquisition (SLA) research. The construct referred to is intelligibility, which is usually
referred to as understanding the words of the message delivered by the speaker (Derwing &
Munro, 1997). Intelligibility tests are therefore usually conducted by having participants
transcribe what they hear, and interfering factors are for example background noise or
someone slurring their language when they are tired or drunk. Listening Comprehension (LC)
is not about understanding what is being said word for word, as intelligibility tests prove. It is
about truly understanding the content of speech which is why it is so important for
communication in interaction. Listening comprehension is however a complicated component
of language learning. It is optimal when the listeners are able to pay attention as well as
access their knowledge of the world, and the foreign language, while they are processing
(Rubin J. , 1990). Listening Comprehension is what is tested in formal second language
education by asking participants to prove their accurate understanding of the meaning in an
oral message, not intelligibility. For this reason, Listening Comprehension, along with
comprehensibility, are the focus in the this current study.
Finally, a linguistic dimension which has been found to have an effect on LC and
comprehensibility, is the a speaker’s accent. An increasing amount of research has shown that
the accent of a speaker, can affect listening comprehension of the listener to such a degree that
it can affect assessment scores (e.g. Anderson-Hsieh & Kohler, 1988; Bilbow, 1989; Derwing
& Munro, 1997; Eisenstein & Berkowitz, 1981; Kang, Moran, & Thomson, 2019).
Major, Fitzmaurice, Bunta, & Balasubramanian (2002) were pioneers with their large-
scale study comparing four groups of 100 listeners from Spain, China, Japan and the USA.
The participants listened to English speech spoken with the respective countries’ accents and
conclusively considered native English speech as more comprehensible, because it was easier
to follow. Other research has gone along the avenue of measuring whether an accent that was
14
less well-known to the participants, would be less comprehensible. A North American English
accent was for example perceived to be more comprehensible than an Indian one because the
Japanese participants were more familiar with it from media exposure (Matsuura R., Chiba,
Mahoney, & Rilling, 2014). Harding (2012) showed that a speaker’s L1 accent when they
spoke in an L2, had a positive effect on the listener’s academic L2 listening comprehension
test scores when that listener shared the speaker’s L1. He showed, in essence, a shared-L1
advantage. Major et. al. (2002) however only found a shared-L1 advantaged listener’s L2
English listening comprehension test scores when the speaker and listener shared Spanish as
their L1, however not when they shared Chinese as an L1. It has thus been proven in different
studies that the accent of a speaker can affect comprehensibility.
Conflicting results can also be found in the relationship between LC scores and
comprehensibility ratings. These are often due to the choice of accents that were used in the
audio input used in experiments. Barlow’s (as cited in Kagitci, 2017) participants perceived
native speakers of the L2 audio input as more comprehensible than non-native speakers, even
though the participant’s actual LC test-results showed no difference between audio recordings
made by native and non-native speakers. This shows that while listeners may perceive certain
speech as difficult to understand, their actual comprehension might not be effected at all.
Munro & Derwing (1995a) found comparable results in a study looking at Mandarin-accented
speech. They discovered English natives heard perfectly what was said in the Mandarin-
accented speech files, even though they only heard the audio once and the English natives had
considered the speakers with that accent as not very comprehensible (Munro & Derwing,
1995a). One hypothesis about the reason behind this, is that there is an increase in processing
difficulty of speech that has a more unfamiliar accent. This increased processing time would
be the reason that speech, spoken in unfamiliar foreign accents, would be considered less
comprehensible even though that speech is understood perfectly (Munro & Derwing, 1995b).
15
While it would be logical to believe that familiarity with an accent, a phenomenon also known
as amount of exposure to an accent, would have a positive impact LC and comprehensibility,
the research on this topic has not been conclusive either (Adank, Evans, Stuart-Smith, &
Scotti, 2009; Bent & Bradlow, 2003; Gass & Varonis, 1984; Ockey & French, 2014).
Matsuura, Chiba, & Fujieda (1999) studied the effect of unfamiliar and familiar accents on
test scores and perceived comprehensibility, focusing on the standard American accent and
Irish accents. The Japanese participants in the study were very familiar with the American
accent because it was the dominant accent in school, while Irish was unfamiliar to them. The
results showed that the students considered the more familiar accent (American) as more
comprehensible, even though such higher comprehensibility did not lead to improved test
results. Ockey and French (2014) however found an effect of familiarity of accent on TOEFL
LC scores when they investigated the effect of different accents (American, Australian and
British) on listening comprehension test scores. Unfortunately, they did not measure the LC
test scores to comprehensibility scores given by the speakers which is unfortunate for the fact
that the relationship of accent on LC scores with the additional comprehensibility construct
would have been interesting.
This effect shown on listening comprehension might not only have an effect on test
scores but it can differ from test taker to test taker (Taylor, 2006). This indicates a certain
unfairness when it comes to using only one accent in LC assessment (Schmitz, 2015). Studies
in the subfield of research on accents have therefore questioned the value of using only a
single accent in English listening comprehension tests (L2 LC) (Abeywickrama, 2013;
Harding, n.d.; Ockey & French, 2014; Taylor & Garenpayeh, 2011).
2.3 Effect of Attitude on Listening Comprehension, Comprehensibility & Teach ability
As previously stated, research on the relationship between, accent and LC in second language
acquisition (SLA) has mostly focused on to what degree attitudes towards accents affect LC
16
and comprehensibility. Most of the research has concentrated on L2 speech production and
whether this accented speech is comprehensible to native speakers (Derwing & Munro, 1997).
This is surprising, as there are many more listeners of, for example, English as a second
language, than there are native English listeners. Additionally, seeing as a bias toward a
particular language or even accent is already enough evoke preferences, it can disadvantage
foreign language learners that happen to comprehend one accent better than another.
Specifically when that foreign accent is used in listening comprehension tests (Kang, Moran,
& Thomson, 2019). Carrier (1999) substantiates this in her research and adds to it by
highlighting the role of attitude in listening comprehension testing specifically. She observes
that attitudes have an effect on language behavior, which leads to an effect on L2 listening
comprehension. She however reaches this conclusion based on research done on the effect of
status on conversational interaction.
Munro & Derwing (1995b), discuss the influence of attitudes on all communication,
stating that prejudice against a particular speaker may hinder communication, even though a
speaker’s message may be perfectly understood. They describe this prejudice as ‘by no means
the speaker’s fault’ (Munro & Derwing, 1995b, p. 290), but that they are formed, on the
listener’s end, through a combination of social, economic and political factors. These factors
are specifically mentioned as having a possible influence on attitudes towards accented
speech. However, they choose not to attempt to investigate attitudes in their research (Munro
& Derwing, 1995b), in spite of a number of other researchers also noting ‘irritation, a
downgrading of attitudes towards speakers, or outright discrimination’ (Munro & Derwing,
1995b, p. 290) because of an accent or dialect (Albrechtsen, Henriksen, & Faerch, 1980;
Anisfeld, Bogo, & Lambert, 1962; Brennan & Brennan, 1981a; Brennen & Brennen, 1981b;
Cunningham-Andersson, 1993; Fayer & Krasinski, 1987; Gumperz, 1982; Gynan, 1985;
Johansson, 1978; Kalin & Rayko, 1978; Sato, 1991).
17
The bias or attitude towards an accent, as well as exposure have even been proven to
affect how students judge their teachers, rightly or wrongly, on their ability to teach certain
subjects (Barbour, 2014), sometimes to such a degree that students will not take certain
college classes. This attitude has thus been proven to play a role in LC, but also
comprehensibility and perceived teach ability (e.g. Major et. al., 2002), however to what
degree this is so, remains to be seen. It is clear that although some studies have dealt with the
effects of attitude on multiple constructs, the topic has yet to be fully examined.
Regarding research on attitudes to accents, and English accents in particular, Bayard et. al.
(2001) discovered that General American (GA) was rated higher on status and power, over the
standard British accent (Received Pronunciation or RP, Australian English and New Zealand
English. The participants were however all native English speakers from these countries. It
was hypothesized by Bayard et. al. (2001) that American English, because of how widespread
it is becoming, would replace RP as the previously preferred variant. Ladegaard (1998a)
studied language attitudes towards RP, GA and Australian English in Denmark, where the use
of both accents is similar to that of the Netherlands. The results indeed showed that there was
a higher status and competence attributed to the RP accent, compared to the other two. In
contrast, scores for the dimensions of social attractiveness, personal integrity and linguistic
attractiveness were higher for the American and Australian accents than for RP. This in
contrast to listening comprehension scores, which may not be affected at all by these alleged
preferences, or which may be better for the GA accent, which is heard more frequently in the
Dutch mainstream media. Exposure may thus have a more significant effect on Listening
Comprehension, as shown in the previously mentioned research exposure and familiarity of
accent.
Contrasting results came from Serrarens (2017), who in an even more recent study,
compared the status and social attractiveness dimensions towards the RP and GA accents in
18
the Netherlands, and found that the social attractiveness was higher for RP than for GA. One
reason for this could be the way the USA politics have appeared in the news more recently.
The Netherlands, as a more liberal, socialist country, has strong opinions about policy
changes since president Trump has been elected. This could account for the changes in
attitude (Serrarens, 2017). Particularly for this reason, it could be argued that these newly
formed, or altered attitudes may end up affecting comprehensibility or the other constructs.
In sum, research on the relationship between LC and accents is inconclusive.
Moreover, there is scant research examining the role that attitude plays in both listening
comprehension scores and comprehensibility and even perceived teach ability. Against such
backdrop the current study seeks to shed some light on the discrepancies around such a
phenomenon, taking a special interest in identifying individual variability in the results.
2.4 This Study
The aim of this study was to examine whether the attitude towards an accent has an effect on
listening comprehension, comprehensibility and perceived teach ability in the case of L1
speakers of Dutch that speak English as their L2. Its objective was to measure whether just
hearing different natively produced L2 accents, triggers different attitudes in the case of L1
speakers of Dutch that speak English as their L2, and whether those attitudes or exposure,
affect listening comprehension, comprehensibility and perceived teach ability.
English was chosen as the L2 language to focus on because the number of people that
speak English as an L2 almost doubled between 1997 and 2003 (to over 430 million) and it is
safe to assume this number has only increased since then (Jenkins, 2009). Dutch is chosen as
the L1 because the Netherlands as a country is exposed to a large amount of English. It takes
an important place in society as an L2 (Schmitz, 2015). The accents that will therefore be
examined in this study are the accepted standard accents of the two varieties of English most
frequently heard in the Netherlands and to which EFL learners are most exposed. While it
19
may be true that real-world performance (i.e. performance outside of the language classroom)
could be affected negatively by only focusing on well-known English accents in education,
this is still mostly done at the present such as is done in the Netherlands (Kang, Moran, &
Thomson, 2019). There, most listening comprehension testing is developed around the only
the two most well-known standardized accents, namely General American (GA) of the United
States of America and Received Pronunciation (RP) of England. Therefore, looking into the
effect that attitudes towards these accents can have on listening comprehension and
comprehensibility has great implications for second language testing in the Netherlands, and
depending on the results, for second language testing everywhere.
When looking at what could influence attitudes of different English accents the
participants are exposed to, Jenkins (2009) points out that there is the view in countries close
to the United Kingdom, that the British accent is superior. More often than not, speakers using
RP are regarded as more prestigious, successful and well-educated individuals (Smith, 2017).
Since the Netherlands is close to the United Kingdom in both geographical location and
general contact, the idea of the superiority of a British accent, and in particular RP, prevails.
This is partly exacerbated by its use in formal settings in the Netherlands, as for example in
higher education and all English communication coming from the government (Schmitz,
2015). In contrast to a British accent, an American accent is overwhelmingly dominant not in
formal settings but in the media (social media, television, Netflix, music etc.). As seen from
the previous literature, both attitude and exposure have, to differing degrees, been proven to
effect listening comprehension, comprehensibility and perceived teach ability. Therefore this
previous literature was used to form the following research questions and hypotheses.
2.5 The Research Question and Hypotheses:
Since there has not been much research at all into whether the attitude of an accent has an
effect on listening comprehension and comprehensibility, which could therefore affect L2
20
learning, the main research interest and question is:
RQ1: Do the attitudes of Dutch EFL learners toward natively produced American and British
English accents affect the Listening Comprehension, Comprehensibility and perceived Teach
Ability, of these accents and does exposure play a role?
This research questions encompasses the following questions:
- Subquestion 1: What are the differences in Dutch Intermediate EFL learners’ attitudes
towards the standard varieties of natively produced British English (RP) and American
English (GA) accents respectively.
- Subquestion 2: How does Attitude towards an Accent, relate to Listening Comprehension,
Comprehensibility and perceived Teach Ability scores?
- Subquestion 3: How does exposure towards an accent, relate to Attitude, Listening
Comprehension, Comprehensibility and perceived Teach Ability?
On the basis of the above literature review, the following hypotheses were formed:
1. In the Netherlands, most students will have a better attitude towards the standard British
accent (RP) than towards the standard American accent (GA), due to higher ratings for
specifically the status attitude dimensions.
2. When attitude scores are higher towards one accent, participants will want to pay more
attention to that accent, wherefore it will be perceived as easier to understand. This will result
in a have a higher comprehensibility rating and perceived teach ability rating for that higher
rated attitude.
3. The actual listening comprehension scores will be higher for the American accent because
the Netherlands as a country is exposed to more American English in media. There will be a
perceivable effect of exposure on this construct.
21
3. Methods
3.1 Design
The main aim of this study was to discover the effect of attitudes towards native English
accents, on the listening comprehension, comprehensibility and perceived teach ability
scores of Dutch EFL learners, with an additional focus on the independent variable of
exposure. The accents chosen for examination were the standard accents of England (RP)
and The United States of America (GA). The accents used in this experiment had to be as
close to these possible. Two different research sections (parts 1 and 2) were conducted in a
mixed design (see the experimental design in Figure 1). Data collection took place in the
Netherlands.
Prior to starting part 1, an information questionnaire was used as a measure to gain
insight into the participants’ backgrounds (See Appendix E). Part 1 was then used to
measure the two independent variables in this study: attitudes towards accents, and
exposure to the accents. The attitudes towards each respective accent were measured by
exposing the participants to 1 audio file per accent that participants listened to (See
Appendix F). The participants had to rate each accent based on 11 attitude dimensions
encompassing both status traits and solidarity traits. The participants were asked to use
adapted 9-point Likert scales to rate the attitude dimensions on (See Appendix G).
Part 2 of the study was devoted to gathering data about the dependent variables: the EFL
learners’ objective listening comprehension scores and subjective comprehensibility and
perceived teach ability ratings, in regards to RP and GA accents respectively. Firstly, in
order to have an objective measure of listening performance, students were administered a
conventional listening test in each accent, that was created specifically for this study. This
was done to accurately compare the listening comprehension scores for two accents (See
Appendices H and I). Secondly, in order to measure comprehensibility and perceived teach
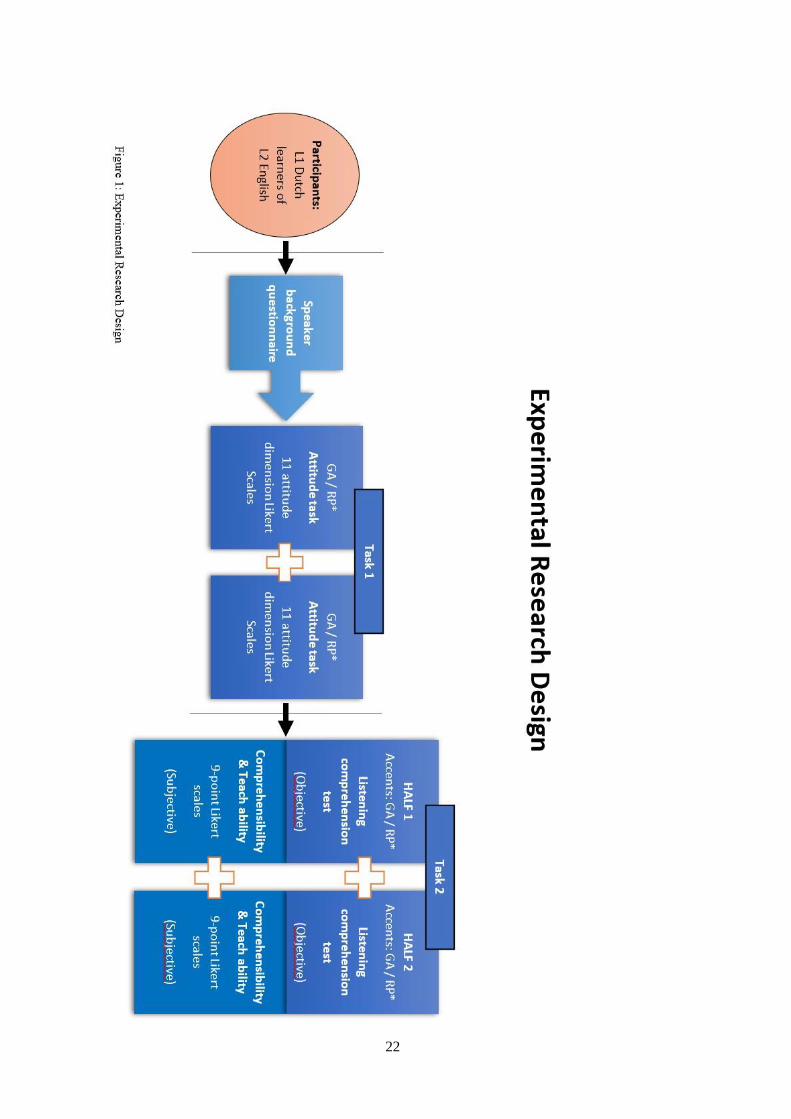
22
23
ability, the participants were asked to use adjusted Likert- 9 point scales subjective
measures of ease of understanding (comprehensibility) and perceived teach ability (see
Appendix I). In order to be able to conduct both parts of the experiment, speakers of both
accents were needed for material creation.
3.2 Speakers
Not enough audio samples could be found, online or otherwise, that in content and in
speaker -voice quality. Therefore, the decision was made to record all samples for both
parts of the experiment in order to avoid all audio sample anomalies. The speakers were
selected carefully. This experiment for instance does not look at speaker gender as a
variable, so both speakers had to be either male or female. Additionally, a similar age,
height (for larynx length), voice quality and non-smokers status were desirable.
As mentioned previously, the study was designed to have 2 parts. For part 1, two male
speakers were found that matched in these different aspects1. Prior to recording, they filled
out a speaker consent form (See Appendix B) and a personal information questionnaire
(See Appendix A, and Table 1: Speaker Demographic). This was done in accordance to the
European Union’s regulations on Data Protection and Freedom of Information criteria
(European Commission, 2012; European Union, 1995; Science Europe, 2013). Following
the recordings, the speakers were all given a debriefing letter. This was done in order to
show appreciation for what they had done, as well as give additional information about the
study (See Appendix C). The speakers were all academically educated as they had all
completed a bachelor, and speakers #1 and #3 were in the process of doing a master’s
1 It would have been ideal if the speakers for part 1 and part 2 had been the same, however unfortunately the
British speaker that recorded for the first part (speaker #2) was unable to record for part 2. He was replaced by
another British speaker (speaker #3) that again matched the established requisites, and that additionally
matched the accent and voice quality of speaker #1 seemingly perfectly.
24
degree in connected to linguistics at the time of recording. Additionally, all speakers were
employed as English language teachers in Catalonia and therefore had experience in
education and with linguistics.
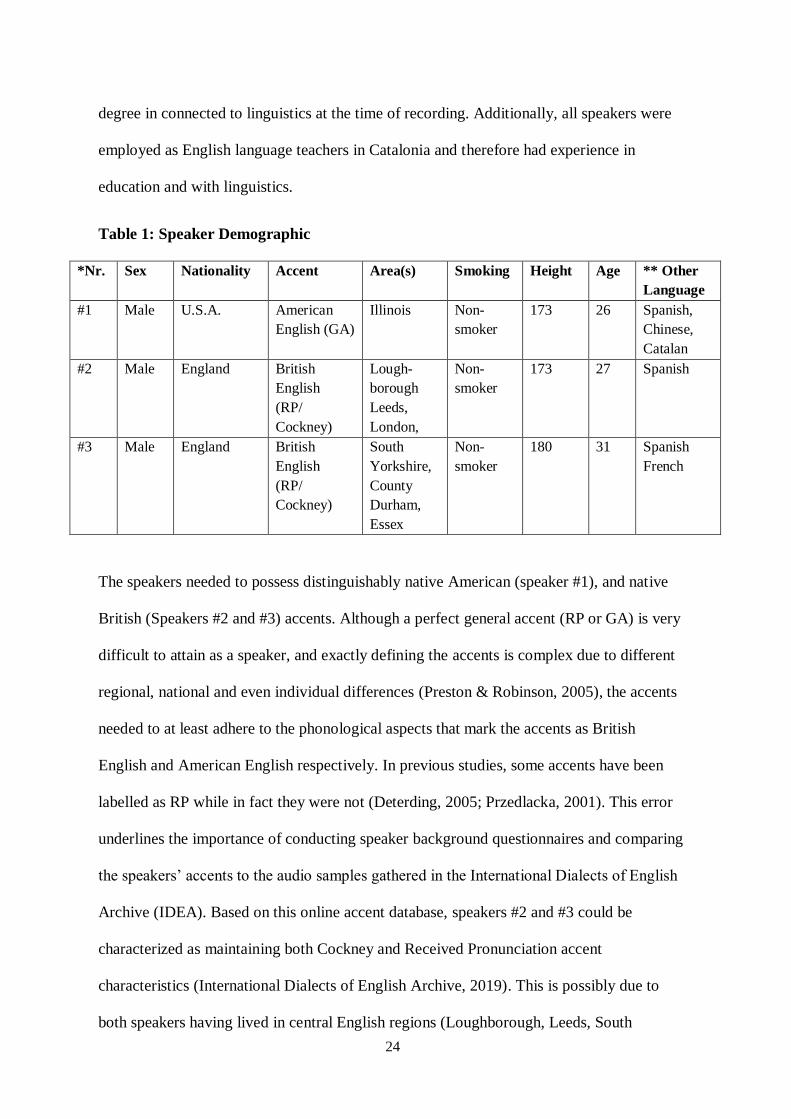
Table 1: Speaker Demographic
*Nr. Sex Nationality Accent Area(s) Smoking Height Age ** Other
Language
#1 Male U.S.A. American
English (GA)
Illinois Non-
smoker
173 26 Spanish,
Chinese,
Catalan
#2 Male England British
English
(RP/
Cockney)
Lough-
borough
Leeds,
London,
Non-
smoker
173 27 Spanish
#3 Male England British
English
(RP/
Cockney)
South
Yorkshire,
County
Durham,
Essex
Non-
smoker
180 31 Spanish
French
The speakers needed to possess distinguishably native American (speaker #1), and native
British (Speakers #2 and #3) accents. Although a perfect general accent (RP or GA) is very
difficult to attain as a speaker, and exactly defining the accents is complex due to different
regional, national and even individual differences (Preston & Robinson, 2005), the accents
needed to at least adhere to the phonological aspects that mark the accents as British
English and American English respectively. In previous studies, some accents have been
labelled as RP while in fact they were not (Deterding, 2005; Przedlacka, 2001). This error
underlines the importance of conducting speaker background questionnaires and comparing
the speakers’ accents to the audio samples gathered in the International Dialects of English
Archive (IDEA). Based on this online accent database, speakers #2 and #3 could be
characterized as maintaining both Cockney and Received Pronunciation accent
characteristics (International Dialects of English Archive, 2019). This is possibly due to
both speakers having lived in central English regions (Loughborough, Leeds, South
25
Yorkshire and County Durham), and the greater London area (encompassing Essex). The
accents were therefore distinguishable as natively British. The American speaker (#1) was
very close to a General American accent, a result of growing up in a part of Illinois that is
considered part of the North Midland. This region retains a General American Accent
(Labov, Ash, & Boberg, 2006).
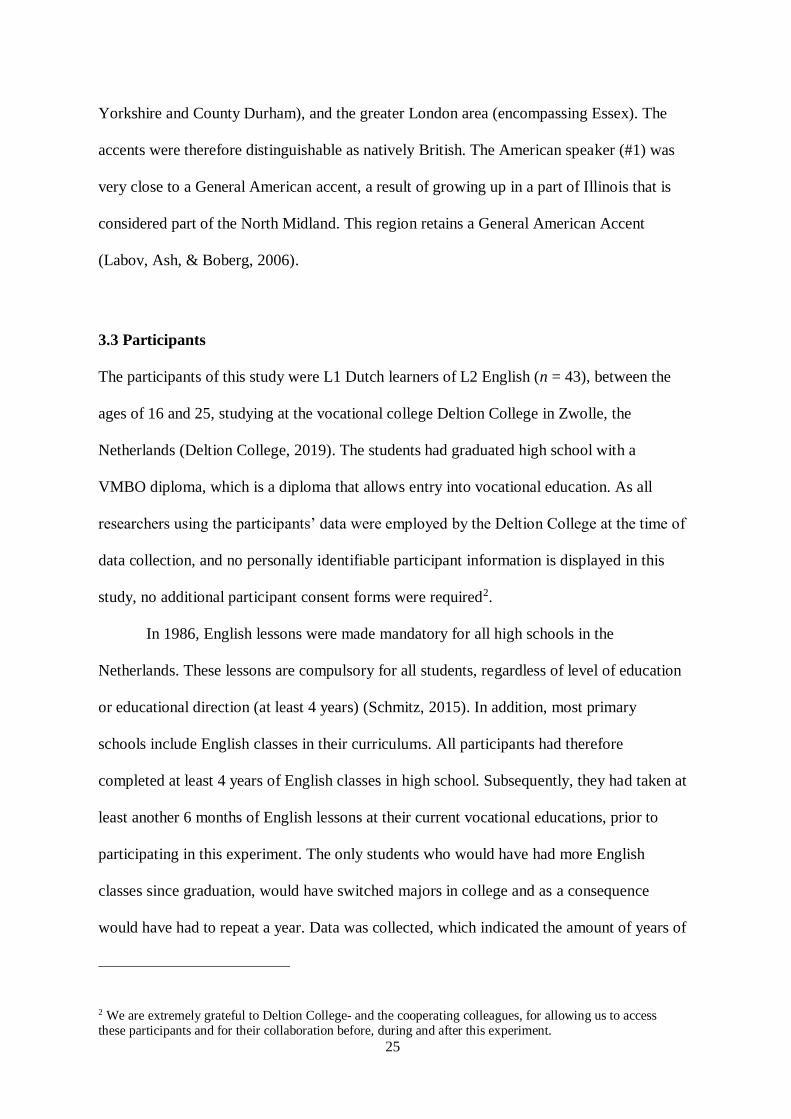
3.3 Participants
The participants of this study were L1 Dutch learners of L2 English (n = 43), between the
ages of 16 and 25, studying at the vocational college Deltion College in Zwolle, the
Netherlands (Deltion College, 2019). The students had graduated high school with a
VMBO diploma, which is a diploma that allows entry into vocational education. As all
researchers using the participants’ data were employed by the Deltion College at the time of
data collection, and no personally identifiable participant information is displayed in this
study, no additional participant consent forms were required2.
In 1986, English lessons were made mandatory for all high schools in the
Netherlands. These lessons are compulsory for all students, regardless of level of education
or educational direction (at least 4 years) (Schmitz, 2015). In addition, most primary
schools include English classes in their curriculums. All participants had therefore
completed at least 4 years of English classes in high school. Subsequently, they had taken at
least another 6 months of English lessons at their current vocational educations, prior to
participating in this experiment. The only students who would have had more English
classes since graduation, would have switched majors in college and as a consequence
would have had to repeat a year. Data was collected, which indicated the amount of years of
2 We are extremely grateful to Deltion College- and the cooperating colleagues, for allowing us to access these participants and for their collaboration before, during and after this experiment.
26
English classes taken as between 23 and 11 (M = 5.7). The participants had all passed a
previous English listening comprehension exam at A2/ B1 Common European Framework
of Reference (CEFR) level, which counted for half of their total, self-reported grade of
between 4,6 and 9,3 (M = 6.8) (Council of Europe, 2001). This exam was part of their final
high school examinations in the Netherlands, and the students would have had to follow
and complete their high school English classes and examinations in order to be able to
graduate with a VMBO diploma and gain access to vocational training in college. The
participants were gathered based on availability of classes at the Deltion College, at this
level, during data collection period4.
Since this study is interested in how attitudes towards two specific accents affect
comprehension and comprehensibility of the accents, these specific participants were
chosen because in the current growing international society, they are a group that spends a
large amount of time receiving input from different sources of media. The participants are
therefore, and because of their age, more likely to be more opinionated and biased about the
chosen accents5. This would show larger effects when collecting data. For this specific
reason, the participants were asked to fill out the speaker informational background
questionnaire (See Appendix E). This would divulge any information that would have
heavily influenced participants’ attitudes towards one or both of the accents. The
participants had not lived in any English speaking country, nor did they have close relatives
in any English speaking countries. Out of the total number of participants, 42% visited an
3 Two self-reports (2 & 3 years of previous English classes taken were different than expected, because of the
obligatory nature of English classes in the Dutch educational system. The two self-reports might have been
off, or the two participants under question could have been subject to special circumstances such as being
exempt from the classes for a specific reason.
4 The data collection was conducted throughout the last month of this Master’s course (2018-19). 5 No other age group was chosen given that this experiment does not look into the issues of age, educational level or language level as independent.
27
English speaking country (the United States of America, Ireland, the United Kingdom,
Canada and Ireland) in their lives, with the most frequently visited country being the United
Kingdom. No participant spent more than 5 weeks in any English speaking country. As
additionally gleaned from the participation questionnaire (Appendix E), the participants
reported between 0-3 and 12+ hours of exposure, with the most frequent answer being 3-6
hours of exposure.
3.4 Materials and Procedure
3.4.1 Materials:
Attitudes towards languages or accents are most often measured by using a ‘speaker
evaluation paradigm’, also known as matched guise technique or verbal guise technique
(Lambert, Hodgson, Gardner, & Fillenbaum, 1960; Soukop, 2012). This technique allows
the participants to evaluate different audio samples, purely based on what they hear. They
receive no previous information about the speakers, and can therefore only evaluate them
based on the audio they are presented with. In this study the preference was given to a
verbal guise, over a matched guise test, as the stimulus to rate. This technique is preferable
according to Garrett (2011), because for a matched guise, one specific speaker tries to
imitate different accents. For the verbal guise technique, several native speakers record
speech in their own respective accents, which makes the verbal guise stimuli sounds more
authentic, less forced and less exaggerated (Garrett, 2011). This required the speakers for
the GA and RP accents to come to the Second Language Acquisition Laboratory at
Universitat de Barcelona, on two different days, in order to record the audio samples for the
verbal guise stimuli.
During both recording sessions, the GA and RP sat side by side in order for them to take
turns and copy delivery and intonation precisely. This was done to make sure that the only
28
difference between the audio recordings would be the accent. The recordings were
practiced and repeated until equivalent recordings were gathered for all texts for both tasks.
2.4.1 Part 1 For part 1, it was preferred to record texts in the two different accents, that were at the
lower end of the participant’s level (A2). This approach was chosen, to assure a level of
comprehension on the participant’s part as to enable the participants to focus on listening to
the accents, rather than on trying to understand difficult lexical items or grammatical
structures. The texts chosen to record, were adopted from the British council material
available on their internet website (see Appendix F). The British council assesses their texts
thoroughly to make sure the language level is correct, and the content is appropriate for
learners studying English as a foreign language (British Council, 2019). The two texts
chosen (Story 1 and Story 2 in Appendix F) had the same topic and length, just under 2
minutes each, so as to prevent any listener bias from occurring. The texts were adapted in
order to remove any factors that might have influenced the participants’ attitudes, in a
manner unrelated to the speakers’ accents. Factors that were adapted for this reason were
the genders and ages of the subjects of the two stories, and even the tone of the texts so that
one text was not more defiant and/or cold than the other. Additionally, in order for the texts
to be congruent, they were adapted for each speaker to reflect where the accent was from in
terms of geographical location.
After recording the texts in both accents, the audio recordings were uploaded into
Praat, and annotated to be made suitable for extraction. Careful attention was paid to make
sure the audio files had the same amount of milliseconds on both ends of the recordings,
that the audio isolations were cut at the precise zero-point intervals and merged correctly
when separate paragraphs had been were recorded. The audio samples were then matched
for syllables per minute by matching speech duration, brought to equal intensity, and
cleaned of all background noises and anomalies by using the Praat Vocal Toolkit and GSU
29
Praat Tool plugin (Owren, 2008). The audio files were then converted to mp4 files, and
uploaded to YouTube so they could be embedded into the chosen survey tool (YouTube,
2019). The tool chosen to create both tasks was Google Forms (Google Forms, 2019). It
was chosen as the preferred survey tool because it is frequently used at the Deltion College.
This means that all necessary permission forms are in place for it. Additionally, Google
Forms, unlike for instance Praat script, is not required to be installed on any computers
prior to executing the tasks. This made it the preferred online tool to use, as the participants
would be bringing their own laptops on the data collection dates.
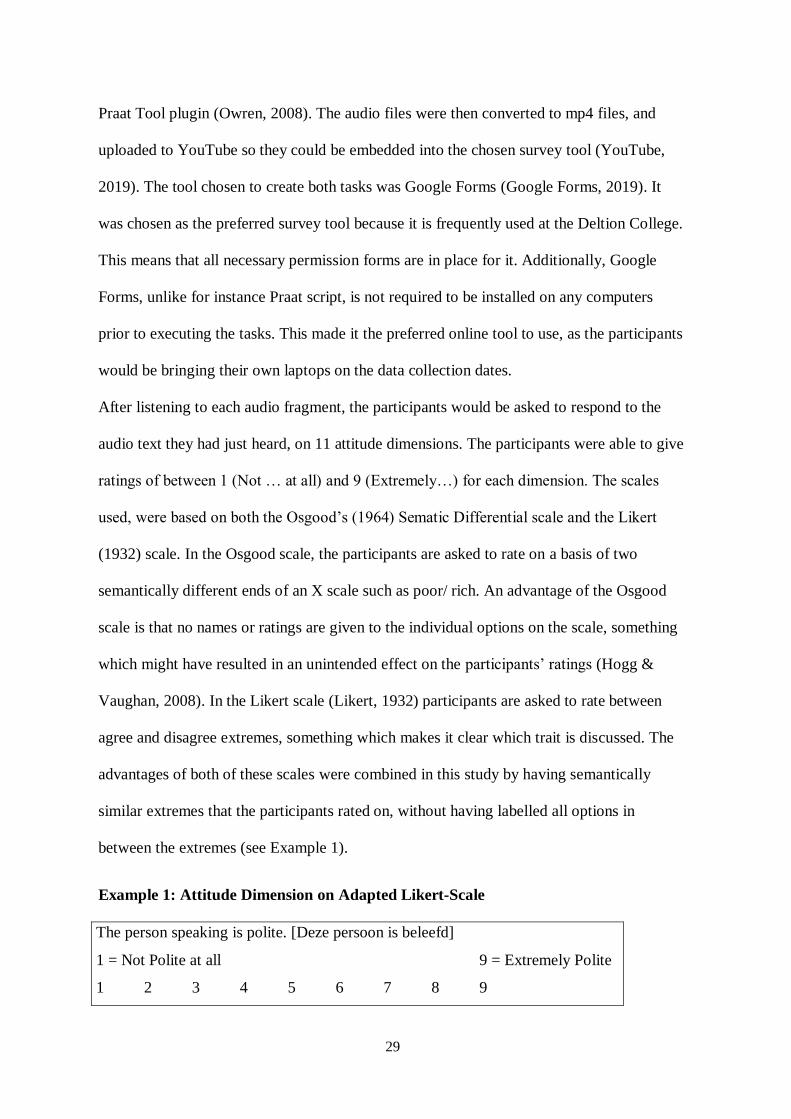
After listening to each audio fragment, the participants would be asked to respond to the
audio text they had just heard, on 11 attitude dimensions. The participants were able to give
ratings of between 1 (Not … at all) and 9 (Extremely…) for each dimension. The scales
used, were based on both the Osgood’s (1964) Sematic Differential scale and the Likert
(1932) scale. In the Osgood scale, the participants are asked to rate on a basis of two
semantically different ends of an X scale such as poor/ rich. An advantage of the Osgood
scale is that no names or ratings are given to the individual options on the scale, something
which might have resulted in an unintended effect on the participants’ ratings (Hogg &
Vaughan, 2008). In the Likert scale (Likert, 1932) participants are asked to rate between
agree and disagree extremes, something which makes it clear which trait is discussed. The
advantages of both of these scales were combined in this study by having semantically
similar extremes that the participants rated on, without having labelled all options in
between the extremes (see Example 1).
Example 1: Attitude Dimension on Adapted Likert-Scale
The person speaking is polite. [Deze persoon is beleefd]
1 = Not Polite at all 9 = Extremely Polite
1 2 3 4 5 6 7 8 9
30
The statements used in these scales were created on the basis of solidarity traits and status
traits. Both types of traits were included, based on prior research showing that an evaluation
of a speaker’s language is typically made based on these two different judgement
dimensions (Ryan, 1983). Solidarity traits include dimensions such as kindness and
politeness, while status traits include aspects such as high education level and wealth (Ito &
Cacioppo, 2019). These major trait groups are sometimes also referred to the constructs
social attractiveness and prestige respectively (Barbour, 2014; Derwing & Munro, 2013). In
total the participants had to rate 11 dimensions, consisting of status traits and solidarity
traits. These 11 dimensions were carefully chosen and revised several times to avoid
overlap, and clearer, more simplistic versions in order to improve ease of understanding.
Subsequently, the 11 dimensions were embedded into the google forms format. This
list was presented to students as: ‘The person speaking is..’ with the following final 11
dimensions in order of easy to difficult to understand and rate: Polite, Nice, Funny,
Reliable, Open-minded, Intelligent, Hard-Working, Good Leader, High level of Education,
Rich and Worthy of Respect. To accommodate the students in the Netherlands, Dutch
translations were created and added to all text instructions and all dimensions. The
translations were made by a native Dutch speaker with an English teaching degree.
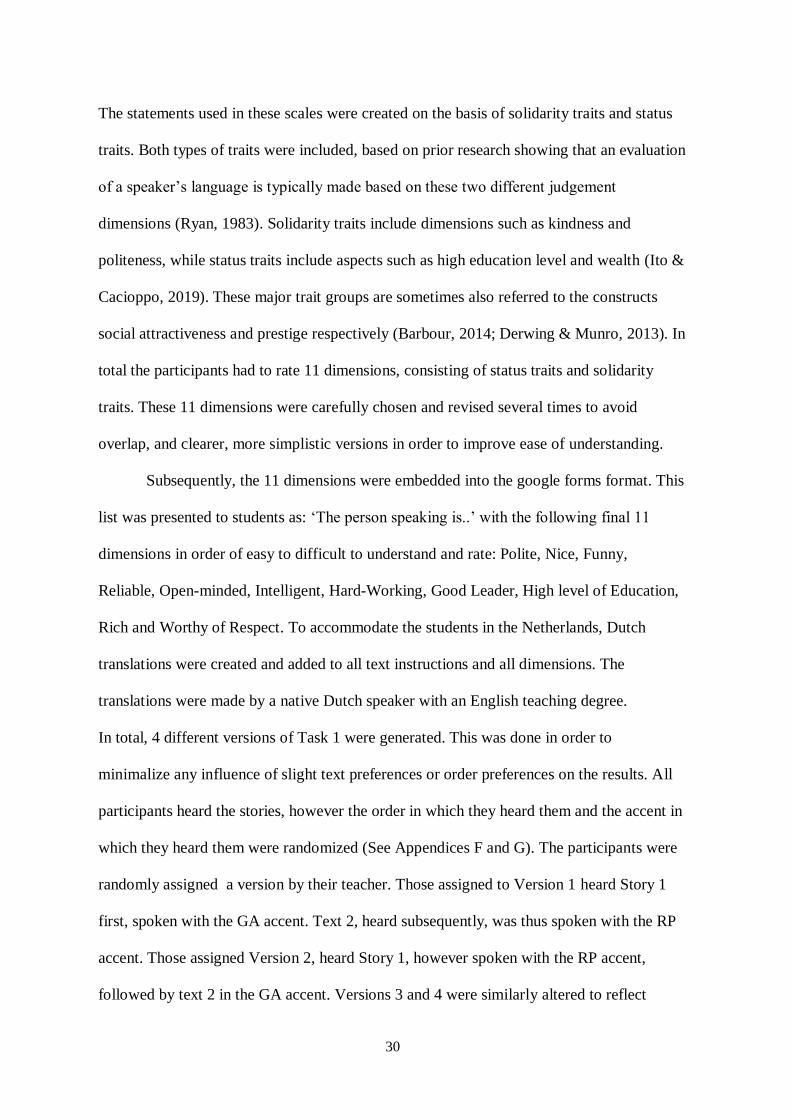
In total, 4 different versions of Task 1 were generated. This was done in order to
minimalize any influence of slight text preferences or order preferences on the results. All
participants heard the stories, however the order in which they heard them and the accent in
which they heard them were randomized (See Appendices F and G). The participants were
randomly assigned a version by their teacher. Those assigned to Version 1 heard Story 1
first, spoken with the GA accent. Text 2, heard subsequently, was thus spoken with the RP
accent. Those assigned Version 2, heard Story 1, however spoken with the RP accent,
followed by text 2 in the GA accent. Versions 3 and 4 were similarly altered to reflect
31
different accent orders and story versions (See Table 2).
Table 2: Task 1 Versions
Version 1 Version 2 Version 3 Version 4
GA - Story 1
RP - Story 2
RP - Story 1
GA - Story 2
GA - Story 2
RP - Story 1
RP - Story 2
GA - Story 1
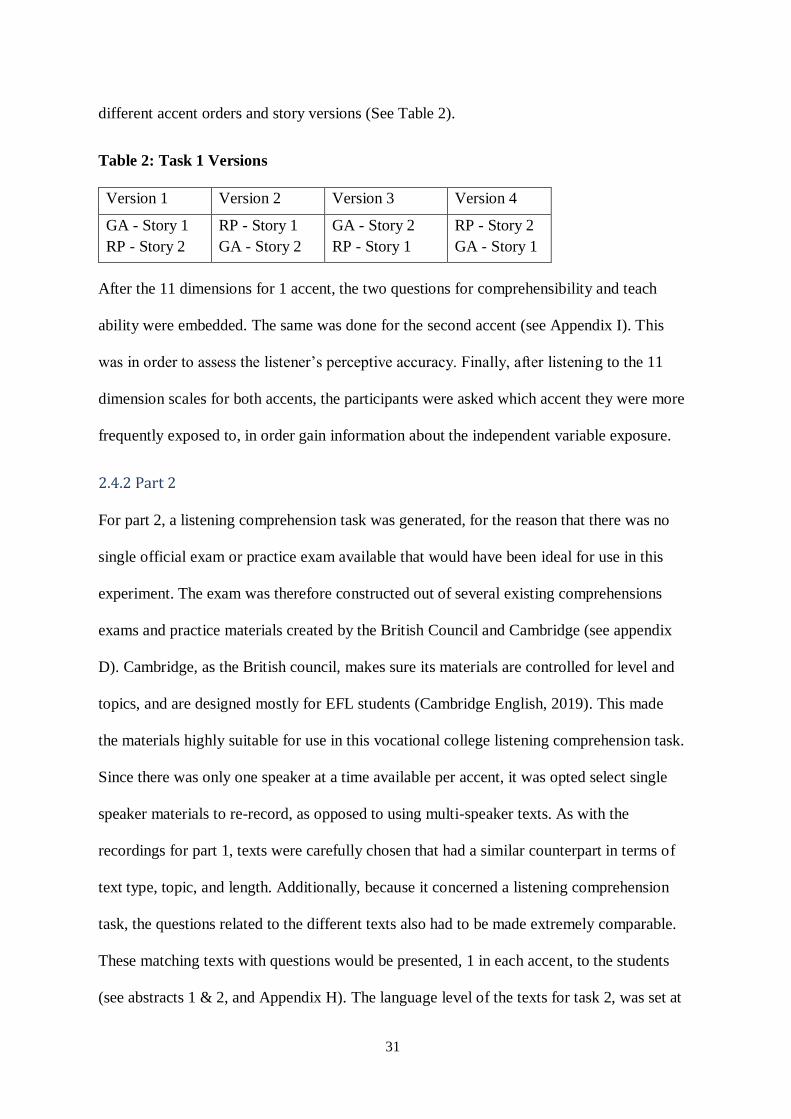
After the 11 dimensions for 1 accent, the two questions for comprehensibility and teach
ability were embedded. The same was done for the second accent (see Appendix I). This
was in order to assess the listener’s perceptive accuracy. Finally, after listening to the 11
dimension scales for both accents, the participants were asked which accent they were more
frequently exposed to, in order gain information about the independent variable exposure.
2.4.2 Part 2
For part 2, a listening comprehension task was generated, for the reason that there was no
single official exam or practice exam available that would have been ideal for use in this
experiment. The exam was therefore constructed out of several existing comprehensions
exams and practice materials created by the British Council and Cambridge (see appendix
D). Cambridge, as the British council, makes sure its materials are controlled for level and
topics, and are designed mostly for EFL students (Cambridge English, 2019). This made
the materials highly suitable for use in this vocational college listening comprehension task.
Since there was only one speaker at a time available per accent, it was opted select single
speaker materials to re-record, as opposed to using multi-speaker texts. As with the
recordings for part 1, texts were carefully chosen that had a similar counterpart in terms of
text type, topic, and length. Additionally, because it concerned a listening comprehension
task, the questions related to the different texts also had to be made extremely comparable.
These matching texts with questions would be presented, 1 in each accent, to the students
(see abstracts 1 & 2, and Appendix H). The language level of the texts for task 2, was set at
32
the higher end of the participant’s listening proficiency level (B1-B2) in order to guarantee
that the participants would not be able to understand what was being said word for word.
Rather, they would have to strain themselves, and put in more effort in order to understand
difficult content, which is where a willingness to understand, or an effect of attitude could
come in. If the level would have been A2 again, the participants would have been able to
obtain full listening comprehension marks too easily for both accent tests.
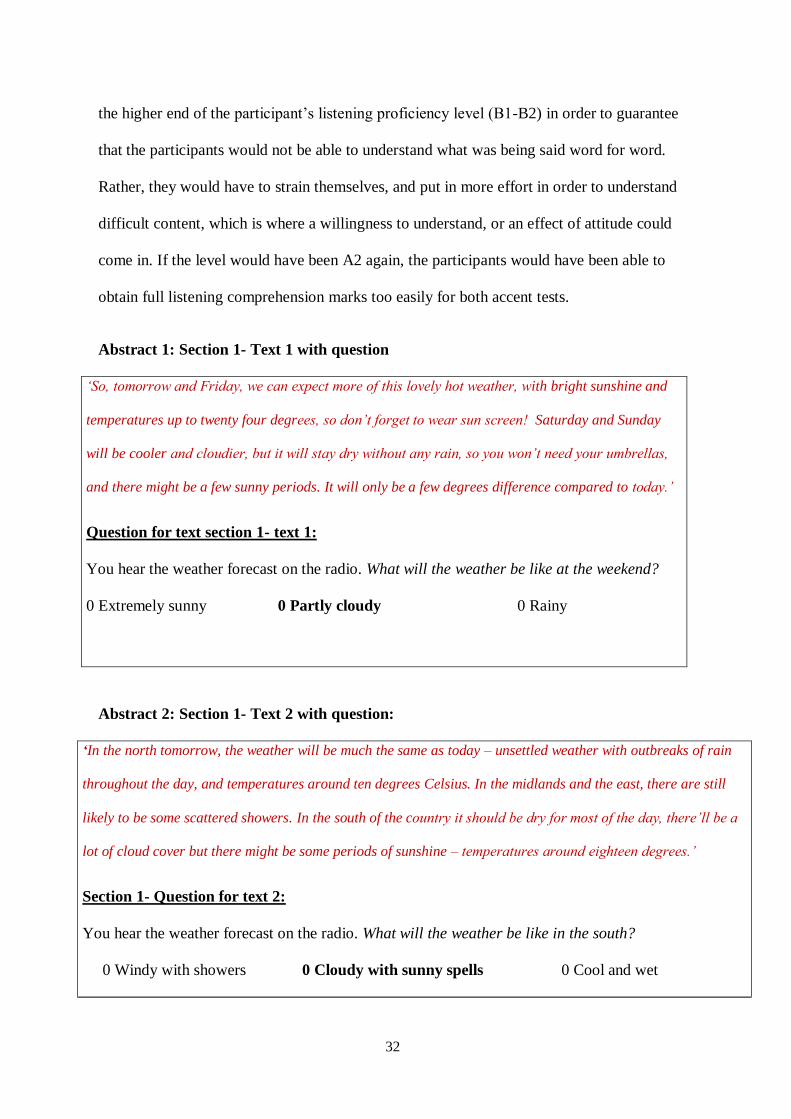
Abstract 1: Section 1- Text 1 with question
‘So, tomorrow and Friday, we can expect more of this lovely hot weather, with bright sunshine and
temperatures up to twenty four degrees, so don’t forget to wear sun screen! Saturday and Sunday
will be cooler and cloudier, but it will stay dry without any rain, so you won’t need your umbrellas,
and there might be a few sunny periods. It will only be a few degrees difference compared to today.’
Question for text section 1- text 1:
You hear the weather forecast on the radio. What will the weather be like at the weekend?
0 Extremely sunny 0 Partly cloudy 0 Rainy
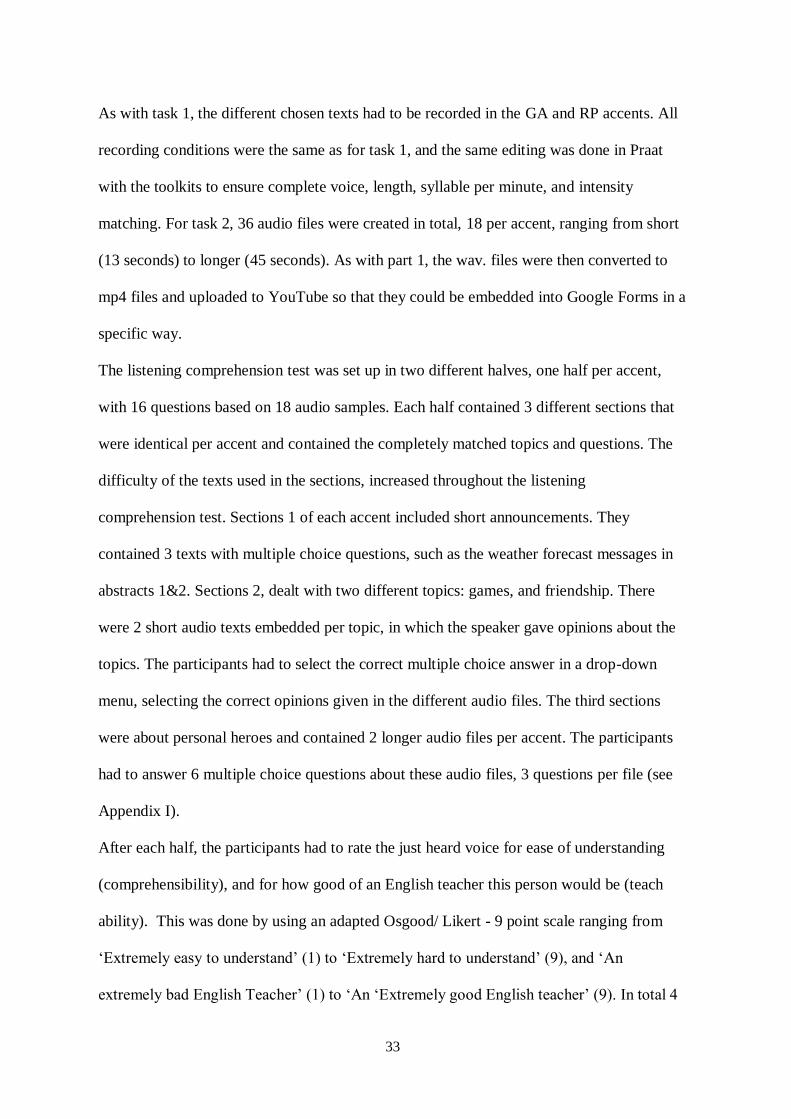
Abstract 2: Section 1- Text 2 with question:
‘In the north tomorrow, the weather will be much the same as today – unsettled weather with outbreaks of rain
throughout the day, and temperatures around ten degrees Celsius. In the midlands and the east, there are still
likely to be some scattered showers. In the south of the country it should be dry for most of the day, there’ll be a
lot of cloud cover but there might be some periods of sunshine – temperatures around eighteen degrees.’
Section 1- Question for text 2:
You hear the weather forecast on the radio. What will the weather be like in the south?
0 Windy with showers 0 Cloudy with sunny spells 0 Cool and wet
33
As with task 1, the different chosen texts had to be recorded in the GA and RP accents. All
recording conditions were the same as for task 1, and the same editing was done in Praat
with the toolkits to ensure complete voice, length, syllable per minute, and intensity
matching. For task 2, 36 audio files were created in total, 18 per accent, ranging from short
(13 seconds) to longer (45 seconds). As with part 1, the wav. files were then converted to
mp4 files and uploaded to YouTube so that they could be embedded into Google Forms in a
specific way.
The listening comprehension test was set up in two different halves, one half per accent,
with 16 questions based on 18 audio samples. Each half contained 3 different sections that
were identical per accent and contained the completely matched topics and questions. The
difficulty of the texts used in the sections, increased throughout the listening
comprehension test. Sections 1 of each accent included short announcements. They
contained 3 texts with multiple choice questions, such as the weather forecast messages in
abstracts 1&2. Sections 2, dealt with two different topics: games, and friendship. There
were 2 short audio texts embedded per topic, in which the speaker gave opinions about the
topics. The participants had to select the correct multiple choice answer in a drop-down
menu, selecting the correct opinions given in the different audio files. The third sections
were about personal heroes and contained 2 longer audio files per accent. The participants
had to answer 6 multiple choice questions about these audio files, 3 questions per file (see
Appendix I).
After each half, the participants had to rate the just heard voice for ease of understanding
(comprehensibility), and for how good of an English teacher this person would be (teach
ability). This was done by using an adapted Osgood/ Likert - 9 point scale ranging from
‘Extremely easy to understand’ (1) to ‘Extremely hard to understand’ (9), and ‘An
extremely bad English Teacher’ (1) to ‘An ‘Extremely good English teacher’ (9). In total 4
34
different versions of the comprehension exam were made, for the same reasons as in part 1,
namely to be able to disregard any accent order effects and random texts preferences (See
Table 3). They were distributed randomly between all participants, with a different
randomization than for task 1.
Table 3: Task 2 Versions
Version 1 Version 2 Version 3 Version 4
First Half: RP
Stories & Questions:
Section 1: 1+3+5
Section 2/1: 1+3
Section 2/2: 1+3
Section 3: 1+3
Second half: GA
Stories & Questions:
Section 1: 2+4+6
Section 2/1: 2+4
Section 2/2: 2+4
Section 3: 2+4
First Half: GA
Stories & Questions:
Section 1: 1+3+5
Section 2/1: 1+3
Section 2/2: 1+3
Section 3: 1+3
Second half: RP
Stories & Questions:
Section 1: 2+4+6
Section 2/1: 2+4
Section 2/2: 2+4
Section 3: 2+4
First Half: GA
Stories & Questions:
Section 1: 2+4+6
Section 2/1: 2+4
Section 2/2: 2+4
Section 3: 2+4
Second half: RP
Stories & Questions:
Section 1: 1+3+5
Section 2/1: 1+3
Section 2/2: 1+3
Section 3: 1+3
First Half: RP
Stories & Questions:
Section 1: 2+4+6
Section 2/1: 2+4
Section 2/2: 2+4
Section 3: 2+4
Second half: GA
Stories & Questions:
Section 1: 1+3+5
Section 2/1: 1+3
Section 2/2: 1+3
Section 3: 1+3
Procedure:
For both parts of this experiment, the test conditions were the following. The participants
were asked to come to their English class, prepared with laptop and headphones. Their
teacher sent them an email as to which version they were randomly assigned to take. The
students were told they needed to take the assignment seriously as participation would be
35
taken into account in their end of term classroom participation assessments. They were told
that there were no wrong answers, but that they would need to focus. The participants were
allowed to listen to the audio files as many times as they preferred, they however only had
20 minutes to complete Task 1, and 1 hour to complete task 2. Most students took 15
minutes, and 45 minutes respectively. If the participants had had any uncertainties they
were allowed to ask questions. No questions arose during task 1, other than questions about
materials (2 participants forgot their headphones and borrowed them from the researchers).
During task 2 the participants had some questions, mainly about how long it would take,
and about Section 2/1 and 2/2 for which most had to read the instructions more carefully.
36
4. Results
The main research of this study reads as follows:
‘RQ: Do the attitudes of Dutch EFL learners toward natively produced American and
British English accents affect the Listening Comprehension, Comprehensibility and
Perceived Teach Ability, of these accents and does exposure play a role?’
In order to address the above question, three sub-questions were established. The first
subquestion deals with establishing the independent ‘attitude’, and allows us to establish
research groups which will be instrumental for the second subquestion. This second
subquestion deals with correlations between the independent attitude and the three main
dependent variables in the study. Finally, subquestion three was formed in order to examine
the link between the independent variable exposure and the dependents. The results for each
subquestion are presented below according to topic, before being thoroughly discussed in
order to finally answer the main question in the conclusion. An extensive datafile was used
in SPSS (See Appendix L).
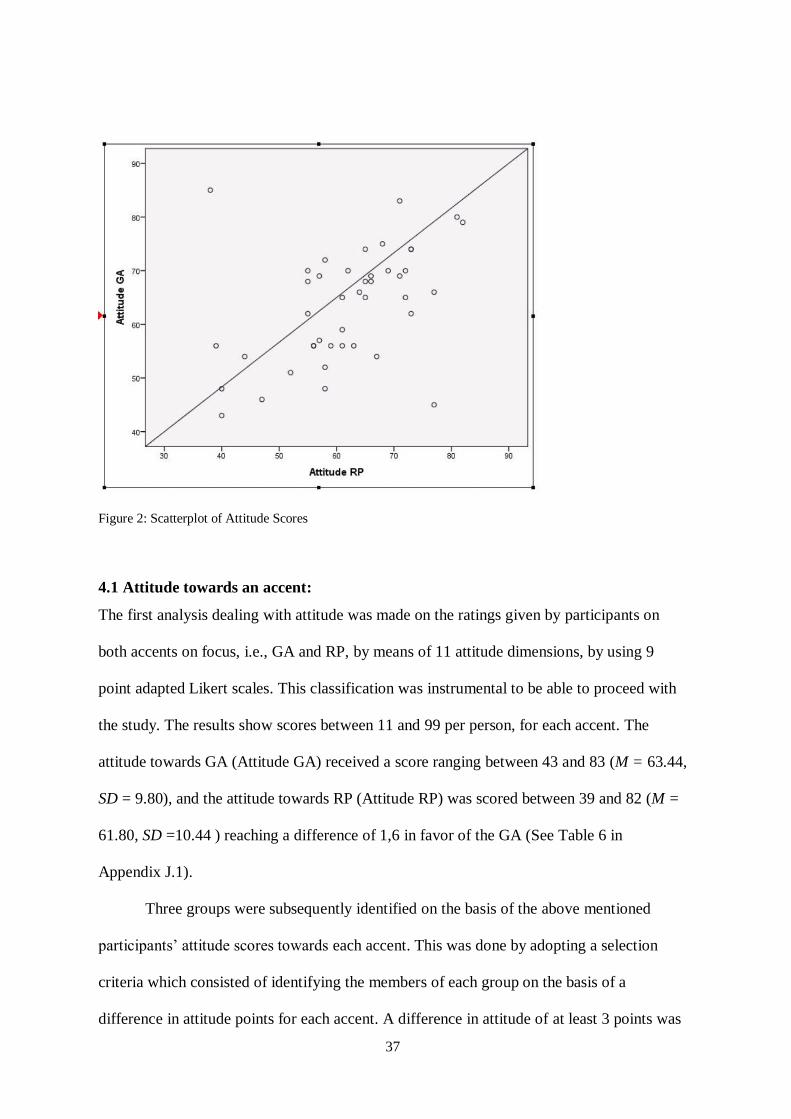
Prior to diving into the individual result sections, an issue of normality has to be
considered, as the step in any statistical analysis. Much of the data was not normally
distributed. Therefore, a scatterplot was used to examine this data. The scatterplot (See
Figure 2) displayed two extreme outliers in the attitude responses. After examination, the
absolute differences in attitude scores between attitude scores of GA and RP (of between 11
and 99), were: 47 (participant 46) and 32 (participant 8). The next largest difference in
absolute attitude scores was 17 and there were multiple participants with an attitude
difference of only 15. As a result of this observation, participants 46 and 8 were excluded.
Following that, there were no extreme outliers left, and more of the data showed normality.
Still not all data was normally distributed however, so a combination of different
parametric and non-parametric tests had to be conducted.
37
Figure 2: Scatterplot of Attitude Scores
4.1 Attitude towards an accent:
The first analysis dealing with attitude was made on the ratings given by participants on
both accents on focus, i.e., GA and RP, by means of 11 attitude dimensions, by using 9
point adapted Likert scales. This classification was instrumental to be able to proceed with
the study. The results show scores between 11 and 99 per person, for each accent. The
attitude towards GA (Attitude GA) received a score ranging between 43 and 83 (M = 63.44,
SD = 9.80), and the attitude towards RP (Attitude RP) was scored between 39 and 82 (M =
61.80, SD =10.44 ) reaching a difference of 1,6 in favor of the GA (See Table 6 in
Appendix J.1).
Three groups were subsequently identified on the basis of the above mentioned
participants’ attitude scores towards each accent. This was done by adopting a selection
criteria which consisted of identifying the members of each group on the basis of a
difference in attitude points for each accent. A difference in attitude of at least 3 points was
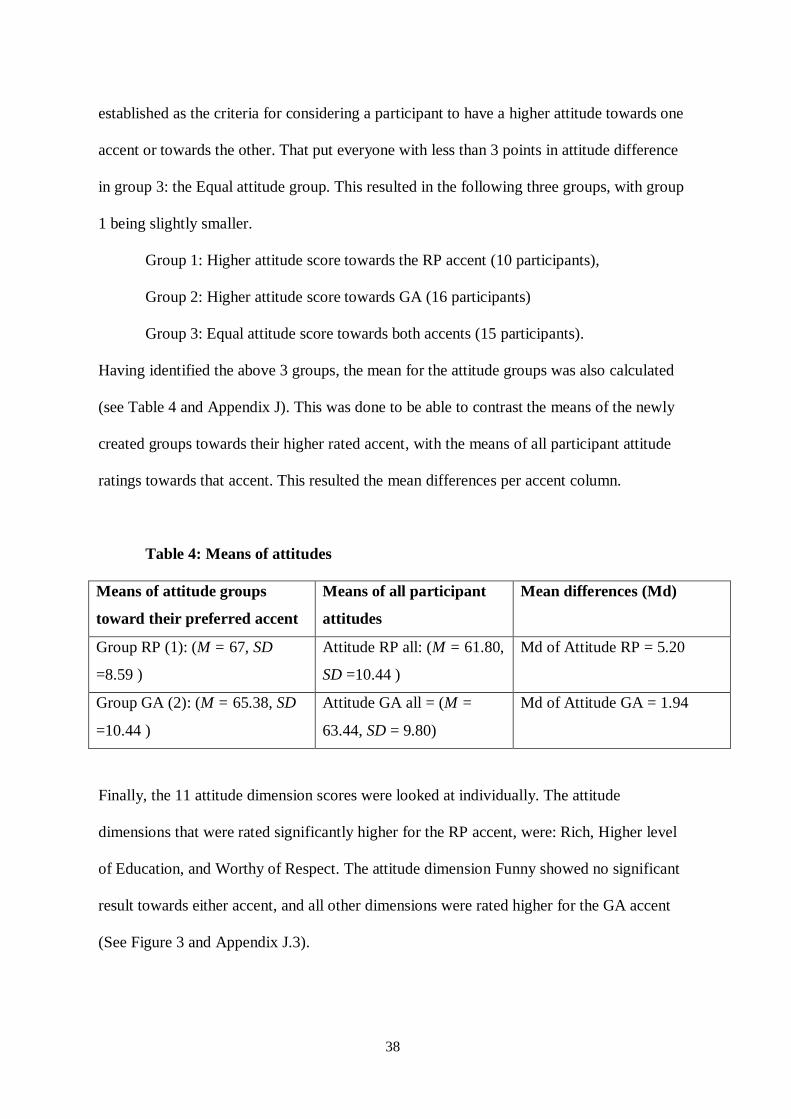
38
established as the criteria for considering a participant to have a higher attitude towards one
accent or towards the other. That put everyone with less than 3 points in attitude difference
in group 3: the Equal attitude group. This resulted in the following three groups, with group
1 being slightly smaller.
Group 1: Higher attitude score towards the RP accent (10 participants),
Group 2: Higher attitude score towards GA (16 participants)
Group 3: Equal attitude score towards both accents (15 participants).
Having identified the above 3 groups, the mean for the attitude groups was also calculated
(see Table 4 and Appendix J). This was done to be able to contrast the means of the newly
created groups towards their higher rated accent, with the means of all participant attitude
ratings towards that accent. This resulted the mean differences per accent column.
Table 4: Means of attitudes
Means of attitude groups
toward their preferred accent
Means of all participant
attitudes
Mean differences (Md)
Group RP (1): (M = 67, SD
=8.59 )
Attitude RP all: (M = 61.80,
SD =10.44 )
Md of Attitude RP = 5.20
Group GA (2): (M = 65.38, SD
=10.44 )
Attitude GA all = (M =
63.44, SD = 9.80)
Md of Attitude GA = 1.94
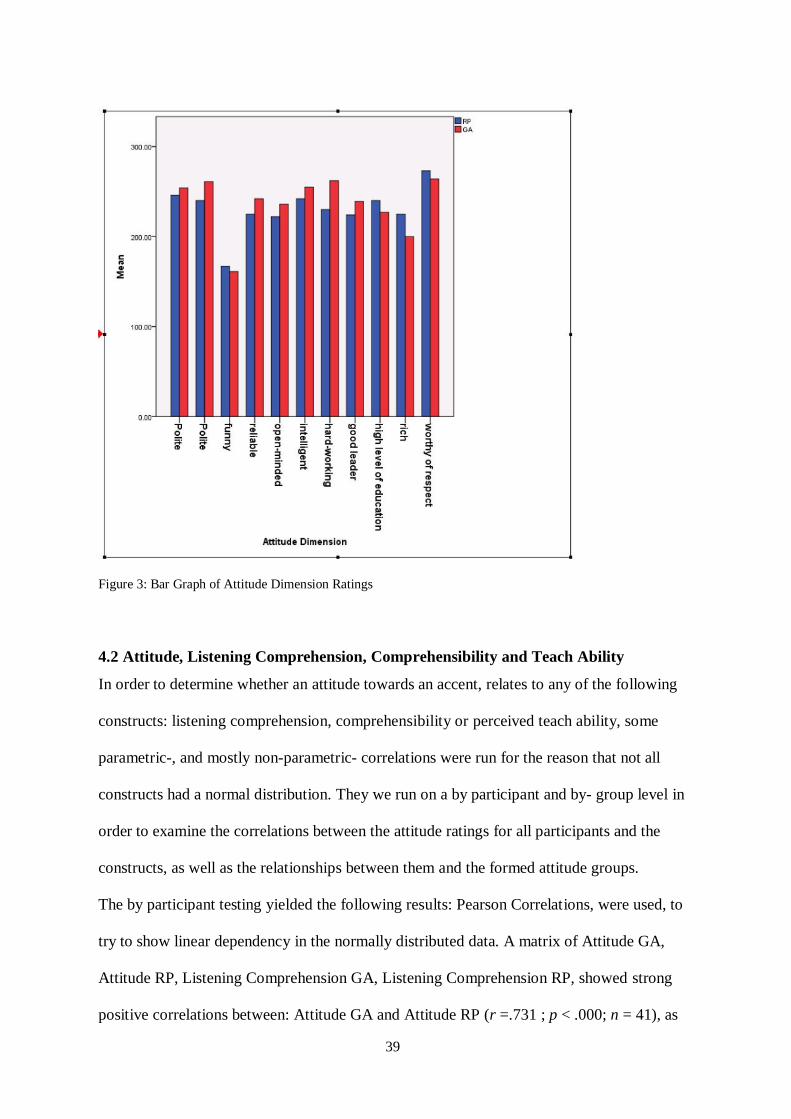
Finally, the 11 attitude dimension scores were looked at individually. The attitude
dimensions that were rated significantly higher for the RP accent, were: Rich, Higher level
of Education, and Worthy of Respect. The attitude dimension Funny showed no significant
result towards either accent, and all other dimensions were rated higher for the GA accent
(See Figure 3 and Appendix J.3).
39
Figure 3: Bar Graph of Attitude Dimension Ratings
4.2 Attitude, Listening Comprehension, Comprehensibility and Teach Ability
In order to determine whether an attitude towards an accent, relates to any of the following
constructs: listening comprehension, comprehensibility or perceived teach ability, some
parametric-, and mostly non-parametric- correlations were run for the reason that not all
constructs had a normal distribution. They we run on a by participant and by- group level in
order to examine the correlations between the attitude ratings for all participants and the
constructs, as well as the relationships between them and the formed attitude groups.
The by participant testing yielded the following results: Pearson Correlations, were used, to
try to show linear dependency in the normally distributed data. A matrix of Attitude GA,
Attitude RP, Listening Comprehension GA, Listening Comprehension RP, showed strong
positive correlations between: Attitude GA and Attitude RP (r =.731 ; p < .000; n = 41), as
40
well as Listening Comprehension GA and Listening Comprehension RP (r =.751; p < .000,
n = 41). In this matrix an additional, negative, weaker correlation was found between
Attitude GA and Listening Comprehension GA (r = -.393; p = .011; n 41). And the
following two construct pairs were tested with Spearman correlations as not all data was
normally distributed. Both pairs showed strong positive correlations: Comprehensibility
rating GA and Comprehensibility RP: r = . .541, p < .000; n = 41, and Teach Ability GA
and Teach Ability RP: r =.622, p < .000; n = 41.
Following this, specific correlations between the independent and dependent
variables of each single accent were examined, in order to see whether any linear
correlation, causational or not, exists between the attitude towards an accent, and the related
accent constructs under inspection. Or even singularly between the constructs themselves.
This was done, starting with the GA variables: Attitude GA, Listening Comprehension GA,
Comprehensibility GA, and perceived Teach Ability GA. In this matrix, the following
significant results were found: a strong, positive correlation between Listening
Comprehension score GA and Comprehensibility rating GA: r = .672; p < .000; n = 41, a
weak, negative correlation between Attitude GA and Listening Comprehension score GA: r
= -.386; p = .013; n = 41, and a strong, positive correlation between Comprehensibility
rating GA with perceived Teach Ability rating GA: r = .506; p = .001; n = 41 (See Table 10
in Appendix K.2).
Then the same was done for the independent and dependents of RP (Attitude RP,
Listening Comprehension RP, Comprehensibility RP, and Teach Ability RP), the following
correlations were found: a weak, positive correlation between Attitude RP and Teach
Ability RP (r = .393; p = .011; n = 41), a weak, positive correlation between Listening
Comprehension score RP and Comprehensibility rating RP (r = .313 p = .046; n = 41) and a
strong, positive correlation between Comprehensibility rating RP and Teach Ability rating
41
RP (r = .501, p = .001; n = 41) (See Table 11 in Appendix K.3).
Following both specific correlations between the independent and dependent
variables of a single accent, cross correlations were run to see if there was any relation
between the attitude towards one accent, and the dependents of the other accent (Attitude
RP with Listening Comprehension GA, Comprehensibility GA, and Teach Ability GA and
in reverse). The only significant (weak) correlation found, was the attitude score towards
RP with the perceived Teach Ability of a speaker of the GA accent (p =.362).
As previously stated, additional by group testing was undertaken in order to
examine the following, normally distributed data: Attitude groups (1,2 or 3), More
Exposure To groups (RP, GA, Equal Exposure), and Attitude with Comprehensibility
ratings for GA and RP. This was done by conducting a one-way multivariate analysis of
variance (MANOVA). This MANOVA was conducted to examine the possibility of
differences between the means of the different identified groups, on a combination of
dependent variables. No significant results were obtained in the MANOVA (Wilk’s Lamda
= .771, F = .804, p = .526). It was not possible to reject the 0-hypothesis that the Attitude
groups had the same levels of Comprehensibility scores, or Attitudes, nor was this possible
for any factors in relation to Exposure within this matrix, however those results belong with
the next section.
A non-parametric Kruskal-Wallis test was used to examine whether there was a
group difference between Attitude Group, and the dependents Listening Comprehension
and perceived Teach Ability. The results for Teach Ability GA (p = .003) showed
significance, indicating a rejection of the null-hypothesis, that the distribution of perceived
Teach Ability of the GA accent was the same across all categories of Attitude group.
Following this result, a Mann-Whitney U test was run, only including two groups at a time.
When excluding the Equal Attitude group, the value for Teach Ability GA (U = 25.5, p =
42
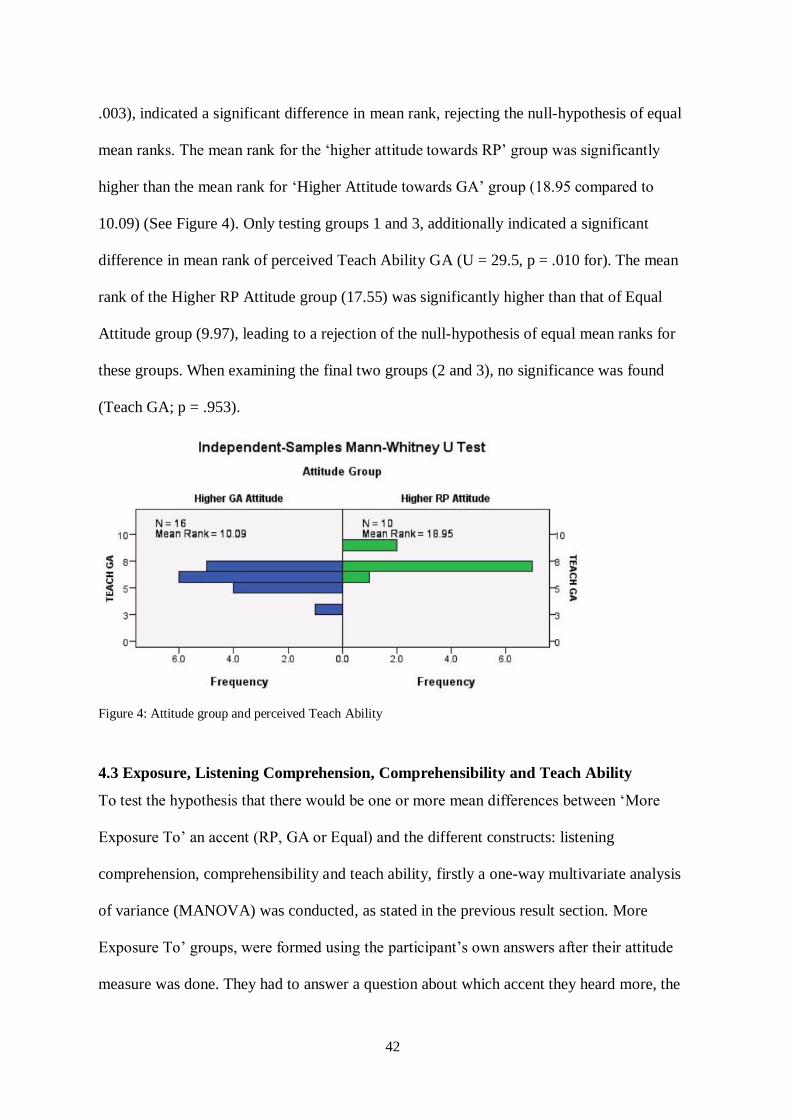
.003), indicated a significant difference in mean rank, rejecting the null-hypothesis of equal
mean ranks. The mean rank for the ‘higher attitude towards RP’ group was significantly
higher than the mean rank for ‘Higher Attitude towards GA’ group (18.95 compared to
10.09) (See Figure 4). Only testing groups 1 and 3, additionally indicated a significant
difference in mean rank of perceived Teach Ability GA (U = 29.5, p = .010 for). The mean
rank of the Higher RP Attitude group (17.55) was significantly higher than that of Equal
Attitude group (9.97), leading to a rejection of the null-hypothesis of equal mean ranks for
these groups. When examining the final two groups (2 and 3), no significance was found
(Teach GA; p = .953).
Figure 4: Attitude group and perceived Teach Ability
4.3 Exposure, Listening Comprehension, Comprehensibility and Teach Ability
To test the hypothesis that there would be one or more mean differences between ‘More
Exposure To’ an accent (RP, GA or Equal) and the different constructs: listening
comprehension, comprehensibility and teach ability, firstly a one-way multivariate analysis
of variance (MANOVA) was conducted, as stated in the previous result section. More
Exposure To’ groups, were formed using the participant’s own answers after their attitude
measure was done. They had to answer a question about which accent they heard more, the
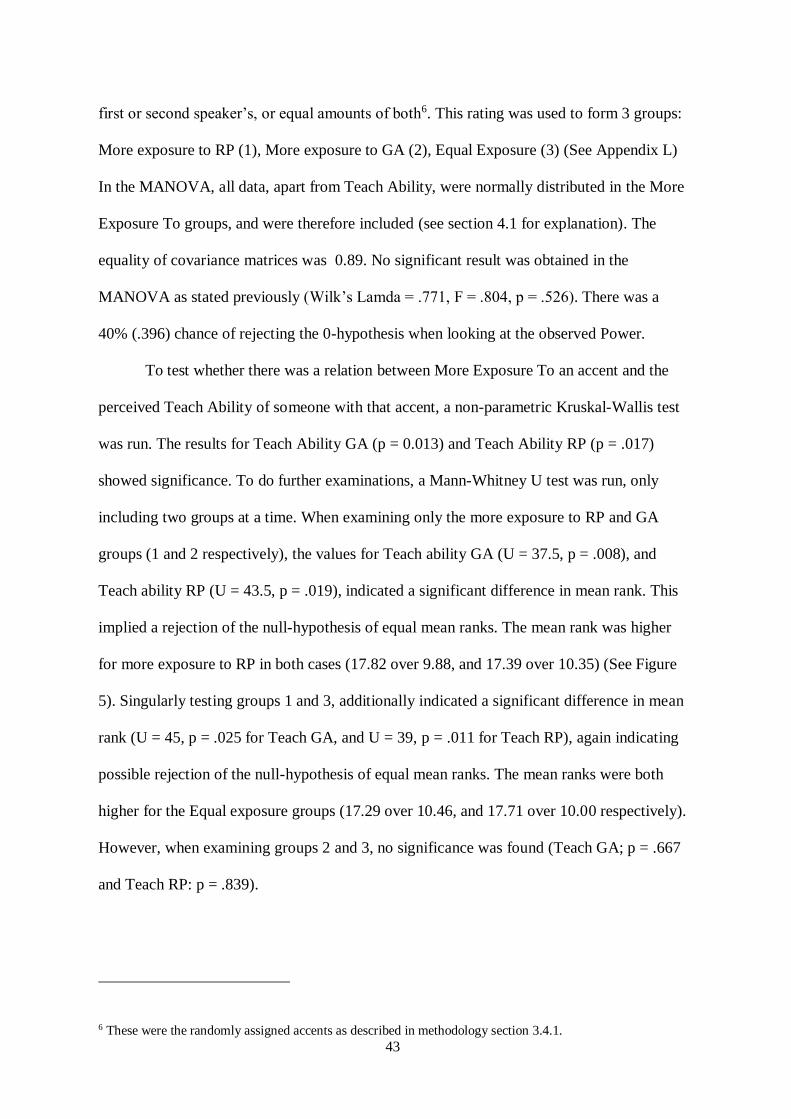
43
first or second speaker’s, or equal amounts of both6. This rating was used to form 3 groups:
More exposure to RP (1), More exposure to GA (2), Equal Exposure (3) (See Appendix L)
In the MANOVA, all data, apart from Teach Ability, were normally distributed in the More
Exposure To groups, and were therefore included (see section 4.1 for explanation). The
equality of covariance matrices was 0.89. No significant result was obtained in the
MANOVA as stated previously (Wilk’s Lamda = .771, F = .804, p = .526). There was a
40% (.396) chance of rejecting the 0-hypothesis when looking at the observed Power.
To test whether there was a relation between More Exposure To an accent and the
perceived Teach Ability of someone with that accent, a non-parametric Kruskal-Wallis test
was run. The results for Teach Ability GA (p = 0.013) and Teach Ability RP (p = .017)
showed significance. To do further examinations, a Mann-Whitney U test was run, only
including two groups at a time. When examining only the more exposure to RP and GA
groups (1 and 2 respectively), the values for Teach ability GA (U = 37.5, p = .008), and
Teach ability RP (U = 43.5, p = .019), indicated a significant difference in mean rank. This
implied a rejection of the null-hypothesis of equal mean ranks. The mean rank was higher
for more exposure to RP in both cases (17.82 over 9.88, and 17.39 over 10.35) (See Figure
5). Singularly testing groups 1 and 3, additionally indicated a significant difference in mean
rank (U = 45, p = .025 for Teach GA, and U = 39, p = .011 for Teach RP), again indicating
possible rejection of the null-hypothesis of equal mean ranks. The mean ranks were both
higher for the Equal exposure groups (17.29 over 10.46, and 17.71 over 10.00 respectively).
However, when examining groups 2 and 3, no significance was found (Teach GA; p = .667
and Teach RP: p = .839).
6 These were the randomly assigned accents as described in methodology section 3.4.1.
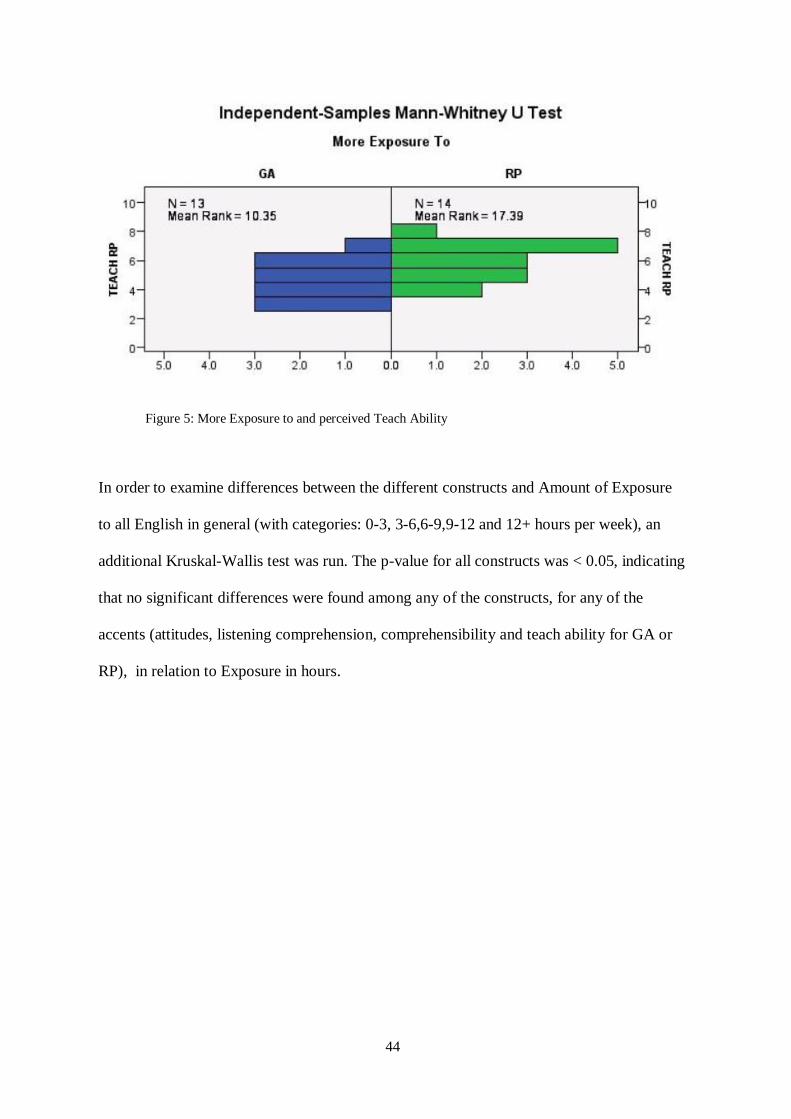
44
Figure 5: More Exposure to and perceived Teach Ability
In order to examine differences between the different constructs and Amount of Exposure
to all English in general (with categories: 0-3, 3-6,6-9,9-12 and 12+ hours per week), an
additional Kruskal-Wallis test was run. The p-value for all constructs was < 0.05, indicating
that no significant differences were found among any of the constructs, for any of the
accents (attitudes, listening comprehension, comprehensibility and teach ability for GA or
RP), in relation to Exposure in hours.
45
5. Discussion
- Sub question 1: What are the differences in Dutch Intermediate EFL learners’
attitudes towards the standard varieties of native British English (RP) and
American English (GA) accents respectively.
The hypothesis for Subquestion 1 is the following: ‘In the Netherlands, most students will
have a better attitude towards the standard British accent (RP) than towards the standard
American accent (GA), due to higher ratings for specifically the status attitude dimensions’.
Although one has to be careful in interpreting means with a high standard deviation,
some interesting patterns do appear. As seen in the results of the means of attitudes table,
the mean of attitude group 1 (RP), was higher than the mean of attitude group 2 (GA). This
points to stronger preference of the participants who had a preferred attitude towards RP.
However, when looking at the means of all participants, RP is rated lower than GA. This
indicates that, while the participants that preferred RP had a much stronger liking for this
accent (group 1), this was not enough to outweigh all other participants, of which there
were more, and who comparatively had a much lower attitude towards this accent, creating
the larger difference between the means (5.20 difference in means for RP, compared to 1,94
for GA). This resulted in General American being the overall preferred accent of the Dutch
EFL learners.
Looking specifically at the results within the dimensions that the participants did
significantly rate RP higher on (Wealth, Higher Education Level & Worthy of Respect), are
considered to be Status dimensions (Ito & Cacioppo, 2019). This falls in line with part of
the hypothesis for this subquestion, predicting that Dutch learners would consider the
standard British Accent as having a higher status than the standard American accent
(Jenkins, 2009; Smith, 2017). These higher ratings for status dimensions did however not
impact the total attitude score enough to surpass the overall attitude score of GA, which had
46
an overwhelmingly higher score for the solidarity, or social dimension traits (Ito &
Cacioppo, 2019). This goes against the hypothesis for this subquestion, which was thought
to replicate Serrarens’(2017) findings that RP was the preferred overall attitude. It seems
that this study therefore at least tentatively corroborates the results of Bayard et. al. (2001),
who hypothesized that American, because of how widespread it is becoming, would replace
the standard British accent as the previously preferred variant.
A possible reason for the discrepancy between the attitude results of this study, and
Serrarens’ (2017) results (who found that the solidarity or social traits were higher rated for
RP than for GA), could lie with participants. She specifically tested students in higher
education, at university level, while the participants of this study are in lower levels of
vocational training. The background literature includes that the Netherlands, as a more
liberal, socialist country, has had strong opinions about policy changes since president
Trump has been elected. According to Serraren (2017), this could have accounted for the
higher attitude ratings towards GA to drop, between her data collection period and Bayard
et. al.’s (2001). The participants of this study would, however, not be likely to keep up with
world politics, in contrast to university students. It would therefore be interesting to
investigate this possible link between educational level and accent attitudes in future
research.
- Subquestion 2: How does Attitude towards an Accent, relate to Listening
Comprehension, Comprehensibility and perceived Teach Ability scores?
The hypothesis for this question is: ‘When attitude scores are higher towards one accent,
participants will want to pay more attention to that accent, wherefore it will be perceived
as easier to understand. This will result in a have a higher comprehensibility rating and
perceived teach ability rating for that higher rated attitude.’
47
This question was attempted to be answered by running tests on the different independents:
Attitude Groups and attitude by participant scores, with the dependents: Listening
Comprehension, Comprehensibility and perceived Teach Ability. In order to understand the
most important data, a selection is analyzed here more thoroughly because of the strength
of the correlations or because they showed the most interesting results.
Firstly, by looking at the by participant data, several issues stand out. This data is in
a sense more interesting, as the correlations which have resulted from the analyses are the
result of the data for all participants, regardless of their ‘higher attitude towards’ ratings that
the attitude groups were based on.
Both by-participant Attitude scores (Attitude GA and Attitude RP), correlate with
their own Listening Comprehension ratings. This indicates that when Dutch EFL learners
perceive an accent as more effortful and difficult to understand7, this is also reflected in
their Listening Comprehension score of that accent. The Dutch learners can thus, in a sense,
accurately predict their own Listening Comprehension test results for each accent, on the
basis of whether they it was more effortful and more difficult, to understand the speaker.
However, with this observation, a certain tentativeness is warranted because of the way in
which Comprehensibility was gaged, it would be better measured seperately8. In this study
however, the correlation between the Listening Comprehension score of GA and its
Compressibility rating is much stronger than the correlation between the same constructs of
RP, even though there is a very strong correlation between the Listening Comprehension
scores for both tests (p = .751) and a very strong correlation between the Comprehensibility
ratings for both tests (p = .541). The correlations seen between both Attitude scores and
7 Comprehensibility is about ease or difficulty in understand. 8 More on this will follow in the limitations of the study.
48
their own Listening Comprehension ratings, could arguably therefore solely exist because
both constructs were tested as they were intended.
It is additionally exceedingly interesting that the attitude score for GA, correlates in
a negative way with its own Listening Comprehension (LC) score, and nothing else, while
the attitude towards standard British, correlates only with a perceived Teach Ability of the
speaker of that accent, in a positive way. It could be argued that both of these results have
to do with the attitude dimension results as discussed in the previous section. It could be
seen in that section, that all participants rated RP higher than GA for the status dimensions.
As seen in the previous literature, status traits are considered to be connected with being
more well-spoken and having a higher level of education (Ito & Cacioppo, 2019; Smith,
2017). If these traits are connected with the RP accent, it is therefore not surprising that any
participants, even the ones who have a preference for the General American accent, would
not want to put in as much effort when listening to audio texts spoken by a speaker that
they don’t consider to be well-spoken or highly educated. Therefore the hypothesis for this
subsection is correct. Rather than stating that when participants have a higher attitude rating
towards one accent, it would be more accurate to say that results could be much more easily
effected by very specific attitude dimensions.
- Subquestion 3: How does exposure towards an accent, relate to Attitude, Listening
Comprehension, Comprehensibility and perceived Teach Ability?
The hypothesis for this subquestion was the following: ‘The actual listening comprehension
scores will be higher for the American accent because the Netherlands as a country is
exposed to more American English in media. There will be a perceivable effect of exposure
on this construct.‘
49
From the results of the non-parametric tests on More Exposure To, in relation to
perceived Teach Ability, can be gathered that a higher exposure to RP, and Equal amounts
of exposure, have a significant effect on the perceived Teach Ability that Dutch EFL
learners can have of others. The group with more exposure to the General American accent,
showed that they had no significant relationship with perceived Teach Ability for either
accent. There are no other significant relationships between exposure, whether in amount of
hours or in type of exposure, and Attitude towards an accent, Listening Comprehension
scores or Comprehensibility. This is surprising considering the background literature, as
more exposure to a language variation in hours, as well as exposure to more familiar
accents have been proven to have a strong effect on listening comprehension scores and
comprehensibility scores specifically (Adank, Evans, Stuart-Smith, & Scotti, 2009; Bent &
Bradlow, 2003; Gass & Varonis, 1984; Ockey & French, 2014).
If significant results had been found with both independent variables: Exposure and
Attitude, regressions would have been run with those respective variables as predictors of
the dependent measures. This would have given information as to the relative predictive
power of attitude versus exposure, and could have been used to answer the question: ‘Does
attitude or does exposure explain a larger amount of variance in predicting the dependent
variables?’
50
6. Conclusion
The main research question was: ‘RQ: Do the attitudes of Dutch EFL learners toward
natively produced American and British English accents affect the Listening
Comprehension, Comprehensibility and perceived Teach Ability, of these accents and
does exposure play a role?’
In order to find out the conclusion to the research question, experimental research was
conducted that yielded many results. The attitudes of the Dutch EFL learners showed
contrasting results compared to the most previous attitude study. More students have a
better attitude towards the standard American English accent (GA) than towards standard
British English accent (RP) larger number of Dutch EFL learners has a higher attitude
score towards the GA accent. The participants specifically only rated British higher than
GA on status traits, showing a persevering higher status for RP in the Netherlands.
However, Ga overtook RP as the favored accent.
The attitudes towards accents do have an effect on several of the dependent
measures, such as strong, returning correlations regarding perceived Teach Ability. The
conclusion can be made, based on the significant results regarding multiple teach ability
correlations, that the attitude someone has to an accent, is directly related to thinking this
person would be a good language teacher, whether it is true or not.
Attitudes towards an accent interestingly also do not only positively correlate with
the constructs based on the same accent. Such as the General American accent, negatively
correlating with its own Listening Comprehension score, for reasons that could very well
be related to the specific attitude dimensions as well.
Additionally interesting are the correlations found between the dependent
measures. Seeing as both listening comprehension tests correlated highly with their
corresponding accent comprehensibility scores, and these listening comprehension scores
51
did not correlate to their opposite accent comprehensibility scores in addition to
correlating highly to the same measure (LC to LC and Comprehensibility to
Comprehensibility), this means that means that Dutch EFL learners can actually gage
quite well whether they find something easy or difficult to understand. This is in contrast
to previous research that did not give conclusive evidence one way or another.
Limitations of the study & future research
No study is without limitations, certainly not this one. The main limitations of this study
come from a time constraint, and were exacerbated due to issues that related to
containment of the study to a reasonable size. Due to the amount of independents,
dependents and other information sources, it was hard to exclude any information under
the acceptance that it would just not be possible to go into everything. Several items were
excluded, such as final high school grade, and many of the painstakingly gathered and
analyzed results, did not receive the time they deserved to showcase their implications in
the discussion and conclusion sections. Time had simply run out. Fewer dependents
should have been researched in the allotted time, so that they could have been more
carefully examined in the final stage, as the results of this piece of research are truly
fascinating.
Aside from time-constraints, there were some limitations to the study itself. As
previously mentioned, the Comprehensibility ratings for both accents would have ideally
been tested completely separate from the Listening Comprehension task. Due to time and
classroom- circumstance constraints, this was however not possible. With the way the
Comprehension judgement task was set up now, the correlations seen could be a result of
the participants answering their Comprehensibility scales, purely on the basis of whether
the Listening Comprehension exam in that accent was difficult, rather than rating
52
Comprehensibility for which it was meant: Perceived difficulty of understanding.
Therefore, there is no way to be completely certain where the correlation comes from
unless this issue is dealt with in a possible replication study. In order to avoid any
uncertainty in the future, any research that will be conducted on the relationship between
Listening Comprehension and Comprehensibility, should test the Comprehensibility
construct at a different time, using fresh audio samples. This should aid in avoiding any
correlational results that were unintentionally affected by the Listening Comprehension
tests themselves.
Additionally, in future research it would be good to take multiple educational
levels into account, which could not be done during this study. A possible cause for the
found attitude result discrepancies between this study and Sarrerens’ (2017) study, could
have been because of educational level. Her students were all at university level, while the
participants of this study were not. The difference between the attitudes could simply be
explained do to a lesser interest in world affairs and politics of this participant group,
compared to university students. It would therefore be very interesting to look into level
of education as a predictor for the type of attitude someone has towards an accent.
Final conclusion and research implications
The final conclusion is therefore the following:
The Dutch EFL students showed clear ratings for the two examined accents, resulting in
an overall higher attitude score for the General American accent, in spite of a higher status
attitude score for Received pronunciation. The effects of the attitudes on Listening
Comprehension and Comprehensibility are diverse and inconsistent. Sometimes there is a
negative effect of attitude, such as shown in a negative correlation such as between
attitude towards the GA accent and the Listening Comprehension scores of that same
53
accent. Some effects are positive, such as the effects of attitude towards an accent on
perceived Teach ability of both accents which is one of the most consistent results. The
perceived teach ability construct is additionally the only one that exposure has a strong,
consistent relationship with. This study has highlighted two specific aspects more clearly.
Attitude towards an accent, at least not regarding GA and RP, do not have a negative
effect on listening comprehension test results. Additionally, attitude is a complicated
phenomenon, not easily generalized because of its many dimensions and possible
causalities. The previous literature on these constructs has been so inconclusive and
diverse, that the effects of attitude on constructs seems difficult to answer, even a study
comparing multiple of the dependents and two independents, in a manner that has never
been attempted before. Future research will be needed on a much larger scale in order to
fully examine the implications of attitudes towards a language variation, on foreign
language learning specifically.
All in all, in spite of the limitations of this study, this avenue of research had to be
investigated for its possible word-wide second language testing applications. It is
therefore in a sense fortunate that the attitudes towards an accent do not have an effect on
listening comprehension testing scores.
54
7. Bibliography
(2019, 05 20). Retrieved from International Dialects of English Archive:
https://www.dialectsarchive.com/
(2019, 03 01). Retrieved from Google Forms: https://docs.google.com/forms
(2019, 03 01). Retrieved from Cambridge English:
https://www.cambridgeenglish.org/learning-english/activities-for-
learners/?skill=listening
(2019, 02 01). Retrieved from Deltion College: https://www.deltion.nl
(2019, 02 01). Retrieved from British Council: https://www.britishcouncil.org
(2019, 03 01). Retrieved from YouTube: https://www.youtube.com
Abeywickrama, P. (2013). Why not Non-Native Varieties of English as Listening
Comprehension Test Input? RELC Journal, 44(1), 59-74.
Adank, P., Evans, B., Stuart-Smith, J., & Scotti, S. (2009). Comprehension of familiar and
unfamiliar native accents under adverse listening conditions. Journal of
Experimental Psychology: Human Perception and Performance, 35(2), 520-529.
Albrechtsen, D., Henriksen, B., & Faerch, C. (1980). Native speaker reactions to learners'
spoken interlanguage. Language Learning, 30, 365-396.
Anderson-Hsieh, J., & Kohler, K. (1988). The Effect of Foreign Accent and Speaking
Rate on Native Speaker Comprehension. Language Learning, 38(4), 561-613.
Anisfeld, M., Bogo, N., & Lambert, W. (1962). Evaluational reactions to accented English
speech. Journal of Abnormal Social Psychology, 69, 89-97.
Ash, S. (2013). Social Class. In N. S. J.K. Chambers, The Handbook of language
variation and change (pp. 350-367). Chichester: Wiley-Blackwell Press.
Barbour, M.-A. (2014). The hidden effects within Catalan EFL learner's perceptions and
attitudes to English accents. Barcelona: Universitat de Barcelona.
Bayard, D., Weatherall, A., Gallois, C., & Pittam, J. (2001). Pax Americana: Accent
attitudinal evaluations in New Zealand, Australia, and America. Journal of
Sociolinguistics, 5(1), 22-49.
Bent, T., & Bradlow, A. R. (2003). The Interlanguage Speech Intelligibility Benefit.
Journal of the Acoustical Society of America, 114(3), 1600-1610.
Bilbow, G. T. (1989). Towards an Understanding of Overseas Students’ Difficulties in
Lectures: A phenomenographic approach Volume 13, 1989 - Issue 3. Journal of
Further and Higher Education, 13(3), 85-99.
Bradac, J. J. (1990). Language attitudes and impression formation. In H. Giles, & W. P.
Robinson, Handbook of Language and Social Psychology (pp. 387-412).
Chichester, England: John Wiley & Sons Ltd.
Brennan, E., & Brennan, J. (1981a). Accent scaling and language attitudes: reactions to
Mexican American English speech. Language and Speech, 24, 207-221.
Brennan, E., & Brennan, J. (1981b). Measurements of accent and attitude toward Mexican
American speech. Journal of Psycholinguistic Research, 10, 487-501.
C. Snow. (2002). Reading for understanding. Retrieved from Rand:
https://www.rand.org/content/dam/rand/pubs/monograph_reports/MR1465/MR146
5.ch2.pdf
Cargile, A. C., Giles, H., Ryan, E. B., & Bradac, J. J. (1994). Language attitudes as a
social process: A conceptual model and new directions. Language &
Communication, 14(3), 211-236.
Carrier, K. (1999). The Environment of Second Language Listening: Does Status Play a
Role in Comprehension. The Modern Language Journal, 65-79.
Council of Europe. (2001). Common European Framework of Reference for Languages:
55
Learning, Teaching, Assessment. Strasbourg: Language Policy Unit.
Cunningham-Andersson, U. (1993). Stigmatized pronunciations in non-native Swedish.
PERILUS, 17, 81-106.
Derwing, T. M., & Munro, M. J. (1997). Accent, Intelligibility, and Comprehensibility:
Evidence from Four L1s. Studies in Second Language Acquisition, 20, 1-16.
Deterding, D. (2005). Listening to Estuary English in Singapore. TESOL Quarterly, 39(3),
425-440.
Dunn, M., Greenhill, S. J., Levinson, S. C., & Gray, R. D. (2011). Evolved structure of
language shows lineage-specific trends in word-order universals. Nature,
473(7345), 79-82.
Eagly, A. H., & Mladinic, A. (1989). Gender stereotypes and attitudes toward women and
men. Personality and Social Psychology Bulletin, 15(4), 543-558.
Edwards, J. (1982). Language attitudes and their implications among English speakers. In
Ryan, E. B.; Giles, H. (Eds.), Attitudes Towards Language Variation. Social and
Applied Contexts (pp. 20-33). London: Edward Arnold.
Eisenstein, M., & Berkowitz, D. (1981). The effect of phonological variation on adult
learner comprehension. Studies in Second Language Acquisition, 4, 75-80.
European Commission. (2012, January 25). Proposal for a General Data Protection
Regulation. Retrieved April 8, 2019, from European Commission:
http://ec.europa.eu/justice/data-
protection/document/review2012/com_2012_11_en.pdf
European Union. (1995, October 24). Directive 95/46/EC of the European Parliament and
of the Council. Retrieved April 11, 2019, from EUR-Lex: from http://eur-
lex.europa.eu/smartapi/cgi/sga_doc?smartapi!celexplus!prod!CELEXnumdoc&lg=
EN&numdoc=31995L0046
Fayer, J., & Krasinski, E. (1987). Native and nonnative judgements of intelligibility and
irritation. Language Learning, 37, 313-326.
Garrett, P. (2011). Attitudes to Language. Cambridge: Cambridge University Press.
Gass, S., & Varonis, E. M. (1984). The Effect of Familiarity on the Comprehensibility of
Non-Native speech. Language Learning, 34(1), 65-89.
Gawronski, B., & Bodenhausen, G. V. (2006). Associative and propositional processes in
evaluation: an integrative review of implicit and explicit attitude change.
Psychological Bulletin, 132(5), 692-731.
Giles, H. (1970). Evaluative reactions to accents. Educational Review, 22, 211-227.
Giles, H., & Coupland, N. (1991). Language: Contexts and Consequences. Milton
Keynes: Open University Press.
Giles, H., Bourhis, R. Y., & Davies, A. P. (1974). Prestige speech styles: The imposed
norm and inherent value hypotheses. In W. C. McCormack, W. C.; Wurm, S.
(Eds), Language in Anthropology IV: Language in May Ways. Den Haag: Mouton.
Giles, H., Bourhis, R. Y., Lewis, A., & Trudgill, P. (1974). The imposed norm hypothesis:
A validation. Quarterly Journal of Speech, 60(4), 405-410.
Gluszek, A., & Dovidio, J. F. (2010). The way they speak: A social psychological
perspective on the stigma of nonnative accents in communication. Personality and
Social Psychology Review, 14, 214-237.
Greenwald, A. G., & Banaji, M. R. (1995). Implicit social cognition: Attitudes, self-
esteem, and stereotypes . Psychological Review, 102(1), 4-26.
Gumperz, J. (1982). Discourse Strategies. Cambridge, U.K.: Cambridge University Press.
Gynan, S. (1985). Comprehension, irritation and error hierarchies. Hispania, 68, 160-165.
Harding. (2012). Accent, listening assessment and the potential for a shared-L1
advantage: A DIF perspective. Language Testing, 29, 163-180.
56
Harding. (n.d.). Accent and Listening Assessment: A Validation of the Use of Speakers
with L2 Accents on an Academic English Listening Test. Peter Lang.
Hogg, M. A., & Vaughan, G. M. (2008). Social Psychology (5th ed.). Pearson.
Huang, R., Hansen, J. H., & Angkititrakul, P. (2007). Dialect/accent classification using
unrestricted audio. IEEE Transactions on Audio, Speech, and Language
Processing, 15(2), 453-464.
Ito, T., & Cacioppo, J. (2019). Attitudes as Mental and Neural States of Readiness: Using
Physiological Measures to Study Implicit Attitudes.
Jenkins, J. (2009). World Englishes, a recource book for students. Oxon: Routledge.
Johansson, S. (1978). Studies in error gravity: Native reactions to errors produced by
Swedish learners of English. Gothenburg Studies in English, 44.
Kagitci, Y. B. (2017). The effects of Speaker's accent on Listening Comprehension Tests.
International Journal of Curriculum and Instruction, 107-124.
Kalin, R., & Rayko, D. (1978). Discrimination in evaluative judgements against foreign
accented job candidates. Psychological Reports, 43, 1203-1209.
Kang, O., Moran, M., & Thomson, R. (2019). The effects of international accents and
shared first language on listening comprehension tests. Tesol quarterly, 56-81.
Kinzler, K. D., Dupoux, E., & Spelke, E. S. (2007). The native language of social
cognition. Proceedings of the National Academy of Sciences.
Labov, W. (1966). The social stratification of English in New York City. Washington, DC:
Center for Applied Linguistics.
Labov, W., Ash, S., & Boberg, C. (2006). The Atlas of North American English:
Phonetics, Phonology and Sound Change. Berlin and New York: Mouton de
Gruyter.
Ladegaard, H. J. (1998a). Assessing National Stereotypes in Language Attitude Studies:
The Case of Class-consciousness in Denmark. Journal of Multilingual and
Multicultural Development, 19(3), 182-198.
Ladegaard, H. J. (1998b). National Stereotypes and Language Attitudes: The Perception
of British, American and Australian Language and Culture in Denmark. Language
& Communication, 18, 251-274.
Lambert, W. E. (1967). A social psychology of bilingualism. Journal of Social Issues, 23,
91-109.
Lambert, W. E., Hodgson, R. C., Gardner, R. C., & Fillenbaum, S. (1960). Evaluational
reactions to spoken languages. The Journal of Abnormal and Social Psychology,
60(1), 44-51.
Lewis, P. (2009). Ethnologue: Languages of the World, 16th edition. SIL Publications.
Likert, R. (1932). A Technique for the Measurement of Attitudes. Archives of Psychology,
22(140), 5-55.
Lippmann, W. (1922). Public Opinion. New York: The Free Press.
Major, R., Fitzmaurice, S. M., Bunta, F., & Balasubramanian, C. (2002). The effects of
nonnative accents on listening comprehension: Implications for ESL assessment.
TESOL Quarterly, 173-190.
Major, R., Fitzmaurice, S. M., Bunta, F., & Balasubramanian, C. (2005). Testing the
effects of regional, ethnic and international dialects of English on listening
comprehension. Language Learning 55, 37-69.
Matsuura, H., Chiba, R., & Fujieda, M. (1999). Intelligibility and Comprehensibility of
American and Irish Englishes in Japan. World Englishes, 18(1), 49-62.
Matsuura, R., Chiba, R., Mahoney, S., & Rilling, S. (2014). Accent and speech rate effects
in English as a lingua franca. SYSTEM volume 46, 143-150.
Moyer, A. (2009). Input as a Critical Means to an End: Quantity and Quality of L2
57
Experience in Phonological Attainment. In A. Moyer, Input matters in SLA (pp.
159-174). Multilingual Matters.
Munro, M., & Derwing, T. (1995a). Foreign accent, comprehensibility and intelligibility
in the speech of second language learners. Language Learning 45, 73-97.
Munro, M., & Derwing, T. (1995b). Processing time, accent, and comprehensibility in the
perception of native and foreign- accented speech. Language and Speech, 38(3),
289-306.
Ockey, J. G., & French, R. (2014). From One to Multiple Accents on a Test of L2
Listening Comprehension. Applied Linguistics Advance Access, 1-24.
Owren, M. J. (2008). GSU Praat Tools: Scripts for Modifying and Analyzing Sounds
using Praat Acoustics Software. Behavior Research Methods, 40(3), 822-829.
Pantos, A. J., & Perkins, A. W. (2013). Measuring Implicit and Explicit Attitudes Toward
Foreign Accented Speech. Journal of Language and Social Psychology , 32(1), 3-
20.
Preston, D. R. (1989). Perceptual Dialectology: Nonlinguists' Views of Areal Linguistics.
Providence, Rhode Island: Walter de Gruyter.
Preston, D. R., & Robinson, G. C. (2005). Dialect Perception and Attitudes to Variation.
In M. J. Ball, Clinical Sociolinguistics (pp. 133-149). Blackwell Publishing Ltd.
Przedlacka, J. (2001). Estuary English and RP: Some Recent Findings. Studia Anglica
Posnaniensia, 36, 35-50.
Rubin, D. L., & Smith, K. A. (1990). Effects of accent, ethinicity and lecture topic on
undergraduates' perceptions of nonnative English-speaking teaching assistants.
The University of Georgia: Department of Speech Communication.
Rubin, J. (1990). Improving foreign language comprehension. In J. E. Alatis, Georgetown
University Round table on Languages and Linguistics. Georgetown: Georgetown
University Press.
Ryan, E. B. (1982). Prolegomena for developing a social psychological theory of language
attitudes. In E. B. Ryan, & H. G. (Eds.), Attitudes toward language variation:
Social and applied contexts (pp. 208-223). London: Arnold.
Ryan, E. B. (1983). Social Psychological Mechanisms Underlying Native Speaker
Evaluations of Non-Native Speech. Studies in Second Language Acquisition, 5(2),
148-159.
Sato, C. (1991). Sociolinguistic variation and language attitudes in Hawaii. In J. C. (Ed.),
English around the world: Sociolinguistic perspectives. Cambrigde, U.K.:
Cambridge University Press.
Schmitz, A. J. (2015). The Effect of Native English Accents on Comprehensibility Among
Dutch Students. Utrecht: Utrecht University.
Science Europe. (2013, May). Documents Science Europe Position Statement: On the
Proposed European General Data Protection Regulation. Retrieved from
http://www.scienceeurope.org/downloads
Serrarens, J. (2017). American versus British English: Dutch attitudes towards Standard
American English and Recieved Pronunciation. Nijmegen: Radboud University .
Smith, A. M. (2017). U wot m8?; American and British attitudes toward regional accents.
Scripps College.
Soukop, B. (2012). Current issues in the social psychological study of 'language attitudes':
Construction, context, and the attitude-behavior link. Language And Linguistics
Compass, 6(4), 212-224.
Strack, F., & Deutsch, R. (2004). Reflective and impulsive determinants of social
behavior. Personality and Social Psychology Review: An Official Journal of the
Society for Personality and Social Psychology, Inc, 8(3), 220-247.
58
Tajfel, H. (1982). Social Identity and Intergroup Relations. Cambridge: Cambridge
University Press.
Taylor, L. (2006). The Changing Landscape of English: Implications for English
Language Assessment. ELT Journal, 60(1), 51-60.
Taylor, L., & Garenpayeh, A. (2011). Assessing English for academic purposes: Defining
and operationalizing the test construct. Journal of English for Academic Purposes,
10, 89-101.
Upton, C., & Widdowson, J. D. (2006). An atlas of English dialects. London: Routledge.
Vincent, D. (2016). Recieved Pronunciation - The Characteristically British Accent. ELT
Learning Journeys.
Watson, S., Watson, W., & Tay, L. (2018). The development and validation of the
Attitudinal Learning Inventory (ALI): A measure of attitudinal learning and
instruction. Education Technology Research and Development.
Zahn, C. J., & Hopper, R. (1985). Measuring Language Attitudes: The Speech Evaluation
Instrument. Journal of Language and Social Psychology, 4(2), 113-123.
Zimbardo, P. G., & Leippe, M. R. (1991). The Psychology of Attitude Change and Social
Influence. Philadelphia: Temple UNiversity Press.
59
8. Table of Figures
Figure 1: Experimental Research Design 22
Figure 2: Scatterplot of Attitude Scores 37
Figure 3: Bar Graph of Attitude Dimension Ratings 39
Figure 4: Attitude group and perceived Teach Ability 42
Figure 5: More Exposure to and perceived Teach Ability 44
Tables
Table 1: Speaker’s personal information 24
Table 2: Task 1 Versions 31
Table 3: Task 2 Versions 34
Table 4: Means of attitudes 38
Table 5: Speaker Demographics 66
Table 6: Table of participant’s attitude scores 114
Table 7 : Differences between means 115
Table 8: Attitude Dimension (AD) Ratings 115
Table 9: Pearson correlation 136
Table 10: Spearman correlation GA 116
Table 11: Spearman correlation RP 117
Table 12: Raw data file SPSS 118

60

61
9. Appendices
Appendix A - Speaker Background Questionnaire
1. Name:
2. Age:
3. Sex:
4. Height:
5. Nationality:
6. Native Languages:
7. Languages spoken apart from English:
8. Hometown:
(Region/Country):
9. What is your current place of
residence:
10. How long have you lived there:
(months/years)
11. Highest level of education
completed:
12. List the number of years lived outside
of your home country:
13. Choose one of the following:
Smoker or Non-smoker
Thank you for your participation!
62
Appendix B - Speaker Consent Form
Departament de Traducció i
Ciències del llenguatge
Universitat Pompeu Fabra
Campus de la Comunicació-Poblenou
C/ Roc Boronat, 138
08018 Barcelona
Consent form
I undersigned ……………………………………….. (name and surnames), of age, with ID no.
………………………………………………..... ... ... .. and residing at ... ... ... ... ... ... ... ... ... ... ...., born in ...
.... ... ... ... ... ... ... .... in the year ... ... ...
DECLARE:
that I have been informed that in compliance with Spanish Law 15/1999 of December 13th on the
Protection of Personal Data and in accordance with Royal Decree 1720/2007 of December 21st,
approving the development of this regulation, the personal data I provide will be stored in the
archives of Projectes de recerca, desenvolupament i innovació (‘Research, Development
and Innovation Projects’) whose holder is the Pompeu Fabra University. These data will be used
63
for the sole purpose of carrying out research projects in the field of Linguistics.
I authorize the Pompeu Fabra University, through the Masters in Theoretical and Applied
Linguistics (coordinated by Dr. Pilar Prieto), to reproduce and publish in any medium and form
the recordings done as a result of my participation, and that these recordings will be used
exclusively for educational, research and nonprofit purposes.
I authorize the release of these data to other research institutions for the purpose of carrying
out research projects in Linguistics, under the condition that the university and the host
institution carry out non-profit activities with these data.
I have been informed that the body responsible for the archives of the University is the Gerent
(University Manager) and that I can exercise the rights of access, rectification, cancellation and
opposition by sending a written request, accompanied by a photocopy of an identification card
or other equivalent identification document, addressed to: Gerent. Universitat Pompeu Fabra,
Plaça de la Mercè, 10-12, 08002 Barcelona
________________________, __ / __/ _____
(Place) (date)
..........................................................................................................................
(Signature)
64
Appendix C - Speaker Debriefing Letter
Departament de Traducció i
Ciències del llenguatge
Universitat Pompeu Fabra
Campus de la Comunicació-Poblenou
C/ Roc Boronat, 138
08018 Barcelona
Debriefing Letter
Dear Volunteer,
Thank you for volunteering your accent variety in this project. The purpose of this research is to
explore the connections between accents, attitude, comprehensibility, and listening
comprehension in the context of second language acquisition.
The audio samples will be used for research conducted in The Netherlands for two individual
Master Thesis projects. The data you have provided in this study will be held anonymously and
in strict confidence. All participants will have the right to access the findings of this study. A
copy of the final report and its finding can be made available to you upon your request.
65
If you have any questions or concerns regarding this project, please do not hesitate to contact
the researchers: Kristyn Johnson at [email protected] and Jarna van Gelder
at [email protected] or the supervisors of these studies: Dr. Carmen Perez
Vidal at [email protected] and Dr. Joan Carles Mora at [email protected]
No known risks are associated with volunteering in this Project, beyond those you may
experience in everyday life. However, in the unlikely event that you feel you may be be
experiencing distress or discomfort because of volunteering in this study, you may find the
following service helpful:
External Helpline
The Samaritans in Spain
Free, completely confidential, non-judgmental,
emotional support for any English speaker of
any age who may be experiencing distress or despair.
Tel: 902 88 35 35
Thank you very much for your participation and assistance!
Kristyn Johnson & Jarna van Gelder
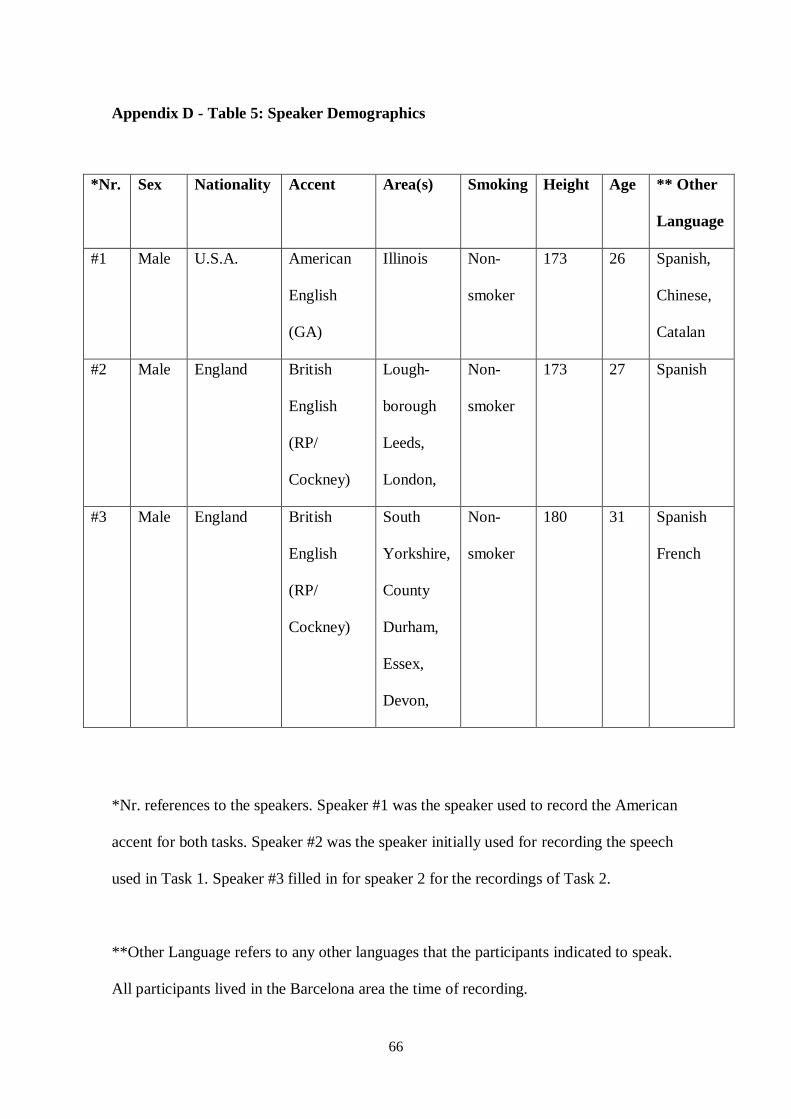
66
Appendix D - Table 5: Speaker Demographics
*Nr. Sex Nationality Accent Area(s) Smoking Height Age ** Other
Language
#1 Male U.S.A. American
English
(GA)
Illinois Non-
smoker
173 26 Spanish,
Chinese,
Catalan
#2 Male England British
English
(RP/
Cockney)
Lough-
borough
Leeds,
London,
Non-
smoker
173 27 Spanish
#3 Male England British
English
(RP/
Cockney)
South
Yorkshire,
County
Durham,
Essex,
Devon,
Non-
smoker
180 31 Spanish
French
*Nr. references to the speakers. Speaker #1 was the speaker used to record the American
accent for both tasks. Speaker #2 was the speaker initially used for recording the speech
used in Task 1. Speaker #3 filled in for speaker 2 for the recordings of Task 2.
**Other Language refers to any other languages that the participants indicated to speak.
All participants lived in the Barcelona area the time of recording.

67
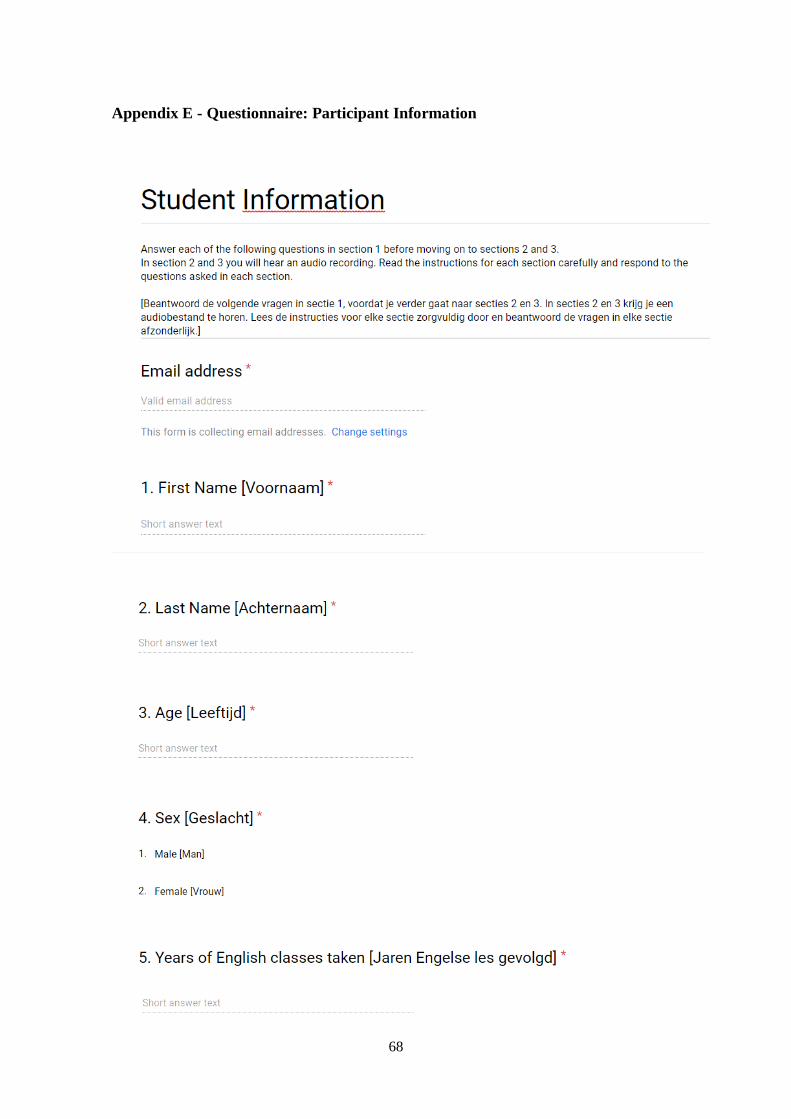
68
Appendix E - Questionnaire: Participant Information
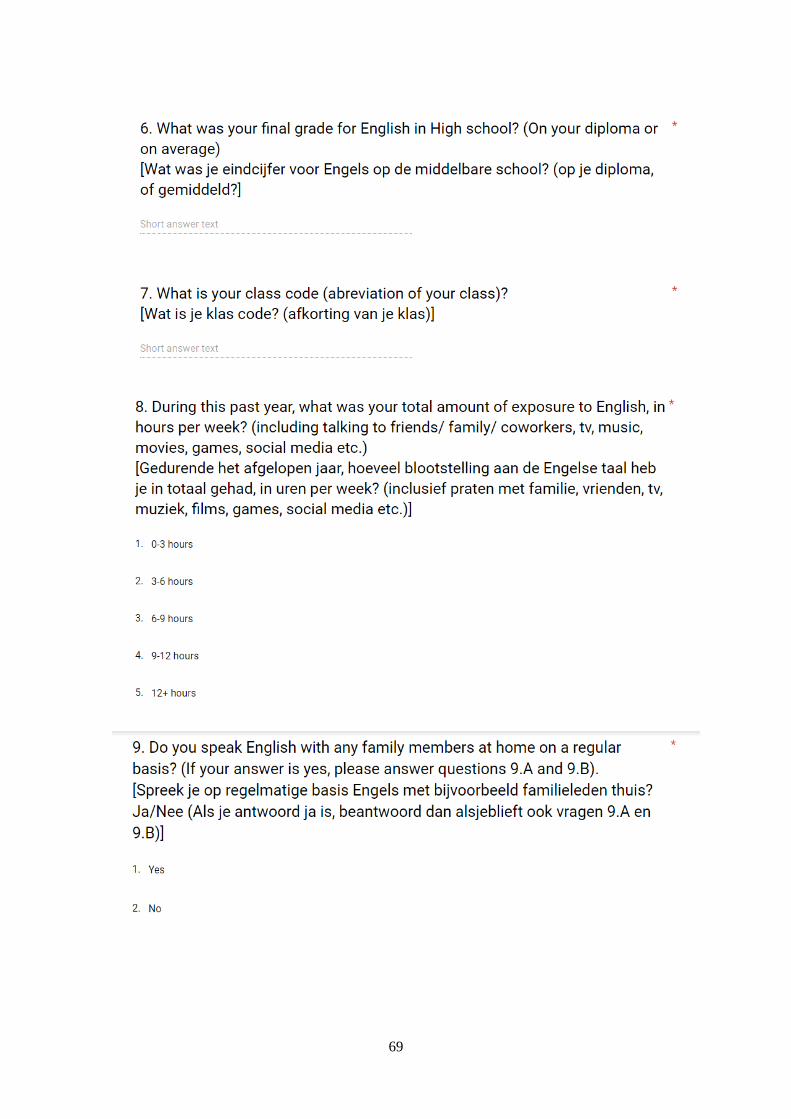
69
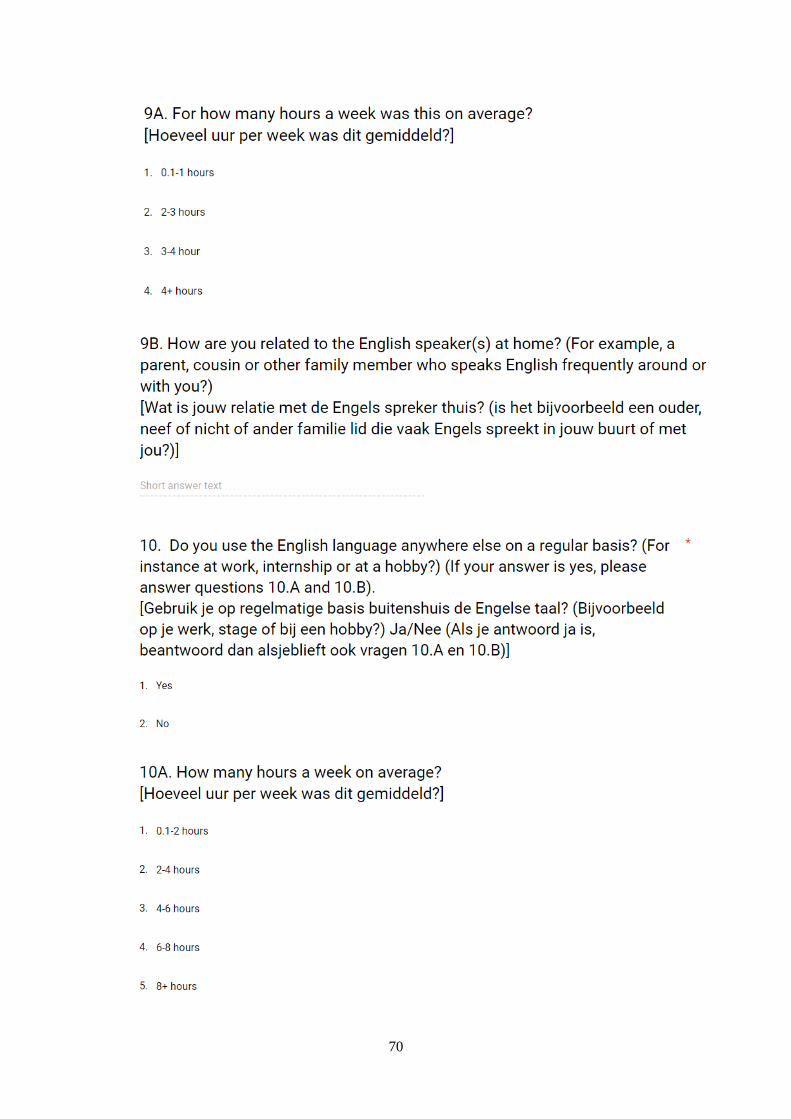
70
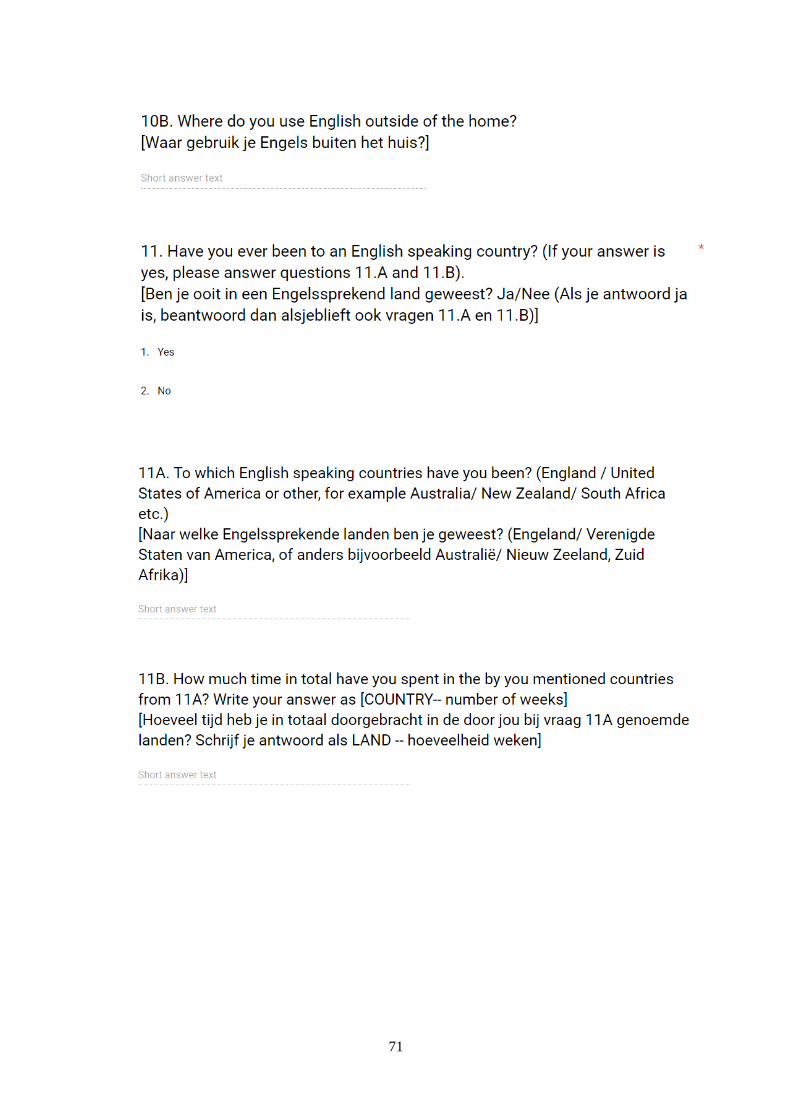
71
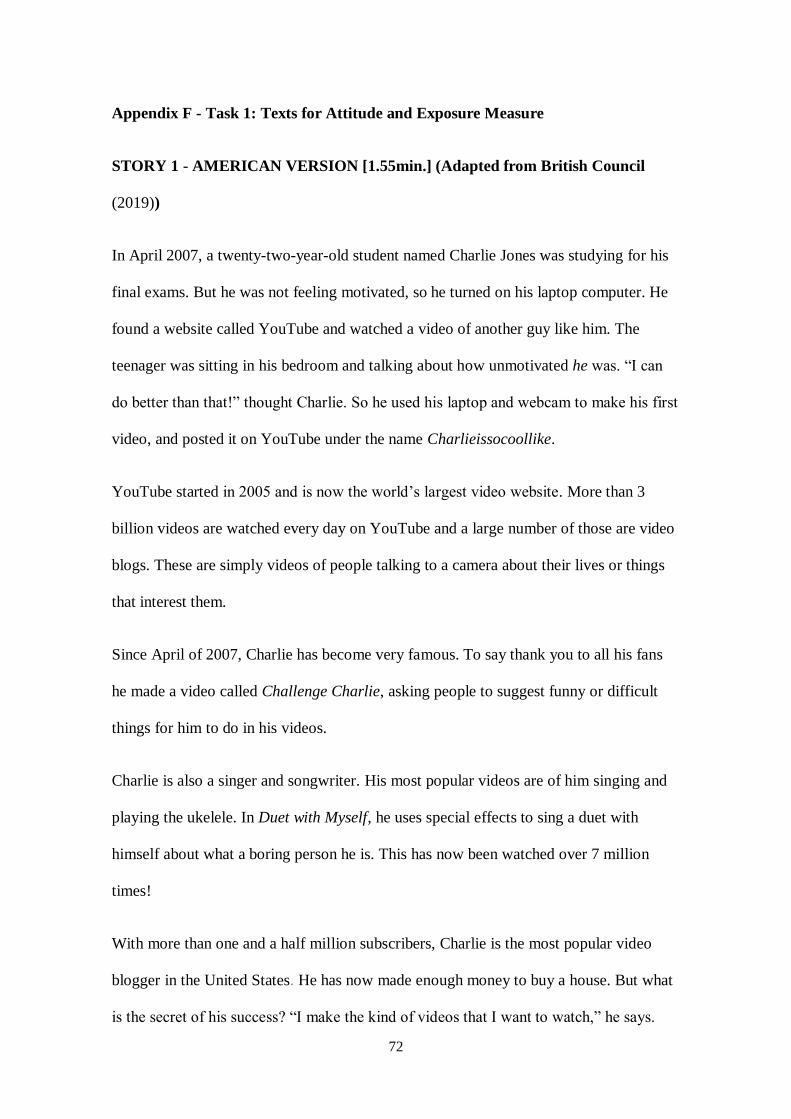
72
Appendix F - Task 1: Texts for Attitude and Exposure Measure
STORY 1 - AMERICAN VERSION [1.55min.] (Adapted from British Council
(2019))
In April 2007, a twenty-two-year-old student named Charlie Jones was studying for his
final exams. But he was not feeling motivated, so he turned on his laptop computer. He
found a website called YouTube and watched a video of another guy like him. The
teenager was sitting in his bedroom and talking about how unmotivated he was. “I can
do better than that!” thought Charlie. So he used his laptop and webcam to make his first
video, and posted it on YouTube under the name Charlieissocoollike.
YouTube started in 2005 and is now the world’s largest video website. More than 3
billion videos are watched every day on YouTube and a large number of those are video
blogs. These are simply videos of people talking to a camera about their lives or things
that interest them.
Since April of 2007, Charlie has become very famous. To say thank you to all his fans
he made a video called Challenge Charlie, asking people to suggest funny or difficult
things for him to do in his videos.
Charlie is also a singer and songwriter. His most popular videos are of him singing and
playing the ukelele. In Duet with Myself, he uses special effects to sing a duet with
himself about what a boring person he is. This has now been watched over 7 million
times!
With more than one and a half million subscribers, Charlie is the most popular video
blogger in the United States. He has now made enough money to buy a house. But what
is the secret of his success? “I make the kind of videos that I want to watch,” he says.
73
And when asked how fame has affected him, Charlie says, "I still sit in my bedroom
talking to my camera, and that's what I want to do."
Oh, and how did Charlie do on his final exams back in 2007? Well, he passed with nine
A grades and one B! He says that he wants to continue his education in the future but
decided to try and make a career on YouTube before that. So, far, it’s going very well!
WORD COUNT: 355
STORY 2 - AMERICAN VERSION [1.50min.] (Adapted from British Council
(2019))
https://learnenglishteens.britishcouncil.org/study-break/graded-reading/life-youtuber-
level-1
Do funny or interesting things happen to you a lot? Do you think hundreds of thousands
of people will want to listen to you tell stories about your life?
That’s what life is like for YouTube star, David Smith. More than 150 million people
watch his videos of funny stories about himself, and subscribers to his channel grow
every day.
Twenty-three-year-old David from the United States, turns his life into his work, six
days a week. ‘I spend all of Sunday having ideas for videos to film that week,’ says
David, ‘Then, on Monday, I wake up early to start making the videos. Usually, a video
takes just over an hour to make. I try to make around five, so it takes most of my day.
Then, from Tuesday to Friday, I edit them.’
David also spends a few hours a week writing to his fans. Sometimes he meets fans
because people recognize him when he goes out. ‘The other day I went to buy coffee,’
74
he said, ‘and the girl serving me almost dropped my coffee when she saw that it was me.
She left the coffee shop to meet me outside to take pictures. It always makes me happy
to see that my fans are happy.’
David has some advice about what kind of videos to make. ‘Be yourself. Don’t change
to try to make people like you. They will love YOU! When I first started YouTube, I
wanted to look good. In my old videos, I don’t look comfortable because I'm not being
myself. But in my videos now, you can see that I’m 100 percent myself. I’m crazy and
strange, and I don’t care what people think.’
David also says you should make your channel about something you really care about
because that will inspire people. People know when you’re not being the real you
because you just want to be popular. ‘Make videos about something you love and your
channel will grow much faster, believe me!’
WORD COUNT: 331
STORY 1 - BRITISH VERSION [approx. 1.55min.] (Adapted from British Council
(2019))
In April 2007, a 22-year-old student named Charlie Jones was studying for his final
exams. But he was not feeling motivated, so he turned on his laptop computer. He found
a website called YouTube and watched a video of another guy like him. The teenager
was sitting in his bedroom and talking about how unmotivated he was. “I can do better
than that!” thought Charlie. So he used his laptop and webcam to make his first video,
and posted it on YouTube under the name Charlieissocoollike.
YouTube started in 2005 and is now the world’s largest video website. More than 3
billion videos are watched every day on YouTube and a large number of those videos
75
are video blogs. These are simply videos of people talking to a camera about their lives
or things that interest them.
Since April of 2007, Charlie has become very famous. To say thank you to all his fans
he made a video called Challenge Charlie, asking people to suggest funny or difficult
things for him to do in his videos.
Charlie is also a singer and songwriter. His most popular videos are of him singing and
playing the ukelele. In Duet with Myself, he uses special effects to sing a duet with
himself about what a boring person he is. This has now been watched over 7 million
times!
With more than one and a half million subscribers, Charlie is the most popular video
blogger in England. He has now made enough money to buy a house. But what is the
secret to his success? “I make the kind of videos that I want to watch,” he says. And
when asked how fame has affected him, Charlie says, "I still sit in my bedroom talking
to my camera, and that's what I want to do."
Oh, and how did Charlie do on his final exams back in 2007? Well, he passed with nine
A grades and one B! He says that he wants to continue his education in the future but
decided to try and make a career on YouTube before that. So, far, it’s going very well!
WORD COUNT: 354
STORY 2 - BRITISH VERSION [approx. 1.50min.] (Adapted from British Council
(2019))
Do funny or interesting things happen to you a lot? Do you think hundreds of thousands

76
of people will want to listen to you tell stories about your life?
That’s what life is like for YouTube star, David Smith. More than 150 million people
watch his videos of funny stories about himself, and subscribers to his channel grow
every day.
Twenty-three-year-old David from England, turns his life into his work, six days a week.
‘I spend all of Sunday having ideas for videos to film that week,’ says David, ‘Then, on
Monday, I wake up early to start making the videos. Usually, a video takes just over an
hour to make. I try to make around five, so it takes most of my day. Then, from Tuesday
to Friday, I edit them.’
David also spends a few hours a week writing to his fans. Sometimes he meets fans
because people recognise him when he goes out. ‘The other day I went to buy coffee,’
he said, ‘and the girl serving me almost dropped my coffee when she saw it was me. She
left the coffee shop to meet me outside to take pictures. It always makes me happy to see
my fans are happy.’
David has some advice about what kind of videos to make. ‘Be yourself. Don’t change
to try to make people like you. They will love YOU! When I first started YouTube, I
wanted to look good. In my old videos, I don’t look comfortable because I'm not being
myself. But in my videos now, you can see that I’m 100 percent myself. I’m crazy and
strange, and I don’t care what people think.’
David also says you should make your channel about something you really care about
because that will inspire people. People know when you’re not being the real you
because you just want to be popular. ‘Make videos about something you love and your
channel will grow much faster, believe me!’
77
WORD COUNT: 327
Appendix G - Task 1: Attitude and Exposure Measure
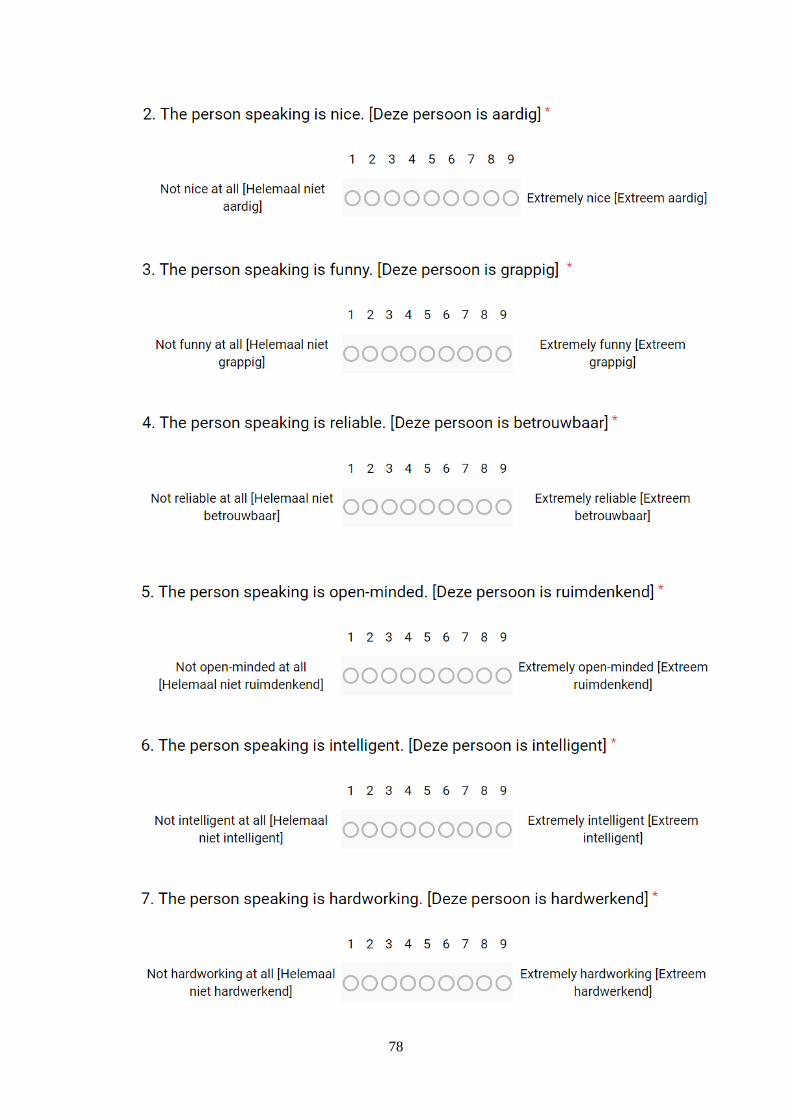
78
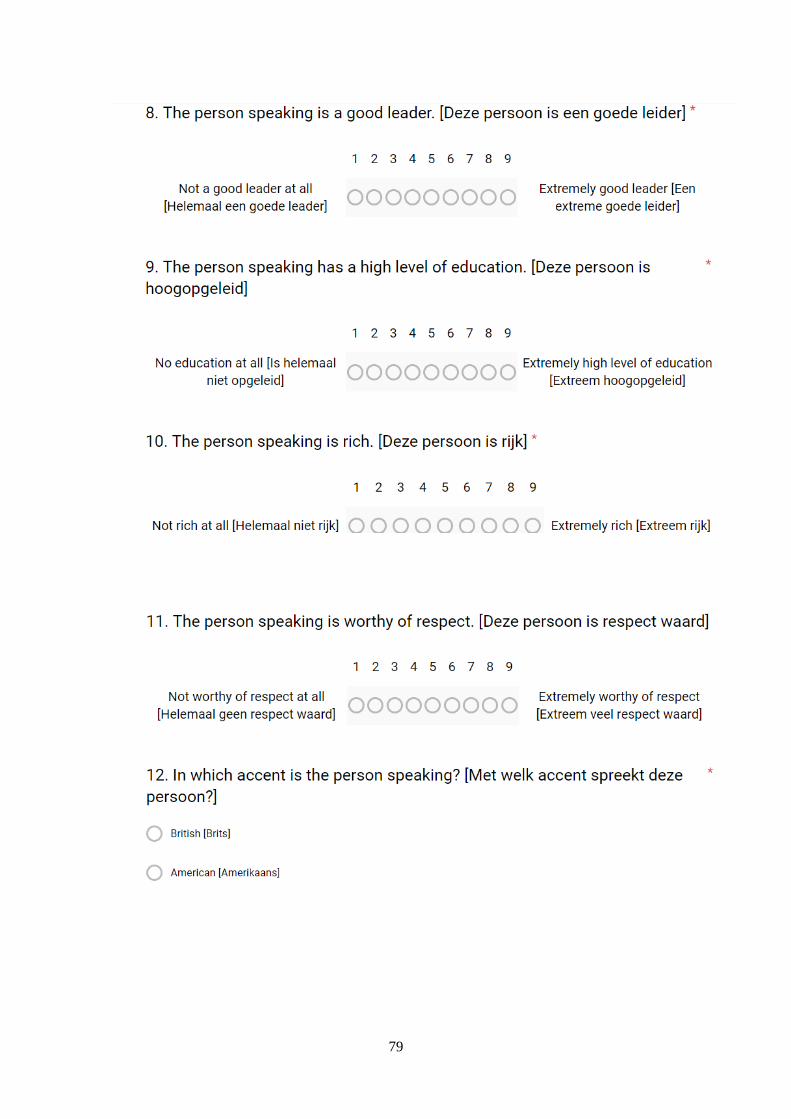
79
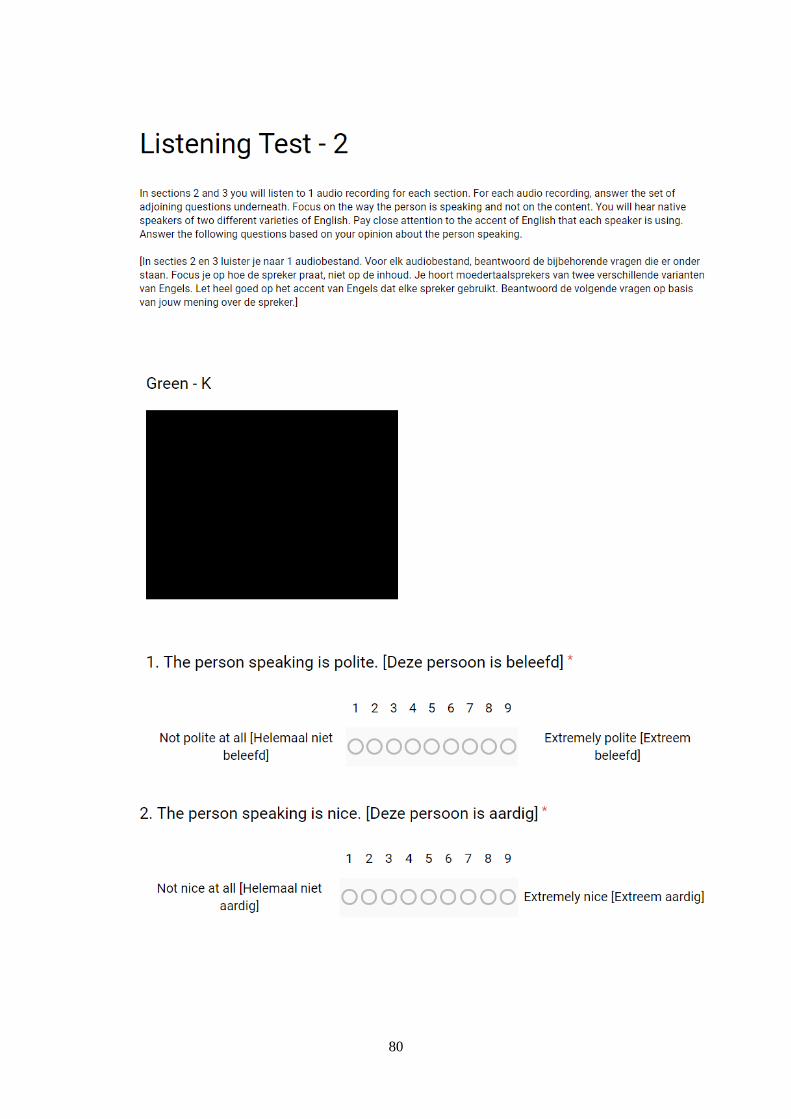
80
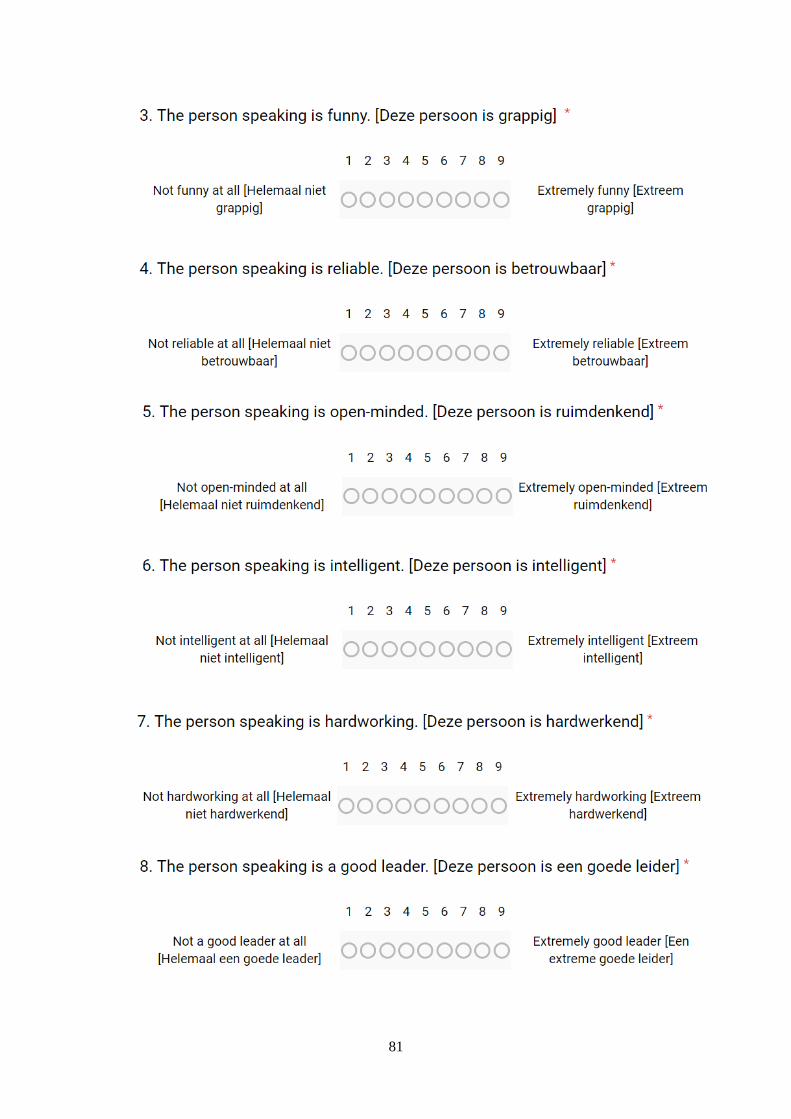
81
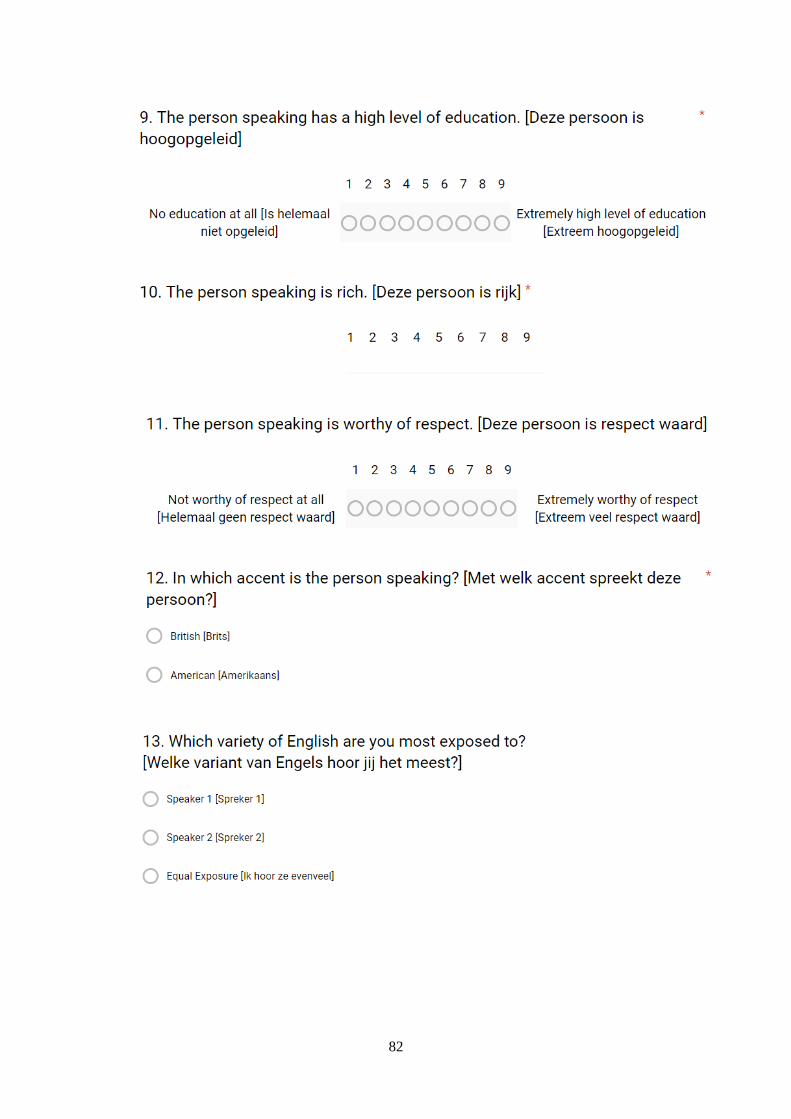
82

83
Appendix H - Task 2: Texts for Listening Comprehension Test
In Red are the parts that were recorded in both the British and American standard
accents. These were the audio files that were given to the students to listen to, in
different order, within the different versions of the listening comprehension exam.
Section 1: Multiple choice
Section 1-Text 1:
So, tomorrow and Friday, we can expect more of this lovely hot weather, with bright
sunshine and temperatures up to twenty four degrees, so don’t forget to wear sun
screen! Saturday and Sunday will be cooler and cloudier, but it will stay dry without
any rain, so you won’t need your umbrellas, and there might be a few sunny periods. It
will only be a few degrees difference compared to today.
Section 1-Text 2:
In the north tomorrow, the weather will be much the same as today – unsettled weather
with outbreaks of rain throughout the day, and temperatures around ten degrees Celsius.
In the midlands and the east, there are still likely to be some scattered showers. In the
south of the country it should be dry for most of the day, there’ll be a lot of cloud cover
but there might be some periods of sunshine – temperatures around eighteen degrees.
Section 1-Text 3:
Could passengers travelling to stations to Hastings please make sure they are in coaches
A and B, and passengers travelling to Ashford please go to coaches C, D or E, as this
train will divide in Tonbridge.
Section 1-Text 4:
Anyone travelling on to Lenton Bridge? This bus isn’t going any further. If you want to
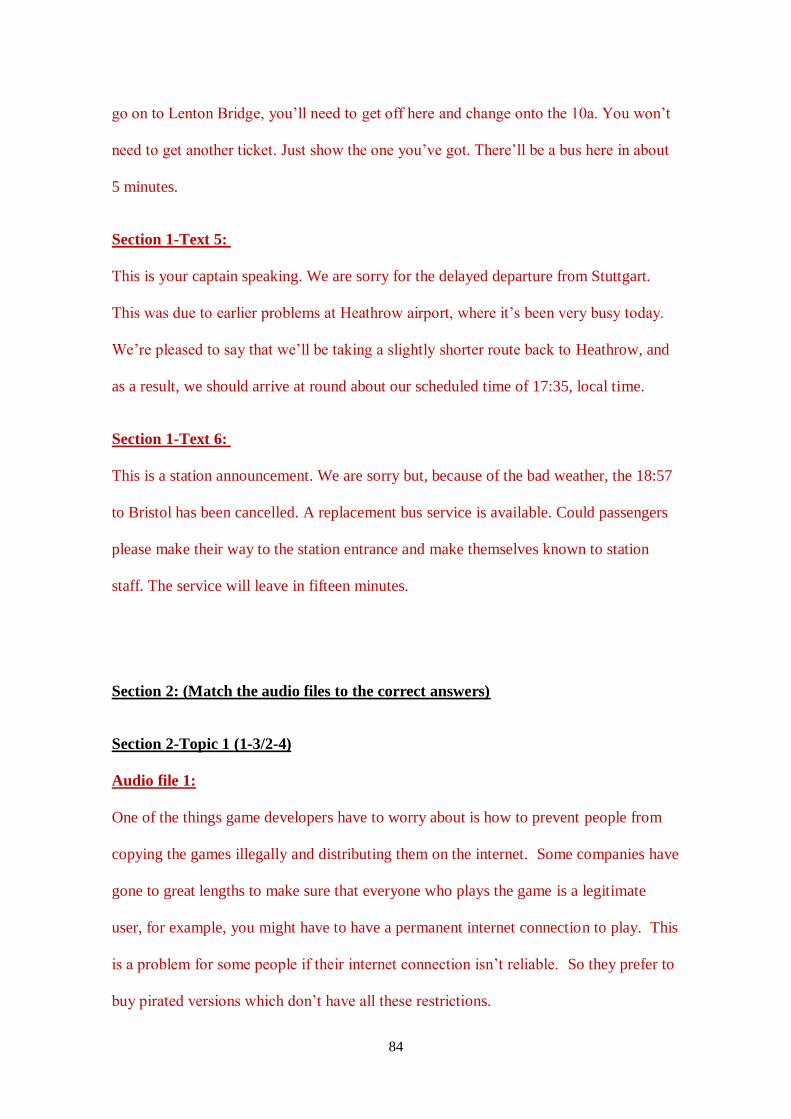
84
go on to Lenton Bridge, you’ll need to get off here and change onto the 10a. You won’t
need to get another ticket. Just show the one you’ve got. There’ll be a bus here in about
5 minutes.
Section 1-Text 5:
This is your captain speaking. We are sorry for the delayed departure from Stuttgart.
This was due to earlier problems at Heathrow airport, where it’s been very busy today.
We’re pleased to say that we’ll be taking a slightly shorter route back to Heathrow, and
as a result, we should arrive at round about our scheduled time of 17:35, local time.
Section 1-Text 6:
This is a station announcement. We are sorry but, because of the bad weather, the 18:57
to Bristol has been cancelled. A replacement bus service is available. Could passengers
please make their way to the station entrance and make themselves known to station
staff. The service will leave in fifteen minutes.
Section 2: (Match the audio files to the correct answers)
Section 2-Topic 1 (1-3/2-4)
Audio file 1:
One of the things game developers have to worry about is how to prevent people from
copying the games illegally and distributing them on the internet. Some companies have
gone to great lengths to make sure that everyone who plays the game is a legitimate
user, for example, you might have to have a permanent internet connection to play. This
is a problem for some people if their internet connection isn’t reliable. So they prefer to
buy pirated versions which don’t have all these restrictions.
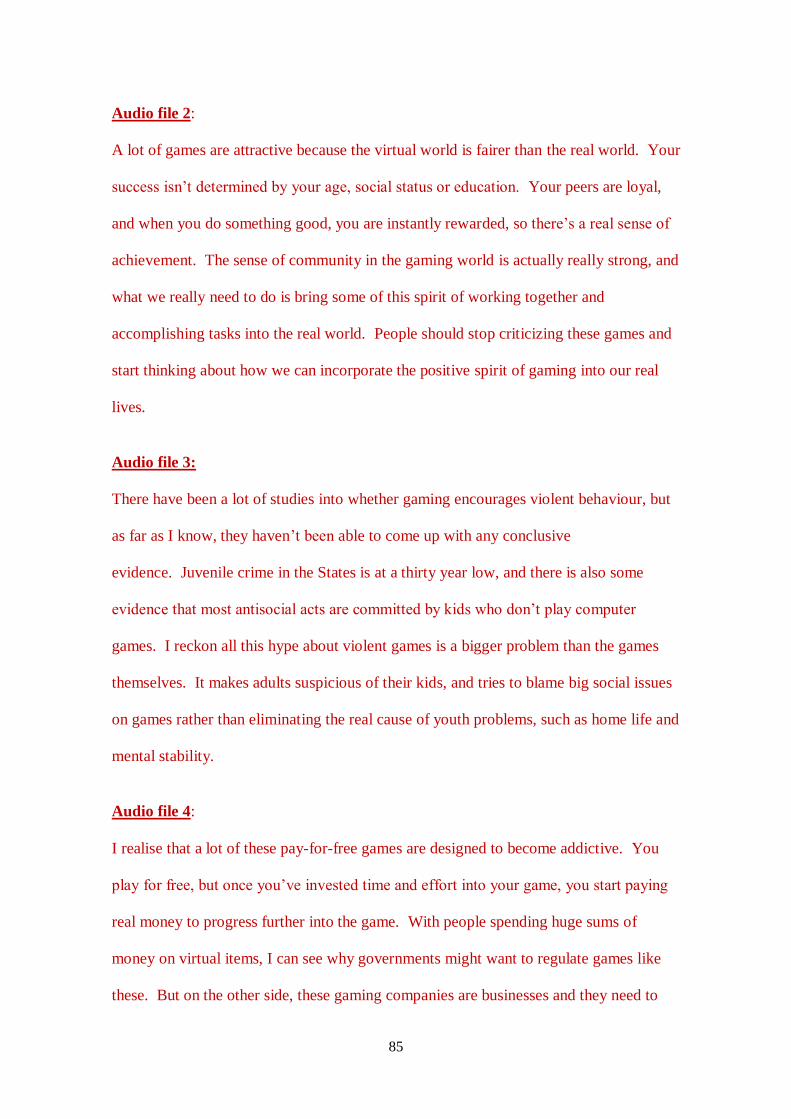
85
Audio file 2:
A lot of games are attractive because the virtual world is fairer than the real world. Your
success isn’t determined by your age, social status or education. Your peers are loyal,
and when you do something good, you are instantly rewarded, so there’s a real sense of
achievement. The sense of community in the gaming world is actually really strong, and
what we really need to do is bring some of this spirit of working together and
accomplishing tasks into the real world. People should stop criticizing these games and
start thinking about how we can incorporate the positive spirit of gaming into our real
lives.
Audio file 3:
There have been a lot of studies into whether gaming encourages violent behaviour, but
as far as I know, they haven’t been able to come up with any conclusive
evidence. Juvenile crime in the States is at a thirty year low, and there is also some
evidence that most antisocial acts are committed by kids who don’t play computer
games. I reckon all this hype about violent games is a bigger problem than the games
themselves. It makes adults suspicious of their kids, and tries to blame big social issues
on games rather than eliminating the real cause of youth problems, such as home life and
mental stability.
Audio file 4:
I realise that a lot of these pay-for-free games are designed to become addictive. You
play for free, but once you’ve invested time and effort into your game, you start paying
real money to progress further into the game. With people spending huge sums of
money on virtual items, I can see why governments might want to regulate games like
these. But on the other side, these gaming companies are businesses and they need to
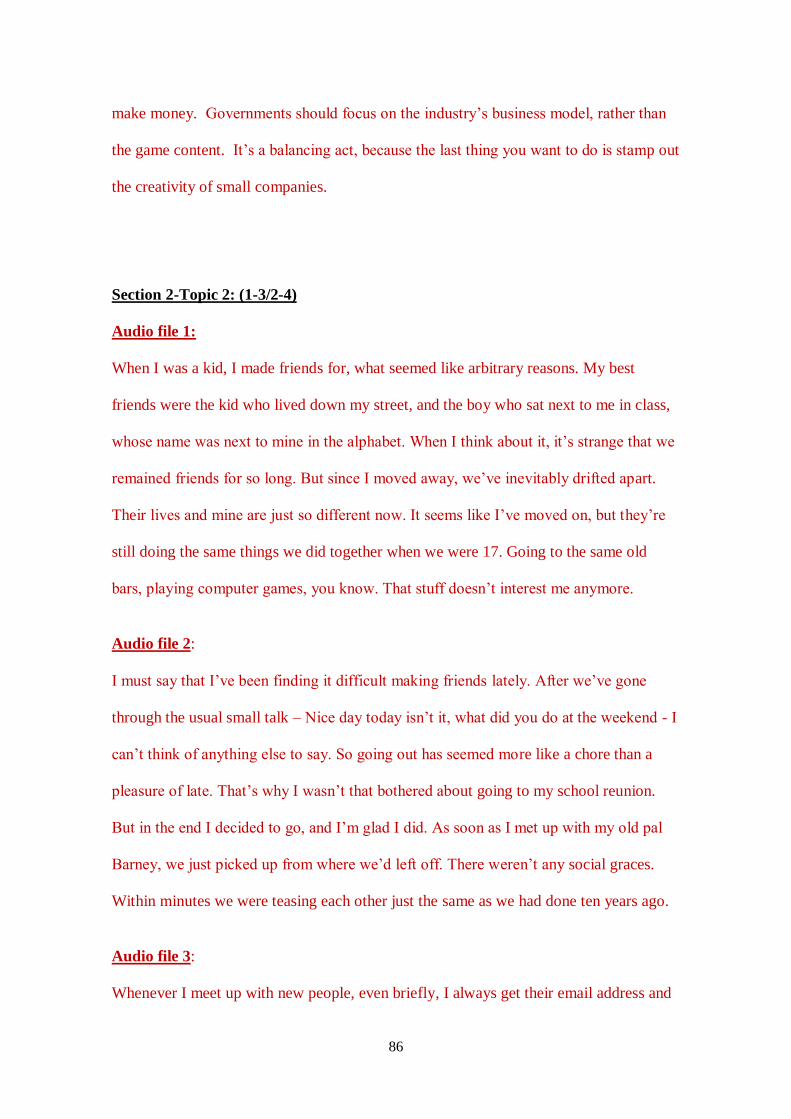
86
make money. Governments should focus on the industry’s business model, rather than
the game content. It’s a balancing act, because the last thing you want to do is stamp out
the creativity of small companies.
Section 2-Topic 2: (1-3/2-4)
Audio file 1:
When I was a kid, I made friends for, what seemed like arbitrary reasons. My best
friends were the kid who lived down my street, and the boy who sat next to me in class,
whose name was next to mine in the alphabet. When I think about it, it’s strange that we
remained friends for so long. But since I moved away, we’ve inevitably drifted apart.
Their lives and mine are just so different now. It seems like I’ve moved on, but they’re
still doing the same things we did together when we were 17. Going to the same old
bars, playing computer games, you know. That stuff doesn’t interest me anymore.
Audio file 2:
I must say that I’ve been finding it difficult making friends lately. After we’ve gone
through the usual small talk – Nice day today isn’t it, what did you do at the weekend - I
can’t think of anything else to say. So going out has seemed more like a chore than a
pleasure of late. That’s why I wasn’t that bothered about going to my school reunion.
But in the end I decided to go, and I’m glad I did. As soon as I met up with my old pal
Barney, we just picked up from where we’d left off. There weren’t any social graces.
Within minutes we were teasing each other just the same as we had done ten years ago.
Audio file 3:
Whenever I meet up with new people, even briefly, I always get their email address and
87
hook up with them online. People say it’s stupid and these aren’t real friendships. ‘A
friend is someone you spend time with, face to face’ – they say. I don’t think that’s
strictly true, as people have written to pen friends for decades, and I’m sure most people
consider people friends even if they only see them once in a blue moon. I love going
online, reading people’s posts and seeing what they’ve been up to. We get into random
conversations and comment on interesting topics. I know that without the Internet, our
friendships would never have withstood the test of time.
Audio file 4:
I was at an anniversary dinner party not long ago, where I didn’t really know anyone
except my parents. I was on a table of young people in their late teens and early
twenties, which I thought was nice. After all, I didn’t want to hang around with my
parents all night. But it soon became apparent that the oldies were having a far better
time than we were. I tried to make conversation, but everything I said seemed to fall flat.
The people on my table all had their smart phones switched on, and they spent the whole
evening texting. They barely said a word. My parents had a fantastic time and by the end
of the night, they’d been invited to three more social engagements with people they’d
only just met. I came away with nothing, and felt profoundly miserable.
Section 3: My Heroes
Audio file A:
My hero isn’t very famous, but she ought to be. She’s Mary Anning, who was only 12
years old and from a poor family when she made an amazing discovery. She found the
first dinosaur skeleton, that of an ichthyosaur, on the cliffs of Lyme Regis in the south of
England. That was in 1811, and until then people had thought that it was impossible for
88
an animal to become extinct. Because she was a woman and didn’t have enough money
for a proper education, she wasn’t able to take part properly in the scientific community
of the time. But she read as much scientific literature as she could and continued to
search for fossils, often risking her own life to get them by climbing dangerous cliffs.
She once nearly died in a landslide which killed her dog. Although she didn’t write
famous books about fossils, her contribution to palaeontology, the study of fossils, is
said to be enormous. I admire her because she kept on trying to make new discoveries at
a time when usually only men, and men with money, were allowed to be scientists. After
her death the writer Charles Dickens said that ‘the carpenter’s daughter has won a name
for herself, and has deserved to win it’.
Audio file B:
I’m really interested in ecology and my hero, or heroine, is Rachel Carson because she
first got people thinking about the way we humans are causing permanent damage to the
Earth’s ecosystems. She began as a biologist, specialising in writing about the sea, but
she gradually became aware of the danger of using pesticides like DDT and the way
they can harm the whole of the food chain, from the worm to humans! She wrote her
classic book Silent Spring in 1962 to explain this to the general public, to explain how
humans and nature are interdependent. The title of Silent Spring refers to the fact that
one day all the birds might be dead so they won’t be able to sing in the springtime. The
agricultural and chemical industries reacted very badly to the book and said she was
unprofessional. But further research by other scientists proved that she was right about
the dangers of chemicals used to kill insects. Nowadays there is a growing movement
for organic food production, but unfortunately things in general are still getting worse,
rather than better. We still need to read Rachel Carson’s book and think about its
message.
89
Audio file C:
My hero is Kailash Satyarthi, who has been campaigning against child slavery for years.
He is from India and first became aware of the problem of children working when he
was 6 and noticed that a boy younger than himself had to spend all day polishing shoes
and was unable to go to school. When he was 11, he began to collect money to help buy
textbooks for other children, and when he was 26 he gave up his job as an electrical
engineer to fight child slavery in India, by doing things like raiding factories where
children were forced to work, making rugs or glass bottles. He introduced a programme
first called RugMark, now known as Goodweave, which puts tags on child-labour-free
rugs made in factories. He has saved many thousands of children, over 80,000, from a
terrible life of enforced labour in South Asia and helped them to get an education. He
has often been physically attacked for helping children, for example for trying to free
Nepalese children forced to work in a circus. He regularly risks his life to fight injustice;
two of his colleagues have been murdered. I believe that the best thing he has done is to
change how people think about child slavery and to make it an international issue.
Audio file D:
My choice of hero isn’t very original, I’m afraid, but he’s the person I would most like
to have met: John Lennon. He died a long time before I was born, and his most famous
songs were written long before that, but when I listen to his music I really feel as if he’s
speaking to me personally. I love the whole range of the Beatles’ music, from the early
pop songs to the very experimental music at the end of their time as a group. John
Lennon was the most innovative writer in the Beatles and he continued to create exciting
music when he left and went solo. But although I love his music, what I admire about
him is his dedication to universal peace. It’s amazing that the song Imagine, written in
1971, is still incredibly popular after all this time. It’s about a world where everyone can

90
be equal, a world with no wars, no divisions between countries, no greed, no hunger, no
material possessions ... I’d like to meet him because he was a lifelong rebel, and
although he could be a difficult person, he was original, clever and funny. It was awful
that he was killed in 1980 when he was only 40. I wonder what he would be doing if he
was alive now.
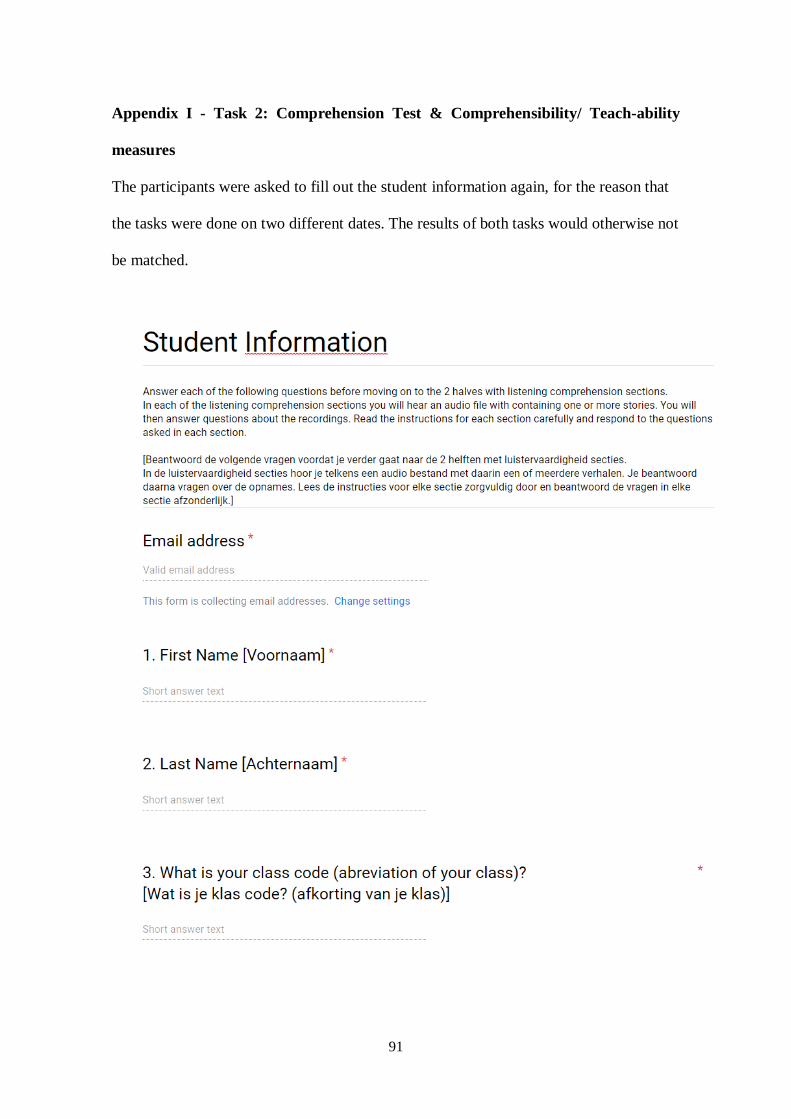
91
Appendix I - Task 2: Comprehension Test & Comprehensibility/ Teach-ability
measures
The participants were asked to fill out the student information again, for the reason that
the tasks were done on two different dates. The results of both tasks would otherwise not
be matched.
92
93
94
95
96
97
98
99
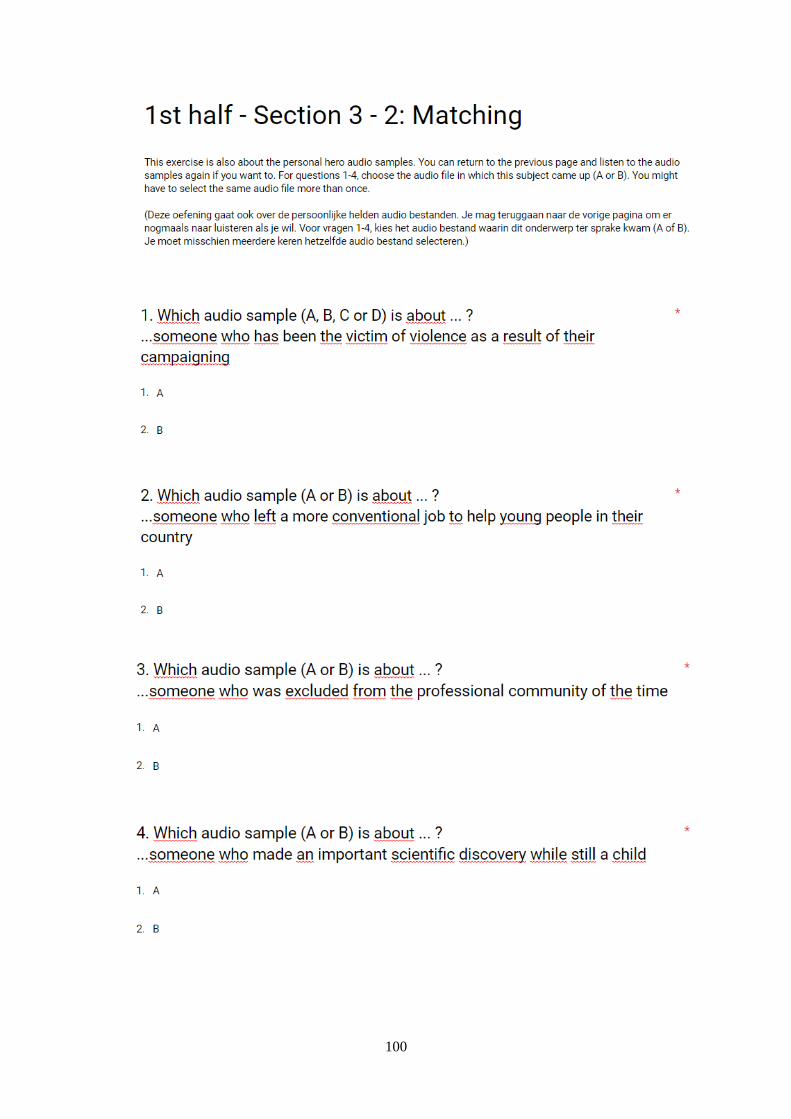
100
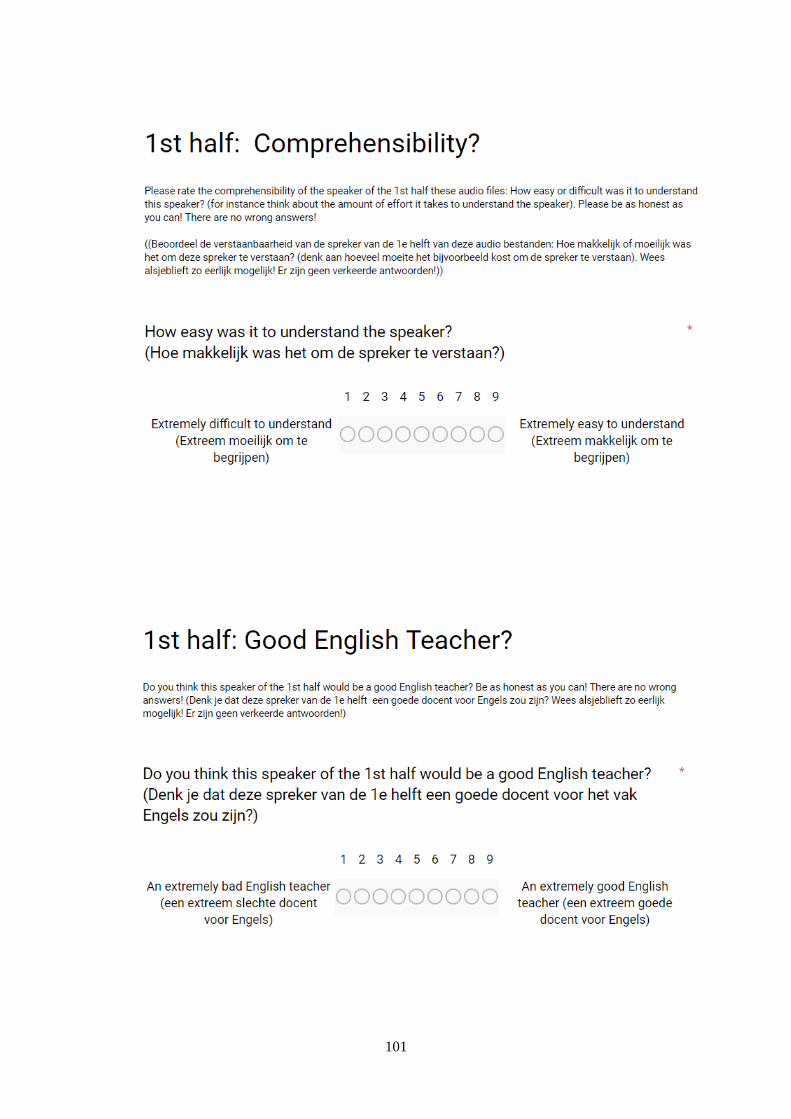
101
102
103
104
105
106

107
108
109
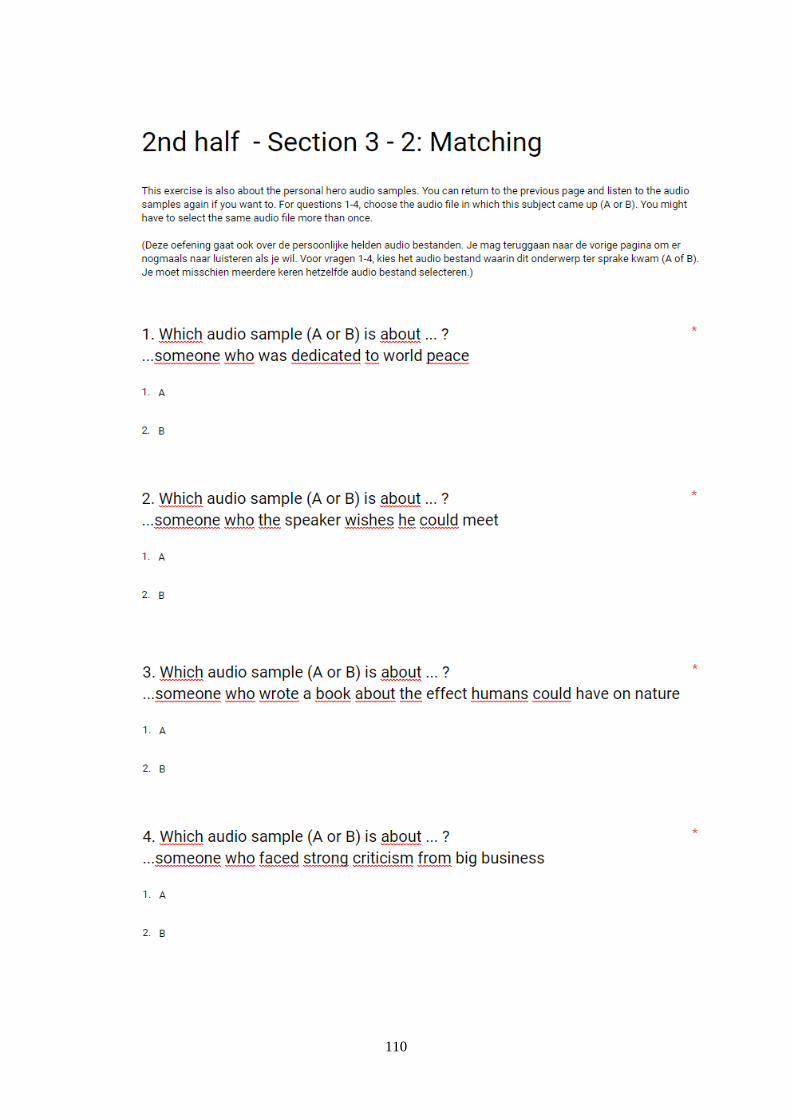
110
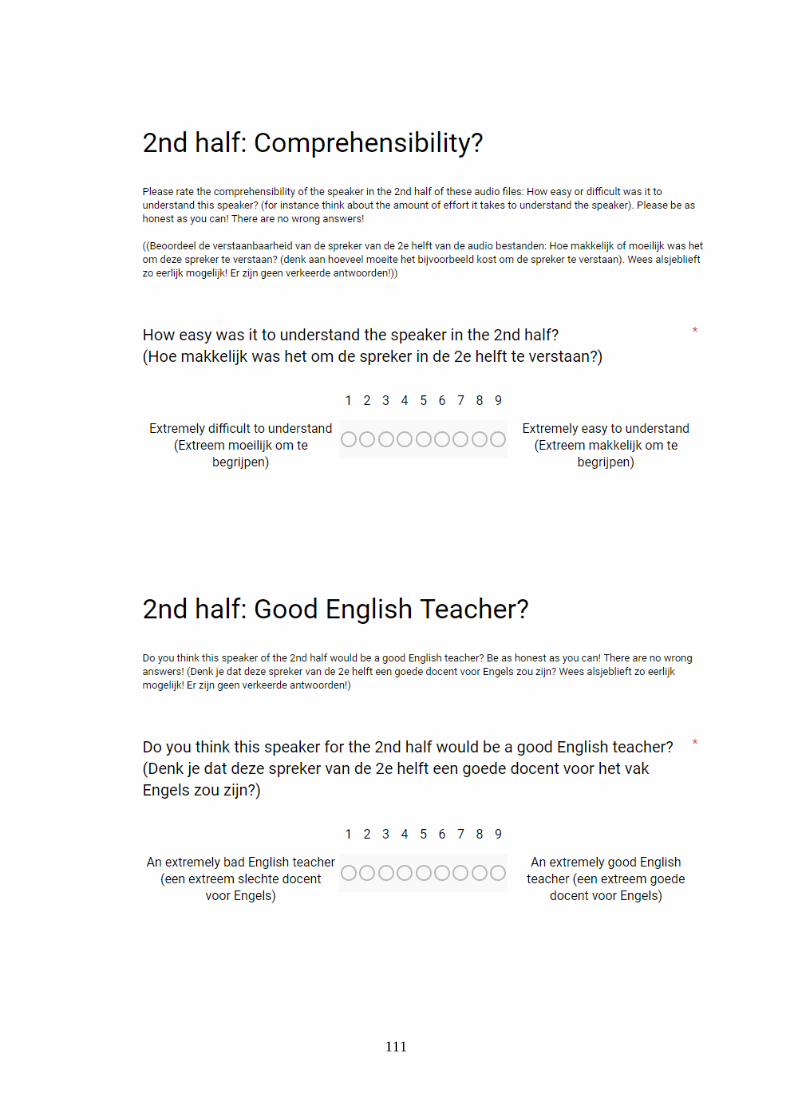
111
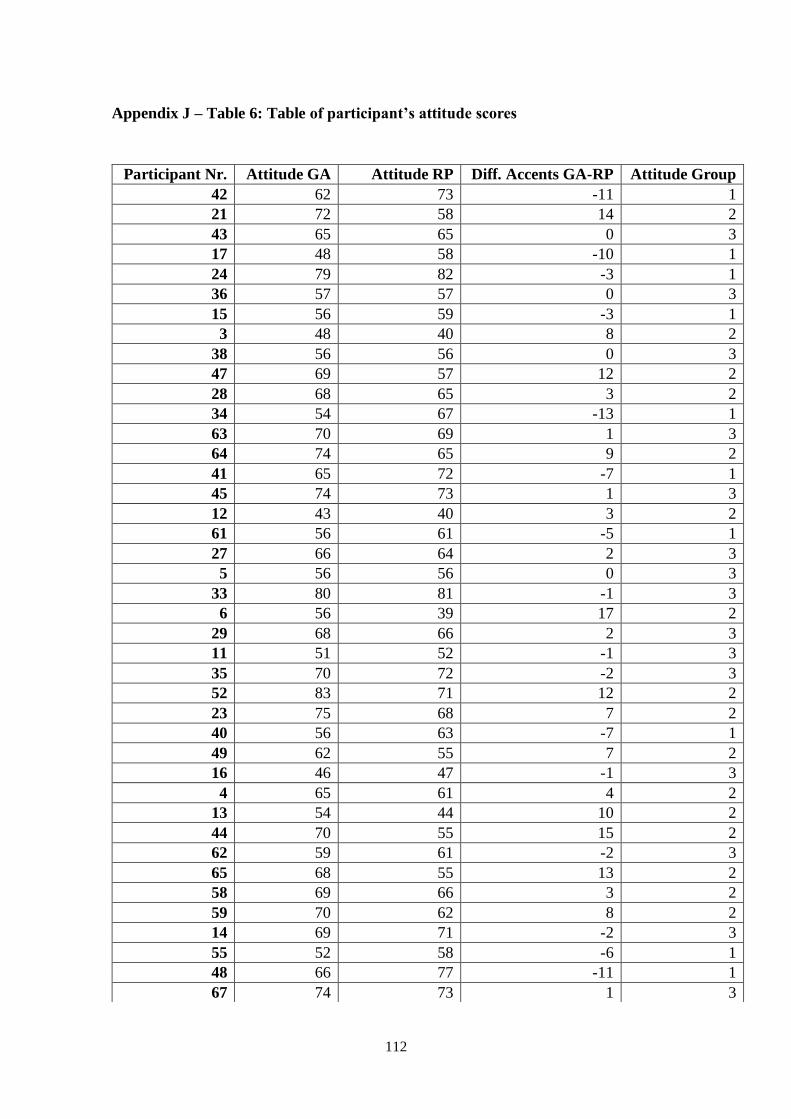
112
Appendix J – Table 6: Table of participant’s attitude scores
Participant Nr. Attitude GA Attitude RP Diff. Accents GA-RP Attitude Group
42 62 73 -11 1
21 72 58 14 2
43 65 65 0 3
17 48 58 -10 1
24 79 82 -3 1
36 57 57 0 3
15 56 59 -3 1
3 48 40 8 2
38 56 56 0 3
47 69 57 12 2
28 68 65 3 2
34 54 67 -13 1
63 70 69 1 3
64 74 65 9 2
41 65 72 -7 1
45 74 73 1 3
12 43 40 3 2
61 56 61 -5 1
27 66 64 2 3
5 56 56 0 3
33 80 81 -1 3
6 56 39 17 2
29 68 66 2 3
11 51 52 -1 3
35 70 72 -2 3
52 83 71 12 2
23 75 68 7 2
40 56 63 -7 1
49 62 55 7 2
16 46 47 -1 3
4 65 61 4 2
13 54 44 10 2
44 70 55 15 2
62 59 61 -2 3
65 68 55 13 2
58 69 66 3 2
59 70 62 8 2
14 69 71 -2 3
55 52 58 -6 1
48 66 77 -11 1
67 74 73 1 3
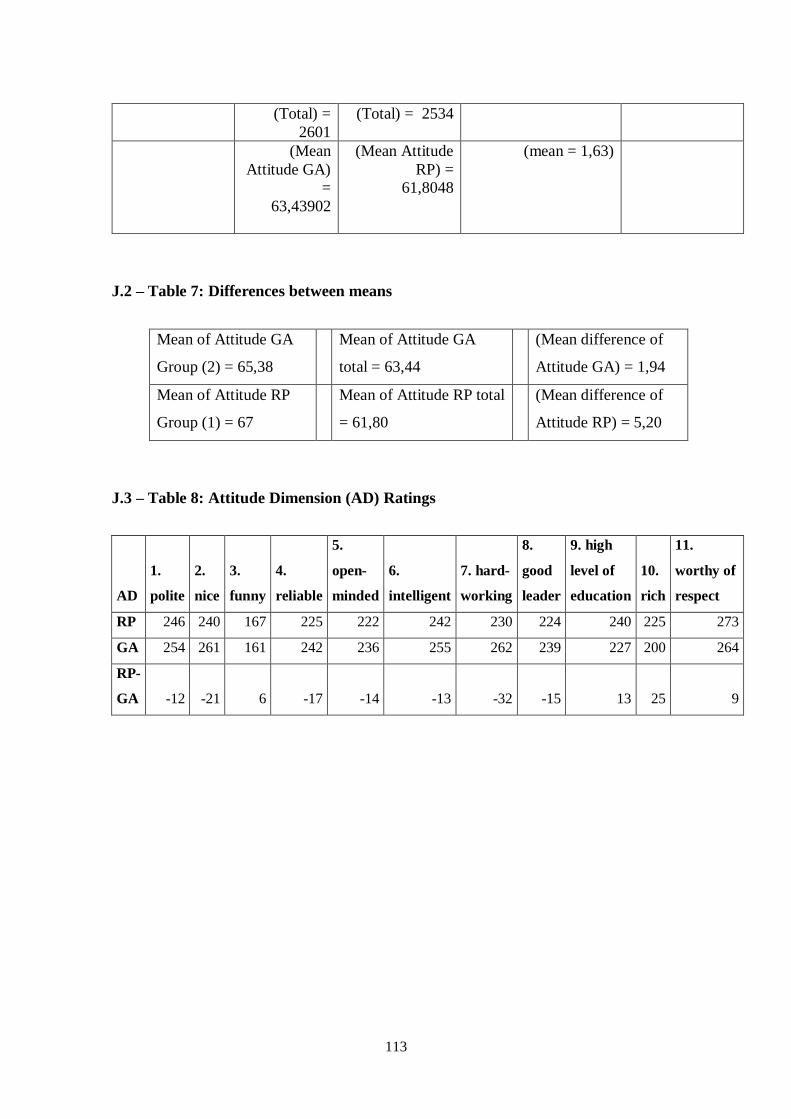
113
J.2 – Table 7: Differences between means
Mean of Attitude GA
Group (2) = 65,38
Mean of Attitude GA
total = 63,44
(Mean difference of
Attitude GA) = 1,94
Mean of Attitude RP
Group (1) = 67
Mean of Attitude RP total
= 61,80
(Mean difference of
Attitude RP) = 5,20
J.3 – Table 8: Attitude Dimension (AD) Ratings
AD
1.
polite
2.
nice
3.
funny
4.
reliable
5.
open-
minded
6.
intelligent
7. hard-
working
8.
good
leader
9. high
level of
education
10.
rich
11.
worthy of
respect
RP 246 240 167 225 222 242 230 224 240 225 273
GA 254 261 161 242 236 255 262 239 227 200 264
RP-
GA -12 -21 6 -17 -14 -13 -32 -15 13 25 9
(Total) =
2601
(Total) = 2534
(Mean
Attitude GA)
=
63,43902
(Mean Attitude
RP) =
61,8048
(mean = 1,63)
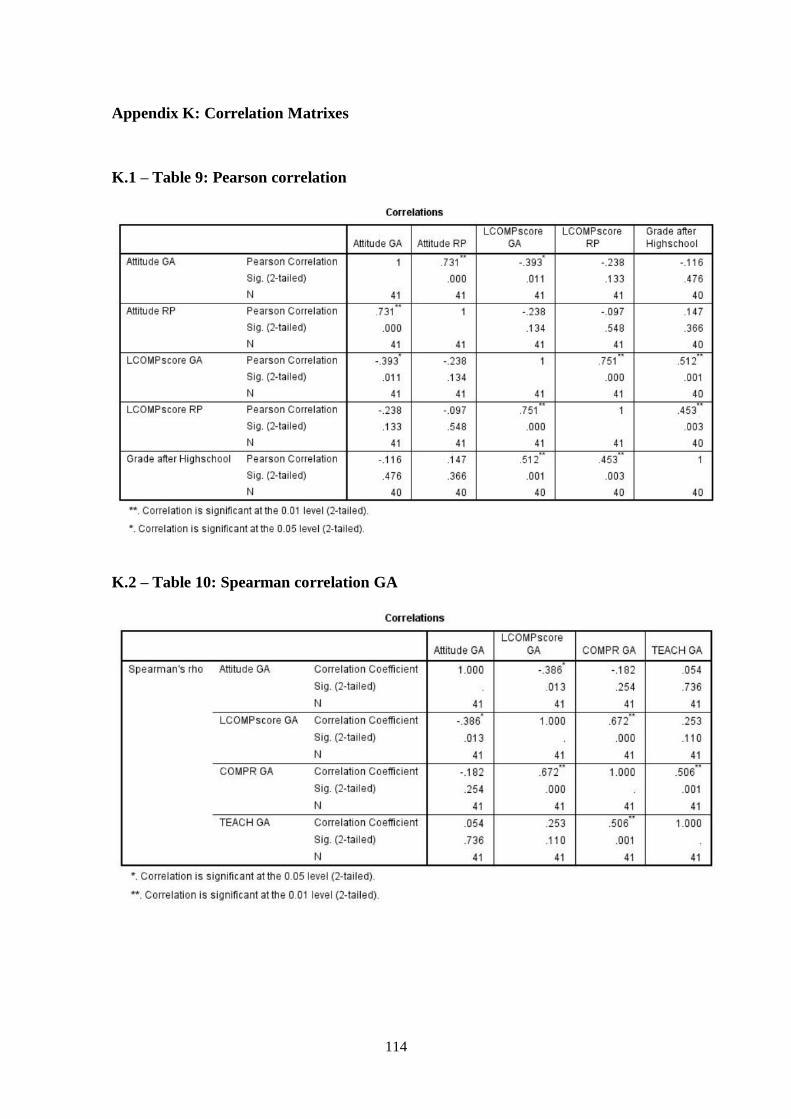
114
Appendix K: Correlation Matrixes
K.1 – Table 9: Pearson correlation
K.2 – Table 10: Spearman correlation GA
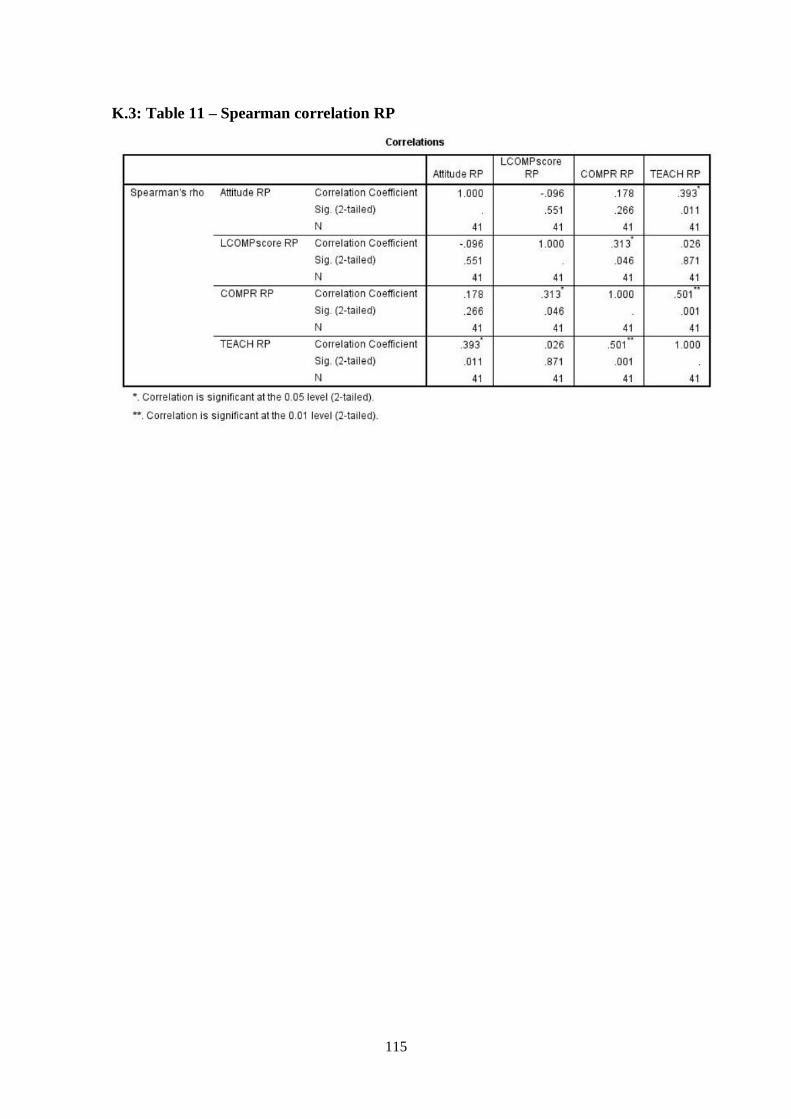
115
K.3: Table 11 – Spearman correlation RP
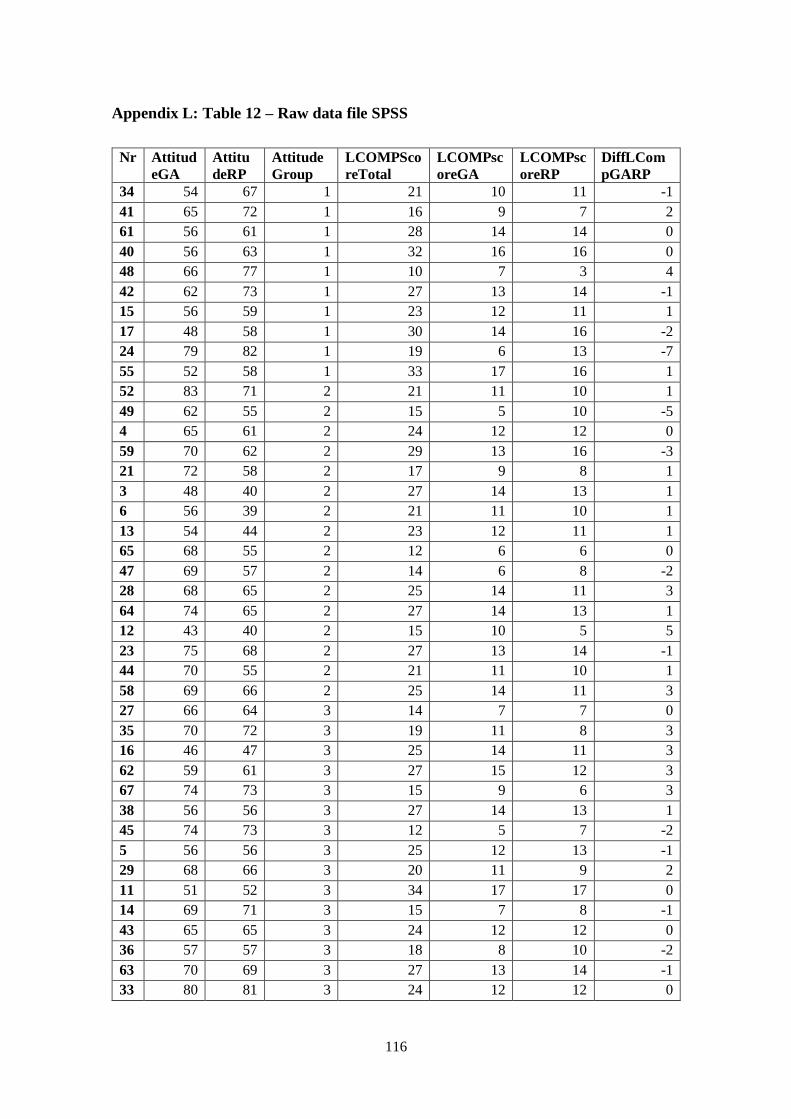
116
Appendix L: Table 12 – Raw data file SPSS
Nr Attitud
eGA
Attitu
deRP
Attitude
Group
LCOMPSco
reTotal
LCOMPsc
oreGA
LCOMPsc
oreRP
DiffLCom
pGARP
34 54 67 1 21 10 11 -1
41 65 72 1 16 9 7 2
61 56 61 1 28 14 14 0
40 56 63 1 32 16 16 0
48 66 77 1 10 7 3 4
42 62 73 1 27 13 14 -1
15 56 59 1 23 12 11 1
17 48 58 1 30 14 16 -2
24 79 82 1 19 6 13 -7
55 52 58 1 33 17 16 1
52 83 71 2 21 11 10 1
49 62 55 2 15 5 10 -5
4 65 61 2 24 12 12 0
59 70 62 2 29 13 16 -3
21 72 58 2 17 9 8 1
3 48 40 2 27 14 13 1
6 56 39 2 21 11 10 1
13 54 44 2 23 12 11 1
65 68 55 2 12 6 6 0
47 69 57 2 14 6 8 -2
28 68 65 2 25 14 11 3
64 74 65 2 27 14 13 1
12 43 40 2 15 10 5 5
23 75 68 2 27 13 14 -1
44 70 55 2 21 11 10 1
58 69 66 2 25 14 11 3
27 66 64 3 14 7 7 0
35 70 72 3 19 11 8 3
16 46 47 3 25 14 11 3
62 59 61 3 27 15 12 3
67 74 73 3 15 9 6 3
38 56 56 3 27 14 13 1
45 74 73 3 12 5 7 -2
5 56 56 3 25 12 13 -1
29 68 66 3 20 11 9 2
11 51 52 3 34 17 17 0
14 69 71 3 15 7 8 -1
43 65 65 3 24 12 12 0
36 57 57 3 18 8 10 -2
63 70 69 3 27 13 14 -1
33 80 81 3 24 12 12 0
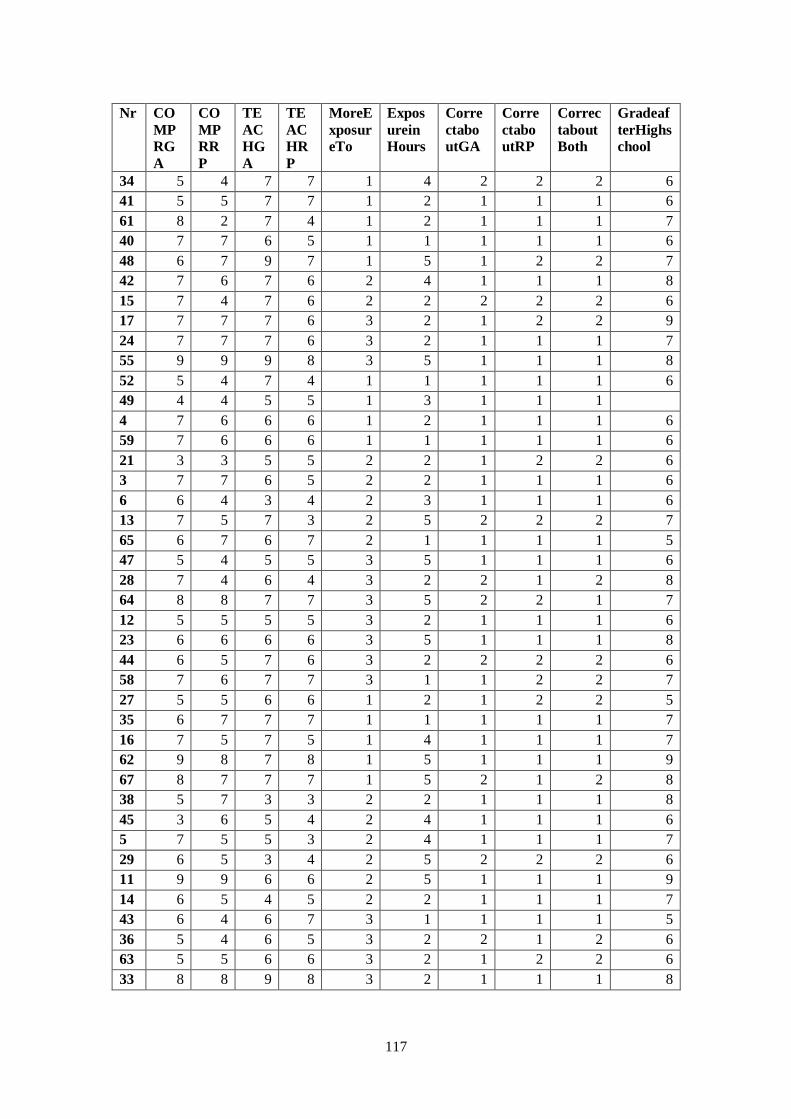
117
Nr CO
MP
RG
A
CO
MP
RR
P
TE
AC
HG
A
TE
AC
HR
P
MoreE
xposur
eTo
Expos
urein
Hours
Corre
ctabo
utGA
Corre
ctabo
utRP
Correc
tabout
Both
Gradeaf
terHighs
chool
34 5 4 7 7 1 4 2 2 2 6
41 5 5 7 7 1 2 1 1 1 6
61 8 2 7 4 1 2 1 1 1 7
40 7 7 6 5 1 1 1 1 1 6
48 6 7 9 7 1 5 1 2 2 7
42 7 6 7 6 2 4 1 1 1 8
15 7 4 7 6 2 2 2 2 2 6
17 7 7 7 6 3 2 1 2 2 9
24 7 7 7 6 3 2 1 1 1 7
55 9 9 9 8 3 5 1 1 1 8
52 5 4 7 4 1 1 1 1 1 6
49 4 4 5 5 1 3 1 1 1
4 7 6 6 6 1 2 1 1 1 6
59 7 6 6 6 1 1 1 1 1 6
21 3 3 5 5 2 2 1 2 2 6
3 7 7 6 5 2 2 1 1 1 6
6 6 4 3 4 2 3 1 1 1 6
13 7 5 7 3 2 5 2 2 2 7
65 6 7 6 7 2 1 1 1 1 5
47 5 4 5 5 3 5 1 1 1 6
28 7 4 6 4 3 2 2 1 2 8
64 8 8 7 7 3 5 2 2 1 7
12 5 5 5 5 3 2 1 1 1 6
23 6 6 6 6 3 5 1 1 1 8
44 6 5 7 6 3 2 2 2 2 6
58 7 6 7 7 3 1 1 2 2 7
27 5 5 6 6 1 2 1 2 2 5
35 6 7 7 7 1 1 1 1 1 7
16 7 5 7 5 1 4 1 1 1 7
62 9 8 7 8 1 5 1 1 1 9
67 8 7 7 7 1 5 2 1 2 8
38 5 7 3 3 2 2 1 1 1 8
45 3 6 5 4 2 4 1 1 1 6
5 7 5 5 3 2 4 1 1 1 7
29 6 5 3 4 2 5 2 2 2 6
11 9 9 6 6 2 5 1 1 1 9
14 6 5 4 5 2 2 1 1 1 7
43 6 4 6 7 3 1 1 1 1 5
36 5 4 6 5 3 2 2 1 2 6
63 5 5 6 6 3 2 1 2 2 6
33 8 8 9 8 3 2 1 1 1 8


![[XamarinDay] Développez de manière 100% native avec Xamarin](https://img.pdfslide.fr/doc/110x75/58ab93f41a28abe3188b559f/xamarinday-developpez-de-maniere-100-native-avec-xamarin.jpg)