Embed Size (px)
Citation preview
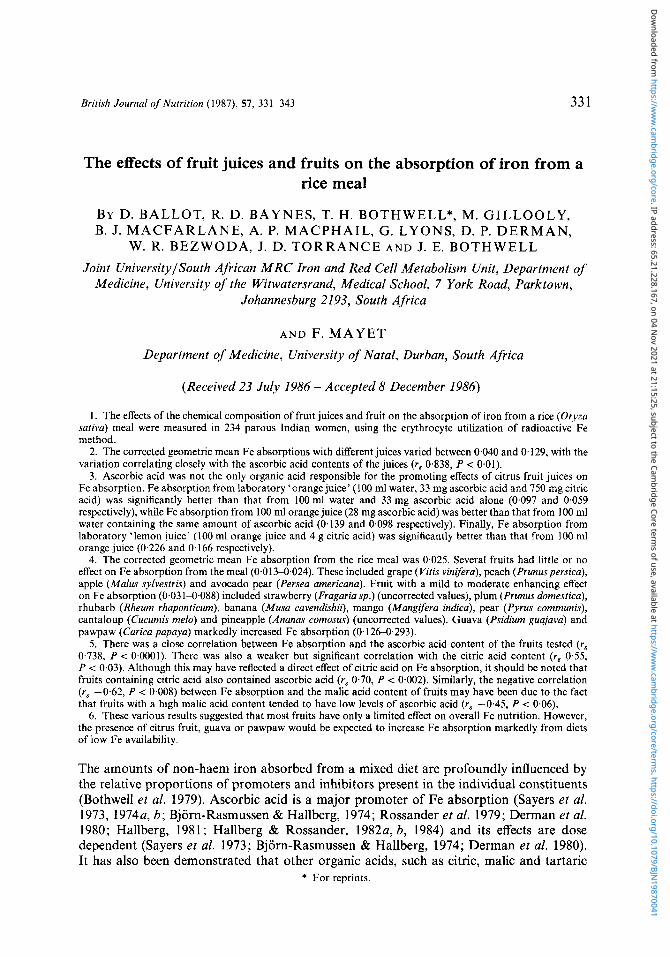
Brirish Journal of Nutririon (1987), 51, 331-343 33 1
The effects of fruit juices and fruits on the absorption of iron from a rice meal
BY D. BALLOT, R. D. BAYNES, T. H. BOTHWELL*, M. GILLOOLY, B. J. MACFARLANE, A. P. MACPHAIL, G. LYONS, D. P. DERMAN,
W. R. BEZWODA, J. D. T O R R A N C E A N D J. E. BOTHWELL Joint UniversitylSouth African MRC Iron and Red Cell Metabolism Unit, Department of
Medicine, University of the Witwatersrand, Medical School, 7 York Road, Parktown, Johannesburg 2193, South Africa
A N D F. MAYET Department of Medicine, University of Natal, Durban, South Africa
(Received 23 July 1986 - Accepted 8 December 1986)
I . The effects of the chemical composition of fruit juices and fruit on the absorption of iron from a rice (Oryza sativa) meal were measured in 234 parous Indian women, using the erythrocyte utilization of radioactive Fe method.
2. The corrected geometric mean Fe absorptions with different juices varied between 0.040 and 0.129, with the variation correlating closely with the ascorbic acid contents of the juices (r8 0.838, P < 0.01).
3. Ascorbic acid was not the only organic acid responsible for the promoting effects of citrus fruit juices on Fe absorption. Fe absorption from laboratory ‘orange juice’ (100 ml water, 33 mg ascorbic acid and 750 mg citric acid) was significantly better than that from 100 ml water and 33 mg ascorbic acid alone (0.097 and 0.059 respectively), while Fe absorption from 100 ml orange juice (28 mg ascorbic acid) was better than that from 100 ml water containing the same amount of ascorbic acid (0.139 and 0.098 respectively). Finally, Fe absorption from laboratory ‘lemon juice’ (100 ml orange juice and 4 g citric acid) was significantly better than that from 100 ml orange juice (0.226 and 0,166 respectively).
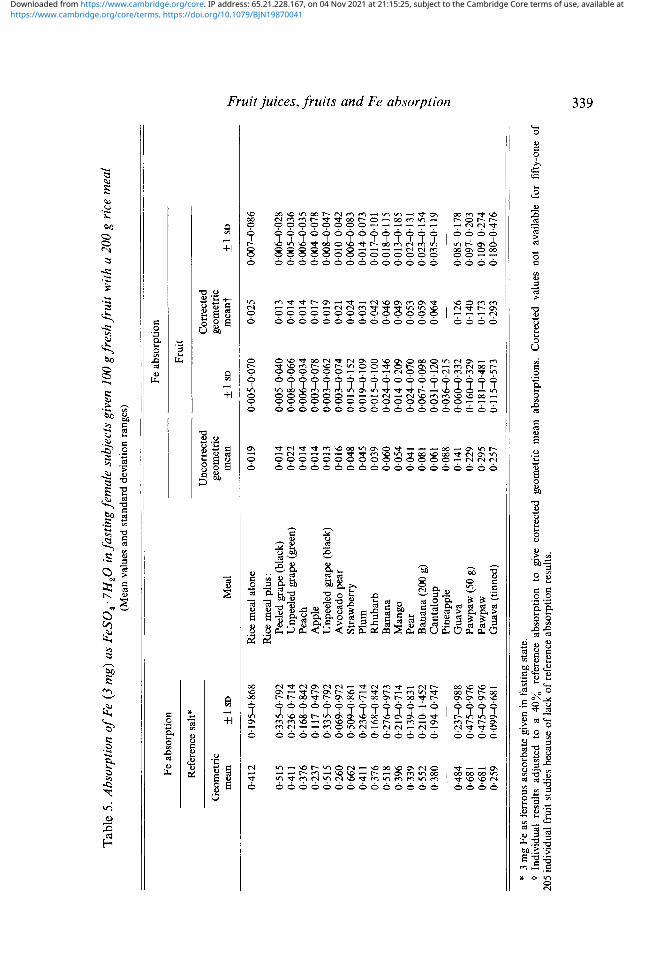
4. The corrected geometric mean Fe absorption from the rice meal was 0.025. Several fruits had little or no effect on Fe absorption from the meal (0.013-0.024). These included grape (Vitis vinifera), peach (Prunuspersica), apple (Malus sylvestris) and avocado pear (Persea americana). Fruit with a mild to moderate enhancing effect on Fe absorption (0.03 1-0.088) included strawberry (Fragaria sp.) (uncorrected values), plum (Prunus domestica), rhubarb (Rheum rhaponticum), banana (Musa cavendishii), mango (Mangifera indica), pear (Pyrus cornmunis), cantaloup (Cucumis melo) and pineapple (Ananas comosus) (uncorrected values). Guava (Psidium guajava) and pawpaw (Carica papaya) markedly increased Fe absorption (0.126-0.293).
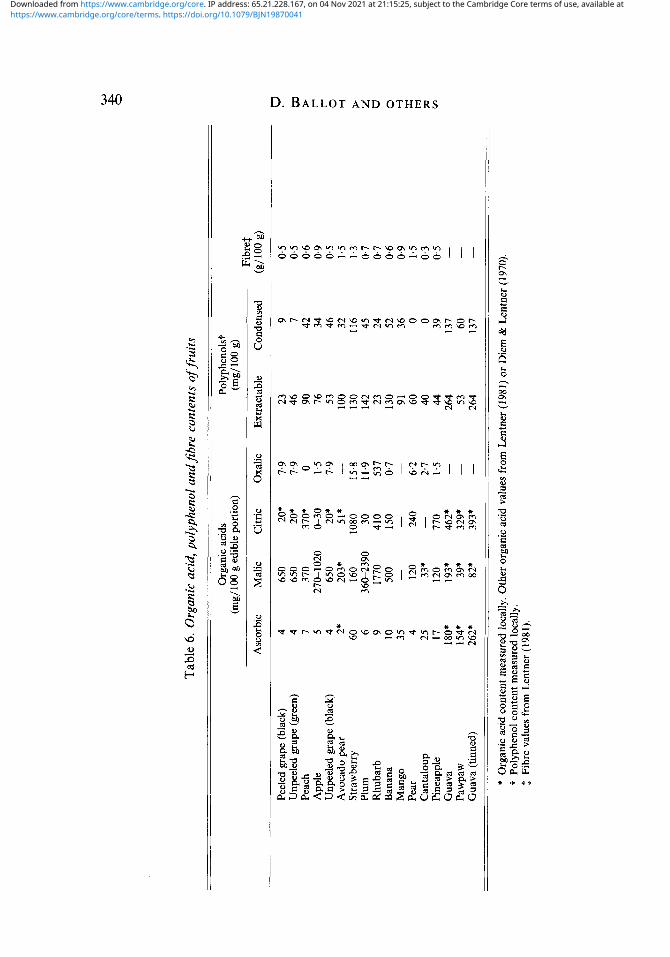
5. There was a close correlation between Fe absorption and the ascorbic acid content of the fruits tested (rs 0.738, P < 0.0001). There was also a weaker but significant correlation with the citric acid content (rs 0.55, P < 0.03). Although this may have reflected a direct effect of citric acid on Fe absorption, it should be noted that fruits containing citric acid also contained ascorbic acid (rs 0.70, P < 0.002). Similarly, the negative correlation (r8 -0.62, P < 0,008) between Fe absorption and the malic acid content of fruits may have been due to the fact that fruits with a high malic acid content tended to have low levels of ascorbic acid (r8 -0.45, P < 0.06).
6. These various results suggested that most fruits have only a limited effect on overall Fe nutrition. However, the presence of citrus fruit, guava or pawpaw would be expected to increase Fe absorption markedly from diets of low Fe availability.
The amounts of non-haem iron absorbed from a mixed diet are profoundly influenced by the relative proportions of promoters and inhibitors present in the individual constituents (Bothwell et al. 1979). Ascorbic acid is a major promoter of Fe absorption (Sayers et al. 1973, 1974a, b ; Bjorn-Rasmussen & Hallberg, 1974; Rossander et al. 1979; Derman et al. 1980; Hallberg, 1981; Hallberg & Rossander, 1982a,b, 1984) and its effects are dose dependent (Sayers et al. 1973; Bjorn-Rasmussen & Hallberg, 1974; Derman et al. 1980). It has also been demonstrated that other organic acids, such as citric, malic and tartaric
* For reprints.
Dow
nloaded from https://w
ww
.cambridge.org/core . IP address: 65.21.228.167 , on 04 N
ov 2021 at 21:15:25 , subject to the Cambridge Core term
s of use, available at https://ww
w.cam
bridge.org/core/terms . https://doi.org/10.1079/BJN
19870041
332 D. BALLOT AND O T H E R S
acids, have a similar though less-marked promoting effect on Fe absorption (Gillooly et al. 1983). In contrast, non-hydrolysable polyphenols (Gillooly et al. 1983) and phytates (Turnbull et al. 1962; Hallberg, 1981 ; Gillooly et al. 1983, 1984) inhibit Fe absorption. The present study was done in order to document the effects of fruit juices and fruit on Fe absorption from a rice meal, with particular reference to their organic acid, and polyphenol contents.
E X P E R I M E N T A L
Subjects A group of 234 parous Indian housewives took part in the study. None was pregnant or lactating and all were unpaid volunteers. Their ages ranged between 21 and 74 (mean 37) years. They lived in municipal housing schemes in the Chatsworth and Phoenix areas near Durban. It has been established previously that Fe deficiency is a common problem among the women of this community (Mayet et al. 1972; MacPhail et al. 1981; Baynes et al. 1987).
Preparation and administration of the meals The effect of a known amount of fruit and fruit juice on the absorption of Fe from a basic 200 g rice meal containing 0.4 mg Fe was measured in each of the studies. Two meals were consumed on consecutive days after an overnight fast. Only water was permitted during the meal and for 3 h afterwards. The rice meal was prepared by boiling parboiled polished rice (1 kg) for 20 min in 2000 ml water containing 20 g table salt. Since the Fe content in all the fruits tested was low, Fe as FeSO, * 7H,O (3 mg Fe per subject) was added as a solution and thoroughly mixed in at the start of cooking. On one morning the meal was labelled with 2-3 ,uCi 5DFe and on the other with 3 pCi 55Fe (Amersham International plc, Amersham, Bucks). After boiling, 75 g yellow margarine and 150 g sucrose were added. Each subject received 200 g of the cooked rice meal. In 129 of the studies, Fe absorption from the basal rice meal was compared with that from the same meal supplemented with a fruit or fruit juice. In the remainder of the studies, a fruit or fruit juice was given with the rice meal on both days.
Fresh fruit was purchased within 24 h of administration. The fruit was peeled and chopped into small portions and served with the rice pudding. In all rice meals with fruit the mass of fruit eaten was 100 g/meal except in the case of pawpaw (Caricapapaya), where both 100g/meal and 50g/meal were eaten, and banana (Musa cavendishii) where 100 g/meal and 200 g/meal were eaten. In one of the guava (Psidium guajuva) studies, tinned guavas were used after the syrup had been drained and the fruit depipped. In the pineapple (Ananas comosus), strawberry (Fragaria sp.) and fresh guava studies, a fresh fruit puree was prepared in a food blender. With rhubarb (Rheum rhaponticum), plums (Prunus domestica), grapes (Vitis vinifera) and peaches (Prunuspersica) a similar purCe was prepared after gentle heating.
All fruit juices used in the fruit juice-rice meal studies were commercial preparations of pure juice. A 100 mi portion of each juice was consumed concurrently with a 200 g rice pudding meal.
Measurements of Fe absorption At 2 weeks after the administration of the radiolabelled meals, blood was obtained by venepuncture for the measurement of 59Fe, 55Fe, haemoglobin concentration, serum Fe, total Fe-binding capacity and serum ferritin concentration. The blood was taken in the fasting state, stored at 4" and processed within 24 h. Immediately after venepuncture each subject drank 100 ml water containing 3 mg elemental Fe as FeSO, * 7H,O, 3 pCi 59Fe and 30 mg ascorbic acid. Only water was permitted for the following 3 h. Further blood samples
Dow
nloaded from https://w
ww
.cambridge.org/core . IP address: 65.21.228.167 , on 04 N
ov 2021 at 21:15:25 , subject to the Cambridge Core term
s of use, available at https://ww
w.cam
bridge.org/core/terms . https://doi.org/10.1079/BJN
19870041
Fruit juices, fruits and Fe absorption 333 were taken 14 d later and the absorption of this reference dose of Fe was determined from the increment of 59Fe in the blood. By expressing the absorption of Fe from the meals in relation to the reference absorption, a basis for comparison between subjects of differing Fe storage status was established (Rossander et al. 1979; Hallberg, 1981).
Radioisotopic, chemical and statistical methods Duplicate 10 ml blood samples, duplicate rice samples and duplicate portions of standard radioactive Fe solutions were prepared for differential radioactive counting using the method of Eakins & Brown (1966). The activities of 55Fe and 59Fe in the processed samples were determined in Insta-Gel Scintillant (Packard Instrument Co., Illinois, USA) using a liquid-scintillation spectrometer (Packard-Tri-Carb AAA spectrometer, model no. 3375). The counting efficiency at optimal gain and window settings was 24% for 55Fe and 42% for 59Fe. The 59Fe activity in 4-ml blood samples collected immediately before the reference Fe salt was administered and 2 weeks later was assessed against suitable standards using a Packard Autogamma Counter no. 5850 with a counting efficiency of 60%. The absorption values were calculated on the basis that 100% of the absorbed radioactivity was present in the haemoglobin of circulating erythrocytes (Bothwell et al. 1979), and that the blood volume of each subject was 65 ml/kg body-weight (Diem & Lentner, 1970). The calculated food Fe absorption was then corrected to an absorption of 0.40 for the reference Fe salt
calculated food Fe absorption x 0.40 calculated reference Fe salt absorption
as follows: corrected food Fe absorption =
A value of 0.40 was selected as the reference point, since it represents approximately the amount absorbed by subjects who lack Fe stores but who are not yet anaemic (Hallberg, 1981). The corrected food Fe absorptions would therefore be expected to provide a fairly sensitive indicator of the relative availability of Fe in different meals.
Haemoglobin concentrations were measured by the cyanmethaemoglobin method. Serum Fe and total Fe-binding capacity were measured in accordance with the recommendations of the iron panel of the International Committee for Standardization in Haematology (1978a, b). The serum ferritin concentration was measured by the enzyme-linked im- munosorbent assay described by Conradie & Mbhele (1980). The total and extractable polyphenol contents of fruits were measured by the method of Singleton & Rossi (1965). Concentrations of organic acids were either obtained from published values (Diem & Lentner, 1970; Lentner, 1981) or, if unavailable, measured locally using Boeringer- Mannheim food analysis kits (Mannheim, West Germany). While there is certainly variability in the organic acid content of fruits as a function of variety, maturity and post-harvest handling, the published values indicate the relative amounts present and the wide variation between fruit types. The phytate content of fruits was measured by the indirect method of Haugh & Lantzsch (1983). Crude fibre contents of the fruit tested were obtained from Lentner (198 1). Since serum ferritin concentrations and Fe absorption values were positively skewed, they were expressed as geometric means and standard deviation ranges to normalize the distributions. Studies in which one meal was compared directly with another in the same group of subjects were evaluated by means of Student's paired t test. Spearman rank correlations were utilized to relate the geometric mean absorption of Fe from meals containing either fruit or fruit juices to their ascorbic acid contents.
Ethical considerations Approval for these studies was obtained from the Committee for Research on Human Subjects of the University of the Witwatersrand, Johannesburg. Written, informed consent was obtained from each subject after the nature of the experiment had been explained to
13 N U T 57
Dow
nloaded from https://w
ww
.cambridge.org/core . IP address: 65.21.228.167 , on 04 N
ov 2021 at 21:15:25 , subject to the Cambridge Core term
s of use, available at https://ww
w.cam
bridge.org/core/terms . https://doi.org/10.1079/BJN
19870041
334 D. BALLOT A N D O T H E R S
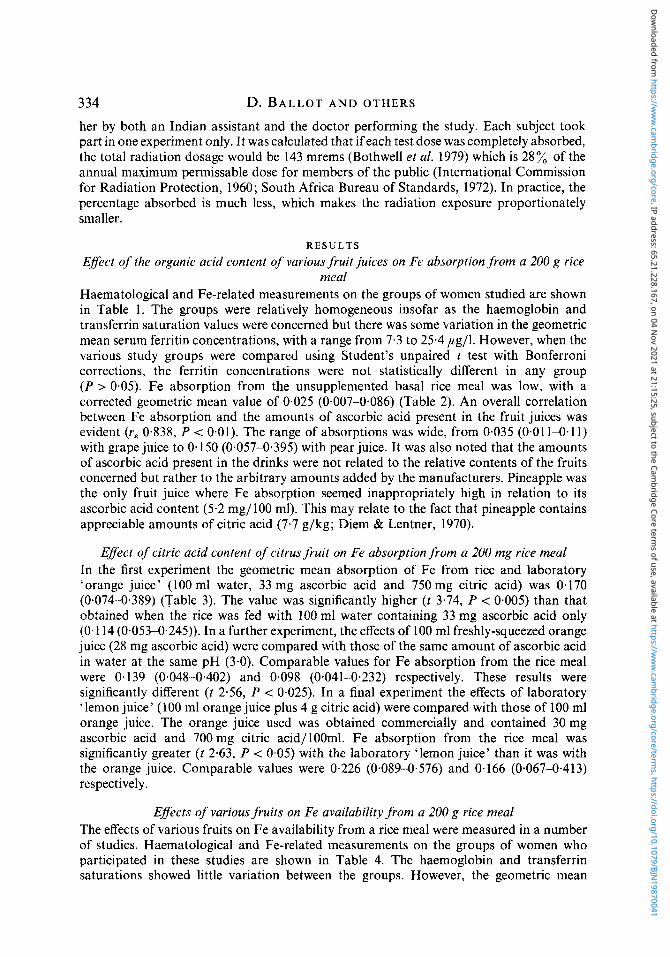
her by both an Indian assistant and the doctor performing the study. Each subject took part in one experiment only. It was calculated that if each test dose was completely absorbed, the total radiation dosage would be 143 mrems (Bothwell et al. 1979) which is 28% of the annual maximum permissable dose for members of the public (International Commission for Radiation Protection, 1960; South Africa Bureau of Standards, 1972). In practice, the percentage absorbed is much less, which makes the radiation exposure proportionately smaller.
R E S U L T S
Eflect of the organic acid content of various fruit juices on Fe absorption from a 200 g rice meal
Haematological and Fe-related measurements on the groups of women studied are shown in Table 1. The groups were relatively homogeneous insofar as the haemoglobin and transferrin saturation values were concerned but there was some variation in the geometric mean serum ferritin concentrations, with a range from 7.3 to 25.4 pg/l. However, when the various study groups were compared using Student’s unpaired t test with Bonferroni corrections, the ferritin concentrations were not statistically different in any group (P > 0.05). Fe absorption from the unsupplemented basal rice meal was low, with a corrected geometric mean value of 0.025 (0.007-0.086) (Table 2). An overall correlation between Fe absorption and the amounts of ascorbic acid present in the fruit juices was evident (rs 0.838, P < 0.01). The range of absorptions was wide, from 0.035 (0.01 1-0.11) with grape juice to 0.150 (0.057-0.395) with pear juice. It was also noted that the amounts of ascorbic acid present in the drinks were not related to the relative contents of the fruits concerned but rather to the arbitrary amounts added by the manufacturers. Pineapple was the only fruit juice where Fe absorption seemed inappropriately high in relation to its ascorbic acid content (5.2 mg/100 ml). This may relate to the fact that pineapple contains appreciable amounts of citric acid (7.7 g/kg; Diem & Lentner, 1970).
EfSect of citric acid content of citrus fruit on Fe absorption from a 200 mg rice meal In the first experiment the geometric mean absorption of Fe from rice and laboratory ‘orange juice’ (100 ml water, 33 mg ascorbic acid and 750 mg citric acid) was 0.170 (0.074-0.389) (Table 3). The value was significantly higher ( t 3.74, P < 0.005) than that obtained when the rice was fed with 100 ml water containing 33 mg ascorbic acid only (0.1 14 (0.053-0.245)). In a further experiment, the effects of 100 ml freshly-squeezed orange juice (28 mg ascorbic acid) were compared with those of the same amount of ascorbic acid in water at the same pH (3.0). Comparable values for Fe absorption from the rice meal were 0.1 39 (0.048-0.402) and 0.098 (0.041-0.232) respectively. These results were significantly different ( t 2.56, P < 0.025). In a final experiment the effects of laboratory ‘lemon juice’ (100 ml orange juice plus 4 g citric acid) were compared with those of 100 ml orange juice. The orange juice used was obtained commercially and contained 30mg ascorbic acid and 700mg citric acid/lOOml. Fe absorption from the rice meal was significantly greater ( t 2.63, P < 0.05) with the laboratory ‘lemon juice’ than it was with the orange juice. Comparable values were 0.226 (0.089-0.576) and 0.166 (0.067-0.413) respectively.
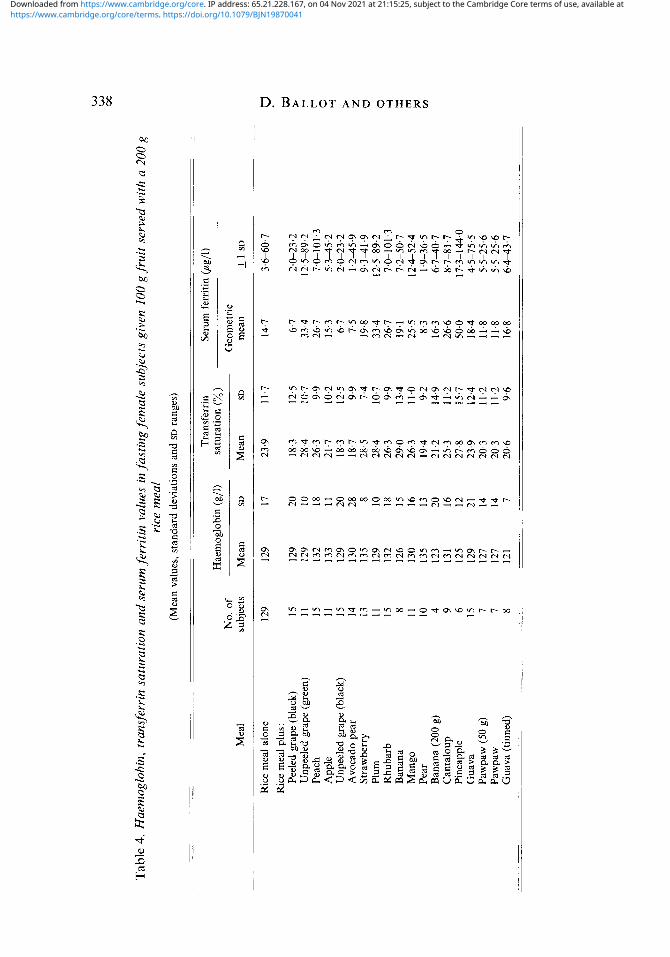
Eflects of various fruits on Fe availability from a 200 g rice meal The effects of various fruits on Fe availability from a rice meal were measured in a number of studies. Haematological and Fe-related measurements on the groups of women who participated in these studies are shown in Table 4. The haemoglobin and transferrin saturations showed little variation between the groups. However, the geometric mean
Dow
nloaded from https://w
ww
.cambridge.org/core . IP address: 65.21.228.167 , on 04 N
ov 2021 at 21:15:25 , subject to the Cambridge Core term
s of use, available at https://ww
w.cam
bridge.org/core/terms . https://doi.org/10.1079/BJN
19870041
Fruit juices, fruits and Fe absorption 335
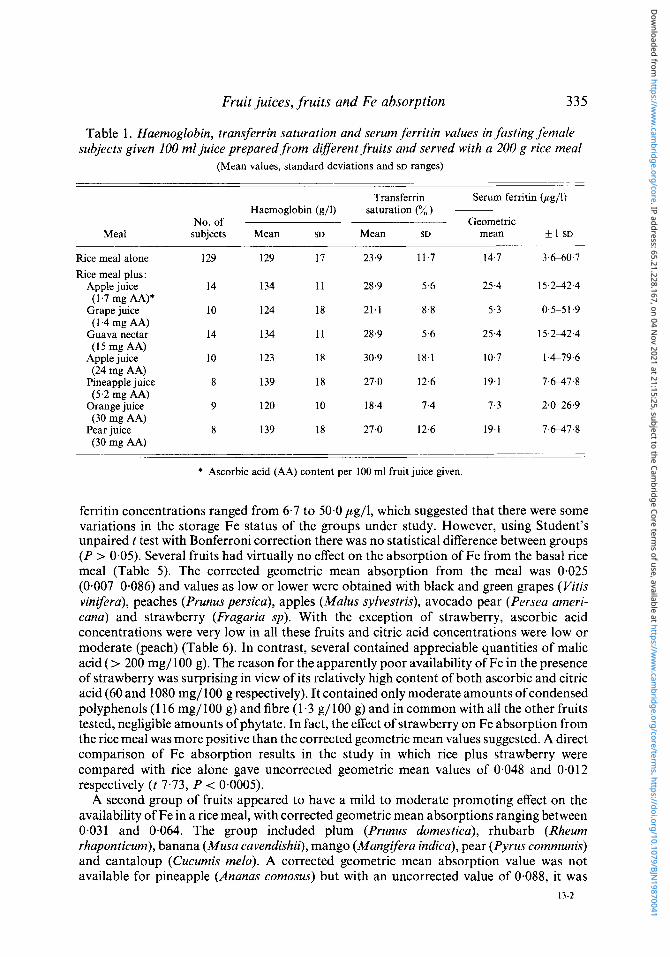
Table 1. Haemoglobin, transferrin saturation and serum ferritin values in fasting female subjects given 100 ml juice prepared from different fruits and served with a 200 g rice meal
(Mean values, standard deviations and SD ranges) -
Trdnsferrin Serum ferritin (pg/l) Haemoglobin (g/l) saturation (%)
No. of Geometric Meal subjects Mean SD Mean SD mean SD
Rice meal alone 129 129 17 23.9 11.7 14.7 3.6-60.7
Rice meal plus: Apple juice 14 134 11 28.9 5.6 25-4 15.242.4
(1.7 mg AA)* Grape juice 10 124 18 21.1 8.8 5-3 0'5-51.9 (1.4 mg AA)
Guava nectar 14 134 11 28.9 5.6 25.4 15.242.4 (15 mg AA)
(24 mg AA)
(5.2 mg AA)
(30 mg AA)
(30 mg AA)
Apple juice 10 123 18 30.9 18.1 10.7 1.4-79.6
Pineapple juice 8 139 18 27.0 12.6 19.1 7.6-47.8
Orange juice 9 120 10 18.4 7.4 7.3 2.0-26.9
Pear juice 8 139 18 27.0 12.6 19.1 7.6-47.8
* Ascorbic acid (AA) content per 100 ml fruit juice given.
ferritin concentrations ranged from 6.7 to 50.0 pg/l, which suggested that there were some variations in the storage Fe status of the groups under study. However, using Student's unpaired t test with Bonferroni correction there was no statistical difference between groups (P > 0.05). Several fruits had virtually no effect on the absorption of Fe from the basal rice meal (Table 5). The corrected geometric mean absorption from the meal was 0.025 (0.007-0.086) and values as low or lower were obtained with black and green grapes (Vitzs vinifera), peaches (Prunus persica), apples (Malus sylvestris), avocado pear (Persea ameri- cana) and strawberry (Fragaria sp). With the exception of strawberry, ascorbic acid concentrations were very low in all these fruits and citric acid concentrations were low or moderate (peach) (Table 6). In contrast, several contained appreciable quantities of malic acid (> 200 mg/100 g). The reason for the apparently poor availability of Fe in the presence of strawberry was surprising in view of its relatively high content of both ascorbic and citric acid (60 and 1080 mg/100 g respectively). It contained only moderate amounts of condensed polyphenols (1 16 mg/100 g) and fibre (1.3 g/100 g) and in common with all the other fruits tested, negligible amounts of phytate. In fact, the effect of strawberry on Fe absorption from the rice meal was more positive than the corrected geometric mean values suggested. A direct comparison of Fe absorption results in the study in which rice plus strawberry were compared with rice alone gave uncorrected geometric mean values of 0.048 and 0.012 respectively ( t 7.73, P < 0.0005).
A second group of fruits appeared to have a mild to moderate promoting effect on the availability of Fe in a rice meal, with corrected geometric mean absorptions ranging between 0.031 and 0.064. The group included plum (Prunus domestica), rhubarb (Rheum rhaponticum), banana (Mum cavendishii), mango (Mangifera indica), pear (Pyrus communis) and cantaloup (Cucumis melo). A corrected geometric mean absorption value was not available for pineapple (Ananas comosus) but with an uncorrected value of 0.088, it was
13-2
Dow
nloaded from https://w
ww
.cambridge.org/core . IP address: 65.21.228.167 , on 04 N
ov 2021 at 21:15:25 , subject to the Cambridge Core term
s of use, available at https://ww
w.cam
bridge.org/core/terms . https://doi.org/10.1079/BJN
19870041
W
W
a\
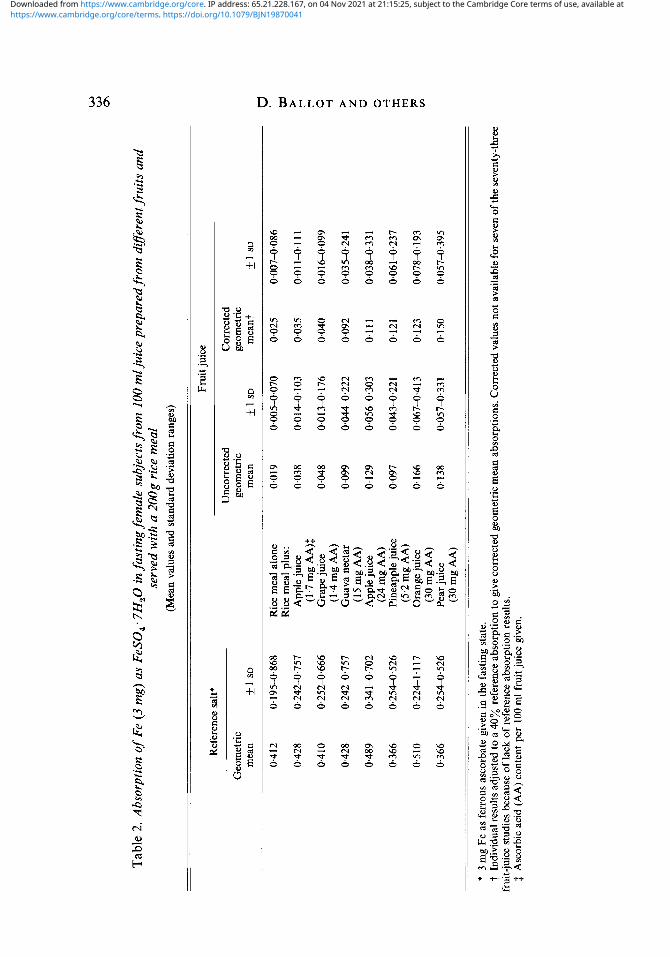
Tab
le 2
. Abs
orpt
ion
of F
e (3
mg)
as
FeS
O,. 7H20 in fa
stin
g fem
ale
subj
ects
from
100 m
l jui
ce p
repa
red
from
difl
eren
t fru
its a
nd
serv
ed w
ith a
200
g ri
ce m
eal
(Mea
n va
lues
and
sta
ndar
d de
viat
ion
rang
es)
Frui
t jui
ce
Ref
eren
ce sa
lt*
Unc
orre
cted
C
orre
cted
G
eom
etric
ge
omet
ric
geom
etric
m
ean
-
+1 S
D
mea
n -
-t- 1
SD
mea
nt
-
+1
SD
0.41
2 0.
195-
O.8
68
Ric
e m
eal a
lone
0.
019
0~00
5-0~
070
0.02
5 0.
0074
.086
0~01
14~
111
0.42
8 0,
2424
,757
A
pple
juic
e 0.
038
0.01
44 10
3 0.
035
0.41
0 0.
2524
.666
G
rape
juic
e 0.
048
0.01
H. 1
76
0.04
0 0.
01&
0.09
9
0.42
8 0,
2424
.75 7
G
uava
nec
tar
0.09
9 0.
0440
.222
0.
092
0.03
5424
1
Ric
e m
eal p
lus:
(1.7
mg
AA
)S
(1.4
mg
AA
)
(15
mg
AA
) 0.
0384
331
0,48
9 0.
3414
702
App
le ju
ice
0.12
9 0.
05&
@30
3 0.
111
(24
mg
AA
)
(5.2
mg
AA
)
(30
mg
AA
)
(30
mg
AA
)
0.36
6 0.
254-
0.52
6 Pi
neap
ple j
uice
0.
097
0.04
34.2
21
0.12
1 0.
0614
.237
0.07
8-0.
193
0.51
0 0.
224-
1.1 1
7 O
rang
e ju
ice
0.16
6 0.
0674
.413
0.
123
0.36
6 0,
2544
526
Pear
juic
e 0.
138
0.05
7-0.
331
0.15
0 0.
0574
395
* 3
mg
Fe a
s fe
rrou
s as
corb
ate
give
n in
the
fast
ing
stat
e.
t In
divi
dual
resu
lts a
djus
ted
to a
40%
ref
eren
ce a
bsor
ptio
n to
giv
e cor
rect
ed g
eom
etric
mea
n ab
sorp
tions
. Cor
rect
ed v
alue
s not
ava
ilabl
e fo
r sev
en o
f the
sev
enty
-thre
e
3 A
scor
bic
acid
(AA
) con
tent
per
100
ml f
ruit
juic
e gi
ven.
fr
uit-j
uice
stud
ies
beca
use
of la
ck o
f re
fere
nce a
bsor
ptio
n re
sults
.
https://www.cambridge.org/core/terms. https://doi.org/10.1079/BJN19870041Downloaded from https://www.cambridge.org/core. IP address: 65.21.228.167, on 04 Nov 2021 at 21:15:25, subject to the Cambridge Core terms of use, available at
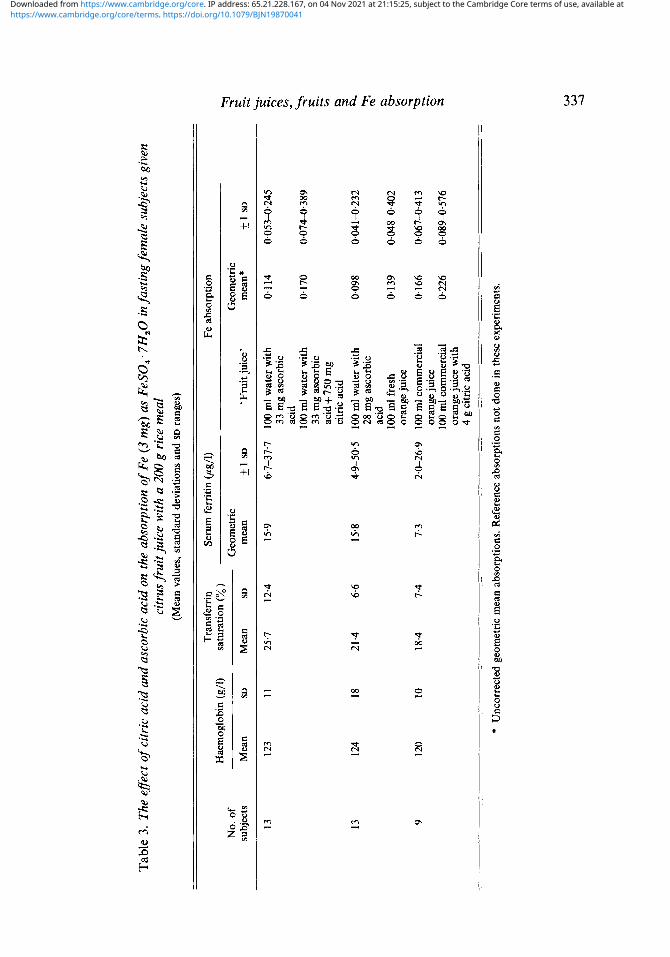
Tab
le 3
. The
eff
ect o
f ci
tric
aci
d an
d as
corb
ic a
cid
on th
e ab
sorp
tion
of F
e (3
mg)
as
FeS
O;
7H,O
in fa
stin
g fe
mal
e su
bjec
ts g
iven
ci
trus
frui
t jui
ce w
ith a
200
g r
ice
mea
l (M
ean
valu
es, s
tand
ard
devi
atio
ns a
nd S
D ra
nges
)
Tran
sfer
rin
Seru
m fe
rriti
n (p
g/l)
Fe
abs
orpt
ion
Hae
mog
lobi
n (g
/l)
satu
ratio
n (%
) N
o. o
f G
eom
etric
G
eom
etric
su
bjec
ts
Mea
n SD
M
ean
SD
mea
n - + 1
SD
‘Fru
it ju
ice’
m
ean*
SD
13
123
11
25.7
12
.4
15.9
6.
7-37
.7
100
ml w
ater
with
0.
114
0.05
3424
5 33
mg
asco
rbic
ac
id
33 m
g as
corb
ic
acid
+ 750
mg
citri
c ac
id
28 m
g as
corb
ic
acid
oran
ge ju
ice
oran
ge ju
ice
oran
ge juice
with
4
g ci
tric
acid
100 m
l wat
er w
ith
0.17
0 0.
074-
0.38
9
13
124
18
21.4
6.
6 15
.8
4.9-
50.5
10
0 m
l wat
er w
ith
0.09
8 04
41-0
.232
100
ml f
resh
0.
139
0448
4402
9 I2
0 10
18
.4
7.4
7.3
2.G
26.9
10
0 m
l com
mer
cial
0.
166
0.06
7-0.
413
100 ml
com
mer
cial
0.
226
0,08
9457
6
* U
ncor
rect
ed g
eom
etric
mea
n ab
sorp
tions
. R
efer
ence
abs
orpt
ions
not
don
e in
thes
e ex
perim
ents
.
9
E.
c1
L.
cs E.
-2 R ii. w
w 4
https://www.cambridge.org/core/terms. https://doi.org/10.1079/BJN19870041Downloaded from https://www.cambridge.org/core. IP address: 65.21.228.167, on 04 Nov 2021 at 21:15:25, subject to the Cambridge Core terms of use, available at
w
w
00
Tab
le 4
. Hae
mog
lohi
n, tr
ansf
erri
n sa
tura
tion
and
seru
m fe
rriti
n va
lues
in j
ustin
g fe
mal
e su
bjec
ts g
iven
I00
g fr
uit
serv
ed w
ith a
200
g
rice
mea
l (M
ean
valu
es, s
tand
ard
devi
atio
ns a
nd S
D ra
nges
)
Tran
sfer
rin
Seru
m f
errit
in (
pg/l)
H
aem
oglo
bin
(g/l)
sa
tura
tion
(%)
No.
of
Geo
met
ric
Mea
l su
bjec
ts
Mea
n SD
M
ean
SD
mea
n SD
Ric
e m
eal
alon
e 12
9 12
9 17
23
.9
11.7
14
.7
3.6-
60.7
R
ice
mea
l plu
s:
Peel
ed g
rape
(bla
ck)
15
129
20
18.3
12
.5
6.7
2.c2
3.2
Unp
eele
d gr
ape
(gre
en)
11
129
10
28.4
10
.7
33,4
12
,5-8
9,2
Peac
h 15
13
2 18
26
.3
9.9
26.7
7f
k101
.3
App
le
11
133
11
21.7
10
.2
15.3
5.
345.
2 U
npee
led
grap
e (b
lack
) 15
12
9 20
18
.3
12.5
6.
7 2.
0-23
.2
Avo
cado
pea
r 14
13
0 28
18
.7
9.9
7.5
1.24
5.9
Stra
wbe
rry
13
135
8 28
.5
7.4
19.8
9.
341.
9
Rhu
barb
15
13
2 18
26
.3
9.9
26.7
7+
101,
3 B
anan
a 8
126
15
29.0
13
.4
19.1
7.
2-50
.7
Man
go
11
130
16
26.3
11
.0
25.5
12
4-52
.4
Ban
ana
(200
g)
4 12
3 20
21
.2
14.9
16
.3
6.7-
40.7
Plum
11
12
9 10
28
.4
10.7
33
.4
12.5
-89.
2
Pear
10
13
5 13
19
.4
9.2
8.3
1.9-
36'5
Can
talo
up
9 13
1 16
25
.3
11.2
26
.6
8.7-
81'7
Pi
neap
ple
6 12
5 12
27
.8
15.7
50
.0
17'3-
1 44.0
Gua
va
15
129
21
23.9
12
.4
18.4
4.
5-75
.5
Paw
paw
(50
g)
7 12
7 14
20
.3
11.2
11
.8
5.5-
25.6
Pa
wpa
w
7 12
7 14
20
.3
11.2
11
.8
5.5-
25.6
G
uava
(tin
ned)
8
121
7 20
.6
9.6
16.8
6.
443.
7
p W
P r
r
0
+I
P z
https://www.cambridge.org/core/terms. https://doi.org/10.1079/BJN19870041Downloaded from https://www.cambridge.org/core. IP address: 65.21.228.167, on 04 Nov 2021 at 21:15:25, subject to the Cambridge Core terms of use, available at
Tab
le 5
. Abs
orpt
ion
of Fe
(3 m
g> as
FeS
O,.
7H
20
in fa
stin
g fe
mal
e su
bjec
ts g
iven
100
g fr
esh
frui
t w
ith a
200
g r
ice
mea
l (M
ean
valu
es a
nd s
tand
ard
devi
atio
n ra
nges
)
Fe a
bsor
ptio
n
Frui
t Fe
abs
orpt
ion
Ref
eren
ce s
alt*
U
ncor
rect
ed
Cor
rect
ed
Geo
met
ric
geom
etri
c ge
omet
ric
mea
n SD
M
eal
mea
n SD
m
eant
SD
0.41
2 0.
195-
0.86
8 R
ice
mea
l alo
ne
0.0 1
9 04
05-0
~070
0.
025
0.00
7-0.
086
0.51
5 0.
335-
0.79
2 Pe
eled
gra
pe (b
lack
) 0.
0 14
0~00
5-0~
040
0.01
3 04
0W.0
28
0.41
1 0.
23W
.714
U
npee
led
grap
e (g
reen
) 0.
022
0408
-0.0
66
0.0 1
4 04
05-0
.036
0.
376
0.16
8-0.
842
Peac
h 0.
0 14
0.00
6403
4 0.
014
040&
0.03
5 0.
237
0,11
7-0.
479
App
le
0.0 1
4 09
03-0
.078
0.
017
0~00
40~
078
0408
-0.0
47
0,51
5 0.
335-
0.79
2 U
npee
led
grap
e (b
lack
) 0.
013
0.00
3-0.
062
0.01
9 0.
260
0.06
9-0.
972
Avo
cado
pea
r 0.
016
0403
-0.0
74
0.02
1 0.
010.
042
0.66
2 0.
509-
0.86
1 St
raw
berr
y 0.
048
0.01
5-0.
152
0.02
4 O
.OO
W.0
83
0.41
1 0,
2364
714
Plum
0.
045
0.01
9-0.
109
0.03
1 0.
0144
073
0.37
6 0,
1684
,842
R
huba
rb
0,03
9 0.
0 1 5-
0.10
0 0.
042
0.0 1
7-0.
1 0 1
0.51
8 0.
27W
.973
B
anan
a 0.
060
0.02
40.1
46
0,04
6 0.
018-
0.11
5 0.
396
0.21
9-0.
714
Man
go
0.054
0.0 1
4-0.
209
0,04
9 0.
0134
~185
0.
339
0.13
9-0.
831
Pear
0.
041
0.02
40.0
70
0,05
3 0.
022-
0.13
1 0.
552
0.21
0-1.
452
Ban
ana
(200
g)
0.08
1 0.
067-
0.09
8 0.
059
0.02
3-0.
154
0.38
0 0.
1940
.747
C
anta
loup
0.
061
0.03
1-0.
120
0.06
4 0.
035-
0.1 1
9
0.48
4 0,
2374
988
Gua
va
0.14
1 0.
060.
332
0.12
6 0.
085-
0.17
8 0.
681
0.47
5-0.
976
Paw
paw
(50
g)
0.22
9 0.
160.
329
0.14
0 0.
097-
0.20
3 0.
1094
.274
0.
681
0.47
5-0.
976
Paw
paw
0.
295
0.18
14.
48 1
0.17
3 0.
259
0.09
9-0.
681
Gua
va (
tinne
d)
0.25
7 0.
115-
0.57
3 0.
293
0.18
0.47
6
Ric
e m
eal p
lus:
-
-
Pine
appl
e 0.
088
0.03
6-0.
215
-
-
* 3
mg
Fe a
s fe
rrou
s as
corb
ate
give
n in
fas
ting
stat
e.
t In
divi
dual
res
ults
adj
uste
d to
a 4
0%
refe
renc
e ab
sorp
tion
to g
ive
corr
ecte
d ge
omet
ric
mea
n ab
sorp
tions
. C
orre
cted
val
ues
not
avai
labl
e fo
r fif
ty-o
ne o
f 20
5 in
divi
dual
frui
t stu
dies
bec
ause
of
lack
of
refe
renc
e ab
sorp
tion
resu
lts.
3 E.
-+ a 3 9
W
w
W
https://www.cambridge.org/core/terms. https://doi.org/10.1079/BJN19870041Downloaded from https://www.cambridge.org/core. IP address: 65.21.228.167, on 04 Nov 2021 at 21:15:25, subject to the Cambridge Core terms of use, available at
w
P
0
Tab
le 6
. Org
anic
aci
d, po
lyph
enol
and
fibr
e co
nten
ts of f
ruits
Org
anic
aci
ds
(mg/
100
g ed
ible
por
tion)
Fi
bre$
A
scor
bic
Mal
ic
Citr
ic
Oxa
lic
Extra
ctab
le
Con
dens
ed
(g/ 1
00 g
) ~~
Peel
ed g
rape
(bl
ack)
4
650
20*
7.9
23
9 0.
5 U
npee
led
grap
e (g
reen
) 4
650
20*
7.9
46
7 0.
5 Pe
ach
7 37
0 37
0*
0 90
42
0.
6 A
pple
5
270-
1020
0-
30
1.5
76
34
0.9
Unp
eele
d gr
ape
(bla
ck)
4 65
0 20
* 7.
9 53
46
0.
5 A
voca
do p
ear
2*
203'
51*
-
100
32
1.5
Stra
wbe
rry
60
160
I080
15
.8
130
116
1.3
Plum
6
360-
2390
30
11
.9
142
45
0.7
Rhu
barb
9
1770
41
0 53
7 23
24
0.
7 B
anan
a 10
50
0 15
0 0.
7 I3
0 52
0.
6 -
91
36
0.9
Pear
4
120
240
6.2
60
0 1.
5 C
anta
loup
25
33
* -
2.7
40
0 0.
3 Pi
neap
ple
17
120
770
1.5
44
39
0.5
Gua
va
180*
19
3*
462*
-
264
137
-
53
60
Paw
paw
15
4*
39*
329*
-
Gua
va (
tinne
d)
262*
82
* 39
3*
-
264
137
-
-
Man
go
35
-
-
* O
rgan
ic a
cid
cont
ent
mea
sure
d lo
cally
. Oth
er o
rgan
ic a
cid
valu
es fr
om L
entn
er (1
981)
or D
iem
& L
entn
er (1
970)
. t
Poly
phen
ol c
onte
nt m
easu
red
loca
lly.
$ Fi
bre
valu
es fr
om L
entn
er (
1981
).
P m * r r 0
H * z b 0
4
3: m z
https://www.cambridge.org/core/terms. https://doi.org/10.1079/BJN19870041Downloaded from https://www.cambridge.org/core. IP address: 65.21.228.167, on 04 Nov 2021 at 21:15:25, subject to the Cambridge Core terms of use, available at
Fruit juices, .fruits and Fe absorption 34 1
also included in the group. Insofar as organic acid, polyphenol and fibre contents were concerned, the findings were very similar to the previous group, although several had marginally higher ascorbic acid contents (Table 6).
The last group of fruit, which included pawpaw (Carica papaya) and guava (Psidium guujava), was associated with markedly increased availability of Fe from a rice meal, with corrected geometric mean absorption values varying between 0.140 and 0.293. The increased availability was directly related to the high ascorbic acid contents of these fruits.
DISCUSSION
The enhancing effects of certain fruit juices and fruit on food Fe absorption have previously been demonstrated in several studies. Moore & Dubach (1951) showed that Fe absorption from eggs was improved when eaten with 200 ml orange juice and attributed the effect to the ascorbic acid present in the juice. Similar findings were reported by Callender et al. (1 970), while there are several studies demonstrating the enhancing effect of orange-juice drinks containing between 70 and 110 mg ascorbic acid on Fe absorption from different meals (Rossander et al. 1979; Hallberg, 1981). Insofar as fruits are concerned, Layrisse et al. (1974) showed that the addition of a portion of pawpaw containing 66 mg ascorbic acid increased Fe absorption from a maize meal from 0.014 to 0.088. In addition, Hallberg et al. (1974) found that a fruit mix of pawpaw, banana and orange (35 mg ascorbic acid per portion) improved absorption from a Thai meal threefold.
The present findings confirm and extend those of previous workers. In our studies, various fruit juices and fruits were tested for their ability to modify Fe absorption from a 200 g rice meal of low Fe availability. The overall pattern of results was uniform. The ability of various fruit juices to enhance Fe absorption from the rice meal was correlated with their ascorbic acid contents ( I , 0.85, P < 0.02) and the same was true of the fruits that were tested ( r , 0.78, P < 0.0001). On this basis, the only fruits that exerted an important enhancing effect on Fe absorption were those with high ascorbic acid contents. They included orange, pawpaw and guava. While other fruit, such as banana, cantaloup and pineapple, which contained lesser amounts of ascorbic acid, also promoted Fe absorption, the effects were modest. The dose-related effects of ascorbic acid were further suggested by two studies in which 100 g banana were compared with 200 g banana and 50 g pawpaw with 100 g pawpaw. Fe absorption was greater with the larger portion in each instance.
A second objective of the present study was to find out whether other organic acids present in fruit affect Fe absorption. This was done since we have previously shown that the geometric mean Fe absorption from a rice meal was increased significantly from 0.028 to 0.085 with 1 g citric acid, from 0.048 to 0-095 with 1 g L-malic acid and from 0.041 to 0.096 with tartaric acid (Gillooly et al. 1983). The only exception was oxalic acid; the addition of 1 g calcium oxalate to cabbage (Brassica oleraceae) was associated with some depression in Fe absorption from 0-320 to 0.195. There is still, however, controversy on the effect of individual organic acids. For example, citric acid has been reported to decrease by two-thirds Fe absorption from a simple Latin-American-type meal in human subjects (Hallberg & Rossander, 1984), while calcium oxalate has been found to have no effect on Fe absorption in rats (Van Campen & Welch, 1980). Special attention was paid to citric acid in the present study, since citrus fruit contains both ascorbic acid and citric acid in significant amounts. A direct comparison of a solution containing ascorbic acid (33 mg) with one containing the same amount of ascorbic acid and 1 g citric acid, indicated that the citric acid had an enhancing effect on the corrected geometric mean Fe absorption from the rice meal (0.114 and 0.170 respectively). In addition, orange juice was more effective than water containing the same amount of ascorbic acid (0.139 and 0-098 respectively).
Dow
nloaded from https://w
ww
.cambridge.org/core . IP address: 65.21.228.167 , on 04 N
ov 2021 at 21:15:25 , subject to the Cambridge Core term
s of use, available at https://ww
w.cam
bridge.org/core/terms . https://doi.org/10.1079/BJN
19870041
342 D. BALLOT A N D O T H E R S
Finally, when orange juice was supplemented with an amount of citric acid equivalent to that present in lemon juice, it had a greater promoting effect on Fe absorption (0.226 and 0.166 respectively). These three results suggest that the effect of citric acid is additive to that of ascorbic acid. Its action presumably occurs through its carboxylic and hydroxyl groups, which prevent polymerization of Fe hydroxides by forming unstable soluble complexes with Fe. However, its overall effects on Fe nutrition were difficult to assess. While there was a significant correlation between Fe absorption and the citric acid content of fruits ( r , 0.55, P < 0.03), those fruits with high citric acid contents also tended to have high ascorbic acid contents (r, 0.70, P < 0.02) (Tables 5 and 6). It was also difficult to assign a definite role to malic acid. In fact, there was a significant negative correlation ( r , - 0.62, P < 0.008) between the malic acid content of fruits and Fe absorption from the rice meal. It is doubtful whether this was due to a direct inhibitory effect, since we have previously shown that malic acid is itself a mild promoter of Fe absorption (Gillooly et al. 1983). It seems more likely that it was due to the fact that there was a suggestive inverse relation ( r , -0.45, P < 0.06) between the malic acid and ascorbic acid contents of fruits. Insofar as oxalic acid was concerned, only one fruit, rhubarb, had a high oxalate content (Table 6). It also had a high malic acid content and its overall effect was to cause a mild enhancement of the corrected geometric mean absorption of Fe from the rice meal (0.042 as compared with 0.025).
The question as to whether any of the fruit tested might have a major inhibitory effect on Fe absorption was not directly addressed, since the basal rice meal being tested was one of low Fe availability. However, from the composition of the fruit, it was apparent that none of them contained large amounts of known inhibitors of Fe absorption (Table 6). They contained negligible amounts of phytate, amounts of condensed polyphenols less than those that have been found to be inhibitory in previous vegetable studies (Gillooly et al. 1983) and only moderate amounts of fibre (Lentner, 1981).
One methodological point deserves mention. In the past, it was difficult to compare results obtained with different meals because of the major effects exerted on Fe absorption by the storage Fe status of the individuals tested. Because of this, it has become customary to find out the absorbing capacity of each individual by feeding a small ‘reference’ dose of ferrous ascorbate. Food Fe absorption results are then corrected to a reference absorption of 0.40, since this is the proportion absorbed by subjects with borderline deficiency (Hallberg, 1981). While the approach may have validity when the groups studied vary widely in terms of their storage Fe status, it appears to be of less value in a study such as the present one where the groups of Indian women were relatively homogeneous insofar as haemoglobin, transferrin saturation and ferritin values were concerned (Tables 1 and 4) (Baynes et al. 1987). Uncorrected and corrected Fe absorption values were very similar and the correlations between the uncorrected Fe absorption results and the ascorbic acid contents of the fruit juices and fruits were, in fact, higher than those obtained with the corrected results. For fruit juices the comparable values were r, 0.95 ( P < 0.008) and r, 0.85 ( P < 0.02), and for fruits r , 0.86 ( P < 0.0001) and r , 0.78 ( P < 0.0001).
In summary, the present findings indicate that the majority of fruit tested would be expected to exert a minimal effect on overall Fe nutrition when administered as part of a mixed meal. Several, however, with high ascorbic acid contents were shown to have a marked enhancing effect on Fe absorption from a rice meal. It is concluded that pawpaw, guava and citrus fruits could have a significant positive effect on Fe nutrition if they were regularly present in staple cereal diets of low Fe availability.
Dow
nloaded from https://w
ww
.cambridge.org/core . IP address: 65.21.228.167 , on 04 N
ov 2021 at 21:15:25 , subject to the Cambridge Core term
s of use, available at https://ww
w.cam
bridge.org/core/terms . https://doi.org/10.1079/BJN
19870041
Fruit juices, fruits and Fe absorption 343
REFERENCES Baynes, R. D., Bothwell, T. H., Bezwoda, W. R., MacPhail, A. P. & Derman, D. P. (1987). Annals of Nutrition
Bjorn-Rasmussen, E. & Hallberg, L. (1974). Nutrition and Metabolism 16, 94-100. Bothwell, T. H., Charlton, R. W., Cook, J. D. & Finch, C. A. (1979). Iron Metabolism in Man, pp. 412415,
Callender, S. T., Marney, S. R. & Warner, G. T. (1970). British Journal of Haematology 19. 657-665. Conradie, J. D. & Mbhele, B. E. L. (1980). South African Medical Journal 57, 282-287. Derman, D. P., Bothwell, T. H., MacPhail, A. P., Torrance, J. D., Bezwoda, W. R., Charlton, R. W. & Mayet,
Diem, K. & Lentner, C. (editors) (1970). Documenta Geigy Scientific Tables, 7th ed. Basel, Switzerland: J. R. Geigy,
Eakins, J. D. & Brown, D. A. (1966). International Journal of Applied Radiation and Isotopes 17, 391-397. Gillooly, M., Bothwell, T. H., Charlton, R. W., Torrance, J. D., Bezwoda, W. R., MacPhail, A. P., Derman, D. P.
Gillooly, M., Bothwell, T. H., Torrance, J. D., MacPhail, A. P., Derman, D. P., Bezwoda, W. R., Mills, W. &
Hallberg, L. (1981). Annual Review ofNutrition 1, 123-147. Hallberg, L., Garby, L., Suwanik, R. & Bjorn-Rasmussen, E. (1974). American Journal of Clinical Nutrition 27,
Hallberg, L. & Rossander, L. (1982a). Scandinavian Journal of Gastroenterology 17, 151-160. Hallberg, L. & Rossander, L. (1982b). Human Nutrition: Applied Nutrition 36, 116123. Hallberg, L. & Rossander, L. (1984). American Journal of Clinical Nutrition 39, 577-583. Haugh, N & Lantzsch, H. J. (1983). Journal of ihe Science ofFood and Agriculture 34, 1423-1426. International Commission for Radiation Protection (1960). Report ofCommittee IIon Permissible Doses of Internal
International Committee for Standardization in Haematology (1978a). British Journal of Haematology 38,
International Committee for Standardization in Haematology (I978 b). British Journal of Haemurology 38,
Layrisse, M., Martinez-Torres, C. & Gonzalez, M. (1974). American Journal of Clinical Nutrition 27, 152-162. Lentner, C. (editor) (1981). Geigy Scientific Tables, vol. 1. 8th ed. Basel, Switzerland: J. R. Geigy, S.A. MacPhail, A. P., Bothwell, T. H., Torrance, J. D., Derman, D. P., Bezwoda, W. R., Charlton, R. W. & Mayet,
Mayet, F. G. H., Adams, E. B., Moodley, T., Kleber, E. E. & Cooper, S. K. (1 972). South African Medical Journal
Moore, C. V. & Dubach, R. (1951). Transactions of the Association of American Physicians 64, 245-256. Rossander, L., Hallberg, L. & Bjorn-Rasmussen, E. (1979). American Journal of Clinical Nutrition 32,24842489, Sayers, M. H., Lynch, S . R., Charlton, R. W., Bothwell, T. H., Walker, R. B. & Mayet, F. (1974a). British Journal
Sayers, M. H., Lynch, S. R., Charlton, R. W., Bothwell, T. H., Walker, R. B. &Mayet, F. (19746). British Journal
Sayers, M. H., Lynch, S. R., Jacobs, P., Charlton, R. W., Bothwell, T. H., Walker, R. B. & Mayet, F. (1973).
Singleton, V. L. & Rossi, J. A. (1965). In Methods for Analysis of Wines and Musts, p . 183 [M. A. Amerine and
South African Bureau of Standards (1972). Code of Practice for Medical Use of Ionizing Radiations, document
Spiro, T. G. & Saltman, P. (1970). In Iron in Biochemistry and Medicine, pp. 1-28 [A. A. Jacobs and M. M.
Turnbull, A. L., Cleton, F. & Finch, C. A. (1962). Journal of Clinical Investigation 41, 1898-1907. Van Campen, D. R. & Welch, R. M. (1980). Journal ofNutrition 110, 1618-1621.
and Metabolism (In the Press).
43 1433 . Oxford : Blackwell Scientific Publications.
F. G. H. (1980). Scandinavian Journal of Haernatology 25, 193-201.
S . A.
& Mayet, F. (1984). British Journal of Nutrition 51, 3746.
Charlton, R. W. (1983). British Journal of Nutrition 49, 331-341.
826-836.
Radiation. ICRP Publication no. 2. Oxford: Pergamon Press.
291-294.
28 1-290.
F. G. H. (1981). South African Medical Journal 59, 939-942.
46, 1427-1430.
of Nutrition 21, 367-375.
of Haemato1og.v 28, 483495.
British Journal of Haematology 24, 209-218.
C. C. Ough, editors]. New York: J. Wiley & Sons.
no. 07.
Worwood, editors]. New York : Academic Press.
Printed in Great Britain
Dow
nloaded from https://w
ww
.cambridge.org/core . IP address: 65.21.228.167 , on 04 N
ov 2021 at 21:15:25 , subject to the Cambridge Core term
s of use, available at https://ww
w.cam
bridge.org/core/terms . https://doi.org/10.1079/BJN
19870041