Embed Size (px)
Citation preview
UNIVERSITÉ DU QUÉBEC À MONTRÉAL
DIVERSITÉ ET FONCTION DE LA FAUNE CAVICOLE À LA TRANSITION DE
LA FORÊT BORÉALE MIXTE ET RÉSINEUSE DE L’EST DU CANADA
THÈSE
PRÉSENTÉE
COMME EXIGENCE PARTIELLE
DU DOCTORAT EN BIOLOGIE
PAR
PHILIPPE CADIEUX
FÉVRIER 2017


À Abbie, Eva et Thea

REMERCIEMENTS
Voilà que s'achève une grande aventure et qu'en débute une autre. Le doctorat a été
pour moi, rempli de plaisirs, de découvertes et de moments plus difficiles. Les
meilleurs moments ont toujours été en bonne compagnie et je vous en remercie.
Je voudrais tout d'abord remercier mon directeur de thèse Pierre Drapeau. Pierre,
merci pour ta motivation contagieuse, ton soutien inébranlable, ta grande générosité
et ta grande vision. Merci d'avoir partagé avec moi tes connaissances et ton
expérience. Tu m'as permis d'étudier un système incroyablement intéressant.
Le travail de terrain restera inoubliable. Quelles aventures ! C'est à ce moment qu'on
fait face directement à l'objet d'étude, et à tout ce qui l'entoure. La réalité du terrain
est souvent loin de ce qu'on s'imagine. J'ai eu la chance inouïe de partager mes étés de
terrain avec des personnes extraordinaires et motivées. Je remercie du fond du coeur
tous ceux et celles qui m'ont accompagné dans ces aventures : Camille Morin, Carole
Besson, Jean-Simon Houle, Antoine Plouffe Leboeuf, Hanna Brais Harvey, Louis-
Joseph Drapeau, Simon Paradis, Vincent Poupart, Delphine Favorel, Jillian Slater,
Sarah Wood, Derek Yarjeau et Alexandre Fouillet. Je tiens à remercier spécialement
Réjean Deschênes qui depuis ma maîtrise m'accompagne de temps à autre sur le
terrain. Merci pour ton amitié, ta joie de vivre, ton leadership, ta persévérance et ton
expérience d'une valeur inestimable.
Je remercie tous les étudiants et les finissants du laboratoire de Pierre Drapeau pour
votre passion et dévotion et pour les nombreuses discussions intéressantes que nous
avons pu partager : Maxime Allard, Ugo O. Lapointe, Simon Bédard, Tyler Rudolph,
Michel St-Germain, Carine Côté-Germain, Geneviève Potvin, Chantal Cloutier, Anne
vi
Piuze-Paquet, Nathalie Gendron, Delphine Favorel, Alexandre Fouillet, Antoine
Plouffe Leboeuf, Juliette Duranleau, Violette Bertrand et Annick Antaya.
Merci à Alain Leduc, Antoine Nappi et Marianne Cheveau pour leur participation
active dans l'élaboration du chapitre 3. Merci à tous ceux et celles qui m'ont aidé et
appuyé : Mélanie Desrochers, Daniel Lesieur, Luc Lauzon et Virginie Arielle Angers.
Finalement, j’aimerais dire un immense merci à ma femme, Abbie. Merci de m'avoir
accompagné dans les meilleurs et les pires moments, merci pour ta patience, ton
intérêt, ton sens critique et ton soutien. J’aimerais aussi sincèrement remercier toute
ma famille de m'avoir accompagné et encouragé durant ce long parcours.
AVANT-PROPOS
Cette thèse comporte trois chapitres rédigés sous forme d'articles. À titre de candidat
à au doctorat, j'ai procédé à la récolte des données, à l'analyse des résultats et à la
rédaction des articles à titre de premier auteur. Le premier article “Are old boreal
forests a safe bet for the conservation of the avifauna associated with decayed wood
in eastern Canada?” a été publié dans la revue Forest Ecology and Management en
2017 (385: 127-139). Le deuxième article “Persistence, changes, and robustness in
ecological networks at the transition between mixedwood and coniferous boreal
forests: the case of nest webs” sera soumis sous peu dans la revue Ecology. Le
troisième article “The Pileated Woodpecker (Dryocopus pileatus): an umbrella
species for cavity nesters in boreal forests” sera soumis sous peu dans la revue
Biological Conservation. En tant que directeur de thèse, Pierre Drapeau est coauteur
des trois articles. De plus, Alexandre Fouillet est coauteur du deuxième chapitre, car
il a participé à l'élaboration du protocole de recherche et à la récolte de données sur le
terrain et à la conception de l'article. Le troisième chapitre découle d'un stage doctoral
avec Antoine Nappi du Bureau du forestier en chef du Québec et avec Marianne
Cheveau du Ministère des Forêts, de la Faune et des Parcs du Québec. Ces deux
chercheurs ont participé à l'élaboration et à la direction du projet et ils s'ajoutent à
cette étude comme coauteurs. De plus, Alain Leduc a participé à l'élaboration du
projet et aux analyses statistiques et est ajouté comme coauteur de ce chapitre.
Cette thèse a été défendue le 6 octobre 2016 à l'Université du Québec à Montréal. Les
membres du jury de thèse étaient :
Pierre Drapeau, professeur, directeur de thèse, Département des sciences biologiques,
Université du Québec à Montréal;
viii
Daniel Kneeshaw, professeur, président du jury, Département des sciences
biologiques, Université du Québec à Montréal;
Louis Imbeau, professeur, Institut de Recherche sur les Forêts, Université du Québec
en Abitibi-Témiscamingue;
Jean-Michel Roberge, professeur associé, Department of Wildlife, Fish and
Environmental Studies, Université suédoise des sciences agricoles.
TABLE DES MATIÈRES
AVANT-PROPOS ...................................................................................................... vii
TABLE DES MATIÈRES ........................................................................................... ix
LISTE DES FIGURES .............................................................................................. xiii
LISTE DES TABLEAUX ........................................................................................ xvii
RÉSUMÉ ................................................................................................................... xxi
ABSTRACT ............................................................................................................. xxv
INTRODUCTION GÉNÉRALE .................................................................................. 1
La dynamique du recrutement de bois mort en forêt boréale .................................... 2
L’utilisation des arbres morts par la faune cavicole et corticole en forêt boréale ..... 5
Rôle des vieilles forêts résineuses dans l'apport de bois mort pour la faune cavicole en pessière à mousses ................................................................................................ 7Les forêts mixtes isolées en pessière à mousses, des oasis de biodiversité ? ............ 8
L’aménagement forestier et les pics comme indicateurs de diversité ....................... 9
Objectifs de la thèse ................................................................................................. 11
CHAPITRE 1ARE OLD BOREAL FORESTS A SAFE BET FOR THE CONSERVATION OF THE AVIFAUNA ASSOCIATED WITH DECAYED WOOD IN EASTERN CANADA? .................................................................................................................. 15
1.1 Résumé .............................................................................................................. 16
1.2 Abstract .............................................................................................................. 17
1.3 Introduction ....................................................................................................... 18
1.4 Methods ............................................................................................................. 20
1.4.1 Study area .................................................................................................... 20
1.4.2 Site selection ............................................................................................... 21
1.4.3 Habitat sampling ......................................................................................... 22
1.4.4 Bird sampling .............................................................................................. 22
x
1.4.5 Statistical analyses ....................................................................................... 24
1.5 Results ............................................................................................................... 27
1.5.1 Overall landscape patterns .......................................................................... 27
1.5.2 Habitat characteristics ................................................................................. 27
1.5.3 Patterns of distribution of deadwood birds ................................................. 29
1.5.4 Influence of habitat variables on species richness and individual species of deadwood birds .................................................................................................... 301.5.5 Influence of habitat variables on abundances of trees with foraging marks 31
1.6 Discussion .......................................................................................................... 32
1.6.1 Black spruce forests .................................................................................... 33
1.6.2 Mixedwood forests ...................................................................................... 34
1.6.3 Species detection probability ...................................................................... 36
1.6.4 Management implications ........................................................................... 36
1.7 Acknowledgements ........................................................................................... 38
1.8 References ......................................................................................................... 38
1.9 Tables ................................................................................................................. 46
1.10 Figures ............................................................................................................. 52
1.11 Appendix A. ..................................................................................................... 57
CHAPITRE 2PERSISTENCE, CHANGES AND ROBUSTNESS IN ECOLOGICAL NETWORKS AT THE TRANSITION BETWEEN MIXEDWOOD AND CONIFEROUS BOREAL FORESTS: THE CASE OF NEST WEBS ...................... 59
2.1 Résumé .............................................................................................................. 60
2.2 Abstract .............................................................................................................. 61
2.3 Introduction ....................................................................................................... 62
2.4 Methods ............................................................................................................. 65
2.4.1 Study area .................................................................................................... 65
2.4.2 Sampling plots ............................................................................................. 65
2.4.3 Nest search and cavity monitoring .............................................................. 66
2.4.4 Vegetation sampling .................................................................................... 67
xi
2.4.5 Landscape scale characteristics ................................................................... 68
2.4.6 Statistical analyses ....................................................................................... 68
2.5 Results ............................................................................................................... 70
2.5.1 Landscape scale characteristics of forest regions ........................................ 70
2.5.2 Local scale characteristics ........................................................................... 70
2.5.4 Nest-webs structure and robustness to the loss of key species ................... 71
2.6 Discussion .......................................................................................................... 73
2.6.1 Stand senescence and beaver flooding at the root of nest webs along the latitudinal gradient ................................................................................................ 742.6.2 Keystone excavators along the latitudinal gradient .................................... 76
2.6.3 Protection of old trembling aspen patches and management of productive old coniferous forests ........................................................................................... 78
2.7 Acknowledgements ........................................................................................... 79
2.8 References ......................................................................................................... 79
2.9 Tables ................................................................................................................. 87
2.10 Figures ............................................................................................................. 88
2.11 Appendix A. ..................................................................................................... 97
2.12 Appendix B. ..................................................................................................... 98
CHAPITRE 3 THE PILEATED WOODPECKER (DRYOCOPUS PILEATUS): AN UMBRELLA SPECIES FOR CAVITY NESTERS IN BOREAL FORESTS ............................... 101
3.1 Résumé ............................................................................................................ 102
3.2 Abstract ............................................................................................................ 103
3.3 Introduction ..................................................................................................... 104
3.4 Methods ........................................................................................................... 107
3.4.1 Study area .................................................................................................. 107
3.4.2 Cavity search and nest monitoring ............................................................ 108
3.4.3 GIS data preparation and sampling ........................................................... 109
3.4.4 Statistical analyses ..................................................................................... 110
3.5 Results ............................................................................................................. 115
xii
3.5.2 Habitat specificity and selection by cavity nesters .................................... 115
3.5.1 Co-occurrence analysis ............................................................................. 117
3.5.3 Simulation of site selection with potential umbrella species .................... 118
3.6 Discussion ........................................................................................................ 119
3.6.1 Strong selection of highly coveted resources ............................................ 119
3.6.2 The Pileated Woodpecker: an umbrella species ........................................ 120
3.6.3 Scope and limitations of using the Pileated Woodpecker as an umbrella species ................................................................................................................ 122
3.7 Acknowledgements ......................................................................................... 123
3.8 References ....................................................................................................... 123
3.9 Tables ............................................................................................................... 132
3.10 Figures ........................................................................................................... 139
3.11 Appendix A .................................................................................................... 145
CONCLUSION GÉNÉRALE .................................................................................. 147
Diversité spécifique des oiseaux associés au bois mort en pessière à mousses .... 148
Diversité fonctionnelle de l’avifaune associée au bois mort ................................. 149
Espèces indicatrices de diversité ........................................................................... 151
Implications en aménagement forestier ................................................................. 152
Perspectives futures de recherche .......................................................................... 154
RÉFÉRENCES CITÉES DANS L'INTRODUCTION ET LA CONCLUSION GÉNÉRALE ............................................................................................................. 157
LISTE DES FIGURES
Figure 1.1. Location of sampling sites by forest cover type in northwestern Québec, Canada. ................................................................................................................ 52
Figure 1.2. Proportion of forest cover types in the studied landscape in northwestern Québec. Proportions are calculated according to categories of forest cover types and age classes available on the digital forest cover maps (MRNF 2011). ........ 53
Figure 1.3. Mean observed occurrence per habitat type defined by age and tree species composition in northwestern Québec, Canada. Values for the observed occurrence are the proportion of sites where there was at least one response to the playback calls in 3 visits. Bs = Black spruce, UnderPalud = Undergoing paludification, Palud = Paludified, Mx is for mixedwood. ................................. 54
Figure 1.4. Estimated species richness for deadwood birds within 8 habitat types along an age, structure and composition gradient of boreal forests in northwestern Québec. Multi-model inferences on group differences were calculated to identify the habitat types that are significantly different (different letter combinations). The error bars represent the 95% confidence intervals. .... 55
Figure 1.5. Densities of trees with foraging signs for the Picoides bark scaling, the Picoides foraging excavations, the Pileated Woodpecker's foraging excavations and the Yellow-bellied Sapsucker's sapwells across habitat types. Multi-model inferences on group differences were calculated to identify the habitat types that are significantly different (different letter combinations). The error bars represent the 95% confidence intervals. Bs = Black spruce, UnderPalud = Undergoing paludification, Palud = Paludified, Mx = mixedwood. ................... 56
Figure 2.1. Location of sampling plots in northwestern Québec, Canada. ................. 88
Figure 2.2. Proportion of cover types for BSM (north of the 49th parallel) and BFWB (48th parallel) in northwestern Québec, Canada. ................................................. 89
Figure 2.3. Nest webs for a) BFWB closed-canopy forests, b) BSM closed-canopy forests, c) BFWB beaver ponds, and d) BSM beaver ponds in northwestern Québec, Canada. Nest data were collected from 2003 to 2015 for BFWB and from 2012 to 2013 for BSM. Lines between species represent the use of cavity resource. N is the number of occupied cavities found and E is the number of excavated cavities that were used by the excavator and by other cavity nesters. Links between the excavator level and the tree level represent the proportion of
xiv
occupied cavities found in the tree species and the links between secondary cavity nesters, and excavators represent the proportion of nests or presence of mammals found in reused cavities. Reuse of cavities by excavators is indicated by lines between the base of the excavator that reused the cavity and the top of the excavator that created the cavity. .................................................................. 90
Figure 2.4. Means and 95 % confidence intervals of Shannon-Weaver diversity index for nest webs characteristics of BSM forests and beaver ponds and of BFWB forests and beaver ponds. We compared the diversity of cavity tree species, woodpecker species, secondary cavity nester species and interspecific interactions. The bootstrap procedure is described in section 2.4.6.3. Differences between habitats were considered significant when the 95 % confidence intervals did not overlap. These are indicated with letters. ................................. 95
Figure 2.5. Evaluation of the robustness of nest webs to the loss of a) excavator species and b) tree species in BSM forests and beaver ponds and in BFWB forests and beaver ponds. We show the means and 95 % confidence intervals of the proportion of species loss due to the simulation of targeted species removal. Differences between habitats were considered significant when the 95 % confidence intervals did not overlap. These are indicated with letters. .............. 96
Figure 2B. Model averaged prediction of mean cavity height (m) for open and closed canopy forested habitat in the two regions (BSM = black spruce-moss region, BFWB = balsam fir-white birch region). Significant differences are indicated with letters. .......................................................................................................... 98
Figure 3.1. Location of study sites in northwestern Québec, Canada. ...................... 139
Figure 3.2. Predictions of the average species richness for polygons where there was at least one cavity tree of the focal excavator. GLMMs were done on three levels of the response variable species richness: a) all expected beneficiary species, b) cavity excavators and c) secondary cavity nesters. Letters represent statistically significant differences where the confidence intervals do not overlap. The predictions and 95 % confidence intervals were calculated using a bootstrapping procedure with 1000 permutations for a polygon size of 3 ha. ......................... 141
Figure 3.3. Species accumulation curves based on random resampling of all polygons (gray polygon) and collectors’ curves ordered by the HSMs of the Downy Woodpecker (smaller dashed lines), the Yellow-bellied Sapsucker (larger dashed lines) and the Pileated Woodpecker (full lines). Vertical lines indicate where the maximum number of species is attained for the collectors’ curves. The species accumulation curves are plotted against the polygon area size accumulation and
xv
were done on three levels of the response variable species richness: All expected beneficiary species, cavity excavators and secondary cavity nesters. .............. 143
Figure 3.4. Predicted species richness as a function of the predicted probability of presence calculated with HSMs of the Downy Woodpecker (full lines), the Yellow-bellied Sapsucker (smaller dashed lines) and the Pileated Woodpecker (larger dashed lines). GLMMs were computed for three levels of the response variable species richness: a) All expected beneficiary species, b) cavity excavators and c) secondary cavity nesters. The predictions and 95 % confidence intervals (gray bands) were calculated using a bootstrapping procedure with 1000 permutations. ............................................................................................ 144

xvi
LISTE DES TABLEAUX
Table 1.1. List and description of habitat variables. ................................................... 46
Table 1.2. Comparison between estimates [95% CI] of habitat variables among habitat types. Multi-model inferences on group differences were calculated to identify the habitat types that are significantly different (different letter combinations). ..................................................................................................... 47
Table 1.3. Observed occurrences, detection probabilities and occupancy probabilities for deadwood bird species measured with the response to playback calls. Values for the observed occurrence are the proportion of sites where there was at least one response to the playback calls in 3 visits. Values for the detection and occurrence probabilities are taken from the null model. ..................................... 49
Table 1.4. Most-supported models based on Akaike’s Information Criterion corrected for small samples (AICc) for estimating individual species occurrence in relation to habitat and detection variables. The most supported models (ΔAICc < 2) are contrasted to the null model (constant detection and constant occurrence). β values in bold have 95% CI that do not include the zero. Species with a detection probability < 0.15 were not considered (Table 3). .............................................. 50
Table 1.5. Most-supported models based on quasi-likelihood Akaike’s Information Criterion corrected for small samples (QAICc) for estimating foraging sign abundances in relation to habitat variables. The most supported models (ΔQAICc < 2) are contrasted to the null model. β values in bold have 95% CI that do not include the zero. .................................................................................................. 51
Table 1A. Species nesting and foraging requirements and association with decaying wood. ................................................................................................................... 57
Table 2.1. Comparisons of average proportions (± SD) of cavity trees and available trees characteristics. Characteristics were compared between cavity trees and available trees, for each habitat types in the two forest regions (BFWB = balsam fir-white birch region , BSM = black spruce-moss region) with Kruskal-Wallis tests. .................................................................................................................... 87
Table 2A. Proportions of cavity trees having hardwood, heart rot and equally degraded wood in forest flooded by the beaver and in closed canopy forests. Wood hardness was measured by coring the tree at breast height on a subsample
xviii
of cavity trees found. Trees were classified as living or dead and inspected for fungal conks. ....................................................................................................... 97
Table 3.1. List of habitat variables at the stand and landscape scale taken from digital cover maps and used for habitat selection by cavity nesters. ........................... 132
Table 3.2. List of candidate models and hypotheses for habitat selection at the stand and landscape scale. In order to take into account the hierarchical sampling design, Plot is added as a random variable and Area is added as an offset in every model. ...................................................................................................... 133
Table 3.3. Number of cavity trees, number of polygons with cavity trees, proportions of cavity tree that are in trembling aspen and specificity to polygons with a forest height of > 10 m for all cavity nester species found. Cavity trees and nests were found during two cavity search surveys done in 106 plots 2008-2015 in northwestern Quebec, Canada. Species were considered beneficiary species if at least one nest was found in closed-canopy forests. ........................................... 134
Table 3.4. Model selection results at stand and landscape scales for habitat selection by cavity nesters. Grouped cavity users represent species richness of 10 species for which < 20 polygons with cavity trees were found. The offset Area and the random effects Plots are included in each model. We present all the models with a ΔAICc < 2. Model fit was evaluated with a pseudo-R2 (R2). The fit of bootstrapped predictions to observations for single species HSM was evaluated with Cohen’s Kappa statistic (κ). In the case of multi-species models we evaluated this fit with spearman correlation (Spear.Cor) and with the beta of a linear regression (±SE). .................................................................................... 135
Table 3.5. Estimated parameter values of best HSM models for the stand and landscape scale (ΔAICc < 2). Grouped cavity users represent species richness of 10 species for which > 20 polygons with cavity trees were found. Parameters and 95 % confidence intervals were calculated using a bootstrapping procedure with 1000 permutations. Values in bold have 95 % confidence intervals that do not include the zero. .......................................................................................... 136
Table 3.6. Estimated parameter values of the HSM of the Downy Woodpecker, the Yellow-bellied Sapsucker and the Pileated Woodpecker on the species richness for polygons. GLMM were done on three levels of the response variable species richness: all expected beneficiary species, cavity excavators and secondary cavity nesters. A pseudo-R2 based on the likelihood-ratio test is computed for each model by comparing the model to a null model containing the offset Area and the random effect Plot. All estimated values differed significantly from zero............................................................................................................................ 138
xix
Table 3A. Estimated parameter values of the size of polygons on species richness for polygons where there was at least one cavity tree of the focal excavator. GLMMs were done on three levels of the response variable species richness: All expected beneficiary species, cavity excavators and secondary cavity nesters. The parameters and 95 % confidence intervals were calculated using a bootstrapping procedure with 1000 permutations. Values in bold are significant as their 95 % confidence intervals do not include zero. ................................... 145

RÉSUMÉ
Les vieilles forêts constituent des habitats clés pour la diversité biologique en forêt boréale. Elles sont cruciales au maintien des espèces qui utilisent les arbres à cavités dans nos paysages forestiers, grâce entre autres, à un apport substantiel et constant d’arbres sénescents et morts. Toutefois, un important gradient latitudinal passant de la forêt mixte à la forêt de conifères démarque la forêt boréale de l’est du Canada. Ce gradient de composition du couvert forestier se traduit par une réduction considérable de la disponibilité d’arbres morts et sénescents de grand diamètre, et donc de la qualité des substrats de nidification et d’alimentation de la faune utilisatrice d’arbres à cavités. L’abondance et la qualité réduites de ces ressources comptent parmi les causes probables de la limite nordique de répartition de plusieurs espèces de ce groupe. La réponse fonctionnelle de la faune cavicole à ces changements régionaux de composition et de structure du couvert forestier boréal demeure peu connue. Cette thèse propose une analyse quantitative de cette question selon des thèmes qui abordent dans trois chapitres ; (1) la distribution de la faune associée aux arbres à cavités en région de pessière à mousses (2), la structure des réseaux d’utilisateurs de cavités entre les régions de la forêt mixte et de la forêt de conifères dominées par l’épinette noire et enfin (3) le rôle d’espèce parapluie du Grand Pic (Dryocopus pileatus). Le premier chapitre examine l’importance des forêts âgées mixtes et de conifères pour les oiseaux associés au bois sénescent et mort selon un gradient d’âge, de structure et de composition forestière en pessière à mousses, une portion de la forêt boréale dominée par une matrice d’épinettes noires. Nos résultats montrent que les vieilles forêts mixtes qui ne représentent que 4 % du recouvrement forestier dans cette région d’étude étaient de loin les plus utilisées par l’avifaune associée au bois sénescent et mort. Dans les vieilles forêts de conifères, ces oiseaux ont montré une réponse modale au vieillissement alors que leur richesse en espèces atteint son maximum à 160 ans pour décliner par la suite. Les très vieilles forêts entourbées, représentant plus de 40 % du territoire d’étude, ont étés associées à une richesse d'espèces significativement plus pauvre d'oiseaux cavicoles et corticoles. La diversité structurale des tiges est la variable d’habitat qui explique le mieux la richesse d’espèces de ce groupe fonctionnel ainsi que l’abondance de traces d’alimentation des pics. Chez les espèces individuelles, la quantité et la qualité d’arbres morts dans un peuplement expliquent le mieux leur occurrence et l’abondance de leurs traces d’alimentation. Nous concluons qu’en pessière à mousses la conservation de l’avifaune associée au bois mort devrait être priorisée dans les peuplements productifs mixtes et résineux.
xxii
Le deuxième chapitre traite du changement, de la persistance et de la robustesse des réseaux écologiques le long d’un gradient latitudinal traduisant la transition de la composition d’un couvert forestier dominé par des peuplements mixtes à un couvert dominé par les conifères, qui s’étend sur plus de 200 km en forêt boréale. Les réseaux d’utilisateurs de cavités dans ce biome sont souvent composés d’une minorité d’espèces ayant de nombreuses interactions. Il est suggéré que de tels réseaux soient peu robustes à la perte d’espèces clés de voûte. De plus, tout au long de ce gradient un agent important de transformation des habitats forestiers, le castor d’Amérique (Castor canadensis) inonde par ses ouvrages de rétention d’eau des forêts qui entraînent la mortalité synchrone d’arbres qui deviennent propices à être excavés par les pics et utilisés par la communauté cavicole. À l’aide de données portant sur la reproduction d’espèces cavicoles récoltées le long de ce gradient latitudinal, tant dans les forêts fermées que dans les forêts ouvertes inondées par le castor nous montrons que des changements structurels dans les réseaux d’utilisateurs de cavités sont associés à des changements importants dans la disponibilité d’arbres adéquats à l’excavation de cavités. Nous observons que le rôle clé joué par le peuplier faux-tremble persiste dans les forêts mixtes au nord de ce gradient qui sont souvent isolées et ne représentent qu’une très faible proportion du territoire dans ces grandes matrices forestières résineuses. Ces forêts ont des réseaux riches, complexes et très similaires à ceux trouvés dans les forêts mixtes situées plus au sud. Au contraire, les forêts boréales résineuses avaient une densité très faible d’arbres de nidification. Nous montrons que les peuplements forestiers inondés par le castor ont hébergé des réseaux riches et complexes dans les deux régions. Tandis que le Grand Pic reste tant au nord qu’au sud de la forêt boréale, l’espèce clé de voûte pour les utilisateurs secondaires de grande taille en forêts fermées, le Pic flamboyant, était l’espèce responsable de la majorité de cavités de moyenne à grande taille dans les forêts résineuses à canopée ouverte et fermée. Des analyses simulant le retrait d’espèces clés de voûte montrent que les réseaux des forêts fermées sont peu robustes à la perte du peuplier faux-tremble et à moindre degré, à la perte du Grand Pic. Les forêts inondées par le castor montrent une plus grande robustesse due à une diversité accrue d’espèces d’arbres pour l’excavation de cavités. Ayant ciblé dans les chapitres précédents les vieilles forêts mixtes de peuplier faux-tremble comme des habitats à prioriser pour la conservation de l’avifaune associée au bois mort et le Grand Pic comme une espèce clé de voûte, le troisième chapitre porte sur l’évaluation de cet excavateur comme une espèce parapluie pour la faune cavicole en forêt boréale. Nous vérifions l’hypothèse selon laquelle la conservation de l’habitat pour le Grand Pic conserverait aussi l’habitat des autres espèces cavicoles vu que cette espèce est très exigeante en ce qui concerne la qualité de son habitat. Nos résultats montrent que le Grand Pic sélectionne fortement les peuplements qui sont aussi sélectionnés par la grande majorité des utilisateurs de cavités : les vieux peuplements de forêts mixtes avec peupliers faux-trembles. Le Grand Pic est l’espèce dont la présence d’une cavité à un site est la plus susceptible de prévoir la présence de
xxiii
cavités de nidification des autres espèces cavicoles. De plus, son modèle de sélection d’habitats est celui qui explique le mieux la richesse des autres espèces cavicoles et qui s’avère être le plus efficace pour prioriser les sites les plus riches en espèces cavicoles. Le Grand Pic peut donc être considéré comme une espèce parapluie pour ce qui est de la qualité de l’habitat de reproduction de l’ensemble de la faune cavicole associée aux forêts mixtes, un compartiment clé de la biodiversité en forêt boréale. Cette thèse montre que l'âge, la productivité et la composition des forêts boréales sont des facteurs clés dans le maintien de la diversité spécifique et fonctionnelle de la faune associée au bois sénescent et mort. Les vieilles forêts mixtes, malgré leur faible représentation dans le paysage sont désignées comme habitats clés et devraient être ciblées pour la conservation. Dans ces forêts, le Grand Pic joue le double rôle d’espèce clé de voûte et d’espèce parapluie pour la faune cavicole. Les vieilles forêts résineuses sont généralement pauvres, mais semblent cruciales pour l’alimentation du Pic à dos noir et du Pic à dos rayé. Toutefois, la faible contribution des vieilles forêts résineuses aux réseaux d'utilisateurs de cavités est compensée par les réseaux complexes d'espèces cavicoles dans les forêts ouvertes par l’activité du castor dans les marais sur l’ensemble du territoire.
Mots-clés : forêt boréale, bois sénescent et mort, pics, faune cavicole, sélection d’habitat, réseaux d’utilisateurs de cavités, paludification, robustesse, peuplier faux-tremble, épinette noire

ABSTRACT
Old-growth forests are key habitats for the biodiversity in the boreal forest. They are crucial to the maintenance of species that use cavity trees in our forest landscapes, partly because they provide a substantial and constant amount of senescent and dead trees. However, there is an important latitudinal gradient in the boreal forest, going from mixedwood forests to coniferous forest in eastern Canada. In this gradient of forest cover composition there is a considerable reduction in the availability of large diameter senescent and dead trees, and thus of trees adequate for nesting and foraging for the dead wood associated fauna. The low availability or quality of these resources is the probable cause of the northern distribution limit for many of these species. The functional response of cavity nesters to these regional changes in composition and structure of boreal forest cover remains mostly unknown. This thesis proposes a quantitative analysis of this question while addressing the following themes: (1) the distribution of the fauna associated with cavity trees in the black spruce moss region (2), the network structure of cavity users between the mixedwood regions and the black spruce feather moss region and finally (3) the umbrella species role played by the Pileated Woodpecker (Dryocopus pileatus). The first chapter examines the importance of old mixed and coniferous boreal forests for decaying and dead wood associated birds along a forest age, structure and composition gradient in black spruce feather moss, a portion of the boreal forest dominated by black spruce stands. The results show that even though old mixedwood stands represent only 4 % of the forest cover in the study region, these forests were by far the most used by the deadwood avifauna. In old coniferous stands, these birds had a modal response to forest age with species richness reaching their peak at 160 years followed by a decline. Representing more than 40 % of the landscape, old paludified stands were associated with a significantly lower species richness of deadwood birds. Structural diversity was the habitat variable that best explained species richness and abundance of woodpecker foraging marks on trees. At the level of individual species the quantity and quality of dead trees in the stand best explained the species occurrence and abundance of foraging marks. We conclude that in the black spruce feather moss, productive coniferous and mixedwood stands should be prioritized for the conservation of the deadwood associated avifauna. The second chapter investigates the changes, the persistence and the robustness of ecological networks along a latitudinal gradient in the boreal forest, going from mixedwood to coniferous dominated forest cover stretching for more than 200 km in the boreal forest. Nest webs in this biome are often composed of a few highly connected species suggesting low robustness to the loss of keystone species. In addition, along this gradient an important agent of transformation of forested habitat,
xxvi
the American beaver (Castor canadensis) flood forests by retaining water and causes synchronous tree mortality that becomes propitious to cavity excavation by woodpeckers and use by the cavity-nesting community. With data on the reproduction of cavity nesters collected along this latitudinal gradient, as much in closed forest than in open forest flooded by the beaver we show that structural changes in nest webs are associated to drastic changes in the availability of trees adequate for cavity excavation. We observed that the key role played by the trembling aspen persists in mixedwood forests in the northern portion of this gradient, which are often isolated and represent only a small portion of the territory dominated by coniferous forests. These forests had rich and complex networks very similar to those found in southern mixedwoods. To the contrary, coniferous forests had very low nest tree densities. We demonstrate that forests flooded by the actions of the beaver harbored similarly rich and complex nest webs in both forest regions. Whereas the Pileated Woodpecker (Dryocopus pileatus) remained the pivotal species for large secondary cavity users in closed-canopy forests dominated by trembling aspen in both forest regions, the Northern Flicker was the main provider of medium to large cavities in open forests and in closed-canopy black spruce stands. Targeted removal simulations highlighted that closed-canopy forest networks had low robustness to the removal of trembling aspen and to a lesser degree to the loss of the Pileated Woodpecker. The majority of links within these networks were driven by these two species. Open forests created by beaver ponds showed more robust nest webs mainly because primary excavators relied on a higher diversity of tree species, downsizing the use of trembling aspen. Having identified in chapters one and two old mixedwoods with trembling aspen as key habitats and the Pileated Woodpecker as a keystone species, the third chapters aimed to evaluate this large cavity excavator as an umbrella species for cavity nesters in the boreal forest. We verify the hypothesis that the conservation of the Pileated Woodpecker's habitat would also conserve the habitat for other cavity nesters since this species is very demanding in terms of habitat quality. Our results show that the Pileated Woodpecker strongly selects forest stands also selected by the majority of cavity nesters: old mixedwoods with trembling aspen. The Pileated Woodpecker is the species in which the presence of its cavities at a site was the most susceptible to predict the presence of other species nesting cavities. With a simulation of site selection for conservation of cavity nesters, we show that prioritizing sites with the Pileated Woodpecker as an umbrella species is efficient. Hence, the Pileated Woodpecker is depicted as an umbrella species for the quality of reproduction habitat for cavity nesters associated with mixedwoods, a key component of biodiversity in boreal forests. This thesis demonstrates that age, productivity and composition of boreal forests are key factors for maintaining specific and functional diversity of decayed and dead wood associated fauna. Despite their low availability in the landscape, old
xxvii
mixedwood forests are key habitats and are targeted as habitats of special concern for conservation. In these forests, the Pileated Woodpecker plays the double role of keystone and umbrella species for the cavity nesters. Old coniferous forests are generally poor but seemed crucial for the foraging of the Black-backed Woodpecker and the American Three-toed Woodpecker. However, even in the absence of these old forests, complex cavity users networks composed of open canopy forest associated species persisted in beaver ponds throughout the latitudinal gradient. Keywords: boreal forest, senescent and dead wood, woodpeckers, cavity nesters, nest webs, paludification, robustness, Pileated Woodpecker, trembling aspen, black spruce

xxviii
INTRODUCTION GÉNÉRALE
Importance du bois mort pour la biodiversité
La dégradation et la décomposition des arbres sont responsables de la présence d’une
grande diversité d’organismes dans nos forêts : champignons, insectes, oiseaux et
mammifères (Franklin et al. 1987, Siitonen 2001). La mort des arbres en particulier
offre une ressource clé pour l’alimentation et la reproduction de multiples espèces
(Thomas 1979, Harmon et al. 1986, Franklin et al. 1987, Darveau et Desrochers
2001, Bunnell et al. 2002, Grove 2002, Nappi et al. 2015). Pour certains groupes
d’espèces, une stratégie évolutive efficace combine le site d’alimentation et le site de
reproduction sur le bois mort; à titre d'exemple, les insectes saproxiliques se
reproduisent et leurs larves se nourrissent et creusent des tunnels dans le bois mort.
En revanche, certains pics se nourrissent de ces insectes et excavent leurs cavités de
reproduction dans des arbres morts et sénescents. Le bois sénescent et mort est donc à
la base de réseaux écologiques complexes. Depuis une trentaine d’années, la
communauté scientifique accorde une importance de plus en plus grande au bois mort
pour le maintien de la biodiversité dans nos forêts (Thomas 1979, Harmon et al.
1986, Grove 2002, Stockland et Siitonen 2012). En forêt boréale Fenno-scandinave,
où l’on a considérablement réduit la disponibilité du bois mort, plusieurs espèces
dépendantes de cette ressource sont menacées ou localement éteintes (Angelstam et
Mikusiński 1994, Siitonen 2001). Parmi les espèces fauniques associées au bois mort,
les pics constituent un groupe facilement mesurable qui pourrait être utilisé comme
groupe d’espèces indicatrices de l’état de la diversité biologique (Angelstam et
Mikusiński 1994, Mikusiński et al. 2001, Virkkala 2006, Drever et al. 2008). Les
espèces d’oiseaux résidentes qui dépendent des cavités dans les arbres morts ou
2
sénescents seraient hautement vulnérables à la diminution de la disponibilité du bois
mort causée par l’aménagement forestier (Imbeau et al. 2001).
La dynamique du recrutement de bois mort en forêt boréale
En forêt boréale, comme dans toutes les forêts sous l’influence d’un régime de
perturbations naturelles, la répartition des arbres morts ou sénescents dans les
peuplements et dans le paysage est hétérogène (Franklin et al. 1987). Le feu est
reconnu comme étant la perturbation naturelle la plus importante influençant la
distribution des classes d’âge et la composition du couvert forestier (Rowe et Scotter
1973, Bergeron et al. 2001, Bergeron et al. 2004, Gauthier et al. 2008b). Cette
perturbation majeure génère un recrutement massif d’arbres récemment morts qui
sont rapidement colonisés par les insectes xylophages (Saint-Germain et al. 2004c,
Saint-Germain et al. 2004b, Saint-Germain et al. 2004a). Parmi les espèces de
vertébrés associées au bois mort, le Pic à dos noir (Picoides arcticus) compte parmi
les espèces les plus associées à ces importants, mais éphémères, apports de ressources
alimentaires (Hutto 1995, Imbeau et al. 1999, Nappi 2009). Les brûlis récents sont
considérés comme des habitats sources pour le Pic à dos noir, offrant à la fois des
conditions de nidification et d’alimentation un substrat d’alimentation adéquat pour
ceux-ci (Hutto 1995, Murphy et Lehnhausen 1998, Nappi 2009, Nappi et al. 2010,
Nappi et Drapeau 2011). En l’absence de perturbations primaires telles que le feu, des
perturbations naturelles secondaires peuvent réguler la composition et la structure
forestière (Kneeshaw et Bergeron 1998). Les épidémies d’insectes, dont celles de la
tordeuse de bourgeons d’épinette, ont d’importants effets sur la structure forestière ;
elles créent des trouées et participent à l’apport en bois mort utilisé par la faune
(Goggans et al. 1989, Kneeshaw et Bergeron 1998, Morin et al. 2008, Bonnot et al.
2009). En revanche, la sénescence des arbres combinés à d’autres facteurs biotiques
et abiotiques (vent, maladies, infection fongique) est responsable d’un recrutement
3
constant d’arbres morts de grand diamètre dans les paysages boréaux (Franklin et al.
1987).
Le rôle du castor (Castor canadensis) comme un agent de perturbation en forêt
boréale est souvent négligé par la littérature puisque des perturbations à plus grande
échelle sont priorisées (Nummi et Kuuluvainen 2013). Par contre, considéré par
plusieurs comme une espèce-ingénieur, le castor est responsable de l’ennoiement et la
mort d’une quantité non négligeable d’arbres et de la création de marécages et de
terres humides, et par ce fait, de la création d’habitats pour une variété
impressionnante d’espèces (Jones et al. 1994, Wright et al. 2002, Rosell et al. 2005,
Nummi et Kuuluvainen 2013). Il est proposé que cette espèce-ingénieur augmente la
richesse d’espèces à l’échelle du paysage (Wright et al. 2002). En l’absence de
perturbations majeures et dans des paysages dominés par des épinettes noires de
petite taille, les forêts ennoyées par le castor sont possiblement une source importante
d’arbres adéquats à l’excavation de cavités. À date, très peu d’études ont abordé la
question de l’utilisation par les pics des forêts inondées par le castor (Lochmiller
1979, Grover et Baldassarre 1995) et nous n'avons répertorié aucune étude publiée
avec révision par des pairs ayant vérifié l’importance de cet habitat pour l’ensemble
de la communauté d’utilisateurs de cavités.
Les forêts qui ont échappé aux feux et autres perturbations suivent une trajectoire
successionnelle qui diffère selon leur composition (Bergeron 2000, Harvey et al.
2002). En pessière noire à mousses, où l’on retrouve une majorité de peuplements
purs d’épinettes noires (Picea mariana), ce sont principalement des changements
dans la structure forestière qui s’effectuent à mesure que les forêts vieillissent, ces
forêts devenant graduellement plus structurellement complexes (Harper et al. 2002,
Harper et al. 2005). Des changements considérables dans la structure et la
composition forestière se produisent tout au long du vieillissement des forêts boréales
mixtes débutant par le peuplier faux-tremble (Populus tremuloides). Pour la portion
4
sud de la forêt boréale mixte, ces forêts passent d’une dominance feuillue et d’une
structure homogène à une forêt dont la canopée est mixte et finalement à une forêt qui
est dominée par les conifères dont la structure est plus hétérogène (Harvey et al.
2002). Dans la portion nord de la forêt boréale, la succession forestière peut
commencer par le peuplier faux-tremble, le pin gris ou l’épinette noire, mais
converge dans le temps autour de peuplements d’épinettes noires (Bergeron et al.
2002, Harper et al. 2003).
Le long d’un gradient successionnel, l’apport maximal d’arbres morts et sénescents
est généralement atteint à la sénescence des peuplements, lorsque les arbres de la
première cohorte meurent de vieillesse et se font graduellement remplacer par les
arbres de la seconde cohorte (Clark et al. 1998, Franklin et al. 2002, Kneeshaw et
Gauthier 2003, Harper et al. 2005). Kneeshaw et Gauthier (2003) définissent ces
forêts comme étant des forêts anciennes (old-growth forests). Le recrutement de bois
mort par la sénescence s’échelonne sous une plus longue période de temps. De ce fait,
plusieurs espèces d’oiseaux associées au bois mort sont aussi associées aux forêts
âgées ou anciennes (Angelstam et Mikusiński 1994, Drapeau et al. 2000, Schieck et
Song 2006). Entre autres, la plupart des excavateurs de cavités en forêt boréale sont
associés aux vieilles forêts (Imbeau 2001, Drapeau et al. 2003, Savignac et Machtans
2006, Cooke 2009, Cadieux 2011). Ces vieilles forêts boréales sont largement
distribuées dans le territoire et assurent un apport constant d’arbres morts pour une
panoplie d’états de dégradation aux espèces qui en dépendent.
Cela dit, l’apport continu en bois mort n’est pas une fonction partagée par toutes les
vieilles forêts. Dans les basses terres de la baie James, dans la ceinture d’argile du
Québec et de l’Ontario, où la topographie est plate et non accidentée (Robitaille et
Saucier 1998), les vieilles forêts d’épinettes noires en pessière à mousses ont
tendance à s’entourber à mesure qu’elles vieillissent (Fenton et al. 2005).
L’accumulation de matière organique au sol, principalement de sphaignes de lumière,
5
cause la baisse de la température du sol et de la disponibilité en nutriments. Cet
entourbement, aussi appelé paludification, cause une diminution importante de la
productivité forestière (Simard et al. 2007) et, par conséquent, du recrutement de gros
arbres et de bois mort (Harper et al. 2005).
L’utilisation des arbres morts par la faune cavicole et corticole en forêt boréale
En forêt boréale sous l’influence d’un régime de perturbations naturelles, il y a
généralement un apport constant d’arbres morts et sénescents. Plusieurs espèces
d’oiseaux forestiers se sont adaptées au cours de leur évolution à l’utilisation de cette
ressource pour subvenir à leurs besoins vitaux : l’alimentation, la nidification, les
refuges et la communication acoustique (Darveau et Desrochers 2001).
Une partie importante de la faune vertébrée des forêts boréales utilise des cavités dans
les arbres pour la nidification ou comme abris (approximativement 37 espèces -
Darveau et Desrochers 2001). Des réseaux d’utilisateurs de cavité ou « nest web »
similaires aux réseaux trophiques sont formés à partir d’interactions interspécifiques
entre les animaux dépendant de cavités (Martin et Eadie 1999). La ressource centrale,
c’est-à-dire les cavités, est partagée selon une hiérarchie d’utilisateurs et de liens
entre ces derniers (Blanc et Walters 2007). En forêt boréale, les excavateurs primaires
sont les pics et ces derniers excavent généralement une cavité annuellement pour y
nicher. Les utilisateurs secondaires de cavités sont un groupe diversifié : passereaux,
oiseaux de proie, canards et mammifères qui dépendent des cavités, mais ne peuvent
les excaver. Les excavateurs faibles peuvent creuser leurs cavités dans du bois très
décomposé ou réutiliser des cavités (Martin et Eadie 1999). En Amérique du Nord, la
grande majorité des cavités utilisées ne résultent pas de la dégradation des arbres,
mais sont excavées par les pics (Raphael et White 1984, Martin et Eadie 1999, Aitken
et Martin 2004, Blanc et Walters 2008a, Cooke 2009, Cadieux 2011, Cockle et al.
6
2011). La création de cavités par les pics est donc considérée comme un processus clé
dans les communautés forestières (Bednarz et al. 2004).
Les excavateurs de cavités de grande taille tels que le Pic flamboyant (Colaptes
auratus) et le Grand Pic (Dryocopus pileatus) sont identifiés comme espèces clés de
voûte par plusieurs études (Bonar 2000, Aubry et Raley 2002, Martin et al. 2004,
Blanc et Walters 2008a, Cooke 2009, Cadieux 2011). Entre autres, les cavités
excavées par le Grand Pic sont significativement moins nombreuses que les autres
types de cavités (Bonar 2000, Vaillancourt et al. 2008) et ceci limite les utilisateurs
de ce type de cavité. Cet excavateur est le seul à pouvoir créer des cavités assez
grandes (soit deux fois le volume des cavités du Pic flamboyant) pour abriter les plus
gros des utilisateurs secondaires, tels que le Garrot à œil d’or (Bucephala clangula)
ou le Garrot d’Islande (Bucephala islandica) (Bonar 2000, Darveau et Desrochers
2001, Aubry et Raley 2002, Evans et al. 2002, Martin et al. 2004, Vaillancourt et al.
2008, Cooke 2009, Vaillancourt et al. 2009).
À la base des réseaux d’utilisateurs de cavités se trouvent les arbres. Dans les
écosystèmes forestiers où le peuplier faux-tremble est présent, cette essence est
hautement sélectionnée comme arbre de nidification (Dobkin et al. 1995, Aitken et al.
2002, Martin et al. 2004, Cadieux 2011). Certaines études ont associé la préférence de
cette essence à la présence d’infections par un champignon : la carie blanche du
tremble (Phellinus tremulae) (Kilham 1971, Hart et Hart 2001, Jackson et Jackson
2004, Martin et al. 2004, Savignac et Machtans 2006, Blanc et Martin 2012, Cooke et
Hannon 2012). De même, les arbres utilisés par les excavateurs en forêt boréale
résineuse sont généralement infectés par une carie du coeur de l’arbre (Goggans et al.
1989, Pechacek et d'Oleire-Oltmanns 2004).
Les arbres morts et sénescents sont d’importants réservoirs alimentaires pour
plusieurs espèces d’oiseaux insectivores dont l’importance de ce rôle est accentuée en
7
hiver. La plupart des espèces de pics se nourrissent d’arthropodes et s’alimentent sur
des arbres sénescents ou morts (Mikusiński 2006, Nappi et al. 2015). Ils se
spécialisent selon l’essence, le diamètre et l’état de dégradation des arbres (voir
Nappi et al. (2015) pour une étude détaillée dans notre région d’étude). Les pics
boréaux, le Pic à dos noir et le Pic à dos rayé sont particulièrement spécialisés sur les
arbres résineux de grand diamètre récemment morts (Darveau et Desrochers 2001,
Imbeau et Desrochers 2002, Nappi et al. 2015). Le Pic à dos noir se nourrit
exclusivement sur des arbres morts où il trouve des insectes foreurs phytophages
(Cerambicidae) alors que le Pic à dos rayé se nourrit d’insectes xylophages sous
l’écorce tant sur des arbres sénescents que morts (Scolitidae) (Murphy et Lehnhausen
1998, Saint-Germain et al. 2007, Nappi et al. 2015). Le Pic mineur (Picoides
pubescens), le Pic maculé (Sphyrapicus varius), le Pic chevelu (Picoides villosus), et
le Grand Pic s’alimentent principalement d’arthropodes retrouvés sur des essences
feuillues et résineuses principalement retrouvées en forêt mixte. L’état de dégradation
des arbres d’alimentation diffère selon les espèces, mais celles-ci utilisent en
moyenne plus d’arbres vivants que ne le font les pics boréaux (Nappi et al. 2015).
Peu d’information existe sur l’utilisation d’arbres morts pour le tambourinage par les
pics. Par contre, Imbeau et Desrochers (2002) caractérisent l’utilisation de ces arbres
pour le Pic à dos rayé. Les arbres de tambourinage utilisés par les pics ont un grand
diamètre, sont morts, creux et secs afin d’avoir les meilleures qualités de transmission
sonore (Eberhardt 1997, Darveau et Desrochers 2001, Imbeau et Desrochers 2002).
Rôle des vieilles forêts résineuses dans l'apport de bois mort pour la faune
cavicole en pessière à mousses
On ne sait que très peu de choses sur la capacité des vieilles forêts de pessière à
mousses quant à leur capacité à offrir de conditions d’habitats adéquates pour les
oiseaux associés au bois mort. Selon des études effectuées dans l’ouest de l’Amérique
8
du Nord, la distribution du bois mort en forêt tempérée de conifères suivrait une
forme de «U» où une grande abondance de chicots serait présente suite au feu, suivi
par une diminution constante de bois mort dans les forêts jeunes et matures et
finalement, suivi par une abondance croissante dans les vieilles forêts (Harmon et al.
1986). Cependant, peu d’études ont été effectuées dans l’est de l’Amérique du Nord
dans les forêts boréales de conifères où les diamètres des arbres sont
considérablement plus faibles. Harper et al. (2005) proposent que cette forme
ressemble davantage à un «J» inversé dans les forêts boréales de l’est de l’Amérique
du Nord et que dans les pessières à mousses susceptibles à l’entourbement, on
distingue même une abondance décroissante de bois mort dans les très vieilles forêts.
En accord avec ceci, Drapeau et al. (2002) rapportent, dans une des seules études
portant sur l’apport de bois mort pour les oiseaux cavicoles effectuée en pessière à
mousses de l’ouest du Québec, que les très vieilles forêts (> 200 ans) ne joueraient
pas un rôle clé dans l’apport d’un substrat adéquat à l’excavation de cavités par les
oiseaux cavicoles. Cependant, nous ne disposons pas de données sur la distribution
des espèces cavicoles le long d’un gradient d’âge et de structure forestière en pessière
à mousses qui traduise les changements fins de structure de la végétation décrits dans
Harper et al. (2005). À ce jour, aucune étude n’a examiné la contribution relative des
forêts âgées encore productives, de celles en voie de paludification ainsi que des
forêts paludifiées quant à la disponibilité du bois sénescent et mort ainsi que de la
réponse des oiseaux associés à ce dernier. Ces forêts représentent pourtant une
proportion non négligeable du domaine de la pessière à mousses.
Les forêts mixtes isolées en pessière à mousses, des oasis de biodiversité ?
Les forêts mixtes se raréfient considérablement du sud au nord de la forêt boréale,
partant de grands massifs dans le domaine de la sapinière à bouleau blanc qui se
fragmentent pour ne composer qu’une très faible proportion du domaine de la
pessière à mousses. Les forêts mixtes seraient néanmoins hautement sélectionnées par
9
plusieurs espèces de vertébrés. Cheveau et al. (2013) ainsi que Potvin et al. (2000)
rapportent que ces endroits seraient possiblement clés pour les populations de martre.
De plus, Crête et Courtois (1997) rapportent que les forêts mixtes, même s’ils
représentent que < 5 % de la forêt en pessière à mousses sont grandement
sélectionnés par les orignaux comme site d’alimentation. Malgré leur isolement dans
les grandes matrices résineuses, on ignore si ces îlots sont des habitats importants
pour la faune cavicole dans le domaine bioclimatique de la pessière à mousses. À
notre connaissance, aucune étude n’a abordé cette question.
L’aménagement forestier et les pics comme indicateurs de diversité
À l’échelle mondiale, les coupes forestières industrielles et la transformation des
paysages forestiers en paysages agricoles ont causé d’importantes baisses de
populations ainsi que des diminutions dans l’aire de répartition pour plusieurs espèces
de pics (Mikusiński 2006, Winkler et al. 2010). Les espèces de grande taille sont
particulièrement touchées, vu leur grand domaine vital et leur dépendance aux arbres
de grand diamètre pour leur reproduction ou comme refuges (Mikusiński 2006).
En forêt boréale, l’aménagement forestier conventionnel à courtes révolutions tend à
normaliser les classes d’âges des peuplements ce qui contribue à considérablement
rajeunir la moyenne d’âge des paysages forestiers (Franklin et Forman 1987, Spies et
al. 1994, Niemi et al. 1998, Cyr et al. 2009), qui est maintenant significativement plus
basse que celle des paysages naturels perturbés par les feux (Bergeron et al. 2001,
Bergeron et al. 2004, Cyr et al. 2009). Ce rajeunissement des paysages forestiers n’est
pas sans conséquence sur l’abondance et la répartition de plusieurs des espèces de
pics ayant le rôle clé d’excavateurs de cavités dans les forêts âgées tant mixtes
(Drapeau et al. 2000, Hobson et Bayne 2000, Savignac et Machtans 2006, Schieck et
Song 2006, Cooke 2009, Cadieux 2011) que résineuses (Imbeau et Desrochers 2002).
En réponse à cet enjeu de rajeunissement des mosaïques forestières aménagées,
10
plusieurs chercheurs ont proposé le concept d’aménagement écosystémique, une
approche d’aménagement forestier qui s’inspire des perturbations naturelles (Gauthier
et al. 2008b). Un des principaux objectifs de cette approche est le maintien de la
structure d’âge et de la proportion des différents types de peuplements qui sont
observés sous un régime de perturbations naturelles (Gauthier et al. 2008a). Cette
approche de filtre brut se base sur la prémisse que les espèces occupant un
écosystème auraient évolué et se seraient adaptées aux régimes de perturbations de ce
dernier (Hunter et al. 1988, Gauthier et al. 2008b). L’évaluation de la capacité de
l’approche écosystémique à maintenir des éléments importants de la diversité
biologique en forêt boréale passe par le suivi d’espèces indicatrices associées aux
habitats les plus affectés par l’aménagement des forêts (Drapeau et al. 2008). Le suivi
des espèces dépendantes du bois sénescent et mort et, plus particulièrement,
d’espèces clés de voûte comme les pics, s’avère donc crucial pour l’évaluation de la
mise en place de l’aménagement écosystémique.
Par ailleurs, plusieurs chercheurs et aménagistes forestiers recommandent l’utilisation
ou utilisent le Grand Pic comme espèce parapluie ou comme espèce indicatrice des
vieilles forêts (McClelland et al. 1979, Bull et al. 1992, Blanchette 1996, McLaren et
al. 1998, McClelland et McClelland 1999, Savignac et al. 2000, Aubry et Raley 2003,
Lemaître et Villard 2005, Cheveau 2015). La conservation de l’habitat du Grand Pic
serait aussi bénéfique pour de multiples autres espèces vu que cette espèce est très
exigeante tant pour ses arbres de nidification que pour les arbres d’alimentation. Par
contre, nous n'avons répertorié aucune étude publiée avec révision par des pairs qui
vérifie de manière empirique en quoi le Grand Pic constitue bel et bien une espèce
parapluie.
11
Objectifs de la thèse
La forêt boréale de l’est de l’Amérique du Nord comprend d’importants gradients de
productivité et de composition forestière : des pessières à mousses qui dominent
largement la composition forestière, mais qui sont souvent affectées par la
paludification, aux forêts mixtes dominées ou co-dominées par le peuplier faux-
tremble qui se raréfient considérablement du sud vers le nord de la forêt boréale, mais
qui ont une productivité nettement supérieure. Les oiseaux associés au bois mort tel
que les pics sont répartis dans le territoire boréal parmi ces importantes sources de
productivité forestière et de recrutement de bois mort et sénescent (Angelstam et
Mikusiński 1994). Par contre, notre connaissance et notre compréhension de cette
distribution s’avèrent incomplètes. En pessière à mousses de l’est de l’Amérique du
Nord, ces oiseaux sont potentiellement limités par l’abondance d’arbres de
nidification et d’alimentation adéquats. Cette thèse a comme objectif d’approfondir
nos connaissances fondamentales sur l’écologie, dont une compréhension accrue du
rôle joué par le bois mort et sénescent dans la diversité fonctionnelle de l’écosystème
boréal. De plus, selon une perspective appliquée, cette thèse vise à développer d’un
modèle de qualité d’habitat multi-espèces.
Dans le premier chapitre, nous explorons la relation que la faune cavicole entretient
avec l’habitat forestier en pessière à mousses. Plus précisément, nous examinons le
rôle des vieilles forêts dans l’apport de bois sénescent et mort et l’importance de cette
ressource pour l’occurrence et l’alimentation par l’avifaune associée au bois mort.
Les vieilles forêts boréales sont des habitats clés pour le recrutement à long terme
d’arbres morts de grand diamètre. Par contre, la paludification des vieilles forêts de
pessière à mousses réduit sévèrement la productivité forestière et, par conséquent, la
production de bois sénescent et mort. Malgré l’importance de ce phénomène, très peu
d’études portent sur les effets de la paludification sur la distribution des oiseaux
associés au bois sénescent et mort (Drapeau et al. 2003). Les implications de ces
12
résultats pour la priorisation des habitats à conserver dans les paysages aménagés sont
importantes ; les vieilles forêts n’ont probablement pas toutes la même valeur en ce
qui concerne la conservation de la diversité aviaire en pessière à mousses.
La contribution des forêts mixtes isolées à la communauté cavicole dans le paysage
résineux de la pessière à mousses est méconnue, mais l’isolement de ces habitats
devrait affecter leur occupation par les espèces cavicoles. Le deuxième chapitre porte
sur l’influence de la disponibilité des arbres adéquats à l’excavation de cavités sur la
structure des réseaux d’utilisateurs de cavités. L’excavation de cavités de nidification
par des excavateurs clés dans le paysage peut avoir de grandes répercussions sur la
nidification d’utilisateurs secondaires de cavités. Les grands utilisateurs secondaires
de cavités tels que le Garrot à oeil d’or (Bucephala clangula) sont particulièrement
dépendants de grandes cavités qui sont quasi exclusivement excavées par le Grand
Pic. Cependant, le processus d’excavation de grandes cavités en pessière à mousses
de l’est de l’Amérique du Nord est fortement contraint par le faible diamètre des
arbres. Depuis une dizaine d’années, plusieurs études ont été effectuées sur la
structure des réseaux d’utilisateurs de cavités (Martin et Eadie 1999, Martin et al.
2004, Blanc et Walters 2007, Blanc et Walters 2008a, Blanc et Walters 2008b,
Bavrlic 2009, Cooke 2009, Cadieux 2011). La grande majorité de celles-ci sont
effectuées en forêt mixte. À notre connaissance, aucune étude en forêt boréale ne
traite de réseaux d’utilisateurs de cavités en paysage dominé par des forêts de
conifères comme la région de la pessière à mousses.
En aménagement écosystémique, il est important de disposer d’indicateurs qui
déterminent la capacité des stratégies d’aménagement à maintenir la diversité
biologique. Ces indicateurs, de type évaluatif, vérifient l’hypothèse d’une relation
entre l’action d’aménagement et son effet sur la diversité biologique (Drapeau et al.
2008). Avoir des cibles d’aménagement qui permettent la cohabitation de
l'aménagement forestier et le maintien des réseaux d’utilisateurs de cavités riches et
13
complexes en forêt boréale sous-tend l’identification des habitats clés à préserver
dans les paysages aménagés. Ces habitats doivent répondre aux exigences des espèces
cavicoles tant sur le plan des gites de reproduction que des arbres d’alimentation. Le
troisième chapitre a pour objectif d’évaluer l’efficacité d’utiliser le Grand Pic comme
une espèce parapluie pour la conservation de l’ensemble de la faune cavicole. Cette
espèce est souvent qualifiée d’espèce parapluie par des chercheurs et des aménagistes
forestiers, mais nous n'avons répertorié aucune étude publiée avec révision par des
pairs ayant vérifié cet énoncé avec des données empiriques. Nous testons l’hypothèse
que la sélection d’habitat effectuée par le Grand Pic engloberait la sélection d’habitat
de la majorité des espèces cavicoles. Par conséquent, la conservation de l’habitat du
Grand Pic serait aussi bénéfique à de multiples autres espèces cavicoles en forêt
boréale.


CHAPITRE 1
ARE OLD BOREAL FORESTS A SAFE BET FOR THE CONSERVATION
OF THE AVIFAUNA ASSOCIATED WITH DECAYED WOOD IN EASTERN
CANADA?
16
1.1 Résumé
Les vieilles forêts boréales sont considérées comme des habitats de qualité pour l'avifaune associée au bois sénescent et mort. Cependant, la quantité et la qualité des arbres morts et sénescents sont probablement influencées par d'importants changements latitudinaux dans la composition et la productivité forestière partant des forêts boréales mixtes du sud aux forêts résineuses nordiques. Nous avons mesuré l'occupation de l'habitat des oiseaux cavicoles et corticoles dans les vieilles forêts à la zone de transition entre la forêt boréale mixte et résineuse du Nord-Ouest du Québec. En utilisant de la repasse de chants et de tambourinage ainsi que des marques récentes d'alimentation sur les arbres, nous avons mesuré l'occurrence de 11 espèces d'oiseaux dans 85 peuplements de forêts mixtes et résineuses non aménagées le long d'un gradient d'âge. Bien qu'ils ne représentent que 4 % du couvert forestier dans la région d'étude, les vieilles forêts mixtes (> 90 ans) étaient de loin les plus utilisées par l'avifaune associée au bois mort. Dans les peuplements dominés par les conifères ces oiseaux ont montré une réponse modale au vieillissement et à la réduction de la productivité forestière atteignant le maximum dans les peuplements de 160 ans pour ensuite redescendre. Les peuplements paludifiés qui composaient plus de 40 % du paysage ont étés associés à une richesse d'espèces significativement plus pauvre d'oiseaux cavicoles et corticoles. La diversité structurale des tiges (diversité des stades de dégradation et du diamètre des arbres) était la variable qui a le mieux expliqué la richesse d'espèces de ce groupe fonctionnel tandis qu’à l'échelle de l'espèce individuelle, de grandes quantité et qualité de bois sénescent et mort dans les peuplements ont le mieux expliqué l'occurrence des espèces et l'abondance de traces d'alimentation des pics. Les traces d'alimentation du Pic à dos noir (Picoides arcticus) et le Pic à dos rayé (Picoides dorsalis) ont atteint leur abondance maximale dans les vieux peuplements productifs résineux. Les traces d'alimentation des autres pics étaient principalement trouvées en forêts mixtes. Les efforts de conservation de l'avifaune associée au bois mort devraient être priorisés dans les vieux peuplements productifs autant résineux que mixtes. Cependant, notre étude désigne les vieilles forêts mixtes comme des habitats qui méritent une préoccupation particulière pour ce groupe fonctionnel d'oiseaux.
17
1.2 Abstract
Old boreal forests are considered quality habitats for birds associated with decaying and dead trees. However, the quantity and quality of these structural attributes in old forest stands are likely to be influenced by important latitudinal changes in tree species composition and productivity from the southern boreal mixed to the northern coniferous forests. We measured habitat occupancy of cavity and bark nesting birds in old forests when the boreal forest landscape shifts from a mixed to a dominant coniferous matrix in the Clay Belt of Québec and Ontario, a region where paludification dominates. Using playback calls, songs, and recent woodpeckers' foraging signs on trees, we measured the occurrence and foraging habitat use of 11 bird species associated with deadwood in 86 unmanaged forest stands along a forest age gradient in both mixed and coniferous stands. In coniferous stands dominated by black spruce, deadwood birds showed a modal distribution in response to the aging of black spruce forests that reached a peak in stands of 160 years and then declined. Unproductive paludified stands, which made up more than 40 % of our study area, were associated with a significantly lower species richness of deadwood birds. At the opposite, although they represented less than 4 % of the forest cover in our study area, old boreal mixedwood forests (> 90 years) were highly utilized habitats by deadwood birds. Structural diversity of trees (diversity of degradation stages and diameter of trees) was the variable that best explained species richness of this functional group of birds whereas at the individual species level, the quantity and quality of dead trees (degradation and size) in stands best explained species occurrence and abundance of foraging signs. Conservation efforts for deadwood birds should focus on old productive stands of both mixed and coniferous composition. However, our study pinpoints old mixedwood stand as habitats of special concern given their disproportionate importance for deadwood birds in northern boreal forests.
18
1.3 Introduction
In old boreal forests, decaying and dead wood represent key structural attributes for
biodiversity (Stokland et al. 2012). Birds that use decaying and dead wood for nesting
represent a major component of old forest bird communities (Angelstam and
Mikusiński 1994, Niemi et al. 1998, Imbeau et al. 1999, 2001, Schmiegelow and
Mönkkönen 2002, Drapeau et al. 2003, 2009, Schieck and Song 2006). They have
been proposed to be general indicators of old forests’ biodiversity (fungi, insects,
birds, mammals) (Mikusiński et al. 2001, Virkkala 2006, Drever et al. 2008, Roberge
et al. 2008). Within this focal group, woodpeckers are keystone species and
ecosystem engineers since they produce most of the cavities that are used by a wide
range of other vertebrates that cannot create their own cavities for roosting and
reproduction (Aubry and Raley 2002, Bednarz et al. 2004, Martin et al. 2004, Cockle
et al. 2012, Tremblay et al. 2015a).
In recent years, studies on cavity-nesting communities in subalpine and boreal forests
across Canada have found that large decaying and dead deciduous trees, particularly
trembling aspen (Populus tremuloides), are the primary nesting substrates for most
cavity users (Martin et al. 2004, Cadieux 2011, Cooke and Hannon 2012, Ouellet-
Lapointe et al. 2012). Whereas decaying and dead trembling aspens are found in a
wide range of old forest cover types in the southern boreal forest (Bergeron and
Charron 1994), their availability may be reduced at more northerly latitudes due to
changes in natural disturbance regimes linked with fire size and severity (Bergeron et
al. 2004), which affects tree species composition of the forest cover (Gauthier et al.
2000). In addition, in some regions, such as in northwestern Québec and northeastern
Ontario, northerly dominant black spruce stands are prone to paludification, a process
of gradual conversion of a mesic forest to a forested peatland through the
accumulation of organic material and water table rise (Taylor et al. 1988, Simard et
al. 2007). Old black spruce stands thus present a wide spectrum of stand structures
19
(Harper et al. 2002, 2003) ranging from increased vertical heterogeneity to extensive
open canopy with smaller sized trees where the oldest stands may resemble bogs
(Lecomte et al. 2006a, 2006b).
Preliminary results on bird communities in black spruce forests of these regions have
shown that species associated with canopy cover (foliage gleaners, canopy nesters)
and old decaying trees (bark foragers, cavity nesters) become rare and are replaced by
open habitat specialists (shrub nesters) in very old black spruce stands (> 200 years
since last fire), as they are not evolving into more complex vertical structures but are
more simplified with an extreme canopy openness (Drapeau et al. 2003). Such
turnover in bird community composition depicts a broad change in forest structure
between recently old (100 – 200 years) and very old forests (> 200 years) in
landscapes prone to paludification. Clear understanding of the degree to which
deadwood birds track structural changes in old black spruce forests is, however,
lacking.
The latitudinal changes in structure and composition of old forests may thus diminish
their role in providing key habitat conditions to deadwood bird species. Increased
knowledge on how regional distribution patterns of this focal group of bird species
changes over the natural transition from mixed to a conifer-dominated matrix in the
boreal forest is thus critical to develop conservation planning of biodiversity in old
stands in managed landscapes. This is still the case as commercial timber harvesting
is unfolding in the north with extensive implementation of short-rotation even-aged
management favoring an increase in the proportion of early-seral habitats and
concurrent reduction in late-seral habitats even though ecosystem-based management
mitigates this change (Gauthier et al. 1996, Bergeron et al. 2002, 2007).
In this study, we evaluate the importance of old boreal forests for deadwood birds
when the boreal forest shifts from a mixed to a conifer-dominated matrix in the Clay
20
Belt region of Québec and Ontario which is greatly affected by paludification. We
hypothesize that old forest stands in this part of the boreal forest provide limited
nesting and foraging conditions, reducing deadwood birds species richness patterns.
More specifically, we make the following predictions at the community and
individual species' levels. At the community level, we predict that in black spruce
stands there will be a modal distribution of deadwood birds species richness and
foraging habitat use, increasing along the age and structure gradient and declining as
forests are affected by paludification. Second, since they are strongly isolated in the
conifer-dominated forest matrix, boreal mixedwood stands will not have a higher
species richness or foraging habitat use than black spruce stands. Third, the quantity
and structural diversity of live and dead trees (size and degradation) will be the best
predictor of deadwood birds’ species richness and abundance of foraging signs.
Fourth, at the species level, deadwood birds’ occurrence and foraging habitat use
patterns will translate into individualistic responses associated with specific structural
attributes of live and dead trees.
1.4 Methods
1.4.1 Study area
The study was conducted in northwestern Québec in the black spruce-moss
bioclimatic domain (Robitaille and Saucier 1998). This region is part of a broad
physiographic unit, the clay belt, which is located south of James Bay and extends
across northern Québec and Ontario. The flat topography of the region originates
from clay deposits left by proglacial lake Ojibway (Vincent and Hardy 1977, Veillette
1994). The study region is characterized by lower altitude (250 m) and the abundance
of wetlands.
To obtain a representative sample of the range of forest cover types in the boreal
forest of northwestern Québec, we sampled a large area of Québec’s Clay Belt
21
(Figure 1.1). Specifically, we selected study sites in two regions, north of La Sarre
(48°48'37.5"N 79°12'34.1"W) in the forest management units (FMU) 8551 and north
of Lebel-Sur-Quévillon (49°03'18.1"N 76°59'42.2"W) in the FMU 8763 that differ in
their topography and therefore their potential for paludification. The average annual
temperature was 0.0 °C with an average annual precipitation of 909 mm, taken at the
nearest weather station in Joutel, Québec, 1981-2010 (49°27′ N; 78°18′ W)
(Environment Canada, 2016).
1.4.2 Site selection
We selected sites along a gradient of forest age, composition and structure,
combining information from digital forest cover maps (MRNF 2011) and field
validation. Coniferous black spruce dominated stands were selected using digital
forest cover maps and time since last fire estimates from two data sources. First, a
study of fire history reconstruction provided extensive information on past historical
fire events on a regional scale (Bergeron et al. 2004). Second, precise estimates of
forest stand age were provided by detailed local scale dendrochronological analysis of
stems (see Chaieb et al. 2015 for details). We selected 43 black spruce dominated
stands aged 61-215 years : 60-90 years (n=8), 90-120 years (n=11), 120-160 years
(n=14), 160-215 years (n=10). We enlarged this structural gradient by adding 21
stands that were in the process of paludification (n=7) and paludified (n=14). For the
former, we selected stands 83-460 years considered forested in the first regional
forest inventory that were later classified as bogs in the third regional forest inventory
(MRNF 1994, 2009). Paludified stands (between 75-3849 years) were considered as
bogs on digital forest cover maps. We selected 22 mixedwood stands dominated or
co-dominated by trembling aspen and from two age-class categories provided on the
digital forest cover maps 70-90 years (n=11) and > 90 years (n=11). In each stand we
positioned one playback station (total n=86 stations) at least 100 m away from the
edge of the stand and separated by > 400 m.
22
1.4.3 Habitat sampling
We positioned three 400 m2 sampling plots within a 100 m radius centered on the
location of the playback stations to measure woodpecker foraging signs and to
characterize the vegetation. One plot was positioned at the playback station whereas
the two others were positioned 60 m away on randomly chosen cardinal directions.
Precise measures were taken for every tree larger than 10 cm in DBH (diameter at
breast height): tree species, degradation class and the presence or absence of
woodpecker foraging signs. Tree degradation was classified based on visual
appearance in 8 categories according to Imbeau et Desrochers (2002) (1 = alive and
healthy > 95 % foliage; 2 = live but senescent, between > 20 % and 95 % foliage; 3 =
dying < 20 % foliage; 4 = recently dead, no green foliage; 5 = hard wood, no dead
foliage, no small twigs; 6 = hard wood, loose bark cover, broken top, > 50 % of
original height; 7 = soft, decomposed wood, broken top with < 50 % of original
height; 8 = stump, height < 2 m). Mean tree diameter and basal area per hectare were
calculated combining all trees from the three vegetation plots. A 120 m transect was
aligned with the center of the three plots to measure, at the point of intersection, the
diameter and degradation of the deadwood on the ground. Downed deadwood volume
(m3/ha) was estimated for each stand with a formula developed by Van Wagner
(1968). We measured the proportion of forest cover types at the landscape scale with
digital forest cover maps (MRNF 2011) delimited by the forest management units of
each region.
1.4.4 Bird sampling
The response to the playback calls in a 75 m radius was used to measure the
occurrence of individual species and the species richness of our focal group
comprised of eleven bird species: Yellow-bellied Sapsucker (Sphyrapicus varius),
Downy Woodpecker (Picoides pubescens), Hairy Woodpecker (Picoides villosus),
American Three-toed Woodpecker (Picoides dorsalis), Black-backed Woodpecker
(Picoides arcticus), Northern Flicker (Colaptes auratus), Pileated Woodpecker
23
(Dryocopus pileatus), Boreal Chickadee (Poecile hudsonicus), Red-breasted Nuthatch
(Sitta canadensis), Brown Creeper (Certhia americana), and Winter Wren
(Troglodytes hiemalis) (Appendix A). The playback calls were comprised of one-
minute calls and drumming for each species interspersed by one minute of silence.
The sequence of calls was ordered by the species body mass from small to large.
Each site was visited three times during the breeding period from the beginning of
May to the end of June between 05:00 and 10:00 and during adequate weather
conditions (no heavy rain or strong winds).
Even though playback methods may be more appropriate for detecting elusive species
that have large home ranges such as woodpeckers, it nevertheless remains that birds
may use our sampling sites without responding to playbacks. The presence of a
woodpecker’s recent foraging signs on trees may thus be considered as a
complementary information that provides an index of foraging activity, and thus, of
habitat use of our study sites. We recorded the presence and absence of 4 types of
foraging signs on trees in the vegetation sampling plots that can be associated with 5
woodpecker species. Foraging signs were identified and associated with woodpecker
species based on an intensive study conducted on the foraging behavioral ecology of
woodpeckers in the same region (Nappi et al. 2015) (Appendix A). We distinguished
recent foraging signs from older ones by the color and sharpness of the wood and
only recent foraging signs are used in the analyses. The Yellow-bellied Sapsucker
sapwells are easily identified by distinctive patterns of small rectangular holes
organized in horizontal rows on live trees that are close to one another to form
vertical chains (Eberhardt 2000) and not horizontal rows that are dispersed on the
trunk as those of American Three-toed Woodpeckers (Bailey 2008). The Pileated
Woodpecker foraging signs are also easily identified because they represent very
large excavations in large senescent or dead trees often leading to carpenter ants
galleries (Bull and Jackson 2011). The Hairy Woodpecker excavates small holes to
find wood-boring beetles and forages mostly on deciduous trees (Nappi et al. 2015).
24
The Black-backed Woodpecker forages almost exclusively on dying or recently dead
coniferous trees by mainly excavating small holes to find wood-boring beetles but
may also forage by scaling bark for bark beetles (Tremblay et al. 2010, Nappi et al.
2015). The American Three-toed Woodpecker mostly scales bark and rarely
excavates as it feeds on bark beetles (Leonard and David 2001, Nappi et al. 2015).
Whereas identification of small foraging signs by the Picoides group (Hairy, Black-
backed and American three-toed woodpeckers) can be separated on the basis of
habitat types in which they are found (Nappi et al. 2015), our censuses are not based
on visual observations of foraging birds. Therefore, to avoid over-interpretation on
species identity, we did not assign excavations and bark scaling foraging signs to
specific species. Small foraging signs for both bark scaling and excavation were thus
combined into a single Picoides group (Hairy, Black-backed and American Three-
toed woodpeckers).
1.4.5 Statistical analyses
We characterized habitats by variables known to be important for nesting and
foraging requirements of the focal group of species under study (Martin et al. 2004,
Cadieux 2011, Nappi et al. 2015), and which represented tree composition and
productivity, the quantity of deadwood in the stand and the tree structural diversity
(Table 1.1). Tree structural diversity was calculated using the Shannon-Weaver
diversity index where our surrogate "species" corresponded to the combination of the
degradation classes and the DBH of trees classified into categories (in 5 cm classes)
for standing and downed trees (Harper et al. 2003). We used a theoretical-information
approach using Akaike information criterion adjusted for small samples (AICc) to
estimate if a model which included the habitat categories performed better than a null
model, a model that included only the intercept (Burnham and Anderson 2002). We
report the model's Akaike weight (wi) which is the strength of evidence for each
model (ratio of ΔAICc) and the null model's difference in AICc (ΔAICc) (Burnham
and Anderson 2002, Mazerolle 2006). For example, a ΔAICc < 2 suggests strong
25
support for the model, values between 3 and 7 suggest substantially less support
whereas models with >10 ΔAICc are considered poorly supported by the data
(Burnham and Anderson 2002, Mazerolle 2006). To model the relationships between
habitat variables and habitat types, we used generalized linear models (GLMs)
assuming a normal distribution for variables with normally distributed residuals and
assuming a Poisson distribution for count data. Non-normally distributed variables
were log transformed to fit the requirements or were analyzed with a Kruskal-Wallis
test followed by Dunn’s test with a Bonferonni correction with a significance level of
0.05. In the case of overdispersion, the quasi-likelihood Akaike information criterion
was used. We calculated 95% confidence intervals through model averaging
predictions with the R-package "AICcmodavg" version 2.0-3 (Mazerolle 2015).
Statistically significant differences between habitat types, represented by different
letter combinations, were calculated with model-averaging of effect size on group
differences in which the confidence intervals were adjusted for multiple comparisons
with the Bonferonni correction (Mazerolle 2015).
To analyze the patterns of distribution of deadwood birds, we compared the
occurrence of individual species, species richness and the abundance of foraging
signs on trees between habitat types. We used the same theoretical-information
approach as discussed earlier.
We determined which habitat variables were the most influential for the occurrence
of individual species, the species richness of deadwood birds, and the abundance of
foraging trees by comparing a list of simple models composed of a single habitat
variable (Table 1.1). We used a theoretical-information approach with Akaike
information criterion adjusted for small samples (AICc) to compare candidate models
and to select the most parsimonious (Burnham and Anderson 2002). Model averaging
was used to calculate model averaged estimates where there were more than one
variable per model as was the case for the individual species occupancy modeling that
26
included detection variables and habitat variables (see below). Model selection and
averaging was performed using the R-package "AICcmodavg" version 2.0-3
(Mazerolle 2015). We report models having a AICc difference (ΔAICc) < 2 and the
null model. The R-package "ggplot2" was used for graphics (Wickham 2009).
Statistical analyses were conducted using the R version 3.2.3 (R Core Team 2015).
For individual species occurrences, we estimated playbacks site occupancy rates with
the R-package "unmarked" using the single season occupancy model function
(MacKenzie et al. 2002, 2006, Fiske and Chandler 2011). This method estimates the
probability of detection of individual species to account for false absences. It allows
for a greater accuracy in occupancy probability compared to the observed occurrence
defined here as the presence or absence of a species in 3 visits at a site (MacKenzie et
al. 2002). However, modeling occupancy probability with this technique does not
perform well when species have very low detection probabilities (< 0.15)
(MacKenzie et al. 2002). For this reason, we excluded species with a detection
probability below this threshold from analyses for individual species occurrences.
Possible variables influencing detection probability were defined as detection
variables: the observers classified by experience (ExpObs; low and high), the time of
the day (Minutes; number of minutes), wind strength (Wind; 3 categories) and the
date (Julian days). To limit the number of parameters in habitat variable models, we
first did a model selection procedure for selecting variables influencing detection
probability. Models with only detection variables were compared to a model with
only the intercept. To be used in the habitat variables models, the detection variables
had to be among the best models (< 2 ΔAICc) and more supported than a model with
only the intercept. Model fit was assessed by comparing the distribution of χ2 of the
model to the distribution of χ2 obtained by parametric bootstraps with 10 000
iterations and models with a bad fit were not used in model selection (MacKenzie et
al. 2006).
27
Species richness of deadwood birds and abundances of foraging trees' relationships
between habitat types and habitat variables were modeled using generalized linear
models (GLMs) assuming a Poisson distribution. In the case of overdispersion, the
quasi-likelihood Akaike information criterion was used (ΔQAICc) instead of the
ΔAICc.
1.5 Results
1.5.1 Overall landscape patterns
At the landscape scale, 84 % of the forest cover in our study region was coniferous
including old paludified coniferous forests and bogs which covered more than 40 %
of our study area (Figure 1.2). Coniferous stands > 90 years were fairly well
represented with 25 % of the forest cover (Figure 1.2). Mixedwood stands were
scarcer with a total of 15 % of forest cover of which only 4 % were mixedwood
stands older than 70 years (Figure 1.2).
1.5.2 Habitat characteristics
Composition and productivity differed strongly between black spruce stands, stands
affected by paludification and mixedwood stands. Diversity of tree species and
trembling aspen basal area were higher in mixedwood stands (Table 1.2). Black
spruce basal area was higher in black spruce stands and lower in paludified stands
and mixedwood stands (Table 1.2). Variables representing forest productivity, the
total basal area and the DBH followed a similar pattern: the lowest values were found
in paludified stands followed by stands undergoing paludification and black spruce
stands and the highest values in mixedwood stands (Table 1.2). Mixedwood stands >
90 years had a significantly higher mean DBH than 70-90 years mixedwood stands
(Table 1.2).
28
The quantity and size of deadwood differed significantly by habitat. Downed
deadwood volume followed a modal distribution along the age and structure gradient
in coniferous stands and was highest in > 90 years mixedwood stands but did not
differ significantly from 70-90 years mixedwood stands (Table 1.2). The mean dead
tree DBH was highest in mixedwood stands > 90 years (> 25 cm) followed by 70-90
years mixedwood stands which did not differ significantly from 90-120 years black
spruce stands and 160-215 years black spruce stands (Table 1.2). Stands affected by
paludification had the lowest mean dead tree DBH values (Table 1.2).
Densities of recently dead and highly degraded trees varied by habitat. The density of
recently dead trees of 10-20 cm DBH only differed significantly between 90-120
years black spruce stands and paludified stands. The density of recently dead trees of
> 20 cm DBH was highest in mixedwood stands > 90 years. However, these values
were not significantly different from 70-90 years mixedwood stands and 90-120 years
black spruce stands. Black spruce stands and stands affected by paludification had
low densities of recently dead trees of > 20 cm DBH (Table 1.2). Densities of highly
degraded trees of 10-20 cm DBH were highest in 70-90 years mixedwood stands and
differed significantly from mixedwood stands > 90 years and paludified stands but
not from other habitat types (Table 1.2). Densities of highly degraded trees of >20 cm
DBH were significantly higher in mixedwood stands > 90 years. These densities were
second highest in 70-90 years mixedwood stands but did not differ significantly from
old black spruce stands (90-120 years) and 160-215 years black spruce stands.
The density of trees adequate for cavity excavation was highest in mixedwood stands
(93.18 trees/ha). Mixedwood stands 70-90 years had the second-highest values but
these did not differ significantly from 90-120 years black spruce stands.
Tree structural diversity followed a modal distribution along the age and structure
gradient in black spruce stands and was highest in mixedwood stands (Table 1.2).
29
Paludified stands had the lowest tree structural diversity, which was not significantly
different, however, from stands undergoing paludification and 60-90 years black
spruce stands (Table 1.2). Black spruce stands 160-215 years had a significantly
higher tree structural diversity than 60-90 years black spruce stands (Table 1.2).
1.5.3 Patterns of distribution of deadwood birds
All species responded to the playback calls. However, for most species, detection
probabilities and occurrences were too low to model adequate occupancy
probabilities across the 8 habitat types. (Table 1.3). Hence, we present means of the
observed occurrences by habitat types (Figure 1.3). The Black-backed Woodpecker
and the American Three-toed Woodpecker were mainly distributed in the coniferous
stands whereas the other woodpecker species were mostly observed in mixedwood
stands (Figure 1.3). The Downy Woodpecker, and the Yellow-bellied Sapsucker,
occurred almost exclusively in mixedwood stands (Figure 1.3). Non-woodpecker
species were distributed throughout black spruce and mixedwood stands but had their
highest occurrence in 90-215 years black spruce stands and mixedwood stands > 90
years (Figure 1.3).
Species richness of deadwood birds was highest in mixedwood stands and followed a
modal distribution in black spruce stands (wi = 1, null model's ΔAICc = 54.31; Figure
1.4). Mixedwood stands > 90 years had the highest species richness but did not differ
significantly from 70-90 years mixedwood stands and 120-160 years black spruce
stands. While there was a trend of higher species richness in black spruce stands > 90
years, only 120-160 years black spruce stands had significantly higher species
richness than 60-90 years black spruce stands whereas paludified stands had the
lowest species richness (Figure 1.4).
Throughout our 86 bird sampling sites, we inspected 8748 trees for 4 types of
woodpecker foraging signs and found 644 trees with recent woodpecker foraging
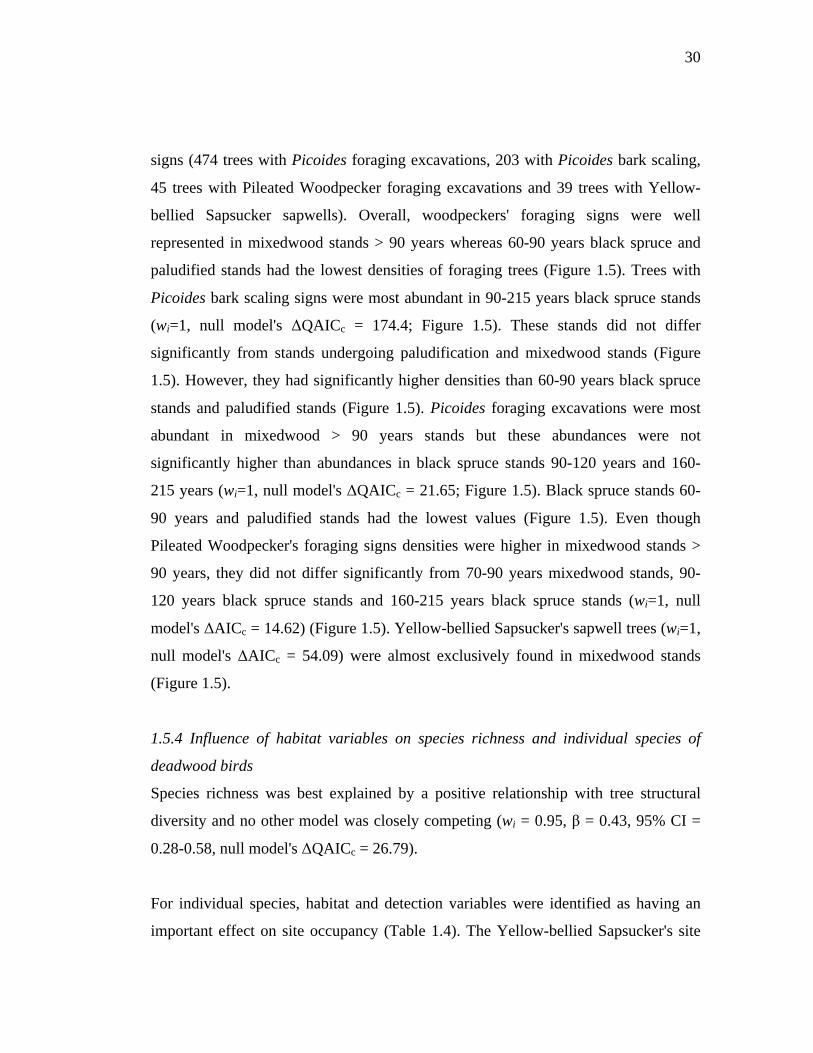
30
signs (474 trees with Picoides foraging excavations, 203 with Picoides bark scaling,
45 trees with Pileated Woodpecker foraging excavations and 39 trees with Yellow-
bellied Sapsucker sapwells). Overall, woodpeckers' foraging signs were well
represented in mixedwood stands > 90 years whereas 60-90 years black spruce and
paludified stands had the lowest densities of foraging trees (Figure 1.5). Trees with
Picoides bark scaling signs were most abundant in 90-215 years black spruce stands
(wi=1, null model's ΔQAICc = 174.4; Figure 1.5). These stands did not differ
significantly from stands undergoing paludification and mixedwood stands (Figure
1.5). However, they had significantly higher densities than 60-90 years black spruce
stands and paludified stands (Figure 1.5). Picoides foraging excavations were most
abundant in mixedwood > 90 years stands but these abundances were not
significantly higher than abundances in black spruce stands 90-120 years and 160-
215 years (wi=1, null model's ΔQAICc = 21.65; Figure 1.5). Black spruce stands 60-
90 years and paludified stands had the lowest values (Figure 1.5). Even though
Pileated Woodpecker's foraging signs densities were higher in mixedwood stands >
90 years, they did not differ significantly from 70-90 years mixedwood stands, 90-
120 years black spruce stands and 160-215 years black spruce stands (wi=1, null
model's ΔAICc = 14.62) (Figure 1.5). Yellow-bellied Sapsucker's sapwell trees (wi=1,
null model's ΔAICc = 54.09) were almost exclusively found in mixedwood stands
(Figure 1.5).
1.5.4 Influence of habitat variables on species richness and individual species of
deadwood birds
Species richness was best explained by a positive relationship with tree structural
diversity and no other model was closely competing (wi = 0.95, β = 0.43, 95% CI =
0.28-0.58, null model's ΔQAICc = 26.79).
For individual species, habitat and detection variables were identified as having an
important effect on site occupancy (Table 1.4). The Yellow-bellied Sapsucker's site
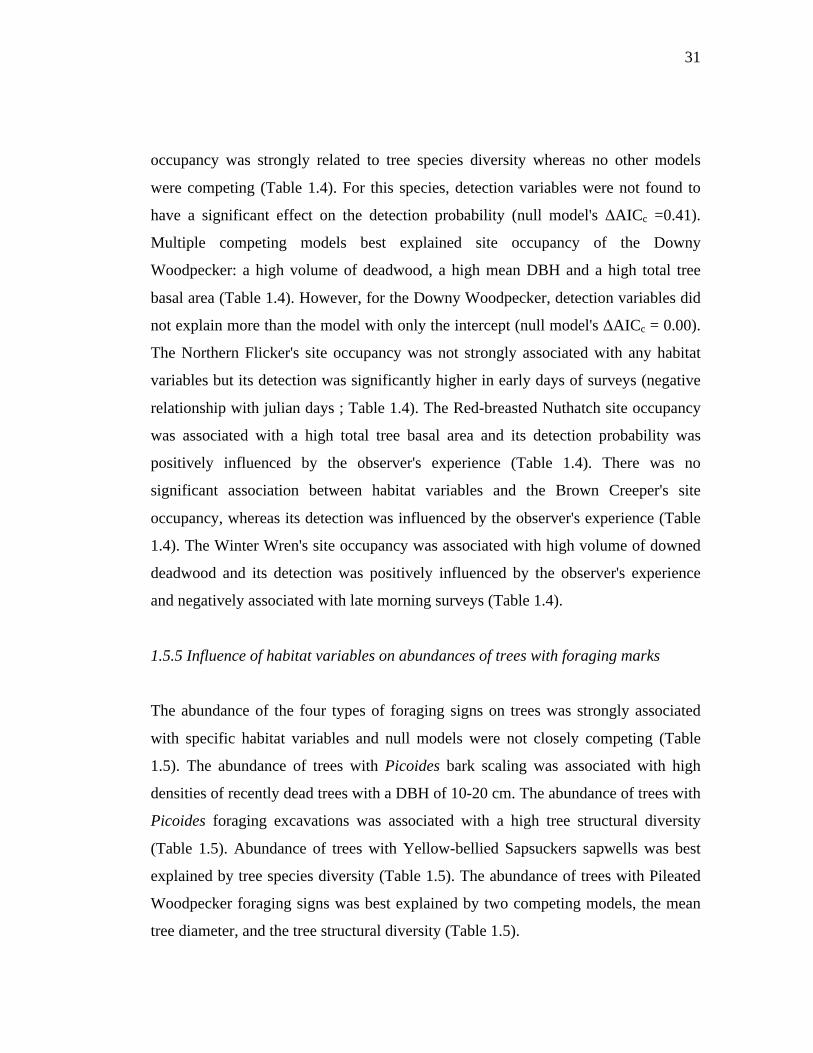
31
occupancy was strongly related to tree species diversity whereas no other models
were competing (Table 1.4). For this species, detection variables were not found to
have a significant effect on the detection probability (null model's ΔAICc =0.41).
Multiple competing models best explained site occupancy of the Downy
Woodpecker: a high volume of deadwood, a high mean DBH and a high total tree
basal area (Table 1.4). However, for the Downy Woodpecker, detection variables did
not explain more than the model with only the intercept (null model's ΔAICc = 0.00).
The Northern Flicker's site occupancy was not strongly associated with any habitat
variables but its detection was significantly higher in early days of surveys (negative
relationship with julian days ; Table 1.4). The Red-breasted Nuthatch site occupancy
was associated with a high total tree basal area and its detection probability was
positively influenced by the observer's experience (Table 1.4). There was no
significant association between habitat variables and the Brown Creeper's site
occupancy, whereas its detection was influenced by the observer's experience (Table
1.4). The Winter Wren's site occupancy was associated with high volume of downed
deadwood and its detection was positively influenced by the observer's experience
and negatively associated with late morning surveys (Table 1.4).
1.5.5 Influence of habitat variables on abundances of trees with foraging marks
The abundance of the four types of foraging signs on trees was strongly associated
with specific habitat variables and null models were not closely competing (Table
1.5). The abundance of trees with Picoides bark scaling was associated with high
densities of recently dead trees with a DBH of 10-20 cm. The abundance of trees with
Picoides foraging excavations was associated with a high tree structural diversity
(Table 1.5). Abundance of trees with Yellow-bellied Sapsuckers sapwells was best
explained by tree species diversity (Table 1.5). The abundance of trees with Pileated
Woodpecker foraging signs was best explained by two competing models, the mean
tree diameter, and the tree structural diversity (Table 1.5).
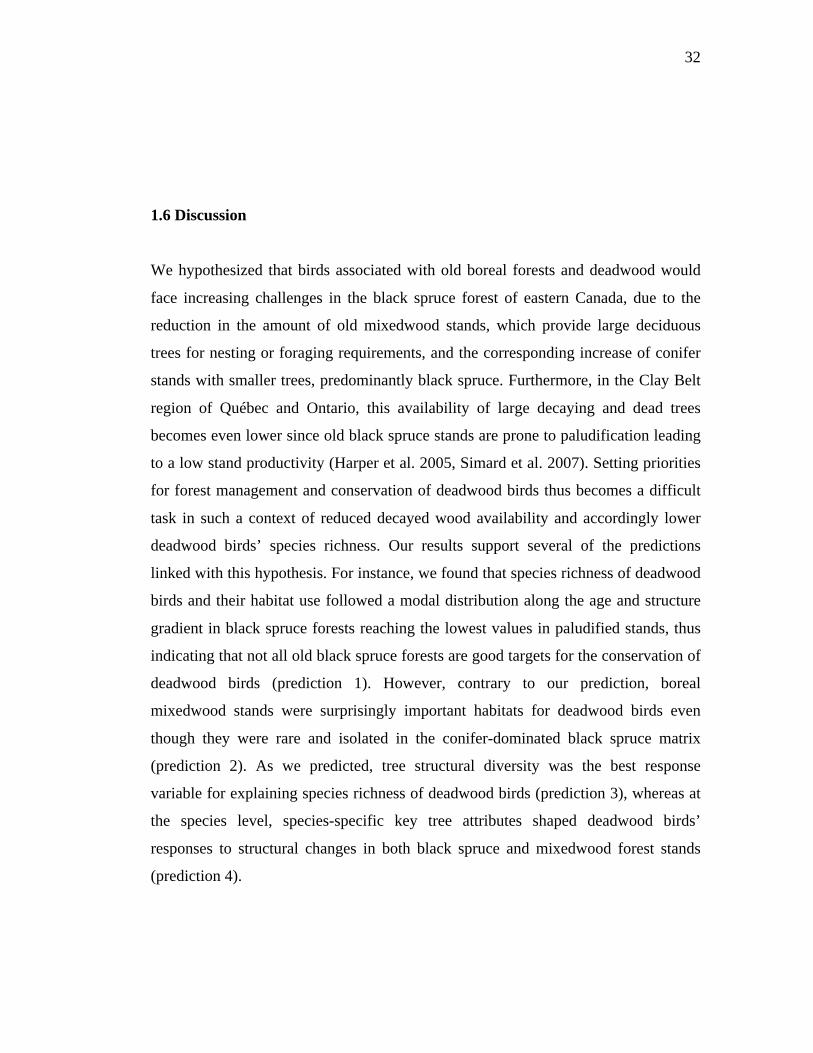
32
1.6 Discussion
We hypothesized that birds associated with old boreal forests and deadwood would
face increasing challenges in the black spruce forest of eastern Canada, due to the
reduction in the amount of old mixedwood stands, which provide large deciduous
trees for nesting or foraging requirements, and the corresponding increase of conifer
stands with smaller trees, predominantly black spruce. Furthermore, in the Clay Belt
region of Québec and Ontario, this availability of large decaying and dead trees
becomes even lower since old black spruce stands are prone to paludification leading
to a low stand productivity (Harper et al. 2005, Simard et al. 2007). Setting priorities
for forest management and conservation of deadwood birds thus becomes a difficult
task in such a context of reduced decayed wood availability and accordingly lower
deadwood birds’ species richness. Our results support several of the predictions
linked with this hypothesis. For instance, we found that species richness of deadwood
birds and their habitat use followed a modal distribution along the age and structure
gradient in black spruce forests reaching the lowest values in paludified stands, thus
indicating that not all old black spruce forests are good targets for the conservation of
deadwood birds (prediction 1). However, contrary to our prediction, boreal
mixedwood stands were surprisingly important habitats for deadwood birds even
though they were rare and isolated in the conifer-dominated black spruce matrix
(prediction 2). As we predicted, tree structural diversity was the best response
variable for explaining species richness of deadwood birds (prediction 3), whereas at
the species level, species-specific key tree attributes shaped deadwood birds’
responses to structural changes in both black spruce and mixedwood forest stands
(prediction 4).
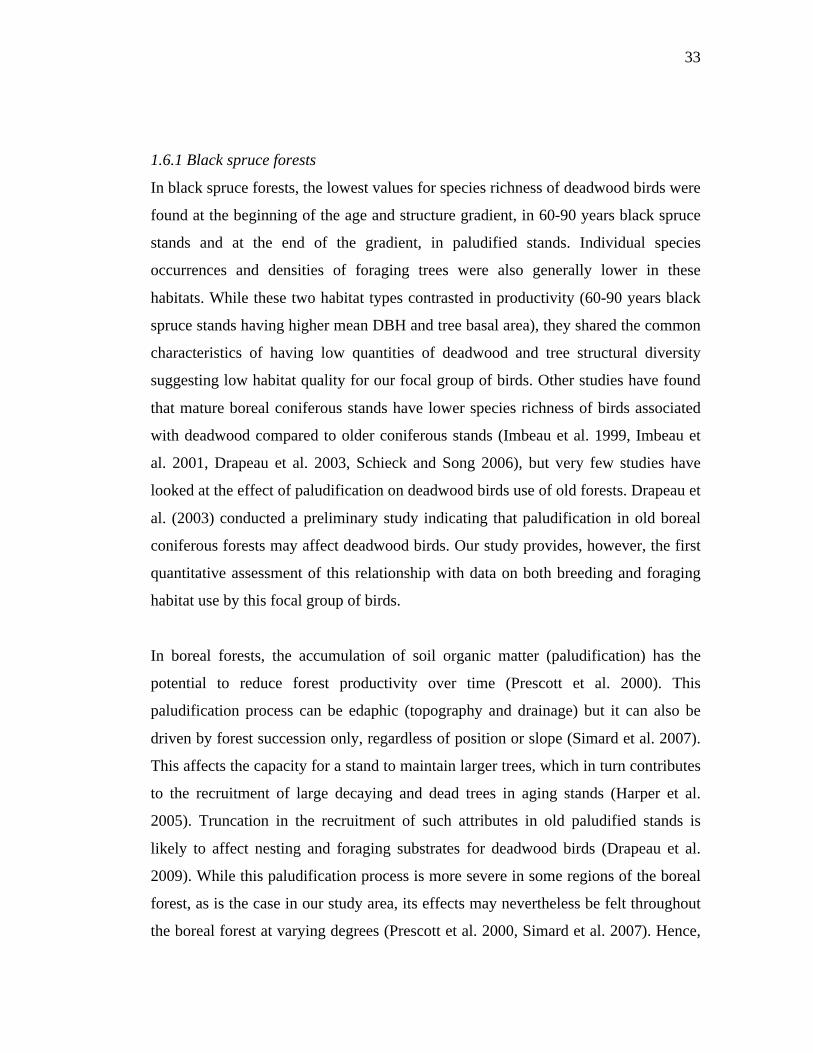
33
1.6.1 Black spruce forests
In black spruce forests, the lowest values for species richness of deadwood birds were
found at the beginning of the age and structure gradient, in 60-90 years black spruce
stands and at the end of the gradient, in paludified stands. Individual species
occurrences and densities of foraging trees were also generally lower in these
habitats. While these two habitat types contrasted in productivity (60-90 years black
spruce stands having higher mean DBH and tree basal area), they shared the common
characteristics of having low quantities of deadwood and tree structural diversity
suggesting low habitat quality for our focal group of birds. Other studies have found
that mature boreal coniferous stands have lower species richness of birds associated
with deadwood compared to older coniferous stands (Imbeau et al. 1999, Imbeau et
al. 2001, Drapeau et al. 2003, Schieck and Song 2006), but very few studies have
looked at the effect of paludification on deadwood birds use of old forests. Drapeau et
al. (2003) conducted a preliminary study indicating that paludification in old boreal
coniferous forests may affect deadwood birds. Our study provides, however, the first
quantitative assessment of this relationship with data on both breeding and foraging
habitat use by this focal group of birds.
In boreal forests, the accumulation of soil organic matter (paludification) has the
potential to reduce forest productivity over time (Prescott et al. 2000). This
paludification process can be edaphic (topography and drainage) but it can also be
driven by forest succession only, regardless of position or slope (Simard et al. 2007).
This affects the capacity for a stand to maintain larger trees, which in turn contributes
to the recruitment of large decaying and dead trees in aging stands (Harper et al.
2005). Truncation in the recruitment of such attributes in old paludified stands is
likely to affect nesting and foraging substrates for deadwood birds (Drapeau et al.
2009). While this paludification process is more severe in some regions of the boreal
forest, as is the case in our study area, its effects may nevertheless be felt throughout
the boreal forest at varying degrees (Prescott et al. 2000, Simard et al. 2007). Hence,
34
the modal distribution of deadwood birds in aging black spruce forests may not only
reflect the extensive occurrence of paludification in the Clay belt region, but also
reveal a potential trajectory of habitat occupancy by deadwood birds in old black
spruce forest for other regions less prone to large-scale paludification.
Black spruce stands 90-215 years were associated with higher species richness of
deadwood birds and higher Picoides foraging habitat use. Higher availability of
deadwood and tree structural diversity explains higher species richness in these
stands. For example, the Winter Wren, which had a high occurrence in these stands,
was strongly associated with high downed deadwood volume reflecting its use for
woody debris or uprooted trees to nests (Bent 1948). Likewise, high values of tree
structural diversity and high densities of recently dead trees of 10-20 cm DBH best
explained densities of foraging excavations and bark scaling by the Picoides group,
respectively. Black-backed and American Three-toed woodpeckers select large
recently dead coniferous trees for foraging (Imbeau and Desrochers 2002, Nappi et al.
2003, 2015, Gagné et al. 2007, Tremblay et al. 2010, 2015a). It is likely that these
two species are the main contributors to the Picoides group for both excavations and
bark scaling signs in black spruce stands > 90 years, even though they showed low
values of observed occurrences and detection probability when using playbacks.
Their very low densities and large home ranges in unburned stands (Goggans et al.
1989, Tremblay et al. 2009) in comparison with high densities and small home ranges
found in recent burns, particularly for the Black-backed Woodpecker (Nappi and
Drapeau, 2009), underlines the interest of using fresh foraging signs data as a
measure of habitat use by these uncommon species.
1.6.2 Mixedwood forests
An important result of our study is how mixedwoods were key habitats for deadwood
birds in black spruce landscapes notwithstanding their isolation and marginal regional
abundance. Mixedwood stands > 90 years harbored the highest species richness of
35
deadwood birds, although they did not significantly differ from mixedwood stands
70-90 years and black spruce stands 120-215 years. Mixedwood stands had high
forest productivity (mean tree DBH, total basal area) contrasting sharply with the
lower productivity of black spruce stands and even more for stands affected by
paludification. Notably, mixedwood stands > 90 years had the highest mean DBH of
living and dead trees and had the highest densities of trees considered adequate for
cavity excavation, i.e., large senescent trembling aspen with fungal conks of
Phellinus tremulae (Cadieux 2011, Cooke and Hannon 2012). Furthermore, large
decaying trembling aspen are also strongly selected for foraging by multiple
woodpecker species (Nappi et al. 2015). Hence, not surprisingly our highest densities
of Pileated Woodpecker and Yellow-bellied Sapsucker foraging signs were found in
mixedwood stands, particularly in mixedwood stands > 90 years. While these two
woodpeckers strongly select large old and senescent trembling aspen for their nesting
cavities, their foraging signs can be found in a multitude of tree species (Eberhardt
2000, Lemaître and Villard 2005, Cadieux 2011, Cooke and Hannon 2012, Nappi et
al. 2015). The Pileated Woodpecker's foraging excavation densities were associated
with a high mean DBH and tree structural diversity. This result corroborates those in
other studies for which this woodpecker selected large senescent and dead trees for
foraging (Lemaître and Villard 2005, Nappi et al. 2015). For the Yellow-bellied
Sapsucker, the density of sapwell trees and its site occupancy was best explained by
high tree species diversity which supports its strong selection for mixedwood stands
and its ability to create sapwells in multiple tree species (Eberhardt 2000).
Finally, the fact that the best predictor of species richness of deadwood birds was the
structural diversity of trees (combining degradation stages and diameter), which
reached its highest values in mixedwood stands, pinpoints the importance of old
mixedwood forests for deadwood birds. The high diversity of tree size and
degradation stages in mixedwood stands provides keystone structures (sensu
Lindenmayer et al., 2012) for a high number of species associated with deadwood to
36
satisfy their ecological requirements for both nesting and foraging (Drapeau et al.
2009, Cadieux 2011, Nappi et al. 2015).
1.6.3 Species detection probability
The primary goal of our study was to measure and highlight potential differences in
habitat occupancy and use by an assemblage of deadwood associated birds along a
composition and structure gradient of forests stands in boreal black spruce
landscapes. However, studying this focal group of species can be challenging given
the range of variability of individual species' home range sizes. Since this
investigation was conducted at the stand level, our study design consisted in a short
lasting playback broadcasting (1 minute / species) constrained into a small radius (75
m). While such protocol is adequate for small home range species (chickadees,
nuthatches, wrens, small woodpeckers and creepers) it may not be optimal for species
with larger home ranges (other woodpeckers). Hence, unsurprisingly we found low
detection probabilities for some of our woodpecker species (Pileated, Hairy, Black-
Backed, and American Three-toed woodpeckers). Improving the detection probability
of these species would require either to conduct a series of playback stations enclosed
in a larger sampling unit closer to these species' home range, as was done by
Baumgardt et al. (2014), or increase the duration of playback calls to attract species
with large territories that will eventually respond to playback (Ibarzabal et
Desmeules, 2006). In our study, this limitation of the playback method for detecting
large home range species is, however, compensated by our censuses of foraging signs
by woodpecker species. In both mixedwood (Pileated and Hairy woodpeckers) and
black spruce forests (Black-backed and American three-toed woodpeckers) foraging
signs provided critical complementary data on habitat use by these species.
1.6.4 Management implications
Old forests are generally considered important habitats for biodiversity (Spies and
Franklin 1996). There is a build-up of species as stands become structurally more
37
complex with increased diversity of large senescent and decaying trees (Franklin et
al. 1987, Newton 1994), creating new habitats for multiple species, of which many
are associated with decaying wood (Franklin et al. 1987). In the Clay Belt region of
Québec and Ontario, this relationship between old forests and species associated with
deadwood is, however, truncated in time by the reduced availability of these
structural attributes induced by the process of paludification (Harper et al. 2005,
Simard et al. 2007). Hence, the functional role of old-growth boreal forests for
deadwood birds is altered by paludification and accordingly, deadwood birds closely
track old productive forests. These forests are, however, also prioritized for
harvesting since their wood volume is greater. Conventional short rotation even-aged
management, which considerably reduces productive old forests and key structural
attributes such as old live and dead trees, is thus jeopardizing the conservation of
deadwood birds. In forest management units, the inclusion of harvesting practices
such as partial cuts and increased variable retention of old forest structural
characteristics in clear-cuts (Bergeron et al. 2007, Fenton et al. 2009, Tremblay et al.
2015a), are thus more likely to benefit birds associated with decaying and deadwood
in black spruce forests, despite landscapes being marginally or strongly affected by
paludification.
While mixedwood stands are rare in northern boreal black spruce forests, our results
indicate that they play a pivotal role for deadwood birds and are thus key habitats for
this focal group of species. Therefore, the protection of these small and isolated
habitats should be a critical component in a conservation strategy of deadwood birds
in old forests of the northern boreal black spruce forests.
Finally, increasing our knowledge of habitat occupancy and distribution patterns of
deadwood birds in old forests is a first step towards assessing the quality of these
habitats for maintaining this focal group of species in the boreal forest. The next step,
however, relies on measuring the reproductive activity and success of these birds in
38
old forests (see Tremblay et al. 2015b). Moreover, determining the ecological
interactions of the cavity-nesting community is a promising approach for increasing
our understanding of old forests’ functional diversity in the boreal ecosystem (Martin
et al. 2004, Cockle et al. 2012).
1.7 Acknowledgements
We thank Camille Morin, Carole Besson and Jean-Simon Houle for their assistance
in the field. We thank Chaieb Chafi, Nicole Fenton and Yves Bergeron for invaluable
dendrochronological field data to determine stand age in our study sites. We thank the
Cree First Nation of Waswanipi for granting us access to their land for field
sampling. We thank Marc Mazerolle for statistical advice and Mélanie Desrochers for
GIS support. Funding was provided by a Natural Sciences and Engineering Research
Council of Canada (NSERC) graduate student scholarship to Cadieux, the Québec
Fonds de la recherche nature et technologies (FRQNT) graduate student scholarship
to Cadieux, the Center for forest research (CFR) scholarship for research
communication, the NSERC CREATE program on Forest Complexity Modeling
scholarship program with industrial and government agency partners, the NSERC
Cooperative Research Development grant to Drapeau and collaborators, the NSERC
Discovery grant to Drapeau, Tembec industries and Lake Duparquet research and
teaching forest.
1.8 References
Angelstam, P., Mikusiński, G. 1994. Woodpecker assemblages in natural and managed boreal and hemiboreal forest - a review. Annales Zoologici Fennici. 31: 157-172.
Aubry, K. B., Raley, C. M. 2002. The Pileated Woodpecker as a keystone habitat
modifier in the Pacific Northwest. In: Laudenslayer, W. F. , Shea, Jr. P. J., Valentine, B., Weatherspoon, C. P. et Lisle, T.E. (Eds), Proceedings of the Symposium on the Ecology and Management of Dead Wood in Western
39
Forests (Reno, NV, November 2-4, 1999). Alabany, CA: USDA Forest Service, 257-274.
Bailey, T.N. 2008. Sap feeding on birch trees by American Three-toed woodpeckers.
Western Birds 39: 171-175. Baumgardt, J. A., Sauder, J. D., Nicholson, K. L. 2014. Occupancy Modeling of
Woodpeckers: Maximizing Detections for Multiple Species With Multiple Spatial Scales. Journal of Fish and Wildlife Management. 5: 2, 198-207.
Bednarz, J. C., Ripper, D., Radley, P. M. 2004. Emerging concepts and research
directions in the study of cavity-nesting birds: keystone ecological processes. The Condor. 106: 1-4.
Bent, A. C. 1948. Life histories of North American nuthatches, wrens, thrashers and
their allies: order Passeriformes. U.S. Natl. Mus. Bull. 195 p. Bergeron, Y., Charron, D. 1994. Postfire stand dynamics in a southern boreal forest
(Québec): a dendroecological approach. Ecoscience. 173-184. Bergeron, Y., Leduc, A., Harvey, B., Gauthier, S. 2002. Natural fire regime: a guide
for sustainable management of the Canadian boreal forest. Silva Fennica. 36: 1, 81-95.
Bergeron, Y., Gauthier, S., Flannigan, M., Kafka, V. 2004. Fire regimes at the
transition between mixedwood and coniferous boreal forest in northwestern Quebec. Ecology. 85: 7, 1916-1932.
Bergeron, Y., Drapeau, P., Gauthier, S., Lecomte, N. 2007. Using knowledge of
natural disturbances to support sustainable forest management in the northern Clay Belt. The Forestry Chronicle. 83: 3, 326-337.
Bull, E. L., Jackson, J. A. 2011. Pileated Woodpecker (Dryocopus pileatus). Cornell
Lab of Ornithology. Online. http://bna.birds.cornell.edu/bna/species/148. Burnham, K. P., Anderson, D. R. 2002. Model selection and multimodel inference: A
practical information-theoretic approach. Springer, 488 p. Cadieux, P. 2011. Dynamique de la faune cavicole le long d'un gradient d'âge en forêt
boréale mixte de l'est de l'Amérique du Nord. M. Sc. Thesis. Université du Québec à Montréal. Montréal. 85 p.
40
Chaieb, C., Fenton, N. J., Lafleur, B., Bergeron, Y. 2015. Can we use forest inventory mapping as a coarse filter in ecosystem based management in the black spruce boreal forest? Forests. 6: 4, 1195-1207.
Cockle, K. L., Martin, K., Robledo, G. 2012. Linking fungi, trees, and hole-using
birds in a Neotropical tree-cavity network: Pathways of cavity production and implications for conservation. Forest Ecology and Management. 264: 0, 210-219.
Cooke, H. A., Hannon, S. J. 2012. Nest-site selection by old boreal forest cavity
excavators as a basis for structural retention guidelines in spatially-aggregated harvests. Forest Ecology and Management. 269: 37-51.
Drapeau, P., Leduc, A., Bergeron, Y., Gauthier, S., Savard, J.-P. 2003. Les
communautés d'oiseaux des vieilles forêts de la pessière à mousses de la ceinture d'argile: Problèmes et solutions face à l'aménagement forestier. The Forestry Chronicle. 79: 3, 531-540.
Drapeau, P., Nappi, A., Imbeau, L., Saint-Germain, M. 2009. Standing deadwood for
keystone bird species in the eastern boreal forest: Managing for snag dynamics. The Forestry Chronicle. 85: 227-234.
Drever, M. C., Aitken, K. E. H., Norris, A. R., Martin, K. 2008. Woodpeckers as
reliable indicators of bird richness, forest health and harvest. Biological Conservation. 141: 3, 624-634.
Eberhardt, L. S. 2000. Use and selection of sap trees by Yellow-bellied Sapsuckers.
The Auk. 117: 41-51. Environment Canada. Canadian Climate Normals 1981–2010. Online.
http://climate.weather.gc.ca/climate_normals/index_e.html. (accessed on 15 April 2016).
Fenton, N., Simard, M., Bergeron, Y. 2009. Emulating natural disturbances: the role
of silviculture in creating even-aged and complex structures in the black spruce boreal forest of eastern North America. Journal of Forest Research. 14: 5, 258-267.
Fiske, I., Chandler, R. 2011. unmarked: An R package for fitting hierarchical models
of wildlife occurrence and abundance. Journal of Statistical Software. 43: 10, 1-23.
41
Franklin, J. F., Shugart, H. H., Harmon, M. E. 1987. Tree death as an ecological process. BioScience. 37: 8, 550-556.
Gagné, C., Imbeau, L., Drapeau, P. 2007. Anthropogenic edges: Their influence on
the American three-toed woodpecker (Picoides dorsalis) foraging behaviour in managed boreal forests of Quebec. Forest Ecology and Management. 252: 1–3, 191-200.
Gauthier, S., Leduc, A., Bergeron, Y. 1996. Forest dynamics modelling under natural
fire cycles: a tool to define natural mosaic diversity for forest management. p. 417-434. In: Global to Local: Ecological Land Classification. Springer Netherlands.
Gauthier, S., De Grandpré, L., Bergeron, Y. 2000. Differences in forest composition
in two boreal forest ecoregions of Quebec. Journal of Vegetation Science. 11: 6, 781-790.
Goggans, R., Dixon, R. D., Seminara, L. C. 1989. Habitat use by three-toed and
black-backed woodpeckers. USDA Deschutes National Forest. Technical Report 87-3-02. Nongame Wildlife Program. Oregon Department of Fish and Wildlife.
Harper, K., Bergeron, Y., Gauthier, S., Drapeau, P. 2002. Post-fire development of
canopy structure and composition in black spruce forests of Abitibi, Québec: a landscape scale study. Silva Fennica. 36: 1, 249-263.
Harper, K., Boudreault, C., DeGrandpré, L., Drapeau, P., Gauthier, S., Bergeron, Y.
2003. Structure, composition, and diversity of old-growth black spruce boreal forest of the Clay Belt region in Quebec and Ontario. Environmental Reviews. 11: S1, S79-S98.
Harper, K., Bergeron, Y., Drapeau, P., Gauthier, S., De Grandpré, L. 2005. Structural
development following fire in black spruce boreal forest. Forest Ecology and Management. 206: 1-3, 293-306.
Ibarzabal, J., Desmeules, P. 2006. Black-backed woodpecker (Picoides arcticus)
detectability in unburned and recently burned mature conifer forests in north-eastern North America. In: (Eds), Proceedings of the Symposium on. Helsinki: Suomen Biologian Seura Vanamo, 1964-, 228-234.
Imbeau, L., Savard, J.-P., Gagnon, R. 1999. Comparing bird assemblages in
successional black spruce stands originating from fire and logging. Canadian Journal of Zoology. 77: 12, 1850-1860.
42
Imbeau, L., Mönkkönen, M., Desrochers, A. 2001. Long-term effects of forestry on
birds of the eastern Canadian boreal forest: a comparison with Fennoscandia. Conservation Biology. 15: 4, 1151-1162.
Imbeau, L., Desrochers, A. 2002. Area sensitivity and edge avoidance: the case of the
Three-toed Woodpecker (Picoides tridactylus) in a managed forest. Forest Ecology and Management. 164: 249-256.
Lecomte, N., Simard, M., Bergeron, Y. 2006a. Effects of fire severity and initial tree
composition on stand structural development in the coniferous boreal forest of northwestern Québec, Canada. Ecoscience. 13: 2, 152-163.
Lecomte, N., Simard, M., Fenton, N., Bergeron, Y. 2006b. Fire severity and long-
term ecosystem biomass dynamics in coniferous boreal forests of eastern Canada. Ecosystems. 9: 8, 1215-1230.
Lemaître, J., Villard, M.-A. 2005. Foraging patterns of pileated woodpeckers in a
managed Acadian forest: a resource selection function. Canadian Journal of Forest Research. 35: 2387-2393.
Leonard, J., David, L. 2001. American Three-toed Woodpecker (Picoides dorsalis).
Cornell Lab of Ornithology. Online. http://bna.birds.cornell.edu/bna/species/588.
Lindenmayer, D. B., Laurance, W. F., Franklin, J. F. 2012. Global decline in large old
trees. Science. 338: 6112, 1305-1306. MacKenzie, D. I., Nichols, J. D., Lachman, G. B., Droege, S., Andrew Royle, J.,
Langtimm, C. A. 2002. Estimating site occupancy rates when detection probabilities are less than one. Ecology. 83: 8, 2248-2255.
MacKenzie, D. I., Nichols, J. D., Royle, J. A., Pollock, K. H., Bailey, L. L., Hines, J.
E. 2006. Occupancy estimation and modeling: inferring patterns and dynamics of species occurrence. Academic Press, 324 p.
Martin, K., Aitken, K. E. H., Wiebe, K. L. 2004. Nest sites and nest webs for cavity-
nesting communities in interior British Colombia, Canada: Nest characteristics and niche partitioning. The Condor. 106: 1, 5-19.
Mazerolle, M. J. 2006. Improving data analysis in herpetology: using Akaike's
Information Criterion (AIC) to assess the strength of biological hypotheses. Amphibia-Reptilia. 27: 2, 169-180.
43
Mazerolle, M. J. 2015. AICcmodavg: model selection and multimodel inference
based on (Q) AIC (C). R package. 2.0-3. Mikusiński, G., Gromadzki, M., Chylarecki, P. 2001. Woodpeckers as indicators of
forest bird diversity. Conservation Biology. 15: 1, 208-217. MRNF. 1994. Normes de cartographie écoforestière. Ministère des Ressources
naturelles et de la Faune, Gouvernement du Québec. Québec. MRNF. 2009. Normes de cartographie écoforestière, Troisième inventaire
écoforestier. Ministère des Ressources naturelles et de la Faune, Gouvernement du Québec. Québec.
MRNF. 2011. Norme de stratification écoforestière, Quatrième inventaire écoforestier
du Québec méridional. Ministère des Ressources naturelles et de la Faune, Gouvernement du Québec. Québec. 101 p.
Nappi, A., Drapeau, P., Giroux, J.-F., Savard, J.-P. L. 2003. Snag use by foraging
black-backed woodpeckers (Picoides articus) in a recently burned eastern boreal forest. The Auk. 120: 2, 505-511.
Nappi, A., Drapeau, P. 2009. Reproductive success of the black-backed woodpecker
(Picoides arcticus) in burned boreal forests: Are burns source habitats? Biological Conservation. 142: 7, 1381-1391.
Nappi, A., Drapeau, P., Leduc, A. 2015. How important is dead wood for
woodpeckers foraging in eastern North American boreal forests? Forest Ecology and Management. 346: 0, 10-21.
Newton, I. 1994. The role of nest sites in limiting the numbers of hole-nesting birds:
A review. Biological Conservation. 70: 3, 265-276. Niemi, G., Hanowski, J., Helle, P., Howe, R., Mönkkönen, M., Venier, L., Welsh, D.
1998. Ecological sustainability of birds in boreal forests. Ecology and Society. 2: 2.
Ouellet-Lapointe, U., Drapeau, P., Cadieux, P., Imbeau, L. 2012. Woodpecker
excavations suitability for and occupancy by cavity users in the boreal mixedwood forest of eastern Canada. Ecoscience. 19: 4, 391-397.
Prescott, C. E., Maynard, D. G., Laiho, R. 2000. Humus in northern forests: friend or foe? Forest Ecology and Management. 133: 1, 23-36.
44
R Core Team. 2015. R: A language and environment for statistical computing. R
Foundation for Statistical Computing. 3.2.3. Roberge, J.-M., Mikusiński, G., Svensson, S. 2008. The white-backed woodpecker:
umbrella species for forest conservation planning? Biodiversity and Conservation. 17: 10, 2479-2494.
Robitaille, A., Saucier, J. P. 1998. Paysages régionaux du Québec méridional.
Québec. Les Publications Du Québec, 220 p. Schieck, J., Song, S. J. 2006. Changes in bird communities throughout succession
following fire and harvest in boreal forests of western North America: Literature review and meta-analyses. Canadian Journal of Forest Research. 36: 5, 1299-1318.
Schmiegelow, F. K. A., Mönkkönen, M. 2002. Habitat loss and fragmentation in
dynamic landscapes: avian perspectives from the boreal forest. Ecological Applications. 12: 2, 375-389.
Simard, M., Lecomte, N., Bergeron, Y., Bernier, P. Y., Paré, D. 2007. Forest
productivity decline caused by successional paludification of boreal soils. Ecological Applications. 17: 6, 1619-1637.
Spies, T. A., Franklin, J. F. 1996. The diversity and maintenance of old-growth
forests. Biodiversity in managed landscapes: theory and practice. Oxford University Press, New York, New York, USA. 296-314.
Stokland, J. N., Siitonen, J., Jonsson, B. G. 2012. Biodiversity in dead wood.
Cambridge University Press p. Taylor, S., Carleton, T., Adams, R. 1988. Understorey vegetation change in a Picea
mariana chronosequence. Vegetatio. 73: 2, 63-72. Tremblay, J. A., Ibarzabal, J., Dussault, C., Savard, J.-P. 2009. Habitat requirements
of breeding black-backed woodpeckers (Picoides arcticus) in managed, unburned boreal forest. Avian Conservation and Ecology. 4: 1, 3.
Tremblay, J. A., Ibarzabal, J., Savard, J.-P. 2010. Foraging ecology of black-backed
woodpeckers (Picoides arcticus) in unburned eastern boreal forest stands. Canadian Journal of Forest Research. 40: 5, 991-999.
45
Tremblay, J. A., Savard, J.-P., Ibarzabal, J. 2015a. Structural retention requirements for a key ecosystem engineer in conifer-dominated stands of a boreal managed landscape in eastern Canada. Forest Ecology and Management. 357: 220-227.
Tremblay, J. A., Ibarzabal, J. and Savard, J.-P. 2015b. Contribution of unburned
boreal forests to the population of black-backed woodpecker in eastern Canada. Ecoscience 22: 145–155.
Veillette, J. 1994. Evolution and paleohydrology of glacial lakes Barlow and
Ojibway. Quaternary Science Reviews. 13: 9, 945-971. Vincent, J. S., Hardy, L. 1977. L’évolution et l'extinction des lacs glaciaires Barlow
et Ojibway en territoire québécois. Géogr. Phys. Quat. 31: 357-372. Virkkala, R. 2006. Why study woodpeckers? The significance of woodpeckers in
forest ecosystems. Annales Zoologici Fennici. 43: 2, 82-85. Van Wagner, C. E. 1968. The line intersect method in forest fuel sampling. Forest
science. 14: 1, 20-26. Wickham, H. 2009. ggplot2: elegant graphics for data analysis. Springer Science & Business Media, 213 p.
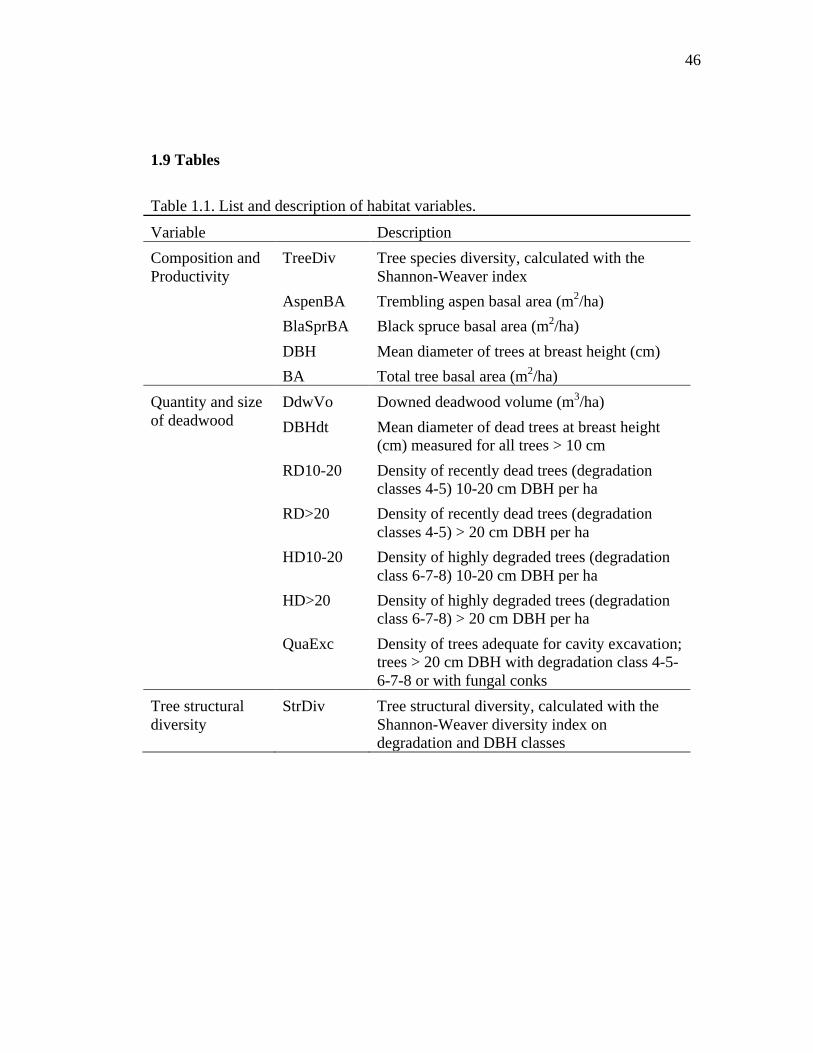
46
1.9 Tables
Table 1.1. List and description of habitat variables.
Variable Description Composition and Productivity
TreeDiv Tree species diversity, calculated with the Shannon-Weaver index
AspenBA Trembling aspen basal area (m2/ha) BlaSprBA Black spruce basal area (m2/ha) DBH Mean diameter of trees at breast height (cm) BA Total tree basal area (m2/ha)
Quantity and size of deadwood
DdwVo Downed deadwood volume (m3/ha) DBHdt Mean diameter of dead trees at breast height
(cm) measured for all trees > 10 cm RD10-20 Density of recently dead trees (degradation
classes 4-5) 10-20 cm DBH per ha RD>20 Density of recently dead trees (degradation
classes 4-5) > 20 cm DBH per ha HD10-20 Density of highly degraded trees (degradation
class 6-7-8) 10-20 cm DBH per ha HD>20 Density of highly degraded trees (degradation
class 6-7-8) > 20 cm DBH per ha QuaExc Density of trees adequate for cavity excavation;
trees > 20 cm DBH with degradation class 4-5-6-7-8 or with fungal conks
Tree structural diversity
StrDiv Tree structural diversity, calculated with the Shannon-Weaver diversity index on degradation and DBH classes
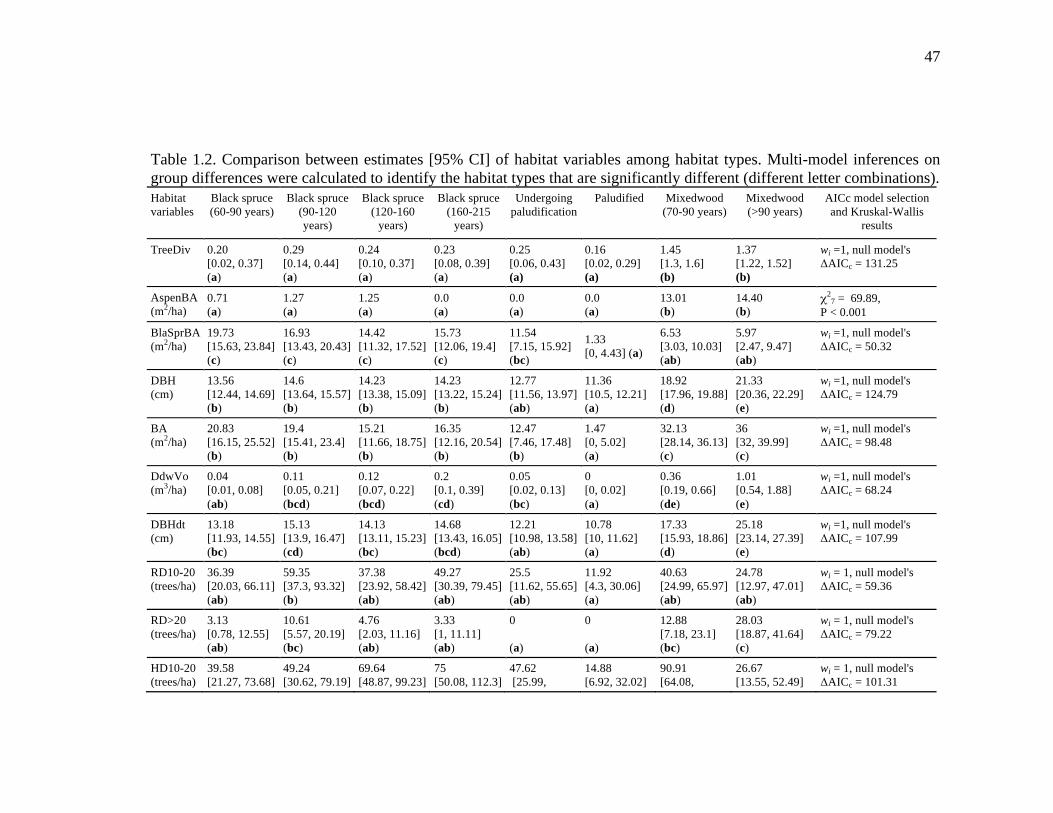
47
Table 1.2. Comparison between estimates [95% CI] of habitat variables among habitat types. Multi-model inferences on group differences were calculated to identify the habitat types that are significantly different (different letter combinations). Habitat variables
Black spruce (60-90 years)
Black spruce (90-120 years)
Black spruce (120-160
years)
Black spruce (160-215
years)
Undergoing paludification
Paludified Mixedwood (70-90 years)
Mixedwood (>90 years)
AICc model selection and Kruskal-Wallis
results
TreeDiv 0.20 [0.02, 0.37] (a)
0.29 [0.14, 0.44] (a)
0.24 [0.10, 0.37] (a)
0.23 [0.08, 0.39] (a)
0.25 [0.06, 0.43] (a)
0.16 [0.02, 0.29] (a)
1.45 [1.3, 1.6] (b)
1.37 [1.22, 1.52] (b)
wi =1, null model's ΔAICc = 131.25
AspenBA (m2/ha)
0.71 (a)
1.27 (a)
1.25 (a)
0.0 (a)
0.0 (a)
0.0 (a)
13.01 (b)
14.40 (b)
χ27 = 69.89,
P < 0.001
BlaSprBA (m2/ha)
19.73 [15.63, 23.84] (c)
16.93 [13.43, 20.43] (c)
14.42 [11.32, 17.52] (c)
15.73 [12.06, 19.4] (c)
11.54 [7.15, 15.92] (bc)
1.33 [0, 4.43] (a)
6.53 [3.03, 10.03] (ab)
5.97 [2.47, 9.47] (ab)
wi =1, null model's ΔAICc = 50.32
DBH (cm)
13.56 [12.44, 14.69] (b)
14.6 [13.64, 15.57] (b)
14.23 [13.38, 15.09] (b)
14.23 [13.22, 15.24] (b)
12.77 [11.56, 13.97] (ab)
11.36 [10.5, 12.21] (a)
18.92 [17.96, 19.88] (d)
21.33 [20.36, 22.29] (e)
wi =1, null model's ΔAICc = 124.79
BA (m2/ha)
20.83 [16.15, 25.52] (b)
19.4 [15.41, 23.4] (b)
15.21 [11.66, 18.75] (b)
16.35 [12.16, 20.54] (b)
12.47 [7.46, 17.48] (b)
1.47 [0, 5.02] (a)
32.13 [28.14, 36.13] (c)
36 [32, 39.99] (c)
wi =1, null model's ΔAICc = 98.48
DdwVo (m3/ha)
0.04 [0.01, 0.08] (ab)
0.11 [0.05, 0.21] (bcd)
0.12 [0.07, 0.22] (bcd)
0.2 [0.1, 0.39] (cd)
0.05 [0.02, 0.13] (bc)
0 [0, 0.02] (a)
0.36 [0.19, 0.66] (de)
1.01 [0.54, 1.88] (e)
wi =1, null model's ΔAICc = 68.24
DBHdt (cm)
13.18 [11.93, 14.55] (bc)
15.13 [13.9, 16.47] (cd)
14.13 [13.11, 15.23] (bc)
14.68 [13.43, 16.05] (bcd)
12.21 [10.98, 13.58] (ab)
10.78 [10, 11.62] (a)
17.33 [15.93, 18.86] (d)
25.18 [23.14, 27.39] (e)
wi =1, null model's ΔAICc = 107.99
RD10-20 (trees/ha)
36.39 [20.03, 66.11] (ab)
59.35 [37.3, 93.32] (b)
37.38 [23.92, 58.42] (ab)
49.27 [30.39, 79.45] (ab)
25.5 [11.62, 55.65] (ab)
11.92 [4.3, 30.06] (a)
40.63 [24.99, 65.97] (ab)
24.78 [12.97, 47.01] (ab)
wi = 1, null model's ΔAICc = 59.36
RD>20 (trees/ha)
3.13 [0.78, 12.55] (ab)
10.61 [5.57, 20.19] (bc)
4.76 [2.03, 11.16] (ab)
3.33 [1, 11.11] (ab)
0 (a)
0 (a)
12.88 [7.18, 23.1] (bc)
28.03 [18.87, 41.64] (c)
wi = 1, null model's ΔAICc = 79.22
HD10-20 (trees/ha)
39.58 [21.27, 73.68]
49.24 [30.62, 79.19]
69.64 [48.87, 99.23]
75 [50.08, 112.3]
47.62 [25.99,
14.88 [6.92, 32.02]
90.91 [64.08,
26.67 [13.55, 52.49]
wi = 1, null model's ΔAICc = 101.31
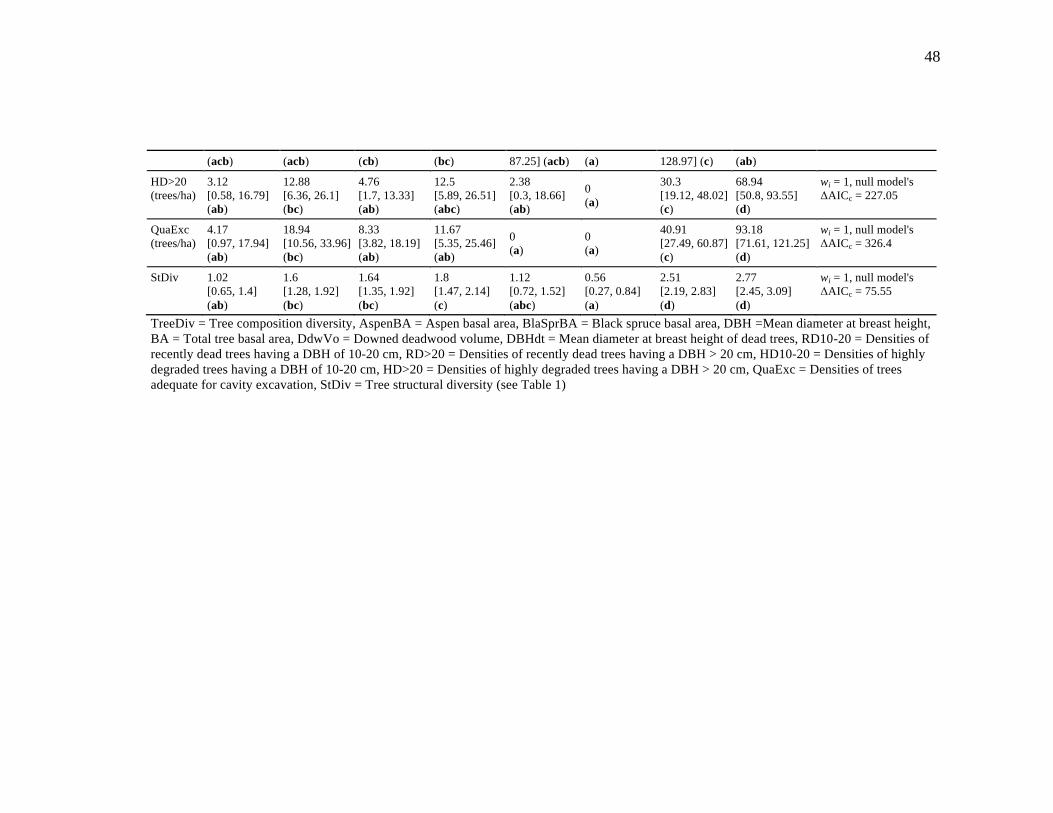
48
(acb) (acb) (cb) (bc) 87.25] (acb) (a) 128.97] (c) (ab)
HD>20 (trees/ha)
3.12 [0.58, 16.79] (ab)
12.88 [6.36, 26.1] (bc)
4.76 [1.7, 13.33] (ab)
12.5 [5.89, 26.51] (abc)
2.38 [0.3, 18.66] (ab)
0 (a)
30.3 [19.12, 48.02] (c)
68.94 [50.8, 93.55] (d)
wi = 1, null model's ΔAICc = 227.05
QuaExc (trees/ha)
4.17 [0.97, 17.94] (ab)
18.94 [10.56, 33.96] (bc)
8.33 [3.82, 18.19] (ab)
11.67 [5.35, 25.46] (ab)
0 (a)
0 (a)
40.91 [27.49, 60.87] (c)
93.18 [71.61, 121.25] (d)
wi = 1, null model's ΔAICc = 326.4
StDiv 1.02 [0.65, 1.4] (ab)
1.6 [1.28, 1.92] (bc)
1.64 [1.35, 1.92] (bc)
1.8 [1.47, 2.14] (c)
1.12 [0.72, 1.52] (abc)
0.56 [0.27, 0.84] (a)
2.51 [2.19, 2.83] (d)
2.77 [2.45, 3.09] (d)
wi = 1, null model's ΔAICc = 75.55
TreeDiv = Tree composition diversity, AspenBA = Aspen basal area, BlaSprBA = Black spruce basal area, DBH =Mean diameter at breast height, BA = Total tree basal area, DdwVo = Downed deadwood volume, DBHdt = Mean diameter at breast height of dead trees, RD10-20 = Densities of recently dead trees having a DBH of 10-20 cm, RD>20 = Densities of recently dead trees having a DBH > 20 cm, HD10-20 = Densities of highly degraded trees having a DBH of 10-20 cm, HD>20 = Densities of highly degraded trees having a DBH > 20 cm, QuaExc = Densities of trees adequate for cavity excavation, StDiv = Tree structural diversity (see Table 1)
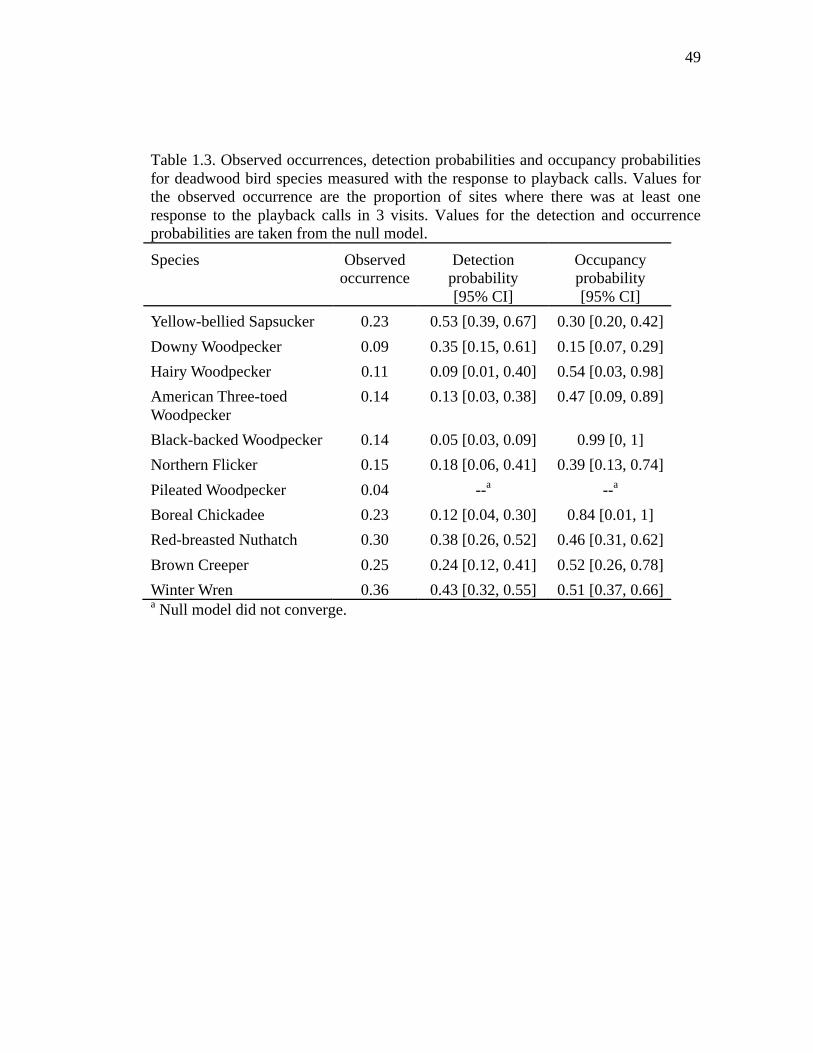
49
Table 1.3. Observed occurrences, detection probabilities and occupancy probabilities for deadwood bird species measured with the response to playback calls. Values for the observed occurrence are the proportion of sites where there was at least one response to the playback calls in 3 visits. Values for the detection and occurrence probabilities are taken from the null model. Species Observed
occurrence Detection probability [95% CI]
Occupancy probability [95% CI]
Yellow-bellied Sapsucker 0.23 0.53 [0.39, 0.67] 0.30 [0.20, 0.42] Downy Woodpecker 0.09 0.35 [0.15, 0.61] 0.15 [0.07, 0.29] Hairy Woodpecker 0.11 0.09 [0.01, 0.40] 0.54 [0.03, 0.98] American Three-toed Woodpecker
0.14 0.13 [0.03, 0.38] 0.47 [0.09, 0.89]
Black-backed Woodpecker 0.14 0.05 [0.03, 0.09] 0.99 [0, 1] Northern Flicker 0.15 0.18 [0.06, 0.41] 0.39 [0.13, 0.74] Pileated Woodpecker 0.04 --a --a Boreal Chickadee 0.23 0.12 [0.04, 0.30] 0.84 [0.01, 1] Red-breasted Nuthatch 0.30 0.38 [0.26, 0.52] 0.46 [0.31, 0.62] Brown Creeper 0.25 0.24 [0.12, 0.41] 0.52 [0.26, 0.78] Winter Wren 0.36 0.43 [0.32, 0.55] 0.51 [0.37, 0.66] a Null model did not converge.
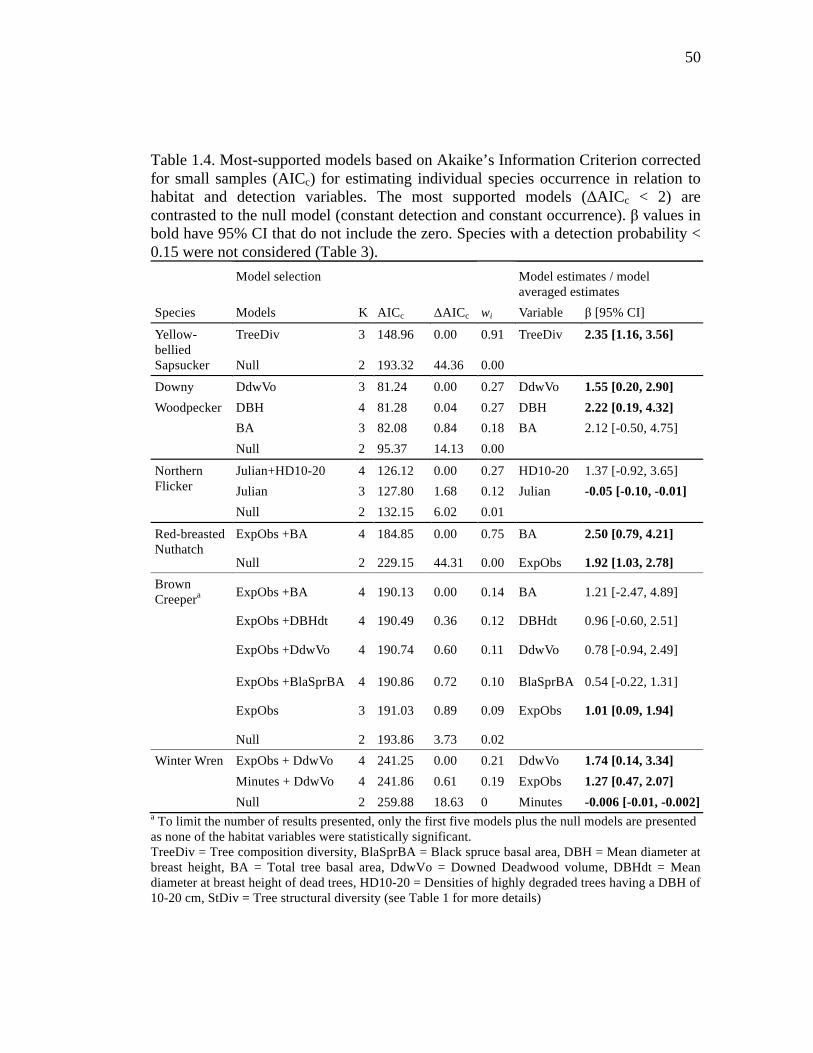
50
Table 1.4. Most-supported models based on Akaike’s Information Criterion corrected for small samples (AICc) for estimating individual species occurrence in relation to habitat and detection variables. The most supported models (ΔAICc < 2) are contrasted to the null model (constant detection and constant occurrence). β values in bold have 95% CI that do not include the zero. Species with a detection probability < 0.15 were not considered (Table 3).
Model selection Model estimates / model
averaged estimates Species Models K AICc ΔAICc wi Variable β [95% CI]
Yellow-bellied Sapsucker
TreeDiv 3 148.96 0.00 0.91 TreeDiv 2.35 [1.16, 3.56]
Null 2 193.32 44.36 0.00
Downy DdwVo 3 81.24 0.00 0.27 DdwVo 1.55 [0.20, 2.90] Woodpecker DBH 4 81.28 0.04 0.27 DBH 2.22 [0.19, 4.32] BA 3 82.08 0.84 0.18 BA 2.12 [-0.50, 4.75] Null 2 95.37 14.13 0.00
Northern Flicker
Julian+HD10-20 4 126.12 0.00 0.27 HD10-20 1.37 [-0.92, 3.65] Julian 3 127.80 1.68 0.12 Julian -0.05 [-0.10, -0.01]
Null 2 132.15 6.02 0.01
Red-breasted Nuthatch
ExpObs +BA 4 184.85 0.00 0.75 BA 2.50 [0.79, 4.21]
Null 2 229.15 44.31 0.00 ExpObs 1.92 [1.03, 2.78] Brown Creepera ExpObs +BA 4 190.13 0.00 0.14 BA 1.21 [-2.47, 4.89]
ExpObs +DBHdt 4 190.49 0.36 0.12 DBHdt 0.96 [-0.60, 2.51]
ExpObs +DdwVo 4 190.74 0.60 0.11 DdwVo 0.78 [-0.94, 2.49]
ExpObs +BlaSprBA 4 190.86 0.72 0.10 BlaSprBA 0.54 [-0.22, 1.31]
ExpObs 3 191.03 0.89 0.09 ExpObs 1.01 [0.09, 1.94]
Null 2 193.86 3.73 0.02 Winter Wren ExpObs + DdwVo 4 241.25 0.00 0.21 DdwVo 1.74 [0.14, 3.34]
Minutes + DdwVo 4 241.86 0.61 0.19 ExpObs 1.27 [0.47, 2.07] Null 2 259.88 18.63 0 Minutes -0.006 [-0.01, -0.002]
a To limit the number of results presented, only the first five models plus the null models are presented as none of the habitat variables were statistically significant. TreeDiv = Tree composition diversity, BlaSprBA = Black spruce basal area, DBH = Mean diameter at breast height, BA = Total tree basal area, DdwVo = Downed Deadwood volume, DBHdt = Mean diameter at breast height of dead trees, HD10-20 = Densities of highly degraded trees having a DBH of 10-20 cm, StDiv = Tree structural diversity (see Table 1 for more details)
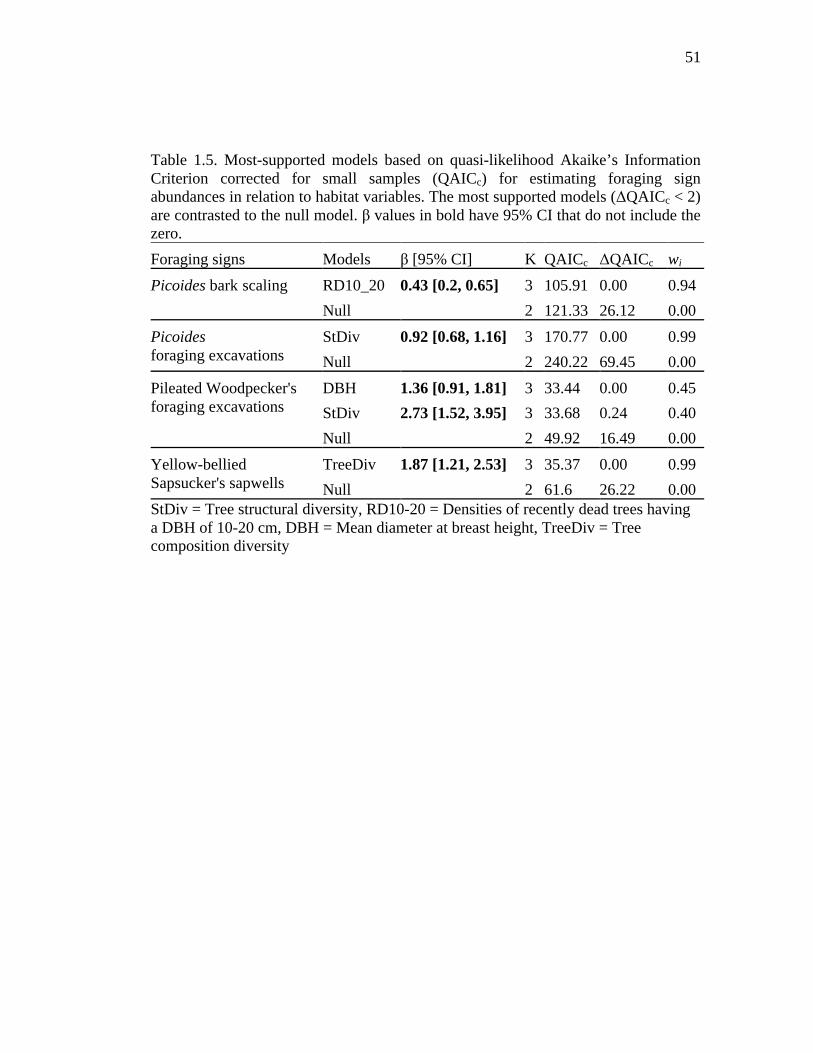
51
Table 1.5. Most-supported models based on quasi-likelihood Akaike’s Information Criterion corrected for small samples (QAICc) for estimating foraging sign abundances in relation to habitat variables. The most supported models (ΔQAICc < 2) are contrasted to the null model. β values in bold have 95% CI that do not include the zero. Foraging signs Models β [95% CI] K QAICc ΔQAICc wi Picoides bark scaling RD10_20 0.43 [0.2, 0.65] 3 105.91 0.00 0.94
Null 2 121.33 26.12 0.00 Picoides foraging excavations
StDiv 0.92 [0.68, 1.16] 3 170.77 0.00 0.99 Null 2 240.22 69.45 0.00
Pileated Woodpecker's foraging excavations
DBH 1.36 [0.91, 1.81] 3 33.44 0.00 0.45 StDiv 2.73 [1.52, 3.95] 3 33.68 0.24 0.40 Null 2 49.92 16.49 0.00
Yellow-bellied Sapsucker's sapwells
TreeDiv 1.87 [1.21, 2.53] 3 35.37 0.00 0.99 Null 2 61.6 26.22 0.00
StDiv = Tree structural diversity, RD10-20 = Densities of recently dead trees having a DBH of 10-20 cm, DBH = Mean diameter at breast height, TreeDiv = Tree composition diversity
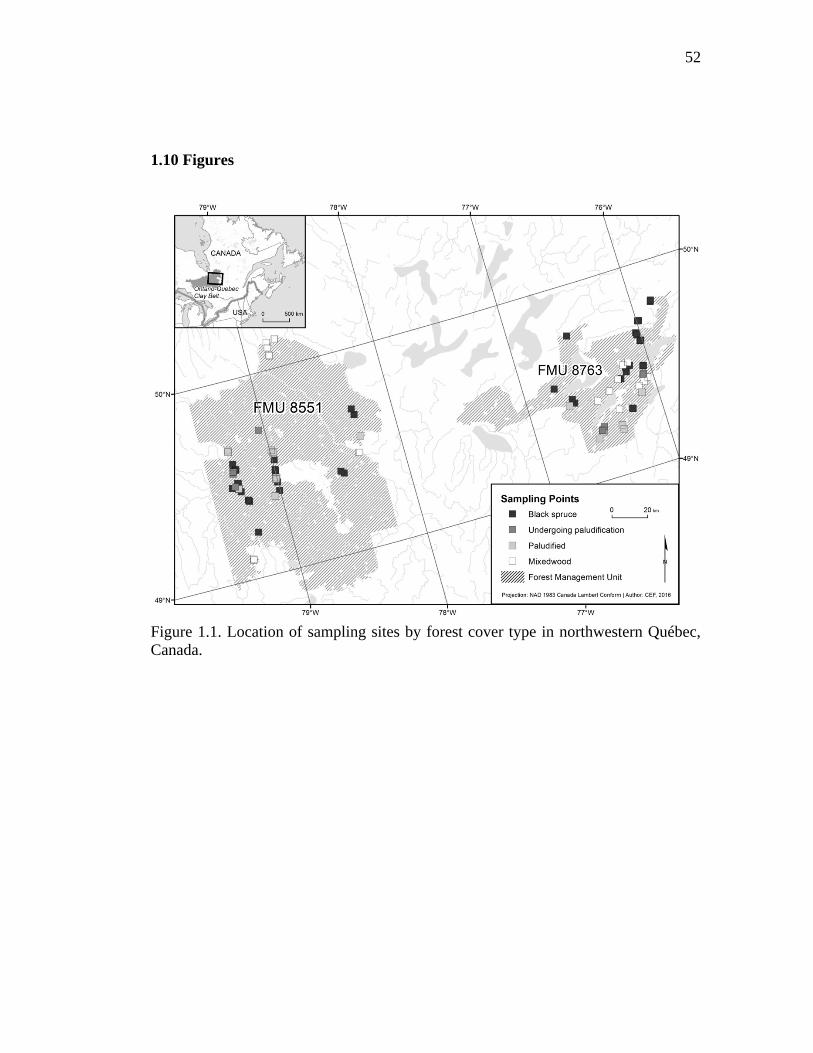
52
1.10 Figures
Figure 1.1. Location of sampling sites by forest cover type in northwestern Québec, Canada.
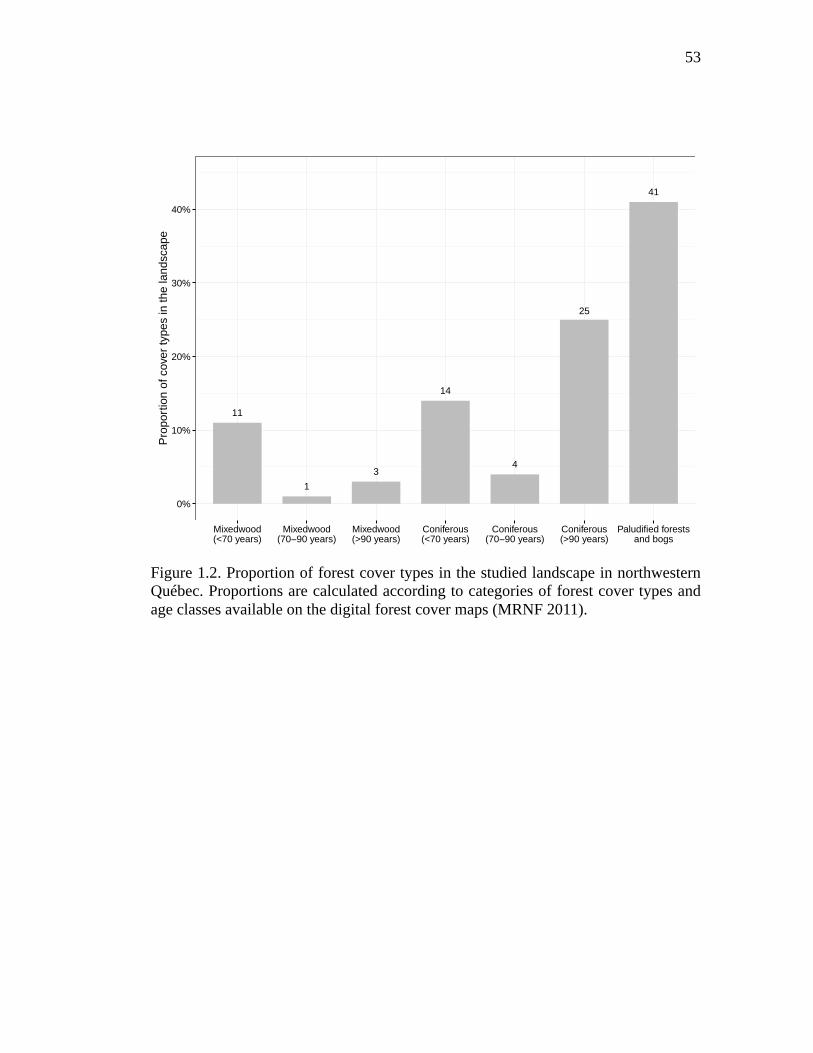
53
Figure 1.2. Proportion of forest cover types in the studied landscape in northwestern Québec. Proportions are calculated according to categories of forest cover types and age classes available on the digital forest cover maps (MRNF 2011).
11
13
14
4
41
0%
10%
20%
30%
40%
Mixedwood(<70 years)
Mixedwood(70−90 years)
Mixedwood(>90 years)
Coniferous(<70 years)
Coniferous(70−90 years)
Coniferous(>90 years)
Paludified forestsand bogs
Prop
ortio
n of
cov
er ty
pes
in th
e la
ndsc
ape
25
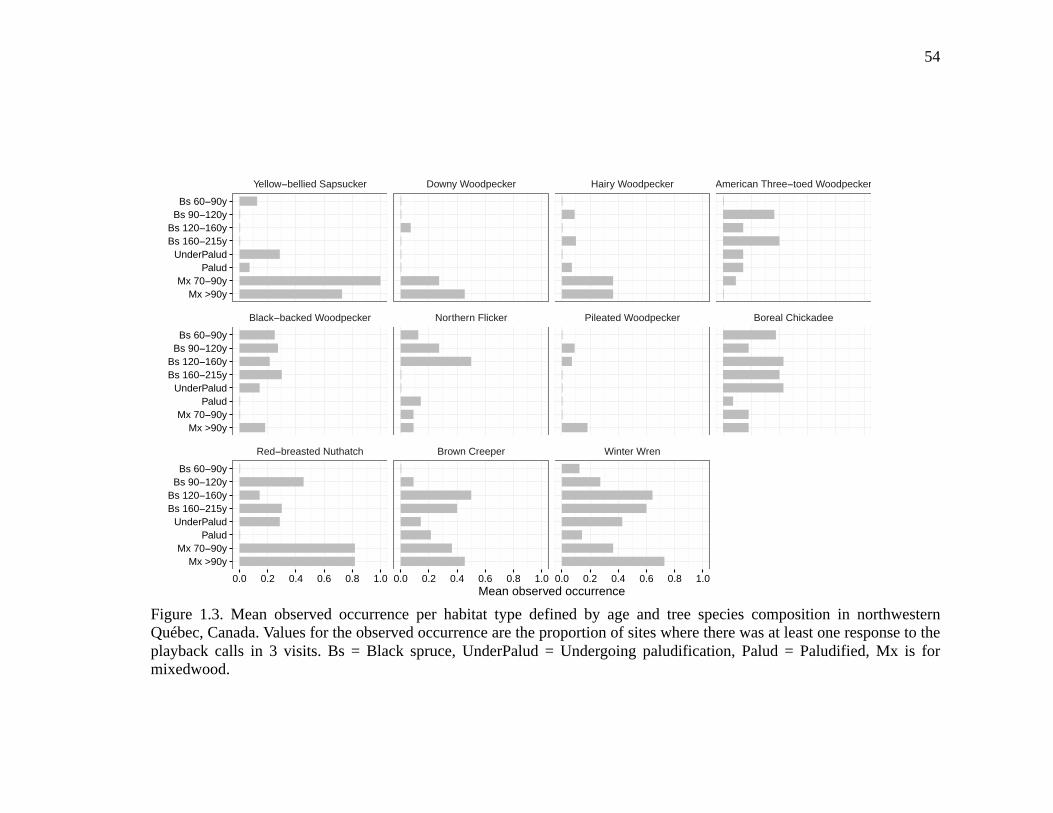
54
Figure 1.3. Mean observed occurrence per habitat type defined by age and tree species composition in northwestern Québec, Canada. Values for the observed occurrence are the proportion of sites where there was at least one response to the playback calls in 3 visits. Bs = Black spruce, UnderPalud = Undergoing paludification, Palud = Paludified, Mx is for mixedwood.
Yellow−bellied Sapsucker Downy Woodpecker Hairy Woodpecker American Three−toed Woodpecker
Black−backed Woodpecker Northern Flicker Pileated Woodpecker Boreal Chickadee
Red−breasted Nuthatch Brown Creeper Winter Wren
Mx >90yMx 70−90y
PaludUnderPalud
Bs 160−215yBs 120−160y
Bs 90−120yBs 60−90y
Mx >90yMx 70−90y
PaludUnderPalud
Bs 160−215yBs 120−160y
Bs 90−120yBs 60−90y
Mx >90yMx 70−90y
PaludUnderPalud
Bs 160−215yBs 120−160y
Bs 90−120yBs 60−90y
0.0 0.2 0.4 0.6 0.8 1.0 0.0 0.2 0.4 0.6 0.8 1.0 0.0 0.2 0.4 0.6 0.8 1.0Mean observed occurrence

55
Figure 1.4. Estimated species richness for deadwood birds within 8 habitat types along an age, structure and composition gradient of boreal forests in northwestern Québec. Multi-model inferences on group differences were calculated to identify the habitat types that are significantly different (different letter combinations). The error bars represent the 95% confidence intervals.
ab abc cd bcd abc a cd d0
2
4
Black spruce(60−90 years)
Black spruce(90−120 years)
Black spruce(120−160 years)
Black spruce(160−215 years)
Undergoingpaludification
Paludified Mixedwood(70−90 years)
Mixedwood(>90 years)
Estim
ated
spe
cies
rich
ness
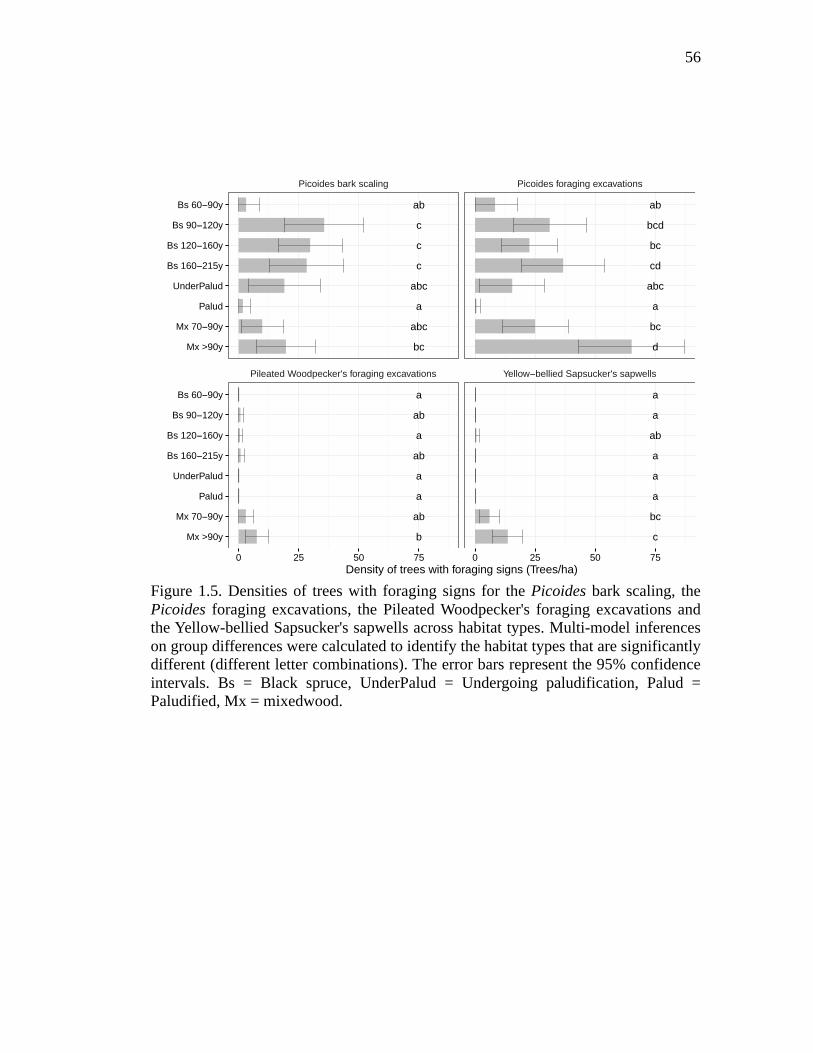
56
Figure 1.5. Densities of trees with foraging signs for the Picoides bark scaling, the Picoides foraging excavations, the Pileated Woodpecker's foraging excavations and the Yellow-bellied Sapsucker's sapwells across habitat types. Multi-model inferences on group differences were calculated to identify the habitat types that are significantly different (different letter combinations). The error bars represent the 95% confidence intervals. Bs = Black spruce, UnderPalud = Undergoing paludification, Palud = Paludified, Mx = mixedwood.
ab
c
c
c
abc
a
abc
bc
ab
bcd
bc
cd
abc
a
bc
d
a
ab
a
ab
a
a
ab
b
a
a
ab
a
a
a
bc
c
Picoides bark scaling Picoides foraging excavations
Pileated Woodpecker's foraging excavations Yellow−bellied Sapsucker's sapwells
Mx >90y
Mx 70−90y
Palud
UnderPalud
Bs 160−215y
Bs 120−160y
Bs 90−120y
Bs 60−90y
Mx >90y
Mx 70−90y
Palud
UnderPalud
Bs 160−215y
Bs 120−160y
Bs 90−120y
Bs 60−90y
0 25 50 75 0 25 50 75Density of trees with foraging signs (Trees/ha)
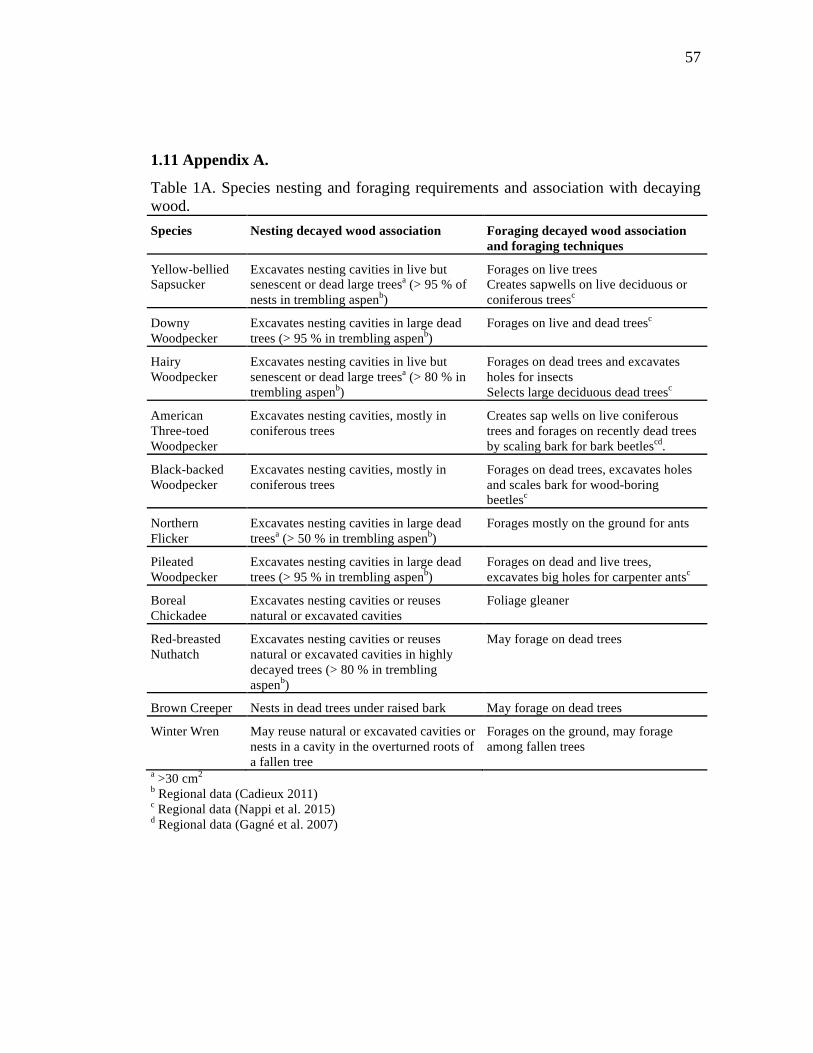
57
1.11 Appendix A.
Table 1A. Species nesting and foraging requirements and association with decaying wood. Species Nesting decayed wood association Foraging decayed wood association
and foraging techniques
Yellow-bellied Sapsucker
Excavates nesting cavities in live but senescent or dead large treesa (> 95 % of nests in trembling aspenb)
Forages on live trees Creates sapwells on live deciduous or coniferous treesc
Downy Woodpecker
Excavates nesting cavities in large dead trees (> 95 % in trembling aspenb)
Forages on live and dead treesc
Hairy Woodpecker
Excavates nesting cavities in live but senescent or dead large treesa (> 80 % in trembling aspenb)
Forages on dead trees and excavates holes for insects Selects large deciduous dead treesc
American Three-toed Woodpecker
Excavates nesting cavities, mostly in coniferous trees
Creates sap wells on live coniferous trees and forages on recently dead trees by scaling bark for bark beetlescd.
Black-backed Woodpecker
Excavates nesting cavities, mostly in coniferous trees
Forages on dead trees, excavates holes and scales bark for wood-boring beetlesc
Northern Flicker
Excavates nesting cavities in large dead treesa (> 50 % in trembling aspenb)
Forages mostly on the ground for ants
Pileated Woodpecker
Excavates nesting cavities in large dead trees (> 95 % in trembling aspenb)
Forages on dead and live trees, excavates big holes for carpenter antsc
Boreal Chickadee
Excavates nesting cavities or reuses natural or excavated cavities
Foliage gleaner
Red-breasted Nuthatch
Excavates nesting cavities or reuses natural or excavated cavities in highly decayed trees (> 80 % in trembling aspenb)
May forage on dead trees
Brown Creeper Nests in dead trees under raised bark May forage on dead trees
Winter Wren May reuse natural or excavated cavities or nests in a cavity in the overturned roots of a fallen tree
Forages on the ground, may forage among fallen trees
a >30 cm2 b Regional data (Cadieux 2011) c Regional data (Nappi et al. 2015) d Regional data (Gagné et al. 2007)

CHAPITRE 2
PERSISTENCE, CHANGES AND ROBUSTNESS IN ECOLOGICAL
NETWORKS AT THE TRANSITION BETWEEN MIXEDWOOD AND
CONIFEROUS BOREAL FORESTS: THE CASE OF NEST WEBS
60
2.1 Résumé
Les réseaux d’utilisateurs de cavités de l’Amérique du Nord sont composés d’une faible proportion d’espèces ayant beaucoup de liens. Ceci suggère une faible robustesse à la perte d’espèces clés de voûte. Dans l'est du Canada, d'importants changements latitudinaux surviennent dans la structure et la composition forestière partant des forêts boréales mixtes aux forêts boréales résineuses. À cette transition, de vieux arbres décidus de grande taille, soit les arbres principalement utilisés par la faune cavicole, laissent place à de petits arbres résineux, majoritairement l'épinette noire (Picea mariana). Nous avons comparé la structure et la robustesse des réseaux d'utilisateurs de cavités de la région de la forêt boréale mixte (48 – 490N) à la région de la pessière à mousses (> 490N). Les données ont été récoltées à l'échelle régionale (12 000 km2) le long d'un gradient latitudinal à la transition entre les forêts mixtes et résineuses dans des forêts à canopée fermée et dans des habitats forestiers ouverts et ennoyés par l’activité du castor (Castor canadensis). La structure des réseaux est restée similaire entre la région de la forêt boréale mixte et la région de la pessière à mousses. Premièrement, le rôle clé du peuplier faux-tremble (Populus tremuloides) a persisté dans la région de la pessière à mousses malgré l’importance marginale de cette essence d’arbre. Deuxièmement, l'ennoiement des peuplements forestiers par l’activité du castor a hébergé des réseaux riches et complexes dans les deux régions. Dans les deux régions forestières, le Grand Pic (Dryocopus pileatus) est demeuré l'espèce pivot pour les espèces d'utilisateurs secondaires de cavités de grande taille en forêts à canopée fermée dominées par le peuplier faux-tremble. Il était, par contre, absent des forêts résineuses à canopée fermée. Le Pic flamboyant (Colaptes auratus) est devenu le principal pourvoyeur de cavités de taille moyenne et grande dans ces forêts et par conséquent dans toute la région de la pessière à mousses. Dans les forêts ennoyées des deux régions, le Pic flamboyant était encore le pourvoyeur principal de cavités de taille moyenne et grande. Les réseaux dans les forêts d'épinettes noires étaient beaucoup plus pauvres que ceux dans les vieilles forêts mixtes avec moins d'excavateurs et d'utilisateurs secondaires et avec une quantité limitée de liens et d'interactions. Des analyses de retraits ciblés d'espèces démontrent que les réseaux des forêts à canopée fermée, particulièrement celles des vieilles forêts mixtes, ont une faible robustesse au retrait du peuplier faux-tremble et à moindre degré à la perte du Grand Pic, la majorité des liens étant reliés à ces espèces. Les réseaux d'utilisateurs de cavités des forêts ennoyées par le castor étaient plus robustes principalement à cause de l'utilisation plus diversifiée des essences par les excavateurs. Nous proposons que les cibles prioritaires pour la conservation des espèces cavicoles des forêts boréales doivent inclure (1) la protection des vieilles forêts mixtes avec peuplier faux-tremble et les forêts ennoyées par le castor et (2) le déploiement dans les forêts résineuses productives aménagées d’approches de rétention de parcelles de forêts fermées pourvues d’arbres vivants et morts de gros diamètre.
61
2.2 Abstract
In eastern Canada, a decline in avian diversity is associated with an important latitudinal shift in forest composition and structure, which occurs from mixedwood to coniferous boreal forest regions. At this transition, large old deciduous trees, the main cavity trees of nest webs, give way to smaller conifer trees, primarily black spruce (Picea mariana). We hypothesized that this latitudinal gradient would bring important changes in the functional diversity of ecological networks of vertebrate cavity users (nest webs) as these are composed of a few highly connected species suggesting low system robustness to the loss of keystone species. We compared the structure and robustness of nest webs in balsam fir-white birch (BFWB) and black spruce-moss (BSM) bioclimatic domains. Data was collected at a regional scale (12 000 km2) along a 200 km latitudinal gradient (480-500N) at the transition between mixedwood and black spruce dominated regions in old closed-canopy and open forest habitats flooded by the American beaver (Castor canadensis). Network structure was surprisingly similar between BFWB and BSM regions. First, the keystone role of old trembling aspen (Populus tremuloides) stands persisted in the northern BSM region despite their marginal importance. Second, the flooding of forest stands by beaver ponds harbored similarly rich and complex nest webs in both forest regions. The Pileated Woodpecker (Dryocopus pileatus) remained the pivotal species across the two forest regions for large secondary cavity users in closed-canopy forests dominated by trembling aspen, it was, however, absent in closed-canopy black spruce stands. In these latter forests and in open flooded forests, the Northern Flicker (Colaptes auratus) was the main medium to large cavity contributor across the two forest regions. Targeted removal simulations highlighted that closed-canopy forest networks, had a low robustness to the removal of trembling aspen and to a lesser degree to the loss of the Pileated Woodpecker, the majority of links within these networks being tied to these two species. Open forests nest webs, created by beaver ponds, were more robust mainly because primary excavators relied on a higher diversity of tree species. We suggest that conservation priorities for the cavity-nesting and roosting community in the northern boreal forest should include (1) the protection of old mixedwood stands and beaver ponds and (2) the retention of old productive coniferous stands with large live and dead trees in managed coniferous landscapes.
62
2.3 Introduction
One of the most recognized patterns in ecology is the general decline in species
diversity along a latitudinal gradient from the tropics to the poles (Rohde 1992,
Begon 1986). Along with this trend, a reduction in functional diversity is also
observed (Kerkhoff 2012). This pattern is also noticeable within the largest forest
biome of the planet, the boreal forest, as avian diversity declines following the habitat
gradient which from the south to the north of the boreal forest, corresponds to the
transition from mixedwood to coniferous dominated forests where smaller size black
spruce (Picea mariana) trees prevail (Gauthier et al. 2000, Drapeau et al. 2003).
However, some studies found that remnant mixedwood stands in black spruce
landscapes were strongly selected by several organisms (the American Marten
(Martes americana) and the moose (Alces alces) (Crête and Courtois 1997, Cheveau
et al. 2013). Hence, the conservation of these old mixedwood stands might also be
critical for cavity users, which represent an important proportion of the vertebrate
diversity that shapes these complex ecological networks in boreal forests (Darveau
and Desrochers 2001, Martin et al. 2004, Cadieux 2011).
In boreal ecosystems, these ecological networks (hereafter called nest webs) have a
scale-free structure (sensu Barabási 2009) i.e, where few species are responsible for
the majority of links and are thus considered network hubs. In these ecosystems the
trembling aspen, the Pileated Woodpecker (Dryocopus pileatus) and the Northern
Flicker (Colaptes auratus) have often been identified as such (Martin et al. 2004,
Cadieux 2011, Cooke and Hannon 2011, Simard et al. 2013). Having the most
connections in these networks, large old senescent and dead trembling aspen are
strongly selected by most boreal woodpeckers for cavity excavation as they require a
minimal tree size and a specific decay type (Martin et al. 2004, Cadieux 2011, Blanc
and Martin 2012, Ouellet-Lapointe et al. 2012). The preferred decay type is heart rot
because it creates a soft interior often surrounded by a hard exterior shell (Jackson
63
and Jackson 2004, Tozer et al. 2012, Lorenz et al. 2015). Whereas scale-free networks
are generally tolerant to the loss of random nodes (species), they usually have low
system robustness to targeted species removal (Albert et al. 2000, Cockle et al. 2012,
Messier et al. 2013, Simard et al. 2013). Along the latitudinal gradient, the loss of
keystone structures (Lindenmayer et al. 2012), for instance, large old senescent and
dead trembling aspen, could have an important negative impact on the cavity-nesting
community limiting the creation of cavities by woodpeckers. However, some cavity
excavators like the Northern Flicker could persist since they use a greater diversity of
nesting substrates suggesting a higher tolerance to the loss of these keystone
structures (Wiebe and Moore 2008).
Trees adequate for cavity excavation are created in multiple ways in the boreal forest.
While fire is often cited as the main disturbance, there are multiple other disturbance
agents acting at different spatial and temporal scales, which could facilitate the
excavation process: wind, fungi, insects and beaver (Holt 1997, Bergeron and Fenton
2012, Nummi and Kuuluvainen 2013). In this study, we focus more closely on two
ecological processes that are common and widespread in the boreal forest and could
be responsible for providing adequate trees for cavity excavation: a) the senescence
of forest stands; b) the flooding of forest stands by the American beaver (Castor
canadensis). Tree senescence combined with abiotic and biotic factors such as heart
rot can generate large cavity trees (Franklin et al. 1987, Bergeron and Fenton 2012).
Such is the case for the trembling aspen which, when it ages and reaches large
diameters, is often affected by heartwood decay (Phellinus tremulae) while still alive
(Basham 1991, Hart and Hart 2001, Jackson and Jackson 2004, Cadieux 2011).
As woodpeckers, the American beaver is considered an ecosystem engineer, creating
habitat for multiple species (Naiman et al. 1986, Wright et al. 2002). There have been
surprisingly few studies that considered the beaver as an agent of boreal forest
dynamics’ (Grover and Baldassarre 1995, Rosell et al. 2005, Nummi and
64
Kuuluvainen 2013) and even less on cavity-nesting bird communities (Lochmiller
1979). Snags in beaver ponds may provide an important source of cavity trees in
forest landscapes highly disturbed by beaver activities such as is the case in our study
region. Acting like a straw, a flooded tree has its roots and lower trunk most of the
time under water whereas the top of the tree is usually in an open environment with
direct sunlight, which hardens its exterior. A humid environment favors rapid
development of fungi and decay organisms in flooded trees (Jackson and Jackson
2004), facilitating their excavation. Moreover, in a context such as the black spruce-
moss forest region, where old large aspens become rare and patchily dispersed across
the landscape, beaver ponds could compensate for the limited sources of cavity trees
adequate for excavation.
In this study we analyze the structure of nest-webs along a latitudinal gradient from
mixedwoods to coniferous boreal forests of eastern Canada. We focus on specific
habitats rich in senescent and dead cavity trees in both closed-canopy forests and
open forest habitats flooded by the American beaver. We compare the characteristics
of cavity trees to available trees, and differences in interactions and species
composition in mixedwood, coniferous and beaver ponds stands. We test the
robustness of nest webs with a species removal analysis focused on keystone species.
We hypothesize that the changes in the availability of adequate cavity trees along our
latitudinal gradient will affect the cavity-nesting communities by changes in the
structure of networks at the tree and cavity excavator levels. We predict that the
strong tree diameter gradient and the changes in tree species composition from
mixedwood to coniferous regions will most likely affect large cavity nesters like the
Pileated Woodpecker. The functional role of large cavity provider in coniferous
boreal landscapes will shift from this excavator to the Northern Flicker, which has
been shown to be more flexible in its nesting substrates (Wiebe and Moore 2008). We
also predict that nest webs in open forest habitats will be more diversified and rich in
the coniferous region than in the mixedwood region given the reduced availability of
65
adequate cavity trees in black spruce closed-canopy forests and the reduced amount
of old mixedwood stands. Hence, nest webs of open forests in the northern coniferous
matrix of the boreal forest could compensate for the lower contribution of closed-
canopy forest stands (black spruce and mixedwood combined).
2.4 Methods
2.4.1 Study area
Our study spans a ~ 200 km latitudinal gradient from the balsam fir-white birch
(BFWB) to the black spruce-moss bioclimatic domain (BSM) located in northwestern
Québec in the northern Clay Belt of Quebec and Ontario (Robitaille and Saucier
1998). It covers a study region of 12 000 km2 (Figure 1). The BFWB region is
characterized by clay soils and low rocky hills (Robitaille and Saucier 1998). The
area contains a complex natural forest mosaic formed by different forest cover types
and by a variety of natural disturbances (Harvey 1999). The BSM has a generally flat
topography (Robitaille and Saucier 1998) and is known for its high vulnerability to
paludification, a process of gradual conversion of a mesic forest to a forested peatland
through the accumulation of organic material and water table rise (Taylor et al. 1988,
Simard et al. 2007). The forest mosaic is dominated by black spruce stands (Gauthier
et al. 2000).
2.4.2 Sampling plots
Sampling plots were vastly dispersed throughout the landscape to cover at a regional
scale the entire study region (Figure 2.1). In the BFWB region, plots were located in
the Lake Duparquet Research and Teaching Forest (LDRTF) at the southern fringe of
the boreal forest in Québec (48°30’ N, 79°22’ W) (Figure 2.1). Research on cavity
nesters is undergoing since 2003 (Nappi 2009, Cadieux 2011, Nappi et al. 2015). In
the BFWB region, we established 12 sampling plots in 2003 (24-40 ha) distributed in
four forest age categories (61-89, 135, 182-208 and 245 years after fire) determined
66
from prior knowledge of the fire regime and fire history over the last three centuries
in the LDRTF area (Bergeron 1991, Dansereau and Bergeron 1993). These age
categories determined by time since last fire were chosen to represent the structural
and compositional changes that occur in the mixedwood forest from early to late
successional stages. Stand composition changed with time since fire, from early seral
stands dominated by deciduous stands composed of trembling aspen and paper birch
(Betula papyrifera), to mixed stands incorporating white spruce (Picea glauca) and
balsam fir (Abies basamea), to coniferous stands with balsam fir, white and black
spruce and eastern white cedar (Thuya occidentalis) (Bergeron 2000). In addition, we
established 20 mixed and coniferous plots in beaver ponds of varying size (10
mixedwood ponds and 10 coniferous ponds).
In the BSM region, stand composition of this portion of our study region is
dominated by coniferous stands of black spruce of differing stand ages (Gauthier et
al. 2000). We established 24 sampling plots (10 ha) in unharvested old forest stands
dominated or co-dominated by trembling aspen (12) and by black spruce (12). These
plots were selected with updated digital forest cover maps (MRNF 2011). To be
selected, a forest patch had to be 1) accessible by road; 2) an old forest (categorized
by the digital cover maps to be older than 70 years after fire); 3) large enough to fit a
10 ha plot (250 m by 400 m); and 4) at least 2 km from another sampling plot. Using
the same methodology as in the BFWB forest region, 24 plots of varying size were
established in beaver ponds (12 in mixedwood ponds and 12 in coniferous ponds).
2.4.3 Nest search and cavity monitoring
In the BSM region, nest searches were conducted between the beginning of May and
the middle of July. Observers walked along transects separated by 50 m and used
visual and auditory cues that would indicate the presence of an occupied cavity:
breeding-bird behavior, begging nestlings or wood chips on the ground. Observers
also scanned trees for cavities. When possible, the excavator of the cavity was
67
visually identified. If no excavator was present at the site, we estimated the excavator
with the size and characteristics of the cavity. If there was a doubt, the excavator
remained unidentified. Two search surveys were made during the breeding season.
The methodology is very similar for the BFWB region and described in Cadieux
(2011). In beaver ponds, observers did a first cavity search survey by walking around
the pond and spot mapping all cavity-nesting species, potential nests and cavity trees.
The second survey was done with high boots and a canoe in which every tree was
inspected for cavities. Furthermore, to ensure a regional perspective and to include as
many interspecific interactions as possible, we took advantage of the lengthy travel
time between plots to opportunistically find occupied cavities along the road network.
All trees with cavities were marked with an aluminum tag and geo-referenced. They
were characterized by their essence, diameter at breast height (DBH) and degradation
(live or dead) and were also checked for exterior signs of heart rot by noting the
presence of fungal conks of fungal species associated to heartwood decay. Cavities
were inspected with a camera mounted on a telescopic pole (TreeTop Peeper™,
Sandpiper Technologies, Manteca, California) to determine the state of the cavity:
non-completed excavation, suitable cavity or occupied cavity. A cavity was
considered “occupied” if it contained at least one egg or nestling, or if a mammal was
present inside the cavity (Martin et al. 2004).
2.4.4 Vegetation sampling
Vegetation sampling was conducted to characterize and compare cavity trees to
available trees. Available trees having a DBH >10 cm were characterized by: tree
species, DBH, and tree degradation (live or dead and presence or absence of fungal
conks).
In the BFWB region, vegetation sampling was done in rectangular shaped subplots
measuring 600 m2 (10 m X 60 m), which were distributed 200 m apart in each closed-
68
canopy forest plot. In the BSM region, this sampling was done in 16 variable-area
subplots which were placed systematically in the closed-canopy forest plots. Factor 2
prisms were used to select trees. In beaver ponds, since access was difficult, we
sampled trees based on their accessibility.
2.4.5 Landscape scale characteristics
Proportions of forest cover types in each forest region were measured with digital
forest cover maps (MRNF 2011). Only polygons representing forested land were used
to compute the proportion of habitat types by their composition in the landscape.
2.4.6 Statistical analyses
2.4.6.1 Local scale characteristics
Characteristics of cavity trees, and available trees were compared between open and
closed-canopy habitats and for the two forest regions by averaging values at the plot.
Closed-canopy habitats were split into mixedwood and coniferous forest cover
because of striking differences in tree characteristics. We compared the mean DBH as
well as the proportion of dead trees, coniferous trees, trembling aspens and trees with
fungal conks. The mean DBH was computed for trees > 10 cm in DBH whereas all
other tree characteristics were computed for trees of DBH > 20 cm. All mean
comparisons were made with a Kruskal-Wallis test since variables were non-normally
distributed.
2.4.6.3 Nest-web structure and robustness to the loss of keystone species
To compare species interactions of trees, cavity producers and cavity users along the
latitudinal gradient, we built nest webs in the BFWB and BSM regions for both
closed and opened canopy forests. For each nest web, we separated the coniferous
trees and deciduous trees to highlight interactions between excavators and trees.
Strength of interactions is computed for each link between species and was calculated
separately for two levels: the tree to excavator level and the cavity reuse level. The
69
linkage strength for cavity reuse by secondary cavity nesters (SCN), weak primary
cavity nesters (WPCN) or primary cavity nesters (PCN) was calculated as the
proportion of total nests located in cavities not excavated by the focal species. The
linkage strength between a tree species and an excavator was defined as the
proportion of an excavator's nests located in a tree species. Three categories of
linkage strength were used: weak links (< 10 %), medium links (11-50 %) and strong
links (> 50 %) (Martin and Eadie 1999). In order to compute interaction diversity,
every occupied cavity was categorized on the basis of its interspecific interactions
stemming from three different levels across our networks: the tree level, the excavator
level and the secondary cavity nesters level.
Sampling with replacement was used to calculate the means and 95 % confidence
intervals of different network characteristics between habitats using 10 000
permutations. We compared Shannon-Weaver’s diversity index for tree species,
woodpecker species and secondary cavity nesters and interspecific interactions for
each resampled network. The sampling size was set to the lowest network size (79
nest trees) in order to equilibrate the number of occupied cavities by habitat.
Differences between habitats were considered significant when the confidence
intervals did not overlap.
Using the same resampling method, we evaluated the robustness of networks to the
loss of specific species. In this case, for each permutation, after having sampled the
data, we removed a specific species. We removed excavator species (Downy
Woodpecker - Picoides pubescens , Yellow-bellied Sapsucker - Sphyrapicus varius,
Black-backed Woodpecker - Picoides arcticus , Northern Flicker or the Pileated
Woodpecker) and tree species (trembling aspen, black spruce, balsam fir, white birch,
balsam poplar - Populus balsamifera). We then measured the proportion of secondary
extinctions (loss of other species).
70
All statistical analyses were performed with R version 3.2.3 (R Core Team 2015) and
graphics were created with the R package: ggplot2 (Wickham et al. 2013).
2.5 Results
2.5.1 Landscape scale characteristics of forest regions
In the BSM region, bogs covered 41 % of the landscape in contrast to only 10 % in
BFWB (Figure 2.2). Conifer forests older than 70 years were well represented in the
BSM with 29 % and 17% in BFWB (Figure 2.2). Only 3 % and 8 % of mixedwood
forest cover > 70 years was found in BSM and BFWB regions respectively compared
to 8 % and 21 % of mixedwood forests < 70 years for BSM and BFWB respectively
(Figure 2.2). A similar trend was observed with deciduous forests with only 1 % and
4 % of forests > 70 years cover found in BSM and BFWB respectively (Figure 2.2).
2.5.2 Local scale characteristics
At the stand scale, we observed different selection patterns between open and closed-
canopy forests when cavity trees characteristics were compared to ones of available
trees with the exception of tree diameter (DBH). Cavity trees had a significantly
higher DBH than available trees in every sampled habitat (Table 2.1). The smallest
mean DBH were found in coniferous closed canopy forests for both available and
used trees (Table 2.1). There was a significantly higher proportion of dead trees used
as cavity trees than for available trees in closed-canopy forests (Table 2.1). In beaver
ponds most trees used and available were dead (Table 2.1). Deciduous trees, mostly
trembling aspen were strongly selected as cavity trees in closed-canopy forests
whereas, in beaver ponds, this was much less the case as this preference for
deciduous trees was only significant in beaver ponds of the mixedwood forest region
(Table 2.1). Finally, cavity trees in closed canopy forests had a significantly higher
proportion of the presence of fungal conks than available trees (Table 2.1). However
71
this selection was not observed in beaver ponds and to the contrary, cavity trees had a
significantly lower proportion of fungal conks than available trees (Table 2.1).
2.5.4 Nest-webs structure and robustness to the loss of key species
During the field seasons of 2012 and 2013 in the BSM region, we found 249 nests
and occupied cavities for 20 cavity-nesting species. In the BFWB region, throughout
the 2003 to 2015 period, we found 844 nests and occupied cavities for 22 cavity-
nesting species. Most cavity nesters found in the BFWB forest region were also found
in the BSM region with the exception of the Wood Duck (Aix sponsa), the Common
Raccoon (Procyon lotor) and the Northern Hawk Owl (Surnia ulula). Moreover, the
American Three-toed Woodpecker (Picoides dorsalis) and the Boreal Owl (Aegolius
funerus), which were absent in the BFWB region, were added in the BSM region
cavity-nesting community. Across forest regions only 5 % of nests were found in
coniferous trees (n = 56), mostly in black spruce and 95 % of nests were found in
deciduous trees, mostly in trembling aspen (n = 1034) (Figure 2.3). Only a few
excavators such as the Boreal Chickadee (Poecile hudsonicus), the Black-capped
Chickadee (Poecile atricapillus) and the Northern Flicker were found in both
coniferous and deciduous trees. All cavity excavators were found to use deciduous
trees at least once for nesting with the exception of the Black-backed Woodpecker.
In BSM’s closed-canopy forests, the majority of cavity trees were in deciduous trees.
We found only a limited number of cavities in coniferous trees that were mainly
excavated by the Black-backed Woodpecker and the Northern Flicker (Figure 2.3b).
The BSM’s deciduous tree nest web contained a diverse community of cavity nesters
very similar to what was observed in the BFWB deciduous tree nest web (Figures
5a,b). In both nest webs, the structure was centered on the trembling aspen as the
main nest tree, the Yellow-bellied Sapsucker as the main cavity excavator and nester
and around the Pileated Woodpecker, which was the cavity excavator with the most
cavities reused by secondary cavity nesters (Figures 5a, b).
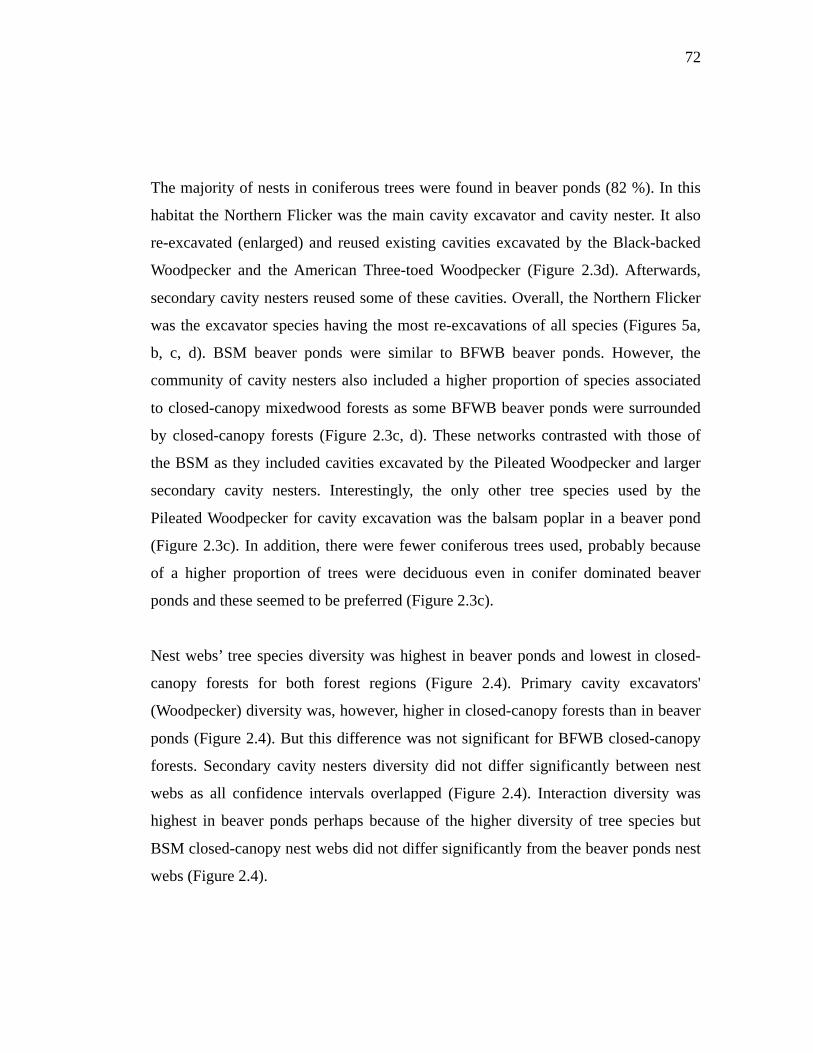
72
The majority of nests in coniferous trees were found in beaver ponds (82 %). In this
habitat the Northern Flicker was the main cavity excavator and cavity nester. It also
re-excavated (enlarged) and reused existing cavities excavated by the Black-backed
Woodpecker and the American Three-toed Woodpecker (Figure 2.3d). Afterwards,
secondary cavity nesters reused some of these cavities. Overall, the Northern Flicker
was the excavator species having the most re-excavations of all species (Figures 5a,
b, c, d). BSM beaver ponds were similar to BFWB beaver ponds. However, the
community of cavity nesters also included a higher proportion of species associated
to closed-canopy mixedwood forests as some BFWB beaver ponds were surrounded
by closed-canopy forests (Figure 2.3c, d). These networks contrasted with those of
the BSM as they included cavities excavated by the Pileated Woodpecker and larger
secondary cavity nesters. Interestingly, the only other tree species used by the
Pileated Woodpecker for cavity excavation was the balsam poplar in a beaver pond
(Figure 2.3c). In addition, there were fewer coniferous trees used, probably because
of a higher proportion of trees were deciduous even in conifer dominated beaver
ponds and these seemed to be preferred (Figure 2.3c).
Nest webs’ tree species diversity was highest in beaver ponds and lowest in closed-
canopy forests for both forest regions (Figure 2.4). Primary cavity excavators'
(Woodpecker) diversity was, however, higher in closed-canopy forests than in beaver
ponds (Figure 2.4). But this difference was not significant for BFWB closed-canopy
forests. Secondary cavity nesters diversity did not differ significantly between nest
webs as all confidence intervals overlapped (Figure 2.4). Interaction diversity was
highest in beaver ponds perhaps because of the higher diversity of tree species but
BSM closed-canopy nest webs did not differ significantly from the beaver ponds nest
webs (Figure 2.4).
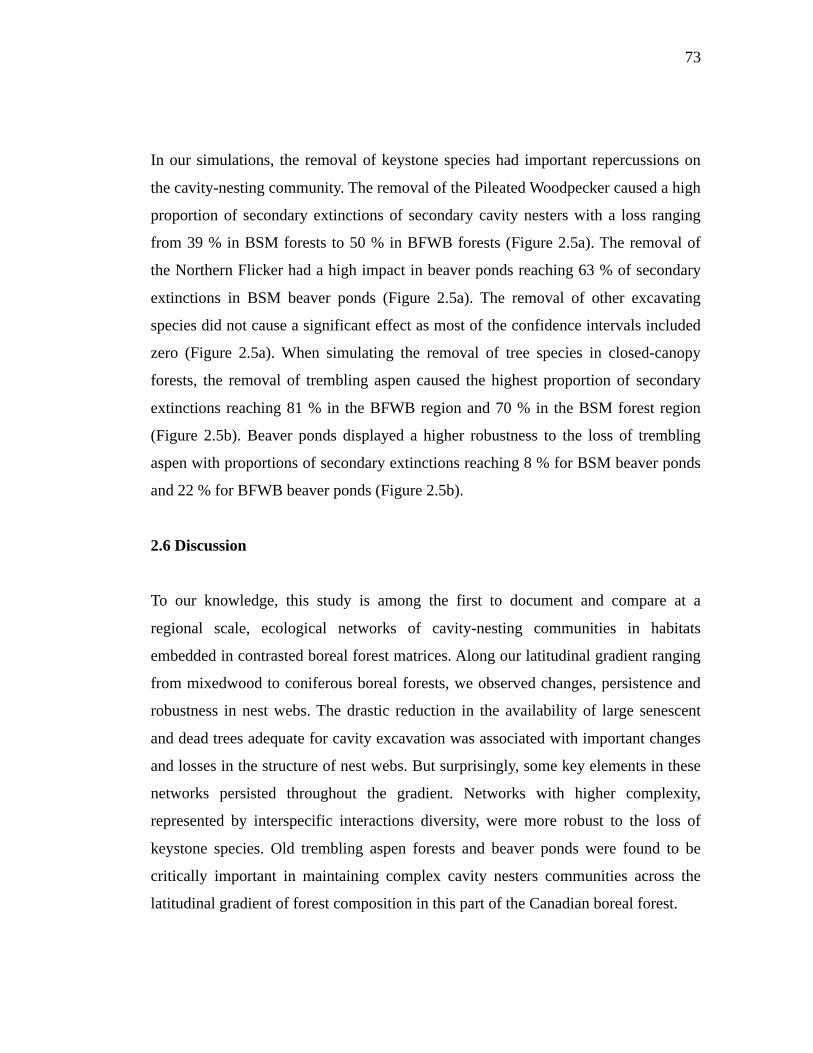
73
In our simulations, the removal of keystone species had important repercussions on
the cavity-nesting community. The removal of the Pileated Woodpecker caused a high
proportion of secondary extinctions of secondary cavity nesters with a loss ranging
from 39 % in BSM forests to 50 % in BFWB forests (Figure 2.5a). The removal of
the Northern Flicker had a high impact in beaver ponds reaching 63 % of secondary
extinctions in BSM beaver ponds (Figure 2.5a). The removal of other excavating
species did not cause a significant effect as most of the confidence intervals included
zero (Figure 2.5a). When simulating the removal of tree species in closed-canopy
forests, the removal of trembling aspen caused the highest proportion of secondary
extinctions reaching 81 % in the BFWB region and 70 % in the BSM forest region
(Figure 2.5b). Beaver ponds displayed a higher robustness to the loss of trembling
aspen with proportions of secondary extinctions reaching 8 % for BSM beaver ponds
and 22 % for BFWB beaver ponds (Figure 2.5b).
2.6 Discussion
To our knowledge, this study is among the first to document and compare at a
regional scale, ecological networks of cavity-nesting communities in habitats
embedded in contrasted boreal forest matrices. Along our latitudinal gradient ranging
from mixedwood to coniferous boreal forests, we observed changes, persistence and
robustness in nest webs. The drastic reduction in the availability of large senescent
and dead trees adequate for cavity excavation was associated with important changes
and losses in the structure of nest webs. But surprisingly, some key elements in these
networks persisted throughout the gradient. Networks with higher complexity,
represented by interspecific interactions diversity, were more robust to the loss of
keystone species. Old trembling aspen forests and beaver ponds were found to be
critically important in maintaining complex cavity nesters communities across the
latitudinal gradient of forest composition in this part of the Canadian boreal forest.
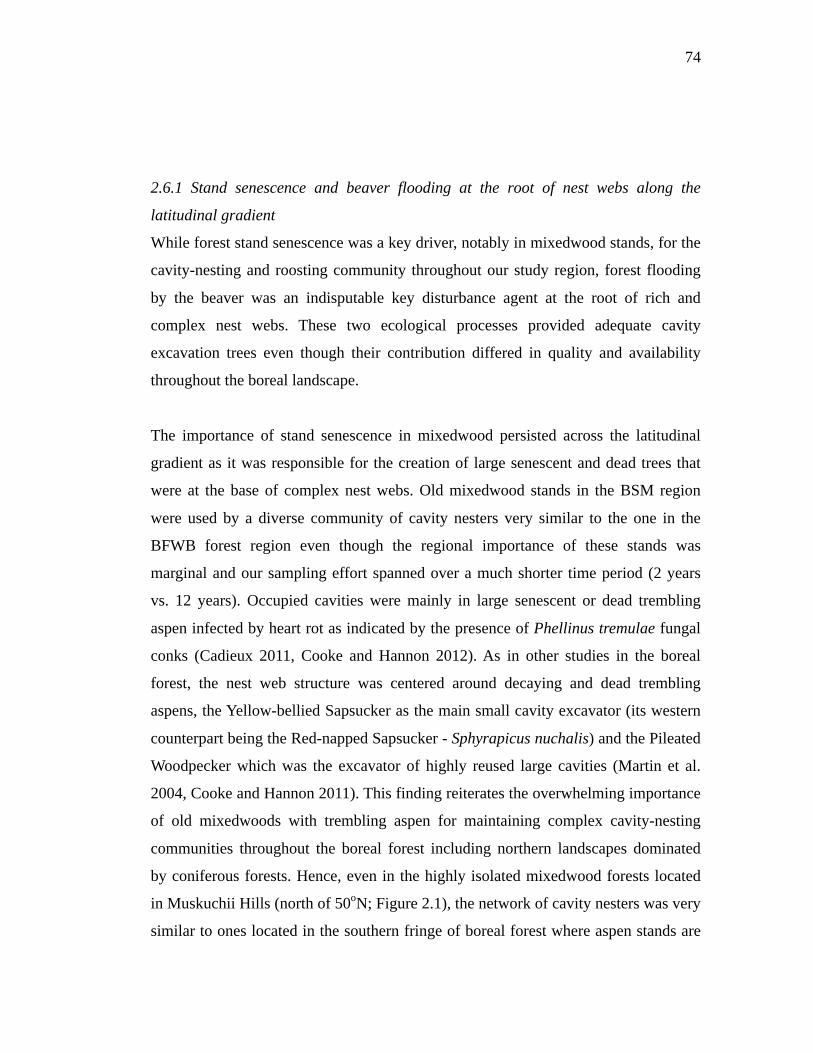
74
2.6.1 Stand senescence and beaver flooding at the root of nest webs along the
latitudinal gradient
While forest stand senescence was a key driver, notably in mixedwood stands, for the
cavity-nesting and roosting community throughout our study region, forest flooding
by the beaver was an indisputable key disturbance agent at the root of rich and
complex nest webs. These two ecological processes provided adequate cavity
excavation trees even though their contribution differed in quality and availability
throughout the boreal landscape.
The importance of stand senescence in mixedwood persisted across the latitudinal
gradient as it was responsible for the creation of large senescent and dead trees that
were at the base of complex nest webs. Old mixedwood stands in the BSM region
were used by a diverse community of cavity nesters very similar to the one in the
BFWB forest region even though the regional importance of these stands was
marginal and our sampling effort spanned over a much shorter time period (2 years
vs. 12 years). Occupied cavities were mainly in large senescent or dead trembling
aspen infected by heart rot as indicated by the presence of Phellinus tremulae fungal
conks (Cadieux 2011, Cooke and Hannon 2012). As in other studies in the boreal
forest, the nest web structure was centered around decaying and dead trembling
aspens, the Yellow-bellied Sapsucker as the main small cavity excavator (its western
counterpart being the Red-napped Sapsucker - Sphyrapicus nuchalis) and the Pileated
Woodpecker which was the excavator of highly reused large cavities (Martin et al.
2004, Cooke and Hannon 2011). This finding reiterates the overwhelming importance
of old mixedwoods with trembling aspen for maintaining complex cavity-nesting
communities throughout the boreal forest including northern landscapes dominated
by coniferous forests. Hence, even in the highly isolated mixedwood forests located
in Muskuchii Hills (north of 50oN; Figure 2.1), the network of cavity nesters was very
similar to ones located in the southern fringe of boreal forest where aspen stands are
75
common (Bergeron 2000). However, more research is needed to assess whether
habitat quality (measured by reproductive success of cavity nesters) of these isolated
forests is as good as southern mixedwood stands.
Along the latitudinal gradient nest webs had low system robustness to the loss of the
trembling aspen, a central node in many North American nest webs (Martin et al.
2004, Cadieux 2011, Cooke and Hannon 2011, Cockle et al. 2012, Simard et al.
2013). The removal of this tree species caused important losses in species triggering
up to 80 % of secondary extinctions in simulated networks. Correspondingly,
numerous woodpecker species nested almost exclusively in mixedwoods and were
not found in coniferous dominated habitats. BSM closed-canopy black spruce forests
did not foster a complex cavity-nesting community as we found only a limited
number of nests and cavity trees. Even though these forests were old (> 90 years), the
amount of large and dead trees was low. Black spruce stands in our study were very
limited in diameter suggesting low productivity resulting from paludification (Fenton
et al. 2005). Further studies on cavity-nesting communities and nest webs in
coniferous forests composed by other conifer species and/or with a higher
productivity such as those in eastern Québec could either corroborate or provide new
insights on the contribution of coniferous forests to nest webs in the black spruce
forest region (see Imbeau and Desrochers 2002, Vaillancourt et al. 2008, Tremblay et
al. 2009).
In both BSM and BFWB regions, forests flooded by the beaver had rich and diverse
cavity user networks. These nest webs had a higher complexity and displayed higher
robustness to the loss of the trembling aspen along the gradient. Contrary to closed-
canopy forests, these habitats remained highly used regardless of tree species
composition and most occupied cavities in coniferous trees in the whole study region
were found in beaver ponds. These networks were as rich in the BSM as in the
BFWB, thus our hypothesis of higher network complexity in the BSM was not
76
supported. However, their relative importance was higher in these coniferous
landscapes. Where large dead trees were not common, forests flooded by the beaver
provided a rare resource of trees adequate for excavation readily used by cavity
nesters. The cavity-nesting community occupying this habitat was composed mainly
of open forest habitat species with the Northern Flicker as the main cavity excavator
and the species with the highest number of occupied cavities. The low mean cavity
height in forests flooded by the beaver did not seem to deter the use of cavities
(Appendix B). Water might thus act as protection for cavity users. More research on
nesting success of cavity-nesting birds in beaver ponds could determine if predation
risk is indeed reduced in this habitat. Although beaver ponds are known to be species
rich (Wright et al. 2002), there are only a few studies that highlight their importance
for dead wood associated birds (Lochmiller 1979, Rendell and Robertson 1989,
Grover and Baldassarre 1995, Nummi and Holopainen 2014). To our knowledge this
is the first study that measures the importance of forests flooded by the beaver in
boreal forest for cavity-nesting communities.
It is noteworthy to mention that more nests of Black-backed Woodpeckers were found
in forests flooded by beavers than in closed-canopy forests. Our results may not be
surprising considering that in the eastern boreal forest of Canada, 1) Black-backed
Woodpeckers reach their highest nesting densities in open habitats originating from
recent wildfires (Nappi et al. 2003, Nappi and Drapeau 2009, Nappi et al. 2010), 2)
are much more dispersed in old black spruce forests, with large home range and low
breeding densities, and 3) are often nesting in remnant snags of recent clearcuts
(Tremblay et al. 2009, 2015).
2.6.2 Keystone excavators along the latitudinal gradient
The Pileated Woodpecker was a keystone species for providing high, large and
greatly reused cavities to the most and to the largest of secondary cavity nesters,
similar to what was found in other studies (Bonar 2000, Aubry and Raley 2002,
77
Martin et al. 2004, Blanc and Walters 2008, Cooke 2009, Cadieux 2011). However,
we confirmed this role throughout our latitudinal gradient as this excavator was as
important in BFWB mixedwood stands as it was in BSM mixedwoods. The loss of
this keystone species in coniferous dominated forests along the latitudinal gradient
and in targeted removal simulations had a strong negative impact on the species
diversity of secondary cavity nesters. Large secondary cavity users who nested almost
exclusively in its cavities were severely limited. Other studies also found that the
distribution of the Pileated Woodpecker was strongly limited by the amount of
mixedwood and trembling aspen stands in eastern Quebec boreal forest at slightly
lower latitudes (Savignac et al. 2000, Gagné 2006, Vaillancourt et al. 2009).
The Northern Flicker, the second-largest cavity excavator of North American boreal
forests, was not limited by the presence of trembling aspen. As found in the literature
(Wiebe and Moore 2008), this species was flexible in its tree species selection for
cavity excavation. This flexibility was probably one of the reasons why medium to
large cavities persisted in boreal coniferous landscapes. The Northern Flicker cavities
were still common in open and closed-canopy forests where the trembling aspen was
absent. Hence, several cavity nesters of different sizes used northern flicker cavities.
One of the largest cavity nesters, the Common Goldeneye was found nesting in a
cavity excavated by this excavator in a black spruce in one of our beaver pond sites,
showing that this large secondary cavity nester can use the Northern Flicker cavities.
With time, cavities originating from Northern Flicker excavations can become bigger
(Edworthy et al. 2012) and be used by larger secondary cavity nesters. However,
compared to the Pileated Woodpecker cavities which are typically excavated in live
but senescent trees in boreal forests making them persistent in time, holes excavated
by the Northern Flicker are usually not the ideal choice since excavated trees are
usually smaller in diameter, dead and cavities are usually lower making them less
secure and ultimately more prone to predation (Fisher and Wiebe 2006). However,
these may be the only possible choice for large cavities users in coniferous boreal
78
forests since cavities excavated by Pileated Woodpecker or created by decay alone,
are extremely rare (this study and Vaillancourt et al. 2009). The combination of two
ecosystem engineers, the beaver and the Northern Flicker might provide the last large
nesting cavity option as we move up north in boreal coniferous landscapes. Our
results corroborate Robles and Martin's (2014) idea that habitat may mediate the
interspecific associations between cavity excavators and secondary cavity users. In
boreal black spruce dominated landscapes where trembling aspen is rare, the key role
of large cavity provider thus shifts towards the Northern Flicker.
2.6.3 Protection of old trembling aspen patches and management of productive old
coniferous forests
Numerous cavity nesters species were only found in mixedwood stands. For these
species, old mixedwood forests with senescent trembling aspen in the BSM region
most likely trace their northern distribution limit. Whereas mixedwood forests were
very similar in the two regions, BSM mixedwoods represented only 4 % of the forest
cover in the landscape. To this day, these forests stands are managed without
considering their overwhelming importance for the maintenance of species richness,
conservation of biodiversity in general (Jacqmain et al. 2008, Cheveau et al. 2013).
Our study clearly reiterates the ecological importance of protecting mixedwood
patches in the northern boreal forest considering their regional contribution for the
cavity user community.
In northwestern Quebec, old growth black spruce forests often have a very low
productivity caused by paludification (Boudreault et al. 2002, Fenton et al. 2005).
Cavity nesters are highly dependent on the size of trees. To maintain complex cavity-
nesting and roosting communities in a coniferous boreal landscape it is therefore
crucial to increase the amount of large live and dead trees in managed landscapes
with a mixture of management approaches that may include extensive use of longer
rotations, partial cutting, or a combination of both (Bergeron et al. 2002, Gauthier et
79
al. 2009). These management approaches are not only more likely to be ecologically
sustainable for boreal birds (Drapeau et al. 2016) but also for key ecological
processes (large tree production and recruitment of deadwood) underlying the
complex ecological networks that support cavity-nesting and roosting communities in
the boreal forest.
2.7 Acknowledgements
We thank Réjean Deschênes, Antoine Plouffe Leboeuf, Hanna Brais Harvey, Louis-
Joseph Drapeau, Simon Paradis, Vincent Poupart, Delphine Favorel, Jillian Slater,
Sarah Wood and Derek Yarjeau for their assistance in the field. Funding was
provided by a Natural Sciences and Engineering Research Council of Canada
(NSERC) graduate student scholarship to Cadieux, the Québec Fonds de la recherche
nature et technologies (FRQNT) graduate student scholarship to Cadieux, the Center
for forest research (CFR) scholarship for research communication, the NSERC
CREATE program on Forest Complexity Modeling scholarship program with
industrial and government agency partners, a NSERC Cooperative Research
Development grant to Drapeau and collaborators, a NSERC Discovery grant to
Drapeau, Tembec industries and Lake Duparquet research and teaching forest.
2.8 References
Albert, R., Jeong, H., Barabási, A.-L. 2000. Error and attack tolerance of complex
networks. Nature. 406: 6794, 378-382. Aubry, K., Raley, C. 2002. Selection of nest and roost trees by Pileated Woodpeckers
in coastal forests of Washington. Journal of Wildlife Management. 66: 2, 392-406.
Barabási, A. L. 2009. Scale-free networks: a decade and beyond. Science. 325: 5939,
412.
80
Basham, J. T. 1991. Stem decay in living trees in Ontario’s forests: a users’ compendium and guide. Forestry Canada. Sault Ste. Marie, Ontario.
Begon, M., Harper, J., Townsend, C. 1986. Ecology: individuals, populations and
communities. Oxford. Blackwell Scientific, 876 p. Bergeron, Y. 1991. The influence of island and mainland lakeshore landscapes on
boreal forest fire regimes. Ecology. 72: 6, 1980-1992. Bergeron, Y. 2000. Species and stand dynamics in the mixed woods of Quebec's
southern boreal forest. Ecology. 81: 6, 1500-1516. Bergeron, Y., Leduc, A., Harvey, B. D., Gauthier, S. 2002. Natural fire regime: a
guide for sustainable management of the Canadian boreal forest. Silva Fennica. 36: 1, 81-95.
Bergeron, Y., Fenton, N. J. 2012. Boreal forests of eastern Canada revisited: old
growth, nonfire disturbances, forest succession, and biodiversity. Botany. 90: 6, 509-523.
Blanc, L. A., Walters, J. R. 2008. Cavity-nest webs in a longleaf pine ecosystem. The
Condor. 110: 1, 80-92. Blanc, L. A., Martin, K. 2012. Identifying suitable woodpecker nest trees using decay
selection profiles in trembling aspen (Populus tremuloides). Forest Ecology and Management. 286: 0, 192-202.
Bonar, R. L. 2000. Availability of Pileated Woodpecker cavities and use by other
species. Journal of Wildlife Management. 64: 1, 52-59. Boudreault, C., Bergeron, Y., Gauthier, S., Drapeau, P. 2002. Bryophyte and lichen
communities in mature to old-growth stands in eastern boreal forests of Canada. Canadian Journal of Forest Research. 32: 6, 1080-1093.
Cadieux, P. 2011. Dynamique de la faune cavicole le long d'un gradient d'âge en forêt
boréale mixte de l'est de l'Amérique du Nord. M. Sc. Thesis. Université du Québec à Montréal. Montréal. 85 p.
Cheveau, M., Imbeau, L., Drapeau, P., Belanger, L. 2013. Marten space use and
habitat selection in managed coniferous boreal forests of eastern Canada. The Journal of Wildlife Management. 77: 4, 749-760.
81
Cockle, K. L., Martin, K., Robledo, G. 2012. Linking fungi, trees, and hole-using birds in a Neotropical tree-cavity network: Pathways of cavity production and implications for conservation. Forest Ecology and Management. 264: 0, 210-219.
Cooke, H. A. 2009. Do aggregated harvests with structural retention conserve cavity
users in old forest in the boreal plains? Ph. D. Thesis. University of Alberta. Edmonton. 233 p.
Cooke, H. A., Hannon, S. J. 2011. Do aggregated harvests with structural retention
conserve the cavity web of old upland forest in the boreal plains? Forest Ecology and Management. 261: 3, 662-674.
Cooke, H. A., Hannon, S. J. 2012. Nest-site selection by old boreal forest cavity
excavators as a basis for structural retention guidelines in spatially-aggregated harvests. Forest Ecology and Management. 269: 0, 37-51.
Crête, M., Courtois, R. 1997. Limiting factors might obscure population regulation of
moose (Cervidae: Alces alces) in unproductive boreal forests. Journal of Zoology. 242: 4, 765-781.
Dansereau, P., Bergeron, Y. 1993. Fire history in the southern boreal forest of
northwestern Quebec. Canadian Journal of Forest Research. 23: 1, 25-32. Darveau, M., Desrochers, A. 2001. Le bois mort et la faune vertébrée: état des
connaissances au Québec. Ministère des Ressources naturelles du Québec, Direction de l'environnement forestier. Rapport DEF-0199. Québec.
Drapeau, P., Leduc, A., Bergeron, Y., Gauthier, S., Savard, J. P. 2003. Les
communautés d'oiseaux des vieilles forêts de la pessière à mousses de la ceinture d'argile: Problèmes et solutions face à l'aménagement forestier. The Forestry Chronicle. 79: 3, 531-540.
Drapeau, P., Villard, M. A., Leduc, A., Hannon, S. J. 2016. Natural disturbance
regimes as templates for the response of bird species assemblages to contemporary forest management. Diversity and Distributions.
Edworthy, A. B., Wiebe, K. L., Martin, K. 2012. Survival analysis of a critical
resource for cavity-nesting communities: patterns of tree cavity longevity. Ecological Applications. 22: 6, 1733-1742.
82
Fenton, N., Lecomte, N., Légaré, S., Bergeron, Y. 2005. Paludification in black spruce (Picea mariana) forests of eastern Canada: Potential factors and management implications. Forest Ecology and Management. 213: 151-159.
Fisher, R. J., Wiebe, K. L. 2006. Nest site attributes and temporal patterns of northern
flicker nest loss: effects of predation and competition. Oecologia. 147: 744-753.
Franklin, J. F., Shugart, H. H., Harmon, M. E. 1987. Tree death as an ecological
process. BioScience. 37: 8, 550-556. Gagné, C. 2006. La répartition spatiale des coupes forestières et ses effets sur la distribution et le comportement alimentaire des oiseaux excavateurs. M. Sc. Thesis. Université du Québec à Montréal. Montréal. 102 p. Gauthier, S., De Grandpré, L., Bergeron, Y. 2000. Differences in forest composition
in two boreal forest ecoregions of Quebec. Journal of Vegetation Science. 11: 6, 781-790.
Gauthier, S., Vaillancourt, M. A., Leduc, A., Grandpré, L., Kneeshaw, D., Morin, H.,
Drapeau, P., Bergeron, Y. 2009. Ecosystem management in the boreal forest. Quebec. Presses de l'Université du Québec, 539 p.
Grover, A., Baldassarre, G. 1995. Bird species richness within beaver ponds in south-
central New York. Wetlands. 15: 2, 108-118. Hart, J. H., Hart, D. L. 2001. Heartrot fungi's role in creating picid nesting sites in
living aspen. In: Shepperd, W. D., Binkley, D., Bartos, D. L., Stohlgren, T. J. et Eskew, L. G. (Eds), Procedings of the Symposium on the Sustaining aspen in western landscapes (Grand Junction, CO, June 13-15, 2000). USDA Forest Service, 207-213.
Harvey, B. D. 1999. The Lake Duparquet Research and Teaching Forest: Building a
foundation for ecosystem management. The Forestry Chronicle. 75: 3, 389-393.
Holt, R. F. 1997. Habitat selection, demography and conservation implications for a
cavity-nesting community in a managed landscape. Ph. D. Thesis. University of Toronto. Canada.
Imbeau, L., Desrochers, A. 2002. Foraging ecology and use of drumming trees by
three-toed woodpecker. Journal of Wildlife Management. 66: 1, 222-231.

83
Jackson, J. A., Jackson, B. J. S. 2004. Ecological relationships between fungi and woodpecker cavity sites. The Condor. 106: 1, 37-49.
Jacqmain, H., Dussault, C. Courtois, R. and Bélanger, L. 2008. Moose–habitat
relationships: integrating local Cree native knowledge and scientific findings in northern Quebec. Canadian Journal of Forest Research, 38: 3120-3132.
Kerkhoff, A. J. 2012. The biogeography and filtering of woody plant functional
diversity in North and South America. Global Ecology and Biogeography. 21: 8, 798-808.
Lindenmayer, D. B., Laurance, W. F., Franklin, J. F. 2012. Global decline in large old
trees. Science. 338: 6112, 1305-1306. Lochmiller, R. L. 1979. Use of beaver ponds by southeastern woodpeckers in winter.
The Journal of Wildlife Management. 43: 1, 263-266. Lorenz, T. J., Vierling, K. T., Johnson, T. R., Fischer, P. C. 2015. The role of wood
hardness in limiting nest site selection in avian cavity excavators. Ecological Applications. 25: 4, 1016-1033.
Martin, K., Eadie, J. M. 1999. Nest webs: A community-wide approach to the
management and conservation of cavity-nesting forest birds. Forest Ecology and Management. 115: 2-3, 243-257.
Martin, K., Aitken, K. E. H., Wiebe, K. L. 2004. Nest sites and nest webs for cavity-
nesting communities in interior British Colombia, Canada: Nest characteristics and niche partitioning. The Condor. 106: 1, 5-19.
Messier, C., J Puettmann, K., Coates, K. D. 2013. Managing Forests as Complex Adaptive Systems. Routledge, 353 p. MRNF. 2011. Norme de stratification écoforestière, Quatrième inventaire écoforestier
du Québec méridional. Ministère des Ressources naturelles et de la Faune, Gouvernement du Québec. Québec. 101 p.
Naiman, R. J., Melillo, J. M., Hobbie, J. E. 1986. Ecosystem alteration of boreal
forest streams by beaver (Castor canadensis). Ecology. 67: 5, 1254-1269. Nappi, A., Drapeau, P., Giroux, J.-F., Savard, J.-P. L. 2003. Snag use by foraging
black-backed woodpeckers (Picoides articus) in a recently burned eastern boreal forest. The Auk. 120: 2, 505-511.
84
Nappi, A. 2009. Utilisation du bois mort et des forêts brûlées par le Pic à dos noir en forêt boréale. Ph. D. Thesis. Université du Québec à Montréal. Montréal. 220 p.
Nappi, A., Drapeau, P. 2009. Reproductive success of the black-backed woodpecker
(Picoides arcticus) in burned boreal forests: Are burns source habitats? Biological Conservation. 142: 7, 1381-1391.
Nappi, A., Drapeau, P., Saint-Germain, M., Angers, V. A. 2010. Effect of fire
severity on long-term occupancy of burned boreal conifer forests by saproxylic insects and wood-foraging birds. International Journal of Wildland Fire. 19: 4, 500-511.
Nappi, A., Drapeau, P., Leduc, A. 2015. How important is dead wood for
woodpeckers foraging in eastern North American boreal forests? Forest Ecology and Management. 346: 0, 10-21.
Nummi, P., Kuuluvainen, T. 2013. Forest disturbance by an ecosystem engineer:
beaver in boreal forest landscapes. Boreal Environment Research. 18 (suppl A): 13-24.
Nummi, P., Holopainen, S. 2014. Whole-community facilitation by beaver:
ecosystem engineer increases waterbird diversity. Aquatic Conservation: Marine and Freshwater Ecosystems.
Ouellet-Lapointe, U., Drapeau, P., Cadieux, P., Imbeau, L. 2012. Woodpecker
excavations suitability for and occupancy by cavity users in the boreal mixedwood forest of eastern Canada. Ecoscience. 19: 4, 391-397.
R Core Team. 2015. R: A language and environment for statistical computing. R
Foundation for Statistical Computing. 3.2.3. Rendell, W. B., Robertson, R. J. 1989. Nest-site characteristics, reproductive success
and cavity availability for Tree Swallows breeding in natural cavities. Condor. 875-885.
Robitaille, A., Saucier, J. P. 1998. Paysages régionaux du Québec méridional.
Québec. Les Publications Du Québec, 220 p. Robles, H., Martin, K. 2014. Habitat-Mediated Variation in the Importance of
Ecosystem Engineers for Secondary Cavity Nesters in a Nest Web. PLoS ONE. 9: 2, e90071.
85
Rohde, K. 1992. Latitudinal gradients in species diversity: the search for the primary cause. Oikos. 514-527.
Rosell, F., Bozser, O., Collen, P., Parker, H. 2005. Ecological impact of beavers
Castor fiber and Castor canadensis and their ability to modify ecosystems. Mammal Review. 35: 3-4, 248-276.
Savignac, C., Desrochers, A., Huot, J. 2000. Habitat use by Pileated Woodpeckers at
two spatial scales in eastern Canada. Canadian Journal of Zoology. 78: 2, 219-225.
Simard, M., Lecomte, N., Bergeron, Y., Bernier, P. Y., Paré, D. 2007. Forest
productivity decline caused by successional paludification of boreal soils. Ecological Applications. 17: 6, 1619-1637.
Simard, S., Martin, K., Vyse, A., Larson, B., Messier, C., Puettmann, K., Coates, K.
2013. Meta-networks of fungi, fauna and flora as agents of complex adaptive systems. Managing Forests as Complex Adaptive Systems: Building Resilience to the Challenge of Global Change. C. Messier, KJ Puettmann, & KD Coates (editors). Routledge, New York, NY. 133-164.
Taylor, S., Carleton, T., Adams, R. 1988. Understorey vegetation change in a Picea
mariana chronosequence. Vegetatio. 73: 2, 63-72. Tozer, D. C., Burke, D. M., Nol, E., Elliott, K. A. 2012. Managing ecological traps:
Logging and sapsucker nest predation by bears. The Journal of Wildlife Management. 76: 5, 887-898.
Tremblay, J. A., Ibarzabal, J., Dussault, C., Savard, J. P. L. 2009. Habitat
requirements of breeding black-backed woodpeckers (Picoides arcticus) in managed, unburned boreal forest. Avian Conservation and Ecology. 4: 1, 3.
Tremblay, J. A., Savard, J.-P., Ibarzabal, J. 2015. Structural retention requirements
for a key ecosystem engineer in conifer-dominated stands of a boreal managed landscape in eastern Canada. Forest Ecology and Management. 357: 220-227.
Vaillancourt, M. A., Drapeau, P., Gauthier, S., Robert, M. 2008. Availability of
standing trees for large cavity-nesting birds in the eastern boreal forest of Quebec, Canada. Forest Ecology and Management. 255: 7, 2272-2285.
Vaillancourt, M. A., Drapeau, P., Robert, M., Gauthier, S. 2009. Origin and
availability of large cavities for Barrow's Goldeneye (Bucephala islandica), a
86
species at risk inhabiting the eastern Canadian boreal forest. Avian Conservation and Ecology. 4: 1, 6.
Wickham, H., Chang, W., Wickham, M. H. 2013. Package ‘ggplot2’. Wiebe, K. L., Moore, W. S. 2008. Northern Flicker (Colaptes auratus). The Birds of
North America Online, Cornell Lab of Ornithology Online. <http://bna.birds.cornell.edu.bnaproxy.birds.cornell.edu/bna/species/166a>.
Wright, J. P., Jones, C. G., Flecker, A. S. 2002. An ecosystem engineer, the beaver,
increases species richness at the landscape scale. Oecologia. 132: 1, 96-101.
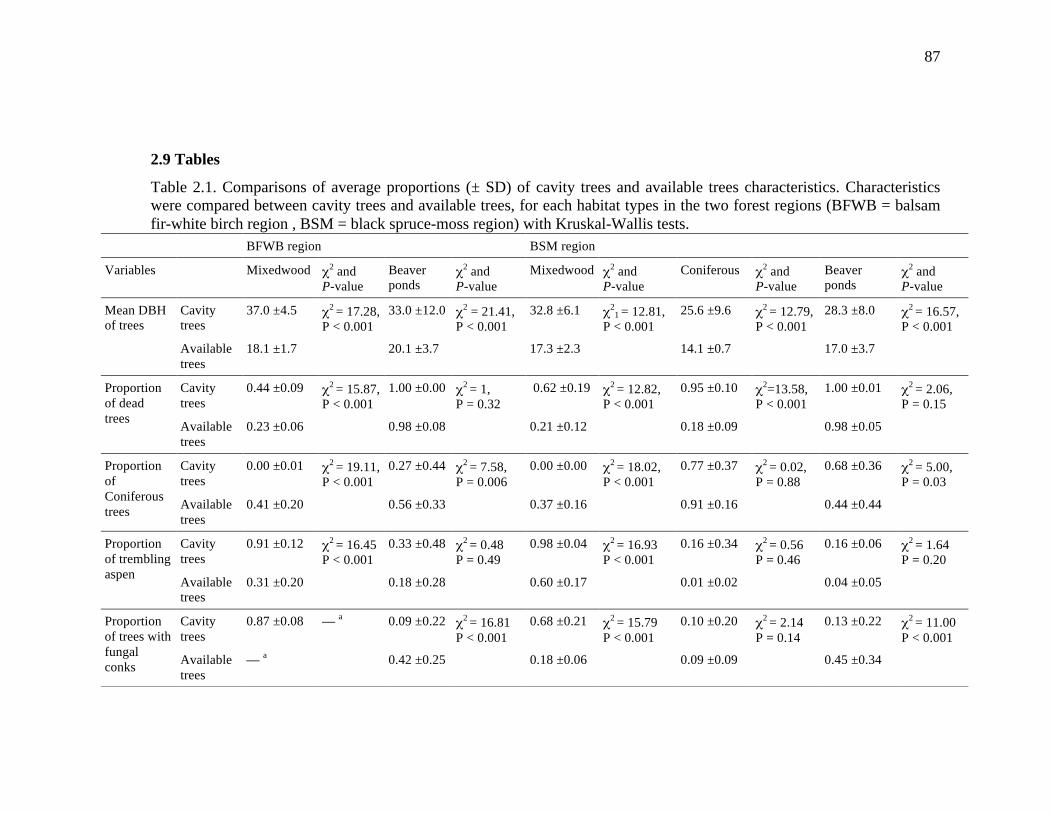
87
2.9 Tables
Table 2.1. Comparisons of average proportions (± SD) of cavity trees and available trees characteristics. Characteristics were compared between cavity trees and available trees, for each habitat types in the two forest regions (BFWB = balsam fir-white birch region , BSM = black spruce-moss region) with Kruskal-Wallis tests.
BFWB region BSM region
Variables
Mixedwood χ2 and P-value
Beaver ponds
χ2 and P-value
Mixedwood χ2 and P-value
Coniferous χ2 and P-value
Beaver ponds
χ2 and P-value
Mean DBH of trees
Cavity trees
37.0 ±4.5 χ2 = 17.28, P < 0.001
33.0 ±12.0 χ2 = 21.41, P < 0.001
32.8 ±6.1 χ21 = 12.81,
P < 0.001 25.6 ±9.6 χ2 = 12.79,
P < 0.001 28.3 ±8.0 χ2 = 16.57,
P < 0.001
Available trees
18.1 ±1.7 20.1 ±3.7 17.3 ±2.3 14.1 ±0.7 17.0 ±3.7
Proportion of dead trees
Cavity trees
0.44 ±0.09 χ2 = 15.87, P < 0.001
1.00 ±0.00 χ2 = 1, P = 0.32
0.62 ±0.19 χ2 = 12.82, P < 0.001
0.95 ±0.10 χ2=13.58, P < 0.001
1.00 ±0.01 χ2 = 2.06, P = 0.15
Available trees
0.23 ±0.06 0.98 ±0.08 0.21 ±0.12 0.18 ±0.09 0.98 ±0.05
Proportion of Coniferous trees
Cavity trees
0.00 ±0.01 χ2 = 19.11, P < 0.001
0.27 ±0.44 χ2 = 7.58, P = 0.006
0.00 ±0.00 χ2 = 18.02, P < 0.001
0.77 ±0.37 χ2 = 0.02, P = 0.88
0.68 ±0.36 χ2 = 5.00, P = 0.03
Available trees
0.41 ±0.20 0.56 ±0.33 0.37 ±0.16 0.91 ±0.16 0.44 ±0.44
Proportion of trembling aspen
Cavity trees
0.91 ±0.12 χ2 = 16.45 P < 0.001
0.33 ±0.48 χ2 = 0.48 P = 0.49
0.98 ±0.04 χ2 = 16.93 P < 0.001
0.16 ±0.34 χ2 = 0.56 P = 0.46
0.16 ±0.06 χ2 = 1.64 P = 0.20
Available trees
0.31 ±0.20 0.18 ±0.28 0.60 ±0.17 0.01 ±0.02 0.04 ±0.05
Proportion of trees with fungal conks
Cavity trees
0.87 ±0.08 — a 0.09 ±0.22 χ2 = 16.81 P < 0.001
0.68 ±0.21 χ2 = 15.79 P < 0.001
0.10 ±0.20 χ2 = 2.14 P = 0.14
0.13 ±0.22 χ2 = 11.00 P < 0.001
Available trees
— a 0.42 ±0.25 0.18 ±0.06 0.09 ±0.09 0.45 ±0.34
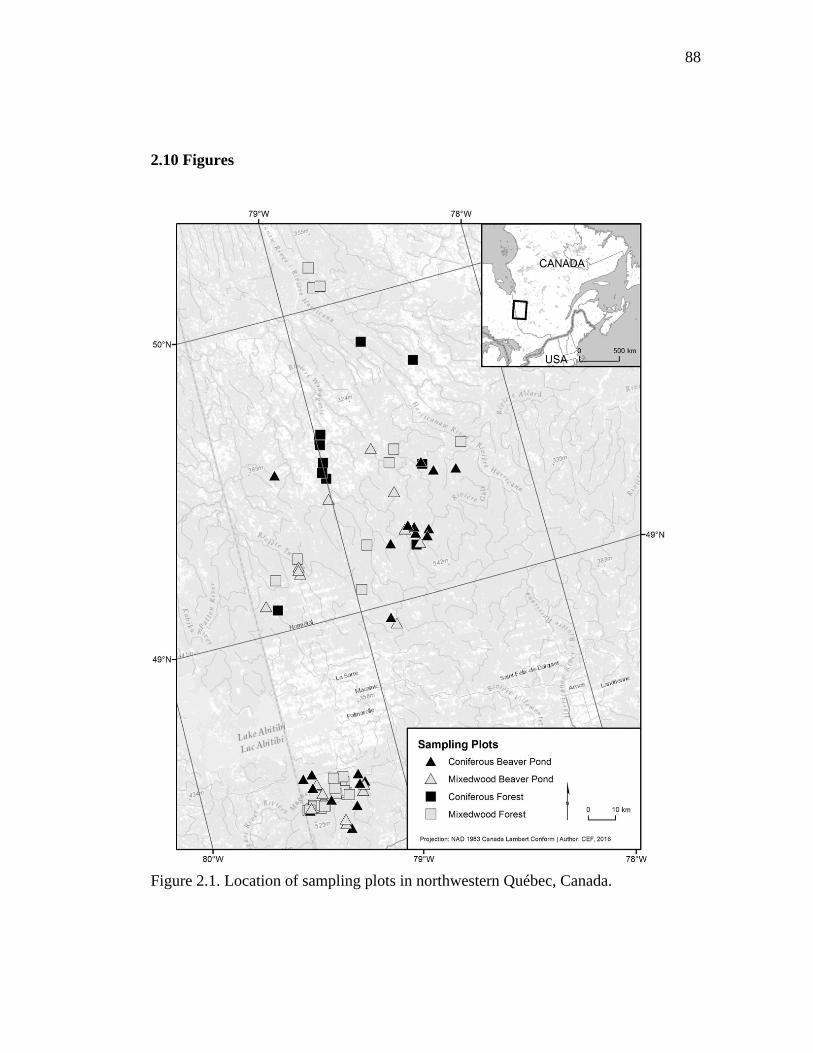
88
2.10 Figures
Figure 2.1. Location of sampling plots in northwestern Québec, Canada.
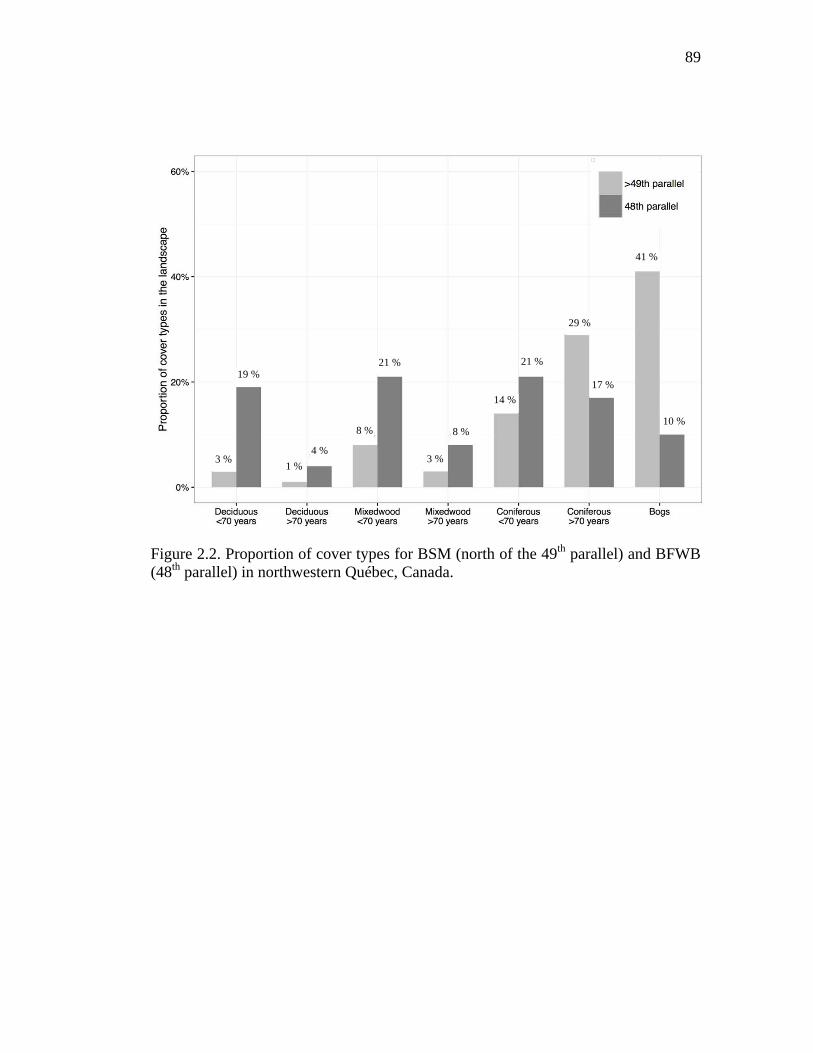
89
Figure 2.2. Proportion of cover types for BSM (north of the 49th parallel) and BFWB (48th parallel) in northwestern Québec, Canada.
3 %
19 %
1 % 4 %
8 %
21 %
3 %
8 %
14 %
21 %
29 %
17 %
41 %
10 %
90
Figure 2.3. Nest webs for a) BFWB closed-canopy forests, b) BSM closed-canopy forests, c) BFWB beaver ponds, and d) BSM beaver ponds in northwestern Québec, Canada. Nest data were collected from 2003 to 2015 for BFWB and from 2012 to 2013 for BSM. Lines between species represent the use of cavity resource. N is the number of occupied cavities found and E is the number of excavated cavities that were used by the excavator and by other cavity nesters. Links between the excavator level and the tree level represent the proportion of occupied cavities found in the tree species and the links between secondary cavity nesters, and excavators represent the proportion of nests or presence of mammals found in reused cavities. Reuse of cavities by excavators is indicated by lines between the base of the excavator that reused the cavity and the top of the excavator that created the cavity.
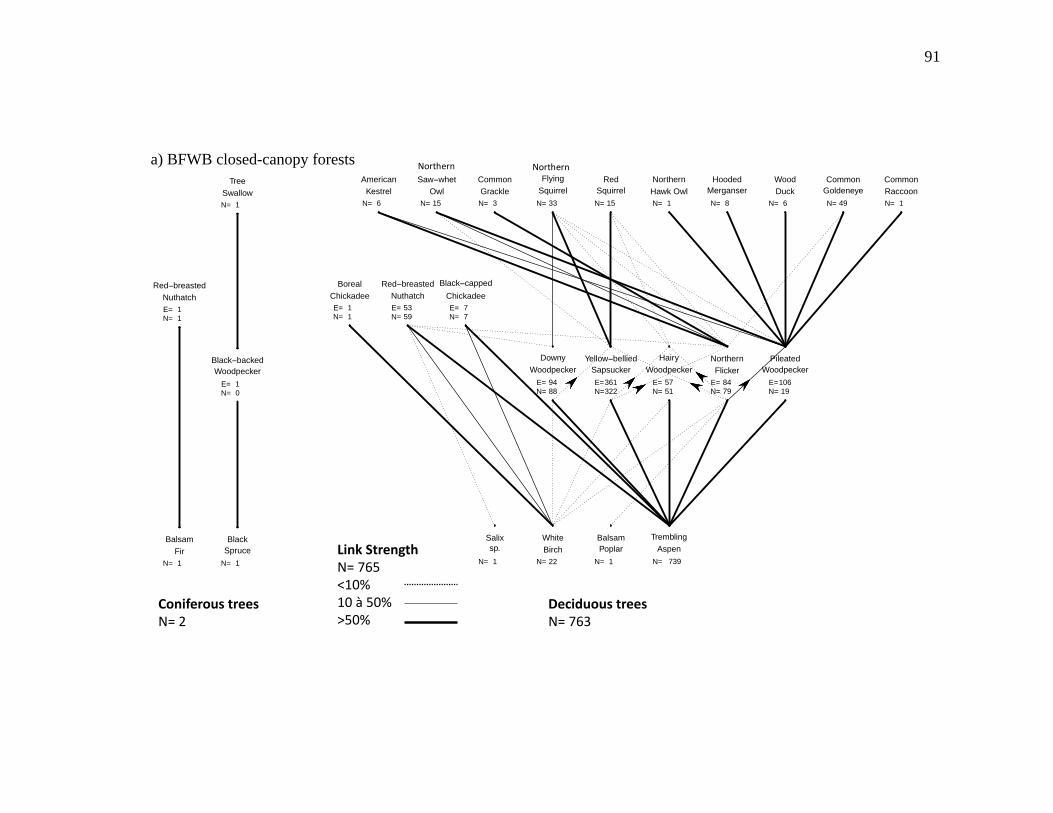
91
a) BFWB closed-canopy forests
AmericanKestrel
N= 6
Saw−whetOwl
N= 15
CommonGrackle
N= 3
FlyingSquirrel
N= 33
RedSquirrel
N= 15
NorthernHawk OwlN= 1
HoodedMerganserN= 8
WoodDuck
N= 6
CommonGoldeneyeN= 49
CommonRaccoonN= 1
BorealChickadeeE= 1N= 1
Red−breastedNuthatchE= 53N= 59
Black−cappedChickadeeE= 7N= 7
DownyWoodpecker
E= 94N= 88
Yellow−belliedSapsuckerE=361N=322
HairyWoodpecker
E= 57N= 51
NorthernFlicker
E= 84N= 79
PileatedWoodpecker
E=106N= 19
Salixsp.
N= 1
WhiteBirch
N= 22
BalsamPoplar
N= 1
TremblingAspen
N= 739
Coniferous*trees!N=!2
Deciduous*trees!N=!763!
Link*StrengthN=!765<10%10!à!50%>50%
a) MXW closed-canopy forests
TreeSwallowN= 1
Red−breastedNuthatchE= 1N= 1
Black−backedWoodpecker
E= 1N= 0
BalsamFir
N= 1
BlackSpruce
N= 1
Link Strength
N= 2
<10%
10 a 50%
>50%
NorthernNorthern
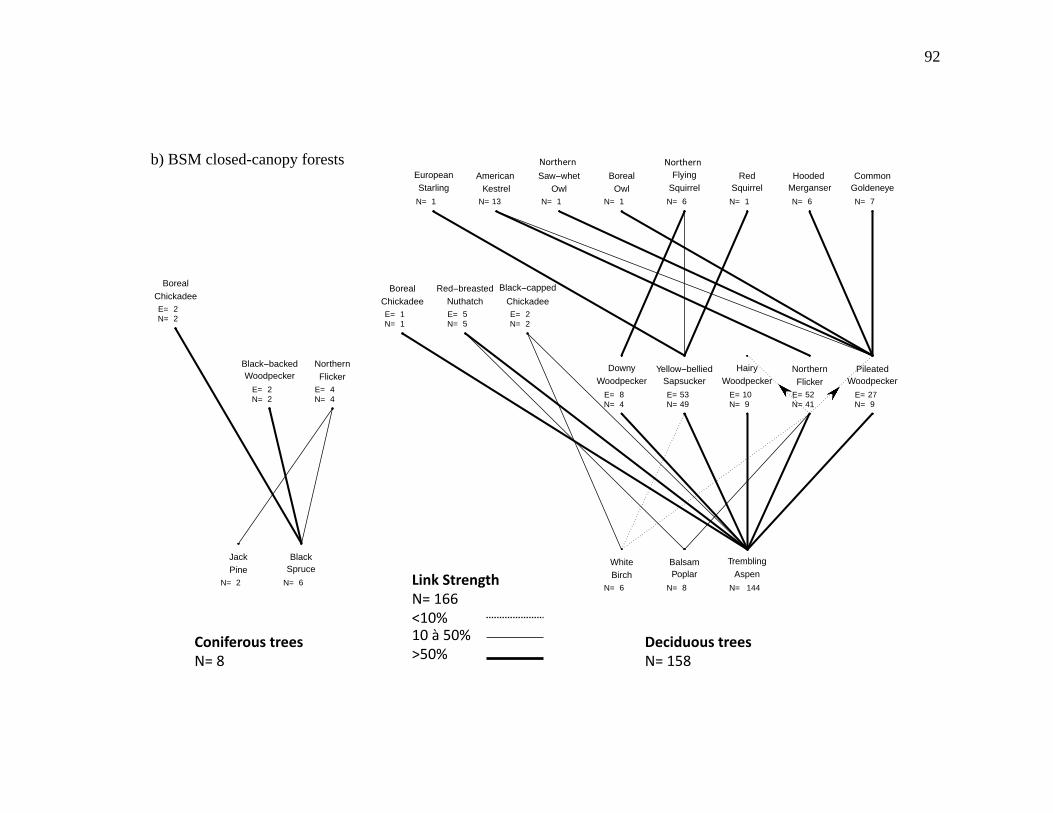
92
b) BSM closed-canopy forests
EuropeanStarling
N= 1
American Kestrel
N= 13
Saw−whetOwl
N= 1
BorealOwl
N= 1
FlyingSquirrel
N= 6
RedSquirrel
N= 1
Hooded MerganserN= 6
CommonGoldeneyeN= 7
BorealChickadeeE= 1N= 1
Red−breastedNuthatchE= 5N= 5
Black−cappedChickadeeE= 2N= 2
DownyWoodpecker
E= 8N= 4
Yellow−belliedSapsuckerE= 53N= 49
HairyWoodpecker
E= 10N= 9
NorthernFlicker
E= 52N= 41
PileatedWoodpecker
E= 27N= 9
WhiteBirch
N= 6
BalsamPoplar
N= 8
TremblingAspen
N= 144
BorealChickadeeE= 2N= 2
Black−backedWoodpecker
E= 2N= 2
NorthernFlicker
E= 4N= 4
JackPine
N= 2
BlackSpruce
N= 6
Link Strength
N= 8
<10%
10 à 50%
>50%
Coniferous*trees!N=!8
Deciduous*trees!N=!158
Link*StrengthN=!166<10%10!à!50%>50%
b) CON closed-canopy forests NorthernNorthern
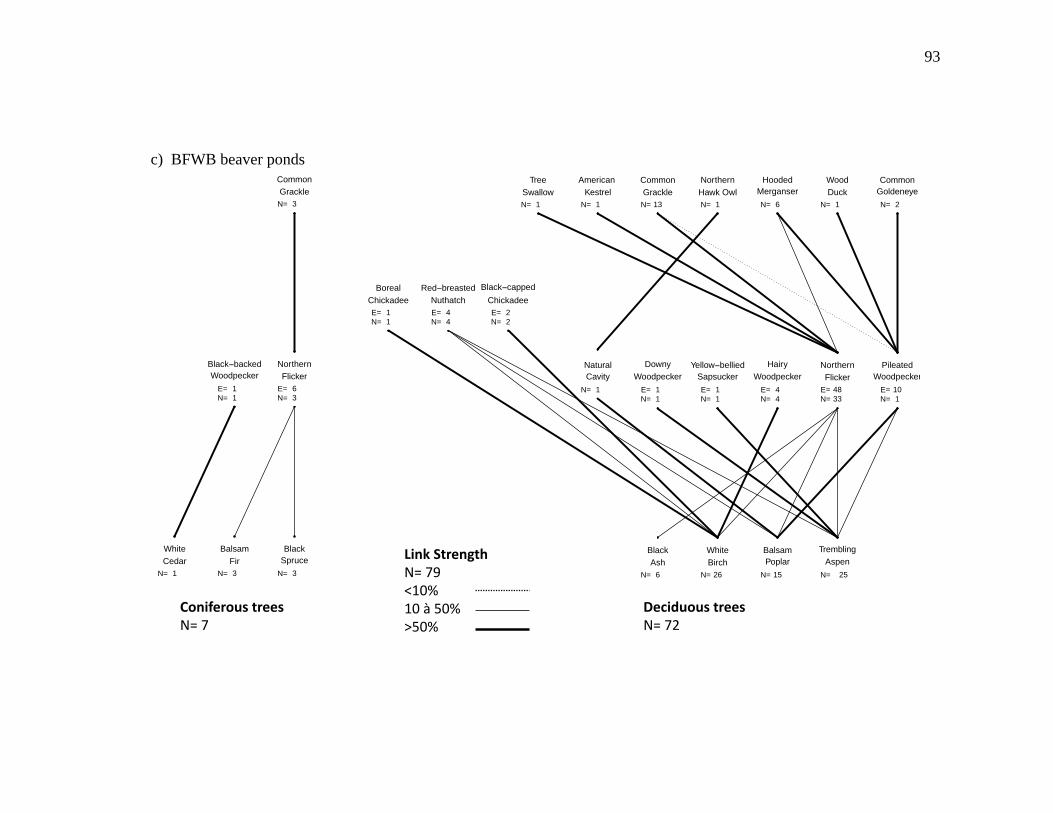
93
c) BFWB beaver ponds
TreeSwallowN= 1
American Kestrel
N= 1
CommonGrackle
N= 13
NorthernHawk OwlN= 1
HoodedMerganserN= 6
WoodDuck
N= 1
CommonGoldeneyeN= 2
BorealChickadeeE= 1N= 1
Red−breastedNuthatchE= 4N= 4
Black−cappedChickadeeE= 2N= 2
NaturalCavity
N= 1
DownyWoodpecker
E= 1N= 1
Yellow−belliedSapsuckerE= 1N= 1
HairyWoodpecker
E= 4N= 4
NorthernFlicker
E= 48N= 33
PileatedWoodpecker
E= 10N= 1
BlackAsh
N= 6
WhiteBirch
N= 26
BalsamPoplar
N= 15
TremblingAspen
N= 25
Link%StrengthN=#79<10%10#à#50%>50%
Coniferous%trees#N=#7
Deciduous%trees#N=#72
b) MXW beaver ponds
CommonGrackle
N= 3
Black−backedWoodpecker
E= 1N= 1
NorthernFlicker
E= 6N= 3
BalsamFir
N= 3
WhiteCedar
N= 1
BlackSpruce
N= 3
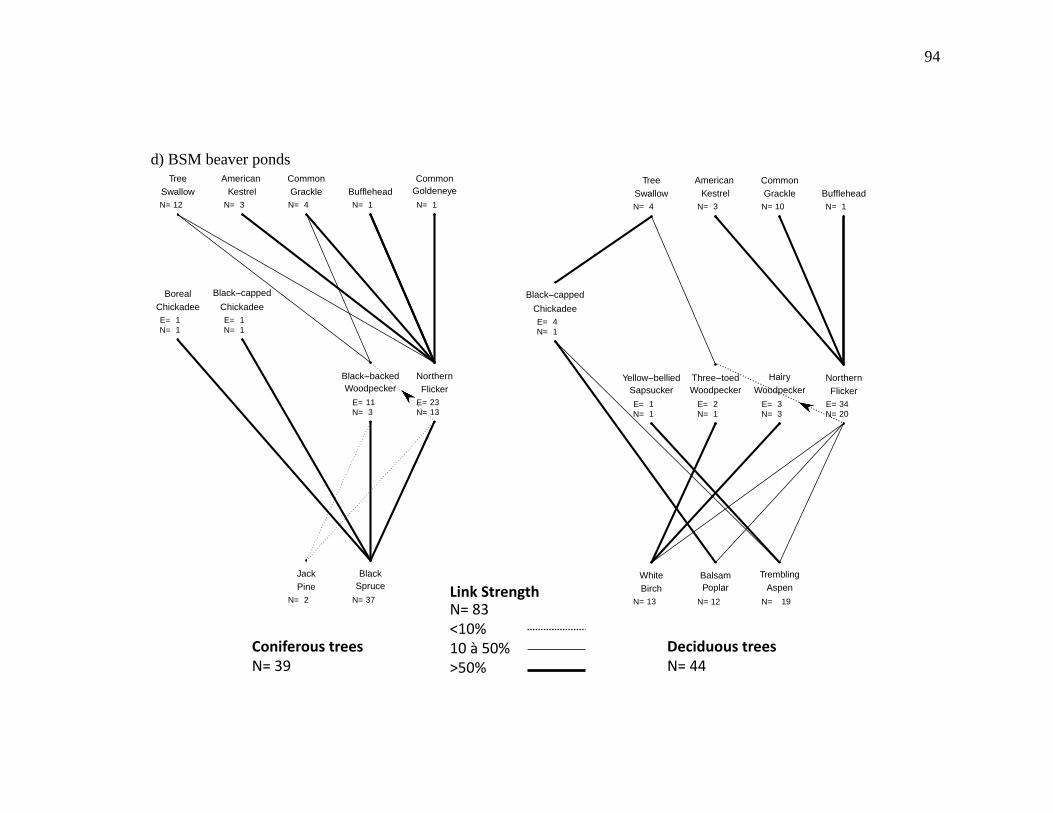
94
d) BSM beaver ponds
Coniferous*trees!N=!39
Deciduous*trees!N=!44
b) CON beaver ponds
TreeSwallowN= 12
American Kestrel
N= 3
CommonGrackle
N= 4BuffleheadN= 1
CommonGoldeneyeN= 1
BorealChickadeeE= 1N= 1
Black−cappedChickadeeE= 1N= 1
Black−backedWoodpecker
E= 11N= 3
NorthernFlicker
E= 23N= 13
JackPine
N= 2
BlackSpruce
N= 37
TreeSwallowN= 4
American Kestrel
N= 3
CommonGrackle
N= 10BuffleheadN= 1
Black−cappedChickadeeE= 4N= 1
Yellow−belliedSapsuckerE= 1N= 1
Three−toedWoodpecker
E= 2N= 1
HairyWoodpecker
E= 3N= 3
NorthernFlicker
E= 34N= 20
WhiteBirch
N= 13
BalsamPoplar
N= 12
TremblingAspen
N= 19Link*StrengthN=!83<10%10!à!50%>50%
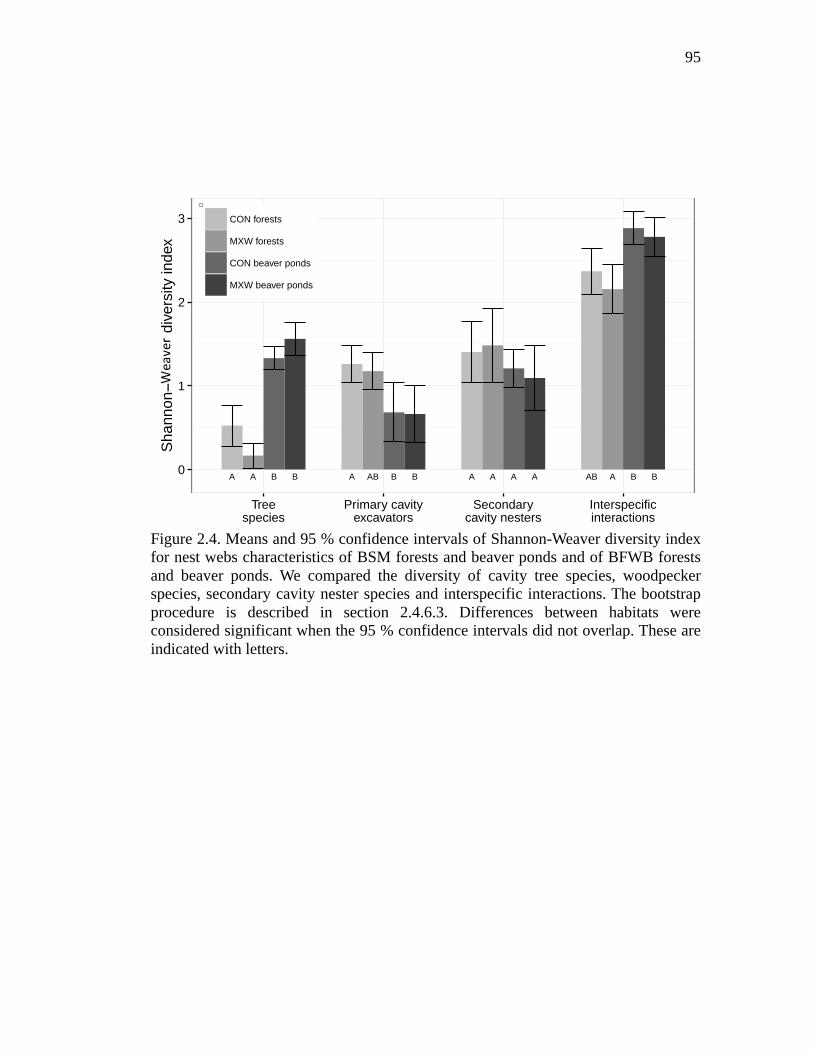
95
Figure 2.4. Means and 95 % confidence intervals of Shannon-Weaver diversity index for nest webs characteristics of BSM forests and beaver ponds and of BFWB forests and beaver ponds. We compared the diversity of cavity tree species, woodpecker species, secondary cavity nester species and interspecific interactions. The bootstrap procedure is described in section 2.4.6.3. Differences between habitats were considered significant when the 95 % confidence intervals did not overlap. These are indicated with letters.
AA B B ABA B B AA A A AAB B B0
1
2
3
Treespecies
Primary cavityexcavators
Secondarycavity nesters
Interspecificinteractions
Shan
non−
Wei
ver d
iver
sity
inde
x
CON forests
MXW forests
CON beaver ponds
MXW beaver ponds
AA B B ABA B B AA A A AAB B B0
1
2
3
Treespecies
Primary cavityexcavators
Secondarycavity nesters
Interspecificinteractions
Shan
non−
Wei
ver d
iver
sity
inde
x
CON forests
MXW forests
CON beaver ponds
MXW beaver ponds
Weaver
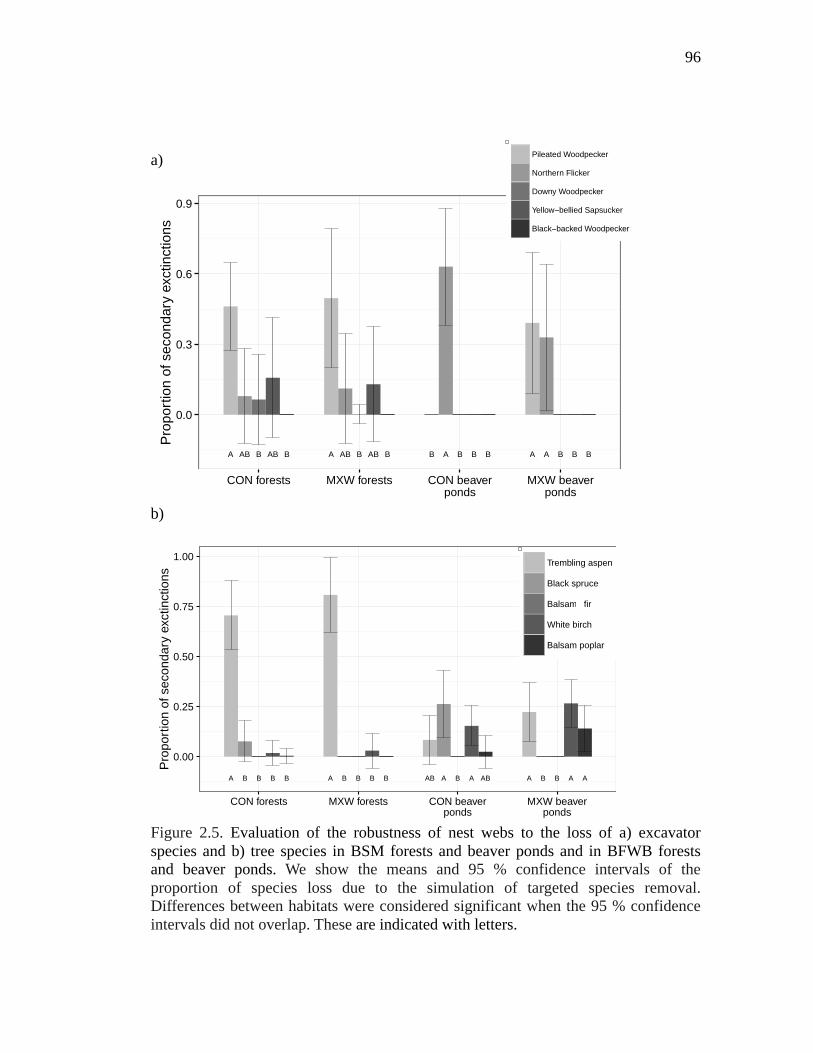
96
a)
b)
Figure 2.5. Evaluation of the robustness of nest webs to the loss of a) excavator species and b) tree species in BSM forests and beaver ponds and in BFWB forests and beaver ponds. We show the means and 95 % confidence intervals of the proportion of species loss due to the simulation of targeted species removal. Differences between habitats were considered significant when the 95 % confidence intervals did not overlap. These are indicated with letters.
A AB B AB B A AB B AB B B A B B B A A B B B
0.0
0.3
0.6
0.9
CON forests MXW forests CON beaverponds
MXW beaverponds
Prop
ortio
n of
sec
onda
ry e
xctin
ctio
ns
Pileated Woodpecker
Northern Flicker
Downy Woodpecker
Yellow−bellied Sapsucker
Black−backed Woodpecker
A B B B B A B B B B AB A B A AB A B B A A
0.00
0.25
0.50
0.75
1.00
CON forests MXW forests CON beaverponds
MXW beaverponds
Prop
ortio
n of
sec
onda
ry e
xctin
ctio
ns
Trembling aspen
Black spruce
Balsams fir
White birch
Balsam poplar
A B B B B A B B B B AB A B A AB A B B A A
0.00
0.25
0.50
0.75
1.00
CON forests MXW forests CON beaverponds
MXW beaverponds
Prop
ortio
n of
sec
onda
ry e
xctin
ctio
ns
Trembling aspen
Black spruce
Balsams fir
White birch
Balsam poplar
A AB B AB B A AB B AB B B A B B B A A B B B
0.0
0.3
0.6
0.9
CON forests MXW forests CON beaverponds
MXW beaverponds
Prop
ortio
n of
sec
onda
ry e
xctin
ctio
ns
Pileated Woodpecker
Northern Flicker
Downy Woodpecker
Yellow−bellied Sapsucker
Black−backed Woodpecker
A B B B B A B B B B AB A B A AB A B B A A
0.00
0.25
0.50
0.75
1.00
CON forests MXW forests CON beaverponds
MXW beaverponds
Pro
port
ion o
f secondary
exctinctions
Trembling aspen
Black spruce
Balsams fir
White birch
Balsam poplar
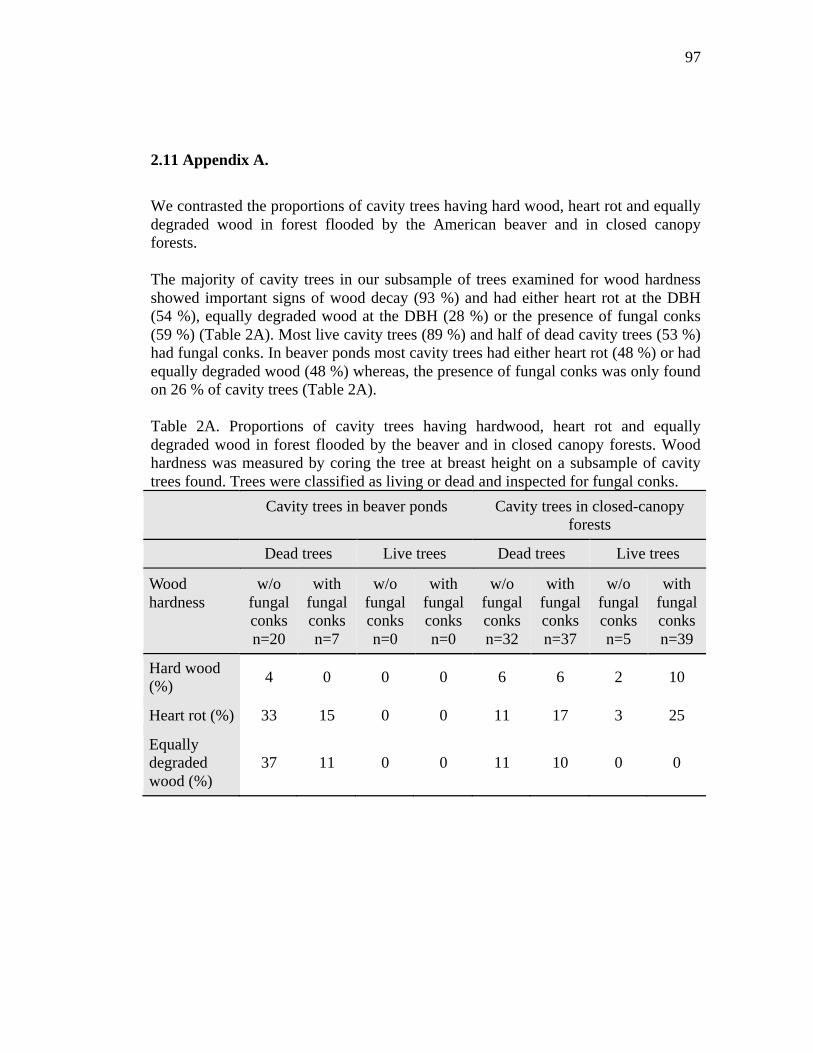
97
2.11 Appendix A.
We contrasted the proportions of cavity trees having hard wood, heart rot and equally degraded wood in forest flooded by the American beaver and in closed canopy forests. The majority of cavity trees in our subsample of trees examined for wood hardness showed important signs of wood decay (93 %) and had either heart rot at the DBH (54 %), equally degraded wood at the DBH (28 %) or the presence of fungal conks (59 %) (Table 2A). Most live cavity trees (89 %) and half of dead cavity trees (53 %) had fungal conks. In beaver ponds most cavity trees had either heart rot (48 %) or had equally degraded wood (48 %) whereas, the presence of fungal conks was only found on 26 % of cavity trees (Table 2A). Table 2A. Proportions of cavity trees having hardwood, heart rot and equally degraded wood in forest flooded by the beaver and in closed canopy forests. Wood hardness was measured by coring the tree at breast height on a subsample of cavity trees found. Trees were classified as living or dead and inspected for fungal conks.
Cavity trees in beaver ponds Cavity trees in closed-canopy forests
Dead trees Live trees Dead trees Live trees
Wood hardness
w/o fungal conks n=20
with fungal conks n=7
w/o fungal conks n=0
with fungal conks n=0
w/o fungal conks n=32
with fungal conks n=37
w/o fungal conks n=5
with fungal conks n=39
Hard wood (%) 4 0 0 0 6 6 2 10
Heart rot (%) 33 15 0 0 11 17 3 25
Equally degraded wood (%)
37 11 0 0 11 10 0 0
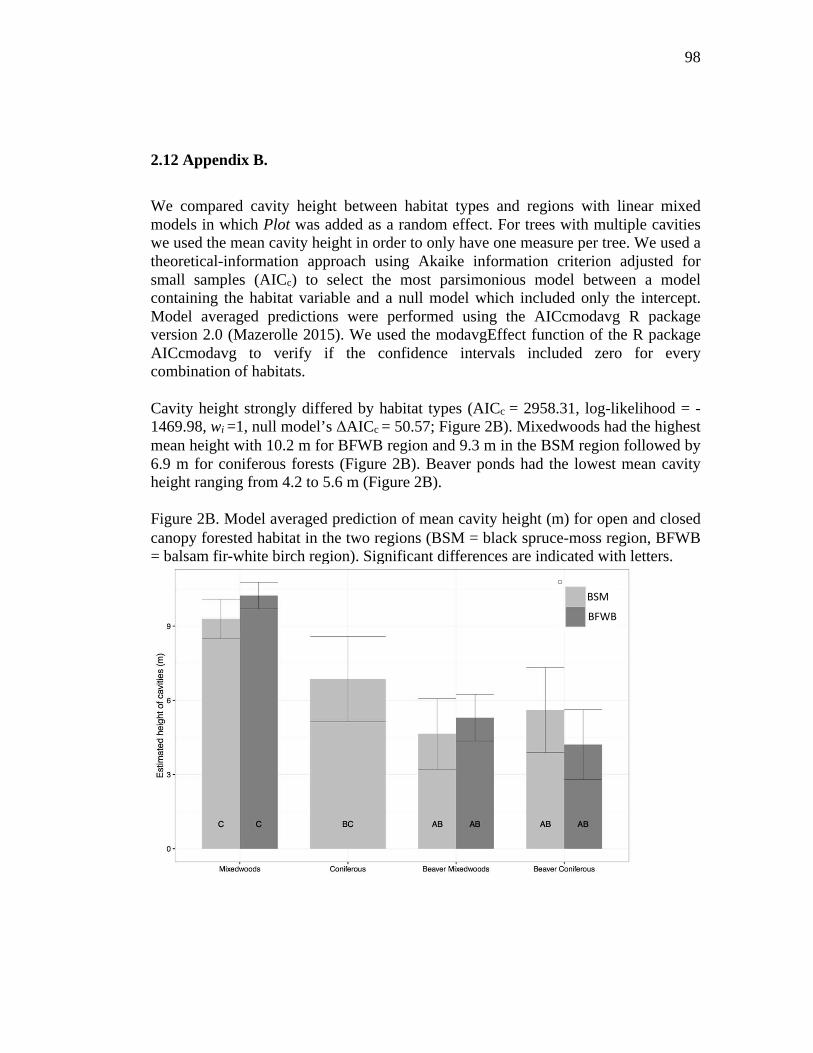
98
2.12 Appendix B.
We compared cavity height between habitat types and regions with linear mixed models in which Plot was added as a random effect. For trees with multiple cavities we used the mean cavity height in order to only have one measure per tree. We used a theoretical-information approach using Akaike information criterion adjusted for small samples (AICc) to select the most parsimonious model between a model containing the habitat variable and a null model which included only the intercept. Model averaged predictions were performed using the AICcmodavg R package version 2.0 (Mazerolle 2015). We used the modavgEffect function of the R package AICcmodavg to verify if the confidence intervals included zero for every combination of habitats. Cavity height strongly differed by habitat types (AICc = 2958.31, log-likelihood = - 1469.98, wi =1, null model’s ΔAICc = 50.57; Figure 2B). Mixedwoods had the highest mean height with 10.2 m for BFWB region and 9.3 m in the BSM region followed by 6.9 m for coniferous forests (Figure 2B). Beaver ponds had the lowest mean cavity height ranging from 4.2 to 5.6 m (Figure 2B). Figure 2B. Model averaged prediction of mean cavity height (m) for open and closed canopy forested habitat in the two regions (BSM = black spruce-moss region, BFWB = balsam fir-white birch region). Significant differences are indicated with letters.
BSM
BFWB

99

100
CHAPITRE 3
THE PILEATED WOODPECKER (DRYOCOPUS PILEATUS): AN
UMBRELLA SPECIES FOR CAVITY NESTERS IN BOREAL FORESTS
102
3.1 Résumé
Plusieurs chercheurs qualifient le Grand Pic (Dyocopus pileatus) d'espèce parapluie, c’est-à-dire que la conservation de son habitat serait aussi bénéfique pour plusieurs autres espèces. Par contre, il y a peu d’études empiriques sur le sujet. Nous avons évalué si la présence d’un arbre à cavité de Grand Pic peut être utilisée comme indicatrice de la qualité d’habitat de nidification de la faune cavicole en forêt boréale. Nous avons utilisé des données provenant d’une étude à long terme (2003-2014) couvrant un vaste territoire (12 000 km2) qui recoupe les domaines bioclimatiques de la sapinière à bouleau blanc et de la pessière à mousses et où ont été récoltées dans 106 placettes d’échantillonnage des données sur la reproduction de la communauté cavicole. Contrairement aux autres études d’espèces indicatrices qui utilisent principalement des données d’occurrence, nous avons utilisé des données d’activité de reproduction (arbres de nidification) ce qui reflète plus directement les ressources limitant le plus ce groupe fonctionnel d’espèces. Nous comparons l’efficacité d’utiliser le Grand Pic par rapport à d’autres excavateurs pour prévoir la richesse en espèces cavicoles. Nos résultats montrent que le Grand Pic sélectionne fortement les peuplements qui sont sélectionnés par la grande majorité des utilisateurs de cavités : les vieux peuplements de forêts mixtes avec peupliers faux-trembles. Le Grand Pic est l’espèce dont la présence d’une cavité à un site est la plus susceptible de prévoir la présence de cavités de nidification des autres espèces cavicoles. De plus, son modèle de sélection d’habitats est celui qui explique le mieux la richesse des autres espèces cavicoles et il s’avère être le plus efficace pour prioriser les sites pour la conservation de ce groupe d'espèces. Le Grand Pic peut donc être considéré comme une espèce parapluie pour ce qui est de la qualité de l’habitat de reproduction de l’ensemble de la communauté cavicole, un compartiment clé de la biodiversité en forêt boréale.
103
3.2 Abstract
Several researchers and wildlife managers qualify the Pileated Woodpecker (Dryocopus pileatus) as an umbrella species or indicator species. The conservation of its habitat would also benefit multiple other co-occuring species. However, there are few empirical studies on the subject. We evaluated if the presence of a Pileated Woodpecker cavity tree can be used as an indicator of habitat quality for the reproduction of cavity nesters in boreal forests. We used data from a long-term study (2003-2014) which covers a vast territory (12 000 km2) and overlaps two bioclimatic domains: the balsam fir white birch and the black spruce moss in eastern Canada. Data on the reproduction of cavity nesters were collected in 106 plots. Contrary to other indicator species studies that generally use occurrence data, we used nesting trees, which more directly reflects the limiting resource for this functional group of species. We compared the efficiency of using the Pileated Woodpecker over other cavity excavators for predicting cavity nesters species richness. Our results show that the Pileated Woodpecker strongly selects stands that are also selected by the majority of cavity nesters: old mixedwoods with trembling aspen. The Pileated Woodpecker is also the species for which the presence of its cavities at a site was the most susceptible to predict the presence of other species’ nesting cavities. Moreover, its habitat selection model best predicted cavity nester species richness and was the most efficient for prioritizing sites for the conservation of this group of species. The Pileated Woodpecker can thus be considered an efficient umbrella species for the quality of breeding habitat for cavity nesters associated with mixedwoods, a key component of biodiversity in boreal forest ecosystems.
104
3.3 Introduction
Old forests and the keystone structures they contain, large old trees, are lost at an
alarming rate everywhere in the world (Noss 1999, Lindenmayer et al. 2012,
Lindenmayer et al. 2014). In the boreal forest, the proportion of old forests, which
was historically regulated by natural disturbances, is now, in large part, also under the
influence of forest management (Cyr et al. 2009, Drapeau et al. 2009a). This
widespread influence of the human footprint throughout the boreal ecosystem has
drastically changed the age structure of the forest cover, increasing the proportion of
early-seral habitats while significantly decreasing the amount of old forests with
regards to their historical importance (Esseen et al. 1997, Angelstam 1998, Bergeron
et al. 2002, Bergeron et al. 2007, Cyr et al. 2009, Drapeau et al. 2009a). Accordingly,
several studies have shown that organisms associated with old forests are affected by
the large-scale loss of this habitat type in managed landscapes (Niemi et al. 1998,
Drapeau et al. 2000, Kouki and Väänänen 2000, Schmiegelow and Mönkkönen 2002,
Venier et al. 2014). Fulfilling the long-term maintenance of biodiversity in the boreal
forest thus greatly relies on conservation planning of old forest habitats in the
managed matrix (Drapeau et al. 2009a, Villard and Jonsson 2009).
Approaches to ensure the retention of old forest habitats within boreal managed
landscapes to maintain biodiversity are thus of paramount importance as the size of
the human footprint in the boreal forest increases (Hansen et al. 2013, Gauthier et al.
2015). While the conservation of all native species in managed landscapes raises
challenges about the appropriateness of using traditional single-species approaches,
the urgency to act in a context of limited funding and knowledge on complex
ecological systems has fostered the development of concepts such as the umbrella
species concept (Lambeck 1997, Fleishman et al. 2001, Roberge and Angelstam
2004). In short, this concept proposes that the conservation of the habitat for the
umbrella species would also benefit multiple other species. This approach has the
105
potential of concentrating and simplifying conservation efforts but runs the risk of
oversimplifying complex ecological problems. It is argued that a single species
cannot take into account all other species habitat requirements. To remedy this,
Lambeck (1997) proposed using a suite of focal species, in which each species would
reflect certain habitat requirements. Lambeck’s focal species approach uses species
that are the most vulnerable to a threat to quantify the habitat conservation.
In the boreal forest, the cavity-nesting and roosting community represents a high
proportion of vertebrates that relies on old forest habitats and its key structural
elements: decaying and dead trees (Martin and Eadie 1999, Cadieux 2011, Cooke and
Hannon 2012, Nappi et al. 2015). Many of these species have been identified as
sensitive to forest management (Imbeau et al. 2001). Among those, woodpeckers are
a keystone group as they are engineers at the base of the creation of most cavities
that provide critical roosting and breeding conditions to most secondary cavity users
in the boreal forest (Bednarz et al. 2004, Cockle et al. 2011). However, to do so they
require adequate trees for excavation, which have a large diameter and are senescent
or dead. In addition, the majority of woodpecker species in the boreal forest also rely
on senescent or dead trees for foraging (Nappi et al. 2015). Their habitat requirements
and sensitivity to forest management makes them good candidates for being indicator
species of forest health and bird diversity (Mikusiński et al. 2001, Roberge and
Angelstam 2006, Virkkala 2006, Drever et al. 2008, Drever and Martin 2010). In
western Canadian mixedwoods, Drever et al. (2010) verified whether woodpecker
species are associated with the same habitat variables in order to assess if
woodpeckers can be managed as a suite of species using the same habitat targets.
They conclude that besides the Black-backed Woodpecker (Picoides arcticus) and the
American Three-toed Woodpecker (Picoides dorsalis), these species can be managed
as a single suite of species since no strong trade-offs appear to exist between them.
However, conservation aimed at the general level of woodpecker species richness
might leave some of the most demanding cavity nester species behind.
106
In this study, we assess if the Pileated woodpecker (Dryocopus pileatus) can be a
good indicator of breeding habitat quality of cavity users in boreal forests since it is
the most demanding species in terms of the nest tree. Being the largest woodpecker
species in North American forests, the Pileated woodpecker requires large senescent
or dead trees for nesting, roosting and foraging, which are only common in old forests
(McClelland et al. 1979, Bull et al. 1992, McClelland and McClelland 1999,
Savignac et al. 2000, Aubry and Raley 2003, Lemaître and Villard 2005, Cadieux
2011, Cooke and Hannon 2012, Nappi et al. 2015). Furthermore, its role as a
keystone species in nest webs for large secondary users is well established (Bonar
2000, Aubry and Raley 2002, Martin et al. 2004, Cadieux 2011, Cooke and Hannon
2011). Its large home range also puts it in line with the initial definition of umbrella
species, where species with large home ranges were favored as umbrella species since
the conservation of their area requirement would also convey protection for multiple
species with smaller home ranges (Wilcox 1984, Roberge and Angelstam 2004).
Several researchers and wildlife managers qualify the Pileated Woodpecker as an
umbrella or indicator species and use this species as part of a suite of focal or
umbrella species (Bull et al. 1992, Blanchette and terrestre 1996, McLaren et al.
1998, Savignac et al. 2000, Aubry and Raley 2003, Lemaître and Villard 2005,
Cheveau 2015). McClelland et al. (1979) proposed that conservation efforts aimed at
the habitat of the Pileated Woodpecker would also conserve habitats for most cavity
nesters, as this excavator was strongly associated with old-growth forests in forests of
northwestern Montana, United States. Even though this species is widely used to this
effect, to our knowledge no study has evaluated empirically the assumption that the
Pileated Woodpecker is an umbrella species for the cavity-nesting community. In fact,
as highlighted by Roberge and Angelstam (2004), only a few studies have
demonstrated empirically the efficiency of the umbrella species concept (see Branton
et Richardson 2011 for a recent review). Moreover, these studies have mainly used
107
species occurrence data to make inferences on the potential habitat use by other
species. Co-occurrence patterns of species do not allow, however, assessing habitat
quality of both the umbrella and its underlying group of species. To do so one needs
to focus on habitat attributes that provide a proxy for assessing the fitness of
individuals of both the indicator and the response group of species. For the cavity-
nesting community, using data of active nest trees focuses on the most demanding
and limiting resource (Newton 1994), which is a more direct information for
evaluating how habitat quality for the cavity-nesting community is tied with habitat
quality of the Pileated Woodpecker.
To evaluate the potential of the Pileated Woodpecker to be an umbrella species for the
cavity-nesting and roosting community we first compare the Pileated
Woodpecker’s selection of nesting habitat with nesting habitat selection by other
woodpeckers and cavity-nesting species to assess how this species fulfills the
assumption of being strongly associated with highly coveted habitat resources by
other species (Roberge and Angelstam 2004, Roberge et al. 2008). Second, we
measured the cavity nester species richness associated with the presence of Pileated
Woodpecker's cavity trees in forest stands. Our assumption is that an umbrella species
should show high co-occurrence with other species (Fleishman et al. 2000). Finally,
using a simulation approach, we evaluate the efficiency of the Pileated Woodpecker
habitat selection model to predict cavity nester species richness (Fleishman et al.
2001, Roberge and Angelstam 2004).
3.4 Methods
3.4.1 Study area
Our study was conducted along a latitudinal gradient of 200 km in the boreal forest of
northern Quebec (Figure 3.1). It was located in the northern Clay Belt of Quebec and
Ontario and overlapped two bioclimatic domains: the balsam fir-white birch
108
mixedwood region (BFWB) and the black spruce-moss, a conifer dominated forest
region (BSM) (Robitaille and Saucier 1998). The BFWB region is characterized by
clay soils and low rocky hills (Robitaille and Saucier 1998). The area contains a
complex natural forest mosaic formed by different forest cover types and by a variety
of natural disturbances (Harvey 1999). The BSM region has a generally flat
topography and therefore has a greater tendency for paludification (Robitaille and
Saucier 1998). The forest mosaic is dominated by black spruce stands (Gauthier et al.
2000).
The data was collected from 2008 to 2015 in 106 plots ranging from 0.5 to 30 ha
(total area = 783 ha) in forests considered quality habitat for cavity users. Closed-
canopy forests were a mixture of mature and old forest stands enclosed in a
continuous forest matrix and in a managed landscape (n = 86). Open-canopy forests
were forests flooded by the action of the beaver (n = 20). The numerous plots and
type of habitat sampled represented well what was found at a landscape scale and
were well suited to help us evaluate the Pileated Woodpecker as an umbrella species
for cavity nesters as a whole.
3.4.2 Cavity search and nest monitoring
Cavity tree data was collected using cavity and nest search surveys and cavity
monitoring using the same protocols throughout the years. Every plot was surveyed
for two years. During the first year, we searched for cavities and nests and during the
second year, those cavities were inspected to assess breeding or roosting activity. In
forests plots, we positioned line transects every 50 m that were visited twice. Nest
searches were conducted between the beginning of May and the middle of July.
Observers walked along line transect and used visual and auditory cues to detect the
presence of an occupied cavity: breeding-bird behavior, begging nestlings or wood
chips on the ground. In beaver ponds, a different survey protocol was elaborated.
Instead of following transects, every tree in the pond was inspected for cavities with a
109
canoe and high boots. All trees with cavities were marked with an aluminum tag and
geo-referenced. These cavities were inspected with a camera mounted on a telescopic
pole (TreeTop Peeper™, Sandpiper Technologies, Manteca, California) to determine
the state of the cavity (unfinished cavity or fully excavated nesting cavity). A cavity
was considered “occupied” if it contained at least one egg or one nestling, or if a
mammal was present inside the cavity. The excavator of the cavity was visually
identified. However, Pileated Woodpecker cavities were also identified with the
characteristics of the cavity since these large cavities are easily distinguished from
other excavating species. These cavities are typically egg-shaped and are almost
twice as large as the Northern Flicker's, the second-largest cavity excavator found in
the study area after the Pileated Woodpecker (Bertrand, Cadieux and Drapeau
unpublished data, Martin et al. 2004).
3.4.3 GIS data preparation and sampling
Digital forest cover maps were used for delimiting forest stand boundaries and
vegetation stand characteristics (Ministère des Ressources naturelles et de la Faune,
2011). This ensured that our results would be easily applicable by forest managers.
We used the geographic information system softwares QGIS (Quantum GIS
Development Team, 2014) and GRASS (GRASS Development Team, 2015) in
combination with R (R Development Core Team, 2015). These maps were updated to
include recent changes in land cover since the creation of the maps. The sampling
plots were superimposed on the digital forest cover maps. The polygons of the digital
forest cover maps were clipped so that only those inside the plots remained. We
attached the cavity tree data to the polygons. The clipping of the digital forest cover
maps by the sampling plots resulted in many small polygons. To eliminate these and
reduce the number of polygons we only used polygons larger than 0.05 hectares,
which kept 99.5 % of nests found (2 polygons with nests and 281 without nests were
discarded resulting in a total of 577 polygons). Locations of cavity trees were verified
in the field and with digital forest cover maps.
110
3.4.4 Statistical analyses
We verified the effectiveness of using the presence of a Pileated Woodpecker cavity
tree and the Pileated Woodpecker habitat selection to identify species rich closed-
canopy forest stands. We compared the Pileated Woodpecker's performance to other
excavators and to null models. The statistical unit was the forest polygon and species
richness referred to the number of species with an active cavity in the polygon.
Analyses were performed with R version 3.2.3 (2015) and graphics were created with
the R package: ggplot2 (Wickham et al. 2013).
3.4.4.1 Habitat specificity and selection by cavity nesters
Using nesting and roosting cavity trees data collected at a regional scale, we first
measured the association of cavity user species to open and closed-forest habitats.
This allowed us to build a list of expected beneficiary species, species that have the
potential of benefiting from the conservation of closed-forest habitats (Roberge and
Angelstam 2004, Roberge et al. 2008) and to measure the degree to which Pileated
Woodpecker and other excavators are specialized to closed-canopy forests, since
umbrella species should not be generalists (Fleishman et al. 2000). Polygons were
classified in two habitat categories using the height of the forest stands: > 10 m for
mature and old closed canopy forests (MOCC) and < 10 m for young and open
canopy forests. The habitat specificity was calculated with presence only data (at least
one cavity or nest tree) as the proportion of polygons classified in either habitat
category. All species having at least one cavity or nest tree located in MOCC were
used to build a list of expected beneficiary species.
To assess how the Pileated Woodpecker fulfills the assumption of being strongly
associated with highly coveted habitat resources by other cavity nester species we
determined habitat selection parameters for the Pileated woodpecker and verified if
they were similar for most cavity nesters. To achieve precise habitat suitability
models (HSMs) and to steer this study towards conservation of critical habitat, we
111
limited this analysis to MOCC which consisted of 307 polygons covering 593 ha.
Habitat selection models were tested for the following excavators: the Pileated
Woodpecker, the Yellow-bellied Sapsucker (Sphyrapicus varius), the Downy
Woodpecker (Picoides pubescens) and the Northern Flicker (Colaptes auratus), in
which the response variable was the presence or absence of a cavity tree in the
polygon. Ten expected beneficiary species did not have enough occupied polygons
for the analysis (≤ 20 polygons). These species were grouped as "grouped cavity
users" and their habitat preferences were modeled with the same candidate models.
However, the species richness was used as the response variable.
We tested a series of HSMs at the stand and landscape scale. The models were
comprised of habitat variables derived from digital forest cover maps and that were
considered important for cavity nesters (Table 3.1). Some variables were highly
correlated (r > 0.7) and were not included in the same models (Aspen - Height and
Aspen - Conif ). To limit the number of models, we used a hierarchical modeling
approach (Table 3.2). First, models with habitat variables at the stand level were
compared. The best models were selected when a ΔAICc < 2 (Burnham and
Anderson 2002). These were then combined with variables at the landscape scale one
at a time (Table 3.2). A radius of 700 m (154 ha) was used as the surrounding area
size for the landscape scale. This area size was chosen because it incorporates most
cavity nesters home ranges. To measure the variables at the landscape scale, digital
cover maps were rasterized at a scale of 20 x 20 m in a binary format for the
landscape variables of interest (Table 3.1). Then, we performed a focal cell analysis
using the r.neighbors function in GRASS which attached the average value of all cells
contained in a 700 m radius to the focal cell. Finally, we used the function v.rast.stats
in GRASS to calculate the mean value of the landscape variable for each polygon.
The diversity of tree species in the landscape was calculated using the Shannon-
Weaver diversity index on the frequencies of dominant or co-dominant tree species.
112
We used generalized mixed models (GLMMs) with Plot as a random effect and
polygon Area as offset in each model (Bates et al. 2015). GLMMs with binomial
error distribution and a complementary log-log link were used for single species
models. GLMMs with a Poisson error distribution and log-link function were used to
identify habitat resources influencing the grouped cavity users. Over-dispersion was
tested for the latter models. We used a theoretical-information approach using Akaike
information criterion adjusted for small samples (AICc) to compare candidate models
and to select the most parsimonious (Mazerolle 2015). Models having a ∆AICc < 2.0
were considered as having strong support. In addition, a pseudo-R2 based on the
likelihood-ratio test was computed for each model with the r.squaredLR function
from the R package MuMIn (Barton 2015). This allowed us to specify the null model
that contained the random effects and the offset. We did bootstraps with a rotation of
1000 samples to predict the probability of presence of cavity trees for every polygon
and to estimate parameters and 95 % confidence intervals (Bates et al. 2015). For
individual species, we evaluated the fit of the bootstrapped predictions using Cohen’s
Kappa statistic. To evaluate the fit of the predictions for the species richness, we use a
linear regression and Spearman’s correlation index on the observed data versus the
predicted data (Potts and Elith 2006). Best models were verified for uninformative
parameters and models containing such parameters were dismissed (Arnold 2010).
Best models with uninformative parameters are generally copies of higher ranked
models with the addition of non-significant variables (Arnold 2010). We identified
uninformative parameters with 85 % confidence intervals computed through
bootstraps with 1000 permutations as proposed by Arnold (2010). Furthermore, if
models were closely competing, we chose the model with the highest Kappa value.
3.4.1.2 Co-occurrence analysis
We calculated and compared mean cavity user species richness for polygons occupied
by the cavity trees of the Downy Woodpecker, the Yellow-bellied Sapsucker and the
Pileated Woodpecker. We limited this comparison to excavators with the potential of
113
being umbrella species: these had to be specific to MOCC and had to have enough
occupied polygons to calculate precise means (≥ 20 polygons). In addition, the mean
species richness was calculated for all polygons to represent a null model. Nests of
the excavator in question were not included in the species richness estimate. To take
into account the hierarchical structure of the sampling design, we used generalized
mixed models (GLMMs) with Plot as a random effect and polygon size was added to
the model as an explanatory variable (Bates et al. 2015). Means and 95% confidence
intervals were estimated for one excavator at a time and compiled. We used the
function bootMer from the R package: Lme4 to perform bootstraps with a rotation of
1000 samples to predict the species richness and 95 % confidence intervals (Bates et
al. 2015). Means were predicted for a polygon size of 3 hectares, which was the
average size of polygons with at least one occupied cavity. We calculated means for
three levels of species richness: a) all expected beneficiary species, b) cavity
excavators and c) secondary cavity nesters.
3.4.1.3 Simulations of site selection with potential umbrella species
These analyses simulate the selection of sites for conservation of cavity nesters with
the concept of the umbrella species. We assess the efficiency of using HSMs of cavity
excavating species to select sites with high cavity nesters’ species richness. We focus
on excavators that were specific to MOCC and that could be adequately modeled with
habitat variables. Three excavators were selected for having a good fit between the
observed and predicted values calculated with the HSMs: the Downy Woodpecker,
Yellow-bellied Sapsucker and the Pileated Woodpecker (kappa values > 0.35).
First, we compared species accumulation curves to assess the efficiency of
prioritizing sites for conservation of cavity nesters with excavator HSMs. This
analysis was chosen because of its sensitivity to rare species. Sites selected with an
umbrella species should accumulate species more efficiently, or with less
accumulated sampled area, than a site selection made with other species or a random
114
site selection since the umbrella species habitat requirements are thought to include
the habitat requirements of the beneficiary species (Fleishman et al. 2001). We
present species accumulation curves called « collectors curve » in which the observed
species accumulation is conditional to a specified order of samples. For selected
excavators, all polygons were ordered by the probabilities of presence of cavity trees
predicted with the HSMs. We compare these curves to a randomly sampled curve
with 95 % confidence intervals. We used the r package vegan with the Specaccum
function and took into account the sampling effort (the size of polygons) (Oksanen et
al. 2013). The accumulation curves were plotted against the polygon area size
accumulation. When the collector’s curve is not included in the random curve it is
considered significantly different from a random selection of polygons. We built
curves for three levels of species richness: a) all expected beneficiary species, b)
cavity excavators and c) secondary cavity nesters (see Table 3.3 for a list of expected
beneficiary species).
Second, we compared the potential of each of our selected excavator species in
predicting cavity nester species richness. In this case, the nests of the focal excavator
were removed from the response variable (species richness). Once again, three levels
of species richness were compared. Each excavator was assigned its predicted
probability of presence based on its HSM. GLMMs with a Poisson error distribution
and log-link function were used to identify which excavators better predicted cavity
nester species richness (Bates et al. 2015). The variable Plot was added as a random
effect. Since the index was positively skewed (many sites having low predictions), we
compared the index data to a log transformed index to maximize the linearity between
dependent and independent variables. Over-dispersion was tested for all models. A
pseudo-R2, as described in the earlier section, was computed for each model in which
the null model contained the offset of polygon size (Barton 2015). We used bootstraps
with a rotation of 1000 samples to predict mean species richness and 95 % confidence
115
intervals and to estimate fixed and random coefficients with 95 % confidence
intervals (Bates et al. 2015).
3.5 Results
Between 2008 and 2015, we found 425 nests or occupied cavities for 18 cavity-
nesting species. The majority of cavity trees were in trembling aspen (84 %). Out of
577 polygons (778.8 ha), 191 had at least one cavity tree and 149 contained at least
one nest or occupied cavity (Table 3.3).
3.5.2 Habitat specificity and selection by cavity nesters
A majority (79 %) of polygons with the presence of cavity trees were in MOCC.
Fourteen species were found in forests with a height > 10 m and thus, made up the list
of expected beneficiary species for an umbrella species specialized on closed canopy
mature and old boreal forests (Table 3.3). Four species were only found in open
forested habitats or in young forests (< 10 m) (Table 3.3). Most excavators were
present in MOCC polygons. Of these, the Downy Woodpecker, the Yellow-bellied
Sapsucker, the Hairy Woodpecker (Picoides villosus) and the Pileated Woodpecker
were the most specific to MOCC habitat (Table 3.3). The Northern Flicker had poor
habitat specificity with 55 % of stands in MOCC (Table 3.3). Few nest trees were
found for the Black-backed Woodpecker (Picoides arcticus) and the American Three-
toed Woodpecker (Picoides dorsalis). However, nests found opportunistically were
mostly located in open forested habitat (< 10 m) (see chapter 2).
The Pileated woodpecker strongly selected habitat resources also selected by other
cavity nesters (Table 3.4, Table 3.5). Woodpeckers and other cavity-nesting species
selected stands with trembling aspen whereas all best models contained a positive
relation with the proportion of trembling aspen (Table 3.4, Table 3.5). For the Pileated
Woodpecker, the Yellow-bellied Sapsucker, the Northern Flicker and the grouped
116
cavity users, the best models also contained the interaction between the proportion of
trembling aspen and the stand age, which indicated a preference for stands with
trembling aspen that increased as the age of stand increased (Table 3.4). Also, for the
Northern Flicker and the grouped cavity users, the model containing only the
proportion of aspen was more parsimonious (Table 3.4).
Variables at the landscape scale (radius of 700 m) added strength to the models and
allowed us to distinguish important differences in habitat selection between species
(Table 3.4). The Pileated Woodpecker strongly selected old trembling aspen stands
surrounded by a high diversity of tree species which was represented by the model
with the interaction between the proportion of trembling aspen and the stand age, and
the diversity of tree species in the landscape (Table 3.4, Table 3.5). This model was
also among the best for the Yellow-bellied Sapsucker but was closely competing with
the model that included the proportion of coniferous stands in the landscape with a
negative relation (Table 3.4, Table 3.5). The presence of a Downy Woodpecker cavity
tree was associated with a high proportion of aspen at the stand level and a high
proportion of mixedwood stands in the landscape (Table 3.4, Table 3.5). Not
surprisingly, the Northern Flicker, which was not specific to MOCC, was positively
associated with stands with trembling aspen but also with young forests and forest
cuts in the landscape (Table 3.4, Table 3.5). There were three closely competing
models for the grouped cavity users. All of these models included the proportion of
trembling aspen and two included the interactions between this tree species and the
stand age (Table 3.4). These models contained a positive relation with the diversity of
tree species in the landscape and a negative relation to the proportion of old forests in
the landscape (Table 3.5). This negative relation with old forests in the landscape can
be explained by the high proportion of old black spruce forests (> 120 years) in some
areas of the study. These forests generally had very low productivity and were often
affected by paludification.
117
Diagnostics of the bootstrapped predictions revealed an overall good fit between the
observed and predicted data. Nevertheless, model fit between excavators was highest
for the Pileated Woodpecker and the Yellow-bellied Sapsucker and lowest for the
Downy Woodpecker and the Northern Flicker (Table 3.4). The prediction data for the
grouped cavity users seemed to adequately predict the observed data (Table 3.4) and
there was no evidence of overdispersion.
3.5.1 Co-occurrence analysis
While only 23 % of polygons had at least one nest, polygons with cavity trees had
much higher proportions (Yellow-bellied Sapsucker - 63 %, Downy Woodpecker - 85
% and Pileated Woodpecker - 86 %). In addition, all expected beneficiary species
were found in polygons with Pileated Woodpecker cavity trees and in polygons with
Yellow-bellied Sapsucker cavity trees, while polygons with Downy Woodpecker
cavity trees had 86 % of these species (see Table 3.3 for a list of expected beneficiary
species).
The presence of Yellow-bellied Sapsucker, Downy Woodpecker and Pileated
Woodpecker cavity trees in a polygon was associated with a higher cavity nester
species richness than the null model, although for the Yellow-bellied Sapsucker, this
relation only differed significantly for the secondary cavity nester species richness
level (Figures 3.2a, b, c). The polygons with Pileated Woodpecker cavity trees had the
highest mean cavity user species richness. It differed significantly from the null
model and the Yellow-bellied Sapsucker but not from the Downy Woodpecker. As for
the presence of Downy Woodpecker cavity trees, they were associated with higher
species richness and differed significantly from the null model but not from the
Yellow-bellied Sapsucker or the Pileated Woodpecker. This trend was similar to the
secondary cavity user species richness and the cavity excavator species richness
levels (Figures 3.2a, b, c). For the secondary cavity nester species richness level, the
presence of a cavity tree from any of the three focal excavators had significantly
118
higher species richness than the null model. The estimated parameter values of the
size of polygons on species richness are presented in Appendix 3.1.
3.5.3 Simulation of site selection with potential umbrella species
With a simulation of site selection for conservation of cavity users, we evaluated the
efficiency of using three potential umbrella species: the Downy Woodpecker, the
Yellow-bellied Sapsucker and the Pileated Woodpecker.
The Pileated Woodpecker HSM is the scenario where the conservation of sites was
the quickest to reach the maximum number of species. Only 30 ha of the best-ranked
stands for the nesting habitat of the Pileated Woodpecker were necessary to
accumulate all of the expected beneficiary species (Figure 3.3a). In comparison, it
took 130 ha for the Yellow-bellied Sapsucker and 180 ha for the Downy Woodpecker
to achieve similar results. The random site selection species accumulation curve 95 %
confidence intervals started to include all species at 114 ha (Figure 3.3a). These
results were consistent for cavity excavators’ species richness and secondary cavity
nesters’ species richness levels (Figures 3a, b, c).
Habitat selection models for the Downy Woodpecker, the Yellow-bellied Sapsucker
and the Pileated Woodpecker were better than null models for predicting species
richness as pseudo-R2 ranged from 0.15 to 0.33 (Table 3.6). Nevertheless, the Pileated
Woodpecker had the highest predicted species richness for all three species richness
levels (Figure 3.4 and Table 3.6). Species richness was about twice as much in sites
with high probabilities of finding Pileated Woodpecker’s nest trees than in sites with
high probability of finding Yellow-bellied Sapsucker’s nest trees (Figure 3.4).
Excavators HSMs had higher explanatory power when transformed to the logarithmic
scale, suggesting an exponential relationship with species richness.
119
3.6 Discussion
The Pileated woodpecker can be considered an effective umbrella species in the
boreal forest as it met several key criteria (sensu Roberge et al. 2008). To our
knowledge, this is the first study to provide empirical evidence to this effect. Using
data on nesting cavity trees which directly reflects the most demanding and limiting
resource for cavity nesters, we showed that this excavator was specific to closed-
canopy forests, had strong selection for resources which were also selected by other
species for their nesting habitat, and was a good predictor of species-rich forest
stands. In addition to being a keystone species with its creation of large cavities, and
an indicator species for habitats of special conservation concern such as old
mixedwood forests, the Pileated Woodpecker’s cavity trees in forest stands were good
predictors of habitat quality for the reproduction of the cavity-nesting community in
the boreal forests.
3.6.1 Strong selection of highly coveted resources
The Pileated woodpecker was specific to closed-canopy forests and had a strong
selection of highly coveted resources by the majority of cavity nester species. This
strong selection for stands older than 80 years with trembling aspen coincided with
the general decline of this tree species after 80 years (Bergeron et al. 1998). The
Pileated Woodpecker selected the transitional stage where many large trembling
aspen are senescent and dying, creating a high volume of dead wood and the opening
of the canopy, thus creating a complex forest structure (Bergeron et al. 1998).
However, the choice of a forest stand for excavating cavities and nesting was also
influenced by landscape attributes as suggested by Savignac et al. (2000). The
Pileated Woodpecker selected a mixture of forest stands with large decaying or dead
trembling aspens for nesting and a higher diversity of tree species, including conifers,
in the landscape (154 ha). This selection might be related to its foraging needs.
Unlike the Northern Flicker which forages for ants on the ground (Elchuk et al. 2003)
120
and the Yellow-bellied Sapsucker that has been shown to use regenerating forests <
10 m to forage (Bédard 2013), the Pileated Woodpecker foraging activities have been
linked to large decaying and dead deciduous and coniferous trees in mixedwood
forests (Lemaître and Villard 2005, Gasse 2007, Nappi et al. 2015). In our study
region, its foraging marks were most commonly found on large dead trees and on live
but senescent white birch and white cedar, which are more common in old
mixedwoods (Cadieux, unpublished data).
3.6.2 The Pileated Woodpecker: an umbrella species
The umbrella species habitat requirements should include the habitat requirements of
the beneficiary species leading to an efficient conservation effort in which the ratio of
costs (area conserved) versus benefits (number of beneficiary species protected)
would be the smallest possible (Fleishman et al. 2001, Roberge and Angelstam 2004).
Using simulations of site selection with the concept of the umbrella species, we
demonstrated that a strategy aimed at conserving the Pileated woodpecker’s preferred
habitat is likely to conserve sites for cavity nesters more efficiently than other
woodpecker species. The nesting habitat requirement of the Pileated Woodpecker
seemed to include the nesting habitat requirements of most cavity nesters as it took
only a small amount of accumulated sampled areas of the sites best ranked for the
presence of the Pileated Woodpecker to reach the maximum number of cavity nester
species in closed-canopy forest. In addition, the presence of this excavator’s cavity
tree was better at predicting cavity nester species richness in stands than could other
excavators or null models. Sites with a Pileated Woodpecker cavity tree had on
average 1.5 more cavity-nesting species than polygons with cavity trees of the most
abundant smaller woodpecker species, the Yellow-bellied Sapsucker.
The white-backed woodpecker (Dendrocopos leucotos) is considered an umbrella
species in Fennoscandia (Martikainen et al. 1998, Virkkala 2006, Roberge et al. 2008,
Bell 2015). Its conservation was associated with the conservation of saproxylic
121
beetles, as these species share the need for deciduous dead wood. Similarly, the
Siberian flying squirrel (Pteromys volans) was identified as an umbrella species for
polypore species (Hurme et al. 2008). It is probable that the Pileated woodpecker
plays a comparable role for similar species in North American boreal forests. Our
results suggest that the habitat strongly selected by this excavator, old mixedwoods
with trembling aspen are very important habitats for most cavity nesters, which
represents a considerable proportion of biodiversity in the boreal forest (chapters 1 et
2). Given that old boreal mixedwoods are also considered to be habitats of special
concern for the conservation of many other species than cavity users, the Pileated
Woodpecker could, by extension, be an umbrella species for these other organisms
(birds - Schieck and Song 2006 and Drever et al. 2008; cavity users - Martin et al.
2004 and Cooke and Hannon 2011; mammals - Crête and Courtois 1997, Potvin et al.
2000 and Cheveau et al. 2013; insects - Komonen 2003). However, more research is
needed to validate this in the field. In the meantime, old boreal mixedwoods stands
should be considered key habitats, a term derived from keystone species due to their
importance for the conservation of overall biodiversity in the boreal forest (Hansson
2001).
Conservation efforts for cavity nesters in boreal forest should be aimed at old-growth
mixedwood forests with old and large decaying and dead trembling aspen. The use of
the Pileated Woodpecker as an umbrella species could be very useful since these
forests are becoming rarer in the southern portion of the boreal forest since
management has drastically changed the proportion of old forests in the landscape
(Bergeron et al. 2004, Cyr et al. 2009) whereas, in the northern portion of boreal
forest, mixedwoods are scattered and rare (Gauthier et al. 2000). We need adequate
indicator and umbrella species for evaluating and monitoring how managed forest
landscapes keep key habitats (old forest stands) and key structural elements (decaying
and deadwood) that are not only critical for the maintenance of the cavity-nesting
122
community but which will ensure the maintenance of biodiversity as a whole
(Drapeau et al. 2009b, Drapeau et al. 2009c).
3.6.3 Scope and limitations of using the Pileated Woodpecker as an umbrella species
The Pileated Woodpecker can be considered an umbrella species for the community
of cavity nesters in closed–canopy mixedwoods throughout the boreal forest. Hence,
while mixedwood stands become marginal habitats at northern latitudes, they
nevertheless harbor most of the cavity-nesting community that characterizes southern
boreal mixedwood stands, including the Pileated Woodpecker (chapters 1 and 2). The
status of umbrella species for the Pileated Woodpecker thus holds in the conifer-
dominated matrix of the northern region of the boreal. However, as coniferous stands
dominate the forest matrix, the Black-backed Woodpecker and the American Three-
toed Woodpecker become important cavity excavators. In the Canadian eastern boreal
forest, these excavators are not associated with closed-canopy mixedwood forests but
rather with open and perturbed conifer-dominated forested habitats, e.g. forests
flooded by the American beaver, edge of forest cuts, burns (chap 2, (Nappi et al.
2003, Nappi and Drapeau 2009, Nappi et al. 2010) or in old productive conifer stands
(Tremblay et al. 2009 and chapter 2). In the conifer-dominated boreal forest we thus
reiterate Lambeck’s (1997) point to use a suite of focal species instead of single
indicator species which can better reflect specific habitat requirements of both
mixedwood and the coniferous component of this forest region. Hence, we propose
that the Pileated Woodpecker be combined with a suite of other umbrella or focal
species that would represent other specific needs (Lambeck 1997, Roberge and
Angelstam 2004, Drapeau et al. 2009b, Cheveau 2015).
Our empirical study clearly shows that it is likely that a conservation strategy aimed
at the habitat of the Pileated Woodpecker will ensure the conservation of rich and
complex cavity-nesting networks in mixedwood stands of the boreal forest.
123
Complementary indicators should, however, be developed for coniferous stands
which represent the dominant large-scale forest cover types in the boreal forest.
3.7 Acknowledgements
We thank Réjean Deschênes, Antoine Plouffe Leboeuf, Hanna Brais Harvey, Louis-
Joseph Drapeau, Simon Paradis, Vincent Poupart, Delphine Favorel, Jillian Slater,
Sarah Wood and Derek Yarjeau for their assistance in the field. Funding was
provided by a Natural Sciences and Engineering Research Council of Canada
(NSERC) graduate student scholarship to Cadieux, the Québec Fonds de la recherche
nature et technologies (FRQNT) graduate student scholarship to Cadieux, the Center
for forest research (CFR) scholarship for research communication, the NSERC
CREATE program on Forest Complexity Modeling scholarship program with
industrial and government agency partners, a NSERC Cooperative Research
Development grant to Drapeau and collaborators, a NSERC Discovery grant to
Drapeau, Tembec industries and Lake Duparquet research and teaching forest.
3.8 References
Angelstam, P. K. 1998. Maintaining and restoring biodiversity in European boreal
forests by developing natural disturbance regimes. Journal of Vegetation Science. 9: 4, 593-602.
Arnold, T. W. 2010. Uninformative parameters and model selection using Akaike's
Information Criterion. The Journal of Wildlife Management. 74: 6, 1175-1178.
Aubry, K. B. and C. M. Raley. 2002. The Pileated Woodpecker as a keystone habitat
modifier in the Pacific Northwest. In: Laudenslayer, W. F. , Shea, Jr. P. J., Valentine, B., Weatherspoon, C. P. et Lisle, T.E. (Eds), Procedings of the Symposium on the Ecology and Management of Dead Wood in Western Forests (Reno, NV, November 2-4, 1999). Alabany, CA: USDA Forest Service, 257-274.
124
Aubry, K. B. and C. M. Raley. 2003. Coming home to roost: The pileated woodpecker as ecosystem engineer. Science findings.
Barton, K. 2015. Package ‘MuMIn’. Version. 1: 18. Bates, D., M. Maechler, B. Bolker, S. Walker, R. H. B. Christensen, H. Singmann, B.
Dai and G. Grothendieck (2015). Package ‘lme4’ Bédard, S. 2013. Qualité des parcelles d'habitat résiduel des paysages aménagés en
forêt boréale mixte pour la reproduction et l'alimentation du Pic Maculé (Sphyrapicus varius). M. Sc. Thesis. Université du Québec à Montréal. Montréal. 132 p.
Bednarz, J. C., D. Ripper and P. M. Radley. 2004. Emerging concepts and research
directions in the study of cavity-nesting birds: keystone ecological processes. The Condor. 106: 106, 1-4.
Bell, D. 2015. Forest restoration guided by an umbrella species. M. Sc. Thesis.
Swedish University of Agricultural Sciences. Umeå. 29 p. Bergeron, Y., P. J. Richard, C. Carcaillet, S. Gauthier, M. Flannigan and Y. T.
Prairie. 1998. Variability in fire frequency and forest composition in Canada’s southeastern boreal forest: a challenge for sustainable forest management. Conservation Ecology. 2: 2, 6.
Bergeron, Y., A. Leduc, B. D. Harvey and S. Gauthier. 2002. Natural fire regime: a
guide for sustainable management of the Canadian boreal forest. Silva Fennica. 36: 1, 81-95.
Bergeron, Y., S. Gauthier, M. Flannigan and V. Kafka. 2004. Fire regimes at the
transition between mixedwood and coniferous boreal forest in northwestern Quebec. Ecology. 85: 7, 1916-1932.
Bergeron, Y., P. Drapeau, S. Gauthier and N. Lecomte. 2007. Using knowledge of
natural disturbances to support sustainable forest management in the northern Clay Belt. The Forestry Chronicle. 83: 3, 326-337.
Blanchette, P. and D. Ostiguy. 1996. Méthode de sélection des espèces
représentatives utilisée dans le cadre du projet de développement de la gestion intégrée des ressources. Gouvernement du Québec, ministère de l’Environnement et de la faune, ministère des Ressources naturelles, Gestion intégrée des ressources, document technique 96/1, 30 p.
125
Bonar, R. L. 2000. Availability of Pileated Woodpecker cavities and use by other species. Journal of Wildlife Management. 64: 1, 52-59.
Branton, M. and J. S. Richardson. 2011. Assessing the Value of the Umbrella-Species
Concept for Conservation Planning with Meta-Analysis. Conservation Biology. 25: 1, 9-20.
Bull, E. L., R. S. Holthausen and M. G. Henjum. 1992. Roost Trees Used by Pileated
Woodpeckers in Northeastern Oregon. Journal of Wildlife Management. 56: 4, 786-793.
Burnham, K. P. and D. R. Anderson. 2002. Model selection and multimodel
inference: A practical information-theoretic approach. Springer, 488 p. Cadieux, P. 2011. Dynamique de la faune cavicole le long d'un gradient d'âge en forêt
boréale mixte de l'est de l'Amérique du Nord. M. Sc. Thesis. Université du Québec à Montréal. Montréal. 85 p.
Cheveau, M., L. Imbeau, P. Drapeau and L. Belanger. 2013. Marten space use and
habitat selection in managed coniferous boreal forests of eastern Canada. The Journal of Wildlife Management. 77: 4, 749-760.
Cheveau, M. 2015. Démarche ayant mené à la sélection des espèces sensibles à
l’aménagement forestier d’intérêt provincial. Gouvernement du Québec. Ministère des Forêts, de la Faune et des Parcs du Québec, Direction générale de l’expertise sur la faune et ses habitats. 16 p.
Cockle, K. L., K. Martin and T. Wesoloski. 2011. Woodpeckers, decay, and the
future of cavity-nesting vertebrate communities worldwide. Frontiers in Ecology and the Environment. 9: 7, 377-382.
Cooke, H. A. and S. J. Hannon. 2011. Do aggregated harvests with structural
retention conserve the cavity web of old upland forest in the boreal plains? Forest Ecology and Management. 261: 3, 662-674.
Cooke, H. A. and S. J. Hannon. 2012. Nest-site selection by old boreal forest cavity
excavators as a basis for structural retention guidelines in spatially-aggregated harvests. Forest Ecology and Management. 269: 0, 37-51.
Crête, M. and R. Courtois. 1997. Limiting factors might obscure population
regulation of moose (Cervidae: Alces alces) in unproductive boreal forests. Journal of Zoology. 242: 4, 765-781.
126
Cyr, D., S. Gauthier, Y. Bergeron and C. Carcaillet. 2009. Forest management is
driving the eastern North American boreal forest outside its natural range of variability. Frontiers in Ecology and the Environment. 7: 10, 519-524.
Drapeau, P., A. Leduc, J. F. Giroux, J. P. L. Savard, Y. Bergeron and W. K. Vickery.
2000. Landscape-scale disturbances and changes in bird communities of boreal mixed-wood forests. Ecological Monographs. 70: 3, 423-444.
Drapeau, P., A. Leduc and Y. Bergeron. 2009a. Bridging ecosystem and multiple
species approaches for setting conservation targets in managed boreal landscapes. p. 129-160. In: Setting conservation targets for managed forest landscapes, Villard, M-A. and B-G, Jonsson, New York, USA. Cambridge University Press.
Drapeau, P., A. Leduc, D. Kneeshaw and S. Gauthier. 2009b. An Adaptive
Framework for Monitoring Ecosytsem Management in the Boreal Black Spruce Forest p. 343-371. In: Ecosystem management in the boreal forest. Presses de l'Université du Québec.
Drapeau, P., A. Nappi, L. Imbeau and M. Saint-Germain. 2009c. Standing deadwood
for keystone bird species in the eastern boreal forest: Managing for snag dynamics. The Forestry Chronicle. 85: 227-234.
Drever, M. C., K. E. H. Aitken, A. R. Norris and K. Martin. 2008. Woodpeckers as
reliable indicators of bird richness, forest health and harvest. Biological Conservation. 141: 3, 624-634.
Drever, M. C. and K. Martin. 2010. Response of woodpeckers to changes in forest
health and harvest: implications for conservation of avian biodiversity. Forest Ecology and Management. 259: 5, 958-966.
Elchuk, C. L., K. L. Wiebe and F. Moore. 2003. Ephemeral food resources and high
conspecific densities as factors explaining lack of feeding territories in Northern Flickers (Colaptes auratus). The Auk. 120: 1, 187-193.
Esseen, P.-A., B. Ehnström, L. Ericson and K. Sjöberg. 1997. Boreal forests.
Ecological Bulletins. 16-47. Fleishman, E., D. D. Murphy and P. F. Brussard. 2000. A new method for selection
of umbrella species for conservation planning. Ecological Applications. 10: 2, 569-579.
127
Fleishman, E., R. B. Blair and D. D. Murphy. 2001. Empirical validation of a method for umbrella species selection. Ecological Applications. 11: 5, 1489-1501.
Gasse, A. 2007. Importance des arbres de grande taille en forêt boréale mixte sur la
distribution des oiseaux cavicoles ainsi que sur les patrons d'alimentation du Grand Pic (Dryocopus pileatus). M. Sc. Thesis. Université du Québec à Montréal. Montréal.
Gauthier, S., L. De Grandpré and Y. Bergeron. 2000. Differences in forest
composition in two boreal forest ecoregions of Quebec. Journal of Vegetation Science. 11: 6, 781-790.
Gauthier, S., P. Bernier, T. Kuuluvainen, A. Shvidenko and D. Schepaschenko. 2015.
Boreal forest health and global change. Science. 349: 6250, 819-822. Hansen, M. C., P. V. Potapov, R. Moore, M. Hancher, S. Turubanova, A. Tyukavina,
D. Thau, S. Stehman, S. Goetz and T. Loveland. 2013. High-resolution global maps of 21st-century forest cover change. Science. 342: 6160, 850-853.
Hansson, L. 2001. Key habitats in Swedish managed forests. Scandinavian Journal of
Forest Research. 16: S3, 52-61. Harvey, B. D. 1999. The Lake Duparquet Research and Teaching Forest: Building a
foundation for ecosystem management. The Forestry Chronicle. 75: 3, 389-393.
Hurme, E., M. Mönkkönen, A.-L. Sippola, H. Ylinen and M. Pentinsaari. 2008. Role
of the Siberian flying squirrel as an umbrella species for biodiversity in northern boreal forests. Ecological Indicators. 8: 3, 246-255.
Imbeau, L., M. Mönkkönen and A. Desrochers. 2001. Long-term effects of forestry
on birds of the eastern Canadian boreal forest: a comparison with Fennoscandia. Conservation Biology. 15: 4, 1151-1162.
Komonen, A. 2003. Hotspots of insect diversity in boreal forests. Conservation
Biology. 17: 4, 976-981. Kouki, J. and A. Väänänen. 2000. Impoverishment of resident old-growth forest bird
assemblages along an isolation gradient of protected areas in eastern Finland. Ornis Fennica. 77: 4, 145-154.
Lambeck, R. J. 1997. Focal Species: A Multi-Species Umbrella for Nature
Conservation. Conservation Biology. 11: 4, 849-856.
128
Lemaître, J. and M.-A. Villard. 2005. Foraging patterns of pileated woodpeckers in a
managed Acadian forest: a resource selection function. Canadian Journal of Forest Research. 35: 2387-2393.
Lindenmayer, D. B., W. F. Laurance and J. F. Franklin. 2012. Global decline in large
old trees. Science. 338: 6112, 1305-1306. Lindenmayer, D. B., W. F. Laurance, J. F. Franklin, G. E. Likens, S. C. Banks, W.
Blanchard, P. Gibbons, K. Ikin, D. Blair and L. McBurney. 2014. New policies for old trees: averting a global crisis in a keystone ecological structure. Conservation Letters. 7: 1, 61-69.
Martikainen, P., L. Kaila and Y. Haila. 1998. Threatened Beetles in White-Backed
Woodpecker Habitats. Conservation Biology. 12: 2, 293-301. Martin, K. and J. M. Eadie. 1999. Nest webs: A community-wide approach to the
management and conservation of cavity-nesting forest birds. Forest Ecology and Management. 115: 2-3, 243-257.
Martin, K., K. E. H. Aitken and K. L. Wiebe. 2004. Nest sites and nest webs for
cavity-nesting communities in interior British Colombia, Canada: Nest characteristics and niche partitioning. The Condor. 106: 1, 5-19.
Mazerolle, M. (2015). AICcmodavg: model selection and multimodel inference based
on (Q) AIC (C).–R package ver. 2.0-3 McClelland, B. R., S. S. Frissell, W. C. Fischer and C. H. Halvorson. 1979. Habitat
management for hole-nesting birds in forests of western larch and Douglas-fir. Journal of Forestry. 77: 8, 480-483.
McClelland, B. R. and P. T. McClelland. 1999. Pileated woodpecker nest and roost
trees in Montana: Links with old-growth and forest 'health'. The Wildlife Society Bulletin. 27: 3, 846-857.
McLaren, M. A., I. D. Thompson and J. A. Baker. 1998. Selection of vertebrate
wildlife indicators for monitoring sustainable forest management in Ontario. The Forestry Chronicle. 74: 2, 241-248.
Mikusiński, G., M. Gromadzki and P. Chylarecki. 2001. Woodpeckers as indicators
of forest bird diversity. Conservation Biology. 15: 1, 208-217.
129
Ministère des Ressources naturelles et de la Faune. 2011. Norme de stratification écoforestière, Quatrième inventaire écoforestier du Québec méridional. Gouvernement du Québec. Faune, Ministère des Ressources naturelles et de la. Québec. 101 p.
Nappi, A., P. Drapeau, J.-F. Giroux and J.-P. L. Savard. 2003. Snag use by foraging
black-backed woodpeckers (Picoides articus) in a recently burned eastern boreal forest. The Auk. 120: 2, 505-511.
Nappi, A. and P. Drapeau. 2009. Reproductive success of the black-backed
woodpecker (Picoides arcticus) in burned boreal forests: Are burns source habitats? Biological Conservation. 142: 7, 1381-1391.
Nappi, A., P. Drapeau, M. Saint-Germain and V. A. Angers. 2010. Effect of fire
severity on long-term occupancy of burned boreal conifer forests by saproxylic insects and wood-foraging birds. International Journal of Wildland Fire. 19: 4, 500-511.
Nappi, A., P. Drapeau and A. Leduc. 2015. How important is dead wood for
woodpeckers foraging in eastern North American boreal forests? Forest Ecology and Management. 346: 0, 10-21.
Newton, I. 1994. The role of nest sites in limiting the numbers of hole-nesting birds:
A review. Biological Conservation. 70: 3, 265-276. Niemi, G., J. Hanowski, P. Helle, R. Howe, M. Mönkkönen, L. Venier and D. Welsh.
1998. Ecological sustainability of birds in boreal forests. Ecology and Society. 2: 2.
Noss, R. F. 1999. Assessing and monitoring forest biodiversity: a suggested
framework and indicators. Forest Ecology and Management. 115: 2, 135-146. Oksanen, J., F. G. Blanchet, R. Kindt, P. Legendre, P. R. Minchin, R. O'Hara, G. L.
Simpson, P. Solymos, M. H. H. Stevens and H. Wagner. 2013. Package ‘vegan’. Community ecology package, version. 2: 9.
Potts, J. M. and J. Elith. 2006. Comparing species abundance models. Ecological
Modelling. 199: 2, 153-163. Potvin, F., L. Bélanger and K. Lowell. 2000. Marten habitat selection in a clearcut
boreal landscape. Conservation Biology. 14: 3, 844-857.
130
Roberge, J.-M. and P. Angelstam. 2004. Usefulness of the umbrella species concept as a conservation tool. Conservation Biology. 18: 1, 76-85.
Roberge, J.-M. and P. Angelstam. 2006. Indicator species among resident forest birds
– A cross-regional evaluation in northern Europe. Biological Conservation. 130: 1, 134-147
Roberge, J.-M., G. Mikusiński and S. Svensson. 2008. The white-backed
woodpecker: umbrella species for forest conservation planning? Biodiversity and Conservation. 17: 10, 2479-2494.
Robitaille, A. and J. P. Saucier. 1998. Paysages régionaux du Québec méridional.
Québec. Les Publications Du Québec, 220 p. Savignac, C., A. Desrochers and J. Huot. 2000. Habitat use by Pileated Woodpeckers
at two spatial scales in eastern Canada. Canadian Journal of Zoology. 78: 2, 219-225.
Schieck, J. and S. J. Song. 2006. Changes in bird communities throughout succession
following fire and harvest in boreal forests of western North America: Literature review and meta-analyses. Canadian Journal of Forest Research. 36: 5, 1299-1318.
Schmiegelow, F. K. A. and M. Mönkkönen. 2002. Habitat loss and fragmentation in
dynamic landscapes: avian perspectives from the boreal forest. Ecological Applications. 12: 2, 375-389.
GRASS Development Team (2015). Geographic Resources Analysis Support System
(GRASS) Software, Open Source Geospatial Foundation En ligne. <http://grass.osgeo.org/>.
Quantum GIS Development Team (2014). Quantum GIS Geographic Information
System, Open Source Geospatial Foundation Project. 2.6.1-Brighton En ligne. <http://qgis.osgeo.org/>.
R Development Core Team (2015). R: A language and environment for statistical
computing. Vienna, Austria, R Foundation for Statistical Computing En ligne. < https://www.r-project.org/>.
Tremblay, J. A., J. Ibarzabal, C. Dussault and J. P. L. Savard. 2009. Habitat
requirements of breeding black-backed woodpeckers (Picoides arcticus) in managed, unburned boreal forest. Avian Conservation and Ecology. 4: 1, 3.
131
Venier, L., I. Thompson, R. Fleming, J. Malcolm, I. Aubin, J. Trofymow, D. Langor, R. Sturrock, C. Patry and R. Outerbridge. 2014. Effects of natural resource development on the terrestrial biodiversity of Canadian boreal forests. Environmental Reviews. 22: 4, 457-490.
Villard, M.-A. and B. G. Jonsson. 2009. Setting conservation targets for managed
forest landscapes. Cambridge University Press Cambridge, 426 p. Virkkala, R. 2006. Why study woodpeckers? The significance of woodpeckers in
forest ecosystems. Annales Zoologici Fennici. 43: 2, 82-85. Wickham, H., W. Chang and M. H. Wickham. 2013. Package ‘ggplot2’. Wilcox, B. A. 1984. In situ conservation of genetic resources: determinants of
minimum area requirements. National parks, conservation and development: the role of protected areas in sustaining society. Smithsonian Institution Press, Washington, DC. 639-647.
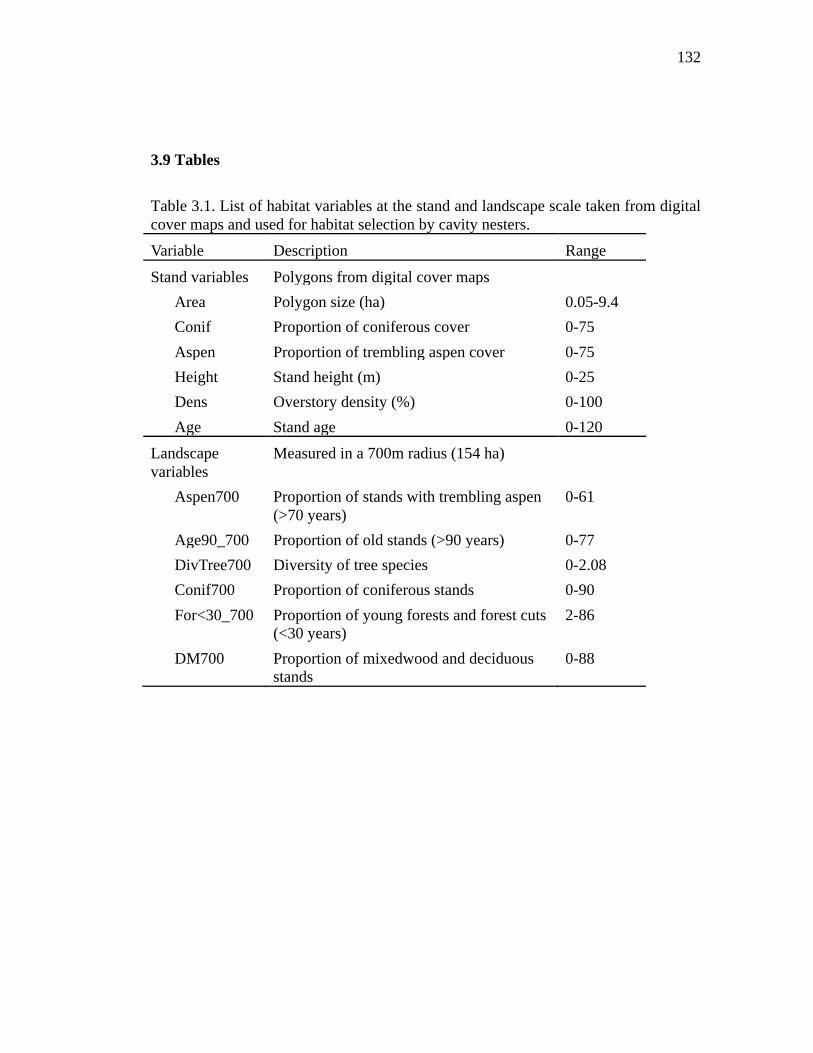
132
3.9 Tables
Table 3.1. List of habitat variables at the stand and landscape scale taken from digital cover maps and used for habitat selection by cavity nesters. Variable Description Range
Stand variables Polygons from digital cover maps Area Polygon size (ha) 0.05-9.4 Conif Proportion of coniferous cover 0-75 Aspen Proportion of trembling aspen cover 0-75 Height Stand height (m) 0-25 Dens Overstory density (%) 0-100 Age Stand age 0-120
Landscape variables
Measured in a 700m radius (154 ha)
Aspen700 Proportion of stands with trembling aspen (>70 years)
0-61
Age90_700 Proportion of old stands (>90 years) 0-77 DivTree700 Diversity of tree species 0-2.08 Conif700 Proportion of coniferous stands 0-90 For<30_700 Proportion of young forests and forest cuts
(<30 years) 2-86
DM700 Proportion of mixedwood and deciduous stands
0-88
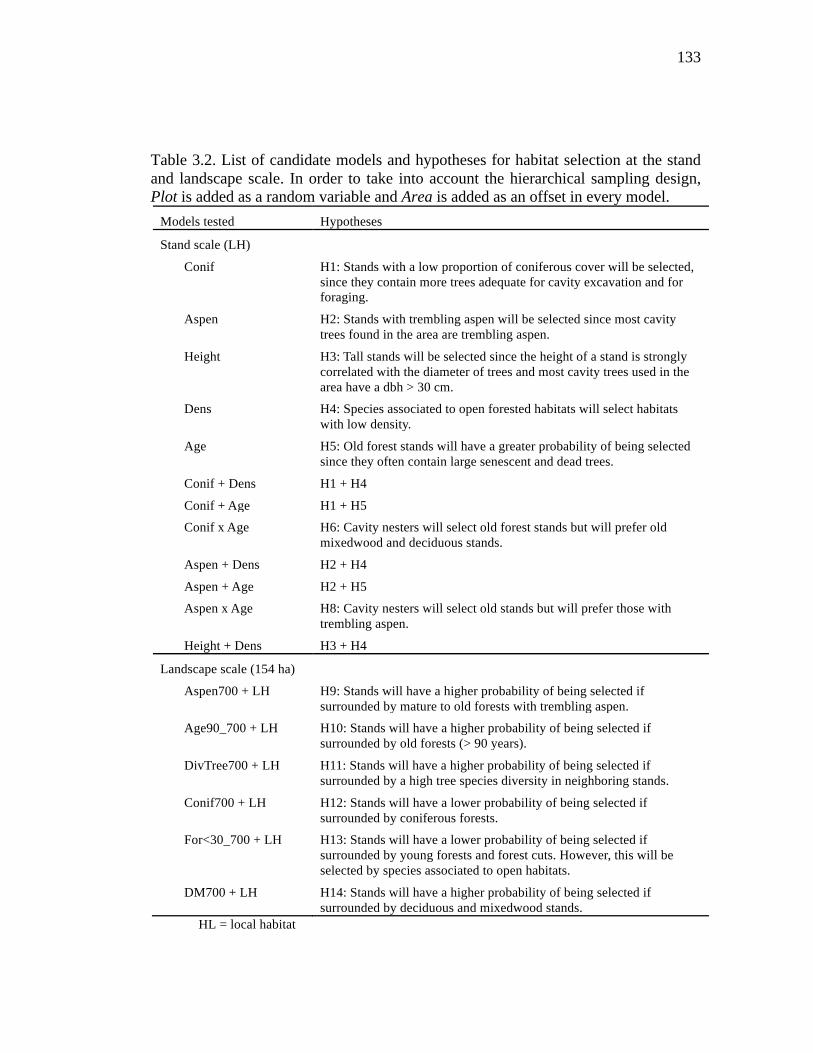
133
Table 3.2. List of candidate models and hypotheses for habitat selection at the stand and landscape scale. In order to take into account the hierarchical sampling design, Plot is added as a random variable and Area is added as an offset in every model.
Models tested Hypotheses
Stand scale (LH)
Conif H1: Stands with a low proportion of coniferous cover will be selected, since they contain more trees adequate for cavity excavation and for foraging.
Aspen H2: Stands with trembling aspen will be selected since most cavity trees found in the area are trembling aspen.
Height H3: Tall stands will be selected since the height of a stand is strongly correlated with the diameter of trees and most cavity trees used in the area have a dbh > 30 cm.
Dens H4: Species associated to open forested habitats will select habitats with low density.
Age H5: Old forest stands will have a greater probability of being selected since they often contain large senescent and dead trees.
Conif + Dens H1 + H4
Conif + Age H1 + H5
Conif x Age H6: Cavity nesters will select old forest stands but will prefer old mixedwood and deciduous stands.
Aspen + Dens H2 + H4
Aspen + Age H2 + H5
Aspen x Age H8: Cavity nesters will select old stands but will prefer those with trembling aspen.
Height + Dens H3 + H4
Landscape scale (154 ha)
Aspen700 + LH H9: Stands will have a higher probability of being selected if surrounded by mature to old forests with trembling aspen.
Age90_700 + LH H10: Stands will have a higher probability of being selected if surrounded by old forests (> 90 years).
DivTree700 + LH H11: Stands will have a higher probability of being selected if surrounded by a high tree species diversity in neighboring stands.
Conif700 + LH H12: Stands will have a lower probability of being selected if surrounded by coniferous forests.
For<30_700 + LH H13: Stands will have a lower probability of being selected if surrounded by young forests and forest cuts. However, this will be selected by species associated to open habitats.
DM700 + LH H14: Stands will have a higher probability of being selected if surrounded by deciduous and mixedwood stands.
HL = local habitat
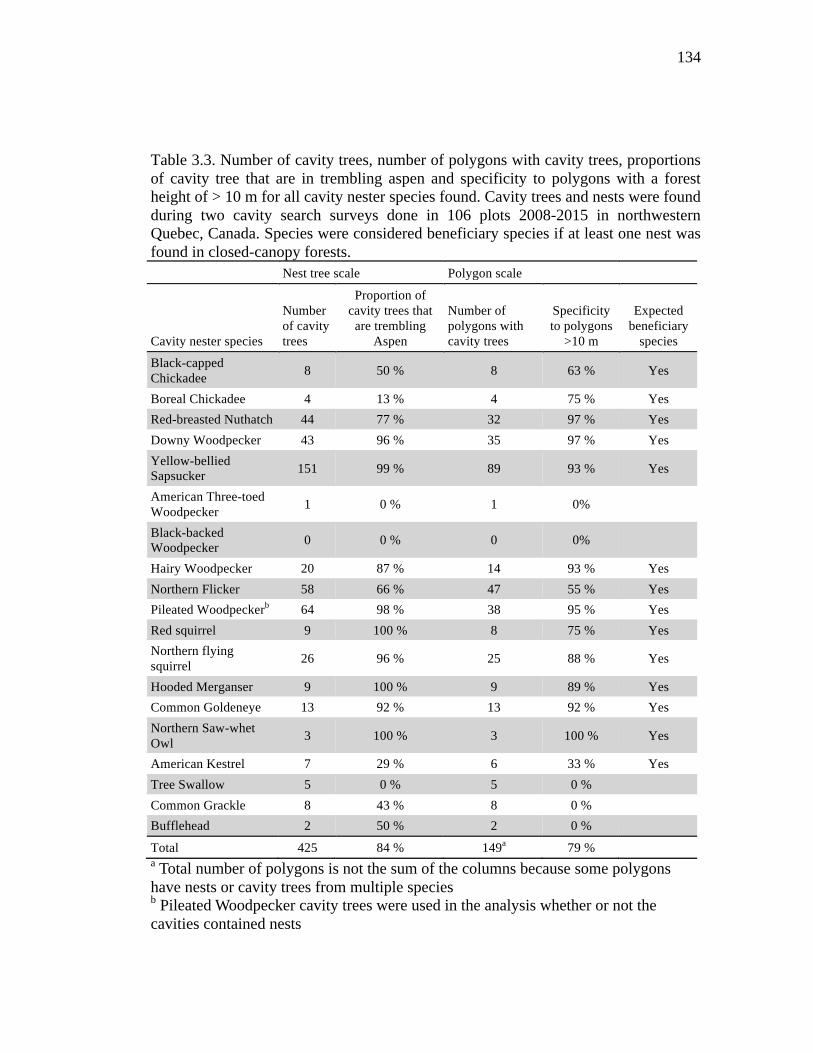
134
Table 3.3. Number of cavity trees, number of polygons with cavity trees, proportions of cavity tree that are in trembling aspen and specificity to polygons with a forest height of > 10 m for all cavity nester species found. Cavity trees and nests were found during two cavity search surveys done in 106 plots 2008-2015 in northwestern Quebec, Canada. Species were considered beneficiary species if at least one nest was found in closed-canopy forests.
Nest tree scale Polygon scale
Cavity nester species
Number of cavity trees
Proportion of cavity trees that are trembling
Aspen
Number of polygons with cavity trees
Specificity to polygons
>10 m
Expected beneficiary
species
Black-capped Chickadee 8 50 % 8 63 % Yes
Boreal Chickadee 4 13 % 4 75 % Yes Red-breasted Nuthatch 44 77 % 32 97 % Yes Downy Woodpecker 43 96 % 35 97 % Yes Yellow-bellied Sapsucker 151 99 % 89 93 % Yes
American Three-toed Woodpecker 1 0 % 1 0%
Black-backed Woodpecker 0 0 % 0 0%
Hairy Woodpecker 20 87 % 14 93 % Yes Northern Flicker 58 66 % 47 55 % Yes Pileated Woodpeckerb 64 98 % 38 95 % Yes Red squirrel 9 100 % 8 75 % Yes Northern flying squirrel 26 96 % 25 88 % Yes
Hooded Merganser 9 100 % 9 89 % Yes Common Goldeneye 13 92 % 13 92 % Yes Northern Saw-whet Owl 3 100 % 3 100 % Yes
American Kestrel 7 29 % 6 33 % Yes Tree Swallow 5 0 % 5 0 % Common Grackle 8 43 % 8 0 % Bufflehead 2 50 % 2 0 %
Total 425 84 % 149a 79 % a Total number of polygons is not the sum of the columns because some polygons have nests or cavity trees from multiple species b Pileated Woodpecker cavity trees were used in the analysis whether or not the cavities contained nests
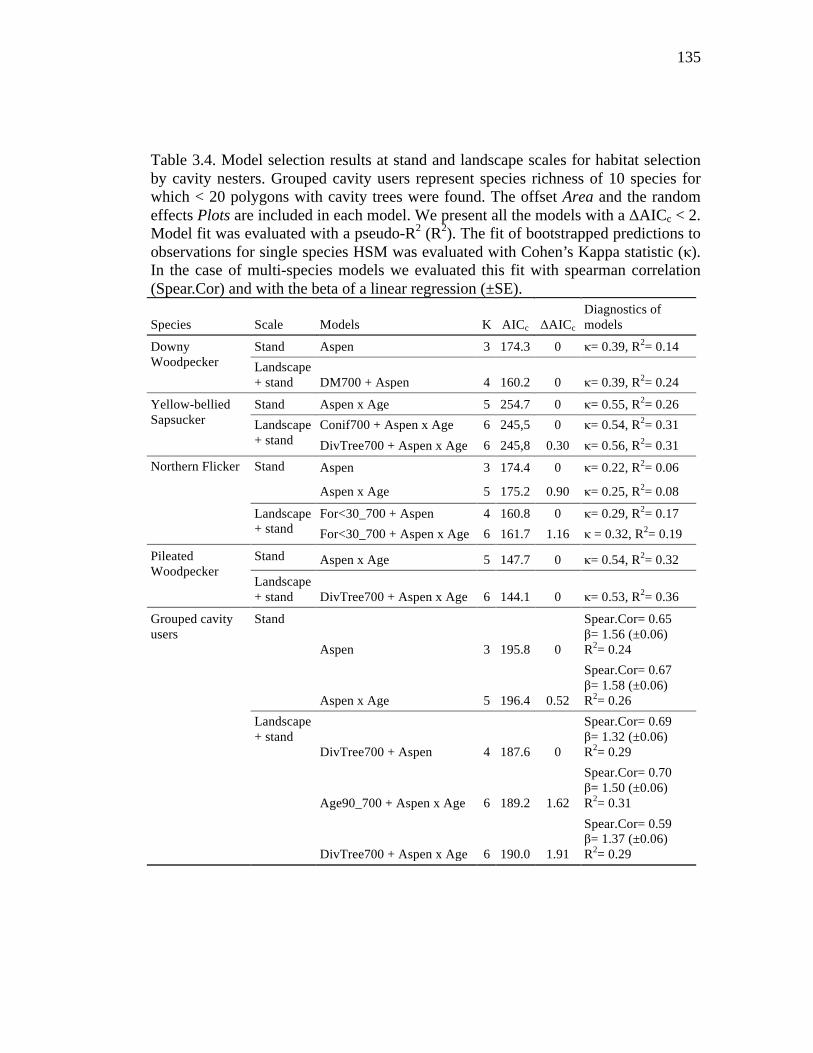
135
Table 3.4. Model selection results at stand and landscape scales for habitat selection by cavity nesters. Grouped cavity users represent species richness of 10 species for which < 20 polygons with cavity trees were found. The offset Area and the random effects Plots are included in each model. We present all the models with a ΔAICc < 2. Model fit was evaluated with a pseudo-R2 (R2). The fit of bootstrapped predictions to observations for single species HSM was evaluated with Cohen’s Kappa statistic (κ). In the case of multi-species models we evaluated this fit with spearman correlation (Spear.Cor) and with the beta of a linear regression (±SE).
Species Scale Models K AICc ΔAICc Diagnostics of models
Downy Woodpecker
Stand Aspen 3 174.3 0 κ= 0.39, R2= 0.14 Landscape + stand DM700 + Aspen 4 160.2 0 κ= 0.39, R2= 0.24
Yellow-bellied Sapsucker
Stand Aspen x Age 5 254.7 0 κ= 0.55, R2= 0.26 Landscape + stand
Conif700 + Aspen x Age 6 245,5 0 κ= 0.54, R2= 0.31 DivTree700 + Aspen x Age 6 245,8 0.30 κ= 0.56, R2= 0.31
Northern Flicker
Stand Aspen 3 174.4 0 κ= 0.22, R2= 0.06
Aspen x Age 5 175.2 0.90 κ= 0.25, R2= 0.08
Landscape + stand
For<30_700 + Aspen 4 160.8 0 κ= 0.29, R2= 0.17 For<30_700 + Aspen x Age 6 161.7 1.16 κ = 0.32, R2= 0.19
Pileated Woodpecker
Stand Aspen x Age 5 147.7 0 κ= 0.54, R2= 0.32
Landscape + stand DivTree700 + Aspen x Age 6 144.1 0 κ= 0.53, R2= 0.36
Grouped cavity users
Stand
Aspen 3 195.8 0
Spear.Cor= 0.65 β= 1.56 (±0.06) R2= 0.24
Aspen x Age 5 196.4 0.52
Spear.Cor= 0.67 β= 1.58 (±0.06) R2= 0.26
Landscape + stand
DivTree700 + Aspen 4 187.6 0
Spear.Cor= 0.69 β= 1.32 (±0.06) R2= 0.29
Age90_700 + Aspen x Age 6 189.2 1.62
Spear.Cor= 0.70 β= 1.50 (±0.06) R2= 0.31
DivTree700 + Aspen x Age 6 190.0 1.91
Spear.Cor= 0.59 β= 1.37 (±0.06) R2= 0.29
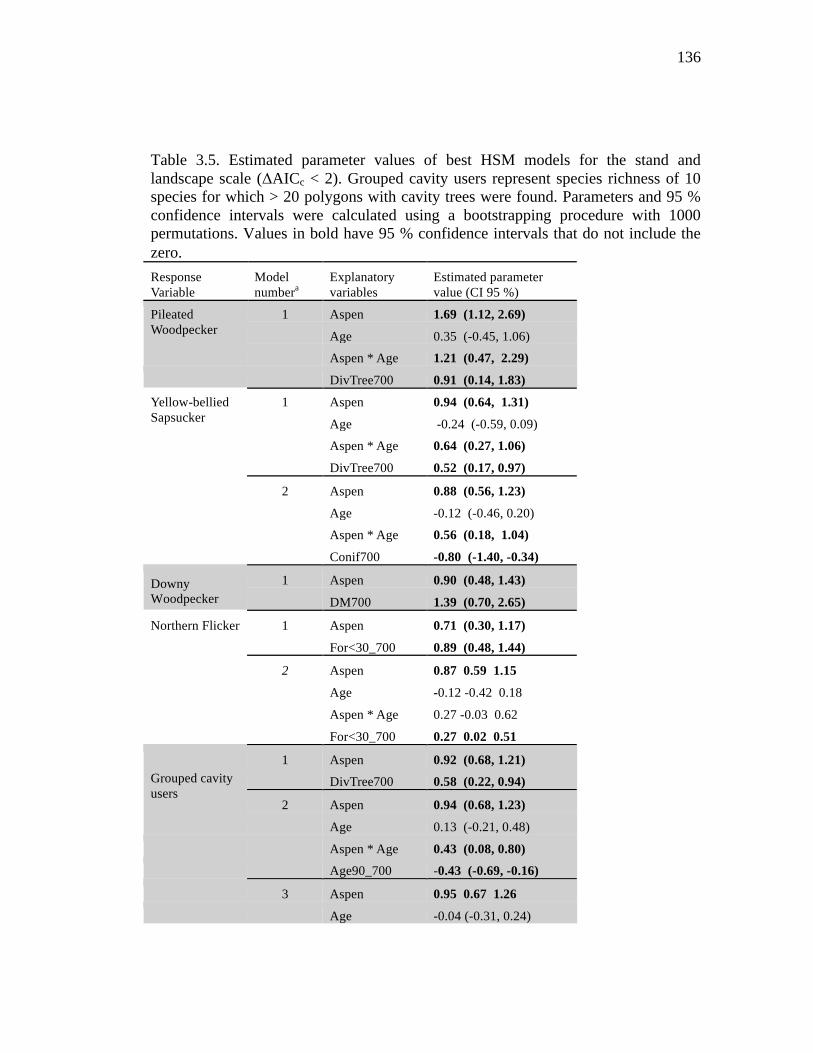
136
Table 3.5. Estimated parameter values of best HSM models for the stand and landscape scale (ΔAICc < 2). Grouped cavity users represent species richness of 10 species for which > 20 polygons with cavity trees were found. Parameters and 95 % confidence intervals were calculated using a bootstrapping procedure with 1000 permutations. Values in bold have 95 % confidence intervals that do not include the zero. Response Variable
Model numbera
Explanatory variables
Estimated parameter value (CI 95 %)
Pileated Woodpecker
1 Aspen 1.69 (1.12, 2.69)
Age 0.35 (-0.45, 1.06)
Aspen * Age 1.21 (0.47, 2.29)
DivTree700 0.91 (0.14, 1.83)
Yellow-bellied Sapsucker
1 Aspen 0.94 (0.64, 1.31)
Age -0.24 (-0.59, 0.09)
Aspen * Age 0.64 (0.27, 1.06)
DivTree700 0.52 (0.17, 0.97)
2 Aspen 0.88 (0.56, 1.23)
Age -0.12 (-0.46, 0.20)
Aspen * Age 0.56 (0.18, 1.04)
Conif700 -0.80 (-1.40, -0.34)
Downy Woodpecker
1 Aspen 0.90 (0.48, 1.43)
DM700 1.39 (0.70, 2.65)
Northern Flicker 1 Aspen 0.71 (0.30, 1.17)
For<30_700 0.89 (0.48, 1.44)
2 Aspen 0.87 0.59 1.15
Age -0.12 -0.42 0.18
Aspen * Age 0.27 -0.03 0.62
For<30_700 0.27 0.02 0.51
Grouped cavity users
1 Aspen 0.92 (0.68, 1.21) DivTree700 0.58 (0.22, 0.94)
2 Aspen 0.94 (0.68, 1.23)
Age 0.13 (-0.21, 0.48)
Aspen * Age 0.43 (0.08, 0.80) Age90_700 -0.43 (-0.69, -0.16)
3 Aspen 0.95 0.67 1.26
Age -0.04 (-0.31, 0.24)

137
Aspen * Age 0.26 (-0.08, 0.59)
DivTree700 0.55 (0.20, 0.92) a Relevant when there are multiple closely competing models (Delta-AICc<2).
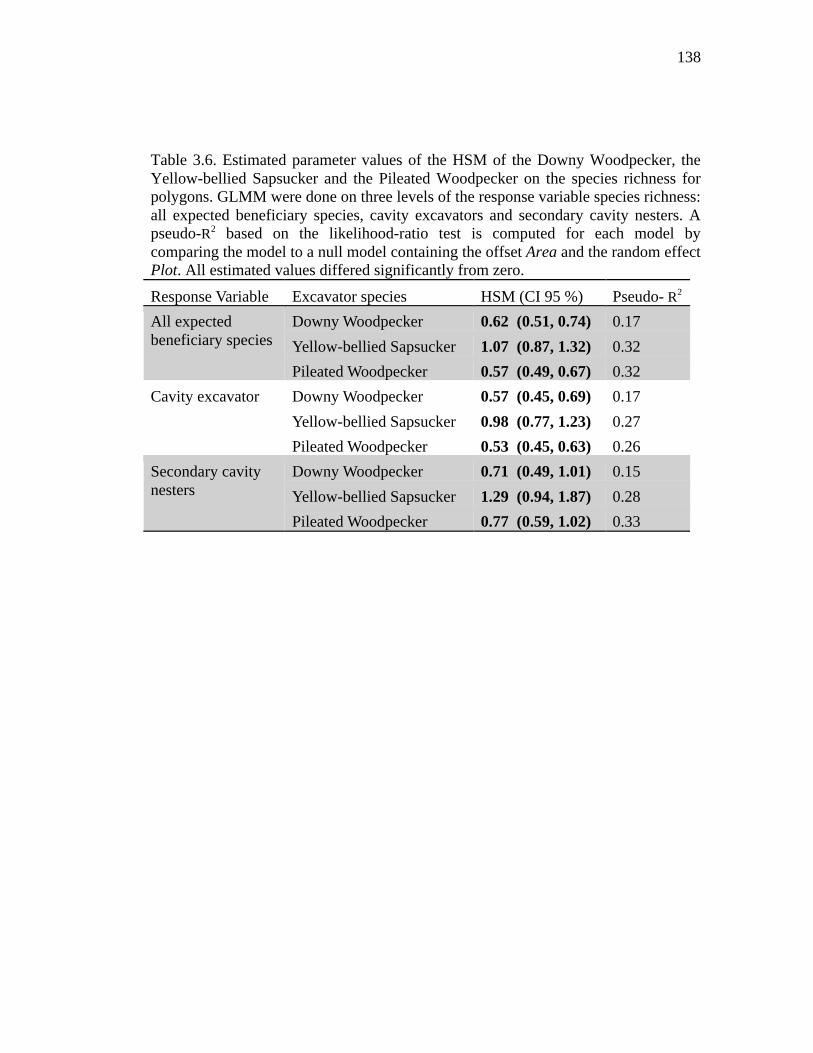
138
Table 3.6. Estimated parameter values of the HSM of the Downy Woodpecker, the Yellow-bellied Sapsucker and the Pileated Woodpecker on the species richness for polygons. GLMM were done on three levels of the response variable species richness: all expected beneficiary species, cavity excavators and secondary cavity nesters. A pseudo-R2 based on the likelihood-ratio test is computed for each model by comparing the model to a null model containing the offset Area and the random effect Plot. All estimated values differed significantly from zero.
Response Variable Excavator species HSM (CI 95 %) Pseudo- R2 All expected beneficiary species
Downy Woodpecker 0.62 (0.51, 0.74) 0.17 Yellow-bellied Sapsucker 1.07 (0.87, 1.32) 0.32 Pileated Woodpecker 0.57 (0.49, 0.67) 0.32
Cavity excavator
Downy Woodpecker 0.57 (0.45, 0.69) 0.17 Yellow-bellied Sapsucker 0.98 (0.77, 1.23) 0.27 Pileated Woodpecker 0.53 (0.45, 0.63) 0.26
Secondary cavity nesters
Downy Woodpecker 0.71 (0.49, 1.01) 0.15 Yellow-bellied Sapsucker 1.29 (0.94, 1.87) 0.28 Pileated Woodpecker 0.77 (0.59, 1.02) 0.33
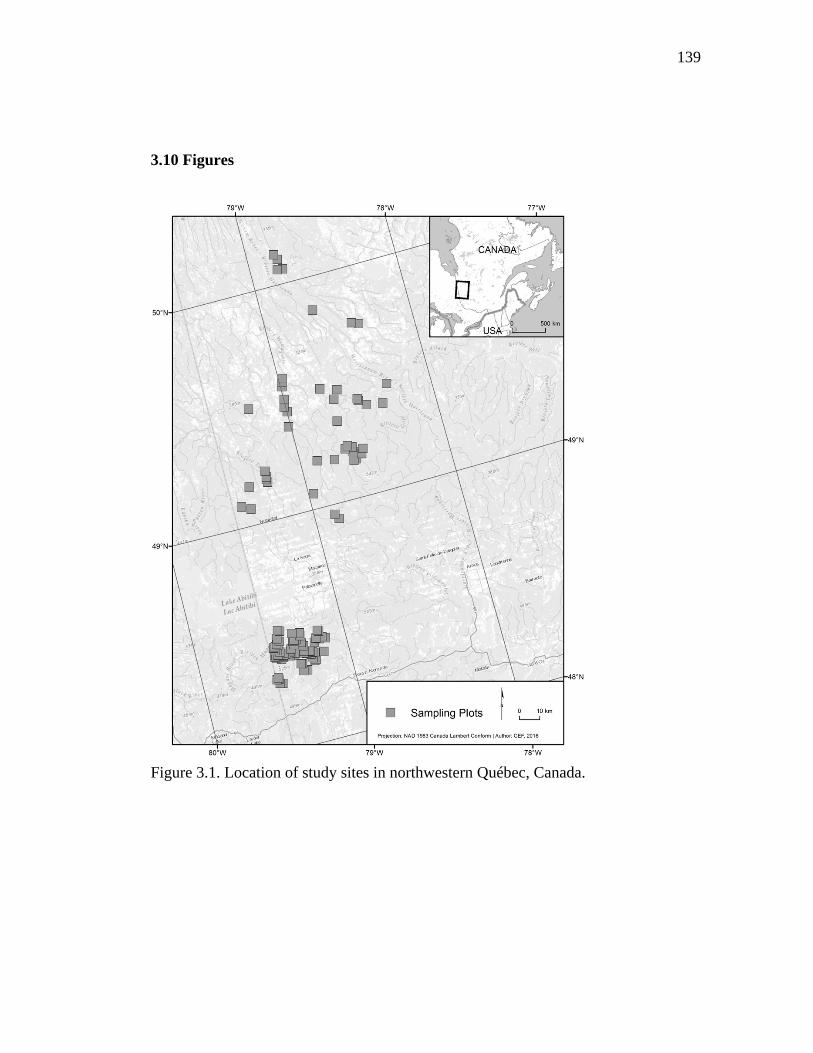
139
3.10 Figures
Figure 3.1. Location of study sites in northwestern Québec, Canada.
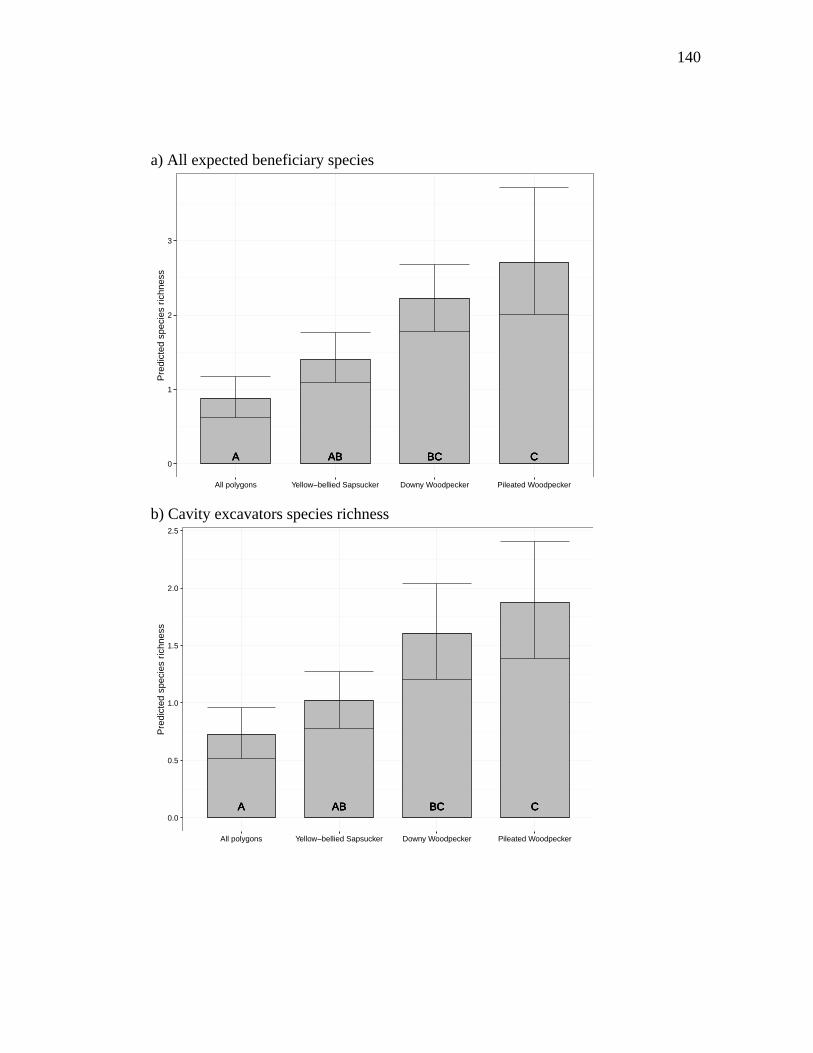
140
a) All expected beneficiary species
b) Cavity excavators species richness
AAAA ABABABAB BCBCBCBC CCCC0
1
2
3
All polygons Yellow−bellied Sapsucker Downy Woodpecker Pileated Woodpecker
Pred
icte
d sp
ecie
s ric
hnes
s
AAAA ABABABAB BCBCBCBC CCCC0.0
0.5
1.0
1.5
2.0
2.5
All polygons Yellow−bellied Sapsucker Downy Woodpecker Pileated Woodpecker
Pred
icte
d sp
ecie
s ric
hnes
s
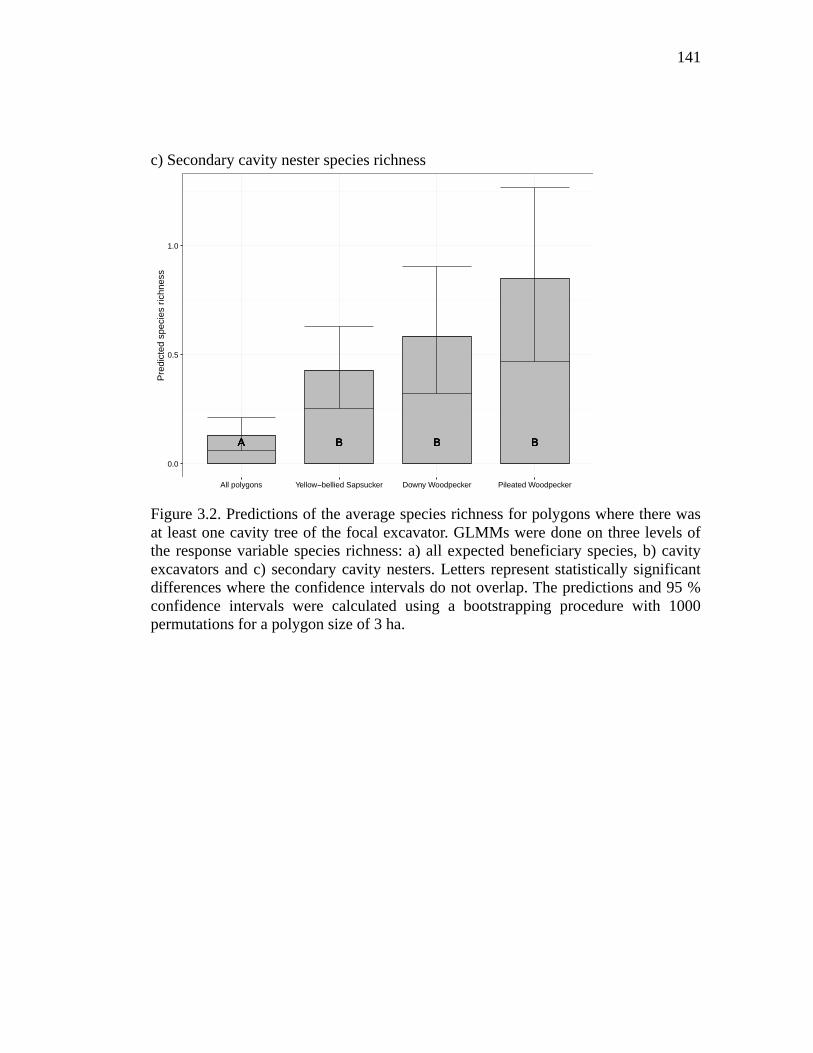
141
c) Secondary cavity nester species richness
Figure 3.2. Predictions of the average species richness for polygons where there was at least one cavity tree of the focal excavator. GLMMs were done on three levels of the response variable species richness: a) all expected beneficiary species, b) cavity excavators and c) secondary cavity nesters. Letters represent statistically significant differences where the confidence intervals do not overlap. The predictions and 95 % confidence intervals were calculated using a bootstrapping procedure with 1000 permutations for a polygon size of 3 ha.
AAAA BBBB BBBB BBBB
0.0
0.5
1.0
All polygons Yellow−bellied Sapsucker Downy Woodpecker Pileated Woodpecker
Pred
icte
d sp
ecie
s ric
hnes
s
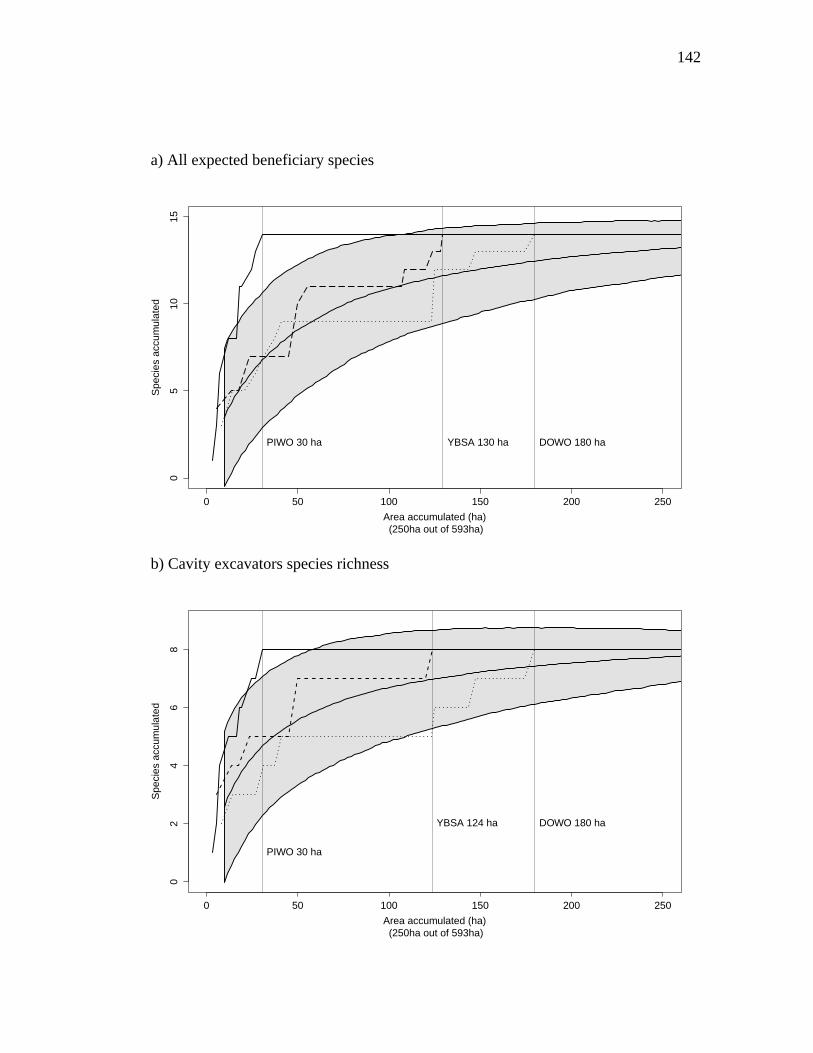
142
a) All expected beneficiary species
b) Cavity excavators species richness
0 50 100 150 200 250
05
1015
Spec
ies
accu
mul
ated
Area accumulated (ha) (250ha out of 593ha)
PIWO 30 ha YBSA 130 ha DOWO 180 ha
0 50 100 150 200 250
02
46
8
Spec
ies
accu
mul
ated
Area accumulated (ha) (250ha out of 593ha)
PIWO 30 ha
YBSA 124 ha DOWO 180 ha
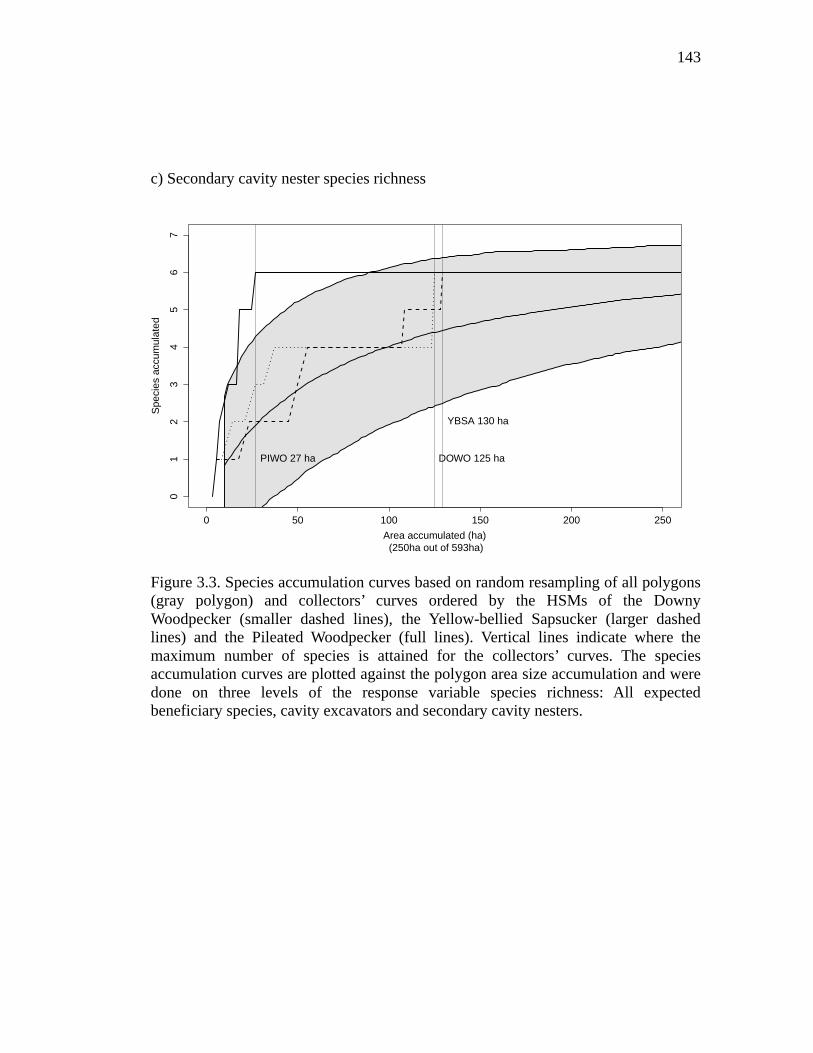
143
c) Secondary cavity nester species richness
Figure 3.3. Species accumulation curves based on random resampling of all polygons (gray polygon) and collectors’ curves ordered by the HSMs of the Downy Woodpecker (smaller dashed lines), the Yellow-bellied Sapsucker (larger dashed lines) and the Pileated Woodpecker (full lines). Vertical lines indicate where the maximum number of species is attained for the collectors’ curves. The species accumulation curves are plotted against the polygon area size accumulation and were done on three levels of the response variable species richness: All expected beneficiary species, cavity excavators and secondary cavity nesters.
0 50 100 150 200 250
01
23
45
67
Spec
ies
accu
mul
ated
Area accumulated (ha) (250ha out of 593ha)
PIWO 27 ha
YBSA 130 ha
DOWO 125 ha
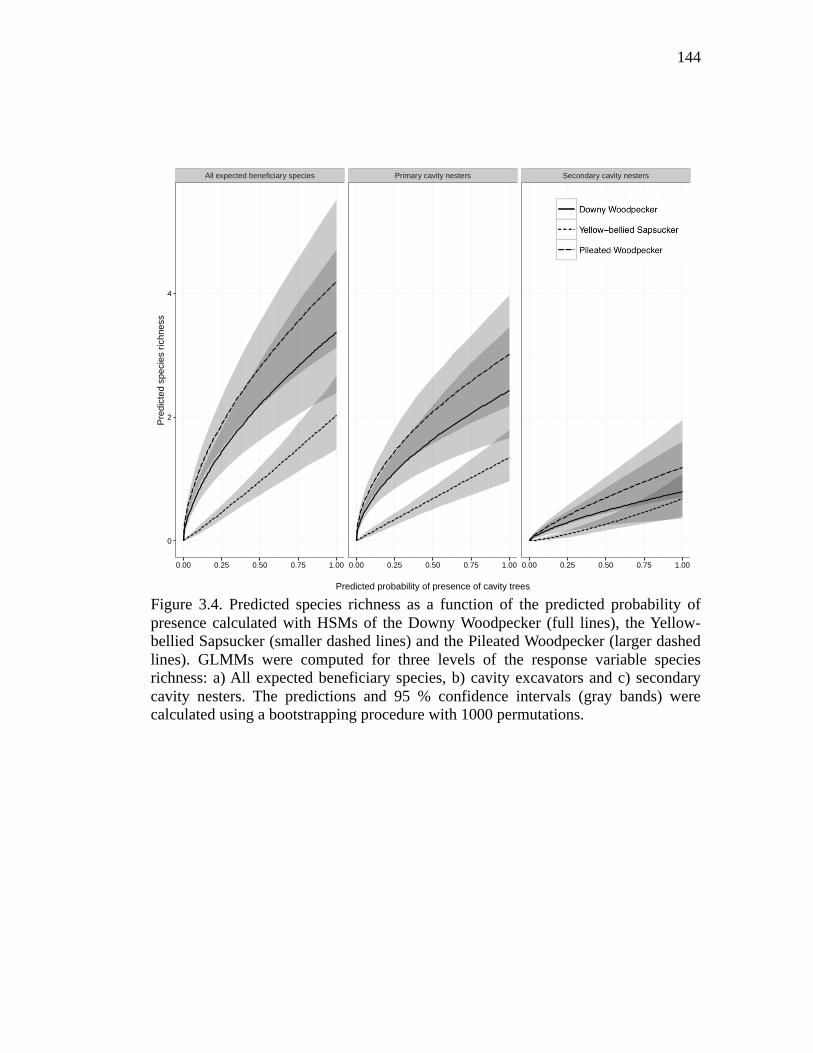
144
Figure 3.4. Predicted species richness as a function of the predicted probability of presence calculated with HSMs of the Downy Woodpecker (full lines), the Yellow-bellied Sapsucker (smaller dashed lines) and the Pileated Woodpecker (larger dashed lines). GLMMs were computed for three levels of the response variable species richness: a) All expected beneficiary species, b) cavity excavators and c) secondary cavity nesters. The predictions and 95 % confidence intervals (gray bands) were calculated using a bootstrapping procedure with 1000 permutations.
All expected beneficiary species Primary cavity nesters Secondary cavity nesters
0
2
4
0.00 0.25 0.50 0.75 1.00 0.00 0.25 0.50 0.75 1.00 0.00 0.25 0.50 0.75 1.00
Predicted probability of presence of cavity trees
Pred
icte
d sp
ecie
s ric
hnes
s
Sp
Downy Woodpecker
Yellow−bellied Sapsucker
Pileated Woodpecker
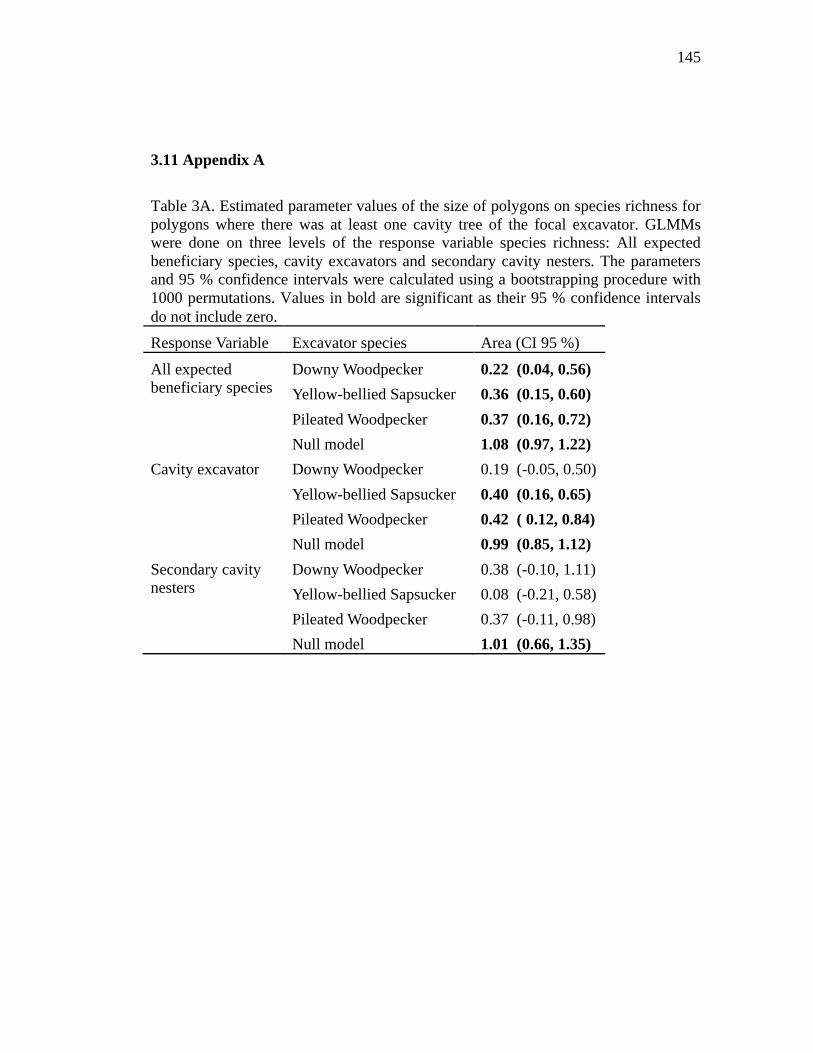
145
3.11 Appendix A
Table 3A. Estimated parameter values of the size of polygons on species richness for polygons where there was at least one cavity tree of the focal excavator. GLMMs were done on three levels of the response variable species richness: All expected beneficiary species, cavity excavators and secondary cavity nesters. The parameters and 95 % confidence intervals were calculated using a bootstrapping procedure with 1000 permutations. Values in bold are significant as their 95 % confidence intervals do not include zero. Response Variable Excavator species Area (CI 95 %)
All expected beneficiary species
Downy Woodpecker 0.22 (0.04, 0.56) Yellow-bellied Sapsucker 0.36 (0.15, 0.60)
Pileated Woodpecker 0.37 (0.16, 0.72) Null model 1.08 (0.97, 1.22)
Cavity excavator
Downy Woodpecker 0.19 (-0.05, 0.50) Yellow-bellied Sapsucker 0.40 (0.16, 0.65)
Pileated Woodpecker 0.42 ( 0.12, 0.84) Null model 0.99 (0.85, 1.12)
Secondary cavity nesters
Downy Woodpecker 0.38 (-0.10, 1.11) Yellow-bellied Sapsucker 0.08 (-0.21, 0.58) Pileated Woodpecker 0.37 (-0.11, 0.98)
Null model 1.01 (0.66, 1.35)

146
CONCLUSION GÉNÉRALE
Cette thèse démontre que l’avifaune associée au bois mort est grandement dépendante
des vieilles forêts boréales. Ces forêts sont distribuées sur l’ensemble du territoire et
assurent un apport constant d’arbres morts et sénescents. Toutefois, le long de
l’important gradient latitudinal de transition d’un couvert forestier mixte à résineux,
on observe une réduction considérable de la disponibilité d’arbres morts et sénescents
de qualité pour la nidification et l’alimentation de ce groupe fonctionnel d’espèces
(Gauthier et al. 2000, Drapeau et al. 2009). Nous montrons que cette réduction des
arbres à cavités en pessière à mousses organise les réseaux d’utilisateurs de cavités
autour des peuplements mixtes isolés ainsi que dans les forêts inondées par les castors
tandis que les forêts âgées résineuses supportent une plus faible richesse en espèces
associées au bois mort ainsi que des réseaux d’utilisateurs de cavités moins
diversifiés et moins complexes. Des habitats ainsi que des espèces clés de voûte sont
identifiés et cette thèse approfondit notre compréhension de leurs rôles respectifs dans
la structure des communautés d’oiseaux cavicoles de l’écosystème boréal tant en
sapinière à bouleau blanc qu’en pessière à mousses. Une espèce en particulier, le
Grand Pic joue le rôle d’espèce parapluie alors que sa sélection fine des habitats de
reproduction recoupe fortement les exigences de l’habitat de reproduction de la
majorité des autres espèces cavicoles. Nous pouvons résumer l’apport des
connaissances acquises dans cette thèse sous trois dimensions : la diversité
spécifique, la diversité fonctionnelle et les espèces indicatrices de l’écosystème
boréal.
148
Diversité spécifique des oiseaux associés au bois mort en pessière à mousses
Les deux premiers chapitres apportent de nouvelles connaissances concernant
l’importance de l’âge, de la productivité et de la composition des forêts pour
l’occurrence, l’alimentation (chapitre 1) et la nidification (chapitre 2) de l’avifaune
associée au bois mort en pessière à mousses.
Les forêts âgées de conifères en pessière à mousses non entourbées étaient plus
utilisées que les forêts matures par le groupe d’espèces d’oiseaux associées au bois
mort. Toutefois, ce ne sont pas toutes les forêts âgées qui offraient des conditions
adéquates pour ce groupe focal d’espèces. L’entourbement des forêts résineuses a eu
un effet négatif important sur l’occupation et l’utilisation de l’habitat par l’avifaune
associée au bois mort. Ainsi, après les forêts matures (avec peu de bois sénescent et
mort) les forêts entourbées (> 160 ans) ont vu leur richesse spécifique ainsi que
l’activité d’alimentation des pics (traces fraîches d’alimentation) diminuer par rapport
aux forêts âgées non entourbées. L’avifaune associée au bois mort a donc montré une
distribution modale en réponse au vieillissement de la forêt et à la baisse de
productivité forestière. Les résultats du chapitre 1 montrent donc clairement que la
richesse spécifique et l’abondance de traces d’alimentation de pics sont liées à une
abondance accrue de bois mort et une plus grande diversité structurale dans ces
vieilles forêts.
Nos résultats montrent clairement que les vieilles forêts mixtes avec peupliers faux-
trembles sont des habitats clés et sont fortement sélectionnés par l’avifaune associée
au bois mort en pessière à mousses. Ainsi, malgré leur faible représentation dans le
paysage (4 %) et le fait qu’ils étaient en général isolés par de grandes étendues de
forêts résineuses ou de tourbières, l’abondance des oiseaux associés au bois sénescent
et mort dans les forêts mixtes de la pessière à mousses a montré une forte
ressemblance à celles de la sapinière à bouleau blanc. Dans ces habitats, nous avons
149
trouvé la plus grande richesse spécifique, les plus grandes abondances de traces
d’alimentation de pics et les réseaux d’utilisateurs de cavités les plus riches.
Il y avait un fort contraste entre les forêts âgées mixtes et les forêts âgées résineuses
qui étaient beaucoup moins prisées par la faune cavicole, et ce malgré un effort
d’échantillonnage considérable (chapitre 2), très peu de nids et d’arbres à cavités ont
été trouvés en forêts résineuses. Malgré la faible abondance de nids trouvés dans les
forêts âgées résineuses non entourbées (chapitre 2), ces dernières étaient fortement
utilisées par le Pic à dos noir et le Pic à dos rayé pour leur alimentation (chapitre 1).
Diversité fonctionnelle de l’avifaune associée au bois mort
Les réseaux d’utilisateurs de cavités de l’Amérique du Nord sont composés d’une
faible proportion d’espèces ayant beaucoup de liens et de peu de redondance dans
leurs rôles fonctionnels (Cockle et al. 2012, Simard et al. 2013). Ceci suggère une
faible robustesse à la perte des espèces qui soutiennent beaucoup de liens (Messier et
al. 2013). Le long du gradient latitudinal, les changements importants dans la
disponibilité des arbres adéquats à l’excavation de cavités, tels qu’observés au
chapitre 1, ont le potentiel de changer la structure des réseaux au niveau des arbres à
cavités et des excavateurs de cavités. Avec une perspective régionale, le chapitre 2
apporte de nouvelles connaissances portant sur la robustesse, le changement et la
persistance des réseaux d’utilisateurs de cavités soumis à la perte de ressources en
bois mort et sénescent.
Bien que les réseaux d’utilisateurs de cavités se prêtent bien au cadre conceptuel et
théorique de l’analyse des réseaux complexes en écologie (Sole et Montoya 2001,
Dunne et al. 2002, Fath et al. 2007), les réseaux d’utilisateurs de cavités trouvés dans
la littérature restent (Martin et Eadie 1999, Blanc et Walters 2007, Simard et al.
2013), à ce jour, des structures descriptives utilisées principalement pour représenter
150
les interactions entre les espèces (Blanc et Walters 2007) (mais voir Cadieux 2011 et
Cockle et al. 2012). Le chapitre 2 est l’une des premières études à analyser à une
échelle régionale les changements de structure des réseaux d’utilisateurs de cavités en
fonction de la variation du couvert forestier et en corollaire, de la disponibilité des
arbres à cavités dans différents paysages forestiers. Grâce à des données récoltées à
long terme (2003-2015) et sur un vaste territoire chevauchant deux régions
bioclimatiques (12 000 km2), cette étude aborde la question de la robustesse de ces
réseaux soumis à d'importants changements écologiques. À l’aide d’une analyse de
retrait ciblé d’espèces, nous montrons que les réseaux d’utilisateurs de cavités dans
les peuplements fermés de la forêt boréale sont peu robustes à la perte d’espèces clés.
La simulation de la perte du peuplier faux-tremble cause > 70 % d’extinctions
secondaires dans ces forêts, et ce même dans la région de la pessière à mousses.
Malgré leur faible représentation régionale, les forêts mixtes de peupliers faux-
trembles conservent un rôle de premier plan dans la structure des réseaux
d’utilisateurs de cavités en pessière à mousses. Nos résultats indiquent toutefois que
la répartition nordique de certaines espèces de pics est fortement liée à cette essence.
Bien que les forêts inondées par le castor d’Amérique sont généralement considérées
comme des environnements importants pour les écosystèmes riverains et la diversité
biologique (Naiman et al. 1986, Macdonald et al. 1995, Stockland et Siitonen 2012,
Smith et Mather 2013), le chapitre 2 compte parmi les premières études à quantifier
l’importance de cet habitat dans la création d’arbres de nidification pour la faune
cavicole. Nos résultats montrent que les forêts inondées par l’activité du castor
contribuent de manière importante aux réseaux d’utilisateurs de cavités sur
l’ensemble de la forêt boréale. Cependant, ces habitats, de pair avec les forêts mixtes,
sont encore plus importants en pessière à mousses vu la faible disponibilité d’habitats
adéquats pour la nidification. Ces réseaux étaient riches et robustes à la perte du
peuplier faux-tremble, étant moins dépendants à cette essence comparativement aux
forêts fermées. L’ennoiement des arbres par le castor crée des arbres adéquats à
151
l’excavation de cavités et à la nidification d’espèces cavicoles associées aux forêts à
canopées ouvertes sans propension marquée pour l’essence.
En incorporant l’analyse des réseaux d’utilisateurs de cavités des forêts perturbées par
le castor, nos travaux apportent non seulement une nouvelle perspective au rôle
écologique de ces habitats dans le maintien de la diversité fonctionnelle en forêt
boréale, mais ils élargissent notre compréhension des réseaux d’utilisateurs de cavités
dans l’écosystème boréal et de l’importance des étangs à castors pour la faune
cavicole.
Espèces indicatrices de diversité
Tel que vu dans plusieurs autres études, deux excavateurs de cavités de taille
moyenne à grande se sont démarqués comme excavateurs clés dans notre étude, le
Grand Pic et le Pic flamboyant (Bonar 2000, Aubry et Raley 2002, Martin et al. 2004,
Blanc et Walters 2008a, Cooke 2009, Cadieux 2011). Le Grand Pic était l’excavateur
dont les cavités étaient les plus réutilisées par les plus grandes espèces cavicoles.
Notre étude apporte de nouvelles connaissances quant à la persistance de ce rôle dans
les peuplements mixtes isolés dans le domaine bioclimatique de la pessière à
mousses. Le Pic flamboyant était l’excavateur ayant le plus de cavités réutilisées en
forêts ouvertes, et ce notamment pour les forêts ennoyées par le castor. La
contribution de ces deux ingénieurs écologiques affecte la structure de réseaux
complexes d’utilisateurs de cavités dans la région de la pessière à mousses.
Bien que plusieurs chercheurs et aménagistes forestiers aient proposé ou encore
utilisent le Grand Pic comme espèce parapluie (McClelland et al. 1979, Bull et al.
1992, Blanchette 1996, McLaren et al. 1998, McClelland et McClelland 1999,
Savignac et al. 2000, Aubry et Raley 2003, Lemaître et Villard 2005, Cheveau 2015),
il n’existe à notre connaissance aucune étude qui n’aient vérifié de façon formelle
152
l’hypothèse que les exigences d’habitat de reproduction Grand Pic puissent recouper
celles d’autres espèces, notamment du groupe fonctionnel des utilisateurs d’arbres à
cavités. Les chapitres 2 et 3 permettent de conclure que le Grand Pic joue le double
rôle d’espèce clé de voûte et d’espèce parapluie pour la faune cavicole associée aux
forêts mixtes tant en sapinière à bouleau blanc qu’en pessière à mousses de la forêt
boréale de l’est du Canada. Une série de tests effectués au chapitre 3 permettent de
confirmer le statut d’espèce parapluie de cet excavateur pour la faune cavicole. Le
Grand Pic sélectionne fortement les peuplements qui sont également convoités par la
majorité de la faune cavicole, les vieilles forêts mixtes composées de peupliers faux-
trembles sénescents de fort diamètre. Cette sélection vient corroborer le rôle clé joué
par les forêts mixtes âgées (chapitres 1 et 2) pour les réseaux écologiques
d’utilisateurs de cavités en forêt boréale. Cependant, le chapitre 3 précise que les
paramètres d’habitat de nidification du Grand Pic sont non seulement aptes à
convenir aux espèces utilisatrices de ses cavités (utilisateurs secondaires de grande
taille), mais à tout le réseau d’espèces cavicoles (y compris les excavateurs et
utilisateurs de petites et moyennes cavités). L'habitat du Grand Pic en forêt boréale
offre donc une option clé pour la planification de la conservation des réseaux
d’utilisateurs de cavités, qui représentent un contingent important de la diversité
spécifique et fonctionnelle des écosystèmes en forêt boréale.
Implications en aménagement forestier
La sénescence et la mort des arbres sont critiques pour de nombreuses espèces en
forêt boréale. Nous devons pratiquer une gestion de nos forêts qui ne cause pas une
trop forte diminution de la disponibilité de ces attributs dans nos paysages forestiers
(Jonsson et al. 2005, Stockland et Siitonen 2012). Une des conclusions importantes
de cette thèse renvoie à l’importance des vieilles forêts productives comme habitats
clés pour le maintien de la diversité spécifique et fonctionnelle de la faune vertébrée
associée au bois mort et sénescent. Cette thèse propose de plus que certaines espèces,
153
comme le Grand Pic (chapitre 3), puissent être des indicateurs dans la planification de
la rétention d’habitats de qualité pour l’ensemble du réseau cavicole dans les
territoires aménagés. De plus, cette espèce pourrait aussi servir d’outil d’évaluation
de l’efficacité de l’aménagement durable des forêts à maintenir la diversité
fonctionnelle des utilisateurs de bois mort en forêt aménagée (Drapeau et al. 2008).
Les vieilles forêts mixtes devraient bénéficier d’une attention particulière de
protection vu leur grande richesse et leur faible représentation dans le paysage,
surtout en région de pessière à mousses.
Contrairement à d’autres écosystèmes forestiers, les vieilles forêts résineuses en
pessière à mousses ne contribuent pas toutes de la même façon aux réseaux
d’utilisateurs de cavités. Leur entourbement progressif diminue grandement leur
capacité à offrir des conditions adéquates de bois sénescent et mort pour les réseaux
d’utilisateurs de cavités (chapitres 1 et 2). Plusieurs espèces cavicoles et corticoles
sont donc influencées par cette diminution marquée dans la disponibilité d’arbres
morts ou sénescents de grande taille. Planifier la conservation du réseau des
utilisateurs de cavités dans les forêts de conifères exige donc de concentrer les efforts
sur les forêts âgées productives, qui sont également convoitées par l’industrie. On ne
peut penser assurer le maintien de la faune cavicole associée aux forêts résineuses de
la pessière à mousses en portant nos stratégies de rétention de forêts âgées sur les
vieilles forêts entourbées. Celles-ci ne peuvent donc être considérées comme de bons
habitats pour la faune associée au bois mort.
Enfin, les forêts inondées constituent des habitats clés pour une portion importante de
la communauté d’espèces cavicoles en forêt boréale. La conservation de ces habitats
constitue une stratégie peu coûteuse considérant que ces habitats ne sont
généralement pas considérés comme productifs et potentiellement exploitables sur le
plan ligneux.
154
Perspectives futures de recherche
Cette thèse appuie l’idée que les vieilles forêts mixtes avec peupliers faux-trembles
sont critiques pour le maintien de la diversité de la faune associée au bois mort pour
l’ensemble de la forêt boréale, et ce indépendamment de la composition régionale de
la matrice forestière. Bien que nous ayons documenté l’utilisation de ces forêts pour
la reproduction et l’alimentation de la faune cavicole, des études sur la productivité
des individus nicheurs sont nécessaires pour comprendre l’effet de cet isolement sur
la valeur sélective (fitness) des individus et statuer sur la contribution démographique
de ces habitats. En effet, la distance de ces forêts isolées aux grands massifs de forêts
mixtes plus au sud pourrait avoir un impact sur le succès d’appariement des individus
reproducteurs ou encore sur le succès des jeunes à l’envol si les ressources
alimentaires s’avèrent de moins bonne qualité comme il a déjà été vu chez des
passereaux dans des forêts fragmentées (Probst et Hayes 1987, Zanette et al. 2000).
De plus, les conditions météorologiques moins clémentes à ces latitudes nordiques
pourraient également avoir un impact sur la capacité de nourrir les jeunes au nid
(Öberg et al. 2015). Il y aurait alors potentiellement des effets négatifs sur le succès
de reproduction et la productivité des nicheurs (nombre moyen de jeunes à l’envol).
Le chapitre 2 démontre que les forêts inondées par le castor sont des habitats où l’on
trouve des réseaux d’utilisateurs de cavités riches et complexes et qui ont une grande
densité de nids d’espèces cavicoles associées aux forêts ouvertes. Par contre, ce sont
aussi les habitats qui ont les cavités arboricoles les plus basses. Il serait important de
mesurer la productivité des espèces cavicoles dans ces habitats pour évaluer si ces
cavités ne sont pas plus vulnérables à la prédation et qu’ils constituent par conséquent
des habitats marginaux par rapport aux forêts fermées quant à leur productivité.
155
Le Grand Pic est clairement identifié comme espèce parapluie pour la faune cavicole
en forêt boréale dans le chapitre 3. D’autres études sont nécessaires pour vérifier si
cet excavateur de cavités serait aussi une espèce parapluie pour un plus large éventail
d’organismes, comme il a été observé pour le Pic à dos blanc (Dendrocopos leucotos)
dans les forêts boréales Fenno-scandinaves (Roberge et al. 2008). Vu sa forte
sélection des vieilles forêts mixtes avec peuplier faux-tremble, il est fort probable que
ce rôle s’applique aussi pour plusieurs autres espèces de vertébrés associées au même
habitat (Potvin et al. 2000, Jacqmain et al. 2008, Cheveau et al. 2013).
Dans cette thèse, nous avons trouvé très peu de nids de Pic à dos noir et de Pic à dos
rayé, et la grande majorité de ces nids étaient situés dans des forêts inondées par le
castor. Cependant, en forêt résineuse à canopée fermée nous avons trouvé beaucoup
de traces d’alimentation de ces deux pics et ces espèces étaient souvent aperçues. De
nouvelles études sont nécessaires pour mieux comprendre l’utilisation des forêts
résineuses non brûlées pour la reproduction de ces deux pics (voir Tremblay et al.
2009, 2015). En l’absence de perturbations majeures comme les feux de forêt, il reste
à voir si le Pic à dos noir et le Pic à dos rayé n’utiliseraient pas de façon préférentielle
les forêts ennoyées par le castor au détriment des forêts fermées âgées.

RÉFÉRENCES CITÉES DANS L'INTRODUCTION ET LA CONCLUSION
GÉNÉRALE
Aitken, K. E. H., K. L. Wiebe et K. Martin. 2002. Nest-site reuse patterns for a
cavity-nesting community in interior British Colombia. The Auk. 119: 2, 391-402.
Aitken, K. E. H. et K. Martin. 2004. Nest cavity availability and selection in aspen-
conifer groves in a grassland landscape. Canadian Journal of Forest Research. 34: 2099-2109.
Angelstam, P. et G. Mikusiński. 1994. Woodpecker assemblages in natural and
managed boreal and hemiboreal forest - a review. Annales Zoologici Fennici. 31: 157-172.
Aubry, K. et C. Raley. 2002. Selection of nest and roost trees by Pileated
Woodpeckers in coastal forests of Washington. Journal of Wildlife Management. 66: 2, 392-406.
Aubry, K. B. et C. M. Raley. 2003. Coming home to roost: The pileated woodpecker
as ecosystem engineer. Science findings. Bavrlic, K. 2009. The effect of partial harvesting on cavity-nesting birds in the
Carolinan forests of southwestern Ontario: habitat responses and species interactions. M. Sc. Thesis. Trent University. Peterborough. 221 p.
Bednarz, J. C., D. Ripper et P. M. Radley. 2004. Emerging concepts and research
directions in the study of cavity-nesting birds: keystone ecological processes. The Condor. 106: 106, 1-4.
Bergeron, Y. 2000. Species and stand dynamics in the mixed woods of Quebec's
southern boreal forest. Ecology. 81: 6, 1500-1516. Bergeron, Y., S. Gauthier, V. Kafka, P. Lefort et D. Lesieur. 2001. Natural fire
frequency for the eastern Canadian boreal forest: consequences for sustainable forestry. Canadian Journal of Forest Research. 31: 384-391.
158
Bergeron, Y., A. Leduc, B. D. Harvey et S. Gauthier. 2002. Natural fire regime: a guide for sustainable management of the Canadian boreal forest. Silva Fennica. 36: 1, 81-95.
Bergeron, Y., S. Gauthier, M. Flannigan et V. Kafka. 2004. Fire regimes at the
transition between mixedwood and coniferous boreal forest in northwestern Quebec. Ecology. 85: 7, 1916-1932.
Blanc, L. A. et J. R. Walters. 2007. Cavity-nesting community webs as predictive
tools: where do we go from here? Journal of Ornithology. 148: 0, 417-423. Blanc, L. A. et J. R. Walters. 2008a. Cavity-nest webs in a longleaf pine ecosystem.
The Condor. 110: 1, 80-92. Blanc, L. A. et J. R. Walters. 2008b. Cavity excavation and enlargement as
mechanisms for indirect interactions in an avian community. Ecology. 89: 2, 506-514.
Blanc, L. A. et K. Martin. 2012. Identifying suitable woodpecker nest trees using
decay selection profiles in trembling aspen (Populus tremuloides). Forest Ecology and Management. 286: 0, 192-202.
Blanchette, P. 1996. Méthode de sélection des espèces représentatives utilisée dans le cadre du projet de développement de la gestion intégrée des ressources. Gouvernement du Quebec, Ministeres des Communications. Bonar, R. L. 2000. Availability of Pileated Woodpecker cavities and use by other
species. Journal of Wildlife Management. 64: 1, 52-59. Bonnot, T. W., J. J. Millspaugh et M. A. Rumble. 2009. Multi-scale nest-site
selection by black-backed woodpeckers in outbreaks of mountain pine beetles. Forest Ecology and Management. 259: 2, 220-228.
Bull, E. L., R. S. Holthausen et M. G. Henjum. 1992. Roost Trees Used by Pileated
Woodpeckers in Northeastern Oregon. Journal of Wildlife Management. 56: 4, 786-793.
Bunnell, F. L., E. Wind et R. Wells. 2002. Dying and dead hardwoods: their
implications to management. USDA Forest Service Gen. Tech. Rep. PSW-GTR-181. 695-716.
159
Cadieux, P. 2011. Dynamique de la faune cavicole le long d'un gradient d'âge en forêt boréale mixte de l'est de l'Amérique du Nord. M. Sc. Thesis. Université du Québec à Montréal. Montréal. 85 p.
Cheveau, M., L. Imbeau, P. Drapeau et L. Belanger. 2013. Marten space use and
habitat selection in managed coniferous boreal forests of eastern Canada. The Journal of Wildlife Management. 77: 4, 749-760.
Cheveau, M. 2015. Démarche ayant mené à la sélection des espèces sensibles à
l’aménagement forestier d’intérêt provincial. Gouvernement du Québec. Ministère des Forêts, de la Faune et des Parcs du Québec, Direction générale de l’expertise sur la faune et ses habitats. 16 p.
Clark, D. F., D. D. Kneeshaw, P. J. Burton et J. A. Antos. 1998. Coarse woody debris
in sub-boreal spruce forests of west-central British Columbia. Canadian Journal of Forest Research. 28: 2, 284-290.
Cockle, K. L., K. Martin et T. Wesoloski. 2011. Woodpeckers, decay, and the future
of cavity-nesting vertebrate communities worldwide. Frontiers in Ecology and the Environment. 9: 7, 377-382.
Cockle, K. L., K. Martin et G. Robledo. 2012. Linking fungi, trees, and hole-using
birds in a Neotropical tree-cavity network: Pathways of cavity production and implications for conservation. Forest Ecology and Management. 264: 0, 210-219.
Cooke, H. A. 2009. Do aggregated harvests with structural retention conserve cavity
users in old forest in the boreal plains? Ph. D. Thesis. University of Alberta. Edmonton. 233 p.
Cooke, H. A. et S. J. Hannon. 2012. Nest-site selection by old boreal forest cavity
excavators as a basis for structural retention guidelines in spatially-aggregated harvests. Forest Ecology and Management. 269: 0, 37-51.
Crête, M. et R. Courtois. 1997. Limiting factors might obscure population regulation
of moose (Cervidae: Alces alces) in unproductive boreal forests. Journal of Zoology. 242: 4, 765-781.
Cyr, D., S. Gauthier, Y. Bergeron et C. Carcaillet. 2009. Forest management is
driving the eastern North American boreal forest outside its natural range of variability. Frontiers in Ecology and the Environment. 7: 10, 519-524.
160
Darveau, M. et A. Desrochers. 2001. Le bois mort et la faune vertébrée: état des connaissances au Québec. Ministère des Ressources naturelles du Québec, Direction de l'environnement forestier. Rapport DEF-0199. Québec. p.
Dobkin, D. S., A. C. Rich, J. A. Pretare et W. H. Pyle. 1995. Nest-site relationships
among cavity-nesting birds of riparian and snowpocket aspen woodlands in the northwestern Great Basin. The Condor. 97: 3, 694-704.
Drapeau, P., A. Leduc, J. F. Giroux, J. P. L. Savard, Y. Bergeron et W. K. Vickery.
2000. Landscape-scale disturbances and changes in bird communities of boreal mixed-wood forests. Ecological Monographs. 70: 3, 423-444.
Drapeau, P., A. Nappi, J. F. Giroux, A. Leduc et J. P. Savard. 2002. Distribution
patterns of birds associated with snags in natural and managed eastern boreal forests. In: Laudenslayer, W. F. , Shea, Jr. P. J., Valentine, B., Weatherspoon, C. P. et Lisle, T.E. (Eds), Procedings of the Symposium on the Ecology and Management of Dead Wood in Western Forests (Reno, NV, November 2-4, 1999). Alabany, CA: USDA Forest Service, 193–205.
Drapeau, P., A. Leduc, Y. Bergeron, S. Gauthier et J. P. Savard. 2003. Les
communautés d'oiseaux des vieilles forêts de la pessière à mousses de la ceinture d'argile: Problèmes et solutions face à l'aménagement forestier. The Forestry Chronicle. 79: 3, 531-540.
Drapeau, P., A. Leduc, D. Kneeshaw et S. Gauthier. 2008. Paramètres à considérer
pour le suivi de l'approche écosystémique dans une perspective d'aménagement adaptatif en pessières à mousses. p. 361-392. In: Aménagement écosystémique en forêt boréale, Québec. La Presse de l'Université du Québec.
Drapeau, P., A. Nappi, L. Imbeau et M. Saint-Germain. 2009. Standing deadwood for
keystone bird species in the eastern boreal forest: Managing for snag dynamics. The Forestry Chronicle. 85: 227-234.
Drever, M. C., K. E. H. Aitken, A. R. Norris et K. Martin. 2008. Woodpeckers as
reliable indicators of bird richness, forest health and harvest. Biological Conservation. 141: 3, 624-634.
Dunne, J. A., R. J. Williams et N. D. Martinez. 2002. Network structure and
biodiversity loss in food webs: Robustness increases with connectance. Ecology Letters. 5: 4, 558-567.
161
Eberhardt, L. S. 1997. A test of an environmental advertisement hypothesis for the function of drumming in Yellow-bellied Sapsuckers. The Condor. 99: 3, 798-803.
Evans, M. R., D. B. Lank, W. S. Boyd et F. Cooke. 2002. A comparison of the
characteristics and fate of Barrow's Goldeneye and Bufflehead nests in nest boxes and natural cavities. The Condor. 104: 3, 610-619.
Fath, B. D., U. M. Scharler, R. E. Ulanowicz et B. Hannon. 2007. Ecological network
analysis: network construction. Ecological Modelling. 208: 1, 49-55. Fenton, N., N. Lecomte, S. Légaré et Y. Bergeron. 2005. Paludification in black
spruce (Picea mariana) forests of eastern Canada: Potential factors and management implications. Forest Ecology and Management. 213: 151-159.
Franklin, J. et R. Forman. 1987. Creating landscape patterns by forest cutting:
Ecological consequences and principles. Landscape Ecology. 1: 1, 5-18. Franklin, J. F., H. H. Shugart et M. E. Harmon. 1987. Tree death as an ecological
process. BioScience. 37: 8, 550-556. Franklin, J. F., T. A. Spies, R. V. Pelt, A. B. Carey, D. A. Thornburgh, D. R. Berg, D.
B. Lindenmayer, M. E. Harmon, W. S. Keeton, D. C. Shaw, K. Bible et J. Chen. 2002. Disturbances and structural development of natural forest ecosystems with silvicultural implications, using Douglas-fir forests as an example. Forest Ecology and Management. 155: 1-3, 399-423.
Gauthier, S., L. De Grandpré et Y. Bergeron. 2000. Differences in forest composition
in two boreal forest ecoregions of Quebec. Journal of Vegetation Science. 11: 6, 781-790.
Gauthier, S., A. Leduc, Y. Bergeron et H. Le Goff. 2008a. La fréquence des feux et
l'aménagement forestier inspiré des perturbations naturelles. p. 61-78. In: Aménagement écosystémique en forêt boréale, Québec. La Presse de l'Université du Québec.
Gauthier, S., M. A. Vaillancourt, A. Leduc, L. Grandpré, D. Kneeshaw, H. Morin, P.
Drapeau et Y. Bergeron. 2008b. Aménagement écosystémique en forêt boréale. Québec. Presses de l'Université du Québec, 568 p.
Goggans, R., R. D. Dixon et L. C. Seminara. 1989. Habitat use by three-toed and
black-backed woodpeckers. USDA Deschutes National Forest. Technical
162
Report 87-3-02. Nongame Wildlife Program. Oregon Department of Fish and Wildlife. 47 p.
Grove, S. J. 2002. Saproxylic insect ecology and the sustainable management of forests. Annual Review of Ecology and Systematics. 33: 1-23. Grover, A. et G. Baldassarre. 1995. Bird species richness within beaver ponds in
south-central New York. Wetlands. 15: 2, 108-118. Harmon, M. E., J. F. Franklin, F. J. Swanson, P. Sollins, S. Gregory, J. Lattin, N.
Anderson, S. Cline, N. Aumen et J. Sedell. 1986. Ecology of coarse woody debris in temperate ecosystems. Advances in Ecological Research. 15: 133-302.
Harper, K., Y. Bergeron, S. Gauthier et P. Drapeau. 2002. Post-fire development of
canopy structure and composition in black spruce forests of Abitibi, Québec: a landscape scale study. Silva Fennica. 36: 1, 249-263.
Harper, K., C. Boudreault, L. DeGrandpré, P. Drapeau, S. Gauthier et Y. Bergeron.
2003. Structure, composition, and diversity of old-growth black spruce boreal forest of the Clay Belt region in Quebec and Ontario. Environmental Reviews. 11: S1, S79-S98.
Harper, K. A., Y. Bergeron, P. Drapeau, S. Gauthier et L. De Grandpré. 2005.
Structural development following fire in black spruce boreal forest. Forest Ecology and Management. 206: 1-3, 293-306.
Hart, J. H. et D. L. Hart. 2001. Heartrot fungi's role in creating picid nesting sites in
living aspen. In: Shepperd, W. D., Binkley, D., Bartos, D. L., Stohlgren, T. J. et Eskew, L. G. (Eds), Procedings of the Symposium on the Sustaining aspen in western landscapes (Grand Junction, CO, June 13-15, 2000). USDA Forest Service, 207-213.
Harvey, B. D., A. Leduc, S. Gauthier et Y. Bergeron. 2002. Stand-landscape
integration in natural disturbance-based management of the southern boreal forest. Forest Ecology and Management. 155: 1-3, 369-385.
Hobson, K. A. et E. Bayne. 2000. Breeding bird communities in boreal forest of
western Canada: Consequences of 'unmixing' the mixedwoods. The Condor. 102: 4, 759-769.
163
Hunter, M. L., G. L. Jacobson et T. Webb. 1988. Paleoecology and the coarse-filter approach to maintaining biological diversity. Conservation Biology. 2: 4, 375-385.
Hutto, R. L. 1995. Composition of bird communities following stand-replacement
fires in northern Rocky Mountain (U.S.A.) conifer forests. Conservation Biology. 9: 5, 1041-1058.
Imbeau, L., J. P. L. Savard et R. Gagnon. 1999. Comparing bird assemblages in
successional black spruce stands originating from fire and logging. Canadian Journal of Zoology. 77: 12, 1850-1860.
Imbeau, L. 2001. Effets à court et à long terme de l'aménagement forestier sur
l'avifaune de la forêt boréale et une de ses espèces-clés : le Pic tridactyle. Ph. D. Thesis. Université Laval. Québec. 125 p.
Imbeau, L., M. Mönkkönen et A. Desrochers. 2001. Long-term effects of forestry on
birds of the eastern Canadian boreal forest: a comparison with Fennoscandia. Conservation Biology. 15: 4, 1151-1162.
Imbeau, L. et A. Desrochers. 2002. Foraging ecology and use of drumming trees by
three-toed woodpecker. Journal of Wildlife Management. 66: 1, 222-231. Jackson, J. A. et B. J. S. Jackson. 2004. Ecological relationships between fungi and
woodpecker cavity sites. The Condor. 106: 1, 37-49. Jacqmain, H., C. Dussault, R. Courtois et L. Bélanger. 2008. Moose-habitat
relationships: integrating local Cree native knowledge and scientific findings in northern Quebec. Canadian Journal of Forest Research. 38: 12, 3120-3132.
Jones, C. G., J. H. Lawton et M. Shachak. 1994. Organisms as ecosystem engineers.
p. 130-147. In: Ecosystem management. Springer. Jonsson, B. G., N. Kruys et T. Ranius. 2005. Ecology of species living on dead wood-
lessons for dead wood management. Silva Fennica. 39: 2, 289-309. Kilham, L. 1971. Reproductive behavior of Yellow-bellied Sapsuckers I. Preference
for nesting in fomes-infected aspens and nest hole interrelations with flying squirrels raccoons and other animals. The Wilson Bulletin. 83: 2, 159-171.
Kneeshaw, D. et S. Gauthier. 2003. Old growth in the boreal forest: A dynamic
perspective at the stand and landscape level. Environmental Reviews. 11: 99-114.
164
Kneeshaw, D. D. et Y. Bergeron. 1998. Canopy gap characteristics and tree
replacement in the southeastern boreal forest. Ecology. 79: 3, 783-794. Lemaître, J. et M.-A. Villard. 2005. Foraging patterns of pileated woodpeckers in a
managed Acadian forest: a resource selection function. Canadian Journal of Forest Research. 35: 2387-2393.
Lochmiller, R. L. 1979. Use of beaver ponds by southeastern woodpeckers in winter.
The Journal of Wildlife Management. 43: 1, 263-266. Macdonald, D. W., F. Tattersall, E. Brown et D. Balharry. 1995. Reintroducing the
European beaver to Britain: nostalgic meddling or restoring biodiversity? Mammal Review. 25: 4, 161-200.
Martin, K. et J. M. Eadie. 1999. Nest webs: A community-wide approach to the
management and conservation of cavity-nesting forest birds. Forest Ecology and Management. 115: 2-3, 243-257.
Martin, K., K. E. H. Aitken et K. L. Wiebe. 2004. Nest sites and nest webs for cavity-
nesting communities in interior British Colombia, Canada: Nest characteristics and niche partitioning. The Condor. 106: 1, 5-19.
McClelland, B. R., S. S. Frissell, W. C. Fischer et C. H. Halvorson. 1979. Habitat
management for hole-nesting birds in forests of western larch and Douglas-fir. Journal of Forestry. 77: 8, 480-483.
McClelland, B. R. et P. T. McClelland. 1999. Pileated woodpecker nest and roost
trees in Montana: Links with old-growth and forest 'health'. The Wildlife Society Bulletin. 27: 3, 846-857.
McLaren, M. A., I. D. Thompson et J. A. Baker. 1998. Selection of vertebrate
wildlife indicators for monitoring sustainable forest management in Ontario. The Forestry Chronicle. 74: 2, 241-248.
Messier, C., J Puettmann, K., Coates, K. D. 2013. Managing Forests as Complex Adaptive Systems. Routledge, 353 p. Mikusiński, G., M. Gromadzki et P. Chylarecki. 2001. Woodpeckers as indicators of
forest bird diversity. Conservation Biology. 15: 1, 208-217. Mikusiński, G. 2006. Woodpeckers: distribution, conservation, and research in a
global perspective. Annales Zoologici Fennici. 43: 86-95.
165
Morin, H., D. Laprise, A. A. Simard et S. Amouch. 2008. Régime des épidémies de la
tordeuse des bourgeons de l'épinette dans l'est de l'Amérique du Nord. p. 165-192. In: Aménagement écosystémique en forêt boréale, Québec. La Presse de l'Université du Québec.
Murphy, E. C. et W. A. Lehnhausen. 1998. Density and foraging ecology of
woodpeckers following a stand-replacement fire. The Journal of Wildlife Management. 62: 4, 1359-1372.
Naiman, R. J., J. M. Melillo et J. E. Hobbie. 1986. Ecosystem alteration of boreal
forest streams by beaver (Castor canadensis). Ecology. 67: 5, 1254-1269. Nappi, A. 2009. Utilisation du bois mort et des forêts brûlées par le Pic à dos noir en
forêt boréale. Ph. D. Thesis. Université du Québec à Montréal. Montréal. 220 p.
Nappi, A., P. Drapeau, M. Saint-Germain et V. A. Angers. 2010. Effect of fire
severity on long-term occupancy of burned boreal conifer forests by saproxylic insects and wood-foraging birds. International Journal of Wildland Fire. 19: 4, 500-511.
Nappi, A. et P. Drapeau. 2011. Pre-fire forest conditions and fire severity as
determinants of the quality of burned forests for deadwood-dependent species: the case of the black-backed woodpecker. Canadian Journal of Forest Research. 41: 5, 994-1003.
Nappi, A., P. Drapeau et A. Leduc. 2015. How important is dead wood for
woodpeckers foraging in eastern North American boreal forests? Forest Ecology and Management. 346: 0, 10-21.
Niemi, G., J. Hanowski, P. Helle, R. Howe, M. Mönkkönen, L. Venier et D. Welsh.
1998. Ecological sustainability of birds in boreal forests. Ecology and Society. 2: 2.
Nummi, P. et T. Kuuluvainen. 2013. Forest disturbance by an ecosystem engineer:
beaver in boreal forest landscapes. Boreal Environment Research. 18: 13-24. Öberg, M., D. Arlt, T. Pärt, A. T. Laugen, S. Eggers et M. Low. 2015. Rainfall during
parental care reduces reproductive and survival components of fitness in a passerine bird. Ecology and Evolution. 5: 2, 345-356.
166
Pechacek, P. et W. d'Oleire-Oltmanns. 2004. Habitat use of the Three-toed Woodpecker in central Europe during the breeding period. Biological Conservation. 116: 3, 333-341.
Potvin, F., L. Bélanger et K. Lowell. 2000. Marten habitat selection in a clearcut
boreal landscape. Conservation Biology. 14: 3, 844-857. Probst, J. R. et J. P. Hayes. 1987. Pairing success of Kirtland's Warblers in marginal
vs. suitable habitat. The Auk. 234-241. Raphael, M. G. et M. White. 1984. Use of snags by cavity-nesting birds in the Sierra
Nevada. Wildlife Monographs. 86. Roberge, J.-M., G. Mikusiński et S. Svensson. 2008. The white-backed woodpecker:
umbrella species for forest conservation planning? Biodiversity and Conservation. 17: 10, 2479-2494.
Robitaille, A. et J. P. Saucier. 1998. Paysages régionaux du Québec méridional.
Québec. Les Publications Du Québec, 220 p. Rosell, F., O. Bozser, P. Collen et H. Parker. 2005. Ecological impact of beavers
Castor fiber and Castor canadensis and their ability to modify ecosystems. Mammal Review. 35: 3-4, 248-276.
Rowe, J. S. et G. W. Scotter. 1973. Fire in the boreal forest. Quaternary Research. 3:
3, 444-464. Saint-Germain, M., P. Drapeau et C. Hébert. 2004a. Comparison of Coleoptera
assemblages from a recently burned and unburned black spruce forests of northeastern North America. Biological Conservation. 118: 5, 583-592.
Saint-Germain, M., P. Drapeau et C. Hébert. 2004b. Xylophagous insect species
composition and patterns of substratum use on fire-killed black spruce in central Quebec. Canadian Journal of Forest Research. 34: 3, 677-685.
Saint-Germain, M., P. Drapeau et C. Hébert. 2004c. Landscape-Scale Habitat
Selection Patterns of Monochamus scutellatus (Coleoptera: Cerambycidae) in a Recently Burned Black Spruce Forest. Environmental Entomology. 33: 6, 1703-1710.
Saint-Germain, M., P. Drapeau et C. M. Buddle. 2007. Host-use patterns of
saproxylic phloeophagous and xylophagous Coleoptera adults and larvae
167
along the decay gradient in standing dead black spruce and aspen. Ecography. 30: 6, 737-748.
Savignac, C., A. Desrochers et J. Huot. 2000. Habitat use by Pileated Woodpeckers at
two spatial scales in eastern Canada. Canadian Journal of Zoology. 78: 2, 219-225.
Savignac, C. et C. S. Machtans. 2006. Habitat requirements of the Yellow-bellied
Sapsucker, Sphyrapicus varius, in boreal mixedwood forests of northwestern Canada. Canadian Journal of Zoology. 84: 9, 1230-1239.
Schieck, J. et S. J. Song. 2006. Changes in bird communities throughout succession
following fire and harvest in boreal forests of western North America: Literature review and meta-analyses. Canadian Journal of Forest Research. 36: 5, 1299-1318.
Siitonen, J. 2001. Forest management, coarse woody debris and saproxylic
organisms: fennoscandian boreal forests as an example. Ecological Bulletins. 49: 11-41.
Simard, M., N. Lecomte, Y. Bergeron, P. Y. Bernier et D. Paré. 2007. Forest
productivity decline caused by successional paludification of boreal soils. Ecological Applications. 17: 6, 1619-1637.
Simard, S., K. Martin et A. Vyse. 2013. complex adaptive systems. Managing Forests
as Complex Adaptive Systems: Building Resilience to the Challenge of Global Change. 133.
Smith, J. M. et M. E. Mather. 2013. Beaver dams maintain fish biodiversity by
increasing habitat heterogeneity throughout a low-gradient stream network. Freshwater Biology. 58: 7, 1523-1538.
Sole, R. V. et M. Montoya. 2001. Complexity and fragility in ecological networks.
Proceedings of the Royal Society of London B: Biological Sciences. 268: 1480, 2039-2045.
Spies, T., W. Ripple et G. Bradshaw. 1994. Dynamics and pattern of a managed
coniferous forest landscape in Oregon. Ecological Applications. 4: 3 555-568. Stockland, J. et J. Siitonen. 2012. Mortality factors and decay succession.
Biodiversity in dead wood. Cambridge University Press, Cambridge. 110-149.
168
Thomas, J. W. 1979. Wildlife habitat in managed forests in the blue mountains of Oregon and Washington. Forest Service. Agriculture Handbook No. 553. U.S. Department of Agriculture. 512 p.
Tremblay, J. A., J. Ibarzabal, C. Dussault et J. P. L. Savard. 2009. Habitat
requirements of breeding black-backed woodpeckers (Picoides arcticus) in managed, unburned boreal forest. Avian Conservation and Ecology. 4: 1, 3.
Tremblay, J. A., J.-P. L. Savard et J. Ibarzabal. 2015. Structural retention
requirements for a key ecosystem engineer in conifer-dominated stands of a boreal managed landscape in eastern Canada. Forest Ecology and Management. 357: 220-227.
Vaillancourt, M. A., P. Drapeau, S. Gauthier et M. Robert. 2008. Availability of
standing trees for large cavity-nesting birds in the eastern boreal forest of Quebec, Canada. Forest Ecology and Management. 255: 7, 2272-2285.
Vaillancourt, M. A., P. Drapeau, M. Robert et S. Gauthier. 2009. Origin and
availability of large cavities for Barrow's Goldeneye (Bucephala islandica), a species at risk inhabiting the eastern Canadian boreal forest. Avian Conservation and Ecology. 4: 1, 6.
Virkkala, R. 2006. Why study woodpeckers? The significance of woodpeckers in
forest ecosystems. Annales Zoologici Fennici. 43: 2, 82-85. Winkler, H., D. A. Christie et D. Nurney. 2010. Woodpeckers: A guide to the
woodpeckers, piculets and wrynecks of the world. London. Christopher Helm Publishers, 1083 p.
Wright, J. P., C. G. Jones et A. S. Flecker. 2002. An ecosystem engineer, the beaver,
increases species richness at the landscape scale. Oecologia. 132: 1, 96-101. Zanette, L., P. Doyle et S. M. Trémont. 2000. Food shortage in small fragments:
evidence from an area-sensitive passerine. Ecology. 81: 6, 1654-1666.