Embed Size (px)
Citation preview

UNIVERSITÉ DU QUÉBEC
MÉMOIRE
PRÉSENTÉ À
L’UNIVERSITÉ DU QUÉBEC À CHICOUTIMI
COMME EXIGENCE PARTIELLE
DE LA MAÎTRISE EN RESSOURCES RENOUVELABLES
PAR
SIMON DUROCHER
B.Sc. (Agr.Env.Sc.)
Éco-conseiller diplômé©
ÉVALUATION DU BILAN DES EMISSIONS DE GAZ A EFFET DE SERRE
ATTRIBUABLES A L’UTILISATION DE BIOSOLIDES DE PAPETIERES POUR LE
REBOISEMENT D’UN PARC A RESIDUS MINIERS NON ACIDES
MAI 2015
RÉSUMÉ
Les changements climatiques figurent parmi les principaux enjeux auxquels doit faire
face l’humanité. Le rôle déterminant et sans précédent des activités humaines sur
l’augmentation observée des concentrations atmosphériques de gaz à effet de serre (GES) et
le réchauffement global qui en résulte nécessite la mise en œuvre conjointe de mesures de
réduction des émissions, d’atténuation des impacts et d’adaptation.
Au Québec, le Plan d’action sur les changements climatiques 2013-2020 prévoit
notamment l’abolition de l’enfouissement des matières organiques putrescibles d’ici 2020;
ces matières incluent les résidus de traitement des eaux de procédés des fabriques de pâtes et
papiers, aussi appelés biosolides de papetières. À l’heure actuelle, il existe trop peu de
données permettant d’estimer les bénéfices climatiques et la faisabilité opérationnelle d’une
telle mesure. À titre d’exemple, certaines contraintes pourraient nécessiter le recours par
l’industrie des pâtes et papiers au stockage temporaire des biosolides de papetières, plutôt
qu’à un enfouissement permanent. Dans cette optique, le bilan des émissions attribuables au
recyclage de biosolides de papetières préalablement enfouis (BPPE) doit être
scientifiquement documenté.
La présente étude a pour but d’évaluer le bilan des émissions de GES attribuables à
l’utilisation de BPPE comme amendement sur un parc à résidus miniers non acides dans le
cadre d’un projet de reboisement visant une fermeture progressive. Les émissions de
protoxyde d’azote (N2O), de dioxyde de carbone (CO2) et de méthane (CH4) à l’interface sol-
air suivant l’application (0, 50, 100 Mg anhydre ha-1) ont été mesurées sur deux saisons
consécutives (2012, 2013) au moyen de chambres statiques fermées. Les émissions
attribuables à l’utilisation d’équipement motorisé mobile ont également été quantifiées
(tCO2e Mg-1 BPPE anhydre).
Les résultats suggèrent un effet significatif de la quantité de biosolides de papetières
épandue sur les émissions cumulées de N2O et de CO2 après une saison. Bien que modestes,
les émissions attribuables à l’utilisation de la machinerie (0.0983 tCO2e Mg-1 BPPE anhydre)
peuvent s’avérer plus élevées que les émissions attribuables aux biosolides eux-mêmes suite
à l’épandage lorsque le CO2 d’origine biogénique est exclu du bilan. Ces résultats mettent en
lumière le besoin de poursuivre les recherches visant à identifier la filière de valorisation la
moins émettrice pour cette matière de façon à ce que le détournement des biosolides de
papetières des lieux d’enfouissement s’accompagne de réels bénéfices climatiques.
AVANT-PROPOS
L’éco-conseil, discipline universitaire depuis 2001, a pour objet l’appropriation de
savoirs et de compétences disciplinaires au service d’une opérationnalisation des principes
du développement durable. Cette démarche s’inscrit dans une perspective praxéologique elle-
même génératrice de nouvelles connaissances et de nouveaux savoir-faire.
Les apprentissages issus de cette approche méthodologique singulière sont enseignés
aux éco-conseillers en formation. La gestion organisationnelle et participative,
l’interprétation spirituelle et symbolique des services écosystémiques et l’analyse de cycle
de vie ne sont que quelques exemples des savoirs et compétences attendus des généralistes
du développement durable que sont les éco-conseillers en exercice. Par leur pratique, ces
« praticiens-chercheurs » assureront un lien itératif (et nécessaire) entre la recherche
académique et la pratique professionnelle.
Par leurs travaux, la Chaire en éco-conseil et le Laboratoire de recherche sur la non-
acceptabilité sociale (LARENAS) de l’Université du Québec à Chicoutimi (UQAC)
contribuent à l’avancement de l’éco-conseil en tant que discipline universitaire et pratique
professionnelle. Au cours des dernières années, de nombreux projets de recherche et
d’intervention ont eu pour objet les secteurs miniers et pétroliers. Ces travaux ont pour
objectif commun de réfléchir le développement durable vis-à-vis l’exploitation de ressources
non-renouvelables.
Le projet de recherche dont fait l’objet le présent mémoire s’insère dans cette
démarche. Les résultats qui en sont issus s’inscrivent en complémentarité avec ceux d’autres
projets dans le but d’élargir les représentations à l’égard d’une problématique complexe, celle
de l’exploitation de ressources finies au sein d’une Nature dont la résilience est sans cesse
mise à l’épreuve par l’avidité humaine.
***
Le projet a été soutenu financièrement par : Niobec, Chaire en éco-conseil (UQAC),
Programme Carbone boréal (UQAC), Fonds québécois de Recherche sur la Nature et les
Technologies (Bourse de maîtrise en recherche) et Recyc-Québec (Bourses d’études
supérieures Recyc-Québec).
Le projet a été réalisé grâce à la collaboration opérationnelle de Niobec et de Produits
forestiers Résolu, usine Kénogami.
L’article scientifique présenté au chapitre premier du présent mémoire a été rédigé
avec la collaboration de M. Philippe Rochette. L’étudiant en est l’auteur principal.

REMERCIEMENTS
Le projet n’aurait pu être possible sans la collaboration, le support et la confiance
des personnes suivantes :
À la Chaire en éco-conseil (UQAC) :
Claude Villeneuve, Jean-François Boucher, Pascal Tremblay, Patrick Faubert, Frédéric
Gagnon, Pascal Dufour, David Tremblay, Pierre-Luc Dessureault, Sylvie Bouchard,
Catherine Lemay-Belisle et toute l’équipe.
Au Département des Sciences fondamentales (UQAC) :
Daniel Gagnon, Denis Walsh, Roch Ouimet, Claire Fournier et Patrick Nadeau.
Chez Niobec :
Thierry Tremblay, Annie Boily, Sylvie Paquette, Amélie Noël-De Tilly et Alexandre
Ouellet.
Chez Entreprises Saint-Honoré :
Jean-François Gagné et Sylvain.
Chez Agriculture et Agro-alimentaire Canada :
Philippe Rochette, Normand Bertrand, Martin Chantigny et Noura Ziadi.
Chez Produits forestiers Résolu :
Michel Gagnon, Stéphane Boukatem, Daniel Desbiens
Chez Claveau et Fils Inc. :
Éric Claveau
Chez Solutions 3R :
Louis Jean
Nicole Huybens et Ian Segers pour leurs précieux conseils.
Joann K. Whalen pour la suggestion par laquelle tout a commencé.
Brad Meldhau, Jean-François Groulx et Trio Jérôme Beaulieu pour leur musique.
Justine et toute ma famille pour leur amour inconditionnel.
TABLE DES MATIÈRES
RÉSUMÉ .............................................................................................................................. II
AVANT-PROPOS .............................................................................................................. III
REMERCIEMENTS ......................................................................................................... IV
TABLE DES MATIÈRES ................................................................................................... V
LISTE DES TABLEAUX .................................................................................................. VI
LISTE DES FIGURES ..................................................................................................... VII
LISTE DES ACRONYMES ET ABRÉVIATIONS .................................................... VIII
INTRODUCTION GÉNÉRALE ......................................................................................... 9
CHAPITRE 1 ...................................................................................................................... 24
1.1. ABSTRACT .......................................................................................................... 25
1.2. INTRODUCTION ................................................................................................ 27
1.3. METHODS ........................................................................................................... 30
1.3.1. STUDY SITE ..................................................................................................... 30
1.3.2. EXPERIMENTAL DESIGN .............................................................................. 30
1.3.3. GAZ FLUX MEASUREMENTS ........................................................................ 31
1.3.4. SOIL SAMPLING AND ANALYSES ................................................................. 35
1.3.5. MACHINERY-RELATED GHG EMISSIONS ................................................... 36
1.3.6. LANDFILLED PMS CHARACTERIZATION ................................................... 36
1.3.7. STATISTICAL ANALYSIS ................................................................................. 37
1.4. RESULTS ............................................................................................................. 38
1.4.1. SOIL-SURFACE N2O EMISSIONS .................................................................. 38
1.4.2. SOIL-SURFACE CO2 EMISSIONS .................................................................. 43
1.4.3. SOIL-SURFACE CH4 EMISSIONS .................................................................. 44
1.4.4. SOIL PARAMETERS ........................................................................................ 45
1.4.5. MACHINERY-RELATED GHG EMISSIONS ................................................... 47
1.5. DISCUSSION ....................................................................................................... 50
1.5.1. SOIL-SURFACE N2O EMISSIONS .................................................................. 50
1.5.2. SOIL-SURFACE CO2 EMISSIONS ................................................................... 55
1.5.3. MACHINERY-RELATED GHG EMISSIONS ................................................... 56
1.5.4. LANDFILLED PMS CHARACTERIZATION ................................................... 57
1.6. CONCLUSION ..................................................................................................... 58
CONCLUSION GÉNÉRALE ............................................................................................ 59
RÉFÉRENCES CITÉES .................................................................................................... 65
LISTE DES TABLEAUX
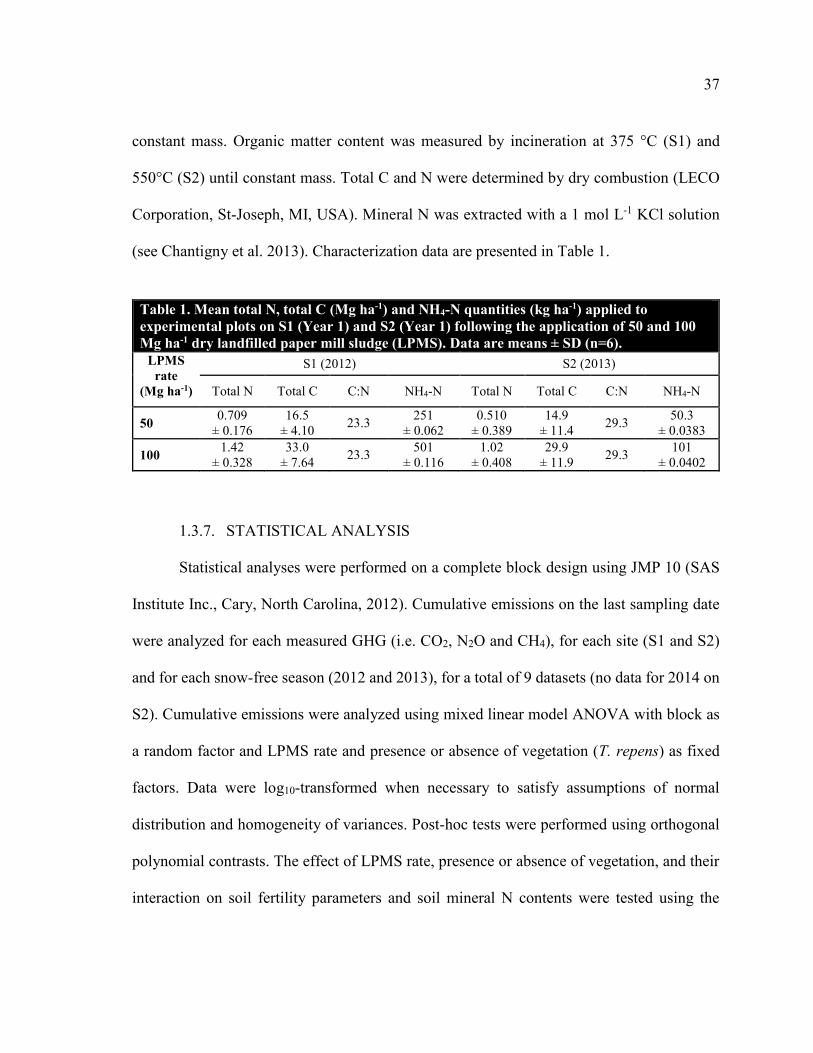
Table 1. Mean total N, total C (Mg ha-1) and NH4-N quantities (kg ha-1) applied to
experimental plots on S1 (Year 1) and S2 (Year 1) following the application of 50 and 100
Mg ha-1 dry landfilled paper mill sludge (LPMS). ............................................................... 37
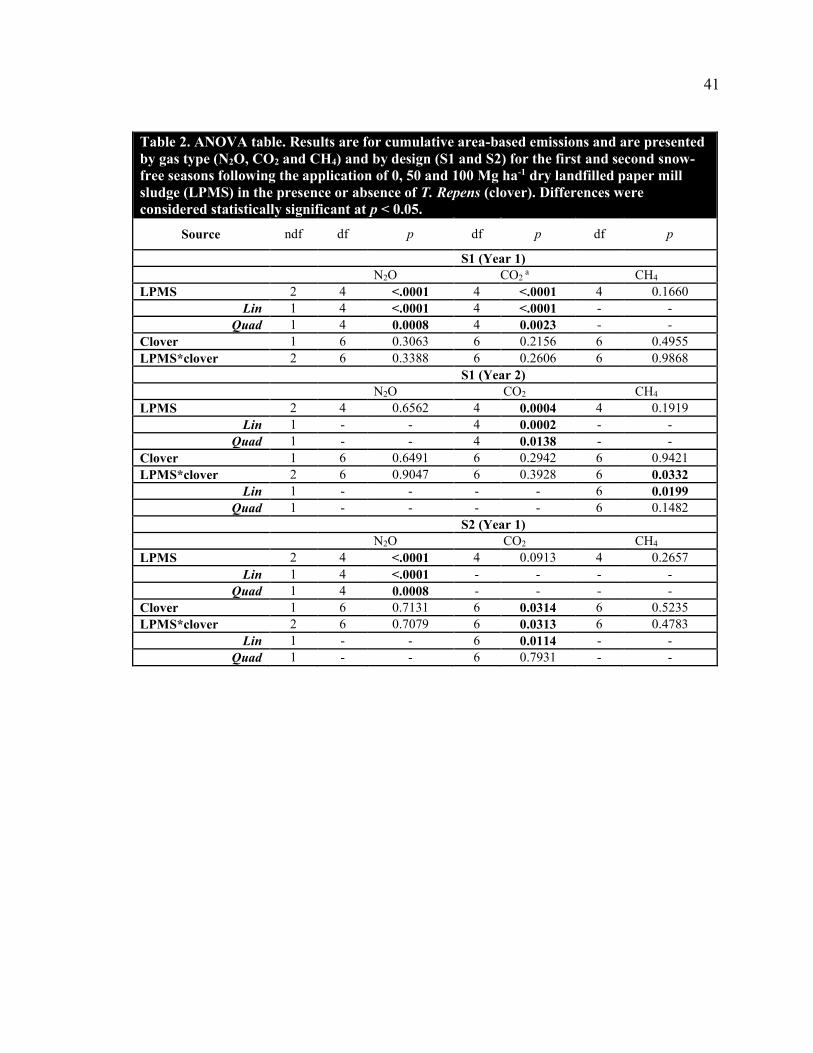
Table 2. ANOVA table. ........................................................................................................ 41
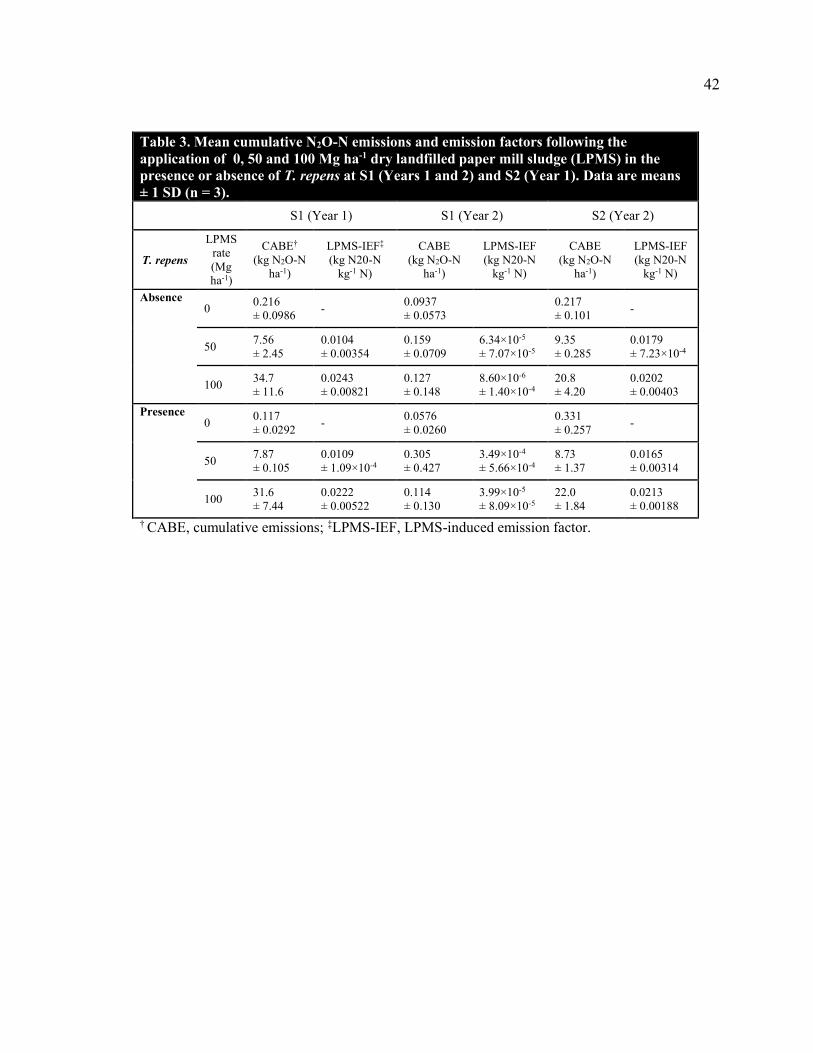
Table 3. Mean cumulative N2O-N emissions and emission factors following the application
of 0, 50 and 100 Mg ha-1 dry landfilled paper mill sludge (LPMS) in the presence or
absence of T. repens at S1 (Years 1 and 2) and S2 (Year 1). ............................................... 42
Table 4. Mean cumulative CO2-C emissions and emission factors following the application
of 0, 50 and 100 Mg ha-1 dry landfilled paper mill sludge (LPMS) in the presence or
absence of T. repens at S1 (Years 1 and 2) and S2 (Year 1). ............................................... 44
Table 5. MANOVA table. ..................................................................................................... 46
Table 6. Machinery-related GHG emissions in tCO2e per Mg dry landfilled paper mill
sludge (LPMS) applied. Emission factors include life cycle emissions of machinery
(Kellenberger et al. 2007). .................................................................................................... 47
LISTE DES FIGURES
Figure 1. Experimental design. ............................................................................................. 31
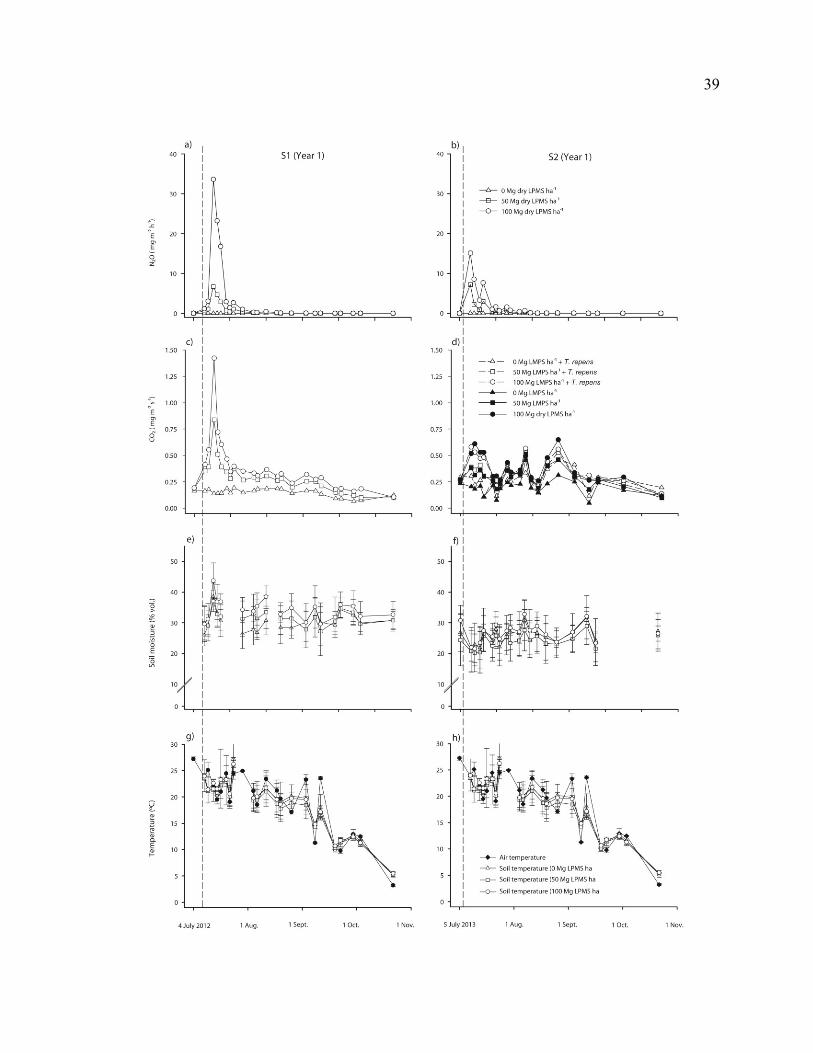
Figure 2. Soil-surface N2O (mg m-2 h-1) and CO2 (mg m-2 s-1) during the first snow-free
season following the application of 0, 50 and 100 Mg ha-1 dry landfilled paper mill sludge
(LPMS). ................................................................................................................................ 40
Figure 3. Soil NH4-N and (NO2+NO3)-N concentrations (mg kg-1) during the first snow-
free season following the application of 0, 50 and 100 Mg ha-1 dry landfilled paper mill
sludge (LPMS) at S2. ............................................................................................................ 46
Figure 4. Total machinery-related emissions and soil-surface GHG emissions (tCO2e)
measured during the first and second snow-free seasons following the application of 0, 50
and 100 Mg ha-1 dry landfilled paper mill sludge (LPMS) at S1 and S2. ............................ 49
LISTE DES ACRONYMES ET ABRÉVIATIONS
APCC Action Plan on Climate Change
AR5 Fifth Assessment Report
BPPE Biosolides de papetières préalablement enfouis
CIS Carbone inorganique du sol
CO2e Équivalent CO2
COS Carbone organique du sol
FIEF Fertilizer-induced emission factor
GES Gaz à effet de serre
GHG Greenhouse gas
GWP Global warming potential
LPMS Landfilled paper mill sludge
LPMS-IEF LPMS-induced emission factor
MDDEP Ministère du Développement durable, de l’Environnement et des Parcs
MRF Matière résiduelle fertilisante
NFT-NSS Non-flow-through non-steady-state
OPW Organic putrescible waste
PMS Pulp and paper mill sludge
PRP Potentiel de réchauffement planétaire
VFA Volatile fatty acid
INTRODUCTION GÉNÉRALE
LA LUTTE AUX CHANGEMENTS CLIMATIQUES
Les changements climatiques figurent parmi les principaux enjeux auxquels doit faire
face l'humanité (Rockstrom et al. 2009). Cette problématique interpelle la recherche
scientifique depuis la fin du XIXe siècle. Par exemple, le suédois Svante Arrhenius
s’intéressait déjà aux effets d'une augmentation de la concentration atmosphérique du
dioxyde de carbone (CO2), plus important gaz à effet de serre (GES) d’origine anthropique,
sur la température moyenne de l’atmosphère à la surface de la Terre (Arrhenius 1896).
Depuis, la science des changements climatiques nous permet de mieux comprendre l'impact
des émissions de GES sur le climat mondial et le rôle des activités anthropiques dans
l'augmentation observée de leur concentration dans l'atmosphère (IPCC 2013).
Les principales sources anthropiques d’émission de CO2 sont les carburants fossiles
(charbon, pétrole, gaz naturel) et le changement d'affectation des terres (IPCC 2014a). Pour
la période 2002-2011, celles-ci correspondaient à environ 8,3 [7,6 à 9,0] Pg C an-1 et 0,9 [0,1
à 1,7] Pg C an-1, respectivement, pour des émissions combinées de l'ordre de 555 [470 à 640]
Pg C depuis 1750. Durant cette période, les concentrations atmosphériques de méthane (CH4)
et de protoxyde d’azote (N2O), principaux GES derrière le CO2, ont augmenté d’un facteur
de 2,5 et de 1,2, respectivement (IPCC 2014a).
10
Ces émissions d'origine anthropique entraînent une hausse de la concentration des
GES dans l'atmosphère en raison de l’incapacité des systèmes naturels à accentuer leur
capacité d’absorption à un rythme équivalent à celui de l’augmentation des émissions
globales de GES. Ainsi, 240 Pg C se seraient accumulés dans l’atmosphère entre 1750 et
2011. L'augmentation historique de la concentration de CO2 dans l'atmosphère était évaluée
en 2011 à 38 % (390,5 ppm) au-dessus du niveau préindustriel (IPCC 2014a); le seuil de 400
ppm fut quant à lui atteint pour la première fois en mai 2013 (NOAA ESRL 2013).
La lutte aux émissions anthropiques de GES commande de prévoir des mécanismes
d'atténuation et des mesures d'adaptation pour limiter l'ampleur des conséquences des
changements climatiques sur les milieux biophysiques et les populations humaines
(VijayaVenkataRaman et al. 2012). Au chapitre de l'atténuation, trois principales stratégies
permettent de réduire la concentration du CO2 atmosphérique : 1) réduire la consommation
globale d'énergie; 2) développer des carburants à faible intensité carbonique; et 3) séquestrer
le CO2 atmosphérique ou les émissions « en bout de tuyau » (Schrag 2007). Cette dernière
option regroupe un vaste ensemble de technologies regroupées sous le vocable « capture et
stockage du carbone » ainsi que des processus biotiques et abiotiques. Ces derniers, qui
incluent notamment l’absorption biologique et océanique et la séquestration géologique du
dioxyde de carbone, permettent de réduire le rythme de l'accroissement de la concentration
des GES dans l'atmosphère en transférant le carbone (C) vers un autre réservoir (Lal 2008).
11
LA SÉQUESTRATION BIOLOGIQUE DU CARBONE
La séquestration biologique du carbone repose sur l’accroissement de la capacité des
plantes et des microorganismes à absorber le CO2 atmosphérique par la photosynthèse (Lal
2008). Parmi les options les plus prisées pour séquestrer biologiquement le carbone
atmosphérique, notons l’augmentation des superficies forestières et l’augmentation des
stocks de carbone sur un territoire donné (Smith et al. 2014). En effet, il est envisageable
d'augmenter la capacité de la végétation et des sols à séquestrer le carbone atmosphérique
par l'adoption de pratiques de gestion appropriées (Dyson 1977; Scholes et Noble 2001). Les
végétaux, notamment les espèces ligneuses, ont la capacité de capter et de stocker le C présent
dans l'atmosphère sous forme de CO2 par la croissance de leurs tissus. Quant à elle, la
séquestration du carbone dans les sols concerne à la fois l'augmentation du carbone organique
(COS) et inorganique (CIS) du sol (Lal 2008).
Malgré son potentiel à atténuer les changements climatiques, la séquestration
biologique du carbone présente plusieurs sources d'incertitudes et pièges potentiels (Janzen
2004). À ce chapitre, notons les questions relatives à la vérification, à l'additionnalité et à la
permanence du stockage (Scholes et Noble 2001; Murray et al. 2007), la sensibilité des
résultats en fonction de l'horizon temporel du projet (Levasseur et al. 2012), les rétroactions
positives (Bonan 2008) et les impacts sur la biodiversité (Lindenmayer et al. 2012).
12
LES SOLS DÉGRADÉS
Les lieux dégradés sont définis par le MDDEP (2005) comme des « surfaces de sol
caractérisées par une carence importante à supporter la végétation, à la suite de différents
travaux, comme un terrain après l'exploitation d'une carrière, d'une sablière, d'une mine,
etc. ». Les sites dégradés incluent par définition les terrils, des sols pédologiquement jeunes
qui se développent sur des mélanges de matériau rocheux pulvérisé ou fragmenté (Ussiri et
Lal 2005). Les terrils se distinguent par un faible contenu en matière organique, une faible
fertilité et des propriétés physico-chimiques et biologiques qui limitent leur qualité et leur
capacité à maintenir la végétation. Ils peuvent être classifiés comme « technosols » puisqu'ils
sont fabriqués à partir d'importantes quantités de matière résultant du développement
technologique (FAO 2006, Séré et al. 2008).
La restauration de ces sites s'avère généralement souhaitable pour l'amélioration de la
qualité de vie des riverains et de l'environnement dans son ensemble (Hargreaves et al. 2012).
Elle présente en outre une opportunité de jumeler la séquestration du C et la valorisation de
matières résiduelles fertilisantes, dans le but d’améliorer la qualité du sol et de lutter contre
les changements climatiques (Palumbo et al. 2004). En effet, les sols dégradés se présentent
comme des candidats intéressants pour la séquestration du carbone atmosphérique (Larney
et Angers 2012) et ce, en raison de leur faible contenu initial en carbone (Vetterlein et Huttl
1999).
13
Le potentiel d'augmentation des stocks de C dans les terrils peut être significatif. Le
taux de séquestration du COS dans les terrils est jugé élevé au cours des 20 à 30 années
suivant la restauration et ce, dans les 15 premiers centimètres du sol (Ussiri et Lal 2005). À
titre d'exemple, des taux de séquestration du COS de l'ordre de 0,3 à 1,85 Mg C ha-1 année-1
et de 0,2 à 1,64 Mg C ha-1 année-1 ont été observés suite à la conversion de sites miniers
dégradés en pâturages et en territoires forestiers, respectivement (Ussiri et Lal 2005).
L’utilisation d’amendements organiques peut, en outre, accroître le potentiel d’augmentation
des stocks de C dans les terrils miniers (Larney et Angers 2012).
LES BIOSOLIDES DE PAPETIÈRES
Les amendements organiques peuvent contribuer à augmenter les stocks de C
séquestré dans les sols dégradés (Ussiri et Lal 2005; Lal 2008). D’après Larney et Angers
(2012), il existe deux situations pour lesquelles l'application d'amendements organiques peut
résulter en une véritable séquestration du carbone atmosphérique : 1) l'application sur des
sols présentant une réelle capacité à stocker le carbone; et 2) l'augmentation de la productivité
primaire nette (PPN) grâce à l'utilisation d’amendements organiques. En effet, ces matières
peuvent créer un potentiel accru pour la photosynthèse en améliorant la fertilité des sites
récepteurs (Brockway 1983). Ce potentiel est plus important pour les amendements
constitués de substances rémanentes dont la décomposition lente favorise l'humification et la
stabilisation à long terme des composés organiques (Lashermes et al. 2009; Larney et Angers
2012). Les résidus de traitement des eaux de papetières figurent au nombre de ces substances
(Camberato et al. 2006).
14
Les résidus de traitement des eaux de papetières démontrent un potentiel intéressant
lorsqu’utilisés comme amendement pour la restauration de sites dégradés (Haering et al.
2000). Plusieurs études sur des sols agricoles et forestiers semblent démontrer une influence
positive de ces résidus sur la production de biomasse, les propriétés physiques du sol, la
rétention des nutriments et la capacité d'échange cationique (CEC), entre autres (Bellamy et
al. 1995). De plus, l'application et l'incorporation des résidus de traitement des papetières
peuvent s'accompagner d'une amélioration de la rétention d'humidité, de l'agrégation et d’une
diminution de l'érosion hydrique et éolienne (Chow et al. 2003).
Les caractéristiques chimiques et physiques des résidus de traitement des eaux de
papetières varient d'une installation de production à une autre (Haering et al. 2000). On les
classe généralement en trois types (Désilets 2003) : 1) les résidus du traitement primaire des
eaux de procédé; 2) les résidus du traitement secondaire des eaux de procédé; et 3) les résidus
de désencrage. Les résidus du traitement primaire sont principalement constitués de fibres de
cellulose; ils ont un contenu élevé en carbone (ratio C:N généralement compris entre 200:1 et
250:1) et un faible contenu en éléments nutritifs (0,1 à 0,25 % N). Les résidus du traitement
secondaire ont un faible contenu en carbone (ratio C:N généralement compris entre 6:1 et
7:1) et un contenu plus élevé en éléments nutritifs (3,0 à 4,0 % N). Finalement, les résidus de
désencrage ont un faible contenu en éléments nutritifs et se distinguent par leur contenu en
argiles kaolinites (Watson et Hoitink 1985; Camberato et al. 2006). Le terme générique
« biosolides » désigne un mélange de résidus primaires, secondaires ou de désencrage
(Désilets 2003).
15
Comparativement aux biosolides municipaux, les biosolides de papetières présentent
des concentrations moins élevées en macronutriments (N, P, K, Ca, Mg, S), en
micronutriments (Cu, Zn) et en métaux (As, Cd, Cr, Hg, Ni, Pb, Sn, Se) (Edwards &
Someshwar 2000). De plus, des sels solubles de Na, SO3 et SO4 peuvent être présents à des
niveaux élevés dans les résidus en raison des additifs utilisés dans les procédés, bien que la
déshydratation des boues réduit considérablement la présence de ces sels (Haering et al.
2000).
L'épandage des biosolides de papetières à des fins de valorisation comporte plusieurs
enjeux, notamment : les coûts (Palumbo et al. 2004), les odeurs (Riffon & Cyr 2000),
l'immobilisation des nutriments (N, P, S) lorsque le ratio C: N est trop élevé (Catricala et al.
1996; Fierro et al. 2000; Price & Voroney 2007) et la contamination potentielle des eaux
souterraines et de surface (Désilets 2003; MDDEP 2005; Camberato et al. 2006). Toutefois,
un suivi adéquat de l'utilisation des biosolides de papetières comme amendement peut
permettre d'éviter les problèmes de pollution du sol (Brockway 1983; Vasconcelos & Cabral
1993). En outre, les résidus de traitement des eaux de papetières ne seraient pas toxiques pour
les organismes du sol dans la plupart des cas (Fraser et al. 2009; Gallardo et al. 2012).
Au Québec, environ 1,38 million de tonnes de biosolides de papetières ont été
produites au cours de l’année 2011 (MDDEFP 2013). De cette quantité, 592 096 tonnes
(42,9 %) on fait l’objet d’une valorisation énergétique, 331 153 tonnes (24,0 %) ont été
recyclées dans les secteurs agricoles et forestiers sous forme d’épandage, 6 142 tonnes
16
(0,4 %) ont été compostées et 59 886 tonnes (4,3 %) ont été valorisées par d’autres modes.
Au total, 391 096 tonnes de biosolides de papetières (28,3 %) ont été vouées à l’élimination
par enfouissement en 2011 (MDDEFP 2013).
Une meilleure performance en ce qui a trait à la valorisation1 des résidus de traitement
des papetières pourrait contribuer à l'objectif de la Politique québécoise de gestion des
matières résiduelles qui vise à recycler 60 % de la matière organique putrescible résiduelle
d'ici 2015 et d'en interdire l'élimination d'ici 2020 (Gouvernement du Québec 2011). Il s’agit
également d’une mesure prévue au Plan d’action 2013-2020 sur les changements climatiques
(PACC 2013-2020) pour l’atteinte de l’objectif québécois de réduire les émissions
provinciales de GES de 20 % sous les niveaux de 1990 d’ici 2020 (Gouvernement du Québec
2012).
À l’heure actuelle, il existe trop peu de données permettant d’estimer les bénéfices
climatiques et surtout, la faisabilité opérationnelle d’une telle mesure. En effet, certaines
contraintes comme les conditions hivernales et l’isolement géographique des fabriques
pourraient nécessiter le recours par l’industrie des pâtes et papiers au stockage temporaire
des biosolides de papetières, plutôt qu’à un enfouissement permanent. Dans cette optique, le
bilan des émissions attribuables au recyclage de biosolides de papetières préalablement
1 La Loi sur la Qualité de l’Environnement (LQE) définit la valorisation comme « toute opération visant par le
réemploi, le recyclage, le traitement biologique, dont le compostage et la biométhanisation, l’épandage sur le
sol, la régénération ou par tout autre action qui ne constitue pas de l’élimination, à obtenir à partir de matières
résiduelles des éléments ou des produits utiles ou de l’énergie ».
17
enfouis (BPPE) devrait être scientifiquement documenté et comparé à d’autres scénarios de
disposition en vue d’évaluer les bénéfices éventuels liés à leur utilisation.
BILAN DE CARBONE DU RECYCLAGE DES BIOSOLIDES DE PAPETIÈRES
Le bilan de carbone se définit comme la différence entre les émissions biologiques et
anthropiques (c.-à-d. sources) et les absorptions de GES (c.-à-d. puits) attribuables à un
système donné, tout en tenant compte du scénario de référence et des émissions liées au cycle
de vie (Gower 2003, Gaboury et al. 2009). Le bilan de carbone d'un projet de valorisation
des biosolides de papetières, préalablement enfouis ou non, demeure méconnu tant à ce qui
a trait aux puits (c.-à-d. biomasse aérienne, biomasse souterraine, sols, etc.) qu’aux sources
(c.-à-d. transport, machinerie, épandage, incorporation, décomposition, etc.).
Des efforts de recherche sont nécessaires afin de mieux connaître le bilan de carbone
attribuable à l'utilisation de biosolides de papetières comme amendement organique sur
l'ensemble du cycle de vie d'un projet de valorisation (Granger et al. 2007), tout
particulièrement pour la remise en état de lieux dégradés (Larney et Angers 2012). À titre
d’exemple, l'influence de l'utilisation des résidus de papetières sur la productivité et la
croissance a été documenté pour plusieurs espèces résineuses et feuillues dont le pin rouge
(Pinus resinosa; Brockway 1983; Stanosz et al. 2004), le pin blanc (Pinus strobus; Brockway
1983), le pin de Monterey (Pinus radiata D.Don; Jackson et al. 2000), le saule (Salix
dasyclados SV1; Quaye et al. 2011), le peuplier hybride (Populus spp.; Carpenter &
Fernandez 2000), le frêne blanc (Fraxinus americana L.), la plantane occidentale (Platanus
18
occidentalis L.), le noyer noir (Juglans nigra L; Kost et al. 1997) et pour des peuplements
d'érable à sucre (Acer saccharum Marsh.) et de peupliers faux-tremble (Populus tremuloides
Michx.; Feldkirchner et al. 2003). Toutefois, aucune de ces études n’a documenté la
séquestration du carbone dans un contexte d’épandage de biosolides de papetières frais ou
préalablement enfouis.
Les sources d'émissions attribuables aux projets de valorisation des biosolides de
papetières demeurent elles aussi peu documentées. Baggs et al. (2002) rapportent des
émissions de N2O de l’ordre de 6,8 ± 2,1 kg N2O-N ha-1 suite à l’application de 44,4 Mg
anhydre ha-1 de biosolides de papetières et une période de mesure de 67 jours (contrôle, 0,2
± 0,08 kg N2O-N ha-1). Chantigny et al. (2013) ont mesuré et comparé les émissions de N2O
attribuables à l'épandage de biosolides de papetières frais (5 à 7 Mg anhydre ha-1), de résidus
de désencrage (26 à 38 Mg anhydre ha-1), de biosolides animaux, de lisier de porc et de
fertilisants minéraux azotés dans un contexte de culture du maïs (Zea mays L.). Les émissions
moyennes de N2O par unité de surface associées à l’épandage de biosolides de papetières ou
de lisier de porc après deux ans d'application étaient significativement inférieures aux
émissions dues à l’épandage d'engrais minéral azoté sur la même période (témoin, 2,0 ± 0.3
kg N2O-N ha-1; biosolides de désencrage, 1.5 ± 0.1 kg N2O-N ha-1; biosolides mixtes, 3.3 ±
0.4 kg N2O-N ha-1; lisier de porc, 6.1 ± 1.1 kg N2O-N ha-1; engrais minéral azoté, 8.3 ± 1.6
kg N2O-N ha-1). Finalement, Brown et Leonard (2004) avancent l’hypothèse que le transport
de biosolides municipaux entre les installations de production et le site de mise en valeur
pourrait jusqu'à annuler les bénéfices de l’épandage de ces résidus en termes de bilan carbone
19
dans un contexte de valorisation en milieu forestier ou agricole. Il appert donc que de
nouvelles recherches seront nécessaires afin de documenter le bilan des émissions
attribuables à un projet de valorisation de biosolides de papetières préalablement enfouis
puisqu’aucune étude ne s’y est intéressée à ce jour.
LA MESURE DES ÉMISSIONS DE GAZ À EFFET DE SERRE DU SOL
Les échanges gazeux à l'interface sol-atmosphère sont un indicateur des phénomènes
biogéochimiques qui y prennent place. Ces flux (f), ou le taux net d'échange gazeux par unité
de surface (ex. mg m-2 s-1) peuvent être représentés comme la somme du débit massique (fm)
et de la diffusion moléculaire (fd) selon l'équation (Kanemasu et al. 1974; Nazaroff 1992;
Livingston et Hutchinson 1995) :
f = fm + fd
Plusieurs méthodes ont été développées pour quantifier ces échanges gazeux. De ces
méthodes, les chambres statiques fermées (NFT-NSS chambers) constituent la méthode la
plus répertoriée dans la littérature (Smith et Conen 2004; Rochette et Hutchinson 2005;
Rochette & Eriksen-Hamel 2008; Rochette 2011), notamment pour le suivi des émissions de
CO2, CH4 et N2O en contexte agricole (Rochette et Bertrand 2008). Les chambres de type
NFT-NSS permettent de restreindre le volume d'air (V) disponible pour les échanges gazeux
à la surface du sol sur une superficie (A) connue, de façon à mesurer les changements de
concentration des gaz étudiés dans le temps (Livingston et Hutchinson 1995). Ce ratio V:A
doit être suffisamment grand pour minimiser les perturbations induites à la surface confinée
tout en étant assez petit pour permettre la mesure des concentrations de gaz sur une période
20
de temps aussi courte que possible (Livingston et Hutchinson 1995).
Cette méthode offre plusieurs avantages dont la robustesse du matériel utilisé, son
faible coût et sa facilité d'utilisation; elle s'avère particulièrement pratique pour les études
nécessitant des mesures répétées dans l'espace et dans le temps (Livingston et Hutchinson
1995; Smith et al. 1995). Cependant, certaines critiques concernent le caractère invasif de la
méthode qui engendre une distorsion des gradients de concentration qui régissent la diffusion
du gaz à l'interface sol-atmosphère. Soulignons également des besoins importants en termes
de manipulations et de main d'œuvre et la nécessité de prévoir un nombre suffisant de réplicas
pour pallier au problème d'hétérogénéité spatiale et temporelle (Smith et al. 1995).
Rochette et Eriksen-Hamel (2007) ont répertorié les études faisant utilisation de la
méthode des chambres NFT-NSS publiées entre 1978 et 2007 et les ont analysées selon
16 caractéristiques regroupées en quatre facteurs, soit 1) le design de la chambre;
2) l'étanchéité du dispositif de mesure; 3) la manutention des fioles et des échantillons; et 4)
le calcul des flux. Au total, seulement 38 % des études ont été jugées bonnes ou très bonnes
par les auteurs pour plus de la moitié des caractéristiques considérées. Pour cette raison,
plusieurs études parues depuis une vingtaine d'années se sont intéressées à perfectionner et à
uniformiser la méthode (Matthias et al. 1978; Hutchinson et Mosier 1981; Livingston et
Hutchison 1995; Pedersen et al. 2001). Rochette et Bertrand (2008) et Rochette (2011) ont
synthétisé ces avancées pour proposer un protocole sur lequel les utilisateurs peuvent se baser
afin d’assurer la crédibilité de leurs résultats. Grâce à ces avancées, la méthode des chambres
21
NFT-NSS devrait demeurer très utilisée à moyen et long termes pour étudier les échanges
gazeux à l'interface sol-atmosphère.
LA MINE NIOBEC : UNE ÉTUDE DE CAS
La mine souterraine de niobium Niobec est située dans la municipalité de Saint-
Honoré, au Québec, Canada (48°32’N, 71°08’O). La propriété couvre une superficie
d’environ 1735 hectares. Les résidus miniers générés par l’exploitation du minerai sont gérés
au moyen de parcs à résidus miniers situés sur le site de la mine. Le parc à résidus
présentement en opération couvre une superficie d'environ 2,5 km x 100 m. Des efforts de
végétalisation au moyen de mort terrain et d’ensemencement (c.-à-d. graines de pacage) ont
été pratiquées sur les pentes externes du parc depuis le début de sa vie utile (environ 2 ans).
Ces pentes, d’une inclinaison d’environ 15 %, s’allongent d'environ 4 à 5 m par an jusqu’à
l’atteinte d’une hauteur totale avoisinant les 30 m.
À l'automne 2011, Niobec et la Chaire en éco-conseil de l'UQAC (ci-après « la
Chaire ») démarraient un projet de collaboration sur la mise en œuvre d’un projet de
reboisement des pentes extérieures du parc au moyen d’espèces arborées. Par cette initiative,
Niobec souhaitait notamment atténuer l'érosion éolienne du parc, réduire l'impact visuel du
site, établir une stratégie de fermeture définitive du parc et évaluer les retombées du projet
sur la séquestration biologique du carbone. En plus de ces objectifs, la Chaire entendait
profiter de cette opportunité pour tester certaines hypothèses de recherche portant sur le bilan
carbone du recyclage des BPPE dans le cadre d'un projet de reboisement d'un site dégradé.
22
L’objectif général de l’initiative de recherche ayant débuté en juin 2013 est d’évaluer
le potentiel de l’utilisation des BPPE comme amendement organique dans le cadre du
reboisement d’un parc à résidus miniers non acides et ce, dans le contexte d’un projet de
réduction des émissions et d’accroissement des absorptions de GES par les puits. De cet
objectif général découlent plusieurs objectifs secondaires, dont : 1) Évaluer le potentiel des
BPPE comme amendement favorable à la séquestration biologique du carbone dans les sols
et dans la biomasse souterraine et aérienne; 2) Évaluer les espèces arborescentes offrant le
meilleur potentiel pour le reboisement avec ou sans biosolides de papetières comme
amendement organique; 3) Quantifier les émissions atmosphériques de dioxyde de carbone
(CO2), de méthane (CH4) et de protoxyde d'azote (N2O) attribuables à l'épandage de BPPE
et développer les facteurs d’émission correspondants; 4) Documenter le bilan de carbone
complet de l'utilisation de BPPE comme amendement, y compris les émissions attribuables
à l’équipement motorisé mobile; et 5) Comparer les émissions atmosphériques de GES
attribuables à l'épandage de BPPE à celles dues à l'enfouissement de cette matière.
L’atteinte des objectifs 3 et 4 requiert dans un premier temps la mesure in situ des
émissions atmosphériques de dioxyde de carbone (CO2), de méthane (CH4) et de protoxyde
d'azote (N2O) attribuables aux BPPE épandus sur le parc à résidus de Niobec. Le présent
mémoire s'intéresse donc spécifiquement à la quantification des émissions atmosphériques
de GES (CO2, N2O, CH4) attribuables à l'épandage de biosolides de papetières préalablement
enfouis dans le cadre d'un projet de reboisement d’un parc à résidus miniers non acides.
23
HYPOTHÈSES ET OBJECTIFS
Les hypothèses retenues sont que l'épandage de BPPE augmente les émissions de
GES (N2O, CO2, CH4) du sol comparativement à un scénario sans amendement et que les
émissions directes attribuables à l’équipement motorisé mobile sont plus importantes que les
émissions attribuables aux BPPE eux-mêmes.
Les objectifs du projet de recherche décrit ci-après sont : 1) Quantifier les émissions
directes de GES (N2O, CO2, CH4) attribuables à l’épandage de biosolides de papetières
préalablement enfouis (BPPE) sur un parc à résidus miniers non acides pendant deux saisons
de croissance; et 2) Quantifier les émissions de GES attribuables à l’utilisation d’équipement
motorisé mobile (t CO2e Mg-1 anhydre).
CHAPITRE 1
N2O EMISSIONS FROM LAND APPLICATION OF LANDFILLED
PAPER MILL SLUDGE (LPMS) ON A NON-ACIDIC MINE TAILING SITE
OVER TWO SNOW-FREE SEASONS
Simon Durocher1, Normand Bertrand2, Jean-François Boucher1, Patrick Faubert1, Rock
Ouimet3, Philippe Rochette2, Pascal Tremblay1, Claude Villeneuve1
1Université du Québec à Chicoutimi, Département des Sciences fondamentales
2Agriculture et Agro-Alimentaire Canada, Centre de recherche et de développement sur les
sols et les grandes cultures
3Ministère de la Forêt, de la Faune et des Parcs, Direction de la recherche forestière,
25
1.1. ABSTRACT
The government of Québec (Canada) has announced the banishment by 2020 of
organic putrescible waste (OPW) landfilling, including pulp and paper mill sludge (PMS).
The objective is to reduce greenhouse gas (GHG) emissions from OPW management through
increased land application on agricultural or degraded lands such as mine tailing sites.
However, unfavourable operational contexts such as winter conditions can make temporary
landfilling of PMS an unavoidable alternative for industrials. In this context, it is not clear if
the potential use of temporary landfilled paper mill sludge (LPMS) for land application on
degraded lands should provide climate benefits. This study aimed at measuring the direct
GHG emissions related to the use of LPMS as a soil amendment on a non-acidic mine tailing
site prior to reforestation efforts. Soil-surface nitrous oxide (N2O), carbon dioxide (CO2) and
methane (CH4) emissions following land application of 50 and 100 dry Mg ha-1 were
measured using non-flow-through non-steady-state gas chambers on two experimental sites
during two consecutive growing seasons (2012, 2013). Machinery-related emissions were
also quantified. Results show that LPMS application increased soil-surface N2O fluxes, with
cumulative emissions ranging from 7.56 to 34.7 kg N2O ha-1 on amended plots one growing
season after application. LPMS-induced emission factors (LPMS-IEF) ranged from 0.0104
to 0.0222 kg N2O-N kg-1 N applied, which is similar to reported values for animal manures
applied to coarse-textured soils in Québec. CO2 emissions from LPMS decomposition had
the greatest impact on total CO2e values for the first and second snow-free season following
application. Total machinery-related emissions (0.0983 tCO2e Mg-1 dry LPMS) can be higher
26
than LPMS-related emissions (0.0538-0.145 tCO2e Mg-1) during the first growing season
when biogenic CO2 is not accounted for. Machinery-related emissions of 0.93 t C ha-1 could
potentially cancel out the climate benefits associated with soil organic carbon (SOC)
sequestration for the first two years of a biological C sequestration project.
27
1.2. INTRODUCTION
The unprecedented influence of human activities on global radiative forcing has been
made clear through science-based evidence (IPCC 2013). Given a business-as-usual scenario
in future years or decades, countless impacts on human and natural ecosystems are to be
witnessed from continued anthropogenic greenhouse gas (GHG) emissions (IPCC 2014b).
Climate change is one of the main global issues facing humanity (Rockstrom et al. 2009) and
thus calls for urgent and science-supported actions (IPCC 2013). Absolute reductions of
GHG emissions, mitigation measures and adaptation to present and future impacts need
immediate and joint implementation (VijayaVankataRaman et al. 2012).
In recent years, the number of national and sub-national mitigation legislations and
strategies has significantly increased worldwide (Dubash et al. 2013). For instance, Québec’s
Action Plan on Climate Change (APCC) includes multi-sectorial initiatives aiming at
reaching the province’s objective of reducing overall emissions by 20 % under the 1990 level
by 2020 (Gouvernement du Québec 2012). Among other engagements, Québec’s latest
APCC prescribes the complete banishment by 2020 of organic putrescible waste (OPW)
landfilling, including pulp and paper mill sludge (PMS); this measure aims at reducing GHG
emissions from OPW management through increased land application. However, it is not
clear to which extent the diversion of OPW from landfills to agricultural or degraded lands
could provide real climate benefits.
28
While no data is currently available on GHG emissions from pulp and paper mill
disposal sites, it is accepted that N2O emissions can lower the technical mitigation potential
of PMS and other biosolids (Smith et al. 2014). Baggs et al. (2002) reported emissions of 6.8
± 2.1 kg N2O-N ha-1 over 67 days following land application of 44.4 Mg ha-1 dry PMS
(control, 0.2 ± 0.08 kg N2O-N ha-1). Chantigny et al. (2013) observed N2O-N emission rates
of 1.5 ± 0.1 and 3.3. ± 0.4 kg ha-1 from soils amended with deinked (26 to 38 Mg ha-1 dry)
and mixed paper pulp sludge (5 to 7 Mg ha-1 dry), respectively (unamended control, 2.0 ±
0.3 kg N2O-N ha-1). Using OPW such as PMS as soil amendment also involves GHG
emissions from fossil fuel combustion: Brown & Leonard (2004) brought the hypothesis that
OPW-related transportation could cancel out climate benefits, if any, associated with land
application. This is of great concern in Québec since large amounts of organic material could
be used on distant degraded lands in future years, given government efforts to promote
mining projects in northern territories. Thus, more research is needed to thoroughly evaluate
the complete budget of GHG emissions associated with land application of OPW such as
PMS on degraded lands (Larney & Angers 2012).
Besides the scientific uncertainty surrounding GHG emissions, the banishment of
OPW disposal poses significant challenges to pulp and paper mill managers who must find
new alternatives to dispose of their process residues. Due to unfavourable meteorological,
geographical and economic conditions, permanent or temporary disposal of PMS quickly
becomes unavoidable. For instance, 391 096 tonnes of PMS (28.3 %) were landfilled in
Québec in 2011. Since the use of temporary landfilled paper mill sludge (LPMS) as a soil
29
amendment has not yet been documented in the scientific literature, uncertainty remains
about the GHG emission budget of using this material for reclamation purposes.
This study aims at measuring the GHG emissions related to the use of LPMS as a soil
amendment on a non-acidic mine tailing site prior to reforestation efforts. Soil-surface nitrous
oxide (N2O), carbon dioxide (CO2) and methane (CH4) direct emissions following land
application were measured using non-flow-through non-steady-state gas chambers during
two consecutive growing seasons (2012, 2013). Secondary objectives are to relate soil-
surface GHG emissions to variations in soil mineral N content, temperature and volumetric
water content, and to quantify machinery-related emission factors on a tCO2e Mg-1 dry LPMS
basis.
30
1.3. METHODS
1.3.1. STUDY SITE
The study was conducted on a non-acidic tailing impoundment facility located on a
private underground mine property (Niobec, Saint-Honoré, Qc, Canada; 48°32’N, 71°08’O).
Soil is classified as a Technosol (FAO classification) made from calcareous tailings (180 μm)
covered with endemic forest burden.
1.3.2. EXPERIMENTAL DESIGN
A portion of the tailing impoundment facility has been selected to establish two
adjacent experimental designs, S1 and S2, structured as complete block designs (Figure 1).
Both designs covered a 625-m2 area and included 18 plots (2 m by 2 m) distributed in 3 blocks
(repetition). Each block was randomly split in three main plots assigned with LPMS
application rate of 0, 50 and 100 Mg dry ha-1. Main plots were then randomly divided into
two subplots to which were randomly assigned two seeding treatments, i.e. with (12 kg ha-1)
and without (0 kg ha-1) white clover (Trifolium repens), since this plant was used as a
perennial soil cover in the reforestation project under study. Buffer strips of 2.5 m and 5 m
were inserted between each subplot and each block, respectively.
The LPMS was extracted from a nearby (25.9 km) commercial printing paper plant
(Resolute Forest Product, Jonquière, Qc, Canada; 48°25’N, 71°14’O). The first experimental
site (S1) was set up from 9 to 10 July 2012 and used LPMS that were excavated and
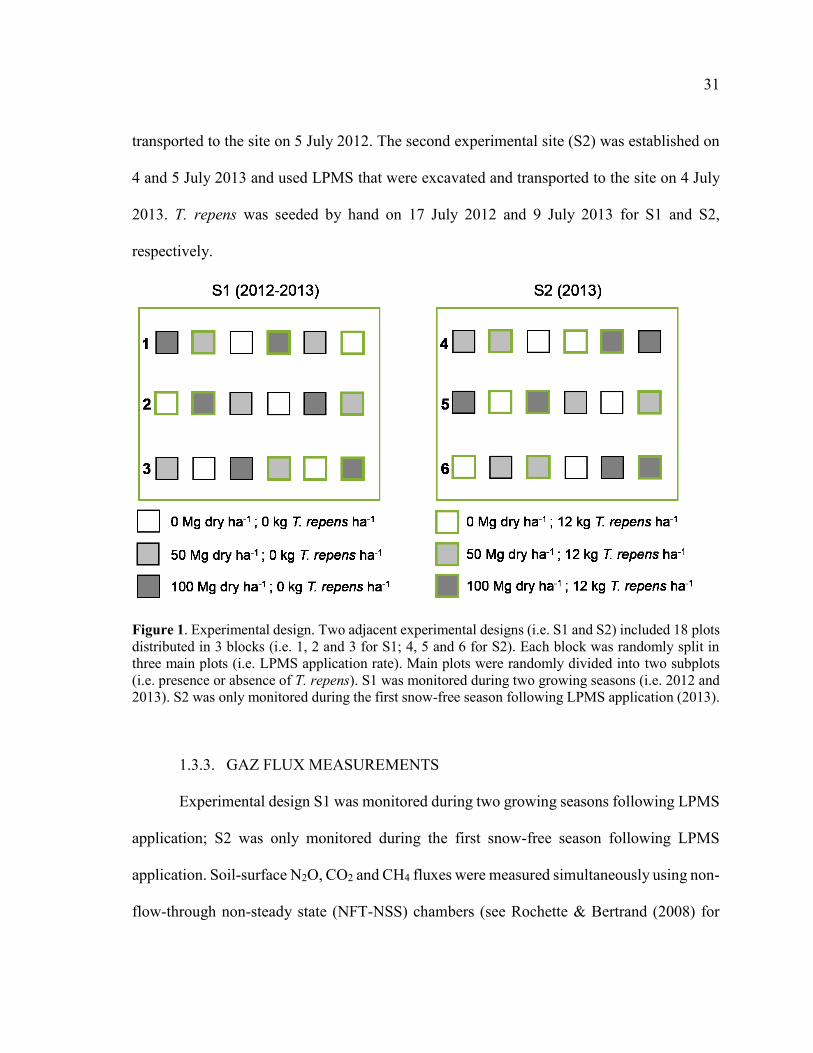
31
transported to the site on 5 July 2012. The second experimental site (S2) was established on
4 and 5 July 2013 and used LPMS that were excavated and transported to the site on 4 July
2013. T. repens was seeded by hand on 17 July 2012 and 9 July 2013 for S1 and S2,
respectively.
Figure 1. Experimental design. Two adjacent experimental designs (i.e. S1 and S2) included 18 plots
distributed in 3 blocks (i.e. 1, 2 and 3 for S1; 4, 5 and 6 for S2). Each block was randomly split in
three main plots (i.e. LPMS application rate). Main plots were randomly divided into two subplots
(i.e. presence or absence of T. repens). S1 was monitored during two growing seasons (i.e. 2012 and
2013). S2 was only monitored during the first snow-free season following LPMS application (2013).
1.3.3. GAZ FLUX MEASUREMENTS
Experimental design S1 was monitored during two growing seasons following LPMS
application; S2 was only monitored during the first snow-free season following LPMS
application. Soil-surface N2O, CO2 and CH4 fluxes were measured simultaneously using non-
flow-through non-steady state (NFT-NSS) chambers (see Rochette & Bertrand (2008) for
32
details). Multi-component acrylic plastic (0.64 cm) enclosures (Livingston & Hutchinson
1995) were composed of a permanent frame (0.75*0.15*0.14 m height) inserted at the center
of each subplot to a 0.1 m depth (Rochette & Eriksen-Hamel 2008) and a removable chamber
(0.75*0.15*0.15 m height) was sealed to the frame at the time of measurement. Gas fluxes
were measured between 0930 and 1130 EDT (Rochette et al. 2000). Sampling was done
thrice a week for the first month following LPMS application, twice a week for the second
month and weekly through the remaining of the first snow-free season. Soil-surface gas
fluxes were also monitored at different intervals during the second snow-free season
following S1 establishment.
Meteorological data (temperature (°C), relative humidity (%), atmospheric pressure
(kPa)) were recorded at the beginning and end of each chamber deployment using a portable
meteorological station (PAH1, Pyle Audio, USA). Soil temperature (°C) and volumetric soil
water content (VSWC) at 10-cm depth were also measured using a handheld thermometer
(Model 11050, DeltaTrak, USA) and TDR probes (Fieldscout, Spectrum Technologies,
USA), respectively. Soil bulk density (BD) on S2 was measured only once at the end of the
growing season; no BD was measured on S1. Water-filled pore space (WFPS) was calculated
for S2 using the equation used by Gagnon et al. (2011):
WFPS=VSWC
1-(BDPD
)
where VSWC is the volumetric soil water content, BD is the bulk density and PD is assumed
mineral density of 2.65 g cm-3. Precipitations (mm) since the last sampling date were
33
recorded using a manual rain gauge. Height of frames above the soil surface was measured
on each sampling date for the first month, then after precipitation events for the remaining of
the snow-free season. Vegetation inside frames was removed by hand on each sampling date,
but vegetation was left undisturbed on the remaining part of each plot (Chantigny et al. 2013).
Chamber headspace air was sampled at 0, 6, 12 and 18 min following chamber
deployment. The chamber base was accessed from the same direction in the plot each time
that GHG emissions were measured. To avoid soil compaction around the chamber caused
by the repeated circulation, a wood board was placed onto the soil surface during GHG
measurements (Livingston & Hutchinson 1995; Holland et al. 1999). Sampling was made
using Luer Lock tipped 20 ml syringes (Norm Ject®, Henke Sass Wolf, Germany) by
inserting 26 gauge needles (26G 3/8, BD Precision GlideTM, USA) through a rubber septum
(Luer-Lock, Vygon, France). Gas samples (20 ml) were immediately transferred to pre-
evacuated 12 ml glass vials (Exetainer, Labco Ltd, UK) equipped with an additional silicon
septum (Rochette & Bertrand 2003) and containing 2-3 mg Mg(ClO4)2 as a desiccant
(Rochette & Bertrand 2008). Gas samples were analyzed using a gas chromatograph (Varian
Inc., Walnut Creek, CA) equipped with an electron capture detector for N2O and a flame
ionization detector for CO2 and CH4 within 15 days of sampling date (Rochette & Bertrand
2008).
34
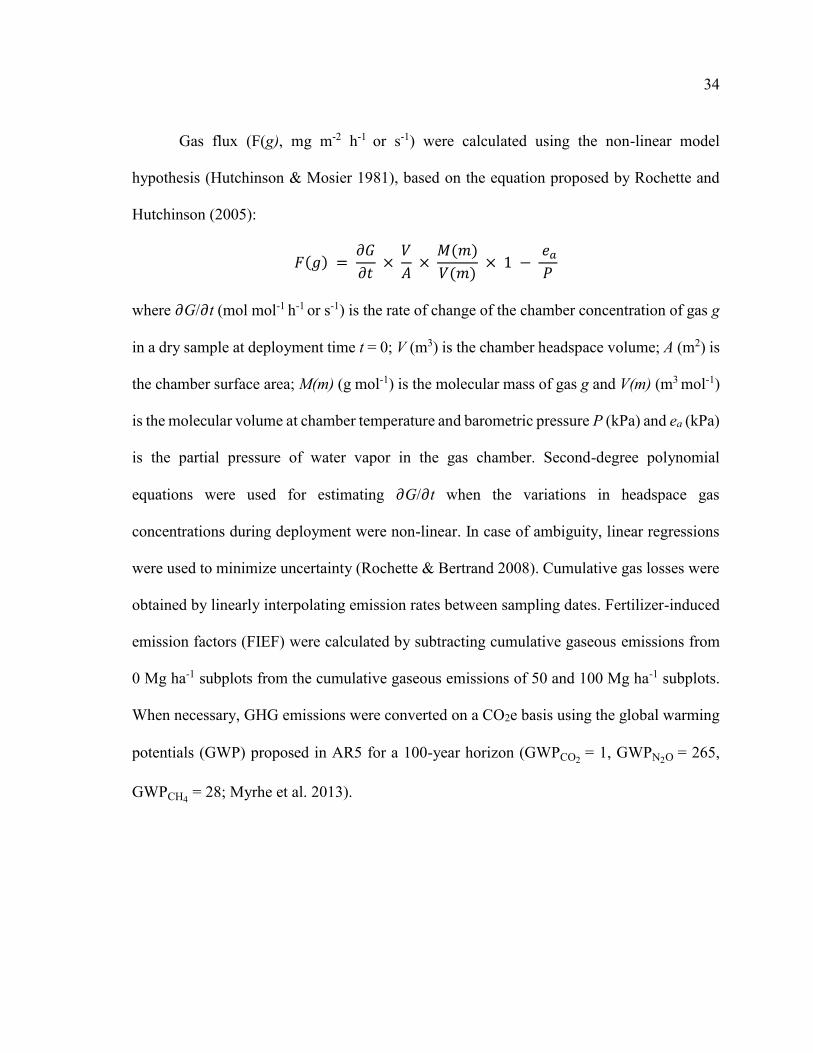
Gas flux (F(g), mg m-2 h-1 or s-1) were calculated using the non-linear model
hypothesis (Hutchinson & Mosier 1981), based on the equation proposed by Rochette and
Hutchinson (2005):
𝐹(𝑔) = 𝜕𝐺
𝜕𝑡 ×
𝑉
𝐴 ×
𝑀(𝑚)
𝑉(𝑚) × 1 −
𝑒𝑎
𝑃
where 𝜕G/𝜕t (mol mol-1 h-1 or s-1) is the rate of change of the chamber concentration of gas g
in a dry sample at deployment time t = 0; V (m3) is the chamber headspace volume; A (m2) is
the chamber surface area; M(m) (g mol-1) is the molecular mass of gas g and V(m) (m3 mol-1)
is the molecular volume at chamber temperature and barometric pressure P (kPa) and ea (kPa)
is the partial pressure of water vapor in the gas chamber. Second-degree polynomial
equations were used for estimating 𝜕G/𝜕t when the variations in headspace gas
concentrations during deployment were non-linear. In case of ambiguity, linear regressions
were used to minimize uncertainty (Rochette & Bertrand 2008). Cumulative gas losses were
obtained by linearly interpolating emission rates between sampling dates. Fertilizer-induced
emission factors (FIEF) were calculated by subtracting cumulative gaseous emissions from
0 Mg ha-1 subplots from the cumulative gaseous emissions of 50 and 100 Mg ha-1 subplots.
When necessary, GHG emissions were converted on a CO2e basis using the global warming
potentials (GWP) proposed in AR5 for a 100-year horizon (GWPCO2 = 1, GWPN2O = 265,
GWPCH4 = 28; Myrhe et al. 2013).
35
1.3.4. SOIL SAMPLING AND ANALYSES
Soil samples were collected only on the second year of experiment (S2 plots only).
Sampling for fertility analysis took place before LPMS application (4 July), after LPMS
application (11 July), at mid-season (18 September) and at the end of the snow-free season
(21 October 2013). On each sampling date, four cores were collected from the top 30 cm
using a stainless steel auger probe. Composite samples were made for each plot and stored
in a plastic bag at 4°C. Within 4 h, composite samples were air-dried at room temperatures
for 7 d and then sent to analysis (Laboratoire de chimie organique et inorganique, Ministère
des Ressources naturelles, Québec, Canada). Samples were analyzed for total organic matter,
total C, organic C, total N, pH, macroelements (K, Ca, Mg, S, Na), microelements (Mn, Al,
Fe), CEC and base saturation.
Soil mineral N (NH4-N and (NO3+NO2)-N) was also analyzed on S2 plots at regular
intervals. Samples were taken before LPMS application (4 July), after LPMS application
(11 July), weekly for a month (18, 25, 30 July and 6 August) and then monthly for the rest
of the snow-free season (12 August, 18 September and 21 October 2013). Four soil cores
were sampled from the top 30 cm using a stainless steel auger probe. Composite samples
were made for each plot and stored in a plastic bag at 4°C. Within 4 h, composite samples
were placed in a refrigerator to be analyzed within the next 24 hours. N analyses were
performed on 25 g of wet soil to which was added 125 ml of 1 mol l-1 KCl solution for
extraction. The soil-solution mixture was agitated on a reciprocal shaker for 30 min, followed
by centrifugation at 3000 x g for 10 min. The supernatant was then filtered using VWR 474
36
paper and the first five drops of filtrate were discarded. The filtered samples were stored at -
18°C until analysis for NH4-N and (NO2+NO3)-N (Laboratoire de chimie organique et
inorganique, Ministère des Ressources naturelles, Québec, Canada).
1.3.5. MACHINERY-RELATED GHG EMISSIONS
GHG emission factors for emissions related to mobile machinery were calculated by
recording fossil fuel consumed by the mechanical equipment used to excavate, transport,
spread and incorporate LPMS. For this experiment, 314 Mg of LPMS were excavated from
the PMS disposal site on 5 July 2012 using a power-operated excavator and transported by
25 and 30 tonne-capacity trucks over a 25.9 km distance. Spreading of LMPS took place on
9 and 10 July 2012 at a targeted rate of 35 Mg dry ha-1 over 3 ha. Applied LPMS were
incorporated to a 20 cm depth on 10 July using an agricultural rotary tiller.
Fuel consumptions were noted throughout the operations from 5 July to 10 July 2012.
Machinery-related emission factors were calculated on a t CO2e Mg-1 dry LPMS using
ecoinvent database v2.0 life cycle inventory data (Kellenberger et al. 2007).
1.3.6. LANDFILLED PMS CHARACTERIZATION
The LPMS were sampled for characterization on 6 July 2012 (S1) and 5 July 2013
(S2). Samples from S1 and S2 were analyzed by two different accredited routine laboratories.
Dry matter content was measured by oven drying at 150 °C (S1) and 105 °C (S2) until
37
constant mass. Organic matter content was measured by incineration at 375 °C (S1) and
550°C (S2) until constant mass. Total C and N were determined by dry combustion (LECO
Corporation, St-Joseph, MI, USA). Mineral N was extracted with a 1 mol L-1 KCl solution
(see Chantigny et al. 2013). Characterization data are presented in Table 1.
1.3.7. STATISTICAL ANALYSIS
Statistical analyses were performed on a complete block design using JMP 10 (SAS
Institute Inc., Cary, North Carolina, 2012). Cumulative emissions on the last sampling date
were analyzed for each measured GHG (i.e. CO2, N2O and CH4), for each site (S1 and S2)
and for each snow-free season (2012 and 2013), for a total of 9 datasets (no data for 2014 on
S2). Cumulative emissions were analyzed using mixed linear model ANOVA with block as
a random factor and LPMS rate and presence or absence of vegetation (T. repens) as fixed
factors. Data were log10-transformed when necessary to satisfy assumptions of normal
distribution and homogeneity of variances. Post-hoc tests were performed using orthogonal
polynomial contrasts. The effect of LPMS rate, presence or absence of vegetation, and their
interaction on soil fertility parameters and soil mineral N contents were tested using the
Table 1. Mean total N, total C (Mg ha-1) and NH4-N quantities (kg ha-1) applied to
experimental plots on S1 (Year 1) and S2 (Year 1) following the application of 50 and 100
Mg ha-1 dry landfilled paper mill sludge (LPMS). Data are means ± SD (n=6).
LPMS
rate
(Mg ha-1)
S1 (2012) S2 (2013)
Total N Total C C:N NH4-N Total N Total C C:N NH4-N
50 0.709
± 0.176
16.5
± 4.10 23.3
251
± 0.062
0.510
± 0.389
14.9
± 11.4 29.3
50.3
± 0.0383
100 1.42
± 0.328
33.0
± 7.64 23.3
501
± 0.116
1.02
± 0.408
29.9
± 11.9 29.3
101
± 0.0402
38
repeated measure statement as individual sampling dates were considered as time-dependent
variables. The effect of soil volumetric water content and temperature on soil-surface
emissions was analyzed using Pearson’s parametric correlation coefficient (r2). Spearman’s
non-parametric correlation coefficient (ρs) was used when data was not normally distributed.
To control for type-I error, only significant results are presented and discussed (Zar 1999).
1.4. RESULTS
1.4.1. SOIL-SURFACE N2O EMISSIONS
Soil-surface fluxes were relatively low (< 0.14 mg N2O m-2 h-1) on 0 Mg LPMS ha-1
plots throughout the experiment (Figures 2a, 2b). On LPMS-amended plots, peak emissions
were observed after 7 and 6 d following applications and fluxes increased for a relatively
short period (4 wk) to values up to 33.64 and 15.14 mg N2O m-2 h-1 on S1 and S2,
respectively. Cumulative N2O emissions from LPMS-amended plots varied from 7.56 to 34.7
kg N2O ha-1 during the first snow-free season following application and were 23 to 297 times
greater than values from control plots, which ranged between 0.117 and 0.331 kg N2O ha-1
(Table 3). Cumulative emissions were 2.2 to 4.6 times higher for plots receiving 100 Mg ha-
1 than for plots receiving 50 Mg ha-1 at both sites (Table 3). At the S1 site, LPMS had no
significant effect on soil-surface N2O emissions during the second year following
application. At both sites and seasons, the presence of T. repens had no significant effect on
cumulative emissions (Table 2). LPMS-induced emission factors (LPMS-IEF) ranged from
0.0104 to 0.0222 kg N2O-N kg-1 N applied (1.04 to 2.22 %) and increased with increasing
application rates (F(1,2) = 50.7658, p = 0.0191).
39

40
Figure 2. Soil-surface N2O (mg m-2 h-1) and CO2 (mg m-2 s-1) during the first snow-free season
following the application of 0, 50 and 100 Mg ha-1 dry landfilled paper mill sludge (LPMS). a) and
b) show soil-surface N2O emissions following application on S1 and S2, respectively. c) shows soil-
surface CO2 emissions following the application on S1. d) shows CO2 emissions following the
application of 0, 50 and 100 Mg ha-1 dry LPMS in the presence or absence of T. repens. e) and f)
show soil volumetric water content (% v/v) at S1 and S2, respectively. g) and h) show soil and air
temperature S1 and S2, respectively. Dotted lines indicate the time of LPMS application.
41
Table 2. ANOVA table. Results are for cumulative area-based emissions and are presented
by gas type (N2O, CO2 and CH4) and by design (S1 and S2) for the first and second snow-
free seasons following the application of 0, 50 and 100 Mg ha-1 dry landfilled paper mill
sludge (LPMS) in the presence or absence of T. Repens (clover). Differences were
considered statistically significant at p < 0.05.
Source ndf df p df p df p
S1 (Year 1)
N2O CO2 a CH4
LPMS 2 4 <.0001 4 <.0001 4 0.1660
Lin 1 4 <.0001 4 <.0001 - -
Quad 1 4 0.0008 4 0.0023 - -
Clover 1 6 0.3063 6 0.2156 6 0.4955
LPMS*clover 2 6 0.3388 6 0.2606 6 0.9868
S1 (Year 2)
N2O CO2 CH4
LPMS 2 4 0.6562 4 0.0004 4 0.1919
Lin 1 - - 4 0.0002 - -
Quad 1 - - 4 0.0138 - -
Clover 1 6 0.6491 6 0.2942 6 0.9421
LPMS*clover 2 6 0.9047 6 0.3928 6 0.0332
Lin 1 - - - - 6 0.0199
Quad 1 - - - - 6 0.1482
S2 (Year 1)
N2O CO2 CH4
LPMS 2 4 <.0001 4 0.0913 4 0.2657
Lin 1 4 <.0001 - - - -
Quad 1 4 0.0008 - - - -
Clover 1 6 0.7131 6 0.0314 6 0.5235
LPMS*clover 2 6 0.7079 6 0.0313 6 0.4783
Lin 1 - - 6 0.0114 - -
Quad 1 - - 6 0.7931 - -
42
Table 3. Mean cumulative N2O-N emissions and emission factors following the
application of 0, 50 and 100 Mg ha-1 dry landfilled paper mill sludge (LPMS) in the
presence or absence of T. repens at S1 (Years 1 and 2) and S2 (Year 1). Data are means
± 1 SD (n = 3).
S1 (Year 1) S1 (Year 2) S2 (Year 2)
T. repens
LPMS
rate
(Mg
ha-1)
CABE†
(kg N2O-N
ha-1)
LPMS-IEF‡
(kg N20-N
kg-1 N)
CABE
(kg N2O-N
ha-1)
LPMS-IEF
(kg N20-N
kg-1 N)
CABE
(kg N2O-N
ha-1)
LPMS-IEF
(kg N20-N
kg-1 N)
Absence
0 0.216
± 0.0986 -
0.0937
± 0.0573
0.217
± 0.101 -
50 7.56
± 2.45
0.0104
± 0.00354
0.159
± 0.0709
6.34×10⁻⁵
± 7.07×10⁻⁵
9.35
± 0.285
0.0179
± 7.23×10⁻⁴
100 34.7
± 11.6
0.0243
± 0.00821
0.127
± 0.148
8.60×10⁻⁶
± 1.40×10⁻⁴
20.8
± 4.20
0.0202
± 0.00403
Presence 0
0.117
± 0.0292 -
0.0576
± 0.0260
0.331
± 0.257 -
50 7.87
± 0.105
0.0109
± 1.09×10⁻⁴
0.305
± 0.427
3.49×10⁻⁴
± 5.66×10⁻⁴
8.73
± 1.37
0.0165
± 0.00314
100 31.6
± 7.44
0.0222
± 0.00522
0.114
± 0.130
3.99×10⁻⁵
± 8.09×10⁻⁵
22.0
± 1.84
0.0213
± 0.00188
† CABE, cumulative emissions; ‡LPMS-IEF, LPMS-induced emission factor.
43
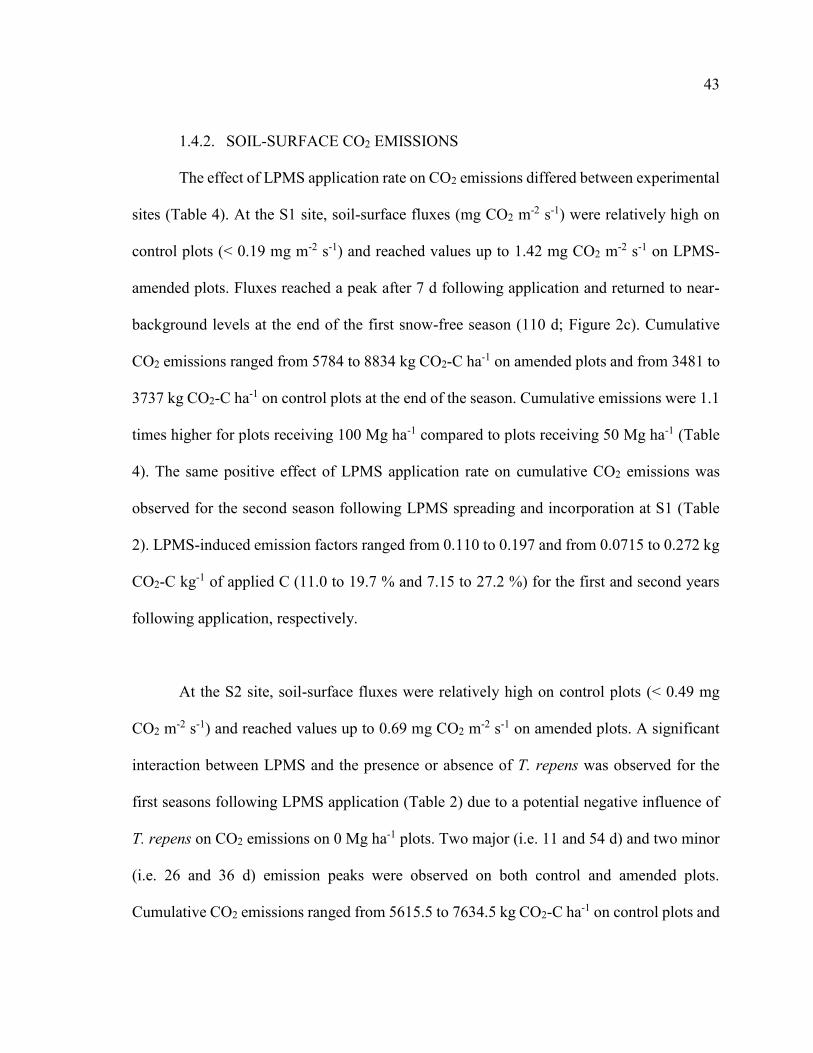
1.4.2. SOIL-SURFACE CO2 EMISSIONS
The effect of LPMS application rate on CO2 emissions differed between experimental
sites (Table 4). At the S1 site, soil-surface fluxes (mg CO2 m-2 s-1) were relatively high on
control plots (< 0.19 mg m-2 s-1) and reached values up to 1.42 mg CO2 m-2 s-1 on LPMS-
amended plots. Fluxes reached a peak after 7 d following application and returned to near-
background levels at the end of the first snow-free season (110 d; Figure 2c). Cumulative
CO2 emissions ranged from 5784 to 8834 kg CO2-C ha-1 on amended plots and from 3481 to
3737 kg CO2-C ha-1 on control plots at the end of the season. Cumulative emissions were 1.1
times higher for plots receiving 100 Mg ha-1 compared to plots receiving 50 Mg ha-1 (Table
4). The same positive effect of LPMS application rate on cumulative CO2 emissions was
observed for the second season following LPMS spreading and incorporation at S1 (Table
2). LPMS-induced emission factors ranged from 0.110 to 0.197 and from 0.0715 to 0.272 kg
CO2-C kg-1 of applied C (11.0 to 19.7 % and 7.15 to 27.2 %) for the first and second years
following application, respectively.
At the S2 site, soil-surface fluxes were relatively high on control plots (< 0.49 mg
CO2 m-2 s-1) and reached values up to 0.69 mg CO2 m
-2 s-1 on amended plots. A significant
interaction between LPMS and the presence or absence of T. repens was observed for the
first seasons following LPMS application (Table 2) due to a potential negative influence of
T. repens on CO2 emissions on 0 Mg ha-1 plots. Two major (i.e. 11 and 54 d) and two minor
(i.e. 26 and 36 d) emission peaks were observed on both control and amended plots.
Cumulative CO2 emissions ranged from 5615.5 to 7634.5 kg CO2-C ha-1 on control plots and
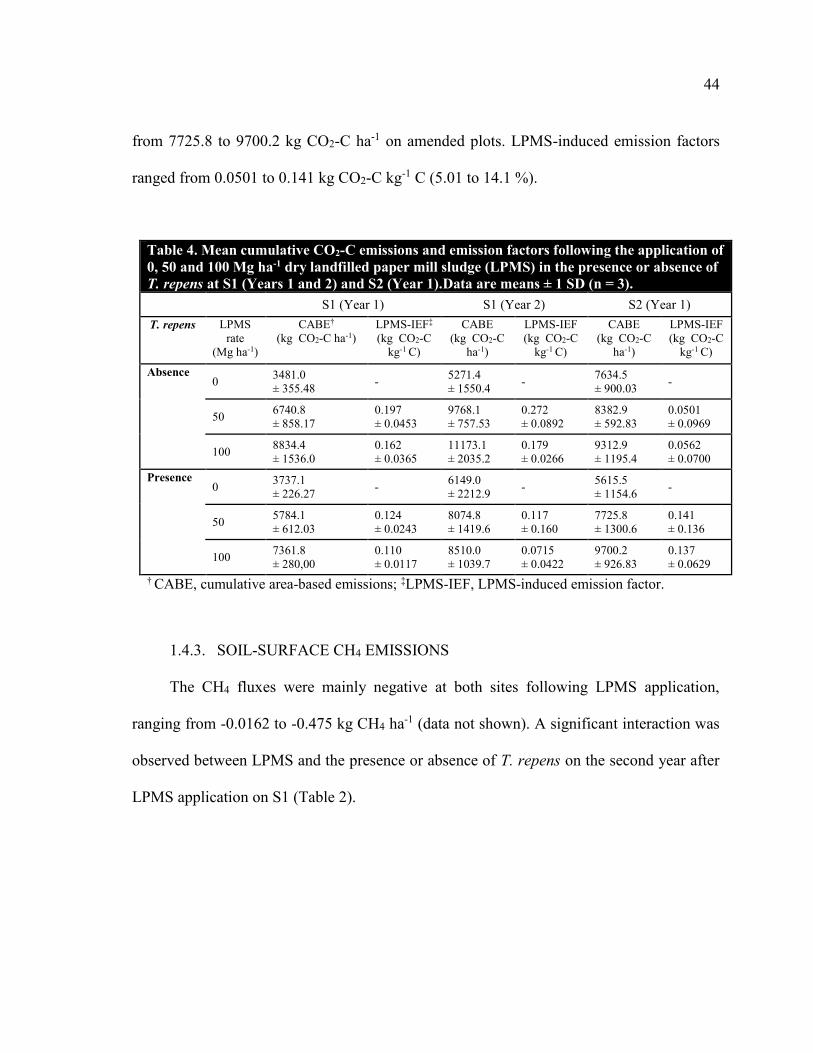
44
from 7725.8 to 9700.2 kg CO2-C ha-1 on amended plots. LPMS-induced emission factors
ranged from 0.0501 to 0.141 kg CO2-C kg-1 C (5.01 to 14.1 %).
1.4.3. SOIL-SURFACE CH4 EMISSIONS
The CH4 fluxes were mainly negative at both sites following LPMS application,
ranging from -0.0162 to -0.475 kg CH4 ha-1 (data not shown). A significant interaction was
observed between LPMS and the presence or absence of T. repens on the second year after
LPMS application on S1 (Table 2).
Table 4. Mean cumulative CO2-C emissions and emission factors following the application of
0, 50 and 100 Mg ha-1 dry landfilled paper mill sludge (LPMS) in the presence or absence of
T. repens at S1 (Years 1 and 2) and S2 (Year 1).Data are means ± 1 SD (n = 3).
S1 (Year 1) S1 (Year 2) S2 (Year 1)
T. repens LPMS
rate
(Mg ha-1)
CABE†
(kg CO2-C ha-1)
LPMS-IEF‡
(kg CO2-C
kg-1 C)
CABE
(kg CO2-C
ha-1)
LPMS-IEF
(kg CO2-C
kg-1 C)
CABE
(kg CO2-C
ha-1)
LPMS-IEF
(kg CO2-C
kg-1 C)
Absence
0 3481.0
± 355.48 -
5271.4
± 1550.4 -
7634.5
± 900.03 -
50 6740.8
± 858.17
0.197
± 0.0453
9768.1
± 757.53
0.272
± 0.0892
8382.9
± 592.83
0.0501
± 0.0969
100 8834.4
± 1536.0
0.162
± 0.0365
11173.1
± 2035.2
0.179
± 0.0266
9312.9
± 1195.4
0.0562
± 0.0700
Presence 0
3737.1
± 226.27 -
6149.0
± 2212.9 -
5615.5
± 1154.6 -
50 5784.1
± 612.03
0.124
± 0.0243
8074.8
± 1419.6
0.117
± 0.160
7725.8
± 1300.6
0.141
± 0.136
100 7361.8
± 280,00
0.110
± 0.0117
8510.0
± 1039.7
0.0715
± 0.0422
9700.2
± 926.83
0.137
± 0.0629
† CABE, cumulative area-based emissions; ‡LPMS-IEF, LPMS-induced emission factor.
45
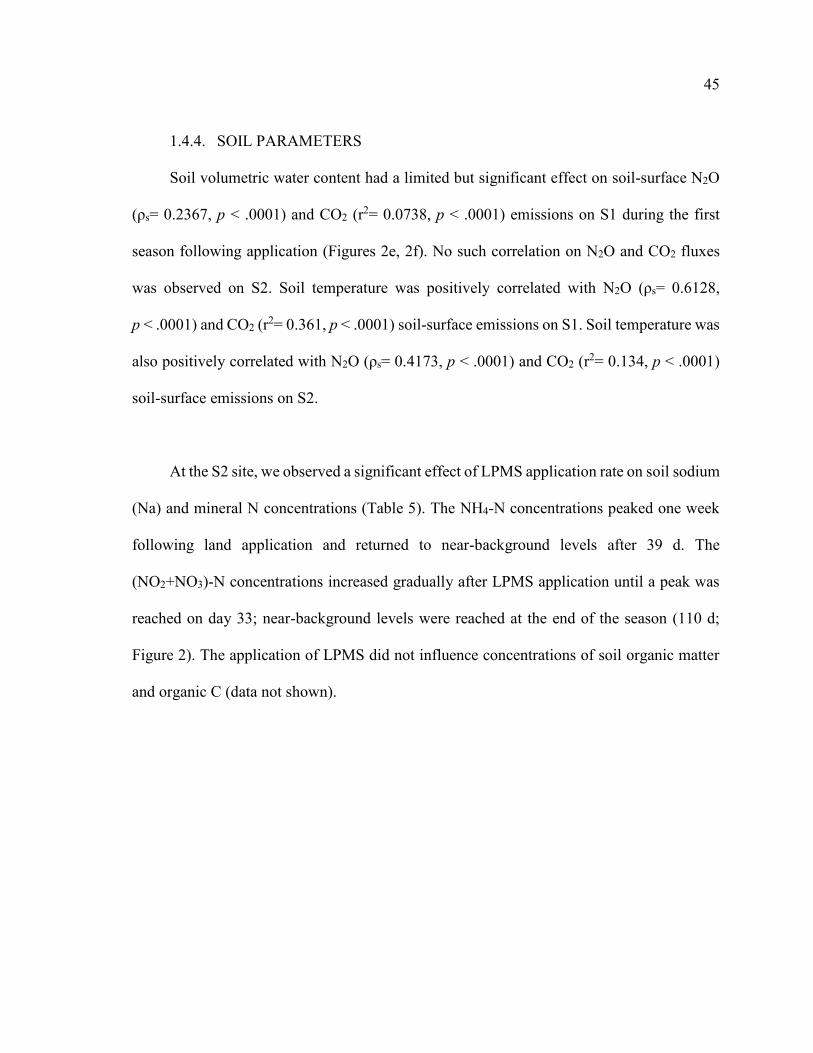
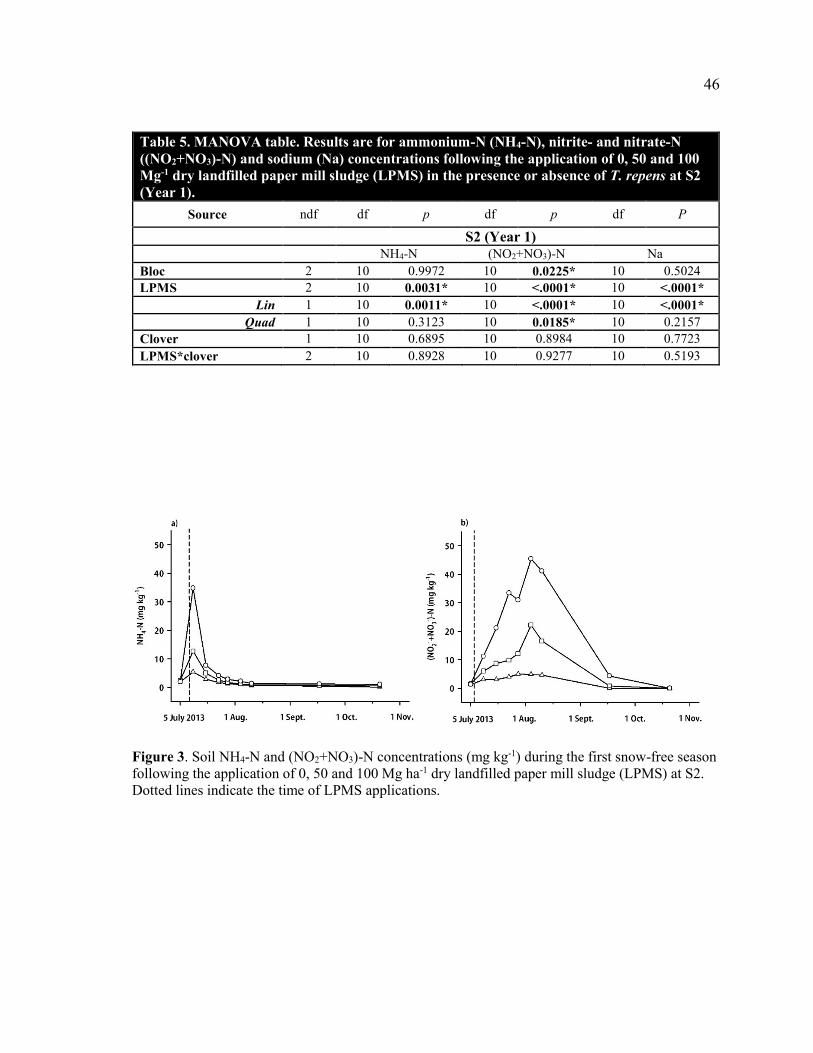
1.4.4. SOIL PARAMETERS
Soil volumetric water content had a limited but significant effect on soil-surface N2O
(ρs= 0.2367, p < .0001) and CO2 (r2= 0.0738, p < .0001) emissions on S1 during the first
season following application (Figures 2e, 2f). No such correlation on N2O and CO2 fluxes
was observed on S2. Soil temperature was positively correlated with N2O (ρs= 0.6128,
p < .0001) and CO2 (r2= 0.361, p < .0001) soil-surface emissions on S1. Soil temperature was
also positively correlated with N2O (ρs= 0.4173, p < .0001) and CO2 (r2= 0.134, p < .0001)
soil-surface emissions on S2.
At the S2 site, we observed a significant effect of LPMS application rate on soil sodium
(Na) and mineral N concentrations (Table 5). The NH4-N concentrations peaked one week
following land application and returned to near-background levels after 39 d. The
(NO2+NO3)-N concentrations increased gradually after LPMS application until a peak was
reached on day 33; near-background levels were reached at the end of the season (110 d;
Figure 2). The application of LPMS did not influence concentrations of soil organic matter
and organic C (data not shown).
46
Table 5. MANOVA table. Results are for ammonium-N (NH4-N), nitrite- and nitrate-N
((NO2+NO3)-N) and sodium (Na) concentrations following the application of 0, 50 and 100
Mg-1 dry landfilled paper mill sludge (LPMS) in the presence or absence of T. repens at S2
(Year 1).
Source ndf df p df p df P
S2 (Year 1)
NH4-N (NO2+NO3)-N Na
Bloc 2 10 0.9972 10 0.0225* 10 0.5024
LPMS 2 10 0.0031* 10 <.0001* 10 <.0001*
Lin 1 10 0.0011* 10 <.0001* 10 <.0001*
Quad 1 10 0.3123 10 0.0185* 10 0.2157
Clover 1 10 0.6895 10 0.8984 10 0.7723
LPMS*clover 2 10 0.8928 10 0.9277 10 0.5193
Figure 3. Soil NH4-N and (NO2+NO3)-N concentrations (mg kg-1) during the first snow-free season
following the application of 0, 50 and 100 Mg ha-1 dry landfilled paper mill sludge (LPMS) at S2.
Dotted lines indicate the time of LPMS applications.
47
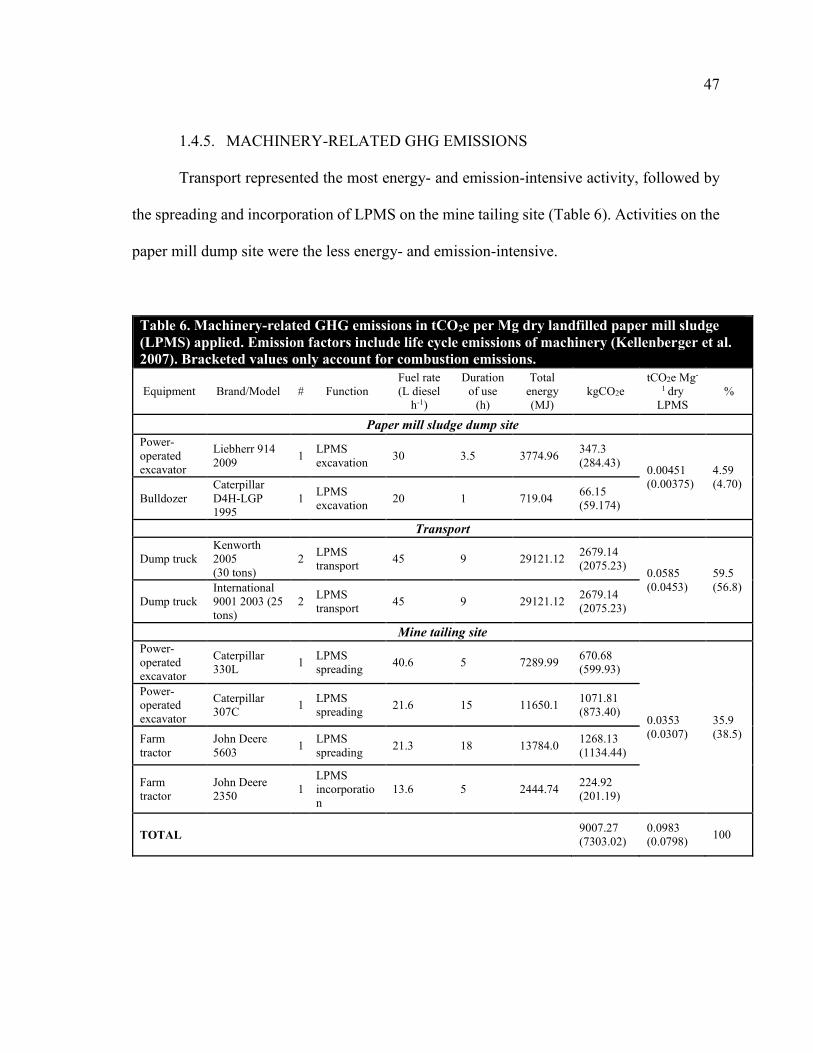
1.4.5. MACHINERY-RELATED GHG EMISSIONS
Transport represented the most energy- and emission-intensive activity, followed by
the spreading and incorporation of LPMS on the mine tailing site (Table 6). Activities on the
paper mill dump site were the less energy- and emission-intensive.
Table 6. Machinery-related GHG emissions in tCO2e per Mg dry landfilled paper mill sludge
(LPMS) applied. Emission factors include life cycle emissions of machinery (Kellenberger et al.
2007). Bracketed values only account for combustion emissions.
Equipment Brand/Model # Function
Fuel rate
(L diesel
h-1)
Duration
of use
(h)
Total
energy
(MJ)
kgCO2e
tCO2e Mg-
1 dry
LPMS
%
Paper mill sludge dump site
Power-
operated
excavator
Liebherr 914
2009 1
LPMS
excavation 30 3.5 3774.96
347.3
(284.43) 0.00451
(0.00375)
4.59
(4.70)
Bulldozer
Caterpillar
D4H-LGP
1995
1 LPMS
excavation 20 1 719.04
66.15
(59.174)
Transport
Dump truck
Kenworth
2005
(30 tons)
2 LPMS
transport 45 9 29121.12
2679.14
(2075.23) 0.0585
(0.0453)
59.5
(56.8)
Dump truck
International
9001 2003 (25
tons)
2 LPMS
transport 45 9 29121.12
2679.14
(2075.23)
Mine tailing site
Power-
operated
excavator
Caterpillar
330L 1
LPMS
spreading 40.6 5 7289.99
670.68
(599.93)
0.0353
(0.0307)
35.9
(38.5)
Power-
operated
excavator
Caterpillar
307C 1
LPMS
spreading 21.6 15 11650.1
1071.81
(873.40)
Farm
tractor
John Deere
5603 1
LPMS
spreading 21.3 18 13784.0
1268.13
(1134.44)
Farm
tractor
John Deere
2350 1
LPMS
incorporatio
n
13.6 5 2444.74 224.92
(201.19)
TOTAL 9007.27
(7303.02)
0.0983
(0.0798) 100
48
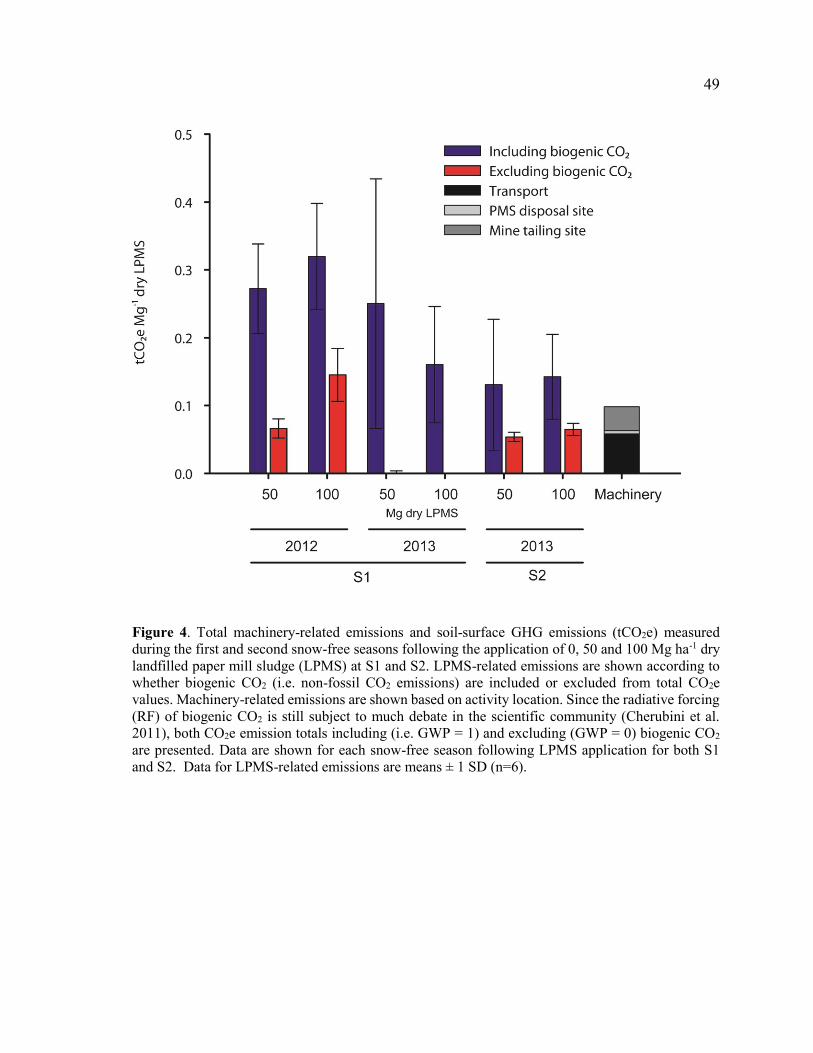
Among the three measured greenhouse gases, CO2 emissions have the greatest impact
on total CO2e values for the first and second snow-free season following LPMS land
application of LPMS (Figure 3). Moreover, CO2 appears to be the only significant contributor
to total CO2e emissions for the second snow free season following application (Figure 3).
Total machinery-related GHG emissions can be higher than LPMS-related emissions for the
first snow-free season following application on S2 when biogenic CO2 was not accounted for
(i.e. non-fossil CO2 emissions are excluded from CO2e values). When biogenic CO2 is
included in total CO2e values, LPMS-related GHG emissions measured during the first and
second snow-free seasons following application were higher than total machinery-related
GHG emissions (Figure 3).
49
Figure 4. Total machinery-related emissions and soil-surface GHG emissions (tCO2e) measured
during the first and second snow-free seasons following the application of 0, 50 and 100 Mg ha-1 dry
landfilled paper mill sludge (LPMS) at S1 and S2. LPMS-related emissions are shown according to
whether biogenic CO2 (i.e. non-fossil CO2 emissions) are included or excluded from total CO2e
values. Machinery-related emissions are shown based on activity location. Since the radiative forcing
(RF) of biogenic CO2 is still subject to much debate in the scientific community (Cherubini et al.
2011), both CO2e emission totals including (i.e. GWP = 1) and excluding (GWP = 0) biogenic CO2
are presented. Data are shown for each snow-free season following LPMS application for both S1
and S2. Data for LPMS-related emissions are means ± 1 SD (n=6).
50
1.5. DISCUSSION
1.5.1. SOIL-SURFACE N2O EMISSION
Cumulative soil-surface N2O emissions on control plots after one growing season
(0.117 to 0.331 kg N2O-N ha-1) were lower than documented average emissions for
unamended agricultural soils (0.405 to 1 kg N2O-N; Granli and Bockman 1994; Bouwman
1996; Mosier et al. 1996; Helgason et al. 2005) and within the documented range for managed
boreal forest soils (0.1 to 0.6 kgN20-N ha-1; IPCC 2006). Cumulative emissions during the
second snow-free seasons were even lower (0.0937 to 0.0576 kgN20-N ha-1), suggesting low
anthropogenic N2O emissions from the non-acidic mine tailing site.
Delays of 6 to 7 d between LPMS application and N2O emission peaks were observed.
Similar delays have been observed by Chadwick et al. (2000) and Chantigny et al. (2001) for
animal farm manures, but other studies have reported much shorter periods (18 to 24 h
(Rochette et al. 2000; 2004). Peak emissions of N2O were short-lived and declined
progressively to reach near background levels after 40 to 46 d. The length of the period of
increased emissions was about 6 d shorter on one site compared to the other site (40 versus
46 d), likely in response to lower N input on S2 (Table 1). These values are in agreement
with periods ranging from 40 to 55 d for mixed primary and secondary paper mill sludge
applied on agricultural clayey soils cropped to corn (Chantigny et al. 2013) and less than 60
d in manure-amended soils (see Rochette et al. 2008). These results suggest that if the
magnitude of N2O-N losses following LPMS application may vary, most of the amendment-
induced emissions are likely to occur within the first 60 d after application.
51
Nitrous oxide is mostly produced in soils as a by-product of nitrification and as an
intermediate of denitrification (Davidson et al. 1986); relationships between factors
controlling the rates of these reactions and measured GHG emissions were therefore
investigated. Soil water content and temperature are known to influence N2O emissions
through their effect on microbial activity and O2 availability (Knowles 1982). In this study,
soil moisture content was found to be correlated with N2O emissions on S1, while the
opposite was observed on S2. Interestingly, peak N2O emissions on S1 were associated with
higher soil moisture, while peaks on S2 were associated with lower WFPS values (i.e. < 50 %,
data not shown). All WFPS values on S2 were lower than the 60-65 % thresholds beyond
which soil water content promotes N2O emissions through intense denitrification (Linn and
Doran 1984; Adviento-Borbe et al., 2006; Maljanen et al. 2007). Moreover, a single sampling
for bulk density at the end of the 2013 growing season is likely to overestimate WFPS values
for S2.
The positive correlation observed between soil temperature and N2O fluxes on both
sites is probably due to the fact that both highest soil-surface emissions and temperatures
were observed at the beginning of the sampling seasons, with both decreasing fluxes and
temperatures later on.
Results thus indicate that soil moisture content (either expressed as % (v/v) or WFPS)
and temperature were poor explanatory variables of soil-surface N2O fluxes in this study.
52
Other studies documented significant effect of these parameters on N2O fluxes following the
input of PMS (Baggs et al. 2002) or manure (Chantigny et al. 2013; Pelster et al. 2012;
Gagnon et al. 2011; Chantigny et al. 2010; Rochette et al. 2008), while Jarecki et al. (2008)
did not observe relationship between WFPS and N2O emission levels in neither sandy or
clayey soils. Therefore, factors other than environmental parameters most probably
influenced N2O emissions in this study.
Easily oxidizable C and mineral N availability have been documented to influence
N2O emissions through nitrification and denitrification, both in laboratory (Azam et al. 2002)
and field experiments (Petersen et al. 2008; Rochette et al. 2008). Anoxic conditions
prevailing in PMS disposal sites create suitable conditions for the production of NH4-N and
easily biodegradable C compounds such as volatile fatty acids (VFA), alcohols and phenols
(Spoelstra 1979). This phenomenon has been documented for several organic amendments
such as pig and cattle slurries (Kirchmann and Lundvall 1993) and poultry manure
(Kirchmann and Witter 1989), and for organic marine sediments (Valdemarsen and
Kristensen 2010). Easily oxidizable C compounds are rapidly utilized by soil microorganisms
in the presence of atmospheric O2 (Paul & Beauchamp 1989, Chantigny et al. 2004). This is
consistent with CO2 emission peaks in the days following LPMS application on both sites
since respiration rates are a good indicator of soil available C levels (Rochette et al. 2000).
53
The observed N2O peaks at S2 were followed by a rapid increase and subsequent
decrease in NH4-N availability during the first three weeks after application, with a peak
reached after one week. This is in agreement with field essays reporting complete nitrification
of NH4-N within 10 to 30 d after pig slurry application (Chantigny et al. 2001; Rochette et
al. 2004; Chantigny et al. 2010). The NH4-N peaks coincided with CO2 emission peaks on
S2, suggesting the presence of heterotrophic nitrification. The substrate, i.e. calcareous
tailings, covered with forest burden is a potentially thriving habitat for fungi, known as
potential heterotrophic nitrifiers (Odu and Adeoye 1970; Kester et al. 1997) under aerobic
conditions, at low pH and in the presence of available organic matter (Papen et al. 1989;
Anderson et al. 1993). Also, Sharma et al. (2010) documented microorganisms (i.e. bacteria
and fungi) active in cellulose breakdown in organic wastes of a paper mill landfill site in the
region of South Assam (India), suggesting that such microorganisms were already present in
the applied LPMS.
At S2, CO2 emission peaks observed later in the growing season, once N2O fluxes
had returned to background levels, further suggest that heterotrophic nitrification took place
on one of our sites. In laboratory assays led by Stevens et al. (1997), denitrification was the
dominant process at the beginning of the incubation, while nitrification was more important
for the remaining of the experiment, contributing to 70 % of the overall N2O fluxes,
regardless of soil moisture content. Nitrification was also documented to continue longer
than observed N2O fluxes (Mulvaney et al. 1997; Williams et al. 1998), which is coherent
54
with the observed late (NO2+NO3)-N build up found in our experiment (Figure 3). These
factors thus suggest that heterotrophic nitrification played a role in N2O production at both
sites following LPMS application.
Soil NH4-N availability promotes microbial activity, which may stimulate O2
consumption and maintain anaerobic conditions at the microsite levels, promoting
denitrification (Bergstrom et al. 1994; Azam et al. 2002), even under apparently aerobic
conditions (Beauchamp et al. 1989). Also, N2O emissions have been documented to be
correlated with soluble organic C availability in coarse-textured soils (Petersen et al. 2008;
Chantigny et al. 2010), likely through increased heterotrophic respiration and denitrifier
activity (Azam et al. 2002). These observations suggest that denitrification also played a role
in N2O production in this study, and was limited by labile C availability, as reported by Azam
et al. (2002), Rochette et al. (2004) and Rochette et al. (2008). The rapid increase and
subsequent decrease in CO2 emissions following LPMS application observed at S1 suggest
that easily oxidizable C was rapidly metabolized by soil microbes, leaving recalcitrant C
material such as lignin and cellulose (Camberato et al. 2006) and limited available C for
denitrification.
Average LPMS-IEF values for applied N (1.04 to 2.22 %) were higher than the
average of 0.9 % reported by Chantigny et al. (2013) for mixed paper sludge. Baggs et al.
(2002) reported values of 5 % but assumed all N2O-N was derived from applied PMS, which
55
likely contributes to overestimations by unknown proportions. LPMS-IEF values were
generally higher than IPCC default value of 1 % (IPCC 2006), which is coherent with other
studies in Québec documenting N2O-N emissions from organic amendments on coarse-
textured soil: 1.3 % for solid manure on loam (Gregorich et al. 2005); 1.23 to 1.65 % for pig
slurry on loam (Rochette et al. 2000); 1.8 % for chicken manure on sandy loam (Pelster et al.
2012); 1.2 to 2.4 % for liquid swine manures on loam (Chantigny et al. 2010) and 2.73 % for
pig slurry on loam (Rochette et al. 2004). Average fertilizer-induced emission factors (FIEF)
values documented for mineral fertilizers (1.18-1.19 %; Gregorich et al. 2005; Helgason et
al. 2005) suggest higher average FIEF for organic amendments than for mineral fertilizers,
such as the LPMS-IEF measured in this study.
1.5.2. SOIL-SURFACE CO2 EMISSIONS
Soil-surface CO2 fluxes have been documented as a good indicator of organic
amendment decomposition and C mineralization rates (Rochette et al. 2006). Soil-surface
CO2 fluxes are coherent with the two phases of organic amendment decomposition generally
observed, i.e. rapid decomposition followed by slow and long-term decomposition (Fierro et
al. 2000; Camberato et al. 2006). High rates of C mineralization immediately after organic
amendment application have been documented on several occasions for liquid manures,
which are rich in volatile organic compounds (Rochette et al. 2004). In this study, cumulative
CO2-C emissions represented 5 to 20 % of C applied with LPMS after the first snow-free
season, and 7 to 27 % after the second snow-free season. Those values are much lower than
56
those reported by Gregorich et al. (1998; 55 % for solid dairy cattle manure), Kirchmann &
Lundvall (1993; 42-65% for swine and cattle slurry), Rochette et al. (2004; 63 % for spring
application of pig slurry) and Bernal & Kirchmann (1992; 105 % for anaerobically treated
manure). This is probably due to the higher content of recalcitrant C such as cellulose and
lignin in LPMS compared to animal manures (Camberato et al 2006). Our results are also
consistent with results from previous studies reporting that 40 % of deinking paper sludge
remained in the soil two years after application (Chantigny et al. 1999). However, this
contrasts with the absence of an effect of LPMS application rate on soil C content. The
absence of variations in soil total C, organic C and organic matter content following land
application is questionable considering the documented effect of PMS application on soil
organic matter content (Gallardo et al. 2012). This could be explained either by the high
inorganic C content of the mine tailings interfering with soil analyses, or by organic C being
mostly available in the form of water exchangeable organic C (WEOC) which has not been
monitored in this study.
1.5.3. MACHINERY-RELATED GHG EMISSIONS
To our knowledge, there is no study quantifying machinery-related GHG emissions
from land application of neither landfilled nor fresh PMS. However, scarce data can be found
for other types of organic amendments. Wu et al. (2013) calculated 0.992, 0.640 and 1.90 kg
CO2e Mg-1 for collection, transportation (5 km) and spreading of feedlot manure,
respectively, which accounts for about 1.2 % of total life cycle emissions associated with
57
land application of manure. The large differences between these results and the values
presented in the present study suggest important methodological incompatibility between the
two methods. Using the BEAM model (CCME 2009), Villeneuve and Dessureault (2011)
modelled 0.023 and 0.0089 tCO2e Mg-1 for transportation and machinery use for agricultural
land application of dry municipal sludge, respectively. These numbers are closer to the
0.0582 and 0.036 tCO2 reported in our study.
Total machinery-related emissions, i.e. 3.4 t CO2e or 0.93 t C ha-1 for a targeted rate
of 35 Mg dry ha-1, can have important repercussions on the carbon budget of reclamation
project using LPMS. Ussiri and Lal (2005) documented SOC sequestration potentials ranging
from 0.3 to 1.85 Mg C ha-1 yr-1 and from 0.2 to 1.64 Mg C ha-1 yr-1 for minesoils under
pasture/grassland and forest land use management, respectively. Emissions of 0.93 t C ha-1
caused by LPMS excavation, transportation and land application could thus potentially
cancel out a significant portion of C sequestered in soils through the use of LPMS as soil
amendment.
1.5.4. LANDFILLED PMS CHARACTERIZATION
Large differences between the two LPMS applications suggest that LPMS properties
were not uniform across the paper mill sludge disposal site. These variations could be
explained by three main factors, namely 1) the inherent spatial variability as affected by
topography, weather and operations; 2) temporal variations in rates of primary-to-secondary
58
sludge generated through pulp production processes; and 3) the uneven disposal of by-
products such as clays and ashes, wood chips and calcic residues (Désilets 2000). These three
factors make it difficult to predict the properties of excavated LPMS. Therefore, this
variability must be taken into account when determining suitability of LPMS for soil
reclamation purposes.
1.6. CONCLUSION
Our results show that the application of 50 and 100 Mg ha-1 dry LPMS on a non-
acidic mine tailing site increased soil-surface N2O fluxes, with cumulative emissions ranging
from 7.56 to 34.7 kg N2O ha-1 after one snow-free season. LPMS-induced emission factors
ranged from 0.0104 to 0.0222 kg N2O-N kg-1 N applied, which is similar to reported values
for well-documented organic amendments such as pig and cattle slurries applied to coarse-
textured soils in Québec. The CO2 emissions from LPMS decomposition had the greatest
contribution on total CO2e values for the first and second snow-free season following
application. Total machinery-related emissions (0.0983 tCO2e Mg-1 dry LPMS) can be higher
than LPMS-related emissions (0.0538-0.145 tCO2e Mg-1 dry LPMS) when biogenic CO2 is
not accounted for. Future studies should aim at quantifying and comparing GHG emission
budgets of alternative PMS disposal options in order to inform climate-sound public policies.
CONCLUSION GÉNÉRALE
Les nouvelles connaissances qu’aura permis d’acquérir le projet de recherche décrit
au présent mémoire sont de trois principaux ordres : 1) d’ordre scientifique et académique de
par la publication de données inédites dans la littérature scientifique; 2) d’ordre opérationnel
grâce à l’acquisition de nouveaux savoir-faire; et 3) d’ordre politique et règlementaire en
raison de l’éclairage que permettent de porter les résultats sur certaines politiques de nature
publique.
Les bénéfices et obstacles liés au recyclage de biosolides de papetières sont bien
documentés dans la littérature scientifique (Camberato et al. 2006). Quelques études
seulement se sont intéressées aux émissions de gaz à effet de serre (GES) attribuables à leur
épandage en contexte agricole (Chantigny et al. 2013; Baggs et al. 2002). Toutefois, aucune
étude publiée n’avait à ce jour documenté les émissions de GES attribuables à chacune des
étapes d’un projet de valorisation de biosolides de papetières préalablement enfouis (BPPE)
pour la remise en état d’un site dégradé.
L’épandage de 50 et 100 Mg anhydre ha-1 de BPPE a augmenté les émissions de
protoxyde d’azote (N2O) et de dioxyde de carbone (CO2) à la surface du sol comparativement
à un scénario sans amendement et ce, au cours de la première saison de croissance suivant
l’épandage. L’effet d’une interaction croisée de la présence de biosolides et de trèfle blanc
60
(T. repens) sur les émissions de CO2 a également été documentée sur l’un des deux sites à
l’étude. Les émissions de CO2 attribuables à l’épandage de 50 et 100 Mg anhydre BPPE ha-
1 demeurent significativement plus élevées qu’en l’absence d’amendement durant la seconde
saison suivant l’épandage. Finalement, une interaction croisée de l’application de biosolides
et de T. repens sur les flux de méthane (CH4) a été observée sur l’un des deux sites lors de la
deuxième année de mesure. La nature (c.-à-d. flux négatifs) et la faible ampleur de ces flux
relativisent cependant l’importance de ce résultat aux fins de l’étude.
L’hypothèse selon laquelle les émissions de GES attribuables à la combustion de
carburants fossiles par la machinerie mobilisée par le projet seraient supérieures aux
émissions issues de la décomposition des boues n’est pas soutenue dans le cas de biosolides
de papetières préalablement enfouis épandus sur un site dégradé. Lorsqu’exprimée en
équivalent-CO2, la moyenne des émissions cumulées de GES dues à la décomposition des
biosolides est supérieure aux émissions attribuables à la machinerie lorsque le CO2 d’origine
biogénique est inclus au bilan (c.-à-d. potentiel de réchauffement planétaire (PRP) attribué
de 1). Dans le cas où le CO2 d’origine biogénique est exclu du bilan (c.-à-d. PRP = 0), les
émissions fossiles associées à la machinerie mobile se sont avérées plus importantes, à
l’exception des parcelles expérimentales ayant reçu 100 Mg anhydre ha-1 sur l’un de deux
sites.
61
Ces résultats mettent en lumière l’importance pour la communauté scientifique de
poursuivre les recherches visant à mieux définir le forçage radiatif attribuable aux émissions
de CO2 issues de la décomposition et de la combustion de la biomasse (Cherubini et al. 2011).
Surtout, ils permettent d’apprécier l’importance d’inclure les émissions liées au transport au
bilan complet des émissions de GES d’un projet de valorisation de MRF, de même que
l’influence importante du transport sur les bénéfices climatiques potentiels de ces projets. En
effet, les distances considérées dans le projet à l’étude (c.-à-d. 25 km entre l’usine de pâtes
et papiers et le site du projet) sont relativement faibles par rapport à d’autres contexte,
notamment celui des terrains dégradés situés en zones isolées (ex. milieux nordiques). En
conséquence, il semble raisonnable de supposer que pour une majorité de projets semblables,
les émissions de GES attribuables à la combustion de carburants fossiles par la machinerie
mobile puissent s’avérer supérieures aux émissions issues de la décomposition des BPPE
pendant deux années.
Aucune étude répertoriée ne s’était par le passé intéressée aux propriétés
agronomiques et au potentiel de valorisation des biosolides de papetières préalablement
enfouis. De l’avis-même du ministère du Développement durable, de l’Environnement et des
Parcs (MDDEP), il s’agissait de la première fois qu’une demande concernant l’extraction de
biosolides enfouis était formulée au bureau régional pour le Saguenay–Lac-St-Jean (Luc
Boily, juin 2012, communication personnelle). Les résultats issus du présent mémoire
suggèrent que certaines caractéristiques des BPPE se comparent à celles d’autres
62
amendements organiques comme les lisiers, notamment en ce qui a trait à la proportion
d’azote appliqué perdu sous forme de N2O-N. Par contre, les caractéristiques des biosolides
de papetières enfouis peuvent s’avérer très variables d’un endroit et d’une profondeur à une
autre sur un même site d’enfouissement. Les implications opérationnelles de cette
observation sont la difficulté de bien prévoir les propriétés du matériel à être excavé et
épandu, de même que les délais supplémentaires à prévoir pour la production des plans de
fertilisation et des certificats d’autorisation exigés pour ce type de matière résiduelle
fertilisante.
La mise en œuvre du projet et les préparatifs l’ayant précédé ont permis de constater
que la valeur agronomique des biosolides de papetières enfouis n’est pas uniforme d’une
fabrique de pâtes et papiers à une autre. Un agriculteur rencontré lors de la mise en place du
dispositif expérimental a confirmé ce constat à la vue et au toucher du matériel utilisé aux
fins de l’étude. À l’inverse, certaines installations pratiquant le désencrage peuvent générer,
entres autres, des résidus de plastique, alors que d’autres mélangent leurs eaux grises aux
eaux de procédé, occasionnant par le fait-même la présence de pathogènes. Ces facteurs
peuvent affecter considérablement le potentiel de valorisation des boues enfouies. Les
industriels intéressés à faire valoir la pertinence du « stockage temporaire » comme filière de
valorisation auraient donc la responsabilité éventuelle de mettre en œuvre les changements
nécessaires afin d’assurer une qualité de matériel intéressante et uniforme pour l’épandage,
ce qui impliquerait des modifications à leur mode de gestion de ces résidus.
63
Finalement, les émissions de GES attribuables à l’épandage de biosolides de
papetières enfouis met en lumière le besoin de poursuivre les recherches visant à identifier la
filière de valorisation la moins émettrice pour cette matière résiduelle fertilisante (MRF). Le
Gouvernement du Québec a récemment identifié l’épandage agricole comme mode de
valorisation à favoriser dans le but de réduire les émissions québécoises de GES liées à cette
source. Toutefois, aucune donnée publiée ne confirme l’hypothèse selon laquelle cette filière
serait préférable à la valorisation énergétique ou à l’enfouissement en termes d’intensité
carbonique sur l’ensemble du cycle de vie. Des efforts de recherche en ce sens ont été menés
au cours des dernières années (Faubert et al. 2014). Dans ce contexte, la présente étude ajoute
de nouveaux éléments d’information aux rares données actuellement disponibles sur le sujet
(Chantigny et al. 2013; Baggs et al. 2002) et soutient l’hypothèse selon laquelle l’épandage
de biosolides de papetières peut représenter une source de GES.
L’objectif québécois d’abolir l’enfouissement de toute matière organique putrescible
d’ici 2020 (Gouvernement du Québec 2011) présente des défis importants pour les
industriels, notamment les usines de pâtes et papiers. Entre autres contraintes, l’accès difficile
aux champs agricoles par temps pluvieux et en période hivernale limite la capacité des
papetières de valoriser en continu leurs résidus de traitements des eaux de procédés. La
présente étude a permis d’évaluer la faisabilité d’extraire d’importantes quantités de matière
des sites d’enfouissement de papetières ainsi que la qualité du produit qui en résulte. Ce
résultat, d’ordre opérationnel, pourrait s’avérer pertinent à la fois pour les industriels, qui

64
doivent planifier la disposition de leurs résidus, et pour les autorités compétentes qui
pourraient faire du « stockage temporaire » une filière de valorisation alternative et distincte
de l’enfouissement traditionnel.
RÉFÉRENCES CITÉES
Adviento-Borbe, M.A.A., J.W. Doran, R.A. Drijber and A. Dobermann. 2006. Soil
electrical conductivity and water content affect nitrous oxide and carbon dioxide emissions
in intensively managed soils. J. Environ. Qual. 35: 1999-2010.
Anderson, I.C., M. Poth, J. Homstead and D. Burdige. 1993. A comparison of NO and N2O
production by the autotrophic nitrifier Nitrosomonas europea and the heterotrophic nitrifier
Alcaligenes faecalis. Appl. Environ. Microbiol. 59: 3525-3533.
Arrhenius, S. 1896. On the influence of carbonic acid in the air upon the temperature of the
ground. Lond. Edinb. Dubl. Phil. Mag. (Fifth series) 41: 237-275.
Azam, F., C. Muller, A. Weiske, G. Benckiser and J.C.G. Ottow. 2002. Nitrification and
denitrification as sources of atmospheric nitrous oxide - role of oxidizable carbon and
applied nitrogen. Biol. Fertil. Soils 35: 54-61.
Baggs, E.M., R.M. Rees, K. Castle, A. Scott, K.A. Smith and A.J.A. Vinten. 2002. Nitrous
oxide release from soils receiving N-rich crop residues and paper mill sludge in eastern
Scotland. Agric. Ecosyst. Environ. 90: 109-123.
Beauchamp, E.G., J.T. Trevors and J.W. Paul. 1989. Carbon sources for bacterial
denitrification. In: B. A. Stewart, editor, Advances in Soil Science. Springer, New York.
p.113-142.
Bellamy, K.L., C. Chong and R.A. Cline. 1995. Paper sludge utilization in agriculture and
container nursery culture. J. Environ. Qual. 24: 1074-1082.
Bernal, M.P. and H. Kirchmann. 1992. Carbon and nitrogen mineralization and ammonia
volatilization from fresh, aerobically and anaerobically treated pig manure during
incubation with soil. Biol. Fertil. Soils 13: 135-141.
Bonan, G.B. 2008. Forests and climate change: Forcings, feedbacks, and the climate
benefits of forests. Science 320: 1444-1449.
Bouwman, A.F. 1996. Direct emission of nitrous oxide from agricultural soils. Nutr. Cycl.
Agroecosyst. 46: 53-70.
Brockway, D.G. 1983. Forest floor, soil, and vegetation responses to sludge fertilization in
red and white pine plantations. Soil Sci. Soc. Am. J. 47: 776-784.
66
Brown, S. and P. Leonard. 2004. Building carbon credits with biosolids recycling.
BioCycle 45: 25-29.
Camberato, J.J., B. Gagnon, D.A. Angers, M.H. Chantigny and W.L. Pan. 2006. Pulp and
paper mill by-products as soil amendments and plant nutrient sources. Can. J. Soil Sci. 86:
641-653.
Carpenter, A.F. and I.J. Fernandez. 2000. Pulp sludge as a component in manufactured
topsoil. J. Environ. Qual. 29: 387-397.
Castignetti, D. and T.C. Hollocher. 1984. Heterotrophic nitrification among denitrifiers.
Appl. Environ. Microbiol. 47: 620-623.
Catricala, C.E., W.B. Bowden, C.T. Smith and W.H. McDowell. 1996. Chemical
characteristics of leachate from pulp and paper mill residuals used to reclaim a sandy soil.
Water Air Soil Pollut. 89: 167-187.
Chadwick, D.R., B.F. Pain and S.K.E. Brookman. 2000. Nitrous oxide and methane
emissions following application of animal manures to grassland. J. Environ. Qual. 29: 277-
287.
Chantigny, M.H., D.A. Angers and C.J. Beauchamp. 1999. Aggregation and organic matter
decomposition in soils amended with de-inking paper sludge. Soil Sci. Soc. Am. J. 63:
1214-1221.
Chantigny, M.H., D.E. Pelster, M.H. Perron, P. Rochette, D.A. Angers, L.E. Parent, et al.
2013. Nitrous oxide emissions from clayey soils amended with paper sludges and biosolids
of separated pig slurry. J. Environ. Qual. 42: 30-39.
Chantigny, M.H., P. Rochette and D.A. Angers. 2001. Short-term C and N dynamics in a
soil amended with pig slurry and barley straw: a field experiment. Can. J. Soil Sci. 81: 131-
137.
Chantigny, M.H., P. Rochette, D.A. Angers, D. Massé and D. Côté. 2004. Ammonia
volatilization and selected soil characteristics following application of anaerobically
digested pig slurry. Soil Sci. Soc. Am. J. 68 : 306-312.
Chantigny, M.H., P. Rochette, D.A. Angers, S. Bittman, K. Buckley, D. Masse, et al. 2010.
Soil nitrous oxide emissions following band-incorporation of fertilizer nitrogen and swine
manure. J. Environ. Qual. 39: 1545-1553.
Cherubini, F., G.P. Peters, T. Berntsen, A.H. Stromman and E. Hertwich. 2011. CO2
emissions from biomass combustion for bioenergy: atmospheric decay and contribution to
global warming. GCB Bioenergy 3: 413-426.
67
Chow, T.L., H.W. Rees, S.H. Fahmy and J.O. Monteith. 2003. Effects of pulp fibre on soil
physical properties and soil erosion under simulated rainfall. Can. J. Soil Sci. 83: 109-119.
Davidson, E.A., W.T. Swank and T.O. Perry. 1986. Distinguishing between nitrification
and denitrification as sources of gaseous nitrogen-production in soil. Appl. Environ.
Microbiol. 52: 1280-1286.
Désilets, L. 2003. Qu'advient-il des boues de traitement des papetières? Vecteur
Environnement 36: 47-53.
Désilets, L. 2000. La valorisation des résidus des papetières : état de la situation et
perspectives. Colloque sur les biosolides. Les biosolides : une richesse pour nos sols,
Montebello. 16-17 mars 2000. Gouvernement du Québec, Ste-Foy.
Dubash, N.K., M. Hagemann, N. Hohne and P. Upadhyaya. 2013. Developments in
national climate change mitigation legislation and strategy. Clim. Policy 13: 649-664.
Dyson, F.J. 1977. Can we control the carbon dioxide in the atmosphere? Energy 2: 287-
291.
Edwards, J.H. and A.V. Someshwar. 2000. Chemical, physical, and biological
characteristics of agricultural and forest by-products for land application. In: J. F. Power, J.
M. Bartels and W. A. Dick, editors, Land application of agricultural, industrial and
municipal by-products. SSSA, Madison, WI. p. 1-62.
ESRL-NOAA. 2013. CO2 at NOAA’s Mauna Loa Observatory reaches new milestone:
Tops 400 ppm. http://www.esrl.noaa.gov/news/2013/CO2400.html (accessed 24 Jan. 2014).
FAO. 2006. World reference base for soil resources 2006. In: I. W. G. WRB, editor, World
Soil Resources Reports. Rome.
Faubert, P., N. Bertrand, S. Bouchard, M.H. Chantigny, R. Côté, P.-L. Dessureault, S.
Durocher, C. Lemay-Bélisle, M. Paré, P. Rochette, P. Tremblay, N. Ziadia, and C.
Villeneuve. 2014. Management of paper mill sludge: what is the best scenario to mitigate
greenhouse gas emissions? Presented at: 7th Canadian Biosolids and Residual Conference,
Vancouver, BC, Canada. 4-7 June, 2014.
Feldkirchner, D.C., C. Wang, S.T. Gower, E.L. Kruger and J. Ferris. 2003. Effects of
nutrient and paper mill biosolids amendments on the growth and nutrient status of
hardwood forests. For. Ecol. Manage. 177: 95-116.
Fierro, A., D.A. Angers and C.J. Beauchamp. 2000. Decomposition of paper de-inking
sludge in a sandpit minesoil during its revegetation. Soil Biol. Biochem. 32: 143-150.
68
Fraser, D.S., K. O'Halloran and M.R. van den Heuvel. 2009. Toxicity of pulp and paper
solid organic waste constituents to soil organisms. Chemosphere 74: 660-668.
Gaboury, S., J.F. Boucher, C. Villeneuve, D. Lord and R. Gagnon. 2009. Estimating the net
carbon balance of boreal open woodland afforestation: A case-study in Quebec's closed-
crown boreal forest. For. Ecol. Manage. 257: 483-494.
Gagnon, B., N. Ziadi, P. Rochette, M.H. Chantigny and D.A. Angers. 2011. Fertilizer
source influenced nitrous oxide emissions from a clay soil under corn. Soil Sci. Soc. Am. J.
75: 595-604.
Gallardo, F., M. Cea, G.R. Tortella and M.C. Diez. 2012. Effect of pulp mill sludge on soil
characteristics, microbial community and vegetal production of Lolium perenne. J. Environ.
Manage. 95: S193-S198.
Gouvernement du Québec. 2012. Plan d'action 2013-2020 sur les changements climatiques.
Le Québec en action vert 2020. Ministère du Développement durable, de l’Environnement
et des Parcs, Québec.
Gouvernement du Québec. 2011. Politique québécoise de gestion des matières résiduelles.
Éditeur officiel du Québec, Décret 100-2011, 16 février 2011, Québec.
Gower, S.T. 2003. Patterns and mechanisms of the forest carbon cycle. Annu. Rev. Env.
Resour. 28: 169-204.
Granger, F., R. Marenger, P.Y. Michon, S. Boukatem, R. Lamaute and S. Sigouin. 2007.
Kraft mill primary sludge mulch for hybrid poplar plantations in western Quebec, Canada:
Results for 8 years of plantation. In: R. J. LeBlanc, P. J. Laughton and R. Tyagi, editors,
Moving forward wastewater biosolids sustainability: technical, managerial, and public
synergy. New-Brunswick. p. 919-925.
Granli, T. and O.C. Bockman. 1994. Nitrous oxide (N2O) from agriculture. Norw. J. Agric.
Sci., Supplement No. 12, 1-128.
Gregorich, E.G., P. Rochette, S. McGuire, B.C. Liang and R. Lessard. 1998. Soluble
organic carbon and carbon dioxide fluxes in maize fields receiving spring-applied manure.
J. Environ. Qual. 27: 209-214.
Gregorich, E.G., P. Rochette, A.J. VandenBygaart and D.A. Angers. 2005. Greenhouse gas
contributions of agricultural soils and potential mitigation practices in Eastern Canada. Soil
Tillage Res. 83: 53-72.
Haering, K.C., W.L. Daniels and S.E. Feagley. 2000. Reclaiming mined lands with
biosolids, manures, and papermill sludges. In: R. Barnhisel, R. G. Darmody and W. L.
69
Daniels, editors, Reclamation of drastically disturbed lands. American Society of
Agronomy, Crop Science Society of America, Soil Science Society of America. p. 615-644.
Hargreaves, J., A. Lock, P. Beckett, G. Spiers, B. Tisch, L. Lanteigne, et al. 2012.
Suitability of an organic residual cover on tailings for bioenergy crop production: A
preliminary assessment. Can. J. Soil Sci. 92: 203-211.
Helgason, B.L., H.H. Janzen, M.H. Chantigny, C.F. Drury, B.H. Ellert, E.G. Gregorich, et
al. 2005. Toward improved coefficients for predicting direct N2O emissions from soil in
canadian agroecosystems. Nutr. Cycl. Agroecosyst. 72: 87-99.
Holland, E.A., G.P. Robertson, J. Greenburg, P. Groffman, R. Boone and J. Gosz. 1999.
Soil CO2, N2O and CH4 exchange. In: G. P. Robertson, C. S. Bledsoe, D. C. Coleman and
P. Sollins, editors, Standard soil methods for long-term ecological research. Oxford
University Press, New-York. p. 185-201.
Hutchinson, G.L. and A.R. Mosier. 1981. Improved soil cover method for field
measurement of nitrous oxide fluxes. Soil Sci. Soc. Am. J. 45: 311-316.
IPCC. 2014. Summary for policymakers. In: O. Edenhofer, R. Pichs-Madruga, Y. Sokona,
E. Farahani, S. Kadner, K. Seyboth, A. Adler, I. Baum, S. Brunner, P. Eickemeier, B.
Kiremann, J. Savolainen, S. Schlömer, C. von Stechow, T. Zwickel and J.C. Minx, editors,
Climate Change 2014, Mitigation of Climate Change. Contribution of Working Group III
to the Fifth Assessment Report of the Intergovernmental Panel on Climate Change.
Cambridge University Press, Cambridge, United Kingdom and New York, NY, USA.
IPCC. 2014. Summary for policymakers. In: C. B. Field, V. R. Barros, D. J. Dokken, K. J.
Mach, M. D. Mastrandrea, T. E. Bilir, M. Chatterjee, K. L. Ebi, Y. O. Estrada, R. C.
Genova, B. Girma, E. S. Kissel, A. N. Levy, S. MacCracken, P. R. Mastrandrea and L. L.
White, editors, Climate Change 2014: Impacts,Adaptation, and Vulnerability. Part A:
Global and Sectoral Aspects. Contribution of Working Group II to the Fifth Assessment
Report of the Intergovernmental Panel on Climate Change. Cambridge University Press,
Cambridge, United Kingdom and New York, NY, USA. p. 32.
IPCC. 2006. 2006 IPCC Guidelines for national greenhouse gas inventories, prepared by
the National Greenhouse Gas Inventories Programme. In: E. H.S., B. L., M. K., N. T. and
T. K., editors, Institute for Global Environmental Studies (IGES), Japan.
IPCC. 2013. Climate Change 2013: The Physical Science Basis. Contribution of Working
Group I to the Fifth Assessment Report of the Intergovernmental Panel on Climate Change.
In: T. F. Stocker, D. Qin, G.-K. Plattner, M. Tignor, S. K. Allen, J. Boschung, A. Nauels,
Y. Xia, V. Bex and P. M. Midgley, editors, Cambridge, United Kingdom and New York,
NY, USA. p. 1535 pp.
70
Janzen, H.H. 2004. Carbon cycling in earth systems - a soil science perspective. Agric.
Ecosyst. Environ. 104: 399-417.
Jarecki, M.K., T.B. Parkin, A.S.K. Chan, J.L. Hatfield and R. Jones. 2008. Greenhouse gas
emissions from two soils receiving nitrogen fertilizer and swine manure slurry. J. Environ.
Qual. 37: 1432-1438.
Kanemasu, E.T., W.L. Powers and J.W. Sij. 1974. Field chamber measurements of CO2
flux from soil surface. Soil Sci. 118: 233-237.
Kellenberger D., Althaus H.-J., Jungbluth N., Künniger T. 2007. Life cycle inventories of
building products. Final report ecoinvent data v2.0. Volume: 7. Swiss Centre for LCI,
Empa - TSL. Dübendorf, CH.
Kester, R.A., M.E. Meijer, J.A. Libochant, W. de Boer and H.J. Laanbroek. 1997.
Contribution of nitrification and denitrification to the NO and N2O emissions of an acid
forest soil, a river sediment and a fertilized grassland soil. Soil Biol. Biochem. 29: 1655-
1664.
Kirchmann, H. and A. Lundvall. 1993. Relationship between N-immobilization and volatile
fatty acids in soil after application of pig and cattle slurry. Biol. Fertil. Soils15: 161-164.
Kirchmann, H. and E. Witter. 1989. Ammonia volatilization during aerobic and anaerobic
manure decomposition. Plant Soil 115: 35-41.
Knowles, R. 1982. Denitrification. Microbiol. Rev. 46: 43-70.
Kost, D.A., D.A. Boutelle, M.M. Larson, W.D. Smith and J.P. Vimmerstedt. 1997.
Papermill sludge amendments, tree protection, and tree establishment on an abandoned coal
minesoil. J. Environ. Qual. 26: 1409-1416.
Lal, R. 2008. Carbon sequestration. Philos. Trans. R. Soc. London, Ser. B. 363: 815-830.
Larney, F.J. and D.A. Angers. 2012. The role of organic amendments in soil reclamation: A
review. Can. J. Soil Sci. 92: 19-38.
Lashermes, G., B. Nicolardot, V. Parnaudeau, L. Thuries, R. Chaussod, M.L. Guillotin, et
al. 2009. Indicator of potential residual carbon in soils after exogenous organic matter
application. Eur. J. Soil Sci. 60: 297-310.
Levasseur, A., M. Brandão, P. Lesage, M. Margni, D. Pennington, R. Clift, et al. 2012.
Valuing temporary carbon storage. Nat. Clim. Chang. 2: 6-8.
71
Lindenmayer, D.B., K.B. Hulvey, R.J. Hobbs, M. Colyvan, A. Felton, H. Possingham, et al.
2012. Avoiding bio-perversity from carbon sequestration solutions. Conserv. Lett. 5: 28-36.
Linn, D.M. and J.W. Doran. 1984. Effect of water-filled pore-space on carbon-dioxyde and
nitrous-oxide production in tilled and nontilled soils. Soil Sci. Soc. Am. J. 48: 1267-1272.
Livingston, G.P. and G.L. Hutchinson. 1995. Enclosure-based measurement of trace gas
exchange : applications and sources of error. In: P. A. Matson and R. C. Harris, editors,
Biogenic trace gases : measuring emissions from soil and water. Blackwell Science Ltd.,
Oxford, UK. p. 14-51.
Maljanen, M., M. Martikkala, H.T. Koponen, P. Virkajarvi and P.J. Martikainen. 2007.
Fluxes of nitrous oxide and nitric oxide from experimental excreta patches in boreal
agricultural soil. Soil Biol. Biochem. 39: 914-920.
Matthias, A.D., D.N. Yarger and R.S. Weinbeck. 1978. A numerical evaluation of chamber
methods for determining gas fluxes. Geophys. Res. Lett. 5: 765-768.
MDDEFP. 2013. Bilan annuel de conformité environnementale 2011 - Secteur des pâtes et
papiers. Direction des politiques de l’eau, Service des eaux industrielles, Gouvernement du
Québec, Québec.
MDDEP. 2005. Guide sur l’utilisation de matières résiduelles fertilisantes (MRF) pour la
restauration de la couverture végétale de lieux dégradés - Critères et exigences. Première
édition. Direction des politiques en milieu terrestre, Ministère du Développement durable,
Gouvernement du Québec, Québec.
Mosier, A.R., J.M. Duxbury, J.R. Freney, O. Heinemeyer and K. Minami. 1996. Nitrous
oxide emissions from agricultural fields: Assessment, measurement and mitigation. Plant
Soil 181: 95-108.
Mulvaney, R.L., S.A. Khan and C.S. Mulvaney. 1997. Nitrogen fertilizers promote
denitrification. Biol. Fertil. Soils 24: 211-220.
Murray, B.C., B. Sohngen and M.T. Ross. 2007. Economic consequences of consideration
of permanence, leakage and additionality for soil carbon sequestration projects. Clim.
Change 80: 127-143.
Myhre, G., D. Shindell, F.-M. Bréon, W. Collins, J. Fuglestvedt, J. Huang, et al. 2013.
Anthropogenic and natural radiative forcing. In: T. F. Stocker, D. Qin, G.-K. Plattner, M.
Tignor, S. K. Allen, J. Boschung, A. Nauels, Y. Xia, V. Bex and P. M. Midgley, editors,
Climate Change 2013: The Physical Science Basis. Contribution of Working Group I to the
Fifth Assessment Report of the Intergovernmental Panel on Climate Change. Cambridge
University Press, Cambridge, United Kingdom and New York, NY, USA. p. 659-740.
72
Nazaroff, W.W. 1992. Radon transport from soil to air. Reviews of Geophysics 30: 137-
160.
Odu, C.T.I. and K.B. Adeoye. 1970. Heterotrophic nitrification in soils— a preliminary
investigation. Soil Biol. Biochem. 2: 41-45.
Palumbo, A.V., J.F. McCarthy, J.E. Amonette, L.S. Fisher, S.D. Wullschleger and W.L.
Daniels. 2004. Prospects for enhancing carbon sequestration and reclamation of degraded
lands with fossil-fuel combustion by-products. Adv. Environ. Res. 8: 425-438.
Papen, H., R. Vonberg, I. Hinkel, B. Thoene and H. Rennenberg. 1989. Heterotrophic
nitrification by Alcaligenes faecalis - NO2-, NO3
-, N2O, and NO production in exponentially
growing cultures. Appl. Environ. Microbiol. 55: 2068-2072.
Paul, J.W. and E.G. Beauchamp. 1989. Effect of carbon constituents in manure on
denitrification in soil. Can. J. Soil Sci. 69: 49-61.
Pedersen, A.R., S.O. Peterson, P. Finn and F.P. Vintherand. 2001. Stochastic diffusion
model for estimating trace gas emissions with static chambers. Soil Sci. Soc. Am. J. 65: 49-
58.
Pelster, D.E., M.H. Chantigny, P. Rochette, D.A. Angers, C. Rieux and A. Vanasse. 2012.
Nitrous oxide emissions respond differently to mineral and organic nitrogen sources in
contrasting soil types. J. Environ. Qual. 41: 427-435.
Petersen, S.O., P. Schjonning, I.K. Thomsen and B.T. Christensen. 2008. Nitrous oxide
evolution from structurally intact soil as influenced by tillage and soil water content. Soil
Biol. Biochem. 40: 967-977.
Price, G.W. and R.P. Voroney. 2007. Papermill biosolids effect on soil physical and
chemical properties. J. Environ. Qual. 36: 1704-1714.
Quaye, A.K., T.A. Volk, S. Hafner, D.J. Leopold and C. Schirmer. 2011. Impacts of paper
sludge and manure on soil and biomass production of willow. Biomass Bioenerg. 35: 2796-
2806.
Riffon, R. and P. Cyr. 2000. La gestion des biosolides : les odeurs. Colloque sur les
biosolides. Les biosolides : une richesse pour nos sols, Montebello. 16-17 mars 2000.
Gouvernement du Québec, Ste-Foy.
Rochette, P. 2011. Towards a standard non-steady-state chamber methodology for
measuring soil N2O emissions. Anim. Feed Sci. Technol. 166-167: 141-146.
73
Rochette, P., D.A. Angers, M.H. Chantigny, N. Bertrand and D. Cote. 2004. Carbon
dioxide and nitrous oxide emissions following fall and spring applications of pig slurry to
an agricultural soil. Soil Sci. Soc. Am. J. 68: 1410-1420.
Rochette, P., D.A. Angers, M.H. Chantigny, B. Gagnon and N. Bertrand. 2006. In situ
mineralization of dairy cattle manures as determined using soil-surface carbon dioxide
fluxes. Soil Sci. Soc. Am. J. 70: 744-752.
Rochette, P., D.A. Angers, M.H. Chantigny, B. Gagnon and N. Bertrand. 2008. N2O fluxes
in soils of contrasting textures fertilized with liquid and solid dairy cattle manures. Can. J.
Soil Sci. 88: 175-187.
Rochette, P., D.A. Angers and D. Cote. 2000. Soil carbon and nitrogen dynamics following
application of pig slurry for the 19th consecutive year: I. Carbon dioxide fluxes and
microbial biomass carbon. Soil Sci. Soc. Am. J. 64: 1389-1395.
Rochette, P. and B. Bertrand. 2003. Soil air sample storage and handling using
polypropylene syringes and glass vials. Can. J. Soil Sci. 83: 631-637.
Rochette, P. and N. Bertrand. 2008. Soil-surface gas emissions. In: M. R. Carter and E. G.
Gregorich, editors, Soil sampling and methods of analysis. CRC Press
Taylor & Francis Group, Boca Raton, FL. p. 851-861.
Rochette, P. and N.S. Eriksen-Hamel. 2008. Chamber measurements of soil nitrous oxide
flux: Are absolute values reliable? Soil Sci. Soc. Am. J. 72: 331.
Rochette, P. and G.L. Hutchinson. 2005. Measurement of soil respiration in situ : chamber
techniques. In: J. Hatfield and J. M. Baker, editors, Micrometeorology in agricultural
systems. ASA monograph #47. American Socitey of Agronomy, Madison, WI. p. 247-286.
Rockstrom, J., W. Steffen, K. Noone, A. Persson, F.S. Chapin, E.F. Lambin, et al. 2009. A
safe operating space for humanity. Nature 461: 472-475.
Scholes, R.J. and I.R. Noble. 2001. Climate change - Storing carbon on land. Science 294:
1012-1013.
Schrag, D.P. 2007. Preparing to capture carbon. Science 315: 812-813.
Sere, G., C. Schwartz, S. Ouvrard, C. Sauvage, J.C. Renat and J.L. Morel. 2008. Soil
construction: A step for ecological reclamation of derelict lands. J. Soil Sediment 8: 130-
136.
Sharma, D., G.D. Sharma and S.K. Ghosh. 2010. Microbial diversity from solid wastes
disposal of paper industry, Panchgram, South Assam. J. Pure Appl.Microbiol. 4: 741-748.
74
Smith, K.A., H. Clayton, I.P. McTaggart, P.E. Thomson, J.R.M. Arah and A. Scott. 1995.
The measurement of nitrous oxide emissions from soil by using chambers. Philos. Trans. R.
Soc. London, A 351: 327-338.
Smith, K.A. and F. Conen. 2004. Measurement of trace gases I : Gas analysis, chamber
methods, and related procedures. In: K. A. Smith and M. C. Cresser, editors, Soil and
environmental analysis : modern Instrumental techniques. 3rd edition. Marcel Dekker Inc.,
New-York, NY. p. 433-476.
Spoelstra, S.F. 1979. Volatile fatty acides in anaerobically stroed piggery wastes. Neth. J.
Agr. Sci. 27: 60-66.
Stanosz, G.R., J. Trobaugh, M.A. Guthmiller and J.C. Stanosz. 2004. Sphaeropsis shoot
blight and altered nutrition in red pine plantations treated with paper mill waste sludge.
Forest. Pathol. 34: 245-253.
Stevens, R.J., R.J. Laughlin, L.C. Burns, J.R.M. Arah and R.C. Hood. 1997. Measuring the
contributions of nitrification and denitrification to the flux of nitrous oxide from soil. Soil
Biol. Biochem. 29: 139-151.
Ussiri, D.A.N. and R. Lal. 2005. Carbon sequestration in reclaimed minesoils. Crit. Rev.
Plant Sci. 24: 151-165.
Valdemarsen, T. and E. Kristensen. 2010. Degradation of dissolved organic monomers and
short-chain fatty acids in sandy marine sediment by fermentation and sulfate reduction.
Geochim. Cosmochim. Ac. 74: 1593-1605.
Vasconcelos, E. and F. Cabral. 1993. Use and environmental implications of pulp-mill
sludge as an organic fertilizer. Environ. Pollut. 80: 159-162.
Vetterlein, D. and R.F. Huttl. 1999. Can applied organic matter fulfil similar functions as
soil organic matter? Risk-benefit analysis for organic matter application as a potential
strategy for rehabilitation of disturbed ecosystems. Plant Soil 213: 1-10.
VijayaVenkataRaman, S., S. Iniyan and R. Goic. 2012. A review of climate change,
mitigation and adaptation. Renew. Sust. Energ. Rev. 16: 878-897.
Villeneuve, C. and P.-L. Dessureault. 2011. Biosolides municipaux - quelle est la meilleure
option pour le climat? Vecteur Environnement 44: 8-12.
Watson, M.E. and H.A.J. Hoitink. 1985. Utilizing papermill sludge - longterm effects in
stripmine reclamation. BioCycle 26: 50-52.
75
Williams, P.H., S.C. Jarvis and E. Dixon. 1998. Emission of nitric oxide and nitrous oxide
from soil under field and laboratory conditions. Soil Biol. Biochem. 30: 1885-1893.
Wu, H.J., M.A. Hanna and D.D. Jones. 2013. Life cycle assessment of greenhouse gas
emissions of feedlot manure management practices: Land application versus gasification.
Biomass Bioenerg. 54: 260-266.
Zar, J.H. 1999. Biostatistical Analysis, fourth ed. Prentice-Hall, Inc., Upper Saddle River,
NJ, USA.