Embed Size (px)
Citation preview
Utiliser la génétique des populations afin de mieux comprendre les épidémies d'insectes forestiers
Patrick M. A. James
Remerciements …
• Jeremy Larroque (UdeM)
• Simon Legault (UdeM)
• Julian Wittische (UdeM)
• Paul Mayrand (UdeM)
• Olivier Pontbriand (UdeM)
• Julie Marleau (UdeM)
• Mat Neau (UdeM)
• Brian Sturtevant (USDA)
• Rob Johns (CFS)
• Lisa Lumley (RAM)
• Michel Cusson (CFS)
• Brian Boyle (IBIS)
• Jerome Laroche (IBIS)
• Felix Sperling (UofA)
• Bryan Brunet (UofA)
• Barry Cooke (CFS)

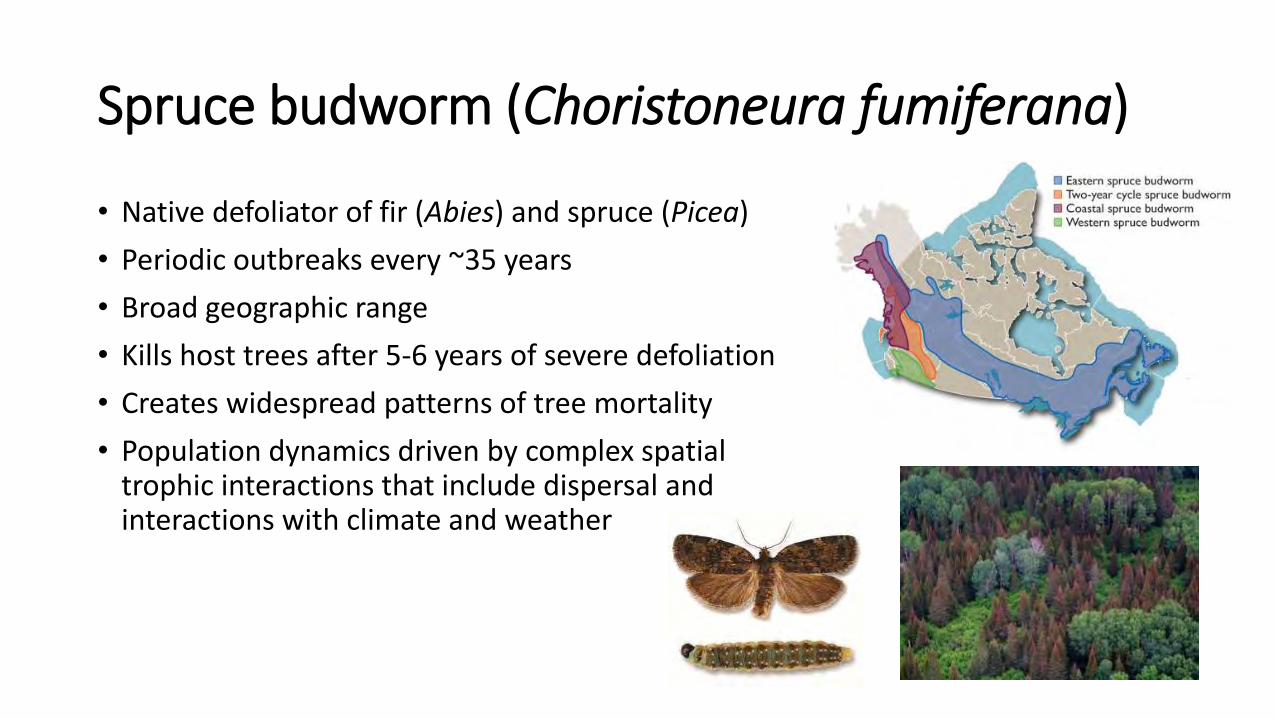
Spruce budworm (Choristoneura fumiferana)
• Native defoliator of fir (Abies) and spruce (Picea)
• Periodic outbreaks every ~35 years
• Broad geographic range
• Kills host trees after 5-6 years of severe defoliation
• Creates widespread patterns of tree mortality
• Population dynamics driven by complex spatial trophic interactions that include dispersal and interactions with climate and weather
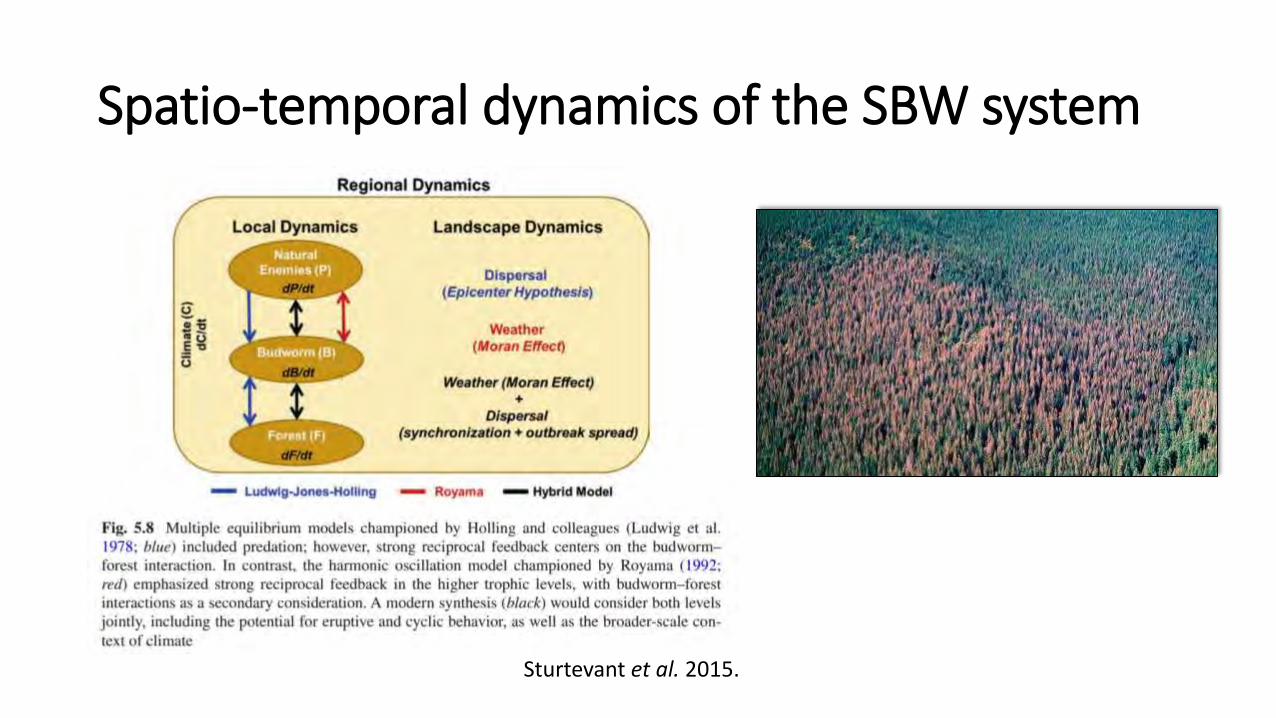
Spatio-temporal dynamics of the SBW system
Sturtevant et al. 2015.
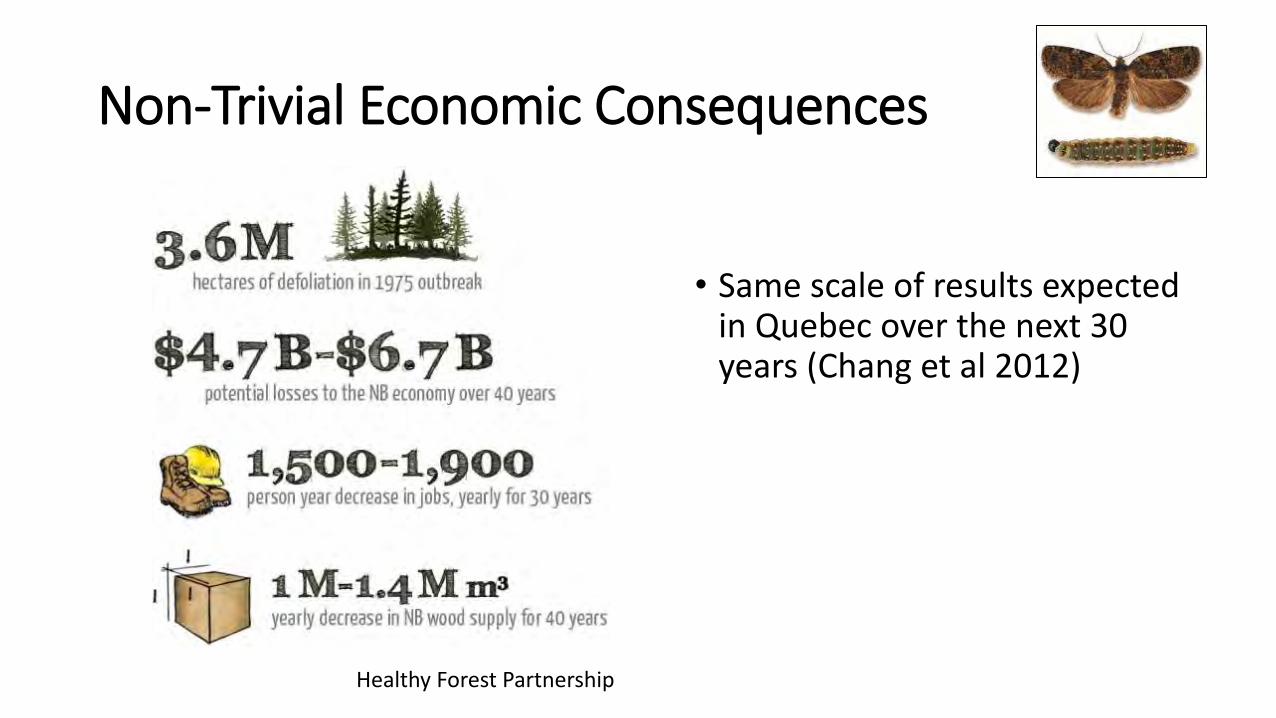
Non-Trivial Economic Consequences
• Same scale of results expected in Quebec over the next 30 years (Chang et al 2012)
Healthy Forest Partnership
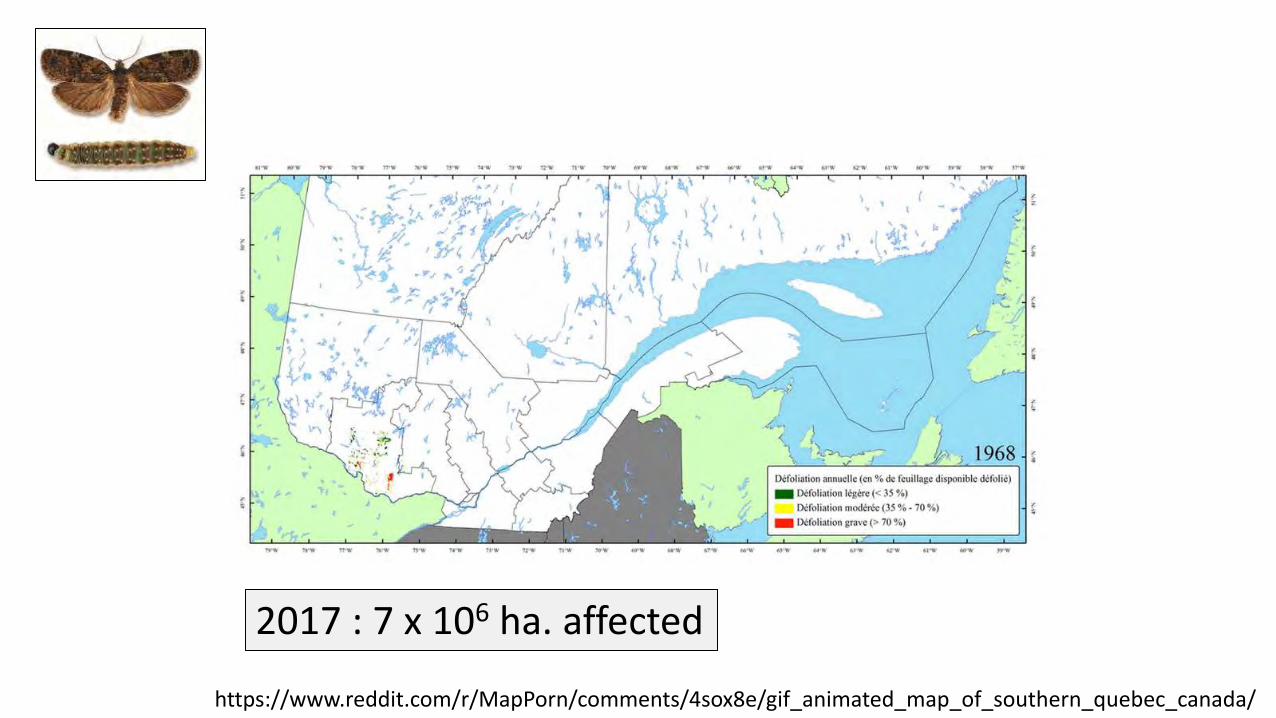
https://www.reddit.com/r/MapPorn/comments/4sox8e/gif_animated_map_of_southern_quebec_canada/
2017 : 7 x 10⁶ ha. affected
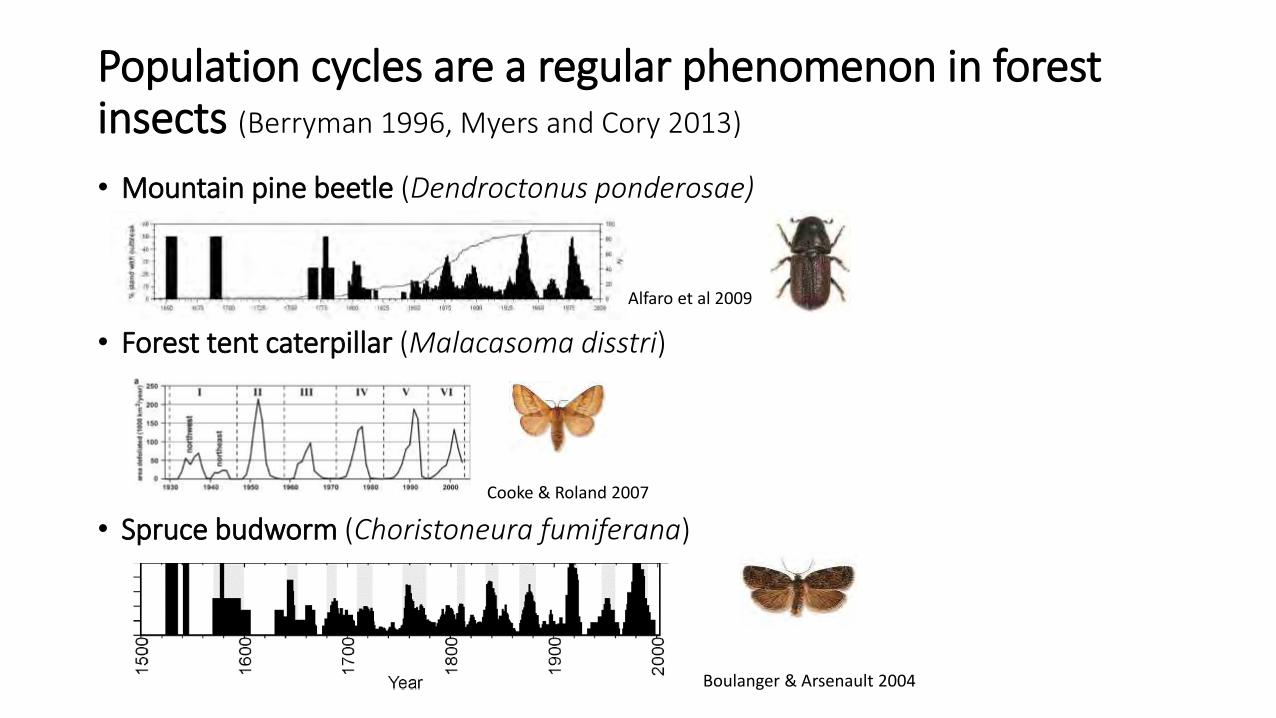
Population cycles are a regular phenomenon in forest insects (Berryman 1996, Myers and Cory 2013)
• Mountain pine beetle (Dendroctonus ponderosae)
• Forest tent caterpillar (Malacasoma disstri)
• Spruce budworm (Choristoneura fumiferana)
Boulanger & Arsenault 2004
Cooke & Roland 2007
Alfaro et al 2009
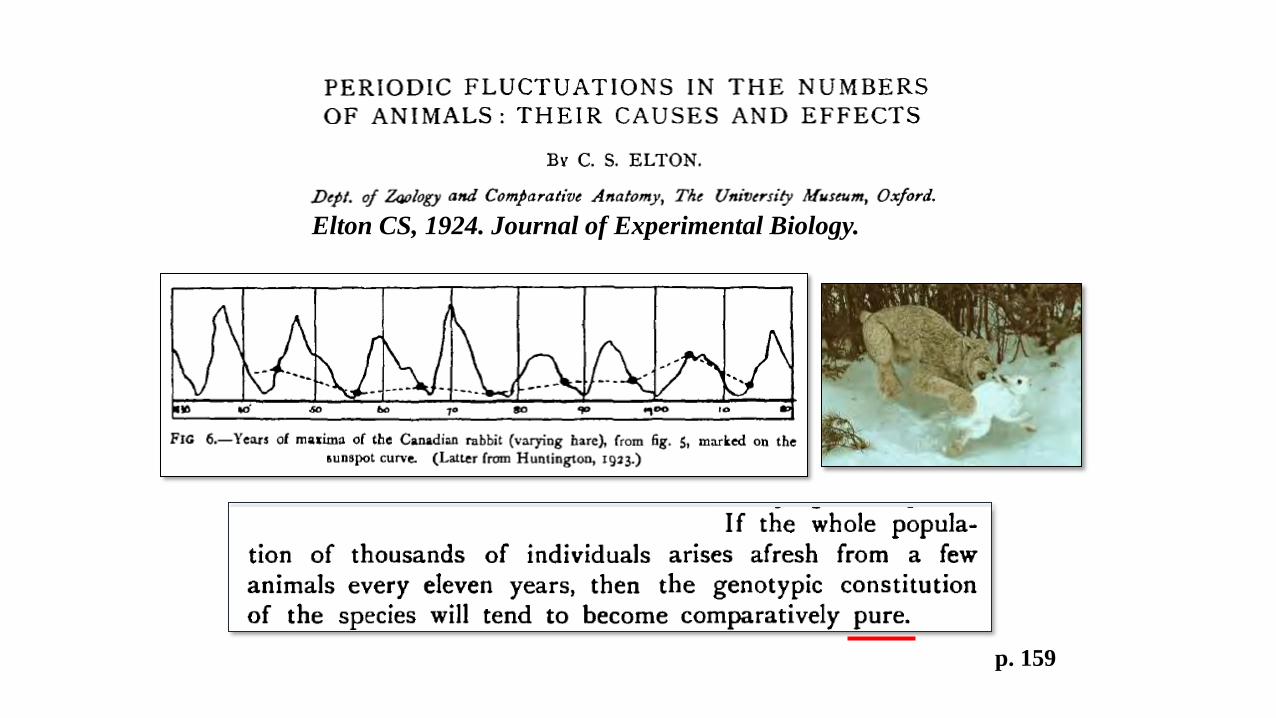
p. 151 p. 159
Elton CS, 1924. Journal of Experimental Biology.
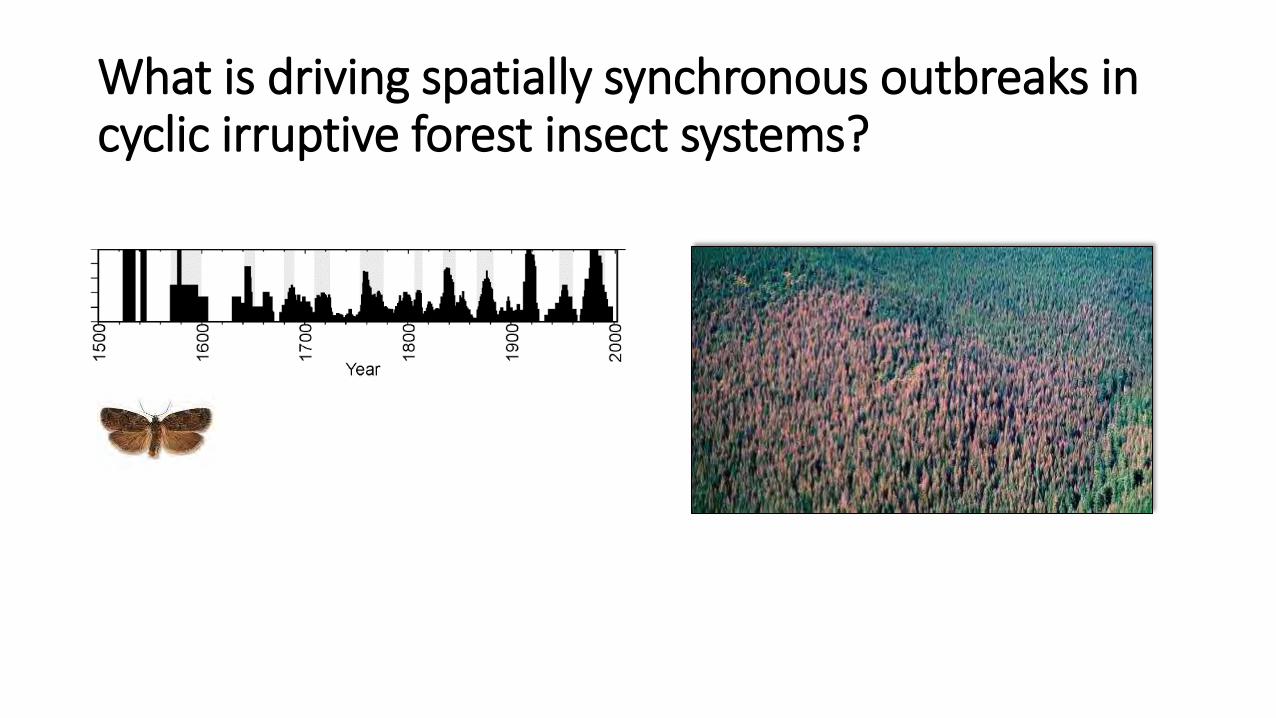
What is driving spatially synchronous outbreaks in cyclic irruptive forest insect systems?
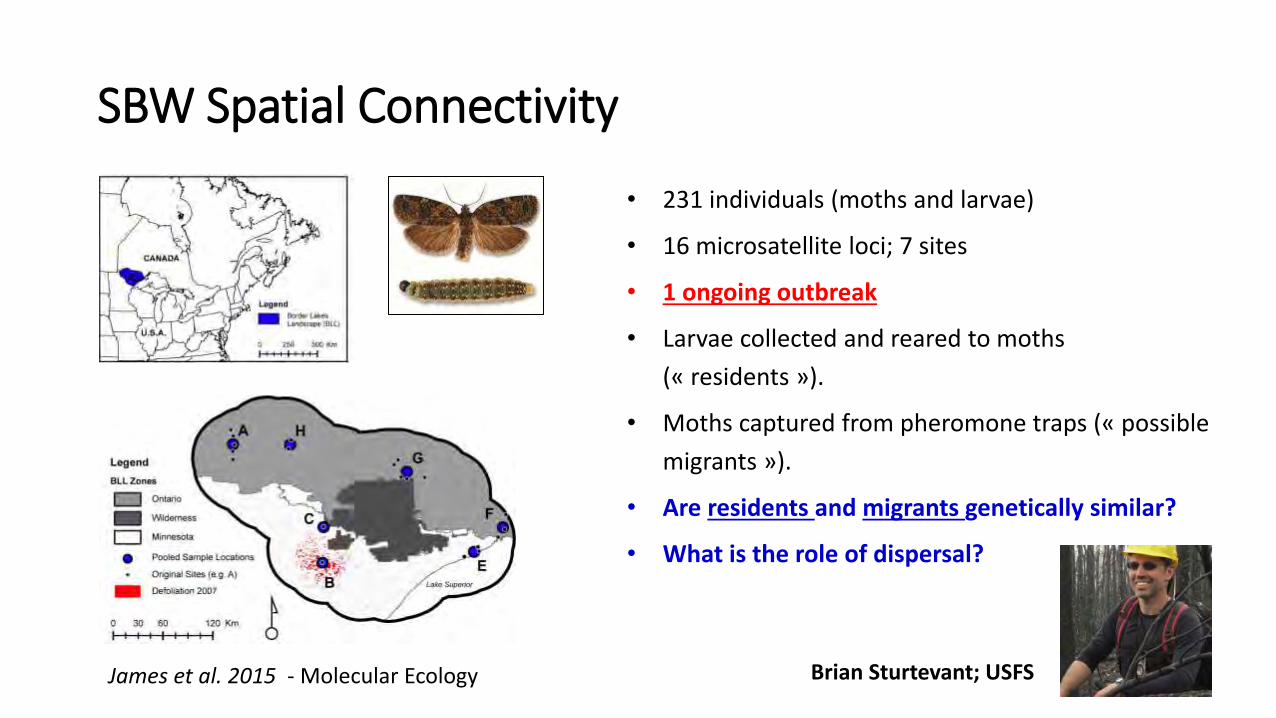
James et al. 2015 - Molecular Ecology Brian Sturtevant; USFS
SBW Spatial Connectivity
• 231 individuals (moths and larvae)
• 16 microsatellite loci; 7 sites
• 1 ongoing outbreak
• Larvae collected and reared to moths
(« residents »).
• Moths captured from pheromone traps (« possible
migrants »).
• Are residents and migrants genetically similar?
• What is the role of dispersal?
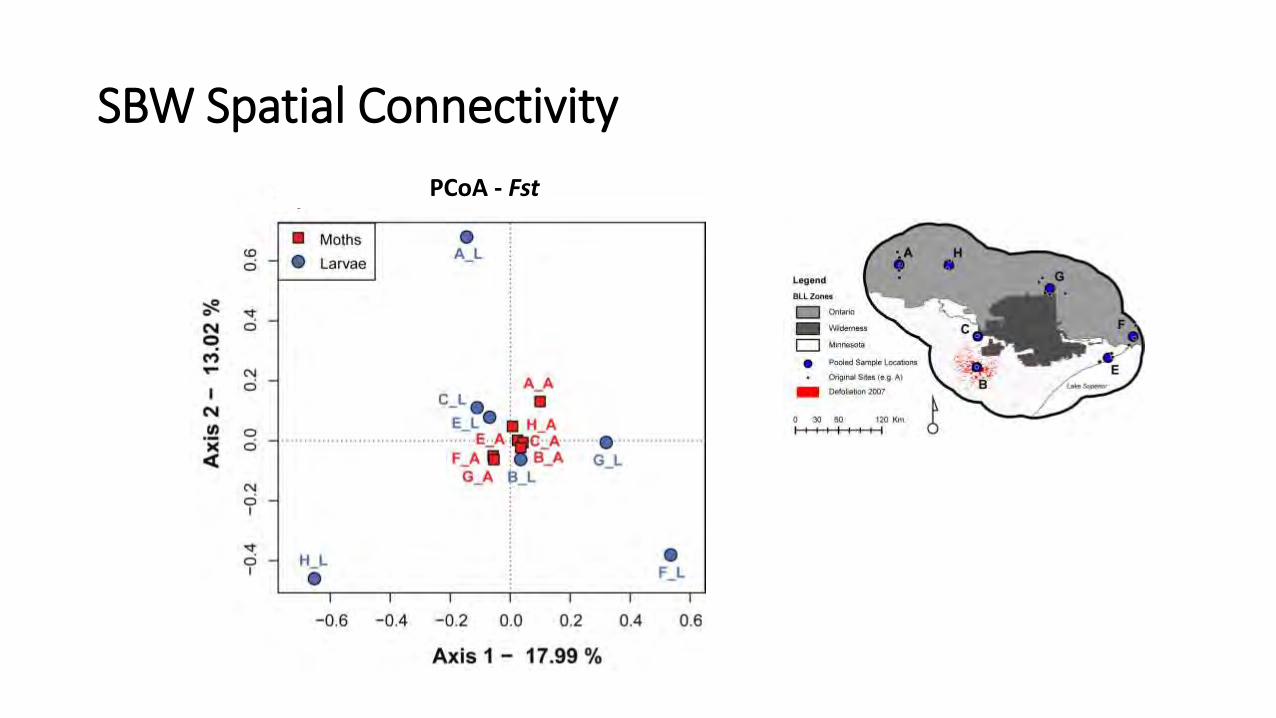
PCoA - Fst
SBW Spatial Connectivity
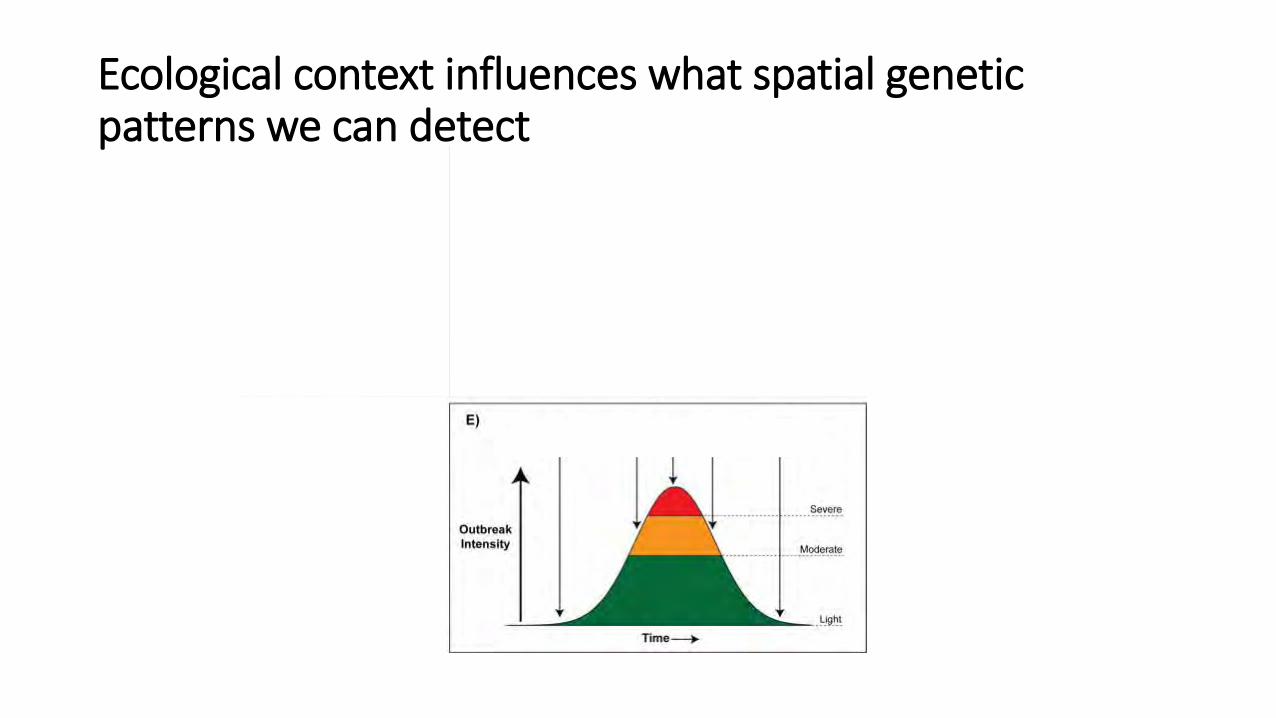
Ecological context influences what spatial genetic patterns we can detect
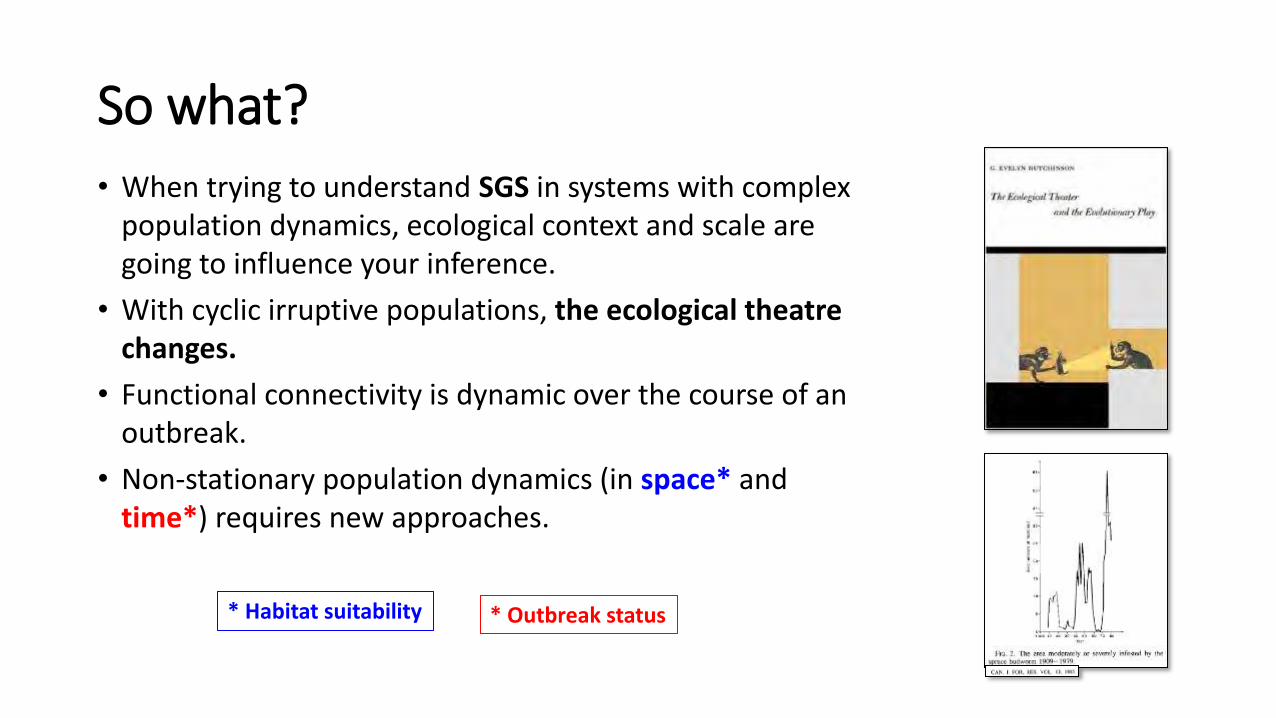
So what?
• When trying to understand SGS in systems with complex population dynamics, ecological context and scale are going to influence your inference.
• With cyclic irruptive populations, the ecological theatre changes.
• Functional connectivity is dynamic over the course of an outbreak.
• Non-stationary population dynamics (in space* and time*) requires new approaches.
* Habitat suitability * Outbreak status
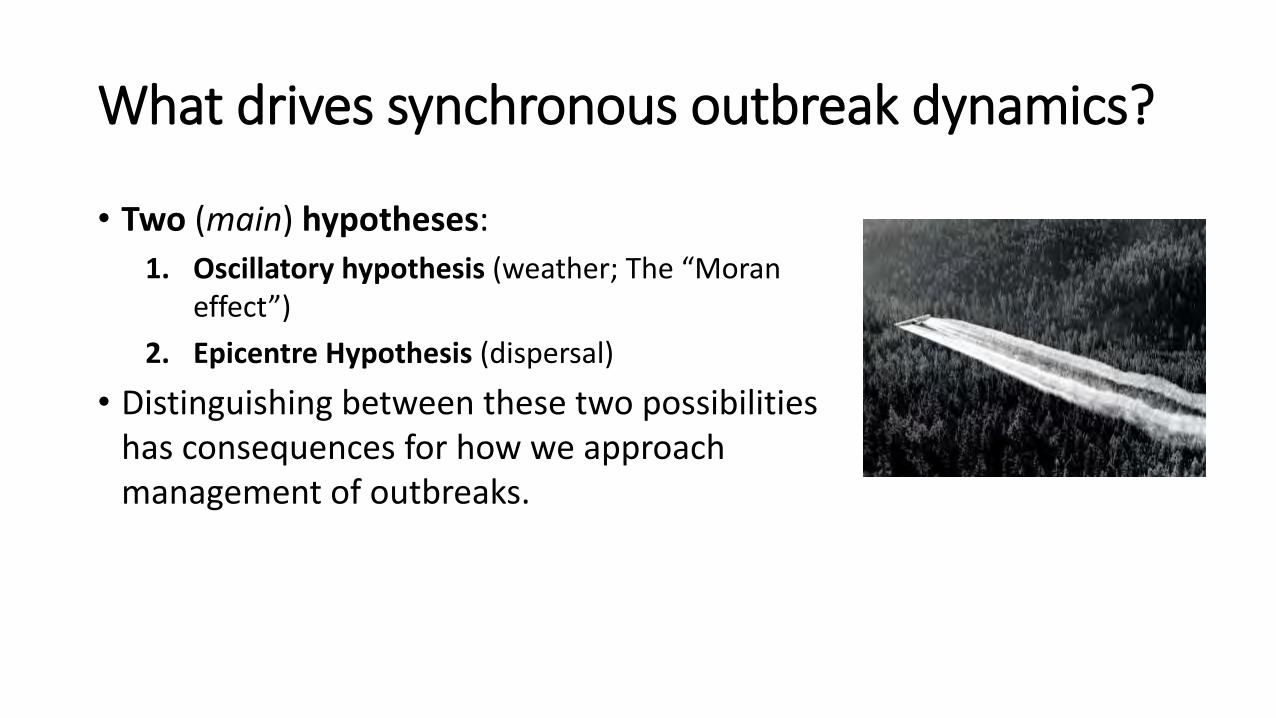
What drives synchronous outbreak dynamics?
• Two (main) hypotheses:
1. Oscillatory hypothesis (weather; The “Moran effect”)
2. Epicentre Hypothesis (dispersal)
• Distinguishing between these two possibilities has consequences for how we approach management of outbreaks.
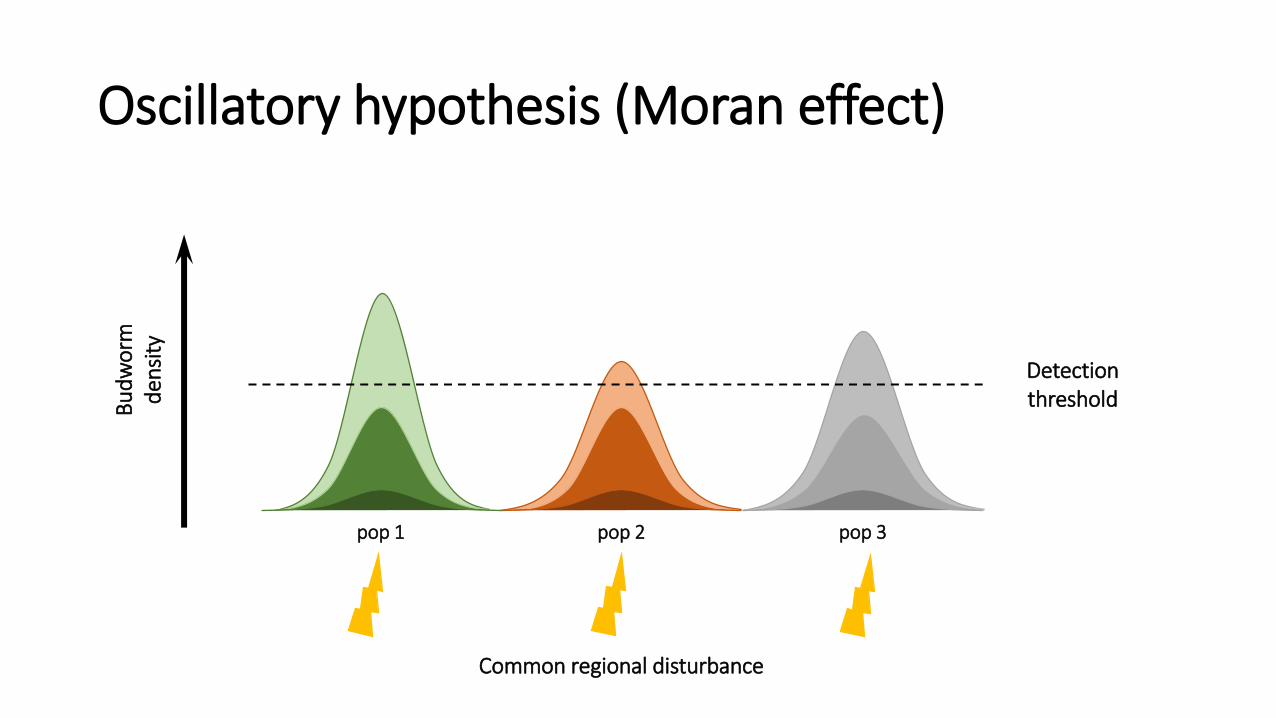
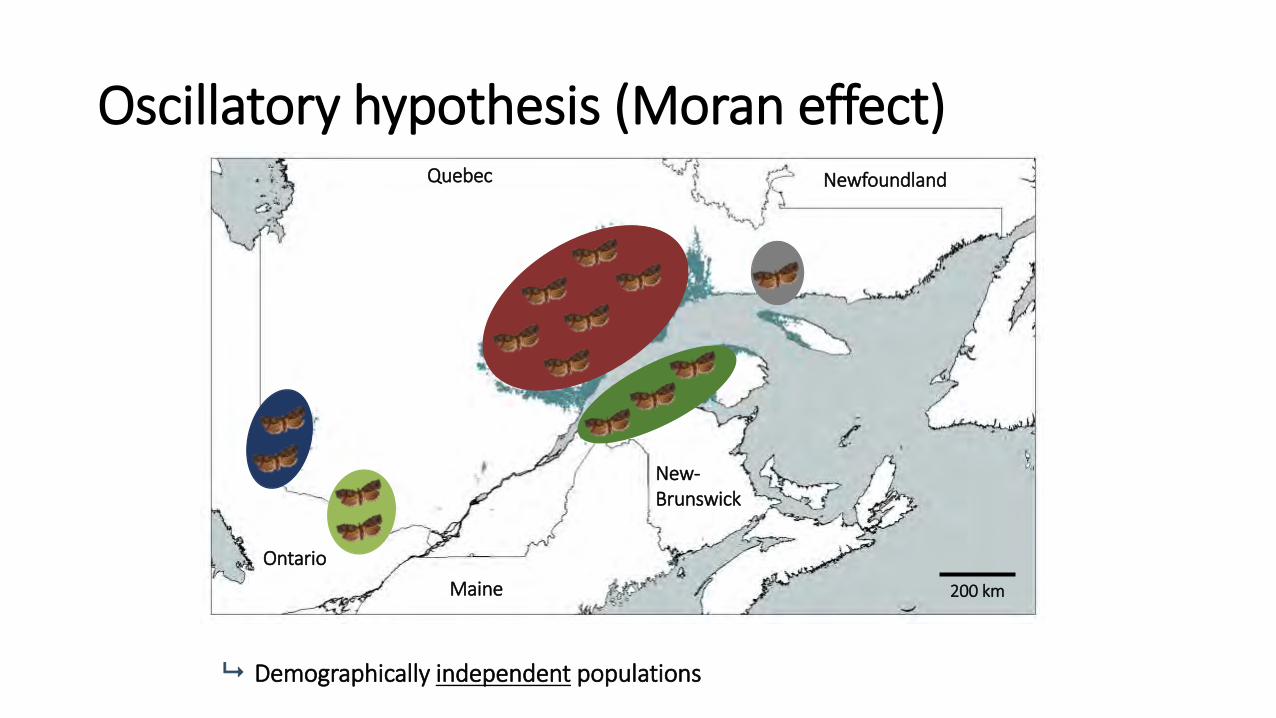
Oscillatory hypothesis (Moran effect)
Detection threshold B
ud
wo
rm
den
sity
pop 1 pop 2 pop 3
Common regional disturbance
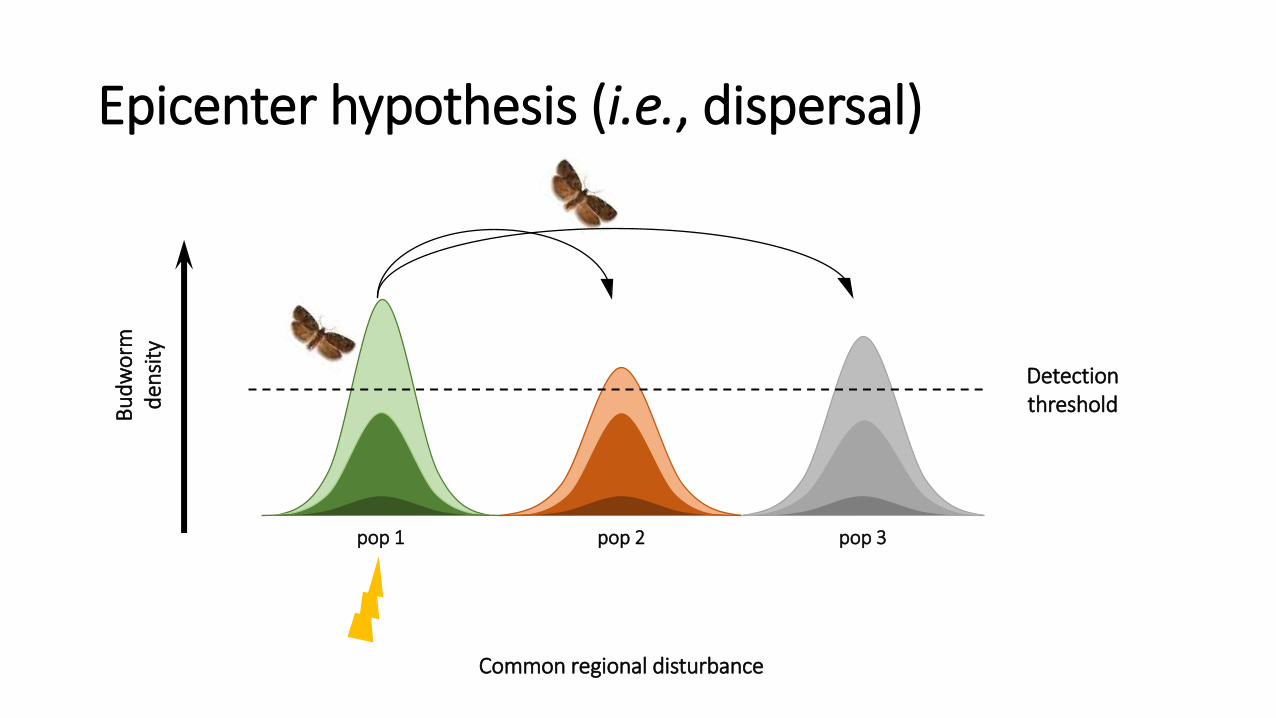
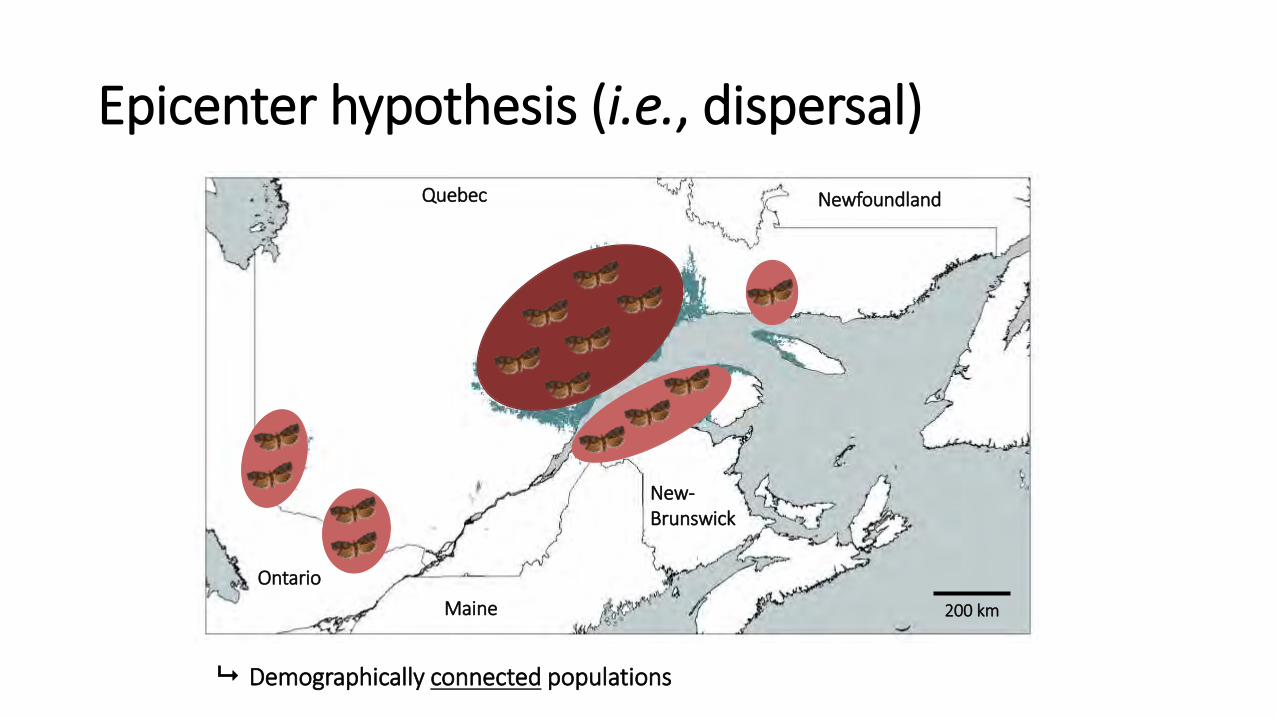
Epicenter hypothesis (i.e., dispersal)
Detection threshold B
ud
wo
rm
den
sity
pop 1 pop 2 pop 3
Common regional disturbance
Oscillatory hypothesis (Moran effect) Quebec
Ontario
Maine
New-Brunswick
Newfoundland
200 km
Demographically independent populations
Epicenter hypothesis (i.e., dispersal)
Quebec
Ontario
Maine
New-Brunswick
Newfoundland
200 km
Demographically connected populations
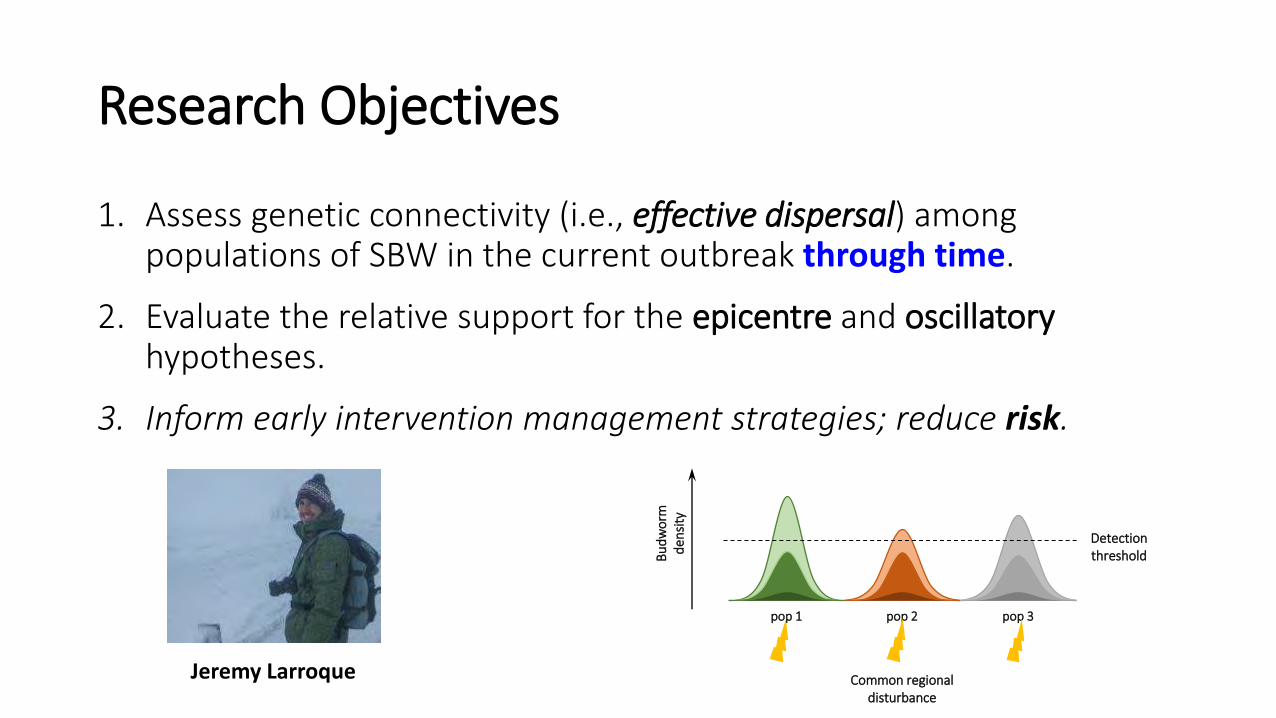
Research Objectives
1. Assess genetic connectivity (i.e., effective dispersal) among populations of SBW in the current outbreak through time.
2. Evaluate the relative support for the epicentre and oscillatory hypotheses.
3. Inform early intervention management strategies; reduce risk.
Detection threshold B
ud
wo
rm
den
sity
pop 1 pop 2 pop 3
Common regional disturbance
Jeremy Larroque
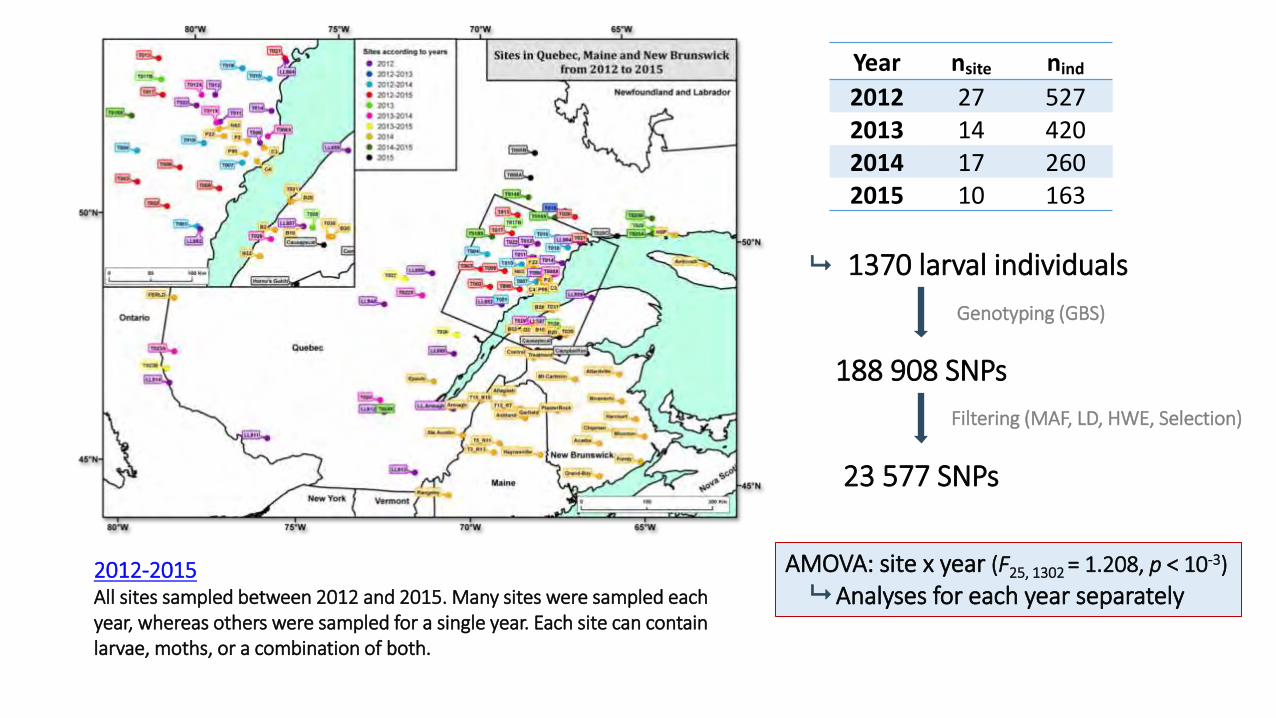
Year nsite nind
2012 27 527 2013 14 420 2014 17 260 2015 10 163
1370 larval individuals
188 908 SNPs
23 577 SNPs
Genotyping (GBS)
Filtering (MAF, LD, HWE, Selection)
AMOVA: site x year (F25, 1302 = 1.208, p < 10-3)
Analyses for each year separately 2012-2015 All sites sampled between 2012 and 2015. Many sites were sampled each year, whereas others were sampled for a single year. Each site can contain larvae, moths, or a combination of both.
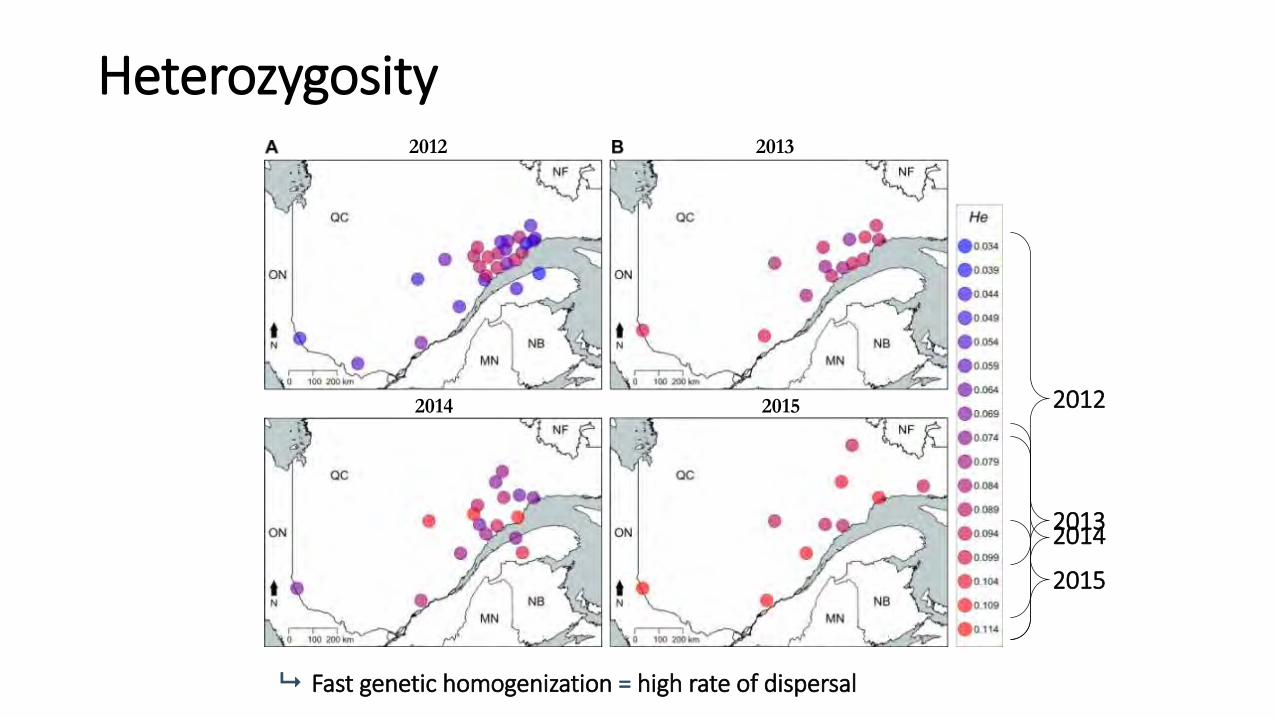
Heterozygosity
2014 2015
Fast genetic homogenization = high rate of dispersal
2012
2013 2014
2015
2012 2013
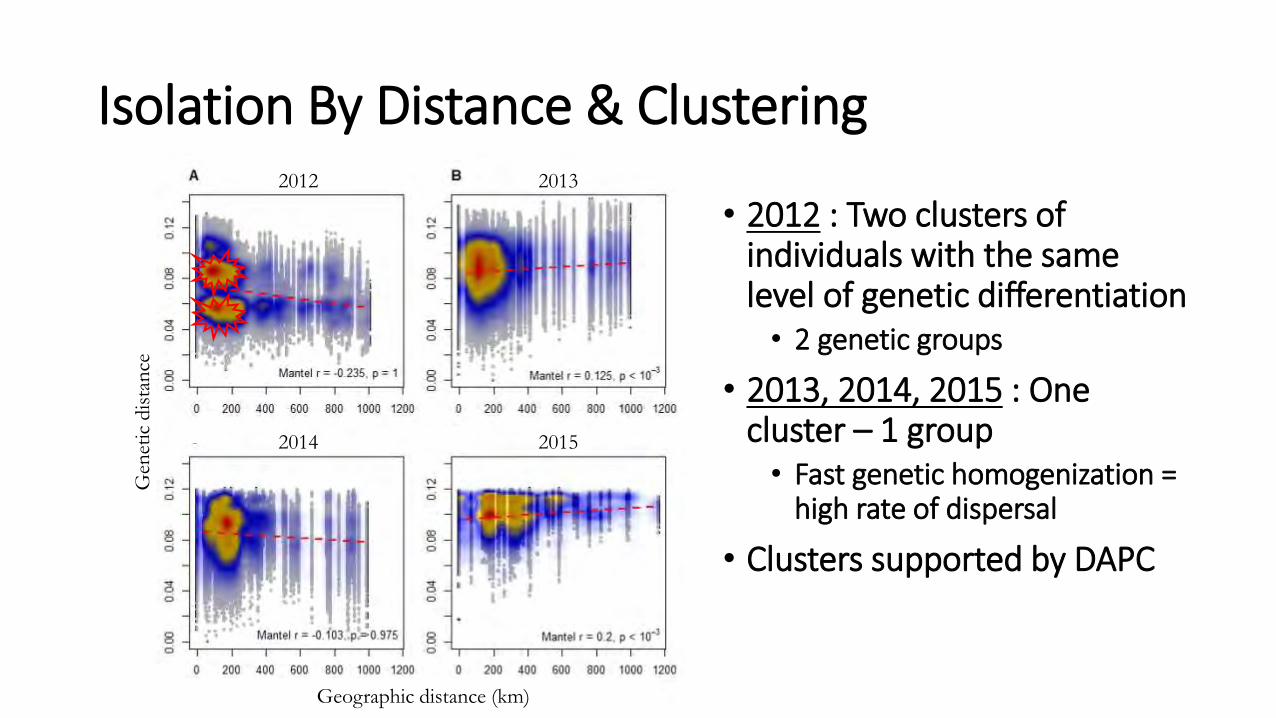
Isolation By Distance & Clustering
• 2012 : Two clusters of individuals with the same level of genetic differentiation • 2 genetic groups
• 2013, 2014, 2015 : One cluster – 1 group • Fast genetic homogenization =
high rate of dispersal
• Clusters supported by DAPC
2012
2014
2013
2015
Geographic distance (km)
Gen
etic
dis
tan
ce
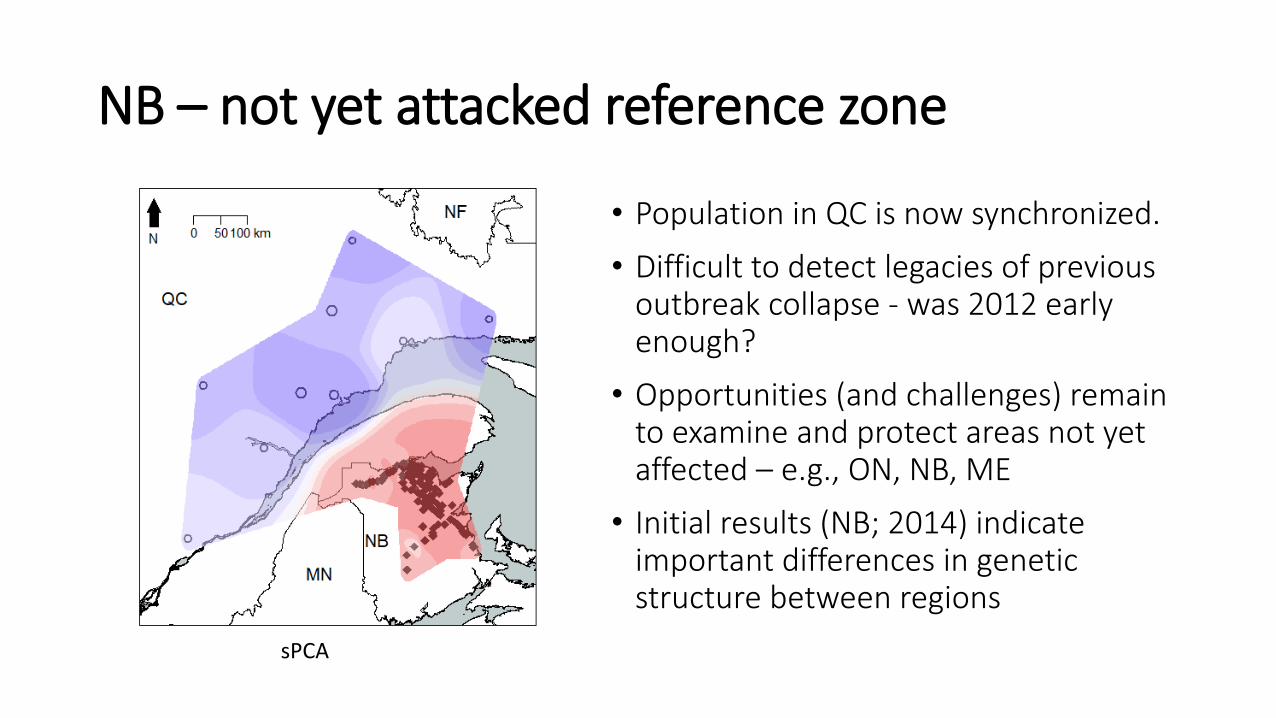
NB – not yet attacked reference zone
• Population in QC is now synchronized.
• Difficult to detect legacies of previous outbreak collapse - was 2012 early enough?
• Opportunities (and challenges) remain to examine and protect areas not yet affected – e.g., ON, NB, ME
• Initial results (NB; 2014) indicate important differences in genetic structure between regions
sPCA
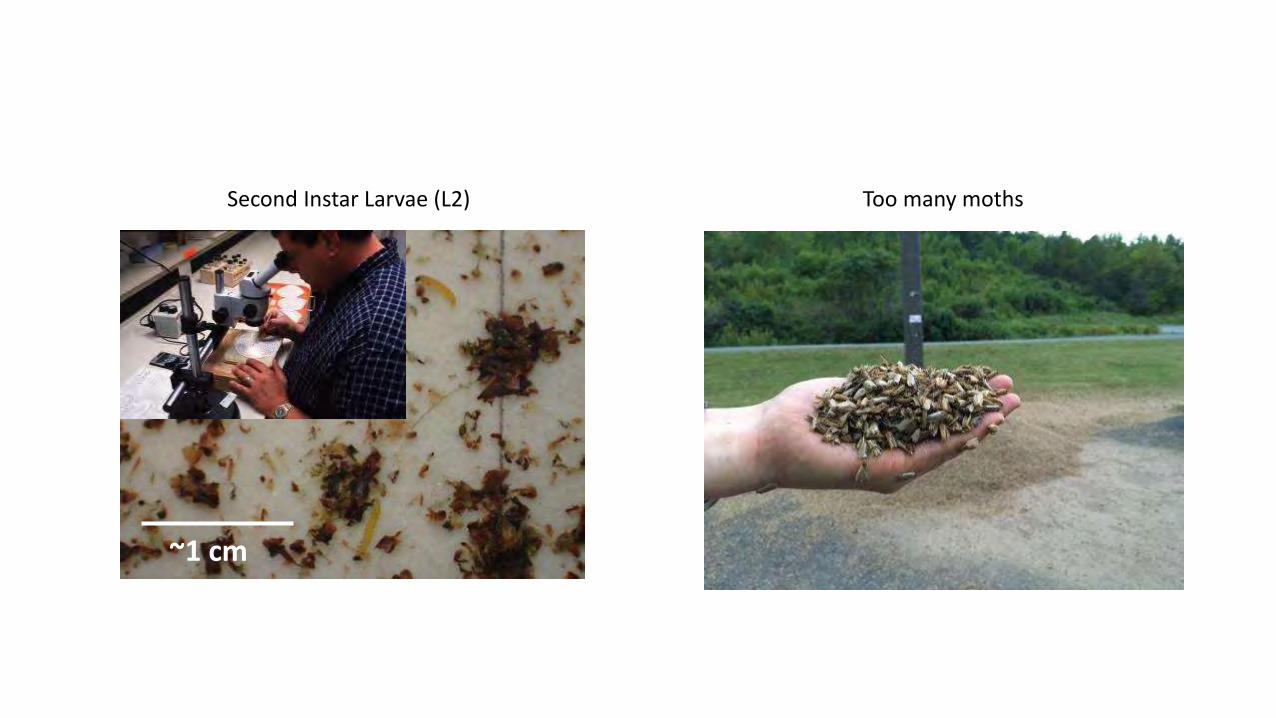
Second Instar Larvae (L2)
~1 cm
Too many moths
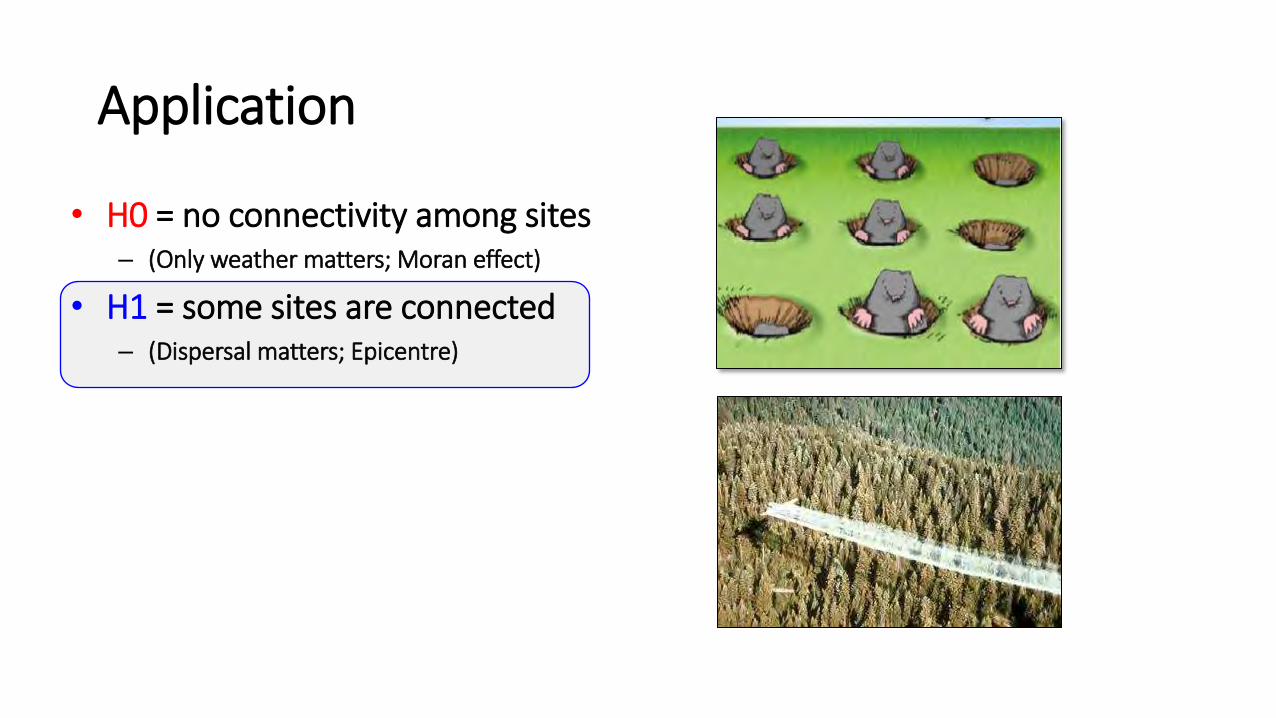
• H0 = no connectivity among sites – (Only weather matters; Moran effect)
• H1 = some sites are connected – (Dispersal matters; Epicentre)
Application
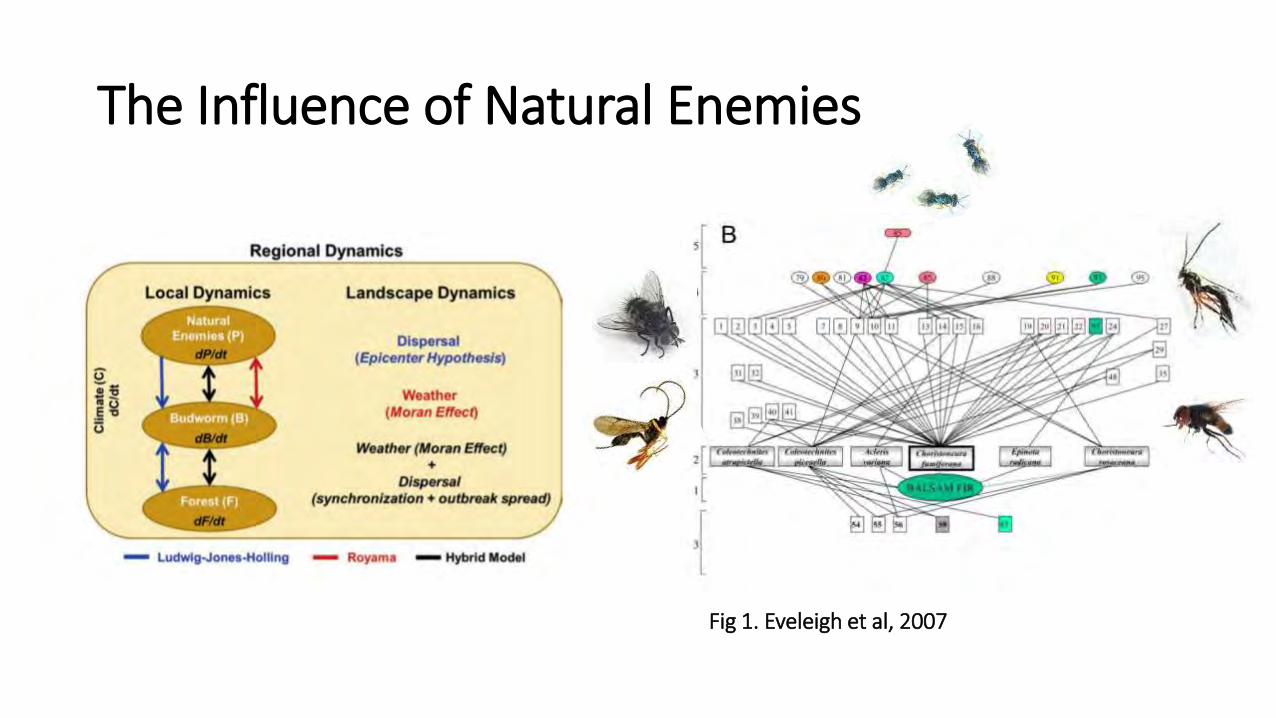
The Influence of Natural Enemies
Fig 1. Eveleigh et al, 2007
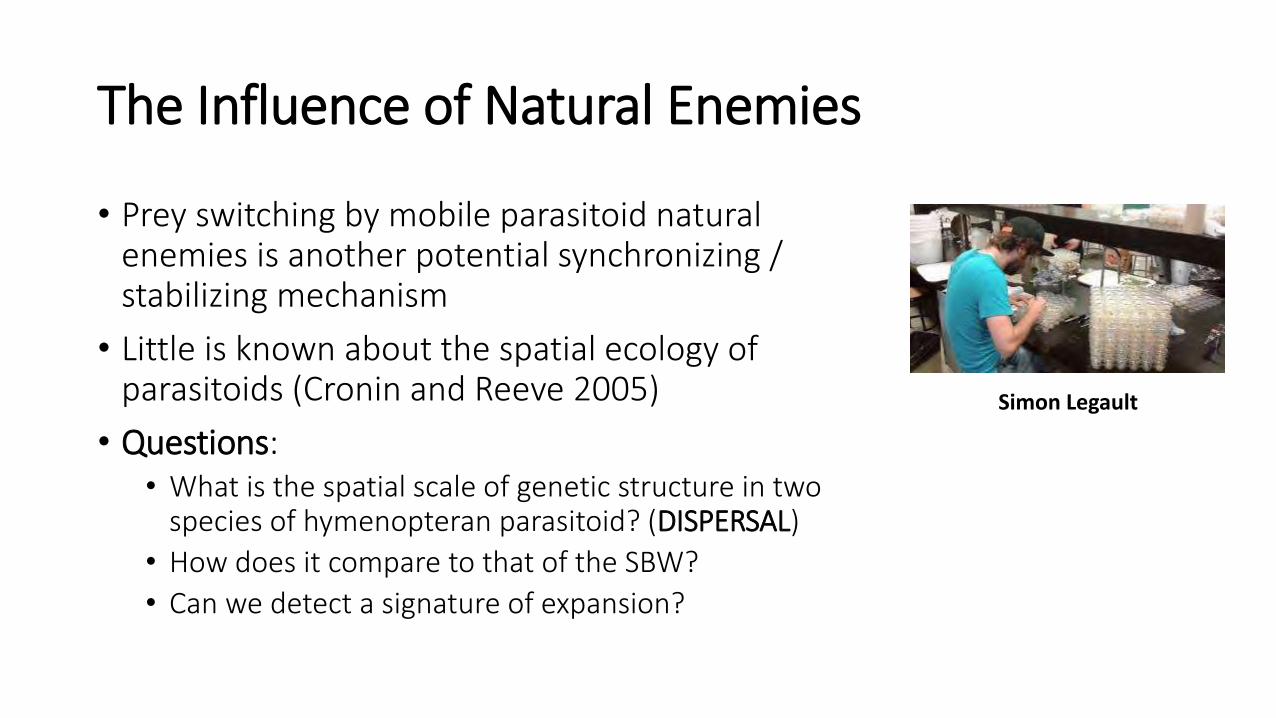
The Influence of Natural Enemies
• Prey switching by mobile parasitoid natural enemies is another potential synchronizing / stabilizing mechanism
• Little is known about the spatial ecology of parasitoids (Cronin and Reeve 2005)
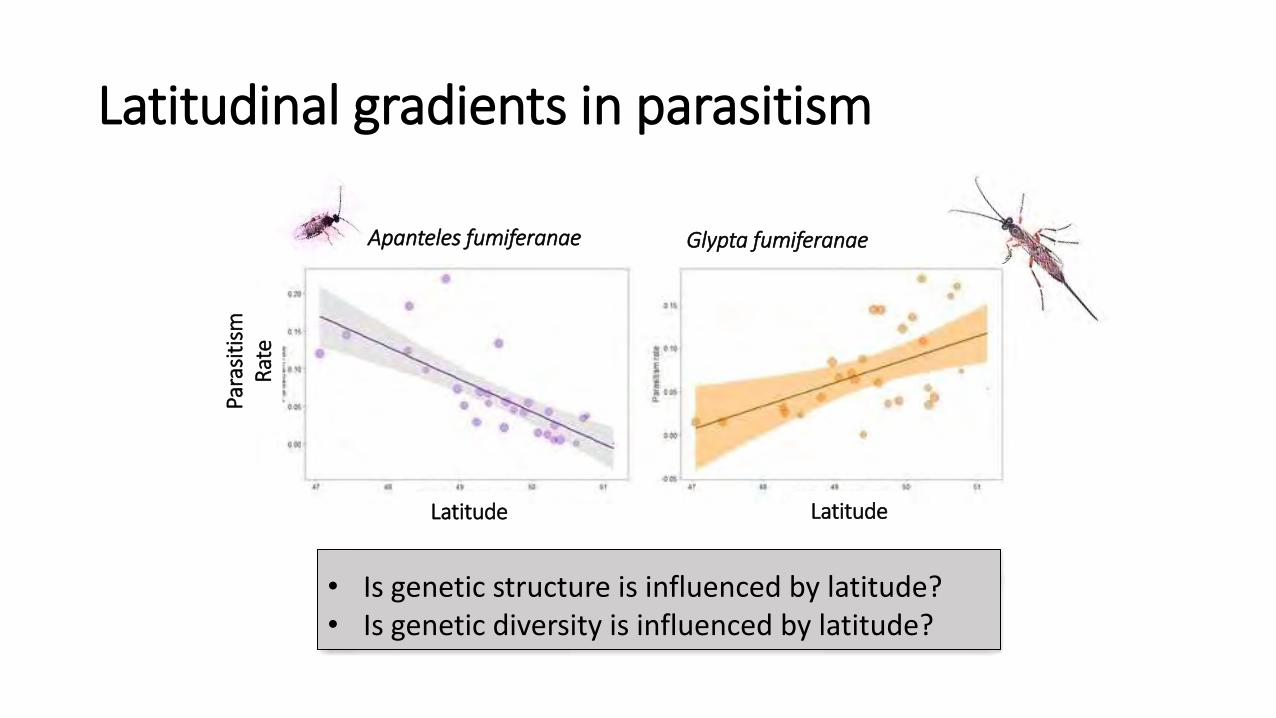
• Questions: • What is the spatial scale of genetic structure in two
species of hymenopteran parasitoid? (DISPERSAL)
• How does it compare to that of the SBW?
• Can we detect a signature of expansion?
Simon Legault
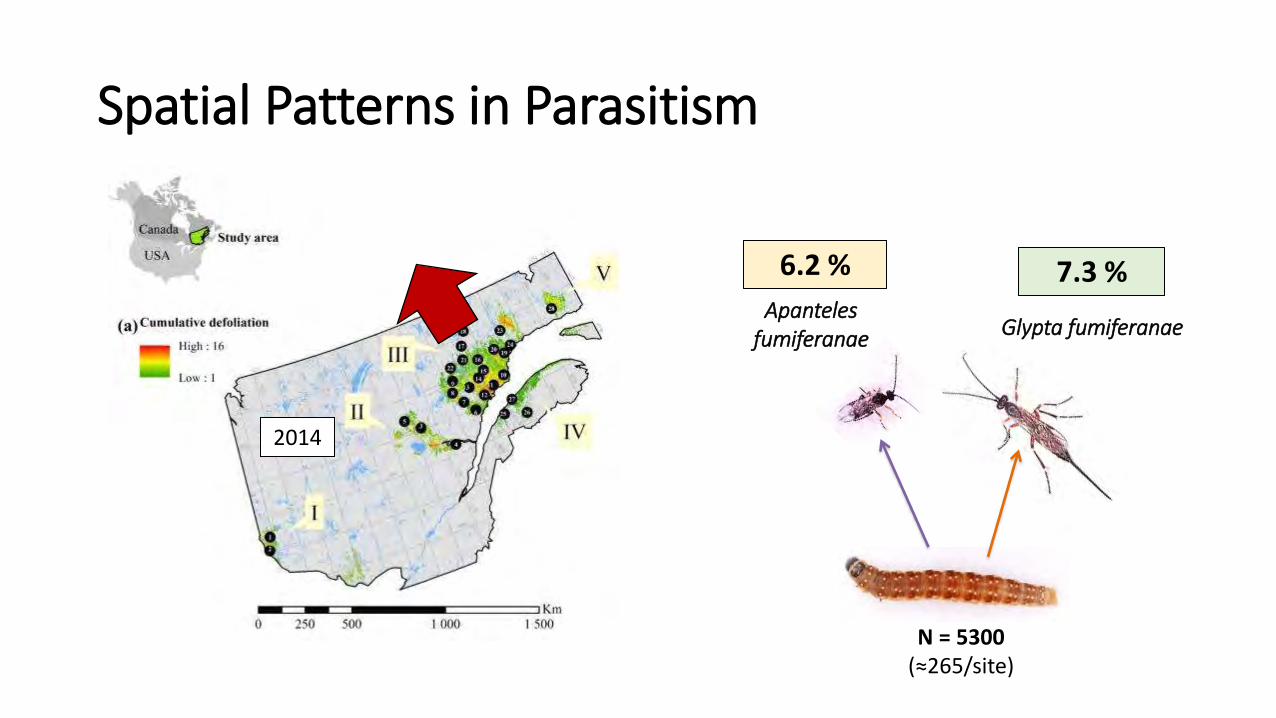
Glypta fumiferanae Apanteles
fumiferanae
2014
N = 5300 (≈265/site)
6.2 % 7.3 %
Spatial Patterns in Parasitism
Apanteles fumiferanae Glypta fumiferanae
Latitudinal gradients in parasitism
• Is genetic structure is influenced by latitude? • Is genetic diversity is influenced by latitude?
Latitude Latitude
Para
siti
sm
Rat
e
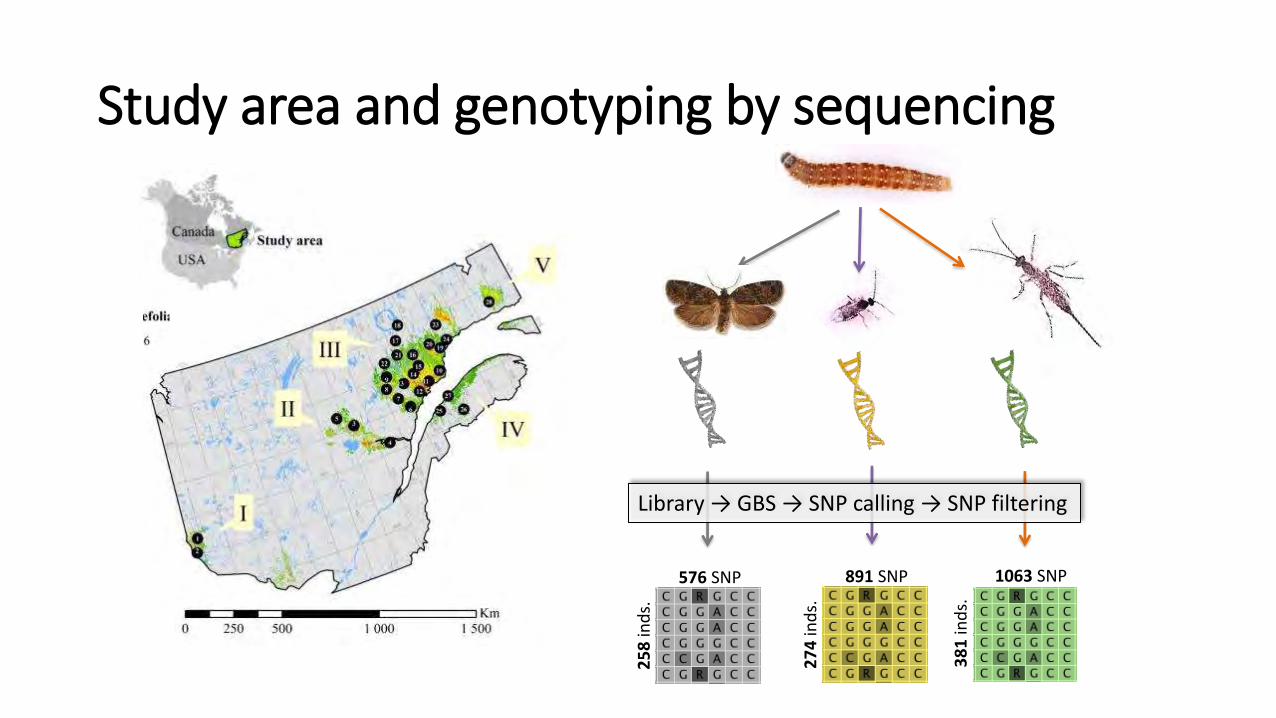
27
4 in
ds.
891 SNP
25
8 in
ds.
576 SNP
38
1 in
ds.
1063 SNP
Library → GBS → SNP calling → SNP filtering
Study area and genotyping by sequencing
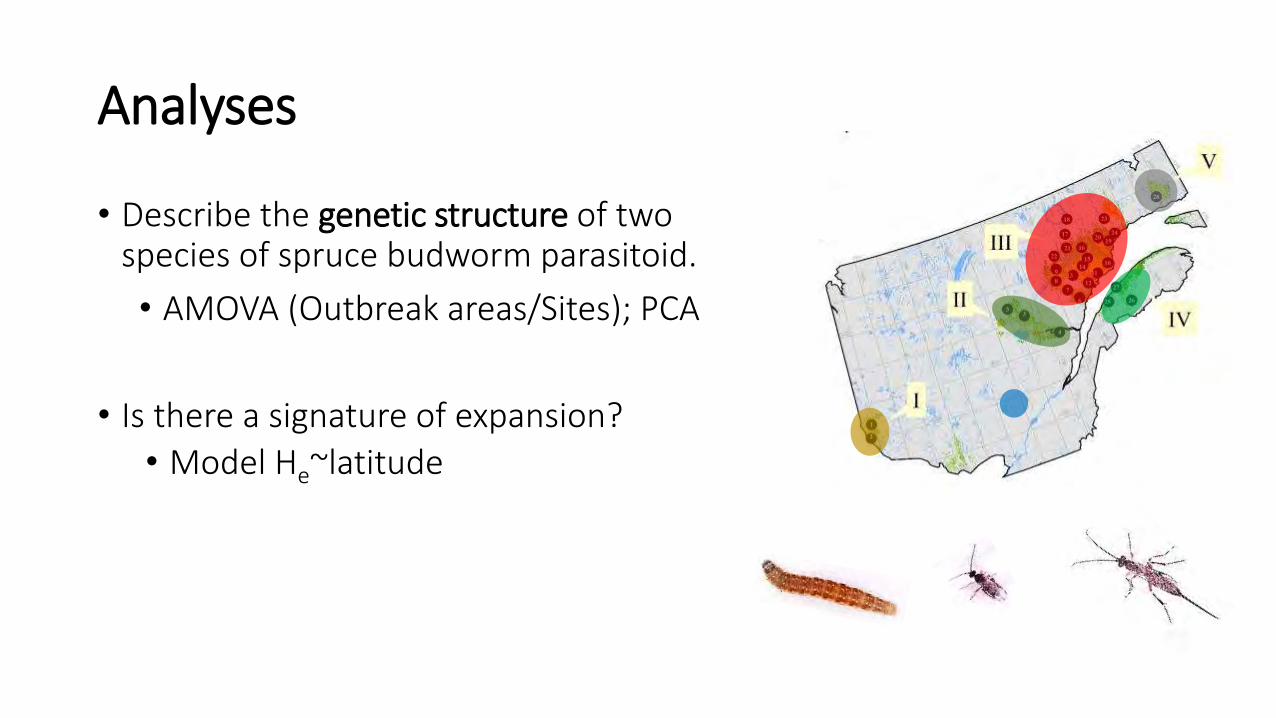
• Describe the genetic structure of two species of spruce budworm parasitoid.
• AMOVA (Outbreak areas/Sites); PCA
• Is there a signature of expansion?
• Model He~latitude
Analyses
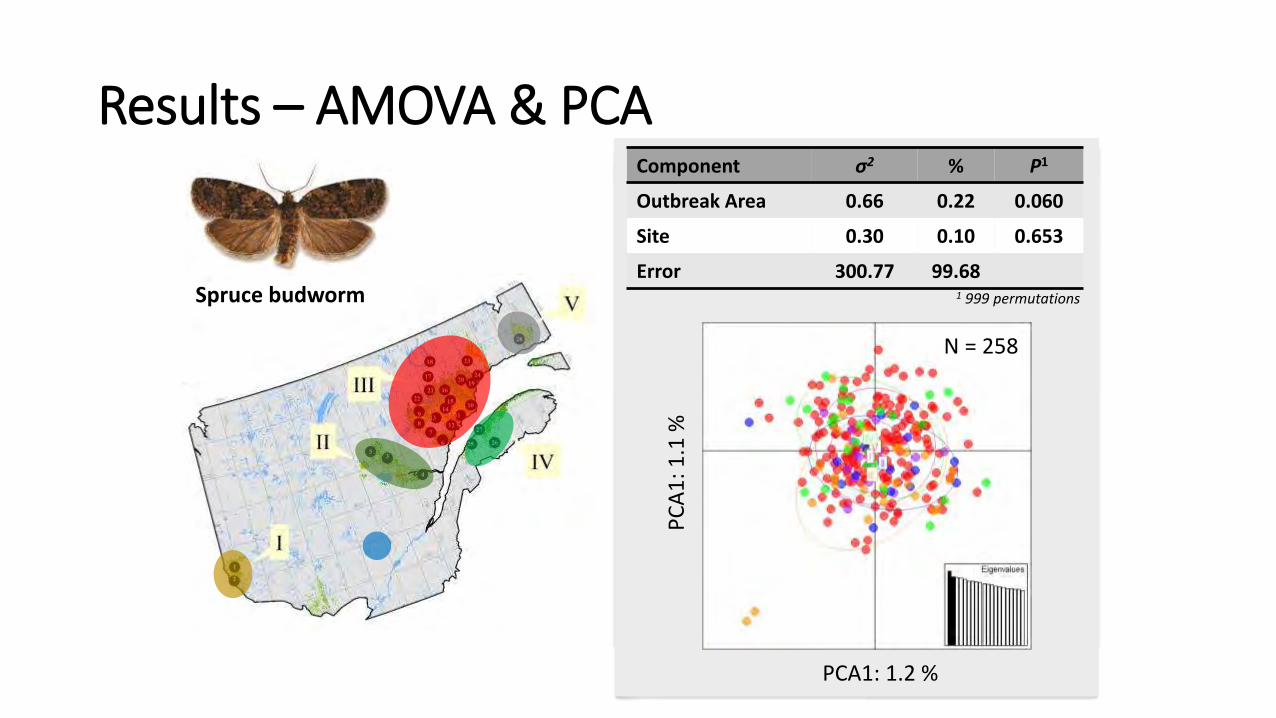
Component σ2 % P1
Outbreak Area 0.66 0.22 0.060
Site 0.30 0.10 0.653
Error 300.77 99.68
PCA1: 1.2 % P
CA
1: 1
.1 %
Spruce budworm
N = 258
1 999 permutations
Results – AMOVA & PCA
PCA1: 1.1 % P
CA
1: 1
.0 %
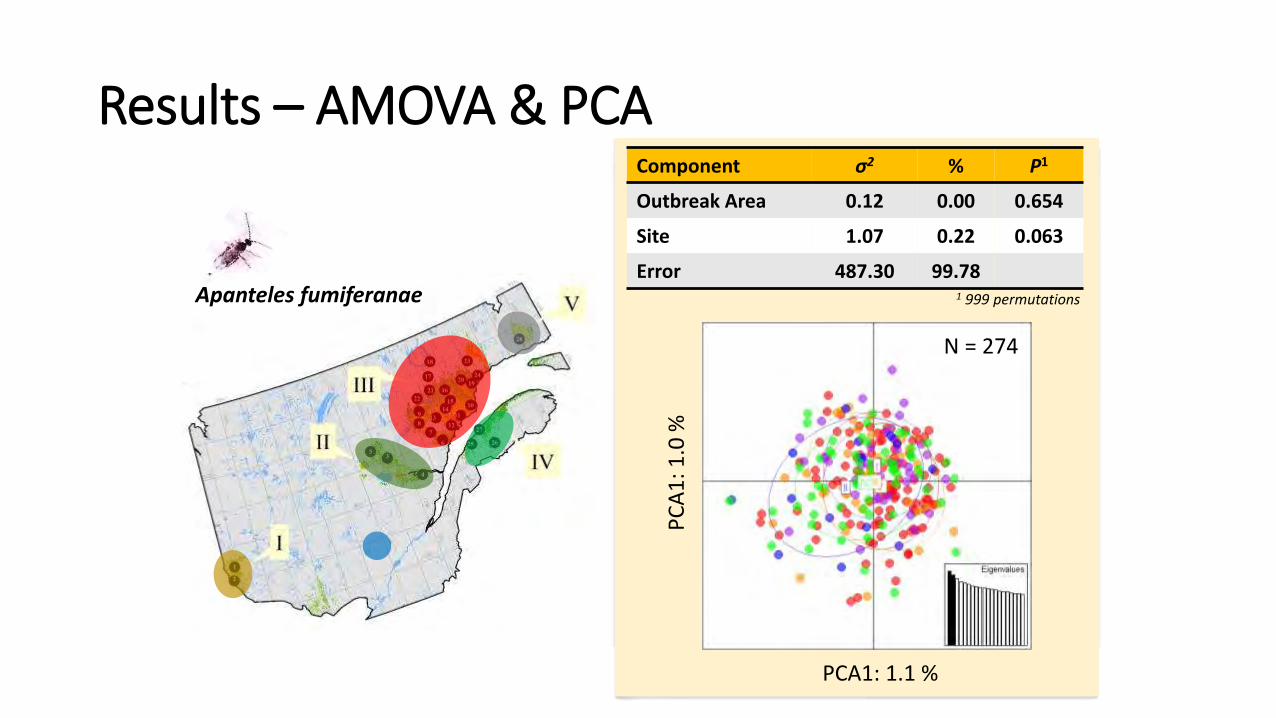
Apanteles fumiferanae
N = 274
1 999 permutations
Component σ2 % P1
Outbreak Area 0.12 0.00 0.654
Site 1.07 0.22 0.063
Error 487.30 99.78
Results – AMOVA & PCA
PCA1: 1.0 % P
CA
1: 1
.0 %
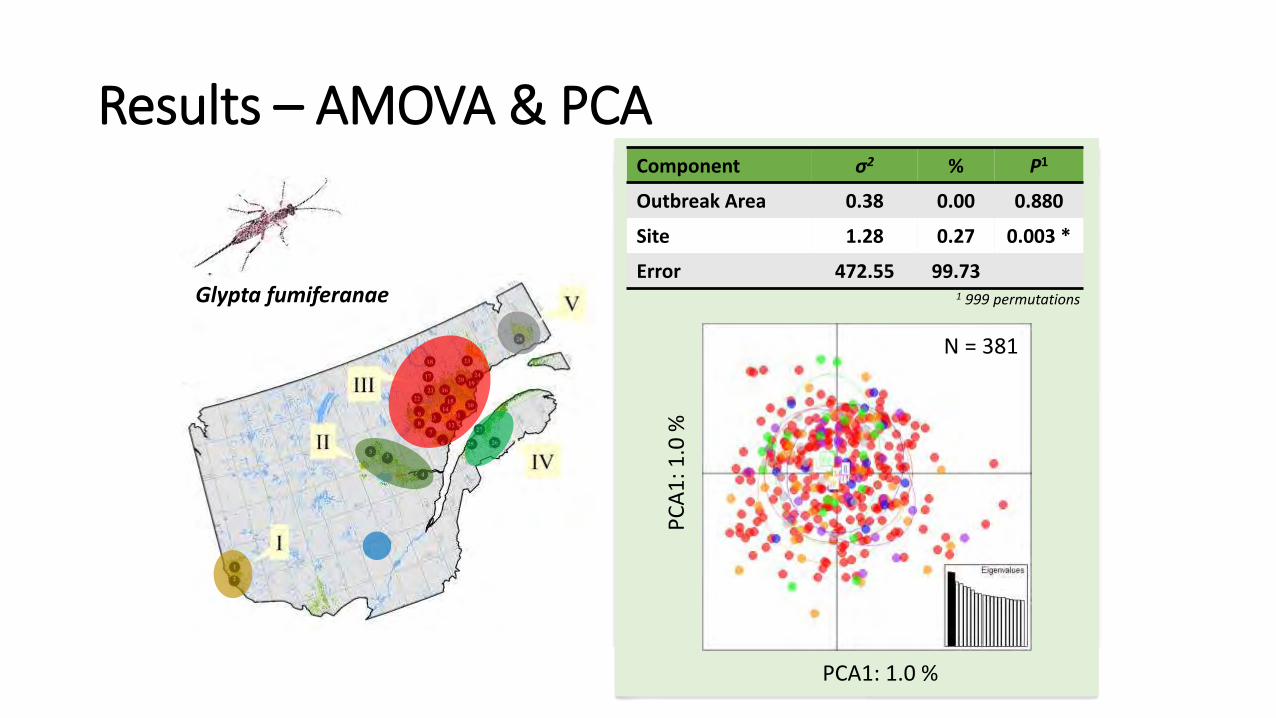
Glypta fumiferanae
N = 381
Component σ2 % P1
Outbreak Area 0.38 0.00 0.880
Site 1.28 0.27 0.003 *
Error 472.55 99.73 1 999 permutations
Results – AMOVA & PCA
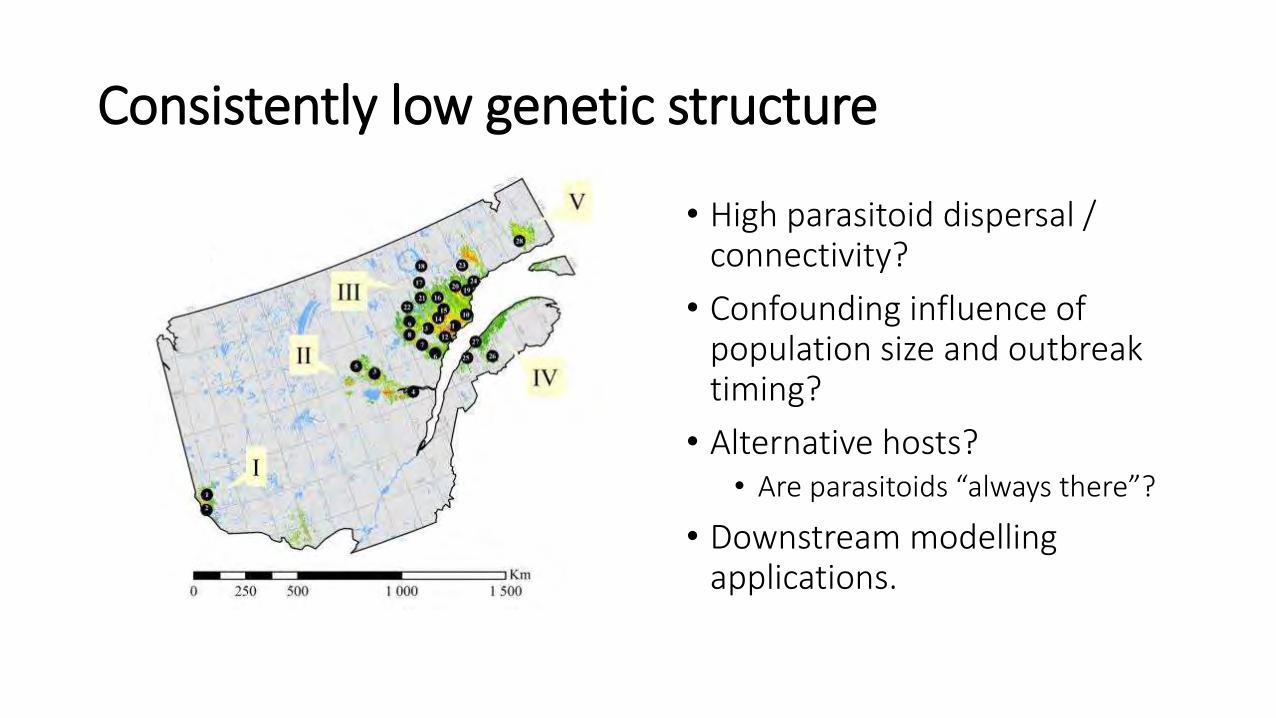
Consistently low genetic structure
• High parasitoid dispersal / connectivity?
• Confounding influence of population size and outbreak timing?
• Alternative hosts? • Are parasitoids “always there”?
• Downstream modelling applications.
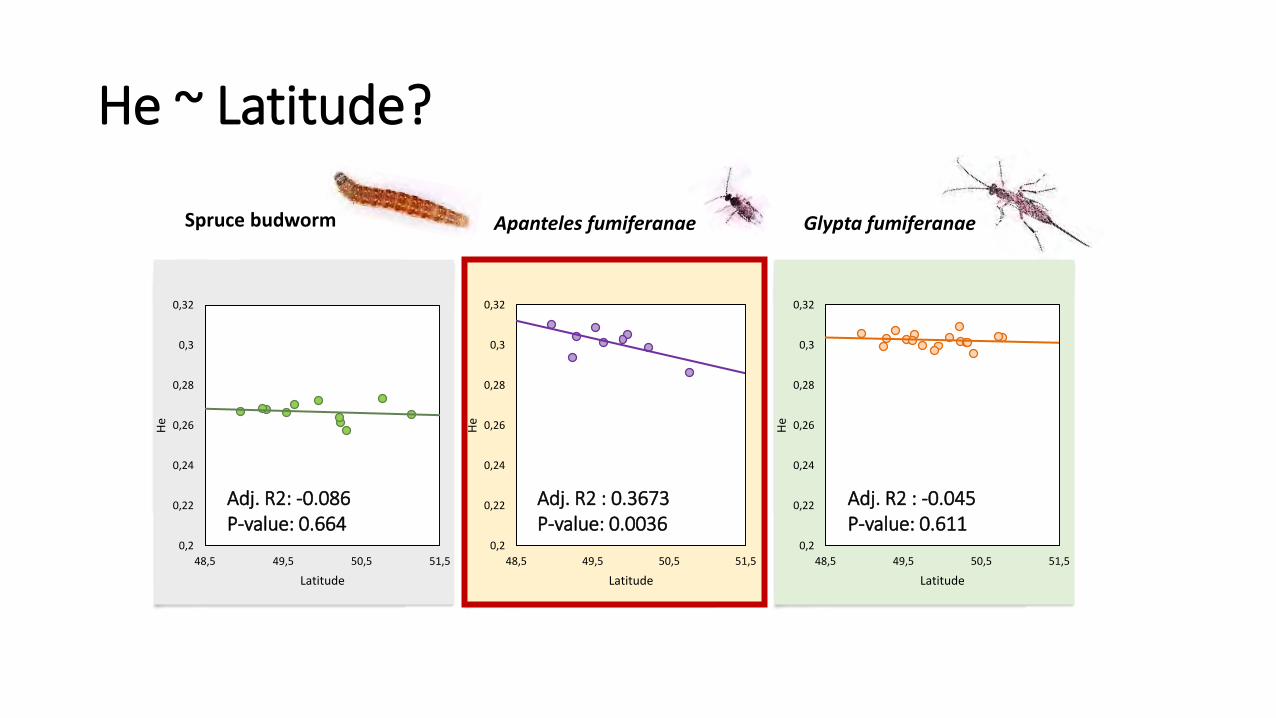
Apanteles fumiferanae Glypta fumiferanae Spruce budworm
0,2
0,22
0,24
0,26
0,28
0,3
0,32
48,5 49,5 50,5 51,5
He
Latitude
0,2
0,22
0,24
0,26
0,28
0,3
0,32
48,5 49,5 50,5 51,5
He
Latitude
0,2
0,22
0,24
0,26
0,28
0,3
0,32
48,5 49,5 50,5 51,5
He
Latitude
Adj. R2: -0.086 P-value: 0.664
Adj. R2 : 0.3673 P-value: 0.0036
Adj. R2 : -0.045 P-value: 0.611
He ~ Latitude?
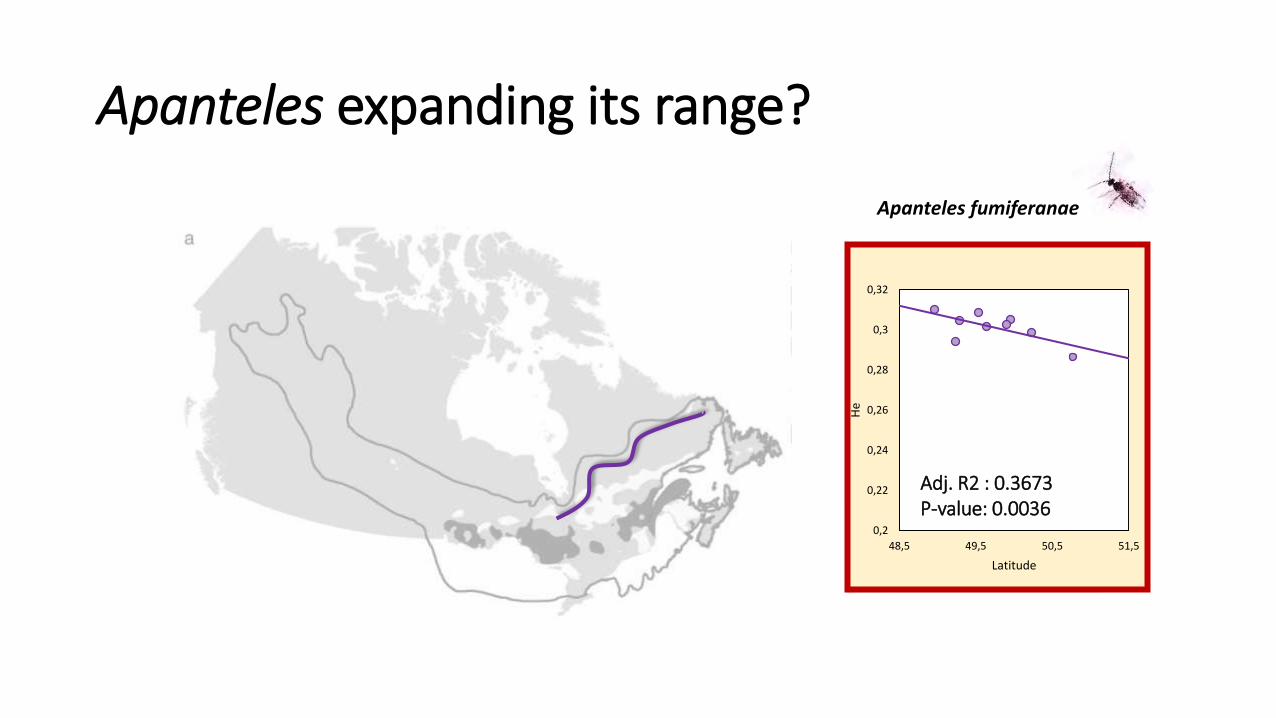
Apanteles expanding its range?
Apanteles fumiferanae
0,2
0,22
0,24
0,26
0,28
0,3
0,32
48,5 49,5 50,5 51,5
He
Latitude
Adj. R2 : 0.3673 P-value: 0.0036
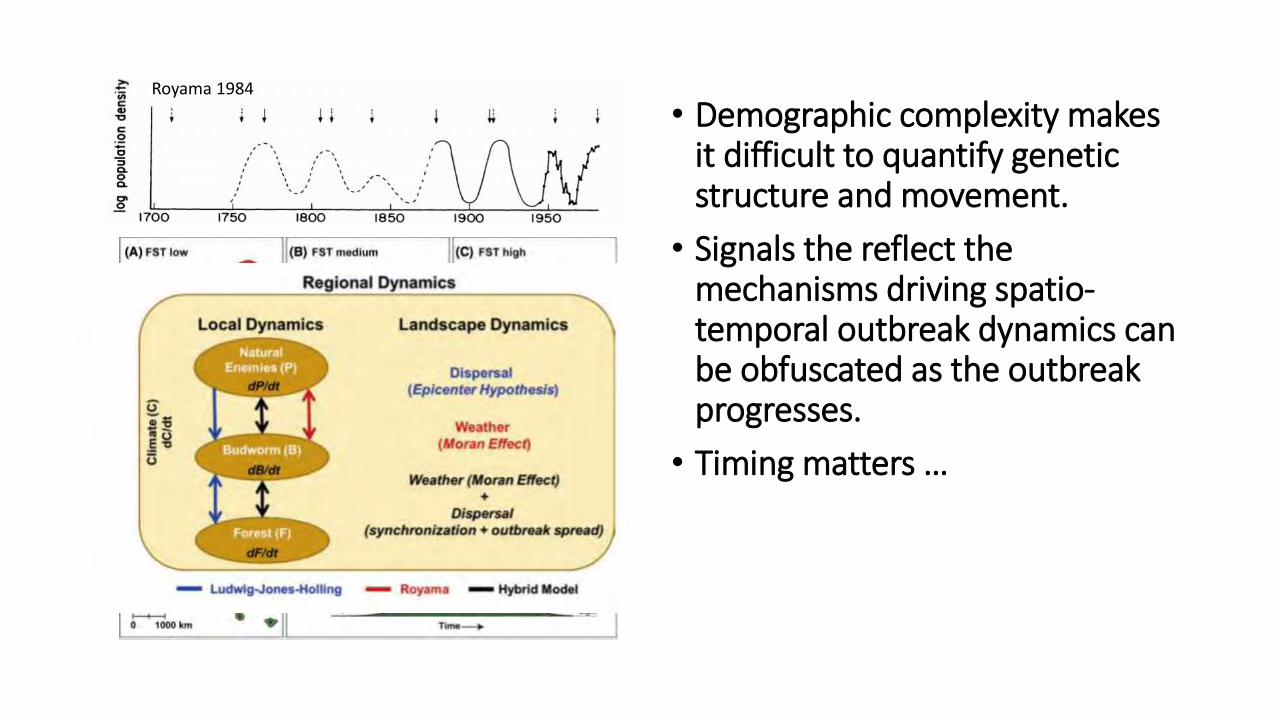
Royama 1984
• Demographic complexity makes it difficult to quantify genetic structure and movement.
• Signals the reflect the mechanisms driving spatio-temporal outbreak dynamics can be obfuscated as the outbreak progresses.
• Timing matters …
Other ongoing work
• Mapping inter- and intra-taxa spatial variation in potentially adaptive loci (SBW and MPB).
• Simulation modelling to examine the consequences of cyclic population dynamics on spatial genetic structure.
• Simulation modelling to examine the consequences of rapid range expansion on identifying signatures of selection in “real” landscapes.
jameslab.ca