Embed Size (px)
Citation preview
EECLAT&2015&–&Ploumanac’h&
E.#D.#Rivière#1#,&J.9P.&Pommereau&2,&Nadir&Amarouche&3,&S.&Khaykin2,&&M.&Ghysels&1,&C.&Stoeffler&1,&I.&Mappé9Fogaing,&F.&CarminaN&4,&&Ph.&Ricaud&4,&J.9B.&Renard&5,&F.&Wienhold&6,&L.&Joly&1,&G.&Durry&1,&and&G.&Held&7#
[1] GSMA, Université Reims Champagne-Ardenne/CNRS, Reims, France [2] LATMOS– CNRS/UVSQ/IPSL, Guyancourt, France [3] DT-INSU, CNRS, Meudon, France. [4] CNRM-GAME/CNRS/Météo-France, Toulouse, France [5] LPCEE/CNRS and Université d’Orléans, France [6] ETH, Institute for Atmospheric and Climate Science, Zürich, Switzerland, [7] IPMet/UNESP, - Bauru, S.P. Brazil,
Vapeur&d’eau&dans&l’UTLS&tropicale&:&PrésentaNon&du&projet&TRO9pico&
EECLAT&2015&–&Ploumanac’h&
EECLAT&2015&–&Ploumanac’h&
stratosphe
re&
Boundary&layer&
Free&troposphere&
tropics&Mid&laNtudes&
Deep&convecNon&
11&km&
17&km&
0&km&
UTLS&Slow&ascent&
cirrus&
Subtropical&
barrier&
19&km&
TTL&
Qnet&=&0&
&overshoots&.&&
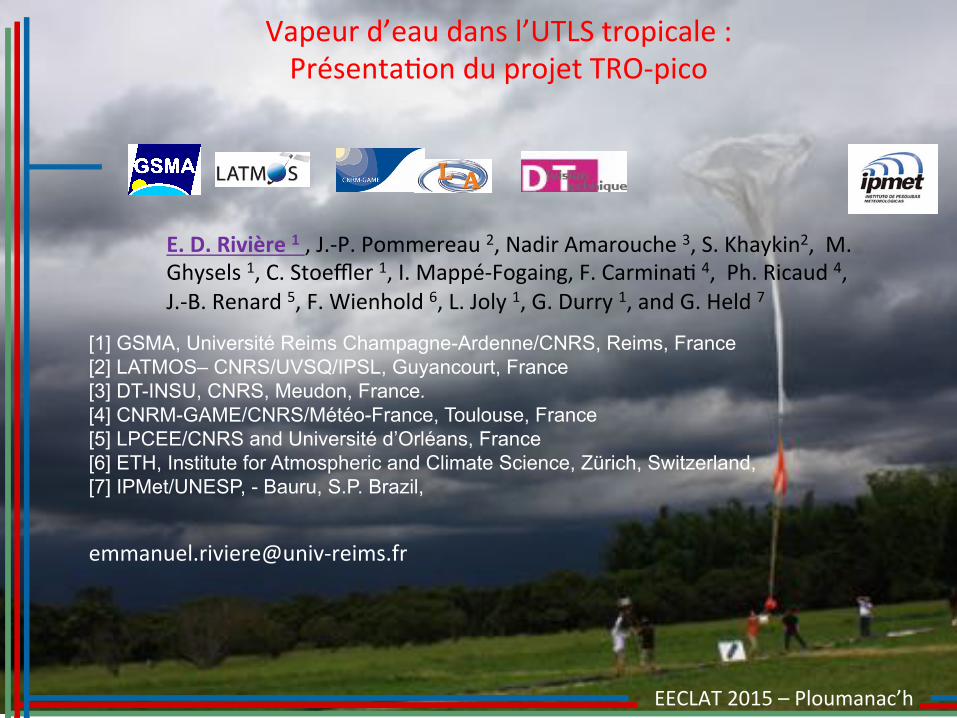
Overshoot& not& seen&at&the&global&scale&by&satellite& H2O& mea9surements&
&Contexte&:&entrée&de&l’eau&dans&la&stratosphère&tropicale&&
9 Ascension#lente#au&dessus&de&Qnet=0&!&températures&froides!&congélaNon!&sédimentaNon&!&déshydrataNon&&(piège&froid)&&
9 Pénétra6ons#convec6ves#dans#la#stratosphère#(overshoots)&(locales)&!&hydrataNon&à&l’échelle&locale&
&
EECLAT&2015&–&Ploumanac’h&
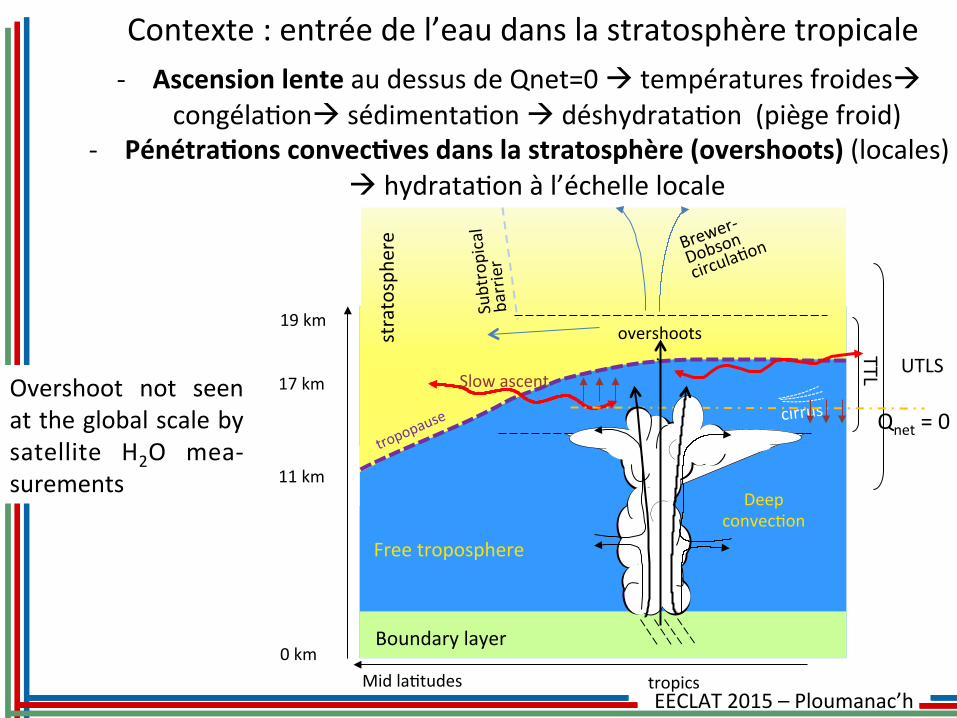
&Piège#froid#est#sans#doute#le#processus#prépondérant&
Contexte&:&Overshoot&Vs.&Piège&froid&?&
Overshoo(ng+convec(on+>+380+K+
Iwasaki et al. 2010, from A-Train
13 events /min above the 380 K in the tropical belt
Etude&de&trajectoire&&avec&calcul&de&déshydrataNon&lors&de&l’ascension&Fueglistaler&et&al.,&(2005),&James&et&al.,&(2008),&Schoeberl#et#al.,#(2013)#
EECLAT&2015&–&Ploumanac’h&
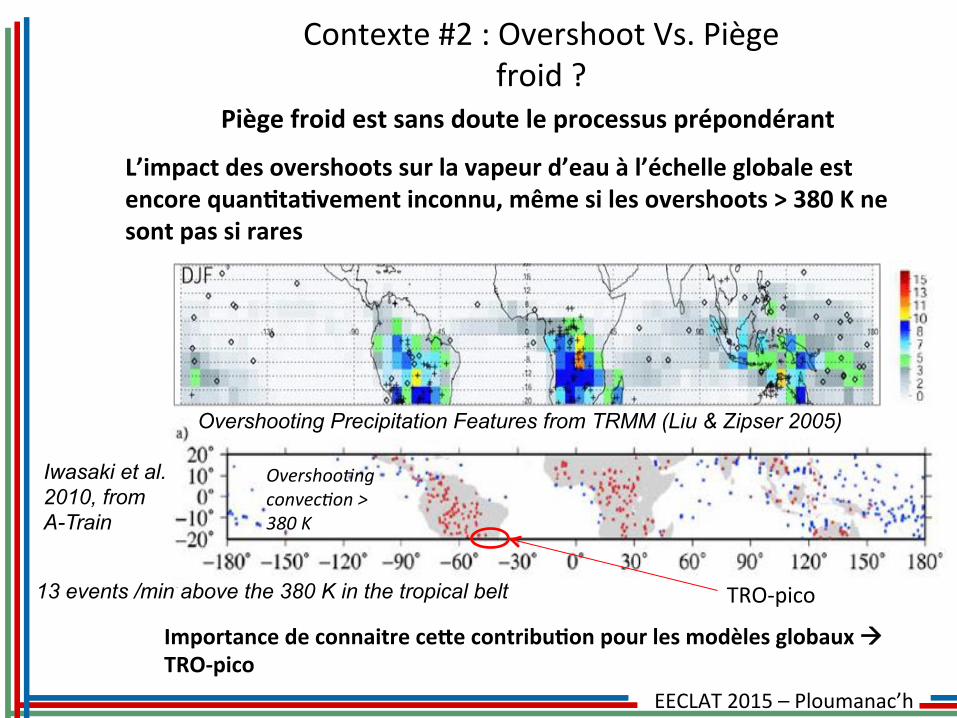
&Piège#froid#est#sans#doute#le#processus#prépondérant&#
L’impact#des#overshoots#sur#la#vapeur#d’eau#à#l’échelle#globale#est#encore#quan6ta6vement#inconnu,#même#si#les#overshoots#>#380#K#ne#sont#pas#si#rares##&
Overshoo(ng+convec(on+>+380+K+
Iwasaki et al. 2010, from A-Train
13 events /min above the 380 K in the tropical belt TRO9pico&
Contexte&:&Overshoot&Vs.&Piège&froid&?&
Importance#de#connaitre#ceOe#contribu6on#pour#les#modèles#globaux#!#TROSpico#
Overshoo(ng+convec(on+>+380+K+
Iwasaki et al. 2010, from A-Train
13 events /min above the 380 K in the tropical belt
Overshooting Precipitation Features from TRMM (Liu & Zipser 2005)
EECLAT&2015&–&Ploumanac’h&
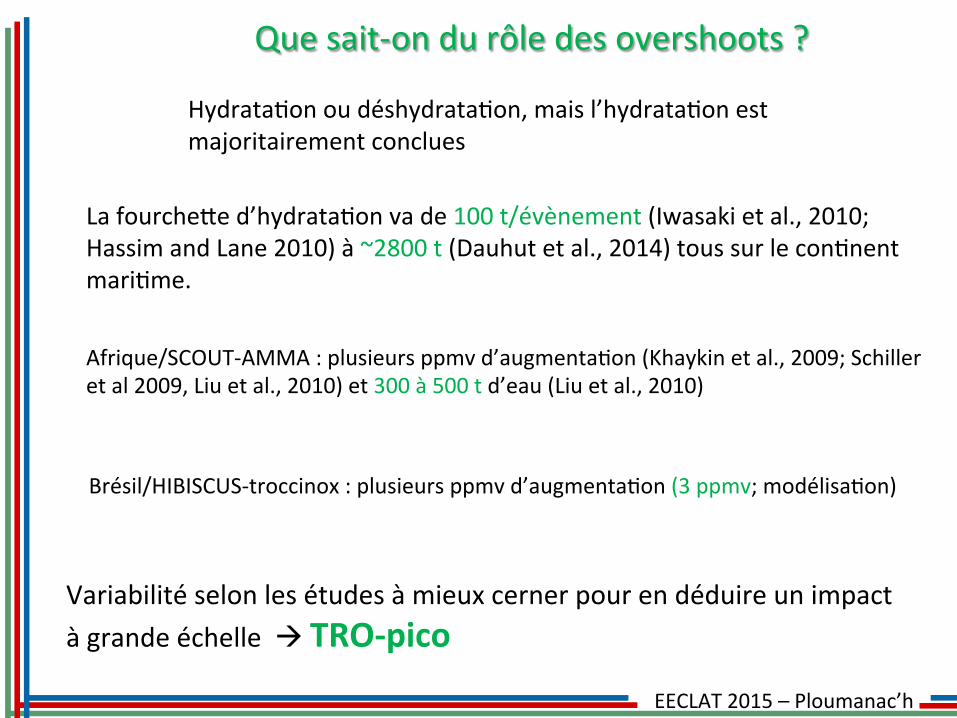
Que&sait9on&du&rôle&des&overshoots&?&
HydrataNon&ou&déshydrataNon,&mais&l’hydrataNon&est&majoritairement&conclues&
Afrique/SCOUT9AMMA&:&plusieurs&ppmv&d’augmentaNon&(Khaykin&et&al.,&2009;&Schiller&et&al&2009,&Liu&et&al.,&2010)&et&300&à&500&t&d’eau&(Liu&et&al.,&2010)&
Brésil/HIBISCUS9troccinox&:&plusieurs&ppmv&d’augmentaNon&(3&ppmv;&modélisaNon)&
La&fourchepe&d’hydrataNon&va&de&100&t/évènement&(Iwasaki&et&al.,&2010;&Hassim&and&Lane&2010)&à&~2800&t&(Dauhut&et&al.,&2014)&tous&sur&le&conNnent&mariNme.&
Variabilité&selon&les&études&à&mieux&cerner&pour&en&déduire&un&impact&&à&grande&échelle&&!&TROSpico#
EECLAT&2015&–&Ploumanac’h&
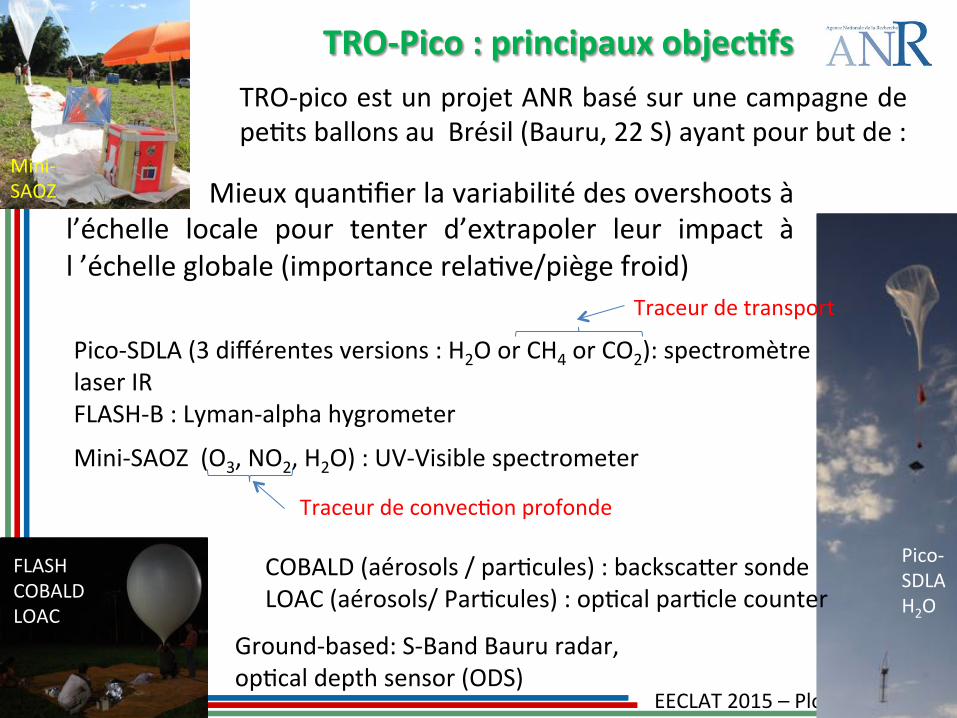
&&&&&&&Mieux&quanNfier&la&variabilité&des&overshoots&à&l’échelle& locale& pour& tenter& d’extrapoler& leur& impact& à&l&’échelle&globale&(importance&relaNve/piège&froid)&
TROSPico#:#principaux#objec6fs#TRO9pico&est&un&projet&ANR&basé&sur&une&campagne&de&peNts&ballons&au&&Brésil&(Bauru,&22&S)&ayant&pour&but&de&:&&
Pico9SDLA&(3&différentes&versions&:&H2O&or&CH4&or&CO2):&spectromètre&laser&IR&
FLASH9B&:&Lyman9alpha&hygrometer&&
Mini9SAOZ&&(O3,&NO2,&H2O)&:&UV9Visible&spectrometer&&&&&&
& &COBALD&(aérosols&/&parNcules)&:&backscaper&sonde&& &LOAC&(aérosols/&ParNcules)&:&opNcal&parNcle&counter&
Traceur&de&transport&
Traceur&de&convecNon&profonde&
Mini9SAOZ&
Pico9SDLA&H2O&
FLASH&COBALD&LOAC&
Ground9based:&S9Band&Bauru&radar,&&&opNcal&depth&sensor&(ODS)&
EECLAT&2015&–&Ploumanac’h&
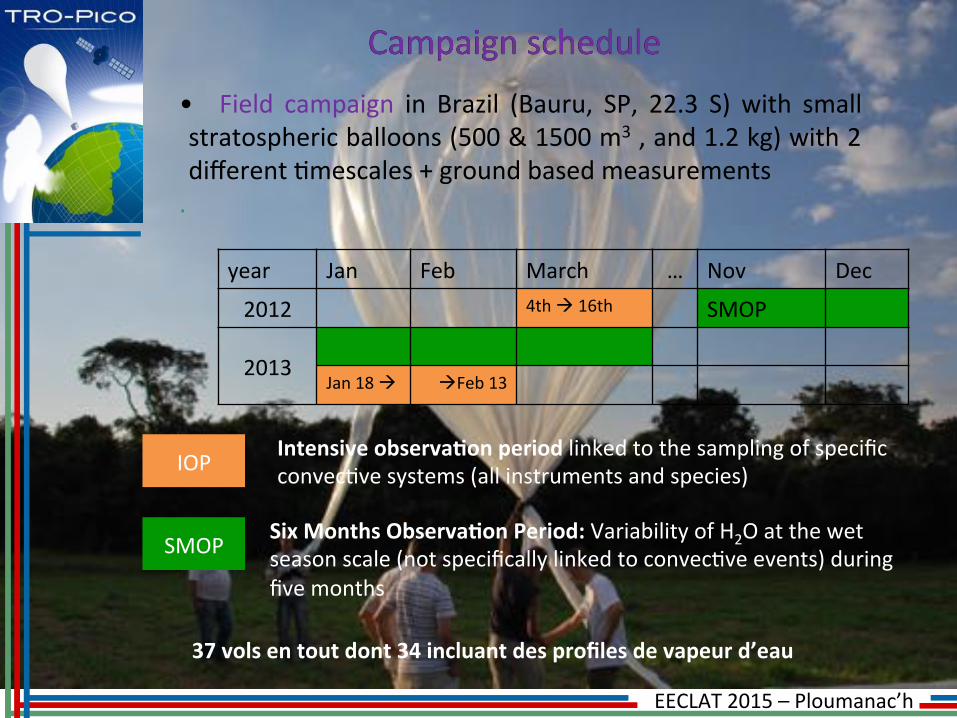
•& & Field& campaign& in& Brazil& (Bauru,& SP,& 22.3& S)& with& small&stratospheric&balloons&(500&&&1500&m3&,&and&1.2&kg)&with&2&different&Nmescales&+&ground&based&measurements&.&&&&&
&&&
year& Jan& Feb& March& …& Nov& Dec&
2012& 4th&!&16th& SMOP&
2013&Jan&18&!&& !Feb&13&
Campaign&schedule&Campaign&schedule&
IOP&
SMOP&
Intensive#observa6on#period#linked&to&the&sampling&of&specific&convecNve&systems&(all&instruments&and&species)&
Six#Months#Observa6on#Period:#Variability&of&H2O&at&the&wet&season&scale&(not&specifically&linked&to&convecNve&events)&during&five&months&
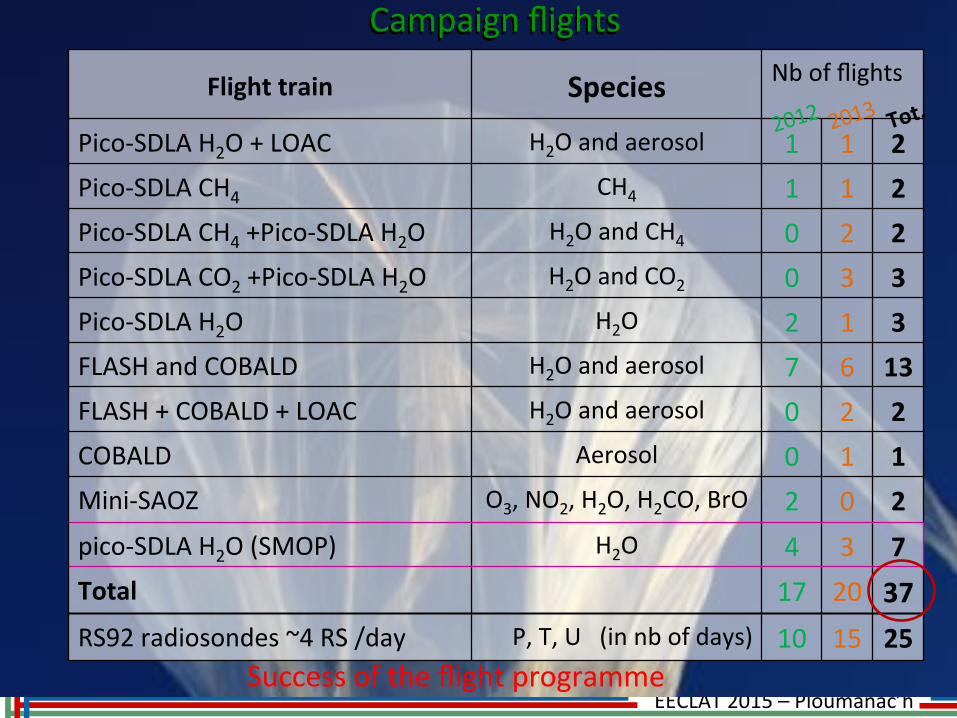
37#vols#en#tout#dont#34#incluant#des#profiles#de#vapeur#d’eau#
EECLAT&2015&–&Ploumanac’h&
30
28
26
24
22
20
18
16
14
12
Heigh
t,/km
1110987654321WV/vmr,/ppmv
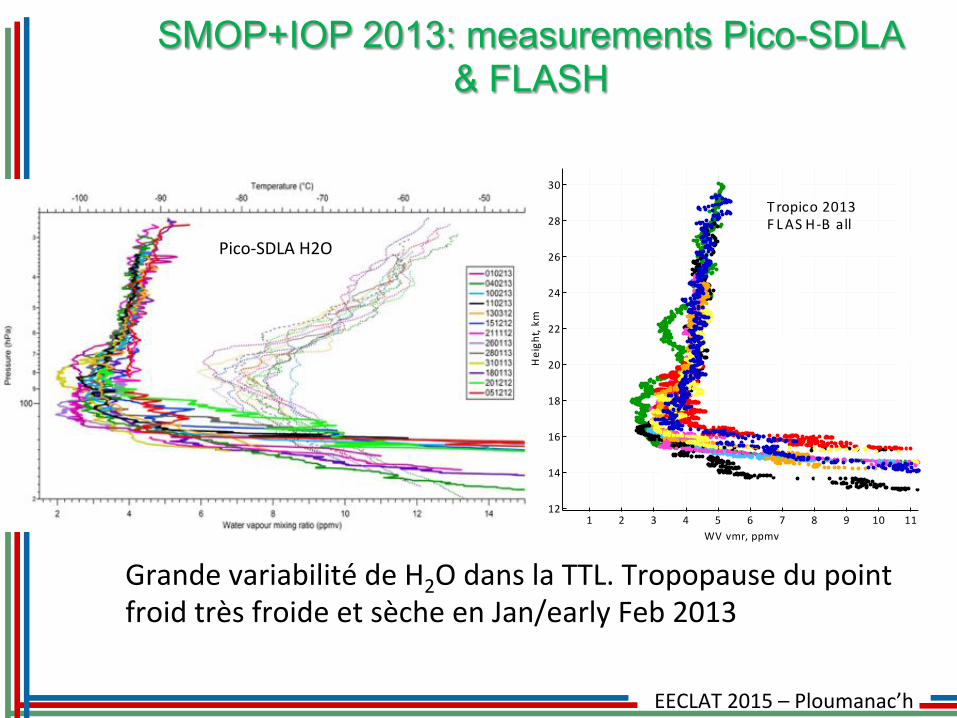
T ropico/2013F LAS HAB /all
Grande&variabilité&de&H2O&dans&la&TTL.&Tropopause&du&point&froid&très&froide&et&sèche&en&Jan/early&Feb&2013&
SMOP+IOP 2013: measurements Pico-SDLA & FLASH
Pico9SDLA&H2O&
EECLAT&2015&–&Ploumanac’h&
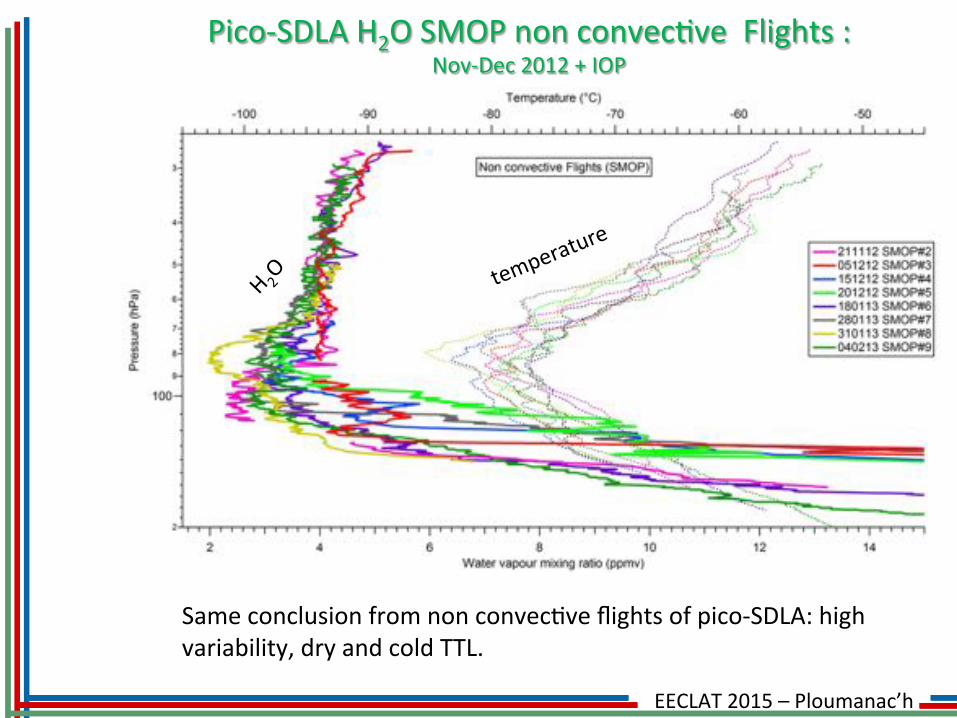
Pico9SDLA&H2O&SMOP&non&convecNve&&Flights&:&&Nov9Dec&2012&+&IOP&
Same&conclusion&from&non&convecNve&flights&of&pico9SDLA:&high&variability,&dry&and&cold&TTL.&
EECLAT&2015&–&Ploumanac’h&
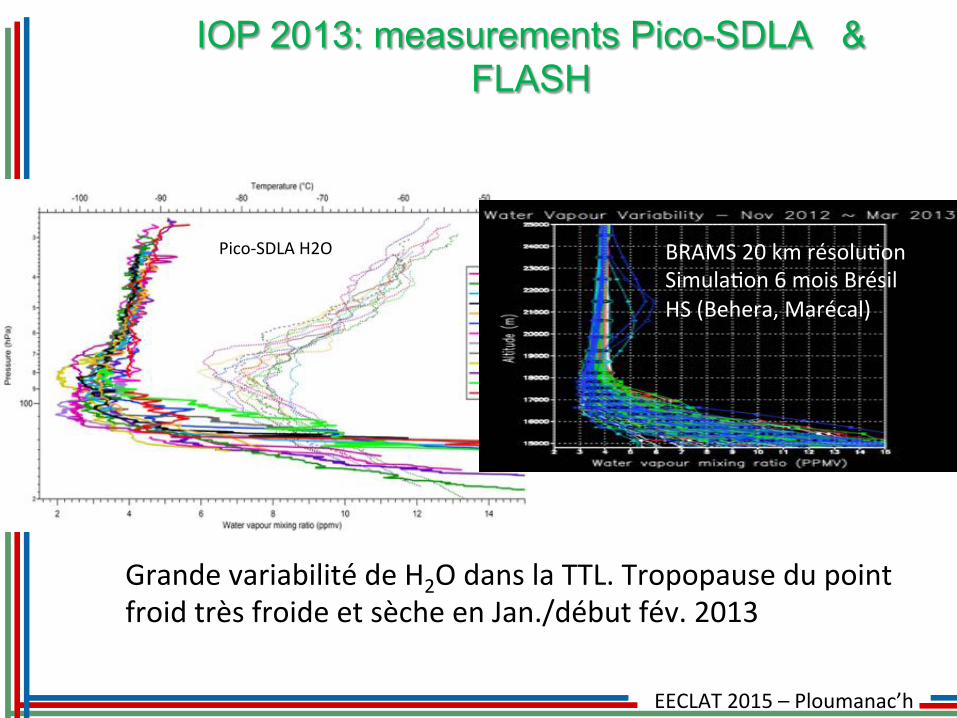
Grande&variabilité&de&H2O&dans&la&TTL.&Tropopause&du&point&froid&très&froide&et&sèche&en&Jan./début&fév.&2013&
IOP 2013: measurements Pico-SDLA & FLASH
Pico9SDLA&H2O& BRAMS&20&km&résoluNon&SimulaNon&6&mois&Brésil&HS&(Behera,&Marécal)&
EECLAT&2015&–&Ploumanac’h&
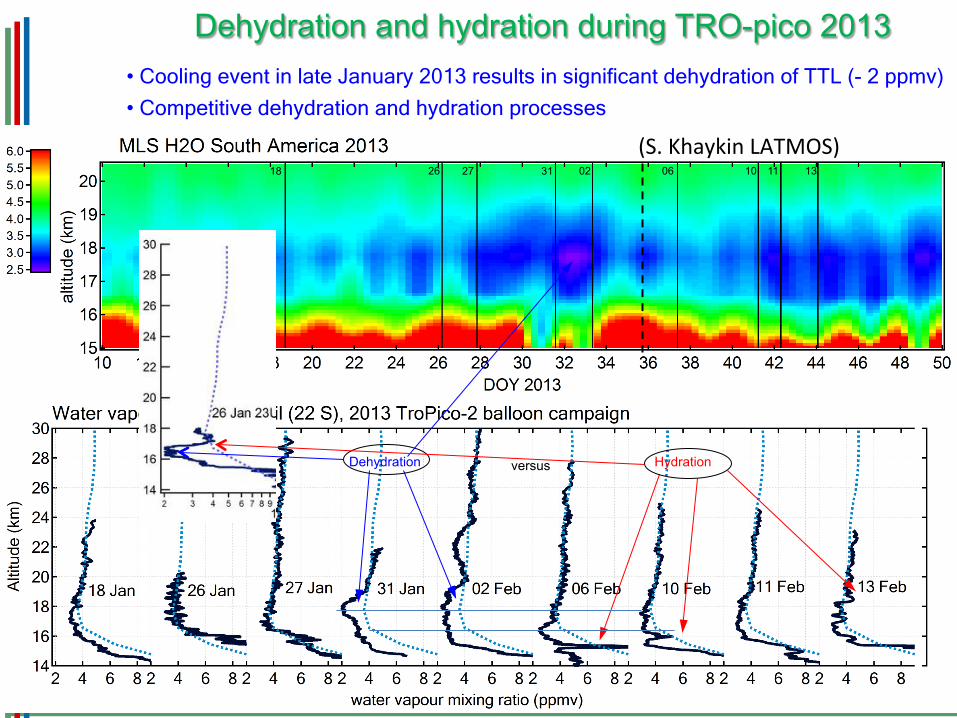
Dehydration and hydration during TRO-pico 2013 • Cooling event in late January 2013 results in significant dehydration of TTL (- 2 ppmv)
• Competitive dehydration and hydration processes
Dehydration versus
18 26 27 31 02 06 10 11 13
Hydration
(S.&Khaykin&LATMOS)&
EECLAT&2015&–&Ploumanac’h&
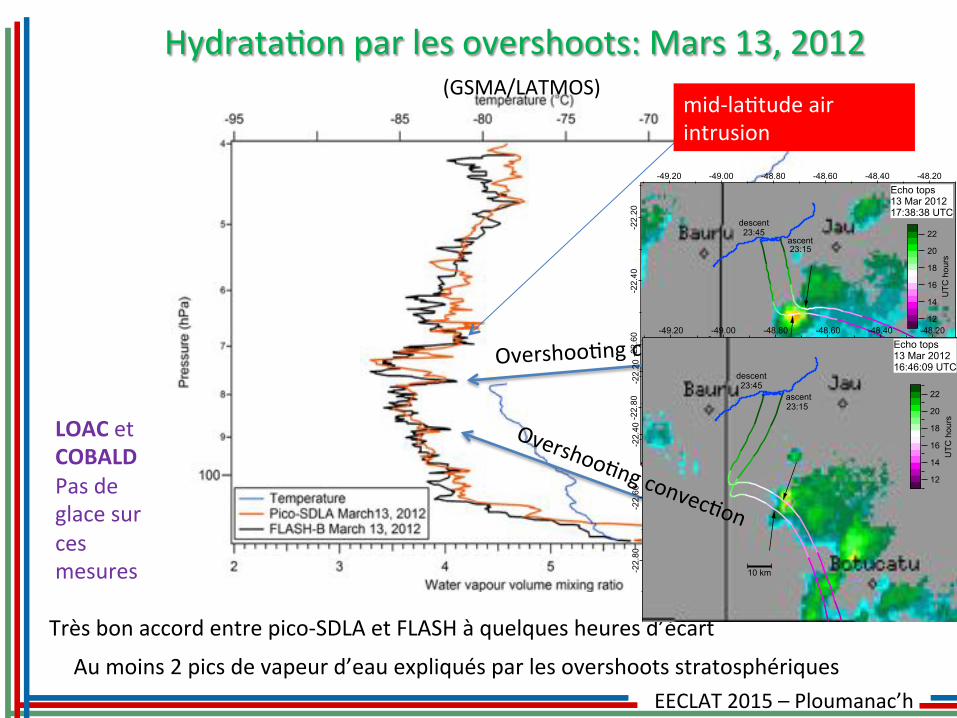
HydrataNon&par&les&overshoots:&Mars&13,&2012&(GSMA/LATMOS)&
Très&bon&accord&entre&pico9SDLA&et&FLASH&à&quelques&heures&d’écart&
Au&moins&2&pics&de&vapeur&d’eau&expliqués&par&les&overshoots&stratosphériques&-2
2.80
-22.
60-2
2.40
-22.
20
-49.20 -49.00 -48.80 -48.60 -48.40 -48.20
descent23:45
ascent23:15
10 km
Echo tops13 Mar 201217:38:38 UTC
22
20
18
16
14
12
UTC
hou
rs
OvershooNng&convecNon&
-22.
80-2
2.60
-22.
40-2
2.20
-49.20 -49.00 -48.80 -48.60 -48.40 -48.20
descent23:45
ascent23:15
10 km
Echo tops13 Mar 201216:46:09 UTC
22
20
18
16
14
12
UTC
hou
rs
mid9laNtude&air&intrusion&
LOAC&et&COBALD&Pas&de&glace&sur&ces&mesures&
EECLAT&2015&–&Ploumanac’h&
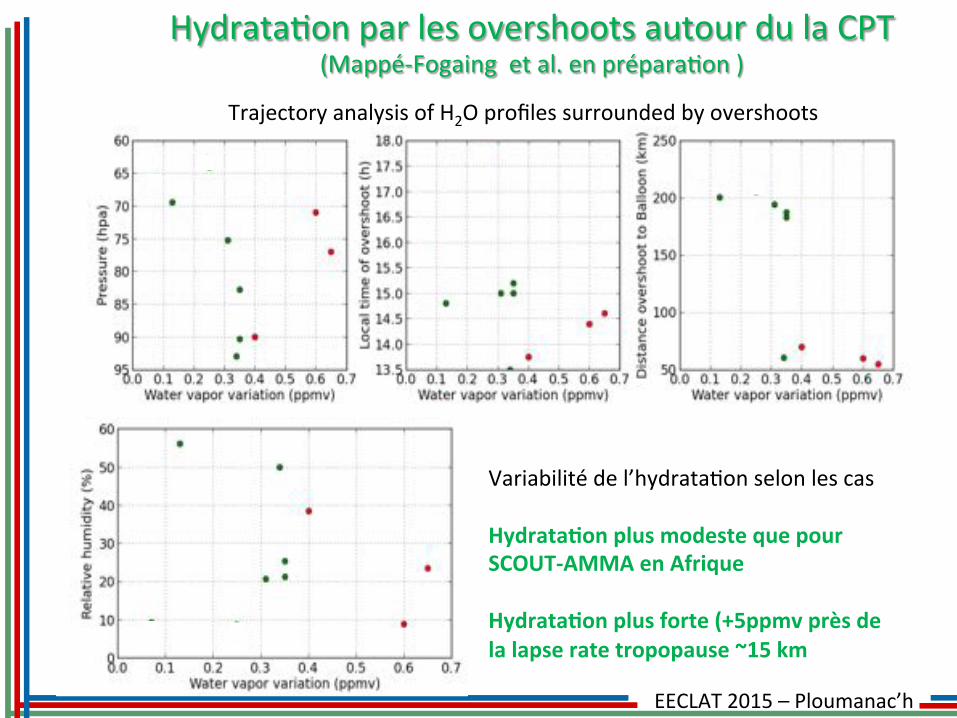
HydrataNon&par&les&overshoots&autour&du&la&CPT&(Mappé9Fogaing&&et&al.&en&préparaNon&)&
Variabilité&de&l’hydrataNon&selon&les&cas&&Hydrata6on#plus#modeste#que#pour#SCOUTSAMMA#en#Afrique##Hydrata6on#plus#forte#(+5ppmv#près#de#la#lapse#rate#tropopause#~15#km#
Trajectory&analysis&of&H2O&profiles&surrounded&by&overshoots&&&
EECLAT&2015&–&Ploumanac’h&
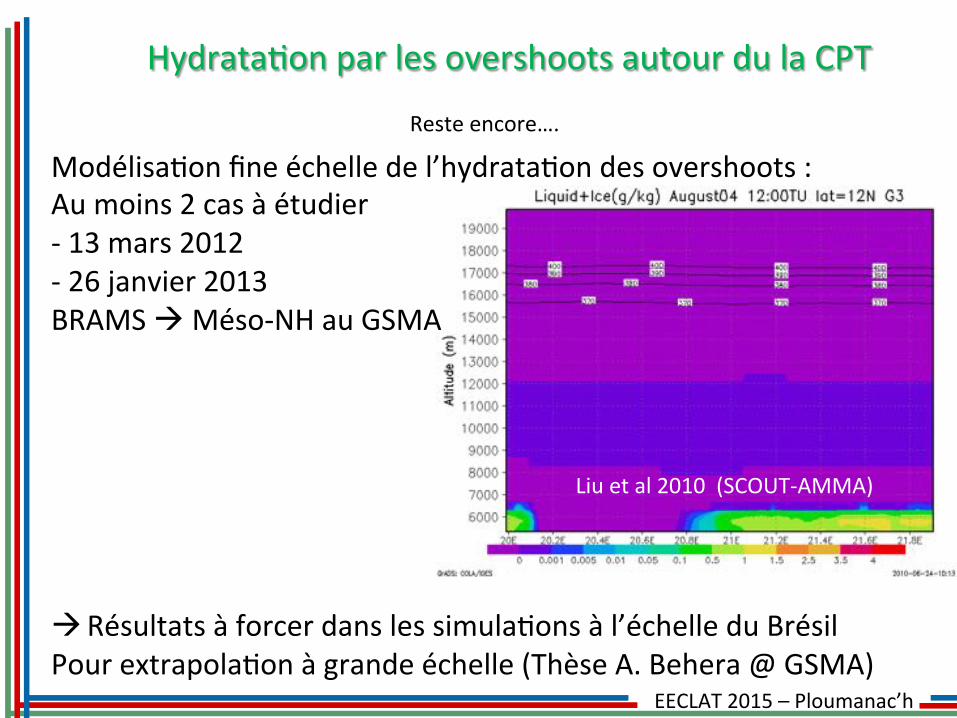
HydrataNon&par&les&overshoots&autour&du&la&CPT&
Reste&encore….&
Liu&et&al&2010&&(SCOUT9AMMA)&
ModélisaNon&fine&échelle&de&l’hydrataNon&des&overshoots&:&Au&moins&2&cas&à&étudier&&9&13&mars&2012&9&26&janvier&2013&BRAMS&!&Méso9NH&au&GSMA&&&&&&&&! Résultats&à&forcer&dans&les&simulaNons&à&l’échelle&du&Brésil&Pour&extrapolaNon&à&grande&échelle&(Thèse&A.&Behera&@&GSMA)&&&
EECLAT&2015&–&Ploumanac’h&
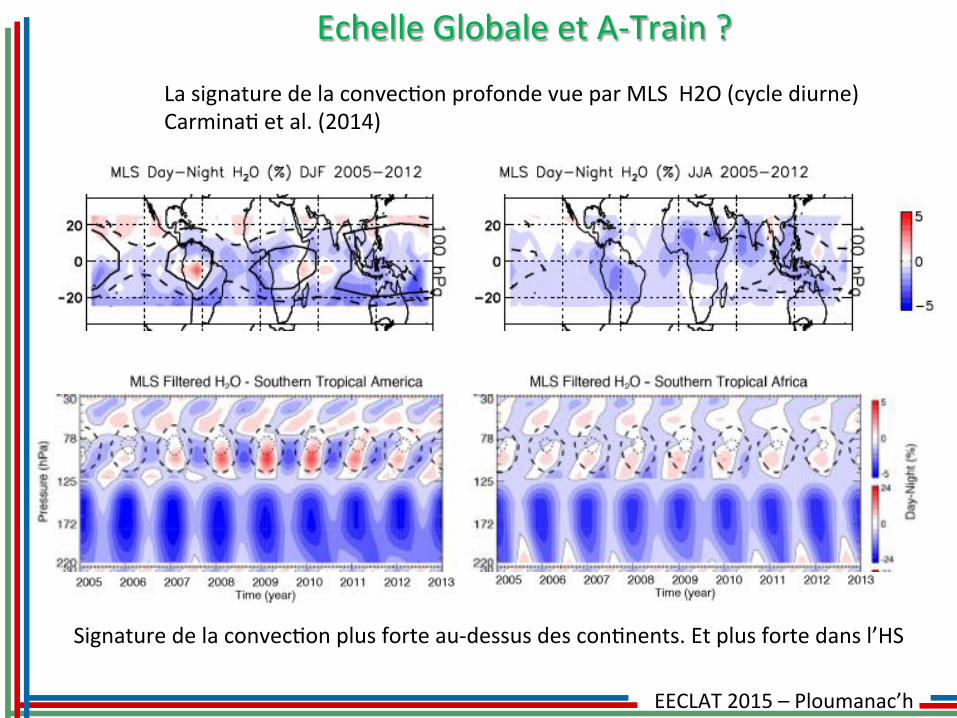
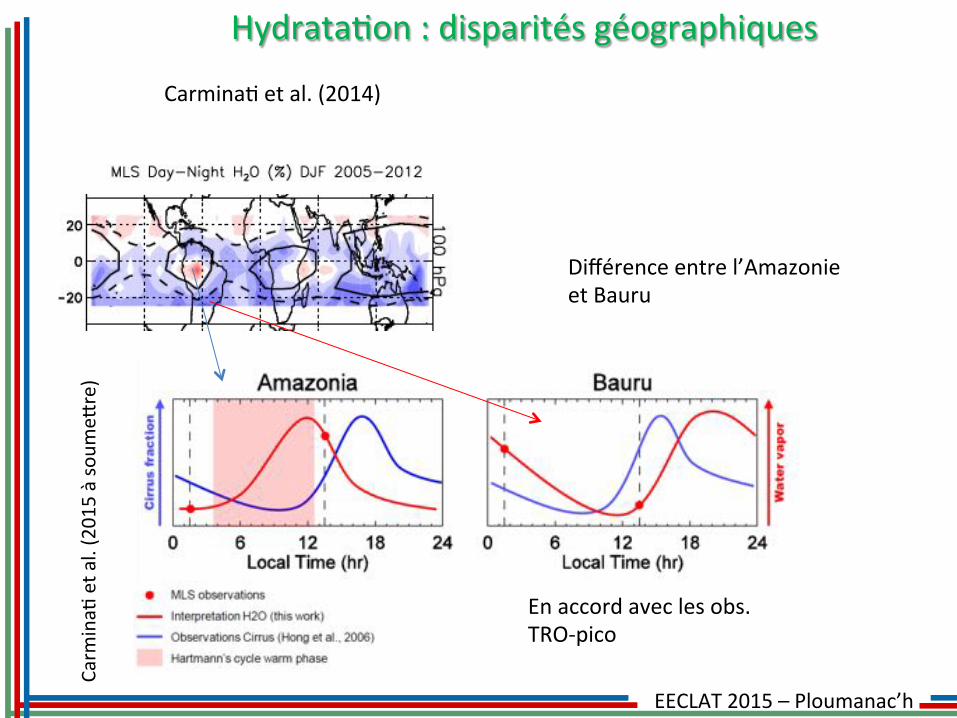
Signature&de&la&convecNon&plus&forte&au9dessus&des&conNnents.&Et&plus&forte&dans&l’HS&
La&signature&de&la&convecNon&profonde&vue&par&MLS&&H2O&(cycle&diurne)&CarminaN&et&al.&(2014)&
Echelle&Globale&et&A9Train&?&
EECLAT&2015&–&Ploumanac’h&
CarminaN&et&al.&(2014)&
HydrataNon&:&disparités&géographiques&Carm
inaN
&et&a
l.&(2015&à&soum
epre)&
Différence&entre&l’Amazonie&&et&Bauru&
En&accord&avec&les&obs.&TRO9pico&
EECLAT&2015&–&Ploumanac’h&
Conclusion - Key points
•&Grand&nombre&de&vols&pour&la&campagne&ballon&TRO9pico&pendant&la& saison&convecNve/humide&de& l’HS.&Succès&de& la&campagne&par&rapport&au&nombre&de&vols&prévus&et& le&bon&foncNonnement&des&instruments.&
&•&Bonne&comparaison&entre&Pico9SDLA&et&FLASH&pour&plusieurs&cas&:&Cohérence&du&jeu&de&données.&&•&grande&variabilité&de&la&vapeur&d’eau&dans&la&TTL&même&pendant&des& vols& “non9convecNfs”.& Contraste& entre& 2012& plus& humide& et&2013&très&sèche.&
&•& Quelques& cas& convecNfs& influencées& par& des& overshoots& locaux&avec&une&hydrataNon&allant&de&0.1&to&0.65&ppmv&:&plus&faible&que&les& cas& africains& de& SCOUT9AMMA.&Dépendance&de& la& région& sur&l’hydrataNon&?&
&•&On&semble&voir&une&variabilité&de&l’hydrataNon&au&niveau&local.&&
EECLAT&2015&–&Ploumanac’h&
Conclusion - Key points •&Travail&en&cours&sur&la&parNe&modélisaNon&peNte&échelle&(CRM)&et&à&grande&échelle.&&
&•&AcNvités&satellite&:& influence&des&overshoots&sur&les&climatologies&de& temperatures& et& de& H2O& (jour)9(nuit)& (Khaykin& et& al& 2013;&CarminaN&et&al.,&2014)&vues&par&satellites&&
&•& Intéressés&par& le& jeu&de&données&?&Accessible&à& tout& le&monde&à&parNr&d’avril& 2015& sur& Ether.& Pour&une&uNlisaNon& spécifique&plus&tôt,&merci&de&me&contacter.&
&&&& &Acknowledgement#:##& &all&IPMET’s&team&& &DT9INSU&parNcipant&& &Pierre&Dedieu&& &IRD&Brazilia&&
EECLAT&2015&–&Ploumanac’h&
Workshop Reims Eau dans l’UTLS tropicale
1er au 3 juillet 2015 ou du 6 au 8 juillet 2015
- In-situ or remote sensing water observations, -Small scale (e.g. overshoots) or large scale (e.g.
freezing-drying) modelling -In situ or remote-sensing overshoot observations - Cirrus clouds and dehydration, - Waves and cross-tropopause transport, - Regional differences in the contribution of
stratospheric water budget - Upscaling issues
EECLAT&2015&–&Ploumanac’h&
EECLAT&2015&–&Ploumanac’h&
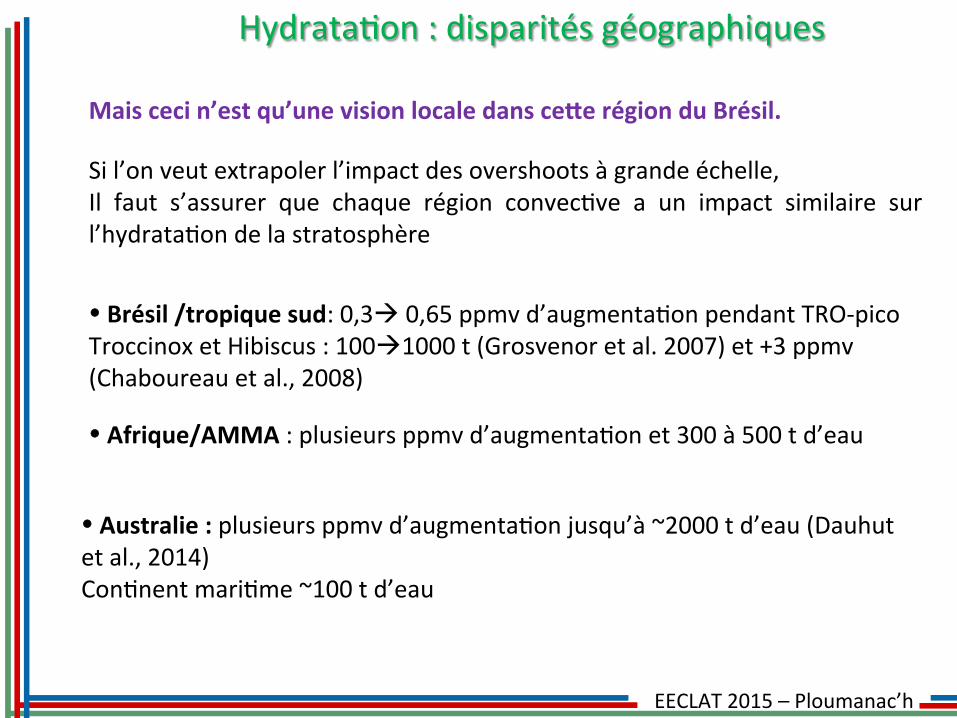
HydrataNon&:&disparités&géographiques&
Mais#ceci#n’est#qu’une#vision#locale#dans#ceOe#région#du#Brésil.#&Si&l’on&veut&extrapoler&l’impact&des&overshoots&à&grande&échelle,&Il& faut& s’assurer& que& chaque& région& convecNve& a& un& impact& similaire& sur&l’hydrataNon&de&la&stratosphère&
•#Brésil#/tropique#sud:&0,3!&0,65&ppmv&d’augmentaNon&pendant&TRO9pico&Troccinox&et&Hibiscus&:&100!1000&t&(Grosvenor&et&al.&2007)&et&+3&ppmv&(Chaboureau&et&al.,&2008)&
•#Afrique/AMMA#:&plusieurs&ppmv&d’augmentaNon&et&300&à&500&t&d’eau&
•#Australie#:#plusieurs&ppmv&d’augmentaNon&jusqu’à&~2000&t&d’eau&(Dauhut&et&al.,&2014)&ConNnent&mariNme&~100&t&d’eau&
EECLAT&2015&–&Ploumanac’h&
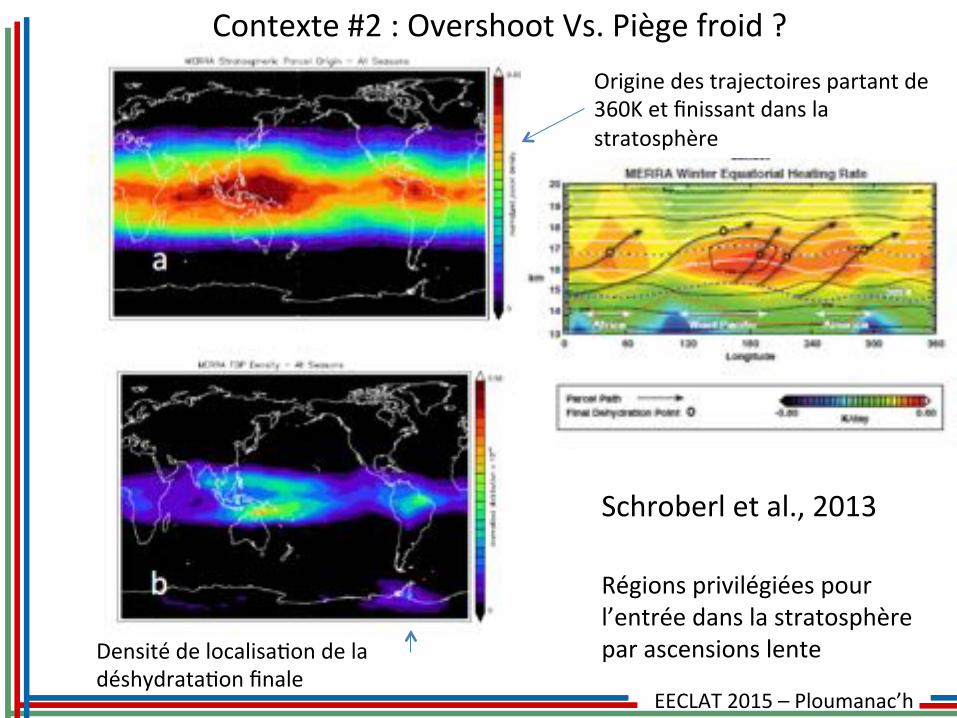
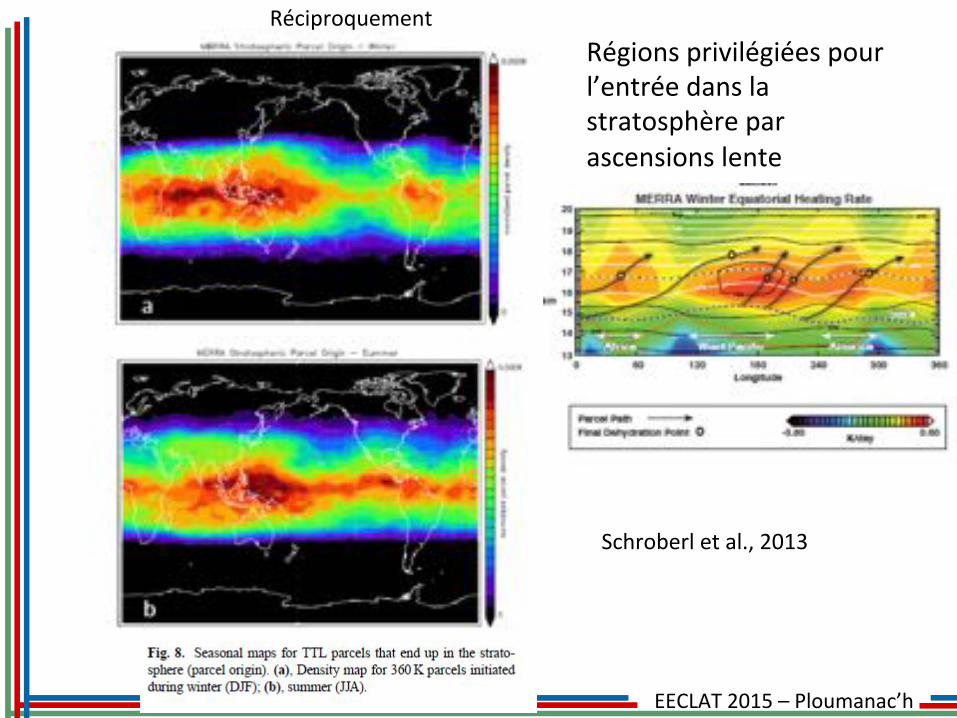
Régions&privilégiées&pour&l’entrée&dans&la&stratosphère&par&ascensions&lente&
Schroberl&et&al.,&2013&
Origine&des&trajectoires&partant&de&360K&et&finissant&dans&la&stratosphère&
Densité&de&localisaNon&de&la&déshydrataNon&finale&
Contexte&:&Overshoot&Vs.&Piège&froid&?&
EECLAT&2015&–&Ploumanac’h&
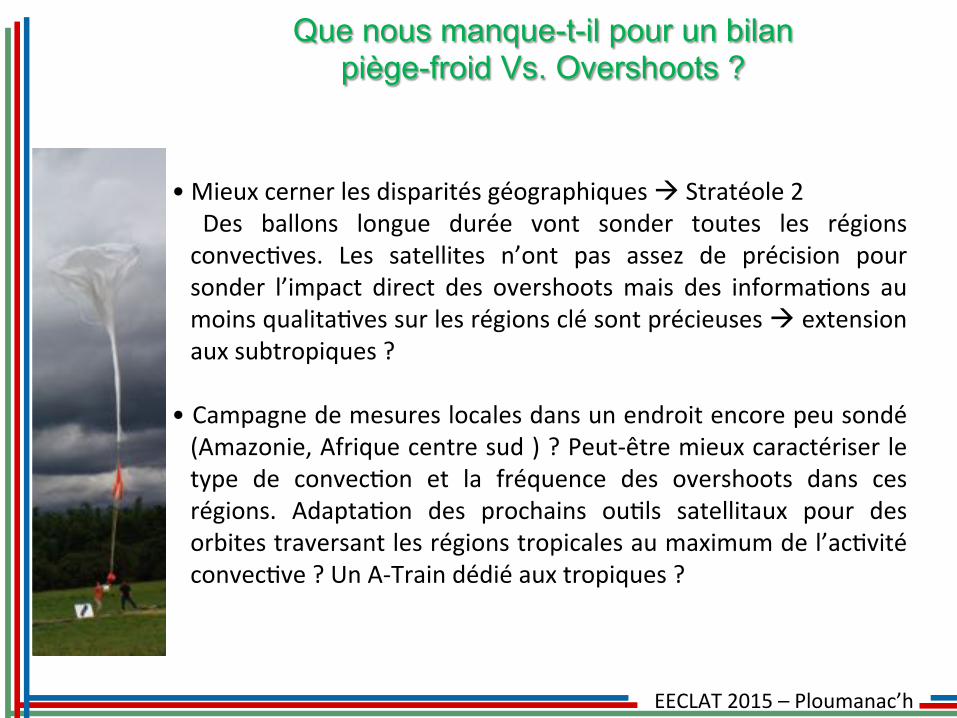
Que nous manque-t-il pour un bilan piège-froid Vs. Overshoots ?
•&Mieux&cerner&les&disparités&géographiques&!&Stratéole&2&& Des& ballons& longue& durée& vont& sonder& toutes& les& régions&convecNves.& Les& satellites& n’ont& pas& assez& de& précision& pour&sonder& l’impact& direct& des& overshoots&mais& des& informaNons& au&moins&qualitaNves&sur&les&régions&clé&sont&précieuses&!&extension&aux&subtropiques&?&
&•&Campagne&de&mesures&locales&dans&un&endroit&encore&peu&sondé&(Amazonie,&Afrique¢re&sud&)&?&Peut9être&mieux&caractériser&le&type& de& convecNon& et& la& fréquence& des& overshoots& dans& ces&régions.& AdaptaNon& des& prochains& ouNls& satellitaux& pour& des&orbites&traversant&les&régions&tropicales&au&maximum&de&l’acNvité&convecNve&?&Un&A9Train&dédié&aux&tropiques&?&
&
EECLAT&2015&–&Ploumanac’h&
Que nous manque-t-il pour un bilan piège-froid Vs. Overshoots ?
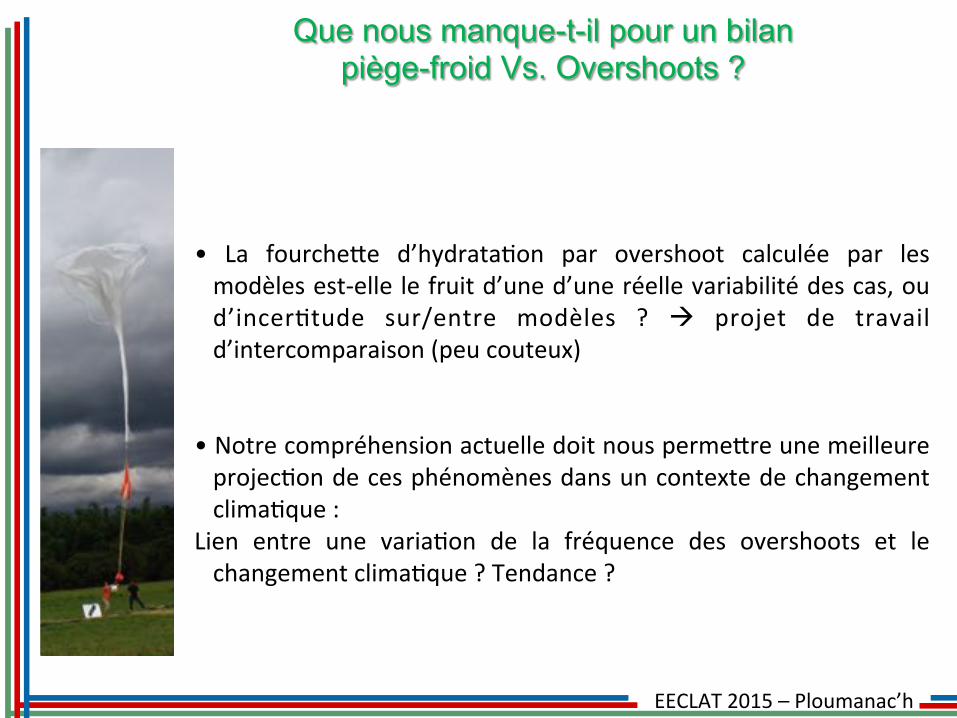
•& La& fourchepe& d’hydrataNon& par& overshoot& calculée& par& les&modèles&est9elle&le&fruit&d’une&d’une&réelle&variabilité&des&cas,&ou&d’incerNtude& sur/entre& modèles& ?& !& projet& de& travail&d’intercomparaison&(peu&couteux)&
&&•&Notre&compréhension&actuelle&doit&nous&permepre&une&meilleure&projecNon&de&ces&phénomènes&dans&un&contexte&de&changement&climaNque&:&
Lien& entre& une& variaNon& de& la& fréquence& des& overshoots& et& le&changement&climaNque&?&Tendance&?&
EECLAT&2015&–&Ploumanac’h&
Régions&privilégiées&pour&l’entrée&dans&la&stratosphère&par&ascensions&lente&
Schroberl&et&al.,&2013&
Réciproquement&&
EECLAT&2015&–&Ploumanac’h&
Flight#train# Species# Nb&of&flights#
Pico9SDLA&H2O&+&LOAC& H2O&and&aerosol& 1# 1& 2#Pico9SDLA&CH4& CH4& 1# 1& 2#Pico9SDLA&CH4&+Pico9SDLA&H2O& H2O&and&CH4& 0# 2& 2#Pico9SDLA&CO2&+Pico9SDLA&H2O& H2O&and&CO2& 0# 3& 3#Pico9SDLA&H2O& H2O&& 2# 1& 3#FLASH&and&COBALD& H2O&and&aerosol& 7# 6& 13#FLASH&+&COBALD&+&LOAC& H2O&and&aerosol 0# 2& 2#COBALD& Aerosol 0# 1& 1#Mini9SAOZ& O3,&NO2,&H2O,&H2CO,&BrO& 2# 0& 2#pico9SDLA&H2O&(SMOP)& H2O& 4# 3& 7#Total## 17# 20& 37#RS92&radiosondes&~4&RS&/day& P,&T,&U&&&(in&nb&of&days) 10& 15& 25#
2013&2012& Tot.#
Campaign&flights&Campaign&flights&
Success&of&the&flight&programme&
EECLAT&2015&–&Ploumanac’h&
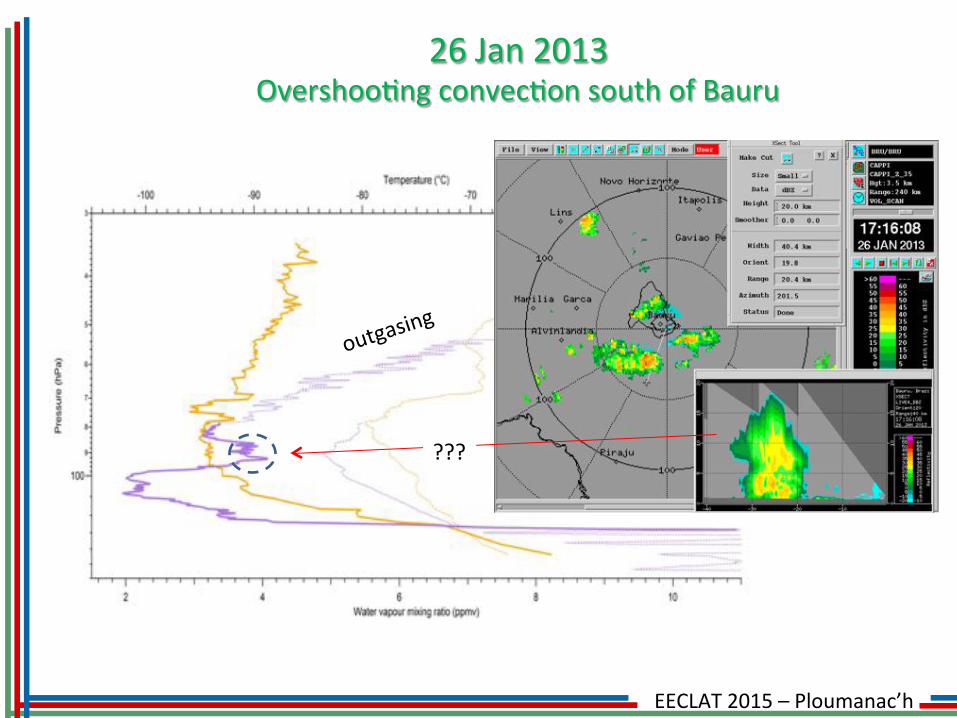
26&Jan&2013&OvershooNng&convecNon&south&of&Bauru&
outgasing&&
???&
EECLAT&2015&–&Ploumanac’h&
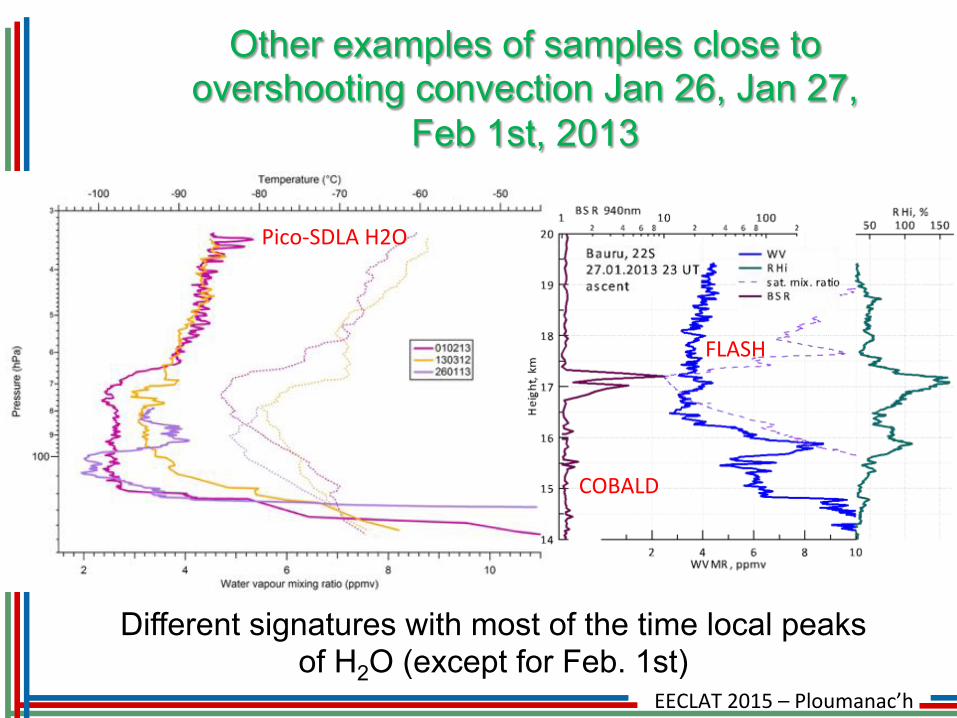
Other examples of samples close to overshooting convection Jan 26, Jan 27,
Feb 1st, 2013
Pico9SDLA&H2O&
COBALD&
FLASH&
Different signatures with most of the time local peaks of H2O (except for Feb. 1st)
EECLAT&2015&–&Ploumanac’h&
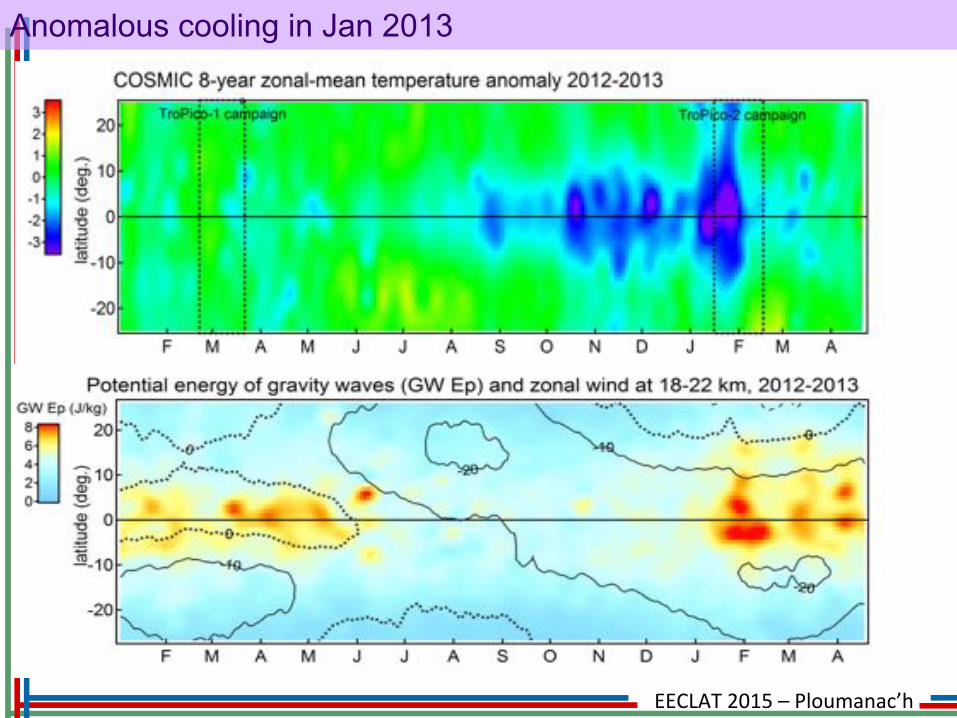
Anomalous cooling in Jan 2013
EECLAT&2015&–&Ploumanac’h&
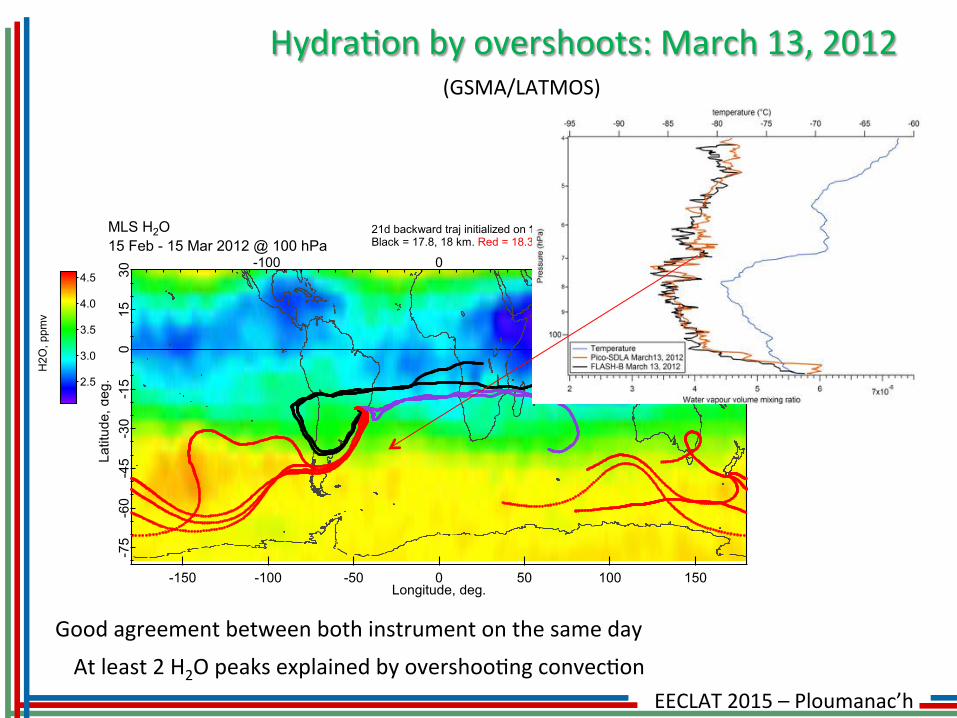
HydraNon&by&overshoots:&March&13,&2012&(GSMA/LATMOS)&
Good&agreement&between&both&instrument&on&the&same&day&At&least&2&H2O&peaks&explained&by&overshooNng&convecNon&
-75
-60
-45
-30
-15
015
30La
titud
e, d
eg.
-150 -100 -50 0 50 100 150Longitude, deg.
1000-1004.5
4.0
3.5
3.0
2.5
H2O
, ppm
v
21d backward traj initialized on 13 Mar 23:45 UTCBlack = 17.8, 18 km. Red = 18.3, 18.4, 18.5, 18.6 rm. Violet = 19, 19.5 km
MLS H2O 15 Feb - 15 Mar 2012 @ 100 hPa