Embed Size (px)
Citation preview
Velocity Field Characteristics in Supersonic Mixing Layers
J. R. Debisschop O. Chambres J. P. Bonnet Centre d'Etudes A~rodynamiques et Thermiques, Laboratoire d'Etudes A£rodynamiques, URA CNRS 191, 43 rue de l'a£rodrome, F-86036 Poitiers cedex, France
• Several compressible mixing layers, with one supersonic and one subsonic streams, are experimentally analyzed by pressure measurements and laser anemometry. Detailed measurements of the mean and fluctuating velocity fields are provided and compared against data from incompressible flows. The effects of compressibility on the flows are observed. The spreading rate of the mixing layers decrease when the Mach number is increased, in good agreement with results found in the literature. Laser Doppler measure- ments are performed for three test cases. The compressibility effects on the fluctuation levels are discussed and compared with existing results. The evolution of the turbulence structure of the flow, when the convective Mach number increases, is considered in the analysis when separate LDA seeding regimens are employed on the two sides of the layers. Some modifications of the large scale organization are observed when supersonic and subsonic mixing layers are compared and the two sides of the super- sonic mixing layers have different characteristics.
Keywords: mixing layer, supersonic, turbulence, compressibility effects, laser-Doppler anemometry (LDA), velocity statistics
INTRODUCTION
Recent developments in supersonic and hypersonic aero- nautical projects have led to a renewal of interest in phenomena inherent to compressible turbulent flows. Var- ious problems related to the compressible character of these flows still remain unanswered, including methods of prediction, their validation, and the physical insight into the phenomena.
The plane turbulent mixing layer represents a particu- larly important test case. This configuration has been the topic of many investigations in the case of incompressible flows and is at present being studied by several teams in the supersonic case, both experimentally [1-9] and computationally [10-13]. For a review, see [14]. The knowledge of conventional quantities, such as mean and fluctuating fields and one-point moments is of relevant importance for the validation of most industrial predictive methods; however, the presence of large-scale structures and their influence cannot be ignored. These turbulent flow structures, even with no organization, play a crucial role in the downstream development, the mixing, and the transport of mass, heat, or contaminant, the generation of noise and interaction with structural members (i.e., vibra- tions). The compressible character of the flow influences in different ways all or a part of these characteristics. It is not the topic of this article to deal in details with the organized motions in supersonic layers, but this character- istic should always be kept in mind when analyzing the results, particularly those obtained using laser-Doppler anemometry (LDA).
Conventional results obtained in different supersonic mixing layers are presented and discussed. Five different
Experimental Thermal and Fluid Science 1994; 9:147-155 © 1994 by Elsevier Science Inc., 655 Avenue of the Americas, New York,
flOWS have been generated corresponding to five com- pressibility levels. Although several experimental results are available in the literature, it is of interest first to increase the experimental data base obtained from dif- ferent experiments using different measurement tech- niques, and second, to analyze the compressibility effects over a wide range of convective Mach number in the same facility and with the same apparatus. Then, effects such as wall proximity, aspect ratio, measurement bias, and others can be considered in the interpretation of the results. Particular emphasis will be given here on three test cases (denoted as cases A, B, and D on Table 1) that correspond to compressibility levels where the most important effects appear (0.5 < M c < 0.7).
All the flows are created in the same wind tunnel, with comparable Reynolds numbers and geometrical condi- tions, such as wall proximity, mixing layer aspect ratio, and so on. Indeed, some of these characteristics can be used to discuss the effect of convective Mach number on the gross features of the flows (e.g., on the spreading rate). The only parameter varied here is the Mach number on the super- sonic side, so the effects related to Reynolds numbers, wall proximity, and other parameters will only be referred to discuss the results.
One of the first consequences of the compressible char- acter of mixing layers lies in the rapid, significant modifi- cation of the spreading rate. Various investigations (e.g., [5, 6, 8]) have shown that there is a decrease in the growth rate. Bogdanoff [15] introduced the notion of convective Mach number as a criterion for compressibility defined as the Mach number of the external streams as seen by an observer moving at the convective velocity of the turbu- lent structures of the mixing layer. When the two flows are
NY 10010 0894-1777/94/$7.00
147
148 J.R. Debisschop et al.
generated by the same gas, the convective Mach number, M c is defined by
AU Mc
a I + a 2 "
AU is the external velocities difference (AU = U 1 - U2) , a is the speed of sound, and the indices ! and 2 refer, respectively, to the high- and low-speed side. Several experimental investigations and direct simulations [10-13] show that the two-dimensional character of these struc- tures tends to fade away for M e > 0.5; transverse instabili- ties then appear and greatly modify the structure and, consequently, the development of the mixing layers.
EXPERIMENTAL APPARATUS AND UNCERTAINTIES
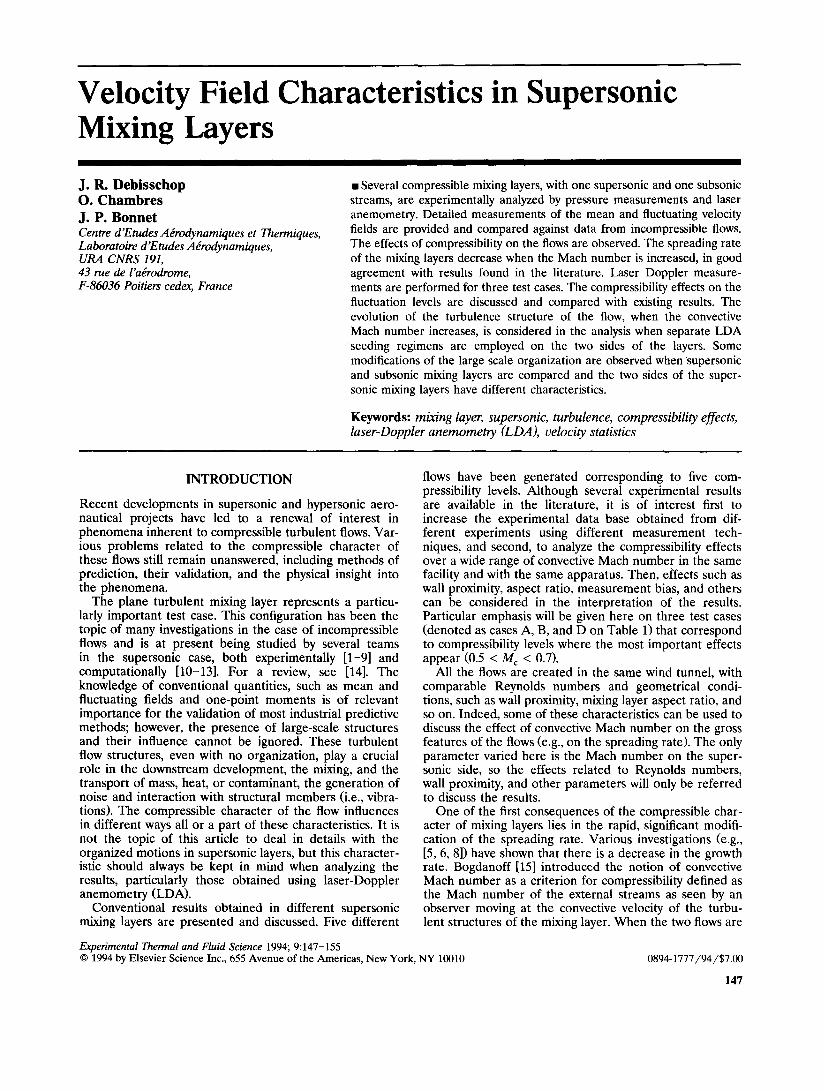
The tests were carried out in a blow-down, high-pressure wind tunnel (maximum duration less than 1 minute) pro- ducing Reynolds numbers of the order of 106/cm. The incidence angle of both the top and the bottom walls is adjustable to minimize the streamwise pressure gradient. The cross-sectional lengths of the test section are 150 x 150 mm z. The assembly is composed, for the supersonic part, of a two-dimensional nozzle (see Fig. 1). The sub- sonic part is fed by air issuing from a settling chamber on the supersonic side. This flow is homogenized by passing through two aluminum grids with different-size meshes. The separating plate of the two streams is roughly 80 cm long, which ensures that the boundary layers on each side of the plate are fully developed at the trailing edge. A sonic throat controls the secondary stream flow rate. A ramp placed downstream of the throat in the low-speed side adjusts the static pressure so as to obtain a practically isobaric mixing region. The role of this reattachment wedge is to stabilize the mixing layer. It makes the layer more horizontal and reduces the parasitic influence of streamline curvature. The location of investigation is lim- ited in a posteriori analyzing the longitudinal evolution of the mean fields. From the measurements, the domain of influence of the wedge is easy to check from the mean velocity profiles, which departs from similarity in this region. Then, all the data obtained in this region, as well as for the mean and fluctuating quantities, are disre- garded. This is particularly important for the turbulence data because they are more sensitive to perturbations. This procedure provides an idea of the confidence interval of the fluctuating velocities. Depending on the Mach number desired, the diameter of the throat and the loca- tion of the ramp are simultaneously adjusted. Once these settings are made, good reproducibility of the tests is
obtained, both for the pressures and the temperatures of the two fluids.
Pressures are measured with conventional total and static pressure probes. The final precision of the Mach number obtained from pitot-static measurements is esti- mated to be better than 1%. The profiles of the total temperatures show slight differences (less than 5%) be- tween the two streams. Two-dimensional LDA measure- ments were made in collaboration with ONERA. Techni- cal descriptions of the system employed are given in [16]. It uses two 15 W argon-laser and especially designed discrete optics. The signals were processed using Dantec counters. The measurements were performed in a two-step operation: For each traverse, each flow was separately seeded. Two types of seeding were considered: For the supersonic region, the seeding used SiO 2 particles in- jected into the settling chamber, at about 40 cm upstream from the throat. The pressure in the settling chamber being higher than the atmospheric pression (from 4 to 7 bar), the injection is performed with a tornado-like pres- surized device especially designed at ONERA. In the subsonic stream, the pressure is close to atmospheric pressure. Thus, atomized vegetable oil was injected through the wall at about 50 cm from the trailing edge of the separating plate. The relative error in the measure of the interfringe is 0.3%, and the resolution of the signal processor is less than 4 m/s. All the experiments follow the requirements developed by Boutier et al. [17], and we assume their precision criteria. The resulting error for 1000 sample data is estimated to be better than 1% of the average mean velocity (400 m/s) and 4% on the RMS quantities.
RESULTS
Main Flow Characteristics
The main characteristics of the flows investigated are presented in Table 1. The flows are denoted as A to E, from lower to higher convective Mach numbers. The ex- ternal characteristics are presented (external Mach num- bers and Reynolds numbers) to complement those quanti- ties usually employed to characterize compressible mixing layers: external velocities and density ratios and convec- tive Mach numbers.
Some previous investigations of these flows have led to qualitative descriptions of the large-scale organization (Bonnet et al. [18] and Debisschop [19]). These descrip- tions have been achieved by comparing results carried out from hot-wire rake measurements and laser planar visual- izations. It appears that compressibility strongly affects the turbulence structures in the mixing layers with some
Figure 1. Description of the wind tun- nel.
Sonic throat Supersonic nozzle ~ _ . . . . i i i ! i ~ ~ Supersonic side (1)
., , , , - .o e l l " ~ ' g,.~ - - -
a s ,
Subsonic side (2) Settling chamber
Velocity Field in Supersonic Mixing Layers 149
Table 1. Main Flow Characteristics
Cases A B C D E
M 1 1.48 1.65 1.76 2.03 3.2 M 2 0.28 0.375 0.36 0.41 0.2 R e 1 = 7 107 m- t -- 9 107 m- 1 - 9 10 7 m- 1 ~ 9 10 7 m- 1 = 9.5 1 0 7 m- 1 Re 2 = 9 106 m-1 = 1 107 m- l = 1 107 m-1 = 8.5 106 m-1 = 1.5 106 m-1
r = U2 /U 1 0.225 0.28 0.26 0.27 0.11 s = P2/Pl 0.7 0.67 0.63 0.57 033
M c 0.525 0.535 0.58 0.64 1.04
important modifications occurring between M c = 0.525 and 0.64. As shown by Bonnet et al. [18], the most impor- tant aspect of these modifications is that on the subsonic side the large-scale structures seem to be comparable to those observed in subsonic mixing layers (with a typical length scale of the order of magnitude of the mixing thickness), while on the high-speed side the typical length scale seems to be reduced when the Mach number in- creases. Another important modification occurs at the supersonic edge of the mixing layer where the communi- cation between the external flow and the turbulent flow is considerably reduced and the intermittency region ap- pears thinner than in the subsonic part.
Mean Velocities Obtained Using Pressure Measurements
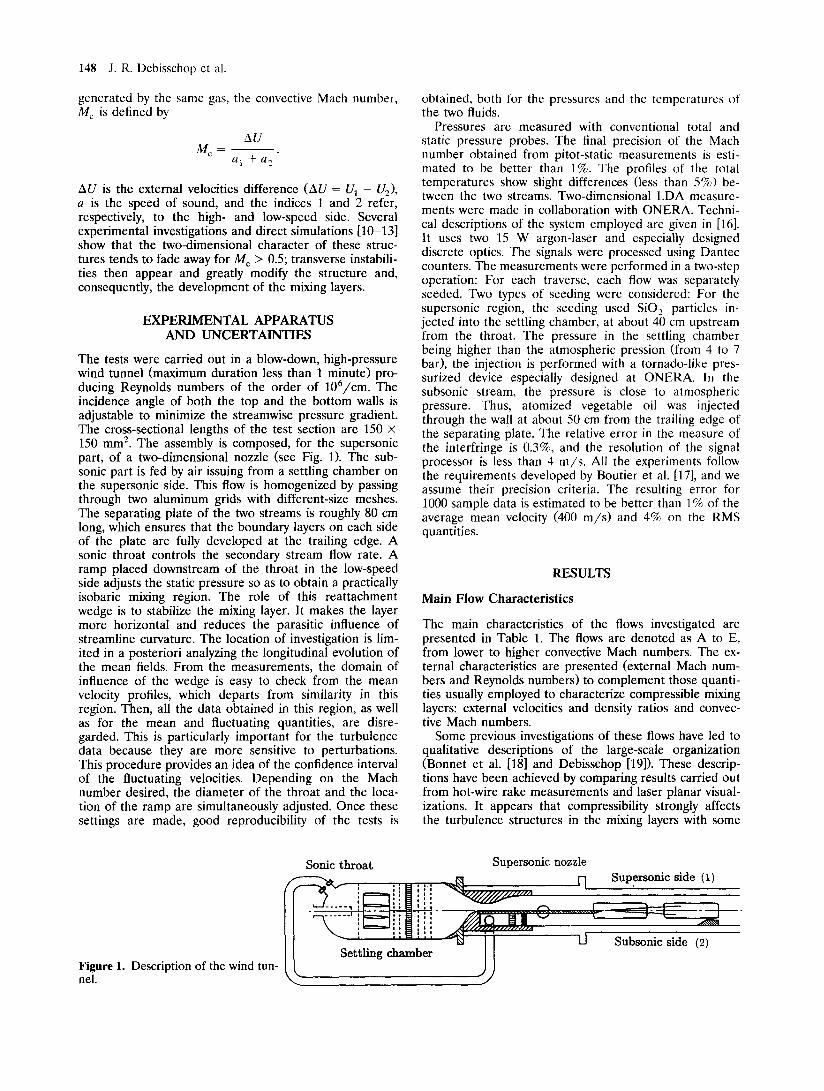
The mean velocity profiles for several positions down- stream of the splitter plate (x direction) were obtained using static and total pressure probes. For Mc = 0.525, the measurements are performed up to 30 cm, while for M c = 1.04, they are done more than 60 cm downstream from the trailing edge of the splitter plate. The conven- tional similarity properties are found from typically 18 cm downstream of the splitter plate. The detailed velocity profiles can be found in [20]. From these data, the vorticity thickness, ~, -- A U / ( O U / O y ) m a ~ , can be calculated, and then the corresponding growth rate can be plotted accord- ing to the convective Mach number in the similarity region. This plot is given in Fig. 2, using the incompress- ible growth rate for normalization as proposed by Pa- pamoschou and Roshko [6]. The values obtained by Elliot and Samimy [4] are also given for comparison. The well- known decrease in the growth rate when the convective Mach number increases can be observed. An important discrepancy is obvious at M c = 0.535 and can be related to, for example, the results of Hall et al. [9]. Indeed, these authors show that for 0.1 _< Mc _< 0.4, there is consider- able (which is deemed to be important here) scatter in the spreading rate. The spreading rate evolves in a quasi-ran- dom way from 0.6 to 0.9. These authors attribute these variations to a high sensitivity to initial conditions.
LDA Measurements
The LDA measurements are contaminated because of the seeding of the flow. The first problem considered is re- lated to the characteristics of the particles. Indeed, while a particle should follow the flow, this is particularly difficult in supersonic flows. This has been studied by Samimy and I~le [21], and the size of the particle used in our case (less than 0.5 /zm) seems well suited for use in compressible
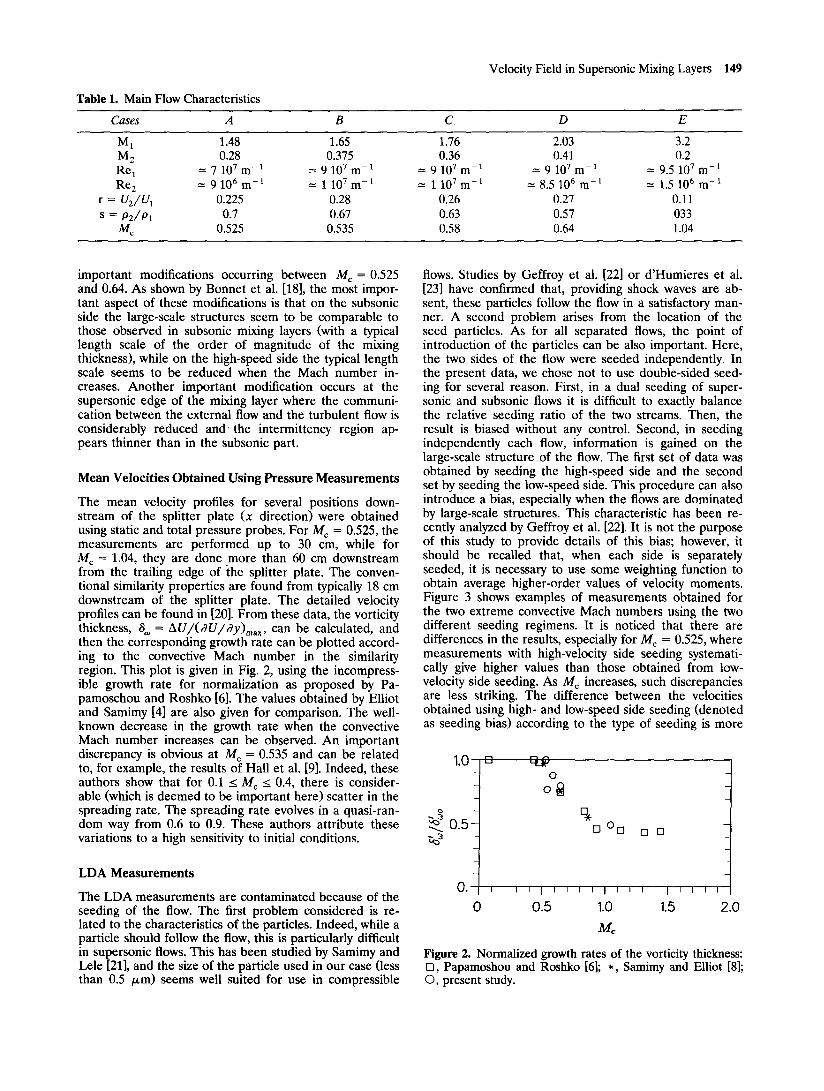
flows. Studies by Geffroy et al. [22] or d'Humieres et al. [23] have confirmed that, providing shock waves are ab- sent, these particles follow the flow in a satisfactory man- ner. A second problem arises from the location of the seed particles. As for all separated flows, the point of introduction of the particles can be also important. Here, the two sides of the flow were seeded independently. In the present data, we chose not to use double-sided seed- ing for several reason. First, in a dual seeding of super- sonic and subsonic flows it is difficult to exactly balance the relative seeding ratio of the two streams. Then, the result is biased without any control. Second, in seeding independently each flow, information is gained on the large-scale structure of the flow. The first set of data was obtained by seeding the high-speed side and the second set by seeding the low-speed side. This procedure can also introduce a bias, especially when the flows are dominated by large-scale structures. This characteristic has been re- cently analyzed by Geffroy et al. [22]. It is not the purpose of this study to provide details of this bias; however, it should be recalled that, when each side is separately seeded, it is necessary to use some weighting function to obtain average higher-order values of velocity moments. Figure 3 shows examples of measurements obtained for the two extreme convective Mach numbers using the two different seeding regimens. It is noticed that there are differences in the results, especially for M c = 0.525, where measurements with high-velocity side seeding systemati- cally give higher values than those obtained from low- velocity side seeding. As M c increases, such discrepancies are less striking. The difference between the velocities obtained using high- and low-speed side seeding (denoted as seeding bias) according to the type of seeding is more
1.0
~ o.5-
O. I
0
0
q [3° [3 O D _j
i I i I I I I I I ~ i I I I I l I I
0.5 1.0 1.5 2.0
Mc
Figure 2. Normalized growth rates of the vorticity thickness: Q, Papamoshou and Roshko [6]; *, Samimy and Elliot [8]; ©, present study.
150 J. R. Debisschop et al.
Figure 3. Examples of mean velocity profiles ob- tained, from each seeding technique, for the higher and the lower convective Mach numbers: (a) M~ = 0.64. (b) M~ = 0.525. ×, High-speed side seeding; zx, low speed side seeding.
2 5
B v £ 0-
I
- 2 5
a b
. .<+
I I I I I I I I I ~ I I l I I I ' 1 I
2so soo 2so soo
U(m/s)
[ - -
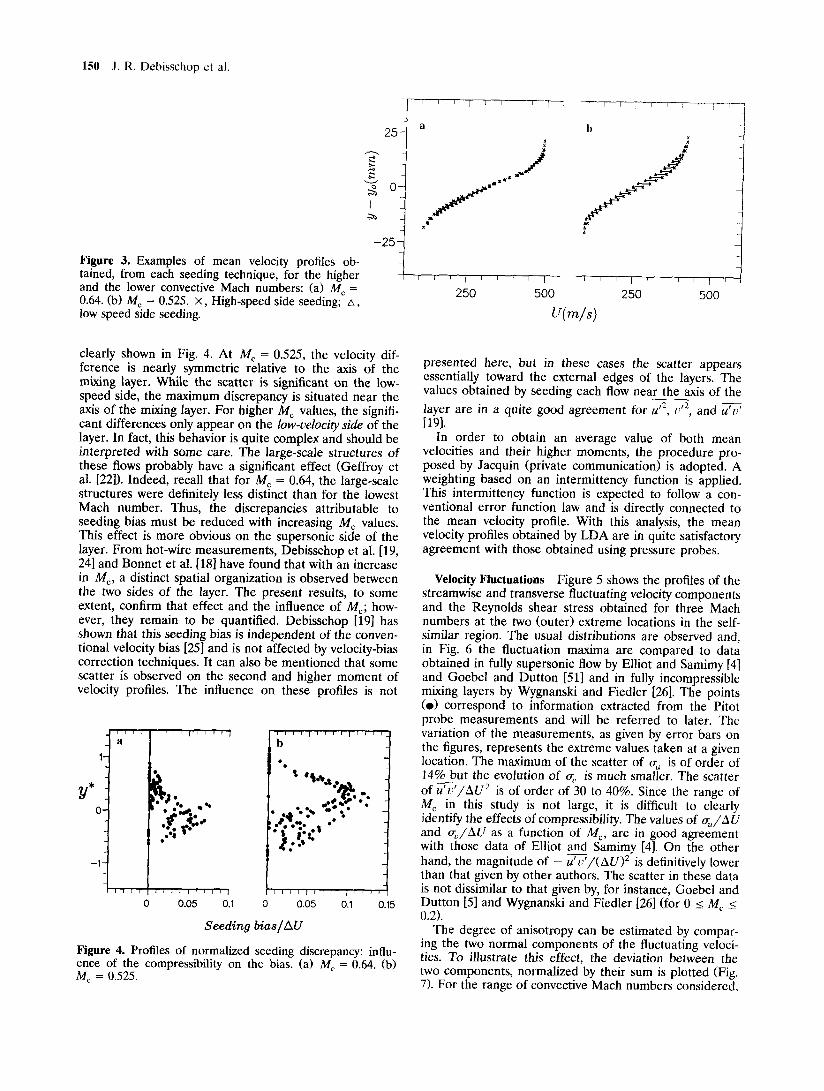
clearly shown in Fig. 4. At M c = 0.525, the velocity dif- ference is nearly symmetric relative to the axis of the mixing layer. While the scatter is significant on the low- speed side, the maximum discrepancy is situated near the axis of the mixing layer. For higher Mc values, the signifi- cant differences only appear on the low-velocity side of the layer. In fact, this behavior is quite complex and should be interpreted with some care. The large-scale structures of these flows probably have a significant effect (Geffroy et al. [22]). Indeed, recall that for M c = 0.64, the large-scale structures were definitely less distinct than for the lowest Mach number. Thus, the discrepancies attributable to seeding bias must be reduced with increasing M c values. This effect is more obvious on the supersonic side of the layer. From hot-wire measurements, Debisschop et al. [19, 24] and Bonnet et al. [18] have found that with an increase in Me, a distinct spatial organization is observed between the two sides of the layer. The present results, to some extent, confirm that effect and the influence of M~; how- ever, they remain to be quantified. Debisschop [19] has shown that this seeding bias is independent of the conven- tional velocity bias [25] and is not affected by velocity-bias correction techniques. It can also be mentioned that some scatter is observed on the second and higher moment of velocity profiles. The influence on these profiles is not
a
l-
y* O-
, + , ' 1 , , , , 1
I 1 1 I I I i i i i i i ]
0 0.05 0.1 0
I I I l ] l r l [ l l [ l [
b
el l
.,,.+.::? . . . "+, ,~:o"
' + i i I I r i I I I I i + + I
0.05 0.1 0.15
Seeding bias/ A U
Figure 4. Profiles of normalized seeding discrepancy: influ- ence of the compressibility on the bias. (a) M~ = 0.64. (b) Mc = 0.525.
presented here, but in these cases the scatter appears essentially toward the external edges of the layers. The values obtained by seeding each flow near the axis of the
layer are in a quite good agreement for u '2, c '2, and [191.
In order to obtain an average value of both mean velocities and their higher moments, the procedure pro- posed by Jacquin (private communication) is adopted. A weighting based on an intermittency function is applied. This intermittency function is expected to follow a con- ventional error function law and is directly connected to the mean velocity profile. With this analysis, the mean velocity profiles obtained by LDA are in quite satisfactory agreement with those obtained using pressure probes.
Velocity Fluctuations Figure 5 shows the profiles of the streamwise and transverse fluctuating velocity components and the Reynolds shear stress obtained for three Mach numbers at the two (outer) extreme locations in the self- similar region. The usual distributions are observed and, in Fig. 6 the fluctuation maxima are compared to data obtained in fully supersonic flow by Elliot and Samimy [4] and Goebel and Dutton [51] and in fully incompressible mixing layers by Wygnanski and Fiedler [26]. The points (o) correspond to information extracted from the Pitot probe measurements and will be referred to later. The variation of the measurements, as given by error bars on the figures, represents the extreme values taken at a given location. The maximum of the scatter of ~, is of order of 14% but the evolution of o; is much smaller. The scatter of u'v ' /AU 2 is of order of 30 to 40%. Since the range of M c in this study is not large, it is difficult to clearly identify the effects of compressibility. The values of ~r,/AU and o; /AU as a function of Me, are in good agreement with those data of Elliot and Samimy [4]. On the other hand, the magnitude of - U'r'/(AU) z is definitively lower than that given by other authors. The scatter in these data is not dissimilar to that given by, for instance, Goebel and Dutton [5] and Wygnanski and Fiedler [26] (for 0 _< Mc _< 0.2).
The degree of anisotropy can be estimated by compar- ing the two normal components of the fluctuating veloci- ties. To illustrate this effect, the deviation between the two components, normalized by their sum is plotted (Fig. 7). For the range of convective Mach numbers considered,
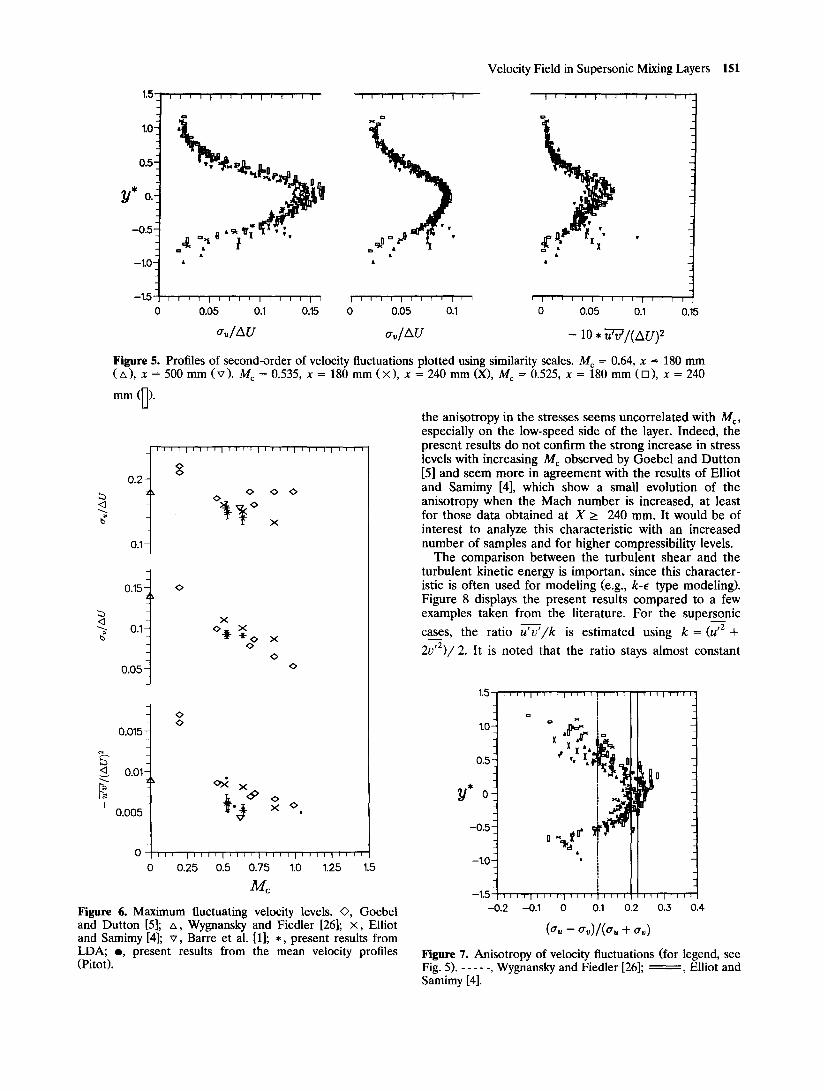
Velocity Field in Supersonic Mixing Layers 1 5 1
¢
¢
1.5-
1 ,0 "
0.5"
~ * o.-
-osJt -I"01
-1.5 0
l l l l l l l l l l l l l l l l l I I I l l l l l l l l I I I I I l l l l l l l l l l
i i i 1 I ~ i i i I i i i i I i I i i i i I i i I i I i i
0.05 0.1 0.15 0 0.05 0.1 I I i r I I J I I I r I I I I I
0 0.05 0.1 0.15
a,,/AU o-dAU - 10 • u--rV'r/(AU)2
Figure 5. Profiles of second-order of velocity fluctuations plotted using similarity scales. M c = 0.64, x = 180 mm (zx), x = 500 mm (v) . Mc = 0.535, x = 180 mm (×) , x = 240 mm (X), M~ = 0.525, x = 180 mm ([]), x = 240
mm (~).
I I I I I I I I I I I I I r l l l l l l l l l l l l [ I I
x <>I x %°×
o
0.2-
0 . 1 -
0.15--
• X O
<> <>
0.1-
the anisotropy in the stresses seems uncorrelated with M c, especially on the low-speed side of the layer. Indeed, the present results do not confirm the strong increase in stress levels with increasing Mc observed by Goebel and Dutton [5] and seem more in agreement with the results of Elliot and Samimy [4], which show a small evolution of the anisotropy when the Mach number is increased, at least for those data obtained at X > 240 mm. It would be of interest to analyze this characteristic with an increased number of samples and for higher compressibility levels.
The comparison between the turbulent shear and the turbulent kinetic energy is importam since this character- istic is often used for modeling (e.g., k-~ type modeling). Figure 8 displays the present results compared to a few examples taken from the literature. For the superso___nic
cases, the ratio u'v'/k is estimated using k = (u'2+ 2v'2)/2. It is noted that the ratio stays almost constant
0.05-
0.015-
O.Ol
F: f
0.005-
0 I I I I I I ] I t I I I I I ~ I I I I I I I I I I I I I I
0 0.25 0.5 0.75 1.0 1.25 1.5
Mc Figure 6. Maximum fluctuating velocity levels. O, Goebel and Dutton [5]; zx, Wygnansky and Fiedler [26]; x , Ell iot and Samimy [4]; v , Barre et al. [1]; *, present results from LDA; o, present results from the mean velocity profiles (Pitot).
1 5 . . . . , . . . . , . . . . I . . . . t , , . . . .
i II
° o LIb 1.0-
x "x~ ' . . •~ II o.5- ' " x;~. ,_° l k
iJ -0.5
-1.0- "
- - 1 . 5 ' ' ' ' I ' ' ' ; I ' ' ' ' 1 ' ' ; ' , , ' 1 ; ; '
- 0 . 2 -0.1 0 0.1 0.2 0.3 0.4
(o,, - - O' , , ) / (o, , + o,,)
Figure 7. Anisotropy of velocity fluctuations (for legend, see Fig. 5). - . . . . , Wygnansky and Fiedler [26]; ~ , Elliot and Samimy [4].
152 J .R. Debisschop ct al.
1.5
1.0
0 . 5
, -
y 0 :
-0.5-~
- 1 . 0
-1.5
i i I I I i i I I I I i I
.i 0 =
I I I i i i I I i I I i I
- 0 . 2 5 0 0.25
- u--~/k
a j
A A
I I I I 1 1
0.5 0.7
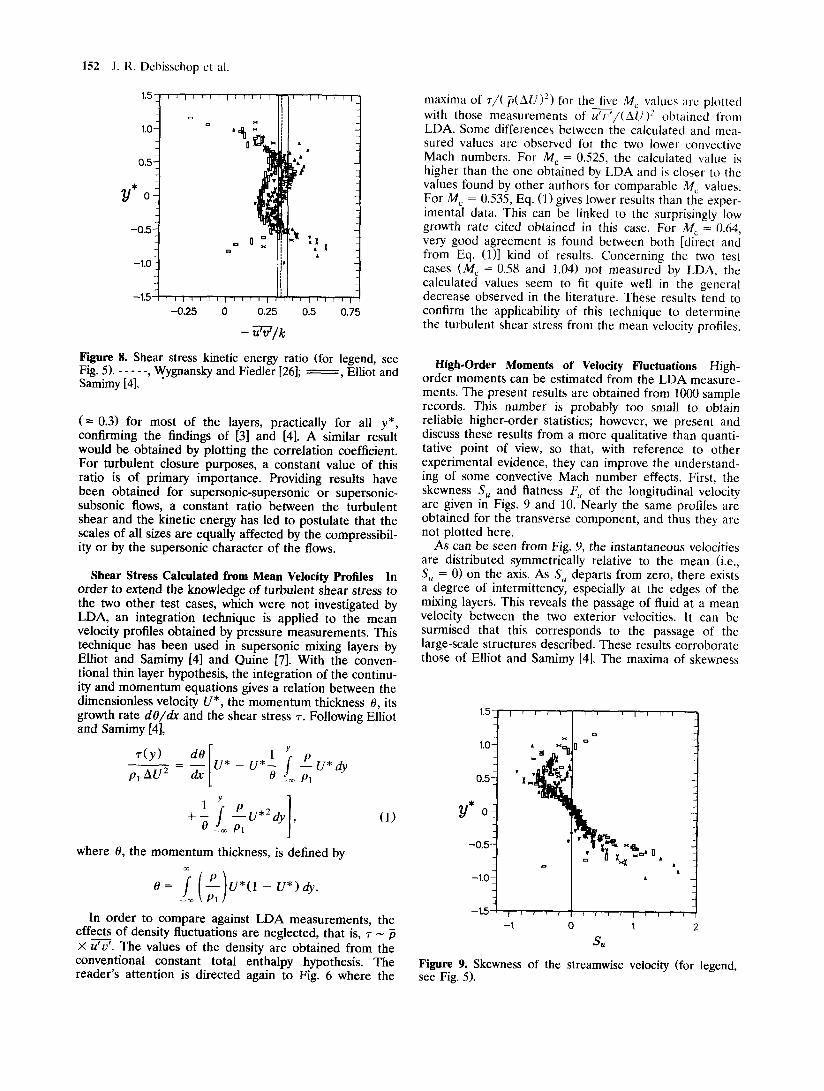
Figure 8. Shear stress kinetic energy ratio (for legend, see Fig. 5). - . . . . , Wygnansky and Fiedler [26]; : , Elliot and Samimy [4].
( = 0.3) for most of the layers, practically for all y*, confirming the findings of [3] and [4]. A similar result would be obtained by plotting the correlation coefficient. For turbulent closure purposes, a constant value of this ratio is of primary importance. Providing results have been obtained for supersonic-supersonic or supersonic- subsonic flows, a constant ratio between the turbulent shear and the kinetic energy has led to postulate that the scales of all sizes are equally affected by the compressibil- ity or by the supersonic character of the flows.
Shear Stress Calculated from Mean Velocity Profiles In order to extend the knowledge of turbulent shear stress to the two other test cases, which were not investigated by LDA, an integration technique is applied to the mean velocity profiles obtained by pressure measurements. This technique has been used in supersonic mixing layers by Elliot and Samimy [4] and Quine [7]. With the conven- tional thin layer hypothesis, the integration of the continu- ity and momentum equations gives a relation between the dimensionless velocity U*, the momentum thickness 0, its growth rate dO/dx and the shear stress ~-. Following Elliot and Samimy [41,
r ( y ) dO[ • _ P U * d y
d- "~ _ P l
where O, the momentum thickness, is defined by oo
In order to compare against LDA measurements, the effects of density fluctuations are neglected, that is, ~- ~ ~ x u'v'. The values of the density are obtained from the conventional constant total enthalpy hypothesis. The reader's attention is directed again to Fig. 6 where the
maxima of r/(~(AU) 2) for the five M c values are plotted with those measurements of u ' I , ' / (AU) 2 obtained from LDA. Some differences between the calculated and mea- sured values are observed for the two lower convective Mach numbers. For M c = 0.525, the calculated value is higher than the one obtained by LDA and is closer to the values found by other authors for comparable M c values. For M~ = 0.535, Eq. (1) gives lower results than the exper- imental data. This can be linked to the surprisingly low growth rate cited obtained in this case. For M~ = 0.64, very good agreement is found between both [direct and from Eq. (1)] kind of results. Concerning the two test cases (M~ = 0.58 and 1.04) not measured by LDA, the calculated values seem to fit quite well in the general decrease observed in the literature. These results tend to confirm the applicability of this technique to determine the turbulent shear stress from the mean velocity profiles.
High-Order Moments of Velocity Fluctuations High- order moments can be estimated from the LDA measure- ments. The present results are obtained from 1000 sample records. This number is probably too small to obtain reliable higher-order statistics; however, we present and discuss these results from a more qualitative than quanti- tative point of view, so that, with reference to other experimental evidence, they can improve the understand- ing of some convective Mach number effects. First, the skewness S, and flatness F, of the longitudinal velocity are given in Figs. 9 and 10. Nearly the same profiles are obtained for the transverse component, and thus they are not plotted here.
As can be seen from Fig. 9, the instantaneous velocities are distributed symmetrically relative to the mean (i.e., S, = 0) on the axis. As S u departs from zero, there exists a degree of intermittency, especially at the edges of the mixing layers. This reveals the passage of fluid at a mean velocity between the two exterior velocities. It can be surmised that this corresponds to the passage of the large-scale structures described. These results corroborate those of Elliot and Samimy [4]. The maxima of skewness
1.5
1.0-
0.5-
y* 0
"--0.5
-1.0
-1.5
x
I I I I I l l l l ,
I t t f ~ t r ~ l l l l
-1 0 1 2
Figure 9. Skewness of the streamwise velocity (for legend, see Fig. 5).
Velocity Field in Supersonic Mixing Layers 153
1.5
1.0
0.5
-1.0--
-1.5 I i i i
2 3
I I I I I I 1 I I I I I ; I I I I I I
, . ~ " I1 O '*°
, *< ... Ox~ n" i • ~ x ~ n ~ d n . x
t,<...o~ ° 0 ,= ,
i i i I I i i i i I t i i i I i i i
4 5 6 F.
1.5
7
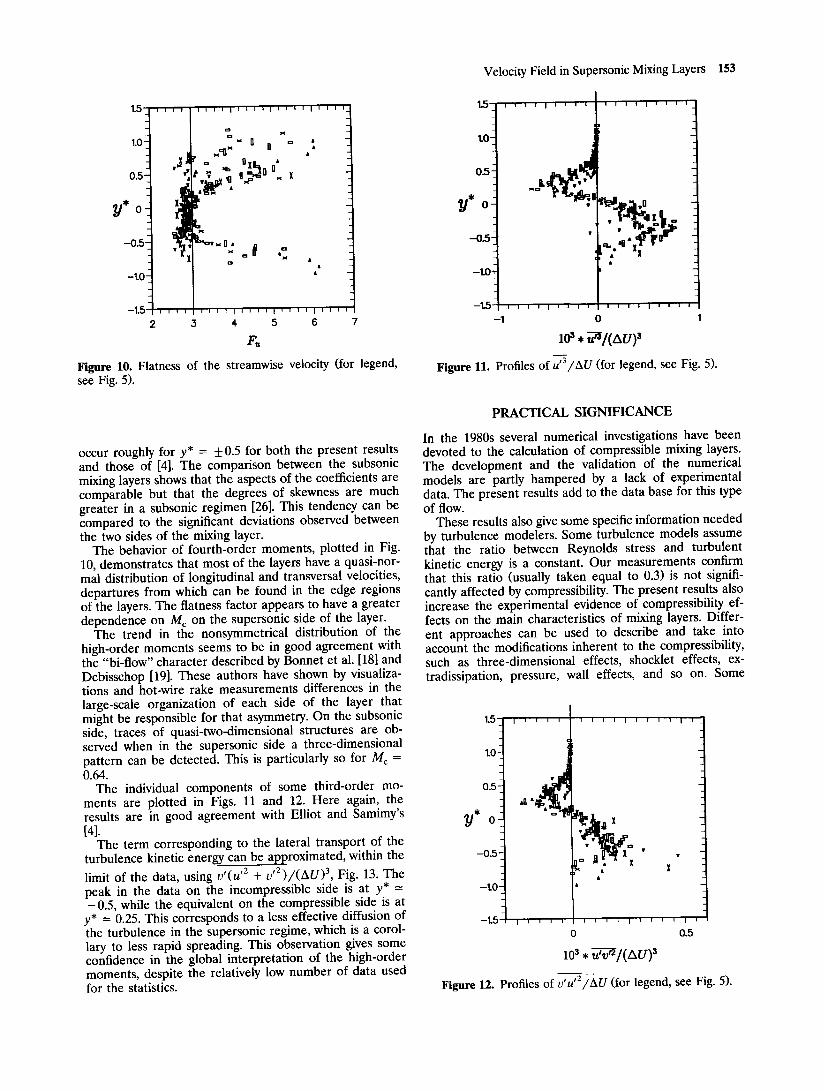
Figure 10. Flatness of the streamwise velocity (for legend, see Fig. 5).
i i i i I i i i i i i i i I i i i i
+
0.5
y * o ~ 1 ~ •
-tO
- t 5 i i i i i i i i i i i i + i i i i i
- 0
10 a , u--~/(AU) +
Figure 11. Profiles of u'3/AU (for legend, see Fig. 5).
occur roughly for y* = + 0.5 for both the present results and those of [4]. The comparison between the subsonic mixing layers shows that the aspects of the coefficients are comparable but that the degrees of skewness are much greater in a subsonic regimen [26]. This tendency can be compared to the significant deviations observed between the two sides of the mixing layer.
The behavior of fourth-order moments, plotted in Fig. 10, demonstrates that most of the layers have a quasi-nor- mal distribution of longitudinal and transversal velocities, departures from which can be found in the edge regions of the layers. The flatness factor appears to have a greater dependence on M c on the supersonic side of the layer.
The trend in the nonsymmetrical distribution of the high-order moments seems to be in good agreement with the "bi-flow" character described by Bonnet et al. [18] and Debisschop [19]. These authors have shown by visualiza- tions and hot-wire rake measurements differences in the large-scale organization of each side of the layer that might be responsible for that asymmetry. On the subsonic side, traces of quasi-two-dimensional structures are ob- served when in the supersonic side a three-dimensional pattern can be detected. This is particularly so for Mc = 0.64.
The individual components of some third-order mo- ments are plotted in Figs. 11 and 12. Here again, the results are in good agreement with Elliot and Samimy's [41.
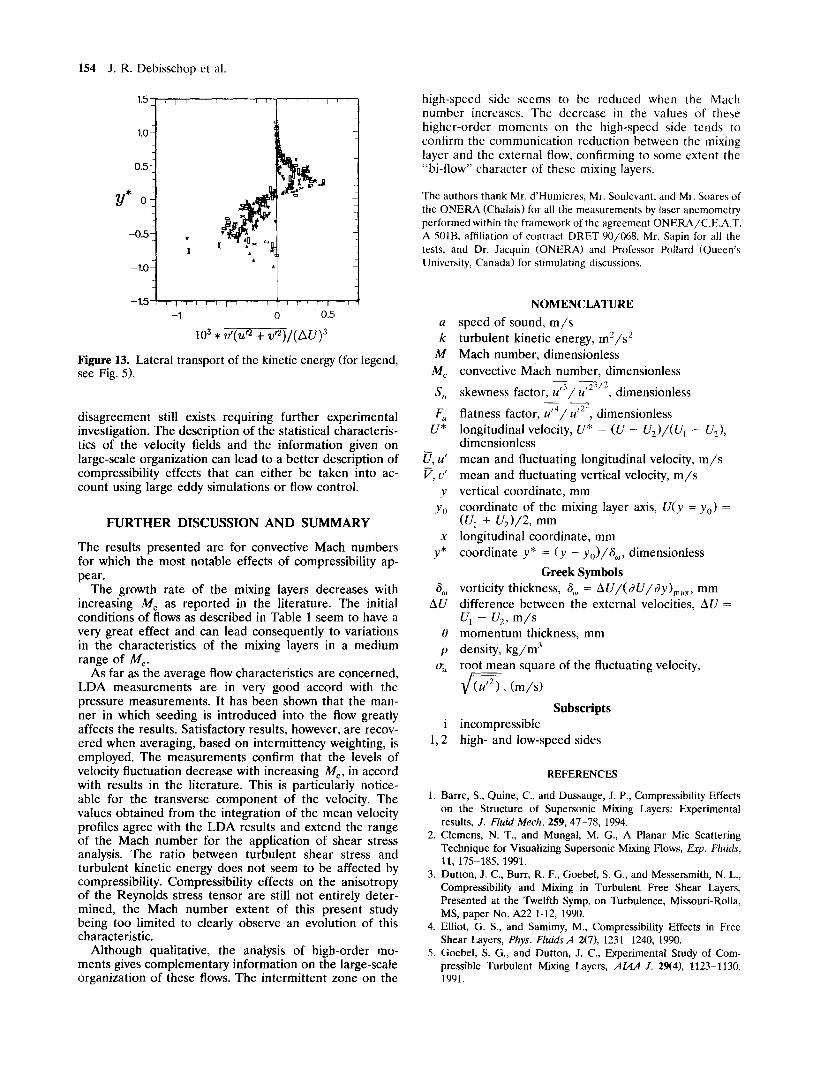
The term corresponding to the lateral transport of the turbulence kinetic energy can be approximated, within the
limit of the data, using v'(u '2 + v'2)/(AU) 3, Fig. 13. The peak in the data on the incompressible side is at y* - -0.5, while the equivalent on the compressible side is at
y* = 0.25. This corresponds to a less effective diffusion of the turbulence in the supersonic regime, which is a corol- lary to less rapid spreading. This observation gives some confidence in the global interpretation of the high-order moments, despite the relatively low number of data used for the statistics.
PRACTICAL SIGNIFICANCE
In the 1980s several numerical investigations have been devoted to the calculation of compressible mixing layers. The development and the validation of the numerical models are partly hampered by a lack of experimental data. The present results add to the data base for this type of flow.
These results also give some specific information needed by turbulence modelers. Some turbulence models assume that the ratio between Reynolds stress and turbulent kinetic energy is a constant. Our measurements confirm that this ratio (usually taken equal to 0.3) is not signifi- cantly affected by compressibility. The present results also increase the experimental evidence of compressibility ef- fects on the main characteristics of mixing layers. Differ- ent approaches can be used to describe and take into account the modifications inherent to the compressibility, such as three-dimensional effects, shocklet effects, ex- tradissipation, pressure, wall effects, and so on. Some
t5 f , , , ,
1.0
0.5
~A
y * 0
+lil -tO
- - 1 . I ' ' '
l ; I t l t l l l l l
x u v I v
i n u I I u u I u
0 0.5
lO ~ , ~,-~v lCZXU) 3
Figure 12. Profiles of v'u'2)/XU (for legend, see Fig. 5).
154 J .R. Debisschop et al.
1 . 5 ~ I I I I I I I ; I I ~ i I I I J
1.0 ~~,I~ @" 0.5"
y 0
-0.5
-1.0
-1.5 --1 0 0 . 5
l o 3 , + v,2)/( A v ?
Figure 13. Lateral transport of the kinetic energy (for legend, see Fig. 5).
disagreement still exists requiring further experimental investigation. The description of the statistical characteris- tics of the velocity fields and the information given on large-scale organization can lead to a better description of compressibility effects that can either be taken into ac- count using large eddy simulations or flow control.
F U R T H E R D I S C U S S I O N A N D SUMMARY
The results presented are for convective Mach numbers for which the most notable effects of compressibility ap- pear.
The growth rate of the mixing layers decreases with increasing M c as reported in the literature. The initial conditions of flows as described in Table 1 seem to have a very great effect and can lead consequently to variations in the characteristics of the mixing layers in a medium range of M c.
As far as the average flow characteristics are concerned, LDA measurements are in very good accord with the pressure measurements. It has been shown that the man- ner in which seeding is introduced into the flow greatly affects the results. Satisfactory results, however, are recov- ered when averaging, based on intermittency weighting, is employed. The measurements confirm that the levels of velocity fluctuation decrease with increasing M c, in accord with results in the literature. This is particularly notice- able for the transverse component of the velocity. The values obtained from the integration of the mean velocity profiles agree with the L DA results and extend the range of the Mach number for the application of shear stress analysis. The ratio between turbulent shear stress and turbulent kinetic energy does not seem to be affected by compressibility. Compressibility effects on the anisotropy of the Reynolds stress tensor are still not entirely deter- mined, the Mach number extent of this present study being too limited to clearly observe an evolution of this characteristic.
Although qualitative, the analysis of high-order mo- ments gives complementary information on the large-scale organization of these flows. The intermittent zone on the
high-speed side seems to be reduced when the Mach number increases. The decrease in the values Of these higher-order moments on the high-speed side tends to confirm the communication reduction between the mixing layer and the external flow, confirming to some extent the "bi-flow" character of these mixing layers.
The authors thank Mr. d'Humieres, Mr. Soulevant, and Mr. Soares of the ONERA (Chalais) for all the measurements by laser anemomet~ performed within the framework of the agreement ONERA/C.E.A.T. A 501B, affiliation of contract DRET 90/068, Mr. Sapin for all the tests, and Dr. Jacquin (ONERA) and Professor Pollard (Queen's University, Canada) for stimulating discussions.
NOMENCLATURE
a speed of sound, m / s k turbulent kinetic energy, m2/s 2
M Mach number, dimensionless M c convective Mach number, dimensionless
, 3 . ~ ' ~ 3 / 2 S, skewness factor, u / u , dimensionless
F, flatness factor, u ' 4 / u 552, dimensionless U* longitudinal velocity, U* = (U - U 2 ) / ( U ~ - U2),
dimensionless U, u' mean and fluctuating longitudinal velocity, m / s V, v' mean and fluctuating vertical velocity, m / s
y vertical coordinate, mm Yo coordinate of the mixing layer axis, U(y = Yo) =
(U I + U2)/2, mm x longitudinal coordinate, mm
y* coordinate y* = (y - yo)/a,o, dimensionless
Greek Symbols 6,0 vorticity thickness, 8,0 = k U / ( g U / O Y ) m a × , mm
AU difference between the external velocities, AU = U 1 - U 2 , m / s
0 momentum thickness, mm p density, k g / m 3
~r. root mean square of the fluctuating velocity,
~ , (m/s ) Subscripts i incompressible
1,2 high- and low-speed sides
REFERENCES
1. Barre, S., Quine, C., and Dussauge, J. P., Compressibility Effects on the Structure of Supersonic Mixing Layers: Experimental results, J. Fluid Mech. 259, 47-78, 1994.
2. Clemens, N. T., and Mungal, M. G., A Planar Mie Scattering Technique for Visualizing Supersonic Mixing Flows, Exp. Fluids, 11, 175-185, 1991.
3. Dunon, J. C., Burr, R. F., Goebel, S. G., and Messersmith, N. L., Compressibility and Mixing in Turbulent Free Shear Layers, Presented at the Twelfth Syrup. on Turbulence, Missouri-Rolla, MS, paper No. A22 1-12, 1990.
4. Elliot, G. S., and Samimy, M., Compressibility Effects in Free Shear Layers, Phys. Fluids A 2(7), 1231-1240, 1990.
5. Goebel, S. G., and Dutton, J. C., Experimental Study of Com- pressible Turbulent Mixing Layers, A/AA J. 29(4), 1123-1130, 1991.
Velocity Field in Supersonic Mixing Layers 155
6. Papamoschou, D., and Roshko, A., The Compressible Turbulent Shear Layers: An Experimental Study, J. Fluid Mech. 197, 453-477, 1988.
7. Quine, C., Etude Exp6rimentale et Num6rique de Couches de M61anqe Turbulentes Supersoniques, Ph.D. Thesis, IMST, Mar- seille, France, 1990.
8. Samimy, M. and Elliot, G. S., Effects of Compressibility on the Characteristics of Free Mixing Layers, A/AA J. 28(3), 439-445, 1990.
9. Hall, J. L., Dimotakis, P. E., and Roseman, H., Experiments in Non-Reacting Compressible Shear Layers, A/AA J. 31(12); 2247-2254, 1993.
10. Comte, P., Fouillet, Y., and Lesieur, M., Simulation Num6rique des Zones de M61ange Compressible, Revue Scientifique et Tech- nique de la Ddfense 3, 43-63, 1992.
11. Vandromme, D. and Ha Minh, H., The Compressible Mixing Layer, in Turbulence and Coherent Structures, 0. Metais and M. Lesieur, Eds., pp. 507-523, Kluwer, Dordrecht, 1991.
12. Gathmann, R. J., Analyse d'Ecoulements Supersoniques et R6ac- tifs par Simulation Num6rique Instationnaire Tridimensionnelle, Thesis LEGI/IMG, Univ. Joseph Fourier, Grenoble, May 1993.
13. Sandham, N. D., and Reynolds, W. C., Three-Dimensional Simu- lation of Large Eddies in the Compressible Mixing Layer, J. Fluid Mech. 224, 133-158, 1991.
14. Lele, S. K., Compressibility Effects on Turbulence, Ann. Rev. Fluid Mech. 26, 211-254, 1994.
15. Bogdanoff, D. W., Compressibility Effects in Turbulent Shear Layers, A/AA J. 21(6), 926-927, 1983.
16. Boutier, A., Three Dimensional Laser Velocimetry Systems, Pre- sented at the Second Int. Conf. on Laser Anemometry, Advances and Applications, Glasgow, September 1987.
17. Boutier, A., Pagan, D., and Soulevant, D., Measurements Accu- racy with 3D Laser Velocimetry, Presented at the First Int. Conf. on Laser Anemometry, Advances and Applications, Manchester, December 1985.
18. Bonnet, J. P., Debisschop, J. R., and Chambres, O., Experimental Studies of the Turbulent Structure of Supersonic Mixing Layers, AIAA Paper No. 93-0217, Reno, NV, 1993.
19. Debisschop, J. R., Comportement de la Turbulence en Couches de M61ange Supersonique, Ph.D. Thesis, CEAT Poitiers, France, 1993.
20. Bonnet, J. P., and Debisschop, J. R., Analyse Exp6rimentale de la Turbulence dans les Couches de M61ange Supersoniques, Revue Scientifique et Technique de la Ddfense 3, 65-84, 1992.
21. Samimy, M., and Lele, S. K., Motions of Particles with Inertia in a Compressible Free Shear Layer, Phys. Fluids 3(8), 1915-1923, 1991.
22. Geffroy, P., Blin, E., Jacquin, L., D'Humiere, C., Soulevant, D., et al., Mesures par V61ocim&rie Laser dans la Couche de M(~lange d'un Jet Supersonique de R6volution, Technical Report ONERA RT 52 1147 AY, October 1991.
23. D'Humieres, C., Micheli, F., and Papirnyck, O., Aerosol Behavior in Supersonic Flows, Presented at the fourth Int. Conf. on Laser Anemometry, Cleveland, OH, ONERA, paper, TP 1991-105, 1991.
24. Debisschop, J. R., Sapin, S., Delville, J. and Bonnet, J. P., Supersonic Mixing Layer Analysis by Laser Planogram and Hot- Wire Based POD, in Eddy Structure Identification in Free Turbu- lent Shear Flows, J. P. Bonnet and M. Glauser, Eds., pp. 453-462, Kluwer, Dordrecht, 1992.
25. McLaughlin, D. K., and Tiederman, W. G., Biasing Correction for Individual Realization of Laser Anemometer Measurements in Turbulent Flows, Phys. Fluids 16(12), 2082-2088, 1973.
26. Wygnanski, I., and Fiedler, H. E., The Two-Dimensional Mixing Region, J. Fluid Mech. 41(2), 327-361, 1970.
Received September 12, 1993; accepted March 3, 1994.