Embed Size (px)
Citation preview
JCAMECH Vol. 47, No. 1, June 2016, pp 53-66 DOI: 10.22059/jcamech.2016.59255
53
Techno-Economy Study of wind energy in Khvaf in Razavi Khorasan Province in Iran
Seyed Erfan Hosseinidoost1, Amirmohammad Sattari1, Mohammadreza Eskandari1, Dara
Vahidi2, Pedram Hanafizadeh1‡, Pouria Ahmadi3
1Center of Excellence in Design and Optimization of Energy Systems, School of Mechanical Engineering, College of Engineering, University of Tehran, Tehran, Iran, P. O. Box: 11155-4563
2 School of Mechanical Engineering, École polytechnique fédérale de Lausanne (Epfl) 3 Fuel Cell Research Lab (FCReL), Mechatronic System Engineering, Simon Fraser University, Vancouver, Canada
Received: 28 Feb. 2016 , Accepted: 1 May 2016
Abstract
In this paper, the 10-minutes period measured wind speed data at different heights (10 m, 30 m, and 40 m) are presented for Khvaf, which is one of the major counties with high wind potential in Khorasan provinces in Iran. To the author’s knowledge, there hasn’t been any assessment works in the mentioned site. From the primary evaluation and by determining mean wind speed and also the Weibull function, the results show that the measurement site falls under class 7 of the International System Wind Classification, which means that the station has very suitable conditions for installing and operating wind farms. On the other hand, a new approach is utilized for evaluating potential power of a region based on comparison between maximum power generation pattern and daily and monthly energy consumption patterns. Furthermore, by using wind roses of speed and turbulence simultaneously, the best direction for installing wind turbines is determined. On the other hand, the situation of topography and surface conditions of Khvaf station has been analyzed; because of its smooth surface, it is appropriate for installing wind turbines. Besides, several types of Vestas Company turbines have been compared by their capacity factors and three of them with highest capacity factor are selected for economic evaluations. One of the important issues in the assessment of wind energy potential is the economic evaluation. This is a major gap that many researches do not have sufficient attention to it. Hence, an economic analysis was performed based on NPV, IRR, and Normal Payback methods in order to select the best wind turbine for this site.
Keywords:
wind speed, power generation, Weibull function, topography, economic analysis
1. Introduction
‡ Corresponding Email: [email protected]
Wind power is classified as the most popular renewable energy source. Historically, wind power has
Hosseinidoost et al.
54
been used for centuries in the form of windmills for various functions; such as water pumping and grinding grain. New wind turbines generate electricity by using rotational energy to run a generator. They are made up of a blade or rotor and a precinct called nacelle that possesses a drive train atop the high tower. There are different size classes of wind turbines. The smallest wind turbine which have a power production less than 10 kW are used in homes, farms and remote applications; whereas intermediate wind turbines (10-250 kW) are useful for village power, hybrid systems and distributed power. The largest wind turbines (660 kW – +3 MW) are used in central station wind farms, distributed power and community wind [1]. A wind farm or wind park is a group of wind turbines in a same site used to generate electricity.
Many of the largest operational onshore wind farms are located in the United States and China. In
terms of illustration, the Gansu Wind Farm in China has a capacity of over 5,000 MW of power with a prospective goal of 20,000 MW by 2020. The Alta Wind Energy Center in California, United States is the largest onshore wind farm outside of China, with a capacity of 1,020 MW [2]. As of April 2013, the 630 MW London Array in the UK is the largest offshore wind farm in the world, followed by the 504 MW Greater Gabbard wind farm in the UK.
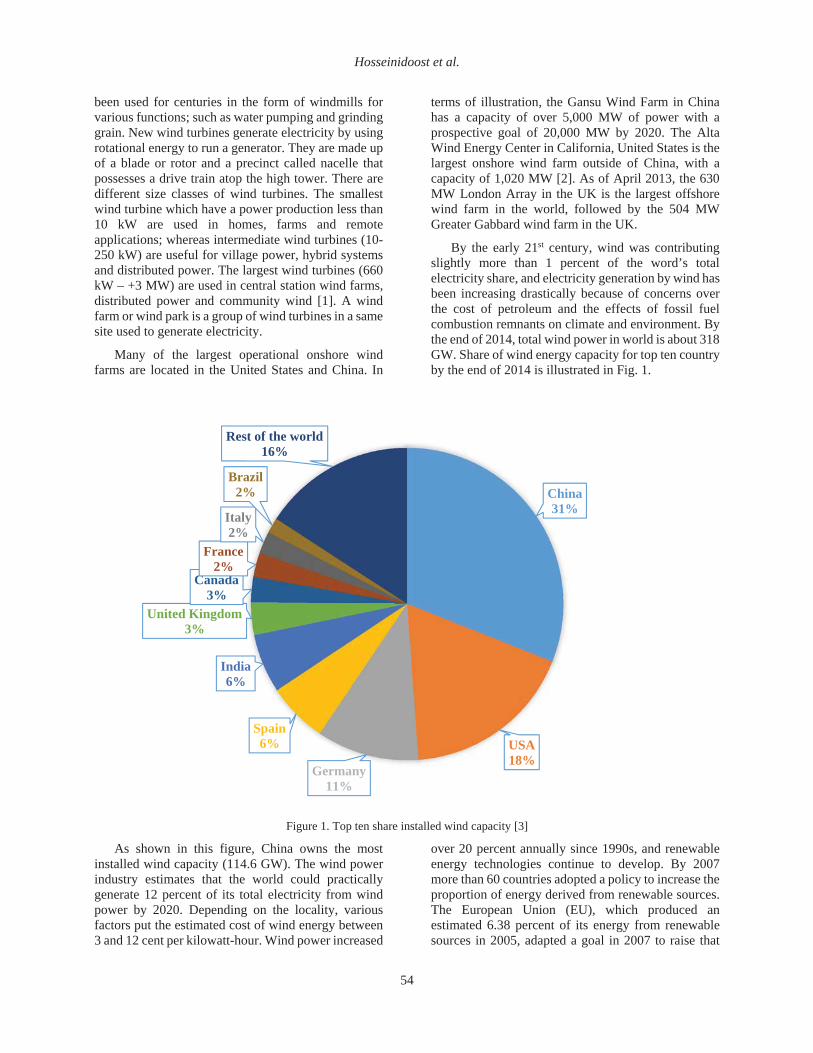
By the early 21st century, wind was contributing slightly more than 1 percent of the word’s total electricity share, and electricity generation by wind has been increasing drastically because of concerns over the cost of petroleum and the effects of fossil fuel combustion remnants on climate and environment. By the end of 2014, total wind power in world is about 318 GW. Share of wind energy capacity for top ten country by the end of 2014 is illustrated in Fig. 1.
Figure 1. Top ten share installed wind capacity [3]
As shown in this figure, China owns the most installed wind capacity (114.6 GW). The wind power industry estimates that the world could practically generate 12 percent of its total electricity from wind power by 2020. Depending on the locality, various factors put the estimated cost of wind energy between 3 and 12 cent per kilowatt-hour. Wind power increased
over 20 percent annually since 1990s, and renewable energy technologies continue to develop. By 2007 more than 60 countries adopted a policy to increase the proportion of energy derived from renewable sources. The European Union (EU), which produced an estimated 6.38 percent of its energy from renewable sources in 2005, adapted a goal in 2007 to raise that
China31%
USA18%
Germany11%
Spain6%
India6%
United Kingdom3%
Canada3%
France2%
Italy2%
Brazil2%
Rest of the world16%
Vol. 47, No. 1, June 2016
55
figure to 20 percent by 2020. Wind energy's share of electricity production in Europe by the end of 2013 was 11.2%. In the United States, numerous states have responded to concerns over climate change and reliance on imported fossil fuels by setting goals to increase renewable energy over time [4].
During the past years, there have been several research studies on the availability of wind energy sources in different countries, such as Wind Energy Resource Atlas of the United States [5], Europe’s energy portal [6], etc. Moreover, a wind map of China, Spain, Peru, Egypt, Jordan, Somalia, Ethiopia and a wind map of the world have been broadcasted [7].
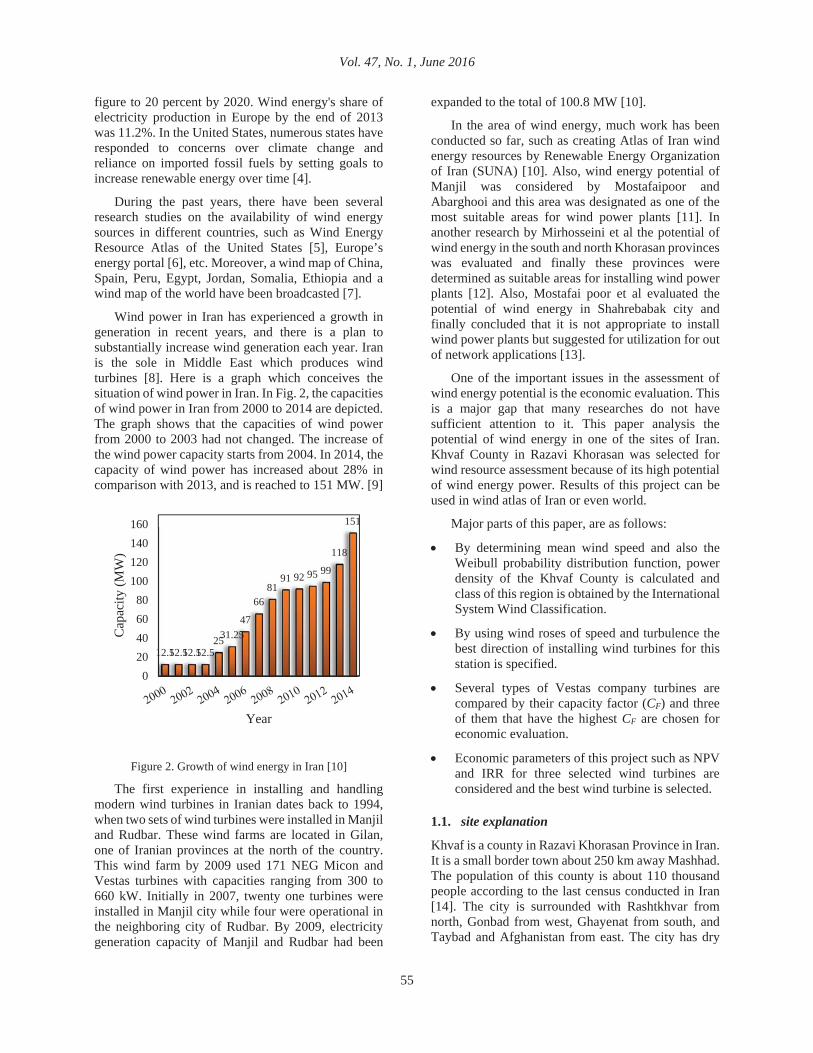
Wind power in Iran has experienced a growth in generation in recent years, and there is a plan to substantially increase wind generation each year. Iran is the sole in Middle East which produces wind turbines [8]. Here is a graph which conceives the situation of wind power in Iran. In Fig. 2, the capacities of wind power in Iran from 2000 to 2014 are depicted. The graph shows that the capacities of wind power from 2000 to 2003 had not changed. The increase of the wind power capacity starts from 2004. In 2014, the capacity of wind power has increased about 28% in comparison with 2013, and is reached to 151 MW. [9]
Figure 2. Growth of wind energy in Iran [10]
The first experience in installing and handling modern wind turbines in Iranian dates back to 1994, when two sets of wind turbines were installed in Manjil and Rudbar. These wind farms are located in Gilan, one of Iranian provinces at the north of the country. This wind farm by 2009 used 171 NEG Micon and Vestas turbines with capacities ranging from 300 to 660 kW. Initially in 2007, twenty one turbines were installed in Manjil city while four were operational in the neighboring city of Rudbar. By 2009, electricity generation capacity of Manjil and Rudbar had been
expanded to the total of 100.8 MW [10].
In the area of wind energy, much work has been conducted so far, such as creating Atlas of Iran wind energy resources by Renewable Energy Organization of Iran (SUNA) [10]. Also, wind energy potential of Manjil was considered by Mostafaipoor and Abarghooi and this area was designated as one of the most suitable areas for wind power plants [11]. In another research by Mirhosseini et al the potential of wind energy in the south and north Khorasan provinces was evaluated and finally these provinces were determined as suitable areas for installing wind power plants [12]. Also, Mostafai poor et al evaluated the potential of wind energy in Shahrebabak city and finally concluded that it is not appropriate to install wind power plants but suggested for utilization for out of network applications [13].
One of the important issues in the assessment of wind energy potential is the economic evaluation. This is a major gap that many researches do not have sufficient attention to it. This paper analysis the potential of wind energy in one of the sites of Iran. Khvaf County in Razavi Khorasan was selected for wind resource assessment because of its high potential of wind energy power. Results of this project can be used in wind atlas of Iran or even world.
Major parts of this paper, are as follows:
By determining mean wind speed and also the Weibull probability distribution function, power density of the Khvaf County is calculated and class of this region is obtained by the International System Wind Classification.
By using wind roses of speed and turbulence the best direction of installing wind turbines for this station is specified.
Several types of Vestas company turbines are compared by their capacity factor (CF) and three of them that have the highest CF are chosen for economic evaluation.
Economic parameters of this project such as NPV and IRR for three selected wind turbines are considered and the best wind turbine is selected.
1.1. site explanation
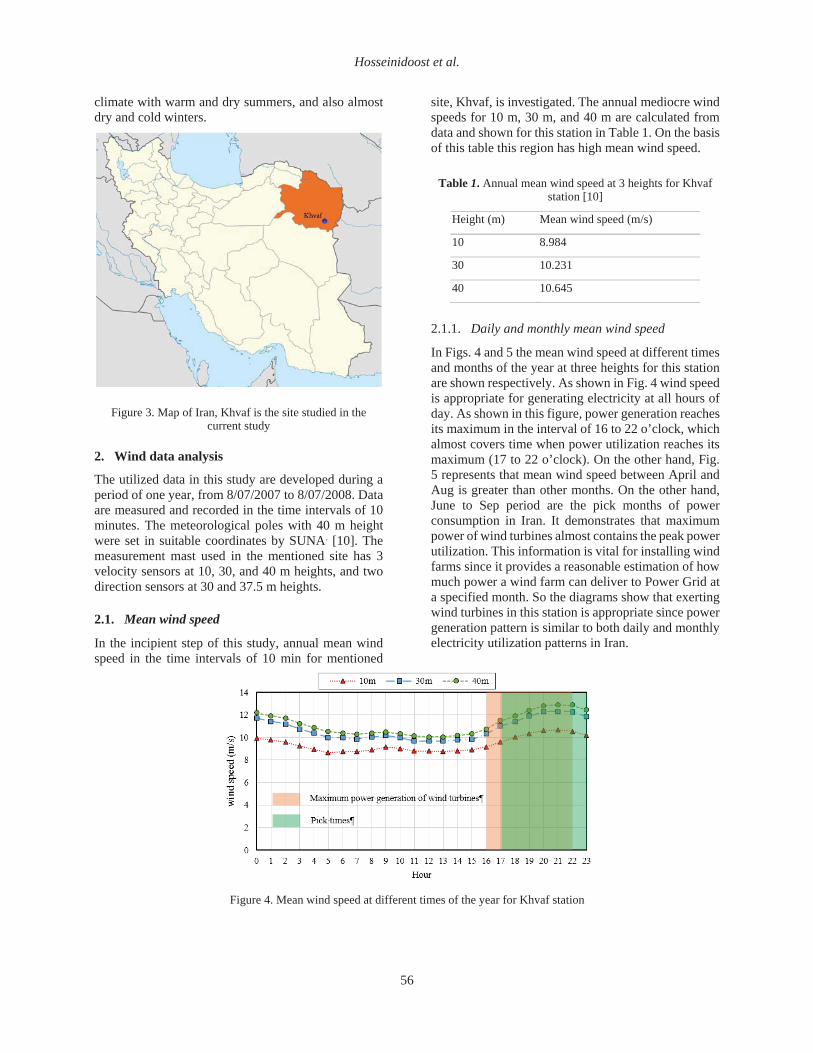
Khvaf is a county in Razavi Khorasan Province in Iran. It is a small border town about 250 km away Mashhad. The population of this county is about 110 thousand people according to the last census conducted in Iran [14]. The city is surrounded with Rashtkhvar from north, Gonbad from west, Ghayenat from south, and Taybad and Afghanistan from east. The city has dry
12.512.512.512.52531.25
47
6681
91 92 95 99
118
151
020406080
100120140160
Cap
acity
(MW
)
Year
Hosseinidoost et al.
56
climate with warm and dry summers, and also almost dry and cold winters.
Figure 3. Map of Iran, Khvaf is the site studied in the current study
2. Wind data analysis
The utilized data in this study are developed during a period of one year, from 8/07/2007 to 8/07/2008. Data are measured and recorded in the time intervals of 10 minutes. The meteorological poles with 40 m height were set in suitable coordinates by SUNA. [10]. The measurement mast used in the mentioned site has 3 velocity sensors at 10, 30, and 40 m heights, and two direction sensors at 30 and 37.5 m heights.
2.1. Mean wind speed
In the incipient step of this study, annual mean wind speed in the time intervals of 10 min for mentioned
site, Khvaf, is investigated. The annual mediocre wind speeds for 10 m, 30 m, and 40 m are calculated from data and shown for this station in Table 1. On the basis of this table this region has high mean wind speed.
Table 1. Annual mean wind speed at 3 heights for Khvaf station [10]
Height (m) Mean wind speed (m/s)
10 8.984
30 10.231
40 10.645
2.1.1. Daily and monthly mean wind speed
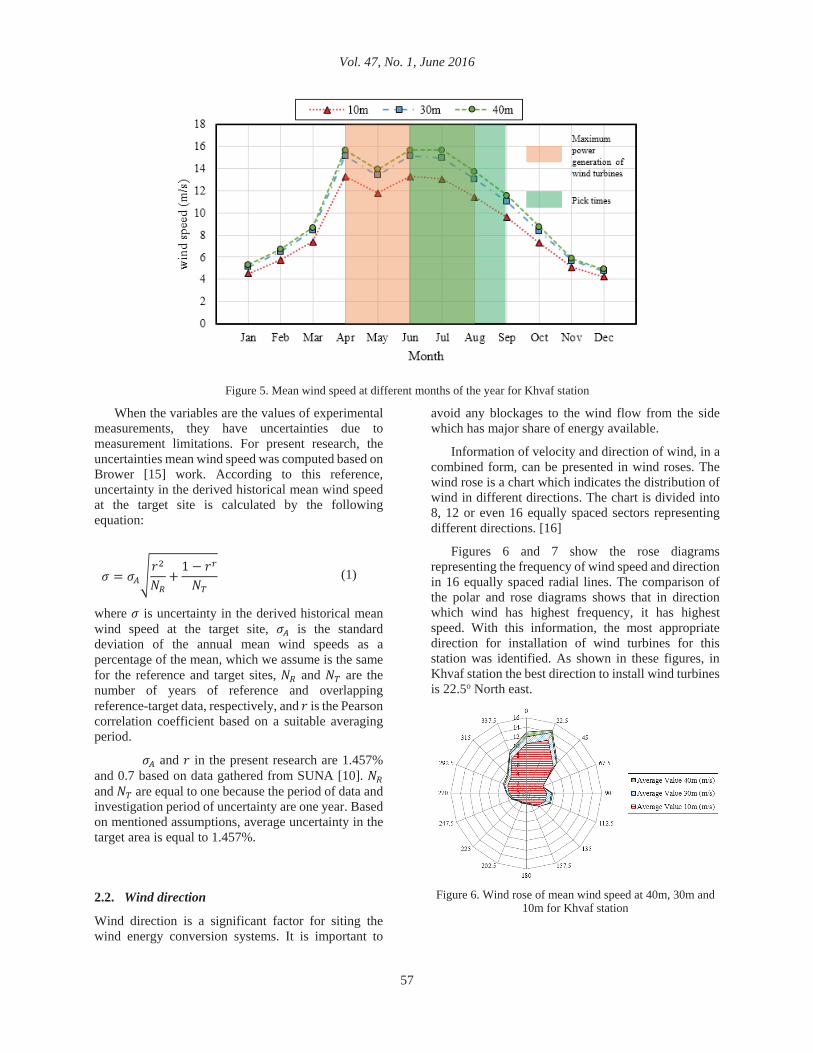
In Figs. 4 and 5 the mean wind speed at different times and months of the year at three heights for this station are shown respectively. As shown in Fig. 4 wind speed is appropriate for generating electricity at all hours of day. As shown in this figure, power generation reaches its maximum in the interval of 16 to 22 o’clock, which almost covers time when power utilization reaches its maximum (17 to 22 o’clock). On the other hand, Fig. 5 represents that mean wind speed between April and Aug is greater than other months. On the other hand, June to Sep period are the pick months of power consumption in Iran. It demonstrates that maximum power of wind turbines almost contains the peak power utilization. This information is vital for installing wind farms since it provides a reasonable estimation of how much power a wind farm can deliver to Power Grid at a specified month. So the diagrams show that exerting wind turbines in this station is appropriate since power generation pattern is similar to both daily and monthly electricity utilization patterns in Iran.
Figure 4. Mean wind speed at different times of the year for Khvaf station
Vol. 47, No. 1, June 2016
57
Figure 5. Mean wind speed at different months of the year for Khvaf station
When the variables are the values of experimental measurements, they have uncertainties due to measurement limitations. For present research, the uncertainties mean wind speed was computed based on Brower [15] work. According to this reference, uncertainty in the derived historical mean wind speed at the target site is calculated by the following equation:
(1)
where is uncertainty in the derived historical mean wind speed at the target site, is the standard deviation of the annual mean wind speeds as a percentage of the mean, which we assume is the same for the reference and target sites, and are the number of years of reference and overlapping reference-target data, respectively, and is the Pearson correlation coefficient based on a suitable averaging period.
and in the present research are 1.457% and 0.7 based on data gathered from SUNA [10]. and are equal to one because the period of data and investigation period of uncertainty are one year. Based on mentioned assumptions, average uncertainty in the target area is equal to 1.457%.
2.2. Wind direction
Wind direction is a significant factor for siting the wind energy conversion systems. It is important to
avoid any blockages to the wind flow from the side which has major share of energy available.
Information of velocity and direction of wind, in a combined form, can be presented in wind roses. The wind rose is a chart which indicates the distribution of wind in different directions. The chart is divided into 8, 12 or even 16 equally spaced sectors representing different directions. [16]
Figures 6 and 7 show the rose diagrams representing the frequency of wind speed and direction in 16 equally spaced radial lines. The comparison of the polar and rose diagrams shows that in direction which wind has highest frequency, it has highest speed. With this information, the most appropriate direction for installation of wind turbines for this station was identified. As shown in these figures, in Khvaf station the best direction to install wind turbines is 22.5o North east.
Figure 6. Wind rose of mean wind speed at 40m, 30m and
10m for Khvaf station
Hosseinidoost et al.
58
Figure 7. Wind rose of wind direction at 30m and 37.5m for Khvaf stationWeibull probability density function
In order to determine the wind energy potential and outputs assessment at this site, statistical analysis can be used. To illustrate the statistical distribution of wind speed, different probability functions can be used for regimes of wind. According to Burton [17] the Weibull distribution has been found to give a good representation of the variation in hourly mean wind speed over a year at many common sites. For determining desired parameters by means of the Weibull probability density function cognizing two parameters are required; k, the shape factor, and c, the scale factor. The Weibull probability density function is given by [18]:
(2)
There are a number of approximations that can lead to reasonable results to determine k and c factors. Here Weibull shape and scale parameters are computed employing the maximum likelihood method which is
given by [19]:
(3)
Where vi and n are the wind speed in time step i and the number of data points respectively. Then scale parameter can be obtained by [20]:
(4)
By the probability density function, P(U), the frequency of incidence of wind speeds may be described. This mathematical function was mentioned as a means of characterizing turbulence. This function may be used to declare the probability of wind speeds occurring between Ua and Ub and is calculated by [18]:
(5)
Also the total area under the probability density curve is calculated by [18]:
(6)
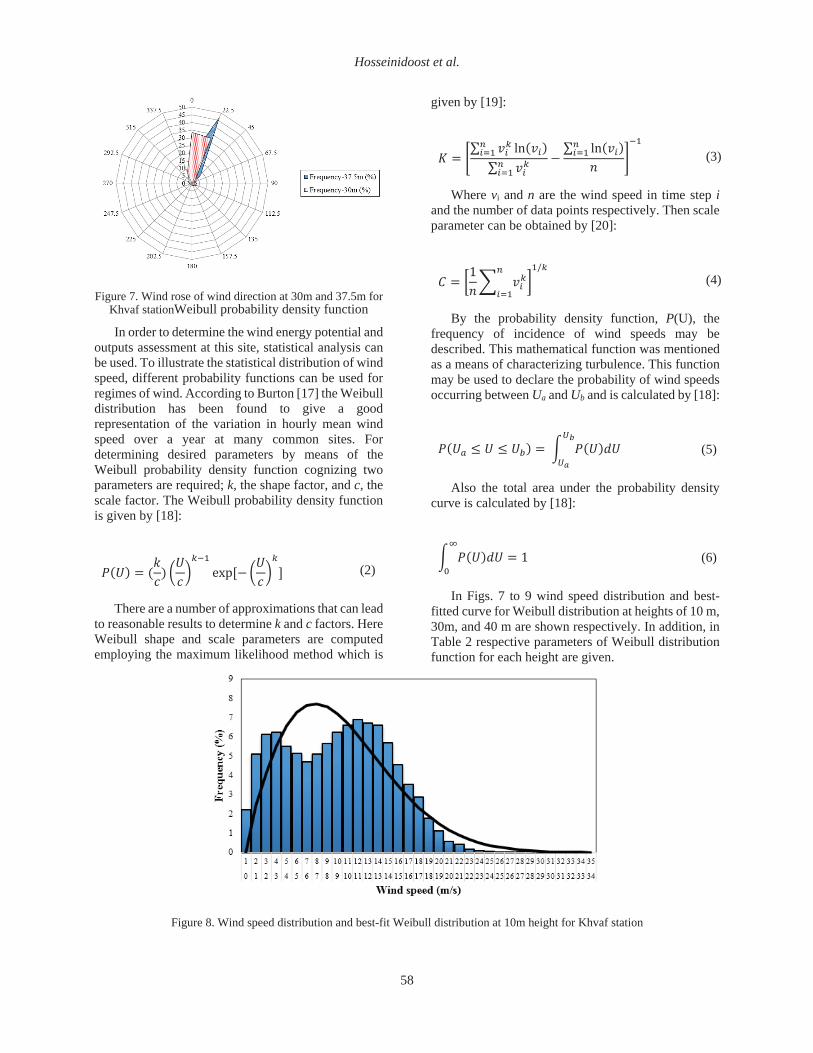
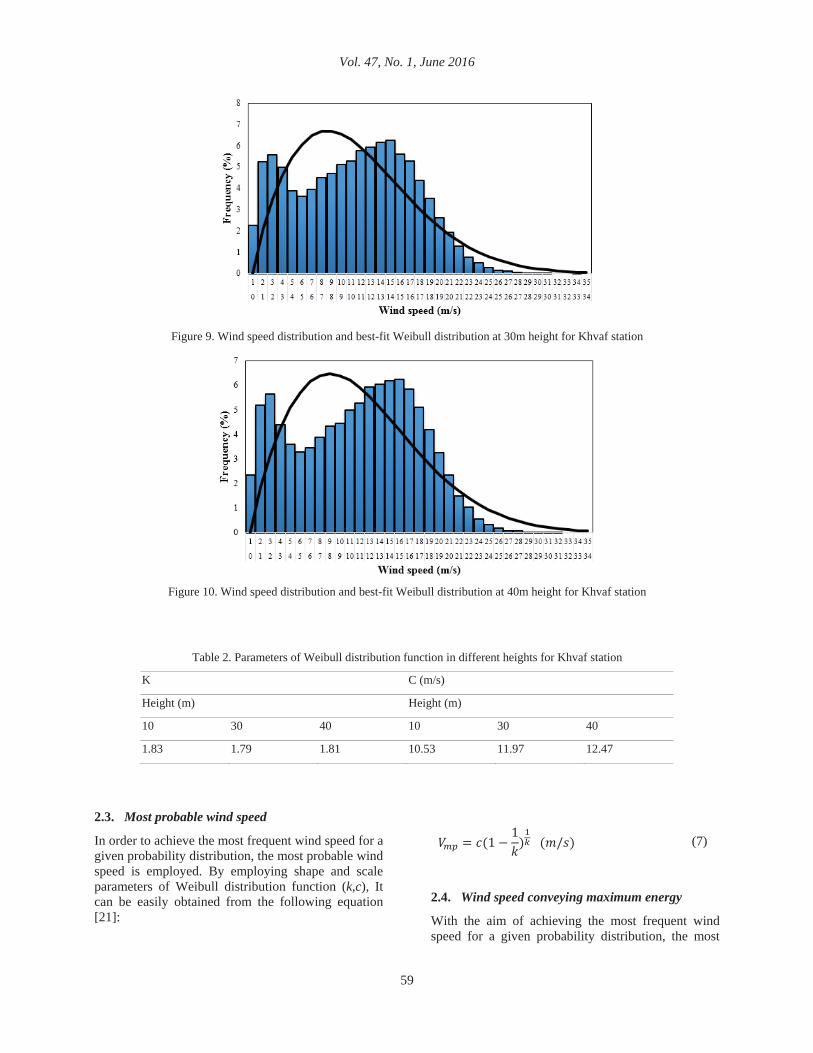
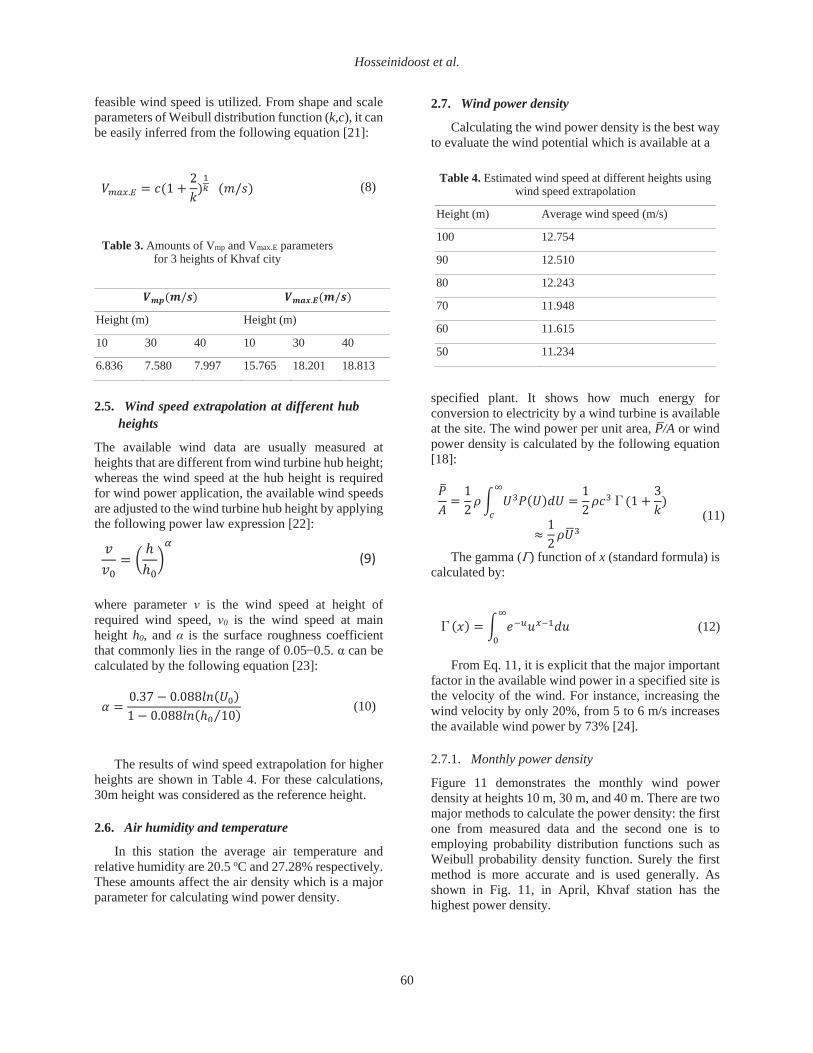
In Figs. 7 to 9 wind speed distribution and best-fitted curve for Weibull distribution at heights of 10 m, 30m, and 40 m are shown respectively. In addition, in Table 2 respective parameters of Weibull distribution function for each height are given.
Figure 8. Wind speed distribution and best-fit Weibull distribution at 10m height for Khvaf station
Vol. 47, No. 1, June 2016
59
Figure 9. Wind speed distribution and best-fit Weibull distribution at 30m height for Khvaf station
Figure 10. Wind speed distribution and best-fit Weibull distribution at 40m height for Khvaf station
Table 2. Parameters of Weibull distribution function in different heights for Khvaf station K C (m/s)
Height (m) Height (m)
10 30 40 10 30 40
1.83 1.79 1.81 10.53 11.97 12.47
2.3. Most probable wind speed
In order to achieve the most frequent wind speed for a given probability distribution, the most probable wind speed is employed. By employing shape and scale parameters of Weibull distribution function (k,c), It can be easily obtained from the following equation [21]:
(7)
2.4. Wind speed conveying maximum energy
With the aim of achieving the most frequent wind speed for a given probability distribution, the most
Hosseinidoost et al.
60
feasible wind speed is utilized. From shape and scale parameters of Weibull distribution function (k,c), it can be easily inferred from the following equation [21]:
(8)
Table 3. Amounts of Vmp and Vmax.E parameters for 3 heights of Khvaf city
Height (m) Height (m)
10 30 40 10 30 40
6.836 7.580 7.997 15.765 18.201 18.813
2.5. Wind speed extrapolation at different hub heights
The available wind data are usually measured at heights that are different from wind turbine hub height; whereas the wind speed at the hub height is required for wind power application, the available wind speeds are adjusted to the wind turbine hub height by applying the following power law expression [22]:
(9)
where parameter is the wind speed at height of required wind speed, 0 is the wind speed at main height h0, and is the surface roughness coefficient that commonly lies in the range of 0.05 0.5. can be calculated by the following equation [23]:
(10)
The results of wind speed extrapolation for higher heights are shown in Table 4. For these calculations, 30m height was considered as the reference height.
2.6. Air humidity and temperature
In this station the average air temperature and relative humidity are 20.5 oC and 27.28% respectively. These amounts affect the air density which is a major parameter for calculating wind power density.
2.7. Wind power density
Calculating the wind power density is the best way to evaluate the wind potential which is available at a
Table 4. Estimated wind speed at different heights using wind speed extrapolation
Height (m) Average wind speed (m/s)
100 12.754
90 12.510
80 12.243
70 11.948
60 11.615
50 11.234
specified plant. It shows how much energy for conversion to electricity by a wind turbine is available at the site. The wind power per unit area, P/A or wind power density is calculated by the following equation [18]:
(11)
The gamma ( ) function of x (standard formula) is calculated by:
(12)
From Eq. 11, it is explicit that the major important factor in the available wind power in a specified site is the velocity of the wind. For instance, increasing the wind velocity by only 20%, from 5 to 6 m/s increases the available wind power by 73% [24].
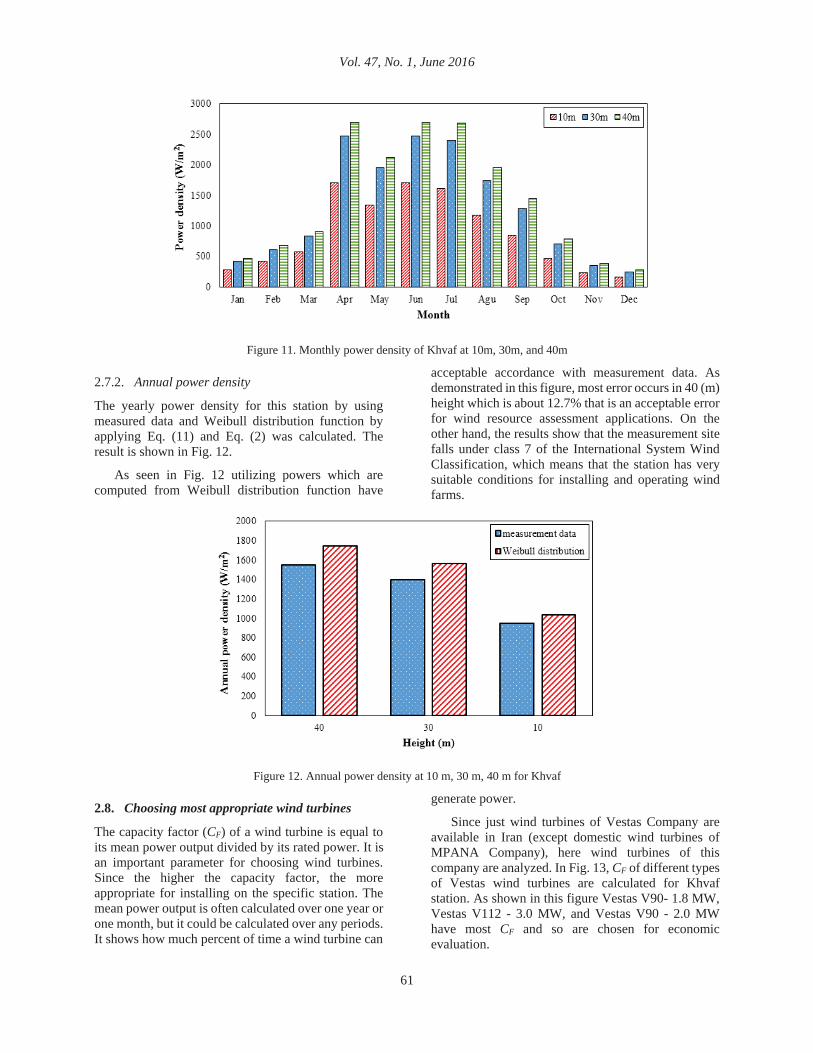
2.7.1. Monthly power density
Figure 11 demonstrates the monthly wind power density at heights 10 m, 30 m, and 40 m. There are two major methods to calculate the power density: the first one from measured data and the second one is to employing probability distribution functions such as Weibull probability density function. Surely the first method is more accurate and is used generally. As shown in Fig. 11, in April, Khvaf station has the highest power density.
Vol. 47, No. 1, June 2016
61
Figure 11. Monthly power density of Khvaf at 10m, 30m, and 40m
2.7.2. Annual power density
The yearly power density for this station by using measured data and Weibull distribution function by applying Eq. (11) and Eq. (2) was calculated. The result is shown in Fig. 12.
As seen in Fig. 12 utilizing powers which are computed from Weibull distribution function have
acceptable accordance with measurement data. As demonstrated in this figure, most error occurs in 40 (m) height which is about 12.7% that is an acceptable error for wind resource assessment applications. On the other hand, the results show that the measurement site falls under class 7 of the International System Wind Classification, which means that the station has very suitable conditions for installing and operating wind farms.
Figure 12. Annual power density at 10 m, 30 m, 40 m for Khvaf
2.8. Choosing most appropriate wind turbines
The capacity factor (CF) of a wind turbine is equal to its mean power output divided by its rated power. It is an important parameter for choosing wind turbines. Since the higher the capacity factor, the more appropriate for installing on the specific station. The mean power output is often calculated over one year or one month, but it could be calculated over any periods. It shows how much percent of time a wind turbine can
generate power.
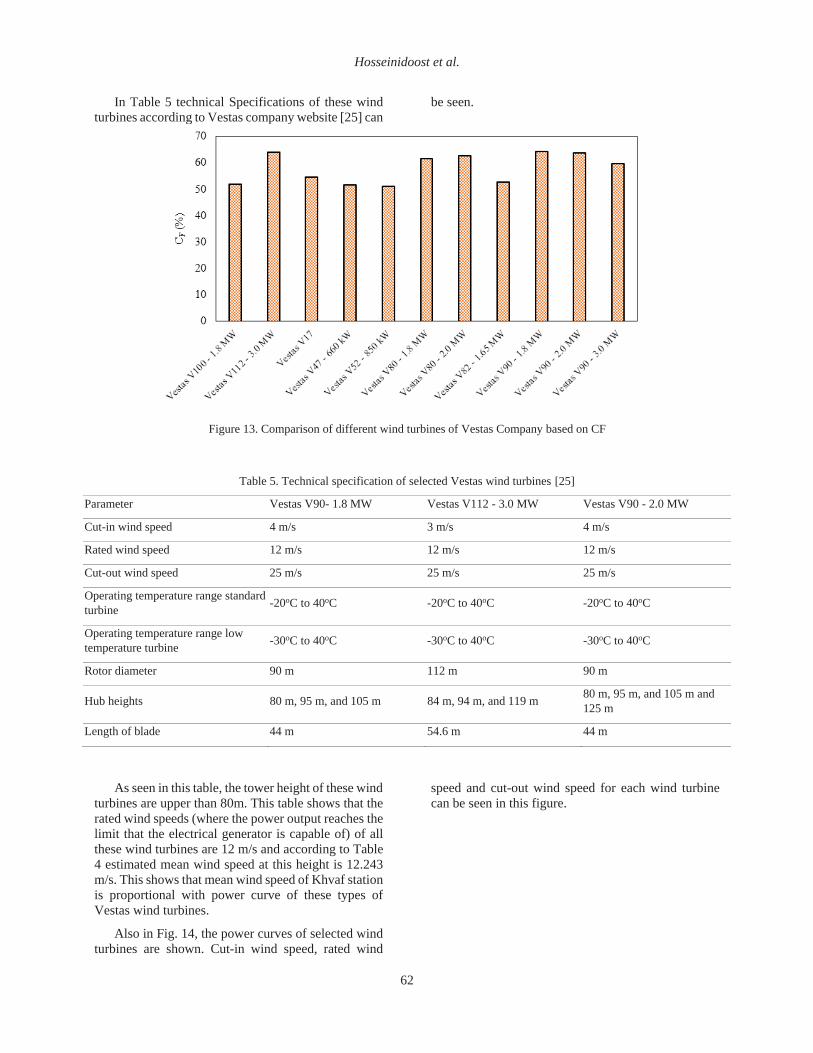
Since just wind turbines of Vestas Company are available in Iran (except domestic wind turbines of MPANA Company), here wind turbines of this company are analyzed. In Fig. 13, CF of different types of Vestas wind turbines are calculated for Khvaf station. As shown in this figure Vestas V90- 1.8 MW, Vestas V112 - 3.0 MW, and Vestas V90 - 2.0 MW have most CF and so are chosen for economic evaluation.
Hosseinidoost et al.
62
In Table 5 technical Specifications of these wind turbines according to Vestas company website [25] can
be seen.
Figure 13. Comparison of different wind turbines of Vestas Company based on CF
Table 5. Technical specification of selected Vestas wind turbines [25] Parameter Vestas V90- 1.8 MW Vestas V112 - 3.0 MW Vestas V90 - 2.0 MW
Cut-in wind speed 4 m/s 3 m/s 4 m/s
Rated wind speed 12 m/s 12 m/s 12 m/s
Cut-out wind speed 25 m/s 25 m/s 25 m/s
Operating temperature range standard turbine -20oC to 40oC -20oC to 40oC -20oC to 40oC
Operating temperature range low temperature turbine -30oC to 40oC -30oC to 40oC -30oC to 40oC
Rotor diameter 90 m 112 m 90 m
Hub heights 80 m, 95 m, and 105 m 84 m, 94 m, and 119 m 80 m, 95 m, and 105 m and 125 m
Length of blade 44 m 54.6 m 44 m
As seen in this table, the tower height of these wind turbines are upper than 80m. This table shows that the rated wind speeds (where the power output reaches the limit that the electrical generator is capable of) of all these wind turbines are 12 m/s and according to Table 4 estimated mean wind speed at this height is 12.243 m/s. This shows that mean wind speed of Khvaf station is proportional with power curve of these types of Vestas wind turbines.
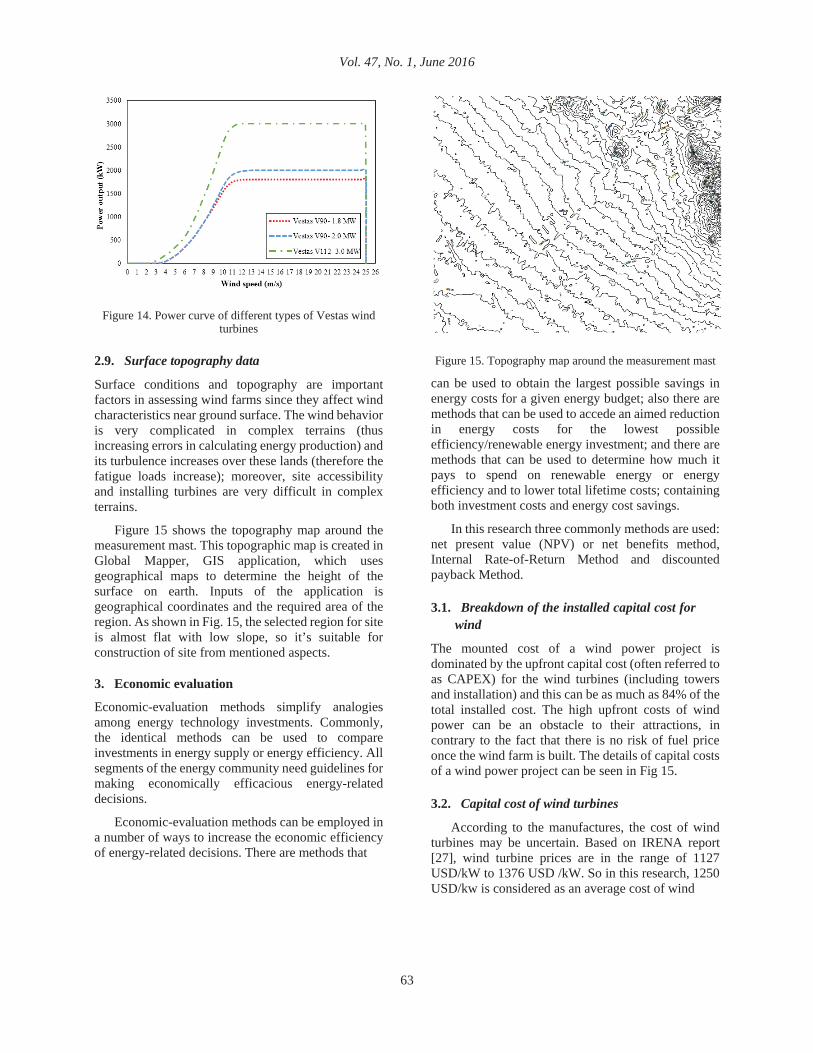
Also in Fig. 14, the power curves of selected wind turbines are shown. Cut-in wind speed, rated wind
speed and cut-out wind speed for each wind turbine can be seen in this figure.
Vol. 47, No. 1, June 2016
63
Figure 14. Power curve of different types of Vestas wind turbines
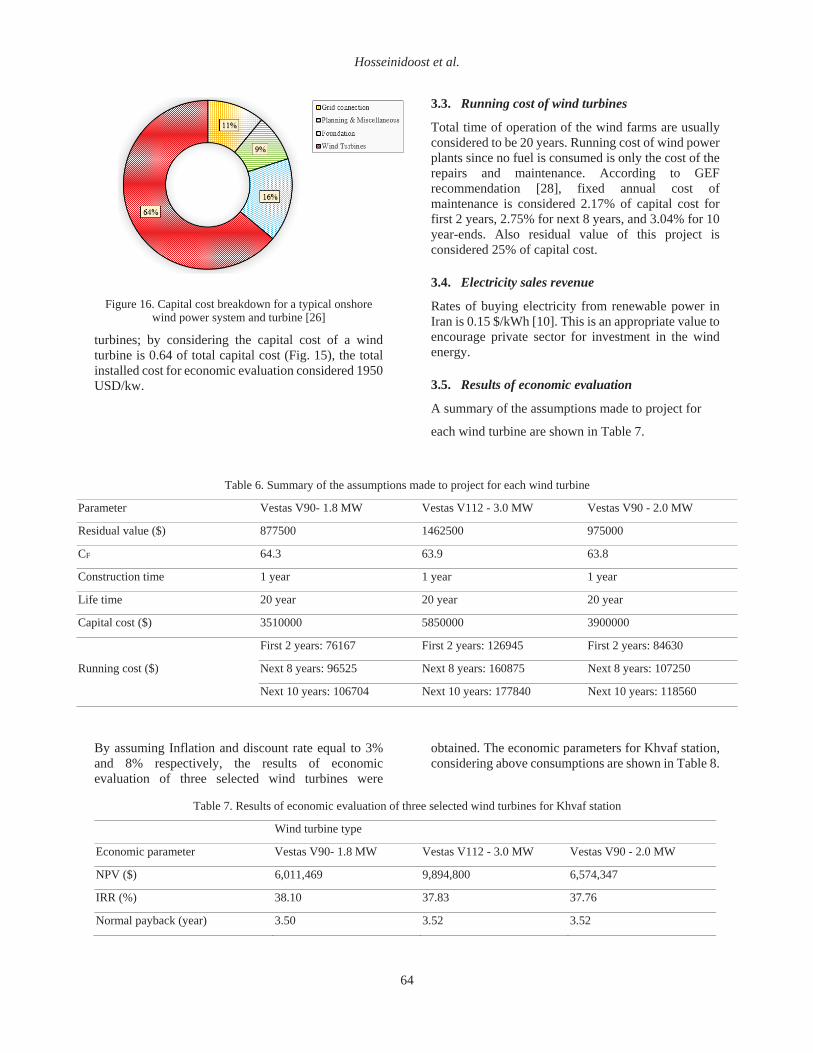
2.9. Surface topography data
Surface conditions and topography are important factors in assessing wind farms since they affect wind characteristics near ground surface. The wind behavior is very complicated in complex terrains (thus increasing errors in calculating energy production) and its turbulence increases over these lands (therefore the fatigue loads increase); moreover, site accessibility and installing turbines are very difficult in complex terrains.
Figure 15 shows the topography map around the measurement mast. This topographic map is created in Global Mapper, GIS application, which uses geographical maps to determine the height of the surface on earth. Inputs of the application is geographical coordinates and the required area of the region. As shown in Fig. 15, the selected region for site is almost flat with low slope, so it’s suitable for construction of site from mentioned aspects.
3. Economic evaluation
Economic-evaluation methods simplify analogies among energy technology investments. Commonly, the identical methods can be used to compare investments in energy supply or energy efficiency. All segments of the energy community need guidelines for making economically efficacious energy-related decisions.
Economic-evaluation methods can be employed in a number of ways to increase the economic efficiency of energy-related decisions. There are methods that
Figure 15. Topography map around the measurement mast
can be used to obtain the largest possible savings in energy costs for a given energy budget; also there are methods that can be used to accede an aimed reduction in energy costs for the lowest possible efficiency/renewable energy investment; and there are methods that can be used to determine how much it pays to spend on renewable energy or energy efficiency and to lower total lifetime costs; containing both investment costs and energy cost savings.
In this research three commonly methods are used: net present value (NPV) or net benefits method, Internal Rate-of-Return Method and discounted payback Method.
3.1. Breakdown of the installed capital cost for wind
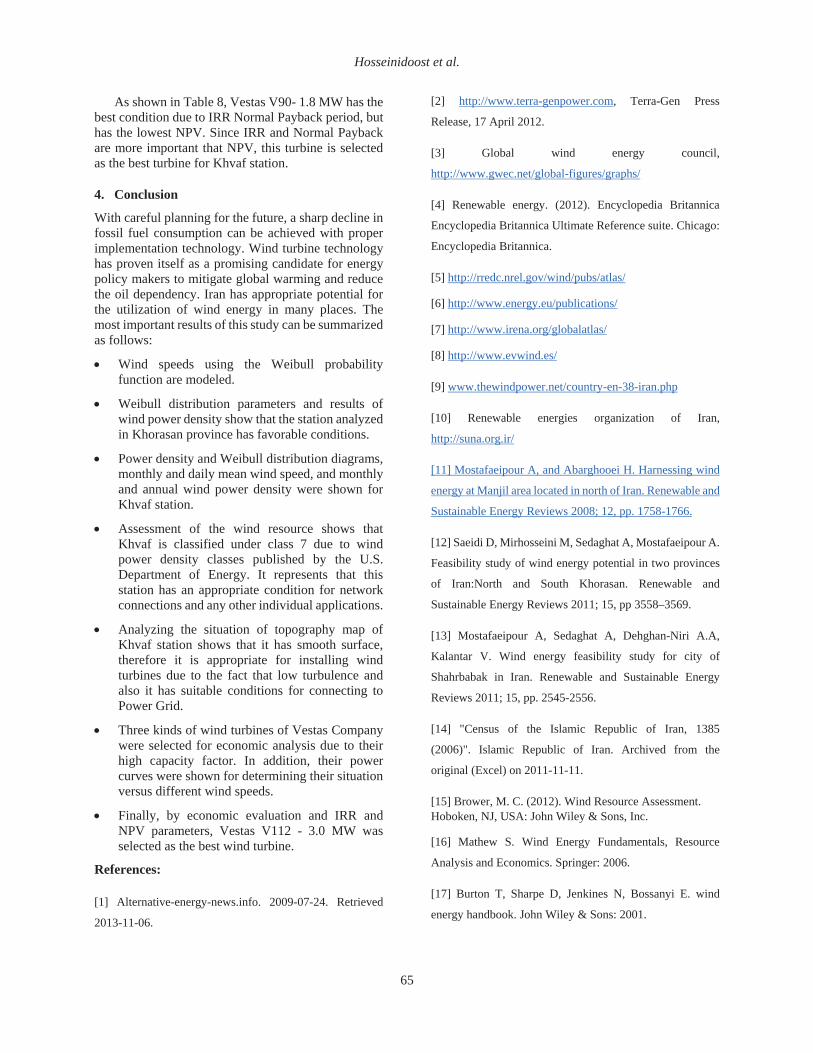
The mounted cost of a wind power project is dominated by the upfront capital cost (often referred to as CAPEX) for the wind turbines (including towers and installation) and this can be as much as 84% of the total installed cost. The high upfront costs of wind power can be an obstacle to their attractions, in contrary to the fact that there is no risk of fuel price once the wind farm is built. The details of capital costs of a wind power project can be seen in Fig 15.
3.2. Capital cost of wind turbines
According to the manufactures, the cost of wind turbines may be uncertain. Based on IRENA report [27], wind turbine prices are in the range of 1127 USD/kW to 1376 USD /kW. So in this research, 1250 USD/kw is considered as an average cost of wind
Hosseinidoost et al.
64
Figure 16. Capital cost breakdown for a typical onshore wind power system and turbine [26]
turbines; by considering the capital cost of a wind turbine is 0.64 of total capital cost (Fig. 15), the total installed cost for economic evaluation considered 1950 USD/kw.
3.3. Running cost of wind turbines
Total time of operation of the wind farms are usually considered to be 20 years. Running cost of wind power plants since no fuel is consumed is only the cost of the repairs and maintenance. According to GEF recommendation [28], fixed annual cost of maintenance is considered 2.17% of capital cost for first 2 years, 2.75% for next 8 years, and 3.04% for 10 year-ends. Also residual value of this project is considered 25% of capital cost.
3.4. Electricity sales revenue
Rates of buying electricity from renewable power in Iran is 0.15 $/kWh [10]. This is an appropriate value to encourage private sector for investment in the wind energy.
3.5. Results of economic evaluation
A summary of the assumptions made to project for
each wind turbine are shown in Table 7.
Table 6. Summary of the assumptions made to project for each wind turbine Parameter Vestas V90- 1.8 MW Vestas V112 - 3.0 MW Vestas V90 - 2.0 MW
Residual value ($) 877500 1462500 975000
CF 64.3 63.9 63.8
Construction time 1 year 1 year 1 year
Life time 20 year 20 year 20 year
Capital cost ($) 3510000 5850000 3900000
Running cost ($)
First 2 years: 76167 First 2 years: 126945 First 2 years: 84630
Next 8 years: 96525 Next 8 years: 160875 Next 8 years: 107250
Next 10 years: 106704 Next 10 years: 177840 Next 10 years: 118560
By assuming Inflation and discount rate equal to 3% and 8% respectively, the results of economic evaluation of three selected wind turbines were
obtained. The economic parameters for Khvaf station, considering above consumptions are shown in Table 8.
Table 7. Results of economic evaluation of three selected wind turbines for Khvaf station
Wind turbine type
Economic parameter Vestas V90- 1.8 MW Vestas V112 - 3.0 MW Vestas V90 - 2.0 MW
NPV ($) 6,011,469 9,894,800 6,574,347
IRR (%) 38.10 37.83 37.76
Normal payback (year) 3.50 3.52 3.52
Hosseinidoost et al.
65
As shown in Table 8, Vestas V90- 1.8 MW has the best condition due to IRR Normal Payback period, but has the lowest NPV. Since IRR and Normal Payback are more important that NPV, this turbine is selected as the best turbine for Khvaf station.
4. Conclusion
With careful planning for the future, a sharp decline in fossil fuel consumption can be achieved with proper implementation technology. Wind turbine technology has proven itself as a promising candidate for energy policy makers to mitigate global warming and reduce the oil dependency. Iran has appropriate potential for the utilization of wind energy in many places. The most important results of this study can be summarized as follows:
Wind speeds using the Weibull probability function are modeled.
Weibull distribution parameters and results of wind power density show that the station analyzed in Khorasan province has favorable conditions.
Power density and Weibull distribution diagrams, monthly and daily mean wind speed, and monthly and annual wind power density were shown for Khvaf station.
Assessment of the wind resource shows that Khvaf is classified under class 7 due to wind power density classes published by the U.S. Department of Energy. It represents that this station has an appropriate condition for network connections and any other individual applications.
Analyzing the situation of topography map of Khvaf station shows that it has smooth surface, therefore it is appropriate for installing wind turbines due to the fact that low turbulence and also it has suitable conditions for connecting to Power Grid.
Three kinds of wind turbines of Vestas Company were selected for economic analysis due to their high capacity factor. In addition, their power curves were shown for determining their situation versus different wind speeds.
Finally, by economic evaluation and IRR and NPV parameters, Vestas V112 - 3.0 MW was selected as the best wind turbine.
References:
[1] Alternative-energy-news.info. 2009-07-24. Retrieved
2013-11-06.
[2] http://www.terra-genpower.com, Terra-Gen Press
Release, 17 April 2012.
[3] Global wind energy council,
http://www.gwec.net/global-figures/graphs/
[4] Renewable energy. (2012). Encyclopedia Britannica
Encyclopedia Britannica Ultimate Reference suite. Chicago:
Encyclopedia Britannica.
[5] http://rredc.nrel.gov/wind/pubs/atlas/
[6] http://www.energy.eu/publications/
[7] http://www.irena.org/globalatlas/
[8] http://www.evwind.es/
[9] www.thewindpower.net/country-en-38-iran.php
[10] Renewable energies organization of Iran,
http://suna.org.ir/
[11] Mostafaeipour A, and Abarghooei H. Harnessing wind
energy at Manjil area located in north of Iran. Renewable and
Sustainable Energy Reviews 2008; 12, pp. 1758-1766.
[12] Saeidi D, Mirhosseini M, Sedaghat A, Mostafaeipour A.
Feasibility study of wind energy potential in two provinces
of Iran:North and South Khorasan. Renewable and
Sustainable Energy Reviews 2011; 15, pp 3558–3569.
[13] Mostafaeipour A, Sedaghat A, Dehghan-Niri A.A,
Kalantar V. Wind energy feasibility study for city of
Shahrbabak in Iran. Renewable and Sustainable Energy
Reviews 2011; 15, pp. 2545-2556.
[14] "Census of the Islamic Republic of Iran, 1385
(2006)". Islamic Republic of Iran. Archived from the
original (Excel) on 2011-11-11.
[15] Brower, M. C. (2012). Wind Resource Assessment. Hoboken, NJ, USA: John Wiley & Sons, Inc.
[16] Mathew S. Wind Energy Fundamentals, Resource
Analysis and Economics. Springer: 2006.
[17] Burton T, Sharpe D, Jenkines N, Bossanyi E. wind
energy handbook. John Wiley & Sons: 2001.
Hosseinidoost et al.
66
[18] Manwell JF, McGowan JG, Rogers AL. Wind energy
explained: theory, design and application. Amherst, USA:
John Wiley & Sons: 2002.
[19] Kececioglu. Reliability engineering handbook. Destech
Publications, Pennsylvania: Vol. 1-2; 2002.
[20] Kollu R, Rayapudi S.R, Narasimham SVL, Pakkurthi
K.M. Mixture probability distribution functions to model
wind speed distributions. International Journal of energy and
environmental engineering 2012; 3:27.
[21] Keyhani A, Ghasemi-Varnamkhasti M, Khanali M,
Abbaszadeh R. An assessment of wind energy potential as a
power generation source in the capital of Iran, Tehran.
Energy 2010; 35(1):188-201.
[22] Ngala G M, Alkali B, Aji M A. Viability of wind energy
as a power generation source in Maiduguri, Borno state,
Nigeria. Renewable Energy 2007; 32(13): 2242 2246.
[23] Ucar A, Balo F. Evaluation of wind energy potential and
electricity generation at six locations in Turkey. Applied
Energy 2009; 86(10): 1864 1872.
[24] Renne D.S, Wilcox S, Marion W, Maxwell G.L, Rymes
M, Phillips J, Berg D.E, Franklin M.A, Brown R.C. Hand
book of energy efficiency and renewable energy. Taylor &
Francis Group: LLC; 2007.
[25] http://www.vestas.com
[26] IRENA: International Renewable Energy Agency,
RENEWABLE ENERGY TECHNOLOGIES: COST
ANALYSIS SERIES. Volume 1: Power Sector; June 2012.
[27] IRENA: International Renewable Energy Agency,
RENEWABLE ENERGY TECHNOLOGIES: COST
ANALYSIS SERIES. Volume 1: Power Sector; January
2015.
[28] Global Environment Facility: In Depth,
http://www.thegef.org/gef/