Embed Size (px)
Citation preview
Wave drag on floating bodiesMarie Le Merrera,b,1, Christophe Claneta,b, David Quéréa,b, Élie Raphaëlc, and Frédéric Chevyd
aLadhyx, Unité Mixte de Recherche 7646, Centre National de la Recherche Scientifique-École Polytechnique, 91120 Palaiseau, France; bPhysique etMécanique des Milieux Hétérogènes, Unité Mixte de Recherche 7636, Centre National de la Recherche Scientifique-Paris 6-Paris 7-École Supérieure dePhysique et de Chimie Industrielles, 75005 Paris, France; cLaboratoire Physico-Chimie Théorique, Gulliver, Unité Mixte de Recherche 7083, Centre Nationalde la Recherche Scientifique-École Supérieure de Physique et de Chimie Industrielles, 10 rue Vauquelin, 75005 Paris, France; and dLaboratoire KastlerBrossel, Ecole Normale Supérieure, Centre National de la Recherche Scientifique, Université Pierre et Marie Curie, 24 rue Lhomond, 75005 Paris, France
Edited by Jerry P. Gollub, Haverford College, Haverford, PA, and approved July 20, 2011 (received for review May 3, 2011)
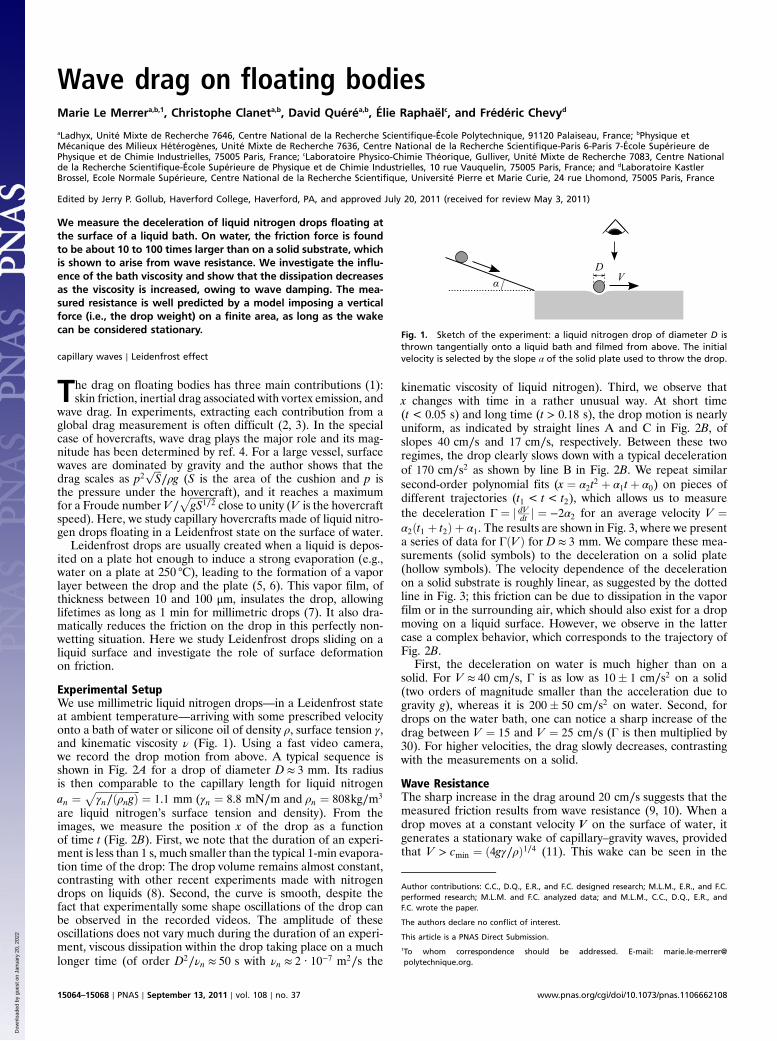
We measure the deceleration of liquid nitrogen drops floating atthe surface of a liquid bath. On water, the friction force is foundto be about 10 to 100 times larger than on a solid substrate, whichis shown to arise from wave resistance. We investigate the influ-ence of the bath viscosity and show that the dissipation decreasesas the viscosity is increased, owing to wave damping. The mea-sured resistance is well predicted by a model imposing a verticalforce (i.e., the drop weight) on a finite area, as long as the wakecan be considered stationary.
capillary waves ∣ Leidenfrost effect
The drag on floating bodies has three main contributions (1):skin friction, inertial drag associated with vortex emission, and
wave drag. In experiments, extracting each contribution from aglobal drag measurement is often difficult (2, 3). In the specialcase of hovercrafts, wave drag plays the major role and its mag-nitude has been determined by ref. 4. For a large vessel, surfacewaves are dominated by gravity and the author shows that thedrag scales as p2
ffiffiffiS
p∕ρg (S is the area of the cushion and p is
the pressure under the hovercraft), and it reaches a maximumfor a Froude number V∕
ffiffiffiffiffiffiffiffiffiffiffigS1∕2
pclose to unity (V is the hovercraft
speed). Here, we study capillary hovercrafts made of liquid nitro-gen drops floating in a Leidenfrost state on the surface of water.
Leidenfrost drops are usually created when a liquid is depos-ited on a plate hot enough to induce a strong evaporation (e.g.,water on a plate at 250 °C), leading to the formation of a vaporlayer between the drop and the plate (5, 6). This vapor film, ofthickness between 10 and 100 μm, insulates the drop, allowinglifetimes as long as 1 min for millimetric drops (7). It also dra-matically reduces the friction on the drop in this perfectly non-wetting situation. Here we study Leidenfrost drops sliding on aliquid surface and investigate the role of surface deformationon friction.
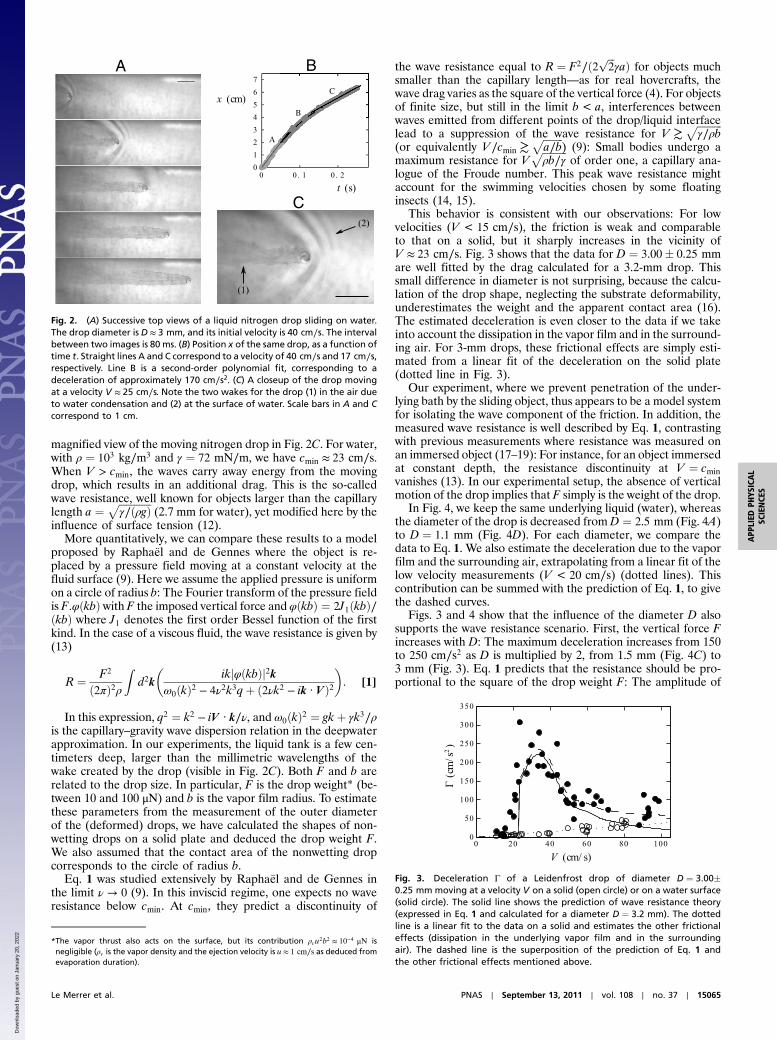
Experimental SetupWe use millimetric liquid nitrogen drops—in a Leidenfrost stateat ambient temperature—arriving with some prescribed velocityonto a bath of water or silicone oil of density ρ, surface tension γ,and kinematic viscosity ν (Fig. 1). Using a fast video camera,we record the drop motion from above. A typical sequence isshown in Fig. 2A for a drop of diameter D ≈ 3 mm. Its radiusis then comparable to the capillary length for liquid nitrogenan ¼ ffiffiffiffiffiffiffiffiffiffiffiffiffiffiffiffiffiffi
γn∕ðρngÞp ¼ 1.1 mm (γn ¼ 8.8 mN∕m and ρn ¼ 808kg∕m3
are liquid nitrogen’s surface tension and density). From theimages, we measure the position x of the drop as a functionof time t (Fig. 2B). First, we note that the duration of an experi-ment is less than 1 s, much smaller than the typical 1-min evapora-tion time of the drop: The drop volume remains almost constant,contrasting with other recent experiments made with nitrogendrops on liquids (8). Second, the curve is smooth, despite thefact that experimentally some shape oscillations of the drop canbe observed in the recorded videos. The amplitude of theseoscillations does not vary much during the duration of an experi-ment, viscous dissipation within the drop taking place on a muchlonger time (of order D2∕νn ≈ 50 s with νn ≈ 2 · 10−7 m2∕s the
kinematic viscosity of liquid nitrogen). Third, we observe thatx changes with time in a rather unusual way. At short time(t < 0.05 s) and long time (t > 0.18 s), the drop motion is nearlyuniform, as indicated by straight lines A and C in Fig. 2B, ofslopes 40 cm∕s and 17 cm∕s, respectively. Between these tworegimes, the drop clearly slows down with a typical decelerationof 170 cm∕s2 as shown by line B in Fig. 2B. We repeat similarsecond-order polynomial fits (x ¼ α2t2 þ α1tþ α0) on pieces ofdifferent trajectories (t1 < t < t2), which allows us to measurethe deceleration Γ ¼ j dVdt j ¼ −2α2 for an average velocity V ¼α2ðt1 þ t2Þ þ α1. The results are shown in Fig. 3, where we presenta series of data for ΓðV Þ for D ≈ 3 mm. We compare these mea-surements (solid symbols) to the deceleration on a solid plate(hollow symbols). The velocity dependence of the decelerationon a solid substrate is roughly linear, as suggested by the dottedline in Fig. 3; this friction can be due to dissipation in the vaporfilm or in the surrounding air, which should also exist for a dropmoving on a liquid surface. However, we observe in the lattercase a complex behavior, which corresponds to the trajectory ofFig. 2B.
First, the deceleration on water is much higher than on asolid. For V ≈ 40 cm∕s, Γ is as low as 10� 1 cm∕s2 on a solid(two orders of magnitude smaller than the acceleration due togravity g), whereas it is 200� 50 cm∕s2 on water. Second, fordrops on the water bath, one can notice a sharp increase of thedrag between V ¼ 15 and V ¼ 25 cm∕s (Γ is then multiplied by30). For higher velocities, the drag slowly decreases, contrastingwith the measurements on a solid.
Wave ResistanceThe sharp increase in the drag around 20 cm∕s suggests that themeasured friction results from wave resistance (9, 10). When adrop moves at a constant velocity V on the surface of water, itgenerates a stationary wake of capillary–gravity waves, providedthat V > cmin ¼ ð4gγ∕ρÞ1∕4 (11). This wake can be seen in the
Fig. 1. Sketch of the experiment: a liquid nitrogen drop of diameter D isthrown tangentially onto a liquid bath and filmed from above. The initialvelocity is selected by the slope α of the solid plate used to throw the drop.
Author contributions: C.C., D.Q., E.R., and F.C. designed research; M.L.M., E.R., and F.C.performed research; M.L.M. and F.C. analyzed data; and M.L.M., C.C., D.Q., E.R., andF.C. wrote the paper.
The authors declare no conflict of interest.
This article is a PNAS Direct Submission.1To whom correspondence should be addressed. E-mail: [email protected].
15064–15068 ∣ PNAS ∣ September 13, 2011 ∣ vol. 108 ∣ no. 37 www.pnas.org/cgi/doi/10.1073/pnas.1106662108
Dow
nloa
ded
by g
uest
on
Janu
ary
20, 2
022
magnified view of the moving nitrogen drop in Fig. 2C. For water,with ρ ¼ 103 kg∕m3 and γ ¼ 72 mN∕m, we have cmin ≈ 23 cm∕s.When V > cmin, the waves carry away energy from the movingdrop, which results in an additional drag. This is the so-calledwave resistance, well known for objects larger than the capillarylength a ¼ ffiffiffiffiffiffiffiffiffiffiffiffiffi
γ∕ðρgÞp(2.7 mm for water), yet modified here by the
influence of surface tension (12).More quantitatively, we can compare these results to a model
proposed by Raphaël and de Gennes where the object is re-placed by a pressure field moving at a constant velocity at thefluid surface (9). Here we assume the applied pressure is uniformon a circle of radius b: The Fourier transform of the pressure fieldis F:φðkbÞ with F the imposed vertical force and φðkbÞ ¼ 2J1ðkbÞ∕ðkbÞ where J1 denotes the first order Bessel function of the firstkind. In the case of a viscous fluid, the wave resistance is given by(13)
R ¼ F2
ð2πÞ2ρZ
d2k�
ikjφðkbÞj2kω0ðkÞ2 − 4ν2k3qþ ð2νk2 − ik · V Þ2
�: [1]
In this expression, q2 ¼ k2 − iV · k∕ν, and ω0ðkÞ2 ¼ gkþ γk3∕ρis the capillary–gravity wave dispersion relation in the deepwaterapproximation. In our experiments, the liquid tank is a few cen-timeters deep, larger than the millimetric wavelengths of thewake created by the drop (visible in Fig. 2C). Both F and b arerelated to the drop size. In particular, F is the drop weight* (be-tween 10 and 100 μN) and b is the vapor film radius. To estimatethese parameters from the measurement of the outer diameterof the (deformed) drops, we have calculated the shapes of non-wetting drops on a solid plate and deduced the drop weight F.We also assumed that the contact area of the nonwetting dropcorresponds to the circle of radius b.
Eq. 1 was studied extensively by Raphaël and de Gennes inthe limit ν → 0 (9). In this inviscid regime, one expects no waveresistance below cmin. At cmin, they predict a discontinuity of
the wave resistance equal to R ¼ F2∕ð2 ffiffiffi2
pγaÞ for objects much
smaller than the capillary length—as for real hovercrafts, thewave drag varies as the square of the vertical force (4). For objectsof finite size, but still in the limit b < a, interferences betweenwaves emitted from different points of the drop/liquid interfacelead to a suppression of the wave resistance for V ≳
ffiffiffiffiffiffiffiffiffiffiγ∕ρb
p(or equivalently V∕cmin ≳
ffiffiffiffiffiffiffiffia∕b
p) (9): Small bodies undergo a
maximum resistance for Vffiffiffiffiffiffiffiffiffiffiρb∕γ
pof order one, a capillary ana-
logue of the Froude number. This peak wave resistance mightaccount for the swimming velocities chosen by some floatinginsects (14, 15).
This behavior is consistent with our observations: For lowvelocities (V < 15 cm∕s), the friction is weak and comparableto that on a solid, but it sharply increases in the vicinity ofV ≈ 23 cm∕s. Fig. 3 shows that the data for D ¼ 3.00� 0.25 mmare well fitted by the drag calculated for a 3.2-mm drop. Thissmall difference in diameter is not surprising, because the calcu-lation of the drop shape, neglecting the substrate deformability,underestimates the weight and the apparent contact area (16).The estimated deceleration is even closer to the data if we takeinto account the dissipation in the vapor film and in the surround-ing air. For 3-mm drops, these frictional effects are simply esti-mated from a linear fit of the deceleration on the solid plate(dotted line in Fig. 3).
Our experiment, where we prevent penetration of the under-lying bath by the sliding object, thus appears to be a model systemfor isolating the wave component of the friction. In addition, themeasured wave resistance is well described by Eq. 1, contrastingwith previous measurements where resistance was measured onan immersed object (17–19): For instance, for an object immersedat constant depth, the resistance discontinuity at V ¼ cminvanishes (13). In our experimental setup, the absence of verticalmotion of the drop implies that F simply is the weight of the drop.
In Fig. 4, we keep the same underlying liquid (water), whereasthe diameter of the drop is decreased fromD ¼ 2.5 mm (Fig. 4A)to D ¼ 1.1 mm (Fig. 4D). For each diameter, we compare thedata to Eq. 1. We also estimate the deceleration due to the vaporfilm and the surrounding air, extrapolating from a linear fit of thelow velocity measurements (V < 20 cm∕s) (dotted lines). Thiscontribution can be summed with the prediction of Eq. 1, to givethe dashed curves.
Figs. 3 and 4 show that the influence of the diameter D alsosupports the wave resistance scenario. First, the vertical force Fincreases with D: The maximum deceleration increases from 150to 250 cm∕s2 as D is multiplied by 2, from 1.5 mm (Fig. 4C) to3 mm (Fig. 3). Eq. 1 predicts that the resistance should be pro-portional to the square of the drop weight F: The amplitude of
A B
C
Fig. 2. (A) Successive top views of a liquid nitrogen drop sliding on water.The drop diameter is D ≈ 3 mm, and its initial velocity is 40 cm∕s. The intervalbetween two images is 80 ms. (B) Position x of the same drop, as a function oftime t. Straight lines A and C correspond to a velocity of 40 cm∕s and 17 cm∕s,respectively. Line B is a second-order polynomial fit, corresponding to adeceleration of approximately 170 cm∕s2. (C) A closeup of the drop movingat a velocity V ≈ 25 cm∕s. Note the two wakes for the drop (1) in the air dueto water condensation and (2) at the surface of water. Scale bars in A and Ccorrespond to 1 cm.
Fig. 3. Deceleration Γ of a Leidenfrost drop of diameter D ¼ 3.00�0.25 mm moving at a velocity V on a solid (open circle) or on a water surface(solid circle). The solid line shows the prediction of wave resistance theory(expressed in Eq. 1 and calculated for a diameter D ¼ 3.2 mm). The dottedline is a linear fit to the data on a solid and estimates the other frictionaleffects (dissipation in the underlying vapor film and in the surroundingair). The dashed line is the superposition of the prediction of Eq. 1 andthe other frictional effects mentioned above.
*The vapor thrust also acts on the surface, but its contribution ρvu2b2 ≈ 10−4 μN isnegligible (ρv is the vapor density and the ejection velocity is u ≈ 1 cm∕s as deduced fromevaporation duration).
Le Merrer et al. PNAS ∣ September 13, 2011 ∣ vol. 108 ∣ no. 37 ∣ 15065
APP
LIED
PHYS
ICAL
SCIENCE
S
Dow
nloa
ded
by g
uest
on
Janu
ary
20, 2
022
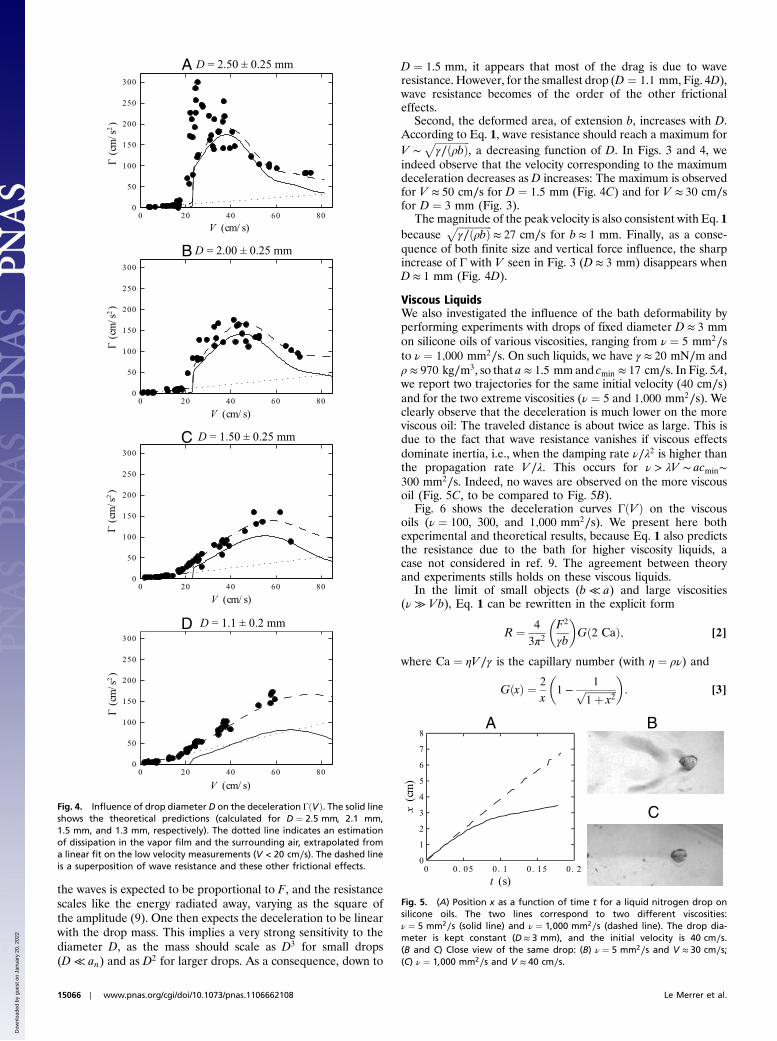
the waves is expected to be proportional to F, and the resistancescales like the energy radiated away, varying as the square ofthe amplitude (9). One then expects the deceleration to be linearwith the drop mass. This implies a very strong sensitivity to thediameter D, as the mass should scale as D3 for small drops(D ≪ an) and as D2 for larger drops. As a consequence, down to
D ¼ 1.5 mm, it appears that most of the drag is due to waveresistance. However, for the smallest drop (D ¼ 1.1 mm, Fig. 4D),wave resistance becomes of the order of the other frictionaleffects.
Second, the deformed area, of extension b, increases with D.According to Eq. 1, wave resistance should reach a maximum forV ∼
ffiffiffiffiffiffiffiffiffiffiffiffiffiffiγ∕ðρbÞp
, a decreasing function of D. In Figs. 3 and 4, weindeed observe that the velocity corresponding to the maximumdeceleration decreases as D increases: The maximum is observedfor V ≈ 50 cm∕s for D ¼ 1.5 mm (Fig. 4C) and for V ≈ 30 cm∕sfor D ¼ 3 mm (Fig. 3).
The magnitude of the peak velocity is also consistent with Eq. 1because
ffiffiffiffiffiffiffiffiffiffiffiffiffiffiγ∕ðρbÞp
≈ 27 cm∕s for b ≈ 1 mm. Finally, as a conse-quence of both finite size and vertical force influence, the sharpincrease of Γ with V seen in Fig. 3 (D ≈ 3 mm) disappears whenD ≈ 1 mm (Fig. 4D).
Viscous LiquidsWe also investigated the influence of the bath deformability byperforming experiments with drops of fixed diameter D ≈ 3 mmon silicone oils of various viscosities, ranging from ν ¼ 5 mm2∕sto ν ¼ 1;000 mm2∕s. On such liquids, we have γ ≈ 20 mN∕m andρ ≈ 970 kg∕m3, so that a ≈ 1.5 mmand cmin ≈ 17 cm∕s. In Fig. 5A,we report two trajectories for the same initial velocity (40 cm∕s)and for the two extreme viscosities (ν ¼ 5 and 1;000 mm2∕s). Weclearly observe that the deceleration is much lower on the moreviscous oil: The traveled distance is about twice as large. This isdue to the fact that wave resistance vanishes if viscous effectsdominate inertia, i.e., when the damping rate ν∕λ2 is higher thanthe propagation rate V∕λ. This occurs for ν > λV ∼ acmin∼300 mm2∕s. Indeed, no waves are observed on the more viscousoil (Fig. 5C, to be compared to Fig. 5B).
Fig. 6 shows the deceleration curves ΓðV Þ on the viscousoils (ν ¼ 100, 300, and 1;000 mm2∕s). We present here bothexperimental and theoretical results, because Eq. 1 also predictsthe resistance due to the bath for higher viscosity liquids, acase not considered in ref. 9. The agreement between theoryand experiments stills holds on these viscous liquids.
In the limit of small objects (b ≪ a) and large viscosities(ν ≫ Vb), Eq. 1 can be rewritten in the explicit form
R ¼ 4
3π2
�F2
γb
�Gð2 CaÞ; [2]
where Ca ¼ ηV∕γ is the capillary number (with η ¼ ρν) and
GðxÞ ¼ 2
x
�1 −
1ffiffiffiffiffiffiffiffiffiffiffiffiffi1þ x2
p�: [3]
A
B
C
D
Fig. 4. Influence of drop diameter D on the deceleration ΓðVÞ. The solid lineshows the theoretical predictions (calculated for D ¼ 2.5 mm, 2.1 mm,1.5 mm, and 1.3 mm, respectively). The dotted line indicates an estimationof dissipation in the vapor film and the surrounding air, extrapolated froma linear fit on the low velocity measurements (V < 20 cm∕s). The dashed lineis a superposition of wave resistance and these other frictional effects.
A B
C
Fig. 5. (A) Position x as a function of time t for a liquid nitrogen drop onsilicone oils. The two lines correspond to two different viscosities:ν ¼ 5 mm2∕s (solid line) and ν ¼ 1;000 mm2∕s (dashed line). The drop dia-meter is kept constant (D ≈ 3 mm), and the initial velocity is 40 cm∕s.(B and C) Close view of the same drop: (B) ν ¼ 5 mm2∕s and V ≈ 30 cm∕s;(C) ν ¼ 1;000 mm2∕s and V ≈ 40 cm∕s.
15066 ∣ www.pnas.org/cgi/doi/10.1073/pnas.1106662108 Le Merrer et al.
Dow
nloa
ded
by g
uest
on
Janu
ary
20, 2
022
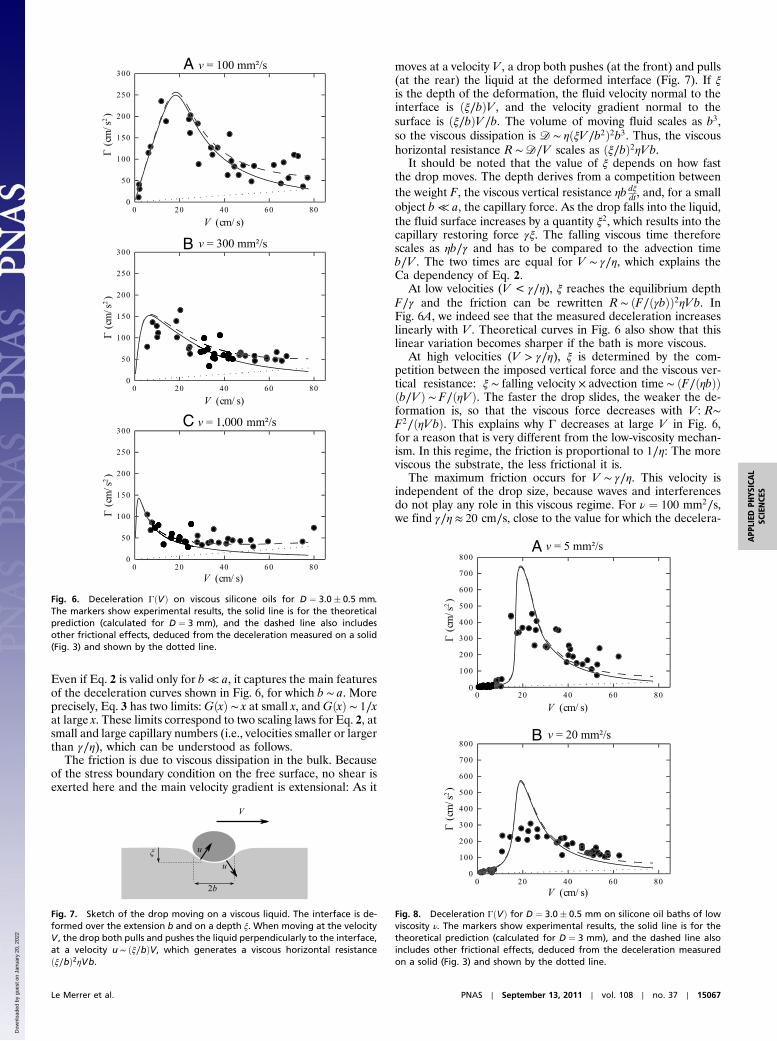
Even if Eq. 2 is valid only for b ≪ a, it captures the main featuresof the deceleration curves shown in Fig. 6, for which b ∼ a. Moreprecisely, Eq. 3 has two limits:GðxÞ ∼ x at small x, andGðxÞ ∼ 1∕xat large x. These limits correspond to two scaling laws for Eq. 2, atsmall and large capillary numbers (i.e., velocities smaller or largerthan γ∕η), which can be understood as follows.
The friction is due to viscous dissipation in the bulk. Becauseof the stress boundary condition on the free surface, no shear isexerted here and the main velocity gradient is extensional: As it
moves at a velocity V , a drop both pushes (at the front) and pulls(at the rear) the liquid at the deformed interface (Fig. 7). If ξis the depth of the deformation, the fluid velocity normal to theinterface is ðξ∕bÞV , and the velocity gradient normal to thesurface is ðξ∕bÞV∕b. The volume of moving fluid scales as b3,so the viscous dissipation is D ∼ ηðξV∕b2Þ2b3. Thus, the viscoushorizontal resistance R ∼D∕V scales as ðξ∕bÞ2ηVb.
It should be noted that the value of ξ depends on how fastthe drop moves. The depth derives from a competition betweenthe weight F, the viscous vertical resistance ηb dξ
dt, and, for a smallobject b ≪ a, the capillary force. As the drop falls into the liquid,the fluid surface increases by a quantity ξ2, which results into thecapillary restoring force γξ. The falling viscous time thereforescales as ηb∕γ and has to be compared to the advection timeb∕V . The two times are equal for V ∼ γ∕η, which explains theCa dependency of Eq. 2.
At low velocities (V < γ∕η), ξ reaches the equilibrium depthF∕γ and the friction can be rewritten R ∼ ðF∕ðγbÞÞ2ηVb. InFig. 6A, we indeed see that the measured deceleration increaseslinearly with V . Theoretical curves in Fig. 6 also show that thislinear variation becomes sharper if the bath is more viscous.
At high velocities (V > γ∕η), ξ is determined by the com-petition between the imposed vertical force and the viscous ver-tical resistance: ξ ∼ falling velocity × advection time ∼ ðF∕ðηbÞÞðb∕V Þ ∼ F∕ðηV Þ. The faster the drop slides, the weaker the de-formation is, so that the viscous force decreases with V : R∼F2∕ðηVbÞ. This explains why Γ decreases at large V in Fig. 6,for a reason that is very different from the low-viscosity mechan-ism. In this regime, the friction is proportional to 1∕η: The moreviscous the substrate, the less frictional it is.
The maximum friction occurs for V ∼ γ∕η. This velocity isindependent of the drop size, because waves and interferencesdo not play any role in this viscous regime. For ν ¼ 100 mm2∕s,we find γ∕η ≈ 20 cm∕s, close to the value for which the decelera-
A
B
C
Fig. 6. Deceleration ΓðVÞ on viscous silicone oils for D ¼ 3.0� 0.5 mm.The markers show experimental results, the solid line is for the theoreticalprediction (calculated for D ¼ 3 mm), and the dashed line also includesother frictional effects, deduced from the deceleration measured on a solid(Fig. 3) and shown by the dotted line.
Fig. 7. Sketch of the drop moving on a viscous liquid. The interface is de-formed over the extension b and on a depth ξ. When moving at the velocityV , the drop both pulls and pushes the liquid perpendicularly to the interface,at a velocity u ∼ ðξ∕bÞV, which generates a viscous horizontal resistanceðξ∕bÞ2ηVb.
A
B
Fig. 8. Deceleration ΓðVÞ for D ¼ 3.0� 0.5 mm on silicone oil baths of lowviscosity ν. The markers show experimental results, the solid line is for thetheoretical prediction (calculated for D ¼ 3 mm), and the dashed line alsoincludes other frictional effects, deduced from the deceleration measuredon a solid (Fig. 3) and shown by the dotted line.
Le Merrer et al. PNAS ∣ September 13, 2011 ∣ vol. 108 ∣ no. 37 ∣ 15067
APP
LIED
PHYS
ICAL
SCIENCE
S
Dow
nloa
ded
by g
uest
on
Janu
ary
20, 2
022
tion is maximum in Fig. 6A. We also expect the maximum force,scaling as F2∕ðγbÞ, to be independent of the viscosity η. The the-oretical curves of Fig. 6, corresponding to increasing bath viscos-ities, show that the maximum Γ occurs for a decreasing velocity Vbut tends to a constant value of the order of 150 cm∕s2.
In Fig. 8, we show both experimental and theoretical resultsfor drops sliding on the two least viscous oils, ν ¼ 5 and20 mm2∕s. In this case, we observe a discrepancy between thedata and the model. The predicted deceleration is higher thanobserved, which we understand as follows: The surface tensionof silicone oil is about three times lower than the tension of water.Therefore, the expected wave resistance, scaling as F2 ffiffiffiffiffi
ρgp ∕γ3∕2 at
V ¼ cmin (9), is higher on oil than on water. If the decelerationdue to waves becomes large, the calculation assuming a steadywake does not hold. Transient effects should be taken into ac-count when the deceleration rate is higher than the propagationrate Γ∕V > V∕λ, that is, when Γ > V 2∕λ ∼ c2min∕a ∼ g. This mightexplain the disagreement between the prediction and experi-ments when Γ becomes larger than 300 cm∕s2 ∼ g∕3.
ConclusionWe showed that small levitating objects moving on a liquid aremainly decelerated by the production of waves along the directionof motion. This model system allowed us to specify a few unusualproperties of this special friction: (i) negligible resistance below acritical velocity (of order 20 cm∕s); (ii) sharp increase (quasidis-continuity) of the resistance above this velocity; (iii) decrease ofthe friction with V at large velocity; (iv) decrease of the friction asthe bath is made more viscous, a consequence of wave damping.However, the low velocity regime remains to be understood, in-cluding the interaction among the vapor layer, the surroundingair, and the drop movement. In addition, the wake created bythe moving drop could be characterized, using recently developedtools for measuring liquid surface deformations (20, 21). Thetheoretical description of wave resistance might also be im-proved, by a more precise description of the deformation ofthe drop/liquid interface (16), and by taking into account transi-ent effects (22) in this decelerated motion.
ACKNOWLEDGMENTS. The authors thank A. Grier for a careful reading of themanuscript. F.C. acknowledges support from Institut Universitaire de France.
1. Faltinsen OM (2005) Hydrodynamics of High-Speed Marine Vehicles (Cambridge UnivPress, Cambridge, UK).
2. Chapman RB (1972) Hydrodynamic design of semisubmerged ships. J Basic Eng ASME94:874–884.
3. Suter R, Rosenberg O, Loeb S, Long H (1997) Locomotion on the water surface:propulsive mechanisms of the fisher spider. J Exp Biol 200:2523–2538.
4. Barratt MJ (1965) The wave drag of a Hovercraft. J Fluid Mech 22:39–47.5. Leidenfrost JG (1756) De Aquae Communis Nonnullis Qualitatibus Tractatus [A Tract
About Some Qualities of Common Water]. Duisburg, in Latin.6. Gottfried BS, Lee CJ, Bell KJ (1966) The Leidenfrost phenomenon: Film boiling of liquid
droplets on a flat plate. Int J Heat Mass Transfer 9:1167–1187.7. Biance A-L, Clanet C, Quéré D (2003) Leidenfrost drops. Phys Fluids 15:1632–1637.8. Snezhko A, Ben Jacob E, Aranson IS (2008) Pulsating–gliding transition in the dynamics
of levitating liquid nitrogen droplets. New J Phys 10:043034.9. Raphaël E, de Gennes P-G (1996) Capillary gravity waves caused by a moving
disturbance: Wave resistance. Phys Rev E Stat Nonlin Soft Matter Phys 53:3448–3455.10. Sun S-M, Keller JB (2001) Capillary-gravity wave drag. Phys Fluids 13:2146–2151.11. Thomson W (1871) Ripples and waves. Nature 5:1–3.12. Lighthill MJ (1978) Waves in Fluids (Cambridge Univ Press, Cambridge, UK).13. Chevy F, Raphaël E (2003) Capillary gravity waves: A “fixed-depth” analysis. Europhys
Lett 61:796.
14. Bush JWM, Hu DL (2006) Walking on water: Biolocomotion at the interface. Annu Rev
Fluid Mech 38:339–369.
15. Voise J, Casas J (2010) The management of fluid and wave resistances by whirligig
beetles. J R Soc Interface 7:343–352.
16. Princen HM,Mason SG (1965) Shape of a fluid drop at a fluid-liquid interface II. Theory
for three-phase systems. J Colloid Sci 20:246–266.
17. Browaeys J, Bacri J-C, Perzynski R, Shliomis MI (2001) Capillary-gravity wave resistance
in ordinary and magnetic fluids. Europhys Lett 53:209–215.
18. Burghelea T, Steinberg V (2001) Onset of wave drag due to generation of
capillary-gravity waves by a moving object as a critical phenomenon. Phys Rev Lett
86:2557–2560.
19. Burghelea T, Steinberg V (2002) Wave drag due to generation of capillary-gravity
surface waves. Phys Rev E Stat Nonlin Soft Matter Phys 66:051204.
20. Moisy F, RabaudM, Salsac K (2010) A synthetic Schlieren method for the measurement
of the topography of a liquid interface. Exp Fluids 46:1021–1036.
21. Cobelli PJ, Maurel A, Pagneux V, Petitjeans P (2010) Global measurement of water
waves by Fourier transform profilometry. Exp Fluids 46:1037–1047.
22. Closa F, Chepelianskii A, Raphaël E (2010) Capillary-gravity waves generated by a
sudden object motion. Phys Fluids 22:052107.
15068 ∣ www.pnas.org/cgi/doi/10.1073/pnas.1106662108 Le Merrer et al.
Dow
nloa
ded
by g
uest
on
Janu
ary
20, 2
022