UNIVERSITÉ DE MONTRÉAL
CADRE DE PLANIFICATION INTÉGRÉE DE LA CHAÎNE LOGISTIQUE
POUR LA GESTION ET L’ÉVALUATION DE STRATÉGIES DE
BIORAFFINAGE FORESTIER
LOUIS PATRICK DANSEREAU
DÉPARTEMENT DE GÉNIE CHIMIQUE
ÉCOLE POLYTECHNIQUE DE MONTRÉAL
THÈSE PRÉSENTÉE EN VUE DE L’OBTENTION
DU DIPLÔME DE PHILOSOPHIAE DOCTOR
(GÉNIE CHIMIQUE)
JUILLET 2013
© Louis Patrick Dansereau, 2013.
UNIVERSITÉ DE MONTRÉAL
ÉCOLE POLYTECHNIQUE DE MONTRÉAL
Cette thèse intitulée:
CADRE DE PLANIFICATION INTÉGRÉE DE LA CHAÎNE LOGISTIQUE POUR LA
GESTION ET L’ÉVALUATION DE STRATÉGIES DE BIORAFFINAGE FORESTIER
présentée par : DANSEREAU Louis Patrick
en vue de l’obtention du diplôme de : Philosophiae Doctor
a été dûment acceptée par le jury d’examen constitué de :
M. PERRIER Michel, Ph.D., président
M. STUART Paul, Ph. D., membre et directeur de recherche
M. EL-HALWAGI Mahmoud, Ph. D., membre et codirecteur de recherche
M. TAVARES Jason-Robert, Ph.D., membre
M. OUHIMMOU Mustapha, Ph.D., membre

iii
DÉDICACE
À ceux que j’aime,
iv
REMERCIEMENTS
« Les neuf dixièmes de l'éducation reposent sur l'encouragement. »
- Anatole France, (1844-1924)
Réaliser un doctorat est avant tout une expérience qui permet d’en apprendre plus sur soi et qui
nous pousse à nous dépasser. Je tiens sincèrement à remercier tous les gens qui m’ont aidé à
passer à travers cette folle aventure, et qui m’ont permis de devenir ce que je suis maintenant.
D’abord, merci à Paul, mon directeur de recherche. Je n’aurais jamais entrepris d’études
supérieures si vous ne m’aviez pas proposé un sujet aussi appliqué, passionnant et stimulant. Ce
fut réellement un plaisir de pouvoir discuter et apprendre sur toute sorte de sujets, autant
académiques, personnels que professionnels. Merci vraiment pour tous vos conseils prodigués et
opportunités partagées au fil des dernières années.
Thanks to Mahmoud, my co-advisor, for all your support and guidance during the early and final
stages of my project. You have been really helpful, especially during critical times.
Merci à Balázs et Paul. Vous avez été des partenaires industriels parfaits. J’ai franchement
beaucoup appris durant ce projet. Merci pour votre temps, votre confiance, votre amitié et vos
commentaires. Sans votre participation, ce projet n’aurait jamais pu être ce qu’il est.
Merci au CRSNG, au FQRNT et au VCO, pour votre soutien financier.
Thanks to my supply-chain buddies José and Behrang, for spicing up the time spent at the office,
for fooling around and for discussing more seriously about about biomass, planning and the
biorefinery. It has been truly a pleasure to do this project at your side.
Merci à Jean-Christophe. Si un doctorat possède d’abord un objectif d’éducation scientifique, tu
as certainement contribué à mon développement spirituel avec toutes nos longues et
passionnantes discussions sur vraiment n’importe quel sujet.
Merci à Jérémie, Jawad et Pierre-Olivier, mes amis français et partenaires de squash, pour avoir
aiguisé mes réflexes à courir après une balle et pour m’avoir gardé en santé. Je crois bien que
mon doctorat n’aurait pu être complet sans toutes ces conversations eues sur le terrain.
v
Merci à Agnès et aux autres étudiants de la Chaire, particulièrement Virginie, Milan, Hakim,
Eemeli et Martin. J’ai eu de la chance de partager tous ces bons et moins bons moments avec
vous.
Merci à mes amis musiciens, Charles-Étienne, Julien et Olivier, pour votre amitié et votre
complicité, et aussi pour tous ces moments d’escapade qui contribuent encore à me garder sain
d’esprit. Nietzsche a dit « Sans la musique, la vie serait une erreur ». Je ne saurais mieux dire.
Merci à ma famille, ma mère Claire, mes frères et sœurs Catherine, Luc, Pierre-Yves et
Véronique, mes beaux-frères et belles-sœurs, ma belle-mère Danielle ainsi que mes autres amis.
Vous avez toujours cru en moi et m’avez réellement épaulé durant toutes ces années. Vraiment, je
ne pourrais pas rêver d’un meilleur entourage.
Merci à mon fils Félix, pour avoir été si sage et si gentil durant tes premiers mois, et ainsi
m’avoir permis de terminer cette étape de ma vie.
Finalement, merci à Amélie, ma femme, mon amie, ma complice de tous les jours. Je ne trouverai
jamais les bons mots pour te remercier autant que je le voudrais. Merci pour ton amour, ta
patience et ton support inconditionnel. Je t’aime!
vi
RÉSUMÉ
Le bioraffinage est maintenant reconnu comme une solution prometteuse pour la transformation
de l’industrie forestière. Ce concept offre l’opportunité aux entreprises forestières de diversifier
leurs revenus par la production de nouveaux bioproduits à valeur ajoutée. La transition vers le
bioraffinage implique toutefois plusieurs changements stratégiques importants, notamment dans
le modèle d’affaires des entreprises. En effet, celles-ci devront à la fois se questionner sur la
pertinence de rester ou non dans le domaine plus traditionnel des pâtes et papiers, faire la
sélection d’un portefeuille de procédés et produits de bioraffinage, pénétrer de nouveaux
marchés, et effectuer une gestion de la production permettant de minimiser le risque de volatilité
du marché.
Au cours des dernières années, les principes de gestion de la chaîne logistique ont été au cœur des
recherches du milieu universitaire et de l’industrie afin d’accroître la rentabilité de l’ensemble des
opérations. L’application des concepts de gestion de la chaîne logistique pourrait donc
grandement aider les entreprises forestières à être plus compétitives globalement.
Dans cette optique, l’objectif principal de cette thèse était de concevoir une approche
systématique pour la gestion et l’évaluation de stratégies de bioraffinage intégrées à une usine
forestière. À cet effet, une approche de gestion de la chaîne logistique dite axée sur les marges de
profit a été développée. Celle-ci intègre des concepts inspirés de la gestion des recettes, de la
flexibilité manufacturière et de la comptabilité par activité. Les concepts sont incorporés dans un
modèle de planification tactique dont l’objectif est de maximiser la rentabilité de l’entreprise.
La structure du modèle mathématique et du modèle de coût associé permettent de représenter le
plus fidèlement possible les activités de l’entreprise, de l’approvisionnement, jusqu’aux ventes. Il
est ainsi possible de modéliser les différentes configurations de procédés présentes dans une usine
et menant à la flexibilité manufacturière. Le modèle peut alors être utilisé comme plateforme
pour évaluer différentes stratégies d’opération de l’entreprise, aux niveaux de la production et de
la chaîne logistique.
vii
L’approche axée sur les marges de profit a été illustrée par l’étude du cas d’une usine de
production de papier journal envisageant l’implantation d’un procédé de fractionnement de la
biomasse pour fabriquer différents bioproduits. Diverses analyses tactiques et stratégiques ont été
effectuées pour montrer la pertinence de l’approche comme outil d’aide à la prise de décision
pour des problèmes de gestion propres au bioraffinage forestier.
Le modèle a été utilisé pour évaluer la rentabilité d’une entreprise lors de sa transformation vers
le bioraffinage, en considérant simultanément l’investissement dans de nouveaux procédés de
bioraffinage et la fermeture d’actifs papetiers. En offrant une meilleure visualisation et une
meilleure compréhension de la dynamique des coûts et de la chaîne logistique sous divers
scénarios, l’outil permet d’éclairer le processus de prise de décision. Couplé à une analyse de
scénarios, il offre aussi la possibilité de développer une stratégie d’implantation par phase qui
stabiliserait les revenus lors de la transformation vers le bioraffinage.
L’outil de planification a aussi été employé pour étudier la gestion de la production du
portefeuille de produits permettant d’atténuer les risques causés par la volatilité du marché. Une
des analyses reliées à la gestion du portefeuille porte sur l’exploitation de la flexibilité au niveau
de la production de pâtes thermomécanique et désencrée afin de minimiser le coût
d’approvisionnement en matières premières selon les conditions du marché. Une autre analyse
étudie l’impact de la flexibilité de l’approvisionnement et de la production d’un procédé de
fractionnement de la biomasse sur les ventes et la rentabilité.
Les résultats de l’étude montrent que les processus d’approvisionnement et de production doivent
être considérablement modifiés selon les conditions de marché pour produire un portefeuille de
produits avec des marges optimales. La dynamique des coûts de production et le nombre
d’interrelations présentes dans une bioraffinerie forestière complexifient l’identification des
meilleures conditions d’opération. Ils corroborent ainsi la pertinence d’utiliser un tel modèle de
planification pour identifier les meilleures opportunités. De plus, les résultats montrent que, dans
un contexte où les ventes peuvent être variées jusqu’à un certain niveau, il peut être souhaitable
de payer davantage pour certains types de biomasse si ces derniers offrent un portefeuille de
produits avec de meilleurs revenus.
viii
ABSTRACT
Biorefining is now recognized as a promising solution to transform the struggling forestry
industry and to generate value-added pathways. The implementation of new products and
processes will help companies to diversify revenues, but implies several strategic changes in the
business model. Companies will face the dilemma of exiting or not traditional pulp and paper
operations, while selecting their biorefinery product and process portfolio. As well, they will
have to enter new markets and manage production to minimize the risk of market volatility.
Over the past decades, both industry and academia paid a lot of attention to supply-chain
management in order to increase the cost effectiveness of overall operations. The application of
supply-chain management concepts could therefore greatly help the transforming North
American forestry industry to compete globally.
The objective of this Ph.D. project was to propose and illustrate an integrated supply-chain
planning framework for the management and the evaluation of forest biorefinery strategies. This
framework, named margins-based, integrates principles from revenue management, activity-
based cost accounting, and manufacturing flexibility in a tactical planning model that maximizes
profit of a company.
The structure of the mathematical model and its associated cost model aims to represent as
closely as possible the activities of a company, from procurement to sales. It enables the
modeling of different process configurations leading to manufacturing flexibility. The model can
thus be used as a platform for evaluating various operating strategies of a company, at both
production and supply-chain levels.
A case study of a newsprint mill implementing a parallel biomass fractionation line producing
several bioproducts was used to illustrate this margins-based approach. Various strategic and
tactical analyses were conducted to show the relevance of the approach as a decision-making tool
for management problems related to the forest biorefinery.
ix
The model was used to evaluate the profitability of a company during its transformation to the
biorefinery, by considering the gradual divestment in pulp and paper activities, while
implementing a new biorefinery process. Results show that the tool can enhance decision-making
activities by providing a better visualization and better comprehension of supply-chain and cost-
related dynamics under different scenarios. Coupled with a scenario analysis, it offers the
opportunity to develop a phased implementation strategy that would stabilize profitability during
the transformation to the biorefinery.
The planning tool was also used to study the management of a product portfolio to mitigate the
risk of market volatility. One analysis focused on the exploitation of thermomechanical and
deinked pulping flexibility in order to minimize the cost of raw material procurement in different
to market conditions. Another analysis examined the impact of feedstock and production
flexibility of a fractionation process on sales and profitability.
Results show that the procurement and production needed to manufacture the product mix that
provides the optimum margins vary significantly. Biorefinery processes can have complex
interrelations that make dynamics and trade-offs between manufacturing options not easy to
identify and understand. Results thus highlight the relevance of using such planning tools to
identify the best opportunities. In a context where sales can be varied to a certain level, results
also show that it may be beneficial to pay more for certain types of biomass if they offer a
product portfolio mix with higher revenues.
x
TABLE DES MATIÈRES
DÉDICACE ................................................................................................................................... III
REMERCIEMENTS ..................................................................................................................... IV
RÉSUMÉ ....................................................................................................................................... VI
ABSTRACT ............................................................................................................................... VIII
TABLE DES MATIÈRES ............................................................................................................. X
LISTE DES TABLEAUX .......................................................................................................... XIV
LISTE DES FIGURES ................................................................................................................ XV
LISTE DES SIGLES ET ABRÉVIATIONS ............................................................................ XVII
LISTE DES ANNEXES .......................................................................................................... XVIII
CHAPITRE 1 INTRODUCTION ................................................................................................ 1
1.1 Mise en contexte et problématique ...................................................................................... 1
1.2 Objectifs .............................................................................................................................. 3
1.3 Plan général de la thèse ....................................................................................................... 4
CHAPITRE 2 REVUE CRITIQUE DE LA LITTÉRATURE ..................................................... 5
2.1 Concepts de gestion de la chaîne logistique ........................................................................ 5
2.1.1 Niveaux décisionnels et intégration ............................................................................. 8
2.1.2 Rôle des technologies de l’information ...................................................................... 10
2.1.3 Modélisation de la chaîne logistique .......................................................................... 11
2.2 Bioraffinage intégré aux opérations forestières ................................................................ 14
2.2.1 Matières premières et approvisionnement .................................................................. 15
2.2.2 Procédés de bioraffinage ............................................................................................ 16
2.2.3 Bioproduits ................................................................................................................. 18
2.2.4 Analyse critique .......................................................................................................... 20
xi
2.3 Planification stratégique dans le cadre du bioraffinage .................................................... 20
2.3.1 Conception du portefeuille de procédés/produits et de la chaîne logistique .............. 20
2.3.2 Intégration dans une usine forestière .......................................................................... 21
2.4 Gestion du risque lié à la volatilité du marché .................................................................. 23
2.4.1 Stratégies de transfert du risque ................................................................................. 25
2.4.2 Stratégies d’acceptation du risque .............................................................................. 26
2.4.3 Analyse critique .......................................................................................................... 29
2.4.4 Configurations de procédés et flexibilité manufacturière .......................................... 30
2.5 Modélisation des coûts d’opération ................................................................................... 32
2.6 Gestion des recettes ........................................................................................................... 34
2.7 Planification tactique et opérationnelle dans l’industrie des procédés .............................. 36
2.7.1 Modèles de planification intégrés .............................................................................. 36
2.7.2 Intégration de la flexibilité manufacturière ................................................................ 37
2.8 Synthèse de la revue de littérature ..................................................................................... 38
2.8.1 Lacunes dans l’ensemble des connaissances .............................................................. 40
2.8.2 Hypothèses ................................................................................................................. 42
CHAPITRE 3 APPROCHE MÉTHODOLOGIQUE ................................................................. 43
CHAPITRE 4 SYNTHÈSE ........................................................................................................ 46
4.1 Présentation des articles .................................................................................................... 46
4.2 Cadre de planification axée sur les marges de profit ........................................................ 50
4.2.1 Approche axée sur les marges de profit ..................................................................... 50
4.2.2 Caractéristiques propres au bioraffinage forestier ..................................................... 52
4.2.3 Définition du problème général d’optimisation ......................................................... 53
4.2.4 Description du modèle mathématique ........................................................................ 55
xii
4.2.5 Modélisation des coûts d’exploitation ........................................................................ 74
4.2.6 Implantation du modèle .............................................................................................. 75
4.2.7 Discussion et conclusion ............................................................................................ 77
4.3 Définition de l’étude de cas ............................................................................................... 78
4.3.1 Description des procédés ............................................................................................ 78
4.3.2 Modélisation par recette ............................................................................................. 80
4.3.3 Données et résultats de l’optimisation ....................................................................... 80
4.4 Application de la planification axée sur les marges de profit à l’industrie forestière ....... 84
4.4.1 Discussion et conclusion ............................................................................................ 88
4.5 Application de la planification axée sur les marges de profit au bioraffinage forestier .... 89
4.5.1 Utilisation de diverses matières premières ................................................................. 90
4.5.2 Flexibilité de l’approvisionnement sous différents scénarios de marché ................... 92
4.5.3 Flexibilité de l’approvisionnement avec variations de prix de biomasse ................... 96
4.5.4 Discussion et conclusion ............................................................................................ 98
4.6 Évaluation de stratégies de modernisation ...................................................................... 100
4.6.1 Coûts de production ................................................................................................. 102
4.6.2 Rentabilité des configurations de modernisation ..................................................... 105
4.6.3 Impact de la volatilité des prix des produits ............................................................. 107
4.6.4 Discussion et conclusion .......................................................................................... 108
CHAPITRE 5 DISCUSSION GÉNÉRALE ............................................................................. 110
5.1 Outil d’aide à la prise de décisions tactiques et stratégiques .......................................... 110
5.1.1 Décisions tactiques ................................................................................................... 110
5.1.2 Décisions stratégiques .............................................................................................. 111
5.1.3 Utilisation de l’outil par le partenaire industriel ...................................................... 112
xiii
5.2 Approche de planification axée sur les marges de profit ................................................ 112
5.3 Évaluation de stratégies de bioraffinage forestier ........................................................... 113
CHAPITRE 6 CONCLUSION................................................................................................. 116
6.1 Contributions à l’ensemble des connaissances ................................................................ 117
6.1.1 Approche de planification axée sur les marges de profit ......................................... 117
6.1.2 Outil d’aide à la prise de décisions tactiques et stratégiques liées à la transformation
d’usines ................................................................................................................................. 118
6.2 Recommandations pour travaux futurs ........................................................................... 120
6.2.1 Planification multi-sites et conception du réseau de la chaîne logistique ................ 120
6.2.2 Intégration de considérations environnementales .................................................... 120
6.2.3 Gestion intégrée et avancée des ventes et de la production ..................................... 121
6.2.4 Planification axée sur les marges de profit en ligne ................................................. 121
LISTE DES RÉFÉRENCES ....................................................................................................... 122
ANNEXES .................................................................................................................................. 138
xiv
LISTE DES TABLEAUX
Tableau 2.1 Configurations conduisant à de la flexibilité manufacturière .................................... 30
Tableau 2.2 Hiérarchie des coûts d'opération (inspiré de [111]).................................................... 33
Tableau 4.1 Liens entre les hypothèses et les articles .................................................................... 49
Tableau 4.2 Informations devant être fournies au modèle ............................................................. 58
Tableau 4.3 Prix de base moyen des produits ................................................................................ 82
Tableau 4.4 Différentes possibilités d’approvisionnement en biomasse testées ............................ 89
Tableau 4.5 Scénarios de marché ................................................................................................... 93
Tableau 4.6 Configurations d’usines ............................................................................................ 102
xv
LISTE DES FIGURES
Figure 2.1 Exemple d’une chaîne logistique (tiré de [17]) .............................................................. 6
Figure 2.2 Matrice de la planification de la chaîne logistique (tiré de [20]) .................................. 10
Figure 2.3 Possibilités de bioraffinage (tiré de [46]) ..................................................................... 15
Figure 2.4 Types de produits chimiques et exemples (inspiré de [67]) ......................................... 19
Figure 2.5 Stratégies d'atténuation du risque de la volatilité du marché ........................................ 25
Figure 2.6 Exploitation de la flexibilité manufacturière d'une bioraffinerie selon les conditions de
marché .................................................................................................................................... 29
Figure 2.7 Exemple illustratif d'une bioraffinerie affichant plusieurs options de flexibilité
manufacturière ........................................................................................................................ 31
Figure 2.8 Problématique de gestion de la chaîne logistique d'une bioraffinerie forestière .......... 40
Figure 3.1 Méthodologie générale du projet .................................................................................. 45
Figure 4.1 Description des articles ................................................................................................. 47
Figure 4.2 Approche axée sur les marges de profit ........................................................................ 50
Figure 4.3 Chaîne logistique d'une bioraffinerie ............................................................................ 54
Figure 4.4 Représentation d'une bioraffinerie ................................................................................ 55
Figure 4.5 Exemple d'un pro forma des revenus et dépenses créé par le modèle .......................... 76
Figure 4.6 Chaîne logistique simplifiée de l'étude de cas .............................................................. 78
Figure 4.7 Coûts variables de production de différents ratios de pâte ........................................... 86
Figure 4.8 Teneur annuelle moyenne en TMP de la pâte utilisée dans les machines à papier ...... 87
Figure 4.9 Augmentation de la rentabilité de la configuration axée sur les marges de profit ........ 88
Figure 4.10 Distribution des produits de bioraffinage des configurations résineux et résineux par
rapport à la configuration feuillus .......................................................................................... 90
Figure 4.11 Source des revenus du procédé de fractionnement pour différents types de biomasse
................................................................................................................................................ 91
xvi
Figure 4.12 Coûts variables du procédé de fractionnement pour différents types de biomasse .... 91
Figure 4.13 Comparaison de la rentabilité d’options ne présentant pas de flexibilité ................... 92
Figure 4.14 Sélection de recettes sur le procédé de fractionnement dans différents scénarios de
marché .................................................................................................................................... 94
Figure 4.15 Distribution des produits principaux selon différents scénarios de marché telle que
recommandé par le modèle d’optimisation ............................................................................ 94
Figure 4.16 Résultats financiers de la configuration optimale par rapport à la configuration
utilisant des feuillus seulement .............................................................................................. 95
Figure 4.17 Sélection optimale de recettes - prix des résineux à 125% du cas de base ................. 97
Figure 4.18 Résultats financiers de la configuration optimale – prix des résineux à 125% du cas
de base .................................................................................................................................... 97
Figure 4.19 Sélection optimale de recettes - prix des feuillus à 75% du cas de base .................... 98
Figure 4.20 Coûts de production de différentes configurations d’usine ...................................... 103
Figure 4.21 Teneur moyenne en pâte TMP dans les machines à papier ...................................... 104
Figure 4.22 Coûts en combustibles de différentes configurations d'usine ................................... 105
Figure 4.23 EBITDA et marge d'EBITDA de différentes configurations d'usine ....................... 107
Figure 4.24 Modification des marges d'EBITDA après une variation de 10% du prix de vente . 107
xvii
LISTE DES SIGLES ET ABRÉVIATIONS
ABC Comptabilité par activité (Activity-based cost accounting)
ADMT Tonne métrique séchée à l’air (90% de siccité)
BDMT Tonne métrique anhydre
DIP Pâte désencrée
EBITDA Revenus avant intérêts, impôts, dotation aux amortissements et provisions sur
immobilisations (Earnings Before Interests, Taxes, Depreciation and
Amortization)
FBR Bioraffinage forestier
HW Feuillus (hard wood)
IT Technologies de l’information
MILP Programmation linéaire avec nombres entiers
P&P Pâtes et papiers
PM Machine à papier
R&D Recherche et développement
RM Gestion des recettes (Revenue management)
SC Chaîne d’approvisionnement / chaîne logistique
SCM Gestion de la chaîne d’approvisionnement / chaîne logistique
SW Résineux (soft wood)
TMP Pâte thermomécanique
xviii
LISTE DES ANNEXES
ANNEXE A Value Chain Management Considerations for the Biorefinery ............................... 138
ANNEXE B Framework for Margins-based Planning: Forest Biorefinery Case Study .............. 229
ANNEXE C Margins-based Planning Applied to Newsprint Manufacturing ............................. 279
ANNEXE D Value-Chain Planning in the Forest Biorefinery: Case Study Analyzing
Manufacturing Flexibility .................................................................................................... 302
ANNEXE E Framework for Evaluating Cost and Supply-Chain Impacts of Retrofit Projects:
Forest Biorefinery Case Study ............................................................................................. 329
1
CHAPITRE 1 INTRODUCTION
« You are educated. Your certification is in your degree. You may think
of it as the ticket to the good life. Let me ask you to think of an alternative.
Think of it as your ticket to change the world. »
- Tom Brokaw (1940-…)
1.1 Mise en contexte et problématique
La forêt couvre une importante superficie du Canada. Un peu plus de 400 millions d’hectares du
territoire canadien forment des terres boisées, représentant 10% du couvert forestier et 30% de la
forêt boréale de la planète [1]. L’accès à cette richesse naturelle a fait de l’industrie forestière un
des piliers de cette société [1-3].
Depuis le début des années 1990 environ, cette industrie éprouve de sérieux problèmes financiers
attribuables à la conjoncture de plusieurs éléments défavorables. En effet, le marché pour certains
produits papetiers, comme le papier journal par exemple, a diminué depuis quelques années et
continue toujours sa descente à cause de la concurrence d’autres secteurs, notamment ceux des
plastiques et des médias électroniques, ainsi qu’aux changements dans les habitudes culturelles.
De plus, l’industrie forestière nord-américaine fait maintenant face à la compétition d’autres pays
émergents en Asie et en Amérique latine, où de nouvelles usines à grande capacité de production
à la fine pointe de la technologie ont été construites et ce, à proximité de forêts à rendement
élevé.
Les coûts de l’électricité et des combustibles fossiles ont aussi augmenté considérablement, ces
coûts d’énergie représentant près du quart des coûts d’opération de certaines usines de pâtes et
papier (P&P). Le dollar canadien s’est grandement apprécié par rapport au dollar américain,
rendant l’industrie canadienne moins concurrentielle. Finalement, l’industrie papetière est
particulièrement exigeante en termes d’investissements et le fardeau fiscal accumulé au cours des
années par les entreprises canadiennes est exceptionnellement lourd. Ce climat commercial tendu
a donc mené à peu d’investissements dans les usines nord-américaines, celles-ci demeurant de
relativement petite capacité et vieillissantes [2, 4-6]. Tous ces éléments ont contribué à ce que
plusieurs ont surnommés « tempête parfaite » s’abattant sur l’industrie forestière canadienne.
2
Afin de surmonter cette période difficile, les entreprises papetières ont implanté des stratégies de
réduction draconienne des coûts ainsi que des stratégies de fusion et d’acquisition, entraînant
plusieurs fermetures d’usines, mises à pied, de même que peu d’investissements en recherche et
développement (R&D) [7, 8]. Ces stratégies ont peut être aidé à la survie de cette industrie à
court terme, mais ne peuvent garantir leur rentabilité à long terme [5]. Selon McNutt [9],
« les modèles d’affaires traditionnels ayant fait la gloire de cette industrie au
cours du XXème siècle ne permettront pas à cette dernière de se sortir de cette
impasse ; des améliorations significatives sont nécessaires afin de surmonter
cette récession. L’industrie forestière ne peut plus s’asseoir sur les lauriers du
succès de son passé d’industrie de produits de base: cette vision n’est
maintenant plus adaptée au marché. »1
Ces dernières années, plusieurs entreprises importantes du domaine forestier ont démontré leur
intérêt dans l’exploration d’opportunités de bioraffinage. Le concept de bioraffinage consiste en
une utilisation plus complète de la matière lignocellulosique de la forêt afin de diversifier la
production ordinaire de cette industrie. À la production de bois, de pâte et de papier, l’industrie
peut ajouter la production d’énergie, de biocarburants et de produits organiques à haute valeur
ajoutée.
Non seulement cette diversification répond au besoin des consommateurs d’avoir accès à des
produits dits « verts », elle offre la possibilité aux entreprises forestières de réduire leurs impacts
environnementaux, et peut-être même devenir carboneutres. De même, étant donné la situation
précaire de l’industrie forestière au Canada et de son importance auprès des communautés, une
transformation des usines en place présenterait des bénéfices considérables au niveau social en
empêchant la fermeture potentielle d’usines et la mise à pied de nombreux travailleurs.
Le bioraffinage représente donc une opportunité sans pareille de se sortir de cette impasse
financière et de faire de l’industrie forestière un véritable leader du développement durable. Cette
transformation implique cependant plusieurs changements stratégiques importants, notamment
dans le modèle d’affaires de chaque entreprise.
1 Traduction libre
3
En effet, plusieurs défis de taille devront être relevés. De nouvelles technologies, qui sont pour la
plupart des cas encore au stade de développement, devront être intégrées aux usines existantes.
Ces entreprises devront pénétrer de nouveaux marchés pour lesquels elles ne connaissent pas
nécessairement les règles, tout en demeurant compétitives dans le marché de produits de
P&P [10]. Au fil de cette transformation, ces entreprises devront aussi se questionner quant à la
pertinence de cesser ou non leurs activités papetières. Selon Thorp [11], le plus grand défi pour
cette industrie sera de se défaire de la mentalité d’une entreprise fabriquant des produits de base:
apporter sur le marché de grands volumes de produits très peu différenciés n’est pas un bon
modèle d’affaire pour le bioraffinage.
Pour sortir de cette impasse financière et possiblement effectuer la transformation d’usines de
P&P en véritables bioraffineries, les concepts de gestion de la chaîne logistique (SCM) s’avèrent
être d’une importance capitale. Par une gestion intégrée de l’approvisionnement, de la
production, de la distribution et des ventes, il serait possible d’augmenter la rentabilité de
l’entreprise. En fait, selon un sondage effectué auprès de hauts dirigeants de l’industrie forestière,
la gestion de la chaîne logistique serait l’une des principales priorités à aborder afin de redevenir
plus compétitif localement et globalement [12].
Une entreprise forestière orientant ses activités vers le bioraffinage devra faire face à de
nouveaux marchés, quitter possiblement le marché dans lequel elle a œuvré durant plusieurs
années et éventuellement gérer un portefeuille élargi de produits avec plusieurs partenaires.
Devant l’énorme complexité de ce nouveau système, une bonne planification de la chaîne
logistique apparaît nécessaire pour garantir de bonnes marges de profits et pour réduire les
risques causés par la volatilité du marché. L’application de principes avancés de la SCM
comblerait donc ce besoin tout en fournissant des modèles holistiques pour l’entreprise, lui
permettant ainsi d’éclairer la prise de décision.
1.2 Objectifs
L’objectif principal de cette thèse est de développer une approche systématique pour la gestion et
l’évaluation de stratégies de bioraffinage intégrées à l’industrie forestière, et d’évaluer ses
bénéfices sur la rentabilité et la compétitivité d’une entreprise à court et à plus long terme.
Les objectifs spécifiques sous-jacents à cet objectif général sont :
4
• le développement d’une approche et d’un outil de planification axés sur les marges de
profit permettant d’exploiter la flexibilité manufacturière des procédés pour une meilleure
gestion du risque de la volatilité du marché,
• l’application de l’approche axée sur les marges de profit aux activités forestières afin d’en
évaluer les bénéfices pour une entreprise existante,
• l’application et l’évaluation des bénéfices de l’approche axée sur les marges de profit au
contexte du bioraffinage forestier, et
• l’application de l’outil de planification pour la prise de décision stratégique reliée à
l’évaluation d’options de transformation d’une usine existante.
1.3 Plan général de la thèse
Cette thèse, qui a pour titre « Cadre de planification intégrée de la chaîne logistique pour la
gestion et l’évaluation de stratégies de bioraffinage forestier », est une thèse présentée par
article. Les travaux présentés dans le cadre de ce travail sont basés sur cinq articles principaux,
situés en annexe.
Le cœur de cette thèse comporte quatre parties principales:
• Le chapitre 2 présente une revue de littérature pertinente au sujet de recherche et identifie
des lacunes dans l’ensemble des connaissances revues.
• Le chapitre 3 introduit l’approche méthodologique qui a été suivie au cours du projet.
• Le chapitre 4 présente la synthèse des travaux effectués. Cette section débute avec une
description du cadre de planification axée sur les marges de profit et du modèle
mathématique, suivie d’une définition de l’étude cas. Elle se termine par une application
de l’outil développé à trois contextes différents :
1) la planification tactique des activités papetières,
2) la planification tactique du bioraffinage intégré à une usine papetière, et
3) l’évaluation de stratégies de bioraffinage intégrées à une usine papetière.
• Une discussion générale reliée à l’ensemble des travaux et leurs implications est présentée
au chapitre 5.
Finalement, le chapitre 6 résume les contributions à l’ensemble des connaissances et apporte des
recommandations quant à de futurs travaux possibles.
5
CHAPITRE 2 REVUE CRITIQUE DE LA LITTÉRATURE
« Information is a source of learning. But unless it is organized,
processed, and available to the right people in a format for
decision making, it is a burden, not a benefit. »
- William Pollard (1828-1893)
Le processus de définition d’une stratégie de bioraffinage pour une entreprise constitue un
problème de conception et de gestion. Trois grands thèmes sont abordés dans cette revue critique
de la littérature.
• D’abord, les sections 2.1 et 2.2 introduisent quelques concepts de base reliés à la gestion
de la chaîne logistique et au bioraffinage forestier. Une revue plus complète de ces
concepts est présentée dans l’article de l’annexe A – Value Chain Management
Considerations for the Biorefinery.
• La section 2.3 aborde ensuite la planification stratégique.
• Les sections 2.4 à 2.7 touchent quant à elles à des thèmes liés la gestion de la chaîne
logistique et la planification. Les thèmes de la gestion du risque lié à la volatilité du
marché, de la modélisation des coûts d’opération, de la gestion des recettes ainsi que de la
planification tactique et opérationnelle y sont discutés.
• Finalement, la section 2.8 fait une synthèse de la revue de littérature et identifie quelques
lacunes dans l’ensemble des connaissances.
2.1 Concepts de gestion de la chaîne logistique
Depuis quelques décennies, les concepts de gestion de la chaîne logistique sont devenus un sujet
d’intérêt grandissant auprès de l’industrie et du milieu académique. Ainsi, plusieurs définitions
ont été élaborées dans la littérature [13-18]. Christopher [18] donne la définition suivante de la
chaîne logistique (SC) :
6
« Une SC est un réseau d’organisations qui sont impliquées dans les différents
processus et activités de production de valeur sous forme de produits et/ou de
services, depuis l’extraction des matières premières jusqu’à la livraison du
bien à l’utilisateur final. »2
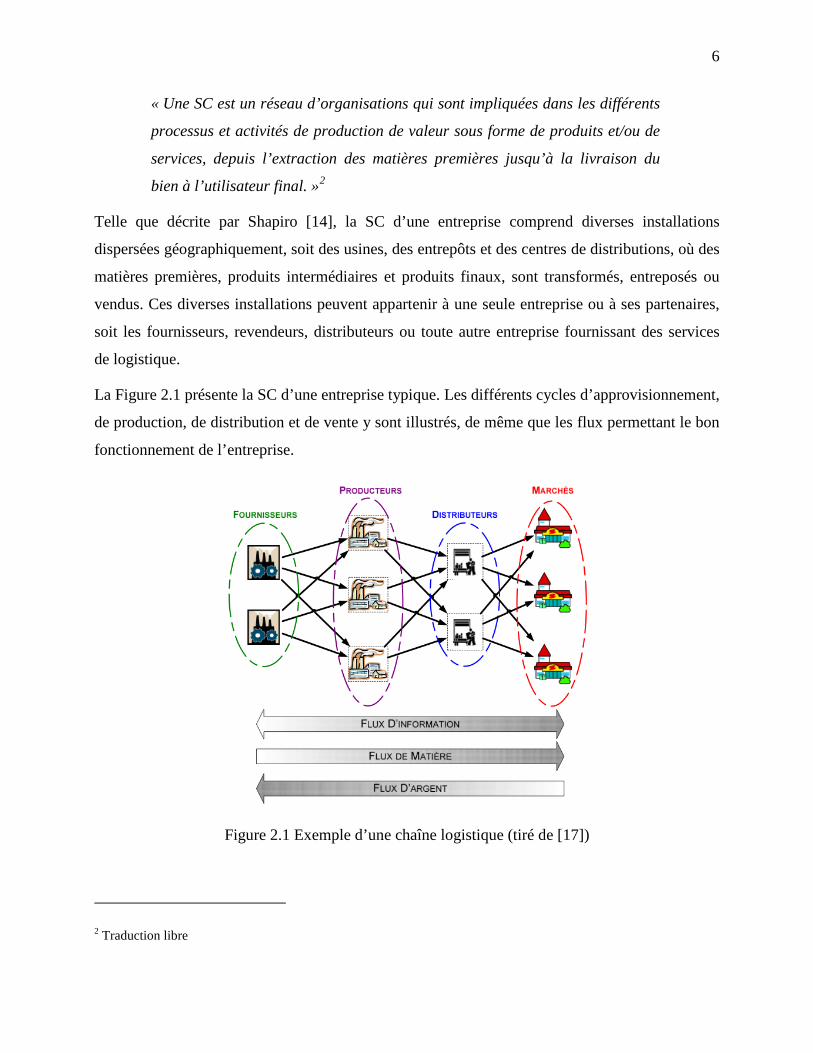
Telle que décrite par Shapiro [14], la SC d’une entreprise comprend diverses installations
dispersées géographiquement, soit des usines, des entrepôts et des centres de distributions, où des
matières premières, produits intermédiaires et produits finaux, sont transformés, entreposés ou
vendus. Ces diverses installations peuvent appartenir à une seule entreprise ou à ses partenaires,
soit les fournisseurs, revendeurs, distributeurs ou toute autre entreprise fournissant des services
de logistique.
La Figure 2.1 présente la SC d’une entreprise typique. Les différents cycles d’approvisionnement,
de production, de distribution et de vente y sont illustrés, de même que les flux permettant le bon
fonctionnement de l’entreprise.
Figure 2.1 Exemple d’une chaîne logistique (tiré de [17])
2 Traduction libre
7
Afin de satisfaire le client et donc de générer des profits pour l’entreprise, il est impératif
d’effectuer une gestion appropriée de la chaîne logistique (SCM). Bien que de nombreux auteurs
aient donné des définitions différentes de la SCM, les points suivants reviennent dans la majorité
de celles-ci [13-18] :
• la planification et la gestion des activités d’approvisionnement en matières premières, de
production, de livraison des produits aux clients et de toute autre activité de logistique
(entreposage, transport),
• la gestion d’un système d’installations (usines, centres de distribution, etc.) dispersées
géographiquement,
• la coordination et la collaboration des activités à l’intérieur de l’entreprise ou entre les
partenaires (fournisseurs, intermédiaires, fournisseurs de services de tierce partie, clients),
et
• l’intégration des flux de matière, d’argent et d’information entre les différents acteurs,
que ce soit à l’intérieur ou à l’extérieur de l’entreprise.
L’objectif de la SCM pourrait donc se résumer comme suit : livrer le bon produit au bon moment
au coût le plus faible possible en coordonnant les différents flux et activités, depuis le fournisseur
jusqu’à l’utilisateur final, afin
1. de maximiser la rentabilité de l’entreprise (et/ou de l’ensemble des partenaires inclus dans
la SC),
2. d’atteindre de hauts niveaux de satisfaction des clients, et de
3. créer un avantage compétitif durable.
Quatre activités principales de planification sont reliées à la gestion de la chaîne logistique :
l’approvisionnement, la production, la distribution et les ventes. L’approvisionnement touche à
tous les processus qui sont liés à la gestion des ressources et matières premières nécessaires à la
production. La planification de la production inclut les activités reliées aux procédés de
fabrication de produits. Les activités de logistique, tel que le transport des produits vers un client,
un détaillant, ou toute autre entreprise ou installation appartenant à l’entreprise, sont traitées au
sein du département de distribution. Enfin, les processus reliés aux ventes impliquent la réception
et la satisfaction des commandes de clients. Toutes les activités de logistiques sont déterminées
par les prévisions de la demande et par les commandes des clients.
8
L’envergure de la SC étudiée varie de façon considérable selon les études. Ainsi, certaines se
centralisent sur une portion seulement de la SC d’une entreprise en particulier (intra-compagnie),
tandis que d’autres se concentrent sur la SC étendue (inter-compagnie), intégrant les différents
partenaires impliqués. Idéalement, il vaudrait mieux maximiser la rentabilité de la SC étendue.
En réalité, il n’est pas rare de voir un manque de coordination au sein même des différents
départements d’une entreprise. Souvent, chacun de ces départements travaille de façon isolée, ne
cherchant qu’à maximiser l’efficacité de leurs opérations et ne partageant que peu d’information
avec les autres. Or, un tel type de gestion ne résulte généralement pas en une utilisation optimale
des ressources. L’optimisation de chacune des parties d’un tout de mène pas nécessairement à la
solution optimale du système. C’est dans cette optique que l’application des principes de SCM
prend tout son sens. Mieux planifier, intégrer et coordonner les différentes parties de la SC
permet de demeurer compétitif globalement ou de le devenir davantage.
2.1.1 Niveaux décisionnels et intégration
Les décisions concernant la gestion et la planification de la chaîne logistique sont généralement
effectuées en trois phases ou niveaux : les planifications stratégique, tactique puis
opérationnelle [14, 15, 19]. Ces niveaux décisionnels dépendent notamment de la fréquence de
décision et de la période considérée. Chaque décision prise dans un des niveaux peut avoir un
impact considérable sur les autres niveaux, d’où l’importance d’effectuer une planification
intégrée [14].
2.1.1.1 Planification stratégique
La planification stratégique traite les décisions reliées à la structure de la chaîne logistique pour
les prochaines années. C’est une planification à long terme (3-10 ans) où sont impliquées des
décisions reliées à l’investissement ou à la cessation de certaines activités, soit des décisions
souvent irréversibles ou très coûteuses à modifier. À ce niveau, la planification devrait prendre en
compte l’incertitude future et anticiper les conditions de marché pour les prochaines années.
9
2.1.1.2 Planification tactique
La planification tactique établit les paramètres selon lesquels une chaîne logistique fonctionnera
pour un horizon de temps plus rapproché. La structure de la SC ayant été fixée lors de la
planification stratégique, les décisions prises à ce niveau ne touchent pas les possibilités
d’investissement, mais plutôt l’attribution des ressources sur un horizon de temps de six à 24
mois environ afin de maximiser les revenus de l’entreprise. Ainsi, les politiques d’opération pour
le court terme sont définies en tenant compte de la flexibilité de la SC qui a été établie lors de la
planification stratégique. Une bonne planification tactique devrait considérer l’incertitude dans la
demande, la variation des taux de change et de la compétition dans cet horizon de temps.
2.1.1.3 Planification opérationnelle
Les décisions à court terme, soient les décisions prises à chaque jour ou semaine, sont prises en
compte lors de la planification opérationnelle. À ce niveau, la configuration de la SC de même
que les politiques d’opération sont considérées comme fixes. Ainsi, l’objectif de cette phase de
planification, référant souvent à l’ordonnancement de la production, de la distribution et du
transport, pourrait se résumer à la gestion des commandes spécifiques des clients afin de
satisfaire le mieux possible leurs besoins.
2.1.1.4 Intégration des différents niveaux décisionnels
Chacun des trois niveaux décisionnels de la SC a un impact important sur la rentabilité et le
succès d’une entreprise [15]. De même, il existe une forte interdépendance entre chacun de ces
niveaux. D’un point de vue descendant, la planification stratégique fixe la structure de la SC pour
les nivaux décisionnels inférieurs, tandis que les politiques d’opération sont définies lors de la
planification tactique. D’un autre côté, la planification opérationnelle donne des indications aux
niveaux supérieurs quant à la capacité de la chaîne logistique en place. La matrice de la
planification de la SC présentée à la Figure 2.2 illustre le genre de décisions prises selon les
cycles de la SC et selon l’échelle de temps.
10
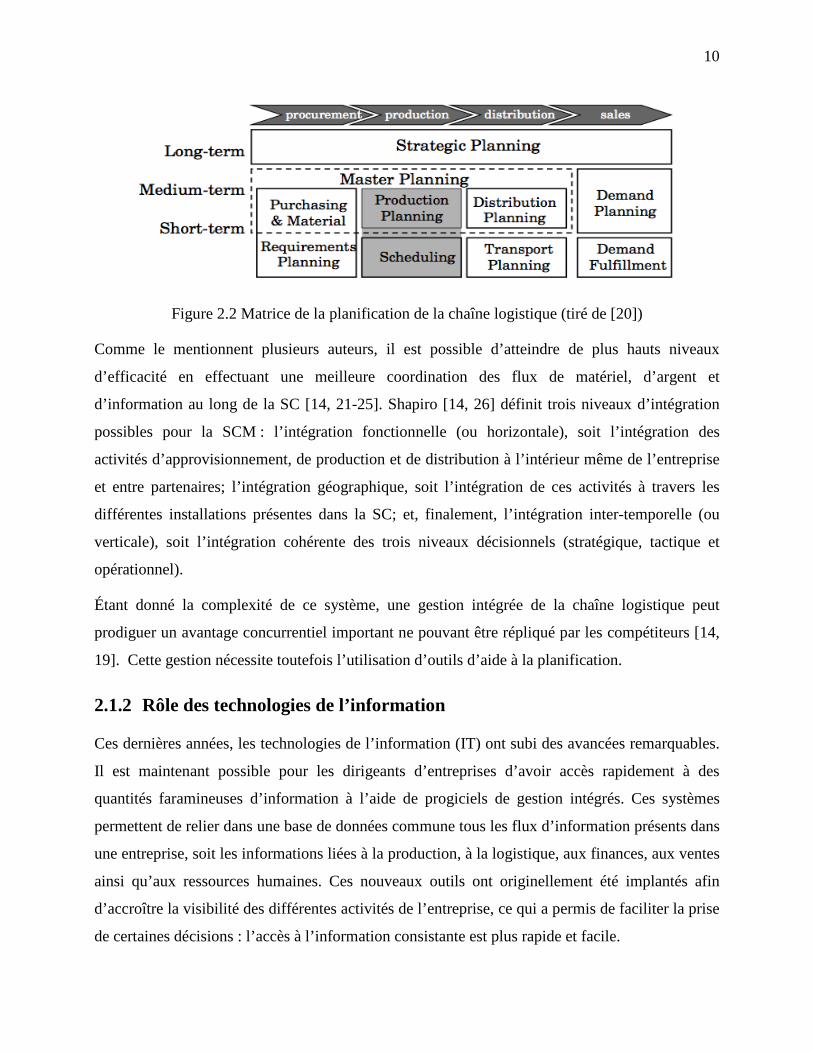
Figure 2.2 Matrice de la planification de la chaîne logistique (tiré de [20])
Comme le mentionnent plusieurs auteurs, il est possible d’atteindre de plus hauts niveaux
d’efficacité en effectuant une meilleure coordination des flux de matériel, d’argent et
d’information au long de la SC [14, 21-25]. Shapiro [14, 26] définit trois niveaux d’intégration
possibles pour la SCM : l’intégration fonctionnelle (ou horizontale), soit l’intégration des
activités d’approvisionnement, de production et de distribution à l’intérieur même de l’entreprise
et entre partenaires; l’intégration géographique, soit l’intégration de ces activités à travers les
différentes installations présentes dans la SC; et, finalement, l’intégration inter-temporelle (ou
verticale), soit l’intégration cohérente des trois niveaux décisionnels (stratégique, tactique et
opérationnel).
Étant donné la complexité de ce système, une gestion intégrée de la chaîne logistique peut
prodiguer un avantage concurrentiel important ne pouvant être répliqué par les compétiteurs [14,
19]. Cette gestion nécessite toutefois l’utilisation d’outils d’aide à la planification.
2.1.2 Rôle des technologies de l’information
Ces dernières années, les technologies de l’information (IT) ont subi des avancées remarquables.
Il est maintenant possible pour les dirigeants d’entreprises d’avoir accès rapidement à des
quantités faramineuses d’information à l’aide de progiciels de gestion intégrés. Ces systèmes
permettent de relier dans une base de données commune tous les flux d’information présents dans
une entreprise, soit les informations liées à la production, à la logistique, aux finances, aux ventes
ainsi qu’aux ressources humaines. Ces nouveaux outils ont originellement été implantés afin
d’accroître la visibilité des différentes activités de l’entreprise, ce qui a permis de faciliter la prise
de certaines décisions : l’accès à l’information consistante est plus rapide et facile.
11
Les technologies de l’information sont généralement classées en deux catégories distinctes, les IT
transactionnelles et les IT analytiques. Les IT transactionnelles permettent l’acquisition, la
gestion et la communication des données brutes et/ou légèrement modifiées d’une entreprise afin
d’en supporter les différents processus. D’un autre côté, les IT analytiques visent à utiliser des
modèles descriptifs et d’optimisation afin d’analyser les données disponibles et d’utiliser les
résultats pour optimiser les performances des entreprises [14].
Ces avancées ont pour la plupart été réalisées dans ce qu’on appelle les IT transactionnelles. Or,
ces outils ne fournissent généralement pas une information pouvant aider à la prise de décision
qui tient compte des interactions et compromis complexes au sein de l’entreprise [14, 21]. En
effet, le simple fait de pouvoir communiquer plus rapidement et à plus faible coût ces
informations n’apporte pas nécessairement un avantage compétitif [14, 21, 27].
Le développement de modèles descriptifs et d’optimisation (outils d’IT analytiques), qui
permettraient d’explorer et d’analyser diverses alternatives, de même que de prédire les
différentes actions à prendre aux niveaux stratégiques, tactiques et opérationnels de la SC,
offrirait aux entreprises la possibilité d’optimiser leur performance économique et d’atteindre de
nouveaux sommets de satisfaction de la clientèle [21]. En d’autres mots, le but visé par ces
modèles est de mieux utiliser l’information disponible pour appuyer la prise de décision,
notamment en permettant l’essai de divers scénarios stratégiques pour ensuite les analyser.
2.1.3 Modélisation de la chaîne logistique
Depuis quelques années, l’optimisation est devenue un domaine de recherche très étudié par la
communauté d’ingénierie des systèmes. En effet, ce domaine a évolué d’une méthodologie
d’intérêt académique à une technologie pouvant avoir des impacts significatifs sur la rentabilité
de l’industrie [14, 28]. Dans le contexte de la SCM, les modèles d’optimisation sont souvent
utilisés pour la planification et l’ordonnancement des activités au sein de l’entreprise, de même
que pour le développement d’outils d’aide à la décision [14, 29, 30].
Un modèle d’optimisation classique comporte quatre éléments clés [30] :
12
• des données, parfois appelées constantes du modèle,
• des variables,
• des contraintes ou restrictions, et
• une fonction objectif.
Les problèmes d’optimisation sont généralement classés en termes de variables continues et de
variables discrètes. Les variables continues correspondent généralement à des variables d’état,
par exemple le débit, la température ou la pression d’un courant, ou encore la quantité d’un
produit stockée en inventaire. Les variables discrètes ne peuvent prendre que certaines valeurs,
soit généralement des variables binaires (0 ou 1) ou tout autre nombre entier. Ces variables sont
généralement utilisées pour décrire des conditions logiques (et, ou) ou des décisions de type « oui
ou non », tels que l’ouverture d’une usine, l’attribution et de tâches à un équipement en
particulier ou le séquençage de tâches sur cet équipement.
De plus, selon les équations présentes, un problème peut être soit linéaire ou non. Il en résulte
ainsi quatre grands groupes de problèmes, soit [30]
• des problèmes de programmation linéaire (LP) (aucune variable discrète),
• des problèmes de programmation linéaire avec nombres entiers (MILP),
• des problèmes de programmation non-linéaire (aucune variable discrète), et
• des problèmes de programmation non-linéaire avec nombres entiers.
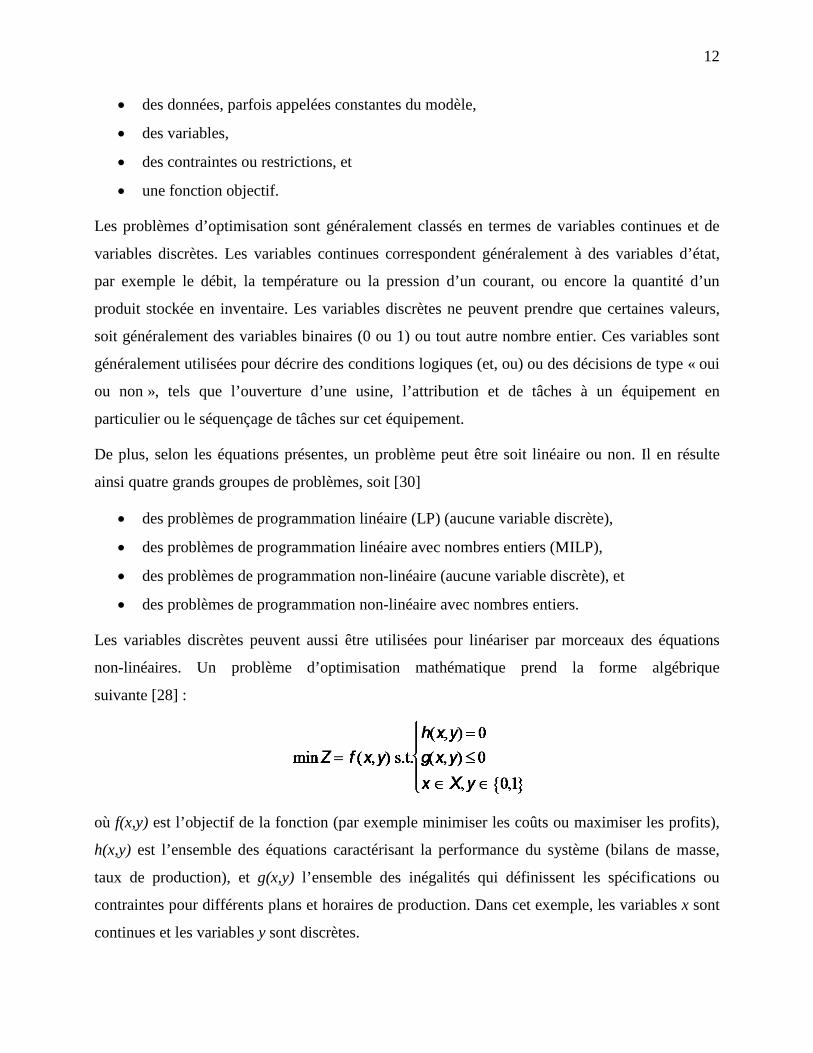
Les variables discrètes peuvent aussi être utilisées pour linéariser par morceaux des équations
non-linéaires. Un problème d’optimisation mathématique prend la forme algébrique
suivante [28] :
où f(x,y) est l’objectif de la fonction (par exemple minimiser les coûts ou maximiser les profits),
h(x,y) est l’ensemble des équations caractérisant la performance du système (bilans de masse,
taux de production), et g(x,y) l’ensemble des inégalités qui définissent les spécifications ou
contraintes pour différents plans et horaires de production. Dans cet exemple, les variables x sont
continues et les variables y sont discrètes.
13
Pour résoudre un problème de type LP, la méthode du simplex [31] ou du point intérieur [32]
sont le plus souvent utilisés. Ces méthodes pour résoudre les problèmes de type LP sont très
répandues et bien implantées [28].
Les problèmes de type MILP sont généralement résolus à l’aide d’algorithme « séparation et
évaluation »3, une méthode énumérative qui consiste à relaxer les variables entières du problème
pour ensuite résoudre à chaque nœud de l’arbre un sous-problème de type LP [33]. Lorsque le
problème MILP est de grande taille, le temps de calcul peut devenir très grand, voire irréalisable,
étant donné que le nombre de nœuds à explorer augmente de façon exponentielle.
Pour contrer ce problème, deux méthodes principales, soit les plans de coupe et le prétraitement,
ont été développées au fil des dernières années afin de réduire le nombre de nœuds à traiter (i.e.
le nombre de problèmes à résoudre) et donc le temps de calcul [34]. Associées à une plus grande
puissance de calcul des ordinateurs, les dernières avancées dans les méthodes de prétraitement et
de plans de coupe ont permis de réduire par plus de dix ordres de grandeurs le temps de calcul
des problèmes de type MILP [34]. Les solveurs commerciaux couramment utilisés, tels que
CPLEX, incorporent les plus récents algorithmes et techniques pour résoudre plus efficacement
ces problèmes.
Toutefois, pour plusieurs problèmes de grande taille, comme par exemple certains problèmes
industriels de planification et d’ordonnancement de la production, ces avancées ne permettent pas
à elles seules d’obtenir une réponse dans un temps acceptable. À ce sujet, Grossmann et Biegler
[35] ont identifié quelques raisons principales qui rendent les problèmes d’optimisation de plus
en plus gros et difficiles à résoudre.
3 Traduction de l’anglais branch and bound
14
• De plus en plus de détails sont ajoutés aux modèles afin d’accroître leur précision dans le
but d’améliorer les décisions de conception et de performance des procédés.
• L’intégration des différentes activités (approvisionnement, production et distribution) et
de niveaux de décision dans un modèle en accroît considérablement la taille.
• Afin de représenter plus exactement la réalité de l’entreprise, les modèles prennent en
compte de plus longues périodes de temps, créant ainsi des modèles multi-périodes.
• La taille des modèles mathématiques accroît considérablement lorsque l’incertitude est
incorporée dans les problèmes de planification et d’ordonnancement sous des
formulations stochastiques.
Pour résoudre ces problèmes de plus en plus complexes, de nouvelles techniques et algorithmes
d’optimisation tentent d’utiliser la structure spécifique du problème et de l’utiliser à bon escient
afin de réduire l’espace de recherche. Parmi celles-ci, on compte les heuristiques et
métaheuristique [36], la relaxation lagrangienne et lagrangienne/subrogative [37, 38], de même
que les techniques de décomposition de Benders [39, 40], de Lagrange [35, 41-43] et bi-niveau
[35, 44].
2.2 Bioraffinage intégré aux opérations forestières
Le bioraffinage forestier consiste en la diversification de la production ordinaire de l’industrie
forestière, traditionnellement production de bois, de pâte et de papier, afin de fabriquer également
des biocarburants et des produits organiques verts à valeur ajoutée. Ragauskas et al. [45]
définissent le bioraffinage par analogie avec le raffinage pétrolier. Dans une raffinerie
conventionnelle, différents carburants et produits chimiques sont produits à partir du pétrole, une
source hétérogène de carbone. De façon analogue, la biomasse, une matière première carbonée,
renouvelable et abondante constituée essentiellement de polysaccharides et de lignine, est
fractionnée et ensuite convertie par différents procédés en une gamme de produits, allant de
l’énergie aux biocarburants, biochimiques et biomatériaux.
15
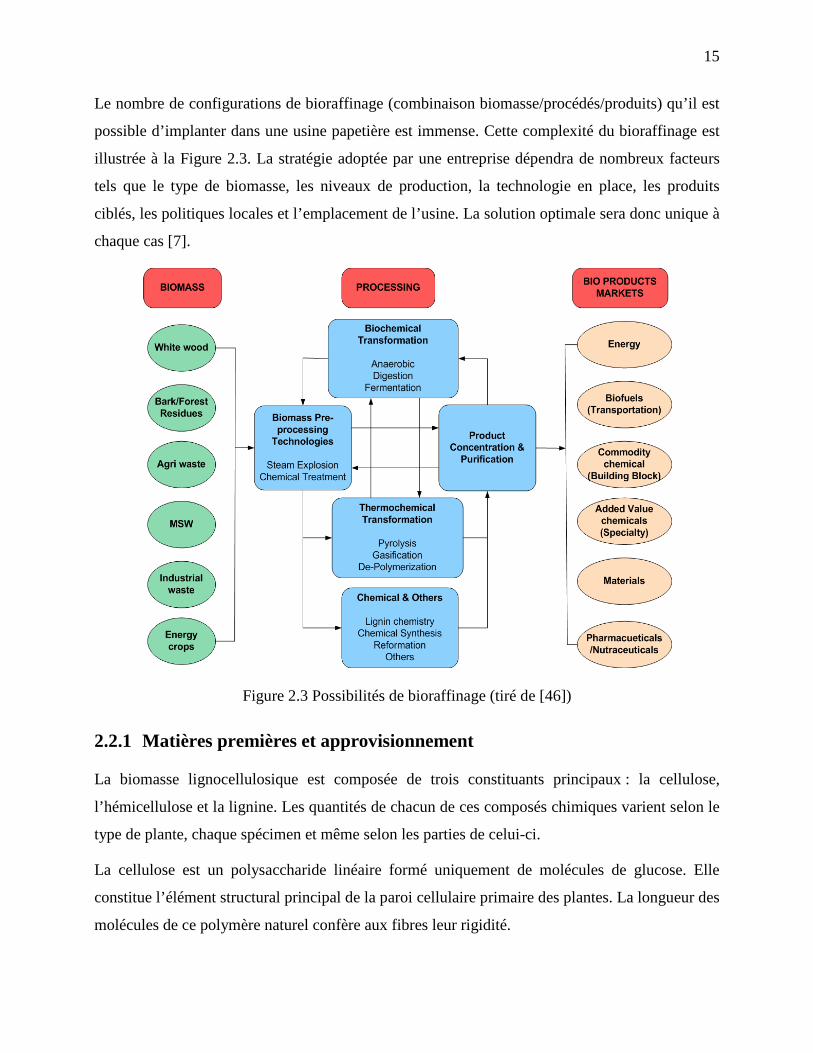
Le nombre de configurations de bioraffinage (combinaison biomasse/procédés/produits) qu’il est
possible d’implanter dans une usine papetière est immense. Cette complexité du bioraffinage est
illustrée à la Figure 2.3. La stratégie adoptée par une entreprise dépendra de nombreux facteurs
tels que le type de biomasse, les niveaux de production, la technologie en place, les produits
ciblés, les politiques locales et l’emplacement de l’usine. La solution optimale sera donc unique à
chaque cas [7].
Figure 2.3 Possibilités de bioraffinage (tiré de [46])
2.2.1 Matières premières et approvisionnement
La biomasse lignocellulosique est composée de trois constituants principaux : la cellulose,
l’hémicellulose et la lignine. Les quantités de chacun de ces composés chimiques varient selon le
type de plante, chaque spécimen et même selon les parties de celui-ci.
La cellulose est un polysaccharide linéaire formé uniquement de molécules de glucose. Elle
constitue l’élément structural principal de la paroi cellulaire primaire des plantes. La longueur des
molécules de ce polymère naturel confère aux fibres leur rigidité.
16
L’hémicellulose est un polysaccharide composé d’hexoses et de pentoses retrouvé sous forme
ramifiée ou linéaire. Ce polymère sert de matrice de support autour des microfibrilles de
cellulose.
La lignine est un polymère organique amorphe de haut poids moléculaire contenant plusieurs
groupements aromatiques. La structure et la composition de ce polymère est assez complexe et
varie énormément selon les essences de bois et son emplacement dans l’arbre. La lignine agit
comme « colle chimique » liant ensemble les fibres et autres constituants du bois. En raison de
leurs compositions chimiques distinctes, ces trois composants peuvent être utilisés pour la
production de différents produits.
La matière lignocellulosique possède une densité plus faible et un contenu en humidité plus élevé
que les matières premières fossiles. De ce fait, l’énergie nécessaire pour le transport, la
densification et la conversion de la biomasse en produits est généralement plus importante que
pour les produits pétroliers. La quantité de biomasse qu’il est possible d’acheminer à une
bioraffinerie d’une manière rentable est donc limitée. L’approvisionnement d’une usine forestière
typique est plutôt local, allant à quelques centaines de kilomètres tout au plus.
Pour chaque bioraffinerie, il existe donc une taille optimale d’usine, déterminé entre autres par
les économies d’échelle atteignables au niveau des procédés de production et les coûts
d’approvisionnement. Meléndez et al. [47] présentent une revue des différentes matières
premières pouvant être utilisées dans une bioraffinerie.
2.2.2 Procédés de bioraffinage
Plusieurs procédés ont été développés au cours des dernières années afin de transformer la
biomasse en différents produits dérivés. Ces procédés de transformation sont généralement
classés en deux grandes voies technologiques, soit les voies thermochimiques et biochimiques.
17
Les technologies de transformation de la voie thermochimique sont caractérisées par l’utilisation
de chaleur et de composés chimiques pour la transformation de la biomasse. Ces procédés
« dégradent » la matière organique en composantes chimiques plus petites qui ne font pas
nécessairement partie de la biomasse originale. Les procédés thermochimiques sont en mesure de
traiter divers types de biomasse, dont des matières plus hétérogènes. Quatre procédés principaux
composent cette voie : la combustion, la gazéification [48], la pyrolyse [49] et la liquéfaction.
Goyal et al. [50] et Frederick [51] présentent une revue des différents procédés thermochimiques
pour la production de biocarburants.
Les procédés appartenant à la voie biochimique consistent à fractionner ou extraire une ou
plusieurs des trois principales composantes de la biomasse, par l’utilisation de vapeur [52], de
solvants et d’enzymes [53, 54] ou une combinaison de ceux-ci. Une fois séparés, les sucres et
autres composantes de la biomasse sont transformés en différents produits chimiques. Divers
types de matières premières peuvent être utilisés, mais il est préférable qu’elles soient le plus
homogènes possible.
Les procédés de bioraffinage peuvent être intégrés dans une usine papetière selon deux stratégies
différentes : une stratégie fortement intégrée et une stratégie parallèle [55-57]. La première
stratégie consiste en une meilleure utilisation des copeaux et billes de bois qui sont présentement
utilisés dans les procédés papetiers, en extrayant diverses composantes qui pourraient être mieux
valorisés que dans la configuration actuelle. La cellulose serait toujours principalement utilisée
pour la production de produits papetiers, tandis que la lignine et les hémicelluloses, qui sont
présentement brûlées dans la chaudière de récupération, seraient plutôt utilisées pour la
production de bioproduits. À titre d’exemples de bioraffineries fortement intégrées aux usines de
P&P, on compte la gazéification de la liqueur noire [58, 59], la précipitation de la lignine [60] et
l’extraction des hémicelluloses [61-63]. À cause de sa forte dépendance aux procédés papetiers,
cette stratégie de bioraffinage semble prometteuse pour les entreprises désirant renforcer leur
position concurrentielle dans le secteur des P&P, tout en augmentant leurs revenus.
18
Selon la stratégie d’implantation en parallèle, le procédé de bioraffinage est construit en marge
des lignes existantes de production de pâte. Les avantages de l’intégration proviennent
principalement de l’intégration énergétique, de l’utilisation commune des installations de
réception et de manutention du bois, du partage des services utilitaires et des frais généraux, ainsi
que de la réutilisation possible de certains équipements. Des exemples de stratégies
d’implantation du bioraffinage comprennent le fractionnement de la biomasse par l’utilisation de
solvants chimiques et d’eau [52, 64-66], ou encore le traitement thermochimique de la biomasse
tels que la pyrolyse [49] et la gazéification suivie d’un reformage Fischer-Tropsch [50, 58, 59].
Par son indépendance aux opérations papetières, cette stratégie de bioraffinage semble adaptée
pour les entreprises désirant quitter le marché des P&P.
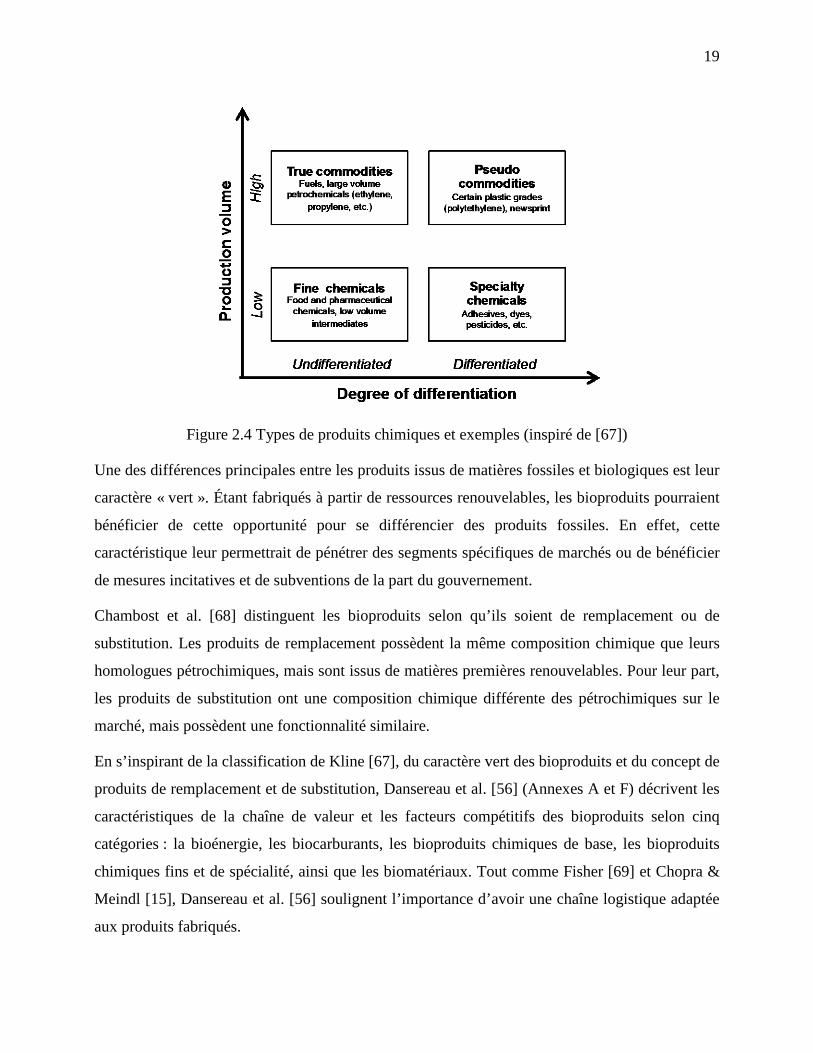
2.2.3 Bioproduits
Kline [67] classe les produits chimiques en quatre grandes catégories selon leur degré de
différentiation et leur volume de production : les vrais produits chimiques de base4, les produits
chimiques fins, les pseudo produits chimiques de base et les produits chimiques de spécialité. La
Figure 2.4 illustre cette classification et présente quelques exemples.
Les produits non-différenciés sont généralement vendus selon des spécifications liées à leur
composition, comme la pureté. Ils peuvent être utilisés dans plusieurs applications différentes et
se présentent alors sous une même forme, et ce peu importe le fournisseur.
Les produits différenciés sont plutôt commercialisés sur la base de leurs performances et ciblent
quelques applications spécifiques. Il peut ainsi y avoir de grandes différences entre les produits
de différents fournisseurs.
4 Traduction de l’anglais de commodity chemical
19
Figure 2.4 Types de produits chimiques et exemples (inspiré de [67])
Une des différences principales entre les produits issus de matières fossiles et biologiques est leur
caractère « vert ». Étant fabriqués à partir de ressources renouvelables, les bioproduits pourraient
bénéficier de cette opportunité pour se différencier des produits fossiles. En effet, cette
caractéristique leur permettrait de pénétrer des segments spécifiques de marchés ou de bénéficier
de mesures incitatives et de subventions de la part du gouvernement.
Chambost et al. [68] distinguent les bioproduits selon qu’ils soient de remplacement ou de
substitution. Les produits de remplacement possèdent la même composition chimique que leurs
homologues pétrochimiques, mais sont issus de matières premières renouvelables. Pour leur part,
les produits de substitution ont une composition chimique différente des pétrochimiques sur le
marché, mais possèdent une fonctionnalité similaire.
En s’inspirant de la classification de Kline [67], du caractère vert des bioproduits et du concept de
produits de remplacement et de substitution, Dansereau et al. [56] (Annexes A et F) décrivent les
caractéristiques de la chaîne de valeur et les facteurs compétitifs des bioproduits selon cinq
catégories : la bioénergie, les biocarburants, les bioproduits chimiques de base, les bioproduits
chimiques fins et de spécialité, ainsi que les biomatériaux. Tout comme Fisher [69] et Chopra &
Meindl [15], Dansereau et al. [56] soulignent l’importance d’avoir une chaîne logistique adaptée
aux produits fabriqués.
20
2.2.4 Analyse critique
Une des caractéristiques de l’industrie des procédés, et par conséquent du bioraffinage, est la
nature divergente des procédés de production : à partir d’une matière première (ex. le bois),
plusieurs produits différents sont co-fabriqués (ex. papier, éthanol, énergie, autres produits
chimiques). Couplée aux faits que l’industrie des procédés soit intensive en capitaux et que la
biomasse soit une matière première onéreuse, cette caractéristique fait en sorte qu’il est
nécessaire d’utiliser les matières premières le plus efficacement possible et de maximiser la
valeur de chaque produit fabriqué pour s’assurer d’une rentabilité.
Les étapes menant à la sélection du portefeuille de procédés/produits sont d’une importance
capitale pour la stratégie de bioraffinage qui sera adoptée par une entreprise. D’autre part, les
nouvelles bioraffineries auront à gérer un portefeuille de produits faisant face à différents
marchés. Ainsi, une stratégie de gestion et de planification globale et intégrée du portefeuille de
produits appert essentielle.
2.3 Planification stratégique dans le cadre du bioraffinage
2.3.1 Conception du portefeuille de procédés/produits et de la chaîne
logistique
D’un point de vue technique, il est possible de produire à peu près n’importe quel produit
chimique ou matériau organique à partir de biomasse. Néanmoins, toutes ces options possibles ne
sont pas nécessairement rentables et ne représentent pas toutes de bonnes solutions pour la
transformation d’entreprises forestières en bioraffineries.
21
Plusieurs auteurs proposent des approches basées sur l’optimisation pour la sélection de produits
et procédés de bioraffinage. Sammons Jr et al. [70] proposent un cadre théorique incluant
différentes mesures de technico-économiques pour la sélection de produits et de procédés. Feng
et al. [71] fournissent un modèle mathématique de conception de la chaîne logistique d’une
bioraffinerie forestière visant à optimiser le retour sur l’investissement. Santibanez-Aguilar et al.
[72] formulent ce problème avec un modèle multi-objectifs considérant des critères de rentabilité
et d’environnement. Sharma et al. [73] optimisent la conception du portefeuille de
produit/procédés avec un modèle ayant pour fonction objectif la maximisation de la valeur pour
les actionnaires. Leur modèle incorpore une monétisation des impacts environnementaux.
Chambost et al. [68] présentent une approche d’implantation du bioraffinage par phase, mettant
l’accent sur la définition et la gestion du portefeuille de produits plutôt que sur la sélection du
procédé de transformation. À la suite de ces travaux, Mansoornejad et al. [74] proposent une
approche hiérarchique pour la conception du portefeuille de produits et du réseau de la chaîne
logistique de bioraffineries.
2.3.2 Intégration dans une usine forestière
Une grande partie de la littérature sur la conception de procédés de bioraffinage porte sur
l’implantation de ceux-ci dans de nouvelles usines. Or, afin de bénéficier des infrastructures de
l’industrie forestière, les bioraffineries forestières seront fort probablement bâties de façon
intégrée aux usines existantes.
Un bon nombre de publications traitent du problème de l’emplacement de bioraffineries.
Généralement, ces problèmes déterminent l’emplacement, le nombre et la taille de bioraffineries
à implanter dans une région donnée [75-84]. Or, dans le contexte d’une entreprise existante, le ou
les procédés de bioraffinage seront intégrés à une usine existante et le nombre d’usines d’une
entreprise donnée est limité. La sélection de l’emplacement optimal du ou des nouveaux procédés
sera fort probablement effectuée selon des contraintes spécifiques à chacun des sites, comme par
exemple leur compétitivité, leur importance stratégique, la présence ou non d’équipements
particuliers, la capacité du système de traitement des eaux usées et des services utilitaires, etc.
22
Pour l’industrie forestière, les projets de bioraffinage se différencient des autres projets
d’investissements puisqu’ils permettent un renouvellement des activités principales en plus d’une
diversification des revenus. Ils font aussi partie d’un processus de véritable transformation de
l’entreprise, où la pertinence de rester dans un créneau du domaine des P&P devrait aussi être
évaluée.
Un des défis importants de l’implantation du bioraffinage intégré consiste à comprendre l’impact
de ces nouveaux procédés sur les procédés existants afin de minimiser leurs répercussions non
désirables [85]. Un autre défi important relié à l’intégration des procédés concerne la gestion des
services utilitaires de l’usine, comme l’énergie et l’eau. En effet, l’implantation de nouveaux
procédés de bioraffinage nécessitera davantage d’énergie. À cet effet, Moshkelani et al. proposent
[86] une approche qui optimise le système des services d’appoint de l’usine existante pour
accommoder l’implantation de nouveaux équipements de bioraffinage en utilisant la
méthodologie d’intégration de l’énergie développée par Mateos-Espejel et al. [87].
Hytönen & Stuart [57, 88] présentent une méthodologie qui incorpore une simulation en régime
permanent du procédé et un modèle de coûts utilisant les principes de la comptabilité par activité
(ABC) pour améliorer le processus de prise de décision reliée à la conception de procédés de
bioraffinage intégrés une usine papetière. Leur analyse montre que les méthodes traditionnelles
de calculs de coûts, où le coût de la vapeur est considéré comme constant, sous-estiment les coûts
de production. Les courbes de rendement des chaudières et des turbines selon leur capacité
d’utilisation devraient donc être incorporées aux simulations pour s’assurer d’une meilleure
représentation des coûts.
Afin de réduire les risques reliés à la transformation au bioraffinage, Chambost et al. [68] ainsi
que Moshkelani et al. [86] proposent une stratégie d’implantation graduelle des procédés de
bioraffinage, produisant d’abord des produits chimiques de base et par la suite des dérivés à
valeur ajoutée. Pour les compagnies désirant quitter partiellement ou complètement le milieu des
P&P, la fermeture des actifs papetiers pourrait aussi s’effectuer de façon graduelle afin de
maintenir la compétitivité de l’installation lors de la transition. Ceci faciliterait la transformation
de l’entreprise vers le bioraffinage, tout en fournissant des flux de trésorerie qui réduiraient le
fardeau de la disponibilité du capital.
23
De telles décisions de transformation d’entreprise, où le développement de nouvelles activités et
la sortie potentielle des activités papetières sont à la fois considérés, devraient être planifiées
consciencieusement. Des paramètres autres que le retour sur l’investissement devraient être
utilisés en parallèle pour s’assurer d’une prise de décision durable.
Les évaluations technico-économiques sont couramment utilisées pour l’analyse de projets
d’investissement de bioraffinage intégrés à des usines de P&P [89]. Dans ces études, les
conséquences de l’intégration de ce procédé au reste de l’usine sont la plupart du temps alloués
aux nouveaux produits en tant que crédits ou coûts additionnels. Or, pour des projets de
transformation majeurs, où certains actifs seront possiblement fermés, les activités papetières et
de bioraffinage doivent être analysées de façon intégrée pour s’assurer de la viabilité de la
nouvelle installation.
Par sa vision intégrée de l’entreprise, un outil de prise de décision basé sur la gestion de la chaîne
logistique apparaît comme un outil approprié pour évaluer la compétitivité du nouveau site. De
même, l’intégration de méthodes avancées de calcul de coûts [17, 88] pourraient améliorer la
prise de décision en aidant à déterminer les marges de profit de chacun des produits.
2.4 Gestion du risque lié à la volatilité du marché
La volatilité du marché provient d’un décalage entre l’offre et la demande. Pour l’industrie des
procédés, elle est augmentée par l’aspect imprévisible de l’approvisionnement en matières
premières. Par exemple, les matières premières de source biologique comme les céréales
montrent une forte volatilité à cause de leur caractère saisonnier et du rendement variable des
récoltes influencées par les conditions climatiques et les maladies. Ainsi, le prix de la biomasse
forestière, dont la croissance et la récolte s’étendent sur plusieurs années, est généralement moins
volatile que celui de la biomasse de source agricole. D’un autre côté, les matières premières non
renouvelables telles que le pétrole et les métaux sont accompagnées de grandes incertitudes au
niveau de l’approvisionnement mondial, notamment en raison de catastrophes naturelles ou de
conflits politiques.
24
Pour les produits de bioraffinage, les conséquences de la volatilité risquent d’être plutôt
imprévisibles. D’un côté, les bioproduits remplaceront pour une grande part des produits issus de
matières non-renouvelables. Par conséquent, leurs prix de vente devraient être liés à ceux prix du
pétrole et du gaz naturel puisque ces derniers sont susceptibles de dominer le marché pour
plusieurs années encore. Or, les prix de vente des produits de base de source fossile sont volatils.
D’autre part, les coûts d’approvisionnement en matières premières des bioproduits risquent aussi
d’être volatils, puisqu’ils sont fabriqués à partir de matières premières biologiques dont les
rendements et la composition peuvent varier. Les bioraffineries devront donc faire face à une
pression importante au niveau de leurs marges de profit.
Plusieurs stratégies d’atténuation du risque de la volatilité du marché peuvent être utilisées [56].
Les approches classiques réduisent le risque à court-terme en le transférant à une tierce partie,
soit le client, le fournisseur de matières premières, par la signature de contrats à plus long terme,
ou une institution financière, par le biais d’instruments financiers. Les approches alternatives
consistent à accepter ce risque et à tenter de réduire son exposition à long terme en minimisant la
consommation de matières premières volatiles : par une amélioration de l’efficacité
opérationnelle, en sécurisant une partie de l’approvisionnement et des ventes par une intégration
verticale des activités ou une entente avec des partenaires, ou bien en exploitant la flexibilité de la
chaîne logistique.
La Figure 2.5 résume les différentes stratégies possibles d’atténuation du risque de la volatilité du
marché. Tel que souligné par la firme PricewaterhouseCoopers [90], seule une approche robuste
et intégrée utilisant un portefeuille de stratégies est susceptible de réussir à réduire l’exposition et
les impacts du risque de la volatilité du marché. Ces stratégies sont brièvement discutées dans les
sous-sections suivantes. Elles sont davantage expliquées dans l’article en annexe A.
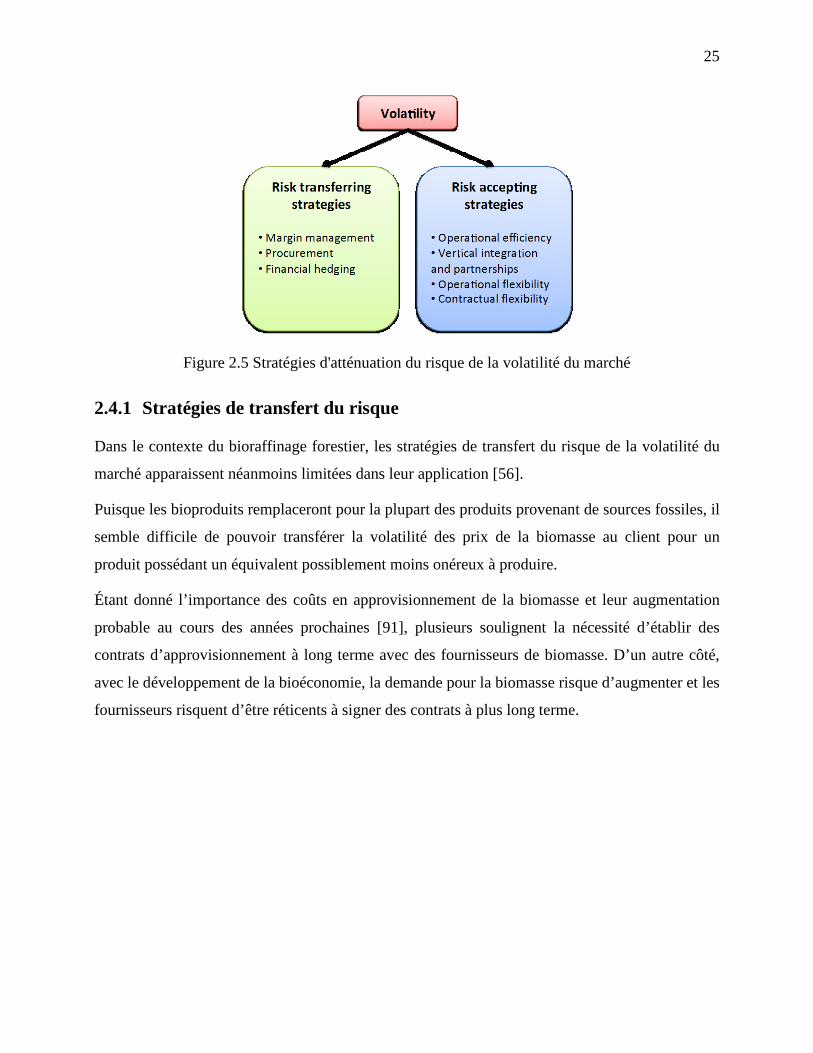
25
Figure 2.5 Stratégies d'atténuation du risque de la volatilité du marché
2.4.1 Stratégies de transfert du risque
Dans le contexte du bioraffinage forestier, les stratégies de transfert du risque de la volatilité du
marché apparaissent néanmoins limitées dans leur application [56].
Puisque les bioproduits remplaceront pour la plupart des produits provenant de sources fossiles, il
semble difficile de pouvoir transférer la volatilité des prix de la biomasse au client pour un
produit possédant un équivalent possiblement moins onéreux à produire.
Étant donné l’importance des coûts en approvisionnement de la biomasse et leur augmentation
probable au cours des années prochaines [91], plusieurs soulignent la nécessité d’établir des
contrats d’approvisionnement à long terme avec des fournisseurs de biomasse. D’un autre côté,
avec le développement de la bioéconomie, la demande pour la biomasse risque d’augmenter et les
fournisseurs risquent d’être réticents à signer des contrats à plus long terme.
26
Barbaro & Bagajewicz [92] ainsi que Park et al. [93] montrent à l’aide de modèles de
planification que l’utilisation d’outils financiers peut aider à réduire le risque lié à la volatilité du
marché dans le cadre des opérations de raffinage. Cependant, l’approvisionnement en biomasse
(copeaux de bois, résidus forestiers et agricoles) est généralement fait de façon locale, et il
n’existe pas encore de commerce international et d’outils financiers reliés à ces matières
premières. De plus, l’achat de matières premières (utilisées pour la production de biens) par le
biais de produits financiers dérivés est souvent limité dans son utilité puisque les producteurs ont
souvent des besoins très spécifiques en ce qui a trait à la qualité de la matière première et aux
conditions de livraison [90].
2.4.2 Stratégies d’acceptation du risque
2.4.2.1 Efficacité opérationnelle
En améliorant l’efficacité opérationnelle, moins d’intrants volatils sont utilisés, réduisant par le
fait même l’exposition au risque de volatilité de l’approvisionnement. Les efforts d’amélioration
de l’efficacité sont particulièrement importants pour l’industrie des procédés, dont fait partie le
bioraffinage, étant donné les quantités considérables de matière première et d’énergie impliquées
dans le processus de fabrication. Or, l’industrie rivale du bioraffinage, celle basée sur le pétrole, a
été grandement optimisée au cours du dernier siècle. En ce sens, l’efficacité opérationnelle est
souvent considérée comme une condition préalable au bioraffinage, d’où l’importance
d’optimiser la chaîne logistique.
2.4.2.2 Intégration verticale et partenariats
Il ne fait aucun doute que l’intégration verticale et les partenariats seront essentiels pour le
développement du bioraffinage [94, 95]. L’approvisionnement en matières premières peut être
sécurisé par l’acquisition ou la collaboration étroite avec des fournisseurs. De même,
l’acquisition d’un client ou la collaboration avec celui-ci peut aider une bioraffinerie à
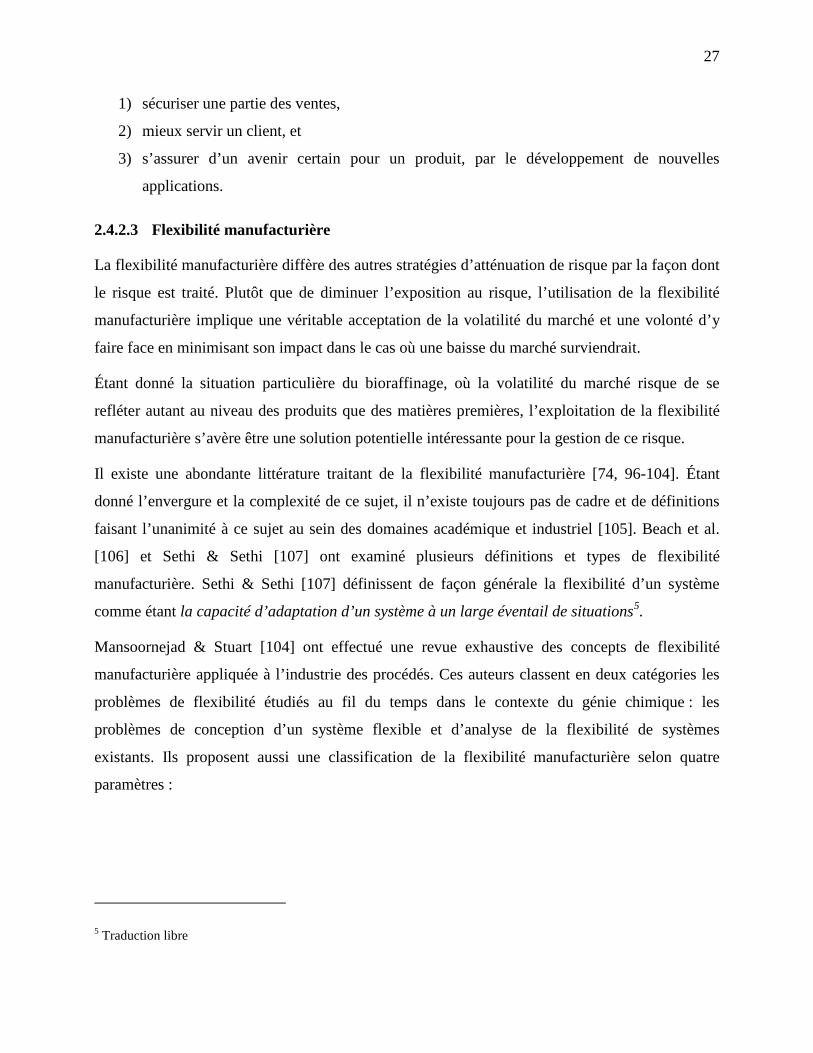
27
1) sécuriser une partie des ventes,
2) mieux servir un client, et
3) s’assurer d’un avenir certain pour un produit, par le développement de nouvelles
applications.
2.4.2.3 Flexibilité manufacturière
La flexibilité manufacturière diffère des autres stratégies d’atténuation de risque par la façon dont
le risque est traité. Plutôt que de diminuer l’exposition au risque, l’utilisation de la flexibilité
manufacturière implique une véritable acceptation de la volatilité du marché et une volonté d’y
faire face en minimisant son impact dans le cas où une baisse du marché surviendrait.
Étant donné la situation particulière du bioraffinage, où la volatilité du marché risque de se
refléter autant au niveau des produits que des matières premières, l’exploitation de la flexibilité
manufacturière s’avère être une solution potentielle intéressante pour la gestion de ce risque.
Il existe une abondante littérature traitant de la flexibilité manufacturière [74, 96-104]. Étant
donné l’envergure et la complexité de ce sujet, il n’existe toujours pas de cadre et de définitions
faisant l’unanimité à ce sujet au sein des domaines académique et industriel [105]. Beach et al.
[106] et Sethi & Sethi [107] ont examiné plusieurs définitions et types de flexibilité
manufacturière. Sethi & Sethi [107] définissent de façon générale la flexibilité d’un système
comme étant la capacité d’adaptation d’un système à un large éventail de situations5.
Mansoornejad & Stuart [104] ont effectué une revue exhaustive des concepts de flexibilité
manufacturière appliquée à l’industrie des procédés. Ces auteurs classent en deux catégories les
problèmes de flexibilité étudiés au fil du temps dans le contexte du génie chimique : les
problèmes de conception d’un système flexible et d’analyse de la flexibilité de systèmes
existants. Ils proposent aussi une classification de la flexibilité manufacturière selon quatre
paramètres :
5 Traduction libre
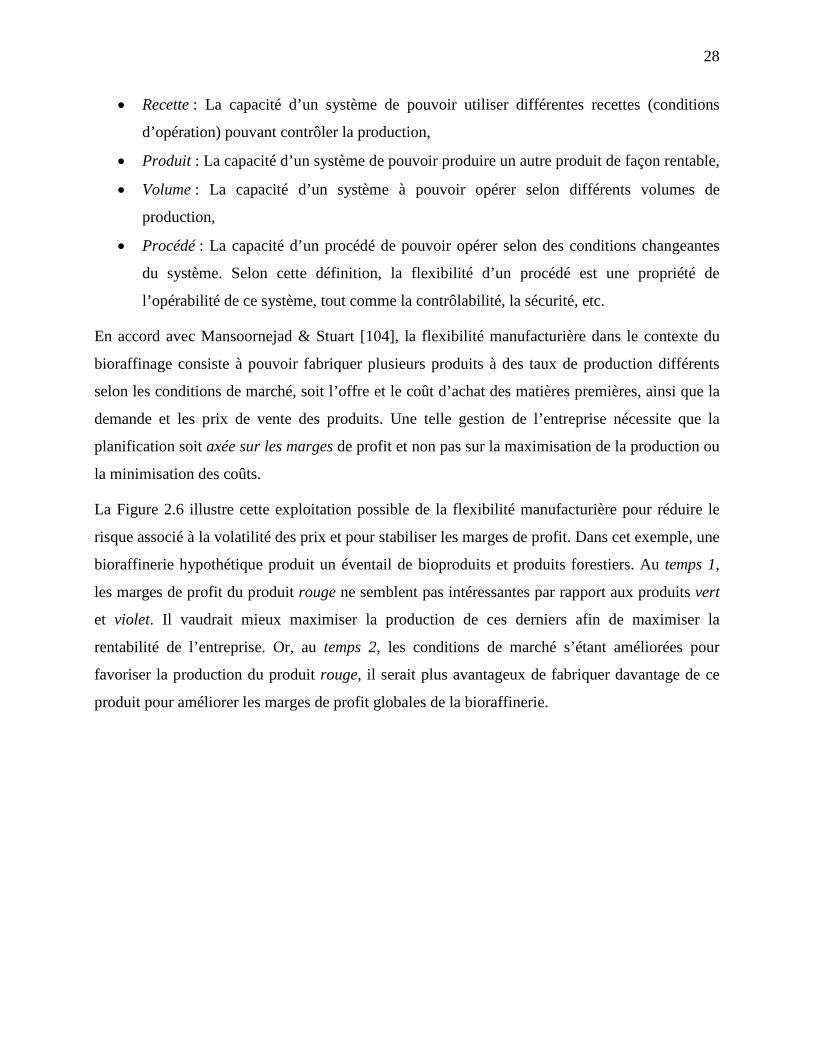
28
• Recette : La capacité d’un système de pouvoir utiliser différentes recettes (conditions
d’opération) pouvant contrôler la production,
• Produit : La capacité d’un système de pouvoir produire un autre produit de façon rentable,
• Volume : La capacité d’un système à pouvoir opérer selon différents volumes de
production,
• Procédé : La capacité d’un procédé de pouvoir opérer selon des conditions changeantes
du système. Selon cette définition, la flexibilité d’un procédé est une propriété de
l’opérabilité de ce système, tout comme la contrôlabilité, la sécurité, etc.
En accord avec Mansoornejad & Stuart [104], la flexibilité manufacturière dans le contexte du
bioraffinage consiste à pouvoir fabriquer plusieurs produits à des taux de production différents
selon les conditions de marché, soit l’offre et le coût d’achat des matières premières, ainsi que la
demande et les prix de vente des produits. Une telle gestion de l’entreprise nécessite que la
planification soit axée sur les marges de profit et non pas sur la maximisation de la production ou
la minimisation des coûts.
La Figure 2.6 illustre cette exploitation possible de la flexibilité manufacturière pour réduire le
risque associé à la volatilité des prix et pour stabiliser les marges de profit. Dans cet exemple, une
bioraffinerie hypothétique produit un éventail de bioproduits et produits forestiers. Au temps 1,
les marges de profit du produit rouge ne semblent pas intéressantes par rapport aux produits vert
et violet. Il vaudrait mieux maximiser la production de ces derniers afin de maximiser la
rentabilité de l’entreprise. Or, au temps 2, les conditions de marché s’étant améliorées pour
favoriser la production du produit rouge, il serait plus avantageux de fabriquer davantage de ce
produit pour améliorer les marges de profit globales de la bioraffinerie.
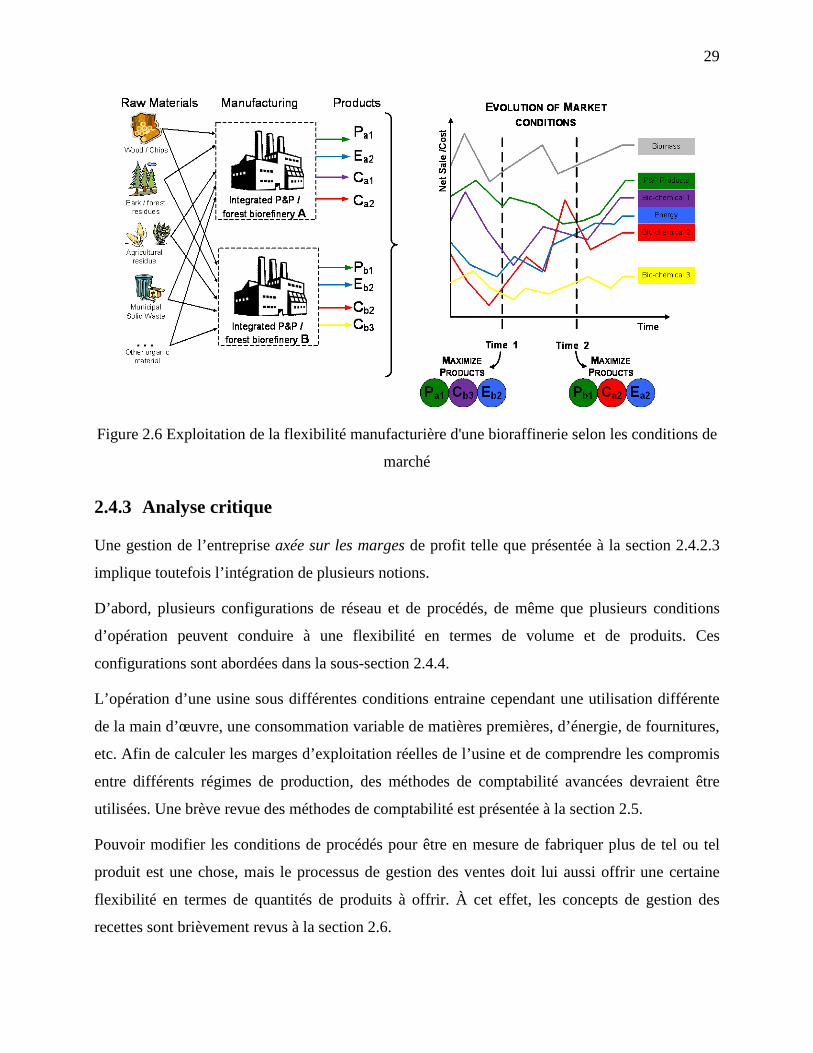
29
Figure 2.6 Exploitation de la flexibilité manufacturière d'une bioraffinerie selon les conditions de
marché
2.4.3 Analyse critique
Une gestion de l’entreprise axée sur les marges de profit telle que présentée à la section 2.4.2.3
implique toutefois l’intégration de plusieurs notions.
D’abord, plusieurs configurations de réseau et de procédés, de même que plusieurs conditions
d’opération peuvent conduire à une flexibilité en termes de volume et de produits. Ces
configurations sont abordées dans la sous-section 2.4.4.
L’opération d’une usine sous différentes conditions entraine cependant une utilisation différente
de la main d’œuvre, une consommation variable de matières premières, d’énergie, de fournitures,
etc. Afin de calculer les marges d’exploitation réelles de l’usine et de comprendre les compromis
entre différents régimes de production, des méthodes de comptabilité avancées devraient être
utilisées. Une brève revue des méthodes de comptabilité est présentée à la section 2.5.
Pouvoir modifier les conditions de procédés pour être en mesure de fabriquer plus de tel ou tel
produit est une chose, mais le processus de gestion des ventes doit lui aussi offrir une certaine
flexibilité en termes de quantités de produits à offrir. À cet effet, les concepts de gestion des
recettes sont brièvement revus à la section 2.6.
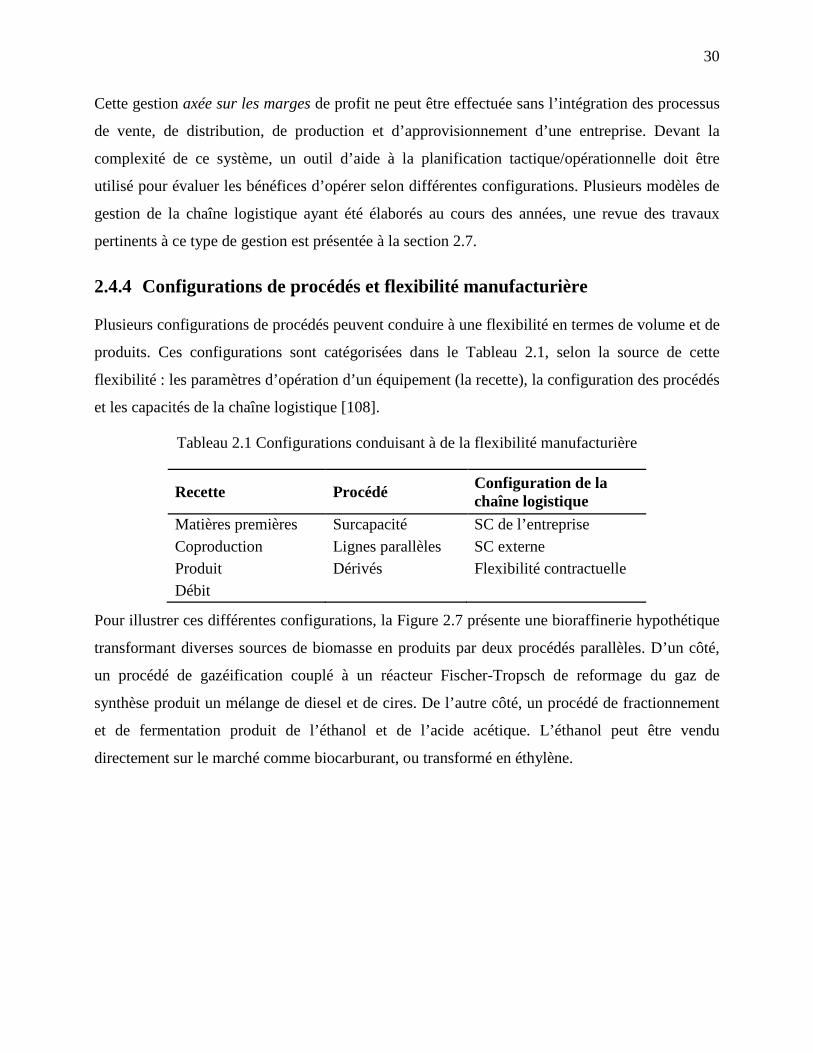
30
Cette gestion axée sur les marges de profit ne peut être effectuée sans l’intégration des processus
de vente, de distribution, de production et d’approvisionnement d’une entreprise. Devant la
complexité de ce système, un outil d’aide à la planification tactique/opérationnelle doit être
utilisé pour évaluer les bénéfices d’opérer selon différentes configurations. Plusieurs modèles de
gestion de la chaîne logistique ayant été élaborés au cours des années, une revue des travaux
pertinents à ce type de gestion est présentée à la section 2.7.
2.4.4 Configurations de procédés et flexibilité manufacturière
Plusieurs configurations de procédés peuvent conduire à une flexibilité en termes de volume et de
produits. Ces configurations sont catégorisées dans le Tableau 2.1, selon la source de cette
flexibilité : les paramètres d’opération d’un équipement (la recette), la configuration des procédés
et les capacités de la chaîne logistique [108].
Tableau 2.1 Configurations conduisant à de la flexibilité manufacturière
Recette Procédé Configuration de la chaîne logistique
Matières premières Surcapacité SC de l’entreprise Coproduction Lignes parallèles SC externe Produit Dérivés Flexibilité contractuelle Débit
Pour illustrer ces différentes configurations, la Figure 2.7 présente une bioraffinerie hypothétique
transformant diverses sources de biomasse en produits par deux procédés parallèles. D’un côté,
un procédé de gazéification couplé à un réacteur Fischer-Tropsch de reformage du gaz de
synthèse produit un mélange de diesel et de cires. De l’autre côté, un procédé de fractionnement
et de fermentation produit de l’éthanol et de l’acide acétique. L’éthanol peut être vendu
directement sur le marché comme biocarburant, ou transformé en éthylène.
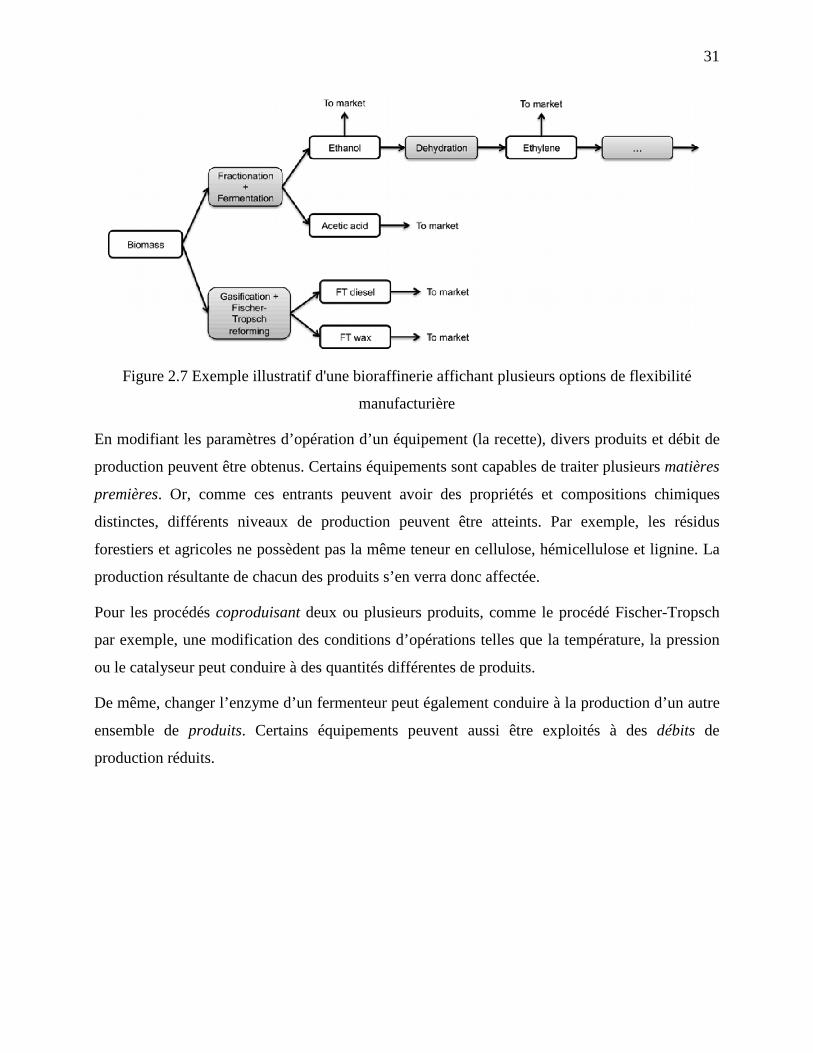
31
Figure 2.7 Exemple illustratif d'une bioraffinerie affichant plusieurs options de flexibilité
manufacturière
En modifiant les paramètres d’opération d’un équipement (la recette), divers produits et débit de
production peuvent être obtenus. Certains équipements sont capables de traiter plusieurs matières
premières. Or, comme ces entrants peuvent avoir des propriétés et compositions chimiques
distinctes, différents niveaux de production peuvent être atteints. Par exemple, les résidus
forestiers et agricoles ne possèdent pas la même teneur en cellulose, hémicellulose et lignine. La
production résultante de chacun des produits s’en verra donc affectée.
Pour les procédés coproduisant deux ou plusieurs produits, comme le procédé Fischer-Tropsch
par exemple, une modification des conditions d’opérations telles que la température, la pression
ou le catalyseur peut conduire à des quantités différentes de produits.
De même, changer l’enzyme d’un fermenteur peut également conduire à la production d’un autre
ensemble de produits. Certains équipements peuvent aussi être exploités à des débits de
production réduits.
32
Différents niveaux de flexibilité manufacturière peuvent aussi être obtenus par la configuration
générale des procédés de production. Avec les années ou par conception, une usine peut avoir des
lignes parallèles de production, permettant de produire divers produits à partir des mêmes
matières premières. Par exemple, une bioraffinerie peut avoir plusieurs fermenteurs et unités de
séparation pour la production d’éthanol ou d’autres produits. La Figure 2.7 montre un autre type
de configuration parallèle, où la biomasse peut être acheminée à deux procédés complètement
distincts, soit la ligne de gazéification ou de fractionnement.
Afin de contrôler le volume de production, une usine peut avoir un excès de capacité de
production. Une usine ayant la possibilité de produire des dérivés peut aussi contrôler son volume
de production en vendant leur intermédiaire directement sur le marché, ou en le transformant
davantage en produit à valeur ajouté.
D’autres opportunités de flexibilité manufacturière sont également possibles au niveau de la
chaîne logistique. Les commandes d’un produit spécifique peuvent être remplies à partir de
plusieurs usines de l’entreprise (SC interne) ou même sous-traitées à un concurrent (SC externe).
Pour ce qui est des ventes, une entreprise peut avoir des clauses contractuelles spécifiques qui
offrent au fabricant une certaine flexibilité de fabrication dans le temps, par exemple en
proposant des options de report de production.
Malgré toutes les options de flexibilité qu’une usine puisse avoir, le procédé central doit
généralement être opéré à un taux de production généralement près de la capacité maximale pour
être rentable, à cause des coûts d’investissement élevés pour les équipements [14].
2.5 Modélisation des coûts d’opération
Deux approches de comptabilité sont généralement utilisées par les gestionnaires d’usines: la
comptabilité générale, utilisée plutôt à des fins financières et préparée pour les intervenants
externes à l’entreprise (ex. les actionnaires), et la comptabilité analytique (ou de gestion), utilisée
pour la prise de décision, la planification, le contrôle et l’évaluation de la performance interne de
l’entreprise. Pour les besoins de cette thèse, la revue de littérature se penche plus précisément sur
la comptabilité analytique.
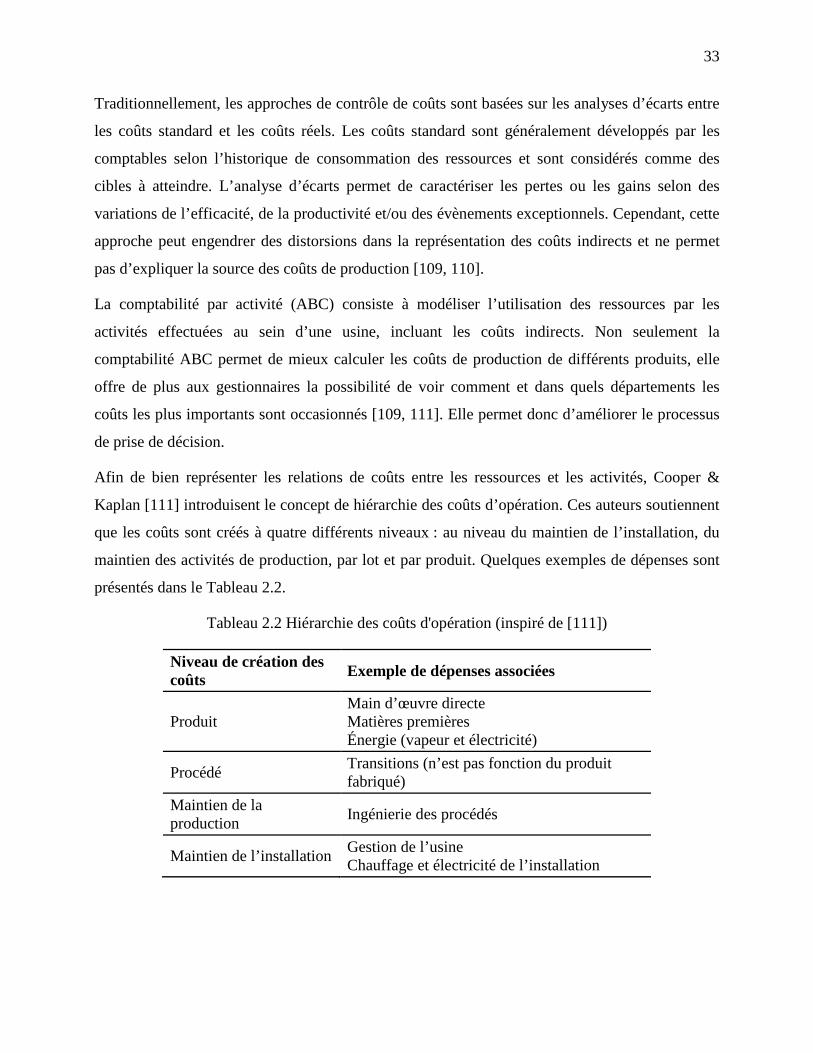
33
Traditionnellement, les approches de contrôle de coûts sont basées sur les analyses d’écarts entre
les coûts standard et les coûts réels. Les coûts standard sont généralement développés par les
comptables selon l’historique de consommation des ressources et sont considérés comme des
cibles à atteindre. L’analyse d’écarts permet de caractériser les pertes ou les gains selon des
variations de l’efficacité, de la productivité et/ou des évènements exceptionnels. Cependant, cette
approche peut engendrer des distorsions dans la représentation des coûts indirects et ne permet
pas d’expliquer la source des coûts de production [109, 110].
La comptabilité par activité (ABC) consiste à modéliser l’utilisation des ressources par les
activités effectuées au sein d’une usine, incluant les coûts indirects. Non seulement la
comptabilité ABC permet de mieux calculer les coûts de production de différents produits, elle
offre de plus aux gestionnaires la possibilité de voir comment et dans quels départements les
coûts les plus importants sont occasionnés [109, 111]. Elle permet donc d’améliorer le processus
de prise de décision.
Afin de bien représenter les relations de coûts entre les ressources et les activités, Cooper &
Kaplan [111] introduisent le concept de hiérarchie des coûts d’opération. Ces auteurs soutiennent
que les coûts sont créés à quatre différents niveaux : au niveau du maintien de l’installation, du
maintien des activités de production, par lot et par produit. Quelques exemples de dépenses sont
présentés dans le Tableau 2.2.
Tableau 2.2 Hiérarchie des coûts d'opération (inspiré de [111])
Niveau de création des coûts Exemple de dépenses associées
Produit Main d’œuvre directe Matières premières Énergie (vapeur et électricité)
Procédé Transitions (n’est pas fonction du produit fabriqué)
Maintien de la production Ingénierie des procédés
Maintien de l’installation Gestion de l’usine Chauffage et électricité de l’installation
34
Laflamme-Mayer et al. [17, 112, 113] présentent une approche de modélisation des coûts axée
sur les opérations inspirée de la comptabilité par activité. Basée sur la compréhension du
procédé, cette approche permet une meilleure caractérisation des coûts directs en fonction des
conditions d’opération. Elle serait plus adaptée pour l’application des principes de comptabilité
ABC à l’industrie des procédés. Les auteurs affirment aussi que l’utilisation d’informations plus
précises à propos de la production facilite l’application de stratégies plus rentables de gestion de
la production.
Korbel [114] développe une méthode d’analyse en ligne des coûts manufacturiers pour éclairer le
processus de prise de décision. Cette méthode utilise et réconcilie en temps réel les données de
procédés et de coût provenant du système de données de l’entreprise. Elle les intègre ensuite à un
modèle de coût inspiré de la comptabilité par activité tel que celui présenté par Laflamme-Mayer
[17] pour calculer les coûts de production de différents régimes d’opération.
Dans le contexte de l’industrie forestière, l’équipe de Uusitalo et al. a développé des modèles de
comptabilité ABC pour les opérations de récolte du bois [115], pour une scierie [116] et pour une
usine Kraft [117].
2.6 Gestion des recettes
Les principes de gestion des recettes (RM) visent à accroître les revenus d’une entreprise par une
gestion active de la demande. Selon Talluri et van Ryzin [118], deux approches de RM peuvent
être utilisées : 1) l’exploitation des différences entre les clients et leur volonté de payer
(segmentation des ventes), et 2) l’utilisation de stratégies de tarification dynamique influençant
activement la demande. La séparation des clients en plusieurs segments peut entre autres
s’effectuer selon leur importance stratégique pour l’entreprise, leurs habitudes d’achat et/ou leur
rentabilité moyenne.
En bref, la RM est un processus d’acceptation et de refus de la demande qui intègre les fonctions
financières, opérationnelles et de marketing pour maximiser les revenus provenant d’une capacité
de production donnée [119]. L’application des principes de RM peut avoir un impact significatif
sur la rentabilité d’une entreprise lorsqu’une ou plusieurs des conditions suivantes existent [15] :
35
• la valeur d’un produit varie selon les différents segments de marché,
• le produit est très périssable, ou la capacité de production inutilisée peut être perdue,
• la demande montre des pics saisonniers ou autres pics, et ou
• le produit peut être à la fois vendu en bloc6 ou sur le marché au comptant7.
Jusqu’à présent, les concepts de RM ont surtout été utilisés dans les industries de services et dans
le commerce de détail. Ils commencent cependant à être de plus en plus appliqués dans l’industrie
manufacturière, comme le montrent certaines études [120, 121]. Selon un sondage effectué
auprès de dirigeants de l’industrie des procédés [122], l’application de concepts de gestion des
recettes est considérée comme étant assez importante pour assurer le succès futur de leur
entreprise. Les méthodes combinant la gestion de la capacité de production avec la gestion des
prix de vente semblent les plus prometteuses [122].
En pratique, deux types de demande peuvent être distinguées pour un produit de l’industrie des
procédés : une demande contractuelle, qui doit être obligatoirement remplie, et une demande au
comptant8, spécifique à chaque transaction et qu’il n’est pas nécessaire de remplir. Une entreprise
peut donc activement prendre des décisions de vente par l’acceptation ou le refus de demandes de
vente au comptant [123].
Les opportunités de RM semblent multiples pour le bioraffinage. En plus de la distinction des
ventes contractuelles et au comptant, certains bioproduits comme les biomatériaux et les produits
chimiques de spécialité peuvent être vendus dans plusieurs segments de marché. Par exemple, la
lignine peut être vendue comme produit chimique à valeur ajoutée ou comme carburant pour
chaudières.
Le caractère « vert » des bioproduits offre aussi la possibilité de pouvoir segmenter les ventes.
Certains clients peuvent être prêts à payer une prime pour un produit « vert », et ce même si
celui-ci est un produit chimique de base.
6 Traduction de l’anglais bulk sale
7 Traduction de l’anglais spot market
8 Traduction de l’anglais spot demand
36
De plus, les possibilités de flexibilité manufacturière au sein d’une usine offrent l’opportunité de
varier les débits de production des différents produits. La demande en bioénergie varie aussi
selon les saisons.
2.7 Planification tactique et opérationnelle dans l’industrie des procédés
La littérature sur les modèles de planification tactique et opérationnelle appliquée à l’industrie
des procédés est particulièrement vaste. Plusieurs revues de la littérature et perspectives
témoignent justement de l’intérêt pour ce domaine de recherche [21-25, 29, 124-132].
De même, de nombreux travaux liés à la conception et à l’opération des réseaux logistiques du
domaine des pâtes et papiers ont été réalisés par les groupes de recherche associés à D’amours et
Rönnqvist [36, 133-141]. Afin de limiter la longueur de cette section, l’accent est mis sur
quelques modèles de planification développés pour l’industrie des procédés et pour lesquels sont
intégrés des concepts de flexibilité manufacturière et d’intégration de l’approvisionnement, de la
production et des ventes.
2.7.1 Modèles de planification intégrés
Laflamme-Mayer et al. [17] introduisent un cadre de planification hiérarchique et « en ligne »
pour une usine de production de pâte. Au niveau tactique, un modèle agrégé de planification de la
capacité est utilisé pour aligner l’approvisionnement en fibre et les prévisions de demande en
pâte. Au niveau opérationnel, un modèle de planification des campagnes de production et
d’ordonnancement des commandes est utilisé pour maximiser la rentabilité à court terme.
À l’aide de ce cadre de planification, Laflamme-Mayer [17] montre comment l’exploitation de la
flexibilité de l’alimentation en copeaux d’essences de bois différentes peut soutenir des stratégies
plus efficaces d’approvisionnement en fibre. Il démontre aussi qu’en faisant varier la capacité de
production, il est possible d’atteindre un alignement plus rentable entre la production et la
demande.
37
Feng et al. [142] ont développé un modèle de planification tactique intégrant
l’approvisionnement, la production, la distribution et les ventes. Une étude de cas appliquée à un
producteur de panneaux à lamelles orientées (OSB) montre les avantages à utiliser un tel modèle
pour aligner la capacité de production et la demande contractuelle et du marché au comptant. Ils
concluent qu’une approche intégrée offre des performances supérieures dans tous les cas.
Cependant, les bénéfices de cette approche semblent augmenter à mesure que le marché devient
de plus en plus contraignant à cause d’une baisse des prix de vente de produits.
Kannegiesser et al. [123, 143, 144] ont développé un modèle de planification intégrée au niveau
tactique de décision pour un producteur mondial de produits chimiques de base. Ce modèle
incorpore des aspects liés au commerce international tels que les taux de change ainsi que le
temps de transport et de transit des marchandises. Ils mettent entres autres l’accent sur la
modélisation des contrats et des ventes au comptant.
Les études de cas de Kannegiesser et al. [123, 143, 144] et Feng et al. [142] démontrent toutes
deux que les variations au niveau des coûts de production, de transport et de distribution ont un
impact moins significatif sur la rentabilité que les fluctuations au niveau des prix des matières
premières et des produits, ainsi que de la demande.
2.7.2 Intégration de la flexibilité manufacturière
Yun et al. [102] proposent un modèle d’optimisation des opérations d’un procédé biochimique
enzymatique flexible pouvant traiter plusieurs sortes de matières premières et pouvant fabriquer
différents produits biochimiques. Ils concluent que les bioraffineries pourraient diminuer la
variabilité de leur profit en diversifiant leur portefeuille de produits et matières premières, ou en
achetant des contrats à termes standardisés9.
9 Traduction de l’anglais de futures contracts
38
Plus la flexibilité d’un système augmente, meilleures sont les perspectives de rentabilité sous
différentes conditions de marché. Or, il existe un compromis entre les coûts d’investissement et le
niveau de flexibilité d’un procédé. À cet effet, Mansoornejad et al. [74, 103, 104, 145, 146]
proposent une méthodologie de conception de la chaîne logistique d’une bioraffinerie. Cette
méthodologie permet notamment de cibler le niveau de flexibilité souhaité d’un système lors de
sa conception afin d’atténuer les risques du marché en tenant compte du compromis
flexibilité/investissement.
2.8 Synthèse de la revue de littérature
L’industrie papetière produit, en grande partie, des produits de base. L’objectif de la majorité des
entreprises de ce domaine est d’être fabricant à faible coût10. Du coup, les administrateurs
exercent des politiques de gestion axées principalement sur la maximisation de l’utilisation de la
capacité de production [17]. Or, comme les récents résultats financiers des entreprises forestières,
les arrêts de production et les fermetures d’usines en témoignent, ces façons de faire ne semblent
pas adaptées lorsque les conditions économiques sont particulièrement instables. Il est nécessaire
de modifier la manière d’opérer.
En fait, cette compréhension de la dynamique des coûts à l’échelle de la chaîne logistique est
erronée : la maximisation de la production afin de répartir les coûts fixes sur une plus grande
production ne mène pas toujours à une minimisation des coûts de production. Il est nécessaire de
prendre en compte tous les cycles de la chaîne logistique (approvisionnement, production,
distribution et vente) afin de maximiser les marges et la rentabilité de l’entreprise. Une meilleure
utilisation de la flexibilité des actifs et de la chaîne logistique rendrait les entreprises plus agiles
et aptes à répondre efficacement aux conditions changeantes de marché. Ce changement dans les
politiques d’opération représente tout un défi pour l’industrie forestière qui devra se défaire de la
mentalité d’entreprise axée sur les produits de base [11].
En d’autres mots, pour l’industrie forestière, le bioraffinage consiste à faire quelque chose de
différent, soit la fabrication de nouveaux produits, mais aussi différemment, soit par une meilleure
gestion de la chaîne logistique.
10 Traduction de l’anglais de low-cost producer
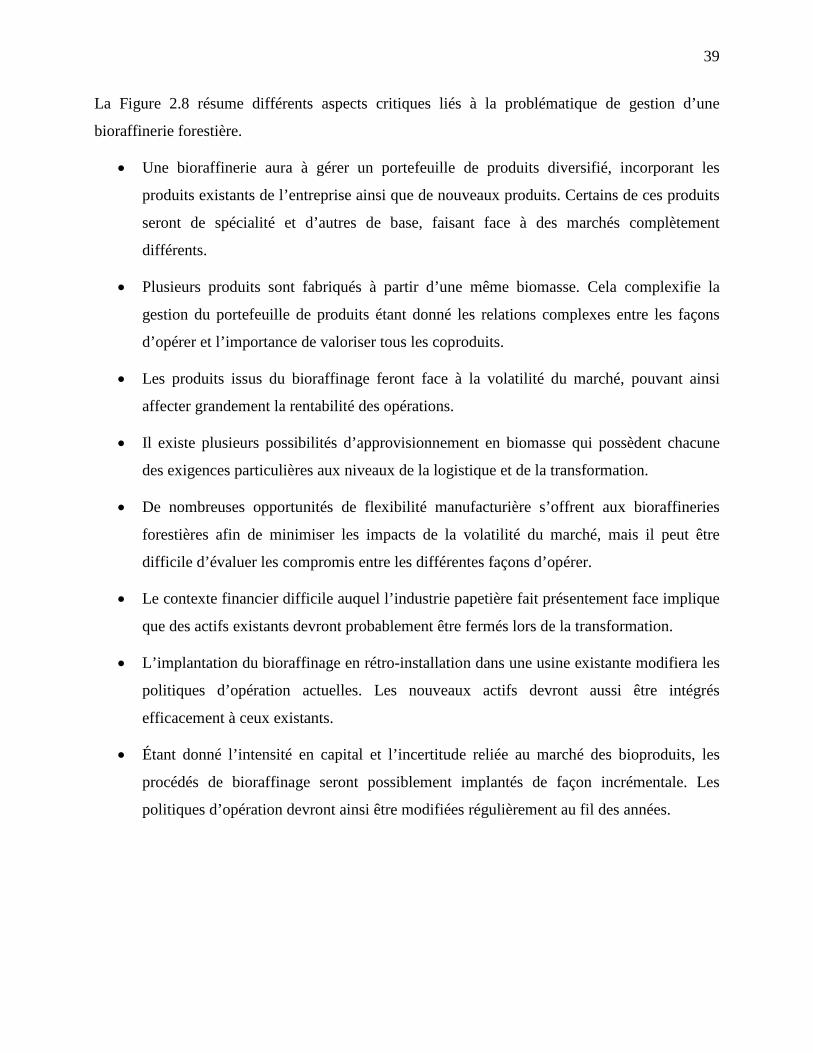
39
La Figure 2.8 résume différents aspects critiques liés à la problématique de gestion d’une
bioraffinerie forestière.
• Une bioraffinerie aura à gérer un portefeuille de produits diversifié, incorporant les
produits existants de l’entreprise ainsi que de nouveaux produits. Certains de ces produits
seront de spécialité et d’autres de base, faisant face à des marchés complètement
différents.
• Plusieurs produits sont fabriqués à partir d’une même biomasse. Cela complexifie la
gestion du portefeuille de produits étant donné les relations complexes entre les façons
d’opérer et l’importance de valoriser tous les coproduits.
• Les produits issus du bioraffinage feront face à la volatilité du marché, pouvant ainsi
affecter grandement la rentabilité des opérations.
• Il existe plusieurs possibilités d’approvisionnement en biomasse qui possèdent chacune
des exigences particulières aux niveaux de la logistique et de la transformation.
• De nombreuses opportunités de flexibilité manufacturière s’offrent aux bioraffineries
forestières afin de minimiser les impacts de la volatilité du marché, mais il peut être
difficile d’évaluer les compromis entre les différentes façons d’opérer.
• Le contexte financier difficile auquel l’industrie papetière fait présentement face implique
que des actifs existants devront probablement être fermés lors de la transformation.
• L’implantation du bioraffinage en rétro-installation dans une usine existante modifiera les
politiques d’opération actuelles. Les nouveaux actifs devront aussi être intégrés
efficacement à ceux existants.
• Étant donné l’intensité en capital et l’incertitude reliée au marché des bioproduits, les
procédés de bioraffinage seront possiblement implantés de façon incrémentale. Les
politiques d’opération devront ainsi être modifiées régulièrement au fil des années.
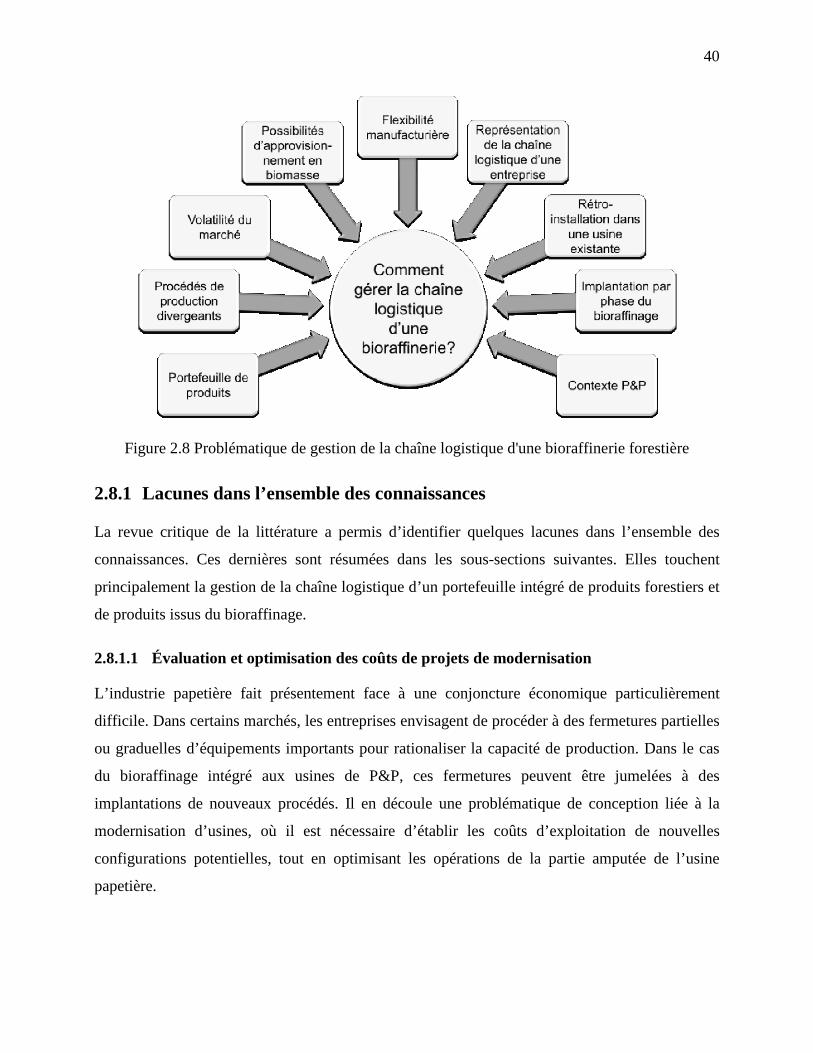
40
Figure 2.8 Problématique de gestion de la chaîne logistique d'une bioraffinerie forestière
2.8.1 Lacunes dans l’ensemble des connaissances
La revue critique de la littérature a permis d’identifier quelques lacunes dans l’ensemble des
connaissances. Ces dernières sont résumées dans les sous-sections suivantes. Elles touchent
principalement la gestion de la chaîne logistique d’un portefeuille intégré de produits forestiers et
de produits issus du bioraffinage.
2.8.1.1 Évaluation et optimisation des coûts de projets de modernisation
L’industrie papetière fait présentement face à une conjoncture économique particulièrement
difficile. Dans certains marchés, les entreprises envisagent de procéder à des fermetures partielles
ou graduelles d’équipements importants pour rationaliser la capacité de production. Dans le cas
du bioraffinage intégré aux usines de P&P, ces fermetures peuvent être jumelées à des
implantations de nouveaux procédés. Il en découle une problématique de conception liée à la
modernisation d’usines, où il est nécessaire d’établir les coûts d’exploitation de nouvelles
configurations potentielles, tout en optimisant les opérations de la partie amputée de l’usine
papetière.
41
Il existe donc un besoin de développer un cadre d'analyse qui permette de considérer à la fois les
impacts sur les coûts de production et sur la chaîne logistique d’une transformation profonde
d’usine, soit une modernisation impliquant simultanément un désinvestissement dans les activités
actuelles et un investissement dans un nouveau procédé de fabrication. Dans cette optique, une
modélisation des coûts inspirée de la comptabilité ABC peut s’avérer être un outil de gestion
particulièrement adapté pour ce genre de prise de décision.
2.8.1.2 Cadre de planification pour la gestion des opérations de bioraffinage
Les gestionnaires de bioraffineries forestières auront à gérer un portefeuille élargi de produits
ayant plusieurs interrelations complexes. En raison de la compétition directe des bioproduits avec
les produits pétroliers et du caractère incertain de l’approvisionnement en biomasse, les
bioraffineries feront aussi face à un environnement particulièrement compétitif et dont les prix
seront possiblement volatils.
La flexibilité manufacturière est reconnue comme un moyen efficace pour minimiser les impacts
de la volatilité des marchés. Dans la plupart des études, cette flexibilité est utilisée pour contrôler
les coûts de production. En effet, très peu de publications considèrent une gestion intégrée du
portefeuille de produits, où les taux de production de chacun des produits sont aussi optimisés
selon les conditions de marché afin d’accroître la rentabilité de l’entreprise et de minimiser les
risques liés à la volatilité du marché.
La mise en œuvre d’une stratégie de gestion dite axée sur les marges de profit nécessite
cependant l’application de concepts de SCM innovateurs, de même qu’une réorganisation de la
chaîne logistique en place. De nouveaux modèles de planification intégrés reflétant la capacité
manufacturière de l’usine doivent être développés afin de comprendre et refléter les compromis
entre les cycles d’approvisionnement, de production, de distribution et de vente.
Un des défis reliés à ces nouveaux modèles touche la représentation de la flexibilité
manufacturière. En effet, un tel outil de planification intégrée qui fait le compromis entre revenus
et coûts se doit de permettre à l’utilisateur de bien modéliser les différentes possibilités de
production d’une usine et leurs coûts associés.
42
2.8.2 Hypothèses
L’hypothèse de recherche principale découlant de la problématique présentée à la section 2.8 se
résume ainsi :
L’utilisation d’un cadre de planification axée sur les marges de profit permet à une entreprise
forestière d’améliorer sa stratégie de transformation vers le bioraffinage par une meilleure
évaluation et une meilleure gestion des stratégies de modernisation de l’usine.
Les hypothèses secondaires rattachées à cette hypothèse principale sont les suivantes :
1. Un modèle mathématique de planification intégrée incorporant des concepts inspirés de la
gestion des recettes, de la flexibilité manufacturière et de la comptabilité par activité peut
être développé pour explorer les avantages d’une stratégie d’opération axée sur les marges
de profit.
2. L’utilisation d’une stratégie de gestion axée sur les marges de profit permet à une
entreprise produisant un portefeuille varié de produits forestiers et de produits de
bioraffinage d’accroître sa rentabilité par une meilleure gestion du risque lié à la volatilité
du marché.
3. Un modèle de planification de la chaîne logistique considérant le profit au niveau
tactique/opérationnel permet d’évaluer systématiquement différentes options de
transformation d’une usine existante, telles que la fermeture d’actifs papetiers et
l’implantation graduelle de procédés de bioraffinage.
43
CHAPITRE 3 APPROCHE MÉTHODOLOGIQUE
Pour accomplir de grandes choses il ne suffit pas d'agir il faut
rêver; il ne suffit pas de calculer, il faut croire. »
- Anatole France (1844-1924)
Les projets de recherche en conception de procédés visent à développer des outils ou méthodes
d’aide à la prise de décision : ils sont le pont entre la recherche théorique et les applications
industrielles. Dans cette optique, la recherche par étude de cas s’avère être un outil privilégié.
Elle permet une compréhension des détails d’une problématique industrielle réelle. Elle permet
aussi le développement d’approches pratiques et pertinentes pour l’industrie.
La Figure 3.1 illustre la méthodologie générale qui a été utilisée pour les travaux rapportés dans
cette thèse. Pour la problématique de la transformation d’entreprises forestières en bioraffineries
et la gestion de la nouvelle chaîne logistique ainsi engendrée, l’application à une étude de cas
revêtait donc une importance particulière. De ce fait, ce projet a été effectué en étroite
collaboration avec une entreprise forestière canadienne.
Plusieurs rencontres ont eu lieu au siège social et à différentes usines de cette entreprise. Afin de
récolter des données et de représenter le plus adéquatement possible les processus de l’entreprise,
les responsables des départements suivants ont été rencontrés à maintes reprises :
• contrôle financier (budgets et prise de décision),
• développement de produits,
• ventes,
• service à la clientèle,
• logistique (transport et inventaire),
• approvisionnement en bois, et
• planification tactique et opérationnelle.
44
Ces données et informations ont alors été mises en commun avec une revue des aspects liés à la
planification de la SC du bioraffinage, dans le but de créer le cadre de planification axée sur les
marges de profit ainsi que le modèle associé. Parallèlement, une analyse technico-économique
d’un procédé de bioraffinage intégré à une usine papetière a été incorporée au modèle de
planification.
Le modèle mathématique a ensuite été utilisé dans trois applications distinctes, soit la
planification tactique des opérations forestières, la planification tactique du bioraffinage forestier
et la planification stratégique de projets de transformation d’usines.
La réalisation des différentes études de cas a permis d’améliorer de façon itérative le cadre de
planification. Elle a également permis d’établir des facteurs compétitifs clés reliés à la
planification de la chaîne logistique du bioraffinage.
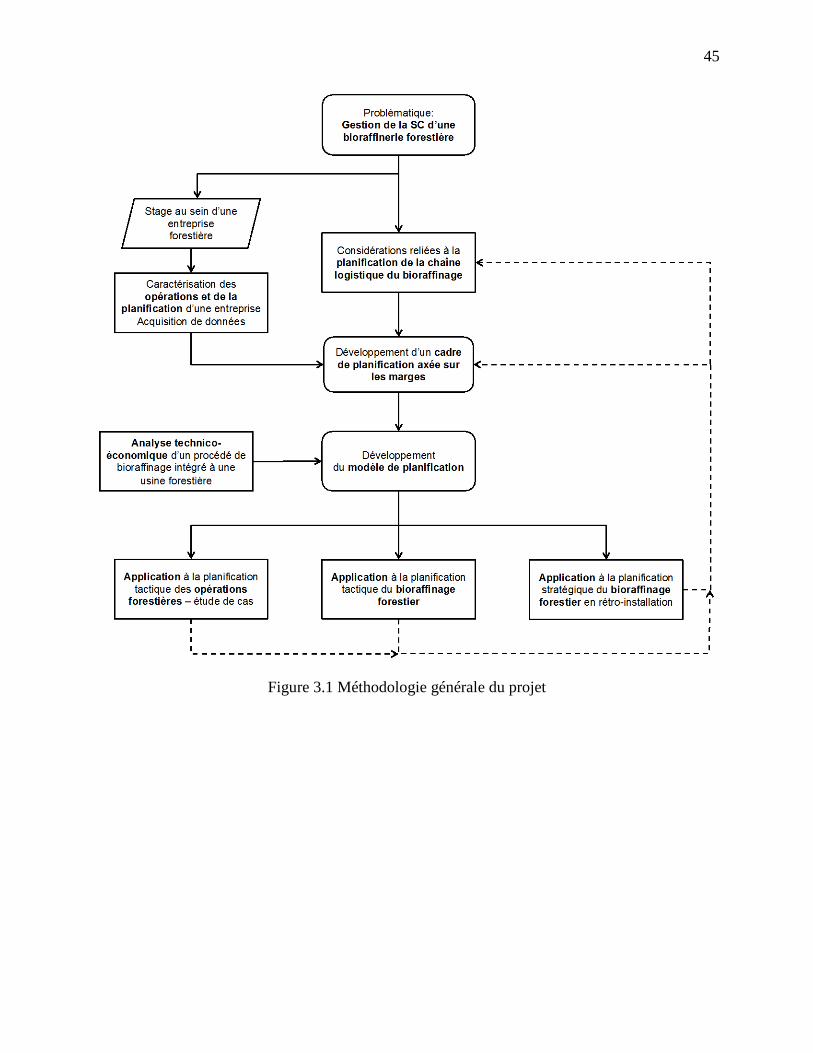
45
Figure 3.1 Méthodologie générale du projet
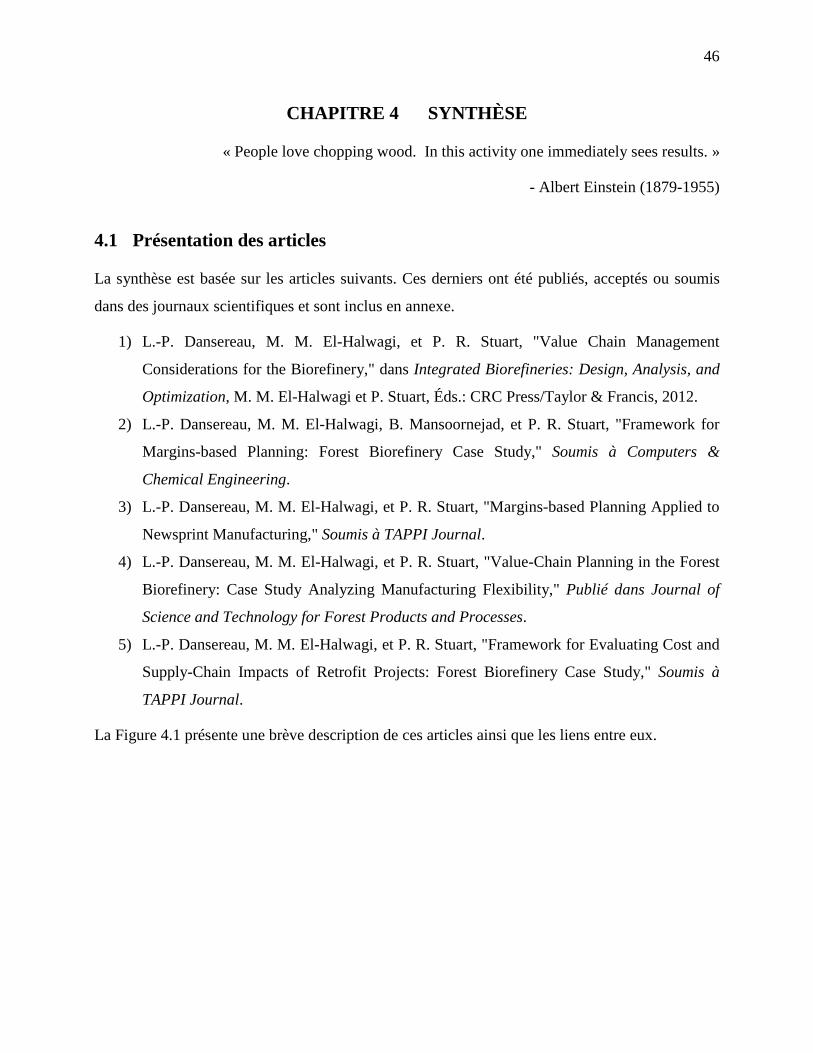
46
CHAPITRE 4 SYNTHÈSE
« People love chopping wood. In this activity one immediately sees results. »
- Albert Einstein (1879-1955)
4.1 Présentation des articles
La synthèse est basée sur les articles suivants. Ces derniers ont été publiés, acceptés ou soumis
dans des journaux scientifiques et sont inclus en annexe.
1) L.-P. Dansereau, M. M. El-Halwagi, et P. R. Stuart, "Value Chain Management
Considerations for the Biorefinery," dans Integrated Biorefineries: Design, Analysis, and
Optimization, M. M. El-Halwagi et P. Stuart, Éds.: CRC Press/Taylor & Francis, 2012.
2) L.-P. Dansereau, M. M. El-Halwagi, B. Mansoornejad, et P. R. Stuart, "Framework for
Margins-based Planning: Forest Biorefinery Case Study," Soumis à Computers &
Chemical Engineering.
3) L.-P. Dansereau, M. M. El-Halwagi, et P. R. Stuart, "Margins-based Planning Applied to
Newsprint Manufacturing," Soumis à TAPPI Journal.
4) L.-P. Dansereau, M. M. El-Halwagi, et P. R. Stuart, "Value-Chain Planning in the Forest
Biorefinery: Case Study Analyzing Manufacturing Flexibility," Publié dans Journal of
Science and Technology for Forest Products and Processes.
5) L.-P. Dansereau, M. M. El-Halwagi, et P. R. Stuart, "Framework for Evaluating Cost and
Supply-Chain Impacts of Retrofit Projects: Forest Biorefinery Case Study," Soumis à
TAPPI Journal.
La Figure 4.1 présente une brève description de ces articles ainsi que les liens entre eux.
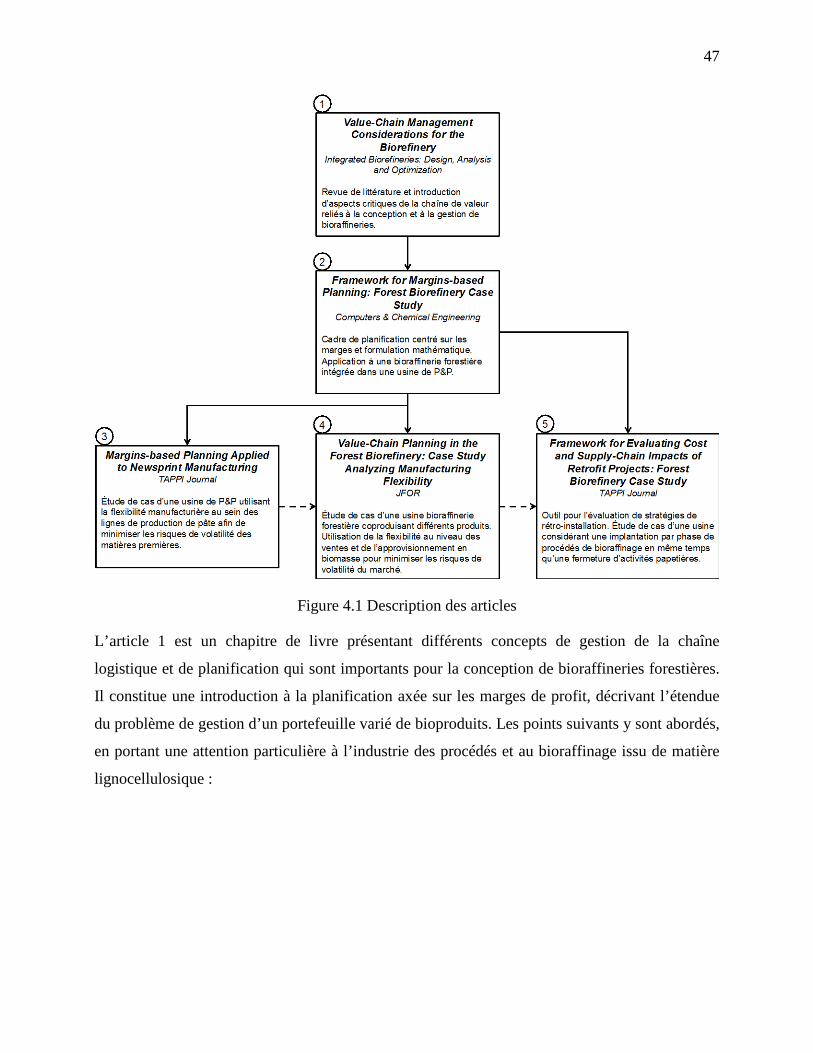
47
Figure 4.1 Description des articles
L’article 1 est un chapitre de livre présentant différents concepts de gestion de la chaîne
logistique et de planification qui sont importants pour la conception de bioraffineries forestières.
Il constitue une introduction à la planification axée sur les marges de profit, décrivant l’étendue
du problème de gestion d’un portefeuille varié de bioproduits. Les points suivants y sont abordés,
en portant une attention particulière à l’industrie des procédés et au bioraffinage issu de matière
lignocellulosique :
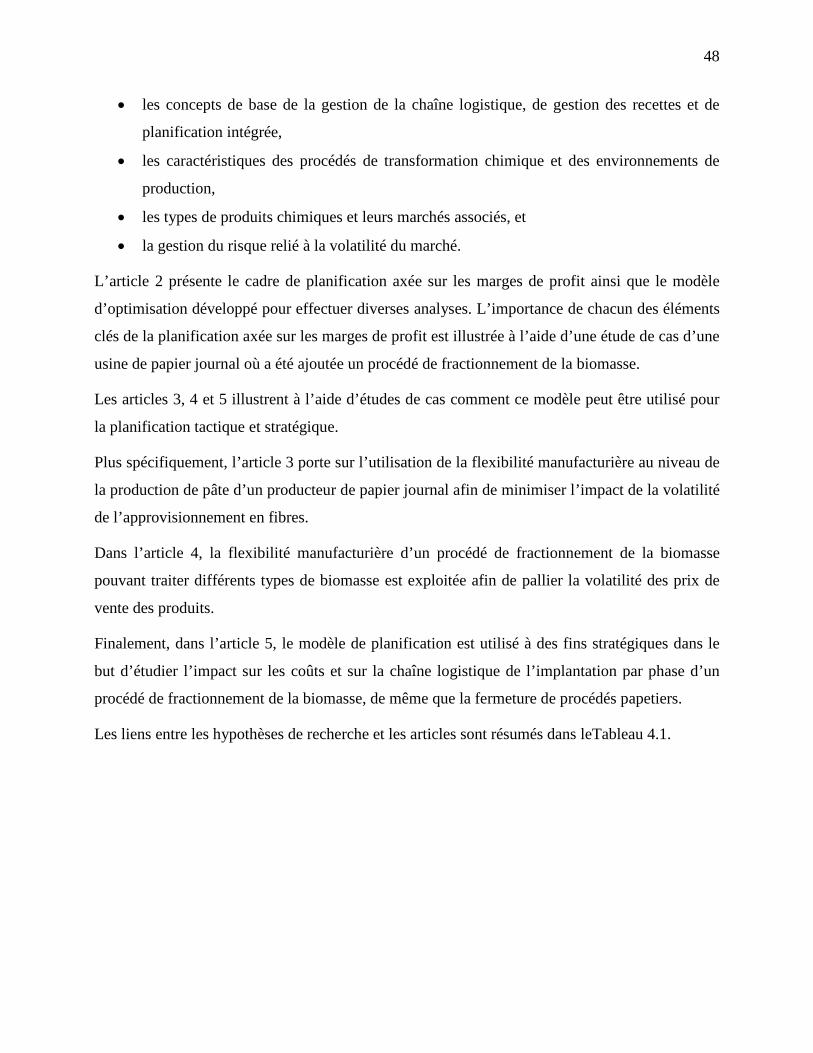
48
• les concepts de base de la gestion de la chaîne logistique, de gestion des recettes et de
planification intégrée,
• les caractéristiques des procédés de transformation chimique et des environnements de
production,
• les types de produits chimiques et leurs marchés associés, et
• la gestion du risque relié à la volatilité du marché.
L’article 2 présente le cadre de planification axée sur les marges de profit ainsi que le modèle
d’optimisation développé pour effectuer diverses analyses. L’importance de chacun des éléments
clés de la planification axée sur les marges de profit est illustrée à l’aide d’une étude de cas d’une
usine de papier journal où a été ajoutée un procédé de fractionnement de la biomasse.
Les articles 3, 4 et 5 illustrent à l’aide d’études de cas comment ce modèle peut être utilisé pour
la planification tactique et stratégique.
Plus spécifiquement, l’article 3 porte sur l’utilisation de la flexibilité manufacturière au niveau de
la production de pâte d’un producteur de papier journal afin de minimiser l’impact de la volatilité
de l’approvisionnement en fibres.
Dans l’article 4, la flexibilité manufacturière d’un procédé de fractionnement de la biomasse
pouvant traiter différents types de biomasse est exploitée afin de pallier la volatilité des prix de
vente des produits.
Finalement, dans l’article 5, le modèle de planification est utilisé à des fins stratégiques dans le
but d’étudier l’impact sur les coûts et sur la chaîne logistique de l’implantation par phase d’un
procédé de fractionnement de la biomasse, de même que la fermeture de procédés papetiers.
Les liens entre les hypothèses de recherche et les articles sont résumés dans leTableau 4.1.
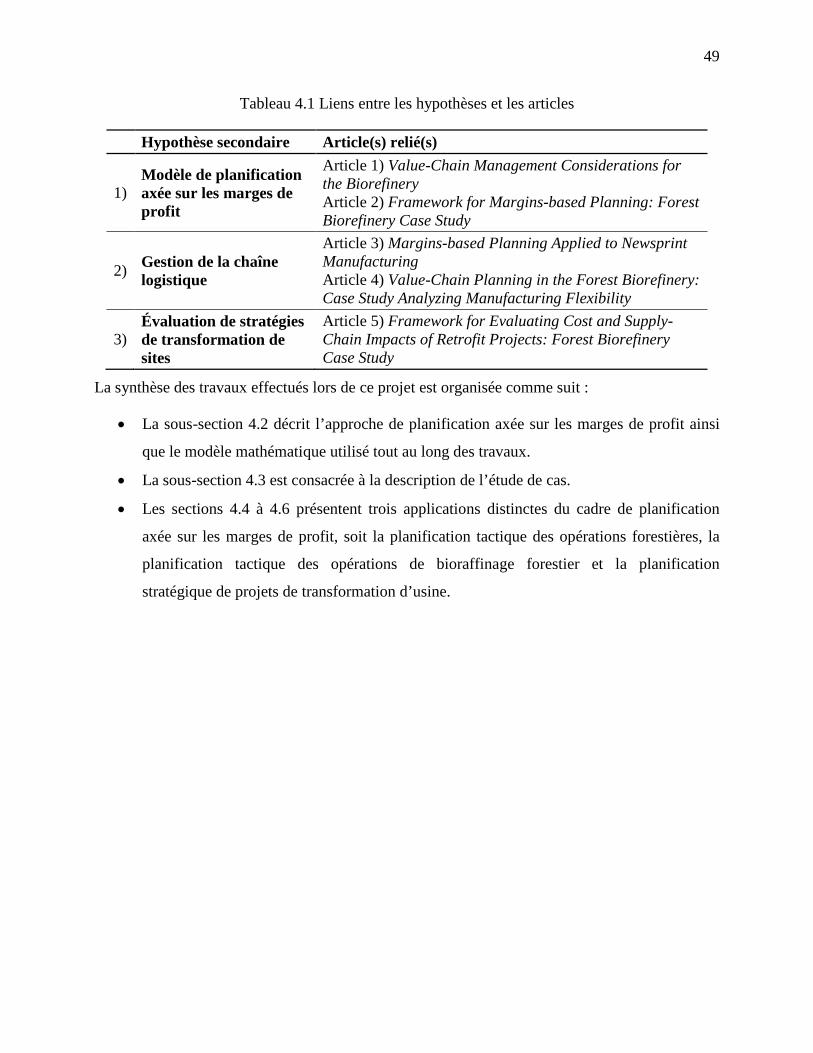
49
Tableau 4.1 Liens entre les hypothèses et les articles
Hypothèse secondaire Article(s) relié(s)
1) Modèle de planification axée sur les marges de profit
Article 1) Value-Chain Management Considerations for the Biorefinery Article 2) Framework for Margins-based Planning: Forest Biorefinery Case Study
2) Gestion de la chaîne logistique
Article 3) Margins-based Planning Applied to Newsprint Manufacturing Article 4) Value-Chain Planning in the Forest Biorefinery: Case Study Analyzing Manufacturing Flexibility
3) Évaluation de stratégies de transformation de sites
Article 5) Framework for Evaluating Cost and Supply-Chain Impacts of Retrofit Projects: Forest Biorefinery Case Study
La synthèse des travaux effectués lors de ce projet est organisée comme suit :
• La sous-section 4.2 décrit l’approche de planification axée sur les marges de profit ainsi
que le modèle mathématique utilisé tout au long des travaux.
• La sous-section 4.3 est consacrée à la description de l’étude de cas.
• Les sections 4.4 à 4.6 présentent trois applications distinctes du cadre de planification
axée sur les marges de profit, soit la planification tactique des opérations forestières, la
planification tactique des opérations de bioraffinage forestier et la planification
stratégique de projets de transformation d’usine.
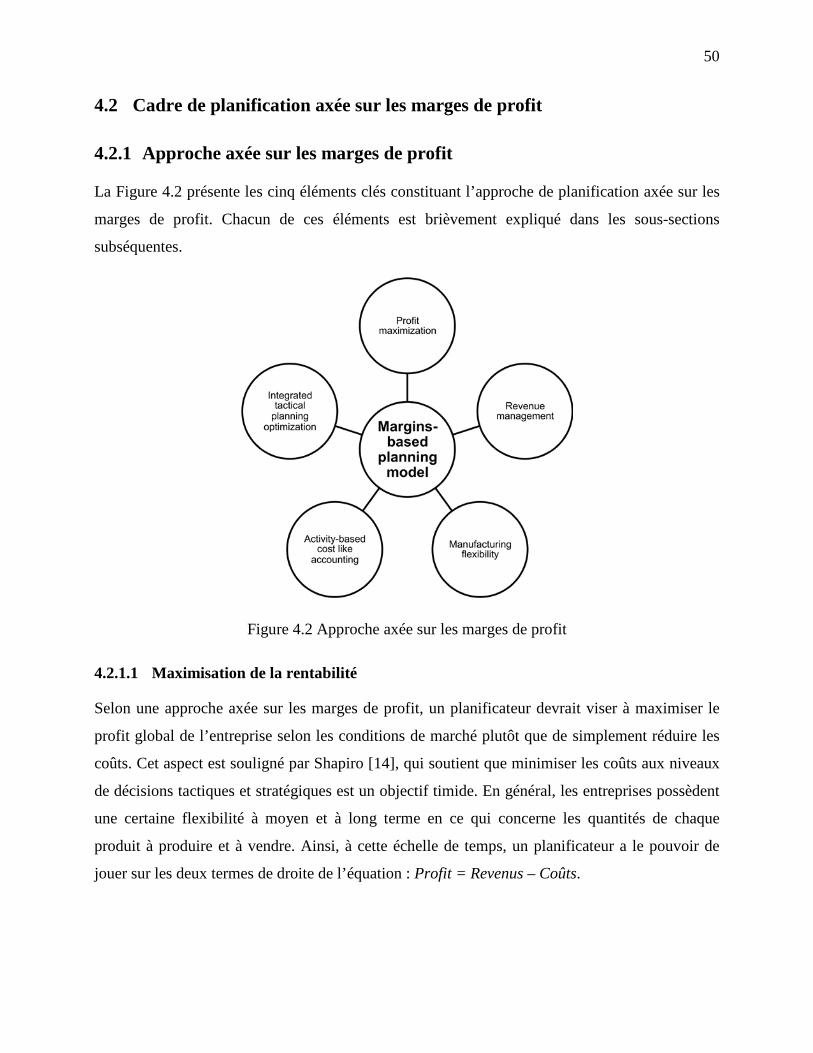
50
4.2 Cadre de planification axée sur les marges de profit
4.2.1 Approche axée sur les marges de profit
La Figure 4.2 présente les cinq éléments clés constituant l’approche de planification axée sur les
marges de profit. Chacun de ces éléments est brièvement expliqué dans les sous-sections
subséquentes.
Figure 4.2 Approche axée sur les marges de profit
4.2.1.1 Maximisation de la rentabilité
Selon une approche axée sur les marges de profit, un planificateur devrait viser à maximiser le
profit global de l’entreprise selon les conditions de marché plutôt que de simplement réduire les
coûts. Cet aspect est souligné par Shapiro [14], qui soutient que minimiser les coûts aux niveaux
de décisions tactiques et stratégiques est un objectif timide. En général, les entreprises possèdent
une certaine flexibilité à moyen et à long terme en ce qui concerne les quantités de chaque
produit à produire et à vendre. Ainsi, à cette échelle de temps, un planificateur a le pouvoir de
jouer sur les deux termes de droite de l’équation : Profit = Revenus – Coûts.
51
4.2.1.2 Gestion des revenus
Pour atteindre cet objectif, les ventes devraient être gérées de façon à ce que le portefeuille en
termes de volume des différents produits fabriqués soit le plus rentable possible. Or, cet équilibre
varie selon les conditions de marché. La gestion du portefeuille de produits devrait se faire de
manière intégrée pour profiter de toutes les opportunités du marché. Idéalement, cette
administration du portefeuille de produits devrait incorporer des lignes directrices pour la
priorisation de certains segments de marchés et types de clients à servir, de même que pour
l’attribution des contrats et des ventes au comptant.
4.2.1.3 Flexibilité manufacturière
La modification du débit de production de certains produits nécessite toutefois un certain niveau
de flexibilité au niveau des procédés de fabrication. Les configurations de la chaîne logistique
décrites à la section 2.4.4 confèrent à chaque usine un niveau de flexibilité qui lui est propre. Une
approche de planification axée sur les marges de profit implique une exploitation optimale de
cette flexibilité manufacturière pour fabriquer le portefeuille de produits le plus rentable selon les
conditions de marché.
4.2.1.4 Comptabilité par activité
Opérer une usine sous différentes conditions engendre des consommations différentes de
ressources. Or, il existe un compromis entre la sélection de recettes et les coûts de production.
Afin d’identifier la meilleure option de production pour une usine dans un temps donné, il
convient donc de pouvoir comprendre et de calculer adéquatement les coûts de production.
L’utilisation de méthodes de calcul de coûts inspirées de la comptabilité par activité permet
justement d’évaluer les coûts selon les conditions d’opération.
4.2.1.5 Planification intégrée
Une gestion d’entreprise où la production est systématiquement planifiée selon les conditions de
marché ne peut s’effectuer qu’en considérant la chaîne logistique en entier, de
l’approvisionnement jusqu’aux ventes, mais idéalement aussi avec les différentes installations de
l’entreprise.
52
À cet effet, le niveau de prise de décision tactique semble le plus adapté. Les décisions reliées à
l’approvisionnement et aux ventes, telles que de servir un client partiellement ou pas du tout, de
signer un contrat d’approvisionnement avec un fournisseur, ou d’allouer d’une partie de la
production aux ventes au comptant, sont plus appropriées à moyen et long termes. Les variations
saisonnières des coûts de production et des ventes peuvent également être représentées à ce
niveau. De même, les changements à l’opération de procédés en continu sont généralement
effectuées tout au plus quelques fois par mois pour maximiser l’efficacité et minimiser les coûts
de production. Par exemple, ces changements peuvent inclure l’utilisation d’une matière première
différente, la production d’un autre produit ou l’arrêt temporaire de la production.
4.2.2 Caractéristiques propres au bioraffinage forestier
Le cadre de planification développé dans cette thèse possède des capacités de modélisation
permettant de représenter adéquatement les caractéristiques propres au bioraffinage forestier en
plus de celles reliées à la planification dans l’industrie des procédés. Cette section introduit
brièvement quelques-uns de ces attributs.
Dans l’industrie des procédés et du bioraffinage, les produits fabriqués peuvent être soit utilisés
comme intermédiaires dans d’autres procédés ou soit vendus à directement sur le marché. Les
intermédiaires et matières premières peuvent aussi être utilisés pour la production de bioénergie.
Le niveau de détail de la modélisation de ces procédés devrait être suffisamment précis pour
évaluer les coûts et implications de différentes options de fabrication.
Les procédés de fabrication du bioraffinage et de l’industrie forestière peuvent être de grands
consommateurs de vapeur et d’électricité. Par exemple, les coûts en électricité d’une usine de
production de pâte thermomécanique peuvent représenter jusqu’à 40% des coûts d’exploitation
directs. Pour les besoins de la production et aussi pour devenir carboneutres, ces installations
produisent déjà ou auront à produire de la bioénergie en plus de leurs produits phares. Ainsi, le
potentiel de cogénération de même que la production et les ventes d’électricité associées
devraient être considérés dans le modèle.
53
Plusieurs types de biomasse peuvent être utilisés simultanément dans une bioraffinerie. Les coûts
d’approvisionnement en biomasse peuvent varier selon les saisons, notamment en raison de
problèmes logistiques. L’approvisionnement en biomasse présente aussi généralement des
déséconomies d’échelle : plus les quantités nécessaires d’un certain type de biomasse sont
grandes, plus loin doit-on aller pour les récolter. Les coûts d’approvisionnement augmentent donc
avec les quantités requises en raison des coûts incrémentaux de transport et de logistique.
De façon analogue, le prix de vente de certains produits peut être amené à diminuer avec de plus
grands volumes. Ceci peut survenir lorsque celui-ci est vendu dans différents marchés, dont
certains possèdent des prix de vente inférieurs. Par exemple, un produit chimique de spécialité
pourrait être vendu dans un marché où sa fonctionnalité spécifique importe moins. Également, un
bioproduit pourrait être vendu avec une surcharge ou non pour son caractère vert.
4.2.3 Définition du problème général d’optimisation
Le problème général de gestion de la chaîne logistique abordé dans le modèle d’optimisation est
illustré à la Figure 4.3. Plusieurs fournisseurs de biomasse et autres matières premières
alimentent les usines d’une entreprise. Ces usines transforment à leur tour ces matières en
produits intermédiaires et produits finis, qui peuvent être transportés vers d’autres usines, centres
de distribution et/ou clients en fonction de leur demande. Ces produits peuvent être gardés en
stock dans les différentes installations de l’entreprise. Différentes voies de transport relient les
fournisseurs, les installations de l’entreprise et les clients.
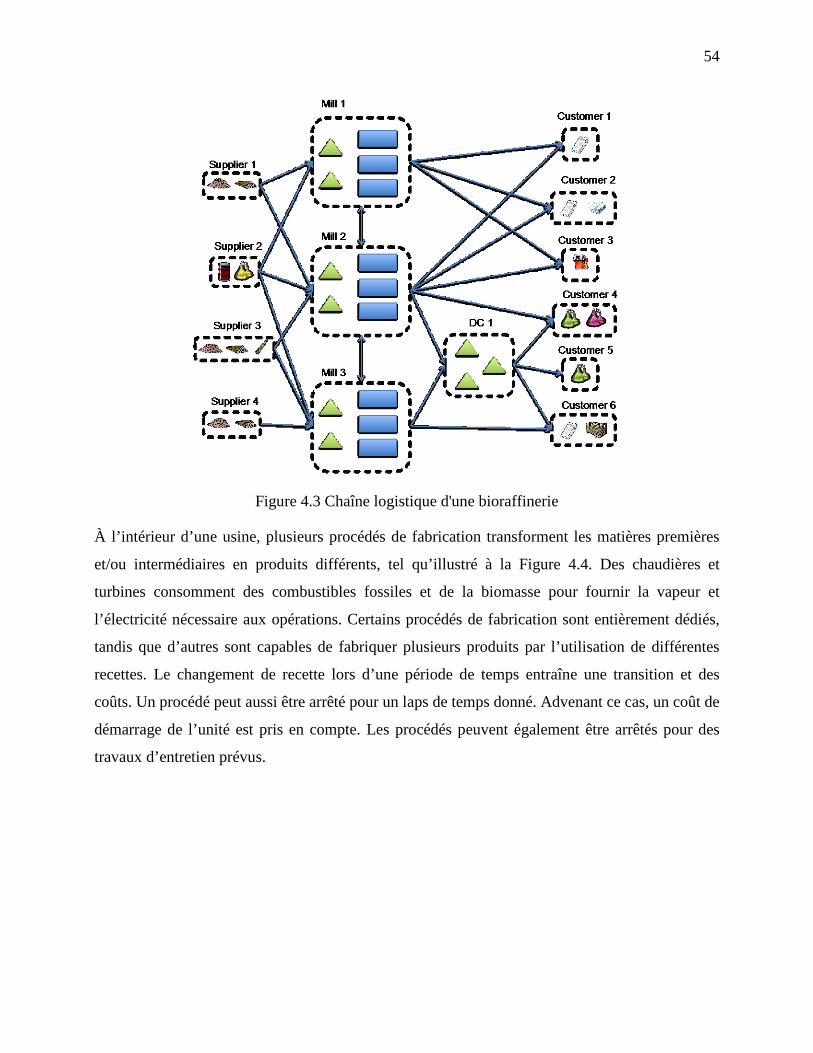
54
Figure 4.3 Chaîne logistique d'une bioraffinerie
À l’intérieur d’une usine, plusieurs procédés de fabrication transforment les matières premières
et/ou intermédiaires en produits différents, tel qu’illustré à la Figure 4.4. Des chaudières et
turbines consomment des combustibles fossiles et de la biomasse pour fournir la vapeur et
l’électricité nécessaire aux opérations. Certains procédés de fabrication sont entièrement dédiés,
tandis que d’autres sont capables de fabriquer plusieurs produits par l’utilisation de différentes
recettes. Le changement de recette lors d’une période de temps entraîne une transition et des
coûts. Un procédé peut aussi être arrêté pour un laps de temps donné. Advenant ce cas, un coût de
démarrage de l’unité est pris en compte. Les procédés peuvent également être arrêtés pour des
travaux d’entretien prévus.
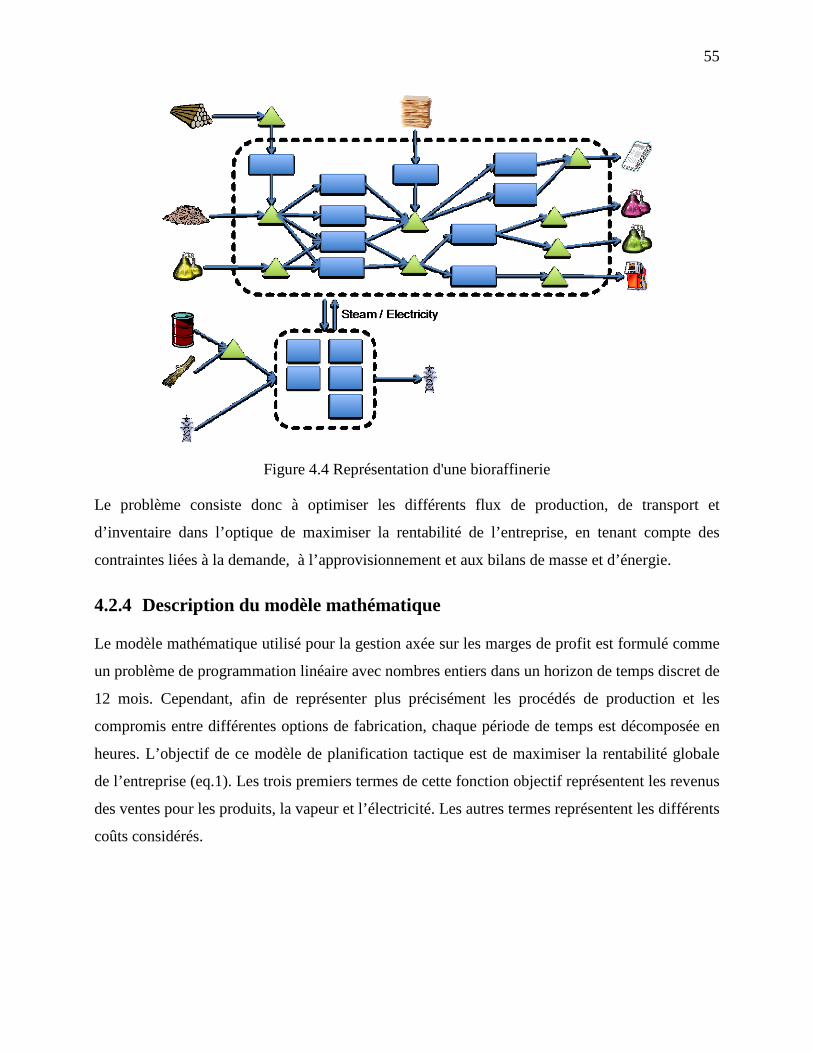
55
Figure 4.4 Représentation d'une bioraffinerie
Le problème consiste donc à optimiser les différents flux de production, de transport et
d’inventaire dans l’optique de maximiser la rentabilité de l’entreprise, en tenant compte des
contraintes liées à la demande, à l’approvisionnement et aux bilans de masse et d’énergie.
4.2.4 Description du modèle mathématique
Le modèle mathématique utilisé pour la gestion axée sur les marges de profit est formulé comme
un problème de programmation linéaire avec nombres entiers dans un horizon de temps discret de
12 mois. Cependant, afin de représenter plus précisément les procédés de production et les
compromis entre différentes options de fabrication, chaque période de temps est décomposée en
heures. L’objectif de ce modèle de planification tactique est de maximiser la rentabilité globale
de l’entreprise (eq.1). Les trois premiers termes de cette fonction objectif représentent les revenus
des ventes pour les produits, la vapeur et l’électricité. Les autres termes représentent les différents
coûts considérés.
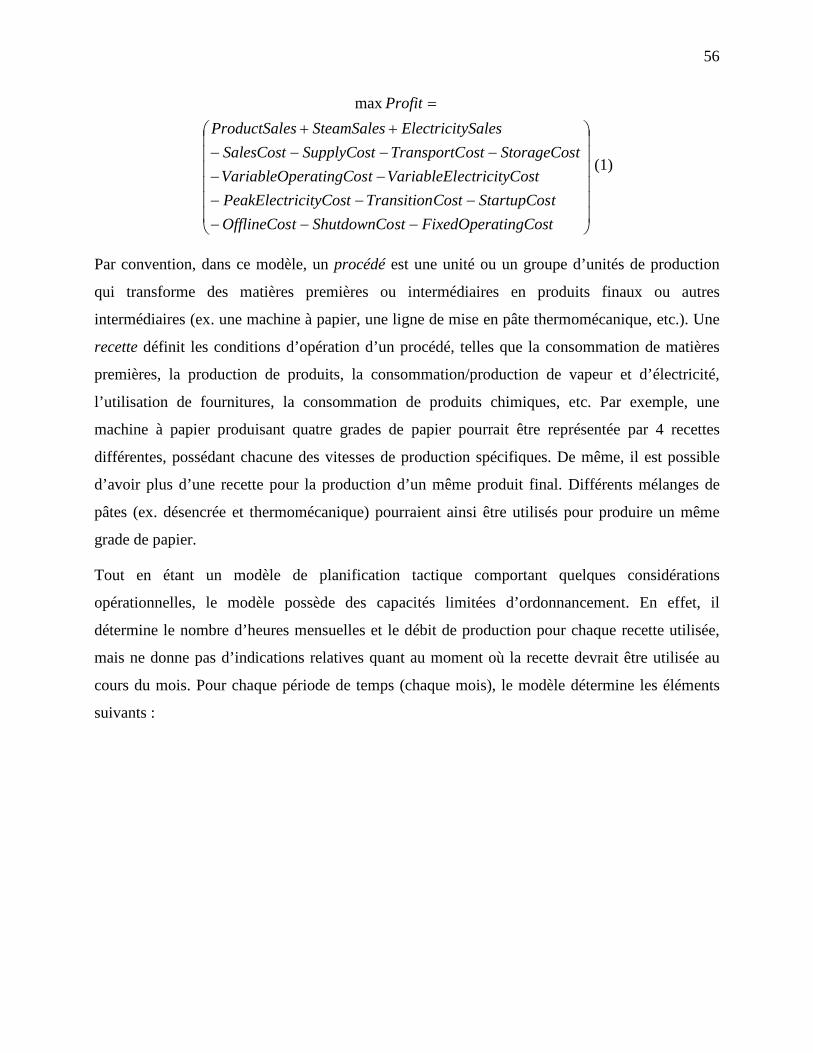
56
−−−−−−
−−−−−−
++
=
tingCostFixedOperastShutdownCotOfflineCostStartupCosCostTransitionicityCostPeakElectr
ostectricityCVariableElteratingCosVariableOptStorageCosostTransportCSupplyCostSalesCost
ySalesElectricitSteamSalesesProductSalProfitmax
(1)
Par convention, dans ce modèle, un procédé est une unité ou un groupe d’unités de production
qui transforme des matières premières ou intermédiaires en produits finaux ou autres
intermédiaires (ex. une machine à papier, une ligne de mise en pâte thermomécanique, etc.). Une
recette définit les conditions d’opération d’un procédé, telles que la consommation de matières
premières, la production de produits, la consommation/production de vapeur et d’électricité,
l’utilisation de fournitures, la consommation de produits chimiques, etc. Par exemple, une
machine à papier produisant quatre grades de papier pourrait être représentée par 4 recettes
différentes, possédant chacune des vitesses de production spécifiques. De même, il est possible
d’avoir plus d’une recette pour la production d’un même produit final. Différents mélanges de
pâtes (ex. désencrée et thermomécanique) pourraient ainsi être utilisés pour produire un même
grade de papier.
Tout en étant un modèle de planification tactique comportant quelques considérations
opérationnelles, le modèle possède des capacités limitées d’ordonnancement. En effet, il
détermine le nombre d’heures mensuelles et le débit de production pour chaque recette utilisée,
mais ne donne pas d’indications relatives quant au moment où la recette devrait être utilisée au
cours du mois. Pour chaque période de temps (chaque mois), le modèle détermine les éléments
suivants :
57
• la quantité de chaque produit à vendre à chacun des clients,
• les quantités de matières premières à acheter aux différents fournisseurs,
• quelle recette utiliser sur chacun des procédés de l’usine, la durée d’utilisation et le débit
de production,
• la consommation de vapeur, d’électricité et de carburant de chacun des procédés, incluant
les chaudières,
• la production de vapeur et d’électricité par le système de services utilitaires,
• les transitions à effectuer, et
• l’inventaire mensuel de chacun des produits/matières premières.
Le modèle est soumis à des contraintes liées à l’approvisionnement, aux ventes, au transport, à
l’inventaire, aux bilans de masse et d’énergie (vapeur et électricité) des procédés, ainsi qu’à des
contraintes opérationnelles liées à la planification. La nomenclature utilisée et ces contraintes
sont présentées dans les sous-sections suivantes. Le Tableau 4.2 résume les données devant être
fournies au modèle.
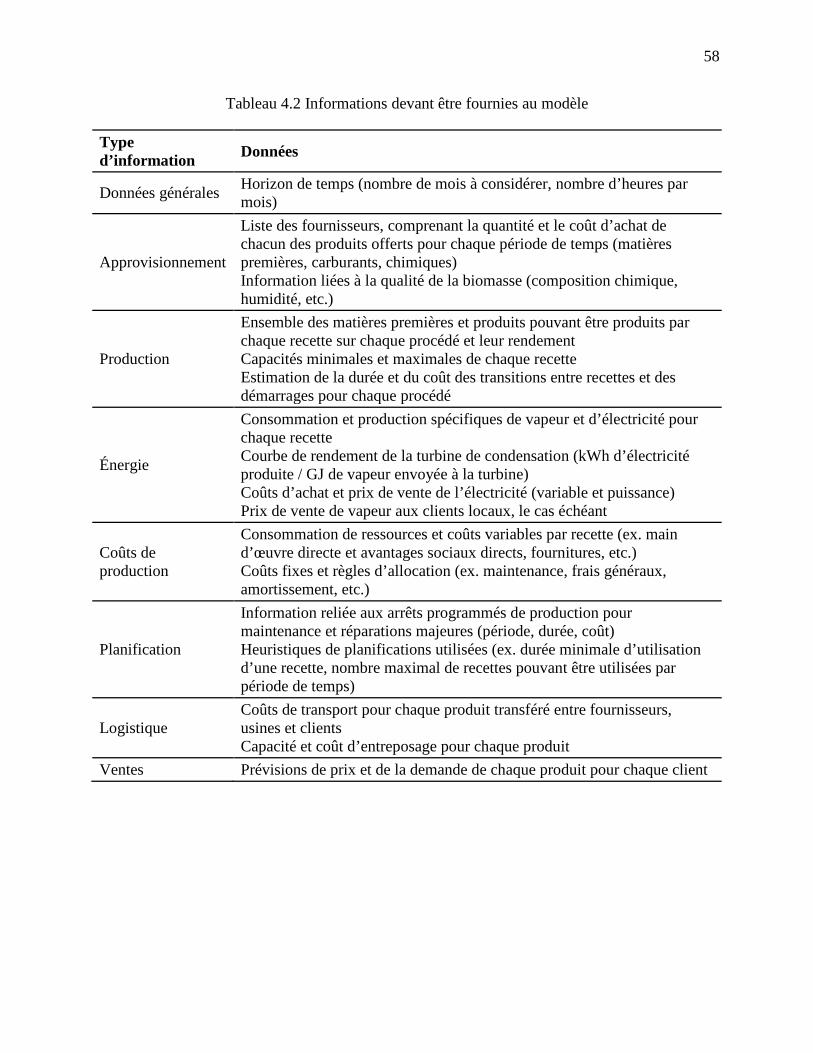
58
Tableau 4.2 Informations devant être fournies au modèle
Type d’information Données
Données générales Horizon de temps (nombre de mois à considérer, nombre d’heures par mois)
Approvisionnement
Liste des fournisseurs, comprenant la quantité et le coût d’achat de chacun des produits offerts pour chaque période de temps (matières premières, carburants, chimiques) Information liées à la qualité de la biomasse (composition chimique, humidité, etc.)
Production
Ensemble des matières premières et produits pouvant être produits par chaque recette sur chaque procédé et leur rendement Capacités minimales et maximales de chaque recette Estimation de la durée et du coût des transitions entre recettes et des démarrages pour chaque procédé
Énergie
Consommation et production spécifiques de vapeur et d’électricité pour chaque recette Courbe de rendement de la turbine de condensation (kWh d’électricité produite / GJ de vapeur envoyée à la turbine) Coûts d’achat et prix de vente de l’électricité (variable et puissance) Prix de vente de vapeur aux clients locaux, le cas échéant
Coûts de production
Consommation de ressources et coûts variables par recette (ex. main d’œuvre directe et avantages sociaux directs, fournitures, etc.) Coûts fixes et règles d’allocation (ex. maintenance, frais généraux, amortissement, etc.)
Planification
Information reliée aux arrêts programmés de production pour maintenance et réparations majeures (période, durée, coût) Heuristiques de planifications utilisées (ex. durée minimale d’utilisation d’une recette, nombre maximal de recettes pouvant être utilisées par période de temps)
Logistique Coûts de transport pour chaque produit transféré entre fournisseurs, usines et clients Capacité et coût d’entreposage pour chaque produit
Ventes Prévisions de prix et de la demande de chaque produit pour chaque client
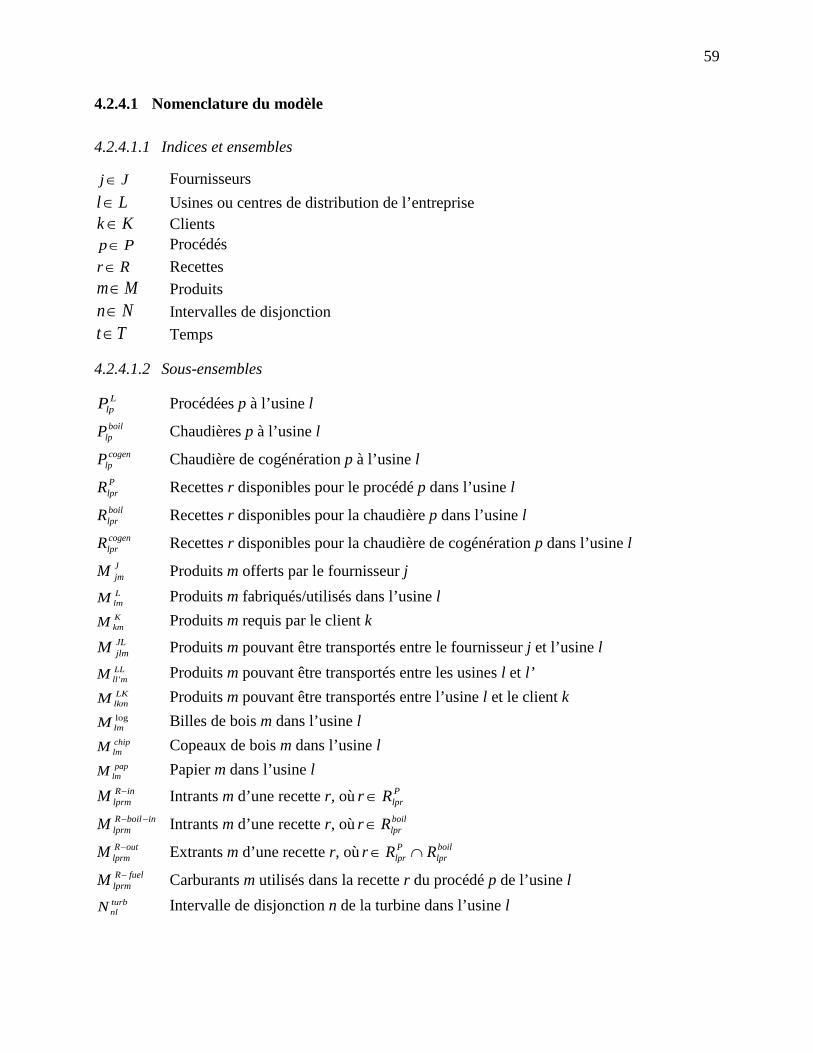
59
4.2.4.1 Nomenclature du modèle
4.2.4.1.1 Indices et ensembles
Jj∈ Fournisseurs Ll∈ Usines ou centres de distribution de l’entreprise Kk ∈ Clients Pp∈ Procédés
Rr∈ Recettes Mm∈ Produits Nn∈ Intervalles de disjonction
Tt∈ Temps
4.2.4.1.2 Sous-ensembles
LlpP Procédées p à l’usine l boil
lpP Chaudières p à l’usine l cogen
lpP Chaudière de cogénération p à l’usine l PlprR Recettes r disponibles pour le procédé p dans l’usine l boillprR Recettes r disponibles pour la chaudière p dans l’usine l cogenlprR Recettes r disponibles pour la chaudière de cogénération p dans l’usine l
JjmM Produits m offerts par le fournisseur j LlmM Produits m fabriqués/utilisés dans l’usine l KkmM Produits m requis par le client k JLjlmM Produits m pouvant être transportés entre le fournisseur j et l’usine l LL
mllM ' Produits m pouvant être transportés entre les usines l et l’ LKlkmM Produits m pouvant être transportés entre l’usine l et le client k loglmM Billes de bois m dans l’usine l chiplmM Copeaux de bois m dans l’usine l pap
lmM Papier m dans l’usine l inR
lprmM − Intrants m d’une recette r, où PlprRr ∈
inboilRlprmM −− Intrants m d’une recette r, où boil
lprRr∈ outR
lprmM − Extrants m d’une recette r, où boillpr
Plpr RRr ∩∈
fuelRlprmM − Carburants m utilisés dans la recette r du procédé p de l’usine l turbnlN Intervalle de disjonction n de la turbine dans l’usine l
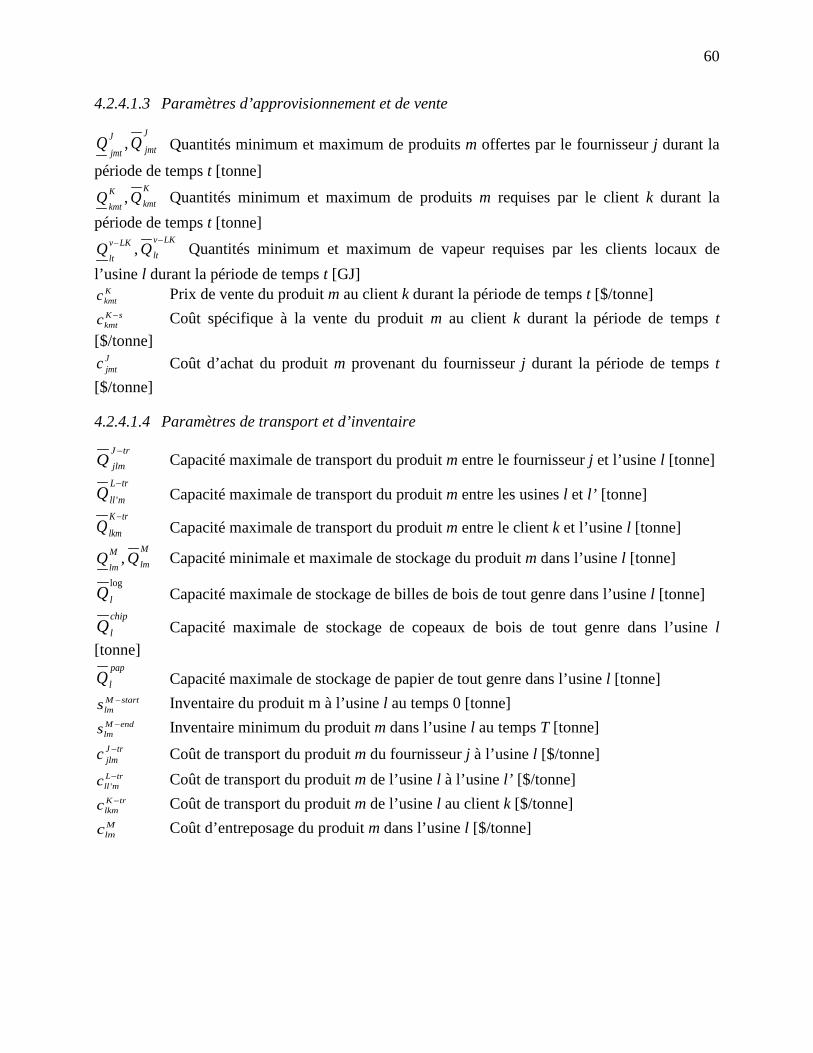
60
4.2.4.1.3 Paramètres d’approvisionnement et de vente
J
jmtJ
jmtQQ , Quantités minimum et maximum de produits m offertes par le fournisseur j durant la
période de temps t [tonne] K
kmtK
kmtQQ , Quantités minimum et maximum de produits m requises par le client k durant la
période de temps t [tonne] LKv
ltLKv
ltQQ
−− , Quantités minimum et maximum de vapeur requises par les clients locaux de l’usine l durant la période de temps t [GJ]
Kkmtc Prix de vente du produit m au client k durant la période de temps t [$/tonne]
sKkmtc − Coût spécifique à la vente du produit m au client k durant la période de temps t
[$/tonne] Jjmtc Coût d’achat du produit m provenant du fournisseur j durant la période de temps t
[$/tonne]
4.2.4.1.4 Paramètres de transport et d’inventaire
trJ
jlmQ−
Capacité maximale de transport du produit m entre le fournisseur j et l’usine l [tonne] trL
mllQ−
' Capacité maximale de transport du produit m entre les usines l et l’ [tonne] trK
lkmQ−
Capacité maximale de transport du produit m entre le client k et l’usine l [tonne] M
lmM
lmQQ , Capacité minimale et maximale de stockage du produit m dans l’usine l [tonne]
log
lQ Capacité maximale de stockage de billes de bois de tout genre dans l’usine l [tonne] chip
lQ Capacité maximale de stockage de copeaux de bois de tout genre dans l’usine l [tonne]
pap
lQ Capacité maximale de stockage de papier de tout genre dans l’usine l [tonne] startM
lms − Inventaire du produit m à l’usine l au temps 0 [tonne] endM
lms − Inventaire minimum du produit m dans l’usine l au temps T [tonne] trJ
jlmc − Coût de transport du produit m du fournisseur j à l’usine l [$/tonne] trL
mllc −' Coût de transport du produit m de l’usine l à l’usine l’ [$/tonne]
trKlkmc − Coût de transport du produit m de l’usine l au client k [$/tonne] Mlmc Coût d’entreposage du produit m dans l’usine l [$/tonne]
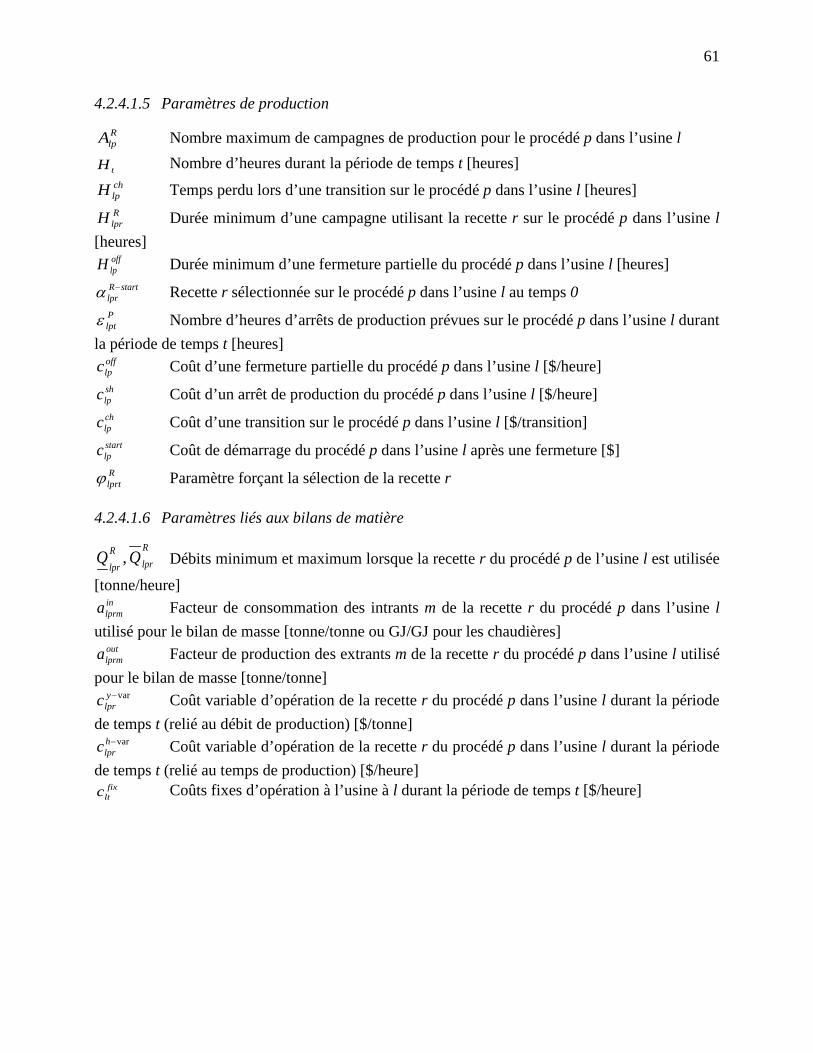
61
4.2.4.1.5 Paramètres de production
RlpA Nombre maximum de campagnes de production pour le procédé p dans l’usine l
tH Nombre d’heures durant la période de temps t [heures] chlpH Temps perdu lors d’une transition sur le procédé p dans l’usine l [heures] RlprH Durée minimum d’une campagne utilisant la recette r sur le procédé p dans l’usine l
[heures] offlpH Durée minimum d’une fermeture partielle du procédé p dans l’usine l [heures]
startRlpr−α Recette r sélectionnée sur le procédé p dans l’usine l au temps 0
Plptε Nombre d’heures d’arrêts de production prévues sur le procédé p dans l’usine l durant
la période de temps t [heures] offlpc Coût d’une fermeture partielle du procédé p dans l’usine l [$/heure] shlpc Coût d’un arrêt de production du procédé p dans l’usine l [$/heure] chlpc Coût d’une transition sur le procédé p dans l’usine l [$/transition] startlpc Coût de démarrage du procédé p dans l’usine l après une fermeture [$] Rlprtϕ Paramètre forçant la sélection de la recette r
4.2.4.1.6 Paramètres liés aux bilans de matière
R
lprR
lprQQ , Débits minimum et maximum lorsque la recette r du procédé p de l’usine l est utilisée
[tonne/heure] inlprma Facteur de consommation des intrants m de la recette r du procédé p dans l’usine l
utilisé pour le bilan de masse [tonne/tonne ou GJ/GJ pour les chaudières] outlprma Facteur de production des extrants m de la recette r du procédé p dans l’usine l utilisé
pour le bilan de masse [tonne/tonne] var−y
lprc Coût variable d’opération de la recette r du procédé p dans l’usine l durant la période de temps t (relié au débit de production) [$/tonne]
var−hlprc Coût variable d’opération de la recette r du procédé p dans l’usine l durant la période
de temps t (relié au temps de production) [$/heure] fix
ltc Coûts fixes d’opération à l’usine à l durant la période de temps t [$/heure]
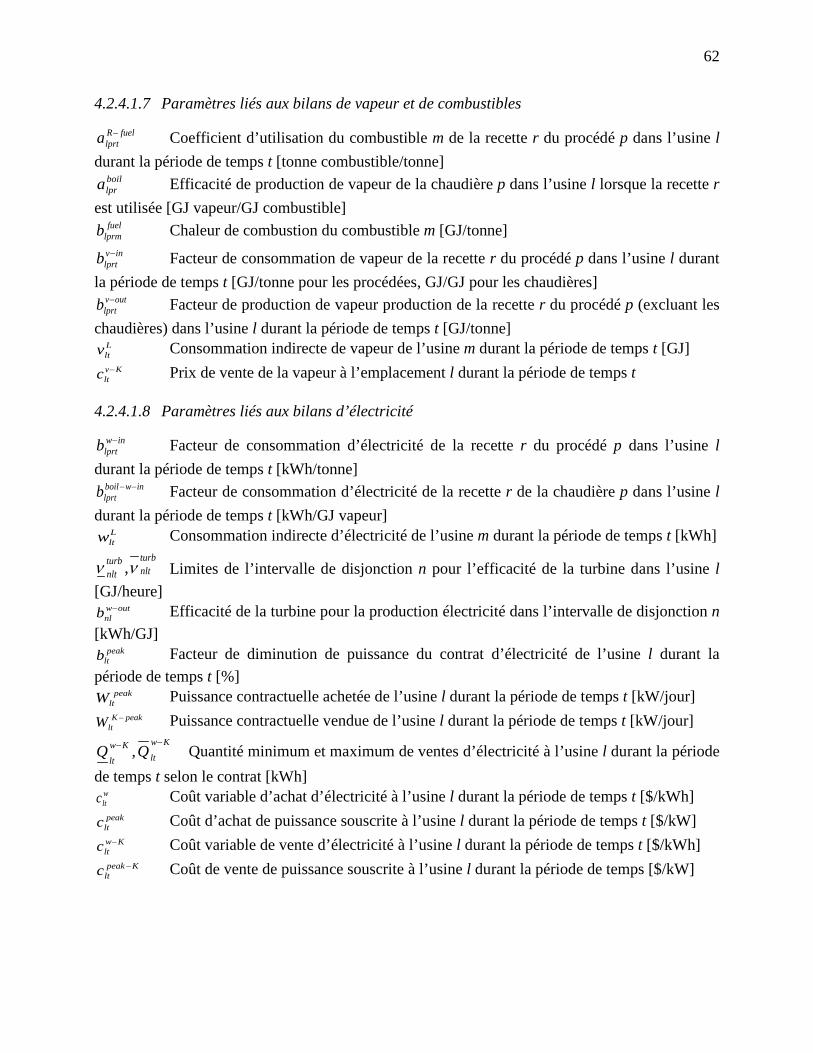
62
4.2.4.1.7 Paramètres liés aux bilans de vapeur et de combustibles
fuelRlprta − Coefficient d’utilisation du combustible m de la recette r du procédé p dans l’usine l
durant la période de temps t [tonne combustible/tonne] boillpra Efficacité de production de vapeur de la chaudière p dans l’usine l lorsque la recette r
est utilisée [GJ vapeur/GJ combustible] fuel
lprmb Chaleur de combustion du combustible m [GJ/tonne] inv
lprtb − Facteur de consommation de vapeur de la recette r du procédé p dans l’usine l durant la période de temps t [GJ/tonne pour les procédées, GJ/GJ pour les chaudières]
outvlprtb − Facteur de production de vapeur production de la recette r du procédé p (excluant les
chaudières) dans l’usine l durant la période de temps t [GJ/tonne] Lltv Consommation indirecte de vapeur de l’usine m durant la période de temps t [GJ]
Kvltc − Prix de vente de la vapeur à l’emplacement l durant la période de temps t
4.2.4.1.8 Paramètres liés aux bilans d’électricité
inwlprtb − Facteur de consommation d’électricité de la recette r du procédé p dans l’usine l
durant la période de temps t [kWh/tonne] inwboil
lprtb −− Facteur de consommation d’électricité de la recette r de la chaudière p dans l’usine l durant la période de temps t [kWh/GJ vapeur]
Lltw Consommation indirecte d’électricité de l’usine m durant la période de temps t [kWh]
turbnlt
turbnlt νν , Limites de l’intervalle de disjonction n pour l’efficacité de la turbine dans l’usine l
[GJ/heure] outw
nlb − Efficacité de la turbine pour la production électricité dans l’intervalle de disjonction n [kWh/GJ]
peakltb Facteur de diminution de puissance du contrat d’électricité de l’usine l durant la
période de temps t [%] peak
ltW Puissance contractuelle achetée de l’usine l durant la période de temps t [kW/jour] peakK
ltW − Puissance contractuelle vendue de l’usine l durant la période de temps t [kW/jour] Kw
ltKw
ltQQ
−− , Quantité minimum et maximum de ventes d’électricité à l’usine l durant la période de temps t selon le contrat [kWh]
wltc Coût variable d’achat d’électricité à l’usine l durant la période de temps t [$/kWh] peakltc Coût d’achat de puissance souscrite à l’usine l durant la période de temps t [$/kW]
Kwltc − Coût variable de vente d’électricité à l’usine l durant la période de temps t [$/kWh]
Kpeakltc − Coût de vente de puissance souscrite à l’usine l durant la période de temps [$/kW]
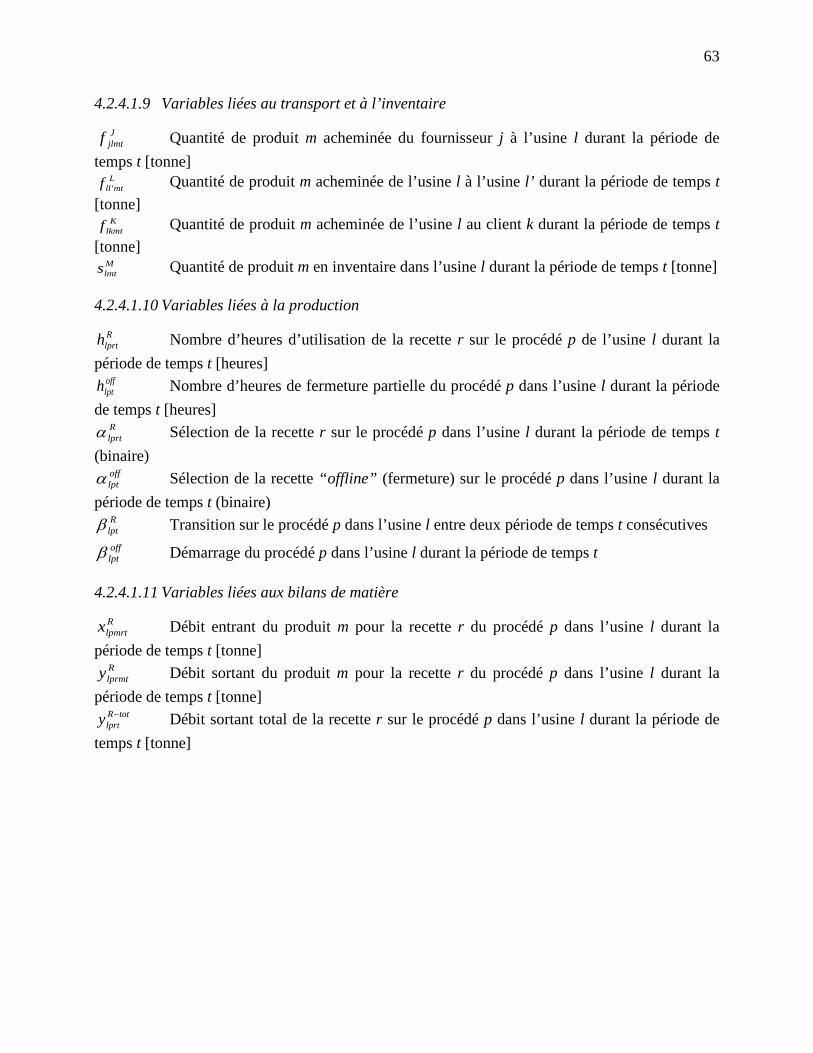
63
4.2.4.1.9 Variables liées au transport et à l’inventaire
Jjlmtf Quantité de produit m acheminée du fournisseur j à l’usine l durant la période de
temps t [tonne] Lmtllf ' Quantité de produit m acheminée de l’usine l à l’usine l’ durant la période de temps t
[tonne] K
lkmtf Quantité de produit m acheminée de l’usine l au client k durant la période de temps t [tonne]
Mlmts Quantité de produit m en inventaire dans l’usine l durant la période de temps t [tonne]
4.2.4.1.10 Variables liées à la production
Rlprth Nombre d’heures d’utilisation de la recette r sur le procédé p de l’usine l durant la
période de temps t [heures] offlpth Nombre d’heures de fermeture partielle du procédé p dans l’usine l durant la période
de temps t [heures] Rlprtα Sélection de la recette r sur le procédé p dans l’usine l durant la période de temps t
(binaire) offlptα Sélection de la recette “offline” (fermeture) sur le procédé p dans l’usine l durant la
période de temps t (binaire) R
lptβ Transition sur le procédé p dans l’usine l entre deux période de temps t consécutives offlptβ Démarrage du procédé p dans l’usine l durant la période de temps t
4.2.4.1.11 Variables liées aux bilans de matière
Rlpmrtx Débit entrant du produit m pour la recette r du procédé p dans l’usine l durant la
période de temps t [tonne] Rlprmty Débit sortant du produit m pour la recette r du procédé p dans l’usine l durant la
période de temps t [tonne] totR
lprty − Débit sortant total de la recette r sur le procédé p dans l’usine l durant la période de temps t [tonne]
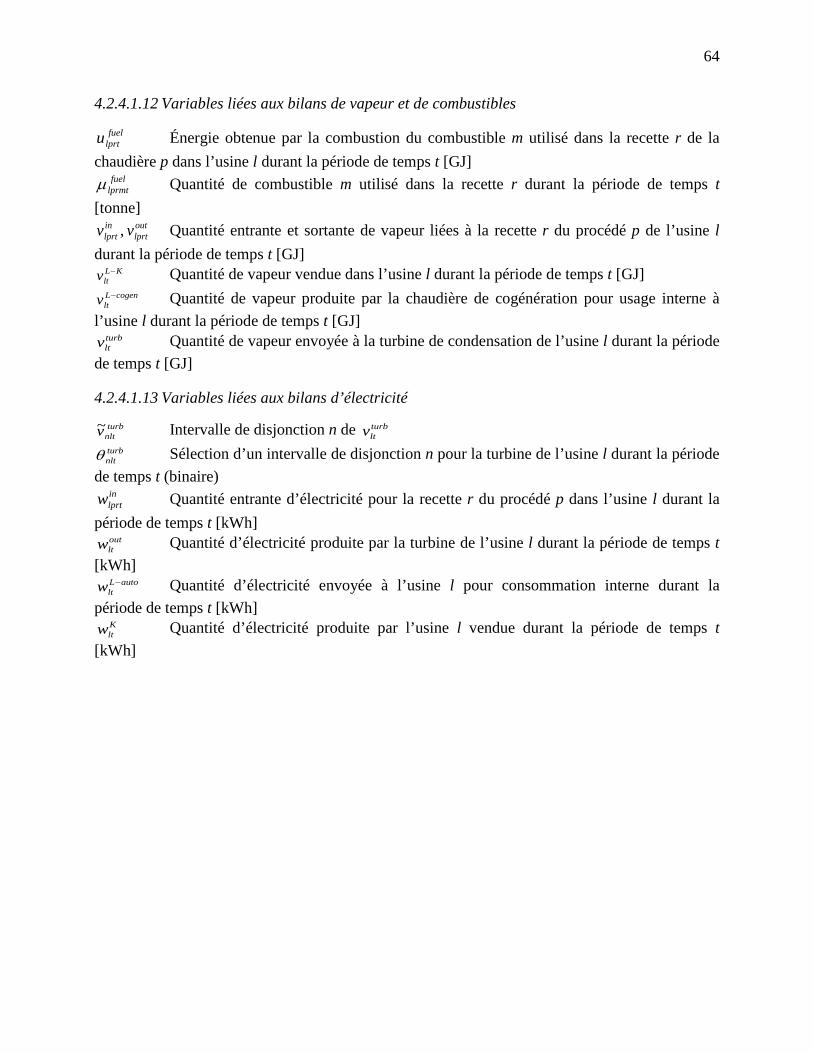
64
4.2.4.1.12 Variables liées aux bilans de vapeur et de combustibles
fuellprtu Énergie obtenue par la combustion du combustible m utilisé dans la recette r de la
chaudière p dans l’usine l durant la période de temps t [GJ] fuellprmtµ Quantité de combustible m utilisé dans la recette r durant la période de temps t
[tonne] outlprt
inlprt vv , Quantité entrante et sortante de vapeur liées à la recette r du procédé p de l’usine l
durant la période de temps t [GJ] KL
ltv − Quantité de vapeur vendue dans l’usine l durant la période de temps t [GJ] cogenL
ltv − Quantité de vapeur produite par la chaudière de cogénération pour usage interne à l’usine l durant la période de temps t [GJ]
turbltv Quantité de vapeur envoyée à la turbine de condensation de l’usine l durant la période
de temps t [GJ]
4.2.4.1.13 Variables liées aux bilans d’électricité turb
nltv~ Intervalle de disjonction n de turbltv
turbnltθ Sélection d’un intervalle de disjonction n pour la turbine de l’usine l durant la période
de temps t (binaire) inlprtw Quantité entrante d’électricité pour la recette r du procédé p dans l’usine l durant la
période de temps t [kWh] outltw Quantité d’électricité produite par la turbine de l’usine l durant la période de temps t
[kWh] autoL
ltw − Quantité d’électricité envoyée à l’usine l pour consommation interne durant la période de temps t [kWh]
Kltw Quantité d’électricité produite par l’usine l vendue durant la période de temps t
[kWh]
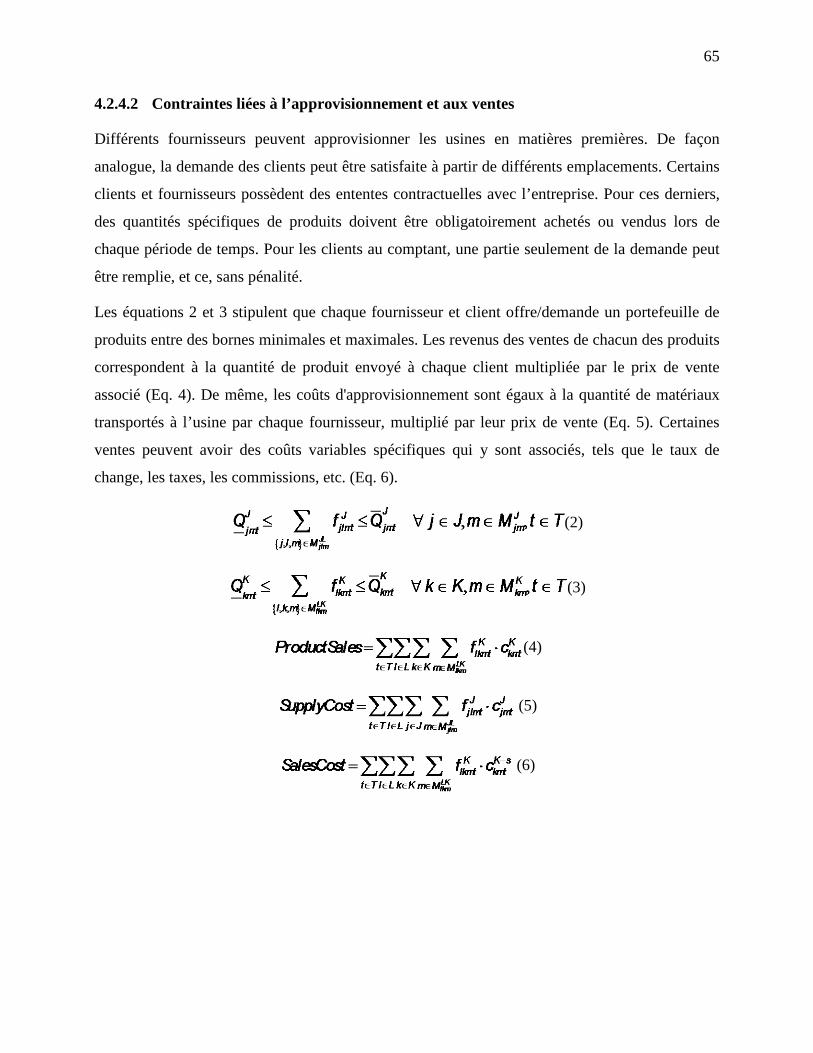
65
4.2.4.2 Contraintes liées à l’approvisionnement et aux ventes
Différents fournisseurs peuvent approvisionner les usines en matières premières. De façon
analogue, la demande des clients peut être satisfaite à partir de différents emplacements. Certains
clients et fournisseurs possèdent des ententes contractuelles avec l’entreprise. Pour ces derniers,
des quantités spécifiques de produits doivent être obligatoirement achetés ou vendus lors de
chaque période de temps. Pour les clients au comptant, une partie seulement de la demande peut
être remplie, et ce, sans pénalité.
Les équations 2 et 3 stipulent que chaque fournisseur et client offre/demande un portefeuille de
produits entre des bornes minimales et maximales. Les revenus des ventes de chacun des produits
correspondent à la quantité de produit envoyé à chaque client multipliée par le prix de vente
associé (Eq. 4). De même, les coûts d'approvisionnement sont égaux à la quantité de matériaux
transportés à l’usine par chaque fournisseur, multiplié par leur prix de vente (Eq. 5). Certaines
ventes peuvent avoir des coûts variables spécifiques qui y sont associés, tels que le taux de
change, les taxes, les commissions, etc. (Eq. 6).
(2)
(3)
(4)
(5)
(6)
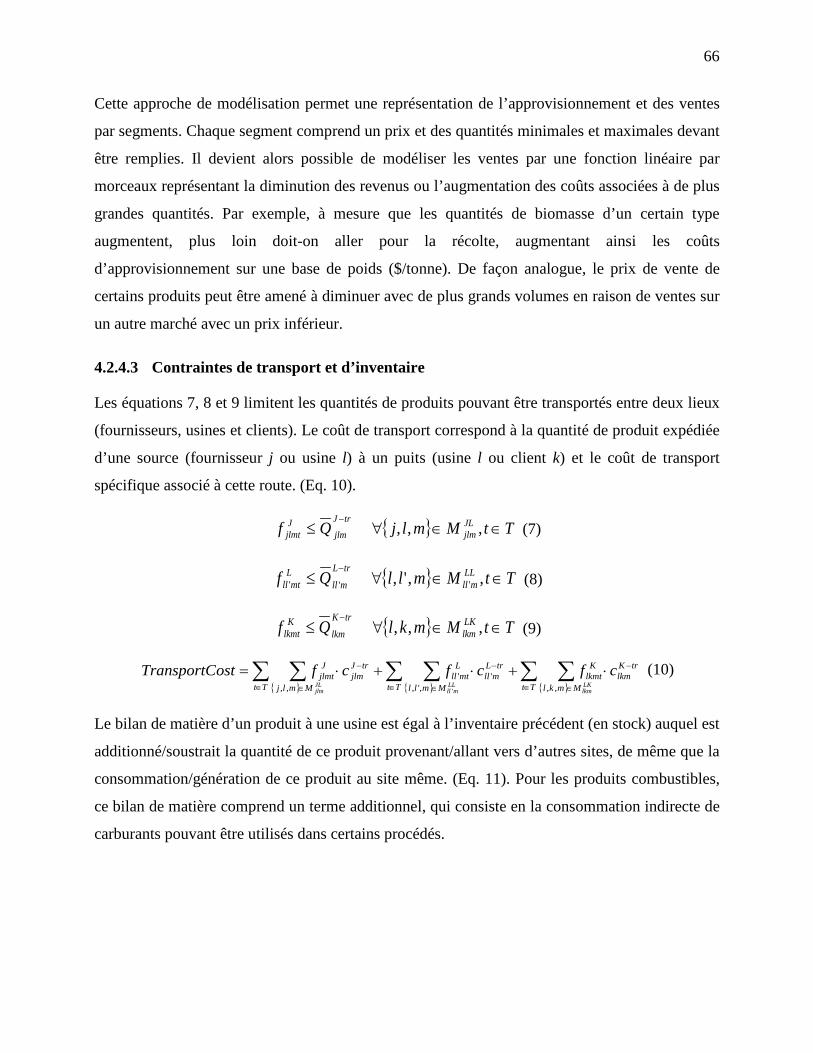
66
Cette approche de modélisation permet une représentation de l’approvisionnement et des ventes
par segments. Chaque segment comprend un prix et des quantités minimales et maximales devant
être remplies. Il devient alors possible de modéliser les ventes par une fonction linéaire par
morceaux représentant la diminution des revenus ou l’augmentation des coûts associées à de plus
grandes quantités. Par exemple, à mesure que les quantités de biomasse d’un certain type
augmentent, plus loin doit-on aller pour la récolte, augmentant ainsi les coûts
d’approvisionnement sur une base de poids ($/tonne). De façon analogue, le prix de vente de
certains produits peut être amené à diminuer avec de plus grands volumes en raison de ventes sur
un autre marché avec un prix inférieur.
4.2.4.3 Contraintes de transport et d’inventaire
Les équations 7, 8 et 9 limitent les quantités de produits pouvant être transportés entre deux lieux
(fournisseurs, usines et clients). Le coût de transport correspond à la quantité de produit expédiée
d’une source (fournisseur j ou usine l) à un puits (usine l ou client k) et le coût de transport
spécifique associé à cette route. (Eq. 10).
{ } TtMmljQf JLjlm
trJ
jlmJjlmt ∈∈∀≤
−,,, (7)
{ } TtMmllQf LLmll
trL
mllLmtll ∈∈∀≤
−,,', ''' (8)
{ } TtMmklQf LKlkm
trK
lkmK
lkmt ∈∈∀≤−
,,, (9)
{ } { } { }∑ ∑∑ ∑∑ ∑∈ ∈
−
∈ ∈
−
∈ ∈
− ⋅+⋅+⋅=Tt Mmkl
trKlkm
Klkmt
Tt Mmll
trLmll
Lmtll
Tt Mmlj
trJjlm
Jjlmt
LKlkm
LLmll
JLjlm
cfcfcfostTransportC,,,',
'',, '
(10)
Le bilan de matière d’un produit à une usine est égal à l’inventaire précédent (en stock) auquel est
additionné/soustrait la quantité de ce produit provenant/allant vers d’autres sites, de même que la
consommation/génération de ce produit au site même. (Eq. 11). Pour les produits combustibles,
ce bilan de matière comprend un terme additionnel, qui consiste en la consommation indirecte de
carburants pouvant être utilisés dans certains procédés.
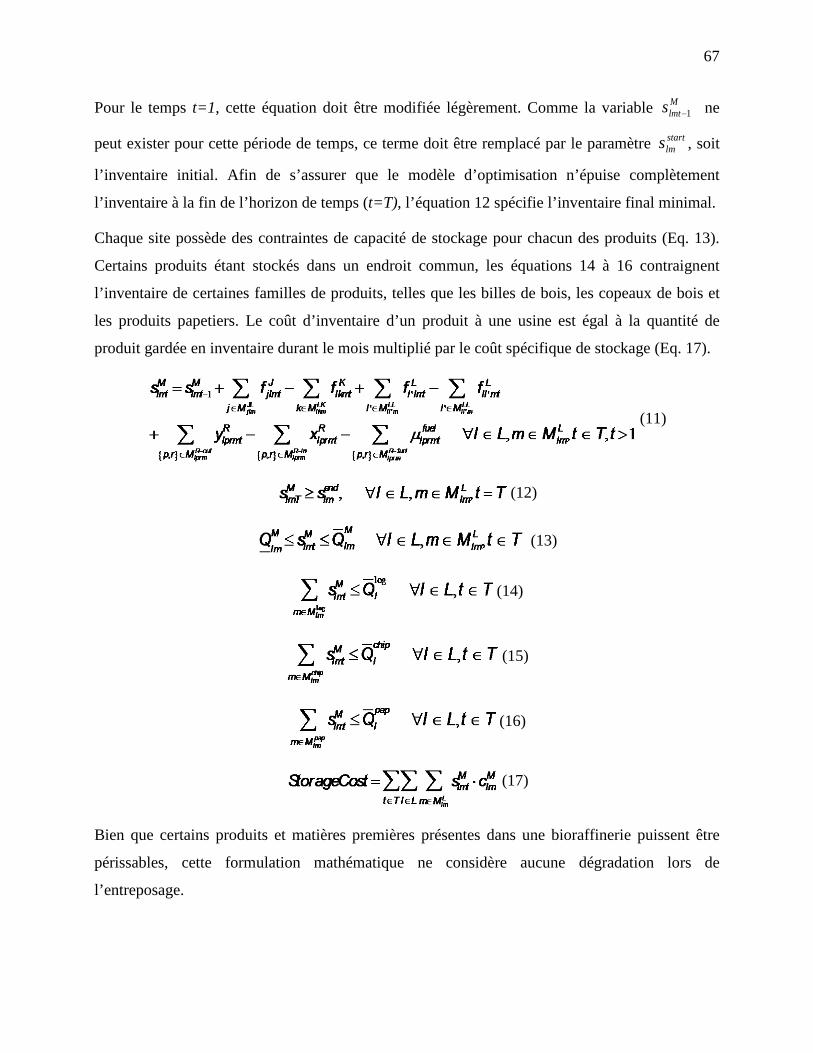
67
Pour le temps t=1, cette équation doit être modifiée légèrement. Comme la variable Mlmts 1− ne
peut exister pour cette période de temps, ce terme doit être remplacé par le paramètre startlms , soit
l’inventaire initial. Afin de s’assurer que le modèle d’optimisation n’épuise complètement
l’inventaire à la fin de l’horizon de temps (t=T), l’équation 12 spécifie l’inventaire final minimal.
Chaque site possède des contraintes de capacité de stockage pour chacun des produits (Eq. 13).
Certains produits étant stockés dans un endroit commun, les équations 14 à 16 contraignent
l’inventaire de certaines familles de produits, telles que les billes de bois, les copeaux de bois et
les produits papetiers. Le coût d’inventaire d’un produit à une usine est égal à la quantité de
produit gardée en inventaire durant le mois multiplié par le coût spécifique de stockage (Eq. 17).
(11)
(12)
(13)
(14)
(15)
(16)
(17)
Bien que certains produits et matières premières présentes dans une bioraffinerie puissent être
périssables, cette formulation mathématique ne considère aucune dégradation lors de
l’entreposage.
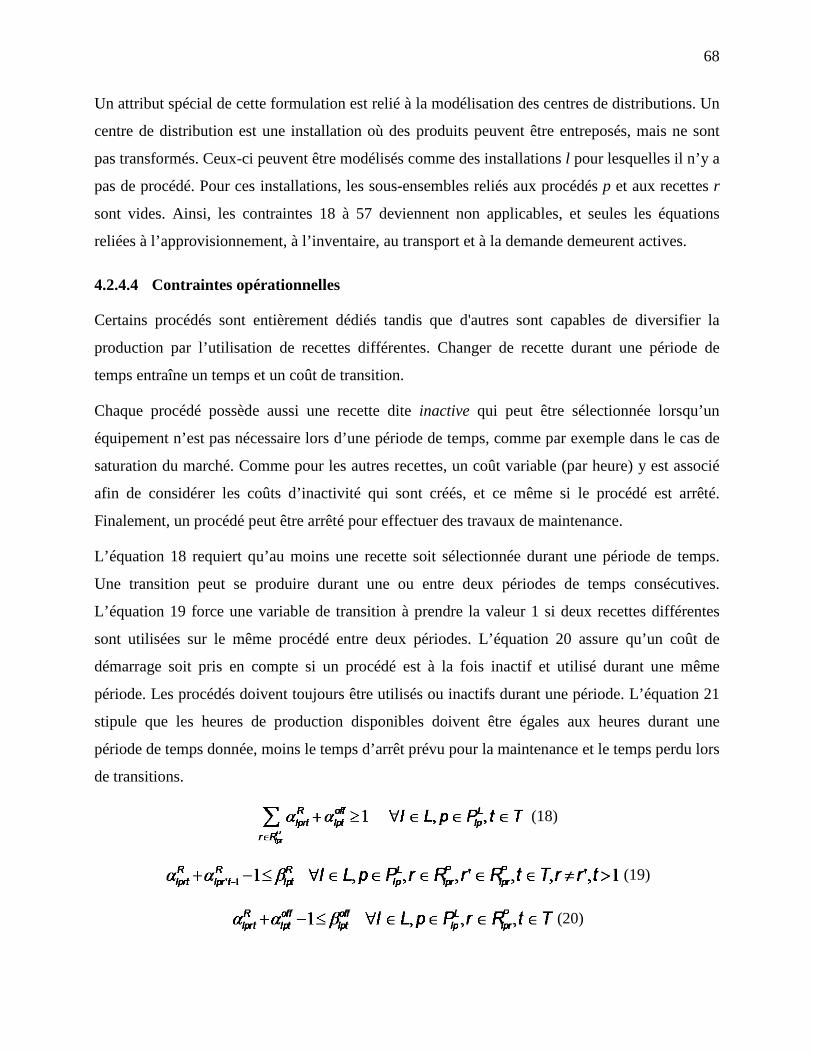
68
Un attribut spécial de cette formulation est relié à la modélisation des centres de distributions. Un
centre de distribution est une installation où des produits peuvent être entreposés, mais ne sont
pas transformés. Ceux-ci peuvent être modélisés comme des installations l pour lesquelles il n’y a
pas de procédé. Pour ces installations, les sous-ensembles reliés aux procédés p et aux recettes r
sont vides. Ainsi, les contraintes 18 à 57 deviennent non applicables, et seules les équations
reliées à l’approvisionnement, à l’inventaire, au transport et à la demande demeurent actives.
4.2.4.4 Contraintes opérationnelles
Certains procédés sont entièrement dédiés tandis que d'autres sont capables de diversifier la
production par l’utilisation de recettes différentes. Changer de recette durant une période de
temps entraîne un temps et un coût de transition.
Chaque procédé possède aussi une recette dite inactive qui peut être sélectionnée lorsqu’un
équipement n’est pas nécessaire lors d’une période de temps, comme par exemple dans le cas de
saturation du marché. Comme pour les autres recettes, un coût variable (par heure) y est associé
afin de considérer les coûts d’inactivité qui sont créés, et ce même si le procédé est arrêté.
Finalement, un procédé peut être arrêté pour effectuer des travaux de maintenance.
L’équation 18 requiert qu’au moins une recette soit sélectionnée durant une période de temps.
Une transition peut se produire durant une ou entre deux périodes de temps consécutives.
L’équation 19 force une variable de transition à prendre la valeur 1 si deux recettes différentes
sont utilisées sur le même procédé entre deux périodes. L’équation 20 assure qu’un coût de
démarrage soit pris en compte si un procédé est à la fois inactif et utilisé durant une même
période. Les procédés doivent toujours être utilisés ou inactifs durant une période. L’équation 21
stipule que les heures de production disponibles doivent être égales aux heures durant une
période de temps donnée, moins le temps d’arrêt prévu pour la maintenance et le temps perdu lors
de transitions.
(18)
(19)
(20)
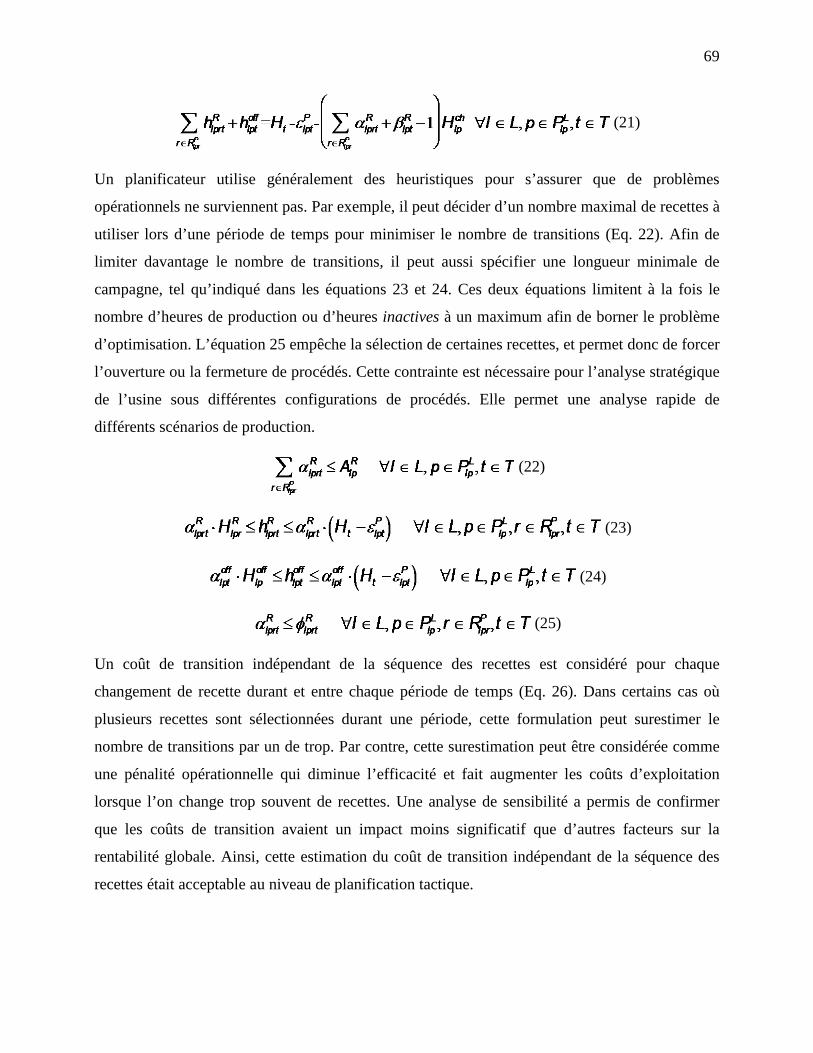
69
(21)
Un planificateur utilise généralement des heuristiques pour s’assurer que de problèmes
opérationnels ne surviennent pas. Par exemple, il peut décider d’un nombre maximal de recettes à
utiliser lors d’une période de temps pour minimiser le nombre de transitions (Eq. 22). Afin de
limiter davantage le nombre de transitions, il peut aussi spécifier une longueur minimale de
campagne, tel qu’indiqué dans les équations 23 et 24. Ces deux équations limitent à la fois le
nombre d’heures de production ou d’heures inactives à un maximum afin de borner le problème
d’optimisation. L’équation 25 empêche la sélection de certaines recettes, et permet donc de forcer
l’ouverture ou la fermeture de procédés. Cette contrainte est nécessaire pour l’analyse stratégique
de l’usine sous différentes configurations de procédés. Elle permet une analyse rapide de
différents scénarios de production.
(22)
(23)
(24)
(25)
Un coût de transition indépendant de la séquence des recettes est considéré pour chaque
changement de recette durant et entre chaque période de temps (Eq. 26). Dans certains cas où
plusieurs recettes sont sélectionnées durant une période, cette formulation peut surestimer le
nombre de transitions par un de trop. Par contre, cette surestimation peut être considérée comme
une pénalité opérationnelle qui diminue l’efficacité et fait augmenter les coûts d’exploitation
lorsque l’on change trop souvent de recettes. Une analyse de sensibilité a permis de confirmer
que les coûts de transition avaient un impact moins significatif que d’autres facteurs sur la
rentabilité globale. Ainsi, cette estimation du coût de transition indépendant de la séquence des
recettes était acceptable au niveau de planification tactique.
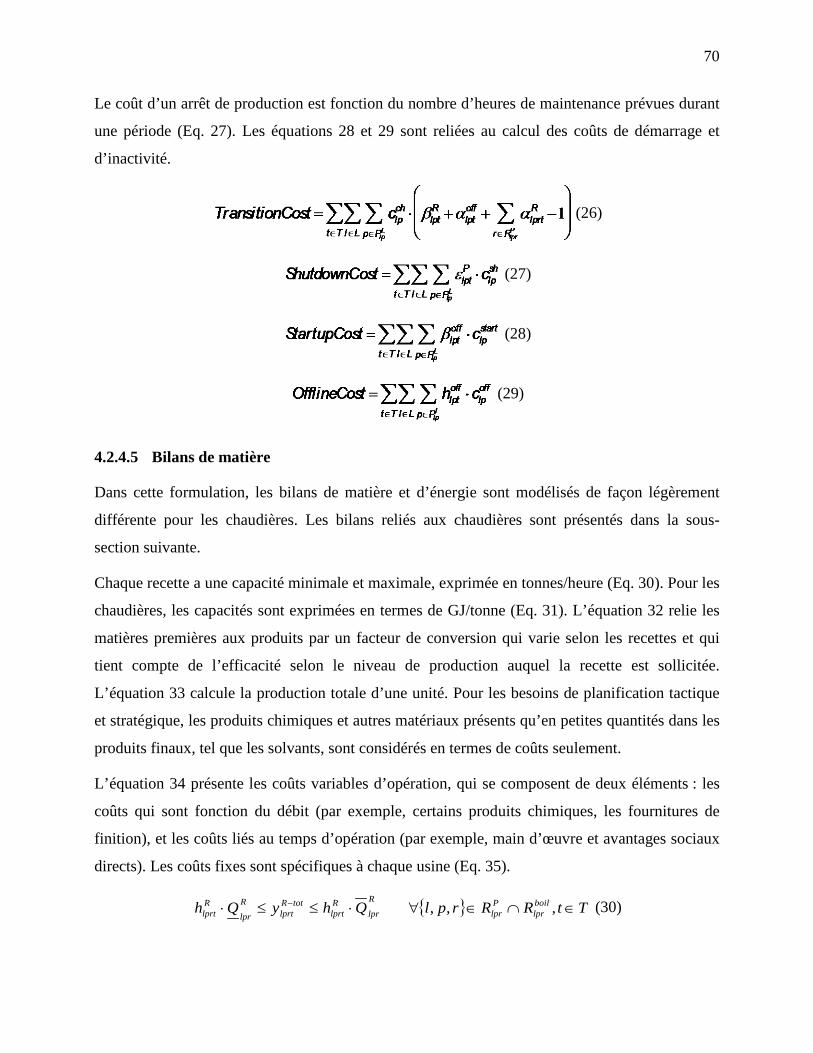
70
Le coût d’un arrêt de production est fonction du nombre d’heures de maintenance prévues durant
une période (Eq. 27). Les équations 28 et 29 sont reliées au calcul des coûts de démarrage et
d’inactivité.
(26)
(27)
(28)
(29)
4.2.4.5 Bilans de matière
Dans cette formulation, les bilans de matière et d’énergie sont modélisés de façon légèrement
différente pour les chaudières. Les bilans reliés aux chaudières sont présentés dans la sous-
section suivante.
Chaque recette a une capacité minimale et maximale, exprimée en tonnes/heure (Eq. 30). Pour les
chaudières, les capacités sont exprimées en termes de GJ/tonne (Eq. 31). L’équation 32 relie les
matières premières aux produits par un facteur de conversion qui varie selon les recettes et qui
tient compte de l’efficacité selon le niveau de production auquel la recette est sollicitée.
L’équation 33 calcule la production totale d’une unité. Pour les besoins de planification tactique
et stratégique, les produits chimiques et autres matériaux présents qu’en petites quantités dans les
produits finaux, tel que les solvants, sont considérés en termes de coûts seulement.
L’équation 34 présente les coûts variables d’opération, qui se composent de deux éléments : les
coûts qui sont fonction du débit (par exemple, certains produits chimiques, les fournitures de
finition), et les coûts liés au temps d’opération (par exemple, main d’œuvre et avantages sociaux
directs). Les coûts fixes sont spécifiques à chaque usine (Eq. 35).
{ } TtRRrplQhyQh boillpr
Plpr
R
lprRlprt
totRlprt
R
lprRlprt ∈∩∈∀⋅≤≤⋅ − ,,, (30)
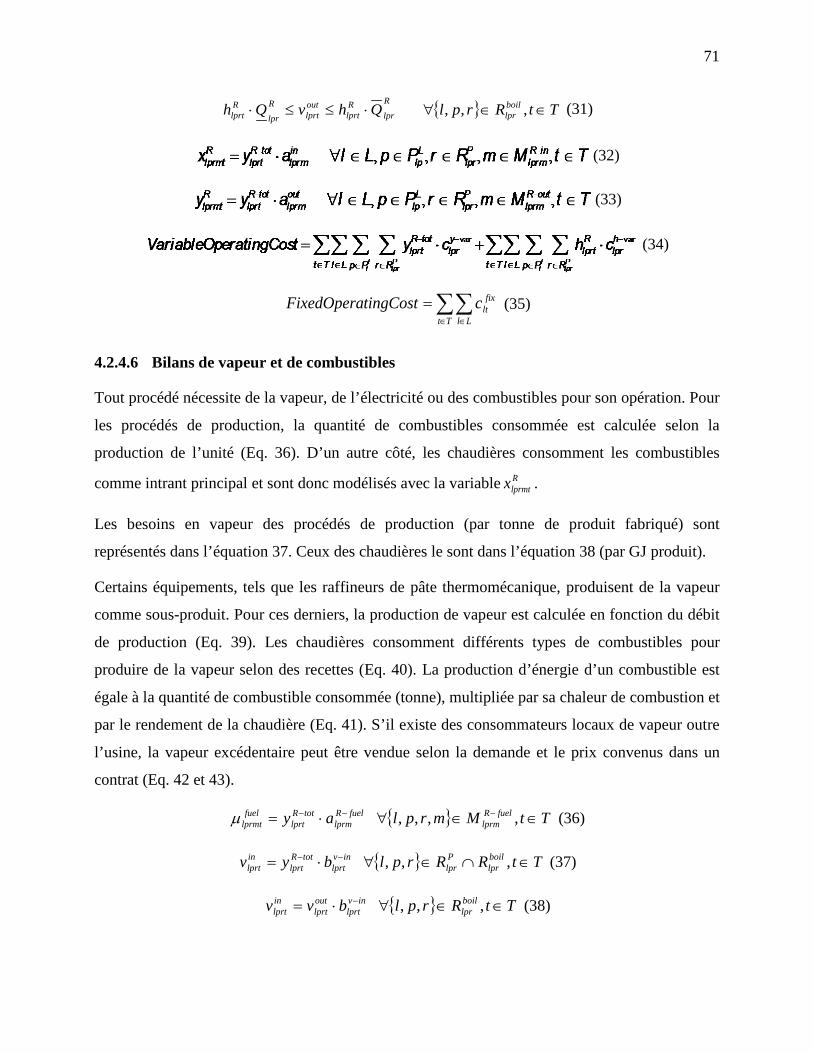
71
{ } TtRrplQhvQh boillpr
R
lprRlprt
outlprt
R
lprRlprt ∈∈∀⋅≤≤⋅ ,,, (31)
(32)
(33)
(34)
∑∑∈ ∈
=Tt Ll
fixltctingCostFixedOpera (35)
4.2.4.6 Bilans de vapeur et de combustibles
Tout procédé nécessite de la vapeur, de l’électricité ou des combustibles pour son opération. Pour
les procédés de production, la quantité de combustibles consommée est calculée selon la
production de l’unité (Eq. 36). D’un autre côté, les chaudières consomment les combustibles
comme intrant principal et sont donc modélisés avec la variable Rlprmtx .
Les besoins en vapeur des procédés de production (par tonne de produit fabriqué) sont
représentés dans l’équation 37. Ceux des chaudières le sont dans l’équation 38 (par GJ produit).
Certains équipements, tels que les raffineurs de pâte thermomécanique, produisent de la vapeur
comme sous-produit. Pour ces derniers, la production de vapeur est calculée en fonction du débit
de production (Eq. 39). Les chaudières consomment différents types de combustibles pour
produire de la vapeur selon des recettes (Eq. 40). La production d’énergie d’un combustible est
égale à la quantité de combustible consommée (tonne), multipliée par sa chaleur de combustion et
par le rendement de la chaudière (Eq. 41). S’il existe des consommateurs locaux de vapeur outre
l’usine, la vapeur excédentaire peut être vendue selon la demande et le prix convenus dans un
contrat (Eq. 42 et 43).
{ } TtMmrplay fuelRlprm
fuelRlprm
totRlprt
fuellprmt ∈∈∀⋅= −−− ,,,, µ (36)
{ } TtRRrplbyv boillpr
Plpr
invlprt
totRlprt
inlprt ∈∩∈∀⋅= −− ,,, (37)
{ } TtRrplbvv boillpr
invlprt
outlprt
inlprt ∈∈∀⋅= − ,,, (38)
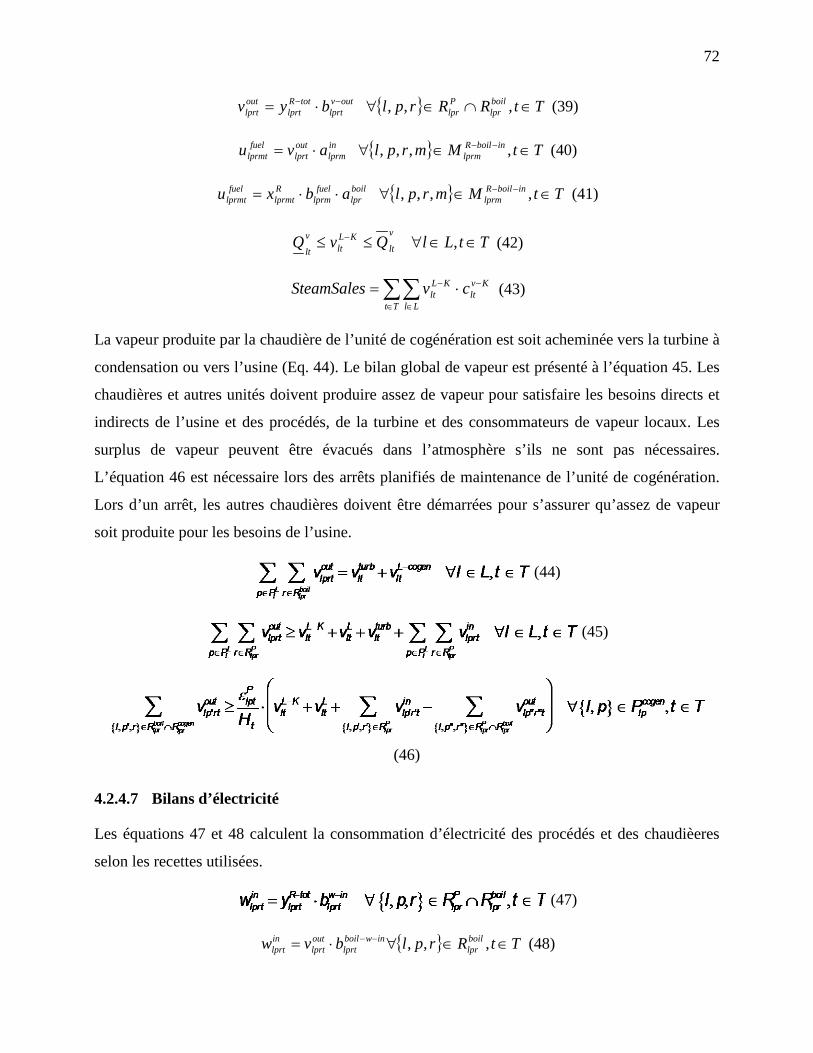
72
{ } TtRRrplbyv boillpr
Plpr
outvlprt
totRlprt
outlprt ∈∩∈∀⋅= −− ,,, (39)
{ } TtMmrplavu inboilRlprm
inlprm
outlprt
fuellprmt ∈∈∀⋅= −− ,,,, (40)
{ } TtMmrplabxu inboilRlprm
boillpr
fuellprm
Rlprmt
fuellprmt ∈∈∀⋅⋅= −− ,,,, (41)
TtLlQvQv
ltKL
ltv
lt∈∈∀≤≤ − , (42)
∑∑∈ ∈
−− ⋅=Tt Ll
Kvlt
KLlt cvSteamSales (43)
La vapeur produite par la chaudière de l’unité de cogénération est soit acheminée vers la turbine à
condensation ou vers l’usine (Eq. 44). Le bilan global de vapeur est présenté à l’équation 45. Les
chaudières et autres unités doivent produire assez de vapeur pour satisfaire les besoins directs et
indirects de l’usine et des procédés, de la turbine et des consommateurs de vapeur locaux. Les
surplus de vapeur peuvent être évacués dans l’atmosphère s’ils ne sont pas nécessaires.
L’équation 46 est nécessaire lors des arrêts planifiés de maintenance de l’unité de cogénération.
Lors d’un arrêt, les autres chaudières doivent être démarrées pour s’assurer qu’assez de vapeur
soit produite pour les besoins de l’usine.
(44)
(45)
(46)
4.2.4.7 Bilans d’électricité
Les équations 47 et 48 calculent la consommation d’électricité des procédés et des chaudièeres
selon les recettes utilisées.
(47)
{ } TtRrplbvw boillpr
inwboillprt
outlprt
inlprt ∈∈∀⋅= −− ,,, (48)
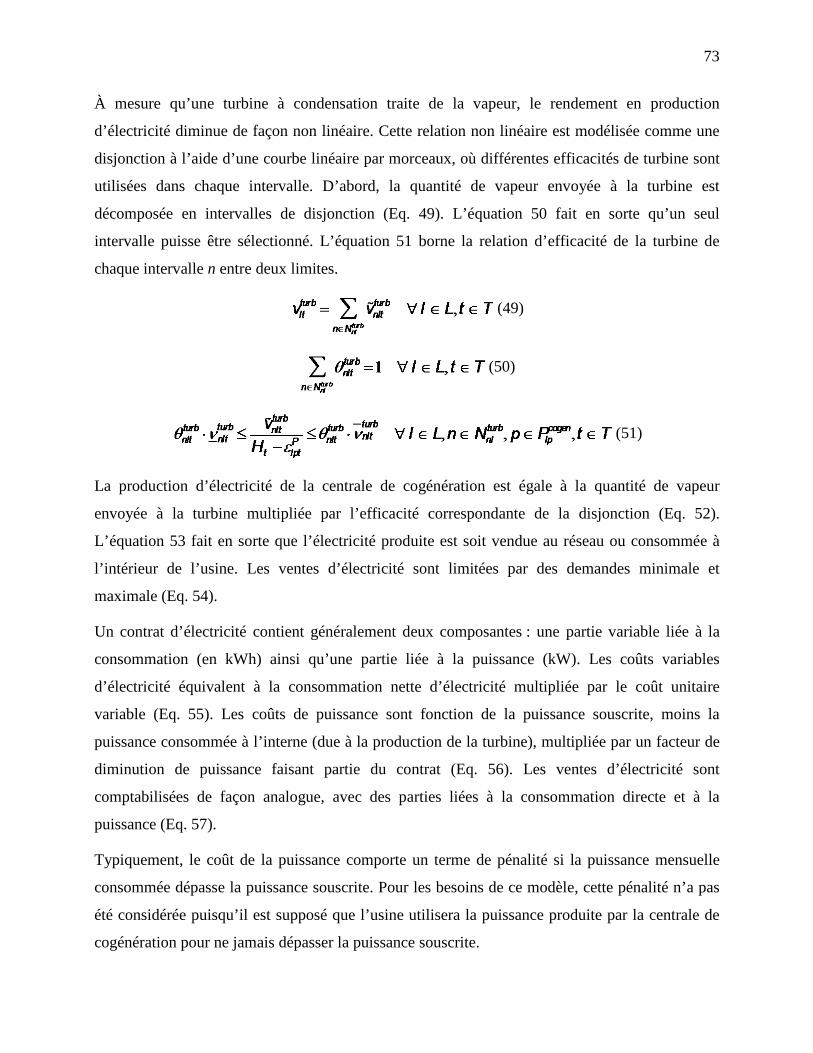
73
À mesure qu’une turbine à condensation traite de la vapeur, le rendement en production
d’électricité diminue de façon non linéaire. Cette relation non linéaire est modélisée comme une
disjonction à l’aide d’une courbe linéaire par morceaux, où différentes efficacités de turbine sont
utilisées dans chaque intervalle. D’abord, la quantité de vapeur envoyée à la turbine est
décomposée en intervalles de disjonction (Eq. 49). L’équation 50 fait en sorte qu’un seul
intervalle puisse être sélectionné. L’équation 51 borne la relation d’efficacité de la turbine de
chaque intervalle n entre deux limites.
(49)
(50)
(51)
La production d’électricité de la centrale de cogénération est égale à la quantité de vapeur
envoyée à la turbine multipliée par l’efficacité correspondante de la disjonction (Eq. 52).
L’équation 53 fait en sorte que l’électricité produite est soit vendue au réseau ou consommée à
l’intérieur de l’usine. Les ventes d’électricité sont limitées par des demandes minimale et
maximale (Eq. 54).
Un contrat d’électricité contient généralement deux composantes : une partie variable liée à la
consommation (en kWh) ainsi qu’une partie liée à la puissance (kW). Les coûts variables
d’électricité équivalent à la consommation nette d’électricité multipliée par le coût unitaire
variable (Eq. 55). Les coûts de puissance sont fonction de la puissance souscrite, moins la
puissance consommée à l’interne (due à la production de la turbine), multipliée par un facteur de
diminution de puissance faisant partie du contrat (Eq. 56). Les ventes d’électricité sont
comptabilisées de façon analogue, avec des parties liées à la consommation directe et à la
puissance (Eq. 57).
Typiquement, le coût de la puissance comporte un terme de pénalité si la puissance mensuelle
consommée dépasse la puissance souscrite. Pour les besoins de ce modèle, cette pénalité n’a pas
été considérée puisqu’il est supposé que l’usine utilisera la puissance produite par la centrale de
cogénération pour ne jamais dépasser la puissance souscrite.
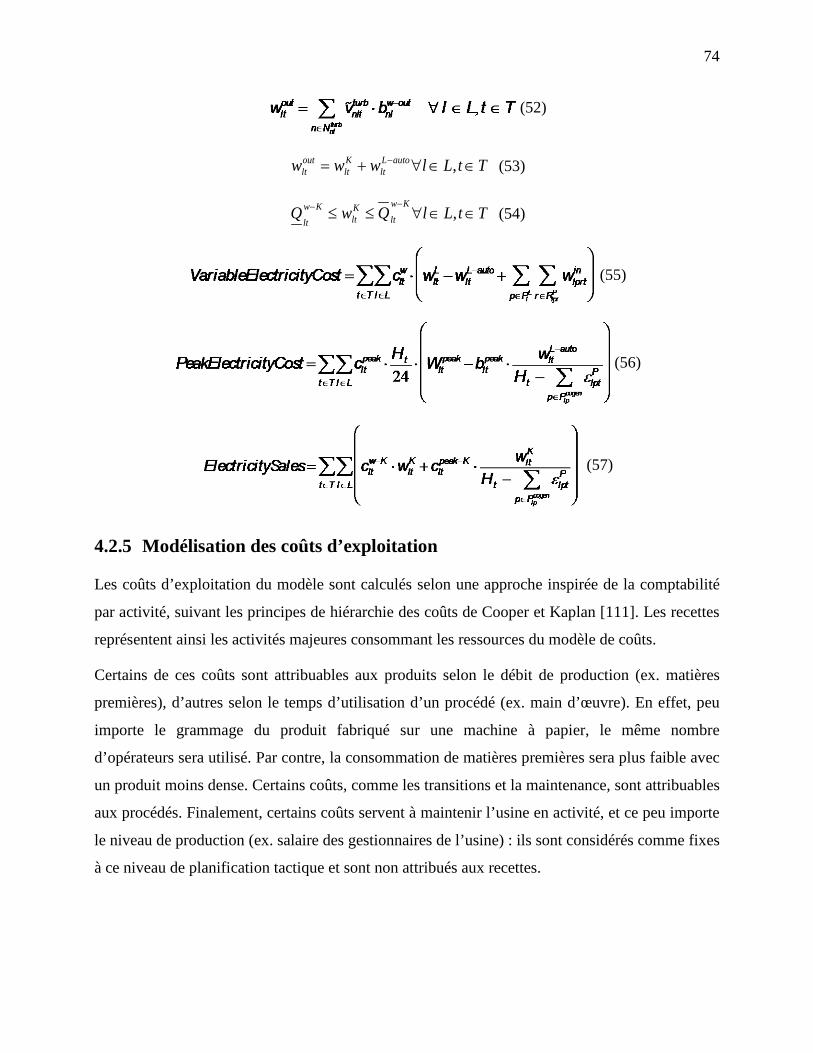
74
(52)
TtLlwww autoLlt
Klt
outlt ∈∈∀+= − , (53)
TtLlQwQKw
ltKlt
Kw
lt∈∈∀≤≤
−− , (54)
(55)
(56)
(57)
4.2.5 Modélisation des coûts d’exploitation
Les coûts d’exploitation du modèle sont calculés selon une approche inspirée de la comptabilité
par activité, suivant les principes de hiérarchie des coûts de Cooper et Kaplan [111]. Les recettes
représentent ainsi les activités majeures consommant les ressources du modèle de coûts.
Certains de ces coûts sont attribuables aux produits selon le débit de production (ex. matières
premières), d’autres selon le temps d’utilisation d’un procédé (ex. main d’œuvre). En effet, peu
importe le grammage du produit fabriqué sur une machine à papier, le même nombre
d’opérateurs sera utilisé. Par contre, la consommation de matières premières sera plus faible avec
un produit moins dense. Certains coûts, comme les transitions et la maintenance, sont attribuables
aux procédés. Finalement, certains coûts servent à maintenir l’usine en activité, et ce peu importe
le niveau de production (ex. salaire des gestionnaires de l’usine) : ils sont considérés comme fixes
à ce niveau de planification tactique et sont non attribués aux recettes.
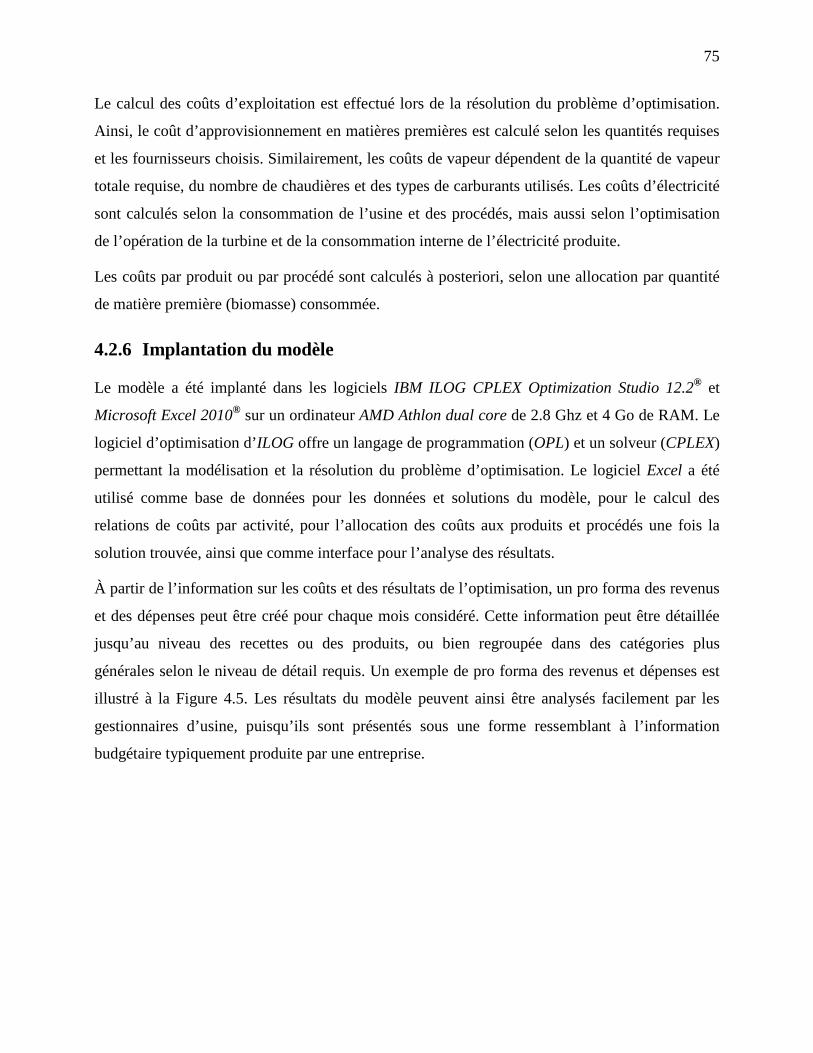
75
Le calcul des coûts d’exploitation est effectué lors de la résolution du problème d’optimisation.
Ainsi, le coût d’approvisionnement en matières premières est calculé selon les quantités requises
et les fournisseurs choisis. Similairement, les coûts de vapeur dépendent de la quantité de vapeur
totale requise, du nombre de chaudières et des types de carburants utilisés. Les coûts d’électricité
sont calculés selon la consommation de l’usine et des procédés, mais aussi selon l’optimisation
de l’opération de la turbine et de la consommation interne de l’électricité produite.
Les coûts par produit ou par procédé sont calculés à posteriori, selon une allocation par quantité
de matière première (biomasse) consommée.
4.2.6 Implantation du modèle
Le modèle a été implanté dans les logiciels IBM ILOG CPLEX Optimization Studio 12.2® et
Microsoft Excel 2010® sur un ordinateur AMD Athlon dual core de 2.8 Ghz et 4 Go de RAM. Le
logiciel d’optimisation d’ILOG offre un langage de programmation (OPL) et un solveur (CPLEX)
permettant la modélisation et la résolution du problème d’optimisation. Le logiciel Excel a été
utilisé comme base de données pour les données et solutions du modèle, pour le calcul des
relations de coûts par activité, pour l’allocation des coûts aux produits et procédés une fois la
solution trouvée, ainsi que comme interface pour l’analyse des résultats.
À partir de l’information sur les coûts et des résultats de l’optimisation, un pro forma des revenus
et des dépenses peut être créé pour chaque mois considéré. Cette information peut être détaillée
jusqu’au niveau des recettes ou des produits, ou bien regroupée dans des catégories plus
générales selon le niveau de détail requis. Un exemple de pro forma des revenus et dépenses est
illustré à la Figure 4.5. Les résultats du modèle peuvent ainsi être analysés facilement par les
gestionnaires d’usine, puisqu’ils sont présentés sous une forme ressemblant à l’information
budgétaire typiquement produite par une entreprise.
76
Figure 4.5 Exemple d'un pro forma des revenus et dépenses créé par le modèle
77
4.2.7 Discussion et conclusion
La structure du modèle permet de représenter le plus fidèlement possible les activités de
l’entreprise, de l’approvisionnement, jusqu’aux ventes. De plus, la vision de l’usine par procédés
et les recettes fournit assez de souplesse à la formulation mathématique pour pouvoir représenter
les différentes configurations de procédés possibles menant à la flexibilité manufacturière
introduites à la section 2.4.4. De même, la modélisation par recette et la séparation des périodes
de temps en heures permet de calculer les coûts d’exploitation à un niveau de précision plus
élevé. Le modèle peut ainsi être utilisé comme plateforme pour effectuer diverses analyses reliées
à la production ou à la chaîne logistique.
Le modèle de planification résultant est linéaire avec nombres entiers, mais comprend plusieurs
relations non linéaires reliées à la modélisation des aspects suivants :
• l’approvisionnement et les ventes (différents fournisseurs/clients avec différents prix,
contrats),
• l’utilisation de différentes recettes sur un même procédé lors d’une période de temps, et
• la production d’électricité de la turbine à condensation.
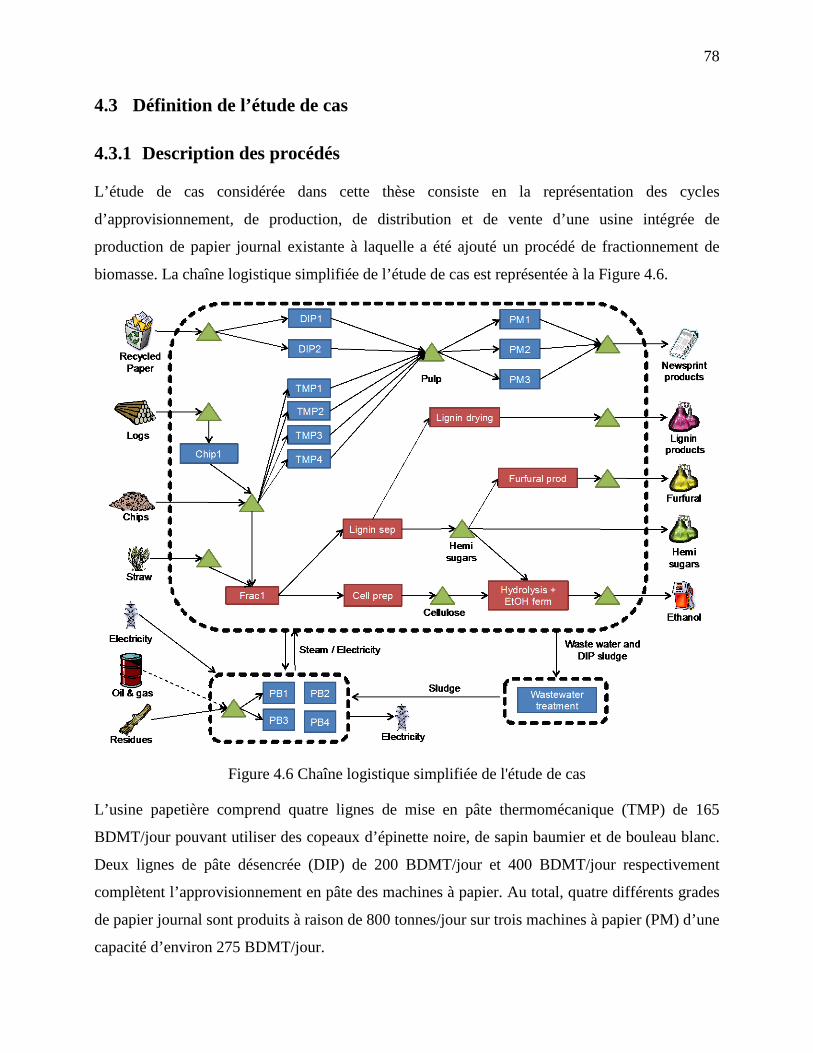
78
4.3 Définition de l’étude de cas
4.3.1 Description des procédés
L’étude de cas considérée dans cette thèse consiste en la représentation des cycles
d’approvisionnement, de production, de distribution et de vente d’une usine intégrée de
production de papier journal existante à laquelle a été ajouté un procédé de fractionnement de
biomasse. La chaîne logistique simplifiée de l’étude de cas est représentée à la Figure 4.6.
Figure 4.6 Chaîne logistique simplifiée de l'étude de cas
L’usine papetière comprend quatre lignes de mise en pâte thermomécanique (TMP) de 165
BDMT/jour pouvant utiliser des copeaux d’épinette noire, de sapin baumier et de bouleau blanc.
Deux lignes de pâte désencrée (DIP) de 200 BDMT/jour et 400 BDMT/jour respectivement
complètent l’approvisionnement en pâte des machines à papier. Au total, quatre différents grades
de papier journal sont produits à raison de 800 tonnes/jour sur trois machines à papier (PM) d’une
capacité d’environ 275 BDMT/jour.
79
L’usine est équipée d’une centrale de cogénération de 25 MW brûlant des boues, des résidus
forestiers et autres résidus de construction. Celle-ci fournit la majeure partie la vapeur nécessaire
aux opérations. Une chaudière électrique et deux chaudières fonctionnant à l’huile et au gaz
naturel sont la plupart du temps inactives, et ne sont utilisées que lors certains mois d’hiver où la
demande en énergie est plus grande et lors de la maintenance de la centrale de cogénération.
L’usine possède également ses propres installations de traitement des eaux usées.
En parallèle aux opérations papetières, un procédé de fractionnement utilisant un mélange de
solvants organiques pour traiter 250 BDMT/jour de biomasse a été modélisé. Ce procédé est
capable de traiter différents types de biomasse lignocellulosique (la paille de blé, les copeaux de
résineux (SW) et de feuillus (HW)), et les séparer dans les trois composantes principales de la
matière végétale lignocellulosique, soit la cellulose, l’hémicellulose et la lignine. Le courant de
cellulose est hydrolysé et fermenté en éthanol pour être vendu comme biocarburant. La lignine
est précipitée et séchée, puis vendue en partie comme chimique à valeur ajoutée ou comme
combustible. Les sucres d’hémicellulose sont soit vendus directement sur le marché ou séparés
par membrane pour être transformés davantage. Les pentoses sont convertis en furfural, en acide
acétique et en acide formique, tandis que les hexoses sont envoyés au procédé de fermentation en
éthanol.
Selon la source d’alimentation utilisée, différentes quantités de produits de bioraffinage sont
fabriquées. Par exemple, les hémicelluloses provenant de résineux contiennent plus d’hexoses
que les feuillus. Ils permettent de produire plus d’éthanol. Les hémicelluloses de feuillus et de
paille contiennent plus de pentoses. La production de furfural et d’acide sera alors maximisée
avec cette matière première. Ainsi, la provenance et la qualité de la biomasse utilisée dans ce
procédé peuvent avoir un impact considérable sur les opérations.
Dans cette étude, il a été considéré que chaque type de biomasse avait une composition moyenne
telle que retrouvée dans Amidon et al. [64]. Cette variabilité et ses conséquences pourraient être
étudiées davantage par la création de différentes recettes distinctes pour chaque type de biomasse,
et en effectuant une analyse de sensibilité sur ce paramètre.
Aucun investissement additionnel dans des services utilitaires n’a été considéré pour l’ajout de ce
procédé de bioraffinage puisque l’usine possède déjà des chaudières inactives qui peuvent être
redémarrées selon la demande.
80
4.3.2 Modélisation par recette
Les machines à papier, les lignes de production de pâte TMP et DIP, le procédé de
fractionnement de la biomasse et le fermenteur ont été modélisés avec différentes recettes pour
représenter les différentes conditions d’opération possibles. Ainsi, chacune de ces recettes est
caractérisée par des paramètres spécifiques reliés aux bilans de masse et d’énergie ainsi qu’aux
coûts de production. Ces paramètres varient selon les matières premières utilisées dans chacun de
ces procédés, mais aussi selon les saisons. Ces recettes ont été élaborées en tenant compte des
contraintes reliées aux procédés et à la planification.
À titre d’exemple, différents ratios de pâte TMP et pâte DIP peuvent être utilisés dans les
machines à papier, allant de 100% TMP à 50% TMP / 50% DIP. Une limite de 50% DIP a été
considérée pour des contraintes liées à la qualité du papier produit. De plus, aucune contrainte
politique et/ou de marketing nécessitant un pourcentage minimal de pâte désencrée dans la
composition du papier n’a été considérée. Les raffineurs TMP peuvent aussi utiliser différents
ratios d’espèces, qui, selon leur densité, entraînent une consommation plus ou moins grande
d’électricité. Les recettes reliées au procédé de fractionnement varient selon le type de biomasse
utilisée, soit la paille de blé, le bois de résineux et de feuillus.
4.3.3 Données et résultats de l’optimisation
4.3.3.1 Données de procédé
Les données concernant les procédés papetiers ont été fournies par un partenaire industriel, alors
que les données du procédé de bioraffinage proviennent d’une étude technico-économique, non
présentée dans cette thèse pour des raisons de confidentialité. Cette étude a été réalisée en
collaboration avec un fournisseur de technologie de bioraffinage. Ce dernier a fourni
l’information sur les étapes de fractionnement de la biomasse, de préparation de la cellulose, de
concentration des sucres d’hémicellulose en sirop, ainsi que de précipitation et de séchage de la
lignine pour en faire un produit à valeur ajoutée. Les étapes d’hydrolyse de la cellulose et de
fermentation des hexoses sont basées sur Humbird et al. [54], tandis que la production de furfural
est basée sur Xing et al. [147].
81
4.3.3.2 Données de vente et d’approvisionnement
Différents ensembles de données de vente et d’approvisionnement ont été utilisés pour les
analyses présentées dans cette thèse. Les données de l’analyse portant sur la planification
appliquée à l’industrie forestière (section 4.4) proviennent des listes actuelles des différents
fournisseurs de matières premières et des prévisions mensuelles de la demande par client.
Puisque ce genre de données n’était pas disponible pour les analyses intégrant un procédé de
bioraffinage (sections 4.5 et 4.6), un autre ensemble de données a été utilisé. L’approche suivante
de modélisation a été employée.
L’approvisionnement en biomasse et les ventes des principaux produits (papier journal, éthanol,
lignine, furfural et sucres d’hémicellulose) sont modélisés à l’aide de cinq segments de marché.
Chaque segment comprend une partie où des quantités de produits doivent obligatoirement être
achetés/vendus. Le reste de l’offre/demande du segment représente les ventes au comptant.
Le prix de vente et la taille de chaque segment de marché devraient en quelque sorte représenter
le marché et l’élasticité des prix de chacun des produits. Par exemple, les produits de base comme
l’éthanol et le papier journal sont généralement vendus à différents clients à un prix similaire.
Pour ce genre de produits, il y a peu de différences entre chaque segment.
Les produits de spécialité peuvent avoir des segments de clientèle spécifiques avec différents
niveaux de prix. Par exemple, cette étude de cas considère qu’une partie de la lignine produite par
le procédé de fractionnement est vendue comme substitut au phénol pour les applications de
résines phényl-formaldéhyde. Ce produit chimique possède une valeur ajoutée et un prix
intéressant, mais aussi une demande limitée pouvant être remplie par une fraction de la capacité
de l’usine. Le reste de la lignine peut néanmoins être écoulé sur le marché des carburants ou
utilisé à l’interne dans les chaudières, à un prix de vente beaucoup moins intéressant.
Cette modélisation des ventes et de l’approvisionnement, avec une diminution des revenus
associée à de plus grandes quantités, vise à représenter les goulots d’étranglement dans la chaîne
logistique. Le marché pour certains produits et la disponibilité de la biomasse n’est pas infinie : le
modèle d’optimisation pourra donc indiquer quels marchés il serait préférable de servir, et
jusqu’à quel niveau, en fonction des contraintes du système.
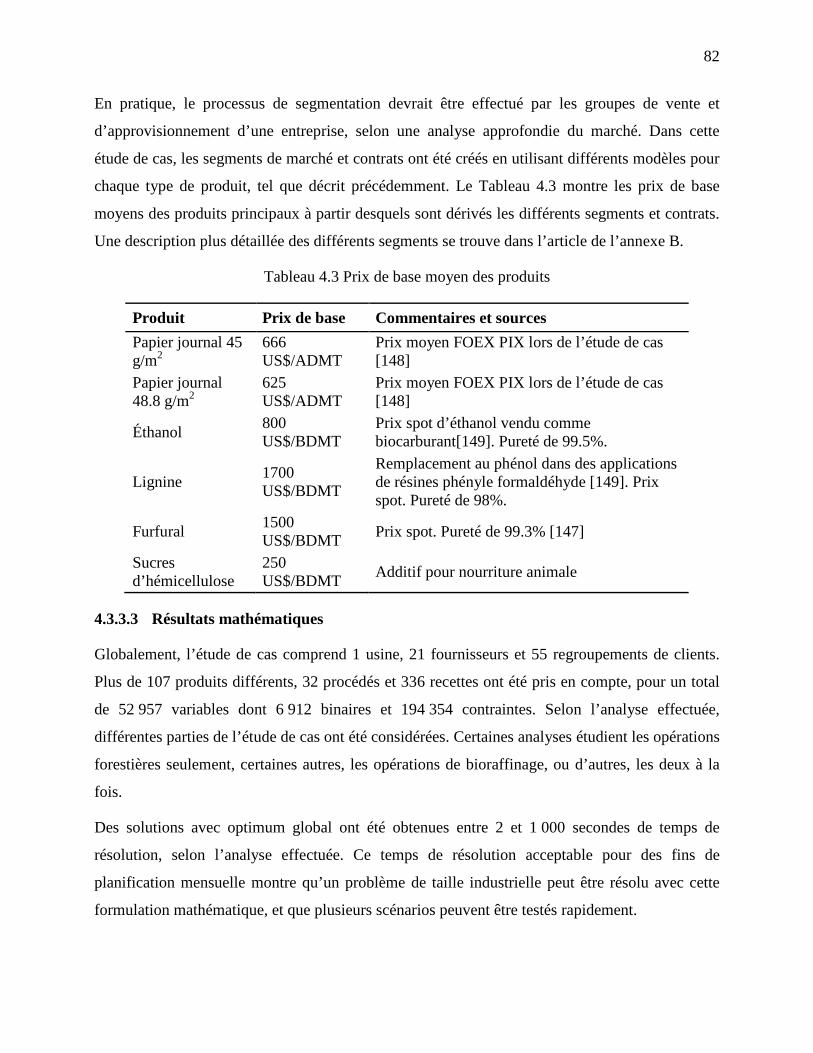
82
En pratique, le processus de segmentation devrait être effectué par les groupes de vente et
d’approvisionnement d’une entreprise, selon une analyse approfondie du marché. Dans cette
étude de cas, les segments de marché et contrats ont été créés en utilisant différents modèles pour
chaque type de produit, tel que décrit précédemment. Le Tableau 4.3 montre les prix de base
moyens des produits principaux à partir desquels sont dérivés les différents segments et contrats.
Une description plus détaillée des différents segments se trouve dans l’article de l’annexe B.
Tableau 4.3 Prix de base moyen des produits
Produit Prix de base Commentaires et sources Papier journal 45 g/m2
666 US$/ADMT
Prix moyen FOEX PIX lors de l’étude de cas [148]
Papier journal 48.8 g/m2
625 US$/ADMT
Prix moyen FOEX PIX lors de l’étude de cas [148]
Éthanol 800 US$/BDMT
Prix spot d’éthanol vendu comme biocarburant[149]. Pureté de 99.5%.
Lignine 1700 US$/BDMT
Remplacement au phénol dans des applications de résines phényle formaldéhyde [149]. Prix spot. Pureté de 98%.
Furfural 1500 US$/BDMT Prix spot. Pureté de 99.3% [147]
Sucres d’hémicellulose
250 US$/BDMT Additif pour nourriture animale
4.3.3.3 Résultats mathématiques
Globalement, l’étude de cas comprend 1 usine, 21 fournisseurs et 55 regroupements de clients.
Plus de 107 produits différents, 32 procédés et 336 recettes ont été pris en compte, pour un total
de 52 957 variables dont 6 912 binaires et 194 354 contraintes. Selon l’analyse effectuée,
différentes parties de l’étude de cas ont été considérées. Certaines analyses étudient les opérations
forestières seulement, certaines autres, les opérations de bioraffinage, ou d’autres, les deux à la
fois.
Des solutions avec optimum global ont été obtenues entre 2 et 1 000 secondes de temps de
résolution, selon l’analyse effectuée. Ce temps de résolution acceptable pour des fins de
planification mensuelle montre qu’un problème de taille industrielle peut être résolu avec cette
formulation mathématique, et que plusieurs scénarios peuvent être testés rapidement.
83
4.3.3.4 Validation du modèle
Le modèle a été validé pour le cas de base de l’usine actuelle papetière existante, soit sans
procédé de bioraffinage. Les résultats des bilans de masse et d’énergie ont d’abord été validés
sous différentes conditions d’opération de l’usine (ex. débits de production différents de papier
journal, niveaux de production ratios des lignes de mise en pâte TMP et DIP) à l’aide des
données historiques rectifiées disponibles, des données budgétaires et d’autres rapports de
production du partenaire industriel. Le modèle de coûts a quant à lui été validé à l’aide de
données budgétaires et d’états financiers. Plusieurs itérations ont été effectuées avec les membres
du département de contrôle financier afin d’obtenir un niveau de confiance jugé suffisant pour ce
niveau de prise de décision.
Les résultats reliés au procédé de bioraffinage n’ont évidemment pas pu être validés au même
niveau que ceux de l’usine papetière puisqu’aucune donnée historique de l’implantation de ce
procédé dans cette usine n’était disponible. Cependant, les différentes options de modernisation
de l’usine ont été conçues en tenant compte du cas de base validé, s’assurant ainsi que les
contraintes du système existant soient respectées.
84
4.4 Application de la planification axée sur les marges de profit à l’industrie
forestière
Afin d’illustrer la pertinence du cadre de planification axée sur les marges de profit pour les
opérations papetières actuelles, le modèle a été testé selon deux configurations de procédés. La
configuration dite axée sur la production représente le cas de base de l’usine de P&P. Les
recettes des lignes de TMP et des machines à papier sont sélectionnées avant l’optimisation à
l’aide d’une heuristique qui facilite la planification de la production et qui, selon les opérateurs,
minimise les coûts de production. Ainsi, les lignes de TMP utilisent toujours un ratio d’essences
de bois de 75% d’épinette et 25% sapin. Les machines à papier utilisent un mélange de pâte avec
60% TMP et 40% DIP. Pour atteindre ce ratio, trois lignes de TMP sur quatre sont utilisées à
pleine capacité, une ligne de DIP est fermée, et l’autre est utilisée à 80% de sa capacité
maximale.
Pour la configuration axée sur les marges de profit, le modèle optimise la sélection de recettes et
le débit des différents équipements selon les différentes contraintes reliées aux procédés et à la
planification, dans le but de maximiser la rentabilité de l’entreprise. Un tel mode d’opération peut
impliquer l’ouverture totale ou partielle de lignes de TMP et de DIP, avec les arrêts et les frais de
démarrage qui y sont associés. Pour cette analyse, aucune variation dans les coûts de production
n’est notée.
Les différences dans les coûts de fabrication de différents ratios de pâte TMP et DIP dans les
machines à papier sont causées principalement par :
• l’approvisionnement de matières premières (copeaux de bois et papier recyclé),
• la consommation de chimiques dans les lignes de TMP et de DIP,
• la consommation d’électricité sur les lignes de TMP,
• la consommation de combustible dans les chaudières, qui est elle même causée par une
variation de la demande en vapeur des procédés, ainsi que
• les démarrages et fermetures de procédés.
85
Afin d’illustrer les modes de consommation de coûts de différentes recettes, la Figure 4.7
introduit les coûts variables de trois différents ratios de pâte dans les machines à papier dans le
scénario de base. Le scénario de base utilise le prix des matières premières fourni par le
partenaire industriel lors de la réalisation de l’étude de cas. Pour des raisons de confidentialité, les
coûts de chacune des configurations sont normalisés par les coûts de la configuration axée sur la
production.
Avec un mélange de pâte constitué de 80% de pâte TMP, les quatre lignes de TMP fonctionnent à
pleine capacité. La production de vapeur est donc maximisée, ce qui réduit à la fois la
consommation de combustibles fossiles dans les chaudières. Cependant, la consommation
d’électricité est à son maximum. Comme les lignes de DIP ne sont que très peu sollicitées, la
consommation de papier recyclé et de produits chimiques est plus faible.
Dans ces conditions de marché, une production de papier avec un contenu de 50% DIP augmente
les coûts de production de 1,4% par rapport au cas axé sur la production. Pour une même
capacité de production de papier, les coûts variables opérationnels peuvent être réduits de 2,6%
en augmentant le ratio de TMP au maximum possible permis par les installations. Pour une telle
industrie possédant de faibles des marges de profit, une réduction de coûts de quelques points de
pourcentage peut avoir des effets considérables sur la rentabilité. En effet, pour l’étude de cas
considérée, une réduction de l’ordre de 1% dans les coûts variables se traduit par une
augmentation de la rentabilité de 7%, soit pratiquement les profits générés par un mois de
production.
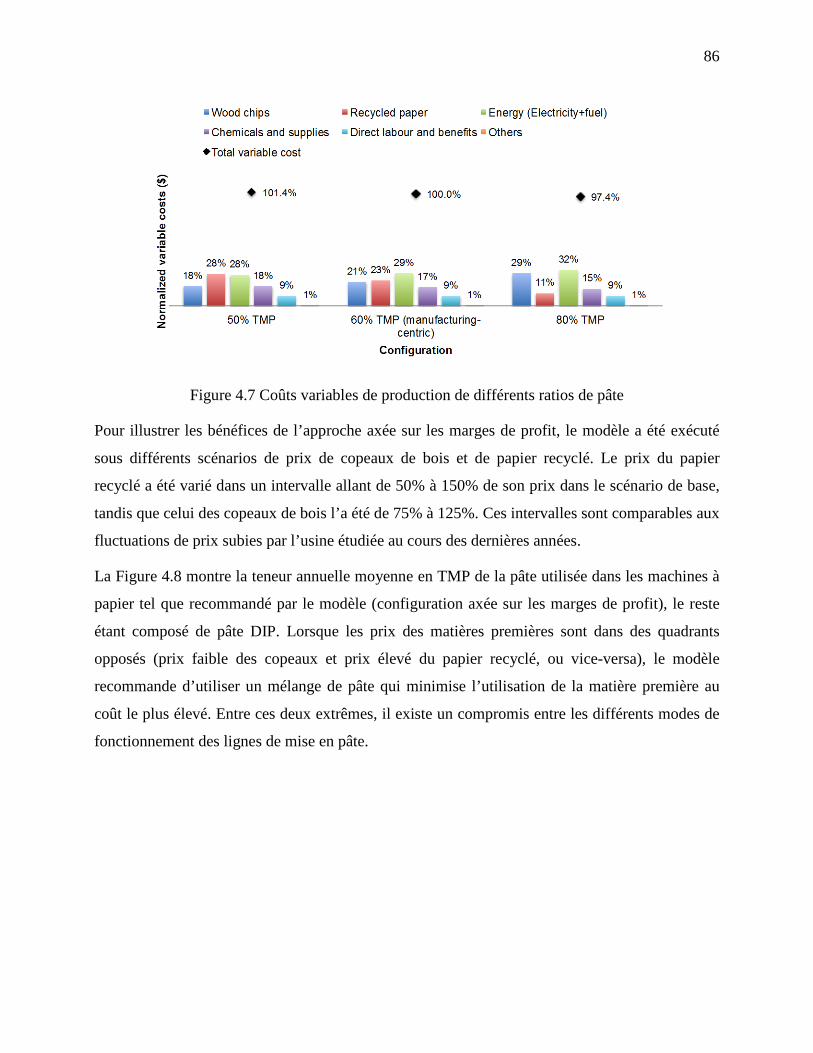
86
Figure 4.7 Coûts variables de production de différents ratios de pâte
Pour illustrer les bénéfices de l’approche axée sur les marges de profit, le modèle a été exécuté
sous différents scénarios de prix de copeaux de bois et de papier recyclé. Le prix du papier
recyclé a été varié dans un intervalle allant de 50% à 150% de son prix dans le scénario de base,
tandis que celui des copeaux de bois l’a été de 75% à 125%. Ces intervalles sont comparables aux
fluctuations de prix subies par l’usine étudiée au cours des dernières années.
La Figure 4.8 montre la teneur annuelle moyenne en TMP de la pâte utilisée dans les machines à
papier tel que recommandé par le modèle (configuration axée sur les marges de profit), le reste
étant composé de pâte DIP. Lorsque les prix des matières premières sont dans des quadrants
opposés (prix faible des copeaux et prix élevé du papier recyclé, ou vice-versa), le modèle
recommande d’utiliser un mélange de pâte qui minimise l’utilisation de la matière première au
coût le plus élevé. Entre ces deux extrêmes, il existe un compromis entre les différents modes de
fonctionnement des lignes de mise en pâte.
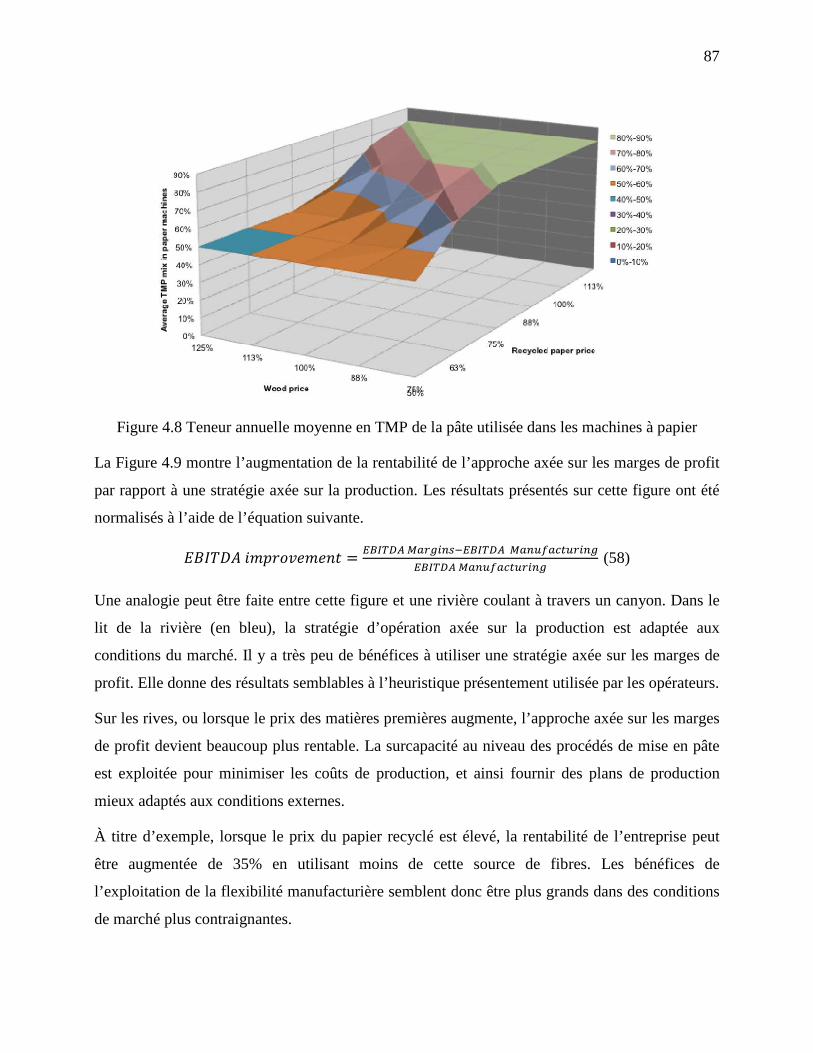
87
Figure 4.8 Teneur annuelle moyenne en TMP de la pâte utilisée dans les machines à papier
La Figure 4.9 montre l’augmentation de la rentabilité de l’approche axée sur les marges de profit
par rapport à une stratégie axée sur la production. Les résultats présentés sur cette figure ont été
normalisés à l’aide de l’équation suivante.
𝐸𝐵𝐼𝑇𝐷𝐴 𝑖𝑚𝑝𝑟𝑜𝑣𝑒𝑚𝑒𝑛𝑡 = 𝐸𝐵𝐼𝑇𝐷𝐴 𝑀𝑎𝑟𝑔𝑖𝑛𝑠−𝐸𝐵𝐼𝑇𝐷𝐴 𝑀𝑎𝑛𝑢𝑓𝑎𝑐𝑡𝑢𝑟𝑖𝑛𝑔𝐸𝐵𝐼𝑇𝐷𝐴 𝑀𝑎𝑛𝑢𝑓𝑎𝑐𝑡𝑢𝑟𝑖𝑛𝑔
(58)
Une analogie peut être faite entre cette figure et une rivière coulant à travers un canyon. Dans le
lit de la rivière (en bleu), la stratégie d’opération axée sur la production est adaptée aux
conditions du marché. Il y a très peu de bénéfices à utiliser une stratégie axée sur les marges de
profit. Elle donne des résultats semblables à l’heuristique présentement utilisée par les opérateurs.
Sur les rives, ou lorsque le prix des matières premières augmente, l’approche axée sur les marges
de profit devient beaucoup plus rentable. La surcapacité au niveau des procédés de mise en pâte
est exploitée pour minimiser les coûts de production, et ainsi fournir des plans de production
mieux adaptés aux conditions externes.
À titre d’exemple, lorsque le prix du papier recyclé est élevé, la rentabilité de l’entreprise peut
être augmentée de 35% en utilisant moins de cette source de fibres. Les bénéfices de
l’exploitation de la flexibilité manufacturière semblent donc être plus grands dans des conditions
de marché plus contraignantes.
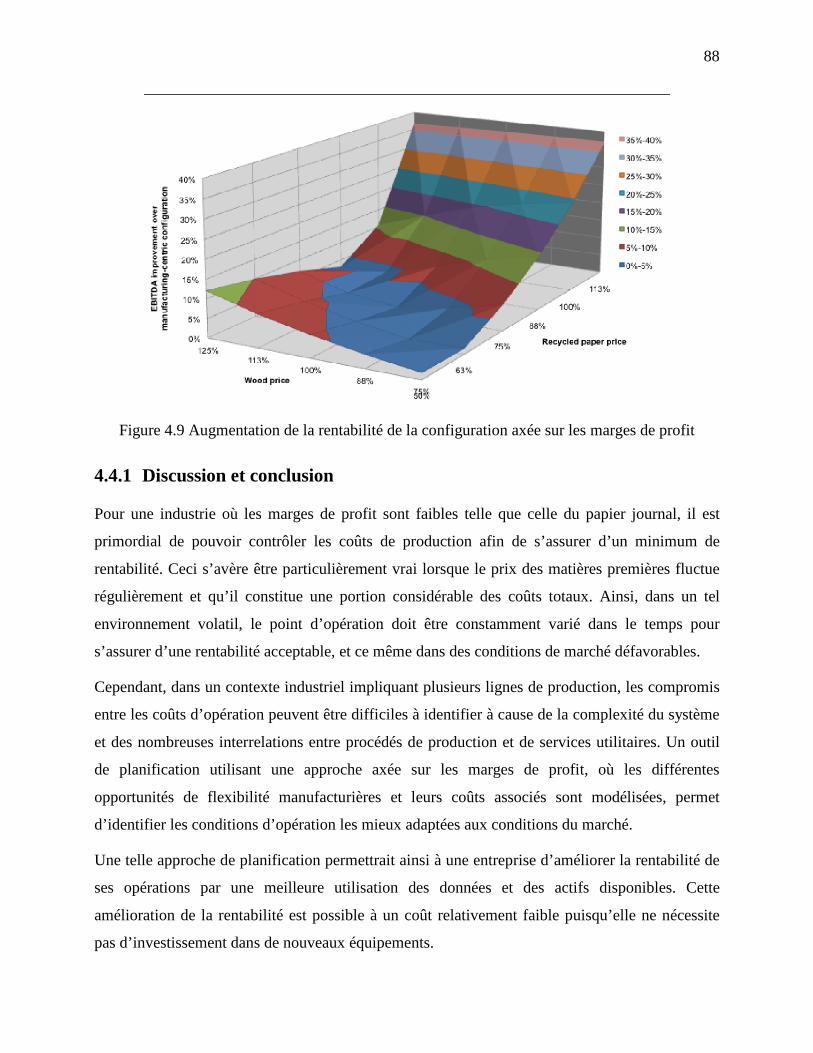
88
Figure 4.9 Augmentation de la rentabilité de la configuration axée sur les marges de profit
4.4.1 Discussion et conclusion
Pour une industrie où les marges de profit sont faibles telle que celle du papier journal, il est
primordial de pouvoir contrôler les coûts de production afin de s’assurer d’un minimum de
rentabilité. Ceci s’avère être particulièrement vrai lorsque le prix des matières premières fluctue
régulièrement et qu’il constitue une portion considérable des coûts totaux. Ainsi, dans un tel
environnement volatil, le point d’opération doit être constamment varié dans le temps pour
s’assurer d’une rentabilité acceptable, et ce même dans des conditions de marché défavorables.
Cependant, dans un contexte industriel impliquant plusieurs lignes de production, les compromis
entre les coûts d’opération peuvent être difficiles à identifier à cause de la complexité du système
et des nombreuses interrelations entre procédés de production et de services utilitaires. Un outil
de planification utilisant une approche axée sur les marges de profit, où les différentes
opportunités de flexibilité manufacturières et leurs coûts associés sont modélisées, permet
d’identifier les conditions d’opération les mieux adaptées aux conditions du marché.
Une telle approche de planification permettrait ainsi à une entreprise d’améliorer la rentabilité de
ses opérations par une meilleure utilisation des données et des actifs disponibles. Cette
amélioration de la rentabilité est possible à un coût relativement faible puisqu’elle ne nécessite
pas d’investissement dans de nouveaux équipements.
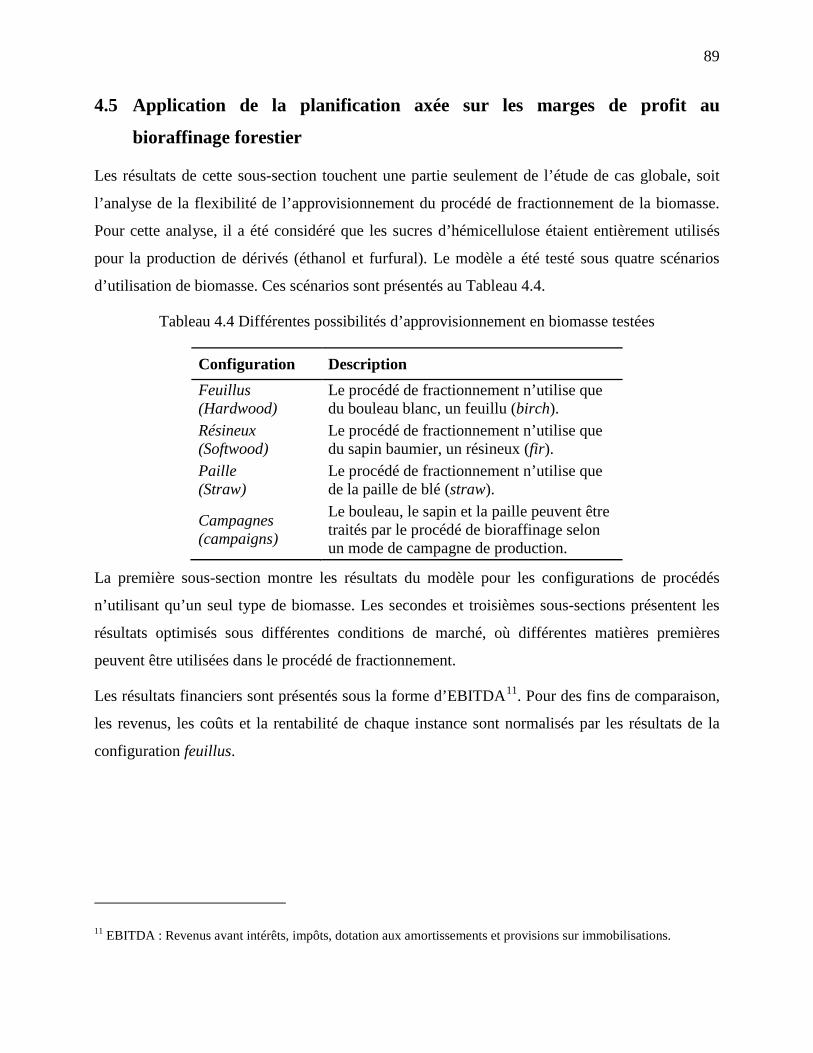
89
4.5 Application de la planification axée sur les marges de profit au
bioraffinage forestier
Les résultats de cette sous-section touchent une partie seulement de l’étude de cas globale, soit
l’analyse de la flexibilité de l’approvisionnement du procédé de fractionnement de la biomasse.
Pour cette analyse, il a été considéré que les sucres d’hémicellulose étaient entièrement utilisés
pour la production de dérivés (éthanol et furfural). Le modèle a été testé sous quatre scénarios
d’utilisation de biomasse. Ces scénarios sont présentés au Tableau 4.4.
Tableau 4.4 Différentes possibilités d’approvisionnement en biomasse testées
Configuration Description Feuillus (Hardwood)
Le procédé de fractionnement n’utilise que du bouleau blanc, un feuillu (birch).
Résineux (Softwood)
Le procédé de fractionnement n’utilise que du sapin baumier, un résineux (fir).
Paille (Straw)
Le procédé de fractionnement n’utilise que de la paille de blé (straw).
Campagnes (campaigns)
Le bouleau, le sapin et la paille peuvent être traités par le procédé de bioraffinage selon un mode de campagne de production.
La première sous-section montre les résultats du modèle pour les configurations de procédés
n’utilisant qu’un seul type de biomasse. Les secondes et troisièmes sous-sections présentent les
résultats optimisés sous différentes conditions de marché, où différentes matières premières
peuvent être utilisées dans le procédé de fractionnement.
Les résultats financiers sont présentés sous la forme d’EBITDA11. Pour des fins de comparaison,
les revenus, les coûts et la rentabilité de chaque instance sont normalisés par les résultats de la
configuration feuillus.
11 EBITDA : Revenus avant intérêts, impôts, dotation aux amortissements et provisions sur immobilisations.
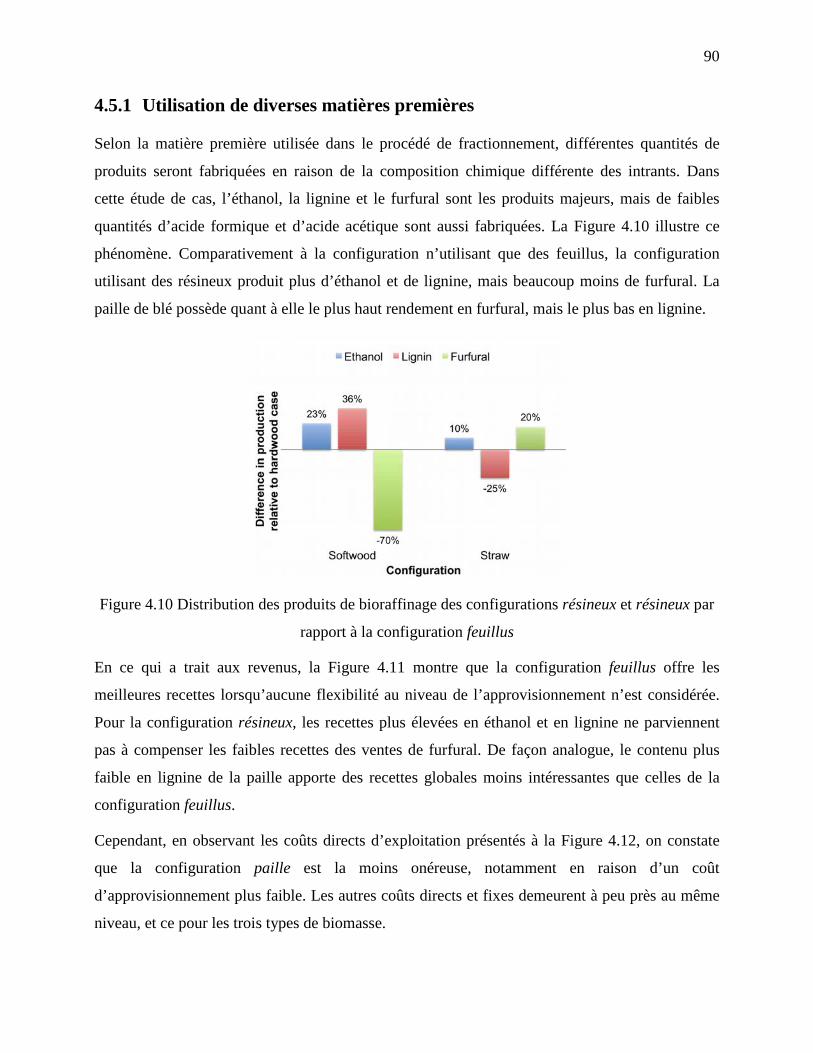
90
4.5.1 Utilisation de diverses matières premières
Selon la matière première utilisée dans le procédé de fractionnement, différentes quantités de
produits seront fabriquées en raison de la composition chimique différente des intrants. Dans
cette étude de cas, l’éthanol, la lignine et le furfural sont les produits majeurs, mais de faibles
quantités d’acide formique et d’acide acétique sont aussi fabriquées. La Figure 4.10 illustre ce
phénomène. Comparativement à la configuration n’utilisant que des feuillus, la configuration
utilisant des résineux produit plus d’éthanol et de lignine, mais beaucoup moins de furfural. La
paille de blé possède quant à elle le plus haut rendement en furfural, mais le plus bas en lignine.
Figure 4.10 Distribution des produits de bioraffinage des configurations résineux et résineux par
rapport à la configuration feuillus
En ce qui a trait aux revenus, la Figure 4.11 montre que la configuration feuillus offre les
meilleures recettes lorsqu’aucune flexibilité au niveau de l’approvisionnement n’est considérée.
Pour la configuration résineux, les recettes plus élevées en éthanol et en lignine ne parviennent
pas à compenser les faibles recettes des ventes de furfural. De façon analogue, le contenu plus
faible en lignine de la paille apporte des recettes globales moins intéressantes que celles de la
configuration feuillus.
Cependant, en observant les coûts directs d’exploitation présentés à la Figure 4.12, on constate
que la configuration paille est la moins onéreuse, notamment en raison d’un coût
d’approvisionnement plus faible. Les autres coûts directs et fixes demeurent à peu près au même
niveau, et ce pour les trois types de biomasse.
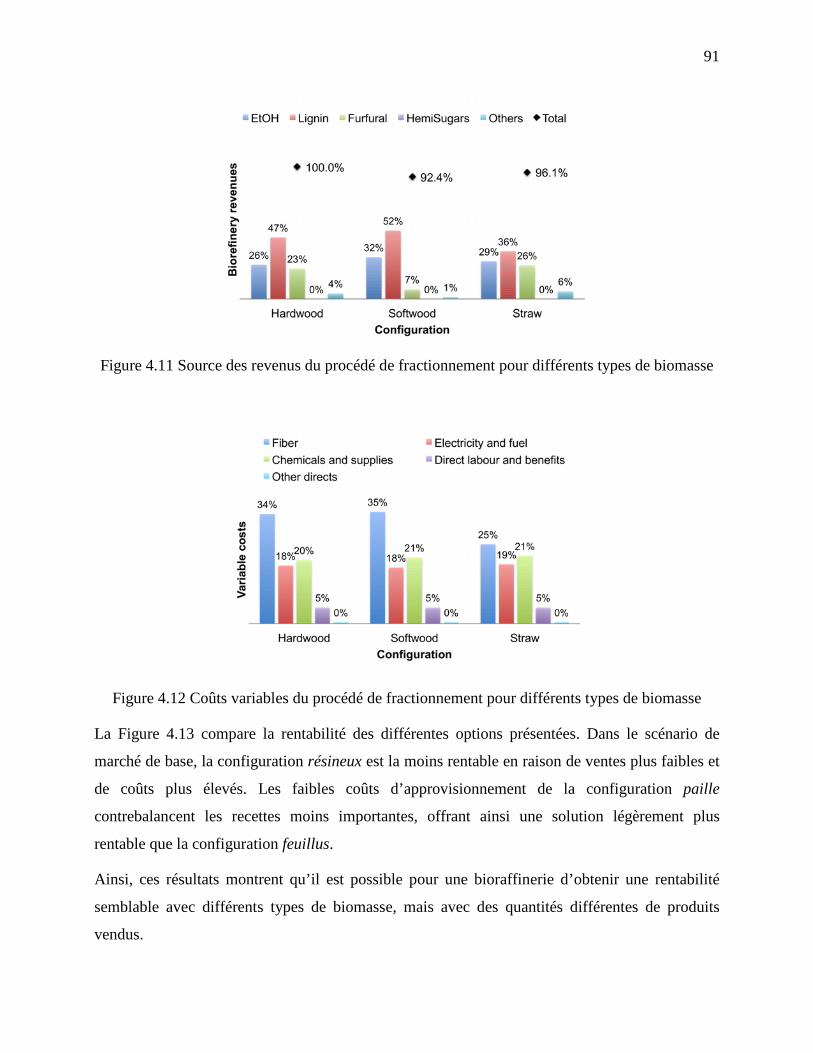
91
Figure 4.11 Source des revenus du procédé de fractionnement pour différents types de biomasse
Figure 4.12 Coûts variables du procédé de fractionnement pour différents types de biomasse
La Figure 4.13 compare la rentabilité des différentes options présentées. Dans le scénario de
marché de base, la configuration résineux est la moins rentable en raison de ventes plus faibles et
de coûts plus élevés. Les faibles coûts d’approvisionnement de la configuration paille
contrebalancent les recettes moins importantes, offrant ainsi une solution légèrement plus
rentable que la configuration feuillus.
Ainsi, ces résultats montrent qu’il est possible pour une bioraffinerie d’obtenir une rentabilité
semblable avec différents types de biomasse, mais avec des quantités différentes de produits
vendus.
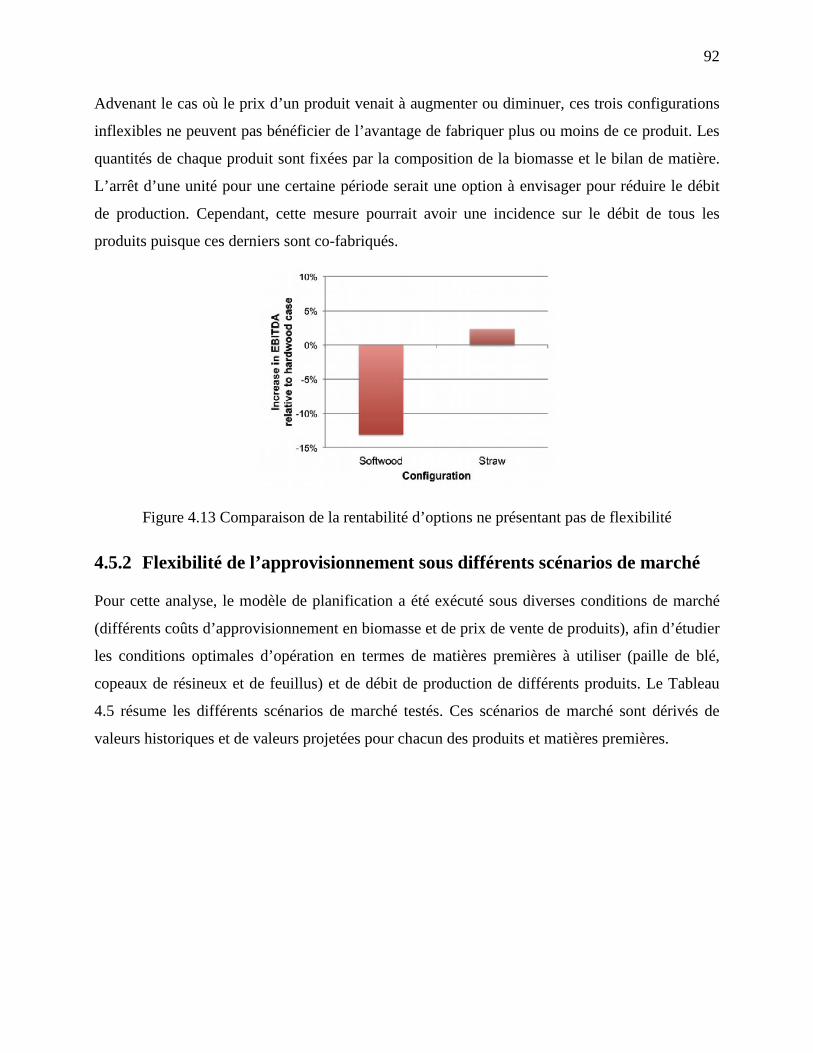
92
Advenant le cas où le prix d’un produit venait à augmenter ou diminuer, ces trois configurations
inflexibles ne peuvent pas bénéficier de l’avantage de fabriquer plus ou moins de ce produit. Les
quantités de chaque produit sont fixées par la composition de la biomasse et le bilan de matière.
L’arrêt d’une unité pour une certaine période serait une option à envisager pour réduire le débit
de production. Cependant, cette mesure pourrait avoir une incidence sur le débit de tous les
produits puisque ces derniers sont co-fabriqués.
Figure 4.13 Comparaison de la rentabilité d’options ne présentant pas de flexibilité
4.5.2 Flexibilité de l’approvisionnement sous différents scénarios de marché
Pour cette analyse, le modèle de planification a été exécuté sous diverses conditions de marché
(différents coûts d’approvisionnement en biomasse et de prix de vente de produits), afin d’étudier
les conditions optimales d’opération en termes de matières premières à utiliser (paille de blé,
copeaux de résineux et de feuillus) et de débit de production de différents produits. Le Tableau
4.5 résume les différents scénarios de marché testés. Ces scénarios de marché sont dérivés de
valeurs historiques et de valeurs projetées pour chacun des produits et matières premières.
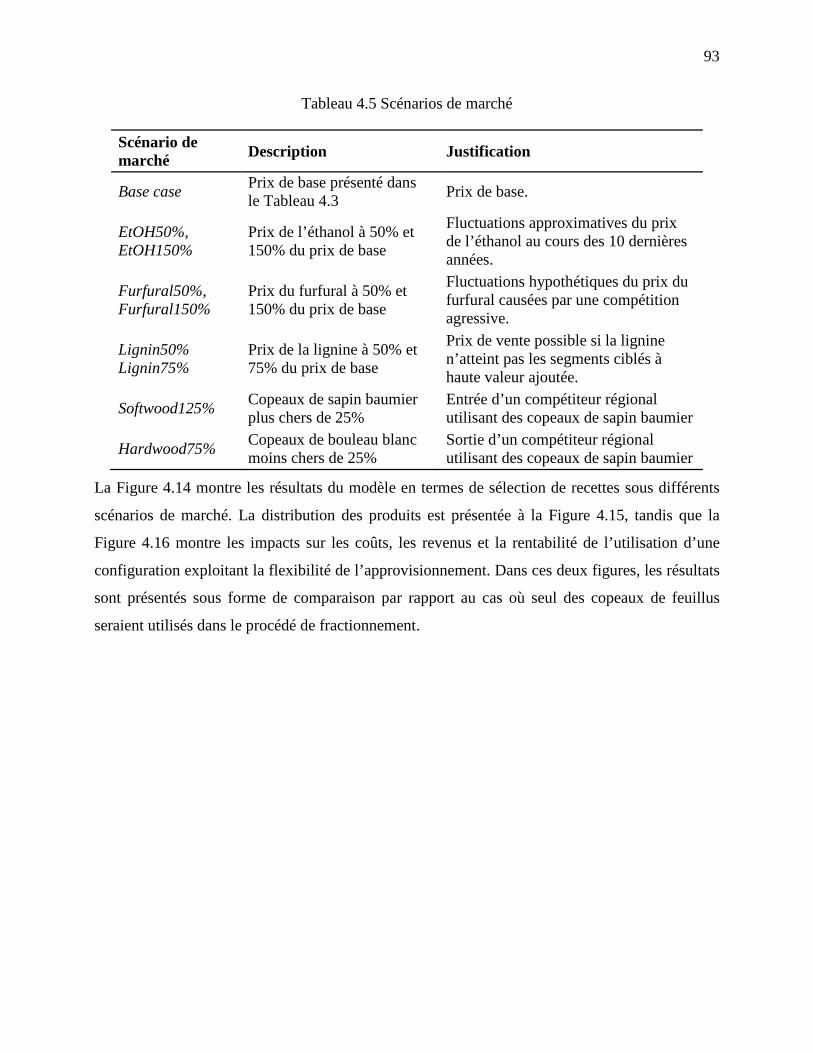
93
Tableau 4.5 Scénarios de marché
Scénario de marché Description Justification
Base case Prix de base présenté dans le Tableau 4.3 Prix de base.
EtOH50%, EtOH150%
Prix de l’éthanol à 50% et 150% du prix de base
Fluctuations approximatives du prix de l’éthanol au cours des 10 dernières années.
Furfural50%, Furfural150%
Prix du furfural à 50% et 150% du prix de base
Fluctuations hypothétiques du prix du furfural causées par une compétition agressive.
Lignin50% Lignin75%
Prix de la lignine à 50% et 75% du prix de base
Prix de vente possible si la lignine n’atteint pas les segments ciblés à haute valeur ajoutée.
Softwood125% Copeaux de sapin baumier plus chers de 25%
Entrée d’un compétiteur régional utilisant des copeaux de sapin baumier
Hardwood75% Copeaux de bouleau blanc moins chers de 25%
Sortie d’un compétiteur régional utilisant des copeaux de sapin baumier
La Figure 4.14 montre les résultats du modèle en termes de sélection de recettes sous différents
scénarios de marché. La distribution des produits est présentée à la Figure 4.15, tandis que la
Figure 4.16 montre les impacts sur les coûts, les revenus et la rentabilité de l’utilisation d’une
configuration exploitant la flexibilité de l’approvisionnement. Dans ces deux figures, les résultats
sont présentés sous forme de comparaison par rapport au cas où seul des copeaux de feuillus
seraient utilisés dans le procédé de fractionnement.
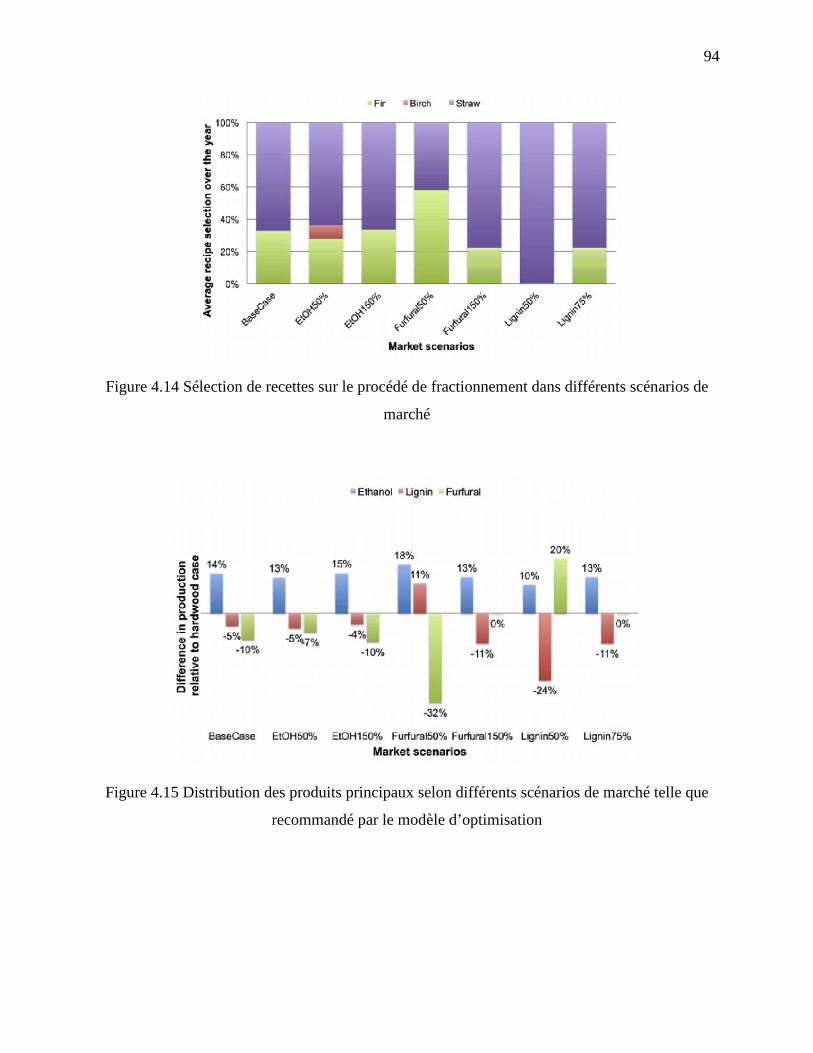
94
Figure 4.14 Sélection de recettes sur le procédé de fractionnement dans différents scénarios de
marché
Figure 4.15 Distribution des produits principaux selon différents scénarios de marché telle que
recommandé par le modèle d’optimisation
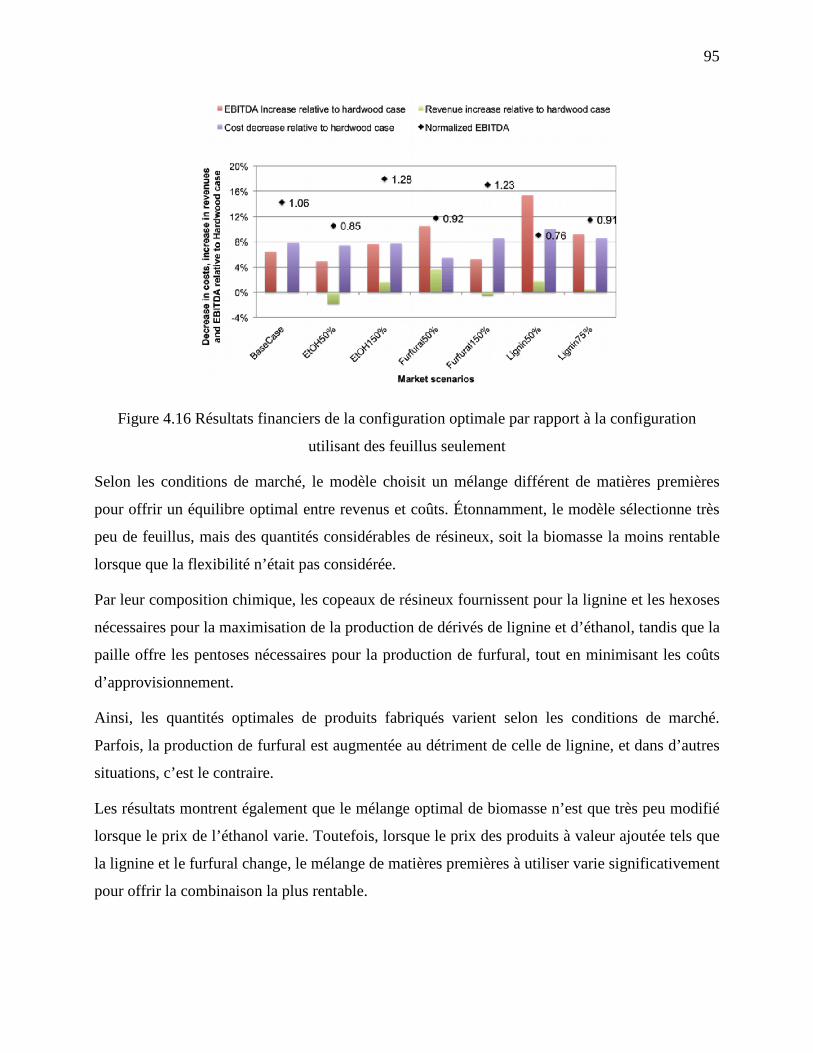
95
Figure 4.16 Résultats financiers de la configuration optimale par rapport à la configuration
utilisant des feuillus seulement
Selon les conditions de marché, le modèle choisit un mélange différent de matières premières
pour offrir un équilibre optimal entre revenus et coûts. Étonnamment, le modèle sélectionne très
peu de feuillus, mais des quantités considérables de résineux, soit la biomasse la moins rentable
lorsque que la flexibilité n’était pas considérée.
Par leur composition chimique, les copeaux de résineux fournissent pour la lignine et les hexoses
nécessaires pour la maximisation de la production de dérivés de lignine et d’éthanol, tandis que la
paille offre les pentoses nécessaires pour la production de furfural, tout en minimisant les coûts
d’approvisionnement.
Ainsi, les quantités optimales de produits fabriqués varient selon les conditions de marché.
Parfois, la production de furfural est augmentée au détriment de celle de lignine, et dans d’autres
situations, c’est le contraire.
Les résultats montrent également que le mélange optimal de biomasse n’est que très peu modifié
lorsque le prix de l’éthanol varie. Toutefois, lorsque le prix des produits à valeur ajoutée tels que
la lignine et le furfural change, le mélange de matières premières à utiliser varie significativement
pour offrir la combinaison la plus rentable.
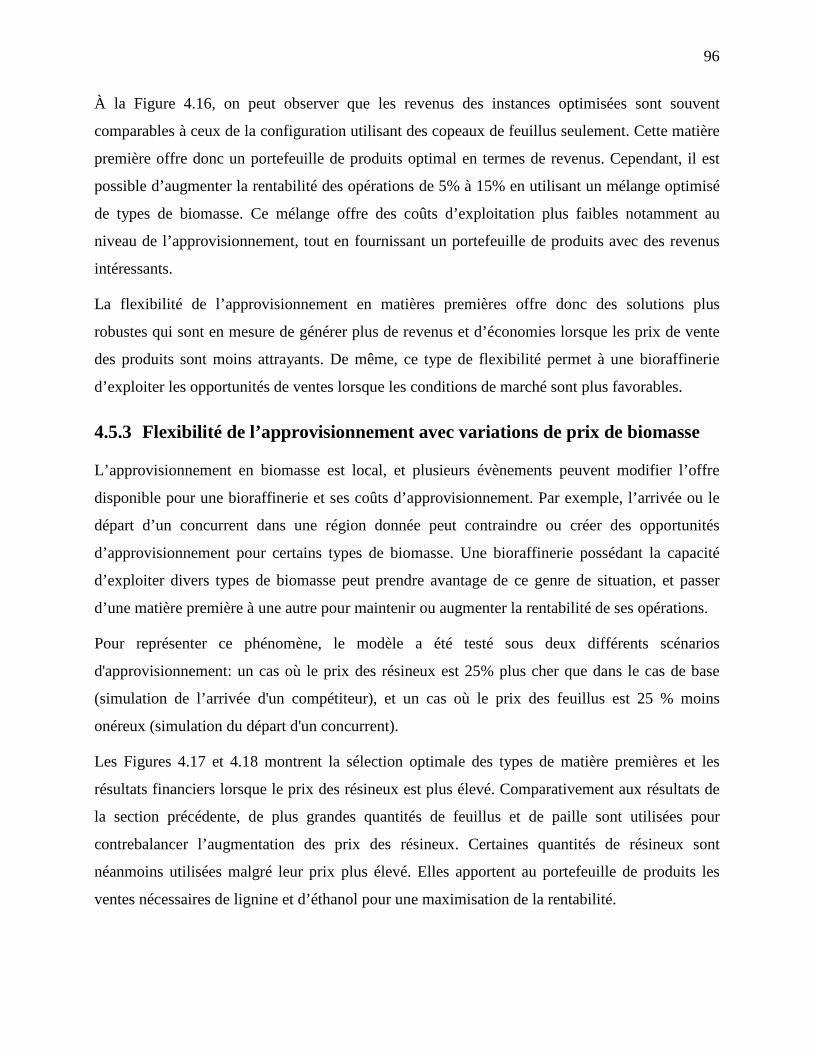
96
À la Figure 4.16, on peut observer que les revenus des instances optimisées sont souvent
comparables à ceux de la configuration utilisant des copeaux de feuillus seulement. Cette matière
première offre donc un portefeuille de produits optimal en termes de revenus. Cependant, il est
possible d’augmenter la rentabilité des opérations de 5% à 15% en utilisant un mélange optimisé
de types de biomasse. Ce mélange offre des coûts d’exploitation plus faibles notamment au
niveau de l’approvisionnement, tout en fournissant un portefeuille de produits avec des revenus
intéressants.
La flexibilité de l’approvisionnement en matières premières offre donc des solutions plus
robustes qui sont en mesure de générer plus de revenus et d’économies lorsque les prix de vente
des produits sont moins attrayants. De même, ce type de flexibilité permet à une bioraffinerie
d’exploiter les opportunités de ventes lorsque les conditions de marché sont plus favorables.
4.5.3 Flexibilité de l’approvisionnement avec variations de prix de biomasse
L’approvisionnement en biomasse est local, et plusieurs évènements peuvent modifier l’offre
disponible pour une bioraffinerie et ses coûts d’approvisionnement. Par exemple, l’arrivée ou le
départ d’un concurrent dans une région donnée peut contraindre ou créer des opportunités
d’approvisionnement pour certains types de biomasse. Une bioraffinerie possédant la capacité
d’exploiter divers types de biomasse peut prendre avantage de ce genre de situation, et passer
d’une matière première à une autre pour maintenir ou augmenter la rentabilité de ses opérations.
Pour représenter ce phénomène, le modèle a été testé sous deux différents scénarios
d'approvisionnement: un cas où le prix des résineux est 25% plus cher que dans le cas de base
(simulation de l’arrivée d'un compétiteur), et un cas où le prix des feuillus est 25 % moins
onéreux (simulation du départ d'un concurrent).
Les Figures 4.17 et 4.18 montrent la sélection optimale des types de matière premières et les
résultats financiers lorsque le prix des résineux est plus élevé. Comparativement aux résultats de
la section précédente, de plus grandes quantités de feuillus et de paille sont utilisées pour
contrebalancer l’augmentation des prix des résineux. Certaines quantités de résineux sont
néanmoins utilisées malgré leur prix plus élevé. Elles apportent au portefeuille de produits les
ventes nécessaires de lignine et d’éthanol pour une maximisation de la rentabilité.
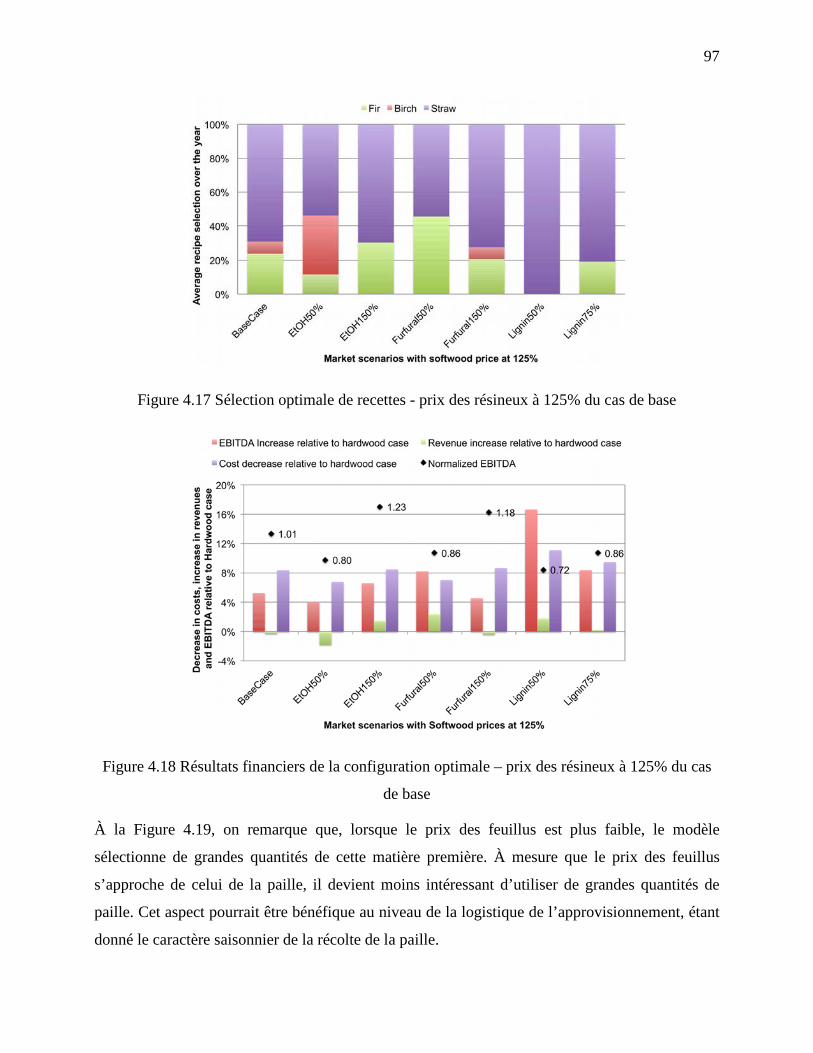
97
Figure 4.17 Sélection optimale de recettes - prix des résineux à 125% du cas de base
Figure 4.18 Résultats financiers de la configuration optimale – prix des résineux à 125% du cas
de base
À la Figure 4.19, on remarque que, lorsque le prix des feuillus est plus faible, le modèle
sélectionne de grandes quantités de cette matière première. À mesure que le prix des feuillus
s’approche de celui de la paille, il devient moins intéressant d’utiliser de grandes quantités de
paille. Cet aspect pourrait être bénéfique au niveau de la logistique de l’approvisionnement, étant
donné le caractère saisonnier de la récolte de la paille.
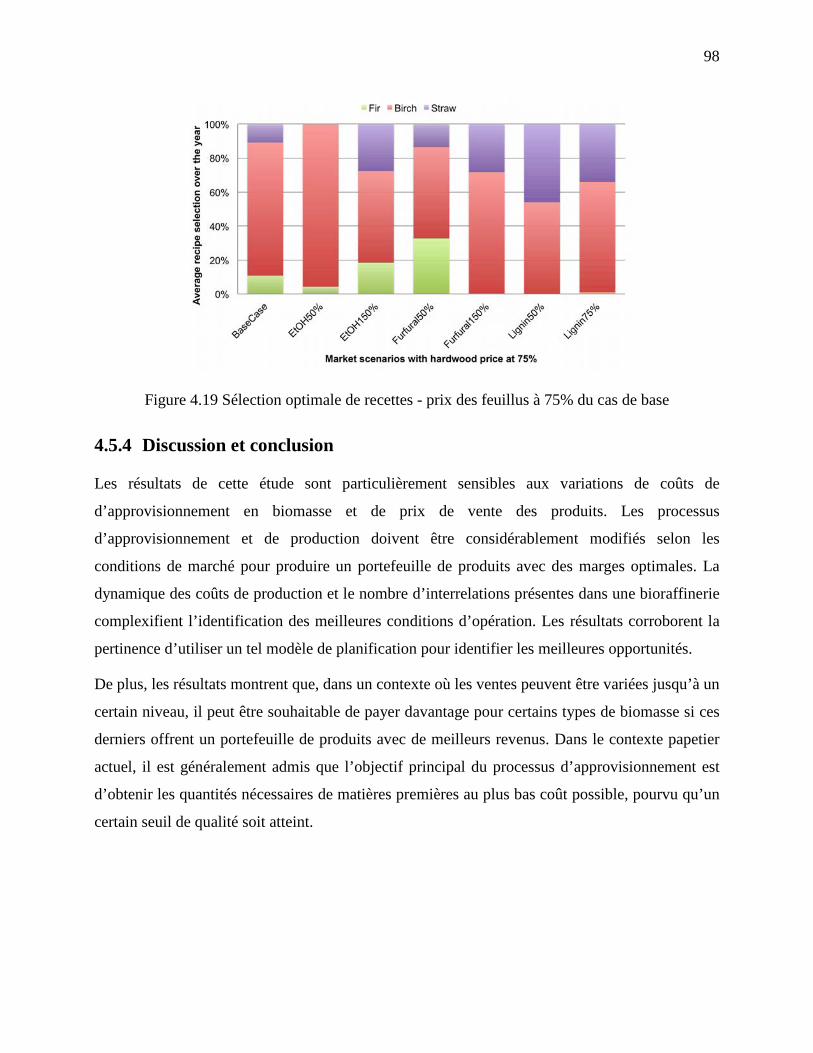
98
Figure 4.19 Sélection optimale de recettes - prix des feuillus à 75% du cas de base
4.5.4 Discussion et conclusion
Les résultats de cette étude sont particulièrement sensibles aux variations de coûts de
d’approvisionnement en biomasse et de prix de vente des produits. Les processus
d’approvisionnement et de production doivent être considérablement modifiés selon les
conditions de marché pour produire un portefeuille de produits avec des marges optimales. La
dynamique des coûts de production et le nombre d’interrelations présentes dans une bioraffinerie
complexifient l’identification des meilleures conditions d’opération. Les résultats corroborent la
pertinence d’utiliser un tel modèle de planification pour identifier les meilleures opportunités.
De plus, les résultats montrent que, dans un contexte où les ventes peuvent être variées jusqu’à un
certain niveau, il peut être souhaitable de payer davantage pour certains types de biomasse si ces
derniers offrent un portefeuille de produits avec de meilleurs revenus. Dans le contexte papetier
actuel, il est généralement admis que l’objectif principal du processus d’approvisionnement est
d’obtenir les quantités nécessaires de matières premières au plus bas coût possible, pourvu qu’un
certain seuil de qualité soit atteint.
99
Pour une bioraffinerie offrant une vaste gamme de produits, l’approvisionnement peut jouer un
rôle de levier important pour augmenter les revenus, tout en minimisant les coûts. Ce processus
peut donc s’avérer être un outil puissant apportant de la robustesse contre des conditions volatiles
de marché, en autant qu’un modèle intégré de planification soit utilisé pour identifier les
compromis entre les ventes et l’approvisionnement.
Cela étant dit, pour bénéficier d’une planification axée sur les marges de profit où différentes
quantités de produits sont fabriquées selon les conditions du marché, il devient aussi nécessaire
de conserver un minimum de flexibilité au niveau des ventes. Une quantité minimale de contrats
peut s’avérer nécessaire pour garantir un niveau de sécurité par rapport aux divers risques
financiers et d’approvisionnement par exemple. Cependant, l’allocation des contrats et des ventes
au comptant devrait être évaluée soigneusement afin de ne pas trop sécuriser de ventes sous
contrats pour profiter des éventuelles opportunités de vendre plus de tel produit ou, au contraire,
d’en vendre moins.
Les résultats de cette étude de cas montrent aussi que les variations de débit de production sont
plus sensibles aux prix de la lignine et du furfural, qui possédaient une plus grande valeur
ajoutée. Il faudrait donc porter une plus grande attention à la gestion de tels produits à valeur
ajoutée. De même, il vaudrait mieux considérer les coproduits de base, tel l’éthanol, comme un
« puits » de vente ou de grandes quantités peuvent être écoulées, contribuant à l’augmentation
des flux de trésorerie de l’entreprise.
L’outil de planification proposé dans cette thèse pourrait être utilisé lors de la conception de
procédés afin de cibler le niveau de flexibilité souhaité pour atténuer les risques du marché.
L’outil serait à la base d’une approche de ciblage du niveau de flexibilité telle que celle proposée
par Mansoornejad [145], où une analyse de scénarios permettrait d’établir le compromis optimal
entre flexibilité et investissement.
100
4.6 Évaluation de stratégies de modernisation
Afin d’estimer la performance d’une usine après la fermeture potentielle d’une ligne de
production, les bilans de matière et d’énergie doivent d’abord être recalculés, de même que les
coûts de production. Dans ce contexte, le modèle de planification décrit précédemment s’avère
être un outil de gestion adéquat pour évaluer différentes configurations d’usine. Étant donné que
les paramètres des bilans ainsi que les relations de coûts basées sur la consommation de
ressources sont déjà développés pour chacun des procédés existants, plusieurs configurations
peuvent être évaluées rapidement.
La méthodologie suivante résume les étapes à suivre pour utiliser et bâtir le modèle servant à
l’évaluation de stratégique d’alternatives de modernisation des procédés :
101
1) Développement du cas de base dans le modèle d’optimisation, dont la définition des items
suivants :
a. Ensembles de procédés, recettes, produits, fournisseurs et clients à considérer
b. Paramètres reliés aux bilans de masse et d’énergie pour le calcul des bilans et
intervalle de validité
c. Relations de coûts d’opération et intervalle de validité
d. Contraintes reliées à la chaîne logistique
i. Plan des ventes
ii. Approvisionnement en matières premières
iii. Logistique et transport
iv. Règles de gestion de l’inventaire
2) Validation du cas de base
a. Validation des bilans de masse et d’énergie sous différentes conditions d’opération
de l’usine
b. Validation du modèle de coûts, en comparant les résultats du modèle avec les états
financiers mensuels
3) Développement de nouvelles alternatives de procédés
a. Bases de conception du procédé
b. Bilans de masse et d’énergie
c. Estimation des coûts d’investissement
d. Développement de stratégies pour une implantation par phase
4) Incorporation des alternatives de procédé dans le modèle d’optimisation, selon les étapes
décrites au point 1
5) Analyse stratégique de configurations d’usine
a. Cession des activités papetières
b. Implantation par phase de procédés de bioraffinage
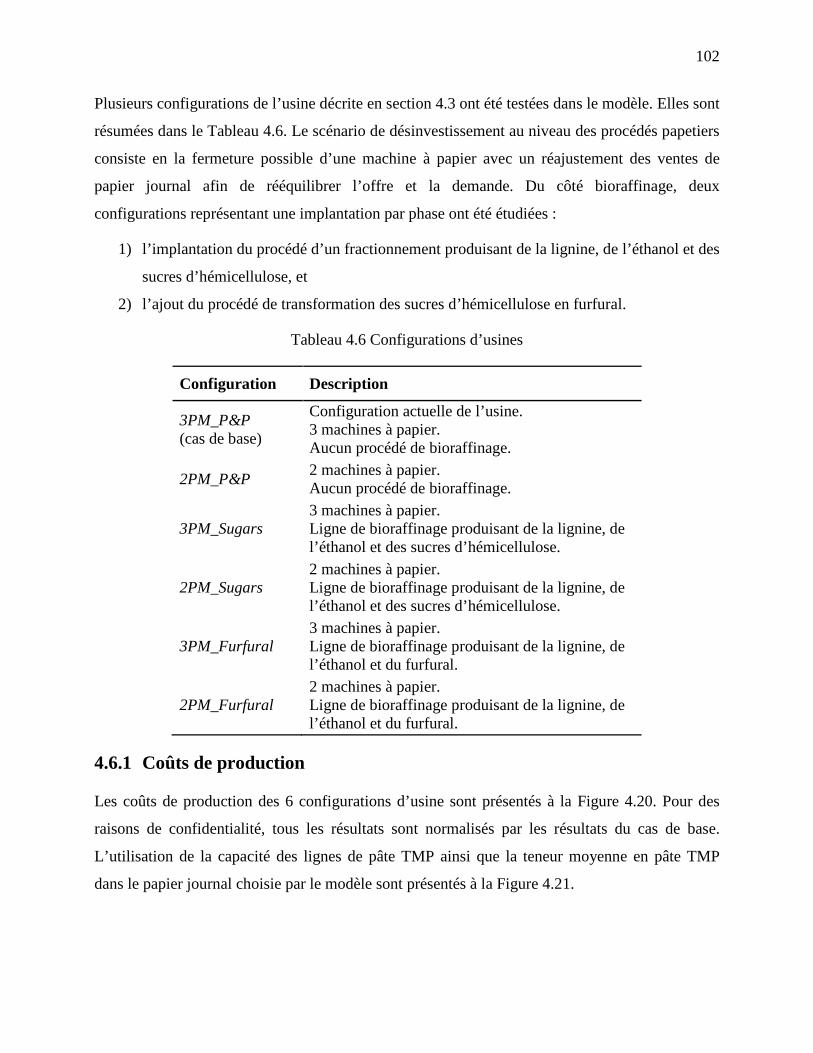
102
Plusieurs configurations de l’usine décrite en section 4.3 ont été testées dans le modèle. Elles sont
résumées dans le Tableau 4.6. Le scénario de désinvestissement au niveau des procédés papetiers
consiste en la fermeture possible d’une machine à papier avec un réajustement des ventes de
papier journal afin de rééquilibrer l’offre et la demande. Du côté bioraffinage, deux
configurations représentant une implantation par phase ont été étudiées :
1) l’implantation du procédé d’un fractionnement produisant de la lignine, de l’éthanol et des
sucres d’hémicellulose, et
2) l’ajout du procédé de transformation des sucres d’hémicellulose en furfural.
Tableau 4.6 Configurations d’usines
Configuration Description
3PM_P&P (cas de base)
Configuration actuelle de l’usine. 3 machines à papier. Aucun procédé de bioraffinage.
2PM_P&P 2 machines à papier. Aucun procédé de bioraffinage.
3PM_Sugars 3 machines à papier. Ligne de bioraffinage produisant de la lignine, de l’éthanol et des sucres d’hémicellulose.
2PM_Sugars 2 machines à papier. Ligne de bioraffinage produisant de la lignine, de l’éthanol et des sucres d’hémicellulose.
3PM_Furfural 3 machines à papier. Ligne de bioraffinage produisant de la lignine, de l’éthanol et du furfural.
2PM_Furfural 2 machines à papier. Ligne de bioraffinage produisant de la lignine, de l’éthanol et du furfural.
4.6.1 Coûts de production
Les coûts de production des 6 configurations d’usine sont présentés à la Figure 4.20. Pour des
raisons de confidentialité, tous les résultats sont normalisés par les résultats du cas de base.
L’utilisation de la capacité des lignes de pâte TMP ainsi que la teneur moyenne en pâte TMP
dans le papier journal choisie par le modèle sont présentés à la Figure 4.21.
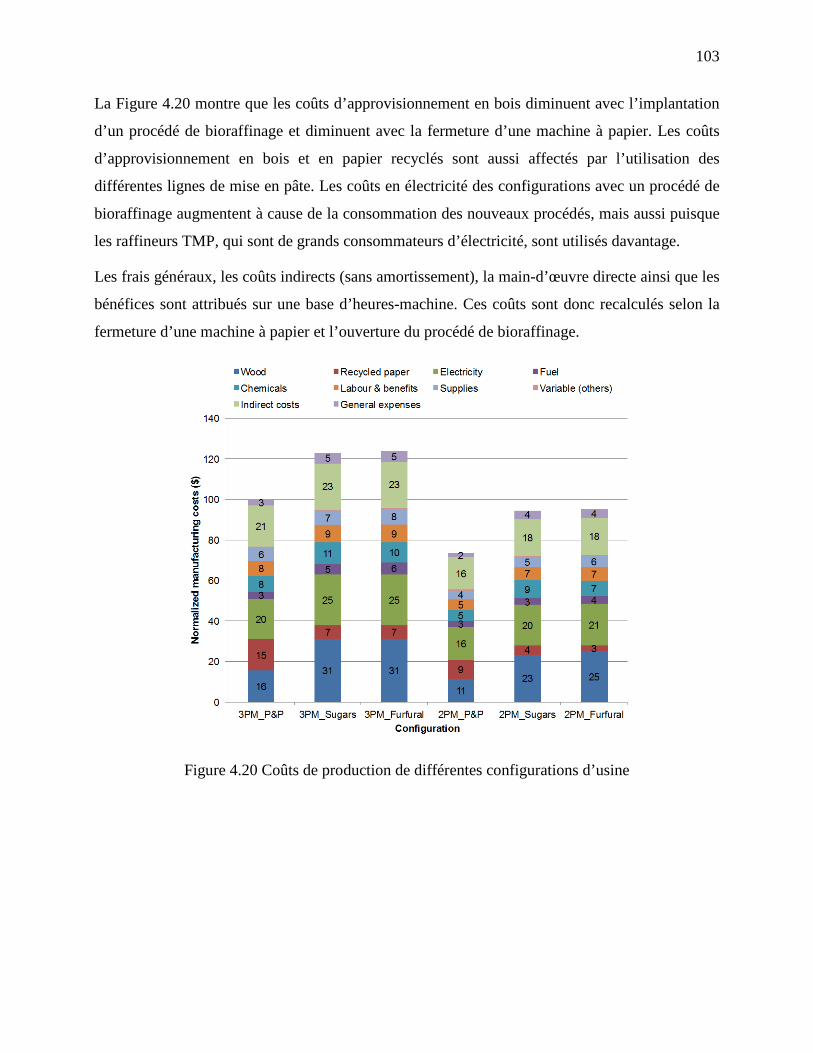
103
La Figure 4.20 montre que les coûts d’approvisionnement en bois diminuent avec l’implantation
d’un procédé de bioraffinage et diminuent avec la fermeture d’une machine à papier. Les coûts
d’approvisionnement en bois et en papier recyclés sont aussi affectés par l’utilisation des
différentes lignes de mise en pâte. Les coûts en électricité des configurations avec un procédé de
bioraffinage augmentent à cause de la consommation des nouveaux procédés, mais aussi puisque
les raffineurs TMP, qui sont de grands consommateurs d’électricité, sont utilisés davantage.
Les frais généraux, les coûts indirects (sans amortissement), la main-d’œuvre directe ainsi que les
bénéfices sont attribués sur une base d’heures-machine. Ces coûts sont donc recalculés selon la
fermeture d’une machine à papier et l’ouverture du procédé de bioraffinage.
Figure 4.20 Coûts de production de différentes configurations d’usine
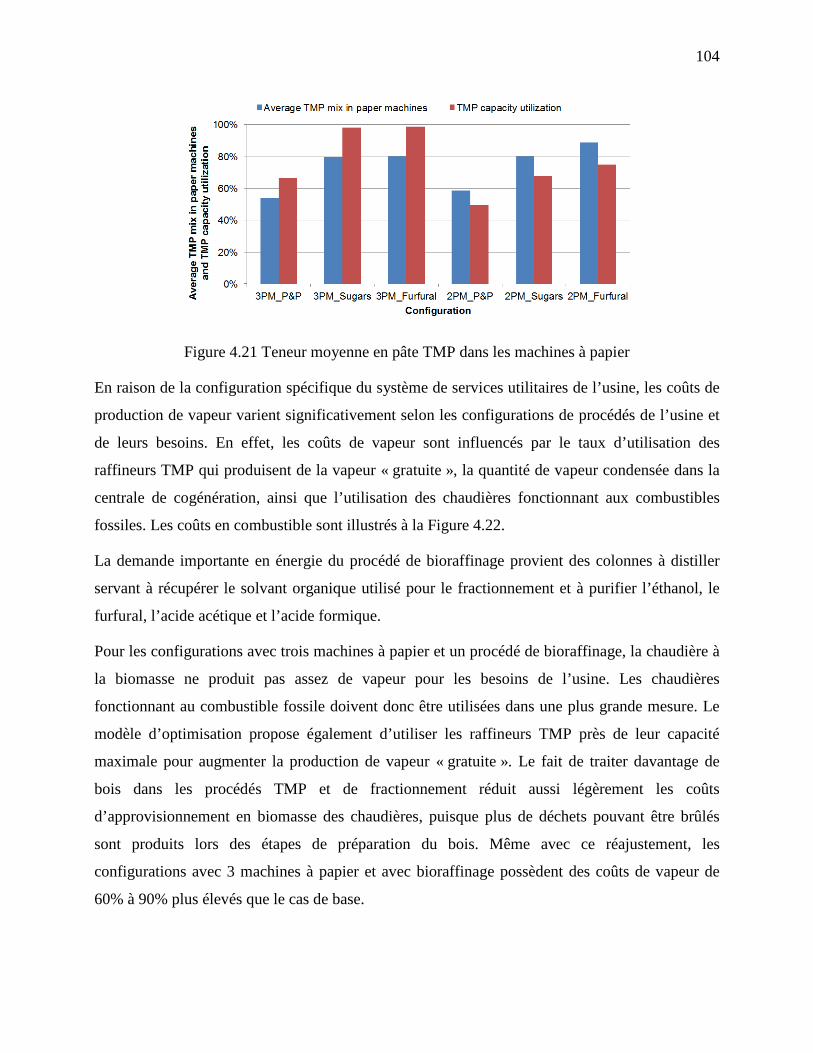
104
Figure 4.21 Teneur moyenne en pâte TMP dans les machines à papier
En raison de la configuration spécifique du système de services utilitaires de l’usine, les coûts de
production de vapeur varient significativement selon les configurations de procédés de l’usine et
de leurs besoins. En effet, les coûts de vapeur sont influencés par le taux d’utilisation des
raffineurs TMP qui produisent de la vapeur « gratuite », la quantité de vapeur condensée dans la
centrale de cogénération, ainsi que l’utilisation des chaudières fonctionnant aux combustibles
fossiles. Les coûts en combustible sont illustrés à la Figure 4.22.
La demande importante en énergie du procédé de bioraffinage provient des colonnes à distiller
servant à récupérer le solvant organique utilisé pour le fractionnement et à purifier l’éthanol, le
furfural, l’acide acétique et l’acide formique.
Pour les configurations avec trois machines à papier et un procédé de bioraffinage, la chaudière à
la biomasse ne produit pas assez de vapeur pour les besoins de l’usine. Les chaudières
fonctionnant au combustible fossile doivent donc être utilisées dans une plus grande mesure. Le
modèle d’optimisation propose également d’utiliser les raffineurs TMP près de leur capacité
maximale pour augmenter la production de vapeur « gratuite ». Le fait de traiter davantage de
bois dans les procédés TMP et de fractionnement réduit aussi légèrement les coûts
d’approvisionnement en biomasse des chaudières, puisque plus de déchets pouvant être brûlés
sont produits lors des étapes de préparation du bois. Même avec ce réajustement, les
configurations avec 3 machines à papier et avec bioraffinage possèdent des coûts de vapeur de
60% à 90% plus élevés que le cas de base.
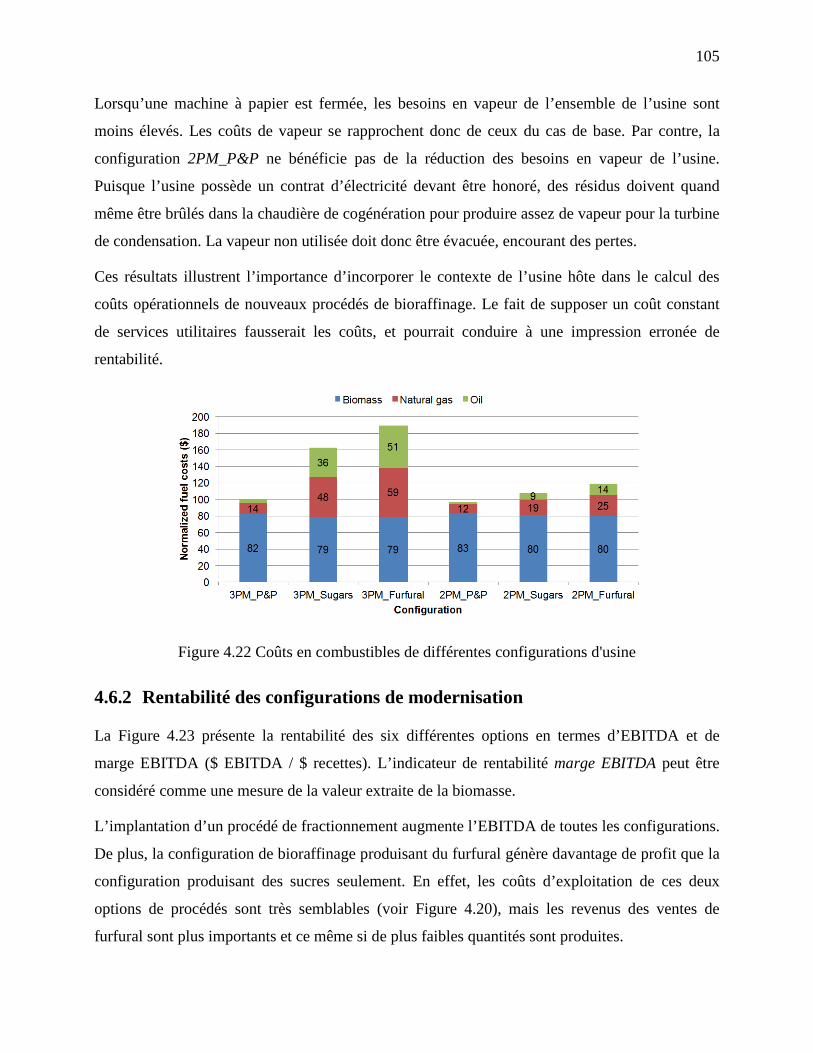
105
Lorsqu’une machine à papier est fermée, les besoins en vapeur de l’ensemble de l’usine sont
moins élevés. Les coûts de vapeur se rapprochent donc de ceux du cas de base. Par contre, la
configuration 2PM_P&P ne bénéficie pas de la réduction des besoins en vapeur de l’usine.
Puisque l’usine possède un contrat d’électricité devant être honoré, des résidus doivent quand
même être brûlés dans la chaudière de cogénération pour produire assez de vapeur pour la turbine
de condensation. La vapeur non utilisée doit donc être évacuée, encourant des pertes.
Ces résultats illustrent l’importance d’incorporer le contexte de l’usine hôte dans le calcul des
coûts opérationnels de nouveaux procédés de bioraffinage. Le fait de supposer un coût constant
de services utilitaires fausserait les coûts, et pourrait conduire à une impression erronée de
rentabilité.
Figure 4.22 Coûts en combustibles de différentes configurations d'usine
4.6.2 Rentabilité des configurations de modernisation
La Figure 4.23 présente la rentabilité des six différentes options en termes d’EBITDA et de
marge EBITDA ($ EBITDA / $ recettes). L’indicateur de rentabilité marge EBITDA peut être
considéré comme une mesure de la valeur extraite de la biomasse.
L’implantation d’un procédé de fractionnement augmente l’EBITDA de toutes les configurations.
De plus, la configuration de bioraffinage produisant du furfural génère davantage de profit que la
configuration produisant des sucres seulement. En effet, les coûts d’exploitation de ces deux
options de procédés sont très semblables (voir Figure 4.20), mais les revenus des ventes de
furfural sont plus importants et ce même si de plus faibles quantités sont produites.
106
La fermeture d’une machine à papier enlève près du tiers de la production de P&P. Pour la
configuration 2PM_P&P, cette réduction de la production équivaut à une réduction de 50% en
EBITDA, en raison de déséconomies d’échelle au niveau des coûts fixes et de main d’œuvre,
ainsi qu’à une utilisation sous-optimale de la vapeur produite dans la centrale de cogénération.
Cette baisse de rentabilité est moins sévère pour les scénarios où des produits de bioraffinage
sont fabriqués. Des économies d’échelle au niveau des coûts fixes sont réalisables, et la vapeur de
la centrale cogénération est mieux utilisée.
L’indicateur marge EBITDA de la Figure 4.23 montre que l’implantation du procédé de
bioraffinage dans l’usine étudiée est plus souhaitable pour la configuration à deux machines que
celle à trois machines. La configuration 3PM_Furfural est globalement moins compétitive que la
configuration 3PM_P&P, alors que plus d’EBITDA est généré. Cela est attribuable à une faible
marge de profit des produits de bioraffinage, expliqué en partie par un faible prix de vente des
sucres d’hémicellulose et des coûts de production plus élevés de 23%.
Pour les configurations avec deux machines à papier, l’implantation d’une ligne de bioraffinage
rend l’usine toujours plus concurrentielle. La marge EBITDA de la configuration 2PM_Furfural
se rapproche de celles à trois machines à papier, et ce même si globalement moins de flux de
trésorerie sont générés. Considérant qu’une certaine capacité de production de papier journal doit
être retirée du marché, cette configuration peut être considérée comme étant la configuration
cible à atteindre, une fois tous les investissements en bioraffinage et désinvestissements en P&P
réalisés.
À partir des informations sur la rentabilité de différentes configurations d’usines, un décideur
peut déduire une stratégie à adopter qui maximiserait les flux de trésorerie disponibles et qui
maintiendrait une rentabilité plus constante lors de la transformation de l’usine papetière vers une
bioraffinerie intégrée.
Dans cette étude de cas, advenant le cas où les investissements ne peuvent être tous réalisés en
même temps, la meilleure stratégie semblerait être d’investir d’abord dans le procédé de
fractionnement produisant des sucres d’hémicellulose. L’implantation du procédé de production
de furfural à partir des sucres d’hémicellulose pourrait être considérée en second lieu, en même
temps que la fermeture d’une machine à papier.
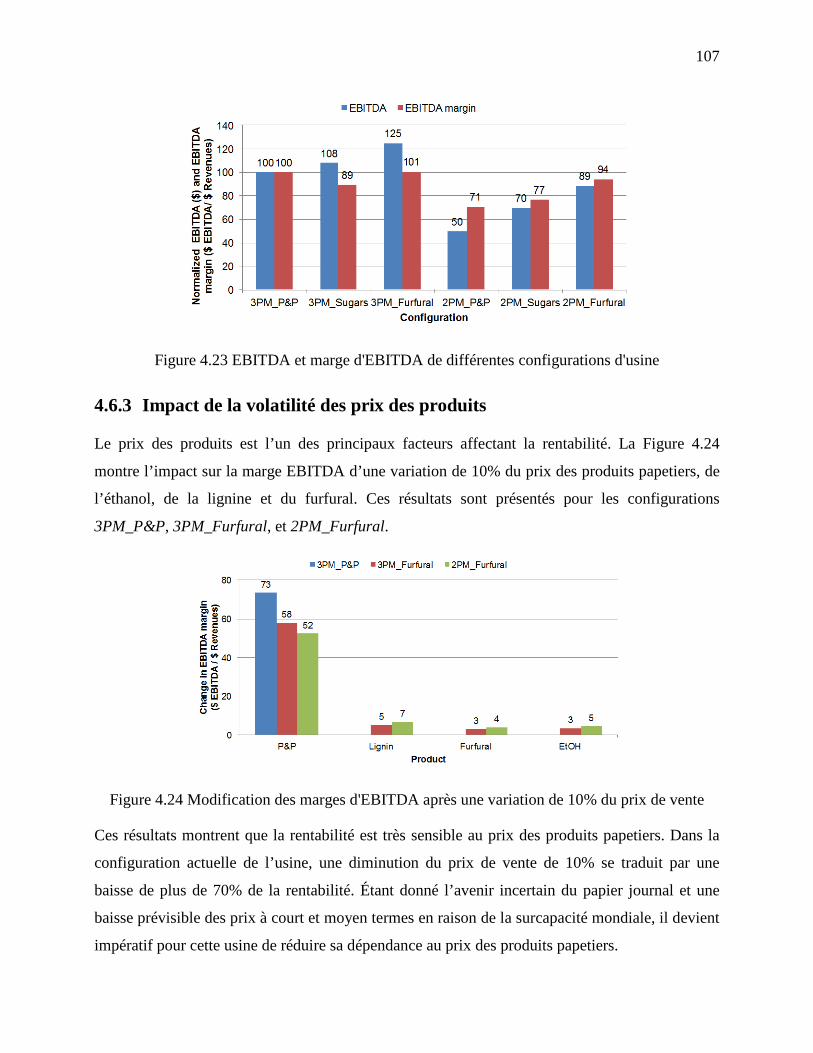
107
Figure 4.23 EBITDA et marge d'EBITDA de différentes configurations d'usine
4.6.3 Impact de la volatilité des prix des produits
Le prix des produits est l’un des principaux facteurs affectant la rentabilité. La Figure 4.24
montre l’impact sur la marge EBITDA d’une variation de 10% du prix des produits papetiers, de
l’éthanol, de la lignine et du furfural. Ces résultats sont présentés pour les configurations
3PM_P&P, 3PM_Furfural, et 2PM_Furfural.
Figure 4.24 Modification des marges d'EBITDA après une variation de 10% du prix de vente
Ces résultats montrent que la rentabilité est très sensible au prix des produits papetiers. Dans la
configuration actuelle de l’usine, une diminution du prix de vente de 10% se traduit par une
baisse de plus de 70% de la rentabilité. Étant donné l’avenir incertain du papier journal et une
baisse prévisible des prix à court et moyen termes en raison de la surcapacité mondiale, il devient
impératif pour cette usine de réduire sa dépendance au prix des produits papetiers.
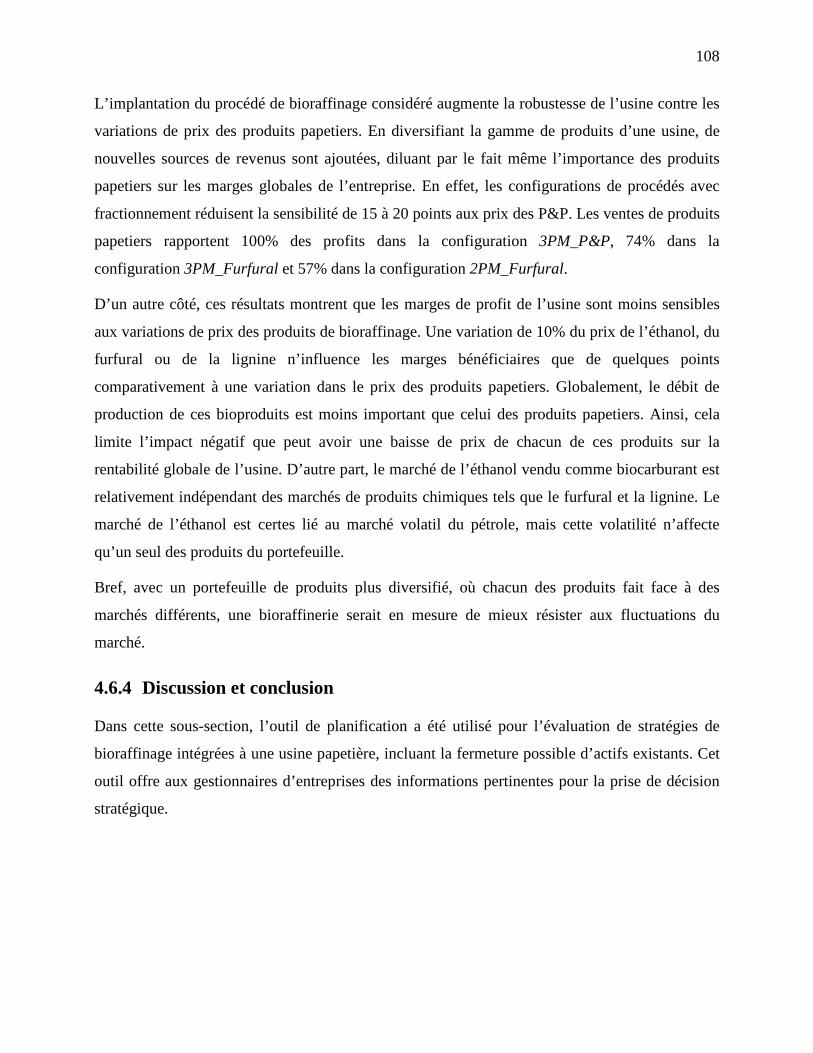
108
L’implantation du procédé de bioraffinage considéré augmente la robustesse de l’usine contre les
variations de prix des produits papetiers. En diversifiant la gamme de produits d’une usine, de
nouvelles sources de revenus sont ajoutées, diluant par le fait même l’importance des produits
papetiers sur les marges globales de l’entreprise. En effet, les configurations de procédés avec
fractionnement réduisent la sensibilité de 15 à 20 points aux prix des P&P. Les ventes de produits
papetiers rapportent 100% des profits dans la configuration 3PM_P&P, 74% dans la
configuration 3PM_Furfural et 57% dans la configuration 2PM_Furfural.
D’un autre côté, ces résultats montrent que les marges de profit de l’usine sont moins sensibles
aux variations de prix des produits de bioraffinage. Une variation de 10% du prix de l’éthanol, du
furfural ou de la lignine n’influence les marges bénéficiaires que de quelques points
comparativement à une variation dans le prix des produits papetiers. Globalement, le débit de
production de ces bioproduits est moins important que celui des produits papetiers. Ainsi, cela
limite l’impact négatif que peut avoir une baisse de prix de chacun de ces produits sur la
rentabilité globale de l’usine. D’autre part, le marché de l’éthanol vendu comme biocarburant est
relativement indépendant des marchés de produits chimiques tels que le furfural et la lignine. Le
marché de l’éthanol est certes lié au marché volatil du pétrole, mais cette volatilité n’affecte
qu’un seul des produits du portefeuille.
Bref, avec un portefeuille de produits plus diversifié, où chacun des produits fait face à des
marchés différents, une bioraffinerie serait en mesure de mieux résister aux fluctuations du
marché.
4.6.4 Discussion et conclusion
Dans cette sous-section, l’outil de planification a été utilisé pour l’évaluation de stratégies de
bioraffinage intégrées à une usine papetière, incluant la fermeture possible d’actifs existants. Cet
outil offre aux gestionnaires d’entreprises des informations pertinentes pour la prise de décision
stratégique.
109
• Il permet une meilleure visualisation et une meilleure compréhension de la dynamique des
coûts et de la chaîne logistique, et ce pour différentes configurations d’usine.
• Les différentes analyses pouvant être effectuées à l’aide de ce modèle permettent de
déterminer et d’optimiser la rentabilité de l’entreprise sous divers scénarios.
• À partir des analyses de scénarios, il est possible de déduire une stratégie d’implantation
par phase qui stabiliserait les revenus lors de la transformation vers le bioraffinage. Cette
analyse pourrait être effectuée sous divers scénarios plausibles de marché pour vérifier si
l’approche par phase demeure intéressante dans d’autres conditions.
Les indicateurs financiers utilisés dans les analyses, l’EBITDA et la marge EBITDA, ne tiennent
pas compte de l’amortissement et donc de l’investissement nécessaire pour implanter les
nouvelles composantes de bioraffinage. Ils permettent de comparer les différentes configurations
de procédés aux niveaux de l’opération et de la flexibilité manufacturière, ajoutant ainsi une
dimension souvent négligée à la prise de décision stratégique.
Néanmoins, l’évaluation de stratégies de transformation de l’entreprise ne saurait être complète
sans une évaluation technico-économique comprenant entre autres une estimation de
l’investissement en capital. L’analyse économique s’avère nécessaire pour l’évaluation du retour
sur l’investissement des options de procédés. L’outil de planification proposé serait donc utilisé
en plus de l’analyse économique classique afin d’apporter des informations pertinentes
additionnelles aux décideurs.
110
CHAPITRE 5 DISCUSSION GÉNÉRALE
« An opinion should be the result of thought, not a substitute for it »
- Jef Mallett (1962-…)
5.1 Outil d’aide à la prise de décisions tactiques et stratégiques
Le marché des pâtes et papiers est présentement en pleine évolution étant donné les changements
rapides dans les habitudes de lecture de la population et de l’évolution des technologies
électroniques remplaçant les papiers de publication. Dans ce contexte, les entreprises forestières
doivent analyser la performance de leurs activités actuelles.
D’autre part, l’environnement dans lequel les bioraffineries œuvreront sera très compétitif. Avec
un approvisionnement onéreux en matières premières, un environnement de production où
différents produits sont simultanément co-fabriqués et des conditions de marché volatiles, une
gestion efficace de la chaîne logistique s’avère d’une importance capitale.
Les bioraffineries forestières qui réussiront seront celles qui parviendront à gérer de façon
optimale leurs actifs et leur chaîne logistique. En effet, la décision de transformer une entreprise
forestière en une bioraffinerie est une transformation où le portefeuille de produits devra être
constamment réévalué afin de fabriquer les produits les plus rentables. Le cadre de planification
axée sur les marges de profit tel que présenté dans cette thèse appert être un outil adapté d’aide à
la prise de décision.
5.1.1 Décisions tactiques
D’une part, le cadre de planification axée sur les marges de profit offre une plateforme pour la
gestion optimale d’un portefeuille de produits faisant face à la volatilité du marché. Par une
gestion intégrée de l’approvisionnement, de la production et des ventes, l’outil développé permet
de comprendre les compromis entre coûts et revenus de différentes configurations d’opération
d’une usine. Il permet aussi d’identifier les meilleures conditions d’opération d’une entreprise,
par l’exploitation de la flexibilité manufacturière disponible pour aligner autant que possible la
production selon les conditions de marché.
111
À cet effet, le niveau de planification tactique appert adapté pour l’approche de planification axée
sur les marges. En raison des ententes contractuelles générales retrouvées dans l’industrie des
procédés, le niveau de flexibilité quant à l’acceptation ou le refus des commandes est
relativement limité à court terme. La détermination d’une cible d’allocation mensuelle de la
production à certains segments de la demande selon les conditions de marché semble donc plus
réalisable à ce niveau de prise de décision. De façon analogue, les décisions reliées à
l’approvisionnement de différents types et quantités de biomasse apparaissent plus adaptées au
niveau mensuel : ce genre de décision est difficilement modifiable au jour le jour notamment
pour des raisons de logistique.
Cela étant dit, les différences au niveau des coûts de production n’auraient pu être adéquatement
représentées si le modèle de planification tactique avait eu un niveau d’agrégation « classique »
en ce qui a trait à la modélisation des coûts opérationnels. C’est pour cette raison que le modèle
de planification présenté dans cette thèse détaille les coûts opérationnels jusqu’au niveau des
heures.
Une autre approche de modélisation dite hiérarchique liant deux modèles, soit un de planification
tactique et un opérationnel, aurait également pu être utilisée pour une planification axée sur les
marges de profit. Cependant, elle implique deux modèles qui utilisent de l’information provenant
de sources différentes et à divers niveaux d’agrégation, et qui seraient utilisés par des personnes
différentes au sein de l’entreprise. L’utilisation d’un seul modèle de planification tactique ayant
des considérations opérationnelles permet de simplifier l’implantation de l’approche axée sur les
marges de profit par les décideurs.
5.1.2 Décisions stratégiques
D’autre part, le cadre de planification axée sur les marges de profit permet une analyse et une
optimisation de la performance des actifs d’une entreprise sous différentes configurations de
procédés et scénarios de marché. Les décisions de transformation d’entreprise, où le
développement de nouvelles activités et la sortie potentielle des activités existantes sont à la fois
considérés, sont d’une importance stratégique capitale. Elles se doivent d’être basées une
approche holistique englobant à la fois :
112
• les actifs existants et potentiels,
• les possibilités d’approvisionnement en matières premières,
• le potentiel de flexibilité des procédés et de la chaîne logistique, ainsi que
• divers scénarios pertinents de marché.
Tel que mentionné précédemment, la transformation d’établissements papetiers en bioraffineries
nécessitera un investissement en capital important qui dictera la façon d’opérer pour de
nombreuses années. À titre d’exemple, certains actifs d’usines papetières sont encore en service
après plus d’une trentaine d’années. Dans cette optique, il est important de prendre en compte les
considérations tactiques et opérationnelles qui affecteront la rentabilité de l’établissement durant
toute sa durée de vie afin d’évaluer toutes les facettes de l’investissement, et ainsi fournir un
meilleur support à la prise de décision.
5.1.3 Utilisation de l’outil par le partenaire industriel
L’utilisation de l’outil pour les analyses tactiques et stratégiques s’est avérée être d’une valeur
importante pour le partenaire industriel. En effet, les résultats ont convaincu l’entreprise
d’adapter plus souvent et de modifier plus agressivement le ratio de pâte dans leurs machines à
papier afin de tirer parti des variations de prix des matières premières. L’entreprise était au
courant de ce potentiel de flexibilité, mais n’était pas en mesure de l’utiliser pleinement
puisqu’elle ne possédait pas les outils nécessaires pour évaluer rapidement les compromis de
production.
D’autre part, l’outil a aussi été utilisé à un intervalle trimestriel pour l’évaluation stratégique de
diverses autres options de modernisation de l’usine, en plus de celles présentées dans la thèse.
Ces autres options n’ont pas été présentées dans cette thèse pour des raisons de confidentialité.
5.2 Approche de planification axée sur les marges de profit
Tel que discuté précédemment, la gestion d’une entreprise selon une approche de planification
axée sur les marges de profit implique plusieurs changements au niveau du modèle d’affaire.
113
D’une part, elle implique une nouvelle définition du rôle de l’approvisionnement,
traditionnellement axé sur la minimisation des coûts. L’approvisionnement peut lui aussi jouer un
rôle important sur les recettes et la rentabilité d’une bioraffinerie, par la modification des débits
de production des différents produits. Dans certaines situations, il peut être plus avantageux
d’utiliser une matière première plus onéreuse si elle offre un portefeuille de produits globalement
plus payant.
Cette approche de gestion demande aussi que les ventes soient administrées d’une façon assez
flexible pour que différentes quantités de produits soient fabriquées selon les prix du marché.
Ainsi, la gestion des segments de marché, des contrats et des ventes au comptant devrait être
coordonnée avec la production et l’approvisionnement afin de produire le portefeuille de produits
optimal.
Ces modifications à l’approvisionnement, à la production et aux ventes requièrent une
réorganisation du processus de planification. En effet, pour bénéficier des améliorations liées à
une gestion axée sur les marges de profit, il est nécessaire d’effectuer une planification centrale et
intégrée de l’entreprise. Cet aspect peut notamment impliquer la création d’un nouveau
département organisationnel. Il nécessite aussi un meilleur partage de l’information entre les
différents départements existants de l’entreprise.
5.3 Évaluation de stratégies de bioraffinage forestier
La conception du bioraffinage est présentement mue par une poussée technologique12, de même
que par une demande accrue de produits verts. Très peu de recherches se penchent sur les
fondements compétitifs de la bio-économie. Comprendre les caractéristiques et autres facteurs
compétitifs de la chaîne logistique des bioproduits mènerait à une conception plus durable du
bioraffinage forestier. Par le fait même, cela aiderait les décideurs à déceler les options de
procédés/bioproduits les moins prometteuses, et de concevoir des stratégies de bioraffinage qui
ne seraient pas vouées à l’échec après seulement quelques années d’existence.
12 Traduction de l’anglais technology push
114
Tel que rappelé par Fisher [69] et Chopra & Meindl [15], il est essentiel d’avoir une chaîne
logistique adaptée aux produits qui sont fabriqués. Il existe un compromis entre l’efficacité et la
réactivité aux niveaux de l’approvisionnement, de la production, de la distribution et des ventes,
pour servir le client selon ses propres besoins.
La recherche effectuée et les résultats obtenus lors de ce projet de doctorat ont permis
l’identification de quelques-uns des facteurs compétitifs clés liés à la gestion de la chaîne
logistique de bioraffineries. L’article en Annexe A aborde les caractéristiques des procédés de
bioraffinage, les stratégies d’approvisionnement et l’avantage compétitif potentiel lié à l’aspect
vert des produits, et ce pour les catégories de bioproduits suivantes :
• la bioénergie,
• les biocarburants,
• les bioproduits de base,
• les bioproduits de chimie fine,
• les bioproduits de spécialité, et
• les biomatériaux.
En raison de la nature divergente des procédés de bioraffinage, plusieurs coproduits seront
fabriqués simultanément. Or, les différents bioproduits fabriqués au cours de l’histoire
démontrent qu’il est essentiel de valoriser tous les produits possibles : un bioproduit ne peut
généralement pas porter à lui seul le coûteux fardeau de la récolte et du transport des matières
premières. À titre d’exemples, on compte le biodiesel et la glycérine issus de la transestérification
des huiles végétales, les produits de construction et les copeaux de bois fabriqués par une scierie,
etc.
Les différents produits d’un portefeuille peuvent aussi nécessiter des facteurs compétitifs
contradictoires. Par exemple, la fabrication d’un biomatériau peut nécessiter l’approvisionnement
d’un type de biomasse plus onéreux avec des caractéristiques spécifiques, alors que son coproduit
devrait normalement requérir une matière première la moins chère possible. Une gestion efficace
et intégrée d’un tel portefeuille constitue tout un défi en soi. Elle représente néanmoins un des
éléments clés pour assurer la rentabilité de futures bioraffineries.
115
La recherche effectuée lors de ce projet suggère qu’il est généralement avantageux pour les
bioraffineries utilisant des matières lignocellulosiques de fabriquer au moins un produit qui soit
différentiable, selon le sens de différentiation présenté à la section 2.2.3.
En effet, les bioraffineries forestières œuvrant uniquement dans les marchés de produits
chimiques de base, plus spécifiquement ceux non différenciés comme les biocarburants, feront
face un jour ou l’autre à des conditions de marché plus volatiles. En raison de leur taille limitée
par l’approvisionnement, ces bioraffineries ne pourront vraisemblablement jamais devenir des
joueurs marquants du marché de l’énergie et des carburants.
En fabriquant des produits plus différenciés, de préférence à valeur ajoutée, les bioraffineries
pourraient pénétrer un marché plus spécialisé et avoir plus de chances de le dominer. Elles
seraient moins sujettes à la volatilité du marché et pourraient tirer leur épingle du jeu, en se
démarquant d’un environnement compétitif dominé par les pétrolières.
116
CHAPITRE 6 CONCLUSION
« Science... never solves a problem without creating ten more. »
-George Bernard Shaw (1856-1950)
L’intégration de procédés et produits de bioraffinage aux usines forestières transformera de façon
considérable le visage de l’industrie des produits forestiers. Cette transition vers le bioraffinage
implique toutefois plusieurs changements stratégiques importants, notamment dans le modèle
d’affaires des entreprises. En effet, ces entreprises devront se questionner sur la pertinence de
rester ou non dans le domaine plus traditionnel des pâtes et papiers et faire la sélection d’un
nouveau portefeuille de procédés et produits. Elles devront aussi pénétrer de nouveaux marchés
dont les règles diffèrent de celles du marché des produits forestiers traditionnels, tout en
effectuant une gestion permettant de minimiser le risque de la volatilité du marché.
Dans cette optique, l’objectif principal de cette thèse était de concevoir une approche
systématique pour la gestion et l’évaluation de stratégies de bioraffinage intégrées à une usine de
pâtes et papiers. À cet effet, une approche de gestion de la chaîne logistique dite axée sur les
marges de profit a été développée. Celle-ci intègre des concepts inspirés de la gestion des
recettes, de la flexibilité manufacturière et de la comptabilité par activité. Ces concepts sont
incorporés dans un modèle de planification tactique dont l’objectif est de maximiser la rentabilité
de l’entreprise.
Cette approche axée sur les marges de profit a été illustrée par une étude de cas d’une usine de
production de papier journal étudiant la possibilité d’implanter un procédé de fractionnement de
la biomasse fabriquant divers bioproduits. Diverses analyses tactiques et stratégiques ont été
effectuées pour montrer la pertinence de l’approche comme outil d’aide à la prise de décision
pour des problèmes de gestion propres au bioraffinage forestier.
L’outil a été utilisé pour évaluer la rentabilité d’une entreprise lors de sa transformation vers le
bioraffinage, en considérant l’investissement dans de nouveaux procédés et la fermeture d’actifs
papetiers. Il a aussi été employé pour étudier la gestion de la production d’un portefeuille de
produits permettant d’atténuer les risques causés par la volatilité du marché.
117
6.1 Contributions à l’ensemble des connaissances
Les travaux présentés dans cette thèse apportent les contributions suivantes à l’ensemble
des connaissances :
6.1.1 Approche de planification axée sur les marges de profit
Le développement et l’application d’une approche de planification axée sur les marges de profit
qui permet de maximiser la rentabilité des opérations d’une bioraffinerie selon différentes
conditions de marché.
• Cette approche repose sur l’exploitation de la flexibilité manufacturière présente dans une
usine afin de réduire le risque lié à la volatilité du marché.
• Elle est fondée sur la gestion intégrée des ventes, de la distribution, de la production, et de
l’approvisionnement. Elle considère donc la rentabilité globale d’une entreprise, en liant à
la fois les recettes et les coûts reliés à la chaîne logistique.
• Elle est basée sur une gestion globale des ventes du portefeuille de produits qui s’inspire
des concepts de gestion des recettes. Cet aspect permet l’identification de segments de
marchés à prioriser, ainsi que le niveau de ventes de chacun des produits pour maximiser
les revenus d’une entreprise.
• Elle utilise une méthode de calcul de coûts inspirée de la comptabilité par activités qui
évalue de façon réaliste les écarts de coûts entre différentes options de production. Ceci
permet d’évaluer les compromis liés à la planification et à l’opération et d’identifier
l’option de production la plus rentable selon les conditions de marché.
• Elle permet à une entreprise d’améliorer la rentabilité de ses opérations par une meilleure
utilisation des données et des actifs existants.
118
Cette approche de planification axée sur les marges de profit a été illustrée pour le cas d’une
usine de production de papier journal existante ayant de la surcapacité au niveau de la production
de pâte. Elle a aussi été illustrée dans un contexte de bioraffinage forestier intégré, où la
flexibilité de l’approvisionnement en biomasse a été exploitée pour effectuer la gestion optimale
d’un portefeuille varié de bioproduits. Globalement, l’approche axée sur les marges de profit a
permis d’identifier les paramètres optimaux d’approvisionnement, de production et de vente pour
maximiser la rentabilité selon les diverses conditions de marché.
L’approche de planification axée sur les marges constitue ainsi un cadre général pouvant être
appliqué à diverses branches de l’industrie des procédés lourde (ex. chimique, minière,
pharmaceutique, etc.). Elle apporte une vision systématique holistique au problème d’atténuation
du risque lié à la volatilité du marché par l’utilisation de la flexibilité manufacturière. Elle
englobe notamment les différentes configurations de procédés, de recettes et de la chaîne
logistique menant à la flexibilité manufacturière, et les relie aux processus de planification des
ventes et de l’approvisionnement.
6.1.2 Outil d’aide à la prise de décisions tactiques et stratégiques liées à la
transformation d’usines
Le développement et l’application d’un outil de planification de la chaîne logistique basé sur
l’optimisation pour l’évaluation de stratégies de transformation d’usines forestières en
bioraffineries.
119
• L’outil de planification est basé sur une superstructure mathématique flexible permettant
de représenter les différentes configurations d’usines et de la chaîne logistique menant à
des opportunités de flexibilité manufacturière. Cette superstructure permet une analyse
rapide de différentes configurations d’usine, ce qui peut être utile pour la comparaison
d’options.
• L’outil effectue le calcul de bilans de vapeur et d’électricité, soit des paramètres
importants du coût et des caractéristiques d’opération de bioraffineries forestières
intégrées.
• Il incorpore une structure de modèle de coûts inspirée de la comptabilité par activités qui
facilite la représentation d’alternatives de modernisation d’usine.
• Il permet une meilleure visualisation et une meilleure compréhension de la dynamique des
coûts et de la chaîne logistique, et ce pour différentes configurations d’usine.
• À l’aide d’une analyse de scénarios, l’outil facilite le développement d’une stratégie
d’implantation par phase qui stabiliserait les revenus lors de la transformation vers le
bioraffinage.
L’utilisation de l’outil de planification apporte donc de l’information additionnelle permettant de
supporter et d’éclairer les processus de décision autant aux niveaux tactique que stratégique. Cet
outil a notamment été utilisé dans une étude de cas réelle pour l’évaluation d’une stratégie de
transformation d’usine de papier journal impliquant à la fois la fermeture d’une machine à papier
et la rationalisation des ventes associées, ainsi que l’ajout d’un procédé de bioraffinage forestier.
120
6.2 Recommandations pour travaux futurs
6.2.1 Planification multi-sites et conception du réseau de la chaîne logistique
En principe, un même marché peut être desservi par plus d’une usine. Ainsi, pour une entreprise
possédant plusieurs sites de production, il peut être avantageux d’optimiser l’utilisation des
ressources et l’allocation de la demande des clients aux différentes usines en considérant le
réseau dans son ensemble.
Dans le contexte du bioraffinage, cette optimisation du réseau de la chaîne logistique de
l’entreprise globale semble particulièrement importante. Il existe plusieurs opportunités
régionales d’approvisionnement, diverses possibilités de transformation d’intermédiaires et
options de distribution.
Le cadre de planification présenté dans cette thèse possède les capacités nécessaires pour
identifier les synergies et évaluer les compromis entre les coûts de transport, les coûts de
production de chacun des sites et les différentes opportunités d’approvisionnement. Une
extension pertinente consisterait à utiliser ce cadre comme base pour la conception stratégique du
réseau de la chaîne logistique.
6.2.2 Intégration de considérations environnementales
Un des piliers du développement du bioraffinage repose sur le désir des consommateurs et de
l’industrie d’avoir accès à des produits verts, et de réduire les impacts environnementaux associés
à la production de produits chimiques. Le bioraffinage forestier répond à cette demande par
l’utilisation d’une matière première renouvelable ainsi que par la production et l’utilisation
d’énergie provenant elle aussi de source renouvelable.
Dans un futur rapproché, de nombreuses politiques et incitatifs comme un bourse du carbone
seront développés afin d’atténuer les émissions des gaz à effet de serre des procédés de
fabrication. Les bioraffineries devront donc incorporer ces aspects environnementaux dans leur
planification tactique et stratégique.
121
Puisque le modèle de planification présenté dans cette thèse considère l’envergure globale de la
chaîne logistique d’une entreprise, l’intégration d’un bilan de la production de gaz à effet de serre
appert être une extension logique au modèle. Ceci pourrait être effectué par l’incorporation d’une
taxe ou d’un crédit de carbone dans la fonction objectif, et l’ajout de contraintes supplémentaires
reliées aux émissions du transport et de la production.
6.2.3 Gestion intégrée et avancée des ventes et de la production
L’approche de planification axée sur les marges de profit présentée dans cette thèse n’intègre que
quelques concepts de gestion de la demande. Dans l’optique d’effectuer une meilleure
planification intégrée de la production et des ventes, une des extensions possibles à ce cadre de
planification concerne l’ajout d’items liés à la gestion de la demande. Par exemple, des méthodes
avancées d’estimation de la demande pourraient être intégrées, de même que la modélisation de
politiques de collaboration avec le client, comme l’inventaire géré par les fournisseurs13 et le
réapprovisionnement en continu14.
6.2.4 Planification axée sur les marges de profit en ligne
Avec l’implantation de progiciels de gestion intégrée et le développement d’outils de
réconciliation des données, les entreprises possèdent dorénavant des quantités impressionnantes
d’information disponible en temps réel. L’intégration de données de procédés et données
financières réconciliées pourrait améliorer la qualité de l’information utilisée par l’approche de
planification axée sur les marges de profit.
13 Traduction de l’anglais de vendor-managed inventory
14 Traduction de l’anglais de continuous replenishment
122
LISTE DES RÉFÉRENCES
[1] R. N. Canada, "Les forêts du Canada," 2009. Disponible: http://foretscanada.rncan.gc.ca/.
[Consulté le 17-07-2009].
[2] "Revue Annuelle," Association des Produits Forestiers du Canada (APFC), Rapport
technique, 2007. [En ligne]. Disponible:
http://www.fpac.ca/documents/fpac_annual_review_f_2007.pdf. [Consulté le 17-09-
2009].
[3] Service Canadien des Forêts, "Retombées économiques et produits forestiers," 2009.
Disponible: http://scf.rncan.gc.ca/index/forestindustryincanada.
[4] "Rapport Annuel," Association des Produits Forestiers du Canada (APFC), Rapport
technique, 2006. [En ligne]. Disponible: http://www.fpac.ca/documents/FPA-
8934_Annual_F_FINAL.pdf. [Consulté le 17-07-2009].
[5] A. Orzechowska, "Saving the Canadian industry: Discussing possible solutions," Pulp
and Paper Canada, vol. 106, no. 1, pp. 25-27, 2005.
[6] "Accelerating Forest Sector S&T Renewal," Forest Products Association of Canada
(FPAC), Rapport technique, 2002. [En ligne]. Disponible:
http://www.fpac.ca/documents/accelerating_forest_sector_E.pdf. [Consulté le 17-07-
2009].
[7] P. R. Stuart, "The forest biorefinery: Survival strategy for Canada's pulp and paper
sector?," Pulp and Paper Canada, vol. 107, no. 6, pp. 13-16, 2006.
[8] "Contexte de l’industrie des pâtes et papiers dans le monde " Ministère des ressources
Naturelles Faunes et Parcs (MRNFP), Rapport technique, 2004. [En ligne]. Disponible:
http://www.mrn.gouv.qc.ca/publications/forets/entreprises/contexte.pdf. [Consulté le 29-
07-2009].
[9] J. McNutt, "State of the North American Pulp&Paper Industry - Into the Breach -08' Q4
Preliminary Data," 2009. Disponible:
http://www.cpbis.gatech.edu/resources/stateofindustry/index.htm.
123
[10] T. Browne, M. Paice, N. Jemaa, M. Paleologou, X. Zhang, M. Champoux, et N. Leclerc,
"Guide de développement - Le bioraffinage dorestier : Possibilité pour les entreprises
québécoises de pâtes et papier," Ministère des Ressources naturelles et Faune, Rapport
technique, 2009. [En ligne]. Disponible:
http://www.mrn.gouv.qc.ca/publications/forets/entreprises/bioraffinage-forestier.pdf.
[Consulté le 28-07-2009].
[11] B. Thorp, "Biorefinery offers industry leaders business model for major change," Pulp &
Paper, vol. 79, no. 11, pp. 35-39, 2005.
[12] PricewaterhouseCooper (PWC), "CEO Perspectives - Viewpoints of CEOs in the forest,
paper & packaging industry worldwide," Rapport technique, 2008. [En ligne]. Disponible:
http://www.pwc.com/gx/en/forest-paper-packaging/ceo2008/index.jhtml. [Consulté le 31-
07-2009].
[13] Council of Supply Chain Management Professionals, "Supply Chain Management
Definitions," 2009. Disponible: http://cscmp.org/aboutcscmp/definitions.asp.
[14] J. F. Shapiro, Modeling the Supply Chain, 2e éd., Pacific Grove, CA: Thomson-
Brooks/Cole, 2007.
[15] S. Chopra et P. Meindl, Supply Chain Management : Strategy, Planning and Operation,
3e éd., Upper Saddle River, NJ: Pearson Prentice Hall, 2007.
[16] C. T. Maravelias et C. Sung, "Integration of Production Planning and Scheduling:
Overview, Challenges and Opportunities," in 5th International Conference on
Foundations of Computer-Aided Process Operations (FOCAPO 08), Cambridge,
Massachusetts, USA, 2008.
[17] M. Laflamme-Mayer, "Cadre de planification de la chaîne logistique basé sur la
representation des procédes pour l'amélioration de la rentabilité de l'industrie des pâtes et
papiers," Ph.D. thesis, Ecole Polytechnique, Montreal, Canada, 2009.
[18] M. Christopher, Logistics and Supply Chain Management, Strategies for Reducing Cost
and Improving Service, 2e éd., London: Financial Times Pitman Publishing, 1998.
124
[19] H. Stadtler et C. Kilger, Supply Chain Management and Advanced Planning: Concepts,
Models, Software and Case Studies 3e éd., New-York: Springer, 2004.
[20] H. Stadtler et C. Kilger, Supply Chain Management and Advanced Planning: Concepts,
Models, Software and Case Studies 4e éd., Berlin: Springer-Verlag, 2008.
[21] I. Grossmann, "Enterprise-wide optimization: A new frontier in process systems
engineering," AIChE Journal, vol. 51, no. 7, pp. 1846-1857, 2005.
[22] H. Stadtler, "Supply chain management and advanced planning - Basics, overview and
challenges," European Journal of Operational Research, vol. 163, no. 3, pp. 575-588,
2005.
[23] V. A. Varma, G. V. Reklaitis, G. E. Blau, et J. F. Pekny, "Enterprise-wide modeling &
optimization - An overview of emerging research challenges and opportunities,"
Computers and Chemical Engineering, vol. 31, no. 5-6, pp. 692-711, 2007.
[24] L. G. Papageorgiou, "Supply Chain Optimisation for the Process Industries: Advances
and Opportunities," in 5th International Conference on Foundations of Computer-Aided
Process Operations (FOCAPO 08), Cambridge, Massachusetts, USA, 2008.
[25] C. T. Maravelias et C. Sung, "Integration of production planning and scheduling
Overview, challenges and opportunities," Computers and Chemical Engineering, vol. 33,
no. 12, pp. 1919, 2008.
[26] J. F. Shapiro, "Beyond Supply Chain Optimization to Enterprise Optimization," Achieving
Supply Chain Excellence through Technology (ASCET), vol. 3, no. May 15, 2001.
Disponible: http://www.ascet.com/documents.asp?d_ID=511. [Consulté le 16-07-2009].
[27] J. F. Shapiro, "Achieving Competitive Supply Chain Management : Explore and Exploit,"
Achieving Supply Chain Excellence through Technology (ASCET), vol. 6, no. June 15,
2004. Disponible: http://www.ascet.com/documents.asp?d_ID=2515. [Consulté le 16-
07-2009].
[28] L. T. Biegler et I. E. Grossmann, "Retrospective on optimization," Computers and
Chemical Engineering, vol. 28, no. 8, pp. 1169-1192, 2004.
125
[29] S. Kreipl et M. Pinedo, "Planning and Scheduling in Supply Chains: An Overview of
Issues in Practice," Production and Operations Management, vol. 13, no. 1, pp. 77-92,
2004.
[30] J. Kallrath, "Mixed integer optimization in the chemical process industry: Experience,
potential and future perspectives," Chemical Engineering Research and Design, vol. 78,
no. 6, pp. 809-822, 2000.
[31] R. J. Dantzig, Linear programming and extensions, Princeton, NJ: Princeton University
Press, 1963.
[32] S. J. Wright, Primal-dual interior point methods, Philadelphia: SIAM, 1996.
[33] R. J. Dakin, "A tree search algorithm for mixed-integer programming problems,"
Computer Journal, vol. 8, pp. 250-255, 1965.
[34] R. E. Bixby, M. Fenelon, Z. Gu, E. Rothberg, et R. Wunderling, "MIP: Theory and
practice - closing the gap," 2002. Disponible:
http://www.ilog.com/products/optimization/tech/research/mip.pdf. [Consulté le 14-09-
2009].
[35] I. E. Grossmann et L. T. Biegler, "Part II. Future perspective on optimization,"
Computers and Chemical Engineering, vol. 28, no. 8, pp. 1193-1218, 2004.
[36] H. Gunnarsson et M. Ronnqvist, "Solving a multi-period supply chain problem for a pulp
company using heuristics-An application to Södra Cell AB," International Journal
of Production Economics, vol. 116, no. 1, pp. 75-94, 2008.
[37] M. G. Narciso et L. A. N. Lorena, "Lagrangean/surrogate relaxation for generalized
assignment problems," European Journal of Operational Research, vol. 114, no. 1, pp.
167-177, 1999.
[38] P. Chen et J. M. Pinto, "Lagrangean-based techniques for the supply chain management
of flexible process networks," Computers and Chemical Engineering, vol. 32, no. 11, pp.
2505-2528, 2008.
126
[39] A. M. Geoffrion, "Generalized Benders Decomposition," Journal of Optimization Theory
and Applications, vol. 10, no. 4, pp. 237-260, 1972.
[40] J.-K. Bok, I. E. Grossmann, et S. Park, "Supply chain optimization in continuous flexible
process networks," Industrial and Engineering Chemistry Research, vol. 39, no. 5, pp.
1279-1290, 2000.
[41] M. L. Fisher, "The Lagrangean relaxation method for solving integer programming
problems," Management Science, vol. 27, no. 1, pp. 1-17, 1981.
[42] M. Guignard, "Lagrangean relaxation: A short course," Belgian Journal of OR, vol.
Special Issue Francoro, no. 35, 1995.
[43] H. Lidestam et M. Ronnqvist, "Use of Lagrangian decomposition in supply chain
planning," Mathematical and Computer Modelling, vol. 54, no. 9-10, pp. 2428-2442,
2011.
[44] R. R. Iyer et I. E. Grossmann, "Bilevel decomposition algorithm for long-range planning
of process networks," Industrial and Engineering Chemistry Research, vol. 37, no. 2, pp.
474-481, 1998.
[45] A. J. Ragauskas, C. K. Williams, B. H. Davison, G. Britovsek, J. Cairney, C. A. Eckert,
W. J. Frederick Jr, J. P. Hallett, D. J. Leak, C. L. Liotta, J. R. Mielenz, R. Murphy, R.
Templer, et T. Tschaplinski, "The path forward for biofuels and biomaterials," Science,
vol. 311, no. 5760, pp. 484-489, 2006.
[46] V. Chambost et P. R. Stuart, "Selecting the most appropriate products for the forest
biorefinery," Industrial Biotechnology, vol. 3, no. 2, pp. 112-119, 2007.
[47] J. Meléndez, L. LeBel, et P. R. Stuart, "A Literature Review of Biomass Feedstocks for a
Biorefinery," in Integrated Biorefineries: Design, Analysis, and Optimization, M. M. El-
Halwagi etP. Stuart, Éds.: CRC Press/Taylor & Francis, 2012.
127
[48] S. Phillips, A. Aden, J. Jechura, D. Dayton, et T. Eggeman, "Thermochemical Ethanol
via Indirect Gasification and Mixed Alcohol Synthesis of Lignocellulosic Biomass,"
National Renewable Energy Laboratory (NREL), Golden, Colorado, USA, Rapport
technique NREL/TP-510-41168, 2007. http://www.nrel.gov/docs/fy07osti/41168.pdf.
[49] B. V. Babu, "Biomass pyrolysis: A state-of-the-art review," Biofuels, Bioproducts and
Biorefining, vol. 2, no. 5, pp. 393-414, 2008.
[50] H. B. Goyal, D. Seal, et R. C. Saxena, "Bio-fuels from thermochemical conversion of
renewable resources: A review," Renewable and Sustainable Energy Reviews, vol. 12, no.
2, pp. 504-517, 2008.
[51] W. J. Frederick Jr, "Thermochemical Conversion of Biomass to Liquid Fuels and
Chemicals," in Integrated Biorefineries: Design, Analysis, and Optimization, M. M. El-
Halwagi etP. Stuart, Éds.: CRC Press/Taylor & Francis, 2012.
[52] T. E. Amidon et S. Liu, "Water-based woody biorefinery," Biotechnology Advances, vol.
27, no. 5, pp. 542-550, 2009.
[53] A. Aden, M. Ruth, K. Isben, J. Jechura, K. Neeves, J. Sheeham, B. Wallace, L.
Montague, A. Slayton, et J. Lukas, "Lignocellulosic Biomass to Ethanol Process Design
and Economics Utilizing Co-Current Dilute Acide Prehydrolysis and Enzymatic
Hydrolysis for Corn Stover," National Renewable Energy Laboratory (NREL), Golden,
Colorado, USA, Rapport technique NREL/TP-510-32438, 2002.
http://www.nrel.gov/docs/fy02osti/32438.pdf.
[54] D. Humbird, R. Davis, L. Tao, C. Kinchin, D. Hsu, A. Aden, P. Shchoen, J. Lukas, B.
Olthof, M. Worley, D. Sexton, et D. Dudgeon, "Process Design and Economics for
Biochemical Conversion of Lignocellulosix Biomass to Ethanol - Dilute-Acid
Pretreatment and Enzymatic Hydrolysis of Corn Stover," National Renewable Energy
Laboratory, Golden, Colorado, Rapport technique NREL/TP-5100-47764, 2011.
http://www.nrel.gov/docs/fy11osti/47764.pdf.
128
[55] J. Jeaidi et P. R. Stuart, "Techno-economic Analysis of Biorefinery Process Options for
Mechanical Pulp Mills," Journal of Science and Technology for Forest Products and
Processes, vol. 1, no. 3, pp. 62-70, 2011.
[56] L. P. Dansereau, M. M. El-Halwagi, et P. R. Stuart, "Value Chain Management
Considerations for the Biorefinery," in Integrated Biorefineries: Design, Analysis, and
Optimization, M. M. El-Halwagi etP. Stuart, Éds.: CRC Press/Taylor & Francis, 2012, pp.
195-250.
[57] E. Hytönen et P. R. Stuart, "Early-stage design methodology for biorefinery capital
appropriation," Tappi Journal, vol. 11, no. 4, pp. 9-23, 2012.
[58] E. D. Larson, S. Consonni, R. E. Katofsky, K. Iisa, et W. James Frederick Jr, "An
assessment of gasification-based biorefining at kraft pulp and paper mills in the United
States, Part A: Background and assumptions," Tappi Journal, vol. 7, no. 11, pp. 8-14,
2008.
[59] E. D. Larson, S. Consonni, R. E. Katofsky, K. Iisa, et W. James Frederick Jr, "An
assessment of gasification-based biorefining at kraft pulp and paper mills in the United
States, Part B: Results," Tappi Journal, vol. 8, no. 1, pp. 27-35, 2009.
[60] P. Tomani, P. Axegard, N. Berglin, A. Lovell, et D. Nordgren, "Integration of lignin
removal into a kraft pulp mill and use of lignin as a biofuel," Cellulose Chemistry and
Technology, vol. 45, no. 7-8, pp. 533-540, 2011.
[61] W. J. Frederick Jr, S. J. Lien, C. E. Courchene, N. A. DeMartini, A. J. Ragauskas, et K.
Iisa, "Production of ethanol from carbohydrates from loblolly pine: A technical and
economic assessment," Bioresource Technology, vol. 99, no. 11, pp. 5051-5057, 2008.
[62] H. Mao, J. M. Genco, A. van Heiningen, et H. Pendse, "Kraft mill biorefinery to produce
acetic acid and ethanol: Technical economic analysis," BioResources, vol. 5, no. 2, pp.
525-544, 2010.
[63] S.-H. Yoon, M. S. Tunc, et A. Van Heiningen, "Near-neutral pre-extraction of
hemicelluloses and subsequent kraft pulping of southern mixed hardwoods," Tappi
Journal, vol. 10, no. 1, pp. 7-15, 2011.
129
[64] T. E. Amidon, C. D. Wood, A. M. Shupe, Y. Wang, M. Graves, et S. Liu, "Biorefinery:
Conversion of woody biomass to chemicals, energy and materials," Journal of Biobased
Materials and Bioenergy, vol. 2, pp. 100-120, 2008.
[65] E. K. Pye, W. B. Armiger, S. R. Winner, et A. Berlin, "High yielding biorefining using
organosolv processing," in AIChE Annual Meeting 2008, Conference Proceedings,
Philadelphia, PA, United states, 2008.
[66] C. Arato, E. K. Pye, et G. Gjennestad, "The lignol approach to biorefining of woody
biomass to produce ethanol and chemicals," Applied Biochemistry and Biotechnology,
vol. 123, pp. 871-882, 2005.
[67] C. H. Kline, "Maximizing profits in chemicals," Chemtech, vol. 6, no. 2, pp. 110-117,
1976.
[68] V. Chambost, J. McNutt, et P. R. Stuart, "Guided tour: Implementing the forest
biorefinery (FBR) at existing pulp and paper mills," Pulp and Paper Canada, vol. 109,
no. 7-8, pp. 19-27, 2008.
[69] M. L. Fisher, "What is the right supply chain for your product," Harvard Business
Review, vol. March-April, pp. 105-116, 1997.
[70] N. E. Sammons Jr, W. Yuan, M. R. Eden, B. Aksoy, et H. T. Cullinan, "Optimal
biorefinery product allocation by combining process and economic modeling," Chemical
Engineering Research and Design, vol. 86, no. 7, pp. 800-808, 2008.
[71] Y. Feng, S. D'Amours, L. LeBel, et M. Nourelfath, "Integrated Bio-refinery and Forest
Products Supply Chain Network Design Using Mathematical Programming Approach," in
Integrated Biorefineries: Design, Analysis, and Optimization, M. M. El-Halwagi etP.
Stuart, Éds.: CRC Press/Taylor & Francis, 2012.
[72] J. E. Santibanez-Aguilar, J. B. Gonzalez-Campos, J. M. Ponce-Ortega, M. Serna-
Gonzalez, et M. M. El-Halwagi, "Optimal planning of a biomass conversion system
considering economic and environmental aspects," Industrial and Engineering Chemistry
Research, vol. 50, no. 14, pp. 8558-8570, 2011.
130
[73] P. Sharma, B. R. Sarker, et J. A. Romagnoli, "A decision support tool for strategic
planning of sustainable biorefineries," Computers and Chemical Engineering, vol. 35, no.
9, pp. 1767-1781, 2011.
[74] B. Mansoornejad, V. Chambost, et P. R. Stuart, "Integrating product portfolio design and
supply chain design for the forest biorefinery," Computers and Chemical Engineering,
vol. 34, no. 9, pp. 1497-506, 2010.
[75] S. D. Eksioglu, A. Acharya, L. E. Leightley, et S. Arora, "Analyzing the design and
management of biomass-to-biorefinery supply chain," Computers and Industrial
Engineering, vol. 57, no. 4, pp. 1342-52, 2009.
[76] S. D. Eksioglu, S. Li, S. Zhang, S. Sokhansanj, et D. Petrolia, "Analyzing Impact of
Intermodal Facilities on Design and Management of Biofuel Supply Chain,"
Transportation Research Record, no. 2191, pp. 144-151, 2010.
[77] I. M. Bowling, J. M. Ponce-Ortega, et M. M. El-Halwagi, "Facility location and supply
chain optimization for a biorefinery," Industrial and Engineering Chemistry Research,
vol. 50, no. 10, pp. 6276-6286, 2011.
[78] A. J. Dunnett, C. S. Adjiman, et N. Shah, "A spatially explicit whole-system model of the
lignocellulosic bioethanol supply chain: An assessment of decentralised processing
potential," Biotechnology for Biofuels, vol. 1, 2008.
[79] J. Leboreiro et A. K. Hilaly, "Biomass transportation model and optimum plant size for
the production of ethanol," Bioresource Technology, vol. 102, no. 3, pp. 2712-2723, 2011.
[80] F. You et B. Wang, "Life cycle optimization of biomass-to-liquid supply chains with
distributed-centralized processing networks," Industrial and Engineering Chemistry
Research, vol. 50, no. 17, pp. 10102-10127, 2011.
[81] O. Akgul, A. Zamboni, F. Bezzo, N. Shah, et L. G. Papageorgiou, "Optimization-based
approaches for bioethanol supply chains," Industrial and Engineering Chemistry
Research, vol. 50, no. 9, pp. 4927-4938, 2011.
131
[82] K. Jinkyung, M. J. Realff, et J. H. Lee, "Optimal design and global sensitivity analysis of
biomass supply chain networks for biofuels under uncertainty," Computers and Chemical
Engineering, vol. 35, no. 9, pp. 1738-51, 2011.
[83] A. Zamboni, N. Shah, et F. Bezzo, "Spatially explicit static model for the strategic design
of future bioethanol production systems. 2. multi-objective environmental optimization,"
Energy and Fuels, vol. 23, no. 10, pp. 5134-5143, 2009.
[84] A. Zamboni, N. Shah, et F. Bezzo, "Spatially explicit static model for the strategic design
of future bioethanol production systems. 1. cost minimization," Energy and Fuels, vol. 23,
no. 10, pp. 5121-5133, 2009.
[85] U. Wising et P. R. Stuart, "Identifying the Canadian forest biorefinery," Pulp and Paper
Canada, vol. 107, no. 6, pp. 25-30, 2006.
[86] M. Moshkelani, M. Marinova, M. Perrier, et J. Paris, "The forest biorefinery and its
implementation in the pulp and paper industry: Energy overview," Applied Thermal
Engineering, vol. 50, pp. 1427-1436, 2013.
[87] E. Mateos-Espejel, M. Moshkelani, M. Keshtkar, et J. Paris, "Sustainability of the green
integrated forest biorefinery: A question of energy," Journal of Science and Technology
for Forest Products and Processes, vol. 1, no. 1, pp. 55-61, 2011.
[88] V. E. Hytönen, "Methodology for identifying promising retrofit integrated forest
biorefinery strategies - Design decision making under uncertainty," Ph.D. thesis, Ecole
Polytechnique, Montreal, Canada, 2011.
[89] E. Hytönen et P. R. Stuart, "Technoeconomic Assessment and Risk Analysis of
Biorefinery Processes," in Integrated Biorefineries: Design, Analysis, and Optimization,
M. M. El-Halwagi etP. Stuart, Éds.: CRC Press/Taylor & Francis, 2012.
[90] PricewaterhouseCooper (PWC), "Managing commodity risk through market uncertainty,"
2009. Disponible: http://www.pwc.com/gx/en/metals/commodity-risk/commodity-
risk.jhtml. [Consulté le 17-08-2010].
132
[91] P. Söderholm et R. Lundmark, "Forest-based biorefineries: Implications for market
behavior and policy," Forest Products Journal, vol. 59, no. 1-2, pp. 6-16, 2009.
[92] A. Barbaro et M. J. Bagajewicz, "Managing Financial Risk in Planning under
Uncertainty," AIChE Journal, vol. 50, no. 5, pp. 963-989, 2004.
[93] J. Park, S. Park, C. Yun, et Y. Kim, "Integrated model for financial risk management in
refinery planning," Industrial and Engineering Chemistry Research, vol. 49, no. 1, pp.
374-380, 2010.
[94] V. Chambost, J. McNutt, et P. R. Stuart, "Partnerships for successful enterprise
transformation of forest industry companies implementing the forest biorefinery," Pulp
and Paper Canada, vol. 110, no. 5-6, pp. 19-24, 2009.
[95] M. Janssen, V. Chambost, et P. R. Stuart, "Successful partnerships for the forest
biorefinery," Industrial Biotechnology, vol. 4, no. 4, pp. 352-362, 2008.
[96] D. Aprile, A. Claudio Garavelli, et I. Giannoccaro, "Operations planning and flexibility
in a supply chain," Production Planning and Control, vol. 16, no. 1, pp. 21-31, 2005.
[97] M. Bansal, I. A. Karimi, et R. Srinivasan, "Optimal contract selection for the global
supply and distribution of raw materials," Industrial and Engineering Chemistry
Research, vol. 46, no. 20, pp. 6522-6539, 2007.
[98] V. Bansal, J. D. Perkins, et E. N. Pistikopoulos, "Flexibility analysis and design using a
parametric programming framework," AIChE Journal, vol. 48, no. 12, pp. 2851-2868,
2002.
[99] E. K. Bish, A. Muriel, et S. Biller, "Managing flexible capacity in a make-to-order
environment," Management Science, vol. 51, no. 2, pp. 167-180, 2005.
[100] S. C. Graves et B. T. Tomlin, "Process flexibility in supply chains," Management
Science, vol. 49, no. 7, pp. 907-919, 2003.
[101] M. Reimann et P. Schiltknecht, "Studying the interdependence of contractual and
operational flexibilities in the market of specialty chemicals," European Journal of
Operational Research, vol. 198, no. 3, pp. 760-772, 2009.
133
[102] C. Yun, Y. Kim, J. Park, et S. Park, "Optimal procurement and operational planning for
risk management of an integrated biorefinery process," Chemical Engineering Research
and Design, vol. 87, no. 9, pp. 1184-1190, 2009.
[103] B. Mansoornejad, E. N. Pistikopoulos, et P. R. Stuart, "Incorporating flexibility design
into supply chain for the forest biorefinery," Journal of Science and Technology for
Forest Products and Processes, vol. 1, no. 2, pp. 54-66, 2012.
[104] B. Mansoornejad et P. R. Stuart, "Forest Biorefinery Supply Chain Design and Process
Flexibility," in Integrated Biorefineries: Design, Analysis, and Optimization, M. M. El-
Halwagi etP. Stuart, Éds.: CRC Press/Taylor & Francis, 2012.
[105] N. Slack, "The flexibility of manufacturing systems," International Journal of
Operations & Production Management, vol. 25, no. 12, pp. 1190-1200, 2005.
[106] R. Beach, A. P. Muhlemann, D. H. R. Price, A. Paterson, et J. A. Sharp, "A review of
manufacturing flexibility," European Journal of Operational Research, vol. 122, no. 1,
pp. 41-57, 2000.
[107] A. K. Sethi et S. P. Sethi, "Flexibility in manufacturing: a survey," International Journal
of Flexible Manufacturing Systems, vol. 2, no. 4, pp. 289-328, 1990.
[108] L. P. Dansereau, M. M. El-Halwagi, et P. R. Stuart, "Value-Chain Planning in the Forest
Biorefinery: Case Study Analyzing Manufacturing Flexibility," Journal of Science and
Technology for Forest Products and Processes, vol. 2, no. 4, pp. 60-69, 2012.
[109] A. Gunasekaran, H. B. Marri, et Y. Y. Yusuf, "Application of activity-based costing:
some case experiences," Managerial Auditing Journal, vol. 14, no. 6, pp. 286-293, 1999.
[110] J. Emblemsvåg et B. A. Bras, Activity-based cost and environmental management : a
different approach to ISO 14000 compliance, Norwell, MA, USA: Kluwer Academic
Publishers, 2000.
[111] R. Cooper et R. S. Kaplan, "Profit Priorities from Activity-Based Costing," Harvard
Business Review, vol. May-June, pp. 130-135, 1991.
134
[112] M. Laflamme-Mayer, M. Janssen, et P. R. Stuart, "Development of an Operations-Driven
Cost Model fon Continuous Processes Part 1: Framework for design and operations
decision making," Journal of Science and Technology for Forest Products and Processes,
vol. 1, no. 1, pp. 32-41, 2011.
[113] M. Laflamme-Mayer, J. Linkewich, et P. R. Stuart, "Methodology for using real-time
process data for cost modeling and supply chain decision support in the pulp and paper
industry," Pulp and Paper Canada, vol. 109, no. 3, pp. 44-51, 2008.
[114] M. Korbel, "On-line steady-state data reconciliation for advanced cost analysis in the pulp
and paper industry," Ph.D. thesis, Ecole Polytechnique, Montreal, Canada, 2011.
[115] T. Nurminen, H. Korpunen, et J. Uusitalo, "Applying the activity-based costing to cut-to-
length timber harvesting and trucking," Silva Fennica, vol. 43, no. 5, pp. 847-870, 2009.
[116] H. Korpunen, S. Mochan, et J. Uusitalo, "An activity-based costing method for
sawmilling," Forest Products Journal, vol. 60, no. 5, pp. 420-431, 2010.
[117] H. Korpunen, P. Virtanen, O. Dahl, P. Jylha, et J. Uusitalo, "An activity-based cost
calculation for a kraft pulp mill," Tappi Journal, vol. 11, no. 9, pp. 19-27, 2012.
[118] K. T. Talluri et G. J. van Ryzin, The theory and practice of revenue management, Boston:
Kluwer Academic Publishers, 2004.
[119] F. H. deB. Harris et J. P. Pinder, "Revenue management approach to demand
management and order booking in assemble-to-order manufacturing," Journal of
Operations Management, vol. 13, no. 4, pp. 299-309, 1995.
[120] H. Meyr, "Customer segmentation, allocation planning and order promising in make-to-
stock production," OR Spectrum, vol. 31, no. 1, pp. 229-56, 2009.
[121] T. Spengler, S. Rehkopf, et T. Volling, "Revenue management in make-to-order
manufacturing - an application to the iron and steel industry," OR Spectrum, vol. 29, no.
1, pp. 157-71, 2007.
135
[122] R. Kolisch et D. Zatte, "Stand und Perspecktiven des Einsatzes von Revenue
Management in der Prozessindustrie," Zeitschrift für Planung & Unternehmenssteuerung,
vol. 20, pp. 197-214, 2009.
[123] M. Kannegiesser, H. O. Gunther, P. Beek, M. Grunow, et C. Habla, "Value chain
management for commodities: a case study from the chemical industry," OR Spectrum,
vol. 31, no. 1, pp. 63-93, 2009.
[124] N. Shah, "Process industry supply chains: Advances and challenges," Computers and
Chemical Engineering, vol. 29, no. 6 SPEC. ISS., pp. 1225-1235, 2005.
[125] J. Kallrath, "Planning and scheduling in the process industry," OR Spectrum, vol. 24, no.
3, pp. 219-50, 2002.
[126] C. A. Floudas et L. Xiaoxia, "Continuous-time versus discrete-time approaches for
scheduling of chemical processes: a review," Computers and Chemical Engineering, vol.
28, no. 11, pp. 2109-29, 2004.
[127] N. V. Sahinidis, "Optimization under uncertainty: State-of-the-art and opportunities,"
Computers and Chemical Engineering, vol. 28, no. 6-7, pp. 971-983, 2004.
[128] P. Koskinen et O.-P. Hilmola, "Supply chain challenges of North-European paper
industry," Industrial Management and Data Systems, vol. 108, no. 2, pp. 208-227, 2008.
[129] L. G. Papageorgiou, "Supply chain optimisation for the process industries: advances and
opportunities," Computers and Chemical Engineering, vol. 33, no. 12, pp. 1931-8, 2009.
[130] N. Shah, "Pharmaceutical supply chains: Key issues and strategies for optimisation,"
Computers and Chemical Engineering, vol. 28, no. 6-7, pp. 929-941, 2004.
[131] J. F. Shapiro, "Challenges of strategic supply chain planning and modeling," Computers
and Chemical Engineering, vol. 28, no. 6-7, pp. 855-861, 2004.
[132] I. E. Grossmann, "Challenges in the new millennium: Product discovery and design,
enterprise and supply chain optimization, global life cycle assessment," Computers and
Chemical Engineering, vol. 29, no. 1, pp. 29-39, 2004.
136
[133] D. Bredstrom, J. T. Lundgren, M. Ronnqvist, D. Carlsson, et A. Mason, "Supply chain
optimization in the pulp mill industry - IP models, column generation and novel constraint
branches," European Journal of Operational Research, vol. 156, no. 1, pp. 2-22, 2004.
[134] D. Carlsson, S. D'Amours, A. Martel, et M. Rönnqvist, "Supply Chain Management in the
Pulp and Paper Industry," Interuniversity Research Center on Enterprise Networks,
Loggistics and Transportation (CIRRELT), Université Laval, Québec, Rapport technique,
2006. [En ligne]. Disponible: https://http://www.cirrelt.ca/DocumentsTravail/2006/DT-
2006-AM-3.pdf. [Consulté le 01-09-2009].
[135] D. Carlsson et M. Ronnqvist, "Supply chain management in forestry - Case studies at
Sodra Cell AB," European Journal of Operational Research, vol. 163, no. 3, pp. 589-616,
2005.
[136] H. Bouchriha, M. Ouhimmou, et S. D'Amours, "Lot sizing problem on a paper machine
under a cyclic production approach," International Journal of Production Economics, vol.
105, no. 2, pp. 318-328, 2007.
[137] S. D'Amours, A. Martel, et J.-M. Frayret, "Supply chain planning in the pulp and paper
industry," in 91st Annual Meeting of the Pulp and Paper Technical Association of
Canada, Montreal, Canada, 2005.
[138] S. D'Amours, M. Ronnqvist, et A. Weintraub, "Using Operational Research for supply
chain planning in the forest products industry," Infor, vol. 46, no. 4, pp. 265-281, 2008.
[139] N. Rizk, A. Martel, et S. D'Amours, "Multi-item dynamic production-distribution
planning in process industries with divergent finishing stages," Computers and
Operations Research, vol. 33, no. 12, pp. 3600-3623, 2006.
[140] N. Rizk, A. Martel, et S. D'Amours, "Synchronized production-distribution planning in a
single-plant multi-destination network," Journal of the Operational Research Society, vol.
59, no. 1, pp. 90-104, 2008.
[141] G. Weigel, S. D'Amours, A. Marter, et P. Watson, "A model for maximising value
creation in pulp and paper mills," in 91st Annual Meeting of the Pulp and Paper
Technical Association of Canada, Canada, 2005. Compendex,
137
[142] Y. Feng, S. D'Amours, et R. Beauregard, "The value of sales and operations planning in
oriented strand board industry with make-to-order manufacturing system: Cross
functional integration under deterministic demand and spot market recourse,"
International Journal of Production Economics, vol. 115, no. 1, pp. 189-209, 2008.
[143] M. Kannegiesser, Value Chain Management in the Chemical Industry - Global Value
Chain Planning of Commodities, Berlin: Physica-Verlag, 2008.
[144] M. Kannegiesser et H. O. Gunther, "An integrated optimization model for managing the
global value chain of a chemical commodities manufacturer," Journal of the Operational
Research Society, vol. 62, no. 4, pp. 711-721, 2011.
[145] B. Mansoornejad, "Design for flexibility in the forest biorefinery supply chain," Ph.D.
thesis, Ecole Polytechnique, Montreal, Canada, 2012.
[146] B. Mansoornejad, N. Mostoufi, et F. Jalali-Farahani, "Determining the optimized
controller parameters using a hybrid GA-SQP technique," Chemical Product and Process
Modeling, vol. 2, no. 3, 2007.
[147] R. Xing, W. Qi, et G. W. Huber, "Production of furfural and carboxylic acids from waste
aqueous hemicellulose solutions from the pulp and paper and cellulosic ethanol
industries," Energy and Environmental Science, vol. 4, no. 6, pp. 2193-2205, 2011.
[148] PaperAge, "Newsprint prices by grade per ton," 2012. Disponible:
http://www.paperage.com/foex/newsprint.html. [Consulté le 15-08-2012].
[149] ICIS, "Indicative Chemical Prices A-Z," 2012. Disponible:
http://www.icis.com/chemicals/channel-info-chemicals-a-z/. [Consulté le 12-04-2012].
138
ANNEXE A – Value Chain Management Considerations for
the Biorefinery
Louis Patrick Dansereaua, Mahmoud El-Halwagib and Paul Stuarta
aNSERC Environmental Design Engineering Chair in Process Integration, Department of
Chemical Engineering, École Polytechnique Montréal, Montréal, H3C 3A7, Canada
bDepartment of Chemical Engineering, Texas A&M University, College Station, Texas, 77843,
USA
Recently, most of the research efforts related to the biorefinery have been focused on technology,
process design and synthesis, as well as on biomass logistics. However, research related to
products and integrated planning can also provide interesting insights into how to select a product
portfolio and manage its production. The objective of this chapter is to introduce value chain and
planning considerations that are of critical importance to the design of the biorefinery. In fact,
different products face different market environments in terms of size, number of players,
competition, level of customer service required, price volatility, and other factors. To make the
biorefinery truly profitable and competitive, value-chain management approaches should
therefore be adapted to the biorefinery products that will be manufactured.
This chapter begins with a literature review on supply chain management (basics of planning,
manufacturing environments, process characteristics, types of products, contracts, and
partnerships), followed by an overview of possible biorefinery feedstocks, focusing on
lignocellulosic biomass, processes, and product types (energy, biofuels, commodity
biochemicals, specialty and fine chemicals, and biomaterials). The next two subsections discuss
how integrated supply-chain planning from procurement to sales, i.e., value-chain management,
can be generally used in the process industries, but more specifically in biorefineries, to manage
the risks of market volatility and to increase margins by revenue management and better
coordination, all this depending on the type of product. Products and associated markets,
location, geographical aspects such as access to market and customers, to name a few, highlight
the fact that each biorefinery configuration will be unique, and that therefore its supply chain
should be carefully designed, managed, and adapted accordingly to obtain the most value.
139
1. INTRODUCTION In the quest for sustainable development, academia and the process industry have been showing
increasing interest in carbon-neutral or near carbon-neutral technologies for producing green
alternatives to fossil-based chemicals, materials, and energy. The biorefinery concept therefore
appears as a promising avenue for process-industry companies to enhance their environmental
profile, to diversify their revenue stream, or even to survive, as in the case of the pulp and paper
industry. Because no commercial biorefinery has yet been built, most research efforts have
focused on technology design and biomass logistics. However, from a company’s point of view,
selecting the right product portfolio, as well as its associated technologies and capacities, poses a
major challenge. Furthermore, it cannot be assumed that these biorefineries can compete against
the petroleum industry and be profitable in a price-volatile environment. Fortunately, research
related to products and integrated planning can provide interesting insights on how to select a
product portfolio and manage its production to be as profitable as possible.
The objective of this chapter is to introduce value-chain and planning considerations that are of
critical importance to the design of the biorefinery. In fact, different products face different
market environments in terms of size, number of players, competition, level of customer service
required, price volatility, and other factors. To make the biorefinery truly profitable and
competitive, value-chain management approaches should therefore be adapted to the biorefinery
products that will be manufactured.
This chapter is organized as follows. The first section is a literature review of supply-chain
management concepts as applied to the process industries in general. Aspects of planning,
manufacturing environments, process characteristics, types of products, contracts, and
partnerships are addressed. The second part starts with an overview of biorefinery feedstocks,
focusing on lignocellulosic biomass, and continues with a brief description of biorefinery
processes and their integration in pulp and paper mills. Biorefinery products are then described
according to the supply-chain aspects introduced in the first section. These products have been
grouped into five categories: bioenergy, biofuels, commodity biochemicals, specialty and fine
chemicals, and biomaterials. In the third section, strategies for managing price volatility and
market risk will be introduced and applied in the context of the biorefinery.
140
Finally, the last section addresses integrated supply-chain planning from procurement to sales,
i.e., value chain management, and how it can be generally used in process industries, but more
specifically in biorefineries, to increase margins by revenue management and better coordination.
2. SUPPLY-CHAIN MANAGEMENT IN THE PROCESS INDUSTRY A supply chain (SC), as defined by Christopher, consists of a network of organizations that are
involved, through upstream and downstream linkages, in the different processes and activities
that produce value in the form of products and services in the hands of the ultimate consumer
[1].
As described by Shapiro, a company’s supply chain contains geographically dispersed facilities
where raw materials, intermediate products, or finished products are acquired, transformed,
stored, or sold and transportation links that connect facilities along which products flow. The
facilities may be operated by the company, or they may be operated by vendors, customers, third-
party providers, or other firms with which the company has business arrangements [2].
Over the past decades, supply-chain management (SCM) concepts have become a subject of
growing interest in industry and academia. Several authors have given different definitions of
SCM. However, the following elements are found in the majority of these [2–6]:
• Planning and management of raw materials procurement, production, distribution, and other logistical activities (warehousing, transportation) to satisfy customer demand,
• Management of facilities (plants, distribution centers, etc.) that are dispersed geographically,
• Coordination and collaboration activities within the enterprise and between partners (suppliers, clients, third-party service providers, etc.), and
• Integration of material, cash, and information flows between different actors, whether inside or outside the company.
The objective of SCM could be summarized as follows: to deliver the right product at the right
timing and at the lowest cost by the coordination of material, cash, and information flows from
the supplier to the final customer in order to:
1) Maximize profitability of a company (and/or all its supply-chain partners) 2) Achieve high customer satisfaction levels 3) Create a sustainable competitive advantage.
141
There are four main planning tasks associated with supply-chain management: procurement,
production, distribution, and sales [3,6]. Procurement deals with all processes that provide the
resources (raw materials, personnel, etc.) necessary for production. Production includes all the
capacity-limited processes involved with the manufacturing of products. Distribution bridges the
distance between the production site and the customers, either final clients, retailers, or other
enterprises that will process the products further. Finally, sales processes are involved with
receiving and filling the customer’s orders. All these logistical processes are driven by demand
forecasts and order figures determined by the sales process.
Successful supply-chain management requires many decisions about material, cash, and
information flows. These decisions are usually divided into three levels or phases: strategic,
tactical, and operational [2,3,6]. These levels are characterized by the decision frequency and the
time horizon considered.
Strategic planning deals with decisions related to the structure of the supply chain (e.g., facility
location) for the next few years. It is long-term planning (3–10 years) in which the decisions
involved are related to investment or divestment activities, which are decisions that are often
irreversible or very costly to alter.
Tactical (mid-term) planning establishes the parameters within which a supply chain will work
over a period of time. Investment opportunities are not evaluated at this level since the SC
structure has been fixed during strategic planning. Decisions concern rather the allocation of
resources over a time horizon of 6 to 24 months to maximize the profit of the company. Short-
term operating policies, such as the assignment of production targets to facilities, procurement
planning, and transportation from facilities to warehouses to distribution centers, are defined,
taking into account the flexibility of the SC. On the customer side, demand planning tasks such as
aggregate sales forecasting and what-if scenario analyses are usually performed to support
shorter-term sales decisions.
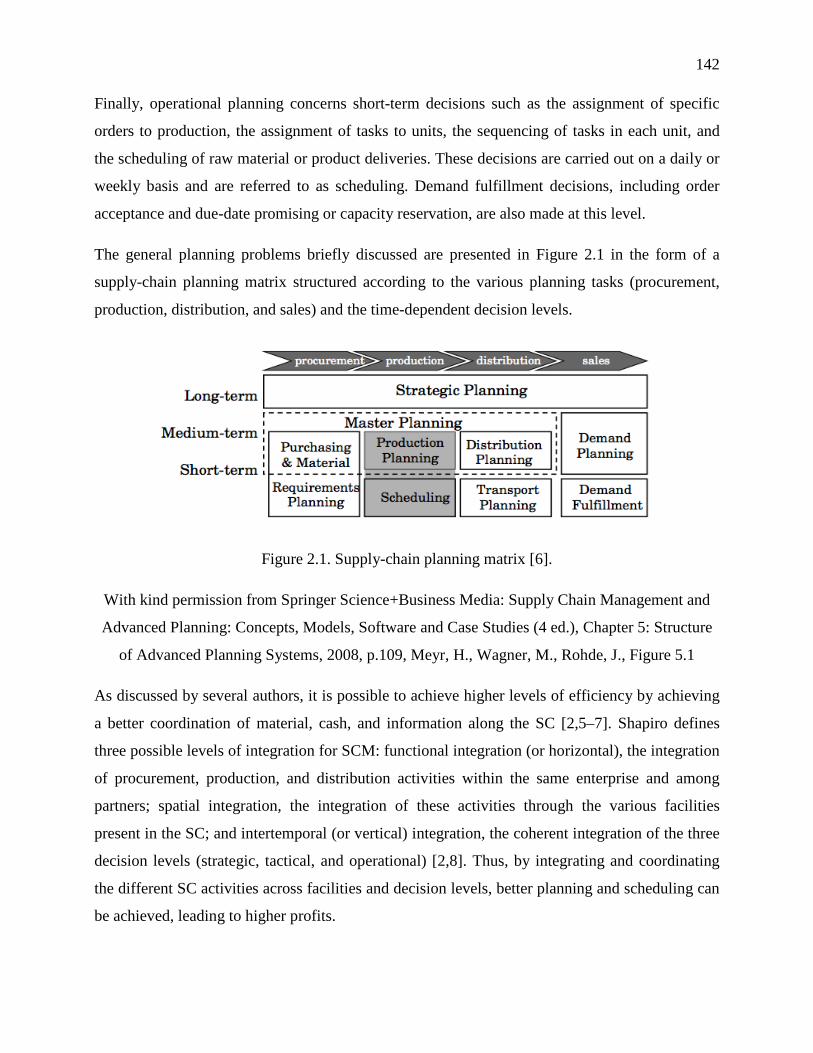
142
Finally, operational planning concerns short-term decisions such as the assignment of specific
orders to production, the assignment of tasks to units, the sequencing of tasks in each unit, and
the scheduling of raw material or product deliveries. These decisions are carried out on a daily or
weekly basis and are referred to as scheduling. Demand fulfillment decisions, including order
acceptance and due-date promising or capacity reservation, are also made at this level.
The general planning problems briefly discussed are presented in Figure 2.1 in the form of a
supply-chain planning matrix structured according to the various planning tasks (procurement,
production, distribution, and sales) and the time-dependent decision levels.
Figure 2.1. Supply-chain planning matrix [6].
With kind permission from Springer Science+Business Media: Supply Chain Management and
Advanced Planning: Concepts, Models, Software and Case Studies (4 ed.), Chapter 5: Structure
of Advanced Planning Systems, 2008, p.109, Meyr, H., Wagner, M., Rohde, J., Figure 5.1
As discussed by several authors, it is possible to achieve higher levels of efficiency by achieving
a better coordination of material, cash, and information along the SC [2,5–7]. Shapiro defines
three possible levels of integration for SCM: functional integration (or horizontal), the integration
of procurement, production, and distribution activities within the same enterprise and among
partners; spatial integration, the integration of these activities through the various facilities
present in the SC; and intertemporal (or vertical) integration, the coherent integration of the three
decision levels (strategic, tactical, and operational) [2,8]. Thus, by integrating and coordinating
the different SC activities across facilities and decision levels, better planning and scheduling can
be achieved, leading to higher profits.
143
The application of SCM and advanced planning concepts has greatly benefited from recent
advances in information technologies. With the implementation of enterprise resource planning
(ERP) systems and other transactional systems, from SAP [9] and Oracle [10] for example, it is
now possible for managers to have rapid access to huge amounts of homogeneous information on
production, logistics, sales, and procurement activities. However, as stated by several authors,
competitive advantage is not gained simply through the acquisition and use of systems providing
faster and cheaper communication of data [2,7,11]. Nevertheless, the use of tools to analyze this
transactional data enables managers to forecast and explore possibilities while designing,
planning, and operating the supply chain. These analytical tools provide comprehensive decision-
making capabilities across the various functions, enabling the supply chain to run more
efficiently.
One of these analytical tools that has been extensively studied is advanced planning15. Advanced
planning systems (APS) do not replace, but rather supplement existing ERP systems. Although
ERP systems are still required for transaction and execution purposes, planning tasks are now
taken over by the APS, which uses optimization models to find better plans and schedules at the
three decision levels (strategic, tactical, and operational). APS software providers typically offer
their models as a set of planning modules divided more or less according to the modular structure
presented in Figure 2.1.
Depending on the decision level, different objective functions might be used, such as revenue
maximization, cost minimization, lead time minimization, and others. Shapiro argues that
strategic and tactical planning should seek to maximize net revenues or return on investment
(ROI) instead of minimizing costs [8]. According to him, minimizing costs at these levels is a
timid and shortsighted objective. To maximize net revenues or ROI, demand and sales should be
included in medium- and long-term planning.
15 See Fleischmann et al. for additional information on advanced planning [12] Fleischmann, B., Meyr, H., and
Wagner, M. Advanced Planning. In: Stadtler, H. and Kilger, C. (eds.), Supply Chain Management and Advanced
Planning: Concepts, Models, Software and Case Studies. Berlin: Springer-Verlag, 2008.
144
Rather than finding the absolute optimum plan, the power and value of APS reside in the
possibility of evaluating different modes of operation. At longer-term levels, different future
development scenarios can be planned to identify a robust next step for the upcoming planning
interval. At a shorter-term level, the planner may evaluate the actual feasibility of the proposed
plans given by the APS, compare the tradeoffs between the options, and choose the best plan
based on his knowledge before it is implemented.
As APS and ERP systems become more widely used, the better use of available data and the new
degree of coordination involve several changes within the company. They demand better
communication of information between departments that have traditionally been accustomed to
working independently. In addition, managers will be increasingly called upon to use models and
other tools to support their decision-making. However, managers have traditionally been reluctant
to use such tools, although this reluctance is beginning to fade [2]. Human planners and decision-
makers typically fear that information technology tools will replace them. In fact, advanced
planning systems are not meant to replace human planners, but are truly decision-support
systems. Models are simplifications of the reality. Therefore, human knowledge, experience, and
skill will always be needed to fill in the gap between model and reality. All these changes
represent a true transformation of the company and in the way companies used to operate.
2.1. Decoupling point and manufacturing environments The different processes in a supply chain can be divided into two categories depending on
whether they are executed in response or in anticipation to a customer order [3]. Processes that
are initiated by a customer order are said to be pull: processes are operated in a context where the
demand is known. By contrast, push processes are initiated and performed without knowing
exactly the actual demand; they are operated using forecasts. Because no supply chain can be
purely push or pull, there exists an interface that divides processes between these two views. This
interface is generally called the decoupling point (DP) or the order penetration point. The position
of the decoupling point in a supply chain varies with products, markets, companies, and other
factors and might also change over time as the market evolves. It should be mentioned, however,
that pull processes are often constrained by inventory and capacity decision that are made in the
push phase.
145
Manufacturing environments can be described according to the position of the decoupling point
and the lead time (average time interval between ordering and receiving a material) that the
customer can accept. Three general environments are often characterized in the literature: make-
to-order, assemble-to-order, and make-to-stock. These environments will be briefly discussed in
the following subsections. For more information on these concepts, the reader is referred to
Kilger and Meyr [13].
2.1.1. Make-to-Order In make-to-order (MTO) environments, the DP is located upstream in the supply chain.
Production is triggered by incoming customer orders, and procurement of raw materials has
already been done according to forecasts. These raw materials are kept in inventory at the DP and
are available for manufacturing. MTO environments are appropriate primarily for high-value or
customer-specific products. Customers place their orders before the start of the manufacturing
process and must wait while their product is manufactured, assembled, and delivered. Because
there is considerable lead time and customers must wait for their orders to be processed, one of
the scheduling problems that arise in MTO is the assignment of orders to equipment and the
promising of order due dates with reference to bottlenecks and available production and
distribution capacity.
2.1.2. Assemble-to-Order In assemble-to-order (ATO) environments, basic manufacturing steps have already occurred
when the order is placed. Processing steps after the DP are related to final product assembly,
customization, and distribution to the client. Inventory kept at the DP consists of fairly standard
products or components that are produced according to forecasts. These intermediates may be
produced by the company, but are often delivered by external suppliers.
This type of manufacturing is common in the discrete industries, such as the automobile industry,
where some parts are manufactured (by external suppliers or by the company) and stored. The
final assembly of the car is only done once an order is placed. ATO processing is also found for
certain products in some process industries, such as pulp and paper. Some types of standardized
paper rolls are produced and kept in inventory at the mill, and once an order arrives, these rolls
are cut and wrapped according to the customer’s specifications.
146
2.1.3. Make-to-Stock Production is based on forecasts in make-to-stock (MTS) environments. Final products are
manufactured and held in inventory, ready for final distribution to the customer. Customer
requests are served directly from this stock. The DP is therefore located downstream in the
supply chain. MTS are especially adapted for products that require no specific customization,
such as in the consumer-goods industries where standardized packaging is used. In this kind of
environment, customers usually expect short lead times, and this might in fact be a condition for
sale. Therefore, multiple warehouses or distribution centers may exist to reduce this lead time to
the minimum. In a MTS production environment, good forecasting accuracy is important as
inventory and warehousing costs can be substantial.
2.1.4. Position of the decoupling point Deciding where the DP will be and therefore the nature of the manufacturing environment when
designing a company’s supply chain is an important strategic question which must be addressed
because it will have numerous implications for procurement, production, distribution, and sales
decisions. On one side, the closer the DP is to the market, the shorter is the customer’s service
time, and the higher the inventory levels will be. Because customer orders are mostly served
directly from the inventory of finished products, demand forecasting accuracy becomes of critical
importance. On the other side, when the DP is located further from the market, response times
will be longer, and inventory levels will be lower. The promising of delivery dates and
production capacity allocation decisions become important points to address.
The position of the decoupling point in MTO, ATO, and MTS environments is shown in Figure
2.2. The type of inventory at the decoupling point will vary depending on the production
environment. For instance, in MTO, the safety stock will be constituted of raw materials. Final
products will be held in inventory in MTS, while in ATO, intermediates will be kept.
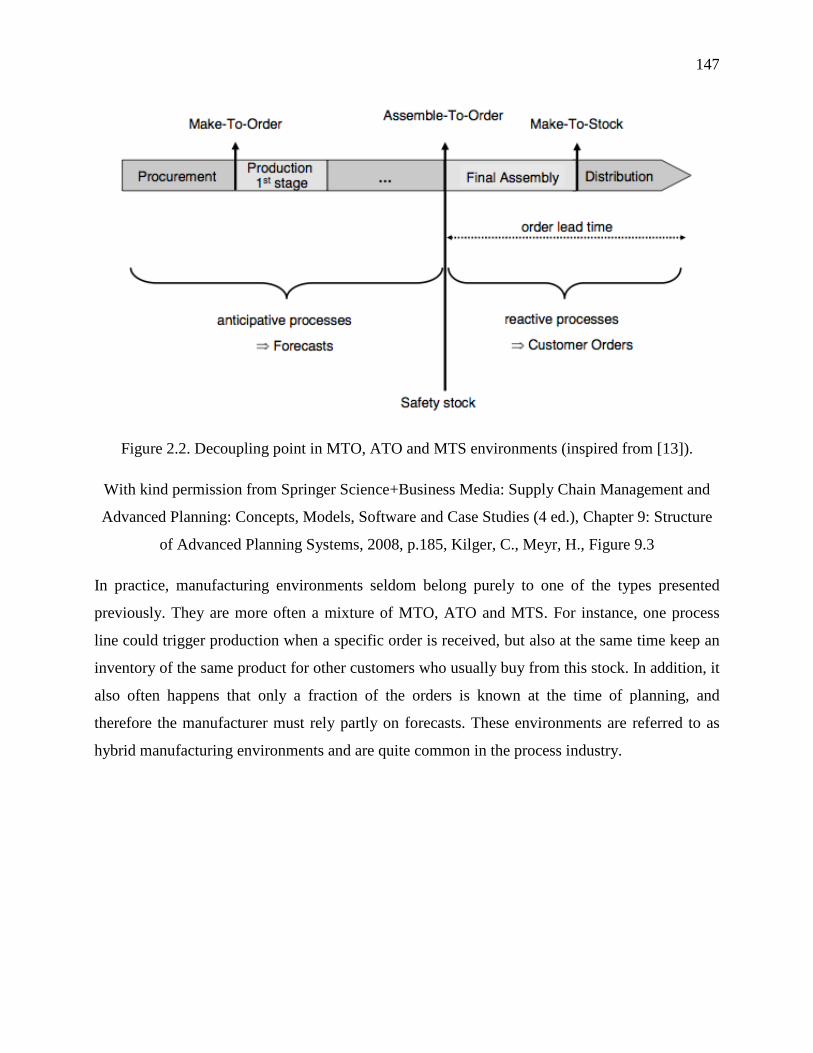
147
Figure 2.2. Decoupling point in MTO, ATO and MTS environments (inspired from [13]).
With kind permission from Springer Science+Business Media: Supply Chain Management and
Advanced Planning: Concepts, Models, Software and Case Studies (4 ed.), Chapter 9: Structure
of Advanced Planning Systems, 2008, p.185, Kilger, C., Meyr, H., Figure 9.3
In practice, manufacturing environments seldom belong purely to one of the types presented
previously. They are more often a mixture of MTO, ATO and MTS. For instance, one process
line could trigger production when a specific order is received, but also at the same time keep an
inventory of the same product for other customers who usually buy from this stock. In addition, it
also often happens that only a fraction of the orders is known at the time of planning, and
therefore the manufacturer must rely partly on forecasts. These environments are referred to as
hybrid manufacturing environments and are quite common in the process industry.
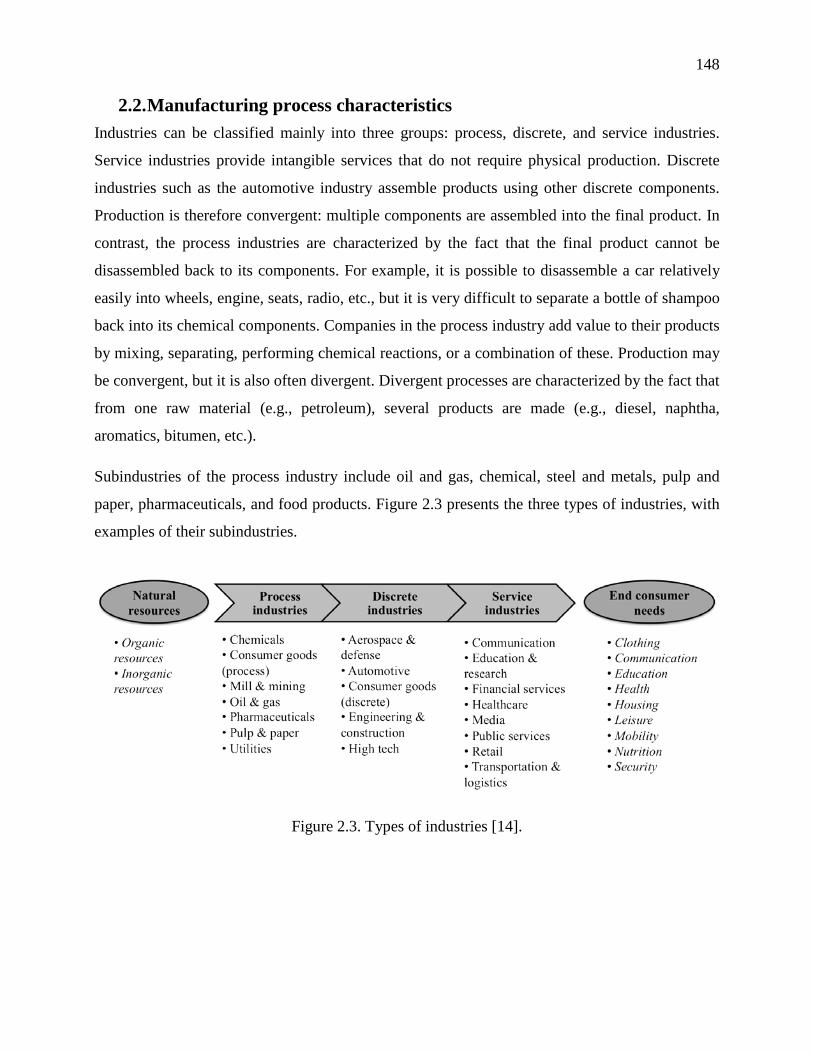
148
2.2. Manufacturing process characteristics Industries can be classified mainly into three groups: process, discrete, and service industries.
Service industries provide intangible services that do not require physical production. Discrete
industries such as the automotive industry assemble products using other discrete components.
Production is therefore convergent: multiple components are assembled into the final product. In
contrast, the process industries are characterized by the fact that the final product cannot be
disassembled back to its components. For example, it is possible to disassemble a car relatively
easily into wheels, engine, seats, radio, etc., but it is very difficult to separate a bottle of shampoo
back into its chemical components. Companies in the process industry add value to their products
by mixing, separating, performing chemical reactions, or a combination of these. Production may
be convergent, but it is also often divergent. Divergent processes are characterized by the fact that
from one raw material (e.g., petroleum), several products are made (e.g., diesel, naphtha,
aromatics, bitumen, etc.).
Subindustries of the process industry include oil and gas, chemical, steel and metals, pulp and
paper, pharmaceuticals, and food products. Figure 2.3 presents the three types of industries, with
examples of their subindustries.
Figure 2.3. Types of industries [14].
149
With kind permission from Springer Science+Business Media: Value Chain Management in the
Chemical Industry - Global Value Chain Planning of Commodities, 2008, p.64, Kannegiesser,
M., Figure 25
Chemical process units (mixers, separators, or reactors) are often dedicated units that have been
designed solely for their specific purpose. Their design has been optimized to maximize
production yield and security, taking into account process characteristics such as the phases
present, heating/cooling requirements, temperature, pressure, corrosion potential, material flow,
etc. However, some pieces of equipment are designed to withstand a range of conditions and are
able to produce several products at different throughputs. Chemical process equipments may run
either in continuous or in batch mode.
In continuous units, reactants are added and products removed at a constant mass flow rate. The
throughput may nevertheless be varied within a certain predefined range without stopping the
process. These kinds of units are adapted for large daily production rates and are mainly single-
purpose assets.
Batch processes are suited for smaller production rates and when long reaction times are needed
to achieve the desired selectivity. A “batch” of raw materials (reactants) is introduced into one
unit which is operated at the desired conditions until the target conversion is reached. The
throughput, start time, and end time for this batch of production is therefore defined. Batch
processes may be multipurpose assets capable of producing several different products.
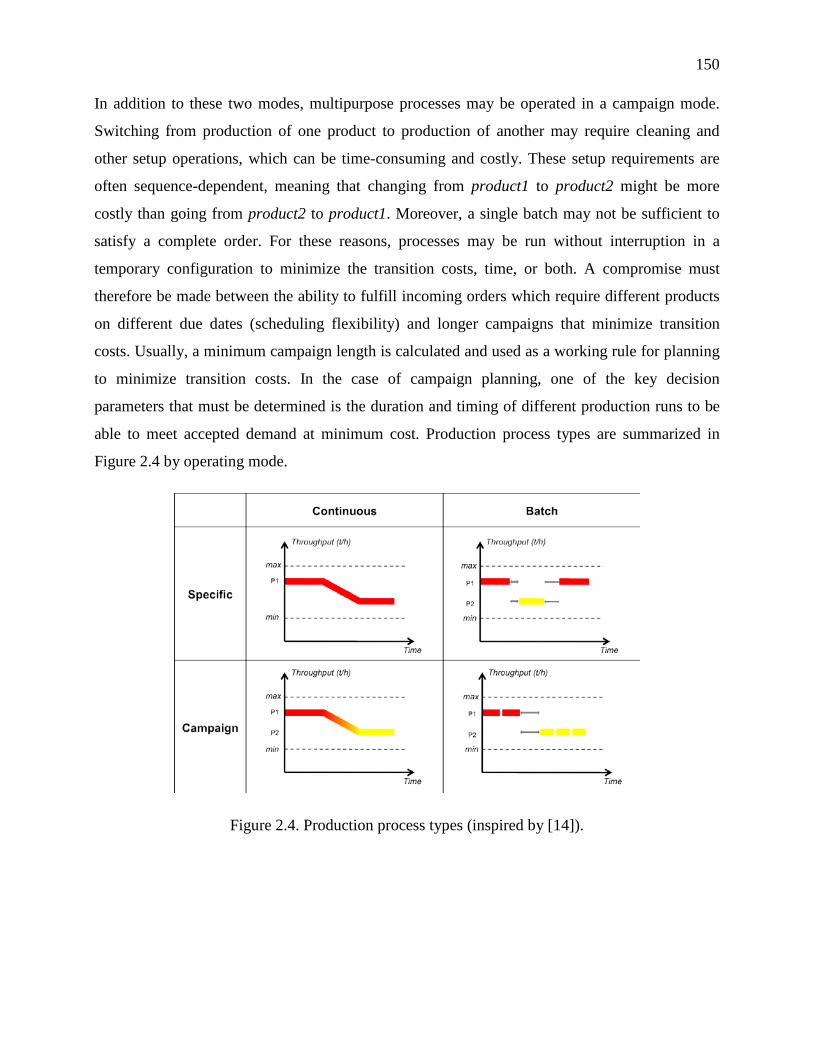
150
In addition to these two modes, multipurpose processes may be operated in a campaign mode.
Switching from production of one product to production of another may require cleaning and
other setup operations, which can be time-consuming and costly. These setup requirements are
often sequence-dependent, meaning that changing from product1 to product2 might be more
costly than going from product2 to product1. Moreover, a single batch may not be sufficient to
satisfy a complete order. For these reasons, processes may be run without interruption in a
temporary configuration to minimize the transition costs, time, or both. A compromise must
therefore be made between the ability to fulfill incoming orders which require different products
on different due dates (scheduling flexibility) and longer campaigns that minimize transition
costs. Usually, a minimum campaign length is calculated and used as a working rule for planning
to minimize transition costs. In the case of campaign planning, one of the key decision
parameters that must be determined is the duration and timing of different production runs to be
able to meet accepted demand at minimum cost. Production process types are summarized in
Figure 2.4 by operating mode.
Figure 2.4. Production process types (inspired by [14]).
151
With kind permission from Springer Science+Business Media: Value Chain Management in the
Chemical Industry - Global Value Chain Planning of Commodities, 2008, p.68, Kannegiesser,
M., Figure 29
An example of a continuous/campaign process is a paper machine. These multipurpose units
produce different grades of paper 24 hours a day. When a transition between grades occurs, off-
spec paper is produced. Transitions are often planned to occur at the beginning or the end of a roll
to minimize the impact on printing operations. This paper may be given to the customer as part of
the contract agreement or may be repulped.
Another key characteristic of the process industry is the fabrication of coproducts and
byproducts. Byproducts are usually undesired and are produced instead of the main product
because of imperfect reaction selectivity. By contrast, coproducts are produced alongside the
main product and are generally necessary for further processing steps or are sold to the market.
They are hence considered desirable. Valorization of these secondary products is essential to
ensure the profitability of the process. However, the production of secondary materials during
process operations complicates considerably the planning and scheduling of inventory, capacity,
and sales, because these secondary materials must be addressed simultaneously with the
manufacturing of the main products.
Moreover, as in the chemical industry, there may be more than one way of producing one
material in a factory, i.e., the product may be obtainable through different combinations of
processes. The yields may also change depending on raw materials, time, and external conditions
such as external temperature. In addition, if for certain reasons, part of the normal production
does not comply with product standards (which is obviously not desirable and should be
minimized), but has sufficient purity or functionality for another purpose, the off-spec products
might also be reprocessed and sold to other customers at a lesser price, or might be marketed as
second-quality products. These specific aspects of the process industry further complicate the
planning and scheduling of production.
152
The different subindustries of the process industries each have specific characteristics that make
its supply chain planning problems unique. For instance, products from the food and
pharmaceutical industries have expiration dates. The final product cannot be held in inventory for
prolonged periods, otherwise it will be wasted. In the chemical industry, products can be
intermediates and finished products at the same time, being sold or used for the manufacturing of
other products (e.g., ethylene may be sold to plastic producers to produce polyethylene, but may
also be used by the same company to synthesize other chemicals). Hence, planning tools and
heuristics that are developed in certain industries cannot always be generalized because specific
constraints in each industry must be addressed.
No matter what type of process is in place, because of high capital investments, machines and
plants in the process industry must be operated continuously and near capacity to realize a profit
on investment [2]. Hence, production is limited by capacity. When total demand for one product
cannot be entirely fulfilled by a company, which is the case most of the time, companies must
make capacity-management decisions, that is, to decide which part of the market to serve from
the available capacity. Unlike the discrete or service industries, strategies to enhance capacity
temporarily, such as using time flexibility from the workforce (overtime work) or hiring
additional seasonal workforce can be applied to a greater or lesser extent. Subcontracting can be
practiced, but the customer must agree to the use of such methods. Decisions regarding which
part of the demand to fulfill are therefore critical for the profitability of process enterprises.
2.3. Types of products and markets Kline classified chemical products according to their degree of differentiation and production
volume [15]. Even though this classification was made for chemicals, it could be applied to other
process industries, including oil and gas, steel and metals, pulp and paper, pharmaceuticals, and
food.
Materials that are produced in a substantially identical form by several suppliers are said to be
undifferentiated products. They are usually sold according to specifications on their composition
(purity) and may be used in many different applications. One example of such a product is
ethylene. Ethylene produced by one company or another is the same as long as it has the same
compositional purity. Ethylene is a chemical used in a wide range of processes for producing
several polymers and other chemicals.
153
On the other hand, differentiated products are materials that are either produced with real
differences among products from different suppliers, or are at least marketed on the basis of an
imputed difference. Consumer goods are generally differentiated products. For example, yogurt
from two companies will have a similar, but slightly different, taste and composition. Moreover,
one company could differentiate itself from its competitors by providing different packaging.
Products that fall into this category are generally used in one or at most a few different
applications. Rather than being sold on the basis of their compositional specifications, they are
sold on the basis of their performance characteristics.
Taking into account the degree of differentiation as well as production volume, chemical
products can be classified into four broad categories, as shown in Figure 2.5: true commodities,
fine chemicals, pseudo-commodities, and specialty chemicals. True commodities are large-
volume compounds sold to generally accepted compositional specifications. They have several
possible end uses and are sold to a wide variety of customers, even if sales are usually
concentrated in a small group of large buyers. Fine chemicals are also undifferentiated products
sold to standardized specifications, but produced in much lower volumes. Most of the time, they
are sold to a small number of specialized customers. Like true commodities, pseudo-commodities
are produced in large quantities. However, these compounds will be sold according to their
performance specifications in their related end uses. They will often be bought by a few large
customers. Ultimately, specialty chemicals are synthesized in small quantities and are designed
according to customer-specific characteristics. These products are typically sold to several small-
volume customers.
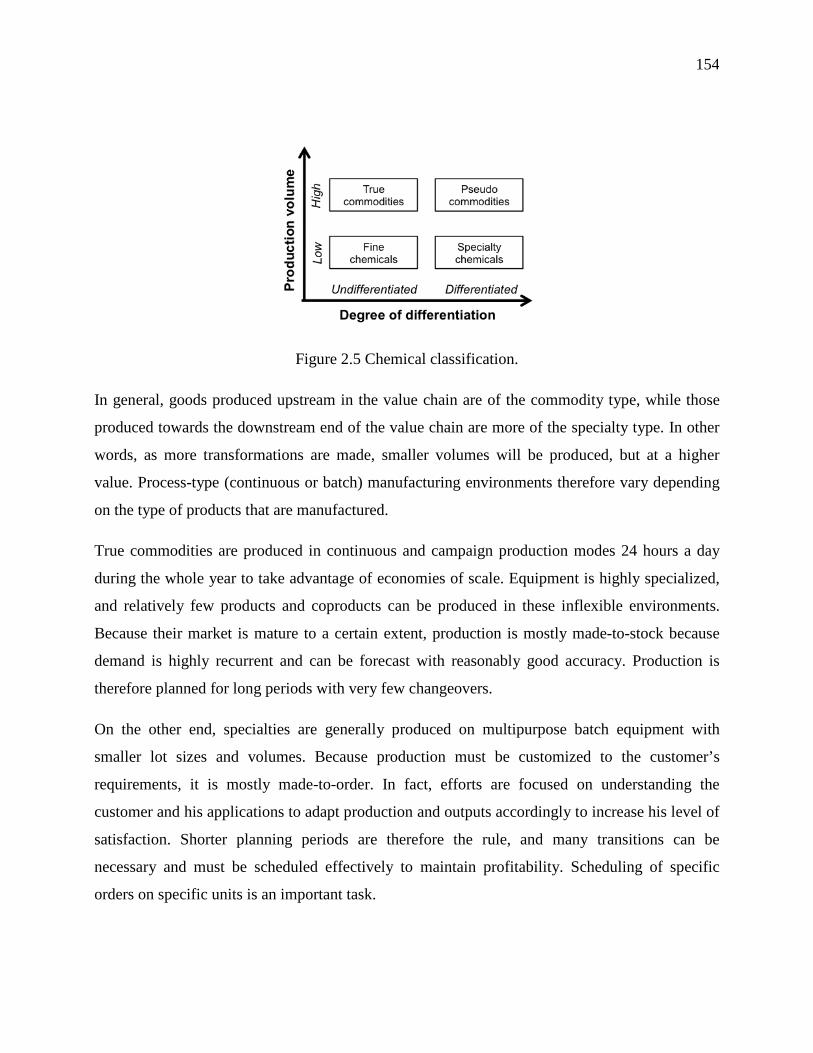
154
Figure 2.5 Chemical classification.
In general, goods produced upstream in the value chain are of the commodity type, while those
produced towards the downstream end of the value chain are more of the specialty type. In other
words, as more transformations are made, smaller volumes will be produced, but at a higher
value. Process-type (continuous or batch) manufacturing environments therefore vary depending
on the type of products that are manufactured.
True commodities are produced in continuous and campaign production modes 24 hours a day
during the whole year to take advantage of economies of scale. Equipment is highly specialized,
and relatively few products and coproducts can be produced in these inflexible environments.
Because their market is mature to a certain extent, production is mostly made-to-stock because
demand is highly recurrent and can be forecast with reasonably good accuracy. Production is
therefore planned for long periods with very few changeovers.
On the other end, specialties are generally produced on multipurpose batch equipment with
smaller lot sizes and volumes. Because production must be customized to the customer’s
requirements, it is mostly made-to-order. In fact, efforts are focused on understanding the
customer and his applications to adapt production and outputs accordingly to increase his level of
satisfaction. Shorter planning periods are therefore the rule, and many transitions can be
necessary and must be scheduled effectively to maintain profitability. Scheduling of specific
orders on specific units is an important task.
155
Fine chemicals and pseudo-commodities share characteristics from both true commodities and
specialties. Therefore, their characterization is more difficult. Like true commodities, fine
chemicals are mostly produced continuously, but may also be produced in batch campaign mode.
However, they are produced on much smaller scales and may also be produced partly as
coproducts in different processing steps. Because they are undifferentiated products that can be
stored without additional processing or customization for different orders and customers, fine
chemicals are commonly suitable for make-to-stock environments. They may also be produced in
make-to-order environments when produced, for example, on multipurpose batch equipment.
On the other hand, pseudo-commodities may be produced partly continuously, with some
customization, such as different packaging steps, performed on batch equipment. Hence, make-
to-order, assemble-to-order, make-to-stock environments, or hybrids of these can be found for
these products. For example, even though newsprint rolls are produced in large tonnages, their
production is generally MTO because different customers ask for different characteristics (roll
size, quality, diameter, etc.). Raw materials are purchased in advance, but manufacturing is
committed only upon order arrival because the amount of customization needed for each order is
considerable. However, plastics produced in high tonnages and in a standardized quality, such as
polyethylene pellets, might be manufactured according to forecasts, i.e., MTS.
These different product categories face different market environments. For instance, commodities
are characterized by highly competitive businesses with substantial price volatility, while fine and
specialty chemicals are less sensitive to changes in price and demand because of lower levels of
competition, and because of product differentiation in the case of specialties.
As the business for a particular product matures, several forces put additional pressure on a
company that wants to remain in this business segment. On one side, the arrival of competitors
puts pressure on the market, lowering selling prices. Products that were traditionally fine
chemicals and specialties are now confronted with commoditization, which renders their business
more vulnerable to price and demand variability. On the other side, because of this increased
supply, customers ask for higher service levels and customization for the same price, thus
augmenting distribution and production costs and leading to even higher margin pressure. Hence,
supply-chain strategies must evolve over time to adapt themselves to the market.
156
In addition to this product classification by Kline, products may be differentiated by their
perishability and life cycle. Perishability refers to the amount of time during which a product can
be held in inventory. Because perishable items cannot be stored for sale in the future, it is not a
real possibility for the customer to wait until the price decreases. For this reason, sales in a
particular period usually do not influence future sales. Most food products, like dairy products,
are perishable: they cannot be stored for a long period, and customers will still purchase them
even if the price is slightly higher or lower than the week before. Overstocking perishables is
expensive; accurate forecasting thus serves a crucial role in the profitability of perishable
products manufacturing companies. In contrast, high-tech products such as computers are
durable; they last for a few years, but because customers typically buy one computer every few
years, today’s purchase may affect future purchases. Perishable and durable products therefore
require different production, inventory, and sales planning strategies.
The product life cycle refers to the length of the selling season. In general, products from the
process industry have especially long life cycles. For instance, chemicals, drugs, types of paper,
and food are sold in a similar configuration for several years or decades. In contrast, computers
have very short life cycles: after only three or four years, a computer model is considered to be
outdated, and its selling price will drastically decrease because newer and more powerful models
are now available. Sales and marketing strategies should be different for short and long product
life cycles. In addition, product innovation and product portfolio refreshment is especially
important for short life cycle products. These are also important for long life cycle products, but
to a lesser extent. As a product matures, there comes a time when its market demand declines
because of its replacement by better, greener, more efficient, or more acceptable products. When
this situation arises, as is the case for the pulp and paper industry which faces declining markets
for some of its products (e.g., people are reading fewer and fewer printed newspapers and
magazines, preferring to inform themselves by other means, such as television or the Internet),
product innovation becomes important for survival.
157
2.4. Contracts, spot markets, and collaboration A large part of the supply-chain literature deals with models in which demand must be met.
However, in industrial practice, demand may not be completely fulfilled by a company. In fact,
market demand is both price-sensitive and uncertain. Two types of demand can be distinguished:
contract demand, and spot-market demand. On one hand, spot-market sales can be highly
variable in both price and quantity. In spot demand, no long-term agreement exists between the
company and its customers; only agreements on price and quantity for this specific transaction
are addressed. Therefore, this type of demand does not necessarily need to be fulfilled. The
company can therefore make active sales decisions on the acceptance or rejection of spot sales
requests [16].
On the other hand, contract demand is based on agreements between the company and the
customer, and these agreements stipulate commitments. This type of demand is much less
flexible and must be fulfilled to the level and price that were specified and agreed upon. The
motivations for contracts is related to the desire to share the risks arising from various
uncertainties in the business environment such as demand, supply, delivery, inventory, price,
exchange rate, etc. [17]. Contracts also facilitate long-term relationships. When the demand for a
specific product or raw material is predictable and constant over time, agreement on a contract
will ease several repetitive supply-chain operations such as regular deliveries and payments.
Service and product quality, reliability, and other nonquantifiable criteria are further reasons why
a customer would consider entering a long-term commitment.
158
Contracts enable the various players in the SC (supplier, manufacturer, retailer) to be better
coordinated and aligned with demand, leading to higher SC profits. Typically, a contract includes
specifications with respect to contract length, quantity, price, delivery terms, discounts, and
penalties for nonfulfillment of conditions [17,18]. These specifications should capture the
material, information, and financial flows encountered in a supply chain. Several authors have
characterized and classified contracts according to the clauses included in them. For example,
Tsay et al. classified contracts according to their specification of decision rights, pricing,
minimum purchase commitments, quantity flexibility, buyback policies, allocation rules, lead
time, and quality [19]. Höhn characterizes contracts according to these eight contract clauses, but
adds horizon length (contract duration), periodicity of ordering, and information sharing [20]. In
the following subsections, contracts will be characterized according to contract specifications
such as general terms and conditions, purchase commitments, pricing, payment terms, and other
contract options. However, the intent is not to provide an exhaustive overview of all contract
types and specifications.
2.4.1. General terms and conditions Contracts are negotiated individually between the customer and the manufacturer or retailer.
Because of these one-to-one negotiations, contract clauses and specifications will differ from
contract to contract, from customer to customer, and over time, even if the company continues to
provide the same range of products.
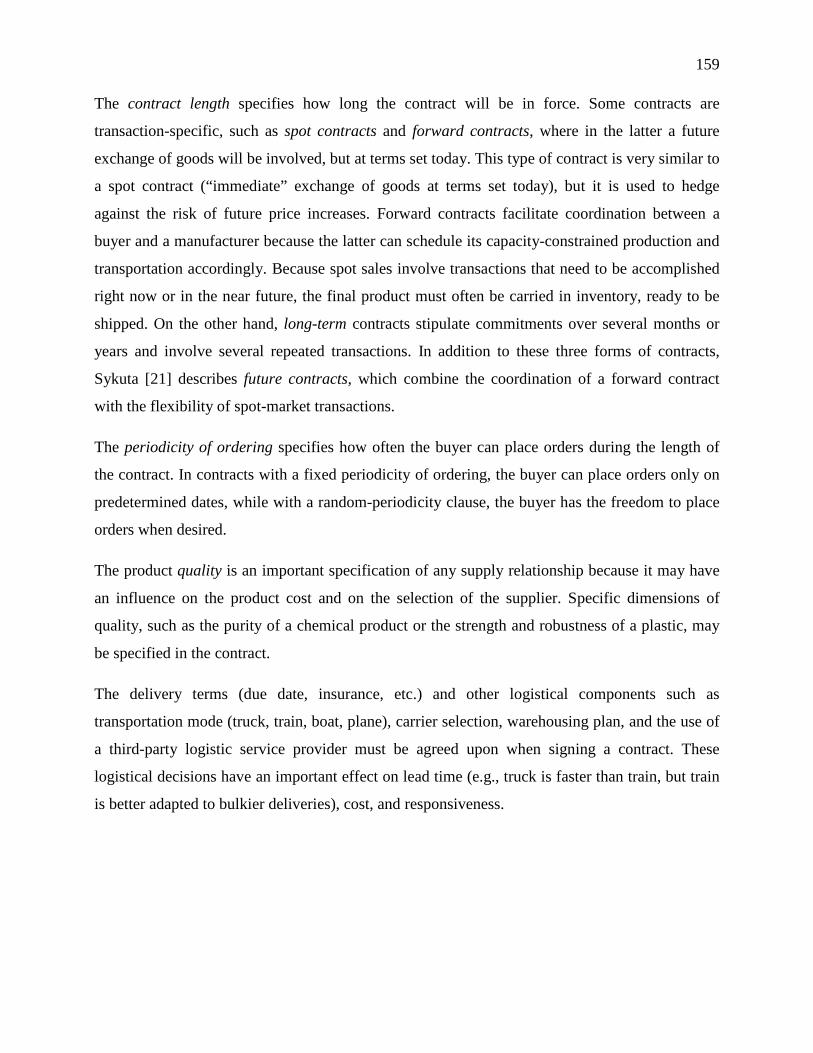
159
The contract length specifies how long the contract will be in force. Some contracts are
transaction-specific, such as spot contracts and forward contracts, where in the latter a future
exchange of goods will be involved, but at terms set today. This type of contract is very similar to
a spot contract (“immediate” exchange of goods at terms set today), but it is used to hedge
against the risk of future price increases. Forward contracts facilitate coordination between a
buyer and a manufacturer because the latter can schedule its capacity-constrained production and
transportation accordingly. Because spot sales involve transactions that need to be accomplished
right now or in the near future, the final product must often be carried in inventory, ready to be
shipped. On the other hand, long-term contracts stipulate commitments over several months or
years and involve several repeated transactions. In addition to these three forms of contracts,
Sykuta [21] describes future contracts, which combine the coordination of a forward contract
with the flexibility of spot-market transactions.
The periodicity of ordering specifies how often the buyer can place orders during the length of
the contract. In contracts with a fixed periodicity of ordering, the buyer can place orders only on
predetermined dates, while with a random-periodicity clause, the buyer has the freedom to place
orders when desired.
The product quality is an important specification of any supply relationship because it may have
an influence on the product cost and on the selection of the supplier. Specific dimensions of
quality, such as the purity of a chemical product or the strength and robustness of a plastic, may
be specified in the contract.
The delivery terms (due date, insurance, etc.) and other logistical components such as
transportation mode (truck, train, boat, plane), carrier selection, warehousing plan, and the use of
a third-party logistic service provider must be agreed upon when signing a contract. These
logistical decisions have an important effect on lead time (e.g., truck is faster than train, but train
is better adapted to bulkier deliveries), cost, and responsiveness.
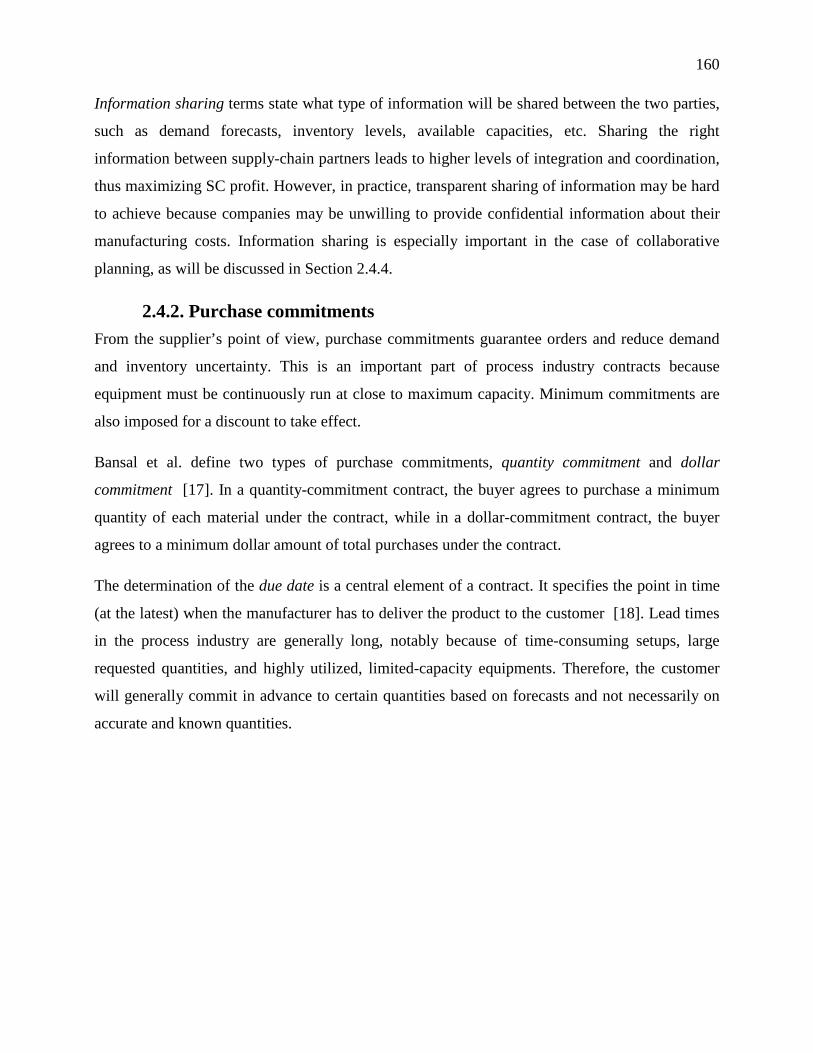
160
Information sharing terms state what type of information will be shared between the two parties,
such as demand forecasts, inventory levels, available capacities, etc. Sharing the right
information between supply-chain partners leads to higher levels of integration and coordination,
thus maximizing SC profit. However, in practice, transparent sharing of information may be hard
to achieve because companies may be unwilling to provide confidential information about their
manufacturing costs. Information sharing is especially important in the case of collaborative
planning, as will be discussed in Section 2.4.4.
2.4.2. Purchase commitments From the supplier’s point of view, purchase commitments guarantee orders and reduce demand
and inventory uncertainty. This is an important part of process industry contracts because
equipment must be continuously run at close to maximum capacity. Minimum commitments are
also imposed for a discount to take effect.
Bansal et al. define two types of purchase commitments, quantity commitment and dollar
commitment [17]. In a quantity-commitment contract, the buyer agrees to purchase a minimum
quantity of each material under the contract, while in a dollar-commitment contract, the buyer
agrees to a minimum dollar amount of total purchases under the contract.
The determination of the due date is a central element of a contract. It specifies the point in time
(at the latest) when the manufacturer has to deliver the product to the customer [18]. Lead times
in the process industry are generally long, notably because of time-consuming setups, large
requested quantities, and highly utilized, limited-capacity equipments. Therefore, the customer
will generally commit in advance to certain quantities based on forecasts and not necessarily on
accurate and known quantities.
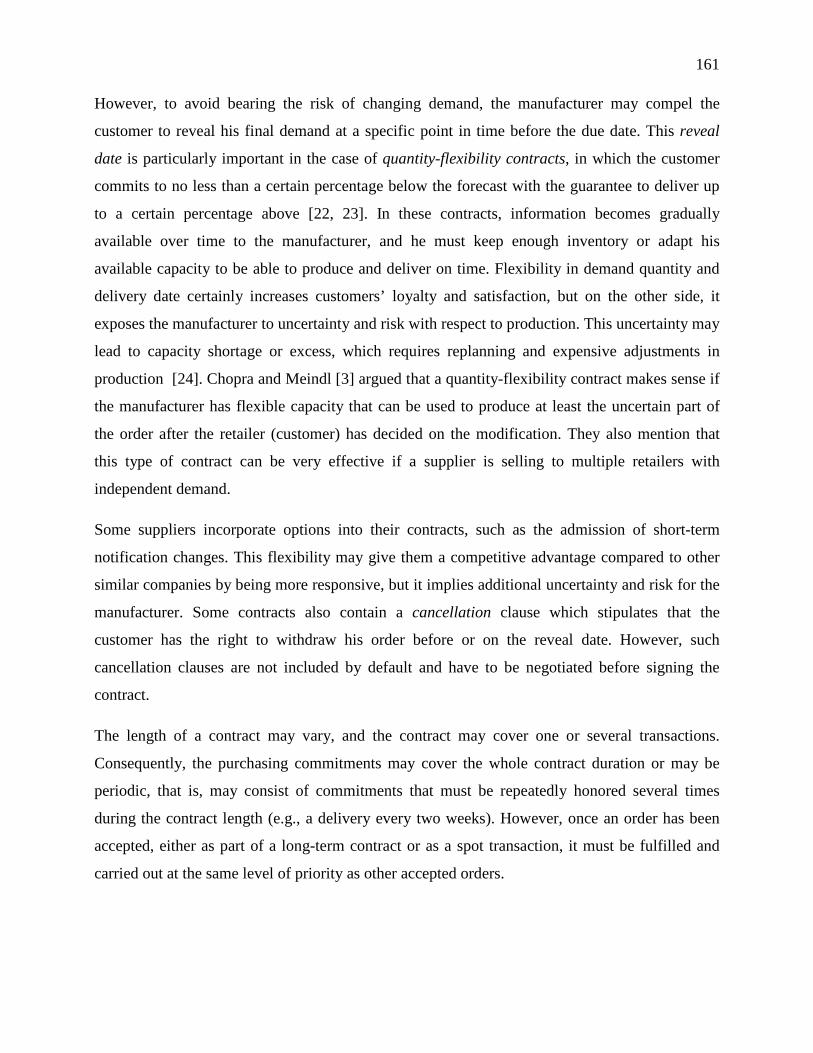
161
However, to avoid bearing the risk of changing demand, the manufacturer may compel the
customer to reveal his final demand at a specific point in time before the due date. This reveal
date is particularly important in the case of quantity-flexibility contracts, in which the customer
commits to no less than a certain percentage below the forecast with the guarantee to deliver up
to a certain percentage above [22, 23]. In these contracts, information becomes gradually
available over time to the manufacturer, and he must keep enough inventory or adapt his
available capacity to be able to produce and deliver on time. Flexibility in demand quantity and
delivery date certainly increases customers’ loyalty and satisfaction, but on the other side, it
exposes the manufacturer to uncertainty and risk with respect to production. This uncertainty may
lead to capacity shortage or excess, which requires replanning and expensive adjustments in
production [24]. Chopra and Meindl [3] argued that a quantity-flexibility contract makes sense if
the manufacturer has flexible capacity that can be used to produce at least the uncertain part of
the order after the retailer (customer) has decided on the modification. They also mention that
this type of contract can be very effective if a supplier is selling to multiple retailers with
independent demand.
Some suppliers incorporate options into their contracts, such as the admission of short-term
notification changes. This flexibility may give them a competitive advantage compared to other
similar companies by being more responsive, but it implies additional uncertainty and risk for the
manufacturer. Some contracts also contain a cancellation clause which stipulates that the
customer has the right to withdraw his order before or on the reveal date. However, such
cancellation clauses are not included by default and have to be negotiated before signing the
contract.
The length of a contract may vary, and the contract may cover one or several transactions.
Consequently, the purchasing commitments may cover the whole contract duration or may be
periodic, that is, may consist of commitments that must be repeatedly honored several times
during the contract length (e.g., a delivery every two weeks). However, once an order has been
accepted, either as part of a long-term contract or as a spot transaction, it must be fulfilled and
carried out at the same level of priority as other accepted orders.
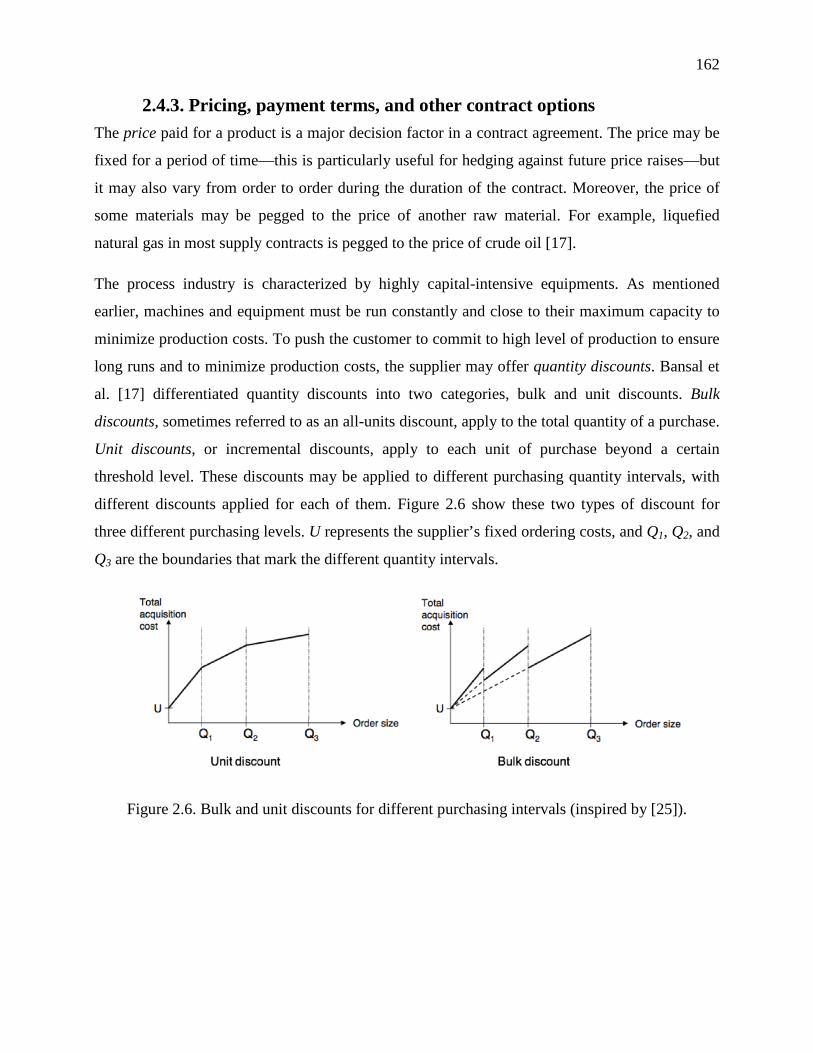
162
2.4.3. Pricing, payment terms, and other contract options The price paid for a product is a major decision factor in a contract agreement. The price may be
fixed for a period of time—this is particularly useful for hedging against future price raises—but
it may also vary from order to order during the duration of the contract. Moreover, the price of
some materials may be pegged to the price of another raw material. For example, liquefied
natural gas in most supply contracts is pegged to the price of crude oil [17].
The process industry is characterized by highly capital-intensive equipments. As mentioned
earlier, machines and equipment must be run constantly and close to their maximum capacity to
minimize production costs. To push the customer to commit to high level of production to ensure
long runs and to minimize production costs, the supplier may offer quantity discounts. Bansal et
al. [17] differentiated quantity discounts into two categories, bulk and unit discounts. Bulk
discounts, sometimes referred to as an all-units discount, apply to the total quantity of a purchase.
Unit discounts, or incremental discounts, apply to each unit of purchase beyond a certain
threshold level. These discounts may be applied to different purchasing quantity intervals, with
different discounts applied for each of them. Figure 2.6 show these two types of discount for
three different purchasing levels. U represents the supplier’s fixed ordering costs, and Q1, Q2, and
Q3 are the boundaries that mark the different quantity intervals.
Figure 2.6. Bulk and unit discounts for different purchasing intervals (inspired by [25]).
163
With kind permission from Springer Science+Business Media: Supply Chain Management and
Advanced Planning: Concepts, Models, Software and Case Studies (4 ed.), Chapter 11: Structure
of Advanced Planning Systems, 2008, p.228, Stadtler, H., Figure 11.7
Quantity discount contracts decrease overall costs but lead to higher lot sizes and therefore higher
levels of inventory in the SC. This type of contract is typically justified only for commodity
products for which the supplier has high fixed costs per lot [3].
To attract buyers and create additional demand, some suppliers offer discounts for buying various
combinations of materials. This type of promotion is generally referred to as product bundling.
Such contract specifications may impose various types of minimum purchase commitments.
A customer penalty, such as a late notification change or a cancellation, may be attached to a
contract in case the buyer does not respect his engagement. There may also be a supplier penalty
if the manufacturer cannot cover the requested demand. In some instances, backlogging clauses
may be included, i.e., the possibility for the manufacturer to fulfill demand after the due date,
with or without a penalty. This supplier penalty can be viewed either as a financial penalty for
shortfall or as the cost of outsourcing production to a third company, i.e., subcontracting.
Subcontracting to another company must, however, be accepted by the customer.
Some contracts offer the buyer to have the right, but not the obligation, to purchase a certain
quantity of a product at a specified price for an upfront premium payment. The supplier thus
reserves a certain level of production capacity. This type of contract is known as an option
contract and has been considered by several authors for planning under uncertainty [26–28].
Using the terms introduced, an option contract can be represented as contract with a cancellation
clause and in which the reservation price acts as a customer penalty.
Other contracts include buyback options, which allow the customer to return unsold inventory up
to a certain percentage at an agreed-upon price [20]. This buyback price is typically lower than or
equal to the wholesale price. Manufacturers benefit the most from these contracts when they
provide high-margin products, because they encourage retailers to increase the level of product
availability [3].
164
Finally, payment terms specify the amount due and the requested conditions such as payment
asked in advance or on delivery, the level of credit accepted, deferred payment period of x days,
early-payment discounts, etc. Other specific payment terms exist, such as revenue-sharing
contracts, in which the buyer pays the supplier a wholesale price for each unit purchased plus a
percentage of his revenue [29].
2.4.4. Collaborative planning With increased pressure from global competition and the shortening of product life cycles,
business has become too complex and expensive for one company to go it alone and prosper [30].
It has been argued by several writers that companies must therefore collaborate to take advantage
of each other’s skills and expertise to compete and be more profitable. With collaboration, global
supply-chain operations and decision-making among the partners should be better integrated and
coordinated. However, a prerequisite for collaboration is an agreement regarding the exchange of
a specific set of data [31]. Stadtler defined collaborative planning as “a joint decision making
process for aligning plans of individual SC members with the aim of achieving coordination in
light of information asymmetry” [32]. What is meant by information asymmetry is the following.
When a supply-chain member is about to make a decision (e.g., to buy a product), he has his own
objectives, constraints, and preferences (e.g., to buy at the lowest cost possible and in small
quantities to minimize inventory). However, another member might have conflicting objectives
and preferences (e.g., the seller wants to sell at the highest price and maybe in bigger lot sizes to
minimize production costs). Hence, these two parties do not have the necessary information to
make decisions that would result in coordinating their activities and improving the profitability of
the whole SC.
Without providing an overview of collaborative planning as has already been done by Kilger et
al. [31] and Audy et al. [33], two types of collaborative planning approaches used in the process
industry will be briefly presented: vendor-managed inventory (VMI) and continuous
replenishment. Implementation costs in terms of financial, material, and human resources can be
very high, but can also lead to substantial benefits, as attested by several success stories available
in the literature. Consequently, the potential costs and benefits of these strategies must be
carefully evaluated before such agreements are entered into [33].
165
A producer under a VMI agreement is responsible for managing the inventory of its customer
[34]. The customer provides the supplier with information about his daily consumption, and the
latter is responsible for replenishing the customer’s inventory to a fixed level without waiting for
orders. Hence, VMIs reduce demand fluctuation and minimize safety stocks. The supplier can
thus optimize his production-distribution resources to minimize costs.
Continuous replenishment (CR) agreements are structured on the basis of pre-reservation of a
part of the manufacturer’s capacity. The purchaser commits to buying a minimum quantity, and
the supplier then reserves a part of his capacity for that customer. The customer might have the
flexibility to order more than the forecasted commitment. In this case, this type of collaborative
planning is equivalent to the quantity-flexibility contract with a forward sale agreement, as
discussed in the previous section. CR agreements have been studied by Durango-Cohen and
Yano [35].
To make collaborative planning strategies successful, it is important that collaborating companies
share relevant information (demand profiles, forecasts, available capacity, etc.) and show
goodwill to make these practices profitable. Too often, collaborative planning initiatives are
designed by some companies as a way to pass on their inventory costs to their suppliers.
However, the latter have to carry the burden of holding more products in stock or producing in
different lot sizes than they are used to, thus reducing the overall supply-chain profitability or
even making the supplier’s operations unprofitable. Trust and goodwill between companies are
therefore prerequisites for establishing these collaborative planning strategies, or else this
approach might fail to yield its expected rewards.
2.4.5. Levels of collaboration Relationships between SC partners are not all equivalent. Some have been running for several
years and incorporate several exchanges (material, information, and cash) to maximize the
profitability of both companies, while others are transaction-specific. Lambert et al. classified the
different types of relationships between organizations into six categories, as shown in Figure 2.7
[36].
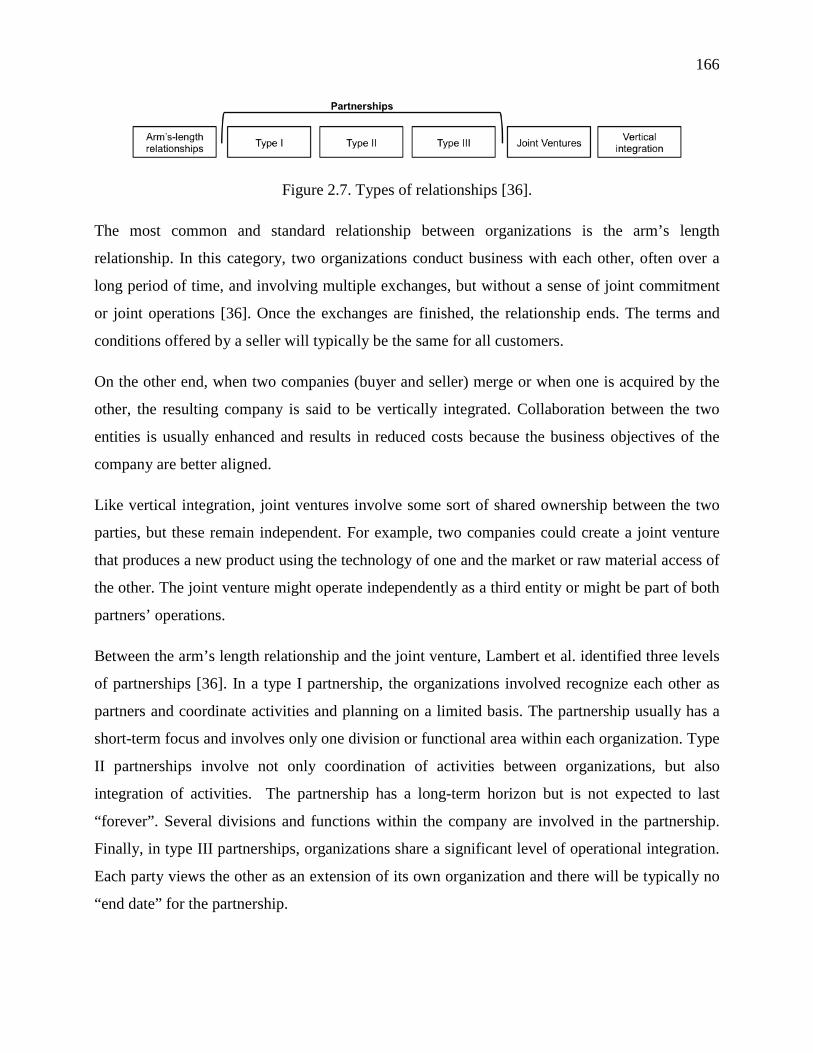
166
Figure 2.7. Types of relationships [36].
The most common and standard relationship between organizations is the arm’s length
relationship. In this category, two organizations conduct business with each other, often over a
long period of time, and involving multiple exchanges, but without a sense of joint commitment
or joint operations [36]. Once the exchanges are finished, the relationship ends. The terms and
conditions offered by a seller will typically be the same for all customers.
On the other end, when two companies (buyer and seller) merge or when one is acquired by the
other, the resulting company is said to be vertically integrated. Collaboration between the two
entities is usually enhanced and results in reduced costs because the business objectives of the
company are better aligned.
Like vertical integration, joint ventures involve some sort of shared ownership between the two
parties, but these remain independent. For example, two companies could create a joint venture
that produces a new product using the technology of one and the market or raw material access of
the other. The joint venture might operate independently as a third entity or might be part of both
partners’ operations.
Between the arm’s length relationship and the joint venture, Lambert et al. identified three levels
of partnerships [36]. In a type I partnership, the organizations involved recognize each other as
partners and coordinate activities and planning on a limited basis. The partnership usually has a
short-term focus and involves only one division or functional area within each organization. Type
II partnerships involve not only coordination of activities between organizations, but also
integration of activities. The partnership has a long-term horizon but is not expected to last
“forever”. Several divisions and functions within the company are involved in the partnership.
Finally, in type III partnerships, organizations share a significant level of operational integration.
Each party views the other as an extension of its own organization and there will be typically no
“end date” for the partnership.
167
Several drivers are compelling companies to partner, notably the opportunity to identify asset and
cost efficiencies, to improve customer service, to gain market advantage, and to stabilize profit
and to grow the business. However, a company should not partner with every supplier, customer,
or third-party service provider because partnerships are costly in terms of the time and effort
required. In fact, type III partnerships and joint ventures, i.e., strong partnerships, should be
reserved only for customers or suppliers that are critical to an organization’s long-term success
[36]. Briefly, commodities are less well suited to strong partnerships. Because the commodity
buyer is looking for a standardized item which could be easily replaced by the product from
another competitor, supplier know-how becomes of limited value for downstream product or
process development [37]. On the other hand, manufacturers of differentiated products,
specialties in particular, can gain a lot from these collaborations because of their strong customer
focus. Because these producers are often critical suppliers of a certain component, their
knowledge may be crucial for further process and product development and therefore for long-
term success.
Without rigorously classifying contract clauses by partnership types between manufacturers and
their customers, several links can be made. Strong partnerships (type III) usually have the
shortest and least specific contract agreements [36], while arm’s length and type I partnerships—
i.e., more distant collaborations—will have many more contract specifications and will be less
flexible. For instance, the contract terms for a spot sales transaction will specify quantity, price,
due date, and delivery means rigidly. For a customer that buys regularly, but with whom no joint
commitment is implied, i.e., an arm’s length relationship, a manufacturer may offer a quantity
discount contract. Continuous replenishment contracts can loosely be characterized as type I
partnerships because there is coordination of activities to gain certain advantages such as
evenness of production and delivery schedules over time. VMI agreements or contracts are
implemented when the collaborating companies are seeking to integrate several activities to
realize further savings on global SC costs. These can thus be classified as type II partnerships.
Finally, in a type III partnership, strategic planning might even be done together because one
company’s success depends highly on the other’s. Therefore, contract clauses should not be too
restrictive to leave space for flexibility.
168
3. PLANNING THE BIOREFINERY SUPPLY CHAIN From the forestry point of view, biorefining implies a more complete utilization of the renewable
forest biomass and the diversification of the traditional core business into the production of
value-added green organic chemicals, biofuels, and energy. It offers companies an interesting
opportunity to enhance their environmental profile and to become independent from petroleum
derivatives, both on the energy and the raw material side. Ragauskas et al. defined the biorefinery
by analogy with petroleum refining [38]. In a conventional refinery, various fuels, chemicals, and
also energy are produced from petroleum, a heterogeneous source of carbon. Similarly, biomass,
a carbonaceous feedstock mainly composed of polysaccharides and lignin, can be fractionated
and converted into a variety of products and also energy. Because the concept of the biorefinery
relies on new ways to produce chemicals and fuels from renewable resources, it consequently
implies an independence of fossil resources.
Nevertheless, one of the important differences between the biorefinery and the petroleum refinery
is that chemicals and materials from biological sources contain more oxygen than their petroleum
counterparts. This feature offers the opportunity to produce certain specific organic chemicals,
but it also reduces the energy density of products, making them less attractive for some large-
scale energy applications. Moreover, biomass raw materials have lower density and higher
humidity content than fossil raw materials. Hence, the energy necessary to transport and densify
biomass, as well as to convert it into products, is usually greater than for petrochemicals and
fossil fuels. To be consistent with the biorefinery concept, this extra energy should come from
renewable forms of energy such as solar, wind, hydro power, or bioenergy. It is apparent that two
conflicting forces are opposing each other with regards to the design and size of biorefineries. On
one side, the additional quantities of biomass necessary to produce energy and also to benefit
from economies of scale in production units push towards biorefineries of large size. On the other
side, the supply of biomass that can be brought to the plant site in a cost-efficient manner is
usually limited due to transportation and preprocessing costs. The low density and high humidity
content of biomass limits the quantity of valuable organic material that can be transported on one
truck or railcar. Moreover, as more biomass is needed, it must be obtained from further away
because yields per hectare are limited, thus increasing transportation costs on a marginal basis.
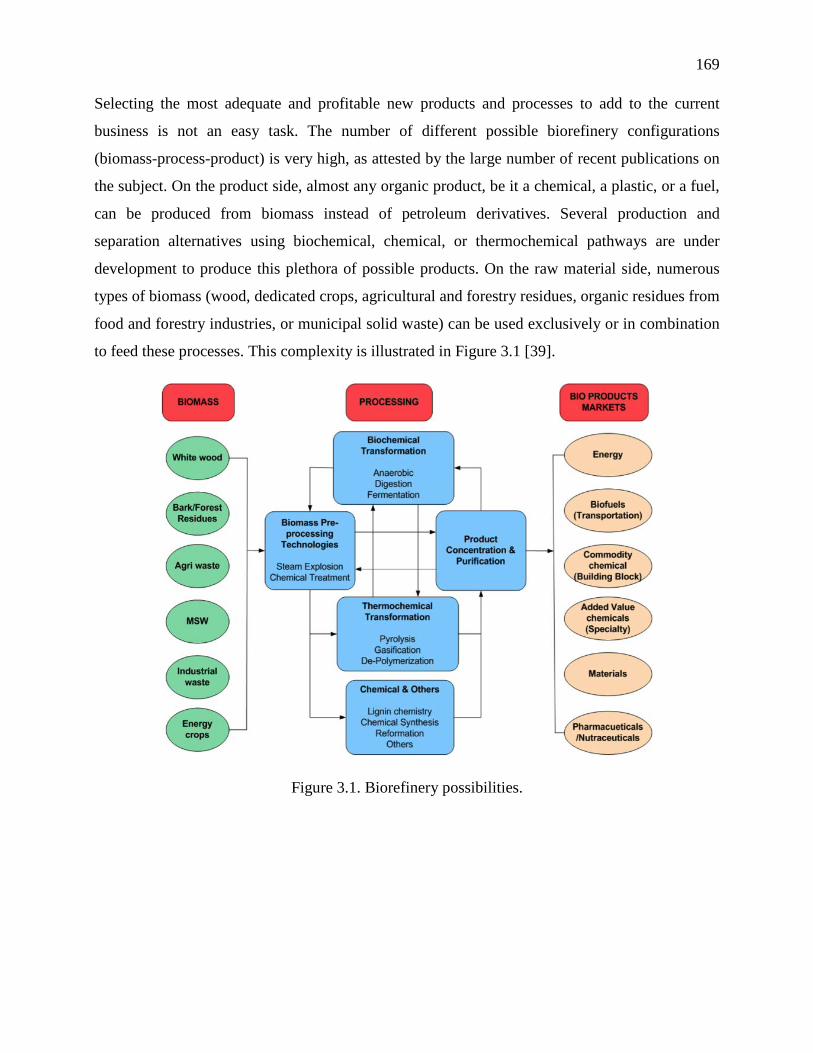
169
Selecting the most adequate and profitable new products and processes to add to the current
business is not an easy task. The number of different possible biorefinery configurations
(biomass-process-product) is very high, as attested by the large number of recent publications on
the subject. On the product side, almost any organic product, be it a chemical, a plastic, or a fuel,
can be produced from biomass instead of petroleum derivatives. Several production and
separation alternatives using biochemical, chemical, or thermochemical pathways are under
development to produce this plethora of possible products. On the raw material side, numerous
types of biomass (wood, dedicated crops, agricultural and forestry residues, organic residues from
food and forestry industries, or municipal solid waste) can be used exclusively or in combination
to feed these processes. This complexity is illustrated in Figure 3.1 [39].
Figure 3.1. Biorefinery possibilities.
170
Depending on who is going to implement the biorefinery (forestry industries, agricultural
companies, petrochemical companies, or independents) and where, the configuration and size of
the plant and the products that will be chosen will differ. Regions of the world that are suitable
for biorefining differ in many ways, starting with their geography and types of biomass. For
instance, softwood and bagasse, a sugarcane residual, do not come from the same types of land,
and these two varieties of feedstock would therefore not represent competing biomass options in
a particular region. The presence of a particular industry sector in a region will also certainly
influence the type of mill and the products that will be manufactured. For example, forestry
companies have a privileged access to renewable raw materials (wood) and can take advantage of
their existing facilities and biomass-harvesting network. Chemical and petrochemical hubs, while
being generally more distant from renewable raw materials, have extensive processing equipment
and knowledge. Finally, policies in place in different locations will favor the production of
specific products. For instance, the development of biofuels such as ethanol in the United States
is highly favored by the policies in force.
Hence, because of all these differences between possible biorefining regions, it is likely that there
will be no unique biorefinery solution. Rather, the biorefinery will be region-specific, industry-
specific, and even mill-specific. To discuss and highlight the various supply-chain characteristics
and considerations for the different biorefinery possibilities, the products, processes, and raw
materials will first be described in more detail in the following subsections.
3.1. Biorefinery raw materials and procurement Biorefineries have many similarities with oil refineries, especially on the product side: several
products are made from a heterogeneous source of carbon. However, raw material characteristics
and procurement differ considerably between the two.
171
Crude oil is predominantly a mixture of four types of hydrocarbons: paraffins, naphthenes,
aromatics, and asphaltics. Its chemical composition varies highly among different oil fields.
Crude oil is first extracted from the ground or from the ocean in specific locations by oil wells or
oil platforms. It is then transported by pipeline, tanker, or both to refineries, where it will be
further processed and transformed into different products. Refineries typically obtain their
petroleum from different sources scattered around the world. Hence, supply lead times are quite
long, ranging from two to eight weeks, because oil often has to travel thousands of kilometers in
tankers before being refined [40]. Because crude oils differ in their composition, yields, and
characteristics, depending on the type of crude that is used in a refinery, different products in
different quantities will be obtained. The management of procurement operations is especially
important in this industry because procurement costs may represent up to 80% of the total
production costs [17] and because raw material prices have been particularly volatile recently.
Biomass is a carbonaceous feedstock that comes from living, or recently living, organisms.
Hence, carbon from both vegetable and animal sources can be considered as biomass, but plants
are generally preferred for industrial biorefining purposes because their production yields are
much higher. Because living organisms contain significant quantities of water, the moisture
content of biomass is considerable. Plants have been used and grown by humans for millennia as
a source of food and energy, but also as a source of materials for construction, tools, and clothing.
In general, edible plants are grown and harvested for their grains, fruits, or tubers because these
contain the most valuable components in terms of nutrition (carbohydrates, fats, proteins,
vitamins, and minerals).
172
Industrial-scale biorefinery products such as bioethanol and biodiesel are currently made from
grains because the components of grains, sugars and lipids, are readily accessible. However, these
biorefinery uses are in direct competition with crops for food use. On the other hand, when
harvested, annual crops produce residues such as straw, stover, etc. These are used mainly for
animal feed, but represent an interesting alternative raw material for the production of
bioproducts. Unlike grains, they cannot be transformed into human food products, and their use
would therefore avoid the “food versus fuel” debate. Similarly, bagasse, the fibrous residue of
sugarcane obtained after sugar has been extracted, also represents an interesting biorefinery raw
material. This nonedible part of the crop (straw, stover, bagasse) is made of lignocellulosic
material, a term which refers its main components: cellulose, hemicelluloses and lignin. These
three components also form the bulk of other plants which are not edible by humans, such as
trees (conifers and angiosperm trees) and grasses (switchgrass, Miscanthum, etc.), which are
other potential raw materials for the biorefinery. Because lignocellulosic biomass appears to be
the most sustainable and publicly acceptable alternative for the biorefinery, only this type of raw
material will be considered in this chapter.
The chemical composition of lignocellulosic material varies significantly by plant species, by
individual plant, and even by parts of the plant. Cellulose is the main structural component of the
primary cell wall of plants. It is a linear polysaccharide composed solely of glucose units. The
length of this polymer has a direct impact on biomass rigidity. Hemicelluloses are also
polysaccharides, but composed both of hexoses and pentoses. Hemicellulose chains are much
shorter than those of cellulose and can be found both in branched and linear forms. They serve as
support matrices around the cellulose microfibrils. Lignin is an amorphous organic polymer of
high molecular weight containing multiple aromatic groups. The structure and composition of
this polymer is highly complex and varies greatly depending on the plant species and even its
location within the plant. Lignin is present the secondary cell wall of plants and acts as a
strengthener. Because of their differences in chemical composition, these three components of
lignocellulosic biomass can be used for producing different bioproducts.
173
As opposed to the global procurement of crudes in petrochemical sites and refineries, biomass
procurement in biorefineries is most likely to be done on a local and regional basis, up to a few
hundred kilometers from the mill. First of all, compared to petroleum, biomass has a much lower
value in terms of mass and energy content because of its low density, its high moisture content,
and its significant oxygen content. Moreover, biomass decays if not properly stored, as do most
biological materials. Hence, long-distance transportation and long-term storage of bulky and low-
value raw materials may not be cost-efficient unless the biomass is further treated, dried, and
densified to more acceptable levels. Biomass harvesting also differs considerably from oil
drilling. While oil drilling equipment is installed in one location until the well is depleted,
biomass is distributed geographically and has to be harvested in different locations using the
same equipment. Because the yield per unit area is limited, the more biomass is needed, the
further from the mill one has to go to get the raw material. Greater distances imply additional
fuel, which currently comes mostly from fossil sources, thus increasing transportation costs and
reducing the green aspect of the delivered biorefinery product. All this implies that biorefineries
will probably be of much smaller scale than their fossil counterparts. Moreover, it took several
decades and several billion dollars of investment for refineries and the petrochemical industries to
reach the point where they are right now. It would be very unlikely that biorefineries could, in
just a few years, become competitive in terms of tonnage for the production of chemicals and
fuels.
Biomass production, harvesting, procurement, and other related logistics activities also differ
depending on whether the plant comes from the forest or is agriculturally grown. These activities
also have different patterns in terms of seasonality. Annual plants and their residues are grown in
specific fixed locations (farms) and usually in large quantities because farming is an intensive
process designed for additional efficiency. As its name implies, harvesting can only happen once
or maybe a few times a year and must be done during a short time window of a few weeks.
Consequently, logistical operations are complicated because harvesting equipment must be
allocated to fields and efficiently utilized.
174
On the other hand, forest trees may be harvested any time of year, and even years later, although
the spring thaw in northern regions limits the amounts of lumber that can be transported on some
roads during that season. Once the desired quantities of wood have been cut in a specific location,
the harvesting equipment is moved elsewhere. An efficient road and transportation infrastructure
is therefore required to access harvest areas and for forestry operations to be profitable. Because
the different parts of the tree do not have the same value, they are not used for the same purpose.
Trees are first cut, and branches are removed. Branches, treetops, and stumps, i.e., forest residues,
are typically left in the forest or harvested and chipped for energy purposes. The tree is then cut
into logs of specific dimensions and quality, with various parts being used for veneer, lumber, or
pulp. Finally, logs are transported to sawmills and pulp and paper mills, where the logs are
debarked and transformed into products.
Forestry operations are conducted differently in different parts of the world. For example,
bucking operations may be done in the forest, at terminals, or in mills. Branches and residues
may be removed in the forest or on the side of the road, or even left in the forest, making
availability highly variable. Forests may be organized into dedicated plantations to increase yield
or may be left to grow naturally. Some regions practice precommercial thinning, selecting and
cutting specific trees to let other surrounding trees grow bigger, thus increasing the yield of
merchantable trees per acre. Intensive silviculture and genomics may also be used to increase
forest yields. Hence, biomass yield, availability, and cost structure will vary by region according
to geography, the existing infrastructure, and forestry and silviculture policies.
Because biomass composition and procurement vary depending on its origin, several authors
have proposed various classifications for biomass. In particular, Perlack et al. [41] classified
biomass into two main categories according to its origin (forest or agriculture). They further
subdivided these categories into three classes, depending on the number of transformations
undergone: directly harvested biomass and byproducts, byproducts from the industry, and
postconsumer waste. Examples of biomass according to this classification are presented in Table
3.1.
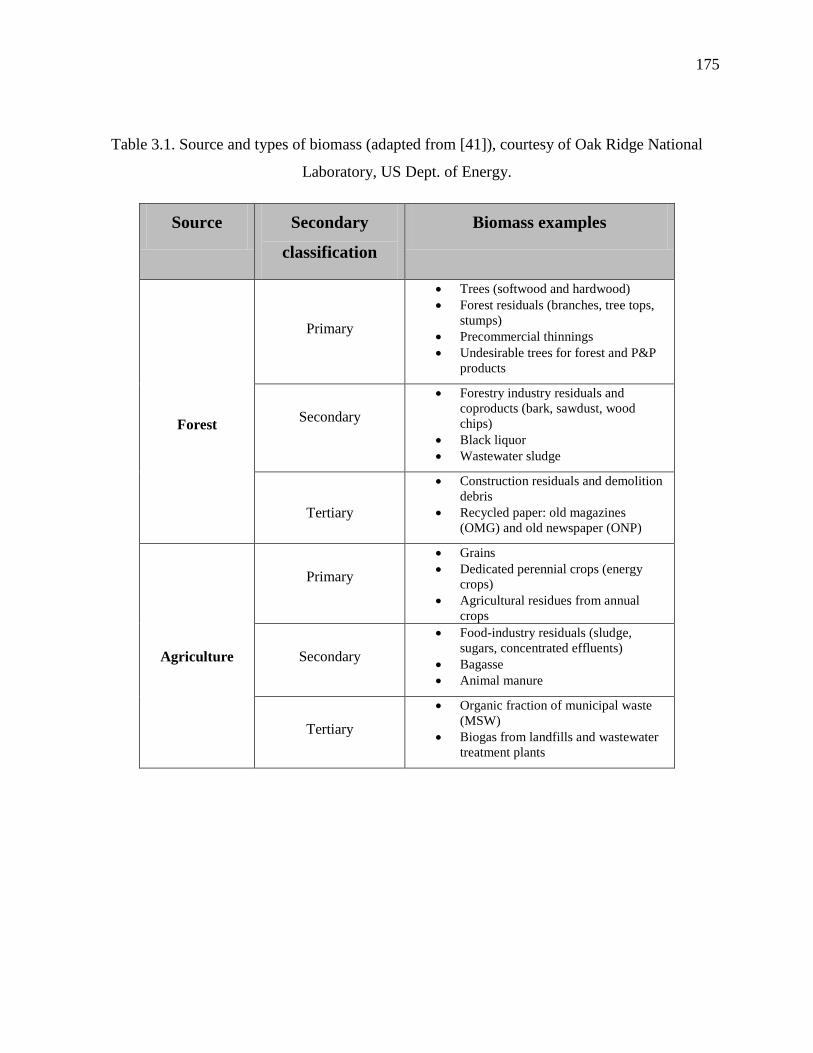
175
Table 3.1. Source and types of biomass (adapted from [41]), courtesy of Oak Ridge National
Laboratory, US Dept. of Energy.
Source Secondary
classification
Biomass examples
Forest
Primary
• Trees (softwood and hardwood) • Forest residuals (branches, tree tops,
stumps) • Precommercial thinnings • Undesirable trees for forest and P&P
products
Secondary
• Forestry industry residuals and coproducts (bark, sawdust, wood chips)
• Black liquor • Wastewater sludge
Tertiary
• Construction residuals and demolition debris
• Recycled paper: old magazines (OMG) and old newspaper (ONP)
Agriculture
Primary
• Grains • Dedicated perennial crops (energy
crops) • Agricultural residues from annual
crops
Secondary
• Food-industry residuals (sludge, sugars, concentrated effluents)
• Bagasse • Animal manure
Tertiary
• Organic fraction of municipal waste (MSW)
• Biogas from landfills and wastewater treatment plants
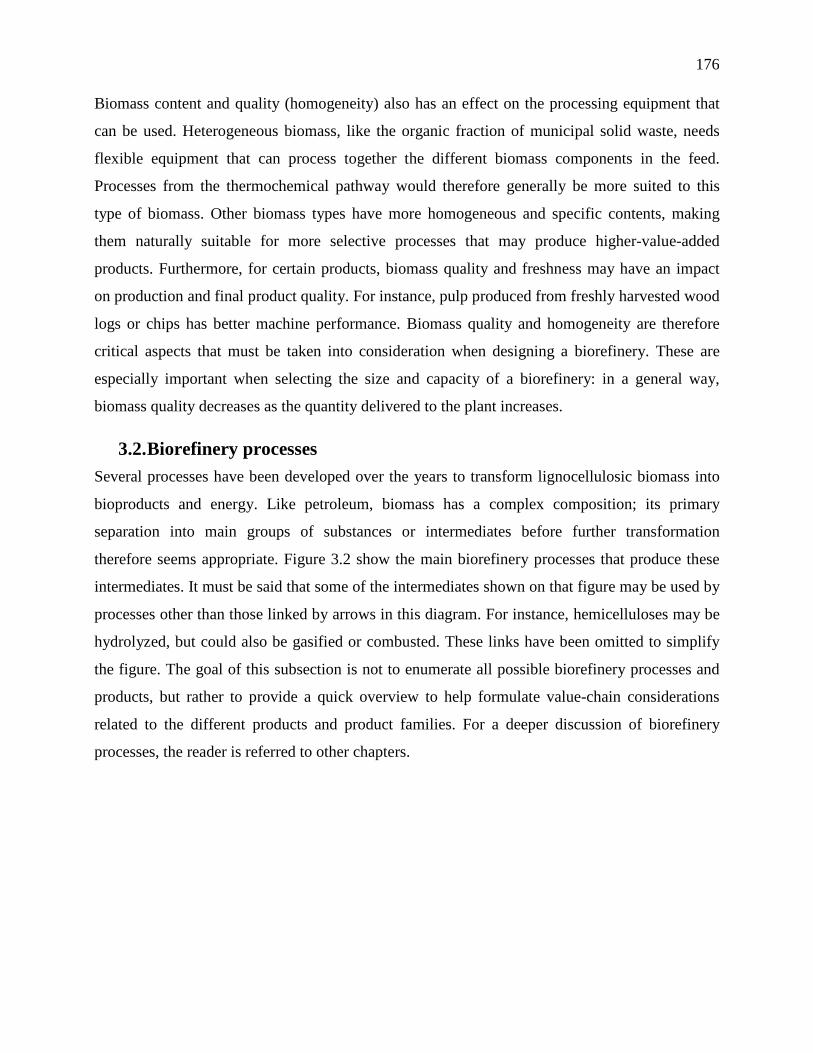
176
Biomass content and quality (homogeneity) also has an effect on the processing equipment that
can be used. Heterogeneous biomass, like the organic fraction of municipal solid waste, needs
flexible equipment that can process together the different biomass components in the feed.
Processes from the thermochemical pathway would therefore generally be more suited to this
type of biomass. Other biomass types have more homogeneous and specific contents, making
them naturally suitable for more selective processes that may produce higher-value-added
products. Furthermore, for certain products, biomass quality and freshness may have an impact
on production and final product quality. For instance, pulp produced from freshly harvested wood
logs or chips has better machine performance. Biomass quality and homogeneity are therefore
critical aspects that must be taken into consideration when designing a biorefinery. These are
especially important when selecting the size and capacity of a biorefinery: in a general way,
biomass quality decreases as the quantity delivered to the plant increases.
3.2. Biorefinery processes Several processes have been developed over the years to transform lignocellulosic biomass into
bioproducts and energy. Like petroleum, biomass has a complex composition; its primary
separation into main groups of substances or intermediates before further transformation
therefore seems appropriate. Figure 3.2 show the main biorefinery processes that produce these
intermediates. It must be said that some of the intermediates shown on that figure may be used by
processes other than those linked by arrows in this diagram. For instance, hemicelluloses may be
hydrolyzed, but could also be gasified or combusted. These links have been omitted to simplify
the figure. The goal of this subsection is not to enumerate all possible biorefinery processes and
products, but rather to provide a quick overview to help formulate value-chain considerations
related to the different products and product families. For a deeper discussion of biorefinery
processes, the reader is referred to other chapters.
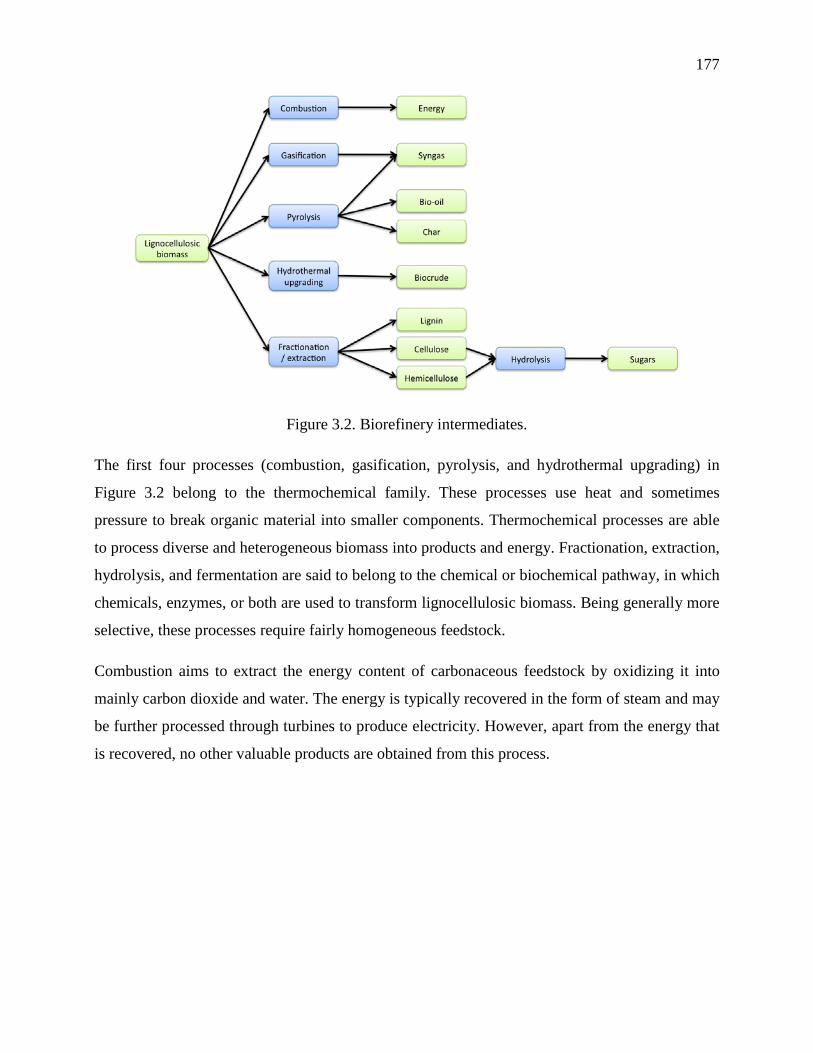
177
Figure 3.2. Biorefinery intermediates.
The first four processes (combustion, gasification, pyrolysis, and hydrothermal upgrading) in
Figure 3.2 belong to the thermochemical family. These processes use heat and sometimes
pressure to break organic material into smaller components. Thermochemical processes are able
to process diverse and heterogeneous biomass into products and energy. Fractionation, extraction,
hydrolysis, and fermentation are said to belong to the chemical or biochemical pathway, in which
chemicals, enzymes, or both are used to transform lignocellulosic biomass. Being generally more
selective, these processes require fairly homogeneous feedstock.
Combustion aims to extract the energy content of carbonaceous feedstock by oxidizing it into
mainly carbon dioxide and water. The energy is typically recovered in the form of steam and may
be further processed through turbines to produce electricity. However, apart from the energy that
is recovered, no other valuable products are obtained from this process.
178
In gasification, steam or low quantities of oxygen are introduced into a reactor to transform
organic materials into a gas phase called syngas. Syngas is a mixture which is composed of
mostly hydrogen, carbon monoxide, carbon dioxide, and water, but contains also light
hydrocarbons like methane, ethane, ethylene, etc. Syngas can be simply burned in boilers or kilns
for its energy content, but it can also be transformed by fermentation or catalytic reforming into
chemicals and fuels such as hydrogen, methanol, ethanol, ammonia, mixed alcohols, dimethyl
ether, and Fischer-Tropsch fuels. Because of its multiple uses and multiple possible outputs,
syngas is generally considered to be one of the most promising platforms for the production of
chemicals and fuels.
Pyrolysis is the thermal decomposition of organic material in the absence of oxygen. It is
theoretically the first stage of gasification and combustion, but in the latter two reactions, partial
oxidation (gasification) or total oxidation (combustion) follows. Pyrolysis produces a charcoal-
like solid, a liquid (bio-oil), and a gas similar in composition to syngas. Depending on the
operating conditions (temperature, pressure, and residence time), the yield of these three products
will vary: slow pyrolysis produces more solids, while fast pyrolysis produces higher quantities of
liquids. Pyrolysis solids can be burned in the same way as coal or gasified to produce syngas.
They can also be further processed for the production of activated carbon or even carbon
nanotubes [42]. Bio-oil, the main product of pyrolysis, is a complex mixture of various
oxygenated organics (acids, alcohols, ketones, aldehydes, phenols, etc.). Like pyrolysis solids,
bio-oil can be burned for energy or gasified, but the diversity of organic products present in this
mixture represent an interesting opportunity for the extraction and production of adhesives,
resins, fertilizers, aromas, additives, etc. However, this molecular diversity has its disadvantages
because extraction becomes more complex and costly. Bio-oil has also been proposed as an
intermediate densification step for transporting biomass more efficiently to centralized
biorefineries.
179
Finally, hydrothermal upgrading is a thermochemical process in which biomass in a water
medium is transformed into a liquid called bio-crude using a highly pressurized vessel. Bio-crude
is a mixture of various organic chemicals with a wide molecular-weight distribution, but, unlike
bio-oil, it contains lower quantities of oxygen because the critical conditions in the reactor
remove much of the oxygen contained in the biomass. This mixture can be separated into two
fractions, which can be either blended with fuels or further gasified.
While thermochemical processes transform lignocellulosic materials into products not present in
the original raw material, fractionation and extraction transform biomass into its main
constituents, cellulose, hemicelluloses, and lignin, using steam, chemicals, enzymes, or a
combination of these. Kraft pulping is in fact one of the most widely known fractionation
processes. It uses sodium sulfide and sodium hydroxide to convert woody biomass into a
cellulose-rich stream (pulp) and black liquor, which contains lignin, a fraction of the
hemicelluloses, and inorganic chemicals from pulping. Fractionation processes will separate,
break, or transform biomass components differently depending on the conditions and chemicals
used.
Cellulose is usually considered to be the most valuable components of biomass. In a general
sense, if cellulose is recovered in its polymerized form after the fractionation, it is better suited
for the production of cellulose derivatives and other biomaterials. However, if cellulose is
recovered in a partially depolymerized form, it is better to hydrolyze it into sugars and other
organic chemicals. Sugars can then be fermented into various oxygenated organic chemicals,
including biofuels such as ethanol and butanol. In fact, along with syngas, sugars are considered
as the other most promising platform for producing chemicals and fuels.
Hemicellulose streams obtained by extraction or fractionation usually come in a highly
decomposed form. They are therefore better suited for conversion into sugars that can be further
fermented and transformed into valuable products. Unlike cellulose, hemicelluloses typically
cannot constitute a primary process because they are the least abundant of the three main
components of lignocellulosic biomass.
180
Lignin composition differs greatly according to the biomass source and fractionation/extraction
methods. Because it is a complex mixture, selective modification of lignin is currently difficult to
attain. Hence, its thermochemical transformation by combustion, gasification, and pyrolysis
appears to be the most promising pathway in the short term. Other usages for lignin include its
chemical modification by catalysis to isolate monomers from lignin, as well as the production of
macromolecules such as carbon fibers, polymer additives, resins, and adhesives.
3.2.1. Integrated pulp and paper biorefinery Existing pulp and paper (P&P) mills represent natural sites for biorefineries because these
facilities have been processing woody biomass for decades to produce P&P products, energy, and
chemicals. The process of papermaking involves first transforming wood chips into pulp, a dilute
suspension of fibers. This suspension is then brought to a paper machine where it is successively
drained, pressed, and dried to create a web of fibers, which is paper. The last steps consist of
cutting and converting operations, depending on the application. Two main process families have
been invented to transform wood chips into pulp. In mechanical pulping, wood chips are ground
in refiners to produce pulp. The yield of this process may be as high as 95% because all the
components of the biomass are present in the paper. However, paper made from mechanical pulp
has a tendency to yellow over time because lignin reacts with light. This problem of yellowing is
avoided in chemical pulping processes like the Kraft process. In these processes, the lignin is
separated from cellulose, the main constituent of paper. The pulping conditions also degrade
most of the hemicelluloses, which are recovered together with lignin and pulping chemicals in the
black liquor. Black liquor is burned in a recovery boiler to produce the energy necessary for the
pulping, chemical recovery and paper drying steps.
P&P mills possess units that could be used for both papermaking and biorefinery operations, such
as the woodyard and other raw-material preprocessing units, boilers, and wastewater treatment
plants. However, two distinct strategies exist for biorefinery implementation in P&P mills.
Biorefinery processes can be implemented either in series or in parallel with the pulping line.
181
The first strategy implies a better utilization of the wood chips and logs that are currently used in
the P&P processes by extracting biomass components that could be better valorized than in the
current configuration. Using this strategy, cellulose would still be used for P&P products, at least
during the first years of implementation. New biorefinery products would instead be produced
from wood lignin and hemicelluloses, which are currently mostly burned for energy. Hence,
integrated P&P biorefineries like the one just described would not require the input of new types
of biomass. Nonetheless, additional quantities of wood chips and logs may be necessary to
counterbalance the decrease in pulp production because some components would be extracted for
the biorefinery and therefore not present in the paper.
Possible processes for the integrated chemical pulping biorefinery include hemicellulose
extraction before pulping (the so-called value prior to pulping process, or VPP), black liquor
gasification, and lignin precipitation from black liquor. Biorefinery options for mechanical pulp
mills are more limited because most of the wood is still present in the paper. However, two main
biorefinery possibilities exist. First, part of the hemicellulose can be extracted before pulping (the
bio-pulping process). Although this process decreases the wood-to-pulp yield, it also decreases
the refining energy in addition to creating a new sugar/hemicellulose stream. The other
possibility is the modification of screen retention, keeping wood fibers of a certain size for other
application such as biomaterials. Figure 3.3 shows a simplified block diagram of a possible Kraft
pulp integrated biorefinery.
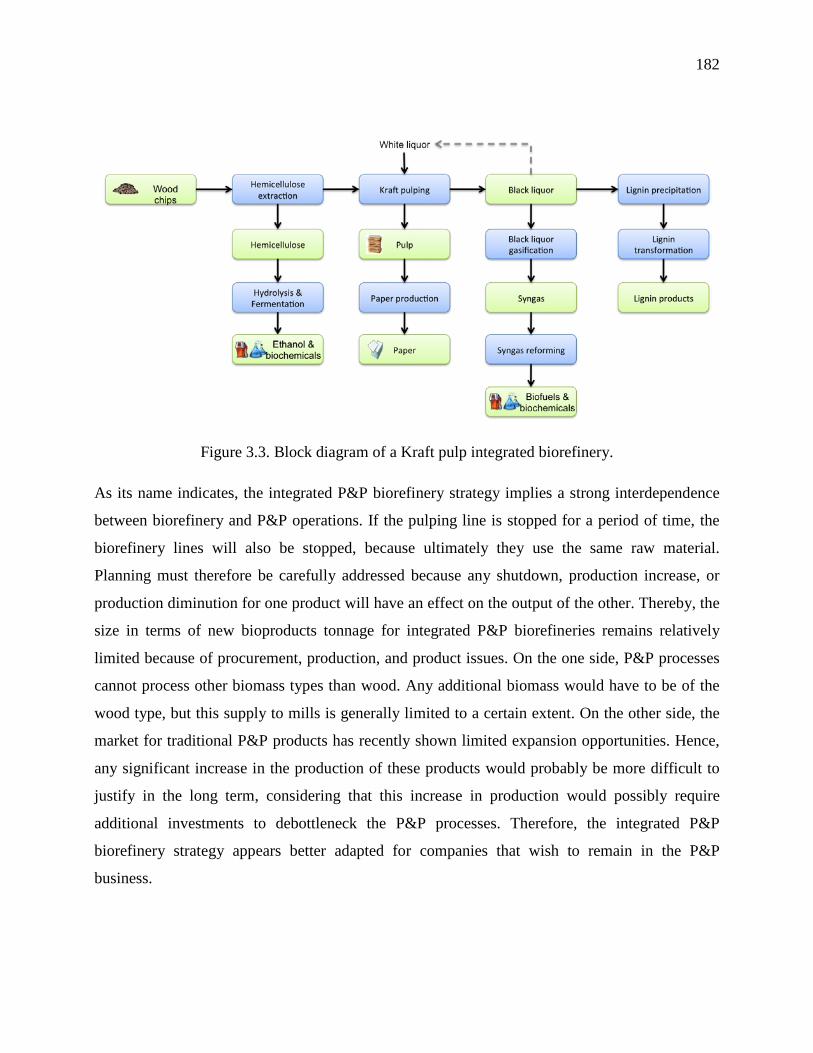
182
Figure 3.3. Block diagram of a Kraft pulp integrated biorefinery.
As its name indicates, the integrated P&P biorefinery strategy implies a strong interdependence
between biorefinery and P&P operations. If the pulping line is stopped for a period of time, the
biorefinery lines will also be stopped, because ultimately they use the same raw material.
Planning must therefore be carefully addressed because any shutdown, production increase, or
production diminution for one product will have an effect on the output of the other. Thereby, the
size in terms of new bioproducts tonnage for integrated P&P biorefineries remains relatively
limited because of procurement, production, and product issues. On the one side, P&P processes
cannot process other biomass types than wood. Any additional biomass would have to be of the
wood type, but this supply to mills is generally limited to a certain extent. On the other side, the
market for traditional P&P products has recently shown limited expansion opportunities. Hence,
any significant increase in the production of these products would probably be more difficult to
justify in the long term, considering that this increase in production would possibly require
additional investments to debottleneck the P&P processes. Therefore, the integrated P&P
biorefinery strategy appears better adapted for companies that wish to remain in the P&P
business.
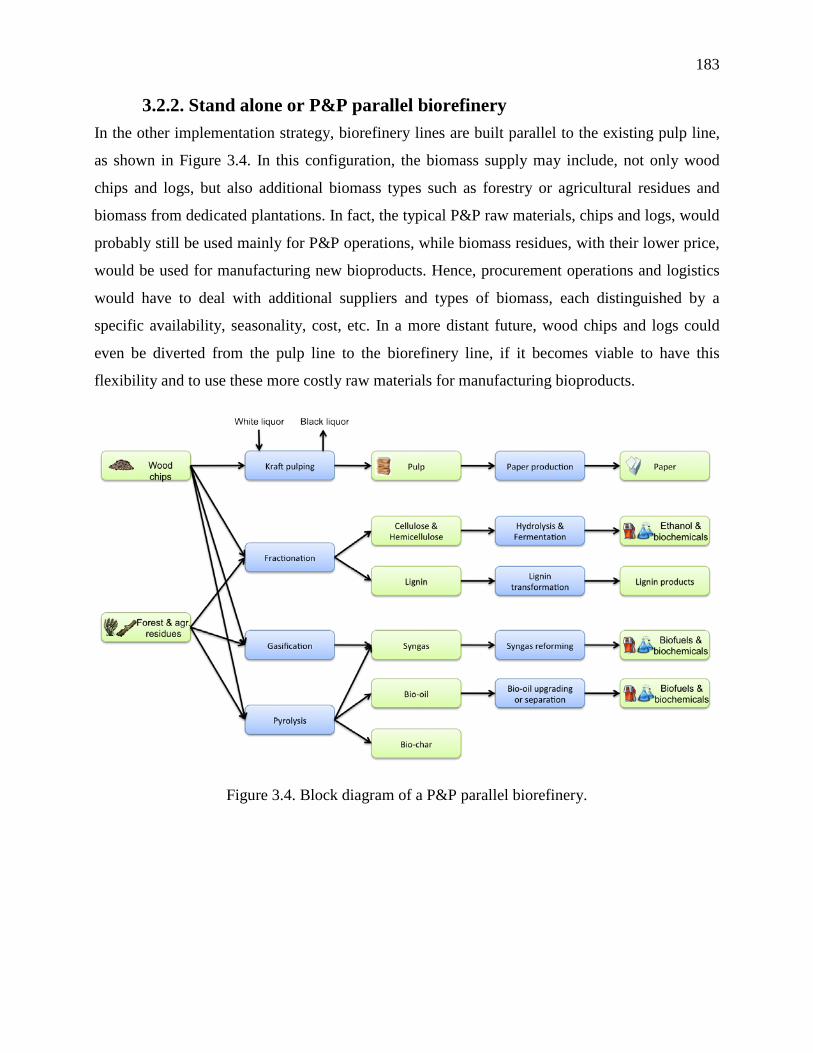
183
3.2.2. Stand alone or P&P parallel biorefinery In the other implementation strategy, biorefinery lines are built parallel to the existing pulp line,
as shown in Figure 3.4. In this configuration, the biomass supply may include, not only wood
chips and logs, but also additional biomass types such as forestry or agricultural residues and
biomass from dedicated plantations. In fact, the typical P&P raw materials, chips and logs, would
probably still be used mainly for P&P operations, while biomass residues, with their lower price,
would be used for manufacturing new bioproducts. Hence, procurement operations and logistics
would have to deal with additional suppliers and types of biomass, each distinguished by a
specific availability, seasonality, cost, etc. In a more distant future, wood chips and logs could
even be diverted from the pulp line to the biorefinery line, if it becomes viable to have this
flexibility and to use these more costly raw materials for manufacturing bioproducts.
Figure 3.4. Block diagram of a P&P parallel biorefinery.
184
The integration of parallel biorefinery lines into P&P mills benefits mainly from the common
utilization and sharing of auxiliary units such as boilers, wastewater treatment system, etc., as
well as potential energy integration between units. Apart from these, the manufacture of P&P
products would remain pretty well unaffected by and independent of the manufacture of
biorefinery products. The pulp line could be stopped for, say, one month without impeding
bioproducts production significantly because different raw materials would be used. Planning
tasks for these two product families would then be less interrelated and could almost be
performed independently. Hence, from a P&P business perspective, the parallel biorefinery
strategy appears better suited for P&P companies that want to exit the P&P market and repurpose
their mills to full biorefineries.
Pretty much any biorefinery process (gasification, pyrolysis, fractionation, etc.) can be
implemented in stand-alone or P&P parallel fashion to take advantage of new sources of biomass.
In fact, biorefineries of larger tonnage would theoretically be possible in this configuration
because larger quantities of biomass could be supplied and because the output would not be
related to relatively market-limited traditional P&P products.
3.3. Biorefinery products As mentioned earlier, organic chemicals, fuels, and materials can be made out of biomass instead
of from petroleum derivatives. Nevertheless, one of the main differences between biorefinery
products and their fossil counterparts is their green aspect. Even if the chemical composition of
the two products (green or fossil) is practically the same, the fact of being manufactured from a
renewable raw material differentiates one from the other. Bioproducts might benefit from
government incentives and subsidies in some regions because of this fact.
185
Chambost et al. classified biorefinery products into three categories [43]. Replacement products
are identical in their chemical composition, but possess the green features mentioned above. For
example, green ethylene is chemically identical to fossil-based ethylene, but comes from a
renewable source. Substitution products have a different chemical composition than existing
products, but similar functionality – e.g., plastic bottles for water and juice currently made from
polyethylene terephthalate (PET) can be replaced by polylactic acid (PLA) bottles. Finally, other
products will be positioned as novel products. For instance, new biomaterials with enhanced
functionality like nanocrystalline cellulose are likely to find a niche in new markets. While the
market for replacement products is relatively secure—green products are replacing products for
which a market already exists—the market for substitution and novel products is much more
uncertain and typically involves more risk because new functionalities and applications must be
developed.
In another vein, the green differentiation of biorefinery products provides opportunities for
specific marketing and sales strategies related to this differentiation. Even for replacement
products such as green ethylene, small market segments can be targeted and entirely dominated,
preventing serious competitors from entering then. In that example, supposing that green ethylene
is not further processed onsite, it may be sold to large polyethylene (PE) producers who would
then produce green PE. However, the demand for this material in this market would be quite
high, most probably larger than the production of a biorefinery. Hence, in the short-to-medium
term, competitors could enter this segment, which would put additional pressure on sale prices,
reducing the chemical supplier’s profit. Green ethylene could instead be sold to small specialty
chemical producers that would use small quantities to manufacture products made of 100%
renewable raw materials. If the production exceeds that market, the surplus could be sold on the
spot market, using a different pricing scheme. This strategy would offer market segmentation and
therefore revenue management possibilities (see Section 5). For substitution and novel products,
additional differentiation may be obtained by specifically designing a product to perform a
certain function. A constant focus on innovating to maintain differentiation will permit a supplier
to dominate each of its markets by being the best supplier in each.
186
In addition, policies that require a certain percentage of material from renewable sources would
help bioproducts producers compete against traditional petrochemical producers. By guaranteeing
market demand, and with subsidies that reduce bioproducts production costs, the impact of
competition from petrochemical companies can be diminished. In the following subsections, five
biorefinery products requiring different supply-chain considerations will be introduced.
3.3.1. Bioenergy One of the simplest and oldest products that can be obtained from biomass is bioenergy. By
burning this raw material, it is possible to retrieve its energy content. A great number of industrial
processes require heat to transform products, but this heat is seldom distributed over long
distances because of losses. Hence, heat and power is usually generated from fossil fuel boilers
installed directly on the manufacturing plant site or in over-the-fence arrangements. In these mills
and in biorefineries, this heat and power could instead be provided by biomass boilers, as long as
sufficient biomass were available at a reasonable cost.
Many boilers are equipped with cogeneration capabilities. The electricity that is produced along
with heat can be used directly in the process or sold to the grid. However, to be profitable, these
combined heat and power plants (CHP) need heat sinks. Because pulp and paper mills need high
quantities of steam, these mills represent excellent candidates for CHP facilities. Some regions
around the world, such as Scandinavia, have developed district heating systems, in which the
extra heat is distributed to houses and buildings within the municipality. However, the
infrastructure of district heating plants is costly, which may make the development of new plants
too expensive.
187
Biomass in many different forms can be burned for producing bioenergy. It can be burned as is
(in the form of chips) or dried beforehand. Removing part of the moisture content in biomass
increases the adiabatic flame temperature, thereby improving the quality of the heat provided.
Biomass may also be transformed into pellets before feeding it to boilers. Pelletization can be
defined as drying and pressing of biomass under high pressure to produce cylindrical pieces of
compressed and extruded biomass [44]. Pellets have several advantages over wood chips for
bioenergy: they have a smaller volume and a higher volumetric energy density, which makes
storage, transportation, and energy conversion more efficient. They also represent a uniform and
stable fuel that produces less dust [44]. Biosolids obtained by thermochemical processes (tars,
chars) can also be burned for energy. Finally, biomass can be transformed into liquid or gaseous
fuel by pyrolysis or gasification.
Current biomass cogeneration boilers use solid residues (bark, forest, and agricultural residues,
sludge, etc.) and generate electricity using a steam turbine. More electricity could be produced
with the help of gas turbines because these are more efficient. Using a combined cycle (a gas
turbine coupled with a steam turbine), even more power could be generated. However, gas
turbines require liquid and gaseous fuels, and further developments are still needed to use bio-oil
and syngas, the pyrolysis and gasification products, directly.
The current and future market for bioenergy is and will remain highly region-specific because
some grids are regulated and some not. For example, the province of Quebec in Canada already
produces more than 96% of its electricity as hydroelectricity [45], a renewable source, while in its
neighboring province, Ontario, nuclear- and fossil-based plants represent more than 74% of
electricity production [46]. Because sustainable benefits appear easier to attain in the latter
province, bioenergy efforts are naturally favored in Ontario, as attested by the recent subsidies for
bioenergy given by that province’s government. However, it is clear that product differentiation
can be attained only with difficulty for bioenergy.
188
3.3.2. Liquid biofuels as transportation fuels Liquid biofuels are perhaps the most popular and most discussed new biorefinery products
because they provide a short- and medium-term option for replacing fossil fuels while offering
the potential for reducing greenhouse-gas emissions as well as ensuring energy security [47].
Recently, major oil companies have been making biofuel production a priority [48]. This is no
surprise because these players have good competitive advantage and motivations: they have good
knowledge of the fuel market as well as of blending operations, are used to very large-capacity
production, and are willing to expend considerable efforts to green their image.
The main processes for producing lignocellulosic-based biofuels include sugar or syngas
fermentation (ethanol and butanol), catalytic reforming of syngas (dimethyl ether (DME),
Fischer-Tropsch (FT) fuels, ethanol, and mixed alcohols), and pyrolysis (bio-oil). Alcohols and
FT fuels can be used in their pure form in combustion engines, sometimes requiring slight
modifications, but they are generally blended with gasoline or diesel. DME, with characteristics
similar to LPG, is envisaged for use in modified diesel engines. Because bio-oil is not miscible
with hydrocarbons, it cannot be blended with diesel without modification. It must either be
upgraded (deoxygenation by hydrotreatment or catalytic vapor cracking) or emulsified by the
addition of surfactants [49]. Because these products have a different chemical composition from
gasoline and diesel, but serve the same function, they are categorized as substitution products
according to the terminology introduced earlier in this subsection.
The market for biofuels is immense: for energy security and sustainability reasons, several
governments have announced policies requiring liquid transportation fuel to contain a certain
percentage from renewable sources. Hence, biofuels will need to be produced in large tonnages
according to specified standards for combustion engines or blending applications. They can
therefore be categorized as true commodities. As a combustible, biofuel will have a selling price
closely related that of to gasoline and consequently of crude oil. They will therefore face
substantial price volatility and uncertainty in terms of profitability, just like typical commodities.
189
As commodities, biofuels should be produced in a MTS environment characterized by high
production efficiency because the product does not require customization and demand is
predictable (almost infinite). Hence, competitive advantage for biofuel producers would come
from low-cost, effective, and high-volume procurement, production, and distribution. In a general
sense, biorefineries of larger size, either stand-alone or P&P parallel, using low-cost biomass
residues or high yield per year-hectare dedicated crops, would be favored for biofuel production.
With a large market share, these facilities would have an efficiency advantage in this highly
competitive environment. This is not to say that smaller facilities such as P&P integrated biofuel
facilities could not be competitive. However, being a small player in a huge market increases
exposure to fluctuations and vulnerability compared to larger producers, because a smaller
producer cannot control the market. Efforts towards differentiation in the biofuel sector are
therefore limited, except for supply-chain efficiency.
3.3.3. Biochemical commodities Besides energy and liquid fuel production, numerous chemicals and materials can be produced
from biomass. From a sustainability perspective, the idea of replacing fossil chemicals with green
equivalents seems particularly appealing. Along this line, green chemicals can be obtained in two
ways: by utilizing current petrochemical routes, but using building blocks from renewable
sources (by replacing commodities), or by creating new chemical derivatives through biological
and chemical transformation (by substituting for commodities).
190
Petrochemistry is based on the use of half a dozen building-block chemicals to create all sorts of
solvents, detergents, adhesives, polymers, lubricants, fertilizers, etc. These building blocks are
divided into two categories: aliphatics (mainly olefins, but especially ethylene, propylene, and
butylene) and aromatics (mainly benzene, toluene, and xylene). Producing some or all of these
six basic chemicals from biomass instead of from fossil sources implies different processing steps
for removing oxygen from the molecules originating from biological sources. Theoretically,
aromatics could be produced from lignin groups, but the process is still under development. On
the aliphatic side, bio-ethylene appears to be the most promising replacement for basic
petrochemical building blocks because it can be obtained relatively easily from ethanol by
catalysis, and because ethylene is such a versatile and widely used chemicals. Moreover, syngas
reforming, notably to methanol, appears promising for the production of green versions of
traditional petrochemical derivatives.
Producing these commodities from biomass offers certain advantages. To start, the market for
these products is very big. Assuming that they can be produced at a competitive price compared
to fossil routes, green petrochemicals would have a relatively secure market. Furthermore, these
green petrochemicals could also benefit from the existing infrastructure for producing polymers,
materials, and other chemicals, which has already been optimized to a certain extent. However,
because these commodities are indirectly related to crude oil, their selling price would face major
volatility. Just as in biofuel production, being a large producer would provide an efficiency
advantage.
191
Instead of using the well-known petrochemical building blocks, new chemistry lines can be
created from new building blocks such as, for instance, acetic acid, lactic acid, levulinic acid,
succinic acid, citric acid, sorbitol, and xylitol. These building blocks are obtained by
transforming sugar through fermentation, enzymatic catalysis, or chemical modification.
However, the current market for these chemicals is pretty well saturated. In addition, producing
these chemicals from lignocellulosic sources would not provide a green advantage because they
are already manufactured mostly from other sources of sugars, which are a renewable source of
carbon. To increase the demand for these chemical intermediates, new derivatives and
applications need to be discovered which can substitute for existing products. Hence, in the short
and medium term, producing significant quantities of these chemicals for bulk sale is not
particularly appealing because there is little space left in the market. This strategy would make
sense only if most of the production were dedicated to further processing to other products for
which there is a market. However, with the development of new applications, the selling price of
these chemicals will diminish over time as they become more and more commoditized.
Assuming that there will be demand for these “green petrochemicals” and new intermediates as
commodities at some time in the future, these products would be produced and distributed in
considerable quantities according to accepted composition standards. Hence, production in
continuous MTS environments would be favored.
3.3.4. Fine and specialty biochemicals Compared to commodities, fine and specialty biochemicals are characterized by much smaller
production tonnages and higher added value, but generally more transformation steps. One of the
main differences between specialties and fine chemicals, though, is that specialties are developed
according to customer’s needs for more technical applications.
192
Fine biochemicals, such as active medicinal ingredients, vitamins, aromas, and low-volume
intermediates, and specialty biochemicals, including notably adhesives, surfactants, low-volume
additives, and end-user products, can be obtained essentially either by extraction from biomass,
as coproducts, or by further processing and separating biomass main components or
biocommodities (biofuels, biochemicals). Products obtained by the latter pathway, i.e., by
additional transformation, will be referred to as derivatives. Producing replacement specialty
chemicals, i.e., green petrochemicals specialties, will require several processing steps, which
represent a costly investment. Therefore, their production in the short term seems more unlikely.
On the other hand, novel or substitution green specialty products appear more probable in the
near term.
Solvent extraction of biochemicals from biomass is generally done before further transformation
such as fractionation. However, extractibles are generally present in low concentrations in bulk
lignocellulosic material. Greater, but still not very high, concentrations are found in the more
specialized parts of plants such as leaves, bark, knots, seeds, and fruits. Therefore, extraction of
biochemicals appears to be an interesting additional value-adding processing step, but would be
hard to justify as a main process. Even though these products have high added value, their overall
yield is not very high. Other biomass components should also be used to manufacture other
products as part of an overall solution for transforming the entire mass of raw material.
Moreover, because different plants produce different extractible compounds, only specific types
of biomass should be used in an extraction process; efficient extraction requires fairly
homogeneous raw materials.
193
Currently, fossil-based specialty chemicals are manufactured mostly from purchased raw
materials. There is little to no integration back to crude oil or natural gas: companies purchase
intermediates from the market to produce these derivatives. Rather than focusing on production
efficiency and cost minimization, these companies focus more on the development of products
which are truly adapted to their customers. Efforts toward differentiation are necessary to provide
good customer service because, unlike the case of commodities, low production costs and low
selling price may not be very important. In the case of biorefineries producing specialty
chemicals, process efficiency will also be important to be competitive, but should not be the main
focus. These chemicals are likely to be costly to produce, especially in the short term, but good
customer service should remain as the main objective. As pointed out by several supply-chain
authors [3,50], it is crucial to have a supply chain that is adapted to your products. There are
tradeoffs to be made between efficiency and responsiveness at the procurement, production,
distribution, and sales levels so that the customer is served according to his needs (low cost
versus high service levels), which differ evidently depending on the type of products. As stated
by Leavy, Fisher, and Lee [37,51,52], too much value gets destroyed when trying to manage
supply chains for efficiency where responsiveness should be the priority and vice versa.
Because fine and specialty chemicals are produced in much smaller tonnages than commodities,
the smaller production scale of biorefineries compared to their petrochemical relatives appears to
be naturally better adapted to market needs. However, the market for these products would
quickly become saturated; in many cases, one plant would be able to satisfy and dominate a large
share of the market. This aspect would have to be carefully addressed and analyzed when
designing the biorefinery to ensure that plants are built with capacity that is adapted to market
needs.
Over time, as the biorefinery matures and becomes more and more fully implemented, fine and
specialty chemicals will face commoditization. At this point, it will be important to reevaluate the
position of these products in the market and to adapt the supply chain accordingly, for example
by shifting more towards efficiency rather than responsiveness, by standardizing and diminishing
product configurations, or producing in an MTS configuration.
194
3.3.5. Biomaterials Apart from biochemicals and biofuels, biomass components and derivatives can be used for their
material properties, notably in textiles, construction, or any end-consumer applications where
structure is needed. While the products described in Sections 3.3.3 and 3.3.4 are mostly
chemicals in the gaseous or liquid state that are used as reactants and intermediates, materials
derived from biomass, i.e., biomaterials, are solids. Their handling, storage, uses, and markets
differ in consequence, but many of the concerns raised in the two previous sections apply both to
commodities and to specialties. In the overall supply chain, biomaterials are typically closer to
the end-user. Hence, their potential for differentiation is fairly high.
Biomaterials from lignocellulose can exist in several forms, ranging from bioplastics and
biocomposites, which are based on polymers, to carbon-based structures such as carbon fibers.
Bioplastics can be produced either as derivatives from biochemical monomers or from the
modification of naturally existing polymers. Examples of monomer-based bioplastics include
green polyethylene and polylactic acid, which are obtained from ethylene and lactic acid
respectively. Cellulose, a naturally occurring polymer in plants, can be transformed and then
regenerated into packaging plastics (e.g., cellophane) or textiles (e.g., rayon), to name a few.
Biocomposites are materials formed by a polymer matrix (from a fossil or renewable source)
reinforced with natural fibers. Finally, carbon fibers are produced through carbonization of
polymer precursors such as rayon or lignin.
Obviously, some bioplastics would be produced in great quantities, possibly in MTS
environments and according to established standards (pseudo-commodities). Others, such as
biocomposites and carbon fibers, would rather be engineered materials categorized as specialties
and should therefore be produced in MTO mode.
195
3.4. Biorefinery product families Raw material procurement in the process industry is a costly activity, notably because of
harvesting/drilling operations and transportation, but also because of the high costs of investment
in and maintenance of equipment and transportation infrastructure. As a consequence of this and
of the divergent nature of the processes, extensive efforts are being made to use these raw
materials in the most efficient way, or in other words, to produce and valorize several products at
the same time. For example, petroleum is separated and cracked into fuels, chemicals, asphalt,
and many other products. The different parts of the tree are used to produce lumber, panels,
engineered wood products, and pulp and paper products, as well as energy. Seeds that are used
for producing bioethanol and biodiesel are also transformed into several other commercial
products. Distillers grain, which is traditionally used as animal feed, and syrup are also obtained
from corn kernels in addition to ethanol. In the biodiesel industry, sales of glycerin, the byproduct
of the transformation of vegetable oil, plays a vital function in the profitability of these plants. All
these examples highlight the fact that in general, one product alone cannot support the economic
burden of harvesting or drilling operations. Rather, there must be a strong interdependence
between the products and the various supply-chain players.
196
For these reasons, biorefineries would most probably have to produce more than one type of
product, such as those described in the previous five subsections, to be profitable in the long run
[53]. These biorefining sites, owned and operated by one or several companies just like
petrochemical hubs today, would convert either forest or agricultural biomass or both in a central
location to benefit from economies of scale and common operating steps. Hence, each biorefinery
would have its own combination of biorefinery products, or in other words, its own product
family, obtained by a variety of extraction processes, derivatives conversion processes, parallel
lines, etc., as shown in Figure 3.5. This example illustrates the divergent nature and complexity
of managing a biorefinery product family. Because coproducts are simultaneously produced and
could theoretically be sold on the market (all chemical products can be finished products), it is
impossible to plan and control the production system using a single strategy. Indeed, some core
products may be produced according to demand pull, while other side products will have to be
pushed to the market. For example, when sawmills produce lumber, wood chips are coproduced.
Because lumber provides better margins than chips (it is the core product), it may be produced in
a demand-pull fashion, while the chips will be pushed to the market. Although side products may
provide less marginal value than core products, they are nonetheless indispensable for a
company’s profitability because they provide another stream of revenues and a better utilization
of raw materials.
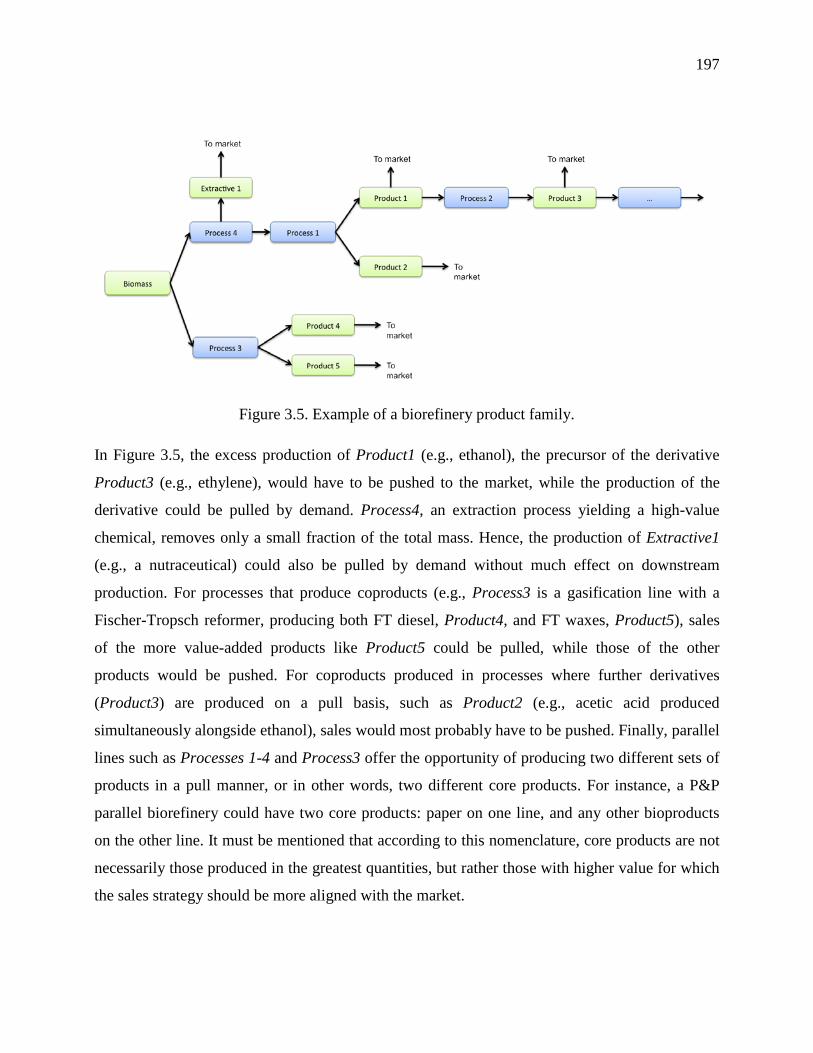
197
Figure 3.5. Example of a biorefinery product family.
In Figure 3.5, the excess production of Product1 (e.g., ethanol), the precursor of the derivative
Product3 (e.g., ethylene), would have to be pushed to the market, while the production of the
derivative could be pulled by demand. Process4, an extraction process yielding a high-value
chemical, removes only a small fraction of the total mass. Hence, the production of Extractive1
(e.g., a nutraceutical) could also be pulled by demand without much effect on downstream
production. For processes that produce coproducts (e.g., Process3 is a gasification line with a
Fischer-Tropsch reformer, producing both FT diesel, Product4, and FT waxes, Product5), sales
of the more value-added products like Product5 could be pulled, while those of the other
products would be pushed. For coproducts produced in processes where further derivatives
(Product3) are produced on a pull basis, such as Product2 (e.g., acetic acid produced
simultaneously alongside ethanol), sales would most probably have to be pushed. Finally, parallel
lines such as Processes 1-4 and Process3 offer the opportunity of producing two different sets of
products in a pull manner, or in other words, two different core products. For instance, a P&P
parallel biorefinery could have two core products: paper on one line, and any other bioproducts
on the other line. It must be mentioned that according to this nomenclature, core products are not
necessarily those produced in the greatest quantities, but rather those with higher value for which
the sales strategy should be more aligned with the market.
198
In brief, different biorefinery products types require different planning environments and
strategies for their production, but at the same time, the process configuration (derivative chains,
parallel lines, coproducts) constrains these strategies. Although the idea of having several parallel
lines and a couple of derivatives chains, like petrochemical hubs, appears interesting on paper,
the capital investment needed would be substantial, ranging from a few millions to several
hundred millions of dollars. From a practical standpoint, companies investing in the biorefinery
are more likely to focus on a few targeted products and to invest in a step-by-step fashion because
access to capital is limited and the risks elevated. However, because multiproduct facilities are
likely to be the endpoint of the biorefinery, it is therefore important for investors to keep the
future product-portfolio strategy in mind while implementing biorefinery processes over time.
The first investments might provide a lower return on investment in the short term, but will have
a critical impact on the flexibility and profitability of future biorefining investments.
4. RISK MITIGATION OF MARKET VOLATILITY AND THE BIOREFINERY
Markets in the process industry, such as oil and gas, commodity chemicals, steel and metals, and
food have been facing especially volatile environments in recent years. Price volatility comes
from a mismatch between supply and demand. Especially for the industries just mentioned,
volatility is increased by the unpredictable aspect of raw material supply. For instance, biomass-
related raw materials such as cereals show high volatility because of their seasonality and
variable yields. Nonrenewable raw materials such as metals and oil are accompanied by high
uncertainties in the world’s supply availability, notably due to politics and natural disasters.
Moreover, global consumption of and demand for commodities is constantly changing. For
example, China’s and India’s demand for these resources has increased considerably in the last
decades. All these uncontrollable reasons related to both the supply and demand sides unbalance
the equilibrium between the two, thus leading to volatility.
199
Volatility tends to decrease downstream in the supply chain: the more a product is transformed,
the less price-volatile it is [54]. Specialized product manufacturers are therefore usually favored
over basic product (commodity) manufacturers from a supply-price volatility viewpoint; because
they use more highly transformed raw materials, their supply costs are more predictable. In a
general sense, because the process industries are upstream in the supply chain, raw material and
energy price and supply volatility are important aspects to be dealt with in these industries. On
the other hand, some industries, especially those manufacturing more specialized products which
are sold to a small group of customers, e.g., fine and specialty chemicals, might face high
uncertainty on the demand side. Demand for these products is constantly evolving, but at the
same time, competition between a few key suppliers might be fierce. Hence, contracts with great
flexibilities in the quantities that may be purchased are traditionally negotiated to increase the
customer’s loyalty and satisfaction levels [18,24]. Because these contracts may be necessary to
maintain a strong market presence in a particular segment, this uncertainty in demand quantities
remains an important risk to address.
In the case of biorefinery products, volatility effects are likely to be rather uncertain. On one side,
biorefinery products will mostly replace or substitute for traditional fossil-based products. Hence,
their price should ultimately be linked to crude oil and natural gas prices because fossil products
are still likely to dominate the marketplace. However, as bioproducts enter the market, the
equilibrium between supply and demand will evolve. On the other side, because bioproducts
come from biomass, volatility on the supply side will also be influenced by factors such as
weather and government policies. Therefore, biorefineries will have to deal with significant
margin pressure due to volatility.
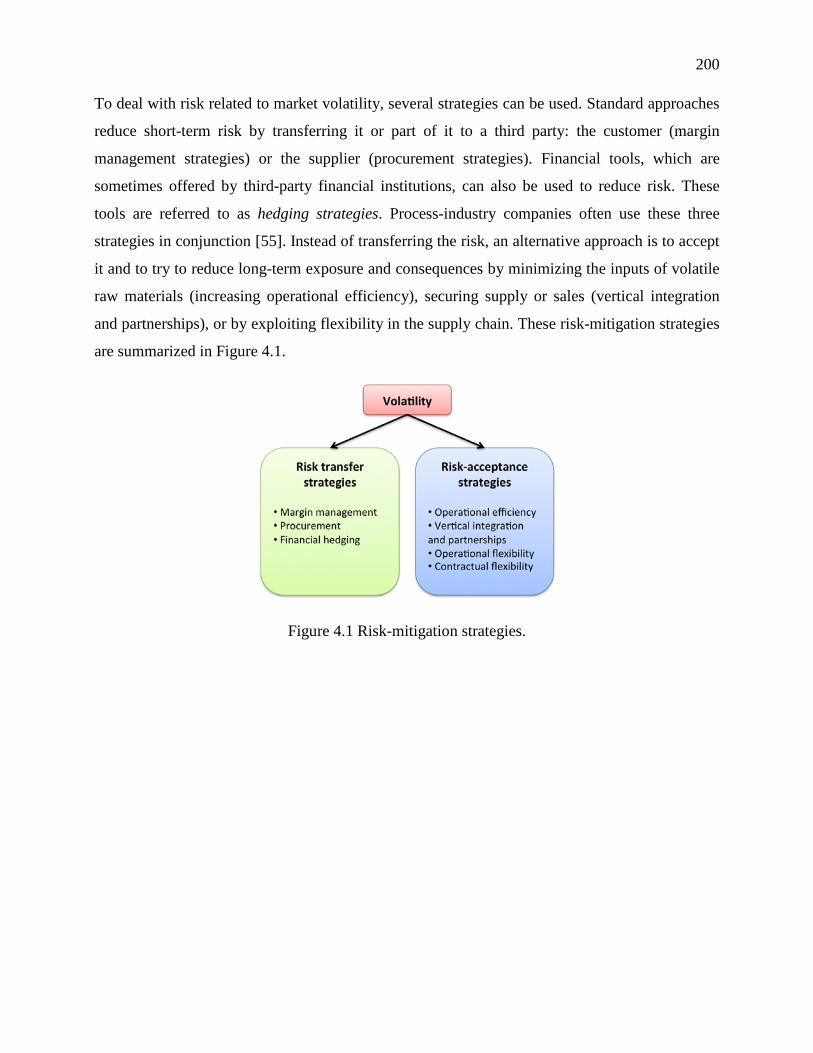
200
To deal with risk related to market volatility, several strategies can be used. Standard approaches
reduce short-term risk by transferring it or part of it to a third party: the customer (margin
management strategies) or the supplier (procurement strategies). Financial tools, which are
sometimes offered by third-party financial institutions, can also be used to reduce risk. These
tools are referred to as hedging strategies. Process-industry companies often use these three
strategies in conjunction [55]. Instead of transferring the risk, an alternative approach is to accept
it and to try to reduce long-term exposure and consequences by minimizing the inputs of volatile
raw materials (increasing operational efficiency), securing supply or sales (vertical integration
and partnerships), or by exploiting flexibility in the supply chain. These risk-mitigation strategies
are summarized in Figure 4.1.
Figure 4.1 Risk-mitigation strategies.
201
4.1. Risk transfer strategies
4.1.1. Margin management strategies The most common and least wide-ranging approach, margin management, consists of avoiding
risk by passing it to the customer. The oil industry, for instance, is able to pass on part of its raw-
material cost volatility to the customer. When crude prices go up, the gasoline price at the pump
will also go up, stabilizing the company’s margins. This approach is, however, limited by the
price elasticity of demand, which is a measure of how the magnitude of demand varies with price
[56]. The extent of this elasticity depends notably on the strength of demand, the level of product
differentiation, capacity utilization, market concentration, and the availability of substitute
products [55]. Returning to the gasoline example, the market demand is very strong and global.
Because there are few substitute fuels that can yet be used in a car engine, refiners have the
opportunity to raise their price according to crude-oil volatility without having a big impact on
demand, at least in the short term. For other industries where there is excess production capacity,
e.g., newsprint, this strategy may not be available because the customer can switch to another
cheaper supplier.
In the biorefinery, as mentioned earlier, the relationship between raw material prices and product
prices will not be obvious. Unless serious efforts are made to differentiate bioproducts from the
fossil resources they replace, margin management strategies will have only limited effectiveness.
How can biomass volatility be transferred to a bioproduct that is pegged to crude-oil prices and
for which there are alternatives which are possibly cheaper? Local and regional policies enforcing
a minimum content of renewable materials will, in that sense, have a significant impact on
differentiation and the extent to which margin-management strategies as defined above can be
effective.
4.1.2. Procurement strategies Risk can also be managed by procurement strategies, such as entering into fixed-price contracts
of various lengths with suppliers. Volatility fluctuations in raw material supply are thus
eliminated to a certain extent, but often a price is paid in the form of higher costs and reduced
flexibility. Indeed, in exchange for guaranteed supply and simplicity, suppliers will ask for
specific volume commitments, even at higher prices. Moreover, signing long-term fixed contracts
in a rapidly changing price environment may create thorny vendor-management issues [55].
202
Because they will be part of the process industries, biorefineries will need to run their equipment
to a certain capacity level to be profitable. Biomass will also represent a large fraction of the
operating costs. Moreover, biomass prices will increase over time [57]. For these reasons,
potential biorefiners underline the importance of signing long-term supply contracts to secure the
amount of biomass that will be brought to the facility. On the other side, with several future
biorefineries on the horizon, biomass suppliers may be reluctant to sign long-term fixed contracts
because soon there will be more competition and more demand for their products, and therefore
more opportunities for profit.
Like a good personal investment plan, raw-material procurement strategies should be composed
of a well-diversified portfolio of contracts plus spot opportunities adapted to the company’s level
of risk acceptance, with some more wide-ranging but less risky options, and some more
rewarding yet riskier ones. Efficient procurement strategies should be developed to secure part of
the supply, but also to benefit from the best opportunities.
4.1.3. Hedging strategies Financial derivative instruments can also be used to mitigate raw material and energy volatility.
These hedging strategies include forward contracts, future contracts, swaps, and option contracts.
The Chicago Mercantile Exchange (CME), for example, is a place where these financial
derivatives are traded for several commodity materials, including crude oil, natural gas, and
several agricultural crops. Several companies have been successfully using these tools to manage
financial risk in energy purchases (electricity, natural gas, transportation fuels). However,
financial derivatives can be highly complex and should be used carefully because improper use
can be disastrous for the corporate budget.
Purchasing raw materials through commodity derivatives is often of limited effectiveness because
commodity users normally have highly specific needs for product specifications, timing, and
delivery terms [55]. However, using operational planning models, some authors have shown that
financial derivatives can help reduce financial risk in refineries [28,58]. Therefore, using hedging
as part of a raw material procurement strategy for process-industry enterprises appears to be a
potential opportunity.
203
Because lignocellulosic materials and their biomass-based commodities are not yet exchanged
globally, financial derivative instruments for these products have not been developed. However,
some argue that in the near future, in 5 to 20 years, an international biomass trade in commodities
markets will exist [59]. Nevertheless, because of the more local/regional aspect of procurement
(especially for biomass residues), it is likely that these contracts will rather be one-to-one
agreements. Therefore, financial derivatives seem to be limited in terms of the opportunities and
effectiveness they offer to the biorefinery, at least in the short term.
4.2. Risk-acceptance strategies Section 4.1 has described how risk-transfer strategies can be fairly limited in their application and
effectiveness, especially for the biorefinery. Biocommodity prices will be indirectly related to
crude oil and therefore dependent on its price fluctuations. For these products, it will
consequently be difficult, for instance, to pass on the volatility in biomass prices to the customers
without a substantial effect on future demand. Long-term fixed-supply contracts are also limited
to a certain extent: as more biorefineries are built, the demand for biomass will augment, pushing
costs higher. Therefore, over the long term, biomass producers will be unlikely to sell their raw
materials through fixed long-term contracts because they will want to benefit from price
increases. Finally, biomass procurement is likely to be local or regional, which limits the scope of
financial derivative tools. For the biorefinery, risk-acceptance strategies might prove to be a more
efficient approach to reducing a company’s long-term risk exposure and its associated
consequences. These strategies reduce risk exposure by either avoiding it or by minimizing its
impact in case it occurs.
204
4.2.1. Operational efficiency Companies may reduce their risk exposure by increasing their operational efficiency, i.e., making
efforts to reduce waste and to use inputs more efficiently. By using fewer volatile inputs overall,
exposure to risk is reduced. These efforts have been especially important in the process industry
because the material and energy resources involved in these processes are enormous. In
particular, techniques that analyze the process holistically to improve process design and retrofits,
as well as optimizing mass and energy exchanges, namely process integration [60], have proven
to be effective and are increasingly used in industry. In addition to improving process operations,
improving logistical operations can also help to attain higher levels of efficiency. Better
management of inventory, transportation, and distribution, or even reconfiguring the distribution
network, are examples of what can be done to reduce the consumption of inputs such as fuels.
As they are implemented, biorefineries will have to compete with petroleum-based industries,
which have been optimized to a great extent over the last century. In this sense, operational
efficiency, both in harvesting and processing applications, is often viewed as a prerequisite for
the biorefinery, even for specialty bioproducts producers, who should nonetheless strive to
maintain a customer focus. Supply-chain efficiency will be especially important for reducing
procurement and distribution costs at the mill gate.
On the production side, increasing the yield and selectivity of transformation and separation
processes is a necessary step to reduce costs further and to increase the quality of products. In
addition, using new separation technologies, such as membranes instead of distillation, would
help increase production efficiency and even the flexibility of units.
On the procurement side, additional efforts should be made to increase biomass yields and to
optimize transportation to reduce costs. For example, forests are currently not being used to their
full potential. Of course, a fraction of the cuts should be left on the forest floor for regeneration,
but much of the precommercial thinnings, branches, and stumps could also be harvested along
with the logs and then further sorted by quality, homogeneity, etc., for different uses.
205
On the distribution side, biorefineries are expected to be disadvantaged in terms of market access
because of their remoteness: farms and forests are usually not very close to end markets, which
are in cities for the most part. To compete, transport efficiency should be maximized in both
directions: from the mill to the market, but also from the market to the mill, with an effort to
minimize the number of one-way truck trips.
4.2.2. Vertical integration and partnerships One of the oldest strategies for risk mitigation is vertical integration. By acquiring suppliers that
produce raw materials, or by acquiring a downstream supply-chain producer, exposure to
commodity-price volatility can be controlled. For example, several P&P companies have reduced
their procurement cost variability and their dependence on external sources of biomass by
performing operations ranging from harvesting, to sawmilling, to pulp and paper production
themselves. Companies in this industry segment are also reducing their dependence on volatile
fossil-based energy supplies by producing their own energy by building or acquiring biomass
boilers, hydroelectric dams, or windmills. In addition to mitigating risk, these strategies have the
benefit of reducing the company’s environmental footprint. On the other side of the supply chain,
downstream vertical integration ensures that part of the market for the manufactured product is
secured and isolated from the competition. At the same time, the value created in subsequent
process steps is captured. Although vertical integration offers several advantages for risk
mitigation of market volatility, it also requires significant capital investment and can be complex
to accomplish.
Like vertical integration, but without the actual acquisition of other supply-chain members, a
strong collaboration between two companies, such as a type III partnership or a joint venture,
could also help mitigate price volatility. In the same way, access to markets or raw materials
could be secured, but at a fraction of the cost of vertical integration. However, partnerships do not
come without challenges. They increase the degree of dependence on the other partner, and like
human relationships, they can be costly, time-consuming, and difficult to maintain. As underlined
previously, partnerships should not be concluded with everyone, nor for every type of product.
They should only be made with suppliers and producers whose knowledge is critical for further
process and product development. For instance, strong partnerships are typically less of a
requirement for commodities than for specialties.
206
As for the biorefinery, there is no doubt that partnerships, vertical integration, or both will be
essential for the development of this new business. Upstream, biomass costs can be volatile.
Moreover, the composition, homogeneity, and quality of biomass inputs are important parameters
that must be controlled for most processes and applications. Hence, to secure part of the supply in
terms of quantity and to ensure a certain level of raw-material quality, upstream integration and
partnerships are likely to be beneficial for biocommodity and biofuel producers because they
would provide an efficiency advantage. By contrast, specialty biochemicals and biomaterials
would be best served by a responsiveness advantage and would therefore benefit much more
from downstream integration and partnerships which could help them: 1) secure the market, 2)
better serve the customer, and 3) develop new products and applications for the end user.
4.2.3. Operational flexibility Market-volatility risk can also be mitigated through the use of operational or manufacturing
flexibility. For more information on this topic, the reader is referred to the chapter, Forest
Biorefinery Supply-Chain Design and Process Flexibility. Broadly, these flexibilities can be
divided into three categories: feedstock, production, and product flexibility. Manufacturing
flexibilities differ from the previously introduced risk-management strategies in the way risk is
dealt with. While the previous strategies treated risk mainly by diminishing exposure to it
(transferring it to third parties or reducing the quantities of volatile raw materials involved),
manufacturing flexibility truly implies an acceptance of market volatility and a will to deal with it
by minimizing its impact in case it occurs.
207
Being able to handle a wider range of input materials, either on the energy or the raw material
side, is referred to as feedstock flexibility. Many plants obtain their energy mix using several
boilers that run or are able to run on different fuel types, such as Bunker C, natural gas, biomass,
sludge, electricity, etc. On the raw material side, some metal companies have upgraded their
rolling equipment to take metal or recycled material as inputs. P&P mills are able to use different
mixes of tree species in their pulp lines to make products with similar properties. Likewise,
refineries process different crudes to produce fuels and other chemicals. Similarly, biorefineries
could take advantage of the different biomass sources available in a region to minimize
procurement costs and risks, but also to obtain additional quantities and thus benefit from
processing economies of scale. Because feedstocks may represent the most price-volatile
products that are bought or sold by a company in the process industry, diversification of the
feedstock portfolio might be an efficient strategy to minimize risk. However, a careful assessment
must be performed before deciding to use different raw-materials type, because a reduction in
procurement costs and risks may be achieved at the expense of higher processing costs.
Two main production flexibility options exist. On the one hand, having the capability to slow
down or speed up production rates can be referred to as volume flexibility. This flexibility is
typically governed by one or several bottleneck units. On the other hand, many plants have
several machines, units, or groups of units that are able to produce the same products. In these
cases, the manufacturer has machine flexibility that he can take advantage of in his planning to
choose the most suitable production alternative to minimize production costs. These production
flexibilities enable better coordination of production with sales and thus enable planning to be
adapted in case of demand volatility, in terms of both price and quantity. How to use integrated
planning for better management of sales and production together will in fact be the topic of
Section 5.
208
Some units can change the product mix that they manufacture. For example, some reactors may
be able to produce different compounds by changing the catalyst used. These highly flexible units
are generally of the batch type and are mostly found in the production of specialty products,
where they serve to customize (differentiate) orders at the end of the production sequence. Not all
chemical units or processes incorporate such product flexibility because they are often designed
to maximize yield. Following this argument further, units producing commodities in capital-
intensive, dedicated, and continuous processes, would not benefit much from product flexibility.
However, for specialty products, flexibility permits a coordination of production with sales to
manage risk related to demand, in the same way as production flexibility.
In addition to manufacturing flexibilities, external flexibilities related to distribution and
purchasing may be used to minimize risk. Maintaining a diversified basket of transportation
alternatives for procurement and distribution, as well as a diversified set of suppliers, might
protect a company from certain price and quantity fluctuations. The idea here is not to put all
one’s eggs in the same basket to minimize the consequences in case of sudden fluctuations
arising from a third party.
4.2.4. Contractual flexibilities As seen in Section 2.4, companies in the process industries traditionally negotiate contracts with
a reveal-date and due-date structure because of the long lead times involved. However, this
involves a certain level of uncertainty in demand, but not necessarily in price. Companies can
reduce this risk by the inclusion of contractual flexibilities. Schiltknecht has identified several
reactive components of contracts that can be included to minimize the effects of uncertainty [24].
209
In fact, the structure of reveal- and due-date agreements greatly influences who will bear the
greatest risk. Close reveal- and due- dates give less time to the manufacturer to react and plan
production efficiently, but decrease lead times, thus increasing customer satisfaction.
Consequently, manufacturers will ask for early reveal dates and late due dates, while customers
will ask for the opposite. Therefore, several clauses related to this structure can be included to
minimize the manufacturer’s risk. Before the reveal date, the manufacturer may ask the customer
for a quantity window for his final demand. Although some contracts offer the customer the
freedom to make significant changes to the quantities ordered and even to cancel the order at the
reveal date, reducing the quantity window will help the producer plan production more
efficiently. Some contracts have due-date postponement clauses which allow the manufacturer to
postpone final product delivery within a certain time window, generally with the inclusion of a
penalty. Others include the possibility of outsourcing (subcontracting). These clauses must,
however, be accepted by the customer because they might entail quality and other product
differences.
The possibility of using some or all of strategies described above may not always exist for a
manufacturer because certain market segments may be highly competitive. In fact, contracts are
often formulated to attract customers and are therefore more restrictive for the manufacturer.
Giving slightly more ordering flexibility to the customer (increasing customer service) can be a
differentiator from competition. This may apply even for commodities, but as mentioned before,
it should not be the main focus. Responsiveness efforts should not be the center of attention when
efficiency is needed. Contractual flexibilities are therefore more likely to be available in a market
for differentiated products, particularly in specialties, in which the manufacturer retains a certain
degree of power by making its products unique to the customer. By extension, these risk-
mitigation strategies are more available to collaborating companies.
210
To conclude the topic of risk mitigation, when individually used, each of these strategies will be
effective only to a certain extent depending on the context of the product that is manufactured.
Price volatility and market uncertainty cannot be entirely controlled, but should rather be tamed.
This holds especially true for the biorefinery because the price volatility and market uncertainty
related to bioproducts are influenced by many different factors. As underlined by several
consulting firms such as PriceWaterhouseCoopers, there is no single solution for risk mitigation.
Only a robust and integrated approach using a portfolio of strategies and tactics is likely to
succeed in reducing risk exposure and impacts [55].
5. VALUE-CHAIN MANAGEMENT AND THE BIOREFINERY With increasing levels of competition, more demanding customers, and more restrictive
regulations related to sustainable development, doing a profitable business in the process
industries is becoming more and more challenging. Process-industry companies must manage
supply chains that are more complex than ever, including several locations, various raw material
types, diverse processes, and many suppliers and customers, to name only a few. Decision-
making related to the design of the supply chain and to operations planning must therefore be
carefully addressed to make the best of available resources.
Fortunately, recent advances in information technology and optimization modeling are now
enabling the development of advanced planning tools that can help to manage the supply chain
holistically to become more competitive. Overall, research efforts in supply-chain management
have been focused mainly on integrating procurement, production, and distribution to minimize
costs and inventory, improve efficiency, and deliver better service. These are, in other words, the
costs term of the profit equation, Profit = Revenues – Costs. Hence, supply-chain management
has traditionally concentrated on controlling volume and logistics while fulfilling fixed demand.
However, much less research has been devoted to linking sales more efficiently with production
and other logistical operations, i.e., the revenues term. By better managing demand and by
incorporating it with supply-chain activities, the business strategy can be better aligned with the
plant strategy, thus helping manufacturing companies to increase their profitability, to realize
additional improvements in efficiency, and to provide more value to customers.
211
In fact, some authors, like Shapiro [2] and Chopra and Meindl [3], already consider sales and
demand management as part of supply-chain management. However, for purposes of this chapter,
this holistic planning process, integrating demand with production and logistics, will be referred
to as Value Chain Management (VCM), in accordance with VCM definitions provided by
Kannegiesser [14] and Schulz et al. [61]. In this section, key VCM concepts such as revenue
management and integrated planning concepts will be explained, as well as how they can be
applied to the process industry and particularly to the biorefinery.
5.1. Revenue Management The concept of revenue management (RM), sometimes called yield management, was developed
in the late 1970s in the airline industry. At that time, some airlines started to offer discounts to
early-bird customers to optimize the capacity utilization of their flights. One decision problem
that soon emerged was how many seats should be sold at the early-bird rate, while reserving
enough seats for last-minute customers who would pay a higher price. These capacity-reservation
decision problem have since attracted wide interest in academia and have been increasingly
studied in many other industries besides airlines, such as hotels and resorts, rental cars,
telecommunications systems, and cargo transportation [62–64].
As defined by Talluri and van Ryzin, revenue management involves demand-management
decisions aimed at increasing a company’s revenues [65]. The authors distinguish two RM
approaches: quantity-based and price-based. The first approach relies on exploiting the
differences between customers and their willingness to pay. It divides customers into multiple
segments with different buying behavior, strategic importance, and/or average profitability and
prioritizes these segments when allocating scarce capacity. The key idea is that giving priority to
high-margin segments yields higher revenues than selling scarce capacity on a first-come-first-
served basis. The second RM approach uses dynamic pricing strategies as a tool for demand
management. These strategies adjust prices dynamically over time in response to nonstationary
demand, during a finite selling season, or through auctions. Demand is thus actively influenced.
In brief, the basis of revenue management is an order acceptance and refusal process that
integrates the marketing, financial, and operations functions to maximize revenue from existing
capacity [66]. According to Chopra and Meindl, RM has a significant impact on supply-chain
profitability when one or more of the following four conditions exist: [3]
212
1. The value of the product varies in different market segments. 2. The product is highly perishable, or product wastage occurs. 3. Demand has seasonal or other peaks. 4. The product is sold both in bulk and on the spot market.
Until now, revenue-management concepts have been used mainly in the service and retail
industries. They are, however, finding more and more acceptance and application in the process
industries when some of the preceding conditions apply, as reported by some authors [67,68].
Recently, a survey done by Kolisch and Zatta with managers in this industry showed that RM
concepts were considered fairly important for the future success of a company [69]. According to
industry leaders, methods combining capacity management with price management seemed to be
the most promising. Even so, the survey identified several hurdles that are preventing the wide
development and use of RM methods in the process industry. These included the lack of a clearly
defined and communicated pricing strategy, the lack of experience with RM, and the lack of
appropriate RM approach.
Because the type of product that is manufactured (true or pseudo-commodity, fine or specialty
chemical) has an effect on the process type chosen, the manufacturing environment, and therefore
the sales mechanisms that are used, RM strategies should differ depending on how production
and sales are done in these particular market segments. Quante et al. presented a supply chain
framework for revenue management and demand fulfillment because these two concepts are
closely linked [70]. Giving examples from the retail, service, and manufacturing industries, the
authors identified five types of attributes that are relevant to RM and demand fulfillment and that
could be used to identify applications that have the same or similar RM and demand fulfillment
requirements. Explanations of these attributes and their connection to the process industries are
presented in Table 5.1. They also analyzed different models and software applications supporting
mainly short-term decision-making about demand fulfillment and revenue management, with the
intention of matching applications, models, and software.
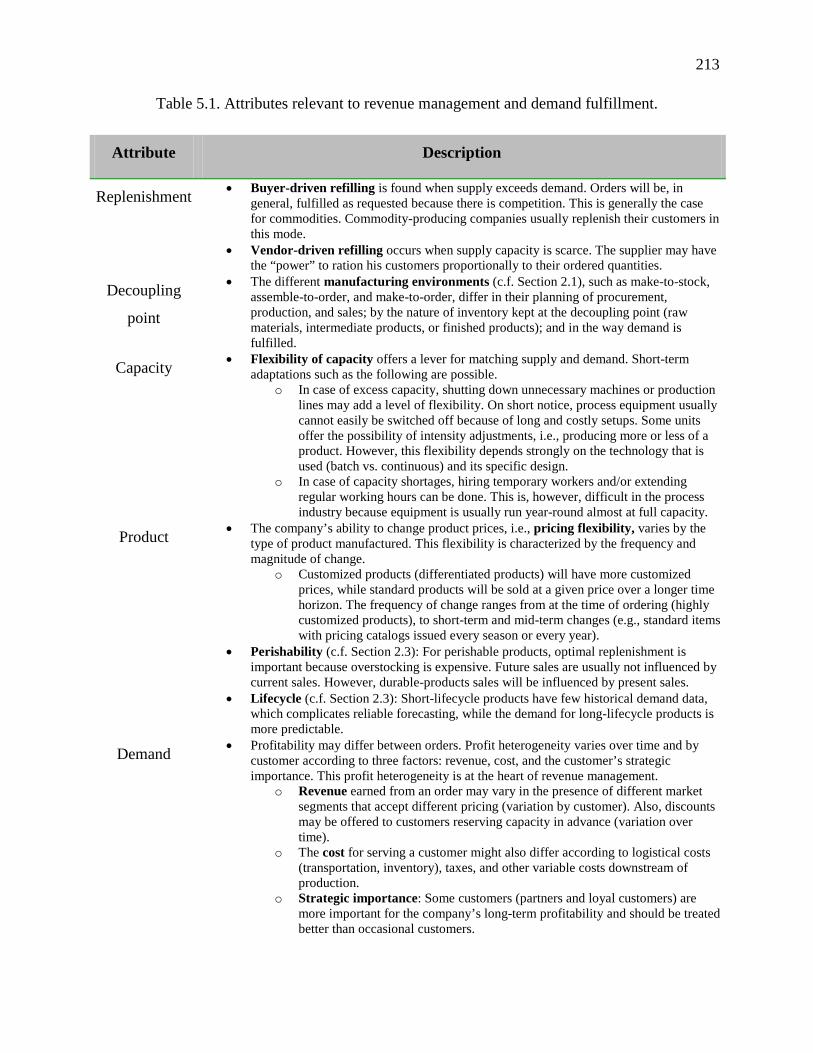
213
Table 5.1. Attributes relevant to revenue management and demand fulfillment.
Attribute Description
Replenishment • Buyer-driven refilling is found when supply exceeds demand. Orders will be, in general, fulfilled as requested because there is competition. This is generally the case for commodities. Commodity-producing companies usually replenish their customers in this mode.
• Vendor-driven refilling occurs when supply capacity is scarce. The supplier may have the “power” to ration his customers proportionally to their ordered quantities.
Decoupling
point
• The different manufacturing environments (c.f. Section 2.1), such as make-to-stock, assemble-to-order, and make-to-order, differ in their planning of procurement, production, and sales; by the nature of inventory kept at the decoupling point (raw materials, intermediate products, or finished products); and in the way demand is fulfilled.
Capacity • Flexibility of capacity offers a lever for matching supply and demand. Short-term adaptations such as the following are possible.
o In case of excess capacity, shutting down unnecessary machines or production lines may add a level of flexibility. On short notice, process equipment usually cannot easily be switched off because of long and costly setups. Some units offer the possibility of intensity adjustments, i.e., producing more or less of a product. However, this flexibility depends strongly on the technology that is used (batch vs. continuous) and its specific design.
o In case of capacity shortages, hiring temporary workers and/or extending regular working hours can be done. This is, however, difficult in the process industry because equipment is usually run year-round almost at full capacity.
Product • The company’s ability to change product prices, i.e., pricing flexibility, varies by the type of product manufactured. This flexibility is characterized by the frequency and magnitude of change.
o Customized products (differentiated products) will have more customized prices, while standard products will be sold at a given price over a longer time horizon. The frequency of change ranges from at the time of ordering (highly customized products), to short-term and mid-term changes (e.g., standard items with pricing catalogs issued every season or every year).
• Perishability (c.f. Section 2.3): For perishable products, optimal replenishment is important because overstocking is expensive. Future sales are usually not influenced by current sales. However, durable-products sales will be influenced by present sales.
• Lifecycle (c.f. Section 2.3): Short-lifecycle products have few historical demand data, which complicates reliable forecasting, while the demand for long-lifecycle products is more predictable.
Demand • Profitability may differ between orders. Profit heterogeneity varies over time and by customer according to three factors: revenue, cost, and the customer’s strategic importance. This profit heterogeneity is at the heart of revenue management.
o Revenue earned from an order may vary in the presence of different market segments that accept different pricing (variation by customer). Also, discounts may be offered to customers reserving capacity in advance (variation over time).
o The cost for serving a customer might also differ according to logistical costs (transportation, inventory), taxes, and other variable costs downstream of production.
o Strategic importance: Some customers (partners and loyal customers) are more important for the company’s long-term profitability and should be treated better than occasional customers.
214
For manufacturing applications, Quante et al. matched models and software according to MTO,
ATO, and MTS manufacturing environments because these differ in terms of customer
expectations and order fulfillment, and therefore in how revenue management can be applied
[70]. Because process-industry manufacturing environments are mainly MTS or MTO (or hybrids
of these), only these two environments will be discussed.
In MTS (most commodity products, undifferentiated), production is triggered according to
forecasts, and orders are served from inventory. Because of general contracting practices, short-
term demand fulfillment options such as order acceptance and pricing flexibility are somewhat
limited. Pricing decisions and demand-management options are therefore more appropriate at the
medium-term planning level. Using an integrated tactical model, quantities can be allocated to
different customer classes to determine the best combination of sales, production, and
replenishment quantities. The idea is to benefit from production flexibilities to link sales to
production in the most effective and profitable manner. However, because sales planning at this
level uses aggregated forecasts, allocation according to profitability cannot be carried down to the
level of specific orders.
Still in the MTS environment, but on a short-term level, revenue-management strategies,
software, and applicable models can be used to deal with order promising (c.f. [13,71] for more
information on this subject). Simpler order-promising approaches/models take into account the
current inventory and possible future replenishments, i.e., the available remaining production
capacity (considered to be known or fixed in time) and fulfill orders on a first-come-first-served
basis. Newer and promising approaches instead process several orders together and assign the
available remaining capacity by profitability classes [67,70].
215
Because of their high degree of customization, MTO environments are characterized by
multistage and often complex production steps. Production-capacity assignment and reliable due-
date promising therefore becomes critical because lead times are long. The variation in order
profitability by demand attributes (revenue, logistical costs, and strategic importance) is typically
greater in MTO than in MTS environments because of this customization. This gives rise to
greater pricing flexibility and offers opportunities for segmentation strategies even at the order
level. This difference between customer order profitability should, however, be calculated before
using RM tactics. Hopefully, marginal costing methods can help to find minimum acceptable
prices by accounting for the different processing and customization steps used for each order.
Integrated advanced planning systems, i.e., optimization models, can also be used to test options
and to find the best production sequence that serves more profitable orders first (revenue
maximization by customer segmentation), while at the same time minimizing production costs by
efficient campaign planning. This scenario analysis should, however, be run rapidly to provide a
quick answer to the customers’ main question: acceptance or rejection of their order. Hence, one
problem that arises with this potential strategy is the development of models that yield a good
balance between short response times and the quality and reliability of the solution [70].
5.2. Integrated Value-Chain Management for Margins-based Planning The process industry (including the biorefinery) is highly intensive in terms of capital spending.
Assets must therefore be utilized to a certain extent to provide good return on the capital invested.
However, minimizing production costs by maximizing production output does not always result
in highest profitability as it is often believed, because other supply-chain costs are neglected [72].
Moreover, fulfilling demand is not necessarily the optimal way to increase profits because low-
priced contracts do not always factor in variable and fixed costs [61]. To be profitable,
production-capacity allocation must be performed to generate the most profitable sales (revenue
management), while at the same time accounting for manufacturing costs and coordinating
procurement and distribution accordingly.
216
In this context, marginal costing and integrated planning appear to be key approaches. Breaking
down costs to single units or groups of units and to recipes makes it possible to evaluate tradeoffs
between different ways of producing and/or different capacity levels. The same marginal-costing
philosophy can be applied to the procurement and sales levels by segmenting customers and
suppliers into groups of different profitability or importance to the company. Finally, with the
idea that optimizing the whole gives better results than optimizing one part at a time, linking the
various locations (mills, distribution centers, etc.) and the four supply-chain planning tasks into a
single integrated planning framework would result in a more profitable plan for adding value.
On the down side, from a mathematical-optimization point of view, integrating more information
and more decisions together leads to larger and larger problems that must be solved within an
acceptable time for the results to be used by decision-makers. In this context, Grossmann
identified four challenges related to the development of integrated planning frameworks in the
process industries: 1) a modeling challenge, 2) a multiscale optimization challenge (how to
coordinate long-term with medium- and short-term decisions), 3) an algorithmic and
computational challenge, and 4) an uncertainty challenge [7]. These challenges mostly remain to
be addressed before integrated models can be used efficiently to support decision-making
activities inside a company.
Recently, several authors have incorporated certain revenue management concepts (without
necessarily using this nomenclature) and have developed integrated planning models and
strategies in accordance to a margins-based planning approach, i.e., an approach that maximizes
profit instead of only minimizing costs [14,16,50,73,74].
217
Laflamme-Mayer developed a multiscale online planning framework for a pulp mill [50]. First,
an activity-based cost model was developed to show how various process conditions affect
resource use and therefore costs. At the tactical level, an aggregated capacity-planning model was
used to balance fiber supply with pulp demand according to forecasts. At the operational level, a
campaign-planning and order-scheduling model was used to maximize short-term profitability
given orders and supply-chain capabilities. Using this framework, he showed for a case study
how process flexibility in terms of raw material input (chip input ratio) could be used to support
more effective procurement and thus increase profit. He also demonstrated that by varying
production capacity at the mill, a more profitable alignment between production and demand
could be reached. Although this framework was used to prove the benefits of integrated planning,
production flexibility, and capacity allocation, sales decisions such as accepting or rejecting
orders, contracts, and spot sales were not considered in this framework.
Feng et al. developed a supply-chain-based sales and operations planning model for an oriented
strandboard (OSB) mill running in an MTO environment [73]. Using a tactical model that
integrated sales, production, distribution, and procurement, the authors showed the benefits of
using such a model to align production capacity with contracted and spot demand, which is
treated as a decision variable. Two of the key findings were the following: the integrated
approach provides superior performance in all cases, but as market price decreases (the market
environment becomes more difficult), its benefits tends to increase. Moreover, variations in cost
factors (production, transportation, distribution) have a less significant impact on profitability
than fluctuations in market price and demand factors.
218
Kannegiesser et al. [14,16,74] developed an integrated tactical model for a chemical commodity
manufacturer operating in an MTS environment. The model optimizes profitability by
coordinating sales quantity, price, and supply decisions throughout the value chain. In a similar
way to Feng et al. [73], they studied capacity management with respect to contract and spot sales
in a situation in which contract demand had to be fulfilled, but not necessarily spot demand. In
addition, they considered linear recipe functions for production to represent variable production
costs more accurately. Using this model, they tested two optimization approaches: a classical
one-phase optimization strategy that maximizes expected profit across one or multiple price
scenarios, and a robust two-phase optimization strategy that maximizes expected profit across
multiple price scenarios given that a minimum profit level has been reached.
5.3. Value-Chain Management for the Biorefinery With new sources of raw materials, new processes, and new products and markets, the selection
of products and processes, as well as the design and management of the biorefinery value chain,
cannot be left to chance. In fact, several believe that technology will provide only a short-term
advantage [75]. In the long run, the value-chain design (product portfolio, facility location, access
to market and to raw materials, etc.) and its management will differentiate between successful
and unsuccessful biorefineries. As stated by Shapiro [2] and Stadtler and Kilger [6], efficient
management of the value chain can be a source of a competitive advantage that cannot be
replicated by others. Hence, the use of optimization models to manage the value chain could
greatly help decision makers to plan better and thus to realize this potential competitive
advantage. Referring to Figure 3.5 and the earlier discussions of biorefinery products and product
families, the specificities of each of these products and their associated processes require
different RM strategies and a different use of operational flexibilities.
219
Processes that simultaneously produce coproducts usually produce undifferentiated products. For
these products, MTS environments in which revenue management concepts are applied mainly at
the tactical level, such as the Kannegiesser framework [14], seem to be better adapted. Depending
on the type of undifferentiated product being produced and the scale of production (fine
chemicals or true commodities), different sales strategies should be used. True commodities, such
as bio-commodities and biofuels, can be sold directly to the market through contracts or spot
sales, but can also be used as platform chemicals for derivatives. Hence, RM opportunities
include on one side the more traditional segmentation of market customers and also the
“company’s internal derivative market.” In addition, because these products are produced
upstream in the supply chain and are therefore more vulnerable to raw-material price volatility,
they would benefit more from feedstock flexibility than from value-added chemicals. One the
other side, fine biochemicals, for which the number of buyers is typically much smaller, would
offer fewer opportunities for customer segmentation because customers should be more equally
important to the company. Processes which have a certain amount of flexibility in terms of
volume could better adapt to market needs and prices and their associated fluctuations. This
volume flexibility could take the form of overall throughput flexibility, capacity to change the
yield of output products (same throughput, but more or less of certain coproducts), or both. For
these processes, distinguishing core from side products is of critical importance to identify which
products would benefit from a more demand-driven sales strategy and should be managed
accordingly.
Biochemicals obtained by extraction in low volumes could be produced on a demand-driven
basis in an MTO environment, with the opportunity of accepting or rejecting sales at the order
level. Because these products are extracted only in small volumes, the extraction steps could be
bypassed or not according to demand conditions, without affecting the main production line
significantly.
220
Specialty biochemicals and biomaterials typically involve several processing steps and are
obtained in the last stages of derivative chains. Because they usually require some sort of
customization and high levels of responsiveness, flexible MTO environments coupled with
revenue-management concepts applied at the operational level would seem to be most
appropriate. Hence, batch equipment possessing both volume and product flexibility to react to
customer requirements and demand conditions appears to be especially well suited to this case.
For pseudo-commodity biomaterials, which are obtained by polymerization or by cellulose
modification, value-chain management strategies should depend on the amount of customization
that can be done to differentiate products between orders, as well as whether products are of the
replacement or substitution type. Replacement biomaterials like “green” polyethylene should be
managed in a similar way to true commodities. However, because this “commodity” product
comes from lignocellulosic raw materials, several processing steps are needed to obtain it:
ethanol must first be obtained (by gasification and reforming, or by fractionation, hydrolysis, and
fermentation) and then converted to ethylene and polyethylene before being molded into a
material. This is a large number of steps to manufacture a commodity product which does not
bring much added value. Moreover, apart for its “green” characteristics, this material has been in
existence for decades already, which makes product differentiation more difficult. On the other
side, substitution biomaterials like polylactic acid, which are relatively novel, can benefit from
more differentiation opportunities and therefore more customer-segmentation opportunities.
Hence, they would be able to take advantage of more flexible environments in terms of
customization with a demand-pull approach, i.e., MTO environments.
As for bioenergy, demand for electricity and heat is seasonal (people require more heat in winter)
and varies even according to the time of the day. Hence, there seems to be opportunities for using
value-chain management strategies, both for reducing the amount of heat and electricity
consumed during more expensive periods and for maximizing extra sales of power when the grid
demand for energy is high. However, these strategies depend highly on the structure and policies
of the electricity grid in place in the region.
221
The value-chain management of a biorefinery product portfolio composed of both commodities
and specialties will not be an easy task. Furthermore, parallel lines offer additional flexibilities
and opportunities for adjusting capacity to market by switching production between different
products, thus reducing the impact of price volatility and increasing revenues. For instance, a
P&P parallel biorefinery could use wood chips and shift production between paper and other
bioproducts. In another biorefinery configuration, part of the sugar stream could be allocated to
ethanol production, while the other would produce other bioproducts like succinic acid. Because
the management of these biorefinery plant configurations and their associated supply chain is not
obvious, the development and use of value-chain management models would help understand the
subtleties of fulfilling demand and operating a complex plant in different conditions. It is only by
doing so that manufacturers will be able to take full advantage of the biorefinery value chain and
make it more profitable overall.
6. CONCLUSIONS Products and their associated markets, location, the players implementing the biorefinery,
geographical aspects such as access to markets and customers, to name only a few factors,
highlight the fact that each biorefinery configuration will be unique, and its supply chain should
therefore be carefully designed, managed, and adapted accordingly to yield the most value. For
biorefineries, but also for any process-industry company, the value chain and its management are
the elements that can provide a real competitive advantage that others cannot replicate, both in
the short and the long term. The true key to profitability lies in four simple rules (inspired from
[15]):
1. Be different: “To make unusual profits, a company must do unusual things.” In this sense, the specificities and uniqueness of products and supply-chain assets such as responsiveness and efficiency can give a company an advantage. Examples of differentiators include (non-exhaustively) an access to good-quality biomass at an attractive price, an effective collaboration between partners and other supply-chain actors, distribution synergies, and product differentiation to control the marketplace.
2. Be among the first: “Once a new market attracts outside attention, it’s too late to get in.” Being first to market will undoubtedly be a key success factor for biorefinery establishment, especially for biochemical specialties. The market for these products is small, and the entire production could easily be undertaken by one plant. Any addition of production capacity would greatly affect demand patterns and thus the profitability and rationale for existence of current and entering players.
222
3. Be prepared for hard times: “Best means of entry are important, but also the best means of survival.” With the current and future uncertainty about price volatility, efficient planning is necessary to minimize the impact of volatility on profitability. Value-chain management coupled with robust planning approaches can help decision makers to test scenarios and evaluate the tradeoffs between procurement, production, and sales, as well as developing better plans and making a profit even in difficult market environments.
4. Think profit: “Profitability frequently varies inversely with technological glamor.” Technology and capacity utilization are important parameters to consider, but should not be the main focus of a company. It is by adjusting production capacity to the market and fulfilling the most profitable demand first that manufacturing companies can achieve higher levels of profitability. This profitable planning can only be done by managing the value chain in an integrated way.
7. REFERENCES [1] Christopher, M. (1998). Logistics and Supply Chain Management: Strategies for Reducing Cost
and Improving Service, 2nd ed. London: Financial Times Pitman Publishing.
[2] Shapiro, J.F. (2007). Modeling the Supply Chain, 2nd ed. Pacific Grove, CA: Thomson-
Brooks/Cole.
[3] Chopra, S. and Meindl, P. (2007). Supply Chain Management: Strategy, Planning, and Operation,
3rd ed. Upper Saddle River NJ: Pearson Prentice-Hall.
[4] Council of Supply Chain Management Professionals (2009). Supply Chain Management
Definitions. URL: http://cscmp.org/aboutcscmp/definitions.asp. [Date: 15-07-2009].
[5] Maravelias, C.T. and Sung, C. (2008). Integration of production planning and scheduling:
overview, challenges, and opportunities. Proceedings, 5th International Conference on
Foundations of Computer-Aided Process Operations (FOCAPO 08), Cambridge MA. June 29-
July 2.
[6] Stadtler, H. and Kilger, C. (2008). Supply Chain Management and Advanced Planning: Concepts,
Models, Software, and Case Studies, 4th ed. Berlin: Springer-Verlag.
[7] Grossmann, I. (2005). "Enterprise-wide optimization: a new frontier in process systems
engineering. AIChE Journal 51(7): 1846–1857.
[8] Shapiro, J.F. (2001). Beyond supply chain optimization to enterprise optimization. Achieving
Supply Chain Excellence through Technology (ASCET) 3. URL:
http://www.ascet.com/documents.asp?d_ID=511. [Date: 16-07-2009].
223
[9] SAP (2010). SAP - Business Management Software Solutions Application and Services. no. 01-09-
2010. URL: http://www.sap.com/index.epx. [Date: 01-09-2010].
[10] Oracle (2010). Oracle - Hardware and Software, Engineered to Work Together. URL:
http://www.oracle.com/index.html. [Date: 01-09-2010].
[11] Shapiro, J.F. (2004). Achieving competitive supply chain management: explore and exploit.
Achieving Supply Chain Excellence through Technology (ASCET) 6. URL:
http://www.ascet.com/documents.asp?d_ID=2515. [Date: 16-07-2009].
[12] Fleischmann, B., Meyr, H., and Wagner, M. (2008). Advanced Planning. In: Stadtler, H. and
Kilger, C. (eds.), Supply Chain Management and Advanced Planning: Concepts, Models,
Software and Case Studies. Berlin: Springer-Verlag.
[13] Kilger, C. and Meyr, H. (2008). Demand Fulfilment and ATP. In: Stadtler, H. and Kilger, C.
(eds), Supply Chain Management and Advanced Planning: Concepts, Models, Software and Case
Studies. Berlin: Springer-Verlag.
[14] Kannegiesser, M. (2008). Value Chain Management in the Chemical Industry - Global Value
Chain Planning of Commodities. Berlin: Physica-Verlag.
[15] Kline, C.H. (1976). Maximizing profits in chemicals. Chemtech 6(2): 110–117, 1976.
[16] Kannegiesser, M., Gunther, H.O., Beek, P., Grunow, M., and Habla, C. (2009). Value chain
management for commodities: a case study from the chemical industry. OR Spectrum 31(1): 63–
93.
[17] Bansal, M., Karimi, I.A., and Srinivasan, R. (2007). Optimal contract selection for the global
supply and distribution of raw materials. Industrial and Engineering Chemistry Research 46(20):
6522–6539.
[18] Reimann, M. and Schiltknecht, P. (2009). Studying the interdependence of contractual and
operational flexibilities in the market of specialty chemicals. European Journal of Operational
Research 198(3): 760–772.
[19] Tsay, A.A., Nahmias, S., and Agrawal, N. (1999). Modeling Supply Chain Contracts: A Review.
In: Tayur, S., Ganesham, R. and Magazine, M. (eds), Quantitative Models for Supply Chain
Management. Dordrecht: Kluwer.
224
[20] Höhn, M.I. (2010). Relational supply contracts - optimal concessions in return policies for
continuous quality improvements. Lecture Notes in Economics and Mathematical Systems, vol.
629, Berlin: Springer.
[21] Sykuta, M.E. (1996). Futures trading and supply contracting in the oil refining industry. Journal
of Corporate Finance 2: 317–334.
[22] Tsay, A.A. and Lovejoy, W.S. (1999). Quantity flexibility contracts and supply chain
performance. Manufacturing and Service Operations Management, 1(2): 89–111.
[23] Barnes-Schuster, D., Bassok, Y., and Anupindi, R. Coordination and flexibility in supply
contracts with options. Manufacturing and Service Operations Management 4(3): 171–207.
[24] Schiltknecht, P. (2007). Capacity Management and Contract Engineering. PhD Dissertation, ETH
Zurich, Zurich.
[25] Stadtler, H. (2008). Purchasing and Material Requirements. In: Stadtler, H. and Kilger, C. (eds.),
Supply Chain Management and Advanced Planning: Concepts, Models, Software and Case
Studies. Berlin: Springer-Verlag.
[26] Bonfill, A., Bagajewicz, M., Espuna, A., and Puigjaner, L. (2004). Risk management in the
scheduling of batch plants under uncertain market demand. Industrial and Engineering Chemistry
Research 43(3): 741–750.
[27] Park, M., Park, S., Mele, F.D., and Grossmann, I.E. (2006). Modeling of purchase and sales
contracts in supply chain optimization. Industrial and Engineering Chemistry Research 45(14):
5013–5026.
[28] Barbaro, A. and Bagajewicz, M.J. (2004). Managing financial risk in planning under uncertainty.
AIChE Journal 50(5): 963–989.
[29] Cachon, G.P. and Lariviere, M.A. (2005). Supply chain coordination with revenue-sharing
contracts: strengths and limitations. Management Science 51(1): 30–44.
[30] Stock, J.R. and Lambert, D.M. (2001). Strategic Logistics Management, 4th ed. New-York:
McGraw-Hill.
[31] Kilger, C., Reuter, B., and Stadtler, H. (2008). Collaborative Planning. In: Stadtler, H. and Kilger,
C. (eds.), Supply Chain Management and Advanced Planning: Concepts, Models, Software and
Case Studies. Berlin: Springer-Verlag.
225
[32] Stadtler, H. (2009). A framework for collaborative planning and state-of-the-art. OR Spectrum 31:
5–30.
[33] Audy, J.-F., D'Amours, S., Lehoux, N., and Ronnqvist, M. (2009). A review of collaborative
logistics. Proceedings, International Conference on Industrial Engineering and Systems
Management (IESM 2009), Montreal, Canada, May 13-15.
[34] Barratt, M. and Oliveira, A. Exploring the experiences of collaborative planning initiatives.
International Journal of Physical Distribution & Logistics Management 31(4): 266–289.
[35] Durango-Cohen, E.J. and Yano, C.A. (2006). Supplier commitment and production decisions
under a forecast-commitment contract. Management Science 52(1): 54–67.
[36] Lambert, D.M., Emmelhainz, M.A., and Gardner, J.T. (1996). Developing and implementing
supply chain partnerships. International Journal of Logistics Management 7(2): 17.
[37] Leavy, B. (2006). Supply chain effectiveness: strategy and integration. Handbook of Business
Strategy 7(1): 331–336.
[38] Ragauskas, A.J., Williams, C.K., Davison, B.H., Britovsek, G., Cairney, J., Eckert, C.A.,
Frederick, W.J. Jr, Hallett, J.P., Leak, D.J., Liotta, C.L., Mielenz, J.R., Murphy, R., Templer, R.,
and Tschaplinski, T. (2006). The path forward for biofuels and biomaterials. Science 311(5760):
484–489.
[39] Chambost, V. and Stuart, P.R. (2007). Selecting the most appropriate products for the forest
biorefinery. Industrial Biotechnology 3(2): 112–119.
[40] Roitsch, M. and Meyr, H. (2008). Oil Industry. In: Stadtler, H. and Kilger, C. (eds), Supply Chain
Management and Advanced Planning: Concepts, Models, Software and Case Studies. Berlin:
Springer-Verlag.
[41] Perlack, R.D., Wright, L.L., Turhollow, A.F., Graham, R.L., Stokes, B.J., and Erbach, D.C.
(2005). Biomass as a Feedstock for a Bioenergy and Bioproducts Industry: The Technical
Feasibility of a Billion-Ton Annual Supply. , Technical Report, Oak Ridge National Laboratory,
Oak Ridge, Tennessee.
[42] Goyal, H.B., Seal, D., and Saxena, R.C. (2008). Bio-fuels from thermochemical conversion of
renewable resources: a review. Renewable and Sustainable Energy Reviews 12(2): 504–517.
[43] Chambost, V., McNutt, J., and Stuart, P.R. (2008). Guided tour: implementing the forest
biorefinery (FBR) at existing pulp and paper mills. Pulp and Paper Canada 109(7–8): 19–27.
226
[44] Uslu, A., Faaij, P.C, and Bergman, P.C.A. (2008). Pre-treatment technologies and their effect on
international bioenergy supply chain logistics: techno-economic evaluation of torrefaction, fast
pyrolysis and pelletisation. Energy 33(8): 1206–1223.
[45] ______ (2010). List of Power Stations in Quebec. Wikipedia, the Free Encyclopedia. URL:
http://en.wikipedia.org/wiki/List_of_power_stations_in_Quebec. [Date: 17-11-2010].
[46] ______ (2010). List of Power Stations in Ontario. Wikipedia, the Free Encyclopedia. URL:
http://en.wikipedia.org/wiki/List_of_power_stations_in_Ontario. [Date: 17-11-2010].
[47] Taylor, G. (2008). Biofuels and the biorefinery concept. Energy Policy 36(12): 4406–4409.
[48] ______ (2010). The Growing Biofuel Market. URL: http://www.chemicals-
technology.com/features/feature87153/. [Date: 23-09-2010].
[49] Czernik, S. and Bridgwater, A.V. (2004). Overview of applications of biomass fast pyrolysis oil.
Energy and Fuels 18(2): 590–598.
[50] Laflamme-Mayer, M. (2009). Cadre de planification de la chaîne logistique basée sur la
représentation des procédés pour l'amélioration de la rentabilité de l'industrie des pâtes et papiers.
PhD Dissertation, École Polytechnique, Montreal (Canada).
[51] Lee, H.L. (2001). Aligning supply chain strategies with product uncertainties. California
Management Review, Spring, 105–119.
[52] Fisher, M.L. (1997). What is the right supply chain for your product? Harvard Business Review,
March-April, 105–116.
[53] Lynd, L.R., Wyman, C., Laser, M., Johnson, D., and Landucci, R. (2005). Strategic Biorefinery
Analysis: Analysis of Biorefineries. National Renewable Energy Laboratory (NREL), Golden,
Colorado, USA, Technical Report NREL/SR-510-35578.
[54] Regnier, E. (2007). Oil and energy price volatility. Energy Economics 29(3): 405–427.
[55] PriceWaterhouseCooper (PWC) (2009). Managing Commodity Risk Through Market Uncertainty.
Technical Report. URL: http://www.pwc.com/gx/en/metals/commodity-risk/commodity-risk.jhtml
[Date: 17-08-2010].
[56] ______ (2010). Price Elasticity of Demand. Wikipedia, the Free Encyclopedia. URL:
http://en.wikipedia.org/wiki/Price_elasticity_of_demand. [Date: 17-08-2010].
[57] Soderholm, P., and Lundmark, R. (2009). Forest-based biorefineries: implications for market
behavior and policy. Forest Products Journal 59(1–2): 6–16.
227
[58] Park, J., Park, S., Yun, C., and Kim, Y. (2010). Integrated model for financial risk management in
refinery planning. Industrial and Engineering Chemistry Research 49(1) 374–380.
[59] Sanders, J.P.M., Annevelink, B., and van der Hoeven, D. (2009). The development of
biocommodities and the role of North West European ports in biomass chains. Biofuels,
Bioproducts, and Biorefining 3,(3): 395–409.
[60] El-Halwagi, M.M. (2006). Process Integration, 1st ed. San Diego: Elsevier.
[61] Schulz, O., Kannegiesser, M., and Disteldorf, H. (2007). Supply Chain: What's Next? Managing
the Entire Value Chain for Volume and Profits. AT Kearney, Technical Report. URL:
http://www.atkearney.com/index.php/Publications/supply-chain-whats-next.html. [Date: 24-06-
2010].
[62] Bartodziej, P., Derigs, U., and Zils, M. (2007). O&D revenue management in cargo airlines: a
mathematical programming approach. OR Spectrum 29(1): 105–121.
[63] Gosavi, A., Ozkaya, E., and Kahraman, A.R. (2007). Simulation optimization for revenue
management of airlines with cancellations and overbooking. OR Spectrum, 29(1): 21–38.
[64] Defregger, F. and Kuhn, H. (2007). Revenue management for a make-to-order company with
limited inventory capacity. OR Spectrum 29( 1): 137–156.
[65] Talluri, K.T. and van Ryzin, G.J. (2004). The Theory and Practice of Revenue Management.
Boston: Kluwer.
[66] Harris, F.H. deB. and Pinder, J.P. (1995). Revenue management approach to demand management
and order booking in assemble-to-order manufacturing. Journal of Operations Management 13(4):
299–309.
[67] Meyr, H. (2009). Customer segmentation, allocation planning and order promising in make-to-
stock production. OR Spectrum 31(1): 229–256.
[68] Spengler, T., Rehkopf, S., and Volling, T. (2007). Revenue management in make-to-order
manufacturing: an application to the iron and steel industry. OR Spectrum 29(1): 157–171.
[69] Kolisch, R. and Zatte, D. (2009). Stand und Perspecktiven des Einsatzes von Revenue
Management in der Prozessindustrie. Zeitschrift für Planung und Unternehmenssteuerung 20:
197–214.
[70] Quante, R., Meyr, H., and Fleischmann, M. (2009). Revenue management and demand
fulfillment: matching applications, models, and software. OR Spectrum 31(1): 31–62.
228
[71] Fleischmann, B. and Meyr, H. (2004). Customer Orientation in Advanced Planning Systems. In:
Dyckhoff, H., Lackes, R., and Reese, J. (eds.), Supply Chain Management and Reverse Logistics.
Berlin: Springer, 297–321.
[72] Dansereau, L.-P., El-Halwagi, M.M., and Stuart, P. (2009). Sustainable supply chain planning for
the forest biorefinery. in Design for Energy and the Environment - 7th International Conference
on the Foundation of Computer-Aided Process Design, Breckenridge, Colorado, 1101–1105, June
7-12.
[73] Feng, Y., D'Amours, S., and Beauregard, R. (2008). The value of sales and operations planning in
oriented strand board industry with make-to-order manufacturing system: cross-functional
integration under deterministic demand and spot market recourse. International Journal of
Production Economics 115(1): 189–209.
[74] Kannegiesser, M. and Gunther, H.O. (2010). An integrated optimization model for managing the
global value chain of a chemical commodities manufacturer. Journal of the Operational Research
Society 62(4): 711–721.
[75] Chambost, V., McNutt, J., and Stuart, P.R. (2009). Partnerships for successful enterprise
transformation of forest industry companies implementing the forest biorefinery. Pulp and Paper
Canada 110(5–6): 19–24.
229
ANNEXE B – Framework for Margins-based Planning:
Forest Biorefinery Case Study
Louis Patrick Dansereau a,b, Mahmoud El-Halwagi c, Behrang Mansoornejad a and Paul Stuart a16
a NSERC Environmental Design Engineering Chair in Process Integration,
Department of Chemical Engineering, École Polytechnique Montréal, Montréal,
H3C 3A7, Canada
b KSH Solutions Inc., 1 Place Alexis Nihon, 3400 de Maisonneuve O.,
bureau 1600, Montréal, H3Z 3B8, Canada
c Department of Chemical Engineering, Texas A&M University, College Station,
Texas, 77843, USA
Abstract
The biorefinery concept offers a promising solution to transform the struggling forestry industry.
Not only will the implementation of new products and processes help to diversify revenues, it
will also offer an opportunity to change the manufacturing culture by better managing the
flexibility of assets to react to volatile market conditions. In this paper, an integrated supply-chain
planning framework is presented. It is based on optimizing a superstructure to help decision
makers identify different supply-chain policies to adapt to different market conditions. It
integrates revenue management concepts, activity-based cost accounting principles,
manufacturing flexibility and supply-chain flexibility in a tactical model to maximize profit in a
price-volatile environment. A case study of a newsprint mill implementing a parallel biomass
fractionation line producing several biochemicals is used to illustrate this approach. Results and
benefits are presented for the traditional pulp and paper business and for the transformed
biorefinery in different market scenarios.
Keywords
Supply-chain management, manufacturing flexibility, forest biorefinery, tactical planning
16 To whom all correspondence should be addressed
230
1. INTRODUCTION The forest products industry of North America has been facing a difficult economic situation
recently. To exit this stalemate situation, some major companies have shown increasing interest
in the biorefinery concept, which consists in a more complete utilization of renewable forest
biomass to manufacture value-added products such as biochemicals, biomaterials and biofuels, in
addition to the traditional production of the industry.
From a forest products industry perspective, investments in biorefinery strategies will represent
more than typical capital-spending projects. As stated by (Chambost et al., 2008), the biorefinery
represents at first a diversification of the product and process portfolio, but it will also change the
enterprise, its vision, mission and reason for existence. Such transformation decisions should be
planned wisely. For instance, environment and social aspects should be somehow included. As
well, new marketing, product distribution, production and procurement strategies should be
investigated.
According to (Thorp, 2005), the biggest challenge for the forest products industry will be to
move away from the commodity business mentality. Traditionally, this industry is
manufacturing-centric: it views process efficiency as the key for low-cost manufacturing and
profitability. However, using this strategy, other supply-chain costs are often ignored, resulting in
lesser profit, especially in difficult and changing market conditions (Dansereau et al., 2009; Feng
et al., 2008).
In a transformed biorefinery business, producing high volumes of undistinguished products with
low margins will not be sustainable. Indeed, bioproducts will likely face market volatility as they
will replace or substitute mainly traditional fossil-based commodities. Their price should
ultimately be linked to crude oil and natural gas prices, as fossil products will still dominate the
marketplace.
At the same time, biomass prices will increase as the demand for new bioproducts such as
biofuels grows (Söderholm & Lundmark, 2009). Moreover, biomass quantities are typically
limited per location and over the year, resulting in biorefineries that will be potentially smaller
than their petrochemical counterparts.
231
As an example, (Browne et al., 2011) compared the biggest Canadian pulp mill with a medium-
small sized refinery. The now-closed Shell refinery of Montreal was treating about 130 000
barrels per day (~ 18 200 ton/d), while the biggest Canadian pulp mill treats about 5000 tons/d of
biomass. From this comparison, it is obvious that forest biorefineries will hardly reach the same
level of economies of scale as petrochemical sites do, and be able to compete on price based on
production efficiency. Biorefineries will therefore have to deal with significant margin pressure
on both the sales and procurement sides.
To be profitable in the long run, forest biorefineries (FBR) should produce more than one type of
products, and especially value-added ones rather than producing solely commodity products
(Lynd et al., 2005). In order to better compete in this new market environment but also in the
current one, companies should also seek to maximize their margins over the overall supply chain,
even if it implies higher manufacturing costs due to increased grade/product changes.
In recent times, considerable efforts have been put on efficient supply-chain management in the
chemical process industry. (Maravelias & Sung, 2008) present an overview of the integration of
production planning and scheduling in the process industry. (Sousa et al., 2008) developed a
multi-level planning framework where they first design the global supply-chain network of an
agrochemical supplier and then optimize production and distribution. (Kim et al., 2008)
developed an integrated model of supply network and production planning for multi-site
refineries. (Kannegiesser & Gunther, 2011) developed a mathematical model for the global
value-chain planning of a chemical commodity manufacturer. (Guillen-Gosalbez & Grossmann,
2009) address the design and planning of sustainable chemical supply chains in the presence of
uncertainty. (Feng et al., 2008) developed an integrated tactical planning framework for an
oriented strand board company.
232
The objective of this paper is to propose a margins-based framework that can be used by existing
chemical and forest products companies, as well as future retrofitted biorefineries for maximizing
their profitability over the supply chain. The framework consists of an integrated tactical
planning model based on optimization that aims to maximize profit considering sales and
manufacturing flexibilities. This framework would not only help companies gain competitive
advantage through efficient supply-chain management of a multi-product portfolio, it represents
some of the changes that are necessary to perform at the corporate level for a successful
biorefinery transformation. A case study of an existing forestry looking for the implementation of
a selected promising biorefinery process and product portfolio is presented to illustrate the
framework.
The paper is structured as follows. First, five key concepts related to margins-based planning are
introduced. The model and case study are then briefly described, the full mathematical
formulation being in appendix. Finally, results for different runs of the model, representing
different operating policies for both pulp and paper and biorefinery operations, are discussed to
show the benefits of this framework and the importance of each concept of the framework.
2. MARGINS-BASED PLANNING FRAMEWORK The key aspects of the margins-based framework are depicted in Figure 1 and will be further
discussed in the next subsections
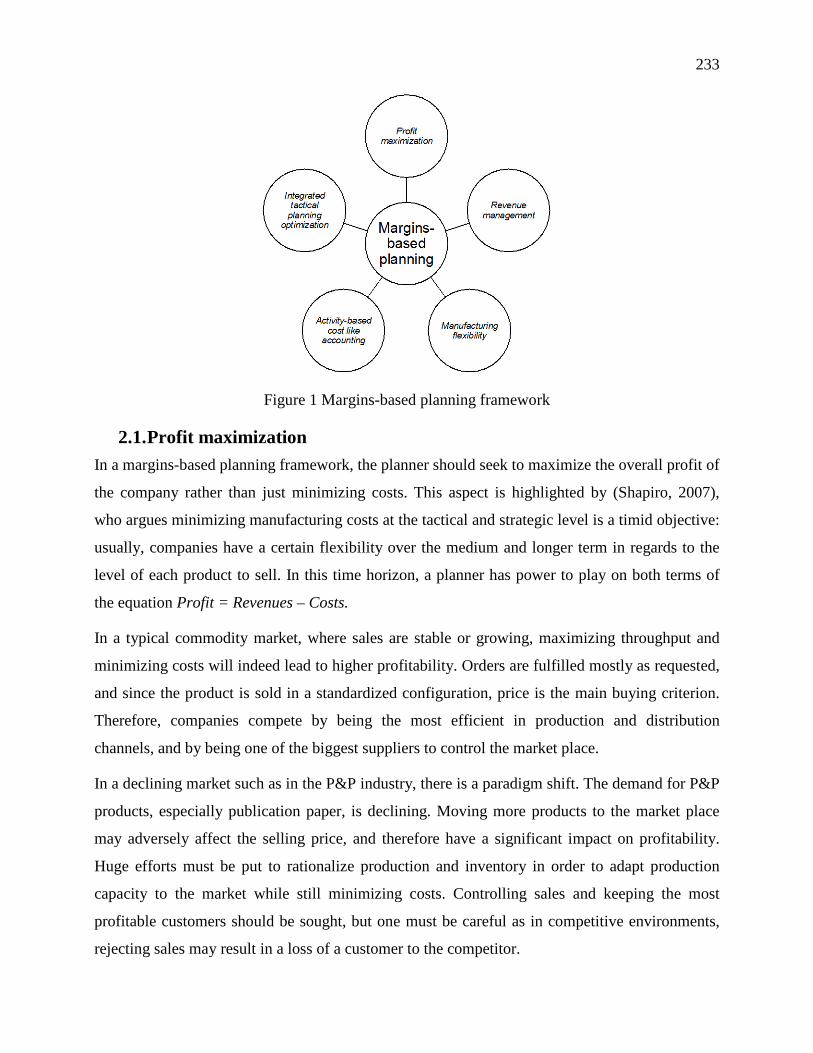
233
Figure 1 Margins-based planning framework
2.1. Profit maximization In a margins-based planning framework, the planner should seek to maximize the overall profit of
the company rather than just minimizing costs. This aspect is highlighted by (Shapiro, 2007),
who argues minimizing manufacturing costs at the tactical and strategic level is a timid objective:
usually, companies have a certain flexibility over the medium and longer term in regards to the
level of each product to sell. In this time horizon, a planner has power to play on both terms of
the equation Profit = Revenues – Costs.
In a typical commodity market, where sales are stable or growing, maximizing throughput and
minimizing costs will indeed lead to higher profitability. Orders are fulfilled mostly as requested,
and since the product is sold in a standardized configuration, price is the main buying criterion.
Therefore, companies compete by being the most efficient in production and distribution
channels, and by being one of the biggest suppliers to control the market place.
In a declining market such as in the P&P industry, there is a paradigm shift. The demand for P&P
products, especially publication paper, is declining. Moving more products to the market place
may adversely affect the selling price, and therefore have a significant impact on profitability.
Huge efforts must be put to rationalize production and inventory in order to adapt production
capacity to the market while still minimizing costs. Controlling sales and keeping the most
profitable customers should be sought, but one must be careful as in competitive environments,
rejecting sales may result in a loss of a customer to the competitor.
234
In diverging production processes such as the biorefinery, several products are produced from the
same few raw materials. The product portfolio may also contain different types of products,
ranging from biofuels, to fine chemicals and specialty biomaterials. Each of these products
requires a different operating policy, with a different trade-off between efficiency and
responsiveness. Therefore, minimizing production costs only may hinder the opportunity of
selling more of the most profitable products. Planning at medium and longer term should rather
look at identifying the best equilibrium in terms of sales of each product of the portfolio
depending on the market situation. In certain instances, it can be more profitable to sell more of
one item of the portfolio, even if it implies more costs.
2.2. Revenue management Revenue management aims to increase revenues of a company by actively managing demand
(Talluri & van Ryzin, 2004). According to these authors, this can be done either by exploiting the
differences between customers and their willingness to pay, or by using dynamic pricing
strategies to influence actively demand.
In industrial practice, two main types of demand can be distinguished: contract demand, which
must be fulfilled, and spot demand, which is transaction specific and may not be repeated.
Companies can therefore make active sales decisions on the acceptance or rejection of spot sales
requests (Kannegiesser et al., 2009). Moreover, each product has a different market structure. For
example, a specialty product can be sold to one customer at a certain price and at a different price
to another customer because of a different end-use. In a margins-based framework, it is important
to identify these different customer segments in order to develop and adapt revenue management
strategies to particular markets.
235
For the specific case of the biorefinery and of diverging production processes, additional revenue
management opportunities exist. A biorefinery with a product portfolio composed of both
commodities and specialties could decide to manufacture more or less of one type of product in
certain market conditions to maximize revenues and to reduce the impact of price volatility
(Dansereau et al., 2012). However, throughput modification of certain products in the portfolio
necessitates some level of flexibility in manufacturing processes and in sales. Securing too much
sales in contracts in advance hinders the opportunity of selling more profitable products. The
management of the product portfolio, or at least guidelines to manage the global product
portfolio, should be done in an integrated way to take advantage of every opportunity.
2.3. Manufacturing flexibility (Mansoornejad & Stuart, 2012) carried out a literature review on manufacturing flexibility and its
application to the biorefinery. They categorized manufacturing flexibility in the chemical
engineering context into four major types: product, volume, recipe and process flexibility.
Product and volume flexibility refer to the ability of a system to produce different products at
different throughputs. A system having adaptable recipes that can control the process output is
referred to recipe flexibility. Finally, process flexibility refers to capability of a process to have
feasible operation under changing conditions. It is a property of the operability of the system,
along with controllability, safety, etc.
In a margins-based framework, opportunities of manufacturing different products in different
volumes during time periods are evaluated according to market conditions. Several process
configurations can lead to this product and volume flexibility: overcapacity, producing
derivatives or selling intermediates to the market, using different raw materials, etc. Each process
design presents its own level of flexibility through its unique process, recipe and supply-chain
configuration.
236
2.4. Activity-based cost “like” accounting A margins-based policy should exploit the manufacturing flexibility of the system and wisely
manage sales to maximize profitability. However, each manufacturing option has its own raw
material, chemical, steam, and electricity consumption pattern, leading to different costs.
Moreover, these manufacturing options may have different seasonal consumptions. In a margins-
based framework, it is necessary to identify where and how those costs are created in order to
identify the most profitable manufacturing option in each time period.
Activity-based cost accounting (ABC) is method developed for modern manufacturing
environments, which consists of modeling the usage of resources by activities performed and
activities required by the cost object. In addition to calculating costs, ABC provides management
with useful information: it is possible to see where the most important costs occur as well as what
produces them (Gunasekaran et al., 1999). Overheads and other indirect costs are also typically
traced to activities performed through allocation rules.
In this framework, an ABC-like costing method is used to calculate manufacturing costs. This
method uses ABC principles to trace direct manufacturing costs to the different recipes of each
process (Laflamme-Mayer et al., 2011) . Using an ABC-like model, (Laflamme-Mayer, 2009)
developed a multi-scale online planning framework for a pulp mill and showed how various
process conditions affect the use of resources and costs.
2.5. Integrated tactical planning and optimization Several authors argue that it is possible to achieve higher levels of efficiency by better
coordinating material, cash and information along the supply chain (Maravelias & Sung, 2008;
Shapiro, 2007; Stadtler & Kilger, 2008). (Shapiro, 2007) defines three possible levels of
integration for supply-chain management:
• functional integration (or horizontal), the integration of procurement, production, distribution and sales activities within the same enterprise and among partners;
• spatial integration, the integration of these activities through the various facilities present in the supply chain;
• intertemporal (or vertical) integration, the coherent integration of the three decision levels (strategic, tactical, and operational).
237
In order to address and maximize the overall profitability of the company, a margins-based
framework should integrate activities from procurement to sales, but ideally also from different
facilities. The tactical decision level seems the most adapted for this type of planning. First, sales
and procurement related decisions such as serving a customer segment, partially or not at all,
signing a contract with a supplier, or allocating a certain percentage to the spot market, are more
appropriate at medium and longer term. Seasonal patterns in production costs and sales can also
be represented at this level.
Managing a company in a margins-based fashion can be a challenging task. Fortunately, recent
advances in information technology and optimization modeling are now enabling the
development of advanced planning tools that support decision-making by managing the supply
chain holistically. An integrated optimization model representing the company and it supply
chain enables decision-makers to see and understand how different manufacturing and sales
policies behave in various market conditions. It is thus possible to account for trade-offs that are
difficult to see for complex systems such as multi-product biorefineries.
3. MODEL DESCRIPTION The proposed model is formulated as a mixed-integer linear programming problem with a
discrete time horizon of 12 months. As a convention, processes refer to units or groups of units
that transform materials into products and intermediates, e.g. pulping lines, paper machines. A
recipe defines operating conditions on a process such as raw material consumption, product
throughput, consumption/production of steam and electricity, supplies and chemical
consumption, direct labor, etc. Processes and recipes provide the modeling framework with
enough flexibility to represent different manufacturing flexibility configurations that can be
possible in a facility.
To represent more precisely the production processes and trade-offs between different
manufacturing options, each time period is broken down into hours. While being a tactical model
with some operational considerations, it has limited scheduling considerations. It determines the
number of hours and the throughput of processes for each recipe used, but will not give
indications as per when to produce during the month.
238
The objective of the model is to maximize the global profit of the company. For each time period,
the model determines how much of each product should be sold to different customers, which
recipe to use on each process, for how long and its throughput, biomass procurement quantities
from each supplier, as well as the inventory of each material. Steam, fuel and electricity flows,
along with changeovers are also determined.
The model is subject to constraints related to procurement and sales, flow and inventory,
production, process mass balances, steam, fuel and electricity balances. Full mathematical
formulation and nomenclature are presented in appendix. The list below summarizes the type of
information that is considered as known a priori for the model.
• General data o The planning horizon
• Procurement o The list of suppliers, with corresponding availabilities and cost for each material
they provide o Fuel, chemical and electricity cost estimates for each time period
• Production o The set of potential raw materials and products that can be manufactured by each
recipe on a process, and corresponding yields to products o Process throughput minimum and maximum for each recipe o Steam, electricity and fuel consumption/production usage for each recipe o The condensing turbine efficiency curve (kWh of electricity produced per GJ
steam sent to the turbine) o Variable costs for each recipe, including chemical usage, direct labor, benefits,
supplies, etc. o Fixed costs, including indirect labor and benefits, maintenance, depreciation, etc. o Cost and time estimations for transitions and start-ups of each process o Inventory holding capacity and costs for each material at every location o Planning heuristics used by planners of the company, (e.g. minimum time on a
recipe) o Information related to scheduled shutdowns for maintenance and major repairs
• Transportation and distribution costs for each material between each locations • Sales
o Demand/price forecasts for each products and customer cluster o Variable and peak electricity selling price to the local grid o Steam selling price to local customers, if any
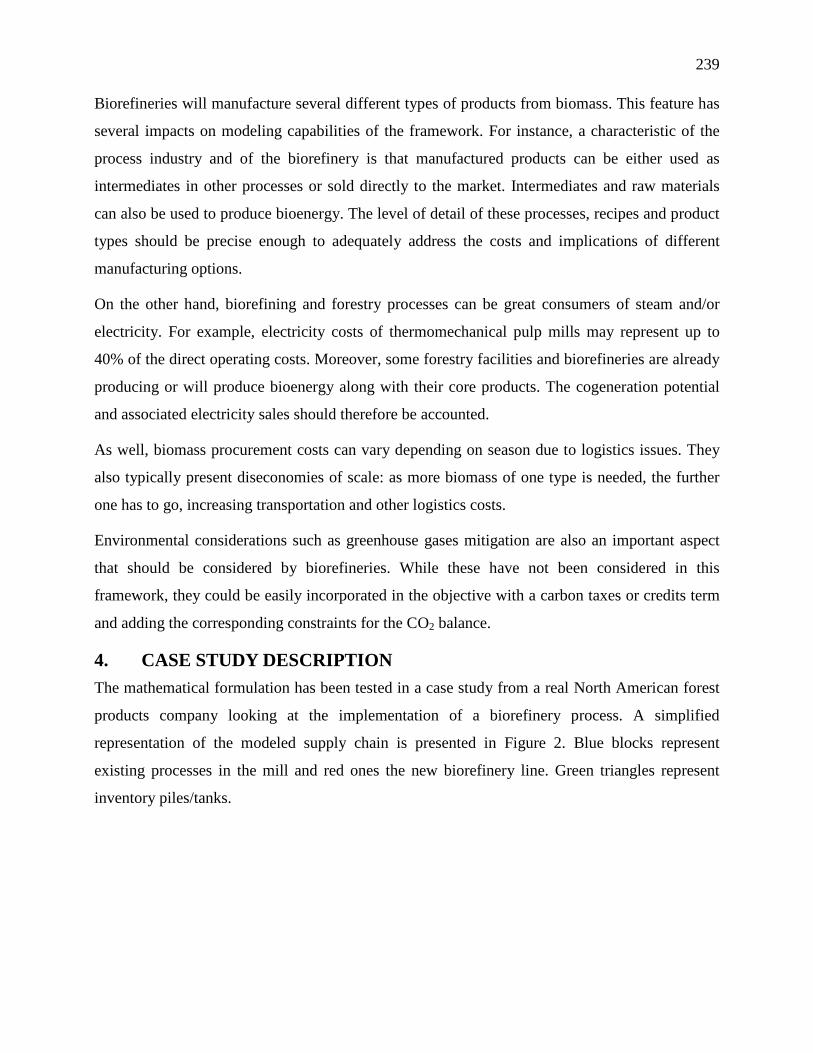
239
Biorefineries will manufacture several different types of products from biomass. This feature has
several impacts on modeling capabilities of the framework. For instance, a characteristic of the
process industry and of the biorefinery is that manufactured products can be either used as
intermediates in other processes or sold directly to the market. Intermediates and raw materials
can also be used to produce bioenergy. The level of detail of these processes, recipes and product
types should be precise enough to adequately address the costs and implications of different
manufacturing options.
On the other hand, biorefining and forestry processes can be great consumers of steam and/or
electricity. For example, electricity costs of thermomechanical pulp mills may represent up to
40% of the direct operating costs. Moreover, some forestry facilities and biorefineries are already
producing or will produce bioenergy along with their core products. The cogeneration potential
and associated electricity sales should therefore be accounted.
As well, biomass procurement costs can vary depending on season due to logistics issues. They
also typically present diseconomies of scale: as more biomass of one type is needed, the further
one has to go, increasing transportation and other logistics costs.
Environmental considerations such as greenhouse gases mitigation are also an important aspect
that should be considered by biorefineries. While these have not been considered in this
framework, they could be easily incorporated in the objective with a carbon taxes or credits term
and adding the corresponding constraints for the CO2 balance.
4. CASE STUDY DESCRIPTION The mathematical formulation has been tested in a case study from a real North American forest
products company looking at the implementation of a biorefinery process. A simplified
representation of the modeled supply chain is presented in Figure 2. Blue blocks represent
existing processes in the mill and red ones the new biorefinery line. Green triangles represent
inventory piles/tanks.
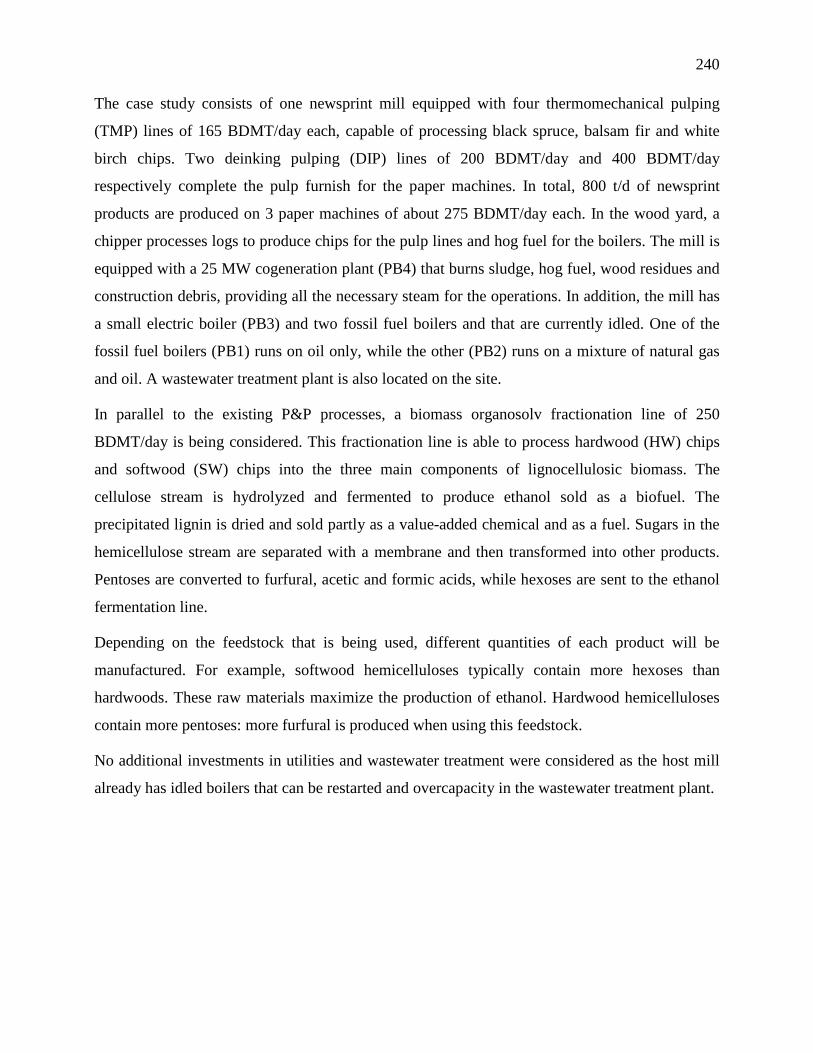
240
The case study consists of one newsprint mill equipped with four thermomechanical pulping
(TMP) lines of 165 BDMT/day each, capable of processing black spruce, balsam fir and white
birch chips. Two deinking pulping (DIP) lines of 200 BDMT/day and 400 BDMT/day
respectively complete the pulp furnish for the paper machines. In total, 800 t/d of newsprint
products are produced on 3 paper machines of about 275 BDMT/day each. In the wood yard, a
chipper processes logs to produce chips for the pulp lines and hog fuel for the boilers. The mill is
equipped with a 25 MW cogeneration plant (PB4) that burns sludge, hog fuel, wood residues and
construction debris, providing all the necessary steam for the operations. In addition, the mill has
a small electric boiler (PB3) and two fossil fuel boilers and that are currently idled. One of the
fossil fuel boilers (PB1) runs on oil only, while the other (PB2) runs on a mixture of natural gas
and oil. A wastewater treatment plant is also located on the site.
In parallel to the existing P&P processes, a biomass organosolv fractionation line of 250
BDMT/day is being considered. This fractionation line is able to process hardwood (HW) chips
and softwood (SW) chips into the three main components of lignocellulosic biomass. The
cellulose stream is hydrolyzed and fermented to produce ethanol sold as a biofuel. The
precipitated lignin is dried and sold partly as a value-added chemical and as a fuel. Sugars in the
hemicellulose stream are separated with a membrane and then transformed into other products.
Pentoses are converted to furfural, acetic and formic acids, while hexoses are sent to the ethanol
fermentation line.
Depending on the feedstock that is being used, different quantities of each product will be
manufactured. For example, softwood hemicelluloses typically contain more hexoses than
hardwoods. These raw materials maximize the production of ethanol. Hardwood hemicelluloses
contain more pentoses: more furfural is produced when using this feedstock.
No additional investments in utilities and wastewater treatment were considered as the host mill
already has idled boilers that can be restarted and overcapacity in the wastewater treatment plant.
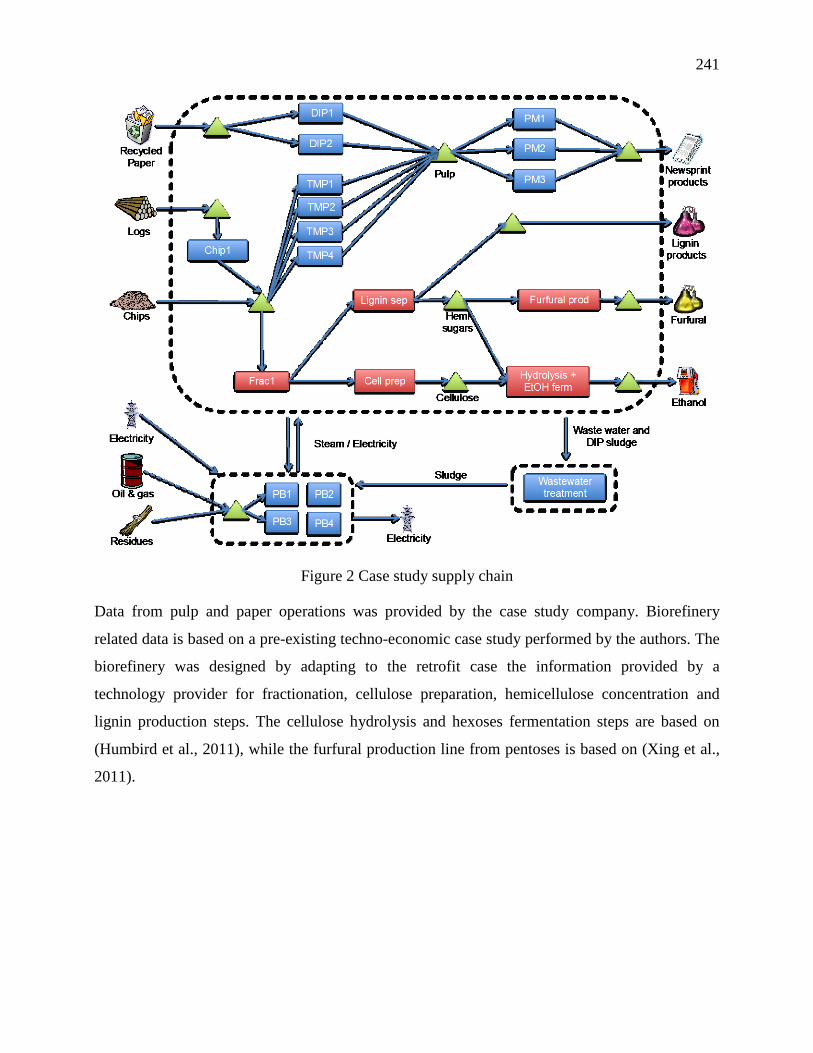
241
Figure 2 Case study supply chain
Data from pulp and paper operations was provided by the case study company. Biorefinery
related data is based on a pre-existing techno-economic case study performed by the authors. The
biorefinery was designed by adapting to the retrofit case the information provided by a
technology provider for fractionation, cellulose preparation, hemicellulose concentration and
lignin production steps. The cellulose hydrolysis and hexoses fermentation steps are based on
(Humbird et al., 2011), while the furfural production line from pentoses is based on (Xing et al.,
2011).
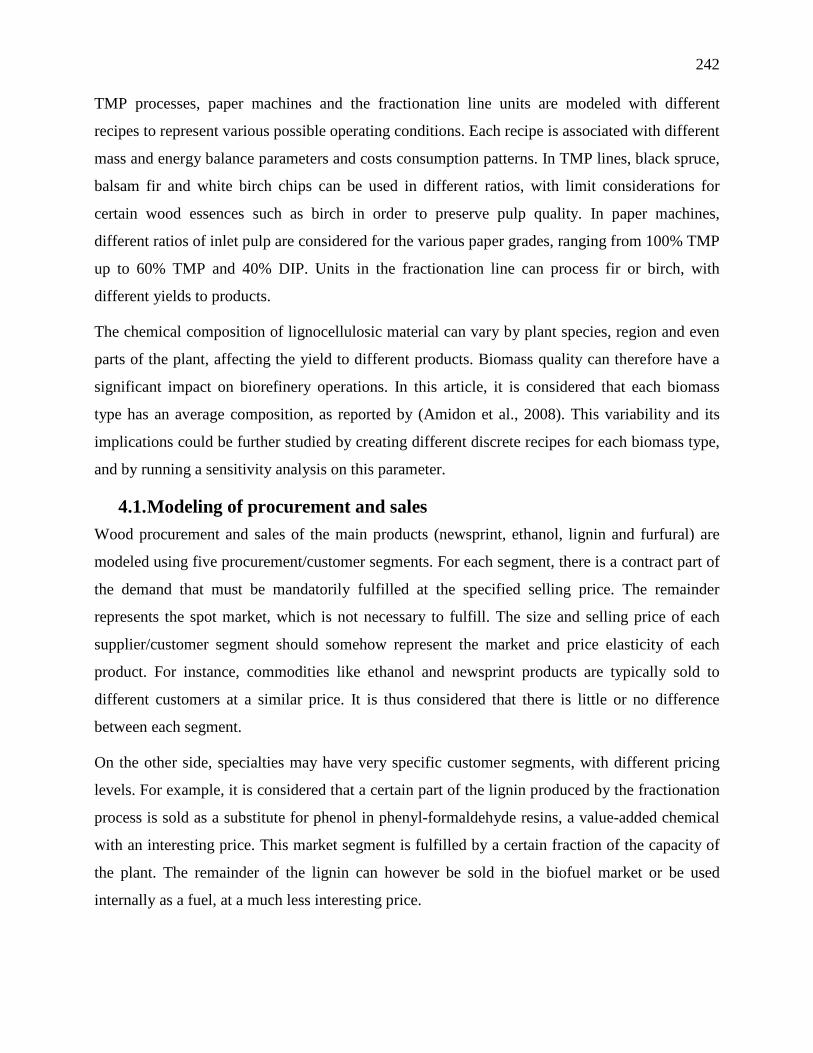
242
TMP processes, paper machines and the fractionation line units are modeled with different
recipes to represent various possible operating conditions. Each recipe is associated with different
mass and energy balance parameters and costs consumption patterns. In TMP lines, black spruce,
balsam fir and white birch chips can be used in different ratios, with limit considerations for
certain wood essences such as birch in order to preserve pulp quality. In paper machines,
different ratios of inlet pulp are considered for the various paper grades, ranging from 100% TMP
up to 60% TMP and 40% DIP. Units in the fractionation line can process fir or birch, with
different yields to products.
The chemical composition of lignocellulosic material can vary by plant species, region and even
parts of the plant, affecting the yield to different products. Biomass quality can therefore have a
significant impact on biorefinery operations. In this article, it is considered that each biomass
type has an average composition, as reported by (Amidon et al., 2008). This variability and its
implications could be further studied by creating different discrete recipes for each biomass type,
and by running a sensitivity analysis on this parameter.
4.1. Modeling of procurement and sales Wood procurement and sales of the main products (newsprint, ethanol, lignin and furfural) are
modeled using five procurement/customer segments. For each segment, there is a contract part of
the demand that must be mandatorily fulfilled at the specified selling price. The remainder
represents the spot market, which is not necessary to fulfill. The size and selling price of each
supplier/customer segment should somehow represent the market and price elasticity of each
product. For instance, commodities like ethanol and newsprint products are typically sold to
different customers at a similar price. It is thus considered that there is little or no difference
between each segment.
On the other side, specialties may have very specific customer segments, with different pricing
levels. For example, it is considered that a certain part of the lignin produced by the fractionation
process is sold as a substitute for phenol in phenyl-formaldehyde resins, a value-added chemical
with an interesting price. This market segment is fulfilled by a certain fraction of the capacity of
the plant. The remainder of the lignin can however be sold in the biofuel market or be used
internally as a fuel, at a much less interesting price.
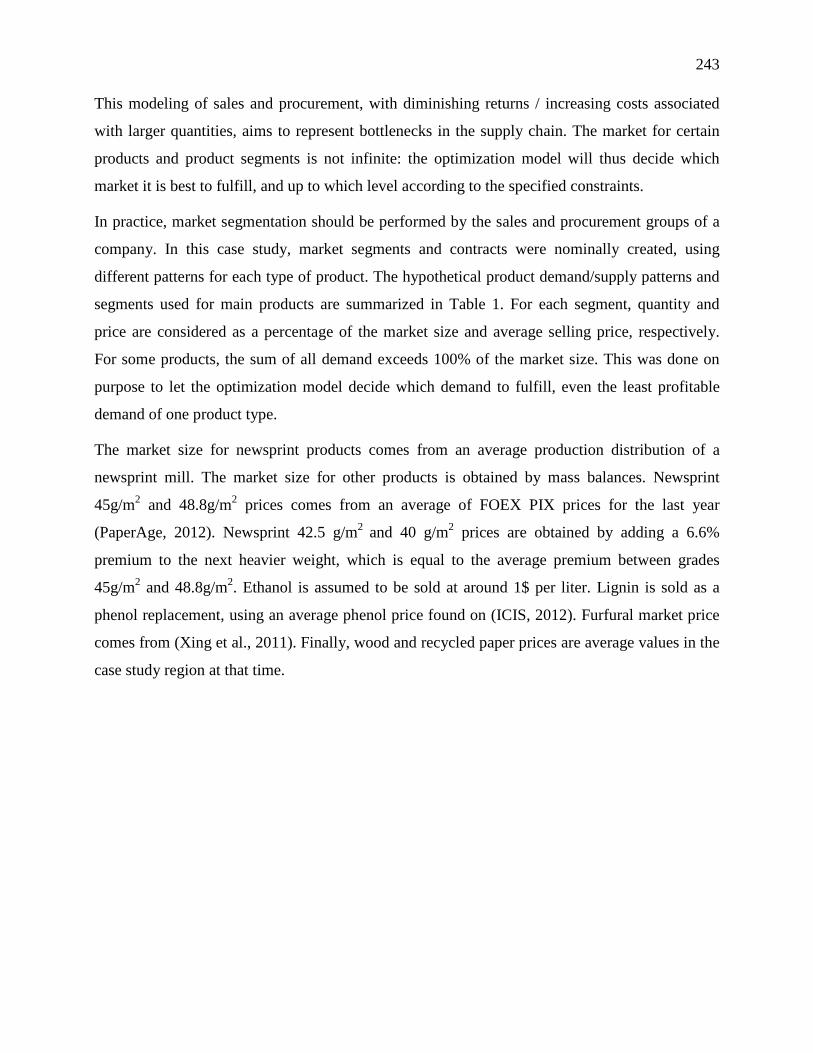
243
This modeling of sales and procurement, with diminishing returns / increasing costs associated
with larger quantities, aims to represent bottlenecks in the supply chain. The market for certain
products and product segments is not infinite: the optimization model will thus decide which
market it is best to fulfill, and up to which level according to the specified constraints.
In practice, market segmentation should be performed by the sales and procurement groups of a
company. In this case study, market segments and contracts were nominally created, using
different patterns for each type of product. The hypothetical product demand/supply patterns and
segments used for main products are summarized in Table 1. For each segment, quantity and
price are considered as a percentage of the market size and average selling price, respectively.
For some products, the sum of all demand exceeds 100% of the market size. This was done on
purpose to let the optimization model decide which demand to fulfill, even the least profitable
demand of one product type.
The market size for newsprint products comes from an average production distribution of a
newsprint mill. The market size for other products is obtained by mass balances. Newsprint
45g/m2 and 48.8g/m2 prices comes from an average of FOEX PIX prices for the last year
(PaperAge, 2012). Newsprint 42.5 g/m2 and 40 g/m2 prices are obtained by adding a 6.6%
premium to the next heavier weight, which is equal to the average premium between grades
45g/m2 and 48.8g/m2. Ethanol is assumed to be sold at around 1$ per liter. Lignin is sold as a
phenol replacement, using an average phenol price found on (ICIS, 2012). Furfural market price
comes from (Xing et al., 2011). Finally, wood and recycled paper prices are average values in the
case study region at that time.
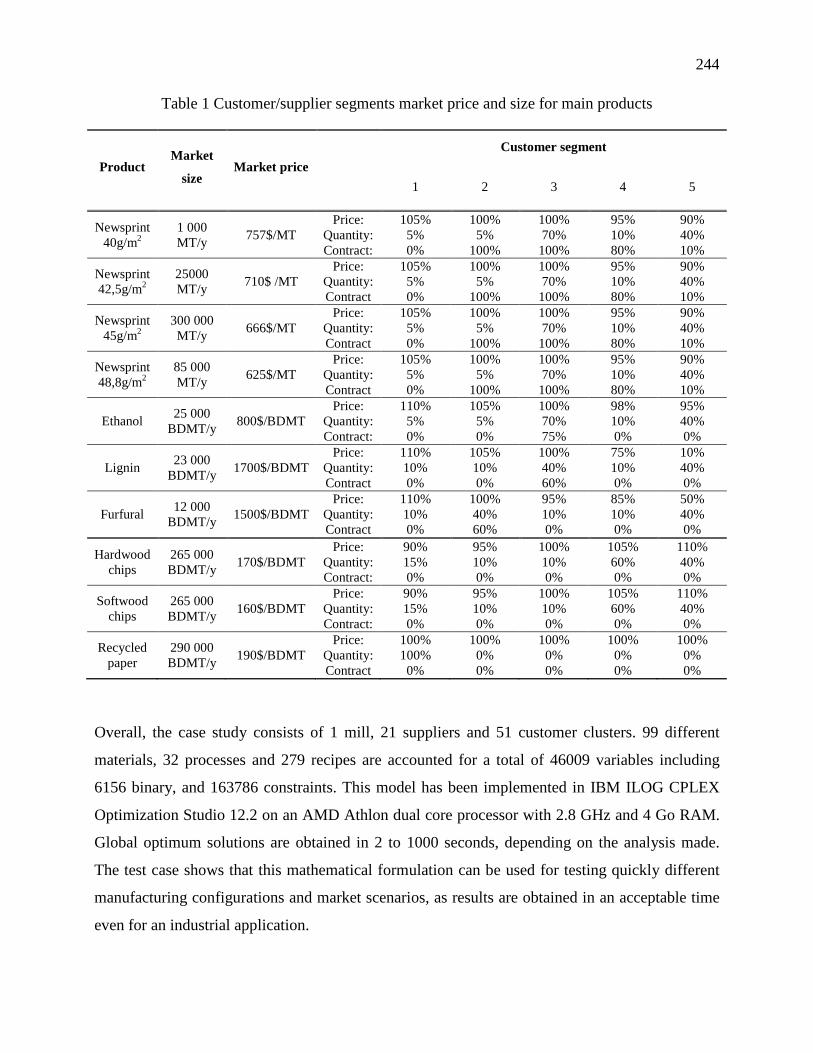
244
Table 1 Customer/supplier segments market price and size for main products
Product Market
size Market price
Customer segment
1 2 3 4 5
Newsprint 40g/m2
1 000 MT/y 757$/MT
Price: Quantity: Contract:
105% 5% 0%
100% 5%
100%
100% 70%
100%
95% 10% 80%
90% 40% 10%
Newsprint 42,5g/m2
25000 MT/y 710$ /MT
Price: Quantity: Contract
105% 5% 0%
100% 5%
100%
100% 70%
100%
95% 10% 80%
90% 40% 10%
Newsprint 45g/m2
300 000 MT/y 666$/MT
Price: Quantity: Contract
105% 5% 0%
100% 5%
100%
100% 70%
100%
95% 10% 80%
90% 40% 10%
Newsprint 48,8g/m2
85 000 MT/y 625$/MT
Price: Quantity: Contract
105% 5% 0%
100% 5%
100%
100% 70%
100%
95% 10% 80%
90% 40% 10%
Ethanol 25 000 BDMT/y 800$/BDMT
Price: Quantity: Contract:
110% 5% 0%
105% 5% 0%
100% 70% 75%
98% 10% 0%
95% 40% 0%
Lignin 23 000 BDMT/y 1700$/BDMT
Price: Quantity: Contract
110% 10% 0%
105% 10% 0%
100% 40% 60%
75% 10% 0%
10% 40% 0%
Furfural 12 000 BDMT/y 1500$/BDMT
Price: Quantity: Contract
110% 10% 0%
100% 40% 60%
95% 10% 0%
85% 10% 0%
50% 40% 0%
Hardwood chips
265 000 BDMT/y 170$/BDMT
Price: Quantity: Contract:
90% 15% 0%
95% 10% 0%
100% 10% 0%
105% 60% 0%
110% 40% 0%
Softwood chips
265 000 BDMT/y 160$/BDMT
Price: Quantity: Contract:
90% 15% 0%
95% 10% 0%
100% 10% 0%
105% 60% 0%
110% 40% 0%
Recycled paper
290 000 BDMT/y 190$/BDMT
Price: Quantity: Contract
100% 100% 0%
100% 0% 0%
100% 0% 0%
100% 0% 0%
100% 0% 0%
Overall, the case study consists of 1 mill, 21 suppliers and 51 customer clusters. 99 different
materials, 32 processes and 279 recipes are accounted for a total of 46009 variables including
6156 binary, and 163786 constraints. This model has been implemented in IBM ILOG CPLEX
Optimization Studio 12.2 on an AMD Athlon dual core processor with 2.8 GHz and 4 Go RAM.
Global optimum solutions are obtained in 2 to 1000 seconds, depending on the analysis made.
The test case shows that this mathematical formulation can be used for testing quickly different
manufacturing configurations and market scenarios, as results are obtained in an acceptable time
even for an industrial application.
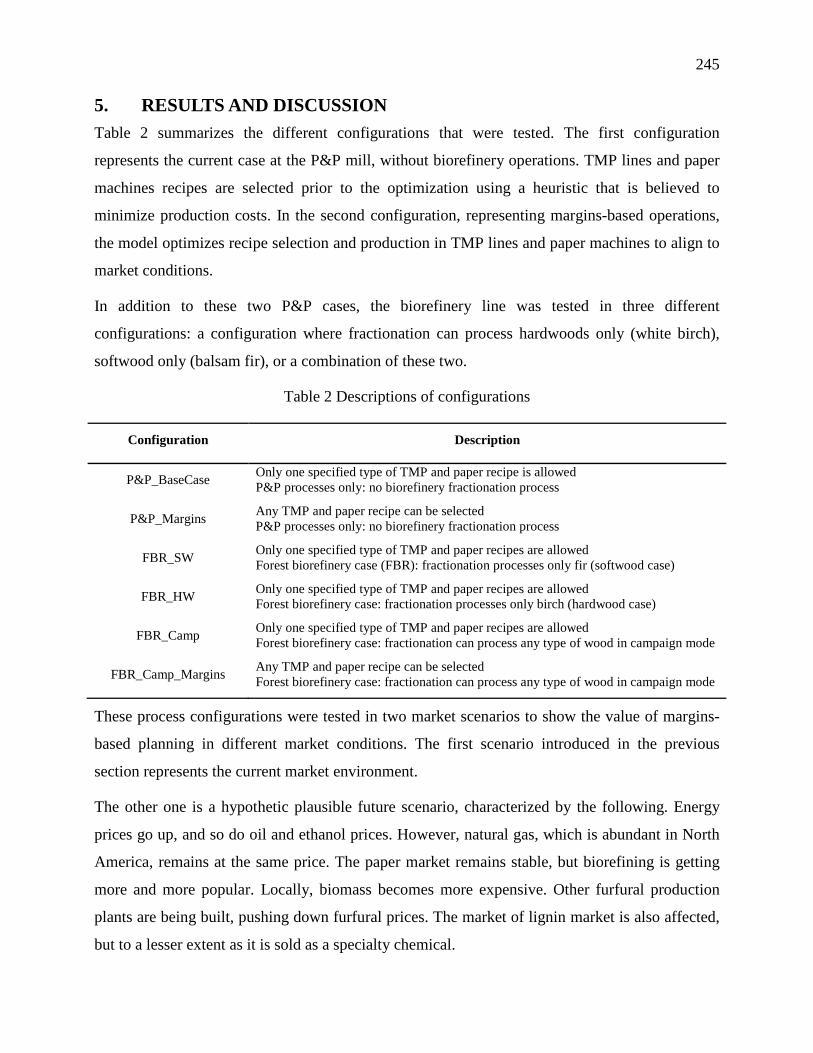
245
5. RESULTS AND DISCUSSION Table 2 summarizes the different configurations that were tested. The first configuration
represents the current case at the P&P mill, without biorefinery operations. TMP lines and paper
machines recipes are selected prior to the optimization using a heuristic that is believed to
minimize production costs. In the second configuration, representing margins-based operations,
the model optimizes recipe selection and production in TMP lines and paper machines to align to
market conditions.
In addition to these two P&P cases, the biorefinery line was tested in three different
configurations: a configuration where fractionation can process hardwoods only (white birch),
softwood only (balsam fir), or a combination of these two.
Table 2 Descriptions of configurations
Configuration Description
P&P_BaseCase Only one specified type of TMP and paper recipe is allowed P&P processes only: no biorefinery fractionation process
P&P_Margins Any TMP and paper recipe can be selected P&P processes only: no biorefinery fractionation process
FBR_SW Only one specified type of TMP and paper recipes are allowed Forest biorefinery case (FBR): fractionation processes only fir (softwood case)
FBR_HW Only one specified type of TMP and paper recipes are allowed Forest biorefinery case: fractionation processes only birch (hardwood case)
FBR_Camp Only one specified type of TMP and paper recipes are allowed Forest biorefinery case: fractionation can process any type of wood in campaign mode
FBR_Camp_Margins Any TMP and paper recipe can be selected Forest biorefinery case: fractionation can process any type of wood in campaign mode
These process configurations were tested in two market scenarios to show the value of margins-
based planning in different market conditions. The first scenario introduced in the previous
section represents the current market environment.
The other one is a hypothetic plausible future scenario, characterized by the following. Energy
prices go up, and so do oil and ethanol prices. However, natural gas, which is abundant in North
America, remains at the same price. The paper market remains stable, but biorefining is getting
more and more popular. Locally, biomass becomes more expensive. Other furfural production
plants are being built, pushing down furfural prices. The market of lignin market is also affected,
but to a lesser extent as it is sold as a specialty chemical.
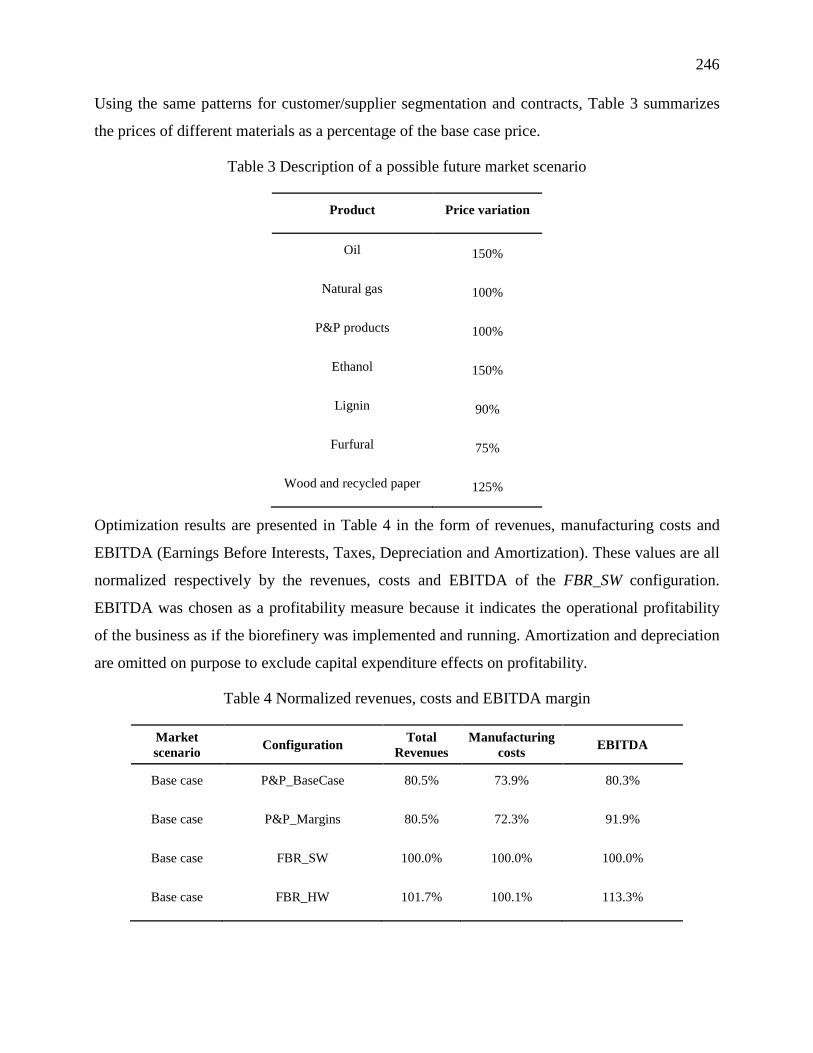
246
Using the same patterns for customer/supplier segmentation and contracts, Table 3 summarizes
the prices of different materials as a percentage of the base case price.
Table 3 Description of a possible future market scenario
Product Price variation
Oil 150%
Natural gas 100%
P&P products 100%
Ethanol 150%
Lignin 90%
Furfural 75%
Wood and recycled paper 125%
Optimization results are presented in Table 4 in the form of revenues, manufacturing costs and
EBITDA (Earnings Before Interests, Taxes, Depreciation and Amortization). These values are all
normalized respectively by the revenues, costs and EBITDA of the FBR_SW configuration.
EBITDA was chosen as a profitability measure because it indicates the operational profitability
of the business as if the biorefinery was implemented and running. Amortization and depreciation
are omitted on purpose to exclude capital expenditure effects on profitability.
Table 4 Normalized revenues, costs and EBITDA margin
Market scenario Configuration Total
Revenues Manufacturing
costs EBITDA
Base case P&P_BaseCase 80.5% 73.9% 80.3%
Base case P&P_Margins 80.5% 72.3% 91.9%
Base case FBR_SW 100.0% 100.0% 100.0%
Base case FBR_HW 101.7% 100.1% 113.3%
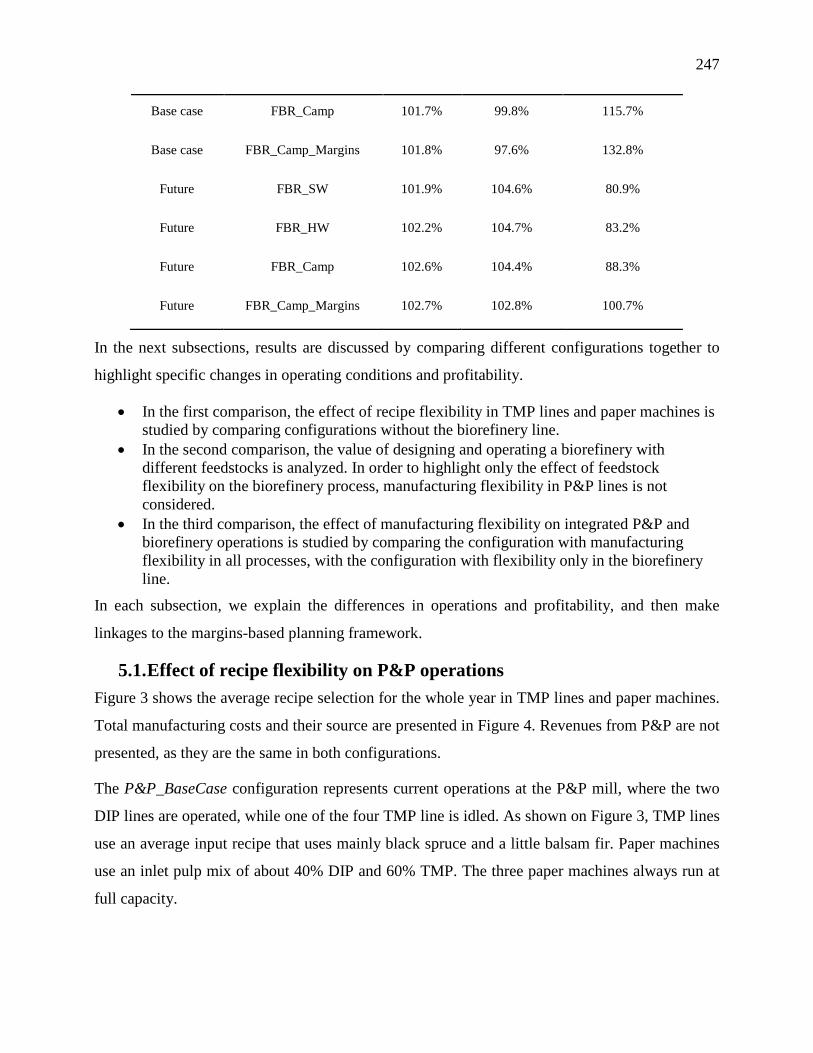
247
Base case FBR_Camp 101.7% 99.8% 115.7%
Base case FBR_Camp_Margins 101.8% 97.6% 132.8%
Future FBR_SW 101.9% 104.6% 80.9%
Future FBR_HW 102.2% 104.7% 83.2%
Future FBR_Camp 102.6% 104.4% 88.3%
Future FBR_Camp_Margins 102.7% 102.8% 100.7%
In the next subsections, results are discussed by comparing different configurations together to
highlight specific changes in operating conditions and profitability.
• In the first comparison, the effect of recipe flexibility in TMP lines and paper machines is studied by comparing configurations without the biorefinery line.
• In the second comparison, the value of designing and operating a biorefinery with different feedstocks is analyzed. In order to highlight only the effect of feedstock flexibility on the biorefinery process, manufacturing flexibility in P&P lines is not considered.
• In the third comparison, the effect of manufacturing flexibility on integrated P&P and biorefinery operations is studied by comparing the configuration with manufacturing flexibility in all processes, with the configuration with flexibility only in the biorefinery line.
In each subsection, we explain the differences in operations and profitability, and then make
linkages to the margins-based planning framework.
5.1. Effect of recipe flexibility on P&P operations Figure 3 shows the average recipe selection for the whole year in TMP lines and paper machines.
Total manufacturing costs and their source are presented in Figure 4. Revenues from P&P are not
presented, as they are the same in both configurations.
The P&P_BaseCase configuration represents current operations at the P&P mill, where the two
DIP lines are operated, while one of the four TMP line is idled. As shown on Figure 3, TMP lines
use an average input recipe that uses mainly black spruce and a little balsam fir. Paper machines
use an inlet pulp mix of about 40% DIP and 60% TMP. The three paper machines always run at
full capacity.
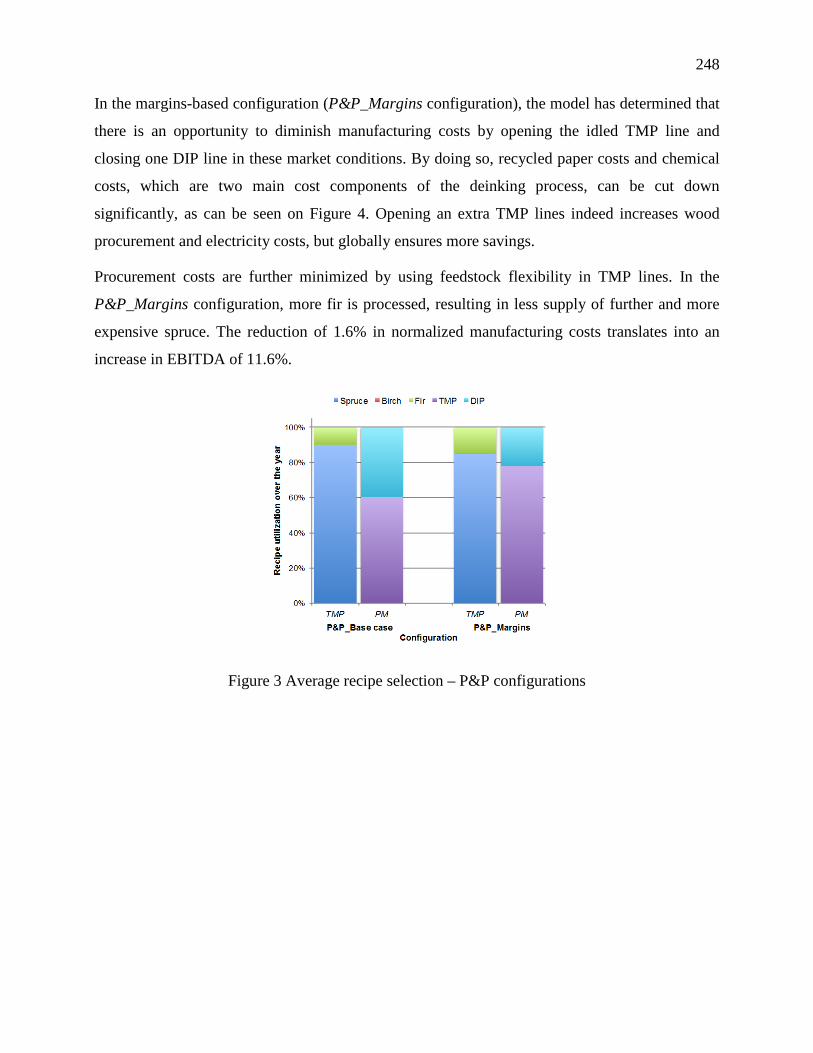
248
In the margins-based configuration (P&P_Margins configuration), the model has determined that
there is an opportunity to diminish manufacturing costs by opening the idled TMP line and
closing one DIP line in these market conditions. By doing so, recycled paper costs and chemical
costs, which are two main cost components of the deinking process, can be cut down
significantly, as can be seen on Figure 4. Opening an extra TMP lines indeed increases wood
procurement and electricity costs, but globally ensures more savings.
Procurement costs are further minimized by using feedstock flexibility in TMP lines. In the
P&P_Margins configuration, more fir is processed, resulting in less supply of further and more
expensive spruce. The reduction of 1.6% in normalized manufacturing costs translates into an
increase in EBITDA of 11.6%.
Figure 3 Average recipe selection – P&P configurations
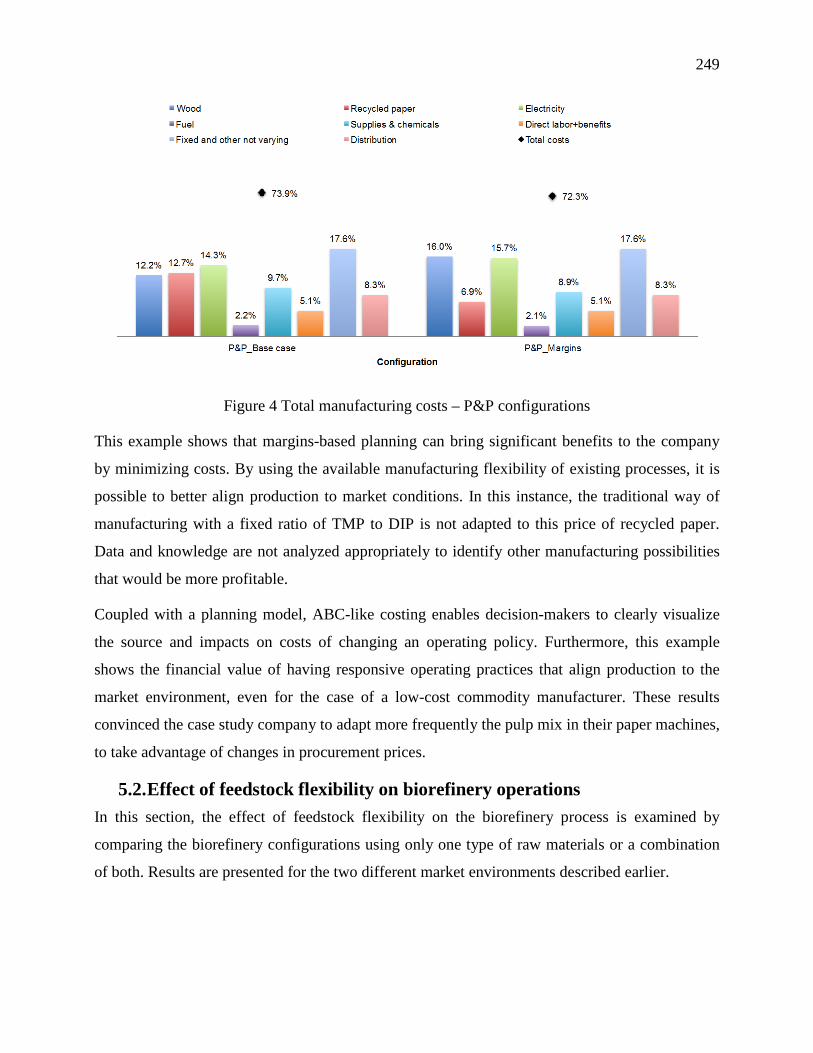
249
Figure 4 Total manufacturing costs – P&P configurations
This example shows that margins-based planning can bring significant benefits to the company
by minimizing costs. By using the available manufacturing flexibility of existing processes, it is
possible to better align production to market conditions. In this instance, the traditional way of
manufacturing with a fixed ratio of TMP to DIP is not adapted to this price of recycled paper.
Data and knowledge are not analyzed appropriately to identify other manufacturing possibilities
that would be more profitable.
Coupled with a planning model, ABC-like costing enables decision-makers to clearly visualize
the source and impacts on costs of changing an operating policy. Furthermore, this example
shows the financial value of having responsive operating practices that align production to the
market environment, even for the case of a low-cost commodity manufacturer. These results
convinced the case study company to adapt more frequently the pulp mix in their paper machines,
to take advantage of changes in procurement prices.
5.2. Effect of feedstock flexibility on biorefinery operations In this section, the effect of feedstock flexibility on the biorefinery process is examined by
comparing the biorefinery configurations using only one type of raw materials or a combination
of both. Results are presented for the two different market environments described earlier.
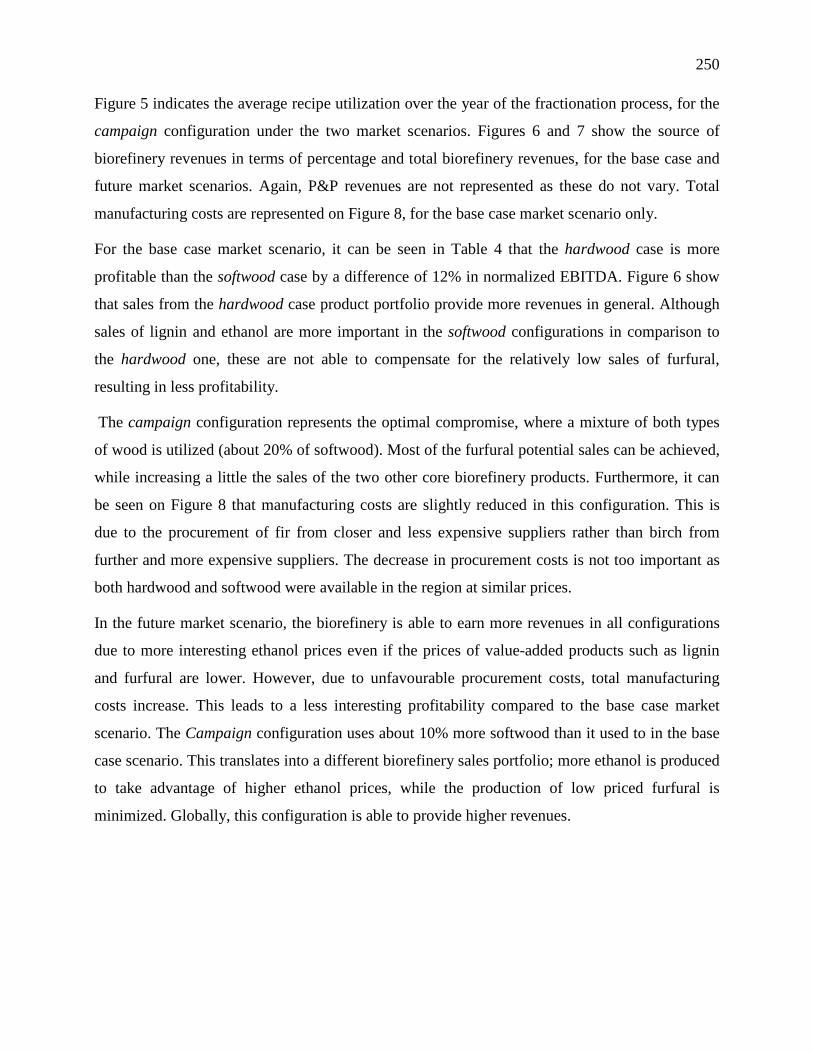
250
Figure 5 indicates the average recipe utilization over the year of the fractionation process, for the
campaign configuration under the two market scenarios. Figures 6 and 7 show the source of
biorefinery revenues in terms of percentage and total biorefinery revenues, for the base case and
future market scenarios. Again, P&P revenues are not represented as these do not vary. Total
manufacturing costs are represented on Figure 8, for the base case market scenario only.
For the base case market scenario, it can be seen in Table 4 that the hardwood case is more
profitable than the softwood case by a difference of 12% in normalized EBITDA. Figure 6 show
that sales from the hardwood case product portfolio provide more revenues in general. Although
sales of lignin and ethanol are more important in the softwood configurations in comparison to
the hardwood one, these are not able to compensate for the relatively low sales of furfural,
resulting in less profitability.
The campaign configuration represents the optimal compromise, where a mixture of both types
of wood is utilized (about 20% of softwood). Most of the furfural potential sales can be achieved,
while increasing a little the sales of the two other core biorefinery products. Furthermore, it can
be seen on Figure 8 that manufacturing costs are slightly reduced in this configuration. This is
due to the procurement of fir from closer and less expensive suppliers rather than birch from
further and more expensive suppliers. The decrease in procurement costs is not too important as
both hardwood and softwood were available in the region at similar prices.
In the future market scenario, the biorefinery is able to earn more revenues in all configurations
due to more interesting ethanol prices even if the prices of value-added products such as lignin
and furfural are lower. However, due to unfavourable procurement costs, total manufacturing
costs increase. This leads to a less interesting profitability compared to the base case market
scenario. The Campaign configuration uses about 10% more softwood than it used to in the base
case scenario. This translates into a different biorefinery sales portfolio; more ethanol is produced
to take advantage of higher ethanol prices, while the production of low priced furfural is
minimized. Globally, this configuration is able to provide higher revenues.
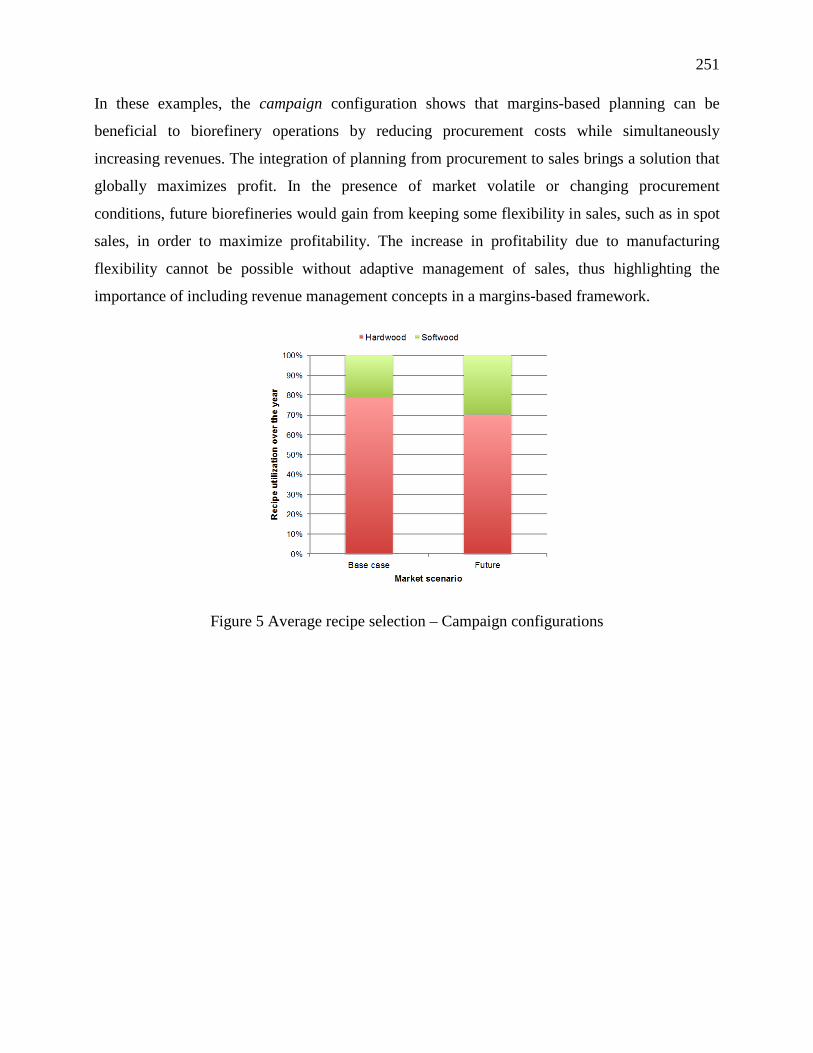
251
In these examples, the campaign configuration shows that margins-based planning can be
beneficial to biorefinery operations by reducing procurement costs while simultaneously
increasing revenues. The integration of planning from procurement to sales brings a solution that
globally maximizes profit. In the presence of market volatile or changing procurement
conditions, future biorefineries would gain from keeping some flexibility in sales, such as in spot
sales, in order to maximize profitability. The increase in profitability due to manufacturing
flexibility cannot be possible without adaptive management of sales, thus highlighting the
importance of including revenue management concepts in a margins-based framework.
Figure 5 Average recipe selection – Campaign configurations
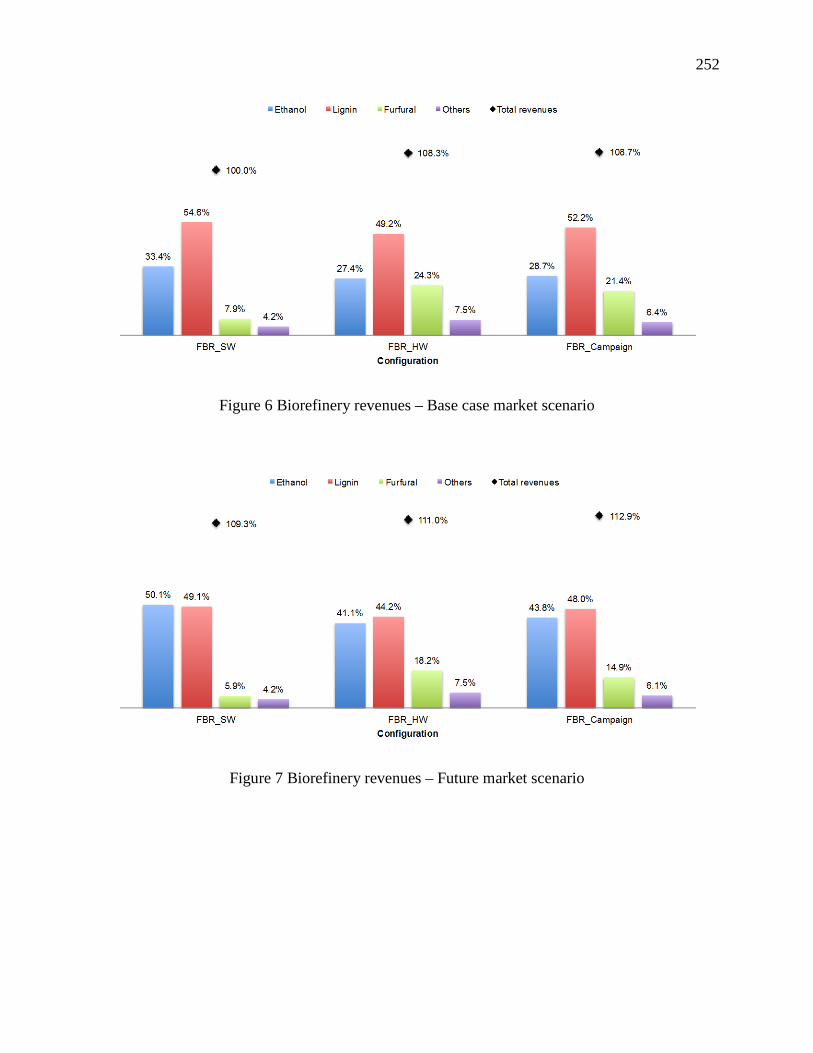
252
Figure 6 Biorefinery revenues – Base case market scenario
Figure 7 Biorefinery revenues – Future market scenario
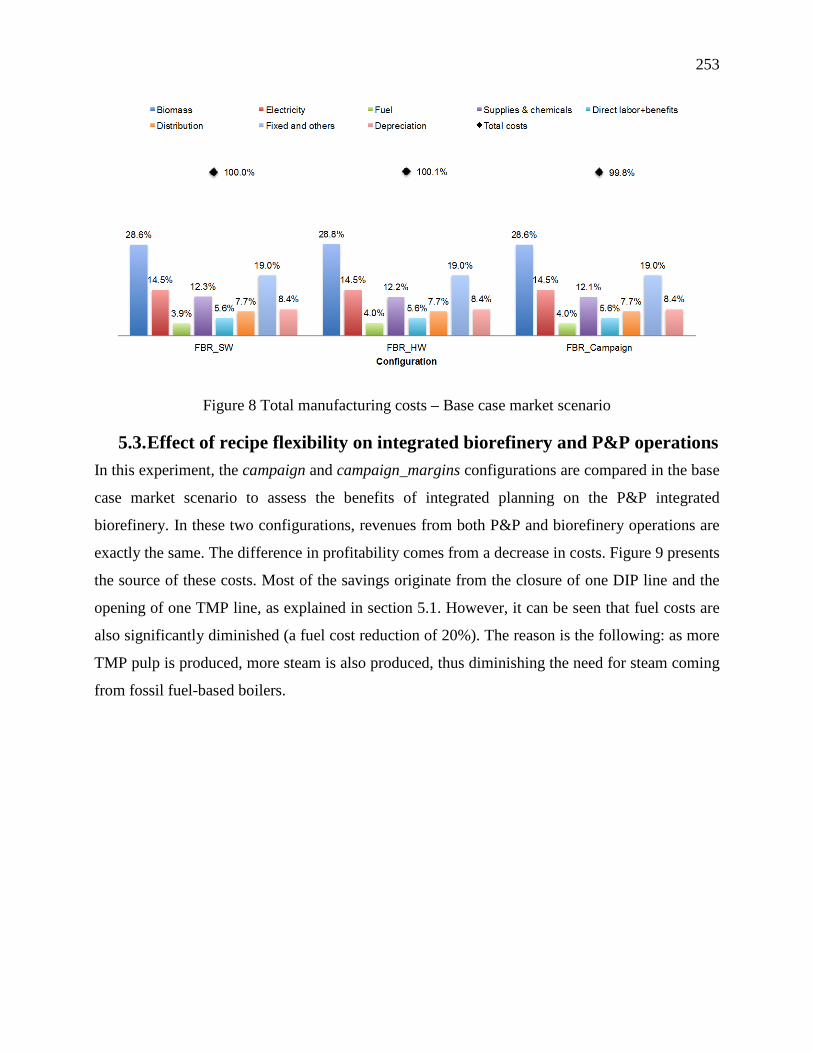
253
Figure 8 Total manufacturing costs – Base case market scenario
5.3. Effect of recipe flexibility on integrated biorefinery and P&P operations In this experiment, the campaign and campaign_margins configurations are compared in the base
case market scenario to assess the benefits of integrated planning on the P&P integrated
biorefinery. In these two configurations, revenues from both P&P and biorefinery operations are
exactly the same. The difference in profitability comes from a decrease in costs. Figure 9 presents
the source of these costs. Most of the savings originate from the closure of one DIP line and the
opening of one TMP line, as explained in section 5.1. However, it can be seen that fuel costs are
also significantly diminished (a fuel cost reduction of 20%). The reason is the following: as more
TMP pulp is produced, more steam is also produced, thus diminishing the need for steam coming
from fossil fuel-based boilers.
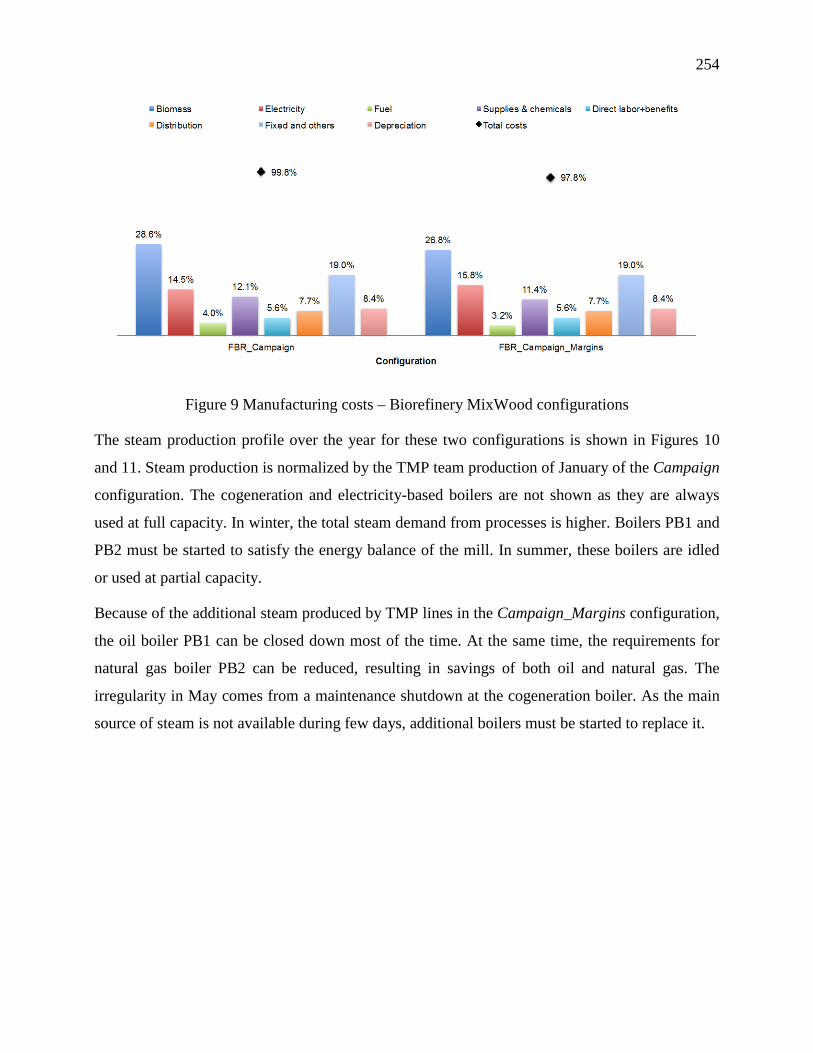
254
Figure 9 Manufacturing costs – Biorefinery MixWood configurations
The steam production profile over the year for these two configurations is shown in Figures 10
and 11. Steam production is normalized by the TMP team production of January of the Campaign
configuration. The cogeneration and electricity-based boilers are not shown as they are always
used at full capacity. In winter, the total steam demand from processes is higher. Boilers PB1 and
PB2 must be started to satisfy the energy balance of the mill. In summer, these boilers are idled
or used at partial capacity.
Because of the additional steam produced by TMP lines in the Campaign_Margins configuration,
the oil boiler PB1 can be closed down most of the time. At the same time, the requirements for
natural gas boiler PB2 can be reduced, resulting in savings of both oil and natural gas. The
irregularity in May comes from a maintenance shutdown at the cogeneration boiler. As the main
source of steam is not available during few days, additional boilers must be started to replace it.
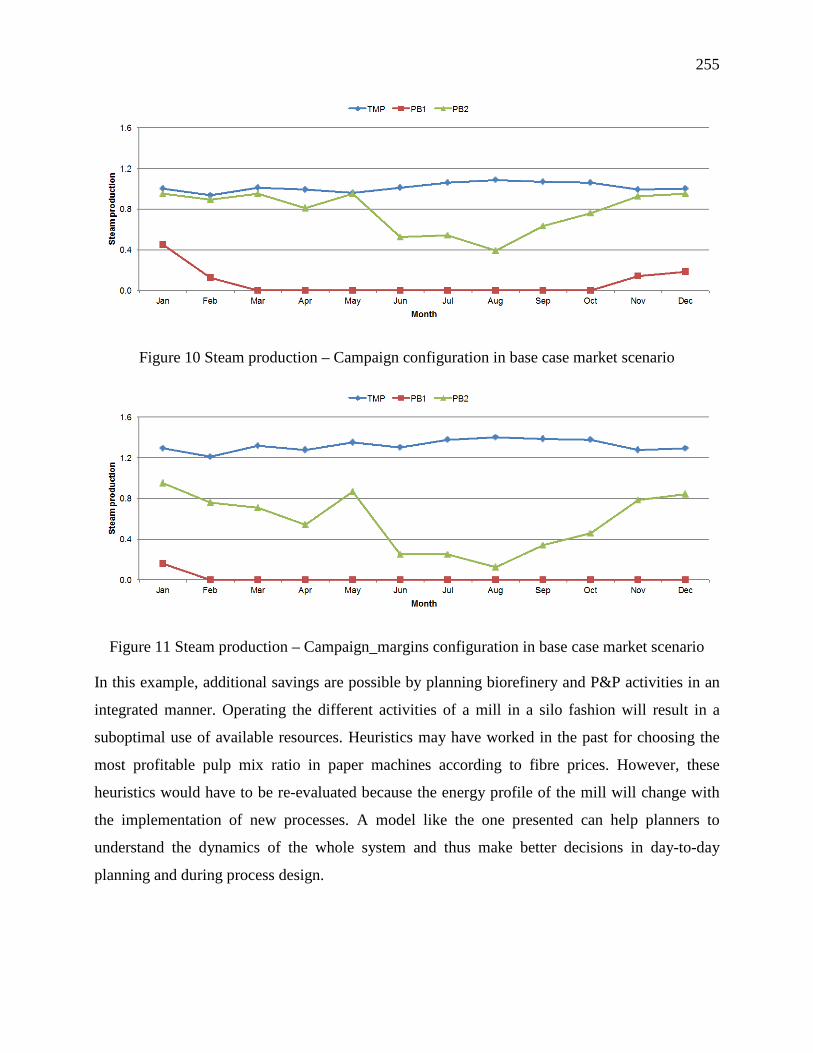
255
Figure 10 Steam production – Campaign configuration in base case market scenario
Figure 11 Steam production – Campaign_margins configuration in base case market scenario
In this example, additional savings are possible by planning biorefinery and P&P activities in an
integrated manner. Operating the different activities of a mill in a silo fashion will result in a
suboptimal use of available resources. Heuristics may have worked in the past for choosing the
most profitable pulp mix ratio in paper machines according to fibre prices. However, these
heuristics would have to be re-evaluated because the energy profile of the mill will change with
the implementation of new processes. A model like the one presented can help planners to
understand the dynamics of the whole system and thus make better decisions in day-to-day
planning and during process design.
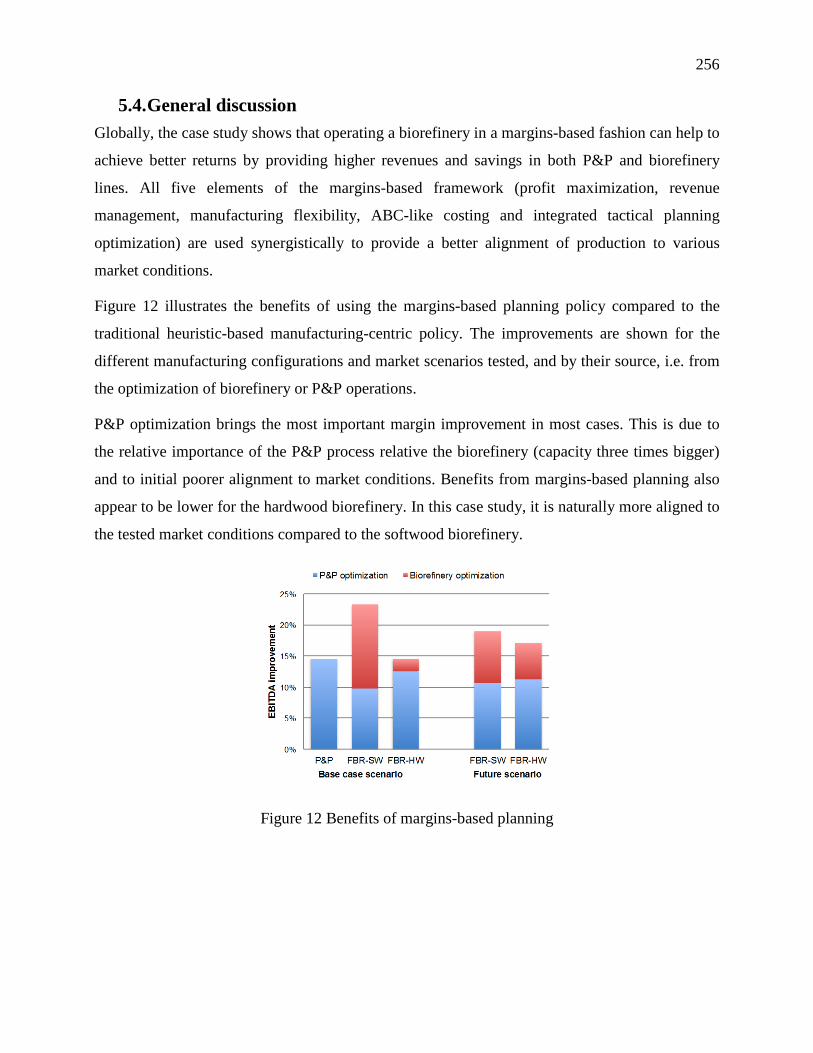
256
5.4. General discussion Globally, the case study shows that operating a biorefinery in a margins-based fashion can help to
achieve better returns by providing higher revenues and savings in both P&P and biorefinery
lines. All five elements of the margins-based framework (profit maximization, revenue
management, manufacturing flexibility, ABC-like costing and integrated tactical planning
optimization) are used synergistically to provide a better alignment of production to various
market conditions.
Figure 12 illustrates the benefits of using the margins-based planning policy compared to the
traditional heuristic-based manufacturing-centric policy. The improvements are shown for the
different manufacturing configurations and market scenarios tested, and by their source, i.e. from
the optimization of biorefinery or P&P operations.
P&P optimization brings the most important margin improvement in most cases. This is due to
the relative importance of the P&P process relative the biorefinery (capacity three times bigger)
and to initial poorer alignment to market conditions. Benefits from margins-based planning also
appear to be lower for the hardwood biorefinery. In this case study, it is naturally more aligned to
the tested market conditions compared to the softwood biorefinery.
Figure 12 Benefits of margins-based planning
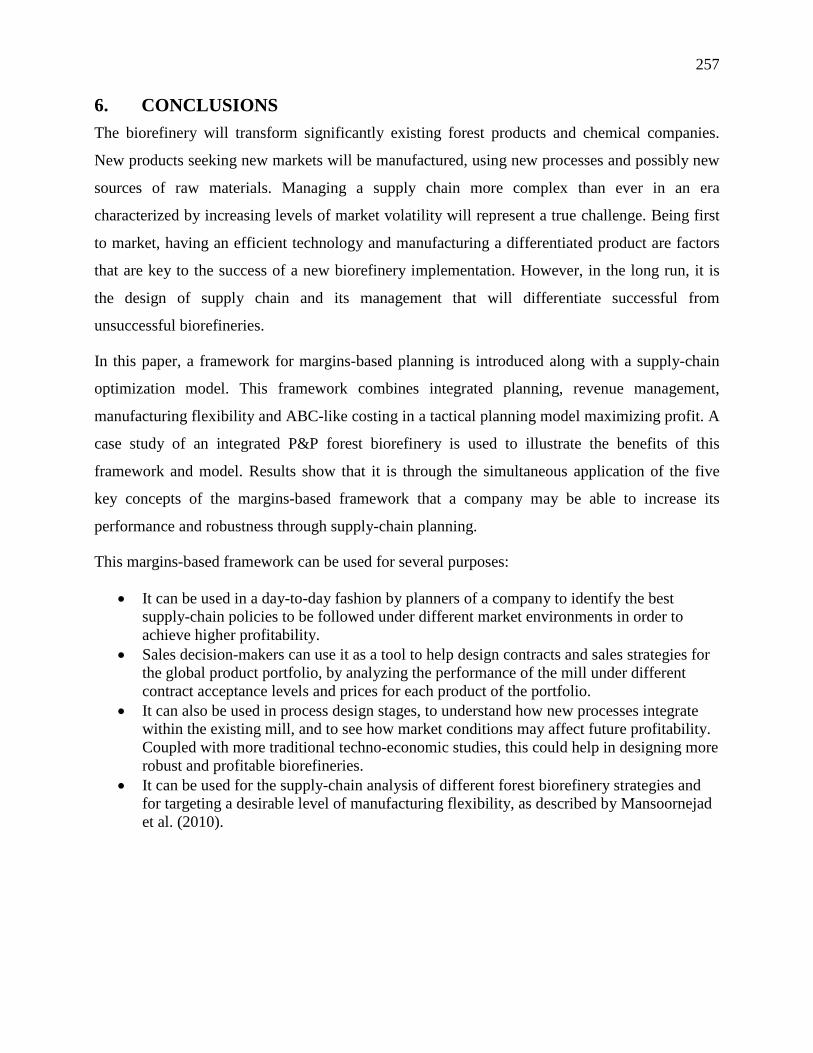
257
6. CONCLUSIONS The biorefinery will transform significantly existing forest products and chemical companies.
New products seeking new markets will be manufactured, using new processes and possibly new
sources of raw materials. Managing a supply chain more complex than ever in an era
characterized by increasing levels of market volatility will represent a true challenge. Being first
to market, having an efficient technology and manufacturing a differentiated product are factors
that are key to the success of a new biorefinery implementation. However, in the long run, it is
the design of supply chain and its management that will differentiate successful from
unsuccessful biorefineries.
In this paper, a framework for margins-based planning is introduced along with a supply-chain
optimization model. This framework combines integrated planning, revenue management,
manufacturing flexibility and ABC-like costing in a tactical planning model maximizing profit. A
case study of an integrated P&P forest biorefinery is used to illustrate the benefits of this
framework and model. Results show that it is through the simultaneous application of the five
key concepts of the margins-based framework that a company may be able to increase its
performance and robustness through supply-chain planning.
This margins-based framework can be used for several purposes:
• It can be used in a day-to-day fashion by planners of a company to identify the best supply-chain policies to be followed under different market environments in order to achieve higher profitability.
• Sales decision-makers can use it as a tool to help design contracts and sales strategies for the global product portfolio, by analyzing the performance of the mill under different contract acceptance levels and prices for each product of the portfolio.
• It can also be used in process design stages, to understand how new processes integrate within the existing mill, and to see how market conditions may affect future profitability. Coupled with more traditional techno-economic studies, this could help in designing more robust and profitable biorefineries.
• It can be used for the supply-chain analysis of different forest biorefinery strategies and for targeting a desirable level of manufacturing flexibility, as described by Mansoornejad et al. (2010).
258
Operating in a margins-based fashion represents a shift in corporate planning. Planning heuristics
that worked in the past, such as maximizing production and minimizing production costs only,
are no longer adapted to changing market conditions. Rather, a company managing a complex
multi-product facility such as the biorefinery should look at being more reactive and align
production using available manufacturing and sales flexibilities.
Presented results show a priori the importance of feedstock flexibility for a biochemical
biorefinery producing a portfolio of both commodities and specialties. In addition, it was shown
that existing overcapacity and process flexibility in P&P operations can increase current and
future profitability. Even though results are specific to this case study, the authors believe that
biorefineries should be designed with a certain level of flexibility to mitigate the risk of market
volatility. Future work will consist of a more in depth study of different process configurations
leading to manufacturing flexibility to better understand their importance and implications in
various market conditions.
7. ACKNOWLEDGMENTS This work was supported by Natural Sciences Engineering Research Council of Canada
(NSERC) Environmental Design Engineering Chair at Ecole Polytechnique in Montréal. Louis
Patrick Dansereau is supported by a scholarship provided by Le Fond Québécois de la Recherche
sur la Nature et les Technologies. The authors also wish to thank the case study company and the
biorefinery technology provider for information and insights provided, as well as Jawad Jeaidi for
helping with the techno-economic study.
8. REFERENCES Amidon, T. E., Wood, C. D., Shupe, A. M., Wang, Y., Graves, M., & Liu, S. (2008). Biorefinery:
Conversion of woody biomass to chemicals, energy and materials. Journal of Biobased
Materials and Bioenergy, 2, 100-120.
Browne, T., Singbeil, D., Gilsenan, R., & Paleologou, M. (2011). Bio-energy and Bio-chemicals
Synthesis Report. In: FPInnovations.
Chambost, V., McNutt, J., & Stuart, P. R. (2008). Guided tour: Implementing the forest
biorefinery (FBR) at existing pulp and paper mills. Pulp and Paper Canada, 109, 19-27.
259
Dansereau, L. P., El-Halwagi, M. M., & Stuart, P. R. (2009). Sustainable Supply Chain Planning
for the Forest Biorefinery. In M. M. El-Halwagi & A. A. Linninger (Eds.), Design for
Energy and the Environment - 7th International Conference on the Foundation of
Computer-Aided Process Design (pp. 1101-1105). Breckenridge, USA: Taylor & Francis.
Dansereau, L. P., El-Halwagi, M. M., & Stuart, P. R. (2012). Value Chain Management
Considerations for the Biorefinery. In M. M. El-Halwagi & P. Stuart (Eds.), Integrated
Biorefineries: Design, Analysis, and Optimization (pp. 195-250): CRC Press/Taylor &
Francis.
Feng, Y., D'Amours, S., & Beauregard, R. (2008). The value of sales and operations planning in
oriented strand board industry with make-to-order manufacturing system: Cross
functional integration under deterministic demand and spot market recourse. International
Journal of Production Economics, 115, 189-209.
Guillen-Gosalbez, G., & Grossmann, I. E. (2009). Optimal design and planning of sustainable
chemical supply chains under uncertainty. AIChE Journal, 55, 99-121.
Gunasekaran, A., Marri, H. B., & Yusuf, Y. Y. (1999). Application of activity-based costing:
some case experiences. Managerial Auditing Journal, 14, 286-293.
Humbird, D., Davis, R., Tao, L., Kinchin, C., Hsu, D., Aden, A., Shchoen, P., Lukas, J., Olthof,
B., Worley, M., Sexton, D., & Dudgeon, D. (2011). Process Design and Economics for
Biochemical Conversion of Lignocellulosix Biomass to Ethanol - Dilute-Acid
Pretreatment and Enzymatic Hydrolysis of Corn Stover. In (pp. 147). Golden, Colorado:
National Renewable Energy Laboratory.
ICIS. (2012). Indicative Chemical Prices A-Z. In.
Kannegiesser, M., & Gunther, H. O. (2011). An integrated optimization model for managing the
global value chain of a chemical commodities manufacturer. Journal of the Operational
Research Society, 62, 711-721.
Kannegiesser, M., Gunther, H. O., Beek, P., Grunow, M., & Habla, C. (2009). Value chain
management for commodities: a case study from the chemical industry. OR Spectrum, 31,
63-93.
260
Kim, Y., Yun, C., Park, S. B., Park, S., & Fan, L. T. (2008). An integrated model of supply
network and production planning for multiple fuel products of multi-site refineries.
Computers and Chemical Engineering, 32, 2529-2535.
Laflamme-Mayer, M. (2009). Cadre de planification de la chaine logistique base sur la
representation des procedes pour l'amelioration de la rentabilite de l'industrie des pates et
papiers. Ecole Polytechnique, Montreal, Canada.
Laflamme-Mayer, M., Janssen, M., & Stuart, P. R. (2011). Development of an Operations-Driven
Cost Model fon Continuous Processes Part 1: Framework for design and operations
decision making. Journal of Science and Technology for Forest Products and Processes,
1, 32-41.
Lynd, L. R., Wyman, C., Laser, M., Johnson, D., & Landucci, R. (2005). Strategic Biorefinery
Analysis: Analysis of Biorefineries. In. Golden, Colorado, USA: National Renewable
Energy Laboratory (NREL).
Mansoornejad, B., & Stuart, P. R. (2012). Forest Biorefinery Supply Chain Design and Process
Flexibility. In M. M. El-Halwagi & P. Stuart (Eds.), Integrated Biorefineries: Design,
Analysis, and Optimization: CRC Press/Taylor & Francis.
Maravelias, C. T., & Sung, C. (2008). Integration of production planning and scheduling
Overview, challenges and opportunities. Computers and Chemical Engineering, 33, 1919.
PaperAge. (2012). Newsprint prices by grade per ton. In.
Shapiro, J. F. (2007). Modeling the Supply Chain (2 ed.). Pacific Grove, CA: Thomson-
Brooks/Cole.
Söderholm, P., & Lundmark, R. (2009). Forest-based biorefineries: Implications for market
behavior and policy. Forest Products Journal, 59, 6-16.
Sousa, R., Shah, N., & Papageorgiou, L. G. (2008). Supply chain design and multilevel planning-
An industrial case. Computers and Chemical Engineering, 32, 2643-2663.
Stadtler, H., & Kilger, C. (2008). Supply Chain Management and Advanced Planning: Concepts,
Models, Software and Case Studies (4 ed.). Berlin: Springer-Verlag.
261
Talluri, K. T., & van Ryzin, G. J. (2004). The theory and practice of revenue management.
Boston: Kluwer Academic Publishers.
Thorp, B. (2005). Biorefinery offers industry leaders business model for major change. Pulp &
Paper, 79, 35-39.
Xing, R., Qi, W., & Huber, G. W. (2011). Production of furfural and carboxylic acids from waste
aqueous hemicellulose solutions from the pulp and paper and cellulosic ethanol industries.
Energy and Environmental Science, 4, 2193-2205.
262
APPENDIX – MATHEMATICAL FORMULATION
General Forest Biorefinery Problem Definition
The general supply-chain problem addressed in this article is depicted in Figure A1. Several
biomass and other raw materials suppliers/locations supply the mills of a company. These mills
in turn transform raw materials into intermediates and final products, which can be transported to
other mills, distribution centers and/or final customers according to their demand. Inventory of
materials can be held in the facilities of the company. Some customers and suppliers have
contract agreements with the forest biorefinery company. For these, specific quantities of
material must be obligatory purchased/sold every time period. For other spot customers and
suppliers, demand/procurement can be partially fulfilled. Capacitated transportation routes link
suppliers, facilities and customers together.
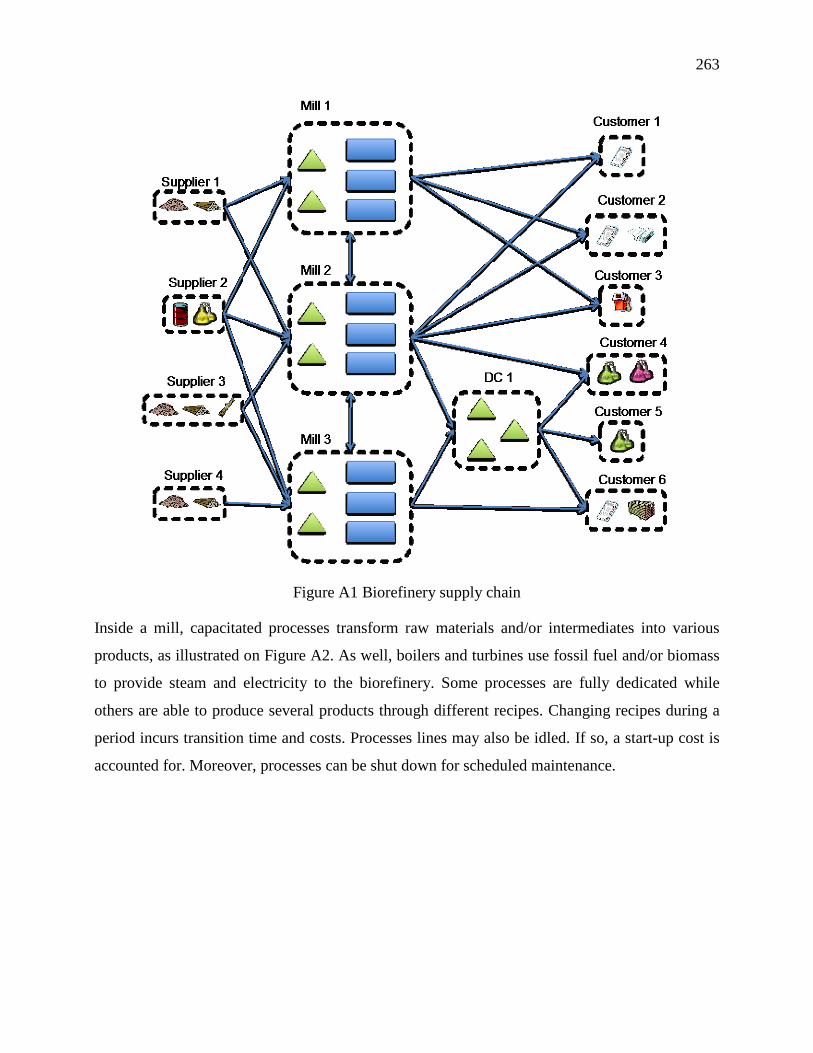
263
Figure A1 Biorefinery supply chain
Inside a mill, capacitated processes transform raw materials and/or intermediates into various
products, as illustrated on Figure A2. As well, boilers and turbines use fossil fuel and/or biomass
to provide steam and electricity to the biorefinery. Some processes are fully dedicated while
others are able to produce several products through different recipes. Changing recipes during a
period incurs transition time and costs. Processes lines may also be idled. If so, a start-up cost is
accounted for. Moreover, processes can be shut down for scheduled maintenance.
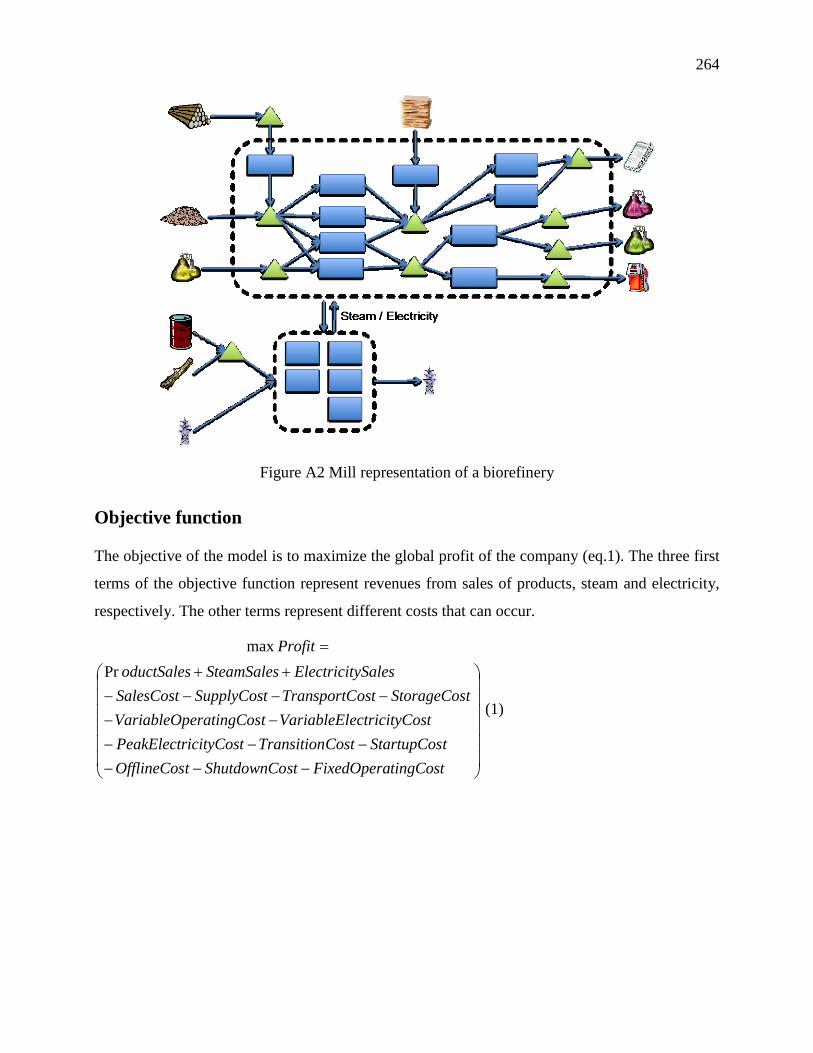
264
Figure A2 Mill representation of a biorefinery
Objective function
The objective of the model is to maximize the global profit of the company (eq.1). The three first
terms of the objective function represent revenues from sales of products, steam and electricity,
respectively. The other terms represent different costs that can occur.
−−−−−−
−−−−−−
++
=
tingCostFixedOperastShutdownCotOfflineCostStartupCosCostTransitionicityCostPeakElectr
ostectricityCVariableElteratingCosVariableOptStorageCosostTransportCSupplyCostSalesCost
ySalesElectricitSteamSalesoductSalesProfit
Prmax
(1)
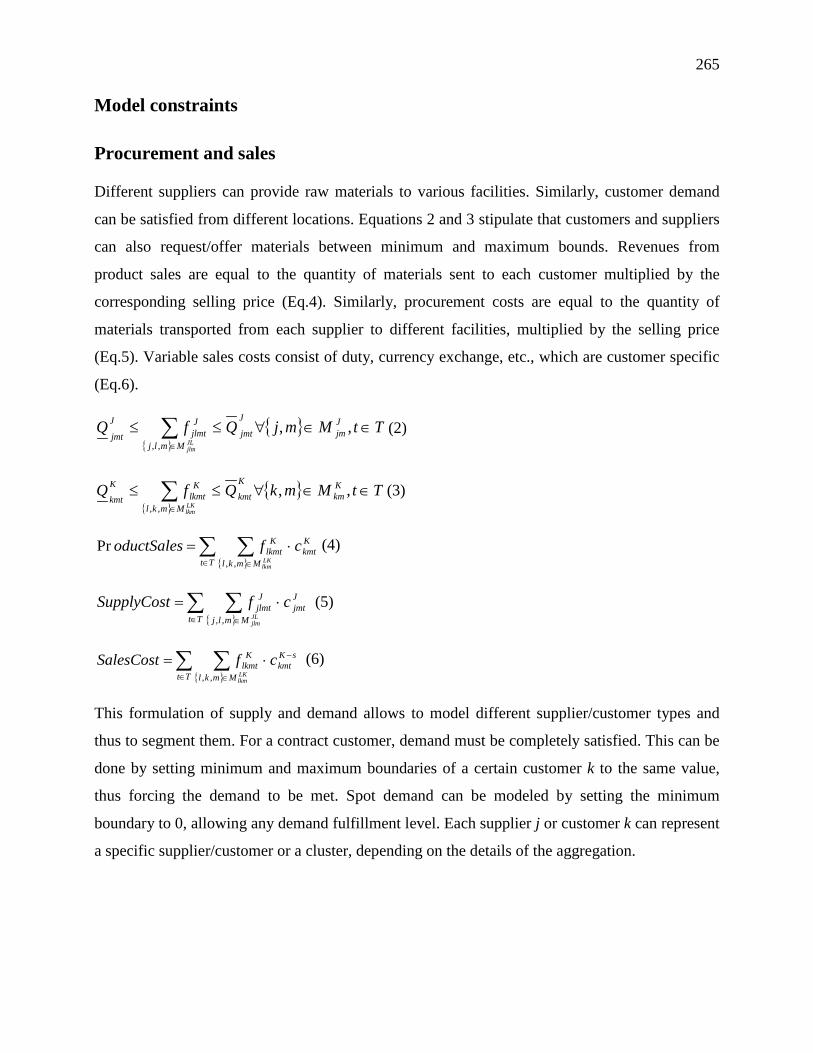
265
Model constraints
Procurement and sales
Different suppliers can provide raw materials to various facilities. Similarly, customer demand
can be satisfied from different locations. Equations 2 and 3 stipulate that customers and suppliers
can also request/offer materials between minimum and maximum bounds. Revenues from
product sales are equal to the quantity of materials sent to each customer multiplied by the
corresponding selling price (Eq.4). Similarly, procurement costs are equal to the quantity of
materials transported from each supplier to different facilities, multiplied by the selling price
(Eq.5). Variable sales costs consist of duty, currency exchange, etc., which are customer specific
(Eq.6).
{ }{ } TtMmjQfQ J
jmJ
jmtMmlj
Jjlmt
J
jmtJLjlm
∈∈∀≤≤ ∑∈
,,,,
(2)
{ }{ } TtMmkQfQ K
kmK
kmtMmkl
Klkmt
K
kmtLKlkm
∈∈∀≤≤ ∑∈
,,,,
(3)
{ }∑ ∑∈ ∈
⋅=Tt Mmkl
Kkmt
Klkmt
LKlkm
cfoductSales,,
Pr (4)
{ }∑ ∑∈ ∈
⋅=Tt Mmlj
Jjmt
Jjlmt
JLjlm
cfSupplyCost,,
(5)
{ }∑ ∑∈ ∈
−⋅=Tt Mmkl
sKkmt
Klkmt
LKlkm
cfSalesCost,,
(6)
This formulation of supply and demand allows to model different supplier/customer types and
thus to segment them. For a contract customer, demand must be completely satisfied. This can be
done by setting minimum and maximum boundaries of a certain customer k to the same value,
thus forcing the demand to be met. Spot demand can be modeled by setting the minimum
boundary to 0, allowing any demand fulfillment level. Each supplier j or customer k can represent
a specific supplier/customer or a cluster, depending on the details of the aggregation.
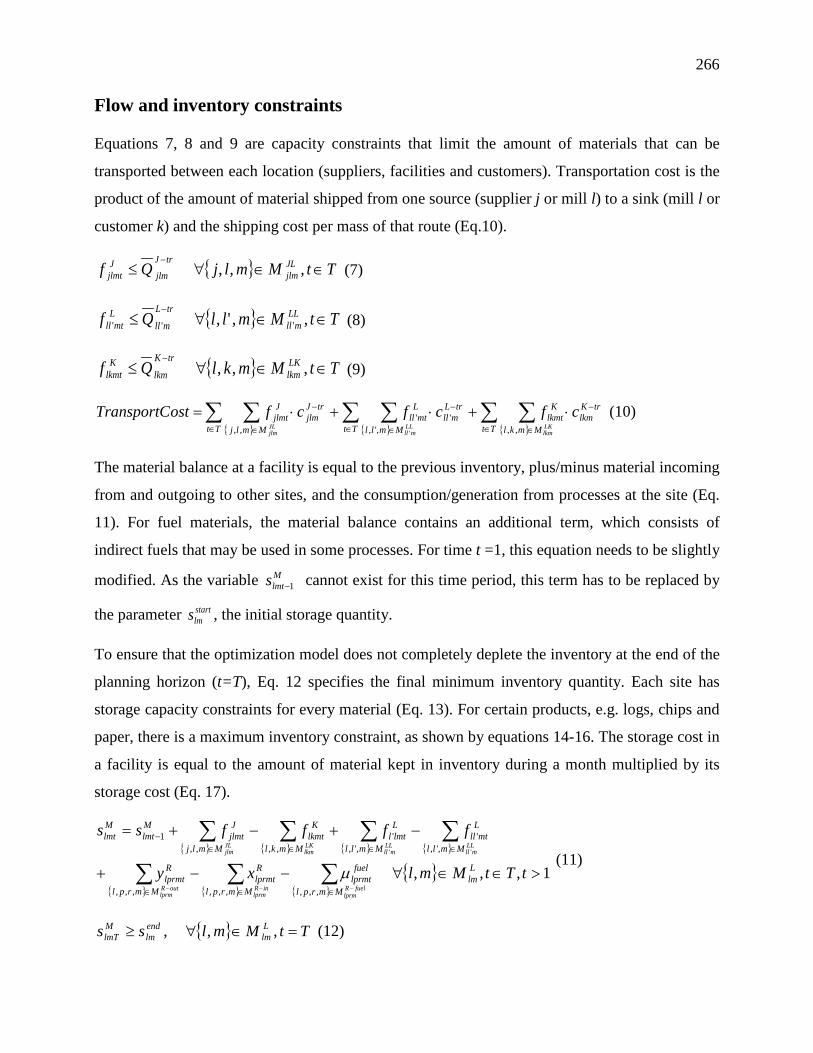
266
Flow and inventory constraints
Equations 7, 8 and 9 are capacity constraints that limit the amount of materials that can be
transported between each location (suppliers, facilities and customers). Transportation cost is the
product of the amount of material shipped from one source (supplier j or mill l) to a sink (mill l or
customer k) and the shipping cost per mass of that route (Eq.10).
{ } TtMmljQf JLjlm
trJ
jlmJjlmt ∈∈∀≤
−,,, (7)
{ } TtMmllQf LLmll
trL
mllLmtll ∈∈∀≤
−,,', ''' (8)
{ } TtMmklQf LKlkm
trK
lkmK
lkmt ∈∈∀≤−
,,, (9)
{ } { } { }∑ ∑∑ ∑∑ ∑∈ ∈
−
∈ ∈
−
∈ ∈
− ⋅+⋅+⋅=Tt Mmkl
trKlkm
Klkmt
Tt Mmll
trLmll
Lmtll
Tt Mmlj
trJjlm
Jjlmt
LKlkm
LLmll
JLjlm
cfcfcfostTransportC,,,',
'',, '
(10)
The material balance at a facility is equal to the previous inventory, plus/minus material incoming
from and outgoing to other sites, and the consumption/generation from processes at the site (Eq.
11). For fuel materials, the material balance contains an additional term, which consists of
indirect fuels that may be used in some processes. For time t =1, this equation needs to be slightly
modified. As the variable Mlmts 1− cannot exist for this time period, this term has to be replaced by
the parameter startlms , the initial storage quantity.
To ensure that the optimization model does not completely deplete the inventory at the end of the
planning horizon (t=T), Eq. 12 specifies the final minimum inventory quantity. Each site has
storage capacity constraints for every material (Eq. 13). For certain products, e.g. logs, chips and
paper, there is a maximum inventory constraint, as shown by equations 14-16. The storage cost in
a facility is equal to the amount of material kept in inventory during a month multiplied by its
storage cost (Eq. 17).
{ } { } { } { }
{ } { } { }{ } 1,,,
,,,,,,,,,
,','
,','
,,,,1
''
>∈∈∀−−+
−+−+=
∑∑∑
∑∑∑∑
−−− ∈∈∈
∈∈∈∈−
tTtMmlxy
ffffss
Llm
Mmrpl
fuellprmt
Mmrpl
Rlprmt
Mmrpl
Rlprmt
Mmll
Lmtll
Mmll
Llmtl
Mmkl
Klkmt
Mmlj
Jjlmt
Mlmt
Mlmt
fuelRlprm
inRlprm
outRlprm
LLmll
LLmll
LKlkm
JLjlm
µ
(11)
{ } TtMmlss Llm
endlm
MlmT =∈∀≥ ,, , (12)
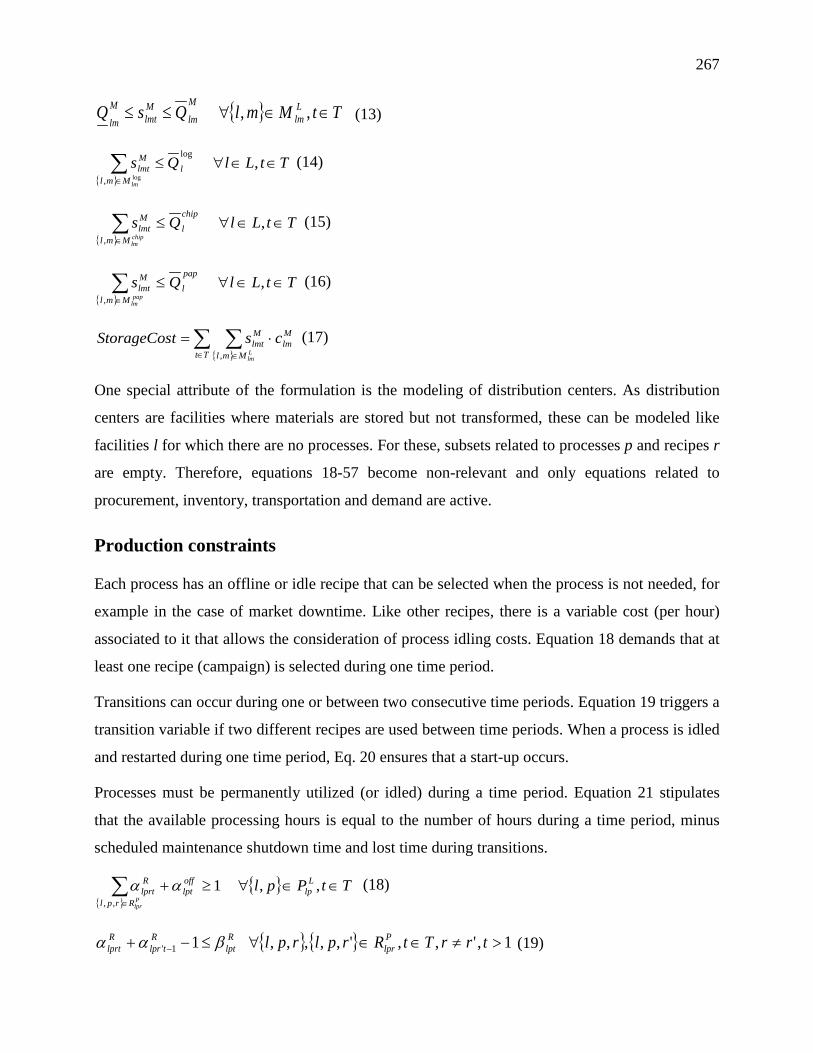
267
{ } TtMmlQsQ Llm
M
lmMlmt
M
lm∈∈∀≤≤ ,, (13)
{ }TtLlQs l
Mml
Mlmt
lm
∈∈∀≤∑∈
, log
, log (14)
{ }TtLlQs
chip
lMml
Mlmt
chiplm
∈∈∀≤∑∈
, ,
(15)
{ }TtLlQs
pap
lMml
Mlmt
paplm
∈∈∀≤∑∈
, ,
(16)
{ }∑ ∑∈ ∈
⋅=Tt Mml
Mlm
Mlmt
Llm
cstStorageCos,
(17)
One special attribute of the formulation is the modeling of distribution centers. As distribution
centers are facilities where materials are stored but not transformed, these can be modeled like
facilities l for which there are no processes. For these, subsets related to processes p and recipes r
are empty. Therefore, equations 18-57 become non-relevant and only equations related to
procurement, inventory, transportation and demand are active.
Production constraints
Each process has an offline or idle recipe that can be selected when the process is not needed, for
example in the case of market downtime. Like other recipes, there is a variable cost (per hour)
associated to it that allows the consideration of process idling costs. Equation 18 demands that at
least one recipe (campaign) is selected during one time period.
Transitions can occur during one or between two consecutive time periods. Equation 19 triggers a
transition variable if two different recipes are used between time periods. When a process is idled
and restarted during one time period, Eq. 20 ensures that a start-up occurs.
Processes must be permanently utilized (or idled) during a time period. Equation 21 stipulates
that the available processing hours is equal to the number of hours during a time period, minus
scheduled maintenance shutdown time and lost time during transitions.
{ }{ } TtPpl L
lpofflpt
Rrpl
Rlprt
Plpr
∈∈∀≥+∑∈
,, 1,,
αα (18)
{ } { } 1,',,',,,,, 11' >≠∈∈∀≤−+ − trrTtRrplrpl Plpr
Rlpt
Rtlpr
Rlprt βαα (19)
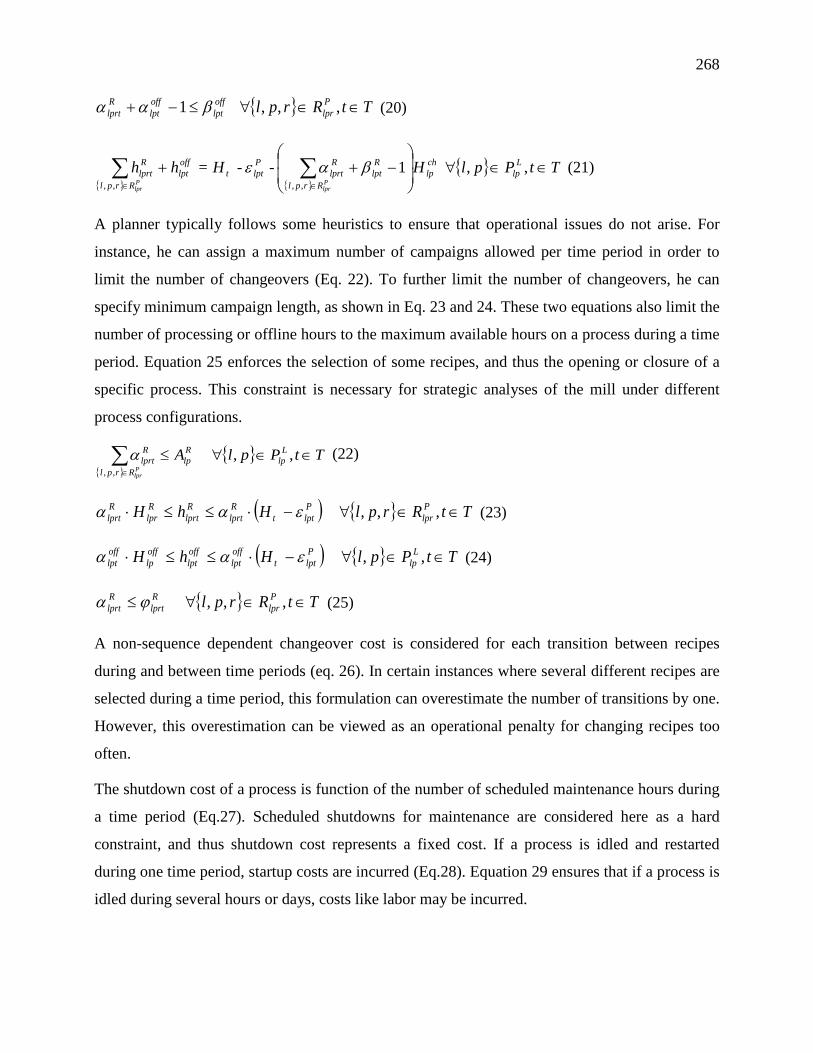
268
{ } TtRrpl Plpr
offlpt
offlpt
Rlprt ∈∈∀≤−+ ,,, 1 βαα (20)
{ } { }{ } TtPplHHhh L
lpchlp
Rlpt
Rrpl
Rlprt
Plptt
offlpt
Rrpl
Rlprt
Plpr
Plpr
∈∈∀
−++ ∑∑
∈∈
,, 1--=,,,,
βαε (21)
A planner typically follows some heuristics to ensure that operational issues do not arise. For
instance, he can assign a maximum number of campaigns allowed per time period in order to
limit the number of changeovers (Eq. 22). To further limit the number of changeovers, he can
specify minimum campaign length, as shown in Eq. 23 and 24. These two equations also limit the
number of processing or offline hours to the maximum available hours on a process during a time
period. Equation 25 enforces the selection of some recipes, and thus the opening or closure of a
specific process. This constraint is necessary for strategic analyses of the mill under different
process configurations.
{ }{ } TtPplA L
lpRlp
Rrpl
Rlprt
Plpr
∈∈∀≤∑∈
,, ,,
α (22)
( ) { } TtRrplHhH Plpr
Plptt
Rlprt
Rlprt
Rlpr
Rlprt ∈∈∀−⋅≤≤⋅ ,,, εαα
(23)
( ) { } TtPplHhH Llp
Plptt
offlpt
offlpt
offlp
offlpt ∈∈∀−⋅≤≤⋅ ,, εαα (24)
{ } TtRrpl Plpr
Rlprt
Rlprt ∈∈∀≤ ,,, ϕα (25)
A non-sequence dependent changeover cost is considered for each transition between recipes
during and between time periods (eq. 26). In certain instances where several different recipes are
selected during a time period, this formulation can overestimate the number of transitions by one.
However, this overestimation can be viewed as an operational penalty for changing recipes too
often.
The shutdown cost of a process is function of the number of scheduled maintenance hours during
a time period (Eq.27). Scheduled shutdowns for maintenance are considered here as a hard
constraint, and thus shutdown cost represents a fixed cost. If a process is idled and restarted
during one time period, startup costs are incurred (Eq.28). Equation 29 ensures that if a process is
idled during several hours or days, costs like labor may be incurred.
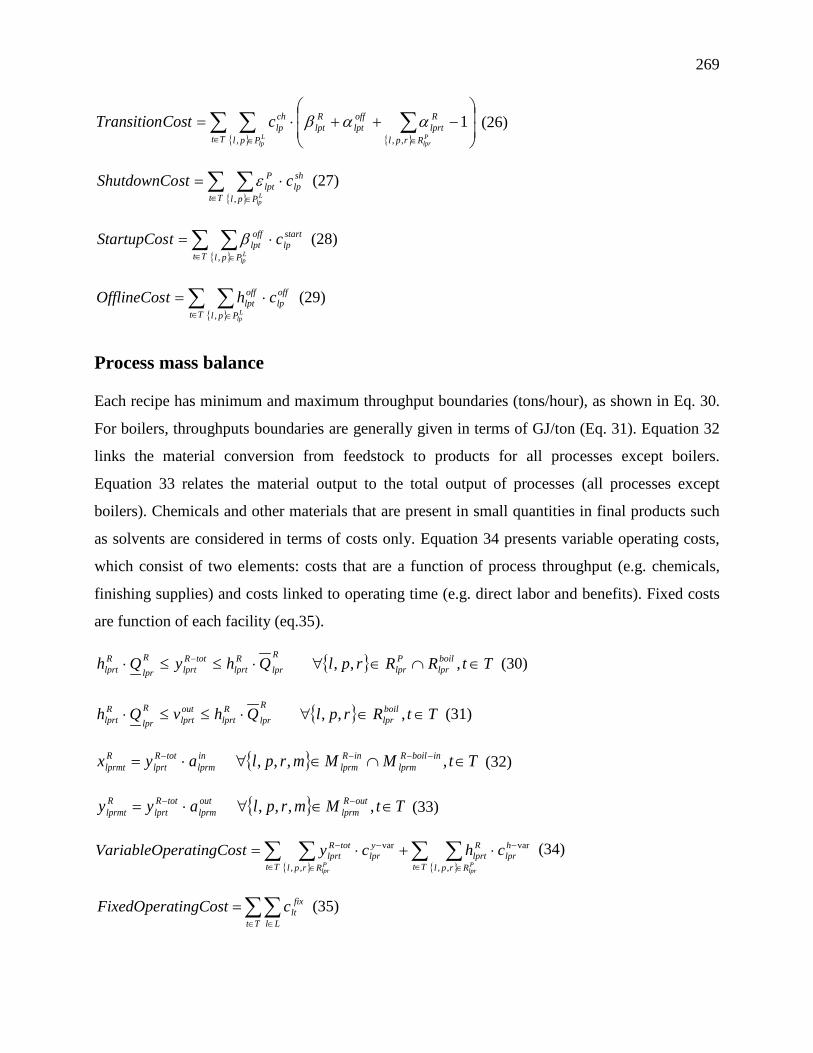
269
{ }{ }∑ ∑ ∑∈ ∈ ∈
−++⋅=
Tt Ppl Rrpl
Rlprt
offlpt
Rlpt
chlp
Llp
Plpr
cCostTransition, ,,
1ααβ (26)
{ }∑ ∑∈ ∈
⋅=Tt Ppl
shlp
Plpt
Llp
cstShutdownCo,
ε (27)
{ }∑ ∑∈ ∈
⋅=Tt Ppl
startlp
offlpt
Llp
ctStartupCos,
β (28)
{ }∑ ∑∈ ∈
⋅=Tt Ppl
offlp
offlpt
Llp
chtOfflineCos,
(29)
Process mass balance
Each recipe has minimum and maximum throughput boundaries (tons/hour), as shown in Eq. 30.
For boilers, throughputs boundaries are generally given in terms of GJ/ton (Eq. 31). Equation 32
links the material conversion from feedstock to products for all processes except boilers.
Equation 33 relates the material output to the total output of processes (all processes except
boilers). Chemicals and other materials that are present in small quantities in final products such
as solvents are considered in terms of costs only. Equation 34 presents variable operating costs,
which consist of two elements: costs that are a function of process throughput (e.g. chemicals,
finishing supplies) and costs linked to operating time (e.g. direct labor and benefits). Fixed costs
are function of each facility (eq.35).
{ } TtRRrplQhyQh boillpr
Plpr
R
lprRlprt
totRlprt
R
lprRlprt ∈∩∈∀⋅≤≤⋅ − ,,, (30)
{ } TtRrplQhvQh boillpr
R
lprRlprt
outlprt
R
lprRlprt ∈∈∀⋅≤≤⋅ ,,, (31)
{ } TtMMmrplayx inboilRlprm
inRlprm
inlprm
totRlprt
Rlprmt ∈∩∈∀⋅= −−−− ,,,, (32)
{ } TtMmrplayy outRlprm
outlprm
totRlprt
Rlprmt ∈∈∀⋅= −− ,,,, (33)
{ } { }∑ ∑∑ ∑∈ ∈
−
∈ ∈
−− ⋅+⋅=Tt Rrpl
hlpr
Rlprt
Tt Rrpl
ylpr
totRlprt
Plpr
Plpr
chcyteratingCosVariableOp,,
var
,,
var (34)
∑∑∈ ∈
=Tt Ll
fixltctingCostFixedOpera (35)
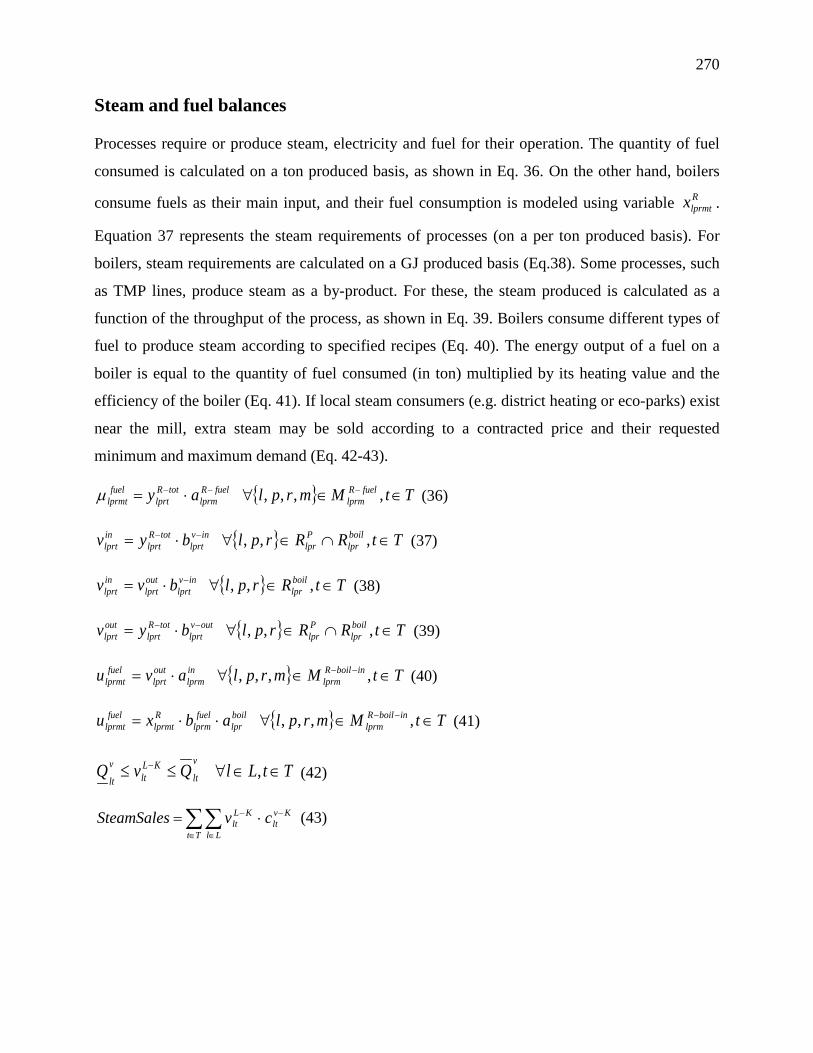
270
Steam and fuel balances
Processes require or produce steam, electricity and fuel for their operation. The quantity of fuel
consumed is calculated on a ton produced basis, as shown in Eq. 36. On the other hand, boilers
consume fuels as their main input, and their fuel consumption is modeled using variable Rlprmtx .
Equation 37 represents the steam requirements of processes (on a per ton produced basis). For
boilers, steam requirements are calculated on a GJ produced basis (Eq.38). Some processes, such
as TMP lines, produce steam as a by-product. For these, the steam produced is calculated as a
function of the throughput of the process, as shown in Eq. 39. Boilers consume different types of
fuel to produce steam according to specified recipes (Eq. 40). The energy output of a fuel on a
boiler is equal to the quantity of fuel consumed (in ton) multiplied by its heating value and the
efficiency of the boiler (Eq. 41). If local steam consumers (e.g. district heating or eco-parks) exist
near the mill, extra steam may be sold according to a contracted price and their requested
minimum and maximum demand (Eq. 42-43).
{ } TtMmrplay fuelRlprm
fuelRlprm
totRlprt
fuellprmt ∈∈∀⋅= −−− ,,,, µ (36)
{ } TtRRrplbyv boillpr
Plpr
invlprt
totRlprt
inlprt ∈∩∈∀⋅= −− ,,, (37)
{ } TtRrplbvv boillpr
invlprt
outlprt
inlprt ∈∈∀⋅= − ,,, (38)
{ } TtRRrplbyv boillpr
Plpr
outvlprt
totRlprt
outlprt ∈∩∈∀⋅= −− ,,, (39)
{ } TtMmrplavu inboilRlprm
inlprm
outlprt
fuellprmt ∈∈∀⋅= −− ,,,, (40)
{ } TtMmrplabxu inboilRlprm
boillpr
fuellprm
Rlprmt
fuellprmt ∈∈∀⋅⋅= −− ,,,, (41)
TtLlQvQv
ltKL
ltv
lt∈∈∀≤≤ − , (42)
∑∑∈ ∈
−− ⋅=Tt Ll
Kvlt
KLlt cvSteamSales (43)
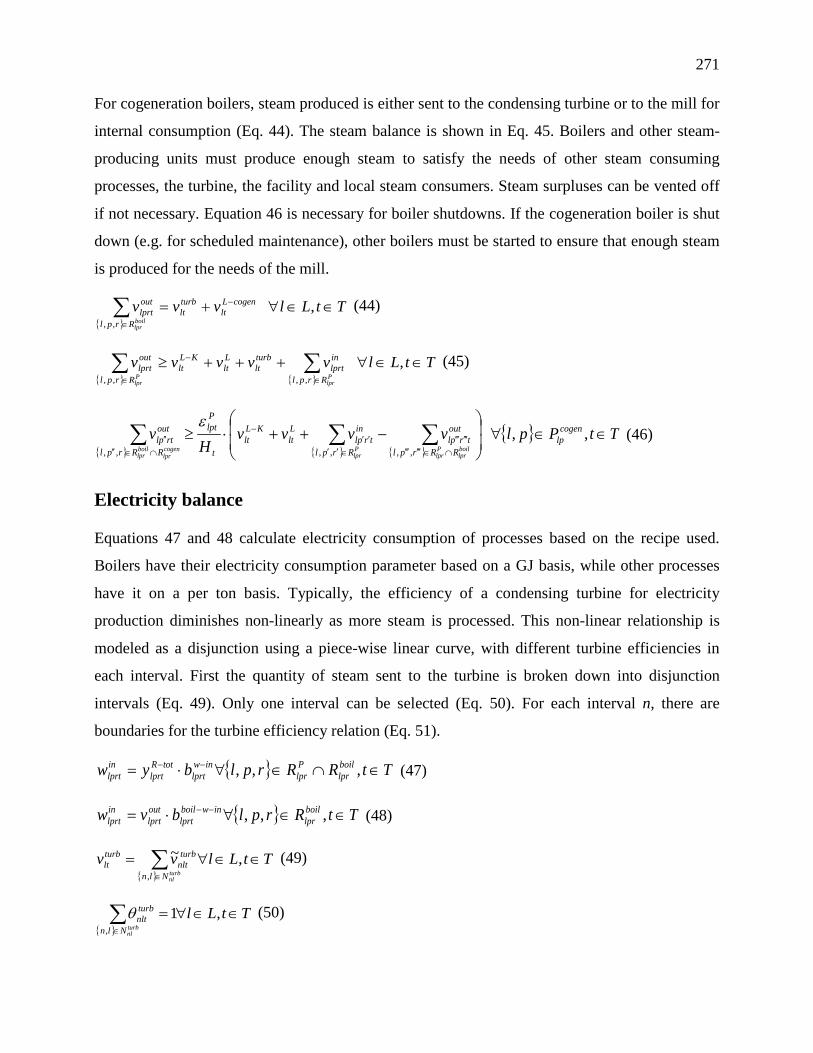
271
For cogeneration boilers, steam produced is either sent to the condensing turbine or to the mill for
internal consumption (Eq. 44). The steam balance is shown in Eq. 45. Boilers and other steam-
producing units must produce enough steam to satisfy the needs of other steam consuming
processes, the turbine, the facility and local steam consumers. Steam surpluses can be vented off
if not necessary. Equation 46 is necessary for boiler shutdowns. If the cogeneration boiler is shut
down (e.g. for scheduled maintenance), other boilers must be started to ensure that enough steam
is produced for the needs of the mill.
{ }TtLlvvv cogenL
ltturblt
Rrpl
outlprt
boillpr
∈∈∀+= −
∈∑ , ,,
(44)
{ } { }TtLlvvvvv
Plpr
Plpr Rrpl
inlprt
turblt
Llt
KLlt
Rrpl
outlprt ∈∈∀+++≥ ∑∑
∈
−
∈
, ,,,,
(45)
{ } { } { }{ } TtPplvvvv
Hv cogen
lpRRrpl
outtrpl
Rrpl
intrpl
Llt
KLlt
t
Plpt
RRrpl
outrtpl
boillpr
Plpr
Plpr
cogenlpr
boillpr
∈∈∀
−++⋅≥ ∑∑∑
∩∈′′′′′′′′′′′′
∈′′′′
−
∩∈′′′′ ,,
,,,,,,
ε (46)
Electricity balance
Equations 47 and 48 calculate electricity consumption of processes based on the recipe used.
Boilers have their electricity consumption parameter based on a GJ basis, while other processes
have it on a per ton basis. Typically, the efficiency of a condensing turbine for electricity
production diminishes non-linearly as more steam is processed. This non-linear relationship is
modeled as a disjunction using a piece-wise linear curve, with different turbine efficiencies in
each interval. First the quantity of steam sent to the turbine is broken down into disjunction
intervals (Eq. 49). Only one interval can be selected (Eq. 50). For each interval n, there are
boundaries for the turbine efficiency relation (Eq. 51).
{ } TtRRrplbyw boillpr
Plpr
inwlprt
totRlprt
inlprt ∈∩∈∀⋅= −− ,,, (47)
{ } TtRrplbvw boillpr
inwboillprt
outlprt
inlprt ∈∈∀⋅= −− ,,, (48)
{ }TtLlvv
turbnlNln
turbnlt
turblt ∈∈∀= ∑
∈
,~,
(49)
{ }TtLl
turbnlNln
turbnlt ∈∈∀=∑
∈
,1,
θ (50)
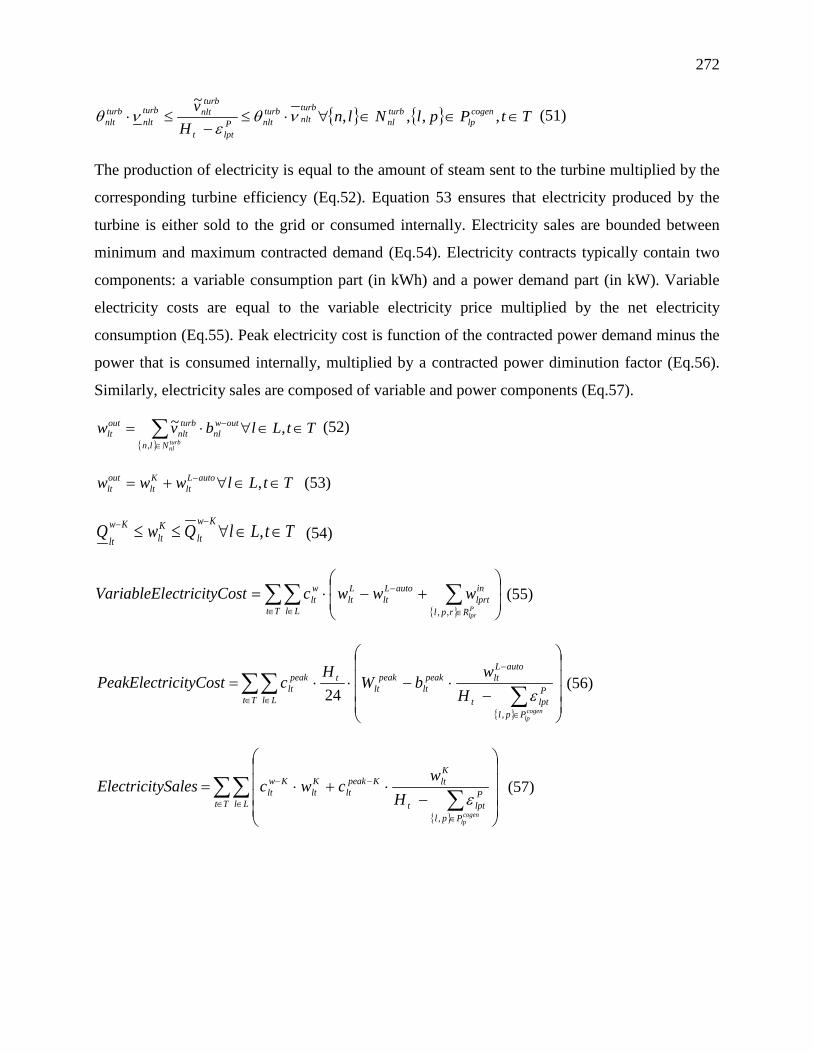
272
{ } { } TtPplNlnH
v cogenlp
turbnl
turbnlt
turbnltP
lptt
turbnltturb
nltturbnlt ∈∈∈∀⋅≤
−≤⋅ ,,,,
~νθ
ενθ (51)
The production of electricity is equal to the amount of steam sent to the turbine multiplied by the
corresponding turbine efficiency (Eq.52). Equation 53 ensures that electricity produced by the
turbine is either sold to the grid or consumed internally. Electricity sales are bounded between
minimum and maximum contracted demand (Eq.54). Electricity contracts typically contain two
components: a variable consumption part (in kWh) and a power demand part (in kW). Variable
electricity costs are equal to the variable electricity price multiplied by the net electricity
consumption (Eq.55). Peak electricity cost is function of the contracted power demand minus the
power that is consumed internally, multiplied by a contracted power diminution factor (Eq.56).
Similarly, electricity sales are composed of variable and power components (Eq.57).
{ }TtLlbvw
turbnlNln
outwnl
turbnlt
outlt ∈∈∀⋅= ∑
∈
− ,~,
(52)
TtLlwww autoLlt
Klt
outlt ∈∈∀+= − , (53)
TtLlQwQKw
ltKlt
Kw
lt∈∈∀≤≤
−− , (54)
{ }∑∑ ∑∈ ∈ ∈
−
+−⋅=
Tt Ll Rrpl
inlprt
autoLlt
Llt
wlt
Plpr
wwwcostectricityCVariableEl,,
(55)
{ }
∑∑ ∑∈ ∈∈
−
−⋅−⋅⋅=
Tt LlPpl
Plptt
autoLltpeak
ltpeak
lttpeak
lt
cogenlp
Hw
bWH
cicityCostPeakElectr
,
24 ε (56)
{ }
∑∑ ∑∈ ∈∈
−−
−⋅+⋅=
Tt LlPpl
Plptt
KltKpeak
ltKlt
Kwlt
cogenlp
Hw
cwcySalesElectricit
,
ε (57)
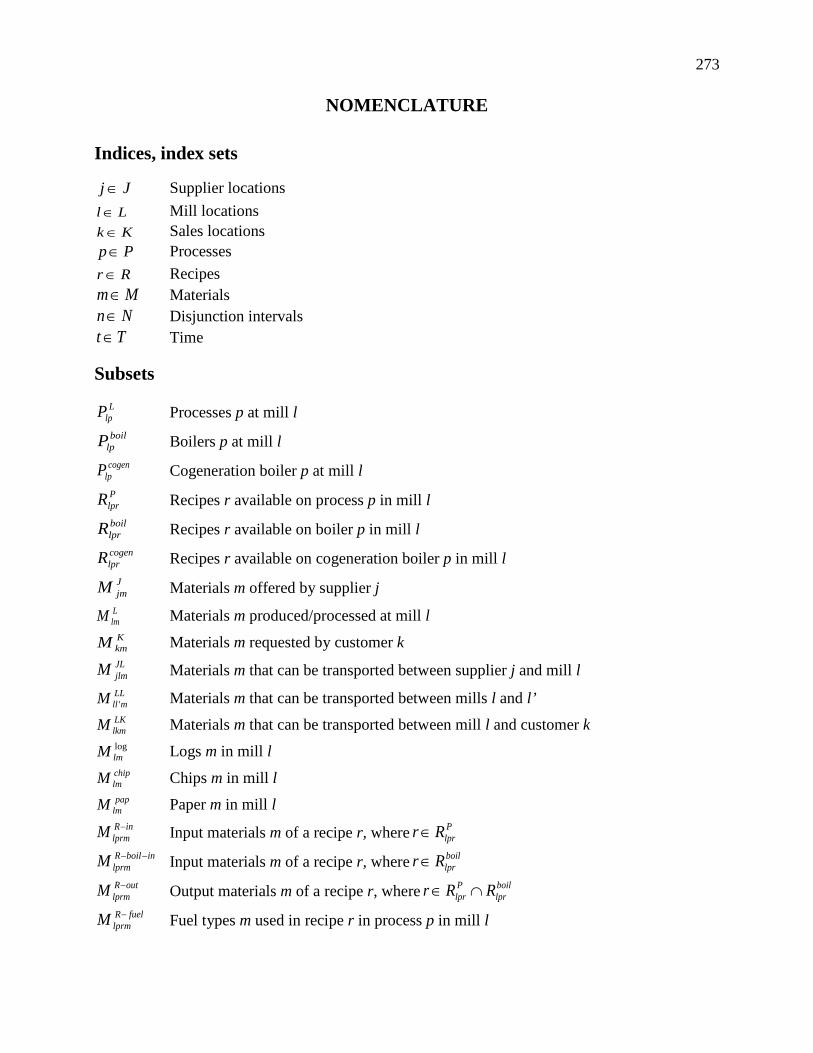
273
NOMENCLATURE
Indices, index sets
Jj∈ Supplier locations Ll∈ Mill locations Kk ∈ Sales locations Pp∈ Processes Rr ∈ Recipes Mm∈ Materials Nn∈ Disjunction intervals
Tt∈ Time
Subsets L
lpP Processes p at mill l boil
lpP Boilers p at mill l cogen
lpP Cogeneration boiler p at mill l PlprR Recipes r available on process p in mill l boillprR Recipes r available on boiler p in mill l cogenlprR Recipes r available on cogeneration boiler p in mill l
JjmM Materials m offered by supplier j
LlmM Materials m produced/processed at mill l
KkmM Materials m requested by customer k JLjlmM Materials m that can be transported between supplier j and mill l LL
mllM ' Materials m that can be transported between mills l and l’ LKlkmM Materials m that can be transported between mill l and customer k loglmM Logs m in mill l chiplmM Chips m in mill l pap
lmM Paper m in mill l inR
lprmM − Input materials m of a recipe r, where PlprRr∈
inboilRlprmM −− Input materials m of a recipe r, where boil
lprRr∈ outR
lprmM − Output materials m of a recipe r, where boillpr
Plpr RRr ∩∈
fuelRlprmM − Fuel types m used in recipe r in process p in mill l
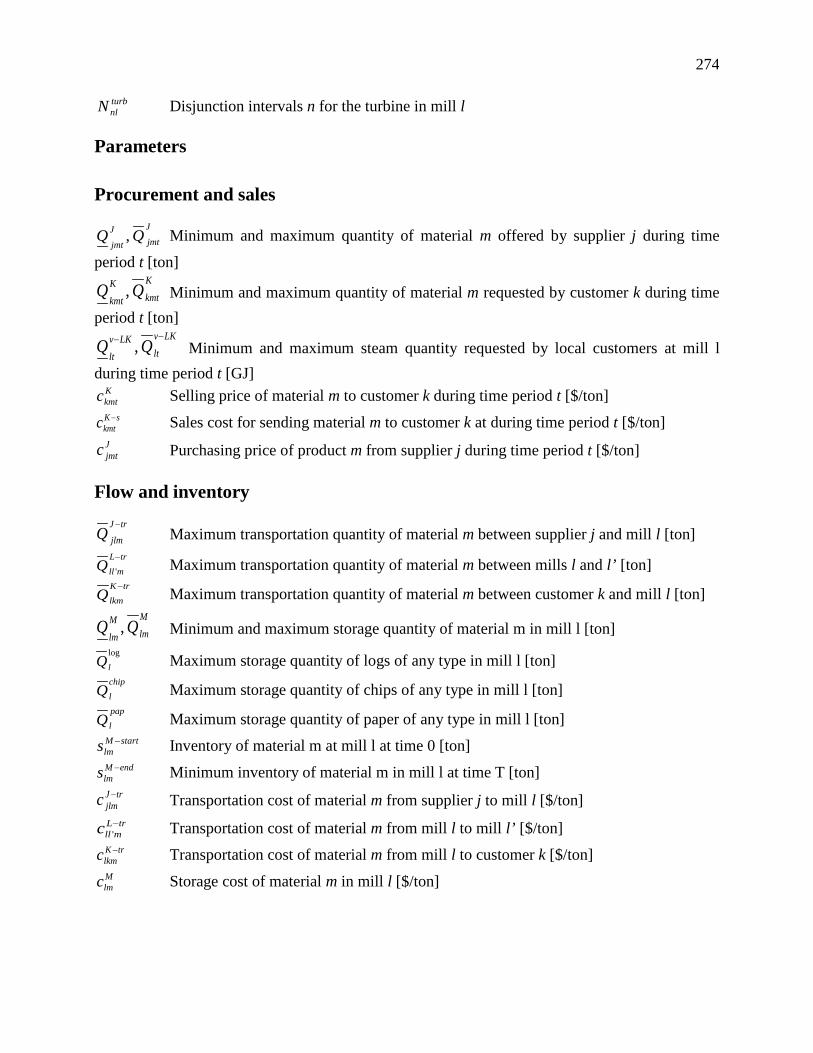
274
turbnlN Disjunction intervals n for the turbine in mill l
Parameters
Procurement and sales J
jmtJ
jmtQQ , Minimum and maximum quantity of material m offered by supplier j during time
period t [ton] K
kmtK
kmtQQ , Minimum and maximum quantity of material m requested by customer k during time
period t [ton] LKv
ltLKv
ltQQ
−− , Minimum and maximum steam quantity requested by local customers at mill l during time period t [GJ]
Kkmtc Selling price of material m to customer k during time period t [$/ton]
sKkmtc − Sales cost for sending material m to customer k at during time period t [$/ton] Jjmtc Purchasing price of product m from supplier j during time period t [$/ton]
Flow and inventory trJ
jlmQ−
Maximum transportation quantity of material m between supplier j and mill l [ton] trL
mllQ−
' Maximum transportation quantity of material m between mills l and l’ [ton] trK
lkmQ− Maximum transportation quantity of material m between customer k and mill l [ton]
M
lmM
lmQQ , Minimum and maximum storage quantity of material m in mill l [ton]
log
lQ Maximum storage quantity of logs of any type in mill l [ton] chip
lQ Maximum storage quantity of chips of any type in mill l [ton] pap
lQ Maximum storage quantity of paper of any type in mill l [ton] startM
lms − Inventory of material m at mill l at time 0 [ton] endM
lms − Minimum inventory of material m in mill l at time T [ton] trJ
jlmc − Transportation cost of material m from supplier j to mill l [$/ton] trL
mllc −' Transportation cost of material m from mill l to mill l’ [$/ton]
trKlkmc − Transportation cost of material m from mill l to customer k [$/ton] Mlmc Storage cost of material m in mill l [$/ton]
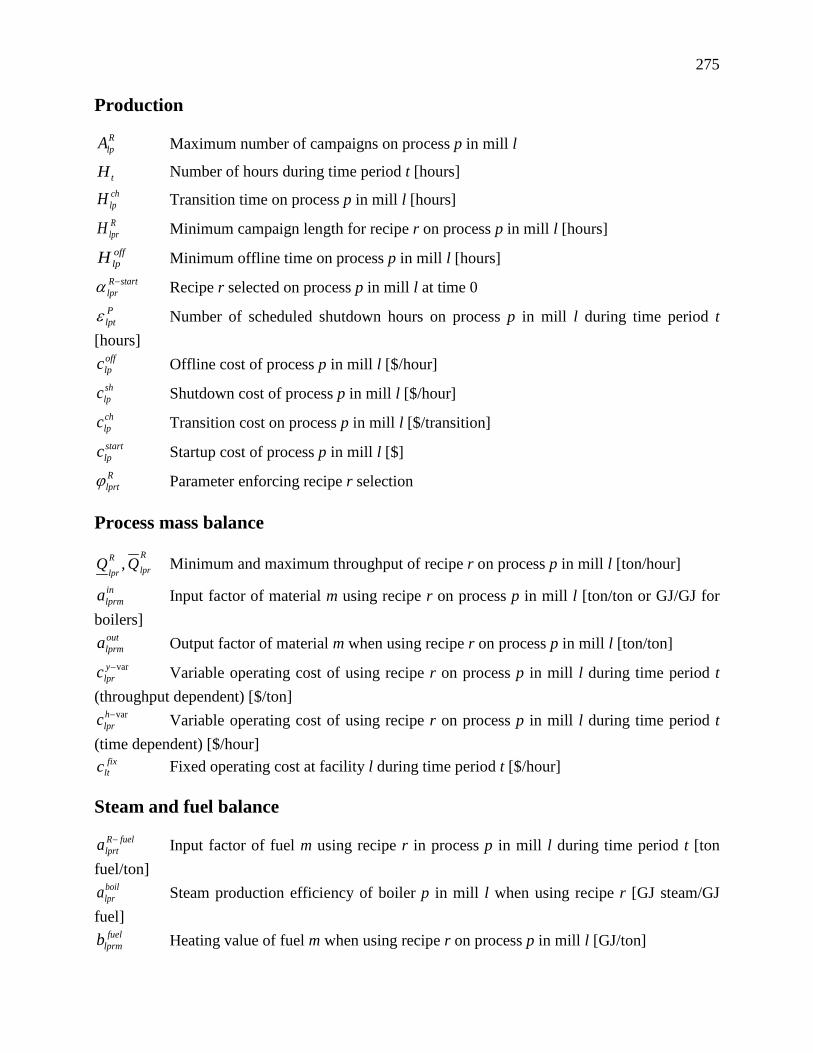
275
Production RlpA Maximum number of campaigns on process p in mill l
tH Number of hours during time period t [hours] chlpH Transition time on process p in mill l [hours] RlprH Minimum campaign length for recipe r on process p in mill l [hours] offlpH Minimum offline time on process p in mill l [hours]
startRlpr−α Recipe r selected on process p in mill l at time 0
Plptε Number of scheduled shutdown hours on process p in mill l during time period t
[hours] offlpc Offline cost of process p in mill l [$/hour] shlpc Shutdown cost of process p in mill l [$/hour] chlpc Transition cost on process p in mill l [$/transition] startlpc Startup cost of process p in mill l [$] Rlprtϕ Parameter enforcing recipe r selection
Process mass balance Rlpr
Rlpr
QQ , Minimum and maximum throughput of recipe r on process p in mill l [ton/hour] inlprma Input factor of material m using recipe r on process p in mill l [ton/ton or GJ/GJ for
boilers] outlprma Output factor of material m when using recipe r on process p in mill l [ton/ton]
var−ylprc Variable operating cost of using recipe r on process p in mill l during time period t
(throughput dependent) [$/ton] var−h
lprc Variable operating cost of using recipe r on process p in mill l during time period t (time dependent) [$/hour]
fixltc Fixed operating cost at facility l during time period t [$/hour]
Steam and fuel balance fuelR
lprta − Input factor of fuel m using recipe r in process p in mill l during time period t [ton fuel/ton]
boillpra Steam production efficiency of boiler p in mill l when using recipe r [GJ steam/GJ
fuel] fuel
lprmb Heating value of fuel m when using recipe r on process p in mill l [GJ/ton]
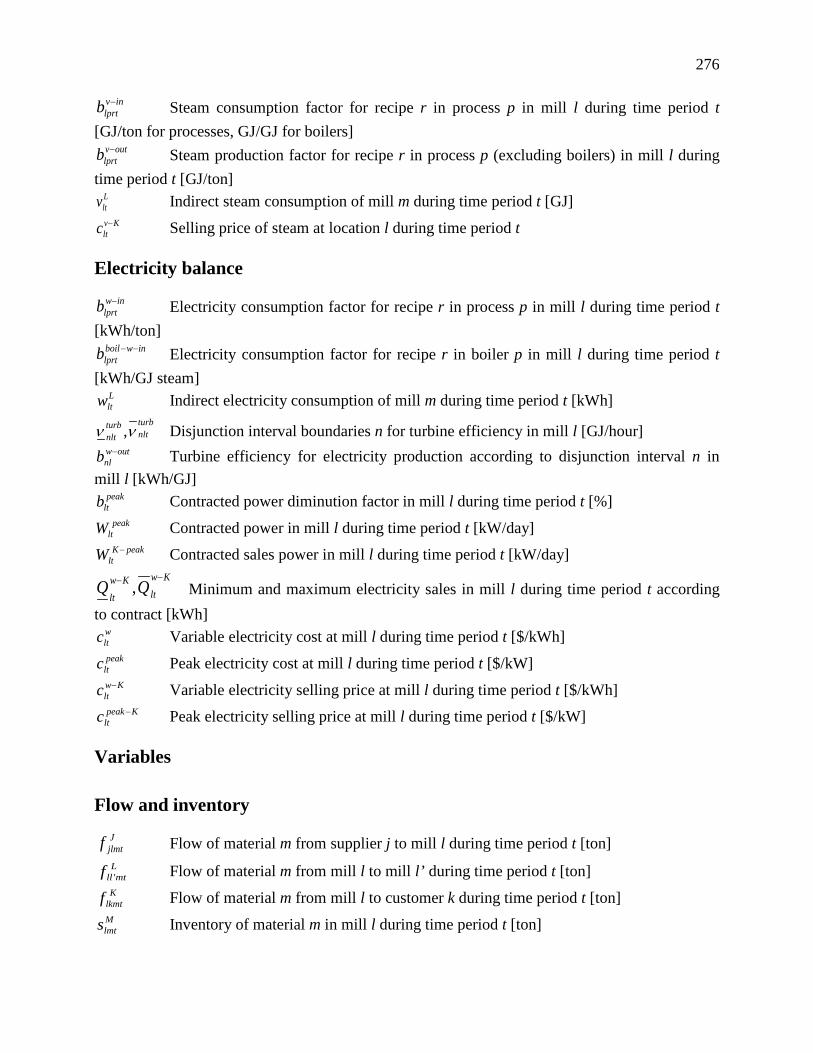
276
invlprtb − Steam consumption factor for recipe r in process p in mill l during time period t
[GJ/ton for processes, GJ/GJ for boilers] outv
lprtb − Steam production factor for recipe r in process p (excluding boilers) in mill l during time period t [GJ/ton]
Lltv Indirect steam consumption of mill m during time period t [GJ]
Kvltc − Selling price of steam at location l during time period t
Electricity balance inw
lprtb − Electricity consumption factor for recipe r in process p in mill l during time period t [kWh/ton]
inwboillprtb −− Electricity consumption factor for recipe r in boiler p in mill l during time period t
[kWh/GJ steam] Lltw Indirect electricity consumption of mill m during time period t [kWh]
turbnlt
turbnlt νν , Disjunction interval boundaries n for turbine efficiency in mill l [GJ/hour]
outwnlb − Turbine efficiency for electricity production according to disjunction interval n in
mill l [kWh/GJ] peak
ltb Contracted power diminution factor in mill l during time period t [%] peak
ltW Contracted power in mill l during time period t [kW/day] peakK
ltW − Contracted sales power in mill l during time period t [kW/day] Kw
ltKw
ltQQ
−− , Minimum and maximum electricity sales in mill l during time period t according to contract [kWh]
wltc Variable electricity cost at mill l during time period t [$/kWh] peakltc Peak electricity cost at mill l during time period t [$/kW]
Kwltc − Variable electricity selling price at mill l during time period t [$/kWh]
Kpeakltc − Peak electricity selling price at mill l during time period t [$/kW]
Variables
Flow and inventory Jjlmtf Flow of material m from supplier j to mill l during time period t [ton] Lmtllf ' Flow of material m from mill l to mill l’ during time period t [ton]
Klkmtf Flow of material m from mill l to customer k during time period t [ton] Mlmts Inventory of material m in mill l during time period t [ton]
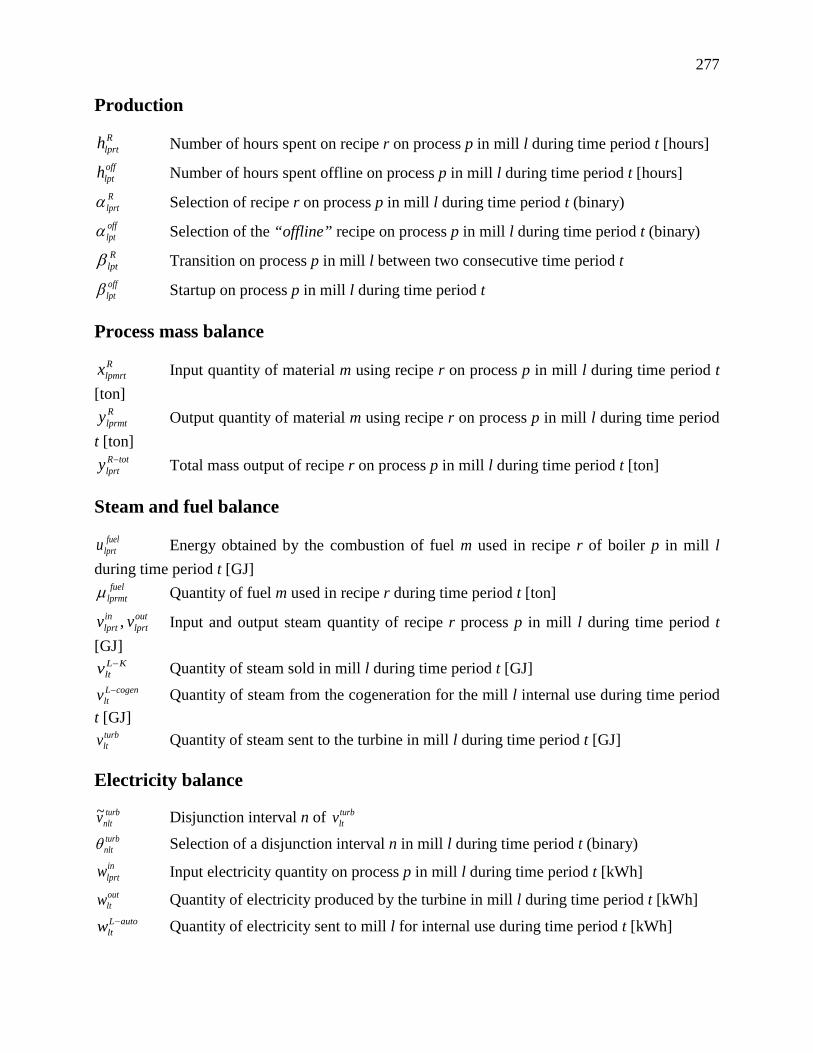
277
Production Rlprth Number of hours spent on recipe r on process p in mill l during time period t [hours] offlpth Number of hours spent offline on process p in mill l during time period t [hours] Rlprtα Selection of recipe r on process p in mill l during time period t (binary) offlptα Selection of the “offline” recipe on process p in mill l during time period t (binary) R
lptβ Transition on process p in mill l between two consecutive time period t offlptβ Startup on process p in mill l during time period t
Process mass balance Rlpmrtx Input quantity of material m using recipe r on process p in mill l during time period t
[ton] Rlprmty Output quantity of material m using recipe r on process p in mill l during time period
t [ton] totR
lprty − Total mass output of recipe r on process p in mill l during time period t [ton]
Steam and fuel balance fuel
lprtu Energy obtained by the combustion of fuel m used in recipe r of boiler p in mill l during time period t [GJ]
fuellprmtµ Quantity of fuel m used in recipe r during time period t [ton]
outlprt
inlprt vv , Input and output steam quantity of recipe r process p in mill l during time period t
[GJ] KL
ltv − Quantity of steam sold in mill l during time period t [GJ] cogenL
ltv − Quantity of steam from the cogeneration for the mill l internal use during time period t [GJ]
turbltv Quantity of steam sent to the turbine in mill l during time period t [GJ]
Electricity balance turb
nltv~ Disjunction interval n of turbltv
turbnltθ Selection of a disjunction interval n in mill l during time period t (binary) inlprtw Input electricity quantity on process p in mill l during time period t [kWh] outltw Quantity of electricity produced by the turbine in mill l during time period t [kWh]
autoLltw − Quantity of electricity sent to mill l for internal use during time period t [kWh]

278
Kltw Quantity of electricity produced by mill l sold to the grid during time period t [kWh]
279
ANNEXE C – Margins-based Planning Applied to Newsprint
Manufacturing
Louis Patrick Dansereau a,b, Mahmoud El-Halwagi c and Paul Stuart b17
a KSH Solutions Inc., 1 Place Alexis Nihon, 3400 de Maisonneuve O.,
bureau 1600, Montréal, H3Z 3B8, Canada
b NSERC Environmental Design Engineering Chair in Process Integration,
Department of Chemical Engineering, École Polytechnique Montréal, Montréal,
H3C 3A7, Canada
c Department of Chemical Engineering, Texas A&M University, College Station,
Texas, 77843, USA
Abstract
The North American newsprint industry is currently facing a difficult financial situation due to
notably a major market decline. The application of supply-chain management concepts could
greatly help this struggling industry by enhancing the cost effectiveness of operations. In this
paper, an integrated tactical planning model based on optimization is used to exploit
manufacturing flexibility in order to adapt production to changing market conditions. This model
was applied to a real case study of a newsprint mill with overcapacity in its thermomechanical
and deinking pulping lines. Results show that by utilizing a margins-based planning model to
identify better adapted operating policies in case of varying wood chips and recycled paper
prices, EBITDA can be increased by up to 35%. The benefits of exploiting manufacturing
flexibility were found to be more important in difficult market scenarios, highlighting its
pertinence for providing more robust planning approaches. With the future incorporation of forest
biorefining activities into their core business, pulp and paper companies would benefit from
utilizing margins-based planning models to manage the complexity of their new production,
including a wider range of value-added products likely to face market volatility.
17 To whom all correspondence should be addressed
280
Application
This work highlights the potential for a pulp and paper manufacturer to use advanced planning tools for better
managing the flexibility of production assets.
Keywords
Supply-chain management, tactical planning, manufacturing flexibility, newsprint, biorefinery
transformation,
About the authors
One of the biggest challenges for the pulp and paper industry and the future forest biorefinery
relates to the management of market volatility. Exploiting the flexibility of manufacturing
systems is getting increasingly considered as an effective mean to mitigate this risk. However, it
is often not fully exploited because market and process information cannot be properly analyzed
due to the lack of appropriate tools.
To address this issue, we developed an integrated planning tool based on optimization to identify
cost trade-offs between manufacturing options and to exploit the flexibility of manufacturing
systems. In this paper, we demonstrate the usefulness of this tool through a case study of an
existing commodity pulp and paper manufacturer. The most challenging part of the study was
related to the model development and its validation to represent adequately existing operations.
The next steps involve the addition of biorefinery process options to the model in order to
optimize the management of a more complex product portfolio. We believe that it is through the
use of such models that stakeholders will be able to understand and address the complexity of the
forest biorefinery supply chain, and make it more profitable.
Dansereau was a Ph.D. student in the NSERC Design Chair at École Polytechnique de Montréal
in Montréal, Qc, Canada at the time of this study. He is now a consultant in Supply Chain
Management for KSH Solutions, an engineering and management consulting company based in
Montréal, QC, Canada.
Dr. Mahmoud El-Halwagi is the McFerrin Professor of Chemical Engineering at the Artie
McFerrin Department of Chemical Engineering, Texas A&M University in College Station.
Stuart is chairholder of the NSERC Design Engineering Chair and professor of Chemical
Engineering at École Polytechnique de Montréal. Email Stuart at [email protected].
281
INTRODUCTION Forestry commodity producers have been struggling in the last few years. Especially, the North
American newsprint sector is severely affected, facing a major decline in domestic market and
several mill closures. The traditional way of manufacturing, which aims at being the lowest cost
producer by maximizing throughput, may have worked for many years, but it now seems to be
not sufficient or no longer adapted to the current business environment. Huge efforts must be put
to rationalize production and inventory in order to adapt production capacity to the shrinking
market, while still minimizing costs.
In front of these challenges, Eamer and Stuart [1], identified three possible strategies for the pulp
and paper (P&P) industry: 1) to continue to be the lowest cost commodity producer, 2) to seek
emerging markets, and 3) to diversify the core business into forest biorefining, i.e. the production
of new value-added products from wood. They stressed that all three strategies should be
accomplished for survival. Doing only the first two will be a temporary solution, as the drop in
demand for publication papers doesn’t seem to be abating.
Transforming the traditional P&P core business to the biorefinery represents a challenge in itself.
It implies not only the incorporation of new products and processes, but it will also change the
enterprise, its vision, mission and reason for existence [2]. Several strategic changes in the
business model and manufacturing culture are needed. According to Thorp [3], the biggest
challenge for this industry will be to move away from the commodity business mentality.
Producing high volumes of undistinguished products with low margins is not a sustainable
business model for the biorefinery.
Biorefinery products will either enter new markets or replace traditional fossil-based products,
thus facing market volatility. With new usages for biomass, raw material prices are also likely to
increase [4]. Efforts should therefore be made to manage and adapt production to market
conditions in order to maximize profitability. For the forestry industry, biorefining consists in
producing something different (new products), but also differently, with a better management of
the supply chain.
282
Over the past decades, both industry and academia paid a lot of attention to supply-chain
management (SCM) in order to increase the cost effectiveness of overall operations. Specifically,
the latest trends in this domain are to manage the supply chain holistically, that is by integrating
procurement, production, distribution and sales, the different facilities of a company, as well as
the strategic, tactical and operational planning levels [5]. SCM concepts could greatly help the
North American P&P industry to compete globally [6] and during the transformation to the forest
biorefinery. In fact, SCM will be necessary for the three strategies identified by Eamer and Stuart
[1]: for survival and for transformation.
A lot of research has been recently made on supply-chain management in the forest products
industry, but maybe not as much as in other sectors [7]. D’amours et al. reviewed major planning
problems and models developed in this industry [8]. Carlsson & Rönnqvist present logistics and
planning problems addressed by a Scandinavian pulp company [9]. Feng et al. developed a sales
and operations planning model for an oriented strandboard mill running in a make-to-order
environment [10]. In the chemical commodity industry, Kannegiesser & Gunther developed a
mathematical model for the global value-chain planning of a manufacturer [11]. Specifically,
their model optimizes profitability by coordinating sales quantity, price, and supply decisions
throughout the value chain.
Such models help planners to identify more profitable operating policies, but also to understand
complex interactions of a system. To provide valuable plans, operating costs of different
production modes should also be well estimated. Lail argued that financial data and process
information should be better brought together to support decision-making [12]. According to him,
information related to costs, such as price changes from suppliers or changes in production
capabilities, is often misperceived, resulting in less profitable plans.
283
Hytönen & Stuart developed a methodology for enhancing the decision-making process related to
strategic investment for retrofit forest biorefinery implementation [13]. In order to represent
better production costs, part of this methodology involves a steady-state process model combined
with product costing using the principles of activity-based cost accounting (ABC). ABC
accounting is a managerial accounting method that was developed in the mid-1980s in order to
get more reliable product cost and enhance decision-making [14]. Recently, Korpunen et al. [15]
Laflamme-Mayer et al. [16], and Korbel [17, 18] developed ABC models and operations-driven
costing methods for various types of facilities in the forest products sector. They concluded that
the ABC method is applicable for cost predicting and controlling of pulp and paper mills.
In earlier work, Dansereau et al. [19-22] proposed a margins-based framework and a tactical
planning model that seeks to maximize the profitability of a company under various market
conditions by better managing the flexibility of assets. This framework aims to help decision
makers in managing the supply chain of forest biorefineries, which is expected to be even more
complex than pulp and paper due to the introduction of new products and processes. The
framework consists of five elements integrated in an optimization model, as illustrated on Fig.1.
First, a company should seek to maximize profit and not minimizing production costs only.
Second, to achieve the latter, sales should be managed to manufacture the most profitable
products combination, inspired notably by revenue management concepts. Third, to produce this
desired combination, flexibility in manufacturing should be exploited. However, different
manufacturing modes have different operating costs in terms of raw material, chemicals, steam,
electricity, labour, etc. Therefore, the fourth aspect relates to the use of costing methods inspired
by activity-based cost (ABC) accounting. Through a better representation of cost consumption
patterns of production recipes, ABC costing enables a quantification of cost trade-offs between
different manufacturing modes. Finally, these concepts should be included in an integrated
tactical planning model that considers the overall supply chain, from procurement to production,
distribution and sales.
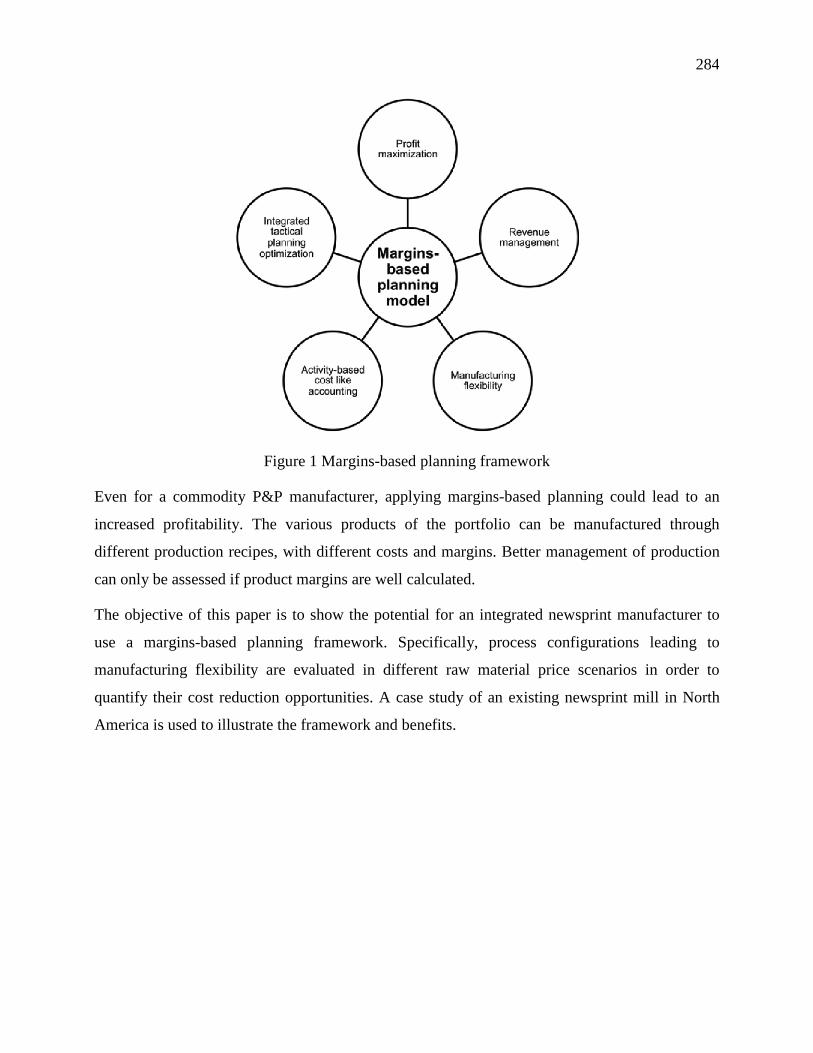
284
Figure 1 Margins-based planning framework
Even for a commodity P&P manufacturer, applying margins-based planning could lead to an
increased profitability. The various products of the portfolio can be manufactured through
different production recipes, with different costs and margins. Better management of production
can only be assessed if product margins are well calculated.
The objective of this paper is to show the potential for an integrated newsprint manufacturer to
use a margins-based planning framework. Specifically, process configurations leading to
manufacturing flexibility are evaluated in different raw material price scenarios in order to
quantify their cost reduction opportunities. A case study of an existing newsprint mill in North
America is used to illustrate the framework and benefits.
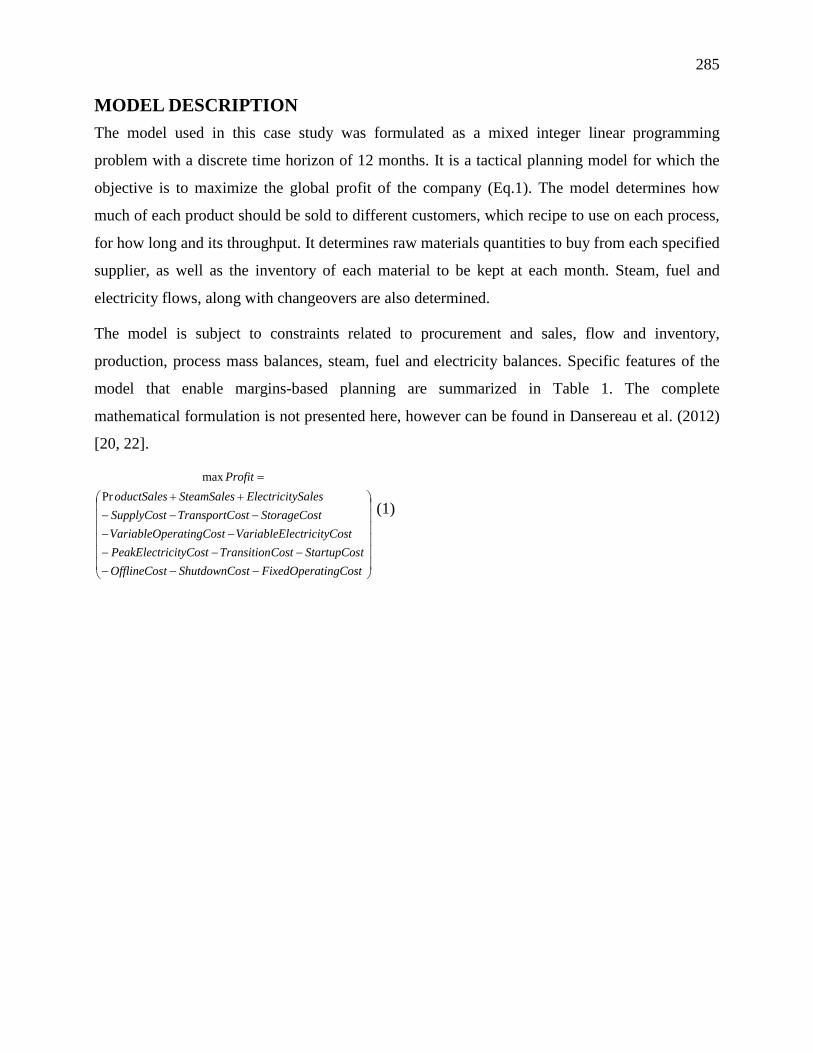
285
MODEL DESCRIPTION The model used in this case study was formulated as a mixed integer linear programming
problem with a discrete time horizon of 12 months. It is a tactical planning model for which the
objective is to maximize the global profit of the company (Eq.1). The model determines how
much of each product should be sold to different customers, which recipe to use on each process,
for how long and its throughput. It determines raw materials quantities to buy from each specified
supplier, as well as the inventory of each material to be kept at each month. Steam, fuel and
electricity flows, along with changeovers are also determined.
The model is subject to constraints related to procurement and sales, flow and inventory,
production, process mass balances, steam, fuel and electricity balances. Specific features of the
model that enable margins-based planning are summarized in Table 1. The complete
mathematical formulation is not presented here, however can be found in Dansereau et al. (2012)
[20, 22].
−−−−−−
−−−−−
++
=
tingCostFixedOperastShutdownCotOfflineCostStartupCosCostTransitionicityCostPeakElectr
ostectricityCVariableElteratingCosVariableOptStorageCosostTransportCSupplyCost
ySalesElectricitSteamSalesoductSalesProfit
Prmax
(1)
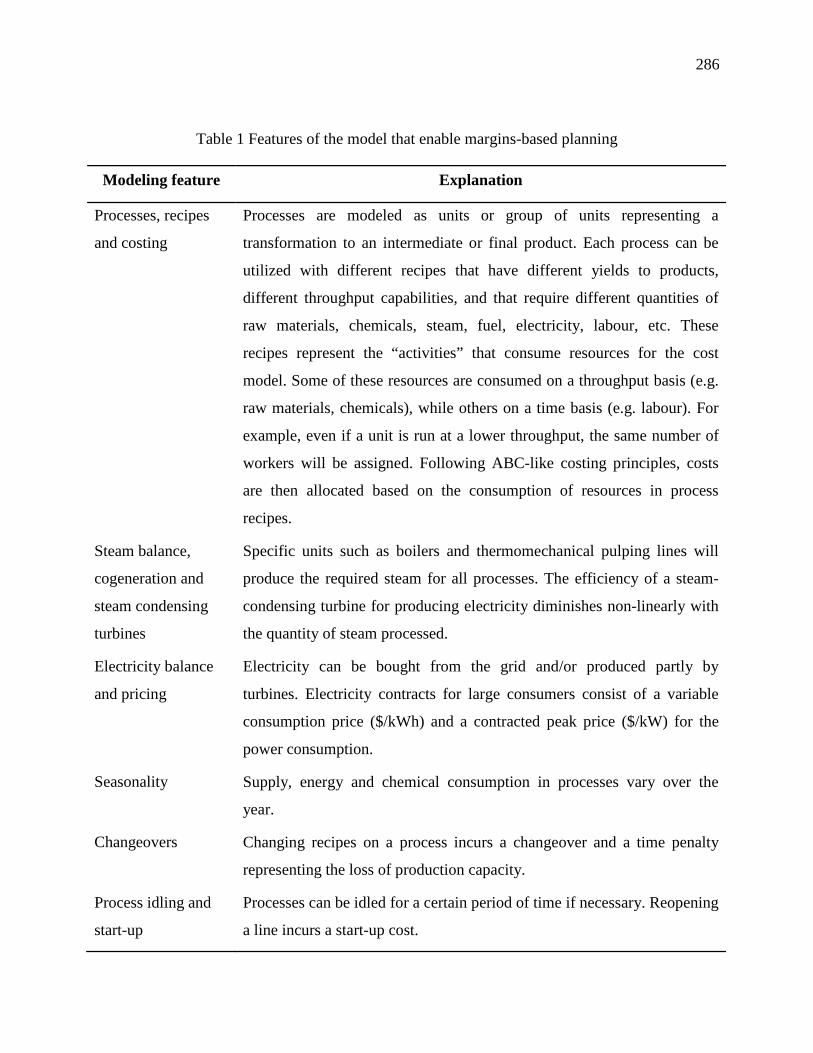
286
Table 1 Features of the model that enable margins-based planning
Modeling feature Explanation
Processes, recipes
and costing
Processes are modeled as units or group of units representing a
transformation to an intermediate or final product. Each process can be
utilized with different recipes that have different yields to products,
different throughput capabilities, and that require different quantities of
raw materials, chemicals, steam, fuel, electricity, labour, etc. These
recipes represent the “activities” that consume resources for the cost
model. Some of these resources are consumed on a throughput basis (e.g.
raw materials, chemicals), while others on a time basis (e.g. labour). For
example, even if a unit is run at a lower throughput, the same number of
workers will be assigned. Following ABC-like costing principles, costs
are then allocated based on the consumption of resources in process
recipes.
Steam balance,
cogeneration and
steam condensing
turbines
Specific units such as boilers and thermomechanical pulping lines will
produce the required steam for all processes. The efficiency of a steam-
condensing turbine for producing electricity diminishes non-linearly with
the quantity of steam processed.
Electricity balance
and pricing
Electricity can be bought from the grid and/or produced partly by
turbines. Electricity contracts for large consumers consist of a variable
consumption price ($/kWh) and a contracted peak price ($/kW) for the
power consumption.
Seasonality Supply, energy and chemical consumption in processes vary over the
year.
Changeovers Changing recipes on a process incurs a changeover and a time penalty
representing the loss of production capacity.
Process idling and
start-up
Processes can be idled for a certain period of time if necessary. Reopening
a line incurs a start-up cost.
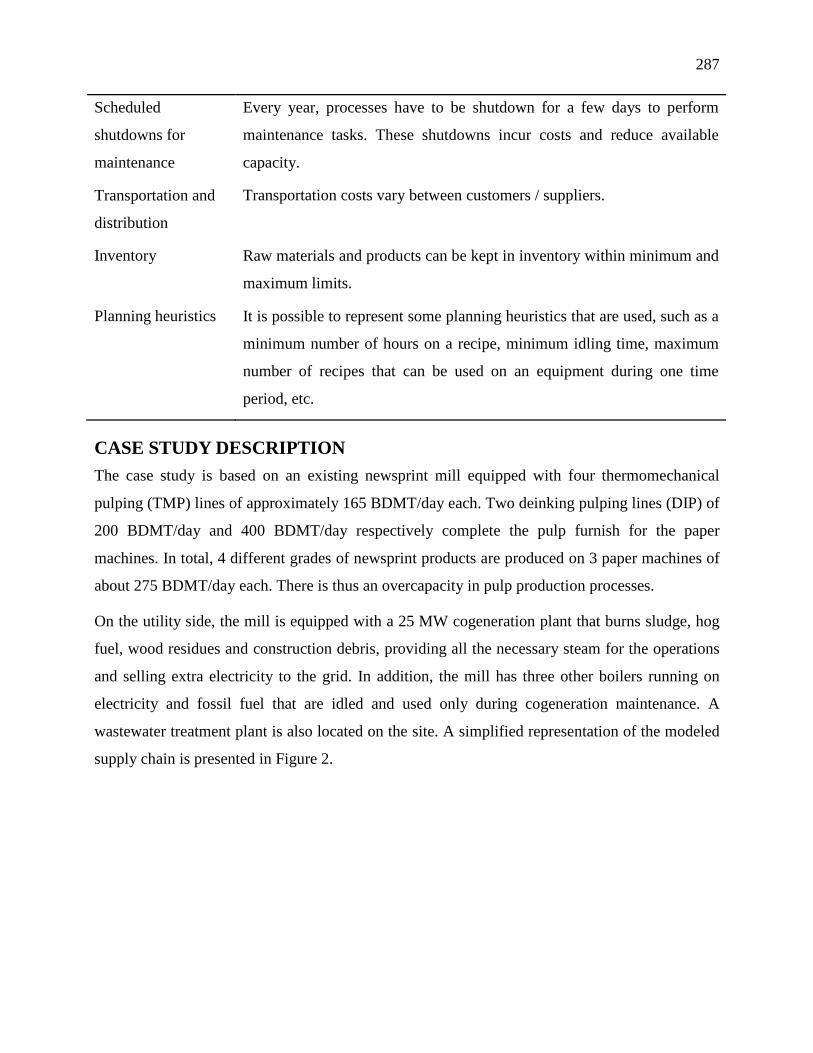
287
Scheduled
shutdowns for
maintenance
Every year, processes have to be shutdown for a few days to perform
maintenance tasks. These shutdowns incur costs and reduce available
capacity.
Transportation and
distribution
Transportation costs vary between customers / suppliers.
Inventory Raw materials and products can be kept in inventory within minimum and
maximum limits.
Planning heuristics It is possible to represent some planning heuristics that are used, such as a
minimum number of hours on a recipe, minimum idling time, maximum
number of recipes that can be used on an equipment during one time
period, etc.
CASE STUDY DESCRIPTION The case study is based on an existing newsprint mill equipped with four thermomechanical
pulping (TMP) lines of approximately 165 BDMT/day each. Two deinking pulping lines (DIP) of
200 BDMT/day and 400 BDMT/day respectively complete the pulp furnish for the paper
machines. In total, 4 different grades of newsprint products are produced on 3 paper machines of
about 275 BDMT/day each. There is thus an overcapacity in pulp production processes.
On the utility side, the mill is equipped with a 25 MW cogeneration plant that burns sludge, hog
fuel, wood residues and construction debris, providing all the necessary steam for the operations
and selling extra electricity to the grid. In addition, the mill has three other boilers running on
electricity and fossil fuel that are idled and used only during cogeneration maintenance. A
wastewater treatment plant is also located on the site. A simplified representation of the modeled
supply chain is presented in Figure 2.
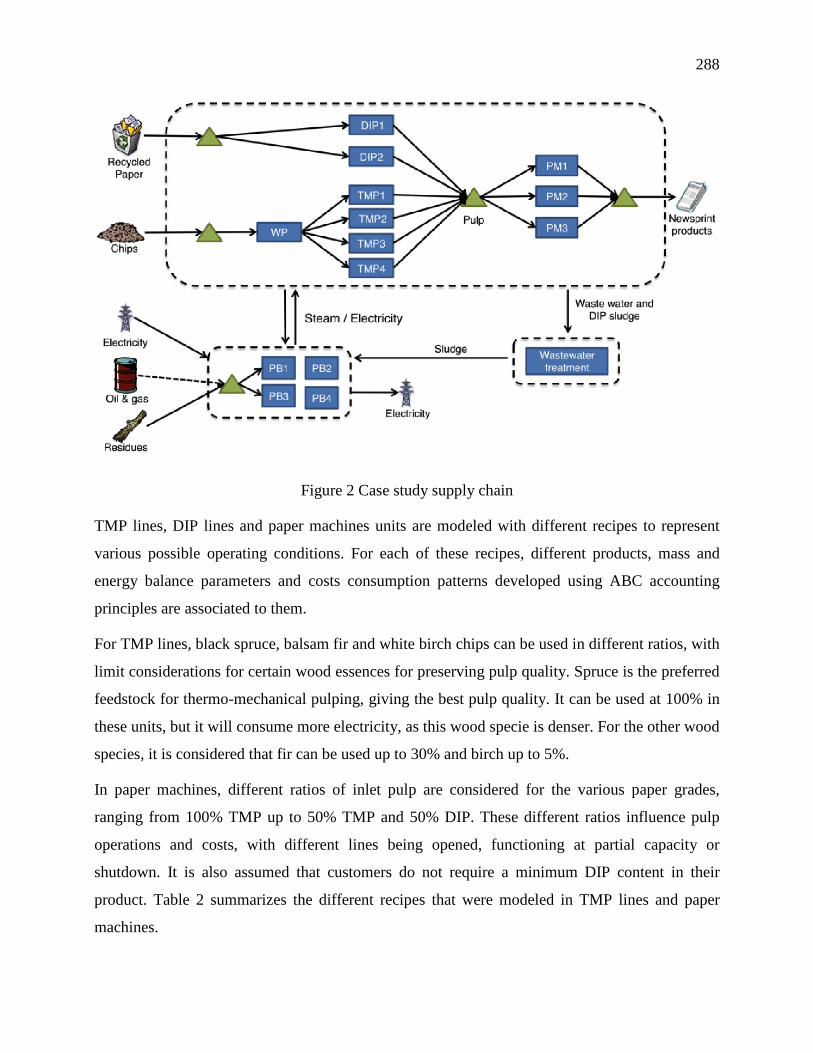
288
Figure 2 Case study supply chain
TMP lines, DIP lines and paper machines units are modeled with different recipes to represent
various possible operating conditions. For each of these recipes, different products, mass and
energy balance parameters and costs consumption patterns developed using ABC accounting
principles are associated to them.
For TMP lines, black spruce, balsam fir and white birch chips can be used in different ratios, with
limit considerations for certain wood essences for preserving pulp quality. Spruce is the preferred
feedstock for thermo-mechanical pulping, giving the best pulp quality. It can be used at 100% in
these units, but it will consume more electricity, as this wood specie is denser. For the other wood
species, it is considered that fir can be used up to 30% and birch up to 5%.
In paper machines, different ratios of inlet pulp are considered for the various paper grades,
ranging from 100% TMP up to 50% TMP and 50% DIP. These different ratios influence pulp
operations and costs, with different lines being opened, functioning at partial capacity or
shutdown. It is also assumed that customers do not require a minimum DIP content in their
product. Table 2 summarizes the different recipes that were modeled in TMP lines and paper
machines.
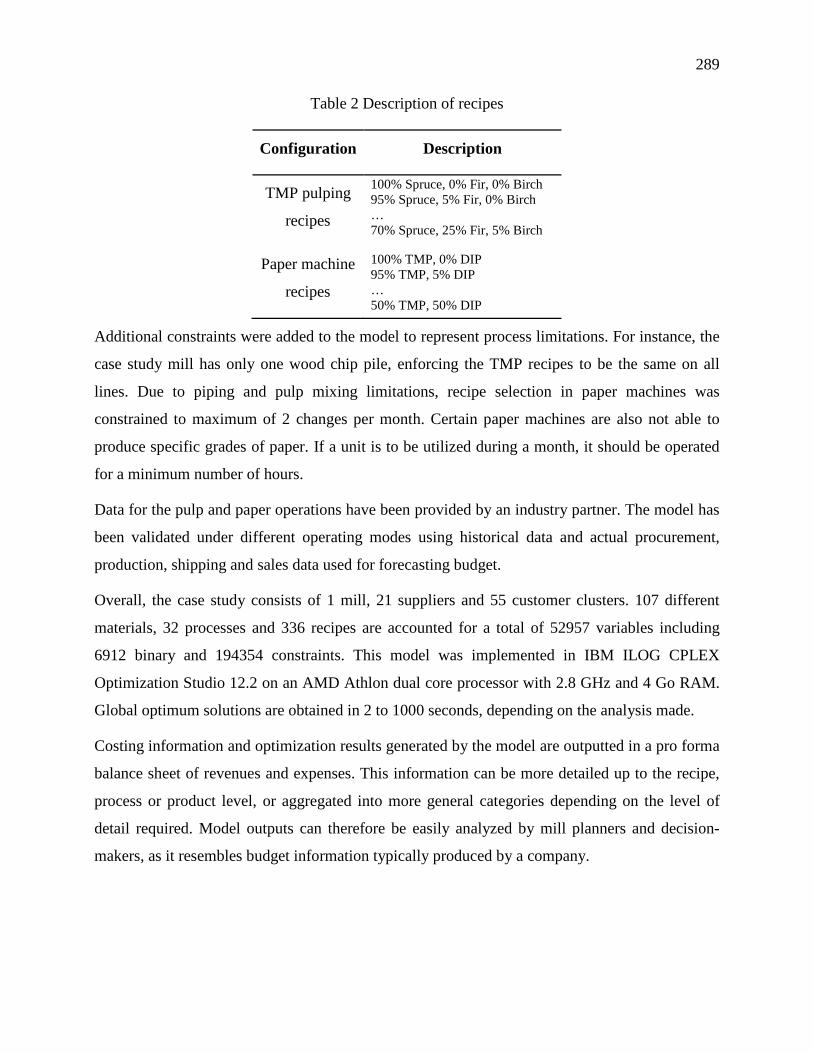
289
Table 2 Description of recipes
Configuration Description
TMP pulping
recipes
100% Spruce, 0% Fir, 0% Birch 95% Spruce, 5% Fir, 0% Birch … 70% Spruce, 25% Fir, 5% Birch
Paper machine
recipes
100% TMP, 0% DIP 95% TMP, 5% DIP … 50% TMP, 50% DIP
Additional constraints were added to the model to represent process limitations. For instance, the
case study mill has only one wood chip pile, enforcing the TMP recipes to be the same on all
lines. Due to piping and pulp mixing limitations, recipe selection in paper machines was
constrained to maximum of 2 changes per month. Certain paper machines are also not able to
produce specific grades of paper. If a unit is to be utilized during a month, it should be operated
for a minimum number of hours.
Data for the pulp and paper operations have been provided by an industry partner. The model has
been validated under different operating modes using historical data and actual procurement,
production, shipping and sales data used for forecasting budget.
Overall, the case study consists of 1 mill, 21 suppliers and 55 customer clusters. 107 different
materials, 32 processes and 336 recipes are accounted for a total of 52957 variables including
6912 binary and 194354 constraints. This model was implemented in IBM ILOG CPLEX
Optimization Studio 12.2 on an AMD Athlon dual core processor with 2.8 GHz and 4 Go RAM.
Global optimum solutions are obtained in 2 to 1000 seconds, depending on the analysis made.
Costing information and optimization results generated by the model are outputted in a pro forma
balance sheet of revenues and expenses. This information can be more detailed up to the recipe,
process or product level, or aggregated into more general categories depending on the level of
detail required. Model outputs can therefore be easily analyzed by mill planners and decision-
makers, as it resembles budget information typically produced by a company.
290
RESULTS AND DISCUSSION
Recipe flexibility in paper machines To show the value of margins-based planning, the model has been run under two different
process and flexibility configurations. The first configuration, named manufacturing-centric,
represents the current case at the P&P mill. TMP lines and paper machines recipes are selected
prior to the optimization using a heuristic that facilitates operations and that is believed to
minimize production costs. TMP lines always run with a mixture of 75% spruce and 25% fir, and
paper machines use an inlet pulp ratio of 60% TMP, 40% DIP. To achieve the latter pulp mix,
three TMP lines out of four are utilized at full capacity, one DIP line is closed and the other one
is used at 80% of the maximum capacity.
In the margins-based configuration, the model optimizes the recipe selection and throughput of
pulping lines and paper machines to maximize profitability, considering various constraints
related to processes and planning. This can imply partial or total opening/shutdown of TMP or
DIP lines, with associated shutdown and start-up costs.
Pulping costs are incurred by the procurement of various raw materials, the chemical
consumption in DIP lines, the electricity consumption in TMP lines, the fuel consumption in
boilers due to higher/lower steam needs/production from processes, as well as the start-up and
shutdowns of lines. To illustrate the cost production pattern of different production recipes,
Figure 3 introduces variable costs of three different TMP mix in paper machines in the base case
market scenario (wood chips and recycled paper prices at 100% of their value). For
confidentiality reasons, costs are normalized by the cost of the manufacturing-centric
configuration in the base case scenario.
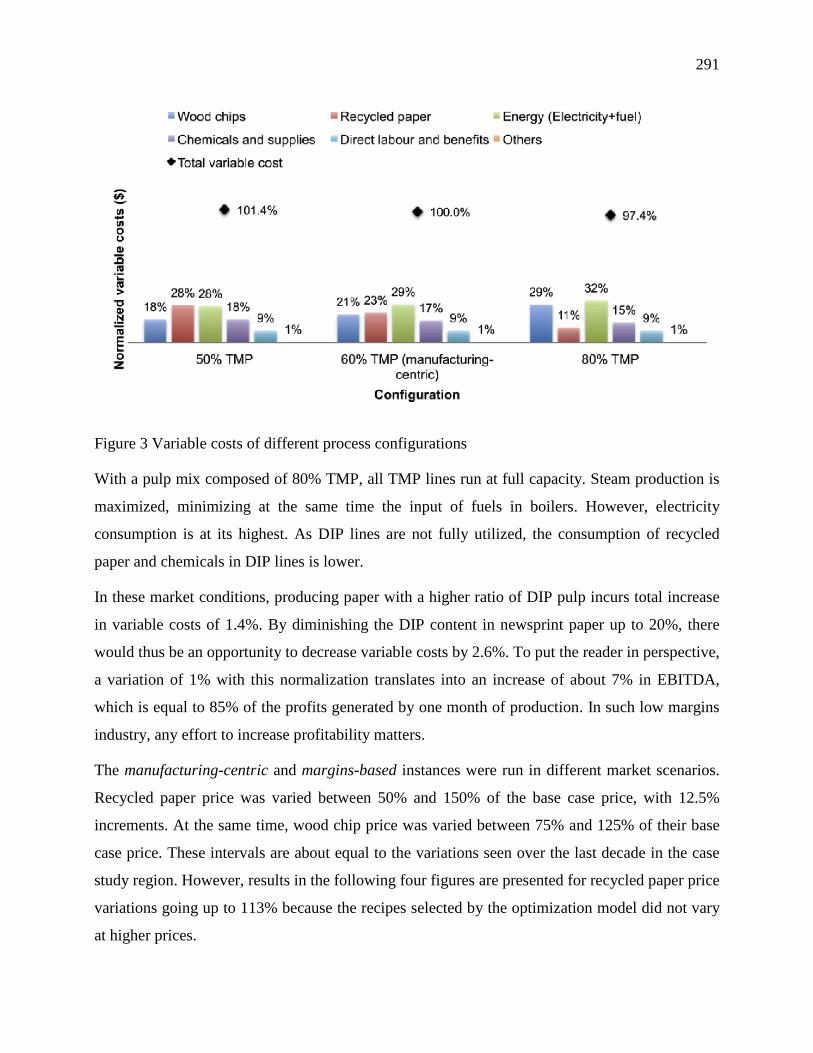
291
Figure 3 Variable costs of different process configurations
With a pulp mix composed of 80% TMP, all TMP lines run at full capacity. Steam production is
maximized, minimizing at the same time the input of fuels in boilers. However, electricity
consumption is at its highest. As DIP lines are not fully utilized, the consumption of recycled
paper and chemicals in DIP lines is lower.
In these market conditions, producing paper with a higher ratio of DIP pulp incurs total increase
in variable costs of 1.4%. By diminishing the DIP content in newsprint paper up to 20%, there
would thus be an opportunity to decrease variable costs by 2.6%. To put the reader in perspective,
a variation of 1% with this normalization translates into an increase of about 7% in EBITDA,
which is equal to 85% of the profits generated by one month of production. In such low margins
industry, any effort to increase profitability matters.
The manufacturing-centric and margins-based instances were run in different market scenarios.
Recycled paper price was varied between 50% and 150% of the base case price, with 12.5%
increments. At the same time, wood chip price was varied between 75% and 125% of their base
case price. These intervals are about equal to the variations seen over the last decade in the case
study region. However, results in the following four figures are presented for recycled paper price
variations going up to 113% because the recipes selected by the optimization model did not vary
at higher prices.
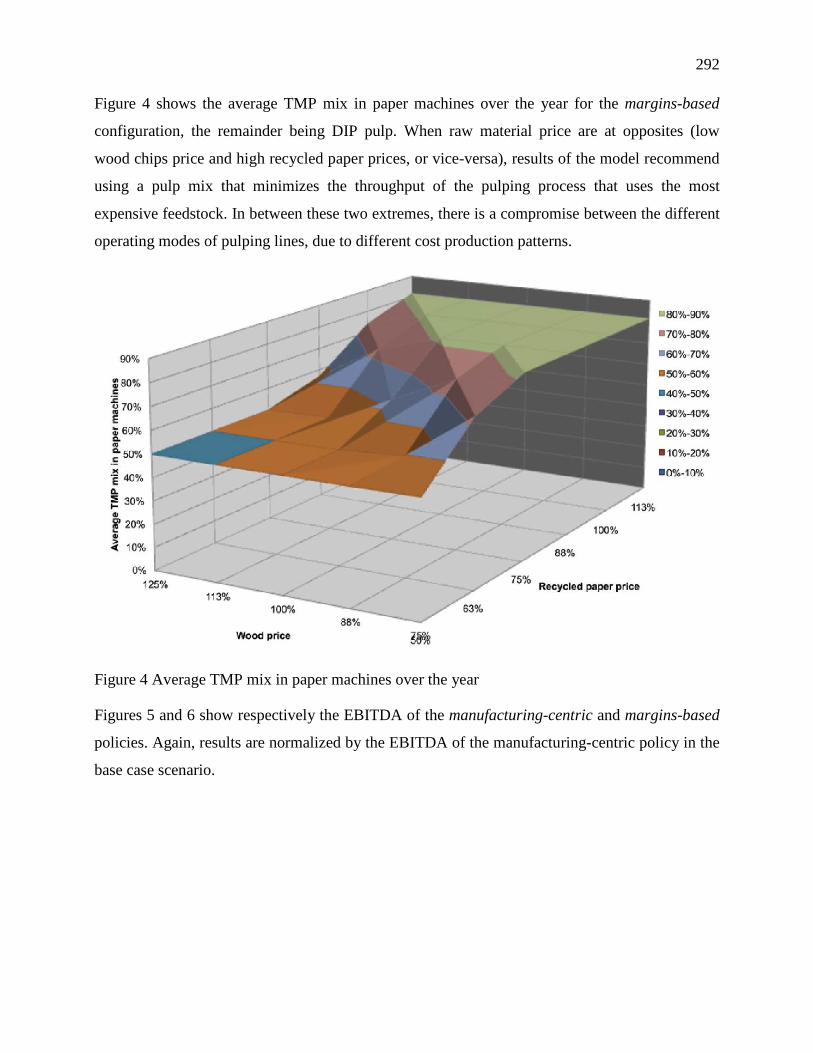
292
Figure 4 shows the average TMP mix in paper machines over the year for the margins-based
configuration, the remainder being DIP pulp. When raw material price are at opposites (low
wood chips price and high recycled paper prices, or vice-versa), results of the model recommend
using a pulp mix that minimizes the throughput of the pulping process that uses the most
expensive feedstock. In between these two extremes, there is a compromise between the different
operating modes of pulping lines, due to different cost production patterns.
Figure 4 Average TMP mix in paper machines over the year
Figures 5 and 6 show respectively the EBITDA of the manufacturing-centric and margins-based
policies. Again, results are normalized by the EBITDA of the manufacturing-centric policy in the
base case scenario.
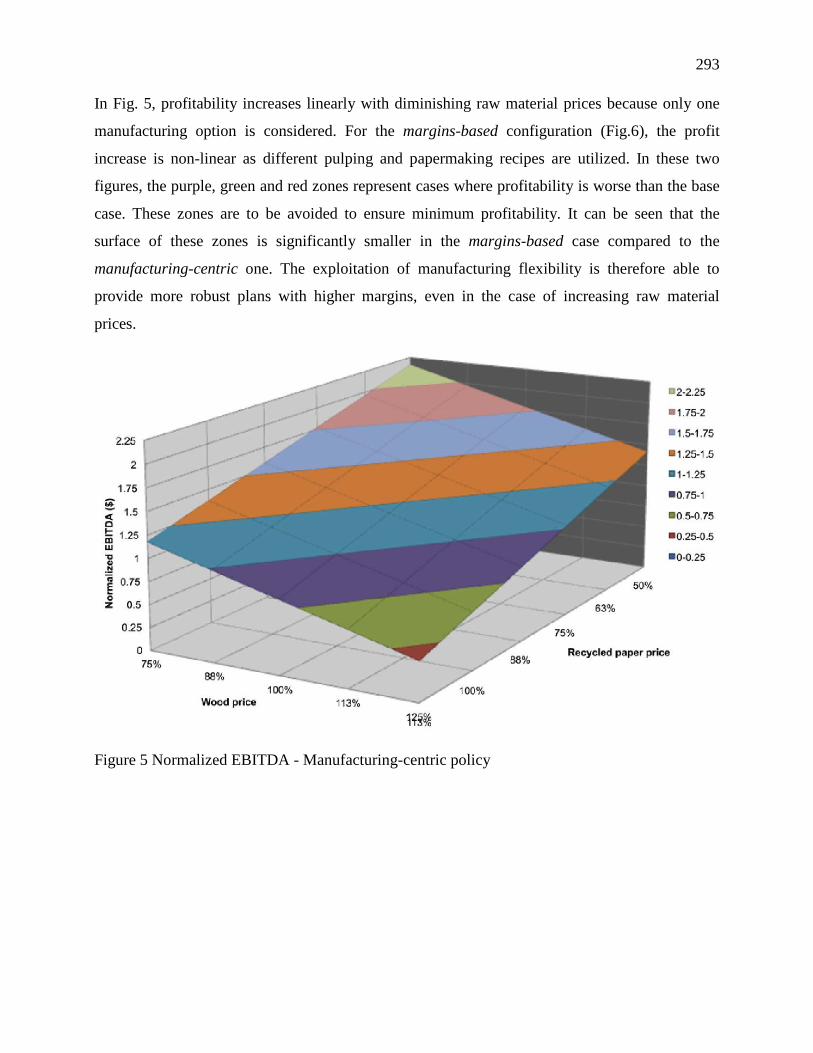
293
In Fig. 5, profitability increases linearly with diminishing raw material prices because only one
manufacturing option is considered. For the margins-based configuration (Fig.6), the profit
increase is non-linear as different pulping and papermaking recipes are utilized. In these two
figures, the purple, green and red zones represent cases where profitability is worse than the base
case. These zones are to be avoided to ensure minimum profitability. It can be seen that the
surface of these zones is significantly smaller in the margins-based case compared to the
manufacturing-centric one. The exploitation of manufacturing flexibility is therefore able to
provide more robust plans with higher margins, even in the case of increasing raw material
prices.
Figure 5 Normalized EBITDA - Manufacturing-centric policy
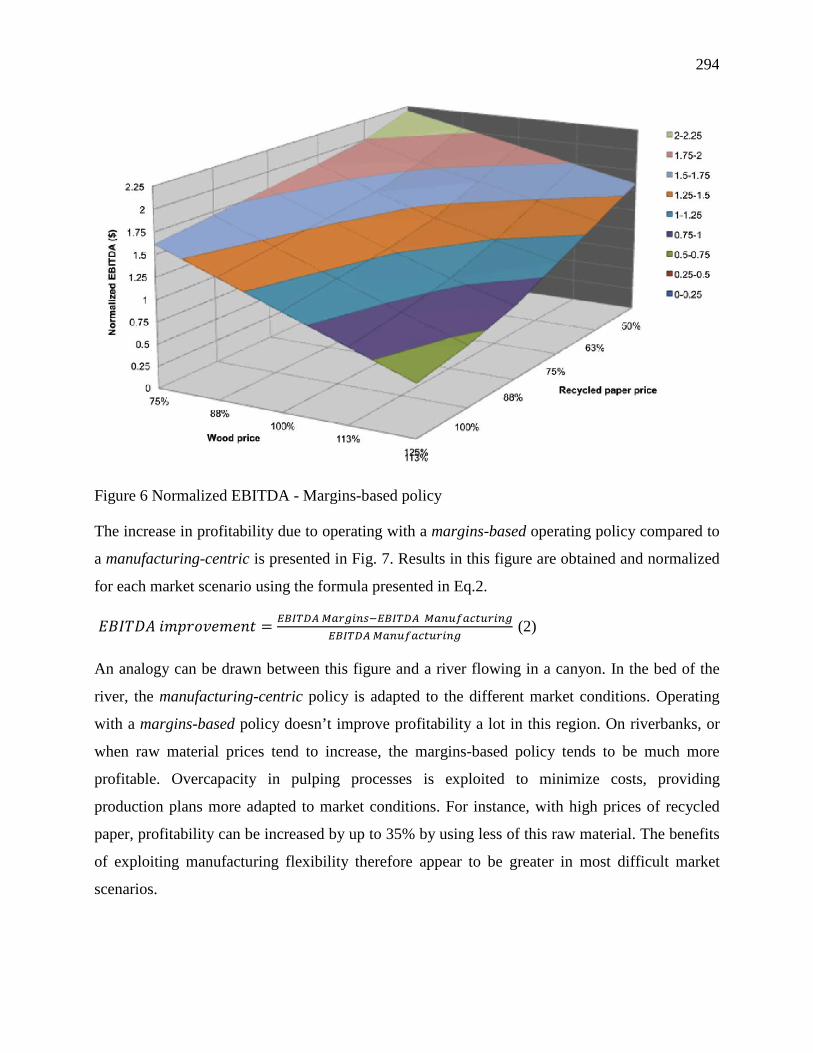
294
Figure 6 Normalized EBITDA - Margins-based policy
The increase in profitability due to operating with a margins-based operating policy compared to
a manufacturing-centric is presented in Fig. 7. Results in this figure are obtained and normalized
for each market scenario using the formula presented in Eq.2.
𝐸𝐵𝐼𝑇𝐷𝐴 𝑖𝑚𝑝𝑟𝑜𝑣𝑒𝑚𝑒𝑛𝑡 = 𝐸𝐵𝐼𝑇𝐷𝐴 𝑀𝑎𝑟𝑔𝑖𝑛𝑠−𝐸𝐵𝐼𝑇𝐷𝐴 𝑀𝑎𝑛𝑢𝑓𝑎𝑐𝑡𝑢𝑟𝑖𝑛𝑔𝐸𝐵𝐼𝑇𝐷𝐴 𝑀𝑎𝑛𝑢𝑓𝑎𝑐𝑡𝑢𝑟𝑖𝑛𝑔
(2)
An analogy can be drawn between this figure and a river flowing in a canyon. In the bed of the
river, the manufacturing-centric policy is adapted to the different market conditions. Operating
with a margins-based policy doesn’t improve profitability a lot in this region. On riverbanks, or
when raw material prices tend to increase, the margins-based policy tends to be much more
profitable. Overcapacity in pulping processes is exploited to minimize costs, providing
production plans more adapted to market conditions. For instance, with high prices of recycled
paper, profitability can be increased by up to 35% by using less of this raw material. The benefits
of exploiting manufacturing flexibility therefore appear to be greater in most difficult market
scenarios.
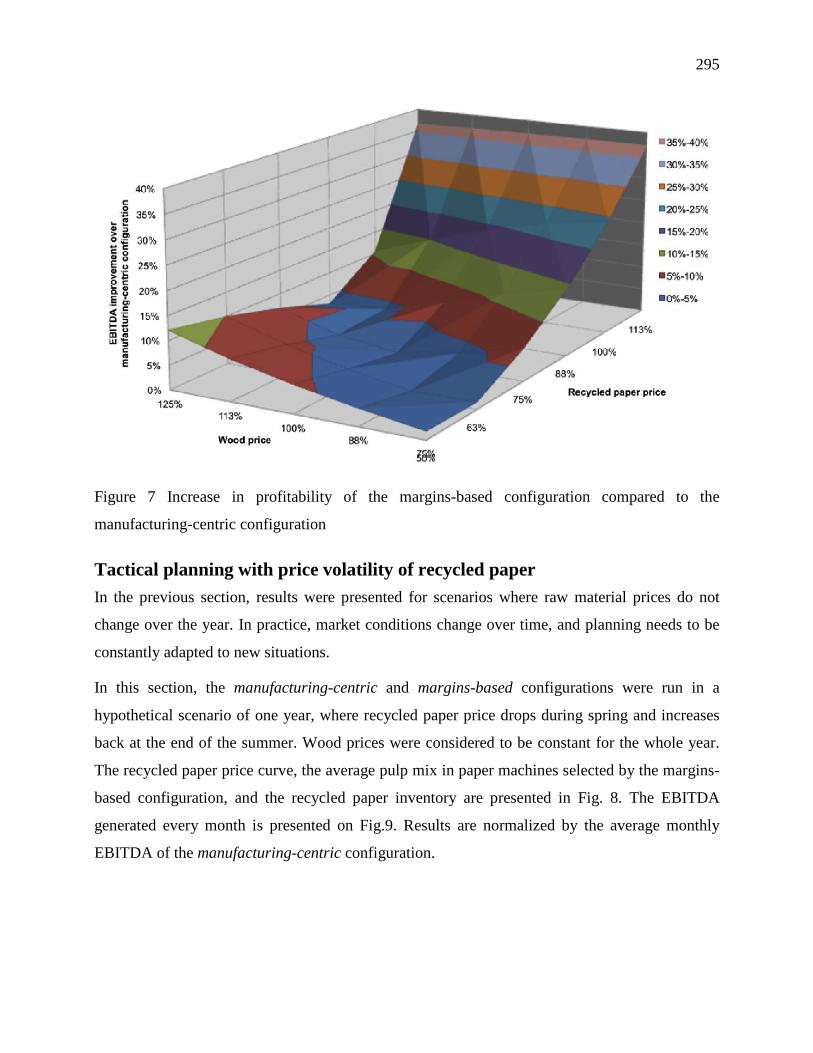
295
Figure 7 Increase in profitability of the margins-based configuration compared to the
manufacturing-centric configuration
Tactical planning with price volatility of recycled paper In the previous section, results were presented for scenarios where raw material prices do not
change over the year. In practice, market conditions change over time, and planning needs to be
constantly adapted to new situations.
In this section, the manufacturing-centric and margins-based configurations were run in a
hypothetical scenario of one year, where recycled paper price drops during spring and increases
back at the end of the summer. Wood prices were considered to be constant for the whole year.
The recycled paper price curve, the average pulp mix in paper machines selected by the margins-
based configuration, and the recycled paper inventory are presented in Fig. 8. The EBITDA
generated every month is presented on Fig.9. Results are normalized by the average monthly
EBITDA of the manufacturing-centric configuration.
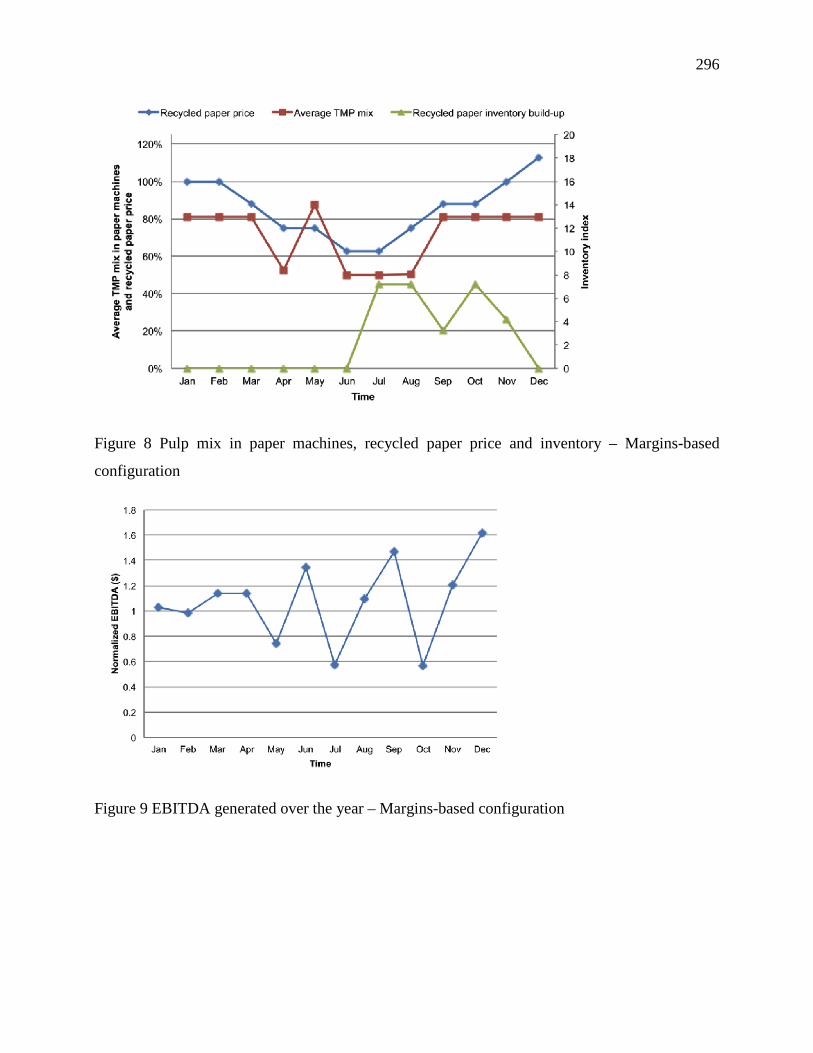
296
Figure 8 Pulp mix in paper machines, recycled paper price and inventory – Margins-based
configuration
Figure 9 EBITDA generated over the year – Margins-based configuration
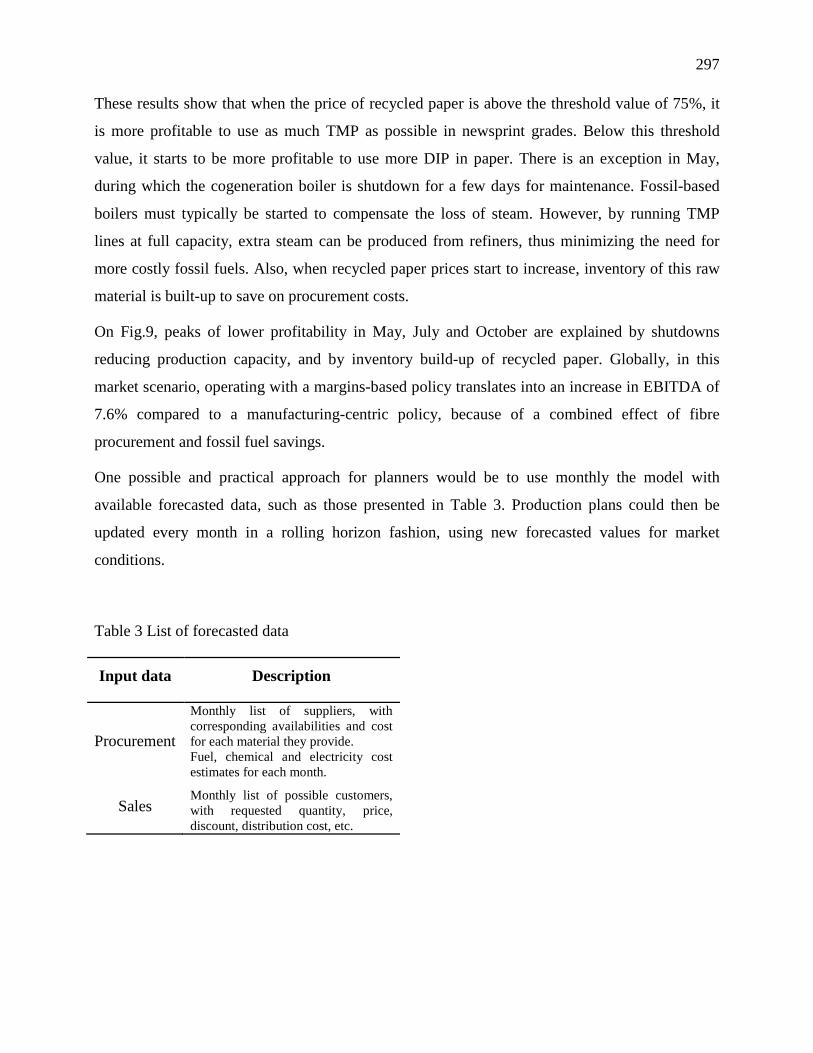
297
These results show that when the price of recycled paper is above the threshold value of 75%, it
is more profitable to use as much TMP as possible in newsprint grades. Below this threshold
value, it starts to be more profitable to use more DIP in paper. There is an exception in May,
during which the cogeneration boiler is shutdown for a few days for maintenance. Fossil-based
boilers must typically be started to compensate the loss of steam. However, by running TMP
lines at full capacity, extra steam can be produced from refiners, thus minimizing the need for
more costly fossil fuels. Also, when recycled paper prices start to increase, inventory of this raw
material is built-up to save on procurement costs.
On Fig.9, peaks of lower profitability in May, July and October are explained by shutdowns
reducing production capacity, and by inventory build-up of recycled paper. Globally, in this
market scenario, operating with a margins-based policy translates into an increase in EBITDA of
7.6% compared to a manufacturing-centric policy, because of a combined effect of fibre
procurement and fossil fuel savings.
One possible and practical approach for planners would be to use monthly the model with
available forecasted data, such as those presented in Table 3. Production plans could then be
updated every month in a rolling horizon fashion, using new forecasted values for market
conditions.
Table 3 List of forecasted data
Input data Description
Procurement
Monthly list of suppliers, with corresponding availabilities and cost for each material they provide. Fuel, chemical and electricity cost estimates for each month.
Sales Monthly list of possible customers, with requested quantity, price, discount, distribution cost, etc.
298
CONCLUSIONS AND IMPLICATIONS In this paper, a case study of a newsprint manufacturer that has the flexibility of changing the
pulp mix in his paper machines was introduced. An integrated planning model was used to
identify the best manufacturing option in different raw material price scenarios, considering the
different trade-offs in procurement and production. Case study results showed that profitability
could be increased by up to 35% in some scenarios by adapting pulping production to fit market
conditions. Exploiting manufacturing flexibility appeared to be most beneficial in difficult market
scenarios.
Manufacturing flexibility options are often present in pulp and paper facilities, but are often not
fully exploited because market and process information cannot be properly analyzed. As process
and utility interrelations can be complicated, trade-offs between different manufacturing options
are generally difficult to identify. An integrated planning model, considering the possible recipes
that can be utilized on the different processes as well as their associated costing patterns, can help
decision-makers identify and understand trade-offs, and in turn propose more profitable
production plans. These results convinced the case study company to adapt more frequently and
more aggressively the pulp mix in their paper machines, to take advantage of changes in
procurement prices. The company was aware of this potential for flexibility, but was not able to
systematically address it, as it lacked tools to quickly evaluate production trade-offs.
With a dramatic decrease in the demand of its products, the newsprint sector is facing a stalemate
situation. On the other side, assets are already paid off for several mills in North America, and
provide free cash flow to the company. Several companies are thus asking themselves whether
they should remain in the business, or to shift away from newsprint manufacture. In both cases,
implementing biorefinery processes will either help these mills in ensuring their competitive
position, or in shifting their business model away from P&P products [23].
299
No matter what direction is sought, applying supply-chain management concepts, such as
margins-based planning, can help to improve profitability of the current business by better
adapting production to market conditions. At the same time, it represents a first step in the
transition that is needed in corporate planning for producing a new bio-product portfolio
composed of both commodities and specialties. As bio-products replace for the most part fossil-
based products, it is likely that biorefineries will face a difficult market environment with
substantial volatility on both the raw material and product sides. In this new environment,
flexibility will be paramount to mitigate risks of market volatility [24]. Moreover, new
biorefinery products will face completely different markets, requiring different management
focus. The use of supply-chain management models would help planners understand the
subtleties of fulfilling different demand levels, and operating a more complex plant in different
conditions. P&P facilities operating already in a margins-based fashion would be ready for this
transition. Through the use of such planning models, manufacturers will be able to take full
advantage of the biorefinery value chain and make it more profitable overall.
ACKNOWLEDGMENTS This work was supported by Natural Sciences Engineering Research Council of Canada
(NSERC) Environmental Design Engineering Chair at Ecole Polytechnique in Montréal. Louis
Patrick Dansereau is supported by a scholarship provided by Le Fond Québécois de la Recherche
sur la Nature et les Technologies. The authors also wish to thank the case study company for
information and insights provided.
LITERATURE CITED 1. Orzechowska, A., Pulp Paper Can. 106(1):25(2005).
2. Chambost, V., McNutt, J., and Stuart, P. R., Pulp Paper Can. 109(7-8):19(2008).
3. Thorp, B., Pulp Pap 79(11):35(2005).
4. Söderholm, P. and Lundmark, R., For Prod J 59(1-2):6(2009).
5. Shapiro, J. F., Modeling the Supply Chain, Thomson-Brooks/Cole, Pacific Grove, CA,
2007, p. 608.
6. McLean, S., Pulp Paper Intl 41(10):28(1999).
300
7. Lail, P. W., Supply Chain Best Practices for the Pulp and Paper Industry, Tappi Press,
Atlanta, GA, 2003.
8. D'Amours, S., Ronnqvist, M., and Weintraub, A., Infor 46(4):265(2008).
9. Carlsson, D. and Ronnqvist, M., Eur J Oper Res 163(3):589(2005).
10. Feng, Y., D'Amours, S., and Beauregard, R., Int J Prod Econ 115(1):189(2008).
11. Kannegiesser, M. and Gunther, H. O., J.Oper.Res.Soc. 62(4):711(2011).
12. Lail, P. W., Pulp Pap 80(11):23(2006).
13. Hytönen, E. and Stuart, P. R., Tappi J. 11(4):9(2012).
14. Turney, P., Common Cents: How to Succeed with Activity-Based Costing and Activity-
Based Management, McGraw-Hill, New-York, 2005, p. 336.
15. Korpunen, H., Virtanen, P., Dahl, O., et al., Tappi J. 11(9):19(2012).
16. Laflamme-Mayer, M., Janssen, M., and Stuart, P. R., J-FOR 1(1):32(2011).
17. Korbel, M., "On-line steady-state data reconciliation for advanced cost analysis in the
pulp and paper industry," Ph.D. thesis, Ecole Polytechnique, Montreal, Canada, 2011.
18. Korbel, M. and Stuart, P. R. in Integrated Biorefineries: Design, Analysis, and
Optimization (M. M. El-Halwagi and P. Stuart, Eds.), CRC Press/Taylor & Francis, 2012.
19. Dansereau, L. P., El-Halwagi, M. M., and Stuart, P. R. in Integrated Biorefineries:
Design, Analysis, and Optimization (M. M. El-Halwagi and P. Stuart, Eds.), CRC Press/Taylor &
Francis, 2012, pp. 195-250.
20. Dansereau, L. P., El-Halwagi, M. M., and Stuart, P. R. 6th International Conference on
Foundations of Computer-Aided Process Operations (FOCAPO 12), Savannah, GA, USA.
21. Dansereau, L. P., El-Halwagi, M. M., and Stuart, P. R., J-FOR 2(4):60(2012).
22. Dansereau, L. P., El-Halwagi, M. M., Mansoornejad, B., et al., Submitted to Computers &
Chemical Engineering.
23. Jeaidi, J. and Stuart, P. R., J-FOR 1(3):62(2011).

301
24. PricewaterhouseCooper (PWC). "Growing the future." Available [Online]
http://www.pwc.com/en_GX/gx/forest-paper-packaging/publications/pdf/growing-future-new-
version.pdf [17-04-2011].
302
ANNEXE D – Value-Chain Planning in the Forest
Biorefinery: Case Study Analyzing Manufacturing
Flexibility
Louis Patrick Dansereau a, Mahmoud El-Halwagi b, c and Paul Stuart a *
a NSERC Environmental Design Engineering Chair in Process Integration, Department of
Chemical Engineering, École Polytechnique Montréal, Montréal, H3C 3A7, Canada
b Department of Chemical Engineering, Texas A&M University, College Station, Texas, 77843,
USA
c Adjunct Faculty at the Chemical and Materials Engineering Department, Faculty of
Engineering, King Abdulaziz University, Jeddah, 21589. P.O. Box 80204, Saudi Arabia
303
ABSTRACT
The biorefinery concept is emerging as a promising solution to transform the pulp and paper
industry and improve the fundamental business model, including the development of more robust
planning approaches that consider overall supply-chain profitability. Products manufactured by
biorefineries will certainly face market price volatility, as they will replace or substitute for
fossil-based products. Several strategies can be applied to mitigate this risk of market volatility
such as financial hedging, vertical integration, partnerships, but also manufacturing flexibility.
With better planning and management of the flexibility of processes, production and procurement
costs can be reduced, while maximizing revenues at the same time. The objective of this paper is
to study the benefits and implications of manufacturing flexibility in a multi-product biorefinery.
A case study of a newsprint mill is used that implements a biorefinery based on wood
fractionation producing ethanol, hemicellulose sugars, furfural and lignin. These are sold both as
specialty chemicals and fuels. Supply-chain planning is optimized under different market
scenarios using a tactical model formulated as a mixed-integer linear program with a profit
maximization objective. Results of the case study show that, for a multi-product biorefinery,
feedstock and throughput flexibility can have significant impacts on the profitability of
operations, and can thus be useful for mitigating market volatility. In certain market scenarios,
exploiting manufacturing flexibility can increase EBITDA up to 15%. The results also show the
importance of designing biorefinery processes with manufacturing flexibility in order to benefit
from opportunities in sales and procurement.
Keywords
Forest biorefinery, supply-chain management, manufacturing flexibility, margins-based planning
304
INTRODUCTION
The biorefinery concept represents an interesting opportunity to transform the pulp and paper
industry. Biorefining implies the production of a diversified bioproduct portfolio, ideally
including several value-added products. As highlighted by Chambost et al. [1] and Thorp [2],
incorporating new products in the pulp and paper product portfolio will be challenging, but
perhaps, changing the business model and manufacturing culture will be even more difficult. As
bioproducts are likely to replace fossil-based commodities, these will face market volatility, and
as the bio-economy takes hold, biomass procurement costs may also be volatile and increasing in
the future. To compete in this complex environment, biorefinery mills should manage their
supply chain in a proactive way, by adapting production to meet market needs, while focusing at
the same time on maximizing overall margins. Producing high volumes of undistinguished
products at the lowest possible cost is less likely to constitute a sustainable business plan for
multi-product biorefineries.
According to the consulting firm PriceWaterhouseCoopers [3], several strategies can be applied
to mitigate market volatility risk. Margins management, contract procurement strategies, and
financial hedging are strategies that aim to mitigate risk by transferring it to someone else: the
customer, the supplier or a financial institution. With other strategic alternatives, such as vertical
integration and manufacturing flexibility, companies accept the risk of market volatility and
manage it. In the context of the forest biorefinery, manufacturing flexibility looks as a promising
strategy to manage the risk of market volatility [4].
With a diversified product portfolio, there is an opportunity to produce more or less of products
according to market conditions. However, given the complexity of the biorefinery supply chain,
proper planning tools are needed to exploit the flexibility of production assets. The interrelations
between product selling prices, procurement costs and the various modes of operation of a facility
are not easy to identify and manage.
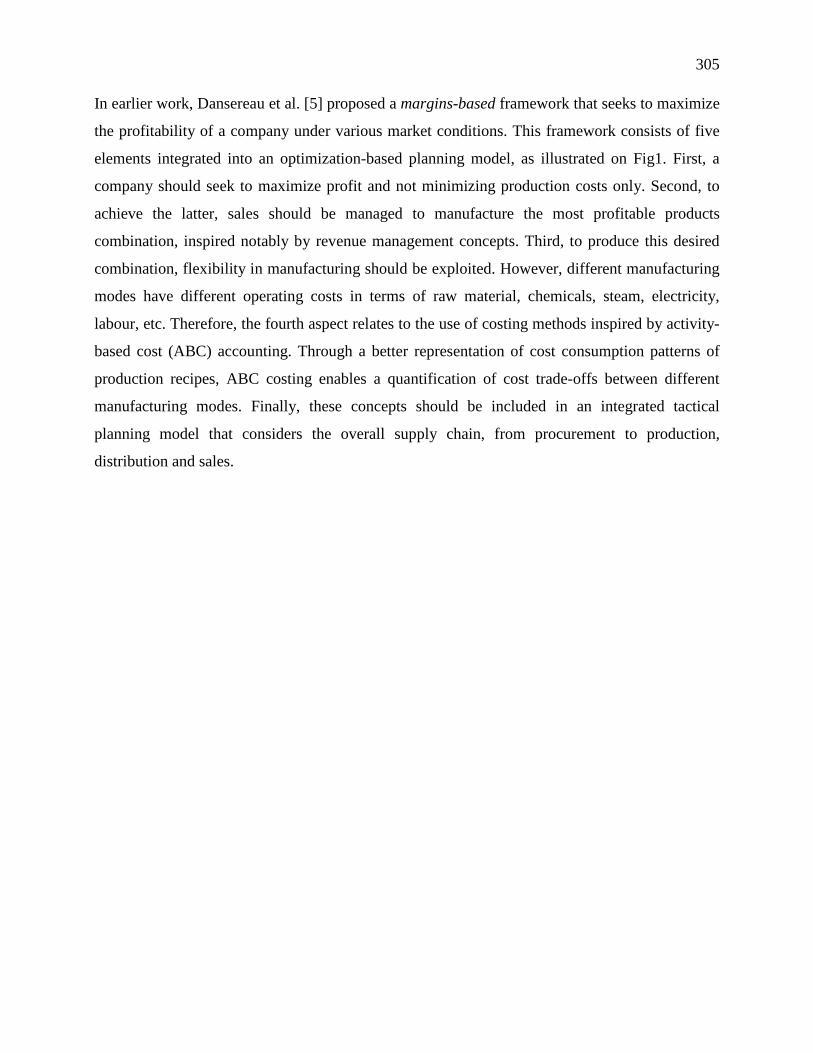
305
In earlier work, Dansereau et al. [5] proposed a margins-based framework that seeks to maximize
the profitability of a company under various market conditions. This framework consists of five
elements integrated into an optimization-based planning model, as illustrated on Fig1. First, a
company should seek to maximize profit and not minimizing production costs only. Second, to
achieve the latter, sales should be managed to manufacture the most profitable products
combination, inspired notably by revenue management concepts. Third, to produce this desired
combination, flexibility in manufacturing should be exploited. However, different manufacturing
modes have different operating costs in terms of raw material, chemicals, steam, electricity,
labour, etc. Therefore, the fourth aspect relates to the use of costing methods inspired by activity-
based cost (ABC) accounting. Through a better representation of cost consumption patterns of
production recipes, ABC costing enables a quantification of cost trade-offs between different
manufacturing modes. Finally, these concepts should be included in an integrated tactical
planning model that considers the overall supply chain, from procurement to production,
distribution and sales.
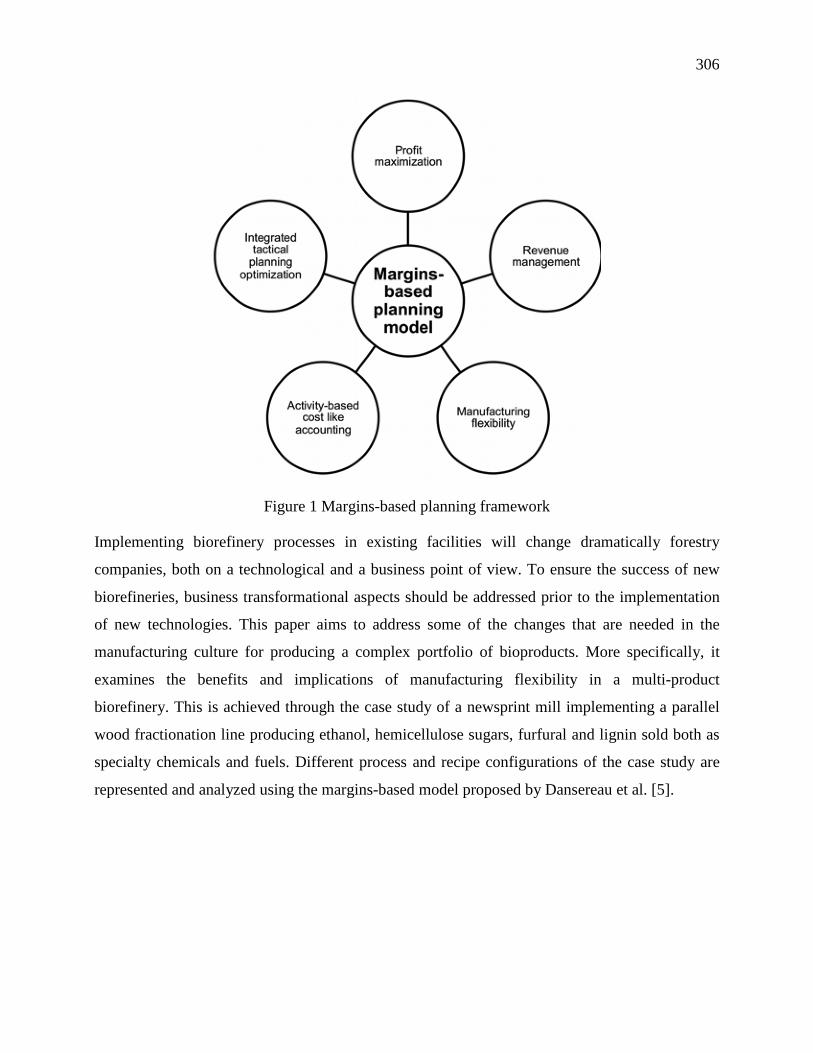
306
Figure 1 Margins-based planning framework
Implementing biorefinery processes in existing facilities will change dramatically forestry
companies, both on a technological and a business point of view. To ensure the success of new
biorefineries, business transformational aspects should be addressed prior to the implementation
of new technologies. This paper aims to address some of the changes that are needed in the
manufacturing culture for producing a complex portfolio of bioproducts. More specifically, it
examines the benefits and implications of manufacturing flexibility in a multi-product
biorefinery. This is achieved through the case study of a newsprint mill implementing a parallel
wood fractionation line producing ethanol, hemicellulose sugars, furfural and lignin sold both as
specialty chemicals and fuels. Different process and recipe configurations of the case study are
represented and analyzed using the margins-based model proposed by Dansereau et al. [5].
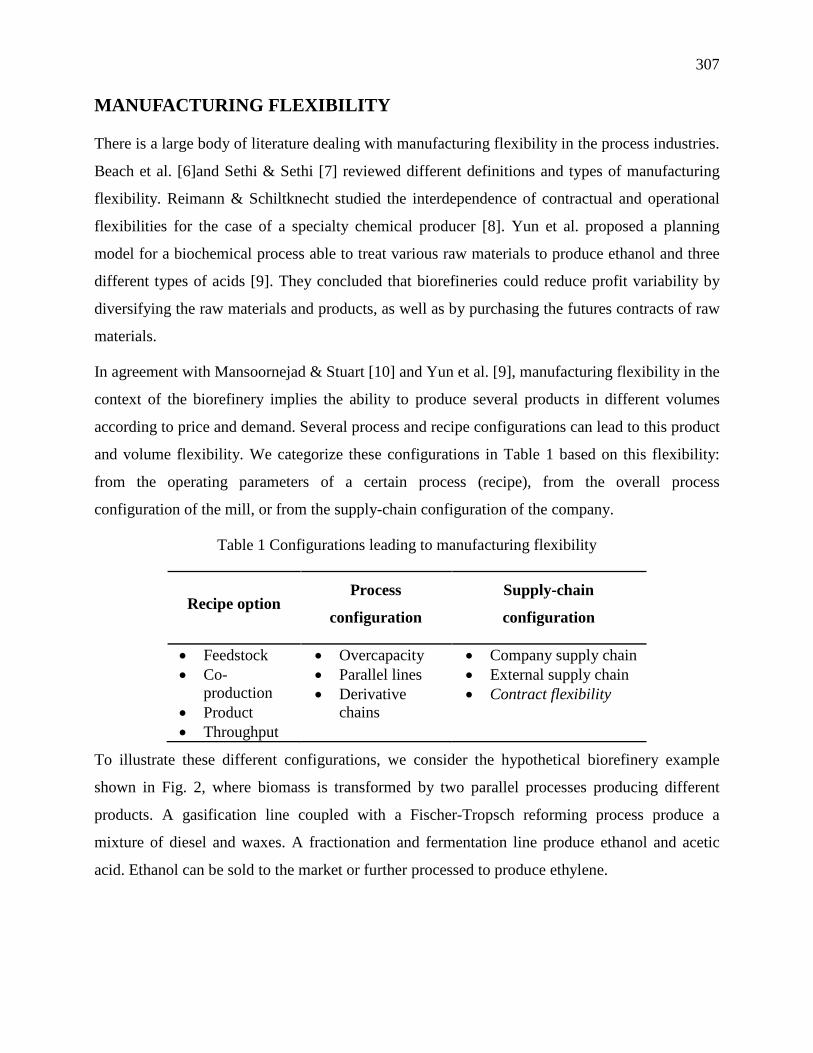
307
MANUFACTURING FLEXIBILITY
There is a large body of literature dealing with manufacturing flexibility in the process industries.
Beach et al. [6]and Sethi & Sethi [7] reviewed different definitions and types of manufacturing
flexibility. Reimann & Schiltknecht studied the interdependence of contractual and operational
flexibilities for the case of a specialty chemical producer [8]. Yun et al. proposed a planning
model for a biochemical process able to treat various raw materials to produce ethanol and three
different types of acids [9]. They concluded that biorefineries could reduce profit variability by
diversifying the raw materials and products, as well as by purchasing the futures contracts of raw
materials.
In agreement with Mansoornejad & Stuart [10] and Yun et al. [9], manufacturing flexibility in the
context of the biorefinery implies the ability to produce several products in different volumes
according to price and demand. Several process and recipe configurations can lead to this product
and volume flexibility. We categorize these configurations in Table 1 based on this flexibility:
from the operating parameters of a certain process (recipe), from the overall process
configuration of the mill, or from the supply-chain configuration of the company.
Table 1 Configurations leading to manufacturing flexibility
Recipe option Process
configuration
Supply-chain
configuration
• Feedstock • Co-
production • Product • Throughput
• Overcapacity • Parallel lines • Derivative
chains
• Company supply chain • External supply chain • Contract flexibility
To illustrate these different configurations, we consider the hypothetical biorefinery example
shown in Fig. 2, where biomass is transformed by two parallel processes producing different
products. A gasification line coupled with a Fischer-Tropsch reforming process produce a
mixture of diesel and waxes. A fractionation and fermentation line produce ethanol and acetic
acid. Ethanol can be sold to the market or further processed to produce ethylene.
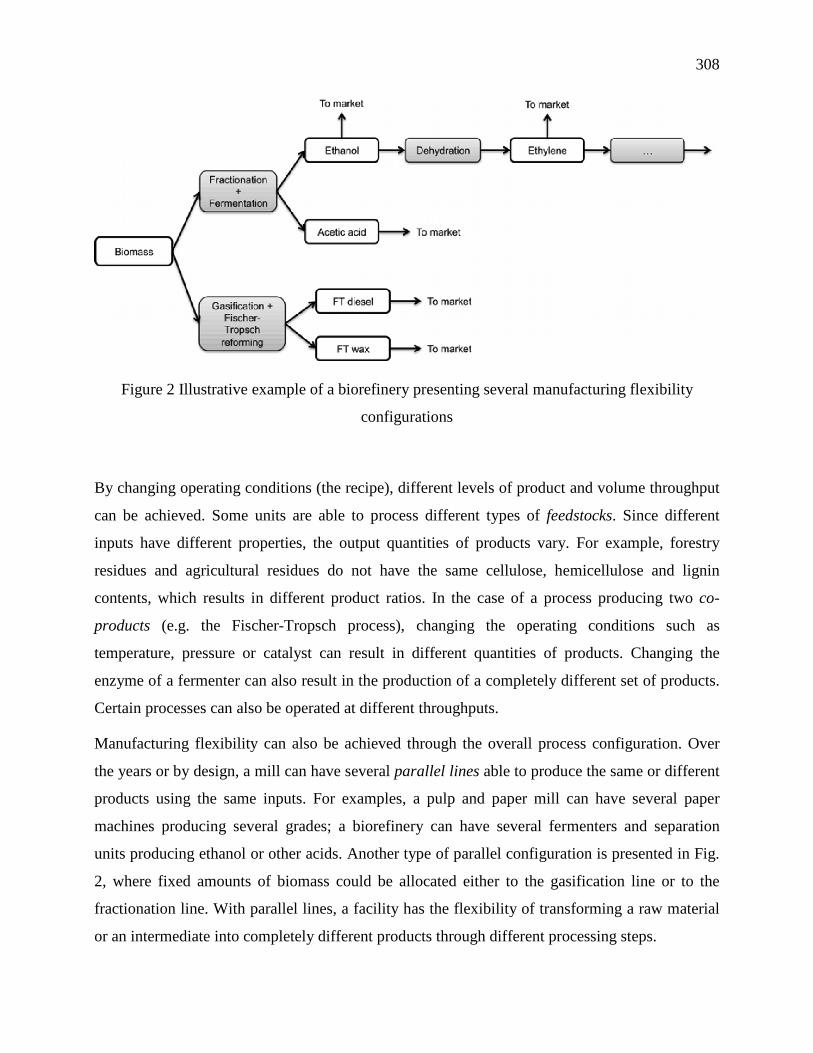
308
Figure 2 Illustrative example of a biorefinery presenting several manufacturing flexibility
configurations
By changing operating conditions (the recipe), different levels of product and volume throughput
can be achieved. Some units are able to process different types of feedstocks. Since different
inputs have different properties, the output quantities of products vary. For example, forestry
residues and agricultural residues do not have the same cellulose, hemicellulose and lignin
contents, which results in different product ratios. In the case of a process producing two co-
products (e.g. the Fischer-Tropsch process), changing the operating conditions such as
temperature, pressure or catalyst can result in different quantities of products. Changing the
enzyme of a fermenter can also result in the production of a completely different set of products.
Certain processes can also be operated at different throughputs.
Manufacturing flexibility can also be achieved through the overall process configuration. Over
the years or by design, a mill can have several parallel lines able to produce the same or different
products using the same inputs. For examples, a pulp and paper mill can have several paper
machines producing several grades; a biorefinery can have several fermenters and separation
units producing ethanol or other acids. Another type of parallel configuration is presented in Fig.
2, where fixed amounts of biomass could be allocated either to the gasification line or to the
fractionation line. With parallel lines, a facility has the flexibility of transforming a raw material
or an intermediate into completely different products through different processing steps.
309
To control production volume, mills can also have an excess of production capacity. In this case,
shutting down unnecessary production lines can add a level of flexibility. However typically,
process equipment cannot easily be switched off on short notice because of costly setups.
Overcapacity options can be impractical as chemical processes are capital intensive.
The last process configuration leading to manufacturing flexibility relates to the production of
derivatives. Some biorefineries will have the opportunity of either selling their intermediates
directly to the market (ethanol in the example of Fig. 2), or transforming them into value-added
chemicals (ethylene).
Manufacturing flexibility opportunities are also available at the supply-chain level. Orders for a
specific product might be fulfilled from one or another mill of the company (internal supply
chain), or even by a competitor (external supply chain). At the sales level, a company can have
specific contractual clauses that empower the manufacturer with specific manufacturing
flexibility options. For example, a contract can include production postponing options or even
options to accept earlier deliveries.
All these possibilities in recipe, process and supply-chain configurations give a manufacturing
site a certain level of flexibility, which can then be exploited to mitigate the risk of market
volatility. However, operating a facility under different recipe/process configuration will incur
different cost consumption patterns that should be accounted for in order to determine the
operating conditions that maximize profit. A framework that aims to exploit manufacturing
flexibility should have modeling capabilities to represent these recipe, process and supply-chain
configurations, and their associated costs.
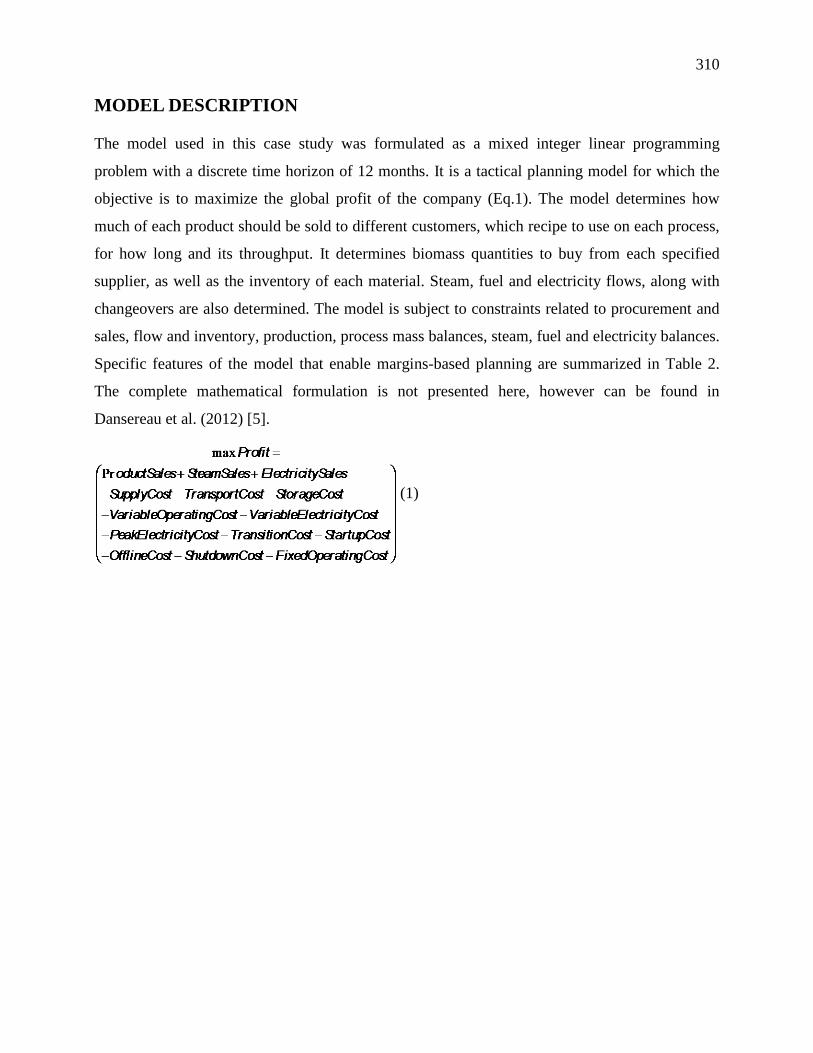
310
MODEL DESCRIPTION
The model used in this case study was formulated as a mixed integer linear programming
problem with a discrete time horizon of 12 months. It is a tactical planning model for which the
objective is to maximize the global profit of the company (Eq.1). The model determines how
much of each product should be sold to different customers, which recipe to use on each process,
for how long and its throughput. It determines biomass quantities to buy from each specified
supplier, as well as the inventory of each material. Steam, fuel and electricity flows, along with
changeovers are also determined. The model is subject to constraints related to procurement and
sales, flow and inventory, production, process mass balances, steam, fuel and electricity balances.
Specific features of the model that enable margins-based planning are summarized in Table 2.
The complete mathematical formulation is not presented here, however can be found in
Dansereau et al. (2012) [5].
(1)
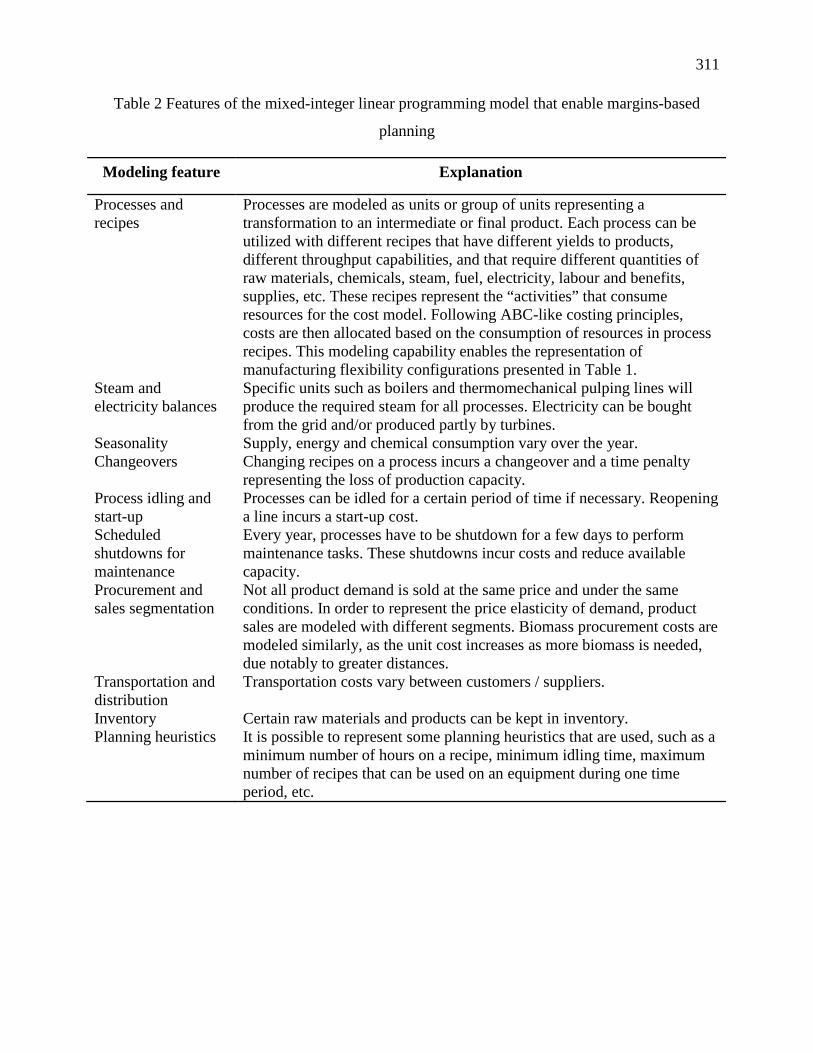
311
Table 2 Features of the mixed-integer linear programming model that enable margins-based
planning
Modeling feature Explanation
Processes and recipes
Processes are modeled as units or group of units representing a transformation to an intermediate or final product. Each process can be utilized with different recipes that have different yields to products, different throughput capabilities, and that require different quantities of raw materials, chemicals, steam, fuel, electricity, labour and benefits, supplies, etc. These recipes represent the “activities” that consume resources for the cost model. Following ABC-like costing principles, costs are then allocated based on the consumption of resources in process recipes. This modeling capability enables the representation of manufacturing flexibility configurations presented in Table 1.
Steam and electricity balances
Specific units such as boilers and thermomechanical pulping lines will produce the required steam for all processes. Electricity can be bought from the grid and/or produced partly by turbines.
Seasonality Supply, energy and chemical consumption vary over the year. Changeovers Changing recipes on a process incurs a changeover and a time penalty
representing the loss of production capacity. Process idling and start-up
Processes can be idled for a certain period of time if necessary. Reopening a line incurs a start-up cost.
Scheduled shutdowns for maintenance
Every year, processes have to be shutdown for a few days to perform maintenance tasks. These shutdowns incur costs and reduce available capacity.
Procurement and sales segmentation
Not all product demand is sold at the same price and under the same conditions. In order to represent the price elasticity of demand, product sales are modeled with different segments. Biomass procurement costs are modeled similarly, as the unit cost increases as more biomass is needed, due notably to greater distances.
Transportation and distribution
Transportation costs vary between customers / suppliers.
Inventory Certain raw materials and products can be kept in inventory. Planning heuristics It is possible to represent some planning heuristics that are used, such as a
minimum number of hours on a recipe, minimum idling time, maximum number of recipes that can be used on an equipment during one time period, etc.
312
CASE STUDY DESCRIPTION
The case study is based on an existing newsprint mill with four thermomechanical pulping lines,
two deinking lines and three paper machines producing a total of 800 t/d of newsprint products.
The mill is equipped with a 25 MW biomass-based cogeneration plant as well as additional
boilers running on fossil fuel.
In addition to pulp and paper operations, a hypothetical organosolv fractionation line treating 250
BDMT/day of biomass is added. This fractionation line is able to process wheat straw, hardwood
(HW) chips and softwood (SW) chips into the three main components of lignocellulosic biomass.
The cellulose stream is hydrolyzed and fermented to produce ethanol sold as a biofuel. The
precipitated lignin is dried and sold partly as a value-added chemical and partly as a fuel.
Hemicellulose sugars are either sold directly to the market, or separated with a membrane for
further transformation where pentoses are converted to furfural, acetic and formic acids, and
hexoses are sent to the ethanol fermentation line. Depending on the feedstock being used,
different quantities of each product will be manufactured. For example, softwood hemicelluloses
contain more hexoses than hardwoods – and thus produce more ethanol. Hardwood
hemicelluloses contain more pentoses, thus more furfural is produced. No additional investments
in utilities and wastewater treatment have been considered as the retrofit mill already has idled
boilers that can be restarted, and overcapacity in the wastewater treatment plant. A simplified
representation of the case study biorefinery is presented in Fig. 3.
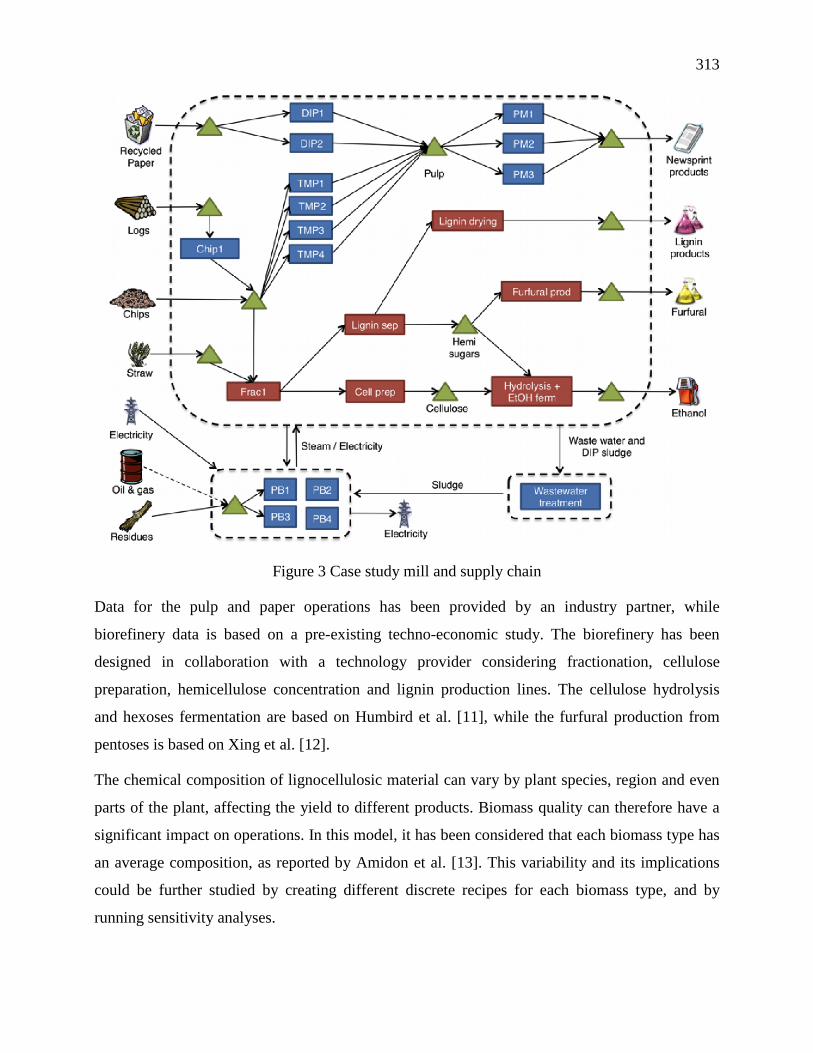
313
Figure 3 Case study mill and supply chain
Data for the pulp and paper operations has been provided by an industry partner, while
biorefinery data is based on a pre-existing techno-economic study. The biorefinery has been
designed in collaboration with a technology provider considering fractionation, cellulose
preparation, hemicellulose concentration and lignin production lines. The cellulose hydrolysis
and hexoses fermentation are based on Humbird et al. [11], while the furfural production from
pentoses is based on Xing et al. [12].
The chemical composition of lignocellulosic material can vary by plant species, region and even
parts of the plant, affecting the yield to different products. Biomass quality can therefore have a
significant impact on operations. In this model, it has been considered that each biomass type has
an average composition, as reported by Amidon et al. [13]. This variability and its implications
could be further studied by creating different discrete recipes for each biomass type, and by
running sensitivity analyses.
314
Wood procurement and sales of the main products (newsprint, ethanol, lignin and furfural) have
been modeled using various procurement/customer segments. Each segment includes a price, and
minimum and maximum quantities to be fulfilled. This modeling enables the representation of
price elasticities for raw materials and products, with diminishing returns / increasing costs
associated with larger quantities. As more biomass of a given type is needed, the further one has
to go to harvest it, and the price increases. Similarly, the market for some products can have
lower revenues associated with greater volumes of sales, due to the sales in another market with a
different application and lower price, or due to discounting practices. Nominal prices of main
products and raw materials are presented in Table 3 and will be referred to as the base case
market scenario. For all scenarios, it has been considered that there are no constraints relative to
the availability of each raw material.
Table 3 Nominal prices of products and raw materials
Product / feedstock
Nominal price (US$/bone dry metric ton)
Comment
White birch
160 Average price delivered at the mill gate in the case study region
Balsam fir 160 Average price delivered at the mill gate in the case study region
Wheat straw
110 Estimated price delivered at the mill gate [14]
Ethanol 800 Spot ethanol price, sold as a biofuel [15]. 99.5% purity.
Lignin 1700 Phenol replacement in phenyl formaldehyde resin applications [15]. Spot price. 98% purity.
Furfural 1500 [12]. Spot price. 99.3% purity.
Overall, the case study consists of 1 mill, 21 suppliers and 55 customer clusters. 107 different
materials, 32 processes and 336 recipes are accounted for a total of 52957 variables including
6912 binary, and 194354 constraints. This model was implemented in IBM ILOG CPLEX
Optimization Studio 12.2 on an AMD Athlon dual core processor with 2.8 GHz and 4 Go RAM.
Global optimum solutions are obtained in 2 to 1000 seconds, depending on the analysis made.
315
RESULTS
The model was run with different recipe configurations to represent possible feedstock flexibility
options in the biorefinery line. Table 4 summarizes the different scenarios tested. In the first
subsection, results for configurations using only one type of feedstock are presented. The next
two subsections deal with the configuration with feedstock flexibility under different market and
procurement scenarios. Other flexibility configurations in the biorefinery line and in pulp and
paper lines are subject of future work.
Table 4 Process and recipe scenarios tested
Process / recipe configuration
Scenario name
Description
Feedstock
Hardwood The biorefinery line processes white birch only.
Softwood The biorefinery line processes balsam fir only.
Straw The biorefinery line processes wheat straw only.
Wood+straw campaigns
White birch, balsam fir and wheat straw can be treated by the biorefinery in a campaign mode.
Profitability results are presented as EBITDA (earnings before interests, taxes, depreciation and
amortization). For comparison purposes, revenues, costs and profitability of each instance are
normalized by the respective results of the hardwood configuration using the base case price
scenario.
Hardwood, softwood and straw feedstocks
In this section, results from cases that do not exploit manufacturing flexibility (hardwood,
softwood and straw feedstock) are compared to each other under the base case market scenario.
Depending on the recipe utilized for the biorefinery process, ethanol, lignin and furfural will be
produced in different quantities because the raw material properties differ. Figure 4 illustrates this
phenomenon. Compared to the hardwood configuration, the softwood configuration produces
more lignin and ethanol, but much less furfural. The straw configuration produces the least
lignin, but the most furfural.
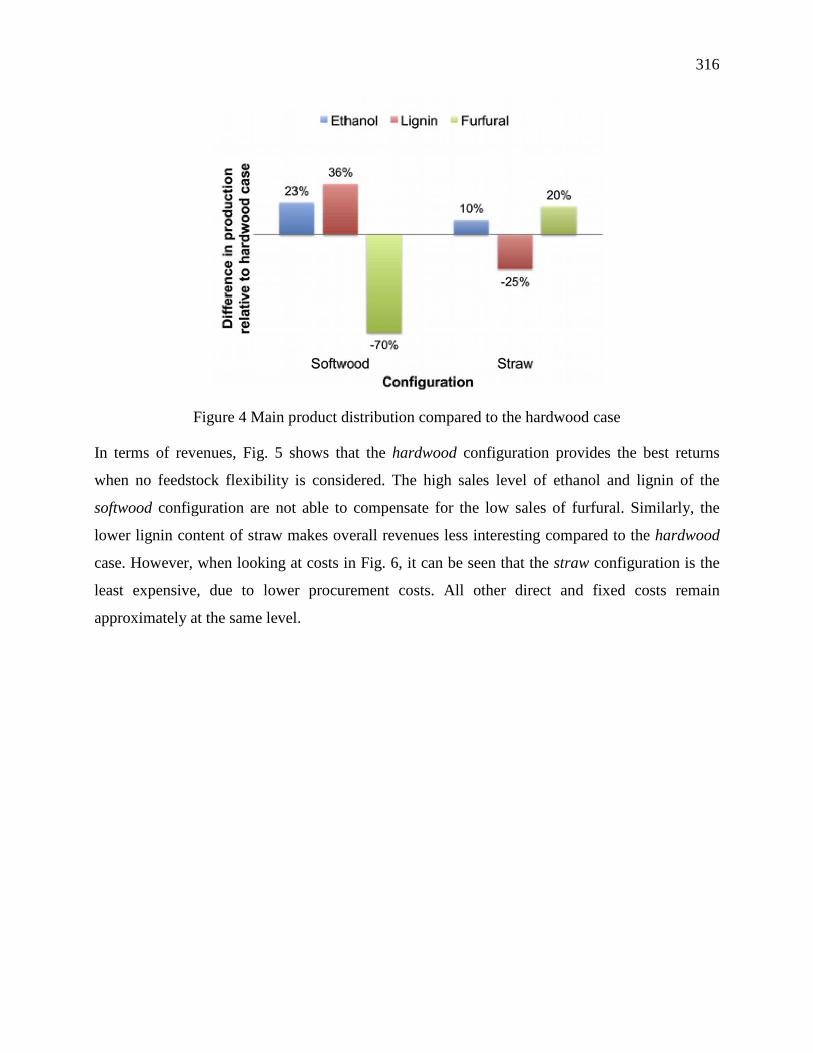
316
Figure 4 Main product distribution compared to the hardwood case
In terms of revenues, Fig. 5 shows that the hardwood configuration provides the best returns
when no feedstock flexibility is considered. The high sales level of ethanol and lignin of the
softwood configuration are not able to compensate for the low sales of furfural. Similarly, the
lower lignin content of straw makes overall revenues less interesting compared to the hardwood
case. However, when looking at costs in Fig. 6, it can be seen that the straw configuration is the
least expensive, due to lower procurement costs. All other direct and fixed costs remain
approximately at the same level.
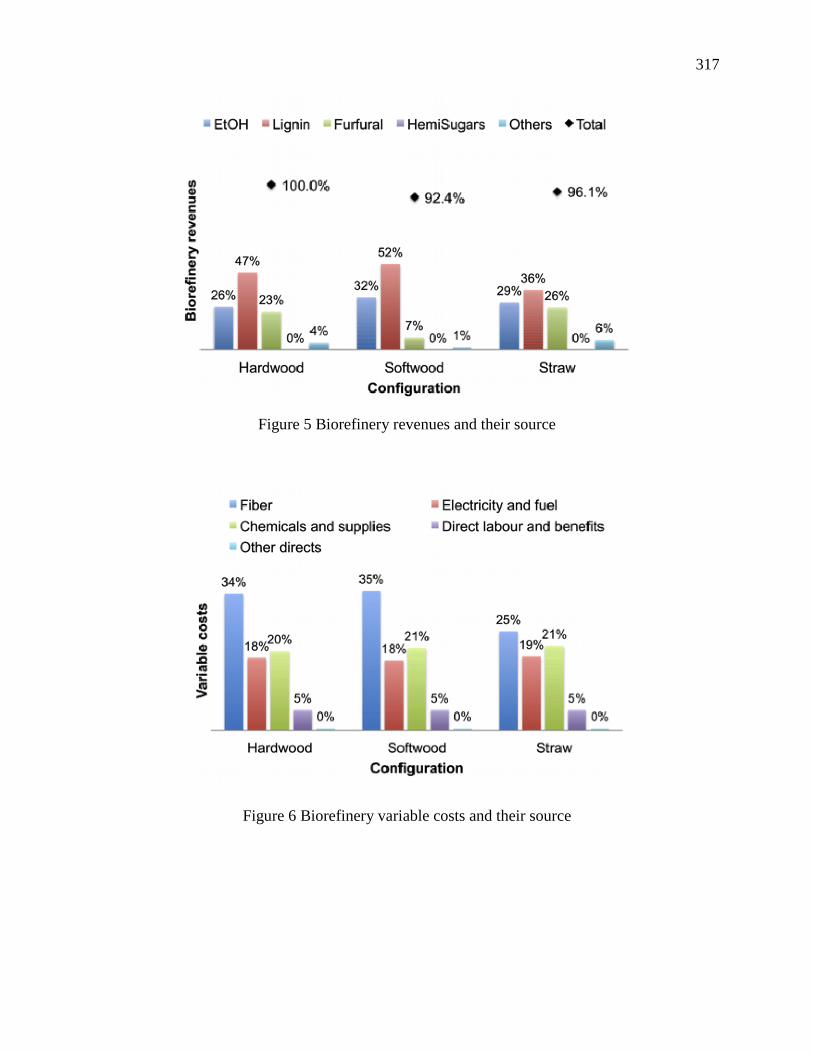
317
Figure 5 Biorefinery revenues and their source
Figure 6 Biorefinery variable costs and their source
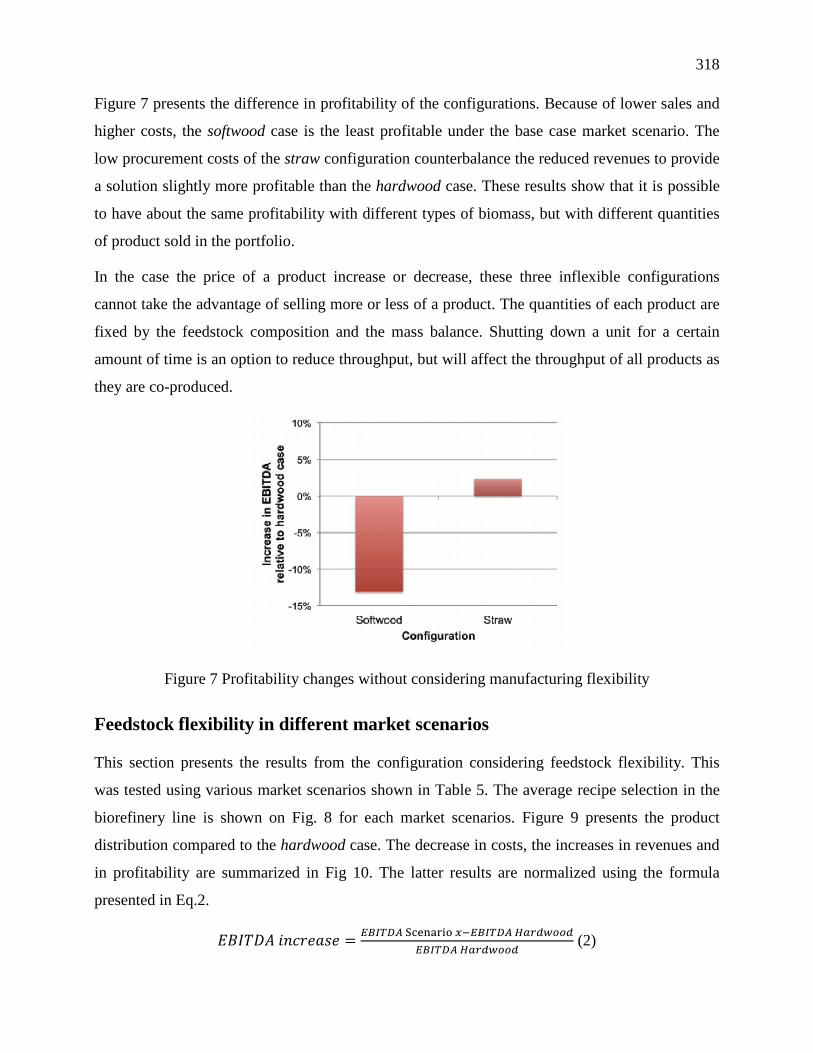
318
Figure 7 presents the difference in profitability of the configurations. Because of lower sales and
higher costs, the softwood case is the least profitable under the base case market scenario. The
low procurement costs of the straw configuration counterbalance the reduced revenues to provide
a solution slightly more profitable than the hardwood case. These results show that it is possible
to have about the same profitability with different types of biomass, but with different quantities
of product sold in the portfolio.
In the case the price of a product increase or decrease, these three inflexible configurations
cannot take the advantage of selling more or less of a product. The quantities of each product are
fixed by the feedstock composition and the mass balance. Shutting down a unit for a certain
amount of time is an option to reduce throughput, but will affect the throughput of all products as
they are co-produced.
Figure 7 Profitability changes without considering manufacturing flexibility
Feedstock flexibility in different market scenarios
This section presents the results from the configuration considering feedstock flexibility. This
was tested using various market scenarios shown in Table 5. The average recipe selection in the
biorefinery line is shown on Fig. 8 for each market scenarios. Figure 9 presents the product
distribution compared to the hardwood case. The decrease in costs, the increases in revenues and
in profitability are summarized in Fig 10. The latter results are normalized using the formula
presented in Eq.2.
𝐸𝐵𝐼𝑇𝐷𝐴 𝑖𝑛𝑐𝑟𝑒𝑎𝑠𝑒 = 𝐸𝐵𝐼𝑇𝐷𝐴 Scenario 𝑥−𝐸𝐵𝐼𝑇𝐷𝐴 𝐻𝑎𝑟𝑑𝑤𝑜𝑜𝑑𝐸𝐵𝐼𝑇𝐷𝐴 𝐻𝑎𝑟𝑑𝑤𝑜𝑜𝑑
(2)
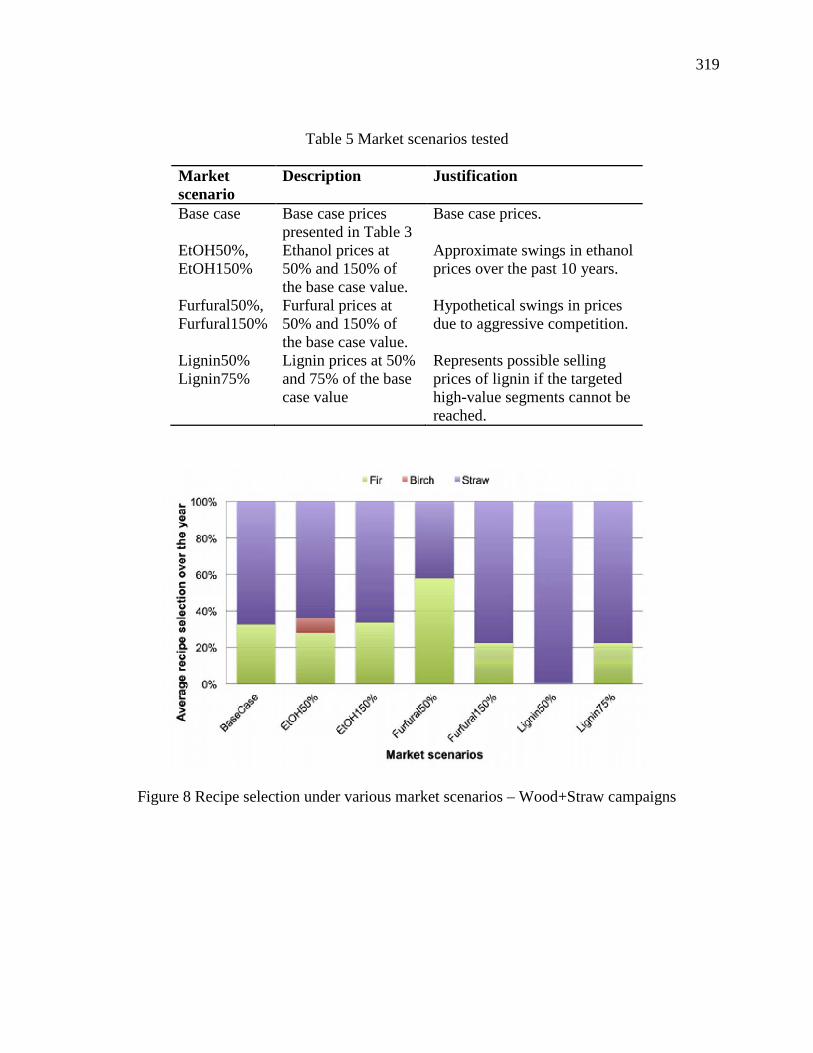
319
Table 5 Market scenarios tested
Market scenario
Description Justification
Base case Base case prices presented in Table 3
Base case prices.
EtOH50%, EtOH150%
Ethanol prices at 50% and 150% of the base case value.
Approximate swings in ethanol prices over the past 10 years.
Furfural50%, Furfural150%
Furfural prices at 50% and 150% of the base case value.
Hypothetical swings in prices due to aggressive competition.
Lignin50% Lignin75%
Lignin prices at 50% and 75% of the base case value
Represents possible selling prices of lignin if the targeted high-value segments cannot be reached.
Figure 8 Recipe selection under various market scenarios – Wood+Straw campaigns
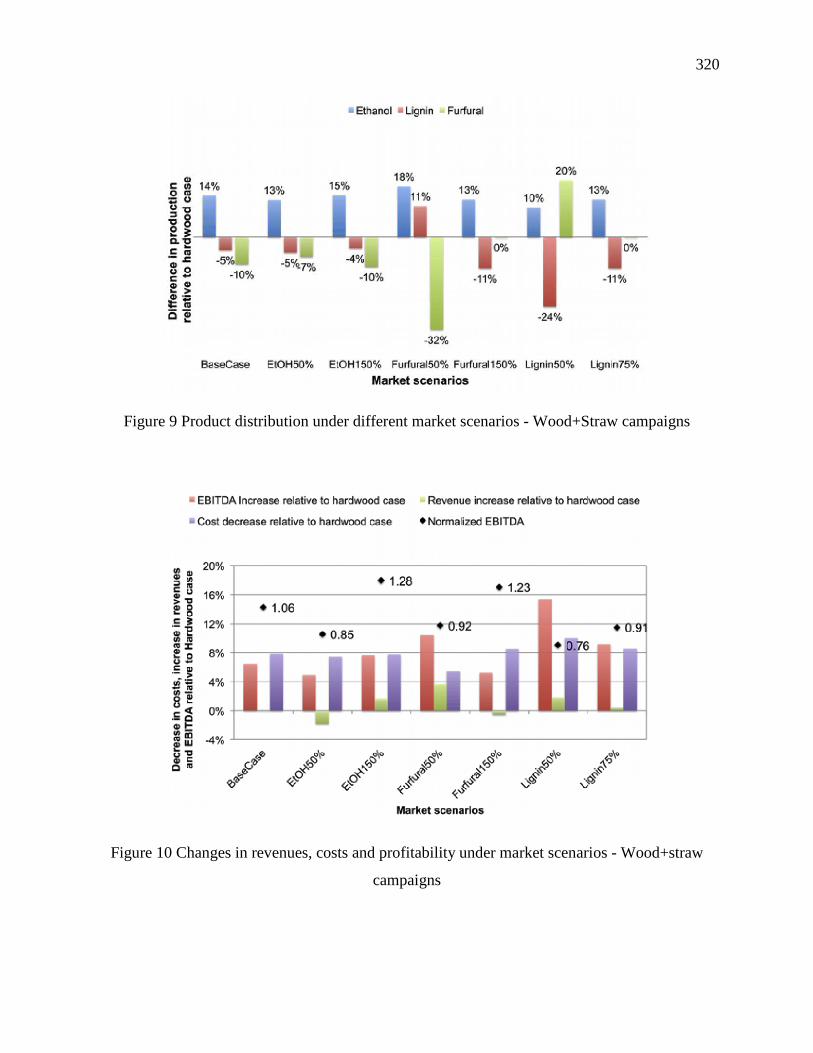
320
Figure 9 Product distribution under different market scenarios - Wood+Straw campaigns
Figure 10 Changes in revenues, costs and profitability under market scenarios - Wood+straw
campaigns
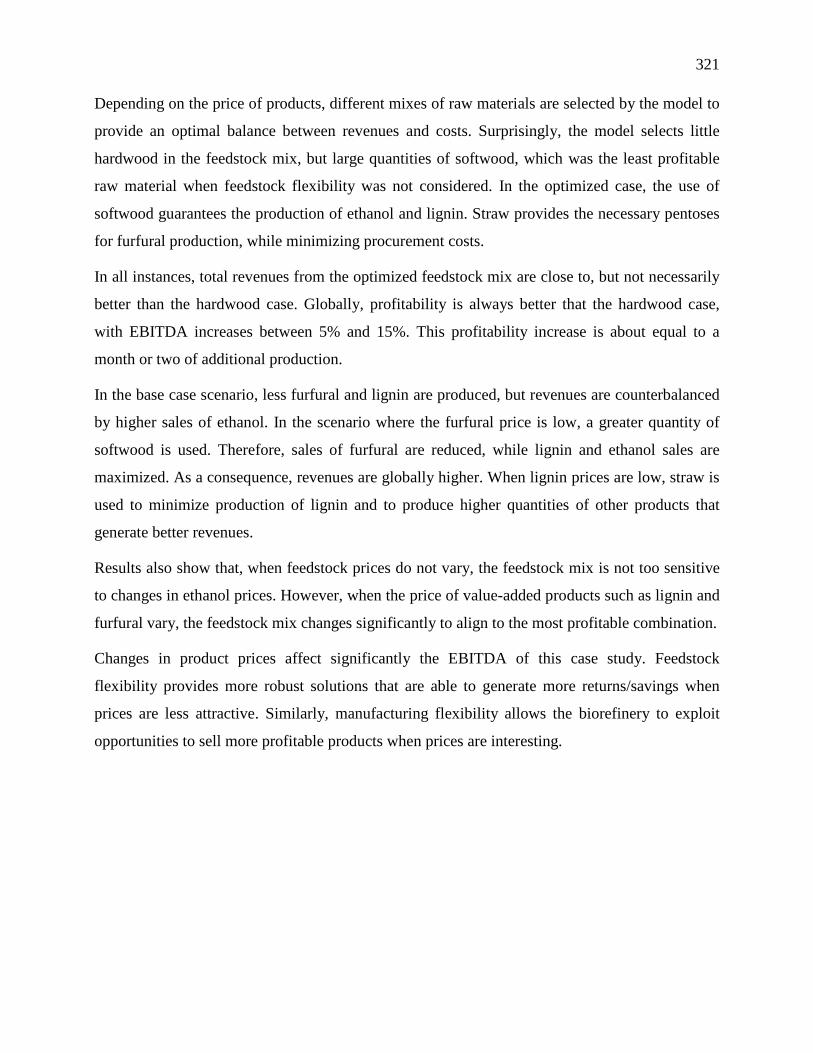
321
Depending on the price of products, different mixes of raw materials are selected by the model to
provide an optimal balance between revenues and costs. Surprisingly, the model selects little
hardwood in the feedstock mix, but large quantities of softwood, which was the least profitable
raw material when feedstock flexibility was not considered. In the optimized case, the use of
softwood guarantees the production of ethanol and lignin. Straw provides the necessary pentoses
for furfural production, while minimizing procurement costs.
In all instances, total revenues from the optimized feedstock mix are close to, but not necessarily
better than the hardwood case. Globally, profitability is always better that the hardwood case,
with EBITDA increases between 5% and 15%. This profitability increase is about equal to a
month or two of additional production.
In the base case scenario, less furfural and lignin are produced, but revenues are counterbalanced
by higher sales of ethanol. In the scenario where the furfural price is low, a greater quantity of
softwood is used. Therefore, sales of furfural are reduced, while lignin and ethanol sales are
maximized. As a consequence, revenues are globally higher. When lignin prices are low, straw is
used to minimize production of lignin and to produce higher quantities of other products that
generate better revenues.
Results also show that, when feedstock prices do not vary, the feedstock mix is not too sensitive
to changes in ethanol prices. However, when the price of value-added products such as lignin and
furfural vary, the feedstock mix changes significantly to align to the most profitable combination.
Changes in product prices affect significantly the EBITDA of this case study. Feedstock
flexibility provides more robust solutions that are able to generate more returns/savings when
prices are less attractive. Similarly, manufacturing flexibility allows the biorefinery to exploit
opportunities to sell more profitable products when prices are interesting.
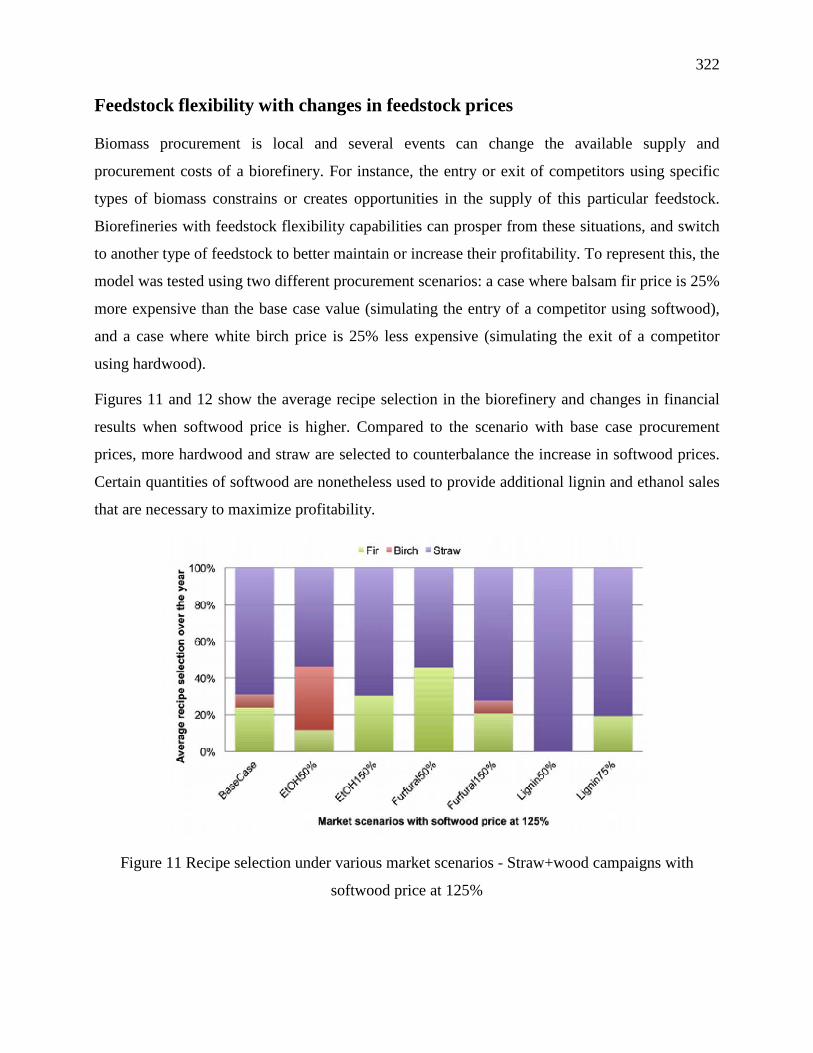
322
Feedstock flexibility with changes in feedstock prices
Biomass procurement is local and several events can change the available supply and
procurement costs of a biorefinery. For instance, the entry or exit of competitors using specific
types of biomass constrains or creates opportunities in the supply of this particular feedstock.
Biorefineries with feedstock flexibility capabilities can prosper from these situations, and switch
to another type of feedstock to better maintain or increase their profitability. To represent this, the
model was tested using two different procurement scenarios: a case where balsam fir price is 25%
more expensive than the base case value (simulating the entry of a competitor using softwood),
and a case where white birch price is 25% less expensive (simulating the exit of a competitor
using hardwood).
Figures 11 and 12 show the average recipe selection in the biorefinery and changes in financial
results when softwood price is higher. Compared to the scenario with base case procurement
prices, more hardwood and straw are selected to counterbalance the increase in softwood prices.
Certain quantities of softwood are nonetheless used to provide additional lignin and ethanol sales
that are necessary to maximize profitability.
Figure 11 Recipe selection under various market scenarios - Straw+wood campaigns with
softwood price at 125%
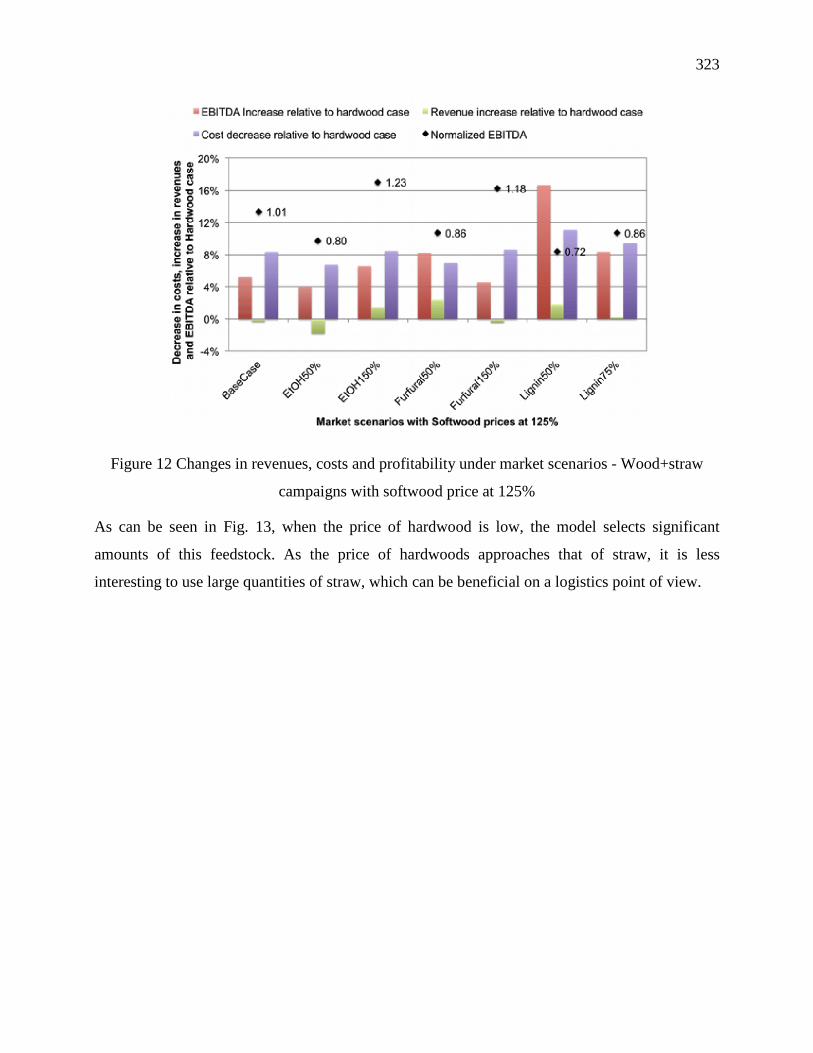
323
Figure 12 Changes in revenues, costs and profitability under market scenarios - Wood+straw
campaigns with softwood price at 125%
As can be seen in Fig. 13, when the price of hardwood is low, the model selects significant
amounts of this feedstock. As the price of hardwoods approaches that of straw, it is less
interesting to use large quantities of straw, which can be beneficial on a logistics point of view.
324
Figure 13 Recipe selection under various market scenarios - Straw+wood campaigns with
hardwood price at 75%
DISCUSSION
There are several implications from these case study results regarding the management of multi-
product biorefineries. The results are surprisingly sensitive to changes in feedstock and product
prices. The procurement and production needed to manufacture the product mix that provides the
optimum margins can vary significantly. Biorefinery processes will have complex interrelations
that make dynamics and trade-offs between manufacturing options not easy to identify and
understand. As introduced in earlier section, different recipes, processes, and supply-chain
configurations can lead to different levels of manufacturing flexibility. Manufacturing flexibility
can hardly be practically exploited without the help of an optimization model that considers the
integrated supply chain to identify the conditions that maximize profit.
325
In this case study, it was assumed that wheat straw was available all year long and in sufficient
quantity to sustain the biorefinery. Inventory and logistics issues related to the handling of an
annual crop such as straw have not been considered. However, the results showed that for most
market scenarios, only part of the available straw supply was needed to maximize profitability. It
was beneficial to pay more for certain types of biomass if they were manufacturing a product
portfolio mix with higher revenues. The objective of procurement is typically to minimize costs,
provided that product quality can be met. For a biorefinery producing several different products,
procurement plays an important leverage role that can increase revenues while minimizing costs.
Therefore, it can be a powerful tool that provides robustness against volatile market conditions.
The benefit from manufacturing flexibility is clear. However providing for manufacturing
flexibility requires additional investment. For example, additional processing steps can be
required for the pre-treatment of different feedstock sources. As well, extra capacity in
downstream processing units for separation and purification can be necessary to support
throughput variations. In the case study example, it was assumed that the fractionation step was
the process bottleneck, and that other units were able to handle throughput variations. To
maximize profitability under all market scenarios considered, it was found that lignin throughput
should vary from -24% and +11% of its nominal throughput, considering hardwood only. For
biorefineries producing products facing market volatile conditions, it would be advantageous for
biorefinery process designs to incorporate manufacturing flexibility. Tactical/operational analyses
such as those presented in this article can be used to target manufacturing flexibility, following
the approach proposed by Mansoornejad et al. [10].
There are implications of this work to company sales policy. A biorefinery operating in a
margins-based fashion will have to adapt the sales of the portfolio products over time according
to market conditions. Therefore, contract and spot sales allocation for products should be
carefully assessed to leave enough flexibility to produce more or less of a product depending on
market conditions. Kannegiesser & Gunther [16] concluded that a global commodity chemical
producer should not secure too much sales as contracts to take advantage of the spot market. For
a biorefinery coproducing several products, this consideration would become even more
important, as product throughputs are interrelated.
326
For the multi-product portfolio considered in this study, the results showed that product
throughput variations were more sensitive to the price of lignin and furfural, which are value-
added products. Co-produced commodities, such as ethanol, should be viewed as a sales “sink” to
provide cash flow.
CONCLUSIONS
New planning approaches will be required to maximize the value that can be extracted from
forest biomass in biorefineries. Specifically, it will be important to exploit manufacturing
flexibility and align production to market conditions, especially in response to market price
volatility.
In this paper, a characterization of different recipe, process, and supply chain configurations was
introduced for a case study of a multi-product forest biorefinery having feedstock flexibility.
Using an integrated tactical planning model based on optimization, different manufacturing
configurations were analyzed under various market scenarios. Case study results showed that
profitability can be enhanced by up to 15% in EBITDA utilizing a feedstock mix that balances
higher revenues with lower procurement costs. This was made possible by varying the throughput
of the different products by 5% to 30%. With changing market conditions, the feedstock mix had
to be adapted to provide optimal returns.
Operating a biorefinery in a margins-based fashion offers profitability improvement, but it
requires moving away from traditional commodity-business planning. Sales and procurement will
have to be adapted to produce the most profitable product portfolio combination. Advanced
planning tools will undoubtedly have to be more systematically utilized to identify trade-offs
between procurement, different manufacturing options and sales.
ACKNOWLEDGEMENTS
This work was supported by the Natural Sciences Engineering Research Council of Canada
(NSERC) Environmental Design Engineering Chair at Ecole Polytechnique in Montréal. Louis
Patrick Dansereau was supported by a scholarship provided by Le Fond Québécois de la
Recherche sur la Nature et les Technologies. The authors also wish to thank the case study
company and the biorefinery technology provider for the information and insights provided, as
well as Jawad Jeaidi for the techno-economic study of the biorefinery.
327
REFERENCES
[1] Chambost, V., McNutt, J. and Stuart, P.R. "Guided tour: Implementing the forest
biorefinery (FBR) at existing pulp and paper mills". Pulp and Paper Canada, 109(7-8):
19-27 (2008).
[2] Thorp, B. "Biorefinery offers industry leaders business model for major change". Pulp &
Paper, 79(11): 35-39 (2005).
[3] PricewaterhouseCooper (PWC). (2009). Managing commodity risk through market
uncertainty. http://www.pwc.com/gx/en/metals/commodity-risk/commodity-risk.jhtml,
Accessed 17-08-2010
[4] Dansereau, L.-P., El-Halwagi, M.M. and Stuart, P.R., "Value Chain Management
Considerations for the Biorefinery". In: El-Halwagi, M.M. and Stuart, P. (eds.) Integrated
Biorefineries: Design, Analysis, and Optimization. CRC Press/Taylor & Francis, (2012).
[5] Dansereau, L.-P., El-Halwagi, M.M. and Stuart, P.R., "An Integrated Tactical Planning
Model for Margins-based Operations in the Forest Biorefinery". In: Sahinidis, N. and
Pinto, J. (eds.) 6th International Conference on Foundations of Computer-Aided Process
Operations (FOCAPO 12). Savannah, GA, USA (2012).
[6] Beach, R., Muhlemann, A.P., Price, D.H.R., Paterson, A. and Sharp, J.A. "A review of
manufacturing flexibility". European Journal of Operational Research, 122(1): 41-57
(2000).
[7] Sethi, A.K. and Sethi, S.P. "Flexibility in manufacturing: a survey". International Journal
of Flexible Manufacturing Systems, 2(4): 289-328 (1990).
[8] Reimann, M. and Schiltknecht, P. "Studying the interdependence of contractual and
operational flexibilities in the market of specialty chemicals". European Journal of
Operational Research, 198(3): 760-772 (2009).
[9] Yun, C., Kim, Y., Park, J. and Park, S. "Optimal procurement and operational planning
for risk management of an integrated biorefinery process". Chemical Engineering
Research and Design, 87(9): 1184-1190 (2009).
328
[10] Mansoornejad, B., Pistikopoulos, E.N. and Stuart, P.R. "Incorporating flexibility design
into supply chain for the forest biorefinery". Journal of Science and Technology for
Forest Products and Processes, 1(2): 54-66 (2012).
[11] Humbird, D., Davis, R., Tao, L., Kinchin, C., Hsu, D., Aden, A., Shchoen, P., Lukas, J.,
Olthof, B., Worley, M., Sexton, D. and Dudgeon, D., "Process Design and Economics for
Biochemical Conversion of Lignocellulosix Biomass to Ethanol - Dilute-Acid
Pretreatment and Enzymatic Hydrolysis of Corn Stover," National Renewable Energy
Laboratory, Golden, Colorado NREL/TP-5100-47764, (2011).
[12] Xing, R., Qi, W. and Huber, G.W. "Production of furfural and carboxylic acids from
waste aqueous hemicellulose solutions from the pulp and paper and cellulosic ethanol
industries". Energy and Environmental Science, 4(6): 2193-2205 (2011).
[13] Amidon, T.E., Wood, C.D., Shupe, A.M., Wang, Y., Graves, M. and Liu, S. "Biorefinery:
Conversion of woody biomass to chemicals, energy and materials". Journal of Biobased
Materials and Bioenergy, 2: 100-120 (2008).
[14] Sharma, P., Sarker, B.R. and Romagnoli, J.A. "A decision support tool for strategic
planning of sustainable biorefineries". Computers and Chemical Engineering, 35(9):
1767-1781 (2011).
[15] ICIS. (2012). Indicative Chemical Prices A-Z. http://www.icis.com/chemicals/channel-
info-chemicals-a-z/, Accessed 12 April 2012
[16] Kannegiesser, M. and Gunther, H.O. "An integrated optimization model for managing the
global value chain of a chemical commodities manufacturer". Journal of the Operational
Research Society, 62(4): 711-721 (2011).
329
ANNEXE E – Framework for Evaluating Cost and Supply-
Chain Impacts of Retrofit Projects: Forest Biorefinery Case
Study
Louis Patrick Dansereau a,b and Paul Stuart b18
a KSH Solutions Inc., 1 Place Alexis Nihon, 3400 de Maisonneuve O.,
bureau 1600, Montréal, H3Z 3B8, Canada
b NSERC Environmental Design Engineering Chair in Process Integration,
Department of Chemical Engineering, École Polytechnique Montréal, Montréal,
H3C 3A7, Canada
Abstract
The implementation of biorefinery processes in existing pulp and paper facilities will transform
significantly pulp and paper companies: new products, processes and markets will have to be
mastered. Manufacturers will also face the dilemma of exiting or not traditional pulp and paper
operations. Therefore, decision-makers will have to analyze simultaneously the impacts of new
retrofit projects and core business divestment projects. In this paper, a framework combining
tactical supply-chain management modeling and activity-based cost accounting for the strategic
analysis of retrofit options is presented. This framework is illustrated through a case study of a
newsprint mill considering the gradual divestment in pulp and paper activities, while
implementing a fractionation process producing mainly ethanol, hemicellulose sugars, furfural
and lignin. Case study results show that the profitability of the integrated biorefinery varies
significantly with the configuration of the host mill due to different cost consumption patterns.
Profitability was also found to be very sensitive to newsprint prices and much less to biorefinery
prices. Results suggest that implementing biorefinery processes could help reducing the
sensitivity of a mill to newsprint price fluctuations.
18 To whom all correspondence should be addressed
330
Application
This work highlights the potential for a pulp and paper manufacturer to use an advanced planning tool based on
optimization for the strategic analysis of biorefinery options.
Keywords
Biorefinery transformation, strategic planning, pulp and paper industry, retrofit, supply-chain
management
About the authors
At a time when the forest products industry is facing a major change in its structure, companies
must assess the current competitiveness of their core business and evaluate the potential for new
biorefinery options. Decisions of strategic importance, such as permanently idling assets or
investing in new process options, need to be analyzed systematically as this will transform the
nature of the product portfolio. During such transformational process, stakeholders seek to
maintain and increase the competitiveness of their mill, while minimizing risk in the
implementation process.
To address this issue, we developed an integrated planning tool based on optimization that can
help decision-makers to identify cost trade-offs between different manufacturing options and
supply-chain configurations. In this paper, we demonstrate the usefulness of this tool through the
case study of a pulp and paper manufacturer looking at the restructuration of their current core
business while implementing a biorefinery process.
Results of the case study highlighted that the profitability of integrated biorefinery options varied
significantly with the configuration of the host mill. Given the uncertain nature of the future pulp
and paper market environment, it becomes necessary to evaluate the competitiveness of
integrated biorefineries under various process configurations and market scenarios to ensure good
returns in the event of a partial shutdown of assets.

331
Dansereau was a Ph.D. student in the NSERC Design Chair at École Polytechnique de Montréal
in Montréal, Qc, Canada at the time of this study. He is now a consultant in Supply Chain
Management for KSH Solutions, an engineering and management consulting company based in
Montréal, QC, Canada. Stuart is chairholder of the NSERC Design Engineering Chair and
professor of Chemical Engineering at École Polytechnique de Montréal. Email Stuart at
332
INTRODUCTION The pulp and paper (P&P) industry of North America has been facing a difficult economic
situation recently, due to among other things a significant decrease in product demand. To
overcome this crisis, Eamer and Stuart [1] identified three possible strategies for the P&P
industry: 1) to continue to be the lowest cost commodity producer, 2) to seek emerging markets,
and 3) to diversify the core business into forest biorefining, i.e. the production of new value-
added products from wood. Notably, they stressed that all three strategies should be
accomplished for survival. Doing only the first two will be a temporary solution.
Transforming the traditional P&P core business to the biorefinery represents more than typical
capital-spending projects. It implies not only the incorporation of new products and processes,
but it will also change the enterprise, its vision, mission and reason for existence [2]. In addition
to selecting the portfolio of biorefinery products, transforming P&P companies will have to
decide whether or not to remain in the P&P marketplace. Indeed, inherent to forest biorefining is
the concept of maximizing the economic value that can be extracted from a tree, by valorizing all
possible co-products. Through the implementation of the biorefinery, transforming P&P
companies should seek to achieve better margins than the actual P&P production.
Two different strategies can be employed for integrating biorefinery processes in retrofit in P&P
mils [3-5]: a strongly integrated strategy and a parallel-integrated strategy. The strongly
integrated strategy implies a better utilization of the wood chips and logs that are currently used
in the P&P processes, by extracting biomass components that could be better valorized than in
the current configuration. Cellulose would still be mainly used for producing P&P products,
while lignin and hemicelluloses, which are traditionally burned for energy, would instead be used
to manufacture new biorefinery products. Examples of strongly integrated forest biorefineries
include black liquor gasification [6, 7], lignin precipitation [8] and hemicellulose extraction [9-
11]. Due to its strong dependence to P&P processes, this strategy looks promising for companies
that aim to strengthen their competitive position in the P&P business while increasing revenues.
333
In the parallel strategy, the biorefinery line is built adjacent to the existing pulp lines. Integration
benefits come mainly from wood procurement and preparation, energy integration, the sharing of
utilities and overhead, as well as the possible repurposing of assets. Examples include
thermochemical treatment of biomass such as pyrolysis [12] and gasification followed by
Fischer-Tropsch reforming [6, 7, 13] and biomass fractionation using water or other chemical
solvents [14-17]. Because of its independence from P&P operations, this strategy appears adapted
for companies desiring to exit the P&P marketplace.
Biorefining offers great promises to the P&P industry, but it is associated with several challenges
and risks. New products will be manufactured, implying new markets to be penetrated. With the
development of the bio-economy, biomass prices will increase [18]. Several bio-products will
replace traditional fossil-based commodities, facing likely market volatility. Biorefinery
technologies are for the main part still at the development stage and will require significant
capital investment at a commercial scale. These technologies will also have to be carefully
integrated within existing P&P installations. However, this aspect provides more sustainable and
economically attractive solutions: it can help reducing overhead costs and the capital investment
needed, while maintaining jobs that will keep many rural communities viable [19].
In order to mitigate risks related to the biorefinery transformation, Chambost et al. [2] proposed a
phased approach to the implementation of the biorefinery. This approach recommends to expand
the product portfolio and production capacity over time, producing at first lower risk commodity
products, and later value-added derivatives. For companies desiring to exit the P&P business, this
transition can also be executed gradually by reducing P&P production. This would ensure a
smoother transition to the biorefinery, while providing cash flow to reduce the burden for capital
availability.
Such transformational decisions should be planned wisely. Metrics other than just the return on
investment should be used in conjunction to ensure a sustainable decision. For instance,
environment and social aspects should be included, as well as marketing, product distribution and
procurement strategies. The decision of maintaining partially, fully or not at all the P&P business
is another aspect that needs to be addressed.
334
Traditional techno-economic assessments are commonly used for the analysis of new biorefinery
investments integrated in P&P facilities [20]. In these studies, integration impacts are often
allocated to new products as credits or additional costs. For major transformational studies, where
some assets may be closed down, such important impacts should not be allocated to the new
processes. The current core P&P business and future biorefinery business need to be analyzed in
an integrated way to ensure the viability of the new installation. In this context, supply-chain
management appears as an appropriate tool to evaluate the competitiveness of the new
transformed site through its integrated vision of the company. Advanced costing methods could
also enhance business decision-making by helping in determining true product margins.
Objectives The objective of this paper is to present a framework that combines tactical supply-chain
management modeling and activity-based cost accounting for the strategic analysis of retrofit
projects. This framework is demonstrated through a case study of a retrofit biorefinery
implementation in a newsprint mill, where the company is considering simultaneously divesting
from commodity P&P activities, while implementing new biorefinery activities.
LITERATURE REVIEW Over the past decades, both industry and academia paid a lot of attention to supply-chain
management in order to increase the cost effectiveness of overall operations. Through an
integrated management of the various sites of a company, from raw material procurement, to
production, distribution and sales, the focus of supply-chain management is to better coordinate
activities [21]. Supply-chain management concepts could greatly help the P&P industry to
compete globally [22] and during the transformation to the forest biorefinery. In fact, these
concepts will be necessary for all the strategies identified by Eamer and Stuart [1]: for survival
and for transformation [4].
335
Sammons Jr et al. developed a framework based on optimization for determining the optimal
product allocation and process design of a biorefinery [23]. Eksioglu et al. developed a
mathematical model to design the supply chain and to manage logistics of biorefineries [24]. The
model determines the number, size and location of biofuel producing facilities in Mississippi.
Feng et al. developed a mixed-integer linear programming model for optimal investment
decisions in the biorefinery for the forest products industry [25]. Sharma et al. developed a model
for technology and product portfolio design of a biorefinery, maximizing the stakeholder value
[26]. This strategic model determines which technologies should be established, their associated
capacity and feedstock, based on a preselected set of products and technologies. Santibanez-
Aguilar et al. present a multi-objective optimization model for the optimal selection of feedstock,
processing technology and a set of products considering environmental and profitability criteria
[27]. These frameworks offer a promising basis for the development of biorefinery
product/process portfolios and their associated supply chain. However, the retrofit context of the
implementation is often neglected.
Hytönen & Stuart developed a methodology for enhancing the decision-making process related to
strategic investment for retrofit forest biorefinery implementation [5, 28]. In order to represent
better production costs, part of this methodology involves a steady-state process model combined
with a product costing method that uses the principles of activity-based cost accounting (ABC).
ABC costing is a cost accounting method developed to assist the industry to better account for
indirect costs, as the industry shifted over the decades from being labour-intensive to more
automated manufacturing. It consists of modeling the usage of resources by activities performed
and activities required by the cost object.
The analyses of Hytönen & Stuart [5, 28] showed that traditional costing practices, where a
constant steam cost is assumed, underestimates production costs of bioproducts. Boiler and
turbine efficiency curves should thus be incorporated into simulations for better representation of
costs. This supports Lail’s claim that financial data and process information should be better
brought together to support decision-making [29].
336
On a planning point of view, information related to costs – such as price changes from suppliers
or changes in production capabilities – is often misperceived, resulting in less profitable plans. In
that vein, Korpunen et al. [30] Laflamme-Mayer et al. [31, 32], and Korbel [33] developed ABC-
like models and operations-driven costing methods for various types of facilities in the forest
products sector.
In earlier work, Dansereau et al. [4, 34-36] proposed a margins-based planning framework for the
profitable management of complex product portfolio such as biorefining. The idea under the
margins-based planning philosophy is to seek to fulfill the most profitable demand while
minimizing supply-chain related costs by managing the flexibility of production assets. For the
biorefinery, but also for several products of the chemical industry, procurement and sales are
among the biggest drivers of profitability. They should therefore be managed in an integrated
manner. This framework is based on the following key concepts:
• profit maximization, i.e. the management of both revenues and costs; • sales management inspired from revenue management principles [37]; • manufacturing flexibility, for producing products in different quantities according to
market conditions and at the lowest possible cost; • ABC-like costing, for enhanced production cost assessment and analysis; and • an integrated supply-chain management model based on optimization, for managing such
complexity and for helping decision-makers identifying the best operating policies.
During the complex process of transforming the core P&P business into the forest biorefinery,
the current business should be optimized both in terms of infrastructure and cash flow to mitigate
risks. Therefore, knowing operational costs related to P&P and biorefinery activities in retrofitted
configurations is of critical importance. Combined with more traditional techno-economic
analysis, the margins-based framework proposed by Dansereau et al. [4, 34-36] provides a basis
for analyzing current core P&P business as well as future biorefinery business performance.
MODEL DESCRIPTION The model used for the evaluation of retrofit projects is formulated as a mixed integer linear
programming problem with a discrete time horizon of 12 months. It is a tactical planning model
for which the objective is to maximize the global profit of the company (Eq.1).
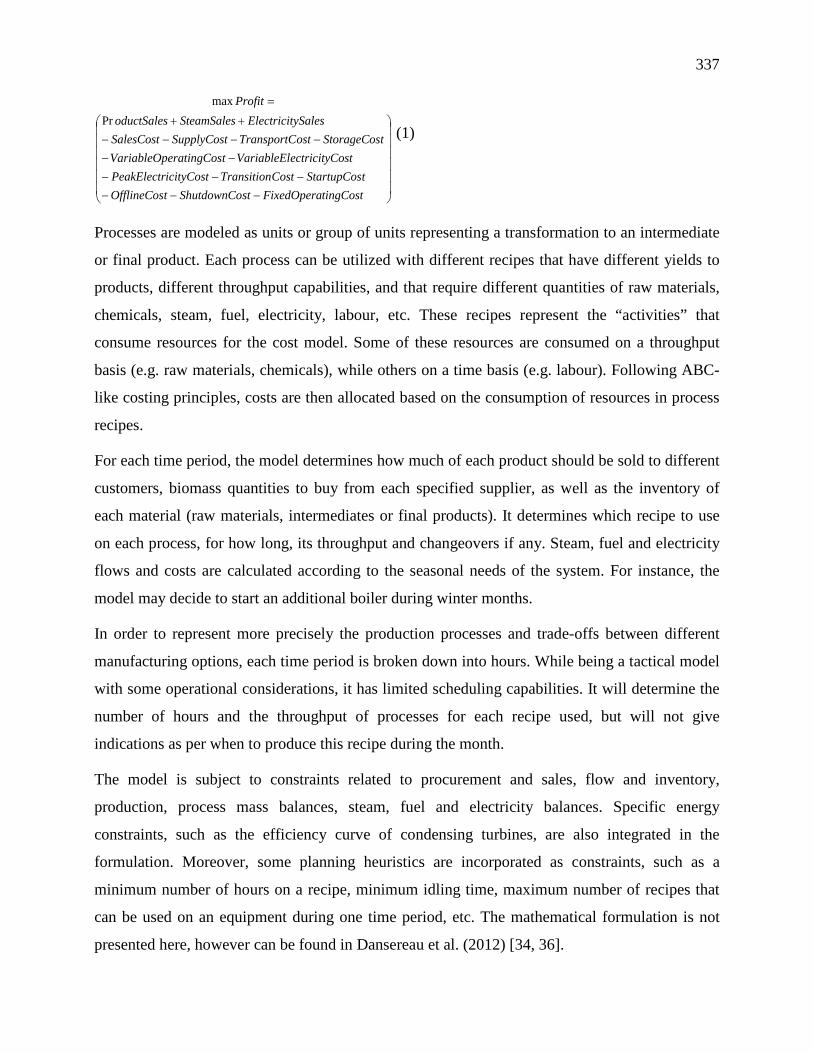
337
−−−−−−
−−−−−−
++
=
tingCostFixedOperastShutdownCotOfflineCostStartupCosCostTransitionicityCostPeakElectr
ostectricityCVariableElteratingCosVariableOptStorageCosostTransportCSupplyCostSalesCost
ySalesElectricitSteamSalesoductSalesProfit
Prmax
(1)
Processes are modeled as units or group of units representing a transformation to an intermediate
or final product. Each process can be utilized with different recipes that have different yields to
products, different throughput capabilities, and that require different quantities of raw materials,
chemicals, steam, fuel, electricity, labour, etc. These recipes represent the “activities” that
consume resources for the cost model. Some of these resources are consumed on a throughput
basis (e.g. raw materials, chemicals), while others on a time basis (e.g. labour). Following ABC-
like costing principles, costs are then allocated based on the consumption of resources in process
recipes.
For each time period, the model determines how much of each product should be sold to different
customers, biomass quantities to buy from each specified supplier, as well as the inventory of
each material (raw materials, intermediates or final products). It determines which recipe to use
on each process, for how long, its throughput and changeovers if any. Steam, fuel and electricity
flows and costs are calculated according to the seasonal needs of the system. For instance, the
model may decide to start an additional boiler during winter months.
In order to represent more precisely the production processes and trade-offs between different
manufacturing options, each time period is broken down into hours. While being a tactical model
with some operational considerations, it has limited scheduling capabilities. It will determine the
number of hours and the throughput of processes for each recipe used, but will not give
indications as per when to produce this recipe during the month.
The model is subject to constraints related to procurement and sales, flow and inventory,
production, process mass balances, steam, fuel and electricity balances. Specific energy
constraints, such as the efficiency curve of condensing turbines, are also integrated in the
formulation. Moreover, some planning heuristics are incorporated as constraints, such as a
minimum number of hours on a recipe, minimum idling time, maximum number of recipes that
can be used on an equipment during one time period, etc. The mathematical formulation is not
presented here, however can be found in Dansereau et al. (2012) [34, 36].
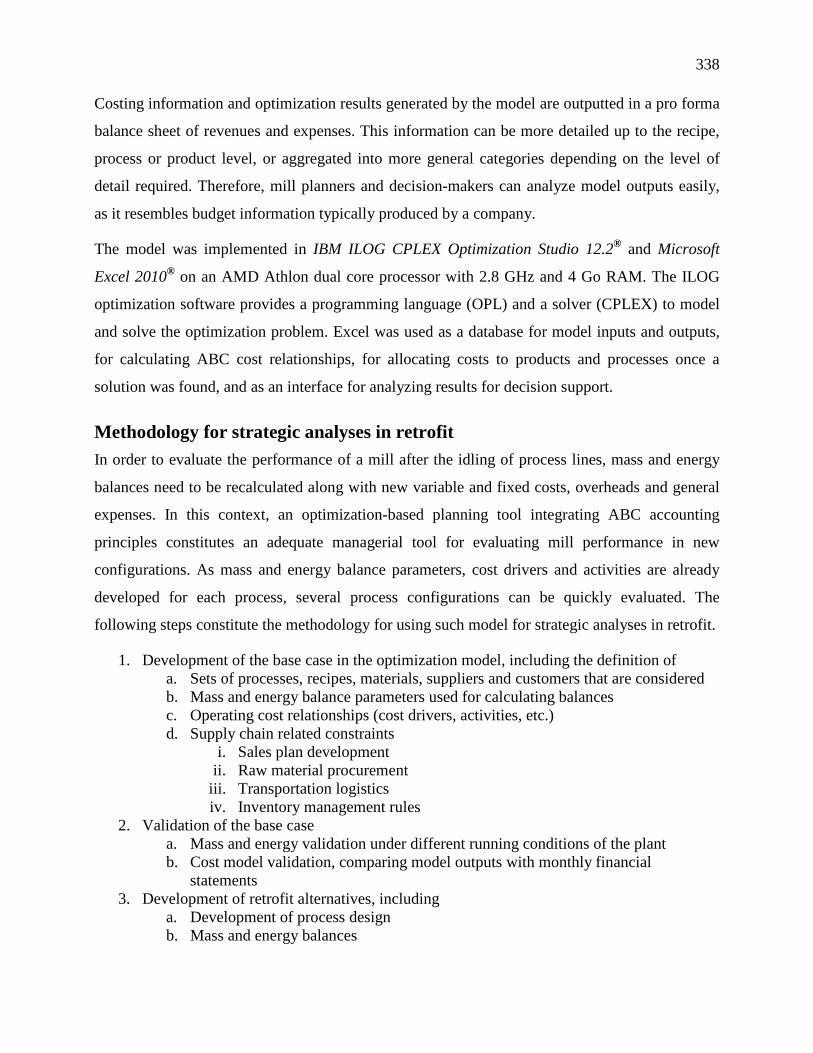
338
Costing information and optimization results generated by the model are outputted in a pro forma
balance sheet of revenues and expenses. This information can be more detailed up to the recipe,
process or product level, or aggregated into more general categories depending on the level of
detail required. Therefore, mill planners and decision-makers can analyze model outputs easily,
as it resembles budget information typically produced by a company.
The model was implemented in IBM ILOG CPLEX Optimization Studio 12.2® and Microsoft
Excel 2010® on an AMD Athlon dual core processor with 2.8 GHz and 4 Go RAM. The ILOG
optimization software provides a programming language (OPL) and a solver (CPLEX) to model
and solve the optimization problem. Excel was used as a database for model inputs and outputs,
for calculating ABC cost relationships, for allocating costs to products and processes once a
solution was found, and as an interface for analyzing results for decision support.
Methodology for strategic analyses in retrofit In order to evaluate the performance of a mill after the idling of process lines, mass and energy
balances need to be recalculated along with new variable and fixed costs, overheads and general
expenses. In this context, an optimization-based planning tool integrating ABC accounting
principles constitutes an adequate managerial tool for evaluating mill performance in new
configurations. As mass and energy balance parameters, cost drivers and activities are already
developed for each process, several process configurations can be quickly evaluated. The
following steps constitute the methodology for using such model for strategic analyses in retrofit.
1. Development of the base case in the optimization model, including the definition of a. Sets of processes, recipes, materials, suppliers and customers that are considered b. Mass and energy balance parameters used for calculating balances c. Operating cost relationships (cost drivers, activities, etc.) d. Supply chain related constraints
i. Sales plan development ii. Raw material procurement
iii. Transportation logistics iv. Inventory management rules
2. Validation of the base case a. Mass and energy validation under different running conditions of the plant b. Cost model validation, comparing model outputs with monthly financial
statements 3. Development of retrofit alternatives, including
a. Development of process design b. Mass and energy balances
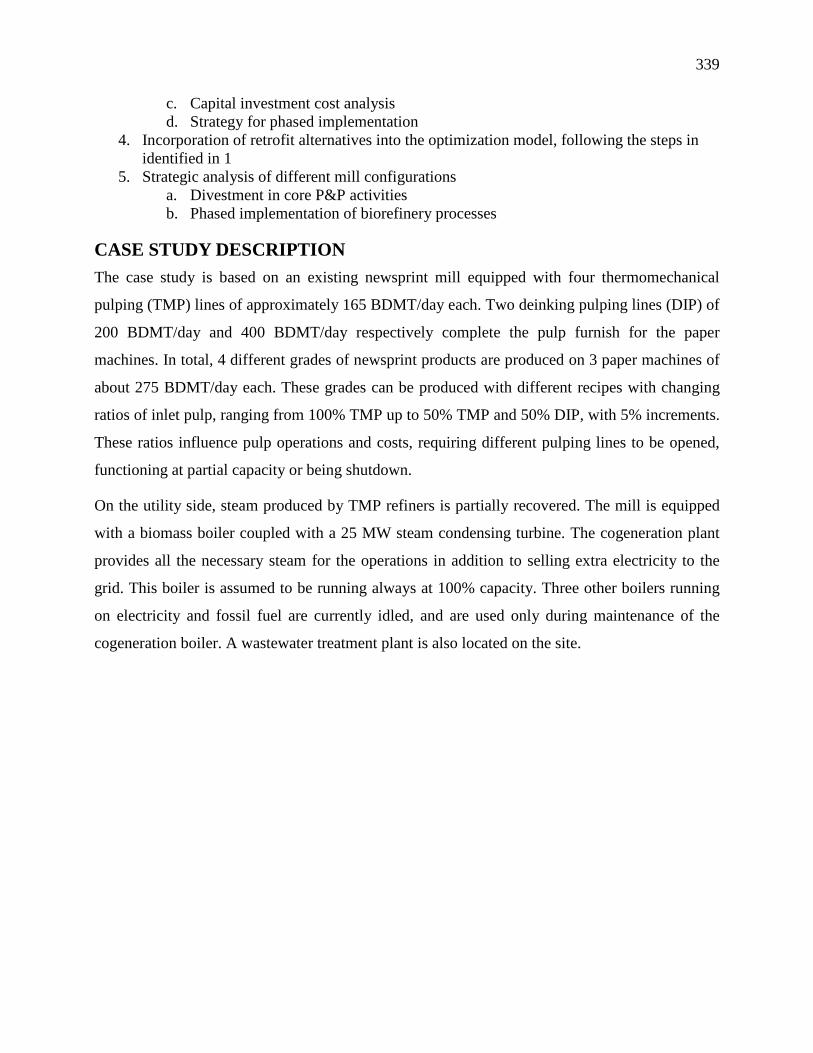
339
c. Capital investment cost analysis d. Strategy for phased implementation
4. Incorporation of retrofit alternatives into the optimization model, following the steps in identified in 1
5. Strategic analysis of different mill configurations a. Divestment in core P&P activities b. Phased implementation of biorefinery processes
CASE STUDY DESCRIPTION The case study is based on an existing newsprint mill equipped with four thermomechanical
pulping (TMP) lines of approximately 165 BDMT/day each. Two deinking pulping lines (DIP) of
200 BDMT/day and 400 BDMT/day respectively complete the pulp furnish for the paper
machines. In total, 4 different grades of newsprint products are produced on 3 paper machines of
about 275 BDMT/day each. These grades can be produced with different recipes with changing
ratios of inlet pulp, ranging from 100% TMP up to 50% TMP and 50% DIP, with 5% increments.
These ratios influence pulp operations and costs, requiring different pulping lines to be opened,
functioning at partial capacity or being shutdown.
On the utility side, steam produced by TMP refiners is partially recovered. The mill is equipped
with a biomass boiler coupled with a 25 MW steam condensing turbine. The cogeneration plant
provides all the necessary steam for the operations in addition to selling extra electricity to the
grid. This boiler is assumed to be running always at 100% capacity. Three other boilers running
on electricity and fossil fuel are currently idled, and are used only during maintenance of the
cogeneration boiler. A wastewater treatment plant is also located on the site.
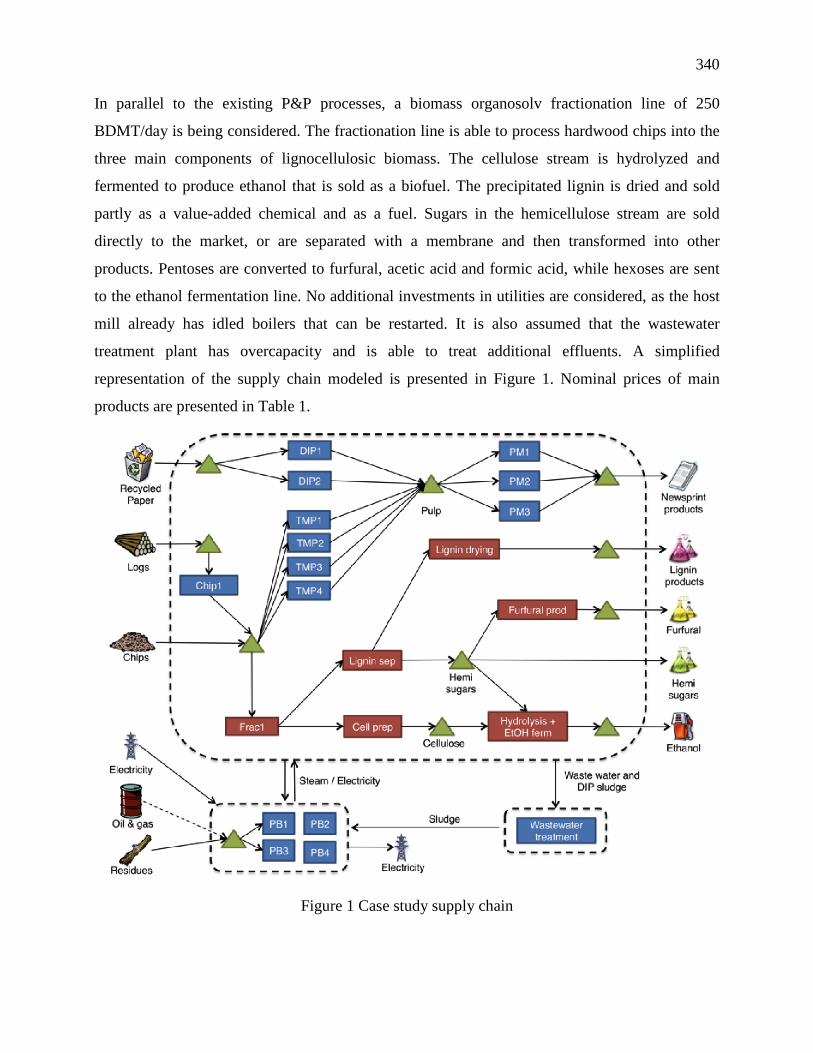
340
In parallel to the existing P&P processes, a biomass organosolv fractionation line of 250
BDMT/day is being considered. The fractionation line is able to process hardwood chips into the
three main components of lignocellulosic biomass. The cellulose stream is hydrolyzed and
fermented to produce ethanol that is sold as a biofuel. The precipitated lignin is dried and sold
partly as a value-added chemical and as a fuel. Sugars in the hemicellulose stream are sold
directly to the market, or are separated with a membrane and then transformed into other
products. Pentoses are converted to furfural, acetic acid and formic acid, while hexoses are sent
to the ethanol fermentation line. No additional investments in utilities are considered, as the host
mill already has idled boilers that can be restarted. It is also assumed that the wastewater
treatment plant has overcapacity and is able to treat additional effluents. A simplified
representation of the supply chain modeled is presented in Figure 1. Nominal prices of main
products are presented in Table 1.
Figure 1 Case study supply chain
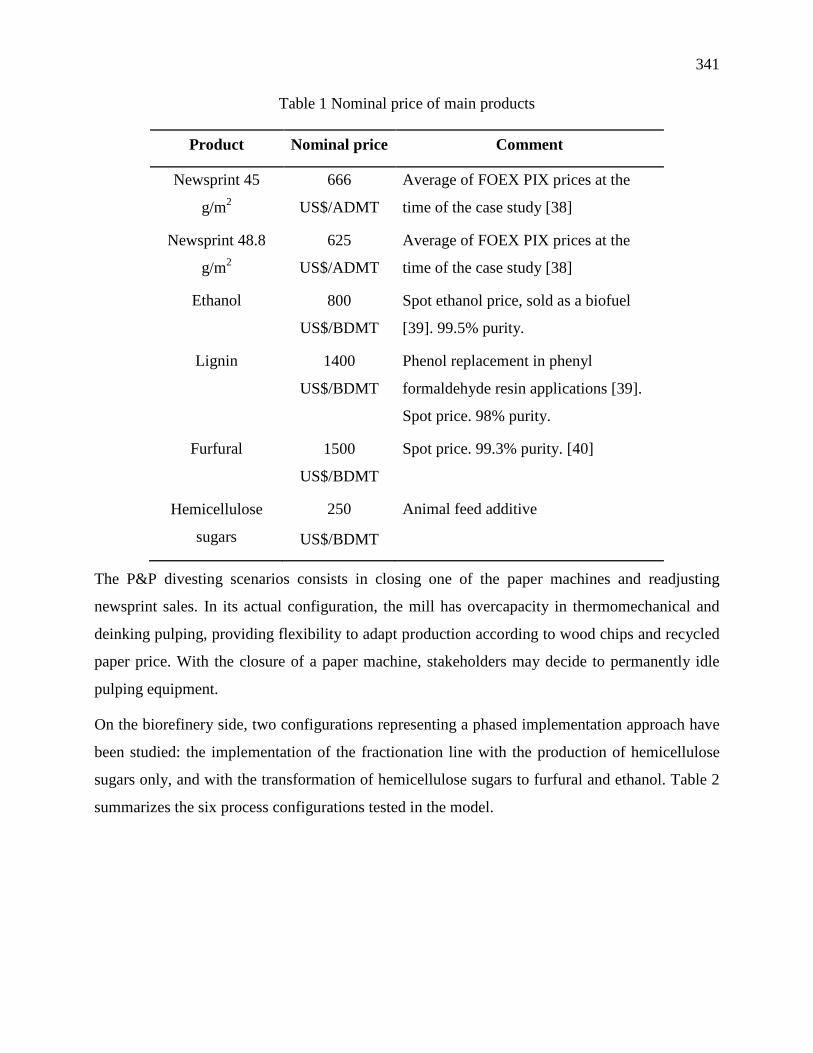
341
Table 1 Nominal price of main products
Product Nominal price Comment
Newsprint 45
g/m2
666
US$/ADMT
Average of FOEX PIX prices at the
time of the case study [38]
Newsprint 48.8
g/m2
625
US$/ADMT
Average of FOEX PIX prices at the
time of the case study [38]
Ethanol 800
US$/BDMT
Spot ethanol price, sold as a biofuel
[39]. 99.5% purity.
Lignin 1400
US$/BDMT
Phenol replacement in phenyl
formaldehyde resin applications [39].
Spot price. 98% purity.
Furfural 1500
US$/BDMT
Spot price. 99.3% purity. [40]
Hemicellulose
sugars
250
US$/BDMT
Animal feed additive
The P&P divesting scenarios consists in closing one of the paper machines and readjusting
newsprint sales. In its actual configuration, the mill has overcapacity in thermomechanical and
deinking pulping, providing flexibility to adapt production according to wood chips and recycled
paper price. With the closure of a paper machine, stakeholders may decide to permanently idle
pulping equipment.
On the biorefinery side, two configurations representing a phased implementation approach have
been studied: the implementation of the fractionation line with the production of hemicellulose
sugars only, and with the transformation of hemicellulose sugars to furfural and ethanol. Table 2
summarizes the six process configurations tested in the model.
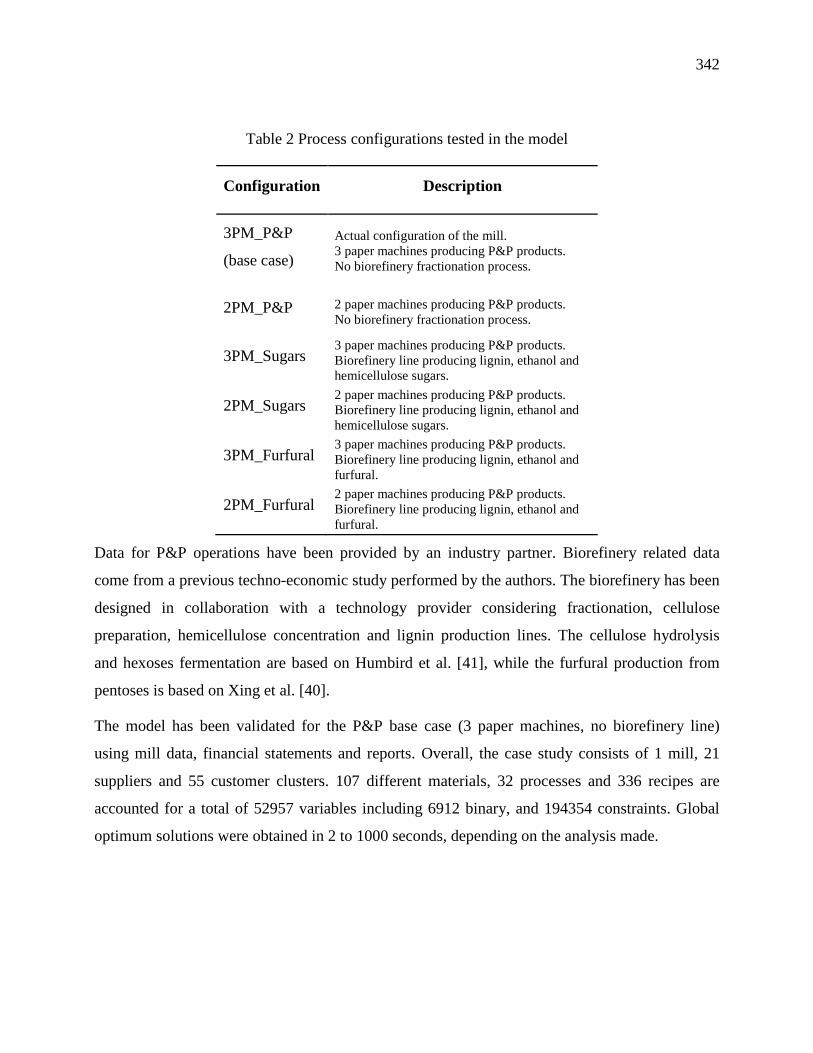
342
Table 2 Process configurations tested in the model
Configuration Description
3PM_P&P
(base case) Actual configuration of the mill. 3 paper machines producing P&P products. No biorefinery fractionation process.
2PM_P&P 2 paper machines producing P&P products. No biorefinery fractionation process.
3PM_Sugars 3 paper machines producing P&P products. Biorefinery line producing lignin, ethanol and hemicellulose sugars.
2PM_Sugars 2 paper machines producing P&P products. Biorefinery line producing lignin, ethanol and hemicellulose sugars.
3PM_Furfural 3 paper machines producing P&P products. Biorefinery line producing lignin, ethanol and furfural.
2PM_Furfural 2 paper machines producing P&P products. Biorefinery line producing lignin, ethanol and furfural.
Data for P&P operations have been provided by an industry partner. Biorefinery related data
come from a previous techno-economic study performed by the authors. The biorefinery has been
designed in collaboration with a technology provider considering fractionation, cellulose
preparation, hemicellulose concentration and lignin production lines. The cellulose hydrolysis
and hexoses fermentation are based on Humbird et al. [41], while the furfural production from
pentoses is based on Xing et al. [40].
The model has been validated for the P&P base case (3 paper machines, no biorefinery line)
using mill data, financial statements and reports. Overall, the case study consists of 1 mill, 21
suppliers and 55 customer clusters. 107 different materials, 32 processes and 336 recipes are
accounted for a total of 52957 variables including 6912 binary, and 194354 constraints. Global
optimum solutions were obtained in 2 to 1000 seconds, depending on the analysis made.
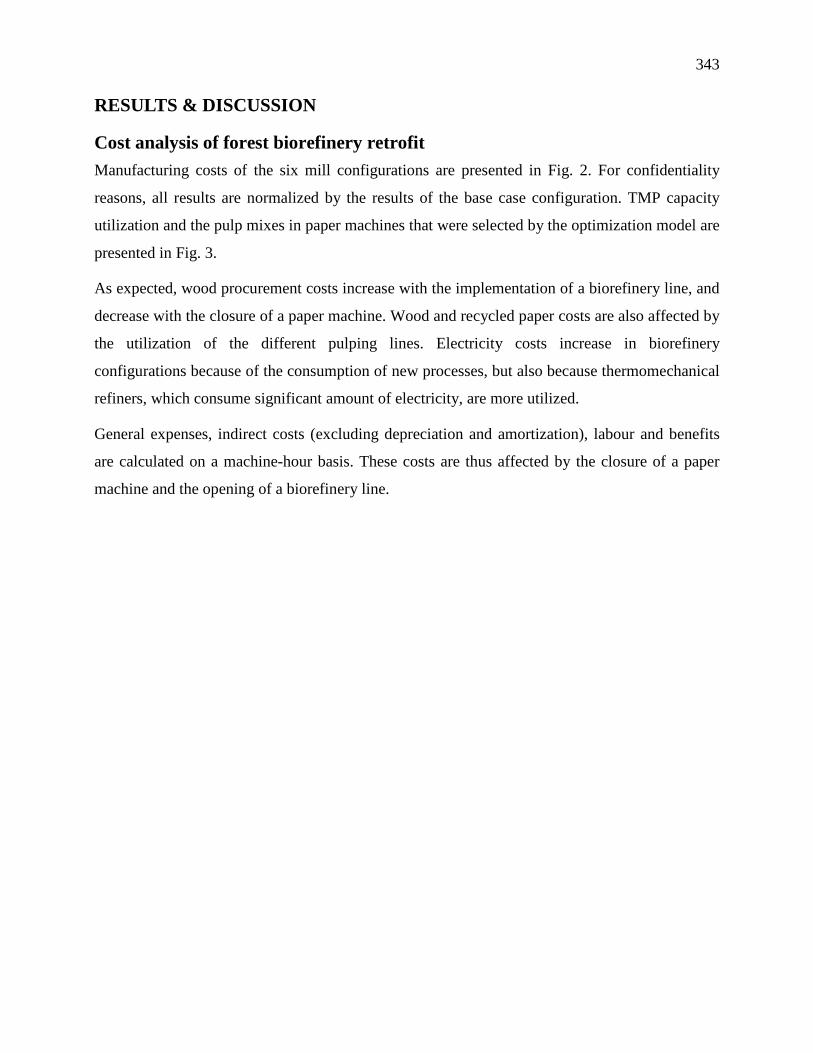
343
RESULTS & DISCUSSION
Cost analysis of forest biorefinery retrofit Manufacturing costs of the six mill configurations are presented in Fig. 2. For confidentiality
reasons, all results are normalized by the results of the base case configuration. TMP capacity
utilization and the pulp mixes in paper machines that were selected by the optimization model are
presented in Fig. 3.
As expected, wood procurement costs increase with the implementation of a biorefinery line, and
decrease with the closure of a paper machine. Wood and recycled paper costs are also affected by
the utilization of the different pulping lines. Electricity costs increase in biorefinery
configurations because of the consumption of new processes, but also because thermomechanical
refiners, which consume significant amount of electricity, are more utilized.
General expenses, indirect costs (excluding depreciation and amortization), labour and benefits
are calculated on a machine-hour basis. These costs are thus affected by the closure of a paper
machine and the opening of a biorefinery line.
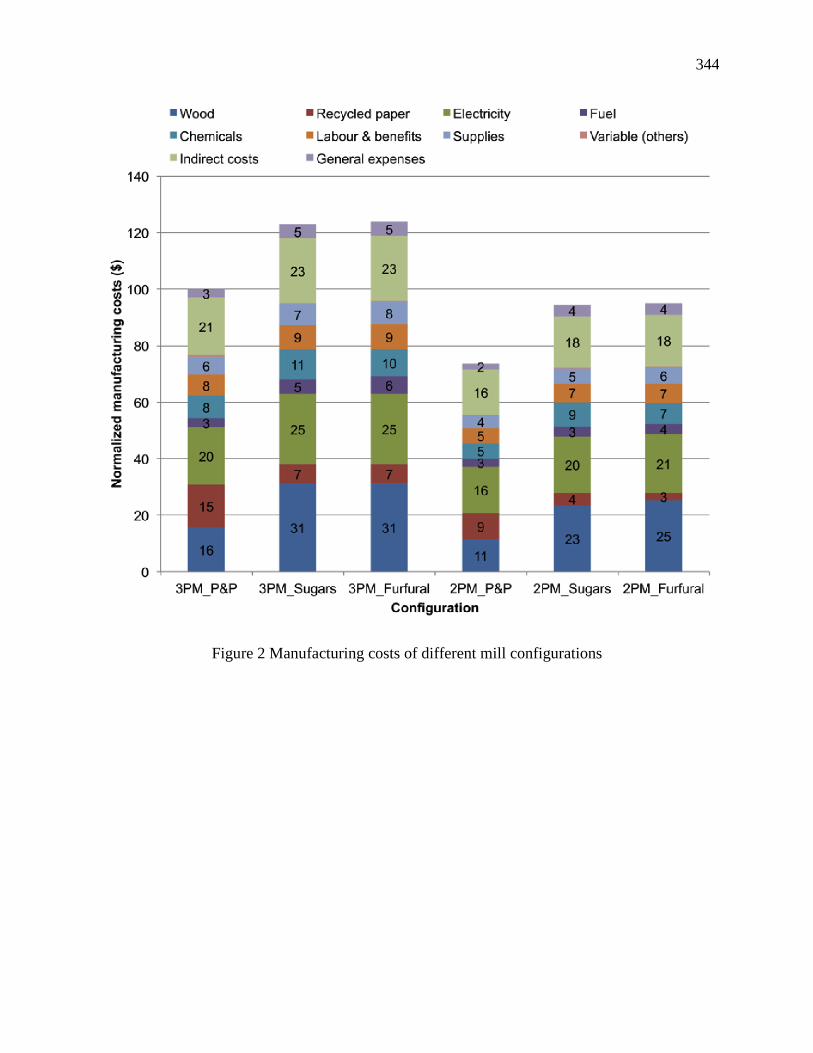
344
Figure 2 Manufacturing costs of different mill configurations
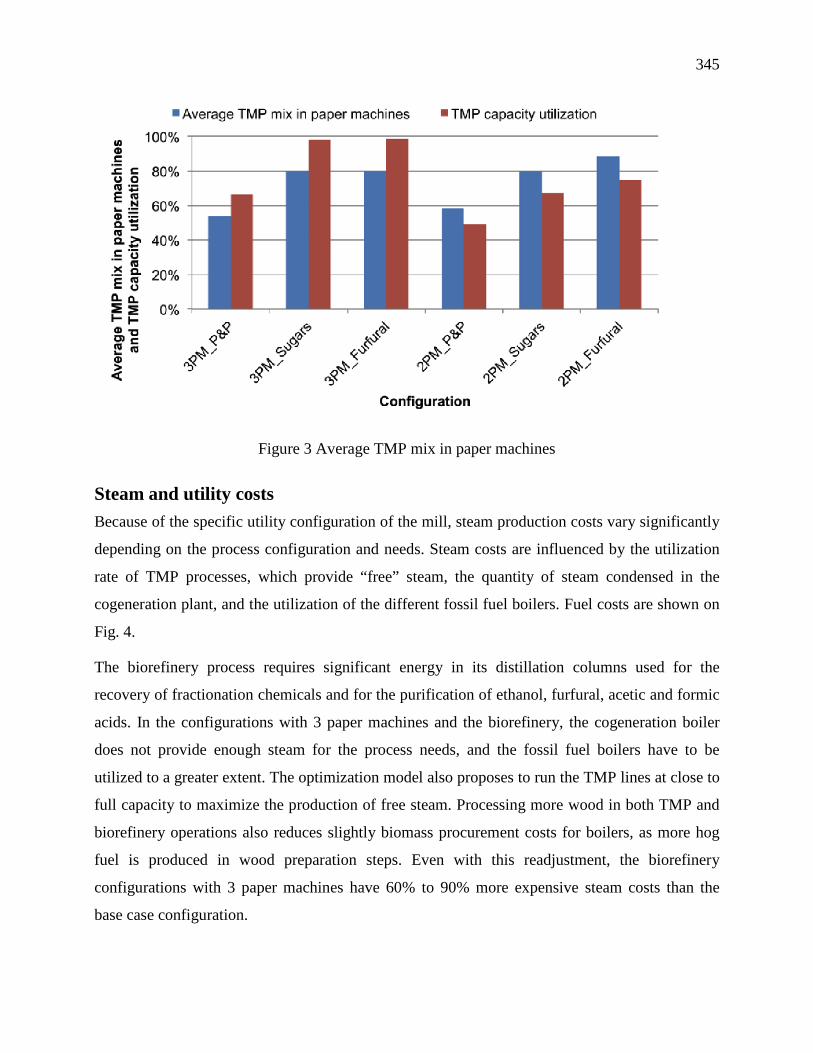
345
Figure 3 Average TMP mix in paper machines
Steam and utility costs Because of the specific utility configuration of the mill, steam production costs vary significantly
depending on the process configuration and needs. Steam costs are influenced by the utilization
rate of TMP processes, which provide “free” steam, the quantity of steam condensed in the
cogeneration plant, and the utilization of the different fossil fuel boilers. Fuel costs are shown on
Fig. 4.
The biorefinery process requires significant energy in its distillation columns used for the
recovery of fractionation chemicals and for the purification of ethanol, furfural, acetic and formic
acids. In the configurations with 3 paper machines and the biorefinery, the cogeneration boiler
does not provide enough steam for the process needs, and the fossil fuel boilers have to be
utilized to a greater extent. The optimization model also proposes to run the TMP lines at close to
full capacity to maximize the production of free steam. Processing more wood in both TMP and
biorefinery operations also reduces slightly biomass procurement costs for boilers, as more hog
fuel is produced in wood preparation steps. Even with this readjustment, the biorefinery
configurations with 3 paper machines have 60% to 90% more expensive steam costs than the
base case configuration.
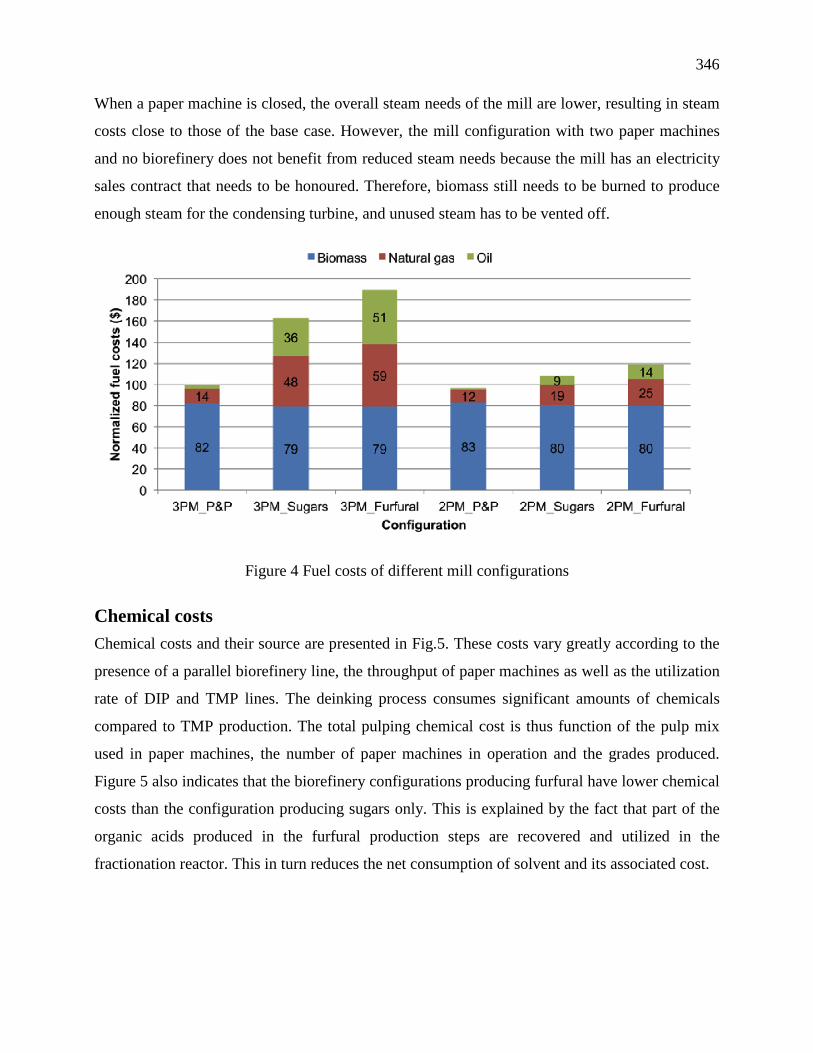
346
When a paper machine is closed, the overall steam needs of the mill are lower, resulting in steam
costs close to those of the base case. However, the mill configuration with two paper machines
and no biorefinery does not benefit from reduced steam needs because the mill has an electricity
sales contract that needs to be honoured. Therefore, biomass still needs to be burned to produce
enough steam for the condensing turbine, and unused steam has to be vented off.
Figure 4 Fuel costs of different mill configurations
Chemical costs Chemical costs and their source are presented in Fig.5. These costs vary greatly according to the
presence of a parallel biorefinery line, the throughput of paper machines as well as the utilization
rate of DIP and TMP lines. The deinking process consumes significant amounts of chemicals
compared to TMP production. The total pulping chemical cost is thus function of the pulp mix
used in paper machines, the number of paper machines in operation and the grades produced.
Figure 5 also indicates that the biorefinery configurations producing furfural have lower chemical
costs than the configuration producing sugars only. This is explained by the fact that part of the
organic acids produced in the furfural production steps are recovered and utilized in the
fractionation reactor. This in turn reduces the net consumption of solvent and its associated cost.
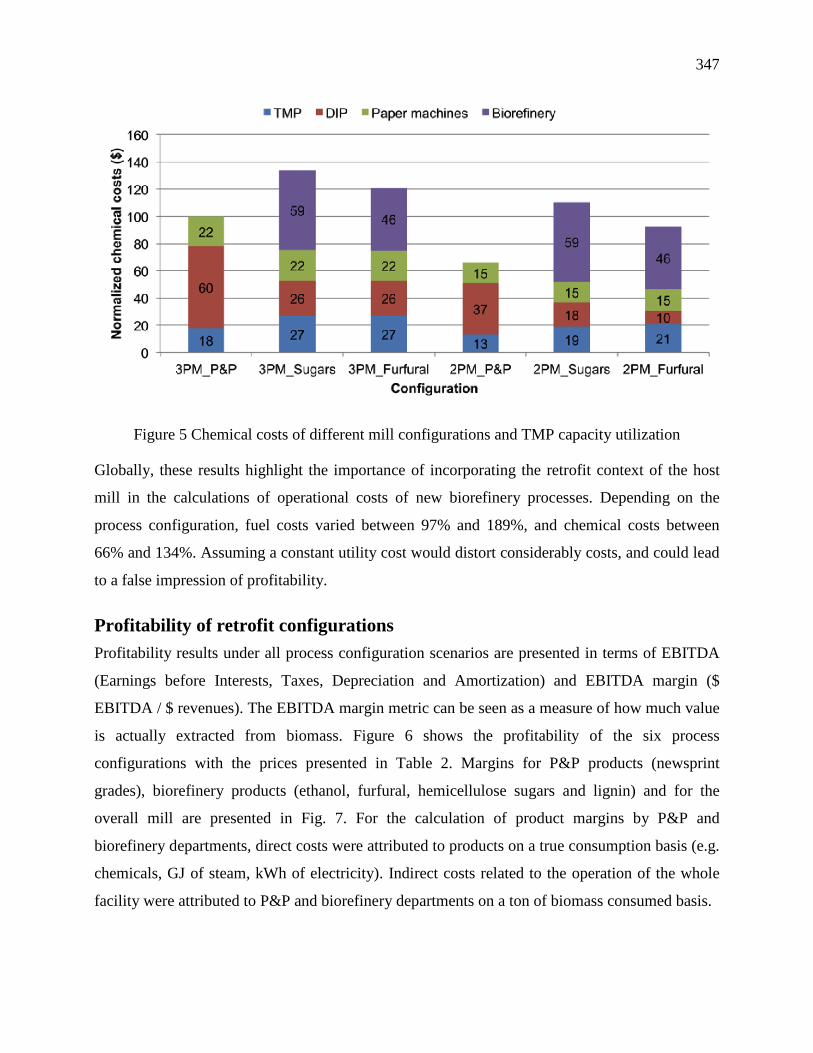
347
Figure 5 Chemical costs of different mill configurations and TMP capacity utilization
Globally, these results highlight the importance of incorporating the retrofit context of the host
mill in the calculations of operational costs of new biorefinery processes. Depending on the
process configuration, fuel costs varied between 97% and 189%, and chemical costs between
66% and 134%. Assuming a constant utility cost would distort considerably costs, and could lead
to a false impression of profitability.
Profitability of retrofit configurations Profitability results under all process configuration scenarios are presented in terms of EBITDA
(Earnings before Interests, Taxes, Depreciation and Amortization) and EBITDA margin ($
EBITDA / $ revenues). The EBITDA margin metric can be seen as a measure of how much value
is actually extracted from biomass. Figure 6 shows the profitability of the six process
configurations with the prices presented in Table 2. Margins for P&P products (newsprint
grades), biorefinery products (ethanol, furfural, hemicellulose sugars and lignin) and for the
overall mill are presented in Fig. 7. For the calculation of product margins by P&P and
biorefinery departments, direct costs were attributed to products on a true consumption basis (e.g.
chemicals, GJ of steam, kWh of electricity). Indirect costs related to the operation of the whole
facility were attributed to P&P and biorefinery departments on a ton of biomass consumed basis.
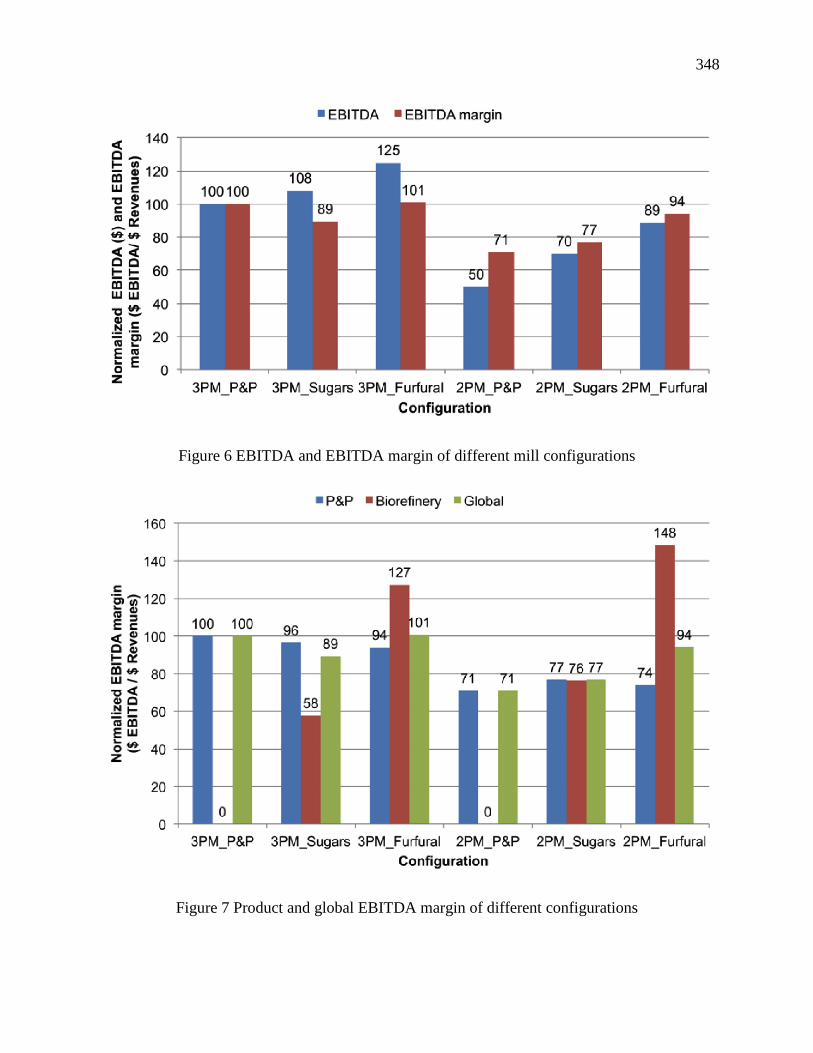
348
Figure 6 EBITDA and EBITDA margin of different mill configurations
Figure 7 Product and global EBITDA margin of different configurations
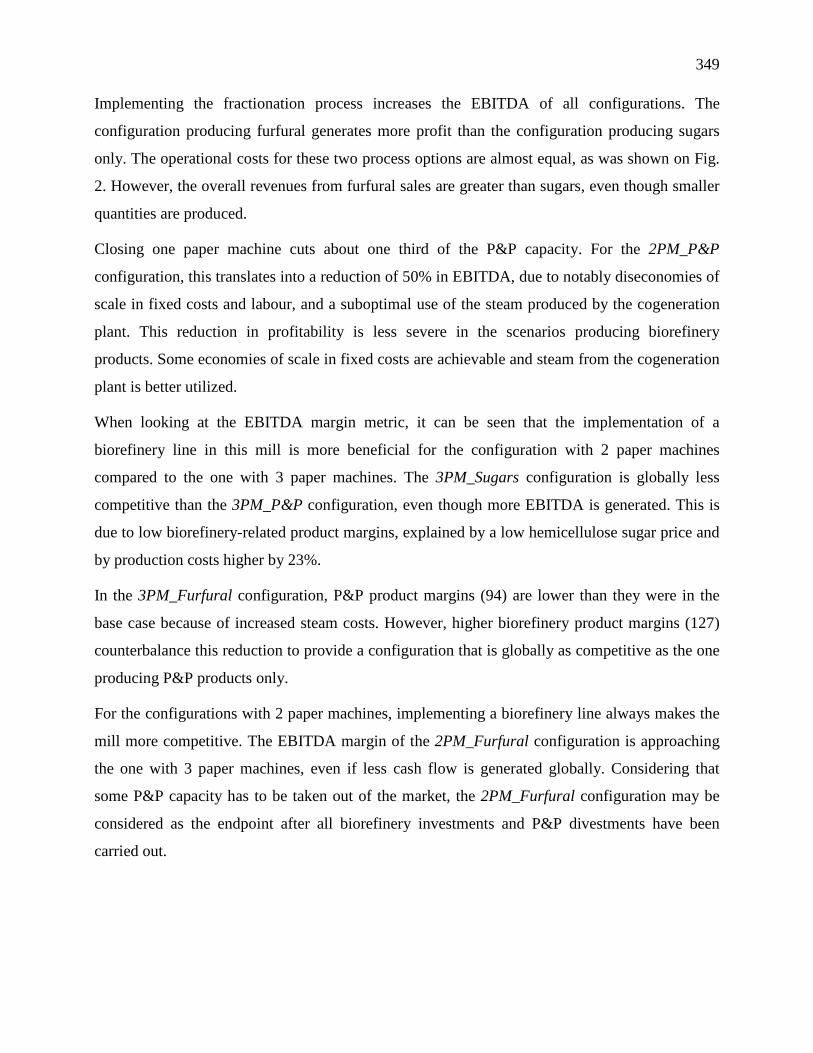
349
Implementing the fractionation process increases the EBITDA of all configurations. The
configuration producing furfural generates more profit than the configuration producing sugars
only. The operational costs for these two process options are almost equal, as was shown on Fig.
2. However, the overall revenues from furfural sales are greater than sugars, even though smaller
quantities are produced.
Closing one paper machine cuts about one third of the P&P capacity. For the 2PM_P&P
configuration, this translates into a reduction of 50% in EBITDA, due to notably diseconomies of
scale in fixed costs and labour, and a suboptimal use of the steam produced by the cogeneration
plant. This reduction in profitability is less severe in the scenarios producing biorefinery
products. Some economies of scale in fixed costs are achievable and steam from the cogeneration
plant is better utilized.
When looking at the EBITDA margin metric, it can be seen that the implementation of a
biorefinery line in this mill is more beneficial for the configuration with 2 paper machines
compared to the one with 3 paper machines. The 3PM_Sugars configuration is globally less
competitive than the 3PM_P&P configuration, even though more EBITDA is generated. This is
due to low biorefinery-related product margins, explained by a low hemicellulose sugar price and
by production costs higher by 23%.
In the 3PM_Furfural configuration, P&P product margins (94) are lower than they were in the
base case because of increased steam costs. However, higher biorefinery product margins (127)
counterbalance this reduction to provide a configuration that is globally as competitive as the one
producing P&P products only.
For the configurations with 2 paper machines, implementing a biorefinery line always makes the
mill more competitive. The EBITDA margin of the 2PM_Furfural configuration is approaching
the one with 3 paper machines, even if less cash flow is generated globally. Considering that
some P&P capacity has to be taken out of the market, the 2PM_Furfural configuration may be
considered as the endpoint after all biorefinery investments and P&P divestments have been
carried out.
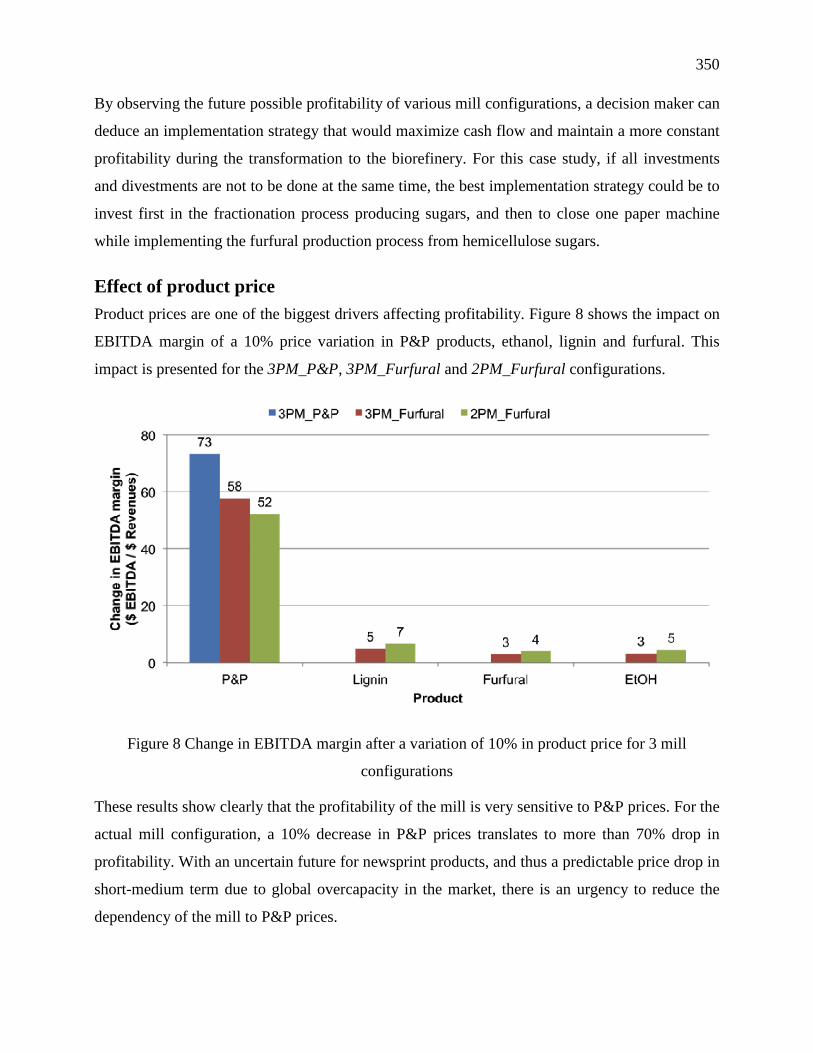
350
By observing the future possible profitability of various mill configurations, a decision maker can
deduce an implementation strategy that would maximize cash flow and maintain a more constant
profitability during the transformation to the biorefinery. For this case study, if all investments
and divestments are not to be done at the same time, the best implementation strategy could be to
invest first in the fractionation process producing sugars, and then to close one paper machine
while implementing the furfural production process from hemicellulose sugars.
Effect of product price Product prices are one of the biggest drivers affecting profitability. Figure 8 shows the impact on
EBITDA margin of a 10% price variation in P&P products, ethanol, lignin and furfural. This
impact is presented for the 3PM_P&P, 3PM_Furfural and 2PM_Furfural configurations.
Figure 8 Change in EBITDA margin after a variation of 10% in product price for 3 mill
configurations
These results show clearly that the profitability of the mill is very sensitive to P&P prices. For the
actual mill configuration, a 10% decrease in P&P prices translates to more than 70% drop in
profitability. With an uncertain future for newsprint products, and thus a predictable price drop in
short-medium term due to global overcapacity in the market, there is an urgency to reduce the
dependency of the mill to P&P prices.
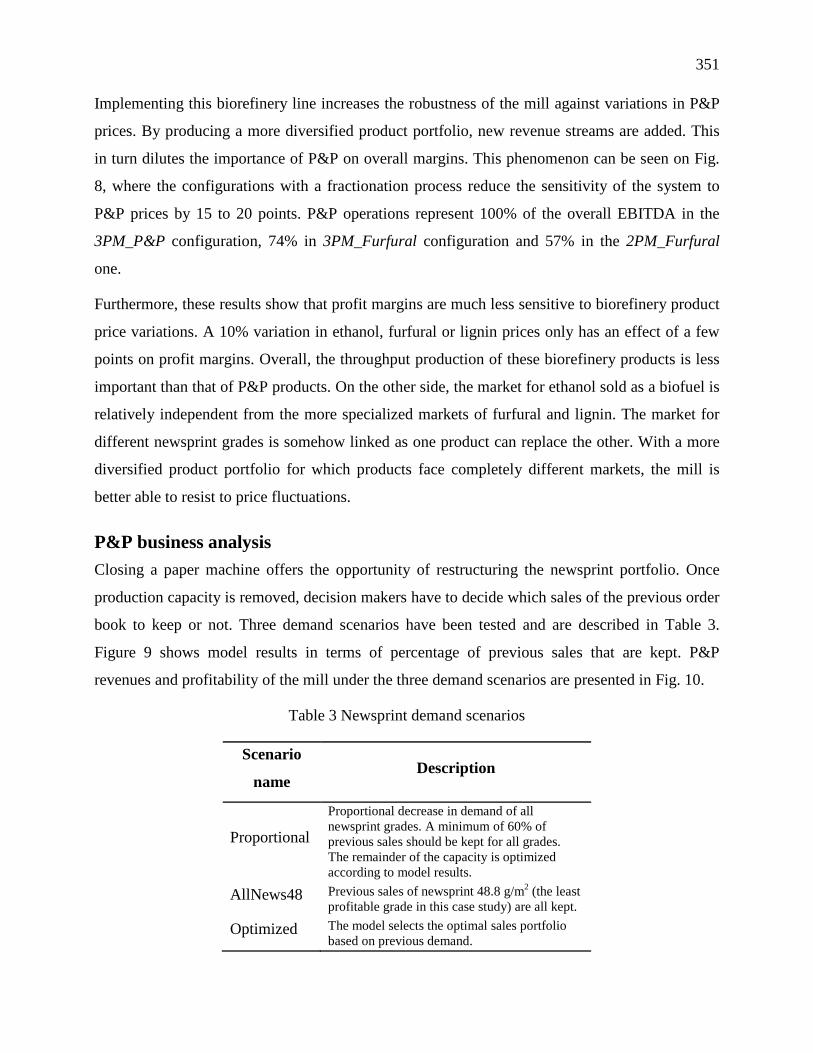
351
Implementing this biorefinery line increases the robustness of the mill against variations in P&P
prices. By producing a more diversified product portfolio, new revenue streams are added. This
in turn dilutes the importance of P&P on overall margins. This phenomenon can be seen on Fig.
8, where the configurations with a fractionation process reduce the sensitivity of the system to
P&P prices by 15 to 20 points. P&P operations represent 100% of the overall EBITDA in the
3PM_P&P configuration, 74% in 3PM_Furfural configuration and 57% in the 2PM_Furfural
one.
Furthermore, these results show that profit margins are much less sensitive to biorefinery product
price variations. A 10% variation in ethanol, furfural or lignin prices only has an effect of a few
points on profit margins. Overall, the throughput production of these biorefinery products is less
important than that of P&P products. On the other side, the market for ethanol sold as a biofuel is
relatively independent from the more specialized markets of furfural and lignin. The market for
different newsprint grades is somehow linked as one product can replace the other. With a more
diversified product portfolio for which products face completely different markets, the mill is
better able to resist to price fluctuations.
P&P business analysis Closing a paper machine offers the opportunity of restructuring the newsprint portfolio. Once
production capacity is removed, decision makers have to decide which sales of the previous order
book to keep or not. Three demand scenarios have been tested and are described in Table 3.
Figure 9 shows model results in terms of percentage of previous sales that are kept. P&P
revenues and profitability of the mill under the three demand scenarios are presented in Fig. 10.
Table 3 Newsprint demand scenarios
Scenario
name Description
Proportional
Proportional decrease in demand of all newsprint grades. A minimum of 60% of previous sales should be kept for all grades. The remainder of the capacity is optimized according to model results.
AllNews48 Previous sales of newsprint 48.8 g/m2 (the least profitable grade in this case study) are all kept.
Optimized The model selects the optimal sales portfolio based on previous demand.
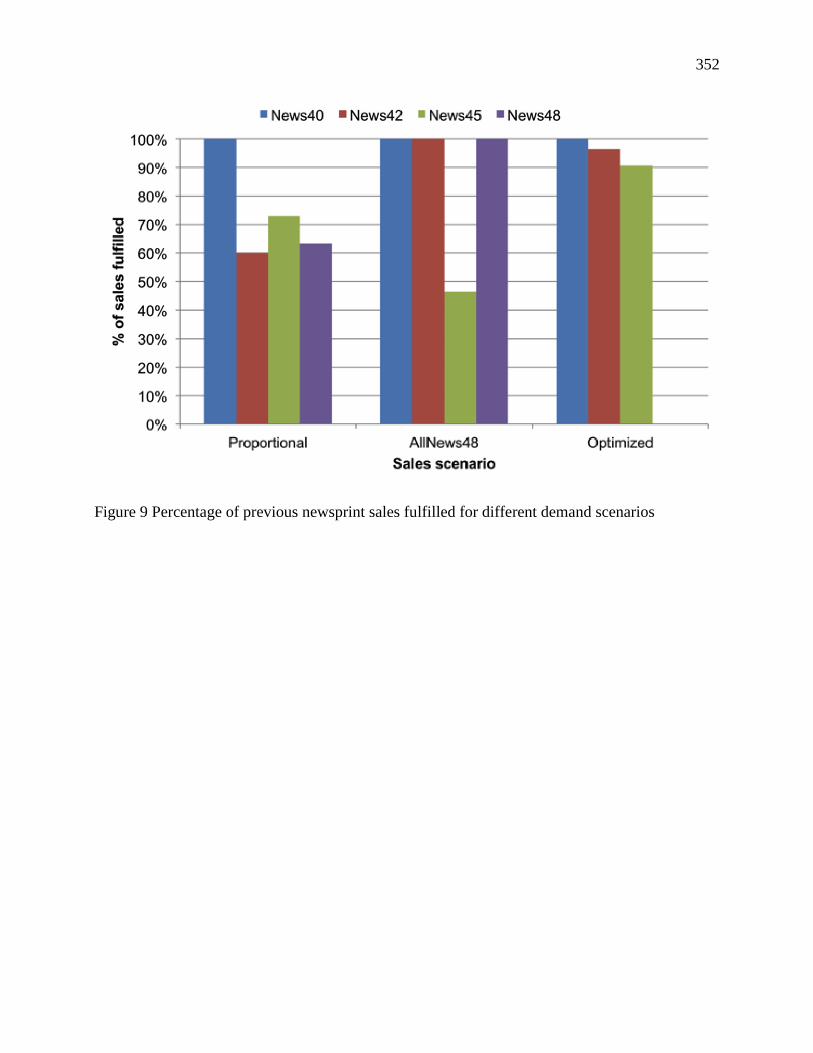
352
Figure 9 Percentage of previous newsprint sales fulfilled for different demand scenarios
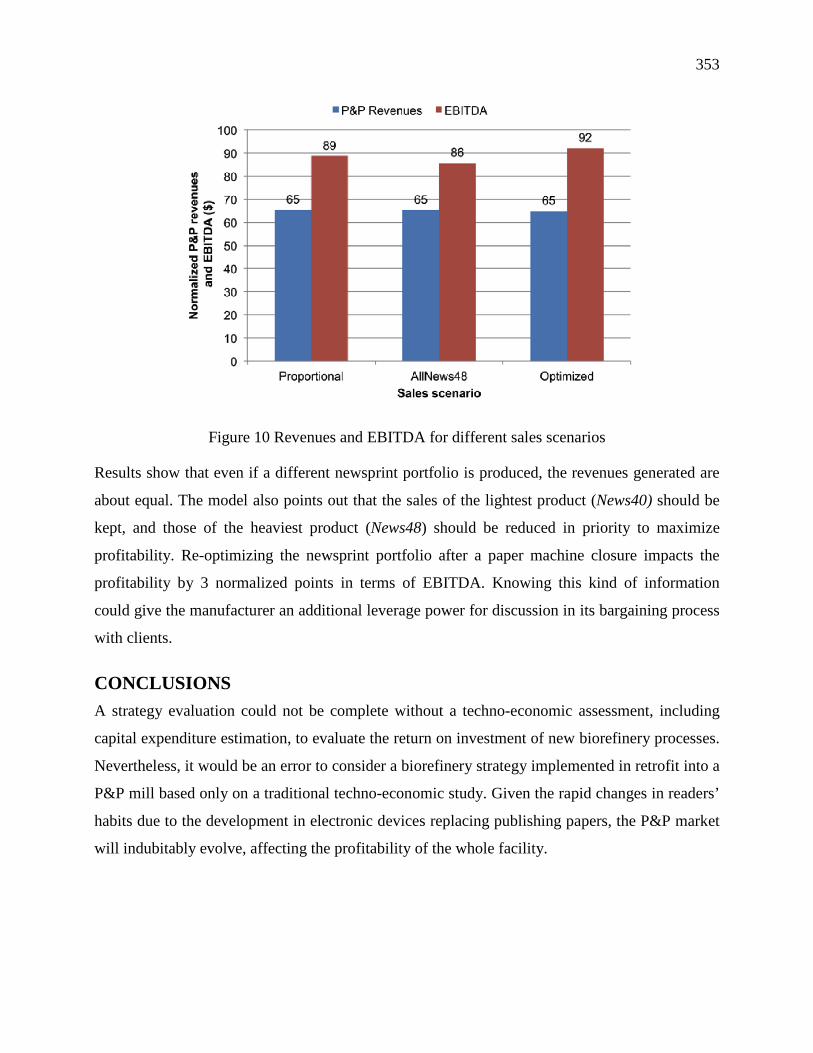
353
Figure 10 Revenues and EBITDA for different sales scenarios
Results show that even if a different newsprint portfolio is produced, the revenues generated are
about equal. The model also points out that the sales of the lightest product (News40) should be
kept, and those of the heaviest product (News48) should be reduced in priority to maximize
profitability. Re-optimizing the newsprint portfolio after a paper machine closure impacts the
profitability by 3 normalized points in terms of EBITDA. Knowing this kind of information
could give the manufacturer an additional leverage power for discussion in its bargaining process
with clients.
CONCLUSIONS A strategy evaluation could not be complete without a techno-economic assessment, including
capital expenditure estimation, to evaluate the return on investment of new biorefinery processes.
Nevertheless, it would be an error to consider a biorefinery strategy implemented in retrofit into a
P&P mill based only on a traditional techno-economic study. Given the rapid changes in readers’
habits due to the development in electronic devices replacing publishing papers, the P&P market
will indubitably evolve, affecting the profitability of the whole facility.
354
In this paper, a novel framework for the strategic analysis of retrofit options has been presented.
This framework integrates supply-chain management concepts and ABC like accounting in an
optimization model to determine the profitability of various mill configurations. It allows
company stakeholders to visualize and understand cost and supply-chain dynamics of the
integrated system, providing valuable insights for decision-making. To illustrate this approach, a
case study of a newsprint mill evaluating the implementation of a fractionation process while
divesting at the same time partially from P&P operations has been presented.
Case study results showed that the profitability of the integrated biorefinery varied significantly
with the configuration of the host mill, due to notably different chemical, energy, labour and
indirect cost consumption patterns.
Profitability was also found to be very sensitive to newsprint prices. This sensitivity was reduced
with the implementation of a parallel biorefinery line. An analysis of the restructuring of the
newsprint product portfolio in the case of a paper machine closure showed that any newsprint
grade could be kept in the portfolio without a major impact on profitability.
More analyses could have been undoubtedly carried out for a comprehensive strategy evaluation.
For instance, a sensitivity analysis on feedstock prices could give insights related to the
pertinence of keeping both TMP and DIP lines open for providing manufacturing flexibility to
mitigate price volatility. However, the number of analyses has been limited for the purpose of
demonstrating the utility of the optimization model for strategic decision-making. The focus was
not to determine the potential of this particular biorefinery process.
Deciding to transform to the biorefinery is an ongoing transformation where the product portfolio
will have to be constantly re-evaluated to make sure the best products are manufactured. The
future environment in which biorefineries will have to compete will be highly competitive.
Successful biorefineries will be those that manage optimally their assets and their supply chain. A
margins-based framework is therefore adapted to this purpose, by providing a platform for
managing the product portfolio under volatile market conditions [35], and for revaluating
investment and divestment opportunities.
355
ACKNOWLEDGMENTS This work was supported by Natural Sciences Engineering Research Council of Canada
(NSERC) Environmental Design Engineering Chair at École Polytechnique in Montréal. Louis
Patrick Dansereau is supported by a scholarship provided by Le Fond Québécois de la Recherche
sur la Nature et les Technologies. The authors also wish to thank the case study company and the
biorefinery technology provider for information and insights provided, as well as Jawad Jeaidi for
helping with the techno-economic study.
REFERENCES
1. Orzechowska, A., Pulp Paper Can. 106(1):25(2005).
2. Chambost, V., McNutt, J., and Stuart, P. R., Pulp Paper Can. 109(7-8):19(2008).
3. Jeaidi, J. and Stuart, P. R., J-FOR 1(3):62(2011).
4. Dansereau, L. P., El-Halwagi, M. M., and Stuart, P. R. in Integrated Biorefineries:
Design, Analysis, and Optimization (M. M. El-Halwagi and P. Stuart, Eds.), CRC Press/Taylor &
Francis, 2012, pp. 195-250.
5. Hytönen, E. and Stuart, P. R., Tappi J. 11(4):9(2012).
6. Larson, E. D., Consonni, S., Katofsky, R. E., et al., Tappi J. 7(11):8(2008).
7. Larson, E. D., Consonni, S., Katofsky, R. E., et al., Tappi J. 8(1):27(2009).
8. Tomani, P., Axegard, P., Berglin, N., et al., Cell. Chem. Tech. 45(7-8):533(2011).
9. Frederick Jr, W. J., Lien, S. J., Courchene, C. E., et al., Bioresour. Technol.
99(11):5051(2008).
10. Mao, H., Genco, J. M., van Heiningen, A., et al., BioRes. 5(2):525(2010).
11. Yoon, S.-H., Tunc, M. S., and Van Heiningen, A., Tappi J. 10(1):7(2011).
12. Babu, B. V., Biofpr 2(5):393(2008).
13. Goyal, H. B., Seal, D., and Saxena, R. C., Renewable Sustainable Energy Rev
12(2):504(2008).
14. Amidon, T. E., Wood, C. D., Shupe, A. M., et al., J. Biobased Mater. Bioenergy
2:100(2008).
15. Amidon, T. E. and Liu, S., Biotechnol. Adv. 27(5):542(2009).
356
16. Pye, E. K., Armiger, W. B., Winner, S. R., et al. AIChE Annual Meeting 2008,
Conference Proceedings, American Institute of Chemical Engineers, Philadelphia, PA, United
states.
17. Arato, C., Pye, E. K., and Gjennestad, G., Appl. Biochem. Biotechnol. 123:871(2005).
18. Söderholm, P. and Lundmark, R., For Prod J 59(1-2):6(2009).
19. FPAC. "Transforming Canada's Forest Products Industry - Summary of findings from the
Future Bio-pathways Project." Available [Online] http://www.fpac.ca/publications/Biopathways
ENG.pdf [10 January 2013].
20. Hytönen, E. and Stuart, P. R. in Integrated Biorefineries: Design, Analysis, and
Optimization (M. M. El-Halwagi and P. Stuart, Eds.), CRC Press/Taylor & Francis, 2012.
21. Shapiro, J. F., Modeling the Supply Chain, Thomson-Brooks/Cole, Pacific Grove, CA,
2007, p. 608.
22. McLean, S., Pulp Paper Intl 41(10):28(1999).
23. Sammons Jr, N. E., Yuan, W., Eden, M. R., et al., Chem. Eng. Res. Des. 86(7):800(2008).
24. Eksioglu, S. D., Acharya, A., Leightley, L. E., et al., Comput. Ind. Eng. (UK)
57(4):1342(2009).
25. Feng, Y., D'Amours, S., LeBel, L., et al. in Integrated Biorefineries: Design, Analysis,
and Optimization (M. M. El-Halwagi and P. Stuart, Eds.), CRC Press/Taylor & Francis, 2012.
26. Sharma, P., Sarker, B. R., and Romagnoli, J. A., Comput. Chem. Eng. 35(9):1767(2011).
27. Santibanez-Aguilar, J. E., Gonzalez-Campos, J. B., Ponce-Ortega, J. M., et al., Ind. Eng.
Chem. Res. 50(14):8558(2011).
28. Hytönen, V. E., "Methodology for identifying promising retrofit integrated forest
biorefinery strategies - Design decision making under uncertainty," Ph.D. thesis, Ecole
Polytechnique, Montreal, Canada, 2011.
29. Lail, P. W., Pulp Pap 80(11):23(2006).
30. Korpunen, H., Virtanen, P., Dahl, O., et al., Tappi J. 11(9):19(2012).
31. Laflamme-Mayer, M., Linkewich, J., and Stuart, P. R., Pulp Paper Can. 109(3):44(2008).
32. Laflamme-Mayer, M., Janssen, M., and Stuart, P. R., J-FOR 1(1):32(2011).
33. Korbel, M., "On-line steady-state data reconciliation for advanced cost analysis in the
pulp and paper industry," Ph.D. thesis, Ecole Polytechnique, Montreal, Canada, 2011.
357
34. Dansereau, L. P., El-Halwagi, M. M., and Stuart, P. R. 6th International Conference on
Foundations of Computer-Aided Process Operations (FOCAPO 12), Savannah, GA, USA.
35. Dansereau, L. P., El-Halwagi, M. M., and Stuart, P. R., J-FOR 2(4):60(2012).
36. Dansereau, L. P., El-Halwagi, M. M., Mansoornejad, B., et al., Submitted to Computers &
Chemical Engineering.
37. Talluri, K. T. and van Ryzin, G. J., The theory and practice of revenue management,
Kluwer Academic Publishers, Boston, 2004.
38. PaperAge. "Newsprint prices by grade per ton." Available [Online]
http://www.paperage.com/foex/newsprint.html.
39. ICIS. "Indicative Chemical Prices A-Z." Available [Online]
http://www.icis.com/chemicals/channel-info-chemicals-a-z/ [12-04-2012].
40. Xing, R., Qi, W., and Huber, G. W., Energy Environ Sci 4(6):2193(2011).
41. Humbird, D., Davis, R., Tao, L., et al., "Process Design and Economics for Biochemical
Conversion of Lignocellulosix Biomass to Ethanol - Dilute-Acid Pretreatment and Enzymatic
Hydrolysis of Corn Stover," National Renewable Energy Laboratory, Golden, Colorado
NREL/TP-5100-47764, 2011.
Recommended