1
INSTITUT FRANÇAIS DU PETROLE CONFIDENTIELTechniques d'Applications EnergétiquesFevrier 2004Objectif: Moteurs-EnergieN° de projet: L215N° d’étude: L215002Niveau de confidentialité: 3Nombre d’exemplaires: 30
EETP: "European Emission Test Programme"Final report
N.JEULAND – X. MONTAGNE (RL50)
Summary
Fuels and engines used in road transportation have to face two main challenges in a highlycompetitive economy:• the reduction of pollutant emission levels to such values that air quality in cities complies with
World Health Organisation standards• the reduction of carbon dioxide emissions (CO2), considered as being the major greenhouse gas
contributing to global warming and climate change.
Among the technical solutions available to face up to these two challenges, the use of automotiveLPG deserved to be further investigated. Indeed, the potential of this gas to reduce CO2 emissionsis important due to its high H/C ratio. Moreover, its simple chemical composition seems apromising way to reduce the emissions of some significant pollutant.In order to compare the emission levels of vehicles currently sold in Europe, which run on each ofthe three fuels - diesel, petrol or LPG - the programme designed to update data on regulated andnon regulated emissions was developed by the LPG industry and environmental /governmentalbodies, all over Europe and implemented in four laboratories.This programme also aimed at assessing the relative impact of these fuels on the air quality in termsof health and greenhouse effects.A specific test sequence was developed on the basis of the three different driving cycles that arerepresentative of real-life driving conditions. A large number of vehicles sold in Europe were testedon a pan-European basis. LPG vehicles were either produced by car manufacturers or post-equipped under their control.
All the emissions, environmental index and health effect indicators have been compared betweeneach fuel, allowing a more accurate comparison of each technology advantages and drawbacks
The main conclusions are:
• as far as pollutant emissions are concerned, LPG vehicles have significantly lower emissions ofNOx and particulates than diesel vehicles. They also have similar or lower emissions for mostnon-regulated pollutants compared to diesel vehicles, especially oxygenated compounds
2
(formaldehyde, acetaldehyde) and benzene (equivalent level LPG / diesel, but significantlylower for LPG than for petrol).
• In any event, the CO2 emissions measured for LPG vehicles were much lower than those ofpetrol vehicles and were close to those of diesel vehicles. In certain situations (motorwaycycle), some vehicles even have lower CO2 emissions in LPG than in diesel. It couldconsequently represent a promising way to contribute to the reduction of CO2 emissions.
• The environmental and health effect indicators calculated showed that exhaust emissions fromLPG vehicles had lower cancer index (mainly linked to the lower particulate emission level),acidification potential (due to their lower NOx emission level) and regional ozone formingpotential (TOCP) than diesel vehicles
Some points still remain to be optimised, such as :
• CO emissions, that remain higher for LPG vehicles
• HC emissions, which for LPG vehicles are equal compared to petrol on NEDC but slightlyincreased on CADC.
• As far as ozone formation is concerned, the above-mentioned conclusion should be mitigatedwhen considering the local ozone forming potential (POCP) which is higher for LPG vehicles.Moreover, in terms of cancer index, the level of LPG and petrol vehicles can be joined by thediesel ones if equipped with the DPF (Diesel Particulate Filter).
The programme also has shown that LPG engine map tuning is one of the key elements influencingpollutant emissions.Consequently, as long as precise ECU calibration is done, LPG vehicles can be seen as a promisingway to further reduce the main pollutant emissions, especially :
Ø NOx,
Ø Particulates (LPG vehicles are however at the level of the most modern diesel technologieseg: DPF),
Ø Concerning CO and HC it seems that progress can be done with a relevant development onmapping on ECU.
Ø Mobile Source Air Toxics (MSAT)
while limiting the increase in CO2 emissions.
3
This European Emission Test Programme has been initiated and founded by:
ADEME (Agence De l'Environnement et de la Maîtrise de l'Energie, France)
BP LPG Europe
CFBP (Comité Français du Butane et du Propane, France)
E.S.T (Energy Saving Trust, UK)
LPGA (Liquefied Petroleum Gas Association, UK)
SHELL LPG / Global Autogas
SHV Gas
TOTALGAZ
V.V.G. (Vereniging Vloeibaar Gas , the Netherlands).
The Netherlands Ministry of Spatial Planning, Housing and the Environment (VROM)
4
1 INTRODUCTION.....................................................................................................................................................7
1.1 BACKGROUND.........................................................................................................................................................71.2 AIM OF THE PROGRAMME .......................................................................................................................................91.3 METHODOLOGY: .....................................................................................................................................................91.4 RESULTS DISPLAY .................................................................................................................................................10
2 PROGRAMME DESCRIPTION..........................................................................................................................10
2.1 SELECTED LABORATORIES....................................................................................................................................102.2 VEHICLE SELECTION: ............................................................................................................................................102.3 DRIVING CYCLES: .................................................................................................................................................11
2.3.1 New European driving cycle (NEDC)........................................................................................................112.3.2 ARTEMIS (CADC) Cycles..........................................................................................................................122.3.3 Warm Start testing......................................................................................................................................14
2.4 FUELS....................................................................................................................................................................142.5 MEASUREMENTS...................................................................................................................................................14
3 RESULTS................................................................................................................................................................15
3.1 ROUND ROBIN TESTS RESULTS .............................................................................................................................153.1.1 Round robin test description ......................................................................................................................153.1.2 Results.........................................................................................................................................................153.1.3 Conclusion of the round robin tests ...........................................................................................................18
3.2 FULL TEST RESULTS..............................................................................................................................................193.2.1 Regulated emissions ...................................................................................................................................19
3.2.1.1 NOx emissions...................................................................................................................................................193.2.1.2 CO emissions.....................................................................................................................................................223.2.1.3 HC emissions.....................................................................................................................................................273.2.1.4 PM emissions.....................................................................................................................................................30
3.2.2 CO2 emissions.............................................................................................................................................323.2.3 Unregulated Pollutant emissions results ...................................................................................................38
3.2.3.1 Oxygenated products .........................................................................................................................................383.2.3.2 PAH results........................................................................................................................................................413.2.3.3 BTX emissions ..................................................................................................................................................443.2.3.4 Particle Size.......................................................................................................................................................483.2.3.5 NO2 emissions...................................................................................................................................................51
3.3 ENVIRONMENTAL IMPACT AND HEALTH EFFECT...................................................................................................553.3.1 Ozone (O3) Formation................................................................................................................................553.3.2 Cancer risk .................................................................................................................................................573.3.3 Acidification ...............................................................................................................................................593.3.4 Climate change...........................................................................................................................................61
3.3.4.1 Global Warming Potential..................................................................................................................................613.3.4.2 Life Cycle Assessment.......................................................................................................................................63
3.4 COMPARISON WITH ALTERNATIVE TECHNOLOGIES / FUELS..................................................................................673.4.1 Diesel vehicle equipped with DPF.............................................................................................................673.4.2 CNG vehicle................................................................................................................................................68
3.4.2.1 Regulated pollutant emissions............................................................................................................................683.4.2.2 CO2 emissions ...................................................................................................................................................703.4.2.3 Unregulated pollutant emissions........................................................................................................................703.4.2.4 Summary ...........................................................................................................................................................71
3.4.3 Big van........................................................................................................................................................713.4.3.1 Background .......................................................................................................................................................713.4.3.2 Test results.........................................................................................................................................................723.4.3.3 Summary ...........................................................................................................................................................75
4 SUMMARY OF MAIN RESULTS OBTAINED.................................................................................................76
4.1.1 Tables..........................................................................................................................................................764.1.2 Diagrams ....................................................................................................................................................77
5 MAIN CONCLUSION ...........................................................................................................................................79
5
6 REFERENCES........................................................................................................................................................81
7 APPENDICES.........................................................................................................................................................83
7.1 FUEL ANALYSIS.....................................................................................................................................................847.2 CURRENT AND FUTURE REGULATIONS .................................................................................................................877.3 LIST OF VEHICLES TESTED ....................................................................................................................................887.4 TABLES OF NUMERICAL RESULTS..........................................................................................................................89
7.4.1 NOx emissions ............................................................................................................................................897.4.2 CO2 emissions.............................................................................................................................................927.4.3 CO emissions ..............................................................................................................................................967.4.4 HC emissions ..............................................................................................................................................997.4.5 PM emissions............................................................................................................................................1027.4.6 Oxygenated compounds............................................................................................................................1067.4.7 PAH ..........................................................................................................................................................1077.4.8 BTX ...........................................................................................................................................................1087.4.9 NO2 ...........................................................................................................................................................1117.4.10 Ozone formation .......................................................................................................................................1127.4.11 Acidification potential ..............................................................................................................................1137.4.12 Global warming potential ........................................................................................................................113
6
Glossary of abbreviations
ACEA: Association des Constructeurs Européens d'AutomobilesBTX: Benzene Toluene XylenesCADC: Common Artemis Driving CycleCITEPA: Centre Interprofessionel Technique d'Etude de la Pollution AtmosphériqueCNG: Compressed Natural GasCO: Carbon monoxideCO2: Carbon dioxideCONCAWE: Conservation of Clean Air and Water in Europe (the oil companies' european
association for environment, health and safety in refining and distribution)CPV: Cancer Potency ValueCVS: Constant Volume Sampler: dilution system used for exhaust gas sampling and
analysis.DPF: Diesel Particulate FilterECE cycle: Economic Commission for Europe driving cycle (also called "UDC")ECU: Electronic Control UnitEUCAR: European Council for Automotive R & DEETP: European Emission Tests ProgrammeELPI: Electric Low Pressure ImpactorEPA: Environmental Protection AgencyEUDC: Extra-Urban Driving CycleGHG: Green House GasGM: General MotorsGREET: Greenhouse gases, Regulated Emissions, and Energy use in TransportationGWP: Global Warming PotentialHC: HydrocarbonsIARC: International Agency for Research on CancerICRP: International Commission on Radiological ProtectionIPCC: Intergovernmental Panel on Climate ChangeJRC: Joint Research Center (European Comission)MSAT: Mobile Source Air ToxicsNEDC: New European Driving CycleNOx: Nitrogen oxides: include NO (nitric oxide) and NO2 (nitrogen dioxide)N2O: Nitrous oxideOEHHA: Office of Environmental Health Hazard AssessmentPAH: Poly Aromatic HydrocarbonsPM: Particulate MassPM10: Particulate Matter 10µm: mass of particulate with a diameter equal or lower than
10 µmPMP: Particulate Matter Programme: UNECE programme for the study of particulate size
measurement technique for low emission levelsPOCP: Photochemical Ozone Creation PotentialsTOFP: Tropospheric Ozone Forming PotentialsUDC: Urban Driving CycleURF: Unit Risk FactorVOC: Volatile organic compoundsWHO: World Health Organization
7
1 Introduction
1.1 Background
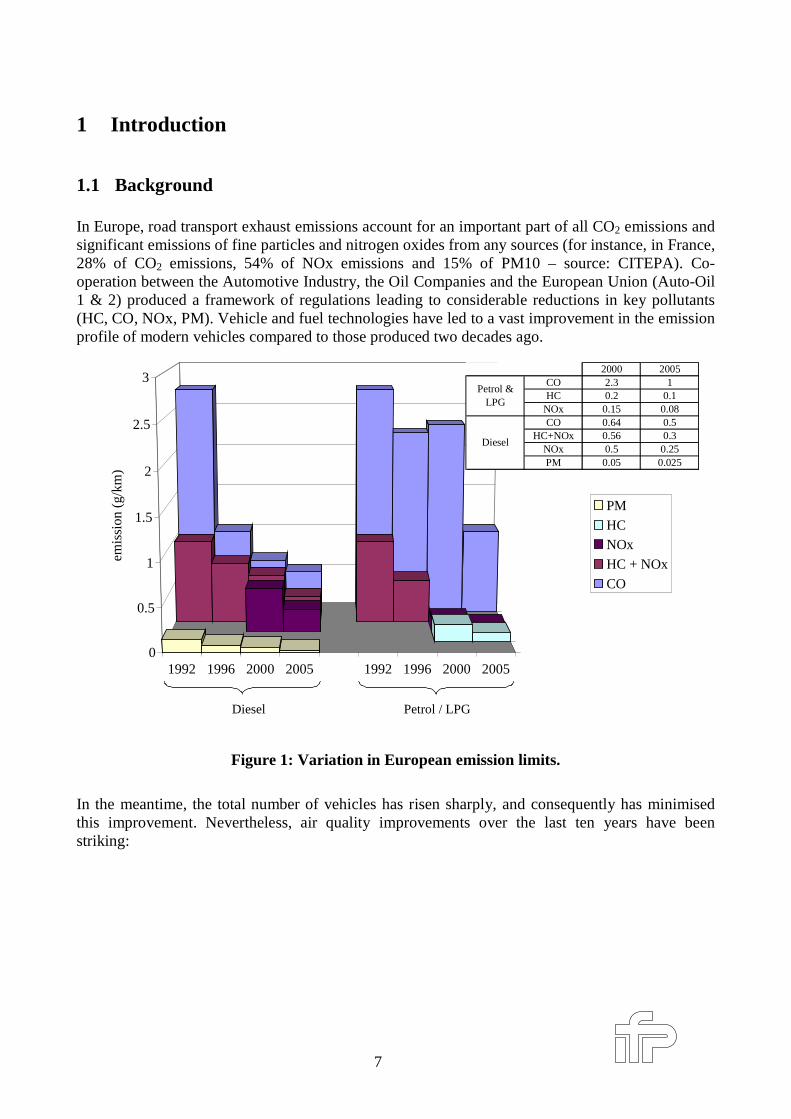
In Europe, road transport exhaust emissions account for an important part of all CO2 emissions andsignificant emissions of fine particles and nitrogen oxides from any sources (for instance, in France,28% of CO2 emissions, 54% of NOx emissions and 15% of PM10 – source: CITEPA). Co-operation between the Automotive Industry, the Oil Companies and the European Union (Auto-Oil1 & 2) produced a framework of regulations leading to considerable reductions in key pollutants(HC, CO, NOx, PM). Vehicle and fuel technologies have led to a vast improvement in the emissionprofile of modern vehicles compared to those produced two decades ago.
1992 1996 2000 2005 1992 1996 2000 20050
0.5
1
1.5
2
2.5
3
emis
sion
(g/
km)
PM
HCNOx
HC + NOx
CO
Diesel Petrol / LPG
2000 2005CO 2.3 1HC 0.2 0.1NOx 0.15 0.08CO 0.64 0.5
HC+NOx 0.56 0.3NOx 0.5 0.25PM 0.05 0.025
Petrol & LPG
Diesel
Figure 1: Var iation in European emission limits.
In the meantime, the total number of vehicles has risen sharply, and consequently has minimisedthis improvement. Nevertheless, air quality improvements over the last ten years have beenstriking:
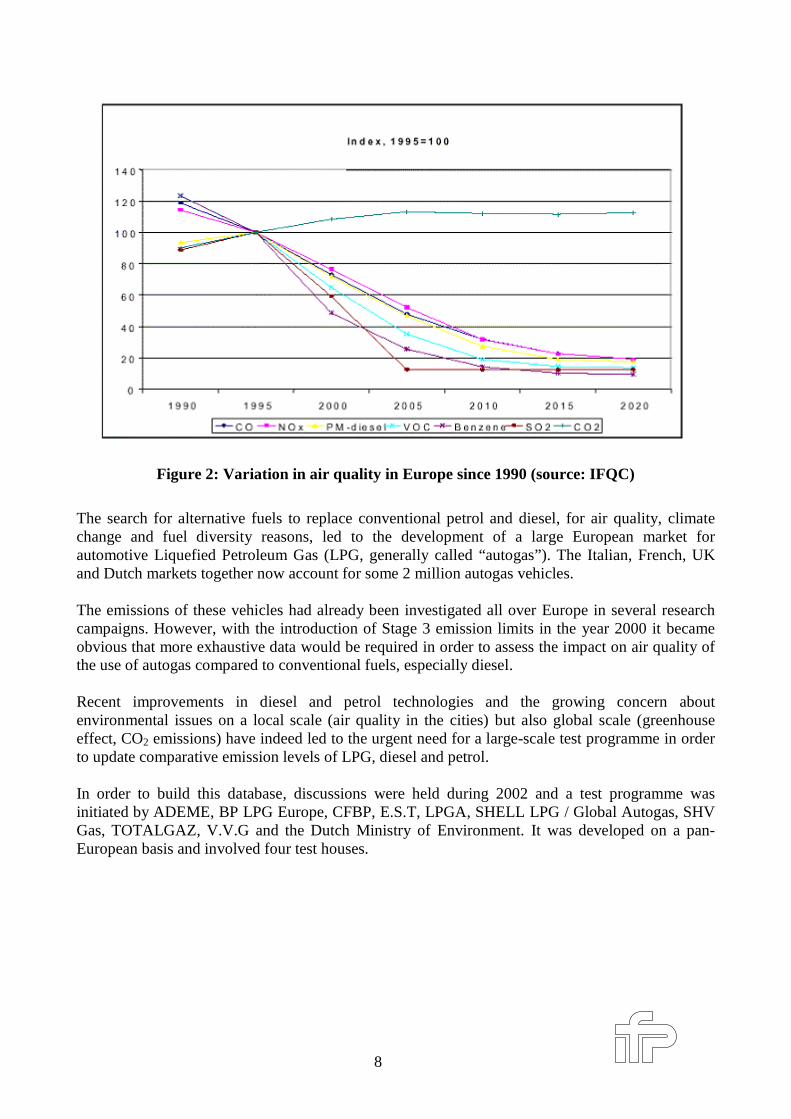
8
Figure 2: Var iation in air quality in Europe since 1990 (source: IFQC)
The search for alternative fuels to replace conventional petrol and diesel, for air quality, climatechange and fuel diversity reasons, led to the development of a large European market forautomotive Liquefied Petroleum Gas (LPG, generally called “autogas”). The Italian, French, UKand Dutch markets together now account for some 2 million autogas vehicles.
The emissions of these vehicles had already been investigated all over Europe in several researchcampaigns. However, with the introduction of Stage 3 emission limits in the year 2000 it becameobvious that more exhaustive data would be required in order to assess the impact on air quality ofthe use of autogas compared to conventional fuels, especially diesel.
Recent improvements in diesel and petrol technologies and the growing concern aboutenvironmental issues on a local scale (air quality in the cities) but also global scale (greenhouseeffect, CO2 emissions) have indeed led to the urgent need for a large-scale test programme in orderto update comparative emission levels of LPG, diesel and petrol.
In order to build this database, discussions were held during 2002 and a test programme wasinitiated by ADEME, BP LPG Europe, CFBP, E.S.T, LPGA, SHELL LPG / Global Autogas, SHVGas, TOTALGAZ, V.V.G and the Dutch Ministry of Environment. It was developed on a pan-European basis and involved four test houses.
9
1.2 Aim of the programmeThe purpose of this test programme was to compare emission levels of vehicles currently sold inEurope which run on one of the three fuels: diesel, petrol or LPG.To achieve this, information about emission profiles of vehicles using these fuels was updated anddata on their relative impact on the air quality in terms of health and greenhouse effects wascollected.In order to compare the air quality implications in the "real world", a specific driving cycle wasused.
1.3 Methodology:
Vehicles:Vehicles were selected in order to be representative of the car manufacturer’s production, asvehicles currently available on the European market (passenger car / vans, small / average / bigvehicles…), see section 2.2.This selection and the number of vehicles tested (30 vehicles) enables reliable processing of thedata.
Laboratories:Tests were conducted in 4 different test houses, selected among recognised laboratories in theEuropean Union.Since different official test houses are involved in the programme, a reference or correlationbetween them needed to be established.Three vehicles were therefore tested in these laboratories for round robin purpose, to ensure thereproducibility of the measurements.
Tests:Since vehicles are used in different ways and there are many different traffic conditions (congestedcity traffic; extra-urban conditions; motorway use), the tests were performed according to threecycles. These cycles respected a common sequence in order to ensure reproducibility between testhouses:
• a NEDC, followed by• a "warm" start cycle based on the NEDC, followed by• a CADC, with warm start and running conditions closer to "real life" driving.
Measurements were taken during each cycle in order to assess the performances of vehicles in eachdriving situation. In addition, where appropriate, each phase of the cycles was measured separately.Three vehicles were tested by the four laboratories on the NEDC for the purpose of the round-robintest. They were tested at the same (or nearly the same) mileage by transporting them between testsin order to avoid any drift due to vehicle mileage.
Finally, a consistent database was established with all the emission test results, thus enabling acomparison of LPG, petrol and diesel emission levels.
10
1.4 Results display
All the measurement results are presented in appendices (section 7).Tables and figures showing the most significant results are shown in section 3.For each emission, the background and commented results are shown, and a summary is proposed.
Conclusions are shown in section 5.
2 Programme descr iption
2.1 Selected laborator ies
The participating laboratories were:
TNO (The Netherlands)MILLBROOK PROVING GROUND (UK)IFP (France)RWTÜV (Germany)
2.2 Vehicle selection:For each of the three fuels, ten models of vehicles were selected. This led to the testing of 30vehicles.Nine models are classified in category "M" (passenger cars, according the 70/220 directive) or "N1< 1760 kg" and one in category "N1 > 1760 kg" (light duty vehicles)
The selected vehicles comply with the following criteria:- most modern technology available on the European market, on each fuel;- models developed in a LPG version and marketed as such by the car manufacturer or its
importer, in at least one of the countries concerned by the test programme;- existing in very similar versions in petrol and diesel (equivalent equipment, same range
of power), allowing customer choice based on the fuel technology only;- minimum of 5 000 km and maximum of 25 000 km on the odometer;- at least Euro 3 type approval for each fuel.
The selected LPG vehicles were either manufactured on the production line or post-equipped underthe control of the car manufacturer.
Two vehicles were chosen to evaluate the emission from other fuels (CNG) and after-treatmentstrategies (DPF).
The list of vehicles is shown in appendices (section 7.3).
Since the aim of the program was to compare the emission performance of different fuels and notthe performance of either cars or manufacturers, throughout the report vehicles are encoded with aletter.
11
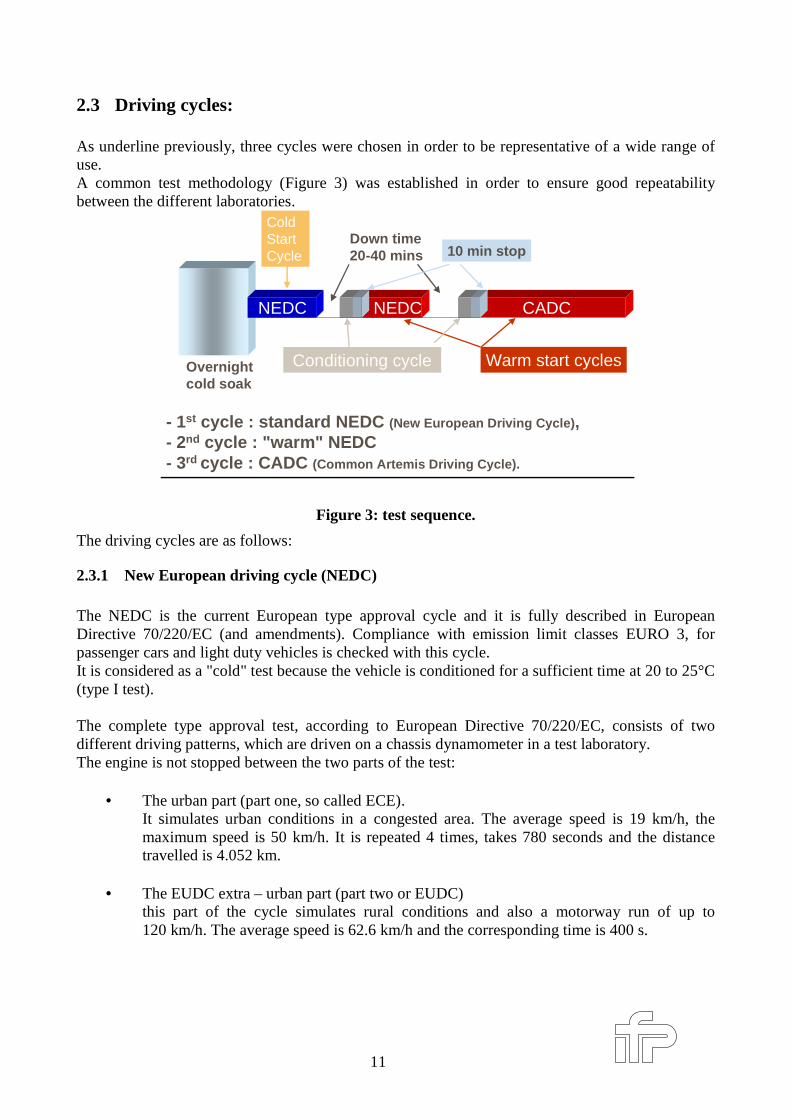
2.3 Driving cycles:
As underline previously, three cycles were chosen in order to be representative of a wide range ofuse.A common test methodology (Figure 3) was established in order to ensure good repeatabilitybetween the different laboratories.
- 1st cycle : standard NEDC (New European Driving Cycle),- 2nd cycle : "warm" NEDC- 3rd cycle : CADC (Common Artemis Driving Cycle).
ColdStartCycle
Conditioning cycle
NEDC
Down time20-40 mins 10 min stop
Overnightcold soak
Warm start cycles
NEDC CADC
Figure 3: test sequence.
The driving cycles are as follows:
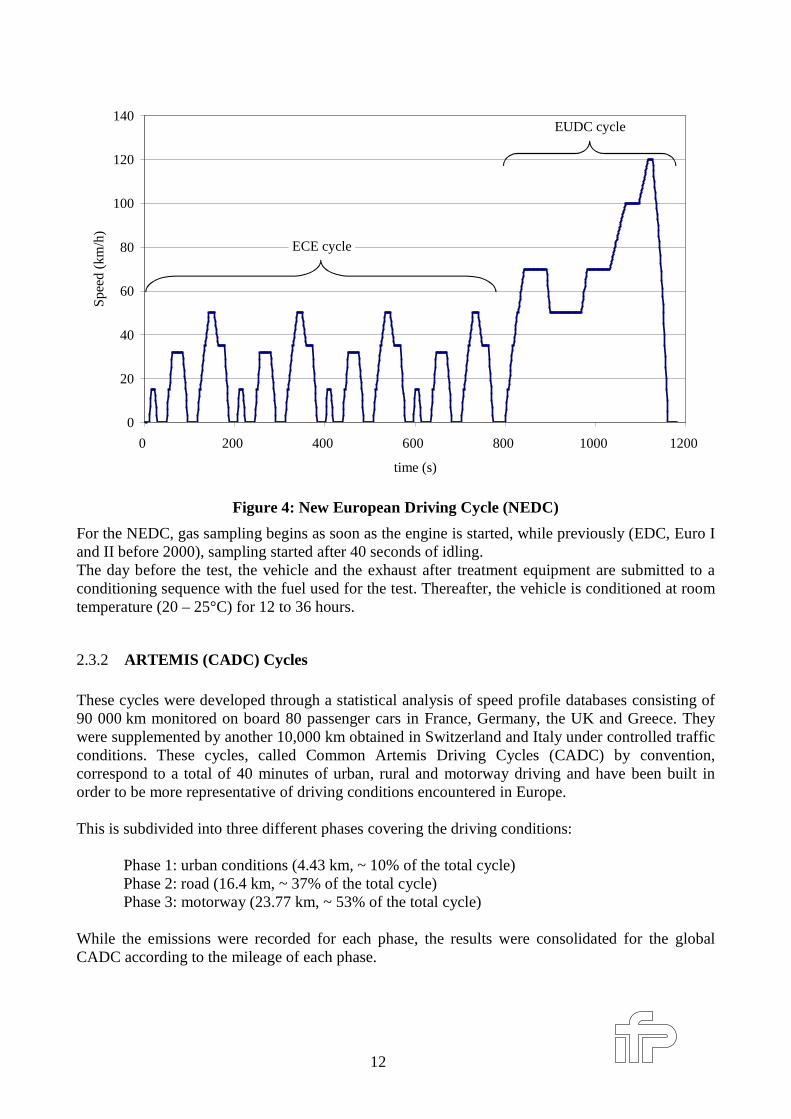
2.3.1 New European dr iving cycle (NEDC)
The NEDC is the current European type approval cycle and it is fully described in EuropeanDirective 70/220/EC (and amendments). Compliance with emission limit classes EURO 3, forpassenger cars and light duty vehicles is checked with this cycle.It is considered as a "cold" test because the vehicle is conditioned for a sufficient time at 20 to 25°C(type I test).
The complete type approval test, according to European Directive 70/220/EC, consists of twodifferent driving patterns, which are driven on a chassis dynamometer in a test laboratory.The engine is not stopped between the two parts of the test:
• The urban part (part one, so called ECE).It simulates urban conditions in a congested area. The average speed is 19 km/h, themaximum speed is 50 km/h. It is repeated 4 times, takes 780 seconds and the distancetravelled is 4.052 km.
• The EUDC extra – urban part (part two or EUDC)this part of the cycle simulates rural conditions and also a motorway run of up to120 km/h. The average speed is 62.6 km/h and the corresponding time is 400 s.
12
0
20
40
60
80
100
120
140
0 200 400 600 800 1000 1200
time (s)
Spe
ed (
km/h
)
ECE cycle
EUDC cycle
Figure 4: New European Dr iving Cycle (NEDC)
For the NEDC, gas sampling begins as soon as the engine is started, while previously (EDC, Euro Iand II before 2000), sampling started after 40 seconds of idling.The day before the test, the vehicle and the exhaust after treatment equipment are submitted to aconditioning sequence with the fuel used for the test. Thereafter, the vehicle is conditioned at roomtemperature (20 – 25°C) for 12 to 36 hours.
2.3.2 ARTEMIS (CADC) Cycles
These cycles were developed through a statistical analysis of speed profile databases consisting of90 000 km monitored on board 80 passenger cars in France, Germany, the UK and Greece. Theywere supplemented by another 10,000 km obtained in Switzerland and Italy under controlled trafficconditions. These cycles, called Common Artemis Driving Cycles (CADC) by convention,correspond to a total of 40 minutes of urban, rural and motorway driving and have been built inorder to be more representative of driving conditions encountered in Europe.
This is subdivided into three different phases covering the driving conditions:
Phase 1: urban conditions (4.43 km, ~ 10% of the total cycle)Phase 2: road (16.4 km, ~ 37% of the total cycle)Phase 3: motorway (23.77 km, ~ 53% of the total cycle)
While the emissions were recorded for each phase, the results were consolidated for the globalCADC according to the mileage of each phase.
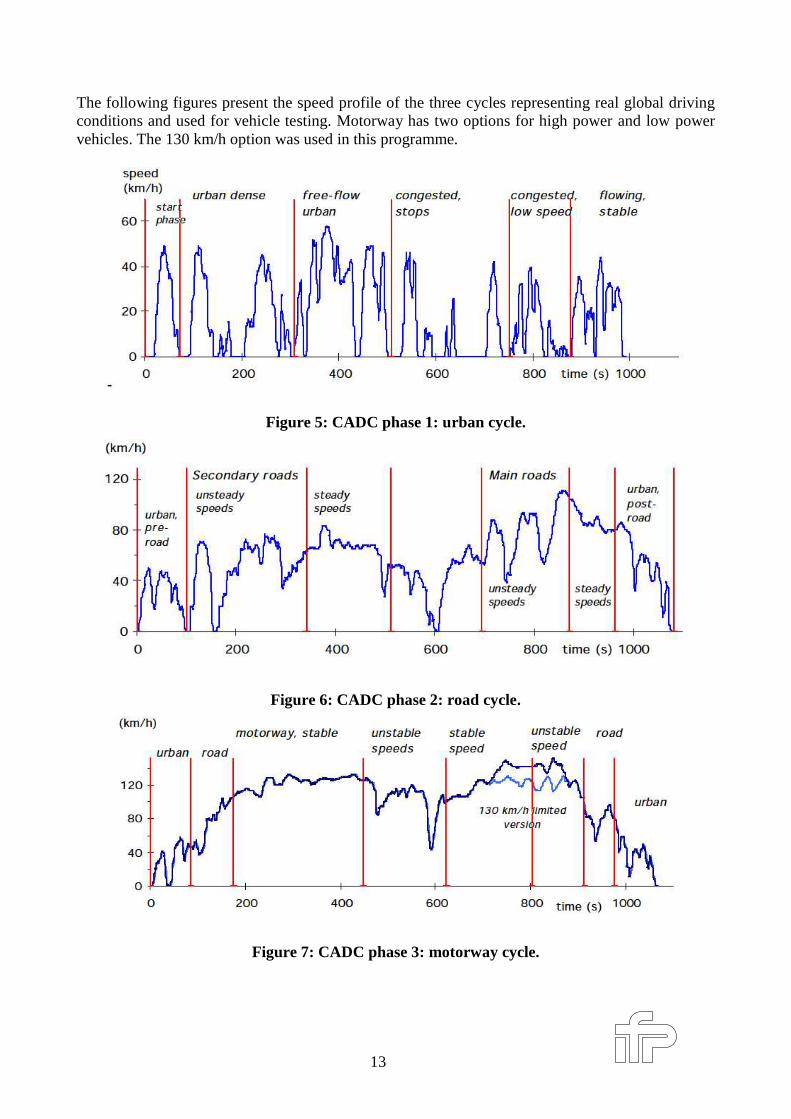
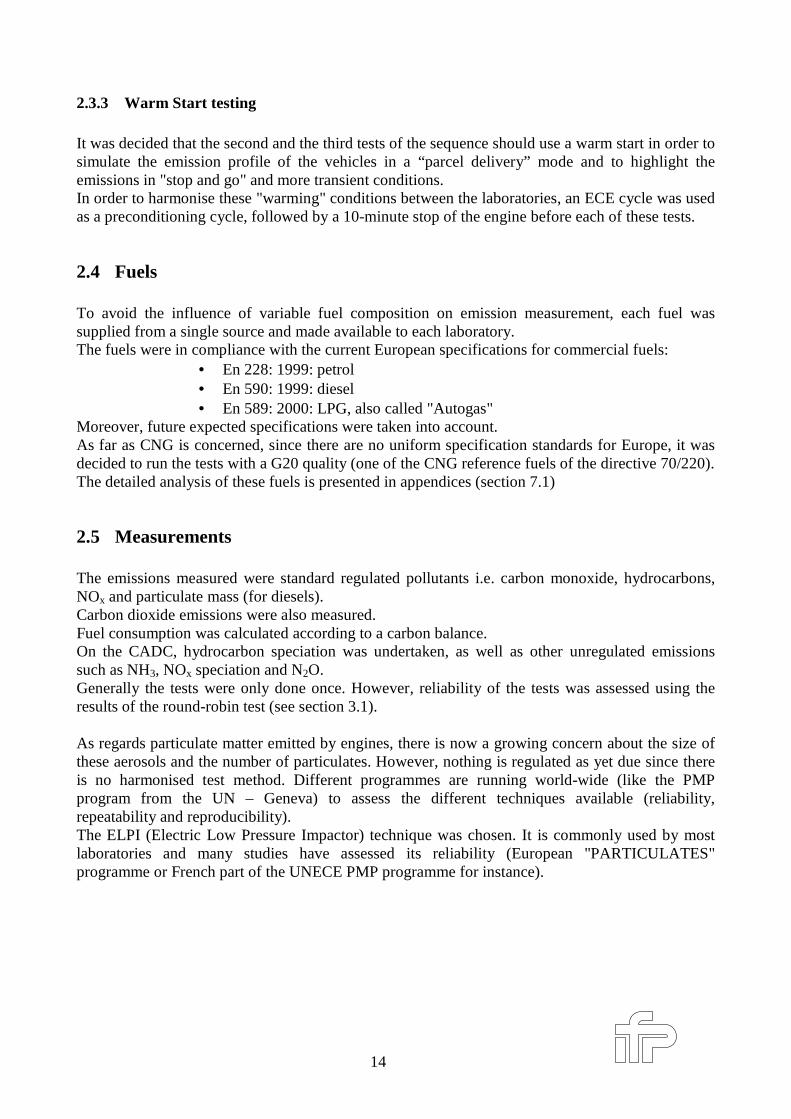
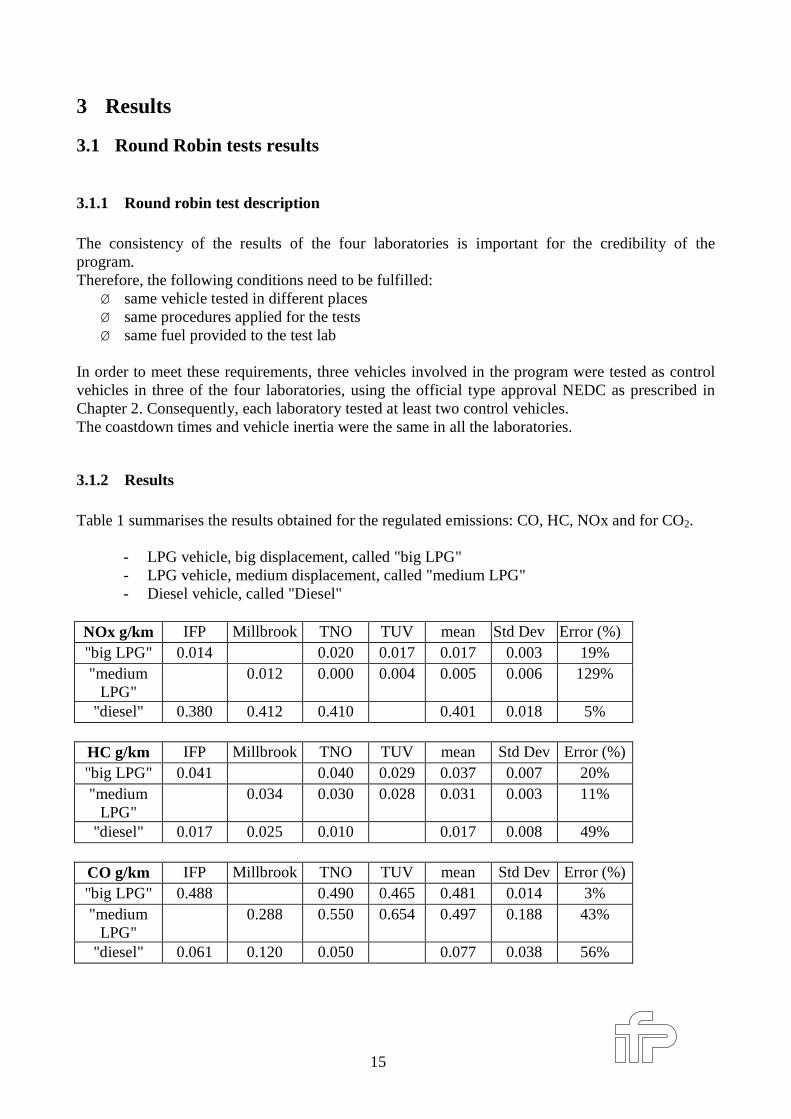
13
The following figures present the speed profile of the three cycles representing real global drivingconditions and used for vehicle testing. Motorway has two options for high power and low powervehicles. The 130 km/h option was used in this programme.
Figure 5: CADC phase 1: urban cycle.
Figure 6: CADC phase 2: road cycle.
Figure 7: CADC phase 3: motorway cycle.
14
2.3.3 Warm Star t testing
It was decided that the second and the third tests of the sequence should use a warm start in order tosimulate the emission profile of the vehicles in a “parcel delivery” mode and to highlight theemissions in "stop and go" and more transient conditions.In order to harmonise these "warming" conditions between the laboratories, an ECE cycle was usedas a preconditioning cycle, followed by a 10-minute stop of the engine before each of these tests.
2.4 Fuels
To avoid the influence of variable fuel composition on emission measurement, each fuel wassupplied from a single source and made available to each laboratory.The fuels were in compliance with the current European specifications for commercial fuels:
• En 228: 1999: petrol• En 590: 1999: diesel• En 589: 2000: LPG, also called "Autogas"
Moreover, future expected specifications were taken into account.As far as CNG is concerned, since there are no uniform specification standards for Europe, it wasdecided to run the tests with a G20 quality (one of the CNG reference fuels of the directive 70/220).The detailed analysis of these fuels is presented in appendices (section 7.1)
2.5 Measurements
The emissions measured were standard regulated pollutants i.e. carbon monoxide, hydrocarbons,NOx and particulate mass (for diesels).Carbon dioxide emissions were also measured.Fuel consumption was calculated according to a carbon balance.On the CADC, hydrocarbon speciation was undertaken, as well as other unregulated emissionssuch as NH3, NOx speciation and N2O.Generally the tests were only done once. However, reliability of the tests was assessed using theresults of the round-robin test (see section 3.1).
As regards particulate matter emitted by engines, there is now a growing concern about the size ofthese aerosols and the number of particulates. However, nothing is regulated as yet due since thereis no harmonised test method. Different programmes are running world-wide (like the PMPprogram from the UN – Geneva) to assess the different techniques available (reliability,repeatability and reproducibility).The ELPI (Electric Low Pressure Impactor) technique was chosen. It is commonly used by mostlaboratories and many studies have assessed its reliability (European "PARTICULATES"programme or French part of the UNECE PMP programme for instance).
15
3 Results
3.1 Round Robin tests results
3.1.1 Round robin test descr iption
The consistency of the results of the four laboratories is important for the credibility of theprogram.Therefore, the following conditions need to be fulfilled:
Ø same vehicle tested in different placesØ same procedures applied for the testsØ same fuel provided to the test lab
In order to meet these requirements, three vehicles involved in the program were tested as controlvehicles in three of the four laboratories, using the official type approval NEDC as prescribed inChapter 2. Consequently, each laboratory tested at least two control vehicles.The coastdown times and vehicle inertia were the same in all the laboratories.
3.1.2 Results
Table 1 summarises the results obtained for the regulated emissions: CO, HC, NOx and for CO2.
- LPG vehicle, big displacement, called "big LPG"- LPG vehicle, medium displacement, called "medium LPG"- Diesel vehicle, called "Diesel"
NOx g/km IFP Millbrook TNO TUV mean Std Dev Error (%)"big LPG" 0.014 0.020 0.017 0.017 0.003 19%"medium
LPG"0.012 0.000 0.004 0.005 0.006 129%
"diesel" 0.380 0.412 0.410 0.401 0.018 5%
HC g/km IFP Millbrook TNO TUV mean Std Dev Error (%)"big LPG" 0.041 0.040 0.029 0.037 0.007 20%"medium
LPG"0.034 0.030 0.028 0.031 0.003 11%
"diesel" 0.017 0.025 0.010 0.017 0.008 49%
CO g/km IFP Millbrook TNO TUV mean Std Dev Error (%)"big LPG" 0.488 0.490 0.465 0.481 0.014 3%"medium
LPG"0.288 0.550 0.654 0.497 0.188 43%
"diesel" 0.061 0.120 0.050 0.077 0.038 56%
16
CO2 g/km IFP Millbrook TNO TUV mean Std Dev Error (%)"big LPG" 205.5 210.7 204.7 207.0 3.281 2%"medium
LPG"155.1 161.7 156.7 157.8 3.460 2%
"diesel" 129.4 137.2 138.8 135.2 5.035 4%
PM g/km IFP Millbrook TNO TUV mean Std Dev Error (%)"Diesel" 0.028 - 0.030 0.029 0.001 6%
Table 1: Round-robin tests results.
The relative error on NOx appears to be very high for the "medium LPG" vehicle (130% in table 1).Nevertheless, it must be considered in relation with the very low absolute level of NOx emissionsof this vehicle (5 mg/km), which is close to the detection limit of the method.The CO2 emission measurements of the laboratories were roughly the same for each controlvehicle, which means that the vehicles were not affected by transport between test facilities.
Together with table 1 above, the figures 8, 9 and 10 also illustrate the reproducibility check.For each pollutant, a mean value and an "error bar" (calculated according to the 95% confidenceinterval) are shown:
0.000
0.100
0.200
0.300
0.400
0.500
0.600
0.700
CO HC NOx HC+NOx PM
Em
issi
on (
g/km
)
MillbrookIFP
TNO
Mean
Euro 3Euro 4
Figure 8: " diesel" vehicle
17
0.0
0.1
0.2
0.3
0.4
0.5
0.6
0.7
0.8
0.9
1.0
CO HC NOx HC+NOx
emis
sion
(g/
km)
TÜVMillbrook
TNO
Mean
Euro 3
Euro 4
Euro 3 : 2.3 g/km
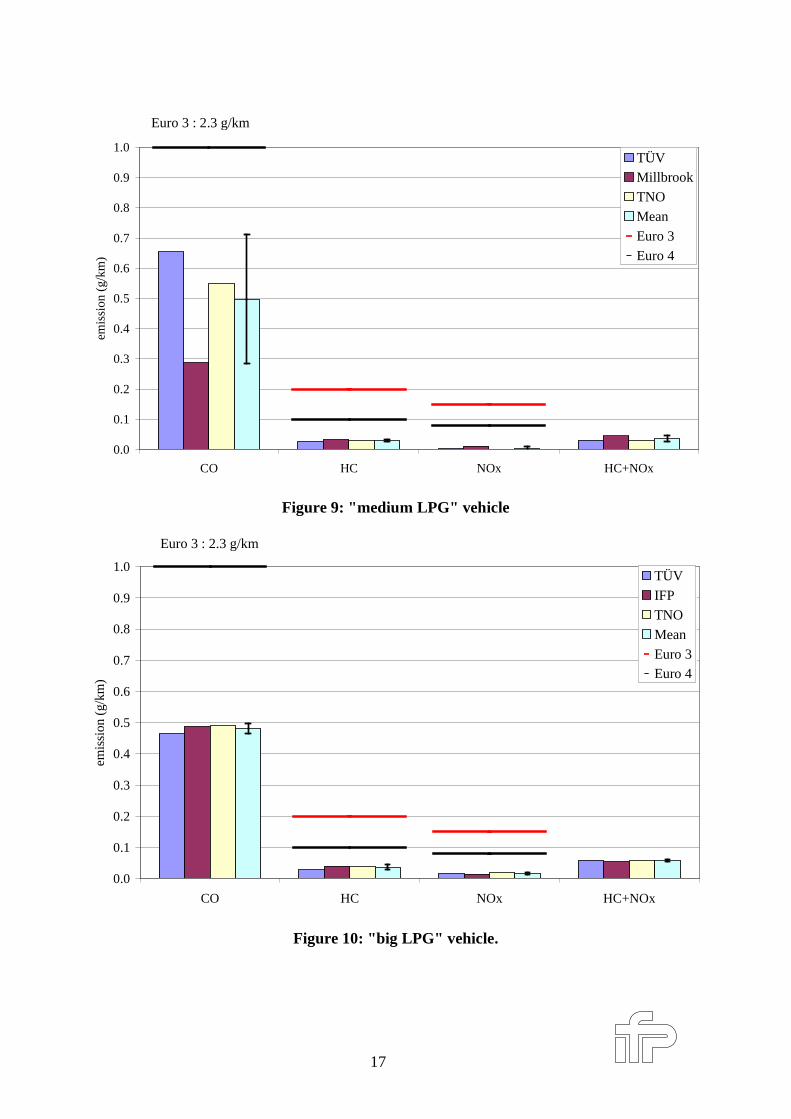
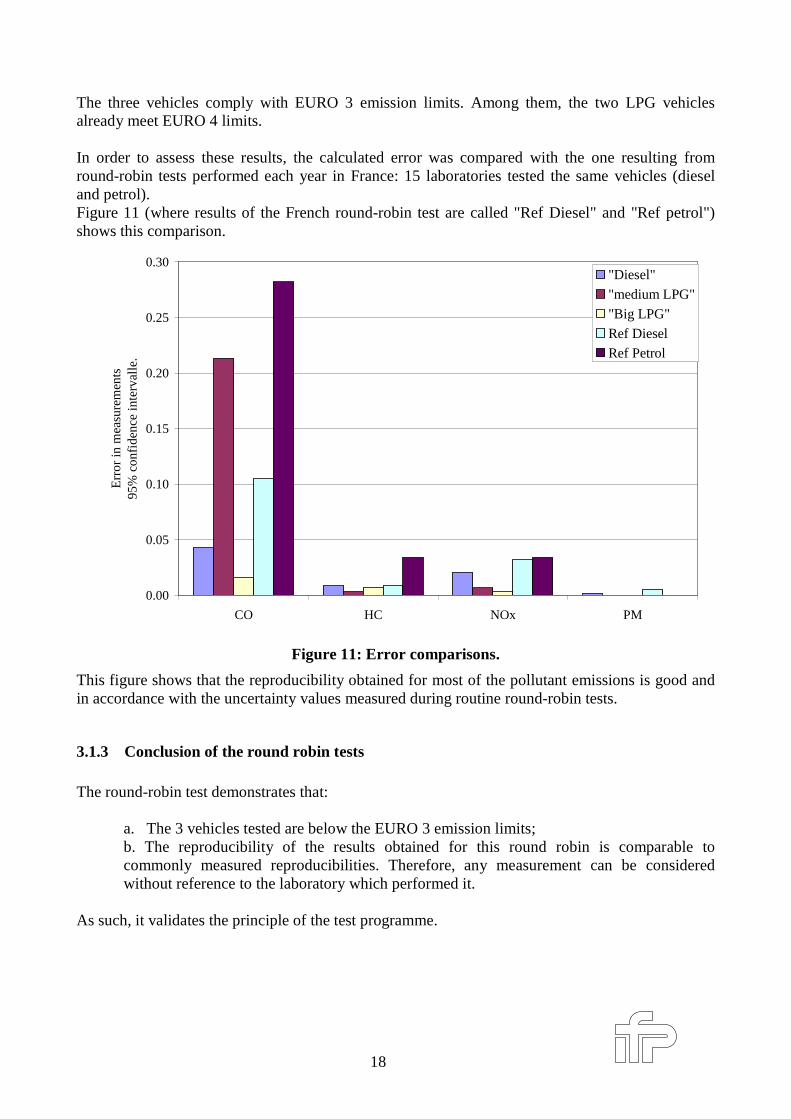
Figure 9: " medium LPG" vehicle
0.0
0.1
0.2
0.3
0.4
0.5
0.6
0.7
0.8
0.9
1.0
CO HC NOx HC+NOx
emis
sion
(g/
km)
TÜV
IFP
TNO
Mean
Euro 3Euro 4
Euro 3 : 2.3 g/km
Figure 10: " big LPG" vehicle.
18
The three vehicles comply with EURO 3 emission limits. Among them, the two LPG vehiclesalready meet EURO 4 limits.
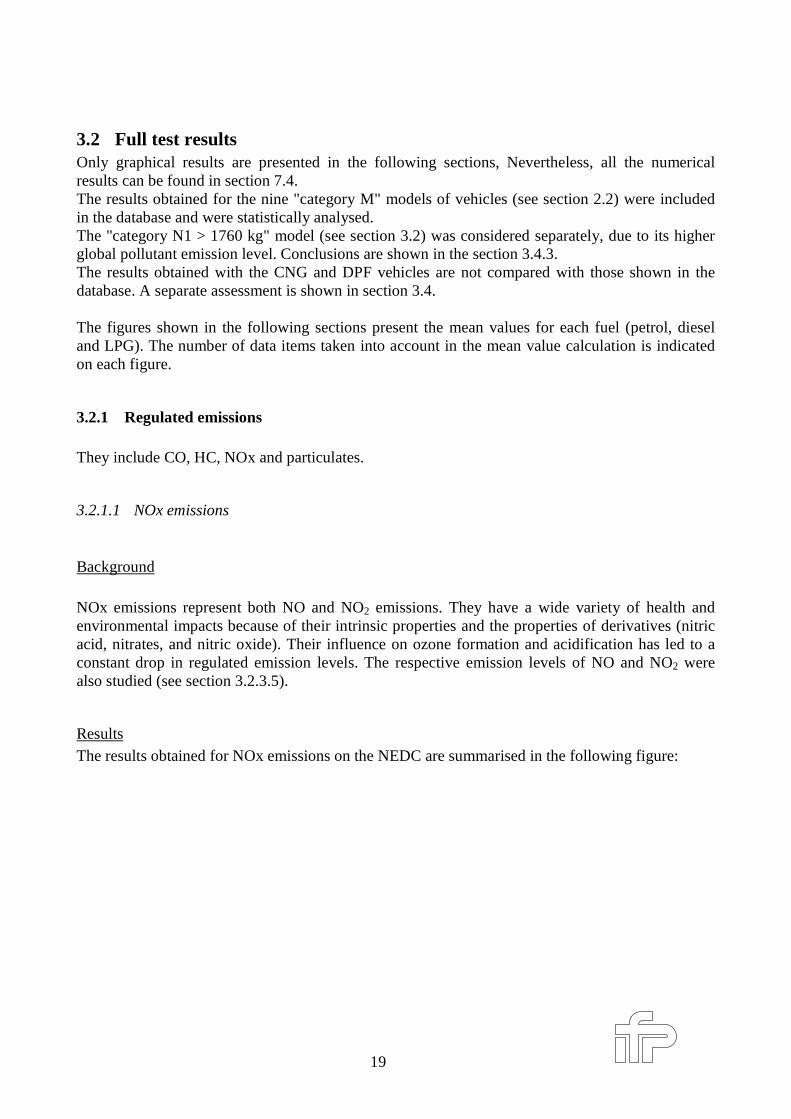
In order to assess these results, the calculated error was compared with the one resulting fromround-robin tests performed each year in France: 15 laboratories tested the same vehicles (dieseland petrol).Figure 11 (where results of the French round-robin test are called "Ref Diesel" and "Ref petrol")shows this comparison.
0.00
0.05
0.10
0.15
0.20
0.25
0.30
CO HC NOx PM
Err
or in
mea
sure
men
ts95
% c
onfi
denc
e in
terv
alle
.
"Diesel"
"medium LPG"
"Big LPG"
Ref Diesel
Ref Petrol
Figure 11: Error compar isons.
This figure shows that the reproducibility obtained for most of the pollutant emissions is good andin accordance with the uncertainty values measured during routine round-robin tests.
3.1.3 Conclusion of the round robin tests
The round-robin test demonstrates that:
a. The 3 vehicles tested are below the EURO 3 emission limits;b. The reproducibility of the results obtained for this round robin is comparable tocommonly measured reproducibilities. Therefore, any measurement can be consideredwithout reference to the laboratory which performed it.
As such, it validates the principle of the test programme.
19
3.2 Full test resultsOnly graphical results are presented in the following sections, Nevertheless, all the numericalresults can be found in section 7.4.The results obtained for the nine "category M" models of vehicles (see section 2.2) were includedin the database and were statistically analysed.The "category N1 > 1760 kg" model (see section 3.2) was considered separately, due to its higherglobal pollutant emission level. Conclusions are shown in the section 3.4.3.The results obtained with the CNG and DPF vehicles are not compared with those shown in thedatabase. A separate assessment is shown in section 3.4.
The figures shown in the following sections present the mean values for each fuel (petrol, dieseland LPG). The number of data items taken into account in the mean value calculation is indicatedon each figure.
3.2.1 Regulated emissions
They include CO, HC, NOx and particulates.
3.2.1.1 NOx emissions
Background
NOx emissions represent both NO and NO2 emissions. They have a wide variety of health andenvironmental impacts because of their intrinsic properties and the properties of derivatives (nitricacid, nitrates, and nitric oxide). Their influence on ozone formation and acidification has led to aconstant drop in regulated emission levels. The respective emission levels of NO and NO2 werealso studied (see section 3.2.3.5).
ResultsThe results obtained for NOx emissions on the NEDC are summarised in the following figure:
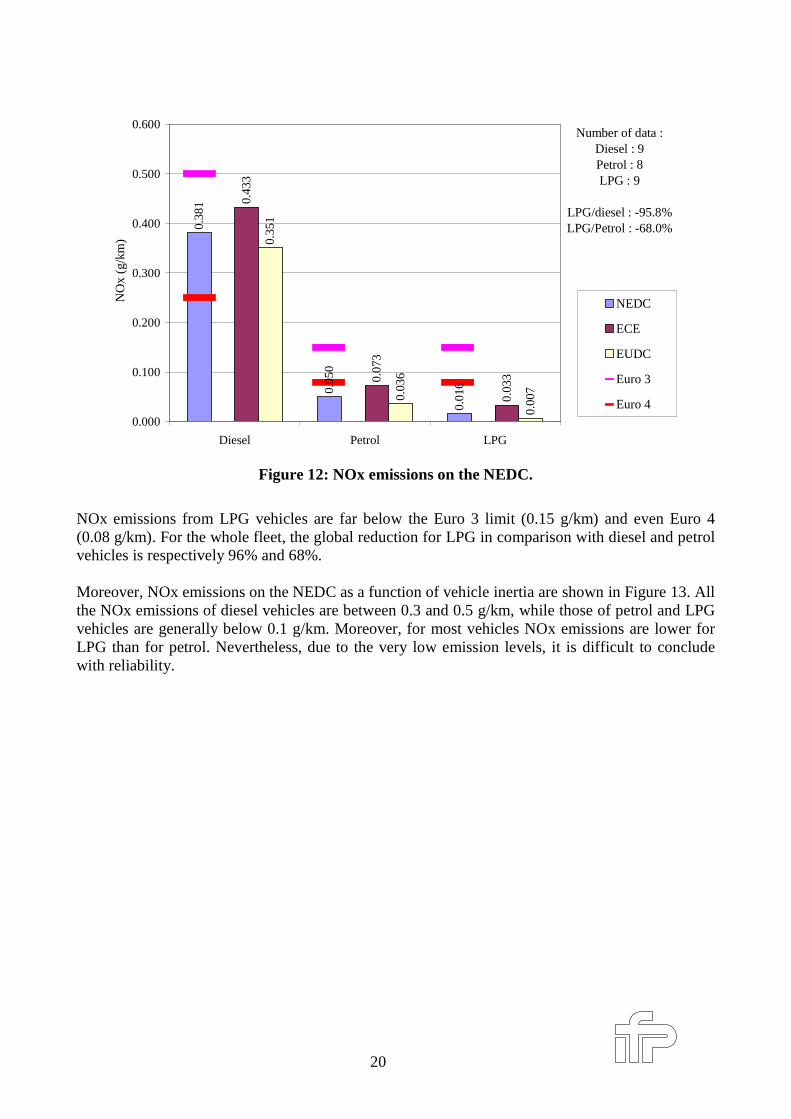
20
0.38
1
0.05
0
0.01
6
0.43
3
0.07
3
0.03
3
0.35
1
0.03
6
0.00
7
0.000
0.100
0.200
0.300
0.400
0.500
0.600
Diesel Petrol LPG
NO
x (g
/km
)
NEDC
ECE
EUDC
Euro 3
Euro 4
Number of data :Diesel : 9Petrol : 8LPG : 9
LPG/diesel : -95.8%LPG/Petrol : -68.0%
Figure 12: NOx emissions on the NEDC.
NOx emissions from LPG vehicles are far below the Euro 3 limit (0.15 g/km) and even Euro 4(0.08 g/km). For the whole fleet, the global reduction for LPG in comparison with diesel and petrolvehicles is respectively 96% and 68%.
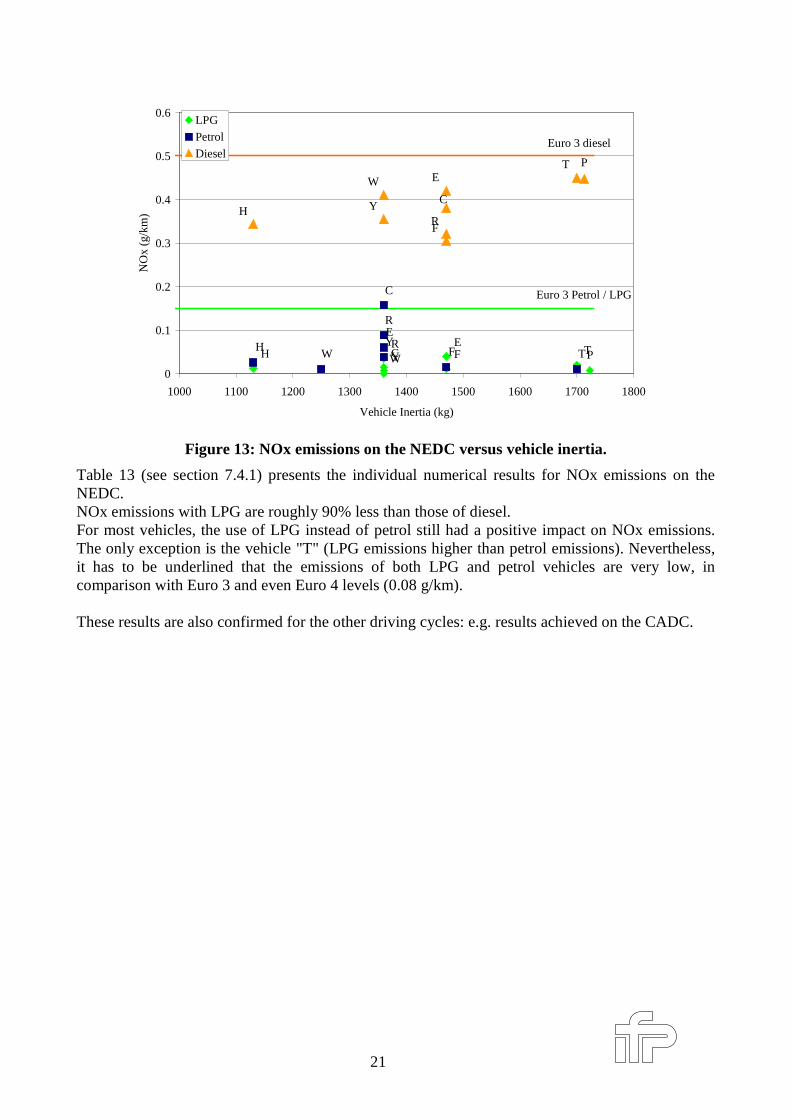
Moreover, NOx emissions on the NEDC as a function of vehicle inertia are shown in Figure 13. Allthe NOx emissions of diesel vehicles are between 0.3 and 0.5 g/km, while those of petrol and LPGvehicles are generally below 0.1 g/km. Moreover, for most vehicles NOx emissions are lower forLPG than for petrol. Nevertheless, due to the very low emission levels, it is difficult to concludewith reliability.
21
PC FWT
EH Y
R
C
FW T
EH Y
R
RYH
ET
W
F
C
P
0
0.1
0.2
0.3
0.4
0.5
0.6
1000 1100 1200 1300 1400 1500 1600 1700 1800
Vehicle Inertia (kg)
NO
x (g
/km
)
LPG
Petrol
DieselEuro 3 diesel
Euro 3 Petrol / LPG
Figure 13: NOx emissions on the NEDC versus vehicle iner tia.
Table 13 (see section 7.4.1) presents the individual numerical results for NOx emissions on theNEDC.NOx emissions with LPG are roughly 90% less than those of diesel.For most vehicles, the use of LPG instead of petrol still had a positive impact on NOx emissions.The only exception is the vehicle "T" (LPG emissions higher than petrol emissions). Nevertheless,it has to be underlined that the emissions of both LPG and petrol vehicles are very low, incomparison with Euro 3 and even Euro 4 levels (0.08 g/km).
These results are also confirmed for the other driving cycles: e.g. results achieved on the CADC.
22
0.83
9
0.08
9
0.04
1
0.97
4
0.16
8
0.08
3
0.65
8
0.09
0
0.04
2
0.96
4
0.07
7
0.03
4
0.000
0.200
0.400
0.600
0.800
1.000
1.200
Diesel Petrol LPG
NO
x (g
/km
)
CADCCADC Urban
CADC RoadCADC Motorway
Number of data :Diesel : 9Petrol : 8LPG : 9
LPG/Diesel : -95.1%LPG/Petrol : -53.7%
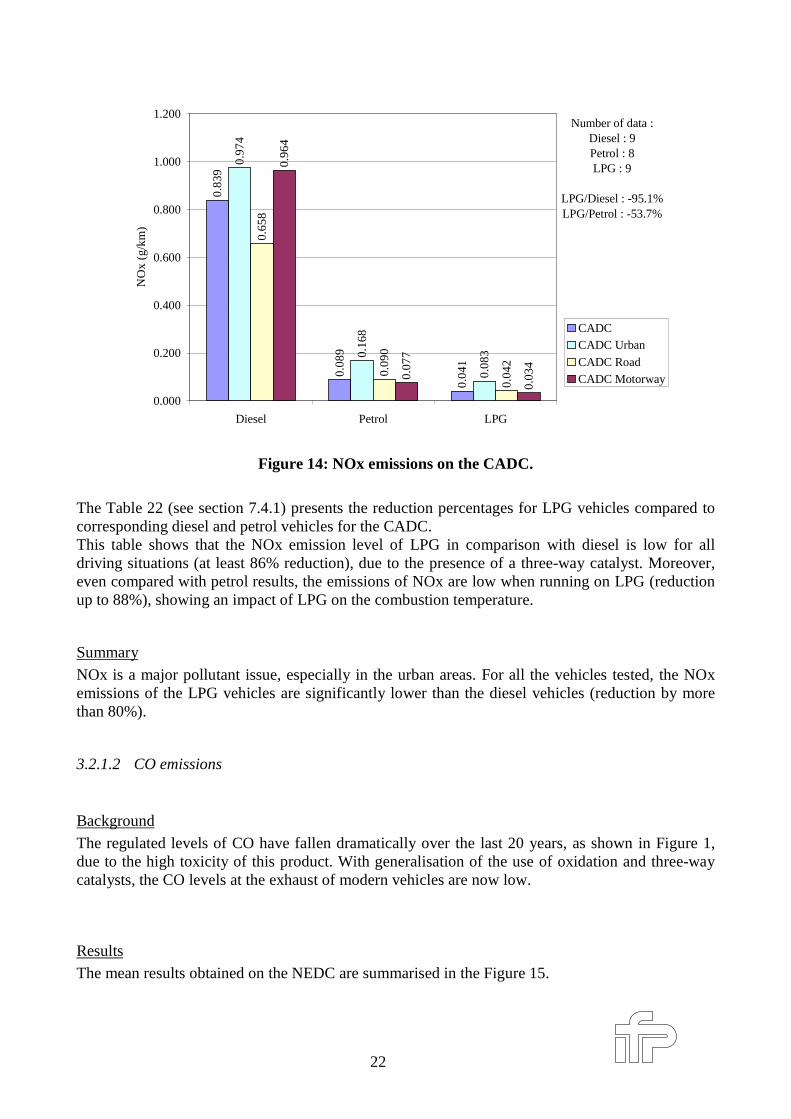
Figure 14: NOx emissions on the CADC.
The Table 22 (see section 7.4.1) presents the reduction percentages for LPG vehicles compared tocorresponding diesel and petrol vehicles for the CADC.This table shows that the NOx emission level of LPG in comparison with diesel is low for alldriving situations (at least 86% reduction), due to the presence of a three-way catalyst. Moreover,even compared with petrol results, the emissions of NOx are low when running on LPG (reductionup to 88%), showing an impact of LPG on the combustion temperature.
Summary
NOx is a major pollutant issue, especially in the urban areas. For all the vehicles tested, the NOxemissions of the LPG vehicles are significantly lower than the diesel vehicles (reduction by morethan 80%).
3.2.1.2 CO emissions
Background
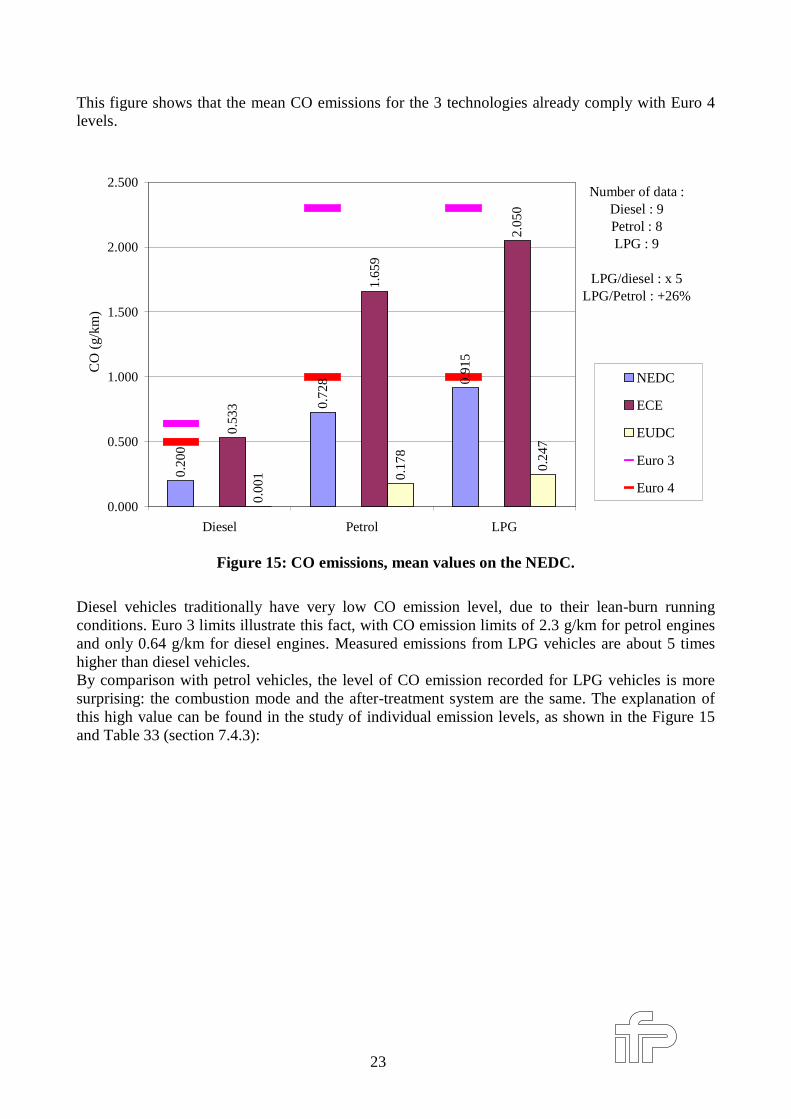
The regulated levels of CO have fallen dramatically over the last 20 years, as shown in Figure 1,due to the high toxicity of this product. With generalisation of the use of oxidation and three-waycatalysts, the CO levels at the exhaust of modern vehicles are now low.
Results
The mean results obtained on the NEDC are summarised in the Figure 15.
23
This figure shows that the mean CO emissions for the 3 technologies already comply with Euro 4levels.
0.20
0
0.72
8 0.91
5
0.53
3
1.65
9
2.05
0
0.00
1 0.17
8
0.24
7
0.000
0.500
1.000
1.500
2.000
2.500
Diesel Petrol LPG
CO
(g/
km)
NEDC
ECE
EUDC
Euro 3
Euro 4
Number of data :Diesel : 9Petrol : 8LPG : 9
LPG/diesel : x 5LPG/Petrol : +26%
Figure 15: CO emissions, mean values on the NEDC.
Diesel vehicles traditionally have very low CO emission level, due to their lean-burn runningconditions. Euro 3 limits illustrate this fact, with CO emission limits of 2.3 g/km for petrol enginesand only 0.64 g/km for diesel engines. Measured emissions from LPG vehicles are about 5 timeshigher than diesel vehicles.By comparison with petrol vehicles, the level of CO emission recorded for LPG vehicles is moresurprising: the combustion mode and the after-treatment system are the same. The explanation ofthis high value can be found in the study of individual emission levels, as shown in the Figure 15and Table 33 (section 7.4.3):
24
P
C
FW T
E
H
Y
R
C
FW
TE
H
YR
RY
H E
T
W
F
C
P
0
0.5
1
1.5
2
2.5
1000 1100 1200 1300 1400 1500 1600 1700 1800
Vehicle Inertia (kg)
CO
(g/
km)
LPG
Petrol
Diesel
Euro 3 diesel
Euro 3 Petrol / LPG
Figure 16: CO emissions versus vehicle iner tia (NEDC).
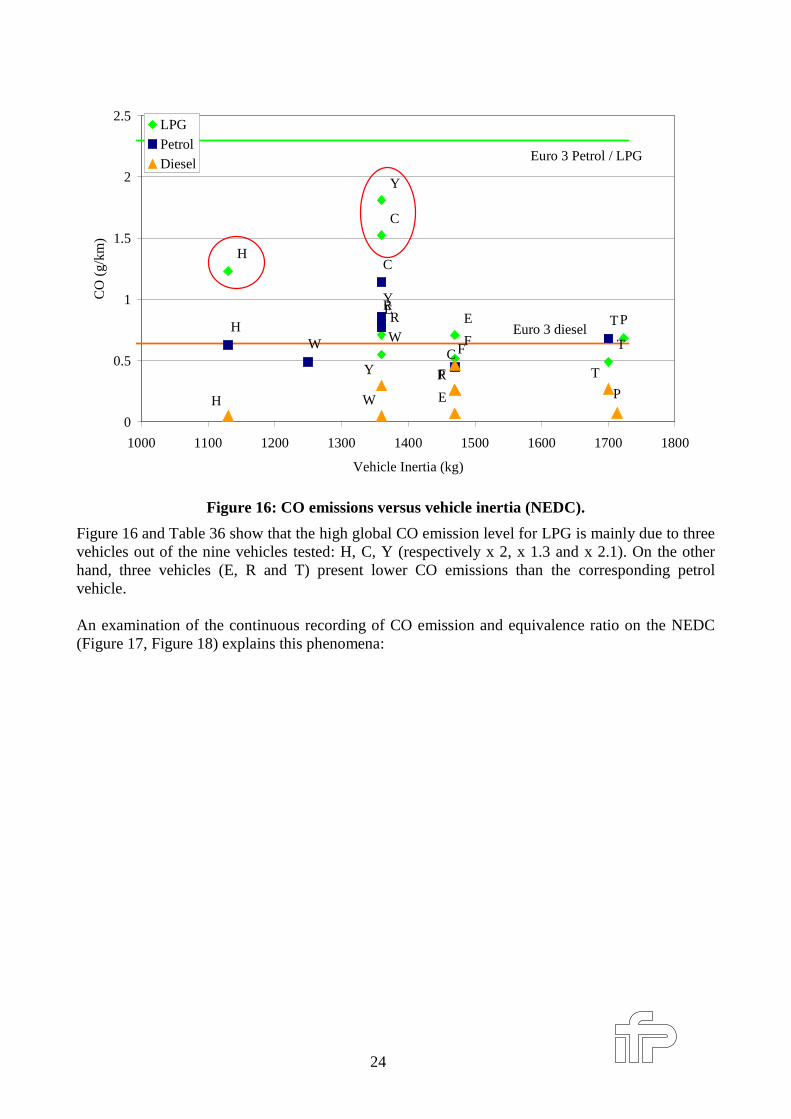
Figure 16 and Table 36 show that the high global CO emission level for LPG is mainly due to threevehicles out of the nine vehicles tested: H, C, Y (respectively x 2, x 1.3 and x 2.1). On the otherhand, three vehicles (E, R and T) present lower CO emissions than the corresponding petrolvehicle.
An examination of the continuous recording of CO emission and equivalence ratio on the NEDC(Figure 17, Figure 18) explains this phenomena:
25
0
20
40
60
80
100
120
140
160
0 200 400 600 800 1000 1200
time (s)
CO
em
issi
on
(m
g/s
)
0
30
60
90
120
150
180
210
240
Sp
eed
(km
/h)
LPGPetrolSpeed
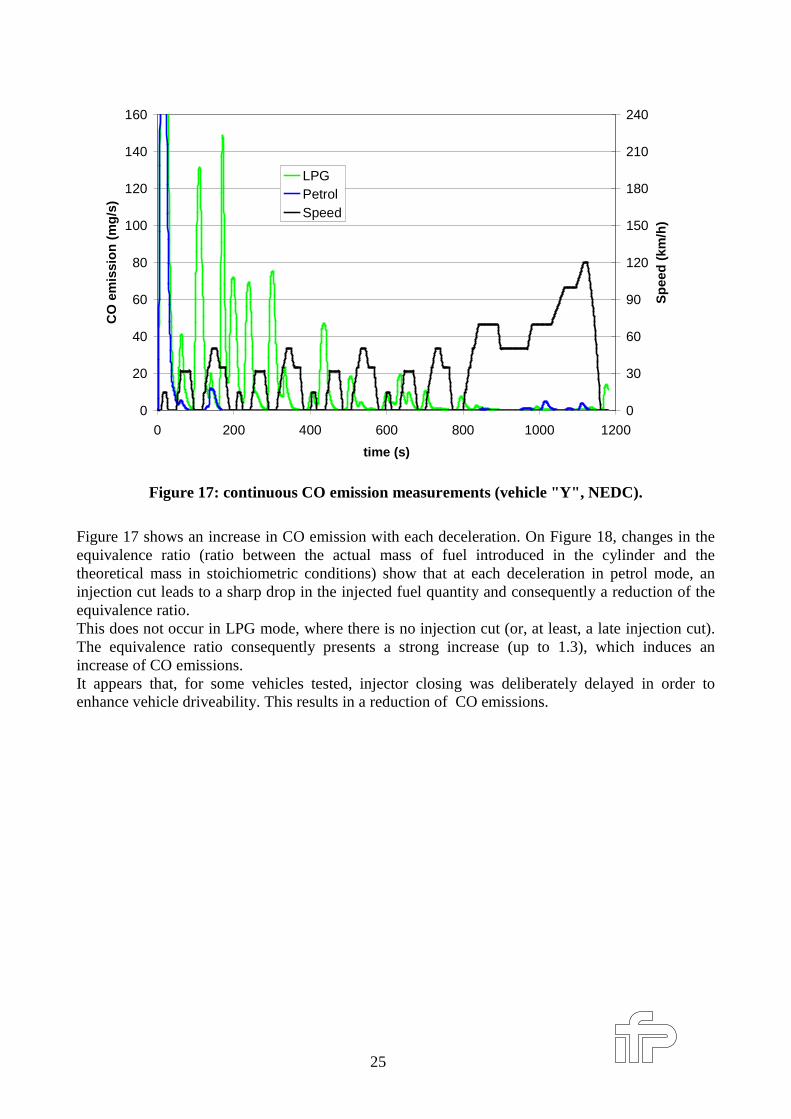
Figure 17: continuous CO emission measurements (vehicle " Y" , NEDC).
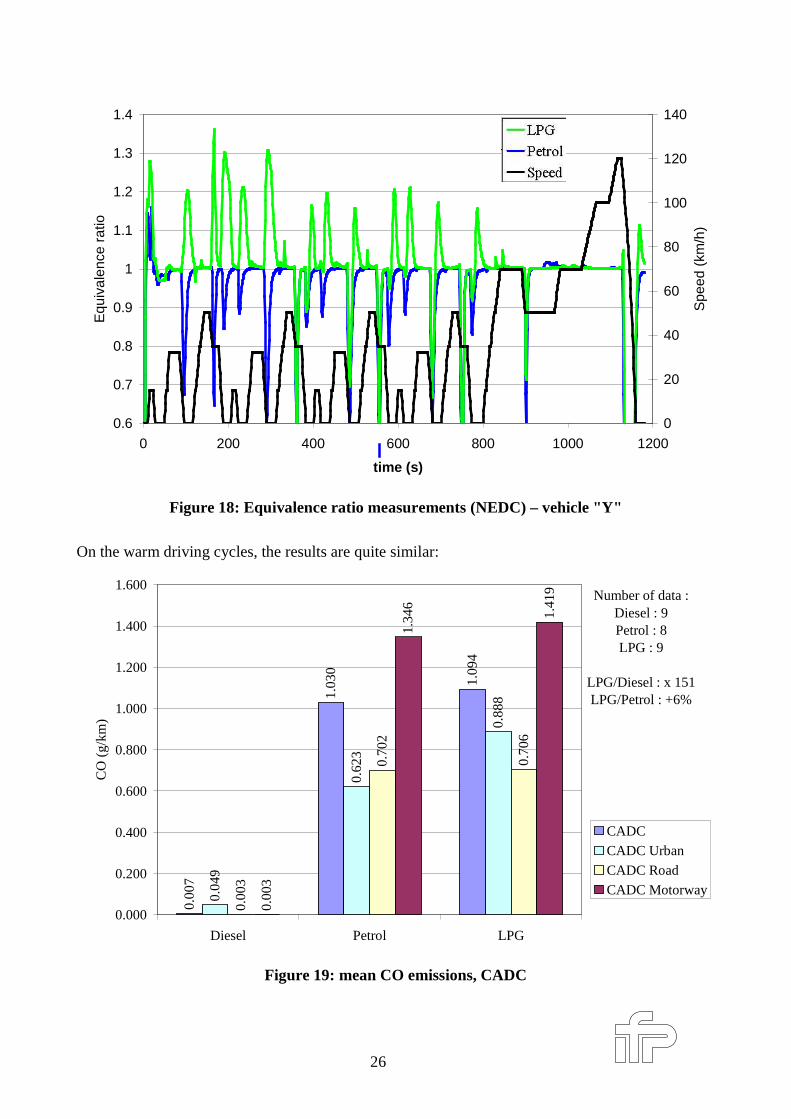
Figure 17 shows an increase in CO emission with each deceleration. On Figure 18, changes in theequivalence ratio (ratio between the actual mass of fuel introduced in the cylinder and thetheoretical mass in stoichiometric conditions) show that at each deceleration in petrol mode, aninjection cut leads to a sharp drop in the injected fuel quantity and consequently a reduction of theequivalence ratio.This does not occur in LPG mode, where there is no injection cut (or, at least, a late injection cut).The equivalence ratio consequently presents a strong increase (up to 1.3), which induces anincrease of CO emissions.It appears that, for some vehicles tested, injector closing was deliberately delayed in order toenhance vehicle driveability. This results in a reduction of CO emissions.
26
0.6
0.7
0.8
0.9
1
1.1
1.2
1.3
1.4
0 200 400 600 800 1000 1200
time (s)
Equ
ival
ence
rat
io
0
20
40
60
80
100
120
140
Spe
ed (
km/h
)
Figure 18: Equivalence ratio measurements (NEDC) – vehicle " Y"
On the warm driving cycles, the results are quite similar:
0.00
7
1.03
0
1.09
4
0.04
9
0.62
3
0.88
8
0.00
3
0.70
2
0.70
6
0.00
3
1.34
6
1.41
9
0.000
0.200
0.400
0.600
0.800
1.000
1.200
1.400
1.600
Diesel Petrol LPG
CO
(g/
km)
CADC
CADC Urban
CADC Road
CADC Motorway
Number of data :Diesel : 9Petrol : 8LPG : 9
LPG/Diesel : x 151LPG/Petrol : +6%
Figure 19: mean CO emissions, CADC
27
0.01
0
0.26
3
0.26
3
0.02
3
0.31
5
0.29
4
0.00
2
0.23
2
0.24
5
0.000
0.050
0.100
0.150
0.200
0.250
0.300
0.350
Diesel Petrol LPG
CO
(g/
km)
warm NEDCwarm ECE
warm EUDC
Number of data :Diesel : 9Petrol : 8GPL : 9
LPG/Diesel : x 27LPG/Petrol : 0%
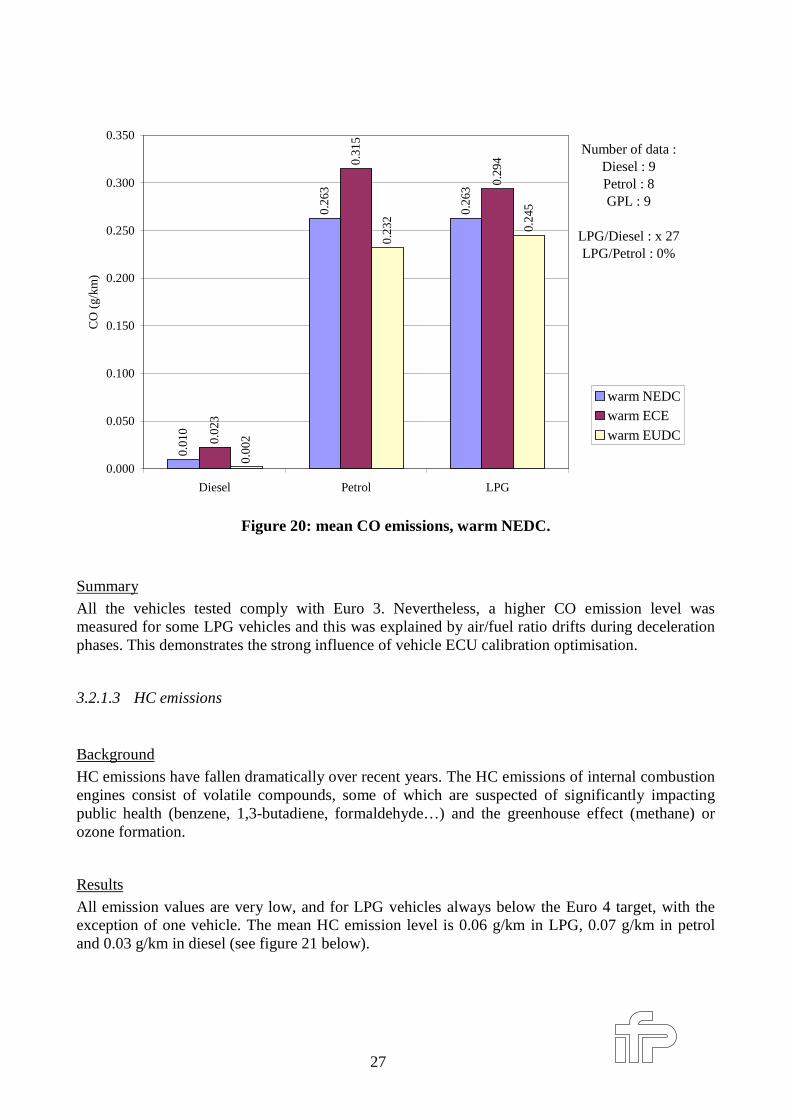
Figure 20: mean CO emissions, warm NEDC.
Summary
All the vehicles tested comply with Euro 3. Nevertheless, a higher CO emission level wasmeasured for some LPG vehicles and this was explained by air/fuel ratio drifts during decelerationphases. This demonstrates the strong influence of vehicle ECU calibration optimisation.
3.2.1.3 HC emissions
Background
HC emissions have fallen dramatically over recent years. The HC emissions of internal combustionengines consist of volatile compounds, some of which are suspected of significantly impactingpublic health (benzene, 1,3-butadiene, formaldehyde…) and the greenhouse effect (methane) orozone formation.
Results
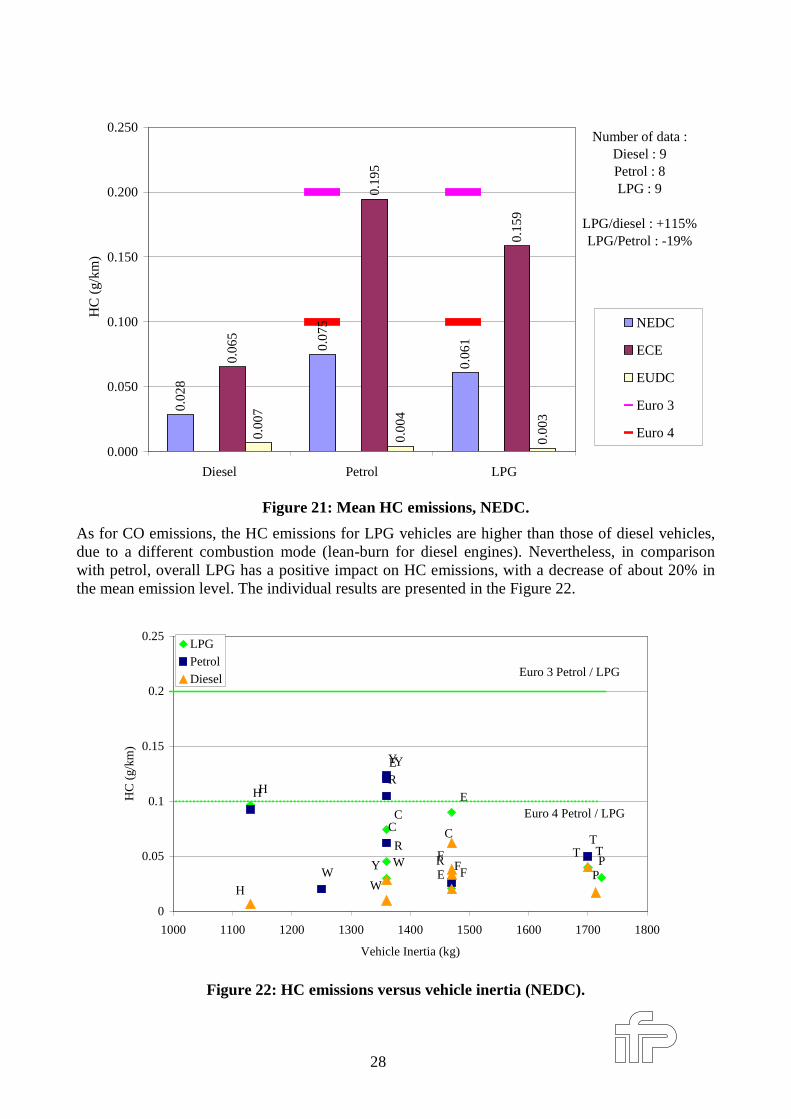
All emission values are very low, and for LPG vehicles always below the Euro 4 target, with theexception of one vehicle. The mean HC emission level is 0.06 g/km in LPG, 0.07 g/km in petroland 0.03 g/km in diesel (see figure 21 below).
28
0.02
8
0.07
5
0.06
1
0.06
5
0.19
5
0.15
9
0.00
7
0.00
4
0.00
3
0.000
0.050
0.100
0.150
0.200
0.250
Diesel Petrol LPG
HC
(g/
km)
NEDC
ECE
EUDC
Euro 3
Euro 4
Number of data :Diesel : 9Petrol : 8LPG : 9
LPG/diesel : +115%LPG/Petrol : -19%
Figure 21: Mean HC emissions, NEDC.
As for CO emissions, the HC emissions for LPG vehicles are higher than those of diesel vehicles,due to a different combustion mode (lean-burn for diesel engines). Nevertheless, in comparisonwith petrol, overall LPG has a positive impact on HC emissions, with a decrease of about 20% inthe mean emission level. The individual results are presented in the Figure 22.
P
C
FW
T
EH
Y
R
C
FW
T
E
H
Y
R
RY
HE
T
W
F
C
P
0
0.05
0.1
0.15
0.2
0.25
1000 1100 1200 1300 1400 1500 1600 1700 1800
Vehicle Inertia (kg)
HC
(g/
km)
LPG
Petrol
Diesel
Euro 4 Petrol / LPG
Euro 3 Petrol / LPG
Figure 22: HC emissions versus vehicle iner tia (NEDC).
29
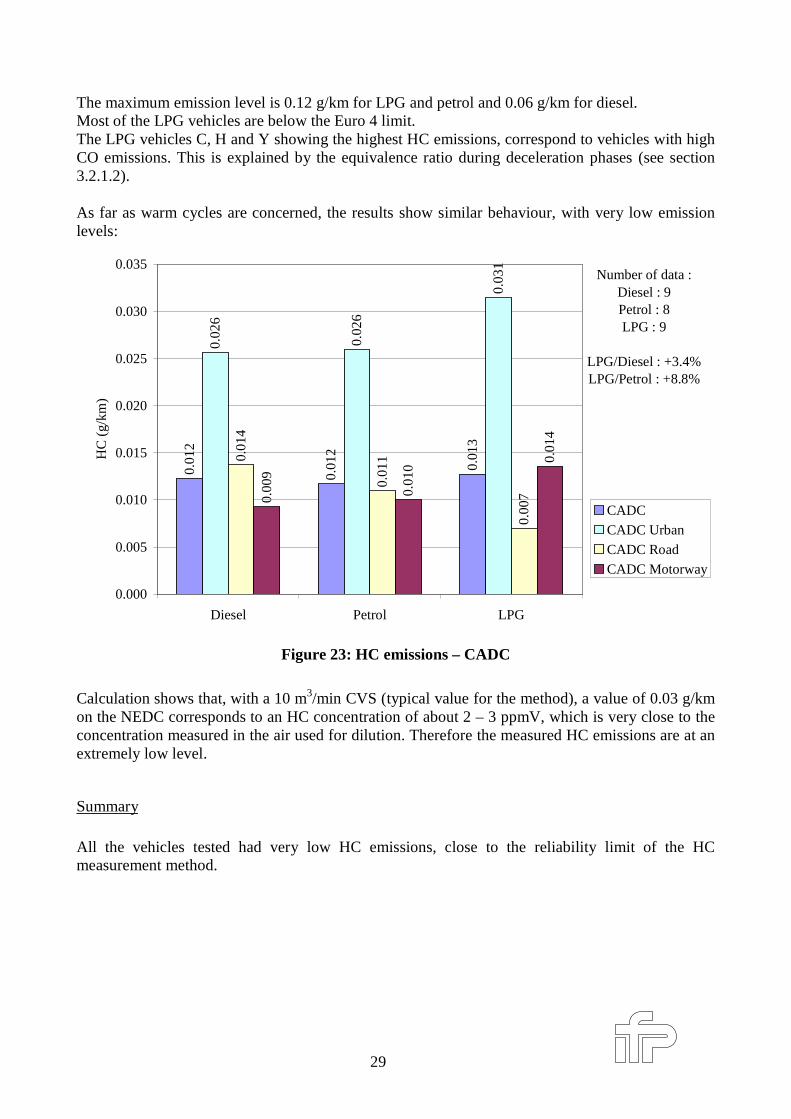
The maximum emission level is 0.12 g/km for LPG and petrol and 0.06 g/km for diesel.Most of the LPG vehicles are below the Euro 4 limit.The LPG vehicles C, H and Y showing the highest HC emissions, correspond to vehicles with highCO emissions. This is explained by the equivalence ratio during deceleration phases (see section3.2.1.2).
As far as warm cycles are concerned, the results show similar behaviour, with very low emissionlevels:
0.01
2
0.01
2
0.01
3
0.02
6
0.02
6
0.03
1
0.01
4
0.01
1
0.00
70.00
9
0.01
0
0.01
4
0.000
0.005
0.010
0.015
0.020
0.025
0.030
0.035
Diesel Petrol LPG
HC
(g/
km)
CADC
CADC Urban
CADC Road
CADC Motorway
Number of data :Diesel : 9Petrol : 8LPG : 9
LPG/Diesel : +3.4%LPG/Petrol : +8.8%
Figure 23: HC emissions – CADC
Calculation shows that, with a 10 m3/min CVS (typical value for the method), a value of 0.03 g/kmon the NEDC corresponds to an HC concentration of about 2 – 3 ppmV, which is very close to theconcentration measured in the air used for dilution. Therefore the measured HC emissions are at anextremely low level.
Summary
All the vehicles tested had very low HC emissions, close to the reliability limit of the HCmeasurement method.
30
3.2.1.4 PM emissions
Background
Particulate mass emissions are currently only regulated for diesel vehicles. Only diesel vehiclespresent a significant particulate mass emission level. In most industrialised countries this is alsorecognized as an indicator of ambient air pollution.The potential adverse health effects of particulate air pollution has been a major focus of attentionfor many years. A substantial number of publications have appeared in scientific and popularliterature demonstrating a correlation between particulate air pollution levels in regions and citiesand a number of adverse health effects, including the number of hospital admissions for cardiac andpulmonary disease, increased asthmatic symptoms and mortalities i.e. in individuals whose healthis already impaired.
Results
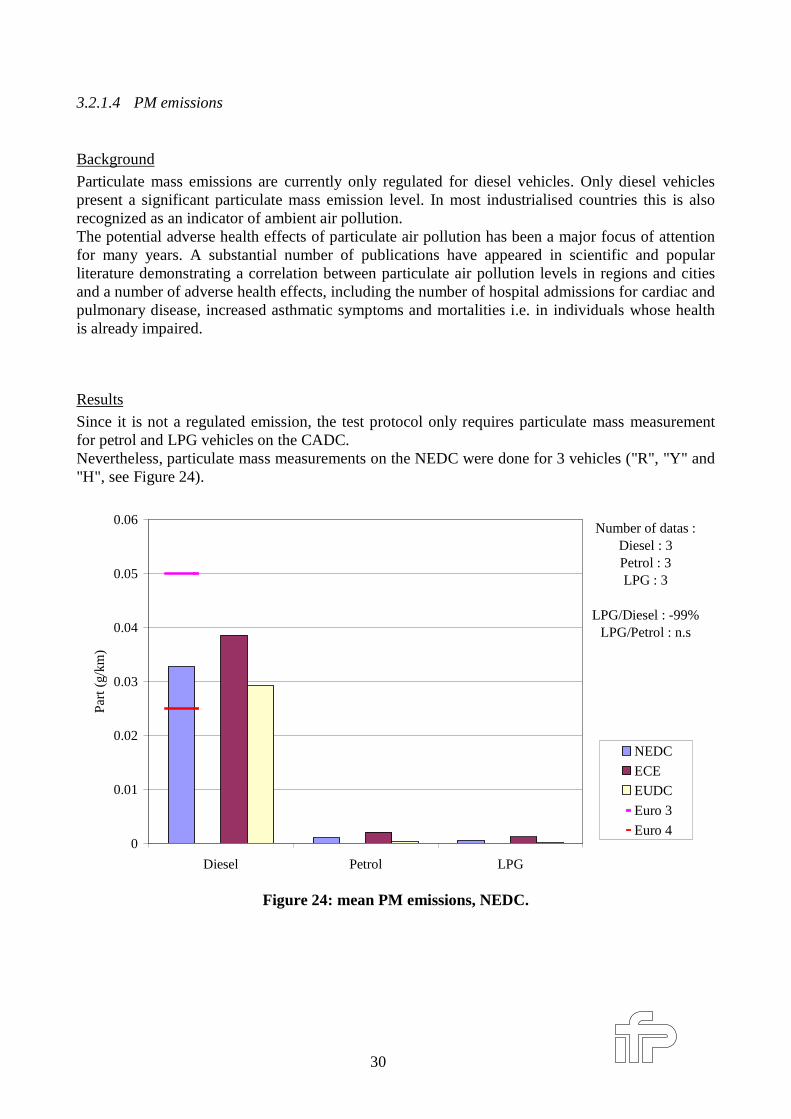
Since it is not a regulated emission, the test protocol only requires particulate mass measurementfor petrol and LPG vehicles on the CADC.Nevertheless, particulate mass measurements on the NEDC were done for 3 vehicles ("R", "Y" and"H", see Figure 24).
0
0.01
0.02
0.03
0.04
0.05
0.06
Diesel Petrol LPG
Part
(g/
km)
NEDC
ECE
EUDC
Euro 3
Euro 4
Number of datas :Diesel : 3Petrol : 3LPG : 3
LPG/Diesel : -99%LPG/Petrol : n.s
Figure 24: mean PM emissions, NEDC.
31
RYH RY
H
H Y
R
0
0.01
0.02
0.03
0.04
0.05
0.06
1000 1100 1200 1300 1400 1500 1600
Vehicle inertia (kg)
PM
(g/
km)
LPGPetrol
DieselEuro 3 diesel
Euro 4 diesel
Figure 25: PM emissions, NEDC.
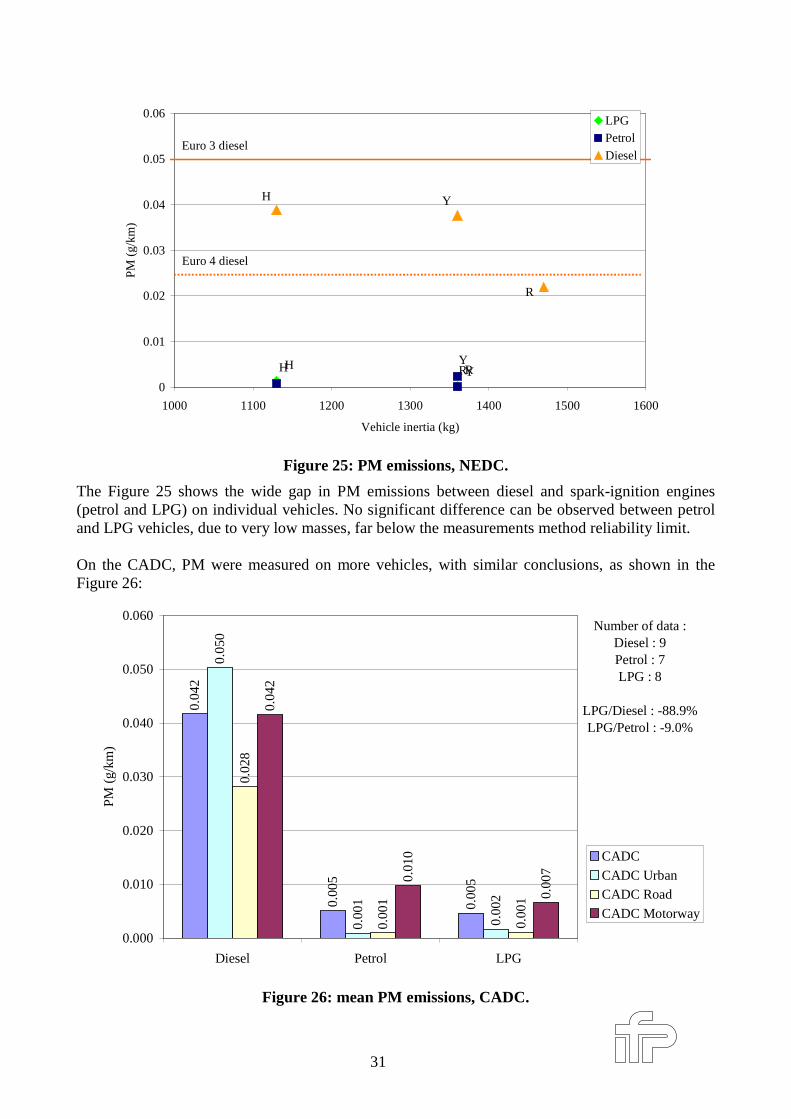
The Figure 25 shows the wide gap in PM emissions between diesel and spark-ignition engines(petrol and LPG) on individual vehicles. No significant difference can be observed between petroland LPG vehicles, due to very low masses, far below the measurements method reliability limit.
On the CADC, PM were measured on more vehicles, with similar conclusions, as shown in theFigure 26:
0.04
2
0.00
5
0.00
5
0.05
0
0.00
1
0.00
2
0.02
8
0.00
1
0.00
1
0.04
2
0.01
0
0.00
7
0.000
0.010
0.020
0.030
0.040
0.050
0.060
Diesel Petrol LPG
PM
(g/
km)
CADC
CADC UrbanCADC Road
CADC Motorway
Number of data :Diesel : 9Petrol : 7LPG : 8
LPG/Diesel : -88.9%LPG/Petrol : -9.0%
Figure 26: mean PM emissions, CADC.
32
This figure shows the very low PM emission levels of petrol and LPG vehicles. The mean valuesare around 3 to 4 mg/km, which is below the reliable measurement limit of the sampling methoddescribed in the 70/220 directive.
Summary
The particulate mass measurements show the low emission level of spark-ignition engines (petroland LPG), which is always below the quantification limit of the method.
3.2.2 CO2 emissions
Background
CO2 is considered as a major contributor to the greenhouse effect. (see section 3.3.4)In July 1998 ACEA made a voluntary commitment with the EU to reduce new passenger cars CO2
emissions [1]. This commitment is based on 5 points:1. the marketing of individual car models with CO2 emissions of 120 g/km or less by 2000;2. an average CO2 emission level of 140 g/km by 2008 for new cars sold in the EU – a 25%
reduction compared to 1995;3. an estimated target range of 165–170 gCO2/km in 2003 – a 9-11% reduction compared to 1995;4. in 2003, review of the potential for additional improvements in order to raise the new car fleet
average to 120 gCO2/km by 2012;5. joint ACEA/Commission monitoring of all the relevant factors related to the commitments.
In this context, the marketing of low CO2 emission vehicles is of paramount importance. Since1998, the CO2 commitment has been fulfilled mainly by an increase in the diesel vehiclepopulation.
Recent discussions between car manufacturers and the European Commission about theimplementation of this commitment have shown that this goal remains difficult to reach.
Results
The results obtained on the vehicles tested are presented in the following figures:
33
155.
1
185.
4
165.
1
201.
4
250.
9
222.
0
128.
0 147.
0
131.
8
0.0
50.0
100.0
150.0
200.0
250.0
300.0
Diesel Petrol LPG
CO
2 (g
/km
)
NEDC
ECE
EUDC
ACEA 2008
ACEA 2012
Number of data :Diesel : 9Petrol : 8LPG : 9
LPG/diesel : +6.4%LPG/Petrol : -11.0%
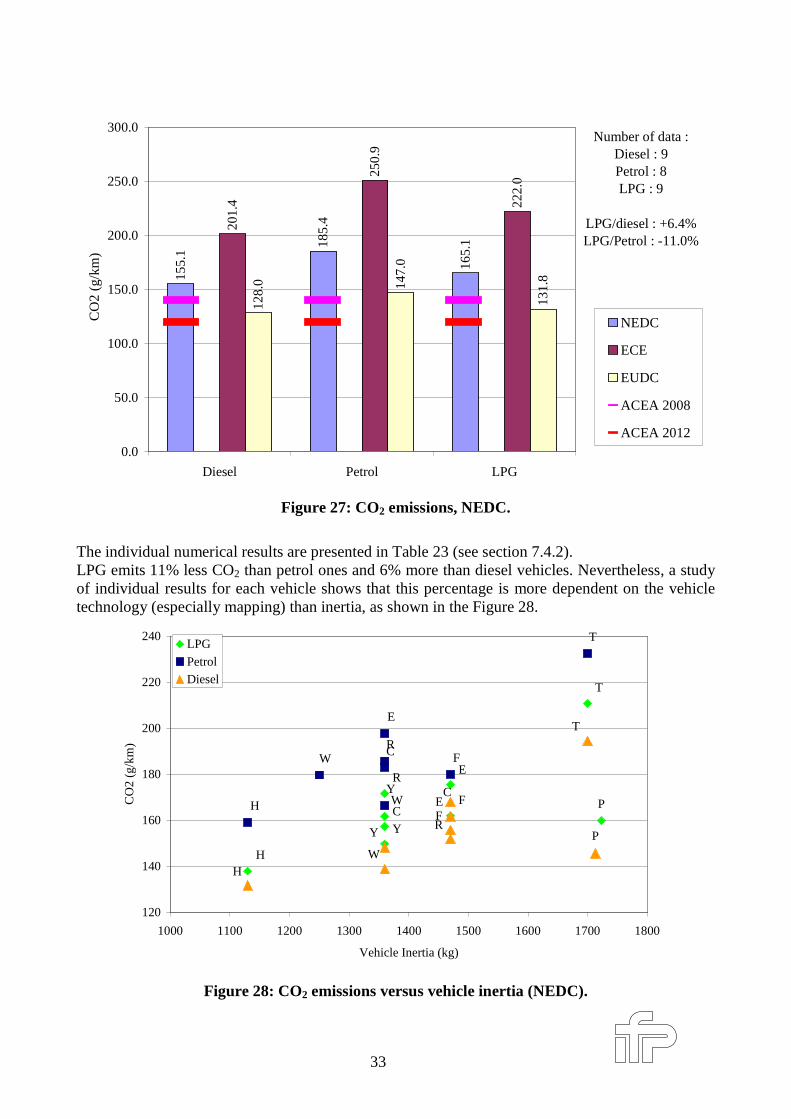
Figure 27: CO2 emissions, NEDC.
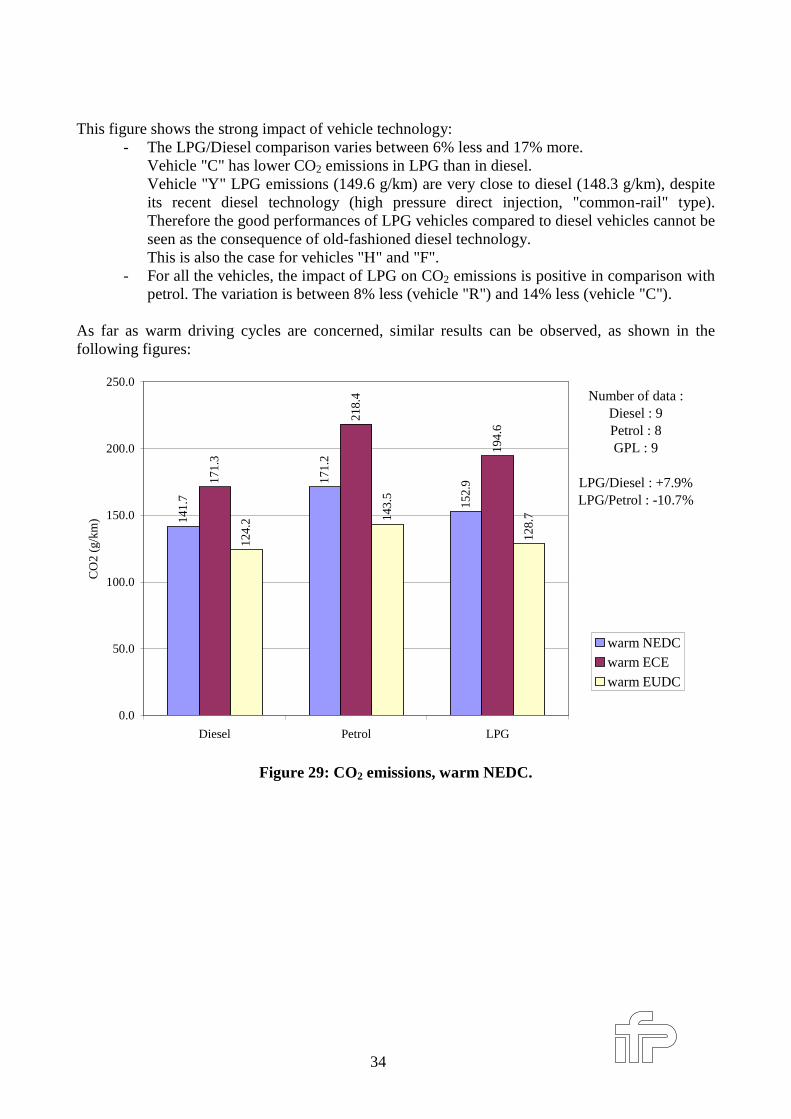
The individual numerical results are presented in Table 23 (see section 7.4.2).LPG emits 11% less CO2 than petrol ones and 6% more than diesel vehicles. Nevertheless, a studyof individual results for each vehicle shows that this percentage is more dependent on the vehicletechnology (especially mapping) than inertia, as shown in the Figure 28.
PC
FW
T
E
H
Y
R
C FW
T
E
HY
R
RY
H
E
T
W
F
C
P
120
140
160
180
200
220
240
1000 1100 1200 1300 1400 1500 1600 1700 1800
Vehicle Inertia (kg)
CO
2 (g
/km
)
LPG
PetrolDiesel
Figure 28: CO2 emissions versus vehicle iner tia (NEDC).
34
This figure shows the strong impact of vehicle technology:- The LPG/Diesel comparison varies between 6% less and 17% more.
Vehicle "C" has lower CO2 emissions in LPG than in diesel.Vehicle "Y" LPG emissions (149.6 g/km) are very close to diesel (148.3 g/km), despiteits recent diesel technology (high pressure direct injection, "common-rail" type).Therefore the good performances of LPG vehicles compared to diesel vehicles cannot beseen as the consequence of old-fashioned diesel technology.This is also the case for vehicles "H" and "F".
- For all the vehicles, the impact of LPG on CO2 emissions is positive in comparison withpetrol. The variation is between 8% less (vehicle "R") and 14% less (vehicle "C").
As far as warm driving cycles are concerned, similar results can be observed, as shown in thefollowing figures:
141.
7
171.
2
152.
9171.
3
218.
4
194.
6
124.
2 143.
5
128.
7
0.0
50.0
100.0
150.0
200.0
250.0
Diesel Petrol LPG
CO
2 (g
/km
)
warm NEDCwarm ECE
warm EUDC
Number of data :Diesel : 9Petrol : 8GPL : 9
LPG/Diesel : +7.9%LPG/Petrol : -10.7%
Figure 29: CO2 emissions, warm NEDC.
35
160.
6 177.
4
160.
7
228.
7
279.
6
247.
3
144.
9
159.
7
146.
3164.
0
175.
9
159.
8
0.0
50.0
100.0
150.0
200.0
250.0
300.0
Diesel Petrol LPG
CO
2 (g
/km
)
CADC
CADC Urban
CADC Road
CADC Motorway
Number of data :Diesel : 9Petrol : 8LPG : 9
LPG/Diesel : +0.1%LPG/Petrol : -9.4%
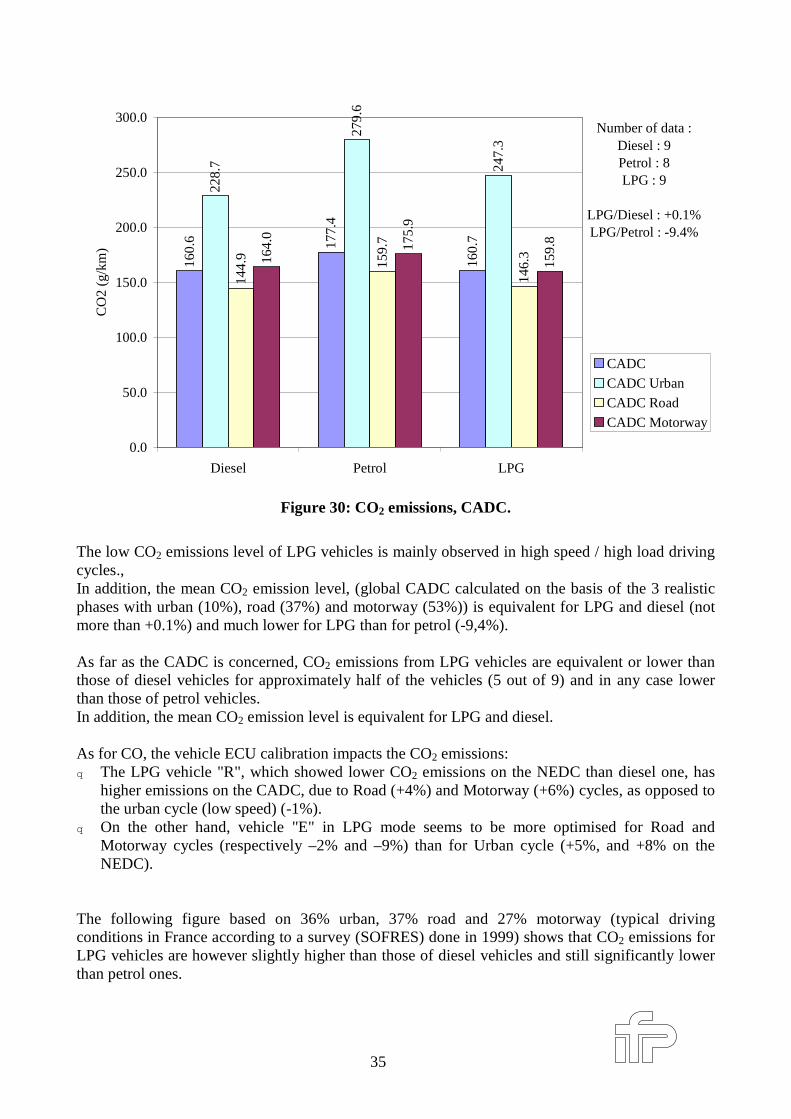
Figure 30: CO2 emissions, CADC.
The low CO2 emissions level of LPG vehicles is mainly observed in high speed / high load drivingcycles.,In addition, the mean CO2 emission level, (global CADC calculated on the basis of the 3 realisticphases with urban (10%), road (37%) and motorway (53%)) is equivalent for LPG and diesel (notmore than +0.1%) and much lower for LPG than for petrol (-9,4%).
As far as the CADC is concerned, CO2 emissions from LPG vehicles are equivalent or lower thanthose of diesel vehicles for approximately half of the vehicles (5 out of 9) and in any case lowerthan those of petrol vehicles.In addition, the mean CO2 emission level is equivalent for LPG and diesel.
As for CO, the vehicle ECU calibration impacts the CO2 emissions:q The LPG vehicle "R", which showed lower CO2 emissions on the NEDC than diesel one, has
higher emissions on the CADC, due to Road (+4%) and Motorway (+6%) cycles, as opposed tothe urban cycle (low speed) (-1%).
q On the other hand, vehicle "E" in LPG mode seems to be more optimised for Road andMotorway cycles (respectively –2% and –9%) than for Urban cycle (+5%, and +8% on theNEDC).
The following figure based on 36% urban, 37% road and 27% motorway (typical drivingconditions in France according to a survey (SOFRES) done in 1999) shows that CO2 emissions forLPG vehicles are however slightly higher than those of diesel vehicles and still significantly lowerthan petrol ones.
36
228.
7
144.
9 164.
0 180.
2
279.
6
159.
7 175.
9
207.
2
247.
3
146.
3
159.
8 186.
3
0.0
50.0
100.0
150.0
200.0
250.0
300.0
CADC Urban CADC Road CADC Motorway CADC "France"
Diesel
Petrol
LPG
Number of data :Diesel : 9Petrol : 8LPG : 9
LPG/Diesel : +3.4%LPG/Petrol : -10.1%
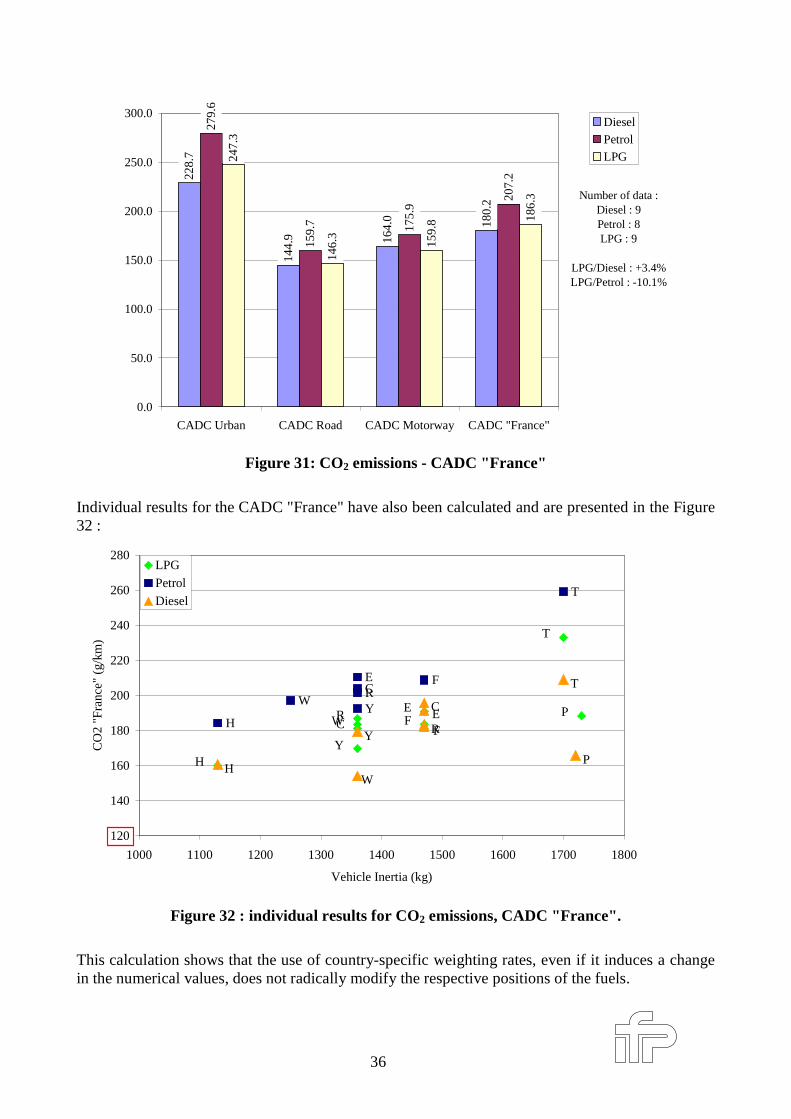
Figure 31: CO2 emissions - CADC " France"
Individual results for the CADC "France" have also been calculated and are presented in the Figure32 :
PC FW
T
E
HY
R
CF
W
T
E
HYR
P
C
F
W
T
E
H
Y R
120
140
160
180
200
220
240
260
280
1000 1100 1200 1300 1400 1500 1600 1700 1800
Vehicle Inertia (kg)
CO
2 "F
ranc
e" (
g/km
)
LPG
Petrol
Diesel
Figure 32 : individual results for CO2 emissions, CADC " France" .
This calculation shows that the use of country-specific weighting rates, even if it induces a changein the numerical values, does not radically modify the respective positions of the fuels.
37
Summary:
On the vehicles tested, the mean CO2 emissions of LPG vehicles are between those of diesel andpetrol vehicles, but closer to diesel. This conclusion is also valid for the CADC, regardless of therelative importance given to each phase. It was shown that an appropriate ECU calibration canlower the CO2 emissions of LPG vehicles to diesel levels in certain driving conditions.In addition to this analysis, a well to wheel assessment has been led and is presented in section3.3.4.
38
3.2.3 Unregulated Pollutant emissions results
Unregulated pollutant emissions were measured on NEDC for three models. In addition, they weremeasured on the CADC for all the vehicles.
The molecules quantified were:- oxygenated compounds (aldehydes)- Benzene, Toluene, xylenes ("BTX")- Poly-Aromatic Hydrocarbons ("PAH")- Particle size measurements
Moreover, some N2O and NO2 measurements were taken but most of them were below thedetection limit.
3.2.3.1 Oxygenated products
Background
Aldehydes are irritants and their toxicity increases with lower molecular weight.Formaldehyde, which irritates the ocular mucous membranes in low concentrations, irritates thethroat and bronchial tubes as the concentration rises[3].
The most prominent features of formaldehyde vapour are its pungent odour and its irritant effectson the mucosa of the eyes and upper airways. Odour-detection thresholds are generally reported tobe in the range of 0.1-0.3 mg/m3. Eye and respiratory-tract irritation generally occurs at levels ofabout 1 mg/m3, but discomfort has been reported at much lower levels. Moreover, WHO reportshave stressed the fact that formaldehyde is positive in a wide range of mutagenicity test systems invitro ; it has been shown to form DNA-protein crosslinks in vitro and in vivo [8].
Results
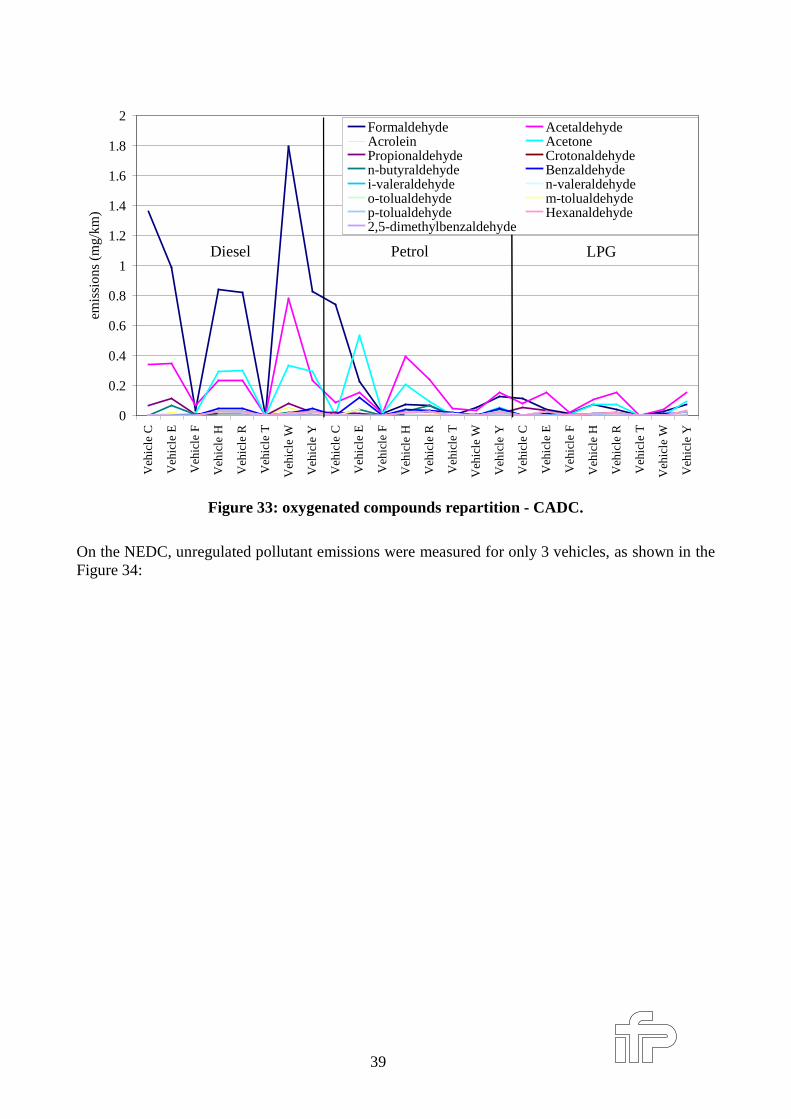
Oxygenated compound emissions are mainly composed of formaldehyde and acetaldehyde, asshown in the Figure 33. Moreover, this figure shows that LPG emissions are globally much lowerthan diesel emissions.
39
0
0.2
0.4
0.6
0.8
1
1.2
1.4
1.6
1.8
2
Veh
icle
C
Veh
icle
E
Veh
icle
F
Veh
icle
H
Veh
icle
R
Veh
icle
T
Veh
icle
W
Veh
icle
Y
Veh
icle
C
Veh
icle
E
Veh
icle
F
Veh
icle
H
Veh
icle
R
Veh
icle
T
Veh
icle
W
Veh
icle
Y
Veh
icle
C
Veh
icle
E
Veh
icle
F
Veh
icle
H
Veh
icle
R
Veh
icle
T
Veh
icle
W
Veh
icle
Y
emis
sion
s (m
g/km
)
Formaldehyde AcetaldehydeAcrolein AcetonePropionaldehyde Crotonaldehyden-butyraldehyde Benzaldehydei-valeraldehyde n-valeraldehydeo-tolualdehyde m-tolualdehydep-tolualdehyde Hexanaldehyde2,5-dimethylbenzaldehyde
Diesel Petrol LPG
Figure 33: oxygenated compounds repar tition - CADC.
On the NEDC, unregulated pollutant emissions were measured for only 3 vehicles, as shown in theFigure 34:
40
0
1
2
3
4
5
6
7
8
9
Diesel Petrol LPG
emis
sion
s (g
/km
)acroleine
acetaldehyde
formaldehyde
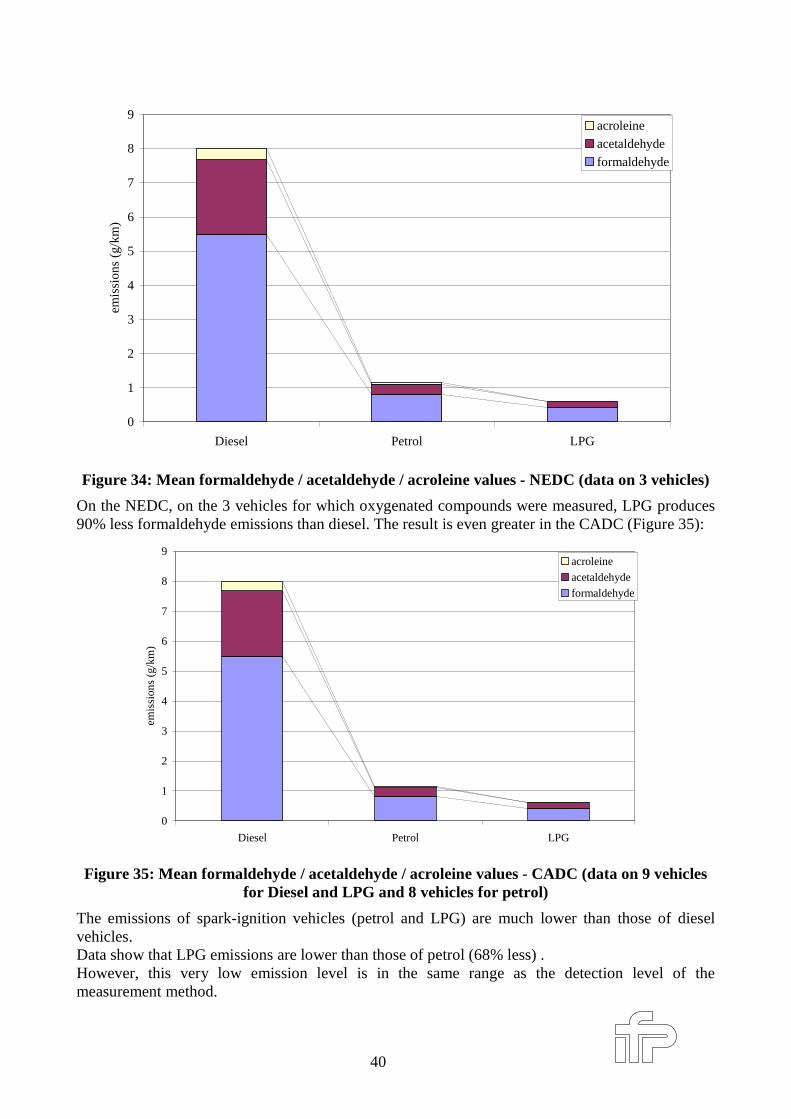
Figure 34: Mean formaldehyde / acetaldehyde / acroleine values - NEDC (data on 3 vehicles)
On the NEDC, on the 3 vehicles for which oxygenated compounds were measured, LPG produces90% less formaldehyde emissions than diesel. The result is even greater in the CADC (Figure 35):
0
1
2
3
4
5
6
7
8
9
Diesel Petrol LPG
emis
sion
s (g
/km
)
acroleineacetaldehydeformaldehyde
Figure 35: Mean formaldehyde / acetaldehyde / acroleine values - CADC (data on 9 vehiclesfor Diesel and LPG and 8 vehicles for petrol)
The emissions of spark-ignition vehicles (petrol and LPG) are much lower than those of dieselvehicles.Data show that LPG emissions are lower than those of petrol (68% less) .However, this very low emission level is in the same range as the detection level of themeasurement method.
41
Summary
The measurement of oxygenated compounds (aldehydes) has shown that these emissions aremainly composed by formaldehyde and acetaldehyde.The formaldehyde emission of LPG on the CADC is much lower than that for diesel (95% less).
3.2.3.2 PAH results
Background
PAH (Poly Aromatic Hydrocarbons) are suspected for their carcinogenicity. Most of them wereclassified in class "2" by IARC (International Agency for Research on Cancer).In this class, 2 types of PAH can be found:
- category "2A" (probably carcinogenic: Benzo(a)anthracene, benzo(a)pyrene,dibenzo(a,h)anthracene.
- Category "2B" (possibly carcinogenic): benzo(b)fluoranthene, benzo(k)fluoranthene,indeno(1,2,3-cd)pyrene, dibenzo(a,h)pyrene.
Results
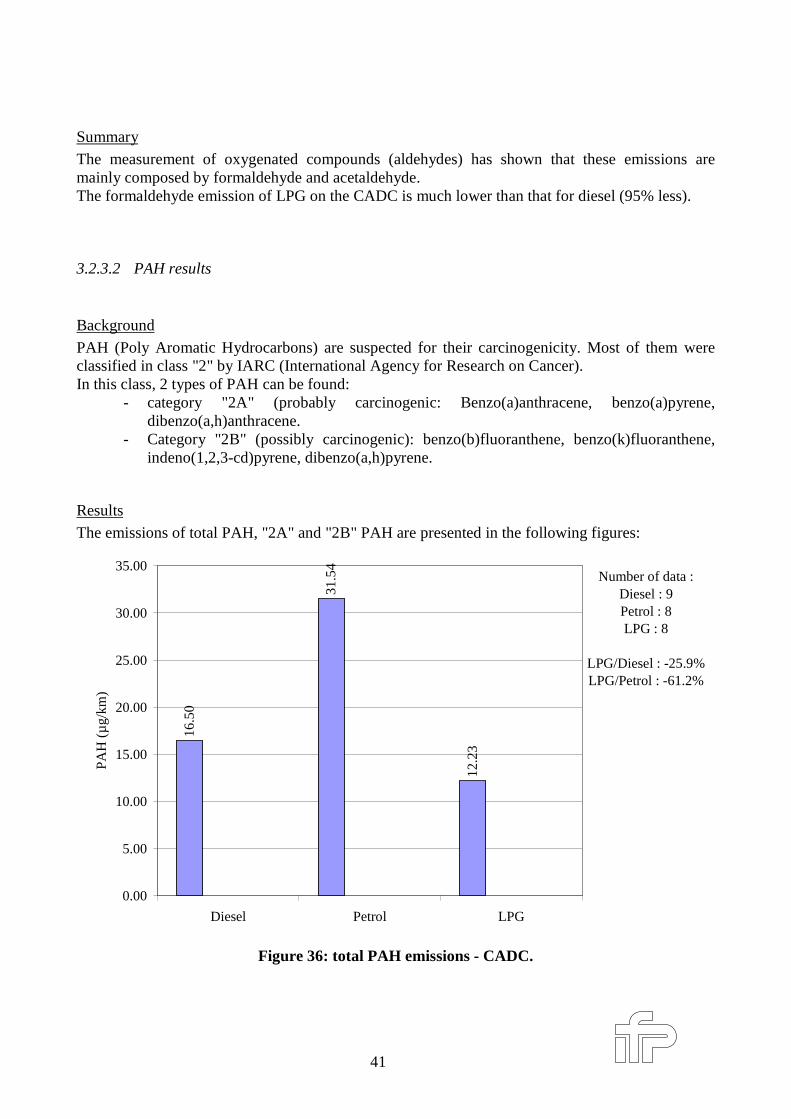
The emissions of total PAH, "2A" and "2B" PAH are presented in the following figures:
16.5
0
31.5
4
12.2
3
0.00
5.00
10.00
15.00
20.00
25.00
30.00
35.00
Diesel Petrol LPG
PA
H (
µg/
km)
Number of data :Diesel : 9Petrol : 8LPG : 8
LPG/Diesel : -25.9%LPG/Petrol : -61.2%
Figure 36: total PAH emissions - CADC.
42
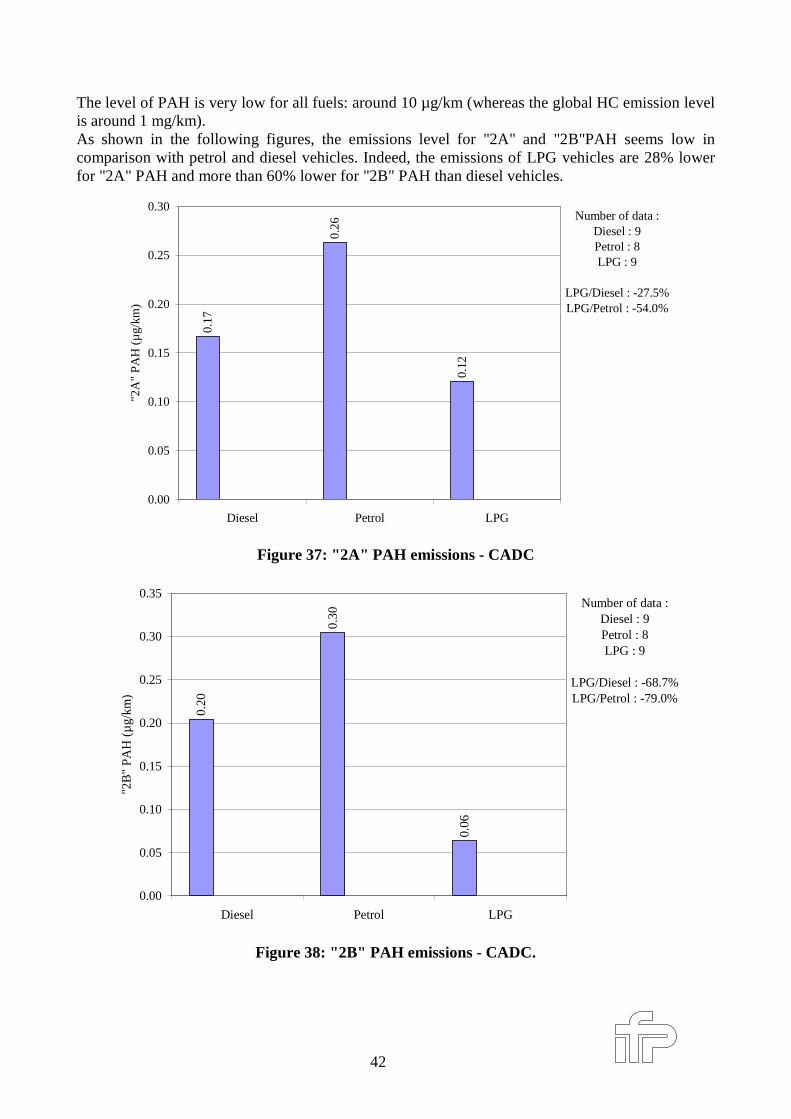
The level of PAH is very low for all fuels: around 10 µg/km (whereas the global HC emission levelis around 1 mg/km).As shown in the following figures, the emissions level for "2A" and "2B"PAH seems low incomparison with petrol and diesel vehicles. Indeed, the emissions of LPG vehicles are 28% lowerfor "2A" PAH and more than 60% lower for "2B" PAH than diesel vehicles.
0.17
0.26
0.12
0.00
0.05
0.10
0.15
0.20
0.25
0.30
Diesel Petrol LPG
"2A
" P
AH
(µ
g/km
)
Number of data :Diesel : 9Petrol : 8LPG : 9
LPG/Diesel : -27.5%LPG/Petrol : -54.0%
Figure 37: " 2A" PAH emissions - CADC
0.20
0.30
0.06
0.00
0.05
0.10
0.15
0.20
0.25
0.30
0.35
Diesel Petrol LPG
"2B
" P
AH
(µ
g/km
)
Number of data :Diesel : 9Petrol : 8LPG : 9
LPG/Diesel : -68.7%LPG/Petrol : -79.0%
Figure 38: " 2B" PAH emissions - CADC.
43
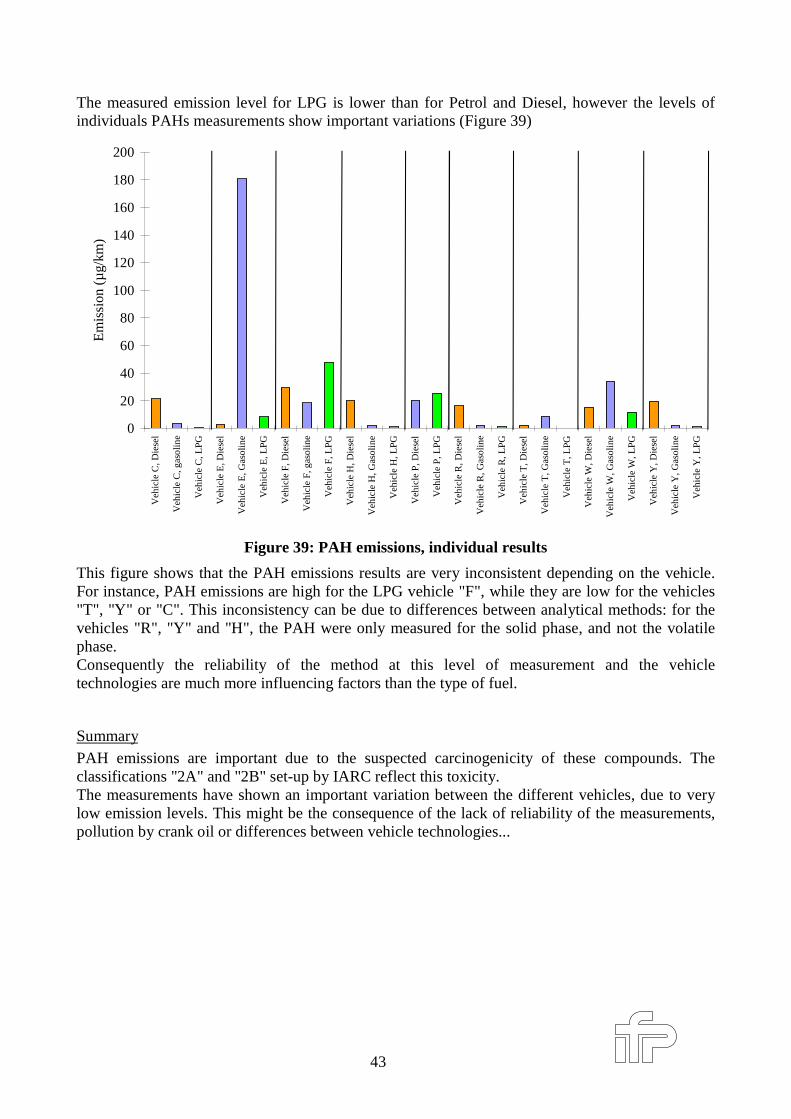
The measured emission level for LPG is lower than for Petrol and Diesel, however the levels ofindividuals PAHs measurements show important variations (Figure 39)
0
20
40
60
80
100
120
140
160
180
200V
ehic
le C
, Die
sel
Veh
icle
C, g
asol
ine
Veh
icle
C, L
PG
Veh
icle
E, D
iese
l
Veh
icle
E, G
asol
ine
Veh
icle
E, L
PG
Veh
icle
F, D
iese
l
Veh
icle
F, g
asol
ine
Veh
icle
F, L
PG
Veh
icle
H, D
iese
l
Veh
icle
H, G
asol
ine
Veh
icle
H, L
PG
Veh
icle
P, D
iese
l
Veh
icle
P, L
PG
Veh
icle
R, D
iese
l
Veh
icle
R, G
asol
ine
Veh
icle
R, L
PG
Veh
icle
T, D
iese
l
Veh
icle
T, G
asol
ine
Veh
icle
T, L
PG
Veh
icle
W, D
iese
l
Veh
icle
W, G
asol
ine
Veh
icle
W, L
PG
Veh
icle
Y, D
iese
l
Veh
icle
Y, G
asol
ine
Veh
icle
Y, L
PG
Em
issi
on (
µg/
km)
Figure 39: PAH emissions, individual results
This figure shows that the PAH emissions results are very inconsistent depending on the vehicle.For instance, PAH emissions are high for the LPG vehicle "F", while they are low for the vehicles"T", "Y" or "C". This inconsistency can be due to differences between analytical methods: for thevehicles "R", "Y" and "H", the PAH were only measured for the solid phase, and not the volatilephase.Consequently the reliability of the method at this level of measurement and the vehicletechnologies are much more influencing factors than the type of fuel.
SummaryPAH emissions are important due to the suspected carcinogenicity of these compounds. Theclassifications "2A" and "2B" set-up by IARC reflect this toxicity.The measurements have shown an important variation between the different vehicles, due to verylow emission levels. This might be the consequence of the lack of reliability of the measurements,pollution by crank oil or differences between vehicle technologies...
44
3.2.3.3 BTX emissions
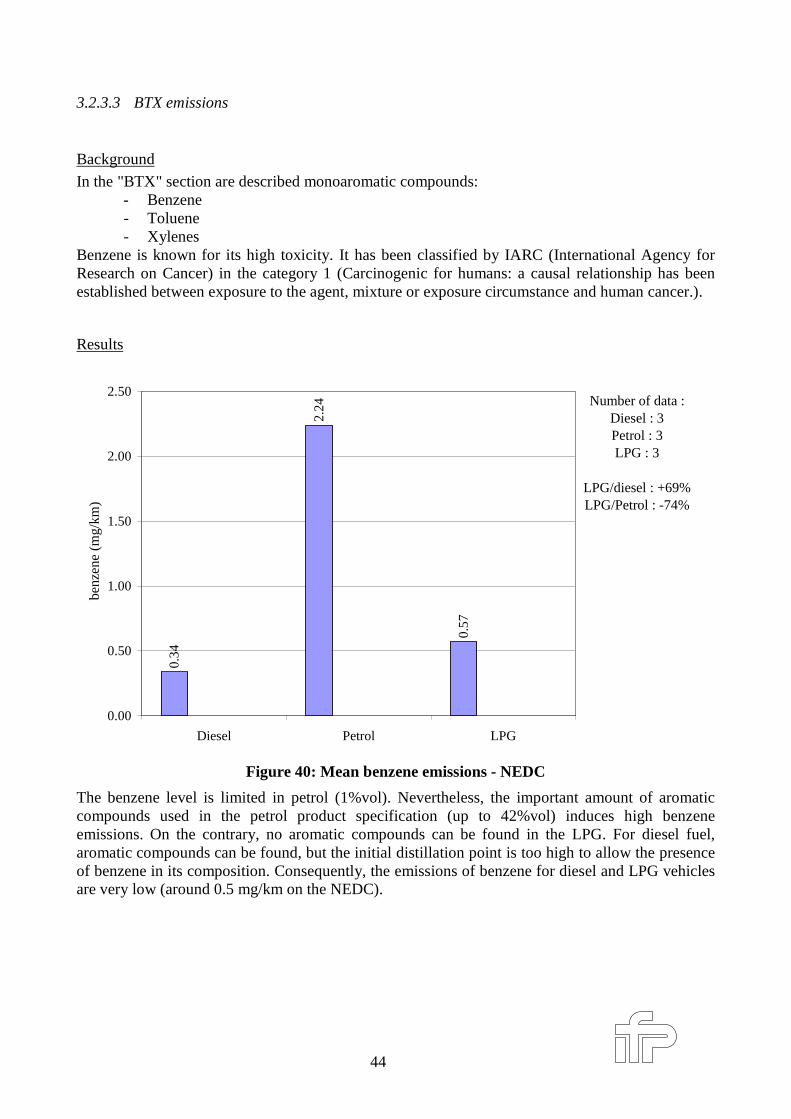
Background
In the "BTX" section are described monoaromatic compounds:- Benzene- Toluene- Xylenes
Benzene is known for its high toxicity. It has been classified by IARC (International Agency forResearch on Cancer) in the category 1 (Carcinogenic for humans: a causal relationship has beenestablished between exposure to the agent, mixture or exposure circumstance and human cancer.).
Results
0.34
2.24
0.57
0.00
0.50
1.00
1.50
2.00
2.50
Diesel Petrol LPG
benz
ene
(mg/
km)
Number of data :Diesel : 3Petrol : 3LPG : 3
LPG/diesel : +69%LPG/Petrol : -74%
Figure 40: Mean benzene emissions - NEDC
The benzene level is limited in petrol (1%vol). Nevertheless, the important amount of aromaticcompounds used in the petrol product specification (up to 42%vol) induces high benzeneemissions. On the contrary, no aromatic compounds can be found in the LPG. For diesel fuel,aromatic compounds can be found, but the initial distillation point is too high to allow the presenceof benzene in its composition. Consequently, the emissions of benzene for diesel and LPG vehiclesare very low (around 0.5 mg/km on the NEDC).
45
0.15
0.61
0.11
0.00
0.10
0.20
0.30
0.40
0.50
0.60
0.70
Diesel Petrol LPG
benz
ene
(mg/
km)
Number of data :Diesel : 9Petrol : 8LPG : 9
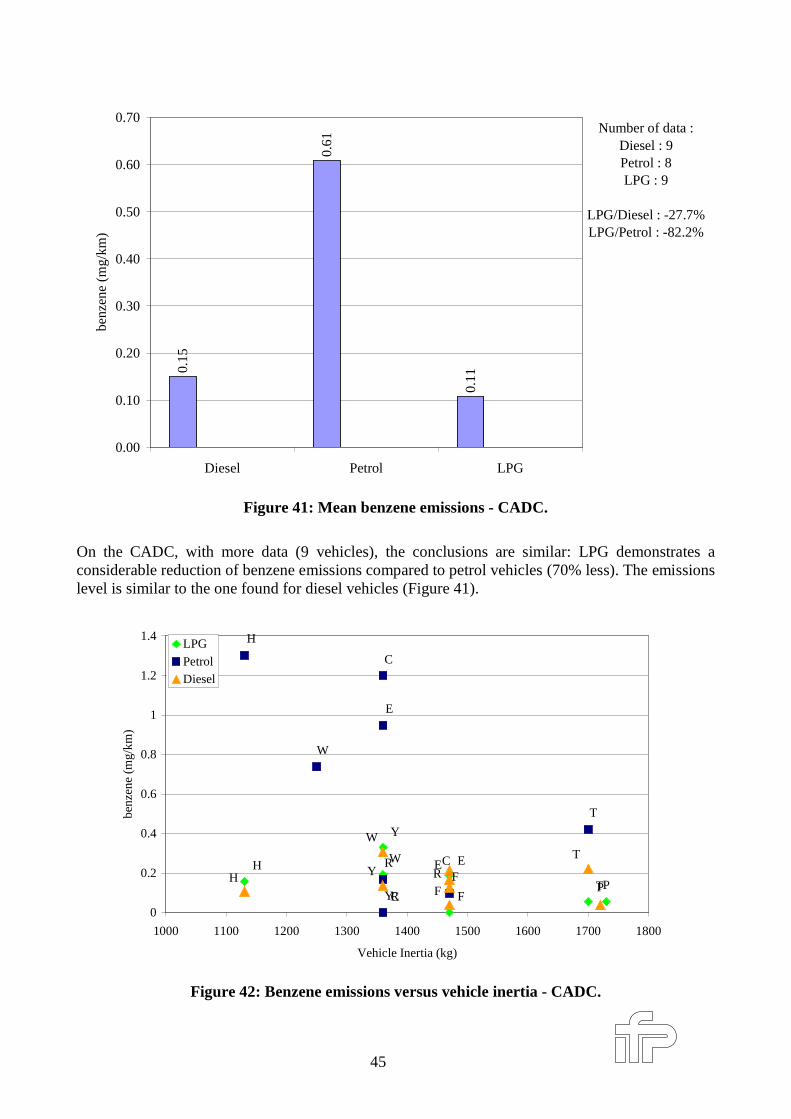
LPG/Diesel : -27.7%LPG/Petrol : -82.2%
Figure 41: Mean benzene emissions - CADC.
On the CADC, with more data (9 vehicles), the conclusions are similar: LPG demonstrates aconsiderable reduction of benzene emissions compared to petrol vehicles (70% less). The emissionslevel is similar to the one found for diesel vehicles (Figure 41).
PC F
W
T
EH
Y
R
C
F
W
T
E
H
Y
RRYHE
TW
F
C
P
0
0.2
0.4
0.6
0.8
1
1.2
1.4
1000 1100 1200 1300 1400 1500 1600 1700 1800
Vehicle Inertia (kg)
benz
ene
(mg/
km)
LPG
PetrolDiesel
Figure 42: Benzene emissions versus vehicle iner tia - CADC.
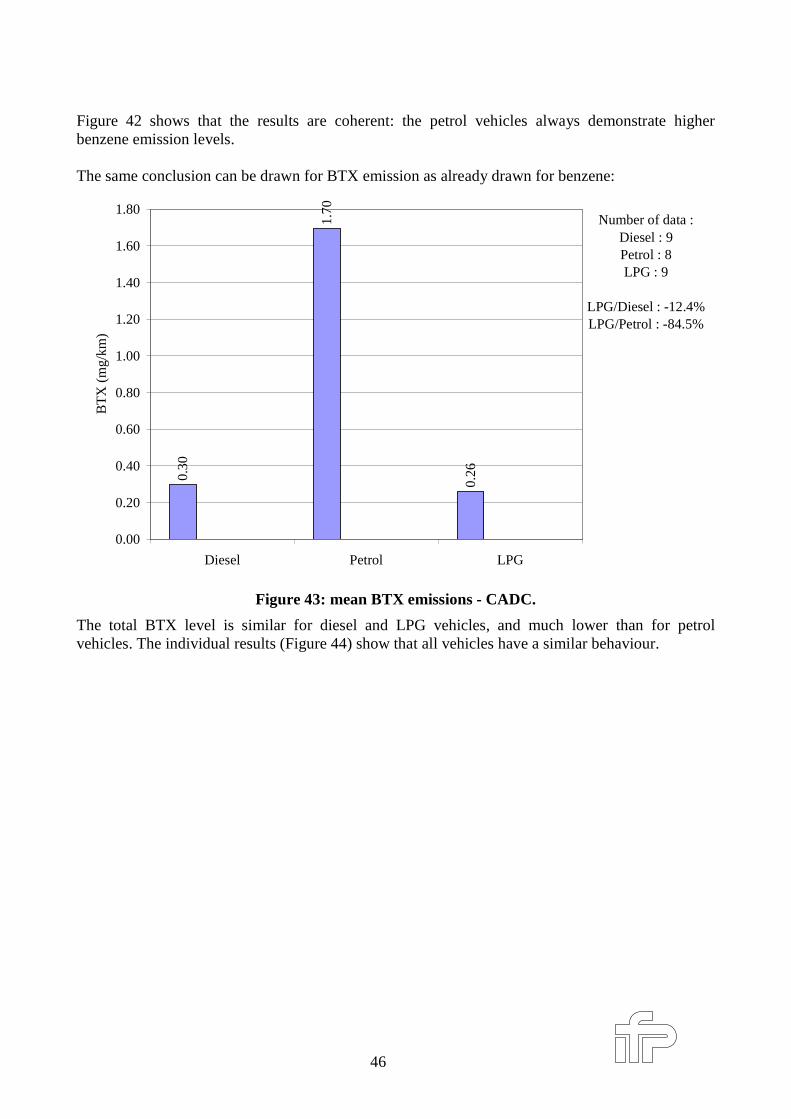
46
Figure 42 shows that the results are coherent: the petrol vehicles always demonstrate higherbenzene emission levels.
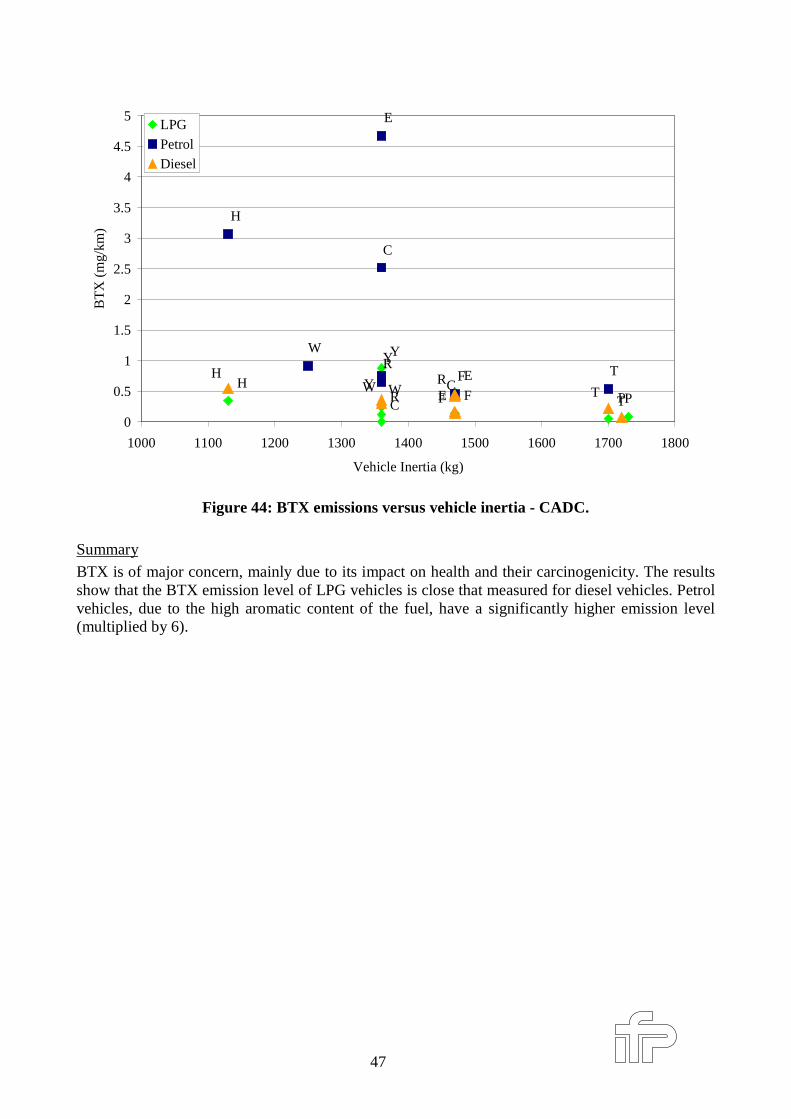
The same conclusion can be drawn for BTX emission as already drawn for benzene:0.
30
1.70
0.26
0.00
0.20
0.40
0.60
0.80
1.00
1.20
1.40
1.60
1.80
Diesel Petrol LPG
BT
X (
mg/
km)
Number of data :Diesel : 9Petrol : 8LPG : 9
LPG/Diesel : -12.4%LPG/Petrol : -84.5%
Figure 43: mean BTX emissions - CADC.
The total BTX level is similar for diesel and LPG vehicles, and much lower than for petrolvehicles. The individual results (Figure 44) show that all vehicles have a similar behaviour.
47
PCFW
T
EH
Y
R
C
F
W
T
E
H
YRRY
H
E TWF
CP
0
0.5
1
1.5
2
2.5
3
3.5
4
4.5
5
1000 1100 1200 1300 1400 1500 1600 1700 1800
Vehicle Inertia (kg)
BT
X (
mg/
km)
LPG
Petrol
Diesel
Figure 44: BTX emissions versus vehicle iner tia - CADC.
Summary
BTX is of major concern, mainly due to its impact on health and their carcinogenicity. The resultsshow that the BTX emission level of LPG vehicles is close that measured for diesel vehicles. Petrolvehicles, due to the high aromatic content of the fuel, have a significantly higher emission level(multiplied by 6).
48
3.2.3.4 Particle Size
Background
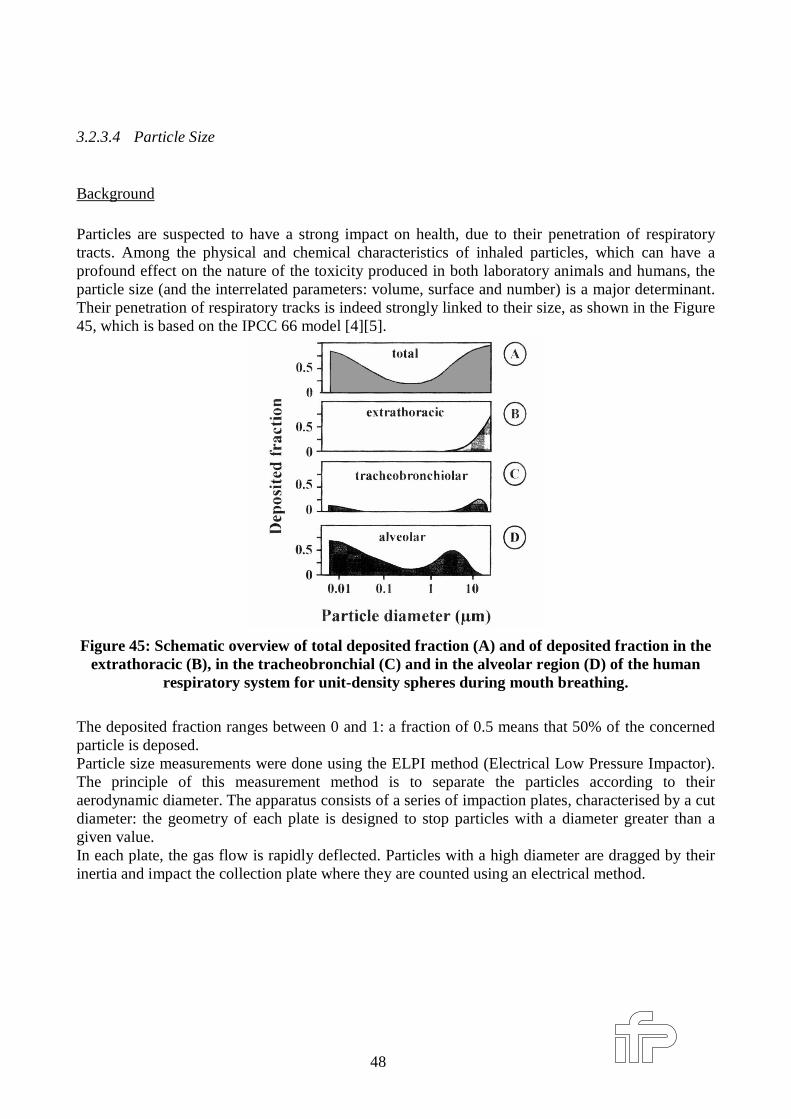
Particles are suspected to have a strong impact on health, due to their penetration of respiratorytracts. Among the physical and chemical characteristics of inhaled particles, which can have aprofound effect on the nature of the toxicity produced in both laboratory animals and humans, theparticle size (and the interrelated parameters: volume, surface and number) is a major determinant.Their penetration of respiratory tracks is indeed strongly linked to their size, as shown in the Figure45, which is based on the IPCC 66 model [4][5].
Figure 45: Schematic overview of total deposited fraction (A) and of deposited fraction in theextrathoracic (B), in the tracheobronchial (C) and in the alveolar region (D) of the human
respiratory system for unit-density spheres dur ing mouth breathing.
The deposited fraction ranges between 0 and 1: a fraction of 0.5 means that 50% of the concernedparticle is deposed.Particle size measurements were done using the ELPI method (Electrical Low Pressure Impactor).The principle of this measurement method is to separate the particles according to theiraerodynamic diameter. The apparatus consists of a series of impaction plates, characterised by a cutdiameter: the geometry of each plate is designed to stop particles with a diameter greater than agiven value.In each plate, the gas flow is rapidly deflected. Particles with a high diameter are dragged by theirinertia and impact the collection plate where they are counted using an electrical method.
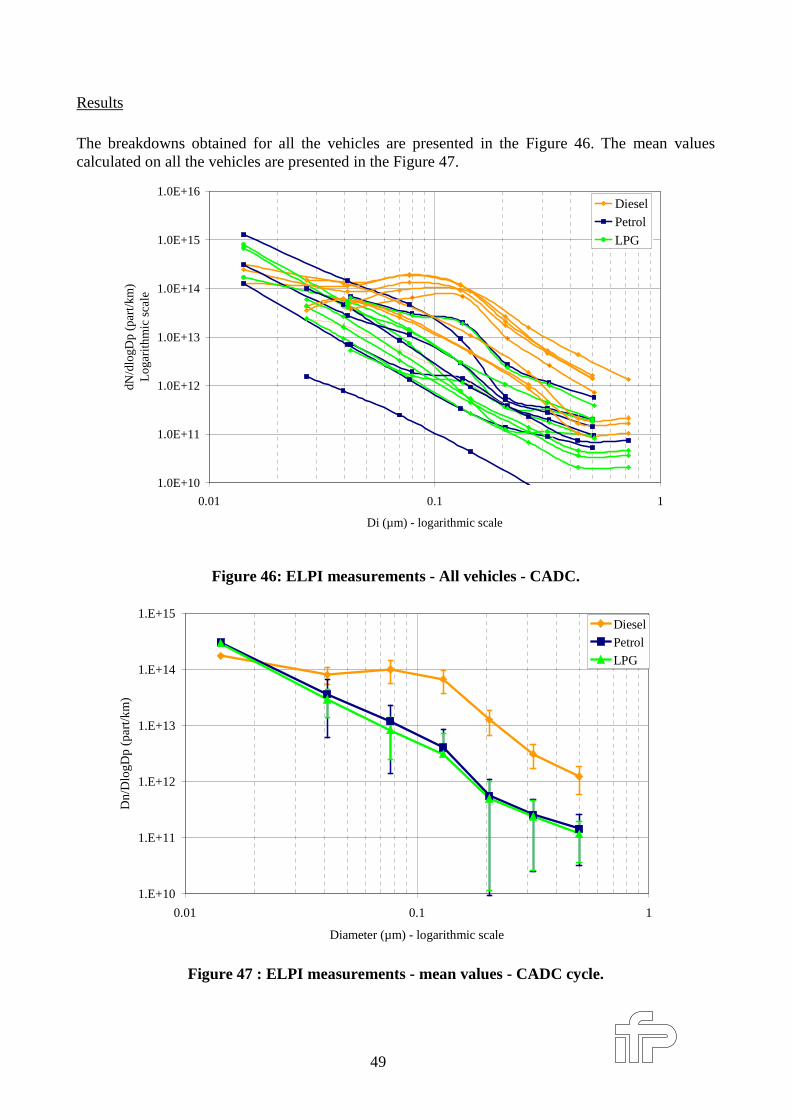
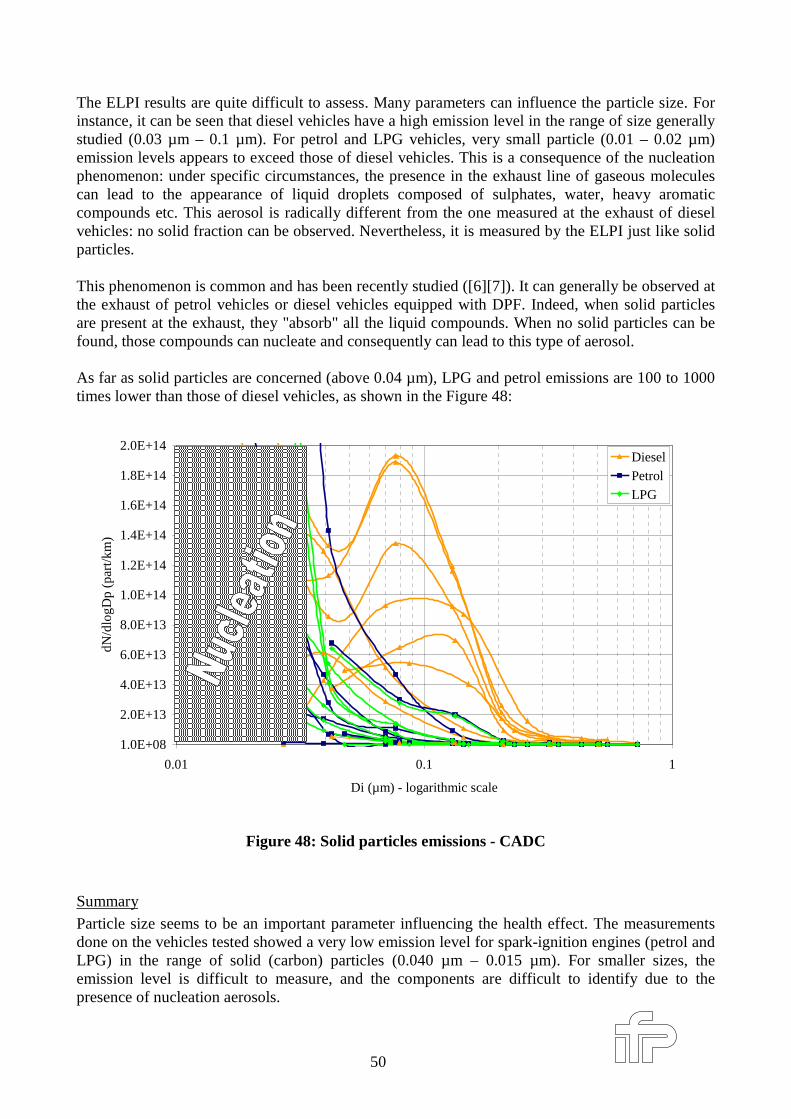
49
Results
The breakdowns obtained for all the vehicles are presented in the Figure 46. The mean valuescalculated on all the vehicles are presented in the Figure 47.
1.0E+10
1.0E+11
1.0E+12
1.0E+13
1.0E+14
1.0E+15
1.0E+16
0.01 0.1 1
Di (µm) - logarithmic scale
dN/d
logD
p (p
art/
km)
Log
arit
hmic
sca
le
DieselPetrol
LPG
Figure 46: ELPI measurements - All vehicles - CADC.
1.E+10
1.E+11
1.E+12
1.E+13
1.E+14
1.E+15
0.01 0.1 1
Diameter (µm) - logarithmic scale
Dn/
Dlo
gDp
(par
t/km
)
Diesel
Petrol
LPG
Figure 47 : ELPI measurements - mean values - CADC cycle.
50
The ELPI results are quite difficult to assess. Many parameters can influence the particle size. Forinstance, it can be seen that diesel vehicles have a high emission level in the range of size generallystudied (0.03 µm – 0.1 µm). For petrol and LPG vehicles, very small particle (0.01 – 0.02 µm)emission levels appears to exceed those of diesel vehicles. This is a consequence of the nucleationphenomenon: under specific circumstances, the presence in the exhaust line of gaseous moleculescan lead to the appearance of liquid droplets composed of sulphates, water, heavy aromaticcompounds etc. This aerosol is radically different from the one measured at the exhaust of dieselvehicles: no solid fraction can be observed. Nevertheless, it is measured by the ELPI just like solidparticles.
This phenomenon is common and has been recently studied ([6][7]). It can generally be observed atthe exhaust of petrol vehicles or diesel vehicles equipped with DPF. Indeed, when solid particlesare present at the exhaust, they "absorb" all the liquid compounds. When no solid particles can befound, those compounds can nucleate and consequently can lead to this type of aerosol.
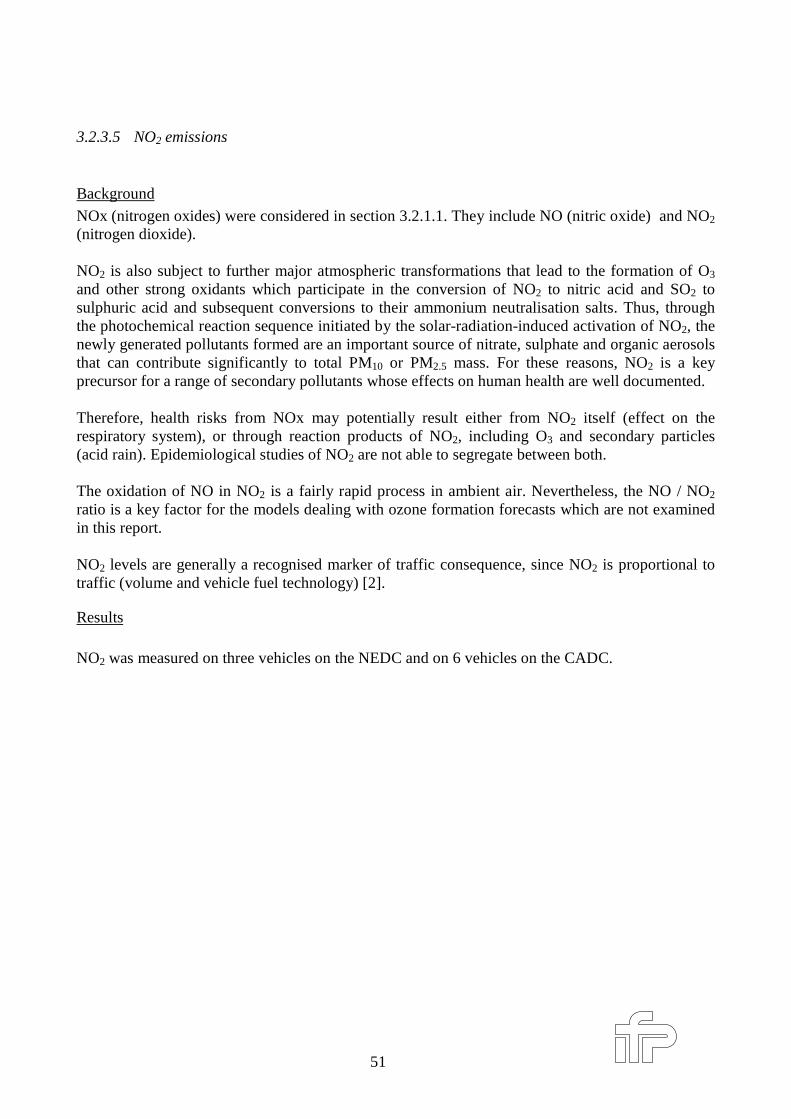
As far as solid particles are concerned (above 0.04 µm), LPG and petrol emissions are 100 to 1000times lower than those of diesel vehicles, as shown in the Figure 48:
1.0E+08
2.0E+13
4.0E+13
6.0E+13
8.0E+13
1.0E+14
1.2E+14
1.4E+14
1.6E+14
1.8E+14
2.0E+14
0.01 0.1 1
Di (µm) - logarithmic scale
dN/d
logD
p (p
art/k
m)
Diesel
Petrol
LPG
Figure 48: Solid par ticles emissions - CADC
Summary
Particle size seems to be an important parameter influencing the health effect. The measurementsdone on the vehicles tested showed a very low emission level for spark-ignition engines (petrol andLPG) in the range of solid (carbon) particles (0.040 µm – 0.015 µm). For smaller sizes, theemission level is difficult to measure, and the components are difficult to identify due to thepresence of nucleation aerosols.
51
3.2.3.5 NO2 emissions
Background
NOx (nitrogen oxides) were considered in section 3.2.1.1. They include NO (nitric oxide) and NO2
(nitrogen dioxide).
NO2 is also subject to further major atmospheric transformations that lead to the formation of O3
and other strong oxidants which participate in the conversion of NO2 to nitric acid and SO2 tosulphuric acid and subsequent conversions to their ammonium neutralisation salts. Thus, throughthe photochemical reaction sequence initiated by the solar-radiation-induced activation of NO2, thenewly generated pollutants formed are an important source of nitrate, sulphate and organic aerosolsthat can contribute significantly to total PM10 or PM2.5 mass. For these reasons, NO2 is a keyprecursor for a range of secondary pollutants whose effects on human health are well documented.
Therefore, health risks from NOx may potentially result either from NO2 itself (effect on therespiratory system), or through reaction products of NO2, including O3 and secondary particles(acid rain). Epidemiological studies of NO2 are not able to segregate between both.
The oxidation of NO in NO2 is a fairly rapid process in ambient air. Nevertheless, the NO / NO2
ratio is a key factor for the models dealing with ozone formation forecasts which are not examinedin this report.
NO2 levels are generally a recognised marker of traffic consequence, since NO2 is proportional totraffic (volume and vehicle fuel technology) [2].
Results
NO2 was measured on three vehicles on the NEDC and on 6 vehicles on the CADC.
52
57.4
0
26.4
5 31.1
6
47.8
1
27.5
1
35.4
7
64.2
9
23.4
6
26.0
2
0.00
10.00
20.00
30.00
40.00
50.00
60.00
70.00
Diesel Petrol LPG
NO
2 (%
age)
NEDC
ECE
EUDC
Number of data :Diesel : 3Petrol : 3LPG : 3
LPG/diesel : -45.7%LPG/Petrol : +17.8%
Figure 49: mean NO2 propor tion of total NOx emissions, NEDC.
54.9
6
17.5
0
17.7
8
0.00
10.00
20.00
30.00
40.00
50.00
60.00
70.00
Diesel Petrol LPG
NO
2 (%
age)
CADC
CADC Urban
CADC Road
CADC Motorway
Number of data :Diesel : 6Petrol : 6LPG : 6
LPG/Diesel : -67.6%LPG/Petrol : +1.7%
Figure 50: mean NO2 propor tion of total NOx emissions, CADC.
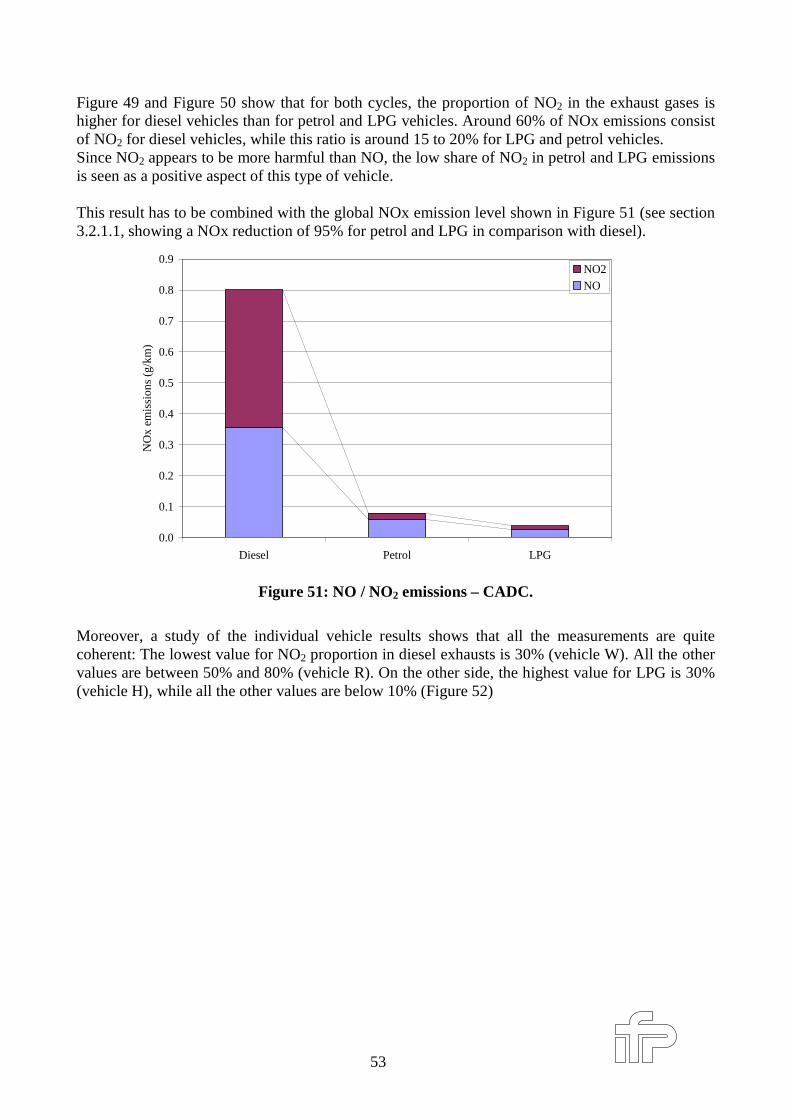
53
Figure 49 and Figure 50 show that for both cycles, the proportion of NO2 in the exhaust gases ishigher for diesel vehicles than for petrol and LPG vehicles. Around 60% of NOx emissions consistof NO2 for diesel vehicles, while this ratio is around 15 to 20% for LPG and petrol vehicles.Since NO2 appears to be more harmful than NO, the low share of NO2 in petrol and LPG emissionsis seen as a positive aspect of this type of vehicle.
This result has to be combined with the global NOx emission level shown in Figure 51 (see section3.2.1.1, showing a NOx reduction of 95% for petrol and LPG in comparison with diesel).
0.0
0.1
0.2
0.3
0.4
0.5
0.6
0.7
0.8
0.9
Diesel Petrol LPG
NO
x em
issi
ons
(g/k
m)
NO2
NO
Figure 51: NO / NO2 emissions – CADC.
Moreover, a study of the individual vehicle results shows that all the measurements are quitecoherent: The lowest value for NO2 proportion in diesel exhausts is 30% (vehicle W). All the othervalues are between 50% and 80% (vehicle R). On the other side, the highest value for LPG is 30%(vehicle H), while all the other values are below 10% (Figure 52)
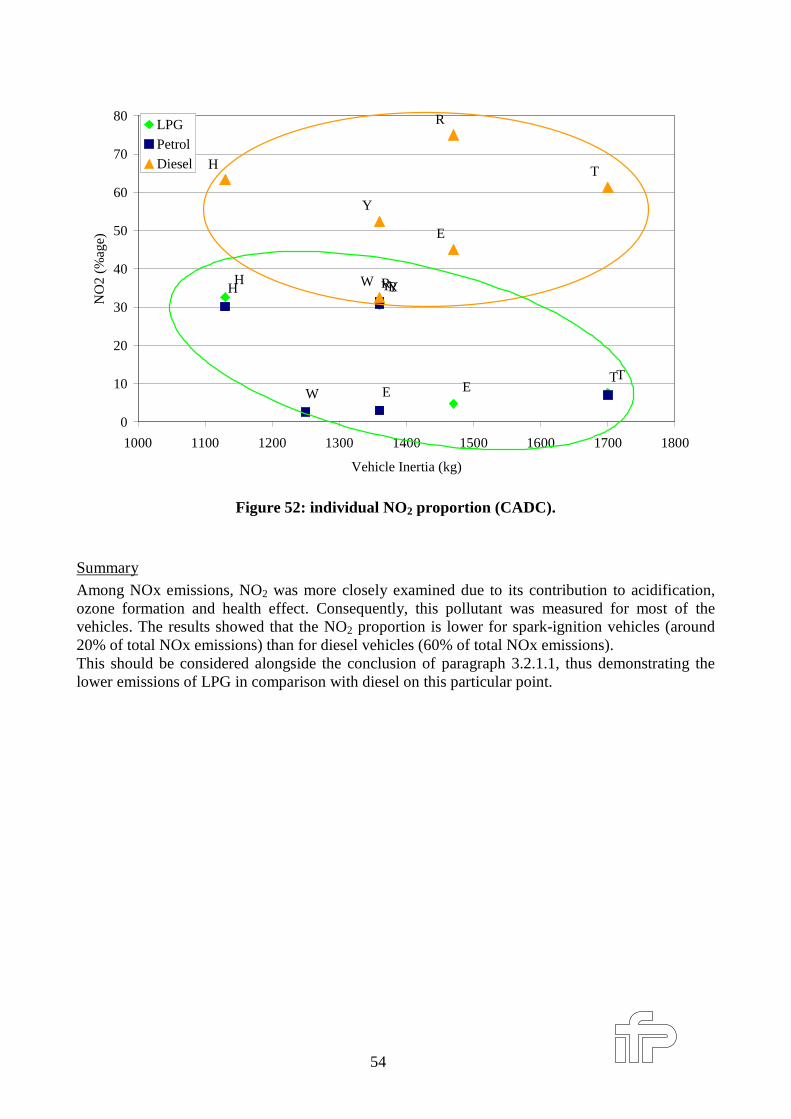
54
TE
H YR
WT
E
H YR
R
Y
H
E
T
W
0
10
20
30
40
50
60
70
80
1000 1100 1200 1300 1400 1500 1600 1700 1800
Vehicle Inertia (kg)
NO
2 (%
age)
LPG
Petrol
Diesel
Figure 52: individual NO2 propor tion (CADC).
Summary
Among NOx emissions, NO2 was more closely examined due to its contribution to acidification,ozone formation and health effect. Consequently, this pollutant was measured for most of thevehicles. The results showed that the NO2 proportion is lower for spark-ignition vehicles (around20% of total NOx emissions) than for diesel vehicles (60% of total NOx emissions).This should be considered alongside the conclusion of paragraph 3.2.1.1, thus demonstrating thelower emissions of LPG in comparison with diesel on this particular point.
55
3.3 Environmental impact and health effect
3.3.1 Ozone (O3) Formation
Background
Ozone is the largest photochemical oxidant in the troposphere. It is formed by photochemicalreactions in the presence of precursor pollutants such as NOx and volatile organic compounds(VOC). In the vicinity of strong NOx emission sources, where there is an abundance of NO, O3 is“scavenged” and as a result its concentrations are often low in busy urban centres and higher insuburban and adjacent rural areas. On the other hand, O3 is also subject to long-range atmospherictransport and is therefore considered as a trans-boundary problem.According to recent studies led by the WHO (World Health Organization), there is evidence fromcontrolled human and animal exposure studies of the potential for O3 to cause adverse healtheffects. There are few epidemiological studies on the chronic effects of ozone on human health.Incidence of asthma, a decreased lung function growth, lung cancer and total mortality are the mainoutcomes studied. At levels currently observed in Europe, the evidence linking O3 exposure toasthma incidence and prevalence in children and adults is not consistent. Available evidencesuggests that long-term exposure to O3 reduces lung function growth in children. There is littleevidence for an independent long-term O3 effect on lung cancer or total mortality. The plausibilityof chronic damage to the human lung from prolonged O3 exposure is supported by the results of aseries of chronic animal exposure studies.
Two indexes can be used in order to evaluate the impact of exhaust gases on ground-level ozone:the TOFP and POCP:
• TOFP: "Tropospheric Ozone Forming Potentials", which is representative of regionalconditions (for example northwest Europe) takes into account the vehicle’s own NOxemissions. It is consequently calculated according to NOx, NMVOC, CO and methaneemissions, balanced by individual coefficients:
NOx: 1.22, NMVOC: 1, CO: 0.11, CH4: 0.014• POCP: "Photochemical Ozone Creation Potentials", as defined by Derwent and Jenkin, is more
representative of local conditions (e.g. urban area). It describes the relative ability of organiccompounds to generate ozone defined relative to a value of 100 for ethene, and represents thequantity of ozone formed from the unit mass emission of a given VOC, compared to that fromthe emission from an identical mass of ethene. The calculation was done according to the lastversion of the coefficients (2003, [12][13]), using 33 molecules. This index is representative oflocal conditions.
POCP, more dependent on local conditions, is more representative of the impact of the vehicle onozone formation in a local area, defined by its own air composition.On the contrary, TOFP is representative of the impact on ozone of the vehicle itself.As a consequence, both are indicators of health impact, but TOFP is a more appropriate index inrelation to the environmental impact.
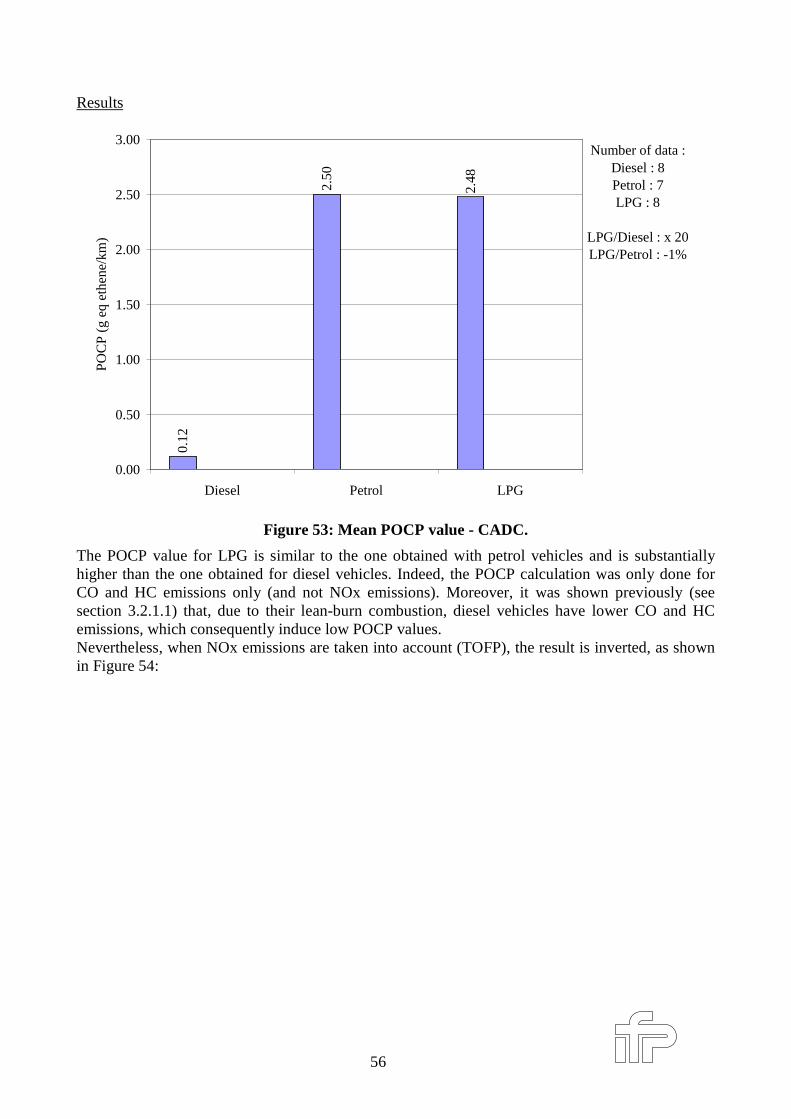
56
Results
0.12
2.50
2.48
0.00
0.50
1.00
1.50
2.00
2.50
3.00
Diesel Petrol LPG
PO
CP
(g
eq e
then
e/km
)
Number of data :Diesel : 8Petrol : 7LPG : 8
LPG/Diesel : x 20LPG/Petrol : -1%
Figure 53: Mean POCP value - CADC.
The POCP value for LPG is similar to the one obtained with petrol vehicles and is substantiallyhigher than the one obtained for diesel vehicles. Indeed, the POCP calculation was only done forCO and HC emissions only (and not NOx emissions). Moreover, it was shown previously (seesection 3.2.1.1) that, due to their lean-burn combustion, diesel vehicles have lower CO and HCemissions, which consequently induce low POCP values.Nevertheless, when NOx emissions are taken into account (TOFP), the result is inverted, as shownin Figure 54:
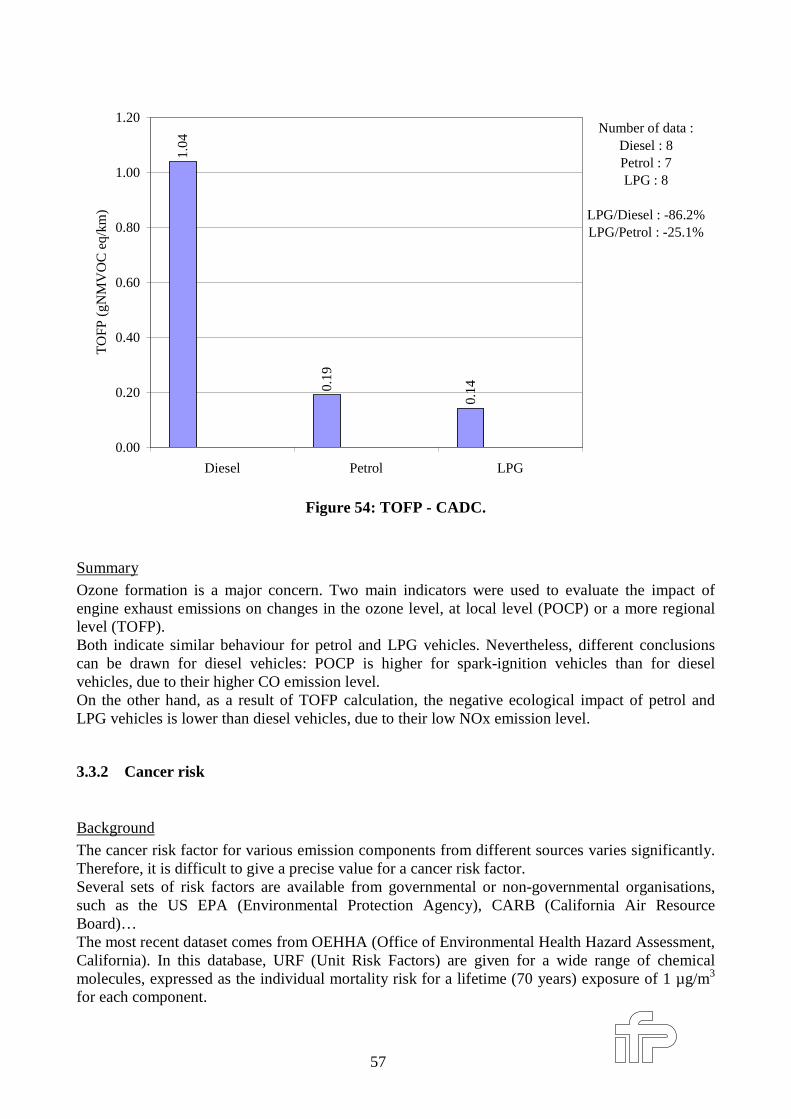
57
1.04
0.19
0.14
0.00
0.20
0.40
0.60
0.80
1.00
1.20
Diesel Petrol LPG
TO
FP
(gN
MV
OC
eq/
km)
Number of data :Diesel : 8Petrol : 7LPG : 8
LPG/Diesel : -86.2%LPG/Petrol : -25.1%
Figure 54: TOFP - CADC.
Summary
Ozone formation is a major concern. Two main indicators were used to evaluate the impact ofengine exhaust emissions on changes in the ozone level, at local level (POCP) or a more regionallevel (TOFP).Both indicate similar behaviour for petrol and LPG vehicles. Nevertheless, different conclusionscan be drawn for diesel vehicles: POCP is higher for spark-ignition vehicles than for dieselvehicles, due to their higher CO emission level.On the other hand, as a result of TOFP calculation, the negative ecological impact of petrol andLPG vehicles is lower than diesel vehicles, due to their low NOx emission level.
3.3.2 Cancer r isk
Background
The cancer risk factor for various emission components from different sources varies significantly.Therefore, it is difficult to give a precise value for a cancer risk factor.Several sets of risk factors are available from governmental or non-governmental organisations,such as the US EPA (Environmental Protection Agency), CARB (California Air ResourceBoard)…The most recent dataset comes from OEHHA (Office of Environmental Health Hazard Assessment,California). In this database, URF (Unit Risk Factors) are given for a wide range of chemicalmolecules, expressed as the individual mortality risk for a lifetime (70 years) exposure of 1 µg/m3
for each component.
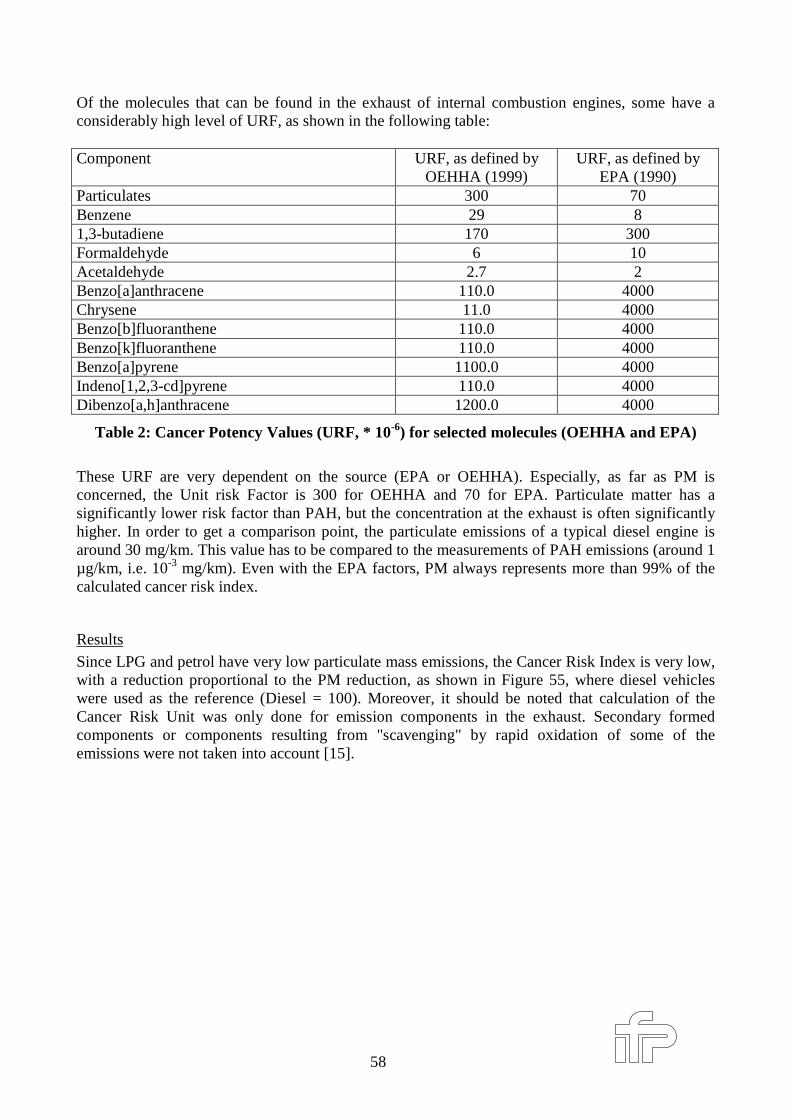
58
Of the molecules that can be found in the exhaust of internal combustion engines, some have aconsiderably high level of URF, as shown in the following table:
Component URF, as defined byOEHHA (1999)
URF, as defined byEPA (1990)
Particulates 300 70Benzene 29 81,3-butadiene 170 300Formaldehyde 6 10Acetaldehyde 2.7 2Benzo[a]anthracene 110.0 4000Chrysene 11.0 4000Benzo[b]fluoranthene 110.0 4000Benzo[k]fluoranthene 110.0 4000Benzo[a]pyrene 1100.0 4000Indeno[1,2,3-cd]pyrene 110.0 4000Dibenzo[a,h]anthracene 1200.0 4000
Table 2: Cancer Potency Values (URF, * 10-6) for selected molecules (OEHHA and EPA)
These URF are very dependent on the source (EPA or OEHHA). Especially, as far as PM isconcerned, the Unit risk Factor is 300 for OEHHA and 70 for EPA. Particulate matter has asignificantly lower risk factor than PAH, but the concentration at the exhaust is often significantlyhigher. In order to get a comparison point, the particulate emissions of a typical diesel engine isaround 30 mg/km. This value has to be compared to the measurements of PAH emissions (around 1µg/km, i.e. 10-3 mg/km). Even with the EPA factors, PM always represents more than 99% of thecalculated cancer risk index.
Results
Since LPG and petrol have very low particulate mass emissions, the Cancer Risk Index is very low,with a reduction proportional to the PM reduction, as shown in Figure 55, where diesel vehicleswere used as the reference (Diesel = 100). Moreover, it should be noted that calculation of theCancer Risk Unit was only done for emission components in the exhaust. Secondary formedcomponents or components resulting from "scavenging" by rapid oxidation of some of theemissions were not taken into account [15].
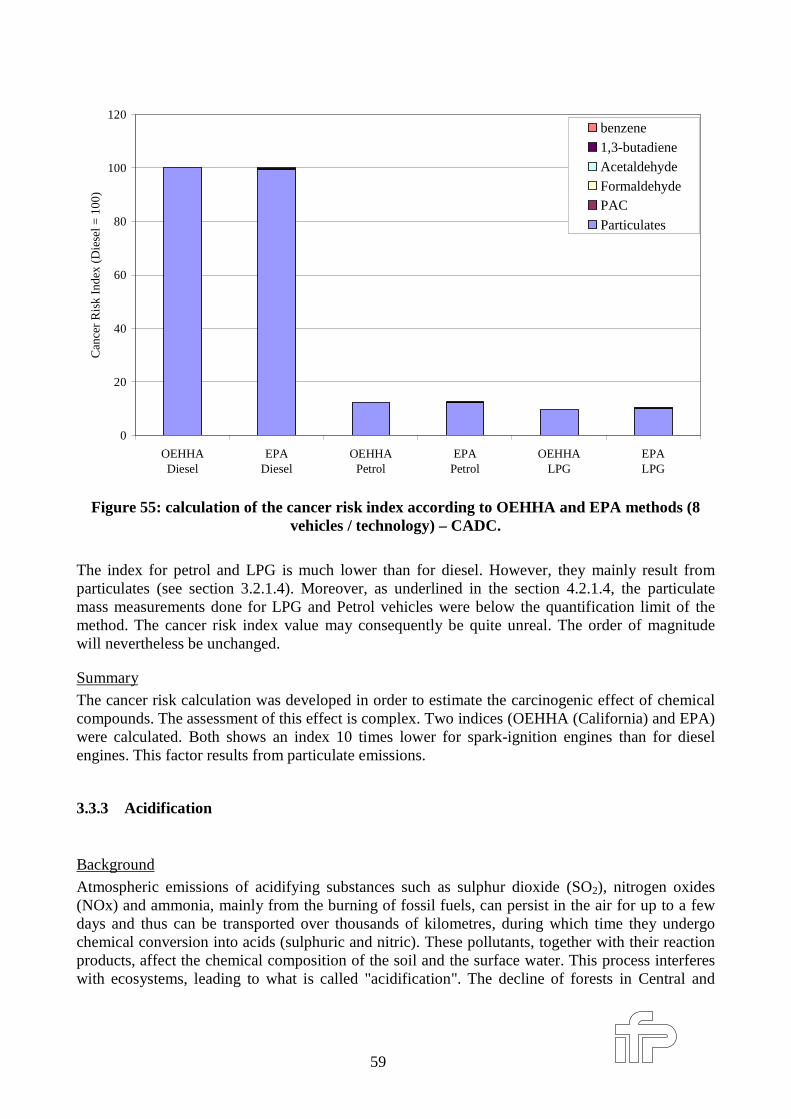
59
0
20
40
60
80
100
120
OEHHADiesel
EPADiesel
OEHHAPetrol
EPAPetrol
OEHHALPG
EPALPG
Can
cer
Ris
k In
dex
(Die
sel =
100
)
benzene1,3-butadieneAcetaldehydeFormaldehydePAC
Particulates
Figure 55: calculation of the cancer r isk index according to OEHHA and EPA methods (8vehicles / technology) – CADC.
The index for petrol and LPG is much lower than for diesel. However, they mainly result fromparticulates (see section 3.2.1.4). Moreover, as underlined in the section 4.2.1.4, the particulatemass measurements done for LPG and Petrol vehicles were below the quantification limit of themethod. The cancer risk index value may consequently be quite unreal. The order of magnitudewill nevertheless be unchanged.
Summary
The cancer risk calculation was developed in order to estimate the carcinogenic effect of chemicalcompounds. The assessment of this effect is complex. Two indices (OEHHA (California) and EPA)were calculated. Both shows an index 10 times lower for spark-ignition engines than for dieselengines. This factor results from particulate emissions.
3.3.3 Acidification
Background
Atmospheric emissions of acidifying substances such as sulphur dioxide (SO2), nitrogen oxides(NOx) and ammonia, mainly from the burning of fossil fuels, can persist in the air for up to a fewdays and thus can be transported over thousands of kilometres, during which time they undergochemical conversion into acids (sulphuric and nitric). These pollutants, together with their reactionproducts, affect the chemical composition of the soil and the surface water. This process interfereswith ecosystems, leading to what is called "acidification". The decline of forests in Central and
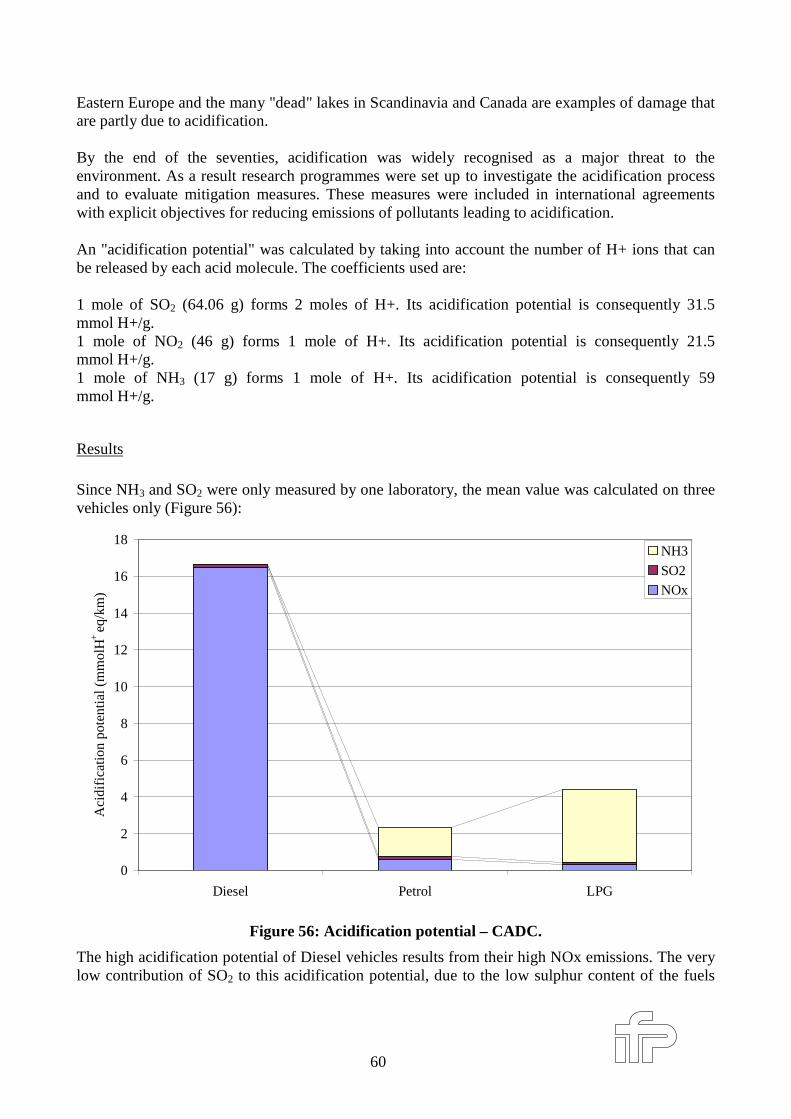
60
Eastern Europe and the many "dead" lakes in Scandinavia and Canada are examples of damage thatare partly due to acidification.
By the end of the seventies, acidification was widely recognised as a major threat to theenvironment. As a result research programmes were set up to investigate the acidification processand to evaluate mitigation measures. These measures were included in international agreementswith explicit objectives for reducing emissions of pollutants leading to acidification.
An "acidification potential" was calculated by taking into account the number of H+ ions that canbe released by each acid molecule. The coefficients used are:
1 mole of SO2 (64.06 g) forms 2 moles of H+. Its acidification potential is consequently 31.5mmol H+/g.1 mole of NO2 (46 g) forms 1 mole of H+. Its acidification potential is consequently 21.5mmol H+/g.1 mole of NH3 (17 g) forms 1 mole of H+. Its acidification potential is consequently 59mmol H+/g.
Results
Since NH3 and SO2 were only measured by one laboratory, the mean value was calculated on threevehicles only (Figure 56):
0
2
4
6
8
10
12
14
16
18
Diesel Petrol LPG
Aci
difi
cati
on p
oten
tial
(m
mol
H+
eq/k
m)
NH3
SO2NOx
Figure 56: Acidification potential – CADC.
The high acidification potential of Diesel vehicles results from their high NOx emissions. The verylow contribution of SO2 to this acidification potential, due to the low sulphur content of the fuels
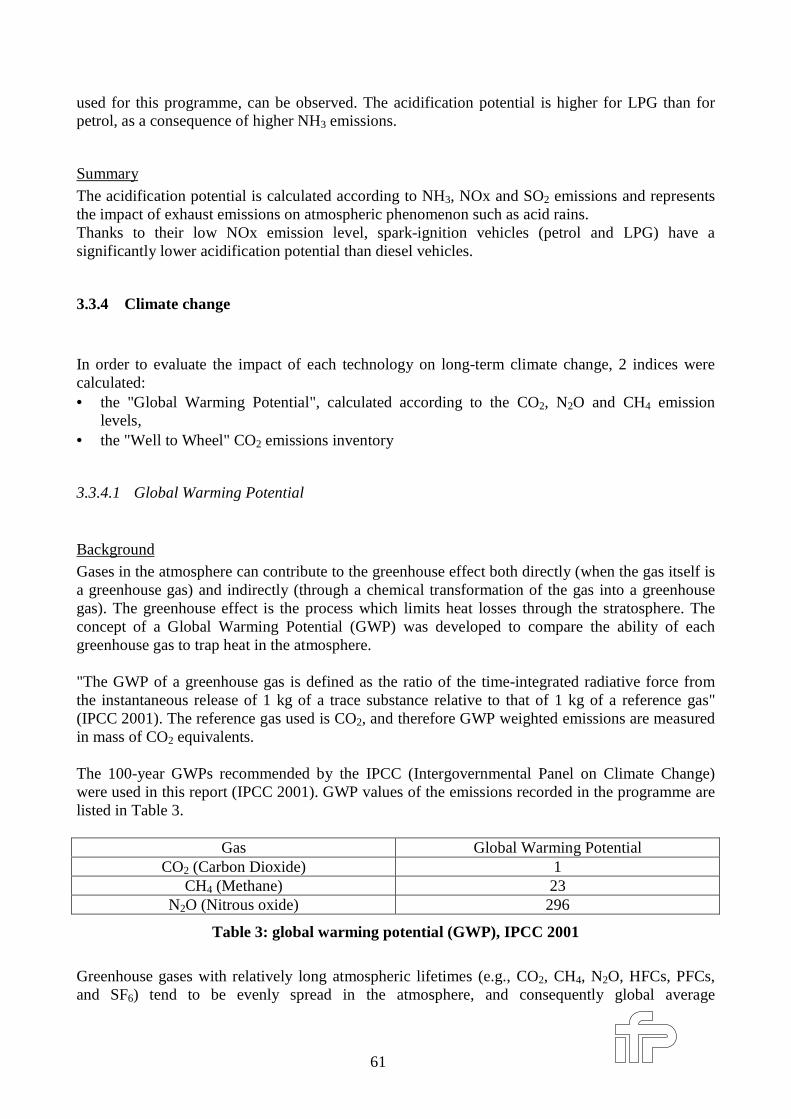
61
used for this programme, can be observed. The acidification potential is higher for LPG than forpetrol, as a consequence of higher NH3 emissions.
Summary
The acidification potential is calculated according to NH3, NOx and SO2 emissions and representsthe impact of exhaust emissions on atmospheric phenomenon such as acid rains.Thanks to their low NOx emission level, spark-ignition vehicles (petrol and LPG) have asignificantly lower acidification potential than diesel vehicles.
3.3.4 Climate change
In order to evaluate the impact of each technology on long-term climate change, 2 indices werecalculated:• the "Global Warming Potential", calculated according to the CO2, N2O and CH4 emission
levels,• the "Well to Wheel" CO2 emissions inventory
3.3.4.1 Global Warming Potential
BackgroundGases in the atmosphere can contribute to the greenhouse effect both directly (when the gas itself isa greenhouse gas) and indirectly (through a chemical transformation of the gas into a greenhousegas). The greenhouse effect is the process which limits heat losses through the stratosphere. Theconcept of a Global Warming Potential (GWP) was developed to compare the ability of eachgreenhouse gas to trap heat in the atmosphere.
"The GWP of a greenhouse gas is defined as the ratio of the time-integrated radiative force fromthe instantaneous release of 1 kg of a trace substance relative to that of 1 kg of a reference gas"(IPCC 2001). The reference gas used is CO2, and therefore GWP weighted emissions are measuredin mass of CO2 equivalents.
The 100-year GWPs recommended by the IPCC (Intergovernmental Panel on Climate Change)were used in this report (IPCC 2001). GWP values of the emissions recorded in the programme arelisted in Table 3.
Gas Global Warming PotentialCO2 (Carbon Dioxide) 1
CH4 (Methane) 23N2O (Nitrous oxide) 296
Table 3: global warming potential (GWP), IPCC 2001
Greenhouse gases with relatively long atmospheric lifetimes (e.g., CO2, CH4, N2O, HFCs, PFCs,and SF6) tend to be evenly spread in the atmosphere, and consequently global average
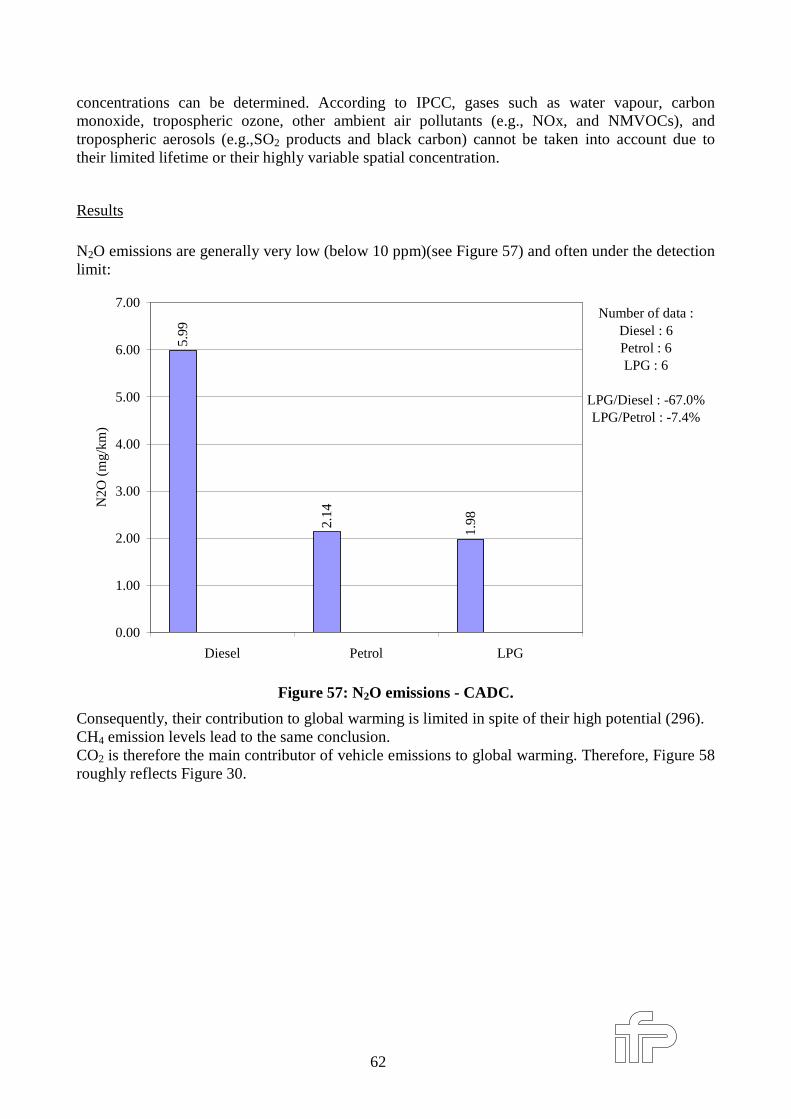
62
concentrations can be determined. According to IPCC, gases such as water vapour, carbonmonoxide, tropospheric ozone, other ambient air pollutants (e.g., NOx, and NMVOCs), andtropospheric aerosols (e.g.,SO2 products and black carbon) cannot be taken into account due totheir limited lifetime or their highly variable spatial concentration.
Results
N2O emissions are generally very low (below 10 ppm)(see Figure 57) and often under the detectionlimit:
5.99
2.14
1.98
0.00
1.00
2.00
3.00
4.00
5.00
6.00
7.00
Diesel Petrol LPG
N2O
(m
g/km
)
Number of data :Diesel : 6Petrol : 6LPG : 6
LPG/Diesel : -67.0%LPG/Petrol : -7.4%
Figure 57: N2O emissions - CADC.
Consequently, their contribution to global warming is limited in spite of their high potential (296).CH4 emission levels lead to the same conclusion.CO2 is therefore the main contributor of vehicle emissions to global warming. Therefore, Figure 58roughly reflects Figure 30.
63
160.
3 178.
9
162.
5
0.0
20.0
40.0
60.0
80.0
100.0
120.0
140.0
160.0
180.0
200.0
Diesel Petrol LPG
GW
P (
2001
) (g
CO
2/km
equ
)
Number of data :Diesel : 6Petrol : 6LPG : 6
LPG/Diesel : +1.4%LPG/Petrol : -9.2%
Figure 58: Global Warming Potential (2001) - CADC.
Summary
The Global Warming Potential is calculated according to CO2, N2O and methane and represents theimpact of exhaust gases on the greenhouse effect. Due to the low emission level of N2O andmethane in comparison with CO2, the GWP is strongly linked to the CO2 emission level. Therefore,the same conclusion can be drawn as in section 3.2.2: LPG vehicles rank between petrol and dieselvehicles and are roughly equivalent to diesel vehicles.
3.3.4.2 Life Cycle Assessment
Background
In a common misconception, people tend to only focus on a fuel’s energy use or emission when itis burned or otherwise consumed in vehicle engines. The same misconception applies toconsiderations of fuel safety and fuel cost. Too little attention is devoted to the technology or theinfrastructure that helped create the fuel and got it to the vehicle’s tank. By contracts, a faircomparison of automotive fuels must take into account the fuel’s entire history, from raw materialto energy output. For example, fuels that show very low pollutant emissions from the vehicle mayhave high emissions during their production phases. Fuels that are very suitable for use incombustion engines may be difficult and costly to transport and store. A fuel’s history resides in thecomplete “well-to-wheel” fuel chain. The chain has five stages: feedstock production, feedstocktransportation, fuel production, fuel distribution and, finally, vehicle use. This study looksconsistently at the entire chain to examine all the aspects of fuel production and use, includingfeedstocks, energy consumption, emissions, safety, technology, costs and infrastructure [16].
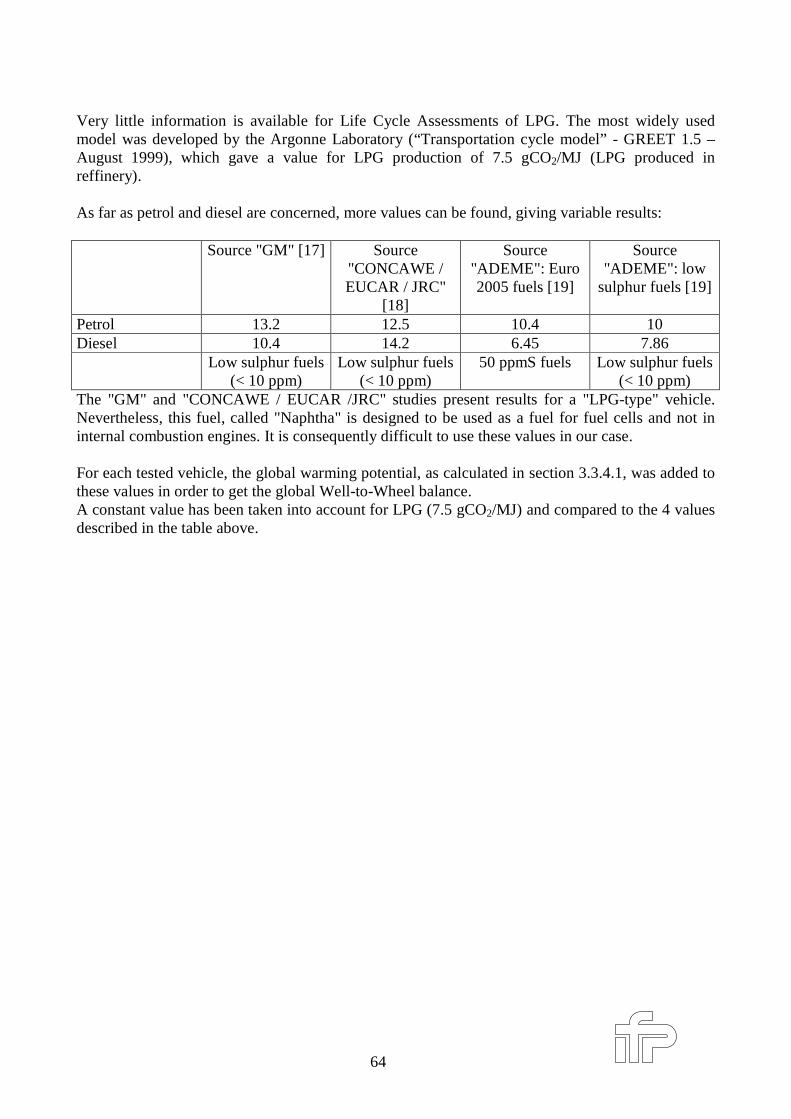
64
Very little information is available for Life Cycle Assessments of LPG. The most widely usedmodel was developed by the Argonne Laboratory (“Transportation cycle model” - GREET 1.5 –August 1999), which gave a value for LPG production of 7.5 gCO2/MJ (LPG produced inreffinery).
As far as petrol and diesel are concerned, more values can be found, giving variable results:
Source "GM" [17] Source"CONCAWE /EUCAR / JRC"
[18]
Source"ADEME": Euro2005 fuels [19]
Source"ADEME": low
sulphur fuels [19]
Petrol 13.2 12.5 10.4 10Diesel 10.4 14.2 6.45 7.86
Low sulphur fuels(< 10 ppm)
Low sulphur fuels(< 10 ppm)
50 ppmS fuels Low sulphur fuels(< 10 ppm)
The "GM" and "CONCAWE / EUCAR /JRC" studies present results for a "LPG-type" vehicle.Nevertheless, this fuel, called "Naphtha" is designed to be used as a fuel for fuel cells and not ininternal combustion engines. It is consequently difficult to use these values in our case.
For each tested vehicle, the global warming potential, as calculated in section 3.3.4.1, was added tothese values in order to get the global Well-to-Wheel balance.A constant value has been taken into account for LPG (7.5 gCO2/MJ) and compared to the 4 valuesdescribed in the table above.
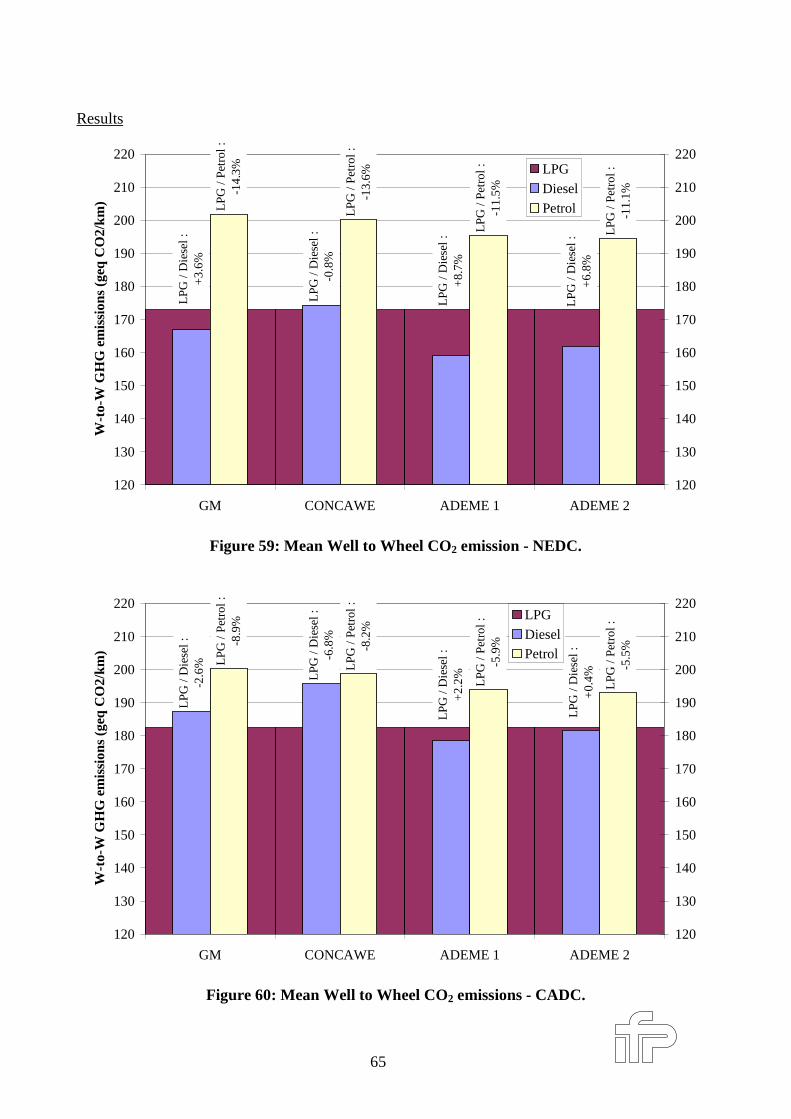
65
Results
LPG
/ D
iese
l :
+6.
8%
LPG
/ D
iese
l :
+8.
7%
LPG
/ D
iese
l :
-0.8
%
LPG
/ D
iese
l :
+3.
6%
LPG
/ Pe
trol
: -1
1.1%
LPG
/ Pe
trol
: -1
1.5%
LPG
/ Pe
trol
: -1
3.6%
LPG
/ Pe
trol
: -1
4.3%
120
130
140
150
160
170
180
190
200
210
220
GM CONCAWE ADEME 1 ADEME 2
W-t
o-W
GH
G e
mis
sion
s (g
eq C
O2/
km)
120
130
140
150
160
170
180
190
200
210
220LPG
Diesel
Petrol
Figure 59: Mean Well to Wheel CO2 emission - NEDC.
LPG
/ D
iese
l :
+0.
4%
LPG
/ D
iese
l :
+2.
2%LPG
/ D
iese
l :
-6.8
%
LPG
/ D
iese
l :
-2.6
%
LPG
/ Pe
trol
: -5
.5%
LPG
/ Pe
trol
: -5
.9%
LPG
/ Pe
trol
: -8
.2%
LPG
/ Pe
trol
: -8
.9%
120
130
140
150
160
170
180
190
200
210
220
GM CONCAWE ADEME 1 ADEME 2
W-t
o-W
GH
G e
mis
sion
s (g
eq C
O2/
km)
120
130
140
150
160
170
180
190
200
210
220LPG
DieselPetrol
Figure 60: Mean Well to Wheel CO2 emissions - CADC.
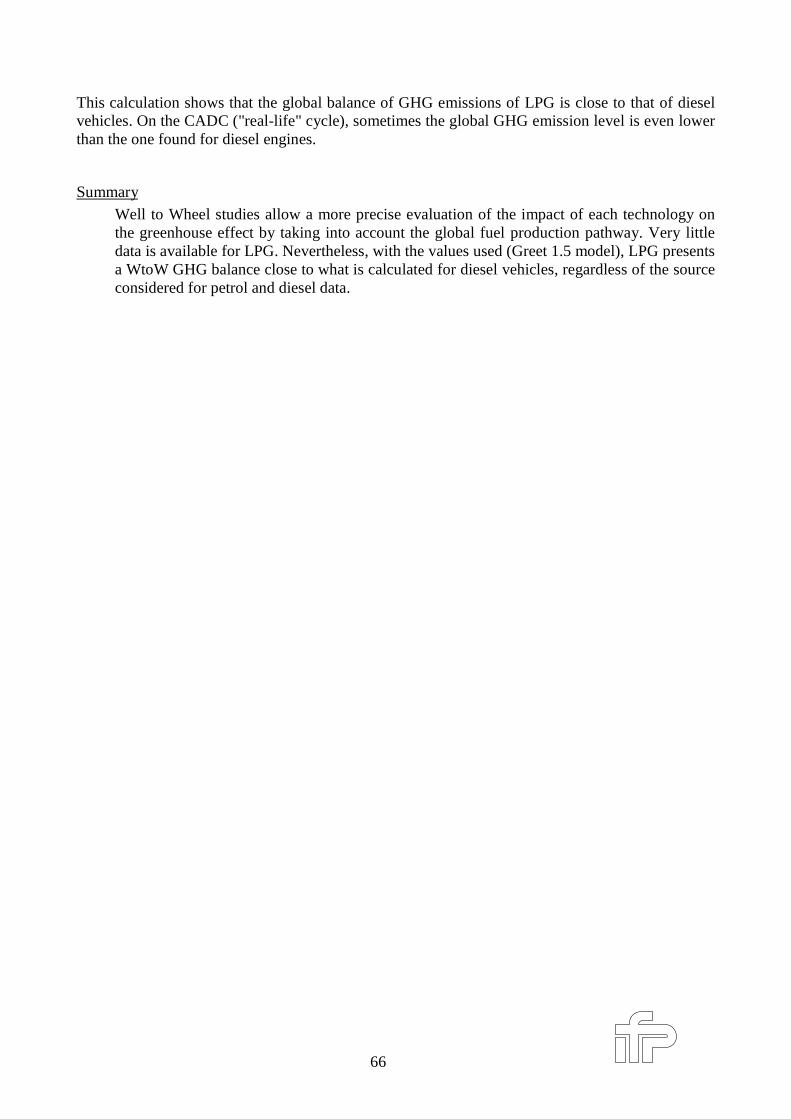
66
This calculation shows that the global balance of GHG emissions of LPG is close to that of dieselvehicles. On the CADC ("real-life" cycle), sometimes the global GHG emission level is even lowerthan the one found for diesel engines.
Summary
Well to Wheel studies allow a more precise evaluation of the impact of each technology onthe greenhouse effect by taking into account the global fuel production pathway. Very littledata is available for LPG. Nevertheless, with the values used (Greet 1.5 model), LPG presentsa WtoW GHG balance close to what is calculated for diesel vehicles, regardless of the sourceconsidered for petrol and diesel data.
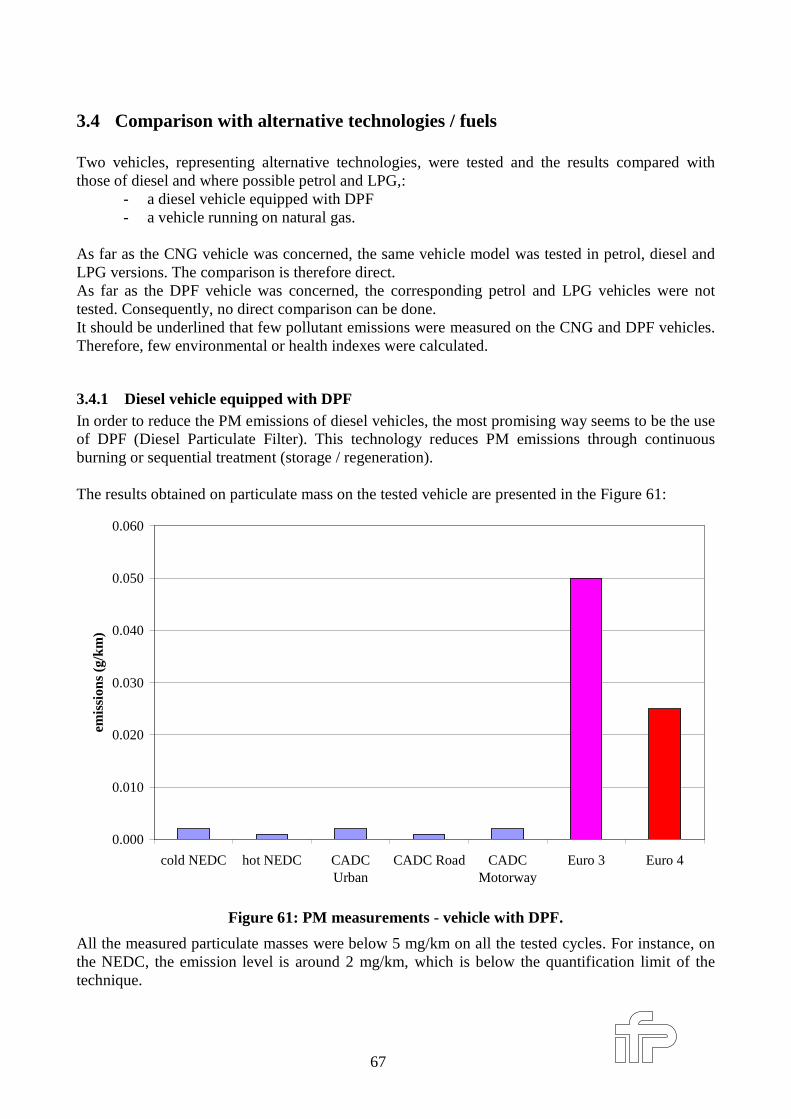
67
3.4 Compar ison with alternative technologies / fuels
Two vehicles, representing alternative technologies, were tested and the results compared withthose of diesel and where possible petrol and LPG,:
- a diesel vehicle equipped with DPF- a vehicle running on natural gas.
As far as the CNG vehicle was concerned, the same vehicle model was tested in petrol, diesel andLPG versions. The comparison is therefore direct.As far as the DPF vehicle was concerned, the corresponding petrol and LPG vehicles were nottested. Consequently, no direct comparison can be done.It should be underlined that few pollutant emissions were measured on the CNG and DPF vehicles.Therefore, few environmental or health indexes were calculated.
3.4.1 Diesel vehicle equipped with DPFIn order to reduce the PM emissions of diesel vehicles, the most promising way seems to be the useof DPF (Diesel Particulate Filter). This technology reduces PM emissions through continuousburning or sequential treatment (storage / regeneration).
The results obtained on particulate mass on the tested vehicle are presented in the Figure 61:
0.000
0.010
0.020
0.030
0.040
0.050
0.060
cold NEDC hot NEDC CADCUrban
CADC Road CADCMotorway
Euro 3 Euro 4
emis
sion
s (g
/km
)
Figure 61: PM measurements - vehicle with DPF.
All the measured particulate masses were below 5 mg/km on all the tested cycles. For instance, onthe NEDC, the emission level is around 2 mg/km, which is below the quantification limit of thetechnique.
68
This considerable reduction of particulate mass emissions induces a decrease of someenvironmental indices. For instance, it was outlined that cancer potency values were mainly linkedto the particulate mass. Consequently, the use of DPF will lead to a big drop in this parameterwhich is at the same level as that of LPG or petrol.
As far as the other emissions are concerned, no comparison can be done since the correspondingpetrol and LPG vehicles were not tested. Especially, the impact of DPF on CO2 emissions cannotbe precisely evaluated.
3.4.2 CNG vehicleA vehicle was tested in its diesel, petrol, LPG and CNG versions. The results obtained for diesel,petrol and LPG were included in the database and have been assessed in the previous section.
3.4.2.1 Regulated pollutant emissions
0
0.1
0.2
0.3
0.4
0.5
0.6
0.7
0.8
Diesel Petrol LPG CNG
CO
(g/
km)
LPG / Diesel : +81.5%LPG / Petrol : -27.9%LPG / CNG : +35.4%
0
0.2
0.4
0.6
0.8
1
1.2
1.4
1.6
1.8
Diesel Petrol LPG CNG
CO
(g/
km)
LPG / Diesel : x 130.0LPG / Petrol : +173.8%LPG / CNG : x 7.3
Figure 62: CO emissions – NEDC (left) and CADC (r ight).
0
0.01
0.02
0.03
0.04
0.05
0.06
Diesel Petrol LPG CNG
HC
(g/
km)
LPG / Diesel : -0.0%LPG / Petrol : -20.0%LPG / CNG : -21.6%
0
0.002
0.004
0.006
0.008
0.01
0.012
0.014
Diesel Petrol LPG CNG
HC
(g/
km)
LPG / Diesel : -4.9%LPG / Petrol : x 6.3LPG / CNG : -51.4%
Figure 63: HC emissions – NEDC (left) and CADC (r ight).
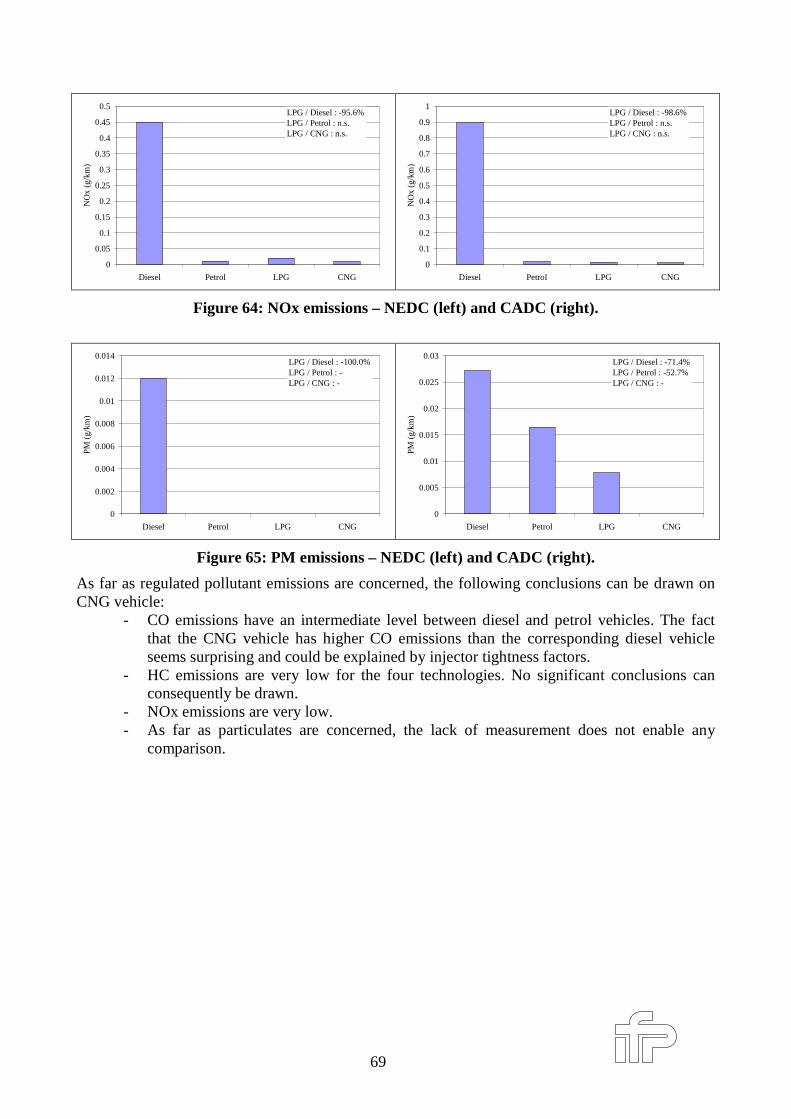
69
0
0.05
0.1
0.15
0.2
0.25
0.3
0.35
0.4
0.45
0.5
Diesel Petrol LPG CNG
NO
x (g
/km
)
LPG / Diesel : -95.6%LPG / Petrol : n.s.LPG / CNG : n.s.
0
0.1
0.2
0.3
0.4
0.5
0.6
0.7
0.8
0.9
1
Diesel Petrol LPG CNG
NO
x (g
/km
)
LPG / Diesel : -98.6%LPG / Petrol : n.s.LPG / CNG : n.s.
Figure 64: NOx emissions – NEDC (left) and CADC (r ight).
0
0.002
0.004
0.006
0.008
0.01
0.012
0.014
Diesel Petrol LPG CNG
PM (
g/km
)
LPG / Diesel : -100.0%LPG / Petrol : -LPG / CNG : -
0
0.005
0.01
0.015
0.02
0.025
0.03
Diesel Petrol LPG CNG
PM (
g/km
)
LPG / Diesel : -71.4%LPG / Petrol : -52.7%LPG / CNG : -
Figure 65: PM emissions – NEDC (left) and CADC (r ight).
As far as regulated pollutant emissions are concerned, the following conclusions can be drawn onCNG vehicle:
- CO emissions have an intermediate level between diesel and petrol vehicles. The factthat the CNG vehicle has higher CO emissions than the corresponding diesel vehicleseems surprising and could be explained by injector tightness factors.
- HC emissions are very low for the four technologies. No significant conclusions canconsequently be drawn.
- NOx emissions are very low.- As far as particulates are concerned, the lack of measurement does not enable any
comparison.
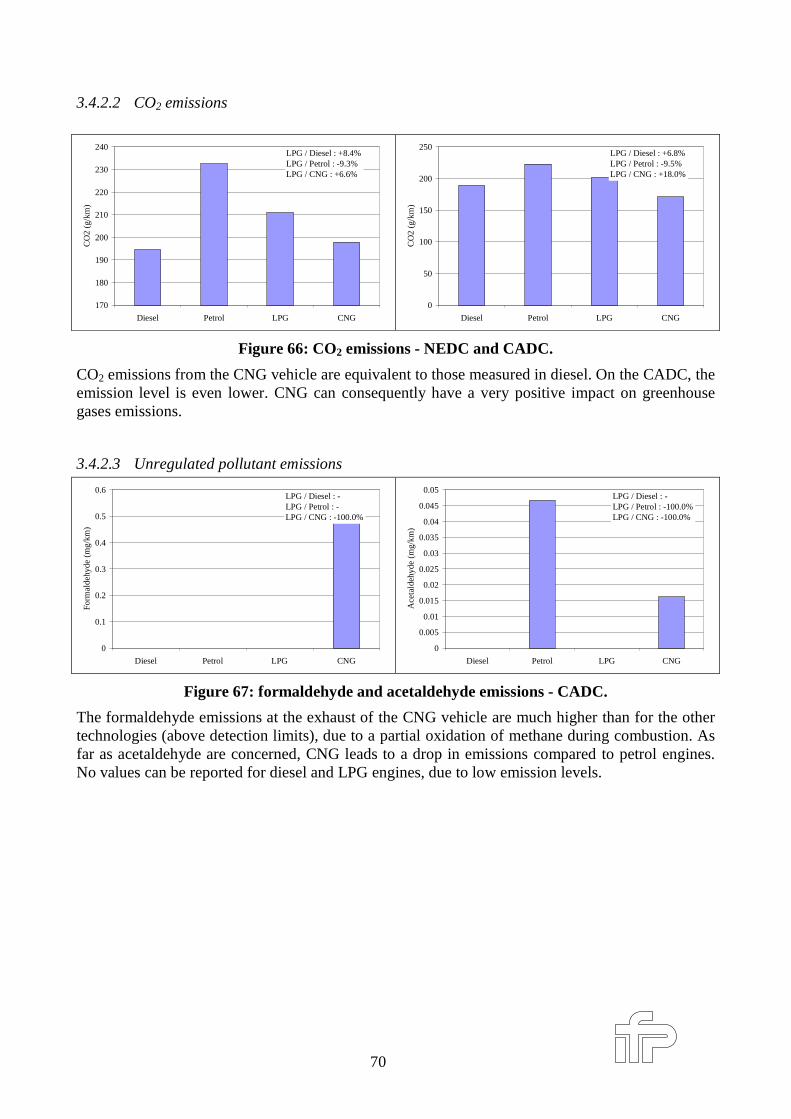
70
3.4.2.2 CO2 emissions
170
180
190
200
210
220
230
240
Diesel Petrol LPG CNG
CO
2 (g
/km
)
LPG / Diesel : +8.4%LPG / Petrol : -9.3%LPG / CNG : +6.6%
0
50
100
150
200
250
Diesel Petrol LPG CNG
CO
2 (g
/km
)
LPG / Diesel : +6.8%LPG / Petrol : -9.5%LPG / CNG : +18.0%
Figure 66: CO2 emissions - NEDC and CADC.
CO2 emissions from the CNG vehicle are equivalent to those measured in diesel. On the CADC, theemission level is even lower. CNG can consequently have a very positive impact on greenhousegases emissions.
3.4.2.3 Unregulated pollutant emissions
0
0.1
0.2
0.3
0.4
0.5
0.6
Diesel Petrol LPG CNG
Form
alde
hyde
(m
g/km
)
LPG / Diesel : -LPG / Petrol : -LPG / CNG : -100.0%
0
0.005
0.01
0.015
0.02
0.025
0.03
0.035
0.04
0.045
0.05
Diesel Petrol LPG CNG
Ace
tald
ehyd
e (m
g/km
)
LPG / Diesel : -LPG / Petrol : -100.0%LPG / CNG : -100.0%
Figure 67: formaldehyde and acetaldehyde emissions - CADC.
The formaldehyde emissions at the exhaust of the CNG vehicle are much higher than for the othertechnologies (above detection limits), due to a partial oxidation of methane during combustion. Asfar as acetaldehyde are concerned, CNG leads to a drop in emissions compared to petrol engines.No values can be reported for diesel and LPG engines, due to low emission levels.
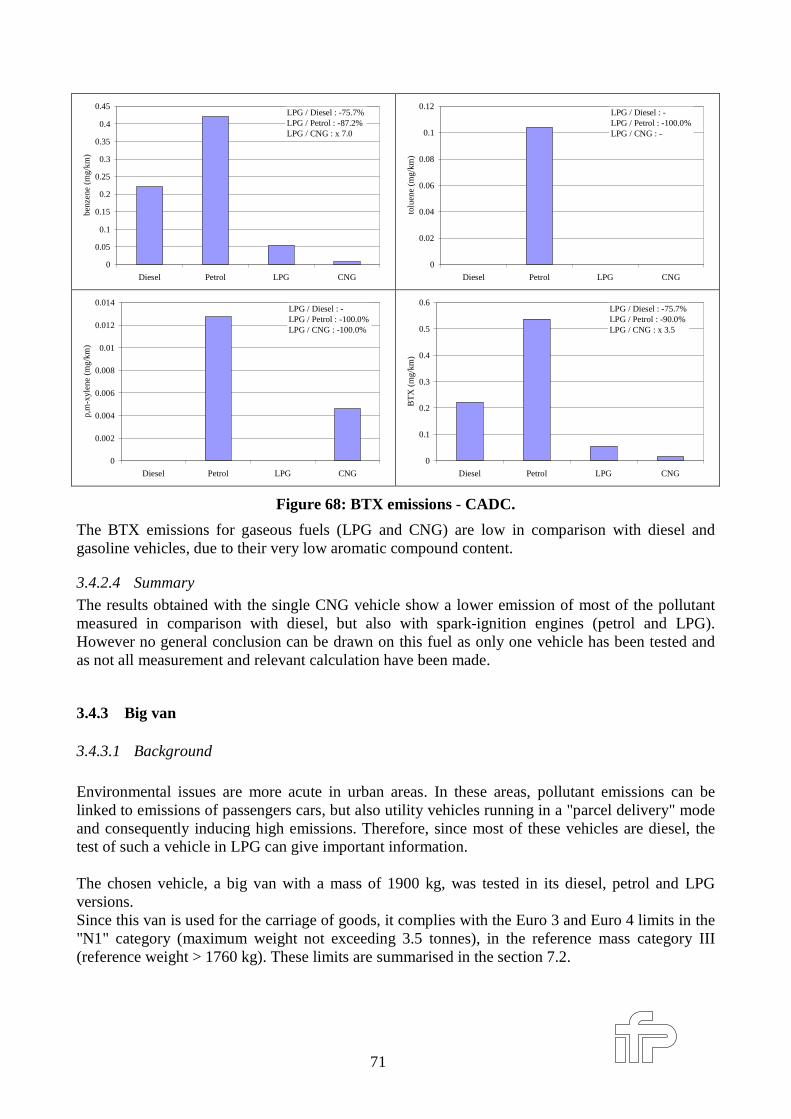
71
0
0.05
0.1
0.15
0.2
0.25
0.3
0.35
0.4
0.45
Diesel Petrol LPG CNG
benz
ene
(mg/
km)
LPG / Diesel : -75.7%LPG / Petrol : -87.2%LPG / CNG : x 7.0
0
0.02
0.04
0.06
0.08
0.1
0.12
Diesel Petrol LPG CNG
tolu
ene
(mg/
km)
LPG / Diesel : -LPG / Petrol : -100.0%LPG / CNG : -
0
0.002
0.004
0.006
0.008
0.01
0.012
0.014
Diesel Petrol LPG CNG
p,m
-xyl
ene
(mg/
km)
LPG / Diesel : -LPG / Petrol : -100.0%LPG / CNG : -100.0%
0
0.1
0.2
0.3
0.4
0.5
0.6
Diesel Petrol LPG CNG
BT
X (
mg/
km)
LPG / Diesel : -75.7%LPG / Petrol : -90.0%LPG / CNG : x 3.5
Figure 68: BTX emissions - CADC.
The BTX emissions for gaseous fuels (LPG and CNG) are low in comparison with diesel andgasoline vehicles, due to their very low aromatic compound content.
3.4.2.4 Summary
The results obtained with the single CNG vehicle show a lower emission of most of the pollutantmeasured in comparison with diesel, but also with spark-ignition engines (petrol and LPG).However no general conclusion can be drawn on this fuel as only one vehicle has been tested andas not all measurement and relevant calculation have been made.
3.4.3 Big van
3.4.3.1 Background
Environmental issues are more acute in urban areas. In these areas, pollutant emissions can belinked to emissions of passengers cars, but also utility vehicles running in a "parcel delivery" modeand consequently inducing high emissions. Therefore, since most of these vehicles are diesel, thetest of such a vehicle in LPG can give important information.
The chosen vehicle, a big van with a mass of 1900 kg, was tested in its diesel, petrol and LPGversions.Since this van is used for the carriage of goods, it complies with the Euro 3 and Euro 4 limits in the"N1" category (maximum weight not exceeding 3.5 tonnes), in the reference mass category III(reference weight > 1760 kg). These limits are summarised in the section 7.2.
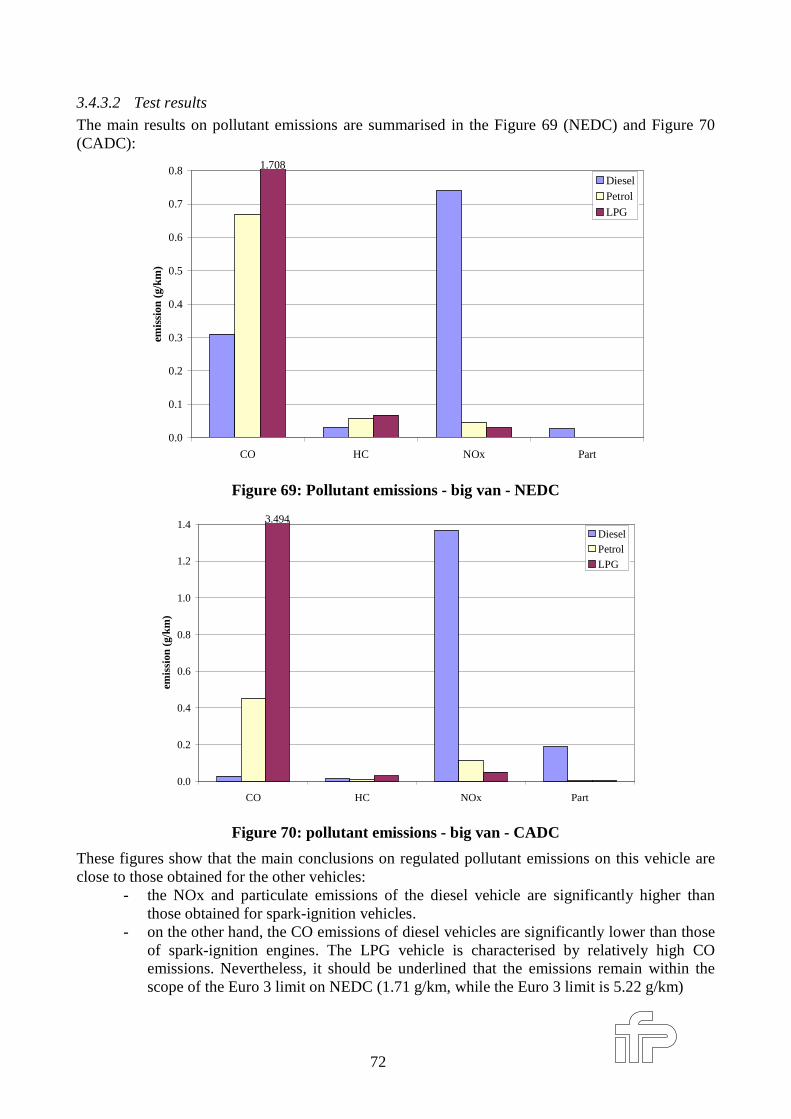
72
3.4.3.2 Test results
The main results on pollutant emissions are summarised in the Figure 69 (NEDC) and Figure 70(CADC):
1.708
0.0
0.1
0.2
0.3
0.4
0.5
0.6
0.7
0.8
CO HC NOx Part
emis
sion
(g/
km)
DieselPetrol
LPG
Figure 69: Pollutant emissions - big van - NEDC
3.494
0.0
0.2
0.4
0.6
0.8
1.0
1.2
1.4
CO HC NOx Part
emis
sion
(g/
km)
DieselPetrol
LPG
Figure 70: pollutant emissions - big van - CADC
These figures show that the main conclusions on regulated pollutant emissions on this vehicle areclose to those obtained for the other vehicles:
- the NOx and particulate emissions of the diesel vehicle are significantly higher thanthose obtained for spark-ignition vehicles.
- on the other hand, the CO emissions of diesel vehicles are significantly lower than thoseof spark-ignition engines. The LPG vehicle is characterised by relatively high COemissions. Nevertheless, it should be underlined that the emissions remain within thescope of the Euro 3 limit on NEDC (1.71 g/km, while the Euro 3 limit is 5.22 g/km)
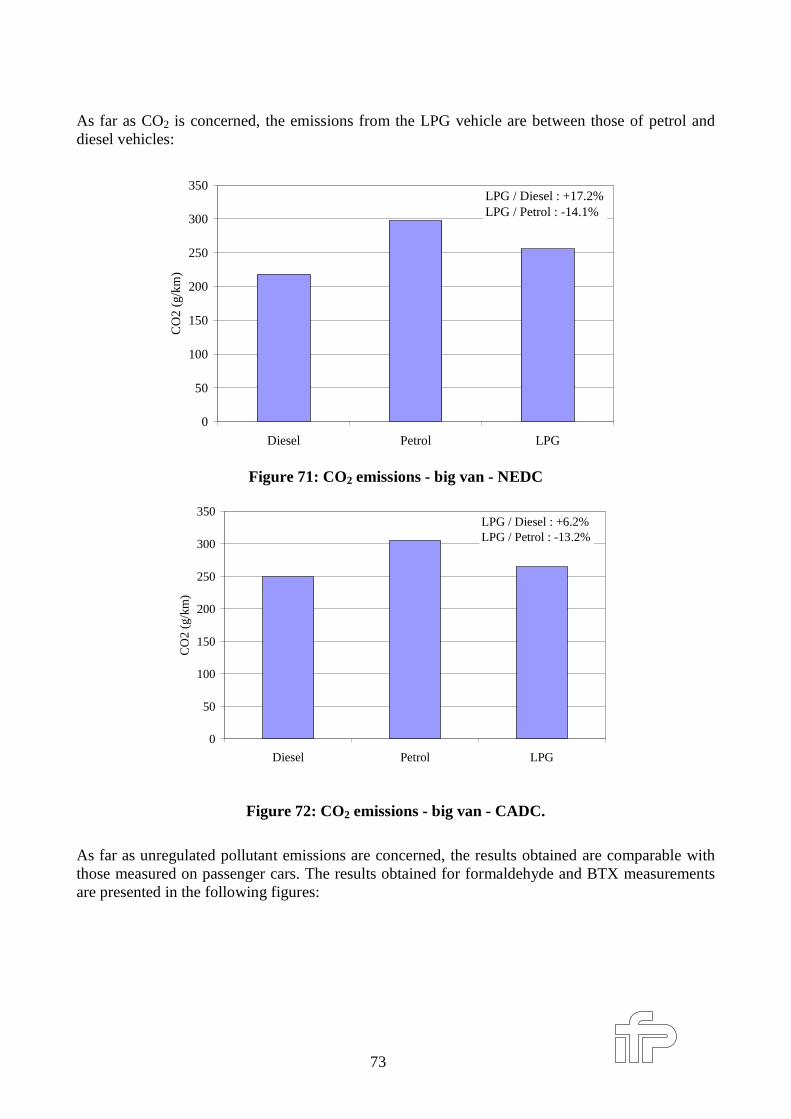
73
As far as CO2 is concerned, the emissions from the LPG vehicle are between those of petrol anddiesel vehicles:
0
50
100
150
200
250
300
350
Diesel Petrol LPG
CO
2 (g
/km
)
LPG / Diesel : +17.2%LPG / Petrol : -14.1%
Figure 71: CO2 emissions - big van - NEDC
0
50
100
150
200
250
300
350
Diesel Petrol LPG
CO
2 (g
/km
)
LPG / Diesel : +6.2%LPG / Petrol : -13.2%
Figure 72: CO2 emissions - big van - CADC.
As far as unregulated pollutant emissions are concerned, the results obtained are comparable withthose measured on passenger cars. The results obtained for formaldehyde and BTX measurementsare presented in the following figures:
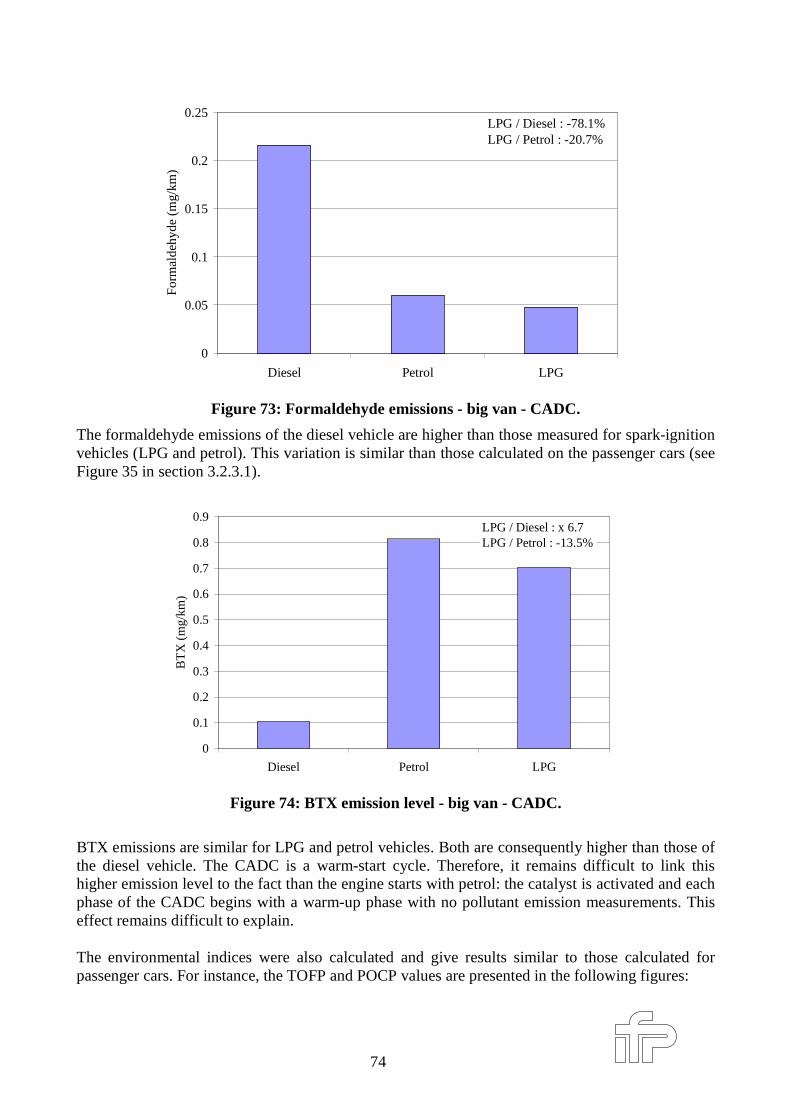
74
0
0.05
0.1
0.15
0.2
0.25
Diesel Petrol LPG
For
mal
dehy
de (
mg/
km)
LPG / Diesel : -78.1%LPG / Petrol : -20.7%
Figure 73: Formaldehyde emissions - big van - CADC.
The formaldehyde emissions of the diesel vehicle are higher than those measured for spark-ignitionvehicles (LPG and petrol). This variation is similar than those calculated on the passenger cars (seeFigure 35 in section 3.2.3.1).
0
0.1
0.2
0.3
0.4
0.5
0.6
0.7
0.8
0.9
Diesel Petrol LPG
BT
X (
mg/
km)
LPG / Diesel : x 6.7LPG / Petrol : -13.5%
Figure 74: BTX emission level - big van - CADC.
BTX emissions are similar for LPG and petrol vehicles. Both are consequently higher than those ofthe diesel vehicle. The CADC is a warm-start cycle. Therefore, it remains difficult to link thishigher emission level to the fact than the engine starts with petrol: the catalyst is activated and eachphase of the CADC begins with a warm-up phase with no pollutant emission measurements. Thiseffect remains difficult to explain.
The environmental indices were also calculated and give results similar to those calculated forpassenger cars. For instance, the TOFP and POCP values are presented in the following figures:
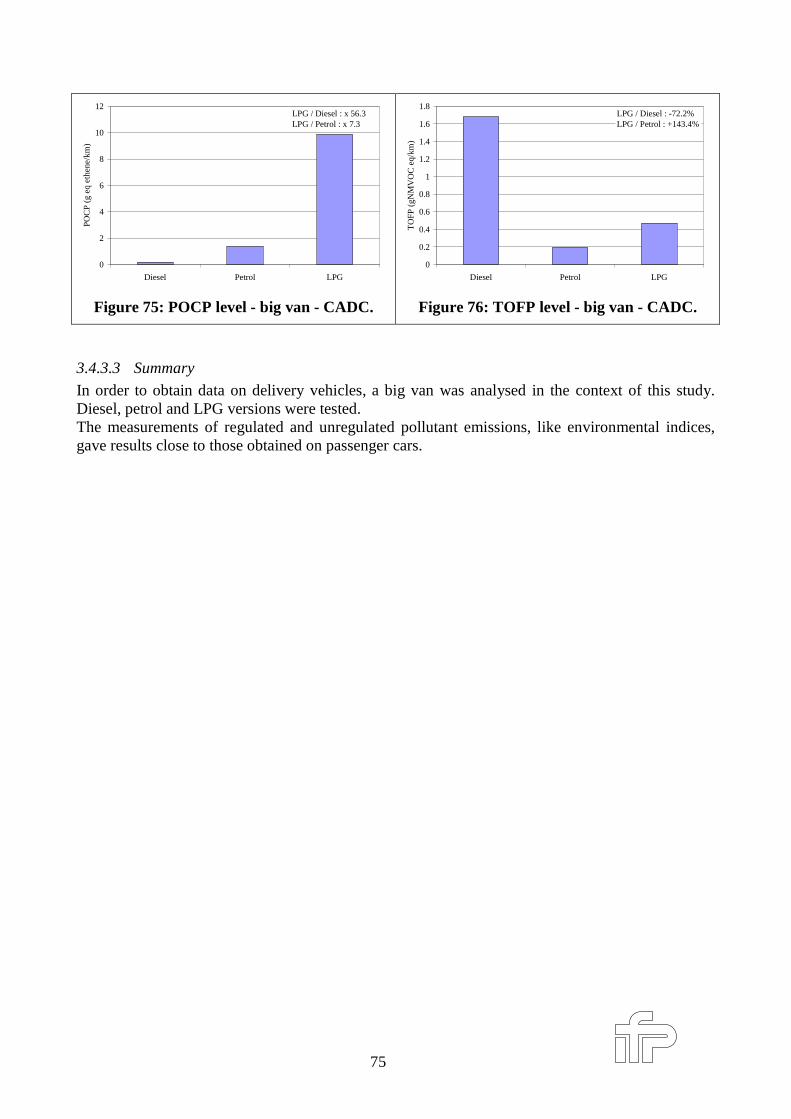
75
0
2
4
6
8
10
12
Diesel Petrol LPG
POC
P (g
eq
ethe
ne/k
m)
LPG / Diesel : x 56.3LPG / Petrol : x 7.3
Figure 75: POCP level - big van - CADC.
0
0.2
0.4
0.6
0.8
1
1.2
1.4
1.6
1.8
Diesel Petrol LPG
TO
FP (
gNM
VO
C e
q/km
)
LPG / Diesel : -72.2%LPG / Petrol : +143.4%
Figure 76: TOFP level - big van - CADC.
3.4.3.3 Summary
In order to obtain data on delivery vehicles, a big van was analysed in the context of this study.Diesel, petrol and LPG versions were tested.The measurements of regulated and unregulated pollutant emissions, like environmental indices,gave results close to those obtained on passenger cars.
76
4 Summary of main results obtainedThe following tables and diagrams summarise the main impact of LPG.
4.1.1 TablesIn each case, the increase or decrease of the parameter compared with diesel or petrol has beenquantified. The reliability of the comparison was also tabulated ("high rel.", "average rel." or "lowrel.") estimated according to the measurement reliability, the number of vehicles tested, thereliability or the calculation method…
LPG versus Diesel LPG versus petrolRegulated pollutant emissions
CO ↑↑↑ (high rel.) ↑ (high rel.)HC ↑↑ (low rel.) ~ (low rel.)NOx ↓↓↓ (high rel.) ↓↓ (high rel.)PM ↓↓↓ (high rel.) n.s.CO2 ↑ (high rel.) ↓ (high rel.)
NO2 ↓↓ (high rel.) ~ (high rel.)Formaldehyde ↓↓↓ (average rel.) ~ (average rel.)Acetaldehyde ↓↓↓ (average rel.) ~ (average rel.)Benzene ↑ (low rel.) ↓↓ (low rel.)1,3-butadiene n.s. n.s.
Total - -"2A" - -
MSAT(MobileSource Air-Toxics, asdefined byEPA)
PAH
"2B" - -Cancer Unit Risk Index - -
POCP - -TOFP - -Acidification Potential - -
Global Warming Potential(2001)
- -
Well to Wheel CO2 - -
Table 4: Summary of the results obtained on the NEDC
77
LPG versus Diesel LPG versus petrolRegulated pollutant emissions
CO ↑↑↑ (high rel.) ↑↑ (high rel.)HC ↑ (average rel.) ↑↑ (average rel.)NOx ↓↓↓ (high rel.) ↓↓↓ (high rel.)PM ↓↓↓ (high rel. n.s.
CO2 ~ (high rel.) ↓↓ (high rel.)
NO2 ↓↓ (high rel.) ~ (high rel.)Formaldehyde ↓↓↓ (average rel.) ↓↓↓ (average rel.)Acetaldehyde ↓↓↓ (average rel.) ↓↓ (average rel.)Benzene ↓↓ (average rel.) ↓↓↓ (high rel.)1,3-butadiene n.s. n.s.
Total ↓↓ (low rel.) ↓↓↓ (low rel.)"2A" ↓↓ (low rel.) ↓↓ (low rel.)
MSAT(MobileSource Air-Toxics, asdefined byEPA)
PAH
"2B" ↓↓↓ (low rel.) ↓↓↓ (low rel.)Cancer Unit Risk Index ↓↓↓ (high rel.) ↓↓ (high rel.)
POCP ↑↑↑ (high rel.) ~ (high rel.)TOFP ↓↓↓ (high rel.) ↓↓ (high rel.)Acidification Potential ↓↓↓ (low rel.) ↑↑↑ (low rel.)
Global Warming Potential(2001)
~ (high rel.) ↓↓ (high rel.)
Well to Wheel CO2 ~ (low rel.) ↓↓ (low rel.)
Table 5: Summary of the results obtained on the CADC
4.1.2 Diagrams
The diagrams below show, for the main emissions (NOx, CO, HC, Particulates and CO2), therespective levels of each type of vehicle (petrol, LPG and diesel). Error bars are calculatedaccording to the 95% confidence interval by including all the vehicles.
78
0
0.2
0.4
0.6
0.8
1
1.2
1.4
0 0.02 0.04 0.06 0.08 0.1 0.12
HC (g/km)
CO
(g/
km)
LPGPetrolDiesel
0
0.5
1
1.5
2
2.5
0 0.005 0.01 0.015 0.02
HC (g/km)
CO
(g/
km)
LPGPetrolDiesel
0
0.005
0.01
0.015
0.02
0.025
0.03
0.035
0.04
0 0.1 0.2 0.3 0.4 0.5
NOx (g/km)
PM
(g/
km)
LPGPetrolDiesel
0
0.01
0.02
0.03
0.04
0.05
0.06
0 0.2 0.4 0.6 0.8 1 1.2
NOx (g/km)
PM (
g/km
)
LPGPetrolDiesel
120
130
140
150
160
170
180
190
200
210
0 0.1 0.2 0.3 0.4 0.5
NOx (g/km)
CO
2 (g
/km
)
LPGPetrolDiesel
120
130
140
150
160
170
180
190
200
0 0.2 0.4 0.6 0.8 1 1.2
NOx (g/km)
CO
2 (g
/km
)
LPGPetrolDiesel
Table 6 : Compar ison of main emissions for Petrol, LPG and diesel on the NEDC (left) andCADC (r ight).
0
0.5
1
1.5
2
2.5
3
0 0.5 1 1.5 2 2.5 3 3.5 4
Formaldehyde (mg/km)
Ace
tald
ehyd
e (m
g/km
)
LPGPetrolDiesel
0
0.05
0.1
0.15
0.2
0.25
0.3
0.35
0.4
0.45
0 0.2 0.4 0.6 0.8 1 1.2 1.4
Formaldehyde (mg/km)
Ace
tald
ehyd
e (m
g/km
)
LPGPetrolDiesel
Table 7 : Compar ison of main unregulated emissions for petrol, LPG and diesel on theCADC.
79
5 Main conclusion
Fuels and engines used in road transportation have to face two main challenges in a highlycompetitive economy:• the reduction of pollutant emission levels to such values that air quality in cities complies with
World Health Organisation standards• the reduction of carbon dioxide emissions (CO2), considered as being the major greenhouse gas
contributing to global warming and climate change.
Among the technical solutions available to face up to these two challenges, the use of automotiveLPG deserved to be further investigated. Indeed, the potential of this gas to reduce CO2 emissionsis important due to its high H/C ratio. Moreover, its simple chemical composition seems apromising way to reduce the emissions of some significant pollutant.In order to compare the emission levels of vehicles currently sold in Europe, which run on each ofthe three fuels - diesel, petrol or LPG - the programme designed to update data on regulated andnon regulated emissions was developed by the LPG industry and environmental /governmentalbodies, all over Europe and implemented in four laboratories.This programme also aimed at assessing the relative impact of these fuels on the air quality in termsof health and greenhouse effects.A specific test sequence was developed on the basis of the three different driving cycles that arerepresentative of real-life driving conditions. A large number of vehicles sold in Europe were testedon a pan-European basis. LPG vehicles were either produced by car manufacturers or post-equipped under their control.
All the emissions, environmental index and health effect indicators have been compared betweeneach fuel, allowing a more accurate comparison of each technology advantages and drawbacks
The main conclusions are:
• as far as pollutant emissions are concerned, LPG vehicles have significantly lower emissions ofNOx and particulates than diesel vehicles (respectively 95% less and 90% less on the CADC).They also have similar or lower emissions for most non-regulated pollutants compared to dieselvehicles, especially oxygenated compounds (95% less formaldehyde, 70% less acetaldehyde)and benzene (equivalent level LPG / diesel, but 80% less for LPG in comparison with petrol).
• In any event, the CO2 emissions measured for LPG vehicles were much lower than those ofpetrol vehicles and were close to those of diesel vehicles. In certain situations (motorwaycycle), some vehicles even have lower CO2 emissions in LPG than in diesel. It couldconsequently represent a promising way to contribute to the reduction of CO2 emissions.
• The environmental and health effect indicators calculated showed that exhaust emissions fromLPG vehicles had lower cancer index (mainly linked to the lower particulate emission level),acidification potential (due to their lower NOx emission level) and regional ozone formingpotential (TOCP) than diesel vehicles
80
Some points still remain to be optimised, such as :
• CO emissions, that remain higher for LPG vehicles
• HC emissions, which for LPG vehicles are equal compared to petrol on NEDC but slightlyincreased on CADC.
• As far as ozone formation is concerned, the above-mentioned conclusion should be mitigatedwhen considering the local ozone forming potential (POCP) which is higher for LPG vehicles.Moreover, in terms of cancer index, the level of LPG and petrol vehicles can be joined by thediesel ones if equipped with the DPF (Diesel Particulate Filter).
The programme also has shown that LPG engine map tuning is one of the key elements influencingpollutant emissions.Consequently, as long as precise ECU calibration is done, LPG vehicles can be seen as a promisingway to further reduce the main pollutant emissions, especially :
Ø NOx,
Ø Particulates (LPG vehicles are however at the level of the most modern diesel technologieseg: DPF),
Ø Concerning CO and HC it seems that progress can be done with a relevant development onmapping on ECU.
Ø Mobile Source Air Toxics (MSAT)
while limiting the increase in CO2 emissions.
81
6 References
[1] ACEA's CO2 Commitment (05/12/2002), http://www.acea.be/ACEA/brochure_CO2.pdf
[2] "Health Aspects of Air Pollution with Particulate Matter, Ozone and Nitrogen Dioxide", Reporton a WHO (World Health Organization) Working Group, Bonn, Germany, 13-15 January 2003
[3] "Health Effect of Aldehydes and Alcohols in Mobile Source Emissions", in "Air Pollution, TheAutomobile and Public Health", 1988, The National Academy of Sciences.
[4] Schulz, H., Brand, P., and Heyder, J. (2000). Particle deposition in the respiratory tract. InParticle-lung interactions (J. H. Peter Gehr, eds.), pp. 229-290. Marcel Dekker, Inc, New-York.
[5] "Human Respiratory Tract Model for Radiological Protection", Annals of the ICRP, volume 24,ICRP publication 66.
[6] "Characterization of Exhaust Particulate Emissions From Road Vehicles", Z. Samaras, L.Ntziachristos, B. Giechaskiel, Paper presented at the FISITA 2002 conference, June 2-7 2002,Helsinki, Finland
[7] Jeuland N., Dementhon J.B., Momique J.C, Belot G., Plassat G., Corroler P., Bruchet D.,"Performances and durability of DPF (diesel particulate filter) tested on a fleet of Peugeot 607Taxis~First and second test phases results", SAE 2002-01-2790.
[8] Formaldehyde, ENVIRONMENTAL HEALTH CRITERIA 89, 1989, WHO (World HealthOrganisation)
[9] Acetaldehyde, ENVIRONMENTAL HEALTH CRITERIA 1679, 1995, WHO (World HealthOrganisation)
[10]: "Nitrogen Dioxide: Evaluation of current California Air Quality Standards with respect toprotection of Children", California Office of Environmental Health Hazard Assessment
[11] William P. L. Carter: "DEVELOPMENT OF OZONE REACTIVITY SCALES FORVOLATILE ORGANIC COMPOUNDS", Journal of the Air and Waste Management Association,Vol 44, pages 881-899, 1994
[12] M.E. Jenkin & al: "Protocol for the development of the Master Chemical Mechanism, MCMv3 (part A): tropospheric degradation of non-aromatic volatile organic compounds", Atmos. Chem.Phys., 3, 161-180, 2003
[13] M.E. Jenkin & al: "Protocol for the development of the Master Chemical Mechanism, MCMv3 (part A): tropospheric degradation of aromatic volatile organic compounds", Atmos. Chem.Phys., 3, 181-193, 2003
[14] EPEFE: "European Programme on Emissions, Fuels and Engine Technologies", ACEAEuropia
82
[15] "Cancer Risk Ranking of HD vehicles - Comparison between diesel fuels and CNG usingdifferent unit risk factors" - Ecotraffic ERD, August 2000.
[16] "Automotive Fuels for the Future - The search for Alternative" - report from IAE(International Energy Agency).
[17] GM Well-To-Wheel Analysis of Energy Use and Greenhouse Gas Emissions of AdvancedFuel / Vehicle Systems - A European Study", L-BlSystemtechnik GmBH, September 2002.
[18] "Well-To-Wheels analysis of Future automotive fuels and powertrains in the Europeancontext", CONCAWE, EUCAR, JRC, December 2003
[19] "bilans énergétiques et gaz à effet de serre des filières de production de biocarburants enFrance", ADEME, DIREM, September 2002

83
7 Appendices
84
7.1 Fuel analysismethod Result Unit
Density (15°C) EN ISO 3675 751 kg/m3PVSE EN 13016-1 600 mbarDistillation:IBP 38 °C5% 46 °C10% 51 °C20% 57 °C30% 65 °C40% 77 °C50% 93 °C60% 109 °C70% 122 °C80% 141 °C90% 171 °C95% 185 °CFBP 194 °CResidue 1 %(V/V)Losses 1.8 %(V/V)E100 55.6 %(V/V)E150
EN ISO 3405
84.4 %(V/V)CompositionSaturates 53.4 %(V/V)Olefins 7.9 %(V/V)Aromatics 32.6 %(V/V)Oxygenates
ASTM D1319-95
6.1 %(V/V)Benzene EN 12177-98 0.5 %(V/V)OctaneRON EN 25164-93 96.8MON EN 25163-93 86
Oxidation stability EN ISO 7536 >480 minExistent Gum EN ISO 6246 <4 mg/100 mlSulfur content EN ISO 20846 64 mg/kgPhosphorus content ASTM D3231 <0.0013 g/lLead content EN 237-96 <0.005 g/lCopper Corrosion 3h, 50°C ISO 2160 <1C/H Ratio GPC 6.53Calorific Value 10119 kcal/kg%C 85.8 %(m/m)%H 13.1 %(m/m)%O 1.06 %(m/m)
Table 8: petrol analysis.
85
Characteristics Method Result UnitDensity @ 15°C EN ISO 3675 841.9 kg/m3Flash Point EN 22719 85.5 °CCloud Point EN 23015 1 °CPour Point -9 °CCold Filter Plugging Point EN 116 -7 °CAcidity index ASTM D664 0.02 gKOH/gSulfur content EN ISO 14596 35 mg/kgViscosity @ 20°C EN ISO 3104 6.187 mm2/sViscosity @ 40°C EN ISO 3104 3.731 mm2/sWater content EN ISO 12937 163 % mg/kgAshes EN ISO 6245 < 0.01 % weightConradson Carbon residue EN ISO 10370 0.050 % weightGross Heating Value ASTM D240 45970 kJ/kgNet Heating Value Calculated 43130 kJ/kgDistillationInitial Point 200.6 °C5% 228.9 °C10% 245.2 °C20% 261.3 °C30% 274.7 °C40% 284.7 °C50% 294.060% 303.1 °C70% 313.5 °C80% 326.0 °C90% 343.3 °C95% 358.2 °CFinal Point 364.2 °CDistillated fraction 97.6 % volumeResidue 1.6 % volumeLosses
EN ISO 3104
0.7 % volumeElementary AnalysisCarbon 85.87 % m/mHydrogen
ASTM D529113.46 %
Oxygen ESTM D 5622 0.35 %H/C ratio Calculated 1.87O/C ratio Calculated 0.0031Chemical compositionAromatics 29.60 %(v/v)Saturated compounds 70.40 %(v/v)
Measured Cetane number EN ISO 5165 54.8
Table 9: Diesel fuel analysis.
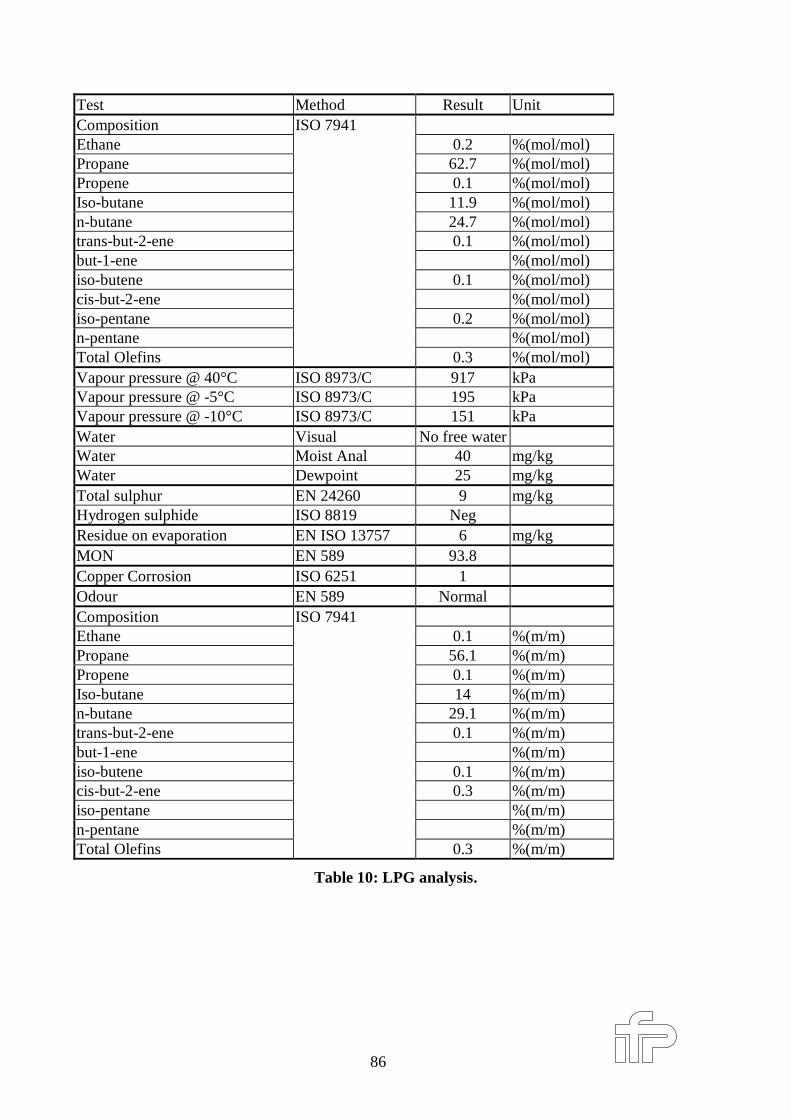
86
Test Method Result UnitCompositionEthane 0.2 %(mol/mol)Propane 62.7 %(mol/mol)Propene 0.1 %(mol/mol)Iso-butane 11.9 %(mol/mol)n-butane 24.7 %(mol/mol)trans-but-2-ene 0.1 %(mol/mol)but-1-ene %(mol/mol)iso-butene 0.1 %(mol/mol)cis-but-2-ene %(mol/mol)iso-pentane 0.2 %(mol/mol)n-pentane %(mol/mol)Total Olefins
ISO 7941
0.3 %(mol/mol)Vapour pressure @ 40°C ISO 8973/C 917 kPaVapour pressure @ -5°C ISO 8973/C 195 kPaVapour pressure @ -10°C ISO 8973/C 151 kPaWater Visual No free waterWater Moist Anal 40 mg/kgWater Dewpoint 25 mg/kgTotal sulphur EN 24260 9 mg/kgHydrogen sulphide ISO 8819 NegResidue on evaporation EN ISO 13757 6 mg/kgMON EN 589 93.8Copper Corrosion ISO 6251 1Odour EN 589 NormalCompositionEthane 0.1 %(m/m)Propane 56.1 %(m/m)Propene 0.1 %(m/m)Iso-butane 14 %(m/m)n-butane 29.1 %(m/m)trans-but-2-ene 0.1 %(m/m)but-1-ene %(m/m)iso-butene 0.1 %(m/m)cis-but-2-ene 0.3 %(m/m)iso-pentane %(m/m)n-pentane %(m/m)Total Olefins
ISO 7941
0.3 %(m/m)
Table 10: LPG analysis.
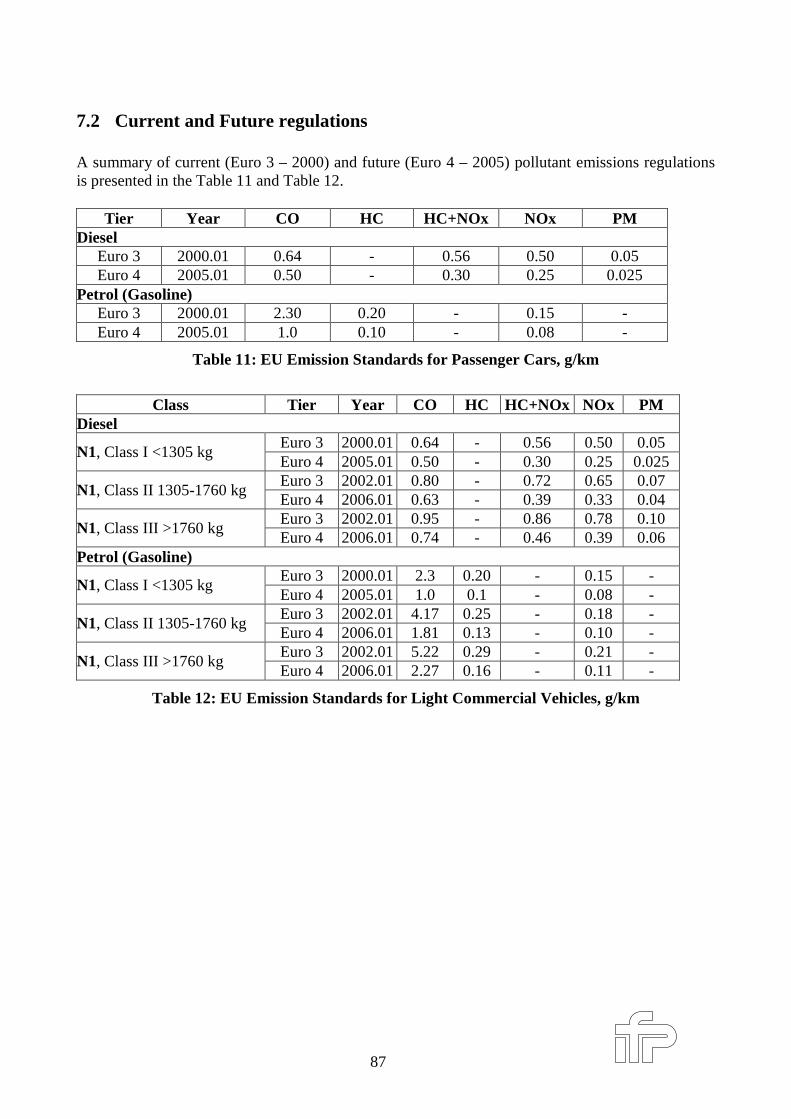
87
7.2 Current and Future regulations
A summary of current (Euro 3 – 2000) and future (Euro 4 – 2005) pollutant emissions regulationsis presented in the Table 11 and Table 12.
Tier Year CO HC HC+NOx NOx PMDiesel
Euro 3 2000.01 0.64 - 0.56 0.50 0.05Euro 4 2005.01 0.50 - 0.30 0.25 0.025
Petrol (Gasoline)Euro 3 2000.01 2.30 0.20 - 0.15 -Euro 4 2005.01 1.0 0.10 - 0.08 -
Table 11: EU Emission Standards for Passenger Cars, g/km
Class Tier Year CO HC HC+NOx NOx PMDiesel
Euro 3 2000.01 0.64 - 0.56 0.50 0.05N1, Class I <1305 kg
Euro 4 2005.01 0.50 - 0.30 0.25 0.025Euro 3 2002.01 0.80 - 0.72 0.65 0.07
N1, Class II 1305-1760 kgEuro 4 2006.01 0.63 - 0.39 0.33 0.04Euro 3 2002.01 0.95 - 0.86 0.78 0.10
N1, Class III >1760 kgEuro 4 2006.01 0.74 - 0.46 0.39 0.06
Petrol (Gasoline)Euro 3 2000.01 2.3 0.20 - 0.15 -
N1, Class I <1305 kgEuro 4 2005.01 1.0 0.1 - 0.08 -Euro 3 2002.01 4.17 0.25 - 0.18 -
N1, Class II 1305-1760 kgEuro 4 2006.01 1.81 0.13 - 0.10 -Euro 3 2002.01 5.22 0.29 - 0.21 -
N1, Class III >1760 kgEuro 4 2006.01 2.27 0.16 - 0.11 -
Table 12: EU Emission Standards for L ight Commercial Vehicles, g/km
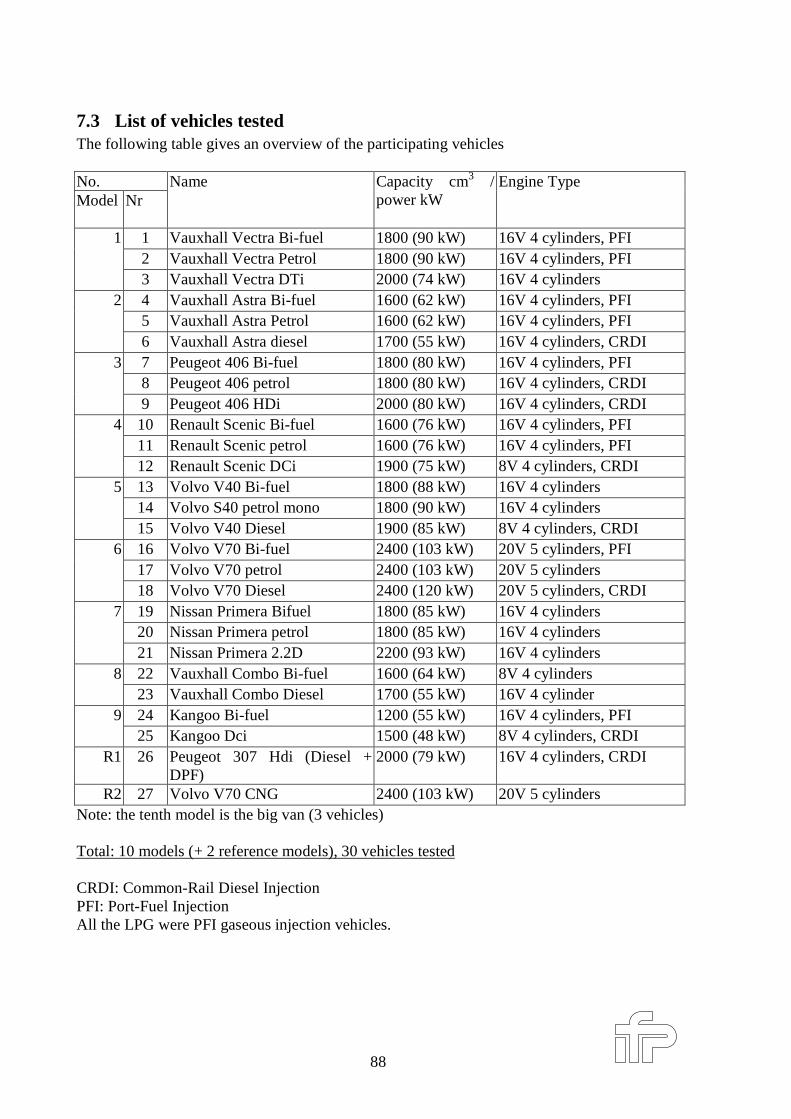
88
7.3 List of vehicles testedThe following table gives an overview of the participating vehicles
No.Model Nr
Name Capacity cm3 /power kW
Engine Type
1 Vauxhall Vectra Bi-fuel 1800 (90 kW) 16V 4 cylinders, PFI2 Vauxhall Vectra Petrol 1800 (90 kW) 16V 4 cylinders, PFI
1
3 Vauxhall Vectra DTi 2000 (74 kW) 16V 4 cylinders4 Vauxhall Astra Bi-fuel 1600 (62 kW) 16V 4 cylinders, PFI5 Vauxhall Astra Petrol 1600 (62 kW) 16V 4 cylinders, PFI
2
6 Vauxhall Astra diesel 1700 (55 kW) 16V 4 cylinders, CRDI7 Peugeot 406 Bi-fuel 1800 (80 kW) 16V 4 cylinders, PFI8 Peugeot 406 petrol 1800 (80 kW) 16V 4 cylinders, CRDI
3
9 Peugeot 406 HDi 2000 (80 kW) 16V 4 cylinders, CRDI10 Renault Scenic Bi-fuel 1600 (76 kW) 16V 4 cylinders, PFI11 Renault Scenic petrol 1600 (76 kW) 16V 4 cylinders, PFI
4
12 Renault Scenic DCi 1900 (75 kW) 8V 4 cylinders, CRDI13 Volvo V40 Bi-fuel 1800 (88 kW) 16V 4 cylinders14 Volvo S40 petrol mono 1800 (90 kW) 16V 4 cylinders
5
15 Volvo V40 Diesel 1900 (85 kW) 8V 4 cylinders, CRDI16 Volvo V70 Bi-fuel 2400 (103 kW) 20V 5 cylinders, PFI17 Volvo V70 petrol 2400 (103 kW) 20V 5 cylinders
6
18 Volvo V70 Diesel 2400 (120 kW) 20V 5 cylinders, CRDI19 Nissan Primera Bifuel 1800 (85 kW) 16V 4 cylinders20 Nissan Primera petrol 1800 (85 kW) 16V 4 cylinders
7
21 Nissan Primera 2.2D 2200 (93 kW) 16V 4 cylinders22 Vauxhall Combo Bi-fuel 1600 (64 kW) 8V 4 cylinders823 Vauxhall Combo Diesel 1700 (55 kW) 16V 4 cylinder24 Kangoo Bi-fuel 1200 (55 kW) 16V 4 cylinders, PFI925 Kangoo Dci 1500 (48 kW) 8V 4 cylinders, CRDI
R1 26 Peugeot 307 Hdi (Diesel +DPF)
2000 (79 kW) 16V 4 cylinders, CRDI
R2 27 Volvo V70 CNG 2400 (103 kW) 20V 5 cylindersNote: the tenth model is the big van (3 vehicles)
Total: 10 models (+ 2 reference models), 30 vehicles tested
CRDI: Common-Rail Diesel InjectionPFI: Port-Fuel InjectionAll the LPG were PFI gaseous injection vehicles.
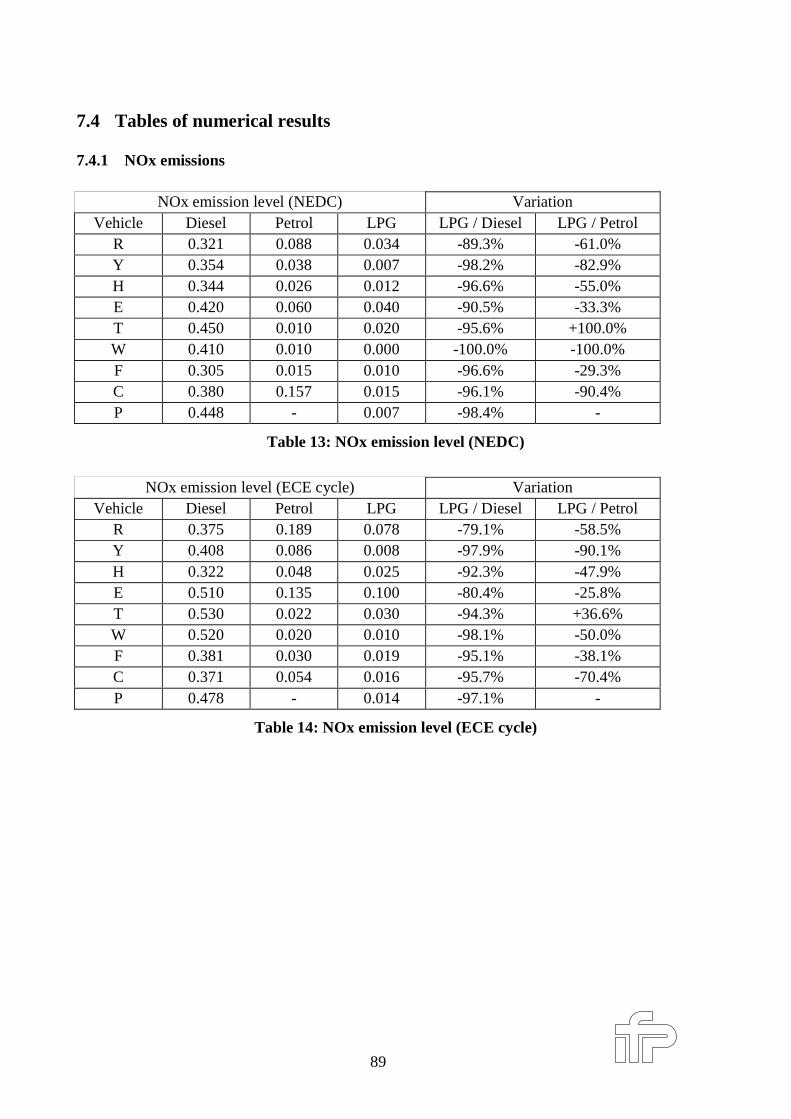
89
7.4 Tables of numer ical results
7.4.1 NOx emissions
NOx emission level (NEDC) VariationVehicle Diesel Petrol LPG LPG / Diesel LPG / Petrol
R 0.321 0.088 0.034 -89.3% -61.0%Y 0.354 0.038 0.007 -98.2% -82.9%H 0.344 0.026 0.012 -96.6% -55.0%E 0.420 0.060 0.040 -90.5% -33.3%T 0.450 0.010 0.020 -95.6% +100.0%W 0.410 0.010 0.000 -100.0% -100.0%F 0.305 0.015 0.010 -96.6% -29.3%C 0.380 0.157 0.015 -96.1% -90.4%P 0.448 - 0.007 -98.4% -
Table 13: NOx emission level (NEDC)
NOx emission level (ECE cycle) VariationVehicle Diesel Petrol LPG LPG / Diesel LPG / Petrol
R 0.375 0.189 0.078 -79.1% -58.5%Y 0.408 0.086 0.008 -97.9% -90.1%H 0.322 0.048 0.025 -92.3% -47.9%E 0.510 0.135 0.100 -80.4% -25.8%T 0.530 0.022 0.030 -94.3% +36.6%W 0.520 0.020 0.010 -98.1% -50.0%F 0.381 0.030 0.019 -95.1% -38.1%C 0.371 0.054 0.016 -95.7% -70.4%P 0.478 - 0.014 -97.1% -
Table 14: NOx emission level (ECE cycle)
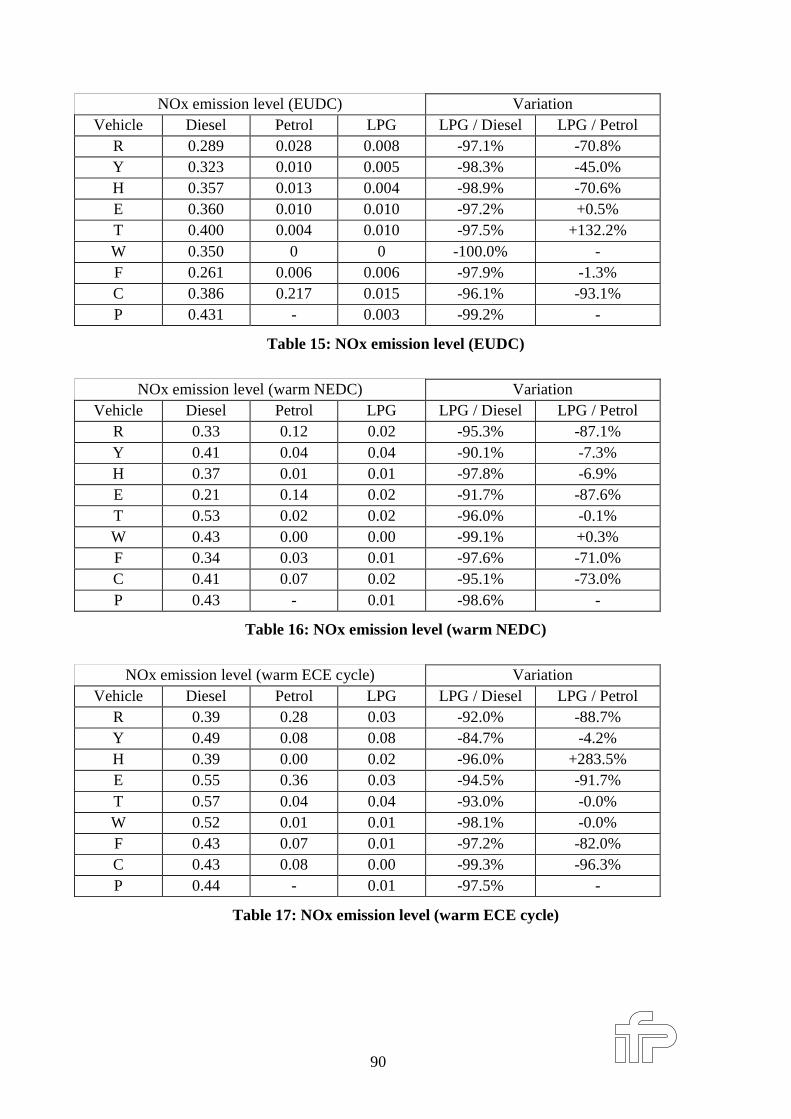
90
NOx emission level (EUDC) VariationVehicle Diesel Petrol LPG LPG / Diesel LPG / Petrol
R 0.289 0.028 0.008 -97.1% -70.8%Y 0.323 0.010 0.005 -98.3% -45.0%H 0.357 0.013 0.004 -98.9% -70.6%E 0.360 0.010 0.010 -97.2% +0.5%T 0.400 0.004 0.010 -97.5% +132.2%W 0.350 0 0 -100.0% -F 0.261 0.006 0.006 -97.9% -1.3%C 0.386 0.217 0.015 -96.1% -93.1%P 0.431 - 0.003 -99.2% -
Table 15: NOx emission level (EUDC)
NOx emission level (warm NEDC) VariationVehicle Diesel Petrol LPG LPG / Diesel LPG / Petrol
R 0.33 0.12 0.02 -95.3% -87.1%Y 0.41 0.04 0.04 -90.1% -7.3%H 0.37 0.01 0.01 -97.8% -6.9%E 0.21 0.14 0.02 -91.7% -87.6%T 0.53 0.02 0.02 -96.0% -0.1%W 0.43 0.00 0.00 -99.1% +0.3%F 0.34 0.03 0.01 -97.6% -71.0%C 0.41 0.07 0.02 -95.1% -73.0%P 0.43 - 0.01 -98.6% -
Table 16: NOx emission level (warm NEDC)
NOx emission level (warm ECE cycle) VariationVehicle Diesel Petrol LPG LPG / Diesel LPG / Petrol
R 0.39 0.28 0.03 -92.0% -88.7%Y 0.49 0.08 0.08 -84.7% -4.2%H 0.39 0.00 0.02 -96.0% +283.5%E 0.55 0.36 0.03 -94.5% -91.7%T 0.57 0.04 0.04 -93.0% -0.0%W 0.52 0.01 0.01 -98.1% -0.0%F 0.43 0.07 0.01 -97.2% -82.0%C 0.43 0.08 0.00 -99.3% -96.3%P 0.44 - 0.01 -97.5% -
Table 17: NOx emission level (warm ECE cycle)
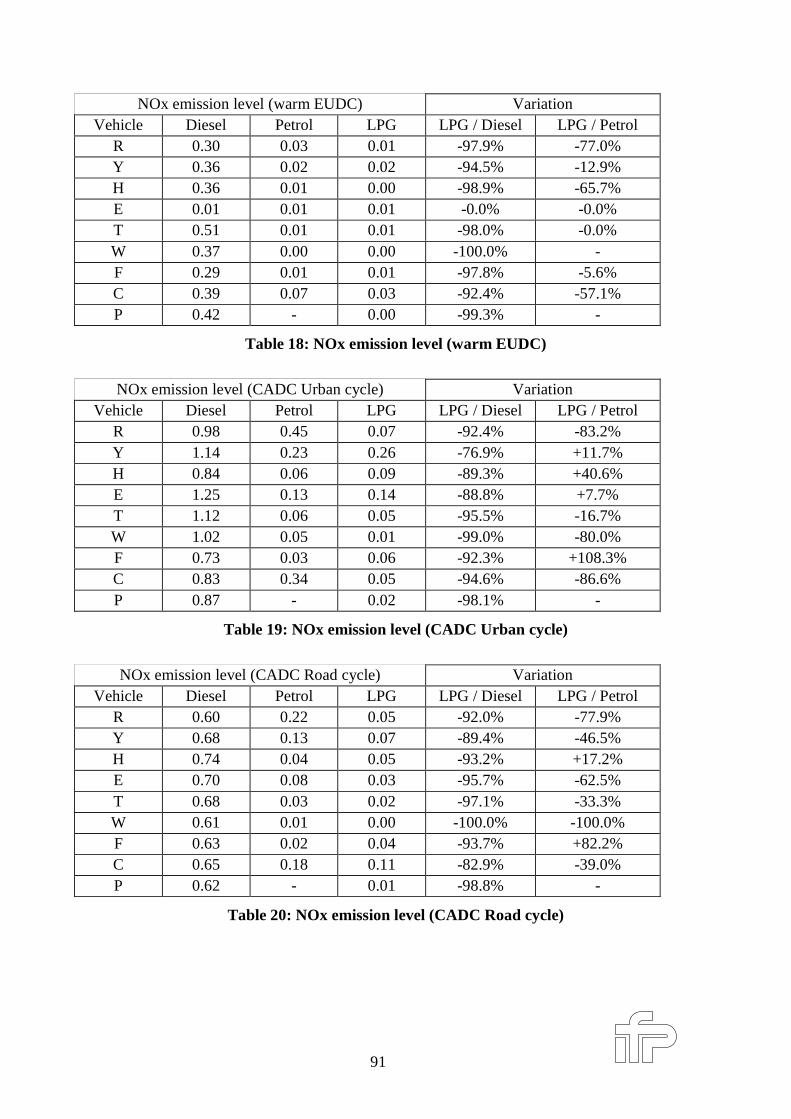
91
NOx emission level (warm EUDC) VariationVehicle Diesel Petrol LPG LPG / Diesel LPG / Petrol
R 0.30 0.03 0.01 -97.9% -77.0%Y 0.36 0.02 0.02 -94.5% -12.9%H 0.36 0.01 0.00 -98.9% -65.7%E 0.01 0.01 0.01 -0.0% -0.0%T 0.51 0.01 0.01 -98.0% -0.0%W 0.37 0.00 0.00 -100.0% -F 0.29 0.01 0.01 -97.8% -5.6%C 0.39 0.07 0.03 -92.4% -57.1%P 0.42 - 0.00 -99.3% -
Table 18: NOx emission level (warm EUDC)
NOx emission level (CADC Urban cycle) VariationVehicle Diesel Petrol LPG LPG / Diesel LPG / Petrol
R 0.98 0.45 0.07 -92.4% -83.2%Y 1.14 0.23 0.26 -76.9% +11.7%H 0.84 0.06 0.09 -89.3% +40.6%E 1.25 0.13 0.14 -88.8% +7.7%T 1.12 0.06 0.05 -95.5% -16.7%W 1.02 0.05 0.01 -99.0% -80.0%F 0.73 0.03 0.06 -92.3% +108.3%C 0.83 0.34 0.05 -94.6% -86.6%P 0.87 - 0.02 -98.1% -
Table 19: NOx emission level (CADC Urban cycle)
NOx emission level (CADC Road cycle) VariationVehicle Diesel Petrol LPG LPG / Diesel LPG / Petrol
R 0.60 0.22 0.05 -92.0% -77.9%Y 0.68 0.13 0.07 -89.4% -46.5%H 0.74 0.04 0.05 -93.2% +17.2%E 0.70 0.08 0.03 -95.7% -62.5%T 0.68 0.03 0.02 -97.1% -33.3%W 0.61 0.01 0.00 -100.0% -100.0%F 0.63 0.02 0.04 -93.7% +82.2%C 0.65 0.18 0.11 -82.9% -39.0%P 0.62 - 0.01 -98.8% -
Table 20: NOx emission level (CADC Road cycle)
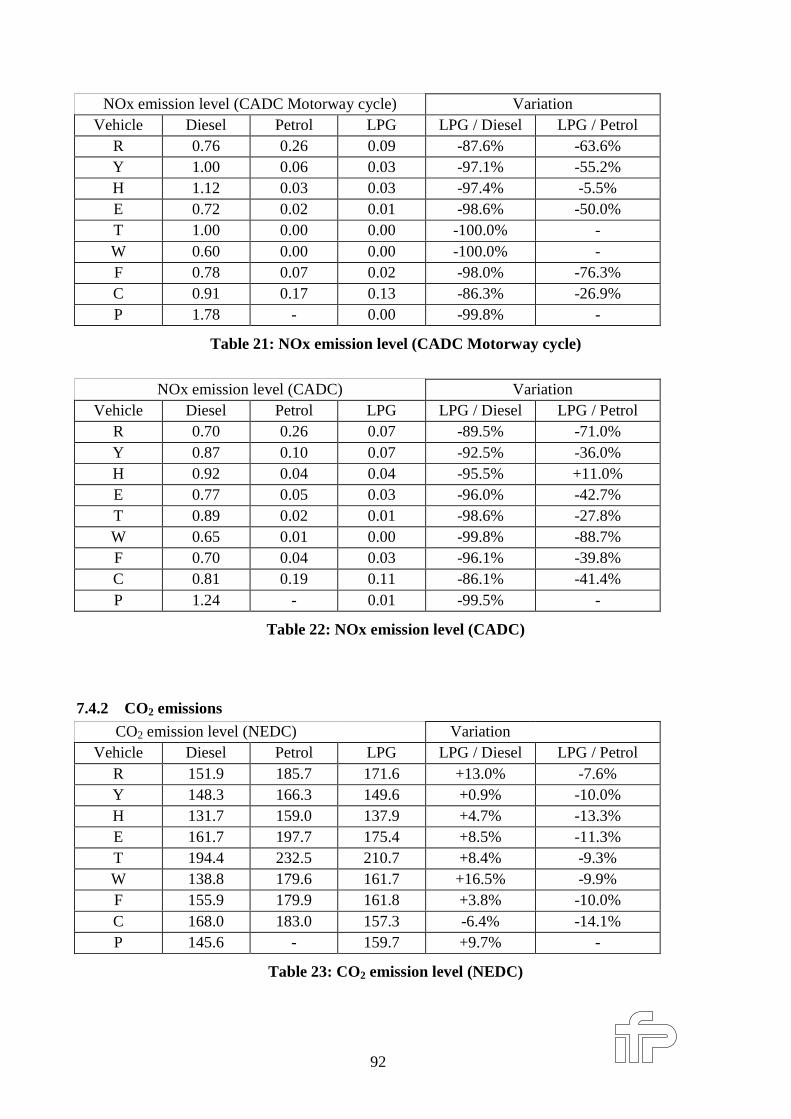
92
NOx emission level (CADC Motorway cycle) VariationVehicle Diesel Petrol LPG LPG / Diesel LPG / Petrol
R 0.76 0.26 0.09 -87.6% -63.6%Y 1.00 0.06 0.03 -97.1% -55.2%H 1.12 0.03 0.03 -97.4% -5.5%E 0.72 0.02 0.01 -98.6% -50.0%T 1.00 0.00 0.00 -100.0% -W 0.60 0.00 0.00 -100.0% -F 0.78 0.07 0.02 -98.0% -76.3%C 0.91 0.17 0.13 -86.3% -26.9%P 1.78 - 0.00 -99.8% -
Table 21: NOx emission level (CADC Motorway cycle)
NOx emission level (CADC) VariationVehicle Diesel Petrol LPG LPG / Diesel LPG / Petrol
R 0.70 0.26 0.07 -89.5% -71.0%Y 0.87 0.10 0.07 -92.5% -36.0%H 0.92 0.04 0.04 -95.5% +11.0%E 0.77 0.05 0.03 -96.0% -42.7%T 0.89 0.02 0.01 -98.6% -27.8%W 0.65 0.01 0.00 -99.8% -88.7%F 0.70 0.04 0.03 -96.1% -39.8%C 0.81 0.19 0.11 -86.1% -41.4%P 1.24 - 0.01 -99.5% -
Table 22: NOx emission level (CADC)
7.4.2 CO2 emissions
CO2 emission level (NEDC) VariationVehicle Diesel Petrol LPG LPG / Diesel LPG / Petrol
R 151.9 185.7 171.6 +13.0% -7.6%Y 148.3 166.3 149.6 +0.9% -10.0%H 131.7 159.0 137.9 +4.7% -13.3%E 161.7 197.7 175.4 +8.5% -11.3%T 194.4 232.5 210.7 +8.4% -9.3%W 138.8 179.6 161.7 +16.5% -9.9%F 155.9 179.9 161.8 +3.8% -10.0%C 168.0 183.0 157.3 -6.4% -14.1%P 145.6 - 159.7 +9.7% -
Table 23: CO2 emission level (NEDC)
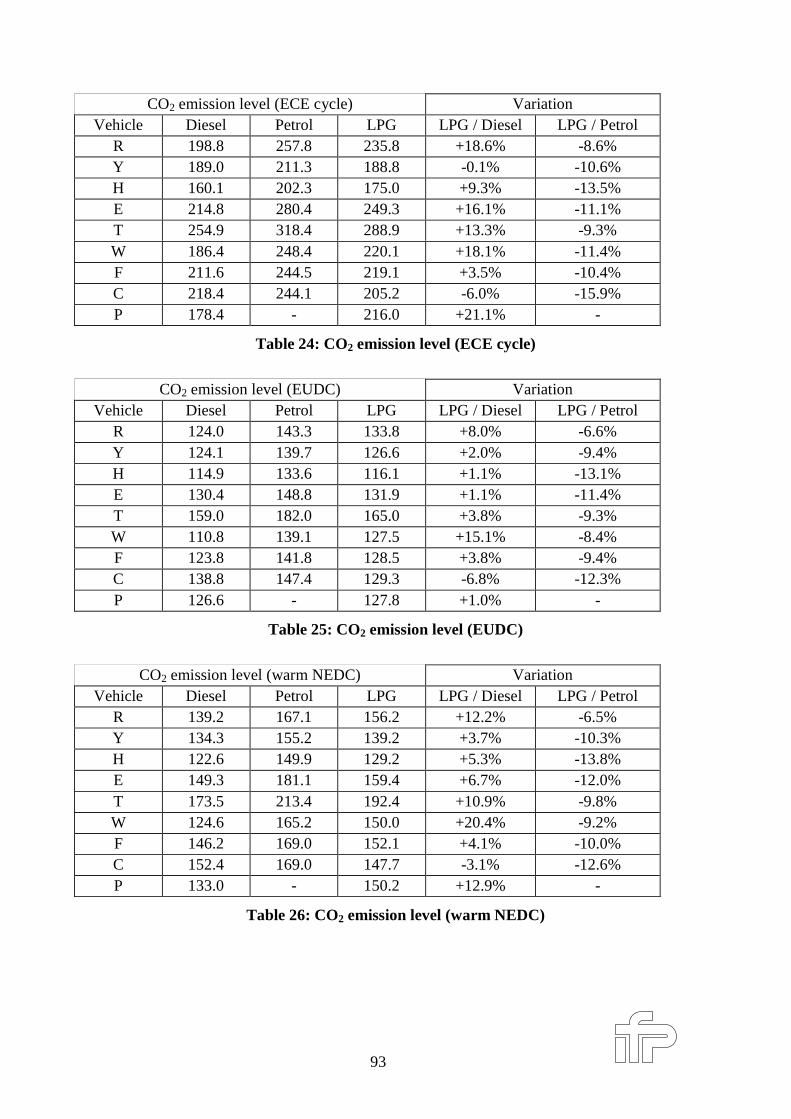
93
CO2 emission level (ECE cycle) VariationVehicle Diesel Petrol LPG LPG / Diesel LPG / Petrol
R 198.8 257.8 235.8 +18.6% -8.6%Y 189.0 211.3 188.8 -0.1% -10.6%H 160.1 202.3 175.0 +9.3% -13.5%E 214.8 280.4 249.3 +16.1% -11.1%T 254.9 318.4 288.9 +13.3% -9.3%W 186.4 248.4 220.1 +18.1% -11.4%F 211.6 244.5 219.1 +3.5% -10.4%C 218.4 244.1 205.2 -6.0% -15.9%P 178.4 - 216.0 +21.1% -
Table 24: CO2 emission level (ECE cycle)
CO2 emission level (EUDC) VariationVehicle Diesel Petrol LPG LPG / Diesel LPG / Petrol
R 124.0 143.3 133.8 +8.0% -6.6%Y 124.1 139.7 126.6 +2.0% -9.4%H 114.9 133.6 116.1 +1.1% -13.1%E 130.4 148.8 131.9 +1.1% -11.4%T 159.0 182.0 165.0 +3.8% -9.3%W 110.8 139.1 127.5 +15.1% -8.4%F 123.8 141.8 128.5 +3.8% -9.4%C 138.8 147.4 129.3 -6.8% -12.3%P 126.6 - 127.8 +1.0% -
Table 25: CO2 emission level (EUDC)
CO2 emission level (warm NEDC) VariationVehicle Diesel Petrol LPG LPG / Diesel LPG / Petrol
R 139.2 167.1 156.2 +12.2% -6.5%Y 134.3 155.2 139.2 +3.7% -10.3%H 122.6 149.9 129.2 +5.3% -13.8%E 149.3 181.1 159.4 +6.7% -12.0%T 173.5 213.4 192.4 +10.9% -9.8%W 124.6 165.2 150.0 +20.4% -9.2%F 146.2 169.0 152.1 +4.1% -10.0%C 152.4 169.0 147.7 -3.1% -12.6%P 133.0 - 150.2 +12.9% -
Table 26: CO2 emission level (warm NEDC)
94
CO2 emission level (warm ECE cycle) VariationVehicle Diesel Petrol LPG LPG / Diesel LPG / Petrol
R 171.7 215.4 198.5 +15.6% -7.8%Y 161.4 186.2 166.3 +3.0% -10.7%H 142.1 180.5 155.1 +9.2% -14.0%E 185.2 237.2 212.0 +14.5% -10.6%T 211.8 274.5 245.9 +16.1% -10.5%W 153.9 216.4 194.1 +26.1% -10.3%F 181.5 222.6 200.7 +10.6% -9.8%C 183.2 214.3 183.7 +0.3% -14.3%P 150.5 - 195.2 +29.7% -
Table 27: CO2 emission level (warm ECE cycle)
CO2 emission level (warm EUDC) VariationVehicle Diesel Petrol LPG LPG / Diesel LPG / Petrol
R 119.8 138.5 131.3 +9.6% -5.2%Y 118.2 136.8 123.3 +4.3% -9.9%H 111.1 131.9 113.8 +2.5% -13.7%E 128.4 148.0 128.6 +0.1% -13.1%T 151.2 177.5 161.1 +6.6% -9.3%W 107.4 135.0 124.0 +15.4% -8.2%F 125.4 137.9 124.5 -0.7% -9.8%C 134.3 142.4 126.5 -5.8% -11.1%P 122.3 - 125.0 +2.2% -
Table 28: CO2 emission level (warm EUDC)
CO2 emission level (CADC Urban cycle) VariationVehicle Diesel Petrol LPG LPG / Diesel LPG / Petrol
R 250.3 273.1 246.5 -1.5% -9.7%Y 231.0 254.5 216.3 -6.4% -15.0%H 196.8 240.9 210.2 +6.8% -12.8%E 246.5 280.0 258.8 +5.0% -7.6%T 268.2 360.3 315.7 +17.7% -12.4%W 200.9 268.4 248.5 +23.7% -7.4%F 232.4 287.9 251.8 +8.3% -12.5%C 247.6 271.4 239.5 -3.3% -11.7%P 184.3 - 238.8 +29.5% -
Table 29: CO2 emission level (CADC Urban cycle)
95
CO2 emission level (CADC Road cycle) VariationVehicle Diesel Petrol LPG LPG / Diesel LPG / Petrol
R 142.0 156.4 148.2 +4.4% -5.2%Y 140.5 144.2 130.6 -7.0% -9.4%H 131.7 142.4 122.5 -7.0% -14.0%E 153.7 169.4 151.2 -1.6% -10.7%T 165.0 189.3 180.6 +9.5% -4.6%W 121.6 155.0 142.5 +17.2% -8.1%F 153.8 164.9 145.5 -5.4% -11.7%C 157.4 155.8 140.7 -10.6% -9.7%P 138.4 - 154.4 +11.6% -
Table 30: CO2 emission level (CADC Road cycle)
CO2 emission level (CADC Motorway cycle) VariationVehicle Diesel Petrol LPG LPG / Diesel LPG / Petrol
R 150.9 167.8 159.9 +6.0% -4.7%Y 163.8 176.0 160.8 -1.9% -8.7%H 152.7 166.2 144.1 -5.6% -13.3%E 170.1 174.0 154.2 -9.4% -11.4%T 190.3 219.7 194.8 +2.4% -11.4%W 136.2 159.8 152.9 +12.3% -4.3%F 153.3 163.5 145.2 -5.2% -11.2%C 179.2 180.3 159.1 -11.2% -11.7%P 179.1 - 167.5 -6.5% -
Table 31: CO2 emission level (CADC Motorway cycle)
CO2 emission level (CADC) VariationVehicle Diesel Petrol LPG LPG / Diesel LPG / Petrol
R 152.2 168.3 158.7 +4.3% -5.7%Y 156.7 166.8 150.4 -4.0% -9.9%H 144.5 159.6 138.2 -4.3% -13.4%E 171.7 182.9 163.6 -4.7% -10.5%T 188.6 222.5 201.4 +6.8% -9.5%W 137.2 168.9 158.5 +15.5% -6.2%F 156.2 170.2 151.0 -3.4% -11.3%C 178.0 180.3 160.3 -9.9% -11.1%P 159.9 - 164.3 +2.7% -
Table 32: CO2 emission level (CADC)
96
7.4.3 CO emissions
CO emission level (NEDC) VariationVehicle Diesel Petrol LPG LPG / Diesel LPG / Petrol
R 0.260 0.805 0.711 +173.1% -11.7%Y 0.296 0.861 1.812 x 6 +110.5%H 0.049 0.628 1.231 x 25 +96.2%E 0.070 0.770 0.710 x 10 -7.8%T 0.270 0.680 0.490 +81.5% -27.9%W 0.050 0.490 0.550 x 11 +12.2%F 0.266 0.447 0.519 +95.3% +16.2%C 0.465 1.141 1.525 +228.0% +33.7%P 0.073 - 0.684 x 9 -
Table 33: CO emission level (NEDC)
CO emission level (ECE cycle) VariationVehicle Diesel Petrol LPG LPG / Diesel LPG / Petrol
R 0.697 2.131 1.541 +121.0% -27.7%Y 0.796 2.277 4.859 x 6 +113.4%H 0.132 1.611 3.227 x 25 +100.4%E 0.190 1.994 1.750 x 9 -12.2%T 0.720 1.447 1.050 +45.8% -27.5%W 0.140 0.720 1.200 x 9 +66.7%F 0.660 0.942 0.884 +33.9% -6.2%C 1.266 2.147 2.821 +122.8% +31.4%P 0.193 - 1.117 +477.4% -
Table 34: CO emission level (ECE cycle)
CO emission level (EUDC) VariationVehicle Diesel Petrol LPG LPG / Diesel LPG / Petrol
R 0.000 0.026 0.222 - x 9Y 0.000 0.023 0.018 - -22.4%H 0.000 0.049 0.055 - +11.4%E 0.000 0.043 0.110 - +157.9%T 0.000 0.223 0.150 - -32.6%W 0.000 0.350 0.160 - -54.3%F 0.001 0.157 0.307 x 307 +95.1%C 0.001 0.556 0.770 x 770 +38.5%P 0.003 - 0.435 x 133 -
Table 35: CO emission level (EUDC)
97
CO emission level (warm NEDC) VariationVehicle Diesel Petrol LPG LPG / Diesel LPG / Petrol
R 0.00 0.02 0.41 - x 24Y 0.03 0.09 0.22 x 8 +144.4%H 0.00 0.05 0.08 - +62.9%E 0.00 0.44 0.33 x 89 -24.7%T 0.00 0.31 0.11 - -65.0%W 0.01 0.56 0.15 x 11 -72.9%F 0.01 0.09 0.30 x 52 +226.5%C 0.03 0.55 0.57 x 17 +3.4%P 0.01 - 0.20 x 37 -
Table 36: CO emission level (warm NEDC)
CO emission level (warm ECE cycle) VariationVehicle Diesel Petrol LPG LPG / Diesel LPG / Petrol
R 0.00 0.00 0.41 - -Y 0.07 0.16 0.58 x 8 +267.7%H 0.00 0.07 0.10 - +53.6%E 0.01 1.13 0.67 x 67 -40.7%T 0.00 0.50 0.09 - -82.0%W 0.02 0.09 0.05 +150.0% -44.4%F 0.01 0.02 0.14 x 14 x 9C 0.09 0.56 0.53 x 6 -6.9%P 0.01 - 0.08 x 9 -
Table 37: CO emission level (warm ECE cycle)
CO emission level (warm EUDC) VariationVehicle Diesel Petrol LPG LPG / Diesel LPG / Petrol
R 0.00 0.03 0.40 - x 15Y 0.00 0.05 0.00 - -93.2%H 0.00 0.04 0.07 - +71.1%E 0.00 0.03 0.13 - +333.3%T 0.00 0.20 0.12 - -40.0%W 0.01 0.83 0.21 x 21 -74.7%F 0.00 0.14 0.40 x 127 +189.6%C 0.00 0.54 0.60 x 598 +9.9%P 0.00 - 0.27 x 78 -
Table 38: CO emission level (warm EUDC)
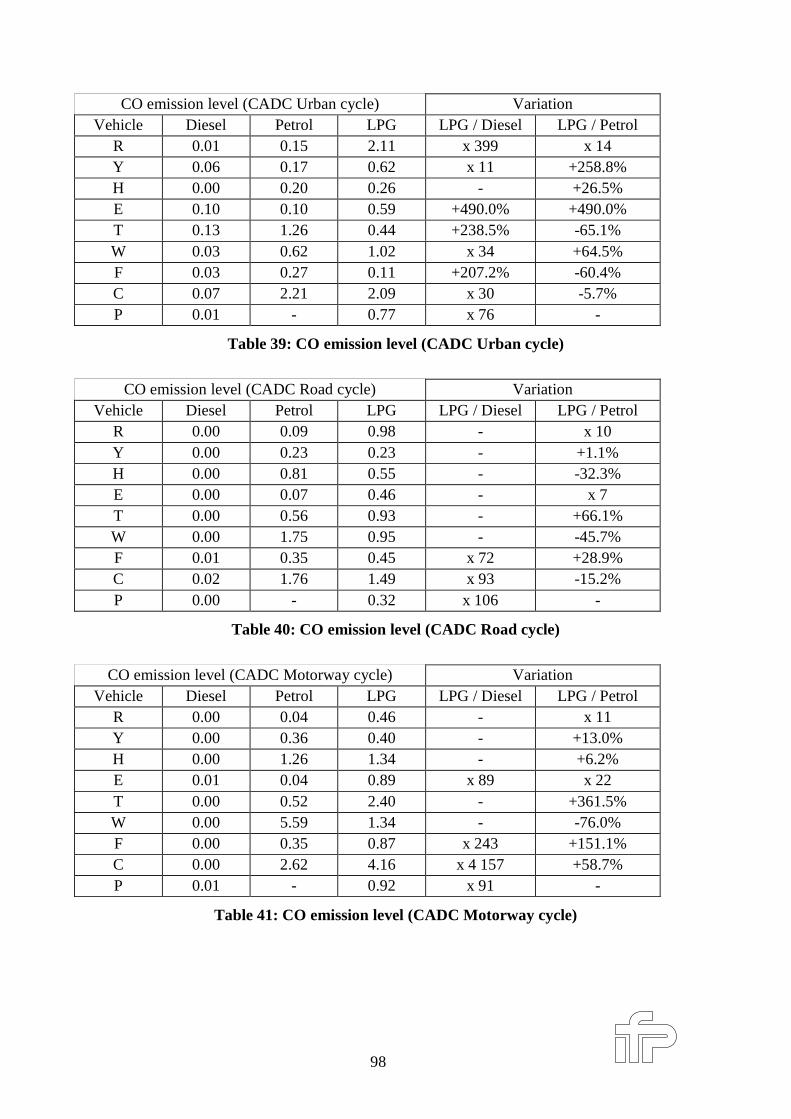
98
CO emission level (CADC Urban cycle) VariationVehicle Diesel Petrol LPG LPG / Diesel LPG / Petrol
R 0.01 0.15 2.11 x 399 x 14Y 0.06 0.17 0.62 x 11 +258.8%H 0.00 0.20 0.26 - +26.5%E 0.10 0.10 0.59 +490.0% +490.0%T 0.13 1.26 0.44 +238.5% -65.1%W 0.03 0.62 1.02 x 34 +64.5%F 0.03 0.27 0.11 +207.2% -60.4%C 0.07 2.21 2.09 x 30 -5.7%P 0.01 - 0.77 x 76 -
Table 39: CO emission level (CADC Urban cycle)
CO emission level (CADC Road cycle) VariationVehicle Diesel Petrol LPG LPG / Diesel LPG / Petrol
R 0.00 0.09 0.98 - x 10Y 0.00 0.23 0.23 - +1.1%H 0.00 0.81 0.55 - -32.3%E 0.00 0.07 0.46 - x 7T 0.00 0.56 0.93 - +66.1%W 0.00 1.75 0.95 - -45.7%F 0.01 0.35 0.45 x 72 +28.9%C 0.02 1.76 1.49 x 93 -15.2%P 0.00 - 0.32 x 10⁶ -
Table 40: CO emission level (CADC Road cycle)
CO emission level (CADC Motorway cycle) VariationVehicle Diesel Petrol LPG LPG / Diesel LPG / Petrol
R 0.00 0.04 0.46 - x 11Y 0.00 0.36 0.40 - +13.0%H 0.00 1.26 1.34 - +6.2%E 0.01 0.04 0.89 x 89 x 22T 0.00 0.52 2.40 - +361.5%W 0.00 5.59 1.34 - -76.0%F 0.00 0.35 0.87 x 243 +151.1%C 0.00 2.62 4.16 x 4 157 +58.7%P 0.01 - 0.92 x 91 -
Table 41: CO emission level (CADC Motorway cycle)
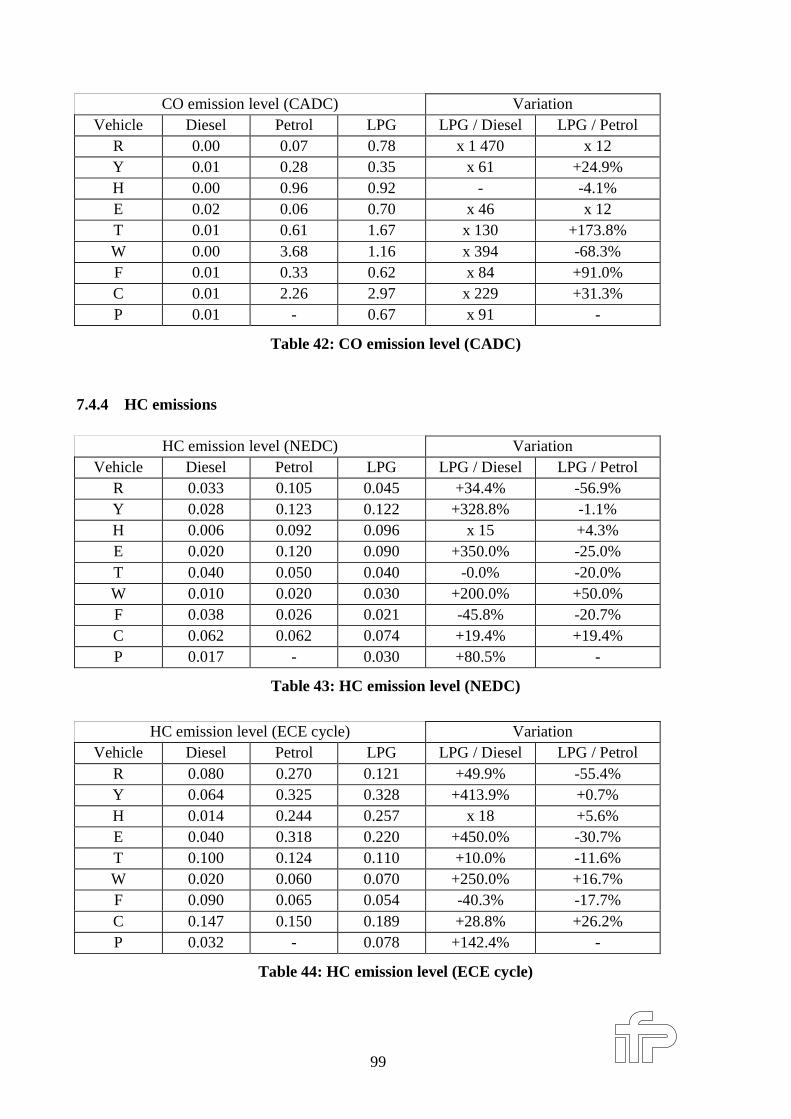
99
CO emission level (CADC) VariationVehicle Diesel Petrol LPG LPG / Diesel LPG / Petrol
R 0.00 0.07 0.78 x 1 470 x 12Y 0.01 0.28 0.35 x 61 +24.9%H 0.00 0.96 0.92 - -4.1%E 0.02 0.06 0.70 x 46 x 12T 0.01 0.61 1.67 x 130 +173.8%W 0.00 3.68 1.16 x 394 -68.3%F 0.01 0.33 0.62 x 84 +91.0%C 0.01 2.26 2.97 x 229 +31.3%P 0.01 - 0.67 x 91 -
Table 42: CO emission level (CADC)
7.4.4 HC emissions
HC emission level (NEDC) VariationVehicle Diesel Petrol LPG LPG / Diesel LPG / Petrol
R 0.033 0.105 0.045 +34.4% -56.9%Y 0.028 0.123 0.122 +328.8% -1.1%H 0.006 0.092 0.096 x 15 +4.3%E 0.020 0.120 0.090 +350.0% -25.0%T 0.040 0.050 0.040 -0.0% -20.0%W 0.010 0.020 0.030 +200.0% +50.0%F 0.038 0.026 0.021 -45.8% -20.7%C 0.062 0.062 0.074 +19.4% +19.4%P 0.017 - 0.030 +80.5% -
Table 43: HC emission level (NEDC)
HC emission level (ECE cycle) VariationVehicle Diesel Petrol LPG LPG / Diesel LPG / Petrol
R 0.080 0.270 0.121 +49.9% -55.4%Y 0.064 0.325 0.328 +413.9% +0.7%H 0.014 0.244 0.257 x 18 +5.6%E 0.040 0.318 0.220 +450.0% -30.7%T 0.100 0.124 0.110 +10.0% -11.6%W 0.020 0.060 0.070 +250.0% +16.7%F 0.090 0.065 0.054 -40.3% -17.7%C 0.147 0.150 0.189 +28.8% +26.2%P 0.032 - 0.078 +142.4% -
Table 44: HC emission level (ECE cycle)
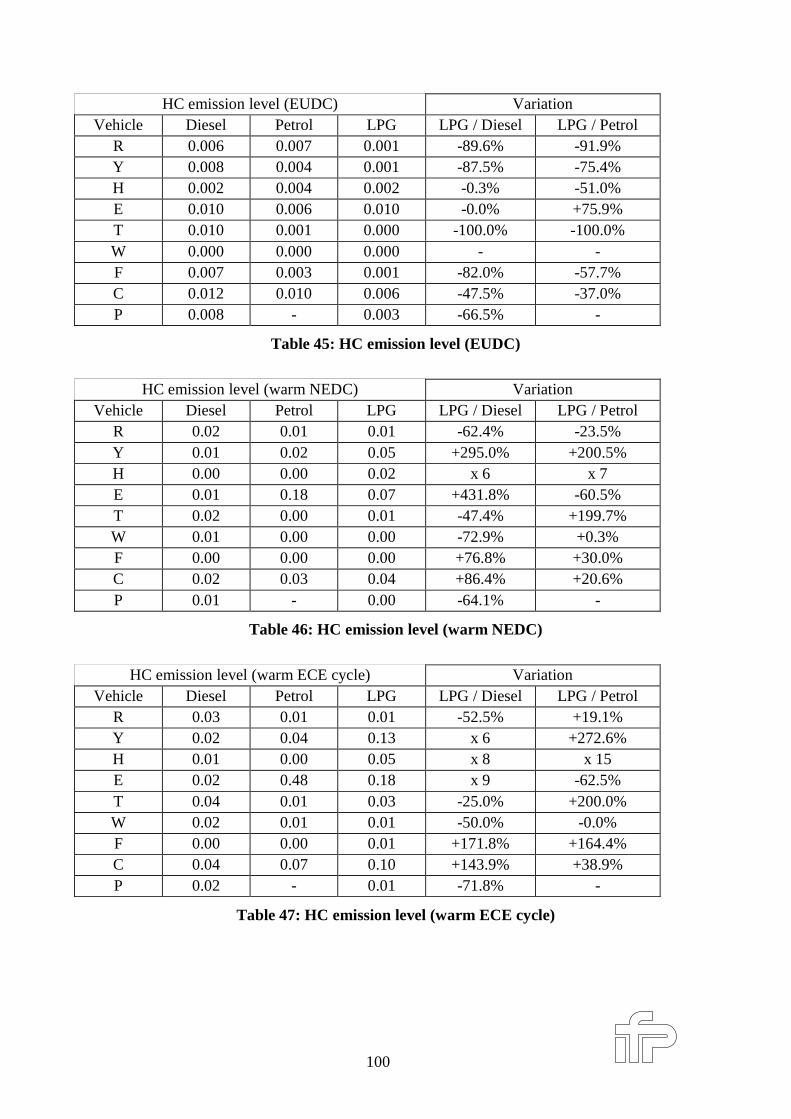
100
HC emission level (EUDC) VariationVehicle Diesel Petrol LPG LPG / Diesel LPG / Petrol
R 0.006 0.007 0.001 -89.6% -91.9%Y 0.008 0.004 0.001 -87.5% -75.4%H 0.002 0.004 0.002 -0.3% -51.0%E 0.010 0.006 0.010 -0.0% +75.9%T 0.010 0.001 0.000 -100.0% -100.0%W 0.000 0.000 0.000 - -F 0.007 0.003 0.001 -82.0% -57.7%C 0.012 0.010 0.006 -47.5% -37.0%P 0.008 - 0.003 -66.5% -
Table 45: HC emission level (EUDC)
HC emission level (warm NEDC) VariationVehicle Diesel Petrol LPG LPG / Diesel LPG / Petrol
R 0.02 0.01 0.01 -62.4% -23.5%Y 0.01 0.02 0.05 +295.0% +200.5%H 0.00 0.00 0.02 x 6 x 7E 0.01 0.18 0.07 +431.8% -60.5%T 0.02 0.00 0.01 -47.4% +199.7%W 0.01 0.00 0.00 -72.9% +0.3%F 0.00 0.00 0.00 +76.8% +30.0%C 0.02 0.03 0.04 +86.4% +20.6%P 0.01 - 0.00 -64.1% -
Table 46: HC emission level (warm NEDC)
HC emission level (warm ECE cycle) VariationVehicle Diesel Petrol LPG LPG / Diesel LPG / Petrol
R 0.03 0.01 0.01 -52.5% +19.1%Y 0.02 0.04 0.13 x 6 +272.6%H 0.01 0.00 0.05 x 8 x 15E 0.02 0.48 0.18 x 9 -62.5%T 0.04 0.01 0.03 -25.0% +200.0%W 0.02 0.01 0.01 -50.0% -0.0%F 0.00 0.00 0.01 +171.8% +164.4%C 0.04 0.07 0.10 +143.9% +38.9%P 0.02 - 0.01 -71.8% -
Table 47: HC emission level (warm ECE cycle)
101
HC emission level (warm EUDC) VariationVehicle Diesel Petrol LPG LPG / Diesel LPG / Petrol
R 0.01 0.01 0.00 -85.2% -79.2%Y 0.01 0.01 0.00 -88.8% -83.7%H 0.00 0.00 0.00 +72.7% +6.9%E 0.01 0.01 0.01 -0.0% -0.0%T 0.01 0.00 0.00 -100.0% -W 0.01 0.00 0.00 -100.0% -F 0.00 0.00 0.00 +9.1% -32.1%C 0.01 0.01 0.01 -36.4% -41.7%P 0.01 - 0.00 -51.3% -
Table 48: HC emission level (warm EUDC)
HC emission level (CADC Urban cycle) VariationVehicle Diesel Petrol LPG LPG / Diesel LPG / Petrol
R 0.03 0.01 0.02 -42.3% +46.8%Y 0.02 0.03 0.12 +469.5% +236.5%H 0.01 0.02 0.04 +270.2% +145.4%E 0.03 0.04 0.07 +133.3% +75.0%T 0.03 0.01 0.01 -66.7% -0.0%W 0.03 0.01 0.00 -100.0% -100.0%F 0.02 0.00 0.00 -93.0% -70.6%C 0.04 0.08 0.03 -40.9% -68.3%P 0.02 - 0.00 -90.5% -
Table 49: HC emission level (CADC Urban cycle)
HC emission level (CADC Road cycle) VariationVehicle Diesel Petrol LPG LPG / Diesel LPG / Petrol
R 0.01 0.01 0.00 -41.4% -37.4%Y 0.01 0.02 0.02 +98.6% -1.7%H 0.01 0.02 0.02 +158.7% -11.4%E 0.02 0.01 0.00 -100.0% -100.0%T 0.01 0.00 0.00 -100.0% -W 0.02 0.00 0.00 -100.0% -F 0.01 0.00 0.00 -73.3% -37.7%C 0.02 0.02 0.01 -62.1% -54.5%P 0.01 - 0.00 -71.3% -
Table 50: HC emission level (CADC Road cycle)
102
HC emission level (CADC Motorway cycle) VariationVehicle Diesel Petrol LPG LPG / Diesel LPG / Petrol
R 0.00 0.01 0.01 +129.7% +27.0%Y 0.00 0.01 0.02 +289.7% +17.4%H 0.01 0.02 0.02 +290.0% +32.8%E 0.03 0.01 0.02 -33.3% +100.0%T 0.00 0.00 0.01 - -W 0.01 0.01 0.00 -100.0% -100.0%F 0.01 0.01 0.01 +74.8% +57.9%C 0.01 0.02 0.02 +86.0% +3.3%P 0.02 - 0.02 +21.7% -
Table 51: HC emission level (CADC Motorway cycle)
HC emission level (CADC) VariationVehicle Diesel Petrol LPG LPG / Diesel LPG / Petrol
R 0.01 0.01 0.01 -5.8% +8.2%Y 0.01 0.02 0.03 +247.3% +51.1%H 0.01 0.02 0.02 +235.6% +23.8%E 0.03 0.01 0.02 -32.8% +36.1%T 0.01 0.00 0.01 -4.9% x 6W 0.02 0.01 0.00 -100.0% -100.0%F 0.01 0.01 0.01 -23.8% +20.3%C 0.02 0.03 0.02 -12.2% -36.8%P 0.01 - 0.01 -18.7% -
Table 52: HC emission level (CADC)
7.4.5 PM emissions
PM emission level (NEDC) VariationVehicle Diesel Petrol LPG LPG / Diesel LPG / Petrol
R 0.022 < 0.001 < 0.001 -98.5% -Y 0.038 0.002 < 0.001 -99.8% -H 0.039 0.001 0.001 -96.4% -E 0.027 - - - -T 0.012 - - - -W 0.030 - 0.001 -96.7% -F 0.039 - - - -C 0.024 - - - -P 0.042 - - - -
Table 53: PM emission level (NEDC)
103
PM emission level (ECE cycle) VariationVehicle Diesel Petrol LPG LPG / Diesel LPG / Petrol
R 0.028 < 0.001 < 0.001 -99.6% -Y 0.041 0.005 < 0.001 -99.7% -H 0.047 0.001 0.003 -92.7% +154.5%E 0.038 - - - -T 0.019 - - - -W 0.035 - 0.001 -97.1% -F 0.046 - - - -C 0.030 - - - -P 0.049 - - - -
Table 54: PM emission level (ECE cycle)
PM emission level (EUDC) VariationVehicle Diesel Petrol LPG LPG / Diesel LPG / Petrol
R 0.019 < 0.001 < 0.001 -97.7% -Y 0.035 0.001 < 0.001 -99.8% -H 0.034 0.000 < 0.001 -99.4% -E 0.020 - - - -T 0.007 - - - -W 0.027 - 0.001 -96.3% -F 0.025 - - - -C 0.020 - - - -P 0.037 - - - -
Table 55: PM emission level (EUDC)
PM emission level (warm NEDC) VariationVehicle Diesel Petrol LPG LPG / Diesel LPG / Petrol
R 0.019 < 0.001 < 0.001 -97.4% -Y 0.029 0.001 < 0.001 -98.8% -63.4%H 0.032 0.003 0.001 -96.4% -57.0%E 0.026 - - - -T 0.008 - - - -W 0.024 - 0.002 -93.3% -F 0.033 - - - -C 0.017 - - - -P 0.034 - - - -
Table 56: PM emission level (warm NEDC)
104
PM emission level (warm ECE cycle) VariationVehicle Diesel Petrol LPG LPG / Diesel LPG / Petrol
R 0.019 < 0.001 < 0.001 -97.5% -Y 0.031 0.002 < 0.001 -98.4% -H 0.031 0.005 0.002 -93.3% -61.5%E 0.034 - - - -T 0.011 - - - -W 0.025 - 0.001 -96.0% -F 0.026 - - - -C 0.016 - - - -P 0.036 - - - -
Table 57: PM emission level (warm ECE cycle)
PM emission level (warm EUDC) VariationVehicle Diesel Petrol LPG LPG / Diesel LPG / Petrol
R 0.019 < 0.001 0.001 -97.3% -Y 0.028 0.001 0.000 -99.0% -42.7%H 0.032 0.001 0.001 -98.2% -43.0%E 0.022 - - - -T 0.007 - - - -W 0.024 - 0.002 -91.7% -F 0.036 - - - -C 0.017 - - - -P 0.033 - - - -
Table 58: PM emission level (warm EUDC)
PM emission level (CADC Urban cycle) VariationVehicle Diesel Petrol LPG LPG / Diesel LPG / Petrol
R 0.085 < 0.001 0.002 -97.2% -Y 0.073 0.001 0.001 -99.0% +16.2%H 0.075 0.001 0.003 -95.3% +464.8%E 0.063 0.001 0.002 -96.8% +100.0%T 0.039 0.001 0.001 -97.4% -0.0%W 0.039 0.002 0.002 -94.9% -0.0%F - - - - -C 0.029 - - - -P - - - - -
Table 59: PM emission level (CADC Urban cycle)
105
PM emission level (CADC Road cycle) VariationVehicle Diesel Petrol LPG LPG / Diesel LPG / Petrol
R 0.039 < 0.001 0.001 -96.6% -Y 0.030 0.001 < 0.001 -98.3% -H 0.039 0.001 0.001 -98.0% +7.9%E 0.037 0.002 0.002 -94.2% +6.5%T 0.030 0.001 0.002 -93.3% +100.0%W 0.030 0.001 0.001 -96.7% -0.0%F - - - - -C 0.020 - - - -P - - - - -
Table 60: PM emission level (CADC Road cycle)
PM emission level (CADC Motorway cycle) VariationVehicle Diesel Petrol LPG LPG / Diesel LPG / Petrol
R 0.029 0.002 0.005 -84.3% +161.1%Y 0.032 0.002 0.003 -89.0% +76.8%H 0.055 0.006 0.003 -94.7% -51.6%E 0.123 0.013 0.011 -90.7% -11.7%T 0.023 0.030 0.013 -43.5% -56.7%W 0.046 0.006 0.011 -76.1% +83.3%F - - - - -C 0.025 - - - -P - - - - -
Table 61: PM emission level (CADC Motorway cycle)
PM emission level (CADC) VariationVehicle Diesel Petrol LPG LPG / Diesel LPG / Petrol
R 0.037 0.001 0.003 -91.6% +178.0%Y 0.034 0.001 0.002 -93.9% +58.0%H 0.050 0.003 0.002 -95.7% -38.4%E 0.085 0.008 0.007 -91.7% -8.5%T 0.027 0.016 0.008 -71.4% -52.7%W 0.039 0.004 0.006 -83.7% +71.1%F 0.035 0.002 0.002 -95.7% -18.6%C 0.023 - - - -P 0.045 - 0.007 -84.3% -
Table 62: PM emission level (CADC)
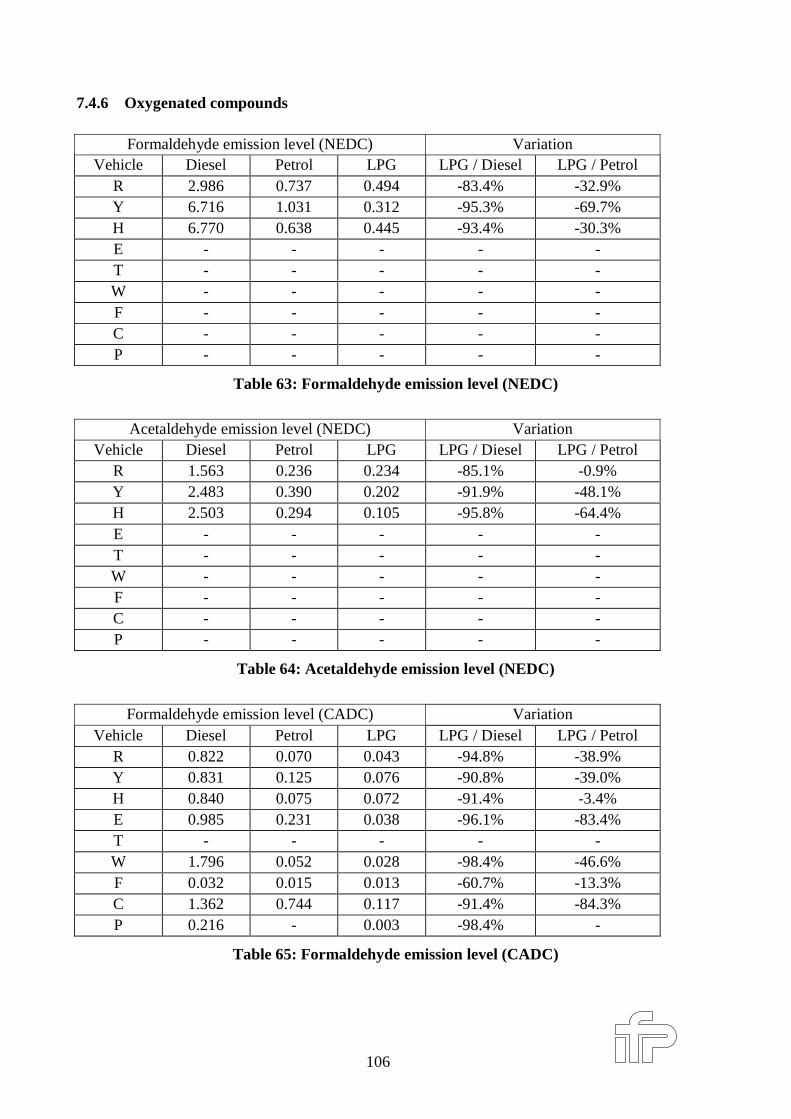
106
7.4.6 Oxygenated compounds
Formaldehyde emission level (NEDC) VariationVehicle Diesel Petrol LPG LPG / Diesel LPG / Petrol
R 2.986 0.737 0.494 -83.4% -32.9%Y 6.716 1.031 0.312 -95.3% -69.7%H 6.770 0.638 0.445 -93.4% -30.3%E - - - - -T - - - - -W - - - - -F - - - - -C - - - - -P - - - - -
Table 63: Formaldehyde emission level (NEDC)
Acetaldehyde emission level (NEDC) VariationVehicle Diesel Petrol LPG LPG / Diesel LPG / Petrol
R 1.563 0.236 0.234 -85.1% -0.9%Y 2.483 0.390 0.202 -91.9% -48.1%H 2.503 0.294 0.105 -95.8% -64.4%E - - - - -T - - - - -W - - - - -F - - - - -C - - - - -P - - - - -
Table 64: Acetaldehyde emission level (NEDC)
Formaldehyde emission level (CADC) VariationVehicle Diesel Petrol LPG LPG / Diesel LPG / Petrol
R 0.822 0.070 0.043 -94.8% -38.9%Y 0.831 0.125 0.076 -90.8% -39.0%H 0.840 0.075 0.072 -91.4% -3.4%E 0.985 0.231 0.038 -96.1% -83.4%T - - - - -W 1.796 0.052 0.028 -98.4% -46.6%F 0.032 0.015 0.013 -60.7% -13.3%C 1.362 0.744 0.117 -91.4% -84.3%P 0.216 - 0.003 -98.4% -
Table 65: Formaldehyde emission level (CADC)
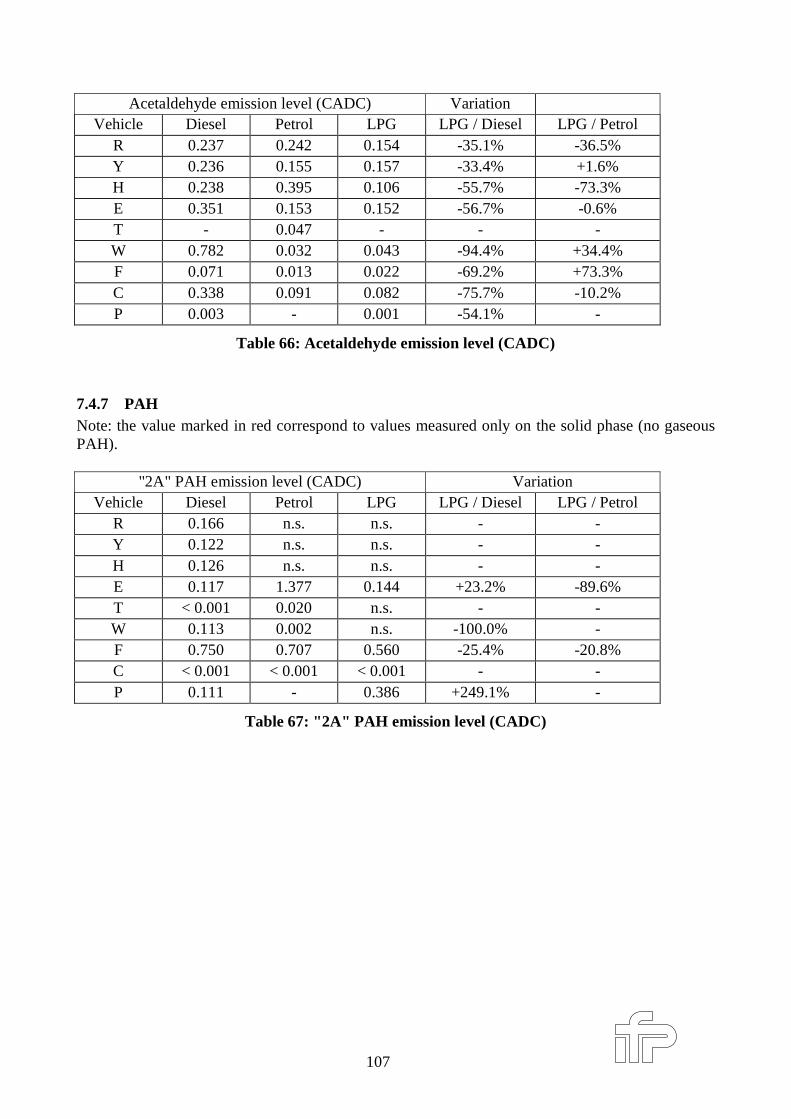
107
Acetaldehyde emission level (CADC) VariationVehicle Diesel Petrol LPG LPG / Diesel LPG / Petrol
R 0.237 0.242 0.154 -35.1% -36.5%Y 0.236 0.155 0.157 -33.4% +1.6%H 0.238 0.395 0.106 -55.7% -73.3%E 0.351 0.153 0.152 -56.7% -0.6%T - 0.047 - - -W 0.782 0.032 0.043 -94.4% +34.4%F 0.071 0.013 0.022 -69.2% +73.3%C 0.338 0.091 0.082 -75.7% -10.2%P 0.003 - 0.001 -54.1% -
Table 66: Acetaldehyde emission level (CADC)
7.4.7 PAHNote: the value marked in red correspond to values measured only on the solid phase (no gaseousPAH).
"2A" PAH emission level (CADC) VariationVehicle Diesel Petrol LPG LPG / Diesel LPG / Petrol
R 0.166 n.s. n.s. - -Y 0.122 n.s. n.s. - -H 0.126 n.s. n.s. - -E 0.117 1.377 0.144 +23.2% -89.6%T < 0.001 0.020 n.s. - -W 0.113 0.002 n.s. -100.0% -F 0.750 0.707 0.560 -25.4% -20.8%C < 0.001 < 0.001 < 0.001 - -P 0.111 - 0.386 +249.1% -
Table 67: " 2A" PAH emission level (CADC)
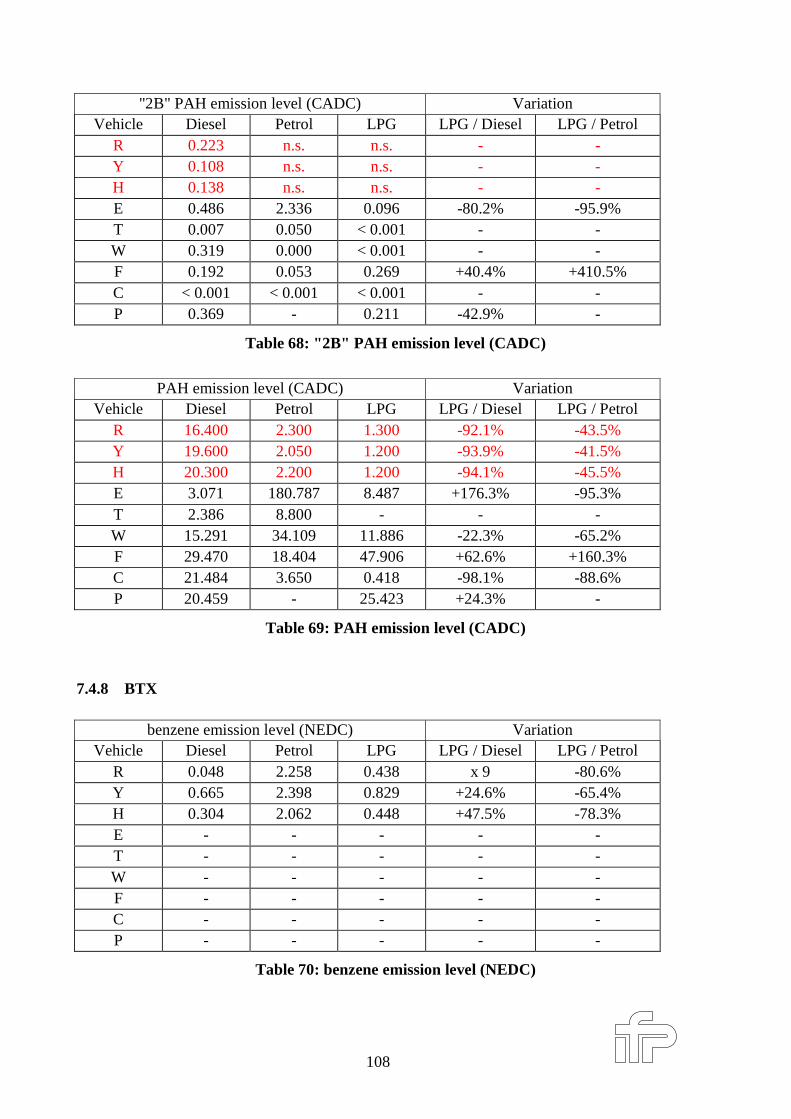
108
"2B" PAH emission level (CADC) VariationVehicle Diesel Petrol LPG LPG / Diesel LPG / Petrol
R 0.223 n.s. n.s. - -Y 0.108 n.s. n.s. - -H 0.138 n.s. n.s. - -E 0.486 2.336 0.096 -80.2% -95.9%T 0.007 0.050 < 0.001 - -W 0.319 0.000 < 0.001 - -F 0.192 0.053 0.269 +40.4% +410.5%C < 0.001 < 0.001 < 0.001 - -P 0.369 - 0.211 -42.9% -
Table 68: " 2B" PAH emission level (CADC)
PAH emission level (CADC) VariationVehicle Diesel Petrol LPG LPG / Diesel LPG / Petrol
R 16.400 2.300 1.300 -92.1% -43.5%Y 19.600 2.050 1.200 -93.9% -41.5%H 20.300 2.200 1.200 -94.1% -45.5%E 3.071 180.787 8.487 +176.3% -95.3%T 2.386 8.800 - - -W 15.291 34.109 11.886 -22.3% -65.2%F 29.470 18.404 47.906 +62.6% +160.3%C 21.484 3.650 0.418 -98.1% -88.6%P 20.459 - 25.423 +24.3% -
Table 69: PAH emission level (CADC)
7.4.8 BTX
benzene emission level (NEDC) VariationVehicle Diesel Petrol LPG LPG / Diesel LPG / Petrol
R 0.048 2.258 0.438 x 9 -80.6%Y 0.665 2.398 0.829 +24.6% -65.4%H 0.304 2.062 0.448 +47.5% -78.3%E - - - - -T - - - - -W - - - - -F - - - - -C - - - - -P - - - - -
Table 70: benzene emission level (NEDC)
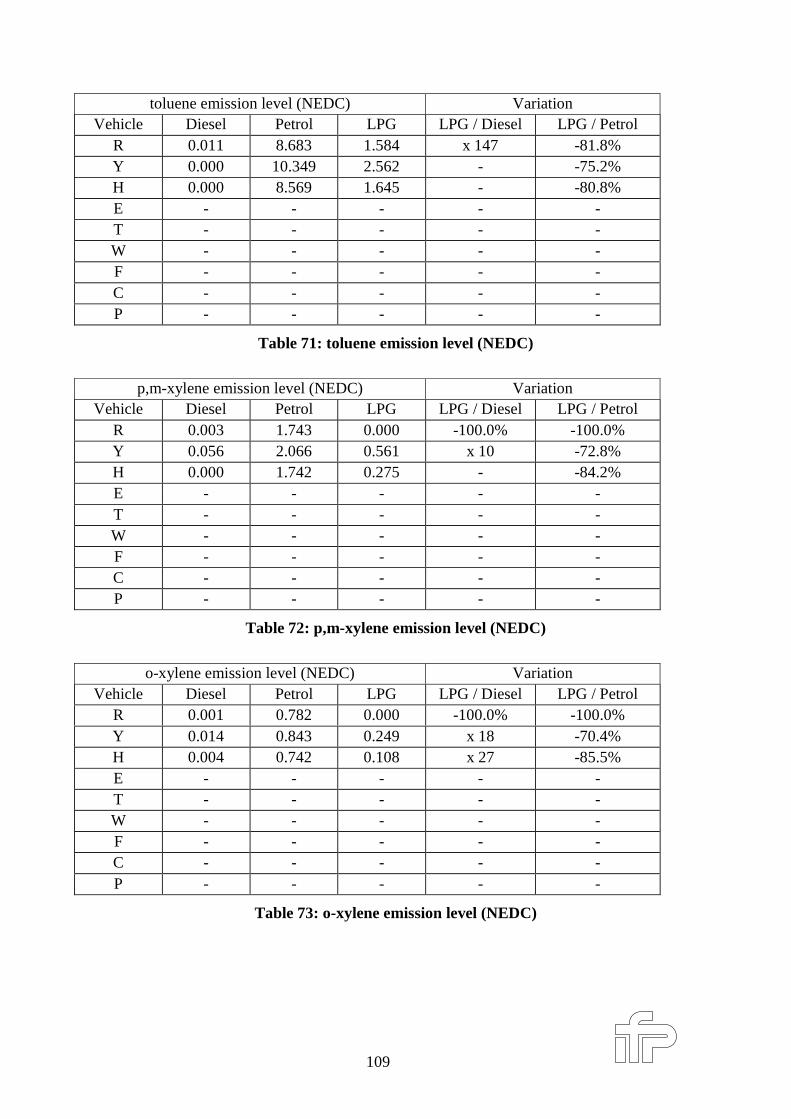
109
toluene emission level (NEDC) VariationVehicle Diesel Petrol LPG LPG / Diesel LPG / Petrol
R 0.011 8.683 1.584 x 147 -81.8%Y 0.000 10.349 2.562 - -75.2%H 0.000 8.569 1.645 - -80.8%E - - - - -T - - - - -W - - - - -F - - - - -C - - - - -P - - - - -
Table 71: toluene emission level (NEDC)
p,m-xylene emission level (NEDC) VariationVehicle Diesel Petrol LPG LPG / Diesel LPG / Petrol
R 0.003 1.743 0.000 -100.0% -100.0%Y 0.056 2.066 0.561 x 10 -72.8%H 0.000 1.742 0.275 - -84.2%E - - - - -T - - - - -W - - - - -F - - - - -C - - - - -P - - - - -
Table 72: p,m-xylene emission level (NEDC)
o-xylene emission level (NEDC) VariationVehicle Diesel Petrol LPG LPG / Diesel LPG / Petrol
R 0.001 0.782 0.000 -100.0% -100.0%Y 0.014 0.843 0.249 x 18 -70.4%H 0.004 0.742 0.108 x 27 -85.5%E - - - - -T - - - - -W - - - - -F - - - - -C - - - - -P - - - - -
Table 73: o-xylene emission level (NEDC)
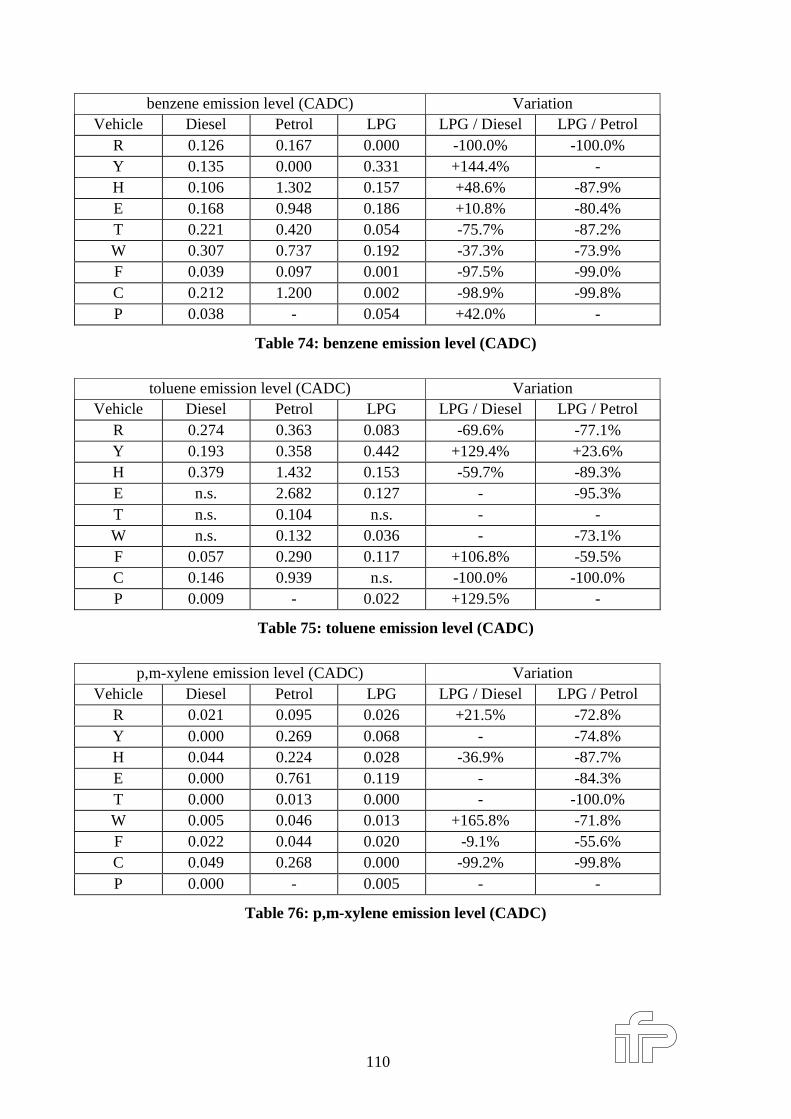
110
benzene emission level (CADC) VariationVehicle Diesel Petrol LPG LPG / Diesel LPG / Petrol
R 0.126 0.167 0.000 -100.0% -100.0%Y 0.135 0.000 0.331 +144.4% -H 0.106 1.302 0.157 +48.6% -87.9%E 0.168 0.948 0.186 +10.8% -80.4%T 0.221 0.420 0.054 -75.7% -87.2%W 0.307 0.737 0.192 -37.3% -73.9%F 0.039 0.097 0.001 -97.5% -99.0%C 0.212 1.200 0.002 -98.9% -99.8%P 0.038 - 0.054 +42.0% -
Table 74: benzene emission level (CADC)
toluene emission level (CADC) VariationVehicle Diesel Petrol LPG LPG / Diesel LPG / Petrol
R 0.274 0.363 0.083 -69.6% -77.1%Y 0.193 0.358 0.442 +129.4% +23.6%H 0.379 1.432 0.153 -59.7% -89.3%E n.s. 2.682 0.127 - -95.3%T n.s. 0.104 n.s. - -W n.s. 0.132 0.036 - -73.1%F 0.057 0.290 0.117 +106.8% -59.5%C 0.146 0.939 n.s. -100.0% -100.0%P 0.009 - 0.022 +129.5% -
Table 75: toluene emission level (CADC)
p,m-xylene emission level (CADC) VariationVehicle Diesel Petrol LPG LPG / Diesel LPG / Petrol
R 0.021 0.095 0.026 +21.5% -72.8%Y 0.000 0.269 0.068 - -74.8%H 0.044 0.224 0.028 -36.9% -87.7%E 0.000 0.761 0.119 - -84.3%T 0.000 0.013 0.000 - -100.0%W 0.005 0.046 0.013 +165.8% -71.8%F 0.022 0.044 0.020 -9.1% -55.6%C 0.049 0.268 0.000 -99.2% -99.8%P 0.000 - 0.005 - -
Table 76: p,m-xylene emission level (CADC)
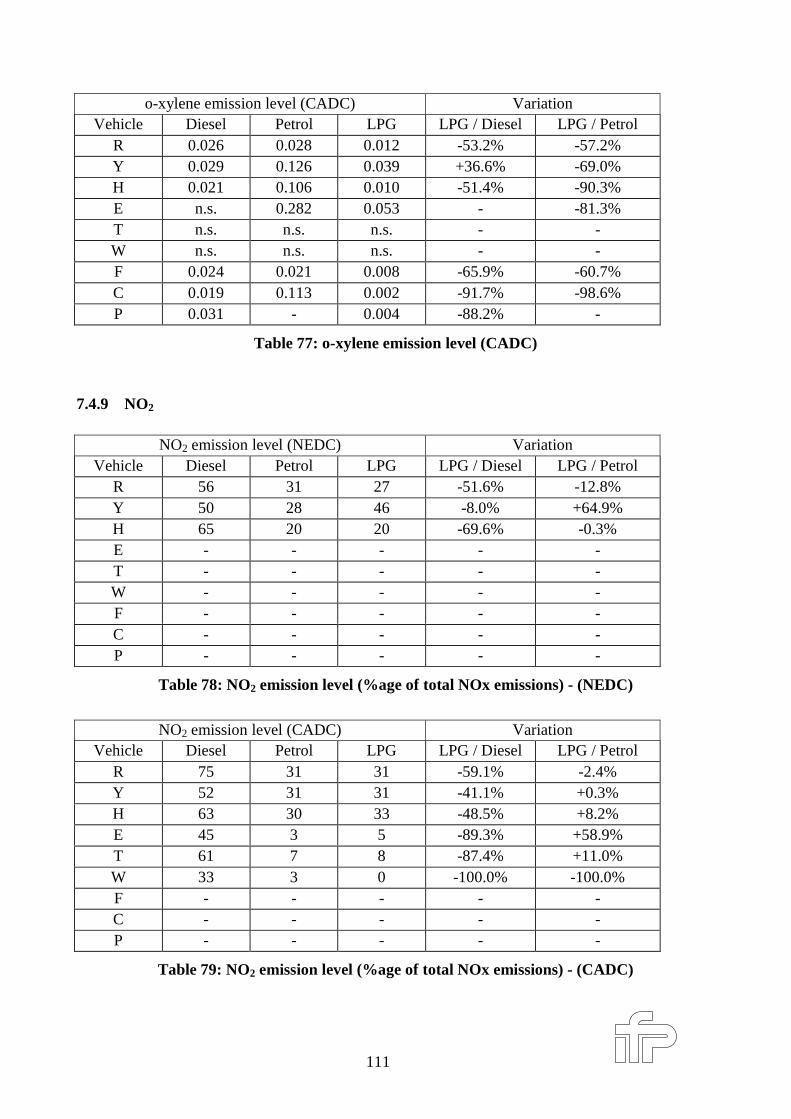
111
o-xylene emission level (CADC) VariationVehicle Diesel Petrol LPG LPG / Diesel LPG / Petrol
R 0.026 0.028 0.012 -53.2% -57.2%Y 0.029 0.126 0.039 +36.6% -69.0%H 0.021 0.106 0.010 -51.4% -90.3%E n.s. 0.282 0.053 - -81.3%T n.s. n.s. n.s. - -W n.s. n.s. n.s. - -F 0.024 0.021 0.008 -65.9% -60.7%C 0.019 0.113 0.002 -91.7% -98.6%P 0.031 - 0.004 -88.2% -
Table 77: o-xylene emission level (CADC)
7.4.9 NO2
NO2 emission level (NEDC) VariationVehicle Diesel Petrol LPG LPG / Diesel LPG / Petrol
R 56 31 27 -51.6% -12.8%Y 50 28 46 -8.0% +64.9%H 65 20 20 -69.6% -0.3%E - - - - -T - - - - -W - - - - -F - - - - -C - - - - -P - - - - -
Table 78: NO2 emission level (%age of total NOx emissions) - (NEDC)
NO2 emission level (CADC) VariationVehicle Diesel Petrol LPG LPG / Diesel LPG / Petrol
R 75 31 31 -59.1% -2.4%Y 52 31 31 -41.1% +0.3%H 63 30 33 -48.5% +8.2%E 45 3 5 -89.3% +58.9%T 61 7 8 -87.4% +11.0%W 33 3 0 -100.0% -100.0%F - - - - -C - - - - -P - - - - -
Table 79: NO2 emission level (%age of total NOx emissions) - (CADC)
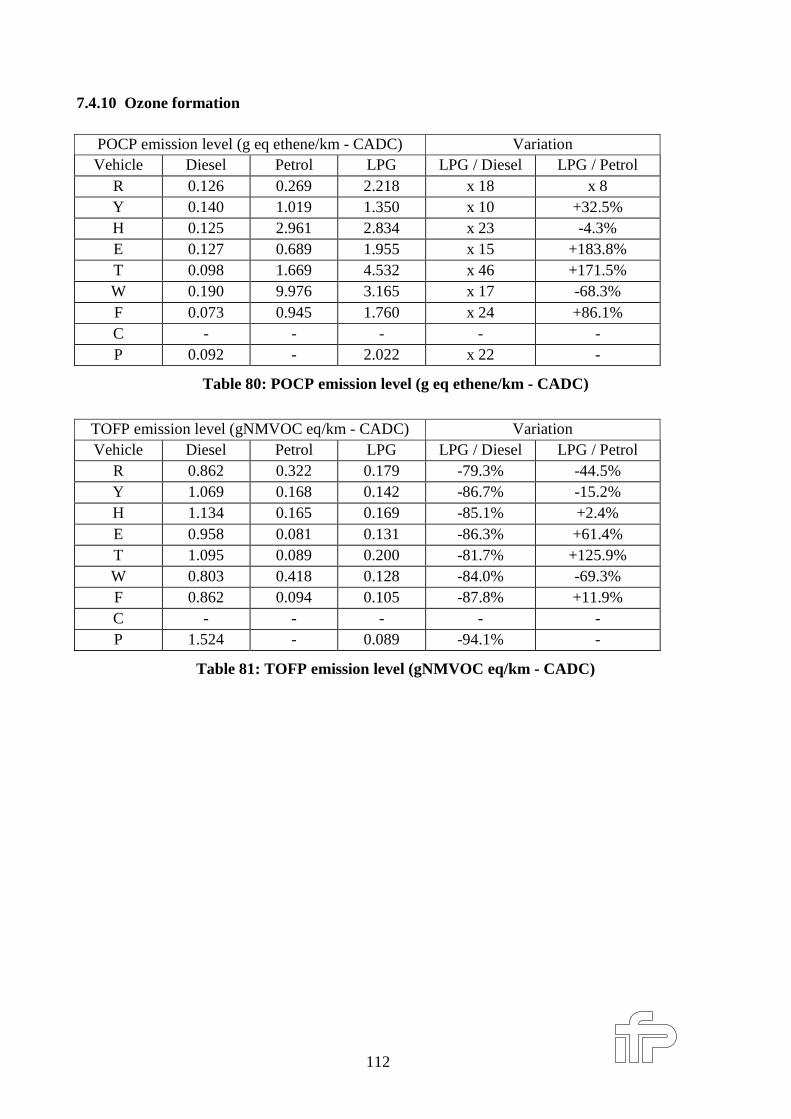
112
7.4.10 Ozone formation
POCP emission level (g eq ethene/km - CADC) VariationVehicle Diesel Petrol LPG LPG / Diesel LPG / Petrol
R 0.126 0.269 2.218 x 18 x 8Y 0.140 1.019 1.350 x 10 +32.5%H 0.125 2.961 2.834 x 23 -4.3%E 0.127 0.689 1.955 x 15 +183.8%T 0.098 1.669 4.532 x 46 +171.5%W 0.190 9.976 3.165 x 17 -68.3%F 0.073 0.945 1.760 x 24 +86.1%C - - - - -P 0.092 - 2.022 x 22 -
Table 80: POCP emission level (g eq ethene/km - CADC)
TOFP emission level (gNMVOC eq/km - CADC) VariationVehicle Diesel Petrol LPG LPG / Diesel LPG / Petrol
R 0.862 0.322 0.179 -79.3% -44.5%Y 1.069 0.168 0.142 -86.7% -15.2%H 1.134 0.165 0.169 -85.1% +2.4%E 0.958 0.081 0.131 -86.3% +61.4%T 1.095 0.089 0.200 -81.7% +125.9%W 0.803 0.418 0.128 -84.0% -69.3%F 0.862 0.094 0.105 -87.8% +11.9%C - - - - -P 1.524 - 0.089 -94.1% -
Table 81: TOFP emission level (gNMVOC eq/km - CADC)
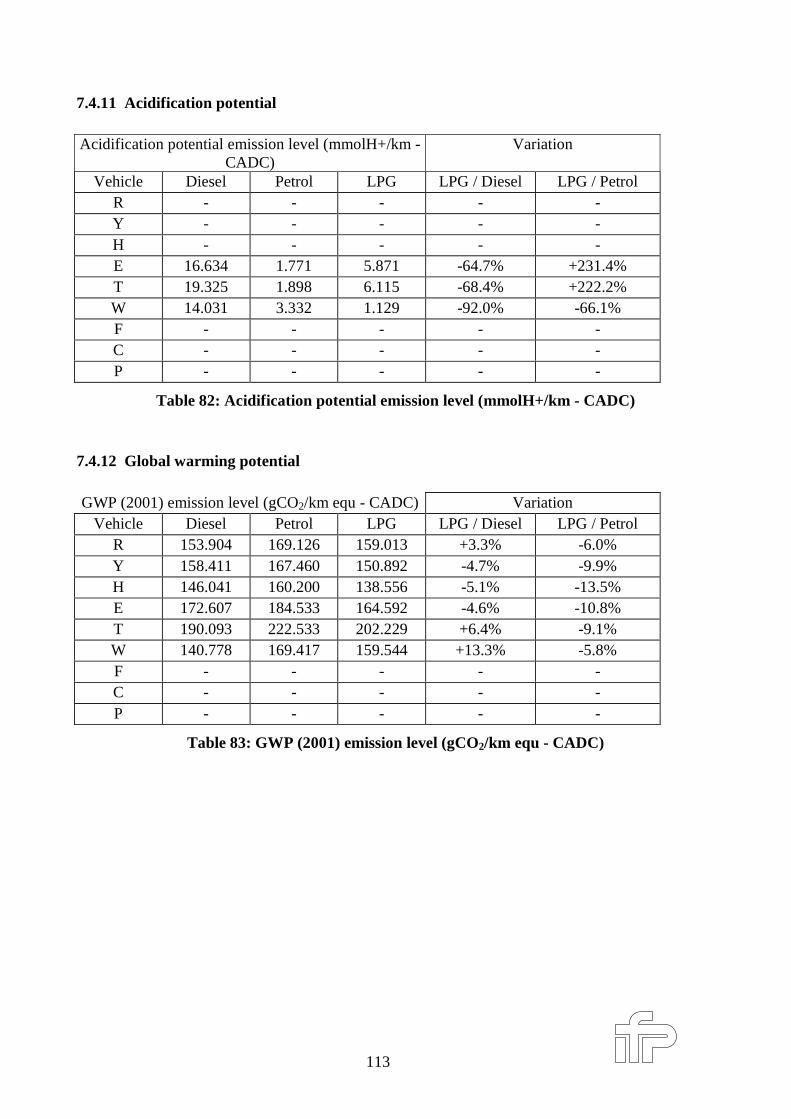
113
7.4.11 Acidification potential
Acidification potential emission level (mmolH+/km -CADC)
Variation
Vehicle Diesel Petrol LPG LPG / Diesel LPG / PetrolR - - - - -Y - - - - -H - - - - -E 16.634 1.771 5.871 -64.7% +231.4%T 19.325 1.898 6.115 -68.4% +222.2%W 14.031 3.332 1.129 -92.0% -66.1%F - - - - -C - - - - -P - - - - -
Table 82: Acidification potential emission level (mmolH+/km - CADC)
7.4.12 Global warming potential
GWP (2001) emission level (gCO2/km equ - CADC) VariationVehicle Diesel Petrol LPG LPG / Diesel LPG / Petrol
R 153.904 169.126 159.013 +3.3% -6.0%Y 158.411 167.460 150.892 -4.7% -9.9%H 146.041 160.200 138.556 -5.1% -13.5%E 172.607 184.533 164.592 -4.6% -10.8%T 190.093 222.533 202.229 +6.4% -9.1%W 140.778 169.417 159.544 +13.3% -5.8%F - - - - -C - - - - -P - - - - -
Table 83: GWP (2001) emission level (gCO2/km equ - CADC)
Recommended