Policy Research Working Paper 7524
Land Market Restrictions, Women’s Labor Force Participation, and Wages in a Rural Economy
M. Shahe EmranForhad Shilpi
Development Research GroupEnvironment and Energy TeamDecember 2015
WPS7524P
ublic
Dis
clos
ure
Aut
horiz
edP
ublic
Dis
clos
ure
Aut
horiz
edP
ublic
Dis
clos
ure
Aut
horiz
edP
ublic
Dis
clos
ure
Aut
horiz
ed
Produced by the Research Support Team
Abstract
The Policy Research Working Paper Series disseminates the findings of work in progress to encourage the exchange of ideas about development issues. An objective of the series is to get the findings out quickly, even if the presentations are less than fully polished. The papers carry the names of the authors and should be cited accordingly. The findings, interpretations, and conclusions expressed in this paper are entirely those of the authors. They do not necessarily represent the views of the International Bank for Reconstruction and Development/World Bank and its affiliated organizations, or those of the Executive Directors of the World Bank or the governments they represent.
Policy Research Working Paper 7524
This paper is a product of the Environment and Energy Team, Development Research Group. It is part of a larger effort by the World Bank to provide open access to its research and make a contribution to development policy discussions around the world. Policy Research Working Papers are also posted on the Web at http://econ.worldbank.org. The authors may be contacted at [email protected].
This paper analyzes the effects of land market restrictions on the rural labor market outcomes for women. The exist-ing literature emphasizes two mechanisms through which land restrictions can affect the economic outcomes: the collateral value of land, and (in) security of property rights. Analysis of this paper focuses on an alternative mechanism where land restrictions increase costs of migration out of villages. The testable prediction of collateral effect is that both wages and labor force participation move in the same direction, and insecurity of property rights reduces labor
force participation and increases wages. In contrast, if land restrictions work primarily through higher migration costs, labor force participation increases, while wages decline. For identification, this paper exploits a natural experiment in Sri Lanka where historical malaria played a unique role in land policy. This paper provides robust evidence of a positive effect of land restrictions on women’s labor force participation, but a negative effect on female wages. The empirical results thus contradict a collateral or insecure property rights effect, but support migration costs as the primary mechanism.
Land Market Restrictions, Women's Labor Force Participation, and Wages in a
Rural Economy1
M. Shahe Emran
IPD, Columbia University
Forhad Shilpi
World Bank
Key Words: Land Market Restrictions, Collateral Effect, Property Rights Insecurity,
Migration Costs, Labor Market, Women's Labor Force Participation, Wage, Sri Lanka,
Historical Malaria
JEL Codes: O10, O12, J31, J61
1 We would like to thank two anonymous referees, Beata Javorcik, Larry Katz, Steve Pischke, Toan-Do, Leo
Feller, Michael Clemens and seminar participants at Center for Global Development for helpful discussions and
Chaitri Hapugalle for help with historical data. Email for correspondence: [email protected],
(1) Introduction
There is a growing literature in economics that analyzes the effects of restrictions on land mar-
kets on household choices and outcomes. The literature has focused on the effects of restrictions
on the alienability of land on credit access, labor supply, agricultural productivity, and savings
(see, for example, Field (2007), Iyer at al. (2009)), and on the effects of uncertainty about prop-
erty rights on incentives to invest (see, for example, Besley (1995), Jacoby et al. (2002), Goldstein
and Udry (2008)). This paper deals with a set of issues that have largely been ignored in the
economics literature: the effects of restrictions on sales and rental on the labor force participation
of rural women and their wages.
The effects of insecure property rights to land on women’s labor market are well-recognized
in the literature; reforms that improve security of property rights can lead to higher labor supply
by women, as they do not need guard labor (Field, 2007). Formalized alienable property rights
in land can potentially create collateral value and better access to credit (de Soto, 1989). Policy
restrictions on sales and rental may create insecurity, and destroy the collateral value of land, as
the banks cannot claim the land in case of a default.
The literature has, however, so far largely neglected another important channel through which
sales and rental restrictions may affect women’s labor force participation and wages in a village:
rural-urban migration.1 As emphasized recently by Hayashi and Prescott (2008), land market
restrictions increase costs of migration substantially as a household loses the income stream from
the land when it decides to leave the village. We explore the implications of the migration
channel, both theoretically and empirically, and contrast it with the predictions of the more
widely-recognized collateral and property rights channels.
To understand the workings of the migration mechanism, we develop a model that focuses on
women’s traditional role in producing home goods for labor force participation decision, and the
land market restrictions imply that a household loses the land in the event of out-migration from
the village.2 It is straightforward to see that higher migration costs are likely to reduce migration
1We use “urban” as a short for any destination which includes international migration.2The standard model of labor-leisure trade-off can be seen as a special case of our model where the home goods
production function is CRTS: one unit of labor produces one unit of leisure. Note that in our model, home goods
1
and lower the equilibrium wage rate in the local labor market. The effects of land restrictions on
women’s propensity of labor force participation are, however, not obvious; it depends on whether
the women who stay back in the village at the margin are more or less likely to participate in the
labor force compared to an average rural woman before land restrictions. Since a household is
more likely to benefit from the higher wages in the urban labor market when it uses only a small
proportion of its labor endowment in home goods production, propensity to migrate is a negative
function of productivity in home goods production. An important result from our analysis is
that the set of women whose migration status is changed by land restrictions are the ones with
the highest productivity among the migrants in the initial equilibrium, but they have the lowest
productivity compared to the women who chose not to migrate without the land restrictions.
This also implies that these women are more likely to participate in the labor force compared
to an average rural woman. Imposition of land restrictions thus increases women’s propensity of
labor force participation in a village.3 The resulting higher labor supply to the market reduces
the wage rate.
We thus have predictions from three different mechanisms that can mediate the effects of
land market restrictions. Insecure rights imply higher wage and lower labor force participation, a
collateral effect implies that wage and labor force participation move in the same direction, and a
higher migration cost yields the prediction that wages go down, but participation goes up. These
contrasting predictions allow us to discriminate among these three alternative mechanisms.
To identify and estimate the effects of land market restrictions on women’s labor force par-
ticipation and wage, we take advantage of a historical natural experiment in Sri Lanka where
the cross-section variations in the incidence of land restrictions across different sub-districts (i.e.,
proportion of land under policy restrictions) were primarily determined by historical malaria
prevalence (endemicity) through its effects on ‘crown land’. Historical malaria caused an exodus
of households from the affected areas during the 13-18th centuries, and the abandoned land was
include many more things such as child bearing and rearing, home schooling, meal preparation, house care, andtending to kitchen garden.
3Interpreting the increased labor force participation in rural areas as a sign of women’s economic mobility may,however, not be appropriate, as the increased labor force participation in rural areas comes at the expense ofmigration and better jobs in urban areas.
2
taken over by the government during the colonial period and designated as crown land (Peebles
(2006), De Silva (1981)). The crown land was later distributed through settlements, and restric-
tions on sales, mortgage and rental were imposed. The historical malaria thus is significantly
correlated with the extent of land restrictions in an area through the availability of crown land.
We exploit this correlation between historical malaria and the incidence of land restrictions in a
sub-district to identify the causal effects of land restrictions. To be more precise, we rely on the
interaction of historical malaria and average rainfall across different sub-districts for identification
in an empirical model with district fixed effects. This approach uses subdistrict level rainfall as
weights to uncover variations in malaria across subdistricts from the district level average esti-
mates available from Newman (1965) (see the discussion on empirical strategy in section 4 below).
This strategy is motivated by two considerations. First, the variation in land restrictions in the
data is at the subdistrict level and the interaction of district level malaria with the subdistrict
level rainfall provides an instrument that varies across subdistricts. Second, a large literature
shows that rainfall is one of the most important determinants of spatial variations in malaria in
Sri Lanka; the malaria incidence is lower in a subdistrict within a district if it has higher rainfall
((Clemesha, 1934; Rustomjee, 1944; Briet et al, 2008). As we discuss in detail later, we control
for rainfall in a subdistrict in the regressions to ensure that the exclusion restriction imposed is
credible. In addition, the interpretation that the interaction of historical malaria with subdistrict
rainfall provides an estimate of historical malaria variations across subdistricts implies testable
sign restriction in the first stage regression, which is borne out by the empirical results reported
later. The strength of our identification strategy derives from the following observations: (i) the
timing of the malaria eradication program was determined by the technological breakthrough
abroad for tackling malaria (DDT), and thus can plausibly be treated as exogenous,4 (ii) a suc-
cessful nationwide malaria eradication program was implemented in Sri Lanka in 1947; malaria
endemicity (as measured by enlarged spleen rates) fell close to zero by 1950-51.5 We thus rely
4Although DDT was first synthesized in 1874, its insecticidal properties were discovered in 1939 by Swiss scientistPaul H Muller. It was widely used during second World War to control malaria and typhus, and after the war DDTwas made available as an agricultural pesticide and for malaria eradication programs.
5Reported malaria cases in Sri Lanka were reduced from about 3 million per year during pre-eradication era toonly 29 in 1964 (Harrison, 1978). The number of malaria death cases were 30 in 2002 among a population of 21
3
on historical malaria more than half a century ago to identify the effects of land restrictions, and
(iii) most of the current population in a subdistrict ravaged by high historical malaria were never
exposed to historical malaria there, as they were resettled from other relatively malaria free areas.
A number of possible objections to the identification scheme and evidence on their relevance are
discussed in detail later in the paper (please see section 4.3 below).
The empirical results show that the incidence of land market restrictions has a numerically and
statistically significant negative effect on the wages. More interestingly, the effects on women’s
labor force participation is positive: a one percentage point increase in the land under policy
restrictions in a sub-district leads to about a 2.3 percent increase in the labor force participation
of women (evaluated at the mean). The corresponding estimates for wages imply that a one
percentage point increase in land under restrictions leads to a 1.7 percent decrease in female
wage. The results on wages thus reject the hypothesis that land restrictions affect women’s labor
market because of insecurity of rights to land. The results on labor force participation on the other
hand contradict the collateral channel. The evidence on both wages and labor force participation
is consistent with the predictions from the model developed in this paper that focuses on higher
migration costs.
The rest of the paper is organized as follows. Section 2 develops a simple model to understand
the effects of land market restrictions on women in rural labor markets that focuses on migration
costs and women’s traditional role in home production. Section 3 discusses data and variables
definitions. Section 4 lays out the identification approach we use. Section 5, arranged in a
number of subsections, report the results of the empirical analysis. The paper ends with some
concluding remarks.
2. Land Market Restrictions, Migration, and Women’s Labor Market:
Theory
We develop a simple model of wage determination that incorporates higher migration costs
due to land restrictions. The labor force participation is determined by the shadow value of labor
million. The reported malaria death were 4 in 2003, and 0 in 2005.
4
in home production that includes, among other things, child bearing and rearing, home making,
meal preparation, and homework help for kids. As noted earlier, the home good can also be
interpreted as leisure.
The Basic Set-up
Each household owns L amount of female labor, but they differ in terms of land endowment.
Household i owns Hi = 0 amount of land. There are two goods: a home good (denotes as d good),
and an agricultural good (denoted as a good). We assume that the agricultural good is traded
beyond the village and its price is normalized to 1, i.e., P a = 1. The household can produce
the agricultural good in its own land and can buy from the market if it earns wage income. The
agricultural production function takes the Cobb-Douglas form with CRTS:
Qa = F (H,La) = Hγ (La)1−γ
The technology for home goods production is household specific which generates heterogeneity
in labor force participation (i.e., labor supply to market activities, either own farming, or wage
labor):6
Qdi =
(Ld
)δi
A household consumes two goods (home good and agricultural good) and the utility function
is:
Ui = αLn(C
d
i
)+ βCa
i
The utility function captures the idea that women perform some necessary home production
6We thank an anonymous referee for noting the importance of heterogeneity in labor force participation in ouranalysis. Women’s labor force participation may partly depend on other factors not captured in the simple modelhere. For example, educated women are, in general, more likely to participate in the labor force and labor market,because of skill premium earned in the labor market. We chose not to focus on the heterogeneity in human capitalas a driving force in labor force participation for the sake of both realism and tractability. In a model with educationand skill heterogeneity, education also will be relevant for migration decisions and labor market equilibrium will becharacterized by a vector of wages reflecting skill premium for different levels of education. The model thus becomessubstantially more complex without generating important new insights about the effects of land restrictions in ourcontext.
5
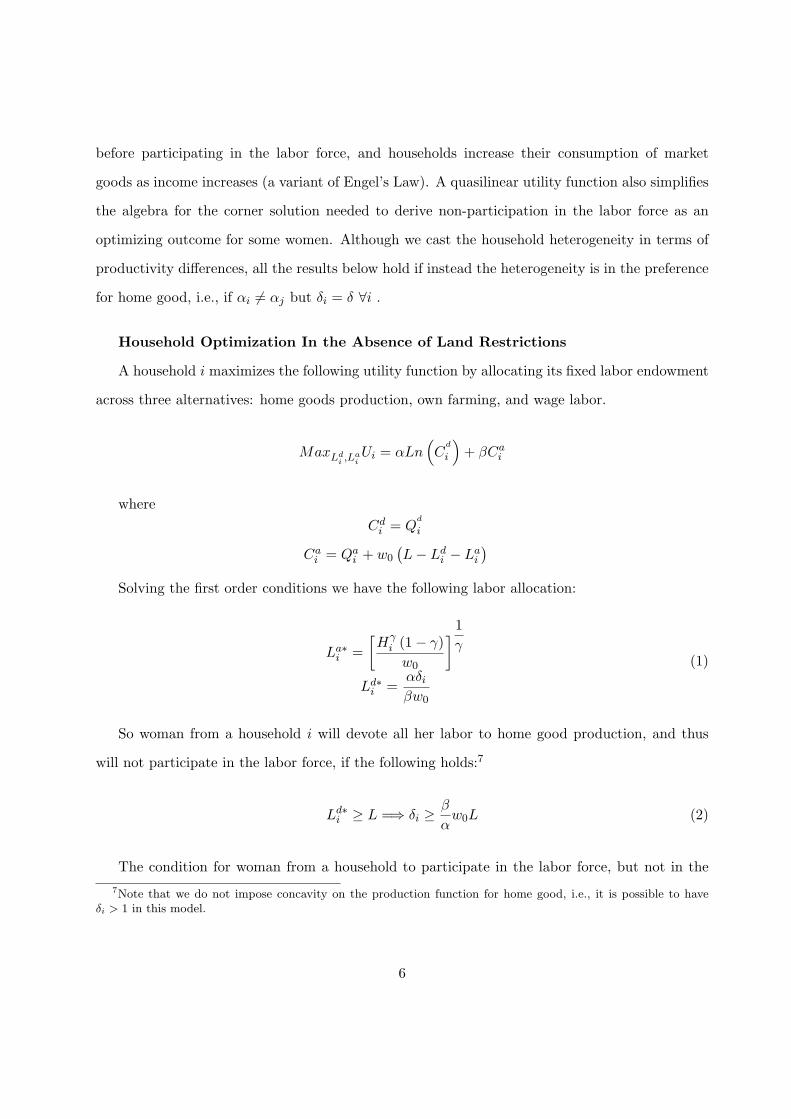
before participating in the labor force, and households increase their consumption of market
goods as income increases (a variant of Engel’s Law). A quasilinear utility function also simplifies
the algebra for the corner solution needed to derive non-participation in the labor force as an
optimizing outcome for some women. Although we cast the household heterogeneity in terms of
productivity differences, all the results below hold if instead the heterogeneity is in the preference
for home good, i.e., if αi ̸= αj but δi = δ ∀i .
Household Optimization In the Absence of Land Restrictions
A household i maximizes the following utility function by allocating its fixed labor endowment
across three alternatives: home goods production, own farming, and wage labor.
MaxLdi ,L
aiUi = αLn
(C
d
i
)+ βCa
i
where
Cdi = Q
d
i
Cai = Qa
i + w0
(L− Ld
i − Lai
)Solving the first order conditions we have the following labor allocation:
La∗i =
[Hγ
i (1− γ)
w0
]1γ
Ld∗i =
αδiβw0
(1)
So woman from a household i will devote all her labor to home good production, and thus
will not participate in the labor force, if the following holds:7
Ld∗i ≥ L =⇒ δi ≥
β
αw0L (2)
The condition for woman from a household to participate in the labor force, but not in the
7Note that we do not impose concavity on the production function for home good, i.e., it is possible to haveδi > 1 in this model.
6
labor market is given by:
δi ∋ Ld∗i < L and Ld∗
i + La∗i ≥ L (3)
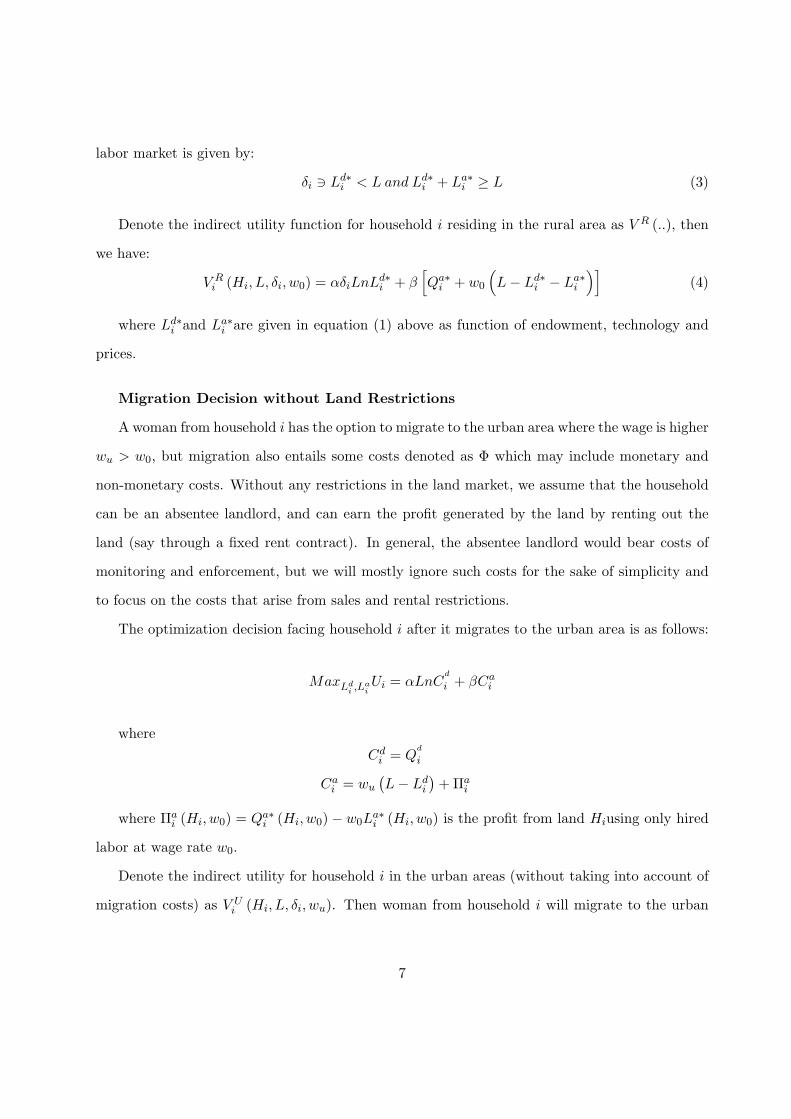
Denote the indirect utility function for household i residing in the rural area as V R (..), then
we have:
V Ri (Hi, L, δi, w0) = αδiLnL
d∗i + β
[Qa∗
i + w0
(L− Ld∗
i − La∗i
)](4)
where Ld∗i and La∗
i are given in equation (1) above as function of endowment, technology and
prices.
Migration Decision without Land Restrictions
A woman from household i has the option to migrate to the urban area where the wage is higher
wu > w0, but migration also entails some costs denoted as Φ which may include monetary and
non-monetary costs. Without any restrictions in the land market, we assume that the household
can be an absentee landlord, and can earn the profit generated by the land by renting out the
land (say through a fixed rent contract). In general, the absentee landlord would bear costs of
monitoring and enforcement, but we will mostly ignore such costs for the sake of simplicity and
to focus on the costs that arise from sales and rental restrictions.
The optimization decision facing household i after it migrates to the urban area is as follows:
MaxLdi ,L
aiUi = αLnC
d
i + βCai
where
Cdi = Q
d
i
Cai = wu
(L− Ld
i
)+Πa
i
where Πai (Hi, w0) = Qa∗
i (Hi, w0)− w0La∗i (Hi, w0) is the profit from land Hiusing only hired
labor at wage rate w0.
Denote the indirect utility for household i in the urban areas (without taking into account of
migration costs) as V Ui (Hi, L, δi, wu). Then woman from household i will migrate to the urban
7
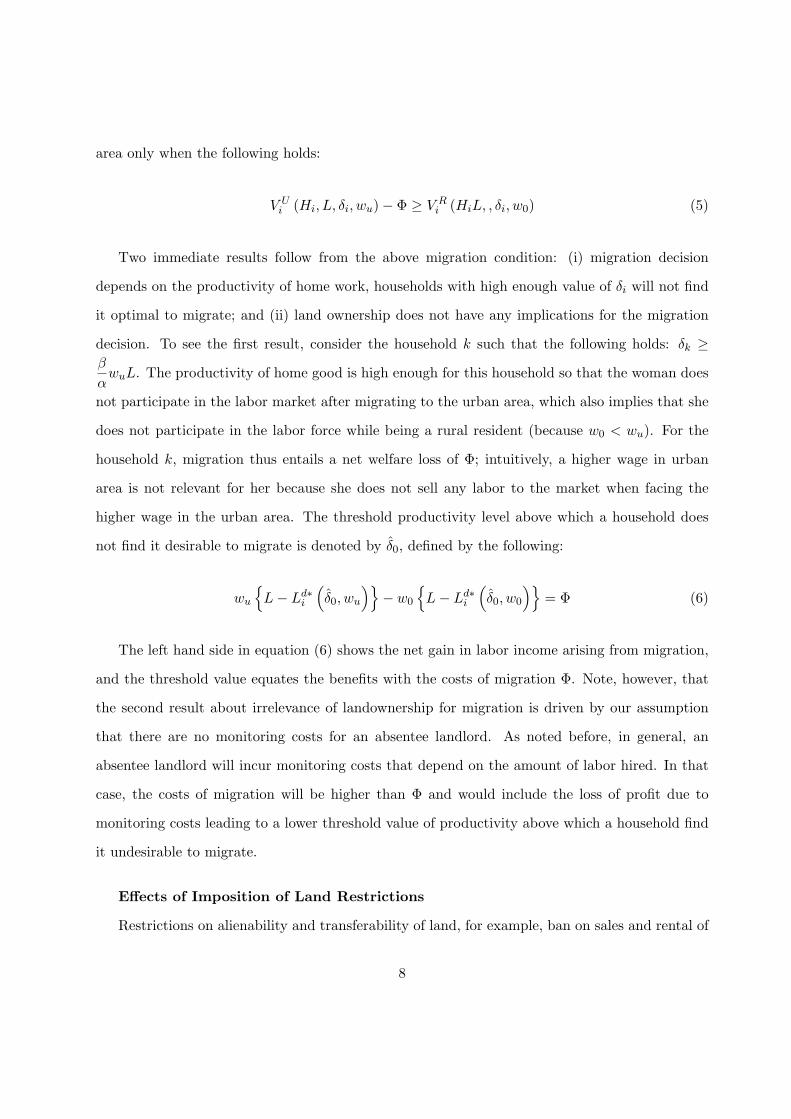
area only when the following holds:
V Ui (Hi, L, δi, wu)− Φ ≥ V R
i (HiL, , δi, w0) (5)
Two immediate results follow from the above migration condition: (i) migration decision
depends on the productivity of home work, households with high enough value of δi will not find
it optimal to migrate; and (ii) land ownership does not have any implications for the migration
decision. To see the first result, consider the household k such that the following holds: δk ≥β
αwuL. The productivity of home good is high enough for this household so that the woman does
not participate in the labor market after migrating to the urban area, which also implies that she
does not participate in the labor force while being a rural resident (because w0 < wu). For the
household k, migration thus entails a net welfare loss of Φ; intuitively, a higher wage in urban
area is not relevant for her because she does not sell any labor to the market when facing the
higher wage in the urban area. The threshold productivity level above which a household does
not find it desirable to migrate is denoted by δ̂0, defined by the following:
wu
{L− Ld∗
i
(δ̂0, wu
)}− w0
{L− Ld∗
i
(δ̂0, w0
)}= Φ (6)
The left hand side in equation (6) shows the net gain in labor income arising from migration,
and the threshold value equates the benefits with the costs of migration Φ. Note, however, that
the second result about irrelevance of landownership for migration is driven by our assumption
that there are no monitoring costs for an absentee landlord. As noted before, in general, an
absentee landlord will incur monitoring costs that depend on the amount of labor hired. In that
case, the costs of migration will be higher than Φ and would include the loss of profit due to
monitoring costs leading to a lower threshold value of productivity above which a household find
it undesirable to migrate.
Effects of Imposition of Land Restrictions
Restrictions on alienability and transferability of land, for example, ban on sales and rental of
8
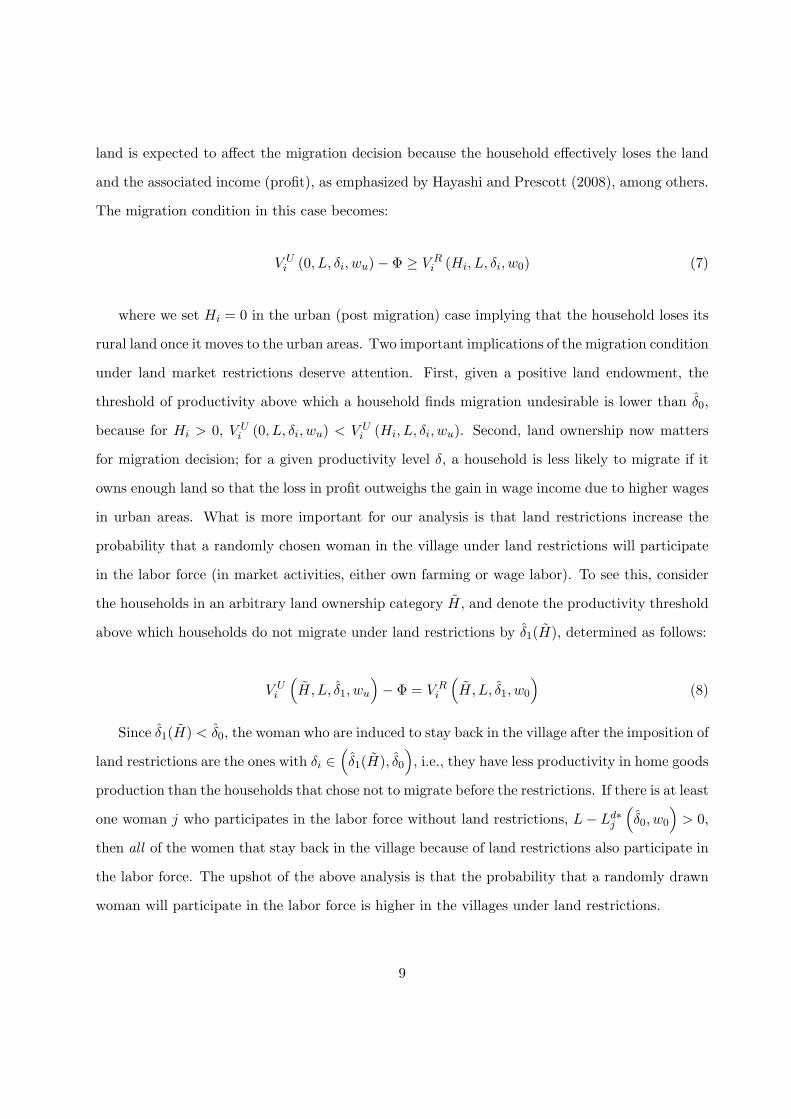
land is expected to affect the migration decision because the household effectively loses the land
and the associated income (profit), as emphasized by Hayashi and Prescott (2008), among others.
The migration condition in this case becomes:
V Ui (0, L, δi, wu)− Φ ≥ V R
i (Hi, L, δi, w0) (7)
where we set Hi = 0 in the urban (post migration) case implying that the household loses its
rural land once it moves to the urban areas. Two important implications of the migration condition
under land market restrictions deserve attention. First, given a positive land endowment, the
threshold of productivity above which a household finds migration undesirable is lower than δ̂0,
because for Hi > 0, V Ui (0, L, δi, wu) < V U
i (Hi, L, δi, wu). Second, land ownership now matters
for migration decision; for a given productivity level δ, a household is less likely to migrate if it
owns enough land so that the loss in profit outweighs the gain in wage income due to higher wages
in urban areas. What is more important for our analysis is that land restrictions increase the
probability that a randomly chosen woman in the village under land restrictions will participate
in the labor force (in market activities, either own farming or wage labor). To see this, consider
the households in an arbitrary land ownership category H̃, and denote the productivity threshold
above which households do not migrate under land restrictions by δ̂1(H̃), determined as follows:
V Ui
(H̃, L, δ̂1, wu
)− Φ = V R
i
(H̃, L, δ̂1, w0
)(8)
Since δ̂1(H̃) < δ̂0, the woman who are induced to stay back in the village after the imposition of
land restrictions are the ones with δi ∈(δ̂1(H̃), δ̂0
), i.e., they have less productivity in home goods
production than the households that chose not to migrate before the restrictions. If there is at least
one woman j who participates in the labor force without land restrictions, L− Ld∗j
(δ̂0, w0
)> 0,
then all of the women that stay back in the village because of land restrictions also participate in
the labor force. The upshot of the above analysis is that the probability that a randomly drawn
woman will participate in the labor force is higher in the villages under land restrictions.
9
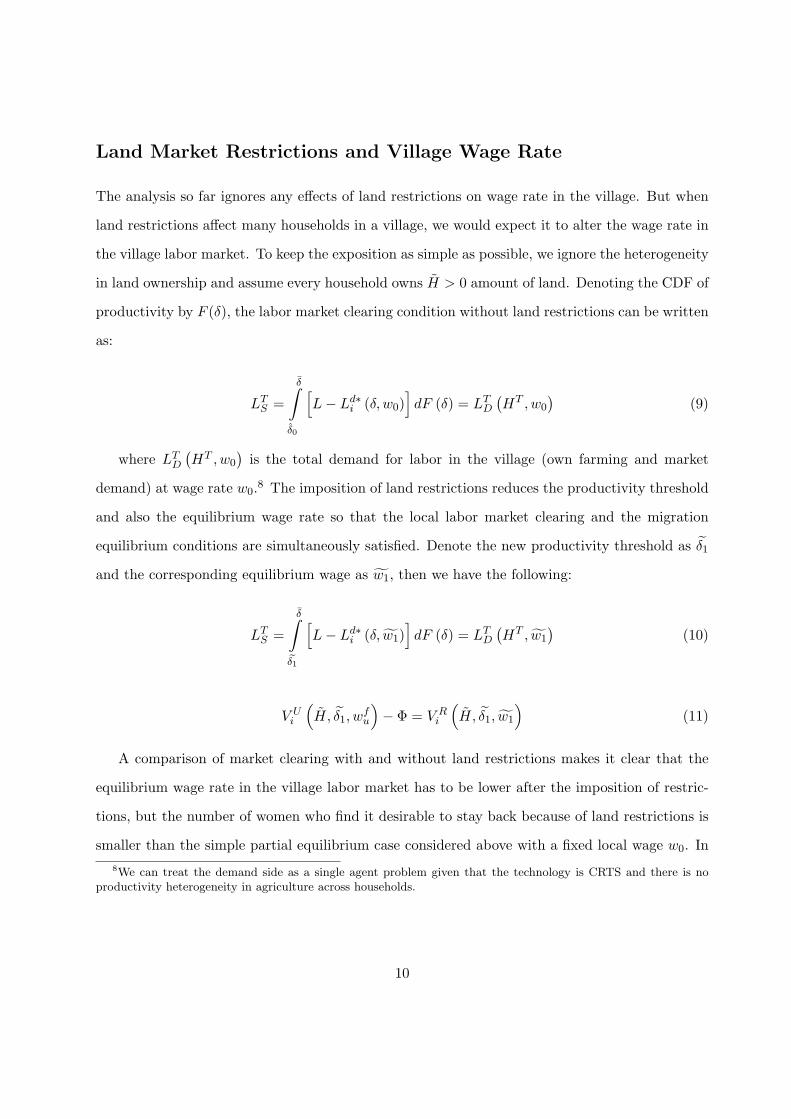
Land Market Restrictions and Village Wage Rate
The analysis so far ignores any effects of land restrictions on wage rate in the village. But when
land restrictions affect many households in a village, we would expect it to alter the wage rate in
the village labor market. To keep the exposition as simple as possible, we ignore the heterogeneity
in land ownership and assume every household owns H̃ > 0 amount of land. Denoting the CDF of
productivity by F (δ), the labor market clearing condition without land restrictions can be written
as:
LTS =
δ̄∫δ̂0
[L− Ld∗
i (δ, w0)]dF (δ) = LT
D
(HT , w0
)(9)
where LTD
(HT , w0
)is the total demand for labor in the village (own farming and market
demand) at wage rate w0.8 The imposition of land restrictions reduces the productivity threshold
and also the equilibrium wage rate so that the local labor market clearing and the migration
equilibrium conditions are simultaneously satisfied. Denote the new productivity threshold as δ̃1
and the corresponding equilibrium wage as w̃1, then we have the following:
LTS =
δ̄∫δ̃1
[L− Ld∗
i (δ, w̃1)]dF (δ) = LT
D
(HT , w̃1
)(10)
V Ui
(H̃, δ̃1, w
fu
)− Φ = V R
i
(H̃, δ̃1, w̃1
)(11)
A comparison of market clearing with and without land restrictions makes it clear that the
equilibrium wage rate in the village labor market has to be lower after the imposition of restric-
tions, but the number of women who find it desirable to stay back because of land restrictions is
smaller than the simple partial equilibrium case considered above with a fixed local wage w0. In
8We can treat the demand side as a single agent problem given that the technology is CRTS and there is noproductivity heterogeneity in agriculture across households.
10
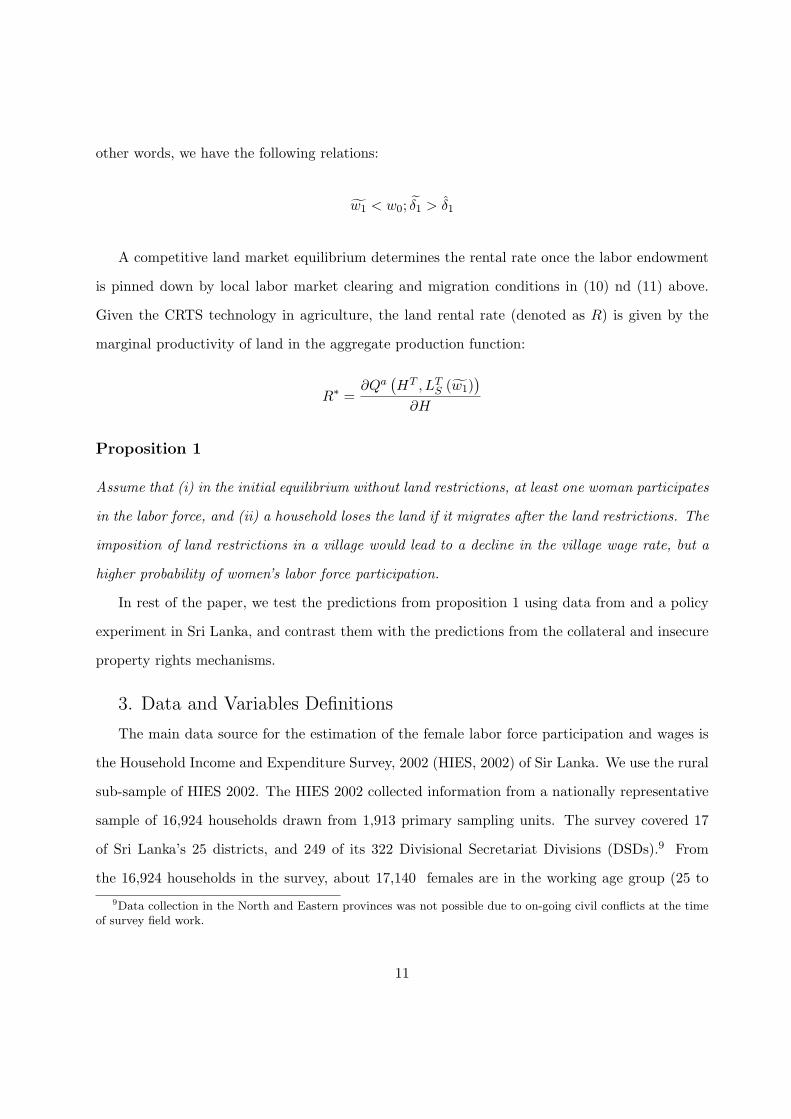
other words, we have the following relations:
w̃1 < w0; δ̃1 > δ̂1
A competitive land market equilibrium determines the rental rate once the labor endowment
is pinned down by local labor market clearing and migration conditions in (10) nd (11) above.
Given the CRTS technology in agriculture, the land rental rate (denoted as R) is given by the
marginal productivity of land in the aggregate production function:
R∗ =∂Qa
(HT , LT
S (w̃1))
∂H
Proposition 1
Assume that (i) in the initial equilibrium without land restrictions, at least one woman participates
in the labor force, and (ii) a household loses the land if it migrates after the land restrictions. The
imposition of land restrictions in a village would lead to a decline in the village wage rate, but a
higher probability of women’s labor force participation.
In rest of the paper, we test the predictions from proposition 1 using data from and a policy
experiment in Sri Lanka, and contrast them with the predictions from the collateral and insecure
property rights mechanisms.
3. Data and Variables Definitions
The main data source for the estimation of the female labor force participation and wages is
the Household Income and Expenditure Survey, 2002 (HIES, 2002) of Sir Lanka. We use the rural
sub-sample of HIES 2002. The HIES 2002 collected information from a nationally representative
sample of 16,924 households drawn from 1,913 primary sampling units. The survey covered 17
of Sri Lanka’s 25 districts, and 249 of its 322 Divisional Secretariat Divisions (DSDs).9 From
the 16,924 households in the survey, about 17,140 females are in the working age group (25 to
9Data collection in the North and Eastern provinces was not possible due to on-going civil conflicts at the timeof survey field work.
11
65 years). To define our sample, we used two criteria: (i) we excluded age groups which may
have been exposed to historical malaria that afflicted Sri Lanka before 1950; (ii) we focused on
the rural sample. Note that the rural sample does not include any household that has moved
to urban areas with all the members, but the split households where some members stay behind
in the village are part of the sample. The number of adult females who were born after 1950
and are currently residing in rural areas is 10,850. The sample for the wage regressions are,
however, smaller. Among females in our main sample (10,850), 42 percent are employed. About
a third of those employed are self-employed. We have thus complete information on wages and
other relevant variables for 2,918 females who were born after 1950 and live in rural areas. The
dependent variable in the wage regression is deflated using the region specific consumer price
index.
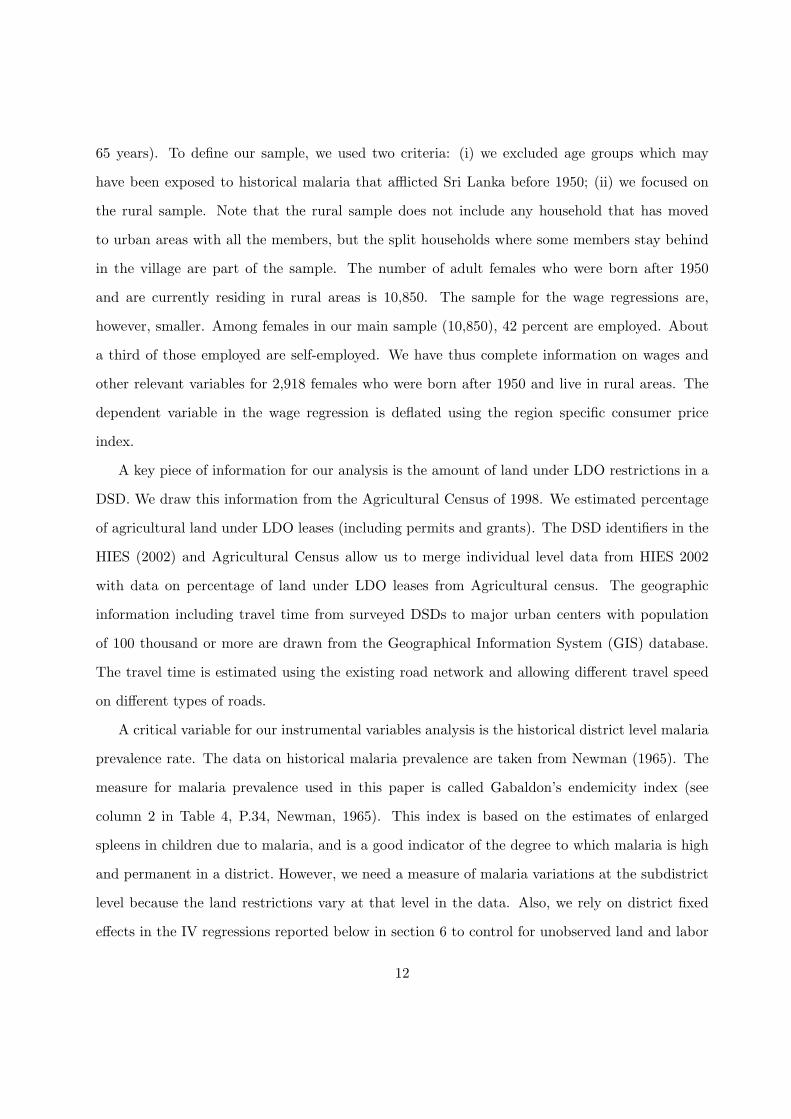
A key piece of information for our analysis is the amount of land under LDO restrictions in a
DSD. We draw this information from the Agricultural Census of 1998. We estimated percentage
of agricultural land under LDO leases (including permits and grants). The DSD identifiers in the
HIES (2002) and Agricultural Census allow us to merge individual level data from HIES 2002
with data on percentage of land under LDO leases from Agricultural census. The geographic
information including travel time from surveyed DSDs to major urban centers with population
of 100 thousand or more are drawn from the Geographical Information System (GIS) database.
The travel time is estimated using the existing road network and allowing different travel speed
on different types of roads.
A critical variable for our instrumental variables analysis is the historical district level malaria
prevalence rate. The data on historical malaria prevalence are taken from Newman (1965). The
measure for malaria prevalence used in this paper is called Gabaldon’s endemicity index (see
column 2 in Table 4, P.34, Newman, 1965). This index is based on the estimates of enlarged
spleens in children due to malaria, and is a good indicator of the degree to which malaria is high
and permanent in a district. However, we need a measure of malaria variations at the subdistrict
level because the land restrictions vary at that level in the data. Also, we rely on district fixed
effects in the IV regressions reported below in section 6 to control for unobserved land and labor
12
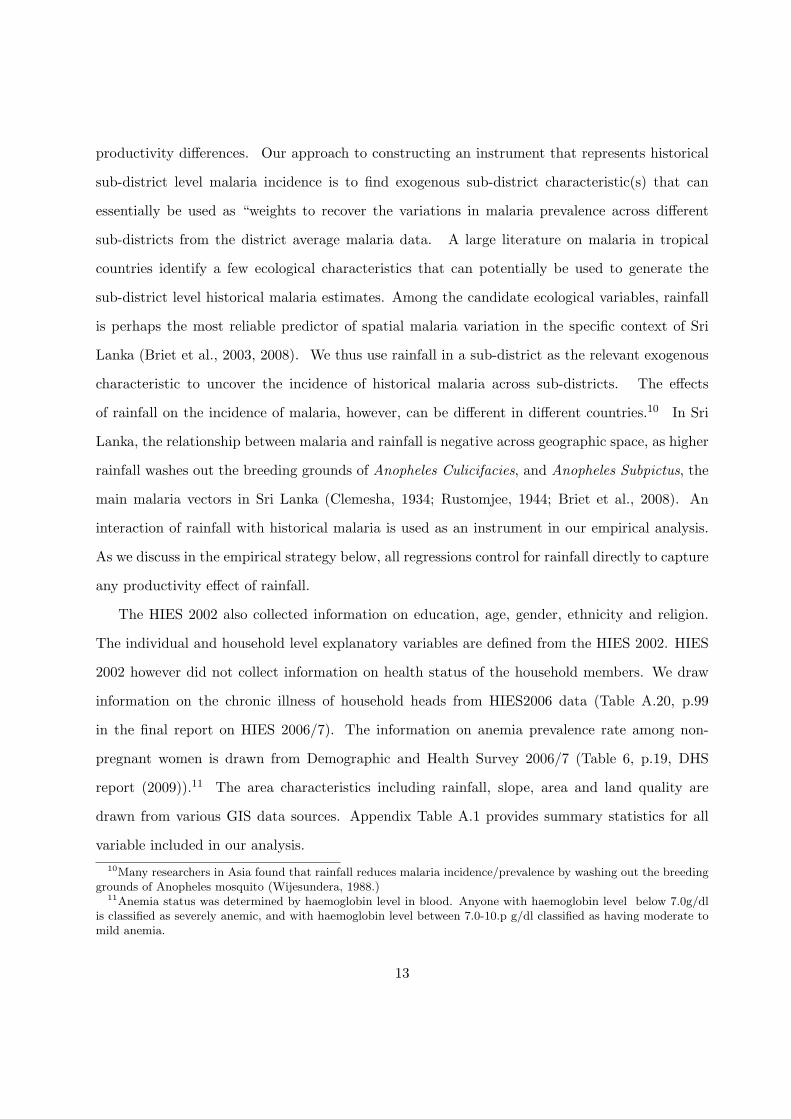
productivity differences. Our approach to constructing an instrument that represents historical
sub-district level malaria incidence is to find exogenous sub-district characteristic(s) that can
essentially be used as “weights to recover the variations in malaria prevalence across different
sub-districts from the district average malaria data. A large literature on malaria in tropical
countries identify a few ecological characteristics that can potentially be used to generate the
sub-district level historical malaria estimates. Among the candidate ecological variables, rainfall
is perhaps the most reliable predictor of spatial malaria variation in the specific context of Sri
Lanka (Briet et al., 2003, 2008). We thus use rainfall in a sub-district as the relevant exogenous
characteristic to uncover the incidence of historical malaria across sub-districts. The effects
of rainfall on the incidence of malaria, however, can be different in different countries.10 In Sri
Lanka, the relationship between malaria and rainfall is negative across geographic space, as higher
rainfall washes out the breeding grounds of Anopheles Culicifacies, and Anopheles Subpictus, the
main malaria vectors in Sri Lanka (Clemesha, 1934; Rustomjee, 1944; Briet et al., 2008). An
interaction of rainfall with historical malaria is used as an instrument in our empirical analysis.
As we discuss in the empirical strategy below, all regressions control for rainfall directly to capture
any productivity effect of rainfall.
The HIES 2002 also collected information on education, age, gender, ethnicity and religion.
The individual and household level explanatory variables are defined from the HIES 2002. HIES
2002 however did not collect information on health status of the household members. We draw
information on the chronic illness of household heads from HIES2006 data (Table A.20, p.99
in the final report on HIES 2006/7). The information on anemia prevalence rate among non-
pregnant women is drawn from Demographic and Health Survey 2006/7 (Table 6, p.19, DHS
report (2009)).11 The area characteristics including rainfall, slope, area and land quality are
drawn from various GIS data sources. Appendix Table A.1 provides summary statistics for all
variable included in our analysis.
10Many researchers in Asia found that rainfall reduces malaria incidence/prevalence by washing out the breedinggrounds of Anopheles mosquito (Wijesundera, 1988.)
11Anemia status was determined by haemoglobin level in blood. Anyone with haemoglobin level below 7.0g/dlis classified as severely anemic, and with haemoglobin level between 7.0-10.p g/dl classified as having moderate tomild anemia.
13
Among 10,850 women in our main sample, 51 percent participated in the labor force, with
42 percent employed and another 8.65 percent unemployed but seeking jobs. Though Sri Lanka
has a higher per capita income compared with rest of the South Asian countries, the labor force
participation rate in Sri Lanka (51 percent) is somewhat larger than that in India (around 34
percent) but smaller than that in the two poorest countries, Bangladesh (57 percent) and Nepal
(58 percent) (Chaudhuri, 2010). As opposed to other South Asian countries where work migration
among women is very limited due to social and cultural norms, Sri Lankan women are quite mobile
in search of jobs. For instance, about half of all emigrant workers in Sri Lanka are women (about
2.5 million women) and a large fraction of garment workers – the most important manufacturing
– are also women who migrated from rural areas (Ukwatta, 2003). In the following section, we
discuss our empirical strategy.
4. Empirical Strategy
The core identification challenge is that the different sub-districts may differ systematically in
observed and unobserved dimensions, and when the unobserved characteristics are correlated with
both the incidence of land restrictions and the outcome variables across different sub-districts,
it may lead to omitted variables bias. The sources of omitted variables bias are likely to be
unobserved labor and land productivity heterogeneity.
4.1 Possible Sources of Bias
It is common for governments to impose restrictions on sales of land in settlement areas, and
settlement usually takes place in low quality marginal land. Also, historically private property
rights emerge first in high productivity land. As a result, when we observe land under private
property rights to coexist with land under government restrictions, the land under restrictions
in general turns out to be of lower quality. A second important issue is the labor productivity
heterogeneity. Since lands under policy restrictions in Sri Lanka are mainly settlement lands, one
might worry that the people who were brought to these lands are of lower productivity due to
adverse human capital characteristics. Evidence from Sri Lanka however shows that land and
labor productivity is higher in areas under land policy restrictions.
14
Crop yield is a good summary statistic for the land and labor productivity of an area. Crop
yields are found to be higher in land under policy restrictions for a number of different crops
including rice, the main crop in Sri Lanka ( please see Table 1 for details). There is no evidence of
adverse health conditions in areas under land restrictions. The correlations between two indicators
of health status – incidence of chronic illness and disability, and percentage of non-pregnant
women suffering from different degrees of anemia – with proportion of land under restrictions
are statistically insignificant and mostly bear negative signs (please see Table 2). The higher
land productivity in areas under land restrictions are outcomes of Sri Lanka government’s heavy
investment in irrigation development in resettled areas. Similarly investments in health, education
and social services across the entire country successfully eliminated regional differences in the labor
productivity outcomes as well (Sen, 1981).
Higher productivity in a subdistrict, however, does not have unambiguous effects on women’s
labor force participation and wage, because it can have conflicting effects on the demand and
supply sides of the labor market. On the demand side, higher land/labor productivity increases
marginal productivity of labor and thus raises demand for labor and equilibrium wages. How-
ever, higher land quality also implies higher income for the land owning households which can
reduce labor force participation (and labor supply) by women when work outside the home is
associated with social stigma (Goldin (1995)). The bias from unobserved land and labor quality
thus depends on the net effect: if the labor demand shift due to higher productivity dominates,
the OLS estimates will tend to overestimate the effects of land restrictions on women’s labor force
participation (because the causal effect is positive according to the theory), and underestimate
their effects on wage (because the causal effect is negative according to the theory).
Another potentially important issue is measurement error in the land restrictions variable
and the resulting ‘attenuation bias’. Thus the OLS estimates of the effects on both labor force
participation and equilibrium wages are likely to be biased toward zero.
4.2 Historical Malaria as a Natural Experiment
To estimate the effects of land restrictions on women’s labor force participation and wage, we
need to find a source of exogenous variation in the incidence of land restrictions in different sub-
15
districts. The unique role played by malaria infestation starting from the 13th century till early
twentieth century in the history of land policy of Sri Lanka offers such an exogenous source of vari-
ations. The areas affected by historical malaria endemicity witnessed exodus of population and
abandonment of land (De Silva (1981)). The abandoned land was taken over by the government
and designated as ‘crown land’ during the colonial period. The crown land was later distributed
after the independence in 1948 under Land Development Ordinance of 1935, and restrictions on
sales, mortgage, and rental were imposed (henceforth called LDO restrictions). Since the amount
of crown land available in a sub-district was historically determined by the intensity of malaria,
the historical malaria incidence created exogenous variations in the incidence of land restrictions
in a sub-district; the proportion of land under restrictions is higher in a sub-district, the higher
was the intensity of historical malaria prevalence.12
An important part of our empirical strategy is to use district fixed effects to control for time-
invariant land and labor productivity factors which are the main sources of omitted variables bias.
This precludes the use of district level malaria variation for identification. More important, we need
an instrument that can provide variations at the subdistrict level to explain the incidence of land
restrictions which varies across different subdistricts. Also, the district average is likely to smooth
out a large part of the identifying variation in historical malaria across different subdistricts, and
thus may result in weak instrument problem. This is important because there were significant
variation in the historical malaria endemicity across different sub-districts within the same district.
For example, in Jaffna district, the Jaffna city was almost malaria free while the south Jaffna
suffered from severe malaria in early 1930s (Newman (1965), p. 35). To uncover this variation
across sub-districts in a district, we exploit the correlation between rainfall and malaria by using
interaction of these two terms as instrument. As discussed in the data and variables section above
(section 4), rainfall is one of the most important exogenous ecological determinant of malaria in
Sri Lanka, and the higher the rainfall in a subdistrict (DSD) in a district, the lower is the
12One potential worry is that the households facing historical malaria might have abandoned land selectivelywhich can create a negative correlation between the extent of land restrictions in a sub-district and its land quality,because one would expect a household to abandon the low quality lands first. However, as discussed earlier, thelands under the restrictions are of higher quality, which implies that we do not need to worry about such selectiveland abandonment. We thank Michael Clemens for raising this point.
16
malaria incidence compared to the other DSDs in the district, because rainfall washes away the
breeding grounds (standing waters in ponds, canals, marshes etc.) of the main malaria vectors
(see, for example, the discussion on the effects of rainfall on historical malaria in (Clemesha,
1934; Rustomjee, 1944). Thus the interaction of district level malaria estimate with DSD level
rainfall in the first stage regression of the incidence of land restrictions that includes district fixed
effects will have a negative sign, if the interaction in fact represents variation in historical malaria
across DSDs. This a priori sign restriction is useful for our identification strategy, because one
might worry that the interaction represents primarily variation in productivity due to rainfall
differences across DSDs, instead of variations in historical malaria across DSDs within a district.
Note that we directly control for rainfall in the regressions, but if our instrument is still picking
up productivity effects of rainfall, we would find a positive coefficient on the interaction of malaria
and rainfall at the DSD level in the first stage regressions. This is because productivity is higher in
high land restrictions areas, as discussed earlier, and higher rainfall increases crop yield. The sign
of the instrument in the first stage thus provides us with a way to check whether the interaction
based instrument captures the variations in historical malaria across DSDs.
4.3 Potential Objections to Identification Strategy
There are a number of possible objections to our identification scheme which we discuss below.
A legitimate concern is that the sub-district level historical malaria might proxy for the direct
effect of rainfall on the labor market, especially in the agricultural sector. To make sure that our
instrument (rainfall weighted historical malaria) does not capture the direct effect of rainfall on
the labor market, we control for rainfall in a sub-district directly in all of the IV regressions.13 In
addition to rainfall, regressions control for slope (steeper slope means less standing water and less
malaria), share of paddy land in total agricultural land and a dummy indicating whether the DSD
is within 5 km of a river (land productivity). The district level fixed effects are also included to
control for land and labor productivity heterogeneity. As discussed before, land productivity as
13Since rainfall is conducive to rice cultivation, one might worry that they might affect the cropping mix in asubdistrict. We thank Andy Foster for raising this point. To the extent crops differ in terms of their labor intensity,it might affect demand for labor. The rainfall as control should pick up the resulting variation in labor demandacross sub-districts. As an additional check, we later report IV results that control for share of paddy land.
17
measured by yield is not lower in high land restriction areas. The evidence in Table 1 also indicates
that conditional on exogenous indicators of land productivity (rainfall, slope and nearness to river
dummy and district fixed effects), our instrument is not correlated with crop yields. This is strong
evidence in favor of the identification scheme.
Another important objection to the identification strategy comes from the recent literature
on institutions and growth that shows that historical malaria can affect the quality of institutions
through its influence on settler mortality (Acemoglu et al, 2001). However, it is important to
appreciate that the long-term effects of malaria on the quality of institutions emphasized in the
cross-country literature are not relevant for our identification scheme. Because identification in
our case comes from variations in historical malaria across sub-districts within a district, as we
use district fixed effects.14 The relevant institutions such as legal system and enforcement of
contracts and property rights, however, are determined at the national level. As an additional
precaution, we also control for the proportion of Sinhalese population in a sub-district as a measure
of ethno-linguistic fractionalization that can potentially affect public goods provision.15 A further
concern is that historical malaria may have affected human capital of current labor force adversely
in our sample. There are good reasons to believe that this is not the case. First, and probably
the most important, is the fact that the settlement schemes brought in people from relatively
malaria free regions to the subdistricts which were abandoned because of historical malaria. As
a result, vast majority of the current population were never exposed to historical malaria in the
sub-district of their current residence (i.e, residence in 2002). Second, we exclude the cohorts that
were potentially exposed (in utero or post-natal) to historical malaria in Sri Lanka.16 Thus our
sample is not contaminated by the possibility that someone might have been exposed to historical
malaria before his/her mom resettled in a historical malaria ravaged sub-district.17 The upshot
14A district as an administrative unit is similar to a county in USA.15We, however, do not find any evidence that ethnolinguistic fractionalization is correlated with the incidence
of land restrictions across sub-districts in Sri Lanka. A regression of proportion of land under restrictions on aconstant and share of Sinhalese population yields a coefficient close to zero (-0.002) with a very low t statistic(-0.33).
16Since malaria exposure in utero can have effects on adult health and education, we exclude cohorts born before1950, even though nationwide malaria eradication was implemented in 1947.
17Note that the probability of such exposure is not high as malaria endemicity was much lower in the sub-districtsfrom where the people were resettled.
18
of the above discussion is that historical malaria in a sub-district should not be correlated with
the health outcomes of most of the current population. Indeed, evidence in Table 2 confirms
that the interaction of historical malaria and rainfall is not correlated with the current health
conditions (measured by anemia and chronic illness/disablity). To allay the concern that historical
malaria might pick up the current malaria infections, we control for recent malaria incidence (both
Plasmodium Vivax and Plasmodium Falciparum infection rates).
Note that historical malaria can potentially affect the attitude (for example, risk preference)
of the exposed population, and it can have long-term effects on women’s labor force participation
if intergenerational transmission of changes in attitude is significant enough. But, in our sample,
such effects are not possible because the parents and grandparents of the current generation
were never exposed to the historical malaria in the current village of residence, as they were
resettled from relatively malaria free parts of the country. This fact also implies that the migration
network inherited by the current generation was not affected by historical malaria in their current
residence. This is important because historical malaria can have direct effects on migration if
parental generation was exposed.
5. Empirical Results
(5.1) OLS Estimates
We start with the simple OLS results for alternative sets of controls and samples. Regressions
include a set of individual and household level controls, area-specific controls, and a dummy
for estate (tea plantation). The estate dummy captures variation in economic opportunities
particularly for women as tea estates in Sri Lanka employ primarily women workers. The distance
to the nearest city plays a double role; it represents the standard migration costs due to transport
and search, but it may also capture differences in economic structure, as the composition of
output and pattern of crop specialization in a village economy depend on the access to urban
markets (Emran and Shilpi (2012)). The area-specific controls include share of Sinhalese (main
ethnic group in the country), number of cases of Plasmodium Vivax and Plasmodium Falciparum
infections in 2002. The set of individual and household level controls vary slightly depending on the
19
dependent variable of the regression. Most regressions also include land productivity controls such
as average rainfall, average slope, a dummy indicating whether sub-district is within 5 kilometer
of a river, and proportion of land devoted to paddy and district level fixed effects. In addition to
capturing unobserved land and labor heterogeneity, the district fixed effects also control for any
formal or informal institutional differences across areas which might be relevant for labor market.
All standard errors reported in this paper are corrected for heteroskedasticity and clustered at
DSD level.
The regressions for labor force participation are reported in columns 1 and 2, and for wage in
columns 3 and 4 of Table 3 respectively. The wage regressions correct for selection into employment
as labor force participation rate among women is about 51 percent. The estimates of Table 3
exploit heteroskedasticity for identification following a growing econometric literature that shows
that identification can be obtained without any exclusion restrictions if there is heteroskedasticity
in the participation equation (Schaffner (2002), Lewbel (2012), Klein and Vella (2009)). As
shown by Schaffner (2002) and Klein and Vella (2009), heteroskedasticity effectively induces an
exclusion restriction even if there is no external instrument available.18 The second approach
we take imposes explicit exclusion restriction following Mulligan and Rubinstein (2008) who use
numbers of infants and toddlers as instruments for sample selection correction in female wage
equation (the corresponding OLS results are omitted for the sake of brevity).19
The specifications in columns 1 and 3 of Table 3 include controls for individual and household
characteristics, a dummy for estate (mainly tea) and distance to the nearest large city but do not
include land productivity controls or district fixed effects. We include individual and household
level characteristics that are expected to affect a women’s reservation and actual wages; age (in
log), marital status, education level (log) and indicators of differences in stigma effect of women’s
work (religion and ethnicity). The labor force participation regression includes a squared term for
education as education is observed to have non-linear effect on participation decision. The simple
18For recent applications of heteroskedasticity based identification, see, for example, Chowdhury et al. (2014),Emran and Hou (2013), Emran and Shilpi (2012), Emran et al. (2014), Mallick (2011).
19We, however, present the results that include number of infants and toddlers as an identifying instrument ofthe selection equation as part of the robustness checks of the main IV results.
20
OLS regressions indicate no significant correlations between land restrictions and women’s labor
force participation and wage. These regressions, however, do not control for any agro-climatic or
other indicators of productivity such as rainfall. Thus potential negative effect of land restrictions
may be offset by the omitted productivity effects.
The next specifications (columns 2 and 4) add geographic (slope, proximity to river), agro-
climatic (rainfall), and land productivity (share of paddy land) variables to the specification in
columns 1 and 3. They also include district level fixed effects. The estimated partial correlation
between land restrictions and women’s labor force participation is positive, large in magnitude
(0.28) and statistically significant at the 1 percent significance level.20 The estimated partial
correlation (-1.42) in the case of wage is on the other hand negative and statistically significant at
the 1 percent level. The estimates in column 2 and 4 thus provide some preliminary indication that
the omitted land and labor productivity may bias the estimates of the impact of land restrictions
on women’s labor force participation and wage toward zero.
(5.2) Estimates from the Instrumental Variables Approach
The OLS regressions in Table 3 provide some interesting preliminary evidence on the effects
of land restrictions on women’s labor force participation and wages. However, the estimates are
likely to be biased due to unobserved heterogeneity and measurement error. To correct for the
possible bias in the estimates in Table 3, we use the instrumental variables approach developed
in section (5) above. We use the most complete specifications in columns 2 and 4 of Table 3
for the instrumental variables estimation. Table 4 reports the main results from the instrumental
variables approach. The first row shows the IV estimates of the effects of land restrictions on
women’s labor force participation and wages, and the following four rows report the first stage
regressions and diagnostics for the relevance of the instrument.
The first stage results show that historical malaria incidence at the subdistrict level has ex-
cellent power in explaining the variation in the incidence of land restrictions (proportion of land
under restrictions), even after district fixed effects are included. The lowest Kleibergen-Paap
20The pattern of the estimates from the probit models for labor force participation are similar to the ones fromOLS and are omitted for the sake of brevity.
21
F statistic for the exclusion of the instrument are 11.99 across the four IV regressions in Table
4, implying that all of the F statistics are larger than the Stock-Yogo critical value 9.08 for 10
percent maximal relative bias.21 The sign of the instrument (interaction of district malaria with
DSD rainfall) in the first stage regressions is negative across all four regressions. As discussed
before, this can be interpreted as strong evidence that the interaction of rainfall with historical
malaria in fact captures the variation in historical malaria across DSDs (after employing district
fixed effects); if the interaction represents direct productivity effects of rainfall instead, we should
have observed a positive coefficient on the instrument in the first stage regression. This provides
additional evidence that conditional on district fixed effects, subdistrict rainfall, and a rich set of
controls in the IV regressions, the exclusion restriction imposed on the rainfall weighted historical
malaria is credible.
Columns (1) and (2) in the first row of Table 4 reports the estimated causal effects of land
restrictions on women’s labor force participation. The specification in column (2) adds number of
infants and toddlers as additional regressors. The estimated effect of land restrictions on women’s
labor force participation is statistically significant at the 1 percent level, and the magnitudes (1.05
and 1.04) are significantly larger than the corresponding OLS estimates.
Columns (3) and (4) in row 1 of Table 4 present the 2SLS estimates of the effects of land
restrictions on female wage. The wage regressions include a selection term to correct for self
selection into the labor force. The specification in column 3 exploits heteroskedasticty in the
participation equation following a growing econometric literature that shows that identification
can be obtained without any external instruments when there is heteroskedasticity in the selection
equation (Schaffner (2002), Lewbel (2012) and Klein and Vella (2009, 2010). Since the selection
equation is a binary choice model, one can argue that it is identified from the nonlinearity of the
normal CDF. However, it is well-appreciated in the literature that such identification is weak,
as it relies on the data variation in the tails of the distribution (Altonji et al. (2005)). When
there is heteroskedasticity, it allows us to exploit the observations from the middle part of the
21We use the critical value for 3 instruments, as Stock-Yogo (2005) do not report the critical value for 2 instru-ments.
22
distribution which is approximately linear, and thus the resulting identification is no longer weak
(for a discussion, see Klein and Vella (2009)). The specification in column 4 on the other hand
utilizes the number of infants and toddler as identifying instrument in the selection equation
following Mulligan and Rubinstein (2008).
The estimated effect of land restrictions on female wage as reported in column (3) is negative,
numerically substantial (-1.54) and statistically significant at the 5 percent level (row 1). The
estimate using the alternative selection correction scheme reported in column 4 also suggests
statistically significant (at 1 percent level) and negative (-1.78) effect of land restrictions on
female wage. The IV estimates of the effects of land restrictions on female wage are numerically
(in absolute magnitude) larger than the OLS estimates reported in Table 3 (column 4). The IV
estimates for both labor force participation and wage seem to justify the worry that the OLS
estimates are significantly biased toward zero due to omitted variables and measurement error.
We also perform a variety of robustness checks for the IV results in Table 4, but we omit the
results for the sake of brevity (available in an online appendix to this paper). The robustness
exercises deal with the following issues: (i) potential correlation between unobserved land pro-
ductivity and farm size,22 (ii) possible effects of malaria eradication in 1947 on the population
and hence density of economic activity, (iii) broader measure of relevant urban market for a sub-
district, and (iv) heterogeneity in non-farm opportunities, and investments in land improvements
across subdistricts.
(5.3) Mechanisms: Collateral for Credit, Insecure Property Rights, or Migration
Costs?
The results discussed so far provide strong evidence that the land market restrictions affect
women’s labor force participation and wages significantly. The evidence is consistent with the
theoretical analysis in section (3) above that identifies rural-urban migration as the main channel
through which the land market restrictions work.
The results reported so far are, however, not consistent with the predictions from the two
22This was raised by Andrew Foster.
23
other alternative mechanisms discussed in the introduction. First, consider the implications of
an important credit and interest rate channel for the land market restrictions. A lower access to
formal credit can have conflicting effects on the demand for labor. On the one hand, a higher
interest rate faced in the informal sector would lead to capital-labor substitutions in favor of
relatively cheaper labor, and thus increase the demand for labor in a sub-district with higher
proportion of land under restrictions.23 The equilibrium wage in this case will be higher along
with higher level of labor force participation in the rural areas. The fact that we find very robust
evidence of a negative effect of land restrictions on equilibrium wage casts strong doubts on the
relevance of such interest rate channel in our case. However, at least in some cases, the capital
and labor may be complementary. For example, if lower access to credit reduces the adoption of
new seed technology in agriculture, this might reduce demand for labor.24 More generally, a lack
of credit and higher interest rate will affect investment adversely and also can lead to failure and
exit of non-farm business in a village. Such negative effects at the extensive margin will reduce
the demand for labor. In this case, we would observe a reduction in both wage and labor force
participation by women. Our evidence that labor force participation in fact increases after land
restrictions thus contradicts this particular credit mechanism.
If land market restrictions create uncertainty regarding property rights, then women would
need to stay back home to guard and protect property rights as in Field (2007). In the context of
our model, this can be interpreted as higher productivity in home work, which now also includes
guard labor. More insecurity in property rights would reduce women’s labor force participation
and push up wages in the village labor market. Our evidence on both wages and participation
contradict both of these predictions.
(5.4) Additional Evidence on Migration Mechanism
In this section, we provide additional evidence that the effects of land restrictions on women’s
labor force participation and wage are due to the increased costs of migration arising from re-
23The farmers would not find it profitable to adopt labor saving technologies such as tractors and thrashingmachines.
24Most of the existing evidence shows that the green revolution increases demand for labor.
24
strictions in the land market. We provide several pieces of evidence that relates to the effects
of higher migration costs.25 First, we find that propensity of outmigration is lower (see Figure
1 based on population census 2012) and proportion of split households where some members are
left behind to hold on to the land is higher (see FIgure 2 based on HIES 2002) in villages with
land retrictions. The census did not provide the out-migration data by gender. To check if female
migration is also less in the areas with higher land restrictions, we use census data on female
share in total population. The census data show that share of female in total population is higher
when land restrictions are higher (Figure 3). This is true if we focus only on adult women (graph
omitted for brevity). Using population census data from 2002 and 2012, we compute the change
in female share of population for the same age cohort (15-49 year old in 2002 and 25-59 year old
in 2012). Figure 4 plots this variable against proportion of land under restrictions. The positive
slope confirms that more female are staying back in areas with more land under restrictions.
Third, female share in the labor force –defined from HIES 2002 data – is also positively correlated
with the incidence of land restrictions (see Figure 5). Taken together, these can be interpreted as
strong direct evidence in favor of the proposition that women stay back in the village in response
to higher migration costs arising from land restrictions. Finally, using HIES 2002 data, we find
that farm size is negatively correlated with land restrictions, as one would expect if more women
(and possibly some men) stay back in the village facing higher migration costs (Figure 6).
We also find suggestive evidence that support the model where heterogeneity in labor force
participation and the consequences of higher migration costs depend on productivity in home
goods production. Due to cultural norms, women are responsible for providing home goods in
Sri Lanka, and this gender role creates productivity differences between male and female in home
goods production. It is also common that the older women bear most of the responsibility for
home, and accumulate advantages due to learning effects and experience. If home production is
important as postulated in our model, then increased migration costs due to land restrictions will
affect the men much less than the women, and among women, the effect will be smaller on the
25We are grateful to an anonymous referee for suggesting these additional test for the migration mechanism. Asmentioned before that the migration mechanism has prediction for farm size was also noted by Andrew Foster.
25
younger women. In an online appendix (see Table A.3), we report evidence on differential effects
of land market restrictions across gender and different age cohorts of women. The evidence is
consistent with an important role of home production heterogeneity.
(5.5) Economic Significance
Are the estimated effects economically important enough to warrant attention? A 10 percent
increase in the land under restrictions starting from a mean incidence level of restrictions increases
women’s labor force participation by about 2.3 percent according to the estimate in Table 4. The
mean level of land restrictions in our data set is about 11 percent, thus a 10 percent increase
in the land under restrictions is equivalent to an increase of about 1 percentage point for an
average sub-district. A close to 2.3 percent increase in the labor force participation due to a 1
percentage point increase in the land restrictions is not a small effect given that the mean labor
force participation rate for women in our sample is 51 percent. The estimates for female wage
imply that a one percentage point increase in land under restrictions reduces wage by about 1.7
percent. The average annual real wage for women is Rs. 51133 in our sample. A 1 percentage
point increase in land under restrictions decreases annual wage by Rs.866 (evaluated at the mean
so that the area of land under restrictions goes up from 11 percent to 12 percent). The official
poverty line annual expenditure for 2002 was Rs.17076, and food poverty line was Rs. 11676. The
reduction of wage due to a percentage point increase in land under restrictions accounts for 5.1
percent of official poverty line expenditure and 7.4 percent of food poverty line expenditure. The
results thus indicate that the effect of land market restrictions on female wage is substantial.
6. Conclusions
This paper examines the effects of land market restrictions on female labor force participation
and wages in a rural labor market. The existing literature emphasizes two channels through
which land restrictions affect the economic outcomes of a household: the collateral value of land,
and insecurity of property rights. Our theoretical analysis focuses on an alternative mechanism
where land restrictions increase costs of migration. In a model where women differ in terms of
their productivity in home goods production, we show that land restrictions lower the equilibrium
26
wage, but increase the labor force participation rate. This evidence contradicts both the collateral
and insecure property rights mechanisms.
We use a historical quasi experiment in land policy in Sri Lanka to estimate the effects of
land market restrictions on the local labor market. The IV estimates that exploit the historical
natural experiment show that the effect of land restrictions on women’s labor force participation
is numerically substantial and statistically significant at the 1 percent level. According to the
IV estimates, when the land restrictions increase by 1 percentage point (starting from a mean
level of restrictions), it increases women’s labor force participation by close to 2.3 percent. The
corresponding estimate is 1.7 percent reduction in the wage for women. The results also suggest
a greater burden of land market restriction on older women, and a much lower effect on men. To
the best of our knowledge, the theoretical and empirical analysis presented in this paper is the
first attempt in the economics literature to understand the effects of land market restrictions on
women’s labor force participation and wage in rural areas of a developing country.
References
Acemoglu, D and Simon Johnson and James A. Robinson, 2001. “The Colonial Origins of
Comparative Development: An Empirical Investigation”, American Economic Review, American
Economic Association, vol. 91(5), pages 1369-1401, December.
Besley, T (1995): “Property Rights and Investment Incentives: Theory and Evidence from
Ghana.” Journal of Political Economy, 103, 5, 1995: 903-937.
Briet, O. J. T, P. Vounatsou, D. M. Gunawardena, G. Galappaththy, P. Amerasinghe (2008),
“Temporal Correlation Between Malaria and Rainfall in Sri Lanka”, Malaria Journal, May 2008.
Chowdhury, Mohammad Tarequl H., Bhattacharya, Prasad Sankar, Mallick, Debdulal, and
Ulubasoglu, Mehmet Ali, 2014. “An empirical inquiry into the role of sectoral diversification in
exchange rate regime choice, European Economic Review, Elsevier, vol. 67(C), pages 210-227.
Clemesha, W (1934), “Brief Account of the Natural History of Malaria in Ceylon”, Ceylon
Journal of Science, 1934, 3: 157-172.
De Silva, K. M. (1981), A History of Sri Lanka, London, C. Hurst Publisher.
27
Department of Census and Statistics (2008), Household Income and Expenditure Survey-
2006/07: Final Report, Colombo: Sri Lanka.
Department of Census and Statistics (2009), Demographic and Health Survey 2006/07: Preva-
lence of Anemia among Children and Women in Sri Lanka, Colombo: Sri Lanka.
Emran, M. Shahe and F. Shilpi (2012), “The Extent of the Market and Stages of Agricultural
Specialization”, Canadian Journal of Economics, August, 2012.
Emran, M. Shahe and F. Shilpi (forthcoming), “General Equilibrium Effects of Land Market
Restrictions on Labor Market: Evidence from Wages in Sri Lanka”, forthcoming in American
Journal of Agricultural Economics. Prepublication working paper version available from SSRN.
Emran, M. Shahe and Zhaoyang Hou, 2013. “Access to Markets and Rural Poverty: Evidence
from Household Consumption in China, The Review of Economics and Statistics, MIT Press, vol.
95(2), pages 682-697, May.
Emran, M. Shahe, Virginia Robano, and Stephen C. Smith, 2014. “Assessing the Fron-
tiers of Ultrapoverty Reduction: Evidence from Challenging the Frontiers of Poverty Reduc-
tion/Targeting the Ultra-poor, an Innovative Program in Bangladesh, Economic Development
and Cultural Change, University of Chicago Press, vol. 62(2), pages 339 - 380.
Field, Erica, (2007), “Entitled to Work: Urban Property Rights and the Labor Supply in
Peru,” Quarterly Journal of Economics, Vol. 122(4), p1561-1602.
Goldin, C (1995), The U-Shaped Female Labor Force Function in Economic Development and
Economic History, in Investment in Women’s Human Capital and Economic Development, Ed.
by T. Paul Schultz, Chicago University Press.
Hayashi, Fumio and Edward C. Prescott (2008), “The Depressing Effect of Agricultural In-
stitutions on the Prewar Japanese Economy, Journal of Political Economy, vol. 116(4), pages
573-632.
Harrison, G (1978), Mosquitos, Malaria and Man: A History of the Hostilities Since 1880s,
John Murray, London.
Iyer, Lakshmi, Xin Meng and Nancy Qian (2009), “Unbundling Property Rights: The Impact
of Urban Housing Reforms on Labor Mobility and Savings in China, mimeo.
28
Jacoby, H, Guo, L, and S. Rozelle (2002), “Hazards of Expropriation: Tenure Insecurity and
Investment in Rural China”, American Economic Review, December, 2002.
Klein, R and F. Vella (2009), “A Semiparametric Model for Binary Response and Continuous
Outcomes under Index Heteroscedasticity”, Journal of Applied Econometrics, v. 24, iss. 5, pp.
736-62
Klein, Roger and Francis Vella. (2010) “Estimating a Class of Triangular Simultaneous Equa-
tions Models Without Exclusion Restrictions.” Journal of Econometrics.
Lewbel, A (2012), “Using Heteroskedasticity to Identify and Estimate Mismeasured and En-
dogenous Regressor Models”, Journal of Business and Economic Statistics.
Mulligan, C and Y. Rubinstein (2008), “Selection, Investment, and Women’s Relative Wages
Over Time”, Quarterly Journal of Economics, vol. 123. no. 3.
Newman, P (1965): Malaria Eradication and Population Growth: With Special Reference to
ceylon and British Guyana, School of Public Health, University of Michigan.
Peebles, Patrick, 2006, A History of Sri Lanka, Greenwood Publishing Group.
Rustomjee, J (1944): Observations Upon the Epidemiology of Malaria in Ceylon, Sessional
Paper 24, 1944, Government Press, Colombo.
Schaffner, J. A (2002), “Heteroskedastic Sample Selection And Developing-Country Wage
Equations”, The Review of Economics and Statistics, vol. 84, issue 2.
Sen, A (1981), “Public Action and the Quality of Life in Developing Countries”, Oxford
Bulletin of Economics and Statistics, 43, 287-319.
Wijesundera, M (1988), “Malaria Outbreaks in New Foci in Sri Lanka”, Parasitol Today, 1988.
World Bank (2008), Land Reforms in Sri Lanka: A Poverty and Social Impact Analysis, South
Asia Region, World Bank, Washington DC.
29
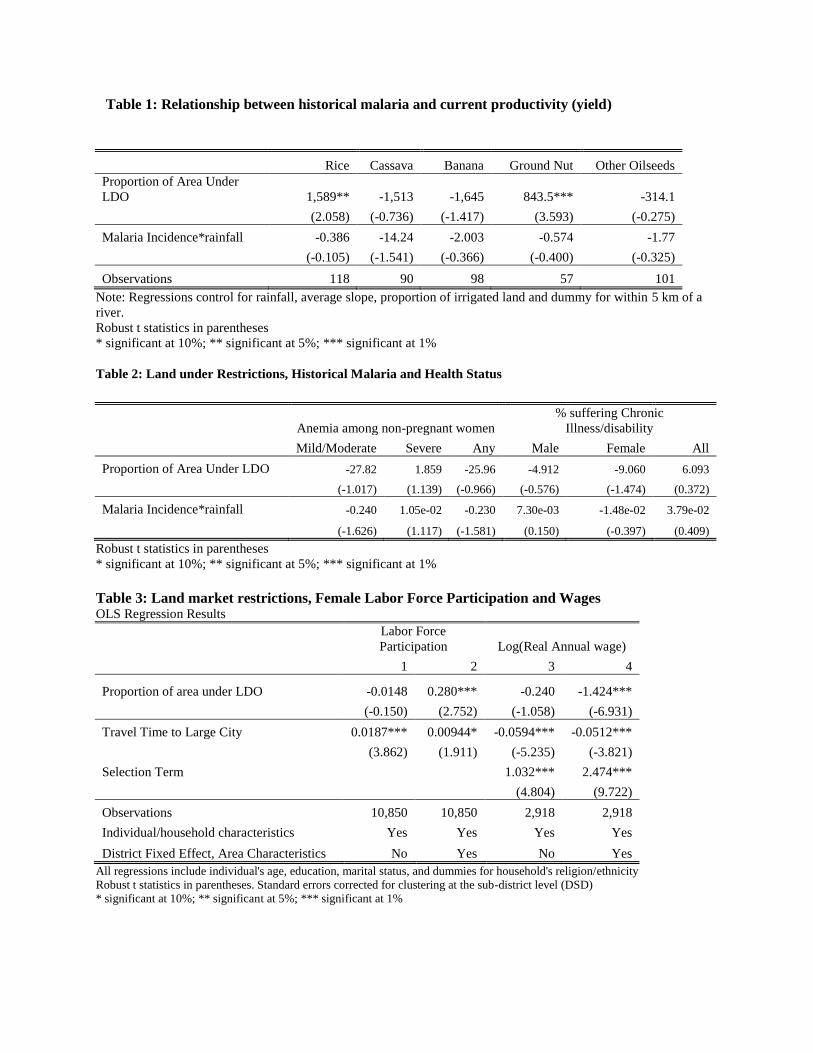
Table 1: Relationship between historical malaria and current productivity (yield)
Rice Cassava Banana Ground Nut Other Oilseeds
Proportion of Area Under
LDO 1,589** -1,513 -1,645 843.5*** -314.1
(2.058) (-0.736) (-1.417) (3.593) (-0.275)
Malaria Incidence*rainfall -0.386 -14.24 -2.003 -0.574 -1.77
(-0.105) (-1.541) (-0.366) (-0.400) (-0.325)
Observations 118 90 98 57 101
Note: Regressions control for rainfall, average slope, proportion of irrigated land and dummy for within 5 km of a
river.
Robust t statistics in parentheses * significant at 10%; ** significant at 5%; *** significant at 1%
Table 2: Land under Restrictions, Historical Malaria and Health Status
Anemia among non-pregnant women
% suffering Chronic
Illness/disability
Mild/Moderate Severe Any Male Female All
Proportion of Area Under LDO -27.82 1.859 -25.96 -4.912 -9.060 6.093
(-1.017) (1.139) (-0.966) (-0.576) (-1.474) (0.372)
Malaria Incidence*rainfall -0.240 1.05e-02 -0.230 7.30e-03 -1.48e-02 3.79e-02
(-1.626) (1.117) (-1.581) (0.150) (-0.397) (0.409)
Robust t statistics in parentheses * significant at 10%; ** significant at 5%; *** significant at 1%
Table 3: Land market restrictions, Female Labor Force Participation and Wages OLS Regression Results
Labor Force
Participation Log(Real Annual wage)
1 2 3 4
Proportion of area under LDO -0.0148 0.280*** -0.240 -1.424***
(-0.150) (2.752) (-1.058) (-6.931)
Travel Time to Large City 0.0187*** 0.00944* -0.0594*** -0.0512***
(3.862) (1.911) (-5.235) (-3.821)
Selection Term
1.032*** 2.474***
(4.804) (9.722)
Observations 10,850 10,850 2,918 2,918
Individual/household characteristics Yes Yes Yes Yes
District Fixed Effect, Area Characteristics No Yes No Yes
All regressions include individual's age, education, marital status, and dummies for household's religion/ethnicity
Robust t statistics in parentheses. Standard errors corrected for clustering at the sub-district level (DSD)
* significant at 10%; ** significant at 5%; *** significant at 1%
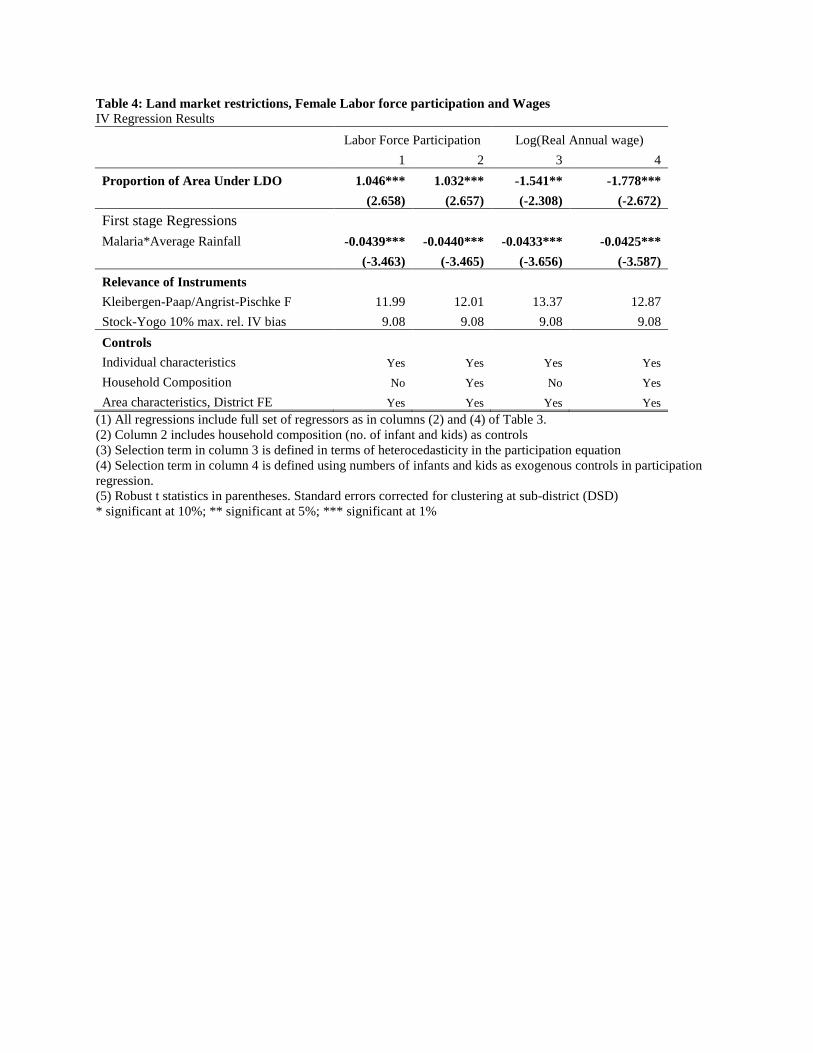
Table 4: Land market restrictions, Female Labor force participation and Wages
IV Regression Results
Labor Force Participation Log(Real Annual wage)
1 2 3 4
Proportion of Area Under LDO 1.046*** 1.032*** -1.541** -1.778***
(2.658) (2.657) (-2.308) (-2.672)
First stage Regressions Malaria*Average Rainfall -0.0439*** -0.0440*** -0.0433*** -0.0425***
(-3.463) (-3.465) (-3.656) (-3.587)
Relevance of Instruments
Kleibergen-Paap/Angrist-Pischke F 11.99 12.01 13.37 12.87
Stock-Yogo 10% max. rel. IV bias 9.08 9.08 9.08 9.08
Controls Individual characteristics Yes Yes Yes Yes
Household Composition No Yes No Yes
Area characteristics, District FE Yes Yes Yes Yes
(1) All regressions include full set of regressors as in columns (2) and (4) of Table 3.
(2) Column 2 includes household composition (no. of infant and kids) as controls
(3) Selection term in column 3 is defined in terms of heterocedasticity in the participation equation
(4) Selection term in column 4 is defined using numbers of infants and kids as exogenous controls in participation
regression. (5) Robust t statistics in parentheses. Standard errors corrected for clustering at sub-district (DSD) * significant at 10%; ** significant at 5%; *** significant at 1%
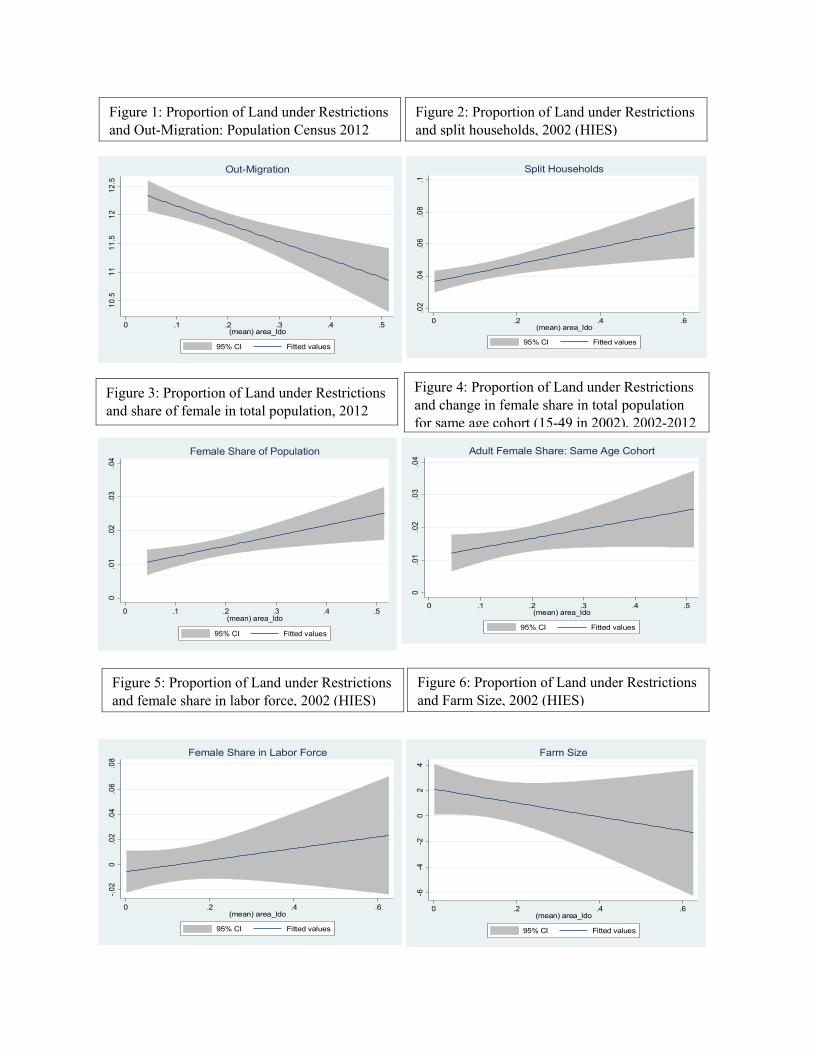
10.
51
11
1.5
12
12.
5
0 .1 .2 .3 .4 .5(mean) area_ldo
95% CI Fitted values
Out-Migration
.02
.04
.06
.08
.1
0 .2 .4 .6(mean) area_ldo
95% CI Fitted values
Split Households
0.0
1.0
2.0
3.0
4
0 .1 .2 .3 .4 .5(mean) area_ldo
95% CI Fitted values
Female Share of Population
0.0
1.0
2.0
3.0
4
0 .1 .2 .3 .4 .5(mean) area_ldo
95% CI Fitted values
Adult Female Share: Same Age Cohort
-.02
0.0
2.0
4.0
6.0
8
0 .2 .4 .6(mean) area_ldo
95% CI Fitted values
Female Share in Labor Force
-6-4
-20
24
0 .2 .4 .6(mean) area_ldo
95% CI Fitted values
Farm Size
Figure 1: Proportion of Land under Restrictionsand Out-Migration: Population Census 2012
Figure 3: Proportion of Land under Restrictionsand share of female in total population, 2012
Figure 4: Proportion of Land under Restrictions and change in female share in total population for same age cohort (15-49 in 2002), 2002-2012
Figure 5: Proportion of Land under Restrictionsand female share in labor force, 2002 (HIES)
Figure 6: Proportion of Land under Restrictionsand Farm Size, 2002 (HIES)
Figure 2: Proportion of Land under Restrictionsand split households, 2002 (HIES)
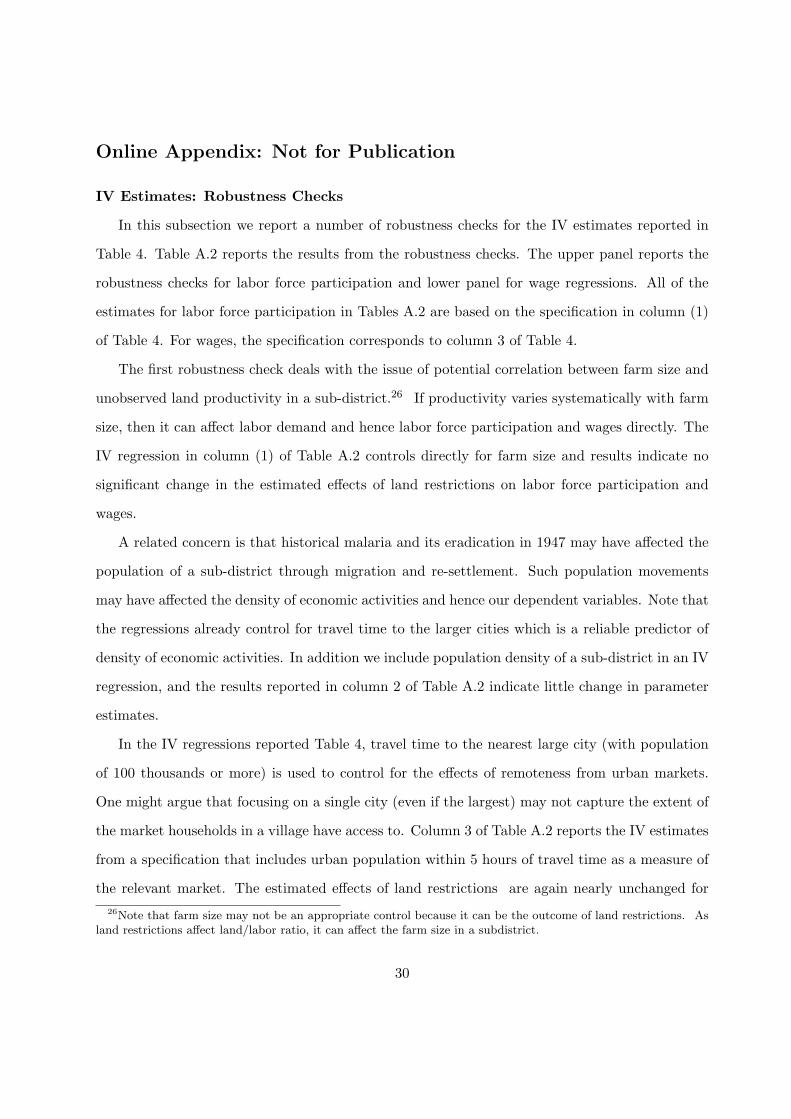
Online Appendix: Not for Publication
IV Estimates: Robustness Checks
In this subsection we report a number of robustness checks for the IV estimates reported in
Table 4. Table A.2 reports the results from the robustness checks. The upper panel reports the
robustness checks for labor force participation and lower panel for wage regressions. All of the
estimates for labor force participation in Tables A.2 are based on the specification in column (1)
of Table 4. For wages, the specification corresponds to column 3 of Table 4.
The first robustness check deals with the issue of potential correlation between farm size and
unobserved land productivity in a sub-district.26 If productivity varies systematically with farm
size, then it can affect labor demand and hence labor force participation and wages directly. The
IV regression in column (1) of Table A.2 controls directly for farm size and results indicate no
significant change in the estimated effects of land restrictions on labor force participation and
wages.
A related concern is that historical malaria and its eradication in 1947 may have affected the
population of a sub-district through migration and re-settlement. Such population movements
may have affected the density of economic activities and hence our dependent variables. Note that
the regressions already control for travel time to the larger cities which is a reliable predictor of
density of economic activities. In addition we include population density of a sub-district in an IV
regression, and the results reported in column 2 of Table A.2 indicate little change in parameter
estimates.
In the IV regressions reported Table 4, travel time to the nearest large city (with population
of 100 thousands or more) is used to control for the effects of remoteness from urban markets.
One might argue that focusing on a single city (even if the largest) may not capture the extent of
the market households in a village have access to. Column 3 of Table A.2 reports the IV estimates
from a specification that includes urban population within 5 hours of travel time as a measure of
the relevant market. The estimated effects of land restrictions are again nearly unchanged for
26Note that farm size may not be an appropriate control because it can be the outcome of land restrictions. Asland restrictions affect land/labor ratio, it can affect the farm size in a subdistrict.
30
both labor force participation and wage regressions.
Column (4) of Table A.2 addresses the question whether the negative effect of land restrictions
can partially reflect heterogeneity in the availability of non-farm opportunities. The estimate, after
controlling for the share of non-farm employment in a village (PSU), is 1.15 (with a P-value of
0.00) for labor force participation and -1.35 (p-value=0.05) for wage. One should however interpret
these estimates with caution, as non-farm activities are likely to respond to the incidence of land
restrictions, and thus may be a ‘bad control’ a la Angrist and Pischke (2009), when the focus is
on estimating the causal effects of land restrictions on equilibrium wages.
An additional concern is that eradication of historical malaria in 1947 may have induced
private investment in land improvement affecting labor demand in post-eradication periods.27
This, however, has not been the case in Sri Lanka. In the case of lands under restrictions which
were distributed under the Land Development Ordinance Act, government invested massively
in the development of large-scale irrigation systems as well as other land improvements prior
to distributing these lands to private individuals. Treating all irrigation investment as private
investment, we include proportion of agricultural land irrigated in a subdistrict as an additional
control in the IV regression. The results in column 5 of Table A.2 again show some change in the
estimates of the effect of land restrictions on female labor force participation and wages though
in opposite direction. Even after inclusion of irrigation, the estimates suggest numerically and
statistically significant impacts of land restrictions on female labor force participation and wages.
As in the case of non-farm employment, irrigation qualifies as a ‘bad’ control since land restriction
may affect private investment in irrigation directly.
Finally we check the sensitivity of the estimates with respect to the inclusion/exclusion of
DSDs with very high incidence of land restrictions; are the estimates driven by a few outliers in
the right tail? Column (6) of Table A.2 reports the estimates from a sample that excludes sub-
districts with proportion of land under restrictions more than 30 percent. The restricted sample
has 212 DSDs and thus loses 30 out of a 242 DSDs in the full sample. The estimated effects are
27It is important to appreciate that positive land or labor productivity improvements cannot explain our resultthat land restrictions have a negative effect on wages; such productivity increases would result in higher wages.
31
significant at 5 percent or less and much larger in magnitudes (1.73 for labor force participation,
and -2.01 for wage).
The results in Tables A.2 are very reassuring; although the precise numerical magnitudes of
the estimated effects of land restrictions on women’s labor force participation and wages vary
somewhat across different specifications, the estimates for the full sample fall within reasonably
tight bounds. The range of estimates are [0.85, 1.15] for women’s labor force participation, [–1.39,
-1.56] for female wage.
Suggestive Evidence on the Relevance of Home Goods Production
The variation in labor force participation in our model comes from the heterogeneity in pro-
ductivity of home good production. While we do not have data to analyze this heterogeneity
directly, we provide two pieces of supporting evidence. In a traditional South Asian society such
as Sri Lanka, women bear a disproportionate share of home production with minimal participa-
tion from men. One can model this as a heterogeneity in productivity of home production with
δi larger for women than men.28 An implication of this heterogeneity is that men will be more
likely to migrate than women after imposition of land restrictions, and as a consequence, impact
of land restrictions should be smaller for men compared to women. The first column in Table A.3
reports the IV results for men’s wage using a regression specification similar to column 3 of Table
4 in the main text.29 The estimated coefficient of proportion of land under restriction (-0.978)
is much smaller in absolute magnitude compared with that for women (-1.54). This is consistent
with a model where land restrictions impose less burden on men due to heterogeneity in home
good production. Note that labor force participation by men is close to 100 percent, thus we do
not report estimates for them.
To the extent older women are more responsible for home production – as is the custom in
much of South Asia including Sri Lanka – one would expect productivity in home production to
28Although we cast the heterogeneity in the production technology, one could alternatively interpret the modelas one involving preference heterogeneity where δi) is a preference parameter that varies across households and theproduction of home goods is done with the same technology.
29The selection term is not included in this regression as labor participation is nearly universal among adult malein Sri Lanka.
32
be different between older and younger women. Older women are likely to be more productivity
in home production because of learning by doing and accumulated experience. Having an older
woman in the household also means less burden of provision of home goods for younger women
allowing them to participate and spend more time in outside work. This in turn implies that
migration costs imposed by land restrictions will be lower for younger women compared with
older ones. If this is so, then we expect land restrictions to have larger impact on labor force
participation of older women. As to impact on wage, a change in labor supply by anyone regardless
of age could have general equilibrium effect particularly if there is no segmentation in the labor
market in terms of types of task performed by different age cohorts. If, on the other hand, older
and younger women perform differentiated tasks in the labor market allowing some degree of
labor market segmentation, then we expect larger impact of land restriction on wages of older
women as well. To check these possibilities, we split the female sample into two age groups:
older women [age > 40 years] and younger women [25-40 years]. Columns 2 and 3 of Table A.3
report the IV results for labor force participation and columns 4 and 5 report that for wages.
The results in columns 2 and 3 of Table A.4 are interesting: the estimated effect land restrictions
on labor force participation becomes smaller for the younger women. The land restrictions have
statistically significant and positive effects on the participation rates of both groups of women,
but the magnitude of effect is larger for older women (1.33) compared with younger women (0.86).
The pattern of the estimates between age groups is consistent with what one would expect when
older women play a greater role in the provision of home goods. For wages, the IV results suggest
significant negative effects for both groups, and the absolute magnitude of the effect is slightly
larger for the older women. The results for wages are consistent with the case where tasks done
by older and younger women in the labor market are only mildly differentiated. The robustness
checks (not reported here for brevity) shows that the patterns reported above hold for other age
cohorts as well.
The labor force participation pattern reported in Table A.3 also provides convincing evidence
that the estimates of effects of land restrictions are not picking up any omitted intergenerational
health effect emanating from transmission of parental exposure to malaria. One would expect
33
the health of the older age cohort to have been affected more adversely due to intergenerational
transmission of historical malaria’s effect on parental health. To the extent bad health affects
female labor force participation adversely, one should expect to find a smaller effect of land
restrictions on the labor force participation for older age cohorts compared with that of younger
age cohorts if our identification scheme is compromised by such intergenerational health effects.
The results in Table A.3 are quite the opposite. This, however, may not be surprising to a keen
observer of impressive achievements in health, nutrition and education across the board during
the post eradication period, thus offsetting any lingering intergenerational effects (for a discussion,
please see for example, Sen (1981)).
34
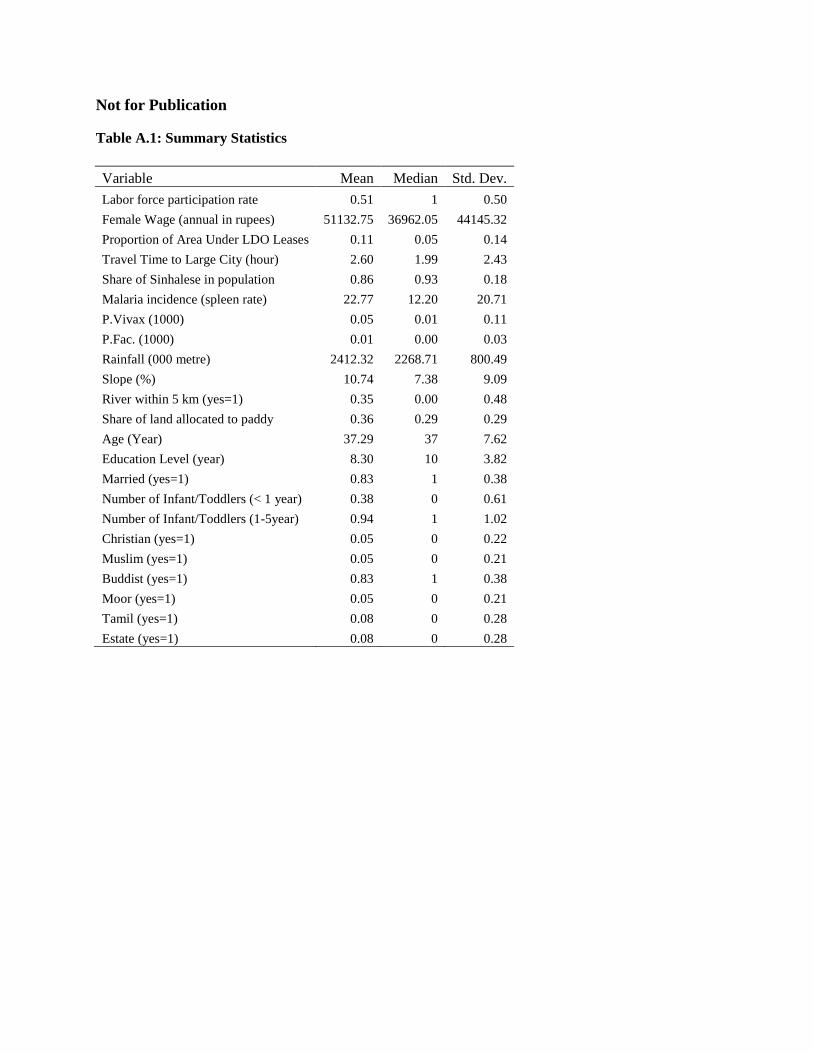
Not for Publication
Table A.1: Summary Statistics
Variable Mean Median Std. Dev.
Labor force participation rate 0.51 1 0.50
Female Wage (annual in rupees) 51132.75 36962.05 44145.32
Proportion of Area Under LDO Leases 0.11 0.05 0.14
Travel Time to Large City (hour) 2.60 1.99 2.43
Share of Sinhalese in population 0.86 0.93 0.18
Malaria incidence (spleen rate) 22.77 12.20 20.71
P.Vivax (1000) 0.05 0.01 0.11
P.Fac. (1000) 0.01 0.00 0.03
Rainfall (000 metre) 2412.32 2268.71 800.49
Slope (%) 10.74 7.38 9.09
River within 5 km (yes=1) 0.35 0.00 0.48
Share of land allocated to paddy 0.36 0.29 0.29
Age (Year) 37.29 37 7.62
Education Level (year) 8.30 10 3.82
Married (yes=1) 0.83 1 0.38
Number of Infant/Toddlers (< 1 year) 0.38 0 0.61
Number of Infant/Toddlers (1-5year) 0.94 1 1.02
Christian (yes=1) 0.05 0 0.22
Muslim (yes=1) 0.05 0 0.21
Buddist (yes=1) 0.83 1 0.38
Moor (yes=1) 0.05 0 0.21
Tamil (yes=1) 0.08 0 0.28
Estate (yes=1) 0.08 0 0.28
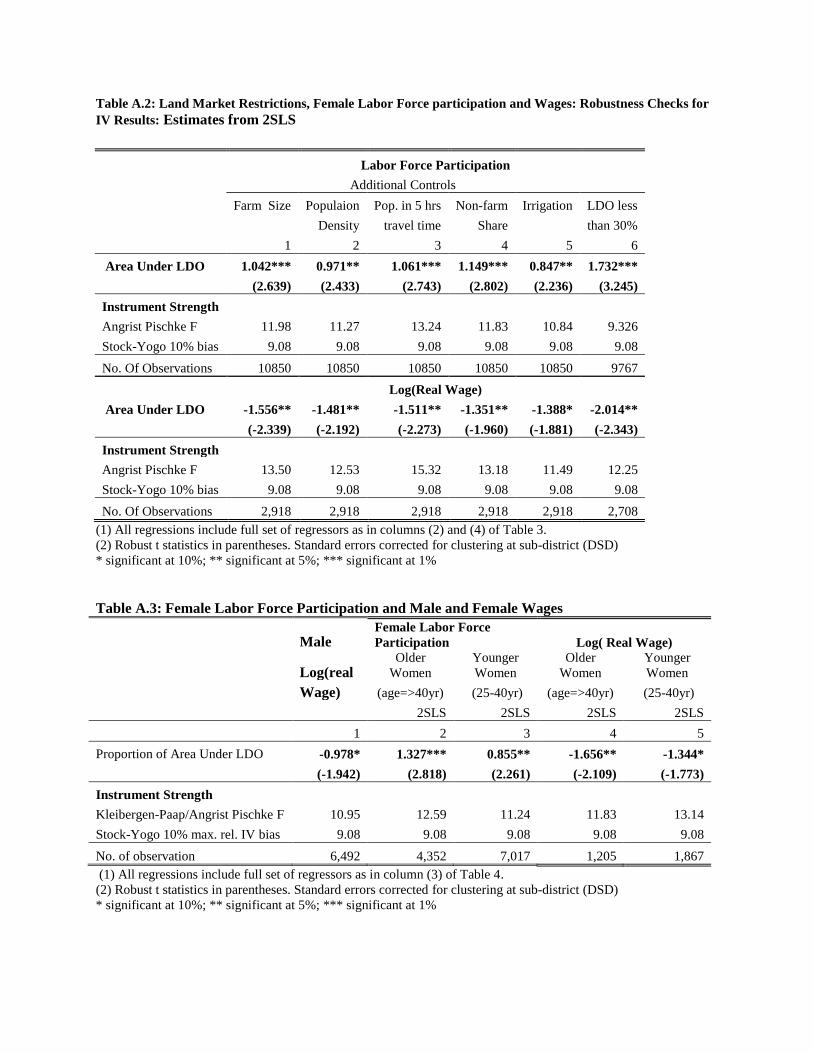
Table A.2: Land Market Restrictions, Female Labor Force participation and Wages: Robustness Checks for
IV Results: Estimates from 2SLS
Labor Force Participation
Additional Controls
Farm Size Populaion Pop. in 5 hrs Non-farm Irrigation LDO less
Density travel time Share
than 30%
1 2 3 4 5 6
Area Under LDO 1.042*** 0.971** 1.061*** 1.149*** 0.847** 1.732***
(2.639) (2.433) (2.743) (2.802) (2.236) (3.245)
Instrument Strength
Angrist Pischke F 11.98 11.27 13.24 11.83 10.84 9.326
Stock-Yogo 10% bias 9.08 9.08 9.08 9.08 9.08 9.08
No. Of Observations 10850 10850 10850 10850 10850 9767
Log(Real Wage)
Area Under LDO -1.556** -1.481** -1.511** -1.351** -1.388* -2.014**
(-2.339) (-2.192) (-2.273) (-1.960) (-1.881) (-2.343)
Instrument Strength
Angrist Pischke F 13.50 12.53 15.32 13.18 11.49 12.25
Stock-Yogo 10% bias 9.08 9.08 9.08 9.08 9.08 9.08
No. Of Observations 2,918 2,918 2,918 2,918 2,918 2,708
(1) All regressions include full set of regressors as in columns (2) and (4) of Table 3.
(2) Robust t statistics in parentheses. Standard errors corrected for clustering at sub-district (DSD) * significant at 10%; ** significant at 5%; *** significant at 1%
Table A.3: Female Labor Force Participation and Male and Female Wages
Male
Female Labor Force
Participation Log( Real Wage)
Log(real Older
Women
Younger
Women
Older
Women
Younger
Women
Wage) (age=>40yr) (25-40yr) (age=>40yr) (25-40yr)
2SLS 2SLS 2SLS 2SLS
1 2 3 4 5
Proportion of Area Under LDO -0.978* 1.327*** 0.855** -1.656** -1.344*
(-1.942) (2.818) (2.261) (-2.109) (-1.773)
Instrument Strength
Kleibergen-Paap/Angrist Pischke F 10.95 12.59 11.24 11.83 13.14
Stock-Yogo 10% max. rel. IV bias 9.08 9.08 9.08 9.08 9.08
No. of observation 6,492 4,352 7,017 1,205 1,867
(1) All regressions include full set of regressors as in column (3) of Table 4.
(2) Robust t statistics in parentheses. Standard errors corrected for clustering at sub-district (DSD) * significant at 10%; ** significant at 5%; *** significant at 1%
Recommended


![Land Acquisition Act, 1894...Land Acquisition Act, 1894 ၁၈၉၄ ၁၉၆၀ ၀ Burma Land Acquisition Manual, 1947 ၁၉၃၄ ၃1 THE LAND ACQUISITION ACT [ACT I, 1894] (1st](https://img.pdfslide.fr/doc/110x75/6002be9f983db76f6a708206/land-acquisition-act-1894-land-acquisition-act-1894-.jpg)