Page 129
(1; 2)
(1; 1)
( 1; 1 _ 2 )
TranslaTion of graPhs (1)The parabola and hyperbola
learning outcomes and assessment standards
learning outcome 2: functions and algebraassessment standard as 2Generate as many graphs as necessary, initially by means of point-by-point plotting, supported by available technology, to make and test conjectures about the effect of the parameters k, p, a and q for the functions including:y = sin kx y = cos kxy = tan kx y = sin (x + p)y = cos (x + p) y = tan (x + p)y = a(x + p)2 + qy = a·bx + p + q y = a_ x + p + q
OverviewIn this lesson you will:
Draw the functions you learnt in Grade 10 and exercise vertical translation and reflection across both the x- and y-axesTranslate graphs horizontally along the x-axesTranslate graphs both vertically and horizontally.
Lesson
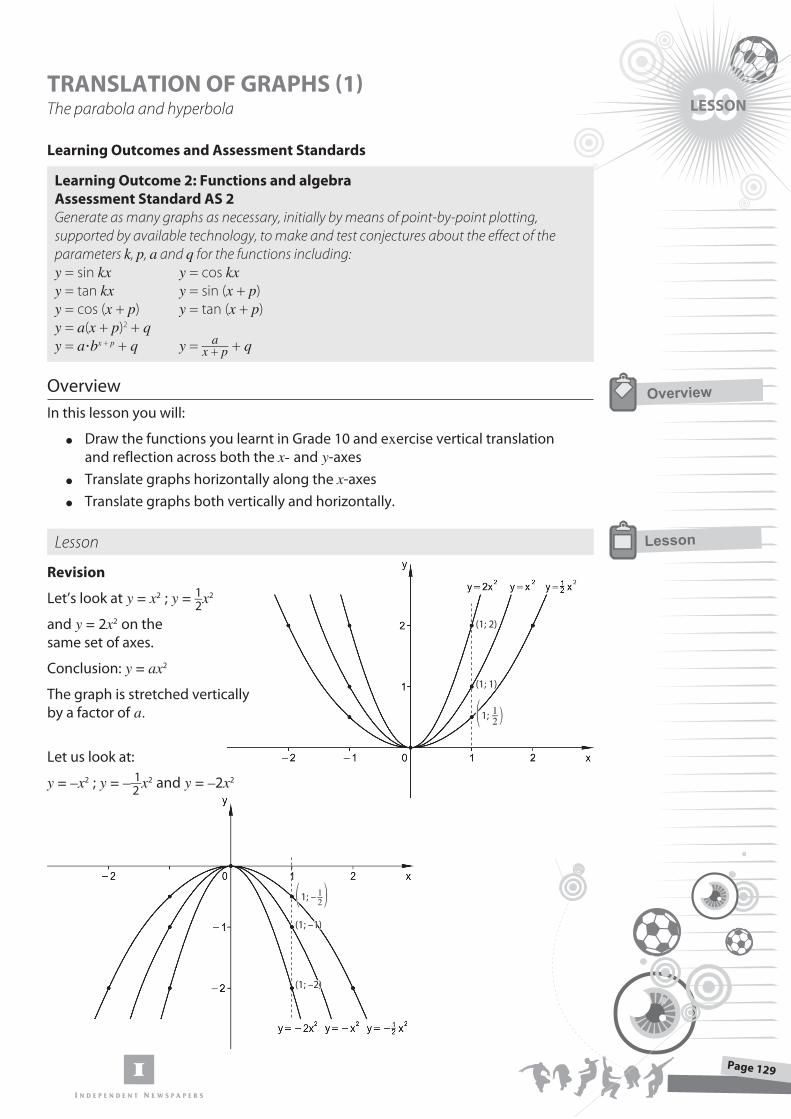
revision
Let’s look at y = x2 ; y = 1 _ 2 x2
and y = 2x2 on the same set of axes.
Conclusion: y = ax2
The graph is stretched vertically by a factor of a.
Let us look at:
y = –x2 ; y = – 1 _ 2 x2 and y = –2x2
( 1; – 1 _ 2 )(1; –1)
(1; –2)
●
●
●
30lesson
Overview
Lesson
Lesson 1 | Algebra
Page 1Page 130Lesson 1 | Algebra
Page 1
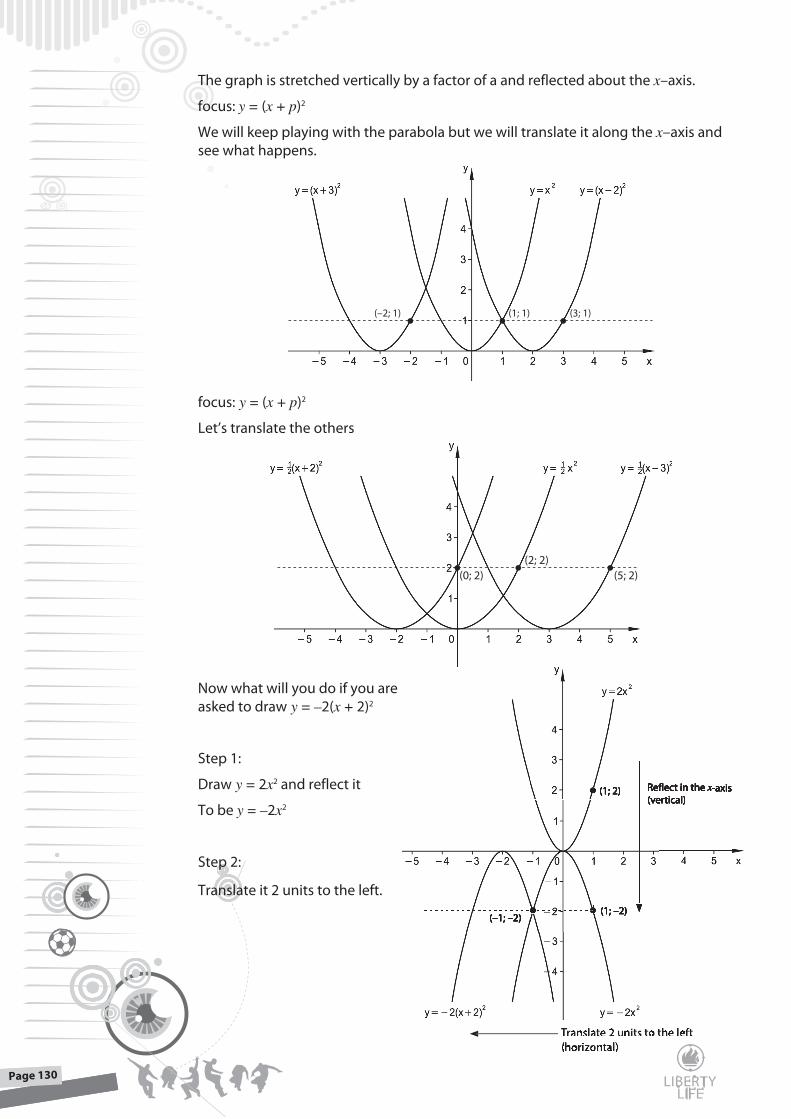
The graph is stretched vertically by a factor of a and reflected about the x–axis.
focus: y = (x + p)2
We will keep playing with the parabola but we will translate it along the x–axis and see what happens.
(–2; 1) (1; 1) (3; 1)
focus: y = (x + p)2
Let’s translate the others
(2; 2)(0; 2) (5; 2)
Now what will you do if you are asked to draw y = –2(x + 2)2
Step 1:
Draw y = 2x2 and reflect it
To be y = –2x2
Step 2:
Translate it 2 units to the left.
(1; 2)(1; 2)(1; 2)
(–1; –2)(–1; –2)(–1; –2)(1; –2)(1; –2)(1; –2)
Refl ect in the Refl ect in the Refl ect in the xxx-axis-axis-axis(vertical)(vertical)(vertical)
Translate 2 units to the leftTranslate 2 units to the leftTranslate 2 units to the left(horizontal)(horizontal)(horizontal)
Lesson 1 | Algebra
Page 1Lesson 1 | Algebra
Page 1Page 131
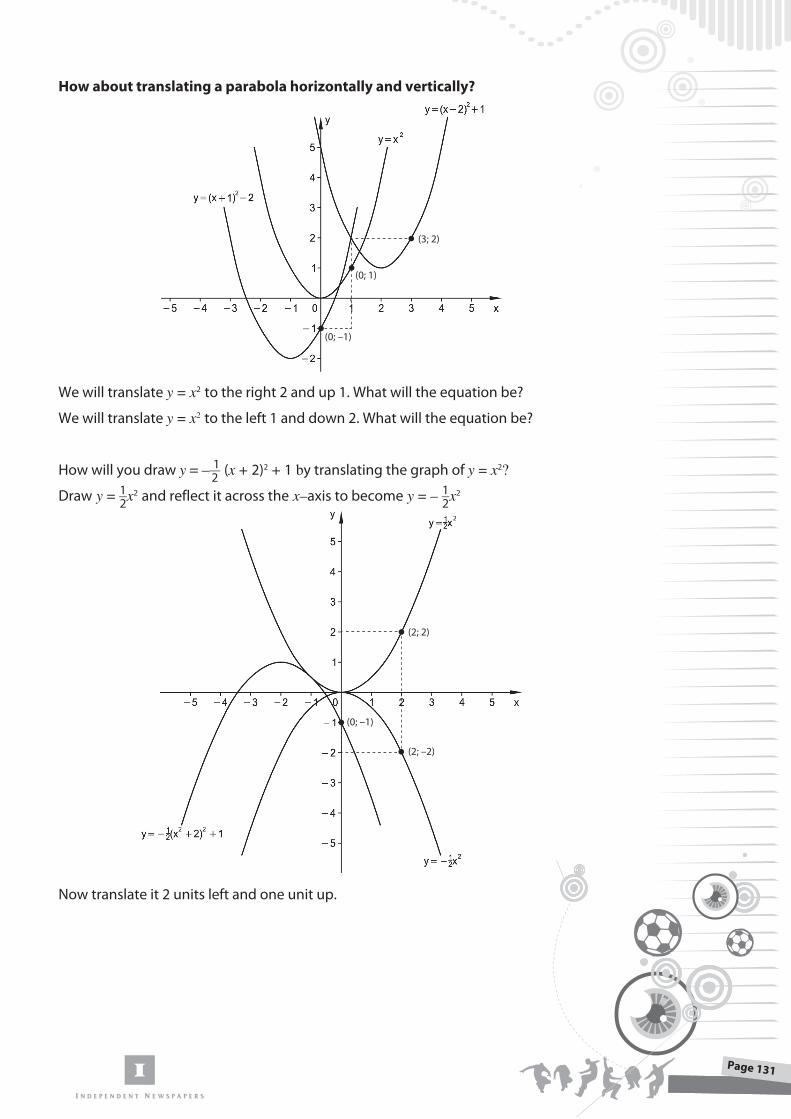
how about translating a parabola horizontally and vertically?
(3; 2)
(0; 1)
(0; –1)
We will translate y = x2 to the right 2 and up 1. What will the equation be?
We will translate y = x2 to the left 1 and down 2. What will the equation be?
How will you draw y = – 1 _ 2 (x + 2)2 + 1 by translating the graph of y = x2?
Draw y = 1 _ 2 x2 and reflect it across the x–axis to become y = – 1 _ 2 x2
(2; 2)
(2; –2)
(0; –1)
Now translate it 2 units left and one unit up.
Lesson 1 | Algebra
Page 1Page 132Lesson 1 | Algebra
Page 1
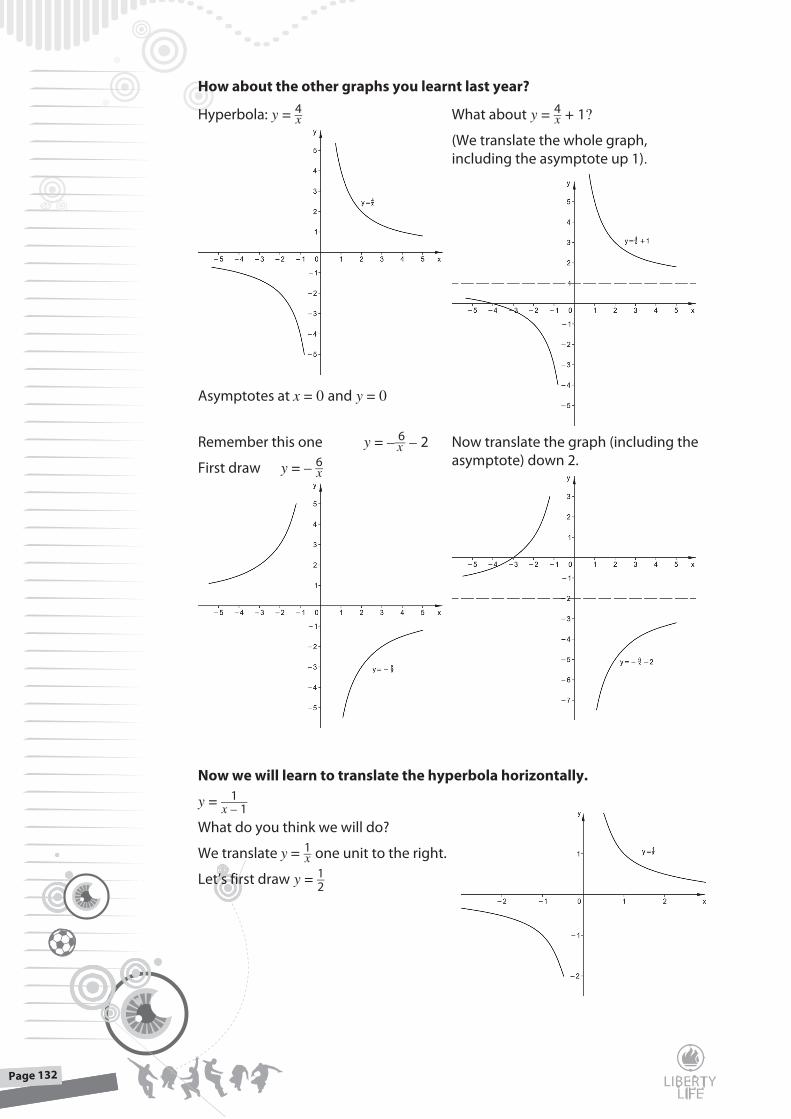
how about the other graphs you learnt last year?
Hyperbola: y = 4 _ x
Asymptotes at x = 0 and y = 0
What about y = 4 _ x + 1?
(We translate the whole graph, including the asymptote up 1).
Remember this one y = – 6 _ x – 2
First draw y = – 6 _ x
Now translate the graph (including the asymptote) down 2.
now we will learn to translate the hyperbola horizontally.
y = 1 _ x – 1
What do you think we will do?
We translate y = 1 _ x one unit to the right.
Let’s first draw y = 1 _ 2
Lesson 1 | Algebra
Page 1Lesson 1 | Algebra
Page 1Page 133
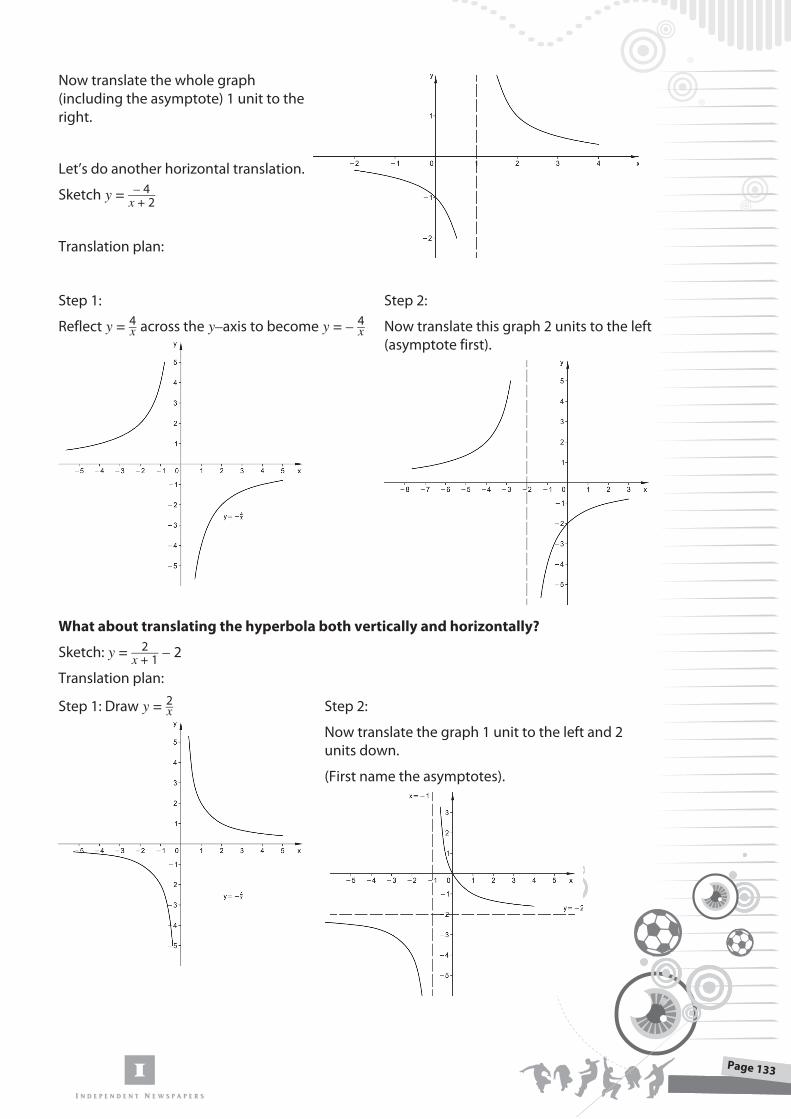
Now translate the whole graph (including the asymptote) 1 unit to the right.
Let’s do another horizontal translation.
Sketch y = – 4 _ x + 2
Translation plan:
Step 1:
Reflect y = 4 _ x across the y–axis to become y = – 4 _ x
Step 2:
Now translate this graph 2 units to the left (asymptote first).
What about translating the hyperbola both vertically and horizontally?
Sketch: y = 2 _ x + 1 – 2
Translation plan:
Step 1: Draw y = 2 _ x Step 2:
Now translate the graph 1 unit to the left and 2 units down.
(First name the asymptotes).
Lesson 1 | Algebra
Page 1Page 134Lesson 1 | Algebra
Page 1
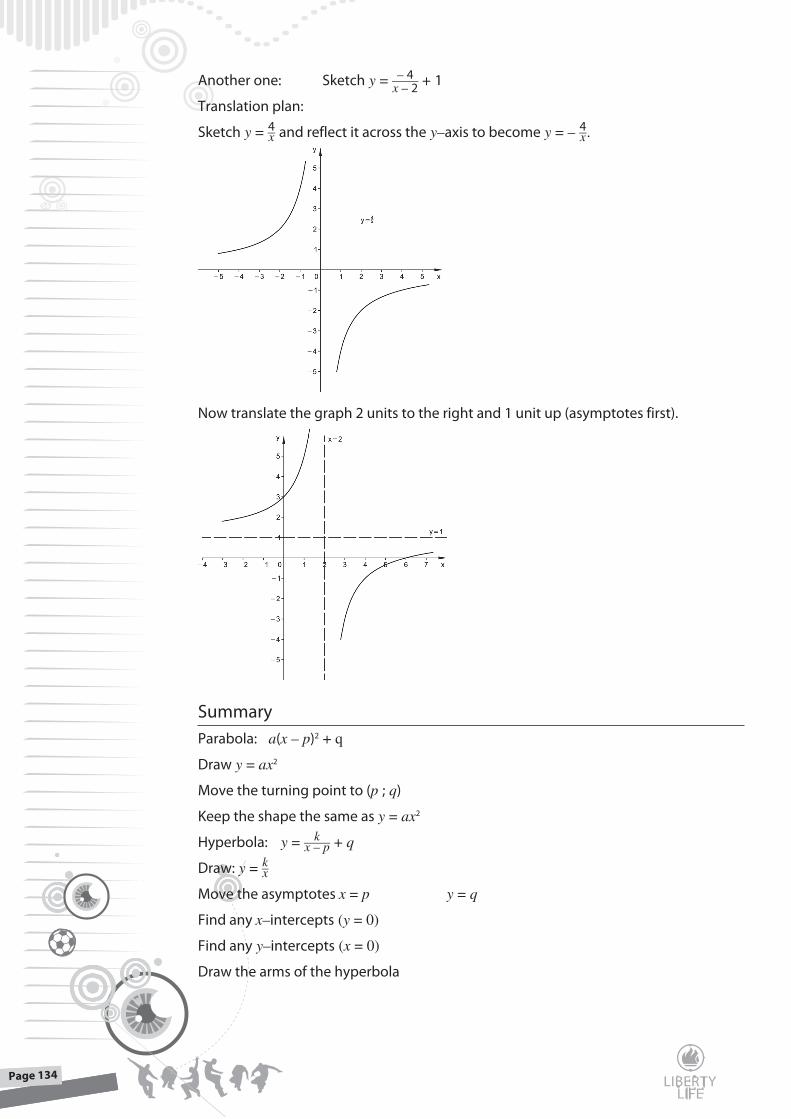
Another one: Sketch y = – 4 _ x – 2 + 1
Translation plan:
Sketch y = 4 _ x and reflect it across the y–axis to become y = – 4 _ x .
Now translate the graph 2 units to the right and 1 unit up (asymptotes first).
SummaryParabola: a(x – p)2 + q
Draw y = ax2
Move the turning point to (p ; q)
Keep the shape the same as y = ax2
Hyperbola: y = k_ x – p + q
Draw: y = k_ x
Move the asymptotes x = p y = q
Find any x–intercepts (y = 0)
Find any y–intercepts (x = 0)
Draw the arms of the hyperbola
Lesson 1 | Algebra
Page 1Lesson 1 | Algebra
Page 1Page 135
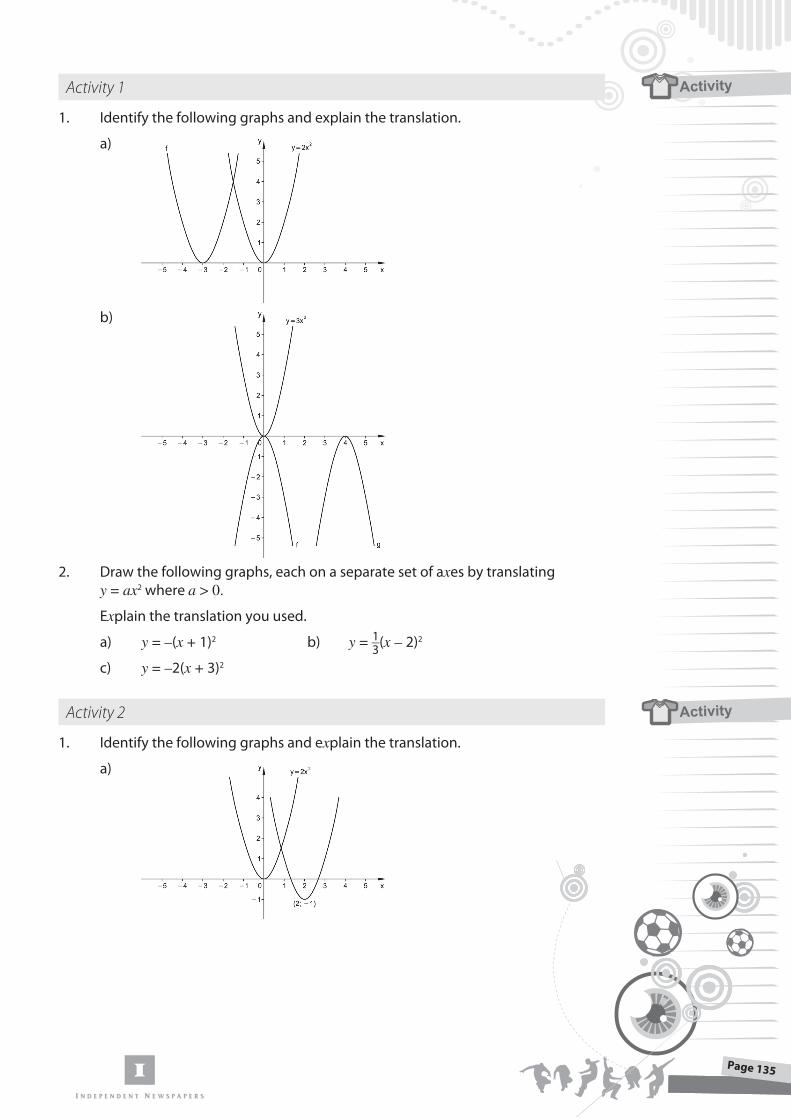
Activity 1
1. Identify the following graphs and explain the translation.
a)
b)
2. Draw the following graphs, each on a separate set of axes by translating y = ax2 where a > 0.
Explain the translation you used.
a) y = –(x + 1)2 b) y = 1 _ 3 (x – 2)2
c) y = –2(x + 3)2
Activity 2
1. Identify the following graphs and explain the translation.
a)
Activity
Activity
Lesson 1 | Algebra
Page 1Page 136
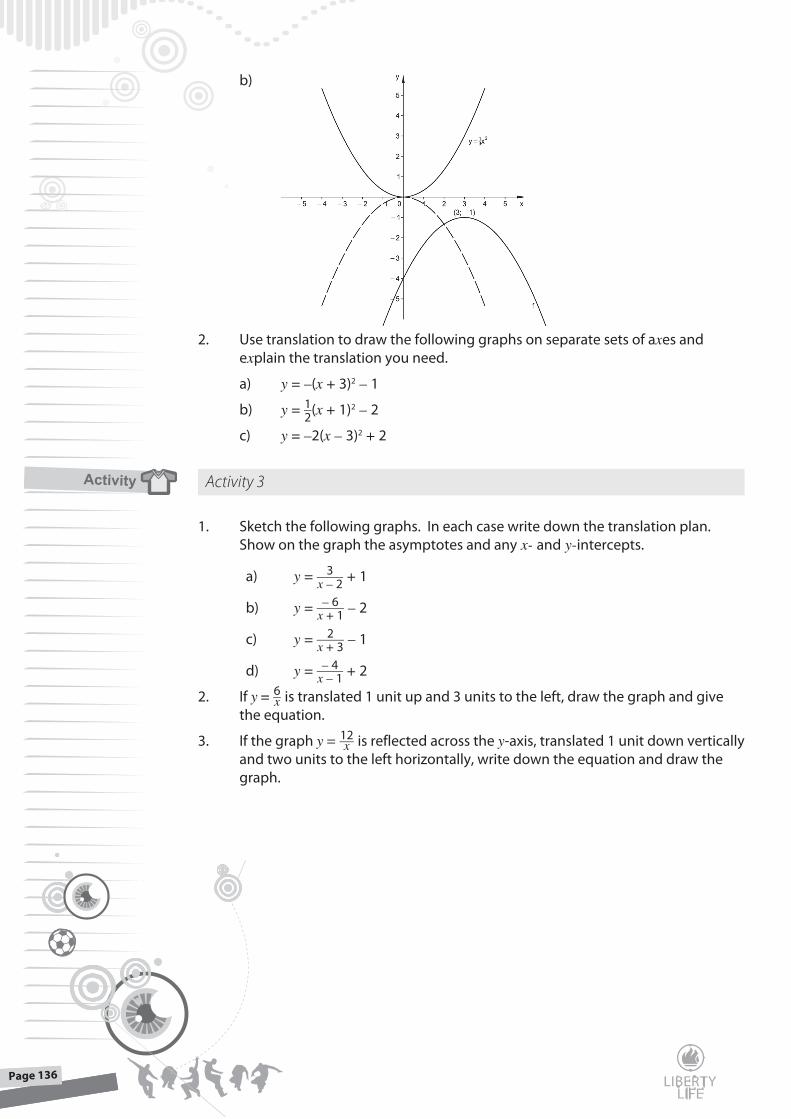
b)
2. Use translation to draw the following graphs on separate sets of axes and explain the translation you need.
a) y = –(x + 3)2 – 1
b) y = 1 _ 2 (x + 1)2 – 2
c) y = –2(x – 3)2 + 2
Activity 3
1. Sketch the following graphs. In each case write down the translation plan.
Show on the graph the asymptotes and any x- and y-intercepts.
a) y = 3 _ x – 2 + 1
b) y = – 6 _ x + 1 – 2
c) y = 2 _ x + 3 – 1
d) y = – 4 _ x – 1 + 2
2. If y = 6 _ x is translated 1 unit up and 3 units to the left, draw the graph and give the equation.
3. If the graph y = 12 _ x is reflected across the y-axis, translated 1 unit down vertically and two units to the left horizontally, write down the equation and draw the graph.
Activity