Sustainable Mobility : 100 Investment Ideas

3 Document non contractuel, strictement limité à l’usage privé du destinataire, les informations fournies dans ce document proviennent de sources dignes de foi mais ne
peuvent être garanties. Les appréciations formulées reflètent notre opinion à la date de publication et sont donc susceptibles d’être révisées ultérieurement
ODDO SECURITIES
Jean-Philippe Desmartin
+33 (0)1 44 51 81 89 - [email protected]
S. Thévoux-Chabuel
+33 (0)1 44 51 84 31 - [email protected]
With the participation of sector analysts
SUSTAINALYTICS
Jean-Florent Helfre
+31 20 205 00 11 - [email protected]
Arne Philipp Klug
+49 69 33 29 65 62 - [email protected]
Laurence Loubières
+1 416 861 0403 - ext.25 - [email protected]
SRI Wednesday 5 October 2011
Sustainable mobility: 100 investment ideas This thematic study carried out in partnership with Oddo Securities, the leading
independent brokerage in France, aims to provide an overview of mobility: both
physical (transport) and virtual. The study examines the ESG challenges, risks and
opportunities presented by sustainable mobility as well as 100 investment ideas
(worldwide coverage) combining buoyant positioning (batteries, rail) and a best-in-
class approach. Within its European financial coverage, Oddo Securities has 4 strong
investment ideas on Buy recommendation with a 12-month view, Amadeus (TP € 17),
Eurotunnel (TP € 7.8), Michelin (TP € 62) and Vodafone (TP 185p).
By sustainable mobility we mean the "ability to meet the needs of a society to
move freely, gain access, communicate, trade and establish relationships without
sacrificing other essential human or ecological values today or in the future".
Therefore, the challenges are enormous.
This study considers the ESG challenges associated with different types of
transport (air, rail, maritime and road transport) distinguishing between freight and
passenger transport on which a distinction has also been drawn between
developed and emerging countries. It also looks at the major alternatives offered
by virtual mobility and e-substitution.
We have also addressed the dynamics (global village, hyper-mobility,
urbanisation), areas for improvement/risks (air pollution, climate change,
congestion, noise, peak oil, land take, road safety) and environmental and social
opportunities (batteries, second-generation biofuels, public transport, rail, virtual
mobility) associated with sustainable mobility which are many and complex. Oddo
Securities proposes an ESG allocation (overweight, neutral and underweight) for
25 mobility positionings with regards to sustainable development.
The 100 investment ideas proposed by Oddo Securities and Sustainalytics, cover
Europe (52 stocks), North America (29 stocks) and the rest of the world (19
stocks). These ideas are presented in the appendices in the form of an ESG
SWOT analysis.
The companies identified cover traditional transport business models (airlines, car
makers, shipping) as well as emerging business models (batteries, biofuels) and
businesses in recovery (bicycles, rail).
Within its European financial coverage, Oddo Securities has 4 strong investment
ideas on Buy recommendation with a 12-month view, Amadeus (TP € 17),
Eurotunnel (TP € 7.8), Michelin (TP € 62) and Vodafone (TP 185p).
4 Document non contractuel, strictement limité à l’usage privé du destinataire, les informations fournies dans ce document proviennent de sources dignes de foi mais ne
peuvent être garanties. Les appréciations formulées reflètent notre opinion à la date de publication et sont donc susceptibles d’être révisées ultérieurement
The information herein has been obtained from sources that Sustainalytics believes to be reliable. However, Sustainalytics does not guarantee its accuracy or completeness. Copyright © 2011 Sustainalytics. All rights reserved. No portion of this material may be reproduced in any form without the expressed written permission of Sustainalytics.
This publication is exclusively intended for Oddo & Cie‘s customers; it is sent by way of information and cannot be divulged to a third party without the prior consent of Oddo & Cie.
This document is not and should not be construed as an offer to sell or the solicitation of an offer to purchase or subscribe for any investment.
This research has been prepared in accordance with regulatory provisions designed to promote the independence of investment research.
While all reasonable effort has been made to ensure that the information contained is not untrue or misleading at the time of publication, no representation is made as to its accuracy or completeness and it should not be relied upon as such.
Past performances offer no guarantee as to future performances.
All opinions expressed in the present document reflect the current context and which is subject to change without notice.
Oddo & Cie is licensed by the Comité de Contrôle Prudentiel (ACP) and regulated by the Autorité des Marchés Financiers (AMF).
This research has been prepared in accordance with regulatory provisions designed to promote the independence of investment research.
―Chinese walls‖ (information barrier) have been implemented to avert the unauthorised dissemination of confidential information and to prevent and manage situations of conflict of interest.
At the time of publication of this document, Oddo & Cie and/or one of its subsidiaries may have a conflict of interest with the issuer mentioned.
In particular, it may be the case that Oddo & Cie and/or one of its subsidiaries is acting or intends to act in the next twelve months as an injector of liquidity, market maker, advisor or investment bank for one of the companies mentioned in the present publication.
Distribution to U.S. Investors: Notice to US Investors: This report is issued solely to major US institutional investors pursuant to SEC Rule 15a-6. Oddo Securities Corp. MEMBER: NASD / SIPC is distributing this document in the United States of America and, in connection there with, accepts responsibility for its contents. Any US customer wishing to effect transactions in any securities referred to herein or options there on should do so only by contacting a representative of Oddo Securities Corp. and not one of its overseas affiliates, including the producer of the research, Oddo et Cie.
Contact Info
Oddo Securities Corp. MEMBER: NASD/SIPC (U.S.INVESTORS)
A wholly owned subsidiary of Oddo et Cie
Patrick Oddoux President, Oddo Securities Corp. (NewYork),
150 East 52nd Street NewYork,
New York 10022
212-481-4002
The disclosures of all companies mentioned in this document may be consulted on Oddo & Cie‘s research site.
Our stock market recommendations Our stock market recommendations reflect the RELATIVE performance expected for each stock on a 12-month timeframe.
Buy: performance expected to exceed that of the benchmark index, sectoral (large caps) or other (small and mid caps).
Neutral: performance expected to to be comparable to that of the benchmark index, sectoral (large caps) or other (small and mid caps).
Reduce: performance expected to fall short of that of the benchmark index, sectoral (large caps) or other (small and mid caps).
5 Document non contractuel, strictement limité à l’usage privé du destinataire, les informations fournies dans ce document proviennent de sources dignes de foi mais ne
peuvent être garanties. Les appréciations formulées reflètent notre opinion à la date de publication et sont donc susceptibles d’être révisées ultérieurement
Contents
Sustainable Mobility - definitions, challenges and prospects 6
Transport vs. mobility, sustainability and sustainable mobility - What do we mean?
Mobility and its dynamics over the long term: towards Hypermobility
Overview of passenger and freight transport worldwide
Global trends of mobility
The revolution in motion: the new paradigms of mobility
Issues of mobility - The Unbearable Lightness of mobility today? 31
Environmental issues
Social issues
Sustainable mobility is a source of opportunities that go far beyond the transportation sector 50
Infrastructure companies
Manufacturers
Component producers in the world
Energy providers
Renewable electricity: towards more consolidation
Ticketing, leasing and self-service systems
Virtual Mobility
100 investment ideas 75
1 – Preliminary comments
2 – Which business positioning to favour?
3 – Sustainable mobility: 100 investment ideas
4 – Four strong investment ideas within Oddo Securities' Europe financial coverage
Europe first choice 79
Europe second choice 83
North America first choice 91
North America second choice 94
Rest of the World First choice 98
Rest of the World second choice 100
6
SUSTAINABLE MOBILITY - DEFINITIONS, CHALLENGES AND
PROSPECTS
“Today, after more than a century of electric technology, we have extended our
central nervous system itself in a global embrace, abolishing both space and
time as far as our planet is concerned”
Marshall McLuhan, 1964, Understanding Media
"If the automobile, the subway and the aircraft were the emblems of transport in
the twentieth century, especially the shoes and the Smartphone, are those of
Homo Mobilis fluid and connected to the twenty-first century”
Georges Amar, Homo Mobilis the new age of mobility, 2010
Transport vs. mobility, sustainability and
sustainable mobility - What do we mean?
What is mobility and sustainable mobility?
Mobility can be defined as ―the behavioural movement of humans in space,
whether for frequent travel of everyday life, displacement of disruption in daily
life such as tourism, or changes in residential areas involving a change in
territory lived.‖1
Adapting the definition of sustainability given by the World Business Council for
Sustainable Development, sustainable mobility is the ability to meet the needs
of a society to move freely, gain access, communicate, trade and establish
relationship without sacrificing other essential human or ecological value today
or in the future.
One can understand that for mobility to be sustainable, it must follow and adapt
itself to the new environment and new needs of society while avoiding
disruptions in the societal, environmental and economic well-being that could
offset the socio-economic benefits of accessibility improvement…
From "transport" to "mobility"…
Over the past few years, the notion of mobility has replaced that of transport,
and this trend reflects a change in our way of considering our displacements
and travels.
1 Jean-Pierre Orfeuil, Marie-Hélène Massot, THOUGHT THE MOBILITY OF TOMORROW - TEST FOR PROSPECTIVE
CLAIRVOYANCE, Research Centre for Environment and Transport Area Local Institutions, University Paris XIII Val de Marne,
First half 2005
7
The notion of transport with its grammatically in inherent duality between the
carrier and the passenger, expresses a certain passivity of the individual
being transported. It also implies that the movement is not an end in itself but
merely a means to get from one point to another, from a point of origin to a
destination.
In contrast, mobility is less passive, it is an activity. The notion of mobility
recognises and values the active nature of the mobile person. This
enhancement explains the revival of soft modes (cycling, walking ...) but also
involves the cognitive action of the traveller who guides him/herself in the
transportation networks
Another difference between transport and mobility is the universal nature of
mobility. Transportation equipment is a tool, whereas mobility is an attribute of
people, objects, companies and local areas. Mobility becomes almost a human
right as evidenced in developed countries by the progress made around the
"disabled", the establishment of "minimum service" in transport and in
developing countries by the unavoidable extension of major roads and public
transport.
Mobility is a key and strategic activity of modern life. Both in developed and
developing countries, one can hardly understand any professional life, leisure,
study, friendship, community or cultural activities or even family life, without a
relatively large capacity for movement. An increasing proportion of the activities
of daily life takes place "in mobility", rather than in fixed locations only. The
improvement of technologies has made mobility easier: quicker transport, more
services to help people to organise their trips (from the GPS to the travel
agency) and obviously more choices (between types of transport and tools used
to organise journeys). This rise in the number of tools and types of transport,
makes mobility choices very strategic and subsequently prompts people to
consider mobility not only as a need but also as an opportunity.
A wide scope of analysis
We aim to analyse the present and the future of sustainable mobility both in
developed countries and emerging countries. To this end, we will have to
examine the contrasts between the features of mobility in these two groups of
countries. These differences are referred as “the mobility divide” (or ―the
mobility opportunity divide‖), which corresponds to the wide disparity in mobility
opportunities that currently exist between the mobility options available to the
average citizen in the poorest developing regions and those experienced today
by the average citizen in the developed world.
Furthermore, we aim to encompass in our analysis both physical mobility (the
actual transportation of goods and people) and virtual mobility (the use of the
internet and telecommunications technology, or ICT) to connect people to
people and people to goods.
In 1998, Andreas Schafer, in his book The future mobility of the world
population, pointed out that in the early 1960s two-thirds of the distance made
were by the OECD countries. 30 years later, this figure stood at just over 50%.
This evolution of the demand and the transport dynamic towards developing
countries will be a focal point of our study.
Taking into account the specificities of mobility issues between developed and
developing countries, and analysing the development and limits of virtual and
physical mobility, we will explain what sustainable mobility is made for, how and
what benefits players can draw from it.
Mobility is almost a
human right
Mobility is active,
universal and strategic
From the poorest to the
richest
Both physical and
virtual mobility
8
Mobility and its dynamics over the long term:
towards Hypermobility
The emergence of the "Global Village" (M. McLuhan)
In 1964, Marshall McLuhan popularised the notion of ―global village‖ in his book,
Understanding Media: ―Today, after more than a century of electric technology,
we have extended our central nervous system itself in a global embrace,
abolishing both space and time as far as our planet is concerned‖.
The ―global village‖ defined by Marshall McLuhan was enabled by:
the surge in car use and the development of major roads which have
fostered people‘s autonomy and mobility
the triumph of container transport by sea and by air which has made the
long-distance goods transportation of goods easier and cheaper than before
the opening up of trade barriers and frontiers thanks to new global
regulations (WTO, Schengen Area, etc.)
Whilst in 1950, five hundred and fifty million tons of goods were traded between
the US, Europe and Asia, by 2010 trade between this regions amounted to 7
trillion tons!
Nonetheless, one has to mention that this global village was defined before it
actually existed. Indeed, although in the 60s physical mobility was clearly
improving, it was in the 90s that the internet was making the global village real.
Note that today, the term "Global Village" is mostly used as a metaphor to
describe the World Wide Web. By enabling people to interact and share
information easily from all over the world, this technology fosters the idea of a
global village in which everyone can be informed and react quickly on what is
happening in other regions, other countries.
Is virtual mobility a substitute for physical mobility? In the early 1990s,
people were becoming aware of the need for reducing greenhouse gases and
other issues due to the development of transport (congestion, road casualties
etc.). Therefore, the development of the internet and the mobile phone could
have been a way to substitute for travel. However, total travel volumes have
continued to grow and the impact of virtual mobility has not been able to reverse
this trend. There are reasons to believe that IT has fostered people‘s desire to
travel, as it facilitates more contacts in a given time over larger distances, and
that these contacts generate the need or willingness to meet face-to-face. That
is why we can describe this trend as a kind of ―virtual mobility‖ which is fully a
part of our life‘s mobility.
Everyday strategic hypermobility!
The academic article “Green Mobility: the evolution of transport” published in
2000 by the Rockefeller University of New York pointed out some human
instincts related to mobility defined by Yacov Zahavi in 1980.
Yacov Zahavi measured travel time in the 1970s: the result was about one
hour per day over the year and the entire adult population. What is surprising is
that recent measures give the same result; the travel time budget was also
about one hour 5,000 years ago. This can be explained by the fact that some
activities are being rationalised (bulk purchases in supermarkets, working all
day long), others were being replaced by remote contacts (relationship banking,
making appointments), while others grow (accompanying children, visits and
leisure especially among inactive).
Another human instinct mentioned by Yacov Zahavi is that of returning to the
lair in the evening. This ―homing instinct‖ lies at the heart of airlines‘ success.
“Shoes and the
smartphone are the
emblems of Homo
Mobilis”
The internet increases
willingness to meet face-
to-face
Transport: about one
hour a day
9
Airbus Industries found that about 60% of air passengers in Europe do their
business and return on the same day, notwithstanding the higher fare.
Finally, Yacov Zahavi highlighted the fact that humans are territorial animals.
The objective of territorial animals is to have as large a territory as possible
within the natural limits of the possibilities to acquire and manage it. Most of
human history is a bloody testimony to the instinct to maximise range. For
humans, a large accessible territory means greater liberty in choosing the three
points of gravity of lives: the home, the workplace, and the school. Four-fifths of
all travel ends in this ambit.
These elements allow drawing a kind of rational model in the Weber
perspective, on the production of mobility and its transformations in the long
term. Jean-Pierre Orfeuil in the academic report “Imagine tomorrow’s mobility”
published in 2005, points out that individual players are not "minimisers" of cost,
but "maximisers‖ of opportunities: they leverage the best of city resources and
conditions of mobility (in terms of price, speed and modes network structure) in
an envelope of money and time budget data.
Ultimately, individuals develop important organisational skills. The activities
which require transport and movements are less routine, times and places
frequented are now more varied than yesterday.
Overview of passenger and freight transport
worldwide
Obviously, more and more people are travelling: from one street to another,
from one city to another, from one country to another. But, what is more difficult
is to describe the global modal split in passenger transport i.e. evaluate the
number of km travelled by road/train/bus/metro/sea/air. The main difficulty
stems from the lack of information about transport particularly from developing
countries which do not have set up yet efficient tools to collect transport data.
The OECD database can provide us with transport statistics since the 1970s but
not every year for every country; figures for China every year, for example, are
not published. The most accurate and exhaustive available statistics are those
from the UE as all members have to collect transport data which is regularly
compiled by Eurostat.
Overview of passenger transport
Passenger transport: roads dominate overall
One of the mean features about passenger transport in the world is that both
in developing and developed countries, roads remain the means of
transport of choice for much of the population.
In developed countries, urbanisation has always been vehicle-oriented: most
residents have a strong preference for travelling in the comfortable, air-
conditioned motors cars that are often among their proudest possession.
The Car is one of the symbols of The Glorious Thirty (1950s-1970s), owning
a car was often considered the symbol of success and in a way complies
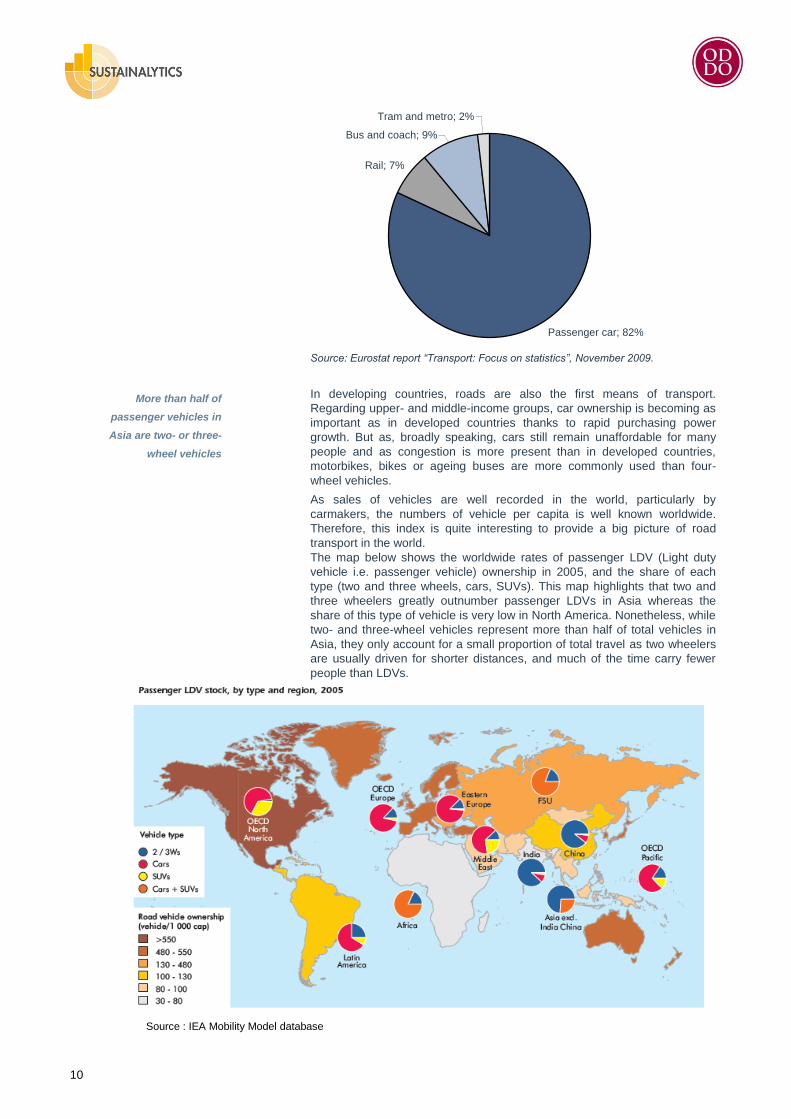
with the consumer society‘s desire for autonomy and individuality. As shown
in the graph below, transport by passenger cars dominates by far in the EU-
27 (82%) and by including ―bus and coaches‖, roads correspond to 91% of
the km travelled by passengers in the EU.
Most of European
business men are day-
trippers
Four-fifths of travel is
between the home, the
workplace and the school
A vehicle-oriented
urbanisation in developed
countries
10
Source: Eurostat report “Transport: Focus on statistics”, November 2009.
In developing countries, roads are also the first means of transport.
Regarding upper- and middle-income groups, car ownership is becoming as
important as in developed countries thanks to rapid purchasing power
growth. But as, broadly speaking, cars still remain unaffordable for many
people and as congestion is more present than in developed countries,
motorbikes, bikes or ageing buses are more commonly used than four-
wheel vehicles.
As sales of vehicles are well recorded in the world, particularly by
carmakers, the numbers of vehicle per capita is well known worldwide.
Therefore, this index is quite interesting to provide a big picture of road
transport in the world.
The map below shows the worldwide rates of passenger LDV (Light duty
vehicle i.e. passenger vehicle) ownership in 2005, and the share of each
type (two and three wheels, cars, SUVs). This map highlights that two and
three wheelers greatly outnumber passenger LDVs in Asia whereas the
share of this type of vehicle is very low in North America. Nonetheless, while
two- and three-wheel vehicles represent more than half of total vehicles in
Asia, they only account for a small proportion of total travel as two wheelers
are usually driven for shorter distances, and much of the time carry fewer
people than LDVs.
Passenger transport in the EU-27 by type of transport, 2006 -% in km
Passenger car; 82%
Rail; 7%
Bus and coach; 9%
Tram and metro; 2%
More than half of
passenger vehicles in
Asia are two- or three-
wheel vehicles
Source : IEA Mobility Model database
11
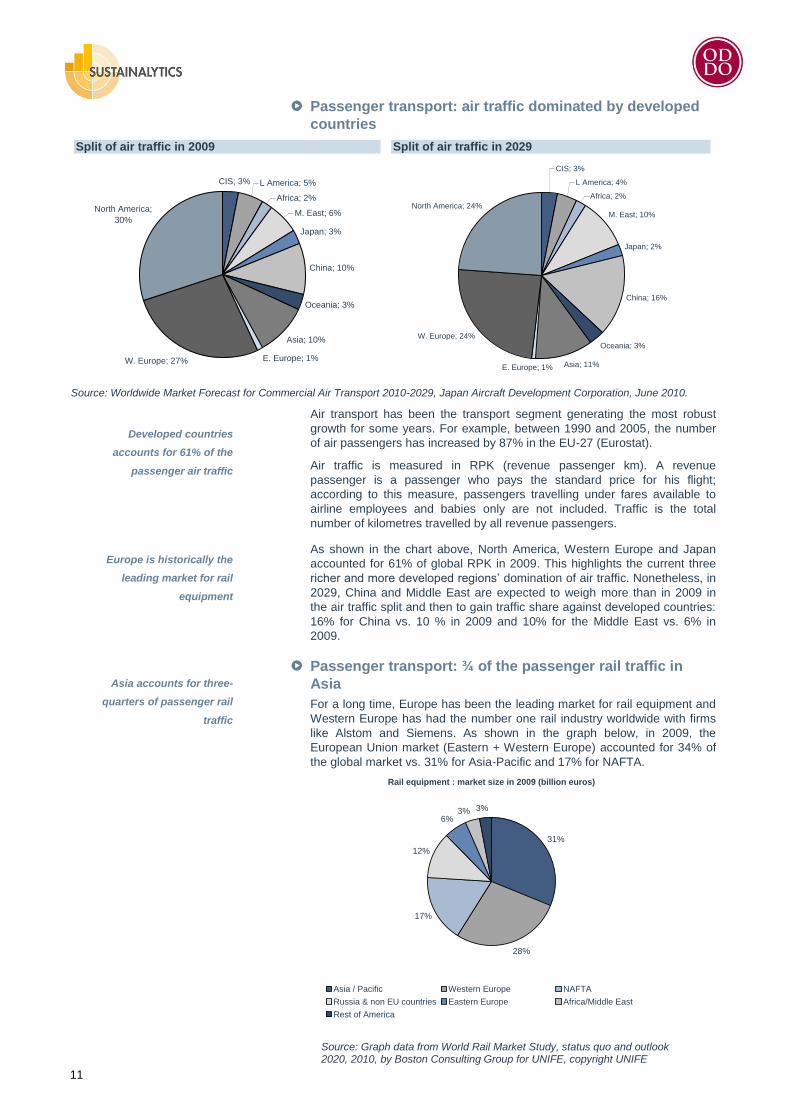
Passenger transport: air traffic dominated by developed
countries
Split of air traffic in 2009 Split of air traffic in 2029
Source: Worldwide Market Forecast for Commercial Air Transport 2010-2029, Japan Aircraft Development Corporation, June 2010.
Air transport has been the transport segment generating the most robust
growth for some years. For example, between 1990 and 2005, the number
of air passengers has increased by 87% in the EU-27 (Eurostat).
Air traffic is measured in RPK (revenue passenger km). A revenue
passenger is a passenger who pays the standard price for his flight;
according to this measure, passengers travelling under fares available to
airline employees and babies only are not included. Traffic is the total
number of kilometres travelled by all revenue passengers.
As shown in the chart above, North America, Western Europe and Japan
accounted for 61% of global RPK in 2009. This highlights the current three
richer and more developed regions‘ domination of air traffic. Nonetheless, in
2029, China and Middle East are expected to weigh more than in 2009 in
the air traffic split and then to gain traffic share against developed countries:
16% for China vs. 10 % in 2009 and 10% for the Middle East vs. 6% in
2009.
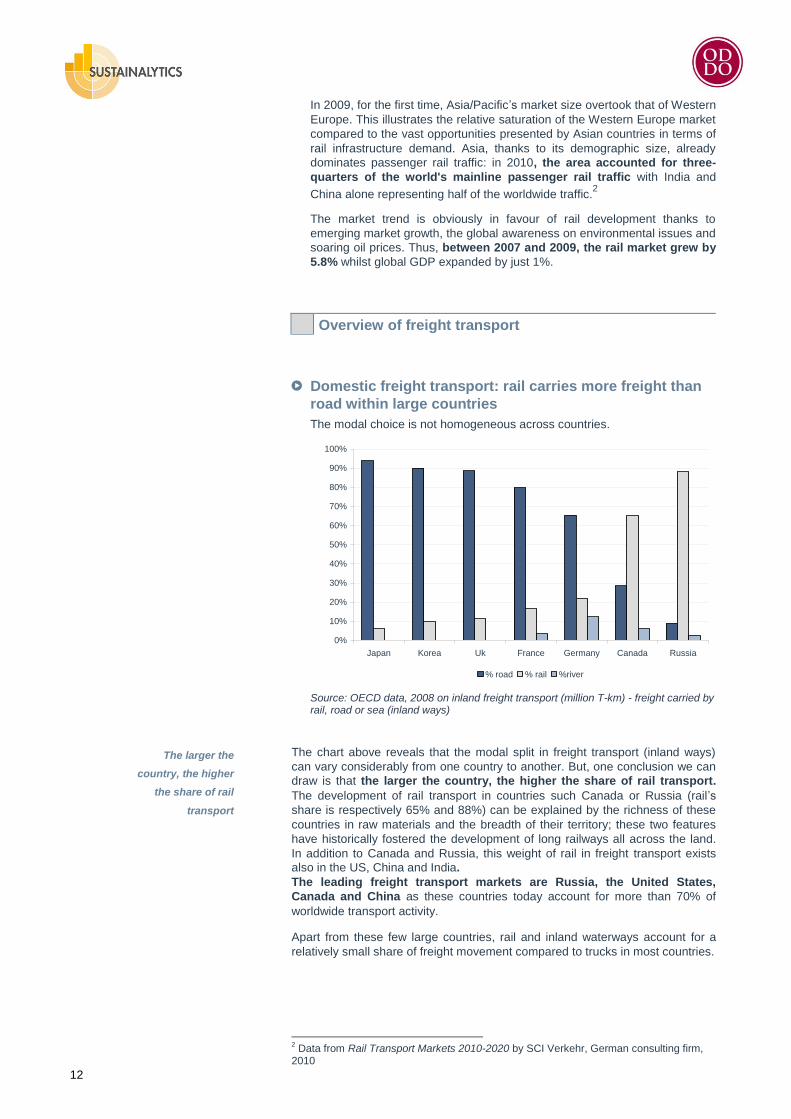
Passenger transport: ¾ of the passenger rail traffic in
Asia
For a long time, Europe has been the leading market for rail equipment and
Western Europe has had the number one rail industry worldwide with firms
like Alstom and Siemens. As shown in the graph below, in 2009, the
European Union market (Eastern + Western Europe) accounted for 34% of
the global market vs. 31% for Asia-Pacific and 17% for NAFTA.
Splt of air traffic in 2009
CIS; 3% L America; 5%
Africa; 2%
M. East; 6%
Japan; 3%
China; 10%
Oceania; 3%
Asia; 10%
E. Europe; 1%W. Europe; 27%
North America;
30%
Split of air traffic 2029
CIS; 3%
L America; 4%
Africa; 2%
M. East; 10%
Japan; 2%
China; 16%
Oceania; 3%
Asia; 11%E. Europe; 1%
W. Europe; 24%
North America; 24%
Rail equipment : market size in 2009 (billion euros)
31%
28%
17%
12%
6%3% 3%
Asia / Pacific Western Europe NAFTA
Russia & non EU countries Eastern Europe Africa/Middle East
Rest of America
Developed countries
accounts for 61% of the
passenger air traffic
Europe is historically the
leading market for rail
equipment
Asia accounts for three-
quarters of passenger rail
traffic
Source: Graph data from World Rail Market Study, status quo and outlook 2020, 2010, by Boston Consulting Group for UNIFE, copyright UNIFE
12
In 2009, for the first time, Asia/Pacific‘s market size overtook that of Western
Europe. This illustrates the relative saturation of the Western Europe market
compared to the vast opportunities presented by Asian countries in terms of
rail infrastructure demand. Asia, thanks to its demographic size, already
dominates passenger rail traffic: in 2010, the area accounted for three-
quarters of the world's mainline passenger rail traffic with India and
China alone representing half of the worldwide traffic.2
The market trend is obviously in favour of rail development thanks to
emerging market growth, the global awareness on environmental issues and
soaring oil prices. Thus, between 2007 and 2009, the rail market grew by
5.8% whilst global GDP expanded by just 1%.
Overview of freight transport
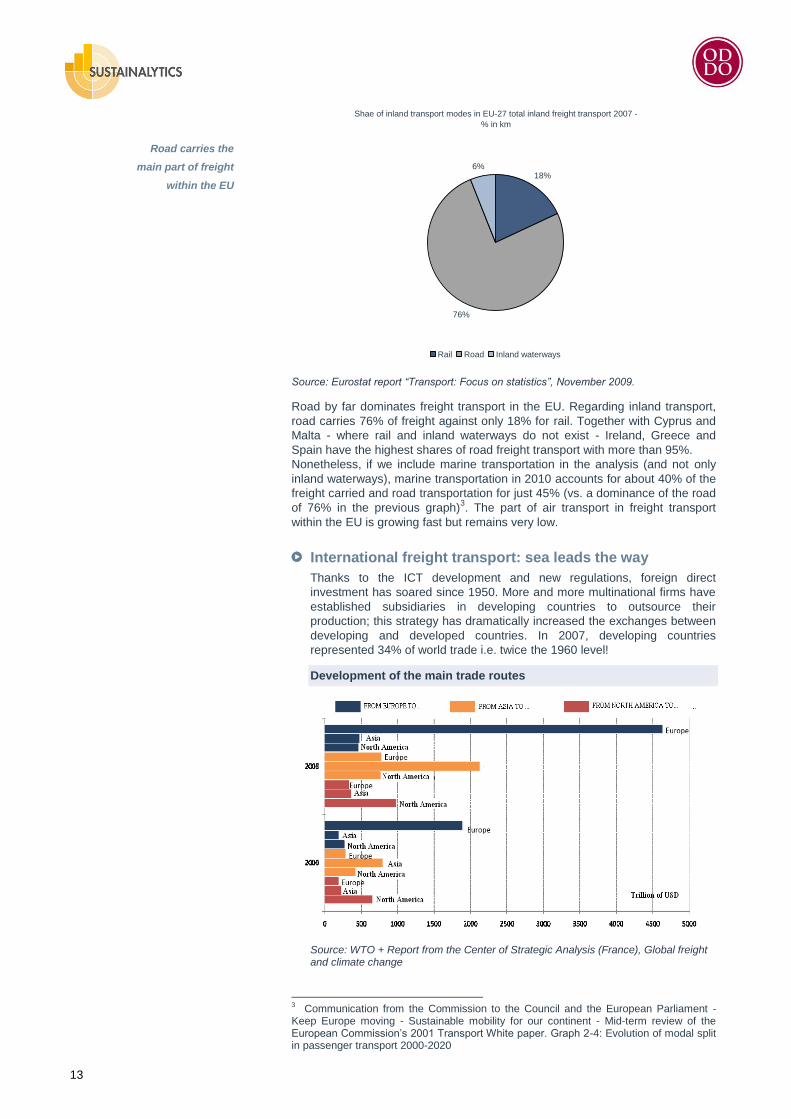
Domestic freight transport: rail carries more freight than
road within large countries
The modal choice is not homogeneous across countries.
Source: OECD data, 2008 on inland freight transport (million T-km) - freight carried by rail, road or sea (inland ways)
The chart above reveals that the modal split in freight transport (inland ways)
can vary considerably from one country to another. But, one conclusion we can
draw is that the larger the country, the higher the share of rail transport.
The development of rail transport in countries such Canada or Russia (rail‘s
share is respectively 65% and 88%) can be explained by the richness of these
countries in raw materials and the breadth of their territory; these two features
have historically fostered the development of long railways all across the land.
In addition to Canada and Russia, this weight of rail in freight transport exists
also in the US, China and India.
The leading freight transport markets are Russia, the United States,
Canada and China as these countries today account for more than 70% of
worldwide transport activity.
Apart from these few large countries, rail and inland waterways account for a
relatively small share of freight movement compared to trucks in most countries.
2 Data from Rail Transport Markets 2010-2020 by SCI Verkehr, German consulting firm,
2010
0%
10%
20%
30%
40%
50%
60%
70%
80%
90%
100%
Japan Korea Uk France Germany Canada Russia
% road % rail %river
The larger the
country, the higher
the share of rail
transport
13
Source: Eurostat report “Transport: Focus on statistics”, November 2009.
Road by far dominates freight transport in the EU. Regarding inland transport,
road carries 76% of freight against only 18% for rail. Together with Cyprus and
Malta - where rail and inland waterways do not exist - Ireland, Greece and
Spain have the highest shares of road freight transport with more than 95%.
Nonetheless, if we include marine transportation in the analysis (and not only
inland waterways), marine transportation in 2010 accounts for about 40% of the
freight carried and road transportation for just 45% (vs. a dominance of the road
of 76% in the previous graph)3. The part of air transport in freight transport
within the EU is growing fast but remains very low.
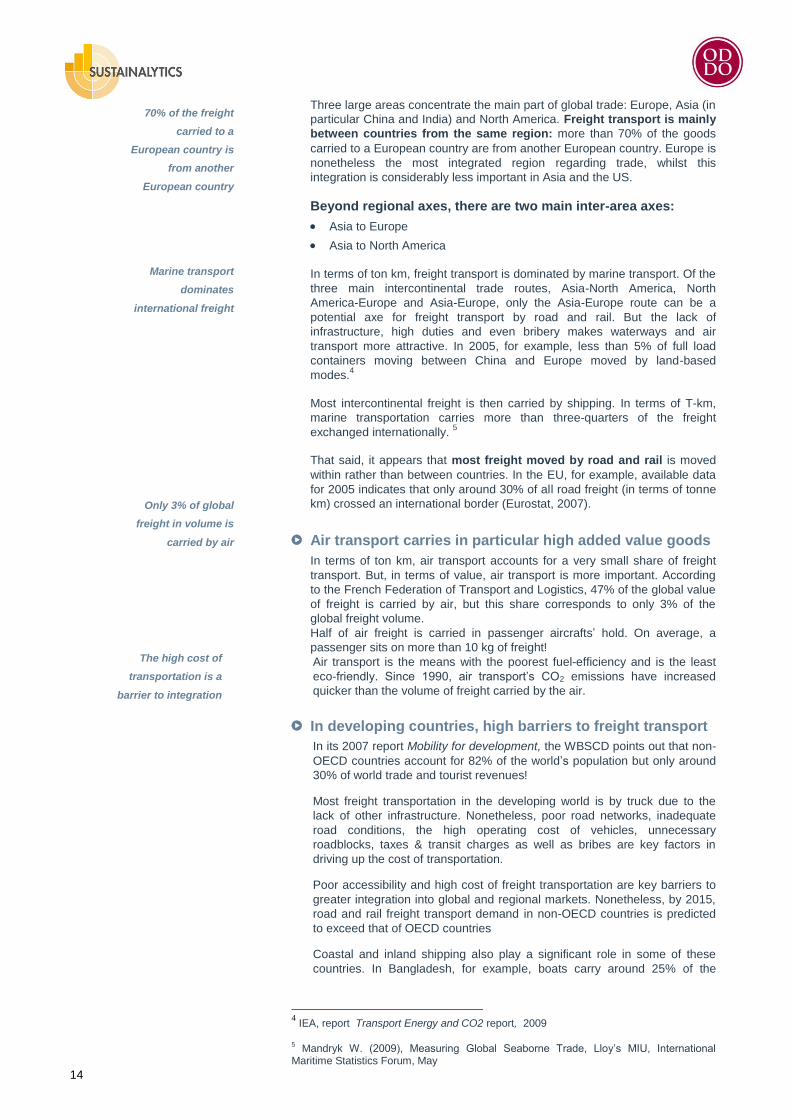
International freight transport: sea leads the way
Thanks to the ICT development and new regulations, foreign direct
investment has soared since 1950. More and more multinational firms have
established subsidiaries in developing countries to outsource their
production; this strategy has dramatically increased the exchanges between
developing and developed countries. In 2007, developing countries
represented 34% of world trade i.e. twice the 1960 level!
Development of the main trade routes
Source: WTO + Report from the Center of Strategic Analysis (France), Global freight and climate change
3 Communication from the Commission to the Council and the European Parliament -
Keep Europe moving - Sustainable mobility for our continent - Mid-term review of the European Commission‘s 2001 Transport White paper. Graph 2-4: Evolution of modal split in passenger transport 2000-2020
Shae of inland transport modes in EU-27 total inland freight transport 2007 -
% in km
18%
76%
6%
Rail Road Inland waterways
Road carries the
main part of freight
within the EU
14
Three large areas concentrate the main part of global trade: Europe, Asia (in
particular China and India) and North America. Freight transport is mainly
between countries from the same region: more than 70% of the goods
carried to a European country are from another European country. Europe is
nonetheless the most integrated region regarding trade, whilst this
integration is considerably less important in Asia and the US.
Beyond regional axes, there are two main inter-area axes:
Asia to Europe
Asia to North America
In terms of ton km, freight transport is dominated by marine transport. Of the
three main intercontinental trade routes, Asia-North America, North
America-Europe and Asia-Europe, only the Asia-Europe route can be a
potential axe for freight transport by road and rail. But the lack of
infrastructure, high duties and even bribery makes waterways and air
transport more attractive. In 2005, for example, less than 5% of full load
containers moving between China and Europe moved by land-based
modes.4
Most intercontinental freight is then carried by shipping. In terms of T-km,
marine transportation carries more than three-quarters of the freight
exchanged internationally. 5
That said, it appears that most freight moved by road and rail is moved
within rather than between countries. In the EU, for example, available data
for 2005 indicates that only around 30% of all road freight (in terms of tonne
km) crossed an international border (Eurostat, 2007).
Air transport carries in particular high added value goods
In terms of ton km, air transport accounts for a very small share of freight
transport. But, in terms of value, air transport is more important. According
to the French Federation of Transport and Logistics, 47% of the global value
of freight is carried by air, but this share corresponds to only 3% of the
global freight volume.
Half of air freight is carried in passenger aircrafts‘ hold. On average, a
passenger sits on more than 10 kg of freight!
Air transport is the means with the poorest fuel-efficiency and is the least
eco-friendly. Since 1990, air transport‘s CO2 emissions have increased
quicker than the volume of freight carried by the air.
In developing countries, high barriers to freight transport
In its 2007 report Mobility for development, the WBSCD points out that non-
OECD countries account for 82% of the world‘s population but only around
30% of world trade and tourist revenues!
Most freight transportation in the developing world is by truck due to the
lack of other infrastructure. Nonetheless, poor road networks, inadequate
road conditions, the high operating cost of vehicles, unnecessary
roadblocks, taxes & transit charges as well as bribes are key factors in
driving up the cost of transportation.
Poor accessibility and high cost of freight transportation are key barriers to
greater integration into global and regional markets. Nonetheless, by 2015,
road and rail freight transport demand in non-OECD countries is predicted
to exceed that of OECD countries
Coastal and inland shipping also play a significant role in some of these
countries. In Bangladesh, for example, boats carry around 25% of the
4 IEA, report Transport Energy and CO2 report, 2009
5 Mandryk W. (2009), Measuring Global Seaborne Trade, Lloy‘s MIU, International
Maritime Statistics Forum, May
70% of the freight
carried to a
European country is
from another
European country
Marine transport
dominates
international freight
Only 3% of global
freight in volume is
carried by air
The high cost of
transportation is a
barrier to integration
15
country‘s freight. In the Mekong delta area of Vietnam, over two-thirds of
freight is carried by inland waterways.
Global trends of mobility
Trends in passenger transport
Car ownership: emerging countries are catching up with
developed countries
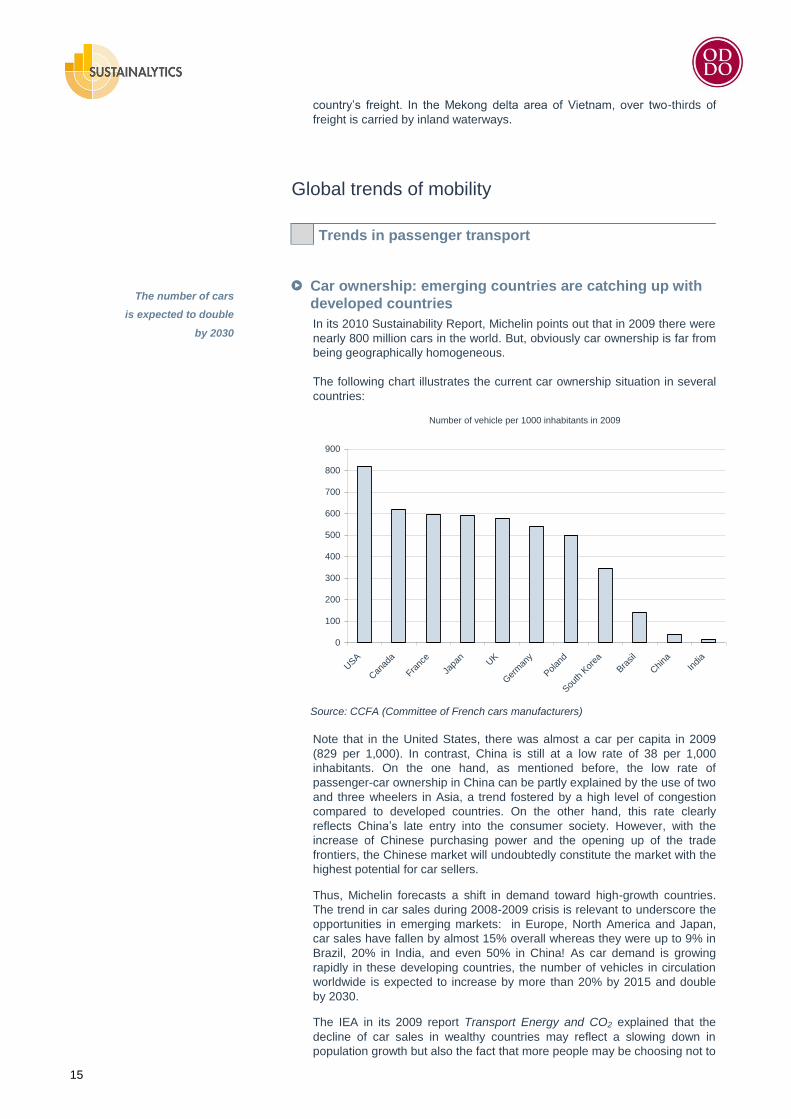
In its 2010 Sustainability Report, Michelin points out that in 2009 there were
nearly 800 million cars in the world. But, obviously car ownership is far from
being geographically homogeneous.
The following chart illustrates the current car ownership situation in several
countries:
Source: CCFA (Committee of French cars manufacturers)
Note that in the United States, there was almost a car per capita in 2009
(829 per 1,000). In contrast, China is still at a low rate of 38 per 1,000
inhabitants. On the one hand, as mentioned before, the low rate of
passenger-car ownership in China can be partly explained by the use of two
and three wheelers in Asia, a trend fostered by a high level of congestion
compared to developed countries. On the other hand, this rate clearly
reflects China‘s late entry into the consumer society. However, with the
increase of Chinese purchasing power and the opening up of the trade
frontiers, the Chinese market will undoubtedly constitute the market with the
highest potential for car sellers.
Thus, Michelin forecasts a shift in demand toward high-growth countries.
The trend in car sales during 2008-2009 crisis is relevant to underscore the
opportunities in emerging markets: in Europe, North America and Japan,
car sales have fallen by almost 15% overall whereas they were up to 9% in
Brazil, 20% in India, and even 50% in China! As car demand is growing
rapidly in these developing countries, the number of vehicles in circulation
worldwide is expected to increase by more than 20% by 2015 and double
by 2030.
The IEA in its 2009 report Transport Energy and CO2 explained that the
decline of car sales in wealthy countries may reflect a slowing down in
population growth but also the fact that more people may be choosing not to
Number of vehicle per 1000 inhabitants in 2009
0
100
200
300
400
500
600
700
800
900
USA
Can
ada
Franc
e
Japa
nUK
Ger
man
y
Polan
d
Sou
th K
orea
Bra
sil
China
India
The number of cars
is expected to double
by 2030
16
own an automobile or as a family choose to own only one vehicle instead of
two or more. Recent surveys in Japan show that the younger generation
has to some degree lost some interest in cars and focuses more on new
communication devices such as mobile phones or laptop computers.
But in developing countries, rates of car ownership are growing rapidly,
suggesting that mass transit options are insufficient. Many families
purchase LDVs as soon as they can afford them. The emergence of low-
cost cars, such as the Tata Nano in India, will probably further accelerate
LDV ownership rates. The number of motorised two wheelers also
continues to grow rapidly. Indeed, as congestion is more and more acute,
two wheelers may still be the easiest way to get around.
Urban and conventional rail growth driven by China and
India, potential technological breakthrough expected
Rail growth was and will be driven by megatrends such as population
growth, road congestion, urbanisation and new sustainable development
issues.
Concerning conventional rail: according to Unife (Union of European
Railway Industry), the global rail equipment market is expected to grow
by 2.4% per year until 2016.
Concerning urban rail (metro, bus, and tram): the International union of
railways (in its 2008 report) expects to see an average increase of 3%
per year of the market until 2020.
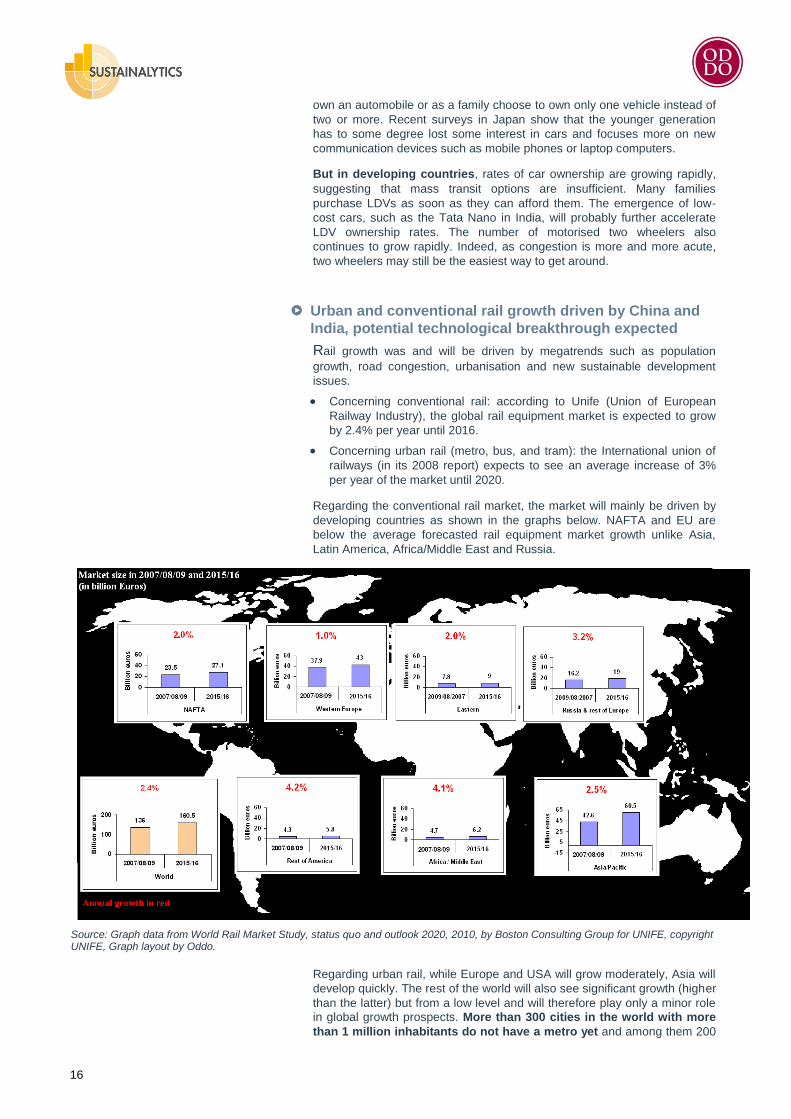
Regarding the conventional rail market, the market will mainly be driven by
developing countries as shown in the graphs below. NAFTA and EU are
below the average forecasted rail equipment market growth unlike Asia,
Latin America, Africa/Middle East and Russia.
Source: Graph data from World Rail Market Study, status quo and outlook 2020, 2010, by Boston Consulting Group for UNIFE, copyright UNIFE, Graph layout by Oddo.
Regarding urban rail, while Europe and USA will grow moderately, Asia will
develop quickly. The rest of the world will also see significant growth (higher
than the latter) but from a low level and will therefore play only a minor role
in global growth prospects. More than 300 cities in the world with more
than 1 million inhabitants do not have a metro yet and among them 200
17
are located in Asia; these figures highlight the high potential of the urban rail
market in Asia.
High population growth, ever-increasing per capita GDP and extensive
investment in rail infrastructure will see China and India continue to drive
growth.
China is likely to bring around 2000 km of new metro lines into service in
the next ten years. Similarly, India is also investing heavily in new
metros, with rapid expansion underway in Delhi and new projects in
several cities.
Long-distance passenger rail will enjoy strong growth due to high-speed
rail projects. In China, 13,000 km of new high-speed lines will be
completed by 2012. Furthermore, Western Europe will benefit from new
lines in Spain, Italy and France as the European Commission aims to
hold 50% of the freight and passenger transport market by train and
waterways by 2050.
Air transport: one-third of the 2009-2029 deliveries of
aircrafts will be for Asia Pacific airlines!
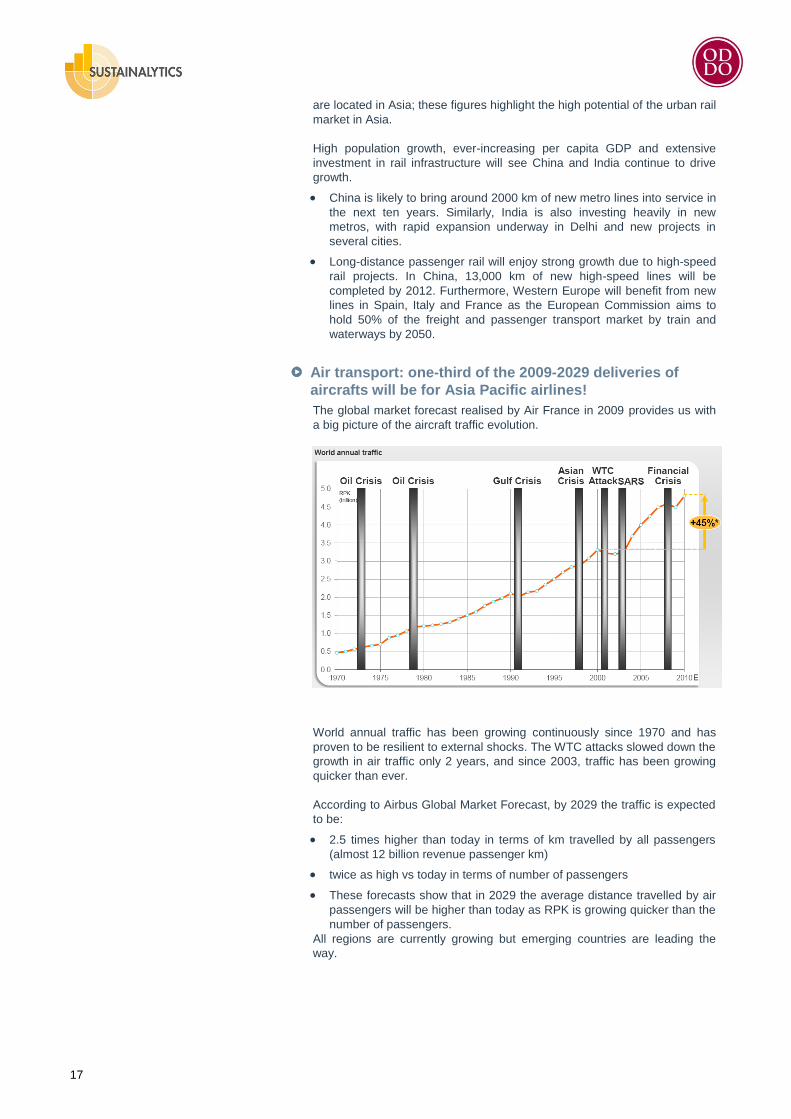
The global market forecast realised by Air France in 2009 provides us with
a big picture of the aircraft traffic evolution.
World annual traffic has been growing continuously since 1970 and has
proven to be resilient to external shocks. The WTC attacks slowed down the
growth in air traffic only 2 years, and since 2003, traffic has been growing
quicker than ever.
According to Airbus Global Market Forecast, by 2029 the traffic is expected
to be:
2.5 times higher than today in terms of km travelled by all passengers
(almost 12 billion revenue passenger km)
twice as high vs today in terms of number of passengers
These forecasts show that in 2029 the average distance travelled by air
passengers will be higher than today as RPK is growing quicker than the
number of passengers.
All regions are currently growing but emerging countries are leading the
way.
18
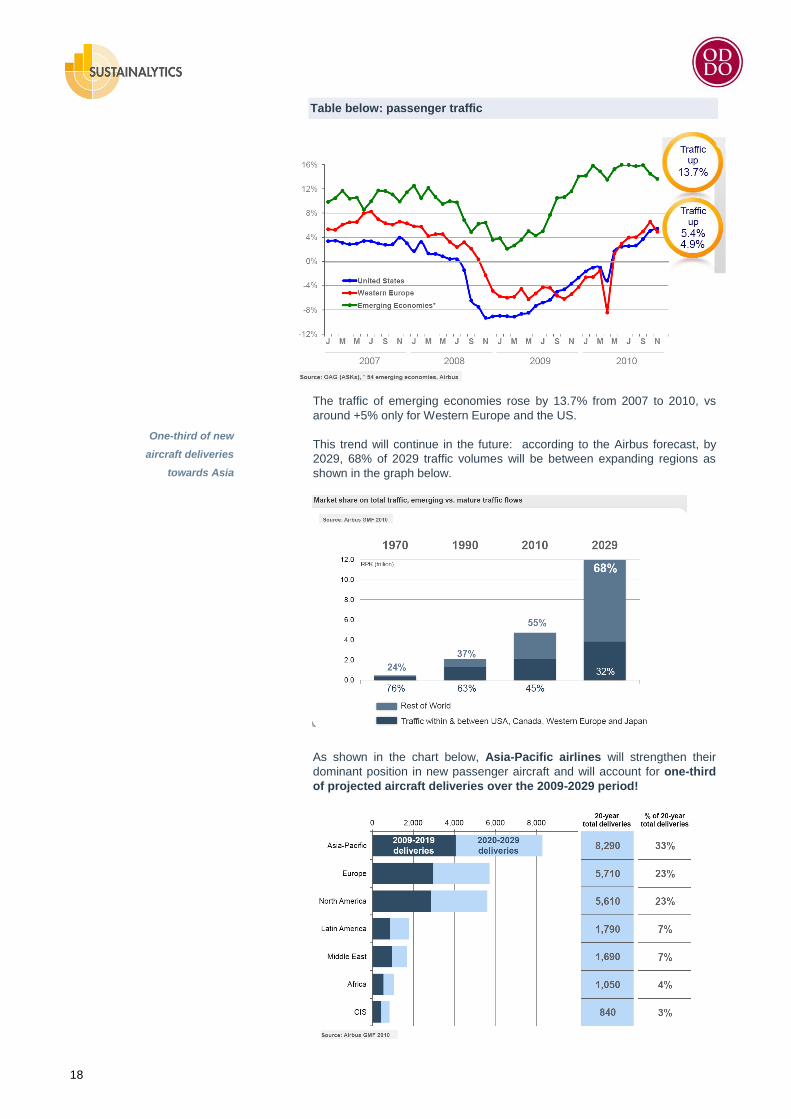
Table below: passenger traffic
The traffic of emerging economies rose by 13.7% from 2007 to 2010, vs
around +5% only for Western Europe and the US.
This trend will continue in the future: according to the Airbus forecast, by
2029, 68% of 2029 traffic volumes will be between expanding regions as
shown in the graph below.
As shown in the chart below, Asia-Pacific airlines will strengthen their
dominant position in new passenger aircraft and will account for one-third
of projected aircraft deliveries over the 2009-2029 period!
One-third of new
aircraft deliveries
towards Asia
19
Trends in freight transport
Three factors will drive growth and the trend in freight
traffic worldwide:
1. Emerging countries’ spectacular growth: China and India will drive
growth in freight traffic. These two countries which currently represent
7% and 3% respectively of the world economy may represent 30% and
14% respectively by 2050 (against 29% for the EU and 27% for the US)
according to the CEPII (French Center of Forecast research and
financial information). Moreover, contrary to the EU and North America,
which mainly consume goods imported from neighbouring countries, the
new Asian emerging countries are more prone to export to developed
countries which may increasingly raise the average distance travelled by
goods. However, another scenario is that the increase of purchasing
power in the region (particularly in China, India and South Korea) makes
the demand enough to significantly increase trade within the Asian area.
In any case, the transport overview will clearly be modified.
2. Scarcity of resources: fuel prices will continue to rise which will
increase the appeal of fuel-efficient transport.
3. Climate change: the political implementation of environmental targets
will also favour fuel-efficient transport‘s appeal.
Positive momentum on worldwide rail freight: rail revival!
The three drivers mentioned above could logically lead to more public
funding concerning investment in railways. Indeed, rail is one of the most
fuel-efficient modes of transport and is compatible with the vast expanse of
a number of emerging countries (Brazil, China, and India). Thus, upgrades
and renewals along rail freight corridors are already being pushed ahead,
especially in India, China, the Middle East and Eastern Europe.
As rail is generally not as flexible as road transport and requires high
investment, many countries will be more inclined to promote an
intermodal system i.e. a partial transfer of freight from road to rail
through financial incentives or regulatory policies.
For already some years, the European Commission has considered
intermodal rail/road system an ideal solution to curb CO2 emissions. But its
words have not really been followed by actions. Indeed, in Europe, since
the 1970s, the share of freight transport carried by train has been
decreasing: the volume of goods carried by train was 16% in 2007 against
29% in 1970.6 The decline in rail can be explained by several reasons: less
industrial activity, greater volatility of the goods carried which makes road
flexibility more attractive, the relatively low price of fuel and, in many
countries, the huge investment made by governments in the development of
highways (6,000 km were built in France between 1970 and 2000) at the
expense of rail investment.
Air transport: Asia will triple its aircraft fleet
In spite of soaring fuel costs, air transport remains interesting for freight with
high added value. Indeed, for these products, the cost of transport is
generally less than 4% of the final price of sales. Then, even if fuel prices
are rising, air transport remains pertinent for this market range.
During the 2008-2009 crisis, which impacted air freight traffic, airline
companies reduced the number of air cargo and optimised the use of
storage room in the passenger aircraft. This leads us to believe that the
crisis and surging fuel price may have a positive effect on air transport GHG
6 French rail freight: the new battle of rail, Hubert HAENEL, François GERBAUD (French
Minister of Transport), February 2003
20
emissions as it has led some companies to make freight transport
optimisation a priority.
Like all the other means of transport, air transport growth will be driven by
development in Asia. Meanwhile, in European and US air markets, demand
is tending more towards the replacement of ageing aircrafts, Boeing
forecast that the number of aircraft in the Asia-Pacific fleet will nearly triple,
from 4,110 in 2009 to 12,200 in 2029. Half of the world‘s new traffic added
during the next 20 years will be to, from, or within the Asia-Pacific region as
the latter depends heavily on air cargo to transport goods over difficult
terrain and vast stretches of ocean.
Some of the world‘s largest and most efficient cargo operators compete to
transport high-value and time-sensitive exports to markets outside the
region. To modernise their fleets and meet the growing demand for air
travel, Asia-Pacific-based airlines will need more than 10,300 new aircraft,
valued at more than US$1.3 trillion, over the next 20 years.
China will remain the largest market for aircraft outside the United States.
Indeed, although high-speed rail is competitive in many short-haul markets,
(less than 800 km), efficient integration of rail and air transport can stimulate
demand for longer-haul air travel. China is forecast to take delivery of 4,330
new aircraft—including those from its own developing aircraft
programmes—valued at US$ 480 billion over the next 20 years.
Marine transportation adopts new strategy
Marine transportation is the least flexible transport since fixed costs are very
high. Then, the 2008-2009 crisis has considerably impacted freight carried
by vessels and consequently many vessels were totally inactive over the
period.
But, in a way, this inactivity had a positive effect: indeed, it led some owners
to scrap their older or less cost-effective vessels. But, in parallel, the crisis
implied the end of new vessel sales: Det Norkske Veritas assesses that
more than 300 orders for new cargo vessels were cancelled in May 2009.
Facing the surge in fuel price and the decrease in demand, some sea
carriers have adopted a new strategy: they negotiate with their clients an
increase of the time needed to transport the goods (i.e. lower vessel speed)
in exchange for transporting more goods (as they had many boats
available). As fuel consumption is correlated to speed cubed, decreasing
the vessel‘s speed can lead to significant cost savings!
Marine transport is one of the most fuel-efficient forms of transport and,
therefore, a key player in sustainable mobility in the future. But its relative
lack of flexibility and high cost implies the need for global regulation and
subsidies to:
foster its development vs growth in road and air transport
enable it to renew its ageing fleet to adopt new efficient vessels and
avoid further oil spills.
Virtual mobility or e-substitution
E-substitution consists in substituting displacements by distance services and
relations. At present, millions of people, particularly in developed countries,
instead of going directly to the bank or to the supermarket, order their new
credit card, buy a new dress, organise their next holidays, comfortably seated at
their computer. Thus, this virtual mobility or e-substitution is a relevant topic in
any discussion of mobility trends.
But virtual mobility doest not mean less physical mobility. Indeed, contrary to
what was expected in the 1990s, ICT has not resulted in a reduction of people‘s
mobility. ICT has fostered the desire of people to meet other people with whom
they interact on the World Wide Web. Some 800 million people are today
600 million people
belong to the
community!
21
members of the Facebook community and this figure is expected to double in
a few years.
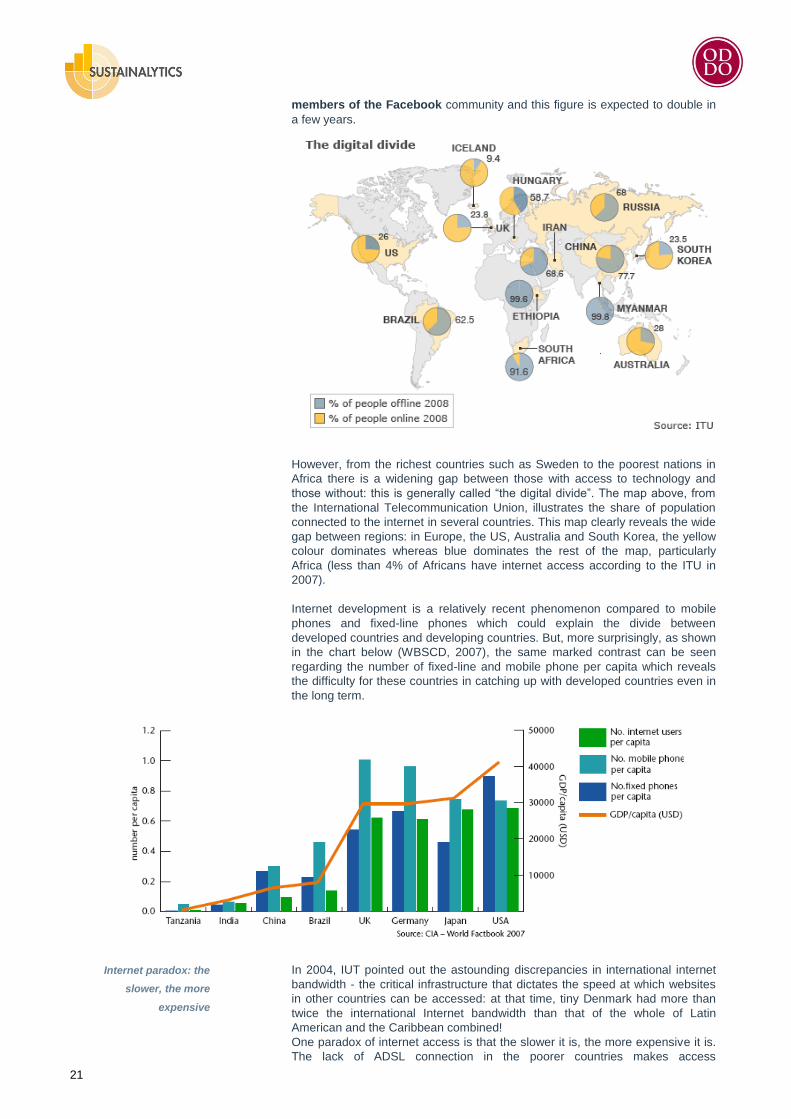
However, from the richest countries such as Sweden to the poorest nations in
Africa there is a widening gap between those with access to technology and
those without: this is generally called ―the digital divide‖. The map above, from
the International Telecommunication Union, illustrates the share of population
connected to the internet in several countries. This map clearly reveals the wide
gap between regions: in Europe, the US, Australia and South Korea, the yellow
colour dominates whereas blue dominates the rest of the map, particularly
Africa (less than 4% of Africans have internet access according to the ITU in
2007).
Internet development is a relatively recent phenomenon compared to mobile
phones and fixed-line phones which could explain the divide between
developed countries and developing countries. But, more surprisingly, as shown
in the chart below (WBSCD, 2007), the same marked contrast can be seen
regarding the number of fixed-line and mobile phone per capita which reveals
the difficulty for these countries in catching up with developed countries even in
the long term.
In 2004, IUT pointed out the astounding discrepancies in international internet
bandwidth - the critical infrastructure that dictates the speed at which websites
in other countries can be accessed: at that time, tiny Denmark had more than
twice the international Internet bandwidth than that of the whole of Latin
American and the Caribbean combined!
One paradox of internet access is that the slower it is, the more expensive it is.
The lack of ADSL connection in the poorer countries makes access
Internet paradox: the
slower, the more
expensive
22
unaffordable for the lion‘s share of the inhabitants. According to the World Bank,
connection fees in Africa are the highest: between US$ 250 and US$ 300 per
month!
Beyond this global view, one can add that the digital divide can also be
observed within countries on the same continent, regions in the same countries,
cities in the same region. In 2006, 37% of Europeans stated that they do not
have any knowledge of computing (Demunter, 2006) and 10% of European
senior citizens are internet users.
The revolution in motion: the new paradigms of
mobility
Unavoidably slow innovation
Over the last decade, the main players in mobility have intended to improve the
ESG impacts of mobility via innovation capacity and improved technologies.
Today‘s trend is to rely on people as well. The framework of this report not only
highlights technological aspects of sustainable mobility, it also takes into
account a change in the behaviour of travellers. Indeed, in order to be more
efficient, sustainable mobility should combine both technological improvement
and behavioural change. This is what we call the new paradigms of mobility.
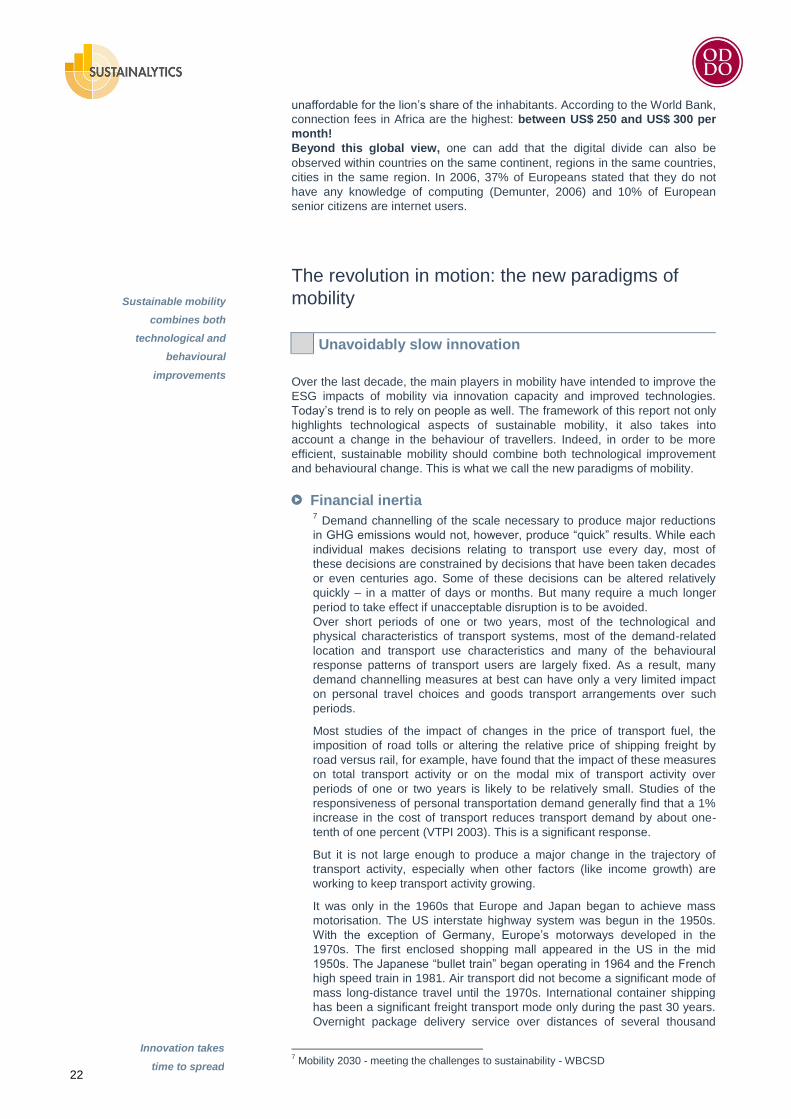
Financial inertia 7 Demand channelling of the scale necessary to produce major reductions
in GHG emissions would not, however, produce ―quick‖ results. While each
individual makes decisions relating to transport use every day, most of
these decisions are constrained by decisions that have been taken decades
or even centuries ago. Some of these decisions can be altered relatively
quickly – in a matter of days or months. But many require a much longer
period to take effect if unacceptable disruption is to be avoided.
Over short periods of one or two years, most of the technological and
physical characteristics of transport systems, most of the demand-related
location and transport use characteristics and many of the behavioural
response patterns of transport users are largely fixed. As a result, many
demand channelling measures at best can have only a very limited impact
on personal travel choices and goods transport arrangements over such
periods.
Most studies of the impact of changes in the price of transport fuel, the
imposition of road tolls or altering the relative price of shipping freight by
road versus rail, for example, have found that the impact of these measures
on total transport activity or on the modal mix of transport activity over
periods of one or two years is likely to be relatively small. Studies of the
responsiveness of personal transportation demand generally find that a 1%
increase in the cost of transport reduces transport demand by about one-
tenth of one percent (VTPI 2003). This is a significant response.
But it is not large enough to produce a major change in the trajectory of
transport activity, especially when other factors (like income growth) are
working to keep transport activity growing.
It was only in the 1960s that Europe and Japan began to achieve mass
motorisation. The US interstate highway system was begun in the 1950s.
With the exception of Germany, Europe‘s motorways developed in the
1970s. The first enclosed shopping mall appeared in the US in the mid
1950s. The Japanese ―bullet train‖ began operating in 1964 and the French
high speed train in 1981. Air transport did not become a significant mode of
mass long-distance travel until the 1970s. International container shipping
has been a significant freight transport mode only during the past 30 years.
Overnight package delivery service over distances of several thousand
7 Mobility 2030 - meeting the challenges to sustainability - WBCSD
Sustainable mobility
combines both
technological and
behavioural
improvements
Innovation takes
time to spread
23
miles is no more than a couple of decades old. Each of these transport
innovations was responsible for major changes in the volume and/or pattern
of transport activity. Each took several decades for its full impact to be felt.
There are many demand-led measures that, in theory, can impact the total
volume of transport activity, the modal mix of transport activity or both. But
the impact of these measures over the short to medium term when
aggregated at a national and/or regional level appears relatively small –
meaning that their potential as a tool for directly reducing transport-related
GHG emissions is likely to be quite limited.
Cultural inertia 8 In KPMG‘s Global Automotive Survey 2011, Bernd Pichler, Managing
Director at Volkswagen (China) states that most customers want to be
environmentally friendly but don‘t want to compromise on performance‖.
Total sales of hybrid/EV are still expected to lag well behind traditional
internal combustion-powered cars due to some significant challenges that
have not yet been resolved, including safety, reliability, comfort, image and
undoubtedly cost.
As indicated by Georges Amar in his book Homo Mobilis – the new age of
mobility, since the existence of statistics on the subject, the first decline in
the number of miles travelled by automobiles in the USA was seen in mid-
2008!
Political inertia is a structural weight
Governments are an important player in terms of shaping the transport or
mobility landscape. Crucial investments in infrastructure have traditionally
been driven by public policies. Note, in particular, that the development and
expansion of the road and railway systems in different countries in the past
decade could not have been achieved without public financing. However, in
the past years a political inertia is becoming evident stemming from
financial and cultural constraints (public investment, heavy inconvenience of
public transport works), strategic industries (oil, automotive, aviation, etc.)
and lobbying activities.
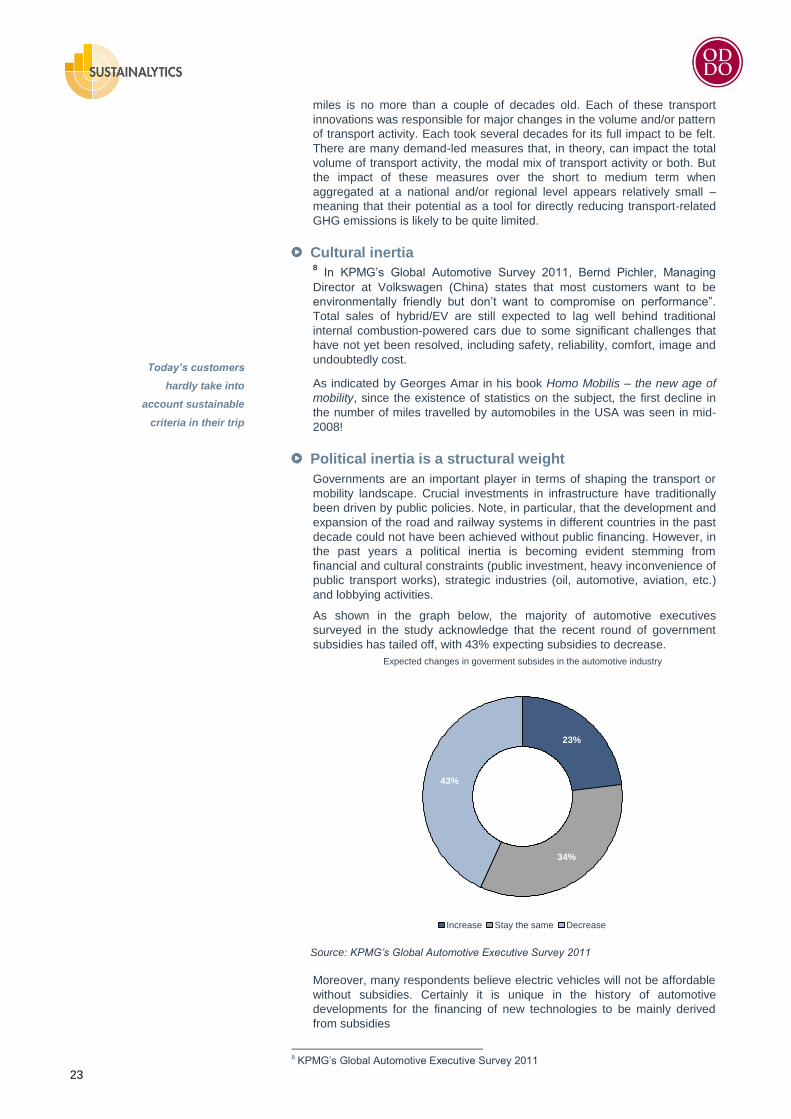
As shown in the graph below, the majority of automotive executives
surveyed in the study acknowledge that the recent round of government
subsidies has tailed off, with 43% expecting subsidies to decrease.
Source: KPMG’s Global Automotive Executive Survey 2011
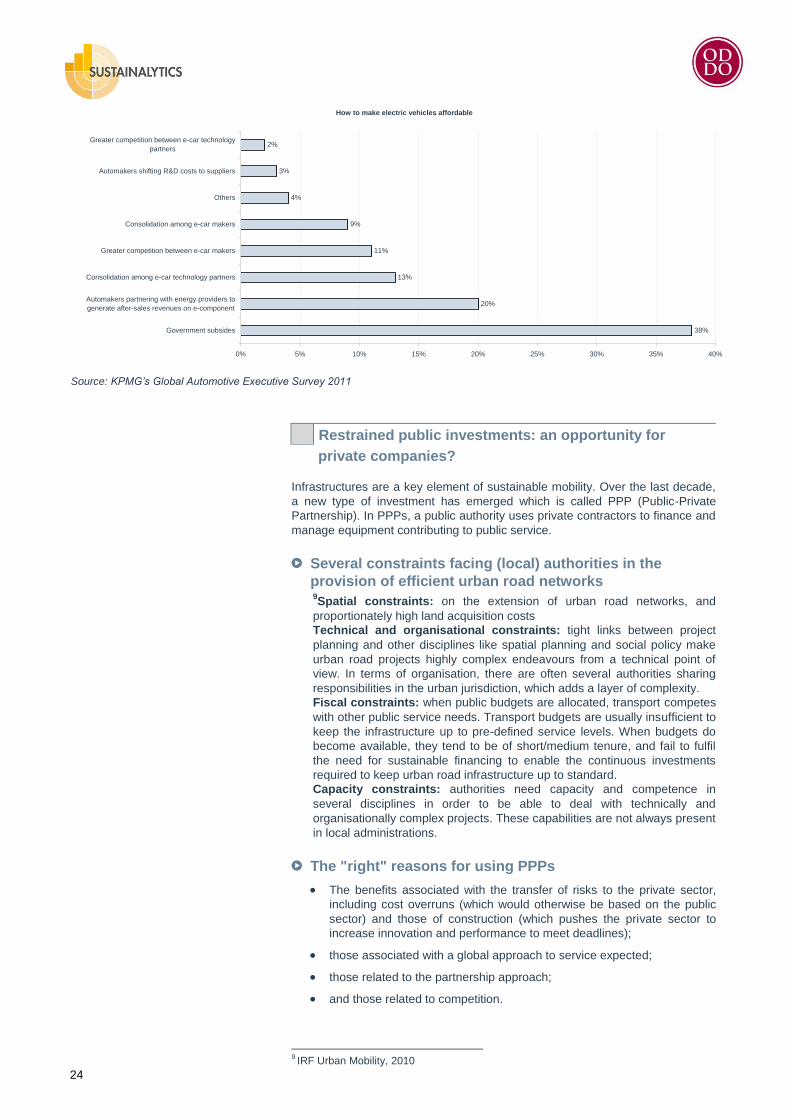
Moreover, many respondents believe electric vehicles will not be affordable
without subsidies. Certainly it is unique in the history of automotive
developments for the financing of new technologies to be mainly derived
from subsidies
8 KPMG‘s Global Automotive Executive Survey 2011
Expected changes in goverment subsides in the automotive industry
23%
34%
43%
Increase Stay the same Decrease
Today’s customers
hardly take into
account sustainable
criteria in their trip
24
Source: KPMG’s Global Automotive Executive Survey 2011
Restrained public investments: an opportunity for
private companies?
Infrastructures are a key element of sustainable mobility. Over the last decade,
a new type of investment has emerged which is called PPP (Public-Private
Partnership). In PPPs, a public authority uses private contractors to finance and
manage equipment contributing to public service.
Several constraints facing (local) authorities in the
provision of efficient urban road networks 9Spatial constraints: on the extension of urban road networks, and
proportionately high land acquisition costs
Technical and organisational constraints: tight links between project
planning and other disciplines like spatial planning and social policy make
urban road projects highly complex endeavours from a technical point of
view. In terms of organisation, there are often several authorities sharing
responsibilities in the urban jurisdiction, which adds a layer of complexity.
Fiscal constraints: when public budgets are allocated, transport competes
with other public service needs. Transport budgets are usually insufficient to
keep the infrastructure up to pre-defined service levels. When budgets do
become available, they tend to be of short/medium tenure, and fail to fulfil
the need for sustainable financing to enable the continuous investments
required to keep urban road infrastructure up to standard.
Capacity constraints: authorities need capacity and competence in
several disciplines in order to be able to deal with technically and
organisationally complex projects. These capabilities are not always present
in local administrations.
The "right" reasons for using PPPs
The benefits associated with the transfer of risks to the private sector,
including cost overruns (which would otherwise be based on the public
sector) and those of construction (which pushes the private sector to
increase innovation and performance to meet deadlines);
those associated with a global approach to service expected;
those related to the partnership approach;
and those related to competition.
9 IRF Urban Mobility, 2010
How to make electric vehicles affordable
38%
20%
13%
11%
9%
4%
3%
2%
0% 5% 10% 15% 20% 25% 30% 35% 40%
Government subsides
Automakers partnering with energy providers to
generate after-sales revenues on e-component
Consolidation among e-car technology partners
Greater competition between e-car makers
Consolidation among e-car makers
Others
Automakers shifting R&D costs to suppliers
Greater competition between e-car technology
partners
25
Urban PPPs cover a wide diversity of possible schemes
Urban congestion charging: schemes which impose a fee on vehicles
entering a certain cordoned area within an urban zone, implemented
through partnership contracts pursuant to which both the public authority
and private contractor concerned bear financial risks.
Urban toll roads: toll motorways in urban areas that are the object of
concessions granted to private operators. The private operator generally
designs, constructs, maintains and operates the road in exchange for the
right to levy tolls from the users. High Occupancy Toll (HOT) lanes would
also come under this working definition.
Combined road and real estate development: PPP schemes in which
functions/aspects like road development, housing development and/or
business accommodation are combined to attain optimum quality and
enable cross-subsidising of project-elements so as to promote a viable
business case.
Urban road operation partnerships: schemes under PPP that aim to
make better use of existing urban road infrastructure capacity by using
Intelligent Transport Systems (ITS). Projects concerning parking
partnerships and interfacing with other modalities, like mass transit systems
and rail, could also be included in this category.
Long-term maintenance contracts for urban road networks: schemes
under PPP addressing long-term maintenance (sometimes including
upgrading) of the urban network, in which revenues are performance-
based.
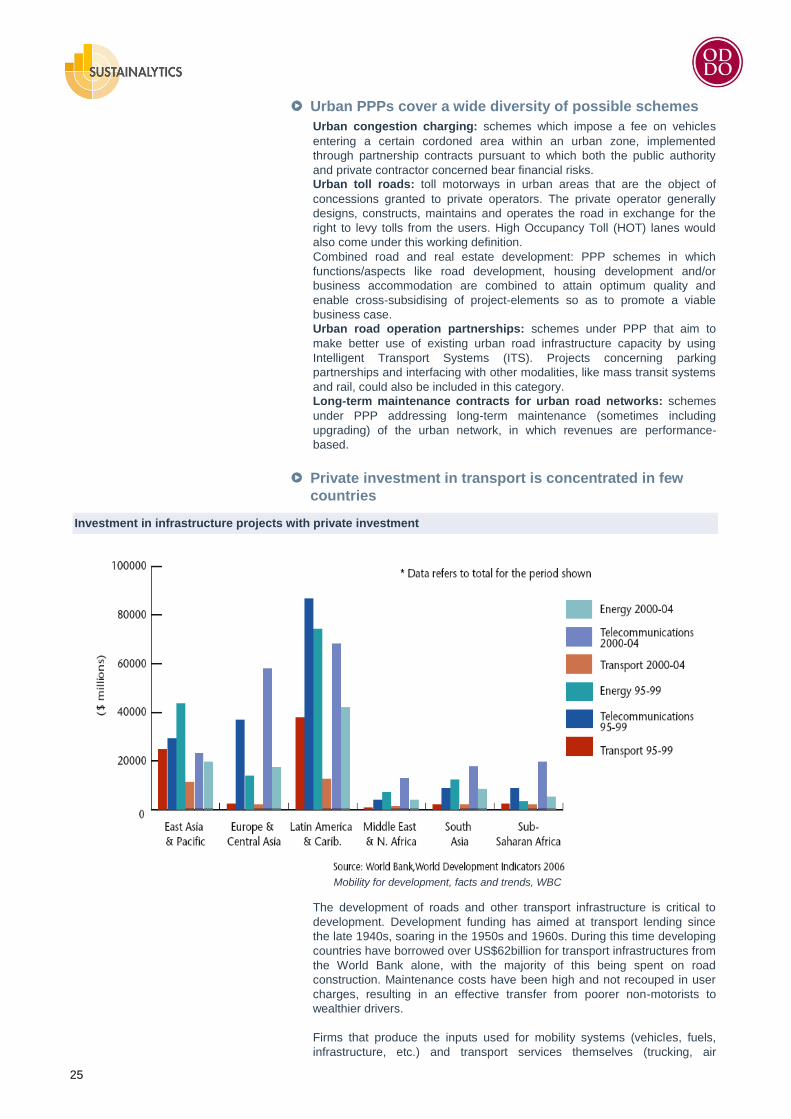
Private investment in transport is concentrated in few
countries
Investment in infrastructure projects with private investment
Mobility for development, facts and trends, WBC
The development of roads and other transport infrastructure is critical to
development. Development funding has aimed at transport lending since
the late 1940s, soaring in the 1950s and 1960s. During this time developing
countries have borrowed over US$62billion for transport infrastructures from
the World Bank alone, with the majority of this being spent on road
construction. Maintenance costs have been high and not recouped in user
charges, resulting in an effective transfer from poorer non-motorists to
wealthier drivers.
Firms that produce the inputs used for mobility systems (vehicles, fuels,
infrastructure, etc.) and transport services themselves (trucking, air
26
transport, shipping, rail transport and ICT) have an essential stake in the
financial sustainability of mobility. For the mobility opportunity divide, these
companies need to be attracted to invest and provide services to the
poorest countries and communities currently underserved by transportation.
The World Bank‘s Private Participation in Infrastructure (PPI) Project
database tracks infrastructure projects in developing countries that involve
private participation in funding and risk-taking. During the fifteen-year period
spanning 1990 to 2004, it showed early growth but a subsequent decline of
private investments in transport. This investment is highly concentrated in a
few countries, with only six accounting for nearly 80% percent of the total
investment shown: China (18%), Brazil (16%), Malaysia (11%), Mexico
(11%), Argentina (11%) and Chile (10%). In most of the other one hundred-
fifty or so developing and transition countries, new private finance for
transport infrastructure has varied from little to none. In all cases both
energy and telecommunications attract higher levels of private investment
than transport infrastructure, but the disparities are greater in those
developing regions such as sub-Saharan Africa and South Asia which are
attracting the least investment overall.
Towards a mutation of uses
For a long time, travelling was considered a tiring activity. People used to take a
means of transport at a scheduled time, from a defined point, to reach a place.
The journey was either long or not; travellers were quite passive (almost like
goods!). Nowadays, even given that the modernisation of transport allows faster
and more comfortable journeys, we are in a new age of mobility. Indeed, we are
witnessing a shift in use whereby the traveller has become more active. The
use of internet, applications on smartphones, more environmentally-friendly
innovations and the constant growth of motorisation in emerging countries have
led the way to the end of the ―ever faster, ever further‖ era. Along with
technology improvement, sustainable mobility implies a change in the behaviour
of travellers.
The empowerment of the traveller: the digital revolution 10
What if mobility did not concern vehicles but smartphones? The new
information technologies and communications that have invaded our daily
lives illustrate how we can integrate and simplify mobility. New phones that
have the ability to interact with their immediate environment provide
travellers with a continuity of information in time and space. Through their
flexibility, they improve the conditions for purchasing transport tickets,
service access and integration modes. By their values of modernity and
innovation, they improve the image of public transport and provide a unique
opportunity to attract new customers. So there is a close integration
between true mobility and digital mobility. The management of this new
intelligence involves partnerships and collaborations with unprecedented
telecom operators, software publishers, manufacturers, packagers, and
requires the commitment of all to the benefit of greater interaction of supply
and demand.
Some players already hold a key role for interactive sustainable mobility.
From an environmental point of view, companies such as Google and Tom-
Tom indicate to car drivers the shortest route from one point to another. As
a result they generate less greenhouse gas emissions.
From a social point of view, these companies are able to provide car drivers
with useful information such as alternative ways to avoid traffic congestions,
the quickest way (not always the shortest) to reach their final destination.
From a governance point of view, some public companies such as RATP,
SNCF (France) intend to provide pedestrians with a live update on
connections, or the forthcoming departures of trains/buses. While
Switzerland has a national coordinator for all means of transport and all
companies, this is not the case in France, where separate coordinators
provide updated information for their own traffic.
10
(European interviews newsletter, n°10 – 2nd semester)
Transport has not
benefited from private
investments over the
last decade
Smartphones represent a
revolutionary tool for 21st
century mobility
27
This new management of mobility makes the traveller more responsible and
active. In the near future, smartphone applications will give carbon
footprints to travellers from a point to another according to the means of
transport they use. In contrast, like raising awareness with shocking images
on cigarette packs, the carbon footprint aims to give a sense of
responsibility to travellers.
To adapt the “mobile life”: new services for people on the
move
With the modernisation of the mobile life, a number of services have been
created to fit with this new lifestyle
11
There are extensive opportunities for innovation in mobility services
Innovation in mobility stem from four sources which can be combined.
Innovative projects for vehicles and mobility services occupy media space,
advertising for car shows, video games. They shape the collective
imagination of developed countries: hybrid vehicles, small city cars, folding
electric bicycles, etc. However, these innovations remain largely at the
prototype stage, or even virtual, but the most advanced occupy only a few
niches which are not yet visible in statistics. They are derived mainly from
four sectors.
The massive use of bicycles. This is a trend observed not only in China
(where a large number of bikes are electrically assisted) or in other
countries in South-East Asia, but also in Europe. Despite urban
development organised around public transport, a number of European
cities have implemented systematic cycling policies, including Denmark and
the Netherlands. Cycling in urban areas is still underdeveloped in France,
although innovative actions have been initiated, such as self service
bicycles (Velib‘ in Paris launched by JCDecaux).
Small motorised vehicles. Many of these models, apparently new,
reinvented mobility systems, which are already widespread in some
emerging countries such as China or India (bicycle taxi, rickshaw) that are
in advance in this domain. Moreover, Japan has developed new concepts of
individual vehicles adapted to the mobility of older adults in dense crowds.
Smartphones. In all large cities, the latest generations of mobile phones,
with their localisation functions, have become a sign of modernity and the
main instrument for urban mobility: the "multi-purpose cell phone‖, a new
way of localisation and thinking within the city.
The development of a service economy. Whether for cycling or automotive
transport, users are increasingly seeking a reliable service, rather than
ownership of their means of transport. This now makes the development of
more elaborate forms of sales possible: from renting an article to supplying
a number of services, involving different transport (train + car, mobility cards
for public transports and car rentals, etc.)
Transport innovation: the heralded end of “ever further,
ever faster”?
Over the last century, mobility of both people and goods has always been
set to improve in terms of speed and making destinations ―closer‖.
However, have we reached a peak? Is our thinking still devoted to ―ever
further, ever faster‖, or are we moving towards more responsible mobility
(uptrend in the oil price, global warming, noise, multimodality issues, etc.)
It is obvious in everyday life: nowadays, advertisements on cars for
example do not highlight the speed characteristics as in the 1980s and
1990s but instead focus on CO2 emission/km, security characteristics, the
stop and go function, etc. It seems that we have entered into a new era
11
New types of mobility: match the car with tomorrow‘s ways of life, CAS, 2010
Development of a service
economy: towards the
purchase of services rather
than goods
28
which is no longer ―ever faster, ever further‖ mobility but ―more responsible‖
mobility.
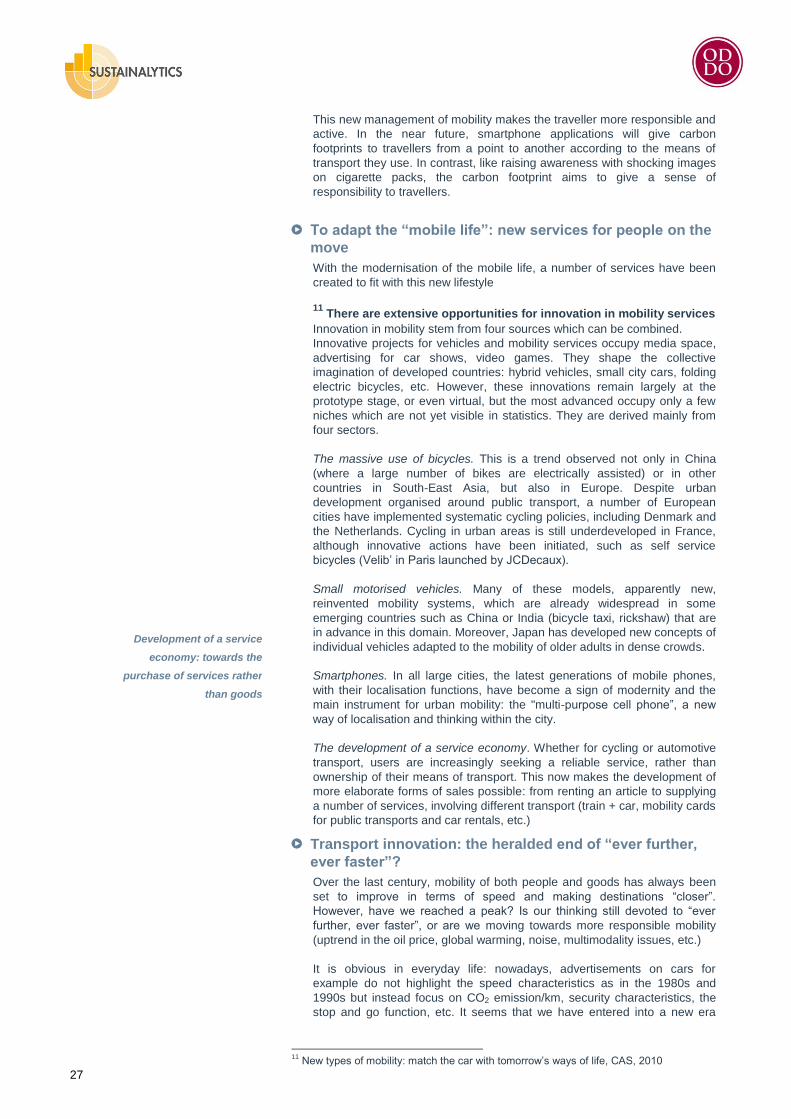
What useful purpose may this innovation serve and how to evaluate it? New
models of vehicles and new mobility services envisaged are analysed
according to two criteria: i) supplements the mobility or accessibility offered
to users (cost, congestion, and parking) and ii) improvements they make to
the environmental community (noise, pollution, energy savings, CO2
emissions).
12
A large number of innovative vehicles exist from the bike to the car.
The conventional thermal electric bike is a bicycle equipped with an
auxiliary electric motor and a rechargeable battery. It allows, compared to a
conventional bike, longer trips (up to 8 km) and easy operation. It is a
credible alternative to most two wheelers for short urban trips, with greater
freedom and speed door-to-door vs public transport. It is also very
economical, at less than EUR 0.10 per 100 km and emits no pollutants.
However, it requires the production and storage of electricity in small
portable batteries. Combining cycling and public transport, including
bicycles availing of dedicated carriages with free bike spaces in (TER)
French regional trains, providing net additional appeal for medium-distance
trips.
The electric scooter is a scooter equipped with an electric motor powered
by rechargeable batteries. Its performance is now comparable to those of a
petrol scooter, but without pollutants and with much lower noise. It is useful
for urban journeys or close to medium distance of about 10 km to 20 km,
and easily fits into urban traffic, particularly for people who travel frequently
and rapidly in urban areas. Its speed allows significantly faster door-to-door
time than travel by car in congested areas.
The "all-electric" car is powered by one or several electric motors with
batteries to be recharged regularly at home, at specific terminals, or
exchanged at coal gas stations for this purpose. Compared to conventional
12 New types of mobility: match the car with tomorrow‘s ways of life, CAS, 2010
29
combustion vehicles, "all-electric" vehicles designed by car manufacturers
have a number of common characteristics:
Cost of manufacturing and use is currently higher than the equivalent
internal combustion vehicle, especially because of the price of batteries,
and requires public intervention to ensure their large-scale marketing
(less tax on the purchase or environmental bonus);
Their use implies the establishment of new rental infrastructure and
recharging batteries in the areas concerned, requiring the intervention of
new energy-supply operators, and the public authorities to adapt to the
road infrastructure;
Their energy efficiency is higher than equivalent internal combustion
vehicles, and CO2 emissions are totally dependent on the production of
electric power: very low in France (nuclear and recharge in off-peak
hours) and significantly higher in Europe on average (gas stations),
though declining because of European commitments from 2008 on
reducing greenhouse gas emissions by 2020. This performance also
depends on charging hours. Batteries offer an effective autonomy of
about 100 km to 150 km, which is adequate for daily mobility in urban
and suburban areas. However, these vehicles are still not suitable for
long-distance regarding the necessity of recharging.
Hybrid cars and plug-in hybrids use several different energy sources: a
gasoline engine and an electric motor powered by a battery (rechargeable),
with different techniques. Despite higher complexity and costs than the "all-
electric" car, this vehicle can both reduce energy consumption and urban
pollution, saving the liquid fuel (for miles driven with electric power) without
the drawback of limited autonomy (due to fossil fuel).
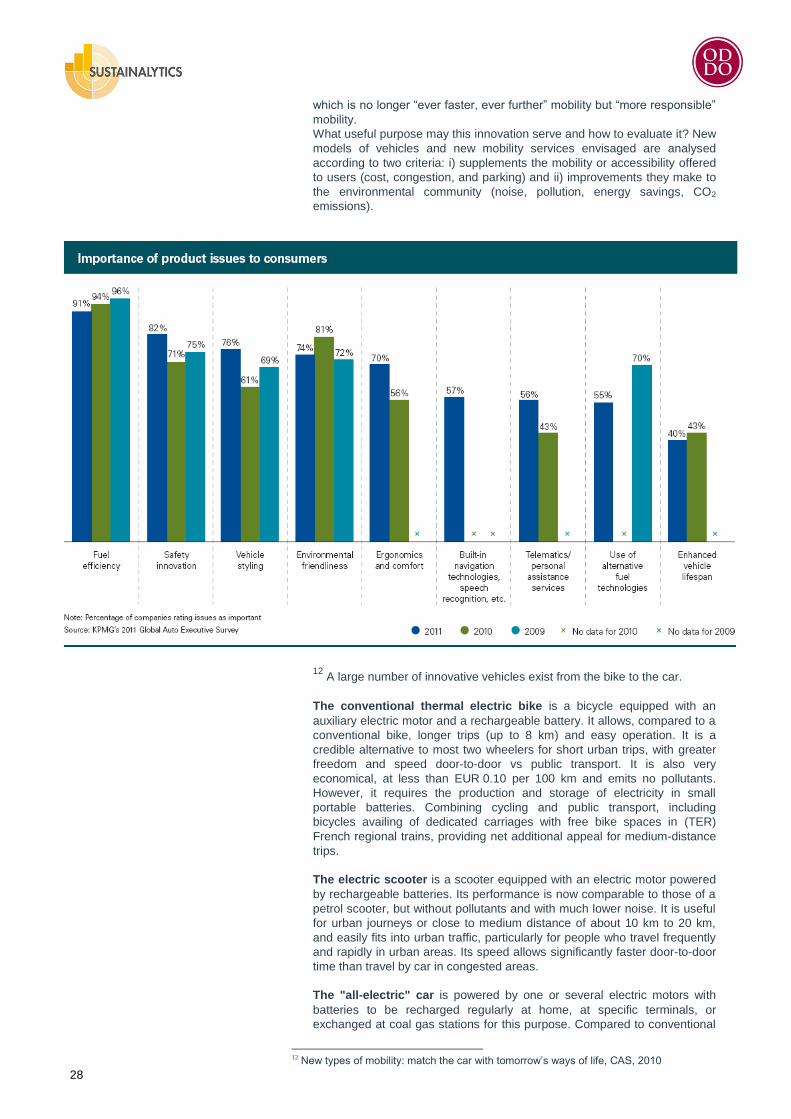
Use of renewable energies in vehicles is expected to increase. The EU
has planned a mandatory blending target of 10% for renewable energies by
2020. As shown in the graph below, the volume of renewable energy used
in the EU27 transport sector is expected to double by 2020.
The "low cost" vehicle is an economic model to minimise its cost, offer
attractive prices and the most competitive rates to drivers. These vehicles
meet a strong demand from users with average salaries: small size, limited
power, without unnecessary equipment, they can be energy efficient and
emit less GHGs in the environment. It depends on the motorisation: Here,
the "low cost" is not necessarily synonymous with lower emissions of
pollutants such as nitrogen oxides (NOx) and particulates.
Rethink Mobility through e-substitution
Several players such as cities, local authorities, companies, researchers or
even citizens intend to rethink their mobility habits. Many suggestions have
been made by Daniel Kaplan and Bruno Marzloff in their reference book
For a freer and more sustainable mobility (2009). The following table shows
the different solutions proposed to players in terms of new approaches to
mobility.
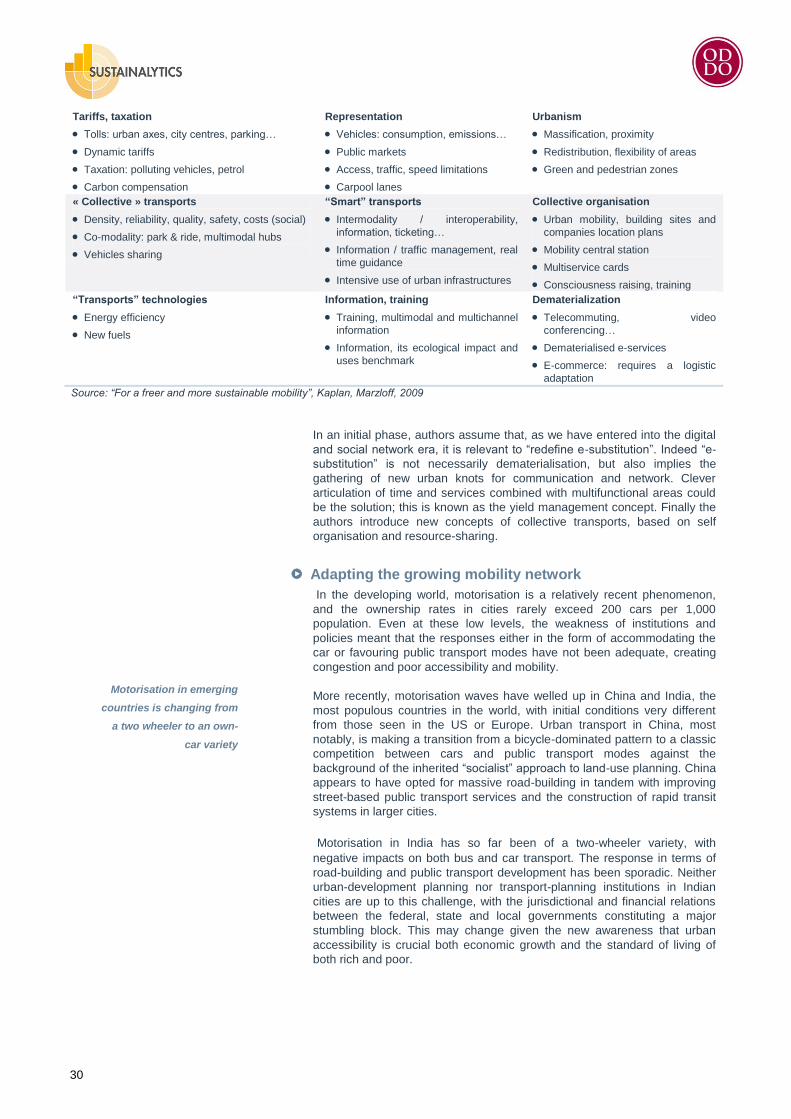
30
Source: “For a freer and more sustainable mobility”, Kaplan, Marzloff, 2009
In an initial phase, authors assume that, as we have entered into the digital
and social network era, it is relevant to ―redefine e-substitution‖. Indeed ―e-
substitution‖ is not necessarily dematerialisation, but also implies the
gathering of new urban knots for communication and network. Clever
articulation of time and services combined with multifunctional areas could
be the solution; this is known as the yield management concept. Finally the
authors introduce new concepts of collective transports, based on self
organisation and resource-sharing.
Adapting the growing mobility network
In the developing world, motorisation is a relatively recent phenomenon,
and the ownership rates in cities rarely exceed 200 cars per 1,000
population. Even at these low levels, the weakness of institutions and
policies meant that the responses either in the form of accommodating the
car or favouring public transport modes have not been adequate, creating
congestion and poor accessibility and mobility.
More recently, motorisation waves have welled up in China and India, the
most populous countries in the world, with initial conditions very different
from those seen in the US or Europe. Urban transport in China, most
notably, is making a transition from a bicycle-dominated pattern to a classic
competition between cars and public transport modes against the
background of the inherited ―socialist‖ approach to land-use planning. China
appears to have opted for massive road-building in tandem with improving
street-based public transport services and the construction of rapid transit
systems in larger cities.
Motorisation in India has so far been of a two-wheeler variety, with
negative impacts on both bus and car transport. The response in terms of
road-building and public transport development has been sporadic. Neither
urban-development planning nor transport-planning institutions in Indian
cities are up to this challenge, with the jurisdictional and financial relations
between the federal, state and local governments constituting a major
stumbling block. This may change given the new awareness that urban
accessibility is crucial both economic growth and the standard of living of
both rich and poor.
Tariffs, taxation
Tolls: urban axes, city centres, parking…
Dynamic tariffs
Taxation: polluting vehicles, petrol
Carbon compensation
Representation
Vehicles: consumption, emissions…
Public markets
Access, traffic, speed limitations
Carpool lanes
Urbanism
Massification, proximity
Redistribution, flexibility of areas
Green and pedestrian zones
« Collective » transports
Density, reliability, quality, safety, costs (social)
Co-modality: park & ride, multimodal hubs
Vehicles sharing
“Smart” transports
Intermodality / interoperability,
information, ticketing…
Information / traffic management, real
time guidance
Intensive use of urban infrastructures
Collective organisation
Urban mobility, building sites and
companies location plans
Mobility central station
Multiservice cards
Consciousness raising, training
“Transports” technologies
Energy efficiency
New fuels
Information, training
Training, multimodal and multichannel
information
Information, its ecological impact and
uses benchmark
Dematerialization
Telecommuting, video
conferencing…
Dematerialised e-services
E-commerce: requires a logistic
adaptation
Motorisation in emerging
countries is changing from
a two wheeler to an own-
car variety
31
ISSUES OF MOBILITY - THE UNBEARABLE LIGHTNESS OF
MOBILITY TODAY?
Humans are the only living beings who can a have warm meal in the air.
Loriot (German humorist), 1978
In light of the technological, economic or social developments in the past
decades, being mobile in modern times has become relatively convenient and
affordable for a large group of people. However, there is often a lack of
awareness that all modes of transportation have negative impacts on the
environment and society in general, which could be direct or indirect with short-
term or long-term implications. The present chapter shows the most material
environmental and social impacts of modern mobility.
Environmental issues
Environmental impacts of mobility become obvious in terms of land take, noise
disturbance or aesthetic issues whereas atmospheric pollution (incl. climate
change), water/soil contamination or threats to biodiversity are issues which are
rather visible only indirectly or in the long run. This chapter highlights the most
significant environmental impacts of mobility.
Climate change
Transportation is the second-largest producer of CO2, after energy and heat
generation. It represented 22% of global CO2 emissions in 2008 and its share is
increasing. Thereafter, global demand for transport appears unlikely to
decrease; the WEO 2009 predicts that transport traffic will increase by 45% by
2030.
The European Union‘s emissions trading scheme, originally enacted in 2005,
will be extended to cover airlines in 2012 and is expected to cost the industry
USD 4.4 billion in annual compliance. All flights to and from the EU, including
those of North American carriers, will have to purchase emissions permits.
Besides market trends, policies could encourage a switch to new, preferably
low-carbon fuels. These include electricity, hydrogen, and a greater use of
biofuels. To avoid a rebound in transport fuel demand, these moves must also
be backed-up by emissions pricing or fuel excise policies. These policies would
both reduce the environmental impact of transport and help to secure domestic
fuel supplies, which are sometimes unsettled by the threat of supply disruptions,
whether due to natural disasters, accidents or the geopolitics of oil trade.
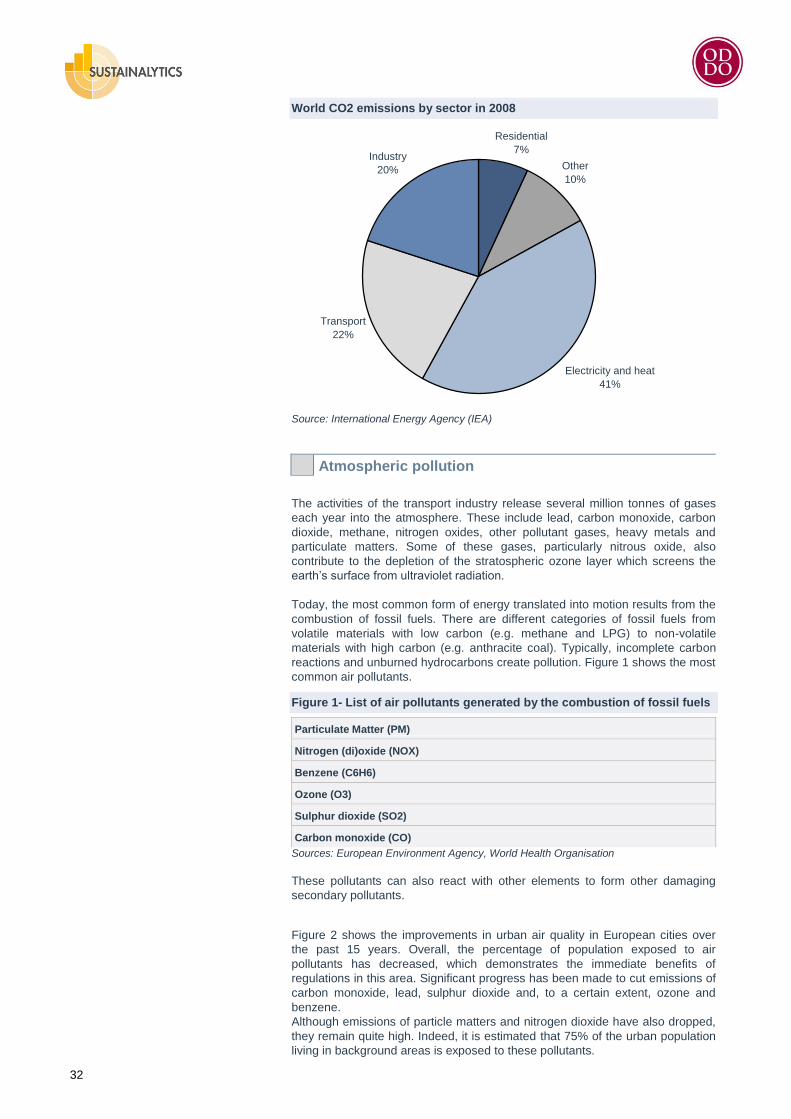
32
World CO2 emissions by sector in 2008
Source: International Energy Agency (IEA)
Atmospheric pollution
The activities of the transport industry release several million tonnes of gases
each year into the atmosphere. These include lead, carbon monoxide, carbon
dioxide, methane, nitrogen oxides, other pollutant gases, heavy metals and
particulate matters. Some of these gases, particularly nitrous oxide, also
contribute to the depletion of the stratospheric ozone layer which screens the
earth‘s surface from ultraviolet radiation.
Today, the most common form of energy translated into motion results from the
combustion of fossil fuels. There are different categories of fossil fuels from
volatile materials with low carbon (e.g. methane and LPG) to non-volatile
materials with high carbon (e.g. anthracite coal). Typically, incomplete carbon
reactions and unburned hydrocarbons create pollution. Figure 1 shows the most
common air pollutants.
Figure 1- List of air pollutants generated by the combustion of fossil fuels
Particulate Matter (PM)
Nitrogen (di)oxide (NOX)
Benzene (C6H6)
Ozone (O3)
Sulphur dioxide (SO2)
Carbon monoxide (CO)
Sources: European Environment Agency, World Health Organisation
These pollutants can also react with other elements to form other damaging
secondary pollutants.
Figure 2 shows the improvements in urban air quality in European cities over
the past 15 years. Overall, the percentage of population exposed to air
pollutants has decreased, which demonstrates the immediate benefits of
regulations in this area. Significant progress has been made to cut emissions of
carbon monoxide, lead, sulphur dioxide and, to a certain extent, ozone and
benzene.
Although emissions of particle matters and nitrogen dioxide have also dropped,
they remain quite high. Indeed, it is estimated that 75% of the urban population
living in background areas is exposed to these pollutants.
World CO2 emissions by sector in 2008
Residential
7%
Other
10%
Electricity and heat
41%
Transport
22%
Industry
20%
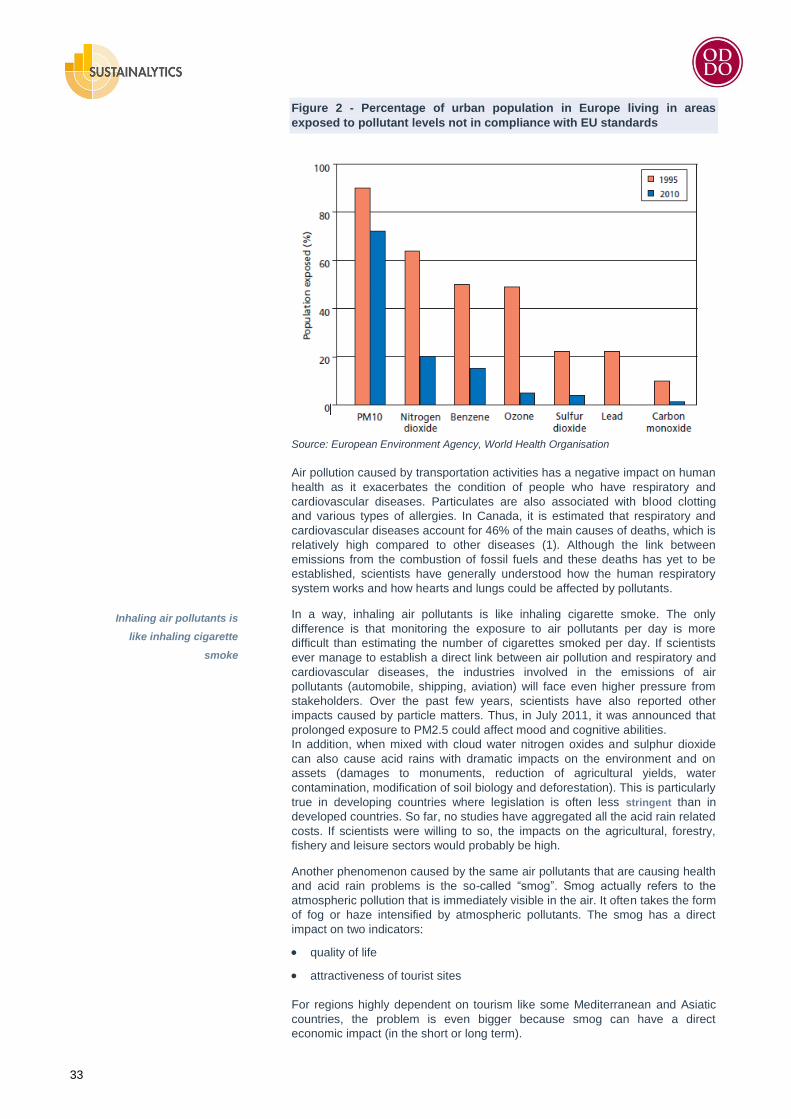
33
Figure 2 - Percentage of urban population in Europe living in areas
exposed to pollutant levels not in compliance with EU standards
Source: European Environment Agency, World Health Organisation
Air pollution caused by transportation activities has a negative impact on human
health as it exacerbates the condition of people who have respiratory and
cardiovascular diseases. Particulates are also associated with blood clotting
and various types of allergies. In Canada, it is estimated that respiratory and
cardiovascular diseases account for 46% of the main causes of deaths, which is
relatively high compared to other diseases (1). Although the link between
emissions from the combustion of fossil fuels and these deaths has yet to be
established, scientists have generally understood how the human respiratory
system works and how hearts and lungs could be affected by pollutants.
In a way, inhaling air pollutants is like inhaling cigarette smoke. The only
difference is that monitoring the exposure to air pollutants per day is more
difficult than estimating the number of cigarettes smoked per day. If scientists
ever manage to establish a direct link between air pollution and respiratory and
cardiovascular diseases, the industries involved in the emissions of air
pollutants (automobile, shipping, aviation) will face even higher pressure from
stakeholders. Over the past few years, scientists have also reported other
impacts caused by particle matters. Thus, in July 2011, it was announced that
prolonged exposure to PM2.5 could affect mood and cognitive abilities.
In addition, when mixed with cloud water nitrogen oxides and sulphur dioxide
can also cause acid rains with dramatic impacts on the environment and on
assets (damages to monuments, reduction of agricultural yields, water
contamination, modification of soil biology and deforestation). This is particularly
true in developing countries where legislation is often less stringent than in
developed countries. So far, no studies have aggregated all the acid rain related
costs. If scientists were willing to so, the impacts on the agricultural, forestry,
fishery and leisure sectors would probably be high.
Another phenomenon caused by the same air pollutants that are causing health
and acid rain problems is the so-called ―smog‖. Smog actually refers to the
atmospheric pollution that is immediately visible in the air. It often takes the form
of fog or haze intensified by atmospheric pollutants. The smog has a direct
impact on two indicators:
quality of life
attractiveness of tourist sites
For regions highly dependent on tourism like some Mediterranean and Asiatic
countries, the problem is even bigger because smog can have a direct
economic impact (in the short or long term).
Inhaling air pollutants is
like inhaling cigarette
smoke
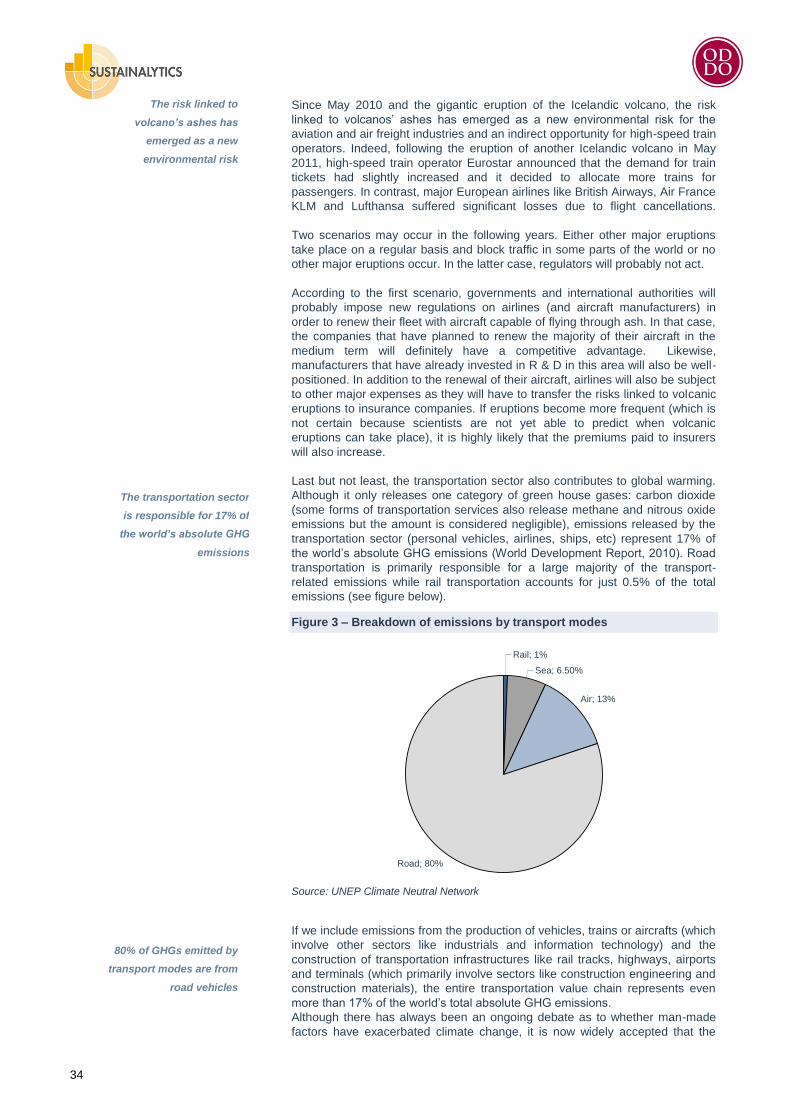
34
Since May 2010 and the gigantic eruption of the Icelandic volcano, the risk
linked to volcanos‘ ashes has emerged as a new environmental risk for the
aviation and air freight industries and an indirect opportunity for high-speed train
operators. Indeed, following the eruption of another Icelandic volcano in May
2011, high-speed train operator Eurostar announced that the demand for train
tickets had slightly increased and it decided to allocate more trains for
passengers. In contrast, major European airlines like British Airways, Air France
KLM and Lufthansa suffered significant losses due to flight cancellations.
Two scenarios may occur in the following years. Either other major eruptions
take place on a regular basis and block traffic in some parts of the world or no
other major eruptions occur. In the latter case, regulators will probably not act.
According to the first scenario, governments and international authorities will
probably impose new regulations on airlines (and aircraft manufacturers) in
order to renew their fleet with aircraft capable of flying through ash. In that case,
the companies that have planned to renew the majority of their aircraft in the
medium term will definitely have a competitive advantage. Likewise,
manufacturers that have already invested in R & D in this area will also be well-
positioned. In addition to the renewal of their aircraft, airlines will also be subject
to other major expenses as they will have to transfer the risks linked to volcanic
eruptions to insurance companies. If eruptions become more frequent (which is
not certain because scientists are not yet able to predict when volcanic
eruptions can take place), it is highly likely that the premiums paid to insurers
will also increase.
Last but not least, the transportation sector also contributes to global warming.
Although it only releases one category of green house gases: carbon dioxide
(some forms of transportation services also release methane and nitrous oxide
emissions but the amount is considered negligible), emissions released by the
transportation sector (personal vehicles, airlines, ships, etc) represent 17% of
the world‘s absolute GHG emissions (World Development Report, 2010). Road
transportation is primarily responsible for a large majority of the transport-
related emissions while rail transportation accounts for just 0.5% of the total
emissions (see figure below).
Figure 3 – Breakdown of emissions by transport modes
Source: UNEP Climate Neutral Network
If we include emissions from the production of vehicles, trains or aircrafts (which
involve other sectors like industrials and information technology) and the
construction of transportation infrastructures like rail tracks, highways, airports
and terminals (which primarily involve sectors like construction engineering and
construction materials), the entire transportation value chain represents even
more than 17% of the world‘s total absolute GHG emissions.
Although there has always been an ongoing debate as to whether man-made
factors have exacerbated climate change, it is now widely accepted that the
Rail; 1%
Sea; 6.50%
Air; 13%
Road; 80%
The risk linked to
volcano’s ashes has
emerged as a new
environmental risk
The transportation sector
is responsible for 17% of
the world’s absolute GHG
emissions
80% of GHGs emitted by
transport modes are from
road vehicles
35
recent increase in green house emissions has an effect on the current global
warming. The table below reflects this trend.
Figure 4 – Possible correlation between the increase in GHG emissions
and other climate-related indicators
Greenhouse gases Other indicators
26% increase in global GHG emissions since 1990 38% increase in CO2 emissions since 1780
Precipitation: 1.9% increase since 1901
Temperature: 1.3°F increase since 1901
Source: US Environmental Protection Agency
Climate change implies two main categories of risks and opportunities for the
transportation sector:
physical risks and opportunities
regulatory & litigation risks and opportunities
competitive risks and opportunities
Peak oil
The transportation sector is the sector that is the most dependent (in terms of
volume) on the production of oil. Indeed, the OECD recently stated that the
transportation sector represents 60% of oil consumption in OECD countries.
The main threat facing the oil sector is peak oil.
Peak oil is a global phenomenon that could have a dramatic impact on the
world‘s economies. If not sufficiently anticipated, peak oil could result in an far
worse economic downturn than that experienced in the 1930s, the 1970s and
more recently during the 2008-2009 financial crisis. Before analysing the
principal negative and positive implications of peak oil on the broad
transportation sector, we will first give a definition and see when peak oil is
likely to happen.
Peak oil relates to the date when the maximum rate of global petroleum
extraction is reached. After this date, the rate of production will decline to
eventually reach a point when there will be no more petroleum on earth. Like for
climate change, no consensus has been reached on whether peak oil will
actually materialise. There are believers and sceptics.
Many scientists and experts believe that oil production will peak before 2040,
but some others think it will happen after that date. In fact, determining the
exact date is extremely complex as it depends on several factors (use of new
technology, new discovery of non pure oil like oil sands, geopolitical events in
unstable nations, currency fluctuations, more stringent policies to tackle climate
change, use of biofuels, etc).
What matters is not when oil production will actually peak, but rather if society is
taking the necessary actions to cope with a future decline of oil. In a way, the
fight to address peak oil is similar to the current combat waged against global
warming and greenhouse gas emissions. Both require adaptation and mitigation
plans implemented by all the stakeholders. If no actions are being taken in the
short term, the likelihood of an emergency situation in the future will surely
increase.
If not sufficiently anticipated, peak oil could have very negative implications on
the economy and on the transport sector in particular.
Due to peak oil, people will:
look for alternatives to fuel-based vehicles
More and more people will opt for electric, hybrid, biofuels or hydrogen-
powered vehicles or non-motorised means such as bicycles (see table
below).
What matters is not when
oil production will peak
but rather whether people
are taking the necessary
preventive actions
36
relocate to be closer to each other
People will need to shorten the distance between their workplace and their
home. Consequently, in several countries, they will relocate within city
centres where public transportation is more accessible.
have more limited recourse to highly expensive forms of transport like
aircraft
Airlines will surely be the transportation services providers that will be the
most affected by peak oil. The majority of customers will not be able to
afford increasingly expensive fares for medium or long distance flights. Yet,
the rich will keep commuting by plane as the latter to some extent remains
the fastest mode of transport.
Although negatively affecting the performance of companies manufacturing or
using conventional vehicles, the future increase in oil prices might also
represent a great opportunity for businesses involved in the production or use
of vehicles powered by alternative energy supplies.
The table below lists some of the different alternatives to fossil fuel-based
vehicles and their associated weaknesses and strengths:
Alternative ESG Weaknesses ESG Strengths
Electric vehicles -Possible lack of availability of lithium or other minerals for batteries
-High energy consumption associated with the production of vehicles
-Dependence on the grid‘s non-renewable electricity in some countries
-Contribution to increasing the demand for electricity and lithium (possibly resulting in
conflicts between countries)
-Significant decrease in GHG emissions compared to fuel powered vehicles (if
electricity used for charging batteries is sourced from renewable electricity)
-Significant noise emission reduction -Significant decrease in the number of
diseases due to air emissions (e.g. PM and NOX)
-Contribution to improving a country‘s renewable electricity generation capacity
and reducing foreign oil dependency
Hybrid vehicles -High energy consumption associated with the production of vehicles
-Decrease in GHG emissions compared to fuel powered vehicles (if electricity used for
charging batteries is sourced from renewable electricity)
-Noise emission reduction -Decrease in the number of diseases due to
air emissions (e.g. PM and NOX) -Contribution to reducing foreign oil
dependency
Biofuel-powered vehicles -High energy consumption associated with the production of vehicles
-Release of air pollutants (e.g. aldehydes) -Impacts on soil and water resources linked to
the production of biofuel crops -Food versus fuel controversy (only for some
biofuel technologies)
-Increase in waste recycling (if biomass) -Contribution to poverty reduction (if biofuel
is produced in developing countries) -Contribution to reducing foreign oil
dependency
Hydrogen powered vehicles -High energy consumption associated with the production of vehicles
-Dependence on the grid‘s non-renewable electricity in some countries
-Release of air pollutants and noise emissions (for hydrogen internal combustion engine cars)
-Contribution to increasing the demand for electricity (possibly resulting in conflicts
between countries)
-Decrease in GHG emissions compared to fuel powered vehicles (if electricity is
sourced from renewable electricity) -Contribution to improving a country‘s
renewable electricity generation capacity and reducing national oil dependency
Non-motorised transport means (e.g. bicycles)
- Possible lack of availability of minerals -Significant decrease in GHG emissions -Significant decrease in air pollutants -Significant noise emission reduction
-Contribution to fighting congestion (if sustainable infrastructures are in place)
-Contribution to reducing foreign oil dependency
-Contribution to fighting conditions like obesity
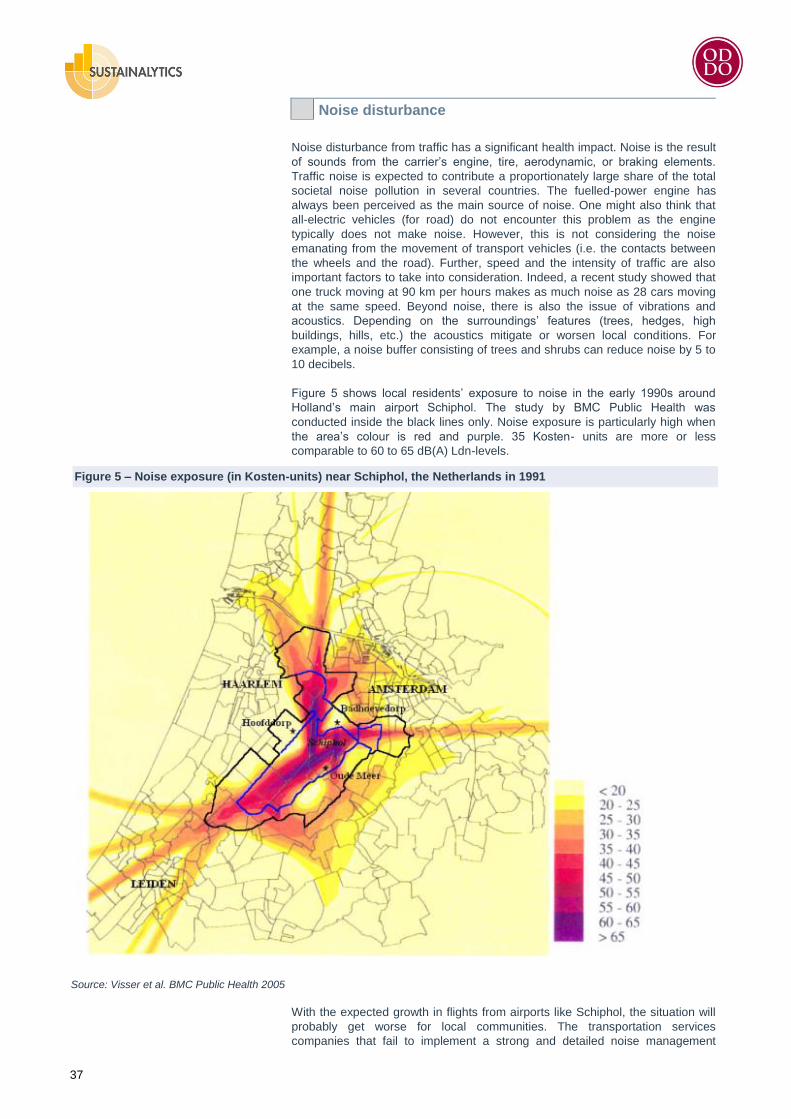
37
Noise disturbance
Noise disturbance from traffic has a significant health impact. Noise is the result
of sounds from the carrier‘s engine, tire, aerodynamic, or braking elements.
Traffic noise is expected to contribute a proportionately large share of the total
societal noise pollution in several countries. The fuelled-power engine has
always been perceived as the main source of noise. One might also think that
all-electric vehicles (for road) do not encounter this problem as the engine
typically does not make noise. However, this is not considering the noise
emanating from the movement of transport vehicles (i.e. the contacts between
the wheels and the road). Further, speed and the intensity of traffic are also
important factors to take into consideration. Indeed, a recent study showed that
one truck moving at 90 km per hours makes as much noise as 28 cars moving
at the same speed. Beyond noise, there is also the issue of vibrations and
acoustics. Depending on the surroundings‘ features (trees, hedges, high
buildings, hills, etc.) the acoustics mitigate or worsen local conditions. For
example, a noise buffer consisting of trees and shrubs can reduce noise by 5 to
10 decibels.
Figure 5 shows local residents‘ exposure to noise in the early 1990s around
Holland‘s main airport Schiphol. The study by BMC Public Health was
conducted inside the black lines only. Noise exposure is particularly high when
the area‘s colour is red and purple. 35 Kosten- units are more or less
comparable to 60 to 65 dB(A) Ldn-levels.
Figure 5 – Noise exposure (in Kosten-units) near Schiphol, the Netherlands in 1991
Source: Visser et al. BMC Public Health 2005
With the expected growth in flights from airports like Schiphol, the situation will
probably get worse for local communities. The transportation services
companies that fail to implement a strong and detailed noise management
38
programme (together with peers and infrastructure companies) will surely face
more complaints from local communities in the coming years.
The effects of noise are well-known. Noise can be traumatising for the hearing
organ when noise levels exceed a certain limit. Furthermore, it has an effect on
the quality of life and ecosystems. In some cases, its health impact can be
considered higher than the impact of air pollution caused by traffic. Several
studies show that it can cause, for instance, sleep disorder or cardiovascular
diseases. According to several studies, up to three per cent of deaths from
ischemic heart disease in Europe can be traced back to a long-term exposure to
traffic noise. Even while persons exposed to traffic noise are asleep, their ears,
brain and body continue to react to sounds by raising levels of stress hormones.
Thus, the reduction of traffic noise is absolutely necessary. However, a certain
level of street noise is unavoidable and to a certain extent, can even be crucial
as a warning function. There are some reported cases of traffic accidents in
Japan between pedestrians and electric or hybrid cars which have a very low
noise level. In this regard, Toyota has planned to install a sound producing
device in its electric cars in order to prevent such accidents. Finally, it should be
noted that noise also has a negative impact on property values.
Although the majority of the world‘s total transport-related emissions are due to
road transportation, all transportation modes are actually emitting noise
emissions because it is all about motion. For high speed trains, the main issue
is aeroacoustic noise. The faster the high-speed trains, greater the effect of
aeroacoustic noise. For airlines, noise comes from the engine, aerodynamics
and ground craft operations.
Transportation infrastructure companies are also accountable for the noise
generated by their operations because they own the infrastructure. Highway
operators might face regulatory constraints or protests from local residents if
they do not take necessary actions to prevent noise. New investments in traffic
noise reduction measures like the installation of sound-absorbing windows,
noise-reduction barriers, or the introduction of speed limits are needed.
Regarding their actual performance, highway operators have already started to
report on new Key Performance Indicators (KPIs). Example of KPIs include
Total Number of Noise-Related Complaints per Year and Number of Kilometers
of Roads/Tracks Equipped with Noise Protection Barriers. The issue of multiple
uses (e.g. the use of noise protection barriers to prevent noise and produce
electricity via photovoltaic cells) represents a real opportunity for highway
operator. Because they are often located in the heart of cities, train stations also
have a significant impact on local residents. This is less evident for harbours,
which are often situated far from city centres and oriented towards the coast.
However, tourism related activities near ports can be seriously impacted.
Water / Soil contamination
Water contamination is highly relevant for the shipping industry. For other
industries, the impacts are less important although fuel, chemical and
hazardous waste from aircraft, vehicles and trains or from port and airport
terminal operations can contaminate rivers, lakes, wetlands and oceans. Thus,
the Austrian highway operator Asfinag recently highlighted the necessity to
build more water pollution control systems and retention facilities along
highways because the ongoing rise in traffic volumes translates into increased
amounts of brake dust, rubber abrasion, traces of oil as well as a variety of
heavy metals.
The first issue to which the shipping industry is exposed is the spilling of oil in
the ocean. The Erika disaster in 2009 resulted in protests from various
stakeholders against oil company Total who last chartered the vessel. It has
had a major impact in France. The sinking of this 25 year old ship triggered the
release of thousands of tons of oil into the sea and killed marine life. If we take
the example of birds alone, contact with oil destroys the capacity of fur and
feathers to insulate and in some cases can make it impossible for the birds to
fly. Following this disaster, Total issued a policy statement for the selection of
vessels, stipulating that none of its vessels must exceed the age limit of 20
Noise has an effect on the
quality of life and
ecosystems
Spilling of oil and
dredging have significant
impact on the environment
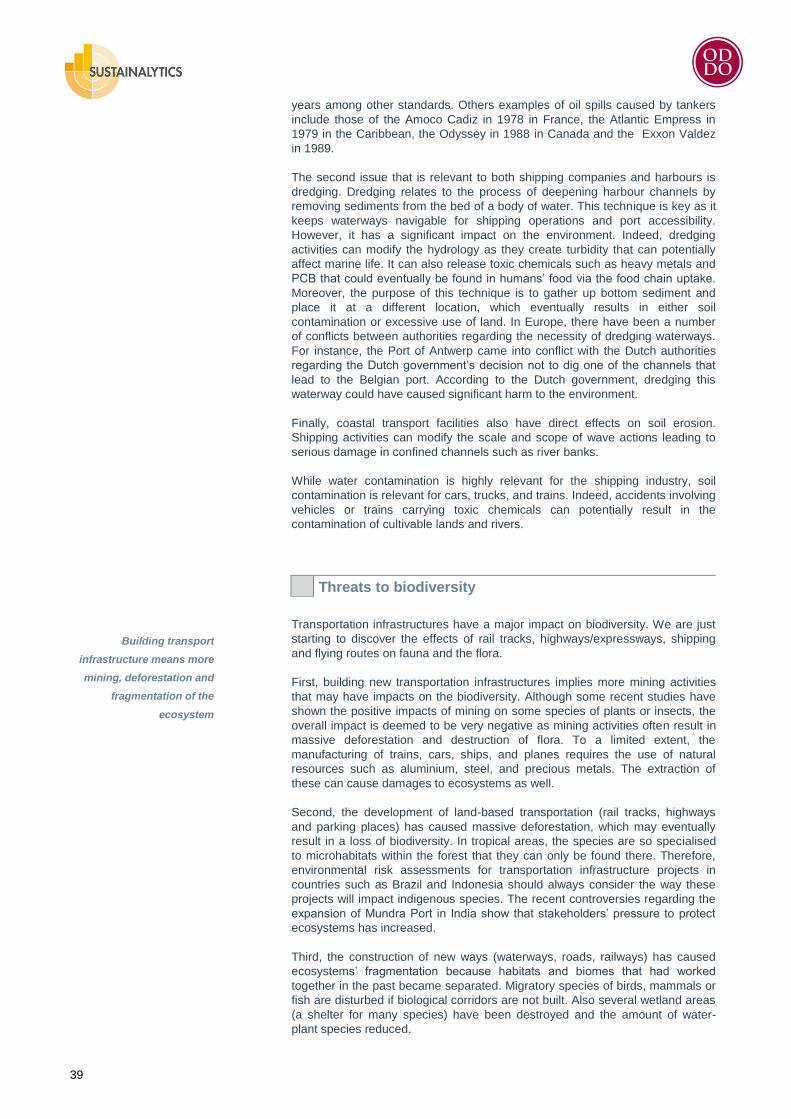
39
years among other standards. Others examples of oil spills caused by tankers
include those of the Amoco Cadiz in 1978 in France, the Atlantic Empress in
1979 in the Caribbean, the Odyssey in 1988 in Canada and the Exxon Valdez
in 1989.
The second issue that is relevant to both shipping companies and harbours is
dredging. Dredging relates to the process of deepening harbour channels by
removing sediments from the bed of a body of water. This technique is key as it
keeps waterways navigable for shipping operations and port accessibility.
However, it has a significant impact on the environment. Indeed, dredging
activities can modify the hydrology as they create turbidity that can potentially
affect marine life. It can also release toxic chemicals such as heavy metals and
PCB that could eventually be found in humans‘ food via the food chain uptake.
Moreover, the purpose of this technique is to gather up bottom sediment and
place it at a different location, which eventually results in either soil
contamination or excessive use of land. In Europe, there have been a number
of conflicts between authorities regarding the necessity of dredging waterways.
For instance, the Port of Antwerp came into conflict with the Dutch authorities
regarding the Dutch government‘s decision not to dig one of the channels that
lead to the Belgian port. According to the Dutch government, dredging this
waterway could have caused significant harm to the environment.
Finally, coastal transport facilities also have direct effects on soil erosion.
Shipping activities can modify the scale and scope of wave actions leading to
serious damage in confined channels such as river banks.
While water contamination is highly relevant for the shipping industry, soil
contamination is relevant for cars, trucks, and trains. Indeed, accidents involving
vehicles or trains carrying toxic chemicals can potentially result in the
contamination of cultivable lands and rivers.
Threats to biodiversity
Transportation infrastructures have a major impact on biodiversity. We are just
starting to discover the effects of rail tracks, highways/expressways, shipping
and flying routes on fauna and the flora.
First, building new transportation infrastructures implies more mining activities
that may have impacts on the biodiversity. Although some recent studies have
shown the positive impacts of mining on some species of plants or insects, the
overall impact is deemed to be very negative as mining activities often result in
massive deforestation and destruction of flora. To a limited extent, the
manufacturing of trains, cars, ships, and planes requires the use of natural
resources such as aluminium, steel, and precious metals. The extraction of
these can cause damages to ecosystems as well.
Second, the development of land-based transportation (rail tracks, highways
and parking places) has caused massive deforestation, which may eventually
result in a loss of biodiversity. In tropical areas, the species are so specialised
to microhabitats within the forest that they can only be found there. Therefore,
environmental risk assessments for transportation infrastructure projects in
countries such as Brazil and Indonesia should always consider the way these
projects will impact indigenous species. The recent controversies regarding the
expansion of Mundra Port in India show that stakeholders‘ pressure to protect
ecosystems has increased.
Third, the construction of new ways (waterways, roads, railways) has caused
ecosystems‘ fragmentation because habitats and biomes that had worked
together in the past became separated. Migratory species of birds, mammals or
fish are disturbed if biological corridors are not built. Also several wetland areas
(a shelter for many species) have been destroyed and the amount of water-
plant species reduced.
Building transport
infrastructure means more
mining, deforestation and
fragmentation of the
ecosystem
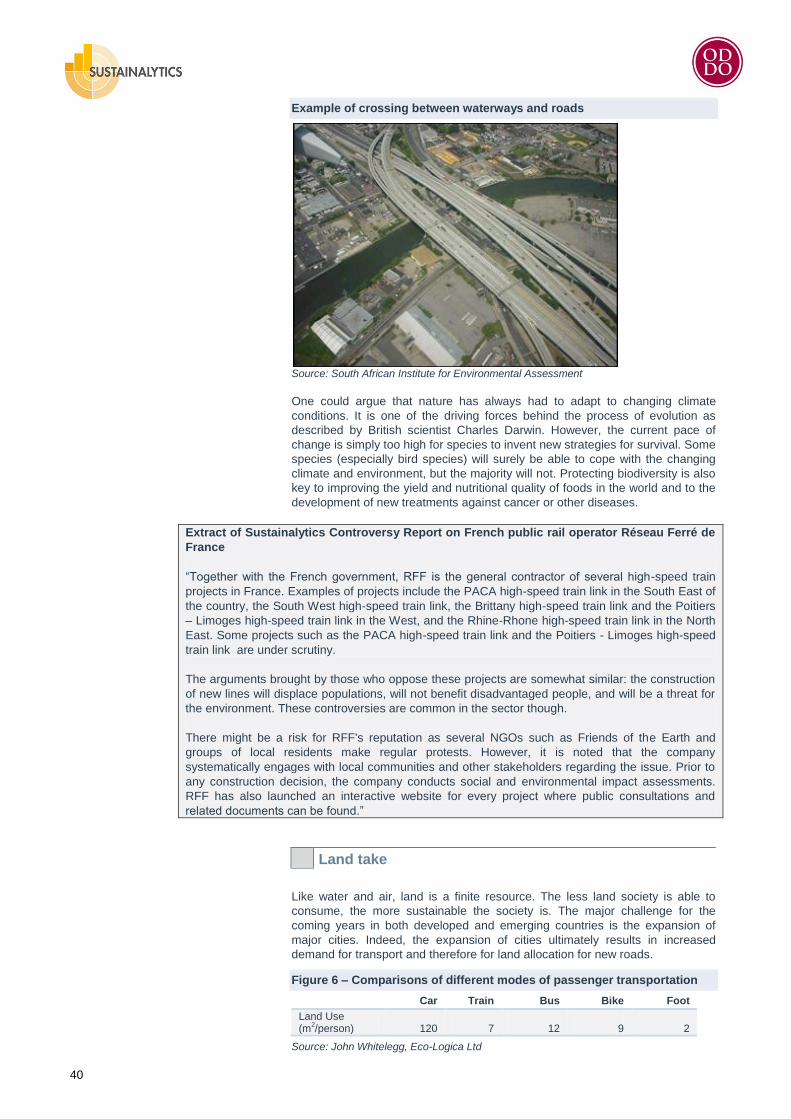
40
Example of crossing between waterways and roads
Source: South African Institute for Environmental Assessment
One could argue that nature has always had to adapt to changing climate
conditions. It is one of the driving forces behind the process of evolution as
described by British scientist Charles Darwin. However, the current pace of
change is simply too high for species to invent new strategies for survival. Some
species (especially bird species) will surely be able to cope with the changing
climate and environment, but the majority will not. Protecting biodiversity is also
key to improving the yield and nutritional quality of foods in the world and to the
development of new treatments against cancer or other diseases.
Extract of Sustainalytics Controversy Report on French public rail operator Réseau Ferré de
France
―Together with the French government, RFF is the general contractor of several high-speed train
projects in France. Examples of projects include the PACA high-speed train link in the South East of
the country, the South West high-speed train link, the Brittany high-speed train link and the Poitiers
– Limoges high-speed train link in the West, and the Rhine-Rhone high-speed train link in the North
East. Some projects such as the PACA high-speed train link and the Poitiers - Limoges high-speed
train link are under scrutiny.
The arguments brought by those who oppose these projects are somewhat similar: the construction
of new lines will displace populations, will not benefit disadvantaged people, and will be a threat for
the environment. These controversies are common in the sector though.
There might be a risk for RFF's reputation as several NGOs such as Friends of the Earth and
groups of local residents make regular protests. However, it is noted that the company
systematically engages with local communities and other stakeholders regarding the issue. Prior to
any construction decision, the company conducts social and environmental impact assessments.
RFF has also launched an interactive website for every project where public consultations and
related documents can be found.‖
Land take
Like water and air, land is a finite resource. The less land society is able to
consume, the more sustainable the society is. The major challenge for the
coming years in both developed and emerging countries is the expansion of
major cities. Indeed, the expansion of cities ultimately results in increased
demand for transport and therefore for land allocation for new roads.
Figure 6 – Comparisons of different modes of passenger transportation
Car Train Bus Bike Foot
Land Use (m
2/person)
120
7
12
9
2
Source: John Whitelegg, Eco-Logica Ltd
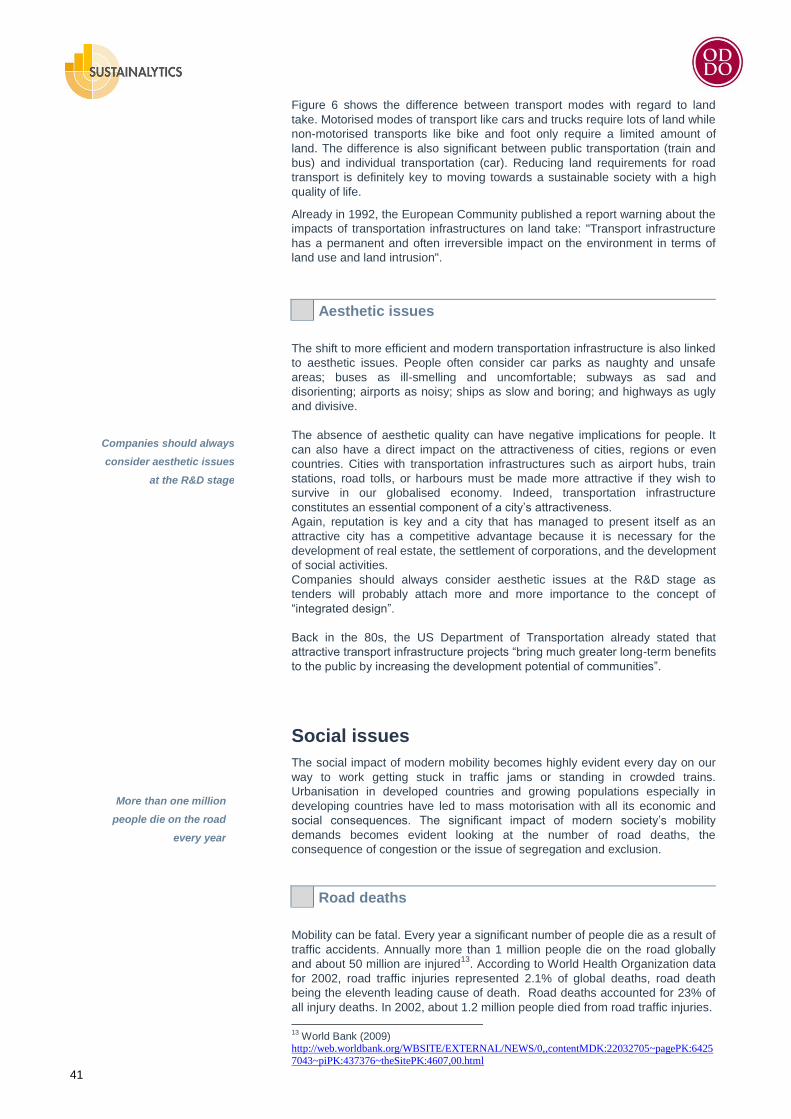
41
Figure 6 shows the difference between transport modes with regard to land
take. Motorised modes of transport like cars and trucks require lots of land while
non-motorised transports like bike and foot only require a limited amount of
land. The difference is also significant between public transportation (train and
bus) and individual transportation (car). Reducing land requirements for road
transport is definitely key to moving towards a sustainable society with a high
quality of life.
Already in 1992, the European Community published a report warning about the
impacts of transportation infrastructures on land take: "Transport infrastructure
has a permanent and often irreversible impact on the environment in terms of
land use and land intrusion".
Aesthetic issues
The shift to more efficient and modern transportation infrastructure is also linked
to aesthetic issues. People often consider car parks as naughty and unsafe
areas; buses as ill-smelling and uncomfortable; subways as sad and
disorienting; airports as noisy; ships as slow and boring; and highways as ugly
and divisive.
The absence of aesthetic quality can have negative implications for people. It
can also have a direct impact on the attractiveness of cities, regions or even
countries. Cities with transportation infrastructures such as airport hubs, train
stations, road tolls, or harbours must be made more attractive if they wish to
survive in our globalised economy. Indeed, transportation infrastructure
constitutes an essential component of a city‘s attractiveness.
Again, reputation is key and a city that has managed to present itself as an
attractive city has a competitive advantage because it is necessary for the
development of real estate, the settlement of corporations, and the development
of social activities.
Companies should always consider aesthetic issues at the R&D stage as
tenders will probably attach more and more importance to the concept of
―integrated design‖.
Back in the 80s, the US Department of Transportation already stated that
attractive transport infrastructure projects ―bring much greater long-term benefits
to the public by increasing the development potential of communities‖.
Social issues
The social impact of modern mobility becomes highly evident every day on our
way to work getting stuck in traffic jams or standing in crowded trains.
Urbanisation in developed countries and growing populations especially in
developing countries have led to mass motorisation with all its economic and
social consequences. The significant impact of modern society‘s mobility
demands becomes evident looking at the number of road deaths, the
consequence of congestion or the issue of segregation and exclusion.
Road deaths
Mobility can be fatal. Every year a significant number of people die as a result of
traffic accidents. Annually more than 1 million people die on the road globally
and about 50 million are injured13
. According to World Health Organization data
for 2002, road traffic injuries represented 2.1% of global deaths, road death
being the eleventh leading cause of death. Road deaths accounted for 23% of
all injury deaths. In 2002, about 1.2 million people died from road traffic injuries.
13
World Bank (2009) http://web.worldbank.org/WBSITE/EXTERNAL/NEWS/0,,contentMDK:22032705~pagePK:6425
7043~piPK:437376~theSitePK:4607,00.html
Companies should always
consider aesthetic issues
at the R&D stage
More than one million
people die on the road
every year
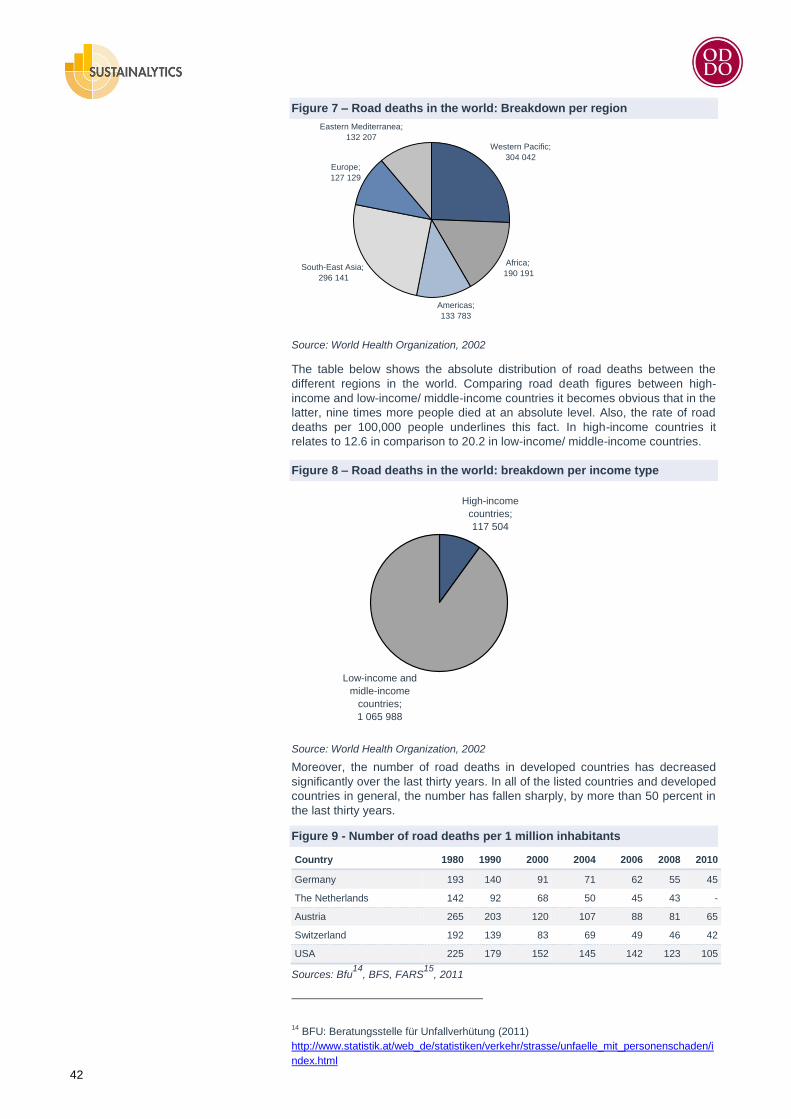
42
Figure 7 – Road deaths in the world: Breakdown per region
Source: World Health Organization, 2002
The table below shows the absolute distribution of road deaths between the
different regions in the world. Comparing road death figures between high-
income and low-income/ middle-income countries it becomes obvious that in the
latter, nine times more people died at an absolute level. Also, the rate of road
deaths per 100,000 people underlines this fact. In high-income countries it
relates to 12.6 in comparison to 20.2 in low-income/ middle-income countries.
Figure 8 – Road deaths in the world: breakdown per income type
Source: World Health Organization, 2002
Moreover, the number of road deaths in developed countries has decreased
significantly over the last thirty years. In all of the listed countries and developed
countries in general, the number has fallen sharply, by more than 50 percent in
the last thirty years.
Figure 9 - Number of road deaths per 1 million inhabitants
Country 1980 1990 2000 2004 2006 2008 2010
Germany 193 140 91 71 62 55 45
The Netherlands 142 92 68 50 45 43 -
Austria 265 203 120 107 88 81 65
Switzerland 192 139 83 69 49 46 42
USA 225 179 152 145 142 123 105
Sources: Bfu14
, BFS, FARS15
, 2011
14 BFU: Beratungsstelle für Unfallverhütung (2011)
http://www.statistik.at/web_de/statistiken/verkehr/strasse/unfaelle_mit_personenschaden/i
ndex.html
Eastern Mediterranea;
132 207
Europe;
127 129
Americas;
133 783
Africa;
190 191South-East Asia;
296 141
Western Pacific;
304 042
Low-income and
midle-income
countries;
1 065 988
High-income
countries;
117 504
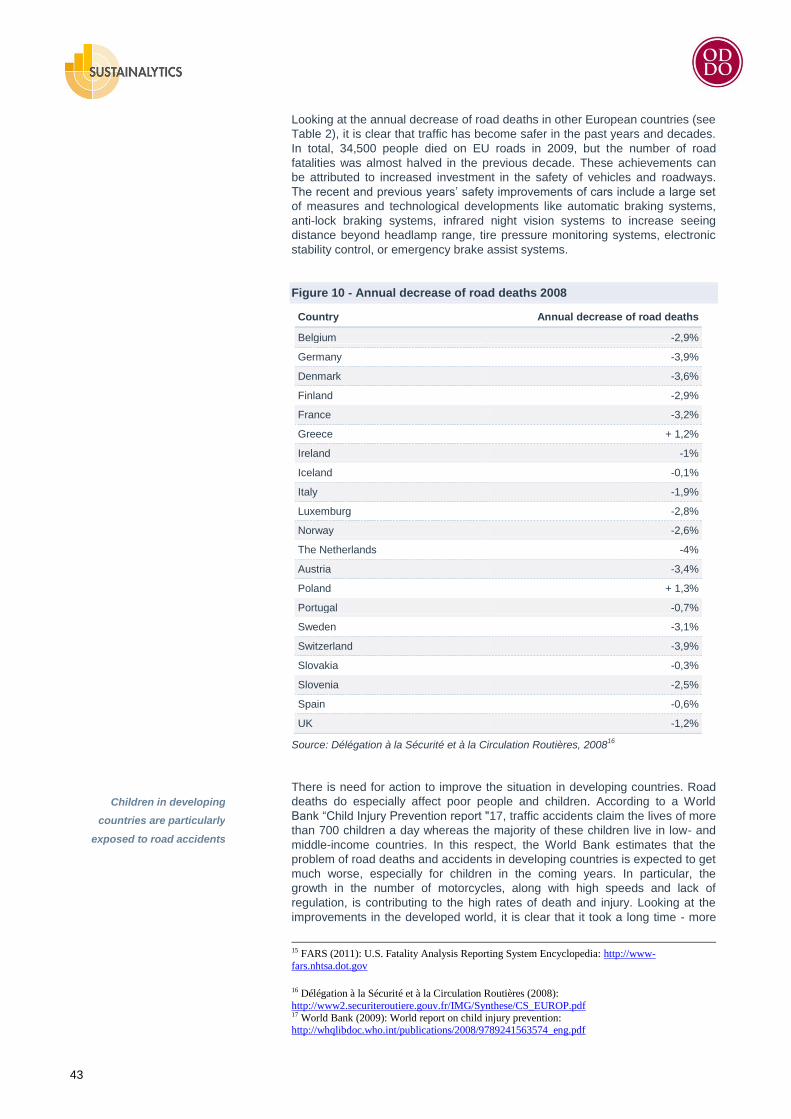
43
Looking at the annual decrease of road deaths in other European countries (see
Table 2), it is clear that traffic has become safer in the past years and decades.
In total, 34,500 people died on EU roads in 2009, but the number of road
fatalities was almost halved in the previous decade. These achievements can
be attributed to increased investment in the safety of vehicles and roadways.
The recent and previous years‘ safety improvements of cars include a large set
of measures and technological developments like automatic braking systems,
anti-lock braking systems, infrared night vision systems to increase seeing
distance beyond headlamp range, tire pressure monitoring systems, electronic
stability control, or emergency brake assist systems.
Figure 10 - Annual decrease of road deaths 2008
Source: Délégation à la Sécurité et à la Circulation Routières, 200816
There is need for action to improve the situation in developing countries. Road
deaths do especially affect poor people and children. According to a World
Bank ―Child Injury Prevention report "17, traffic accidents claim the lives of more
than 700 children a day whereas the majority of these children live in low- and
middle-income countries. In this respect, the World Bank estimates that the
problem of road deaths and accidents in developing countries is expected to get
much worse, especially for children in the coming years. In particular, the
growth in the number of motorcycles, along with high speeds and lack of
regulation, is contributing to the high rates of death and injury. Looking at the
improvements in the developed world, it is clear that it took a long time - more
15 FARS (2011): U.S. Fatality Analysis Reporting System Encyclopedia: http://www-
fars.nhtsa.dot.gov
16 Délégation à la Sécurité et à la Circulation Routières (2008):
http://www2.securiteroutiere.gouv.fr/IMG/Synthese/CS_EUROP.pdf 17 World Bank (2009): World report on child injury prevention: http://whqlibdoc.who.int/publications/2008/9789241563574_eng.pdf
Country Annual decrease of road deaths
Belgium -2,9%
Germany -3,9%
Denmark -3,6%
Finland -2,9%
France -3,2%
Greece + 1,2%
Ireland -1%
Iceland -0,1%
Italy -1,9%
Luxemburg -2,8%
Norway -2,6%
The Netherlands -4%
Austria -3,4%
Poland + 1,3%
Portugal -0,7%
Sweden -3,1%
Switzerland -3,9%
Slovakia -0,3%
Slovenia -2,5%
Spain -0,6%
UK -1,2%
Children in developing
countries are particularly
exposed to road accidents
44
than 40 years - to lower the fatality rates to the current 1 to 2 per 10,000
vehicles. In contrast, developing countries face rates as high as 25-30 per
10,000 vehicles or even higher. Thus, a society – whether it is developed or
developing - has to face the question of the price it wishes to pay for being
mobile. In this regard, the Commission for Global Road Safety recommends that
G8 countries increase their support for developing countries to make roads
safer by means of adopting a 10-year US$ 300 million action plan.
Congestion
Traffic congestion – also called traffic jams - is not a new phenomenon.
Congestion already appeared when farmers in early civilisations carried their
products to the markets through small city gates. However, in the 20th century
traffic congestion has become a daily phenomenon affecting an increase in the
amount of commuters. Congestion generally occurs when the available road
capacity cannot meet vehicles‘ demand for space. In general, congestion is an
issue related to motor vehicle uses, but it can also be linked to cyclists,
pedestrians or other traffic participants. It is mainly caused when at the same
time too many traffic participants intend to use a road‘s capacity which cannot
cope with the amount of users. Congestion, i.e. congested roads can be
considered examples of the tragedy of the commons. The use of roads is often
free of charge, drivers hardly have an incentive not to over-use them up to the
point when congestion occurs. Then, demand becomes limited by opportunity
cost, the costs of any activity measured in terms of the best alternative forgone.
However, congestion can also be attributed to traffic incidents, roadworks, or
bad weather conditions. Of course, congestion can also be a major concern in
the case of other transport systems like air, rail or waterways. In urban centres
or conurbations of developed countries, traffic in the sky, in particular, has
become an issue. In Europe, the Single European Sky initiative was launched in
2001 to reduce air-traffic congestion. However, the focus should be put on road
traffic as its social impact can be considered higher.
Congestion has been a common problem in developed countries for many
decades, especially in urban areas. The following table shows cities in Europe
which are the most affected by traffic jams. UK cities in particular figure
prominently among those listed. London is a good example of a city which
suffers from its old infrastructure, the lack of freeways into the city centre and
the demand of millions of commuters and tourists. In order to reduce the impact
of traffic jams, London introduced a congestion charge system for its city centre
in 2003. The charge system led to a 15% decrease of congestion and to a 20%
reduction of road accidents. In contrast, public transport experienced growth of
50%. However, one in five commuters still spends more than two hours a day
on his/her way to work. Other major European cities face less problems with
congestion than the listed ones. Hamburg in Germany can be considered one of
the fastest and least-congested cities in Europe as it has an efficient public
transportation system and a relatively high amount of incoming freeways.
However, there is significant traffic congestion in Germany, affecting the daily
commuting time in Germany. About 37% of German commuters spend more
than one hour a day getting to work.
Traffic congestion has
become a daily
phenomenon
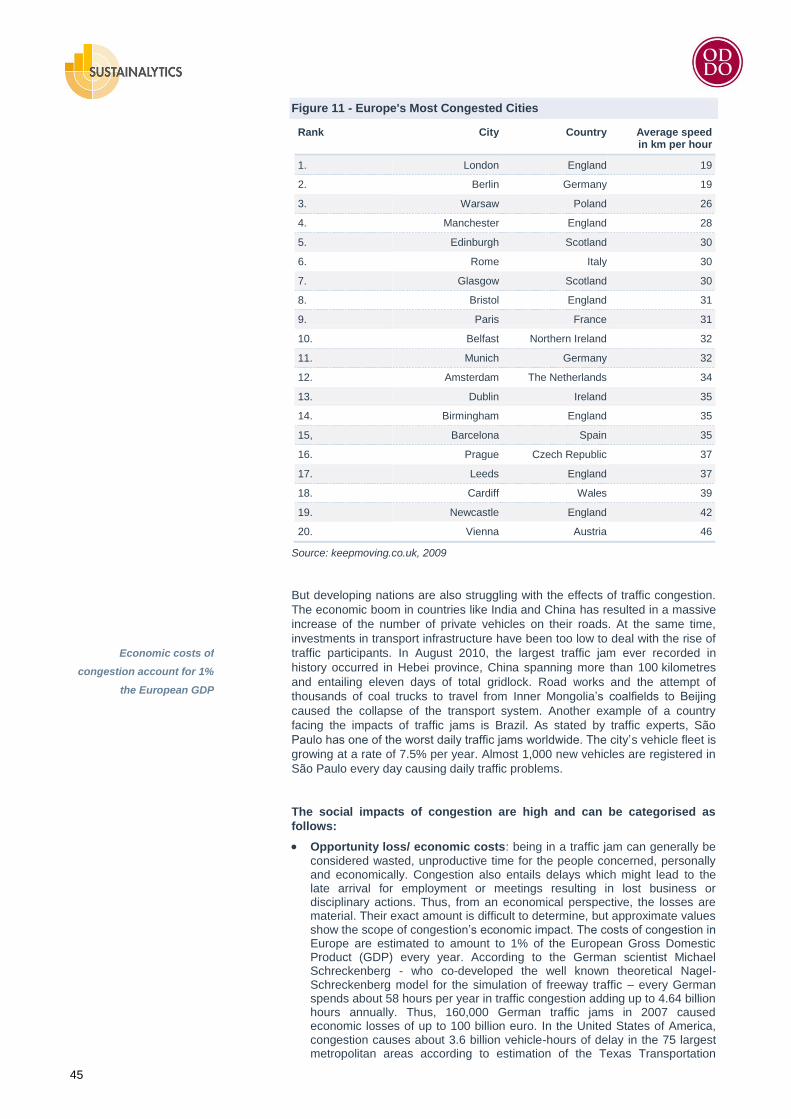
45
Figure 11 - Europe's Most Congested Cities
Source: keepmoving.co.uk, 2009
But developing nations are also struggling with the effects of traffic congestion.
The economic boom in countries like India and China has resulted in a massive
increase of the number of private vehicles on their roads. At the same time,
investments in transport infrastructure have been too low to deal with the rise of
traffic participants. In August 2010, the largest traffic jam ever recorded in
history occurred in Hebei province, China spanning more than 100 kilometres
and entailing eleven days of total gridlock. Road works and the attempt of
thousands of coal trucks to travel from Inner Mongolia‘s coalfields to Beijing
caused the collapse of the transport system. Another example of a country
facing the impacts of traffic jams is Brazil. As stated by traffic experts, São
Paulo has one of the worst daily traffic jams worldwide. The city‘s vehicle fleet is
growing at a rate of 7.5% per year. Almost 1,000 new vehicles are registered in
São Paulo every day causing daily traffic problems.
The social impacts of congestion are high and can be categorised as
follows:
Opportunity loss/ economic costs: being in a traffic jam can generally be
considered wasted, unproductive time for the people concerned, personally and economically. Congestion also entails delays which might lead to the late arrival for employment or meetings resulting in lost business or disciplinary actions. Thus, from an economical perspective, the losses are material. Their exact amount is difficult to determine, but approximate values show the scope of congestion‘s economic impact. The costs of congestion in Europe are estimated to amount to 1% of the European Gross Domestic Product (GDP) every year. According to the German scientist Michael Schreckenberg - who co-developed the well known theoretical Nagel-Schreckenberg model for the simulation of freeway traffic – every German spends about 58 hours per year in traffic congestion adding up to 4.64 billion hours annually. Thus, 160,000 German traffic jams in 2007 caused economic losses of up to 100 billion euro. In the United States of America, congestion causes about 3.6 billion vehicle-hours of delay in the 75 largest metropolitan areas according to estimation of the Texas Transportation
Rank City Country Average speed in km per hour
1. London England 19
2. Berlin Germany 19
3. Warsaw Poland 26
4. Manchester England 28
5. Edinburgh Scotland 30
6. Rome Italy 30
7. Glasgow Scotland 30
8. Bristol England 31
9. Paris France 31
10. Belfast Northern Ireland 32
11. Munich Germany 32
12. Amsterdam The Netherlands 34
13. Dublin Ireland 35
14. Birmingham England 35
15, Barcelona Spain 35
16. Prague Czech Republic 37
17. Leeds England 37
18. Cardiff Wales 39
19. Newcastle England 42
20. Vienna Austria 46
Economic costs of
congestion account for 1%
the European GDP
46
Institute. This number corresponds to a loss of productivity of about 0.7 per cent of the nation's GDP or wasted fuel of 21.6 billion litres. In the United Kingdom, a government-sponsored report estimated that congestion costs might add up to GBP 22 million by 2025.
Maintenance costs: In traffic jams, drivers have to accelerate and use the
brakes frequently. This way of driving has a negative impact on the technical components of the vehicles, leading to wear and tear and thus, resulting in more frequent repairs and replacements.
Emergencies/ road death: Congestion might have an impact on
emergency measure as blocked traffic may interfere with the passage of emergency vehicles. In the worst cases, congestions cause death. Furthermore, road users can get stressed and frustrated being stuck in a traffic jam which again could lead to accidents or even road deaths.
Spillover effects: If congestion occurs on a main road, many drivers tend to
evade and use secondary roads and side streets. In turn, this behaviour affects the neighbourhoods which are located close to these alternative routes. The people concerned have to suffer from the traffic impact, in terms of noise, air pollution or mobility.
Since the impact of congestion is becoming increasingly significant,
governments and institutions have been trying to find solutions to avoid or at
least to reduce traffic jams. One starting point is improving or expanding road
infrastructure, for example installing separate lanes for specific traffic
participants. Another field of improvement is urban planning and design such as
defining motor vehicles free zone or grid planning. A smart traffic management
system featuring traffic reporting systems or navigation systems can further help
to reduce the impact of traffic jams. Furthermore, the regulation of supply and
demand via road pricing is another way to attempt to reduce traffic jams.
Segregation and exclusion
The mobility demands of modern society have a significant effect on the way we
live. People have always tended to settle and to live close to the transportation
network in order to be mobile. Thus, access to transport or virtual mobility is still
crucial to be able to play a role in society. However, access costs are high.
According to Eurostat, about 13.2% on average of every European household's
budget is spent on transport goods and services. Transportation costs for
impoverished classes are material and are in contrast with the mobility demands
of high- or mid-income classes linked to leisure or vacation. The mobility
demands can, therefore, have an exclusionary effect showing social gaps in
society. This gap does not only refer to physical mobility but also to virtual
mobility. The degree of access to modern IT-technology, in particular, the
internet, differs highly amongst and within the population across the globe and
is expected to grow in future years (see 1d. Virtual mobility or e-substitution).
A solid infrastructure is crucial for societies‘ development. Developing countries,
especially in Africa, still lag in this regard. In many African regions, a huge
amount of goods and materials is still moved by feet, animals like horses or
donkeys or by bicycle. Even in African cities, such simple and slow
transportation methods are common. The following graph shows the modal split
in Nairobi/ Kenya. It is clear that walking is the dominant way of being mobile
among the low- and middle-income classes, followed by small private buses
(Matatu). The car is a privilege of higher-income classes, whereas trains are
hardly represented in the model split.
The car is a privilege of
higher-income classes in
some countries
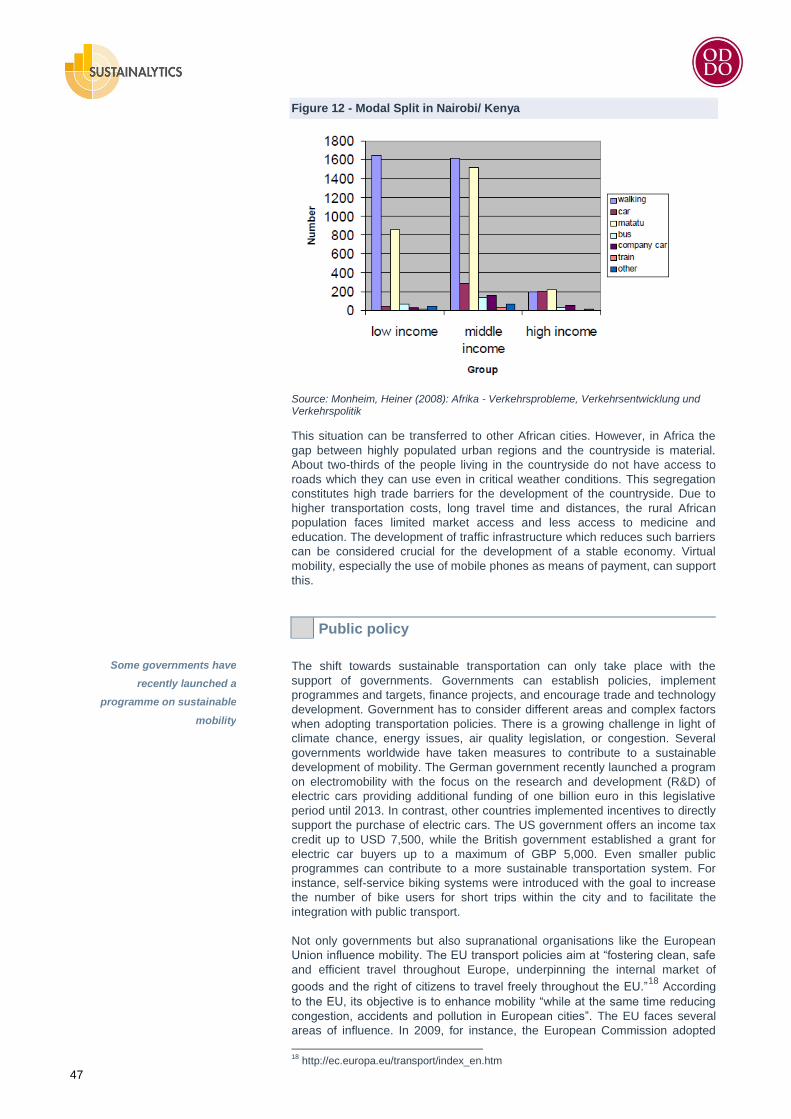
47
Figure 12 - Modal Split in Nairobi/ Kenya
Source: Monheim, Heiner (2008): Afrika - Verkehrsprobleme, Verkehrsentwicklung und Verkehrspolitik
This situation can be transferred to other African cities. However, in Africa the
gap between highly populated urban regions and the countryside is material.
About two-thirds of the people living in the countryside do not have access to
roads which they can use even in critical weather conditions. This segregation
constitutes high trade barriers for the development of the countryside. Due to
higher transportation costs, long travel time and distances, the rural African
population faces limited market access and less access to medicine and
education. The development of traffic infrastructure which reduces such barriers
can be considered crucial for the development of a stable economy. Virtual
mobility, especially the use of mobile phones as means of payment, can support
this.
Public policy
The shift towards sustainable transportation can only take place with the
support of governments. Governments can establish policies, implement
programmes and targets, finance projects, and encourage trade and technology
development. Government has to consider different areas and complex factors
when adopting transportation policies. There is a growing challenge in light of
climate chance, energy issues, air quality legislation, or congestion. Several
governments worldwide have taken measures to contribute to a sustainable
development of mobility. The German government recently launched a program
on electromobility with the focus on the research and development (R&D) of
electric cars providing additional funding of one billion euro in this legislative
period until 2013. In contrast, other countries implemented incentives to directly
support the purchase of electric cars. The US government offers an income tax
credit up to USD 7,500, while the British government established a grant for
electric car buyers up to a maximum of GBP 5,000. Even smaller public
programmes can contribute to a more sustainable transportation system. For
instance, self-service biking systems were introduced with the goal to increase
the number of bike users for short trips within the city and to facilitate the
integration with public transport.
Not only governments but also supranational organisations like the European
Union influence mobility. The EU transport policies aim at ―fostering clean, safe
and efficient travel throughout Europe, underpinning the internal market of
goods and the right of citizens to travel freely throughout the EU.‖18
According
to the EU, its objective is to enhance mobility ―while at the same time reducing
congestion, accidents and pollution in European cities‖. The EU faces several
areas of influence. In 2009, for instance, the European Commission adopted
18
http://ec.europa.eu/transport/index_en.htm
Some governments have
recently launched a
programme on sustainable
mobility
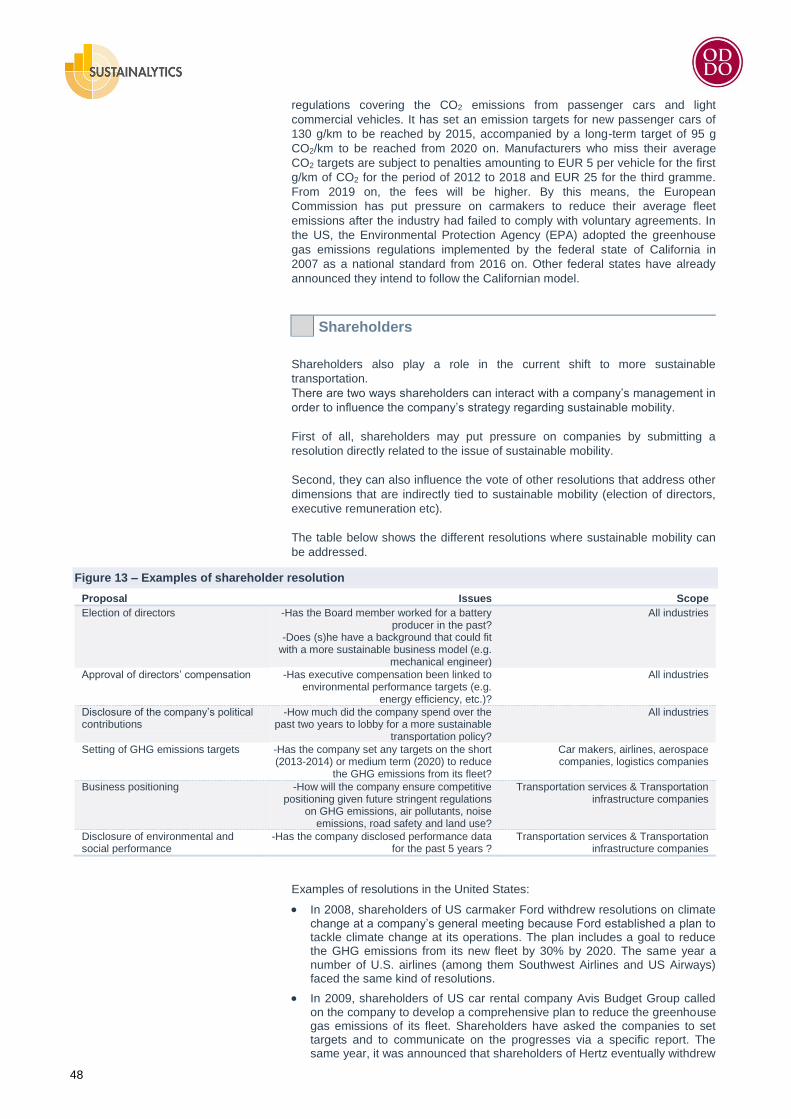
48
regulations covering the CO2 emissions from passenger cars and light
commercial vehicles. It has set an emission targets for new passenger cars of
130 g/km to be reached by 2015, accompanied by a long-term target of 95 g
CO2/km to be reached from 2020 on. Manufacturers who miss their average
CO2 targets are subject to penalties amounting to EUR 5 per vehicle for the first
g/km of CO2 for the period of 2012 to 2018 and EUR 25 for the third gramme.
From 2019 on, the fees will be higher. By this means, the European
Commission has put pressure on carmakers to reduce their average fleet
emissions after the industry had failed to comply with voluntary agreements. In
the US, the Environmental Protection Agency (EPA) adopted the greenhouse
gas emissions regulations implemented by the federal state of California in
2007 as a national standard from 2016 on. Other federal states have already
announced they intend to follow the Californian model.
Shareholders
Shareholders also play a role in the current shift to more sustainable
transportation.
There are two ways shareholders can interact with a company‘s management in
order to influence the company‘s strategy regarding sustainable mobility.
First of all, shareholders may put pressure on companies by submitting a
resolution directly related to the issue of sustainable mobility.
Second, they can also influence the vote of other resolutions that address other
dimensions that are indirectly tied to sustainable mobility (election of directors,
executive remuneration etc).
The table below shows the different resolutions where sustainable mobility can
be addressed.
Figure 13 – Examples of shareholder resolution
Proposal Issues Scope
Election of directors -Has the Board member worked for a battery producer in the past?
-Does (s)he have a background that could fit with a more sustainable business model (e.g.
mechanical engineer)
All industries
Approval of directors‘ compensation -Has executive compensation been linked to environmental performance targets (e.g.
energy efficiency, etc.)?
All industries
Disclosure of the company‘s political contributions
-How much did the company spend over the past two years to lobby for a more sustainable
transportation policy?
All industries
Setting of GHG emissions targets -Has the company set any targets on the short (2013-2014) or medium term (2020) to reduce
the GHG emissions from its fleet?
Car makers, airlines, aerospace companies, logistics companies
Business positioning -How will the company ensure competitive positioning given future stringent regulations
on GHG emissions, air pollutants, noise emissions, road safety and land use?
Transportation services & Transportation infrastructure companies
Disclosure of environmental and social performance
-Has the company disclosed performance data for the past 5 years ?
Transportation services & Transportation infrastructure companies
Examples of resolutions in the United States:
In 2008, shareholders of US carmaker Ford withdrew resolutions on climate change at a company‘s general meeting because Ford established a plan to tackle climate change at its operations. The plan includes a goal to reduce the GHG emissions from its new fleet by 30% by 2020. The same year a number of U.S. airlines (among them Southwest Airlines and US Airways) faced the same kind of resolutions.
In 2009, shareholders of US car rental company Avis Budget Group called on the company to develop a comprehensive plan to reduce the greenhouse gas emissions of its fleet. Shareholders have asked the companies to set targets and to communicate on the progresses via a specific report. The same year, it was announced that shareholders of Hertz eventually withdrew
49
a resolution after that the company released an adequate report on how it addresses the issue of fleet efficiency.
In 2011, shareholders called on US aerospace company Boeing to monitor the performance of its suppliers. The company eventually decided to implement independent third-party monitoring of its supply chain.
The same year, US defence company Gentex Corporation was pressed by investors to issue a sustainability report.
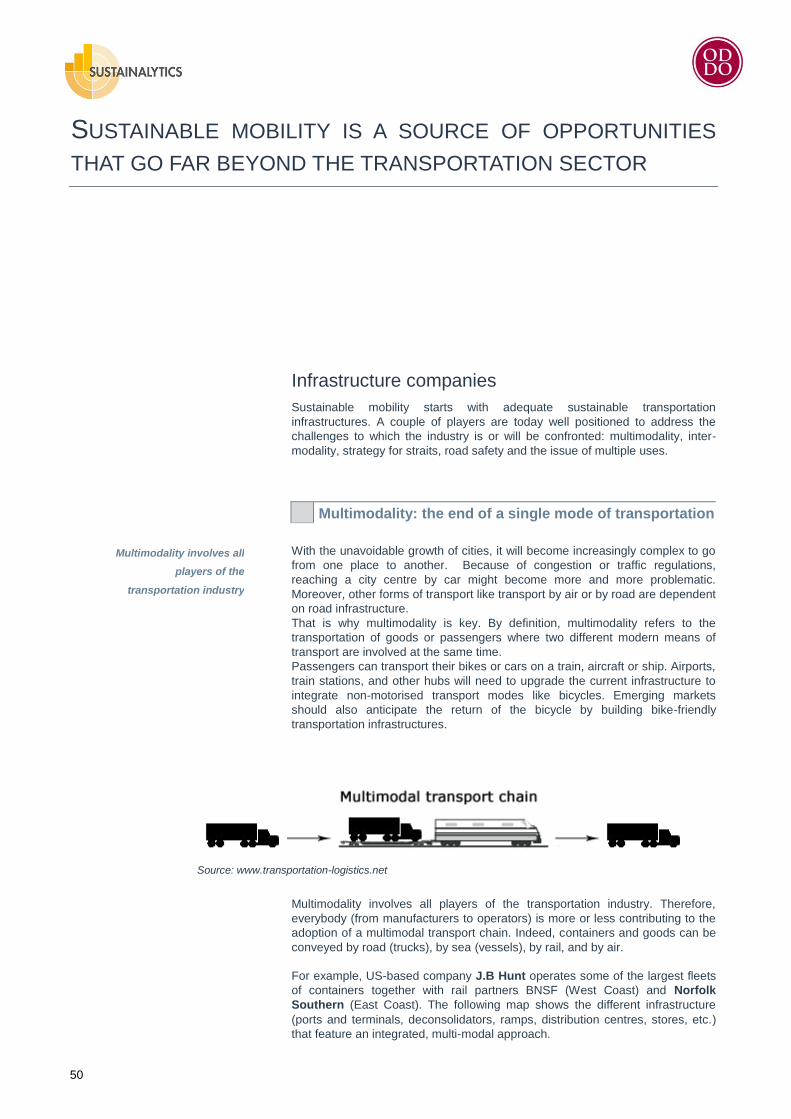
50
SUSTAINABLE MOBILITY IS A SOURCE OF OPPORTUNITIES
THAT GO FAR BEYOND THE TRANSPORTATION SECTOR
Infrastructure companies
Sustainable mobility starts with adequate sustainable transportation
infrastructures. A couple of players are today well positioned to address the
challenges to which the industry is or will be confronted: multimodality, inter-
modality, strategy for straits, road safety and the issue of multiple uses.
Multimodality: the end of a single mode of transportation
With the unavoidable growth of cities, it will become increasingly complex to go
from one place to another. Because of congestion or traffic regulations,
reaching a city centre by car might become more and more problematic.
Moreover, other forms of transport like transport by air or by road are dependent
on road infrastructure.
That is why multimodality is key. By definition, multimodality refers to the
transportation of goods or passengers where two different modern means of
transport are involved at the same time.
Passengers can transport their bikes or cars on a train, aircraft or ship. Airports,
train stations, and other hubs will need to upgrade the current infrastructure to
integrate non-motorised transport modes like bicycles. Emerging markets
should also anticipate the return of the bicycle by building bike-friendly
transportation infrastructures.
Source: www.transportation-logistics.net
Multimodality involves all players of the transportation industry. Therefore,
everybody (from manufacturers to operators) is more or less contributing to the
adoption of a multimodal transport chain. Indeed, containers and goods can be
conveyed by road (trucks), by sea (vessels), by rail, and by air.
For example, US-based company J.B Hunt operates some of the largest fleets
of containers together with rail partners BNSF (West Coast) and Norfolk
Southern (East Coast). The following map shows the different infrastructure
(ports and terminals, deconsolidators, ramps, distribution centres, stores, etc.)
that feature an integrated, multi-modal approach.
Multimodality involves all
players of the
transportation industry
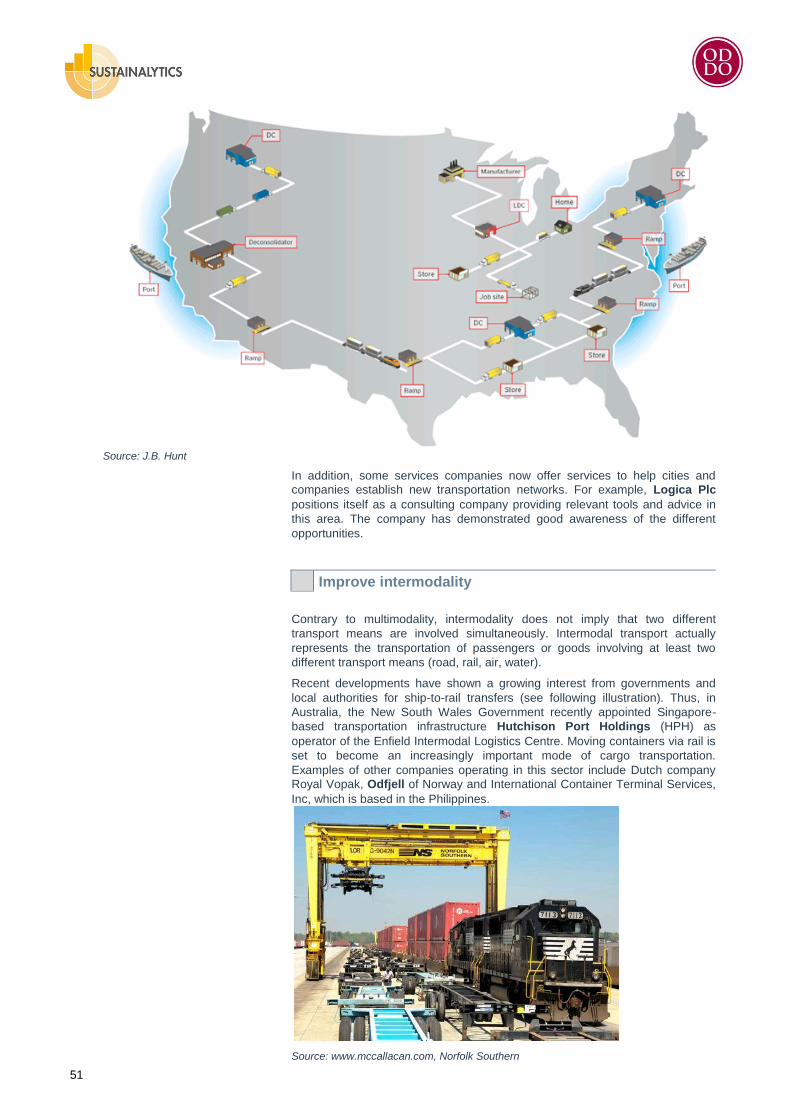
51
Source: J.B. Hunt
In addition, some services companies now offer services to help cities and
companies establish new transportation networks. For example, Logica Plc
positions itself as a consulting company providing relevant tools and advice in
this area. The company has demonstrated good awareness of the different
opportunities.
Improve intermodality
Contrary to multimodality, intermodality does not imply that two different
transport means are involved simultaneously. Intermodal transport actually
represents the transportation of passengers or goods involving at least two
different transport means (road, rail, air, water).
Recent developments have shown a growing interest from governments and
local authorities for ship-to-rail transfers (see following illustration). Thus, in
Australia, the New South Wales Government recently appointed Singapore-
based transportation infrastructure Hutchison Port Holdings (HPH) as
operator of the Enfield Intermodal Logistics Centre. Moving containers via rail is
set to become an increasingly important mode of cargo transportation.
Examples of other companies operating in this sector include Dutch company
Royal Vopak, Odfjell of Norway and International Container Terminal Services,
Inc, which is based in the Philippines.
Source: www.mccallacan.com, Norfolk Southern
52
Enhancing intermodality should involve all the stakeholders of the transportation
sector: transportation infrastructure companies, transportation services
providers, governments etc. In Europe, where transport by road is predominant,
the focus has been on interlinking road and rail. For example, Austria-based
company Asfinag is working on a comprehensive inter-modal system, which
would allow users to receive information while on board.
The importance of straits
Water channels like the Strait of Gibraltar (Spain/Morocco), the Bosphorus Strait
(Turkey), the Channel (United Kingdom/France), the Oresund strait
(Denmark/Sweden), the Palk Strait (India/Sri Lanka), the Bering Strait (United
States/Russia) and the Strait of Malacca (Malaysia/Indonesia) often monopolise
the traffic as they are the only access routes to some areas. The increasing
traffic in these straits causes several environmental damages (threat to
biodiversity, air pollution, water contamination, etc).
On the other hand, straits allow exchanges between two continents, two islands
or an island and a continent. They are often overcrowded due to two-way traffic
(across the strait or along the strait). In the 80s and 90s, some countries
decided to relieve the traffic across the strait route by constructing a subsea
tunnel. For example, Japan built the Seikan Tunnel (linking Honshu with
Hokkaido) and France and the United Kingdom built the Channel Tunnel.
Despite a hard time in the first years of its existence, French group Eurotunnel,
which owns the Channel tunnel, is now appealing for investors. The tunnel
allows for the transportation of passenger trains and rail freight trains, whose
traffic is expected to increase significantly in the following years. Eurotunnel
also has profited from recent changes in regulations that have strengthened its
business model. Indeed, the European Union decided to end Eurostar‘s
monopoly, which will allow other European rail companies like Deutsche Bahn
to run services on the route.
The example of Eurotunnel might be followed by other transportation
infrastructure companies in the world. In Northern Europe, the Femern Baelt‘s
project is expected to be even more successful than the Channel tunnel project
if the former ever materialises. Indeed, this infrastructure will combine an
submersed tube highway and a rail tunnel to allow trains and cars to travel
between Germany and Denmark. The company in charge of this project is
Femern A/S, a subsidiary of the Danish, state-owned Sund & Bælt Holding A/S.
Road Safety: the essential role of infrastructure
companies
Road accidents are due to a multitude of factors, including the status of
transportation infrastructures. For example, highway operator Asfinag considers
road safety as one of the four main opportunities it sees for its growing
business. The company has developed an ambitious road safety programme,
backed by an impressive set of 13 targets (see table below):
The construction of new
infrastructures to relieve
straits is underway
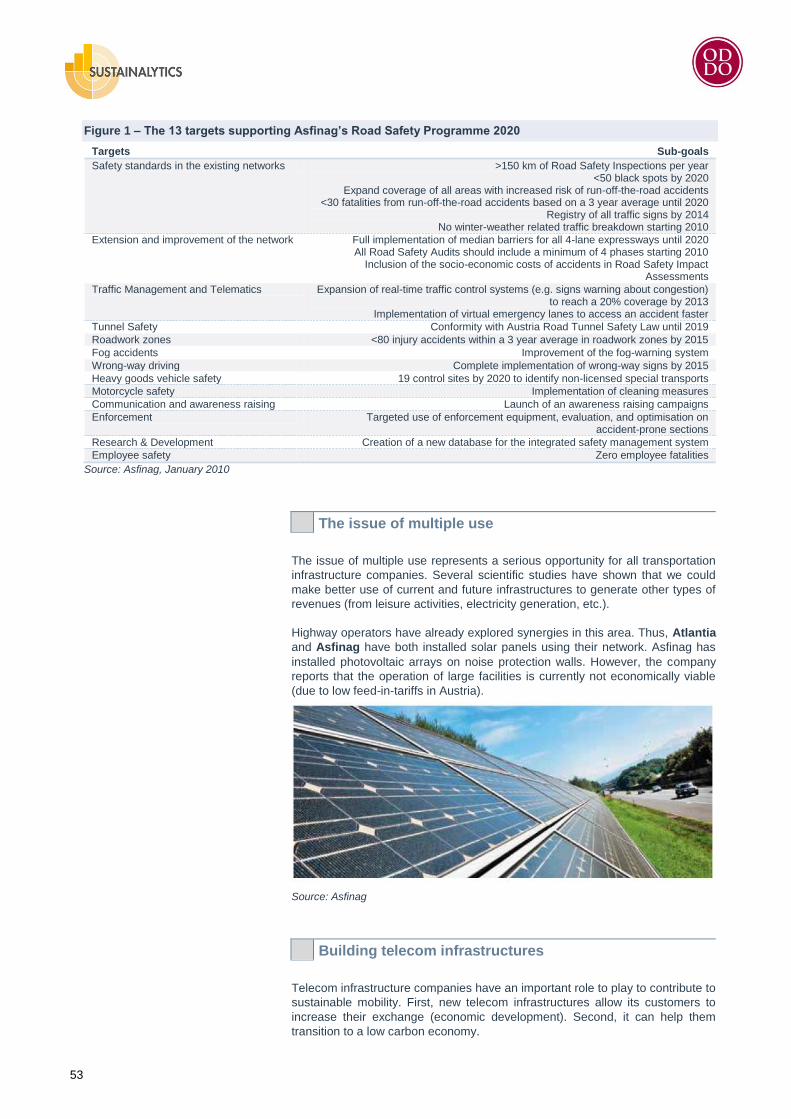
53
Figure 1 – The 13 targets supporting Asfinag’s Road Safety Programme 2020
Targets Sub-goals
Safety standards in the existing networks >150 km of Road Safety Inspections per year <50 black spots by 2020
Expand coverage of all areas with increased risk of run-off-the-road accidents <30 fatalities from run-off-the-road accidents based on a 3 year average until 2020
Registry of all traffic signs by 2014 No winter-weather related traffic breakdown starting 2010
Extension and improvement of the network Full implementation of median barriers for all 4-lane expressways until 2020 All Road Safety Audits should include a minimum of 4 phases starting 2010
Inclusion of the socio-economic costs of accidents in Road Safety Impact Assessments
Traffic Management and Telematics Expansion of real-time traffic control systems (e.g. signs warning about congestion) to reach a 20% coverage by 2013
Implementation of virtual emergency lanes to access an accident faster
Tunnel Safety Conformity with Austria Road Tunnel Safety Law until 2019
Roadwork zones <80 injury accidents within a 3 year average in roadwork zones by 2015
Fog accidents Improvement of the fog-warning system
Wrong-way driving Complete implementation of wrong-way signs by 2015
Heavy goods vehicle safety 19 control sites by 2020 to identify non-licensed special transports
Motorcycle safety Implementation of cleaning measures
Communication and awareness raising Launch of an awareness raising campaigns
Enforcement Targeted use of enforcement equipment, evaluation, and optimisation on accident-prone sections
Research & Development Creation of a new database for the integrated safety management system
Employee safety Zero employee fatalities
Source: Asfinag, January 2010
The issue of multiple use
The issue of multiple use represents a serious opportunity for all transportation
infrastructure companies. Several scientific studies have shown that we could
make better use of current and future infrastructures to generate other types of
revenues (from leisure activities, electricity generation, etc.).
Highway operators have already explored synergies in this area. Thus, Atlantia
and Asfinag have both installed solar panels using their network. Asfinag has
installed photovoltaic arrays on noise protection walls. However, the company
reports that the operation of large facilities is currently not economically viable
(due to low feed-in-tariffs in Austria).
Source: Asfinag
Building telecom infrastructures
Telecom infrastructure companies have an important role to play to contribute to
sustainable mobility. First, new telecom infrastructures allow its customers to
increase their exchange (economic development). Second, it can help them
transition to a low carbon economy.
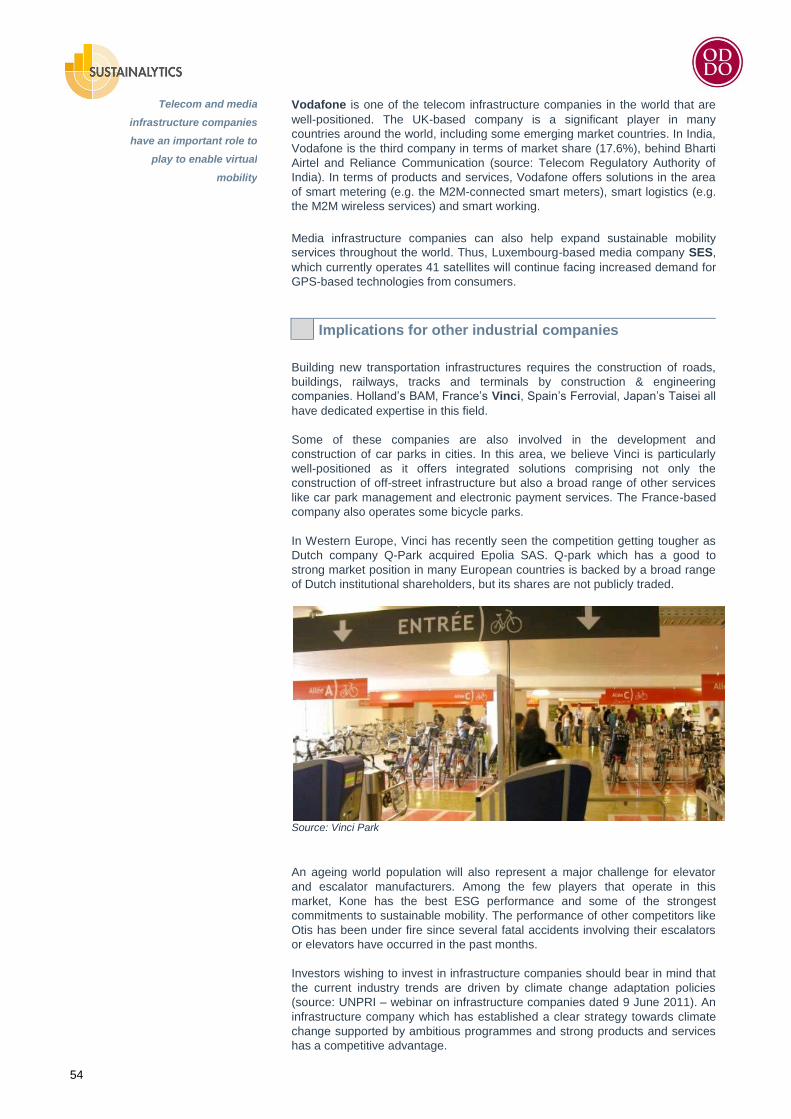
54
Vodafone is one of the telecom infrastructure companies in the world that are
well-positioned. The UK-based company is a significant player in many
countries around the world, including some emerging market countries. In India,
Vodafone is the third company in terms of market share (17.6%), behind Bharti
Airtel and Reliance Communication (source: Telecom Regulatory Authority of
India). In terms of products and services, Vodafone offers solutions in the area
of smart metering (e.g. the M2M-connected smart meters), smart logistics (e.g.
the M2M wireless services) and smart working.
Media infrastructure companies can also help expand sustainable mobility
services throughout the world. Thus, Luxembourg-based media company SES,
which currently operates 41 satellites will continue facing increased demand for
GPS-based technologies from consumers.
Implications for other industrial companies
Building new transportation infrastructures requires the construction of roads,
buildings, railways, tracks and terminals by construction & engineering
companies. Holland‘s BAM, France‘s Vinci, Spain‘s Ferrovial, Japan‘s Taisei all
have dedicated expertise in this field.
Some of these companies are also involved in the development and
construction of car parks in cities. In this area, we believe Vinci is particularly
well-positioned as it offers integrated solutions comprising not only the
construction of off-street infrastructure but also a broad range of other services
like car park management and electronic payment services. The France-based
company also operates some bicycle parks.
In Western Europe, Vinci has recently seen the competition getting tougher as
Dutch company Q-Park acquired Epolia SAS. Q-park which has a good to
strong market position in many European countries is backed by a broad range
of Dutch institutional shareholders, but its shares are not publicly traded.
Source: Vinci Park
An ageing world population will also represent a major challenge for elevator
and escalator manufacturers. Among the few players that operate in this
market, Kone has the best ESG performance and some of the strongest
commitments to sustainable mobility. The performance of other competitors like
Otis has been under fire since several fatal accidents involving their escalators
or elevators have occurred in the past months.
Investors wishing to invest in infrastructure companies should bear in mind that
the current industry trends are driven by climate change adaptation policies
(source: UNPRI – webinar on infrastructure companies dated 9 June 2011). An
infrastructure company which has established a clear strategy towards climate
change supported by ambitious programmes and strong products and services
has a competitive advantage.
Telecom and media
infrastructure companies
have an important role to
play to enable virtual
mobility
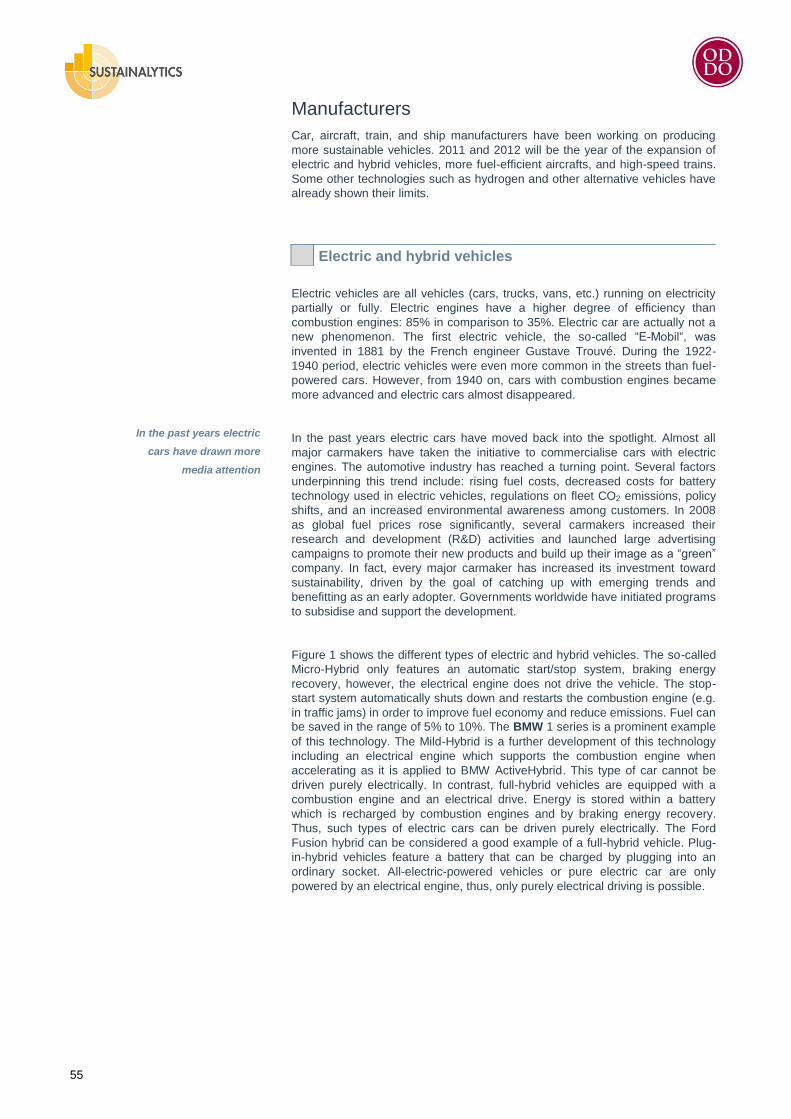
55
Manufacturers
Car, aircraft, train, and ship manufacturers have been working on producing
more sustainable vehicles. 2011 and 2012 will be the year of the expansion of
electric and hybrid vehicles, more fuel-efficient aircrafts, and high-speed trains.
Some other technologies such as hydrogen and other alternative vehicles have
already shown their limits.
Electric and hybrid vehicles
Electric vehicles are all vehicles (cars, trucks, vans, etc.) running on electricity
partially or fully. Electric engines have a higher degree of efficiency than
combustion engines: 85% in comparison to 35%. Electric car are actually not a
new phenomenon. The first electric vehicle, the so-called ―E-Mobil―, was
invented in 1881 by the French engineer Gustave Trouvé. During the 1922-
1940 period, electric vehicles were even more common in the streets than fuel-
powered cars. However, from 1940 on, cars with combustion engines became
more advanced and electric cars almost disappeared.
In the past years electric cars have moved back into the spotlight. Almost all
major carmakers have taken the initiative to commercialise cars with electric
engines. The automotive industry has reached a turning point. Several factors
underpinning this trend include: rising fuel costs, decreased costs for battery
technology used in electric vehicles, regulations on fleet CO2 emissions, policy
shifts, and an increased environmental awareness among customers. In 2008
as global fuel prices rose significantly, several carmakers increased their
research and development (R&D) activities and launched large advertising
campaigns to promote their new products and build up their image as a ―green‖
company. In fact, every major carmaker has increased its investment toward
sustainability, driven by the goal of catching up with emerging trends and
benefitting as an early adopter. Governments worldwide have initiated programs
to subsidise and support the development.
Figure 1 shows the different types of electric and hybrid vehicles. The so-called
Micro-Hybrid only features an automatic start/stop system, braking energy
recovery, however, the electrical engine does not drive the vehicle. The stop-
start system automatically shuts down and restarts the combustion engine (e.g.
in traffic jams) in order to improve fuel economy and reduce emissions. Fuel can
be saved in the range of 5% to 10%. The BMW 1 series is a prominent example
of this technology. The Mild-Hybrid is a further development of this technology
including an electrical engine which supports the combustion engine when
accelerating as it is applied to BMW ActiveHybrid. This type of car cannot be
driven purely electrically. In contrast, full-hybrid vehicles are equipped with a
combustion engine and an electrical drive. Energy is stored within a battery
which is recharged by combustion engines and by braking energy recovery.
Thus, such types of electric cars can be driven purely electrically. The Ford
Fusion hybrid can be considered a good example of a full-hybrid vehicle. Plug-
in-hybrid vehicles feature a battery that can be charged by plugging into an
ordinary socket. All-electric-powered vehicles or pure electric car are only
powered by an electrical engine, thus, only purely electrical driving is possible.
In the past years electric
cars have drawn more
media attention
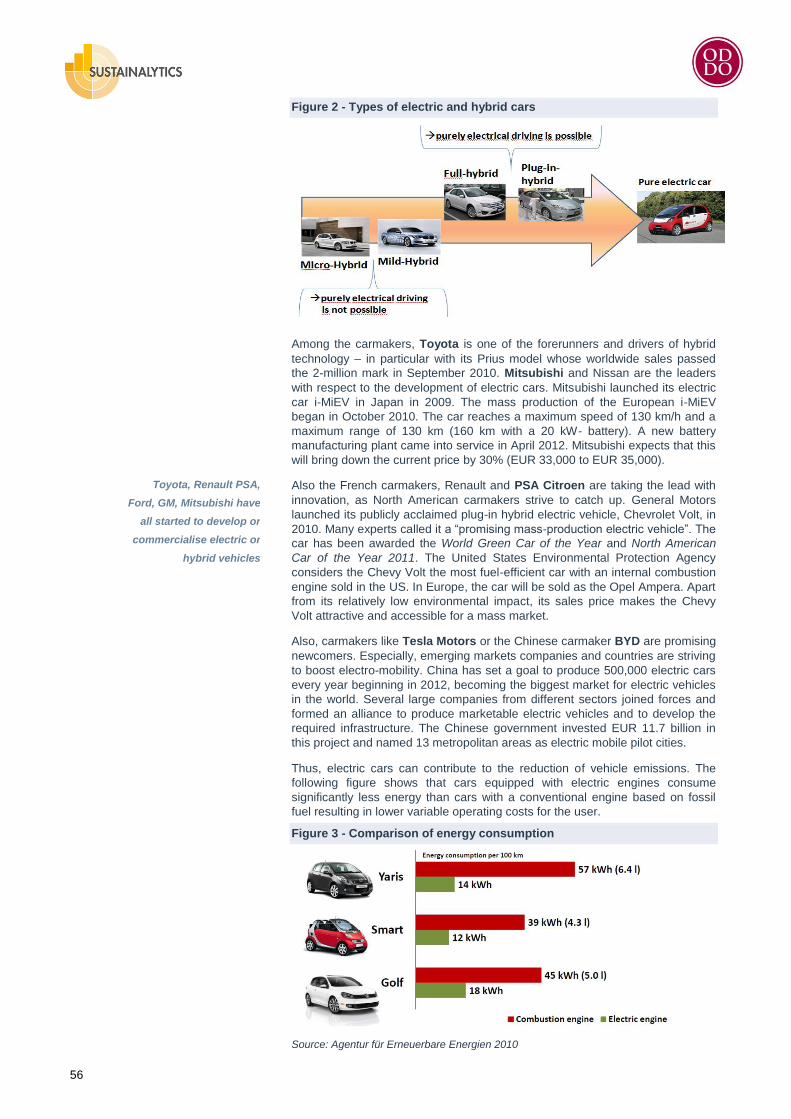
56
Figure 2 - Types of electric and hybrid cars
Among the carmakers, Toyota is one of the forerunners and drivers of hybrid
technology – in particular with its Prius model whose worldwide sales passed
the 2-million mark in September 2010. Mitsubishi and Nissan are the leaders
with respect to the development of electric cars. Mitsubishi launched its electric
car i-MiEV in Japan in 2009. The mass production of the European i-MiEV
began in October 2010. The car reaches a maximum speed of 130 km/h and a
maximum range of 130 km (160 km with a 20 kW- battery). A new battery
manufacturing plant came into service in April 2012. Mitsubishi expects that this
will bring down the current price by 30% (EUR 33,000 to EUR 35,000).
Also the French carmakers, Renault and PSA Citroen are taking the lead with
innovation, as North American carmakers strive to catch up. General Motors
launched its publicly acclaimed plug-in hybrid electric vehicle, Chevrolet Volt, in
2010. Many experts called it a ―promising mass-production electric vehicle‖. The
car has been awarded the World Green Car of the Year and North American
Car of the Year 2011. The United States Environmental Protection Agency
considers the Chevy Volt the most fuel-efficient car with an internal combustion
engine sold in the US. In Europe, the car will be sold as the Opel Ampera. Apart
from its relatively low environmental impact, its sales price makes the Chevy
Volt attractive and accessible for a mass market.
Also, carmakers like Tesla Motors or the Chinese carmaker BYD are promising
newcomers. Especially, emerging markets companies and countries are striving
to boost electro-mobility. China has set a goal to produce 500,000 electric cars
every year beginning in 2012, becoming the biggest market for electric vehicles
in the world. Several large companies from different sectors joined forces and
formed an alliance to produce marketable electric vehicles and to develop the
required infrastructure. The Chinese government invested EUR 11.7 billion in
this project and named 13 metropolitan areas as electric mobile pilot cities.
Thus, electric cars can contribute to the reduction of vehicle emissions. The
following figure shows that cars equipped with electric engines consume
significantly less energy than cars with a conventional engine based on fossil
fuel resulting in lower variable operating costs for the user.
Figure 3 - Comparison of energy consumption
Source: Agentur für Erneuerbare Energien 2010
Toyota, Renault PSA,
Ford, GM, Mitsubishi have
all started to develop or
commercialise electric or
hybrid vehicles
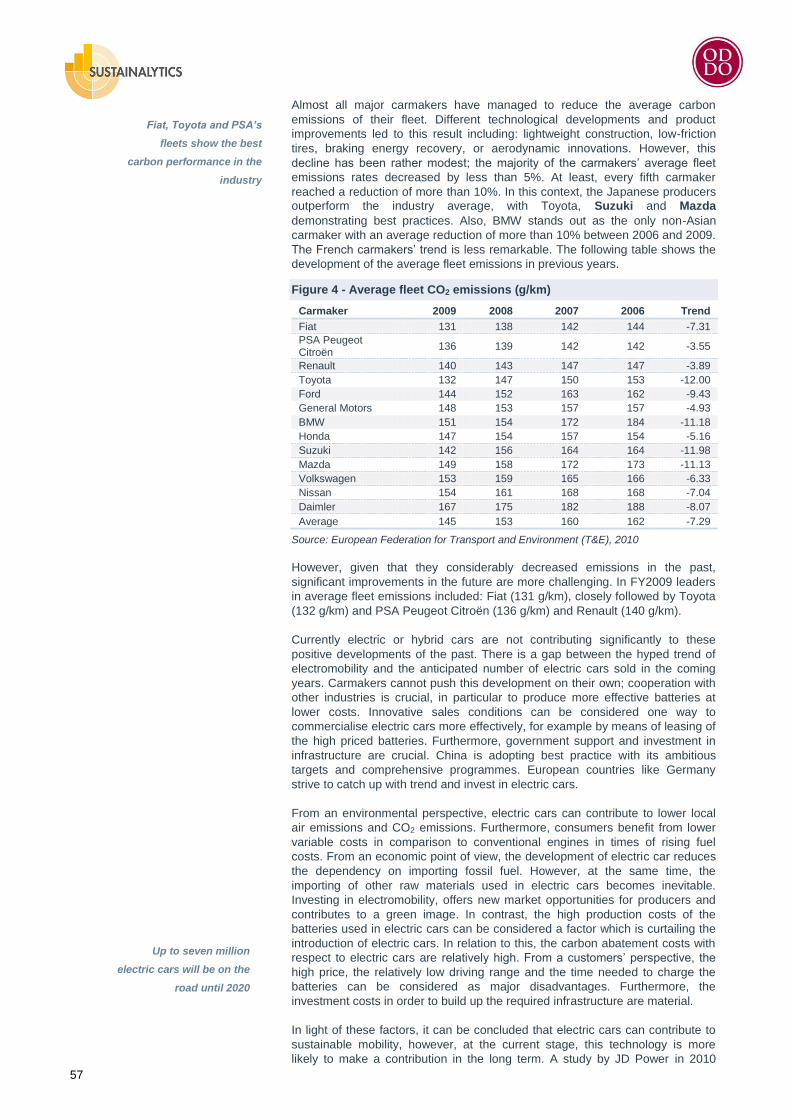
57
Almost all major carmakers have managed to reduce the average carbon
emissions of their fleet. Different technological developments and product
improvements led to this result including: lightweight construction, low-friction
tires, braking energy recovery, or aerodynamic innovations. However, this
decline has been rather modest; the majority of the carmakers‘ average fleet
emissions rates decreased by less than 5%. At least, every fifth carmaker
reached a reduction of more than 10%. In this context, the Japanese producers
outperform the industry average, with Toyota, Suzuki and Mazda
demonstrating best practices. Also, BMW stands out as the only non-Asian
carmaker with an average reduction of more than 10% between 2006 and 2009.
The French carmakers‘ trend is less remarkable. The following table shows the
development of the average fleet emissions in previous years.
Figure 4 - Average fleet CO2 emissions (g/km)
Carmaker 2009 2008 2007 2006 Trend
Fiat 131 138 142 144 -7.31
PSA Peugeot Citroën
136 139 142 142 -3.55
Renault 140 143 147 147 -3.89
Toyota 132 147 150 153 -12.00
Ford 144 152 163 162 -9.43
General Motors 148 153 157 157 -4.93
BMW 151 154 172 184 -11.18
Honda 147 154 157 154 -5.16
Suzuki 142 156 164 164 -11.98
Mazda 149 158 172 173 -11.13
Volkswagen 153 159 165 166 -6.33
Nissan 154 161 168 168 -7.04
Daimler 167 175 182 188 -8.07
Average 145 153 160 162 -7.29
Source: European Federation for Transport and Environment (T&E), 2010
However, given that they considerably decreased emissions in the past,
significant improvements in the future are more challenging. In FY2009 leaders
in average fleet emissions included: Fiat (131 g/km), closely followed by Toyota
(132 g/km) and PSA Peugeot Citroën (136 g/km) and Renault (140 g/km).
Currently electric or hybrid cars are not contributing significantly to these
positive developments of the past. There is a gap between the hyped trend of
electromobility and the anticipated number of electric cars sold in the coming
years. Carmakers cannot push this development on their own; cooperation with
other industries is crucial, in particular to produce more effective batteries at
lower costs. Innovative sales conditions can be considered one way to
commercialise electric cars more effectively, for example by means of leasing of
the high priced batteries. Furthermore, government support and investment in
infrastructure are crucial. China is adopting best practice with its ambitious
targets and comprehensive programmes. European countries like Germany
strive to catch up with trend and invest in electric cars.
From an environmental perspective, electric cars can contribute to lower local
air emissions and CO2 emissions. Furthermore, consumers benefit from lower
variable costs in comparison to conventional engines in times of rising fuel
costs. From an economic point of view, the development of electric car reduces
the dependency on importing fossil fuel. However, at the same time, the
importing of other raw materials used in electric cars becomes inevitable.
Investing in electromobility, offers new market opportunities for producers and
contributes to a green image. In contrast, the high production costs of the
batteries used in electric cars can be considered a factor which is curtailing the
introduction of electric cars. In relation to this, the carbon abatement costs with
respect to electric cars are relatively high. From a customers‘ perspective, the
high price, the relatively low driving range and the time needed to charge the
batteries can be considered as major disadvantages. Furthermore, the
investment costs in order to build up the required infrastructure are material.
In light of these factors, it can be concluded that electric cars can contribute to
sustainable mobility, however, at the current stage, this technology is more
likely to make a contribution in the long term. A study by JD Power in 2010
Fiat, Toyota and PSA’s
fleets show the best
carbon performance in the
industry
Up to seven million
electric cars will be on the
road until 2020
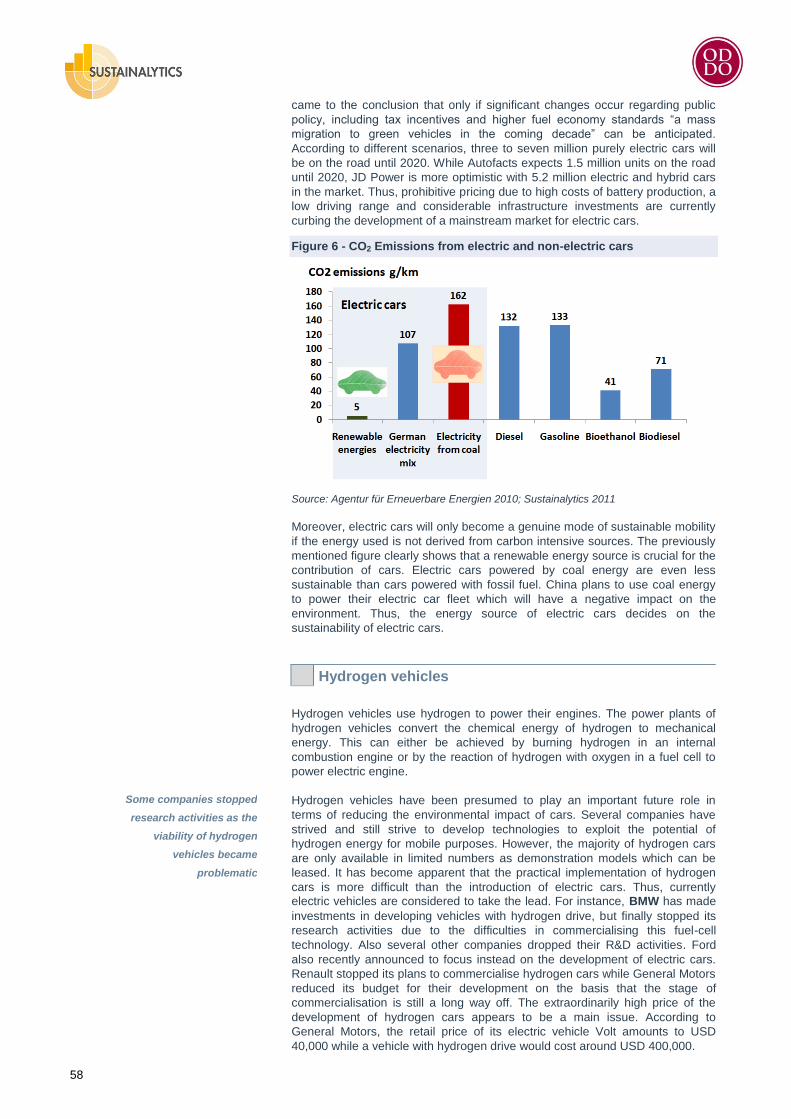
58
came to the conclusion that only if significant changes occur regarding public
policy, including tax incentives and higher fuel economy standards ―a mass
migration to green vehicles in the coming decade‖ can be anticipated.
According to different scenarios, three to seven million purely electric cars will
be on the road until 2020. While Autofacts expects 1.5 million units on the road
until 2020, JD Power is more optimistic with 5.2 million electric and hybrid cars
in the market. Thus, prohibitive pricing due to high costs of battery production, a
low driving range and considerable infrastructure investments are currently
curbing the development of a mainstream market for electric cars.
Figure 6 - CO2 Emissions from electric and non-electric cars
Source: Agentur für Erneuerbare Energien 2010; Sustainalytics 2011
Moreover, electric cars will only become a genuine mode of sustainable mobility
if the energy used is not derived from carbon intensive sources. The previously
mentioned figure clearly shows that a renewable energy source is crucial for the
contribution of cars. Electric cars powered by coal energy are even less
sustainable than cars powered with fossil fuel. China plans to use coal energy
to power their electric car fleet which will have a negative impact on the
environment. Thus, the energy source of electric cars decides on the
sustainability of electric cars.
Hydrogen vehicles
Hydrogen vehicles use hydrogen to power their engines. The power plants of
hydrogen vehicles convert the chemical energy of hydrogen to mechanical
energy. This can either be achieved by burning hydrogen in an internal
combustion engine or by the reaction of hydrogen with oxygen in a fuel cell to
power electric engine.
Hydrogen vehicles have been presumed to play an important future role in
terms of reducing the environmental impact of cars. Several companies have
strived and still strive to develop technologies to exploit the potential of
hydrogen energy for mobile purposes. However, the majority of hydrogen cars
are only available in limited numbers as demonstration models which can be
leased. It has become apparent that the practical implementation of hydrogen
cars is more difficult than the introduction of electric cars. Thus, currently
electric vehicles are considered to take the lead. For instance, BMW has made
investments in developing vehicles with hydrogen drive, but finally stopped its
research activities due to the difficulties in commercialising this fuel-cell
technology. Also several other companies dropped their R&D activities. Ford
also recently announced to focus instead on the development of electric cars.
Renault stopped its plans to commercialise hydrogen cars while General Motors
reduced its budget for their development on the basis that the stage of
commercialisation is still a long way off. The extraordinarily high price of the
development of hydrogen cars appears to be a main issue. According to
General Motors, the retail price of its electric vehicle Volt amounts to USD
40,000 while a vehicle with hydrogen drive would cost around USD 400,000.
Some companies stopped
research activities as the
viability of hydrogen
vehicles became
problematic
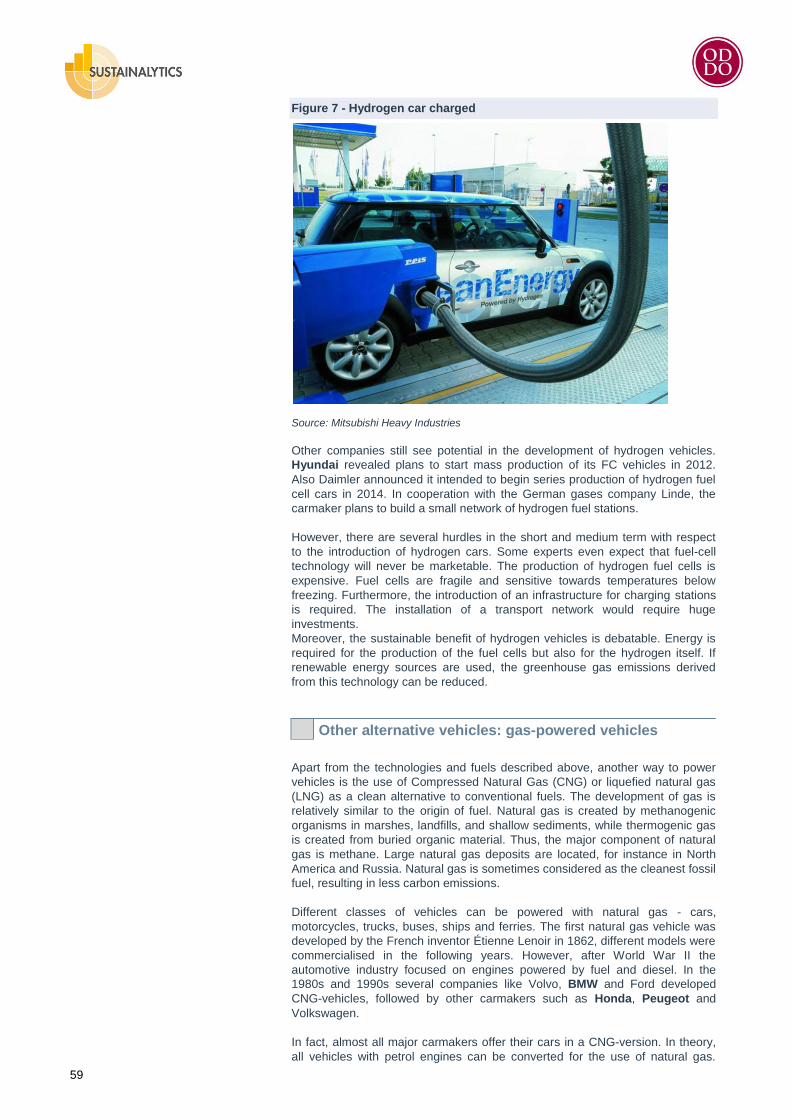
59
Figure 7 - Hydrogen car charged
Source: Mitsubishi Heavy Industries
Other companies still see potential in the development of hydrogen vehicles.
Hyundai revealed plans to start mass production of its FC vehicles in 2012.
Also Daimler announced it intended to begin series production of hydrogen fuel
cell cars in 2014. In cooperation with the German gases company Linde, the
carmaker plans to build a small network of hydrogen fuel stations.
However, there are several hurdles in the short and medium term with respect
to the introduction of hydrogen cars. Some experts even expect that fuel-cell
technology will never be marketable. The production of hydrogen fuel cells is
expensive. Fuel cells are fragile and sensitive towards temperatures below
freezing. Furthermore, the introduction of an infrastructure for charging stations
is required. The installation of a transport network would require huge
investments.
Moreover, the sustainable benefit of hydrogen vehicles is debatable. Energy is
required for the production of the fuel cells but also for the hydrogen itself. If
renewable energy sources are used, the greenhouse gas emissions derived
from this technology can be reduced.
Other alternative vehicles: gas-powered vehicles
Apart from the technologies and fuels described above, another way to power
vehicles is the use of Compressed Natural Gas (CNG) or liquefied natural gas
(LNG) as a clean alternative to conventional fuels. The development of gas is
relatively similar to the origin of fuel. Natural gas is created by methanogenic
organisms in marshes, landfills, and shallow sediments, while thermogenic gas
is created from buried organic material. Thus, the major component of natural
gas is methane. Large natural gas deposits are located, for instance in North
America and Russia. Natural gas is sometimes considered as the cleanest fossil
fuel, resulting in less carbon emissions.
Different classes of vehicles can be powered with natural gas - cars,
motorcycles, trucks, buses, ships and ferries. The first natural gas vehicle was
developed by the French inventor Étienne Lenoir in 1862, different models were
commercialised in the following years. However, after World War II the
automotive industry focused on engines powered by fuel and diesel. In the
1980s and 1990s several companies like Volvo, BMW and Ford developed
CNG-vehicles, followed by other carmakers such as Honda, Peugeot and
Volkswagen.
In fact, almost all major carmakers offer their cars in a CNG-version. In theory,
all vehicles with petrol engines can be converted for the use of natural gas.
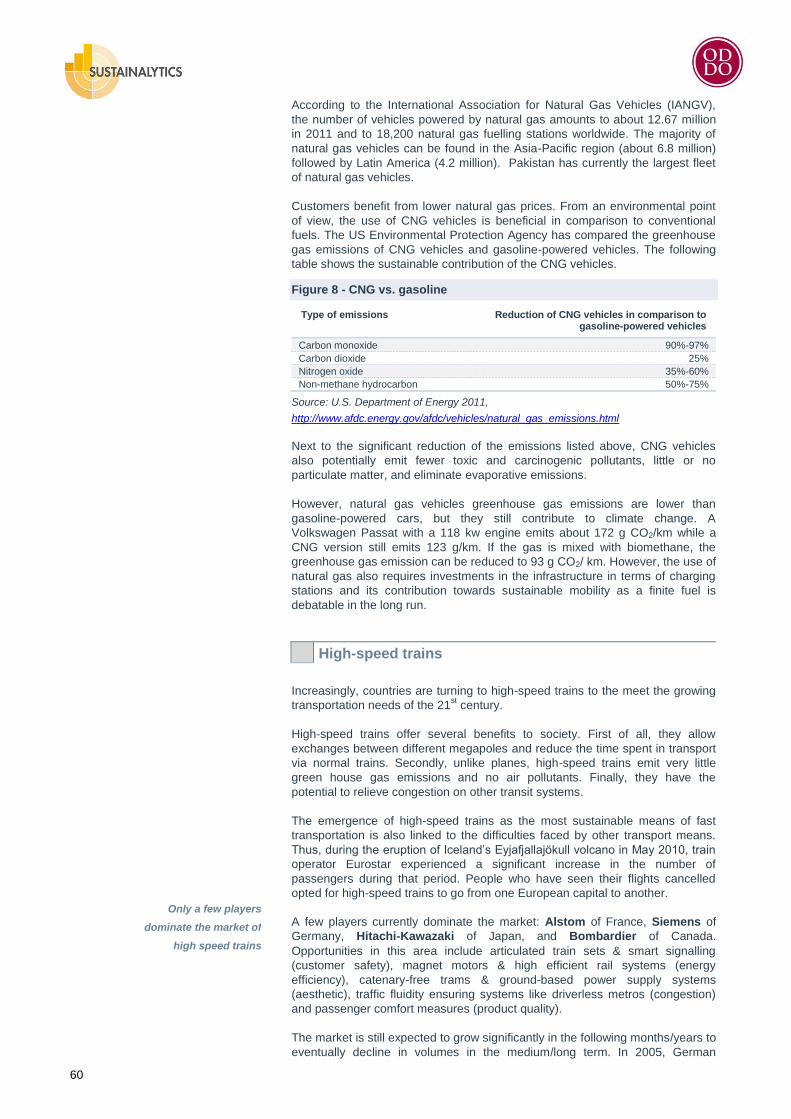
60
According to the International Association for Natural Gas Vehicles (IANGV),
the number of vehicles powered by natural gas amounts to about 12.67 million
in 2011 and to 18,200 natural gas fuelling stations worldwide. The majority of
natural gas vehicles can be found in the Asia-Pacific region (about 6.8 million)
followed by Latin America (4.2 million). Pakistan has currently the largest fleet
of natural gas vehicles.
Customers benefit from lower natural gas prices. From an environmental point
of view, the use of CNG vehicles is beneficial in comparison to conventional
fuels. The US Environmental Protection Agency has compared the greenhouse
gas emissions of CNG vehicles and gasoline-powered vehicles. The following
table shows the sustainable contribution of the CNG vehicles.
Figure 8 - CNG vs. gasoline
Type of emissions Reduction of CNG vehicles in comparison to gasoline-powered vehicles
Carbon monoxide 90%-97%
Carbon dioxide 25%
Nitrogen oxide 35%-60%
Non-methane hydrocarbon 50%-75%
Source: U.S. Department of Energy 2011,
http://www.afdc.energy.gov/afdc/vehicles/natural_gas_emissions.html
Next to the significant reduction of the emissions listed above, CNG vehicles
also potentially emit fewer toxic and carcinogenic pollutants, little or no
particulate matter, and eliminate evaporative emissions.
However, natural gas vehicles greenhouse gas emissions are lower than
gasoline-powered cars, but they still contribute to climate change. A
Volkswagen Passat with a 118 kw engine emits about 172 g CO2/km while a
CNG version still emits 123 g/km. If the gas is mixed with biomethane, the
greenhouse gas emission can be reduced to 93 g CO2/ km. However, the use of
natural gas also requires investments in the infrastructure in terms of charging
stations and its contribution towards sustainable mobility as a finite fuel is
debatable in the long run.
High-speed trains
Increasingly, countries are turning to high-speed trains to the meet the growing
transportation needs of the 21st century.
High-speed trains offer several benefits to society. First of all, they allow
exchanges between different megapoles and reduce the time spent in transport
via normal trains. Secondly, unlike planes, high-speed trains emit very little
green house gas emissions and no air pollutants. Finally, they have the
potential to relieve congestion on other transit systems.
The emergence of high-speed trains as the most sustainable means of fast
transportation is also linked to the difficulties faced by other transport means.
Thus, during the eruption of Iceland‘s Eyjafjallajökull volcano in May 2010, train
operator Eurostar experienced a significant increase in the number of
passengers during that period. People who have seen their flights cancelled
opted for high-speed trains to go from one European capital to another.
A few players currently dominate the market: Alstom of France, Siemens of
Germany, Hitachi-Kawazaki of Japan, and Bombardier of Canada.
Opportunities in this area include articulated train sets & smart signalling
(customer safety), magnet motors & high efficient rail systems (energy
efficiency), catenary-free trams & ground-based power supply systems
(aesthetic), traffic fluidity ensuring systems like driverless metros (congestion)
and passenger comfort measures (product quality).
The market is still expected to grow significantly in the following months/years to
eventually decline in volumes in the medium/long term. In 2005, German
Only a few players
dominate the market of
high speed trains
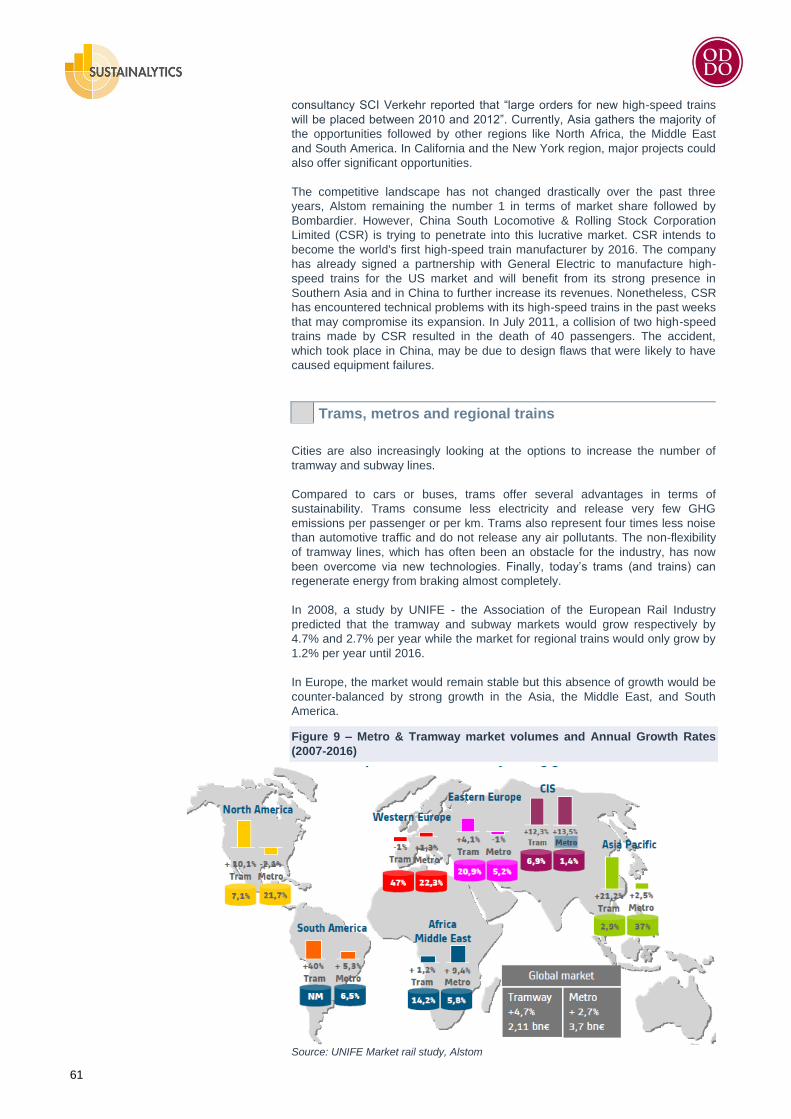
61
consultancy SCI Verkehr reported that ―large orders for new high-speed trains
will be placed between 2010 and 2012‖. Currently, Asia gathers the majority of
the opportunities followed by other regions like North Africa, the Middle East
and South America. In California and the New York region, major projects could
also offer significant opportunities.
The competitive landscape has not changed drastically over the past three
years, Alstom remaining the number 1 in terms of market share followed by
Bombardier. However, China South Locomotive & Rolling Stock Corporation
Limited (CSR) is trying to penetrate into this lucrative market. CSR intends to
become the world's first high-speed train manufacturer by 2016. The company
has already signed a partnership with General Electric to manufacture high-
speed trains for the US market and will benefit from its strong presence in
Southern Asia and in China to further increase its revenues. Nonetheless, CSR
has encountered technical problems with its high-speed trains in the past weeks
that may compromise its expansion. In July 2011, a collision of two high-speed
trains made by CSR resulted in the death of 40 passengers. The accident,
which took place in China, may be due to design flaws that were likely to have
caused equipment failures.
Trams, metros and regional trains
Cities are also increasingly looking at the options to increase the number of
tramway and subway lines.
Compared to cars or buses, trams offer several advantages in terms of
sustainability. Trams consume less electricity and release very few GHG
emissions per passenger or per km. Trams also represent four times less noise
than automotive traffic and do not release any air pollutants. The non-flexibility
of tramway lines, which has often been an obstacle for the industry, has now
been overcome via new technologies. Finally, today‘s trams (and trains) can
regenerate energy from braking almost completely.
In 2008, a study by UNIFE - the Association of the European Rail Industry
predicted that the tramway and subway markets would grow respectively by
4.7% and 2.7% per year while the market for regional trains would only grow by
1.2% per year until 2016.
In Europe, the market would remain stable but this absence of growth would be
counter-balanced by strong growth in the Asia, the Middle East, and South
America.
Figure 9 – Metro & Tramway market volumes and Annual Growth Rates
(2007-2016)
Source: UNIFE Market rail study, Alstom
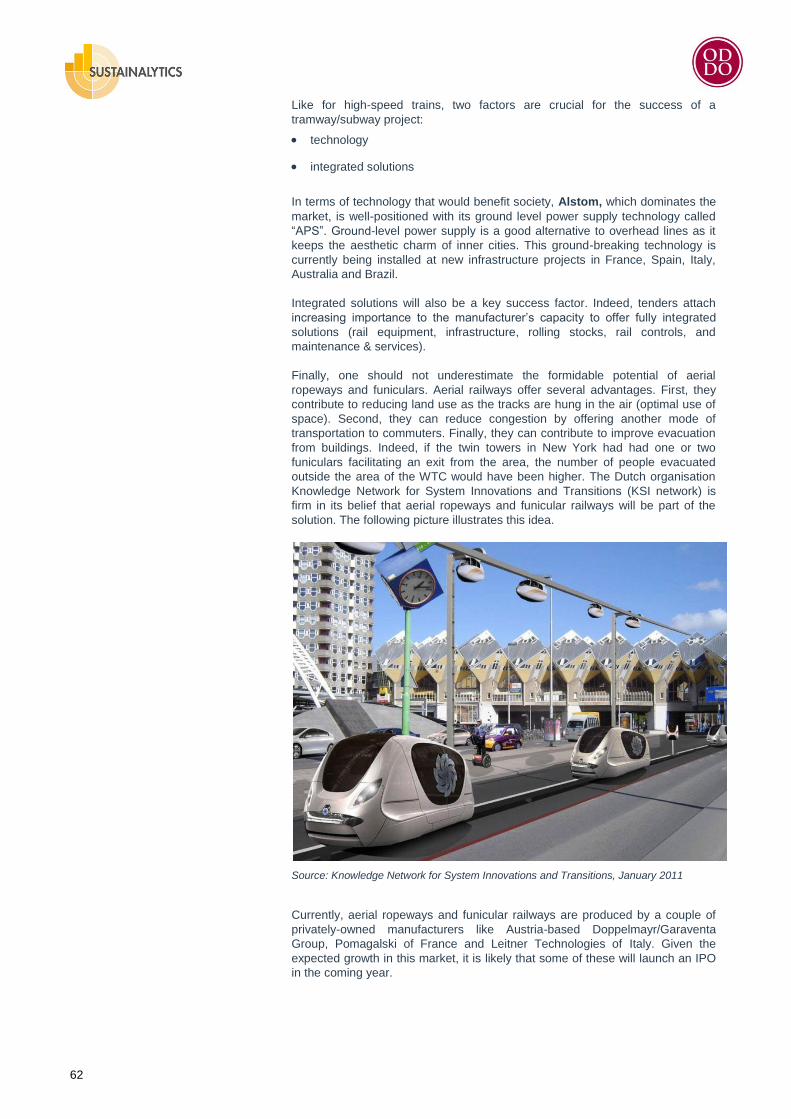
62
Like for high-speed trains, two factors are crucial for the success of a
tramway/subway project:
technology
integrated solutions
In terms of technology that would benefit society, Alstom, which dominates the
market, is well-positioned with its ground level power supply technology called
―APS‖. Ground-level power supply is a good alternative to overhead lines as it
keeps the aesthetic charm of inner cities. This ground-breaking technology is
currently being installed at new infrastructure projects in France, Spain, Italy,
Australia and Brazil.
Integrated solutions will also be a key success factor. Indeed, tenders attach
increasing importance to the manufacturer‘s capacity to offer fully integrated
solutions (rail equipment, infrastructure, rolling stocks, rail controls, and
maintenance & services).
Finally, one should not underestimate the formidable potential of aerial
ropeways and funiculars. Aerial railways offer several advantages. First, they
contribute to reducing land use as the tracks are hung in the air (optimal use of
space). Second, they can reduce congestion by offering another mode of
transportation to commuters. Finally, they can contribute to improve evacuation
from buildings. Indeed, if the twin towers in New York had had one or two
funiculars facilitating an exit from the area, the number of people evacuated
outside the area of the WTC would have been higher. The Dutch organisation
Knowledge Network for System Innovations and Transitions (KSI network) is
firm in its belief that aerial ropeways and funicular railways will be part of the
solution. The following picture illustrates this idea.
Source: Knowledge Network for System Innovations and Transitions, January 2011
Currently, aerial ropeways and funicular railways are produced by a couple of
privately-owned manufacturers like Austria-based Doppelmayr/Garaventa
Group, Pomagalski of France and Leitner Technologies of Italy. Given the
expected growth in this market, it is likely that some of these will launch an IPO
in the coming year.
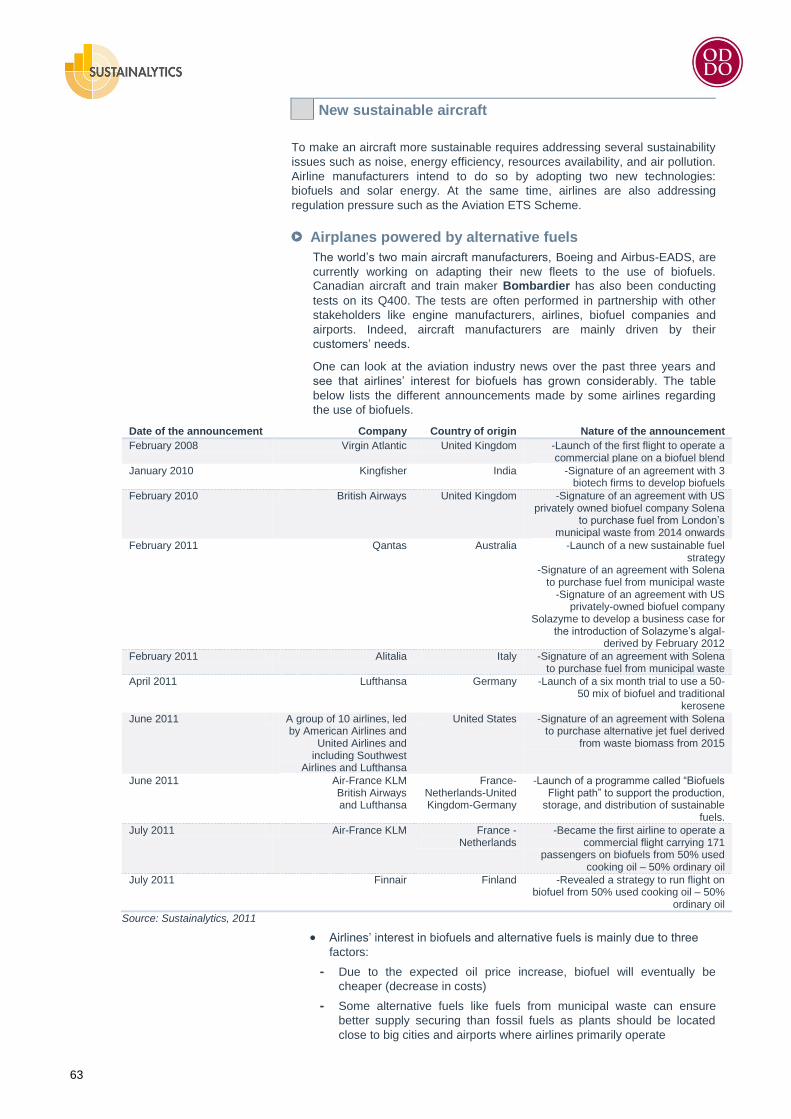
63
New sustainable aircraft
To make an aircraft more sustainable requires addressing several sustainability
issues such as noise, energy efficiency, resources availability, and air pollution.
Airline manufacturers intend to do so by adopting two new technologies:
biofuels and solar energy. At the same time, airlines are also addressing
regulation pressure such as the Aviation ETS Scheme.
Airplanes powered by alternative fuels
The world‘s two main aircraft manufacturers, Boeing and Airbus-EADS, are
currently working on adapting their new fleets to the use of biofuels.
Canadian aircraft and train maker Bombardier has also been conducting
tests on its Q400. The tests are often performed in partnership with other
stakeholders like engine manufacturers, airlines, biofuel companies and
airports. Indeed, aircraft manufacturers are mainly driven by their
customers‘ needs.
One can look at the aviation industry news over the past three years and
see that airlines‘ interest for biofuels has grown considerably. The table
below lists the different announcements made by some airlines regarding
the use of biofuels.
Date of the announcement Company Country of origin Nature of the announcement
February 2008 Virgin Atlantic United Kingdom -Launch of the first flight to operate a commercial plane on a biofuel blend
January 2010 Kingfisher India -Signature of an agreement with 3 biotech firms to develop biofuels
February 2010 British Airways United Kingdom -Signature of an agreement with US privately owned biofuel company Solena
to purchase fuel from London‘s municipal waste from 2014 onwards
February 2011 Qantas Australia -Launch of a new sustainable fuel strategy
-Signature of an agreement with Solena to purchase fuel from municipal waste
-Signature of an agreement with US privately-owned biofuel company
Solazyme to develop a business case for the introduction of Solazyme‘s algal-
derived by February 2012
February 2011 Alitalia Italy -Signature of an agreement with Solena to purchase fuel from municipal waste
April 2011 Lufthansa Germany -Launch of a six month trial to use a 50-50 mix of biofuel and traditional
kerosene
June 2011 A group of 10 airlines, led by American Airlines and
United Airlines and including Southwest
Airlines and Lufthansa
United States -Signature of an agreement with Solena to purchase alternative jet fuel derived
from waste biomass from 2015
June 2011 Air-France KLM British Airways and Lufthansa
France-Netherlands-United Kingdom-Germany
-Launch of a programme called ―Biofuels Flight path‖ to support the production,
storage, and distribution of sustainable fuels.
July 2011 Air-France KLM France - Netherlands
-Became the first airline to operate a commercial flight carrying 171
passengers on biofuels from 50% used cooking oil – 50% ordinary oil
July 2011 Finnair Finland -Revealed a strategy to run flight on biofuel from 50% used cooking oil – 50%
ordinary oil
Source: Sustainalytics, 2011
Airlines‘ interest in biofuels and alternative fuels is mainly due to three
factors:
- Due to the expected oil price increase, biofuel will eventually be
cheaper (decrease in costs)
- Some alternative fuels like fuels from municipal waste can ensure
better supply securing than fossil fuels as plants should be located
close to big cities and airports where airlines primarily operate
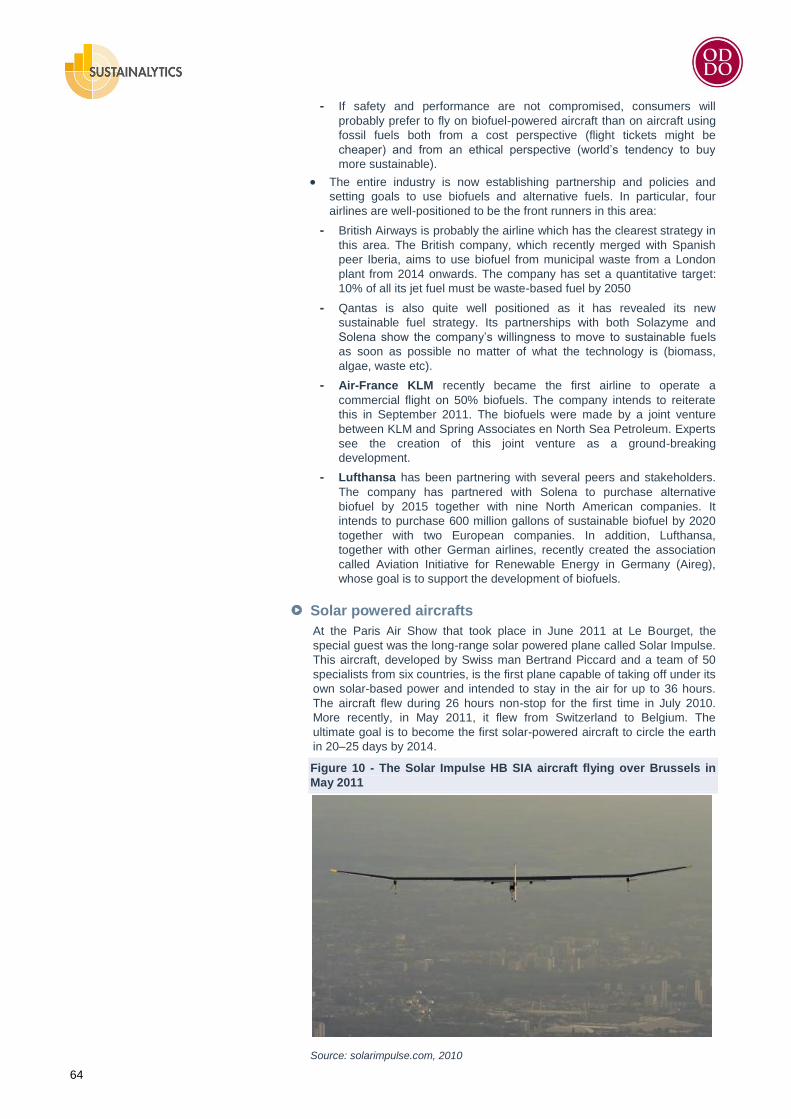
64
- If safety and performance are not compromised, consumers will
probably prefer to fly on biofuel-powered aircraft than on aircraft using
fossil fuels both from a cost perspective (flight tickets might be
cheaper) and from an ethical perspective (world‘s tendency to buy
more sustainable).
The entire industry is now establishing partnership and policies and
setting goals to use biofuels and alternative fuels. In particular, four
airlines are well-positioned to be the front runners in this area:
- British Airways is probably the airline which has the clearest strategy in
this area. The British company, which recently merged with Spanish
peer Iberia, aims to use biofuel from municipal waste from a London
plant from 2014 onwards. The company has set a quantitative target:
10% of all its jet fuel must be waste-based fuel by 2050
- Qantas is also quite well positioned as it has revealed its new
sustainable fuel strategy. Its partnerships with both Solazyme and
Solena show the company‘s willingness to move to sustainable fuels
as soon as possible no matter of what the technology is (biomass,
algae, waste etc).
- Air-France KLM recently became the first airline to operate a
commercial flight on 50% biofuels. The company intends to reiterate
this in September 2011. The biofuels were made by a joint venture
between KLM and Spring Associates en North Sea Petroleum. Experts
see the creation of this joint venture as a ground-breaking
development.
- Lufthansa has been partnering with several peers and stakeholders.
The company has partnered with Solena to purchase alternative
biofuel by 2015 together with nine North American companies. It
intends to purchase 600 million gallons of sustainable biofuel by 2020
together with two European companies. In addition, Lufthansa,
together with other German airlines, recently created the association
called Aviation Initiative for Renewable Energy in Germany (Aireg),
whose goal is to support the development of biofuels.
Solar powered aircrafts
At the Paris Air Show that took place in June 2011 at Le Bourget, the
special guest was the long-range solar powered plane called Solar Impulse.
This aircraft, developed by Swiss man Bertrand Piccard and a team of 50
specialists from six countries, is the first plane capable of taking off under its
own solar-based power and intended to stay in the air for up to 36 hours.
The aircraft flew during 26 hours non-stop for the first time in July 2010.
More recently, in May 2011, it flew from Switzerland to Belgium. The
ultimate goal is to become the first solar-powered aircraft to circle the earth
in 20–25 days by 2014.
Figure 10 - The Solar Impulse HB SIA aircraft flying over Brussels in
May 2011
Source: solarimpulse.com, 2010
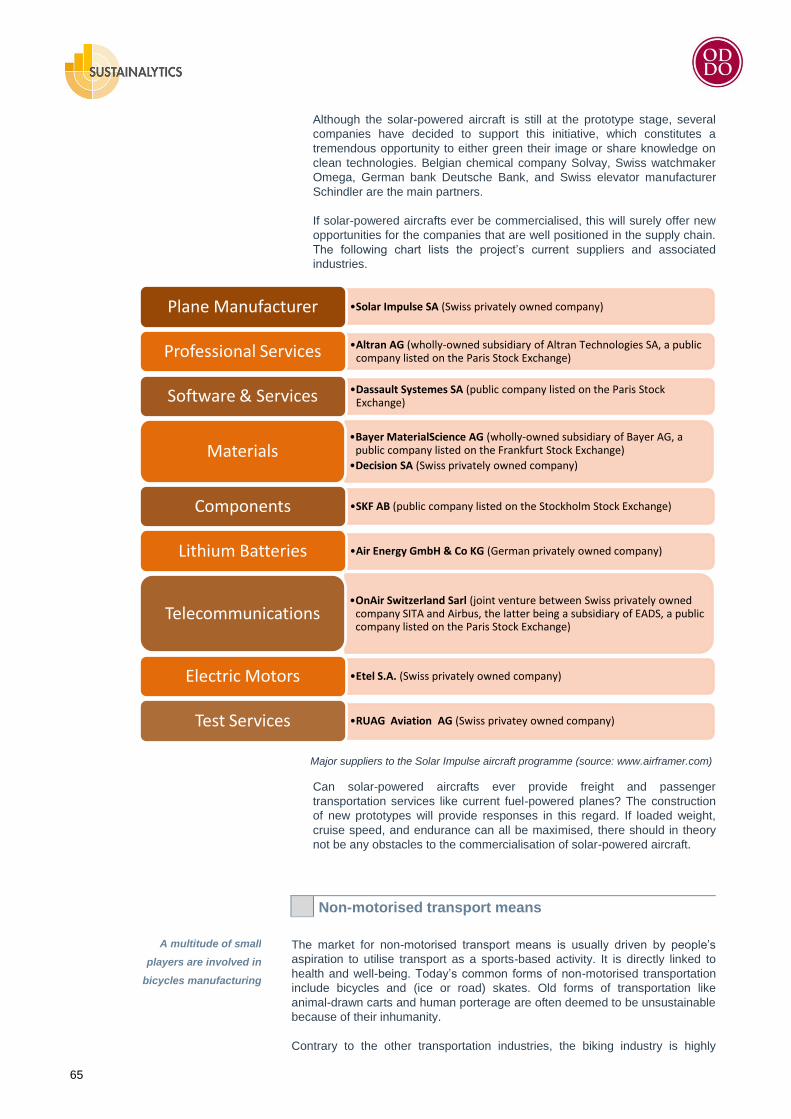
65
Although the solar-powered aircraft is still at the prototype stage, several
companies have decided to support this initiative, which constitutes a
tremendous opportunity to either green their image or share knowledge on
clean technologies. Belgian chemical company Solvay, Swiss watchmaker
Omega, German bank Deutsche Bank, and Swiss elevator manufacturer
Schindler are the main partners.
If solar-powered aircrafts ever be commercialised, this will surely offer new
opportunities for the companies that are well positioned in the supply chain.
The following chart lists the project‘s current suppliers and associated
industries.
Major suppliers to the Solar Impulse aircraft programme (source: www.airframer.com)
Can solar-powered aircrafts ever provide freight and passenger
transportation services like current fuel-powered planes? The construction
of new prototypes will provide responses in this regard. If loaded weight,
cruise speed, and endurance can all be maximised, there should in theory
not be any obstacles to the commercialisation of solar-powered aircraft.
Non-motorised transport means
The market for non-motorised transport means is usually driven by people‘s
aspiration to utilise transport as a sports-based activity. It is directly linked to
health and well-being. Today‘s common forms of non-motorised transportation
include bicycles and (ice or road) skates. Old forms of transportation like
animal-drawn carts and human porterage are often deemed to be unsustainable
because of their inhumanity.
Contrary to the other transportation industries, the biking industry is highly
•Solar Impulse SA (Swiss privately owned company) Plane Manufacturer
•Altran AG (wholly-owned subsidiary of Altran Technologies SA, a public company listed on the Paris Stock Exchange) Professional Services
•Dassault Systemes SA (public company listed on the Paris Stock Exchange) Software & Services
•Bayer MaterialScience AG (wholly-owned subsidiary of Bayer AG, a public company listed on the Frankfurt Stock Exchange)
•Decision SA (Swiss privately owned company) Materials
•SKF AB (public company listed on the Stockholm Stock Exchange) Components
•Air Energy GmbH & Co KG (German privately owned company) Lithium Batteries
•OnAir Switzerland Sarl (joint venture between Swiss privately owned company SITA and Airbus, the latter being a subsidiary of EADS, a public company listed on the Paris Stock Exchange)
Telecommunications
•Etel S.A. (Swiss privately owned company) Electric Motors
•RUAG Aviation AG (Swiss privatey owned company) Test Services
A multitude of small
players are involved in
bicycles manufacturing
66
dependent on factors such as weather conditions and seasonality. The overall
lack of infrastructure (biking paths or roads, parking space, etc.) is also not
encouraging customers to change. Despite such constraints, the outlook looks
relatively positive.
The worldwide bicycle market is currently dominated by two Asian companies,
Chinese privately-owned Tianjin Fushida and Taiwan-based Giant
Manufacturing, and by a multitude of smaller players.
Contrary to auto, train or aircraft manufacturers, the major bicycle
manufacturers often do not report on CSR issues, making it difficult to
benchmark companies. Yet, the industry faces several environmental and social
challenges (working conditions, water/soil contamination from painting activities,
sourcing of aluminium or diversified metals etc). However, some companies like
Dutch company Accell and Indian company Atlas Cycles have made
significant efforts to disclose a clear CSR strategy.
Electric bicycles also represent a major opportunity for bike manufacturers. In
China, for example, the annual production of electric has increased from 58,000
in 1998 to 27 million in 2010 (source: Chinese Statistics Bureau). This growth is
due to several factors:
the expansion of cities implies congestion in some areas;
because they use less space than other vehicles and their average speed is
the same as cars and buses, bikes are often the best alternative for short
distances (<less than 5 km);
the expansion of cities often implies a longer distance between the living
place and the work place (therefore an electric bike is needed);
increased salaries (electric bikes being more expensive than normal bikes)
Component producers in the world
Sustainable mobility also constitutes an opportunity for manufacturers‘ and
infrastructure companies‘ suppliers. We have selected seven
components/systems that will be key for the emergence of sustainable forms of
transportation: electric batteries, charging systems, energy-efficient tyres,
recycling of materials, rail track components, aircraft engines and electrical
propulsion systems for ships.
Electric batteries
Batteries are an essential part of electric cars. They can be considered as the
key technology as batteries are used as energy storage in the cars. There are
different types of batteries applied to cars. Traditionally, the majority of electric
vehicles used lead-acid batteries which are affordable and highly available. In
recent years, lithium-ion batteries, which are commonly used in consumer
electronics like laptops, became the dominating types of batteries for the
development of electric cars. There are also other types of batteries like nickel-
metal hydride batteries which can be considered a relatively mature technology.
The further development of batteries can be considered crucial. There had been
some safety issues with respect to electric batteries used in cars like accident
reports and fire hazards. Furthermore, batteries are still the most expensive
component in the car. Therefore, the reduction of production costs is an
essential factor to commercialise electric vehicles as a mass-market product.
Several companies are striving to develop new types of batteries at a lower
price and with advanced features. For instance, the French company Bolloré
respectively its subsidiary Batscap developed a concept car the "Bluecar" using
Lithium metal polymer (LMP) batteries with a range of 250 km and a maximum
speed of 125 km/h. These LMP batteries feature a higher energy capacity per
unit volume and unit weight. Fully recharging the battery needs six hours while
a two-hour charge will recover 50% capacity.
Batteries are still the most
expensive components in
a car
67
The Chinese company BYD appears to be another promising company. The
former battery manufacturer bought a Chinese carmaker in 2003 and now
combines battery technology and car manufacturing skills. Currently, BYD
further develops lithium iron phosphate batteries which are suitable for high
energy demand providing good safety characteristics and an excellent
electrochemical performance.
Exide Technologies, the world's second-largest producer of automotive lead
acid batteries for automotive and industrial applications, has the potential to
contribute to sustainable mobility with its products. Exide Technologies
develops sole lead-acid battery supplying for instance the Indian company,
Mahindra Reva Electric Vehicles, formerly known as the Reva Electric Car
Company, which designs and manufactures compact electric vehicles. Another
noteworthy producer in this sector is the French firm SAFT.
Charging systems for electric cars
A crucial element of the successful introduction of electric cars is the installation
of systems to charge the batteries of the car. In fact, electric car can be charged
at sockets, but not every driver has the chance to connect his electric car with
the socket. Therefore, charging stations have to be build up to guarantee a
power supply. This expansion of the infrastructure results in high investment
costs. On the positive side, some studies show that there is no need for further
power plants to ensure the energy supply of electric cars. According to the
German Frauenhofer Institute, even if electric cars represent 17% of the
national fleet in Germany, no new plants need to be built. However, after this
threshold, new facilities should be constructed.
The charging time can still be considered an issue for the mass market
introduction of electric cars. It is mainly limited by the capacity of the grid
connection. Average charging times also varies between the different car types.
In order to avoid charging times of six and more hours, fast charging is possible
with some battery types like Lithium-titanate, or certain NiMH variants with
charging times of only 10–20 minutes.
Several companies are involved in the development of an infrastructure for
electric cars. The US-American company Harman International and German
utility company RWE are working on the development of charging systems
featuring fast and secure connections.
Energy-efficient tyres
Along with the engine and the battery, the tyre is one of the components that
require specific attention to achieve the sustainable mobility goals. Tyre
manufacturers like Italian company Pirelli have the opportunity to make
significant progress in terms of energy efficiency. The Pirelli Cinturato and the
white diesel fuel Pirelli GECAM™, for instance, feature innovative compounds,
structure and tread patterns that ensure lower consumption and carbon dioxide
emissions, better durability and improved safety characteristics in both wet and
dry conditions. The company expects that its percentage of green performance
products sales will rise from 37% of the total at the end of 2010 to more than
45% by the end of 2013. Other companies like Michelin are also committed to
sustainable mobility and offer tyres that offer a significant reduction in fuel
consumption (8%).
Recycling of materials
With the expected increase in vehicles in some regions of the world and the
probable more stringent regulations faced by diversified metal companies in the
Rapid charging systems
are key
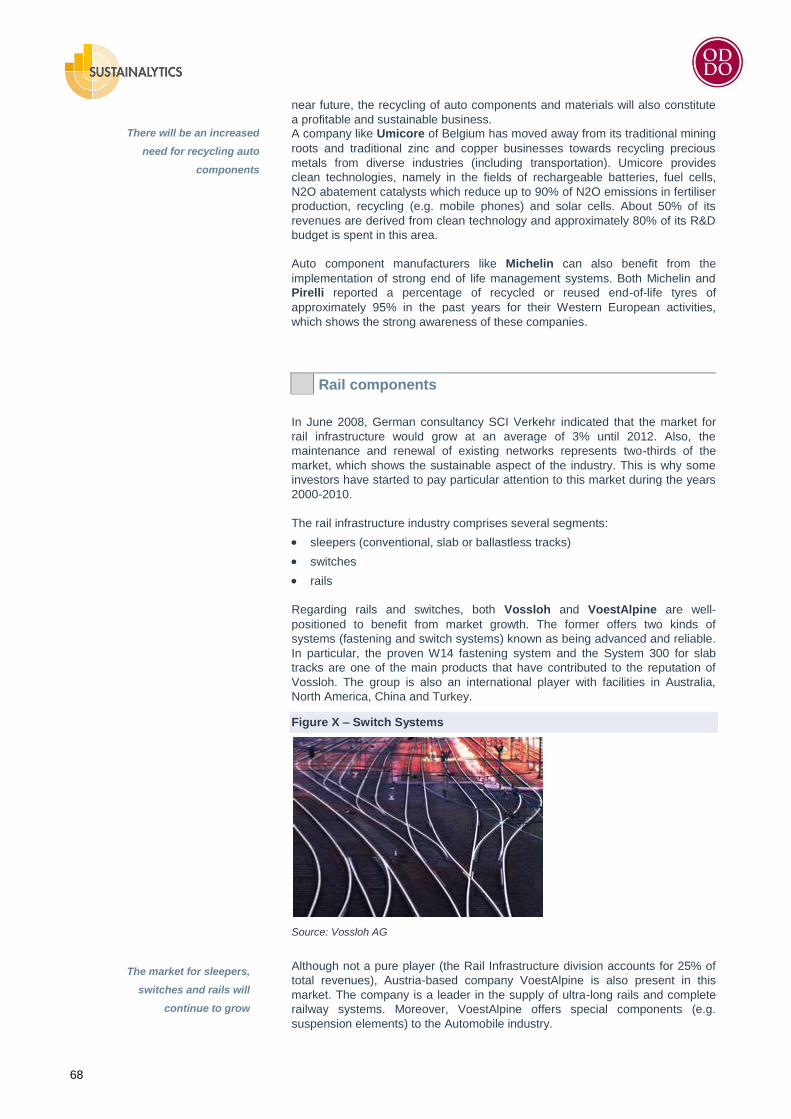
68
near future, the recycling of auto components and materials will also constitute
a profitable and sustainable business.
A company like Umicore of Belgium has moved away from its traditional mining
roots and traditional zinc and copper businesses towards recycling precious
metals from diverse industries (including transportation). Umicore provides
clean technologies, namely in the fields of rechargeable batteries, fuel cells,
N2O abatement catalysts which reduce up to 90% of N2O emissions in fertiliser
production, recycling (e.g. mobile phones) and solar cells. About 50% of its
revenues are derived from clean technology and approximately 80% of its R&D
budget is spent in this area.
Auto component manufacturers like Michelin can also benefit from the
implementation of strong end of life management systems. Both Michelin and
Pirelli reported a percentage of recycled or reused end-of-life tyres of
approximately 95% in the past years for their Western European activities,
which shows the strong awareness of these companies.
Rail components
In June 2008, German consultancy SCI Verkehr indicated that the market for
rail infrastructure would grow at an average of 3% until 2012. Also, the
maintenance and renewal of existing networks represents two-thirds of the
market, which shows the sustainable aspect of the industry. This is why some
investors have started to pay particular attention to this market during the years
2000-2010.
The rail infrastructure industry comprises several segments:
sleepers (conventional, slab or ballastless tracks)
switches
rails
Regarding rails and switches, both Vossloh and VoestAlpine are well-
positioned to benefit from market growth. The former offers two kinds of
systems (fastening and switch systems) known as being advanced and reliable.
In particular, the proven W14 fastening system and the System 300 for slab
tracks are one of the main products that have contributed to the reputation of
Vossloh. The group is also an international player with facilities in Australia,
North America, China and Turkey.
Figure X – Switch Systems
Source: Vossloh AG
Although not a pure player (the Rail Infrastructure division accounts for 25% of
total revenues), Austria-based company VoestAlpine is also present in this
market. The company is a leader in the supply of ultra-long rails and complete
railway systems. Moreover, VoestAlpine offers special components (e.g.
suspension elements) to the Automobile industry.
There will be an increased
need for recycling auto
components
The market for sleepers,
switches and rails will
continue to grow
69
A few other companies around the world are specialised in the supply of
sleepers. Thus, Indian Real Estate Company Alpine Housing Development
Corporation Limited and Australian Steel firm One Steel Limited are the main
suppliers of sleepers in their respective domestic markets.
This market has also seen considerable changes over the past decades. With
the construction of new high-speed railways, the conventional sleepers made of
concrete or steel have showed their limits as they could not handle the huge
pressure provoked by the move of the high-speed trains. A new generation of
sleepers called slab and ballastless tracks has emerged. German privately-
owned company Rail.One is the market leader in this area through its RHEDA
2000® ballastless track system.
The advantages of ballastless systems are multiple: lower maintenance
requirements, increased service life, high resistance allowing for future speed
increases, and the elimination of the risk of damaging vehicles through ballast
particles. Of course, these systems also have disadvantages (e.g. they cause
more vibrations) and they can suffer from other obstacles (e.g. railway systems
for the Shinkanzen in Japan and the high-speed trains in Europe are not
compatible).
Aircraft engines
Aircraft engine makers are facing increased pressure from European regulators
in Europe to make engines more energy efficient and less polluting. In terms of
Key Performance Indicators, the focus is, in particular, on the reduction of CO2
and NOX emissions.
The most promising technology to help tackle CO2 and NOX emissions is the
so-called Intercooled Recuperative Aeroengine (IRA). German company MTU
Aero Engines has been working on developing such a technology that can lead
to a 20% reduction in CO2 emissions and a 80% reduction in NOX emissions
versus existing engines (source: Oddo report on aircraft engines, April 2011).
Although there are still some obstacles to the actual commercialisation of such
an engine, this technology could lead MTU Aero Engines to a flourishing future
on the longer term.
Electrical propulsion systems for ships
Today, most of large-sized vessels run on conventional marine propulsion
systems that involve the combustion of heavy oil. The need to reduce fuel
consumption has paved the way for electric propulsion systems. In this area,
GE Energy (which recently acquired French power conversion company
Converteam) has developed a broad range of products and services for vessel
manufacturers. Privately-owned Norwegian company Stadt also has long-
standing experiences in this field. Electric propulsion offers several benefits like
high overall efficiency, low maintenance, weight and volume savings, and
reduced noise and vibration.
Energy Providers
The concept of sustainable mobility is also closely related to the need for more
sustainable energy sources. Several alternatives to fossil fuels exist. Among
them, biofuels and renewable electricity are the ones that mobilise most efforts.
IRA technology can lead to
a 80% reduction in NOX
emissions
70
The emergence of biofuels
Over the past few years, there has been an increased interest by various
stakeholders (transportation services providers, manufacturers, regulators,
biofuel producers, etc.) in increasing the production of non-fossil fuels. Biofuels
from crops were first presented as a good alternative to fossil fuels. However,
this category of biofuels rapidly became controversial as the production of crop-
based biofuels was deemed to compete with food production and to be carbon
intensive.
Attention then focused on other categories of biofuels that mobilise:
Municipal waste
Algae
Biomass (waste from the agricultural and forestry industries
Used oil (waste from the food and industrials sectors)
All four technologies will surely be viable as they are more or less
complementary. However, algae-based biofuel remains the most promising
technology. First, compared to crops like colza or sunflower), algae facilitate the
production of between 50% and 100% more fuel (source: Laboratoire national
de l’energie et de la geologie). Second, they are not dependent on seasons like
other crops. Third, they are not really demanding in terms of ground and space.
Fourth, algae also have the capacity to absorb a high amount of carbon dioxide
emissions. Finally, algae do not use agricultural land (contrary to crop-based
biofuels) or urban land (contrary to municipal waste). However, algae-based
biofuels are still at an early stage of development and this alternative will face
major obstacles against its commercialisation (high costs, difficulties to develop
large-scale production plants, etc).
Several biofuel companies are currently well-positioned to benefit from the
market‘s expected significant growth:
Algae US privately-owned company Solazyme, Spanish-listed company
Abengoa, and US-listed company Origin Oil;
Municipal waste
US privately-owned company Solena;
Biomass (waste from the agricultural and forestry industries)
German privately-owned company Choren Industries, French-listed
company Global Bioenergies, US-listed company Global Green Solutions;
Used oil (waste from the food and industrials sectors)
Dutch privately-owned company The North Sea Group
Although conventional, crop-based biofuels are controversial, the demand for
them is still expected to rise in the following years. Several oil and gas
companies like Royal Dutch Shell and BP are currently exploring several
options in this area. Among them, Neste Oil has positioned itself as the leading
provider of biodiesel. Although this technology is highly controversial, the
company has established stringent CSR policies regarding the production of
palm oil for example.
Companies developing enzymes are also expected to benefit from the current
shift to biofuels. Indeed, the success of the new generation of biofuels (from
biomass) is highly dependent on the enzymes used. For example, Novozymes
specialises in this area.
The recent demand from airlines such as KLM and Iberia for used cooking oil
will also offer more opportunities for new players like McDonald‘s or Burger King
to sell their cooking oil.
Renewable electricity: towards more
consolidation
The need for renewable electricity providers is expected to increase in the
coming years. With the expected increase in full electricity or hybrid vehicles,
Neste Oil is the leading
provider of biodiesel and
has adequate CSR policies
in place
71
demand for renewable energy will surely grow in the following years.
Nowadays, the direct use of such renewable energy appliances as solar panels
by vehicles is still at the prototype stage. The focus is therefore on renewable
electricity and clean batteries.
The recent consolidation in the Utilities sector (EDF and Iberdrola have
acquired, respectively, renewable electricity providers EDF Energies Nouvelles
and Iberdrola Revovables) shows the need for energy providers to definitely
integrate renewable electricity into their business models. Although these are
purely speculations, other players like Enel and EDP could follow this trend by
acquiring, respectively, Enel Green Power and EDP Renovaveis. In Northern
Europe, the need for re-incorporating renewable electricity into the core
business is not needed as major players such as Vattenvall and Starkraft have
already taken the steps.
Why is the future switch from fuel-based vehicles to full electricity/hybrid
vehicles an opportunity for both energy providers and electric vehicles
manufacturers? Simply because the use of electric cars will increase the
demand for electricity (only if above a certain threshold though). Therefore, in
both developed and emerging markets, utility companies will need to increase
their production capacities. Furthermore, to attract responsible investors,
customers, and other stakeholders, electric-vehicle distributors will need to
monitor the performance of their suppliers, including electricity providers.
Responsible sourcing of electricity will also constitute a competitive advantage
for electric-vehicle manufacturers as compared with traditional auto
manufacturers.
The emergence of electric cars will probably benefit utilities. For example, Dutch
electricity provider Essent (a subsidiary of German company RWE) is working
on building an infrastructure for electric cars and their use. Its MSG (Mobile
Smart Grid) is designed to integrate sustainable energy sources like wind and
sun into an intelligent network solution for recharging the batteries of electric
vehicles. Essent is currently developing 'fast charge points' where a battery can
be fully recharged in the same amount of time it takes to fill up a gasoline-
powered car and drink a cup of coffee.
Ticketing, Leasing and Self-service Systems
Beyond the need for more sustainable transport means and energy, there is
also a need for integrated ticketing and leasing systems.
The expected end of the traditional ticketing system
Ticketless technologies have contributed to make the life of citizens easier. Yet,
there are still a number of metro and tram networks across the world that use
paper tickets with all the disadvantages that these tickets cause to the society
(deforestation, cost of recycling, congestion, etc). There is no doubt: ticketless
technology will become mainstream. The question is: who is operating in this
niche?
The most common form of ticketless technology is the smart card that allows
passengers or commuters to go through ticket barriers without using any paper
tickets. Several IT companies like Logica and Indra are currently conducting
projects to expand the use of ticketless technologies. This system also allows
train, metro or tram operators to collect information on the habits and practices
of customers, which is key to identify the opportunities.
Near Field Communication (NFC) is a key opportunity. Contactless chip are
more and more integrated into other devices like smartphones, entrance
passes, watches and credit cards. Smartphone manufacturers who have
managed to integrate chips into their smartphones and to build a robust
relationship with train operators will surely have a competitive advantage in the
near future. Currently, none of the five biggest smartphone manufacturers
Ticketless technology will
become mainstream
72
(Apple, Samsung, Nokia, HTC, RIM) have revealed a clear strategy in this area.
Besides, operators like Veolia Transport have also set up a team focusing on
ticketing and services on mobile phones.
If it is not the intention of phone manufacturers, the innovation will then probably
come from credit-card makers like French digital security products provider
Gemalto or Swiss credit-card maker Oberthur Card Systems AG. Having a
single card for both banking and transport operations will allow commuters to
pay the journeys directly form their own bank account. Queuing to recharge the
card will become a thing of the past.
Source: Gemalto
Car rental: more synergies to explore
The market for car rentals currently includes a couple of public companies like
Hertz and Avis Budget Group. These companies are already present in airports,
especially Avis. They have also established partnerships with airlines and train
operators to attract people travelling by train or plane. However, there is still a
long way to go until inter-mobility will be optimal. Some more synergies can be
explored in this area, especially regarding virtual booking.
Providing a green fleet to customers is also key. Since 2008, all major players
have renewed at least part of their fleet. Thus, Hertz bought a significant
number of hybrid vehicles (including 3,400 Toyota Yaris) while the Avis Budget
Group established a partnership with Renault to offer electric cars for rental
from 2011 on. Privately-owned company Europcar of France has also signed a
similar agreement with Nissan.
Leasing: a good solution to adopt greener fleets
Corporations usually outsource fleet management solutions to other companies
like Netherlands-based Lease Plan Corporation or US company PHH Arval.
Green car leasing represents a great opportunity for companies to reduce the
GHG emissions from business travels. Indeed, in addition to the financial (or
fiscal) advantages associated with leasing, corporations can green their supply
chain and thus anticipate an excepted rise in oil price.
In addition, some leasing services companies also offer complete fleet
management solutions. Thus, Lease Plan Corp has implemented a programme
called GreenPlan, which allows its customers to receive CO2 emission and fuel
consumption reports for example. The company also grants awards to the
clients that have taken sufficient steps to tackle global warming.
Self-service public vehicle systems: a major opportunity
in urban areas
Outsourcing fleet
management services can
provide environmental
benefits
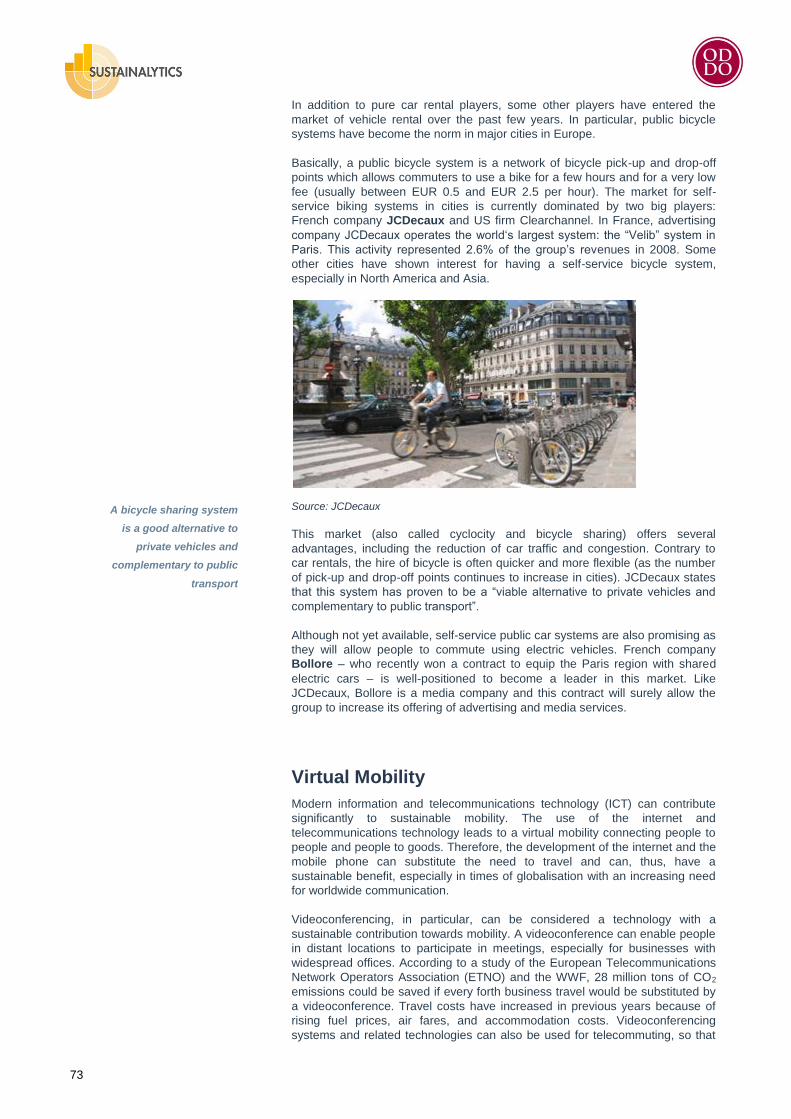
73
In addition to pure car rental players, some other players have entered the
market of vehicle rental over the past few years. In particular, public bicycle
systems have become the norm in major cities in Europe.
Basically, a public bicycle system is a network of bicycle pick-up and drop-off
points which allows commuters to use a bike for a few hours and for a very low
fee (usually between EUR 0.5 and EUR 2.5 per hour). The market for self-
service biking systems in cities is currently dominated by two big players:
French company JCDecaux and US firm Clearchannel. In France, advertising
company JCDecaux operates the world‗s largest system: the ―Velib‖ system in
Paris. This activity represented 2.6% of the group‘s revenues in 2008. Some
other cities have shown interest for having a self-service bicycle system,
especially in North America and Asia.
Source: JCDecaux
This market (also called cyclocity and bicycle sharing) offers several
advantages, including the reduction of car traffic and congestion. Contrary to
car rentals, the hire of bicycle is often quicker and more flexible (as the number
of pick-up and drop-off points continues to increase in cities). JCDecaux states
that this system has proven to be a ―viable alternative to private vehicles and
complementary to public transport‖.
Although not yet available, self-service public car systems are also promising as
they will allow people to commute using electric vehicles. French company
Bollore – who recently won a contract to equip the Paris region with shared
electric cars – is well-positioned to become a leader in this market. Like
JCDecaux, Bollore is a media company and this contract will surely allow the
group to increase its offering of advertising and media services.
Virtual Mobility
Modern information and telecommunications technology (ICT) can contribute
significantly to sustainable mobility. The use of the internet and
telecommunications technology leads to a virtual mobility connecting people to
people and people to goods. Therefore, the development of the internet and the
mobile phone can substitute the need to travel and can, thus, have a
sustainable benefit, especially in times of globalisation with an increasing need
for worldwide communication.
Videoconferencing, in particular, can be considered a technology with a
sustainable contribution towards mobility. A videoconference can enable people
in distant locations to participate in meetings, especially for businesses with
widespread offices. According to a study of the European Telecommunications
Network Operators Association (ETNO) and the WWF, 28 million tons of CO2
emissions could be saved if every forth business travel would be substituted by
a videoconference. Travel costs have increased in previous years because of
rising fuel prices, air fares, and accommodation costs. Videoconferencing
systems and related technologies can also be used for telecommuting, so that
A bicycle sharing system
is a good alternative to
private vehicles and
complementary to public
transport
74
employees can work from home avoiding travelling costs to commute to the
office.
Despite the pros of videoconference, in-person meetings and conversations still
seem to be favoured. According to a study by the ICT company Plantronics
especially when closing a deal or making a mission-critical decision, the vast
majority of respondents, preferred a face-to-face conversation. However,
especially in emerging economies like China or India facing long distance
business travels, but also in the UK or Germany, the acceptance of
videoconferences has grown in previous years.
In rural areas doctors can also use teleconferences for diagnostic purposes,
thus saving lives and reducing health-care costs. For example, in the rural
medical centre in Ohio, United States, the introduction of a videoconferencing
system reduces the number of transfers of sick infants to a hospital 110 km
away, helping patients, cutting costs of nearly USD 10,000 per transfer and
thus, avoiding environmental costs for the transfer. In this respect, companies
like Dassault Systèmes can make a contribution with its products. Dassault
Systèmes is a leading company specialising in 3D and Product Lifecycle
Management software which can be used for medical purposes.
Also, in terms of education, virtual mobility can play an important role. For
instance, the European ministers of Education consider virtual mobility as a
necessary addition to the traditional ways of studying and travelling abroad. E-
learning and online courses require modern ICT and can substitute travels with
education purposes.
There are several companies that offer and develop products and technologies
enabling virtual mobility. The UK telecommunications service provider BT and
the US company Polycom are, for example, well-positioned market players.
Polycom derives the majority of its revenues from videocommunication
respectively teleconference solutions. American company Cisco Systems is
another market leader which offers Internet protocol (IP)-based networking and
other products related to the communications and information technology
industry worldwide. It offers routers that interconnect public and private IP
networks for mobile, data, voice, and video applications; switching products,
which offer connectivity to end-users, workstations, IP phones, access points,
and servers; application networking services; and home networking products,
such as adapters, gateways, modems, and home network management
software products.
Virtual mobility also refers to the use of mobile devices like mobile phones,
smartphones, etc. Mobile phones can play an important role in terms of
avoiding travel. For example, in many African countries the mobile phone has
become a crucial component of business and private life. The mobile phone can
bridge the gap of Africa‘s poor traffic infrastructure, low internet accessibility
causing problems for the economic development of the continent. In several
countries like Uganda, the mobile phone is even used for the purpose of cash
transfers. Thus, telecommunication companies can support the development in
developing countries. But, also in developed countries mobile devices can
substitute physical mobility. Companies like Apple, Google, Nokia have
developed mobile devices and related operating systems. The Canadian
company RIM is the producer of the wireless device BlackBerry® which is a
competing product to other devices like Apple‘s iPhone or iPad.
Wireless technology is
contributing to virtual
mobility
75
100 INVESTMENT IDEAS
Oddo Securities and Sustainalytics propose 100 ideas of investment to deal
with the sustainable mobility thematic on the long term (>12 months horizon).
This list is proposed on a global scale (Emerging markets + Developed Markets)
and is of course neither exhaustive nor definitive. Both ESG research teams at
Oddo Securities and Sustainalytics feel comfortable with these 100 investment
ideas. These companies are part of the broader picture of change towards a
more sustainable society. They also score well in terms of sustainability
performance (ESG Best-in-class approach).
We have identified 25 business models that are associated with the concept of
sustainable mobility. Some of these contribute to sustainable development and
are overweighted in Oddo Securities‘ proposal for strategic asset allocation. On
the other hand, some other business models are underweighted as they face
major ESG constraints/risks.
To make things clearer, we have divided the list of 100 investment ideas into six
lists (Europe 1st choice, Europe 2nd choice, North America 1st choice, North
America 2nd choice, Rest of the World 1st choice and Rest of the World 2nd
choice). The 1st choice lists (43 companies in total) include our most preferred
stocks while our 2nd choice lists (57 companies in total) include companies that
are a bit less well-positioned. All ideas of investment are listed companies with
two exceptions; the Austrian company Asfinag and the German company
Deutsche Bahn. For both companies, we do propose to look at bonds.
Finally, within its European financial coverage, Oddo Securities has 4 strong
investment ideas on Buy recommendation with a 12-month view, Amadeus (TP
€ 17), Eurotunnel (TP € 7.8), Michelin (TP € 62) and Vodafone (TP 185p).
1 – Preliminary comments
ESG performance
Sustainalytics and Oddo Securities have worked together to make an
assessment of the Environmental, Social, and Governance (ESG) performance
of companies engaged in the mobility industry. Like for the analysis used by
Oddo in its SRI Convictions paper, the assessment is based on the so called
SWOT analysis, which is a method used to evaluate the Strengths,
Weaknesses, Opportunities, and Threats (SWOT) involved in a business. For
every theme (E, S or G), strengths and opportunities as well as areas of
improvement and risks (similar to weaknesses and threats) are provided for
each company. In addition, information on a company‘s main business
positioning and contribution to sustainable mobility is given. This analysis is
based on company research and analysis from Sustainalytics‘ Global Platform
as well as the insights of sector analysts from both research teams at
Sustainalytics and Oddo Securities. The Sustainalytics Global Platform covers
more than 3500 securities worldwide with extensive data and analysis on
corporate ESG performance and ESG industry trends.
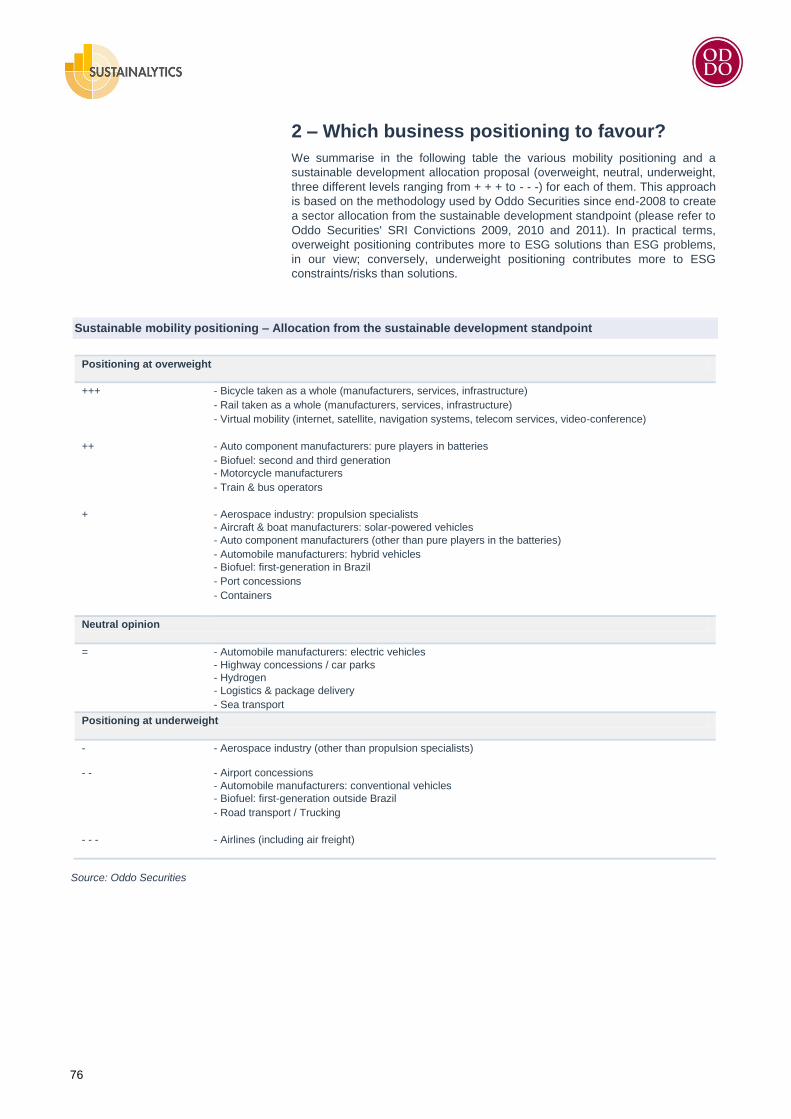
76
2 – Which business positioning to favour?
We summarise in the following table the various mobility positioning and a
sustainable development allocation proposal (overweight, neutral, underweight,
three different levels ranging from + + + to - - -) for each of them. This approach
is based on the methodology used by Oddo Securities since end-2008 to create
a sector allocation from the sustainable development standpoint (please refer to
Oddo Securities' SRI Convictions 2009, 2010 and 2011). In practical terms,
overweight positioning contributes more to ESG solutions than ESG problems,
in our view; conversely, underweight positioning contributes more to ESG
constraints/risks than solutions.
Sustainable mobility positioning – Allocation from the sustainable development standpoint
Positioning at overweight
+++ - Bicycle taken as a whole (manufacturers, services, infrastructure)
- Rail taken as a whole (manufacturers, services, infrastructure)
- Virtual mobility (internet, satellite, navigation systems, telecom services, video-conference)
++ - Auto component manufacturers: pure players in batteries
- Biofuel: second and third generation
- Motorcycle manufacturers
- Train & bus operators
+ - Aerospace industry: propulsion specialists
- Aircraft & boat manufacturers: solar-powered vehicles
- Auto component manufacturers (other than pure players in the batteries)
- Automobile manufacturers: hybrid vehicles
- Biofuel: first-generation in Brazil
- Port concessions
- Containers
Neutral opinion
= - Automobile manufacturers: electric vehicles
- Highway concessions / car parks
- Hydrogen
- Logistics & package delivery
- Sea transport
Positioning at underweight
- - Aerospace industry (other than propulsion specialists)
- - - Airport concessions
- Automobile manufacturers: conventional vehicles
- Biofuel: first-generation outside Brazil
- Road transport / Trucking
- - - - Airlines (including air freight)
Source: Oddo Securities
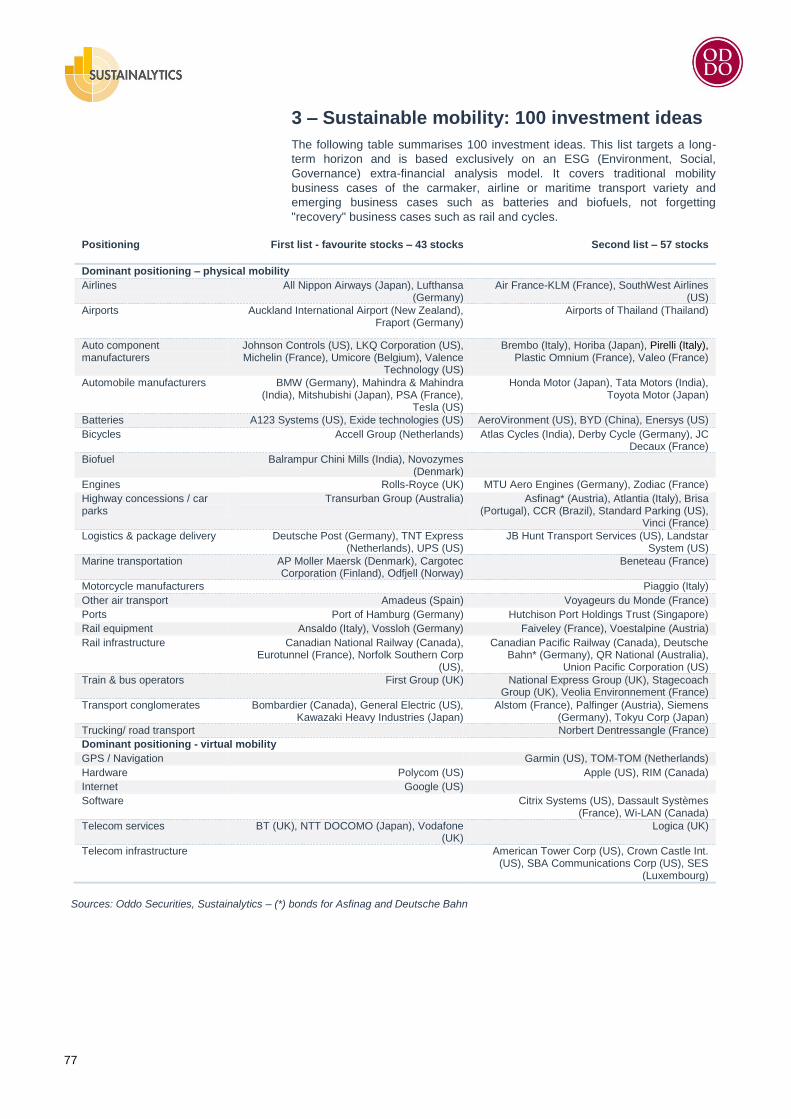
77
3 – Sustainable mobility: 100 investment ideas
The following table summarises 100 investment ideas. This list targets a long-
term horizon and is based exclusively on an ESG (Environment, Social,
Governance) extra-financial analysis model. It covers traditional mobility
business cases of the carmaker, airline or maritime transport variety and
emerging business cases such as batteries and biofuels, not forgetting
"recovery" business cases such as rail and cycles.
Positioning
First list - favourite stocks – 43 stocks Second list – 57 stocks
Dominant positioning – physical mobility
Airlines All Nippon Airways (Japan), Lufthansa (Germany)
Air France-KLM (France), SouthWest Airlines (US)
Airports Auckland International Airport (New Zealand), Fraport (Germany)
Airports of Thailand (Thailand)
Auto component manufacturers
Johnson Controls (US), LKQ Corporation (US), Michelin (France), Umicore (Belgium), Valence
Technology (US)
Brembo (Italy), Horiba (Japan), Pirelli (Italy), Plastic Omnium (France), Valeo (France)
Automobile manufacturers BMW (Germany), Mahindra & Mahindra (India), Mitshubishi (Japan), PSA (France),
Tesla (US)
Honda Motor (Japan), Tata Motors (India), Toyota Motor (Japan)
Batteries A123 Systems (US), Exide technologies (US) AeroVironment (US), BYD (China), Enersys (US)
Bicycles Accell Group (Netherlands) Atlas Cycles (India), Derby Cycle (Germany), JC Decaux (France)
Biofuel Balrampur Chini Mills (India), Novozymes (Denmark)
Engines Rolls-Royce (UK) MTU Aero Engines (Germany), Zodiac (France)
Highway concessions / car parks
Transurban Group (Australia) Asfinag* (Austria), Atlantia (Italy), Brisa (Portugal), CCR (Brazil), Standard Parking (US),
Vinci (France)
Logistics & package delivery Deutsche Post (Germany), TNT Express (Netherlands), UPS (US)
JB Hunt Transport Services (US), Landstar System (US)
Marine transportation AP Moller Maersk (Denmark), Cargotec Corporation (Finland), Odfjell (Norway)
Beneteau (France)
Motorcycle manufacturers Piaggio (Italy)
Other air transport Amadeus (Spain) Voyageurs du Monde (France)
Ports Port of Hamburg (Germany) Hutchison Port Holdings Trust (Singapore)
Rail equipment Ansaldo (Italy), Vossloh (Germany) Faiveley (France), Voestalpine (Austria)
Rail infrastructure Canadian National Railway (Canada), Eurotunnel (France), Norfolk Southern Corp
(US),
Canadian Pacific Railway (Canada), Deutsche Bahn* (Germany), QR National (Australia),
Union Pacific Corporation (US)
Train & bus operators First Group (UK) National Express Group (UK), Stagecoach Group (UK), Veolia Environnement (France)
Transport conglomerates Bombardier (Canada), General Electric (US), Kawazaki Heavy Industries (Japan)
Alstom (France), Palfinger (Austria), Siemens (Germany), Tokyu Corp (Japan)
Trucking/ road transport Norbert Dentressangle (France)
Dominant positioning - virtual mobility
GPS / Navigation Garmin (US), TOM-TOM (Netherlands)
Hardware Polycom (US) Apple (US), RIM (Canada)
Internet Google (US)
Software Citrix Systems (US), Dassault Systèmes (France), Wi-LAN (Canada)
Telecom services BT (UK), NTT DOCOMO (Japan), Vodafone (UK)
Logica (UK)
Telecom infrastructure American Tower Corp (US), Crown Castle Int. (US), SBA Communications Corp (US), SES
(Luxembourg)
Sources: Oddo Securities, Sustainalytics – (*) bonds for Asfinag and Deutsche Bahn
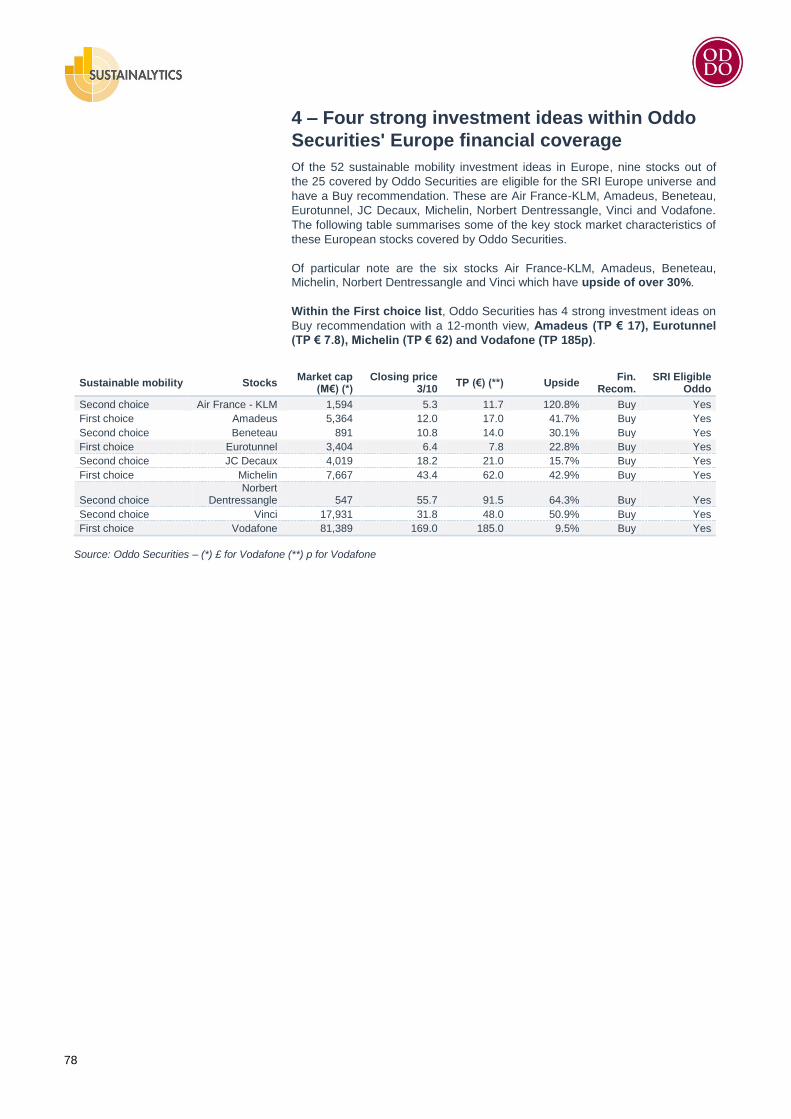
78
4 – Four strong investment ideas within Oddo
Securities' Europe financial coverage
Of the 52 sustainable mobility investment ideas in Europe, nine stocks out of
the 25 covered by Oddo Securities are eligible for the SRI Europe universe and
have a Buy recommendation. These are Air France-KLM, Amadeus, Beneteau,
Eurotunnel, JC Decaux, Michelin, Norbert Dentressangle, Vinci and Vodafone.
The following table summarises some of the key stock market characteristics of
these European stocks covered by Oddo Securities.
Of particular note are the six stocks Air France-KLM, Amadeus, Beneteau,
Michelin, Norbert Dentressangle and Vinci which have upside of over 30%.
Within the First choice list, Oddo Securities has 4 strong investment ideas on
Buy recommendation with a 12-month view, Amadeus (TP € 17), Eurotunnel
(TP € 7.8), Michelin (TP € 62) and Vodafone (TP 185p).
Sustainable mobility Stocks Market cap
(M€) (*) Closing price
3/10 TP (€) (**) Upside
Fin. Recom.
SRI Eligible Oddo
Second choice Air France - KLM 1,594 5.3 11.7 120.8% Buy Yes
First choice Amadeus 5,364 12.0 17.0 41.7% Buy Yes
Second choice Beneteau 891 10.8 14.0 30.1% Buy Yes
First choice Eurotunnel 3,404 6.4 7.8 22.8% Buy Yes
Second choice JC Decaux 4,019 18.2 21.0 15.7% Buy Yes
First choice Michelin 7,667 43.4 62.0 42.9% Buy Yes
Second choice Norbert
Dentressangle 547 55.7 91.5 64.3% Buy Yes
Second choice Vinci 17,931 31.8 48.0 50.9% Buy Yes
First choice Vodafone 81,389 169.0 185.0 9.5% Buy Yes
Source: Oddo Securities – (*) £ for Vodafone (**) p for Vodafone
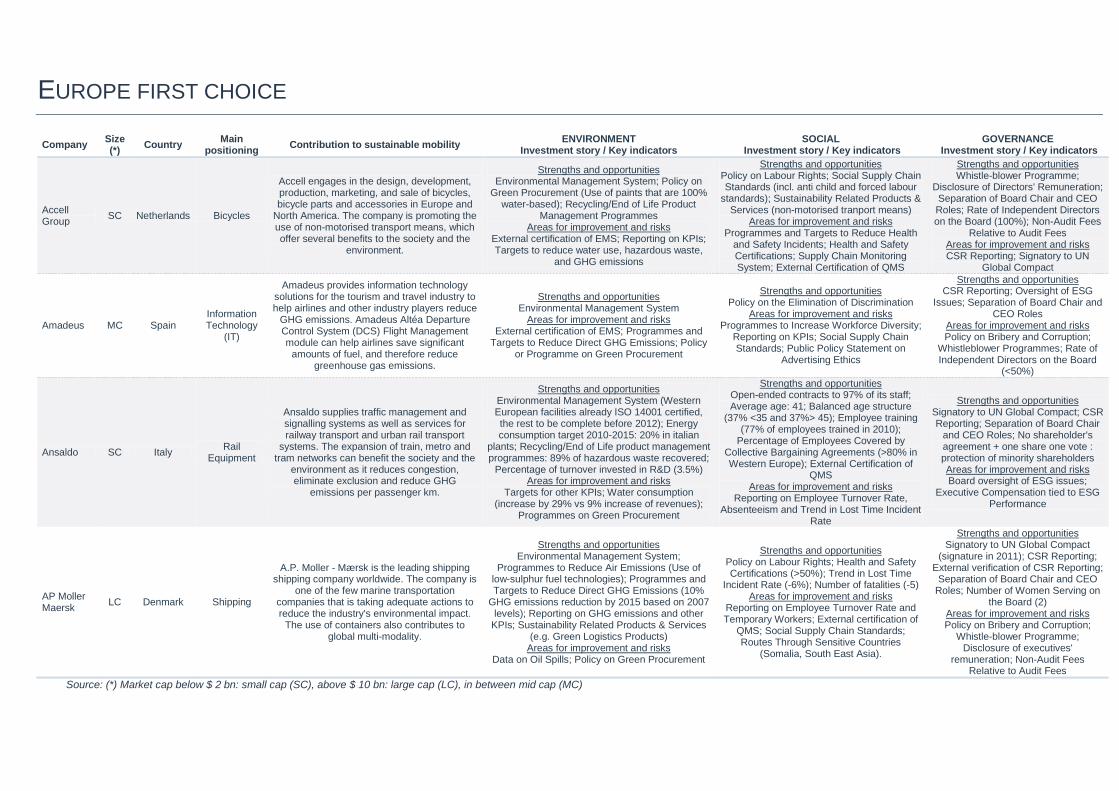
EUROPE FIRST CHOICE
Company Size (*)
Country Main
positioning Contribution to sustainable mobility
ENVIRONMENT Investment story / Key indicators
SOCIAL Investment story / Key indicators
GOVERNANCE Investment story / Key indicators
Accell Group
SC Netherlands Bicycles
Accell engages in the design, development, production, marketing, and sale of bicycles, bicycle parts and accessories in Europe and
North America. The company is promoting the use of non-motorised transport means, which offer several benefits to the society and the
environment.
Strengths and opportunities Environmental Management System; Policy on
Green Procurement (Use of paints that are 100% water-based); Recycling/End of Life Product
Management Programmes Areas for improvement and risks
External certification of EMS; Reporting on KPIs; Targets to reduce water use, hazardous waste,
and GHG emissions
Strengths and opportunities Policy on Labour Rights; Social Supply Chain Standards (incl. anti child and forced labour
standards); Sustainability Related Products & Services (non-motorised tranport means)
Areas for improvement and risks Programmes and Targets to Reduce Health
and Safety Incidents; Health and Safety Certifications; Supply Chain Monitoring System; External Certification of QMS
Strengths and opportunities Whistle-blower Programme;
Disclosure of Directors' Remuneration; Separation of Board Chair and CEO Roles; Rate of Independent Directors on the Board (100%); Non-Audit Fees
Relative to Audit Fees Areas for improvement and risks CSR Reporting; Signatory to UN
Global Compact
Amadeus MC Spain Information Technology
(IT)
Amadeus provides information technology solutions for the tourism and travel industry to help airlines and other industry players reduce
GHG emissions. Amadeus Altéa Departure Control System (DCS) Flight Management module can help airlines save significant
amounts of fuel, and therefore reduce greenhouse gas emissions.
Strengths and opportunities Environmental Management System
Areas for improvement and risks External certification of EMS; Programmes and
Targets to Reduce Direct GHG Emissions; Policy or Programme on Green Procurement
Strengths and opportunities Policy on the Elimination of Discrimination
Areas for improvement and risks Programmes to Increase Workforce Diversity;
Reporting on KPIs; Social Supply Chain Standards; Public Policy Statement on
Advertising Ethics
Strengths and opportunities CSR Reporting; Oversight of ESG
Issues; Separation of Board Chair and CEO Roles
Areas for improvement and risks Policy on Bribery and Corruption;
Whistleblower Programmes; Rate of Independent Directors on the Board
(<50%)
Ansaldo SC Italy Rail
Equipment
Ansaldo supplies traffic management and signalling systems as well as services for railway transport and urban rail transport
systems. The expansion of train, metro and tram networks can benefit the society and the
environment as it reduces congestion, eliminate exclusion and reduce GHG
emissions per passenger km.
Strengths and opportunities Environmental Management System (Western European facilities already ISO 14001 certified, the rest to be complete before 2012); Energy consumption target 2010-2015: 20% in italian
plants; Recycling/End of Life product management programmes: 89% of hazardous waste recovered;
Percentage of turnover invested in R&D (3.5%) Areas for improvement and risks
Targets for other KPIs; Water consumption (increase by 29% vs 9% increase of revenues);
Programmes on Green Procurement
Strengths and opportunities Open-ended contracts to 97% of its staff; Average age: 41; Balanced age structure
(37% <35 and 37%> 45); Employee training (77% of employees trained in 2010);
Percentage of Employees Covered by Collective Bargaining Agreements (>80% in Western Europe); External Certification of
QMS Areas for improvement and risks
Reporting on Employee Turnover Rate, Absenteeism and Trend in Lost Time Incident
Rate
Strengths and opportunities Signatory to UN Global Compact; CSR Reporting; Separation of Board Chair
and CEO Roles; No shareholder's agreement + one share one vote : protection of minority shareholders Areas for improvement and risks Board oversight of ESG issues;
Executive Compensation tied to ESG Performance
AP Moller Maersk
LC Denmark Shipping
A.P. Moller - Mærsk is the leading shipping shipping company worldwide. The company is
one of the few marine transportation companies that is taking adequate actions to reduce the industry's environmental impact.
The use of containers also contributes to global multi-modality.
Strengths and opportunities Environmental Management System;
Programmes to Reduce Air Emissions (Use of low-sulphur fuel technologies); Programmes and Targets to Reduce Direct GHG Emissions (10%
GHG emissions reduction by 2015 based on 2007 levels); Reporting on GHG emissions and other
KPIs; Sustainability Related Products & Services (e.g. Green Logistics Products)
Areas for improvement and risks Data on Oil Spills; Policy on Green Procurement
Strengths and opportunities Policy on Labour Rights; Health and Safety Certifications (>50%); Trend in Lost Time
Incident Rate (-6%); Number of fatalities (-5) Areas for improvement and risks
Reporting on Employee Turnover Rate and Temporary Workers; External certification of
QMS; Social Supply Chain Standards; Routes Through Sensitive Countries
(Somalia, South East Asia).
Strengths and opportunities Signatory to UN Global Compact
(signature in 2011); CSR Reporting; External verification of CSR Reporting;
Separation of Board Chair and CEO Roles; Number of Women Serving on
the Board (2) Areas for improvement and risks Policy on Bribery and Corruption;
Whistle-blower Programme; Disclosure of executives'
remuneration; Non-Audit Fees Relative to Audit Fees
Source: (*) Market cap below $ 2 bn: small cap (SC), above $ 10 bn: large cap (LC), in between mid cap (MC)
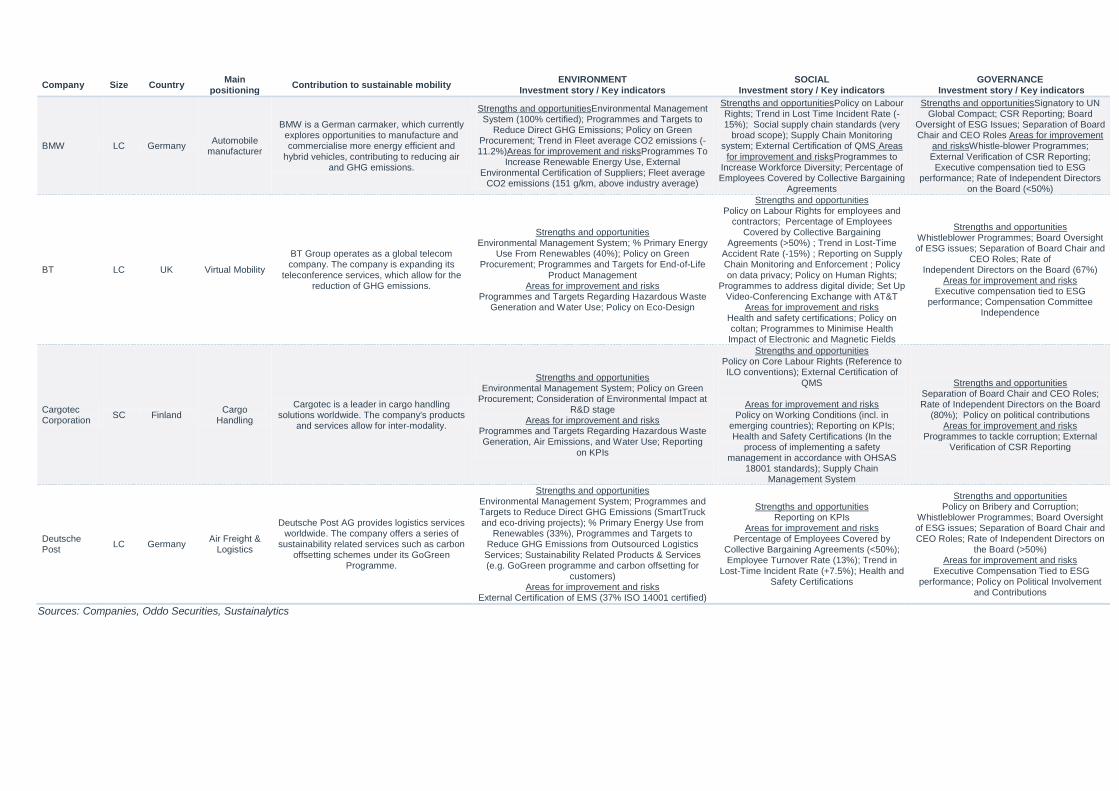
Company Size Country Main
positioning Contribution to sustainable mobility
ENVIRONMENT Investment story / Key indicators
SOCIAL Investment story / Key indicators
GOVERNANCE Investment story / Key indicators
BMW LC Germany Automobile
manufacturer
BMW is a German carmaker, which currently explores opportunities to manufacture and commercialise more energy efficient and
hybrid vehicles, contributing to reducing air and GHG emissions.
Strengths and opportunitiesEnvironmental Management System (100% certified); Programmes and Targets to
Reduce Direct GHG Emissions; Policy on Green Procurement; Trend in Fleet average CO2 emissions (-11.2%)Areas for improvement and risksProgrammes To
Increase Renewable Energy Use, External Environmental Certification of Suppliers; Fleet average
CO2 emissions (151 g/km, above industry average)
Strengths and opportunitiesPolicy on Labour Rights; Trend in Lost Time Incident Rate (-15%); Social supply chain standards (very
broad scope); Supply Chain Monitoring system; External Certification of QMS Areas
for improvement and risksProgrammes to Increase Workforce Diversity; Percentage of Employees Covered by Collective Bargaining
Agreements
Strengths and opportunitiesSignatory to UN Global Compact; CSR Reporting; Board
Oversight of ESG Issues; Separation of Board Chair and CEO Roles Areas for improvement
and risksWhistle-blower Programmes; External Verification of CSR Reporting; Executive compensation tied to ESG
performance; Rate of Independent Directors on the Board (<50%)
BT LC UK Virtual Mobility
BT Group operates as a global telecom company. The company is expanding its
teleconference services, which allow for the reduction of GHG emissions.
Strengths and opportunities Environmental Management System; % Primary Energy
Use From Renewables (40%); Policy on Green Procurement; Programmes and Targets for End-of-Life
Product Management Areas for improvement and risks
Programmes and Targets Regarding Hazardous Waste Generation and Water Use; Policy on Eco-Design
Strengths and opportunities Policy on Labour Rights for employees and
contractors; Percentage of Employees Covered by Collective Bargaining
Agreements (>50%) ; Trend in Lost-Time Accident Rate (-15%) ; Reporting on Supply Chain Monitoring and Enforcement ; Policy on data privacy; Policy on Human Rights;
Programmes to address digital divide; Set Up Video-Conferencing Exchange with AT&T
Areas for improvement and risks Health and safety certifications; Policy on coltan; Programmes to Minimise Health Impact of Electronic and Magnetic Fields
Strengths and opportunities Whistleblower Programmes; Board Oversight of ESG issues; Separation of Board Chair and
CEO Roles; Rate of Independent Directors on the Board (67%)
Areas for improvement and risks Executive compensation tied to ESG
performance; Compensation Committee Independence
Cargotec Corporation
SC Finland Cargo
Handling
Cargotec is a leader in cargo handling solutions worldwide. The company's products
and services allow for inter-modality.
Strengths and opportunities Environmental Management System; Policy on Green
Procurement; Consideration of Environmental Impact at R&D stage
Areas for improvement and risks Programmes and Targets Regarding Hazardous Waste Generation, Air Emissions, and Water Use; Reporting
on KPIs
Strengths and opportunities Policy on Core Labour Rights (Reference to ILO conventions); External Certification of
QMS
Areas for improvement and risks Policy on Working Conditions (incl. in
emerging countries); Reporting on KPIs; Health and Safety Certifications (In the
process of implementing a safety management in accordance with OHSAS
18001 standards); Supply Chain Management System
Strengths and opportunities Separation of Board Chair and CEO Roles; Rate of Independent Directors on the Board
(80%); Policy on political contributions Areas for improvement and risks
Programmes to tackle corruption; External Verification of CSR Reporting
Deutsche Post
LC Germany Air Freight &
Logistics
Deutsche Post AG provides logistics services worldwide. The company offers a series of
sustainability related services such as carbon offsetting schemes under its GoGreen
Programme.
Strengths and opportunities Environmental Management System; Programmes and Targets to Reduce Direct GHG Emissions (SmartTruck and eco-driving projects); % Primary Energy Use from
Renewables (33%), Programmes and Targets to Reduce GHG Emissions from Outsourced Logistics Services; Sustainability Related Products & Services (e.g. GoGreen programme and carbon offsetting for
customers) Areas for improvement and risks
External Certification of EMS (37% ISO 14001 certified)
Strengths and opportunities Reporting on KPIs
Areas for improvement and risks Percentage of Employees Covered by
Collective Bargaining Agreements (<50%); Employee Turnover Rate (13%); Trend in
Lost-Time Incident Rate (+7.5%); Health and Safety Certifications
Strengths and opportunities Policy on Bribery and Corruption;
Whistleblower Programmes; Board Oversight of ESG issues; Separation of Board Chair and CEO Roles; Rate of Independent Directors on
the Board (>50%) Areas for improvement and risks
Executive Compensation Tied to ESG performance; Policy on Political Involvement
and Contributions
Sources: Companies, Oddo Securities, Sustainalytics
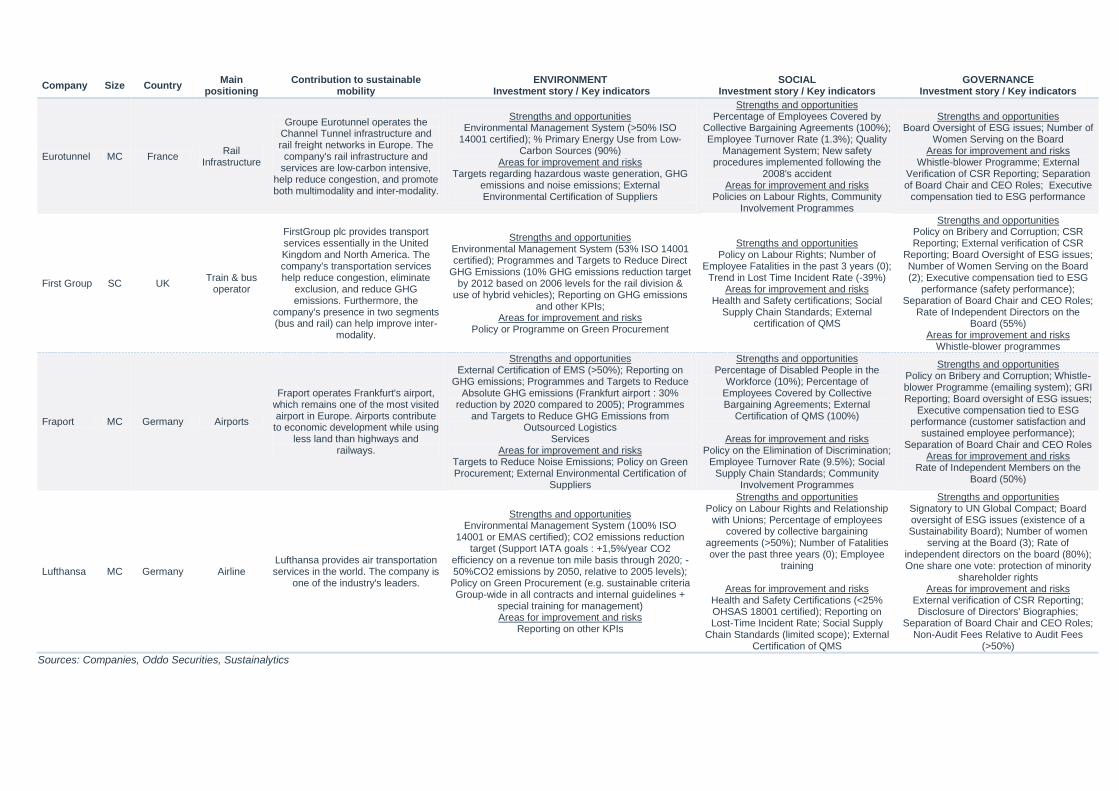
Company Size Country Main
positioning Contribution to sustainable
mobility ENVIRONMENT
Investment story / Key indicators SOCIAL
Investment story / Key indicators GOVERNANCE
Investment story / Key indicators
Eurotunnel MC France Rail
Infrastructure
Groupe Eurotunnel operates the Channel Tunnel infrastructure and rail freight networks in Europe. The company's rail infrastructure and
services are low-carbon intensive, help reduce congestion, and promote both multimodality and inter-modality.
Strengths and opportunities Environmental Management System (>50% ISO
14001 certified); % Primary Energy Use from Low-Carbon Sources (90%)
Areas for improvement and risks Targets regarding hazardous waste generation, GHG
emissions and noise emissions; External Environmental Certification of Suppliers
Strengths and opportunities Percentage of Employees Covered by
Collective Bargaining Agreements (100%); Employee Turnover Rate (1.3%); Quality
Management System; New safety procedures implemented following the
2008's accident Areas for improvement and risks
Policies on Labour Rights, Community Involvement Programmes
Strengths and opportunities Board Oversight of ESG issues; Number of
Women Serving on the Board Areas for improvement and risks
Whistle-blower Programme; External Verification of CSR Reporting; Separation of Board Chair and CEO Roles; Executive
compensation tied to ESG performance
First Group SC UK Train & bus
operator
FirstGroup plc provides transport services essentially in the United Kingdom and North America. The company's transportation services help reduce congestion, eliminate
exclusion, and reduce GHG emissions. Furthermore, the
company's presence in two segments (bus and rail) can help improve inter-
modality.
Strengths and opportunities Environmental Management System (53% ISO 14001 certified); Programmes and Targets to Reduce Direct
GHG Emissions (10% GHG emissions reduction target by 2012 based on 2006 levels for the rail division &
use of hybrid vehicles); Reporting on GHG emissions and other KPIs;
Areas for improvement and risks Policy or Programme on Green Procurement
Strengths and opportunities Policy on Labour Rights; Number of
Employee Fatalities in the past 3 years (0); Trend in Lost Time Incident Rate (-39%)
Areas for improvement and risks Health and Safety certifications; Social
Supply Chain Standards; External certification of QMS
Strengths and opportunities Policy on Bribery and Corruption; CSR Reporting; External verification of CSR
Reporting; Board Oversight of ESG issues; Number of Women Serving on the Board (2); Executive compensation tied to ESG
performance (safety performance); Separation of Board Chair and CEO Roles;
Rate of Independent Directors on the Board (55%)
Areas for improvement and risks Whistle-blower programmes
Fraport MC Germany Airports
Fraport operates Frankfurt's airport, which remains one of the most visited airport in Europe. Airports contribute to economic development while using
less land than highways and railways.
Strengths and opportunities External Certification of EMS (>50%); Reporting on
GHG emissions; Programmes and Targets to Reduce Absolute GHG emissions (Frankfurt airport : 30%
reduction by 2020 compared to 2005); Programmes and Targets to Reduce GHG Emissions from
Outsourced Logistics Services
Areas for improvement and risks Targets to Reduce Noise Emissions; Policy on Green Procurement; External Environmental Certification of
Suppliers
Strengths and opportunities Percentage of Disabled People in the
Workforce (10%); Percentage of Employees Covered by Collective Bargaining Agreements; External
Certification of QMS (100%)
Areas for improvement and risks Policy on the Elimination of Discrimination;
Employee Turnover Rate (9.5%); Social Supply Chain Standards; Community
Involvement Programmes
Strengths and opportunities Policy on Bribery and Corruption; Whistle-blower Programme (emailing system); GRI Reporting; Board oversight of ESG issues;
Executive compensation tied to ESG performance (customer satisfaction and
sustained employee performance); Separation of Board Chair and CEO Roles
Areas for improvement and risks Rate of Independent Members on the
Board (50%)
Lufthansa MC Germany Airline Lufthansa provides air transportation services in the world. The company is
one of the industry's leaders.
Strengths and opportunities Environmental Management System (100% ISO
14001 or EMAS certified); CO2 emissions reduction target (Support IATA goals : +1,5%/year CO2
efficiency on a revenue ton mile basis through 2020; -50%CO2 emissions by 2050, relative to 2005 levels); Policy on Green Procurement (e.g. sustainable criteria Group-wide in all contracts and internal guidelines +
special training for management) Areas for improvement and risks
Reporting on other KPIs
Strengths and opportunities Policy on Labour Rights and Relationship
with Unions; Percentage of employees covered by collective bargaining
agreements (>50%); Number of Fatalities over the past three years (0); Employee
training
Areas for improvement and risks Health and Safety Certifications (<25% OHSAS 18001 certified); Reporting on Lost-Time Incident Rate; Social Supply
Chain Standards (limited scope); External Certification of QMS
Strengths and opportunities Signatory to UN Global Compact; Board oversight of ESG issues (existence of a Sustainability Board); Number of women
serving at the Board (3); Rate of independent directors on the board (80%); One share one vote: protection of minority
shareholder rights Areas for improvement and risks
External verification of CSR Reporting; Disclosure of Directors' Biographies;
Separation of Board Chair and CEO Roles; Non-Audit Fees Relative to Audit Fees
(>50%)
Sources: Companies, Oddo Securities, Sustainalytics
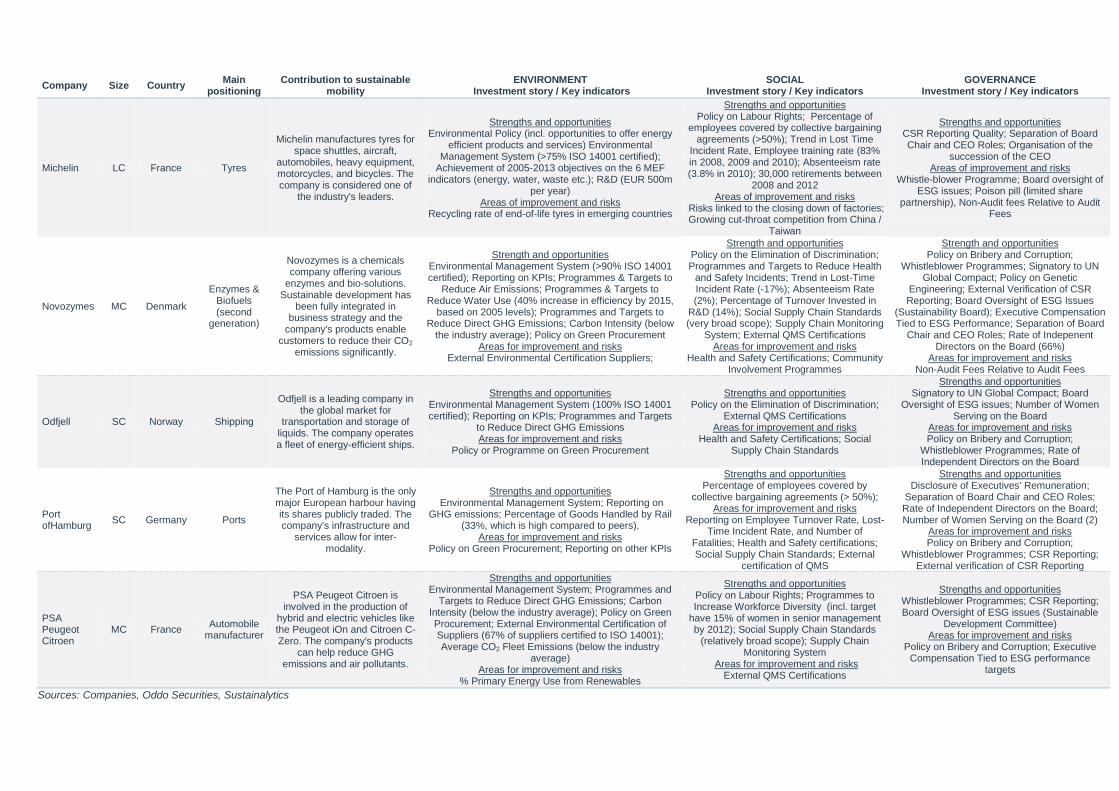
Company Size Country Main
positioning Contribution to sustainable
mobility ENVIRONMENT
Investment story / Key indicators SOCIAL
Investment story / Key indicators GOVERNANCE
Investment story / Key indicators
Michelin LC France Tyres
Michelin manufactures tyres for space shuttles, aircraft,
automobiles, heavy equipment, motorcycles, and bicycles. The company is considered one of
the industry's leaders.
Strengths and opportunities Environmental Policy (incl. opportunities to offer energy
efficient products and services) Environmental Management System (>75% ISO 14001 certified);
Achievement of 2005-2013 objectives on the 6 MEF indicators (energy, water, waste etc.); R&D (EUR 500m
per year) Areas of improvement and risks
Recycling rate of end-of-life tyres in emerging countries
Strengths and opportunities Policy on Labour Rights; Percentage of
employees covered by collective bargaining agreements (>50%); Trend in Lost Time
Incident Rate, Employee training rate (83% in 2008, 2009 and 2010); Absenteeism rate (3.8% in 2010); 30,000 retirements between
2008 and 2012 Areas of improvement and risks
Risks linked to the closing down of factories; Growing cut-throat competition from China /
Taiwan
Strengths and opportunities CSR Reporting Quality; Separation of Board Chair and CEO Roles; Organisation of the
succession of the CEO Areas of improvement and risks
Whistle-blower Programme; Board oversight of ESG issues; Poison pill (limited share
partnership), Non-Audit fees Relative to Audit Fees
Novozymes MC Denmark
Enzymes & Biofuels (second
generation)
Novozymes is a chemicals company offering various
enzymes and bio-solutions. Sustainable development has
been fully integrated in business strategy and the
company's products enable customers to reduce their CO2
emissions significantly.
Strength and opportunities Environmental Management System (>90% ISO 14001 certified); Reporting on KPIs; Programmes & Targets to
Reduce Air Emissions; Programmes & Targets to Reduce Water Use (40% increase in efficiency by 2015,
based on 2005 levels); Programmes and Targets to Reduce Direct GHG Emissions; Carbon Intensity (below
the industry average); Policy on Green Procurement Areas for improvement and risks
External Environmental Certification Suppliers;
Strength and opportunities Policy on the Elimination of Discrimination; Programmes and Targets to Reduce Health
and Safety Incidents; Trend in Lost-Time Incident Rate (-17%); Absenteeism Rate (2%); Percentage of Turnover Invested in
R&D (14%); Social Supply Chain Standards (very broad scope); Supply Chain Monitoring
System; External QMS Certifications Areas for improvement and risks
Health and Safety Certifications; Community Involvement Programmes
Strength and opportunities Policy on Bribery and Corruption;
Whistleblower Programmes; Signatory to UN Global Compact; Policy on Genetic
Engineering; External Verification of CSR Reporting; Board Oversight of ESG Issues
(Sustainability Board); Executive Compensation Tied to ESG Performance; Separation of Board
Chair and CEO Roles; Rate of Indepenent Directors on the Board (66%)
Areas for improvement and risks Non-Audit Fees Relative to Audit Fees
Odfjell SC Norway Shipping
Odfjell is a leading company in the global market for
transportation and storage of liquids. The company operates a fleet of energy-efficient ships.
Strengths and opportunities Environmental Management System (100% ISO 14001 certified); Reporting on KPIs; Programmes and Targets
to Reduce Direct GHG Emissions Areas for improvement and risks
Policy or Programme on Green Procurement
Strengths and opportunities Policy on the Elimination of Discrimination;
External QMS Certifications Areas for improvement and risks
Health and Safety Certifications; Social Supply Chain Standards
Strengths and opportunities Signatory to UN Global Compact; Board
Oversight of ESG issues; Number of Women Serving on the Board
Areas for improvement and risks Policy on Bribery and Corruption;
Whistleblower Programmes; Rate of Independent Directors on the Board
Port ofHamburg
SC Germany Ports
The Port of Hamburg is the only major European harbour having its shares publicly traded. The company's infrastructure and
services allow for inter-modality.
Strengths and opportunities Environmental Management System; Reporting on
GHG emissions; Percentage of Goods Handled by Rail (33%, which is high compared to peers),
Areas for improvement and risks Policy on Green Procurement; Reporting on other KPIs
Strengths and opportunities Percentage of employees covered by
collective bargaining agreements (> 50%); Areas for improvement and risks
Reporting on Employee Turnover Rate, Lost-Time Incident Rate, and Number of
Fatalities; Health and Safety certifications; Social Supply Chain Standards; External
certification of QMS
Strengths and opportunities Disclosure of Executives' Remuneration;
Separation of Board Chair and CEO Roles; Rate of Independent Directors on the Board; Number of Women Serving on the Board (2)
Areas for improvement and risks Policy on Bribery and Corruption;
Whistleblower Programmes; CSR Reporting; External verification of CSR Reporting
PSA Peugeot Citroen
MC France Automobile
manufacturer
PSA Peugeot Citroen is involved in the production of
hybrid and electric vehicles like the Peugeot iOn and Citroen C-Zero. The company's products
can help reduce GHG emissions and air pollutants.
Strengths and opportunities Environmental Management System; Programmes and
Targets to Reduce Direct GHG Emissions; Carbon Intensity (below the industry average); Policy on Green Procurement; External Environmental Certification of Suppliers (67% of suppliers certified to ISO 14001); Average CO2 Fleet Emissions (below the industry
average) Areas for improvement and risks
% Primary Energy Use from Renewables
Strengths and opportunities Policy on Labour Rights; Programmes to Increase Workforce Diversity (incl. target
have 15% of women in senior management by 2012); Social Supply Chain Standards
(relatively broad scope); Supply Chain Monitoring System
Areas for improvement and risks External QMS Certifications
Strengths and opportunities Whistleblower Programmes; CSR Reporting; Board Oversight of ESG issues (Sustainable
Development Committee) Areas for improvement and risks
Policy on Bribery and Corruption; Executive Compensation Tied to ESG performance
targets
Sources: Companies, Oddo Securities, Sustainalytics
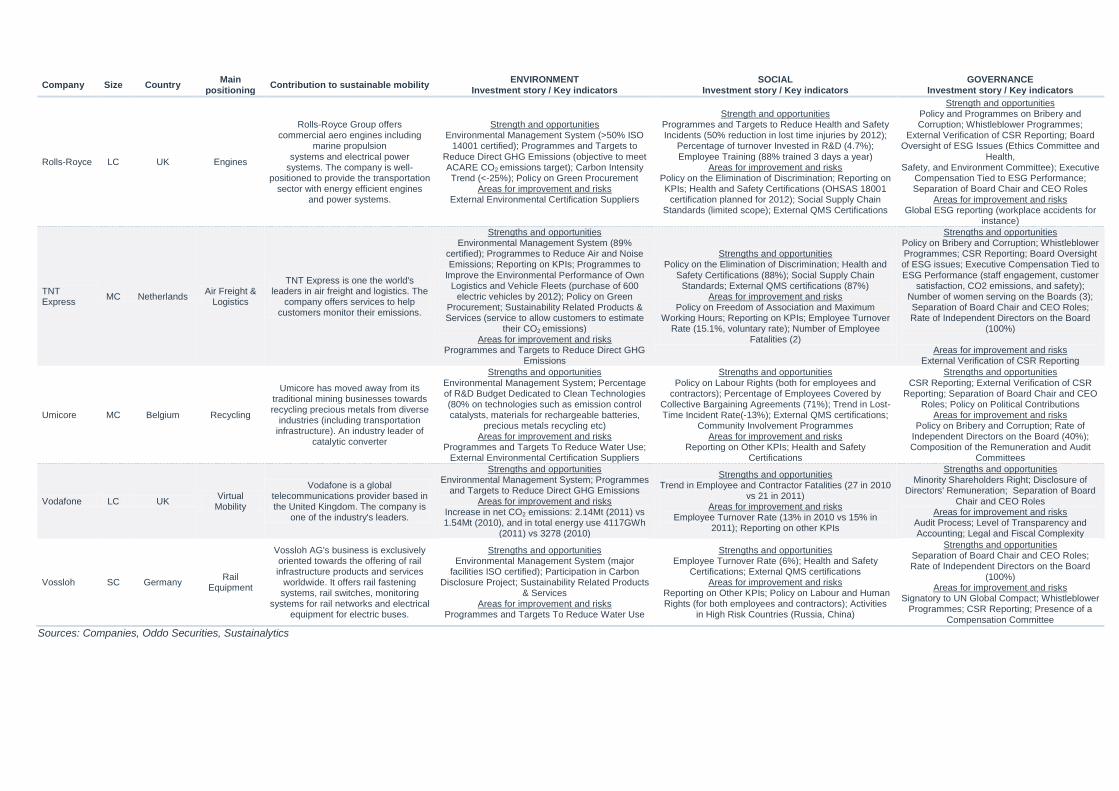
Company Size Country Main
positioning Contribution to sustainable mobility
ENVIRONMENT Investment story / Key indicators
SOCIAL Investment story / Key indicators
GOVERNANCE Investment story / Key indicators
Rolls-Royce LC UK Engines
Rolls-Royce Group offers commercial aero engines including
marine propulsion systems and electrical power
systems. The company is well-positioned to provide the transportation
sector with energy efficient engines and power systems.
Strength and opportunities Environmental Management System (>50% ISO
14001 certified); Programmes and Targets to Reduce Direct GHG Emissions (objective to meet ACARE CO2 emissions target); Carbon Intensity Trend (<-25%); Policy on Green Procurement
Areas for improvement and risks External Environmental Certification Suppliers
Strength and opportunities Programmes and Targets to Reduce Health and Safety Incidents (50% reduction in lost time injuries by 2012);
Percentage of turnover Invested in R&D (4.7%); Employee Training (88% trained 3 days a year)
Areas for improvement and risks Policy on the Elimination of Discrimination; Reporting on KPIs; Health and Safety Certifications (OHSAS 18001
certification planned for 2012); Social Supply Chain Standards (limited scope); External QMS Certifications
Strength and opportunities Policy and Programmes on Bribery and Corruption; Whistleblower Programmes;
External Verification of CSR Reporting; Board Oversight of ESG Issues (Ethics Committee and
Health, Safety, and Environment Committee); Executive
Compensation Tied to ESG Performance; Separation of Board Chair and CEO Roles
Areas for improvement and risks Global ESG reporting (workplace accidents for
instance)
TNT Express
MC Netherlands Air Freight &
Logistics
TNT Express is one the world's leaders in air freight and logistics. The
company offers services to help customers monitor their emissions.
Strengths and opportunities Environmental Management System (89%
certified); Programmes to Reduce Air and Noise Emissions; Reporting on KPIs; Programmes to
Improve the Environmental Performance of Own Logistics and Vehicle Fleets (purchase of 600
electric vehicles by 2012); Policy on Green Procurement; Sustainability Related Products & Services (service to allow customers to estimate
their CO2 emissions) Areas for improvement and risks
Programmes and Targets to Reduce Direct GHG Emissions
Strengths and opportunities Policy on the Elimination of Discrimination; Health and
Safety Certifications (88%); Social Supply Chain Standards; External QMS certifications (87%)
Areas for improvement and risks Policy on Freedom of Association and Maximum
Working Hours; Reporting on KPIs; Employee Turnover Rate (15.1%, voluntary rate); Number of Employee
Fatalities (2)
Strengths and opportunities Policy on Bribery and Corruption; Whistleblower Programmes; CSR Reporting; Board Oversight of ESG issues; Executive Compensation Tied to ESG Performance (staff engagement, customer
satisfaction, CO2 emissions, and safety); Number of women serving on the Boards (3); Separation of Board Chair and CEO Roles; Rate of Independent Directors on the Board
(100%)
Areas for improvement and risks External Verification of CSR Reporting
Umicore MC Belgium Recycling
Umicore has moved away from its traditional mining businesses towards recycling precious metals from diverse
industries (including transportation infrastructure). An industry leader of
catalytic converter
Strengths and opportunities Environmental Management System; Percentage of R&D Budget Dedicated to Clean Technologies (80% on technologies such as emission control catalysts, materials for rechargeable batteries,
precious metals recycling etc) Areas for improvement and risks
Programmes and Targets To Reduce Water Use; External Environmental Certification Suppliers
Strengths and opportunities Policy on Labour Rights (both for employees and
contractors); Percentage of Employees Covered by Collective Bargaining Agreements (71%); Trend in Lost-Time Incident Rate(-13%); External QMS certifications;
Community Involvement Programmes Areas for improvement and risks
Reporting on Other KPIs; Health and Safety Certifications
Strengths and opportunities CSR Reporting; External Verification of CSR
Reporting; Separation of Board Chair and CEO Roles; Policy on Political Contributions
Areas for improvement and risks Policy on Bribery and Corruption; Rate of
Independent Directors on the Board (40%); Composition of the Remuneration and Audit
Committees
Vodafone LC UK Virtual
Mobility
Vodafone is a global telecommunications provider based in the United Kingdom. The company is
one of the industry's leaders.
Strengths and opportunities Environmental Management System; Programmes
and Targets to Reduce Direct GHG Emissions Areas for improvement and risks
Increase in net CO2 emissions: 2.14Mt (2011) vs 1.54Mt (2010), and in total energy use 4117GWh
(2011) vs 3278 (2010)
Strengths and opportunities Trend in Employee and Contractor Fatalities (27 in 2010
vs 21 in 2011) Areas for improvement and risks
Employee Turnover Rate (13% in 2010 vs 15% in 2011); Reporting on other KPIs
Strengths and opportunities Minority Shareholders Right; Disclosure of
Directors' Remuneration; Separation of Board Chair and CEO Roles
Areas for improvement and risks Audit Process; Level of Transparency and Accounting; Legal and Fiscal Complexity
Vossloh SC Germany Rail
Equipment
Vossloh AG's business is exclusively oriented towards the offering of rail infrastructure products and services
worldwide. It offers rail fastening systems, rail switches, monitoring
systems for rail networks and electrical equipment for electric buses.
Strengths and opportunities Environmental Management System (major
facilities ISO certified); Participation in Carbon Disclosure Project; Sustainability Related Products
& Services Areas for improvement and risks
Programmes and Targets To Reduce Water Use
Strengths and opportunities Employee Turnover Rate (6%); Health and Safety
Certifications; External QMS certifications Areas for improvement and risks
Reporting on Other KPIs; Policy on Labour and Human Rights (for both employees and contractors); Activities
in High Risk Countries (Russia, China)
Strengths and opportunities Separation of Board Chair and CEO Roles; Rate of Independent Directors on the Board
(100%) Areas for improvement and risks
Signatory to UN Global Compact; Whistleblower Programmes; CSR Reporting; Presence of a
Compensation Committee
Sources: Companies, Oddo Securities, Sustainalytics
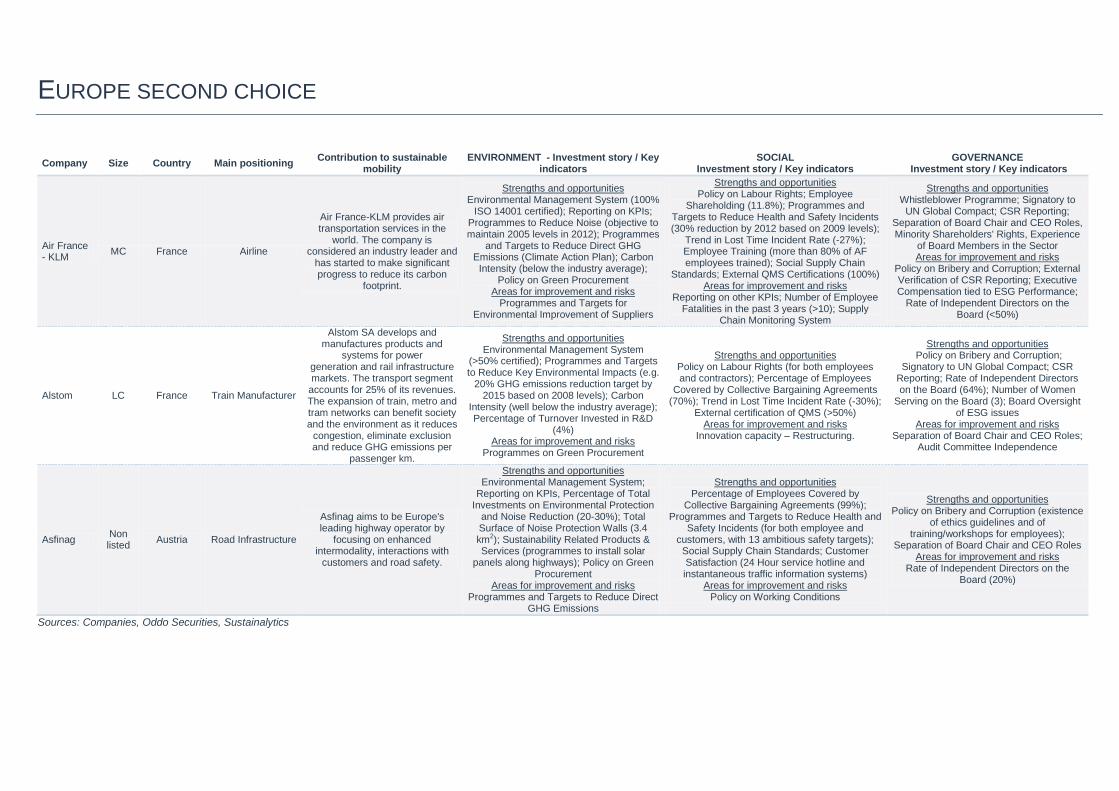
EUROPE SECOND CHOICE
Company Size Country Main positioning Contribution to sustainable
mobility ENVIRONMENT - Investment story / Key
indicators SOCIAL
Investment story / Key indicators GOVERNANCE
Investment story / Key indicators
Air France - KLM
MC France Airline
Air France-KLM provides air transportation services in the
world. The company is considered an industry leader and
has started to make significant progress to reduce its carbon
footprint.
Strengths and opportunities Environmental Management System (100%
ISO 14001 certified); Reporting on KPIs; Programmes to Reduce Noise (objective to maintain 2005 levels in 2012); Programmes
and Targets to Reduce Direct GHG Emissions (Climate Action Plan); Carbon
Intensity (below the industry average); Policy on Green Procurement
Areas for improvement and risks Programmes and Targets for
Environmental Improvement of Suppliers
Strengths and opportunities Policy on Labour Rights; Employee
Shareholding (11.8%); Programmes and Targets to Reduce Health and Safety Incidents (30% reduction by 2012 based on 2009 levels);
Trend in Lost Time Incident Rate (-27%); Employee Training (more than 80% of AF employees trained); Social Supply Chain
Standards; External QMS Certifications (100%) Areas for improvement and risks
Reporting on other KPIs; Number of Employee Fatalities in the past 3 years (>10); Supply
Chain Monitoring System
Strengths and opportunities Whistleblower Programme; Signatory to
UN Global Compact; CSR Reporting; Separation of Board Chair and CEO Roles, Minority Shareholders' Rights, Experience
of Board Members in the Sector Areas for improvement and risks
Policy on Bribery and Corruption; External Verification of CSR Reporting; Executive Compensation tied to ESG Performance;
Rate of Independent Directors on the Board (<50%)
Alstom LC France Train Manufacturer
Alstom SA develops and manufactures products and
systems for power generation and rail infrastructure markets. The transport segment
accounts for 25% of its revenues. The expansion of train, metro and tram networks can benefit society and the environment as it reduces
congestion, eliminate exclusion and reduce GHG emissions per
passenger km.
Strengths and opportunities Environmental Management System
(>50% certified); Programmes and Targets to Reduce Key Environmental Impacts (e.g.
20% GHG emissions reduction target by 2015 based on 2008 levels); Carbon
Intensity (well below the industry average); Percentage of Turnover Invested in R&D
(4%) Areas for improvement and risks
Programmes on Green Procurement
Strengths and opportunities Policy on Labour Rights (for both employees and contractors); Percentage of Employees
Covered by Collective Bargaining Agreements (70%); Trend in Lost Time Incident Rate (-30%);
External certification of QMS (>50%) Areas for improvement and risks
Innovation capacity – Restructuring.
Strengths and opportunities Policy on Bribery and Corruption;
Signatory to UN Global Compact; CSR Reporting; Rate of Independent Directors on the Board (64%); Number of Women
Serving on the Board (3); Board Oversight of ESG issues
Areas for improvement and risks Separation of Board Chair and CEO Roles;
Audit Committee Independence
Asfinag Non listed
Austria Road Infrastructure
Asfinag aims to be Europe's leading highway operator by
focusing on enhanced intermodality, interactions with
customers and road safety.
Strengths and opportunities Environmental Management System;
Reporting on KPIs, Percentage of Total Investments on Environmental Protection
and Noise Reduction (20-30%); Total Surface of Noise Protection Walls (3.4 km2); Sustainability Related Products & Services (programmes to install solar
panels along highways); Policy on Green Procurement
Areas for improvement and risks Programmes and Targets to Reduce Direct
GHG Emissions
Strengths and opportunities Percentage of Employees Covered by
Collective Bargaining Agreements (99%); Programmes and Targets to Reduce Health and
Safety Incidents (for both employee and customers, with 13 ambitious safety targets); Social Supply Chain Standards; Customer Satisfaction (24 Hour service hotline and instantaneous traffic information systems)
Areas for improvement and risks Policy on Working Conditions
Strengths and opportunities Policy on Bribery and Corruption (existence
of ethics guidelines and of training/workshops for employees);
Separation of Board Chair and CEO Roles Areas for improvement and risks
Rate of Independent Directors on the Board (20%)
Sources: Companies, Oddo Securities, Sustainalytics
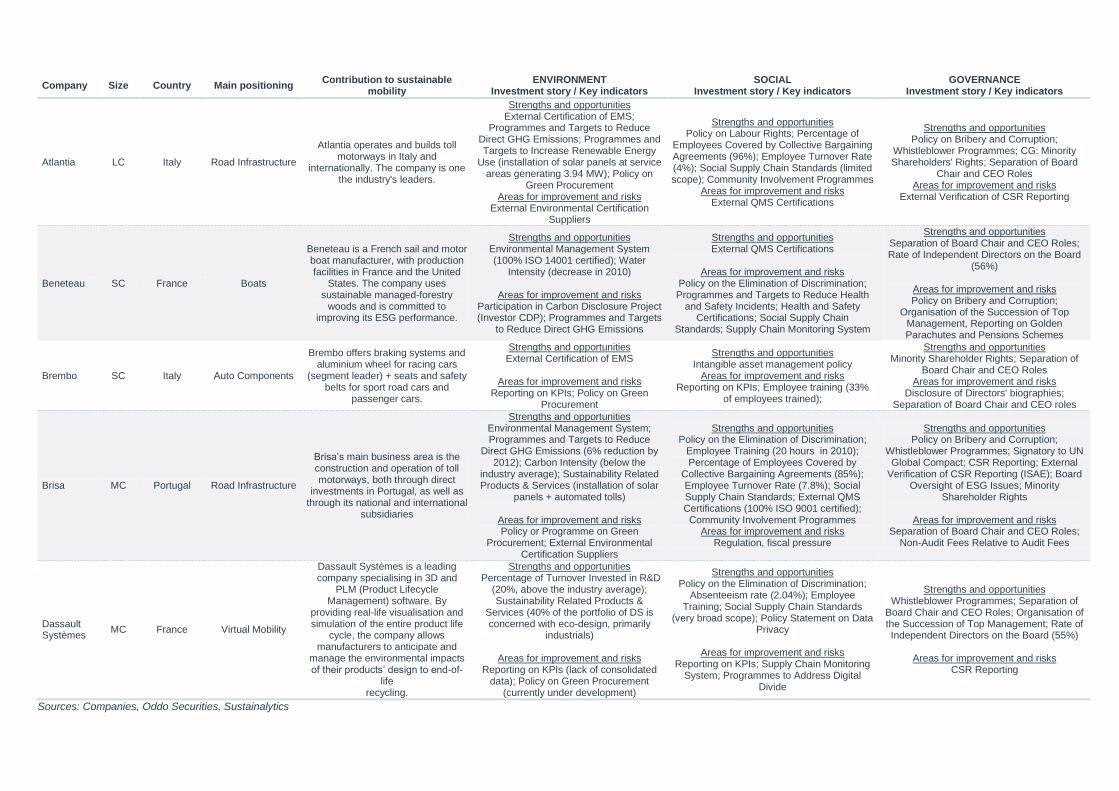
Company Size Country Main positioning Contribution to sustainable
mobility ENVIRONMENT
Investment story / Key indicators SOCIAL
Investment story / Key indicators GOVERNANCE
Investment story / Key indicators
Atlantia LC Italy Road Infrastructure
Atlantia operates and builds toll motorways in Italy and
internationally. The company is one the industry's leaders.
Strengths and opportunities External Certification of EMS;
Programmes and Targets to Reduce Direct GHG Emissions; Programmes and Targets to Increase Renewable Energy
Use (installation of solar panels at service areas generating 3.94 MW); Policy on
Green Procurement Areas for improvement and risks
External Environmental Certification Suppliers
Strengths and opportunities Policy on Labour Rights; Percentage of
Employees Covered by Collective Bargaining Agreements (96%); Employee Turnover Rate (4%); Social Supply Chain Standards (limited scope); Community Involvement Programmes
Areas for improvement and risks External QMS Certifications
Strengths and opportunities Policy on Bribery and Corruption;
Whistleblower Programmes; CG: Minority Shareholders' Rights; Separation of Board
Chair and CEO Roles Areas for improvement and risks
External Verification of CSR Reporting
Beneteau SC France Boats
Beneteau is a French sail and motor boat manufacturer, with production facilities in France and the United
States. The company uses sustainable managed-forestry
woods and is committed to improving its ESG performance.
Strengths and opportunities Environmental Management System (100% ISO 14001 certified); Water
Intensity (decrease in 2010)
Areas for improvement and risks Participation in Carbon Disclosure Project (Investor CDP); Programmes and Targets
to Reduce Direct GHG Emissions
Strengths and opportunities External QMS Certifications
Areas for improvement and risks
Policy on the Elimination of Discrimination; Programmes and Targets to Reduce Health
and Safety Incidents; Health and Safety Certifications; Social Supply Chain
Standards; Supply Chain Monitoring System
Strengths and opportunities Separation of Board Chair and CEO Roles; Rate of Independent Directors on the Board
(56%)
Areas for improvement and risks Policy on Bribery and Corruption;
Organisation of the Succession of Top Management, Reporting on Golden Parachutes and Pensions Schemes
Brembo SC Italy Auto Components
Brembo offers braking systems and aluminium wheel for racing cars
(segment leader) + seats and safety belts for sport road cars and
passenger cars.
Strengths and opportunities External Certification of EMS
Areas for improvement and risks
Reporting on KPIs; Policy on Green Procurement
Strengths and opportunities Intangible asset management policy
Areas for improvement and risks Reporting on KPIs; Employee training (33%
of employees trained);
Strengths and opportunities Minority Shareholder Rights; Separation of
Board Chair and CEO Roles Areas for improvement and risks
Disclosure of Directors' biographies; Separation of Board Chair and CEO roles
Brisa MC Portugal Road Infrastructure
Brisa‘s main business area is the construction and operation of toll motorways, both through direct
investments in Portugal, as well as through its national and international
subsidiaries
Strengths and opportunities Environmental Management System; Programmes and Targets to Reduce
Direct GHG Emissions (6% reduction by 2012); Carbon Intensity (below the
industry average); Sustainability Related Products & Services (installation of solar
panels + automated tolls)
Areas for improvement and risks Policy or Programme on Green
Procurement; External Environmental Certification Suppliers
Strengths and opportunities Policy on the Elimination of Discrimination;
Employee Training (20 hours in 2010); Percentage of Employees Covered by
Collective Bargaining Agreements (85%); Employee Turnover Rate (7.8%); Social Supply Chain Standards; External QMS Certifications (100% ISO 9001 certified); Community Involvement Programmes
Areas for improvement and risks Regulation, fiscal pressure
Strengths and opportunities Policy on Bribery and Corruption;
Whistleblower Programmes; Signatory to UN Global Compact; CSR Reporting; External
Verification of CSR Reporting (ISAE); Board Oversight of ESG Issues; Minority
Shareholder Rights
Areas for improvement and risks Separation of Board Chair and CEO Roles;
Non-Audit Fees Relative to Audit Fees
Dassault Systèmes
MC France Virtual Mobility
Dassault Systèmes is a leading company specialising in 3D and
PLM (Product Lifecycle Management) software. By
providing real-life visualisation and simulation of the entire product life
cycle, the company allows manufacturers to anticipate and
manage the environmental impacts of their products‘ design to end-of-
life recycling.
Strengths and opportunities Percentage of Turnover Invested in R&D
(20%, above the industry average); Sustainability Related Products &
Services (40% of the portfolio of DS is concerned with eco-design, primarily
industrials)
Areas for improvement and risks Reporting on KPIs (lack of consolidated
data); Policy on Green Procurement (currently under development)
Strengths and opportunities Policy on the Elimination of Discrimination;
Absenteeism rate (2.04%); Employee Training; Social Supply Chain Standards
(very broad scope); Policy Statement on Data Privacy
Areas for improvement and risks
Reporting on KPIs; Supply Chain Monitoring System; Programmes to Address Digital
Divide
Strengths and opportunities Whistleblower Programmes; Separation of
Board Chair and CEO Roles; Organisation of the Succession of Top Management; Rate of Independent Directors on the Board (55%)
Areas for improvement and risks
CSR Reporting
Sources: Companies, Oddo Securities, Sustainalytics
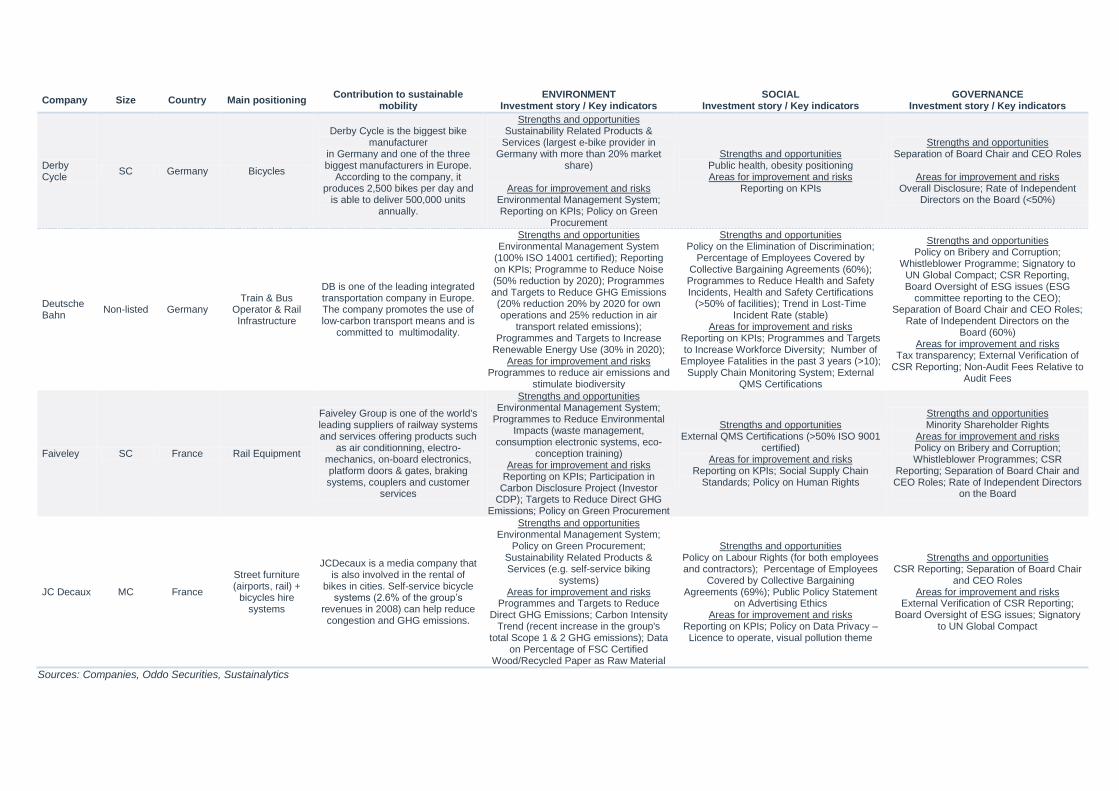
Company Size Country Main positioning Contribution to sustainable
mobility ENVIRONMENT
Investment story / Key indicators SOCIAL
Investment story / Key indicators GOVERNANCE
Investment story / Key indicators
Derby Cycle
SC Germany Bicycles
Derby Cycle is the biggest bike manufacturer
in Germany and one of the three biggest manufacturers in Europe.
According to the company, it produces 2,500 bikes per day and
is able to deliver 500,000 units annually.
Strengths and opportunities Sustainability Related Products &
Services (largest e-bike provider in Germany with more than 20% market
share)
Areas for improvement and risks Environmental Management System; Reporting on KPIs; Policy on Green
Procurement
Strengths and opportunities Public health, obesity positioning Areas for improvement and risks
Reporting on KPIs
Strengths and opportunities Separation of Board Chair and CEO Roles
Areas for improvement and risks
Overall Disclosure; Rate of Independent Directors on the Board (<50%)
Deutsche Bahn
Non-listed Germany Train & Bus
Operator & Rail Infrastructure
DB is one of the leading integrated transportation company in Europe. The company promotes the use of low-carbon transport means and is
committed to multimodality.
Strengths and opportunities Environmental Management System
(100% ISO 14001 certified); Reporting on KPIs; Programme to Reduce Noise (50% reduction by 2020); Programmes and Targets to Reduce GHG Emissions
(20% reduction 20% by 2020 for own operations and 25% reduction in air
transport related emissions); Programmes and Targets to Increase
Renewable Energy Use (30% in 2020); Areas for improvement and risks
Programmes to reduce air emissions and stimulate biodiversity
Strengths and opportunities Policy on the Elimination of Discrimination;
Percentage of Employees Covered by Collective Bargaining Agreements (60%); Programmes to Reduce Health and Safety Incidents, Health and Safety Certifications
(>50% of facilities); Trend in Lost-Time Incident Rate (stable)
Areas for improvement and risks Reporting on KPIs; Programmes and Targets to Increase Workforce Diversity; Number of
Employee Fatalities in the past 3 years (>10); Supply Chain Monitoring System; External
QMS Certifications
Strengths and opportunities Policy on Bribery and Corruption;
Whistleblower Programme; Signatory to UN Global Compact; CSR Reporting, Board Oversight of ESG issues (ESG
committee reporting to the CEO); Separation of Board Chair and CEO Roles;
Rate of Independent Directors on the Board (60%)
Areas for improvement and risks Tax transparency; External Verification of
CSR Reporting; Non-Audit Fees Relative to Audit Fees
Faiveley SC France Rail Equipment
Faiveley Group is one of the world's leading suppliers of railway systems and services offering products such
as air conditionning, electro-mechanics, on-board electronics, platform doors & gates, braking systems, couplers and customer
services
Strengths and opportunities Environmental Management System;
Programmes to Reduce Environmental Impacts (waste management,
consumption electronic systems, eco-conception training)
Areas for improvement and risks Reporting on KPIs; Participation in
Carbon Disclosure Project (Investor CDP); Targets to Reduce Direct GHG
Emissions; Policy on Green Procurement
Strengths and opportunities External QMS Certifications (>50% ISO 9001
certified) Areas for improvement and risks
Reporting on KPIs; Social Supply Chain Standards; Policy on Human Rights
Strengths and opportunities Minority Shareholder Rights
Areas for improvement and risks Policy on Bribery and Corruption; Whistleblower Programmes; CSR
Reporting; Separation of Board Chair and CEO Roles; Rate of Independent Directors
on the Board
JC Decaux MC France
Street furniture (airports, rail) +
bicycles hire systems
JCDecaux is a media company that is also involved in the rental of
bikes in cities. Self-service bicycle systems (2.6% of the group‘s
revenues in 2008) can help reduce congestion and GHG emissions.
Strengths and opportunities Environmental Management System;
Policy on Green Procurement; Sustainability Related Products & Services (e.g. self-service biking
systems) Areas for improvement and risks
Programmes and Targets to Reduce Direct GHG Emissions; Carbon Intensity
Trend (recent increase in the group's total Scope 1 & 2 GHG emissions); Data
on Percentage of FSC Certified Wood/Recycled Paper as Raw Material
Strengths and opportunities Policy on Labour Rights (for both employees and contractors); Percentage of Employees
Covered by Collective Bargaining Agreements (69%); Public Policy Statement
on Advertising Ethics Areas for improvement and risks
Reporting on KPIs; Policy on Data Privacy – Licence to operate, visual pollution theme
Strengths and opportunities CSR Reporting; Separation of Board Chair
and CEO Roles Areas for improvement and risks
External Verification of CSR Reporting; Board Oversight of ESG issues; Signatory
to UN Global Compact
Sources: Companies, Oddo Securities, Sustainalytics
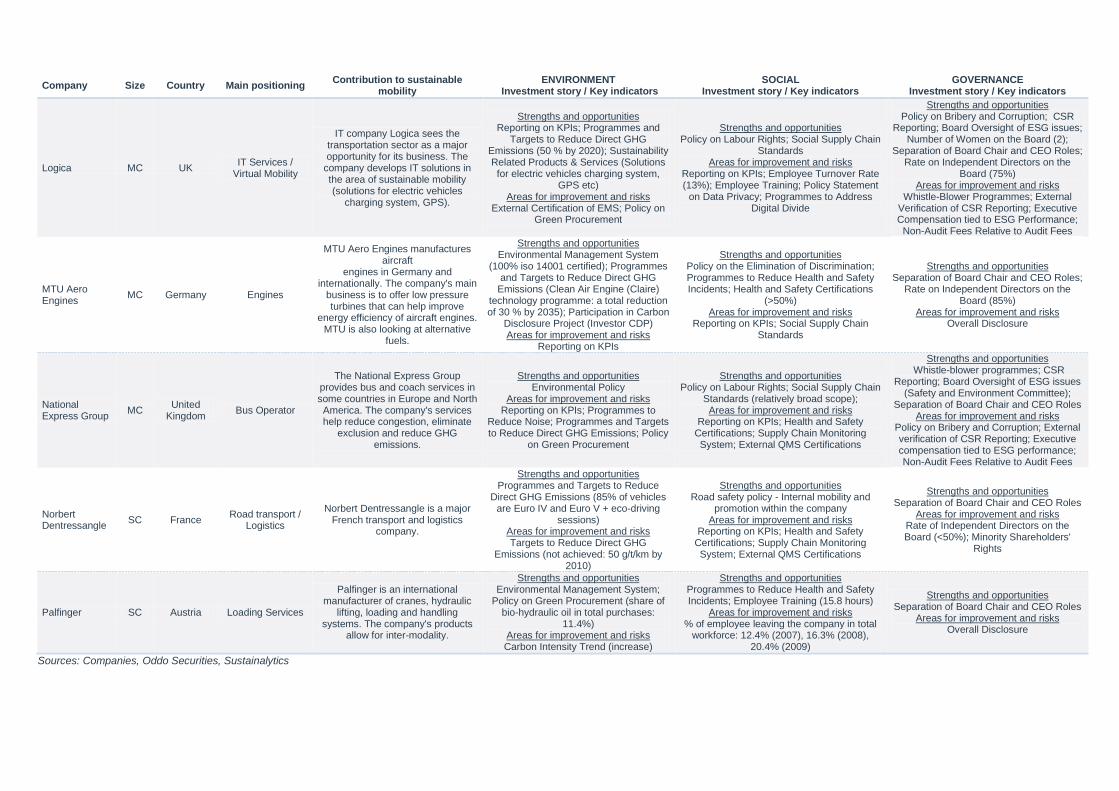
Company Size Country Main positioning Contribution to sustainable
mobility ENVIRONMENT
Investment story / Key indicators SOCIAL
Investment story / Key indicators GOVERNANCE
Investment story / Key indicators
Logica MC UK IT Services /
Virtual Mobility
IT company Logica sees the transportation sector as a major opportunity for its business. The
company develops IT solutions in the area of sustainable mobility (solutions for electric vehicles
charging system, GPS).
Strengths and opportunities Reporting on KPIs; Programmes and
Targets to Reduce Direct GHG Emissions (50 % by 2020); Sustainability Related Products & Services (Solutions for electric vehicles charging system,
GPS etc) Areas for improvement and risks
External Certification of EMS; Policy on Green Procurement
Strengths and opportunities Policy on Labour Rights; Social Supply Chain
Standards Areas for improvement and risks
Reporting on KPIs; Employee Turnover Rate (13%); Employee Training; Policy Statement
on Data Privacy; Programmes to Address Digital Divide
Strengths and opportunities Policy on Bribery and Corruption; CSR
Reporting; Board Oversight of ESG issues; Number of Women on the Board (2);
Separation of Board Chair and CEO Roles; Rate on Independent Directors on the
Board (75%) Areas for improvement and risks
Whistle-Blower Programmes; External Verification of CSR Reporting; Executive Compensation tied to ESG Performance; Non-Audit Fees Relative to Audit Fees
MTU Aero Engines
MC Germany Engines
MTU Aero Engines manufactures aircraft
engines in Germany and internationally. The company's main
business is to offer low pressure turbines that can help improve
energy efficiency of aircraft engines. MTU is also looking at alternative
fuels.
Strengths and opportunities Environmental Management System
(100% iso 14001 certified); Programmes and Targets to Reduce Direct GHG
Emissions (Clean Air Engine (Claire) technology programme: a total reduction of 30 % by 2035); Participation in Carbon
Disclosure Project (Investor CDP) Areas for improvement and risks
Reporting on KPIs
Strengths and opportunities Policy on the Elimination of Discrimination; Programmes to Reduce Health and Safety Incidents; Health and Safety Certifications
(>50%) Areas for improvement and risks
Reporting on KPIs; Social Supply Chain Standards
Strengths and opportunities Separation of Board Chair and CEO Roles;
Rate on Independent Directors on the Board (85%)
Areas for improvement and risks Overall Disclosure
National Express Group
MC United
Kingdom Bus Operator
The National Express Group provides bus and coach services in some countries in Europe and North America. The company's services help reduce congestion, eliminate
exclusion and reduce GHG emissions.
Strengths and opportunities Environmental Policy
Areas for improvement and risks Reporting on KPIs; Programmes to
Reduce Noise; Programmes and Targets to Reduce Direct GHG Emissions; Policy
on Green Procurement
Strengths and opportunities Policy on Labour Rights; Social Supply Chain
Standards (relatively broad scope); Areas for improvement and risks
Reporting on KPIs; Health and Safety Certifications; Supply Chain Monitoring System; External QMS Certifications
Strengths and opportunities Whistle-blower programmes; CSR
Reporting; Board Oversight of ESG issues (Safety and Environment Committee);
Separation of Board Chair and CEO Roles Areas for improvement and risks
Policy on Bribery and Corruption; External verification of CSR Reporting; Executive compensation tied to ESG performance; Non-Audit Fees Relative to Audit Fees
Norbert Dentressangle
SC France Road transport /
Logistics
Norbert Dentressangle is a major French transport and logistics
company.
Strengths and opportunities Programmes and Targets to Reduce
Direct GHG Emissions (85% of vehicles are Euro IV and Euro V + eco-driving
sessions) Areas for improvement and risks Targets to Reduce Direct GHG
Emissions (not achieved: 50 g/t/km by 2010)
Strengths and opportunities Road safety policy - Internal mobility and
promotion within the company Areas for improvement and risks
Reporting on KPIs; Health and Safety Certifications; Supply Chain Monitoring System; External QMS Certifications
Strengths and opportunities Separation of Board Chair and CEO Roles
Areas for improvement and risks Rate of Independent Directors on the Board (<50%); Minority Shareholders'
Rights
Palfinger SC Austria Loading Services
Palfinger is an international manufacturer of cranes, hydraulic
lifting, loading and handling systems. The company's products
allow for inter-modality.
Strengths and opportunities Environmental Management System;
Policy on Green Procurement (share of bio-hydraulic oil in total purchases:
11.4%) Areas for improvement and risks Carbon Intensity Trend (increase)
Strengths and opportunities Programmes to Reduce Health and Safety Incidents; Employee Training (15.8 hours)
Areas for improvement and risks % of employee leaving the company in total
workforce: 12.4% (2007), 16.3% (2008), 20.4% (2009)
Strengths and opportunities Separation of Board Chair and CEO Roles
Areas for improvement and risks Overall Disclosure
Sources: Companies, Oddo Securities, Sustainalytics
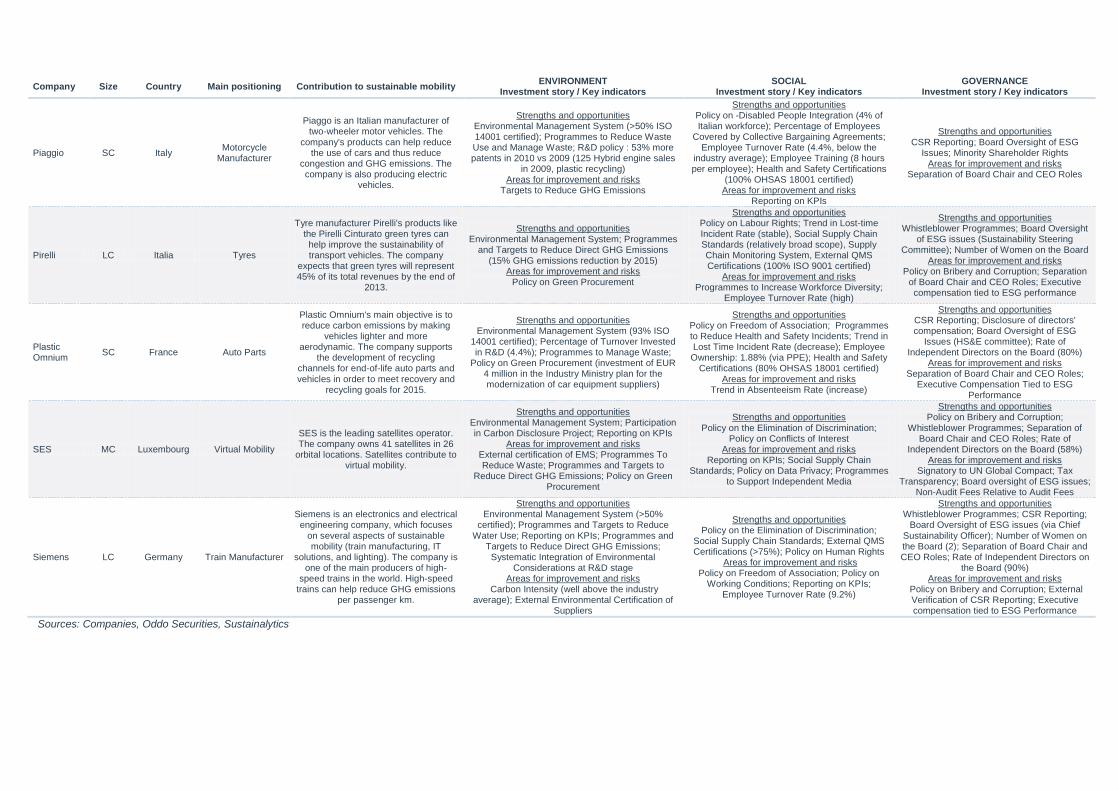
Company Size Country Main positioning Contribution to sustainable mobility ENVIRONMENT
Investment story / Key indicators SOCIAL
Investment story / Key indicators GOVERNANCE
Investment story / Key indicators
Piaggio SC Italy Motorcycle
Manufacturer
Piaggo is an Italian manufacturer of two-wheeler motor vehicles. The
company's products can help reduce the use of cars and thus reduce
congestion and GHG emissions. The company is also producing electric
vehicles.
Strengths and opportunities Environmental Management System (>50% ISO 14001 certified); Programmes to Reduce Waste Use and Manage Waste; R&D policy : 53% more patents in 2010 vs 2009 (125 Hybrid engine sales
in 2009, plastic recycling) Areas for improvement and risks
Targets to Reduce GHG Emissions
Strengths and opportunities Policy on -Disabled People Integration (4% of Italian workforce); Percentage of Employees
Covered by Collective Bargaining Agreements; Employee Turnover Rate (4.4%, below the
industry average); Employee Training (8 hours per employee); Health and Safety Certifications
(100% OHSAS 18001 certified) Areas for improvement and risks
Reporting on KPIs
Strengths and opportunities CSR Reporting; Board Oversight of ESG
Issues; Minority Shareholder Rights Areas for improvement and risks
Separation of Board Chair and CEO Roles
Pirelli LC Italia Tyres
Tyre manufacturer Pirelli's products like the Pirelli Cinturato green tyres can help improve the sustainability of transport vehicles. The company
expects that green tyres will represent 45% of its total revenues by the end of
2013.
Strengths and opportunities Environmental Management System; Programmes
and Targets to Reduce Direct GHG Emissions (15% GHG emissions reduction by 2015)
Areas for improvement and risks Policy on Green Procurement
Strengths and opportunities Policy on Labour Rights; Trend in Lost-time Incident Rate (stable), Social Supply Chain Standards (relatively broad scope), Supply Chain Monitoring System, External QMS Certifications (100% ISO 9001 certified)
Areas for improvement and risks Programmes to Increase Workforce Diversity;
Employee Turnover Rate (high)
Strengths and opportunities Whistleblower Programmes; Board Oversight
of ESG issues (Sustainability Steering Committee); Number of Women on the Board
Areas for improvement and risks Policy on Bribery and Corruption; Separation
of Board Chair and CEO Roles; Executive compensation tied to ESG performance
Plastic Omnium
SC France Auto Parts
Plastic Omnium's main objective is to reduce carbon emissions by making
vehicles lighter and more aerodynamic. The company supports
the development of recycling channels for end-of-life auto parts and vehicles in order to meet recovery and
recycling goals for 2015.
Strengths and opportunities Environmental Management System (93% ISO
14001 certified); Percentage of Turnover Invested in R&D (4.4%); Programmes to Manage Waste;
Policy on Green Procurement (investment of EUR 4 million in the Industry Ministry plan for the modernization of car equipment suppliers)
Strengths and opportunities Policy on Freedom of Association; Programmes to Reduce Health and Safety Incidents; Trend in Lost Time Incident Rate (decrease); Employee Ownership: 1.88% (via PPE); Health and Safety
Certifications (80% OHSAS 18001 certified) Areas for improvement and risks
Trend in Absenteeism Rate (increase)
Strengths and opportunities CSR Reporting; Disclosure of directors' compensation; Board Oversight of ESG
Issues (HS&E committee); Rate of Independent Directors on the Board (80%)
Areas for improvement and risks Separation of Board Chair and CEO Roles;
Executive Compensation Tied to ESG Performance
SES MC Luxembourg Virtual Mobility
SES is the leading satellites operator. The company owns 41 satellites in 26
orbital locations. Satellites contribute to virtual mobility.
Strengths and opportunities Environmental Management System; Participation in Carbon Disclosure Project; Reporting on KPIs
Areas for improvement and risks External certification of EMS; Programmes To Reduce Waste; Programmes and Targets to
Reduce Direct GHG Emissions; Policy on Green Procurement
Strengths and opportunities Policy on the Elimination of Discrimination;
Policy on Conflicts of Interest Areas for improvement and risks
Reporting on KPIs; Social Supply Chain Standards; Policy on Data Privacy; Programmes
to Support Independent Media
Strengths and opportunities Policy on Bribery and Corruption;
Whistleblower Programmes; Separation of Board Chair and CEO Roles; Rate of
Independent Directors on the Board (58%) Areas for improvement and risks
Signatory to UN Global Compact; Tax Transparency; Board oversight of ESG issues;
Non-Audit Fees Relative to Audit Fees
Siemens LC Germany Train Manufacturer
Siemens is an electronics and electrical engineering company, which focuses
on several aspects of sustainable mobility (train manufacturing, IT
solutions, and lighting). The company is one of the main producers of high-
speed trains in the world. High-speed trains can help reduce GHG emissions
per passenger km.
Strengths and opportunities Environmental Management System (>50%
certified); Programmes and Targets to Reduce Water Use; Reporting on KPIs; Programmes and
Targets to Reduce Direct GHG Emissions; Systematic Integration of Environmental
Considerations at R&D stage Areas for improvement and risks
Carbon Intensity (well above the industry average); External Environmental Certification of
Suppliers
Strengths and opportunities Policy on the Elimination of Discrimination;
Social Supply Chain Standards; External QMS Certifications (>75%); Policy on Human Rights
Areas for improvement and risks Policy on Freedom of Association; Policy on
Working Conditions; Reporting on KPIs; Employee Turnover Rate (9.2%)
Strengths and opportunities Whistleblower Programmes; CSR Reporting;
Board Oversight of ESG issues (via Chief Sustainability Officer); Number of Women on the Board (2); Separation of Board Chair and CEO Roles; Rate of Independent Directors on
the Board (90%) Areas for improvement and risks
Policy on Bribery and Corruption; External Verification of CSR Reporting; Executive compensation tied to ESG Performance
Sources: Companies, Oddo Securities, Sustainalytics
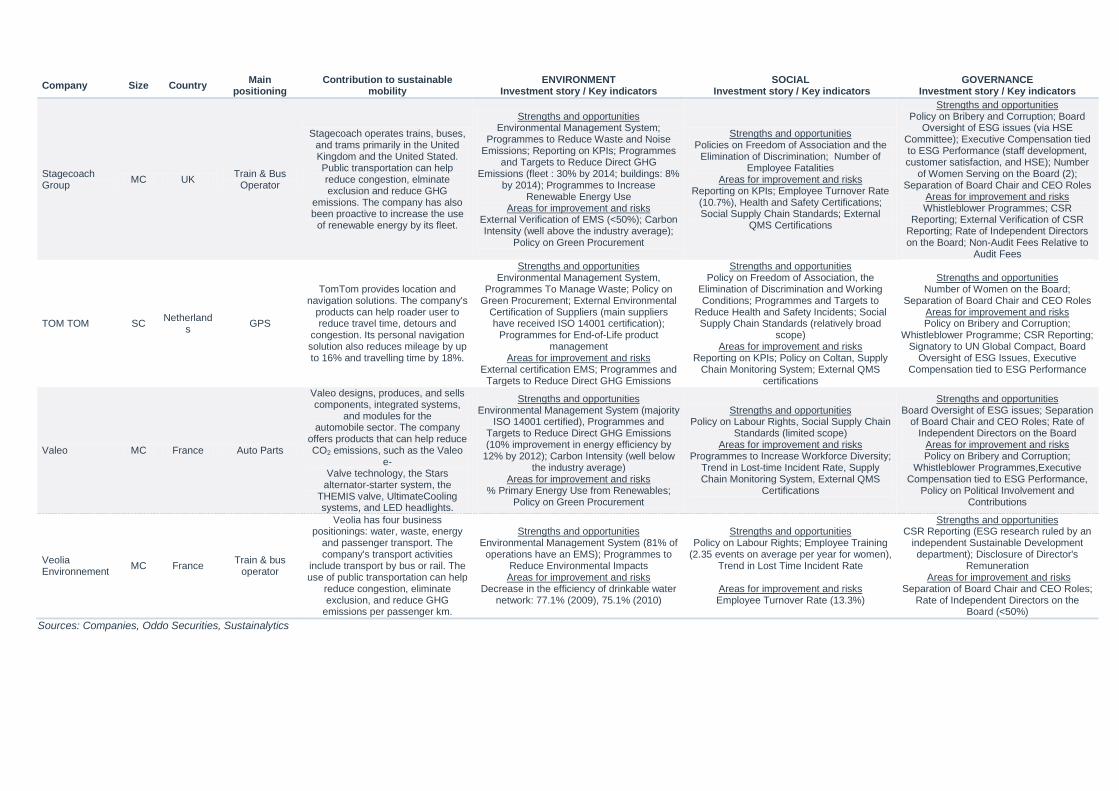
Company Size Country Main
positioning Contribution to sustainable
mobility ENVIRONMENT
Investment story / Key indicators SOCIAL
Investment story / Key indicators GOVERNANCE
Investment story / Key indicators
Stagecoach Group
MC UK Train & Bus
Operator
Stagecoach operates trains, buses, and trams primarily in the United Kingdom and the United Stated. Public transportation can help reduce congestion, elminate exclusion and reduce GHG
emissions. The company has also been proactive to increase the use
of renewable energy by its fleet.
Strengths and opportunities Environmental Management System;
Programmes to Reduce Waste and Noise Emissions; Reporting on KPIs; Programmes
and Targets to Reduce Direct GHG Emissions (fleet : 30% by 2014; buildings: 8%
by 2014); Programmes to Increase Renewable Energy Use
Areas for improvement and risks External Verification of EMS (<50%); Carbon Intensity (well above the industry average);
Policy on Green Procurement
Strengths and opportunities Policies on Freedom of Association and the
Elimination of Discrimination; Number of Employee Fatalities
Areas for improvement and risks Reporting on KPIs; Employee Turnover Rate
(10.7%), Health and Safety Certifications; Social Supply Chain Standards; External
QMS Certifications
Strengths and opportunities Policy on Bribery and Corruption; Board
Oversight of ESG issues (via HSE Committee); Executive Compensation tied to ESG Performance (staff development, customer satisfaction, and HSE); Number
of Women Serving on the Board (2); Separation of Board Chair and CEO Roles
Areas for improvement and risks Whistleblower Programmes; CSR
Reporting; External Verification of CSR Reporting; Rate of Independent Directors on the Board; Non-Audit Fees Relative to
Audit Fees
TOM TOM SC Netherland
s GPS
TomTom provides location and navigation solutions. The company's
products can help roader user to reduce travel time, detours and
congestion. Its personal navigation solution also reduces mileage by up to 16% and travelling time by 18%.
Strengths and opportunities Environmental Management System,
Programmes To Manage Waste; Policy on Green Procurement; External Environmental
Certification of Suppliers (main suppliers have received ISO 14001 certification);
Programmes for End-of-Life product management
Areas for improvement and risks External certification EMS; Programmes and
Targets to Reduce Direct GHG Emissions
Strengths and opportunities Policy on Freedom of Association, the
Elimination of Discrimination and Working Conditions; Programmes and Targets to
Reduce Health and Safety Incidents; Social Supply Chain Standards (relatively broad
scope) Areas for improvement and risks
Reporting on KPIs; Policy on Coltan, Supply Chain Monitoring System; External QMS
certifications
Strengths and opportunities Number of Women on the Board;
Separation of Board Chair and CEO Roles Areas for improvement and risks Policy on Bribery and Corruption;
Whistleblower Programme; CSR Reporting; Signatory to UN Global Compact, Board
Oversight of ESG Issues, Executive Compensation tied to ESG Performance
Valeo MC France Auto Parts
Valeo designs, produces, and sells components, integrated systems,
and modules for the automobile sector. The company
offers products that can help reduce CO2 emissions, such as the Valeo
e- Valve technology, the Stars
alternator-starter system, the THEMIS valve, UltimateCooling systems, and LED headlights.
Strengths and opportunities Environmental Management System (majority
ISO 14001 certified), Programmes and Targets to Reduce Direct GHG Emissions (10% improvement in energy efficiency by
12% by 2012); Carbon Intensity (well below the industry average)
Areas for improvement and risks % Primary Energy Use from Renewables;
Policy on Green Procurement
Strengths and opportunities Policy on Labour Rights, Social Supply Chain
Standards (limited scope) Areas for improvement and risks
Programmes to Increase Workforce Diversity; Trend in Lost-time Incident Rate, Supply Chain Monitoring System, External QMS
Certifications
Strengths and opportunities Board Oversight of ESG issues; Separation
of Board Chair and CEO Roles; Rate of Independent Directors on the Board
Areas for improvement and risks Policy on Bribery and Corruption;
Whistleblower Programmes,Executive Compensation tied to ESG Performance,
Policy on Political Involvement and Contributions
Veolia Environnement
MC France Train & bus
operator
Veolia has four business positionings: water, waste, energy
and passenger transport. The company's transport activities
include transport by bus or rail. The use of public transportation can help
reduce congestion, eliminate exclusion, and reduce GHG
emissions per passenger km.
Strengths and opportunities Environmental Management System (81% of
operations have an EMS); Programmes to Reduce Environmental Impacts Areas for improvement and risks
Decrease in the efficiency of drinkable water network: 77.1% (2009), 75.1% (2010)
Strengths and opportunities Policy on Labour Rights; Employee Training
(2.35 events on average per year for women), Trend in Lost Time Incident Rate
Areas for improvement and risks Employee Turnover Rate (13.3%)
Strengths and opportunities CSR Reporting (ESG research ruled by an
independent Sustainable Development department); Disclosure of Director's
Remuneration Areas for improvement and risks
Separation of Board Chair and CEO Roles; Rate of Independent Directors on the
Board (<50%)
Sources: Companies, Oddo Securities, Sustainalytics
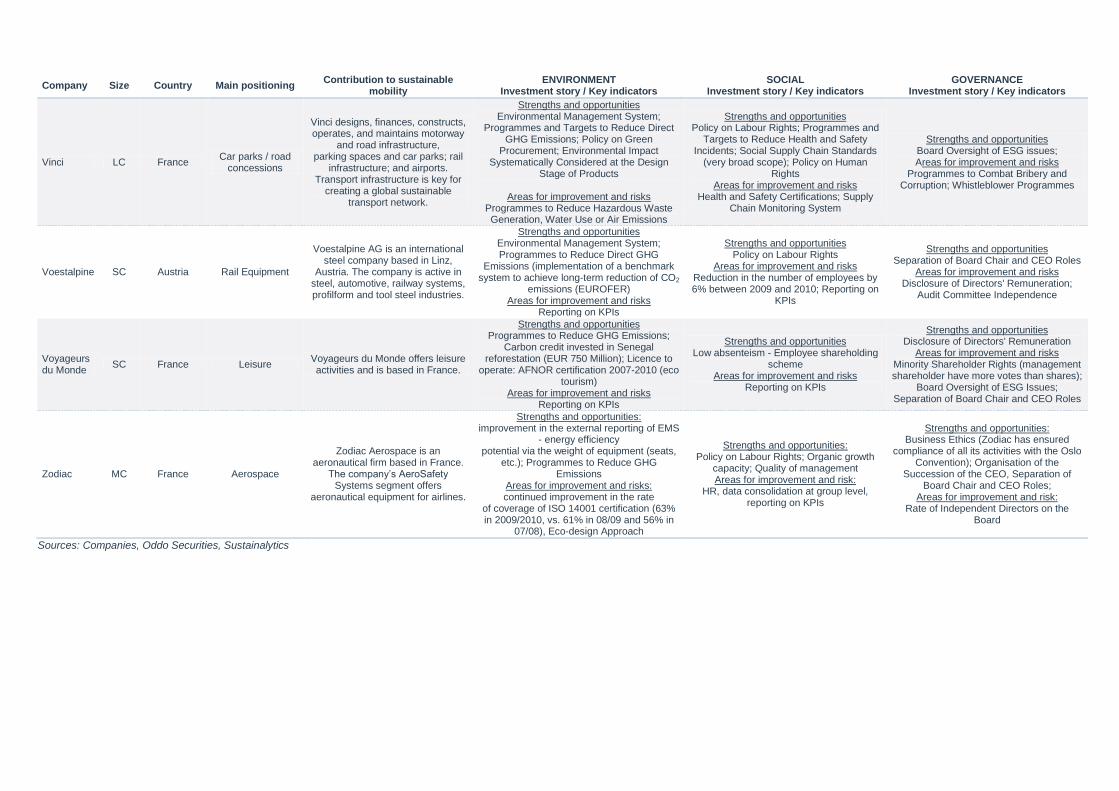
Company Size Country Main positioning Contribution to sustainable
mobility ENVIRONMENT
Investment story / Key indicators SOCIAL
Investment story / Key indicators GOVERNANCE
Investment story / Key indicators
Vinci LC France Car parks / road
concessions
Vinci designs, finances, constructs, operates, and maintains motorway
and road infrastructure, parking spaces and car parks; rail
infrastructure; and airports. Transport infrastructure is key for
creating a global sustainable transport network.
Strengths and opportunities Environmental Management System;
Programmes and Targets to Reduce Direct GHG Emissions; Policy on Green
Procurement; Environmental Impact Systematically Considered at the Design
Stage of Products
Areas for improvement and risks Programmes to Reduce Hazardous Waste Generation, Water Use or Air Emissions
Strengths and opportunities Policy on Labour Rights; Programmes and
Targets to Reduce Health and Safety Incidents; Social Supply Chain Standards
(very broad scope); Policy on Human Rights
Areas for improvement and risks Health and Safety Certifications; Supply
Chain Monitoring System
Strengths and opportunities Board Oversight of ESG issues; Areas for improvement and risks
Programmes to Combat Bribery and Corruption; Whistleblower Programmes
Voestalpine SC Austria Rail Equipment
Voestalpine AG is an international steel company based in Linz,
Austria. The company is active in steel, automotive, railway systems, profilform and tool steel industries.
Strengths and opportunities Environmental Management System; Programmes to Reduce Direct GHG
Emissions (implementation of a benchmark system to achieve long-term reduction of CO2
emissions (EUROFER) Areas for improvement and risks
Reporting on KPIs
Strengths and opportunities Policy on Labour Rights
Areas for improvement and risks Reduction in the number of employees by 6% between 2009 and 2010; Reporting on
KPIs
Strengths and opportunities Separation of Board Chair and CEO Roles
Areas for improvement and risks Disclosure of Directors' Remuneration;
Audit Committee Independence
Voyageurs du Monde
SC France Leisure Voyageurs du Monde offers leisure activities and is based in France.
Strengths and opportunities Programmes to Reduce GHG Emissions;
Carbon credit invested in Senegal reforestation (EUR 750 Million); Licence to
operate: AFNOR certification 2007-2010 (eco tourism)
Areas for improvement and risks Reporting on KPIs
Strengths and opportunities Low absenteism - Employee shareholding
scheme Areas for improvement and risks
Reporting on KPIs
Strengths and opportunities Disclosure of Directors' Remuneration
Areas for improvement and risks Minority Shareholder Rights (management shareholder have more votes than shares);
Board Oversight of ESG Issues; Separation of Board Chair and CEO Roles
Zodiac MC France Aerospace
Zodiac Aerospace is an aeronautical firm based in France.
The company‘s AeroSafety Systems segment offers
aeronautical equipment for airlines.
Strengths and opportunities: improvement in the external reporting of EMS
- energy efficiency potential via the weight of equipment (seats,
etc.); Programmes to Reduce GHG Emissions
Areas for improvement and risks: continued improvement in the rate
of coverage of ISO 14001 certification (63% in 2009/2010, vs. 61% in 08/09 and 56% in
07/08), Eco-design Approach
Strengths and opportunities: Policy on Labour Rights; Organic growth
capacity; Quality of management Areas for improvement and risk:
HR, data consolidation at group level, reporting on KPIs
Strengths and opportunities: Business Ethics (Zodiac has ensured
compliance of all its activities with the Oslo Convention); Organisation of the
Succession of the CEO, Separation of Board Chair and CEO Roles;
Areas for improvement and risk: Rate of Independent Directors on the
Board
Sources: Companies, Oddo Securities, Sustainalytics
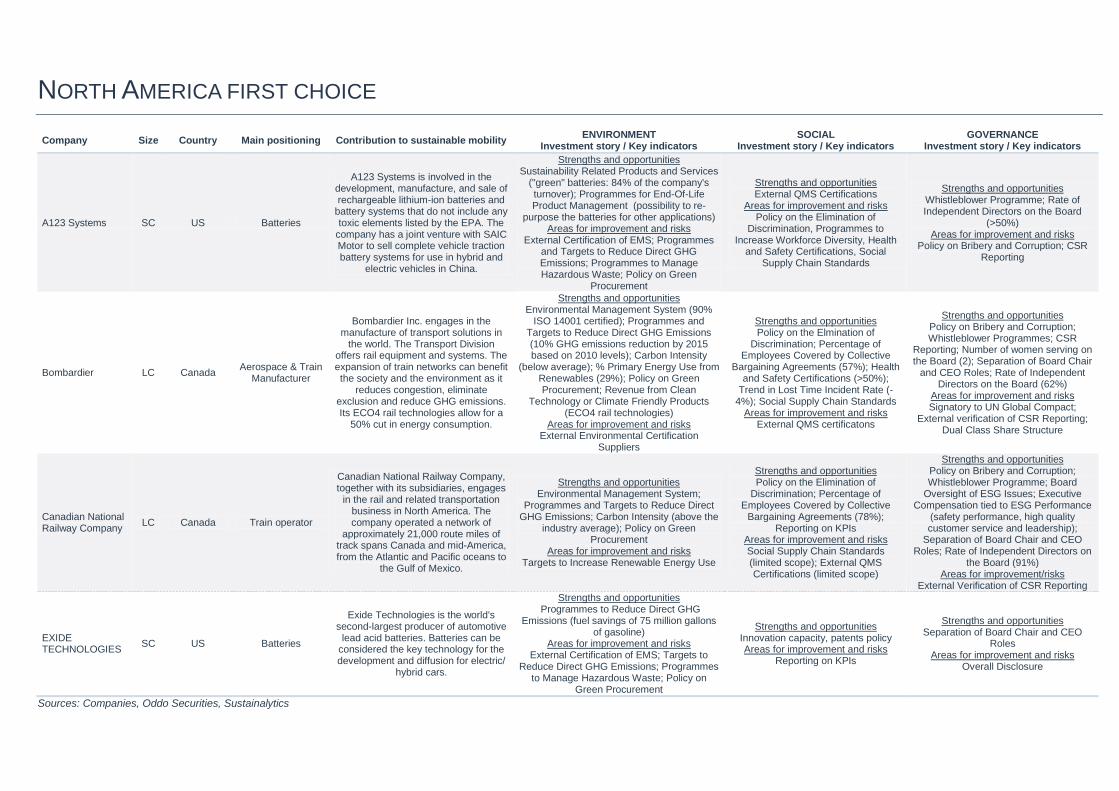
NORTH AMERICA FIRST CHOICE
Company Size Country Main positioning Contribution to sustainable mobility ENVIRONMENT
Investment story / Key indicators SOCIAL
Investment story / Key indicators GOVERNANCE
Investment story / Key indicators
A123 Systems SC US Batteries
A123 Systems is involved in the development, manufacture, and sale of rechargeable lithium-ion batteries and
battery systems that do not include any toxic elements listed by the EPA. The
company has a joint venture with SAIC Motor to sell complete vehicle traction battery systems for use in hybrid and
electric vehicles in China.
Strengths and opportunities Sustainability Related Products and Services
("green" batteries: 84% of the company's turnover); Programmes for End-Of-Life Product Management (possibility to re-
purpose the batteries for other applications) Areas for improvement and risks
External Certification of EMS; Programmes and Targets to Reduce Direct GHG Emissions; Programmes to Manage Hazardous Waste; Policy on Green
Procurement
Strengths and opportunities External QMS Certifications
Areas for improvement and risks Policy on the Elimination of
Discrimination, Programmes to Increase Workforce Diversity, Health
and Safety Certifications, Social Supply Chain Standards
Strengths and opportunities Whistleblower Programme; Rate of Independent Directors on the Board
(>50%) Areas for improvement and risks
Policy on Bribery and Corruption; CSR Reporting
Bombardier LC Canada Aerospace & Train
Manufacturer
Bombardier Inc. engages in the manufacture of transport solutions in
the world. The Transport Division offers rail equipment and systems. The expansion of train networks can benefit the society and the environment as it
reduces congestion, eliminate exclusion and reduce GHG emissions. Its ECO4 rail technologies allow for a
50% cut in energy consumption.
Strengths and opportunities Environmental Management System (90%
ISO 14001 certified); Programmes and Targets to Reduce Direct GHG Emissions (10% GHG emissions reduction by 2015 based on 2010 levels); Carbon Intensity
(below average); % Primary Energy Use from Renewables (29%); Policy on Green Procurement; Revenue from Clean
Technology or Climate Friendly Products (ECO4 rail technologies)
Areas for improvement and risks External Environmental Certification
Suppliers
Strengths and opportunities Policy on the Elmination of
Discrimination; Percentage of Employees Covered by Collective
Bargaining Agreements (57%); Health and Safety Certifications (>50%);
Trend in Lost Time Incident Rate (-4%); Social Supply Chain Standards
Areas for improvement and risks External QMS certificatons
Strengths and opportunities Policy on Bribery and Corruption; Whistleblower Programmes; CSR
Reporting; Number of women serving on the Board (2); Separation of Board Chair
and CEO Roles; Rate of Independent Directors on the Board (62%)
Areas for improvement and risks Signatory to UN Global Compact;
External verification of CSR Reporting; Dual Class Share Structure
Canadian National Railway Company
LC Canada Train operator
Canadian National Railway Company, together with its subsidiaries, engages
in the rail and related transportation business in North America. The company operated a network of
approximately 21,000 route miles of track spans Canada and mid-America, from the Atlantic and Pacific oceans to
the Gulf of Mexico.
Strengths and opportunities Environmental Management System;
Programmes and Targets to Reduce Direct GHG Emissions; Carbon Intensity (above the
industry average); Policy on Green Procurement
Areas for improvement and risks Targets to Increase Renewable Energy Use
Strengths and opportunities Policy on the Elimination of
Discrimination; Percentage of Employees Covered by Collective
Bargaining Agreements (78%); Reporting on KPIs
Areas for improvement and risks Social Supply Chain Standards (limited scope); External QMS Certifications (limited scope)
Strengths and opportunities Policy on Bribery and Corruption; Whistleblower Programme; Board
Oversight of ESG Issues; Executive Compensation tied to ESG Performance
(safety performance, high quality customer service and leadership);
Separation of Board Chair and CEO Roles; Rate of Independent Directors on
the Board (91%) Areas for improvement/risks
External Verification of CSR Reporting
EXIDE TECHNOLOGIES
SC US Batteries
Exide Technologies is the world's second-largest producer of automotive
lead acid batteries. Batteries can be considered the key technology for the development and diffusion for electric/
hybrid cars.
Strengths and opportunities Programmes to Reduce Direct GHG
Emissions (fuel savings of 75 million gallons of gasoline)
Areas for improvement and risks External Certification of EMS; Targets to
Reduce Direct GHG Emissions; Programmes to Manage Hazardous Waste; Policy on
Green Procurement
Strengths and opportunities Innovation capacity, patents policy Areas for improvement and risks
Reporting on KPIs
Strengths and opportunities Separation of Board Chair and CEO
Roles Areas for improvement and risks
Overall Disclosure
Sources: Companies, Oddo Securities, Sustainalytics
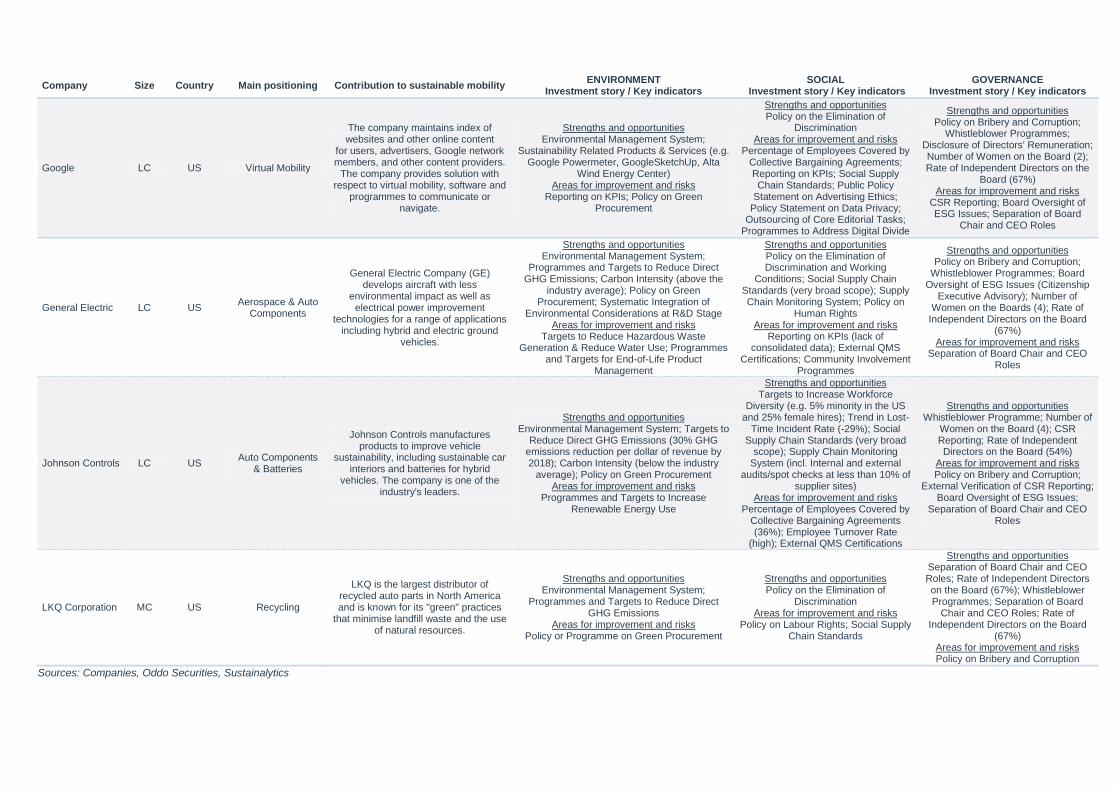
Company Size Country Main positioning Contribution to sustainable mobility ENVIRONMENT
Investment story / Key indicators SOCIAL
Investment story / Key indicators GOVERNANCE
Investment story / Key indicators
Google LC US Virtual Mobility
The company maintains index of websites and other online content
for users, advertisers, Google network members, and other content providers.
The company provides solution with respect to virtual mobility, software and
programmes to communicate or navigate.
Strengths and opportunities Environmental Management System;
Sustainability Related Products & Services (e.g. Google Powermeter, GoogleSketchUp, Alta
Wind Energy Center) Areas for improvement and risks
Reporting on KPIs; Policy on Green Procurement
Strengths and opportunities Policy on the Elimination of
Discrimination Areas for improvement and risks
Percentage of Employees Covered by Collective Bargaining Agreements; Reporting on KPIs; Social Supply Chain Standards; Public Policy
Statement on Advertising Ethics; Policy Statement on Data Privacy;
Outsourcing of Core Editorial Tasks; Programmes to Address Digital Divide
Strengths and opportunities Policy on Bribery and Corruption;
Whistleblower Programmes; Disclosure of Directors' Remuneration; Number of Women on the Board (2); Rate of Independent Directors on the
Board (67%) Areas for improvement and risks
CSR Reporting; Board Oversight of ESG Issues; Separation of Board
Chair and CEO Roles
General Electric LC US Aerospace & Auto
Components
General Electric Company (GE) develops aircraft with less
environmental impact as well as electrical power improvement
technologies for a range of applications including hybrid and electric ground
vehicles.
Strengths and opportunities Environmental Management System;
Programmes and Targets to Reduce Direct GHG Emissions; Carbon Intensity (above the
industry average); Policy on Green Procurement; Systematic Integration of
Environmental Considerations at R&D Stage Areas for improvement and risks
Targets to Reduce Hazardous Waste Generation & Reduce Water Use; Programmes
and Targets for End-of-Life Product Management
Strengths and opportunities Policy on the Elimination of Discrimination and Working
Conditions; Social Supply Chain Standards (very broad scope); Supply Chain Monitoring System; Policy on
Human Rights Areas for improvement and risks
Reporting on KPIs (lack of consolidated data); External QMS
Certifications; Community Involvement Programmes
Strengths and opportunities Policy on Bribery and Corruption;
Whistleblower Programmes; Board Oversight of ESG Issues (Citizenship
Executive Advisory); Number of Women on the Boards (4); Rate of
Independent Directors on the Board (67%)
Areas for improvement and risks Separation of Board Chair and CEO
Roles
Johnson Controls LC US Auto Components
& Batteries
Johnson Controls manufactures products to improve vehicle
sustainability, including sustainable car interiors and batteries for hybrid
vehicles. The company is one of the industry's leaders.
Strengths and opportunities Environmental Management System; Targets to
Reduce Direct GHG Emissions (30% GHG emissions reduction per dollar of revenue by 2018); Carbon Intensity (below the industry
average); Policy on Green Procurement Areas for improvement and risks
Programmes and Targets to Increase Renewable Energy Use
Strengths and opportunities Targets to Increase Workforce
Diversity (e.g. 5% minority in the US and 25% female hires); Trend in Lost-
Time Incident Rate (-29%); Social Supply Chain Standards (very broad
scope); Supply Chain Monitoring System (incl. Internal and external
audits/spot checks at less than 10% of supplier sites)
Areas for improvement and risks Percentage of Employees Covered by
Collective Bargaining Agreements (36%); Employee Turnover Rate
(high); External QMS Certifications
Strengths and opportunities Whistleblower Programme; Number of
Women on the Board (4); CSR Reporting; Rate of Independent Directors on the Board (54%)
Areas for improvement and risks Policy on Bribery and Corruption;
External Verification of CSR Reporting; Board Oversight of ESG Issues;
Separation of Board Chair and CEO Roles
LKQ Corporation MC US Recycling
LKQ is the largest distributor of recycled auto parts in North America and is known for its "green" practices
that minimise landfill waste and the use of natural resources.
Strengths and opportunities Environmental Management System;
Programmes and Targets to Reduce Direct GHG Emissions
Areas for improvement and risks Policy or Programme on Green Procurement
Strengths and opportunities Policy on the Elimination of
Discrimination Areas for improvement and risks
Policy on Labour Rights; Social Supply Chain Standards
Strengths and opportunities Separation of Board Chair and CEO Roles; Rate of Independent Directors on the Board (67%); Whistleblower Programmes; Separation of Board
Chair and CEO Roles; Rate of Independent Directors on the Board
(67%) Areas for improvement and risks Policy on Bribery and Corruption
Sources: Companies, Oddo Securities, Sustainalytics
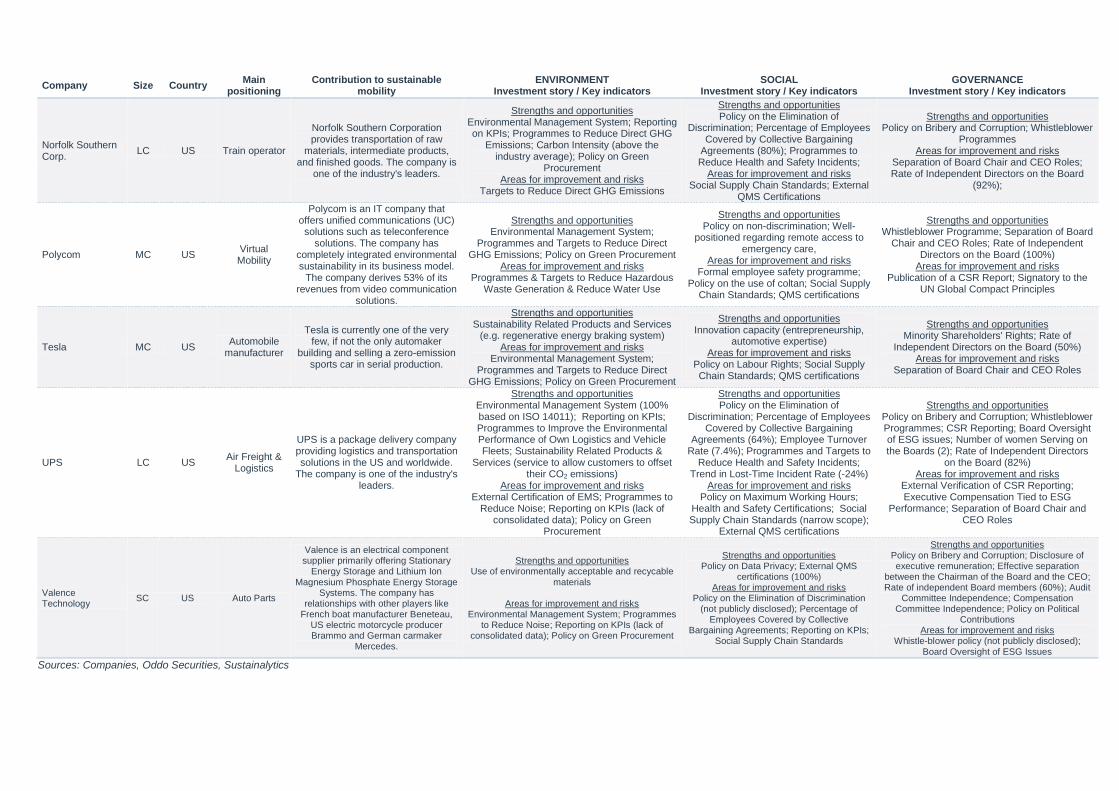
Company Size Country Main
positioning Contribution to sustainable
mobility ENVIRONMENT
Investment story / Key indicators SOCIAL
Investment story / Key indicators GOVERNANCE
Investment story / Key indicators
Norfolk Southern Corp.
LC US Train operator
Norfolk Southern Corporation provides transportation of raw
materials, intermediate products, and finished goods. The company is
one of the industry's leaders.
Strengths and opportunities Environmental Management System; Reporting on KPIs; Programmes to Reduce Direct GHG
Emissions; Carbon Intensity (above the industry average); Policy on Green
Procurement Areas for improvement and risks
Targets to Reduce Direct GHG Emissions
Strengths and opportunities Policy on the Elimination of
Discrimination; Percentage of Employees Covered by Collective Bargaining
Agreements (80%); Programmes to Reduce Health and Safety Incidents;
Areas for improvement and risks Social Supply Chain Standards; External
QMS Certifications
Strengths and opportunities Policy on Bribery and Corruption; Whistleblower
Programmes Areas for improvement and risks
Separation of Board Chair and CEO Roles; Rate of Independent Directors on the Board
(92%);
Polycom MC US Virtual Mobility
Polycom is an IT company that offers unified communications (UC) solutions such as teleconference
solutions. The company has completely integrated environmental sustainability in its business model.
The company derives 53% of its revenues from video communication
solutions.
Strengths and opportunities Environmental Management System;
Programmes and Targets to Reduce Direct GHG Emissions; Policy on Green Procurement
Areas for improvement and risks Programmes & Targets to Reduce Hazardous
Waste Generation & Reduce Water Use
Strengths and opportunities Policy on non-discrimination; Well-
positioned regarding remote access to emergency care,
Areas for improvement and risks Formal employee safety programme;
Policy on the use of coltan; Social Supply Chain Standards; QMS certifications
Strengths and opportunities Whistleblower Programme; Separation of Board
Chair and CEO Roles; Rate of Independent Directors on the Board (100%)
Areas for improvement and risks Publication of a CSR Report; Signatory to the
UN Global Compact Principles
Tesla MC US Automobile
manufacturer
Tesla is currently one of the very few, if not the only automaker
building and selling a zero-emission sports car in serial production.
Strengths and opportunities Sustainability Related Products and Services
(e.g. regenerative energy braking system) Areas for improvement and risks
Environmental Management System; Programmes and Targets to Reduce Direct
GHG Emissions; Policy on Green Procurement
Strengths and opportunities Innovation capacity (entrepreneurship,
automotive expertise) Areas for improvement and risks
Policy on Labour Rights; Social Supply Chain Standards; QMS certifications
Strengths and opportunities Minority Shareholders' Rights; Rate of
Independent Directors on the Board (50%) Areas for improvement and risks
Separation of Board Chair and CEO Roles
UPS LC US Air Freight &
Logistics
UPS is a package delivery company providing logistics and transportation solutions in the US and worldwide.
The company is one of the industry's leaders.
Strengths and opportunities Environmental Management System (100% based on ISO 14011); Reporting on KPIs; Programmes to Improve the Environmental Performance of Own Logistics and Vehicle Fleets; Sustainability Related Products &
Services (service to allow customers to offset their CO2 emissions)
Areas for improvement and risks External Certification of EMS; Programmes to
Reduce Noise; Reporting on KPIs (lack of consolidated data); Policy on Green
Procurement
Strengths and opportunities Policy on the Elimination of
Discrimination; Percentage of Employees Covered by Collective Bargaining
Agreements (64%); Employee Turnover Rate (7.4%); Programmes and Targets to
Reduce Health and Safety Incidents; Trend in Lost-Time Incident Rate (-24%)
Areas for improvement and risks Policy on Maximum Working Hours;
Health and Safety Certifications; Social Supply Chain Standards (narrow scope);
External QMS certifications
Strengths and opportunities Policy on Bribery and Corruption; Whistleblower Programmes; CSR Reporting; Board Oversight of ESG issues; Number of women Serving on the Boards (2); Rate of Independent Directors
on the Board (82%) Areas for improvement and risks
External Verification of CSR Reporting; Executive Compensation Tied to ESG
Performance; Separation of Board Chair and CEO Roles
Valence Technology
SC US Auto Parts
Valence is an electrical component supplier primarily offering Stationary
Energy Storage and Lithium Ion Magnesium Phosphate Energy Storage
Systems. The company has relationships with other players like
French boat manufacturer Beneteau, US electric motorcycle producer Brammo and German carmaker
Mercedes.
Strengths and opportunities Use of environmentally acceptable and recycable
materials
Areas for improvement and risks Environmental Management System; Programmes
to Reduce Noise; Reporting on KPIs (lack of consolidated data); Policy on Green Procurement
Strengths and opportunities Policy on Data Privacy; External QMS
certifications (100%) Areas for improvement and risks
Policy on the Elimination of Discrimination (not publicly disclosed); Percentage of
Employees Covered by Collective Bargaining Agreements; Reporting on KPIs;
Social Supply Chain Standards
Strengths and opportunities Policy on Bribery and Corruption; Disclosure of executive remuneration; Effective separation
between the Chairman of the Board and the CEO; Rate of independent Board members (60%); Audit
Committee Independence; Compensation Committee Independence; Policy on Political
Contributions Areas for improvement and risks
Whistle-blower policy (not publicly disclosed); Board Oversight of ESG Issues
Sources: Companies, Oddo Securities, Sustainalytics
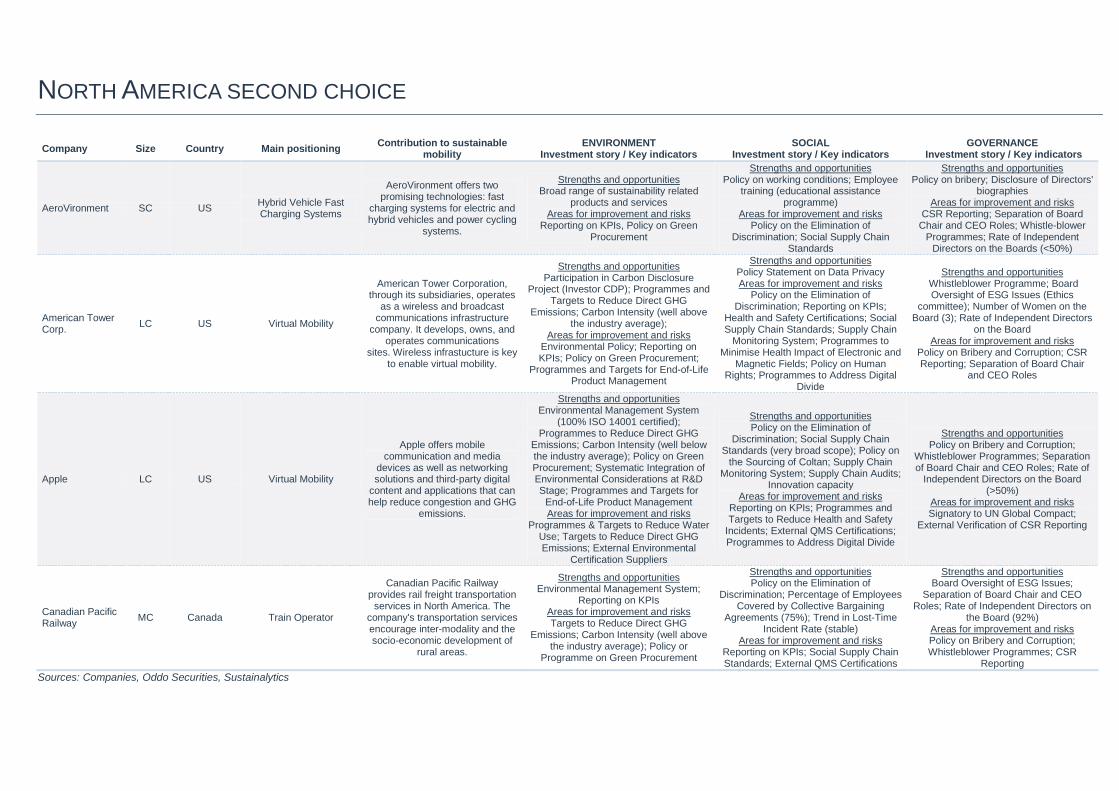
NORTH AMERICA SECOND CHOICE
Company Size Country Main positioning Contribution to sustainable
mobility ENVIRONMENT
Investment story / Key indicators SOCIAL
Investment story / Key indicators GOVERNANCE
Investment story / Key indicators
AeroVironment SC US Hybrid Vehicle Fast Charging Systems
AeroVironment offers two promising technologies: fast
charging systems for electric and hybrid vehicles and power cycling
systems.
Strengths and opportunities Broad range of sustainability related
products and services Areas for improvement and risks
Reporting on KPIs, Policy on Green Procurement
Strengths and opportunities Policy on working conditions; Employee
training (educational assistance programme)
Areas for improvement and risks Policy on the Elimination of
Discrimination; Social Supply Chain Standards
Strengths and opportunities Policy on bribery; Disclosure of Directors'
biographies Areas for improvement and risks
CSR Reporting; Separation of Board Chair and CEO Roles; Whistle-blower
Programmes; Rate of Independent Directors on the Boards (<50%)
American Tower Corp.
LC US Virtual Mobility
American Tower Corporation, through its subsidiaries, operates
as a wireless and broadcast communications infrastructure
company. It develops, owns, and operates communications
sites. Wireless infrastucture is key to enable virtual mobility.
Strengths and opportunities Participation in Carbon Disclosure
Project (Investor CDP); Programmes and Targets to Reduce Direct GHG
Emissions; Carbon Intensity (well above the industry average);
Areas for improvement and risks Environmental Policy; Reporting on KPIs; Policy on Green Procurement;
Programmes and Targets for End-of-Life Product Management
Strengths and opportunities Policy Statement on Data Privacy Areas for improvement and risks
Policy on the Elimination of Discrimination; Reporting on KPIs;
Health and Safety Certifications; Social Supply Chain Standards; Supply Chain
Monitoring System; Programmes to Minimise Health Impact of Electronic and
Magnetic Fields; Policy on Human Rights; Programmes to Address Digital
Divide
Strengths and opportunities Whistleblower Programme; Board Oversight of ESG Issues (Ethics
committee); Number of Women on the Board (3); Rate of Independent Directors
on the Board Areas for improvement and risks
Policy on Bribery and Corruption; CSR Reporting; Separation of Board Chair
and CEO Roles
Apple LC US Virtual Mobility
Apple offers mobile communication and media
devices as well as networking solutions and third-party digital
content and applications that can help reduce congestion and GHG
emissions.
Strengths and opportunities Environmental Management System
(100% ISO 14001 certified); Programmes to Reduce Direct GHG
Emissions; Carbon Intensity (well below the industry average); Policy on Green Procurement; Systematic Integration of Environmental Considerations at R&D Stage; Programmes and Targets for
End-of-Life Product Management Areas for improvement and risks
Programmes & Targets to Reduce Water Use; Targets to Reduce Direct GHG Emissions; External Environmental
Certification Suppliers
Strengths and opportunities Policy on the Elimination of
Discrimination; Social Supply Chain Standards (very broad scope); Policy on
the Sourcing of Coltan; Supply Chain Monitoring System; Supply Chain Audits;
Innovation capacity Areas for improvement and risks
Reporting on KPIs; Programmes and Targets to Reduce Health and Safety
Incidents; External QMS Certifications; Programmes to Address Digital Divide
Strengths and opportunities Policy on Bribery and Corruption;
Whistleblower Programmes; Separation of Board Chair and CEO Roles; Rate of
Independent Directors on the Board (>50%)
Areas for improvement and risks Signatory to UN Global Compact;
External Verification of CSR Reporting
Canadian Pacific Railway
MC Canada Train Operator
Canadian Pacific Railway provides rail freight transportation
services in North America. The company's transportation services encourage inter-modality and the socio-economic development of
rural areas.
Strengths and opportunities Environmental Management System;
Reporting on KPIs Areas for improvement and risks Targets to Reduce Direct GHG
Emissions; Carbon Intensity (well above the industry average); Policy or
Programme on Green Procurement
Strengths and opportunities Policy on the Elimination of
Discrimination; Percentage of Employees Covered by Collective Bargaining
Agreements (75%); Trend in Lost-Time Incident Rate (stable)
Areas for improvement and risks Reporting on KPIs; Social Supply Chain Standards; External QMS Certifications
Strengths and opportunities Board Oversight of ESG Issues;
Separation of Board Chair and CEO Roles; Rate of Independent Directors on
the Board (92%) Areas for improvement and risks Policy on Bribery and Corruption; Whistleblower Programmes; CSR
Reporting
Sources: Companies, Oddo Securities, Sustainalytics
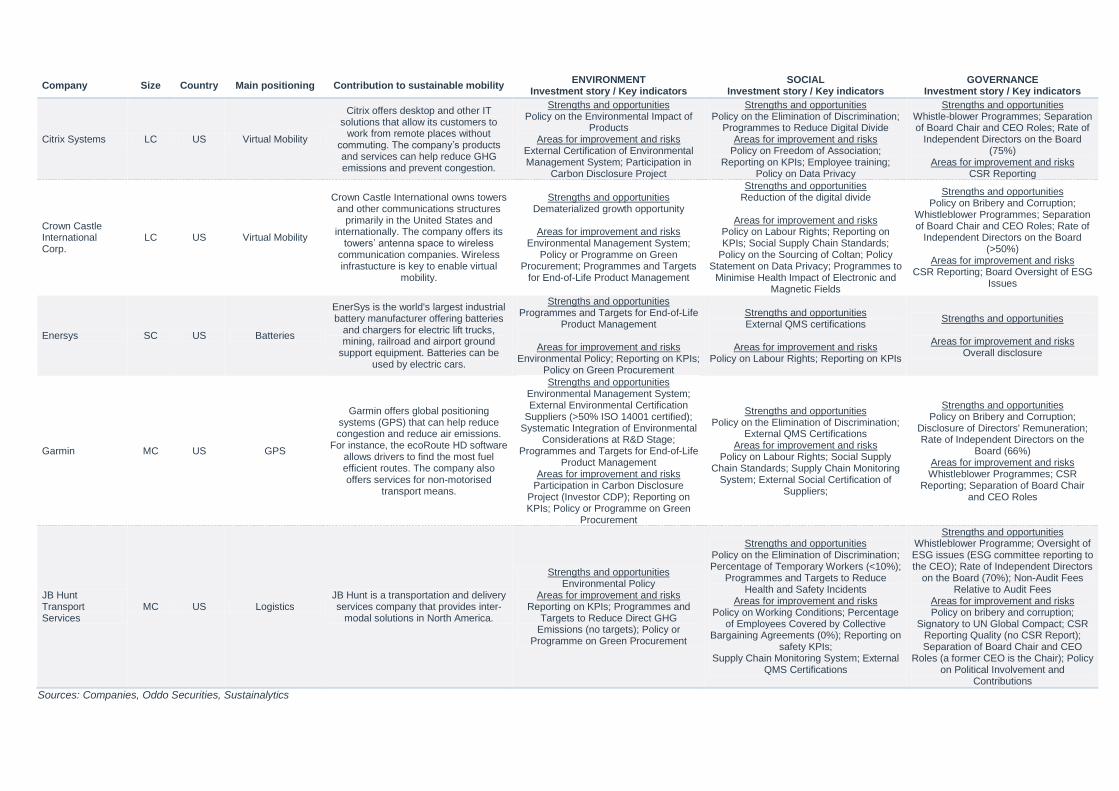
Company Size Country Main positioning Contribution to sustainable mobility ENVIRONMENT
Investment story / Key indicators SOCIAL
Investment story / Key indicators GOVERNANCE
Investment story / Key indicators
Citrix Systems LC US Virtual Mobility
Citrix offers desktop and other IT solutions that allow its customers to
work from remote places without commuting. The company‘s products and services can help reduce GHG emissions and prevent congestion.
Strengths and opportunities Policy on the Environmental Impact of
Products Areas for improvement and risks
External Certification of Environmental Management System; Participation in
Carbon Disclosure Project
Strengths and opportunities Policy on the Elimination of Discrimination;
Programmes to Reduce Digital Divide Areas for improvement and risks
Policy on Freedom of Association; Reporting on KPIs; Employee training;
Policy on Data Privacy
Strengths and opportunities Whistle-blower Programmes; Separation of Board Chair and CEO Roles; Rate of
Independent Directors on the Board (75%)
Areas for improvement and risks CSR Reporting
Crown Castle International Corp.
LC US Virtual Mobility
Crown Castle International owns towers and other communications structures
primarily in the United States and internationally. The company offers its
towers‘ antenna space to wireless communication companies. Wireless infrastucture is key to enable virtual
mobility.
Strengths and opportunities Dematerialized growth opportunity
Areas for improvement and risks
Environmental Management System; Policy or Programme on Green
Procurement; Programmes and Targets for End-of-Life Product Management
Strengths and opportunities Reduction of the digital divide
Areas for improvement and risks
Policy on Labour Rights; Reporting on KPIs; Social Supply Chain Standards;
Policy on the Sourcing of Coltan; Policy Statement on Data Privacy; Programmes to
Minimise Health Impact of Electronic and Magnetic Fields
Strengths and opportunities Policy on Bribery and Corruption;
Whistleblower Programmes; Separation of Board Chair and CEO Roles; Rate of
Independent Directors on the Board (>50%)
Areas for improvement and risks CSR Reporting; Board Oversight of ESG
Issues
Enersys SC US Batteries
EnerSys is the world's largest industrial battery manufacturer offering batteries
and chargers for electric lift trucks, mining, railroad and airport ground
support equipment. Batteries can be used by electric cars.
Strengths and opportunities Programmes and Targets for End-of-Life
Product Management
Areas for improvement and risks Environmental Policy; Reporting on KPIs;
Policy on Green Procurement
Strengths and opportunities External QMS certifications
Areas for improvement and risks
Policy on Labour Rights; Reporting on KPIs
Strengths and opportunities
Areas for improvement and risks Overall disclosure
Garmin MC US GPS
Garmin offers global positioning systems (GPS) that can help reduce congestion and reduce air emissions.
For instance, the ecoRoute HD software allows drivers to find the most fuel efficient routes. The company also offers services for non-motorised
transport means.
Strengths and opportunities Environmental Management System; External Environmental Certification
Suppliers (>50% ISO 14001 certified); Systematic Integration of Environmental
Considerations at R&D Stage; Programmes and Targets for End-of-Life
Product Management Areas for improvement and risks
Participation in Carbon Disclosure Project (Investor CDP); Reporting on KPIs; Policy or Programme on Green
Procurement
Strengths and opportunities Policy on the Elimination of Discrimination;
External QMS Certifications Areas for improvement and risks
Policy on Labour Rights; Social Supply Chain Standards; Supply Chain Monitoring
System; External Social Certification of Suppliers;
Strengths and opportunities Policy on Bribery and Corruption;
Disclosure of Directors' Remuneration; Rate of Independent Directors on the
Board (66%) Areas for improvement and risks Whistleblower Programmes; CSR
Reporting; Separation of Board Chair and CEO Roles
JB Hunt Transport Services
MC US Logistics JB Hunt is a transportation and delivery services company that provides inter-
modal solutions in North America.
Strengths and opportunities Environmental Policy
Areas for improvement and risks Reporting on KPIs; Programmes and
Targets to Reduce Direct GHG Emissions (no targets); Policy or
Programme on Green Procurement
Strengths and opportunities Policy on the Elimination of Discrimination; Percentage of Temporary Workers (<10%);
Programmes and Targets to Reduce Health and Safety Incidents
Areas for improvement and risks Policy on Working Conditions; Percentage
of Employees Covered by Collective Bargaining Agreements (0%); Reporting on
safety KPIs; Supply Chain Monitoring System; External
QMS Certifications
Strengths and opportunities Whistleblower Programme; Oversight of ESG issues (ESG committee reporting to the CEO); Rate of Independent Directors
on the Board (70%); Non-Audit Fees Relative to Audit Fees
Areas for improvement and risks Policy on bribery and corruption;
Signatory to UN Global Compact; CSR Reporting Quality (no CSR Report); Separation of Board Chair and CEO
Roles (a former CEO is the Chair); Policy on Political Involvement and
Contributions
Sources: Companies, Oddo Securities, Sustainalytics
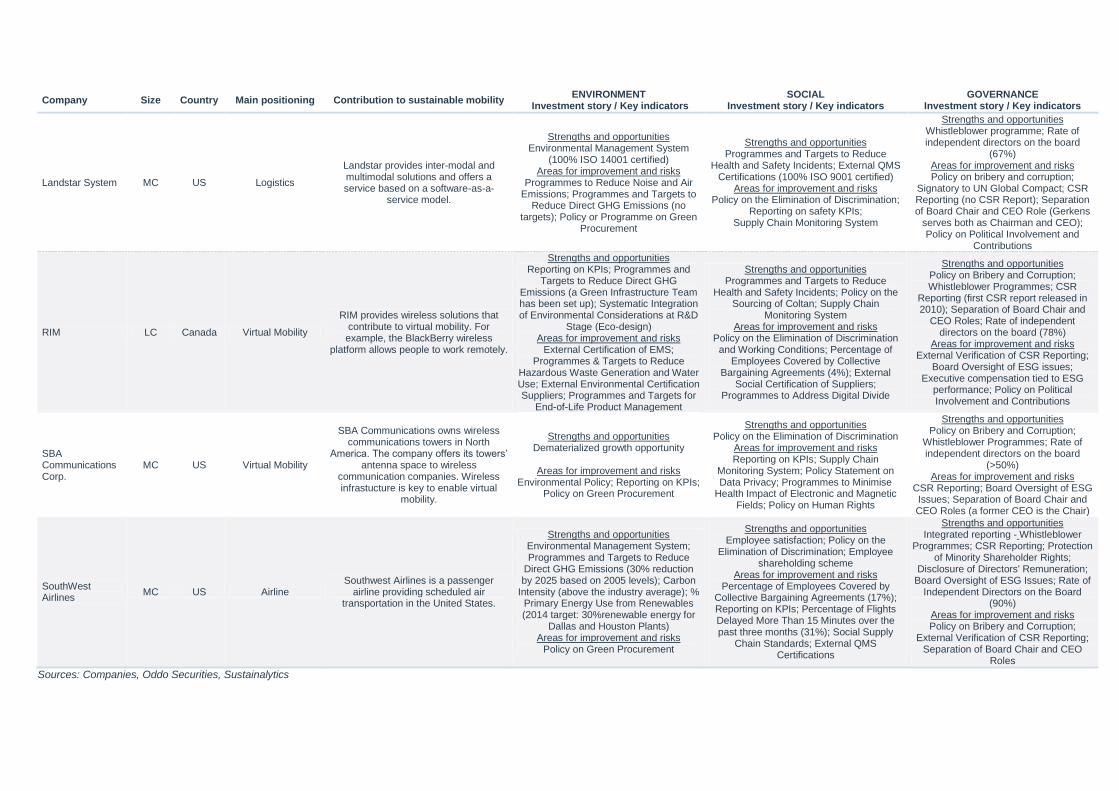
Company Size Country Main positioning Contribution to sustainable mobility ENVIRONMENT
Investment story / Key indicators SOCIAL
Investment story / Key indicators GOVERNANCE
Investment story / Key indicators
Landstar System MC US Logistics
Landstar provides inter-modal and multimodal solutions and offers a service based on a software-as-a-
service model.
Strengths and opportunities Environmental Management System
(100% ISO 14001 certified) Areas for improvement and risks
Programmes to Reduce Noise and Air Emissions; Programmes and Targets to
Reduce Direct GHG Emissions (no targets); Policy or Programme on Green
Procurement
Strengths and opportunities Programmes and Targets to Reduce
Health and Safety Incidents; External QMS Certifications (100% ISO 9001 certified)
Areas for improvement and risks Policy on the Elimination of Discrimination;
Reporting on safety KPIs; Supply Chain Monitoring System
Strengths and opportunities Whistleblower programme; Rate of independent directors on the board
(67%) Areas for improvement and risks Policy on bribery and corruption;
Signatory to UN Global Compact; CSR Reporting (no CSR Report); Separation of Board Chair and CEO Role (Gerkens
serves both as Chairman and CEO); Policy on Political Involvement and
Contributions
RIM LC Canada Virtual Mobility
RIM provides wireless solutions that contribute to virtual mobility. For example, the BlackBerry wireless
platform allows people to work remotely.
Strengths and opportunities Reporting on KPIs; Programmes and
Targets to Reduce Direct GHG Emissions (a Green Infrastructure Team has been set up); Systematic Integration of Environmental Considerations at R&D
Stage (Eco-design) Areas for improvement and risks
External Certification of EMS; Programmes & Targets to Reduce
Hazardous Waste Generation and Water Use; External Environmental Certification Suppliers; Programmes and Targets for
End-of-Life Product Management
Strengths and opportunities Programmes and Targets to Reduce
Health and Safety Incidents; Policy on the Sourcing of Coltan; Supply Chain
Monitoring System Areas for improvement and risks
Policy on the Elimination of Discrimination and Working Conditions; Percentage of
Employees Covered by Collective Bargaining Agreements (4%); External
Social Certification of Suppliers; Programmes to Address Digital Divide
Strengths and opportunities Policy on Bribery and Corruption; Whistleblower Programmes; CSR
Reporting (first CSR report released in 2010); Separation of Board Chair and
CEO Roles; Rate of independent directors on the board (78%)
Areas for improvement and risks External Verification of CSR Reporting;
Board Oversight of ESG issues; Executive compensation tied to ESG
performance; Policy on Political Involvement and Contributions
SBA Communications Corp.
MC US Virtual Mobility
SBA Communications owns wireless communications towers in North
America. The company offers its towers‘ antenna space to wireless
communication companies. Wireless infrastucture is key to enable virtual
mobility.
Strengths and opportunities Dematerialized growth opportunity
Areas for improvement and risks
Environmental Policy; Reporting on KPIs; Policy on Green Procurement
Strengths and opportunities Policy on the Elimination of Discrimination
Areas for improvement and risks Reporting on KPIs; Supply Chain
Monitoring System; Policy Statement on Data Privacy; Programmes to Minimise
Health Impact of Electronic and Magnetic Fields; Policy on Human Rights
Strengths and opportunities Policy on Bribery and Corruption;
Whistleblower Programmes; Rate of independent directors on the board
(>50%) Areas for improvement and risks
CSR Reporting; Board Oversight of ESG Issues; Separation of Board Chair and CEO Roles (a former CEO is the Chair)
SouthWest Airlines
MC US Airline Southwest Airlines is a passenger
airline providing scheduled air transportation in the United States.
Strengths and opportunities Environmental Management System; Programmes and Targets to Reduce
Direct GHG Emissions (30% reduction by 2025 based on 2005 levels); Carbon
Intensity (above the industry average); % Primary Energy Use from Renewables (2014 target: 30%renewable energy for
Dallas and Houston Plants) Areas for improvement and risks
Policy on Green Procurement
Strengths and opportunities Employee satisfaction; Policy on the
Elimination of Discrimination; Employee shareholding scheme
Areas for improvement and risks Percentage of Employees Covered by
Collective Bargaining Agreements (17%); Reporting on KPIs; Percentage of Flights Delayed More Than 15 Minutes over the past three months (31%); Social Supply
Chain Standards; External QMS Certifications
Strengths and opportunities Integrated reporting - Whistleblower
Programmes; CSR Reporting; Protection of Minority Shareholder Rights;
Disclosure of Directors' Remuneration; Board Oversight of ESG Issues; Rate of
Independent Directors on the Board (90%)
Areas for improvement and risks Policy on Bribery and Corruption;
External Verification of CSR Reporting; Separation of Board Chair and CEO
Roles
Sources: Companies, Oddo Securities, Sustainalytics
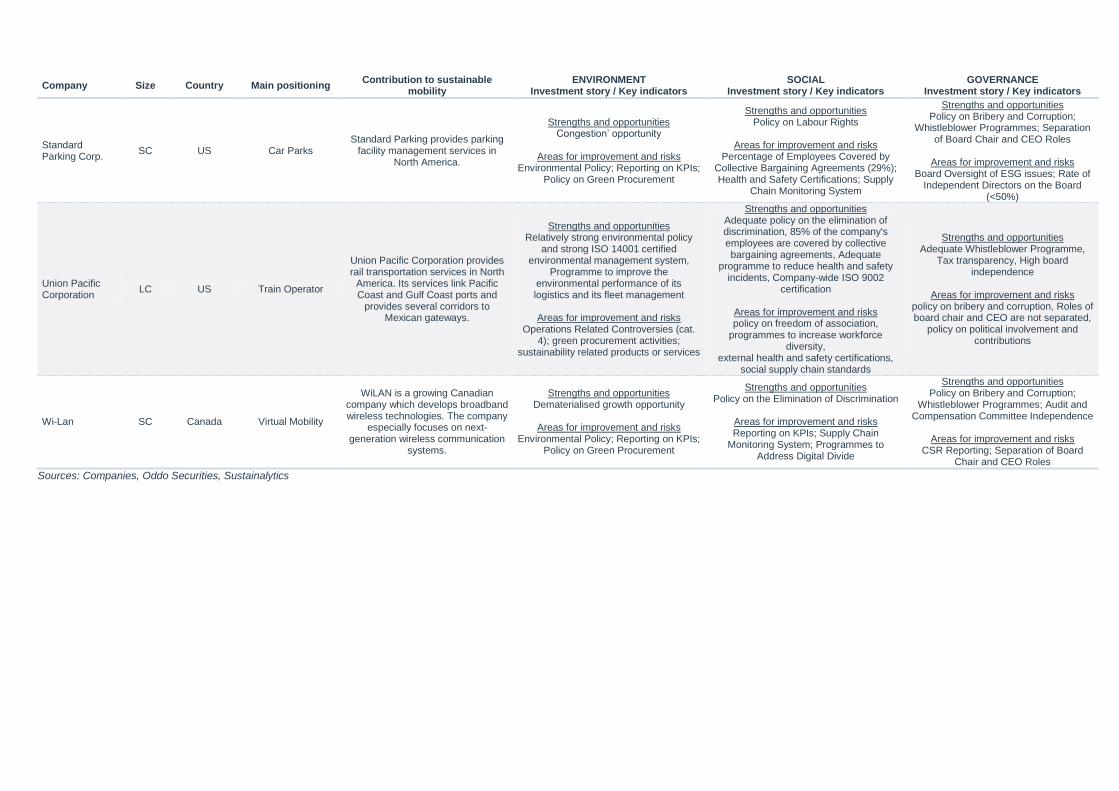
Company Size Country Main positioning Contribution to sustainable
mobility ENVIRONMENT
Investment story / Key indicators SOCIAL
Investment story / Key indicators GOVERNANCE
Investment story / Key indicators
Standard Parking Corp.
SC US Car Parks Standard Parking provides parking
facility management services in North America.
Strengths and opportunities Congestion‘ opportunity
Areas for improvement and risks
Environmental Policy; Reporting on KPIs; Policy on Green Procurement
Strengths and opportunities Policy on Labour Rights
Areas for improvement and risks
Percentage of Employees Covered by Collective Bargaining Agreements (29%); Health and Safety Certifications; Supply
Chain Monitoring System
Strengths and opportunities Policy on Bribery and Corruption;
Whistleblower Programmes; Separation of Board Chair and CEO Roles
Areas for improvement and risks
Board Oversight of ESG issues; Rate of Independent Directors on the Board
(<50%)
Union Pacific Corporation
LC US Train Operator
Union Pacific Corporation provides rail transportation services in North
America. Its services link Pacific Coast and Gulf Coast ports and
provides several corridors to Mexican gateways.
Strengths and opportunities Relatively strong environmental policy
and strong ISO 14001 certified environmental management system,
Programme to improve the environmental performance of its logistics and its fleet management
Areas for improvement and risks
Operations Related Controversies (cat. 4); green procurement activities;
sustainability related products or services
Strengths and opportunities Adequate policy on the elimination of discrimination, 85% of the company's employees are covered by collective bargaining agreements, Adequate
programme to reduce health and safety incidents, Company-wide ISO 9002
certification
Areas for improvement and risks policy on freedom of association,
programmes to increase workforce diversity,
external health and safety certifications, social supply chain standards
Strengths and opportunities Adequate Whistleblower Programme,
Tax transparency, High board independence
Areas for improvement and risks
policy on bribery and corruption, Roles of board chair and CEO are not separated,
policy on political involvement and contributions
Wi-Lan SC Canada Virtual Mobility
WiLAN is a growing Canadian company which develops broadband wireless technologies. The company
especially focuses on next-generation wireless communication
systems.
Strengths and opportunities Dematerialised growth opportunity
Areas for improvement and risks
Environmental Policy; Reporting on KPIs; Policy on Green Procurement
Strengths and opportunities Policy on the Elimination of Discrimination
Areas for improvement and risks Reporting on KPIs; Supply Chain
Monitoring System; Programmes to Address Digital Divide
Strengths and opportunities Policy on Bribery and Corruption;
Whistleblower Programmes; Audit and Compensation Committee Independence
Areas for improvement and risks
CSR Reporting; Separation of Board Chair and CEO Roles
Sources: Companies, Oddo Securities, Sustainalytics
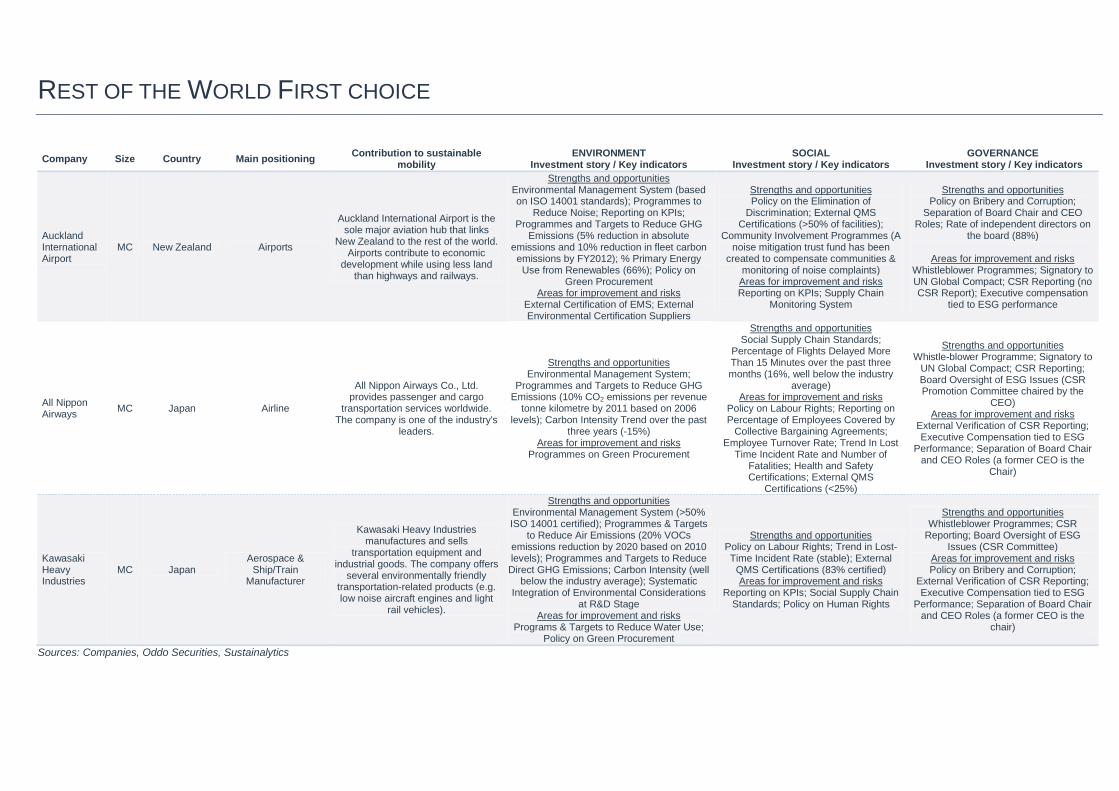
REST OF THE WORLD FIRST CHOICE
Company Size Country Main positioning Contribution to sustainable
mobility ENVIRONMENT
Investment story / Key indicators SOCIAL
Investment story / Key indicators GOVERNANCE
Investment story / Key indicators
Auckland International Airport
MC New Zealand Airports
Auckland International Airport is the sole major aviation hub that links
New Zealand to the rest of the world. Airports contribute to economic
development while using less land than highways and railways.
Strengths and opportunities Environmental Management System (based on ISO 14001 standards); Programmes to
Reduce Noise; Reporting on KPIs; Programmes and Targets to Reduce GHG
Emissions (5% reduction in absolute emissions and 10% reduction in fleet carbon emissions by FY2012); % Primary Energy Use from Renewables (66%); Policy on
Green Procurement Areas for improvement and risks
External Certification of EMS; External Environmental Certification Suppliers
Strengths and opportunities Policy on the Elimination of
Discrimination; External QMS Certifications (>50% of facilities);
Community Involvement Programmes (A noise mitigation trust fund has been
created to compensate communities & monitoring of noise complaints)
Areas for improvement and risks Reporting on KPIs; Supply Chain
Monitoring System
Strengths and opportunities Policy on Bribery and Corruption;
Separation of Board Chair and CEO Roles; Rate of independent directors on
the board (88%)
Areas for improvement and risks Whistleblower Programmes; Signatory to UN Global Compact; CSR Reporting (no CSR Report); Executive compensation
tied to ESG performance
All Nippon Airways
MC Japan Airline
All Nippon Airways Co., Ltd. provides passenger and cargo
transportation services worldwide. The company is one of the industry's
leaders.
Strengths and opportunities Environmental Management System;
Programmes and Targets to Reduce GHG Emissions (10% CO2 emissions per revenue
tonne kilometre by 2011 based on 2006 levels); Carbon Intensity Trend over the past
three years (-15%) Areas for improvement and risks
Programmes on Green Procurement
Strengths and opportunities Social Supply Chain Standards;
Percentage of Flights Delayed More Than 15 Minutes over the past three months (16%, well below the industry
average) Areas for improvement and risks
Policy on Labour Rights; Reporting on Percentage of Employees Covered by
Collective Bargaining Agreements; Employee Turnover Rate; Trend In Lost
Time Incident Rate and Number of Fatalities; Health and Safety Certifications; External QMS
Certifications (<25%)
Strengths and opportunities Whistle-blower Programme; Signatory to
UN Global Compact; CSR Reporting; Board Oversight of ESG Issues (CSR Promotion Committee chaired by the
CEO) Areas for improvement and risks
External Verification of CSR Reporting; Executive Compensation tied to ESG
Performance; Separation of Board Chair and CEO Roles (a former CEO is the
Chair)
Kawasaki Heavy Industries
MC Japan Aerospace &
Ship/Train Manufacturer
Kawasaki Heavy Industries manufactures and sells
transportation equipment and industrial goods. The company offers
several environmentally friendly transportation-related products (e.g. low noise aircraft engines and light
rail vehicles).
Strengths and opportunities Environmental Management System (>50% ISO 14001 certified); Programmes & Targets
to Reduce Air Emissions (20% VOCs emissions reduction by 2020 based on 2010 levels); Programmes and Targets to Reduce Direct GHG Emissions; Carbon Intensity (well
below the industry average); Systematic Integration of Environmental Considerations
at R&D Stage Areas for improvement and risks
Programs & Targets to Reduce Water Use; Policy on Green Procurement
Strengths and opportunities Policy on Labour Rights; Trend in Lost-Time Incident Rate (stable); External
QMS Certifications (83% certified) Areas for improvement and risks
Reporting on KPIs; Social Supply Chain Standards; Policy on Human Rights
Strengths and opportunities Whistleblower Programmes; CSR
Reporting; Board Oversight of ESG Issues (CSR Committee)
Areas for improvement and risks Policy on Bribery and Corruption;
External Verification of CSR Reporting; Executive Compensation tied to ESG
Performance; Separation of Board Chair and CEO Roles (a former CEO is the
chair)
Sources: Companies, Oddo Securities, Sustainalytics
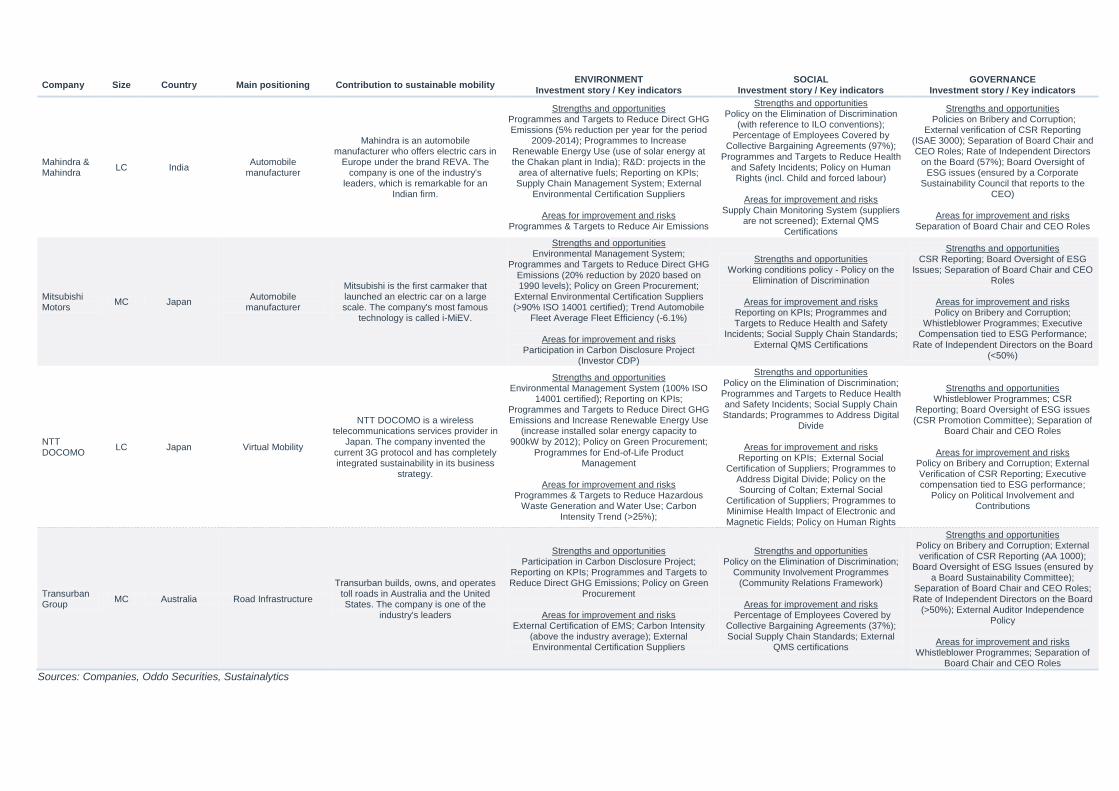
Company Size Country Main positioning Contribution to sustainable mobility ENVIRONMENT
Investment story / Key indicators SOCIAL
Investment story / Key indicators GOVERNANCE
Investment story / Key indicators
Mahindra & Mahindra
LC India Automobile
manufacturer
Mahindra is an automobile manufacturer who offers electric cars in
Europe under the brand REVA. The company is one of the industry's
leaders, which is remarkable for an Indian firm.
Strengths and opportunities Programmes and Targets to Reduce Direct GHG Emissions (5% reduction per year for the period
2009-2014); Programmes to Increase Renewable Energy Use (use of solar energy at the Chakan plant in India); R&D: projects in the
area of alternative fuels; Reporting on KPIs; Supply Chain Management System; External
Environmental Certification Suppliers
Areas for improvement and risks Programmes & Targets to Reduce Air Emissions
Strengths and opportunities Policy on the Elimination of Discrimination
(with reference to ILO conventions); Percentage of Employees Covered by
Collective Bargaining Agreements (97%); Programmes and Targets to Reduce Health
and Safety Incidents; Policy on Human Rights (incl. Child and forced labour)
Areas for improvement and risks
Supply Chain Monitoring System (suppliers are not screened); External QMS
Certifications
Strengths and opportunities Policies on Bribery and Corruption;
External verification of CSR Reporting (ISAE 3000); Separation of Board Chair and CEO Roles; Rate of Independent Directors
on the Board (57%); Board Oversight of ESG issues (ensured by a Corporate
Sustainability Council that reports to the CEO)
Areas for improvement and risks
Separation of Board Chair and CEO Roles
Mitsubishi Motors
MC Japan Automobile
manufacturer
Mitsubishi is the first carmaker that launched an electric car on a large scale. The company's most famous
technology is called i-MiEV.
Strengths and opportunities Environmental Management System;
Programmes and Targets to Reduce Direct GHG Emissions (20% reduction by 2020 based on 1990 levels); Policy on Green Procurement;
External Environmental Certification Suppliers (>90% ISO 14001 certified); Trend Automobile
Fleet Average Fleet Efficiency (-6.1%)
Areas for improvement and risks Participation in Carbon Disclosure Project
(Investor CDP)
Strengths and opportunities Working conditions policy - Policy on the
Elimination of Discrimination
Areas for improvement and risks Reporting on KPIs; Programmes and Targets to Reduce Health and Safety
Incidents; Social Supply Chain Standards; External QMS Certifications
Strengths and opportunities CSR Reporting; Board Oversight of ESG
Issues; Separation of Board Chair and CEO Roles
Areas for improvement and risks Policy on Bribery and Corruption;
Whistleblower Programmes; Executive Compensation tied to ESG Performance;
Rate of Independent Directors on the Board (<50%)
NTT DOCOMO
LC Japan Virtual Mobility
NTT DOCOMO is a wireless telecommunications services provider in
Japan. The company invented the current 3G protocol and has completely integrated sustainability in its business
strategy.
Strengths and opportunities Environmental Management System (100% ISO
14001 certified); Reporting on KPIs; Programmes and Targets to Reduce Direct GHG Emissions and Increase Renewable Energy Use
(increase installed solar energy capacity to 900kW by 2012); Policy on Green Procurement;
Programmes for End-of-Life Product Management
Areas for improvement and risks
Programmes & Targets to Reduce Hazardous Waste Generation and Water Use; Carbon
Intensity Trend (>25%);
Strengths and opportunities Policy on the Elimination of Discrimination; Programmes and Targets to Reduce Health and Safety Incidents; Social Supply Chain Standards; Programmes to Address Digital
Divide
Areas for improvement and risks Reporting on KPIs; External Social
Certification of Suppliers; Programmes to Address Digital Divide; Policy on the Sourcing of Coltan; External Social
Certification of Suppliers; Programmes to Minimise Health Impact of Electronic and Magnetic Fields; Policy on Human Rights
Strengths and opportunities Whistleblower Programmes; CSR
Reporting; Board Oversight of ESG issues (CSR Promotion Committee); Separation of
Board Chair and CEO Roles
Areas for improvement and risks Policy on Bribery and Corruption; External Verification of CSR Reporting; Executive compensation tied to ESG performance;
Policy on Political Involvement and Contributions
Transurban Group
MC Australia Road Infrastructure
Transurban builds, owns, and operates toll roads in Australia and the United States. The company is one of the
industry's leaders
Strengths and opportunities Participation in Carbon Disclosure Project;
Reporting on KPIs; Programmes and Targets to Reduce Direct GHG Emissions; Policy on Green
Procurement
Areas for improvement and risks External Certification of EMS; Carbon Intensity
(above the industry average); External Environmental Certification Suppliers
Strengths and opportunities Policy on the Elimination of Discrimination;
Community Involvement Programmes (Community Relations Framework)
Areas for improvement and risks
Percentage of Employees Covered by Collective Bargaining Agreements (37%); Social Supply Chain Standards; External
QMS certifications
Strengths and opportunities Policy on Bribery and Corruption; External verification of CSR Reporting (AA 1000);
Board Oversight of ESG Issues (ensured by a Board Sustainability Committee);
Separation of Board Chair and CEO Roles; Rate of Independent Directors on the Board
(>50%); External Auditor Independence Policy
Areas for improvement and risks
Whistleblower Programmes; Separation of Board Chair and CEO Roles
Sources: Companies, Oddo Securities, Sustainalytics
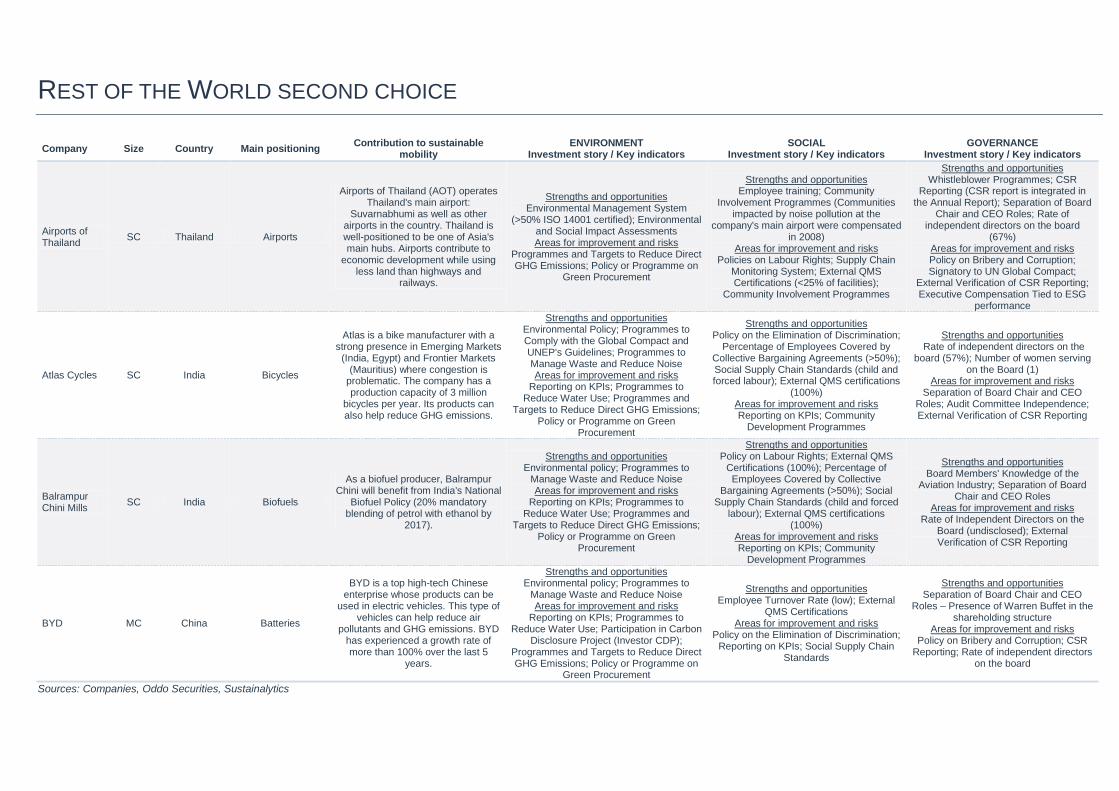
REST OF THE WORLD SECOND CHOICE
Company Size Country Main positioning Contribution to sustainable
mobility ENVIRONMENT
Investment story / Key indicators SOCIAL
Investment story / Key indicators GOVERNANCE
Investment story / Key indicators
Airports of Thailand
SC Thailand Airports
Airports of Thailand (AOT) operates Thailand's main airport:
Suvarnabhumi as well as other airports in the country. Thailand is well-positioned to be one of Asia's main hubs. Airports contribute to
economic development while using less land than highways and
railways.
Strengths and opportunities Environmental Management System
(>50% ISO 14001 certified); Environmental and Social Impact Assessments Areas for improvement and risks
Programmes and Targets to Reduce Direct GHG Emissions; Policy or Programme on
Green Procurement
Strengths and opportunities Employee training; Community
Involvement Programmes (Communities impacted by noise pollution at the
company's main airport were compensated in 2008)
Areas for improvement and risks Policies on Labour Rights; Supply Chain
Monitoring System; External QMS Certifications (<25% of facilities);
Community Involvement Programmes
Strengths and opportunities Whistleblower Programmes; CSR
Reporting (CSR report is integrated in the Annual Report); Separation of Board
Chair and CEO Roles; Rate of independent directors on the board
(67%) Areas for improvement and risks Policy on Bribery and Corruption; Signatory to UN Global Compact;
External Verification of CSR Reporting; Executive Compensation Tied to ESG
performance
Atlas Cycles SC India Bicycles
Atlas is a bike manufacturer with a strong presence in Emerging Markets
(India, Egypt) and Frontier Markets (Mauritius) where congestion is
problematic. The company has a production capacity of 3 million
bicycles per year. Its products can also help reduce GHG emissions.
Strengths and opportunities Environmental Policy; Programmes to Comply with the Global Compact and UNEP's Guidelines; Programmes to Manage Waste and Reduce Noise Areas for improvement and risks
Reporting on KPIs; Programmes to Reduce Water Use; Programmes and
Targets to Reduce Direct GHG Emissions; Policy or Programme on Green
Procurement
Strengths and opportunities Policy on the Elimination of Discrimination;
Percentage of Employees Covered by Collective Bargaining Agreements (>50%); Social Supply Chain Standards (child and forced labour); External QMS certifications
(100%) Areas for improvement and risks Reporting on KPIs; Community
Development Programmes
Strengths and opportunities Rate of independent directors on the
board (57%); Number of women serving on the Board (1)
Areas for improvement and risks Separation of Board Chair and CEO
Roles; Audit Committee Independence; External Verification of CSR Reporting
Balrampur Chini Mills
SC India Biofuels
As a biofuel producer, Balrampur Chini will benefit from India's National
Biofuel Policy (20% mandatory blending of petrol with ethanol by
2017).
Strengths and opportunities Environmental policy; Programmes to
Manage Waste and Reduce Noise Areas for improvement and risks
Reporting on KPIs; Programmes to Reduce Water Use; Programmes and
Targets to Reduce Direct GHG Emissions; Policy or Programme on Green
Procurement
Strengths and opportunities Policy on Labour Rights; External QMS
Certifications (100%); Percentage of Employees Covered by Collective
Bargaining Agreements (>50%); Social Supply Chain Standards (child and forced
labour); External QMS certifications (100%)
Areas for improvement and risks Reporting on KPIs; Community
Development Programmes
Strengths and opportunities Board Members' Knowledge of the
Aviation Industry; Separation of Board Chair and CEO Roles
Areas for improvement and risks Rate of Independent Directors on the
Board (undisclosed); External Verification of CSR Reporting
BYD MC China Batteries
BYD is a top high-tech Chinese enterprise whose products can be
used in electric vehicles. This type of vehicles can help reduce air
pollutants and GHG emissions. BYD has experienced a growth rate of more than 100% over the last 5
years.
Strengths and opportunities Environmental policy; Programmes to
Manage Waste and Reduce Noise Areas for improvement and risks
Reporting on KPIs; Programmes to Reduce Water Use; Participation in Carbon
Disclosure Project (Investor CDP); Programmes and Targets to Reduce Direct GHG Emissions; Policy or Programme on
Green Procurement
Strengths and opportunities Employee Turnover Rate (low); External
QMS Certifications Areas for improvement and risks
Policy on the Elimination of Discrimination; Reporting on KPIs; Social Supply Chain
Standards
Strengths and opportunities Separation of Board Chair and CEO
Roles – Presence of Warren Buffet in the shareholding structure
Areas for improvement and risks Policy on Bribery and Corruption; CSR
Reporting; Rate of independent directors on the board
Sources: Companies, Oddo Securities, Sustainalytics
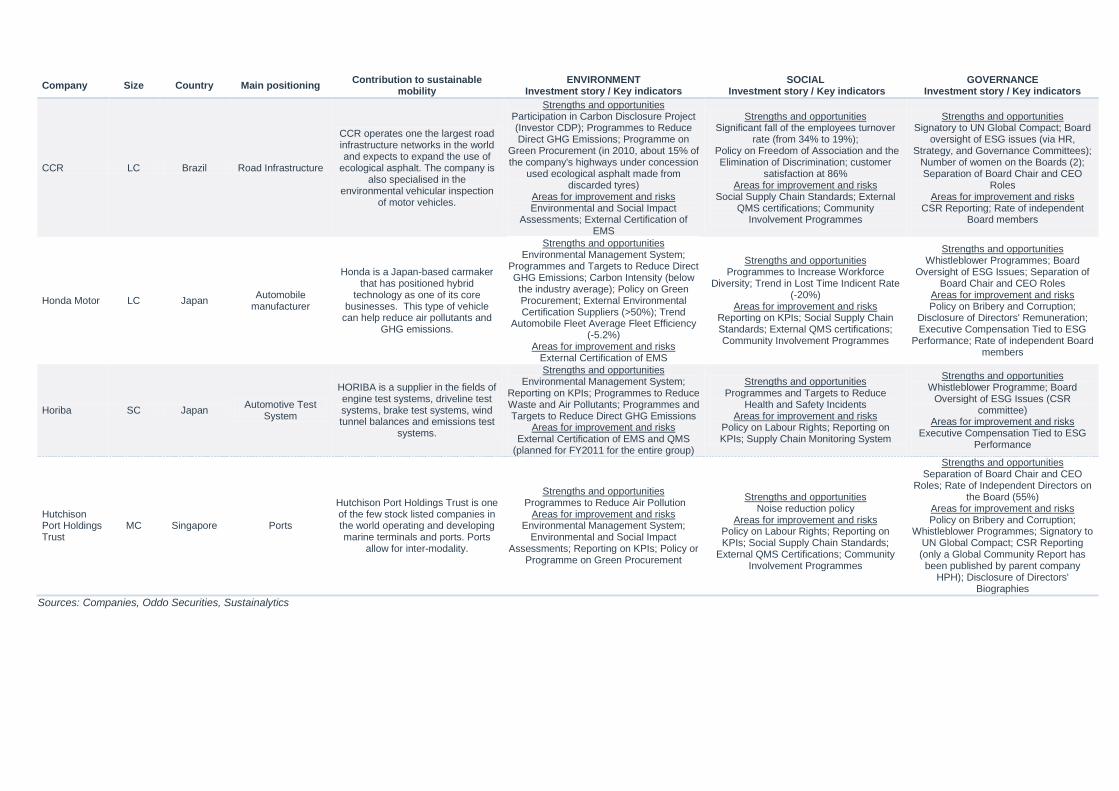
Company Size Country Main positioning Contribution to sustainable
mobility ENVIRONMENT
Investment story / Key indicators SOCIAL
Investment story / Key indicators GOVERNANCE
Investment story / Key indicators
CCR LC Brazil Road Infrastructure
CCR operates one the largest road infrastructure networks in the world and expects to expand the use of
ecological asphalt. The company is also specialised in the
environmental vehicular inspection of motor vehicles.
Strengths and opportunities Participation in Carbon Disclosure Project (Investor CDP); Programmes to Reduce Direct GHG Emissions; Programme on
Green Procurement (in 2010, about 15% of the company's highways under concession
used ecological asphalt made from discarded tyres)
Areas for improvement and risks Environmental and Social Impact
Assessments; External Certification of EMS
Strengths and opportunities Significant fall of the employees turnover
rate (from 34% to 19%); Policy on Freedom of Association and the
Elimination of Discrimination; customer satisfaction at 86%
Areas for improvement and risks Social Supply Chain Standards; External
QMS certifications; Community Involvement Programmes
Strengths and opportunities Signatory to UN Global Compact; Board
oversight of ESG issues (via HR, Strategy, and Governance Committees);
Number of women on the Boards (2); Separation of Board Chair and CEO
Roles Areas for improvement and risks
CSR Reporting; Rate of independent Board members
Honda Motor LC Japan Automobile
manufacturer
Honda is a Japan-based carmaker that has positioned hybrid
technology as one of its core businesses. This type of vehicle
can help reduce air pollutants and GHG emissions.
Strengths and opportunities Environmental Management System;
Programmes and Targets to Reduce Direct GHG Emissions; Carbon Intensity (below the industry average); Policy on Green Procurement; External Environmental Certification Suppliers (>50%); Trend
Automobile Fleet Average Fleet Efficiency (-5.2%)
Areas for improvement and risks External Certification of EMS
Strengths and opportunities Programmes to Increase Workforce
Diversity; Trend in Lost Time Indicent Rate (-20%)
Areas for improvement and risks Reporting on KPIs; Social Supply Chain Standards; External QMS certifications; Community Involvement Programmes
Strengths and opportunities Whistleblower Programmes; Board
Oversight of ESG Issues; Separation of Board Chair and CEO Roles
Areas for improvement and risks Policy on Bribery and Corruption;
Disclosure of Directors' Remuneration; Executive Compensation Tied to ESG
Performance; Rate of independent Board members
Horiba SC Japan Automotive Test
System
HORIBA is a supplier in the fields of engine test systems, driveline test systems, brake test systems, wind tunnel balances and emissions test
systems.
Strengths and opportunities Environmental Management System;
Reporting on KPIs; Programmes to Reduce Waste and Air Pollutants; Programmes and Targets to Reduce Direct GHG Emissions
Areas for improvement and risks External Certification of EMS and QMS
(planned for FY2011 for the entire group)
Strengths and opportunities Programmes and Targets to Reduce
Health and Safety Incidents Areas for improvement and risks
Policy on Labour Rights; Reporting on KPIs; Supply Chain Monitoring System
Strengths and opportunities Whistleblower Programme; Board
Oversight of ESG Issues (CSR committee)
Areas for improvement and risks Executive Compensation Tied to ESG
Performance
Hutchison Port Holdings Trust
MC Singapore Ports
Hutchison Port Holdings Trust is one of the few stock listed companies in the world operating and developing marine terminals and ports. Ports
allow for inter-modality.
Strengths and opportunities Programmes to Reduce Air Pollution
Areas for improvement and risks Environmental Management System;
Environmental and Social Impact Assessments; Reporting on KPIs; Policy or
Programme on Green Procurement
Strengths and opportunities
Noise reduction policy Areas for improvement and risks
Policy on Labour Rights; Reporting on KPIs; Social Supply Chain Standards;
External QMS Certifications; Community Involvement Programmes
Strengths and opportunities Separation of Board Chair and CEO
Roles; Rate of Independent Directors on the Board (55%)
Areas for improvement and risks Policy on Bribery and Corruption;
Whistleblower Programmes; Signatory to UN Global Compact; CSR Reporting (only a Global Community Report has been published by parent company
HPH); Disclosure of Directors' Biographies
Sources: Companies, Oddo Securities, Sustainalytics
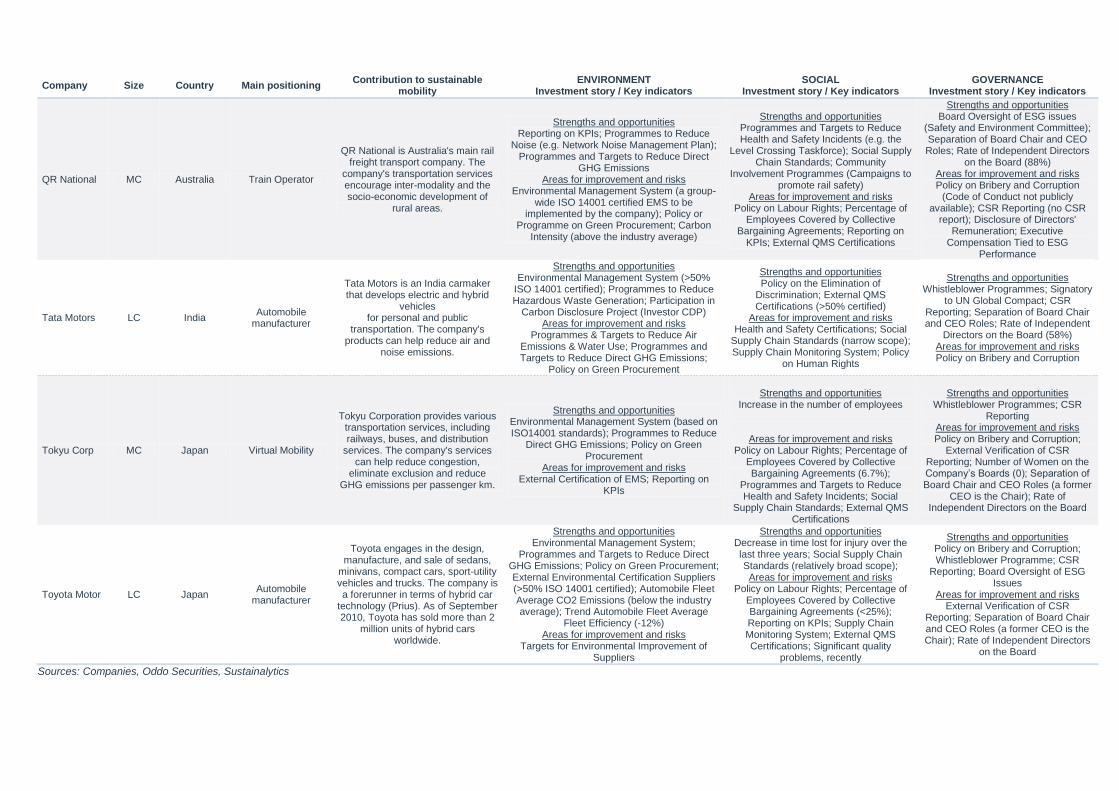
Company Size Country Main positioning Contribution to sustainable
mobility ENVIRONMENT
Investment story / Key indicators SOCIAL
Investment story / Key indicators GOVERNANCE
Investment story / Key indicators
QR National MC Australia Train Operator
QR National is Australia's main rail freight transport company. The
company's transportation services encourage inter-modality and the socio-economic development of
rural areas.
Strengths and opportunities Reporting on KPIs; Programmes to Reduce
Noise (e.g. Network Noise Management Plan); Programmes and Targets to Reduce Direct
GHG Emissions Areas for improvement and risks
Environmental Management System (a group-wide ISO 14001 certified EMS to be
implemented by the company); Policy or Programme on Green Procurement; Carbon
Intensity (above the industry average)
Strengths and opportunities Programmes and Targets to Reduce Health and Safety Incidents (e.g. the
Level Crossing Taskforce); Social Supply Chain Standards; Community
Involvement Programmes (Campaigns to promote rail safety)
Areas for improvement and risks Policy on Labour Rights; Percentage of
Employees Covered by Collective Bargaining Agreements; Reporting on
KPIs; External QMS Certifications
Strengths and opportunities Board Oversight of ESG issues
(Safety and Environment Committee); Separation of Board Chair and CEO Roles; Rate of Independent Directors
on the Board (88%) Areas for improvement and risks Policy on Bribery and Corruption
(Code of Conduct not publicly available); CSR Reporting (no CSR
report); Disclosure of Directors' Remuneration; Executive
Compensation Tied to ESG Performance
Tata Motors LC India Automobile
manufacturer
Tata Motors is an India carmaker that develops electric and hybrid
vehicles for personal and public
transportation. The company's products can help reduce air and
noise emissions.
Strengths and opportunities Environmental Management System (>50%
ISO 14001 certified); Programmes to Reduce Hazardous Waste Generation; Participation in
Carbon Disclosure Project (Investor CDP) Areas for improvement and risks
Programmes & Targets to Reduce Air Emissions & Water Use; Programmes and Targets to Reduce Direct GHG Emissions;
Policy on Green Procurement
Strengths and opportunities Policy on the Elimination of
Discrimination; External QMS Certifications (>50% certified)
Areas for improvement and risks Health and Safety Certifications; Social
Supply Chain Standards (narrow scope); Supply Chain Monitoring System; Policy
on Human Rights
Strengths and opportunities Whistleblower Programmes; Signatory
to UN Global Compact; CSR Reporting; Separation of Board Chair and CEO Roles; Rate of Independent
Directors on the Board (58%) Areas for improvement and risks Policy on Bribery and Corruption
Tokyu Corp MC Japan Virtual Mobility
Tokyu Corporation provides various transportation services, including railways, buses, and distribution
services. The company's services can help reduce congestion,
eliminate exclusion and reduce GHG emissions per passenger km.
Strengths and opportunities Environmental Management System (based on ISO14001 standards); Programmes to Reduce
Direct GHG Emissions; Policy on Green Procurement
Areas for improvement and risks External Certification of EMS; Reporting on
KPIs
Strengths and opportunities
Increase in the number of employees
Areas for improvement and risks Policy on Labour Rights; Percentage of
Employees Covered by Collective Bargaining Agreements (6.7%);
Programmes and Targets to Reduce Health and Safety Incidents; Social
Supply Chain Standards; External QMS Certifications
Strengths and opportunities Whistleblower Programmes; CSR
Reporting Areas for improvement and risks Policy on Bribery and Corruption;
External Verification of CSR Reporting; Number of Women on the Company‘s Boards (0); Separation of Board Chair and CEO Roles (a former
CEO is the Chair); Rate of Independent Directors on the Board
Toyota Motor LC Japan Automobile
manufacturer
Toyota engages in the design, manufacture, and sale of sedans,
minivans, compact cars, sport-utility vehicles and trucks. The company is a forerunner in terms of hybrid car
technology (Prius). As of September 2010, Toyota has sold more than 2
million units of hybrid cars worldwide.
Strengths and opportunities Environmental Management System;
Programmes and Targets to Reduce Direct GHG Emissions; Policy on Green Procurement; External Environmental Certification Suppliers (>50% ISO 14001 certified); Automobile Fleet Average CO2 Emissions (below the industry average); Trend Automobile Fleet Average
Fleet Efficiency (-12%) Areas for improvement and risks
Targets for Environmental Improvement of Suppliers
Strengths and opportunities Decrease in time lost for injury over the last three years; Social Supply Chain Standards (relatively broad scope); Areas for improvement and risks
Policy on Labour Rights; Percentage of Employees Covered by Collective Bargaining Agreements (<25%); Reporting on KPIs; Supply Chain Monitoring System; External QMS Certifications; Significant quality
problems, recently
Strengths and opportunities Policy on Bribery and Corruption; Whistleblower Programme; CSR
Reporting; Board Oversight of ESG Issues
Areas for improvement and risks External Verification of CSR
Reporting; Separation of Board Chair and CEO Roles (a former CEO is the Chair); Rate of Independent Directors
on the Board
Sources: Companies, Oddo Securities, Sustainalytics
ABOUT THE AUTHORS
Jean-Florent Helfre, Lead Analyst Transportation & Transportation Infrastructure,
Sustainalytics (Amsterdam)
Jean-Florent holds Master‘s degrees in Agriculture, Food Industry and Environment from Engineering School
ISARA in Lyon and in Asset Management from Ecole Superieure des Affaires in Lille. Moreover, he holds a
certificate on climate risks and opportunities for the financial sector issued by the United Nations Environmental
Programme Finance Initiative (UNEP FI). Jean-Florent coordinates research activities on the industrials sector,
with a particular focus on the transportation industry. He also manages several client accounts, oversees
Sustainalytics‘ global research universe and coordinates research on climate change-related issues. Previously,
Jean-Florent worked at BNP Paribas as a credit analyst for agribusiness companies. He has work experience in
the agricultural and food sectors and conducted research on renewable energy technologies and their socio-
economic impacts in Senegal, Sweden and France.
Arne Philipp Klug, Lead Analyst Automobiles & Auto Components, Sustainalytics
(Frankfurt)
Arne has a Magister Artium degree in Communication Science, Political Economics and Hispanics from the
University of Münster (Germany). He oversees research for the automobiles/auto components and chemicals
sectors. In addition, he supports external communications at Sustainalytics Frankfurt and is involved in various
sustainability intelligence projects. Prior to joining the company, Arne worked in the CSR management
department of Commerzbank and as a freelance journalist, amongst other activities, for a media group
specialized in sustainability issues.
Laurence Loubieres, Senior Analyst, Sustainalytics (Toronto)
Laurence graduated from the Ecole Supérieure des Sciences Economiques et Commerciales (ESSEC) in Paris.
She coordinates the financial services research team and is in charge of the insurance sector. She is also
involved in the development of Sustainalytics' research products through engagement with clients and
involvement in internal innovation projects. Prior to joining Sustainalytics, Laurence was a responsible
investment analyst for seven years at Meeschaert Gestion Privée, the largest independent private banking firm
in France. She also co-authored a book on sustainable development (Notre mode de vie est-il durable: nouvel
horizon de la responsabilité, Karthala, Paris, 2006) and a book about the reform of the financial system (20
propositions pour réformer le capitalisme, Flammarion, Paris, 2009).
Jean-Philippe Desmartin, Senior Analyst and Head SRI research, Oddo Securities
Jean-Philippe Desmartin graduated in Economics and Finance from IEP Paris (1992) and holds a degree from
Paris II in Business Law (French Institute of Business Law, 1991) and Management (BA, 1990). He has been
the head of SRI research at Oddo Securities since June 2005. He started his career in Crédit du Nord's financial
engineering department in 1993 and then held various positions at the AReSE (France) and Innovest (US)
social and environmental ratings agencies before founding his own consulting firm. He is a lecturer in different
universities/business schools, including ESSEC, HEC, IAE Paris and IEP Paris (Sciences Po). Jean-Philippe is
a member ofvarious ESG international working groups and committees (EFFAS, ICGN, IIRC, PRI, WICI), and
he is also the co-author of a book on socially responsible investment that was published in 2005 by Economica.
Sébastien Thévoux-Chabuel, Senior SRI Analyst, Oddo Securities
Sébastien Thévoux-Chabuel, graduated in with a degree in Economics and Finance from ESCP, a leading
French Business School, in 1997 and holds a post-graduate degree from La Sorbonne in Financial Engineering
which he received in1998. Sébastien is a member of the SFAF (French Association of Chartered Financial
Analysts). He started his career in 1998 at Deutsche Bank (DWS) as a buy-side analyst, then moved in 2001 to
BFT (subsidiary of Credit Agricole) as PM and Buy-side Analyst. He joined Oddo Securities in 2005 as a sell-
side analyst on the European Technology Sector and in 2008 moved to the SRI team.
ABOUT SUSTAINALYTICS
Sustainalytics provides environmental, social and governance (ESG) research and analysis as well as responsible
investment services to investors around the world. The firm offers global perspectives and solutions that are underpinned
by local experience and expertise, serving both values-based and mainstream investors that integrate ESG information
and assessments into their investment management.
Headquartered in Amsterdam, the firm has regional offices in Boston, Frankfurt, Madrid, Paris, Timisoara and Toronto;
and representatives in Brussels and Copenhagen. The firm has more than 90 staff members with a range of
multidisciplinary and industry expertise.
www.sustainalytics.com
Recommended