1
The Asia Oceania Human Proteome Organisation Membrane Proteomics
Initiative. Preparation and characterization of the carbonate-washed
membrane standard
Lifeng Peng1# Eugene A. Kapp2#, David Fenyö3, Min-Seok Kwon4, Pu Jiang5, Songfeng Wu5,
Ying Jiang5, Marie-Isabel Aguilar6, Nikhat Ahmed7, Mark S. Baker8, Zongwei Cai9, Yu-Ju
Chen10, Phan Van Chi11, Maxey C. M. Chung12, Fuchu He5, Alice C. L. Len8, Pao-Chi Liao13,
Kazuyuki Nakamura14, Sai Ming Ngai15, Young-Ki Paik4, Tai-Long Pan16, Terence C. W.
Poon17, Ghasem Hosseini Salekdeh18, Richard J. Simpson2, Ravi Sirdeshmukh19, Chantragan
Srisomsap20, Jisnuson Svasti20,21, Yu-Chang Tyan22, Florian S. Dreyer1, Danyl McLauchlan1,
Pisana Rawson1 and T. William Jordan1
1Centre for Biodiscovery and School of Biological Sciences, Victoria University of
Wellington, Wellington, New Zealand
2Joint Proteomics Laboratory, Ludwig Institute for Cancer Research & The Walter and Eliza
Hall Institute of Medical Research, Parkville, Victoria, Australia
3Laboratory of Mass Spectrometry and Gaseous Ion Chemistry, The Rockefeller University,
New York, NY, USA
© 2010 WILEY-VCH Verlag GmbH & Co. KGaA, Weinheim
Received: February 28, 2010 / Revised: April 12, 2010 / Accepted: April 27, 2010
DOI: 10.1002/pmic.201000126
2
4Department of Biochemistry, Yonsei Proteome Research Center, Yonsei University, Seoul,
Korea
5State Key Laboratory of Proteomics, Beijing Proteome Research Center, Beijing Institute of
Radiation Medicine, Beijing, P. R. China
6Department of Biochemistry & Molecular Biology, Monash University, Clayton, Victoria,
Australia;
7Department of Biochemistry, University of Karachi, Karachi, Pakistan;
8Department of Chemistry and Biomolecular Sciences, Macquarie University, Sydney,
Australia;
9Hong Kong Baptist University, Hong Kong SAR, China;
10Institute of Chemistry, Academia Sinica, Taipei, Taiwan;
11Vietnam Academy of Science and Technology, Hanoi, Vietnam;
12Department of Biochemistry, Yong Loo Lin School of Medicine, National University of
Singapore, Singapore;
13Department of Environmental and Occupational Health, College of Medicine, National
Cheng Kung University, Tainan, Taiwan;
14Yamaguchi University Graduate School of Medicine, Ube, Yamaguchi, Japan;
15Department of Biology and State Key Laboratory of Agrobiotechnology, The Chinese
University of Hong Kong, Hong Kong SAR, China;
16School of Traditional Chinese Medicine, Chang Gung University, Tao-Yuan, Taiwan;
17Medical Proteomics Laboratory, Department of Medicine and Therapeutics, The Chinese
University of Hong Kong, Hong Kong SAR, China;
18Department of Molecular Systems Biology, Royan Institute for Stem Cell Biology and
Technology, Tehran, Iran;
19Centre for Cellular and Molecular Biology, Hyderabad, India;
3
20Laboratory of Biochemistry, Chulabhorn Research Institute, Bangkok, Thailand;
21Department of Biochemistry, Faculty of Science, Mahidol University, Bangkok, Thailand;
22Department of Medical Imaging and Radiological Sciences, Kaohsiung Medical University,
Kaohsiung, Taiwan
Correspondence to: Dr T W Jordan Centre for Biodiscovery School of Biological Sciences Victoria University of Wellington PO Box 600 Wellington New Zealand Phone: +64 4 463 6092 Fax: +64 4 463 5331 E-mail: [email protected] #These authors are equal first authors.
Abbreviations: AOHUPO, Asia Oceania Human Proteome Organisation; ER, endoplasmic
reticulum; MICR, microsomal sample; MPIS, Membrane Proteomics Initiative Standard;
TMD, transmembrane domain
Keywords:
AOHUPO / Integral membrane proteins / Liver / Membrane proteomics
4
Abstract
The Asia Oceania Human Proteome Organisation has embarked on a Membrane Proteomics
Initiative with goals of systematic comparison of strategies for analysis of membrane
proteomes and discovery of membrane proteins. This multi-laboratory project is based on
analysis of a subcellular fraction from mouse liver that contains endoplasmic reticulum and
other organelles. Here we present the strategy used for preparation and initial characterisation
of the membrane sample, including validation that the carbonate-washing step enriches for
integral and lipid-anchored membrane proteins. Analysis of seventeen independent datasets
from five types of proteomic workflows is in progress.
5
1. Introduction
Membrane systems, including membrane proteins, are essential constituents of cellular life.
The topography of proteins in membranes is intimately related to function. Transmembrane
protein architecture includes proteins that span the membrane via TMDs either as beta-barrel
structures or through relatively hydrophobic transmembrane helices [1]. Other proteins are
selectively associated with one face of their membrane, including by binding through
hydrophobic peptide domains or lipid anchors. Technical challenges in the analysis of
membrane proteins and membrane proteomes are well known, ranging from difficulties in
detection of receptors and other proteins present at abundances less than ten thousand copies
per cell to difficulties handling and detecting proteins that contain a high proportion of
hydrophobic transmembrane regions. LC MS/MS of proteolytic peptides is established for
proteomic analysis of membrane fractions [2], including large-scale experiments relevant to
our current study that list hundreds of proteins from normal mouse liver [3-8]. Prior to these
studies, and related shot-gun MS/MS of other membrane systems, membrane proteins were
poorly represented in proteomics reports.
As previously reported, AOHUPO (www.aohupo.org) has embarked on a Membrane
Proteomics Initiative with the goals of systematic comparison of strategies for analysis of
membrane proteomes and discovery of membrane proteins [9, 10]. This multi-laboratory
project is based on analysis of a mouse liver membrane preparation (the Membrane
Proteomics Initiative Standard, MPIS). Liver was chosen because of its relevance to several
of the participating laboratories including those involved in the HUPO Liver Proteome
Project [11], and because of extensive published knowledge about liver biochemistry,
subcellular biology and pathology that can be used for functional analysis of membrane
proteins. The distributed MPIS was prepared by differential centrifugal pelleting of a liver
6
homogenate to yield a microsomal pellet. The resuspended pellet was subsequently washed
with an alkaline carbonate solution [12, 13] to enrich for membrane proteins. We have in
progress analysis of the MPIS using a range of workflows (Table 1) [9, 10]. Here we present
the strategy used for preparation and initial characterisation of the MPIS, based on LC
MS/MS of tryptic digests of the MPIS and precursor microsomes.
2. Materials and methods
2.1 Preparation of membrane fractions
C57BL/6J male mice from the Animal Resources Center (Murdoch, Australia) were shipped
to New Zealand at age 5-6 weeks and maintained in germ free conditions at the Malaghan
Institute of Medical Research (Wellington, New Zealand). Ethical approval was obtained
from the Victoria University of Wellington Animal Ethics Committee. The mice were killed
at age 10-11 weeks using carbon dioxide anaesthesia and livers were excised, and immersed
in ice-cold homogenization medium containing 0.25 M sucrose, 5 mM Tris-HCl pH 7.4, 1
mM tetrasodium EGTA, 1 mM sodium orthovanadate, 2 mM sodium fluoride and 1 % (v/v)
protease inhibitor cocktail (Sigma-Aldrich, MO, P8340). The livers were minced with
scissors, washed twice with fresh medium, and suspended in 4 volumes of again fresh ice-
cold homogenization medium. The sample was then homogenized at 4°C using a Polytron PT
10/35 with a PT-20 probe at speed 5 for 40–60 s at 10 s intervals. Subcellular fractionation
was carried out using differential centrifugation [14] at 4°C. The homogenate was centrifuged
at 12,000gav for 15 min in a Sorvall SuperLiteTM GSA rotor and the resulting supernatant was
centrifuged at 100,000gav for 1 h in a Beckman 45 Ti rotor to produce a microsomal pellet
that was then washed twice by resuspension in fresh medium and centrifugation at 100,000gav
for 1 h. The washed microsomal pellet (MICR) was then resuspended in 20 volumes of ice-
cold 0.1 M sodium carbonate pH 11.5 containing 1% protease inhibitors. The suspension was
7
slowly agitated on a shaker for 1 h at 4 °C and then centrifuged again at 100,000gav for 1 h to
produce a pellet which is called MPIS. The MPIS pellet was resuspended in 5 volumes of
HPLC grade water and aliquots were stored at –80 °C. Aliquots of the stored MPIS were
distributed to the participating laboratories using courier transfer of samples packaged with a
least 10 kg of dry ice. Transport was carried out by Logical Freight Solutions NZ Ltd. who
ensured frozen transfer of the samples from despatch to delivery.
For the work described in this manuscript, aliquots of the homogenate, MICR and
MPIS fractions, and 100,000 g supernatant were processed by precipitation of protein using a
Calbiochem Protein Precipitation Kit (Calbiochem, Germany). Protein concentrations were
measured using a 2-D Quant Kit (GE Healthcare, Bucks, UK). Samples from all fractions
were reconstituted in 40 mM Tris, 7 M urea, 2 M thiourea, 4% w/v CHAPS, 0.5% w/v
aminosulfobetaine-14 and 1% protease inhibitor cocktail at a protein concentration of 5
mg/mL for proteomic analysis.
Aliquots of 20 μg protein from each of the above samples were mixed with Invitrogen
NuPAGE lithium dodecyl sulfate sample buffer and electrophoresed on 4-12% precast
polyacrylamide Bis-Tris NuPage gels using MOPS SDS electrophoresis as described
previously [15]. After electrophoresis, the gels were stained with colloidal Coomassie
Brilliant Blue G-250 and imaged using a Molecular Dynamics Personal Densitometer SI
(Molecular Dynamics, Sunnyvale, CA).
2.2 LC MS/MS of tryptic digests
The reported results are based on replicate (n=6 for each sample) LC MS/MS analyses of
MICR or MPIS samples containing 20 μg protein, dissolved in 8 M urea, 100 mM Tris-HCl,
8
pH 8.5, to a final volume 50 μL. Protein disulfide bonds were reduced with 10 mM DTT for
30 min at 56 °C, followed by alkylation with 55 mM iodoacetamide for 40 min at room
temperature in the dark. The reduced and alkylated samples were diluted 3-fold with 100 mM
Tris-HCl pH 8.5 and digested with trypsin (Roche, modified sequencing grade) at an enzyme-
to-substrate ratio of 1:50 (wt/wt) in the presence of 1 mM CaCl2 overnight at 37 °C. After
digestion, 90% formic acid was added to 4% concentration.
The resulting tryptic peptides were purified using 100 μL OMIX C18 tips according
to the manufacturer’s instructions (Varian Inc., CA). Peptides in each sample were eluted in
20 μL of 70% ACN - 0.1% formic acid and were further diluted with 0.1% formic acid. LC
MS/MS was carried out using a Dionex UltiMateTM 3000 LC system (LC Packings,
Netherlands) and a Thermo Finnigan LTQ mass spectrometer equipped with a nanospray ion
source (Thermo Electron Corporation, USA) as described previously [15]. Peptides were
separated in a 75 μm × 15 cm PepMap C18 analytical column (3 μm, 300 Å Dionex) at a
constant flow rate of 200 nL/min using a gradient constructed from (A) 0.1% formic acid and
(B) 0.1% formic acid in 80% ACN: 0% B for 17 min; 0-15% B for 30 min; 15-30% B for 133
min; 30-55% B for 70 min; 55-100% B for 30 min; 100% B for 5 min; 100-0% B for 5 min.
The LTQ was operated in data-dependent MS/MS mode where the five most abundant
precursor ions detected in a single MS scan from m/z 400 to m/z 2000 were dynamically
selected for subsequent MS/MS scans with collision energy set to 35%, simultaneously
incorporating dynamic exclusion option with 5 s exclusion duration to prevent reacquisition
of MS/MS spectra of the same peptides.
2.3 Bioinformatics
9
In the initial phase of analysis, peak lists were extracted from the raw MS files, and peptide
and protein lists were generated by groups at The Joint Proteomics Laboratory (JPSL) in
Melbourne, Rockefeller University, Yonsei University, and the Beijing Proteome Research
Centre. Subsequently, all extraction and processing of data from the raw files for the purpose
of this manuscript was done at JPSL. Peak lists were extracted using extract-msn (BioWorks
3.3.1 Thermo Scientific) using the following parameters: minimum mass 700; maximum
mass 5000; no merging of scans; 10 peaks minimum and total ion current 100. The
PeakListExtractor program (JPSL, in-house software) was used for generating optimized
Mascot generic files (MGF format) from the DTA files. This program removes duplicate
peak lists for +2 and +3 spectra that are automatically generated by extract_msn because of
the low resolution survey scan of the LTQ instrument. For these spectra, a global
“CHARGE=2+, 3+” was written to the header of each MGF file instructing the Mascot
search algorithm to search these spectra as doubly and triply charged, but retain only the
highest scoring peptide. All other spectra (i.e. not 2+ or 3+) were searched using the specified
local “CHARGE=x” parameter determined by extract_msn. Mascot Server (version 2.2.04,
Matrix Science, U.K.) was used to identify peptides using the uninterpreted MS/MS ions
search mode. Peak lists were searched against the International Protein Index (IPI) mouse
protein sequence database (version 3.36, 51,326 entries). The search parameters were as
follows: carboxyamidomethylation of cysteine as a fixed modification (+57 Da) as well as
variable modifications consisting of NH2-terminal acetylation (+42 Da) and oxidation of
methionine (+16 Da), and allowance for up to two missed tryptic cleavage sites (trypsin/P).
Precursor and fragment ion mass tolerance values were ±3 Da and 0.8 Da respectively.
Mascot result files were loaded into the program MSPro (JPSL, in-house software).
For MSPro, peptide spectral matches with Mascot Ion Scores ≥ 15 were retained and
10
classified as either discrete (i.e., matching a unique protein record) or degenerate (i.e.,
matching multiple protein records). Peptide spectral matches, from six replicate LC MS/MS
analyses for each of the MPIS and precursor microsomes, were classified as significant when
the Ion Score ≥ the reported Homology Score or Identity Score (if the Homology Score was
not present). Protein scores (a slightly modified Mascot MudPIT score) were computed as
previously described [16]. To estimate levels of false positive protein identifications (i.e.
false discovery rate), MS/MS spectra were also searched separately against the corresponding
reversed-sequence (decoy) database. A 1% false discovery rate at the protein level equated to
a protein score of 55. Spectral counts (the number of MS/MS assigned to each protein) of
significant peptide spectral matches were recorded and used to calculate spectral count ratios
in order to estimate fold-changes between MPIS and MICR. Spectral count ratio values
(log2) were calculated according to Beissbarth et al. [17] with a correction factor of 1.25 in
accordance with Old et al. [18] The sum of spectral counts for all inferred proteins (protein
score >55) differed by <7% between MPIS and MICR. IPI accession numbers of inferred
proteins in MPIS and MICR were sent to the GOFact server (http://61.50.138.118/gofact/) for
analysis of Gene Ontology categories of the datasets. TMHMM
(http://www.cbs.dtu.dk/services/TMHMM) was used for TMD prediction. The Mascot search
result files and experimental information were converted to PRIDE XML using PRIDE
Converter (version 2.1.2). These data are available from PRIDE [19]
http://www.ebi.ac.uk/pride/ accession numbers 10632-10633.
3. Results and discussion
3.1 Preparation and characterization of the MPIS
Our goal was to prepare a subcellular fraction that was enriched for integral membrane proteins in
sufficient quantity for the participating laboratories to analyze using a range of proteomics
11
techniques. We used the alkaline carbonate washing method that Fujiki et al. employed to strip
excess protein from ER and other organelle membranes in rat liver subcellular fractions [12, 13].
Although the alkaline carbonate method is frequently used in membrane isolation protocols, this
is often done without systematic characterization of proteins that are depleted or retained after
carbonate washing. We therefore examined the extent to which integral membrane proteins and
lipid-anchored membrane proteins were detected in the carbonate washed MPIS and precursor
microsomes MICR.
Fractionation of the mouse liver homogenate using differential centrifugation resulted
in 100,000 g sediment (MICR) and soluble supernatant fractions that differed in protein
composition from each other and from the original homogenate. Approximately one-tenth of
the homogenate total protein amount separated in the MICR fraction, as is typically achieved
for preparation of a microsomal fraction by differential centrifugation of homogenates [14,
15]. Further processing of the MICR fraction by washing with alkaline carbonate removed
approximately 70% of the protein with recovery of 2.7% of the original homogenate protein
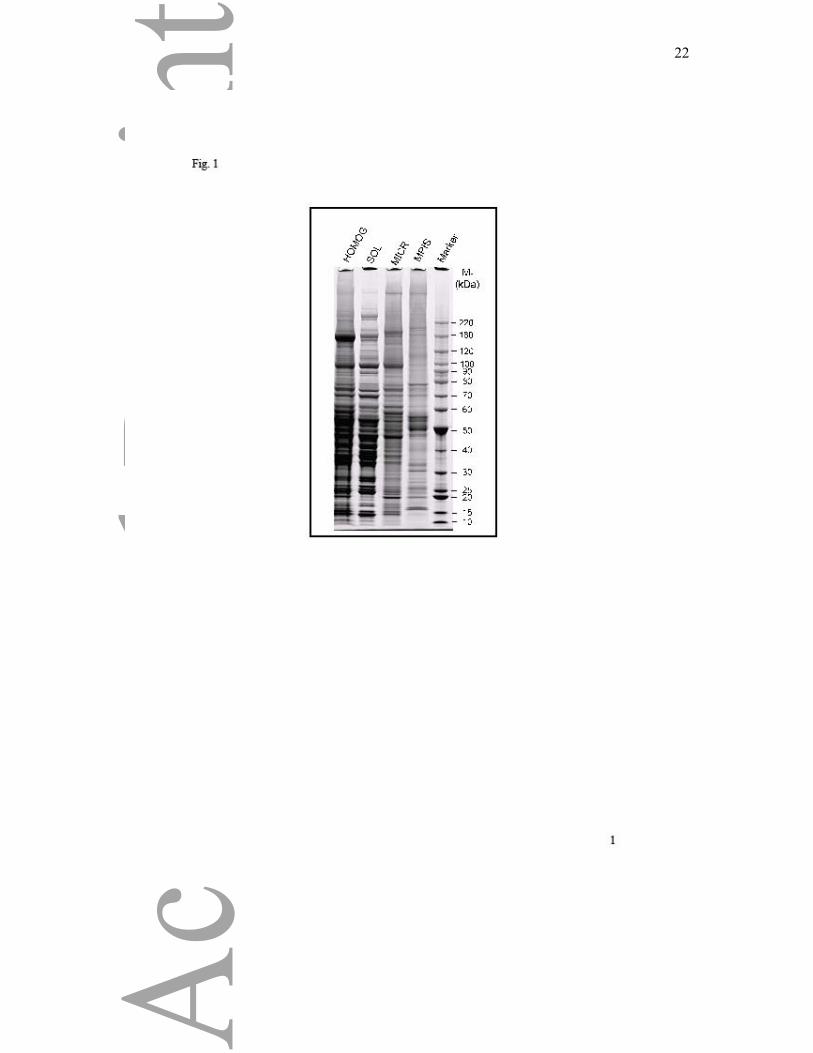
in the MPIS. The protein profiles detected by Coomassie staining of SDS PAGE separations
showed selective retention and depletion of protein bands in the MPIS compared with MICR
and total homogenate (Fig. 1).
The protein compositions of MICR and MPIS were examined by MS/MS of in-
solution tryptic digests of the two fractions (see Supplementary Methods). A total of 628
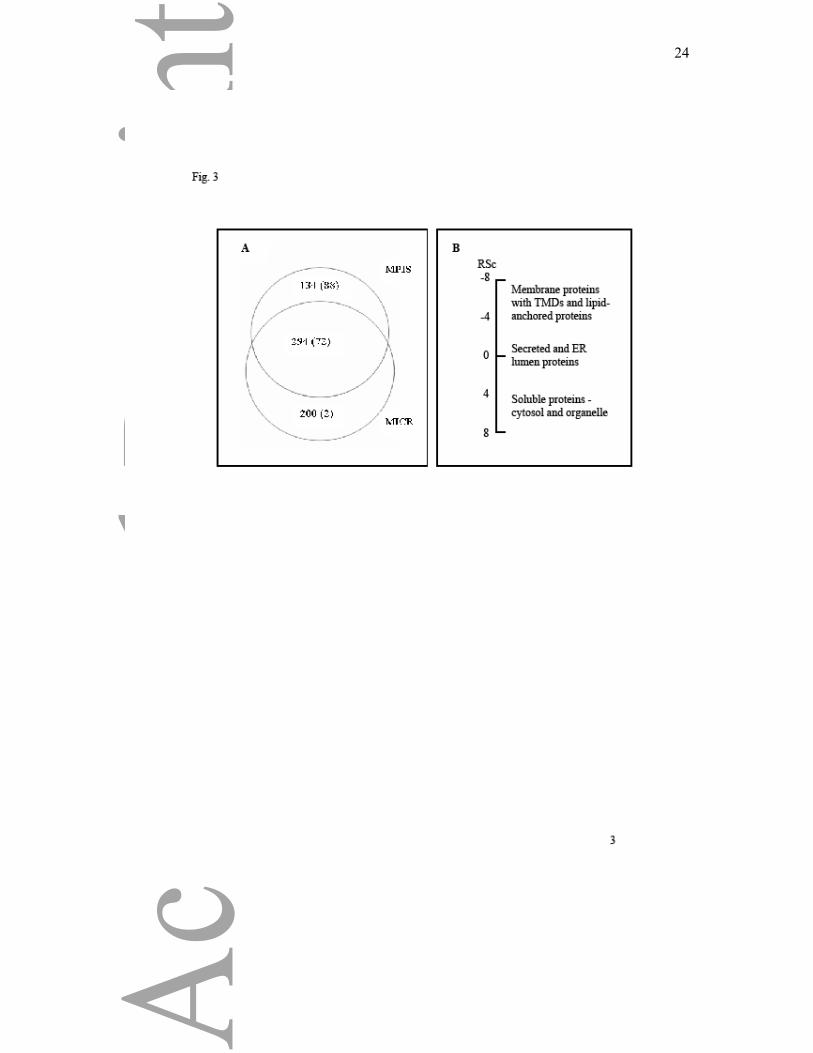
proteins were identified (Supplemental Tables 1 and 2) of which 294 were detected in both
MICR and MPIS, 134 were found only in MPIS, and 200 only in MICR. Analysis of Gene
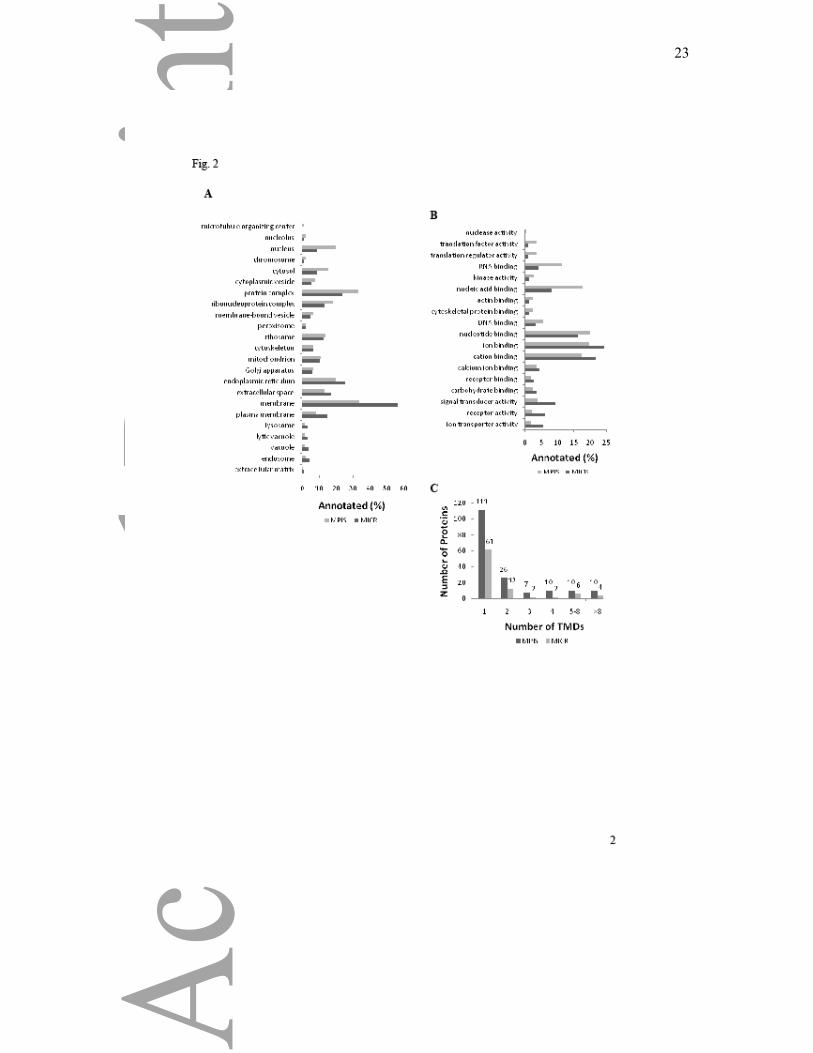
Ontology annotations for Cell Component (Fig. 2A) showed the presence of proteins from
ER, plasma membrane, mitochondrion, Golgi apparatus, endosome, vacuole, lysosome,
nucleus and peroxisome plus cytosol proteins in the precursor MICR as was expected from
12
the differential centrifugation protocol. Comparison of Cell Component annotations for the
carbonate-washed MPIS showed enhancement of annotations for membrane, plasma
membrane, ER, endosome, vacuole and lysosome; plus depletion of proteins derived from
cytosol and nucleus in the MPIS. Accordingly, Molecular Function annotations for nuclear
and cytoplasmic proteins associated with nucleic acid binding were depleted in the MPIS, and
there was enrichment of annotations associated with membrane activities including receptor
and transporter activities (Fig. 2B). The conclusions that membrane proteins were enriched
in the MPIS, and that soluble proteins were depleted, were supported by analysis of numbers
of proteins containing predicted TMDs. Forty-one percent of the 428 MPIS proteins
contained predicted TMDs including 111 with a single predicted TMD, and 63 with predicted
multiple TMDs (Fig. 2C).
3.2 Membrane proteins are enriched in the MPIS
We next considered the extent to which membrane proteins were enriched in the MPIS and
whether the carbonate washing procedure was compromised by loss of membrane proteins.
Proteins that were annotated for membrane locations (for all detected organelle proteins, and
either containing predicted TMDs or membrane anchors), were located preferentially in the
MPIS: numbering 88 in the MPIS alone, plus 72 in both the MPIS and MICR (Fig. 3A). Two
proteins with membrane annotations, each identified by three significant peptides, were
detected only in the precursor MICR. One of these proteins Picalm, is a phosphatidyl inositol-
binding clathrin assembly protein with no predicted TMDs whose membrane annotation
reflects ability to associate with membrane phospholipids. The second protein, Dnaja1, is a
potentially farnesylated protein that would associate with proteins through the farnesyl lipid
anchor. It is possible that Dnaja1 was detected as the unmodified polypeptide.
13
Further support for the use of the carbonate wash to enrich membrane proteins was
provided by analysis of specific proteins that distributed between the MPIS and precursor
MICR. Of the 200 proteins detected only in MICR, approximately half were from the
cytoplasm, including proteins with a dual cytoplasm-organelle location. The most numerous
proteins with dual cytoplasmic-organelle locations were those also annotated nucleus, and
components of the intracellular vesicular transport systems including some clathrin and
coatomer subunits. Fig. 3B illustrates the distributions of groups of proteins between MICR
and MPIS. The effects of the carbonate wash included depletion of many cytosolic proteins.
ER lumen proteins including carboxylesterases (Supplemental Table 3) were also depleted in
the MPIS. These results confirm the action of the 0.1 M pH 11.5 carbonate solution for
removal of soluble proteins and some membrane associated proteins through: (a) disruption
of membrane bound vesicles including ER-derived microsomes [12, 13, 20], and (b)
competing charge interactions between membranes and loosely bound soluble and
cytoskeletal proteins.
Analysis of the distribution of individual proteins between MPIS and MICR indicated
that the relative abundance of membrane proteins with TMDs or lipid anchors increased in
the MPIS. Membrane proteins that were detected included 25 cytochrome P450 proteins, the
enzyme NADPH-cytochrome P450 reductase plus nine members of the UDP-
glucuronosyltransferase family (Supplemental Table 4). All of these proteins were detected in
MPIS, but 11 of the P450s and three of the glucuronosyltransferases were barely or not
detectable in the MICR (0-5 spectral counts). The cytochrome P450 mixed-function oxidase
enzymes are variously distributed in ER or mitochondrial membranes and have roles in
metabolism of a wide range of endogenous and exogenous substrates [21]. Sutton et al. [22]
14
reported 26 P450s using tandem mass spectrometry of gel slices from mouse liver
microsomes separated by SDS-PAGE, and of these 17 matched the P450s we report.
Supplemental Table 5 lists membrane receptor and transport proteins, all of which
were detected in the MPIS but only some in the MICR. The list of receptors includes proteins
from the sinusoidal, basolateral and canalicular domains [23] of the plasma membrane of
liver parenchymal cells (hepatocytes). Detection of sinusoidal, basolateral and canalicular
proteins indicates recovery of plasma membrane derived vesicles in the microsomal fraction
which is consistent with the homogenization and centrifugation conditions that were used
[14, 24]. Lipid-anchored proteins also preferentially distributed in MPIS, including two
transferrin receptor isoforms and Rab monomeric G-protein subunits 1A, 1B, 2A, 5B, 5C,
6A, 7A, 8A, 10, 11B, 14, 18 involved in intracellular membrane traffic. Gilchrist et al.
reported detection of 32 Rabs from a series of subcellular fractions of rat liver, of which 1A,
1B, 7, 2A, 6, 14, 10 and 18 were the most abundant in rough and smooth microsomes, Golgi
and COP1 vesicles [25], consistent with our results.
4. Concluding remarks
In summary, our strategy for the AOHUPO Membrane Proteomics Initiative was to prepare a
subcellular fraction enriched for membrane proteins that could be used to examine the extent
to which membrane proteins can be detected by a range of proteomics workflows. We
therefore prepared a mixed organelle microsomal pellet and used the carbonate washing
procedure to enrich for membrane proteins. The analysis presented here demonstrates that
membrane proteins containing TMDs or lipid anchors were captured and enriched in the
MPIS. Enhanced detection of membrane proteins in the MPIS can be attributed to the greater
concentration of membrane proteins that was achieved by depletion of approximately 70% of
15
the total amount of microsomal protein by carbonate washing (Fig. 1). The depleted
components were largely soluble proteins from the cytoplasm and from organelle matrix and
lumen compartments. We have therefore established that treatment with carbonate enhanced
detection of membrane proteins through depletion of soluble proteins including those from
the membrane enclosed compartments of the ER and other organelles, with retention of
proteins with TMDs, lipid anchors or other membrane binding domains.
Work in progress (Table 1) from the laboratories that are represented by the authors of
this manuscript indicates that up to two times as many membrane proteins can be detected as
those reported here. Our subsequent manuscripts will describe the extent to which membrane
proteins can be analysed using the various workflows, plus characterization of the ER and
plasma membrane proteins and proteomes captured in the MPIS.
16
We are extremely grateful to GE Healthcare for funding to assist with preparation
and distribution of the Membrane Proteomics Initiative samples, and to Magalie Boucher
and Graeme Lindsay for assistance with preparation of the liver subcellular fractions.
The authors have declared no conflict of interest
17
5. References
[1] Tan, S., Tan, H. T., Chung, M. C. M., Membrane proteins and membrane proteomics.
Proteomics 2008, 8, 3924-3932.
[2] Wu, C. C., MacCoss, M. J., Howell, K. E., Yates, J. R. III., A method for the
comprehensive proteomic analysis of membrane proteins. Nat. Biotechnol. 2003, 21, 532-
538.
[3] Kislinger, K., Rahman, K., Radulovic, D., Cox, B. et al., PRISM, a generic large scale
proteomic investigation strategy for mammals. Mol. Cell. Proteomics 2003, 2, 96-106.
[4] Zhang, L., Xie, J., Wang, X., Liu, X. et al., Proteomic analysis of mouse liver plasma
membrane: use of differential extraction to enrich hydrophobic membrane proteins.
Proteomics 2005, 5, 4510-4524.
[5] Shi, R., Kumar, C., Zougman, A., Zhang, Y. et al., Analysis of the mouse liver proteome
using advanced mass spectrometry. J. Proteome Res. 2007, 6, 2963-2972.
[6] Lai, K. K., Kolippakkam, D., Beretta, L., Comprehensive and quantitative proteome
profiling of the mouse liver and plasma. Hepatology 2008, 47, 1043-1051.
[7] Wiśniewski, J. R., Zougman, A., Nagaraj, N., Mann, M., Universal sample preparation
method for proteome analysis. Nat. Methods 2009, 6, 359-362.
[8] Zgoda, V. G., Moshkovskii, S. A., Ponomarenko, E. A., Andreewski, T. V. et al.,
Proteomics of mouse liver microsomes: performance of different protein separation
workflows for LC-MS/MS. Proteomics 2009, 9, 4102-4105.
[9] Chung, M., Nakamura, K., Jordan T. W., The AOHUPO Membrane Proteomics Initiative,
Fourth Workshop 22 June 2008, Cairns, Australia. Proteomics 2008, 8, 3920-3923.
[10] Cottingham, K., AOHUPO takes on membrane proteins. J. Proteome Res. 2009, 8, 1109.
[11] He, F., Human liver proteome project: plan, progress, and perspectives. Mol. Cell.
Proteomics 2005, 4, 1841-1848.
18
[12] Fujiki, Y., Hubbard, A. L., Fowler, S., Lazarow, P. B., Isolation of intracellular
membranes by means of sodium carbonate treatment: application to endoplasmic
reticulum. J. Cell Biol. 1982, 93, 97-102.
[13] Fujiki, Y., Fowler, S., Shio H., Hubbard, A. L., Lazarow, P. B., Polypeptide and
phospholipid composition of the membrane of rat liver peroxisomes: Comparison with
endoplasmic reticulum and mitochondrial membranes. J. Cell Biol. 1982, 93, 103-110.
[14] Lim, W. C., Jordan, T. W., Subcellular distribution of hepatic bile acid-conjugating
enzymes. Biochem. J. 1981, 197, 611-618.
[15] Peng, L., Rawson, P., McLauchlan, D., Lehnert, K. et al., Proteomic analysis of
microsomes from lactating bovine mammary gland. J. Proteome Res.2008, 7, 1427-1432.
[16] Greening, D. W., Glenister, K. M., Kapp, E. A., Moritz, R. L. et al., Comparison of
human platelet membrane-cytoskeletal proteins with the plasma proteome: Towards
understanding the platelet-plasma nexus. Proteomics Clin. Appl 2008, 2, 63-77.
[17] Beissbarth, T., Hyde, L., Smyth, G. K., Job, C. et al., (2004) Statistical modeling of
sequencing errors in SAGE libraries. Bioinformatics 2004, 20, Suppl. 1: i31-i39.
[18] Old, W. M., Meyer-Arendt, K., Aveline-Wolf, L., Pierce, K. G. et al., Comparison of
label-free methods for quantifying human proteins by shotgun proteomics. Mol. Cell.
Proteomics 2005, 4, 1487-1502.
[19] Vizcaíno, J. A., Côté, R., Reisinger, F., Foster, et al., A guide to the Proteomics
Identifications Database proteomics data repository. Proteomics 2009, 9, 4276-4283.
[20] Blackler, A. R., Speers, A. E., Ladinsky, M. S., Wu, C. C., A shotgun proteomic method
for the identification of membrane-embedded proteins and peptides. J. Proteome Res.
2008, 7, 3028-3034.
[21] Porter, T. D., Coon, M. J., Cytochrome P-450 Multiplicity of isoforms, substrates and
catalytic and regulatory mechanisms. J. Biol. Chem. 1991, 266, 13469-13472.
19
[22] Sutton, C.W., Sutherland, M., Shnyder, S., Patterson, L. H., Improved preparation and
detection of cytochrome P450 isoforms using mass spectrometric methods. Proteomics
2010, 10, 327-321.
[23] Hubbard, A. L., Wall, D. A., Ma, A., Isolation of rat hepatocyte plasma membranes. I.
Presence of the three major domains. J. Cell Biol.1983, 96, 217-229.
[24] Wisher, M. H., Evans, M. H., Functional polarity of the rat hepatocyte surface
membrane. Isolation and characterization of plasma-membrane subfractions from the
blood-sinusoidal, bile-canalicular and contiguous surfaces of the hepatocyte. Biochem. J.
1975, 146, 375-388.
[25] Gilchrist, A., Au, C. E., Hiding, J., Bell, A. W. et al., Quantitative proteomics analysis of
the secretory pathway. Cell 2006, 127, 1265-1281.
20
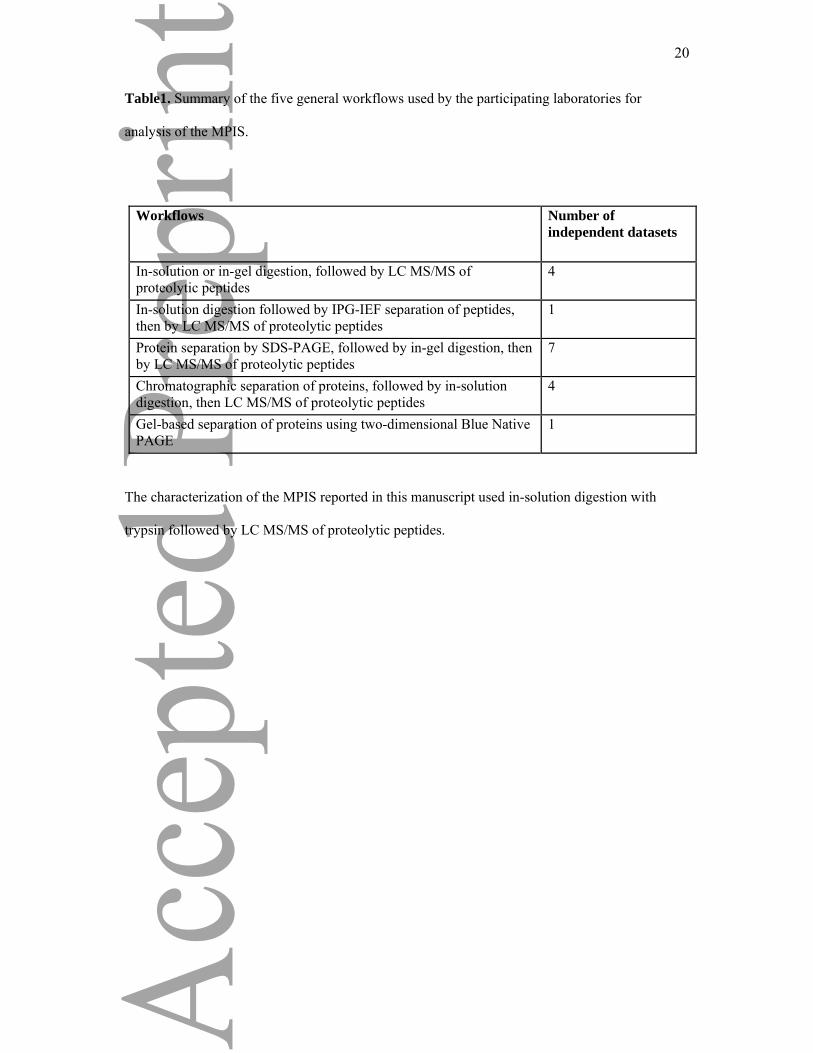
Table1. Summary of the five general workflows used by the participating laboratories for
analysis of the MPIS.
Workflows Number of
independent datasets
In-solution or in-gel digestion, followed by LC MS/MS of proteolytic peptides
4
In-solution digestion followed by IPG-IEF separation of peptides, then by LC MS/MS of proteolytic peptides
1
Protein separation by SDS-PAGE, followed by in-gel digestion, then by LC MS/MS of proteolytic peptides
7
Chromatographic separation of proteins, followed by in-solution digestion, then LC MS/MS of proteolytic peptides
4
Gel-based separation of proteins using two-dimensional Blue Native PAGE
1
The characterization of the MPIS reported in this manuscript used in-solution digestion with
trypsin followed by LC MS/MS of proteolytic peptides.
21
Figure 1. SDS-PAGE of subcellular fractions. Liver homogenate (HOMOG), post-
microsomal supernatant (SOL), MICR, MPIS and marker proteins were electrophoresed and
the gels were stained with Coomassie Blue G-250.
Figure 2. Comparison of MICR and MPIS. Gene Ontology (GO) annotations for Cell
Component (A) and Molecular Function (B) indicate enrichment of membrane proteins and
depletion of soluble proteins in MPIS compared to MICR. MPIS is also enriched for proteins
containing predicted TMDs (C). Dark bars MPIS, light bars MICR.
Figure 3. Membrane proteins are enriched in the MPIS. The Venn diagram (A) shows the
total number of proteins (number with membrane annotation in brackets) in MICR and MPIS.
The second panel (B) illustrates the relative abundance of groups of proteins in the MPIS
compared to the MICR. Spectral count ratios (RSc) negative values are enriched in the MPIS,
positive values are depleted in the MPIS with respect to MICR. The extreme values represent
the most enriched or depleted groups of proteins. Proteins with similar distributions in MPIS
and MICR were in the range -0.4 to 1.3. Ranges of RSc for specific groups of membrane
proteins include cytochrome P450s -1.1 to -6.2, membrane receptors and transporters -0.9 to -
7.6, lipid-anchored proteins including Rabs -1.4 to -7.8. For non-membrane proteins the
ranges were cytosolic 0.2 to 7.4, cytoskeletal -0.2 to -0.8, ER lumen -0.1 to 3.7, histones 1.3
to 5.1, ribosome subunits -2.8 to 6.8, and secreted proteins -2.2 to 2.3.
22
23
24
Recommended