Embed Size (px)
Citation preview
CARMAX, INC. 12800 TUCKAHOE CREEK PARKWAY, RICHMOND, VIRGINIA 23238 804-747-0422 WWW.CARMAX.COM
CA
RM
AX
,IN
C. A
NN
UA
L R
EP
OR
T F
ISC
AL
YE
AR
20
07
Fiscal Year 2007
CARMAX, INC. ANNUAL REPORT
C A R M A X 2 0 0 7
1
Fiscal 2007 was an exceptionally strong year for CarMax.
A number of factors contributed to our continued success last
year, including steady improvement in our operational initia-
tives and increased traffic in our stores and on carmax.com.
As a result, we reported growth in sales and gross margins
for both retail and wholesale vehicle sales, and CarMax Auto
Finance (CAF).
In fiscal 2007, net income increased 48% on a sales increase
of 19%, which included 9% growth in comparable store used
vehicle units. We believe our strong sales growth was fueled by
the combination of expanded CarMax brand awareness, which
drove more customers to our stores and our website, and con-
tinued excellent execution by our store teams. Sales were fur-
ther supported by a number of marketing enhancements in our
Internet, television, and radio advertising, and by a variety of
improvements to our website, carmax.com, all of which we will
continue to refine in fiscal 2008.
Better overall execution also helped improve our gross mar-
gins, which increased for all categories of vehicles—used, whole-
sale, and new. Better execution can be best and most simply
characterized as better vehicle buying, reconditioning, and selling.
We learn more and improve our systems each year, as we add to
our continually-expanding and industry-leading database of infor-
mation on used vehicles. We also continue to improve our whole-
sale vehicle auctions by increasing our operational efficiency and
expanding the services offered to dealer participants.
CAF income grew by 27% in fiscal 2007. CAF offers competi-
tive financing and thus provides qualifying customers with
a dependable financing option that is profitable and risk-
controlled for CarMax. For alternative financing, CarMax partners
with several strong third-party lenders. Most of these lenders pay
us a fixed fee per origination in return for loan portfolios that
we estimate are significantly less risky than their other auto
loan portfolios due to the straightforward way CarMax manages
financing and the meticulous reconditioning of our vehicles.
Our lenders benefit from the superior quality of our informa-
tion, which allows them to make better financing decisions.
We are very excited by our future growth opportunities. The
vast size of our marketplace and our unique consumer offer
are just two of the elements that distinguish the CarMax
growth story. Although we reported $7.5 billion in revenues in
fiscal 2007 and are the largest retailer of used cars in the
United States, we still had only 77 used car superstores open
at year end, and represented only about 2% of the estimated
$290 billion market for 1- to 6- year-old used cars.
We opened 10 stores in fiscal 2007, growing our store base
by 15%, consistent with our long-term objective of 15% to 20%
annual store growth. We expect to open an additional 13 stores
in fiscal 2008, a 17% store growth rate. This rate of growth
suggests that we could double our store base in the next five
years, and have consistent, sustainable growth over the next
decade. We believe this significant growth trajectory distin-
guishes CarMax from most U.S. retailers.
We are fortunate to currently have no similar-format, multi-
market competitors, but we will never be complacent. Concept
innovation, including ongoing analysis and operational initia-
tives, is an important focus for CarMax. We constantly look for
Letter To Shareholders
Tom FolliardPresident and Chief Executive Officer
FINANCIAL HIGHLIGHTS
Corporate and Shareholder Information
Design: VIVO Design, Inc. Store photography: Jeff Zaruba Printing: Peake DeLancey Printers and RR Donnelley
CARMAX, CARMAX THE AUTO SUPERSTORE, THE CARMAX ADVANTAGE, 5 DAY MONEY BACK GUARANTEE (and design), VALUMAX, and
CARMAX.COM are all registered trademarks or service marks of CarMax. Other company, product, and service names may be trademarks
or service marks of their respective owners.
Home OfficeCarMax, Inc.12800 Tuckahoe Creek ParkwayRichmond, Virginia 23238Telephone: (804) 747-0422
Websitewww.carmax.com
Annual Shareholders’ MeetingTuesday, June 26, 2007, at 8:30 a.m. EDTThe Richmond Marriott West Hotel4240 Dominion BoulevardGlen Allen, Virginia 23060
Stock InformationCarMax, Inc. common stock is traded on the New York StockExchange under the ticker symbol KMX.
At February 28, 2007, there were approximately 6,300 CarMaxshareholders of record.
Quarterly Stock Price RangeThe following table sets forth by fiscal quarter the high andlow reported prices of our common stock for the last two fiscal years, adjusted for the March 2007 2-for-1 stock split.
First Second Third FourthQuarter Quarter Quarter Quarter
Fiscal 2007High $18.20 $18.95 $23.99 $29.44Low $15.14 $14.85 $18.59 $23.10
Fiscal 2006High $17.00 $17.12 $16.00 $15.92Low $12.44 $12.32 $13.00 $13.20
Dividend PolicyTo date, we have not paid a cash dividend on our commonstock. We presently intend to retain our net earnings for usein our operations and for geographic expansion and, therefore,we do not anticipate paying any cash dividends in the foresee-able future.
Transfer Agent and RegistrarContact our transfer agent for questions regarding your stock certificates, including changes of address, name, or owner-ship; lost certificates; or to consolidate multiple accounts.
Wells Fargo Bank, N.A.P.O. Box 64854South St. Paul, Minnesota 55164-0854Toll free: (800) 468-9716Hearing impaired: (651) 450-4144www.wellsfargo.com/shareownerservices
Independent AuditorsKPMG LLP1021 East Cary Street, Suite 2000Richmond, Virginia 23219-4023
Financial InformationFor quarterly sales and earnings information, financial reports,filings with the Securities and Exchange Commission (includ-ing Form 10-K), news releases, and other investor information,please visit our investor website at:
http://investor.carmax.com.
Information may also be obtained from the Investor RelationsDepartment at:
Email: [email protected]: (804) 747-0422, ext. 4489
CEO and CFO CertificationsOur chief executive officer and chief financial officer have filedwith the SEC the certifications required by Section 302 of theSarbanes-Oxley Act of 2002 regarding the quality of our publicdisclosure. These certifications are included as exhibits to theAnnual Report on Form 10-K for fiscal 2007. In addition, ourchief executive officer annually certifies to the NYSE that he isnot aware of any violation by CarMax of the NYSE’s corporategovernance listing standards. This certification was submitted,without qualification, as required after the 2006 annual meet-ing of CarMax’s shareholders.
Corporate Governance InformationCopies of the CarMax Corporate Governance Guidelines,the Code of Conduct, and the charters for each of the AuditCommittee, Nominating and Governance Committee, andCompensation and Personnel Committee are available fromour investor website, at http://investor.carmax.com, under the corporate governance tab. Alternatively, shareholders mayobtain, without charge, copies of these documents by writingto Investor Relations at the CarMax home office.
Investor RelationsSecurity analysts and investors are invited to contact:
Katharine Kenny, Assistant Vice President, Investor RelationsTelephone: (804) 935-4591Email: [email protected]
General InformationMembers of the media and others seeking generalinformation about CarMax should contact:
Lisa Van Riper, Assistant Vice President, Public AffairsTelephone: (804) 935-4594Email: [email protected]
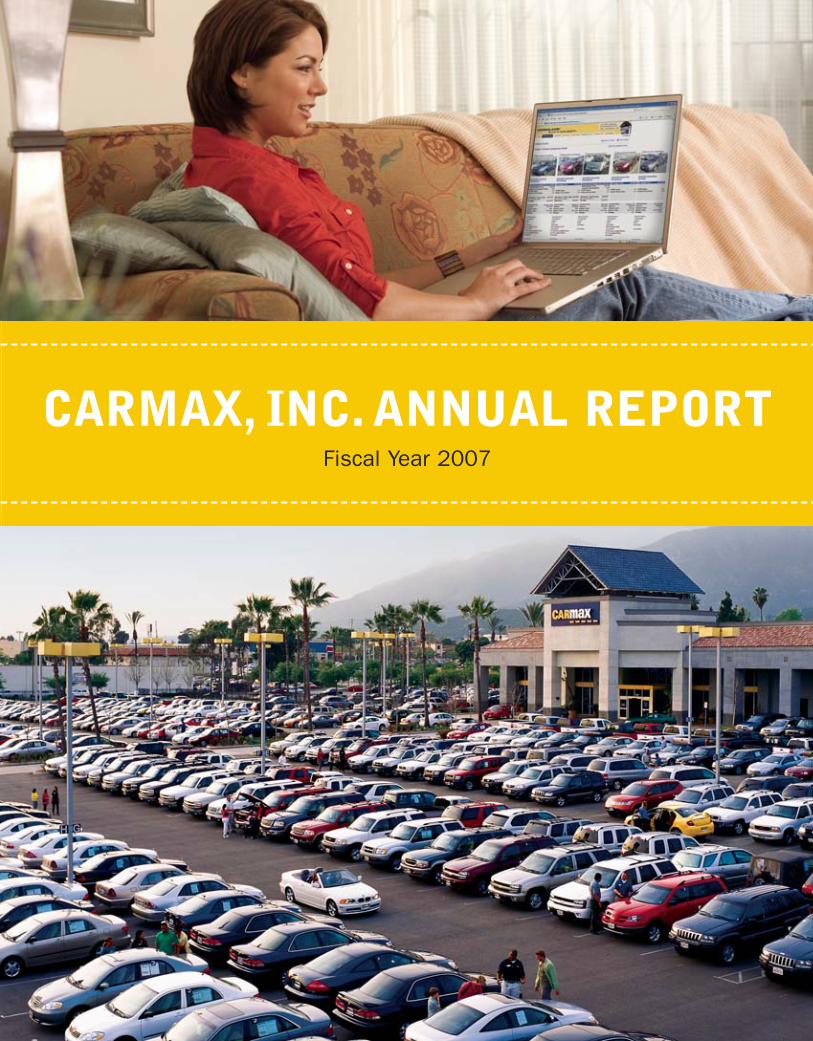
COVER PHOTOS: [TOP] Carmax.com is a valuable marketing, research, and
sales tool. Customers can browse our nationwide inventory of more
than 25,000 vehicles, and virtually any used vehicle can be transferred
to their local superstore. [BOTTOM] CarMax’s Duarte used car superstore
is one of six stores we operate in the large Los Angeles market. We
plan to open two additional stores in this market in fiscal 2008.
% Change Fiscal Years Ended February 28 or 29(1)
(Dollars in millions except per share data) ’06 to’07 2007 2006 2005 2004 2003
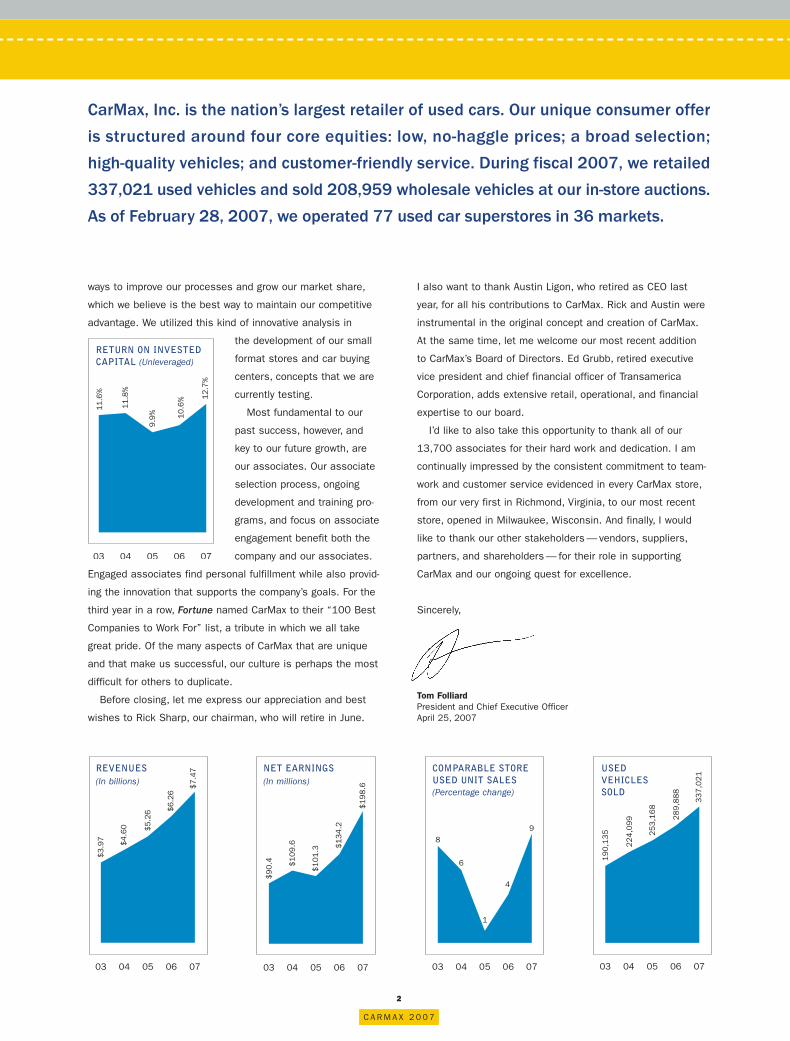
Operating ResultsNet sales and operating revenues 19% $7,465.7 $6,260.0 $5,260.3 $4,597.7 $3,969.9Net earnings 48% $ 198.6 $ 134.2 $ 101.3 $ 109.6 $ 90.4Diluted earnings per share 46% $ 0.92 $ 0.63 $ 0.48 $ 0.52 $ 0.43
Other InformationCash provided by operating activities 16% $ 136.8 $ 117.5 $ 41.8 $ 141.4 $ 57.9Used car superstores, at year-end 15% 77 67 58 49 40
(1) All per share amounts have been adjusted for the effect of the 2-for-1 stock split in March 2007. We adopted SFAS 123R in fiscal 2007, applying the modifiedretrospective method, and prior year amounts have been restated for the effect of the adoption.
07 06 05 04 03 07 06 05 04 03 07 06 05 04 03
1
4
98
6
$5.2
6 $6.2
6
$7.4
7
$3.9
7 $4.6
0
$1
98
.6
$90
.4 $1
09
.6
$1
01
.3 $1
34
.2
07 06 05 04 03
25
3,1
68
28
9,8
88
33
7,0
21
19
0,1
35
22
4,0
99
ways to improve our processes and grow our market share,
which we believe is the best way to maintain our competitive
advantage. We utilized this kind of innovative analysis in
the development of our small
format stores and car buying
centers, concepts that we are
currently testing.
Most fundamental to our
past success, however, and
key to our future growth, are
our associates. Our associate
selection process, ongoing
development and training pro-
grams, and focus on associate
engagement benefit both the
company and our associates.
Engaged associates find personal fulfillment while also provid-
ing the innovation that supports the company’s goals. For the
third year in a row, Fortune named CarMax to their “100 Best
Companies to Work For” list, a tribute in which we all take
great pride. Of the many aspects of CarMax that are unique
and that make us successful, our culture is perhaps the most
difficult for others to duplicate.
Before closing, let me express our appreciation and best
wishes to Rick Sharp, our chairman, who will retire in June.
I also want to thank Austin Ligon, who retired as CEO last
year, for all his contributions to CarMax. Rick and Austin were
instrumental in the original concept and creation of CarMax.
At the same time, let me welcome our most recent addition
to CarMax’s Board of Directors. Ed Grubb, retired executive
vice president and chief financial officer of Transamerica
Corporation, adds extensive retail, operational, and financial
expertise to our board.
I’d like to also take this opportunity to thank all of our
13,700 associates for their hard work and dedication. I am
continually impressed by the consistent commitment to team-
work and customer service evidenced in every CarMax store,
from our very first in Richmond, Virginia, to our most recent
store, opened in Milwaukee, Wisconsin. And finally, I would
like to thank our other stakeholders — vendors, suppliers,
partners, and shareholders — for their role in supporting
CarMax and our ongoing quest for excellence.
Sincerely,
Tom FolliardPresident and Chief Executive OfficerApril 25, 2007
REVENUES (In billions)
NET EARNINGS (In millions)
COMPARABLE STOREUSED UNIT SALES (Percentage change)
USED VEHICLES SOLD
C A R M A X 2 0 0 7
2
CarMax, Inc. is the nation’s largest retailer of used cars. Our unique consumer offer
is structured around four core equities: low, no-haggle prices; a broad selection;
high-quality vehicles; and customer-friendly service. During fiscal 2007, we retailed
337,021 used vehicles and sold 208,959 wholesale vehicles at our in-store auctions.
As of February 28, 2007, we operated 77 used car superstores in 36 markets.
07 06 05 04 03
9.9
% 10.6
% 12.7
%
11.6
%
11.8
%
RETURN ON INVESTEDCAPITAL (Unleveraged)
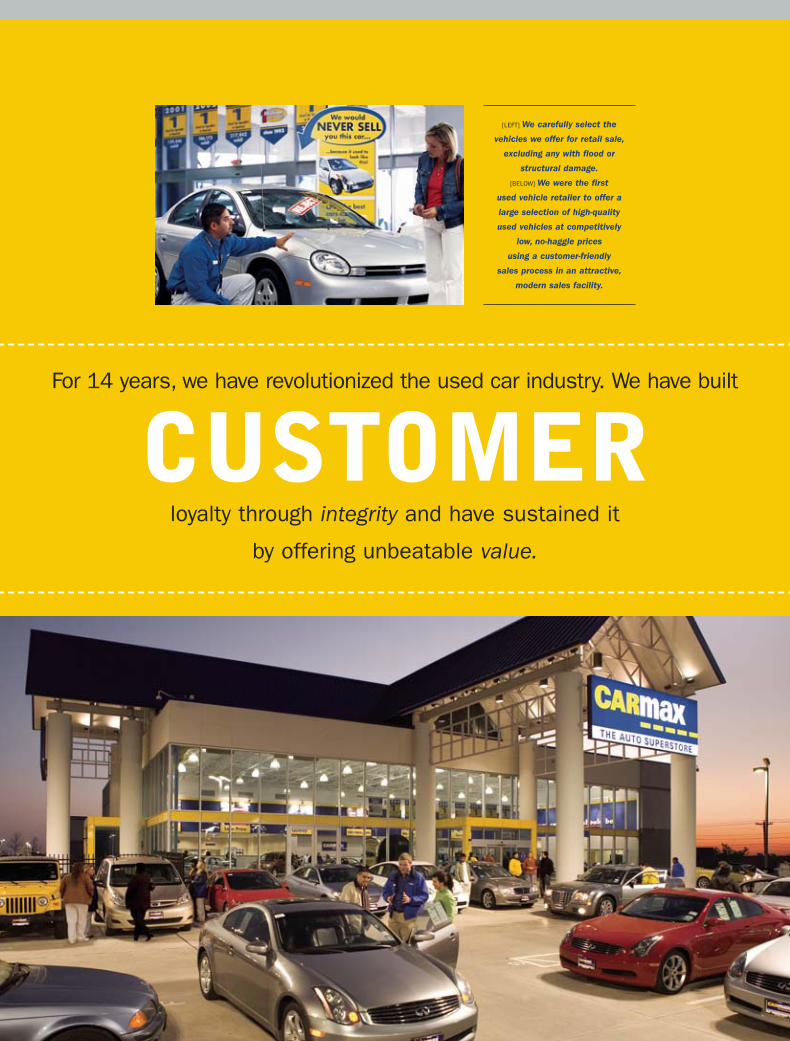
For 14 years, we have revolutionized the used car industry. We have built
loyalty through integrity and have sustained it
by offering unbeatable value.
CUSTOMER
[LEFT] We carefully select the
vehicles we offer for retail sale,
excluding any with flood or
structural damage.
[BELOW] We were the first
used vehicle retailer to offer a
large selection of high-quality
used vehicles at competitively
low, no-haggle prices
using a customer-friendly
sales process in an attractive,
modern sales facility.
We founded CarMax on the belief that an opportunity
existed to address the unmet consumer need for integrity and
transparency in automotive retailing. Surveys indicated that
few consumers trusted the high-pressure sales tactics of tra-
ditional auto retailers, especially for used vehicles. From the
start, we committed ourselves to the principle of integrity,
and our brand name has become synonymous with an offer
consumers know they can trust.
CarMax is more like a “big-box” retailer than a traditional
auto dealership. We offer pre-determined, no-haggle pricing
on all elements of the transaction; open, transparent, and
friendly customer service; and a huge selection of vehicles,
each reconditioned to our high-quality standards. Similar to
big-box retailers, our business is volume-driven. We enhance
our profitability by selling a high volume of cars per store and
leveraging our fixed expenses.
Integrity guides each step of our process. One sales con-
sultant handles all facets of the customer’s car-buying experi-
ence from start to finish. We compensate sales consultants on
a fixed dollar-per-vehicle standard that is not based on the price
or the gross profit of the vehicle. This aligns associate and
customer interests, and removes the incentive to sell cus-
tomers a vehicle they don’t need. Our purchase of vehicles from
our customers is not dependent on their buying a vehicle from
CarMax; we’ll buy their car every time, whether or not they buy
from us. Our buyers will independently appraise the customer’s
vehicle and make an offer based solely on the vehicle’s esti-
mated wholesale value and current market conditions.
Customers also trust in the quality of the vehicles we sell.
We are committed to stringent standards and do not retail
cars with flood or structural damage. For all our used retail
vehicles, our thorough inspection and expert reconditioning
result in a superior product.
We also offer straightforward financing. The sales associate
collects the customer’s credit information and electronically
submits a credit application to CarMax Auto Finance and a
third-party finance company. Applications are automatically
rerouted to additional third-party finance companies, if neces-
sary. Financing offers are competitive and based on the
lender’s assessment of credit risk. The customer sees
each finance offer as it is made directly from the lender,
and, where multiple offers exist, they may choose the one
that best meets their needs. The CarMax associate receives
no commission on the finance process, which eliminates
any incentive to steer customers toward one financing
option over another.
Even those vehicles acquired through our appraisal
process that don’t meet our retail standards are sold at
our wholesale auctions with their own measure of CarMax
integrity. We disclose all known major defects and we
provide outstanding customer service in the form of an
exceptionally high 97% sales rate, access to an on-site
third-party financing provider, a dealer perks program, and
vehicle transportation assistance.
Integrity is fundamental to our company culture. Being
known for integrity in our business practices and corporate
culture helps us recruit and retain superior associates. Our
culture of integrity has resulted in the creation of a diverse
workforce that focuses on treating every associate and cus-
tomer with respect.
C A R M A X 2 0 0 7
4
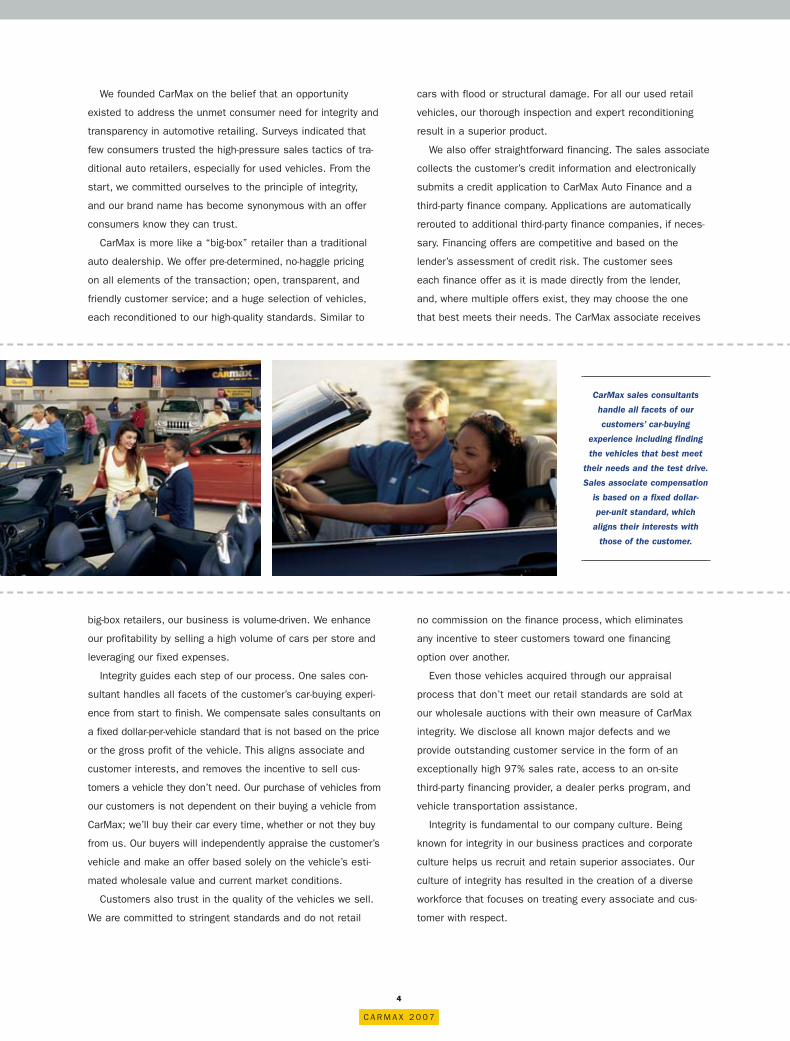
CarMax sales consultants
handle all facets of our
customers’ car-buying
experience including finding
the vehicles that best meet
their needs and the test drive.
Sales associate compensation
is based on a fixed dollar-
per-unit standard, which
aligns their interests with
those of the customer.
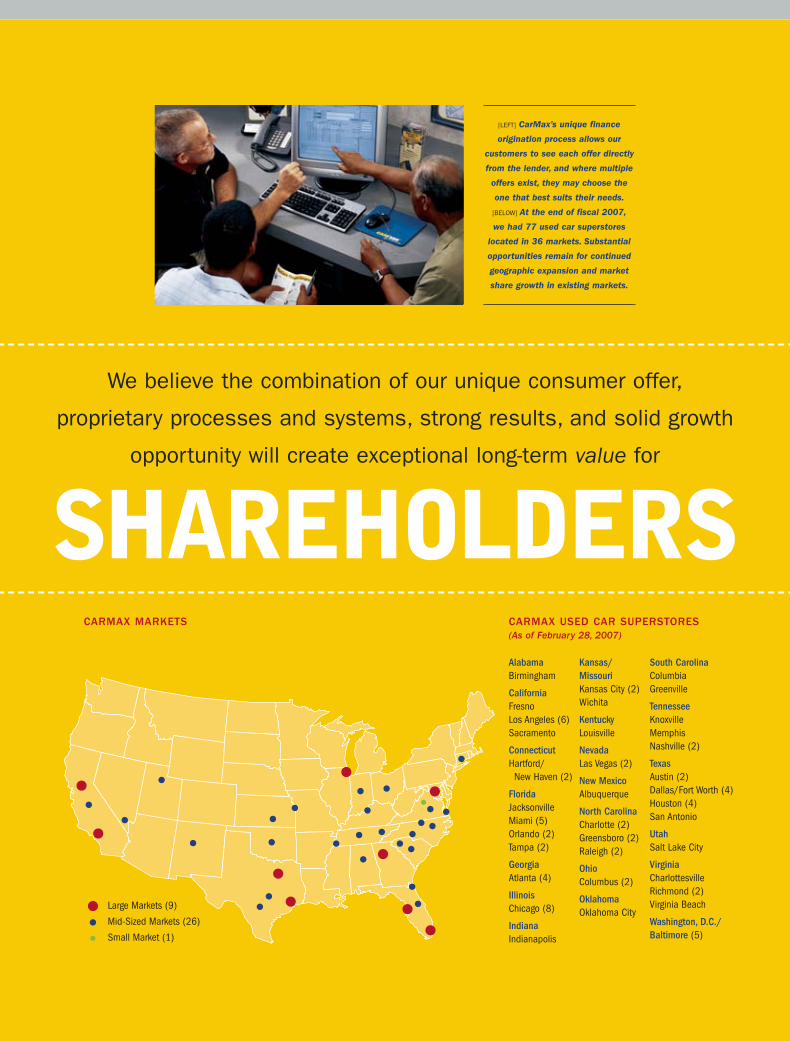
SHAREHOLDERSCARMAX MARKETS CARMAX USED CAR SUPERSTORES
(As of February 28, 2007)
South CarolinaColumbiaGreenville
TennesseeKnoxvilleMemphisNashville (2)
TexasAustin (2)Dallas/Fort Worth (4)Houston (4)San Antonio
UtahSalt Lake City
VirginiaCharlottesvilleRichmond (2)Virginia Beach
Washington, D.C./Baltimore (5)
Kansas/MissouriKansas City (2)Wichita
KentuckyLouisville
NevadaLas Vegas (2)
New MexicoAlbuquerque
North CarolinaCharlotte (2)Greensboro (2)Raleigh (2)
OhioColumbus (2)
OklahomaOklahoma City
AlabamaBirmingham
CaliforniaFresnoLos Angeles (6)Sacramento
ConnecticutHartford/
New Haven (2)
FloridaJacksonvilleMiami (5)Orlando (2)Tampa (2)
GeorgiaAtlanta (4)
IllinoisChicago (8)
IndianaIndianapolis
Large Markets (9)
Mid-Sized Markets (26)
Small Market (1)
[LEFT] CarMax’s unique finance
origination process allows our
customers to see each offer directly
from the lender, and where multiple
offers exist, they may choose the
one that best suits their needs.
[BELOW] At the end of fiscal 2007,
we had 77 used car superstores
located in 36 markets. Substantial
opportunities remain for continued
geographic expansion and market
share growth in existing markets.
We believe the combination of our unique consumer offer,
proprietary processes and systems, strong results, and solid growth
opportunity will create exceptional long-term value for
C A R M A X 2 0 0 7
6
[FAR LEFT] Our extensive training
programs include classroom
and on-line training, as well
as formal mentoring.
[LEFT] Customers can search
each store’s vehicle inventory
and print detailed vehicle spec
sheets using our in-store
information kiosks.
Unlike new vehicles, every used vehicle is unique based on
age, mileage, condition, and options. This uniqueness offers
CarMax the opportunity to add value.
We provide our associates with extensive training and
hands-on experience in buying, reconditioning, and selling
vehicles. In addition, since our inception in 1993, we have
collected and maintained a variety of information on every
vehicle that we have bought and sold, which gives us an
unprecedented database of information on used vehicles. And,
because our unit sales volumes are so high compared with the
average dealer — each month we sell an average of 425 used
cars per store, compared with about 110 used and new cars
for the average new car dealer — we believe we have a scale
and efficiency opportunity unmatched in automotive retail.
We are in a unique position to add value to the consumer
offer by evaluating which vehicles to sell at retail and by recon-
ditioning them to the highest standards in the industry. At the
same time, we enhance the value to our shareholders by main-
taining the most advantageous inventory mix at each location
and by targeting the gross profit per unit that strikes the appro-
priate balance between driving sales and improving profits.
Low, fixed prices, customer-friendly service, and trans-
parency throughout the process of selling and buying a vehicle
are ways CarMax offers greater value. Customers view all per-
tinent information along with their sales consultant, including
financing alternatives; there are no “hand-offs” to finance or
sales managers. Our easy financing process allows the cus-
tomer’s application to be electronically forwarded to multiple
lenders for evaluation and often results in competitive financ-
ing alternatives. Not only does this promote complete trans-
parency, but it assures the customer that the finance offers
are coming directly from the lenders, with no modification by
CarMax associates.
CarMax builds transparency into our consumer offer in
other ways, as well. For example, our appraisal offers are
good for 7 days. We offer our customers a 5-day, money-back
guarantee, a minimum 30-day limited warranty, and a free
3-day payoff option for all loans originated at our stores.
By focusing on used cars, we are not limited by the fran-
chise laws and manufacturer restrictions that restrain organic
growth opportunities for franchised auto retailers. At the end
of fiscal 2007, we had 77 used car superstores located in
36 markets, covering roughly 40% of the U.S. population. We
believe that the combination of continued geographic expan-
sion, together with market share gains in our current markets,
will fuel our growth for years to come.
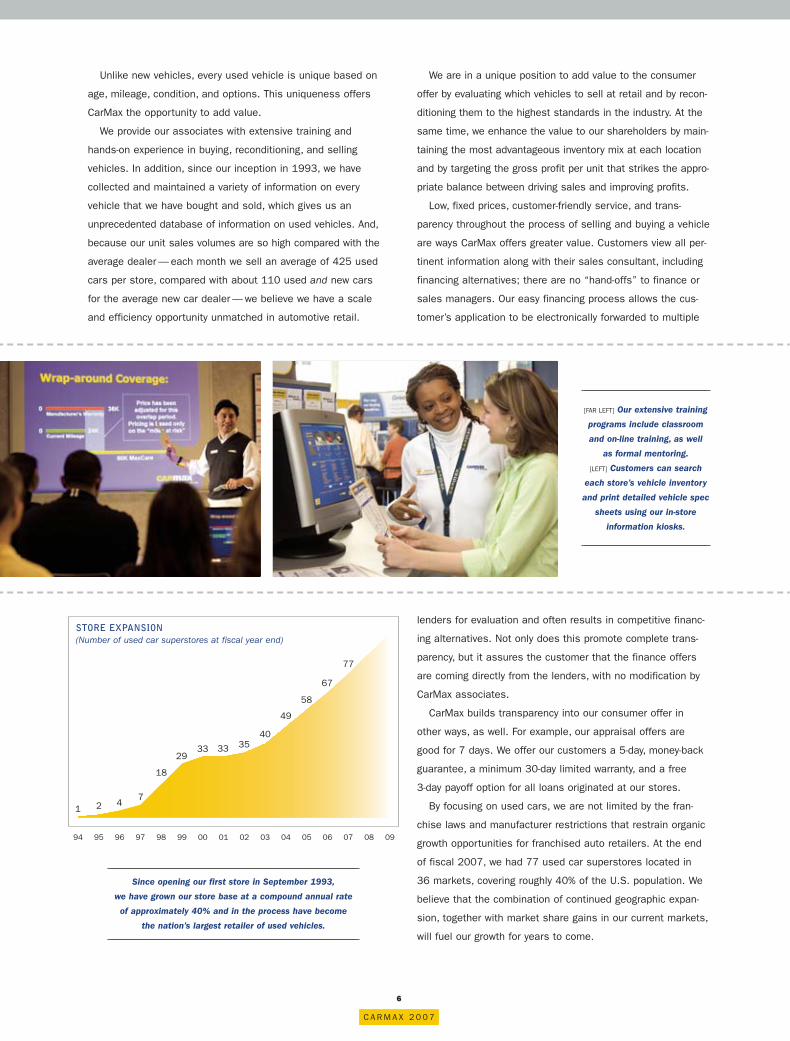
09080706050403020100999897969594
58
67
1 2 47
18
2933 33 35
40
49
77
Since opening our first store in September 1993,
we have grown our store base at a compound annual rate
of approximately 40% and in the process have become
the nation’s largest retailer of used vehicles.
STORE EXPANSION (Number of used car superstores at fiscal year end)
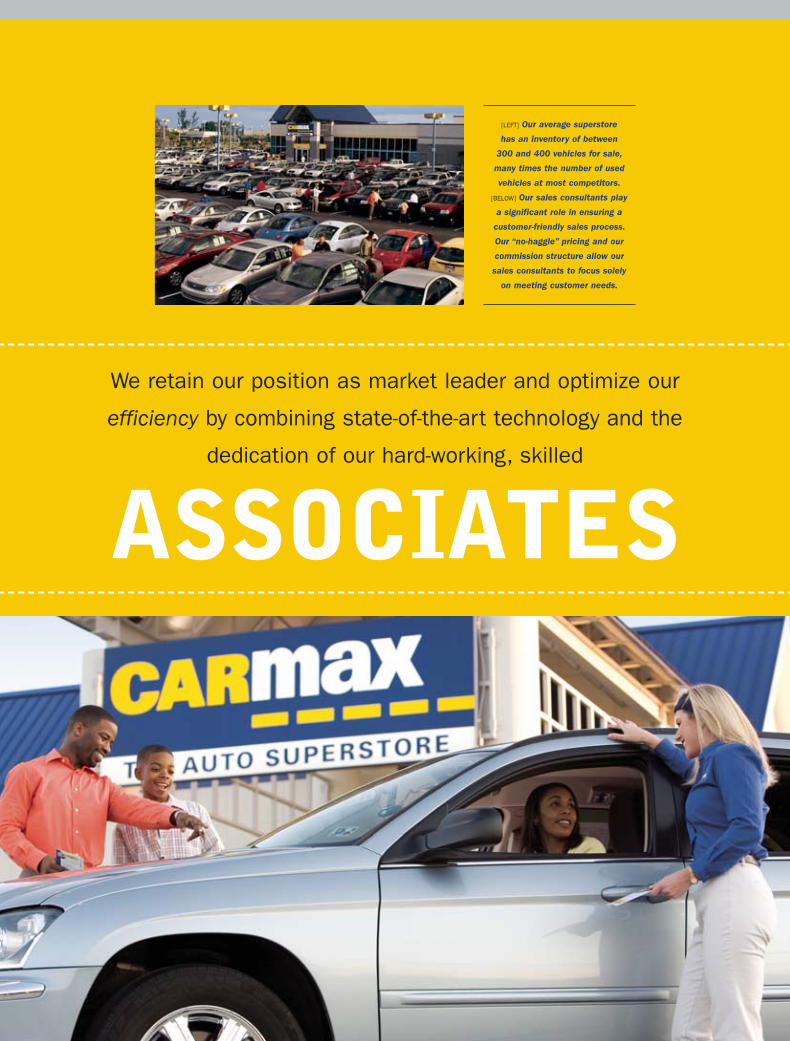
ASSOCIATES
We retain our position as market leader and optimize our
efficiency by combining state-of-the-art technology and the
dedication of our hard-working, skilled
[LEFT] Our average superstore
has an inventory of between
300 and 400 vehicles for sale,
many times the number of used
vehicles at most competitors.
[BELOW] Our sales consultants play
a significant role in ensuring a
customer-friendly sales process.
Our “no-haggle” pricing and our
commission structure allow our
sales consultants to focus solely
on meeting customer needs.
CarMax’s ultimate goal is to have the right vehicle in the right
place at the right time at the right price. Superior, proprietary
systems, our extensive database of vehicle information, and our
team of skilled buyers help us to optimize our inventory selec-
tion and inventory turns. CarMax buyers have online access to
cost and sales information on our current inventory and recent
sales. They also have a variety of wholesale industry information
to assist them in determining the appropriate amount to offer for
both in-store appraisals and auction purchases. In addition, our
high volume of purchases provides our buyers an experience
advantage compared with other used car retailers — approxi-
mately half of our 800+ person buying team have each appraised
more than 5,000 vehicles, and more than 20% have appraised in
excess of 10,000 vehicles. Our inventory management systems
also allow us to ensure our inventory selection is tailored to the
buying preferences at each store, and they help us respond
faster and more effectively to changes in the wholesale vehicle
market, economic conditions, and/or customer demand.
We carefully monitor the business environment and provide
our store teams with the information that allows them to quickly
respond. We have developed a superior inventory management
and pricing system that allows us to make the systematic
pricing adjustments necessary to optimize inventory turnover
and help maintain targeted gross profit dollars per unit.
CarMax has increased profitability over time because we
are committed to continuous improvement in every aspect of
our business. We have increased our stores’ efficiency and
throughput over time by focusing on the most efficient and
effective use of available space. This has allowed us to buy,
recondition, and sell more vehicles through a smaller infra-
structure, providing a substantial offset to inflation in real
estate and construction costs.
CarMax is committed to improving associate engagement
for a variety of reasons. Engaged associates remain with
C A R M A X 2 0 0 7
8
CarMax longer, which reduces the cost of turnover. Engaged
associates also help us target waste reduction and improve
our processes.
Greater efficiency at our auctions continues to attract more
dealers and contributes to the increase in our wholesale
margins. We continue to focus on increasing the speed and
consistency of our auctions, as well as expanding the services
offered to dealers. In fiscal 2007, we upgraded our CarMax
auctions website, expanding the available vehicle data and add-
ing new search and alert features. We also expanded our free
vehicle history service to include all our wholesale vehicles, and
we added a third-party financing provider to all our auctions.
We also continue to improve our vehicle delivery methods
and the associated costs, including the use of our own
transport vehicles on some routes. Transferring vehicles at
the request of our customers adds efficiency to the car-buying
process. Any customer at any store has access to our nation-
wide used vehicle inventory. More than 20% of our used
vehicle sales result from customer-requested transfers.
Our website, carmax.com, boasts more than 25,000 vehicles
and it allows our customers to search makes and models in a
variety of ways. It has become the central feature of our sales
and marketing program and is the most efficient way for our
customers to shop for a vehicle. More than 4 million customers
currently visit our website every month and approximately 70%
of our in-store customers visit the site before coming to the
store, and we expect these statistics to continue to increase
over time. Our ongoing improvements to the website, including
enhancements that we made this year to the vehicle photo-
graphs that accompany each online vehicle description, give
the customer more of the information they need before ever
arriving at our store. Ultimately, our goal for the website is to
replicate the in-store experience of our customers and serve
as a leading site for vehicle-related information.
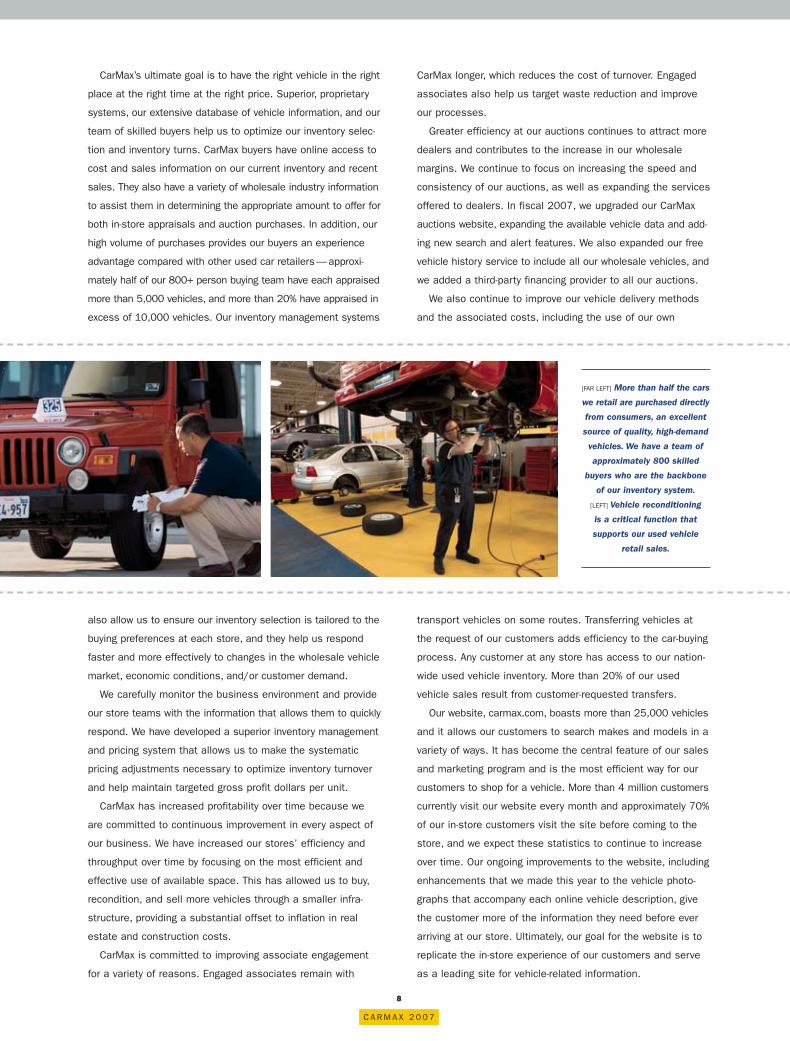
[FAR LEFT] More than half the cars
we retail are purchased directly
from consumers, an excellent
source of quality, high-demand
vehicles. We have a team of
approximately 800 skilled
buyers who are the backbone
of our inventory system.
[LEFT] Vehicle reconditioning
is a critical function that
supports our used vehicle
retail sales.
C A R M A X 2 0 0 7
9
Dedication to our customers.
Outstanding customer service is one of CarMax’s founding
principles. Many of our associates demonstrate commitment
to customers that goes well beyond our own high standards.
We celebrate these special associates with our Above &
Beyond award program. Their stories of care and concern are
what help us identify our monthly winners, who receive com-
pany-wide recognition.
Dedication to our communities.
We established The CarMax Foundation in 2003 as a means
of contributing to the communities where we live and work.
During fiscal 2007, CarMax funded the Foundation with $3 mil-
lion, which the Foundation utilizes to make grants directed
at three primary areas. At the national level, we support
organizations promoting driver and passenger safety, including
Mothers Against Drunk Driving; Driver’s Edge, a young driver
education program; and Healthy Mothers, Healthy Babies,
as providing matching grants for time our associates spend
volunteering — either on their own or through team-building
activities with other associates. In fiscal 2007, CarMax asso-
ciates nationwide
came together in
New Orleans for the
largest coordinated
volunteer effort in
our history. Nearly
400 associates par-
ticipated in a day-
long project hosted
by Habitat for
Humanity for victims
of Hurricane Katrina.
Not only did the asso-
ciates donate almost
3,200 hours to the
rebuilding effort, but
the Foundation also
made a matching contribution for these volunteer hours.
Dedication to making CarMax a great place to work.
At the core of our culture is a dedication to maintaining an
enthusiastic, down-to-earth atmosphere where every associate
and customer is treated with respect. We believe that our
inclusion on the Fortune “100 Best Places to Work For” list for
the third consecutive year is recognition of the success of our
culture. However, we’re not content to rest on our laurels.
While we’re proud of the culture we’ve created, we constantly
look for opportunities for improvement. With the assistance of
the Gallup organization, we’ve instituted an annual associate
engagement benchmarking process, and we’ve set an ambi-
tious goal to achieve world-class associate engagement, as
defined by the Gallup organization, within the next five years.
Engaged associates find personal fulfillment in their jobs and
build success not only for themselves, but for CarMax and
our shareholders.
CarMax associates help rebuild homes in
New Orleans with Habitat for Humanity.
CarMax volunteers at the Salvation Army’s Angel Tree program.
Our unique company culture and the
of our associates are what truly set CarMax apart.
DEDICATION
which promotes booster seat safety. At our hometown level,
we support a variety of organizations focused on education
and youth development. And at the local level, the Foundation
helps our associates give back to their communities through a
matching gifts program. It matches cash contributions made
by our associates to qualifying charitable organizations as well
UNITED STATES SECURITIES AND EXCHANGE COMMISSION
WASHINGTON, D.C. 20549
FORM 10-K ⌧ ANNUAL REPORT PURSUANT TO SECTION 13 OR 15(d) OF THE SECURITIES
EXCHANGE ACT OF 1934
For the fiscal year ended February 28, 2007
OR
TRANSITION REPORT PURSUANT TO SECTION 13 OR 15(d) OF THE SECURITIES EXCHANGE ACT OF 1934
For the transition period from to
Commission File Number: 1-31420
CARMAX, INC. (Exact name of registrant as specified in its charter)
VIRGINIA
(State or other jurisdiction of incorporation or organization)
54-1821055 (I.R.S. Employer
Identification No.)
12800 TUCKAHOE CREEK PARKWAY, RICHMOND, VIRGINIA (Address of principal executive offices)
23238 (Zip Code)
Registrant’s telephone number, including area code: (804) 747-0422
Securities registered pursuant to Section 12(b) of the Act:
Title of each class Common Stock, par value $0.50
Rights to Purchase Series A Preferred Stock, par value $20.00
Name of each exchange on which registered New York Stock Exchange New York Stock Exchange
Securities registered pursuant to Section 12(g) of the Act:
None
Indicate by check mark if the registrant is a well-known seasoned issuer, as defined in Rule 405 of the Securities Act.
Yes ⌧ No Indicate by check mark if the registrant is not required to file reports pursuant to Section 13 or Section 15(d) of the Act.
Yes No ⌧
2
Indicate by check mark whether the registrant (1) has filed all reports required to be filed by Section 13 or 15(d) of the Securities Exchange Act of 1934 during the preceding 12 months (or for such shorter period that the registrant was required to file such reports), and (2) has been subject to such filing requirements for the past 90 days.
Yes ⌧ No Indicate by check mark if disclosure of delinquent filers pursuant to Item 405 of Regulation S-K is not contained herein, and will not be contained, to the best of the registrant’s knowledge, in definitive proxy or information statements incorporated by reference in Part III of this Form 10-K or any amendment to this Form 10-K. ⌧ Indicate by check mark whether the registrant is a large accelerated filer, an accelerated filer, or a non-accelerated filer. See definition of “accelerated filer and large accelerated filer” in Rule 12b-2 of the Exchange Act. (Check one):
Large accelerated filer ⌧ Accelerated filer Non-accelerated filer Indicate by check mark whether the registrant is a shell company (as defined in Rule 12b-2 of the Act).
Yes No ⌧ The aggregate market value of the registrant’s common stock held by non-affiliates as of August 31, 2006, computed by reference to the closing price of the registrant’s common stock on the New York Stock Exchange on that date, was $4.0 billion. On March 31, 2007, there were 216,045,438 outstanding shares of CarMax, Inc. common stock.
DOCUMENTS INCORPORATED BY REFERENCE Portions of the CarMax, Inc. Notice of 2007 Annual Meeting of Shareholders and Proxy Statement are incorporated by reference in Part III of this Form 10-K.
3
CARMAX, INC. FORM 10-K
FOR FISCAL YEAR ENDED FEBRUARY 28, 2007
TABLE OF CONTENTS
Page No.
PART I
Item 1. Business........................................................................................................................................... 4 Item 1A. Risk Factors..................................................................................................................................... 11 Item 1B. Unresolved Staff Comments............................................................................................................ 12 Item 2. Properties......................................................................................................................................... 13 Item 3. Legal Proceedings ........................................................................................................................... 14 Item 4. Submission of Matters to a Vote of Security Holders ..................................................................... 14
PART II Item 5.
Market for the Registrant’s Common Equity, Related Stockholder Matters and Issuer Purchases
of Equity Securities ................................................................................................................... 15 Item 6. Selected Financial Data ................................................................................................................... 17 Item 7. Management’s Discussion and Analysis of Financial Condition and Results of Operations .......... 18 Item 7A. Quantitative and Qualitative Disclosures about Market Risk.......................................................... 34 Item 8. Consolidated Financial Statements and Supplementary Data ......................................................... 35 Item 9. Changes in and Disagreements with Accountants on Accounting and Financial Disclosure .......... 61 Item 9A. Controls and Procedures.................................................................................................................. 61 Item 9B. Other Information............................................................................................................................ 61
PART III Item 10. Directors, Executive Officers and Corporate Governance .............................................................. 62 Item 11. Executive Compensation ................................................................................................................. 63 Item 12.
Security Ownership of Certain Beneficial Owners and Management and Related Stockholder
Matters........................................................................................................................................ 63 Item 13. Certain Relationships and Related Transactions, and Director Independence ................................ 63 Item 14. Principal Accountant Fees and Services.......................................................................................... 63
PART IV Item 15. Exhibits and Financial Statement Schedules ................................................................................... 64
Signatures ....................................................................................................................................... 65
4
PART I In this document, “we,” “our,” “us,” “CarMax,” and “the company” refer to CarMax, Inc. and its wholly owned subsidiaries, unless the context requires otherwise. FORWARD-LOOKING AND CAUTIONARY STATEMENTS This Annual Report on Form 10-K and, in particular, the description of our business set forth in Item 1 and our Management’s Discussion and Analysis of Financial Condition and Results of Operations set forth in Item 7 contain a number of forward-looking statements within the meaning of Section 27A of the Securities Act of 1933 and Section 21E of the Securities Exchange Act of 1934, including statements regarding:
• Our projected future sales growth, comparable store unit sales growth, earnings, and earnings per share.
• Our expected future expenditures, cash needs, and financing sources. • The projected number, timing, and cost of new store openings. • Our sales and marketing plans. • Our assessment of the potential outcome and financial impact of litigation and the potential impact of
unasserted claims. • Our assessment of competitors and potential competitors. • Our assessment of the effect of recent legislation and accounting pronouncements.
In addition, any statements contained in or incorporated by reference into this report that are not statements of historical fact should be considered forward-looking statements. You can identify these forward-looking statements by use of words such as “anticipate,” “believe,” “could,” “estimate,” “expect,” “intend,” “may,” “plan,” “predict,” “should,” “will,” and other similar expressions, whether in the negative or affirmative. We cannot guarantee that we will achieve the plans, intentions, or expectations disclosed in the forward-looking statements. There are a number of important risks and uncertainties that could cause our actual results to differ materially from those indicated by our forward-looking statements. These risks and uncertainties include, without limitation, those set forth in Item 1A under the heading “Risk Factors.” We caution investors not to place undue reliance on any forward-looking statements as these statements speak only as of the date when made. We undertake no obligation to update any forward-looking statements made in this report. Item 1. Business. BUSINESS OVERVIEW CarMax Background. CarMax, Inc. was incorporated under the laws of the Commonwealth of Virginia in 1996. CarMax, Inc. is a holding company and our operations are conducted through our subsidiaries. Our home office is located at 12800 Tuckahoe Creek Parkway, Richmond, Va. Under the ownership of Circuit City Stores, Inc. (“Circuit City”), we began operations in 1993 with the opening of our first CarMax superstore in Richmond, Va. In 1997, Circuit City completed the initial public offering of a tracking stock, Circuit City Stores, Inc.–CarMax Group common stock, which was intended to track separately the performance of the CarMax operations. On October 1, 2002, the CarMax business was separated from Circuit City through a tax-free transaction, becoming an independent, separately traded public company. CarMax Business. We are the nation’s largest retailer of used cars, based on the 337,021 used vehicles we retailed during the fiscal year ended February 28, 2007. As of the end of fiscal 2007, we operated 77 used car superstores in 36 metropolitan markets. In addition, we sold 208,959 wholesale vehicles in fiscal 2007 through our on-site auctions. We were the first used vehicle retailer to offer a large selection of high quality used vehicles at competitively low, fixed prices using a customer-friendly sales process in an attractive, modern sales facility. The CarMax consumer offer provides our customers the opportunity to shop for vehicles the same way they shop for items at other “big-box” retailers, and it is structured around four core equities: low, no-haggle prices; a broad selection; high quality; and customer-friendly service. Our strategy is to better serve the auto retailing market by addressing the major sources of customer dissatisfaction with traditional auto retailers and to maximize operating efficiencies through the use of standardized operating procedures and store formats enhanced by sophisticated, proprietary management information systems.
5
We purchase, recondition, and sell used vehicles. All of the used vehicles we retail are thoroughly reconditioned to meet high mechanical, electrical, safety, and cosmetic standards, and each vehicle must pass a comprehensive inspection before being offered for sale. Approximately 85% of the used vehicles we retail are one to six years old with fewer than 60,000 miles. We also offer a selection of used vehicles at each superstore that are more than six years old or have more than 60,000 miles, but which meet similar quality standards. We also sell new vehicles at seven locations under franchise agreements with four new car manufacturers. In fiscal 2007, new vehicles comprised 5% of our total retail vehicle unit sales. As planned, new car sales have become a smaller part of our business mix over the past several fiscal years as we have divested 14 new car franchises while aggressively growing our used car business. We may divest additional new car franchises in the future. We provide our customers with a full range of related products and services, including the financing of vehicle purchases through CarMax Auto Finance (“CAF”), our own finance operation, and third-party lenders; the sale of extended service plans and accessories; the appraisal and purchase of vehicles directly from consumers; and vehicle repair service. The CarMax consumer offer enables customers to evaluate separately each component of the sales process and to make informed decisions based on comprehensive information about the options, terms, and associated prices of each component. The customer can accept or decline any individual element of the offer without affecting the price or terms of any other component of the offer. Our “no-haggle” pricing and our commission structure, which is based on a fixed dollars-per-unit standard, allow our sales consultants to focus solely on meeting customer needs. We have separated the practice of trading in a used vehicle in conjunction with the purchase of another vehicle into two distinct and independent transactions. We will appraise a consumer’s vehicle and make an offer to buy that vehicle regardless of whether the owner is purchasing a vehicle from us. We acquire the majority of our retail used vehicle inventory through this unique in-store appraisal process. We also acquire a significant portion of our used vehicle inventory through wholesale auctions and, to a lesser extent, directly from other sources, including wholesalers, dealers, and fleet owners. Those vehicles purchased through our in-store appraisal process that do not meet our retail standards are sold at on-site wholesale auctions. Our inventory management and pricing system tracks each vehicle throughout the sales process. Using the information provided by this system, and applying sophisticated statistical modeling techniques, we are able to optimize our inventory mix, anticipate future inventory needs at each store, evaluate sales consultant and buyer performance, and refine our vehicle pricing strategy. Because of the pricing discipline afforded by the inventory management and pricing system, more than 99% of the entire used car inventory offered at retail is sold at retail. Industry and Competition. With calendar year 2006 sales of approximately $340 billion, used vehicles comprise nearly half of the U.S. auto retail market, the largest retail segment of the economy. In calendar 2006, there were an estimated 42.6 million used vehicles sold in the U.S. compared with approximately 16.6 million new vehicles. Our primary focus, late-model vehicles that are 1 to 6 years old, are estimated at approximately $290 billion in annual sales and 20 million units per year. The U.S. used car marketplace is highly fragmented and competitive and includes approximately 21,800 franchised new car dealers and 44,000 independent dealers, as well as millions of private individuals. Our primary competitors are the franchised new car dealers, who sell the majority of late-model used vehicles. Independent dealers predominantly sell older, higher mileage cars than we do. In both the used and new vehicle markets, we seek to distinguish ourselves from traditional dealerships through our consumer offer, sales approach, and other innovative operating strategies. We believe that our principal competitive factors in used vehicle retailing are our ability to provide a high degree of customer satisfaction with the car-buying experience; our competitively low prices; our breadth of selection of the most popular makes and models available both on site and via our website, carmax.com; the quality of our vehicles; our proprietary information systems; and the location of our retail stores. Upon request by a customer, we will transfer virtually any used vehicle in our nationwide inventory to a local superstore. Transfers are free within a market; longer distance transfers include a charge to cover transportation costs. In fiscal 2007, more than 20% of our vehicles sold were transferred at customer request. Our Certified Quality Inspection assures that every vehicle we offer for sale meets stringent mechanical, electrical, and safety standards. We back every vehicle with a 5-day, money-back guarantee, and at least a 30-day limited warranty. Other competitive factors include our ability to offer
6
or arrange customer financing on competitive terms and the comprehensiveness and cost of the extended service plans we offer. We believe that we are competitive in all of these areas and that we enjoy advantages over competitors that employ traditional high-pressure, negotiation-oriented sales techniques. Our sales consultants play a significant role in ensuring a customer-friendly sales process. A sales consultant is paid a commission based on a fixed dollars-per-unit standard, thereby earning the same dollar sales commission regardless of the price or gross margin on the vehicle being sold. The sales consultant receives no commission on the finance process. This ensures that the sales consultant’s primary objective is helping customers find the right vehicles for their needs at prices they can afford. In contrast, sales and finance personnel at traditional dealerships often receive higher commissions for negotiating higher prices and for steering customers toward vehicles with higher gross margins. In the new vehicle market, we compete with other franchised dealers offering vehicles produced by the same or other manufacturers. Historically, the new vehicle market has been served primarily by dealerships employing traditional automotive selling methods. We believe our customer-friendly, low-pressure sales methods are points of competitive differentiation. Marketing and Advertising. Our marketing strategies are focused on developing awareness of the advantages of shopping at our stores and on attracting customers who are already considering buying or selling a vehicle. We use market awareness and customer satisfaction surveys to help tailor our marketing efforts to the purchasing habits and preferences of customers in each market area. Our marketing strategies are implemented primarily through television and radio broadcasts, carmax.com, the Internet, and newspaper advertising. Television and radio broadcast advertisements are designed to build consumer awareness of the CarMax name, carmax.com, and key components of the CarMax offer. Newspaper advertisements promote our broad selection of vehicles and price competitiveness, targeting consumers with immediate purchase intentions. Broadcast, Internet, and newspaper advertisements are designed to drive customers to our stores and to carmax.com. The media landscape is changing rapidly and we are changing our marketing programs in response. We are customizing our marketing program based on awareness levels in each market. In selected markets, we have expanded our use of Internet-based advertising while curtailing our use of newspaper advertising. We are building awareness and driving traffic to our stores and carmax.com by listing every retail vehicle on both AutoTrader.com and cars.com. Through their syndicated networks, AutoTrader.com and cars.com vehicle listings appear on sites that we believe are visited by a majority of late model used vehicle buyers who use the Internet in their shopping process. Our advertising on the Internet also includes banner and key-word advertisements on search engines, such as Google and Yahoo! Our website, carmax.com, is a marketing tool for communicating the CarMax consumer offer in detail, a sophisticated search engine for finding the right vehicle, and a sales channel for customers who prefer to complete a part of the shopping and sales process online. The website offers complete inventory and pricing search capabilities. Information on the more than 25,000 cars available in our nationwide inventory is updated daily. Carmax.com includes detailed information, such as vehicle photos, prices, features, specifications, and store locations, as well as sorting and comparison features that allow consumers to easily compare vehicles. The site also includes features such as detailed vehicle reviews, payment calculators, and an option to estimate trade-in values via a link with Kelley Blue Book. Customers can contact sales consultants online via carmax.com, by telephone, or by fax. Customers can work with these sales consultants from the comfort of home, including applying for financing, and need to visit the store only to sign the paperwork and pick up their vehicle. Suppliers for Used Vehicles. We acquire our used vehicle inventory directly from consumers through our unique in-store appraisal process and through other sources, including local and regional auctions, wholesalers, franchised and independent dealers, and fleet owners, such as leasing companies and rental companies. In calendar 2006, approximately 22 million used vehicles were remarketed in the U.S., of which nearly 10 million were sold at wholesale auction. The majority of our used vehicle inventory is acquired directly from consumers through our appraisal process. The most popular makes and models are more readily available directly from consumers than from other sources. This buying strategy also helps provide an inventory of makes and models that reflects the tastes of each market. In May 2006, we began testing a stand-alone car buying center in the Atlanta market. Our goal for the car buying center is
7
to increase appraisal traffic and generate incremental vehicle purchases from individual consumers. We plan to expand this test by opening three additional car buying centers in fiscal 2008. We have replaced the traditional “trade-in” transaction with a process in which a CarMax-trained buyer appraises the vehicle and provides the vehicle’s owner with a written, guaranteed offer that is good for 7 days. An appraisal is available to every customer free of charge, whether or not the individual purchases a vehicle from us. Based on their age, mileage, or condition, fewer than half of the vehicles acquired through this in-store appraisal process meet our high quality retail standards. Those vehicles that do not meet our retail standards are sold at our on-site wholesale auctions. The inventory purchasing function is primarily performed at the store level and is the responsibility of the buyers, who handle both on-site appraisals and off-site auction purchases. Our buyers evaluate all used vehicles on the basis of their estimated wholesale value and reconditioning costs, and, for off-site purchases, cost of delivery to the store where they will be reconditioned. To decide which inventory to purchase at off-site auctions, our buyers, in collaboration with our home office staff, rely on the extensive inventory and sales trend data available through the CarMax information system. Our inventory and pricing models help the buyers tailor inventories to the buying preferences at each superstore, recommend pricing adjustments, and optimize inventory turnover to help maintain gross margin dollars per unit. Based on consumer acceptance of the in-store appraisal process at existing CarMax stores, our experience and success to date in acquiring vehicles from auctions and other sources, and the large size of the U.S. auction market relative to our needs, we believe that our sources of used vehicles will continue to be sufficient to meet current needs and to support planned expansion. Suppliers for New Vehicles. Our new car operations are governed by the terms of the sales, service, and dealer agreements with DaimlerChrysler, General Motors, Nissan, and Toyota. Among other things, these agreements generally impose operating requirements and restrictions, including inventory levels, working capital, monthly financial reporting, signage, and cooperation with marketing strategies. A manufacturer may terminate a dealer agreement under certain circumstances, including a change in ownership without prior manufacturer approval, failure to maintain adequate customer satisfaction ratings, or a material breach of other provisions of the agreement. In addition to selling new vehicles using our low, no-haggle price strategy, the franchise and dealer agreements generally allow us to perform warranty work on these vehicles and sell related parts and services within a specified market area. Designation of specified market areas generally does not guarantee exclusivity within a specified territory. Seasonality. Our business is seasonal. Most of our superstores experience their strongest traffic and sales in the spring and summer quarters. Sales are typically lowest in the fall quarter, which coincides with the new vehicle model-year-changeover period. In the fall, the new model year introductions and discounts on model year closeouts generally can cause rapid depreciation in used car pricing, particularly for late-model used cars. Customer traffic also tends to slow in the fall as the weather gets colder and as customers shift their spending priorities toward holiday-related expenditures. Seasonal patterns for car buying and selling may vary in different parts of the country and, as we expand geographically, these differences could have an effect on the overall seasonal pattern of our results. Products and Services Merchandising. We offer our customers a broad selection of makes and models of used vehicles, including both domestic and imported vehicles, at competitive prices. Our used car selection covers popular brands from manufacturers such as DaimlerChrysler, Ford, General Motors, Honda, Hyundai, Mazda, Mitsubishi, Nissan, Subaru, Toyota, and Volkswagen and luxury brands such as Acura, BMW, Infiniti, Lexus, and Mercedes. Our primary focus is vehicles that are 1 to 6 years old, have fewer than 60,000 miles, and generally range in price from $11,500 to $30,000. For the more cost-conscious consumer, we also offer used cars that are more than 6 years old or have 60,000 miles or more and that generally range in price from $8,000 to $22,000. We have implemented an everyday low-price strategy under which we set no-haggle prices on both our used and new vehicles. We believe that our pricing is competitive with the best-negotiated prices in the market. Prices on all vehicles are clearly displayed on each vehicle’s information sticker; on carmax.com, AutoTrader.com, and cars.com; and, where applicable, in our newspaper advertising. We extend our no-haggle philosophy to every component of
8
the vehicle transaction, including vehicle appraisal offers, financing rates, accessories, extended service plan pricing, and vehicle documentation fees. Reconditioning and Service. An integral part of our used car consumer offer is the reconditioning process. This process includes a comprehensive, Certified Quality Inspection of the engine and all major systems, including cooling, fuel, drivetrain, transmission, electronics, suspension, brakes, steering, air conditioning, and other equipment, as well as the interior and exterior of the vehicle. Based on this quality inspection, we determine the reconditioning necessary to bring the vehicle up to our high quality standards. Our service technicians complete vehicle inspections. We perform most routine mechanical and minor body repairs in-house; however, for some reconditioning services, we engage third parties specializing in those services. Over the past several years, we have performed an increasing percentage of reconditioning services in-house, and, based on the cost savings realized, we expect this trend to continue. Satellite superstores depend upon nearby mega or standard superstores for reconditioning, which increases efficiency and reduces overhead. All CarMax used car locations provide vehicle repair service including repairs of vehicles covered by our extended service plans. We also provide factory-authorized service at all new car franchises. We have developed systems and procedures that are intended to ensure that our retail repair service is conducted in the same customer-friendly and efficient manner as our other operations. We believe that the efficiency of our reconditioning and service operations is enhanced by our modern facilities, a technician mentoring process, and our information systems. The mentoring process and compensation programs are designed to increase the productivity of technicians, identify opportunities for cost reduction, and achieve high-quality repairs. Our information systems provide the ability to track repair history and enable trend analysis, which serves as guidance for our continuous improvement efforts. Wholesale Auctions. Vehicles purchased through our in-store appraisal process that do not meet our retail standards are sold at on-site wholesale auctions. At February 28, 2007, wholesale auctions were conducted at 46 of our 77 superstores. Auctions are generally not held at satellite superstores. Auctions are held on a weekly, bi-weekly, or monthly basis. Auction frequency at a given superstore is determined by the number of vehicles to be auctioned, which depends on the number of stores and the market awareness of the company and our in-store appraisal offer in that market. The typical wholesale vehicle is approximately 10 years old and has more than 100,000 miles. Participation in our wholesale auctions is restricted to licensed automobile dealers, the majority of whom are independent dealers. To participate in a CarMax auction, dealers must register with our centralized auction support group, at which time we determine the purchase limit available to each dealer. We make conditional announcements on each vehicle, including those for vehicles with major mechanical issues, possible frame or flood damage, branded titles, salvage history, and unknown true mileage. Professional, licensed auctioneers conduct our auctions. These policies result in an auction sales rate that is generally between 95% and 100%. Dealers pay a fee to the company based on the sales price of the vehicles they purchase. Customer Credit. We offer our customers a wide range of financing alternatives, which we believe enhances the CarMax consumer offer. Before the effect of 3-day payoffs and vehicle returns, CAF financed more than 40% of our used vehicle unit sales in fiscal 2007. Customer credit applications are initially reviewed by CAF, and may also be reviewed by Bank of America. Customers who are not approved by either CAF or Bank of America are evaluated by our core, second-tier finance partners, including AmeriCredit Financial Services, Capital One Auto Finance, CitiFinancial Auto, and Wells Fargo Auto Finance. Customers who are not approved by any of these finance partners are evaluated by our third-tier lenders, which include Triad Financial and Drive Financial Services (“Drive”). Having a wide array of lenders not only expands the choices for our customers, but also increases discrete approvals. To this end, we have tested and will continue to test other third-party finance companies. Customers applying for financing provide credit information that is electronically submitted by sales consultants through our proprietary information system. Responses from CAF and Bank of America are generally received in less than five minutes. The vehicle financings, or loans, are retail installment contracts secured by the vehicles financed. We have no recourse liability on retail installment contracts arranged with third-party finance companies. Customers are permitted to refinance or pay off their loans within three business days of a purchase without incurring any finance or related charges. Our arrangements with our primary and second tier third-party finance companies generally provide for payment of a fee to CarMax at the time of financing, provided the loan is not paid in full within 90 days. Drive Financial Services purchases customer loans at a discount.
9
Extended Service Plan Sales. At the time of the sale, we offer the customer an extended service plan. We sell these plans on behalf of unrelated third parties that are the primary obligors. Under the third-party service plan programs, we have no contractual liability to the customer. The extended service plans have terms of coverage from 12 to 72 months, depending on the vehicle age and make. We offer these extended service plans at low, fixed prices, which are based primarily on the repair record of the vehicle and the length of coverage selected. All extended service plans that we sell (other than manufacturers’ warranties) have been designed to our specifications and are administered by the third parties through private-label arrangements under which we receive a commission from the administrator at the time the extended service plan is sold. In fiscal 2007, more than half of the customers purchasing a used vehicle from CarMax also purchased an extended service plan. Our extended service plan customers have access to our vehicle repair service at each CarMax store and to the third-party administrators’ nationwide network of approximately 14,000 independent service providers. We believe that the quality of the services provided by this network, as well as the broad scope of our extended service plans, helps promote customer satisfaction and loyalty, and thus increases the likelihood of repeat and referral business. Systems Our stores are supported by an advanced information system that improves the customer experience while providing tightly integrated automation of all operating functions. Using in-store information kiosks, customers can search each store’s vehicle inventory and print a detailed listing for any vehicle, which includes the vehicle’s features and specifications, and a map showing its specific location on the display lot. Our inventory management system tracks every vehicle through its life from purchase through reconditioning and test-drives to ultimate sale. Bar codes are placed on each vehicle and on each parking space on the display lot, and all vehicle bar codes are scanned daily as a loss prevention measure. Test drive information is captured on every vehicle using radio frequency identification devices, linking the specific vehicle and the sales consultant. We also capture data on vehicles we wholesale, which helps us track market pricing. An online finance application process and computer-assisted document preparation ensure rapid completion of the sales transaction. Behind the scenes, our proprietary store technology provides our management with real-time information about every aspect of store operations, such as inventory management, pricing, vehicle transfers, wholesale auctions, and sales consultant productivity. Our inventory management and pricing system allows us to buy the mix of makes, models, age, mileage, and price points tailored to customer buying preferences at each superstore. This system also generates recommended retail price markdowns for specific vehicles based on complex algorithms that take into account factors including sales history, consumer interest, and seasonal patterns. We believe this systematic approach to vehicle pricing allows us to optimize inventory turns, which minimizes the depreciation risk inherent in used cars and helps us to achieve our targeted gross profit dollars per unit. In addition to inventory management, our Electronic Repair Order system (“ERO”) is used by the service department to sequence reconditioning procedures. ERO provides information that helps increase quality and reduce costs, which further enhances our customer service and profitability. Through our centralized systems, we are able to immediately integrate new stores into our store network, allowing the new stores to rapidly achieve operating efficiency. We continue to enhance and refine our information systems, which we believe to be a core competitive advantage. The design of our information systems incorporates off-site backups, redundant processing, and other measures to reduce the risk of significant data loss in the event of an emergency or disaster. Associates On February 28, 2007, we had a total of 13,736 employees, including 10,394 hourly and salaried associates and 3,342 sales associates, who worked on a commission basis. Sales associates include both full-time and part-time employees. We employ additional associates during peak selling seasons. At February 28, 2007, our location general managers averaged more than 8 years of CarMax experience, in addition to prior retail management experience. Management believes that the company maintains good employee relations. No CarMax associate is subject to a collective bargaining agreement.
10
Training. We place special emphasis on attracting, developing, and retaining qualified associates and believe that our favorable working conditions and compensation programs allow us to attract and retain highly qualified individuals in each market that we enter. We accomplish this partly through our commitment to provide exceptional training to associates. Store associates receive structured, self-paced training programs that introduce them to company policies and their specific job responsibilities through KMX University – our proprietary intranet-based testing and tracking system. KMX University is comprised of customized applications hosted within a learning management system that allow us to author, deliver, and track training events, and to measure associate competency before and after training. Most new store associates are also assigned mentors who provide on-the-job guidance and support. We also provide comprehensive, facilitated classroom training courses to sales consultants, buyers, automotive technicians, and managers. All sales consultants receive extensive customer service training both initially and on an ongoing basis. Buyers-in-training undergo a 6– to 18–month apprenticeship under the supervision of experienced buyers, and they generally will assist with the appraisal of more than one thousand cars before making their first independent purchase. We utilize a mix of internal and external technical training programs in an effort to provide a stable future supply of qualified technicians. Reconditioning and mechanical technicians attend in-house training and vendor-sponsored training programs designed to develop their skills in performing repairs on the diverse makes and models of vehicles we sell. Technicians at our new car franchises also attend manufacturer-sponsored training programs to stay abreast of current diagnostic, repair, and maintenance techniques for those manufacturers’ vehicles. Additionally, our management-training program includes rotations through each functional area. We open new stores with an experienced management team drawn from existing stores. Laws and Regulations Vehicle Dealer and Other Laws and Regulations. We operate in a highly regulated industry. In every state in which we operate, we must obtain various licenses and permits in order to conduct business, including dealer, service, sales, and finance licenses issued by state and certain local regulatory authorities. A wide range of federal, state, and local laws and regulations govern the manner in which we conduct business, including advertising, sales, financing, and employment practices. These laws include consumer protection laws, privacy laws, anti-money laundering laws, and state franchise laws, as well as other laws and regulations applicable to new and used motor vehicle dealers. These laws also include federal and state wage-hour, anti-discrimination, and other employment practices laws. Our financing activities with customers are subject to federal truth-in-lending, consumer leasing, and equal credit opportunity laws and regulations, as well as state and local motor vehicle finance laws, installment finance laws, and usury laws. Claims arising out of actual or alleged violations of law may be asserted against us by individuals or governmental authorities and may expose us to significant damages or other penalties, including revocation or suspension of licenses necessary to conduct business and fines. Environmental, Health, and Safety Laws and Regulations. We are subject to a variety of federal, state, and local laws and requirements that regulate the environment and public health and safety. Our business involves the use, handling, and disposal of hazardous or toxic substances, including motor oil, gasoline, transmission fluid, solvents, lubricants, and other materials. We are subject to compliance with governmental and environmental regulations concerning the past and current operation and/or removal of aboveground and underground storage tanks containing these and other substances. AVAILABILITY OF REPORTS AND OTHER INFORMATION Our annual reports on Form 10-K, quarterly reports on Form 10-Q, current reports on Form 8-K, and proxy statements on Schedule 14A, as well as any amendments to those reports, are available without charge through our website, carmax.com, as soon as reasonably practicable after filing or furnishing the material to the Securities and Exchange Commission. The contents of our website are not, however, part of this report. In addition, our Corporate Governance Guidelines and Code of Conduct, as well as the charters of the Audit Committee, Nominating and Governance Committee, and Compensation and Personnel Committee, are available to shareholders and the public through the “Corporate Governance” link of our investor information home page at investor.carmax.com. Printed copies of these documents are available to any shareholder, without charge, upon written request to our corporate secretary at the address set forth on the cover page of this report. Any changes to these documents or waivers of the Code of Conduct are promptly disclosed on our website.
11
Item 1A. Risk Factors. We are subject to various risks, including the risks described below. Our business, operating results, and financial condition could be materially and adversely affected by any of these risks. Additional risks not presently known or that we currently deem immaterial may also impair the business and our operations. Economic Conditions. In the normal course of business, we are subject to changes in general or regional U.S. economic conditions, including, but not limited to, consumer credit availability, consumer credit delinquency and loss rates, interest rates, gasoline prices, inflation, personal discretionary spending levels, and consumer sentiment about the economy in general. Any significant changes in economic conditions could adversely affect consumer demand and/or increase costs resulting in lower profitability for the company. Competition. Automotive retailing is a highly competitive business. Our competition includes publicly and privately owned franchised new car dealers and independent dealers, as well as millions of private individuals. Our competitors may sell the same or similar makes of vehicles that we offer in the same or similar markets at competitive prices. Further, new entrants to the market could result in increased acquisition costs for used vehicles and lower-than-expected vehicle sales and margins. CAF is subject to competition from various financial institutions. Additionally, competition on vehicle sales and related financing is increasing, as these products are now being marketed and sold over the Internet. Customers are increasingly using the Internet to compare pricing for cars and related financing, which may further reduce our profitability. Retail Prices. Any significant changes in retail prices for used and new vehicles could reduce our sales and margins. If any of our competitors seek to gain or retain market share by reducing prices for used or new vehicles, we would likely reduce our prices in order to remain competitive, which could result in a decrease in our sales and profitability and require a change in our operating strategies. Inventory. A reduction in the availability or access to sources of inventory would adversely affect our business. A failure to adjust appraisal offers to stay in line with the broader market trade-in offer trends, or a failure to recognize those trends, could negatively impact our ability to acquire inventory. Should we develop excess inventory, the inability to liquidate the excess inventory at prices that allow us to meet margin targets or to recover our costs would adversely affect our profitability. Real Estate. The inability to acquire suitable real estate at favorable terms could limit the expansion of our store base and could have a material adverse affect on our future operating results. Management and Workforce. Our success depends upon the continued contributions of our store, region, and corporate management teams. Consequently, the loss of the services of key employees could have a material adverse effect on our results of operations. In addition, we will need to hire additional personnel as we open new stores. The market for qualified employees in the industry and in the regions in which we operate is highly competitive and may result in increased labor costs during periods of low unemployment. Information Systems. Our business is dependent upon the efficient operation of our information systems. In particular, we rely on our information systems to effectively manage sales, inventory, consumer financing, and customer information. The failure of these systems to perform as designed or the failure to maintain and continually enhance or protect the integrity of these systems could disrupt our business, impact sales and profitability, or expose us to customer or third-party claims. Capital. Changes in the availability or cost of capital and working capital financing, including the availability of long-term financing to support our geographic expansion and the availability of securitization financing, could adversely affect growth and operating strategies. Further, our current credit facility and certain securitization and sale-leaseback agreements contain covenants and/or performance triggers. Any failure to comply with these covenants and/or performance triggers could have a material adverse effect on our business. Weather. The occurrence of severe weather events, such as rain, snow, wind, storms, hurricanes, or other natural disasters, adversely affecting consumer traffic at our superstores could negatively impact our operating results.
12
Seasonal Fluctuations. Our business is subject to seasonal fluctuations. We generally realize a higher proportion of revenue and operating profit during the first and second fiscal quarters. If conditions arise that impair vehicle sales during the first or second fiscal quarters, the adverse effect on our revenues and operating profit for the year could be disproportionately large. Geographic Concentration. Our performance is subject to local economic, competitive, and other conditions prevailing in geographic areas where we operate. Since a large number of our superstores are located in the Southeastern U.S. and in the Chicago, Los Angeles, Houston, Dallas, and Washington, D.C./Baltimore markets, our results of operations depend substantially on general economic conditions and consumer spending habits in these markets. In the event that any of these geographic areas experience a downturn in economic conditions, it could adversely affect our business. Regulatory Environment. We are subject to a wide range of federal, state, and local laws and regulations, such as local licensing requirements and laws regarding advertising, vehicle sales, financing, and employment practices. Our facilities and operations are also subject to federal, state, and local laws and regulations relating to environmental protection and human health and safety. The violation of these laws and regulations could result in administrative, civil, or criminal penalties, or in a cease and desist order against operations. As a result, we have incurred, and will continue to incur, capital and operating expenditures and other costs in complying with these laws and regulations. Further, over the past several years, private plaintiffs and federal, state, and local regulatory and law enforcement authorities have increased their scrutiny of advertising, sales, and finance and insurance activities in the sale and leasing of motor vehicles. If, as a result, other automotive retailers adopt more transparent, consumer-oriented business practices, our differentiation versus those retailers could be reduced. Litigation. We are subject to various litigation matters, which, if the outcomes in any significant matters are adverse, could negatively affect our business. Claims arising out of actual or alleged violations of law may be asserted against us by individuals, either individually or through class actions, or by governmental entities in civil or criminal investigations and proceedings. These actions could expose us to adverse publicity and to substantial monetary damages and legal defense costs, injunctive relief, and criminal and civil fines and penalties, including suspension or revocation of licenses to conduct operations. Accounting Matters. The implementation of new accounting requirements or changes to U.S. generally accepted accounting principles could adversely affect our reported financial position or results of operations. Potential changes currently under consideration by the Financial Accounting Standards Board include, but are not limited to, proposed rule changes relating to the accounting for securitization transactions and potential changes in accounting for leases and pension expense. Other Material Events. The occurrence of certain material events including natural disasters, acts of terrorism, the outbreak of war, or other significant national or international events could adversely affect our results. Item 1B. Unresolved Staff Comments. None.
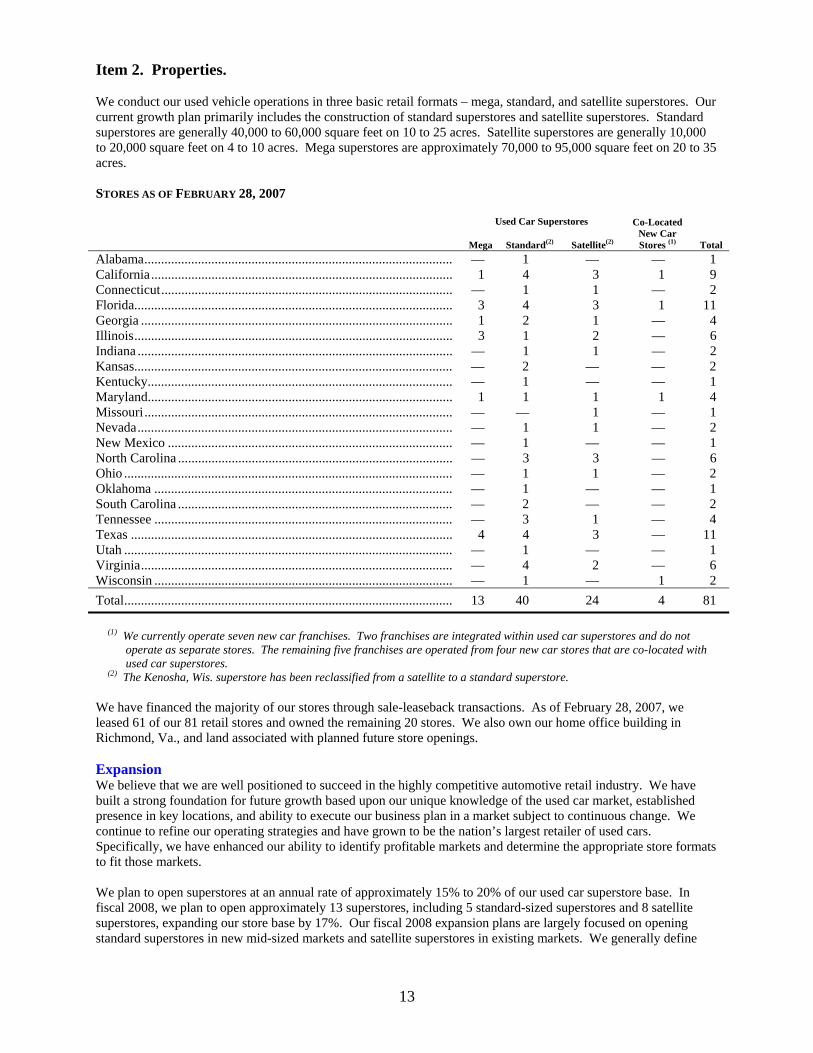
13
Item 2. Properties. We conduct our used vehicle operations in three basic retail formats – mega, standard, and satellite superstores. Our current growth plan primarily includes the construction of standard superstores and satellite superstores. Standard superstores are generally 40,000 to 60,000 square feet on 10 to 25 acres. Satellite superstores are generally 10,000 to 20,000 square feet on 4 to 10 acres. Mega superstores are approximately 70,000 to 95,000 square feet on 20 to 35 acres. STORES AS OF FEBRUARY 28, 2007
Used Car Superstores
Mega
Standard(2)
Satellite(2)
Co-Located
New Car Stores (1)
Total
Alabama............................................................................................ — 1 — — 1 California.......................................................................................... 1 4 3 1 9 Connecticut....................................................................................... — 1 1 — 2 Florida............................................................................................... 3 4 3 1 11 Georgia ............................................................................................. 1 2 1 — 4 Illinois............................................................................................... 3 1 2 — 6 Indiana .............................................................................................. — 1 1 — 2 Kansas............................................................................................... — 2 — — 2 Kentucky........................................................................................... — 1 — — 1 Maryland........................................................................................... 1 1 1 1 4 Missouri............................................................................................ — — 1 — 1 Nevada.............................................................................................. — 1 1 — 2 New Mexico ..................................................................................... — 1 — — 1 North Carolina .................................................................................. — 3 3 — 6 Ohio .................................................................................................. — 1 1 — 2 Oklahoma ......................................................................................... — 1 — — 1 South Carolina .................................................................................. — 2 — — 2 Tennessee ......................................................................................... — 3 1 — 4 Texas ................................................................................................ 4 4 3 — 11 Utah .................................................................................................. — 1 — — 1 Virginia............................................................................................. — 4 2 — 6 Wisconsin ......................................................................................... — 1 — 1 2 Total.................................................................................................. 13 40 24 4 81
(1) We currently operate seven new car franchises. Two franchises are integrated within used car superstores and do not operate as separate stores. The remaining five franchises are operated from four new car stores that are co-located with used car superstores.
(2) The Kenosha, Wis. superstore has been reclassified from a satellite to a standard superstore. We have financed the majority of our stores through sale-leaseback transactions. As of February 28, 2007, we leased 61 of our 81 retail stores and owned the remaining 20 stores. We also own our home office building in Richmond, Va., and land associated with planned future store openings. Expansion We believe that we are well positioned to succeed in the highly competitive automotive retail industry. We have built a strong foundation for future growth based upon our unique knowledge of the used car market, established presence in key locations, and ability to execute our business plan in a market subject to continuous change. We continue to refine our operating strategies and have grown to be the nation’s largest retailer of used cars. Specifically, we have enhanced our ability to identify profitable markets and determine the appropriate store formats to fit those markets. We plan to open superstores at an annual rate of approximately 15% to 20% of our used car superstore base. In fiscal 2008, we plan to open approximately 13 superstores, including 5 standard-sized superstores and 8 satellite superstores, expanding our store base by 17%. Our fiscal 2008 expansion plans are largely focused on opening standard superstores in new mid-sized markets and satellite superstores in existing markets. We generally define
14
mid-sized markets as those with television viewing populations of between 600,000 and 2.5 million people. Historically, mid-sized markets have been the easiest to enter from a real estate and an advertising/awareness building perspective, and they are where we have generally experienced the fastest ramp-up in store sales and profitability. We are also beginning to resume store growth in new large markets. For additional details on fiscal 2008 planned store openings, please see “Operations Outlook,” included in Part II, Item 7, of this Form 10-K. Item 3. Legal Proceedings. On August 29, 2006, Heather Herron, et al. filed a putative class action lawsuit against numerous South Carolina automobile dealers, including CarMax Auto Superstores, Inc., in the Court of Common Pleas in Aiken County, South Carolina. Subject to final judicial approval, we have settled this lawsuit, and we believe the settlement will not materially affect our financial position or results of operations. We are involved in various other legal proceedings in the normal course of business. Based upon our evaluation of information currently available, we believe that the ultimate resolution of any such proceedings will not have a material adverse effect, either individually or in the aggregate, on our financial position, liquidity, or results of operations. Item 4. Submission of Matters to a Vote of Security Holders. No matters were submitted to a vote of security holders during the fourth quarter of fiscal 2007.
15
PART II Item 5. Market for Registrant’s Common Equity, Related Stockholder Matters and Issuer Purchases of Equity Securities. Our common stock is listed and traded on the New York Stock Exchange under the ticker symbol KMX. As of February 28, 2007, there were approximately 6,300 CarMax shareholders of record. The following table sets forth for the fiscal periods indicated, the high and low sales prices per share for our common stock, as reported on the New York Stock Exchange composite tape as adjusted for the effect of the 2-for-1 stock split in March 2007. First
Quarter Second Quarter
Third Quarter
Fourth Quarter
Fiscal 2007 High ................................................... $18.20 $18.95 $23.99 $29.44 Low .................................................... $15.14 $14.85 $18.59 $23.10 Fiscal 2006 High ................................................... $17.00 $17.12 $16.00 $15.92 Low .................................................... $12.44 $12.32 $13.00 $13.20
To date, we have not paid a cash dividend on the CarMax common stock. We presently intend to retain our net earnings for use in our operations and for geographic expansion and, therefore, we do not anticipate paying any cash dividends in the foreseeable future. During the fourth quarter of fiscal 2007, we sold no CarMax equity securities that were not registered under the Securities Act of 1933, as amended. In addition, we did not repurchase any CarMax equity securities during this period. Performance Graph The following graph compares the five-year cumulative total return among CarMax common stock, the S&P 500 Index, and the S&P 500 Retailing Index. The graph assumes an original investment of $100 in our common stock and in each index on February 28, 2002, and the reinvestment of dividends, if applicable. We separated from Circuit City on October 1, 2002. For dates preceding October 1, 2002, the graph reflects information for the Circuit City Stores, Inc.-CarMax Group common stock.
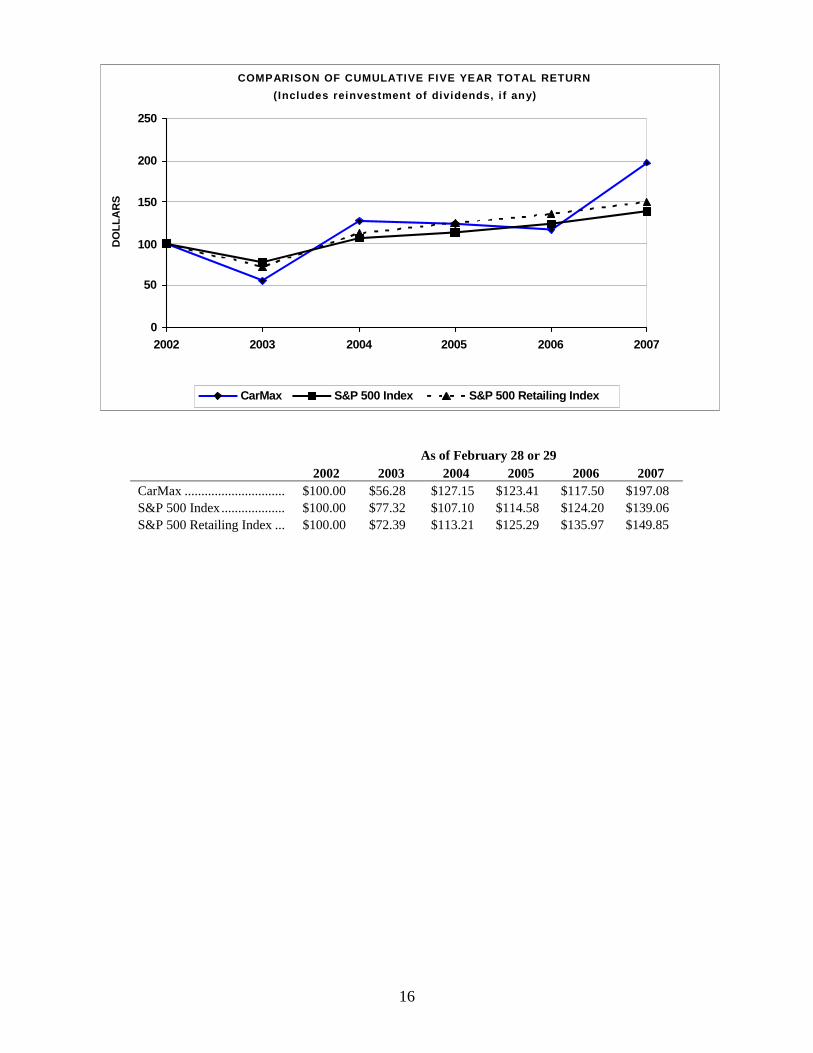
16
COMPARISON OF CUMULATIVE FIVE YEAR TOTAL RETURN
(Includes reinvestment of dividends, i f any)
0
50
100
150
200
250
2002 2003 2004 2005 2006 2007
DO
LLA
RS
CarMax S&P 500 Index S&P 500 Retailing Index
As of February 28 or 29 2002 2003 2004 2005 2006 2007 CarMax .............................. $100.00 $56.28 $127.15 $123.41 $117.50 $197.08 S&P 500 Index................... $100.00 $77.32 $107.10 $114.58 $124.20 $139.06 S&P 500 Retailing Index ... $100.00 $72.39 $113.21 $125.29 $135.97 $149.85
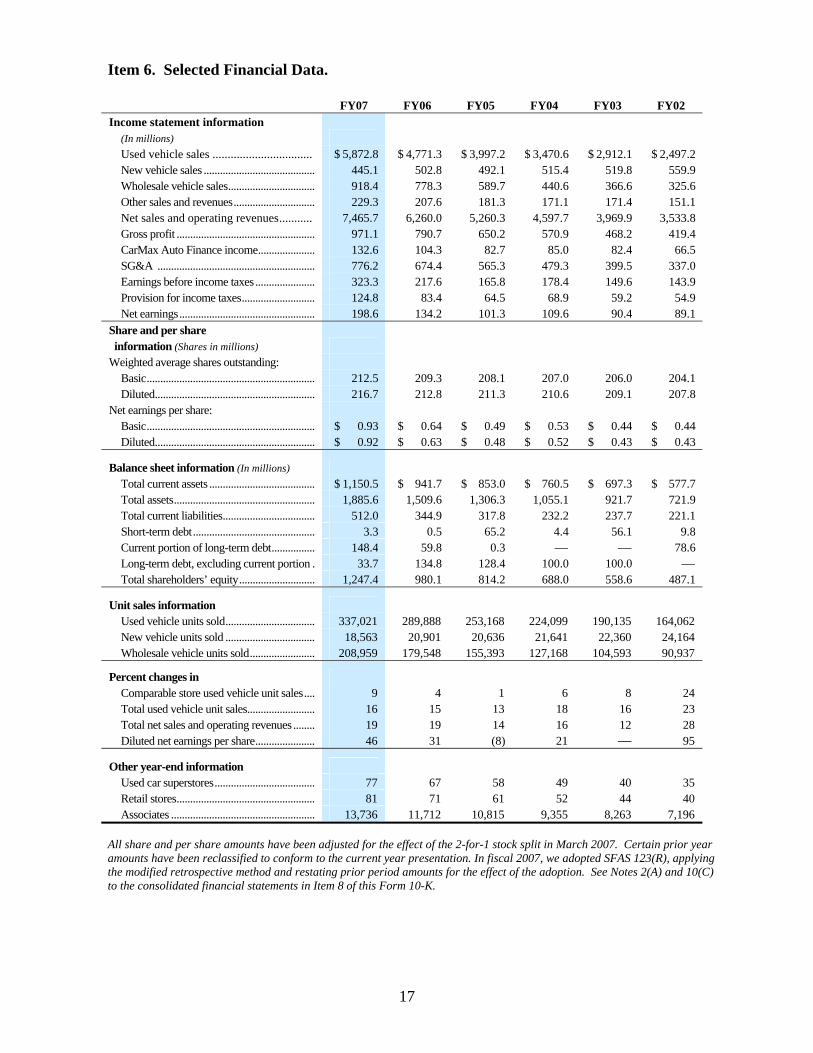
17
Item 6. Selected Financial Data.
FY07 FY06 FY05 FY04 FY03 FY02 Income statement information (In millions) Used vehicle sales ................................. $ 5,872.8 $ 4,771.3 $ 3,997.2 $ 3,470.6 $ 2,912.1 $ 2,497.2 New vehicle sales ......................................... 445.1 502.8 492.1 515.4 519.8 559.9 Wholesale vehicle sales................................ 918.4 778.3 589.7 440.6 366.6 325.6 Other sales and revenues.............................. 229.3 207.6 181.3 171.1 171.4 151.1 Net sales and operating revenues........... 7,465.7 6,260.0 5,260.3 4,597.7 3,969.9 3,533.8 Gross profit ................................................... 971.1 790.7 650.2 570.9 468.2 419.4 CarMax Auto Finance income..................... 132.6 104.3 82.7 85.0 82.4 66.5 SG&A .......................................................... 776.2 674.4 565.3 479.3 399.5 337.0 Earnings before income taxes...................... 323.3 217.6 165.8 178.4 149.6 143.9 Provision for income taxes........................... 124.8 83.4 64.5 68.9 59.2 54.9 Net earnings.................................................. 198.6 134.2 101.3 109.6 90.4 89.1 Share and per share information (Shares in millions) Weighted average shares outstanding: Basic.............................................................. 212.5 209.3 208.1 207.0 206.0 204.1 Diluted........................................................... 216.7 212.8 211.3 210.6 209.1 207.8 Net earnings per share: Basic.............................................................. $ 0.93 $ 0.64 $ 0.49 $ 0.53 $ 0.44 $ 0.44 Diluted........................................................... $ 0.92 $ 0.63 $ 0.48 $ 0.52 $ 0.43 $ 0.43
Balance sheet information (In millions) Total current assets ....................................... $ 1,150.5 $ 941.7 $ 853.0 $ 760.5 $ 697.3 $ 577.7 Total assets.................................................... 1,885.6 1,509.6 1,306.3 1,055.1 921.7 721.9 Total current liabilities.................................. 512.0 344.9 317.8 232.2 237.7 221.1 Short-term debt............................................. 3.3 0.5 65.2 4.4 56.1 9.8 Current portion of long-term debt................ 148.4 59.8 0.3 — — 78.6 Long-term debt, excluding current portion . 33.7 134.8 128.4 100.0 100.0 — Total shareholders’ equity............................ 1,247.4 980.1 814.2 688.0 558.6 487.1
Unit sales information Used vehicle units sold................................. 337,021 289,888 253,168 224,099 190,135 164,062 New vehicle units sold ................................. 18,563 20,901 20,636 21,641 22,360 24,164 Wholesale vehicle units sold........................ 208,959 179,548 155,393 127,168 104,593 90,937
Percent changes in Comparable store used vehicle unit sales.... 9 4 1 6 8 24 Total used vehicle unit sales......................... 16 15 13 18 16 23 Total net sales and operating revenues ........ 19 19 14 16 12 28 Diluted net earnings per share...................... 46 31 (8) 21 — 95
Other year-end information Used car superstores..................................... 77 67 58 49 40 35 Retail stores................................................... 81 71 61 52 44 40 Associates ..................................................... 13,736 11,712 10,815 9,355 8,263 7,196
All share and per share amounts have been adjusted for the effect of the 2-for-1 stock split in March 2007. Certain prior year amounts have been reclassified to conform to the current year presentation. In fiscal 2007, we adopted SFAS 123(R), applying the modified retrospective method and restating prior period amounts for the effect of the adoption. See Notes 2(A) and 10(C) to the consolidated financial statements in Item 8 of this Form 10-K.
18
Item 7. Management’s Discussion and Analysis of Financial Condition and Results of Operations. The following Management’s Discussion and Analysis of Financial Condition and Results of Operations (“MD&A”) is provided as a supplement to, and should be read in conjunction with, our consolidated financial statements and the accompanying notes presented in Item 8, Consolidated Financial Statements and Supplementary Data. Note references are to the notes to consolidated financial statements included in Item 8. Amounts and percentages in tables may not total due to rounding. Certain prior year amounts have been reclassified to conform to the current year’s presentation. We adopted Statement of Financial Accounting Standards (“SFAS”) No. 123 (Revised 2004), “Share-Based Payment” (“SFAS 123(R)”), effective March 1, 2006, applying the modified retrospective method. As a result, prior period amounts have been restated to reflect the adoption of this standard. On February 22, 2007, the board of directors declared a 2-for-1 stock split in the form of a common stock dividend for shareholders of record on March 19, 2007, which was distributed on March 26, 2007. All share and per share data included in MD&A have been adjusted to reflect this stock split. BUSINESS OVERVIEW General CarMax is the nation’s largest retailer of used vehicles. We pioneered the used car superstore concept, opening our first store in 1993. At February 28, 2007, we operated 77 used car superstores in 36 markets, including 26 mid-sized markets, 9 large markets, and 1 small market. We define mid-sized markets as those with television viewing populations generally between 600,000 and 2.5 million people. We also operated seven new car franchises, all of which are integrated or co-located with our used car superstores. In fiscal 2007, we sold 337,021 used cars, representing 95% of the total 355,584 vehicles we sold at retail.
We believe the CarMax consumer offer is unique in the automobile retailing marketplace. Our offer gives consumers a way to shop for cars in the same manner that they shop for items at other “big box” retailers. Our consumer offer is structured around our four core equities: low, no-haggle prices; a broad selection; high quality; and customer-friendly service. Our website, carmax.com, is a valuable tool for communicating the CarMax consumer offer, a sophisticated search engine, and an efficient channel for customers who prefer to conduct their shopping online. We generate revenues, income, and cash flows primarily by retailing used vehicles and associated items including vehicle financing, extended service plans (“ESP”), and retail service. A majority of the used vehicles we sell at retail are purchased directly from consumers. We also generate revenues, income, and cash flows from the sale of vehicles purchased through our appraisal process that do not meet our retail standards. These vehicles are sold at our on-site wholesale auctions. Wholesale auctions are conducted at the majority of our superstores and are held on a weekly, bi-weekly, or monthly basis. In fiscal 2007, we sold 208,959 vehicles at our wholesale auctions. On average, the vehicles we wholesale are approximately 10 years old and have more than 100,000 miles. Participation in our wholesale auctions is restricted to licensed automobile dealers, the majority of whom are independent dealers and licensed wholesalers. CarMax provides financing to qualified customers through CarMax Auto Finance (“CAF”), the company’s finance operation, and Bank of America, and through several other third-party lenders. We collect fixed, prenegotiated fees from the majority of our third-party lenders, and we periodically test additional lenders. CarMax has no recourse liability for the loans provided by third-party lenders. We sell ESPs on behalf of unrelated third parties who are the primary obligors. We have no contractual liability to the customer under these third-party service plans. Extended service plan revenue represents commissions from the unrelated third parties. We are still at a relatively early stage in the national rollout of our retail concept. We believe the primary driver for future earnings growth will be vehicle unit sales growth from comparable stores and from geographic expansion.
19
We target a similar dollar amount of gross profit per used unit, regardless of retail price. Used unit sales growth is our primary focus. We plan to open used car superstores at a rate of approximately 15% to 20% of our used car superstore base each year. In fiscal 2008, we plan to open 13 superstores, expanding our store base by approximately 17%. Over the long term, we expect comparable store used unit sales increases to average in the range of 4% to 8%, reflecting the multi-year ramp in sales at newly opened stores as they mature, continued market share gains at stores that have reached basic maturity sales levels, which we estimate occurs in a store’s fifth year of operation, and underlying industry sales growth.
The principal challenges we face in expanding our store base include our ability to build our management bench strength to support the store growth and our ability to procure suitable real estate at reasonable costs. We staff each newly opened store with an experienced management team. We must therefore continually recruit, train, and develop managers and associates to fill the pipeline necessary to support future store openings. If at any time we believed that the rate of store growth was causing our performance to falter, we would consider slowing the growth rate. Fiscal 2007 Highlights • Net sales and operating revenues increased 19% to $7.47 billion from $6.26 billion in fiscal 2006, while net
earnings increased 48% to $198.6 million, or $0.92 per share, from $134.2 million, or $0.63 per share. • Total used vehicle unit sales increased 16%, reflecting the combination of our 9% increase in comparable store
used unit sales and the growth in our store base. • Total wholesale vehicle unit sales increased 16%, consistent with our used vehicle unit sales growth. • We opened ten used car superstores in fiscal 2007, including five standard superstores and five satellite
superstores. • Our total gross profit per unit increased to $2,731 from $2,544 in fiscal 2006. We realized improvements in
gross profit per unit in all categories, including used vehicles, new vehicles, wholesale vehicles, and other. We believe our used vehicle gross profit benefited from our strong, consistent sales performance, which resulted in fewer pricing markdowns being made, as well as a more stable underlying economic environment.
• CAF income increased 27% to $132.6 million from $104.3 million in fiscal 2006. The improvement reflected the growth in retail vehicle sales and managed receivables, an improvement in the gain on loans originated and sold, and an increase in the average amount financed. CAF income included a benefit of $13.0 million, or $0.04 per share for favorable items, primarily valuation adjustments of our retained interest, in fiscal 2007, compared with a benefit of $15.2 million, or $0.04 per share in fiscal 2006.
• Selling, general, and administrative expenses as a percent of net sales and operating revenues (the “SG&A ratio”) declined to 10.4% from 10.8% in fiscal 2006. We benefited from the leverage of fixed expenses generated by our strong comparable store sales growth.
• As a result of adopting SFAS 123(R) in fiscal 2007, we recognized share-based compensation expense of $0.09 per share in fiscal 2007 compared with $0.07 per share in fiscal 2006, as restated. The fiscal 2007 expense includes costs of $0.02 per share resulting from the retirement of our former chief executive officer.
• Net cash provided by operations increased to $136.8 million from $117.5 million in fiscal 2006, primarily reflecting the improved net earnings offset by increased investment in working capital.
CRITICAL ACCOUNTING POLICIES Our results of operations and financial condition as reflected in the consolidated financial statements have been prepared in accordance with U.S. generally accepted accounting principles. Preparation of financial statements requires management to make estimates and assumptions affecting the reported amounts of assets, liabilities, revenues, expenses, and the disclosures of contingent assets and liabilities. We use our historical experience and other relevant factors when developing our estimates and assumptions. We continually evaluate these estimates and assumptions. Note 2 includes a discussion of significant accounting policies. The accounting policies discussed below are the ones we consider critical to an understanding of our consolidated financial statements because their application places the most significant demands on our judgment. Our financial results might have been different if different assumptions had been used or other conditions had prevailed. Securitization Transactions We use a securitization program to fund substantially all of the automobile loan receivables originated by CAF. The securitization transactions are accounted for as sales. A gain, recorded at the time of the securitization transaction,
20
results from recording a receivable equal to the present value of the expected residual cash flows generated by the securitized receivables. The fair value of our retained interest in securitization transactions includes the present value of the expected residual cash flows generated by the securitized receivables, cash reserve accounts, and an undivided ownership interest in the receivables. The present value of the expected residual cash flows generated by the securitized receivables is determined by estimating the future cash flows using management’s assumptions of key factors, such as finance charge income, loss rates, prepayment rates, and discount rates appropriate for the type of asset and risk. These assumptions are derived from historical experience and projected economic trends. Adjustments to one or more of these assumptions may have a material impact on the fair value of the retained interest. The fair value of the retained interest may also be affected by external factors, such as changes in the behavior patterns of customers, changes in the economy, and developments in the interest rate markets. Note 2(C) includes a discussion of accounting policies related to securitizations. Note 4 includes a discussion of securitizations and provides a sensitivity analysis showing the hypothetical effect on the retained interest if there were variations from the assumptions used. In addition, see the “CarMax Auto Finance Income” section of this MD&A for a discussion of the effect of changes in our assumptions. Revenue Recognition We recognize revenue when the earnings process is complete, generally either at the time of sale to a customer or upon delivery to a customer. We recognize used vehicle revenue when a sales contract has been executed and the vehicle has been delivered, net of a reserve for returns under our 5-day, money-back guarantee. A reserve for vehicle returns is recorded based on historical experience and trends, and it could be affected if future vehicle returns differ from historical averages. We also sell ESPs on behalf of unrelated third parties to customers who purchase a vehicle. Because these third parties are the primary obligors under these programs, we recognize commission revenue on the ESPs at the time of the sale, net of a reserve for returns. The reserve for ESP returns is recorded based on historical experience and trends, and it could be affected if future returns differ from historical averages. Income Taxes Estimates and judgments are used in the calculation of certain tax liabilities and in the determination of the recoverability of certain of the deferred tax assets. In the ordinary course of business, transactions occur for which the ultimate tax outcome is uncertain at the time of the transactions. We adjust our income tax provision in the period in which we determine that it is probable that our actual results will differ from our estimates. Tax law and rate changes are reflected in the income tax provision in the period in which such changes are enacted. We evaluate the need to record valuation allowances that would reduce deferred tax assets to the amount that will more likely than not be realized. When assessing the need for valuation allowances, we consider future reversals of existing temporary differences and future taxable income. We believe that all of our recorded deferred tax assets as of February 28, 2007, will more likely than not be realized. However, if a change in circumstances results in a change in our ability to realize our deferred tax assets, our tax provision would increase in the period when the change in circumstances occurs. In addition, the calculation of our tax liabilities involves dealing with uncertainties in the application of complex tax regulations. We recognize potential liabilities for anticipated tax audit issues in the U.S. and other tax jurisdictions based on our estimate of whether, and the extent to which, additional taxes will be due. If payments of these amounts ultimately prove to be unnecessary, the reversal of the liabilities would result in tax benefits being recognized in the period when we determine the liabilities are no longer necessary. If our estimate of tax liabilities proves to be less than the ultimate assessment, a further charge to expense would result in the period of determination. Information regarding income taxes is presented in Note 7. Defined Benefit Retirement Plan The plan obligations and related assets of our defined benefit retirement plan are presented in Note 8. Plan assets, which consist primarily of marketable equity and debt instruments, are valued using current market quotations. Plan obligations and the annual pension expense are determined by independent actuaries using a number of assumptions provided by the company. Key assumptions used to measure the plan obligations include the discount rate, the
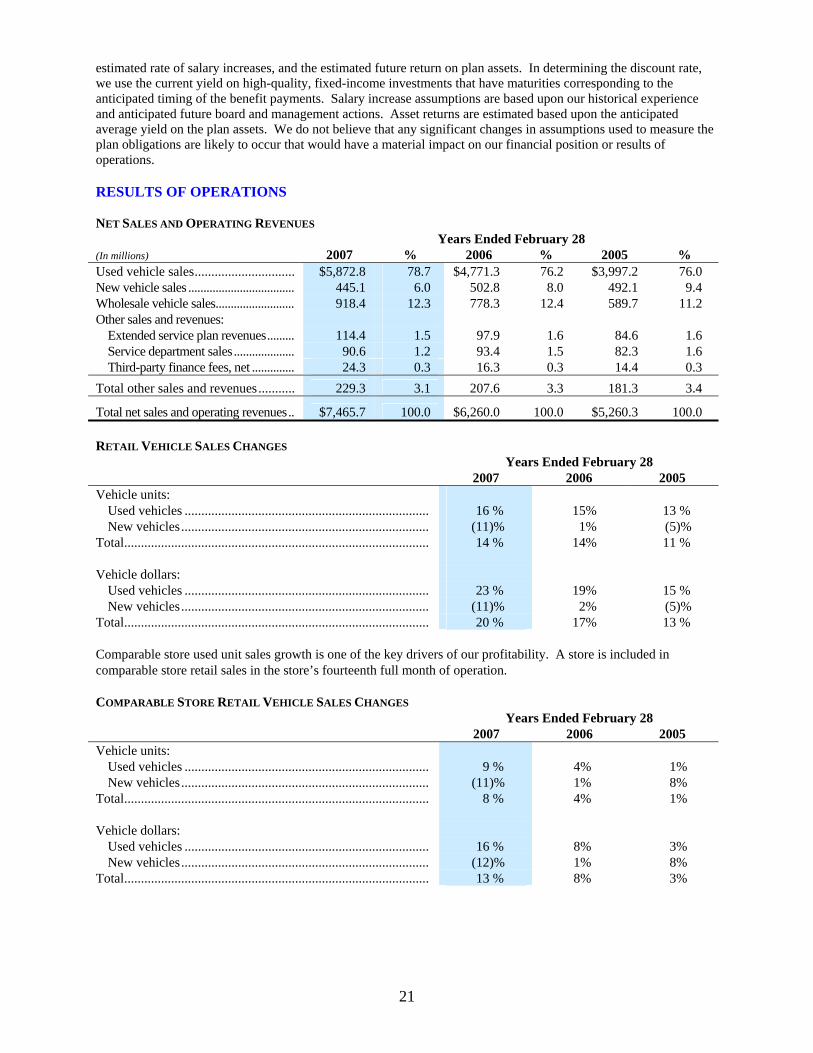
21
estimated rate of salary increases, and the estimated future return on plan assets. In determining the discount rate, we use the current yield on high-quality, fixed-income investments that have maturities corresponding to the anticipated timing of the benefit payments. Salary increase assumptions are based upon our historical experience and anticipated future board and management actions. Asset returns are estimated based upon the anticipated average yield on the plan assets. We do not believe that any significant changes in assumptions used to measure the plan obligations are likely to occur that would have a material impact on our financial position or results of operations. RESULTS OF OPERATIONS NET SALES AND OPERATING REVENUES Years Ended February 28 (In millions) 2007 % 2006 % 2005 % Used vehicle sales.............................. $5,872.8 78.7 $4,771.3 76.2 $3,997.2 76.0 New vehicle sales ................................... 445.1 6.0 502.8 8.0 492.1 9.4 Wholesale vehicle sales.......................... 918.4 12.3 778.3 12.4 589.7 11.2 Other sales and revenues: Extended service plan revenues......... 114.4 1.5 97.9 1.6 84.6 1.6 Service department sales.................... 90.6 1.2 93.4 1.5 82.3 1.6 Third-party finance fees, net .............. 24.3 0.3 16.3 0.3 14.4 0.3 Total other sales and revenues........... 229.3 3.1 207.6 3.3 181.3 3.4
Total net sales and operating revenues.. $7,465.7 100.0 $6,260.0 100.0 $5,260.3 100.0 RETAIL VEHICLE SALES CHANGES Years Ended February 28 2007 2006 2005 Vehicle units: Used vehicles ......................................................................... 16 % 15% 13 % New vehicles.......................................................................... (11)% 1% (5)% Total........................................................................................... 14 % 14% 11 % Vehicle dollars: Used vehicles ......................................................................... 23 % 19% 15 % New vehicles.......................................................................... (11)% 2% (5)% Total........................................................................................... 20 % 17% 13 % Comparable store used unit sales growth is one of the key drivers of our profitability. A store is included in comparable store retail sales in the store’s fourteenth full month of operation. COMPARABLE STORE RETAIL VEHICLE SALES CHANGES Years Ended February 28 2007 2006 2005 Vehicle units: Used vehicles ......................................................................... 9 % 4% 1% New vehicles.......................................................................... (11)% 1% 8% Total........................................................................................... 8 % 4% 1% Vehicle dollars: Used vehicles ......................................................................... 16 % 8% 3% New vehicles.......................................................................... (12)% 1% 8% Total........................................................................................... 13 % 8% 3%
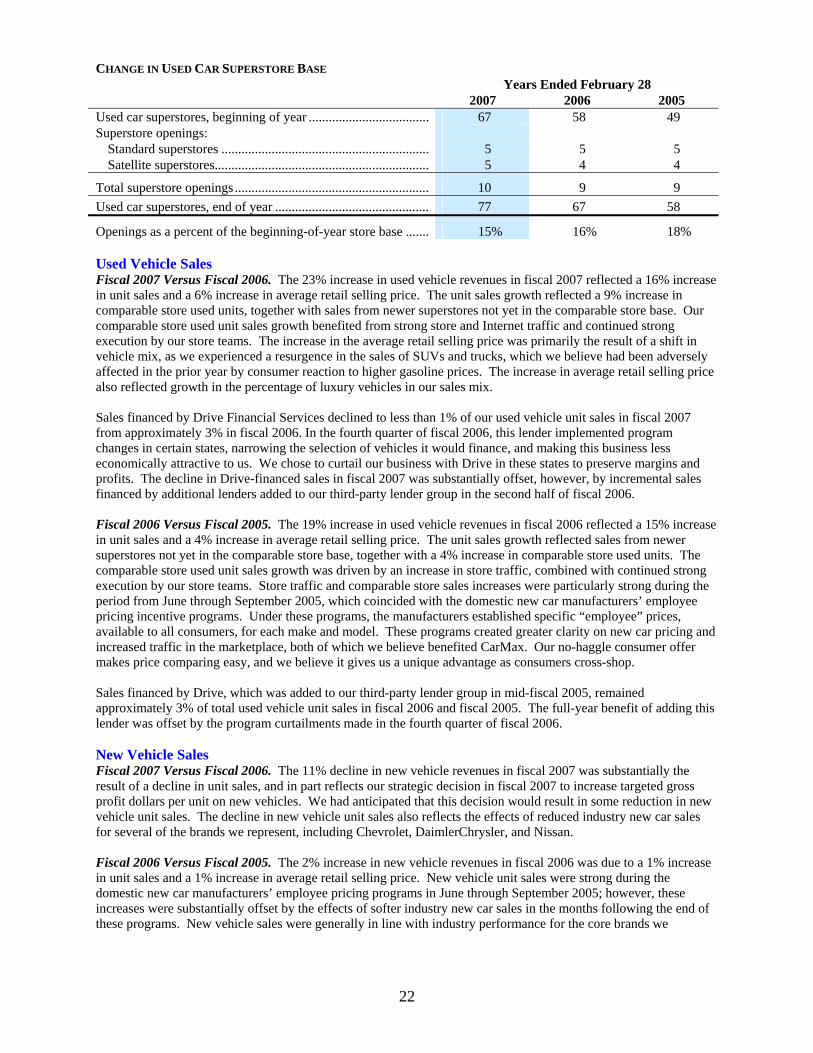
22
CHANGE IN USED CAR SUPERSTORE BASE Years Ended February 28 2007 2006 2005 Used car superstores, beginning of year .................................... 67 58 49 Superstore openings: Standard superstores .............................................................. 5 5 5 Satellite superstores................................................................ 5 4 4
Total superstore openings .......................................................... 10 9 9 Used car superstores, end of year .............................................. 77 67 58
Openings as a percent of the beginning-of-year store base ....... 15% 16% 18% Used Vehicle Sales Fiscal 2007 Versus Fiscal 2006. The 23% increase in used vehicle revenues in fiscal 2007 reflected a 16% increase in unit sales and a 6% increase in average retail selling price. The unit sales growth reflected a 9% increase in comparable store used units, together with sales from newer superstores not yet in the comparable store base. Our comparable store used unit sales growth benefited from strong store and Internet traffic and continued strong execution by our store teams. The increase in the average retail selling price was primarily the result of a shift in vehicle mix, as we experienced a resurgence in the sales of SUVs and trucks, which we believe had been adversely affected in the prior year by consumer reaction to higher gasoline prices. The increase in average retail selling price also reflected growth in the percentage of luxury vehicles in our sales mix. Sales financed by Drive Financial Services declined to less than 1% of our used vehicle unit sales in fiscal 2007 from approximately 3% in fiscal 2006. In the fourth quarter of fiscal 2006, this lender implemented program changes in certain states, narrowing the selection of vehicles it would finance, and making this business less economically attractive to us. We chose to curtail our business with Drive in these states to preserve margins and profits. The decline in Drive-financed sales in fiscal 2007 was substantially offset, however, by incremental sales financed by additional lenders added to our third-party lender group in the second half of fiscal 2006. Fiscal 2006 Versus Fiscal 2005. The 19% increase in used vehicle revenues in fiscal 2006 reflected a 15% increase in unit sales and a 4% increase in average retail selling price. The unit sales growth reflected sales from newer superstores not yet in the comparable store base, together with a 4% increase in comparable store used units. The comparable store used unit sales growth was driven by an increase in store traffic, combined with continued strong execution by our store teams. Store traffic and comparable store sales increases were particularly strong during the period from June through September 2005, which coincided with the domestic new car manufacturers’ employee pricing incentive programs. Under these programs, the manufacturers established specific “employee” prices, available to all consumers, for each make and model. These programs created greater clarity on new car pricing and increased traffic in the marketplace, both of which we believe benefited CarMax. Our no-haggle consumer offer makes price comparing easy, and we believe it gives us a unique advantage as consumers cross-shop.
Sales financed by Drive, which was added to our third-party lender group in mid-fiscal 2005, remained approximately 3% of total used vehicle unit sales in fiscal 2006 and fiscal 2005. The full-year benefit of adding this lender was offset by the program curtailments made in the fourth quarter of fiscal 2006. New Vehicle Sales Fiscal 2007 Versus Fiscal 2006. The 11% decline in new vehicle revenues in fiscal 2007 was substantially the result of a decline in unit sales, and in part reflects our strategic decision in fiscal 2007 to increase targeted gross profit dollars per unit on new vehicles. We had anticipated that this decision would result in some reduction in new vehicle unit sales. The decline in new vehicle unit sales also reflects the effects of reduced industry new car sales for several of the brands we represent, including Chevrolet, DaimlerChrysler, and Nissan.
Fiscal 2006 Versus Fiscal 2005. The 2% increase in new vehicle revenues in fiscal 2006 was due to a 1% increase in unit sales and a 1% increase in average retail selling price. New vehicle unit sales were strong during the domestic new car manufacturers’ employee pricing programs in June through September 2005; however, these increases were substantially offset by the effects of softer industry new car sales in the months following the end of these programs. New vehicle sales were generally in line with industry performance for the core brands we
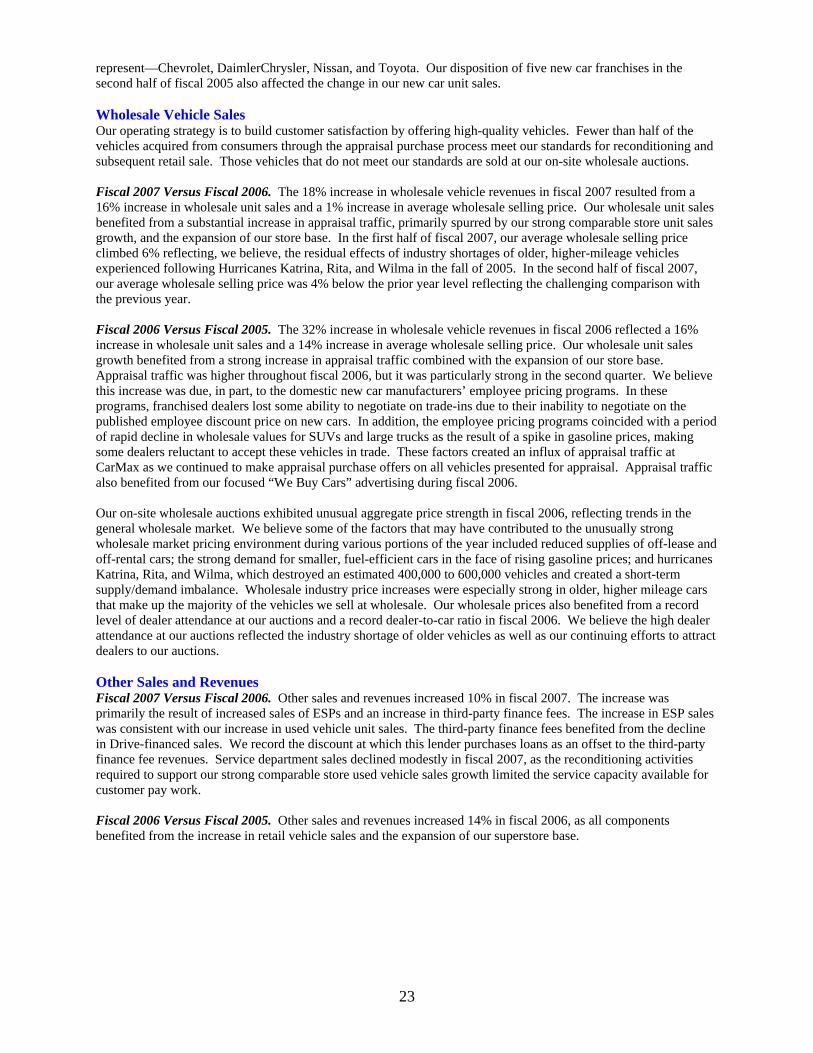
23
represent—Chevrolet, DaimlerChrysler, Nissan, and Toyota. Our disposition of five new car franchises in the second half of fiscal 2005 also affected the change in our new car unit sales. Wholesale Vehicle Sales Our operating strategy is to build customer satisfaction by offering high-quality vehicles. Fewer than half of the vehicles acquired from consumers through the appraisal purchase process meet our standards for reconditioning and subsequent retail sale. Those vehicles that do not meet our standards are sold at our on-site wholesale auctions. Fiscal 2007 Versus Fiscal 2006. The 18% increase in wholesale vehicle revenues in fiscal 2007 resulted from a 16% increase in wholesale unit sales and a 1% increase in average wholesale selling price. Our wholesale unit sales benefited from a substantial increase in appraisal traffic, primarily spurred by our strong comparable store unit sales growth, and the expansion of our store base. In the first half of fiscal 2007, our average wholesale selling price climbed 6% reflecting, we believe, the residual effects of industry shortages of older, higher-mileage vehicles experienced following Hurricanes Katrina, Rita, and Wilma in the fall of 2005. In the second half of fiscal 2007, our average wholesale selling price was 4% below the prior year level reflecting the challenging comparison with the previous year. Fiscal 2006 Versus Fiscal 2005. The 32% increase in wholesale vehicle revenues in fiscal 2006 reflected a 16% increase in wholesale unit sales and a 14% increase in average wholesale selling price. Our wholesale unit sales growth benefited from a strong increase in appraisal traffic combined with the expansion of our store base. Appraisal traffic was higher throughout fiscal 2006, but it was particularly strong in the second quarter. We believe this increase was due, in part, to the domestic new car manufacturers’ employee pricing programs. In these programs, franchised dealers lost some ability to negotiate on trade-ins due to their inability to negotiate on the published employee discount price on new cars. In addition, the employee pricing programs coincided with a period of rapid decline in wholesale values for SUVs and large trucks as the result of a spike in gasoline prices, making some dealers reluctant to accept these vehicles in trade. These factors created an influx of appraisal traffic at CarMax as we continued to make appraisal purchase offers on all vehicles presented for appraisal. Appraisal traffic also benefited from our focused “We Buy Cars” advertising during fiscal 2006.
Our on-site wholesale auctions exhibited unusual aggregate price strength in fiscal 2006, reflecting trends in the general wholesale market. We believe some of the factors that may have contributed to the unusually strong wholesale market pricing environment during various portions of the year included reduced supplies of off-lease and off-rental cars; the strong demand for smaller, fuel-efficient cars in the face of rising gasoline prices; and hurricanes Katrina, Rita, and Wilma, which destroyed an estimated 400,000 to 600,000 vehicles and created a short-term supply/demand imbalance. Wholesale industry price increases were especially strong in older, higher mileage cars that make up the majority of the vehicles we sell at wholesale. Our wholesale prices also benefited from a record level of dealer attendance at our auctions and a record dealer-to-car ratio in fiscal 2006. We believe the high dealer attendance at our auctions reflected the industry shortage of older vehicles as well as our continuing efforts to attract dealers to our auctions. Other Sales and Revenues Fiscal 2007 Versus Fiscal 2006. Other sales and revenues increased 10% in fiscal 2007. The increase was primarily the result of increased sales of ESPs and an increase in third-party finance fees. The increase in ESP sales was consistent with our increase in used vehicle unit sales. The third-party finance fees benefited from the decline in Drive-financed sales. We record the discount at which this lender purchases loans as an offset to the third-party finance fee revenues. Service department sales declined modestly in fiscal 2007, as the reconditioning activities required to support our strong comparable store used vehicle sales growth limited the service capacity available for customer pay work.
Fiscal 2006 Versus Fiscal 2005. Other sales and revenues increased 14% in fiscal 2006, as all components benefited from the increase in retail vehicle sales and the expansion of our superstore base.
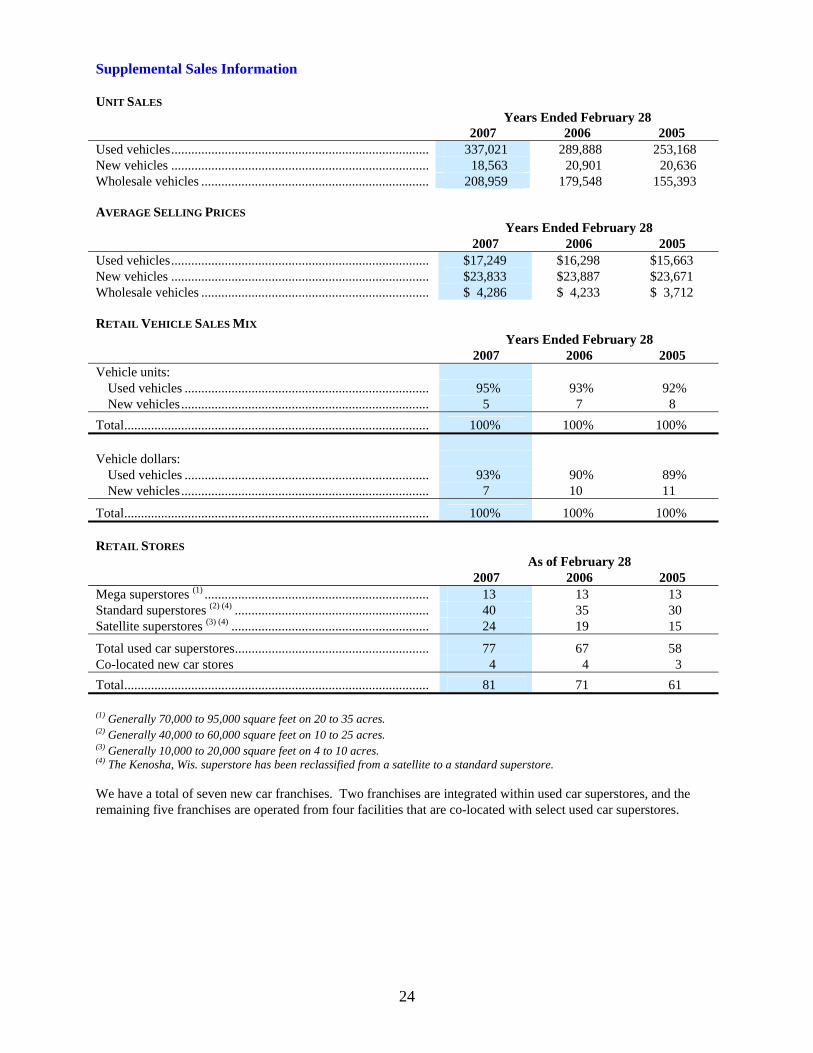
24
Supplemental Sales Information UNIT SALES Years Ended February 28 2007 2006 2005 Used vehicles............................................................................. 337,021 289,888 253,168 New vehicles ............................................................................. 18,563 20,901 20,636 Wholesale vehicles .................................................................... 208,959 179,548 155,393 AVERAGE SELLING PRICES Years Ended February 28 2007 2006 2005 Used vehicles............................................................................. $ 17,249 $ 16,298 $ 15,663 New vehicles ............................................................................. $ 23,833 $ 23,887 $ 23,671 Wholesale vehicles .................................................................... $ 4,286 $ 4,233 $ 3,712 RETAIL VEHICLE SALES MIX Years Ended February 28 2007 2006 2005 Vehicle units: Used vehicles ......................................................................... 95% 93% 92% New vehicles.......................................................................... 5 7 8 Total........................................................................................... 100% 100% 100% Vehicle dollars: Used vehicles ......................................................................... 93% 90% 89% New vehicles.......................................................................... 7 10 11
Total........................................................................................... 100% 100% 100% RETAIL STORES As of February 28 2007 2006 2005 Mega superstores (1) ................................................................... 13 13 13 Standard superstores (2) (4) .......................................................... 40 35 30 Satellite superstores (3) (4) ........................................................... 24 19 15
Total used car superstores.......................................................... 77 67 58 Co-located new car stores 4 4 3 Total........................................................................................... 81 71 61 (1) Generally 70,000 to 95,000 square feet on 20 to 35 acres. (2) Generally 40,000 to 60,000 square feet on 10 to 25 acres. (3) Generally 10,000 to 20,000 square feet on 4 to 10 acres. (4) The Kenosha, Wis. superstore has been reclassified from a satellite to a standard superstore. We have a total of seven new car franchises. Two franchises are integrated within used car superstores, and the remaining five franchises are operated from four facilities that are co-located with select used car superstores.
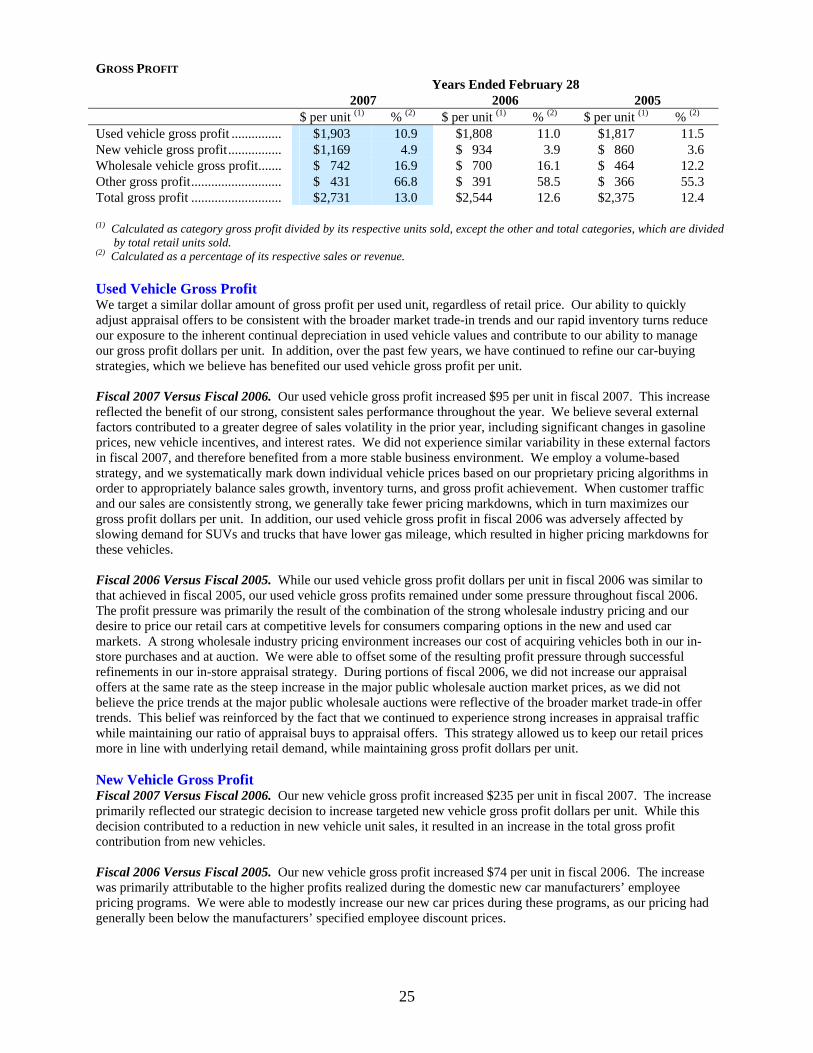
25
GROSS PROFIT Years Ended February 28
2007 2006 2005 $ per unit (1) % (2) $ per unit (1) % (2) $ per unit (1) % (2) Used vehicle gross profit ............... $ 1,903 10.9 $1,808 11.0 $1,817 11.5 New vehicle gross profit................ $ 1,169 4.9 $ 934 3.9 $ 860 3.6 Wholesale vehicle gross profit....... $ 742 16.9 $ 700 16.1 $ 464 12.2 Other gross profit........................... $ 431 66.8 $ 391 58.5 $ 366 55.3 Total gross profit ........................... $ 2,731 13.0 $2,544 12.6 $2,375 12.4 (1) Calculated as category gross profit divided by its respective units sold, except the other and total categories, which are divided
by total retail units sold. (2) Calculated as a percentage of its respective sales or revenue. Used Vehicle Gross Profit We target a similar dollar amount of gross profit per used unit, regardless of retail price. Our ability to quickly adjust appraisal offers to be consistent with the broader market trade-in trends and our rapid inventory turns reduce our exposure to the inherent continual depreciation in used vehicle values and contribute to our ability to manage our gross profit dollars per unit. In addition, over the past few years, we have continued to refine our car-buying strategies, which we believe has benefited our used vehicle gross profit per unit. Fiscal 2007 Versus Fiscal 2006. Our used vehicle gross profit increased $95 per unit in fiscal 2007. This increase reflected the benefit of our strong, consistent sales performance throughout the year. We believe several external factors contributed to a greater degree of sales volatility in the prior year, including significant changes in gasoline prices, new vehicle incentives, and interest rates. We did not experience similar variability in these external factors in fiscal 2007, and therefore benefited from a more stable business environment. We employ a volume-based strategy, and we systematically mark down individual vehicle prices based on our proprietary pricing algorithms in order to appropriately balance sales growth, inventory turns, and gross profit achievement. When customer traffic and our sales are consistently strong, we generally take fewer pricing markdowns, which in turn maximizes our gross profit dollars per unit. In addition, our used vehicle gross profit in fiscal 2006 was adversely affected by slowing demand for SUVs and trucks that have lower gas mileage, which resulted in higher pricing markdowns for these vehicles. Fiscal 2006 Versus Fiscal 2005. While our used vehicle gross profit dollars per unit in fiscal 2006 was similar to that achieved in fiscal 2005, our used vehicle gross profits remained under some pressure throughout fiscal 2006. The profit pressure was primarily the result of the combination of the strong wholesale industry pricing and our desire to price our retail cars at competitive levels for consumers comparing options in the new and used car markets. A strong wholesale industry pricing environment increases our cost of acquiring vehicles both in our in-store purchases and at auction. We were able to offset some of the resulting profit pressure through successful refinements in our in-store appraisal strategy. During portions of fiscal 2006, we did not increase our appraisal offers at the same rate as the steep increase in the major public wholesale auction market prices, as we did not believe the price trends at the major public wholesale auctions were reflective of the broader market trade-in offer trends. This belief was reinforced by the fact that we continued to experience strong increases in appraisal traffic while maintaining our ratio of appraisal buys to appraisal offers. This strategy allowed us to keep our retail prices more in line with underlying retail demand, while maintaining gross profit dollars per unit. New Vehicle Gross Profit Fiscal 2007 Versus Fiscal 2006. Our new vehicle gross profit increased $235 per unit in fiscal 2007. The increase primarily reflected our strategic decision to increase targeted new vehicle gross profit dollars per unit. While this decision contributed to a reduction in new vehicle unit sales, it resulted in an increase in the total gross profit contribution from new vehicles. Fiscal 2006 Versus Fiscal 2005. Our new vehicle gross profit increased $74 per unit in fiscal 2006. The increase was primarily attributable to the higher profits realized during the domestic new car manufacturers’ employee pricing programs. We were able to modestly increase our new car prices during these programs, as our pricing had generally been below the manufacturers’ specified employee discount prices.
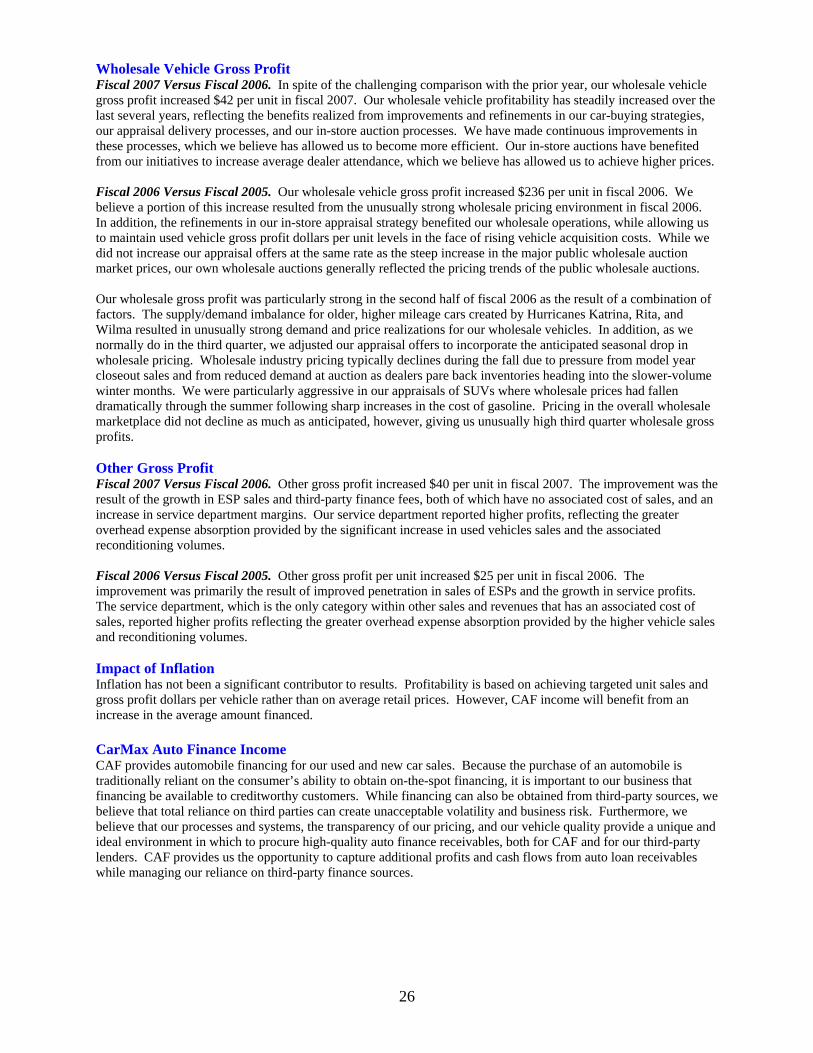
26
Wholesale Vehicle Gross Profit Fiscal 2007 Versus Fiscal 2006. In spite of the challenging comparison with the prior year, our wholesale vehicle gross profit increased $42 per unit in fiscal 2007. Our wholesale vehicle profitability has steadily increased over the last several years, reflecting the benefits realized from improvements and refinements in our car-buying strategies, our appraisal delivery processes, and our in-store auction processes. We have made continuous improvements in these processes, which we believe has allowed us to become more efficient. Our in-store auctions have benefited from our initiatives to increase average dealer attendance, which we believe has allowed us to achieve higher prices. Fiscal 2006 Versus Fiscal 2005. Our wholesale vehicle gross profit increased $236 per unit in fiscal 2006. We believe a portion of this increase resulted from the unusually strong wholesale pricing environment in fiscal 2006. In addition, the refinements in our in-store appraisal strategy benefited our wholesale operations, while allowing us to maintain used vehicle gross profit dollars per unit levels in the face of rising vehicle acquisition costs. While we did not increase our appraisal offers at the same rate as the steep increase in the major public wholesale auction market prices, our own wholesale auctions generally reflected the pricing trends of the public wholesale auctions. Our wholesale gross profit was particularly strong in the second half of fiscal 2006 as the result of a combination of factors. The supply/demand imbalance for older, higher mileage cars created by Hurricanes Katrina, Rita, and Wilma resulted in unusually strong demand and price realizations for our wholesale vehicles. In addition, as we normally do in the third quarter, we adjusted our appraisal offers to incorporate the anticipated seasonal drop in wholesale pricing. Wholesale industry pricing typically declines during the fall due to pressure from model year closeout sales and from reduced demand at auction as dealers pare back inventories heading into the slower-volume winter months. We were particularly aggressive in our appraisals of SUVs where wholesale prices had fallen dramatically through the summer following sharp increases in the cost of gasoline. Pricing in the overall wholesale marketplace did not decline as much as anticipated, however, giving us unusually high third quarter wholesale gross profits. Other Gross Profit Fiscal 2007 Versus Fiscal 2006. Other gross profit increased $40 per unit in fiscal 2007. The improvement was the result of the growth in ESP sales and third-party finance fees, both of which have no associated cost of sales, and an increase in service department margins. Our service department reported higher profits, reflecting the greater overhead expense absorption provided by the significant increase in used vehicles sales and the associated reconditioning volumes. Fiscal 2006 Versus Fiscal 2005. Other gross profit per unit increased $25 per unit in fiscal 2006. The improvement was primarily the result of improved penetration in sales of ESPs and the growth in service profits. The service department, which is the only category within other sales and revenues that has an associated cost of sales, reported higher profits reflecting the greater overhead expense absorption provided by the higher vehicle sales and reconditioning volumes. Impact of Inflation Inflation has not been a significant contributor to results. Profitability is based on achieving targeted unit sales and gross profit dollars per vehicle rather than on average retail prices. However, CAF income will benefit from an increase in the average amount financed. CarMax Auto Finance Income CAF provides automobile financing for our used and new car sales. Because the purchase of an automobile is traditionally reliant on the consumer’s ability to obtain on-the-spot financing, it is important to our business that financing be available to creditworthy customers. While financing can also be obtained from third-party sources, we believe that total reliance on third parties can create unacceptable volatility and business risk. Furthermore, we believe that our processes and systems, the transparency of our pricing, and our vehicle quality provide a unique and ideal environment in which to procure high-quality auto finance receivables, both for CAF and for our third-party lenders. CAF provides us the opportunity to capture additional profits and cash flows from auto loan receivables while managing our reliance on third-party finance sources.
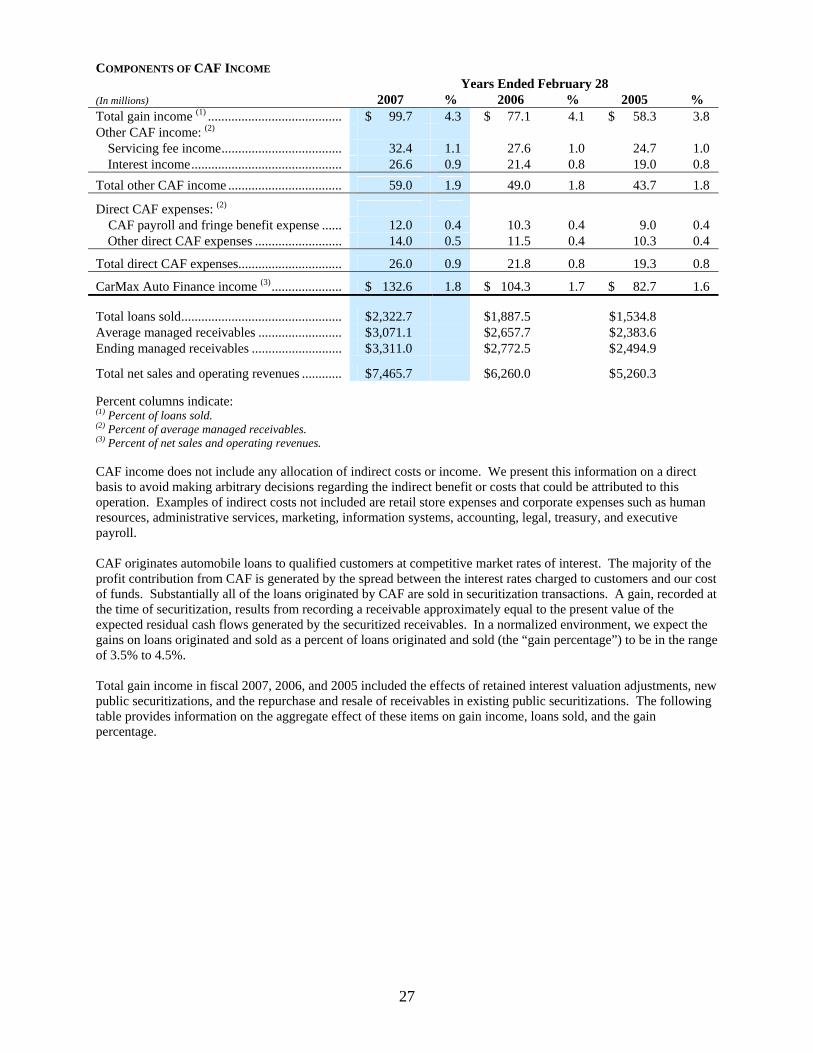
27
COMPONENTS OF CAF INCOME Years Ended February 28 (In millions) 2007 % 2006 % 2005 % Total gain income (1) ........................................ $ 99.7 4.3 $ 77.1 4.1 $ 58.3 3.8 Other CAF income: (2) Servicing fee income.................................... 32.4 1.1 27.6 1.0 24.7 1.0 Interest income............................................. 26.6 0.9 21.4 0.8 19.0 0.8 Total other CAF income .................................. 59.0 1.9 49.0 1.8 43.7 1.8
Direct CAF expenses: (2) CAF payroll and fringe benefit expense ...... 12.0 0.4 10.3 0.4 9.0 0.4 Other direct CAF expenses .......................... 14.0 0.5 11.5 0.4 10.3 0.4
Total direct CAF expenses............................... 26.0 0.9 21.8 0.8 19.3 0.8
CarMax Auto Finance income (3)..................... $ 132.6 1.8 $ 104.3 1.7 $ 82.7 1.6
Total loans sold................................................ $ 2,322.7 $ 1,887.5 $ 1,534.8 Average managed receivables ......................... $ 3,071.1 $ 2,657.7 $ 2,383.6 Ending managed receivables ........................... $ 3,311.0 $ 2,772.5 $ 2,494.9
Total net sales and operating revenues ............ $ 7,465.7 $ 6,260.0 $ 5,260.3 Percent columns indicate: (1) Percent of loans sold. (2) Percent of average managed receivables. (3) Percent of net sales and operating revenues. CAF income does not include any allocation of indirect costs or income. We present this information on a direct basis to avoid making arbitrary decisions regarding the indirect benefit or costs that could be attributed to this operation. Examples of indirect costs not included are retail store expenses and corporate expenses such as human resources, administrative services, marketing, information systems, accounting, legal, treasury, and executive payroll. CAF originates automobile loans to qualified customers at competitive market rates of interest. The majority of the profit contribution from CAF is generated by the spread between the interest rates charged to customers and our cost of funds. Substantially all of the loans originated by CAF are sold in securitization transactions. A gain, recorded at the time of securitization, results from recording a receivable approximately equal to the present value of the expected residual cash flows generated by the securitized receivables. In a normalized environment, we expect the gains on loans originated and sold as a percent of loans originated and sold (the “gain percentage”) to be in the range of 3.5% to 4.5%.
Total gain income in fiscal 2007, 2006, and 2005 included the effects of retained interest valuation adjustments, new public securitizations, and the repurchase and resale of receivables in existing public securitizations. The following table provides information on the aggregate effect of these items on gain income, loans sold, and the gain percentage.
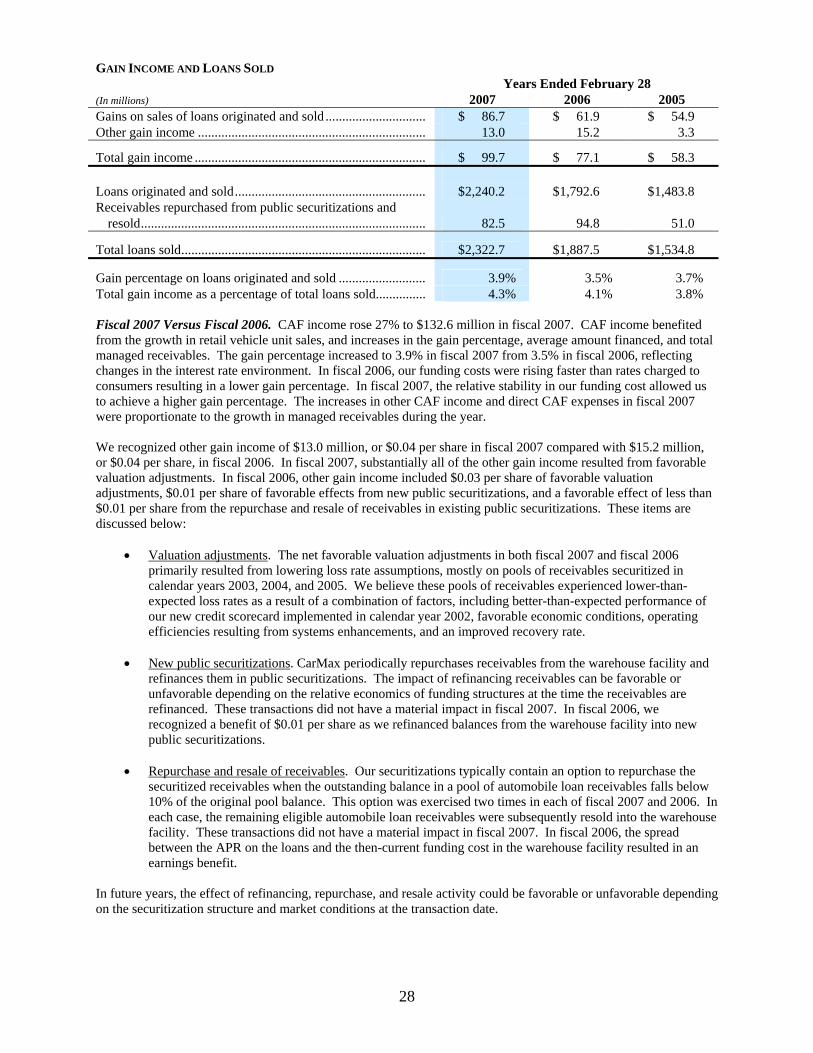
28
GAIN INCOME AND LOANS SOLD Years Ended February 28 (In millions) 2007 2006 2005 Gains on sales of loans originated and sold .............................. $ 86.7 $ 61.9 $ 54.9 Other gain income .................................................................... 13.0 15.2 3.3
Total gain income ..................................................................... $ 99.7 $ 77.1 $ 58.3 Loans originated and sold......................................................... $ 2,240.2 $ 1,792.6 $ 1,483.8 Receivables repurchased from public securitizations and resold..................................................................................... 82.5 94.8 51.0
Total loans sold......................................................................... $ 2,322.7 $ 1,887.5 $ 1,534.8
Gain percentage on loans originated and sold .......................... 3.9% 3.5% 3.7% Total gain income as a percentage of total loans sold............... 4.3% 4.1% 3.8% Fiscal 2007 Versus Fiscal 2006. CAF income rose 27% to $132.6 million in fiscal 2007. CAF income benefited from the growth in retail vehicle unit sales, and increases in the gain percentage, average amount financed, and total managed receivables. The gain percentage increased to 3.9% in fiscal 2007 from 3.5% in fiscal 2006, reflecting changes in the interest rate environment. In fiscal 2006, our funding costs were rising faster than rates charged to consumers resulting in a lower gain percentage. In fiscal 2007, the relative stability in our funding cost allowed us to achieve a higher gain percentage. The increases in other CAF income and direct CAF expenses in fiscal 2007 were proportionate to the growth in managed receivables during the year.
We recognized other gain income of $13.0 million, or $0.04 per share in fiscal 2007 compared with $15.2 million, or $0.04 per share, in fiscal 2006. In fiscal 2007, substantially all of the other gain income resulted from favorable valuation adjustments. In fiscal 2006, other gain income included $0.03 per share of favorable valuation adjustments, $0.01 per share of favorable effects from new public securitizations, and a favorable effect of less than $0.01 per share from the repurchase and resale of receivables in existing public securitizations. These items are discussed below:
• Valuation adjustments. The net favorable valuation adjustments in both fiscal 2007 and fiscal 2006
primarily resulted from lowering loss rate assumptions, mostly on pools of receivables securitized in calendar years 2003, 2004, and 2005. We believe these pools of receivables experienced lower-than-expected loss rates as a result of a combination of factors, including better-than-expected performance of our new credit scorecard implemented in calendar year 2002, favorable economic conditions, operating efficiencies resulting from systems enhancements, and an improved recovery rate.
• New public securitizations. CarMax periodically repurchases receivables from the warehouse facility and
refinances them in public securitizations. The impact of refinancing receivables can be favorable or unfavorable depending on the relative economics of funding structures at the time the receivables are refinanced. These transactions did not have a material impact in fiscal 2007. In fiscal 2006, we recognized a benefit of $0.01 per share as we refinanced balances from the warehouse facility into new public securitizations.
• Repurchase and resale of receivables. Our securitizations typically contain an option to repurchase the
securitized receivables when the outstanding balance in a pool of automobile loan receivables falls below 10% of the original pool balance. This option was exercised two times in each of fiscal 2007 and 2006. In each case, the remaining eligible automobile loan receivables were subsequently resold into the warehouse facility. These transactions did not have a material impact in fiscal 2007. In fiscal 2006, the spread between the APR on the loans and the then-current funding cost in the warehouse facility resulted in an earnings benefit.
In future years, the effect of refinancing, repurchase, and resale activity could be favorable or unfavorable depending on the securitization structure and market conditions at the transaction date.
29
Fiscal 2006 Versus Fiscal 2005. CAF income rose 26% to $104.3 million in fiscal 2006. The fiscal 2006 total gain income benefited from the growth in retail vehicle sales and a substantial increase in other gain income, partially offset by a modest decline in the gain percentage to 3.5% from 3.7% in fiscal 2005. The increases in other CAF income and direct CAF expenses in fiscal 2006 were proportionate to the growth in managed receivables during the year.
Other gain income was $15.2 million in fiscal 2006 compared with $3.3 million in fiscal 2005. In fiscal 2005, approximately half of the other gain income related to favorable valuation adjustments, and the remainder primarily resulted from the repurchase and resale of receivables in existing public securitizations. PAST DUE ACCOUNT INFORMATION As of February 28 (In millions) 2007 2006 2005 Loans securitized ...................................................................... $ 3,242.1 $ 2,710.4 $ 2,427.2 Loans held for sale or investment ............................................. 68.9 62.0 67.7
Total managed receivables ....................................................... $ 3,311.0 $ 2,772.5 $ 2,494.9
Accounts 31+ days past due ..................................................... $ 56.9 $ 37.4 $ 31.1 Past due accounts as a percentage of total managed receivables............................................................................. 1.72% 1.35% 1.24% CREDIT LOSS INFORMATION Years Ended February 28 (In millions) 2007 2006 2005 Net credit losses on managed receivables................................ $ 20.7 $ 18.4 $ 19.5 Average managed receivables ................................................. $ 3,071.1 $ 2,657.7 $ 2,383.6 Net credit losses as a percentage of average managed receivables............................................................................ 0.67% 0.69% 0.82% Recovery rate........................................................................... 51% 51% 46% We are at risk for the performance of the managed securitized receivables to the extent of our retained interest in the receivables. If the managed receivables do not perform in accordance with the assumptions used in determining the fair value of the retained interest, earnings could be impacted. Past due accounts as a percentage of total managed receivables increased moderately in fiscal 2007. While credit losses as a percentage of averaged managed receivables decreased slightly in fiscal 2007, the decrease was attributable to favorability in the first half of the year, offset by higher losses in the second half of the year. We believe the increase in losses during the second half of the year was the result of a combination of factors, including a gradual shift in credit mix of the portfolio as well as less favorable general economic and industry trends. Receivables originated in calendar years 2003, 2004, and early 2005 have experienced loss rates well below both CAF’s historical averages and our targeted loss rates. We believe this favorability was due, in part, to the credit scorecard we implemented in late 2002. As it became evident that the scorecard was resulting in lower-than-expected loss rates, CAF gradually expanded its credit offers beginning in late 2004. As a result, receivables originated in late 2005 and 2006 have been experiencing higher loss and delinquency rates than receivables originated in those prior years. The changes in loss and delinquency rates were largely anticipated and were incorporated in our initial loss assumptions for these pools.
The recovery rate represents the average percentage of the outstanding principal balance we receive when a vehicle is repossessed and liquidated at wholesale auction. We believe the improvement in the recovery rate in fiscal 2006 reflected the stronger wholesale market pricing environment. Selling, General, and Administrative Expenses Fiscal 2007 Versus Fiscal 2006. The SG&A ratio declined to 10.4% from 10.8% in fiscal 2006. We benefited from the leverage of fixed expenses generated by our strong comparable store sales growth. The improvement in the fiscal 2007 SG&A ratio was partially offset by an increase in share-based compensation costs and by the recognition of an impairment loss totaling $4.9 million, or $0.01 per share. The impairment loss related to the write down of intangible assets associated with one of our new car franchises.
30
We recognized $32.7 million, or $0.09 per share, of share-based compensation costs in fiscal 2007, $30.4 million of which was included in SG&A, compared with $22.4 million, or $0.07 per share, in fiscal 2006, all of which was included in SG&A. The increase in share-based compensation cost was driven, in large part, by the accelerated vesting of stock options upon the retirement of our former chief executive officer in August 2006. Fiscal 2006 Versus Fiscal 2005. The SG&A ratio increased slightly to 10.8% from 10.7% in fiscal 2005. The moderate rate of increase in comparable store used unit sales in fiscal 2006 was not sufficient to provide SG&A leverage. The increase in the percentage of our store base that is comprised of newer stores not yet at basic maturity, which generally occurs in the fifth year of operation, also was a contributing factor. Newer stores typically experience higher SG&A ratios during their first four years of operation. On average, 45% of our stores were less than four years old in fiscal 2006 compared with 37% in fiscal 2005. Costs associated with the launch of market-wide television advertising in Los Angeles in fiscal 2006 and the lower-than-normal corporate bonus expense in fiscal 2005 also precluded SG&A leverage. Income Taxes The effective income tax rate was 38.6% in fiscal 2007, 38.3% in fiscal 2006, and 38.9% in fiscal 2005. The fiscal 2006 decrease resulted primarily from a legal entity reorganization in the fourth quarter of fiscal 2005. We created a centralized corporate management entity in an effort to obtain operational, legal, and other benefits that also resulted in state tax efficiencies. OPERATIONS OUTLOOK Store Openings and Capital Expenditures During the fiscal year ending February 29, 2008, we plan to expand our used car superstore base by approximately 17%, opening an estimated 13 used car superstores. FISCAL 2008 PLANNED SUPERSTORE OPENINGS Location
Television Market
Market Status
Standard Superstores
Satellite Superstores
Tucson, Ariz. .................... Tucson................................. New market .................. 1 − Milwaukee, Wis................ Milwaukee........................... New market .................. − 2 Torrance, Calif.................. Los Angeles......................... Existing market............. − 1 Roswell, Ga. ..................... Atlanta................................. Existing market............. − 1 Newport News, Va. .......... Norfolk / Virginia Beach..... Existing market............. − 1 Gastonia, N.C. .................. Charlotte.............................. Existing market............. 1 − Kearney Mesa, Calif. ........ San Diego............................ New market .................. − 1 Modesto, Calif. ................. Sacramento.......................... Existing market............. 1 − Riverside, Calif................. Los Angeles......................... Existing market............. − 1 Omaha, Neb...................... Omaha ................................. New market .................. 1 − Jackson, Miss.................... Jackson ................................ New market .................. 1 − Ellicott City, Md. .............. DC / Baltimore .................... Existing market............. − 1
Total planned openings................................................................................................. 5 8 We expect to enter five new markets and expand our presence in six existing markets in fiscal 2008. We currently expect to open approximately four superstores in the first half of fiscal 2008 and nine superstores in the second half of the year. However, normal construction, permitting, or other scheduling delays could shift opening dates of stores into the following fiscal year. In fiscal 2008, we also plan to open three additional car buying centers, with one each in the Raleigh, Dallas, and Tampa markets. These sites will expand a test begun in fiscal 2007, when we opened our first car buying center in the Atlanta market. We only conduct appraisals and purchase cars at these sites and do not sell cars. These test stores are part of our long-term program to increase both appraisal traffic and retail vehicle sourcing self-sufficiency. We currently estimate gross capital expenditures will total approximately $300 million in fiscal 2008. Planned expenditures primarily relate to new store construction and land purchases associated with future year store openings. Compared with the approximately $192 million spent in fiscal 2007, the fiscal 2008 capital spending
31
estimate reflects more real estate purchases for future development in larger, multi-store markets. In addition, the fiscal 2007 capital spending amount was lower than originally projected, due in part to the acquisition of some store sites pursuant to ground leases. Fiscal 2008 Expectations The fiscal 2008 expectations discussed below are based on historical and current trends in our business and should be read in conjunction with “Risk Factors,” in Part I, Item 1A of this Form 10-K. Fiscal 2008 Sales. We currently anticipate comparable store used unit growth for fiscal 2008 in the range of 3% to 9%. We also expect wholesale unit sales growth to be consistent with our total used unit sales increase. Total revenues are expected to climb by between 14% and 20%, reflecting our expectations for comparable store used unit growth, new store openings, a modest increase in used vehicle average selling price, and a continued decline in our new vehicle sales. Fiscal 2008 Earnings Per Share. We currently anticipate fiscal 2008 earnings per share in the range of $1.03 to $1.14, representing EPS growth in the range of 12% to 24%. We expect modest improvement in both used vehicle and wholesale gross profits per unit in fiscal 2008, as we continue to refine and improve our car-buying processes. We expect CAF income to increase modestly, but at a pace slower than anticipated sales growth, primarily reflecting the challenging comparison created by the $13.0 million of favorable CAF items reported in fiscal 2007. The CAF gain percentage is anticipated to be slightly above the midpoint of our normalized 3.5% to 4.5% range in fiscal 2008, assuming no significant change in the interest rate environment. Our effective tax rate for fiscal 2008 is expected to be similar to the fiscal 2007 rate. However, our diluted share count is expected to increase by approximately 3%, reflecting the effects of the recent increase in our stock price and option exercises on the weighted average share calculation. The diluted share count for the fourth quarter of fiscal 2007 was 1.4% higher than the average for the full year, accounting for approximately one-half of the anticipated 3% increase. RECENT ACCOUNTING PRONOUNCEMENTS For a discussion of recent accounting pronouncements applicable to the company, see Note 15. FINANCIAL CONDITION Operating Activities We generated net cash from operating activities of $136.8 million in fiscal 2007, $117.5 million in fiscal 2006, and $41.8 million in fiscal 2005. Cash generated from operating activities was $19.3 million higher in fiscal 2007 compared with fiscal 2006. The $64.4 million increase in net earnings in fiscal 2007 was more than offset by the increased growth in inventories. Inventories increased by $166.4 million in fiscal 2007 compared with a $93.1 million increase in fiscal 2006. The fiscal 2007 inventory increase related to store openings during fiscal 2007 and shortly after the end of the fiscal year, as well as to added vehicle inventory required to support our strong increase in fourth quarter comparable store used unit sales. Cash generated from operating activities was $75.7 million higher in fiscal 2006 compared with fiscal 2005. The increase reflected the $32.9 million increase in net earnings in fiscal 2006 and a $44.6 million reduction in the year-over-year growth in working capital. The aggregate principal amount of automobile loan receivables funded through securitizations, which are discussed in Notes 3 and 4 totaled $3.24 billion at February 28, 2007, $2.71 billion at February 28, 2006, and $2.43 billion at February 28, 2005. During fiscal 2007, we completed three public automobile securitizations totaling $1.87 billion. At February 28, 2007, the warehouse facility limit was $825.0 million and unused warehouse capacity totaled $227.0 million. The warehouse facility matures in July 2007. Note 4 includes a discussion of the warehouse facility. We anticipate that we will be able to renew, expand, or enter into new securitization arrangements to meet CAF’s future needs.
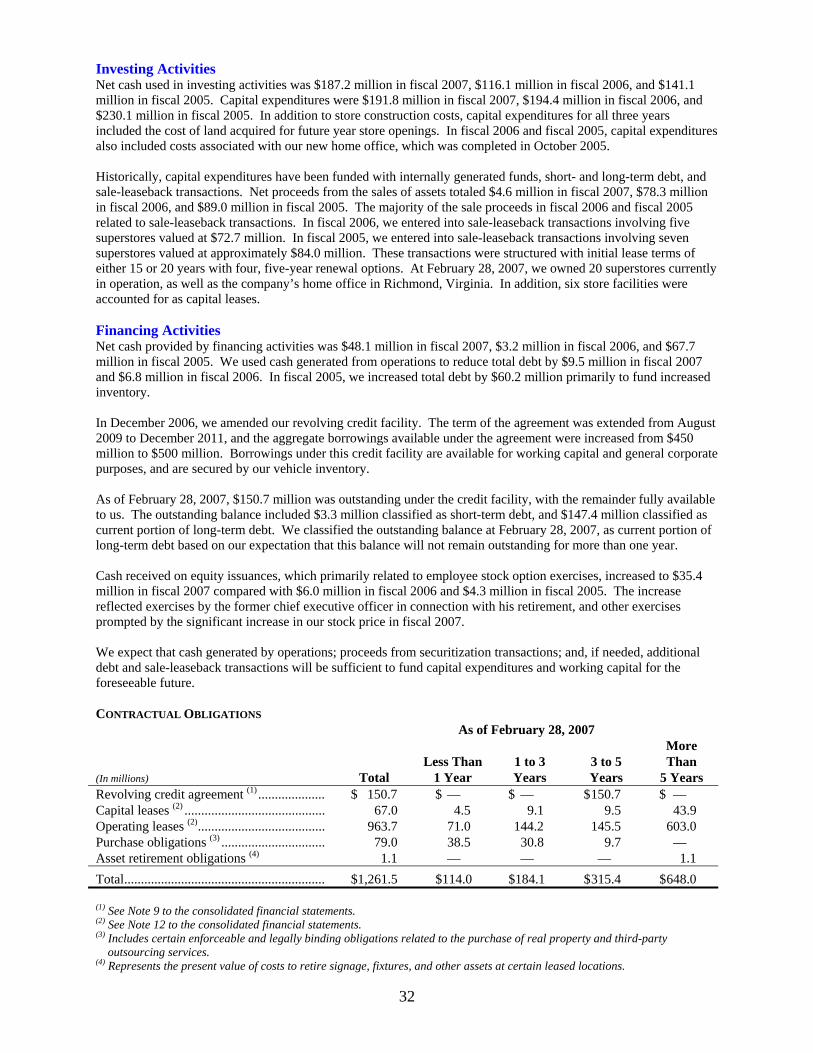
32
Investing Activities Net cash used in investing activities was $187.2 million in fiscal 2007, $116.1 million in fiscal 2006, and $141.1 million in fiscal 2005. Capital expenditures were $191.8 million in fiscal 2007, $194.4 million in fiscal 2006, and $230.1 million in fiscal 2005. In addition to store construction costs, capital expenditures for all three years included the cost of land acquired for future year store openings. In fiscal 2006 and fiscal 2005, capital expenditures also included costs associated with our new home office, which was completed in October 2005. Historically, capital expenditures have been funded with internally generated funds, short- and long-term debt, and sale-leaseback transactions. Net proceeds from the sales of assets totaled $4.6 million in fiscal 2007, $78.3 million in fiscal 2006, and $89.0 million in fiscal 2005. The majority of the sale proceeds in fiscal 2006 and fiscal 2005 related to sale-leaseback transactions. In fiscal 2006, we entered into sale-leaseback transactions involving five superstores valued at $72.7 million. In fiscal 2005, we entered into sale-leaseback transactions involving seven superstores valued at approximately $84.0 million. These transactions were structured with initial lease terms of either 15 or 20 years with four, five-year renewal options. At February 28, 2007, we owned 20 superstores currently in operation, as well as the company’s home office in Richmond, Virginia. In addition, six store facilities were accounted for as capital leases. Financing Activities Net cash provided by financing activities was $48.1 million in fiscal 2007, $3.2 million in fiscal 2006, and $67.7 million in fiscal 2005. We used cash generated from operations to reduce total debt by $9.5 million in fiscal 2007 and $6.8 million in fiscal 2006. In fiscal 2005, we increased total debt by $60.2 million primarily to fund increased inventory. In December 2006, we amended our revolving credit facility. The term of the agreement was extended from August 2009 to December 2011, and the aggregate borrowings available under the agreement were increased from $450 million to $500 million. Borrowings under this credit facility are available for working capital and general corporate purposes, and are secured by our vehicle inventory. As of February 28, 2007, $150.7 million was outstanding under the credit facility, with the remainder fully available to us. The outstanding balance included $3.3 million classified as short-term debt, and $147.4 million classified as current portion of long-term debt. We classified the outstanding balance at February 28, 2007, as current portion of long-term debt based on our expectation that this balance will not remain outstanding for more than one year. Cash received on equity issuances, which primarily related to employee stock option exercises, increased to $35.4 million in fiscal 2007 compared with $6.0 million in fiscal 2006 and $4.3 million in fiscal 2005. The increase reflected exercises by the former chief executive officer in connection with his retirement, and other exercises prompted by the significant increase in our stock price in fiscal 2007. We expect that cash generated by operations; proceeds from securitization transactions; and, if needed, additional debt and sale-leaseback transactions will be sufficient to fund capital expenditures and working capital for the foreseeable future. CONTRACTUAL OBLIGATIONS As of February 28, 2007
(In millions)
Total Less Than
1 Year 1 to 3 Years
3 to 5 Years
More Than
5 Years Revolving credit agreement (1) .................... $ 150.7 $ — $ — $ 150.7 $ — Capital leases (2) .......................................... 67.0 4.5 9.1 9.5 43.9 Operating leases (2)...................................... 963.7 71.0 144.2 145.5 603.0 Purchase obligations (3) ............................... 79.0 38.5 30.8 9.7 — Asset retirement obligations (4) 1.1 — — — 1.1 Total............................................................ $1,261.5 $114.0 $184.1 $ 315.4 $ 648.0 (1) See Note 9 to the consolidated financial statements. (2) See Note 12 to the consolidated financial statements. (3) Includes certain enforceable and legally binding obligations related to the purchase of real property and third-party
outsourcing services. (4) Represents the present value of costs to retire signage, fixtures, and other assets at certain leased locations.
33
Off-Balance Sheet Arrangements CAF provides financing for our used and new car sales. We use a securitization program to fund substantially all of the automobile loan receivables originated by CAF. We sell the automobile loan receivables to a wholly owned, bankruptcy-remote, special purpose entity that transfers an undivided interest in the receivables to a group of third-party investors. This program is referred to as the warehouse facility. We periodically use public securitizations to refinance the receivables previously securitized through the warehouse facility. In a public securitization, a pool of automobile loan receivables is sold to a bankruptcy-remote, special purpose entity that in turn transfers the receivables to a special purpose securitization trust. Additional information regarding the nature, business purposes, and importance of our off-balance sheet arrangement to our liquidity and capital resources can be found in the CarMax Auto Finance Income, Financial Condition, and Market Risk sections of this MD&A, as well as in Notes 3 and 4.
34
Item 7A. Quantitative and Qualitative Disclosures about Market Risk. Automobile Installment Loan Receivables At February 28, 2007, and February 28, 2006, all loans in our portfolio of automobile loan receivables were fixed-rate installment loans. Financing for these automobile loan receivables is achieved through asset securitization programs that, in turn, issue both fixed- and floating-rate securities. We manage the interest rate exposure relating to floating-rate securitizations through the use of interest rate swaps. Receivables held for investment or sale are financed with working capital. Generally, changes in interest rates associated with underlying swaps will not have a material impact on earnings. However, changes in interest rates associated with underlying swaps may have a material impact on cash and cash flows. Credit risk is the exposure to nonperformance of another party to an agreement. We mitigate credit risk by dealing with highly rated bank counterparties. The market and credit risks associated with financial derivatives are similar to those relating to other types of financial instruments. Refer to Note 5 for a description of these items. COMPOSITION OF AUTOMOBILE LOAN RECEIVABLES As of February 28 (In millions) 2007 2006 Principal amount of: Fixed-rate securitizations ......................................................................................... $2,644.1 $2,126.4 Floating-rate securitizations synthetically altered to fixed....................................... 597.5 584.0 Floating-rate securitizations ..................................................................................... 0.6 — Loans held for investment (1) ................................................................................... 62.7 57.9 Loans held for sale (2) ............................................................................................... 6.2 4.1
Total............................................................................................................................. $3,311.0 $2,772.5
(1) The majority is held by a bankruptcy-remote special purpose entity. (2) Held by a bankruptcy-remote special purpose entity. Interest Rate Exposure We also have interest rate risk from changing interest rates related to our outstanding debt. Substantially all of our debt is floating-rate debt based on LIBOR. A 100-basis point increase in market interest rates would have decreased our fiscal 2007 net earnings per share by less than $0.01.
35
Item 8. Consolidated Financial Statements and Supplementary Data. MANAGEMENT’S ANNUAL REPORT ON INTERNAL CONTROL OVER FINANCIAL REPORTING Management is responsible for establishing and maintaining adequate internal control over financial reporting for the company. Because of its inherent limitations, internal control over financial reporting may not prevent or detect misstatements. Accordingly, even effective internal control over financial reporting can provide only reasonable assurance regarding the reliability of financial reporting and the preparation of financial statements for external purposes in accordance with U.S. generally accepted accounting principles. Management conducted an evaluation of the effectiveness of our internal control over financial reporting based on the framework and criteria established in Internal Control—Integrated Framework, issued by the Committee of Sponsoring Organizations of the Treadway Commission. Based on this evaluation, our management has concluded that our internal control over financial reporting was effective as of February 28, 2007. KPMG LLP, the company's independent registered public accounting firm, has issued a report on our management's assessment of our internal control over financial reporting. Their report is included herein.
THOMAS J. FOLLIARD PRESIDENT AND CHIEF EXECUTIVE OFFICER
KEITH D. BROWNING EXECUTIVE VICE PRESIDENT AND CHIEF FINANCIAL OFFICER
36
REPORT OF INDEPENDENT REGISTERED PUBLIC ACCOUNTING FIRM The Board of Directors and Shareholders CarMax, Inc.: We have audited management's assessment, included in the accompanying Management's Annual Report on Internal Control Over Financial Reporting, that CarMax, Inc. and subsidiaries (the “Company”) maintained effective internal control over financial reporting as of February 28, 2007, based on criteria established in Internal Control—Integrated Framework issued by the Committee of Sponsoring Organizations of the Treadway Commission (COSO). The Company's management is responsible for maintaining effective internal control over financial reporting and for its assessment of the effectiveness of internal control over financial reporting. Our responsibility is to express an opinion on management's assessment and an opinion on the effectiveness of the Company's internal control over financial reporting based on our audit. We conducted our audit in accordance with the standards of the Public Company Accounting Oversight Board (United States). Those standards require that we plan and perform the audit to obtain reasonable assurance about whether effective internal control over financial reporting was maintained in all material respects. Our audit included obtaining an understanding of internal control over financial reporting, evaluating management's assessment, testing and evaluating the design and operating effectiveness of internal control, and performing such other procedures as we considered necessary in the circumstances. We believe that our audit provides a reasonable basis for our opinion. A company's internal control over financial reporting is a process designed to provide reasonable assurance regarding the reliability of financial reporting and the preparation of financial statements for external purposes in accordance with U.S. generally accepted accounting principles. A company's internal control over financial reporting includes those policies and procedures that (1) pertain to the maintenance of records that, in reasonable detail, accurately and fairly reflect the transactions and dispositions of the assets of the company; (2) provide reasonable assurance that transactions are recorded as necessary to permit preparation of financial statements in accordance with U.S. generally accepted accounting principles, and that receipts and expenditures of the company are being made only in accordance with authorizations of management and directors of the company; and (3) provide reasonable assurance regarding prevention or timely detection of unauthorized acquisition, use, or disposition of the company's assets that could have a material effect on the consolidated financial statements. Because of its inherent limitations, internal control over financial reporting may not prevent or detect misstatements. Also, projections of any evaluation of effectiveness to future periods are subject to the risk that controls may become inadequate because of changes in conditions, or that the degree of compliance with the policies or procedures may deteriorate. In our opinion, management's assessment that CarMax, Inc. and subsidiaries maintained effective internal control over financial reporting as of February 28, 2007, is fairly stated, in all material respects, based on criteria established in Internal Control—Integrated Framework issued by the Committee of Sponsoring Organizations of the Treadway Commission (COSO). Also, in our opinion, CarMax, Inc. and subsidiaries maintained, in all material respects, effective internal control over financial reporting as of February 28, 2007, based on criteria established in Internal Control—Integrated Framework issued by the Committee of Sponsoring Organizations of the Treadway Commission (COSO). We also have audited, in accordance with the standards of the Public Company Accounting Oversight Board (United States), the consolidated balance sheets of CarMax, Inc. and subsidiaries as of February 28, 2007 and 2006, and the related consolidated statements of earnings, shareholders' equity, and cash flows for each of the fiscal years in the three-year period ended February 28, 2007, and our report dated April 25, 2007 expressed an unqualified opinion on those consolidated financial statements.
Richmond, Virginia April 25, 2007
37
REPORT OF INDEPENDENT REGISTERED PUBLIC ACCOUNTING FIRM
The Board of Directors and Shareholders CarMax, Inc.:
We have audited the accompanying consolidated balance sheets of CarMax, Inc. and subsidiaries (the “Company”) as of February 28, 2007 and 2006, and the related consolidated statements of earnings, shareholders’ equity, and cash flows for each of the fiscal years in the three-year period ended February 28, 2007. In connection with our audits of the consolidated financial statements, we also have audited the financial statement Schedule II – valuation and qualifying accounts as of and for each of the fiscal years in the three-year period ended February 28, 2007. These consolidated financial statements and financial statement schedule are the responsibility of the Company’s management. Our responsibility is to express an opinion on these consolidated financial statements and financial statement schedule based on our audits.
We conducted our audits in accordance with the standards of the Public Company Accounting Oversight Board (United States). Those standards require that we plan and perform the audit to obtain reasonable assurance about whether the financial statements are free of material misstatement. An audit includes examining, on a test basis, evidence supporting the amounts and disclosures in the financial statements. An audit also includes assessing the accounting principles used and significant estimates made by management, as well as evaluating the overall financial statement presentation. We believe that our audits provide a reasonable basis for our opinion.
In our opinion, the consolidated financial statements referred to above present fairly, in all material respects, the financial position of CarMax, Inc. and subsidiaries as of February 28, 2007 and 2006, and the results of their operations and their cash flows for each of the fiscal years in the three-year period ended February 28, 2007, in conformity with U.S. generally accepted accounting principles. Also in our opinion, the related financial statement schedule, when considered in relation to the basic consolidated financial statements taken as a whole, present fairly, in all material respects, the information set forth therein.
As discussed in Notes 2(A) and 10(C) to the consolidated financial statements, the Company adopted the provisions of Statement of Financial Accounting Standards No. 123 (revised 2004) (Statement 123(R)), Share-Based Payment, effective March 1, 2006, using the modified retrospective transition method. As discussed in Note 8(A) to the consolidated financial statements, the Company adopted the provisions of Statement of Financial Accounting Standards No. 158, Employers’ Accounting for Defined Pension and Other Postretirement Plans, effective February 28, 2007.
We also have audited, in accordance with the standards of the Public Company Accounting Oversight Board (United States), the effectiveness of the Company’s internal control over financial reporting as of February 28, 2007, based on criteria established in Internal Control–Integrated Framework issued by the Committee of Sponsoring Organizations of the Treadway Commission (COSO), and our report dated April 25, 2007, expressed an unqualified opinion on management’s assessment of, and the effective operation of, internal control over financial reporting.
Richmond, Virginia April 25, 2007
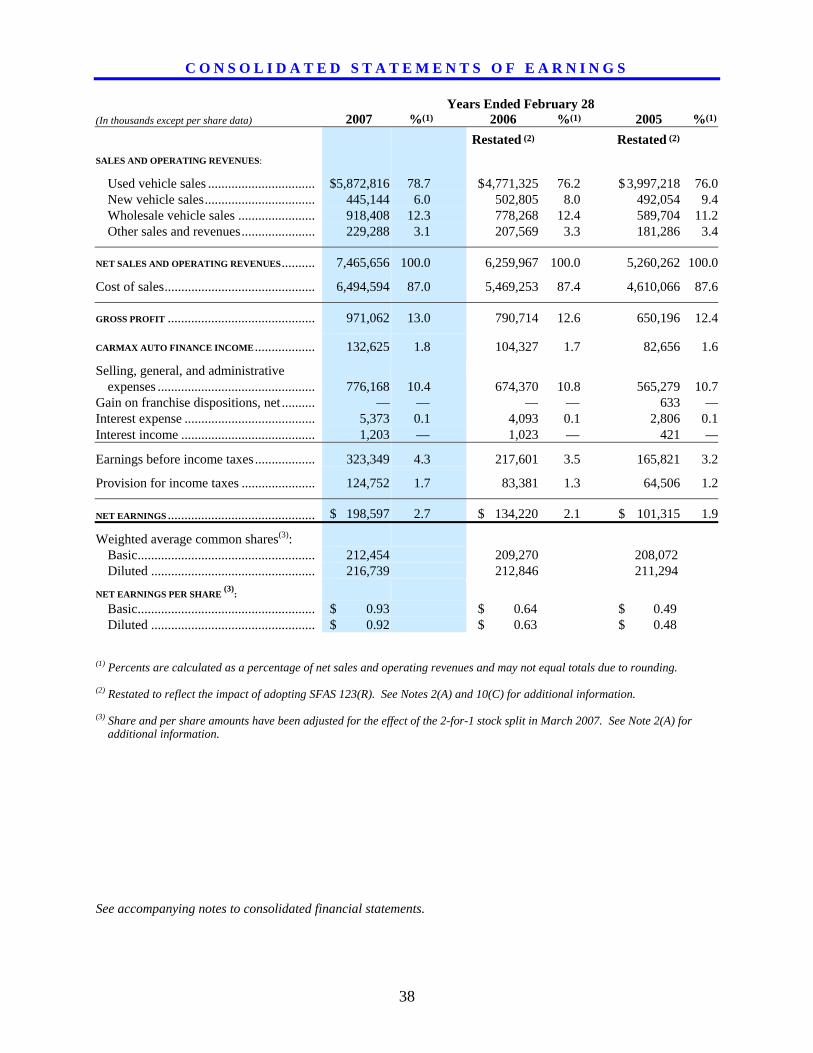
38
C O N S O L I D A T E D S T A T E M E N T S O F E A R N I N G S
Years Ended February 28 (In thousands except per share data) 2007 %(1) 2006 %(1) 2005 %(1)
Restated (2) Restated (2)
SALES AND OPERATING REVENUES:
Used vehicle sales ................................ $ 5,872,816 78.7 $ 4,771,325 76.2 $ 3,997,218 76.0New vehicle sales................................. 445,144 6.0 502,805 8.0 492,054 9.4Wholesale vehicle sales ....................... 918,408 12.3 778,268 12.4 589,704 11.2Other sales and revenues...................... 229,288 3.1 207,569 3.3 181,286 3.4
NET SALES AND OPERATING REVENUES.......... 7,465,656 100.0 6,259,967 100.0 5,260,262 100.0
Cost of sales............................................. 6,494,594 87.0 5,469,253 87.4 4,610,066 87.6
GROSS PROFIT ............................................ 971,062 13.0 790,714 12.6 650,196 12.4
CARMAX AUTO FINANCE INCOME .................. 132,625 1.8 104,327 1.7 82,656 1.6
Selling, general, and administrative expenses ............................................... 776,168 10.4 674,370 10.8 565,279 10.7
Gain on franchise dispositions, net .......... — — — — 633 —Interest expense ....................................... 5,373 0.1 4,093 0.1 2,806 0.1Interest income ........................................ 1,203 — 1,023 — 421 —
Earnings before income taxes.................. 323,349 4.3 217,601 3.5 165,821 3.2
Provision for income taxes ...................... 124,752 1.7 83,381 1.3 64,506 1.2
NET EARNINGS ............................................ $ 198,597 2.7 $ 134,220 2.1 $ 101,315 1.9
Weighted average common shares(3): Basic..................................................... 212,454 209,270 208,072Diluted ................................................. 216,739 212,846 211,294
NET EARNINGS PER SHARE (3):
Basic..................................................... $ 0.93 $ 0.64 $ 0.49Diluted ................................................. $ 0.92 $ 0.63 $ 0.48
(1) Percents are calculated as a percentage of net sales and operating revenues and may not equal totals due to rounding. (2) Restated to reflect the impact of adopting SFAS 123(R). See Notes 2(A) and 10(C) for additional information. (3) Share and per share amounts have been adjusted for the effect of the 2-for-1 stock split in March 2007. See Note 2(A) for
additional information. See accompanying notes to consolidated financial statements.
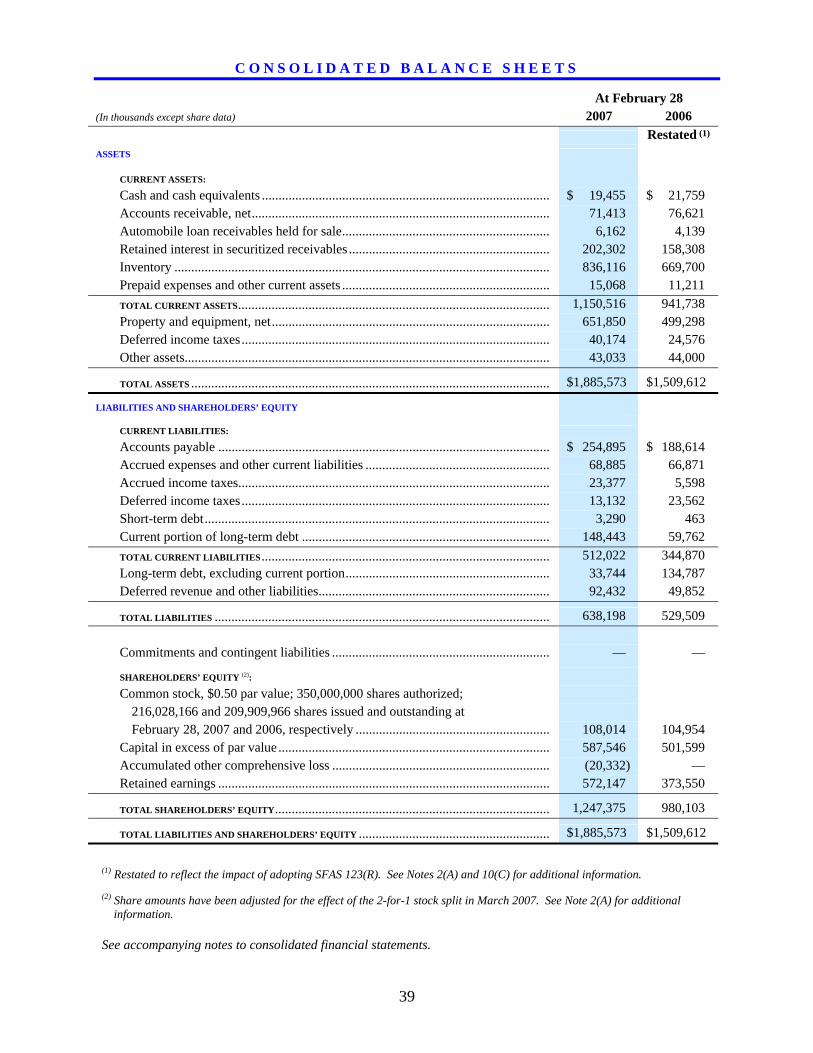
39
C O N S O L I D A T E D B A L A N C E S H E E T S
At February 28 (In thousands except share data) 2007 2006 Restated (1)
ASSETS
CURRENT ASSETS:
Cash and cash equivalents ...................................................................................... $ 19,455 $ 21,759 Accounts receivable, net......................................................................................... 71,413 76,621 Automobile loan receivables held for sale.............................................................. 6,162 4,139 Retained interest in securitized receivables ............................................................ 202,302 158,308 Inventory ................................................................................................................ 836,116 669,700 Prepaid expenses and other current assets .............................................................. 15,068 11,211 TOTAL CURRENT ASSETS............................................................................................. 1,150,516 941,738 Property and equipment, net................................................................................... 651,850 499,298 Deferred income taxes............................................................................................ 40,174 24,576 Other assets............................................................................................................. 43,033 44,000
TOTAL ASSETS ........................................................................................................... $1,885,573 $1,509,612
LIABILITIES AND SHAREHOLDERS’ EQUITY
CURRENT LIABILITIES:
Accounts payable ................................................................................................... $ 254,895 $ 188,614 Accrued expenses and other current liabilities ....................................................... 68,885 66,871 Accrued income taxes............................................................................................. 23,377 5,598 Deferred income taxes............................................................................................ 13,132 23,562 Short-term debt....................................................................................................... 3,290 463 Current portion of long-term debt .......................................................................... 148,443 59,762 TOTAL CURRENT LIABILITIES...................................................................................... 512,022 344,870 Long-term debt, excluding current portion............................................................. 33,744 134,787 Deferred revenue and other liabilities..................................................................... 92,432 49,852
TOTAL LIABILITIES .................................................................................................... 638,198 529,509 Commitments and contingent liabilities ................................................................. — —
SHAREHOLDERS’ EQUITY (2): Common stock, $0.50 par value; 350,000,000 shares authorized;
216,028,166 and 209,909,966 shares issued and outstanding at February 28, 2007 and 2006, respectively .......................................................... 108,014 104,954
Capital in excess of par value ................................................................................. 587,546 501,599 Accumulated other comprehensive loss ................................................................. (20,332) — Retained earnings ................................................................................................... 572,147 373,550
TOTAL SHAREHOLDERS’ EQUITY.................................................................................. 1,247,375 980,103
TOTAL LIABILITIES AND SHAREHOLDERS’ EQUITY ......................................................... $1,885,573 $1,509,612
(1) Restated to reflect the impact of adopting SFAS 123(R). See Notes 2(A) and 10(C) for additional information. (2) Share amounts have been adjusted for the effect of the 2-for-1 stock split in March 2007. See Note 2(A) for additional
information.
See accompanying notes to consolidated financial statements.
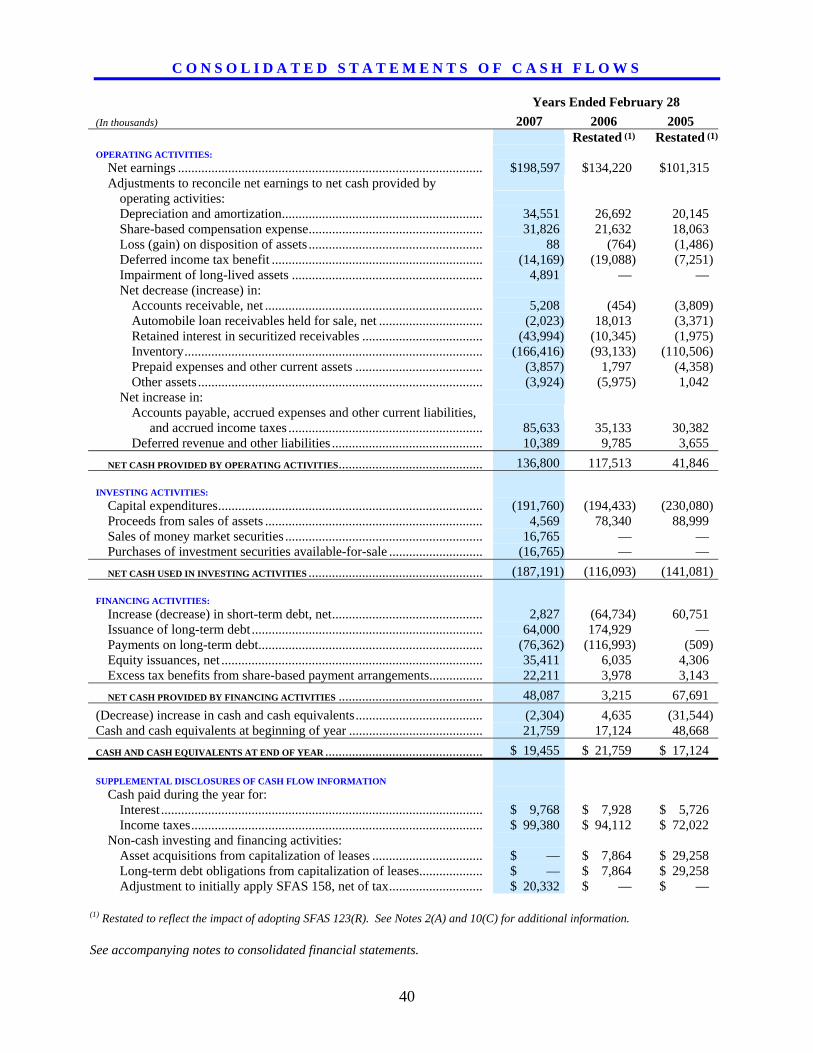
40
C O N S O L I D A T E D S T A T E M E N T S O F C A S H F L O W S
Years Ended February 28 (In thousands) 2007 2006 2005 Restated (1) Restated (1)
OPERATING ACTIVITIES: Net earnings ........................................................................................... $198,597 $134,220 $101,315 Adjustments to reconcile net earnings to net cash provided by
operating activities: Depreciation and amortization............................................................ 34,551 26,692 20,145 Share-based compensation expense.................................................... 31,826 21,632 18,063 Loss (gain) on disposition of assets .................................................... 88 (764) (1,486)Deferred income tax benefit ............................................................... (14,169) (19,088) (7,251)Impairment of long-lived assets ......................................................... 4,891 — — Net decrease (increase) in:
Accounts receivable, net ................................................................. 5,208 (454) (3,809)Automobile loan receivables held for sale, net ............................... (2,023) 18,013 (3,371)Retained interest in securitized receivables .................................... (43,994) (10,345) (1,975)Inventory......................................................................................... (166,416) (93,133) (110,506)Prepaid expenses and other current assets ...................................... (3,857) 1,797 (4,358)Other assets ..................................................................................... (3,924) (5,975) 1,042
Net increase in: Accounts payable, accrued expenses and other current liabilities,
and accrued income taxes .......................................................... 85,633 35,133 30,382 Deferred revenue and other liabilities ............................................. 10,389 9,785 3,655
NET CASH PROVIDED BY OPERATING ACTIVITIES........................................... 136,800 117,513 41,846
INVESTING ACTIVITIES: Capital expenditures............................................................................... (191,760) (194,433) (230,080)Proceeds from sales of assets ................................................................. 4,569 78,340 88,999 Sales of money market securities ........................................................... 16,765 — — Purchases of investment securities available-for-sale ............................ (16,765) — — NET CASH USED IN INVESTING ACTIVITIES .................................................... (187,191) (116,093) (141,081)
FINANCING ACTIVITIES: Increase (decrease) in short-term debt, net............................................. 2,827 (64,734) 60,751 Issuance of long-term debt ..................................................................... 64,000 174,929 — Payments on long-term debt................................................................... (76,362) (116,993) (509)Equity issuances, net .............................................................................. 35,411 6,035 4,306 Excess tax benefits from share-based payment arrangements................ 22,211 3,978 3,143 NET CASH PROVIDED BY FINANCING ACTIVITIES ........................................... 48,087 3,215 67,691
(Decrease) increase in cash and cash equivalents...................................... (2,304) 4,635 (31,544)Cash and cash equivalents at beginning of year ........................................ 21,759 17,124 48,668 CASH AND CASH EQUIVALENTS AT END OF YEAR ............................................... $ 19,455 $ 21,759 $ 17,124
SUPPLEMENTAL DISCLOSURES OF CASH FLOW INFORMATION Cash paid during the year for:
Interest ................................................................................................ $ 9,768 $ 7,928 $ 5,726 Income taxes....................................................................................... $ 99,380 $ 94,112 $ 72,022
Non-cash investing and financing activities: Asset acquisitions from capitalization of leases ................................. $ — $ 7,864 $ 29,258 Long-term debt obligations from capitalization of leases................... $ — $ 7,864 $ 29,258 Adjustment to initially apply SFAS 158, net of tax............................ $ 20,332 $ — $ —
(1) Restated to reflect the impact of adopting SFAS 123(R). See Notes 2(A) and 10(C) for additional information. See accompanying notes to consolidated financial statements.
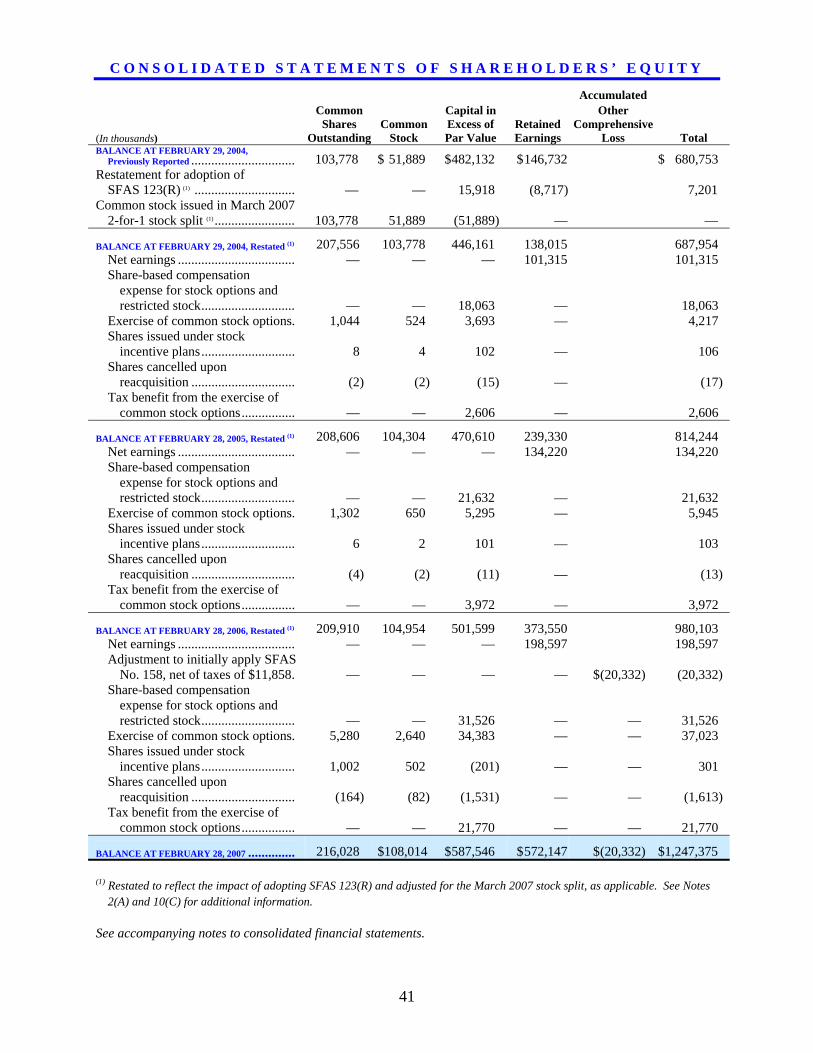
41
C O N S O L I D A T E D S T A T E M E N T S O F S H A R E H O L D E R S ’ E Q U I T Y
Accumulated Common Capital in Other Shares Common Excess of Retained Comprehensive (In thousands) Outstanding Stock Par Value Earnings Loss Total BALANCE AT FEBRUARY 29, 2004,
Previously Reported ............................... 103,778 $ 51,889 $ 482,132 $ 146,732 $ 680,753 Restatement for adoption of
SFAS 123(R) (1) .............................. — — 15,918 (8,717) 7,201 Common stock issued in March 2007
2-for-1 stock split (1) ........................ 103,778 51,889 (51,889) — —
BALANCE AT FEBRUARY 29, 2004, Restated (1) 207,556 103,778 446,161 138,015 687,954 Net earnings ................................... — — — 101,315 101,315 Share-based compensation
expense for stock options and restricted stock............................ — — 18,063 — 18,063
Exercise of common stock options. 1,044 524 3,693 — 4,217 Shares issued under stock
incentive plans............................ 8 4 102 — 106 Shares cancelled upon
reacquisition ............................... (2) (2) (15) — (17) Tax benefit from the exercise of
common stock options................ — — 2,606 — 2,606
BALANCE AT FEBRUARY 28, 2005, Restated (1) 208,606 104,304 470,610 239,330 814,244 Net earnings ................................... — — — 134,220 134,220 Share-based compensation
expense for stock options and restricted stock............................ — — 21,632 — 21,632
Exercise of common stock options. 1,302 650 5,295 — 5,945 Shares issued under stock
incentive plans............................ 6 2 101 — 103 Shares cancelled upon
reacquisition ............................... (4) (2) (11) — (13) Tax benefit from the exercise of
common stock options................ — — 3,972 — 3,972
BALANCE AT FEBRUARY 28, 2006, Restated (1) 209,910 104,954 501,599 373,550 980,103 Net earnings ................................... — — — 198,597 198,597 Adjustment to initially apply SFAS
No. 158, net of taxes of $11,858. — — — — $ (20,332) (20,332) Share-based compensation
expense for stock options and restricted stock............................ — — 31,526 — — 31,526
Exercise of common stock options. 5,280 2,640 34,383 — — 37,023 Shares issued under stock
incentive plans............................ 1,002 502 (201) — — 301 Shares cancelled upon
reacquisition ............................... (164) (82) (1,531) — — (1,613) Tax benefit from the exercise of
common stock options................ — — 21,770 — — 21,770
BALANCE AT FEBRUARY 28, 2007 .............. 216,028 $108,014 $ 587,546 $ 572,147 $ (20,332) $1,247,375 (1) Restated to reflect the impact of adopting SFAS 123(R) and adjusted for the March 2007 stock split, as applicable. See Notes
2(A) and 10(C) for additional information. See accompanying notes to consolidated financial statements.
42
N O T E S T O C O N S O L I D A T E D F I N A N C I A L S T A T E M E N T S
1. BUSINESS AND BACKGROUND
CarMax, Inc. (“we”, “our”, “us”, “CarMax”, and “the company”), including its wholly owned subsidiaries, is the largest retailer of used vehicles in the United States. We were the first used vehicle retailer to offer a large selection of quality used vehicles at low, “no-haggle” prices using a customer-friendly sales process in an attractive, modern sales facility. We also sell new vehicles under various franchise agreements. We provide our customers with a full range of related services, including the financing of vehicle purchases through our own finance operation, CarMax Auto Finance (“CAF”), and third-party lenders; the sale of extended service plans; the appraisal and purchase of vehicles directly from consumers; and vehicle repair service. Vehicles purchased through the appraisal process that do not meet our retail standards are sold at on-site wholesale auctions.
2. SUMMARY OF SIGNIFICANT ACCOUNTING POLICIES
(A) Basis of Presentation and Use of Estimates The consolidated financial statements include the accounts of CarMax and our wholly owned subsidiaries. All significant intercompany balances and transactions have been eliminated in consolidation. The preparation of financial statements in conformity with U.S. generally accepted accounting principles requires management to make estimates and assumptions that affect the reported amounts of assets, liabilities, revenues, and expenses, and the disclosure of contingent assets and liabilities. Actual results could differ from those estimates. We adopted Statement of Financial Accounting Standards (“SFAS”) No. 123 (Revised 2004), “Share-Based Payment” (“SFAS 123(R)”), effective March 1, 2006, applying the modified retrospective method. As a result, we have restated prior period amounts to reflect the adoption of this standard. The impact of the adoption of SFAS 123(R) on net income for fiscal 2006 and fiscal 2005 is consistent with the pro forma amounts disclosed in our previous annual reports to shareholders. See Note 10(C) for further discussion. On February 22, 2007, the board of directors declared a 2-for-1 stock split in the form of a common stock dividend for shareholders of record on March 19, 2007, which was distributed on March 26, 2007. All share and per share data included in the consolidated financial statements and accompanying notes have been adjusted to reflect this stock split. (B) Cash and Cash Equivalents Cash equivalents of $1.5 million at February 28, 2007, and $6.0 million at February 28, 2006, consisted of highly liquid investments with original maturities of three months or less. (C) Securitizations The transfers of receivables associated with our automobile loan securitization program are accounted for as sales. We retain an interest in the automobile loan receivables that we securitize. The retained interest presented on our consolidated balance sheets includes the present value of the expected residual cash flows generated by the securitized receivables, various reserve accounts, and an undivided ownership interest in the securitized receivables. The retained interest is carried at fair value, and changes in fair value are included in earnings. See Notes 3 and 4 for additional discussion of securitizations. (D) Fair Value of Financial Instruments Due to the short-term nature and/or variable rates associated with these financial instruments, the carrying value of our cash and cash equivalents, receivables including automobile loan receivables, accounts payable, short-term debt, and long-term debt approximates fair value. Our retained interest in securitized receivables and derivative financial instruments are recorded on the consolidated balance sheets at fair value. (E) Trade Accounts Receivable Trade accounts receivable, net of an allowance for doubtful accounts, include certain amounts due from finance companies and customers, as well as from manufacturers for incentives and from third parties for warranty reimbursements, and for other miscellaneous receivables. The estimate for doubtful accounts is based on historical experience and trends.
43
(F) Inventory Inventory is comprised primarily of vehicles held for sale or undergoing reconditioning and is stated at the lower of cost or market. Vehicle inventory cost is determined by specific identification. Parts and labor used to recondition vehicles, as well as transportation and other incremental expenses associated with acquiring and reconditioning vehicles, are included in inventory. Certain manufacturer incentives and rebates for new car inventory, including holdbacks, are recognized as a reduction to new car inventory when we purchase the vehicles. We recognize volume-based incentives as a reduction to cost of sales when we determine the achievement of qualifying sales volumes is probable. (G) Property and Equipment Property and equipment is stated at cost less accumulated depreciation and amortization. Depreciation and amortization are calculated using the straight-line method over the shorter of the asset's estimated useful life or the lease term, if applicable. Property held under capital lease is stated at the lesser of the present value of the future minimum lease payments at the inception of the lease or fair value. Amortization of capital lease assets is computed on a straight-line basis over the shorter of the initial lease term or the estimated useful life of the asset and is included in depreciation expense. Costs incurred during new store construction are capitalized as construction-in-progress and reclassified to the appropriate fixed asset category when the store opens. ESTIMATED USEFUL LIVES Life Buildings.......................................................................................................................................... 25 – 40 years Capital leases ................................................................................................................................... 10 – 20 years Leasehold improvements ................................................................................................................. 8 – 15 years Furniture, fixtures, and equipment................................................................................................... 5 – 15 years We review long-lived assets for impairment when circumstances indicate the carrying amount of an asset may not be recoverable. We recognize impairment when the sum of undiscounted estimated future cash flows expected to result from the use of the asset is less than the carrying value of the asset. (H) Other Assets Computer Software Costs We capitalize external direct costs of materials and services used in the development of internal-use software and payroll and payroll-related costs for employees directly involved in the development of internal-use software. We amortize amounts capitalized on a straight-line basis over five years. Goodwill and Intangible Assets We review goodwill and intangible assets for impairment annually or when circumstances indicate the carrying amount may not be recoverable. Restricted Cash Deposits At February 28, 2007, and February 28, 2006, other assets included restricted cash deposits of $21.7 million and $17.7 million, respectively, associated with certain insurance programs. (I) Defined Benefit Plan Obligations Defined benefit retirement plan obligations are included in accrued expenses and other current liabilities and deferred revenue and other liabilities on our consolidated balance sheets. The current portion represents benefits expected to be paid over the next 12 months from our benefit restoration plan. We previously reported defined benefit retirement plan obligations entirely in accrued expenses and other current liabilities. The defined benefit retirement plan obligations are determined by independent actuaries using a number of assumptions provided by the company. Key assumptions used in measuring the plan obligations include the discount rate, the estimated long-term return on plan assets, the estimated rate of compensation increases, and the mortality rate. On February 28, 2007, we adopted SFAS No. 158, “Employers’ Accounting for Defined Benefit Pension and Other Postretirement Plans – an amendment of FASB Statements No. 87, 88, 106 and 132(R),” (“SFAS 158”). See Note 8(A) for additional discussion. (J) Insurance Liabilities Insurance liabilities are included in accrued expenses and other current liabilities on our consolidated balance sheets. We use a combination of insurance and self-insurance for a number of risks including workers' compensation,
44
general liability, and employee-related health care costs, a portion of which is paid by associates. Estimated insurance liabilities are determined by considering historical claims experience, demographic factors, and other actuarial assumptions. (K) Store Opening Expenses Costs related to store openings, including preopening costs, are expensed as incurred. (L) Income Taxes We file a consolidated federal income tax return for a majority of our subsidiaries. Certain subsidiaries are required to file separate partnership or corporate federal income tax returns. Deferred income taxes reflect the impact of temporary differences between the amounts of assets and liabilities recognized for financial reporting purposes and the amounts recognized for income tax purposes, measured by applying currently enacted tax laws. A deferred tax asset is recognized if it is more likely than not that a benefit will be realized. Changes in tax laws and tax rates are reflected in the income tax provision in the period in which the changes are enacted. (M) Revenue Recognition We recognize revenue when the earnings process is complete, generally either at the time of sale to a customer or upon delivery to a customer. As part of our customer service strategy, we guarantee the vehicles we sell with a 5-day, money-back guarantee. If a customer returns the vehicle purchased within the parameters of the guarantee, we will refund the customer's money. We record a reserve for returns based on historical experience and trends. We sell extended service plans on behalf of unrelated third parties. These service plans have terms of coverage ranging from 12 to 72 months. Because the third parties are the primary obligors under these service plans, we recognize commission revenue at the time of sale, net of a reserve for estimated customer returns. The reserve for returns is based on historical experience and trends. We collect sales taxes and other taxes from customers on behalf of governmental authorities at the time of sale. These taxes are accounted for on a net basis and are not included in net sales and operating revenues or cost of sales. (N) Advertising Expenses Advertising costs are expensed as incurred. Advertising expenses are included in selling, general, and administrative expenses in our consolidated statements of earnings. (O) Net Earnings Per Share Basic net earnings per share is computed by dividing net earnings by the weighted average number of shares of common stock outstanding. Diluted net earnings per share is computed by dividing net earnings by the sum of the weighted average number of shares of common stock outstanding and dilutive potential common stock. (P) Derivative Financial Instruments In connection with certain securitization activities, we enter into interest rate swap agreements to manage our exposure to interest rates and to more closely match funding costs to the use of funding. We recognize the interest rate swaps as either assets or liabilities on the consolidated balance sheets at fair value with changes in fair value included in earnings as a component of CAF income. (Q) Risks and Uncertainties We sell used and new vehicles. The diversity of our customers and suppliers and the highly fragmented nature of the U.S. automotive retail market reduce the risk that near term changes in our customer base, sources of supply, or competition will have a severe impact on our business. However, management cannot assure that unanticipated events will not have a negative impact on the company. (R) Reclassifications Certain prior year amounts have been reclassified to conform to the current year’s presentation. The consolidated balance sheets and consolidated statements of cash flows reflect the reclassification of retirement plan liabilities of $18,445 at February 28, 2006, and $11,545 at February 28, 2005, from accrued expenses and other current liabilities to deferred revenue and other liabilities.
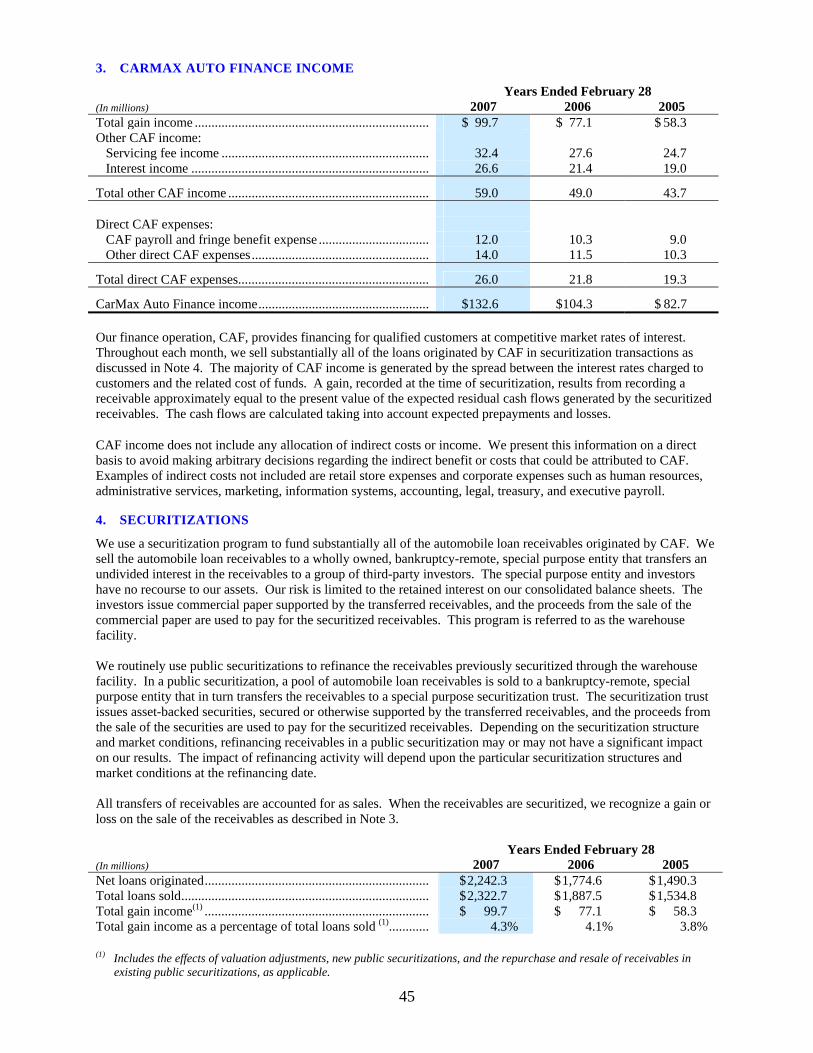
45
3. CARMAX AUTO FINANCE INCOME
Years Ended February 28 (In millions) 2007 2006 2005 Total gain income ...................................................................... $ 99.7 $ 77.1 $ 58.3 Other CAF income: Servicing fee income .............................................................. 32.4 27.6 24.7 Interest income ....................................................................... 26.6 21.4 19.0
Total other CAF income ............................................................ 59.0 49.0 43.7 Direct CAF expenses: CAF payroll and fringe benefit expense ................................. 12.0 10.3 9.0 Other direct CAF expenses..................................................... 14.0 11.5 10.3
Total direct CAF expenses......................................................... 26.0 21.8 19.3
CarMax Auto Finance income................................................... $ 132.6 $ 104.3 $ 82.7 Our finance operation, CAF, provides financing for qualified customers at competitive market rates of interest. Throughout each month, we sell substantially all of the loans originated by CAF in securitization transactions as discussed in Note 4. The majority of CAF income is generated by the spread between the interest rates charged to customers and the related cost of funds. A gain, recorded at the time of securitization, results from recording a receivable approximately equal to the present value of the expected residual cash flows generated by the securitized receivables. The cash flows are calculated taking into account expected prepayments and losses. CAF income does not include any allocation of indirect costs or income. We present this information on a direct basis to avoid making arbitrary decisions regarding the indirect benefit or costs that could be attributed to CAF. Examples of indirect costs not included are retail store expenses and corporate expenses such as human resources, administrative services, marketing, information systems, accounting, legal, treasury, and executive payroll.
4. SECURITIZATIONS
We use a securitization program to fund substantially all of the automobile loan receivables originated by CAF. We sell the automobile loan receivables to a wholly owned, bankruptcy-remote, special purpose entity that transfers an undivided interest in the receivables to a group of third-party investors. The special purpose entity and investors have no recourse to our assets. Our risk is limited to the retained interest on our consolidated balance sheets. The investors issue commercial paper supported by the transferred receivables, and the proceeds from the sale of the commercial paper are used to pay for the securitized receivables. This program is referred to as the warehouse facility. We routinely use public securitizations to refinance the receivables previously securitized through the warehouse facility. In a public securitization, a pool of automobile loan receivables is sold to a bankruptcy-remote, special purpose entity that in turn transfers the receivables to a special purpose securitization trust. The securitization trust issues asset-backed securities, secured or otherwise supported by the transferred receivables, and the proceeds from the sale of the securities are used to pay for the securitized receivables. Depending on the securitization structure and market conditions, refinancing receivables in a public securitization may or may not have a significant impact on our results. The impact of refinancing activity will depend upon the particular securitization structures and market conditions at the refinancing date. All transfers of receivables are accounted for as sales. When the receivables are securitized, we recognize a gain or loss on the sale of the receivables as described in Note 3. Years Ended February 28 (In millions) 2007 2006 2005 Net loans originated................................................................... $ 2,242.3 $ 1,774.6 $ 1,490.3 Total loans sold.......................................................................... $ 2,322.7 $ 1,887.5 $ 1,534.8 Total gain income(1) ................................................................... $ 99.7 $ 77.1 $ 58.3 Total gain income as a percentage of total loans sold (1)............ 4.3% 4.1% 3.8%
(1) Includes the effects of valuation adjustments, new public securitizations, and the repurchase and resale of receivables in existing public securitizations, as applicable.
46
Retained Interest We retain an interest in the automobile loan receivables that we securitize. The retained interest, presented as a current asset on our consolidated balance sheets, serves as a credit enhancement for the benefit of the investors in the securitized receivables. The retained interest includes the present value of the expected residual cash flows generated by the securitized receivables, or “interest-only strip receivables,” various reserve accounts, and an undivided ownership interest in the securitized receivables, or “required excess receivables,” as described below. On a combined basis, the reserve accounts and required excess receivables are generally 2% to 4% of managed receivables. The special purpose entities and the investors have no recourse to our assets. The fair value of the retained interest was $202.3 million as of February 28, 2007, and $158.3 million as of February 28, 2006. The retained interest had a weighted average life of 1.5 years as of February 28, 2007, and February 28, 2006. The weighted average life in periods (for example, months or years) of prepayable assets is calculated by multiplying the principal collections expected in each future period by the number of periods until that future period, summing those products, and dividing the sum by the initial principal balance. Interest-only strip receivables. Interest-only strip receivables represent the present value of residual cash flows we expect to receive over the life of the securitized receivables. The value of these receivables is determined by estimating the future cash flows using our assumptions of key factors, such as finance charge income, loss rates, prepayment rates, and discount rates appropriate for the type of asset and risk. The value of interest-only strip receivables may be affected by external factors, such as changes in the behavior patterns of customers, changes in the strength of the economy, and developments in the interest rate markets; therefore, actual performance may differ from these assumptions. We evaluate the performance of the receivables relative to these assumptions on a regular basis. Any financial impact resulting from a change in performance is recognized in earnings in the period in which it occurs. Reserve accounts. We are required to fund various reserve accounts established for the benefit of the securitization investors. In the event that the cash generated by the securitized receivables in a given period was insufficient to pay the interest, principal, and other required payments, the balances on deposit in the reserve accounts would be used to pay those amounts. In general, each of our securitizations requires that an amount equal to a specified percentage of the original balance of the securitized receivables be deposited in a reserve account on the closing date and that any excess cash generated by the receivables be used to fund the reserve account to the extent necessary to maintain the required amount. If the amount on deposit in the reserve account exceeds the required amount, the excess is released through the special purpose entity to the company. In the public securitizations, the amount required to be on deposit in the reserve account must equal or exceed a specified floor amount. The reserve account remains funded until the investors are paid in full, at which time the remaining balance is released through the special purpose entity to the company. The amount on deposit in reserve accounts was $31.5 million as of February 28, 2007, and $29.0 million as of February 28, 2006. Required excess receivables. The total value of the securitized receivables must exceed, by a specified amount, the principal amount owed to the investors. The required excess receivables balance represents this specified amount. Any cash flows generated by the required excess receivables are used, if needed, to make payments to the investors. Any remaining cash flows from the required excess receivables are released through the special purpose entity to the company. The unpaid principal balance related to the required excess receivables was $57.0 million as of February 28, 2007, and $52.2 million as of February 28, 2006.
Key Assumptions Used in Measuring the Retained Interest and Sensitivity Analysis The following table shows the key economic assumptions used in measuring the fair value of the retained interest at February 28, 2007, and a sensitivity analysis showing the hypothetical effect on the retained interest if there were unfavorable variations from the assumptions used. These sensitivity analyses are hypothetical and should be used with caution. In this table, the effect of a variation in a particular assumption on the fair value of the retained interest is calculated without changing any other assumption; in actual circumstances, changes in one factor may result in changes in another, which might magnify or counteract the sensitivities.
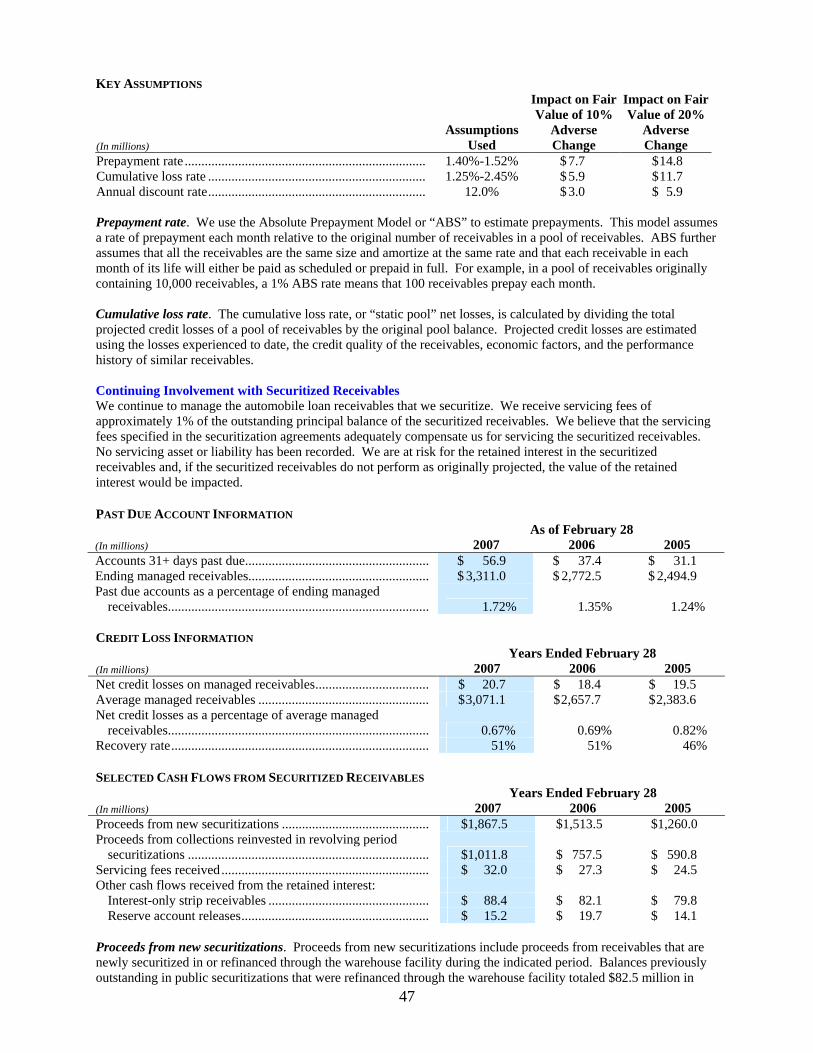
47
KEY ASSUMPTIONS
(In millions) Assumptions
Used
Impact on Fair Value of 10%
Adverse Change
Impact on Fair Value of 20%
Adverse Change
Prepayment rate ........................................................................ 1.40%-1.52% $ 7.7 $ 14.8 Cumulative loss rate ................................................................. 1.25%-2.45% $ 5.9 $ 11.7 Annual discount rate................................................................. 12.0% $ 3.0 $ 5.9
Prepayment rate. We use the Absolute Prepayment Model or “ABS” to estimate prepayments. This model assumes a rate of prepayment each month relative to the original number of receivables in a pool of receivables. ABS further assumes that all the receivables are the same size and amortize at the same rate and that each receivable in each month of its life will either be paid as scheduled or prepaid in full. For example, in a pool of receivables originally containing 10,000 receivables, a 1% ABS rate means that 100 receivables prepay each month. Cumulative loss rate. The cumulative loss rate, or “static pool” net losses, is calculated by dividing the total projected credit losses of a pool of receivables by the original pool balance. Projected credit losses are estimated using the losses experienced to date, the credit quality of the receivables, economic factors, and the performance history of similar receivables. Continuing Involvement with Securitized Receivables We continue to manage the automobile loan receivables that we securitize. We receive servicing fees of approximately 1% of the outstanding principal balance of the securitized receivables. We believe that the servicing fees specified in the securitization agreements adequately compensate us for servicing the securitized receivables. No servicing asset or liability has been recorded. We are at risk for the retained interest in the securitized receivables and, if the securitized receivables do not perform as originally projected, the value of the retained interest would be impacted. PAST DUE ACCOUNT INFORMATION As of February 28 (In millions) 2007 2006 2005 Accounts 31+ days past due....................................................... $ 56.9 $ 37.4 $ 31.1 Ending managed receivables...................................................... $ 3,311.0 $ 2,772.5 $ 2,494.9 Past due accounts as a percentage of ending managed
receivables.............................................................................. 1.72% 1.35% 1.24% CREDIT LOSS INFORMATION Years Ended February 28 (In millions) 2007 2006 2005 Net credit losses on managed receivables.................................. $ 20.7 $ 18.4 $ 19.5 Average managed receivables ................................................... $ 3,071.1 $ 2,657.7 $ 2,383.6 Net credit losses as a percentage of average managed
receivables.............................................................................. 0.67% 0.69% 0.82% Recovery rate............................................................................. 51% 51% 46% SELECTED CASH FLOWS FROM SECURITIZED RECEIVABLES Years Ended February 28 (In millions) 2007 2006 2005 Proceeds from new securitizations ............................................ $1,867.5 $1,513.5 $1,260.0 Proceeds from collections reinvested in revolving period
securitizations ........................................................................ $1,011.8 $ 757.5 $ 590.8 Servicing fees received.............................................................. $ 32.0 $ 27.3 $ 24.5 Other cash flows received from the retained interest: Interest-only strip receivables ................................................ $ 88.4 $ 82.1 $ 79.8 Reserve account releases........................................................ $ 15.2 $ 19.7 $ 14.1 Proceeds from new securitizations. Proceeds from new securitizations include proceeds from receivables that are newly securitized in or refinanced through the warehouse facility during the indicated period. Balances previously outstanding in public securitizations that were refinanced through the warehouse facility totaled $82.5 million in
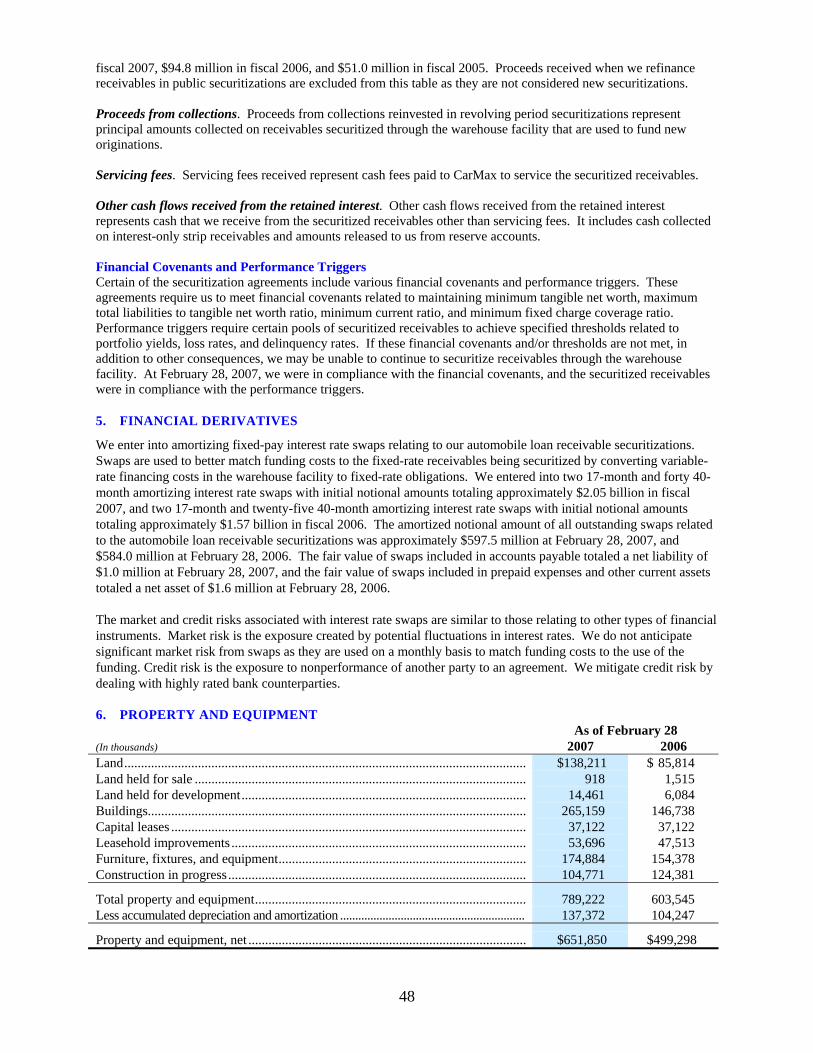
48
fiscal 2007, $94.8 million in fiscal 2006, and $51.0 million in fiscal 2005. Proceeds received when we refinance receivables in public securitizations are excluded from this table as they are not considered new securitizations. Proceeds from collections. Proceeds from collections reinvested in revolving period securitizations represent principal amounts collected on receivables securitized through the warehouse facility that are used to fund new originations. Servicing fees. Servicing fees received represent cash fees paid to CarMax to service the securitized receivables. Other cash flows received from the retained interest. Other cash flows received from the retained interest represents cash that we receive from the securitized receivables other than servicing fees. It includes cash collected on interest-only strip receivables and amounts released to us from reserve accounts. Financial Covenants and Performance Triggers Certain of the securitization agreements include various financial covenants and performance triggers. These agreements require us to meet financial covenants related to maintaining minimum tangible net worth, maximum total liabilities to tangible net worth ratio, minimum current ratio, and minimum fixed charge coverage ratio. Performance triggers require certain pools of securitized receivables to achieve specified thresholds related to portfolio yields, loss rates, and delinquency rates. If these financial covenants and/or thresholds are not met, in addition to other consequences, we may be unable to continue to securitize receivables through the warehouse facility. At February 28, 2007, we were in compliance with the financial covenants, and the securitized receivables were in compliance with the performance triggers.
5. FINANCIAL DERIVATIVES
We enter into amortizing fixed-pay interest rate swaps relating to our automobile loan receivable securitizations. Swaps are used to better match funding costs to the fixed-rate receivables being securitized by converting variable-rate financing costs in the warehouse facility to fixed-rate obligations. We entered into two 17-month and forty 40-month amortizing interest rate swaps with initial notional amounts totaling approximately $2.05 billion in fiscal 2007, and two 17-month and twenty-five 40-month amortizing interest rate swaps with initial notional amounts totaling approximately $1.57 billion in fiscal 2006. The amortized notional amount of all outstanding swaps related to the automobile loan receivable securitizations was approximately $597.5 million at February 28, 2007, and $584.0 million at February 28, 2006. The fair value of swaps included in accounts payable totaled a net liability of $1.0 million at February 28, 2007, and the fair value of swaps included in prepaid expenses and other current assets totaled a net asset of $1.6 million at February 28, 2006. The market and credit risks associated with interest rate swaps are similar to those relating to other types of financial instruments. Market risk is the exposure created by potential fluctuations in interest rates. We do not anticipate significant market risk from swaps as they are used on a monthly basis to match funding costs to the use of the funding. Credit risk is the exposure to nonperformance of another party to an agreement. We mitigate credit risk by dealing with highly rated bank counterparties.
6. PROPERTY AND EQUIPMENT As of February 28 (In thousands) 2007 2006 Land........................................................................................................................ $138,211 $ 85,814 Land held for sale ................................................................................................... 918 1,515 Land held for development..................................................................................... 14,461 6,084 Buildings................................................................................................................. 265,159 146,738 Capital leases .......................................................................................................... 37,122 37,122 Leasehold improvements ........................................................................................ 53,696 47,513 Furniture, fixtures, and equipment.......................................................................... 174,884 154,378 Construction in progress......................................................................................... 104,771 124,381
Total property and equipment................................................................................. 789,222 603,545 Less accumulated depreciation and amortization ............................................................. 137,372 104,247
Property and equipment, net ................................................................................... $651,850 $499,298
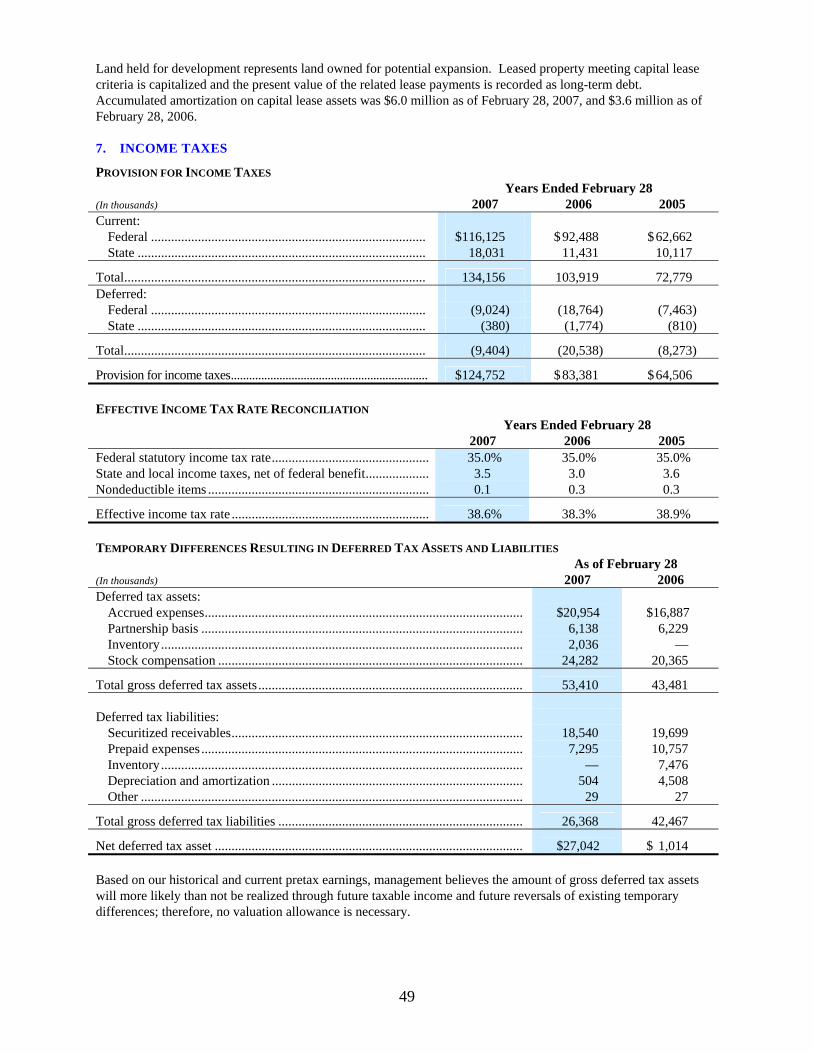
49
Land held for development represents land owned for potential expansion. Leased property meeting capital lease criteria is capitalized and the present value of the related lease payments is recorded as long-term debt. Accumulated amortization on capital lease assets was $6.0 million as of February 28, 2007, and $3.6 million as of February 28, 2006.
7. INCOME TAXES
PROVISION FOR INCOME TAXES Years Ended February 28 (In thousands) 2007 2006 2005 Current:
Federal .................................................................................. $ 116,125 $ 92,488 $ 62,662 State ...................................................................................... 18,031 11,431 10,117
Total.......................................................................................... 134,156 103,919 72,779 Deferred:
Federal .................................................................................. (9,024) (18,764) (7,463) State ...................................................................................... (380) (1,774) (810)
Total.......................................................................................... (9,404) (20,538) (8,273)
Provision for income taxes................................................................. $ 124,752 $ 83,381 $ 64,506 EFFECTIVE INCOME TAX RATE RECONCILIATION Years Ended February 28 2007 2006 2005 Federal statutory income tax rate............................................... 35.0% 35.0% 35.0% State and local income taxes, net of federal benefit................... 3.5 3.0 3.6 Nondeductible items .................................................................. 0.1 0.3 0.3
Effective income tax rate ........................................................... 38.6% 38.3% 38.9% TEMPORARY DIFFERENCES RESULTING IN DEFERRED TAX ASSETS AND LIABILITIES As of February 28 (In thousands) 2007 2006 Deferred tax assets:
Accrued expenses............................................................................................... $20,954 $16,887 Partnership basis ................................................................................................ 6,138 6,229 Inventory............................................................................................................ 2,036 — Stock compensation ........................................................................................... 24,282 20,365
Total gross deferred tax assets............................................................................... 53,410 43,481 Deferred tax liabilities:
Securitized receivables....................................................................................... 18,540 19,699 Prepaid expenses ................................................................................................ 7,295 10,757 Inventory............................................................................................................ — 7,476 Depreciation and amortization ........................................................................... 504 4,508 Other .................................................................................................................. 29 27
Total gross deferred tax liabilities ......................................................................... 26,368 42,467
Net deferred tax asset ............................................................................................ $27,042 $ 1,014 Based on our historical and current pretax earnings, management believes the amount of gross deferred tax assets will more likely than not be realized through future taxable income and future reversals of existing temporary differences; therefore, no valuation allowance is necessary.
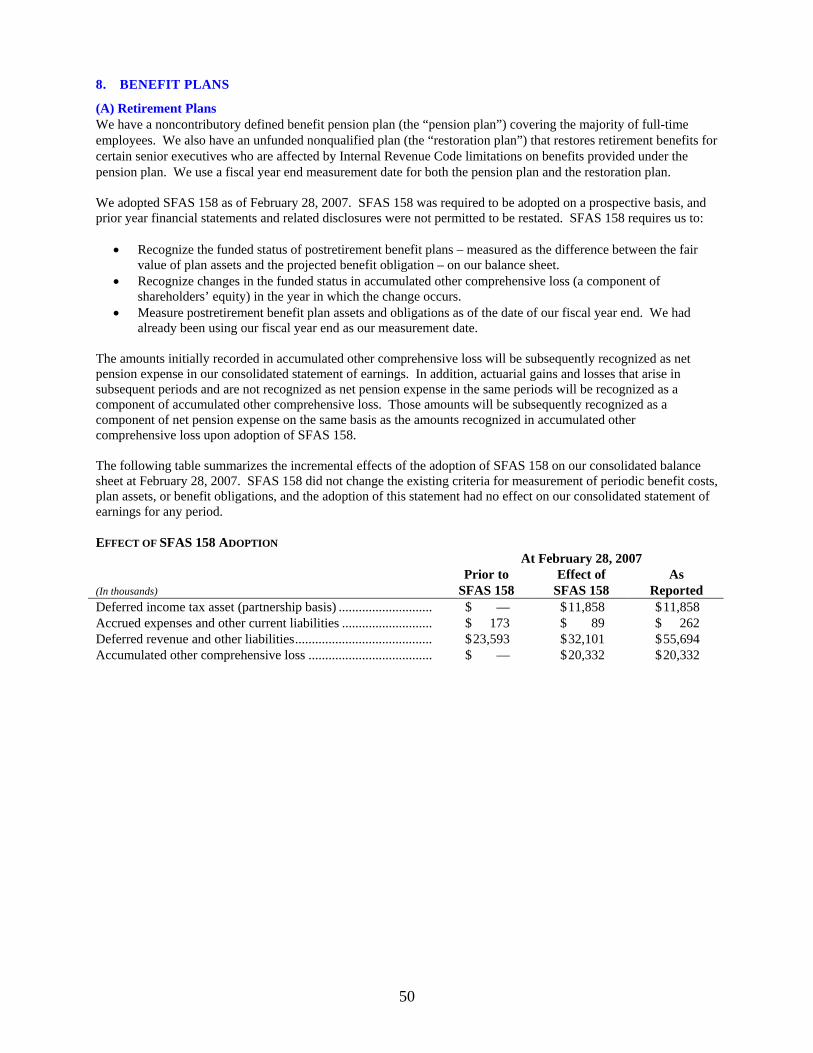
50
8. BENEFIT PLANS
(A) Retirement Plans We have a noncontributory defined benefit pension plan (the “pension plan”) covering the majority of full-time employees. We also have an unfunded nonqualified plan (the “restoration plan”) that restores retirement benefits for certain senior executives who are affected by Internal Revenue Code limitations on benefits provided under the pension plan. We use a fiscal year end measurement date for both the pension plan and the restoration plan. We adopted SFAS 158 as of February 28, 2007. SFAS 158 was required to be adopted on a prospective basis, and prior year financial statements and related disclosures were not permitted to be restated. SFAS 158 requires us to:
• Recognize the funded status of postretirement benefit plans – measured as the difference between the fair value of plan assets and the projected benefit obligation – on our balance sheet.
• Recognize changes in the funded status in accumulated other comprehensive loss (a component of shareholders’ equity) in the year in which the change occurs.
• Measure postretirement benefit plan assets and obligations as of the date of our fiscal year end. We had already been using our fiscal year end as our measurement date.
The amounts initially recorded in accumulated other comprehensive loss will be subsequently recognized as net pension expense in our consolidated statement of earnings. In addition, actuarial gains and losses that arise in subsequent periods and are not recognized as net pension expense in the same periods will be recognized as a component of accumulated other comprehensive loss. Those amounts will be subsequently recognized as a component of net pension expense on the same basis as the amounts recognized in accumulated other comprehensive loss upon adoption of SFAS 158. The following table summarizes the incremental effects of the adoption of SFAS 158 on our consolidated balance sheet at February 28, 2007. SFAS 158 did not change the existing criteria for measurement of periodic benefit costs, plan assets, or benefit obligations, and the adoption of this statement had no effect on our consolidated statement of earnings for any period. EFFECT OF SFAS 158 ADOPTION At February 28, 2007 Prior to Effect of As (In thousands) SFAS 158 SFAS 158 Reported Deferred income tax asset (partnership basis) ............................ $ — $ 11,858 $ 11,858 Accrued expenses and other current liabilities ........................... $ 173 $ 89 $ 262 Deferred revenue and other liabilities......................................... $ 23,593 $ 32,101 $ 55,694 Accumulated other comprehensive loss ..................................... $ — $ 20,332 $ 20,332
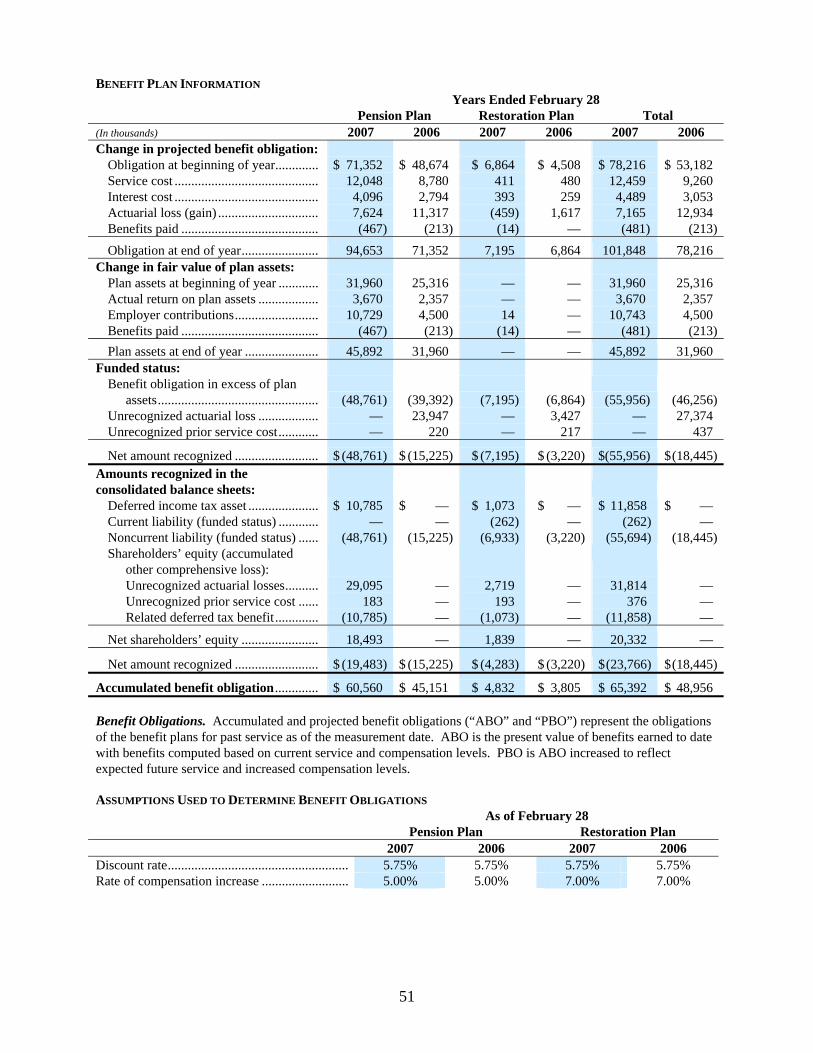
51
BENEFIT PLAN INFORMATION Years Ended February 28 Pension Plan Restoration Plan Total (In thousands) 2007 2006 2007 2006 2007 2006 Change in projected benefit obligation: Obligation at beginning of year............. $ 71,352 $ 48,674 $ 6,864 $ 4,508 $ 78,216 $ 53,182 Service cost ........................................... 12,048 8,780 411 480 12,459 9,260 Interest cost ........................................... 4,096 2,794 393 259 4,489 3,053 Actuarial loss (gain) .............................. 7,624 11,317 (459) 1,617 7,165 12,934 Benefits paid ......................................... (467) (213) (14) — (481) (213) Obligation at end of year....................... 94,653 71,352 7,195 6,864 101,848 78,216 Change in fair value of plan assets: Plan assets at beginning of year ............ 31,960 25,316 — — 31,960 25,316 Actual return on plan assets .................. 3,670 2,357 — — 3,670 2,357 Employer contributions......................... 10,729 4,500 14 — 10,743 4,500 Benefits paid ......................................... (467) (213) (14) — (481) (213) Plan assets at end of year ...................... 45,892 31,960 — — 45,892 31,960 Funded status: Benefit obligation in excess of plan
assets................................................ (48,761) (39,392) (7,195) (6,864) (55,956) (46,256) Unrecognized actuarial loss .................. — 23,947 — 3,427 — 27,374 Unrecognized prior service cost............ — 220 — 217 — 437
Net amount recognized ......................... $ (48,761) $ (15,225) $ (7,195) $ (3,220) $(55,956) $ (18,445)Amounts recognized in the consolidated balance sheets:
Deferred income tax asset ..................... $ 10,785 $ — $ 1,073 $ — $ 11,858 $ — Current liability (funded status) ............ — — (262) — (262) — Noncurrent liability (funded status) ...... (48,761) (15,225) (6,933) (3,220) (55,694) (18,445) Shareholders’ equity (accumulated
other comprehensive loss): Unrecognized actuarial losses.......... 29,095 — 2,719 — 31,814 — Unrecognized prior service cost ...... 183 — 193 — 376 — Related deferred tax benefit............. (10,785) — (1,073) — (11,858) —
Net shareholders’ equity ....................... 18,493 — 1,839 — 20,332 —
Net amount recognized ......................... $ (19,483) $ (15,225) $ (4,283) $ (3,220) $ (23,766) $ (18,445)
Accumulated benefit obligation............. $ 60,560 $ 45,151 $ 4,832 $ 3,805 $ 65,392 $ 48,956 Benefit Obligations. Accumulated and projected benefit obligations (“ABO” and “PBO”) represent the obligations of the benefit plans for past service as of the measurement date. ABO is the present value of benefits earned to date with benefits computed based on current service and compensation levels. PBO is ABO increased to reflect expected future service and increased compensation levels. ASSUMPTIONS USED TO DETERMINE BENEFIT OBLIGATIONS
As of February 28 Pension Plan Restoration Plan 2007 2006 2007 2006
Discount rate...................................................... 5.75% 5.75% 5.75% 5.75% Rate of compensation increase .......................... 5.00% 5.00% 7.00% 7.00%
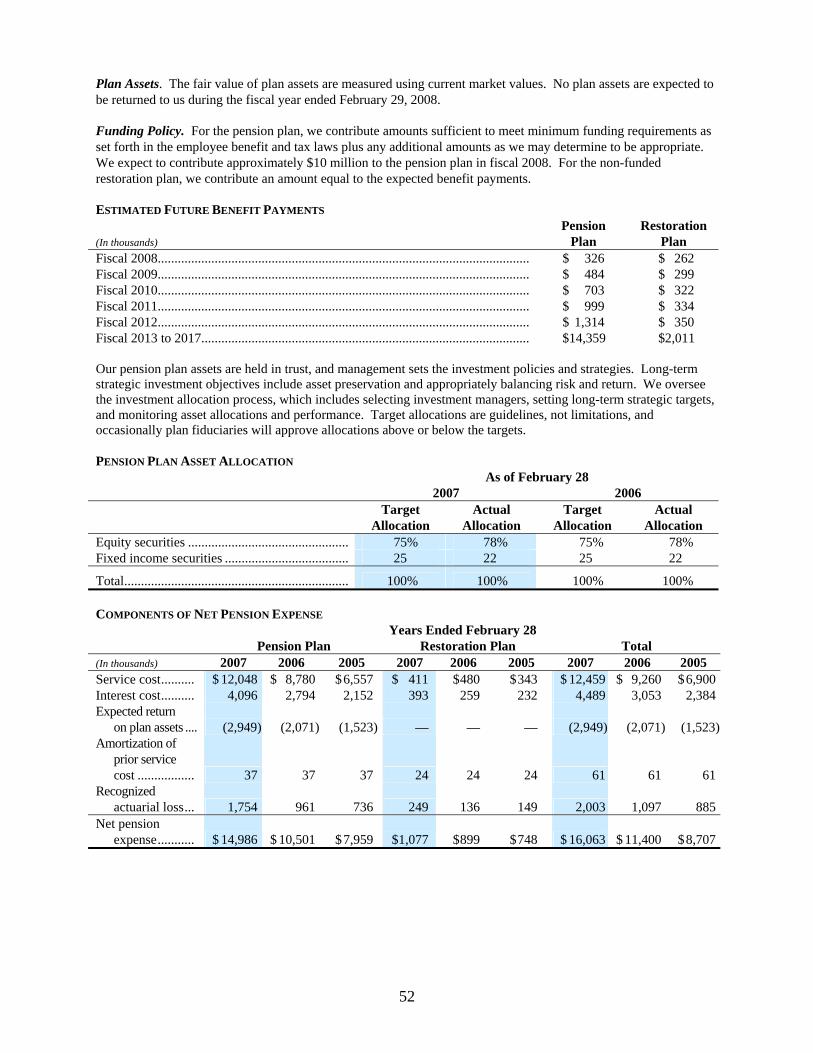
52
Plan Assets. The fair value of plan assets are measured using current market values. No plan assets are expected to be returned to us during the fiscal year ended February 29, 2008. Funding Policy. For the pension plan, we contribute amounts sufficient to meet minimum funding requirements as set forth in the employee benefit and tax laws plus any additional amounts as we may determine to be appropriate. We expect to contribute approximately $10 million to the pension plan in fiscal 2008. For the non-funded restoration plan, we contribute an amount equal to the expected benefit payments. ESTIMATED FUTURE BENEFIT PAYMENTS
(In thousands) Pension
Plan Restoration
Plan Fiscal 2008............................................................................................................... $ 326 $ 262 Fiscal 2009............................................................................................................... $ 484 $ 299 Fiscal 2010............................................................................................................... $ 703 $ 322 Fiscal 2011............................................................................................................... $ 999 $ 334 Fiscal 2012............................................................................................................... $ 1,314 $ 350 Fiscal 2013 to 2017.................................................................................................. $14,359 $2,011 Our pension plan assets are held in trust, and management sets the investment policies and strategies. Long-term strategic investment objectives include asset preservation and appropriately balancing risk and return. We oversee the investment allocation process, which includes selecting investment managers, setting long-term strategic targets, and monitoring asset allocations and performance. Target allocations are guidelines, not limitations, and occasionally plan fiduciaries will approve allocations above or below the targets. PENSION PLAN ASSET ALLOCATION As of February 28 2007 2006 Target Actual Target Actual Allocation Allocation Allocation Allocation Equity securities ................................................ 75% 78% 75% 78% Fixed income securities ..................................... 25 22 25 22
Total................................................................... 100% 100% 100% 100% COMPONENTS OF NET PENSION EXPENSE
Years Ended February 28 Pension Plan Restoration Plan Total
(In thousands) 2007 2006 2005 2007 2006 2005 2007 2006 2005 Service cost.......... $ 12,048 $ 8,780 $ 6,557 $ 411 $ 480 $ 343 $ 12,459 $ 9,260 $ 6,900Interest cost.......... 4,096 2,794 2,152 393 259 232 4,489 3,053 2,384Expected return on plan assets .... (2,949) (2,071) (1,523) — — — (2,949) (2,071) (1,523)Amortization of
prior service cost ................. 37 37 37 24 24 24 61 61 61
Recognized actuarial loss... 1,754 961 736 249 136 149 2,003 1,097 885
Net pension expense........... $ 14,986 $ 10,501 $ 7,959 $ 1,077 $ 899 $ 748 $ 16,063 $ 11,400 $ 8,707
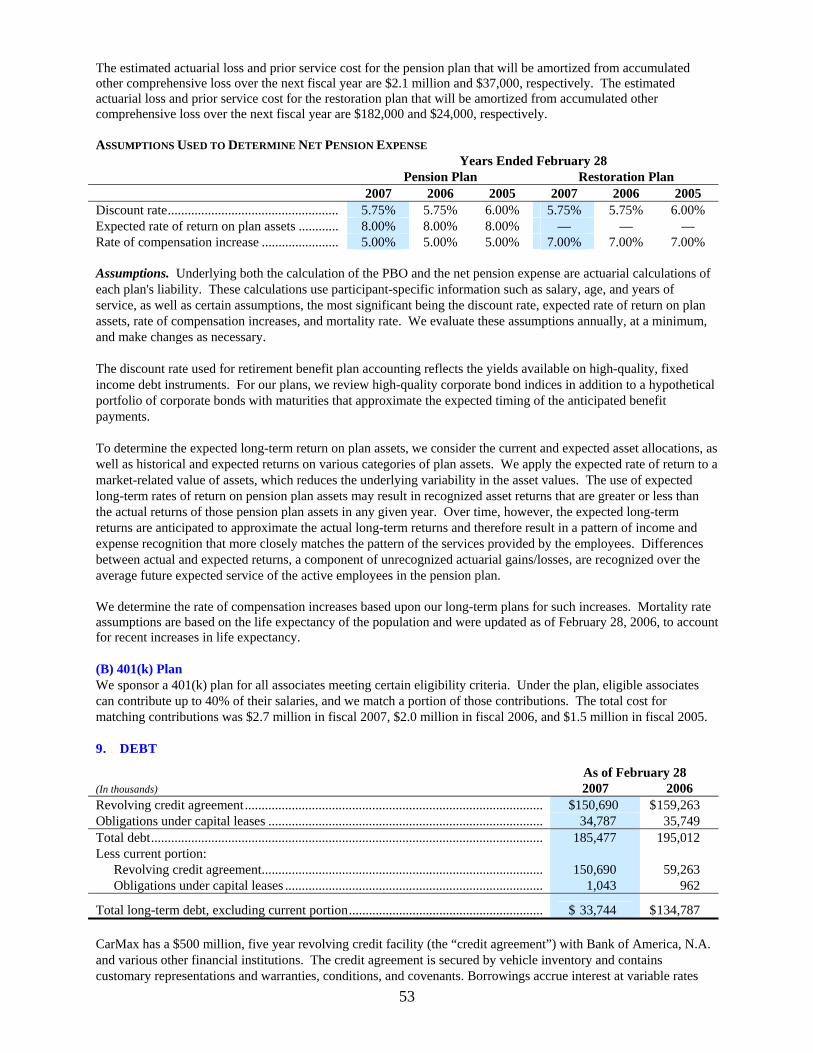
53
The estimated actuarial loss and prior service cost for the pension plan that will be amortized from accumulated other comprehensive loss over the next fiscal year are $2.1 million and $37,000, respectively. The estimated actuarial loss and prior service cost for the restoration plan that will be amortized from accumulated other comprehensive loss over the next fiscal year are $182,000 and $24,000, respectively. ASSUMPTIONS USED TO DETERMINE NET PENSION EXPENSE
Years Ended February 28 Pension Plan Restoration Plan 2007 2006 2005 2007 2006 2005
Discount rate................................................... 5.75% 5.75% 6.00% 5.75% 5.75% 6.00% Expected rate of return on plan assets ............ 8.00% 8.00% 8.00% — — — Rate of compensation increase ....................... 5.00% 5.00% 5.00% 7.00% 7.00% 7.00% Assumptions. Underlying both the calculation of the PBO and the net pension expense are actuarial calculations of each plan's liability. These calculations use participant-specific information such as salary, age, and years of service, as well as certain assumptions, the most significant being the discount rate, expected rate of return on plan assets, rate of compensation increases, and mortality rate. We evaluate these assumptions annually, at a minimum, and make changes as necessary. The discount rate used for retirement benefit plan accounting reflects the yields available on high-quality, fixed income debt instruments. For our plans, we review high-quality corporate bond indices in addition to a hypothetical portfolio of corporate bonds with maturities that approximate the expected timing of the anticipated benefit payments. To determine the expected long-term return on plan assets, we consider the current and expected asset allocations, as well as historical and expected returns on various categories of plan assets. We apply the expected rate of return to a market-related value of assets, which reduces the underlying variability in the asset values. The use of expected long-term rates of return on pension plan assets may result in recognized asset returns that are greater or less than the actual returns of those pension plan assets in any given year. Over time, however, the expected long-term returns are anticipated to approximate the actual long-term returns and therefore result in a pattern of income and expense recognition that more closely matches the pattern of the services provided by the employees. Differences between actual and expected returns, a component of unrecognized actuarial gains/losses, are recognized over the average future expected service of the active employees in the pension plan. We determine the rate of compensation increases based upon our long-term plans for such increases. Mortality rate assumptions are based on the life expectancy of the population and were updated as of February 28, 2006, to account for recent increases in life expectancy. (B) 401(k) Plan We sponsor a 401(k) plan for all associates meeting certain eligibility criteria. Under the plan, eligible associates can contribute up to 40% of their salaries, and we match a portion of those contributions. The total cost for matching contributions was $2.7 million in fiscal 2007, $2.0 million in fiscal 2006, and $1.5 million in fiscal 2005.
9. DEBT
As of February 28 (In thousands) 2007 2006 Revolving credit agreement......................................................................................... $150,690 $ 159,263 Obligations under capital leases .................................................................................. 34,787 35,749 Total debt..................................................................................................................... 185,477 195,012 Less current portion:
Revolving credit agreement.................................................................................... 150,690 59,263 Obligations under capital leases ............................................................................. 1,043 962
Total long-term debt, excluding current portion.......................................................... $ 33,744 $ 134,787 CarMax has a $500 million, five year revolving credit facility (the “credit agreement”) with Bank of America, N.A. and various other financial institutions. The credit agreement is secured by vehicle inventory and contains customary representations and warranties, conditions, and covenants. Borrowings accrue interest at variable rates
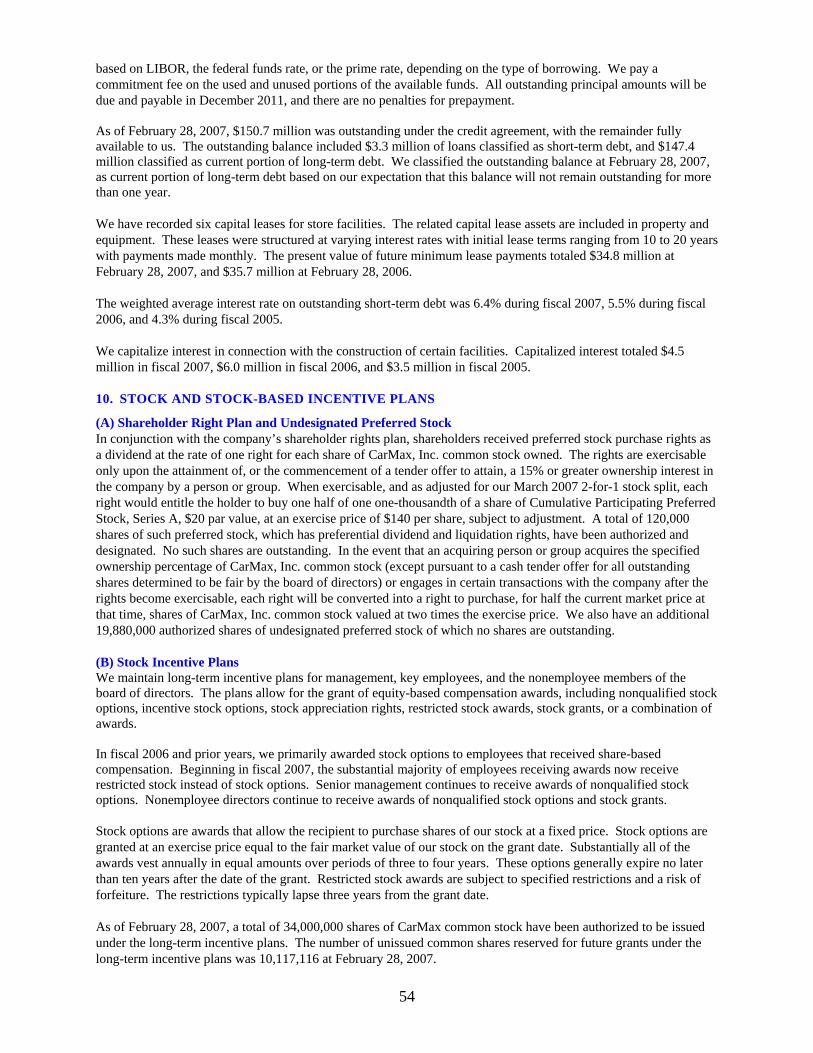
54
based on LIBOR, the federal funds rate, or the prime rate, depending on the type of borrowing. We pay a commitment fee on the used and unused portions of the available funds. All outstanding principal amounts will be due and payable in December 2011, and there are no penalties for prepayment. As of February 28, 2007, $150.7 million was outstanding under the credit agreement, with the remainder fully available to us. The outstanding balance included $3.3 million of loans classified as short-term debt, and $147.4 million classified as current portion of long-term debt. We classified the outstanding balance at February 28, 2007, as current portion of long-term debt based on our expectation that this balance will not remain outstanding for more than one year. We have recorded six capital leases for store facilities. The related capital lease assets are included in property and equipment. These leases were structured at varying interest rates with initial lease terms ranging from 10 to 20 years with payments made monthly. The present value of future minimum lease payments totaled $34.8 million at February 28, 2007, and $35.7 million at February 28, 2006. The weighted average interest rate on outstanding short-term debt was 6.4% during fiscal 2007, 5.5% during fiscal 2006, and 4.3% during fiscal 2005. We capitalize interest in connection with the construction of certain facilities. Capitalized interest totaled $4.5 million in fiscal 2007, $6.0 million in fiscal 2006, and $3.5 million in fiscal 2005.
10. STOCK AND STOCK-BASED INCENTIVE PLANS
(A) Shareholder Right Plan and Undesignated Preferred Stock In conjunction with the company’s shareholder rights plan, shareholders received preferred stock purchase rights as a dividend at the rate of one right for each share of CarMax, Inc. common stock owned. The rights are exercisable only upon the attainment of, or the commencement of a tender offer to attain, a 15% or greater ownership interest in the company by a person or group. When exercisable, and as adjusted for our March 2007 2-for-1 stock split, each right would entitle the holder to buy one half of one one-thousandth of a share of Cumulative Participating Preferred Stock, Series A, $20 par value, at an exercise price of $140 per share, subject to adjustment. A total of 120,000 shares of such preferred stock, which has preferential dividend and liquidation rights, have been authorized and designated. No such shares are outstanding. In the event that an acquiring person or group acquires the specified ownership percentage of CarMax, Inc. common stock (except pursuant to a cash tender offer for all outstanding shares determined to be fair by the board of directors) or engages in certain transactions with the company after the rights become exercisable, each right will be converted into a right to purchase, for half the current market price at that time, shares of CarMax, Inc. common stock valued at two times the exercise price. We also have an additional 19,880,000 authorized shares of undesignated preferred stock of which no shares are outstanding. (B) Stock Incentive Plans We maintain long-term incentive plans for management, key employees, and the nonemployee members of the board of directors. The plans allow for the grant of equity-based compensation awards, including nonqualified stock options, incentive stock options, stock appreciation rights, restricted stock awards, stock grants, or a combination of awards. In fiscal 2006 and prior years, we primarily awarded stock options to employees that received share-based compensation. Beginning in fiscal 2007, the substantial majority of employees receiving awards now receive restricted stock instead of stock options. Senior management continues to receive awards of nonqualified stock options. Nonemployee directors continue to receive awards of nonqualified stock options and stock grants. Stock options are awards that allow the recipient to purchase shares of our stock at a fixed price. Stock options are granted at an exercise price equal to the fair market value of our stock on the grant date. Substantially all of the awards vest annually in equal amounts over periods of three to four years. These options generally expire no later than ten years after the date of the grant. Restricted stock awards are subject to specified restrictions and a risk of forfeiture. The restrictions typically lapse three years from the grant date. As of February 28, 2007, a total of 34,000,000 shares of CarMax common stock have been authorized to be issued under the long-term incentive plans. The number of unissued common shares reserved for future grants under the long-term incentive plans was 10,117,116 at February 28, 2007.
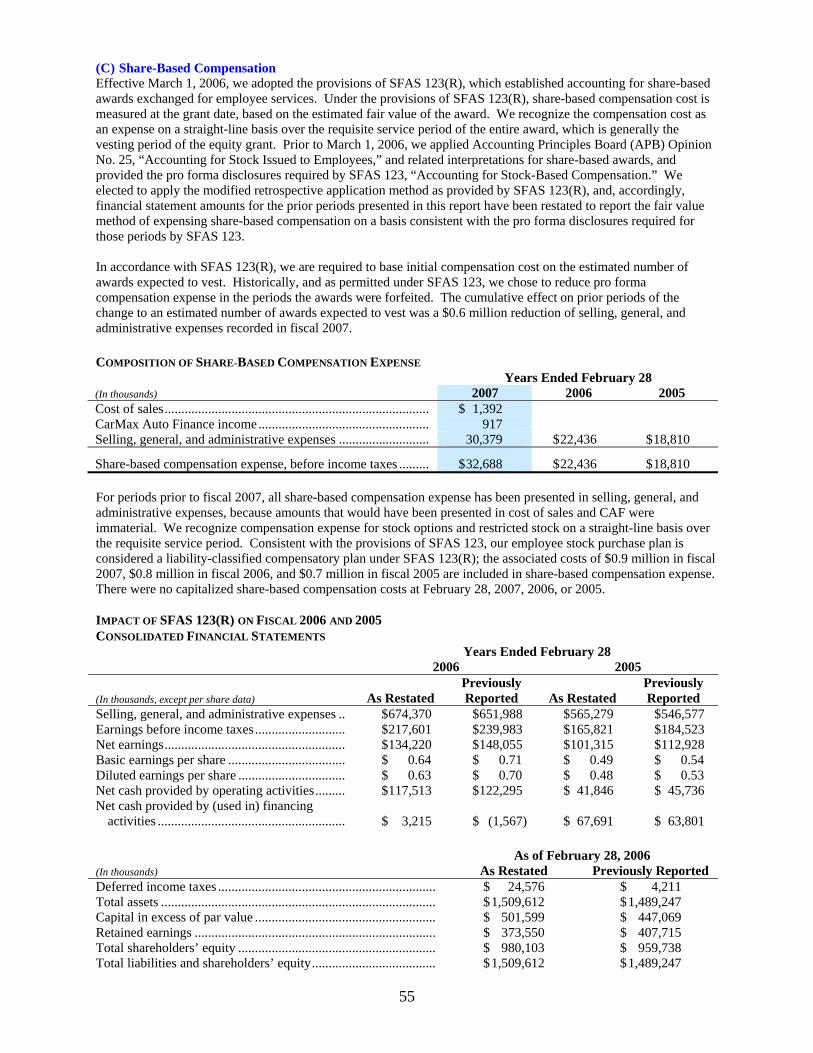
55
(C) Share-Based Compensation Effective March 1, 2006, we adopted the provisions of SFAS 123(R), which established accounting for share-based awards exchanged for employee services. Under the provisions of SFAS 123(R), share-based compensation cost is measured at the grant date, based on the estimated fair value of the award. We recognize the compensation cost as an expense on a straight-line basis over the requisite service period of the entire award, which is generally the vesting period of the equity grant. Prior to March 1, 2006, we applied Accounting Principles Board (APB) Opinion No. 25, “Accounting for Stock Issued to Employees,” and related interpretations for share-based awards, and provided the pro forma disclosures required by SFAS 123, “Accounting for Stock-Based Compensation.” We elected to apply the modified retrospective application method as provided by SFAS 123(R), and, accordingly, financial statement amounts for the prior periods presented in this report have been restated to report the fair value method of expensing share-based compensation on a basis consistent with the pro forma disclosures required for those periods by SFAS 123. In accordance with SFAS 123(R), we are required to base initial compensation cost on the estimated number of awards expected to vest. Historically, and as permitted under SFAS 123, we chose to reduce pro forma compensation expense in the periods the awards were forfeited. The cumulative effect on prior periods of the change to an estimated number of awards expected to vest was a $0.6 million reduction of selling, general, and administrative expenses recorded in fiscal 2007. COMPOSITION OF SHARE-BASED COMPENSATION EXPENSE Years Ended February 28 (In thousands) 2007 2006 2005 Cost of sales............................................................................... $ 1,392 CarMax Auto Finance income................................................... 917 Selling, general, and administrative expenses ........................... 30,379 $ 22,436 $ 18,810
Share-based compensation expense, before income taxes ......... $ 32,688 $ 22,436 $ 18,810 For periods prior to fiscal 2007, all share-based compensation expense has been presented in selling, general, and administrative expenses, because amounts that would have been presented in cost of sales and CAF were immaterial. We recognize compensation expense for stock options and restricted stock on a straight-line basis over the requisite service period. Consistent with the provisions of SFAS 123, our employee stock purchase plan is considered a liability-classified compensatory plan under SFAS 123(R); the associated costs of $0.9 million in fiscal 2007, $0.8 million in fiscal 2006, and $0.7 million in fiscal 2005 are included in share-based compensation expense. There were no capitalized share-based compensation costs at February 28, 2007, 2006, or 2005.
IMPACT OF SFAS 123(R) ON FISCAL 2006 AND 2005 CONSOLIDATED FINANCIAL STATEMENTS Years Ended February 28 2006 2005
(In thousands, except per share data) As Restated Previously Reported As Restated
Previously Reported
Selling, general, and administrative expenses .. $ 674,370 $ 651,988 $ 565,279 $ 546,577 Earnings before income taxes........................... $ 217,601 $ 239,983 $ 165,821 $ 184,523 Net earnings...................................................... $ 134,220 $ 148,055 $ 101,315 $ 112,928 Basic earnings per share ................................... $ 0.64 $ 0.71 $ 0.49 $ 0.54 Diluted earnings per share ................................ $ 0.63 $ 0.70 $ 0.48 $ 0.53 Net cash provided by operating activities......... $ 117,513 $ 122,295 $ 41,846 $ 45,736 Net cash provided by (used in) financing
activities ........................................................ $ 3,215 $ (1,567) $ 67,691 $ 63,801 As of February 28, 2006 (In thousands) As Restated Previously Reported Deferred income taxes ................................................................. $ 24,576 $ 4,211 Total assets .................................................................................. $ 1,509,612 $ 1,489,247 Capital in excess of par value ...................................................... $ 501,599 $ 447,069 Retained earnings ........................................................................ $ 373,550 $ 407,715 Total shareholders’ equity ........................................................... $ 980,103 $ 959,738 Total liabilities and shareholders’ equity..................................... $ 1,509,612 $ 1,489,247
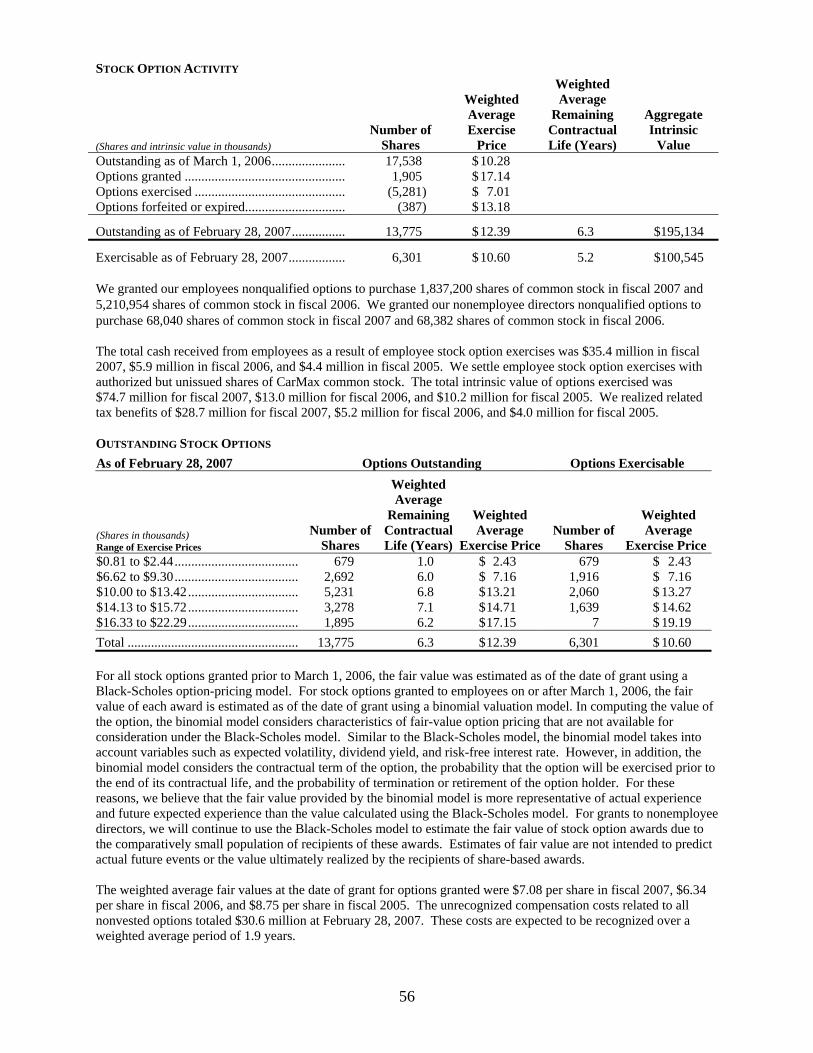
56
STOCK OPTION ACTIVITY
(Shares and intrinsic value in thousands) Number of
Shares
Weighted Average Exercise
Price
Weighted Average
Remaining Contractual Life (Years)
Aggregate Intrinsic
Value Outstanding as of March 1, 2006...................... 17,538 $ 10.28 Options granted ................................................ 1,905 $ 17.14 Options exercised ............................................. (5,281) $ 7.01 Options forfeited or expired.............................. (387) $ 13.18
Outstanding as of February 28, 2007................ 13,775 $ 12.39 6.3 $195,134
Exercisable as of February 28, 2007................. 6,301 $ 10.60 5.2 $100,545 We granted our employees nonqualified options to purchase 1,837,200 shares of common stock in fiscal 2007 and 5,210,954 shares of common stock in fiscal 2006. We granted our nonemployee directors nonqualified options to purchase 68,040 shares of common stock in fiscal 2007 and 68,382 shares of common stock in fiscal 2006. The total cash received from employees as a result of employee stock option exercises was $35.4 million in fiscal 2007, $5.9 million in fiscal 2006, and $4.4 million in fiscal 2005. We settle employee stock option exercises with authorized but unissued shares of CarMax common stock. The total intrinsic value of options exercised was $74.7 million for fiscal 2007, $13.0 million for fiscal 2006, and $10.2 million for fiscal 2005. We realized related tax benefits of $28.7 million for fiscal 2007, $5.2 million for fiscal 2006, and $4.0 million for fiscal 2005. OUTSTANDING STOCK OPTIONS As of February 28, 2007 Options Outstanding Options Exercisable
(Shares in thousands) Range of Exercise Prices
Number of Shares
Weighted Average
Remaining Contractual Life (Years)
Weighted Average
Exercise Price
Number of
Shares
Weighted Average
Exercise Price$0.81 to $2.44..................................... 679 1.0 $ 2.43 679 $ 2.43 $6.62 to $9.30..................................... 2,692 6.0 $ 7.16 1,916 $ 7.16 $10.00 to $13.42................................. 5,231 6.8 $ 13.21 2,060 $ 13.27 $14.13 to $15.72................................. 3,278 7.1 $ 14.71 1,639 $ 14.62 $16.33 to $22.29................................. 1,895 6.2 $ 17.15 7 $ 19.19 Total ................................................... 13,775 6.3 $ 12.39 6,301 $ 10.60 For all stock options granted prior to March 1, 2006, the fair value was estimated as of the date of grant using a Black-Scholes option-pricing model. For stock options granted to employees on or after March 1, 2006, the fair value of each award is estimated as of the date of grant using a binomial valuation model. In computing the value of the option, the binomial model considers characteristics of fair-value option pricing that are not available for consideration under the Black-Scholes model. Similar to the Black-Scholes model, the binomial model takes into account variables such as expected volatility, dividend yield, and risk-free interest rate. However, in addition, the binomial model considers the contractual term of the option, the probability that the option will be exercised prior to the end of its contractual life, and the probability of termination or retirement of the option holder. For these reasons, we believe that the fair value provided by the binomial model is more representative of actual experience and future expected experience than the value calculated using the Black-Scholes model. For grants to nonemployee directors, we will continue to use the Black-Scholes model to estimate the fair value of stock option awards due to the comparatively small population of recipients of these awards. Estimates of fair value are not intended to predict actual future events or the value ultimately realized by the recipients of share-based awards. The weighted average fair values at the date of grant for options granted were $7.08 per share in fiscal 2007, $6.34 per share in fiscal 2006, and $8.75 per share in fiscal 2005. The unrecognized compensation costs related to all nonvested options totaled $30.6 million at February 28, 2007. These costs are expected to be recognized over a weighted average period of 1.9 years.
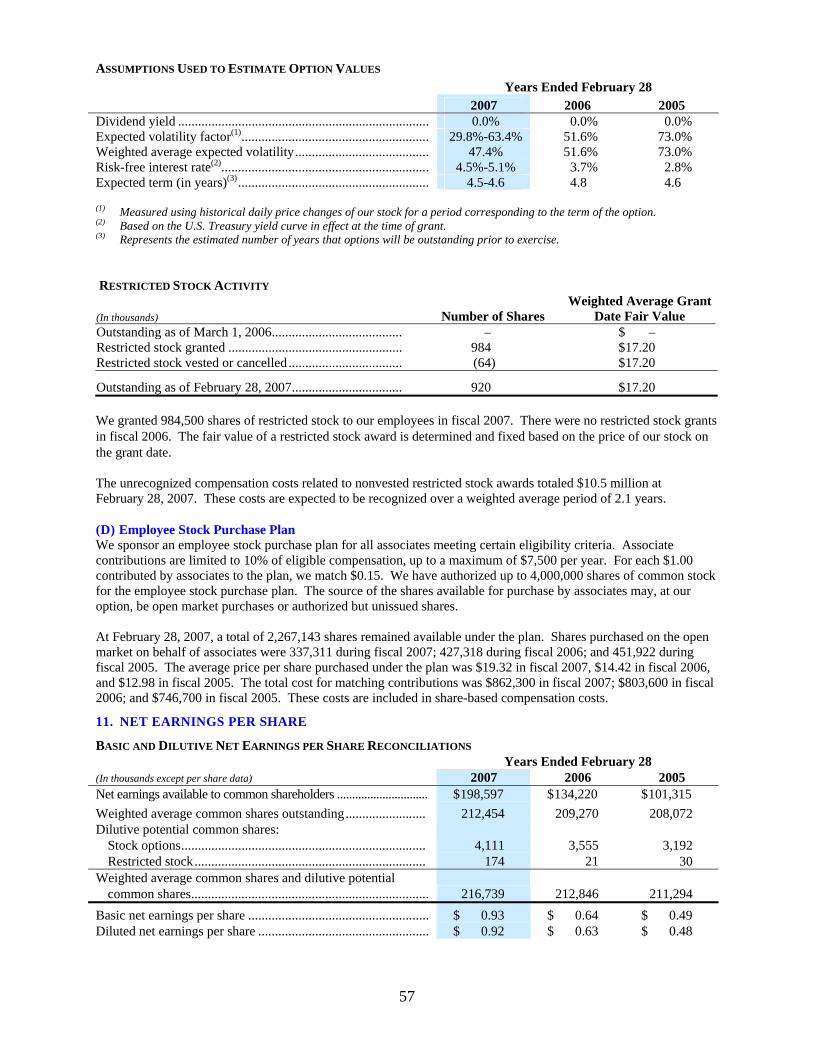
57
ASSUMPTIONS USED TO ESTIMATE OPTION VALUES Years Ended February 28 2007 2006 2005 Dividend yield ........................................................................... 0.0% 0.0% 0.0% Expected volatility factor(1)........................................................ 29.8%-63.4% 51.6% 73.0% Weighted average expected volatility........................................ 47.4% 51.6% 73.0% Risk-free interest rate(2).............................................................. 4.5%-5.1% 3.7% 2.8% Expected term (in years)(3)......................................................... 4.5-4.6 4.8 4.6 (1) Measured using historical daily price changes of our stock for a period corresponding to the term of the option. (2) Based on the U.S. Treasury yield curve in effect at the time of grant. (3) Represents the estimated number of years that options will be outstanding prior to exercise. RESTRICTED STOCK ACTIVITY
(In thousands) Number of Shares Weighted Average Grant
Date Fair Value Outstanding as of March 1, 2006....................................... – $ – Restricted stock granted .................................................... 984 $ 17.20 Restricted stock vested or cancelled .................................. (64) $ 17.20
Outstanding as of February 28, 2007................................. 920 $ 17.20 We granted 984,500 shares of restricted stock to our employees in fiscal 2007. There were no restricted stock grants in fiscal 2006. The fair value of a restricted stock award is determined and fixed based on the price of our stock on the grant date.
The unrecognized compensation costs related to nonvested restricted stock awards totaled $10.5 million at February 28, 2007. These costs are expected to be recognized over a weighted average period of 2.1 years. (D) Employee Stock Purchase Plan We sponsor an employee stock purchase plan for all associates meeting certain eligibility criteria. Associate contributions are limited to 10% of eligible compensation, up to a maximum of $7,500 per year. For each $1.00 contributed by associates to the plan, we match $0.15. We have authorized up to 4,000,000 shares of common stock for the employee stock purchase plan. The source of the shares available for purchase by associates may, at our option, be open market purchases or authorized but unissued shares. At February 28, 2007, a total of 2,267,143 shares remained available under the plan. Shares purchased on the open market on behalf of associates were 337,311 during fiscal 2007; 427,318 during fiscal 2006; and 451,922 during fiscal 2005. The average price per share purchased under the plan was $19.32 in fiscal 2007, $14.42 in fiscal 2006, and $12.98 in fiscal 2005. The total cost for matching contributions was $862,300 in fiscal 2007; $803,600 in fiscal 2006; and $746,700 in fiscal 2005. These costs are included in share-based compensation costs.
11. NET EARNINGS PER SHARE
BASIC AND DILUTIVE NET EARNINGS PER SHARE RECONCILIATIONS Years Ended February 28 (In thousands except per share data) 2007 2006 2005 Net earnings available to common shareholders .............................. $ 198,597 $ 134,220 $ 101,315 Weighted average common shares outstanding........................ 212,454 209,270 208,072 Dilutive potential common shares:
Stock options......................................................................... 4,111 3,555 3,192 Restricted stock..................................................................... 174 21 30
Weighted average common shares and dilutive potential common shares....................................................................... 216,739 212,846 211,294
Basic net earnings per share ...................................................... $ 0.93 $ 0.64 $ 0.49 Diluted net earnings per share ................................................... $ 0.92 $ 0.63 $ 0.48
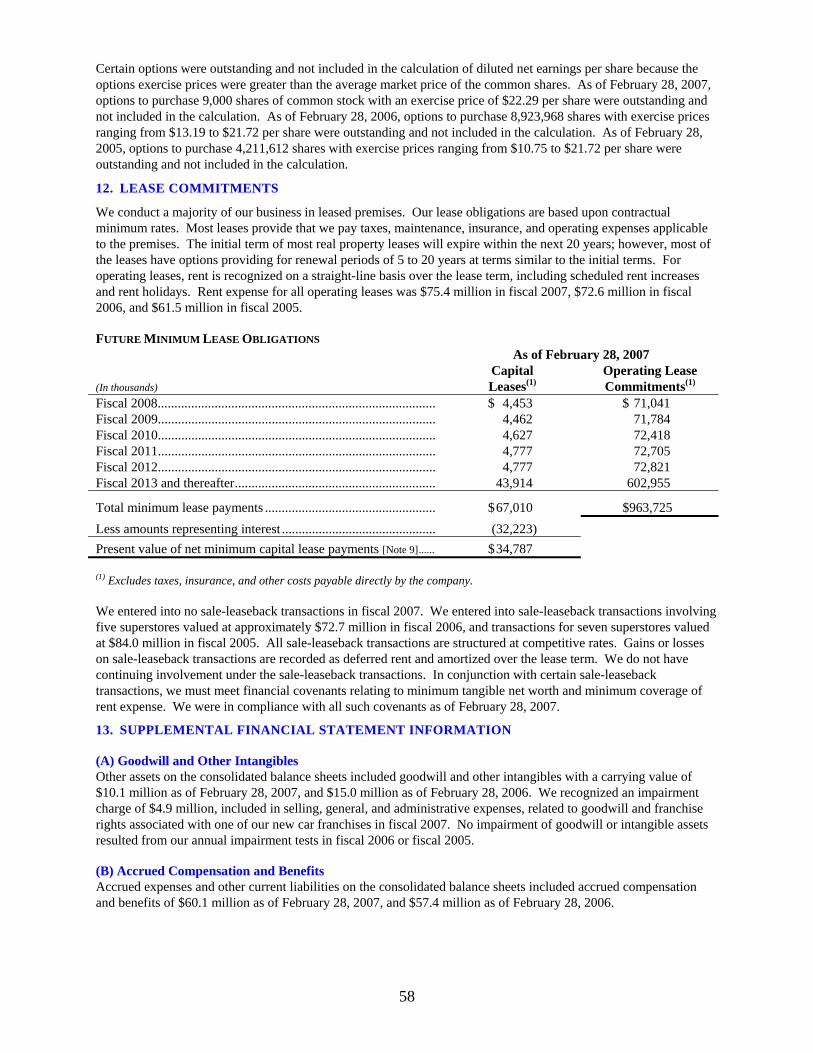
58
Certain options were outstanding and not included in the calculation of diluted net earnings per share because the options exercise prices were greater than the average market price of the common shares. As of February 28, 2007, options to purchase 9,000 shares of common stock with an exercise price of $22.29 per share were outstanding and not included in the calculation. As of February 28, 2006, options to purchase 8,923,968 shares with exercise prices ranging from $13.19 to $21.72 per share were outstanding and not included in the calculation. As of February 28, 2005, options to purchase 4,211,612 shares with exercise prices ranging from $10.75 to $21.72 per share were outstanding and not included in the calculation.
12. LEASE COMMITMENTS
We conduct a majority of our business in leased premises. Our lease obligations are based upon contractual minimum rates. Most leases provide that we pay taxes, maintenance, insurance, and operating expenses applicable to the premises. The initial term of most real property leases will expire within the next 20 years; however, most of the leases have options providing for renewal periods of 5 to 20 years at terms similar to the initial terms. For operating leases, rent is recognized on a straight-line basis over the lease term, including scheduled rent increases and rent holidays. Rent expense for all operating leases was $75.4 million in fiscal 2007, $72.6 million in fiscal 2006, and $61.5 million in fiscal 2005. FUTURE MINIMUM LEASE OBLIGATIONS As of February 28, 2007 Capital Operating Lease (In thousands) Leases(1) Commitments(1) Fiscal 2008................................................................................... $ 4,453 $ 71,041 Fiscal 2009................................................................................... 4,462 71,784 Fiscal 2010................................................................................... 4,627 72,418 Fiscal 2011................................................................................... 4,777 72,705 Fiscal 2012................................................................................... 4,777 72,821 Fiscal 2013 and thereafter............................................................ 43,914 602,955
Total minimum lease payments ................................................... $ 67,010 $963,725 Less amounts representing interest .............................................. (32,223) Present value of net minimum capital lease payments [Note 9]...... $ 34,787
(1) Excludes taxes, insurance, and other costs payable directly by the company. We entered into no sale-leaseback transactions in fiscal 2007. We entered into sale-leaseback transactions involving five superstores valued at approximately $72.7 million in fiscal 2006, and transactions for seven superstores valued at $84.0 million in fiscal 2005. All sale-leaseback transactions are structured at competitive rates. Gains or losses on sale-leaseback transactions are recorded as deferred rent and amortized over the lease term. We do not have continuing involvement under the sale-leaseback transactions. In conjunction with certain sale-leaseback transactions, we must meet financial covenants relating to minimum tangible net worth and minimum coverage of rent expense. We were in compliance with all such covenants as of February 28, 2007.
13. SUPPLEMENTAL FINANCIAL STATEMENT INFORMATION
(A) Goodwill and Other Intangibles Other assets on the consolidated balance sheets included goodwill and other intangibles with a carrying value of $10.1 million as of February 28, 2007, and $15.0 million as of February 28, 2006. We recognized an impairment charge of $4.9 million, included in selling, general, and administrative expenses, related to goodwill and franchise rights associated with one of our new car franchises in fiscal 2007. No impairment of goodwill or intangible assets resulted from our annual impairment tests in fiscal 2006 or fiscal 2005. (B) Accrued Compensation and Benefits Accrued expenses and other current liabilities on the consolidated balance sheets included accrued compensation and benefits of $60.1 million as of February 28, 2007, and $57.4 million as of February 28, 2006.
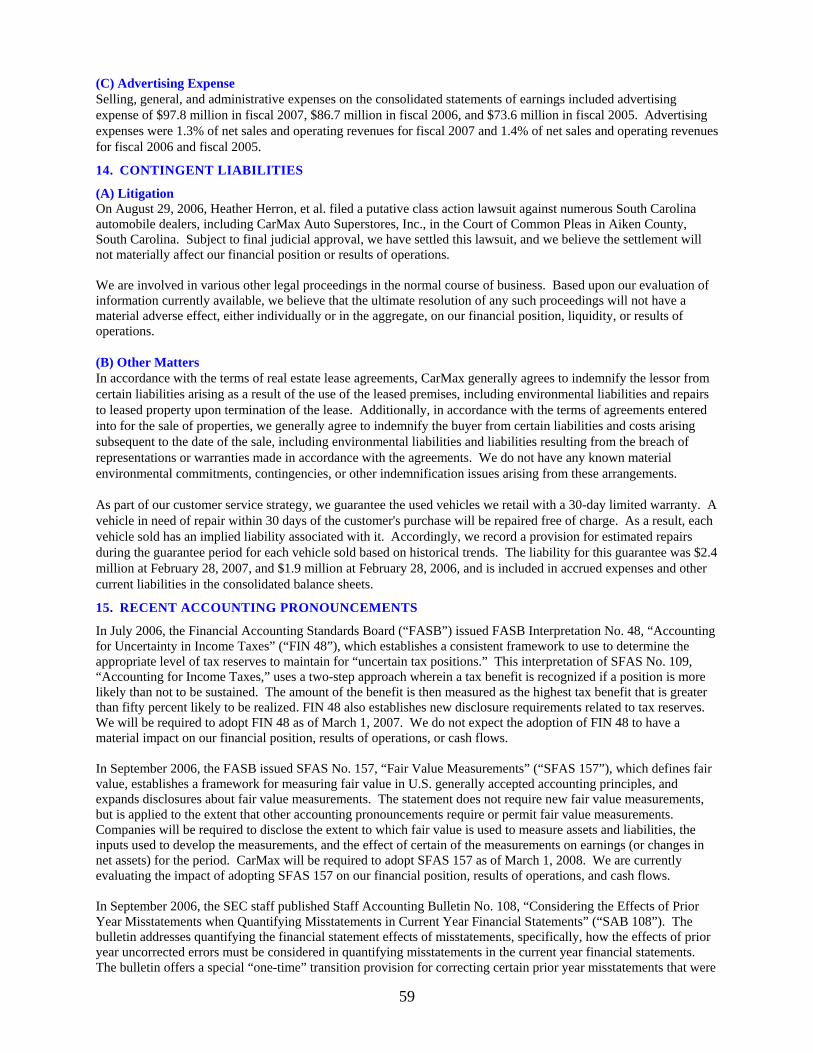
59
(C) Advertising Expense Selling, general, and administrative expenses on the consolidated statements of earnings included advertising expense of $97.8 million in fiscal 2007, $86.7 million in fiscal 2006, and $73.6 million in fiscal 2005. Advertising expenses were 1.3% of net sales and operating revenues for fiscal 2007 and 1.4% of net sales and operating revenues for fiscal 2006 and fiscal 2005.
14. CONTINGENT LIABILITIES
(A) Litigation On August 29, 2006, Heather Herron, et al. filed a putative class action lawsuit against numerous South Carolina automobile dealers, including CarMax Auto Superstores, Inc., in the Court of Common Pleas in Aiken County, South Carolina. Subject to final judicial approval, we have settled this lawsuit, and we believe the settlement will not materially affect our financial position or results of operations. We are involved in various other legal proceedings in the normal course of business. Based upon our evaluation of information currently available, we believe that the ultimate resolution of any such proceedings will not have a material adverse effect, either individually or in the aggregate, on our financial position, liquidity, or results of operations. (B) Other Matters In accordance with the terms of real estate lease agreements, CarMax generally agrees to indemnify the lessor from certain liabilities arising as a result of the use of the leased premises, including environmental liabilities and repairs to leased property upon termination of the lease. Additionally, in accordance with the terms of agreements entered into for the sale of properties, we generally agree to indemnify the buyer from certain liabilities and costs arising subsequent to the date of the sale, including environmental liabilities and liabilities resulting from the breach of representations or warranties made in accordance with the agreements. We do not have any known material environmental commitments, contingencies, or other indemnification issues arising from these arrangements. As part of our customer service strategy, we guarantee the used vehicles we retail with a 30-day limited warranty. A vehicle in need of repair within 30 days of the customer's purchase will be repaired free of charge. As a result, each vehicle sold has an implied liability associated with it. Accordingly, we record a provision for estimated repairs during the guarantee period for each vehicle sold based on historical trends. The liability for this guarantee was $2.4 million at February 28, 2007, and $1.9 million at February 28, 2006, and is included in accrued expenses and other current liabilities in the consolidated balance sheets.
15. RECENT ACCOUNTING PRONOUNCEMENTS
In July 2006, the Financial Accounting Standards Board (“FASB”) issued FASB Interpretation No. 48, “Accounting for Uncertainty in Income Taxes” (“FIN 48”), which establishes a consistent framework to use to determine the appropriate level of tax reserves to maintain for “uncertain tax positions.” This interpretation of SFAS No. 109, “Accounting for Income Taxes,” uses a two-step approach wherein a tax benefit is recognized if a position is more likely than not to be sustained. The amount of the benefit is then measured as the highest tax benefit that is greater than fifty percent likely to be realized. FIN 48 also establishes new disclosure requirements related to tax reserves. We will be required to adopt FIN 48 as of March 1, 2007. We do not expect the adoption of FIN 48 to have a material impact on our financial position, results of operations, or cash flows. In September 2006, the FASB issued SFAS No. 157, “Fair Value Measurements” (“SFAS 157”), which defines fair value, establishes a framework for measuring fair value in U.S. generally accepted accounting principles, and expands disclosures about fair value measurements. The statement does not require new fair value measurements, but is applied to the extent that other accounting pronouncements require or permit fair value measurements. Companies will be required to disclose the extent to which fair value is used to measure assets and liabilities, the inputs used to develop the measurements, and the effect of certain of the measurements on earnings (or changes in net assets) for the period. CarMax will be required to adopt SFAS 157 as of March 1, 2008. We are currently evaluating the impact of adopting SFAS 157 on our financial position, results of operations, and cash flows. In September 2006, the SEC staff published Staff Accounting Bulletin No. 108, “Considering the Effects of Prior Year Misstatements when Quantifying Misstatements in Current Year Financial Statements” (“SAB 108”). The bulletin addresses quantifying the financial statement effects of misstatements, specifically, how the effects of prior year uncorrected errors must be considered in quantifying misstatements in the current year financial statements. The bulletin offers a special “one-time” transition provision for correcting certain prior year misstatements that were
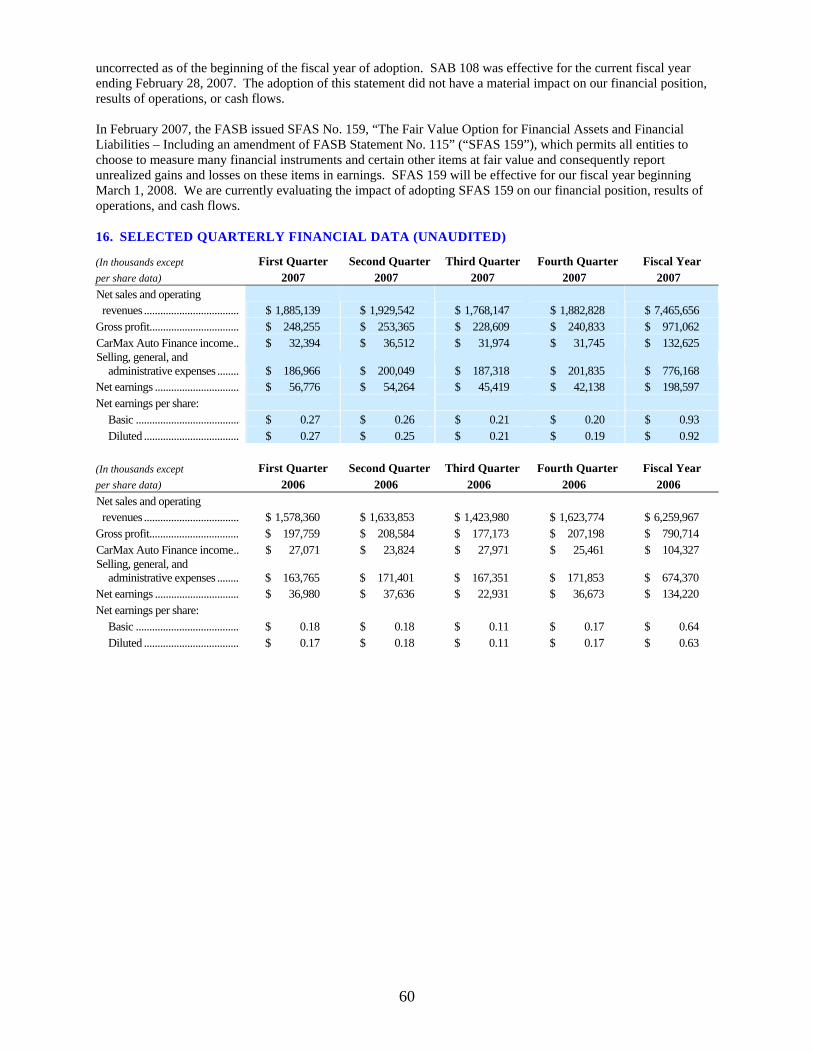
60
uncorrected as of the beginning of the fiscal year of adoption. SAB 108 was effective for the current fiscal year ending February 28, 2007. The adoption of this statement did not have a material impact on our financial position, results of operations, or cash flows. In February 2007, the FASB issued SFAS No. 159, “The Fair Value Option for Financial Assets and Financial Liabilities – Including an amendment of FASB Statement No. 115” (“SFAS 159”), which permits all entities to choose to measure many financial instruments and certain other items at fair value and consequently report unrealized gains and losses on these items in earnings. SFAS 159 will be effective for our fiscal year beginning March 1, 2008. We are currently evaluating the impact of adopting SFAS 159 on our financial position, results of operations, and cash flows. 16. SELECTED QUARTERLY FINANCIAL DATA (UNAUDITED)
First Quarter Second Quarter Third Quarter Fourth Quarter Fiscal Year (In thousands except per share data) 2007 2007 2007 2007 2007 Net sales and operating revenues ................................... $ 1,885,139 $ 1,929,542 $ 1,768,147 $ 1,882,828 $ 7,465,656
Gross profit................................. $ 248,255 $ 253,365 $ 228,609 $ 240,833 $ 971,062 CarMax Auto Finance income.. $ 32,394 $ 36,512 $ 31,974 $ 31,745 $ 132,625 Selling, general, and
administrative expenses ........ $ 186,966 $ 200,049 $ 187,318 $ 201,835 $ 776,168 Net earnings ............................... $ 56,776 $ 54,264 $ 45,419 $ 42,138 $ 198,597 Net earnings per share:
Basic ...................................... $ 0.27 $ 0.26 $ 0.21 $ 0.20 $ 0.93 Diluted ................................... $ 0.27 $ 0.25 $ 0.21 $ 0.19 $ 0.92
First Quarter Second Quarter Third Quarter Fourth Quarter Fiscal Year (In thousands except per share data) 2006 2006 2006 2006 2006 Net sales and operating revenues ................................... $ 1,578,360 $ 1,633,853 $ 1,423,980 $ 1,623,774 $ 6,259,967
Gross profit................................. $ 197,759 $ 208,584 $ 177,173 $ 207,198 $ 790,714 CarMax Auto Finance income.. $ 27,071 $ 23,824 $ 27,971 $ 25,461 $ 104,327 Selling, general, and
administrative expenses ........ $ 163,765 $ 171,401 $ 167,351 $ 171,853 $ 674,370 Net earnings ............................... $ 36,980 $ 37,636 $ 22,931 $ 36,673 $ 134,220 Net earnings per share:
Basic ...................................... $ 0.18 $ 0.18 $ 0.11 $ 0.17 $ 0.64 Diluted ................................... $ 0.17 $ 0.18 $ 0.11 $ 0.17 $ 0.63
61
Item 9. Changes in and Disagreements with Accountants on Accounting and Financial Disclosure. None. Item 9A. Controls and Procedures. Evaluation of Disclosure Controls and Procedures We maintain disclosure controls and procedures (“disclosure controls”) that are designed to ensure that information required to be disclosed in our reports filed under the Securities Exchange Act of 1934 is recorded, processed, summarized, and reported within the time periods specified in the U.S. Securities and Exchange Commission’s rules and forms. Disclosure controls are also designed to ensure that this information is accumulated and communicated to management, including the chief executive officer (“CEO”) and the chief financial officer (“CFO”), as appropriate, to allow timely decisions regarding required disclosure. As of the end of the period covered by this report, we evaluated the effectiveness of the design and operation of our disclosure controls. This evaluation was performed under the supervision and with the participation of management, including the CEO and CFO. Based upon that evaluation, the CEO and CFO concluded that our disclosure controls were effective as of the end of the period. Changes in Internal Control over Financial Reporting There was no change in our internal control over financial reporting that occurred during the quarter ended February 28, 2007, that has materially affected, or is reasonably likely to materially affect, our internal control over financial reporting. Management's Report on Internal Control over Financial Reporting Management's annual report on internal control over financial reporting is included in Item 8, Financial Statements and Supplementary Data, of this Form 10-K, and is incorporated herein by reference. Item 9B. Other Information. None.
62
Part III
With the exception of the information incorporated by reference from the company’s 2007 Proxy Statement in Items 10, 11, 12, 13, and 14 of Part III of this Annual Report on Form 10-K, the company’s 2007 Proxy Statement is not to be deemed filed as a part of this Form 10-K. Item 10. Directors, Executive Officers and Corporate Governance. The following table identifies our executive officers as of February 28, 2007. We are not aware of any family relationships among any of our executive officers or between any of our executive officer and any directors. All executive officers are elected annually and serve for one year or until their successors are elected and qualify. The next election of officers will occur in June 2007. Name Age Office Thomas J. Folliard ................................................... 42 President, Chief Executive Officer, and Director Keith D. Browning .................................................. 54 Executive Vice President, Chief Financial Officer,
Corporate Secretary, and Director Michael K. Dolan .................................................... 57 Executive Vice President and Chief Administrative
Officer Joseph S. Kunkel ..................................................... 44 Senior Vice President, Marketing and Strategy Richard M. Smith .................................................... 49 Senior Vice President and Chief Information Officer Mr. Folliard joined CarMax in 1993 as senior buyer and became director of purchasing in 1994. Mr. Folliard was promoted to vice president of merchandising in 1996, senior vice president of store operations in July 2000, and executive vice president of store operations in April 2001. Mr. Folliard became president and chief executive officer, and a director of CarMax in June 2006. Mr. Browning joined CarMax in 1996 as vice president and chief financial officer after spending 14 years at Circuit City, his last position being corporate controller and vice president. He has been involved in the development of accounting procedures, systems, and internal controls for CarMax since its inception. Mr. Browning was promoted to executive vice president and chief financial officer in 2001. He has served as a director of CarMax since January 1997 and as the company’s corporate secretary since July 2005. Mr. Dolan joined CarMax in 1997 as vice president and chief information officer. He was named senior vice president in April 2001, and was promoted to executive vice president and chief administrative officer in November 2006. Mr. Dolan had prior executive experience in information systems with H.E. Butt Grocery Company, a privately held grocery retailer, where he was vice president and chief information officer. Mr. Kunkel joined CarMax in 1998 as vice president, marketing and strategy. Mr. Kunkel was named senior vice president in April 2001. Prior to joining CarMax, Mr. Kunkel was president of Wholesome Kidfoods, Inc., and a senior manager with McKinsey and Company. Mr. Smith was the first full-time associate of CarMax, having worked on the original CarMax concept while at Circuit City in 1991. He has held various positions in technology and operations throughout his tenure with CarMax, and was promoted to vice president, management information systems, in April 2005. He was promoted to senior vice president and chief information officer in November 2006. The information concerning our directors required by this Item is incorporated by reference to the section titled “Proposal One - Election of Directors” in our 2007 Proxy Statement. The information concerning the audit committee of our board of directors and the audit committee financial expert required by this Item is incorporated by reference to the information included in the sub-section titled “Committees of the Board –Audit Committee” in our 2007 Proxy Statement. The information concerning compliance with Section 16(a) of the Securities Exchange Act of 1934 required by this Item is incorporated by reference to the sub-section titled “Section 16(a) Beneficial Ownership Reporting Compliance” in our 2007 Proxy Statement.

63
The information concerning our code of ethics (“Code of Conduct”) for senior management required by this Item is incorporated by reference to the sub-section titled “Corporate Governance Policies and Practices” in our 2007 Proxy Statement. We have not made any material change to the procedures by which our shareholders may recommend nominees to our board of directors. Item 11. Executive Compensation. The information required by this Item is incorporated by reference to the section titled “Executive Compensation” appearing in our 2007 Proxy Statement. Additional information required by this Item is incorporated by reference to the sub-section titled “Non-Employee Director Compensation in Fiscal 2007” in our 2007 Proxy Statement. Item 12. Security Ownership of Certain Beneficial Owners and Management and Related Stockholder Matters. The information required by this Item is incorporated by reference to the section titled “CarMax Share Ownership” and the sub-section titled “Equity Compensation Plan Information” in our 2007 Proxy Statement. Item 13. Certain Relationships and Related Transactions, and Director Independence. The information required by this Item is incorporated by reference to the section titled “Certain Relationships and Related Transactions” in our 2007 Proxy Statement. The information required by this Item concerning director independence is incorporated by reference to the sub-section titled “Director Independence” in our 2007 Proxy Statement. Item 14. Principal Accountant Fees and Services. The information required by this Item is incorporated by reference to the sub-section titled “Auditor Information” in our 2007 Proxy Statement.
64
Part IV Item 15. Exhibits and Financial Statement Schedules. (a) The following documents are filed as part of this report: 1. Financial Statements. All financial statements as set forth under Item 8 of this Form 10-K.
2. Financial Statement Schedules. “Schedule II – Valuation and Qualifying Accounts and Reserves” and the accompanying Report of Independent Registered Public Accounting Firm on CarMax, Inc. Financial Statement Schedule for the fiscal years ended February 28, 2007, 2006, and 2005, are filed as part of this Form 10-K and should be read in conjunction with the Consolidated Financial Statements of CarMax, Inc. and Notes thereto, included in Item 8 of this Form 10-K.
Schedules not listed above have been omitted because they are not applicable, are not required, or the
information required to be set forth therein is included in the Consolidated Financial Statements and Notes thereto.
3. Exhibits. The Exhibits listed on the accompanying Index to Exhibits immediately following the financial
statement schedule are filed as part of, or incorporated by reference into, this Form 10-K. (b) Exhibits
See Item 15(a)(3) above. (c) Financial Statement Schedules
See Item 15(a)(2) above.
65
Signatures Pursuant to the requirements of Section 13 or 15(d) of the Securities Exchange Act of 1934, the registrant has duly caused this report to be signed on its behalf by the undersigned, thereunto duly authorized. CARMAX, INC. By:
/s/ THOMAS J. FOLLIARD Thomas J. Folliard
President and Chief Executive Officer April 25, 2007
By:
/s/ KEITH D. BROWNING Keith D. Browning
Executive Vice President and Chief Financial Officer April 25, 2007
Pursuant to the requirements of the Securities Exchange Act of 1934, this report has been signed by the following persons on behalf of the registrant and in the capacities and on the dates indicated:
/s/ THOMAS J. FOLLIARD Thomas J. Folliard
President, Chief Executive Officer, and Director April 25, 2007
/s/ HUGH G. ROBINSON* Hugh G. Robinson
Director April 25, 2007
/s/ KEITH D. BROWNING
Keith D. Browning Executive Vice President, Chief Financial Officer,
Chief Accounting Officer, and Director April 25, 2007
/s/ RICHARD L. SHARP * Richard L. Sharp
Director April 25, 2007
/s/ JAMES F. CLINGMAN, JR.*
James F. Clingman, Jr. Director
April 25, 2007
/s/ THOMAS G. STEMBERG * Thomas G. Stemberg
Director April 25, 2007
/s/ JEFFREY E. GARTEN *
Jeffrey E. Garten Director
April 25, 2007
/s/ VIVIAN M. STEPHENSON* Vivian M. Stephenson
Director April 25, 2007
/s/ W. ROBERT GRAFTON *
W. Robert Grafton Director
April 25, 2007
/s/ BETH A. STEWART* Beth A. Stewart
Director April 25, 2007
/s/ EDGAR H. GRUBB *
Edgar H. Grubb Director
April 25, 2007
/s/ WILLIAM R. TIEFEL* William R. Tiefel
Director April 25, 2007
/s/ WILLIAM S. KELLOGG * William S. Kellogg
Director April 25, 2007
*By:
/s/ THOMAS J. FOLLIARD Thomas J. Folliard Attorney-In-Fact
The original powers of attorney authorizing Thomas J. Folliard and Keith D. Browning, or either of them, to sign this annual report on behalf of certain directors and officers of the company are included as Exhibit 24.1.
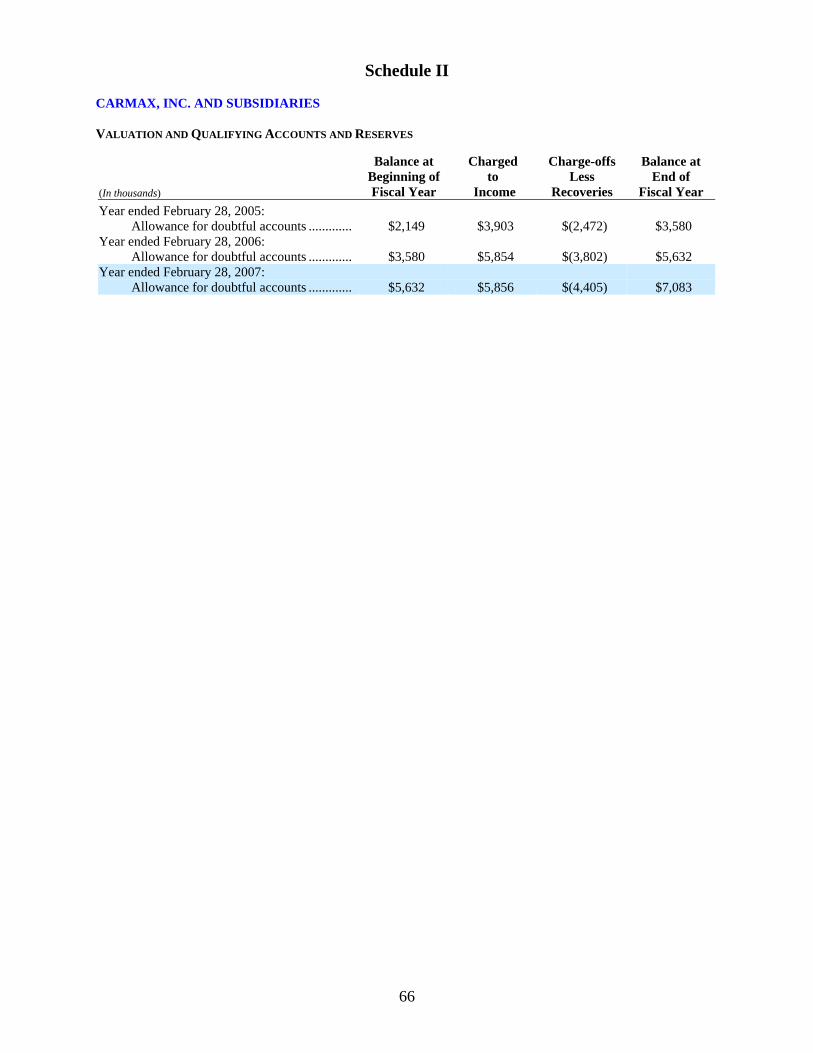
66
Schedule II CARMAX, INC. AND SUBSIDIARIES VALUATION AND QUALIFYING ACCOUNTS AND RESERVES
(In thousands)
Balance at Beginning of Fiscal Year
Charged to
Income
Charge-offs Less
Recoveries
Balance at End of
Fiscal Year Year ended February 28, 2005:
Allowance for doubtful accounts ............. $2,149 $3,903 $(2,472) $3,580 Year ended February 28, 2006:
Allowance for doubtful accounts ............. $3,580 $5,854 $(3,802) $5,632 Year ended February 28, 2007:
Allowance for doubtful accounts ............. $5,632 $5,856 $(4,405) $7,083
67
INDEX TO EXHIBITS
2.1
Separation Agreement, dated May 21, 2002, between Circuit City Stores, Inc. and CarMax, Inc., filed as Exhibit 2.1 to CarMax’s Registration Statement on Form S-4/A, filed June 6, 2002 (File No. 333-85240), is incorporated by this reference.
3.1
CarMax, Inc. Amended and Restated Articles of Incorporation, effective June 6, 2002, filed as Exhibit 3.1 to CarMax’s Current Report on Form 8-K, filed October 3, 2002 (File No. 1-31420), is incorporated by this reference.
3.2
CarMax, Inc. Articles of Amendment to the Amended and Restated Articles of Incorporation, effective June 6, 2002, filed as Exhibit 3.2 to CarMax’s Current Report on Form 8-K, filed October 3, 2002 (File No. 1-31420), is incorporated by this reference.
3.3
CarMax, Inc. Bylaws, as amended and restated January 22, 2007, filed as Exhibit 3.1 to CarMax’s Current Report on Form 8-K, filed January 26, 2007 (File No. 1-31420), is incorporated by this reference.
4.1
Rights Agreement, dated as of May 21, 2002, between CarMax, Inc. and Wells Fargo Bank Minnesota, N.A., as Rights Agent, filed as Exhibit 4.1 to CarMax’s Registration Statement on Form S-4/A, filed June 6, 2002 (File No. 333-85240), is incorporated by this reference.
10.1
Employment Agreement between CarMax, Inc. and Thomas J. Folliard, filed as Exhibit 10.1 to CarMax’s Current Report on Form 8-K/A, filed October 23, 2006 (File No. 1-31420) is incorporated by this reference. *
10.2
Severance Agreement between CarMax, Inc. and Keith D. Browning, filed as Exhibit 10.1 to CarMax’s Current Report on Form 8-K, filed February 21, 2007 (File No. 1-31420) is incorporated by this reference. *
10.3
Severance Agreement between CarMax, Inc. and Michael K. Dolan, filed as Exhibit 10.2 to CarMax’s Current Report on Form 8-K, filed February 21, 2007 (File No. 1-31420) is incorporated by this reference. *
10.4
Severance Agreement between CarMax, Inc. and Joseph S. Kunkel, filed as Exhibit 10.3 to CarMax’s Current Report on Form 8-K, filed February 21, 2007 (File No. 1-31420) is incorporated by this reference. *
10.5
Severance Agreement between CarMax, Inc. and Richard M. Smith, filed as Exhibit 10.4 to CarMax’s Current Report on Form 8-K, filed February 21, 2007 (File No. 1-31420) is incorporated by this reference. *
10.6
CarMax, Inc. Benefit Restoration Plan, as amended and restated October 19, 2004, filed as Exhibit 10.2 to CarMax’s Annual Report on Form 10-K, filed May 13, 2005 (File No. 1-31420), is incorporated by this reference. *
10.7
CarMax, Inc. 2002 Non-Employee Directors Stock Incentive Plan, as amended and restated April 24, 2006, filed as Exhibit 10.4 to CarMax’s Current Report on Form 8-K, filed April 28, 2006 (File No. 1-31420), is incorporated by this reference. *
10.8
CarMax, Inc. 2002 Stock Incentive Plan, as amended and restated April 24, 2006, filed as Exhibit 10.2 to CarMax’s Current Report on Form 8-K, filed April 28, 2006 (File No. 1-31420), is incorporated by this reference. *
10.9
CarMax, Inc. Annual Performance-Based Bonus Plan, as amended and restated April 24, 2006, filed as Exhibit 10.1 to CarMax’s Current Report on Form 8-K, filed April 28, 2006 (File No. 1-31420), is incorporated by this reference. *
68
10.10
CarMax, Inc. 2002 Employee Stock Purchase Plan, as amended and restated July 1, 2006, filed as Exhibit 10.1 to CarMax's Current Report on Form 8-K, filed June 22, 2006 (File No. 1-31420), is incorporated by this reference.
10.11
Credit Agreement, dated August 24, 2005, among CarMax Auto Superstores, Inc., CarMax, Inc., various subsidiaries of CarMax, various Lenders named therein and Bank of America N.A., as Administrative Agent, filed as Exhibit 10.1 to CarMax’s Quarterly Report on Form 10-Q, filed October 7, 2005 (File No. 1-31420), is incorporated by this reference. Certain non-material schedules and exhibits have been omitted from the Credit Agreement as filed. CarMax agrees to furnish supplementally to the Commission upon request a copy of such schedules and exhibits.
10.12
Security Agreement, dated August 24, 2005, among CarMax, Inc., CarMax Auto Superstores, Inc., various subsidiaries of CarMax named therein, and Bank of America N.A., as Administrative Agent, filed as Exhibit 10.2 to CarMax’s Quarterly Report on Form 10-Q, filed October 7, 2005 (File No. 1-31420), is incorporated by this reference.
10.13
Company Guaranty Agreement, dated August 24, 2005, between CarMax, Inc. and Bank of America N.A., as Administrative Agent, filed as Exhibit 10.3 to CarMax's Quarterly Report on Form 10-Q, filed October 7, 2005 (File No. 1-31420), is incorporated by this reference.
10.14
Amendment No. 1 to Credit Agreement and Joinder Agreement, dated December 8, 2006, among CarMax Auto Superstores, Inc., CarMax, Inc, various subsidiaries of CarMax, various Lenders named therein and Bank of America N.A., as Administrative Agent, filed as Exhibit 10.1 to CarMax’s Current Report on Form 8-K, filed December 14, 2006 (File No. 1-31420), is incorporated by this reference. Certain non-material schedules and exhibits have been omitted from Amendment No.1 as filed. CarMax agrees to furnish supplementally to the Commission upon request a copy of such schedules and exhibits.
10.15 Amended and Restated Tax Allocation Agreement between Circuit City Stores, Inc. and CarMax, Inc.,
dated October 1, 2002, filed as Exhibit 99.2 to CarMax’s Current Report on Form 8-K, filed October 3, 2002 (File No. 1-31420), is incorporated by this reference.
10.16
Employee Benefits Agreement between Circuit City Stores, Inc. and CarMax, Inc., dated October 1, 2002, filed as Exhibit 99.4 to CarMax’s Current Report on Form 8-K, filed October 3, 2002 (File No. 1-31420), is incorporated by this reference.
10.17
Confidentiality Agreement between Circuit City Stores, Inc. and CarMax, Inc., dated October 1, 2002, filed as Exhibit 99.5 to CarMax’s Current Report on Form 8-K, filed October 3, 2002 (File No. 1-31420), is incorporated by this reference.
10.18
Form of Notice of Stock Option Grant between CarMax, Inc. and certain named and other executive officers, filed as Exhibit 10.2 to CarMax’s Current Report on Form 8-K, filed October 20, 2006 (File No. 1-31420), is incorporated by this reference. *
10.19
Form of Directors Stock Option Grant Agreement between CarMax, Inc. and certain non-employee directors of the CarMax, Inc. board of directors, filed as Exhibit 10.5 to CarMax’s Current Report on Form 8-K, filed April 28, 2006 (File No. 1-31420), is incorporated by this reference. *
10.20
Form of Stock Grant Notice Letter from CarMax, Inc. to certain non-employee directors of the CarMax, Inc. board of directors, filed as Exhibit 10.20 to CarMax’s Annual Report on Form 10-K, filed May 13, 2005 (File No. 1-31420), is incorporated by this reference. *
21.1 CarMax, Inc. Subsidiaries, filed herewith.
23.1 Consent of KPMG LLP, filed herewith.

69
24.1 Powers of Attorney, filed herewith.
31.1 Certification of the Chief Executive Officer Pursuant to Rule 13a-14(a), filed herewith.
31.2 Certification of the Chief Financial Officer Pursuant to Rule 13a-14(a), filed herewith.
32.1 Certification of the Chief Executive Officer Pursuant to 18 U.S.C. Section 1350, filed herewith.
32.2 Certification of the Chief Financial Officer Pursuant to 18 U.S.C. Section 1350, filed herewith.
* Indicates management contracts, compensatory plans, or arrangements of the company required to be filed as an
exhibit.
70
COMPANY OFFICERS
Senior Management Team
Tom Folliard Anu Agarwal Laura Donahue Todd House Kim Orcutt President Vice President Vice President Vice President Vice President Chief Executive Officer Business Strategy Advertising Corporate Strategy and Controller Concept Innovation Keith Browning Dave Banks Barbara Harvill Tom Reedy Executive Vice President Vice President Vice President Rob Mitchell Vice President Chief Financial Officer Management Information Management Information Vice President Treasurer Corporate Secretary Systems Systems Consumer Finance Scott Rivas Mike Dolan Dan Bickett Jack Hightower Douglass Moyers Vice President Executive Vice President Vice President Vice President Vice President Human Resources Chief Administrative Construction and Facilities Sales Real Estate Officer Fred Wilson Angie Chattin Ed Hill Bill Nash Vice President Joe Kunkel Vice President Vice President Vice President Store Administration Senior Vice President CarMax Auto Finance Service Operations Auction Services Marketing and Strategy Cliff Wood Vice President Richard Smith Merchandising Senior Vice President Chief Information Officer
Home Office and Field Management Team
Mark Adams Jason Day Tracy Hanson John Montegari Brian Stone Assistant Vice President Region Vice President Region Vice President Assistant Vice President Region Vice President Logistics Merchandising Service Operations Media Buyer Development Atlanta Region Nashville Region Rod Baker Lynn Mussatt Lisa Van Riper Region Vice President Brian Dunne Deborah Helms Assistant Vice President Assistant Vice President Service Development Region Vice President Region Vice President Business Operations Public Affairs Service Operations Service Operations Chris Bartee Southwest Region Florida Region Bill Myers Tom Vicini Region Vice President Region Vice President Region Vice President Merchandising Bryan Ennis Veronica Hinckle General Manager General Manager Southwest Region Region Vice President Assistant Vice President Nashville Region Central Region Merchandising Assistant Controller Jeremy Byrnes Nashville Region Tom Nolan Donna Wassel Assistant Vice President Dan Johnston Region Vice President Region Vice President CarMax Auto Finance Edward Fabritiis Region Vice President Retail Service General Manager Assistant Vice President General Manager Southwest Region Mike Callahan Field Human Resources Mid-Atlantic Region Mike Otte Assistant Vice President Region Vice President Joe Wilson CarMax Auto Finance Dodie Fix Katharine Kenny Production Systems Region Vice President Assistant Vice President Assistant Vice President Merchandising Ron Costa Procurement Investor Relations Marty Sberna Central Region Region Vice President Region Vice President Merchandising Jon Geske Chad Kulas Service Operations Tom Wulf Los Angeles Region Region Vice President Assistant Vice President Atlanta Region Assistant Vice President Service Operations Human Resources Store Operations Kevin Cox Los Angeles Region Gary Sheehan Region Vice President Tom Marcey Assistant Vice President Natalie Wyatt General Manager Todd Gibbons Region Vice President Process Engineering Assistant Vice President Atlanta Region Region Vice President Merchandising Assistant Controller Service Operations Mid-Atlantic Region Vaughn Sigmon John Davis Central Region Region Vice President Dugald Yska Region Vice President Bill McChrystal General Manager Region Vice President Service Operations Michelle Halasz Region Vice President Los Angeles Region General Manager Mid-Atlantic Region Assistant Vice President Merchandising Florida Region Deputy General Counsel Florida Region
71
BOARD OF DIRECTORS
Richard L. Sharp William S. Kellogg Chairman of the Board Retired Chairman and Chief Executive Officer CarMax, Inc. Kohl’s Corporation Private Investor (an apparel and home products retailer) Retired Chairman and Chief Executive Officer Oconomowoc, Wisconsin Circuit City Stores, Inc. (a consumer electronics specialty retailer) Major General Hugh G. Robinson (U.S.A. Ret.), P.E. Richmond, Virginia Chairman and Chief Executive Officer Global Building Systems, Inc. Keith D. Browning (a low- and moderate-income housing construction firm) Executive Vice President, Dallas, Texas Chief Financial Officer, and Corporate Secretary Thomas G. Stemberg CarMax, Inc. Founder and Chairman Emeritus Staples, Inc. James F. Clingman, Jr. (an office supply superstore retailer) Retired President and Chief Operating Officer Managing General Partner H.E. Butt Grocery Company Highland Consumer Fund at Highland Capital Partners (a food retailer) (a venture capital firm) San Antonio, Texas Framingham, Massachusetts Thomas J. Folliard Vivian M. Stephenson President and Retired Chief Operating Officer Chief Executive Officer Williams-Sonoma, Inc. CarMax, Inc. (a specialty retailer of products for the home) San Francisco, California Jeffrey E. Garten Juan Trippe Professor in the Practice of Beth A. Stewart International Trade, Finance, and Business Chairman and Chief Executive Officer Yale School of Management Storetrax.com Chairman (an Internet real estate listing service) Garten Rothkopf Bernardsville, New Jersey (an international consulting firm) New Haven, Connecticut William R. Tiefel Chairman Emeritus W. Robert Grafton The Ritz-Carlton Hotel Company, L.L.C. Retired Managing Partner – Chief Executive (a luxury hospitality company) Andersen Worldwide S.C. Retired Vice Chairman (an accounting and professional services firm) Marriott International, Inc. Potomac, Maryland (a diversified hospitality company) Palm Beach, Florida Edgar H. Grubb Retired Executive Vice President and Chief Financial Officer Transamerica Corporation (an insurance and financial services company) Walnut Creek, California
BOARD COMMITTEES
Executive
Audit
Compensation and Personnel
Nominating and Governance
Thomas J. Folliard W. Robert Grafton, Chairman Hugh G. Robinson, Chairman William R. Tiefel, Chairman Keith D. Browning James F. Clingman, Jr. William S. Kellogg Jeffrey E. Garten Edgar H. Grubb Thomas G. Stemberg Vivian M. Stephenson Beth A. Stewart

C A R M A X 2 0 0 7
1
Fiscal 2007 was an exceptionally strong year for CarMax.
A number of factors contributed to our continued success last
year, including steady improvement in our operational initia-
tives and increased traffic in our stores and on carmax.com.
As a result, we reported growth in sales and gross margins
for both retail and wholesale vehicle sales, and CarMax Auto
Finance (CAF).
In fiscal 2007, net income increased 48% on a sales increase
of 19%, which included 9% growth in comparable store used
vehicle units. We believe our strong sales growth was fueled by
the combination of expanded CarMax brand awareness, which
drove more customers to our stores and our website, and con-
tinued excellent execution by our store teams. Sales were fur-
ther supported by a number of marketing enhancements in our
Internet, television, and radio advertising, and by a variety of
improvements to our website, carmax.com, all of which we will
continue to refine in fiscal 2008.
Better overall execution also helped improve our gross mar-
gins, which increased for all categories of vehicles—used, whole-
sale, and new. Better execution can be best and most simply
characterized as better vehicle buying, reconditioning, and selling.
We learn more and improve our systems each year, as we add to
our continually-expanding and industry-leading database of infor-
mation on used vehicles. We also continue to improve our whole-
sale vehicle auctions by increasing our operational efficiency and
expanding the services offered to dealer participants.
CAF income grew by 27% in fiscal 2007. CAF offers competi-
tive financing and thus provides qualifying customers with
a dependable financing option that is profitable and risk-
controlled for CarMax. For alternative financing, CarMax partners
with several strong third-party lenders. Most of these lenders pay
us a fixed fee per origination in return for loan portfolios that
we estimate are significantly less risky than their other auto
loan portfolios due to the straightforward way CarMax manages
financing and the meticulous reconditioning of our vehicles.
Our lenders benefit from the superior quality of our informa-
tion, which allows them to make better financing decisions.
We are very excited by our future growth opportunities. The
vast size of our marketplace and our unique consumer offer
are just two of the elements that distinguish the CarMax
growth story. Although we reported $7.5 billion in revenues in
fiscal 2007 and are the largest retailer of used cars in the
United States, we still had only 77 used car superstores open
at year end, and represented only about 2% of the estimated
$290 billion market for 1- to 6- year-old used cars.
We opened 10 stores in fiscal 2007, growing our store base
by 15%, consistent with our long-term objective of 15% to 20%
annual store growth. We expect to open an additional 13 stores
in fiscal 2008, a 17% store growth rate. This rate of growth
suggests that we could double our store base in the next five
years, and have consistent, sustainable growth over the next
decade. We believe this significant growth trajectory distin-
guishes CarMax from most U.S. retailers.
We are fortunate to currently have no similar-format, multi-
market competitors, but we will never be complacent. Concept
innovation, including ongoing analysis and operational initia-
tives, is an important focus for CarMax. We constantly look for
Letter To Shareholders
Tom FolliardPresident and Chief Executive Officer
FINANCIAL HIGHLIGHTS
Corporate and Shareholder Information
Design: VIVO Design, Inc. Store photography: Jeff Zaruba Printing: Peake DeLancey Printers and RR Donnelley
CARMAX, CARMAX THE AUTO SUPERSTORE, THE CARMAX ADVANTAGE, 5 DAY MONEY BACK GUARANTEE (and design), VALUMAX, and
CARMAX.COM are all registered trademarks or service marks of CarMax. Other company, product, and service names may be trademarks
or service marks of their respective owners.
Home OfficeCarMax, Inc.12800 Tuckahoe Creek ParkwayRichmond, Virginia 23238Telephone: (804) 747-0422
Websitewww.carmax.com
Annual Shareholders’ MeetingTuesday, June 26, 2007, at 8:30 a.m. EDTThe Richmond Marriott West Hotel4240 Dominion BoulevardGlen Allen, Virginia 23060
Stock InformationCarMax, Inc. common stock is traded on the New York StockExchange under the ticker symbol KMX.
At February 28, 2007, there were approximately 6,300 CarMaxshareholders of record.
Quarterly Stock Price RangeThe following table sets forth by fiscal quarter the high andlow reported prices of our common stock for the last two fiscal years, adjusted for the March 2007 2-for-1 stock split.
First Second Third FourthQuarter Quarter Quarter Quarter
Fiscal 2007High $18.20 $18.95 $23.99 $29.44Low $15.14 $14.85 $18.59 $23.10
Fiscal 2006High $17.00 $17.12 $16.00 $15.92Low $12.44 $12.32 $13.00 $13.20
Dividend PolicyTo date, we have not paid a cash dividend on our commonstock. We presently intend to retain our net earnings for usein our operations and for geographic expansion and, therefore,we do not anticipate paying any cash dividends in the foresee-able future.
Transfer Agent and RegistrarContact our transfer agent for questions regarding your stock certificates, including changes of address, name, or owner-ship; lost certificates; or to consolidate multiple accounts.
Wells Fargo Bank, N.A.P.O. Box 64854South St. Paul, Minnesota 55164-0854Toll free: (800) 468-9716Hearing impaired: (651) 450-4144www.wellsfargo.com/shareownerservices
Independent AuditorsKPMG LLP1021 East Cary Street, Suite 2000Richmond, Virginia 23219-4023
Financial InformationFor quarterly sales and earnings information, financial reports,filings with the Securities and Exchange Commission (includ-ing Form 10-K), news releases, and other investor information,please visit our investor website at:
http://investor.carmax.com.
Information may also be obtained from the Investor RelationsDepartment at:
Email: [email protected]: (804) 747-0422, ext. 4489
CEO and CFO CertificationsOur chief executive officer and chief financial officer have filedwith the SEC the certifications required by Section 302 of theSarbanes-Oxley Act of 2002 regarding the quality of our publicdisclosure. These certifications are included as exhibits to theAnnual Report on Form 10-K for fiscal 2007. In addition, ourchief executive officer annually certifies to the NYSE that he isnot aware of any violation by CarMax of the NYSE’s corporategovernance listing standards. This certification was submitted,without qualification, as required after the 2006 annual meet-ing of CarMax’s shareholders.
Corporate Governance InformationCopies of the CarMax Corporate Governance Guidelines,the Code of Conduct, and the charters for each of the AuditCommittee, Nominating and Governance Committee, andCompensation and Personnel Committee are available fromour investor website, at http://investor.carmax.com, under the corporate governance tab. Alternatively, shareholders mayobtain, without charge, copies of these documents by writingto Investor Relations at the CarMax home office.
Investor RelationsSecurity analysts and investors are invited to contact:
Katharine Kenny, Assistant Vice President, Investor RelationsTelephone: (804) 935-4591Email: [email protected]
General InformationMembers of the media and others seeking generalinformation about CarMax should contact:
Lisa Van Riper, Assistant Vice President, Public AffairsTelephone: (804) 935-4594Email: [email protected]
COVER PHOTOS: [TOP] Carmax.com is a valuable marketing, research, and
sales tool. Customers can browse our nationwide inventory of more
than 25,000 vehicles, and virtually any used vehicle can be transferred
to their local superstore. [BOTTOM] CarMax’s Duarte used car superstore
is one of six stores we operate in the large Los Angeles market. We
plan to open two additional stores in this market in fiscal 2008.
% Change Fiscal Years Ended February 28 or 29(1)
(Dollars in millions except per share data) ’06 to’07 2007 2006 2005 2004 2003
Operating ResultsNet sales and operating revenues 19% $7,465.7 $6,260.0 $5,260.3 $4,597.7 $3,969.9Net earnings 48% $ 198.6 $ 134.2 $ 101.3 $ 109.6 $ 90.4Diluted earnings per share 46% $ 0.92 $ 0.63 $ 0.48 $ 0.52 $ 0.43
Other InformationCash provided by operating activities 16% $ 136.8 $ 117.5 $ 41.8 $ 141.4 $ 57.9Used car superstores, at year-end 15% 77 67 58 49 40
(1) All per share amounts have been adjusted for the effect of the 2-for-1 stock split in March 2007. We adopted SFAS 123R in fiscal 2007, applying the modifiedretrospective method, and prior year amounts have been restated for the effect of the adoption.

CARMAX, INC. 12800 TUCKAHOE CREEK PARKWAY, RICHMOND, VIRGINIA 23238 804-747-0422 WWW.CARMAX.COM
CA
RM
AX
,IN
C. A
NN
UA
L R
EP
OR
T F
ISC
AL
YE
AR
20
07
Fiscal Year 2007
CARMAX, INC. ANNUAL REPORT

![INSTALLATION DE TEAM[SCRLPT-MAX]tchattons.free.fr/Script/Tutoriels/Teamscript/Teamscript.pdf · Répondez OUI car c'est la première fois que vous installez ce script, donc forcément](https://img.pdfslide.fr/doc/110x75/601ef613d909a761815d0d65/installation-de-teamscrlpt-max-rpondez-oui-car-cest-la-premire-fois-que-vous.jpg)