Embed Size (px)
Citation preview
Ferromagnetism in Laves-phase WFe2 nanoparticlesM. A. Koten, P. Manchanda, B. Balamurugan, R. Skomski, D. J. Sellmyer, and J. E. Shield Citation: APL Materials 3, 076101 (2015); doi: 10.1063/1.4926610 View online: http://dx.doi.org/10.1063/1.4926610 View Table of Contents: http://scitation.aip.org/content/aip/journal/aplmater/3/7?ver=pdfcov Published by the AIP Publishing Articles you may be interested in Effect of the Zn content in the magnetic properties of Co1−xZnxFe2O4 mixed ferrites J. Appl. Phys. 113, 17B513 (2013); 10.1063/1.4796173 Origin of magnetic anisotropy in ZnO/CoFe2O4 and CoO/CoFe2O4 core/shell nanoparticle systems Appl. Phys. Lett. 101, 252405 (2012); 10.1063/1.4771993 Structural and magnetic properties of nanoparticles of prussian blue analogue Ni 3 [ Cr ( CN ) 6 ] 2 .n H 2 O AIP Conf. Proc. 1447, 229 (2012); 10.1063/1.4709963 Structure and magnetic properties of ternary Tb-Fe-B nanoparticles and nanoflakes Appl. Phys. Lett. 99, 162510 (2011); 10.1063/1.3653256 Size-dependent spin state and ferromagnetism in La 0.8 Ca 0.2 CoO 3 nanoparticles J. Appl. Phys. 108, 063907 (2010); 10.1063/1.3468463
This article is copyrighted as indicated in the article. Reuse of AIP content is subject to the terms at: http://aplmaterials.aip.org/about/rights_and_permissions
Downloaded to IP: 129.93.9.143 On: Mon, 13 Jul 2015 19:55:35
APL MATERIALS 3, 076101 (2015)
Ferromagnetism in Laves-phase WFe2 nanoparticlesM. A. Koten,1 P. Manchanda,2 B. Balamurugan,2 R. Skomski,2D. J. Sellmyer,2 and J. E. Shield11Department of Mechanical and Materials Engineering and Nebraska Center for Materialsand Nanoscience, University of Nebraska, Lincoln, Nebraska 68588-0526, USA2Department of Physics and Astronomy and Nebraska Center for Materials and Nanoscience,University of Nebraska, Lincoln, Nebraska 68588-0299, USA
(Received 15 April 2015; accepted 29 June 2015; published online 9 July 2015)
While rare-earth based Laves phases are known to exhibit large magnetostriction, themagnetic properties of some binary Laves phases containing transition metals aloneare not well known. This is because many of these compounds contain refractory ele-ments that complicate melt processing due to high melting temperatures and extensivephase separation. Here, phase-pure WFe2 nanoclusters, with the hexagonal C14 Lavesstructure, were deposited via inert gas condensation, allowing for the first knownmeasurement of ferromagnetism in this phase, with MS of 26.4 emu/g (346 emu/cm3)and a KU of 286 kerg/cm3, at 10 K, and a TC of 550 K. C 2015 Author(s). All articlecontent, except where otherwise noted, is licensed under a Creative CommonsAttribution 3.0 Unported License. [http://dx.doi.org/10.1063/1.4926610]
For nearly a century, Laves phases1 have been studied in a variety of scientific disciplines fordifferent technological applications. Laves phases are dense-packed compounds of the type AB2that crystallize in one of three crystal structures: cubic C15, hexagonal C14, and hexagonal C36.They are known as size-factor-compounds because their formation is strongly dependent on theradius ratios of the A and B atoms;2 the A atoms are coordinated by a large number of B atoms, and,in the hexagonal structures, the lattice constants follow the c/a = 2
√2/3 relationship. In addition
to exhibiting a variety of magnetic characteristics, some Laves phases are known superconductors,3
while others have served as materials for metal-organic-frameworks4 and rechargeable batteries.5,6
The RFe2 Laves phase magnets, where “R” refers to the Lanthanide series, have the cubic C15MgCu2 type structure, large magnetic moments, and display large magnetostriction.7 In the 1980ssome investigations were made into TFe2 Laves phases, where “T” represents another transitionmetal. Previous theoretical studies focused on predicting the type of magnetism that the Lavesphases were likely to have based on their electronic structures.8,9 However, this proved to be achallenge due to the complexities of transition metal magnetism.10 Ishida et al.9 used this method topredict the magnetism of the WFe2 phase but their results were inconclusive. More recently, Kumaret al.11 predicted that the C14-ordered phase is essentially ferromagnetic, with a small inducedantiparallel or “ferrimagnetic” moment on the W site. Experimentally, the WFe2 phase has beendifficult to form and frequently been referred to as nonmagnetic.12 However, the current thrust tofind rare-earth-free permanent magnets with inexpensive components has renewed interest in TFe2compounds and other related structures.11
The equilibrium λ-WFe2 Laves phase that forms in the C14 structure is a difficult bulk com-pound to produce due to slow diffusion kinetics and a nearly zero enthalpy of mixing.13 As aresult, there are no known reports in the literature detailing the phase-purity necessary to elucidatemagnetic behavior.2,12,14,15 The high melting point of W complicates melt processing, as does thelarge peritectic gap in the equilibrium phase diagram,16 which creates extensive segregation duringsolidification that is difficult, if not impossible, to completely eliminate during homogenization heattreatment. Elemental Fe and W powders can be mechanically alloyed to the point of amorphization,though long milling times (about 300 h) lead to significant Fe contamination and uncertainty in thefinal composition.17
2166-532X/2015/3(7)/076101/6 3, 076101-1 ©Author(s) 2015
This article is copyrighted as indicated in the article. Reuse of AIP content is subject to the terms at: http://aplmaterials.aip.org/about/rights_and_permissions
Downloaded to IP: 129.93.9.143 On: Mon, 13 Jul 2015 19:55:35
076101-2 Koten et al. APL Mater. 3, 076101 (2015)
In this work, the magnetic and structural properties of WFe2 nanoclusters are investigatedexperimentally and using density functional theory (DFT) calculations. WFe2 nanoclusters wereproduced using a sputtering-based inert gas condensation (IGC) method. IGC is a powerful routeto chemically homogeneous structures, as the clusters condense directly from the gas phase.18–20
The compositions can be readily tailored, particularly if the gas source is sputtering, and both crys-talline and amorphous structures have been observed.20,21 As-deposited amorphous structures canbe annealed to form equilibrium or near-equilibrium phases without affecting the composition.22,23
Additionally, nanoscale ferromagnetism can differ from that of the bulk material because of a largerfraction of surface atoms with reduced nearest neighbors and uncompensated surface spins, whichcan lead to magnetization enhancement.24 With this in mind, DFT calculations were performed fora 125 atom nanocluster for comparison to the aforementioned bulk calculation11 and experimentalresults for clusters.
The condensation chamber was held between 17 and 21 ◦C by water cooling, and a mixtureof Ar and He gases was flowed through the system in a ratio of 10:1 for an operating pressureof about 10−1 Torr. The nanoclusters were deposited at a power of 100 W on Si substrates formagnetic characterization and on Cu-mesh grids with an ultrathin C support film for transmissionelectron microscopy. To prevent particle agglomeration, oxidation, and inter-cluster diffusion, theFe-W clusters were covered by a C film that was approximately 2 nm thick. Twenty-five layers ofclusters were deposited onto the Si substrate, with each layer separated by the C layer, for mag-netic measurements, and a single layer was deposited onto the Cu grids for electron microscopy.For post-deposition annealing, the sample was wrapped in Ta foil and placed inside a quartz tubeand then sealed in an Ar atmosphere prior to annealing at 600 ◦C for 30 min. The furnace wasthen switched off and the samples remained inside until the furnace temperature returned to roomtemperature.
The sputtering target (7.62 cm in diameter) was made by embedding six 99.95% pure W plugs(6.35 mm in diameter) in the expected etching region (“racetrack”) of a Fe disk. The area of theetching region and the sputtering yields for Fe and W factored into the placement and numberof plugs embedded in the target for an expected composition of 67 at. % Fe. The compositionwas determined by energy dispersive x-ray spectroscopy (EDS) using an FEI Tecnai Osiris scan-ning transmission electron microscope (S/TEM) operating at 200 kV on regions containing bothisolated, single clusters and thousands of clusters. The particle size distributions were determinedfrom bright-field TEM images sampling approximately 800 clusters, and then quantified using theImageJ software.25 The crystal structure was determined by selected area diffraction (SAD) pat-terns and fast Fourier transforms (FFTs) of high-resolution TEM images. Magnetic hysteresis wasmeasured at 10 and 300 K after annealing using a Quantum Design Magnetic Property Measure-ment System (MPMS) superconducting quantum interference device (SQUID) magnetometer. TheCurie temperature was found by measuring magnetic moment between 300 and 850 K on a Quan-tum Design Physical Properties Measurement System (PPMS). The diamagnetic signal from the Sisubstrate was subtracted from the hysteresis loops. The law of approach to saturation method26 wasused to calculate the anisotropy constant for the WFe2 clusters, and the saturation magnetizationwas found by fitting a line to a plot of the high field M vs 1/H2 data.
The DFT calculations were carried out using the projected augmented wave (PAW) method,as implemented in the Vienna ab initio simulation package (VASP).27,28 The exchange-correlationeffects described by Perdew, Burke, and Ernzerhof (PBE) were implemented by the generalized-gradient approximation (GGA).29 The optimized lattice parameters (a = 4.735 Å, c = 7.732 Å)were used, which are in good agreement with the experimental lattice parameters. A supercell with15 Å vacuum spaces along x, y , and z was used to ensure that there was no interaction betweenneighboring WFe2 nanoclusters. For the nanocluster, the Γ-point was used for k-point sampling dueto the large supercell. The atomic positions for the clusters were relaxed until the force acting oneach atom was less than 0.1 eV/Å, and a convergence criterion of 1 × 10⁻⁵ eV has been used forelectronic structure calculations.
The composition was determined by EDS in both the as-deposited and annealed clusters usingboth regions that encompassed many nanoparticles and from single nanoparticles. The compositionwas found to be between 67 and 68 at. % Fe, which is within the error of the EDS quantification
This article is copyrighted as indicated in the article. Reuse of AIP content is subject to the terms at: http://aplmaterials.aip.org/about/rights_and_permissions
Downloaded to IP: 129.93.9.143 On: Mon, 13 Jul 2015 19:55:35
076101-3 Koten et al. APL Mater. 3, 076101 (2015)
software. The overall uniformity of the cluster composition was excellent, which led to the fabrica-tion of a phase-pure sample. This has been a challenge using other processing techniques for thissystem and specifically for the WFe2 phase.
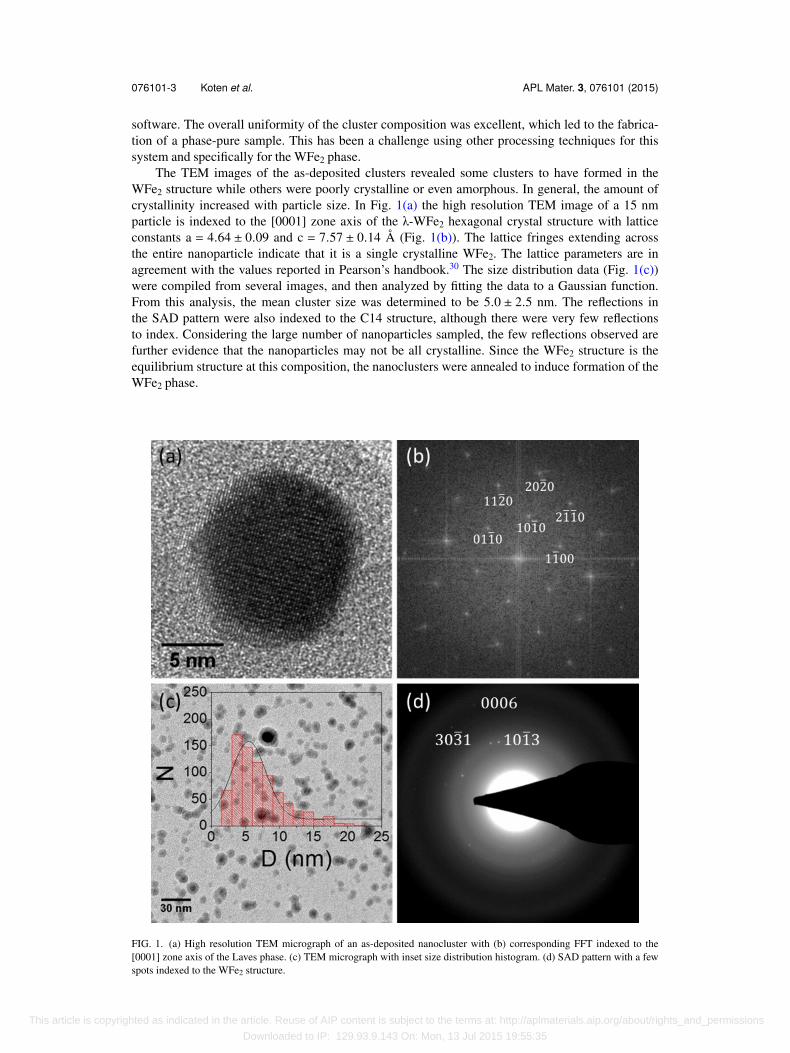
The TEM images of the as-deposited clusters revealed some clusters to have formed in theWFe2 structure while others were poorly crystalline or even amorphous. In general, the amount ofcrystallinity increased with particle size. In Fig. 1(a) the high resolution TEM image of a 15 nmparticle is indexed to the [0001] zone axis of the λ-WFe2 hexagonal crystal structure with latticeconstants a = 4.64 ± 0.09 and c = 7.57 ± 0.14 Å (Fig. 1(b)). The lattice fringes extending acrossthe entire nanoparticle indicate that it is a single crystalline WFe2. The lattice parameters are inagreement with the values reported in Pearson’s handbook.30 The size distribution data (Fig. 1(c))were compiled from several images, and then analyzed by fitting the data to a Gaussian function.From this analysis, the mean cluster size was determined to be 5.0 ± 2.5 nm. The reflections inthe SAD pattern were also indexed to the C14 structure, although there were very few reflectionsto index. Considering the large number of nanoparticles sampled, the few reflections observed arefurther evidence that the nanoparticles may not be all crystalline. Since the WFe2 structure is theequilibrium structure at this composition, the nanoclusters were annealed to induce formation of theWFe2 phase.
FIG. 1. (a) High resolution TEM micrograph of an as-deposited nanocluster with (b) corresponding FFT indexed to the[0001] zone axis of the Laves phase. (c) TEM micrograph with inset size distribution histogram. (d) SAD pattern with a fewspots indexed to the WFe2 structure.
This article is copyrighted as indicated in the article. Reuse of AIP content is subject to the terms at: http://aplmaterials.aip.org/about/rights_and_permissions
Downloaded to IP: 129.93.9.143 On: Mon, 13 Jul 2015 19:55:35
076101-4 Koten et al. APL Mater. 3, 076101 (2015)
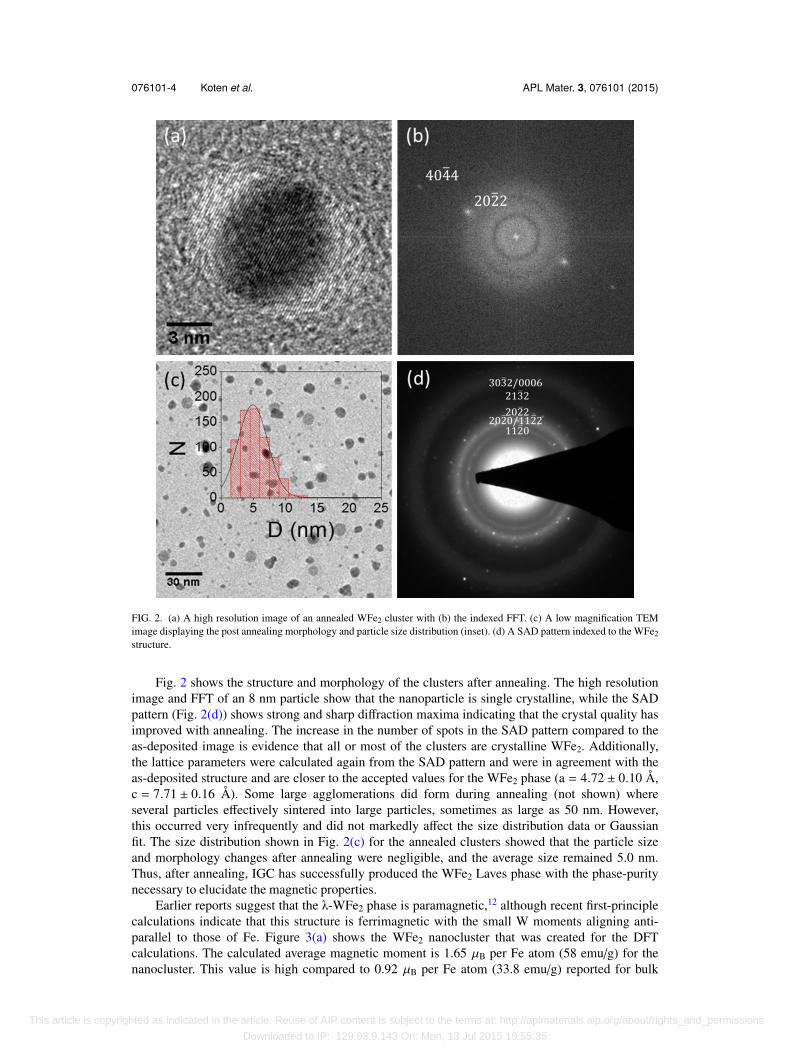
FIG. 2. (a) A high resolution image of an annealed WFe2 cluster with (b) the indexed FFT. (c) A low magnification TEMimage displaying the post annealing morphology and particle size distribution (inset). (d) A SAD pattern indexed to the WFe2structure.
Fig. 2 shows the structure and morphology of the clusters after annealing. The high resolutionimage and FFT of an 8 nm particle show that the nanoparticle is single crystalline, while the SADpattern (Fig. 2(d)) shows strong and sharp diffraction maxima indicating that the crystal quality hasimproved with annealing. The increase in the number of spots in the SAD pattern compared to theas-deposited image is evidence that all or most of the clusters are crystalline WFe2. Additionally,the lattice parameters were calculated again from the SAD pattern and were in agreement with theas-deposited structure and are closer to the accepted values for the WFe2 phase (a = 4.72 ± 0.10 Å,c = 7.71 ± 0.16 Å). Some large agglomerations did form during annealing (not shown) whereseveral particles effectively sintered into large particles, sometimes as large as 50 nm. However,this occurred very infrequently and did not markedly affect the size distribution data or Gaussianfit. The size distribution shown in Fig. 2(c) for the annealed clusters showed that the particle sizeand morphology changes after annealing were negligible, and the average size remained 5.0 nm.Thus, after annealing, IGC has successfully produced the WFe2 Laves phase with the phase-puritynecessary to elucidate the magnetic properties.
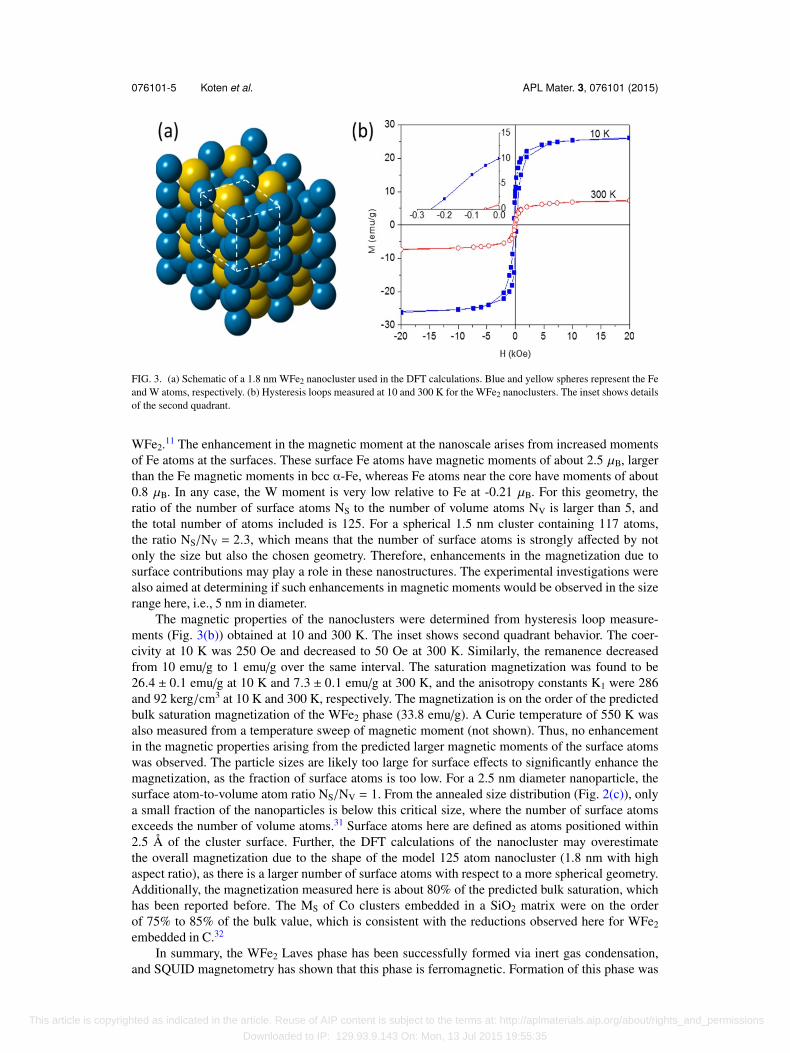
Earlier reports suggest that the λ-WFe2 phase is paramagnetic,12 although recent first-principlecalculations indicate that this structure is ferrimagnetic with the small W moments aligning anti-parallel to those of Fe. Figure 3(a) shows the WFe2 nanocluster that was created for the DFTcalculations. The calculated average magnetic moment is 1.65 µB per Fe atom (58 emu/g) for thenanocluster. This value is high compared to 0.92 µB per Fe atom (33.8 emu/g) reported for bulk
This article is copyrighted as indicated in the article. Reuse of AIP content is subject to the terms at: http://aplmaterials.aip.org/about/rights_and_permissions
Downloaded to IP: 129.93.9.143 On: Mon, 13 Jul 2015 19:55:35
076101-5 Koten et al. APL Mater. 3, 076101 (2015)
FIG. 3. (a) Schematic of a 1.8 nm WFe2 nanocluster used in the DFT calculations. Blue and yellow spheres represent the Feand W atoms, respectively. (b) Hysteresis loops measured at 10 and 300 K for the WFe2 nanoclusters. The inset shows detailsof the second quadrant.
WFe2.11 The enhancement in the magnetic moment at the nanoscale arises from increased momentsof Fe atoms at the surfaces. These surface Fe atoms have magnetic moments of about 2.5 µB, largerthan the Fe magnetic moments in bcc α-Fe, whereas Fe atoms near the core have moments of about0.8 µB. In any case, the W moment is very low relative to Fe at -0.21 µB. For this geometry, theratio of the number of surface atoms NS to the number of volume atoms NV is larger than 5, andthe total number of atoms included is 125. For a spherical 1.5 nm cluster containing 117 atoms,the ratio NS/NV = 2.3, which means that the number of surface atoms is strongly affected by notonly the size but also the chosen geometry. Therefore, enhancements in the magnetization due tosurface contributions may play a role in these nanostructures. The experimental investigations werealso aimed at determining if such enhancements in magnetic moments would be observed in the sizerange here, i.e., 5 nm in diameter.
The magnetic properties of the nanoclusters were determined from hysteresis loop measure-ments (Fig. 3(b)) obtained at 10 and 300 K. The inset shows second quadrant behavior. The coer-civity at 10 K was 250 Oe and decreased to 50 Oe at 300 K. Similarly, the remanence decreasedfrom 10 emu/g to 1 emu/g over the same interval. The saturation magnetization was found to be26.4 ± 0.1 emu/g at 10 K and 7.3 ± 0.1 emu/g at 300 K, and the anisotropy constants K1 were 286and 92 kerg/cm3 at 10 K and 300 K, respectively. The magnetization is on the order of the predictedbulk saturation magnetization of the WFe2 phase (33.8 emu/g). A Curie temperature of 550 K wasalso measured from a temperature sweep of magnetic moment (not shown). Thus, no enhancementin the magnetic properties arising from the predicted larger magnetic moments of the surface atomswas observed. The particle sizes are likely too large for surface effects to significantly enhance themagnetization, as the fraction of surface atoms is too low. For a 2.5 nm diameter nanoparticle, thesurface atom-to-volume atom ratio NS/NV = 1. From the annealed size distribution (Fig. 2(c)), onlya small fraction of the nanoparticles is below this critical size, where the number of surface atomsexceeds the number of volume atoms.31 Surface atoms here are defined as atoms positioned within2.5 Å of the cluster surface. Further, the DFT calculations of the nanocluster may overestimatethe overall magnetization due to the shape of the model 125 atom nanocluster (1.8 nm with highaspect ratio), as there is a larger number of surface atoms with respect to a more spherical geometry.Additionally, the magnetization measured here is about 80% of the predicted bulk saturation, whichhas been reported before. The MS of Co clusters embedded in a SiO2 matrix were on the orderof 75% to 85% of the bulk value, which is consistent with the reductions observed here for WFe2embedded in C.32
In summary, the WFe2 Laves phase has been successfully formed via inert gas condensation,and SQUID magnetometry has shown that this phase is ferromagnetic. Formation of this phase was
This article is copyrighted as indicated in the article. Reuse of AIP content is subject to the terms at: http://aplmaterials.aip.org/about/rights_and_permissions
Downloaded to IP: 129.93.9.143 On: Mon, 13 Jul 2015 19:55:35
076101-6 Koten et al. APL Mater. 3, 076101 (2015)
a significant experimental challenge, but characterization of these nanoparticles revealed that theyhad a high degree of phase purity. While some of the larger as-deposited clusters formed in theLaves phase, the majority of the clusters showed traces of amorphous, poorly crystalline structure.Heat treatment resulted in the formation of the equilibrium phase in nanoparticles with an averagesize of 5 nm. The WFe2 phase is ferromagnetic up to about 550 K. At 10 K, the saturation magne-tization is 26.4 ± 0.1 emu/g, the coercivity is 250 Oe, and the anisotropy constant was determinedto be 286 kerg/cm3. The experimental results show that the cluster’s magnetization is closer to thebulk calculations because the particle sizes were not small enough to observe an increase in magne-tization due to surface effects. The low coercivity for a hexagonal structure is likely a consequenceof the low anisotropy constant, which is explained by the WFe2 phase having easy-plane anisotropyalong the ⟨1000⟩ directions rather than easy-axis anisotropy in the [0001] direction.
J.E.S and M.A.K were financially supported by the U.S. NSF-MPS-DMR (Grant No. 0820521,Program Director D. Finotello). D.J.S, R.S, P.M, and B.B were supported by the U.S. DOE BES(Grant No. DE-FG02-04ER46152, Program Director M. Pechan). Research was performed in thefacilities of the Nebraska Center for Materials and Nanoscience, which are supported by the Ne-braska Research Initiative.1 F. Laves and H. Witte, Metallwirtsch 14, 645 (1935).2 A. K. Sinha and W. Hume-Rothery, J. Iron Steel Inst. 205, 1145 (1967).3 C. Pfleiderer, M. Uhlarz, S. M. Hayden, R. Vollmer, H. V. Lohneysen, N. R. Bernhoeft, and G. G. Lonzarich, Nature 412,
58 (2001).4 S. Hong and C. L. Fu, Phys. Rev. B 66, 094109 (2002).5 K. Young, M. A. Fetcenko, F. Li, and T. Ouchi, J. Alloys Compd. 464, 238 (2008).6 H. Nakano, S. Wakao, and T. Shimizu, J. Alloys Compd. 253-254, 609 (1997).7 K. H. J. Buschow, Rep. Prog. Phys. 40, 1179 (1977).8 S. Ishida, S. Asano, and J. Ishida, J. Phys. Soc. Jpn. 54, 3925 (1985).9 S. Ishida, S. Asano, and J. Ishida, J. Phys. Soc. Jpn. 54, 4695 (1985).
10 S. Asano and S. Ishida, J. Phys. F: Met. Phys. 18, 501 (1988).11 P. Kumar, A. Kashyap, B. Balamurugan, J. E. Shield, D. J. Sellmyer, and R. Skomski, J. Phys.: Condens. Matter 26, 064209
(2014).12 A. A. Novakova, V. V. Lyovina, D. V. Kuznetsov, and A. L. Dzidziguri, J. Alloys Compd. 318, 423 (2001).13 G. H. Lee, S. H. Huh, J. W. Park, and H. K. Kim, J. Phys. Chem. B 105, 5856 (2001).14 U. Herr and K. Samwer, Nanostruct. Mater. 1, 515 (1992).15 K. Sumiyama, M. Hirata, and W. Teshima, Jpn. J. Appl. Phys. 30, 2839 (1991).16 T. B. Massalski, H. Okamoto, P. R. Subramanian, and L. Kacprzak, in Binary Alloy Phase Diagrams, 2nd ed. (ASM Inter-
national, 1990), Vol. 2.17 M. A. Koten and J. E. Shield, “Mechanical alloying within the Fe-W and Fe-Ta systems” (unpublished).18 H. Haberland, M. Karrais, M. Mall, and Y. Thurner, J. Vac. Sci. Technol. A 10, 3266 (1992).19 S. H. Baker, S. C. Thornton, K. W. Edmonds, M. J. Maher, C. Norris, and C. Binns, Rev. Sci. Instrum. 71, 3178 (2000).20 B. Balasubramanian, R. Skomski, X. Li, S. R. Valloppilly, J. E. Shield, G. C. Hadjipanayis, and D. J. Sellmyer, Nano Lett.
11, 1747 (2011).21 F. Golkar, M. J. Kramer, Y. Zhang, R. Skomski, D. J. Sellmyer, and J. E. Shield, J. Nanopart. Res. 15, 1638 (2013).22 P. Mukherjee, Y. Zhang, M. J. Kramer, L. H. Lewis, and J. E. Shield, Appl. Phys. Lett. 100, 211911 (2012).23 E. Folcke, R. Lardé, J. M. L. Breton, M. Gruber, F. Vurpillot, J. E. Shield, X. Rui, and M. M. Patterson, J. Alloys Compd.
517, 40 (2012).24 O. Šipr, M. Košuth, and H. Ebert, Phys. Rev. B 70, 174423 (2004).25 C. A. Schneider, W. S. Rasband, and K. W. Eliceiri, Nat. Methods 9, 671 (2012).26 G. Hadjipanayis, D. J. Sellmyer, and B. Brandt, Phys. Rev. B 23, 3349 (1981).27 G. Kresse and J. Furthmüller, Comput. Mater. Sci. 6, 15 (1996).28 G. Kresse and D. Joubert, Phys. Rev. B 59, 1758 (1999).29 J. P. Perdew, K. Burke, and M. Ernzerhof, Phys. Rev. Lett. 77, 3865 (1996).30 P. Villars, in Pearson’s Handbook Desk Edition Crystallographic Data for Intermetallic Phases (ASM International, 1997),
Vol. 2.31 F. Bodker, S. Morup, and S. Linderoth, Phys. Rev. Lett. 72, 282 (1994).32 Y. Qiang, R. F. Sabiryanov, S. S. Jaswal, Y. Liu, H. Haberland, and D. J. Sellmyer, Phys. Rev. B 66, 064404 (2002).
This article is copyrighted as indicated in the article. Reuse of AIP content is subject to the terms at: http://aplmaterials.aip.org/about/rights_and_permissions
Downloaded to IP: 129.93.9.143 On: Mon, 13 Jul 2015 19:55:35


![arXiv:1907.12934v4 [cs.CV] 26 Sep 2019 · discriminative regions (Durand et al., 2017; Oquab et al., 2015; Sun et al., 2016; Zhang et al., 2018b; Zhou et al., 2016). Multi-instance](https://img.pdfslide.fr/doc/110x75/5f795c13b5d3517287311662/arxiv190712934v4-cscv-26-sep-2019-discriminative-regions-durand-et-al-2017.jpg)