Embed Size (px)
Citation preview
Canadian Payment Methods and Trends
2016
Canadian Payment Methods and Trends: 2016Payments Canada Discussion Paper No. 7 – November 2016
Author notesMichael TompkinsResearch Lead, Research Unit, Payments Canada [email protected]
Viktoria GalociovaResearch Associate, Research Unit, Payments Canada [email protected]
Payments Canada discussion papers concern a variety of issues relevant to the role of Payments Canada. The views expressed in this paper are those of the authors at the time of publication and do not necessarily represent those of Payments Canada.
A number of organizations assisted Payments Canada by providing data and information, guidance on assumptions and feedback on draft document versions. Payments Canada would like to acknowledge the contributions provided by the following organizations:
Bank of Canada INTERAC® INTRIA Symcor Technology Strategies International Euromonitor RFi Group
The views expressed in this report are those of the authors and should not be attributed to the organizations named above.
@paymentscanada
Payments Canada
www.payments.ca
ISSN 2369-3541
© Payments Canada 2016
® Trade-mark of Interac Inc.
32016 C A N A D I A N PAY M E N T M E T H O D S A N D T R E N D S
Debit
Debit
Cheques and paper
EFT
EFT
Credit cards
Creditcards
Cash
Cash
Chequesand
paper
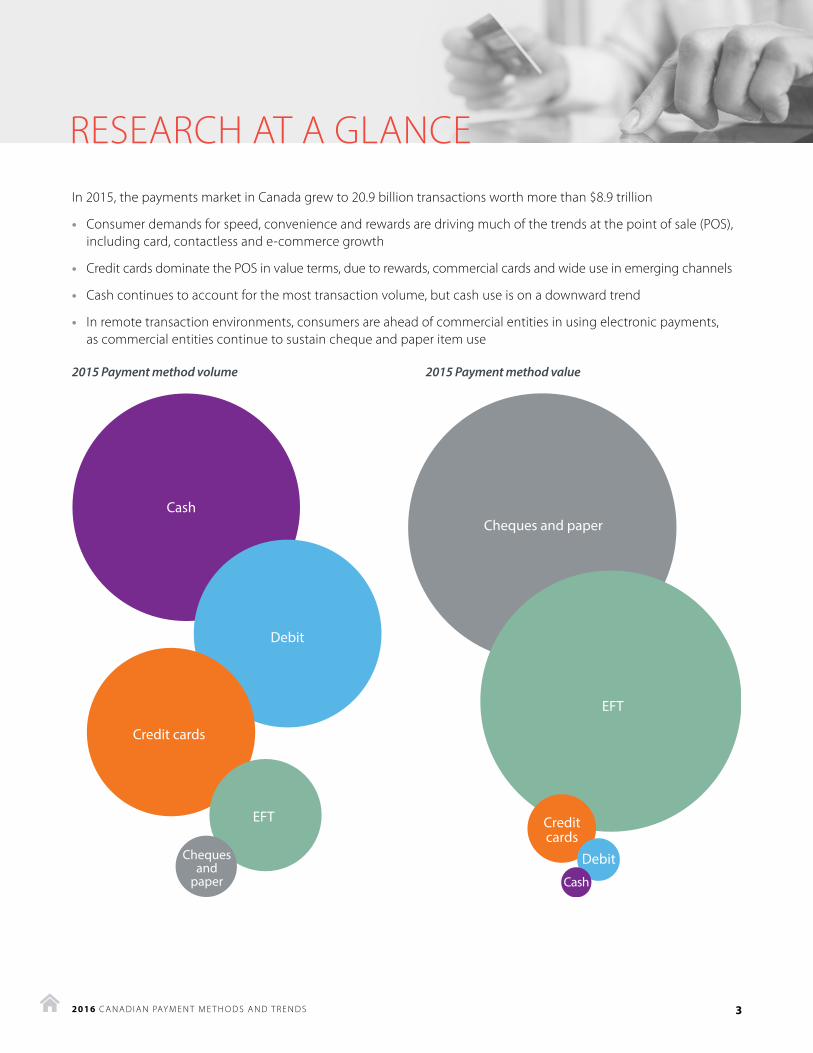
RESEARCH AT A GLANCEIn 2015, the payments market in Canada grew to 20.9 billion transactions worth more than $8.9 trillion
• Consumer demands for speed, convenience and rewards are driving much of the trends at the point of sale (POS), including card, contactless and e-commerce growth
• Credit cards dominate the POS in value terms, due to rewards, commercial cards and wide use in emerging channels
• Cash continues to account for the most transaction volume, but cash use is on a downward trend
• In remote transaction environments, consumers are ahead of commercial entities in using electronic payments, as commercial entities continue to sustain cheque and paper item use
2015 Payment method volume 2015 Payment method value
42016 C A N A D I A N PAY M E N T M E T H O D S A N D T R E N D S
3 Research Highlights
5 Executive Summary
7 Introduction and Methodology
8 Findings
8 2015 Transactions overview
10 The changing POS
11 Cash
11 Credit cards vs. debit cards
12 Prepaid payments
13 Contactless
13 E-commerce payment channel
14 Payments Canada facilitating POS emerging payments
14 Remote transactions
15 Cheque and paper items
15 EFT
16 Online transfers
16 Remote consumer transactions
17 Remote commercial transactions
17 Commercial EFT and cheque use
18 The potential for core payment system modernization in Canada
19 Conclusion
20 Appendix I: Additional charts
20 Figure A1. All segment annual totals
21 Figure A2. All segment average annual growth
22 Figure A3. Average transaction size
23 Appendix II: Methodology, definitions and segment descriptions
23 A. Methodology
24 B. Definitions and segment descriptions
CONTENTSPDF NavigationThis is an interactive PDF. Click on any listing in Contents to be taken to that page. Click on from any page to return to Contents.
52016 C A N A D I A N PAY M E N T M E T H O D S A N D T R E N D S
SOMMAIREEn conformité avec son engagement à agir comme centre d’excellence, Paiements Canada apporte une contribution à l’industrie par le biais d’activités de recherche d’avant-garde dans le domaine des paiements. Compte tenu de cet objectif, Paiements Canada fournit un aperçu annuel des méthodes de paiement et tendances des paiements observées au Canada. Les recherches que nous avons menées en 2016 nous ont amenés à travailler en étroite collaboration avec des fournisseurs de services, des consultants du domaine des paiements et des chercheurs en vue de rassembler un ensemble exhaustif de données sur les paiements.
Dans l’ensemble, le marché des paiements au Canada a crû, atteignant un total de 20,9 milliards de transactions de consommateur et d’entreprise, d’une valeur de plus de 8,9 billions de dollars. Les volumes de paiements par chèques et effets de paiement papier ont reculé de huit pour cent, soit à un rythme supérieur à la moyenne historique de six pour cent. Cependant, la valeur des paiements a augmenté de façon marquée, ce qui met en évidence le fait que les paiements papier (c’est-à-dire les espèces, les chèques et les autres effets de paiement papier) continuent d’être largement utilisés. Les données de 2015 montrent que les paiements électroniques sont florissants sur les nouvelles plateformes de paiement telles que les porte-monnaie électroniques, les paiements sans contact et le commerce en ligne. Le recours aux paiements faisant appel à des cartes de paiement explique une bonne partie de la croissance des plateformes émergentes. Nous relevons ici une accélération du recours aux instruments par cartes de débit et cartes prépayées. En 2015, la croissance du volume de transactions par cartes prépayées a été la plus forte que nos recherches ont fait ressortir. Pour la première fois depuis que nous avons entrepris nos analyses annuelles en 2008, la hausse du volume des paiements par carte de débit a été supérieure à celle des paiements par carte de crédit. Toutefois, les cartes de crédit continuent de l’emporter sur les autres cartes de paiement pour ce qui est de la valeur des transactions.
Le principal facteur à l’origine de cette dichotomie au regard des tendances différentes du volume et de la valeur des transactions est le fait que les Canadiens font leurs transactions dans deux environnements très distincts, à savoir celui des points de service (PS) et celui des paiements à distance. Chaque environnement met en évidence des caractéristiques différentes des comportements des Canadiens en matière de paiements.
Les transactions aux PS incluent les transactions ayant lieu soit aux emplacements physiques des marchands, soit à leurs emplacements virtuels, ces derniers englobant les boutiques en ligne et les achats intégrés au sein d’applications. Les instruments de paiement utilisés aux PS (espèces, cartes prépayées, cartes de débit et cartes de crédit) représentent environ 80 pour cent du volume total des transactions au Canada, mais seulement 10 pour cent de leur valeur totale. Le volume des transactions aux PS est élevé parce qu’il consiste surtout en des paiements enclenchés par des consommateurs dans le cadre de transactions de magasinage et de commerce de faible valeur. Nous observons les tendances suivantes aux PS :
• Les espèces restent la méthode la plus répandue pour les paiements, mais elles accusent un déclin très marqué, avec un recul d’environ 30 pour cent depuis 2008.
• Les cartes de crédit continuent d’occuper le premier rang sur le plan de la valeur des transactions aux PS, ce qui s’explique par leur commodité, le fait qu’elles offrent des récompenses, l’utilisation des cartes commerciales et le fait qu’elles sont largement acceptées sur les plateformes émergentes comme les paiements sans contact et le commerce en ligne.
• Les cartes de débit constituent le deuxième instrument de paiement le plus utilisé aux PS pour ce qui est du nombre de transactions (volume). Le recours aux cartes de débit a été favorisé en 2014 et 2015 par l’adoption rapide des paiements par débit sans contact par les consommateurs.
• Les transactions au moyen de cartes prépayées constituent le type de transactions aux PS qui connaît la croissance la plus rapide, bien qu’elles ne représentent toujours qu’une faible portion de ces transactions au regard du volume et de la valeur.
62016 C A N A D I A N PAY M E N T M E T H O D S A N D T R E N D S
Les transactions à distance incluent toutes les transactions non effectuées à un emplacement physique ou un emplacement virtuel de bénéficiaire (c’est-à-dire par le biais d’applications ou boutiques offertes par le bénéficiaire). Ces transaction font plutôt appel à des institutions financières ou des fournisseurs de services de paiement en tant qu’intermédiaires qui acceptent les instructions de paiement et transfèrent les fonds aux bénéficiaires par le biais de leurs services. Les transactions à distance permettent aux payeurs d’enclencher des transactions pratiquement n’importe où, au moyen de chèques, de transferts de fonds électroniques et de transferts en ligne (porte-monnaie électroniques et transactions de personne-à-personne électroniques). Ces transactions représentent 90 pour cent de la valeur totale des transactions faites au Canada, mais seulement 20 pour cent du volume total. Un des principaux facteurs expliquant pourquoi les transactions à distance représentent une part aussi importante de la valeur des transactions est le fait qu’elles consistent en un nombre élevé de paiements d’un montant relativement élevé à destination et en provenance d’entités commerciales (entreprises, organisations sans but lucratif et gouvernements, p. ex.). Nous observons les tendances suivantes au regard des environnements de paiement à distance en 2015 :
• Les transactions par transfert électronique de fonds (TEF) (paiements de factures, échanges de données informatisés (EDI), débits préautorisés et dépôts directs) forment la grande majorité des transactions à distance pour ce qui est du volume, mais se classent légèrement derrière les chèques pour ce qui est de la valeur.
• Les chèques continuent de représenter une forte proportion des transactions à distance. Le volume de chèques poursuit son recul, les consommateurs ayant adopté les méthodes de paiement plus commodes que représentent les TEF et les transferts en ligne. Toutefois, en raison de la poursuite de l’utilisation des chèques commerciaux, la valeur totale des chèques connaît une croissance, dans un contexte où le nombre de chèques diminue alors que leurs montants augmentent.
• L’utilisation des chèques commerciaux au Canada reste répandue dans le cadre des paiements aux gouvernements (y compris pour les impôts), du paiement des loyers et des paiements à d’autres entreprises pour des biens et services (publicité, médias, matériel informatique et assurances, p. ex.).
• Les transferts en ligne surpassent tous les autres instruments de paiement sur le plan de la croissance, mais ils ne représentent toujours que moins de un pour cent de la valeur et du volume totaux des transactions. Dans l’environnement des transactions à distance, les transferts en ligne commencent à se faire de plus en plus fréquents chez les consommateurs. En effet, on estime que le volume des transferts en ligne faits par des consommateurs a atteint 120 millions de transactions, nombre qui représente un peu moins de la moitié du volume total de chèques émis par des consommateurs (255 millions).1
1 Les transferts en ligne sont des paiements électroniques qui sont enclenchés par l’entremise de services ou fournisseurs en ligne qui sont préprovisionnés ou associés à des comptes de dépôt d’institutions financières (Pay-Pal et virements électroniques, p. ex.).
72016 C A N A D I A N PAY M E N T M E T H O D S A N D T R E N D S
INTRODUCTION AND METHODOLOGYMillions of times each day, Canadians make payments through debit cards, computers, tablets, cheques, etc., which result in the need for payment items and funds to be exchanged across financial institutions. Payments Canada underpins the Canadian financial system by providing safe and efficient clearing and settlement of these transactions. Payments Canada accomplishes this by leading our member financial institutions, regulators and government, and end users in establishing solutions, rules and standards for a shared payment infrastructure.
To support its objective to become a centre of excellence, Payments Canada also contributes to the payments industry through leading-edge payments research. The annual Canadian Payment Methods and Trends research brings Payments Canada system data together with data on all of the other relevant payment providers and networks, offering a holistic view of Canada’s market of payments for 2015.2 Data was collected from payment service providers and networks on an aggregated annual basis, based on actual payment instrument use data. Experts and market survey research are used to fill in data gaps for payment instruments, such as cash, where a full data set may not be available. Finally, market survey data is used to provide detailed insights on the trends observed.3
We combine the data collected from 2015 with data collected from past research to provide a multi-year observation span to view trends. In the following sections, we primarily compare 2011 and 2015 to understand how payment methods and trends have evolved more recently. In some cases, we expand the historical perspective back to 2008 or look at year-over-year comparisons (2014 to 2015) to provide either a broader or more narrow view of the trends being discussed.
The focus of this research is on common domestic consumer and commercial payments and transactions, which includes “on-us” transactions.2 As part of this work, we examine emerging payments and channels that have achieved significant enough volumes to discernably impact the national payments market.4 Some Canadian transactions are not included in our analysis, such as securities and derivatives transactions (and trades) and virtual currencies (e.g., Bitcoin).5 Transactions that clear and settle through Payments Canada’s Large Value Transfer System (LVTS) are also excluded.6 This paper includes value transfers and transactions that may not specifically be used in the exchange for goods or services. For example, ABM transactions are used to obtain cash, where the cash is used for the payments of goods and services. In our analysis, each transaction involved is in our scope as it provides a deeper understanding of payment trends, even though this may be a form of double-counting.
2 For details on the methodology, definitions and assumptions please see Appendix II.3 Also see Appendix II for the methodology related to the consumer and business survey market research.
4 Generally speaking, we are looking for instruments that make up at least one per cent of the volume or value of either remote or point-of-sale transactions.
5 In the 2015 market research data, virtual currencies have yet to have a discernable impact on payments behavior, with only a tiny fraction of respondents indicating their use of Bitcoin or other virtual currencies (Ipsos CFM consumer survey data). These transactions will continue to be tracked in future research.
6 LVTS transactions amount to less than 10 million transactions, or less than 0.1 per cent of the total payments volume observed in this research. In addition, the LVTS has extremely high transaction values that serve to obscure the value trends from other payment segments of interest.
82016 C A N A D I A N PAY M E N T M E T H O D S A N D T R E N D S
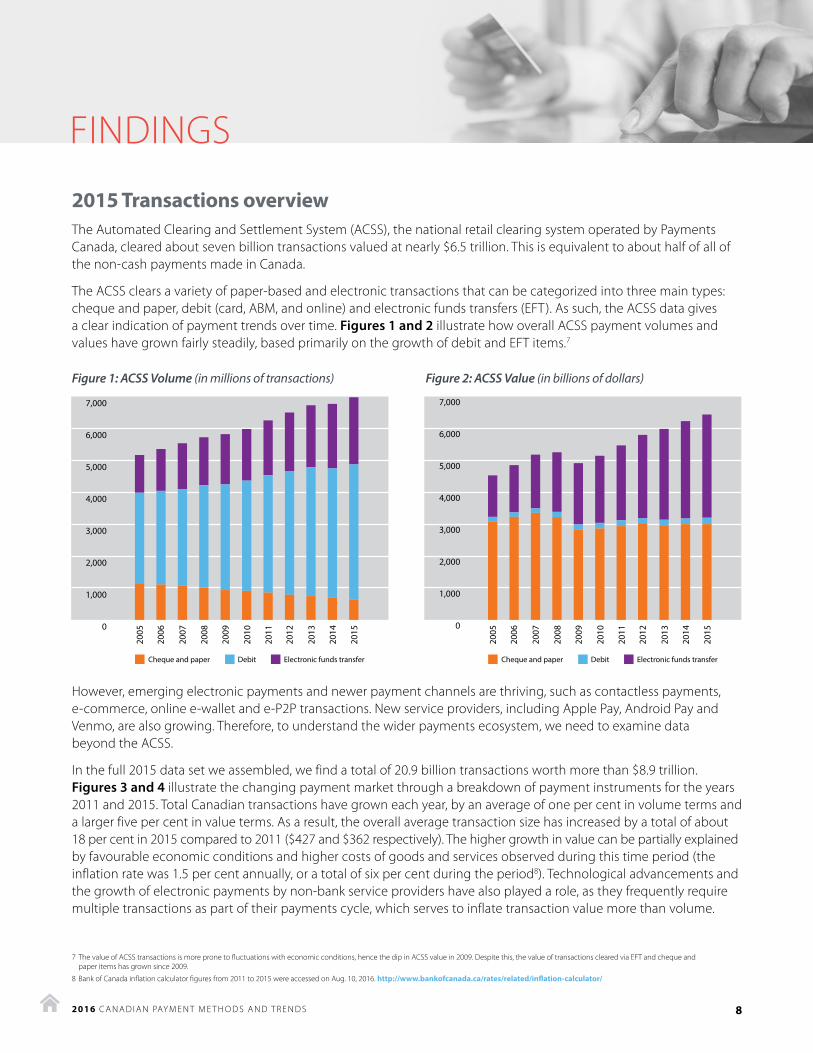
2015 Transactions overview The Automated Clearing and Settlement System (ACSS), the national retail clearing system operated by Payments Canada, cleared about seven billion transactions valued at nearly $6.5 trillion. This is equivalent to about half of all of the non-cash payments made in Canada.
The ACSS clears a variety of paper-based and electronic transactions that can be categorized into three main types: cheque and paper, debit (card, ABM, and online) and electronic funds transfers (EFT). As such, the ACSS data gives a clear indication of payment trends over time. Figures 1 and 2 illustrate how overall ACSS payment volumes and values have grown fairly steadily, based primarily on the growth of debit and EFT items.7
Figure 1: ACSS Volume (in millions of transactions) Figure 2: ACSS Value (in billions of dollars)
However, emerging electronic payments and newer payment channels are thriving, such as contactless payments, e-commerce, online e-wallet and e-P2P transactions. New service providers, including Apple Pay, Android Pay and Venmo, are also growing. Therefore, to understand the wider payments ecosystem, we need to examine data beyond the ACSS.
In the full 2015 data set we assembled, we find a total of 20.9 billion transactions worth more than $8.9 trillion. Figures 3 and 4 illustrate the changing payment market through a breakdown of payment instruments for the years 2011 and 2015. Total Canadian transactions have grown each year, by an average of one per cent in volume terms and a larger five per cent in value terms. As a result, the overall average transaction size has increased by a total of about 18 per cent in 2015 compared to 2011 ($427 and $362 respectively). The higher growth in value can be partially explained by favourable economic conditions and higher costs of goods and services observed during this time period (the inflation rate was 1.5 per cent annually, or a total of six per cent during the period8). Technological advancements and the growth of electronic payments by non-bank service providers have also played a role, as they frequently require multiple transactions as part of their payments cycle, which serves to inflate transaction value more than volume.
7 The value of ACSS transactions is more prone to fluctuations with economic conditions, hence the dip in ACSS value in 2009. Despite this, the value of transactions cleared via EFT and cheque and paper items has grown since 2009.
8 Bank of Canada inflation calculator figures from 2011 to 2015 were accessed on Aug. 10, 2016. http://www.bankofcanada.ca/rates/related/inflation-calculator/
7,000
6,000
5,000
4,000
3,000
2,000
1,000
0
7,000
6,000
5,000
4,000
3,000
2,000
1,000
0
2005
2006
2007
2008
2009
2010
2011
2012
2013
2014
2015
2005
2006
2007
2008
2009
2010
2011
2012
2013
2014
2015
Cheque and paper Debit Electronic funds transfer Cheque and paper Debit Electronic funds transfer
FINDINGS
92016 C A N A D I A N PAY M E N T M E T H O D S A N D T R E N D S
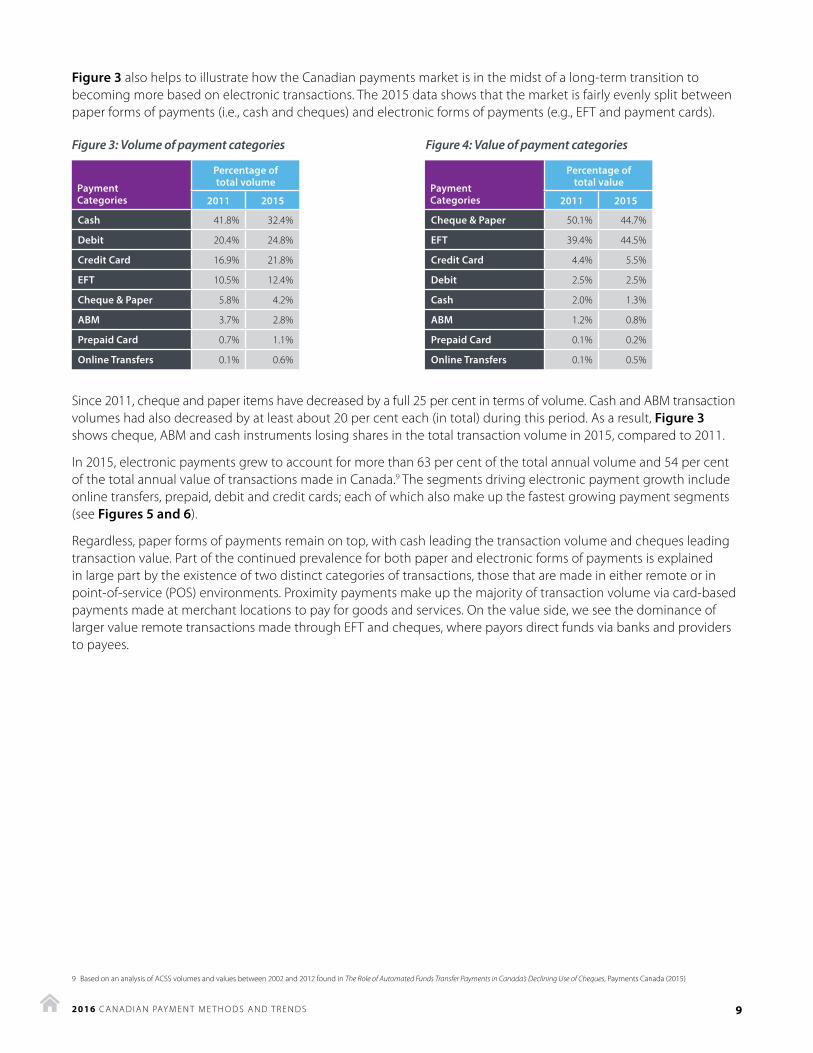
Figure 3 also helps to illustrate how the Canadian payments market is in the midst of a long-term transition to becoming more based on electronic transactions. The 2015 data shows that the market is fairly evenly split between paper forms of payments (i.e., cash and cheques) and electronic forms of payments (e.g., EFT and payment cards).
Figure 3: Volume of payment categories Figure 4: Value of payment categories
Payment Categories
Percentage of total volume Payment
Categories
Percentage of total value
2011 2015 2011 2015
Cash 41.8% 32.4% Cheque & Paper 50.1% 44.7%
Debit 20.4% 24.8% EFT 39.4% 44.5%
Credit Card 16.9% 21.8% Credit Card 4.4% 5.5%
EFT 10.5% 12.4% Debit 2.5% 2.5%
Cheque & Paper 5.8% 4.2% Cash 2.0% 1.3%
ABM 3.7% 2.8% ABM 1.2% 0.8%
Prepaid Card 0.7% 1.1% Prepaid Card 0.1% 0.2%
Online Transfers 0.1% 0.6% Online Transfers 0.1% 0.5%
Since 2011, cheque and paper items have decreased by a full 25 per cent in terms of volume. Cash and ABM transaction volumes had also decreased by at least about 20 per cent each (in total) during this period. As a result, Figure 3 shows cheque, ABM and cash instruments losing shares in the total transaction volume in 2015, compared to 2011.
In 2015, electronic payments grew to account for more than 63 per cent of the total annual volume and 54 per cent of the total annual value of transactions made in Canada.9 The segments driving electronic payment growth include online transfers, prepaid, debit and credit cards; each of which also make up the fastest growing payment segments (see Figures 5 and 6).
Regardless, paper forms of payments remain on top, with cash leading the transaction volume and cheques leading transaction value. Part of the continued prevalence for both paper and electronic forms of payments is explained in large part by the existence of two distinct categories of transactions, those that are made in either remote or in point-of-service (POS) environments. Proximity payments make up the majority of transaction volume via card-based payments made at merchant locations to pay for goods and services. On the value side, we see the dominance of larger value remote transactions made through EFT and cheques, where payors direct funds via banks and providers to payees.
9 Based on an analysis of ACSS volumes and values between 2002 and 2012 found in The Role of Automated Funds Transfer Payments in Canada’s Declining Use of Cheques, Payments Canada (2015)
102016 C A N A D I A N PAY M E N T M E T H O D S A N D T R E N D S
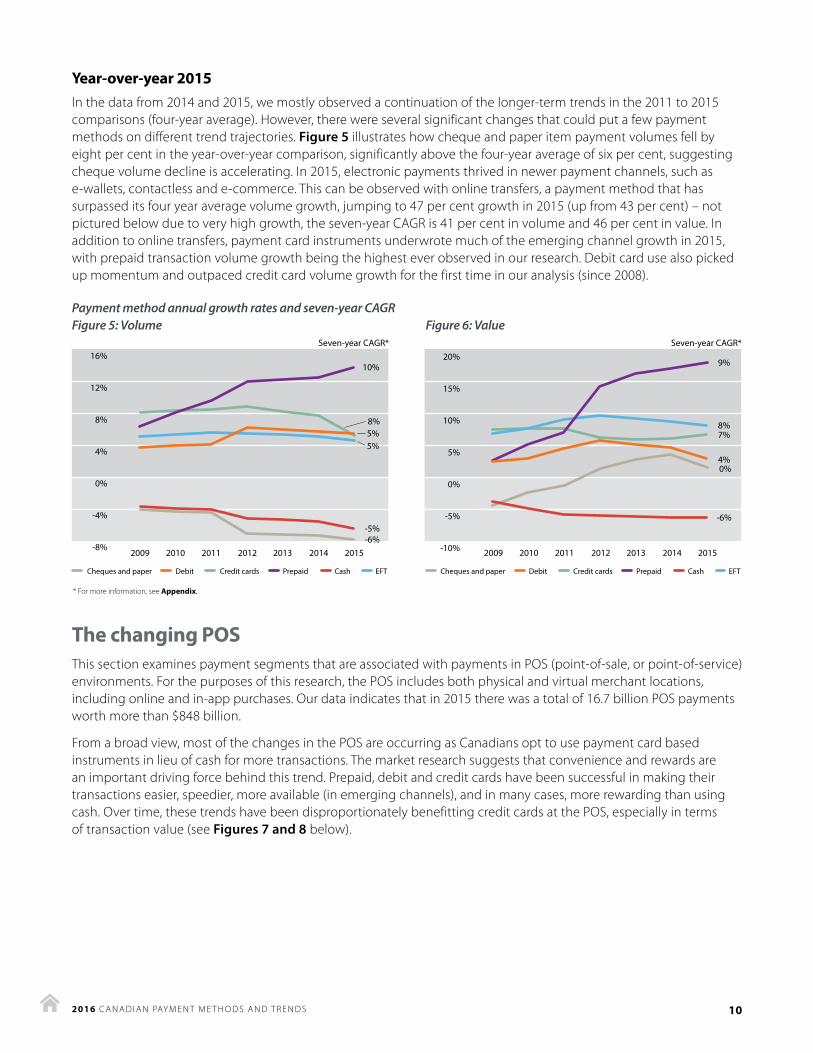
Year-over-year 2015In the data from 2014 and 2015, we mostly observed a continuation of the longer-term trends in the 2011 to 2015 comparisons (four-year average). However, there were several significant changes that could put a few payment methods on different trend trajectories. Figure 5 illustrates how cheque and paper item payment volumes fell by eight per cent in the year-over-year comparison, significantly above the four-year average of six per cent, suggesting cheque volume decline is accelerating. In 2015, electronic payments thrived in newer payment channels, such as e-wallets, contactless and e-commerce. This can be observed with online transfers, a payment method that has surpassed its four year average volume growth, jumping to 47 per cent growth in 2015 (up from 43 per cent) – not pictured below due to very high growth, the seven-year CAGR is 41 per cent in volume and 46 per cent in value. In addition to online transfers, payment card instruments underwrote much of the emerging channel growth in 2015, with prepaid transaction volume growth being the highest ever observed in our research. Debit card use also picked up momentum and outpaced credit card volume growth for the first time in our analysis (since 2008).
Payment method annual growth rates and seven-year CAGR Figure 5: Volume Figure 6: Value
The changing POSThis section examines payment segments that are associated with payments in POS (point-of-sale, or point-of-service) environments. For the purposes of this research, the POS includes both physical and virtual merchant locations, including online and in-app purchases. Our data indicates that in 2015 there was a total of 16.7 billion POS payments worth more than $848 billion.
From a broad view, most of the changes in the POS are occurring as Canadians opt to use payment card based instruments in lieu of cash for more transactions. The market research suggests that convenience and rewards are an important driving force behind this trend. Prepaid, debit and credit cards have been successful in making their transactions easier, speedier, more available (in emerging channels), and in many cases, more rewarding than using cash. Over time, these trends have been disproportionately benefitting credit cards at the POS, especially in terms of transaction value (see Figures 7 and 8 below).
16%
12%
8%
4%
0%
-4%
-8%
20%
15%
10%
5%
0%
-5%
-10%2009 2010 2011 2012 2013 2014 2015
10%
8%7%
4%
-6%
9%
0%
8%
5%5%
-6%-5%
DebitCheques and paper
* For more information, see Appendix.
Prepaid
Seven-year CAGR* Seven-year CAGR*
Credit cards Cash EFT
2009 2010 2011 2012 2013 2014 2015
DebitCheques and paper PrepaidCredit cards Cash EFT
112016 C A N A D I A N PAY M E N T M E T H O D S A N D T R E N D S
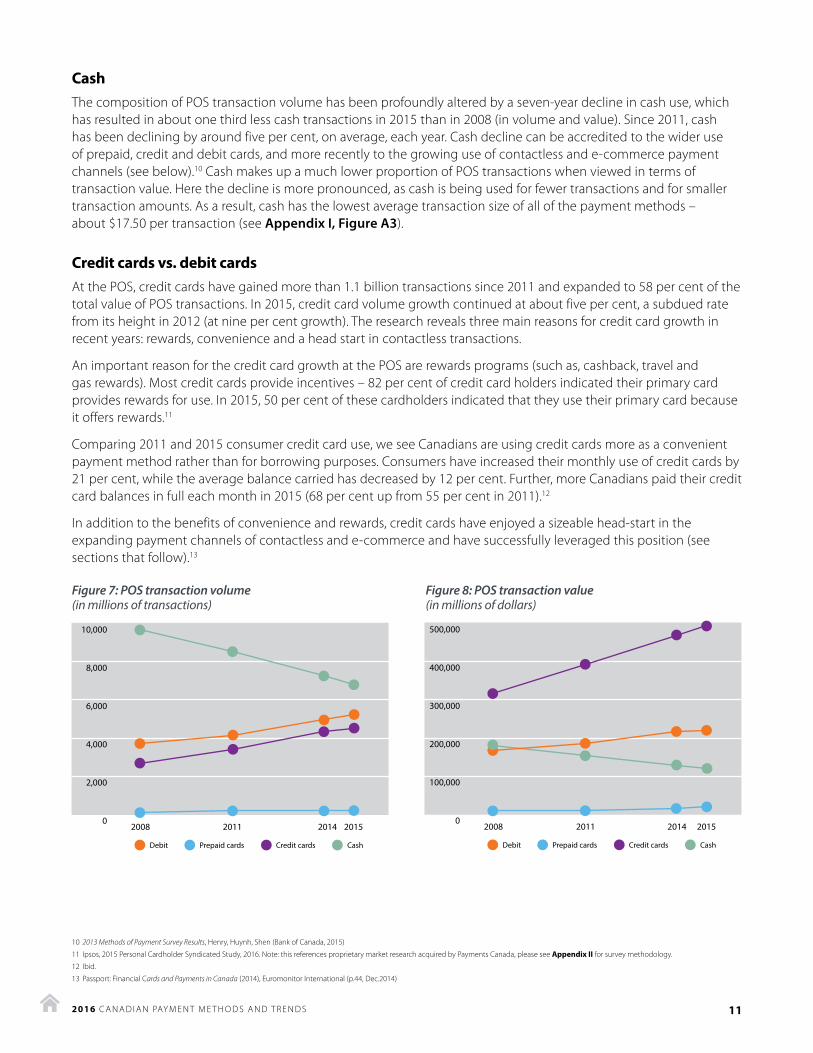
Cash The composition of POS transaction volume has been profoundly altered by a seven-year decline in cash use, which has resulted in about one third less cash transactions in 2015 than in 2008 (in volume and value). Since 2011, cash has been declining by around five per cent, on average, each year. Cash decline can be accredited to the wider use of prepaid, credit and debit cards, and more recently to the growing use of contactless and e-commerce payment channels (see below).10 Cash makes up a much lower proportion of POS transactions when viewed in terms of transaction value. Here the decline is more pronounced, as cash is being used for fewer transactions and for smaller transaction amounts. As a result, cash has the lowest average transaction size of all of the payment methods – about $17.50 per transaction (see Appendix I, Figure A3).
Credit cards vs. debit cardsAt the POS, credit cards have gained more than 1.1 billion transactions since 2011 and expanded to 58 per cent of the total value of POS transactions. In 2015, credit card volume growth continued at about five per cent, a subdued rate from its height in 2012 (at nine per cent growth). The research reveals three main reasons for credit card growth in recent years: rewards, convenience and a head start in contactless transactions.
An important reason for the credit card growth at the POS are rewards programs (such as, cashback, travel and gas rewards). Most credit cards provide incentives – 82 per cent of credit card holders indicated their primary card provides rewards for use. In 2015, 50 per cent of these cardholders indicated that they use their primary card because it offers rewards.11
Comparing 2011 and 2015 consumer credit card use, we see Canadians are using credit cards more as a convenient payment method rather than for borrowing purposes. Consumers have increased their monthly use of credit cards by 21 per cent, while the average balance carried has decreased by 12 per cent. Further, more Canadians paid their credit card balances in full each month in 2015 (68 per cent up from 55 per cent in 2011).12
In addition to the benefits of convenience and rewards, credit cards have enjoyed a sizeable head-start in the expanding payment channels of contactless and e-commerce and have successfully leveraged this position (see sections that follow).13
Figure 7: POS transaction volume Figure 8: POS transaction value(in millions of transactions) (in millions of dollars)
500,000
400,000
300,000
200,000
100,000
02008 20142011 2015
Debit Prepaid cards Credit cards Cash
10,000
8,000
6,000
4,000
2,000
02008 20142011 2015
Debit Prepaid cards Credit cards Cash
10 2013 Methods of Payment Survey Results, Henry, Huynh, Shen (Bank of Canada, 2015)
11 Ipsos, 2015 Personal Cardholder Syndicated Study, 2016. Note: this references proprietary market research acquired by Payments Canada, please see Appendix II for survey methodology.
12 Ibid.
13 Passport: Financial Cards and Payments in Canada (2014), Euromonitor International (p.44, Dec.2014)
122016 C A N A D I A N PAY M E N T M E T H O D S A N D T R E N D S
Canada has long been one of the top countries for its use of debit card transactions. In 2015, debit card transactions further cemented their position in Canada by expanding to account for one out of every four payments made (nearly 5.2 billion transactions). While only equating to three per cent of the value of transactions, debit card transactions have fared well against the international credit card company products in physical point-of-sale merchant environments. For the first time in our analysis, 2015 shows debit transactions narrowly outpacing the growth of credit card transactions (5.5 per cent and 5.3 per cent growth respectively).
Despite the success debit has enjoyed in physical merchant transaction volume, in terms of POS value, debit based transactions have struggled to gain traction. Credit card transaction value has grown almost twice as fast as the value of debit transactions. We identified several contributing factors. First, credit cards have maintained dominance in the purchasing of big ticket items at the POS. More than 40 per cent of Canadians use their credit cards for $1,700 or more in purchases per month (on average in 2015), which is up from only 28 per cent in 2011.14 In addition, credit cards have become the defacto payment method in the growing e-commerce space (see below). Finally, credit card growth is continuing in commercial related POS transactions, transactions that tend to be for higher amounts than consumer purchases (also see below). This has important implications for Canadian payments because it is typically the value of POS transactions that determines the amount merchants must pay to cover interchange and related POS transaction fees.
Commercial credit and charge card use
Our data indicates commercial credit card transactions (including charge cards) are on average about 50 per cent larger than consumer credit card transactions.15 As such, commercial credit card use is a key reason why credit cards own so much of the value of transactions moving through the POS environment. Commercial credit cards account for a low volume of total commercial payments, but the total value of commercial credit cards was more than $57 billion in 2015, an amount that has more than doubled since 2008 (up from $27 billion).
About two-thirds of commercial enterprises routinely use commercial cards to pay for their POS transactions. Common commercial transactions at the POS include paying for travel, food and entertainment. In addition, the reward incentive, which has been so successful for consumers, is starting to have a bigger impact on commercial card use.16 A majority of small to medium sized enterprises indicate that rewards are a main reason for choosing to pay by credit card. Larger enterprises are less influenced by rewards and more motivated by the reporting features offered by cards, suggesting the convenience offered by cards in reconciliation is becoming a bigger factor in payment decisions, as well.17
Prepaid paymentsThis category is made up of prepaid open and closed loop cards, including prepaid store cards, online and mobile prepaid applications. In 2015, prepaid still only accounted for a tiny fraction of the total payments made in Canada. We estimate the total prepaid market to be just over one per cent of all transaction volume or 236 million transactions, worth more than $18 billion. Almost all of the prepaid segment transactions take place in POS environments, where we observe average prepaid growth rates that have topped that of both credit and debit cards (at 12 per cent volume and 16 per cent in terms of value, since 2011, see Figures 5 and 6). The majority of prepaid is attributable to credit card company payment products. As such, as this category continues to grow, much of the growth may have similar implications for merchants, in terms of their concerns for fees, as credit cards.
Another area of growth for prepaid has been in e-commerce, where closed-loop prepaid instruments are becoming a popular payment option for Canadians online. For e-commerce, closed-loop prepaid includes the popular Android and Apple App stores, which offer their own brands of prepaid cards and virtual cards (obtained at popular physical retailers or online). These cards can be used for all of the in-app transactions offered by the app store applications and merchants. Closed-loop e-commerce transactions were used by 25 per cent of online shoppers in 2015.18
14 Ipsos, 2015 Personal Cardholder Syndicated Study, 2016. Note: this references proprietary market research acquired by Payments Canada, please see Appendix II for survey methodology.
15 Based on our data showing commercial use of credit cards in 2015, consisted of about 400 million transactions valued at $57 billion.
16 Passport: Financial Cards and Payments in Canada, Euromonitor International, Nov 2015, p. 44
17 RFi Group business survey market research (2015 and 2016).
18 Canadian Payments Forecast – 2016, TSI, 2016
132016 C A N A D I A N PAY M E N T M E T H O D S A N D T R E N D S
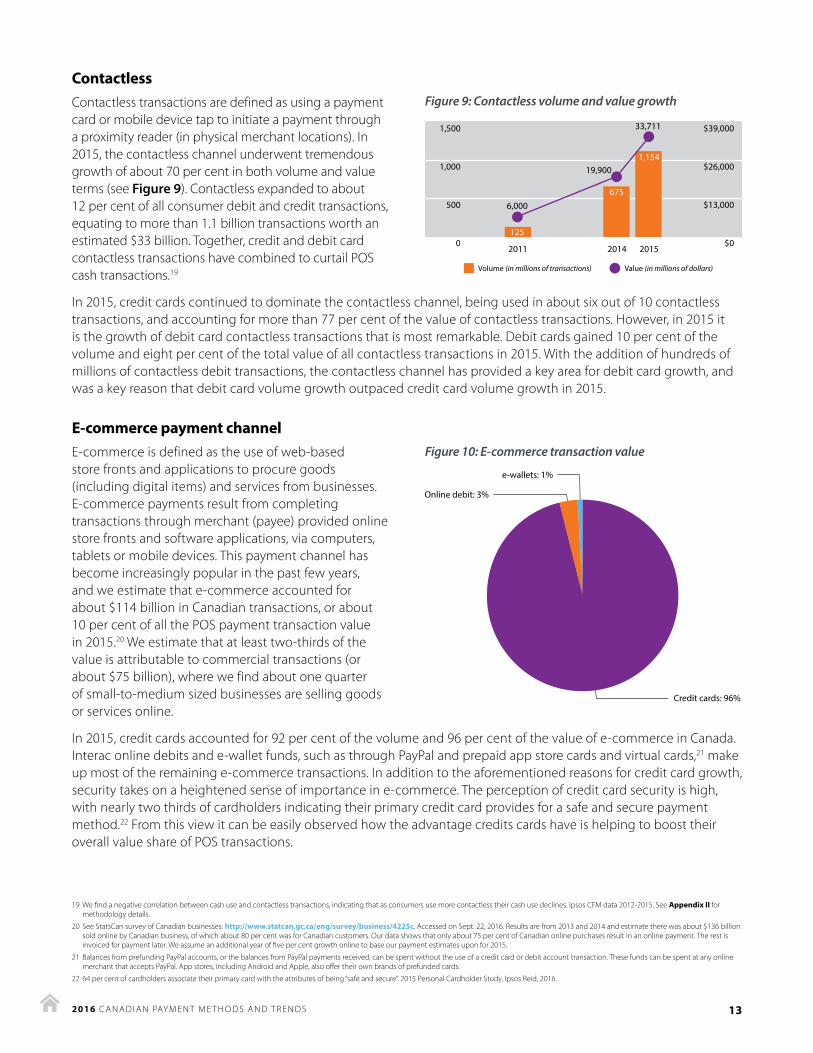
ContactlessContactless transactions are defined as using a payment card or mobile device tap to initiate a payment through a proximity reader (in physical merchant locations). In 2015, the contactless channel underwent tremendous growth of about 70 per cent in both volume and value terms (see Figure 9). Contactless expanded to about 12 per cent of all consumer debit and credit transactions, equating to more than 1.1 billion transactions worth an estimated $33 billion. Together, credit and debit card contactless transactions have combined to curtail POS cash transactions.19
In 2015, credit cards continued to dominate the contactless channel, being used in about six out of 10 contactless transactions, and accounting for more than 77 per cent of the value of contactless transactions. However, in 2015 it is the growth of debit card contactless transactions that is most remarkable. Debit cards gained 10 per cent of the volume and eight per cent of the total value of all contactless transactions in 2015. With the addition of hundreds of millions of contactless debit transactions, the contactless channel has provided a key area for debit card growth, and was a key reason that debit card volume growth outpaced credit card volume growth in 2015.
E-commerce payment channelE-commerce is defined as the use of web-based store fronts and applications to procure goods (including digital items) and services from businesses. E-commerce payments result from completing transactions through merchant (payee) provided online store fronts and software applications, via computers, tablets or mobile devices. This payment channel has become increasingly popular in the past few years, and we estimate that e-commerce accounted for about $114 billion in Canadian transactions, or about 10 per cent of all the POS payment transaction value in 2015.20 We estimate that at least two-thirds of the value is attributable to commercial transactions (or about $75 billion), where we find about one quarter of small-to-medium sized businesses are selling goods or services online.
In 2015, credit cards accounted for 92 per cent of the volume and 96 per cent of the value of e-commerce in Canada. Interac online debits and e-wallet funds, such as through PayPal and prepaid app store cards and virtual cards,21 make up most of the remaining e-commerce transactions. In addition to the aforementioned reasons for credit card growth, security takes on a heightened sense of importance in e-commerce. The perception of credit card security is high, with nearly two thirds of cardholders indicating their primary credit card provides for a safe and secure payment method.22 From this view it can be easily observed how the advantage credits cards have is helping to boost their overall value share of POS transactions.
19 We find a negative correlation between cash use and contactless transactions, indicating that as consumers use more contactless their cash use declines. Ipsos CFM data 2012-2015. See Appendix II for methodology details.
20 See StatsCan survey of Canadian businesses: http://www.statcan.gc.ca/eng/survey/business/4225c. Accessed on Sept. 22, 2016. Results are from 2013 and 2014 and estimate there was about $136 billion sold online by Canadian business, of which about 80 per cent was for Canadian customers. Our data shows that only about 75 per cent of Canadian online purchases result in an online payment. The rest is invoiced for payment later. We assume an additional year of five per cent growth online to base our payment estimates upon for 2015.
21 Balances from prefunding PayPal accounts, or the balances from PayPal payments received, can be spent without the use of a credit card or debit account transaction. These funds can be spent at any online merchant that accepts PayPal. App stores, including Android and Apple, also offer their own brands of prefunded cards.
22 64 per cent of cardholders associate their primary card with the attributes of being “safe and secure”. 2015 Personal Cardholder Study, Ipsos Reid, 2016.
1,500
1,000
500
0
$39,000
$26,000
$13,000
$02011 2015
6,000
19,900
33,711
2014
Volume (in millions of transactions) Value (in millions of dollars)
125
675
1,154
Figure 9: Contactless volume and value growth
Figure 10: E-commerce transaction value
e-wallets: 1%
Credit cards: 96%
Online debit: 3%
142016 C A N A D I A N PAY M E N T M E T H O D S A N D T R E N D S
Payments Canada facilitating POS emerging payments
The POS ecosystem is rapidly changing, especially when it comes to the use of tablets and mobile devices for proximity payments and in e-commerce. These devices have enabled new environments to conduct transactions and provided new channels to facilitate transactions. In response, Payments Canada is working closely with the industry to provide a framework that enables emerging payments to clear in the ACSS.
In 2016, Payments Canada enhanced its rules framework to better accommodate mobile payments at the POS. The amendments to Payments Canada’s rules now contemplate the process of tokenization.* In brief, this is a process whereby a customer’s banking credentials are replaced with proxy credentials, protecting a customer’s sensitive information as they engage with merchants.
For example, the amended rules now facilitate payments initiated via mobile devices, using a mobile wallet and using a broader range of authentication methods, including biometrics, while keeping details such as banking credentials well protected. These amendments support innovation in the market, with new mobile wallet services, including Apple Pay and Samsung Pay, beginning to offer secure mobile device contactless payments to Canadians. Apple Pay’s rollout has been particularly fast, and is already available to customers with debit cards from many of Canada’s major financial institutions.
Payments Canada strives to ensure that its rules remain relevant and reflect current market practices, as well as achieve the appropriate balance between security, flexibility, convenience and enforceability. As the POS ecosystem continues to evolve, we will continue to be responsive to changes and new opportunities, including in-app transactions.
* Tokenization refers to the process whereby a customer’s banking credentials are replaced by a surrogate value (referred to as a token), which may occur prior to or at the time when the customer initiates a payment with a merchant. The token is transmitted through the necessary channels until reaching the Token Service Provider, where the surrogate value is de-tokenized into the customer’s banking credentials before being passed to the customer’s financial institution. With the banking credentials, the financial institution is able to identify the customer and authorize the transaction request.
Remote transactions The main distinguishing factor of POS and remote transactions is that in the POS, payors initiate transactions directly with payee-provided devices or applications. Hence, remote transactions can simply be viewed as transactions that are not made at physical or virtual merchant (payee) provided apps or store fronts. Without a POS device or application, remote transactions require an intermediary to accept payment instructions and initiate the movement of funds to payee accounts on behalf of payors. Remote transaction intermediaries are most typically financial institutions, using instruments such as EFT and cheques and payment service providers via online transfers, including Interac (via the e-Transfer service) and PayPal (via PayPal transactions and Venmo).
In the remote transaction environment, EFT and cheques are the most common types of payment methods.23 Here, EFT dominates in transaction volume and cheques are still on top in terms of remote transaction value. In 2015, remote electronic transactions (i.e., EFT and online transfers) combined to surpass the total value of cheques (see Figure 12) for the first time, marking a significant step in cheque migration. However, as we discuss below, the migration has been driven more by consumer payment habits rather than commercial entities, suggesting the migration still has a long way to go.
23 All cheque volume is assumed to be remote as cheque use has all but disappeared at the POS (even though a very small unknown number of cheques are still paid at the POS). See The Role of Automated Funds Transfer Payments in Canada’s Declining Use of Cheques, Payments Canada (2015)
152016 C A N A D I A N PAY M E N T M E T H O D S A N D T R E N D S
Cheque and paper items The fairly dramatic decline of paper-based payment instruments has been a key discussion over the past few years. Payments Canada research conducted on ACSS transactions in 2012 showed cheque and paper items had already declined by about 50 per cent from their peak in 1990.24 The historic data collected in this analysis shows that the trend has since picked up pace.
In total, there were more than 475 million fewer cheque and paper items in 2015 than in 2008 (a 35 per cent decline). Recent cheque decline has gathered momentum though. From 2008 to 2011 there was a four per cent decline on average each year. The decline increased to about six per cent on average beginning in 2012, and expanded to eight per cent in the 2015 data (see Figure 5 above).
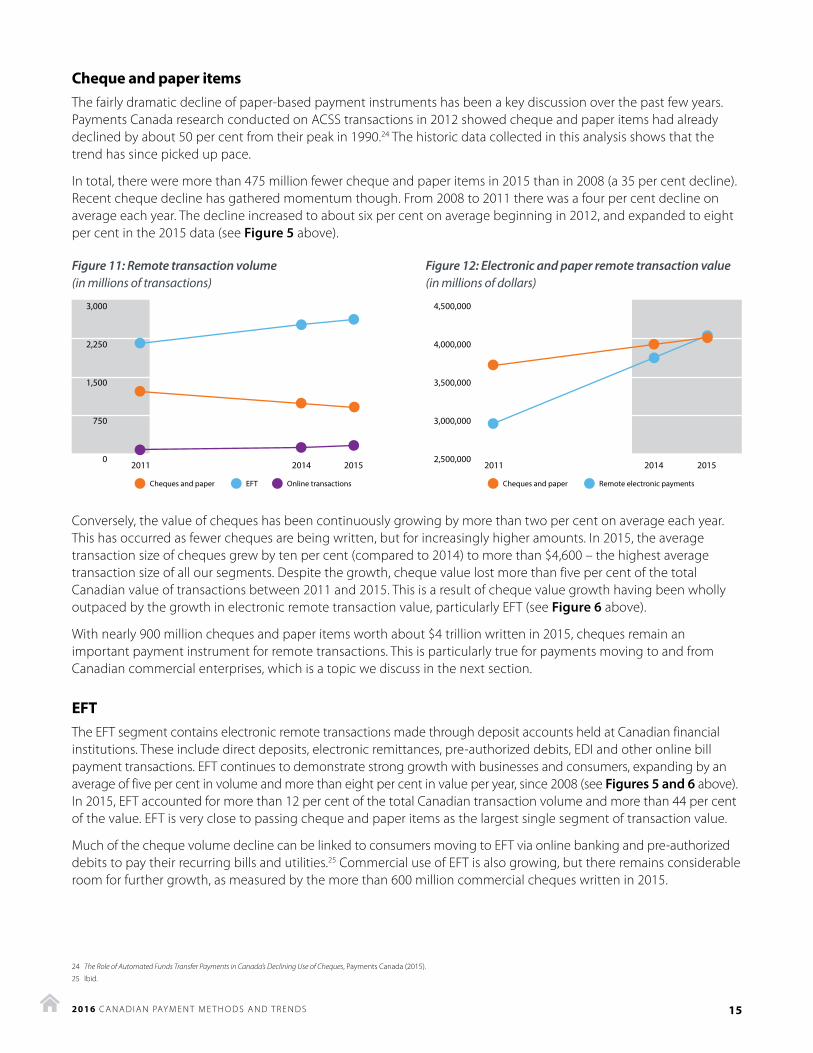
Figure 11: Remote transaction volume Figure 12: Electronic and paper remote transaction value (in millions of transactions) (in millions of dollars)
Conversely, the value of cheques has been continuously growing by more than two per cent on average each year. This has occurred as fewer cheques are being written, but for increasingly higher amounts. In 2015, the average transaction size of cheques grew by ten per cent (compared to 2014) to more than $4,600 – the highest average transaction size of all our segments. Despite the growth, cheque value lost more than five per cent of the total Canadian value of transactions between 2011 and 2015. This is a result of cheque value growth having been wholly outpaced by the growth in electronic remote transaction value, particularly EFT (see Figure 6 above).
With nearly 900 million cheques and paper items worth about $4 trillion written in 2015, cheques remain an important payment instrument for remote transactions. This is particularly true for payments moving to and from Canadian commercial enterprises, which is a topic we discuss in the next section.
EFTThe EFT segment contains electronic remote transactions made through deposit accounts held at Canadian financial institutions. These include direct deposits, electronic remittances, pre-authorized debits, EDI and other online bill payment transactions. EFT continues to demonstrate strong growth with businesses and consumers, expanding by an average of five per cent in volume and more than eight per cent in value per year, since 2008 (see Figures 5 and 6 above). In 2015, EFT accounted for more than 12 per cent of the total Canadian transaction volume and more than 44 per cent of the value. EFT is very close to passing cheque and paper items as the largest single segment of transaction value.
Much of the cheque volume decline can be linked to consumers moving to EFT via online banking and pre-authorized debits to pay their recurring bills and utilities.25 Commercial use of EFT is also growing, but there remains considerable room for further growth, as measured by the more than 600 million commercial cheques written in 2015.
24 The Role of Automated Funds Transfer Payments in Canada’s Declining Use of Cheques, Payments Canada (2015).
25 Ibid.
3,000
2,250
1,500
750
020142011 2015
Cheques and paper EFT Online transactions
4,500,000
4,000,000
3,500,000
3,000,000
2,500,00020142011 2015
Cheques and paper Remote electronic payments
162016 C A N A D I A N PAY M E N T M E T H O D S A N D T R E N D S
Online transfersOnline transfers include online e-wallet and electronic P2P transactions initiated through online services and providers, which are either prefunded or linked to deposit accounts at financial institutions (e.g., e-Transfers, PayPal and Venmo l). In 2015, online transfers only accounted for 0.6 per cent and 0.5 per cent in terms of the total volume and value of Canadian transactions, respectively. However, both e-wallet and e-P2P payment volumes are benefitting as Canadians are becoming more inclined towards the convenience of electronic payments and more comfortable with online/mobile banking and e-commerce. As such, online transfers are the fastest growing payment segment, growing by an average annual growth rate of 43 per cent in volume and 48 per cent in value terms since 2011. While online transfers have the potential to grow into commercial uses, in 2015 they remained primarily consumer-initiated payments.
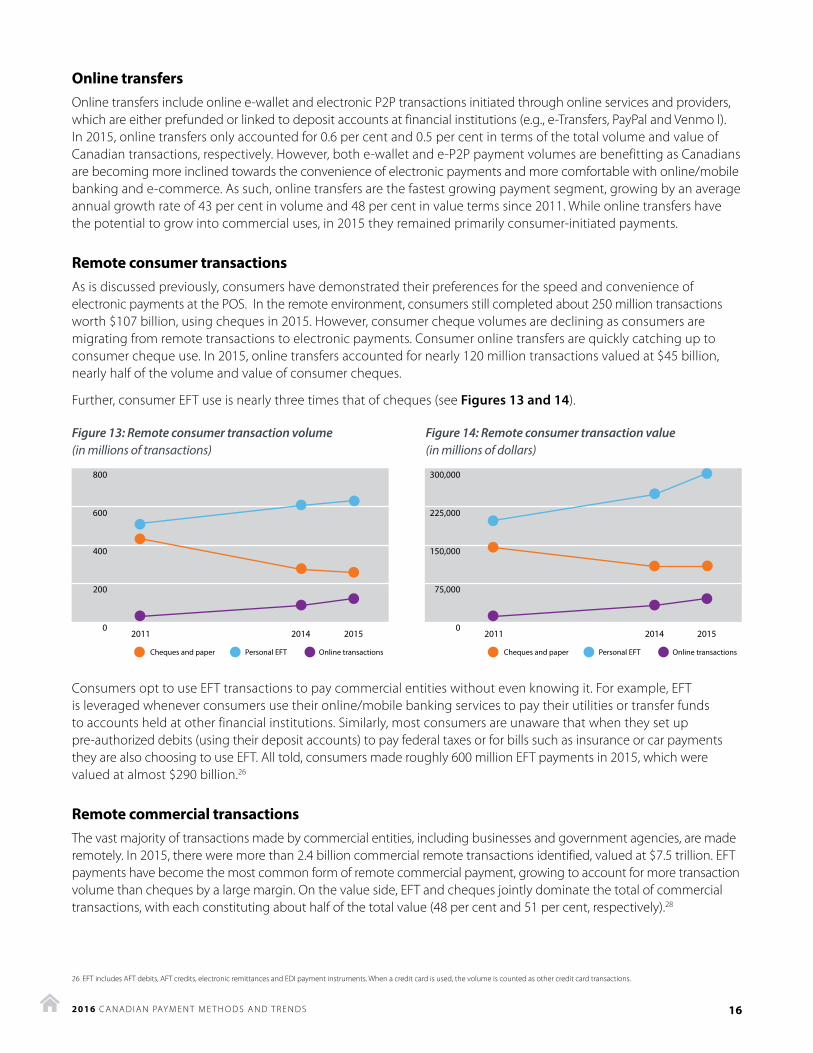
Remote consumer transactionsAs is discussed previously, consumers have demonstrated their preferences for the speed and convenience of electronic payments at the POS. In the remote environment, consumers still completed about 250 million transactions worth $107 billion, using cheques in 2015. However, consumer cheque volumes are declining as consumers are migrating from remote transactions to electronic payments. Consumer online transfers are quickly catching up to consumer cheque use. In 2015, online transfers accounted for nearly 120 million transactions valued at $45 billion, nearly half of the volume and value of consumer cheques.
Further, consumer EFT use is nearly three times that of cheques (see Figures 13 and 14).
Figure 13: Remote consumer transaction volume Figure 14: Remote consumer transaction value (in millions of transactions) (in millions of dollars)
Consumers opt to use EFT transactions to pay commercial entities without even knowing it. For example, EFT is leveraged whenever consumers use their online/mobile banking services to pay their utilities or transfer funds to accounts held at other financial institutions. Similarly, most consumers are unaware that when they set up pre-authorized debits (using their deposit accounts) to pay federal taxes or for bills such as insurance or car payments they are also choosing to use EFT. All told, consumers made roughly 600 million EFT payments in 2015, which were valued at almost $290 billion.26
Remote commercial transactions The vast majority of transactions made by commercial entities, including businesses and government agencies, are made remotely. In 2015, there were more than 2.4 billion commercial remote transactions identified, valued at $7.5 trillion. EFT payments have become the most common form of remote commercial payment, growing to account for more transaction volume than cheques by a large margin. On the value side, EFT and cheques jointly dominate the total of commercial transactions, with each constituting about half of the total value (48 per cent and 51 per cent, respectively).28
26 EFT includes AFT debits, AFT credits, electronic remittances and EDI payment instruments. When a credit card is used, the volume is counted as other credit card transactions.
800
600
400
200
020142011 2015
Cheques and paper Personal EFT Online transactions Cheques and paper Personal EFT Online transactions
300,000
225,000
150,000
75,000
020142011 2015
172016 C A N A D I A N PAY M E N T M E T H O D S A N D T R E N D S
Commercial EFT and cheque use
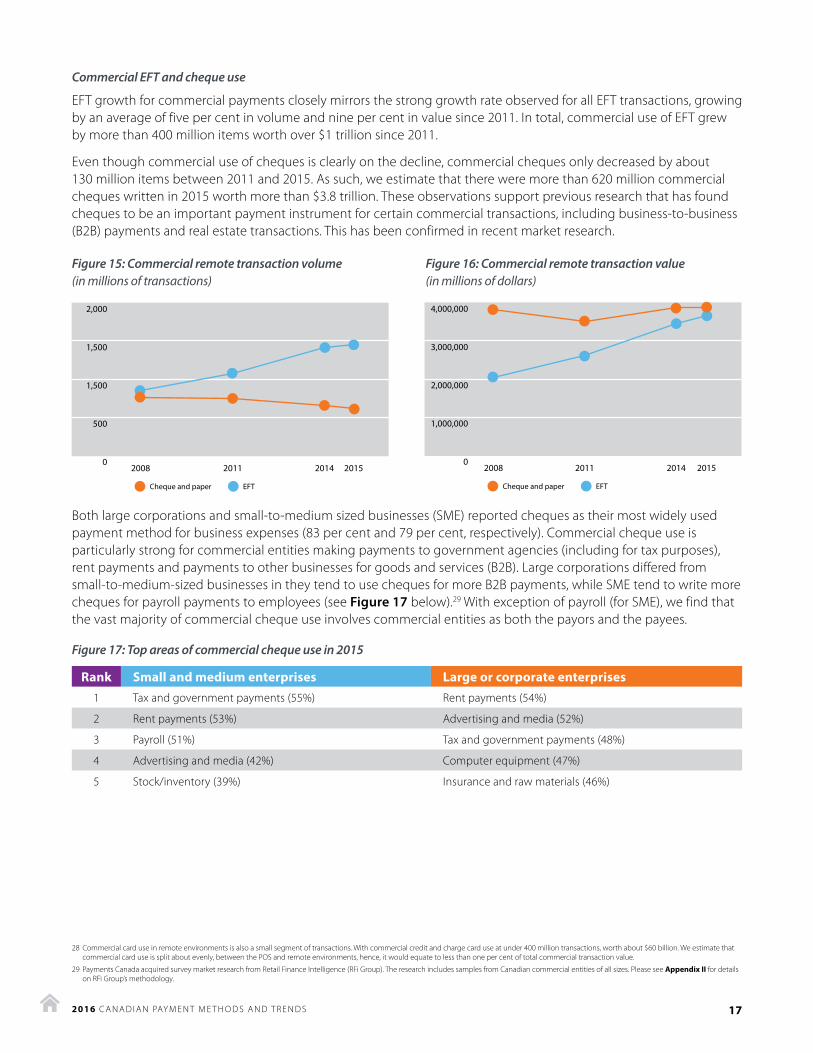
EFT growth for commercial payments closely mirrors the strong growth rate observed for all EFT transactions, growing by an average of five per cent in volume and nine per cent in value since 2011. In total, commercial use of EFT grew by more than 400 million items worth over $1 trillion since 2011.
Even though commercial use of cheques is clearly on the decline, commercial cheques only decreased by about 130 million items between 2011 and 2015. As such, we estimate that there were more than 620 million commercial cheques written in 2015 worth more than $3.8 trillion. These observations support previous research that has found cheques to be an important payment instrument for certain commercial transactions, including business-to-business (B2B) payments and real estate transactions. This has been confirmed in recent market research.
Figure 15: Commercial remote transaction volume Figure 16: Commercial remote transaction value(in millions of transactions) (in millions of dollars)
Both large corporations and small-to-medium sized businesses (SME) reported cheques as their most widely used payment method for business expenses (83 per cent and 79 per cent, respectively). Commercial cheque use is particularly strong for commercial entities making payments to government agencies (including for tax purposes), rent payments and payments to other businesses for goods and services (B2B). Large corporations differed from small-to-medium-sized businesses in they tend to use cheques for more B2B payments, while SME tend to write more cheques for payroll payments to employees (see Figure 17 below).29 With exception of payroll (for SME), we find that the vast majority of commercial cheque use involves commercial entities as both the payors and the payees.
28 Commercial card use in remote environments is also a small segment of transactions. With commercial credit and charge card use at under 400 million transactions, worth about $60 billion. We estimate that commercial card use is split about evenly, between the POS and remote environments, hence, it would equate to less than one per cent of total commercial transaction value.
29 Payments Canada acquired survey market research from Retail Finance Intelligence (RFi Group). The research includes samples from Canadian commercial entities of all sizes. Please see Appendix II for details on RFi Group’s methodology.
4,000,000
3,000,000
2,000,000
1,000,000
02008 20142011 2015
Cheque and paper EFT
2,000
1,500
1,500
500
02008 20142011 2015
Cheque and paper EFT
Figure 17: Top areas of commercial cheque use in 2015
Rank Small and medium enterprises Large or corporate enterprises1 Tax and government payments (55%) Rent payments (54%)
2 Rent payments (53%) Advertising and media (52%)
3 Payroll (51%) Tax and government payments (48%)
4 Advertising and media (42%) Computer equipment (47%)
5 Stock/inventory (39%) Insurance and raw materials (46%)
182016 C A N A D I A N PAY M E N T M E T H O D S A N D T R E N D S
The potential for core payment system modernization in Canada
Canada is one of many countries around the world striving to make payments fast, frictionless and data rich. Payments Canada is leading the charge on payments modernization through collaboration and sound research. The modernization journey began with a large consultation effort with financial institutions, businesses, fintechs and the Canadian public. The result has been a collective view of what more than 100 organizations across Canada want from a modernized payments system. Payments Canada distilled the breadth of insights into a published vision for the payments system that highlights eight user needs: fast, data-rich, transparent, easy, cross-border convenience, oversight-based on activity, open and risk based access, and innovation.* This level-setting piece forms the foundation for Payments Canada’s modernization effort.
With the vision exercise under way, Payments Canada also dove deep into international research. Canada forms part of a “second wave” of modernization initiatives around the world, which has proven to be advantageous, in that it has provided an opportunity to learn from countries that have already modernized. Payments Canada consolidated its observations in a recent paper, comparing 27 jurisdictions’ payments system from around the world.** While each country’s path to modernization was shaped by varied public policy priorities, user needs and legacy payment systems and resulted in a variety of core system configurations; modernization has resulted in some key similarities, including:
• The addition of new near real-time retail systems
• Enhanced batch retail payment systems
• Upgraded large-value payment systems to support enhanced retail systems
• Leveraged centralized infrastructure to improve overall functionality
While Canada is still in the early stages of the modernization work, changes to core payment systems will undoubtedly have an impact on the payment methods and trends observed in Canada. It may be too early to predict specific changes, but it is fair to suggest that much of the potential lies with remote transactions, where faster payments may enable new uses for existing payment methods or inspire new payment methods entirely. At the same time, payments rich in data (such as might be provided by ISO 20022) may encourage a greater shift towards digital payments for commercial enterprises. Additionally, Canadian transactions have the potential to become interoperable with payment systems in other countries, opening up new methods to transact with the rest of the world. Finally, designs that provide for more open environments could help promote innovation and a faster uptake of emerging channels and payment methods. In any event, the impact of modernization on Canadian payment methods and trends is certain to better position Canada for the future.
* Developing a Vision for the Canadian Payments Ecosystem, Payments Canada, Apr. 2016
** Clearing and Settlement Systems Around the World: A Qualitative Analysis, Payments Canada, June 2016
192016 C A N A D I A N PAY M E N T M E T H O D S A N D T R E N D S
The most pervasive trend observed in our data is that slower forms of payments are moving to more expedient and more convenient channels, wherever possible. While this is most obvious looking at cash and cheque volumes, 2015 also marked a year where we observe faster or more convenient electronic payments overtaking slower electronic methods. For example, POS contactless card transactions are growing at the expense of traditional POS card transactions (chip-and-PIN) and in-app online transactions on mobile devices are taking the place of e-commerce via computers. This is highly informative for understanding payments behaviour.
The bottom line is that payors gravitate to transactions that offer increased speed or convenience. The data provides many examples, mostly for consumers in POS and remote environments, for transactions, including EFT, e-commerce, and online transfers. EFT enables easy bill payments through online banking (via mobile devices and computers) and payors to automatically pay without taking any actions (pre-authorized debits). E-commerce, arguably the most convenient channel, has prompted prepaid growth as consumers look for ways to transact online and in-app. Online transfers have emerged to provide near ubiquitous options for consumers paying other consumers through online and mobile application payment service providers (e.g., Venmo, and e-Transfers).
However, to get the full benefits of electronic payments, a challenge remains in providing similar convenience for remote commercial enterprise transactions. Commercial enterprises find convenience in payment methods that are widely accepted and provide for needed payment information. Today, that means a high reliance on cheques as commercial enterprises look to pay each other, with a high degree of certainty their payment will be accepted and that they can use established processes for reconciliation and reporting.
As payment methods and channels continue to evolve in the POS and remote environments, bringing about new payment options, it is important to remember that users have already demonstrated a high drive towards ever faster and more convenient transactions. Opportunities still exist for continuing to migrate consumer payments to more convenient channels and providing ubiquitous electronic commercial transactions that enable easy reconciliation and reporting. With this in mind, payment services and systems should evolve with a focus on providing speed, enabling convenient payment instruments and providing a rich payment information environment. At Payments Canada, this means a continued focus on enabling rules and evolving core payment systems that serve the demands of consumer and business transactions in both the POS and remote environments.
CONCLUSION
202016 C A N A D I A N PAY M E N T M E T H O D S A N D T R E N D S
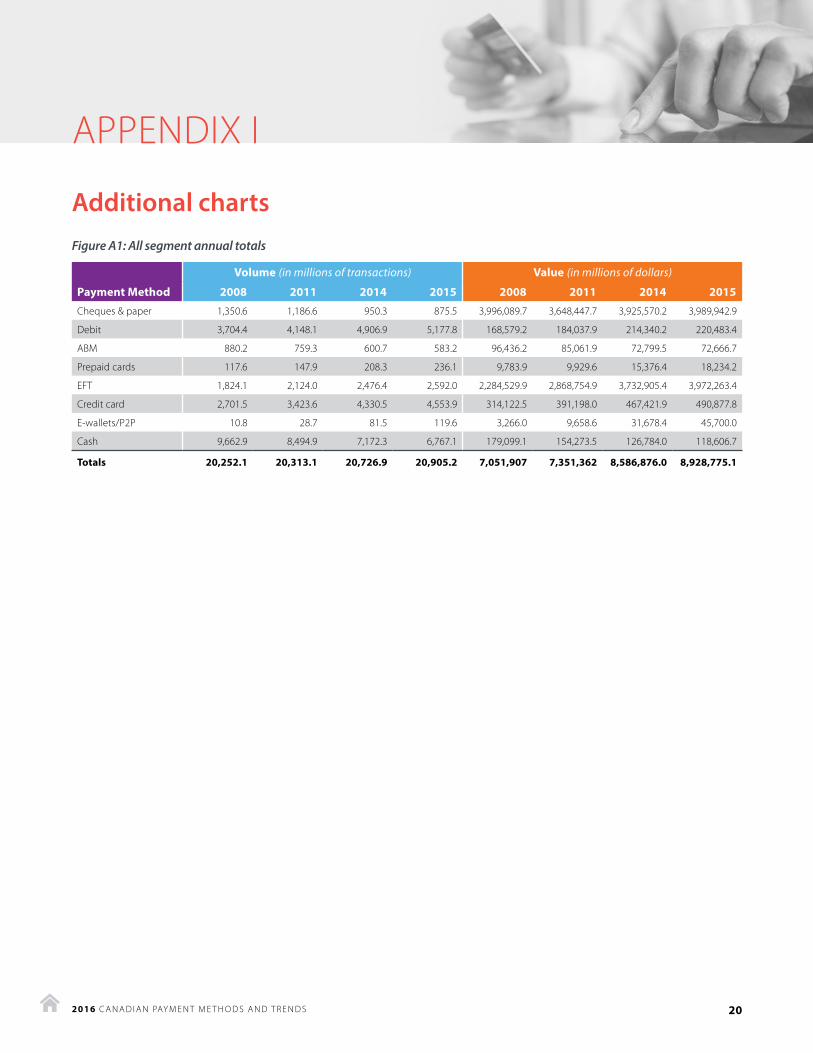
Figure A1: All segment annual totals
Volume (in millions of transactions) Value (in millions of dollars)
Payment Method 2008 2011 2014 2015 2008 2011 2014 2015
Cheques & paper 1,350.6 1,186.6 950.3 875.5 3,996,089.7 3,648,447.7 3,925,570.2 3,989,942.9
Debit 3,704.4 4,148.1 4,906.9 5,177.8 168,579.2 184,037.9 214,340.2 220,483.4
ABM 880.2 759.3 600.7 583.2 96,436.2 85,061.9 72,799.5 72,666.7
Prepaid cards 117.6 147.9 208.3 236.1 9,783.9 9,929.6 15,376.4 18,234.2
EFT 1,824.1 2,124.0 2,476.4 2,592.0 2,284,529.9 2,868,754.9 3,732,905.4 3,972,263.4
Credit card 2,701.5 3,423.6 4,330.5 4,553.9 314,122.5 391,198.0 467,421.9 490,877.8
E-wallets/P2P 10.8 28.7 81.5 119.6 3,266.0 9,658.6 31,678.4 45,700.0
Cash 9,662.9 8,494.9 7,172.3 6,767.1 179,099.1 154,273.5 126,784.0 118,606.7
Totals 20,252.1 20,313.1 20,726.9 20,905.2 7,051,907 7,351,362 8,586,876.0 8,928,775.1
APPENDIX I
Additional charts
212016 C A N A D I A N PAY M E N T M E T H O D S A N D T R E N D S
Online Transfers
Prepaid Card
Credit Card
Debit
Electronic Funds Transfer
Cash
ABM
Cheque & Paper
-10% 0 10% 20% 30% 40%
43%
50%
41%
12%
7%8%
6%5%
5%5%
-6%-5%
-6%
-7%-6%
4 Year CAGR7 Year CAGR
-6%
10%
Online Transfers
Prepaid Card
Electronic Funds Transfer
Credit Card
Debit
Cheque & Paper
ABM
Cash
-10% 0 10% 20% 30% 40%
47.5%
50%
45.8%
16.4%
8.5%8.2%
5.8%6.6%
4.6%3.9%
2.3%0%
-3.9%
4 Year CAGR7 Year CAGR
-4.0%
-6.4%-5.7%
9.3%
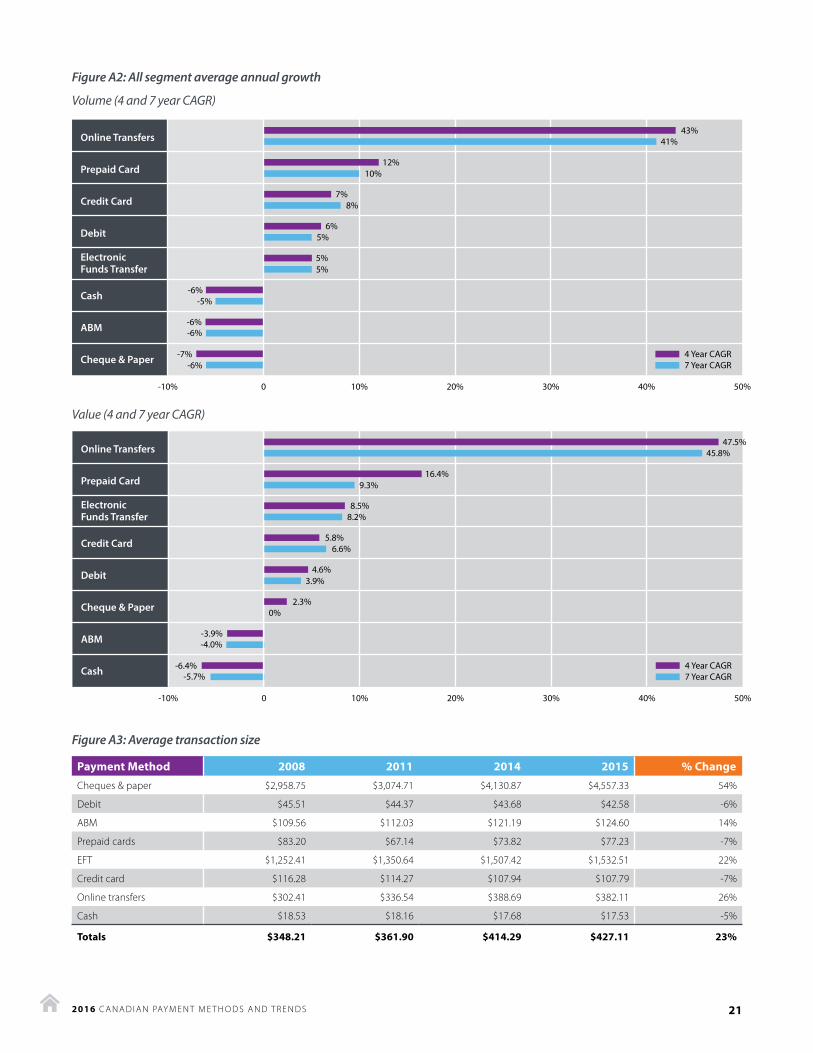
Figure A2: All segment average annual growth
Volume (4 and 7 year CAGR)
Value (4 and 7 year CAGR)
Figure A3: Average transaction size
Payment Method 2008 2011 2014 2015 % Change
Cheques & paper $2,958.75 $3,074.71 $4,130.87 $4,557.33 54%
Debit $45.51 $44.37 $43.68 $42.58 -6%
ABM $109.56 $112.03 $121.19 $124.60 14%
Prepaid cards $83.20 $67.14 $73.82 $77.23 -7%
EFT $1,252.41 $1,350.64 $1,507.42 $1,532.51 22%
Credit card $116.28 $114.27 $107.94 $107.79 -7%
Online transfers $302.41 $336.54 $388.69 $382.11 26%
Cash $18.53 $18.16 $17.68 $17.53 -5%
Totals $348.21 $361.90 $414.29 $427.11 23%
222016 C A N A D I A N PAY M E N T M E T H O D S A N D T R E N D S
APPENDIX II
Methodology, definitions and segment descriptionsA. MethodologyNotes on methodology Where actual data could not found, information from direct sources was leveraged to help create informed estimates. The data is a combination of Payments Canada system data, payment service provider and scheme operator data and estimates made in consultation with industry experts.
Participants contributed either by sharing their internal research and data or by providing expertise that enhanced the data-set’s accuracy. As was assured during the data collection, Payments Canada has made every effort to keep participant data non-discernable, where asked to do so.
This report includes the full data set gathered from past efforts (2008, 2011 and 2014) and contains appropriate updates in methodology, data and findings. As such, this report represents a full replacement of the previously published data points (including those provided in past papers) and should be viewed as essentially replacing the previous data sets.
Survey market research details and methodology
1. Ipsos Reid CFM
The Canadian Financial Monitor (CFM) is a continuous syndicated research service that provides detailed information across a wide range of issues related to Canadian household finances. The survey is the premier source for consumer information on personal banking, investments, credit and insurance. The CFM provides for invaluable long-term data as it has been in continuous operation since 1999. Data is collected each month, yielding an annual sample of 12,000 households that are demographically and regionally representative of the Canadian population. Each household completes a detailed questionnaire – providing comprehensive information on all aspects of its financial holdings and activity.30
2. Ipsos Reid PCS
The Personal Cardholder Study (PCS) is completed through an online sample of Canadian cardholders, using Ipsos’ Internet panel of respondents. Previous survey waves have been conducted online between 2009 and 2014 (inclusive). The sample size for the 2015 survey was 10,551 cardholders and 1,466 non-cardholders.
3. RFi Group business surveys
The RFi Group conducts separate surveys on larger corporate enterprises and small to medium sized enterprises (SME). The corporate survey was in field in late February and early March 2016 with a total of 361 Canadian commercial banking customers being interviewed online. Basic quotas were applied to the sample to ensure that the data is representative of the Canadian commercial population. All respondents had decision-making powers within businesses operating in Canada with global annual revenue of more than $10 million.
RFi Group’s SME survey was field in March 2016 with a total of 526 individuals interviewed online. Basic quotas were applied to the sample to ensure that the data is representative of the Canadian SME market. All respondents had decision making powers within an SME operating in Canada with global annual revenue of less than $10 million.
30 http://www.ipsos.ca/common/dl/pdf/IpsosMarketing_CanadianFinancialMonitor.pdf
232016 C A N A D I A N PAY M E N T M E T H O D S A N D T R E N D S
B. Definitions and segment descriptions
ABM paymentsABM data is derived from data found in published proprietary reports31 and validated with published payment network and CBA data.
CAGRCompound annual growth rate calculates the annual average growth over multiple years, while taking into account the effects of average compounding growth experienced in each year.
CashTotal cash was estimated based upon data from Bank of Canada survey research data (the data was also leveraged for their 2013 Methods-of-Payment Survey).31 Estimates from the data establish the mean number of cash transactions per Canadian per day was (0.65) and the mean cash expenditure per transaction was $11.49. We used these numbers to extrapolate to the larger Canadian population to formulate cash payment estimates and adjusted based on the market research suggestion of cash decline in 2014 and 2015.
Commercial payments Commercial payments include transactions that originate from Canadian organizations, businesses and governments.
Consumer paymentsTransactions that originate from Canadian households and individuals for paying bills, managing accounts at financial institutions and payments for goods and services.
Credit cardCredit card data is a combination of consumer and business credit and charge card payments found in proprietary published reports32. Charge cards differ from credit cards primarily in their application of interest. Credit cards charge interest at an annual percentage rate. Charge cards apply full interest charges after a defined period (typically 30 days) so users are more inclined to pay off balances each month.
Debit paymentsDebit payments include Payments Canada POS debit and online debit transaction data, INTERAC® debit card data and data provided by participants.
EFTEFT was calculated using a combination of AFT (debits and credits), electronic remittances and EDI transactions.
LVTSLVTS payments were excluded from the analysis because the report is focused on more common payments made by consumers and businesses.
31 2013 Methods of Payment Survey Results, Bank of Canada, April 2014.
32 Euromonitor International (2015), Passport: Financial Cards and Payments in Canada, and TSI (2016), Canadian Payments Forecast 2016.
® Trade-mark of Interac Inc.
242016 C A N A D I A N PAY M E N T M E T H O D S A N D T R E N D S
Online transfers Online transfers include online e-wallet and electronic person-to-person (P2P) transactions initiated through online services and providers that are prepaid or linked to deposit accounts at financial institutions (e.g., PayPal). Includes data and estimates for online and mobile environments used to make remote electronic person-to-person payments and payments to merchants, excluding transactions based on credit and debit cards, which are counted in the credit card and debit card categories).
On-usRefers to transactions drawing upon direct deposit accounts (e.g. bank checking accounts or business accounts) where both the payor and payee reside at the same financial institution. A variety of payment types, normally associated with Payments Canada cleared payments, are impacted by on-us items, including cheques, debit and EFT. On-us payments do not result in a Payments Canada clearing entry (and do not appear in Payments Canada system data). On-us payments data must be determined from sources other than Payments Canada. On-us amounts were derived from participant data and estimates. The analysis determined on-us payments to amount to approximately 20 per cent more transactions than can be found in Payments Canada data. On-us amounts differ by payment type, such as cheques ~(21 per cent), debit ~(25 per cent), EFT (20 per cent), etc.
Paper/chequesBased on Payments Canada ACSS data for cheques and paper items (including paper remittance), plus on-us (see above section.)
Prepaid Credit card company and store-branded prepaid product data (both open and closed-loop) is based on proprietary publication data. We also include virtual prepaid products, such that might be purchased through mobile device application stores, such as, Apple and Android.
Proximity environment Point-of-sale or point-of-service transactions include both physical and virtual merchant locations, including online and in-app purchases.
Remote environment Remote transactions include all transactions that are not made at physical payee locations, virtual payee provided apps or store fronts (a.k.a. the POS explained above).