Embed Size (px)
Citation preview
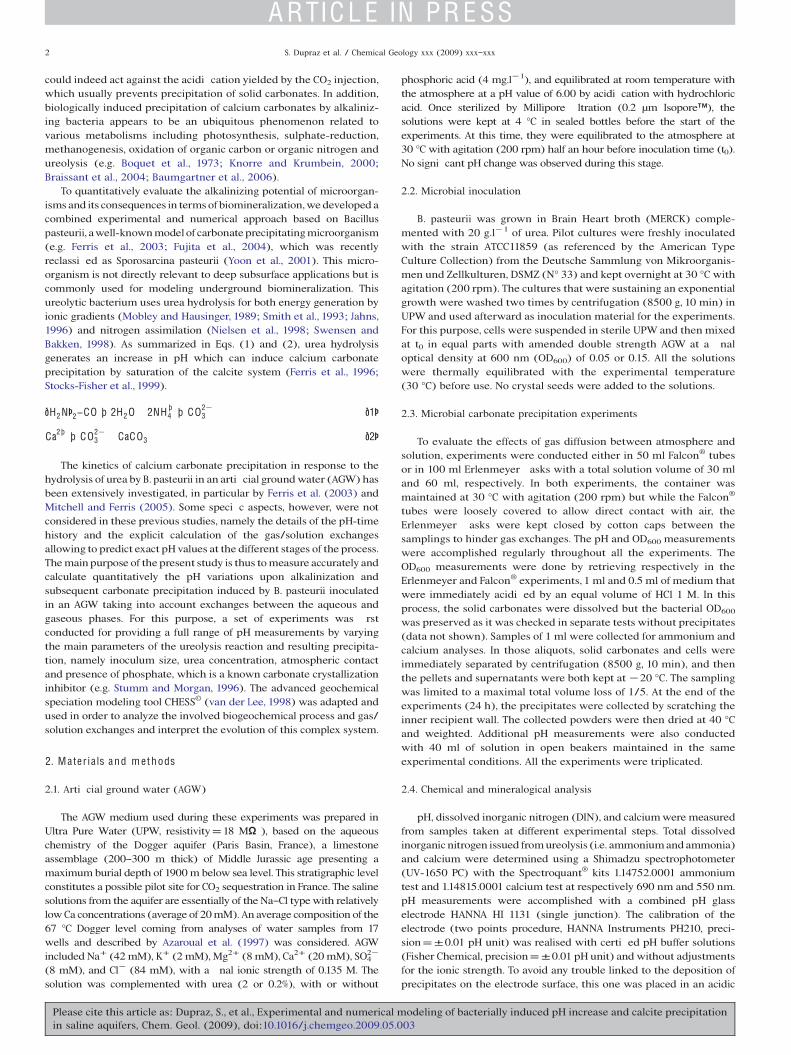
Experimental and numerical modeling of bacterially induced pH increase and calciteprecipitation in saline aquifers
Sébastien Dupraz a,b,!, Marc Parmentier a,1, Bénédicte Ménez a,b, François Guyot a,b
a Centre de Recherches sur le Stockage Géologique du CO2 (IPGP/TOTAL/SCHLUMBERGER/ADEME), Case 89, 4 Place Jussieu, 75252 Paris, Cedex 05, Franceb Equipe Géobiosphère Actuelle et Primitive, IPGP/IMPMC, Case 89, 4 Place Jussieu, 75252 Paris, Cedex 05, France
a b s t r a c ta r t i c l e i n f o
Article history:Accepted 5 May 2009Available online xxxx
Keywords:Calcium carbonate precipitationBacillus pasteuriiBiologically induced mineralizationGeochemical modeling
As a part of an effort to investigate potential implications of microbial activity upon CO2 geologicalsequestration, both the alkalinization of a urea-containing arti cial ground water and the subsequentcalcium carbonate precipitation, induced by Bacillus pasteurii, have been studied in batch experiments. Fourreproducible stages of this microbial process were identi ed and numerically modeled: (1) a rapid rise of pHvalues caused by bacterial ureolysis, (2) a pH plateau due to a dynamic equilibrium between CO2 transferthrough the liquid/gas interface and the ureolysis process, (3) a decrease in pH due to CaCO3 precipitation(4) a slow long term evolution of pH depending on the presence of viable microorganisms which havesurvived to carbonate precipitation. Correlations between the durations and pH values of these four stepswere also evidenced. To interpret quantitatively the observed trends, the geochemical code CHESS© wasadapted for taking into account the enzymatically catalyzed ureolysis reaction as well as the kinetics of gas/solution exchanges and the rate of calcium carbonate precipitation. Finally, new original aspects of B.pasteurii biomineralization were evidenced, namely a cellular calcium phosphate precipitation preceding theformation of calcite and a negative impact of phosphate on ureolysis and calcite precipitation.
© 2009 Elsevier B.V. All rights reserved.
1. I n t r o d u c t i o n
Microbiological activities that occur in subsurface environmentsare largely unknown, although numerous studies have documentedtheir impact on various geological processes (e.g. Edwards et al., 2005;Severmann et al., 2006; Tuck et al., 2006). Their roles in carbonateprecipitation, mineral alteration, oil and gas souring and petroleummaturation have strong economic and environmental implications(e.g. Premuzic and Lin, 1999; Wolfgang, 2003). Recently, intensiveresearch on CO2 geological storage has been undertaken to tackleclimate changes by mitigating the environmental consequences ofenergy production from hydrocarbon fuels. As a result, large amountsof this gas may need to be stored underground as part of a futureglobal atmospheric stabilization strategy. In particular, it might besequestrated into depleted oil and gas reservoirs as well as in deepsaline aquifers, deep-seated coal beds or fractured (ultra)basic rocks,which altogether offer very important storage capacities around theworld (e.g. White et al., 2003; Bachu et al., 2007). This approach willrequire the ability to model the injection of carbon dioxide into deep
geological reservoirs and to predict its fate for thousands of years afterdisposal. In accordance, identi cation and proper knowledge of thecritical controlling processes are strongly required. The deep bio-sphere could have, in that perspective, far reaching implications forCO2 geological sequestration. However, at present, little is knownabout the involved biogeochemical processes. The development ofconceptual and numerical models that would incorporate bioticprocesses both at the pore and reservoir scales has been hindered by alack of understanding of the major involved parameters. To de nerelevant parameters needed for kinetic and thermodynamic compu-tational models focused on microbe/mineral/pore uid processes,improved understanding of interactions between subsurface micro-organisms and CO2 enriched environment is mandatory. In particular,the ability of a large variety of aerobic and anaerobic microorganismsto initiate and enhance carbonate precipitation (e.g. Boquet et al.,1973; Visscher and Stolz, 2005) is of noticeable interest as it may beemployed to convert the injected CO2 into mineral, which is seen asone of the safest CO2 trapping mechanisms (Bachu, 2008). Byconsidering that this process could constitute a potential mean ofsealing pores and fractures in rocks, microbially mediated mineraliza-tion could also have adverse effects by decreasing porosity, henceinjectivity, close to the well and thus should also be studied in thisrespect. Among the biological processes leading to CO2 mineralizationinto solid carbonate phases, the bioalkalinization, i.e. pH increase ofthe local environment related to metabolic activities of microorgan-isms, constitutes a well-documented mechanism. The pH increase
Chemical Geology xxx (2009) xxx–xxx
! Corresponding author. Current address: IPGP, Equipe Géobiosphère Actuelle etPrimitive, Case 89, 4 Place Jussieu, 75252 Paris Cedex 05, France. Tel.: +33144 27 6147;fax: +33 1 44 27 95 16.
E-mail address: [email protected] (S. Dupraz)1 Current address: BRGM, 3 Avenue Claude-Guillemin, BP 36009, 45060 Orléans
Cedex 2, France.
CHEMGE-15740; No of Pages 10
0009-2541/$ – see front matter © 2009 Elsevier B.V. All rights reserved.doi:10.1016/j.chemgeo.2009.05.003
C ont ents lists a v a ilable a t S c ienc e D ire c t
Chemical Geology
j o u r n a l h o m e p a g e : w w w . e l s e v i e r . c o m / l o c a t e / c h e m g e o
A R TIC L E IN P R E S S
Please cite this article as: Dupraz, S., et al., Experimental and numerical modeling of bacterially induced pH increase and calcite precipitationin saline aquifers, Chem. Geol. (2009), doi:10.1016/j.chemgeo.2009.05.003
could indeed act against the acidi cation yielded by the CO2 injection,which usually prevents precipitation of solid carbonates. In addition,biologically induced precipitation of calcium carbonates by alkaliniz-ing bacteria appears to be an ubiquitous phenomenon related tovarious metabolisms including photosynthesis, sulphate-reduction,methanogenesis, oxidation of organic carbon or organic nitrogen andureolysis (e.g. Boquet et al., 1973; Knorre and Krumbein, 2000;Braissant et al., 2004; Baumgartner et al., 2006).
To quantitatively evaluate the alkalinizing potential of microorgan-isms and its consequences in termsofbiomineralization,wedeveloped acombined experimental and numerical approach based on Bacilluspasteurii, awell-knownmodelof carbonateprecipitatingmicroorganism(e.g. Ferris et al., 2003; Fujita et al., 2004), which was recentlyreclassi ed as Sporosarcina pasteurii (Yoon et al., 2001). This micro-organism is not directly relevant to deep subsurface applications but iscommonly used for modeling underground biomineralization. Thisureolytic bacterium uses urea hydrolysis for both energy generation byionic gradients (Mobley and Hausinger, 1989; Smith et al., 1993; Jahns,1996) and nitrogen assimilation (Nielsen et al., 1998; Swensen andBakken, 1998). As summarized in Eqs. (1) and (2), urea hydrolysisgenerates an increase in pH which can induce calcium carbonateprecipitation by saturation of the calcite system (Ferris et al., 1996;Stocks-Fisher et al., 1999).
ðH2 NÞ2–C O þ 2H2 O 2N H þ4 þ C O2!
3 ð1Þ
Ca2 þ þ C O2!3 CaC O3 ð2Þ
The kinetics of calcium carbonate precipitation in response to thehydrolysis of urea by B. pasteurii in an arti cial groundwater (AGW) hasbeen extensively investigated, in particular by Ferris et al. (2003) andMitchell and Ferris (2005). Some speci c aspects, however, were notconsidered in these previous studies, namely the details of the pH-timehistory and the explicit calculation of the gas/solution exchangesallowing to predict exact pH values at the different stages of the process.Themainpurpose of the present study is thus tomeasure accurately andcalculate quantitatively the pH variations upon alkalinization andsubsequent carbonate precipitation induced by B. pasteurii inoculatedin an AGW taking into account exchanges between the aqueous andgaseous phases. For this purpose, a set of experiments was rstconducted for providing a full range of pH measurements by varyingthe main parameters of the ureolysis reaction and resulting precipita-tion, namely inoculum size, urea concentration, atmospheric contactand presence of phosphate, which is a known carbonate crystallizationinhibitor (e.g. Stumm and Morgan, 1996). The advanced geochemicalspeciation modeling tool CHESS© (van der Lee, 1998) was adapted andused in order to analyze the involved biogeochemical process and gas/solution exchanges and interpret the evolution of this complex system.
2. M a t e r i a ls a n d m e t h o ds
2.1. Arti cial ground water (AGW)
The AGW medium used during these experiments was prepared inUltra Pure Water (UPW, resistivity=18 MΩ ), based on the aqueouschemistry of the Dogger aquifer (Paris Basin, France), a limestoneassemblage (200–300 m thick) of Middle Jurassic age presenting amaximum burial depth of 1900 m below sea level. This stratigraphic levelconstitutes a possible pilot site for CO2 sequestration in France. The salinesolutions from the aquifer are essentially of the Na–Cl typewith relativelylowCa concentrations (average of 20mM). An average composition of the67 °C Dogger level coming from analyses of water samples from 17wells and described by Azaroual et al. (1997) was considered. AGWincluded Na+ (42 mM), K+ (2 mM),Mg2+ (8 mM), Ca2+ (20 mM), SO4
2!
(8 mM), and Cl! (84 mM), with a nal ionic strength of 0.135 M. Thesolution was complemented with urea (2 or 0.2%), with or without
phosphoric acid (4 mg.l!1), and equilibrated at room temperature withthe atmosphere at a pH value of 6.00 by acidi cation with hydrochloricacid. Once sterilized by Millipore ltration (0.2 µm Isopore™), thesolutions were kept at 4 °C in sealed bottles before the start of theexperiments. At this time, they were equilibrated to the atmosphere at30 °C with agitation (200 rpm) half an hour before inoculation time (t0).No signi cant pH change was observed during this stage.
2.2. Microbial inoculation
B. pasteurii was grown in Brain Heart broth (MERCK) comple-mented with 20 g.l!1 of urea. Pilot cultures were freshly inoculatedwith the strain ATCC11859 (as referenced by the American TypeCulture Collection) from the Deutsche Sammlung von Mikroorganis-men und Zellkulturen, DSMZ (N° 33) and kept overnight at 30 °C withagitation (200 rpm). The cultures that were sustaining an exponentialgrowth were washed two times by centrifugation (8500 g, 10 min) inUPW and used afterward as inoculation material for the experiments.For this purpose, cells were suspended in sterile UPW and then mixedat t0 in equal parts with amended double strength AGW at a naloptical density at 600 nm (OD600) of 0.05 or 0.15. All the solutionswere thermally equilibrated with the experimental temperature(30 °C) before use. No crystal seeds were added to the solutions.
2.3. Microbial carbonate precipitation experiments
To evaluate the effects of gas diffusion between atmosphere andsolution, experiments were conducted either in 50 ml Falcon® tubesor in 100 ml Erlenmeyer asks with a total solution volume of 30 mland 60 ml, respectively. In both experiments, the container wasmaintained at 30 °C with agitation (200 rpm) but while the Falcon®
tubes were loosely covered to allow direct contact with air, theErlenmeyer asks were kept closed by cotton caps between thesamplings to hinder gas exchanges. The pH and OD600 measurementswere accomplished regularly throughout all the experiments. TheOD600 measurements were done by retrieving respectively in theErlenmeyer and Falcon® experiments, 1 ml and 0.5 ml of medium thatwere immediately acidi ed by an equal volume of HCl 1 M. In thisprocess, the solid carbonates were dissolved but the bacterial OD600
was preserved as it was checked in separate tests without precipitates(data not shown). Samples of 1 ml were collected for ammonium andcalcium analyses. In those aliquots, solid carbonates and cells wereimmediately separated by centrifugation (8500 g, 10 min), and thenthe pellets and supernatants were both kept at !20 °C. The samplingwas limited to a maximal total volume loss of 1/5. At the end of theexperiments (24 h), the precipitates were collected by scratching theinner recipient wall. The collected powders were then dried at 40 °Cand weighted. Additional pH measurements were also conductedwith 40 ml of solution in open beakers maintained in the sameexperimental conditions. All the experiments were triplicated.
2.4. Chemical and mineralogical analysis
pH, dissolved inorganic nitrogen (DIN), and calciumwere measuredfrom samples taken at different experimental steps. Total dissolvedinorganic nitrogen issued fromureolysis (i.e. ammoniumand ammonia)and calcium were determined using a Shimadzu spectrophotometer(UV-1650 PC) with the Spectroquant® kits 1.14752.0001 ammoniumtest and 1.14815.0001 calcium test at respectively 690 nm and 550 nm.pH measurements were accomplished with a combined pH glasselectrode HANNA HI 1131 (single junction). The calibration of theelectrode (two points procedure, HANNA Instruments PH210, preci-sion=±0.01 pH unit) was realised with certi ed pH buffer solutions(Fisher Chemical, precision=±0.01 pH unit) and without adjustmentsfor the ionic strength. To avoid any trouble linked to the deposition ofprecipitates on the electrode surface, this one was placed in an acidic
2 S. Dupraz et al. / Chemical Geology xxx (2009) xxx–xxx
A R TIC L E IN P R E S S
Please cite this article as: Dupraz, S., et al., Experimental and numerical modeling of bacterially induced pH increase and calcite precipitationin saline aquifers, Chem. Geol. (2009), doi:10.1016/j.chemgeo.2009.05.003
storage solution (KCl = 3.5 M, pH"4.0) between each measurement.Care was taken to thoroughly rinse the electrode with deionised waterbefore and after each measurement. In situ, no precipitatewas observedon theglass electrode. Carbonate precipitation thus,didnot affect thepHmeasurements.
Mineral precipitates formed during incubation were identi ed bypowder X-ray diffraction (XRD) using PANalytical X'Pert Pro MPDdiffractometer. Data were registered by Bragg–Brentano theta–thetageometry on a single crystalline silicon sample holder. Opticalmicroscopy in Differential Interferential Contrast mode was performedon precipitates, previously resuspended in ethanol (90%). Observationsand elemental analysis of produced minerals were also carried out byScanning Electron Microscopy (SEM) using a JEOL JSM-840A operatingat 20 kV, by Transmission Electron Microscopy (TEM) and EnergyDispersive X-ray Spectrometry (EDXS) using a JEOL 2100F electronmicroscope operating at 200 kV.
3. B i ogeoc h e m ica l m o d e l i n g
3.1. Conceptual model
The rate rurea (mol.l–1.day!1) of ureolysis reaction (Eq. (1)) isassumed to be associated to a rst order kinetic (Ferris et al., 2003) inurea concentration [urea] (mol.l!1):
rurea = ! kurea urea½ ð3Þ
where kurea is the kinetic constant in day!1. In spite of other parameters,such as pH and enzyme concentration that are known to have an effecton ureolysis rates (Stocks-Fisher et al., 1999), this kinetic law wassuf cient to adequately t the data obtained in this work.
Calcite precipitation (Eq. (2)) can be modeled by the followingsaturation-dependent kinetic (Lasaga,1998) valuable when calcite N1:
rcalcite = kcalcite Xcalcite!1ð Þn ð4Þ
where rcalcite represents the rate of calcite precipitation inmol.l!1.day!1,kcalcite is the rate constant (mol.l!1.day!1) and n the reaction order.Despite the more frequent use of n=2 in literature (Stumm andMorgan, 1996; Ferris et al., 2003), in our case, better ts were obtained
using n=1. The saturation index with respect to calcite, calcite, isde ned by:
Xcalcite = Ca2+n o
CO2 !3
n o= Ks ð5Þ
where Ca2+ and CO32! are Ca2+ and CO3
2! ions activities,respectively. Precipitation starts only when a certain index of saturation( lim) is reached (Stumm and Morgan,1996). The solubility constant Ks
was calculated using the equilibrium reactions and associated thermo-dynamic constants summarized in Table 1.
Gas exchanges of CO2 between atmosphere and solutionwere takeninto account using an interface diffusion kinetics rCO2
(mol.l–1.day):
rCO2= kCO2
CO2 aqð Þ
h i! CO2 aqð Þ
h i
s
ð6Þ
where [CO2(aq)] and [CO2(aq)]s are respectively the current time (t) andsaturation concentrations (mol.l!1) of the aqueous species CO2(aq), andkCO2
is a transfer kinetic constant (day!1). Those exchanges are possibleat any pH regarding the fact that acido–basic reactions are generallymuch faster to equilibrate than transfer reactions (Stumm and Morgan,1996). The saturation concentrations [CO2(aq)]s were xed using theHenry constant (Table 1). Exchanges of NH3 between gas and solution,leading to equilibrium between gaseous and aqueous NH3 species (i.e.NH3(aq) and NH3(g), respectively) were neglected (see Discussion).
3.2. Numerical modeling
Mass conservation of nitrogen during ureolysis (Eq. (1)) associatedto integration on time (t), of Eq. (3) leads to the time evolution of totaldissolved inorganic nitrogen concentration [DIN](t), which, in our case,correspond to the summed concentrations (mol.l!1) of ammoniumanddissolved ammonia produced by ureolysis (Ferris et al. 2003):
DIN½ tð Þ = 2 urea½ 0 1! exp !kureatð Þð Þ ð7Þ
where [urea]0 is the initial concentration of urea in mol.l!1. Forexperiments in which dissolved inorganic nitrogen concentration wasmeasured (i.e. experiments conducted in Erlenmeyer asks), ureolysiskinetic constant kurea (day!1) was determined by best tting of Eq. (7)to experimental data. For other experiments, ureolysis rates werecalculated according to initial urea and cell concentrations.
Ta b l e 1Equilibrium reactions and associated apparent thermodynamic constants at 30 °C and I=0.135 M used to describe the speciation in the geochemical model (van der Lee andLomenech, 2004).
Reactions LogK (30 °C) Reactions LogK (30 °C)
OH!+H+ =H2O !13.8351 CaCl+ = Ca2+ + Cl! !0.2702NH4
+ =NH3(aq)+H+ 9.0914 KCl(aq) = K++ Cl! !2.4768CO2(aq)+H2O=HCO3
!+H+ 6.319 MgCl+ =Mg2+ +Cl! !0.1295CO3
2!+H+ =HCO3! !10.2879 NaCl(aq) =Na++ Cl! !0.7617
CaCO3(aq)+H+ =HCO3!+ Ca2+ !6.9137 CaOH+ +H+ = Ca2+ +H2O !12.6093
CaHCO3+ =HCO3
!+ Ca2+ 1.0528 KOH(aq) +H+ = K+ +H2O !14.2555MgCO3(aq)+H+ =HCO3
!+Mg2+ !7.2815 Mg4(OH)44+ +4H+ =Mg2+ +4H2O !39.75
MgHCO3+ =HCO3
!+Mg2+ 1.0438 MgOH+ +H+ =Mg2+ +H2O !11.4996NaCO3
!+H+ =HCO3!+Na+ !9.8332 NaOH(aq) +H+ =Na+ +H2O !14.0433
NaHCO3(aq) =HCO3!+Na+ 0.1149 PO4
3!+H+ =HPO42! 12.2825
HSO4!= SO4
2!+H+ 2.0402 H2PO4!=HPO4
2!+H+ 7.1945H2SO4(aq) = SO4
2!+2H+ !1.0209 H3PO4(aq) =HPO42!+2H+ 9.3884
CaSO4= SO42!+ Ca2+ 2.1279 CaH2PO4
+ = Ca2+ +HPO42!+H+ 1.4
MgSO4= SO42!+Mg2+ 2.2482 CaHPO4(aq) = Ca2+ +HPO4
2! 2.74KHSO4 = SO4
2!+K+ +H+ !1.3726 CaPO4!= Ca2+ +HPO4
2! !5.8618KSO4
!= SO42!+K+ 0.8893 KHPO4
!= K+ +HPO42! 0.78
NaSO4!= SO4
2!+Na+ 0.7149 MgH2PO4+ =Mg2+ +HPO4
2!+H+ 1.66NH4SO4
!= SO42! NH4
+ 0.9400 MgHPO4(aq) =Mg2+ +HPO42! 2.91
HCl(aq) =H++Cl! !0.7343 MgPO4!+H+ =Mg2+ +HPO4
2! !5.7328CO2(aq) = CO2(g) !1.52623 CaCO3(s)+H+ =HCO3!+Ca2+ !1.7736CaCl2(aq) = Ca2+ +2Cl! !0.6579 NaHPO4
!=HPO42!+Na+ 0.92
3S. Dupraz et al. / Chemical Geology xxx (2009) xxx–xxx
A R TIC L E IN P R E S S
Please cite this article as: Dupraz, S., et al., Experimental and numerical modeling of bacterially induced pH increase and calcite precipitationin saline aquifers, Chem. Geol. (2009), doi:10.1016/j.chemgeo.2009.05.003
Once the ureolysis rate was known, the aqueous speciation at eachstep (i.e. activities and concentrations of each chemical speciesin equilibrium) was calculated. Table 1 summarizes the involvedchemical species and the corresponding apparent equilibrium con-stants at 30 °C and ionic strength I of 0.135 M. This geochemicalmodeling was accomplished with CHESS© (van der Lee,1998)which isable to model mixed equilibrium–kinetic system with exible kineticformulation. Activities and concentrations were related by the activity
coef cients calculated by using an extended Debye–Hückel formula.Initial speciationwas de nedusing the composition of AGW, except for(i) calcium concentration which was set according to the measuredconcentrations in the early stage of experiment and (ii) chlorineconcentration which was set by the model to ensure electroneutralityand a pH of 6.00. According to AGW preparation, initial CO2(aq)
concentration was assumed to be at equilibrium with the atmosphere(i.e. 15 µM).
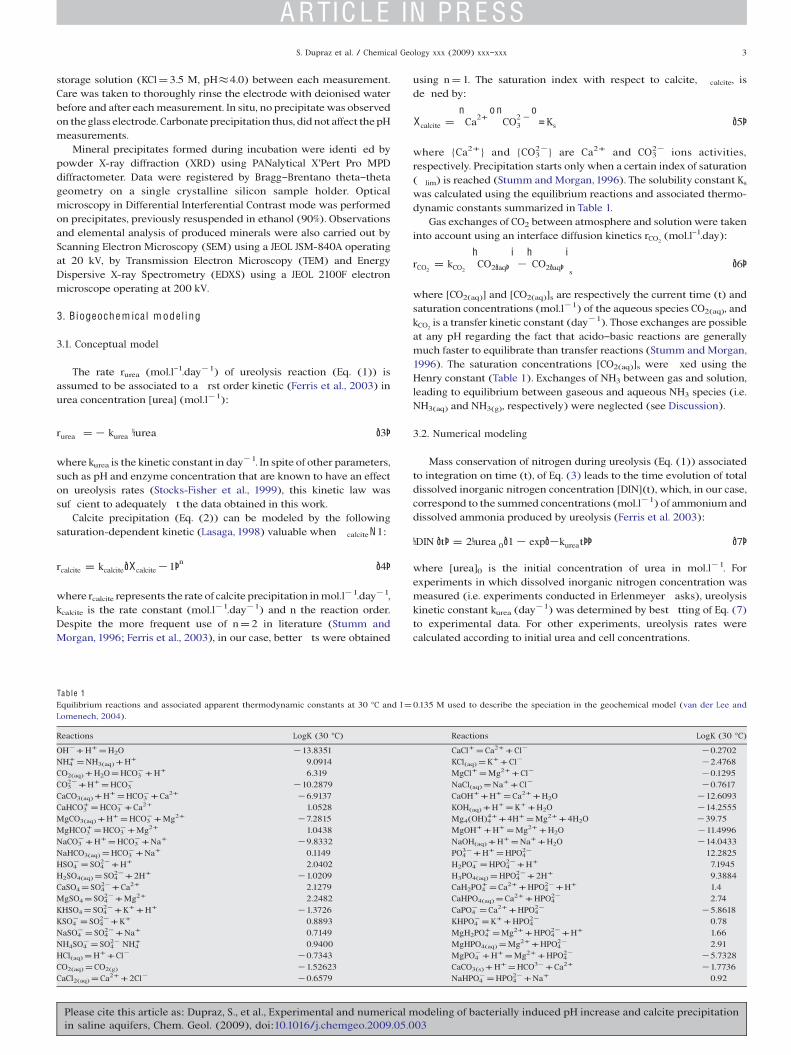
F ig. 1. pH (a,b), total dissolved inorganic nitrogen (c,d) and calcium (e,f) in solution and optical density at 600 nm (g,h) as function of time for experiments with an initial opticaldensity at 600 nm of 0.05 and 0.2% ureawith orwithout phosphate (±p), respectively (b,d,f,h) and (a,c,e,g). Each data point corresponds to the average of triplicate experiments withassociated standard deviation. Solid lines represent the result of the numerical modeling. Dashed lines represent the linear least squares t for optical density experimental values.H1, H2 and H3 positions are displayed together with T1 and T2 (see text). The system is here considered to be closed (kCO2
=0) and free parameters were adjusted to the followingvalues: kcalcite =1.61 mol.l!1.day!1 and X lim =116 for experiments without phosphate and kcalcite =1.13 mol.l!1.day!1 and X lim =116 for experiments with phosphate.
Ta b l e 2Phases duration (T) and pH level (H) of experiments as a function of inoculum size ([OD600](t0) = 0.05 or 0.15), quantity of supplemented urea (2 or 0.2%) and presence (4 mg.l!1,noti ed with “p”) or absence of phosphate. Assays are labeled accordingly. A suf x berlenQ is added if Erlenmeyer asks were used as container (Falcon® tubes if not speci ed).H3 anddry precipitate measurements were respectively achieved at t=21 h and 24 h.
Initial culture conditions ([OD600](t0) /% of urea/ ±phosphate) T1 (min) H1 (pH) T2 (min) H2 (pH) H3 (pH) Dry precipitate (mg.ml!1)
0.15/0.2 24.5 8.84 75.5 8.25 8.69 1.8080.15/0.2 p 28.5 8.84 76.5 8.25 8.69 1.740.15/2 7.5 9.16 13 8.67 9.47 1.8640.15/2 p 13 9.15 29.5 8.69 9.44 1.8360.05/0.2 71 8.78 106 8.09 8.02 0.8440.05/0.2 p 80 8.76 395 8.06 8.06 0.5840.05/2 13.5 9.01 34.5 8.38 8.88 1.8760.05/2 p 14.5 9 63 8.41 8.58 1.8280.05/0.2 erlen 63 8.9 77 8.21 8.26 1.340.05/0.2 p erlen 64 8.89 226 8.29 8.36 1.29
4 S. Dupraz et al. / Chemical Geology xxx (2009) xxx–xxx
A R TIC L E IN P R E S S
Please cite this article as: Dupraz, S., et al., Experimental and numerical modeling of bacterially induced pH increase and calcite precipitationin saline aquifers, Chem. Geol. (2009), doi:10.1016/j.chemgeo.2009.05.003
Each experiment was rst analyzed assuming a closed system wheregas-solution exchange was neglected, i.e. kCO2
= 0. Comparison betweenmodeled and measured pH in an optimization process permitted toevaluate the kinetic constant kcalcite and the sursaturation limit lim byadjustments. When this modeling did not successfully explain the data,gas-solution exchange reactions in an open system were considered bytaking into account the kinetic constant kCO2
, which was then included inthe adjustment procedure. The adjustment of the model free parametersto experimental data was conducted with the Levenberg–Marquardtmethod (Marquardt,1963) toward an optimized 2 (chi-square distribu-tion) function.
In order to provide additional theoretical data for the discussion,numerical modeling was also carried out ignoring CaCO3 precipitationand ureolysis kinetics. Consequently, in this case, the reactionadvancement was described with the consumption of urea and thetheoretical modeling considered instantaneous equilibration with theatmosphere or no equilibration at all (closed system).
4. Resu l ts
Measurements accomplished with the Erlenmeyer asks series aredisplayed in Fig.1a,c,e,g for assays without phosphate and in Fig.1b,d,f,hfor experiments in the presence of phosphate. Solid lines represent theresults of the numerical modeling. Typical evolutions of both experi-mental and calculated pH as a function of time display a sequence ofvariations with the same trend in the two series (Fig. 1a,b). Those aresummarized hereafter and are valid for all the experiments presented inthis study:
(1) After inoculation at time t0, the experiment started with a rapidpH rise of duration labeled T1.
(2) A quasi-stationary value of pH (labeled H1) was reached andmaintained for a duration, labeled T2, varying between 10 and400 min, depending on the initial medium composition.
(3) The second step (2) was followed by a decrease in pH, whichoccurred simultaneously with a direct visual observation ofcarbonateprecipitation in themedium,down to avalue labeledH2.
(4) In some experiments, pH then increased during several hoursto a value labeled H3 and measured at t=21 h.
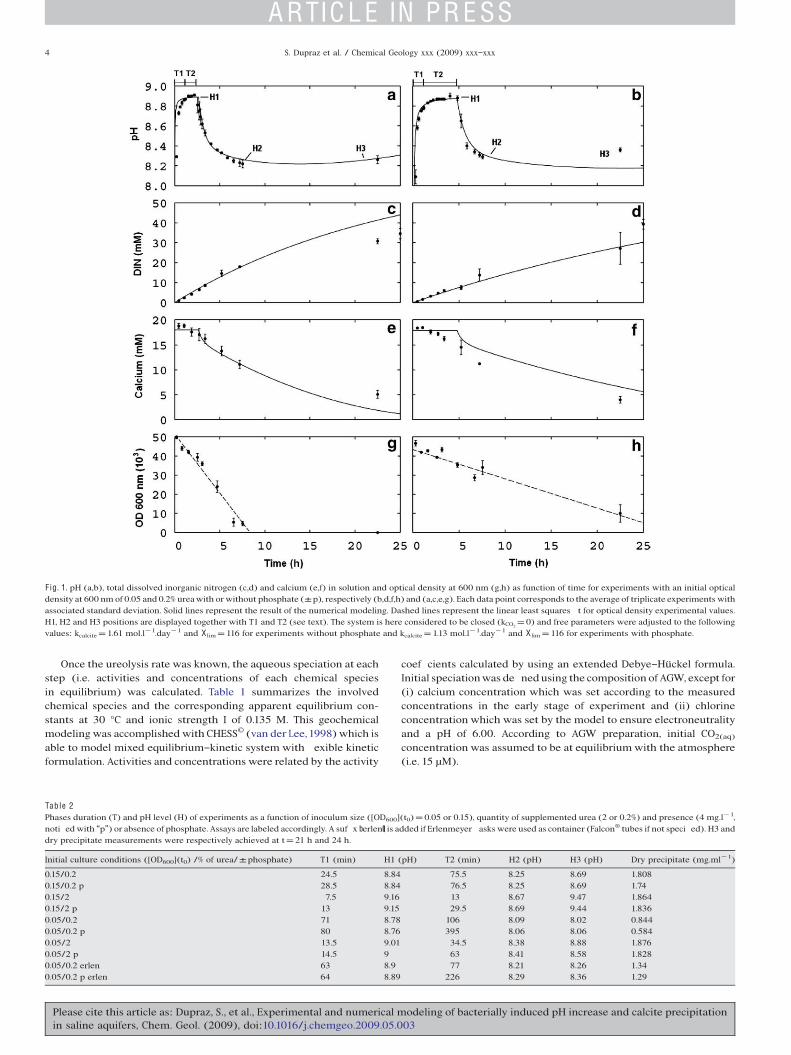
These four stages could be found in all experiments with differentlevels and durations. The effects of the different experimental para-meters (size of the inoculum, initial concentrations of urea and presenceof phosphate) on the H and T values at the different steps as well as onthe dry weights of carbonate precipitates are reported in Table 2.Increasing urea concentrations and inoculum sizes were resulting inhigherH1,H2andH3pHvalues and in shorterT1andT2durations (Table2). On the other hand, no proportionality was observed between totaldissolved inorganic nitrogen (Fig. 1c,d) and cell concentration derivedfrom optical density at 600 nm (Fig. 1g,h). Of particular interest is thestrong correlation between pH values H1, H2 and H3 upon changes inexperimental conditions, as highlighted in Fig. 2a,b. The duration T2 alsoshowed two correlation trends with H1 (Fig. 2c), one for assays withphosphate and small inocula (i.e. 0.05/0.2 p; 0.05/2 p and 0.05/ 0.2 perlen), the other one for remaining assays either without phosphate orwith large inocula. This shows that presence of phosphate increases theduration T2 in the case of small inocula only. Moreover, as this in uencedid not disturb the proportionality link between H1 and H3, it appearsthat the duration T2 of the plateau at H1 does not have any effect on the nal pH value H3.
Calciumcarbonate precipitation occurred at the endof theH1plateauas observed from the visual appearance of precipitates and con rmed bythe decrease of Ca content, as shown in Fig. 1e,f. Higher H1 valuesresulted in earlier start of calcite precipitation, therefore decreasing theduration T2. XRD and EDXS analyses con rmed the nature of theseprecipitates, mainly identi ed as low magnesian calcite (Table 3). Small
quantities of otherpolymorphs, namely vaterite and aragonite,were alsoobserved. With the exception of the series performed with smallinoculum and low urea content (i.e. assays 0.05/0.2), the precipitates(dry weights) presented in Table 2 showed a common value (of about1.8 mg of CaCO3/ml of solution) in spite of different nal pH values (H3).Total precipitation of available calcium would yield 2.0 mg of CaCO3
(20 mM)/ml of solution. The 10% difference between actual measure-ments and the value implied by total calcium carbonate precipitationcould be explained by losses during solid recovery or more likely by thebinding of bivalent ions, like magnesium and calcium ions, to the cellwalls (Fein et al., 1997) or to exopolymeric substances (Ortega-Moraleset al., 2007; Braissant et al., 2007).
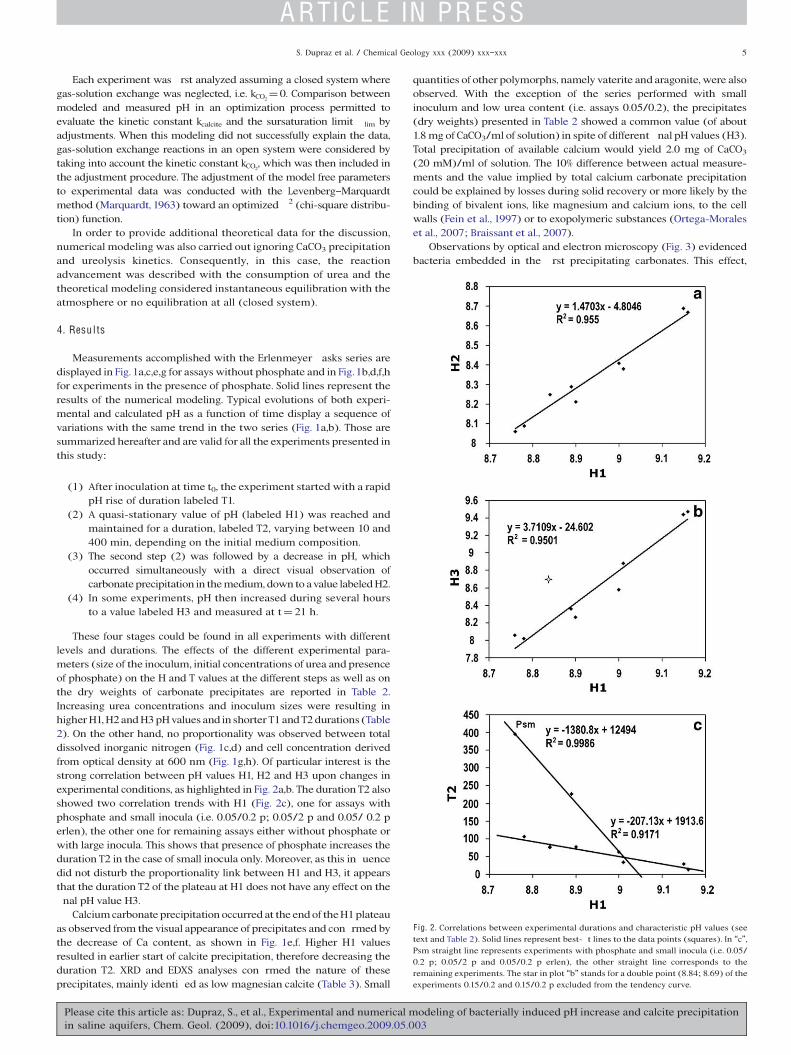
Observations by optical and electron microscopy (Fig. 3) evidencedbacteria embedded in the rst precipitating carbonates. This effect,
F ig. 2. Correlations between experimental durations and characteristic pH values (seetext and Table 2). Solid lines represent best- t lines to the data points (squares). In “c”,Psm straight line represents experiments with phosphate and small inocula (i.e. 0.05/0.2 p; 0.05/2 p and 0.05/0.2 p erlen), the other straight line corresponds to theremaining experiments. The star in plot “b” stands for a double point (8.84; 8.69) of theexperiments 0.15/0.2 and 0.15/0.2 p excluded from the tendency curve.
5S. Dupraz et al. / Chemical Geology xxx (2009) xxx–xxx
A R TIC L E IN P R E S S
Please cite this article as: Dupraz, S., et al., Experimental and numerical modeling of bacterially induced pH increase and calcite precipitationin saline aquifers, Chem. Geol. (2009), doi:10.1016/j.chemgeo.2009.05.003
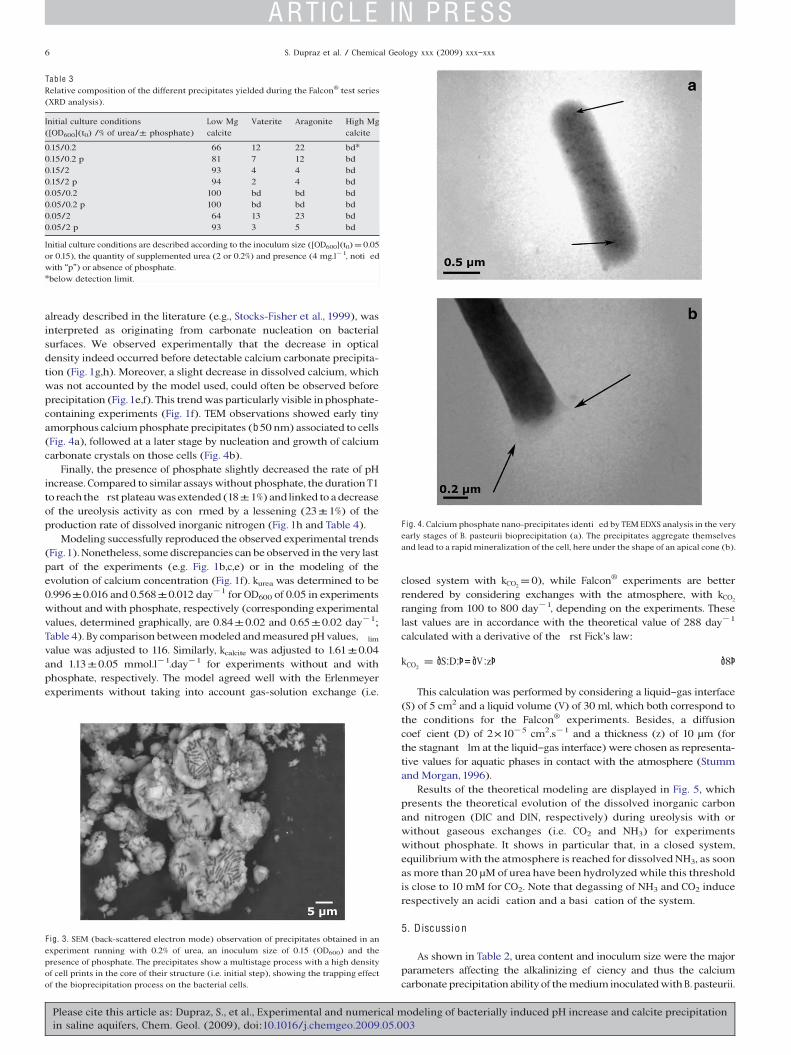
already described in the literature (e.g., Stocks-Fisher et al., 1999), wasinterpreted as originating from carbonate nucleation on bacterialsurfaces. We observed experimentally that the decrease in opticaldensity indeed occurred before detectable calcium carbonate precipita-tion (Fig.1g,h). Moreover, a slight decrease in dissolved calcium, whichwas not accounted by the model used, could often be observed beforeprecipitation (Fig.1e,f). This trendwas particularly visible inphosphate-containing experiments (Fig. 1f). TEM observations showed early tinyamorphous calciumphosphate precipitates (b50 nm) associated to cells(Fig. 4a), followed at a later stage by nucleation and growth of calciumcarbonate crystals on those cells (Fig. 4b).
Finally, the presence of phosphate slightly decreased the rate of pHincrease. Compared to similar assayswithout phosphate, the durationT1to reach the rst plateauwasextended (18±1%) and linked to adecreaseof the ureolysis activity as con rmed by a lessening (23±1%) of theproduction rate of dissolved inorganic nitrogen (Fig. 1h and Table 4).
Modeling successfully reproduced the observed experimental trends(Fig.1).Nonetheless, somediscrepancies can be observed in the very lastpart of the experiments (e.g. Fig. 1b,c,e) or in the modeling of theevolution of calcium concentration (Fig. 1f). kurea was determined to be0.996±0.016 and 0.568±0.012 day!1 for OD600 of 0.05 in experimentswithout and with phosphate, respectively (corresponding experimentalvalues, determined graphically, are 0.84±0.02 and 0.65±0.02 day!1;Table 4). By comparison betweenmodeled andmeasured pH values, limvalue was adjusted to 116. Similarly, kcalcite was adjusted to 1.61±0.04and 1.13±0.05 mmol.l!1.day!1 for experiments without and withphosphate, respectively. The model agreed well with the Erlenmeyerexperiments without taking into account gas-solution exchange (i.e.
closed system with kCO2=0), while Falcon® experiments are better
rendered by considering exchanges with the atmosphere, with kCO2
ranging from 100 to 800 day!1, depending on the experiments. Theselast values are in accordance with the theoretical value of 288 day!1
calculated with a derivative of the rst Fick's law:
kCO2= S:D:ð Þ = V :zð Þ ð8Þ
This calculation was performed by considering a liquid–gas interface(S) of 5 cm2 and a liquid volume (V) of 30 ml, which both correspond tothe conditions for the Falcon® experiments. Besides, a diffusioncoef cient (D) of 2×10!5 cm2.s!1 and a thickness (z) of 10 µm (forthe stagnant lm at the liquid–gas interface) were chosen as representa-tive values for aquatic phases in contact with the atmosphere (Stummand Morgan,1996).
Results of the theoretical modeling are displayed in Fig. 5, whichpresents the theoretical evolution of the dissolved inorganic carbonand nitrogen (DIC and DIN, respectively) during ureolysis with orwithout gaseous exchanges (i.e. CO2 and NH3) for experimentswithout phosphate. It shows in particular that, in a closed system,equilibriumwith the atmosphere is reached for dissolved NH3, as soonas more than 20 µM of urea have been hydrolyzed while this thresholdis close to 10 mM for CO2. Note that degassing of NH3 and CO2 inducerespectively an acidi cation and a basi cation of the system.
5. D isc ussi o n
As shown in Table 2, urea content and inoculum size were the majorparameters affecting the alkalinizing ef ciency and thus the calciumcarbonate precipitation ability of themedium inoculatedwithB.pasteurii.
Ta b l e 3Relative composition of the different precipitates yielded during the Falcon® test series(XRD analysis).
Initial culture conditions([OD600](t0) /% of urea/± phosphate)
Low Mgcalcite
Vaterite Aragonite High Mgcalcite
0.15/0.2 66 12 22 bd!0.15/0.2 p 81 7 12 bd0.15/2 93 4 4 bd0.15/2 p 94 2 4 bd0.05/0.2 100 bd bd bd0.05/0.2 p 100 bd bd bd0.05/2 64 13 23 bd0.05/2 p 93 3 5 bd
Initial culture conditions are described according to the inoculum size ([OD600](t0)=0.05or 0.15), the quantity of supplemented urea (2 or 0.2%) and presence (4 mg.l!1, noti edwith “p”) or absence of phosphate.!below detection limit.
F ig. 3. SEM (back-scattered electron mode) observation of precipitates obtained in anexperiment running with 0.2% of urea, an inoculum size of 0.15 (OD600) and thepresence of phosphate. The precipitates show a multistage process with a high densityof cell prints in the core of their structure (i.e. initial step), showing the trapping effectof the bioprecipitation process on the bacterial cells.
F ig. 4. Calcium phosphate nano-precipitates identi ed by TEM EDXS analysis in the veryearly stages of B. pasteurii bioprecipitation (a). The precipitates aggregate themselvesand lead to a rapid mineralization of the cell, here under the shape of an apical cone (b).
6 S. Dupraz et al. / Chemical Geology xxx (2009) xxx–xxx
A R TIC L E IN P R E S S
Please cite this article as: Dupraz, S., et al., Experimental and numerical modeling of bacterially induced pH increase and calcite precipitationin saline aquifers, Chem. Geol. (2009), doi:10.1016/j.chemgeo.2009.05.003

They indeed represent respectively the substrate and the enzymaticcontent, available for reaction (Eq. (1)). As shown in Fig.1, the productionof ammonium by ureolysis was quasi-constant all over the experimentsand did not show any relationship with the measured optical density.Considering the slopes at the origin of the ammoniumproduction curves,initial ureolysis kinetic constants (kurea) were measured graphically to be0.84±0.02 and 0.65±0.02 day!1 in experiments without and withphosphate, respectively. Fitting Eq. (7) on all measured ammoniumconcentrations gave kurea of 0.996±0.016 and 0.568±0.012 day!1 inexperiments without and with phosphate, respectively. Overall, takinginto account slightly different experimental conditions, these valueswereconsistentwith theconstants reportedby Ferris et al. (2003) andMitchelland Ferris (2005); they are summarized with other literature values inTable 4. The quasi-constant ureolytic activity maintained in the mediumall along the course of an experiment could possibly result from ureaseliberation after cell deaths and lyses. Moreover, some authors haveproposed that urease from B. pasteurii has an extracellular activity
(Kantzas et al.,1992; Stocks-Fischer et al.,1999) which could explain thisobservation. The results of the present study also show that theseenzymes were still able to perform ureolysis under alkaline conditions.Even if the ureases are known to have an optimal pH near neutrality,B. pasteurii urease is indeed quite alkalotolerant (optimum pH=8, Ciurliet al., 1996; StocksFischer et al., 1999) and has already been isolated inorder to perform biochemical precipitation of calcium carbonate inalkaline media (Ciurli et al.,1996; Bang et al., 2001). It should be noticedthat the discrepancies observed between the model and the DINconcentrations after 20 h of experimentation (Fig. 1c,d) demonstratethat the ureolytic activity is nonetheless uctuating. The causes aredif cult to de ne but they likely appear to depend on some speci cconditions in the nal stage of precipitation that are not yet fully takeninto account by the model.
Depending on the experimental setup and culture conditions,experiments performed with B. pasteurii and reported in literature haveyielded quite different pH plateau values (values of H1 ranging between8.78 and 9.16 in the present study, 9.3 in Ferris et al., 2003, 9.6 inStocksFischer et al.,1999, 9.1 in Fujita et al., 2004, see Tables 2 and 4) thatcannot be solely explained by the pKa's of NH4
+/NH3 and of HCO3!/CO3
2!
in a closed system (respectively 9.09 and 10.29 at 30 °C, Table 1). Indeed, ifgas exchanges were not taken into account, model-based pH calculationsin a phosphate-free AGW supplemented with urea and inoculated withB. pasteurii quickly yielded pH values close to 9.00, and predicted a weakincreaseof this pHvalueswith increasingureolysis rates. As an illustration,complete degradations of 2 and 20g.l!1 of urea yielded pH values of 8.94and 9.06, respectively. Note that calcium carbonate precipitation wasending the rst plateau shown in Fig.1 and thus, could not interfere withpH measurement before the end of the plateau. In accordance, gaseousphase/solution exchanges of CO2 and NH3 had thus to be taken intoaccount forcalculatingexact valuesofpHmaximumH1. BothCO2 andNH3
exchanges were actually occurring but the importance of NH3 exchangeswas rather small on those timescales as shownbyprevious literaturedata:with an initial small content of urea (6 mM), authors have measuredstoichiometric amount of total inorganic nitrogen after 1 week ofB. pasteurii growth in AGW at 20 °C (Ferris et al. 2003; Mitchell andFerris, 2005). Because of the large Henry constant of NH3 compared toother common inorganic gas (e.g. KHCO2
=3.4×10!2 mol.l!1.atm!1 andKHNH3=63 mol.l!1.atm!1 at 25 °C, from van der Lee and Lomenech,2004),partiallyclosedatmospherecanequilibrate largeamountofNH3(aq)
in theaqueousphasebycumulatingverysmall amountofNH3(g) in thegasphase. Such property easily leads to formation of a saturation lid at the topof the solution that limits exchanges of NH3 with the atmosphere.Quantitative NH3 degassing may occur but only in cases of a permanentmixing of renewed atmosphere in contact with the solution or on much
Ta b l e 4Literature values of ureolysis kinetic constant (kurea), critical calcite saturation index ( lim) and maximal pH for various experimental conditions.
Bacterial growth Calcium (mM) Urea (mM) Salinity (g.l!1) Temperature (°C) Initial pH kurea(day!1) lim (calcite) Maximal pH References
A 25.2 333 15 25 8.0 – – 9.5 Stock-Fisher et al. (1999)A 25.2 333 15 30 8.0 – – – Bang et al. (2001)A 25.2 333 15 30 8.0 – – 9.4 Bachmeier et al. (2002)R 1.75 6 0.36 20 6.5 0.91 70 9.3 Ferris et al. (2003)R 1.75 25 0.36 15 6.5 0.18 76 9.3 Ferris et al. (2003)R 1.75 25 0.36 10 6.5 0.09 72 9.3 Ferris et al. (2003)– 12.2 266 – 28 6.6 – – 9.4 Hammes et al. (2003)– 12.2 133 – 28 6.6 – – 9.3 Hammes et al. (2003)– 12.2 66 – 28 6.6 – – 9.1 Hammes et al. (2003)– 12.2 33 – 28 6.6 – – 8.5 Hammes et al. (2003)R 1.8 33 0.36 20 7.5 – – 9.1 Fujita et al. (2004)R 1.75 6 0.36 20 6.5 0.73 57 9.1 Mitchell and Ferris (2005)R 1.75 25 0.36 15 6.5 0.064 45 9.1 Mitchell and Ferris (2005)R 1.75 25 0.36 10 6.5 0.069 49 9.1 Mitchell and Ferris (2005)R 1.75 16.5 0.36 20 6.5 0.053 12 9.3 Mitchell and Ferris (2006)R 20 33–333 5.8 30 6.0 0.65–0.84! 83–131! 8.7 – 9.5 This study
“A” stands for amended solution allowing bacterial heterotrophic growth (i.e. containing sources of organic matter other than urea) and “R” for restrictive medium (i.e. onlycontaining mineral salts and urea).!Experimental values corresponding to the Erlenmeyer assays with and without phosphate.
F ig. 5. Calculated dissolved inorganic carbon (DIC) and total dissolved inorganicnitrogen (DIN) concentrations calculated in the model during ureolysis withoutphosphate in absence of gas exchange (solid black line) or instantaneous equilibrationregarding CO2 or NH3 (respectively dashed and dotted curves). Solid gray linesrepresent CO2 and NH3 compositions for equal saturation indexes regarding calcite. Theblack dot circles the equilibrium point of 10 mM urea degradation needed to reach thesolution CO2 saturation relative to the atmosphere.
7S. Dupraz et al. / Chemical Geology xxx (2009) xxx–xxx
A R TIC L E IN P R E S S
Please cite this article as: Dupraz, S., et al., Experimental and numerical modeling of bacterially induced pH increase and calcite precipitationin saline aquifers, Chem. Geol. (2009), doi:10.1016/j.chemgeo.2009.05.003
longer time scales. CO2 exchange between air and solution was thus theonly parameter that could be used to explain the actual values of the pHplateau H1. As urea and atmospheric CO2 were the unique sources ofdissolved inorganic carbon (DIC) in this system, it was thus possible toestablish the level of saturation of the solution with regard to CO2 byknowing both of these parameters. The geochemical speciation modelshowed that, at small to moderate amounts of hydrolyzed urea, the initialrise of pH was leading to the dissolution of atmospheric CO2 into thesolution in spite of the dissolved inorganic carbon generated byureolysis (Eq. (1)). CO2 transfer into the solution generates protonsduring the successive deprotonation phases occurring after hydration(CO2+H2O H2CO3 HCO3
!+H+ CO32!+2 H+). Thus, in the rst
phase of experiments, an increase inCO2 transfer through the air/solutioninterface rendered the medium more acidic and nally maintainedbalance with the pH increase due to ureolysis. This dynamic equilibriumwas ultimately responsible for the pH plateau H1. In experiments carriedout using Erlenmeyer asks, gas/solution exchanges were signi cantlysmaller than in experiments carried out in Falcon® tubes. Therefore, fasterpH increase and carbonate precipitationwere observed in the Erlenmeyer asks series (H1 values for series without phosphate are 8.78 and 8.90 forrespectively, Falcon® and Erlenmeyer asks series). Consequently, thefaster pH increase observed in Erlenmeyer asks was ascribed to thelimitation of CO2 renewing in the Erlenmeyer headspace. Additionalexperiments using beakers fully opened to the atmosphere con rmed thistrend by giving an average H1 value of 8.68 in the same set of conditions.The situation changed drastically once a suf cient quantity of urea hadbeen hydrolyzed. Then, CO2 outgassing from the solution to theatmosphere occurred, leading to higher pHs than those only due toureolysis and to values of H1 larger than 9.0. Calculations carried out inAGW without phosphate in an open system instantaneously equilibratedwith the atmosphere showed that CO2 outgassing occurred once morethan 8mM of urea have been hydrolyzed. This threshold valuewas slowlyincreasingwithdecreasing the ratio of atmosphericCO2 dissolution rate toureolysis rate. Toward the limit of in nitely slow exchanges (closedsystem), this threshold tended to a value of 10 mM of urea hydrolysis inorder to reach CO2 saturation of the solution compared to the atmosphere(Fig. 5). Once degassing, the alkalinization due to the CO2 loss wascumulated to the one due to ureolysis and H1 value was increasing withthe amount of urea hydrolyzed (respective modeled nal pH values forcomplete degradation of 2 and 20 g.l!1 of urea hydrolyzed were 9.23 and9.77). Thewhole range of pH values observed in this and previous studies(Table 4) can thus be predicted by the CHESS© modeling once a model ofexchange at the gas/solution interface is speci ed.
Calcium carbonate precipitation occurs once a critical value lim isreached. The onset of precipitation was thus marked by a pH decrease(transition from H1 to H2) due to the carbonate capture that leads tothe deprotonation of HCO3
! and H2CO3 species. The beginning of thisdecrease was pointed in the experimental curves where lim could becalculated according to Eq. (5) and the results given by the chemicalspeciation of the model (Table 1). In the Erlenmeyer experimentswithout phosphate added, experimental data yielded a value of lim =83 (±2). Considering differences in solution compositions, lim wasconsistent with previously published values for calcium carbonateprecipitation obtained in similar experiments and compiled in Table 4: lim=70–72 in Ferris et al. (2003); lim =49–57 inMitchell and Ferris(2005). Calculations using the model to locate the pH decrease due tocalcium carbonate precipitation provided a lim value of 116, whichwas signi cantly higher than that obtained by determining the pHdecrease with the experimental curves. This discrepancy wasevidenced in Fig. 1a where the beginning of the precipitation (i.e. pHdecrease at the end of theH1 plateau)was slightly differently recordedwhenmeasured by the experimental points or calculated by themodel,thus leading to distinct estimates of lim. This differencewas likely dueto calcium uptake or xation by cells prior to calcium carbonateprecipitation (see below), a complexity which was not introduced inthe model.
In addition, the results showed that the presence of phosphate had anegative effect on ureolysis rate, thus on the rate of pH increase andconsequently on the rapidity and ef ciency of calcium carbonateprecipitation. The effect of phosphate on T1 and H1 may be explainedeither by a toxic effect of phosphate at high concentrations (Smith et al.,1974; Benini et al., 2001), or by metabolic diversion toward phosphateassimilation (Momba and Cloete, 1996). Effect of phosphate on T2duration was following the same trend. Reduction of T2 came partlyfrom the correlated reduction of T1 due to a decrease in the rate ofureolysis. Moreover, it has been established that phosphate is aninhibitorof the carbonate crystallization (e.g. StummandMorgan,1996;Lin and Singer, 2006). Calculations of the critical calcite saturation indexin the Erlenmeyer experimental series con rmed that this phosphateeffect on crystallization occurred: values of lim of 132 (±10) and 83(±2) were calculated from experimental data by the same method asgiven above, in the presence and absence of phosphate, respectively.Consistently, the rate of calcium carbonate precipitation was sloweddown by 30% (±1%) in phosphate experiments. These variations weremainly observed on the assays having small inocula (see Table 2), inwhich cells required more time for uptaking available phosphate thansolutions having large inocula. As no signi cant trends come out fromthe comparison between phosphate-bearing and phosphate-free assayson H2 and H3 data, the impact of this element seemed to be limited tothe initial pH ramp and the precipitation stage. Some additional aspectsofphosphate implications in thebiomineralizationprocess ofB.pasteuriiare also discussed in this issue (Dupraz et al., 2009-this issue).
Note that modeling gave critical saturation index for calciumcarbonate precipitation of 116 in experiments with phosphate added,identical to that calculated for experiments without phosphate added.The similarity in model calculations with and without phosphatecompared to the differences in experimental values between these twocases once again emphasized the complexity of calcium uptake historiesby cells prior to calcium carbonate precipitation. Indeed, the badagreement between the model and the measured calcium concentrationduring the precipitation event (Fig. 1f) suggests that the calciumcarbonate precipitation was controlled in a rst step by intracellularcalcium metabolism, as previously reported in Anderson et al. (1992),McConnaugheyandWhelan (1997), andHammesandVerstraete (2002),or directly xed on the cell surfaces (Fein et al., 2005). The observationssummarized in Fig. 4 strongly suggested that, after this cellular calciumuptake or xation, calcium phosphate formation was precedingcarbonate nucleation on some of the cells. Similar observations ofphosphate minerals (hydroxyapatite) nucleating inside bacterial cellshave been already reported (Streckfuss et al., 1974). We also observedcalcium carbonates not associated with bacterial cells. Some carbonatesindeed likely nucleated independently from cells, as suggested by theexperiments ofMitchell and Ferris (2006)who showed calcitenucleationand growth in solutions separated from bacteria by a cellulose dialysismembrane. Future studies should measure the relative weights of thesetwo modes of nucleation and growth of solid carbonates, phosphatebeing potentially an important factor for determining their respectiveimportance. In this respect, it was noticeable that this cellular calciumphosphate formation also occurred in phosphate free assays thusemphasizing the importance of phosphate in this biomineralizationprocess. In the phosphate tests, no trace of struvite ((NH4)MgPO4·6H2O)was observed although it may be an expected mineral for suchexperiments (Iqbal et al., 2008; Ryu et al., 2008). This is likely due tothe very low amount of phosphate and magnesium introduced into thesolutions (4 mg.l!1 and 2 mM respectively) or to the absorption ofphosphate by the cells.
6. Co n c l usi o n
The results that have been produced during these investigationsshowedcommonpHbehaviors in arti cial groundwaters supplementedwith various amounts of urea and inoculatedwith different quantities of
8 S. Dupraz et al. / Chemical Geology xxx (2009) xxx–xxx
A R TIC L E IN P R E S S
Please cite this article as: Dupraz, S., et al., Experimental and numerical modeling of bacterially induced pH increase and calcite precipitationin saline aquifers, Chem. Geol. (2009), doi:10.1016/j.chemgeo.2009.05.003
B. pasteurii. After a quick pH rise, a dynamical equilibrium was reachedbetweenureolysis andCO2 transfer through the liquid–gas interface. Thevalue of this pHplateau and time to reach it were respectively positivelyand negatively correlated to the urea and inoculum quantities. Then,after a period of stability that was shorter as the pH valuewas larger, thecalcium carbonate precipitation occurred, yielding a pH decrease. Allthese phenomena were modeled successfully using the geochemicalcode CHESS© and could furthermore explain the observed pH variationsregistered inpast studies. SuchpHhistoryandpHplateau characteristicsare likely to be found in several cases of bacterially induced pH increaseand subsequent carbonate calcium formation. Once the kinetics ofwater/gas exchanges are speci ed, the model is predictive as far as theevolution of pH, timing and rate of calcium carbonate precipitation areconcerned. This approach could be extended to environments andmicroorganisms that are linked to subsurface calcium carbonateprecipitation and couldbeapplied to studies on futureCO2 sequestrationsites to assess and predict the impact of alkalinizing bacteria on thecapacity and long term evolution of the storage. In the speci c case of B.pasteurii, the present study has shown that phosphate have a negativeimpact on the alkalinization/precipitation process. It has also demon-strated that bacterial population undergoes a strong mortality duringcalcium carbonate precipitation, which is likely linked to a mechanisminvolving early precipitation of calcium phosphate before nucleation ofcalcium carbonates on cells.
Ac k n o w l e d g m e n ts
This work is supported by the “Centre de Recherches de StockageGéologique du CO2” (IPGP/TOTAL/SCHLUMBERGER/ADEME), theANR (French National Agency for Research, within the framework ofthe Geocarbone–Carbonatation Project under contract ANR05CO2-009-01), the ACI/FNS grant #3033 and the SESAME IdF grant #1775.We are grateful to Omar Boudouma, Guillaume Morin and QuentinDermigny for their help during SEM and XRD studies. CatherineNoiriel, Pascale Bénézeth and two anonymous reviewers providedconstructive and detailed reviews of the manuscript. This is IPGPcontribution 2453.
Re f e r e n ces
Anderson, S., Appana, V.D., Huang, J., Viswanatha, T., 1992. A novel role for calcite incalcium homeostasis. FEBS Lett. 308, 94–96.
Azaroual, M., Fouillac, C., Matray, J.M.,1997. Solubility of silica polymorphs in electrolytesolution, II. Activity of aqueous silica and solid silica polymorphs in deep solutionsfrom the sedimentary Paris basin. Chem. Geol. 140, 167–179.
Bachmeier, K.L., Williams, A.E., Warmington, J.R., Bang, S.S., 2002. Urease activity inmicrobiologically-induced calcite precipitation. J. Biotech. 93, 171–181.
Bachu, S., 2008. CO2 storage in geological media: role, means, status and barriers todeployment. Progr. Energ. Combust. Sci. 34 (2), 254–273.
Bachu, S., Bonijoly, D., Bradshaw, J., Burruss, R., Holloway, S., Christensen, N.P.,Mathiassen, O.M., 2007. CO2 storage capacity estimation: methodology and gaps.Int. J. Greenhouse Gas Control I 430–443.
Bang, S.S., Galinat, J.K., Ramakrishnan, V., 2001. Calcite precipitation induced bypolyurethane-immobilized Bacillus pasteurii. Enzyme Microbial. Tech. 28, 404–409.
Baumgartner, L.K., Reid, R.P., Dupraz, C., Decho, A.W., Buckley, D.H., Spear, J.R., Przekop,K.M., Visscher, P.T., 2006. Sulfate reducing bacteria in microbial mats: changingparadigms, new discoveries. Sed. Geol. 185, 131–145.
Benini, S., Rypniewski, W.R., Wilson, K.S., Ciurli, S., Mangani, S., 2001. Structure-basedrationalization of urease inhibition by phosphate: novel insights into the enzymemechanism. J. Biol. Inorg. Chem. 6, 778–790.
Boquet, E., Boronat, A., Ramos-Cormenzana, A., 1973. Production of calcite (calciumcarbonate) crystals by soil bacteria is a general phenomenon. Nature 246, 527–529.
Braissant, O., Cailleau, G., Aragno, M., Verrecchia, E.P., 2004. Biologically inducedmineralization in the tree Milicia excelsa (Moraceae): its causes and consequencesto the environment. Geobiology 2, 59–66.
Braissant, O., Decho, A.W., Dupraz, C., Glunk, C., Przekop, K.M., Visscher, P.T., 2007.Exopolymeric substances of sulfate-reducing bacteria: interactions with calcium atalkaline pH and implication for formation of carbonate minerals. Geobiology 5,401–411.
Ciurli, S., Marzadori, C., Benini, S., Deiana, S., Gessa, C., 1996. Urease from the soilbacterium Bacillus pasteurii: immobilization on Ca-polygalacturonate. Soil Biol.Biochem. 28, 811–817.
Dupraz, S., Ménez, B., Gouze, P., Leprovost, R., Bénézeth, P., Pokrovsky, O.S., Guyot, F.,2009. Experimental approach of CO2 biomineralization in deep saline aquifers.Chem. Geol. (this issue).
Edwards, K.J., Bach, W., McCollom, T.M., 2005. Geomicrobiology in oceanography: microbe–mineral interactions at and below the sea oor. Trends Microbiol.13, 449–456.
Fein, J.B., Daughney, C.J., Yee, N., Davis, T., 1997. A chemical equilibrium model for metaladsorption onto bacterial surfaces. Geochim. Cosmochim. Acta 61 (16), 3319–3328.
Fein, J.B., Boily, J.F., Yee, N., Gorman-Lewis, D., Turner, B.F., 2005. Potentiometrictitrations of Bacillus subtilis cells to low pH and a comparison of modelingapproaches. Geochim. Cosmochim. Acta 69 (5), 1123–1132.
Ferris, F.G., Stehmeier, L.G., Kantzas, A., Mourits, F.M., 1996. Bacteriogenic mineralplugging. J. Can. Petrol. Tech. 35, 56–61.
Ferris, F.G., Phoenix, V., Fujita, Y., Smith, R.W., 2003. Kinetics of calcite precipitationinduced by ureolytic bacteria at 10 to 20 °C in arti cial groundwater. Geochim.Cosmochim. Acta 67, 1701–1722.
Fujita, Y., Redden, G.D., Ingram, J.C., Cortez, M.M., Ferris, F.G., Smith, R.W., 2004.Strontium incorporation into calcite generated by bacterial ureolysis. Geochim.Cosmochim. Acta 68, 3261–3270.
Hammes, F., Verstraete, W., 2002. Key roles of pH and calcium metabolism in microbialcarbonate precipitation. Rev. Environ. Sci. Biotech. 1, 3–7.
Hammes, F., Boon, N., de Villiers, J., Verstraete, W., Siciliano, S.D., 2003. Strain-speci cureolytic microbial calcium carbonate precipitation. Appl. Environ. Microbiol. 69 (8),4901–4909.
Iqbal, M., Bhuiyan, H., Mavinic, D.S., 2008. Assessing struvite precipitation in a pilot-scale uidized bed crystallizer. Environ Technol. 29 (11), 1157–1167.
Jahns, T., 1996. Ammonium/Urea-dependent generation of a proton electrochemicalpotential and synthesis of ATP in Bacillus pasteurii. J. Bacteriol. 178, 403–409.
Kantzas, A., Ferris, F.G., Stehmeier, L., Marentette, D.F., Jha, K.N., Mourits, F.M., 1992. Anovel method of sand consolidation through bacteriogenic mineral plugging (CIM92-46). Proc. CIM 1992 Annu. Tech. Conf., vol. 2. Petroleum Society of CIM, Calgary,Canada, pp. 1–15.
Knorre, H., Krumbein, W., 2000. Bacterial calci cation. In: Riding, R.E., Awramik, S.M.(Eds.), Microbial sediments. InSpringer-Verlag, Berlin, Germany, pp. 25–31.
Lasaga, A.C., 1998. Kinetic theory and applications in Earth Sciences. PrincetonUniversity Press. 811 pp.
Lin, Y.P., Singer, P.C., 2006. Inhibition of calcite precipitation by orthophosphate:speciation and thermodynamic considerations. Geochim. Cosmochim. Acta. 70,2530–2539.
Marquardt, D.W., 1963. An algorithm for least-squares estimation of nonlinearparameters. SIAM J. Appl. Math. 11, 431–441.
McConnaughey, T.A., Whelan, F.F.,1997. Calci cation generates protons for nutrient andbicarbonate uptake. Earth Sci. Rev. 42, 95–117.
Mitchell, A.C., Ferris, F.G., 2005. The coprecipitation of Sr into calcite precipitatesinduced by bacterial ureolysis in arti cial groundwater: temperature and kineticdependence. Geochim. Cosmochim. Acta 69, 4199–4210.
Mitchell, A.C., Ferris, F.G., 2006. The in uence of Bacillus pasteurii on the nucleation andgrowth of calcium carbonate. Geomicrobiol. J. 23, 213–226.
Mobley, H.L.T., Hausinger, R.P., 1989. Microbial ureases signi cance, regulation andmolecular characterization. Microbiol. Rev. 53, 85–108.
Momba, M.N., Cloete, T.E., 1996. Biomass relationship to growth and phosphate uptakeof Pseudomonas uorescens, Escherichia coli and Acinetobacter radioresistens inmixed liquor medium. J. Indust. Microbiol. Biotech. 16, 364–369.
Nielsen, T.H., Bonde, T.A., Sorensen, J.,1998. Signi cance of microbial urea turnover in Ncycling of three Danish agricultural soils. FEMS Microbiol. Ecol. 25, 147–157.
Ortega-Morales, B.O., Santiago-García 1, J.L., Chan-Bacab, M.J., Moppert, X., Miranda-Tello, E., Fardeau, M.L., Carrero, J.C., Bartolo-Pérez, P., Valadéz-González, A.,Guezennec, J., 2007. Characterization of extracellular polymers synthesized bytropical intertidal bio lm bacteria. J. Appl. Microbiol. 102 (1), 254–264.
Premuzic, E.T., Lin, M.S., 1999. Induced biochemical conversions of heavy crude oils.J. Petroleum Sci. Eng. 22, 171–180.
Ryu,H.D., Kim, D., Lee, S.I.,2008. Application of struvite precipitation in treatingammoniumnitrogen from semiconductor wastewater. J. Hazard Mater.156 (1–3), 163–169.
Severmann, S., Mills, R.A., Palmer, M.R., Telling, J.P., Cragg, B., Parkes, R.J., 2006. The roleof prokaryotes in subsurface weathering of hydrothermal sediments: a combinedgeochemical and microbiological investigation. Geochim. Cosmochim. Acta 70,1677–1694.
Smith, D.K., Benedict, C.D., Weinberg, E.D., 1974. Bacterial culture longevity: control byinorganic phosphate and temperature. Appl. Microbiol. 27, 292–293.
Smith, D.G.E., Russel, W.C., Ingledew, W.J., Thirkell, D.,1993.Hydrolysis of urea byUreaplasmaurealyticum generates a transmembrane potential with resultant ATP synthesis.J. Bacteriol.175, 3253–3258.
Stocks-Fisher, S., Galinat, J.K., Bang, S.S., 1999. Microbiological precipitation of CaCO3.Soil Biol Biochem. 31, 1563–1571.
Stumm, W., Morgan, J.J., 1996. Aquatic Chemistry: chemical equilibria and rates innatural waters. Wiley Interscience. 1022 pp.
Streckfuss, J.L., Smith, W.N., Brown, L.R., Campbell, M.M., 1974. Calci cation of selectedstrains of Streptococcus mutans and Streptococcus sanguis. J. Bacteriol.120, 502–506.
Swensen, B., Bakken, L.R., 1998. Nitri cation potential and urease activity in a mineralsubsoil. Soil Biol. Biochem. 30, 1333–1341.
Tuck, V.A., Edyvean, R.G.J., West, J.M., Bateman, K., Coombs, P., Milodowski, A.E.,McKervey, J.A., 2006. Biologically induced clay formation in subsurface graniticenvironments. J. Geochem. Exploration 90, 123–133.
van der Lee, J., 1998. Thermodynamic and mathematical concepts of CHESS. TechnicalReport Nr. LHM/RD/98/39 CIG-Ecole des Mines de Paris, Fontainebleau, France.
van der Lee, J., Lomenech, C., 2004. Towards a common thermodynamic database forspeciation models. Radiochim. Acta 92, 811–818.
9S. Dupraz et al. / Chemical Geology xxx (2009) xxx–xxx
A R TIC L E IN P R E S S
Please cite this article as: Dupraz, S., et al., Experimental and numerical modeling of bacterially induced pH increase and calcite precipitationin saline aquifers, Chem. Geol. (2009), doi:10.1016/j.chemgeo.2009.05.003

Visscher, P.T., Stolz, J.F., 2005. Microbial mats as bioreactors: populations, processes, andproducts. Palaeogeog. Palaeoclim. Palaeoecol. 219 (1), 87–100.
White, C.M., Strazisar, B.R., Granite, E.J., Hoffman, J.S., Pennline, H.W., 2003. Separationand capture of CO2 from large stationary sources and sequestration in geologicalformations-coalbeds and deep saline aquifers. Air & Waste Management Associa-tion. J. Air Waste Management Assoc. 53, 645–715.
Wolfgang, S., 2003. Microbial life in geothermal waters. Geothermics 32, 655–667.
Yoon, J.H., Lee, K.C., Weiss, N., Kho, Y.H., Kang, K.H., Park, Y.H., 2001. Sporosarcinaaquimarina sp. nov., a bacterium isolated from seawater in Korea, and transfer ofBacillus globisporus (Larkin and Stokes 1967), Bacillus psychrophilus (Nakamura1984) and Bacillus pasteurii (Chester 1898) to the genus Sporosarcina as Sporosar-cina globispora comb. nov., Sporosarcina psychrophila comb. nov. and Sporosarcinapasteurii comb. nov., and emended description of the genus Sporosarcina. Int. J. Syst.Evol. Microbiol. 51 (3), 1079–1086.
10 S. Dupraz et al. / Chemical Geology xxx (2009) xxx–xxx
A R TIC L E IN P R E S S
Please cite this article as: Dupraz, S., et al., Experimental and numerical modeling of bacterially induced pH increase and calcite precipitationin saline aquifers, Chem. Geol. (2009), doi:10.1016/j.chemgeo.2009.05.003