Embed Size (px)
Citation preview
1 1
Cancers des non-fumeurs
Dr Thierry Berghmans Institut Jules Bordet
Service des Soins Intensifs et Urgences Oncologiques & Oncologie Thoracique
Université Libre de Bruxelles
1
2 2
Liens d’intérêt
• Aucun lien d’intérêt à déclarer en relation avec cette présentation
2
3 3
Définition
• Non fumeur: • Patient n’ayant jamais fumé • Tabagisme < 100 cigarettes durant toute sa vie
≠ Ex-fumeur ≠ Fumeur actif
3
4 4
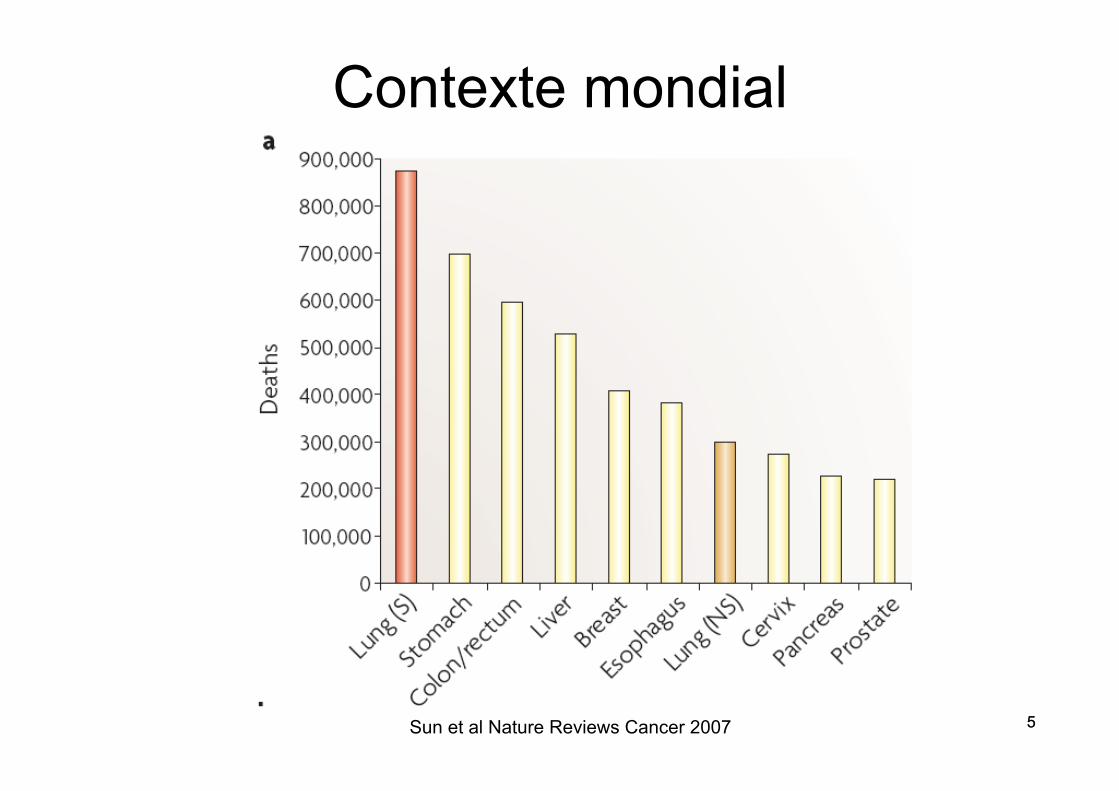
Contexte mondial
• Vaste majorité des CB sont liés au tabagisme actif
! 25% des CB dans le monde ne sont pas attribuables au tabagisme actif
Sun et al Nature Reviews Cancer 2007 4
5 5
Contexte mondial
5 Sun et al Nature Reviews Cancer 2007
6 6
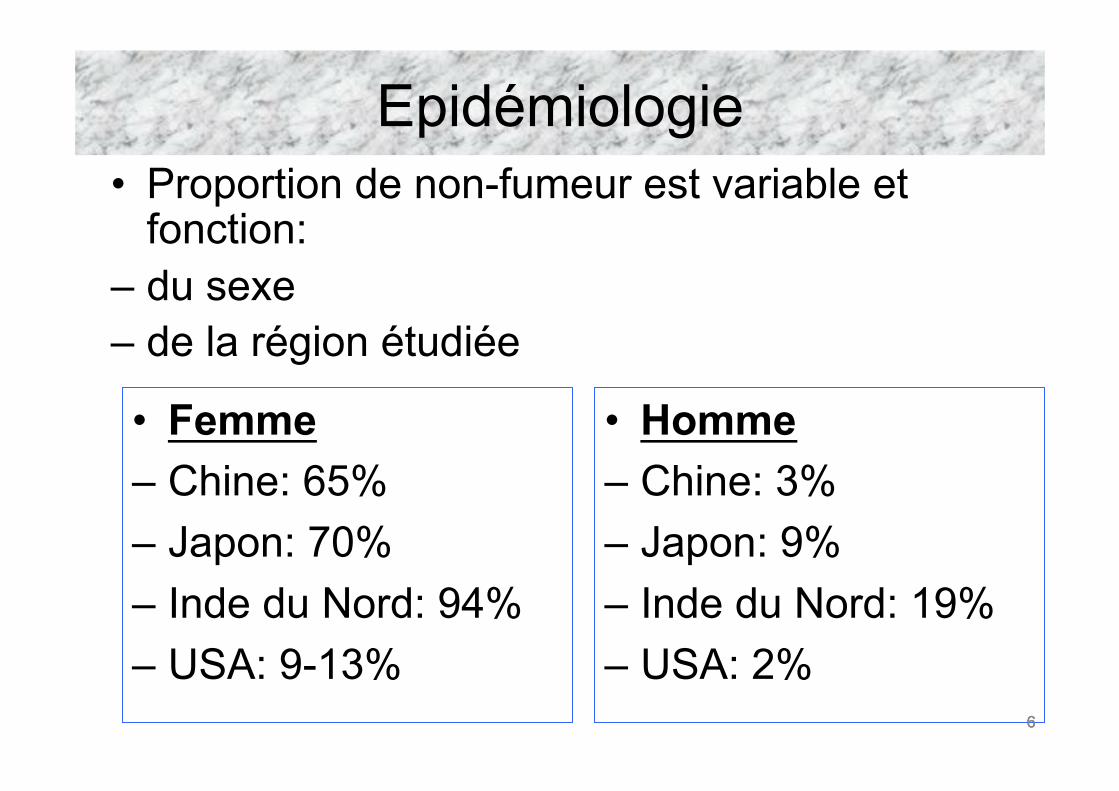
Epidémiologie • Proportion de non-fumeur est variable et
fonction: – du sexe – de la région étudiée
• Femme – Chine: 65% – Japon: 70% – Inde du Nord: 94% – USA: 9-13%
• Homme – Chine: 3% – Japon: 9% – Inde du Nord: 19% – USA: 2%
6
7 7
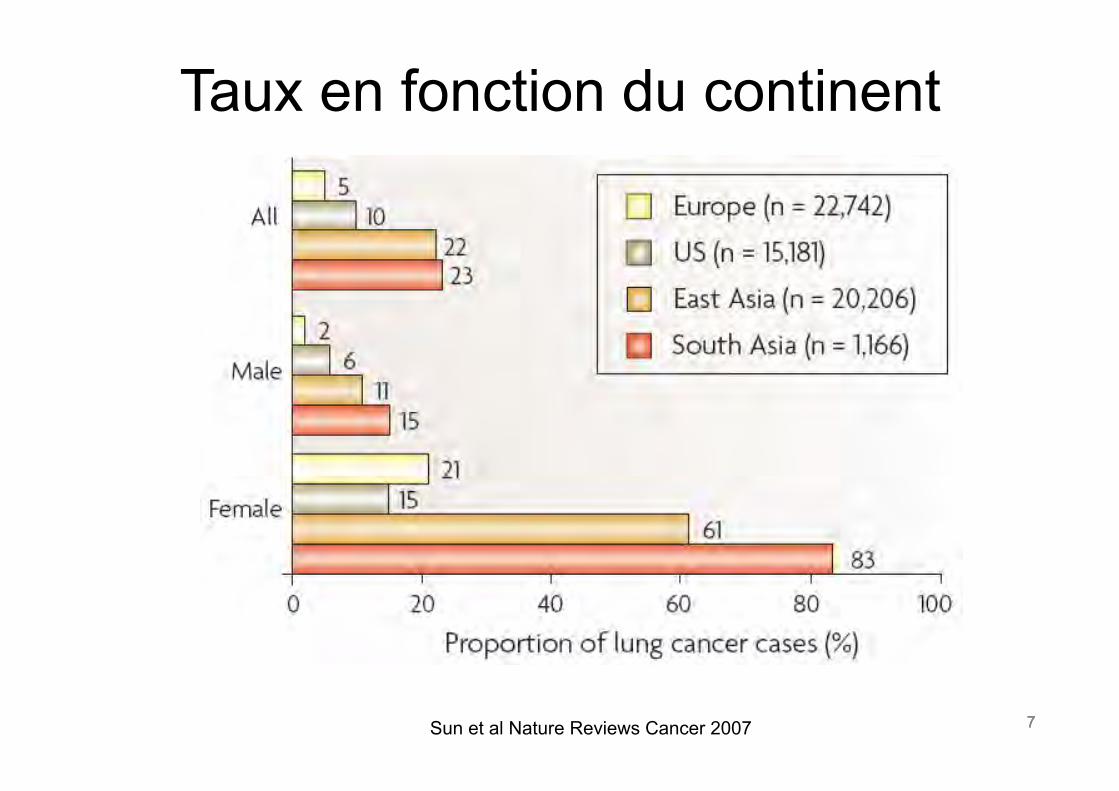
Taux en fonction du continent
Sun et al Nature Reviews Cancer 2007 7
8 8
Table 1. Age-Specific and Age-Standardized Lung Cancer Incidence Rates (Per 100,000) among Women in Selected Populations with Low Female Smoking [15]
Country/Region Region/City Years Age Group (y) AgeStandardizedRatesa
20–24 25–29 30–34 35–39 40–44b 45–49b 50–54b 55–59b 60–64b 65–69b 70–74 75–79 80–84 85þ
India Ahmedabad 1983–1987 0.1 0.1 1.0 0.5 1.8 2.1 5.3 7.8 8.2 12.8 15.1 11.3 7.8 — 5.4Bangalore 1983–1987 0.1 0.1 — 0.6 2.1 1.7 4.9 5.1 10.2 12.3 6.2 12.0 — — 5.2Mumbai 1983–1987 0.2 0.3 0.3 1.3 1.9 3.3 5.1 10.0 10.2 22.1 21.7 18.1 — — 7.3Madras 1983–1987 — 0.1 0.3 1.3 2.0 2.7 5.0 5.6 3.3 7.4 4.3 3.5 — — 4.0
Africa Algeria 1986–1989 — — — 2.1 — 2.5 3.5 2.1 8.9 — — — — — 2.7Mali 1987–1989 — 2.3 4.7 — 2.7 3.7 9.4 7.0 8.0 — — 65.2 — — 5.2
China Qidong city 1983–1987 — 0.7 1.7 3.0 6.5 11.1 18.0 33.4 52.9 75.2 74.9 93.6 86.6 66.8 27.4Shanghai 1983–1987 0.4 0.5 2.4 4.1 9.2 13.4 26.1 44.4 76.0 125.8 162.6 167.7 157.6 129.8 40.2Tianjin 1983–1987 0.5 1.5 1.8 4.4 13.3 29.9 62.7 102.6 179.6 230.2 263.2 200.8 213.7 72.2 85.4Hong Kong 1983–1987 1.0 2.4 2.7 6.6 14.2 24.4 43.8 80.8 139.6 195.9 280.5 314.3 344.7 390.2 68.6
Japan Osaka 1983–1987 — 0.6 0.5 1.6 4.3 7.1 14.8 25.8 39.4 73.4 108.8 154.5 157.7 150.3 22.3Saga 1984–1986 — — 3.0 1.0 7.1 7.1 8.6 22.2 31.4 55.2 82.1 88.0 121.2 137.7 18.2Yamagata 1983–1986 — — 2.7 3.3 7.6 5.7 11.4 22.8 30.9 42.8 73.2 106.5 120.6 86.5 17.1
Philippines Manila 1983–1987 0.2 1.2 1.6 7.8 8.8 17.6 21.0 40.1 81.5 88.0 129.3 133.1 — — 36.2Rizal Province 1983–1987 0.3 1.3 1.7 2.8 6.3 17.8 23.5 44.4 61.7 59.8 91.8 119.0 — — 30.9
Singapore Chinese 1983–1987 0.2 0.6 1.1 4.7 5.0 14.8 29.7 52.8 90.3 138.5 204.4 247.5 227.4 — 44.8Malay 1983–1987 — 1.1 2.7 3.9 4.3 11.8 25.4 15.0 50.3 92.7 137.0 128.2 — — 27.2
Thailand Chiang Mai 1983–1987 — 2.1 2.6 4.7 23.9 37.2 101.3 140.9 153.2 135.9 93.7 118.4 — — 87.8Khon Kaen 1988–1989 — 3.2 — 1.1 2.6 8.0 9.2 18.1 15.1 34.0 19.2 37.7 — — 12.3
Other Spain, Basque 1986–1987 — 0.6 0.7 2.0 2.9 9.6 8.1 7.1 9.2 20.2 25.0 39.4 36.8 24.5 8.6Kuwait 1983–1987 — 1.5 — — — 2.1 13.5 19.4 18.4 27.1 28.4 37.3 79.1 35.1 11.2US, CT 1935–1940 0.2 0.7 1.3 1.0 4.5 4.7 7.6 9.7 13.3 17.5 23.6 23.2 17.5 11.3 8.5
aLung cancer rates at ages 40–69 y standardized to the world population, 2000.bRates at ages 40–69 y considered most reliable.doi:10.1371/journal.pmed.0050185.t001
PLo
SMed
icine|www.plosm
edicin
e.org
Septem
ber
2008|Volume5|Issu
e9|e185
1360
LungCan
cerin
Never-Sm
okers
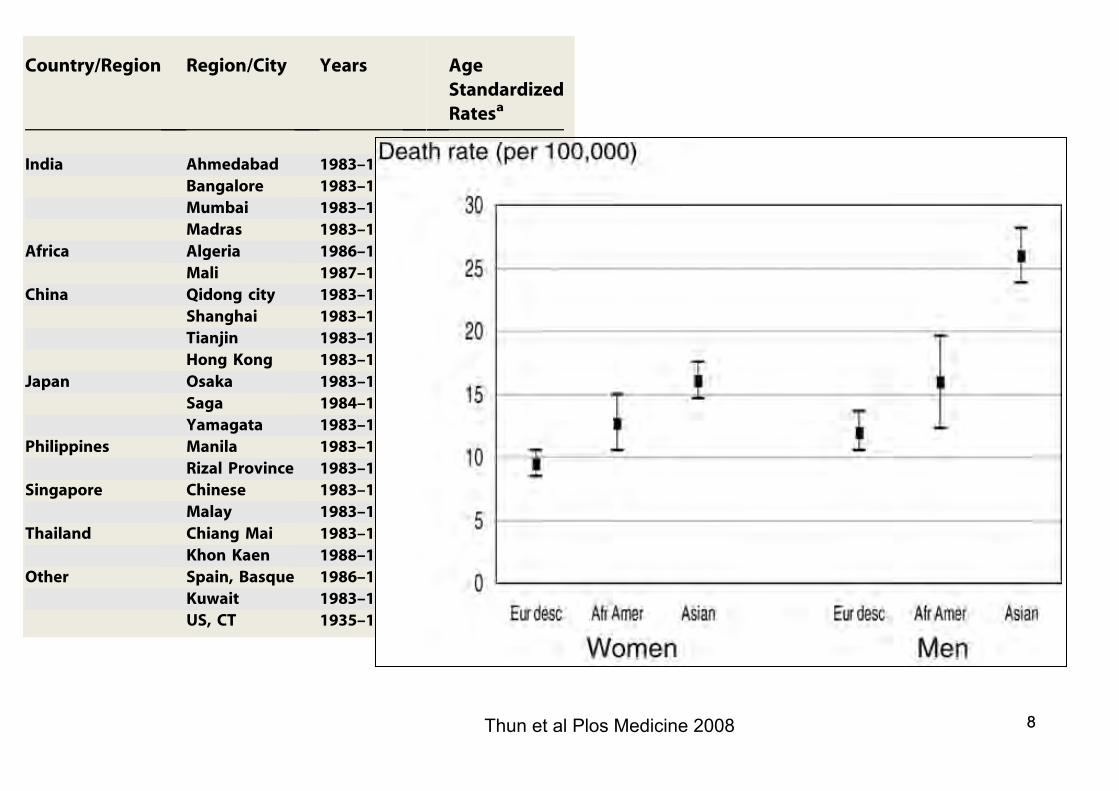
Thun et al Plos Medicine 2008 8
Frequency of lung cancer in never-smokers versus othercancers in population. We compared the mortality andincidence rates from lung cancer among lifelong nonsmokersin the pooled data for individuals of European descent withUS death rates and with SEER incidence rates from othertypes of cancer in the general population (Tables S22 andS23). The lung cancer death rate in never-smokers wascomparable to, and in some cases higher than, the death ratefrom other types of cancer in the general population,especially at older ages. For example, the death rate amongmen of European descent who reported never smokingexceeded the general population death rate for melanomabeginning at age 50 y, from cancer of the brain and othernervous system at ages 65þ y, from cancers of the kidney andliver at ages 70þ y, and from cancer of the esophagus at ages80þ y. The same was observed among women of Europeandescent for cancers of the uterine corpus and liver beginningat age 35 y, for melanoma and cancer of the esophagus at ages40þ y, for all leukemia at ages 45þ y, for uterine cervix at ages50þ y, and for cancers of the brain and other nervous systemat ages 60þ y.
Using the lung cancer death rates in the pooled data, we
estimated the number of lung cancer deaths that would haveoccurred among individuals of European descent and AfricanAmericans in the US in 2004, if the entire population in thesetwo groups, age 40þ y had experienced the death rates oflifelong nonsmokers. We limited the analysis to individuals ofEuropean descent and African Americans, because of the lackof reliable death rates or populations at risk for other racialand ethnic groups. The estimated number of deaths (15,943)comprises slightly more than one-tenth the number of lungcancer deaths (154,202) that actually occurred amongindividuals of European descent and African Americans in2004. This exceeds the number of deaths reported in 2004from five of the 12 most common fatal cancers in the US:cancer of the ovary, liver and intrahepatic bile duct, urinarybladder, esophagus, and kidney or renal pelvis.A similar approach, using the lung cancer incidence rates
in the pooled data for never-smokers of European descentand African American never-smokers and the populations,age 40 y and above living in the 17 SEER areas of the US in2004, estimated that 5,064 incident lung cancers would haveoccurred if no one smoked. By this estimate, lung canceramong never-smokers would rank 11th among the 12 mostcommon incident cancers in SEER areas of the US in 2004. Bycomparison, 6,432 cases of leukemia, 4,737 cases of stomachcancer, and 4,516 cases of thyroid cancer were diagnosedamong African American residents and residents of Euro-pean descent of these SEER areas in 2004.
Discussion
To our knowledge, this is the first comprehensive effort topool and compare data on lung cancer incidence and deathrates in lifelong nonsmokers from multiple sources. Thecombination of data from cohort studies and populationregistries provides a more coherent picture of how back-ground lung cancer risk varies by age, sex, geographiclocation, race/ethnicity, and time period than can be obtainedfrom any single study. All of the available data havelimitations and unknowns regarding the accuracy of thediagnostic information, the validity and comparability of theexposure information on active smoking or its absence, andthe lack of measurements of other exposures that affect lungcancer risk. In the interest of clarity, however, we first discussthe series of questions raised in the introduction and laterconsider how these data limitations could affect ourconclusions.
Figure 3. Age-Standardized Lung Cancer Death Rates by Race and Sex inthe Pooled Analyses
doi:10.1371/journal.pmed.0050185.g003
Table 4. Comparing Pooled Lung Cancer Rates (Per 100,000) among Lifelong Nonsmokers by Race
Variable Category Men Women
Age-Standardized Ratea Rate Ratiob Age-Standardized Ratea Rate Ratiob
Mortality European Descent 12.0 (10.5, 13.6) 1.00 (referent) 9.5 (8.5, 10.5) 1.00 (referent)African American 16.0 (12.3, 19.6) 1.33 (0.9, 2.1) 12.7 (10.5, 15.0) 1.34 (1.1, 1.7)Asian 26.0 (23.8, 28.1) 1.96 (1.7, 2.3) 16.1 (14.6, 17.5) 1.69 (1.5, 1.8)
Incidence European Descent 11.2 (9.8, 12.6) 1.00 (referent) 12.4 (11.3, 13.5) 1.00 (referent)African American 12.3 (3.2, 21.4) 1.10 (0.5, 2.3) 19.4 (14.2, 24.6) 1.56 (1.2, 2.1)Asian 12.9 (6.7, 19.1) 1.15 (0.7, 1.9) 15.0 (10.4, 19.7) 1.14 (0.8, 1.6)
aStandardized to the IARC World Standard Population for 2000, ages 40–84 y (95% confidence intervals).bRate ratio in comparison to individuals of European descent.doi:10.1371/journal.pmed.0050185.t004
PLoS Medicine | www.plosmedicine.org September 2008 | Volume 5 | Issue 9 | e1851365
Lung Cancer in Never-Smokers
9 9
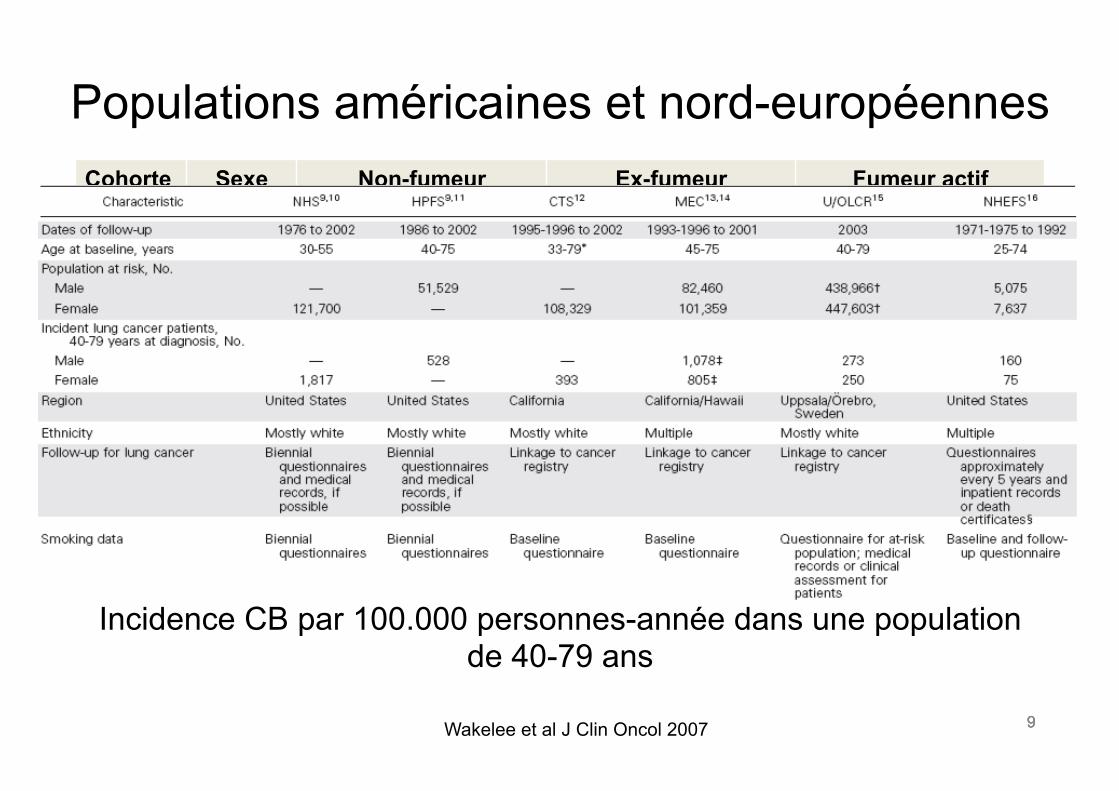
Populations américaines et nord-européennes Cohorte Sexe Non-fumeur Ex-fumeur Fumeur actif
NHS F 15,2 76,9 293,3 CTS F 20,8 65,6 264,4 MEC F 20,7 65,2 233,7 U/OLCR F 14,4 51,4 149,4 NHEFS F 19,3 69,1 168,8
HPFS H 11,2 67,6 304,5 MEC H 13,7 80,0 314,6 U/OLCR H 4,8 59,8 173,7 NHEFS H 12,7 141,4 362,7
Incidence CB par 100.000 personnes-année dans une population de 40-79 ans
Wakelee et al J Clin Oncol 2007 9
10 10
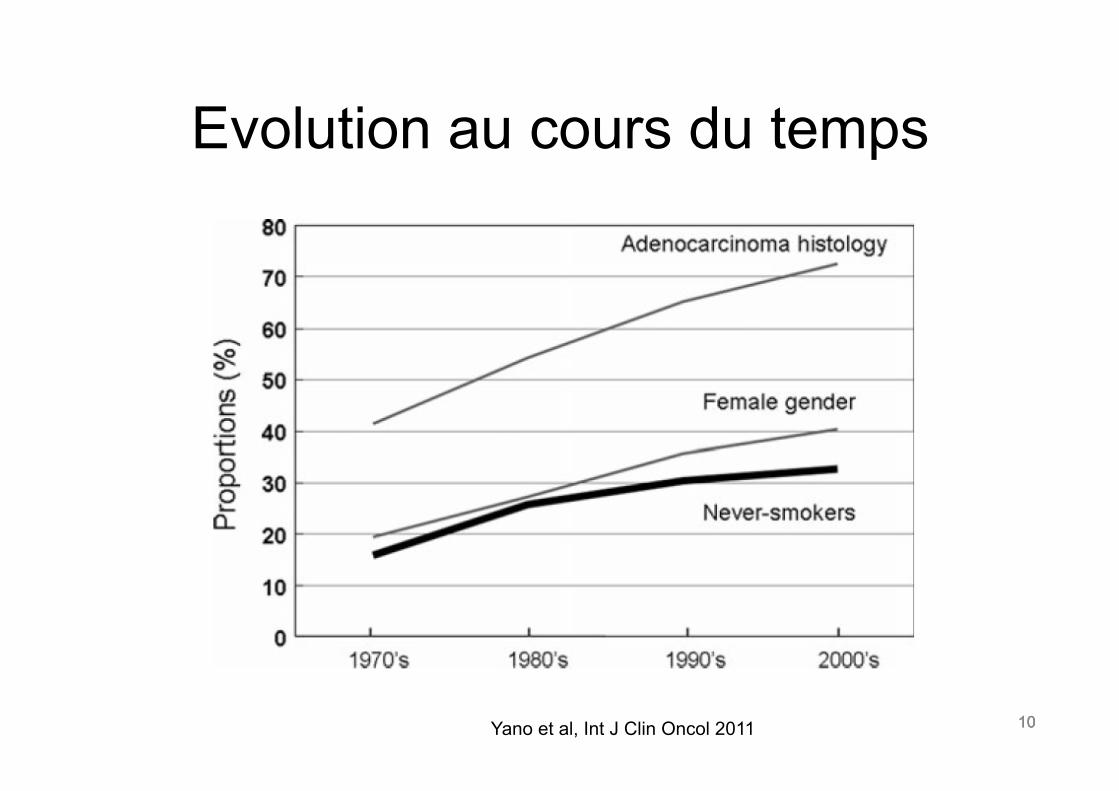
Evolution au cours du temps
10 Yano et al, Int J Clin Oncol 2011
11 11
Facteurs de risque
11
12 12
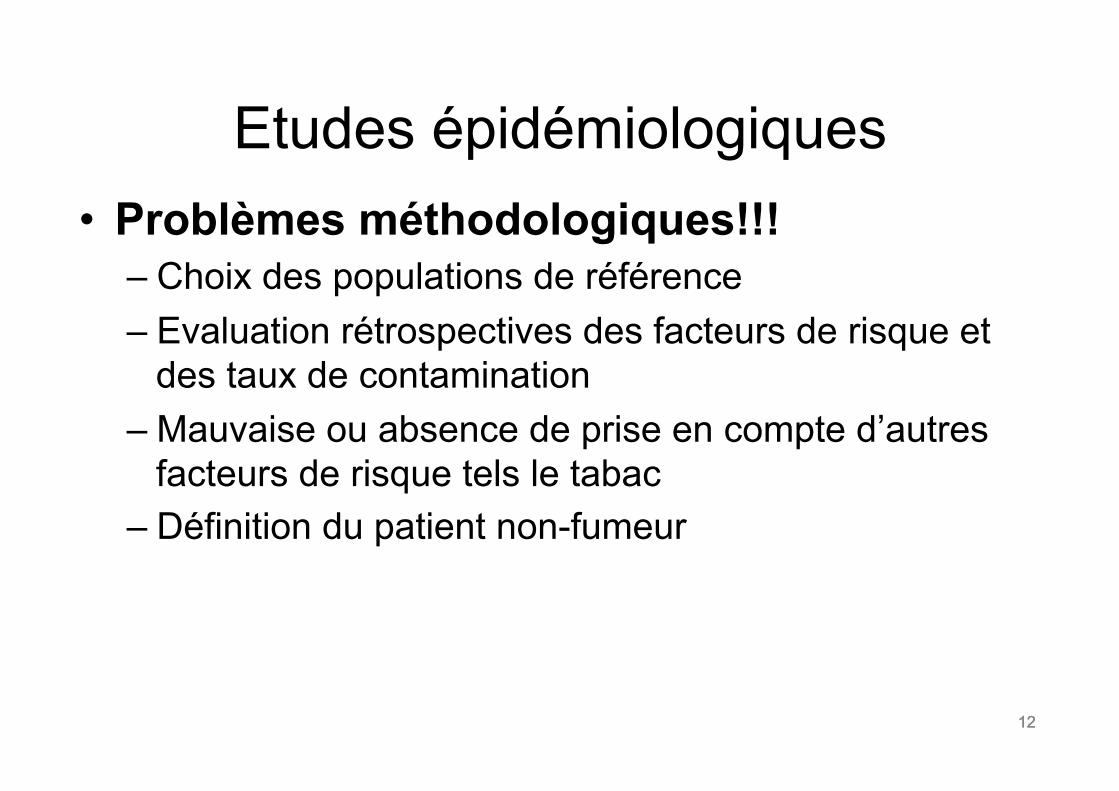
Etudes épidémiologiques • Problèmes méthodologiques!!!
– Choix des populations de référence – Evaluation rétrospectives des facteurs de risque et
des taux de contamination – Mauvaise ou absence de prise en compte d’autres
facteurs de risque tels le tabac – Définition du patient non-fumeur
12
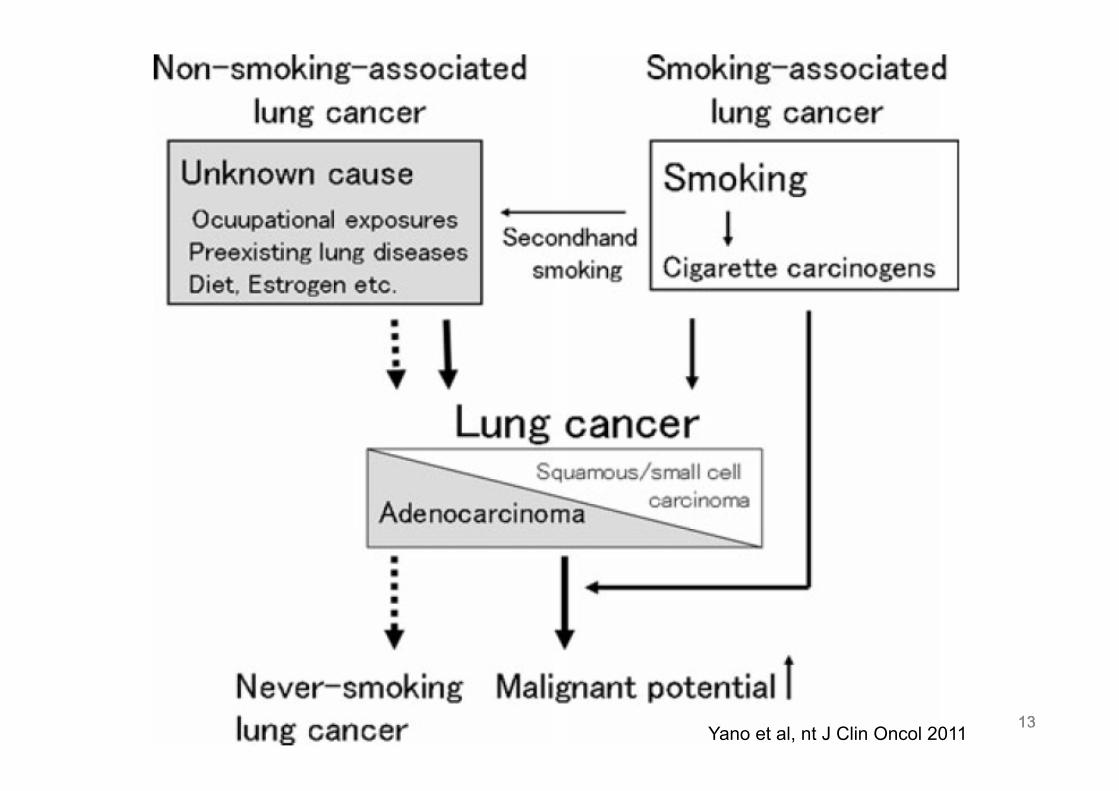
13 13 Sun et al Nature Reviews 2007 13 Yano et al, nt J Clin Oncol 2011
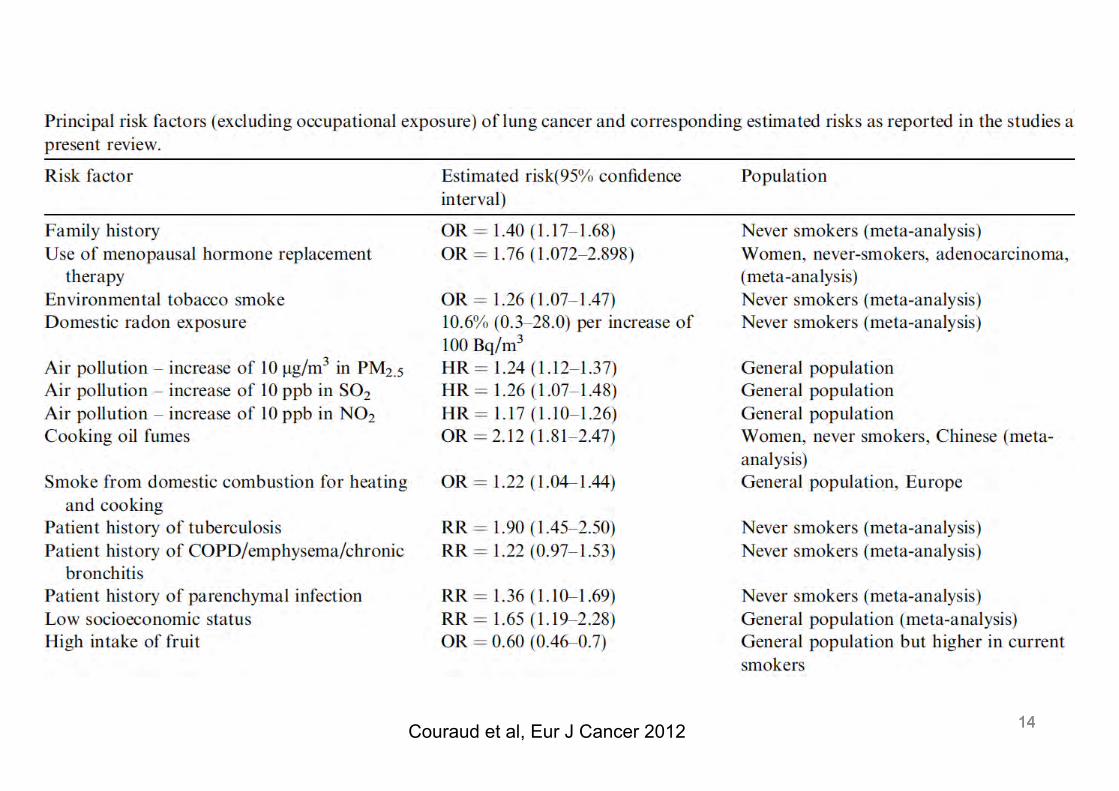
14 14 14 Couraud et al, Eur J Cancer 2012
15 15
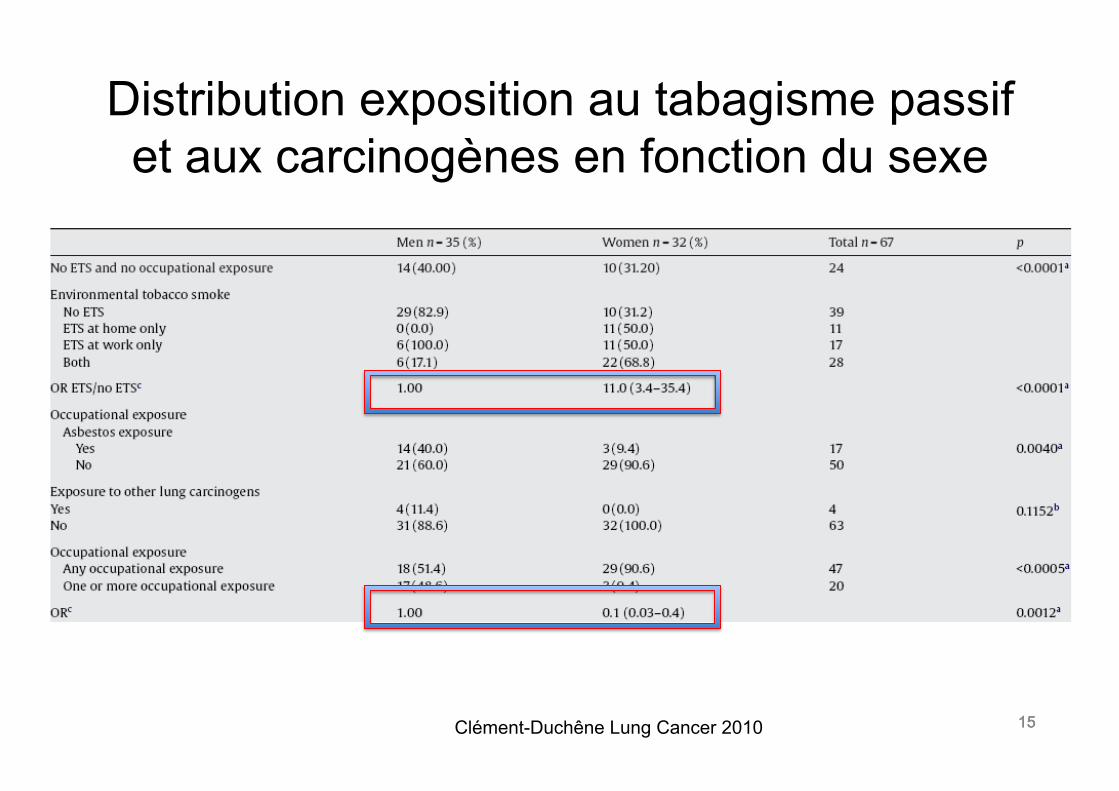
Distribution exposition au tabagisme passif et aux carcinogènes en fonction du sexe
Clément-Duchêne Lung Cancer 2010 15
16 16
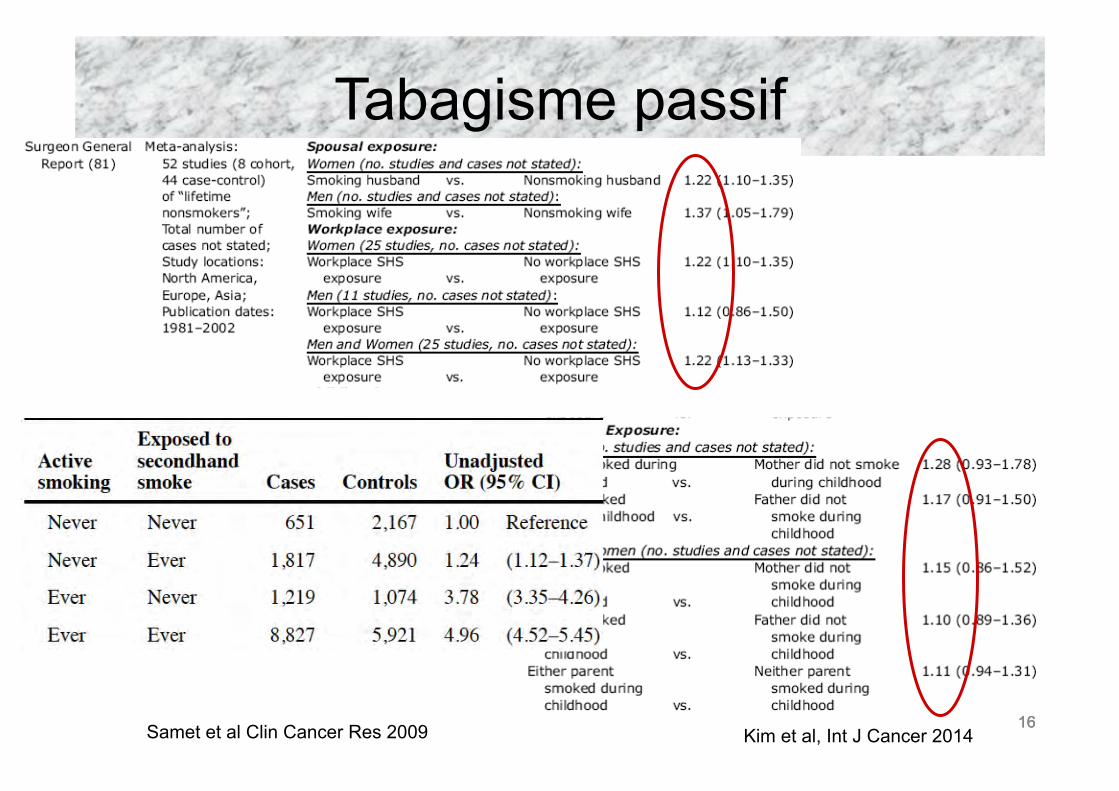
Tabagisme passif
Samet et al Clin Cancer Res 2009 16 Kim et al, Int J Cancer 2014
17 17 17
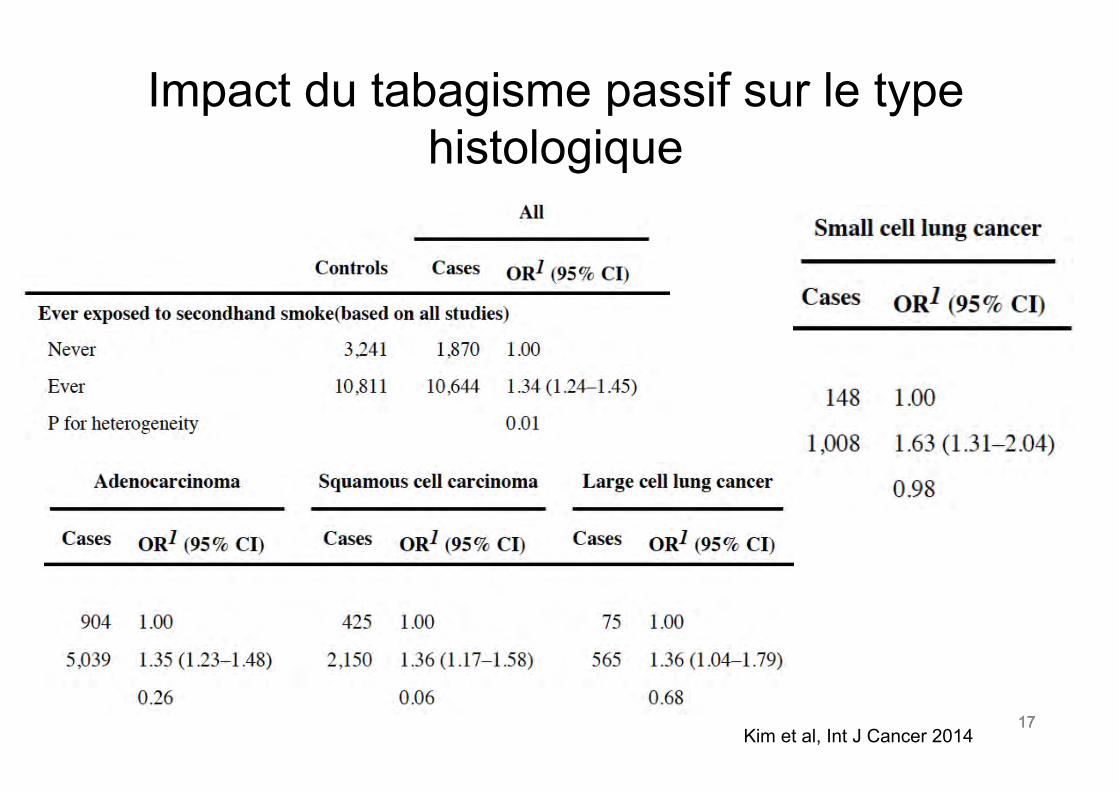
Impact du tabagisme passif sur le type histologique
Kim et al, Int J Cancer 2014
18 18
Asbeste
• Risque fonction de l’intensité et de la durée d’exposition et du type de travail.
• 1 f/ml pendant 40 ans augmente le risque de 2 à 80%.
• RR augmente de 1-4% par fibre-année (f-y/ml) à doublement du risque à 25-100 f-y/m
18 Nielsen et al, Arch Environ Occup Health 2014
19 19
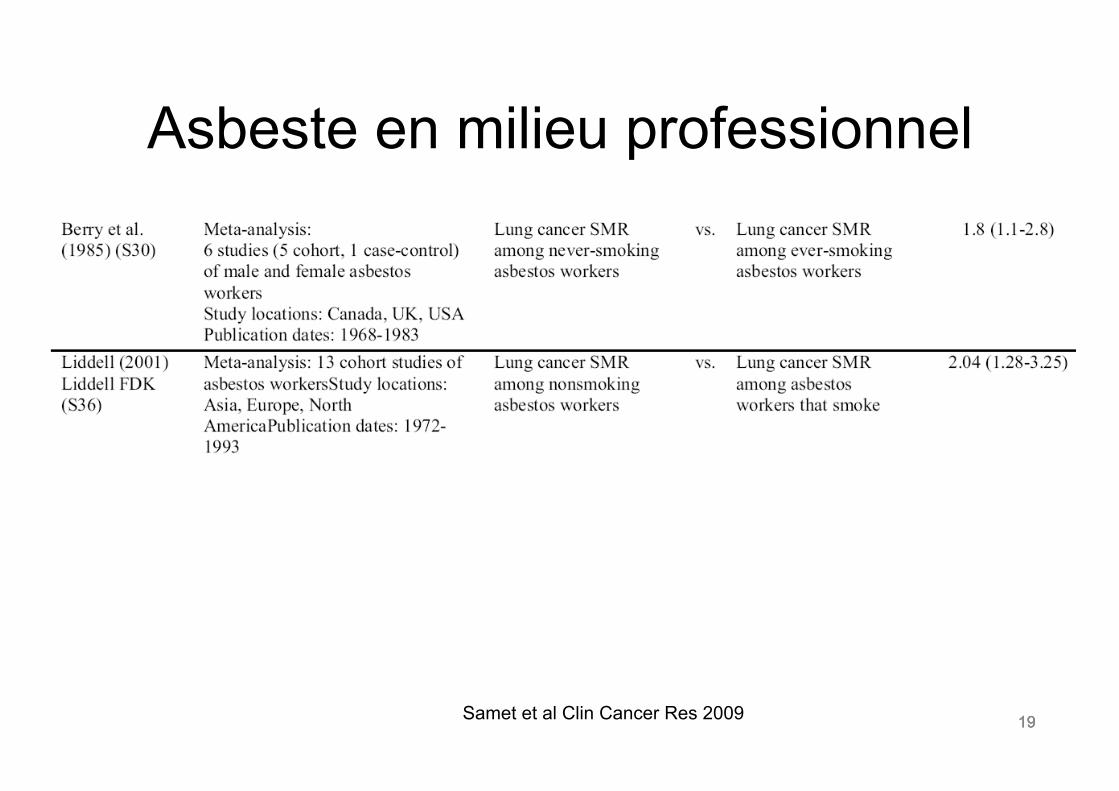
Asbeste en milieu professionnel
Samet et al Clin Cancer Res 2009 19
20 20
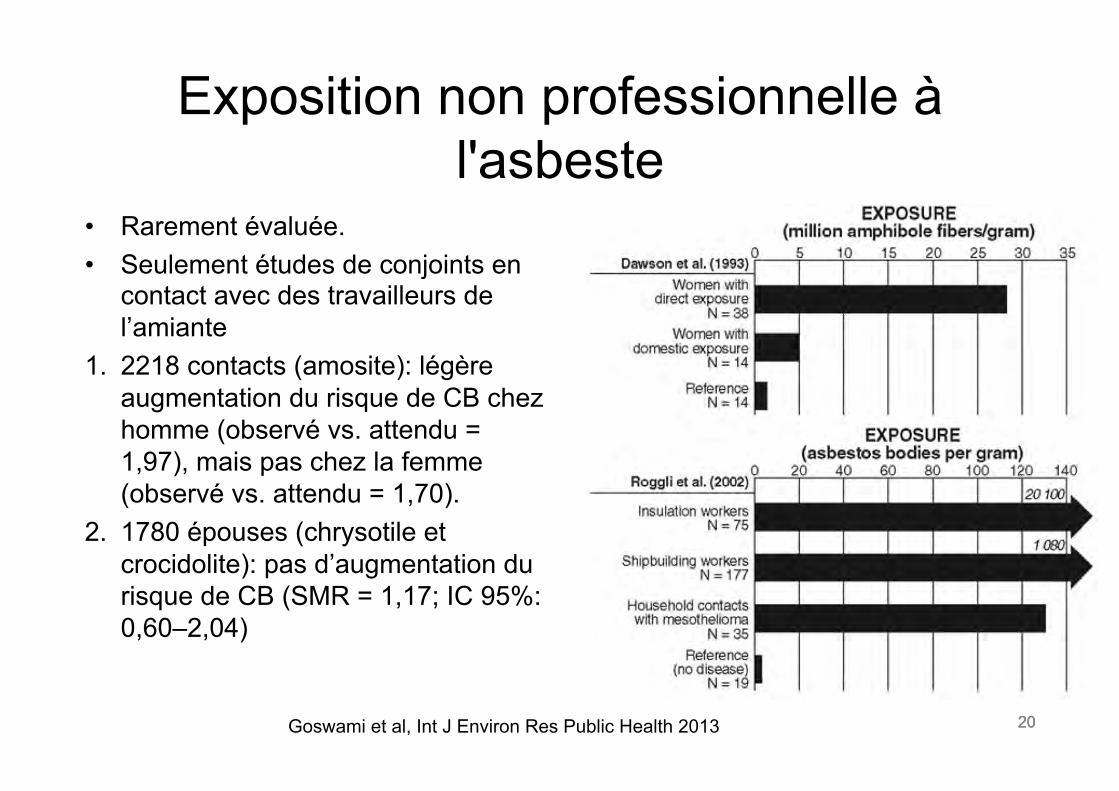
Exposition non professionnelle à l'asbeste
20
• Rarement évaluée. • Seulement études de conjoints en
contact avec des travailleurs de l’amiante
1. 2218 contacts (amosite): légère augmentation du risque de CB chez homme (observé vs. attendu = 1,97), mais pas chez la femme (observé vs. attendu = 1,70).
2. 1780 épouses (chrysotile et crocidolite): pas d’augmentation du risque de CB (SMR = 1,17; IC 95%: 0,60–2,04)
Goswami et al, Int J Environ Res Public Health 2013
21 21
Radon
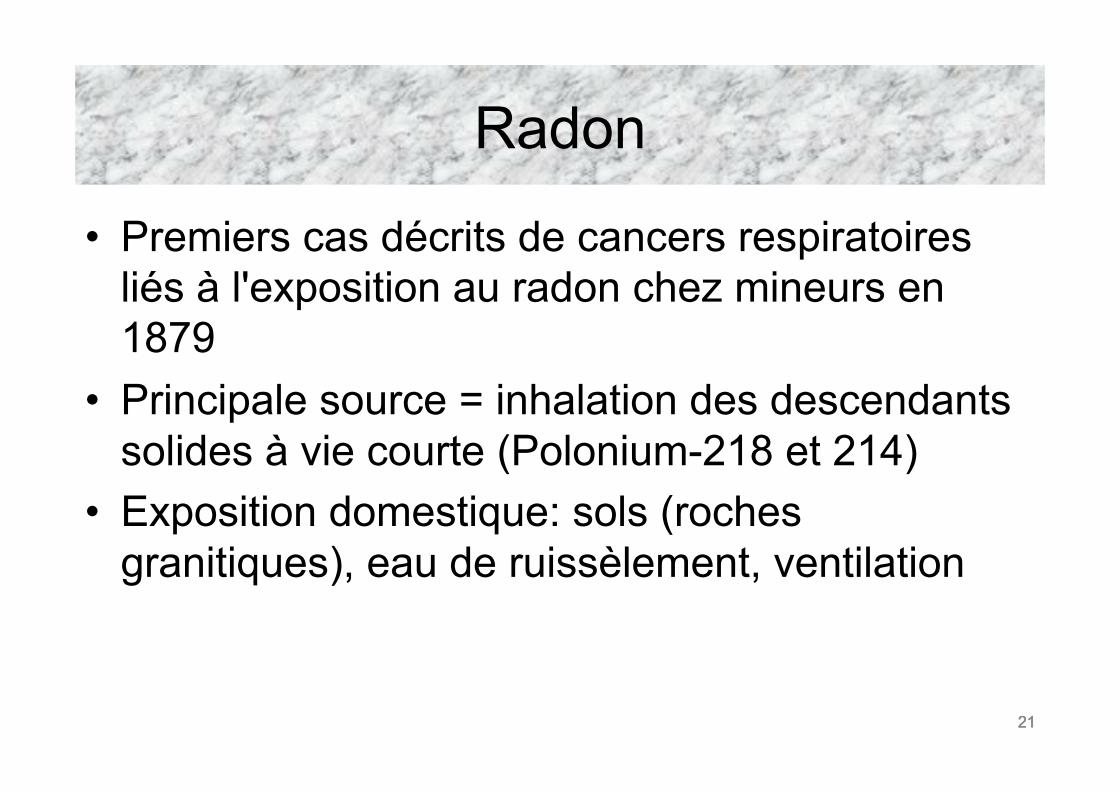
• Premiers cas décrits de cancers respiratoires liés à l'exposition au radon chez mineurs en 1879
• Principale source = inhalation des descendants solides à vie courte (Polonium-218 et 214)
• Exposition domestique: sols (roches granitiques), eau de ruissèlement, ventilation
21
22 22
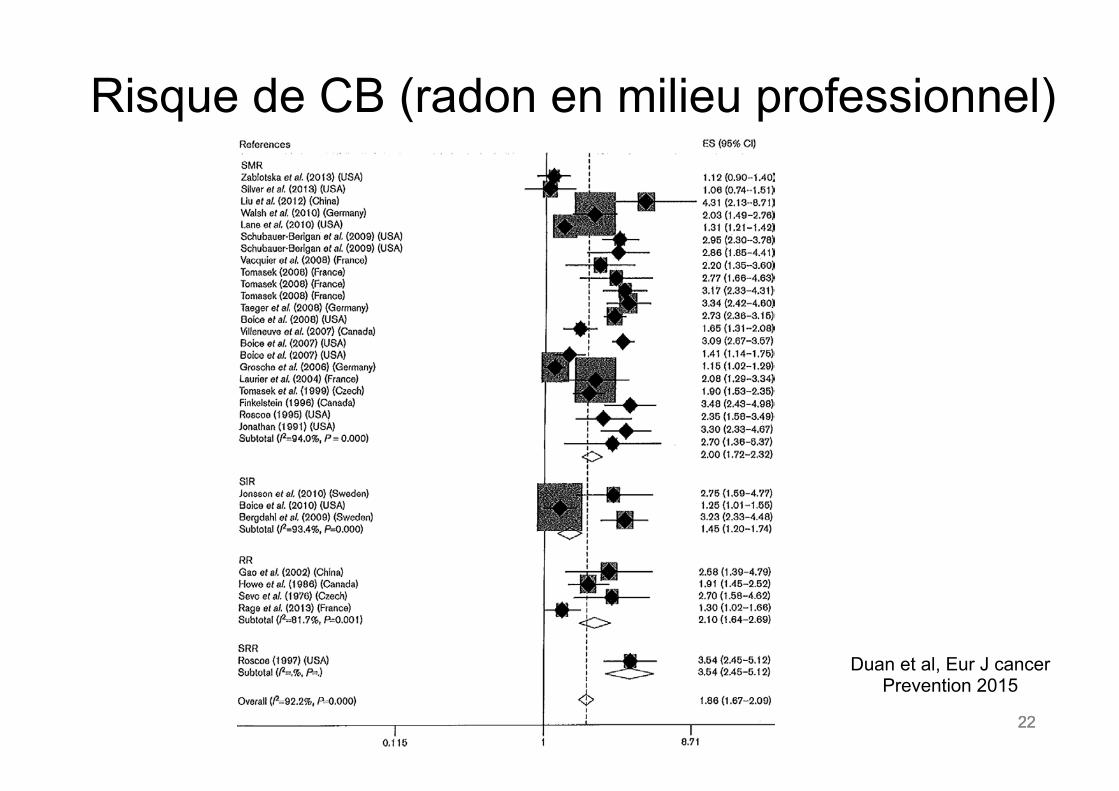
Risque de CB (radon en milieu professionnel)
22
Duan et al, Eur J cancer Prevention 2015
23 23
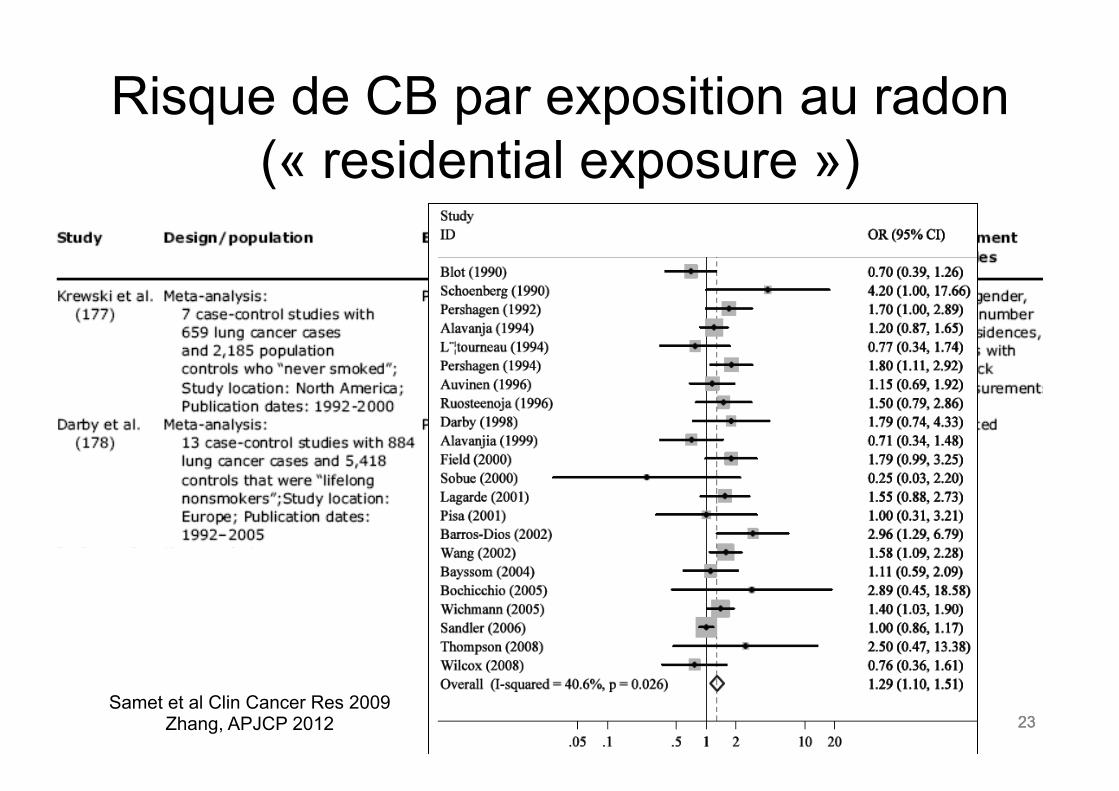
Risque de CB par exposition au radon (« residential exposure »)
23 Samet et al Clin Cancer Res 2009
Zhang, APJCP 2012
24 24
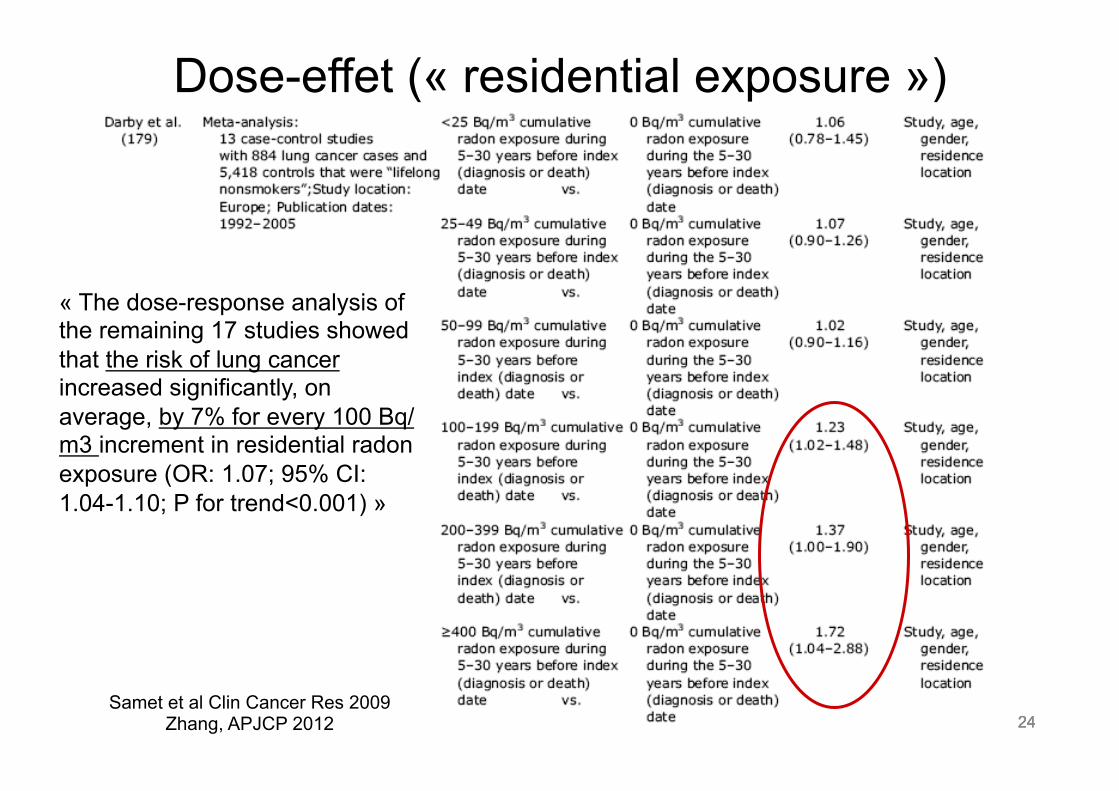
Dose-effet (« residential exposure »)
24
« The dose-response analysis of the remaining 17 studies showed that the risk of lung cancer increased significantly, on average, by 7% for every 100 Bq/m3 increment in residential radon exposure (OR: 1.07; 95% CI: 1.04-1.10; P for trend<0.001) »
Samet et al Clin Cancer Res 2009 Zhang, APJCP 2012
25 25
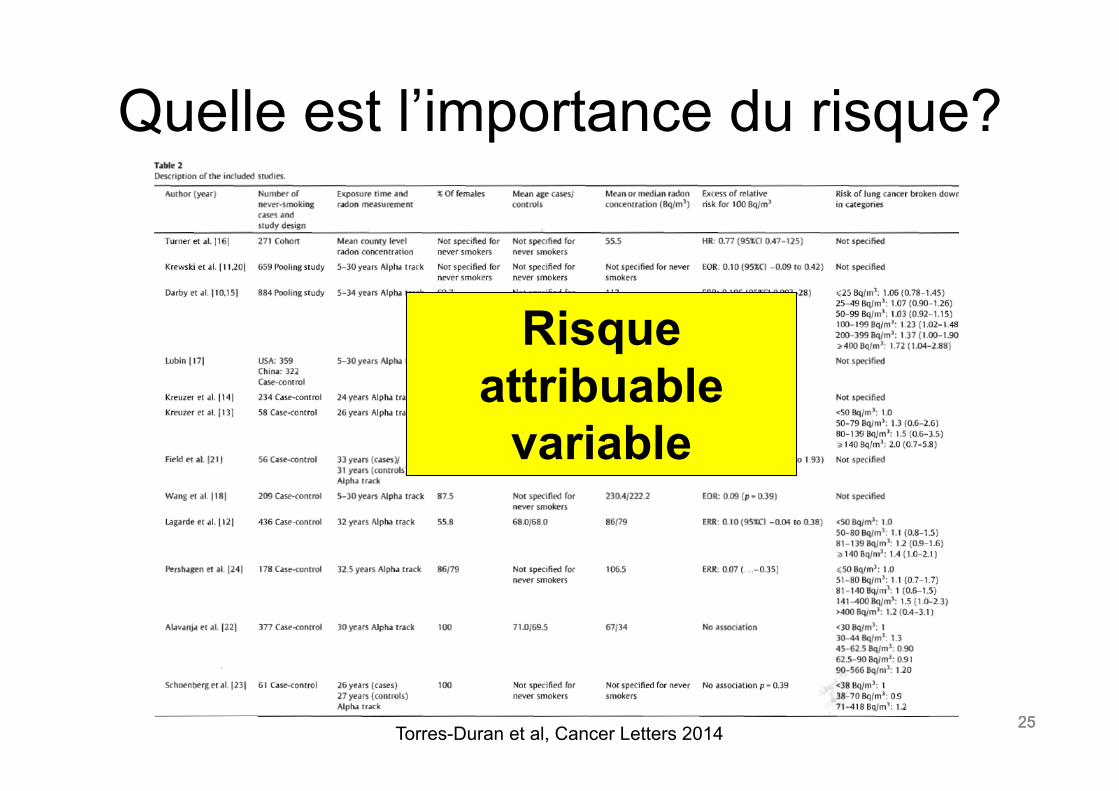
Quelle est l’importance du risque?
25 Torres-Duran et al, Cancer Letters 2014
Risque attribuable
variable
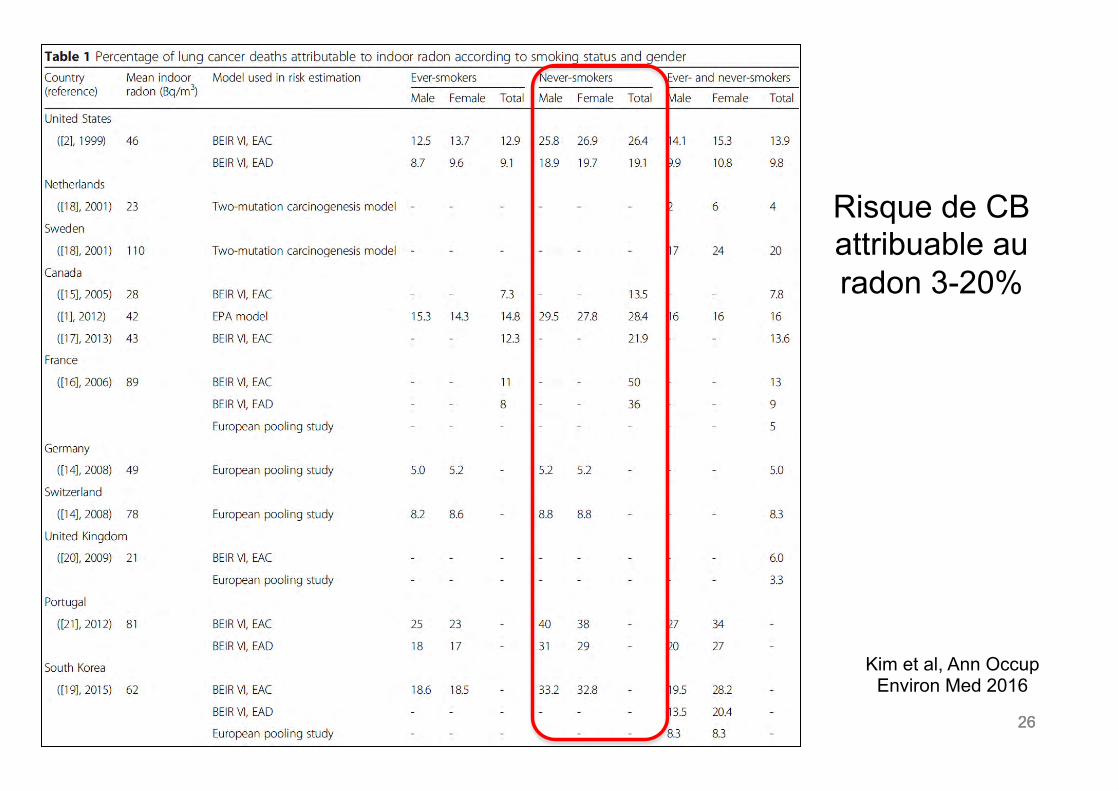
26 26 26
Risque de CB attribuable au radon 3-20%
Kim et al, Ann Occup Environ Med 2016
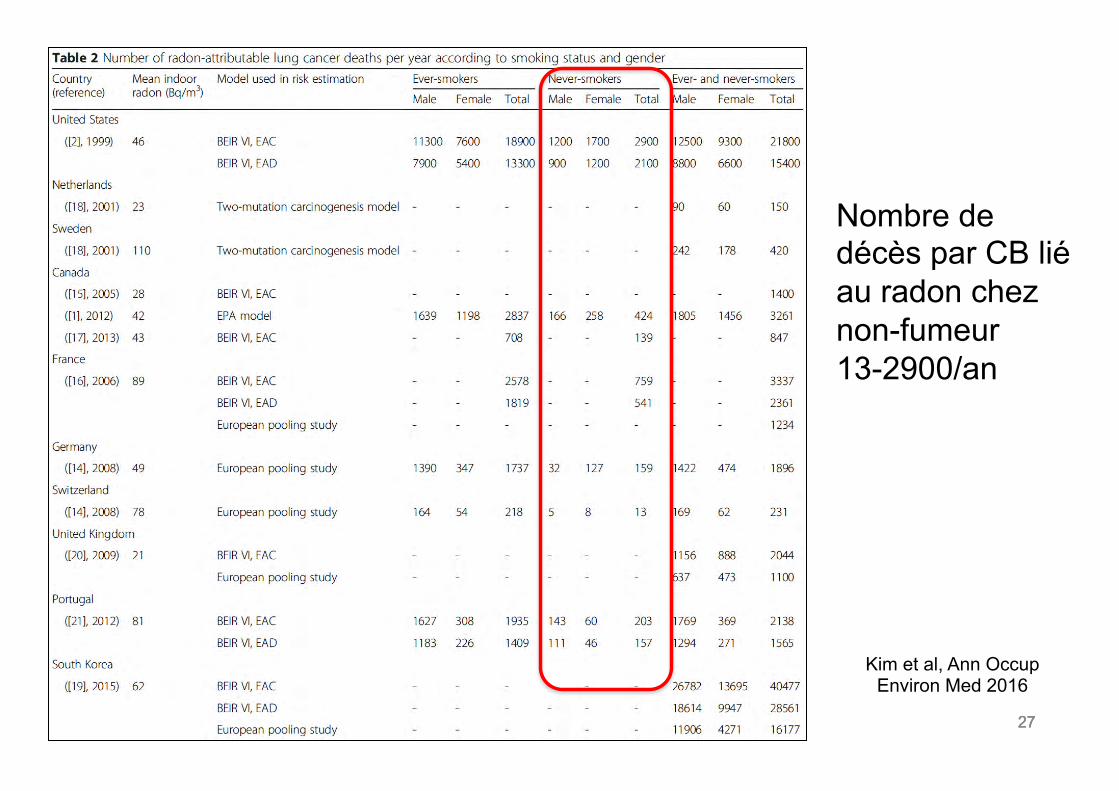
27 27 27
Kim et al, Ann Occup Environ Med 2016
Nombre de décès par CB lié au radon chez non-fumeur 13-2900/an
28 28
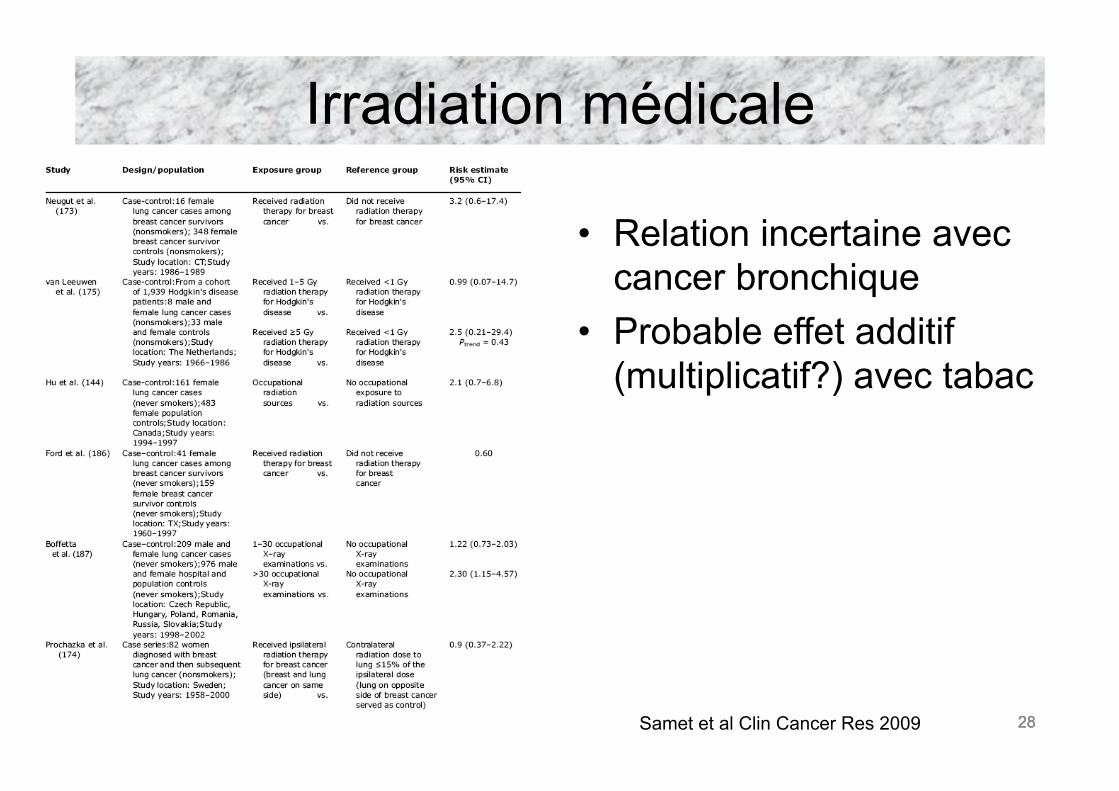
Irradiation médicale
• Relation incertaine avec cancer bronchique
• Probable effet additif (multiplicatif?) avec tabac
Samet et al Clin Cancer Res 2009 28
29 29
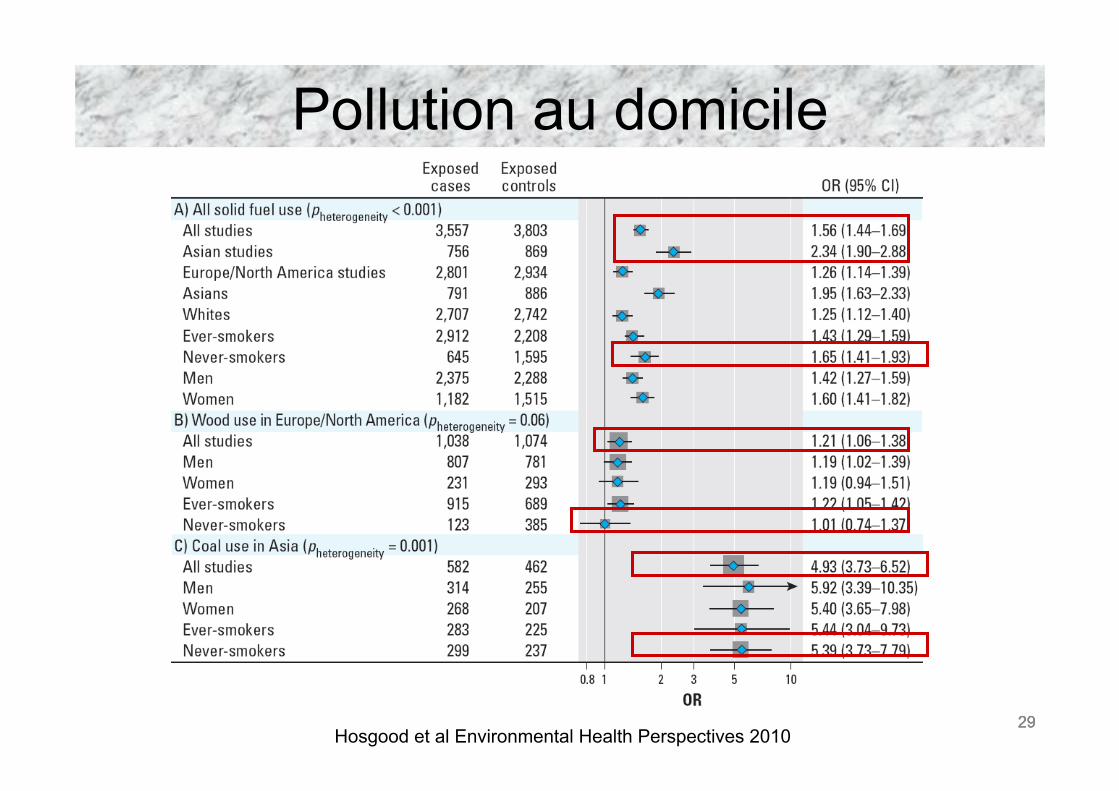
Pollution au domicile
Hosgood et al Environmental Health Perspectives 2010 29
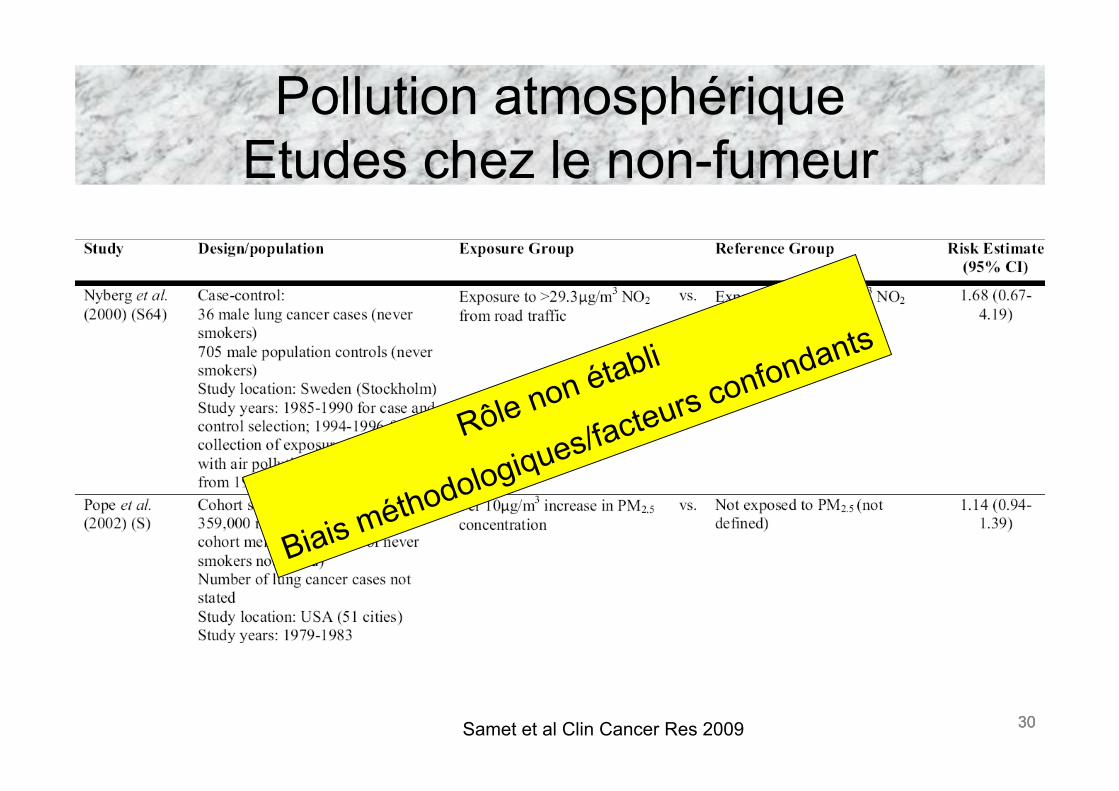
30 30
Pollution atmosphérique Etudes chez le non-fumeur
Samet et al Clin Cancer Res 2009 30
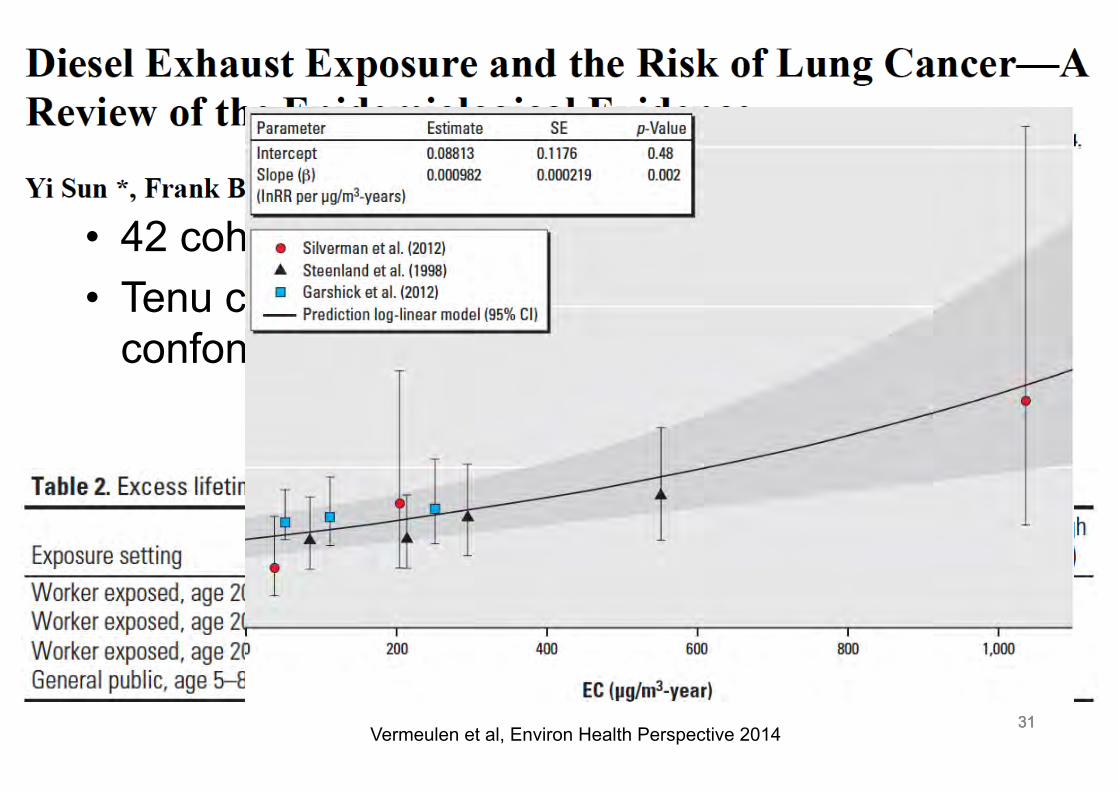
31 31
• 42 cohortes et 32 études cas-témoins • Tenu compte du tabagisme comme facteur
confondant: 9 et 24!
31 Vermeulen et al, Environ Health Perspective 2014
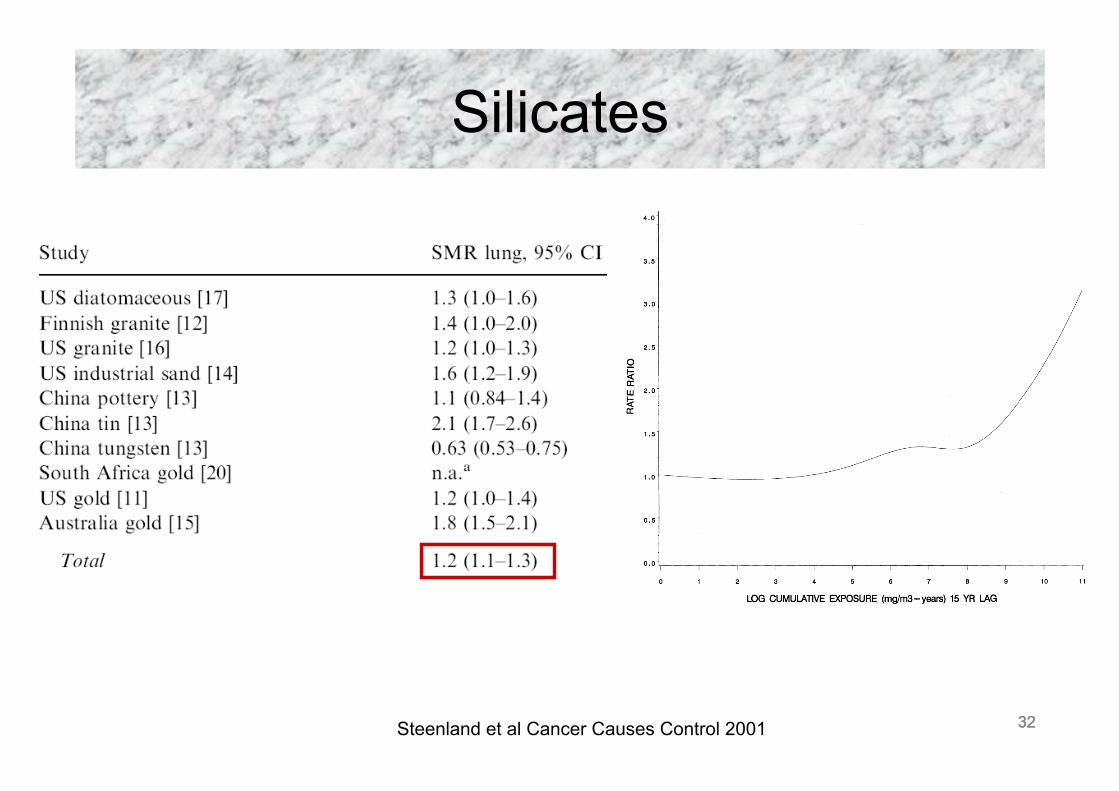
32 32
Silicates
Steenland et al Cancer Causes Control 2001 32
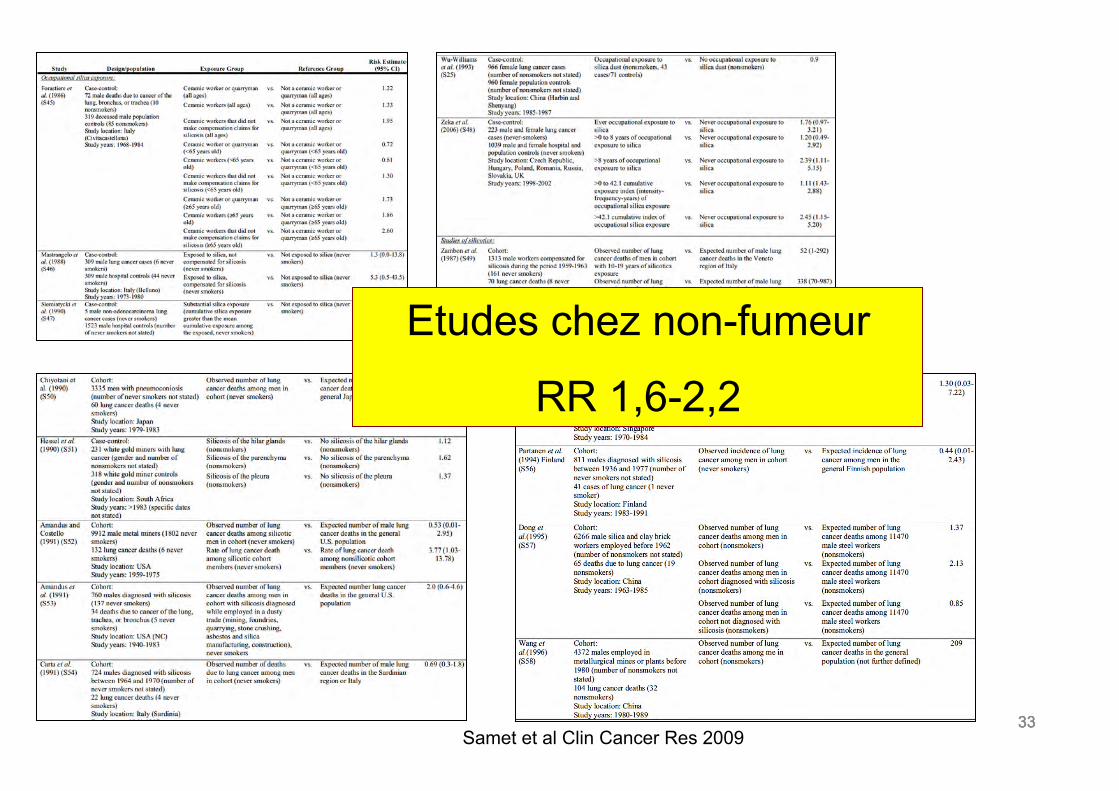
33 33 33
Etudes chez non-fumeur
RR 1,6-2,2
Samet et al Clin Cancer Res 2009
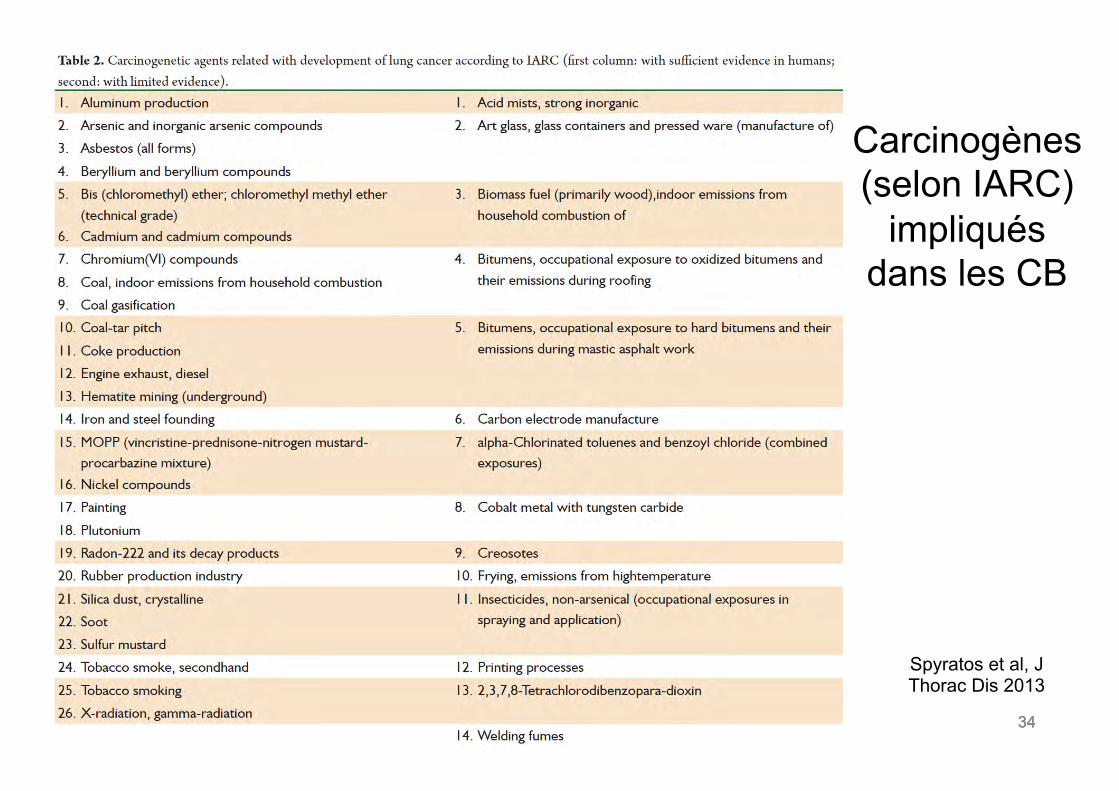
34 34 34
Carcinogènes (selon IARC)
impliqués dans les CB
Spyratos et al, J Thorac Dis 2013
35 35
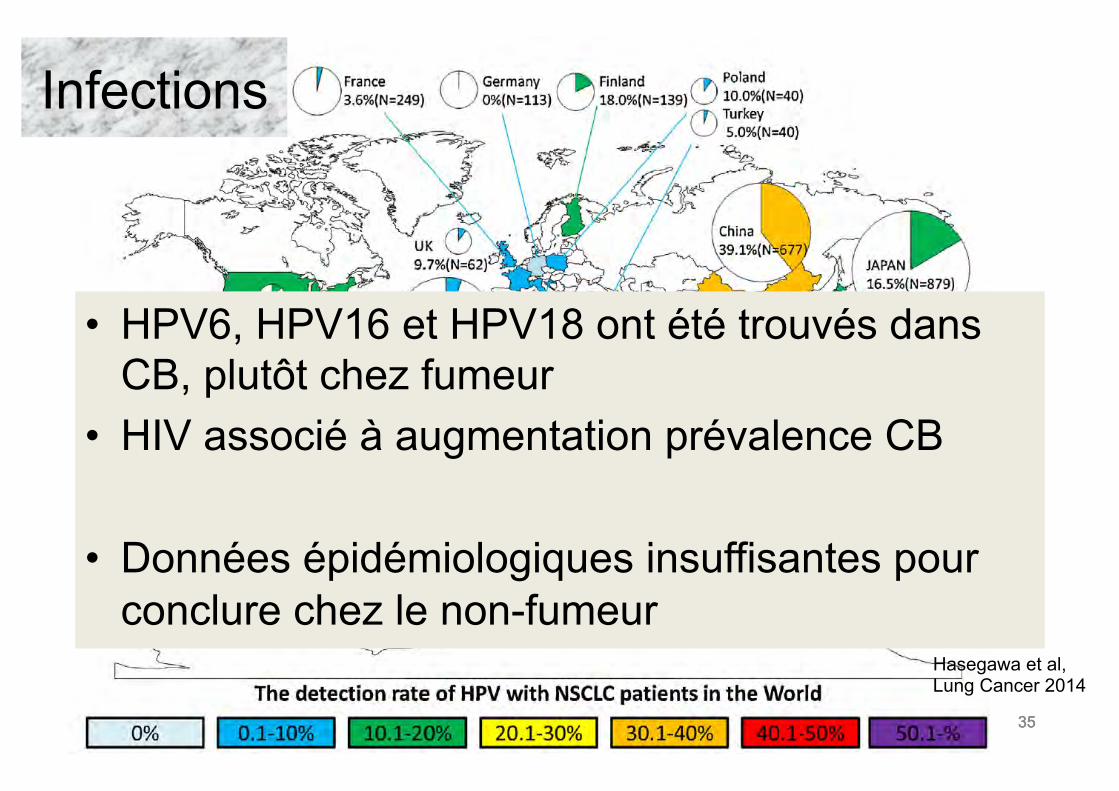
Infections
• HPV6, HPV16 et HPV18 ont été trouvés dans CB, plutôt chez fumeur
• HIV associé à augmentation prévalence CB
• Données épidémiologiques insuffisantes pour conclure chez le non-fumeur
35
Hasegawa et al, Lung Cancer 2014
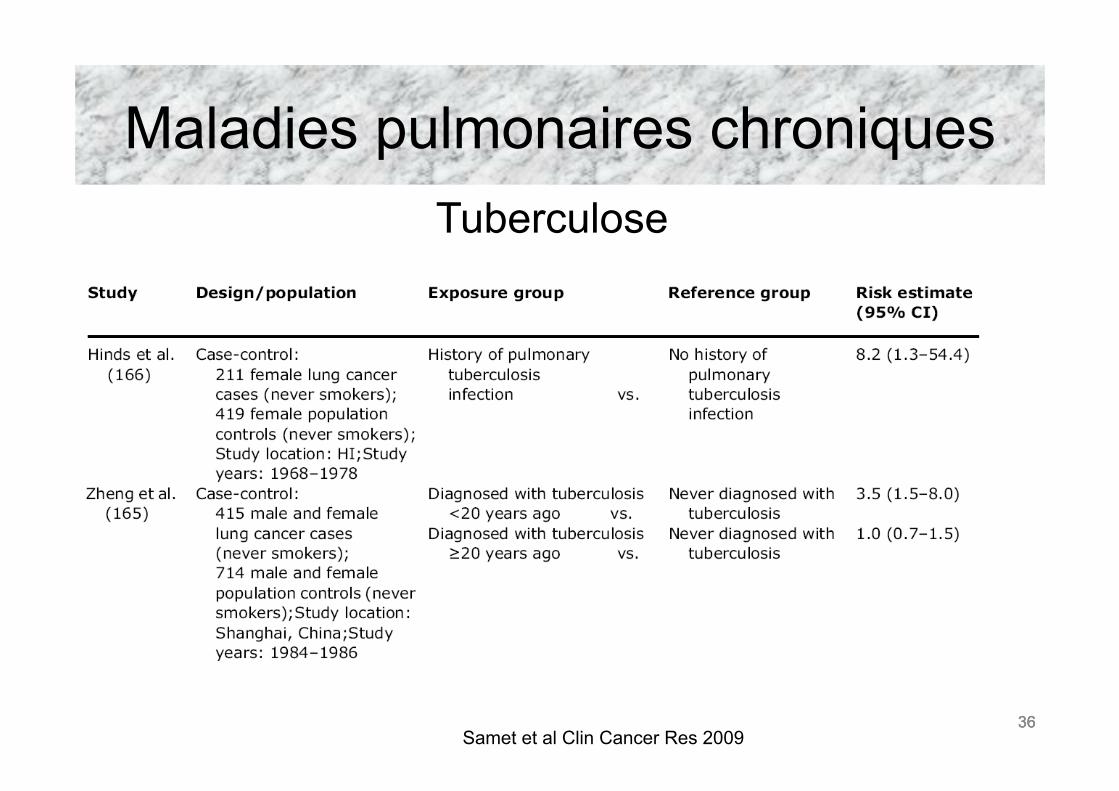
36 36
Maladies pulmonaires chroniques
36 Samet et al Clin Cancer Res 2009
Tuberculose
37 37
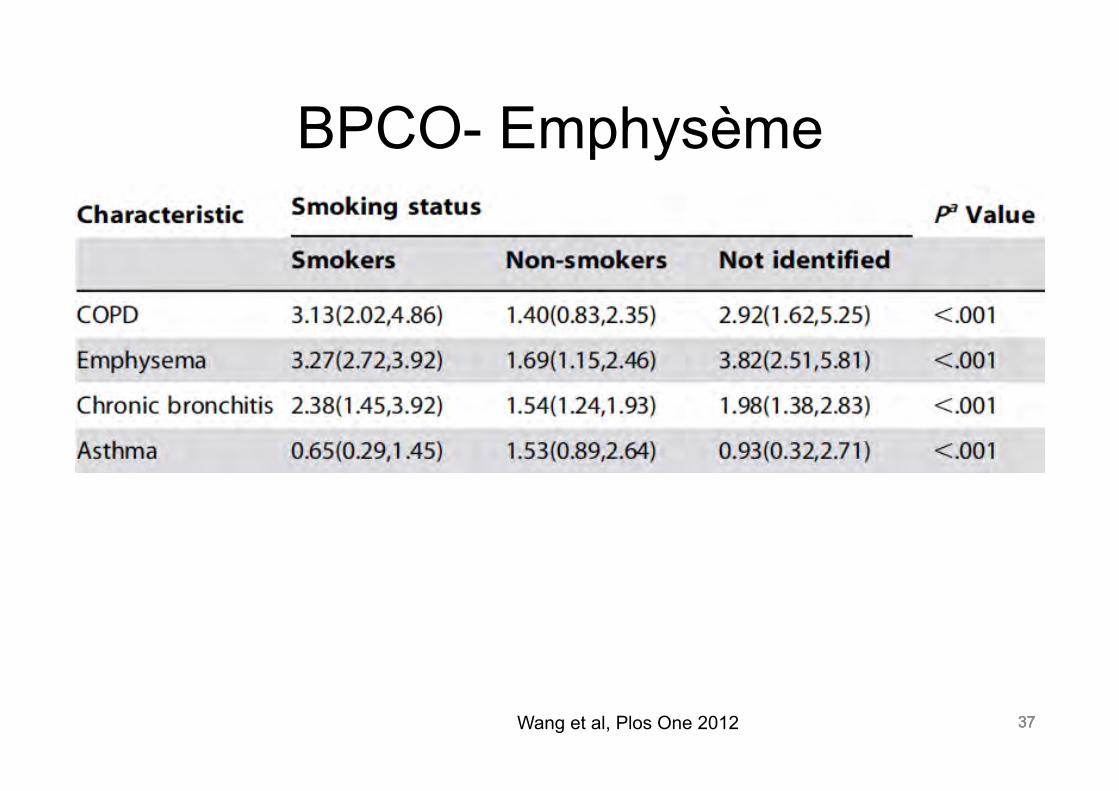
BPCO- Emphysème
37 Wang et al, Plos One 2012
38 38
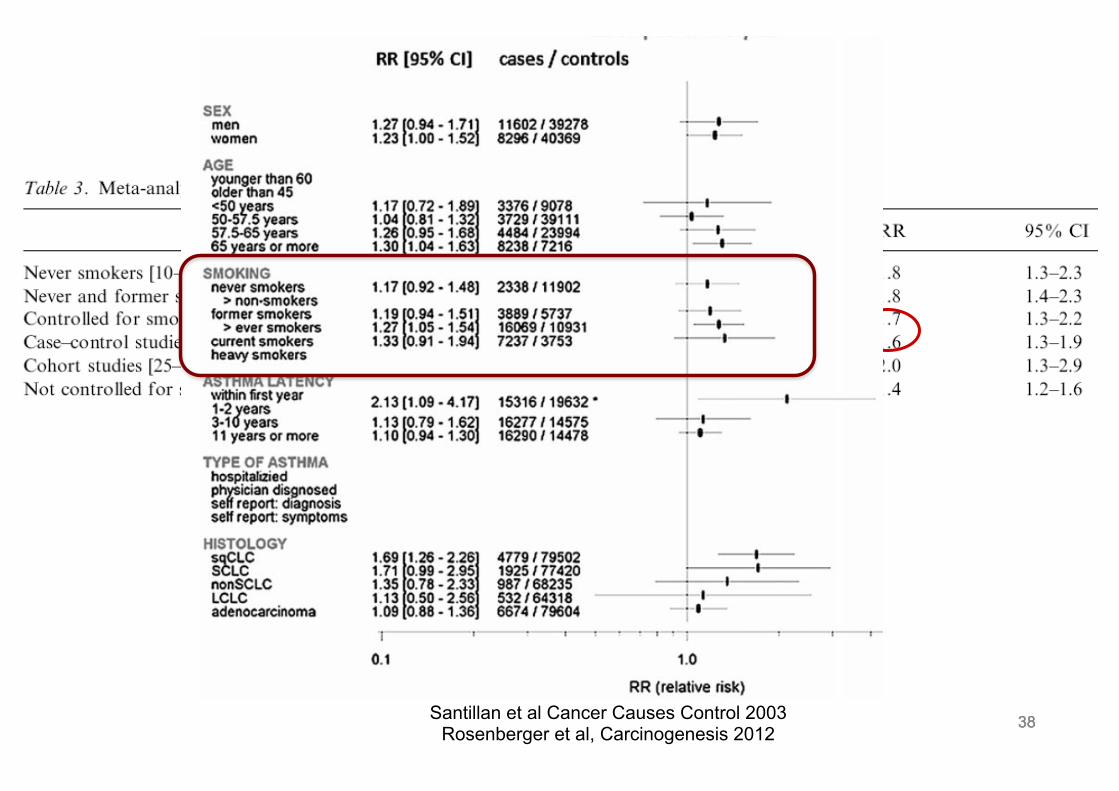
Asthme
Santillan et al Cancer Causes Control 2003 Rosenberger et al, Carcinogenesis 2012
38
39 39
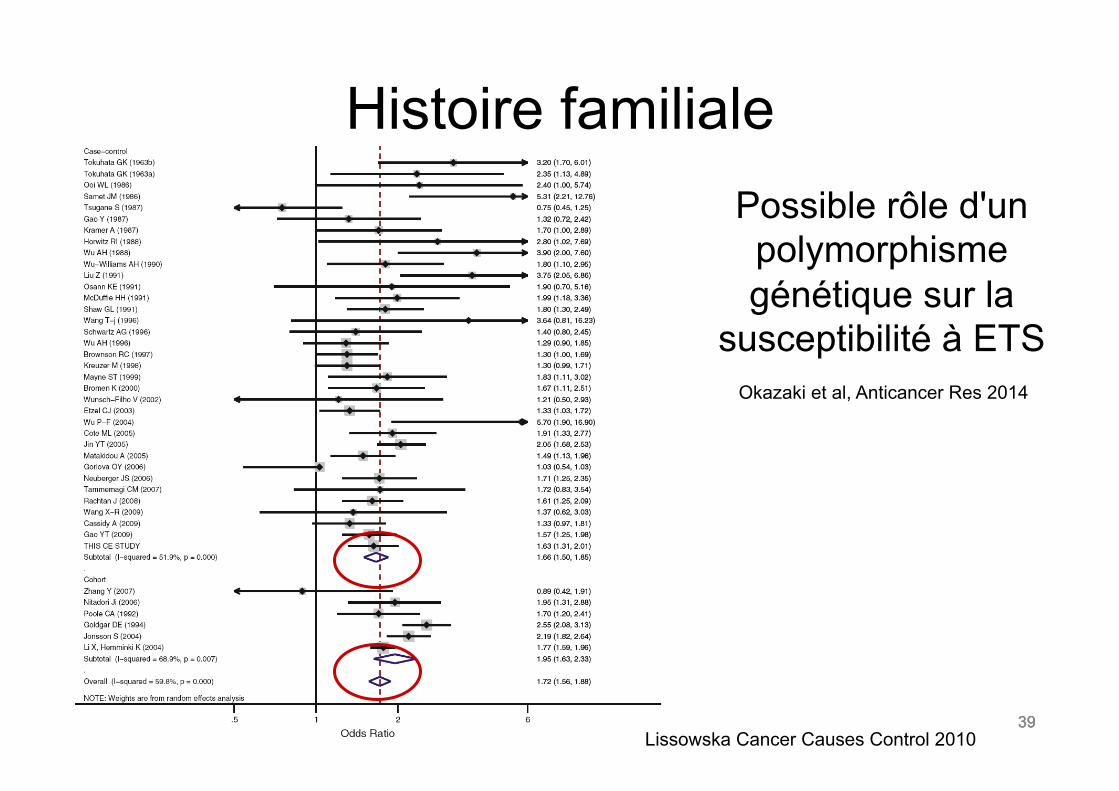
Histoire familiale
Lissowska Cancer Causes Control 2010
Possible rôle d'un polymorphisme génétique sur la
susceptibilité à ETS
39
Okazaki et al, Anticancer Res 2014
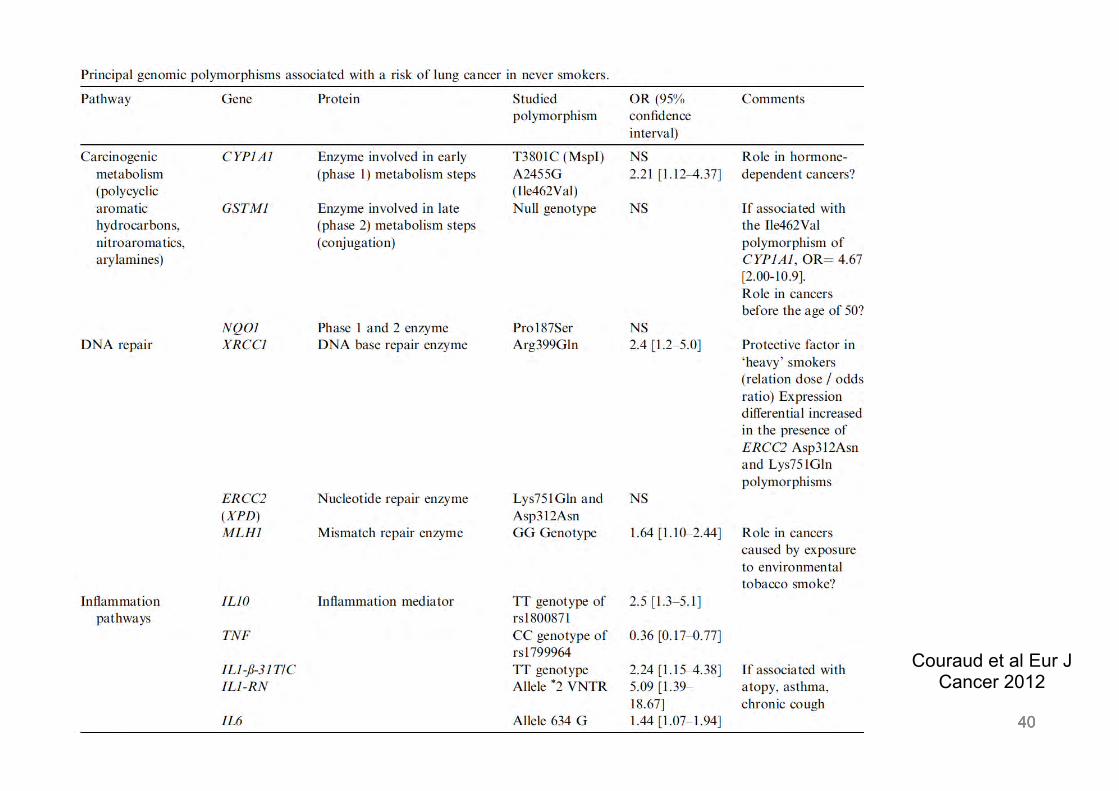
40 40 40
Couraud et al Eur J Cancer 2012
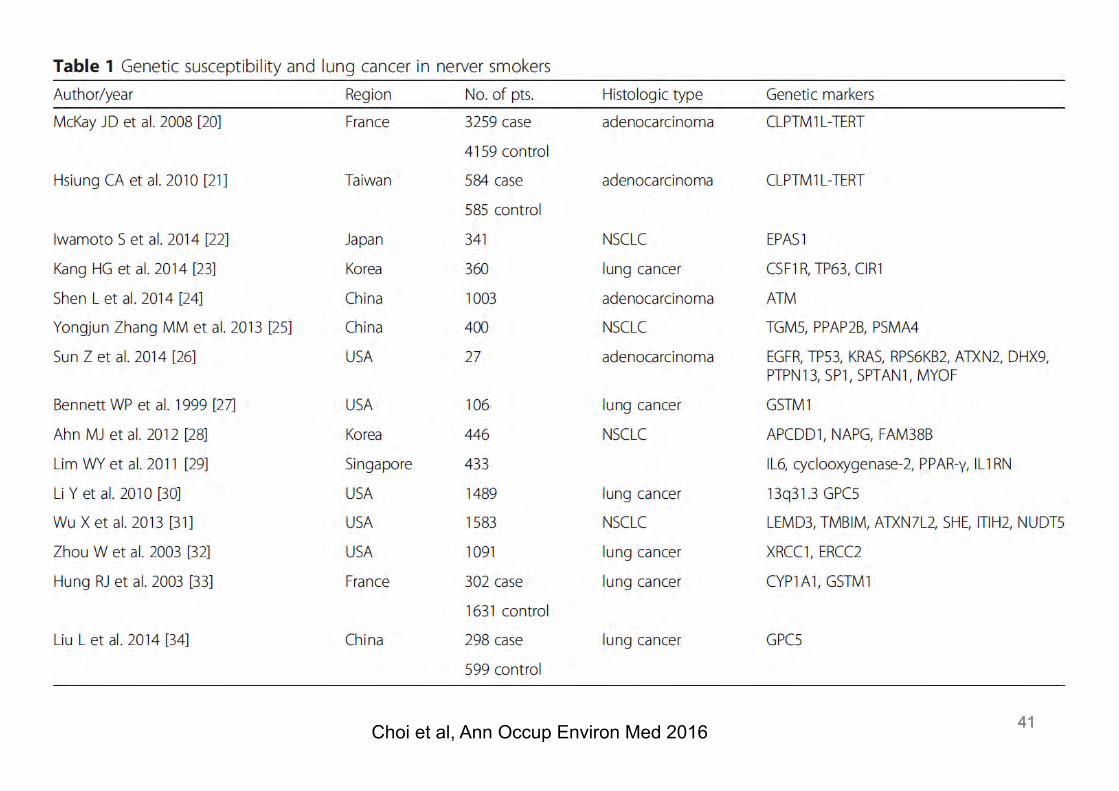
41 41 41 Choi et al, Ann Occup Environ Med 2016
42
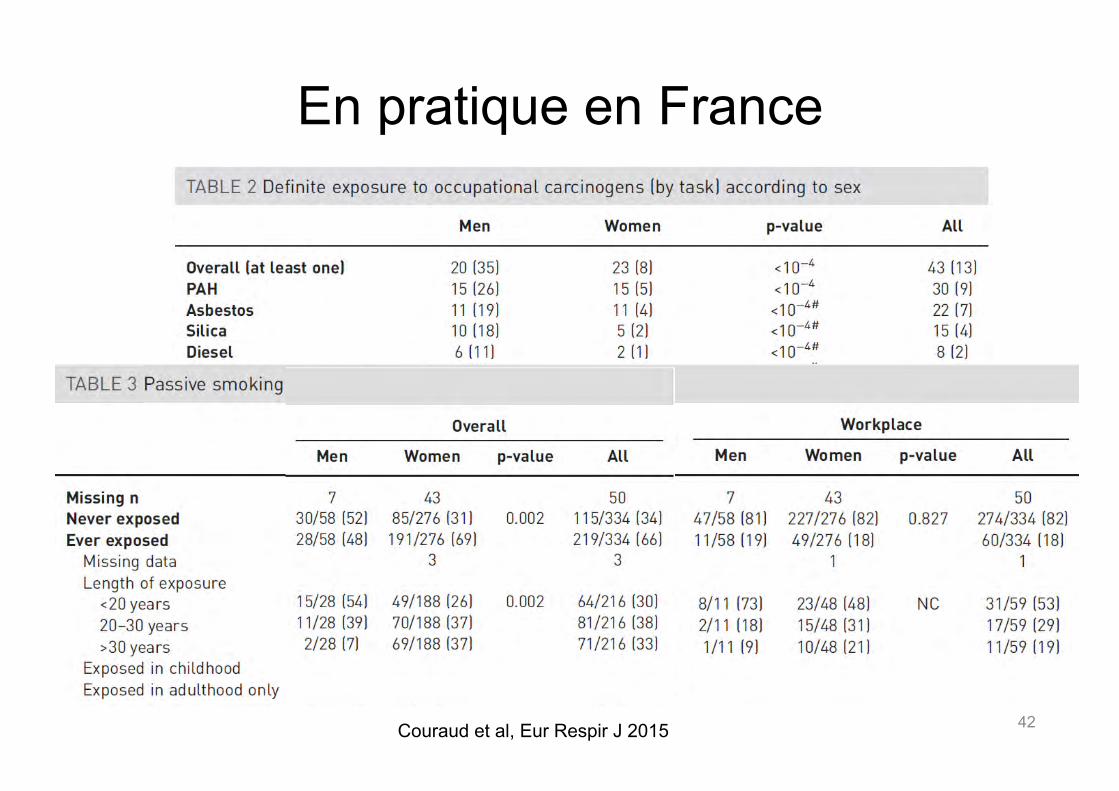
En pratique en France
Couraud et al, Eur Respir J 2015
43 43
Caractéristiques du patient non-fumeur
43
44 44
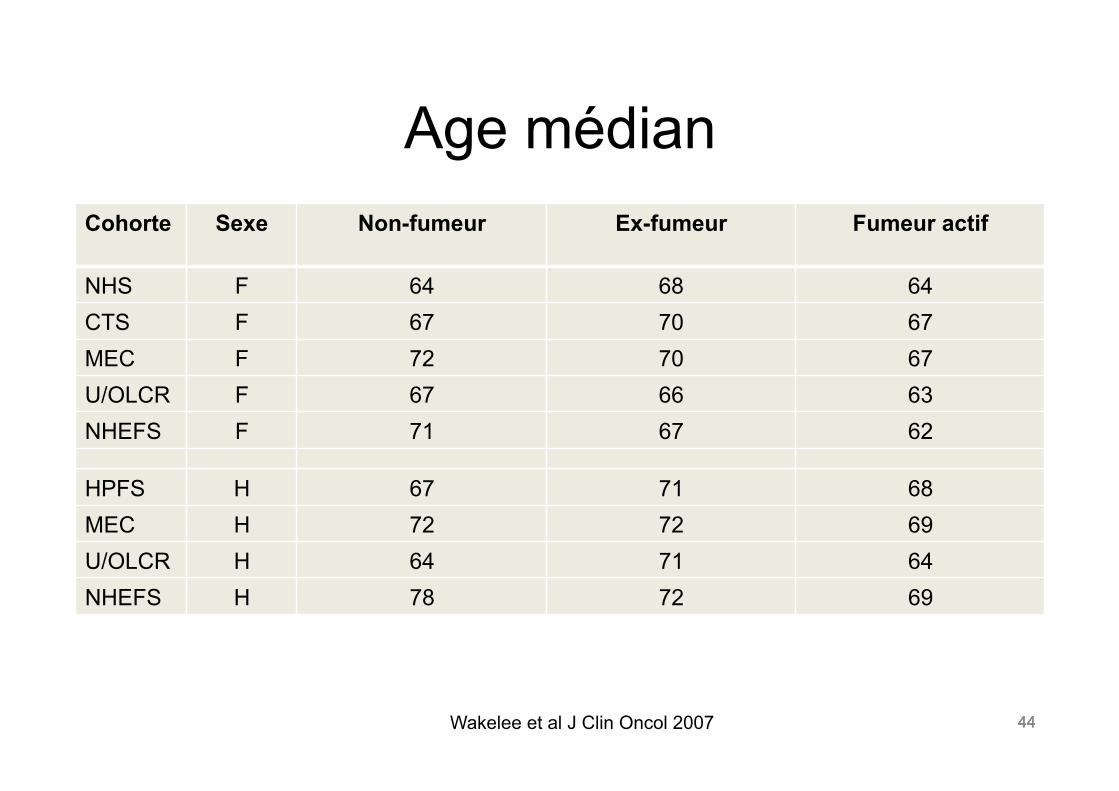
Age médian Cohorte Sexe Non-fumeur Ex-fumeur Fumeur actif
NHS F 64 68 64 CTS F 67 70 67 MEC F 72 70 67 U/OLCR F 67 66 63 NHEFS F 71 67 62
HPFS H 67 71 68 MEC H 72 72 69 U/OLCR H 64 71 64 NHEFS H 78 72 69
Wakelee et al J Clin Oncol 2007 44
45 45
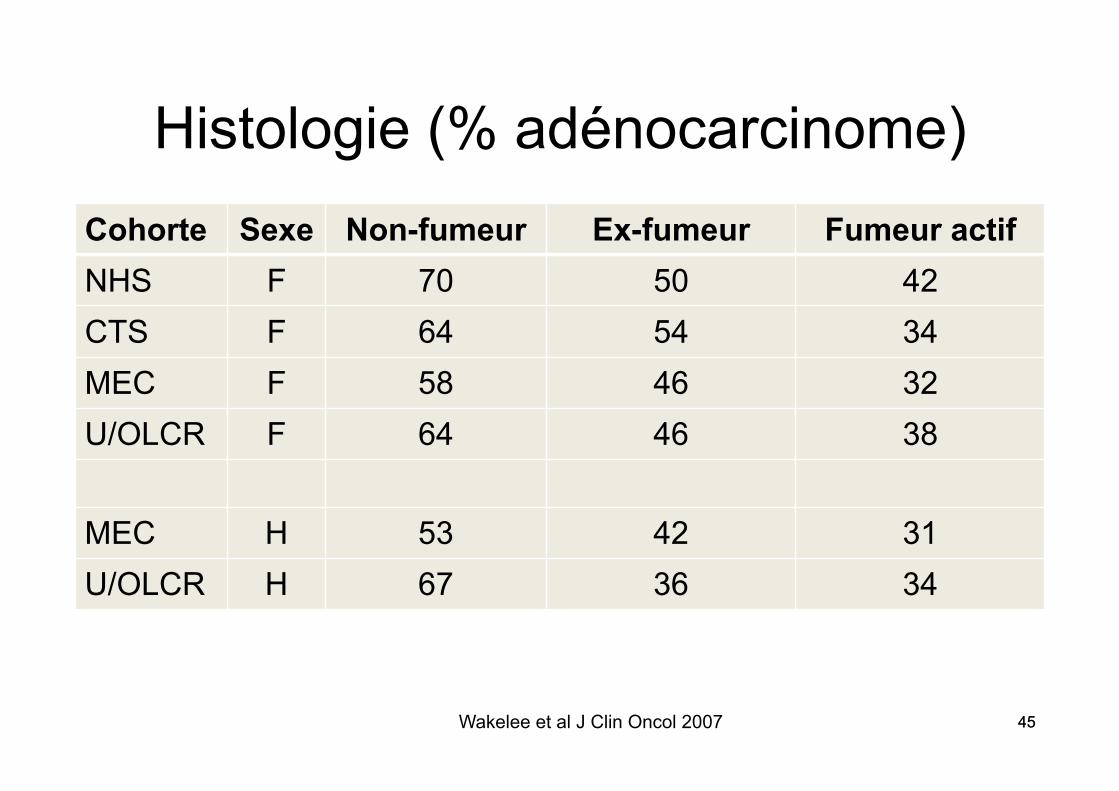
Histologie (% adénocarcinome) Cohorte Sexe Non-fumeur Ex-fumeur Fumeur actif NHS F 70 50 42 CTS F 64 54 34 MEC F 58 46 32 U/OLCR F 64 46 38
MEC H 53 42 31 U/OLCR H 67 36 34
Wakelee et al J Clin Oncol 2007 45
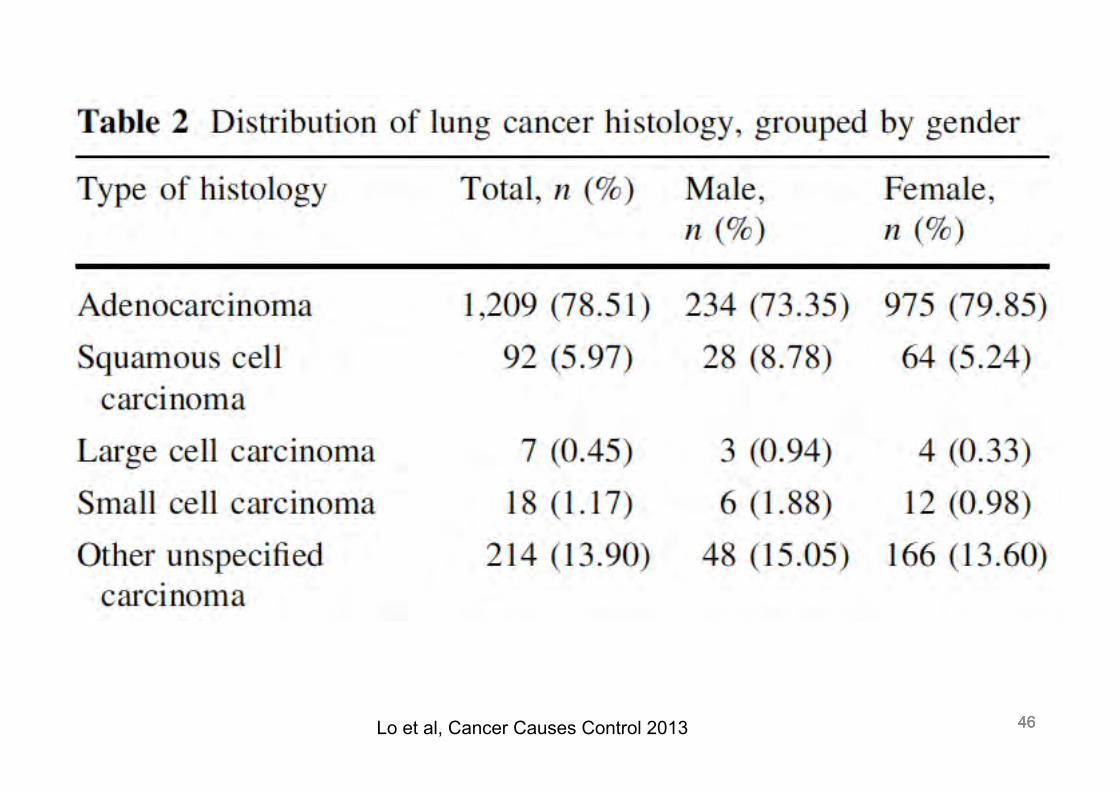
46 46 46 Lo et al, Cancer Causes Control 2013
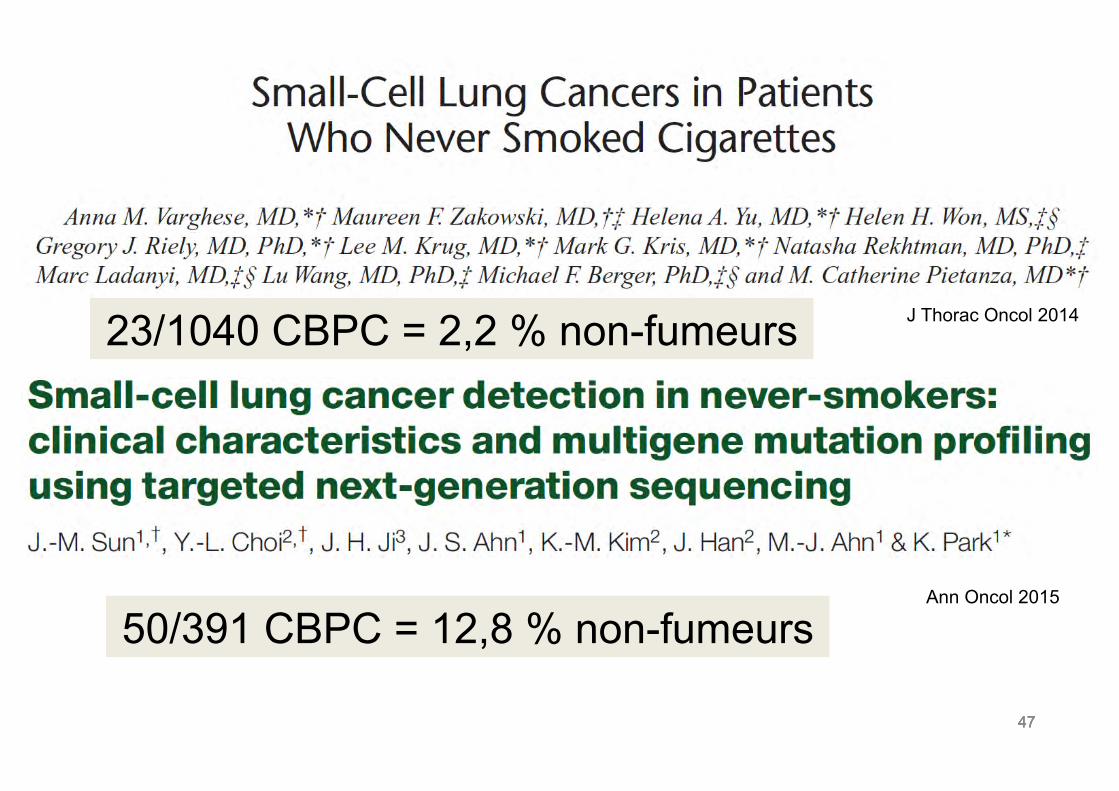
47 47 47
23/1040 CBPC = 2,2 % non-fumeurs J Thorac Oncol 2014
Ann Oncol 2015
50/391 CBPC = 12,8 % non-fumeurs
48 48
Anomalies moléculaires
48
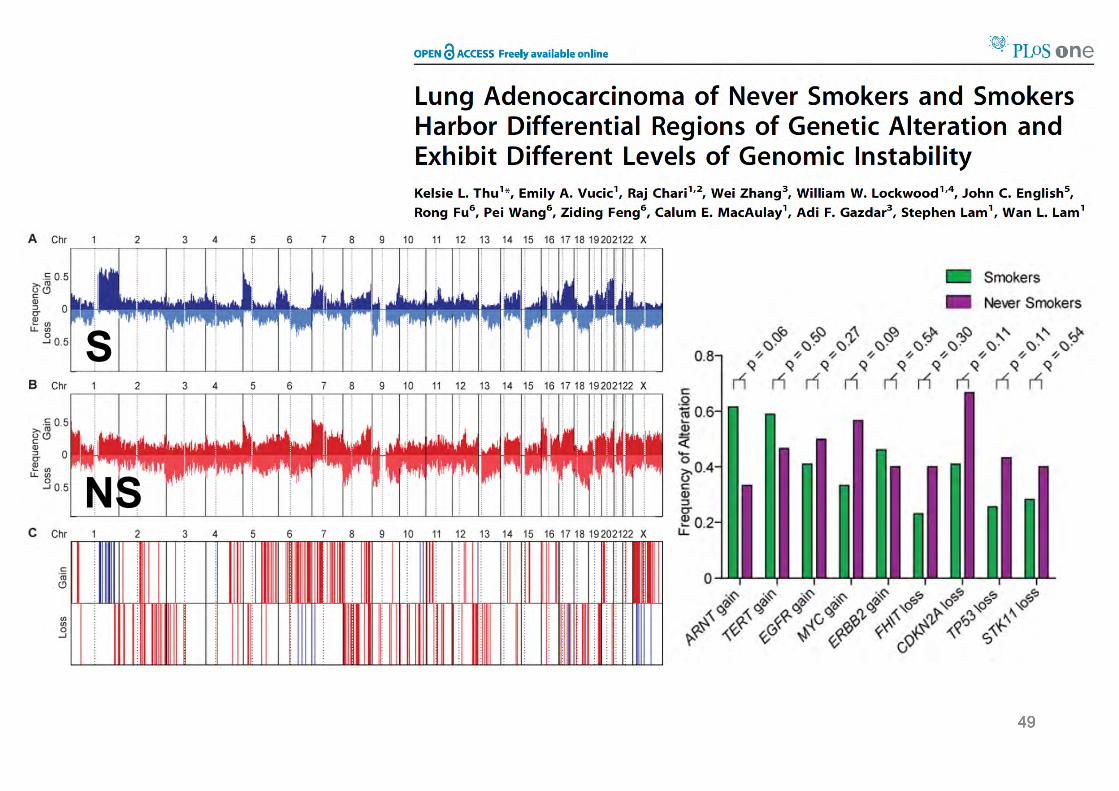
49 49 49
S
NS
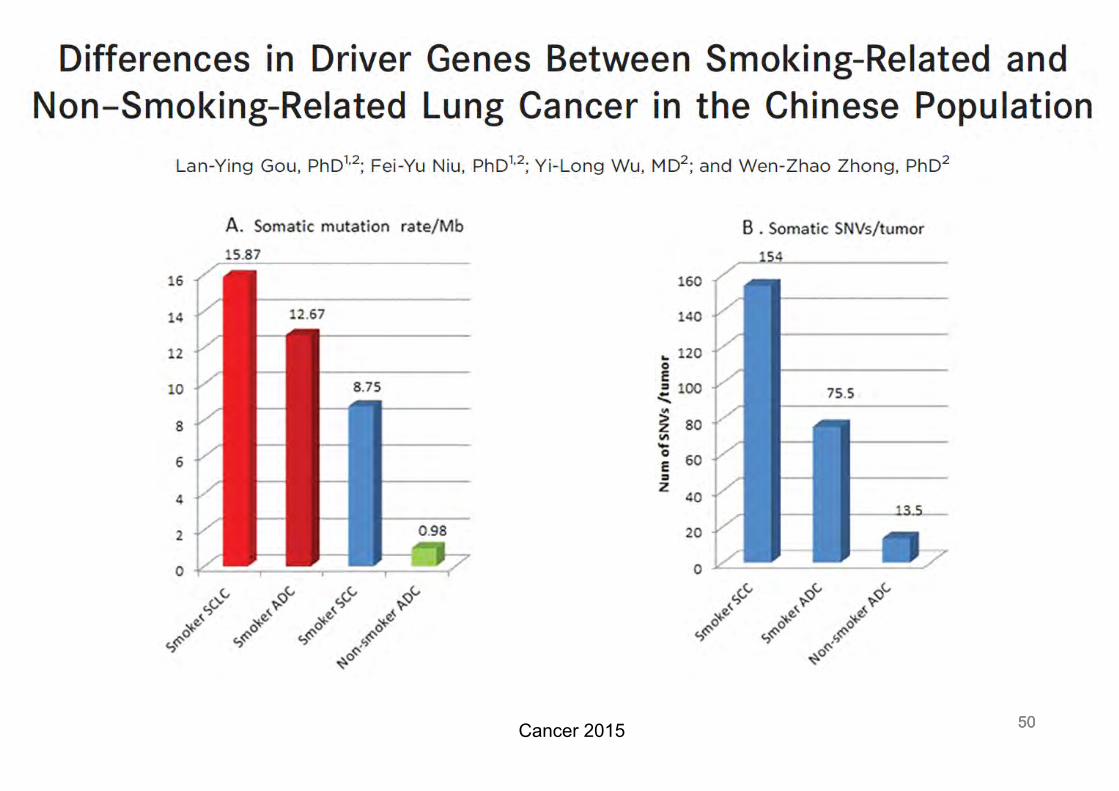
50 50 50 Cancer 2015
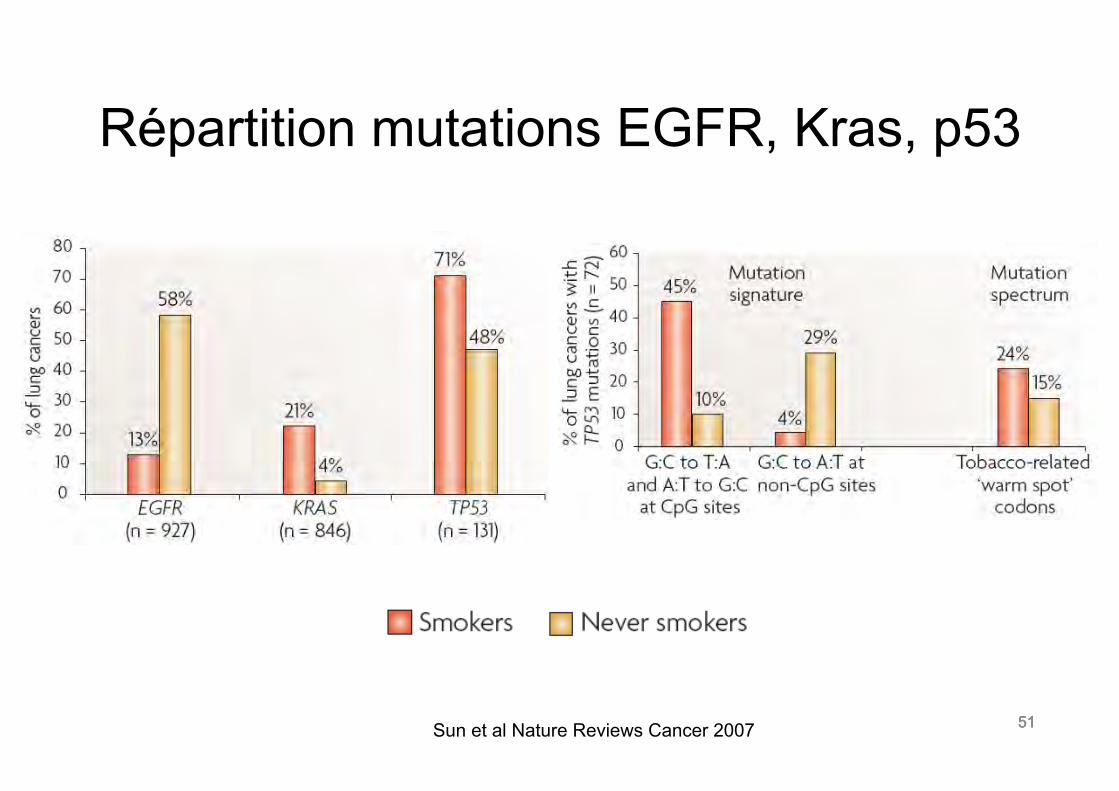
51 51
Répartition mutations EGFR, Kras, p53
Sun et al Nature Reviews Cancer 2007 51
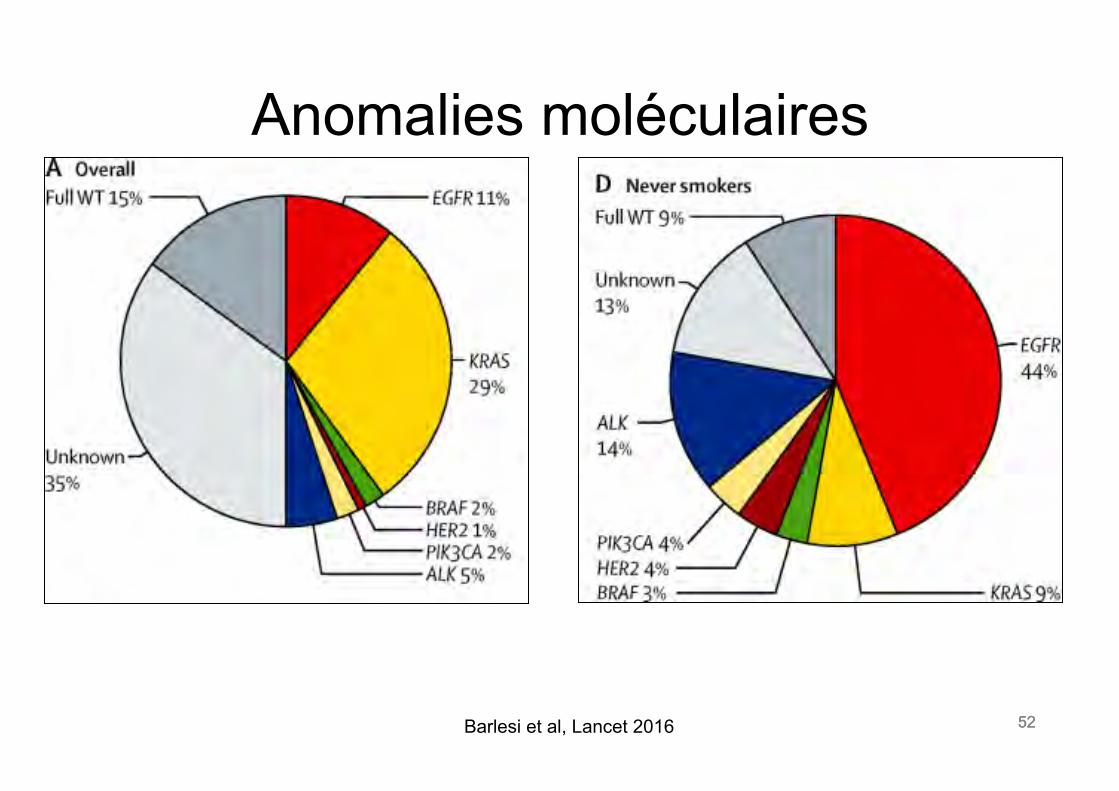
52 52
Anomalies moléculaires
52 Barlesi et al, Lancet 2016
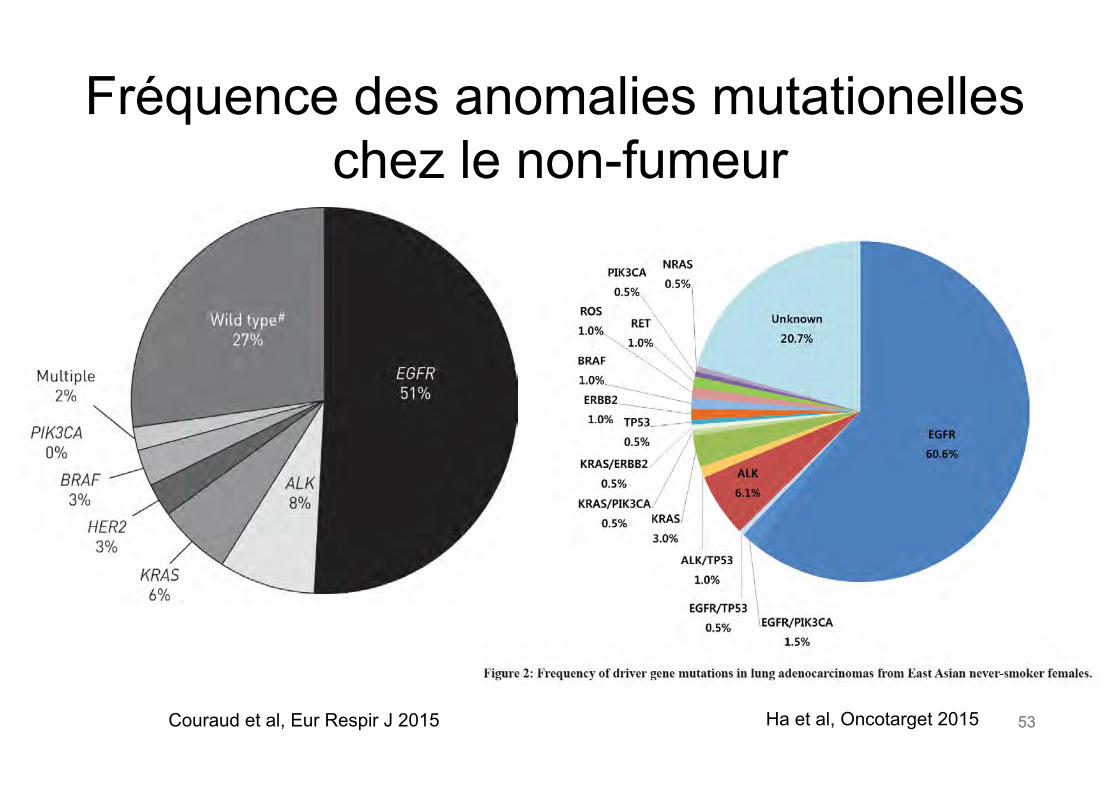
53 53
Fréquence des anomalies mutationelles chez le non-fumeur
Ha et al, Oncotarget 2015 Couraud et al, Eur Respir J 2015
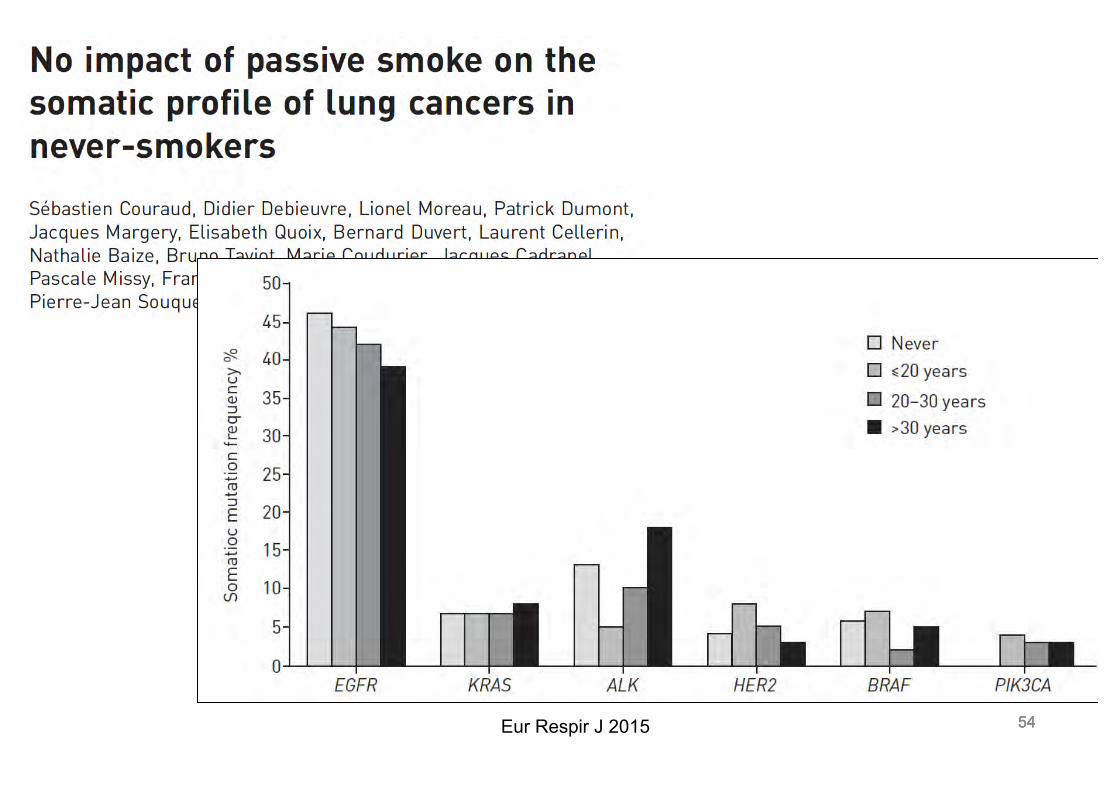
54 54 54 Eur Respir J 2015
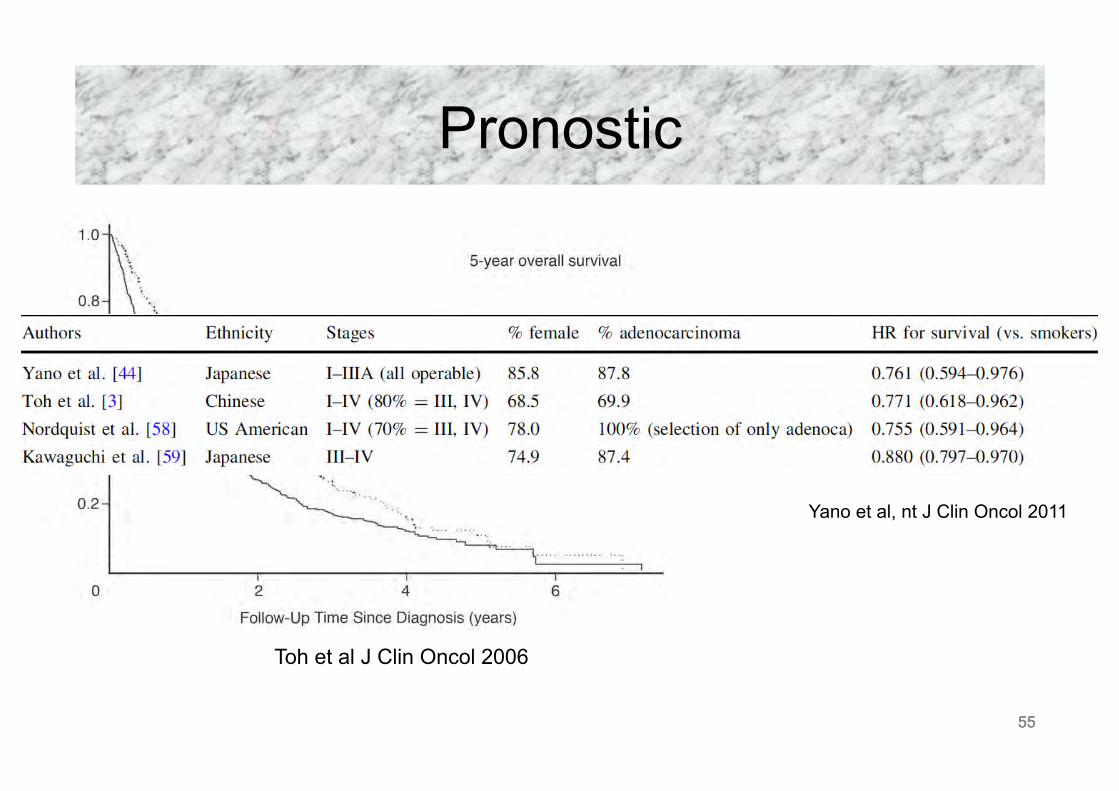
55 55
Pronostic
significant (HR, 1.293; 95% CI 0.971 to 1.723). Similarly, the HR forfemale smokers was higher but statistically nonsignificant (HR, 1.370;95% CI, 0.956 to 1.963.) However, one must bear in mind that suchsubset analyses would result in loss of statistical power to detect asignificant impact of smoking status on survival outcome when ana-lyzed for sex. Among the nonsquamous cell carcinoma subtype, thesmokers had a higher risk of dying compared with the never-smokers(HR, 1.257; 95% CI, 0.989 to 1.598). The small sample size of never-smokers with squamous cell histology may account for the failure to
detect an impact of smoking status in this subset. The smokers havea higher HR of dying at all stages but the risk is much higher amongpatients with early stages (stage I-II) compared with the later stages(stage III and IV; Fig 2).
DISCUSSION
With a significant proportion of never-smokers among NSCLC pa-tients in our population, we were able to compare differences in thecharacteristics and survival outcome between the current-, former-and never-smokers.
It has been shown that lung cancer risk decreases with increasingduration of smoking abstinence.22 In the Nurses Health Study, formersmokers had an age-adjusted risk reduction of 40% compared withcurrent smokers after 2 to 5 years of quitting smoking.23 This wassimilarly observed in the study by Ebbert et al.24 Thus, we analyzed ourdata classifying former smokers as those who had quit smoking formore than 2 years, with the understanding that 2 years is arbitrarilydefined as there is no consensus on an appropriate cut off time period.
Table 2. Comparison Between Male and Female Patients Amongthe Never-Smokers
Variable
Male Female
PNo. % No. %
Age at diagnosis, yearsNo. of patients 90 196 .363Median 60 62Range 29-88 30-91
Histologic subtype (n ! 286) .009Adenocarcinoma 53 58.9 147 75.0Squamous cell carcinoma 5 5.6 12 6.1Others 32 35.6 37 18.9
ECOG status (n ! 280) .6260 11 12.5 26 13.51 65 73.9 135 70.32 8 9.1 20 10.43 3 3.4 11 5.74 1 1.1 0 0
AJCC stage (n ! 284) .168I-II 21 23.6 33 16.9III 20 22.5 63 32.3IV 48 53.9 99 50.8
Comorbidities (n ! 284) .959No 50 56.8 112 57.1Yes 38 43.2 84 42.9
Weight loss, kg (n ! 235) .1060 to 5 65 86.7 149 93.1" 5 10 13.3 11 6.9
Abbreviations: ECOG, Eastern Cooperative Oncology Group; AJCC, Ameri-can Joint Committee on Cancer.
Fig 1. Kaplan-Meier survival curves stratified by smoking status.
Table 3. Univariate Survival Analysis by Cox Regression
Variable Unadjusted HR 95% CI P
Smoking status (n ! 883)Never 1Former 1.274 1.023 to 1.586 .030Current 1.364 1.156 to 1.609 # .001
Sex (n ! 974)Male 1Female 0.877 0.753 to 1.021 .090
Ethnicity (n ! 974)Chinese 1Malay 1.309 1.020 to 1.680 .034Indian 1.155 0.723 to 1.844 .547Others 1.681 0.949 to 2.974 .075
Histologic subtype (n ! 972)Squamous cell carcinoma 1Nonsquamous cell carcinoma 0.940 0.800 to 1.105 .455
ECOG status (n ! 952)0 11 1.295 1.000 to 1.678 .0502 3.354 2.476 to 4.544 # .0013 3.497 2.508 to 4.878 # .0014 9.258 5.382 to 15.926 # .001
AJCC stage (n ! 967)I-II 1III 3.125 2.482 to 3.935 # .001IV 5.135 4.098 to 6.434 # .001
Comorbidities (n ! 965)No 1Yes 1.136 0.988 to 1.307 .073
Weight loss, kg (n ! 741)0 to 5 1" 5 2.292 1.793 to 2.930 # .001
Treatment (n ! 968)Yes 1Supportive/no treatment 2.501 2.079 to 3.007 # .001
Abbreviations: HR, hazard ratio; ECOG, Eastern Cooperative OncologyGroup; AJCC, American Joint Committee on Cancer.
Toh et al
2248 JOURNAL OF CLINICAL ONCOLOGY
Downloaded from jco.ascopubs.org by Thierry Berghmans on March 3, 2011 from 193.191.131.34Copyright © 2006 American Society of Clinical Oncology. All rights reserved.
Toh et al J Clin Oncol 2006
55
Yano et al, nt J Clin Oncol 2011
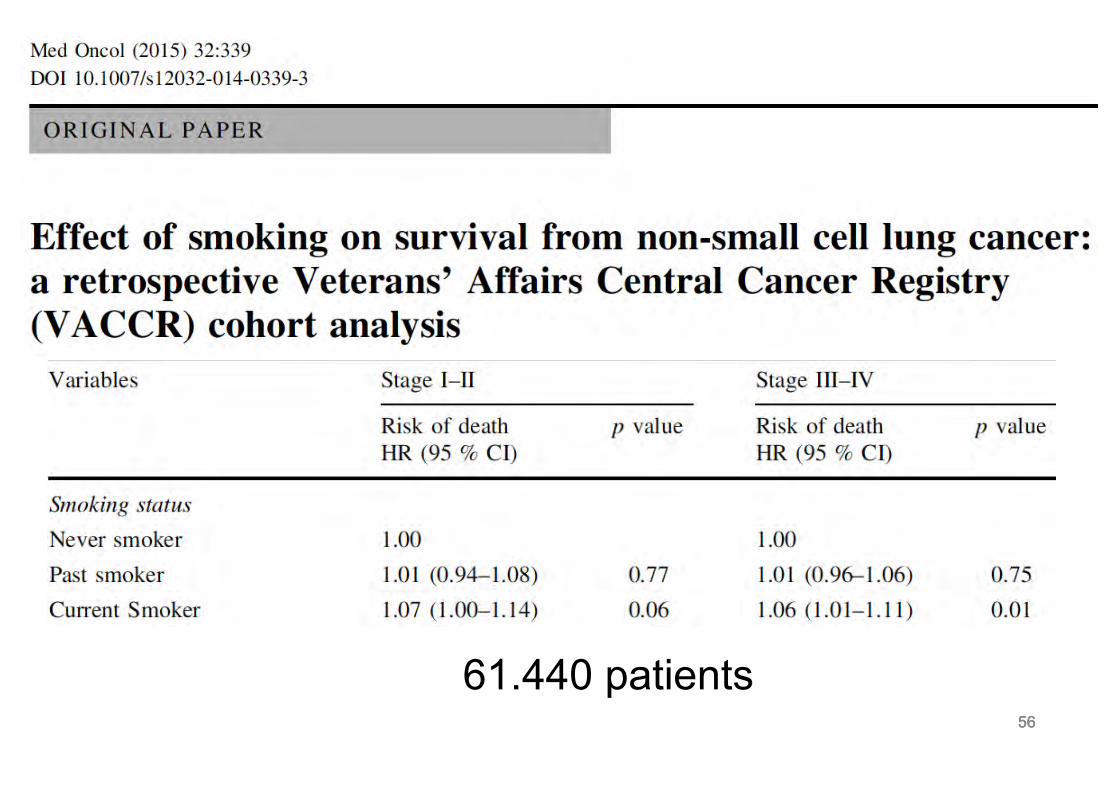
56 56 56
61.440 patients
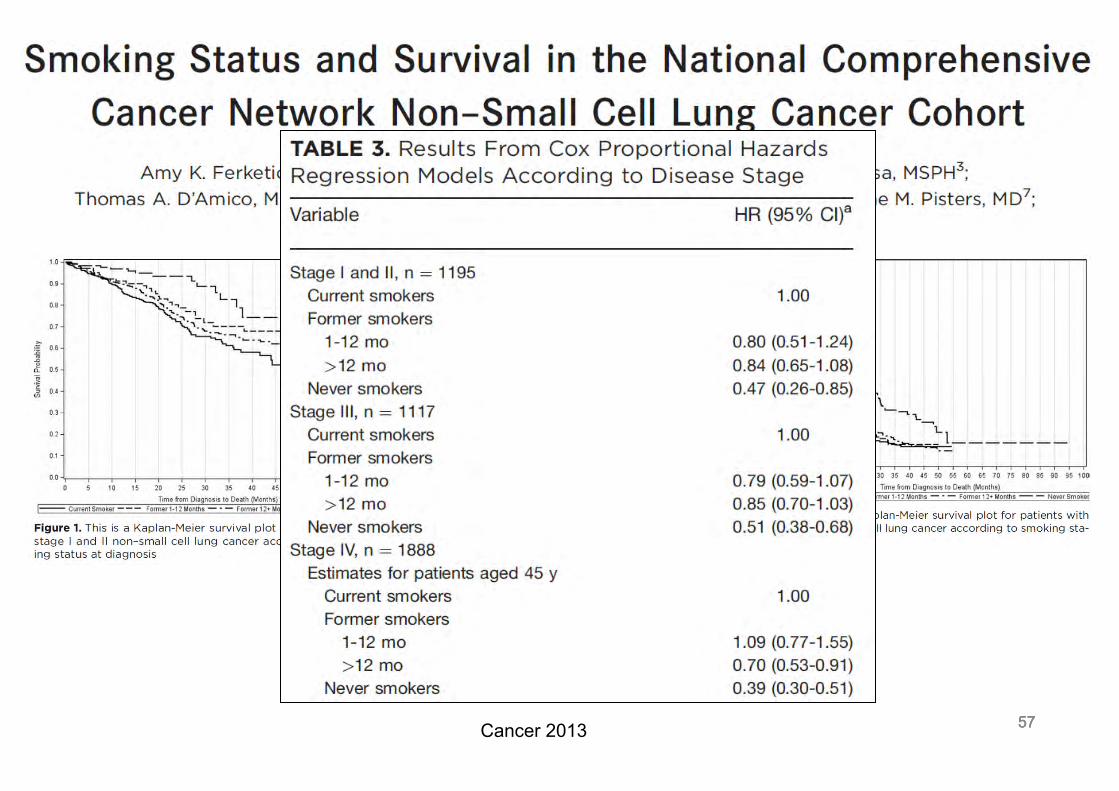
57 57 57 Cancer 2013
58 58
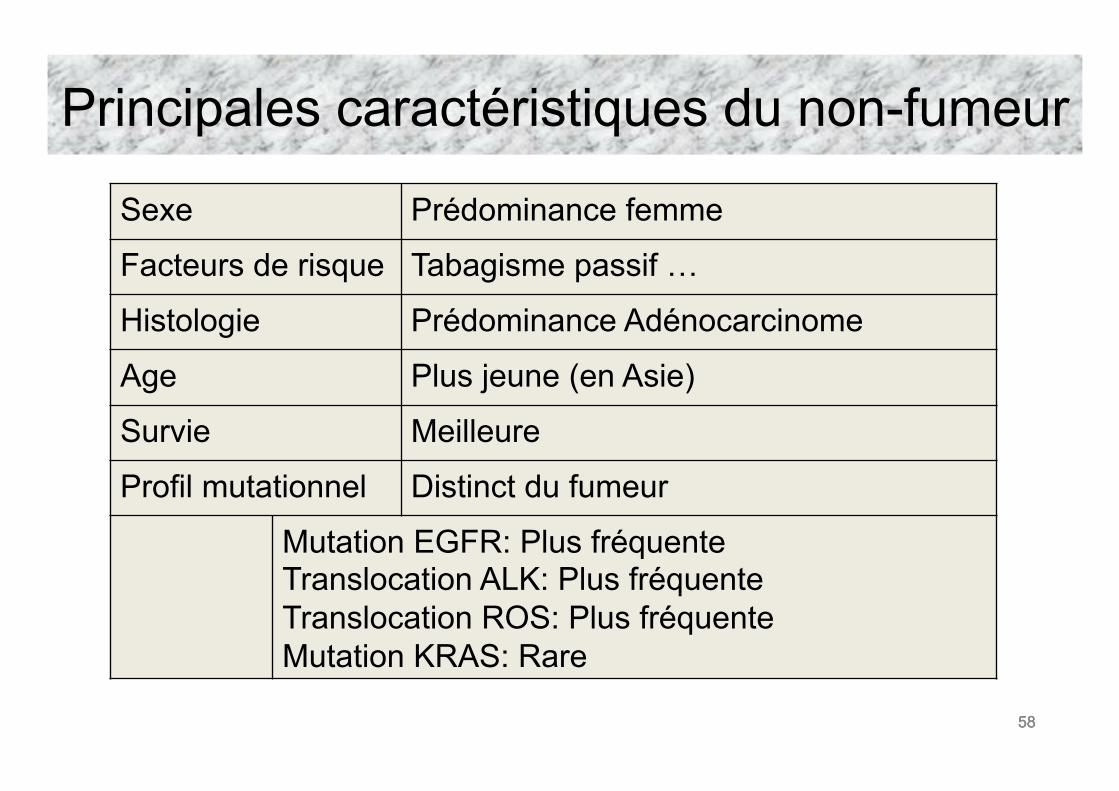
Principales caractéristiques du non-fumeur
Sexe Prédominance femme
Facteurs de risque Tabagisme passif …
Histologie Prédominance Adénocarcinome
Age Plus jeune (en Asie)
Survie Meilleure
Profil mutationnel Distinct du fumeur
Mutation EGFR: Plus fréquente Translocation ALK: Plus fréquente Translocation ROS: Plus fréquente Mutation KRAS: Rare
58
FORMATION CONTINUE
Certificat européen interuniversitaire en oncologie thoracique Examen donnant droit à une attestation de réussite délivrée par l’Université Libre de Bruxelles et l’Université d’Aix-
Marseille
• L’examen aura lieu durant le CPLF à Marseille, le vendredi 27 janvier 2017 à 14h au Mercure Prado
• Condition : être inscrit et avoir assisté au cours du GOLF qui précède le CPLF • L’inscription à l’examen se fait auprès de Madame Caroline Gustin : [email protected]
avec la preuve de participation au cours du GOLF 2016 • Frais d’inscription : 50 € à payer avant le 15/12/2016
• Soit par Virement bancaire à l’ELCWP : compte IBAN : BE62 3100 7281 5461 - Swift/Bic : BBRUBEBB - Banque ING, rue d'Arlon 26 à 1050 Bruxelles avec votre nom en communication + examen
• soit par Visa card/Eurocard (Carte bleue) n° • _ _ _ _ / _ _ _ _ / _ _ _ _ / _ _ _ _ • Date d’expiration……/…… • Nom du titulaire :………………………………… • Signature : • Date limite d’inscription : 15 décembre 2016 - Aucun chèque ne sera accepté