Embed Size (px)
Citation preview
Changing the Face of
the WatersTHE PROMISE AND CHALLENGE
OF SUSTAINABLE AQUACULTURE
A G R I C U L T U R E A N D R U R A L D E V E L O P M E N T
41694
Pub
lic D
iscl
osur
e A
utho
rized
Pub
lic D
iscl
osur
e A
utho
rized
Pub
lic D
iscl
osur
e A
utho
rized
Pub
lic D
iscl
osur
e A
utho
rized
Pub
lic D
iscl
osur
e A
utho
rized
Pub
lic D
iscl
osur
e A
utho
rized
Pub
lic D
iscl
osur
e A
utho
rized
Pub
lic D
iscl
osur
e A
utho
rized
ChangingTHE FACE OFTHE WATERS

ChangingTHE FACE OFTHE WATERS
A G R I C U LT U R E A N D R U R A L D E V E L O P M E N T
The Promise and Challenge of Sustainable Aquaculture
THE WORLD BANK
Washington, DC
© 2007 The International Bank for Reconstruction and Development /The World Bank1818 H Street NWWashington, DC 20433Telephone: 202-473-1000Internet: www.worldbank.orgE-mail: [email protected]
All rights reserved.
1 2 3 4 :: 10 09 08 07
This volume is a product of the staff of the International Bank for Reconstructionand Development/The World Bank. The findings, interpretations, and conclusionsexpressed in this volume do not necessarily reflect the views of the Executive Directorsof The World Bank or the governments they represent.
The World Bank does not guarantee the accuracy of the data included in this work.The boundaries, colors, denominations, and other information shown on any map inthis work do not imply any judgment on the part of The World Bank concerning thelegal status of any territory or the endorsement or acceptance of such boundaries.
Rights and PermissionsThe material in this publication is copyrighted. Copying and/or transmitting portionsor all of this work without permission may be a violation of applicable law. TheInternational Bank for Reconstruction and Development/The World Bank encouragesdissemination of its work and will normally grant permission to reproduce portions ofthe work promptly.
For permission to photocopy or reprint any part of this work, please send a requestwith complete information to the Copyright Clearance Center Inc., 222 RosewoodDrive, Danvers, MA 01923, USA; telephone: 978-750-8400; fax: 978-750-4470; Internet:www.copyright.com.
All other queries on rights and licenses, including subsidiary rights, should beaddressed to the Office of the Publisher, The World Bank, 1818 H Street NW,Washington, DC 20433, USA; fax: 202-522-2422; e-mail: [email protected].
ISBN-10: 0-8213-7015-4ISBN-13: 978-0-8213-7015-5eISBN-10: 0-8213-7016-2eISBN-13: 978-0-8213-7016-2DOI: 10.1596/978-0-8213-7015-5
Cover photo: Michael Phillips and Sena S. DeSilva, NACA.
Library of Congress Cataloging-in-Publication data has been applied for.C O N T E N T S
Boxes, Figures, and Tables vii
Preface and Acknowledgments xi
Acronyms, Abbreviations, Currencies, and Units of Measure xv
Introduction and Overview 1Focus of the Study 1A Surging Global Industry 2Challenges and Approaches 4
1. Trends in Global Aquaculture 13Emergence of a Global Industry 13Production, Markets, and Trade 15Future Supply and Demand Projections 19The Role of External Assistance and the International
Financial Institutions 20
2. Aquaculture, Environment, and Health 23The Impact of Aquaculture on the Environment 23The Impact of Aquaculture on Human Health 29Environmental Services from Aquaculture 35
3. Innovation and Technologies 40Feeds, Seeds, and Disease 40Technology Transfer and Capacity Building 49
v
C O N T E N T S
4. Building Pro-Poor Aquaculture 56Impacts of Aquaculture on Poverty and Livelihoods 56Lessons from Asia 58Creating and Distributing Wealth through Aquaculture 62
5. Catalyzing Aquaculture in Less-Developed Countries 68The Status of Aquaculture in Africa 69Diagnosis for Sub-Saharan Africa 70Unlocking the Potential 72Catalyzing Sustainable Aquaculture in Latin America 78
6. Conclusions and Recommendations 82Conclusions 82Recommendations 91
Annexes 93Annex 1. Definitions of Aquaculture Production Systems 94Annex 2. Selected Codes, Instruments, and Tools for Responsible
Aquaculture 97Annex 3. Portfolio Analysis 103Annex 4. Wealth Creation and Poverty Alleviation—The Asian
Experiences 110Annex 5. Supplementary Statistical Information 135Annex 6. The Diversity of Aquaculture Production Systems and
Business Models 146Annex 7. Guidelines for the Preparation and Implementation of
Aquaculture Projects 156
Notes 163
References 165
Index 180B OX E S , F I G U R E S , A N D TA B L E S
vi CONTENTS
Boxes2.1 Fish and Human Health 32
2.2 Win-Win Situations for Aquaculture and the Environment 33
2.3 Aquaculture and Climate Change—Marine Carbon Sequestration 38
3.1 Public Sector and Fish Breeding and Seed Supply Programs 46
3.2 Benefits of One-Stop Aqua Shops 52
3.3 Guiding Principles from Reviews of External Assistance to Asian Aquaculture 53
4.1 Relative Incomes from Aquaculture and Agriculture 57
4.2 Bringing the Blue Revolution to the Poor 61
4.3 Enabling Factors for Selected Pro-Poor Aquaculture Technologies and Systems 62
4.4 Trade Disputes over Aquaculture Products 67
5.1 The Abuja Declaration on Sustainable Fisheries and Aquaculture in Africa 73
A4.1 China–World Bank Freshwater Fisheries Project, 1986–92 113
A4.2 Constraints of Community-Based Fish Farming—Project Scorecard in Puri District of Orissa and Purulia District of West Bengal 115
vii
B OX E S , F I G U R E S , A N D TA B L E S
A4.3 An Integrated Livestock-Fish-Farming System in Indonesia’s Rice-Based Agriculture 116
A4.4 Enabling Diffusion and Accelerating Adoption of Technology by the Poor 121
A4.5 Group-Based Aquaculture Models in Bangladesh 122
A4.6 Capital Movement and Environmental Controls 128
A5.1 Examples of the Growing Number of Species Artificially Propagated for Stock Enhancement 136
Figures
1.1 Aquaculture Production by Developed and Developing Countries 17
1.2 Global Population and Fish Food Supply from Fish Capture and Culture 18
2.1 Antibiotics and Salmon Production in Norway 34
A4.1 Growth in Fisheries Employment in China, 1974–2000 112
A4.2 Changing Fortunes—Shrimp Aquaculture Production by Selected Producers 127
A5.1 Real Production Costs and Sale Prices of Farmed Atlantic Salmon 141
A5.2 Aquaculture Production of Aquatic Animals by Main Species and Trophic Groups 142
A5.3 Aquaculture Production by Continent, 2004 143
A5.4 Growing Dominance of the Innovators: Global Atlantic Salmon Production 143
A5.5 Global Aquaculture Production 145
A6.1 Schematic Diagram of an Integrated Commercial Farm in Israel 147
A6.2 Generic Representation of a Range of Low- and High-Trophic-Level Aquaculture Production Systems 149
Tables
1.1 Aquaculture Production and Growth in 2004 16
1.2 Top 10 Producer Countries by Quantity and by Unit Value in 2004 16
1.3 World Bank Projects with Aquaculture Components 21
1.4 Recent IFC Aquaculture Loans by Region 22
2.1 Environmental Costs and Benefits of Aquaculture 24
viii BOXES, FIGURES,AND TABLES
2.2 Table-Certified Cultured Fish Products in EU Supermarkets 36
3.1 Changes in Prices and Production for Genetically Improved Species 41
3.2 Responses to Selection for Growth Rate 44
4.1 Characterization of Aquaculture Development Pathways in Asia 59
A3.1 Portfolio of World Bank Projects with an Aquaculture Component 104
A3.2 IFC Aquaculture Projects 1992–2006 107
A4.1 Annual Income by Stakeholder Group within the Bangladesh Shrimp Industry 119
A5.1 Aquaculture Production by Trophic Level of Cultured Species, 2003 135
A5.2 Aquaculture Export Earnings in Some Developing Countries ofAsia, 2003 136
A5.3 Top 40 Aquaculture Producer Nations, 2004 137
A5.4 Projections of Food Fish Demand 139
A5.5 Total Per Capita Food Fish Supply by Continent and Economic Grouping in 2001 140
A5.6 Fish Consumption before and after Adoption of Improved Aquaculture in Bangladesh 144
A5.7 Production by Major African Aquaculture Producers 144
A6.1 Ecological Footprints of Aquaculture Systems 148
BOXES, FIGURES,AND TABLES ix

The World Bank Group has already recognized the important role of aqua-culture, investing approximately $1 billion in aquaculture projects or projectswith an aquaculture component. As with any rapidly evolving industry, thereare challenges across a spectrum of policy, social, and technical issues. Thechallenge of sustainable aquaculture is to contribute to national objectives foreconomic development and food security while simultaneously addressingpoverty reduction and environmental protection.
This study provides strategic orientations and recommendations for Bankclient countries and suggests approaches for the Bank’s role in a rapidly chang-ing industry with high economic potential. It identifies priorities and optionsfor policy adjustments, catalytic investments, and entry points for the Bankand other investors to foster environmentally friendly, wealth-creating, andsustainable aquaculture.
The audience to which this study is addressed includes client countries’ pol-icy and decision makers in aquaculture, fisheries, and natural resource manage-ment, as well as individuals addressing poverty issues, agriculture development,and environmental protection. The target audience also includes food industryand food trade professionals, the scientific community, development partners,and persons engaged in human capacity development for aquaculture.
Aquaculture can be defined as the farming and husbandry of aquatic organ-isms, such as fish, crustaceans, mollusks, and seaweed, and the production offreshwater and marine pearls and a variety of other aquatic species, such ascrocodiles, frogs, sponges, and sea cucumbers. (The word “fish,” unless other-
xi
P R E F A C E A N DA C K N O W L E D G M E N T S
xii PREFACE AND ACKNOWLEDGMENTS
wise stated, is used throughout the report in the generic sense to cover allaquatic animal production, including fish, crustaceans, and mollusks.)
The Food and Agriculture Organization of the United Nations (FAO)defines aquaculture as follows:
The farming of aquatic organisms in inland and coastal areas, involvingintervention in the rearing process to enhance production and the indi-vidual or corporate ownership of the stock being cultivated.
The definition distinguishes aquaculture from capture fisheries; in fact, thegrowth potential of aquaculture lies primarily in its fundamental differencesfrom capture fisheries: with aquaculture, far greater control can be exerted overinputs and production.
In 2001, aquaculture was recognized as a separate economic activity underthe International Standard Industrial Classification of All Economic Activities.The collection of statistical data on aquaculture, separate from fisheries data, isa recent endeavor in many countries. In this study, we refer to aquaculture as asector.
The study reviewed current trends in aquaculture and aquaculture projectsand programs supported by the Bank and its client countries and other inter-national financial institutions (IFIs) and donors to assess their roles andimpacts. Aquaculture codes, guidelines, legislation, and recommended prac-tices were examined, as were the roles of the public and private sectors and thenature of the institutional frameworks for development and management ofaquaculture. Two background studies explored Asian experiences in the use ofaquaculture for poverty alleviation and in the transfer of technology andhuman capacity building. Two additional background studies on aquaculturein Sub-Saharan Africa and in Brazil were complemented by literature surveysand discussions. The study drew on previous work and work in progress byFAO, the WorldFish Center (WFC), the Network of Aquaculture Centres inAsia-Pacific (NACA), and the Norwegian salmon industry.
The review of status and trends drew on draft global and regional reviewsprepared by FAO as a result of a mandate by the FAO Committee on Fisheries(COFI) and its Sub-Committee on Aquaculture: to “provide a prospectiveanalysis of future challenges in global aquaculture as a basis for a discussion of the longer term direction of the Sub-Committee’s work” (para 73) and“work on environmental risk assessment, including species introductions andundertaking a thematic evaluation of social and economic impact of aqua-culture” (para 74) (COFI 2005). The study benefited from a range of studiesprepared by WFC and from the collaboration among the World Bank andother institutions, including FAO and NACA.
The identification, planning, design, and implementation of some 67 WorldBank projects were reviewed, including 30 projects financed by the Bank’s con-cessional (IDA) or public-sector-lending (IBRD) institutions, and 8 projects
with an aquaculture component financed by the Bank’s private-sector-lendinginstitution (IFC) (see annex 3). The study also examined project evaluationsand experiences of other IFIs, including the Asian Development Bank (ADB)and the Inter-American Development Bank (IADB), bilateral and multilateraldevelopment assistance projects (for example, FAO and the United NationsDevelopment Programme [UNDP]), and private and public sector invest-ments. Details of the development agency aquaculture portfolios examined areprovided in annex 3. Aquaculture components are frequently embedded inprojects and programs with a broader scope, for example, coastal managementor rural development. The study extracted those lessons of particular relevanceto aquaculture that are often lost in evaluations that focus on overall projectimpact or larger non-aquaculture components.
The analyses used the Project Completion Reports, Implementation Com-pletion Reports, and similar evaluations of the IFIs. Interviews were held witha number of project leaders, task managers, division chiefs, and sector man-agers within the World Bank Group and IADB. The review also drew on aqua-culture evaluations undertaken by ADB, the Canadian International Develop-ment Agency (CIDA), the U.K. Department for International Development(DFID), the Danish International Development Agency (DANIDA), the Ger-man Agency for Technical Cooperation (GTZ), the International Fund forAgriculture Development (IFAD), the United States Agency for InternationalDevelopment (USAID), and FAO.
The study draws on parallels in other sectors, such as science and technol-ogy, livestock, and agriculture, while forging links to generic policy and plan-ning exercises such as Poverty Reduction Strategy Papers (PRSPs) and Coun-try Assistance Strategies (CASs). In the case of Latin America, the study focuseson Brazil as illustrative of many of the issues facing aquaculture on the conti-nent. Although Chile is Latin America’s most important producer because ofthe unique character of Chilean aquaculture (colder waters and species; forexample, salmon, trout, and scallops), this study does not specifically examineaquaculture in Chile.
ACKNOWLEDGMENTS
This study was prepared under the leadership of Kevin Cleaver, director of theAgriculture and Rural Development (ARD) Department of the World Bank,and Sushma Ganguly, sector manager of ARD. The task team included ZiadShehadeh (consultant), Cornelis de Haan (ARD), Eriko Hoshino (ARD),Ronald Zweig (East Asia Region of the World Bank), and Patrice Talla (LegalVice Presidency of the World Bank). Kieran Kelleher (ARD) was lead authorand task manager.
The team extends its thanks to Mafuzuddin Ahmed (Institute for FisheriesManagement and Coastal Community Development), Pedro Bueno (Network
xiiiPREFACE AND ACKNOWLEDGMENTS
of Aquaculture Centres in Asia-Pacific, NACA), Edward Chobanian (consult-ant), Antonio Diegues (Universidade de São Paulo), and Simon Heck (World-Fish Center) for their valuable input through commissioned studies. Particu-lar thanks is owed to the staff members of the Food and AgricultureOrganization (FAO) Fisheries Department, Inland Water Resources and Aqua-culture Service (FIRI), for their invaluable collaboration and support, and toTrygve Gjedrem (Akvaforsk Genetics Center AS), Otto Gregussen (Embassy ofNorway), Michael Phillips (NACA), Barry Costa-Pierce (University of RhodeIsland), Robert Robelus (Africa Region of World Bank), Oliver Ryan (Interna-tional Finance Corporation), and John Moehl (FAO) for their constructivecomments, suggestions, and assistance.
The task team thanks the ARD Management Committee and members ofthe Fisheries Focal Point for their support and guidance, and Melissa Williams,Marisa Baldwin, Joyce Sabaya, Felicitas Doroteo-Gomez, and Eric Schlesingerof ARD, as well as Daud Khan of FAO, for assistance with logistics and pro-duction of the study.
xiv PREFACE AND ACKNOWLEDGMENTS
AADCP ASEAN-EC Aquaculture Development Coordinating ProgramAAPQIS Aquatic Animal Pathogen and Quarantine Information SystemACIAR Australian Centre for International Agricultural ResearchADB Asian Development BankADCP Aquaculture Development and Coordination Programme of
FAO/UNDPAIT Asian Institute of TechnologyARD Agriculture and Rural DevelopmentASD amnesiac shellfish diseaseASEAN Association of Southeast Asian NationsATSE Australia Academy of Technological Sciences and EngineeringBAP Best Aquaculture PracticesBCSFA British Columbia Salmon Farmers AssociationBMPs codes of practice and best management practicesBSE bovine spongiform encephalopathyCASs Country Assistance StrategiesCCRF Code of Conduct for Responsible FisheriesCERs emission reduction creditsCGEP Code of Good Environmental PracticesCGIAR Consultative Group on International Agriculture ResearchCIDA Canadian International Development AgencyCOD chemical oxygen demandCOFI FAO Committee on Fisheries
xv
C H A P T E R T I T L EA C R O N Y M S , A B B R E V I AT I O N S ,C U R R E N C I E S , A N D U N I T S O FM E A S U R E
CSIRO Commonwealth Scientific and Industrial Research Organisation (Australia)
DANIDA Danish International Development AgencyDFID U.K. Department for International DevelopmentDSAP Development of Sustainable Aquaculture ProjectDSP diarrhetic shellfish poisoningEIAs Environmental Impact AssessmentsEIFAC European Inland Fisheries Advisory CommissionESRP Environmental and Social Review ProcedureFAO Food and Agricultural OrganizationFDI foreign direct investmentFIRI Fisheries Department, Inland Water Resources and Aquaculture
Service (FAO)FSR&E farming systems research and extensionGMOs genetically modified organismsGTZ German Agency for Technical CooperationHAB harmful algal bloomsHACCP Hazard Analysis and Critical Control PointIAA integrated agriculture-aquacultureIADB Inter-American Development BankIBRD International Bank for Reconstruction and DevelopmentICES International Council for the Exploration of the SeasICRs Implementation Completion ReportsICZM integrated coastal zone managementIDA International Development AssociationIDRC International Development Research CenterIFAD International Fund for Agricultural DevelopmentIFC International Finance CorporationIFF integrated fish farmingIFIs international financial institutionsIFPRI International Food Policy Research InstituteIIC Inter-American Investment CorporationINFOFISH Intergovernmental Organization for Marketing Information
and Technical Advisory Services for Fishery Products in theAsia-Pacific Region
INGA International Network on Genetics in AquacultureIP Indigenous Peoples PolicyIR Involuntary Resettlement PolicyIRA Import Risk AnalysisIRR internal rate of returnISA infectious salmon anemiaISO 9000 International Organization for Standardization 9000JICA Japan International Cooperation AgencyLIFDC low-income food-deficit country
xvi ACRONYMS, ABBREVIATIONS, CURRENCIES, AND UNITS OF MEASURE
MDGs Millennium Development GoalsMRC Mekong River CommissionMRL minimum risk levelMTDP Medium Term Development PlanNACA Network of Aquaculture Centers in Asia-PacificNACEE Network of Aquaculture Centres in Central and Eastern EuropeNEPAD New Plan for African DevelopmentNFEP Northwest Fisheries Extension ProjectNGOs nongovernmental organizationsNOAA National Oceanic and Atmospheric AdministrationNRC National Research CouncilNTBs nontariff barriersOIE World Organization for Animal HealthPADEK Partnership for Development in KampucheaPCRs Project Completion ReportsPPAs Producteurs Privé d’Alevins (private fingerling producers)PRSPs Poverty Reduction Strategy PapersRAS recirculating aquaculture systemsRFID radio frequency identificationSAARC South Asian Association for Regional CooperationSAPA 2000 Sustainable Aquaculture for Poverty AlleviationSCALE SAO Cambodia Integrated Aquaculture on Low ExpenditureSEAFDEC Southeast Asia Fisheries Development CenterSida Swedish International Development Cooperation AuthoritySMEs small and medium enterprisesSPS sanitary and phytosanitary measuresSSA Sub-Saharan AfricaSTREAM Support to Regional Aquatic Resources ManagementTCDC Technical Cooperation among Developing CountriesUNDP United Nations Development ProgrammeUSAID United States Agency for International DevelopmentWFC WorldFish CenterWWF World Wildlife Fund
CURRENCIES AND UNITS OF MEASURE
ACRONYMS, ABBREVIATIONS, CURRENCIES, AND UNITS OF MEASURE xvii
€ euroha hectarekg kilogramkm2 square kilometerm2 square meterm3 cubic meterP Philippine peso
Tk Bangladeshi takaton/tons metric ton/tons
(1,000 kg)US$ U.S. dollars (all dollar
amounts are U.S.dollars unless other-wise indicated)
Y Chinese yuan

Total world aquaculture production will have reached between 35 millionand 40 million tonnes of finfish, crustaceans and molluscs in 2010.
—The state of the world fisheries and aquaculture 1998
More than half a decade ahead of these projections, aquaculture pro-duction has already reached 45 million tons, providing more than 40percent of the global food fish supply. As production from capture
fisheries stagnates, aquaculture is changing the face of our waters.
FOCUS OF THE STUDY
The objectives of the study are to inform and provide guidance on sustainableaquaculture to decision makers in the international development communityand in client countries of international finance institutions. The study focuseson several critical issues and challenges:
■ Harnessing the contribution of aquaculture to economic development,including poverty alleviation and wealth creation, to employment and tofood security and trade, particularly for least developed countries (LDCs)
■ Building environmentally sustainable aquaculture, including the role ofaquaculture in the broader suite of environmental management measures
1
I N T R O D U C T I O N A N D OV E R V I E W
■ Creating the enabling conditions for sustainable aquaculture, including thegovernance, policy, and regulatory frameworks, and identifying the roles ofthe public and private sectors
■ Developing and transferring human and institutional capacity in gover-nance, technologies, and business models with special reference to the appli-cation of lessons from Asia to Sub-Saharan Africa and Latin America
A SURGING GLOBAL INDUSTRY
Aquaculture lies at a crossroads. One direction points toward the giant stridesin productivity, intensification and integration, industry concentration, anddiversification in products, species, and culture systems. Another directionpoints toward the risks of environmental degradation and marginalized small-holders. Yet another direction invites aquaculture to champion the poor andprovide vital environmental services to stressed aquatic environments.
The development assistance community has an important role to play insupporting countries as they chart these paths onto a balanced road map forsustainable aquaculture. The vision of sustainable aquaculture demands notonly a favorable business climate, but also a governance framework thatembraces social objectives and enforces environmental standards. Workingwith client countries, development assistance can build cross supports andsynergies between aquaculture’s diverse agendas: the market driven, the envi-ronmental, and the pro-poor.
Aquaculture production has continually outstripped projections, andthere is little reason to believe that it will not continue to do so. It is inher-ently more efficient than livestock production. The production chain isshorter and more efficient than for capture fisheries. Moreover, the increas-ing control over aquaculture production systems is in stark contrast to thefaltering management of capture fisheries, for which rising fuel prices arehaving a disproportionately higher impact on costs. Massive productivitygains are resulting in the falling prices of cultured fish and are extending theconsumer base. The scarcity of wild fish creates further market space, whilesupermarket chains demand stable supplies—uniform-size fish with cleartraceability that cannot be readily supplied by volatile capture fisheries. Inaddition to fish production, responsible aquaculture brings environmentalbenefits, integrating waste management in urban and rural settings.
New legal instruments are emerging to expand the use of aquatic commons,and good governance is taking firm root in several developing countries.Aquatic farming is likely to intensify, expand, and diversify in ways that cur-rently are unforeseen. Artificial selection may increasingly supplant naturalselection and transform aquatic food chains. From fish foods to pharmaceu-ticals, from ocean carbon sequestration to management of entire aquaticecosystems—society will progressively extend control over aquatic resources.
2 CHANGING THE FACE OF THE WATERS
This control will drive a gradual convergence between aquaculture and theecosystem approach to fisheries called for in the Johannesburg Plan of Action.
Fish Supply and Benefits from Aquaculture
Fish supply from capture fisheries has stagnated over the last decade, and nomajor increases can be expected even with improved management practicesand benign climate change. Fish is often the lowest-cost animal protein and theworld’s growing food fish supply gap has a disproportionate impact on thenutrition and health of the poor. Aquaculture must fill that growing supplygap. It is the world’s fastest-growing food production sector, growing at anannual average rate of 10 percent since the mid-1980s, reaching 59.4 milliontons (including aquatic plants) with a farmgate value of $70.3 billion in 2004.More than 90 percent of aquaculture production occurs in developing coun-tries, and China alone accounts for 67 percent of global production. Aqua-culture products account for about 15 percent of global consumption of fishand meat, and in the near future aquaculture is likely to contribute more thanhalf of the world’s supply of food fish. In addition to a growing list of nonfoodproducts and environmental services, aquaculture provides an importantlivelihood, directly employing more than 12 million people in Asia. The sectorprovides important foreign exchange to many developing countries, as trade incultured fish products accounts for 22 percent of the world trade in fish,mostly from the developing world.
Structural Change—From Cottage to Corporation
Modern aquaculture has developed into a dynamic, often capital-intensivebusiness, often with investment by large vertically integrated corporations,some of which are key players in the food retail industry. There have beenmajor increases in aquaculture productivity along the entire production andsupply chain. This growth is attributable to a complex interplay of factors:
Technological advances (in particular, improved broodstock and seeds),improved fish nutrition, and better control of diseases, which drive fishprices downward and open new markets
Intensification of most forms of aquaculture, including diversification of cul-ture systems, the species cultured, business models and feed supplies, andintegration of aquaculture with farming and waste disposal systems
Consolidation and vertical integration through acquisitions and alliances,contracting of the supply chains, elimination of middlemen, generation of costsavings, and facilitation of improved quality of products in response tonational and international market requirements (this structural change altersthe distribution of value added along the production and supply chain, andforces small producers to organize or risk becoming marginalized).
INTRODUCTION AND OVERVIEW 3
The single most important driver of aquaculture is the market, whether forsmallholders or larger commercial farms. It drives increased production, fur-ther intensification, and competition resulting in reduced product prices andfurther market penetration—an expanding feedback loop along a productivitytimeline.
A Knowledge-Based Industry
The modern fish farm is an intensive knowledge-based enterprise, serviced bydedicated commercial scientific institutions devising new technologies andinnovations for corporate clients that move to ever more productive and inten-sive farming practices. Aquaculture has moved from an art to a science. It hasdiversified, intensified, and advanced technologically. Improvements in genet-ics, nutrition, disease management, reproduction control, and environmentalmanagement continue to widen choices for aquaculture, improve its efficiencyand cost-effectiveness, and optimize resource use. These advances not with-standing, aquaculture is still an infant industry. It lags well behind agriculturein application of science and technology and in value chain productivity.Despite advances in the production of high-value carnivorous species (such assalmon and shrimp), more than 70 percent of farmed fish are herbivores,omnivores, or filter-feeders (such as carp, tilapia, or mussels, respectively).
CHALLENGES AND APPROACHES
Three major challenges confront aquaculture: sustainable economic growth,environmental stewardship, and equitable distribution of benefits. An effectiveresponse to these challenges requires a coherent interplay of private investmentand stewardship of public goods. By fostering partnerships and providingaccess to finance and resources, the international community can help devel-oping countries meet these challenges along two intertwined axes of interven-tion: good governance and knowledge generation and dissemination.
Good Governance and the Creation of an Enabling Environment
An effective governance framework will embrace policies and regulationsmolded by a clear vision of the future for aquaculture and a road map to real-ize that vision. The policy framework will address issues of equity and strat-egy, including the following:
■ Principles for use and allocation of the public domain (lakes, reservoirs, seaareas, and freshwater supplies)
■ A socially required balance between smallholder and large aquaculture■ Coherence with other policies and strategies, such as those on poverty alle-
viation, industrial development, water and land use, rights of indigenouspeoples, or regional priorities
4 CHANGING THE FACE OF THE WATERS
■ Environmental sustainability, including mitigation of social and environ-mental externalities
■ Clear definition of the roles of the public and private sectors■ Sector leadership and coordination■ Aquaculture’s fiscal regime
Ideally, a national aquaculture plan and strategy will mainstream aqua-culture into key planning and policy instruments such as Poverty ReductionStrategy Papers (PRSPs), foreign direct investment (FDI) policies, and ruraldevelopment strategies. It will create space for aquaculture in the physical plan-ning processes and coastal zone and water management plans. A national planhas a vital role in creating an attractive investment climate and interagencycoordination, essential to overcome the dynamic nature of an emerging indus-try where public authority is dispersed across sectors, agencies, and disciplines.A participatory process to prepare such national strategies and plans will buildawareness, guide diagnostics, forge a shared public-private vision, and buildpartnerships among government agencies and with the private sector, pro-ducer groups, and nongovernmental organizations (NGOs).
Good governance will draw on codes of practice and best managementpractices (BMPs) to inform and implement policies and plans. Examples ofthese norms include the Food and Agriculture Organization (FAO) Code ofConduct for Responsible Fisheries (CCRF) and its accompanying TechnicalGuidelines; the Holmenkollen Guidelines; the World Organization for AnimalHealth (OIE) International Aquatic Animal Health Code; and other normsprepared with World Bank assistance, such as the International Principles forResponsible Shrimp Farming and the principles for a code of conduct for thesustainable management of mangrove forest ecosystems. Although the appli-cation of these codes may raise production costs, the increased returns fromhealthy and sustainable aquafarms more than justify the costs.
The regulatory and administrative regime will draw on the policies to setout the rights and obligations of fish farmers. The regime may specify, amongother things, the following:
■ Obligation to acquire permits or licenses to establish a farm, based on respon-sible physical planning for aquaculture, including zoning and safeguardingcritical habitats
■ Measures to protect the environment, including environmental impactassessments, audits, environmental monitoring (including benchmarking),and internalizing of the cost of environmental impacts
■ Control and enforcement mechanisms and penalties or means to redressdamage
■ Formal processes for stakeholder consultation with adequate provisions fortransparency and involvement of NGOs
INTRODUCTION AND OVERVIEW 5
■ Standards for aquaculture practices and animal health and certification sys-tems for the health and safety of aquaculture food products and the qualityof seeds and feeds
Private sector investment has dwarfed public investment in aquaculture. Aproactive public sector ideally will be a servant of aquaculture and, in additionto being a steward and guardian, will create an enabling environment that rec-ognizes the role of the private sector as the engine of growth, innovation, andchange. In addition to setting standards and codes, public authorities canestablish a progressive fiscal regime, facilitate access to credit (for example,through secure aquafarm tenure), promote trade, and support applied scienceand capacity building.
Recommendation. The international community can support client countries toimprove aquaculture governance through sector diagnostics and stakeholder dia-logue leading to national policies and plans for sustainable aquaculture. This roadmap will embrace and apply the codes of practices referred to above and establishan enabling environment to nurture private enterprise as a vital innovator andengine of sector growth.
Aquaculture, the Environment, and Human Health
Environmental degradation is aquaculture’s downside. Aggressive export-driven expansion has frequently caused environmental degradation to lands,waters, and coasts; encroached on the livelihoods of the poor; and alienatedcommonages. Biodiversity, critical habitats, and human and animal health havebeen placed at risk through irresponsible aquaculture. However, under increas-ing regulation and public and consumer scrutiny and by drawing on improvedscience, many production systems have become more environmentally friendly,reducing their environmental footprint and even contributing to environmen-tal services. Despite consumer confusion from disinformation on the nutri-tional quality of farmed fish and on the impact of aquaculture on the environ-ment, aquaculture products continue to capture a growing market share.
Aquaculture has domesticated an array of plants and animals in half a dozenphyla. This diversity of species means aquaculture can not only function, buteven thrive in degraded aquatic environments and provide a range of environ-mental services, including waste treatment, water purification, control of humandisease vectors, rebuilding depleted fish stocks, and, possibly in the future, car-bon sequestration. The expansion of freshwater ponds can result in the spreadof human disease vectors, such as snails (bilharzia) and mosquitoes (malaria).Conversely, the stocking of rice paddies, canals, reservoirs, and other publicwaters can reduce the incidence of human disease.
Today’s farmed salmon is a domestic animal with a widening genetic dis-tance from its wild cousins and today, there is more Atlantic salmon in farms
6 CHANGING THE FACE OF THE WATERS
than in the wild. Aquaculture’s threat to aquatic biodiversity and wild germ-plasm is very real and growing: massive numbers of artificially propagated fishand invertebrates released in the wild reproduce, and currents broadcast theirlarvae and progeny over vast distances.
Experience from Asia demonstrated the importance of NGOs and trade inpromoting environmentally sustainable aquaculture, which reverted to farm-ers and national authorities in the form of promoting and adopting betterpractices that reduced or avoided the use of drugs, and advocated water recy-cling or treatment before discharge, efficient feeding regimes, the use of healthyseeds, and clean ponds. Ultimately, it is the returns to the farmer that influenceproduction decisions. Farmers learned that environmental responsibility madegood business sense and that pollution led to the outbreak of diseases; in short,they recognized the link between disease and the environment.
Recommendation. The international community can support an environmen-tally friendly and healthy aquaculture by providing funding for the public goodsdimensions of aquaculture at national and international levels. This includes pro-tection of aquatic biodiversity and wild stocks—a global public good, throughreinforcing application of norms and creation of gene banks. It can also supportthe development of indicators, scorecards, and certification for environmentallyfriendly and pro-poor aquaculture, and inclusion of NGOs in constructive andtransparent partnerships. Further studies are warranted to monitor and evaluatelosses of genetic diversity of cultured species.
Pro-Poor Aquaculture
Experiences in Asia provide lessons on pro-poor aquaculture, which, suitablyadapted, might catalyze aquaculture in Sub-Saharan Africa (SSA) and in partsof Latin America. In Asia, aquaculture was developed under two models: onein which commercial opportunities have been opened for enterprises; and onein which long-term public support targeted at the poor has generated the nec-essary critical mass for smallholder aquaculture. The former has largely beendriven by private sector initiatives and enterprise; the latter through nationalpolicies and programs and external support. The enterprise model has gener-ated growth and employment, often in poor regions. The public support hasendeavored to extend that growth to smallholders through policy support,adaptive technologies, knowledge dissemination, and services. These pro-poorapproaches varied widely from country to country and included the following:
■ Equitable access to resources. Water and land are the two essential resources.Both may be underused capital assets. Not only is a system of property rightsrequired, but it is an equitable mechanism for their allocation, administration,and enforcement. An example is the rezoning of rice land in China and Viet-nam that allowed rice-fish farming and enabled farmers to exit from poverty.
INTRODUCTION AND OVERVIEW 7
■ Use of public waters. Productivity of public waters, such as lakes, canals, andreservoirs, can dramatically increase by stocking fish. In Bangladesh, whencoupled with the grant of community or individual stocking/harvestingconcessions, this strategy proved to be an effective means of targeting thelandless poor.
■ Policy bridges to the enterprise model can create the space for the poor toparticipate in the enterprises. Examples are the concessions and arrange-ments facilitating contract farming and nucleus estates in Indonesia. Insome countries, promotion of small and medium enterprises (SMEs) hasindirectly helped the poor through employment creation.
■ Integrated design of infrastructure (for example, rural road networks, floodcontrol, irrigation, and drainage) can open market access, help rice paddyand floodplain fish farming, and reduce risks to farmers through diversifi-cation of farm production.
■ Knowledge and capacity building has proven crucial for large and smallaquaculture. It has been delivered through government extension services,universities, service providers (such as feed producers), NGOs, producerorganizations, and networks, such as the Network of Aquaculture Centres inAsia-Pacific (NACA).
The poor are also part of the private sector. In Asia, it was recognized thatlack of knowledge and capital, higher risks, high opportunity costs for land andwater, and access to markets limited small aquaculture entrepreneurs. As aresult, new technologies and innovative culture systems have been developedthat specifically target Asia’s poor. These technologies and approaches havebeen shared regionally through the networks supported by the internationalcommunity. Examples include the Genetically Improved Farmed Tilapia (GIFT)initiative financed by the Asian Development Bank (ADB), and the Interna-tional Principles for Responsible Shrimp Farming prepared with World Bankassistance.
The relative merits of low-trophic-level culture (carps) versus high-end car-nivores (intensive shrimp, sea bream) are a matter of ongoing debate. Intensiveculture may be highly profitable but has relatively high risks and a highresource budget. In contrast, most low-trophic-level products are typicallylow-value herbivores or omnivores, yielding modest profits but requiringample pond or water space—capital that the poor may not possess. Their cul-ture may not be sufficiently viable to lift small producers out of poverty,although it may be highly desirable from a food security and environmentalservices standpoint. Thus, as demonstrated by the shrimp farms in West Ben-gal, there is an appreciation that the culture of high-value fish for export maybe a more viable strategy than the culture of low-value food fish for local mar-kets. The strategic approaches in Asia also recognized that the benefits of aqua-culture accrue along the production chain—there are poor producers and poor
8 CHANGING THE FACE OF THE WATERS
consumers—and employment in processing and services may exceed on-farmemployment.
Recommendation. The international community can assist client countries toimplement a suite of measures and supports for pro-poor aquaculture. These mea-sures may include opening access to public waters for the landless, providing fornucleus estate arrangements as a condition of commercial concessions, integratingpublic works such as roads and canals with the needs of aquaculture, and provid-ing for extension services and access to finance. It can also promote equitable tradein cultured fish products and address the effects of unwarranted trade barriers onpoorer fish farmers.
Knowledge Generation and Dissemination
Aquaculture in Asia has benefited from sustained public support for technol-ogy, innovation, and knowledge dissemination under national and regionalpartnerships. Advances in fish seeds, fish nutrition, and control of fish diseaseshave been fundamental, and any country aspiring to create a competitive mod-ern aquaculture industry must establish and maintain the required knowledgeinfrastructure.
Seeds
Advances in seed production have been the springboard of aquaculture. Increas-ing numbers of species are being domesticated—their reproduction understoodand controlled and their reliance on wild seed reduced. Breeding programs suchas GIFT, with an internal rate of return (IRR) of 70 percent, have catapulted pro-ductivity to new levels. The growth rate of catfish, scallops, and shrimp hasincreased by 10 percent per generation. The cost-benefit ratio for Norway’ssalmon breeding program was 1:15. Today, only about 1 percent of aquacultureproduction is based on genetically improved fish, highlighting the potential forthe creation of improved breeds. Dissemination of improved seed is equallyimportant; for example, inbreeding has reduced the growth rate of Chinese carpsby 20 to 30 percent. Such improvements, however, must be accompanied by riskassessments and the application of codes of practices and safeguard policies.
Feeds and Fish Nutrition
Availability of feeds is a major constraint to aquaculture in developing coun-tries. Peri-urban aquaculture benefits from the use of local wastes, while a widerange of polycultures and integrated agriculture-aquaculture systems (forexample, fish in association with rice, pigs, or ducks) offer feed options forrural areas. The vast proportion of aquaculture production occurs at the lowertrophic levels—carnivorous fish account for less than 8 percent of farmed fishproduction. Aquaculture uses about 56 percent of global fish meal production
INTRODUCTION AND OVERVIEW 9
and 81 percent of global fish oil supplies. Because there are no prospects of sig-nificantly increasing fish meal and oil production, and given the rapidly risingprices of these products, there is an intensive search for substitutes and increas-ing use of yeasts and other sources of essential nutrients.
Disease
Heightened risk of disease accompanies intensification. Following a series ofdisastrous disease outbreaks, several advances have allowed production to con-tinue to grow. Disease-free strains are being produced—some as proprietaryproducts. Vaccines have been developed and, in the case of Norwegian salmon,have reduced the use of antibiotics to negligible levels.
Dissemination
In Asia, new fish culture technologies and capacity building spread throughregional cooperation fostered largely by external assistance, including NACA,Southeast Asia Fisheries Development Center (SEAFDEC), and others. Thiscooperation was marked by resource pooling, results sharing, and cooperationand trust. Each initiative built on another, which ensured uptake and continu-ity after project assistance ended. Developing effective producer organizationsis another cost-effective approach to increasing knowledge, achievingeconomies of scale, capturing value and promoting better practices, and gain-ing access to credit and markets. One knowledge dissemination model, theOne-stop Aqua Shop, has been replicated in several Asian countries.
Capacity Building
The experience in Asia shows that the corporate world was again a key toacquiring intangible capital. Companies and producer groups invested notonly in training of their staff, but also in research and innovation. Privatedemand for technical and scientific skills complemented external support forcapacity building. With public support, formal, vocational, and informal train-ing built human capacity. Links were established with external centers ofexpertise and trainers received needed instruction. Development of socialcapital through civil society dialogue, community-based approaches, and co-management of natural resources all benefited from sustained support.
Recommendation. The international community can support applied research andinnovation on adapting proven technologies to local conditions and build mecha-nisms to pilot and transfer the innovations and knowledge to farmers. Particularattention should be directed to productivity gains from fish breeding; integratedfarming systems; use of land and water unsuitable for other purposes; and commer-cially viable and environmentally sustainable systems that can be readily embracedby the poor and landless. The international community should continue to support
10 CHANGING THE FACE OF THE WATERS
institutions, such as WorldFish Center (WFC), to exploit innovations in aquacul-ture, not only at low-trophic levels and for direct uptake by smallholders, but also indevelopment of local replacements for critical inputs, such as fish oils, in fish health,and the role of aquaculture in waste treatment in both closed and open systems.
The Challenge of Aquaculture in Sub-Saharan Africa
In contrast to the rest of the world, per capita fish consumption in this regionhas declined to almost half the global average and, despite suitable natural con-ditions, aquaculture provides only 2 percent of the region’s supply and makesonly a minor contribution to economic growth, employment, and foreignexchange. Past aquaculture development efforts have largely failed because ofweak institutions, poor access to finance, and a heavy reliance on failing gov-ernment extension services and seed production. The focus on subsistenceaquaculture may have been misguided, because it often lacked the driving forceof market demand and impetus provided by commercial reality.
There is evidence of a sea change—urban demand is driving productionincreases and new commercial producers are capitalizing on export marketsopened by capture fisheries. Nigeria, Madagascar, and South Africa are build-ing the critical mass needed for sustainability, while in Malawi integrated aqua-culture-agriculture has proven the vitality of new subsistence farming models.African leaders have also recognized this potential, and key elements of aregional approach have been set out in the New Plan for African Development(NEPAD) Fish for All Declaration and Action Plan. Sub-Saharan Africa andparts of Latin America can apply the lessons of Asia across a suite of policiesand approaches summarized above.
International Partnerships and Finance
Global investment in aquaculture has been estimated at $75 billion in the1987–97 period, compared with a World Bank Group (the Group includes theInternational Finance Corporation [IFC]) investment in aquaculture-relatedprojects of approximately $1 billion (more than 90 percent in Asia) in a longerperiod (1974–2006). Nevertheless, the international financial institutions havemade a significant contribution to the development of aquaculture, particularlythrough capacity and institution building, support for applied research, devel-opment of codes of practice, and capital for investment in the production chain.
Recommendation. In consultation with client countries, the international com-munity should develop a set of safeguards and guidelines for investment in sus-tainable aquaculture that can be applied by the international financial institu-tions and extended through the Equator Principles. The safeguards and guidelineswould be based on existing international codes and best practices. They should bedesigned to facilitate greater alignment of external assistance, assist developing
INTRODUCTION AND OVERVIEW 11
countries in establishing an enabling investment climate, and secure responsibleforeign direct investment (FDI).
Further studies are warranted to acquire a greater understanding of thedynamics of private investment in aquaculture and the means by which publicand international support can catalyze private investment in sustainable aqua-culture and the transfer of benefits to the poor.
Sustained support should be provided for well-conceived regional knowledgeand capacity-building networks that may be established in Africa and LatinAmerica and have a broadly similar role as NACA in Asia.
Client countries and the international community should be made more awareof the entry points for sustainable aquaculture, including natural resource gover-nance, poverty alleviation, integrated coastal and water basin management, andwaste management.
Sustained support for human capacity building and for the transfer and adap-tation of proven technologies should be an integral part of sustainable aquaculturedevelopment programs.
12 CHANGING THE FACE OF THE WATERS
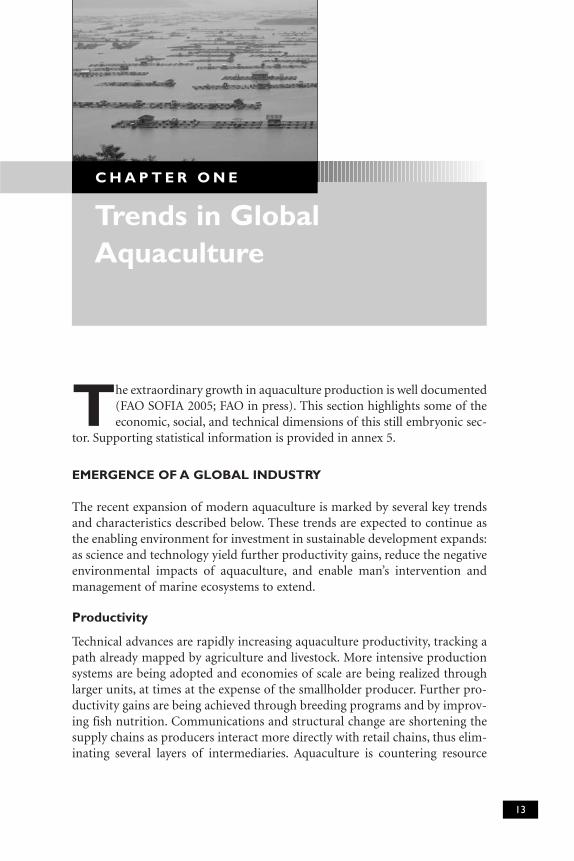
The extraordinary growth in aquaculture production is well documented(FAO SOFIA 2005; FAO in press). This section highlights some of theeconomic, social, and technical dimensions of this still embryonic sec-
tor. Supporting statistical information is provided in annex 5.
EMERGENCE OF A GLOBAL INDUSTRY
The recent expansion of modern aquaculture is marked by several key trendsand characteristics described below. These trends are expected to continue asthe enabling environment for investment in sustainable development expands:as science and technology yield further productivity gains, reduce the negativeenvironmental impacts of aquaculture, and enable man’s intervention andmanagement of marine ecosystems to extend.
Productivity
Technical advances are rapidly increasing aquaculture productivity, tracking apath already mapped by agriculture and livestock. More intensive productionsystems are being adopted and economies of scale are being realized throughlarger units, at times at the expense of the smallholder producer. Further pro-ductivity gains are being achieved through breeding programs and by improv-ing fish nutrition. Communications and structural change are shortening thesupply chains as producers interact more directly with retail chains, thus elim-inating several layers of intermediaries. Aquaculture is countering resource
13
Trends in GlobalAquaculture
C H A P T E R O N E
constraints with knowledge-based advances using fewer resources to producemore at a lower cost. Pressures to internalize negative externalities, such asenvironmental impacts, may raise costs but lead to a more sustainable indus-try in the longer term. Corporate giants like Norway’s $4 billion Pan Fish andThailand’s Charoen Pokphand Group (turnover $13 billion) represent cutting-edge endeavors of the aquaculture industry.
Diversification
The aquaculture sector may be the most diverse of the food production sectorsin terms of species, culture systems, culture environment, type and scale ofoperation, intensity of practice, and type of management.1 The number ofspecies being cultured is increasing while enhanced varieties and strains enablefurther innovations in production systems. From urban fish farms with recir-culating water to seeding of the open oceans, aquaculture presents a challengeto the elaboration of national and international environmental standards. Thisdiversity of production systems and selected business models are furtherdescribed and provided in annex 1 and annex 6.
Key Drivers—Markets and Globalization
Markets are the dominant force driving aquaculture development, adaptation,and innovation. Price competition, changing consumer preferences, newemerging markets, and compliance with environmental and sanitary standardsare forcing adaptation and productivity gains in a dynamic global market. Newcommercial alliances are stripping intermediaries from the production chainas e-commerce, global product standards, and futures markets replace personalcontacts. Strong producers and the consumers gain at the expense of less-organized smallholder producers at the far end of extended production chains.
Aquaculture is already a global industry, and developing countries accountfor 90 percent of global aquaculture production. Fish is the world’s mosttraded food with more than half of world fish trade originating in developingcountries, and aquaculture accounts for an increasing proportion of this trade(trade statistics do not distinguish between captured and cultured fish). Pricecompetition between traditional fish producers and increasingly productivefish farmers, mostly occurring in developing countries, is leading to trade bar-riers and disputes (box 4.4).
Increasing consumer awareness, biosafety, and traceability issues are mold-ing domestic and international markets; and as the yield from capture fisheriesfalls, the fish supply gap grows, opening further opportunities for aquaculture.
Modern aquaculture is becoming a knowledge-based industry driven by newtechnologies, intensive production, and highly competitive global markets. As inother industries in a phase of high innovation, developing countries are likely tolag behind without the catalytic actions designed to help them realize the strate-gic advantages available during a limited window of opportunity.
14 CHANGING THE FACE OF THE WATERS
Environment
Many of the environmental and resource-related concerns in aquaculturereflect a young industry that has grown rapidly in a regulatory void and with amodest underpinning of science. Aquaculture is a minor environmentaloffender compared with agriculture and other industries. While some concernsare legitimate, others often lack balance or have little basis in science. This hasdamaged the public perception of the industry and influenced policy. Substan-tial progress has been made by both private and public sectors to address thenegative environmental impacts of aquaculture. A range of codes and BMPsprovides clear guidance for environmentally friendly sustainable aquaculture,which in some cases is a net contributor to environmental health (e.g., culturedseaweeds and shellfish can serve as an important nutrient sink).
Lessons from Agriculture
The recent history of aquaculture parallels that of agriculture; however, it iscontracted into decades rather than spread over millennia. Just as the forests ofEurope were felled for farmland, the aquatic wilds are being converted toaquatic farms at an accelerating pace and scale. Thus, aquaculture simultane-ously poses the risks of transformation of entire wild ecosystems and thepromise of managed aquatic ecosystems. However, aquaculture differsmarkedly from agriculture and livestock production in several fundamentalways. Water, the medium of culture, greatly facilitates the inadvertent trans-mission and spread of wastes, diseases, and genetic material, including intro-duced species and strains. Unlike terrestrial ecosystems, aquatic, and in partic-ular marine ecosystems, are often more complex and certainly less understood.Aquaculture poses a range of threats to aquatic biodiversity, and control overbreeding and reproduction of farmed species is substantially more difficultthan in the case of most livestock.
PRODUCTION, MARKETS, AND TRADE
Production
Aquaculture has grown at an annual average rate of 10 percent since the mid-1980s, reaching 59.4 million tons with a farmgate value of $70.3 billion in 2004(table 1.1). Production of aquatic animals (excluding aquatic plants) for 2004is reported to be 45.5 million tons (farmgate value of $63.4 billion). Aqua-culture accounted for an estimated 43 percent of the global food fish supply in2004. In comparison, since the 1980s, capture fisheries have averaged an annualgrowth rate of less than 2 percent, and their contribution to direct humannutrition has actually declined by about 10 percent, partly because of anincrease in the proportion of lower-value species, typically used to produce fishmeal for animal feed. Approximately one-third of capture fish production is
TRENDS IN GLOBAL AQUACULTURE 15
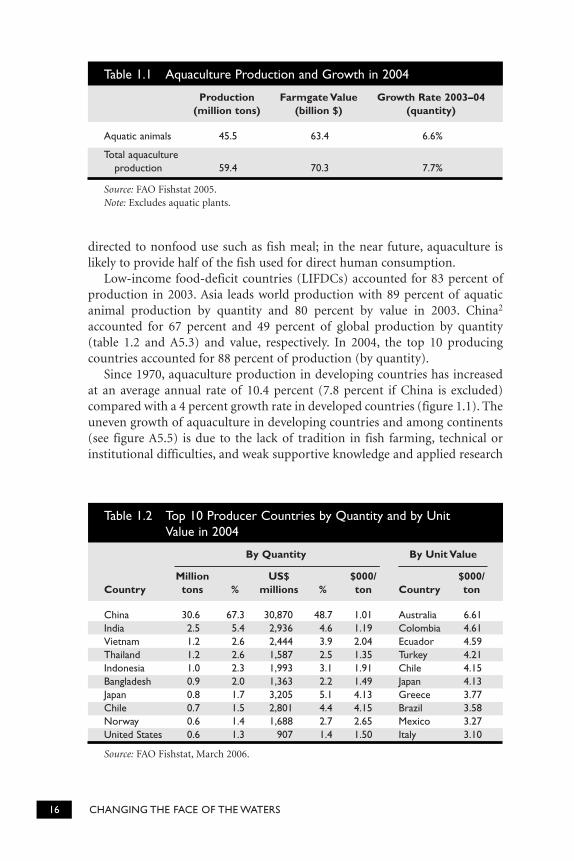
directed to nonfood use such as fish meal; in the near future, aquaculture islikely to provide half of the fish used for direct human consumption.
Low-income food-deficit countries (LIFDCs) accounted for 83 percent ofproduction in 2003. Asia leads world production with 89 percent of aquaticanimal production by quantity and 80 percent by value in 2003. China2
accounted for 67 percent and 49 percent of global production by quantity(table 1.2 and A5.3) and value, respectively. In 2004, the top 10 producingcountries accounted for 88 percent of production (by quantity).
Since 1970, aquaculture production in developing countries has increasedat an average annual rate of 10.4 percent (7.8 percent if China is excluded)compared with a 4 percent growth rate in developed countries (figure 1.1). Theuneven growth of aquaculture in developing countries and among continents(see figure A5.5) is due to the lack of tradition in fish farming, technical orinstitutional difficulties, and weak supportive knowledge and applied research
16 CHANGING THE FACE OF THE WATERS
Table 1.1 Aquaculture Production and Growth in 2004
Production Farmgate Value Growth Rate 2003–04(million tons) (billion $) (quantity)
Aquatic animals 45.5 63.4 6.6%
Total aquaculture production 59.4 70.3 7.7%
Source: FAO Fishstat 2005.Note: Excludes aquatic plants.
Table 1.2 Top 10 Producer Countries by Quantity and by Unit Value in 2004
By Quantity By Unit Value
Million US$ $000/ $000/Country tons % millions % ton Country ton
China 30.6 67.3 30,870 48.7 1.01 Australia 6.61India 2.5 5.4 2,936 4.6 1.19 Colombia 4.61Vietnam 1.2 2.6 2,444 3.9 2.04 Ecuador 4.59Thailand 1.2 2.6 1,587 2.5 1.35 Turkey 4.21Indonesia 1.0 2.3 1,993 3.1 1.91 Chile 4.15Bangladesh 0.9 2.0 1,363 2.2 1.49 Japan 4.13Japan 0.8 1.7 3,205 5.1 4.13 Greece 3.77Chile 0.7 1.5 2,801 4.4 4.15 Brazil 3.58Norway 0.6 1.4 1,688 2.7 2.65 Mexico 3.27United States 0.6 1.3 907 1.4 1.50 Italy 3.10
Source: FAO Fishstat, March 2006.
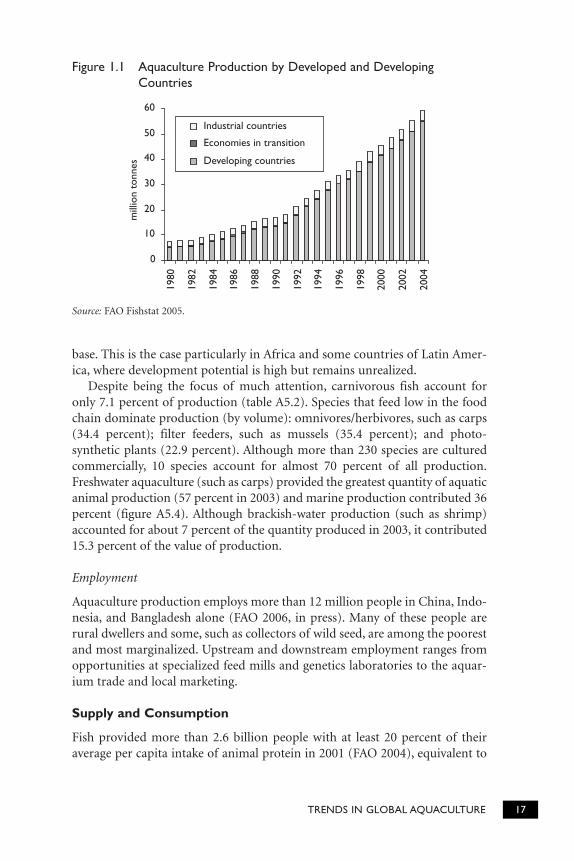
base. This is the case particularly in Africa and some countries of Latin Amer-ica, where development potential is high but remains unrealized.
Despite being the focus of much attention, carnivorous fish account foronly 7.1 percent of production (table A5.2). Species that feed low in the foodchain dominate production (by volume): omnivores/herbivores, such as carps(34.4 percent); filter feeders, such as mussels (35.4 percent); and photo-synthetic plants (22.9 percent). Although more than 230 species are culturedcommercially, 10 species account for almost 70 percent of all production.Freshwater aquaculture (such as carps) provided the greatest quantity of aquaticanimal production (57 percent in 2003) and marine production contributed 36percent (figure A5.4). Although brackish-water production (such as shrimp)accounted for about 7 percent of the quantity produced in 2003, it contributed15.3 percent of the value of production.
Employment
Aquaculture production employs more than 12 million people in China, Indo-nesia, and Bangladesh alone (FAO 2006, in press). Many of these people arerural dwellers and some, such as collectors of wild seed, are among the poorestand most marginalized. Upstream and downstream employment ranges fromopportunities at specialized feed mills and genetics laboratories to the aquar-ium trade and local marketing.
Supply and Consumption
Fish provided more than 2.6 billion people with at least 20 percent of theiraverage per capita intake of animal protein in 2001 (FAO 2004), equivalent to
TRENDS IN GLOBAL AQUACULTURE 17
0
10
20
30
40
50
60
1980
1982
1984
1986
1988
1990
1992
1994
1996
1998
2000
2002
2004
mill
ion
tonn
esIndustrial countries
Economies in transition
Developing countries
Figure 1.1 Aquaculture Production by Developed and DevelopingCountries
Source: FAO Fishstat 2005.
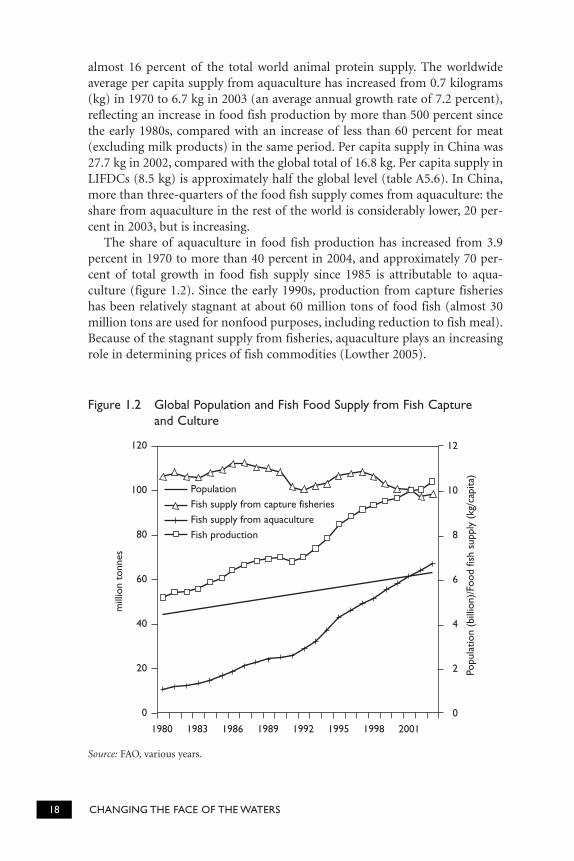
almost 16 percent of the total world animal protein supply. The worldwideaverage per capita supply from aquaculture has increased from 0.7 kilograms(kg) in 1970 to 6.7 kg in 2003 (an average annual growth rate of 7.2 percent),reflecting an increase in food fish production by more than 500 percent sincethe early 1980s, compared with an increase of less than 60 percent for meat(excluding milk products) in the same period. Per capita supply in China was27.7 kg in 2002, compared with the global total of 16.8 kg. Per capita supply inLIFDCs (8.5 kg) is approximately half the global level (table A5.6). In China,more than three-quarters of the food fish supply comes from aquaculture: theshare from aquaculture in the rest of the world is considerably lower, 20 per-cent in 2003, but is increasing.
The share of aquaculture in food fish production has increased from 3.9percent in 1970 to more than 40 percent in 2004, and approximately 70 per-cent of total growth in food fish supply since 1985 is attributable to aqua-culture (figure 1.2). Since the early 1990s, production from capture fisherieshas been relatively stagnant at about 60 million tons of food fish (almost 30million tons are used for nonfood purposes, including reduction to fish meal).Because of the stagnant supply from fisheries, aquaculture plays an increasingrole in determining prices of fish commodities (Lowther 2005).
18 CHANGING THE FACE OF THE WATERS
120
100
80
60
40
20
0
mill
ion
tonn
es
1980 1983 1986 1989 1992 1995 1998 2001
PopulationFish supply from capture fisheriesFish supply from aquacultureFish production
12
10
8
6
4
2
0
Popu
latio
n (b
illio
n)/F
ood
fish
supp
ly (
kg/c
apita
)
Figure 1.2 Global Population and Fish Food Supply from Fish Capture and Culture
Source: FAO, various years.
Trade
International trade in fish and fishery products has grown from $15 billion(exports) in 1980 to an estimated $71 billion in 2004, and about 37 percent ofworld fishery production is now traded internationally. Developing countriesaccounted for 48 percent ($30 billion) of global exports with net earnings of$20 billion in 2004 (see A5.3 for examples). LIFDCs accounted for 20 percentof exports ($13 billion) and imports were $4 billion—export earnings fromfish appear to be paying for food imports in some LIFDCs (Ahmed 2004). Thedeveloped countries absorbed more than 80 percent of exports.
FUTURE SUPPLY AND DEMAND PROJECTIONS
The rising demand for food fish is driven by population growth, higher incomes,and urbanization in developing countries. With production from wild fishstocks at or near its limits, aquaculture is foreseen as the only major source ofadditional supplies. In three different scenarios of stagnating capture fisheryproduction, aquaculture output must grow by between 1.4 and 5.3 percent peryear to bridge the projected future supply gap (table A5.5) and provide the esti-mated 70 million tons of food fish required by 2020. Aggregate production tar-gets of selected countries3 suggest that these global forecasts may have under-estimated the future supply of fish from aquaculture and emphasize the keyrole and potential of such countries as China, Brazil, and Chile.
Asia is projected to continue to produce the bulk of aquaculture output to2020 and continued expansion is predicted in Latin America, the Caribbean,and Africa, albeit from a much lower base. In many Asian countries, there is arelatively high price and income elasticity for fish consumption (Ahmed andLorica 2002), suggesting that with the increase in disposable incomes, con-sumer demand for fish will increase at a higher rate than that of other staplefoods such as meat. Rising incomes in China and India, two of the most popu-lous Asian nations and the top two aquaculture producers, are likely to spur theaquaculture industry to meet this rising demand. Already in China, there hasbeen a rapid rise in the production of high-value species—all for the domesticmarket. Similar changes are likely to occur with increasing frequency elsewhere(De Silva 2001). For example, Vietnam plans to produce 2 million tons by 2010,generating $2.5 billion in exports and 2 million jobs in aquaculture.
Food fish prices in developing countries can decline as more productive cul-ture systems are adopted. In Bangladesh, the Philippines, Thailand, China, andVietnam, adoption of improved strains reduced tilapia prices by 5–16 percent(Dey 2000). This mirrors similar developments in the price of farmed Atlanticsalmon, sea bass, and sea bream brought about by increased production effi-ciency through genetically improved strains, higher feed efficiency, and moreeffective disease control. Innovations have a compounding effect—each inno-vation feeding off another across a broad swathe of technologies, sciences, and
TRENDS IN GLOBAL AQUACULTURE 19
production systems, generating further investment in aquaculture technologyand innovation. Rising energy prices may place wild fish products at a com-petitive disadvantage compared with cultured products, and growth in aqua-culture, predicated on substantial productivity gains, presents the most attrac-tive scenario for increased supplies of low-value food fish. Furthermore,aquaculture can deliver more homogenous cultured products to markets in atimely manner and, because of its social importance, growing support forsmallholder aquaculture may stimulate production.
THE ROLE OF EXTERNAL ASSISTANCE AND THEINTERNATIONAL FINANCIAL INSTITUTIONS
Market-driven private investment has been the engine of growth in aqua-culture, and this growth would have occurred irrespective of the external assis-tance. Global investment in aquaculture has been estimated at $75 billion inthe 1987–97 period, while the combined World Bank Group (that is includingthe IFC) investment in aquaculture-related projects was approximately $1 bil-lion in a longer period (1974–2006).
Between 1978 and 1983, total external assistance to aquaculture develop-ment is estimated at $368 million (Josupeit 1985), of which $190 million (52percent) originated from the three major international development banks(World Bank, ADB, and IADB). During this period, development assistance toaquaculture increased from 8.5 percent to 17.5 percent of the total allocated tothe fisheries sector. Between 1988 and 1995, official aid for aquaculture devel-opment amounted to $995 million, of which development banks financed 69percent. By 1995, the development banks dominated, accounting for 92 per-cent of external funding (FAO 1997b). Asia accounted for 65 percent of theinvestment commitments (38 percent of the projects); Africa accounted for 16percent of commitments and about 25 percent of the projects.
The total value of Bank investment in 24 projects with aquaculture compo-nents in the period from 1974 to 2006 was $898 million. The value of totalloans approved was just over $1 billion4 (see table A3.1 for a listing of projects)and aquaculture is considered underrepresented in the Bank’s portfolio relativeto its weight in the portfolios of ADB and IADB (Chobanian 2006). Of greaterconcern is the skewed nature of the Bank’s aquaculture portfolio in terms ofboth geographic distribution and performance (see table 1.3). Asian countries(greater than 90 percent of loans by value), and China in particular, havereceived repeated loans for projects that generally have been judged merely sat-isfactory. Natural disaster (floods) affected one project in China, and the aqua-culture credit component of an Indonesian project failed.
In contrast, in Latin America and Africa, issues of internal policy coordina-tion (Mexico) and donor alignment (Malawi) have prevented drawdown ofapproved loans. Of the three non-Asian projects for which completion reportsare available, one (Ghana) was rated satisfactory, another (the Arab Republic
20 CHANGING THE FACE OF THE WATERS
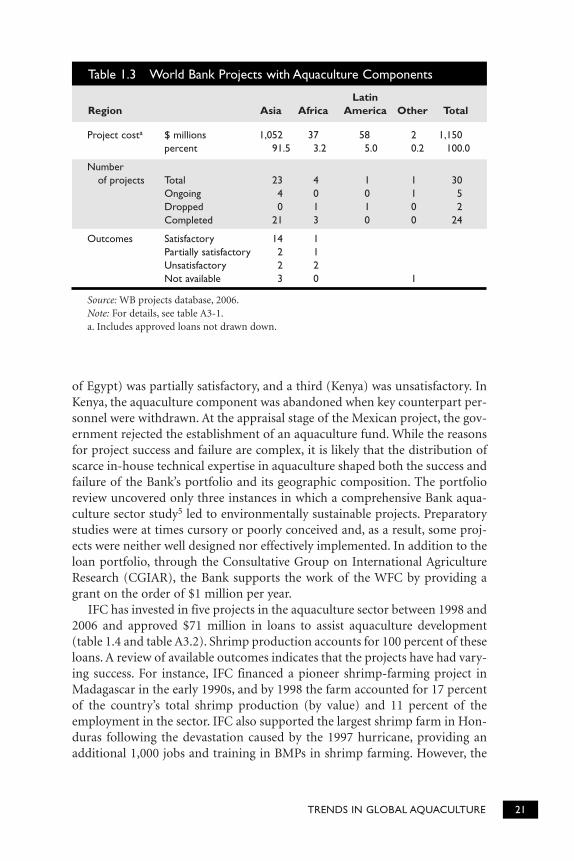
of Egypt) was partially satisfactory, and a third (Kenya) was unsatisfactory. InKenya, the aquaculture component was abandoned when key counterpart per-sonnel were withdrawn. At the appraisal stage of the Mexican project, the gov-ernment rejected the establishment of an aquaculture fund. While the reasonsfor project success and failure are complex, it is likely that the distribution ofscarce in-house technical expertise in aquaculture shaped both the success andfailure of the Bank’s portfolio and its geographic composition. The portfolioreview uncovered only three instances in which a comprehensive Bank aqua-culture sector study5 led to environmentally sustainable projects. Preparatorystudies were at times cursory or poorly conceived and, as a result, some proj-ects were neither well designed nor effectively implemented. In addition to theloan portfolio, through the Consultative Group on International AgricultureResearch (CGIAR), the Bank supports the work of the WFC by providing agrant on the order of $1 million per year.
IFC has invested in five projects in the aquaculture sector between 1998 and2006 and approved $71 million in loans to assist aquaculture development(table 1.4 and table A3.2). Shrimp production accounts for 100 percent of theseloans. A review of available outcomes indicates that the projects have had vary-ing success. For instance, IFC financed a pioneer shrimp-farming project inMadagascar in the early 1990s, and by 1998 the farm accounted for 17 percentof the country’s total shrimp production (by value) and 11 percent of theemployment in the sector. IFC also supported the largest shrimp farm in Hon-duras following the devastation caused by the 1997 hurricane, providing anadditional 1,000 jobs and training in BMPs in shrimp farming. However, the
TRENDS IN GLOBAL AQUACULTURE 21
Table 1.3 World Bank Projects with Aquaculture Components
LatinRegion Asia Africa America Other Total
Project costa $ millions 1,052 37 58 2 1,150percent 91.5 3.2 5.0 0.2 100.0
Number of projects Total 23 4 1 1 30
Ongoing 4 0 0 1 5Dropped 0 1 1 0 2Completed 21 3 0 0 24
Outcomes Satisfactory 14 1Partially satisfactory 2 1Unsatisfactory 2 2Not available 3 0 1
Source: WB projects database, 2006.Note: For details, see table A3-1.a. Includes approved loans not drawn down.
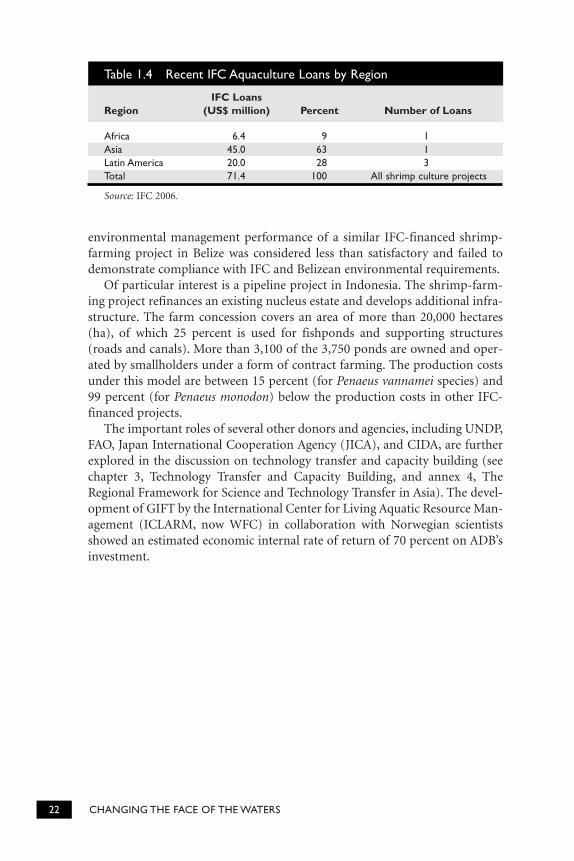
environmental management performance of a similar IFC-financed shrimp-farming project in Belize was considered less than satisfactory and failed todemonstrate compliance with IFC and Belizean environmental requirements.
Of particular interest is a pipeline project in Indonesia. The shrimp-farm-ing project refinances an existing nucleus estate and develops additional infra-structure. The farm concession covers an area of more than 20,000 hectares(ha), of which 25 percent is used for fishponds and supporting structures(roads and canals). More than 3,100 of the 3,750 ponds are owned and oper-ated by smallholders under a form of contract farming. The production costsunder this model are between 15 percent (for Penaeus vannamei species) and99 percent (for Penaeus monodon) below the production costs in other IFC-financed projects.
The important roles of several other donors and agencies, including UNDP,FAO, Japan International Cooperation Agency (JICA), and CIDA, are furtherexplored in the discussion on technology transfer and capacity building (seechapter 3, Technology Transfer and Capacity Building, and annex 4, TheRegional Framework for Science and Technology Transfer in Asia). The devel-opment of GIFT by the International Center for Living Aquatic Resource Man-agement (ICLARM, now WFC) in collaboration with Norwegian scientistsshowed an estimated economic internal rate of return of 70 percent on ADB’sinvestment.
22 CHANGING THE FACE OF THE WATERS
Table 1.4 Recent IFC Aquaculture Loans by Region
IFC LoansRegion (US$ million) Percent Number of Loans
Africa 6.4 9 1Asia 45.0 63 1Latin America 20.0 28 3Total 71.4 100 All shrimp culture projects
Source: IFC 2006.
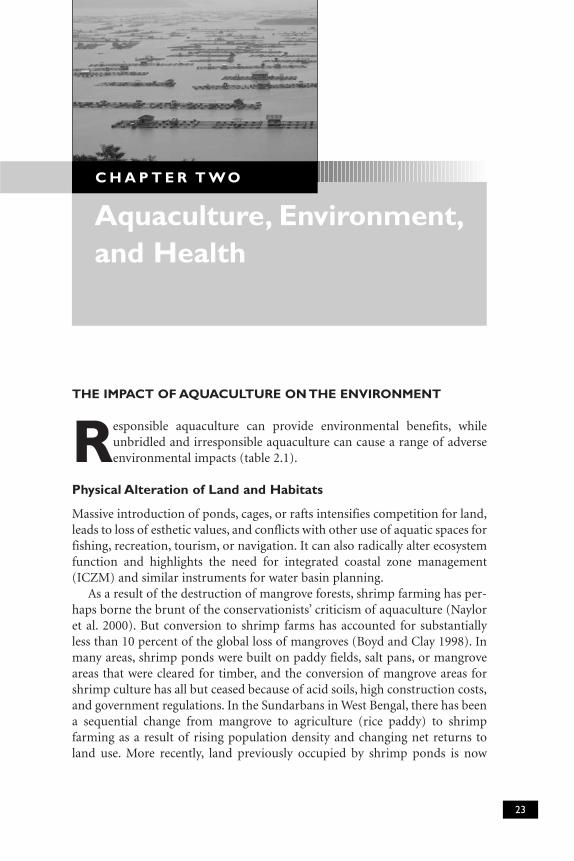
THE IMPACT OF AQUACULTURE ON THE ENVIRONMENT
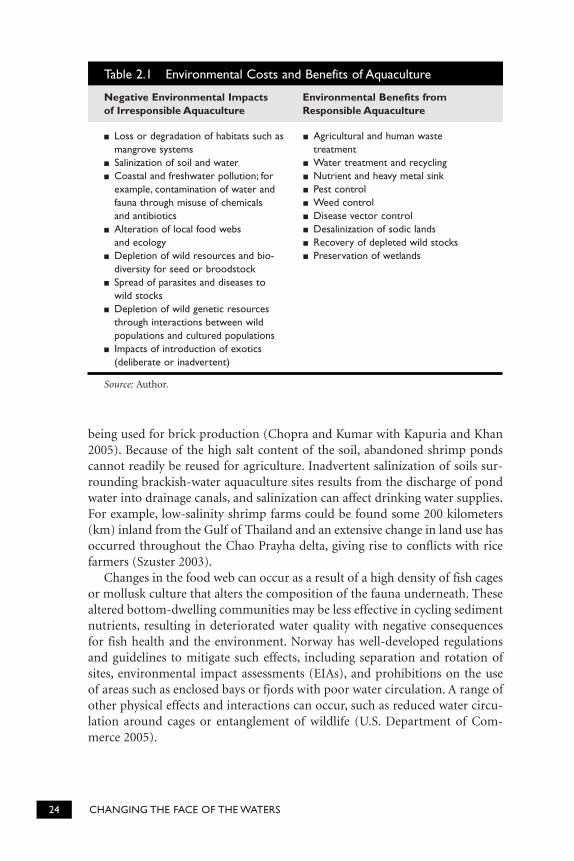
Responsible aquaculture can provide environmental benefits, whileunbridled and irresponsible aquaculture can cause a range of adverseenvironmental impacts (table 2.1).
Physical Alteration of Land and Habitats
Massive introduction of ponds, cages, or rafts intensifies competition for land,leads to loss of esthetic values, and conflicts with other use of aquatic spaces forfishing, recreation, tourism, or navigation. It can also radically alter ecosystemfunction and highlights the need for integrated coastal zone management(ICZM) and similar instruments for water basin planning.
As a result of the destruction of mangrove forests, shrimp farming has per-haps borne the brunt of the conservationists’ criticism of aquaculture (Nayloret al. 2000). But conversion to shrimp farms has accounted for substantiallyless than 10 percent of the global loss of mangroves (Boyd and Clay 1998). Inmany areas, shrimp ponds were built on paddy fields, salt pans, or mangroveareas that were cleared for timber, and the conversion of mangrove areas forshrimp culture has all but ceased because of acid soils, high construction costs,and government regulations. In the Sundarbans in West Bengal, there has beena sequential change from mangrove to agriculture (rice paddy) to shrimpfarming as a result of rising population density and changing net returns toland use. More recently, land previously occupied by shrimp ponds is now
23
Aquaculture, Environment,and Health
C H A P T E R T W O
being used for brick production (Chopra and Kumar with Kapuria and Khan2005). Because of the high salt content of the soil, abandoned shrimp pondscannot readily be reused for agriculture. Inadvertent salinization of soils sur-rounding brackish-water aquaculture sites results from the discharge of pondwater into drainage canals, and salinization can affect drinking water supplies.For example, low-salinity shrimp farms could be found some 200 kilometers(km) inland from the Gulf of Thailand and an extensive change in land use hasoccurred throughout the Chao Prayha delta, giving rise to conflicts with ricefarmers (Szuster 2003).
Changes in the food web can occur as a result of a high density of fish cagesor mollusk culture that alters the composition of the fauna underneath. Thesealtered bottom-dwelling communities may be less effective in cycling sedimentnutrients, resulting in deteriorated water quality with negative consequencesfor fish health and the environment. Norway has well-developed regulationsand guidelines to mitigate such effects, including separation and rotation ofsites, environmental impact assessments (EIAs), and prohibitions on the use of areas such as enclosed bays or fjords with poor water circulation. A range ofother physical effects and interactions can occur, such as reduced water circu-lation around cages or entanglement of wildlife (U.S. Department of Com-merce 2005).
24 CHANGING THE FACE OF THE WATERS
Table 2.1 Environmental Costs and Benefits of Aquaculture
Negative Environmental Impacts Environmental Benefits fromof Irresponsible Aquaculture Responsible Aquaculture
■ Loss or degradation of habitats such as mangrove systems
■ Salinization of soil and water■ Coastal and freshwater pollution; for
example, contamination of water and fauna through misuse of chemicals and antibiotics
■ Alteration of local food webs and ecology
■ Depletion of wild resources and bio-diversity for seed or broodstock
■ Spread of parasites and diseases to wild stocks
■ Depletion of wild genetic resources through interactions between wild populations and cultured populations
■ Impacts of introduction of exotics (deliberate or inadvertent)
Source: Author.
■ Agricultural and human wastetreatment
■ Water treatment and recycling■ Nutrient and heavy metal sink■ Pest control■ Weed control■ Disease vector control■ Desalinization of sodic lands■ Recovery of depleted wild stocks■ Preservation of wetlands
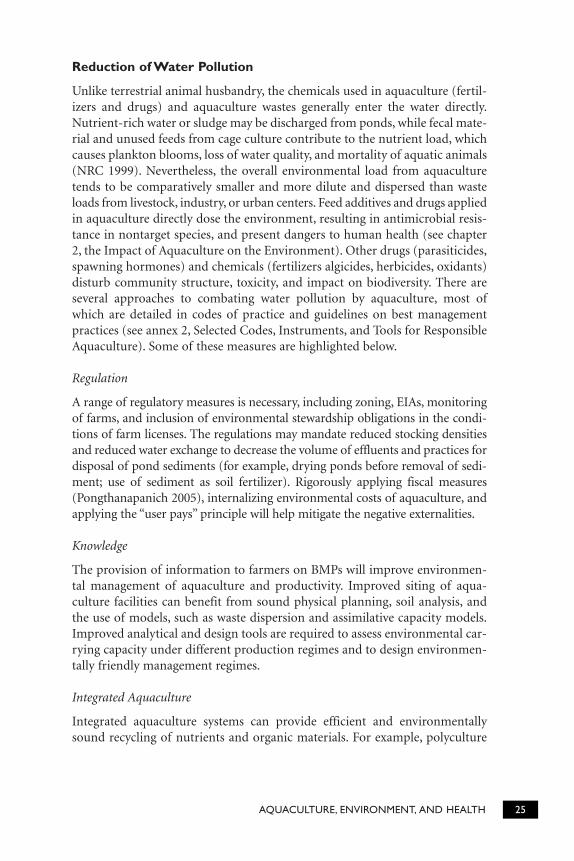
Reduction of Water Pollution
Unlike terrestrial animal husbandry, the chemicals used in aquaculture (fertil-izers and drugs) and aquaculture wastes generally enter the water directly.Nutrient-rich water or sludge may be discharged from ponds, while fecal mate-rial and unused feeds from cage culture contribute to the nutrient load, whichcauses plankton blooms, loss of water quality, and mortality of aquatic animals(NRC 1999). Nevertheless, the overall environmental load from aquaculturetends to be comparatively smaller and more dilute and dispersed than wasteloads from livestock, industry, or urban centers. Feed additives and drugs appliedin aquaculture directly dose the environment, resulting in antimicrobial resis-tance in nontarget species, and present dangers to human health (see chapter2, the Impact of Aquaculture on the Environment). Other drugs (parasiticides,spawning hormones) and chemicals (fertilizers algicides, herbicides, oxidants)disturb community structure, toxicity, and impact on biodiversity. There areseveral approaches to combating water pollution by aquaculture, most ofwhich are detailed in codes of practice and guidelines on best managementpractices (see annex 2, Selected Codes, Instruments, and Tools for ResponsibleAquaculture). Some of these measures are highlighted below.
Regulation
A range of regulatory measures is necessary, including zoning, EIAs, monitoringof farms, and inclusion of environmental stewardship obligations in the condi-tions of farm licenses. The regulations may mandate reduced stocking densitiesand reduced water exchange to decrease the volume of effluents and practices fordisposal of pond sediments (for example, drying ponds before removal of sedi-ment; use of sediment as soil fertilizer). Rigorously applying fiscal measures(Pongthanapanich 2005), internalizing environmental costs of aquaculture, andapplying the “user pays” principle will help mitigate the negative externalities.
Knowledge
The provision of information to farmers on BMPs will improve environmen-tal management of aquaculture and productivity. Improved siting of aqua-culture facilities can benefit from sound physical planning, soil analysis, andthe use of models, such as waste dispersion and assimilative capacity models.Improved analytical and design tools are required to assess environmental car-rying capacity under different production regimes and to design environmen-tally friendly management regimes.
Integrated Aquaculture
Integrated aquaculture systems can provide efficient and environmentallysound recycling of nutrients and organic materials. For example, polyculture
AQUACULTURE, ENVIRONMENT, AND HEALTH 25
of Chinese and Indian major carps, which account for the bulk of world aqua-culture production, is environmentally benign and can convert agriculturalwastes. In open-water aquaculture, filter-feeding species (such as oysters) andeconomically important seaweeds (such as Gracilaria) use suspended matterand dissolved nutrients, respectively. For example, by filtering plankton, mus-sel farms remove nitrogen from the water at a 70 percent higher rate than insurrounding water (Kaspar, Gillespie, Boyer, and MacKenzie 1985). In China,seaweeds and mollusks cultured in proximity to marine cage culture of finfishreduce nutrient loading from the cages or pens. Pond effluents can be treatedby constructed wetlands (settling ponds) that can remove three-quarters oftotal phosphorous and 96 percent of suspended solids,6 or as in Israel throughintegration with the culture of seaweeds and mollusks (figure A6.1).
Feeds
Advances in fish nutrition and breeding have contributed to a significantreduction of environmental loads per unit produced (Ackefors and Enell 1994).Modern feeds contain reduced amounts of phosphorus and nitrogen, and thefeed conversion efficiency has improved to as high as 1:1 on some Atlanticsalmon farms. These feeds are 87–88 percent digestible, reducing the nutrientcontent of feces.
Certification and Ecolabeling
Consumer demand and pressure from environmental NGOs on retailers areforcing the adoption of environmentally friendly aquaculture. The certificationand ecolabeling schemes attest to the character of the production processes andare means of complying with market requirements and adding value to prod-ucts (see chapter 2, Food Safety, Product Quality, and Certification).
Restocking and Introductions of Fish
Lakes, rivers, and seas are regularly stocked with aquatic species to take advan-tage of the natural productivity. The benefits are well known—often accruingto the landless, as in Bangladesh and India. However, these practices may haveundesirable environmental side effects, such as the following:
■ Disturbance of the existing ecological balance and loss of biodiversity
■ Loss of genetic biodiversity of the wild populations
■ Transmission or spread of fish diseases
Many of the negative impacts can be avoided or substantially mitigatedthrough the application of codes7 of practice to preserve ecosystem integrityand conserve biodiversity and genetic diversity (see annex 2, Selected Codes,Instruments, and Tools for Responsible Aquaculture, and chapter 3, SupplyingImproved Seeds).
26 CHANGING THE FACE OF THE WATERS
Introductions
The introduction of a nonindigenous species can transform an ecosystem asshown by the introduction of Nile perch in Lake Victoria, which now domi-nates the lake’s aquatic fauna. While the introduction of Nile perch is generallyconsidered to have yielded economic benefits, the arrival of the invasive waterhyacinth blocked waterways and access to riparian villages and fishing grounds,causing major economic losses.
Restocking and Ranching
Restocking of public water bodies with fish is an important pro-poor aqua-culture strategy that provides a useful community-level entry point. The risksto wild stocks when stocking large numbers of hatchery-produced juveniles torebuild endangered species and depleted stocks or to enhance the productivityof water bodies can be reduced by stocking juveniles with minimal geneticdivergence from their wild counterparts. This can be achieved by using a largenumber of breeders, and using genetic tags to permit monitoring and adaptivemanagement. Similar issues arise with regard to restocking and ranching. Thegenetic interactions between the stocked and wild populations are poorlyunderstood, and the extent to which stocked fish simply replace wild fish inlandings or add to total fish landings requires further study.
Escapes and Breeding in Cages
An estimated 2 million farmed salmon escape annually into the North Atlantic,and there are reports of successful breeding in the wild and genetic flow fromfarmed to wild populations (Naylor et al. 2005). The escapees can disturbspawning grounds, engage in unsuccessful reproduction with wild partners, orsuccessfully reproduce and dilute the genetic diversity of the species. Theseproblems are accentuated in highly fecund species, such as cod, which cancomplete their reproductive cycle while in the ponds or cages, thereby reduc-ing the scope of possible controls. Such events may supplant wild fish and haveadverse effects on wild fisheries.
Loss of Genetic Biodiversity
Traits bred into cultured fish often differ from those of wild fish, and inter-breeding with escaped farmed fish may result not only in loss of genetic diver-sity, but also in loss of important survival traits. The risk is greatest for smallpopulations that are already threatened. Concern over escaped species is likelyto increase as genetically modified fish are developed for aquaculture. Com-mercial farming of transgenic fish—genetically modified organisms (GMOs)—is beginning and pilot programs for transgenic shellfish, freshwater fish, andmarine fish have already been carried out (FAO 2000).
AQUACULTURE, ENVIRONMENT, AND HEALTH 27
Disease
Introductions of nonindigenous species can transfer fish diseases; for example,whirling disease, which is caused by a virus that affects rainbow trout. Whirl-ing disease was introduced to North America from imports of brown troutfrom Europe that appeared healthy, showed no effects of the disease, and in factwere immune to the disease. Another example is white spot disease, a pan-demic in shrimp, which has resulted in hundreds of millions of dollars in lossesworldwide.
Mitigating Measures
Practical management measures to safeguard the genetic and ecological integrityof wild stocks include the following:
■ Policies. Preparation of policies on the use of genetically enhanced aquaticspecies, reflecting the uncertainties associated with their impact on theirwild counterparts and applying science-based risk assessment, combinedwith an adaptive management approach.
■ Introductions. There are several important measures, such as effectiveimplementation of codes of practice and guidelines, for the responsible useof introduced species (Bartley, Subasinghe, and Coates 1996) and GMOs; riskassessments; and application of the precautionary approach to species intro-ductions (FAO 1995a), including improved quarantine systems and consul-tation with neighboring countries before introducing nonindigenous species(including GMOs) into transboundary aquatic ecosystems. Many countriesalready have strict rules on the introduction of nonindigenous species.Unfortunately these rules may not be strictly enforced, and in shared water-sheds and in the sea, species can readily move across the national boundaries.
■ Escapes. A primary emphasis on prevention through improved cage design,anchoring, net management, and guidelines for vessel operation near farms;contingency plans in case of escapes, including fishing to remove escapees asa condition of farm licenses; formal inquiry; improved fish inventory tech-niques combined with tagging and identification of escapees using geneticmarkers; establishment of fish farm zones at a distance from wild stocks (forexample, mouths of breeding rivers) to reduce potential wild/farmed speciesinteraction; and farming of sterile fish.8
Knowledge
The impact on wild populations of restocking and ranching programs, or ofthe escape of farmed fish, is poorly understood. Informed policies and theapplication of mitigating measures require capacity building and expansion ofthe knowledge base about interactions between cultured fish and their wild
28 CHANGING THE FACE OF THE WATERS
counterparts. It requires assistance in the adoption of codes, training of geneti-cists, and enhanced regional cooperation and networking to share scarce skills.
Dependence on Wild Seed
The collection of wild seed for aquaculture affects the wild stock of the targetspecies. Additionally, the fine mesh nets used to collect shrimp seed removejuveniles of a variety of other nontarget species that affect the entire eco-system. Damage to wild stocks has not yet been quantified, but there is agreater threat to heavily fished stocks and species that have low reproductivecapacities. For species under international management, such as bluefin tuna,production from wild seed collection also poses difficulties in monitoringquotas. In addition to the broad collection of wild seed material, “capture-based aquaculture” relies on the capture of mature adults harvested forbroodstock. This is usually an interim measure used while techniques aredeveloped for controlled breeding and mass production of juveniles. Cur-rently, commercial sources of seed do not exist for a number of high-valuefarmed species, including eel, grouper, yellowtail, and tuna, and their cultureis totally dependent on the collection of seed from the wild (Ottolenghi et al.2004; Nash 2005). The total value of farmed production of these speciesgroups is on the order of $1.7 billion.
On the positive side, the practice is labor intensive and can contribute topoverty alleviation and provides alternative livelihood for coastal communi-ties. In Bangladesh, for example, 150,000 people, mostly the very poor, collectshrimp seed for a livelihood. In the absence of other sources of shrimp seedand the creation of alternative livelihoods, these unsustainable practices willcontinue. Models indicate that the social cost of biodiversity loss from shrimpseed collection could readily be absorbed by farmers in Bangladesh (Kapuria,Nisar, and Khan 2005).
As new species are cultured, capture-based aquaculture is likely to expand,and every effort should be made to reduce dependence on wild seed. Regula-tions will need to be based on sound policies and an informed assessment ofthe impact of these practices on target species and the environment. Incentivesfor commercial hatchery seed production and applied research on seed pro-duction for new cultured species is necessary. Alternative livelihoods will needto be created for those engaged in ecologically damaging seed collection.
THE IMPACT OF AQUACULTURE ON HUMAN HEALTH
Aquaculture poses a range of well-known and largely manageable risks tohuman health. New forms of animal associations and manmade food chainspose risks, but because of the considerable metabolic differences between cul-tured fish and humans, the possibility of an equivalent of bovine spongiform
AQUACULTURE, ENVIRONMENT, AND HEALTH 29
encephalopathy (BSE) is considered relatively remote. Human health risksarise from pathogens and the spread of disease vectors, chemicals and toxins,and abuse of antibiotics.
Pathogens and the Spread of Disease Vectors
As with all foods, food safety issues are associated with aquaculture products.In addition, aquaculture can contribute to the spread of water- and insect-borne diseases such as schistosomiasis and malaria.
A range of parasitic worms (flatworms, tapeworms, and roundworms),pathogenic bacteria (Salmonella, Eschericia, Vibrio, and others), and viruses arecommon to both wild and cultured species. While it is possible that poorlymanaged intensive fish culture may render fish more susceptible to disease orbe hosts of human pathogens, there is little evidence that aquaculture con-tributes to increased incidence of these diseases. Many bacteria are already nat-urally present in the water, or more commonly introduced by contaminationfrom livestock, by human waste, or through postharvest contamination inproduct handling and processing. Risks are higher in freshwaters than inmarine waters and higher in tropical than in temperate climates. For example,cholera pathogens are a natural component of tropical waters and can con-taminate mollusks even without their exposure to human fecal material. Thelevel of pathogenic microbes in marine waters has been a constraint in theshellfish industry throughout much of the European Union. Infection ofhumans with fish pathogens has been documented in the United States andIsrael (Bisharat and Raz 1996; Weinstein et al. 1997). Viruses causing disease infish are not pathogenic in humans.
The main cause of human infection is the consumption of raw or inade-quately cooked fish. Most parasitic worms and bacteria are destroyed thoroughcooking and in some cases, by storing fish at low temperatures. Epidemio-logical evidence suggests that the risk to human health is low and needs to beplaced in perspective with improved availability of low-cost fish and increasingsanitary and food safety requirements in commercial aquaculture.
Spread of Disease Vectors
Aquaculture provides a range of environmental services related to humanhealth; in particular, the control of hosts and vectors of pathogens, such asmosquitoes and snails. However, abandoned or poorly managed fishpondshave been associated with the spread of schistosomiasis and malaria. Ducksraised in association with fish farms and the use of chicken dung as fertilizer infish farms may contribute to the spread of diseases, such as highly pathogenicavian influenza, but in this case the ducks are the vector—not the fish (Gu, Hu,and Yang 1996; Skladany 1996; Feare 2006).
30 CHANGING THE FACE OF THE WATERS
Chemicals and Toxins
The risks associated with chemicals and toxins arise from several sources: agri-cultural chemicals, pesticides, veterinary drug residues, and accumulation ofother pollutants. In addition, under certain conditions, some cultured speciescan produce toxins. Poor farming practices have led to major commerciallosses when importing countries have placed import restrictions on shrimpand other products from Asia and Latin America as a result of unacceptablelevels of antibiotic residues in products.
Pesticides and piscicides (chemicals to kill fish) present a risk to humanhealth, and their use has to be carefully monitored. High levels of polychlori-nated triphenyls (PCBs), dioxins, and other contaminants have been reportedin farmed salmon (Hites et al. 2004) and attributed to the bioaccumulation inthe fish meal feed. Metals from mining, use of antifouling agents, or naturalsources can also accumulate in the edible tissues of cultured fish—in particu-lar, of invertebrates. The levels of mercury and organochlorides in fish are apublic health concern. In general, farmed fish, such as salmon, are likely to havelower levels of mercury than their wild counterparts because the feed rationsare monitored and they are harvested younger (mercury accumulates duringthe life of the fish). Although there is still some debate, the benefits of eatingfish, particularly for vulnerable groups such as young children and pregnantand lactating women, have been shown to far outweigh the potential adverseeffects (Eurofish 2004). An increasing number of studies also show a close linkbetween brain function and consumption of fish oils (omega-3 fatty acids) anda growing body of evidence indicates that reduced fish consumption in thepopulation may result in a lowering of the population’s intelligence and inantisocial behavior (see box 2.1).
Toxins
Toxins in bivalves—oysters and mussels—are associated with algal blooms,which are occurring with increasing frequency because of eutrophication ofcoastal waters. These harmful algal blooms (HAB) have threatened the eco-nomic viability of bivalve culture in some parts of Europe because of diarrheticshellfish poisoning (DSP), paralytic shellfish poisoning (PSP), and amnesiacshellfish disease (ASD). The cost of depuration measures such as thoserequired under EC Directive 91/492, is significant to producers, which is anexample of a negative environmental impact on aquaculture caused by otherresource users. In China, a World Bank project (see box 2.2) is helping toaddress these issues.
Antibiotics and Drug Resistance
There are several risks related to the use of veterinary drugs in aquaculture:risks to consumers from ingestion of the drugs, or residues, leading to devel-
AQUACULTURE, ENVIRONMENT, AND HEALTH 31
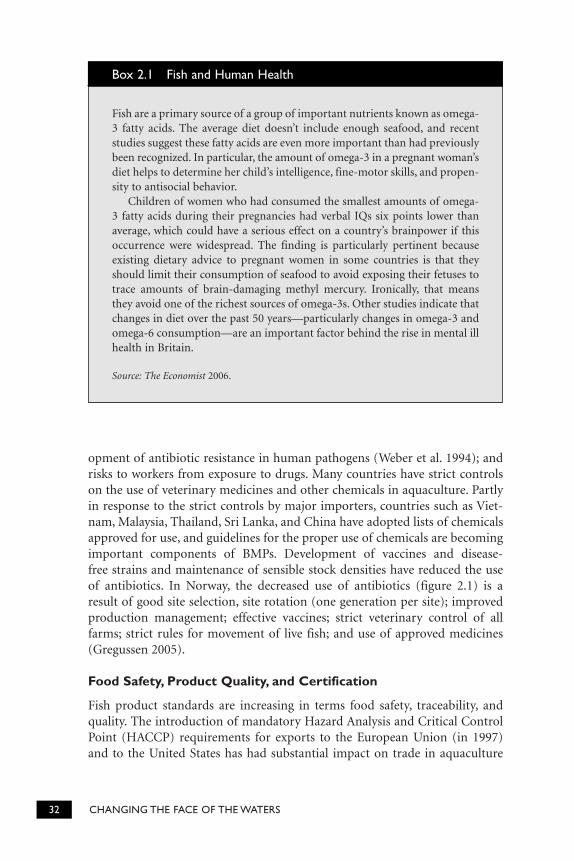
opment of antibiotic resistance in human pathogens (Weber et al. 1994); andrisks to workers from exposure to drugs. Many countries have strict controlson the use of veterinary medicines and other chemicals in aquaculture. Partlyin response to the strict controls by major importers, countries such as Viet-nam, Malaysia, Thailand, Sri Lanka, and China have adopted lists of chemicalsapproved for use, and guidelines for the proper use of chemicals are becomingimportant components of BMPs. Development of vaccines and disease-free strains and maintenance of sensible stock densities have reduced the use of antibiotics. In Norway, the decreased use of antibiotics (figure 2.1) is a result of good site selection, site rotation (one generation per site); improvedproduction management; effective vaccines; strict veterinary control of all farms; strict rules for movement of live fish; and use of approved medicines(Gregussen 2005).
Food Safety, Product Quality, and Certification
Fish product standards are increasing in terms food safety, traceability, andquality. The introduction of mandatory Hazard Analysis and Critical ControlPoint (HACCP) requirements for exports to the European Union (in 1997)and to the United States has had substantial impact on trade in aquaculture
32 CHANGING THE FACE OF THE WATERS
Fish are a primary source of a group of important nutrients known as omega-3 fatty acids. The average diet doesn’t include enough seafood, and recentstudies suggest these fatty acids are even more important than had previouslybeen recognized. In particular, the amount of omega-3 in a pregnant woman’sdiet helps to determine her child’s intelligence, fine-motor skills, and propen-sity to antisocial behavior.
Children of women who had consumed the smallest amounts of omega-3 fatty acids during their pregnancies had verbal IQs six points lower thanaverage, which could have a serious effect on a country’s brainpower if thisoccurrence were widespread. The finding is particularly pertinent becauseexisting dietary advice to pregnant women in some countries is that theyshould limit their consumption of seafood to avoid exposing their fetuses totrace amounts of brain-damaging methyl mercury. Ironically, that meansthey avoid one of the richest sources of omega-3s. Other studies indicate thatchanges in diet over the past 50 years—particularly changes in omega-3 andomega-6 consumption—are an important factor behind the rise in mental illhealth in Britain.
Source: The Economist 2006.
Box 2.1 Fish and Human Health
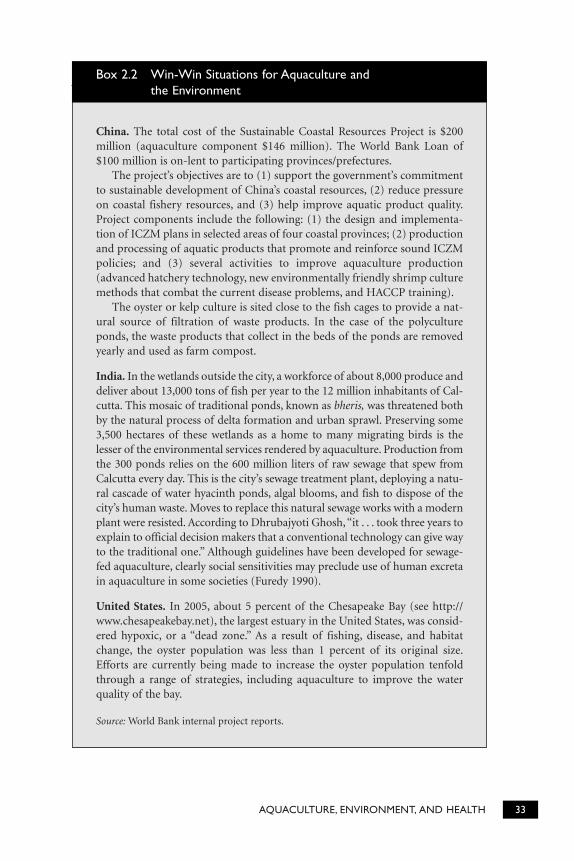
AQUACULTURE, ENVIRONMENT, AND HEALTH 33
China. The total cost of the Sustainable Coastal Resources Project is $200million (aquaculture component $146 million). The World Bank Loan of$100 million is on-lent to participating provinces/prefectures.
The project’s objectives are to (1) support the government’s commitmentto sustainable development of China’s coastal resources, (2) reduce pressureon coastal fishery resources, and (3) help improve aquatic product quality.Project components include the following: (1) the design and implementa-tion of ICZM plans in selected areas of four coastal provinces; (2) productionand processing of aquatic products that promote and reinforce sound ICZMpolicies; and (3) several activities to improve aquaculture production(advanced hatchery technology, new environmentally friendly shrimp culturemethods that combat the current disease problems, and HACCP training).
The oyster or kelp culture is sited close to the fish cages to provide a nat-ural source of filtration of waste products. In the case of the polycultureponds, the waste products that collect in the beds of the ponds are removedyearly and used as farm compost.
India. In the wetlands outside the city, a workforce of about 8,000 produce anddeliver about 13,000 tons of fish per year to the 12 million inhabitants of Cal-cutta. This mosaic of traditional ponds, known as bheris, was threatened bothby the natural process of delta formation and urban sprawl. Preserving some3,500 hectares of these wetlands as a home to many migrating birds is thelesser of the environmental services rendered by aquaculture. Production fromthe 300 ponds relies on the 600 million liters of raw sewage that spew fromCalcutta every day. This is the city’s sewage treatment plant, deploying a natu-ral cascade of water hyacinth ponds, algal blooms, and fish to dispose of thecity’s human waste. Moves to replace this natural sewage works with a modernplant were resisted. According to Dhrubajyoti Ghosh, “it . . . took three years toexplain to official decision makers that a conventional technology can give wayto the traditional one.” Although guidelines have been developed for sewage-fed aquaculture, clearly social sensitivities may preclude use of human excretain aquaculture in some societies (Furedy 1990).
United States. In 2005, about 5 percent of the Chesapeake Bay (see http://www.chesapeakebay.net), the largest estuary in the United States, was consid-ered hypoxic, or a “dead zone.” As a result of fishing, disease, and habitatchange, the oyster population was less than 1 percent of its original size.Efforts are currently being made to increase the oyster population tenfoldthrough a range of strategies, including aquaculture to improve the waterquality of the bay.
Source: World Bank internal project reports.
Box 2.2 Win-Win Situations for Aquaculture and the Environment
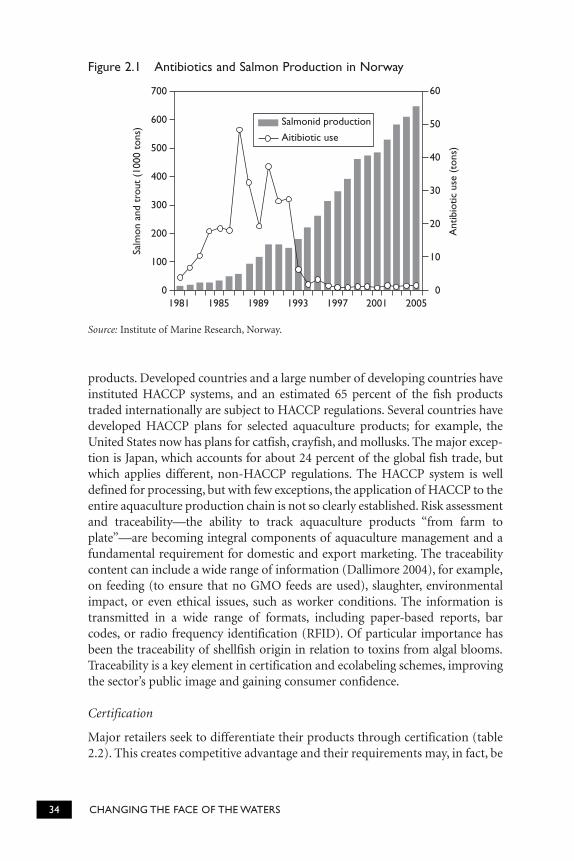
products. Developed countries and a large number of developing countries haveinstituted HACCP systems, and an estimated 65 percent of the fish productstraded internationally are subject to HACCP regulations. Several countries havedeveloped HACCP plans for selected aquaculture products; for example, theUnited States now has plans for catfish, crayfish, and mollusks. The major excep-tion is Japan, which accounts for about 24 percent of the global fish trade, butwhich applies different, non-HACCP regulations. The HACCP system is welldefined for processing, but with few exceptions, the application of HACCP to theentire aquaculture production chain is not so clearly established. Risk assessmentand traceability—the ability to track aquaculture products “from farm toplate”—are becoming integral components of aquaculture management and afundamental requirement for domestic and export marketing. The traceabilitycontent can include a wide range of information (Dallimore 2004), for example,on feeding (to ensure that no GMO feeds are used), slaughter, environmentalimpact, or even ethical issues, such as worker conditions. The information istransmitted in a wide range of formats, including paper-based reports, barcodes, or radio frequency identification (RFID). Of particular importance hasbeen the traceability of shellfish origin in relation to toxins from algal blooms.Traceability is a key element in certification and ecolabeling schemes, improvingthe sector’s public image and gaining consumer confidence.
Certification
Major retailers seek to differentiate their products through certification (table2.2). This creates competitive advantage and their requirements may, in fact, be
34 CHANGING THE FACE OF THE WATERS
700
600
500
400
300
200
100
0
60
50
40
30
20
10
0
Salm
on a
nd t
rout
(10
00 t
ons)
Ant
ibio
tic u
se (
tons
)
1981 1985 1989 1993 1997 2001 2005
Salmonid production
Aitibiotic use
Figure 2.1 Antibiotics and Salmon Production in Norway
Source: Institute of Marine Research, Norway.
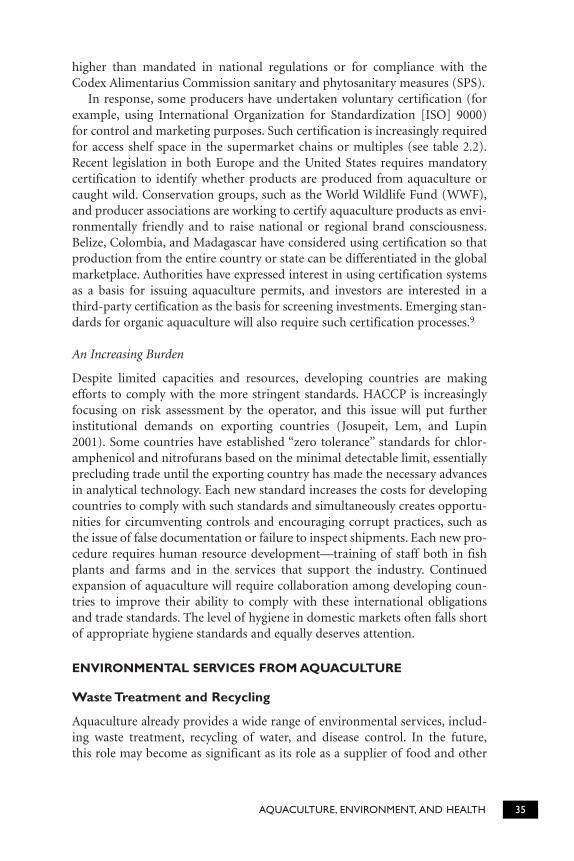
higher than mandated in national regulations or for compliance with theCodex Alimentarius Commission sanitary and phytosanitary measures (SPS).
In response, some producers have undertaken voluntary certification (forexample, using International Organization for Standardization [ISO] 9000) for control and marketing purposes. Such certification is increasingly requiredfor access shelf space in the supermarket chains or multiples (see table 2.2).Recent legislation in both Europe and the United States requires mandatorycertification to identify whether products are produced from aquaculture orcaught wild. Conservation groups, such as the World Wildlife Fund (WWF),and producer associations are working to certify aquaculture products as envi-ronmentally friendly and to raise national or regional brand consciousness.Belize, Colombia, and Madagascar have considered using certification so thatproduction from the entire country or state can be differentiated in the globalmarketplace. Authorities have expressed interest in using certification systemsas a basis for issuing aquaculture permits, and investors are interested in athird-party certification as the basis for screening investments. Emerging stan-dards for organic aquaculture will also require such certification processes.9
An Increasing Burden
Despite limited capacities and resources, developing countries are makingefforts to comply with the more stringent standards. HACCP is increasinglyfocusing on risk assessment by the operator, and this issue will put furtherinstitutional demands on exporting countries (Josupeit, Lem, and Lupin2001). Some countries have established “zero tolerance” standards for chlor-amphenicol and nitrofurans based on the minimal detectable limit, essentiallyprecluding trade until the exporting country has made the necessary advancesin analytical technology. Each new standard increases the costs for developingcountries to comply with such standards and simultaneously creates opportu-nities for circumventing controls and encouraging corrupt practices, such asthe issue of false documentation or failure to inspect shipments. Each new pro-cedure requires human resource development—training of staff both in fishplants and farms and in the services that support the industry. Continuedexpansion of aquaculture will require collaboration among developing coun-tries to improve their ability to comply with these international obligationsand trade standards. The level of hygiene in domestic markets often falls shortof appropriate hygiene standards and equally deserves attention.
ENVIRONMENTAL SERVICES FROM AQUACULTURE
Waste Treatment and Recycling
Aquaculture already provides a wide range of environmental services, includ-ing waste treatment, recycling of water, and disease control. In the future,this role may become as significant as its role as a supplier of food and other
AQUACULTURE, ENVIRONMENT, AND HEALTH 35
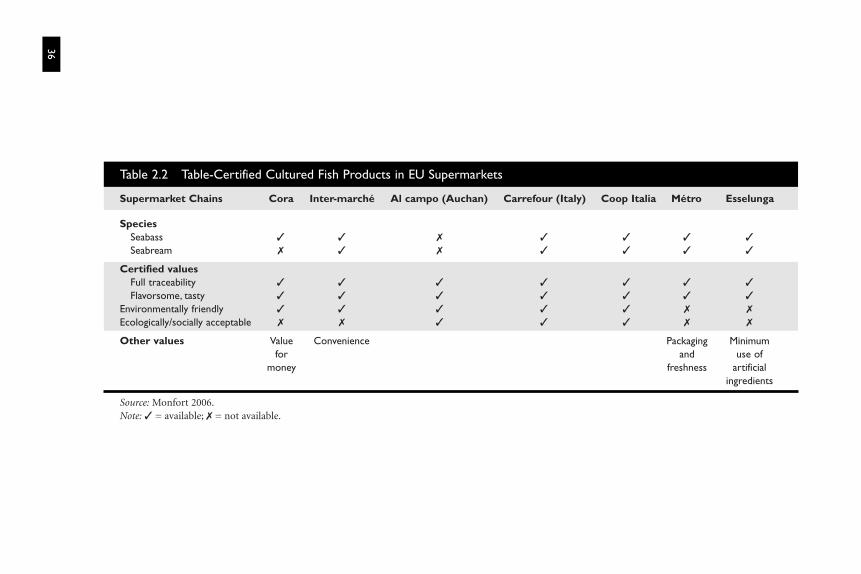
36
Table 2.2 Table-Certified Cultured Fish Products in EU Supermarkets
Supermarket Chains Cora Inter-marché Al campo (Auchan) Carrefour (Italy) Coop Italia Métro Esselunga
SpeciesSeabass ✓ ✓ ✗ ✓ ✓ ✓ ✓
Seabream ✗ ✓ ✗ ✓ ✓ ✓ ✓
Certified valuesFull traceability ✓ ✓ ✓ ✓ ✓ ✓ ✓
Flavorsome, tasty ✓ ✓ ✓ ✓ ✓ ✓ ✓
Environmentally friendly ✓ ✓ ✓ ✓ ✓ ✗ ✗
Ecologically/socially acceptable ✗ ✗ ✓ ✓ ✓ ✗ ✗
Other values Value Convenience Packaging Minimumfor and use of
money freshness artificial ingredients
Source: Monfort 2006.Note: ✓ = available; ✗ = not available.
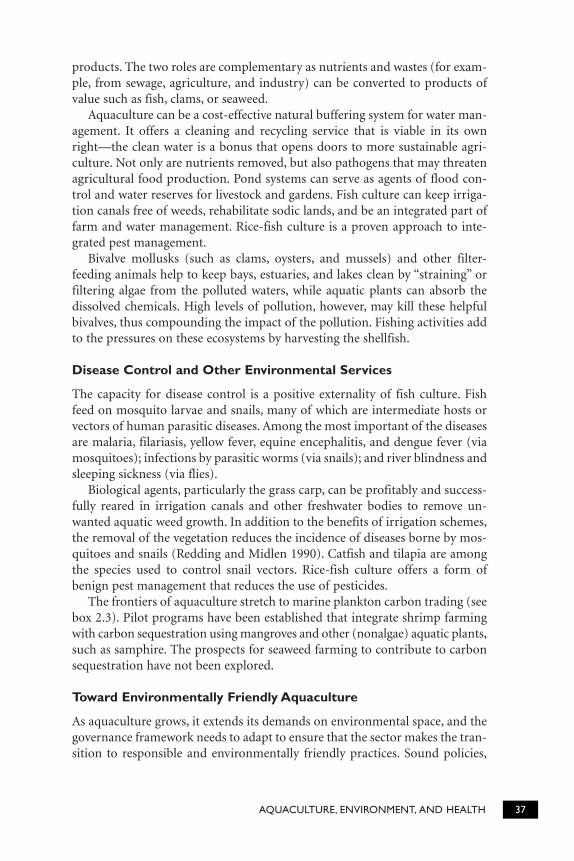
products. The two roles are complementary as nutrients and wastes (for exam-ple, from sewage, agriculture, and industry) can be converted to products ofvalue such as fish, clams, or seaweed.
Aquaculture can be a cost-effective natural buffering system for water man-agement. It offers a cleaning and recycling service that is viable in its ownright—the clean water is a bonus that opens doors to more sustainable agri-culture. Not only are nutrients removed, but also pathogens that may threatenagricultural food production. Pond systems can serve as agents of flood con-trol and water reserves for livestock and gardens. Fish culture can keep irriga-tion canals free of weeds, rehabilitate sodic lands, and be an integrated part offarm and water management. Rice-fish culture is a proven approach to inte-grated pest management.
Bivalve mollusks (such as clams, oysters, and mussels) and other filter-feeding animals help to keep bays, estuaries, and lakes clean by “straining” orfiltering algae from the polluted waters, while aquatic plants can absorb thedissolved chemicals. High levels of pollution, however, may kill these helpfulbivalves, thus compounding the impact of the pollution. Fishing activities addto the pressures on these ecosystems by harvesting the shellfish.
Disease Control and Other Environmental Services
The capacity for disease control is a positive externality of fish culture. Fishfeed on mosquito larvae and snails, many of which are intermediate hosts orvectors of human parasitic diseases. Among the most important of the diseasesare malaria, filariasis, yellow fever, equine encephalitis, and dengue fever (viamosquitoes); infections by parasitic worms (via snails); and river blindness andsleeping sickness (via flies).
Biological agents, particularly the grass carp, can be profitably and success-fully reared in irrigation canals and other freshwater bodies to remove un-wanted aquatic weed growth. In addition to the benefits of irrigation schemes,the removal of the vegetation reduces the incidence of diseases borne by mos-quitoes and snails (Redding and Midlen 1990). Catfish and tilapia are amongthe species used to control snail vectors. Rice-fish culture offers a form ofbenign pest management that reduces the use of pesticides.
The frontiers of aquaculture stretch to marine plankton carbon trading (seebox 2.3). Pilot programs have been established that integrate shrimp farmingwith carbon sequestration using mangroves and other (nonalgae) aquatic plants,such as samphire. The prospects for seaweed farming to contribute to carbonsequestration have not been explored.
Toward Environmentally Friendly Aquaculture
As aquaculture grows, it extends its demands on environmental space, and thegovernance framework needs to adapt to ensure that the sector makes the tran-sition to responsible and environmentally friendly practices. Sound policies,
AQUACULTURE, ENVIRONMENT, AND HEALTH 37
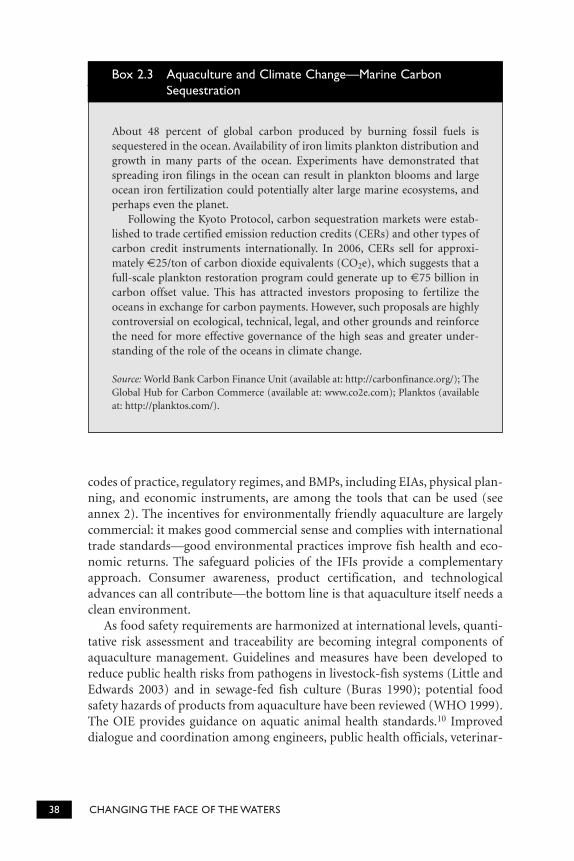
codes of practice, regulatory regimes, and BMPs, including EIAs, physical plan-ning, and economic instruments, are among the tools that can be used (seeannex 2). The incentives for environmentally friendly aquaculture are largelycommercial: it makes good commercial sense and complies with internationaltrade standards—good environmental practices improve fish health and eco-nomic returns. The safeguard policies of the IFIs provide a complementaryapproach. Consumer awareness, product certification, and technologicaladvances can all contribute—the bottom line is that aquaculture itself needs aclean environment.
As food safety requirements are harmonized at international levels, quanti-tative risk assessment and traceability are becoming integral components ofaquaculture management. Guidelines and measures have been developed toreduce public health risks from pathogens in livestock-fish systems (Little andEdwards 2003) and in sewage-fed fish culture (Buras 1990); potential foodsafety hazards of products from aquaculture have been reviewed (WHO 1999).The OIE provides guidance on aquatic animal health standards.10 Improveddialogue and coordination among engineers, public health officials, veterinar-
38 CHANGING THE FACE OF THE WATERS
About 48 percent of global carbon produced by burning fossil fuels issequestered in the ocean. Availability of iron limits plankton distribution andgrowth in many parts of the ocean. Experiments have demonstrated thatspreading iron filings in the ocean can result in plankton blooms and largeocean iron fertilization could potentially alter large marine ecosystems, andperhaps even the planet.
Following the Kyoto Protocol, carbon sequestration markets were estab-lished to trade certified emission reduction credits (CERs) and other types ofcarbon credit instruments internationally. In 2006, CERs sell for approxi-mately €25/ton of carbon dioxide equivalents (CO2e), which suggests that afull-scale plankton restoration program could generate up to €75 billion incarbon offset value. This has attracted investors proposing to fertilize theoceans in exchange for carbon payments. However, such proposals are highlycontroversial on ecological, technical, legal, and other grounds and reinforcethe need for more effective governance of the high seas and greater under-standing of the role of the oceans in climate change.
Source: World Bank Carbon Finance Unit (available at: http://carbonfinance.org/); TheGlobal Hub for Carbon Commerce (available at: www.co2e.com); Planktos (availableat: http://planktos.com/).
Box 2.3 Aquaculture and Climate Change—Marine CarbonSequestration
ians, and aquaculture regulators will improve the environmental services fromaquaculture, help reduce health risks, and avoid trade restrictions.
Public investment is required to create a sound governance framework, fillknowledge gaps, and develop human capacity. Although many modern aqua-culture systems appear more environmentally friendly and benign than live-stock production systems, closer examination of the environmental footprintand impacts of these systems is required. A substantial element in this foot-print is a continued reliance on fish oil derived from capture fisheries (seechapter 3, Feeds, Seeds, and Disease) and increased use of energy as productionintensifies.
Public Perception and Science
Many of the environmental and resource-related concerns in aquaculturereflect a young industry that has grown rapidly in a regulatory vacuum andwith a modest underpinning of science. Scientifically rigorous assessments arerequired to develop solutions to the many legitimate concerns and to avoid amisinformed public perception of an industry that, at times, has been poorlyserved by unbalanced science.
AQUACULTURE, ENVIRONMENT, AND HEALTH 39
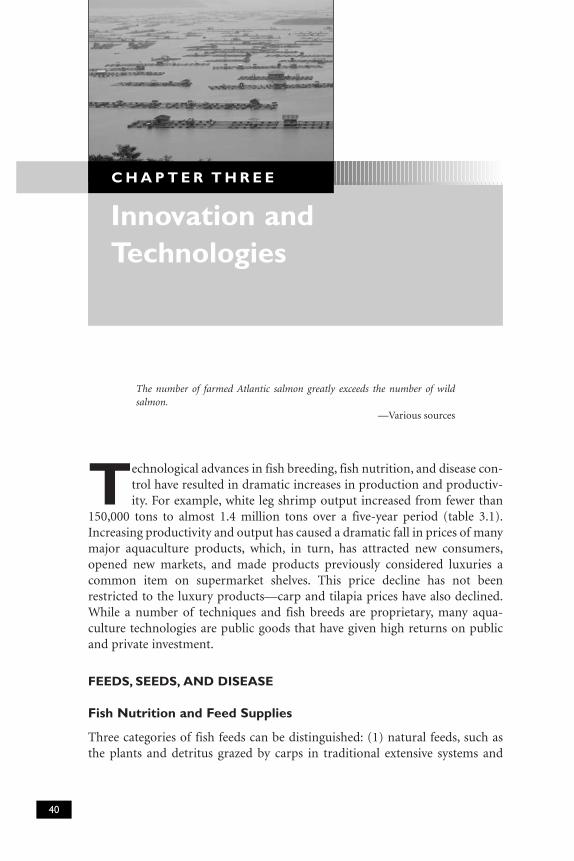
The number of farmed Atlantic salmon greatly exceeds the number of wildsalmon.
—Various sources
Technological advances in fish breeding, fish nutrition, and disease con-trol have resulted in dramatic increases in production and productiv-ity. For example, white leg shrimp output increased from fewer than
150,000 tons to almost 1.4 million tons over a five-year period (table 3.1).Increasing productivity and output has caused a dramatic fall in prices of manymajor aquaculture products, which, in turn, has attracted new consumers,opened new markets, and made products previously considered luxuries acommon item on supermarket shelves. This price decline has not beenrestricted to the luxury products—carp and tilapia prices have also declined.While a number of techniques and fish breeds are proprietary, many aqua-culture technologies are public goods that have given high returns on publicand private investment.
FEEDS, SEEDS, AND DISEASE
Fish Nutrition and Feed Supplies
Three categories of fish feeds can be distinguished: (1) natural feeds, such asthe plants and detritus grazed by carps in traditional extensive systems and
Innovation andTechnologies
C H A P T E R T H R E E
40
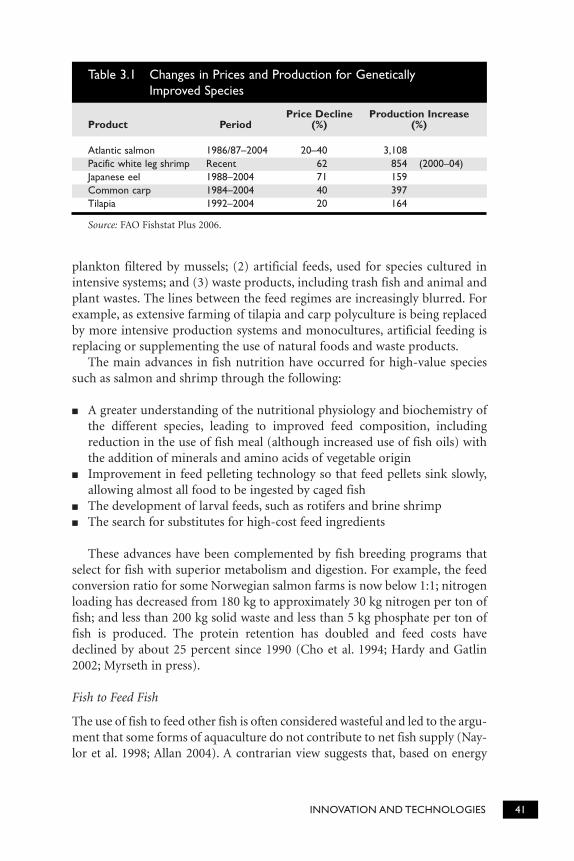
plankton filtered by mussels; (2) artificial feeds, used for species cultured inintensive systems; and (3) waste products, including trash fish and animal andplant wastes. The lines between the feed regimes are increasingly blurred. Forexample, as extensive farming of tilapia and carp polyculture is being replacedby more intensive production systems and monocultures, artificial feeding isreplacing or supplementing the use of natural foods and waste products.
The main advances in fish nutrition have occurred for high-value speciessuch as salmon and shrimp through the following:
■ A greater understanding of the nutritional physiology and biochemistry ofthe different species, leading to improved feed composition, includingreduction in the use of fish meal (although increased use of fish oils) withthe addition of minerals and amino acids of vegetable origin
■ Improvement in feed pelleting technology so that feed pellets sink slowly,allowing almost all food to be ingested by caged fish
■ The development of larval feeds, such as rotifers and brine shrimp■ The search for substitutes for high-cost feed ingredients
These advances have been complemented by fish breeding programs thatselect for fish with superior metabolism and digestion. For example, the feedconversion ratio for some Norwegian salmon farms is now below 1:1; nitrogenloading has decreased from 180 kg to approximately 30 kg nitrogen per ton offish; and less than 200 kg solid waste and less than 5 kg phosphate per ton offish is produced. The protein retention has doubled and feed costs havedeclined by about 25 percent since 1990 (Cho et al. 1994; Hardy and Gatlin2002; Myrseth in press).
Fish to Feed Fish
The use of fish to feed other fish is often considered wasteful and led to the argu-ment that some forms of aquaculture do not contribute to net fish supply (Nay-lor et al. 1998; Allan 2004). A contrarian view suggests that, based on energy
INNOVATION AND TECHNOLOGIES 41
Table 3.1 Changes in Prices and Production for Genetically Improved Species
Price Decline Production IncreaseProduct Period (%) (%)
Atlantic salmon 1986/87–2004 20–40 3,108Pacific white leg shrimp Recent 62 854 (2000–04)Japanese eel 1988–2004 71 159Common carp 1984–2004 40 397Tilapia 1992–2004 20 164
Source: FAO Fishstat Plus 2006.
flow values, aquaculture represents a significant ecological advantage over theperformance of wild fish (Forster 1999). The feed fish are usually small pelagicfish or so-called trash fish (Kelleher 2005)—that is, fish caught but unsuitablefor direct human consumption. Approximately one-third (30 million tons) ofthe annual global marine catch is converted to about 6 million tons of fish mealand 1 million ton of fish oils, values that have remained relatively stable sincethe mid-1980s and that are unlikely to increase. Some 52 percent of world fishmeal and 82 percent of fish oil supply was used by aquaculture in 2004 (Shep-herd 2005; Tacon 2006)—proportions that are steadily increasing (Tacon 2003).Fish oil rather than fish meal is the limiting factor, particularly for carnivorousspecies, although its use in the diet of noncarnivorous fish is also increasing(Pauly et al. 2001). As a result, prices of fish meal and oil are soaring; this, inturn, is driving the search for vegetable substitutes. Substitutes exist, but thecosts of their production and extraction remain high and there is resistance touse of GMO feeds. Fish oil production, or the availability of cost-effective sub-stitutes, is becoming a constraint to the continued expansion of aquaculture.Global supply of compound aquafeed is on the order of 22 million tons, or lessthan 5 percent of global animal feed supply.
Trash Fish and Animal Wastes
Recent estimates indicate that, in addition to the small pelagic fish used for fishmeal production, between 5 and 7 million tons of trash fish are used as rawmaterial for fish meal or are fed directly to fish, particularly in Asia (Tacon2006). It is clear that the market for trash fish is driving overfishing, particu-larly by trawlers. Asia-Pacific Fishery Commission (APFIC) (see http://www.apfic.org) has begun to address the complex fisheries management issuesinvolved, which lie outside the scope of this study. The global supply of ter-restrial animal wastes is between 15 and 30 million tons, but the use of animalwastes as feed is constrained by biosecurity considerations and veterinaryadvice.
Relative Efficiency
Fish are more efficient protein producers than livestock and the nutritionalvalue of fish is greater. The conversion ratio for high-energy feeds on modernsalmon farms is approaching 1:1, compared with 1.8:1 for poultry, the mostefficient livestock converter. There are several reasons for this. Fish are coldblooded, use less energy to perform vital functions, and do not require theheavy bone structure and energy to move on land. Fish catabolism and repro-duction are also more energy efficient. Livestock use 54 percent of global fishmeal supplies, and this superior feed conversion efficiency of fish is rarelynoted by those who argue that using fish meal to feed fish is wasteful.
42 CHANGING THE FACE OF THE WATERS
Sourcing of Feeds in Rural Areas
The supply of fish feeds has been a major constraint to rural aquaculture inSub-Saharan Africa and elsewhere. Aquaculture production often does notattain the critical mass to warrant fish feed production by feed mills, whereasextensive farming may not yield adequate returns and available wastes may notoffer the nutrition required. Clustering of fish farms, organization of farmers,and greater integration of ponds with waste management are among theapproaches advocated. In view of the poverty link, public support is justified topursue the following:
■ Screen and map locally available waste products for their feed potential anddevelop simple and cost-effective methods of increasing their nutritionalvalue
■ Support the adaptation of low-cost processing machinery and improve meth-ods of processing and storing farm-made aqua-feeds
■ Support the setting standards and monitoring of aqua-feeds for the pres-ence of GMO ingredients and contaminants such as mercury or PCBs, andfor provision of advice and monitoring of feed additives such as probiotics
■ Review incentive systems for artificial feed production, such as the removalof tariffs on the import of key ingredients for mills producing fish feeds
■ Support the introduction, where land availability permits, of integratedproduction systems using wastes and natural feeds
Supplying Improved Seeds
There is a strong case for both public and private investment in geneticimprovement and maintenance of genetically vigorous broodstock. The cost-benefit ratio for the Norwegian Salmon National Breeding Program is esti-mated to be 1:15, while the pro-poor GIFT program had an estimated eco-nomic internal rate of return of 70 percent.
Genetic Improvement of Cultured Species
Genetic improvement of cultured species can significantly increase the aqua-culture productivity, contribute to food security, and reduce the impact on theenvironment. Genetic improvement reduces diseases and requirements forfeed, land, and water. The productivity gains result in increased supplies,reduced prices, and improved product quality. Today, only about 1 percent ofaquaculture production is based on genetically improved fish and shellfish(Gjedrem 2000), but recent experience suggests that it may be possible toobtain increases in aquaculture that are equal to or greater than those obtainedin agriculture (Gjedrem 1997) (table 3.2). Genetic improvement of a few cul-tured species has led to significant increases in productivity, resistance to dis-
INNOVATION AND TECHNOLOGIES 43
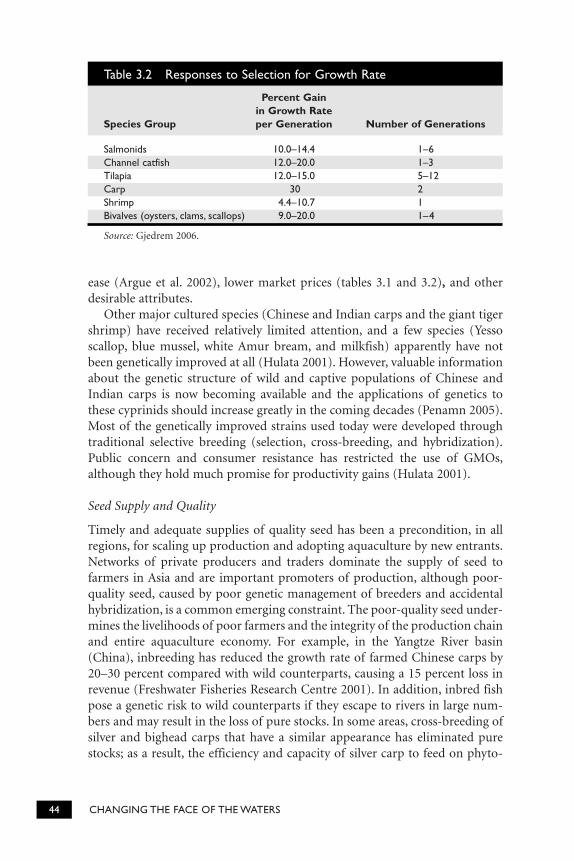
ease (Argue et al. 2002), lower market prices (tables 3.1 and 3.2), and otherdesirable attributes.
Other major cultured species (Chinese and Indian carps and the giant tigershrimp) have received relatively limited attention, and a few species (Yessoscallop, blue mussel, white Amur bream, and milkfish) apparently have notbeen genetically improved at all (Hulata 2001). However, valuable informationabout the genetic structure of wild and captive populations of Chinese andIndian carps is now becoming available and the applications of genetics tothese cyprinids should increase greatly in the coming decades (Penamn 2005).Most of the genetically improved strains used today were developed throughtraditional selective breeding (selection, cross-breeding, and hybridization).Public concern and consumer resistance has restricted the use of GMOs,although they hold much promise for productivity gains (Hulata 2001).
Seed Supply and Quality
Timely and adequate supplies of quality seed has been a precondition, in allregions, for scaling up production and adopting aquaculture by new entrants.Networks of private producers and traders dominate the supply of seed tofarmers in Asia and are important promoters of production, although poor-quality seed, caused by poor genetic management of breeders and accidentalhybridization, is a common emerging constraint. The poor-quality seed under-mines the livelihoods of poor farmers and the integrity of the production chainand entire aquaculture economy. For example, in the Yangtze River basin(China), inbreeding has reduced the growth rate of farmed Chinese carps by20–30 percent compared with wild counterparts, causing a 15 percent loss inrevenue (Freshwater Fisheries Research Centre 2001). In addition, inbred fishpose a genetic risk to wild counterparts if they escape to rivers in large num-bers and may result in the loss of pure stocks. In some areas, cross-breeding ofsilver and bighead carps that have a similar appearance has eliminated purestocks; as a result, the efficiency and capacity of silver carp to feed on phyto-
44 CHANGING THE FACE OF THE WATERS
Table 3.2 Responses to Selection for Growth Rate
Percent Gainin Growth Rate
Species Group per Generation Number of Generations
Salmonids 10.0–14.4 1–6Channel catfish 12.0–20.0 1–3Tilapia 12.0–15.0 5–12Carp 30 2Shrimp 4.4–10.7 1Bivalves (oysters, clams, scallops) 9.0–20.0 1–4
Source: Gjedrem 2006.
plankton have plummeted, reducing growth and compromising the value ofpolyculture in situations in which the different carp species occupy differentpond niches—some feeding on phytoplankton, others on zooplankton. Lack ofadequate seed supplies is also a major constraint to aquaculture developmentin Sub-Saharan Africa.
Dealing with Risks
The risks to the genetic integrity of populations from artificial propagationand genetic manipulation of aquatic species are considerable (Kapuscinski2005; Nash 2005). There is a major difference between aquaculture and live-stock concerning the scale and extent of genetic interactions between culturedand wild populations: (1) it is virtually impossible to prevent escapes; (2)restocking programs may draw on a limited gene pool; (3) fecundity of aquaticspecies is far higher than terrestrial species; (4) fertilized eggs and juvenilesbecome widely dispersed in the water bodies; and (5) mass rearing of juve-niles under artificial conditions may mask traits, causing juvenile mortality inthe wild. Public oversight is therefore essential.
Fish Seeds as Public Goods
The pubic sector has an important role to play in ensuring seed quality andsupply mostly by encouraging private sector investment through various instru-ments (see box 3.1). Public actions, in view of the social and environmentalexternalities and the infant industry argument, may include the following:
■ Producing and distributing seed as a temporary measure until there is ade-quate demand to drive private investment
■ Providing fiscal incentives to encourage investment in hatcheries■ In cases in which broodstock development and maintenance is not com-
mercially attractive, as in many countries of Asia, developing, maintaining,and distributing quality broodstock or fertilized eggs to private sector seedsuppliers
■ Ensuring adherence to precautionary approaches, codes, guidelines, andbest practices, in particular to avoid loss of genetic biodiversity
■ Encouraging public investment in gene banks for threatened wild popula-tions
■ Encouraging and supporting private research on genetic improvement andmeasures to mitigate loss of genetic biodiversity
Sharing Scarce Resources
International collaboration and public support can improve the quality ofseeds and maintain supplies of quality seeds in developing countries. Low-value/low-input species (a mainstay of food fish supplies) are a priority target
INNOVATION AND TECHNOLOGIES 45
for public intervention and genetic enhancement programs. Networks such asthe International Network on Genetics in Aquaculture (INGA) are needed tocircumvent the scarcity of human and infrastructure resources in developingcountries; to optimize the use of scarce funds; to build capacity and share expe-riences; and to bridge a growing north-south “molecular divide.”
Disease Management
Disease is an important constraint to sustainable aquaculture, affecting investorconfidence, profitability, and trade (Subasinghe and Phillips 2002). Pandemicshave devastated shrimp aquaculture, resulting in large areas of abandonedfarms and the destruction of local economies. Aquatic animal health is a globalissue: diseases spread through trade and transboundary movements, and dis-ease control requires international collaboration, while the solutions (best farmpractices, treatments, and vaccines) need technology transfer, capacity build-ing, and trade. Disease outbreaks in cultured fish also pose a threat to wild fishpopulations.
46 CHANGING THE FACE OF THE WATERS
China: The government has responded to seed quality problems by (1)encouraging investment in hatcheries; (2) instituting seed quality controlpolicy measures to improve seed quality management, including the estab-lishment of fish seed certification methods and standards; and (3) encourag-ing and supporting, by law, the production and distribution of quality seed(Hishamunda and Subasinghe 2003).
Vietnam: The Ministry of Fisheries initiated an Aquaculture Seed Develop-ment Program in 1999 to promote the expansion of fish hatcheries and toexpand and improve the production of quality fish seed from commercialhatcheries. National Broodstock Centers produce and distribute qualitybroodstock, provide training in good broodstock management practices andadvanced hatchery technology, and maintain gene banks (Mair and Tuan2002).
National breeding programs for genetic improvement of wild stocks forimproved aquaculture production include the National Breeding Program forAtlantic salmon and rainbow trout in Norway (started in 1975) and thePhilippines’ National Tilapia Breeding Program. Favorable investment condi-tions have fostered private programs in Chile, the United States, and else-where (Olesen et al. 2003).
Box 3.1 Public Sector and Fish Breeding and Seed Supply Programs
A wide range of factors contribute to the globalization of fish disease prob-lems: increased trade, including in ornamental fish; intensification of fish farm-ing; and increasing movement of broodstock and juveniles. Other factorsinclude the introduction of new species for aquaculture development; enhance-ment of marine and coastal areas through the stocking of aquatic animals raisedin hatcheries; unanticipated interactions between cultured and wild popula-tions of aquatic animals; poor or lack of effective biosecurity measures; and lackof awareness on emerging diseases (Bondad-Reantaso et al. 2005).
The World Bank estimated that in 1997 global losses from aquaculturedisease was on the order of $3 billion per year (cited in Subasinghe, Bondad-Reantaso, and McGladdery 2001). Losses caused by shrimp diseases were esti-mated at $3 billion for 11 countries for the period 1987–94 (Bondad-Reantasoet al. 2005). Annual losses for all species in China are estimated at more than$120 million (Shilu and Linhau 1999). Sea-lice mortalities have cost the EUsalmon farming industry an estimated €14 million per year, while viral disease(infectious salmon anemia [ISA]) cost the industries of Norway, Scotland, andCanada on the order of $60 million (MacAlister, Elliott, and Partners 1999).
Threats to Wild Populations
As already noted, disease can be transmitted to wild fish through the water, byescaped fish, or by enhancement programs using diseased seed (Nash 2005;Walker 2004). Exotic pathogens and parasites can be introduced by the un-regulated movement of live aquatic animals, while fish farms can amplify andretransmit diseases and parasites occurring in the indigenous wild popula-tions. Among the well-known examples are sea lice in Atlantic salmon andviruses in shrimp (Goldburg, Eliot, and Naylor 2001; Subasinghe, Bondad-Reantaso, and McGladdery 2001). The risk of disease transfer from farmed fishto wild populations is difficult to quantify. Even disease- or parasite-resistantfish, although without disease symptoms, might act as reservoirs, transmittingpathogens to wild fish that are less protected from the particular pathogen.
The Industry Response
Serious disease outbreaks have been catalysts for profound changes in thestructure and operation of the aquaculture industry and have led governmentsto address more seriously the issue of aquatic animal disease management.There has been an increasing reliance on trade restrictions, often implementedwithout reference to the internationally agreed procedures and protocols setout in the SPS agreement of the WTO that are intended to promote free trade(Chilaud 1996; Walker 2004).
Reducing the Risk
Reducing the incidence of diseases significantly improves production effi-ciency and profitability. It also reduces the use of chemicals and antimicrobials
INNOVATION AND TECHNOLOGIES 47
and minimizes the impact on the environment and wild stocks. A range ofBMPs provide practical operational guidelines to prevent diseases and can beincorporated as mandatory conditions for licensing. These BMPs include theuse of certified disease-free stocks, maintenance of sensible stock densities,stress management methods, good water quality, proper nutrition, proper stor-age and use of feeds, and guidance on the use of antimicrobials. A range ofimproved technical approaches support these BMP, including the following:
■ Improved methods for rapid disease diagnosis and pathogen detection
■ Closed-cycle breeding and selection for disease resistance
■ Use of vaccines as successfully used in marine finfish in Japan and in Nor-way where vaccination has greatly reduced the use of antibiotics for Atlanticsalmon
■ Selective breeding programs have produced disease resistant carp (todropsy), salmon (to vibrio), trout (to furunculosis), and catfish (to catfishvirus) (Dunham et al. 2001)
■ Approaches to assess the ecological carrying capacity of the aquaculturesystem (ICES 2005)
The public role parallels that of the livestock industry, in particular thedevelopment and implementation of a national strategy designating clearresponsibility for aquatic animal health (Bondad-Reantaso 2004). The strategyincludes provisions, among other things, for the following:
■ Diagnostics, health certification, and measures to ensure regular monitoringand reporting of fish health by farmers or veterinary services
■ Mechanisms to identify disease outbreaks and coordinate responses, includ-ing quarantine, alerts, disease zoning, and international collaboration
■ Capacity building among veterinary professionals, fish farmers, and pro-ducers’ associations in fish health care
■ Enforcement of regulations on transboundary movement of live aquaticanimals
■ Application of approaches, such as risk analysis, as a basis for policy devel-opment and decision making, which are increasingly required by importingcountries
■ Creation of an enabling environment for the development of vaccines anddisease-free strains
Developing and Implementing National Strategies
Existing codes and guidelines such as those developed by OIE, FAO, Interna-tional Council for the Exploration of the Seas (ICES), NACA, and others (seeannex 2) can serve as the basis for national strategies and plans for aquaticanimal health. Regional cooperation is a cost-effective means of building
48 CHANGING THE FACE OF THE WATERS
national strategies and strengthening national capacities for aquaculturehealth management (Subasinghe, Arthur, and Shariff 1996). Regional refer-ence laboratories and centers of expertise can provide specialized diagnosticservices, advice, and training; facilitate standardization and validation; andunderpin collaborative research on diseases. International development assis-tance and cooperation can play an important role in helping developingcountries to develop and implement national aquatic animal health strategiesand plans. For example, cooperation among FAO, OIE, and NACA helpedestablish a quarterly aquatic animal disease reporting system, which has beenin place since 1998.
Competing for Freshwater
Freshwater aquaculture accounts for 57 percent of global aquaculture produc-tion, and an adequate supply of quality freshwater is a primary requirement.Aquaculture is an efficient user of water. Fish live in but do not necessarily con-sume water—the water is used merely as a medium for waste removal and oxy-gen supply. Most forms of intensive aquaculture have much higher water pro-ductivity than most crops (Rijsberman 2000), and recirculating aquaculturesystems used for eel and other species consume negligible quantities of water(see annex 6). Nevertheless, there is need not only to increase water productiv-ity in aquaculture, but also to see aquaculture as a cost-effective means of con-serving, recycling, and buffering water supplies at farm and community levels.Strategies for sustaining an adequate water supply for the expansion of aqua-culture may include the following:
■ Improving the competitive access of the sector to water resources—that is,the recognition of aquaculture by government as a legitimate claimant ofresources and its assimilation into natural resource allocation through inte-grated management of catchments and coastal areas
■ Increasing awareness on the water productivity of aquaculture and the poten-tial for its integration into irrigation systems and agriculture farming systems
■ Reducing water demand (and the discharge volume) for aquaculture byscaling up the use of water-efficient intensive aquaculture systems and sup-porting innovation of new water-efficient aquaculture systems
■ Enforcing regulatory measures to reduce pollution by other users to increasethe availability of good quality water
■ Promoting the adoption of water-related BMPs
TECHNOLOGY TRANSFER AND CAPACITY BUILDING
The section highlights elements of the Asian experience in technology transferand capacity building, the main lessons learned from the experience, and theirrelevance to other regions (see annex 4, The Regional Framework for Science
INNOVATION AND TECHNOLOGIES 49
and Technology Transfer in Asia, for details of the institutions involved). Whilesome distinction can be made between technology transfer and its diffusion,the two processes are regarded as a continuum, the diffusion as a process ofextension to capitalize on the benefits of the technology transfer (Konde 2006;Simpson 2006). Critical issues in technology transfer include the lack of capac-ity of recipients and inequalities among recipients to access and apply technol-ogy (for example, between large agribusiness and small farmers).
The flow of aquaculture science and technology in Asia followed severalpaths: (1) within the region from countries with advanced aquaculture to othercountries in the region; (2) from other more mature sectors like crop and live-stock husbandry; and (3) into the region from countries outside the regionwith advanced disciplines and technologies relevant to aquaculture. Duringthis process, the human and institutional resource capacity was strengthenedat many levels from policies, regulations, and planning to financial services andspecific technical disciplines. A wide variety of organizations, agencies, andinstitutions were involved, including the private sector, regional indigenousorganizations, development banks, national governments and institutions, andbilateral and multilateral assistance agencies.
Technology transfer was facilitated by and built on a long-standing base oftraditional production systems, markets, and education systems, and was ham-pered by a highly fragmented production structure (a dispersed multitude ofsmall farmers), weak extension services, and initially, lack of documentation orunderstanding of traditional production systems. With rare exceptions, aqua-culture technology transfer in Asia differed little from the experience in agri-culture and animal husbandry. The most significant and lasting impacts of thisprocess were the development of national and regional institutional frame-works and the human resource base, and the expansion and consolidation ofthe scientific foundation of aquaculture.
Drivers of Technology Transfer and Capacity Building
Key drivers of aquaculture development and attendant technology transfer andcapacity building in the region included (1) market forces, (2) investments bygovernment and in particular by the private sector, (3) sustainability issues,(4) initiatives of donors and assistance agencies, (5) regional coordination, (6)novel approaches to extension, and (7) intersectoral catalysis. Some of thesedrivers and their roles in technology transfer are highlighted below, others arediscussed in more detail in annex 4, The Regional Framework for Science andTechnology Transfer in Asia.
Regional Coordination
Effective cooperation among countries of the region has played an importantrole in facilitating the identification, sharing, adoption, and extension of tech-nologies. This is partly due to the institutional frameworks established in the
50 CHANGING THE FACE OF THE WATERS
early 1980s, from which a number of lessons can be learned (De Silva 2001). Aregional strategy on aquaculture development, agreed to by governments andreflecting their common priorities, provided coherent guidelines and focus forvarious initiatives at the international, regional, national, and local levels. Thecontinuity of the initiatives was underpinned by government ownership, whichalso ensured their uptake into national or state government policies and pro-grams. Bilateral assistance to individual countries benefited from being har-monized with a regional strategy, receiving inputs of expertise and experiencesfrom other participants (or members of the regional community), and havingthe results of such assistance shared more widely in the region. Bolstered bygovernment commitments to regional cooperation, the intergovernmentalnetwork (NACA) has welded what would otherwise have been isolated, dis-parate, and diffused national and institutional activities and external assistanceto national efforts. NACA’s history and development coincides with the stagesof development of Asian aquaculture.
Overcoming Weaknesses in Extension
Weak extension services have hampered a more effective diffusion of technol-ogy, particularly to small farmers. The traditional government-based researchand extension system is not sufficiently responsive to the new challenges andopportunities, neither of aquaculture technologies and markets nor to thedemand of farmers. Alternative approaches have emerged to address thisproblem, such as the following: (1) collaborative links in the public sector,such as pooling of public resources under one agency in Sri Lanka; (2) pub-lic-private partnerships, such as government-NGO extension services inBangladesh, contract farming in Indonesia, and extension services by input(fish feed) providers; (3) One-stop Aqua Shops (OASs), service centers forfarmers and fishers who are interested in aquaculture (see box 3.2); and (4)the organization of farmers into producers’ associations. This organizationhas empowered small farmers to effectively demand and benefit from tech-nical assistance and services and has facilitated the government task ofproviding cost-effective services. For example, India’s Marine Products ExportDevelopment Authority collaborates with a group of institutions. Farmerassociations facilitated the promotion of self-regulating or voluntary manage-ment mechanisms to complement regulations and to adopt BMPs. This accel-erated the transfer of technology and capacity needed for their application.The feedback from NGOs and farmers groups to research and development(R&D) and policy increased the relevance of policy, research, and technology(Yap 2004).
Intersectoral catalysis. Aquaculture also benefited from well-developedinfrastructure and technical expertise in many disciplines (for example, genet-ics and breeding, engineering, biotechnology, feed and nutrition, disease con-trol, and health management). Similarly, aquaculture has built on education,
INNOVATION AND TECHNOLOGIES 51
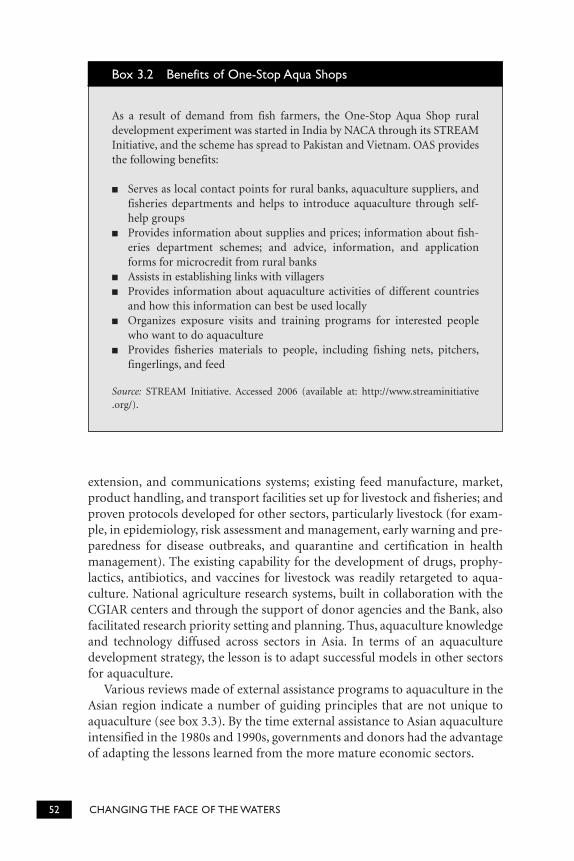
extension, and communications systems; existing feed manufacture, market,product handling, and transport facilities set up for livestock and fisheries; andproven protocols developed for other sectors, particularly livestock (for exam-ple, in epidemiology, risk assessment and management, early warning and pre-paredness for disease outbreaks, and quarantine and certification in healthmanagement). The existing capability for the development of drugs, prophy-lactics, antibiotics, and vaccines for livestock was readily retargeted to aqua-culture. National agriculture research systems, built in collaboration with theCGIAR centers and through the support of donor agencies and the Bank, alsofacilitated research priority setting and planning. Thus, aquaculture knowledgeand technology diffused across sectors in Asia. In terms of an aquaculturedevelopment strategy, the lesson is to adapt successful models in other sectorsfor aquaculture.
Various reviews made of external assistance programs to aquaculture in theAsian region indicate a number of guiding principles that are not unique toaquaculture (see box 3.3). By the time external assistance to Asian aquacultureintensified in the 1980s and 1990s, governments and donors had the advantageof adapting the lessons learned from the more mature economic sectors.
52 CHANGING THE FACE OF THE WATERS
As a result of demand from fish farmers, the One-Stop Aqua Shop ruraldevelopment experiment was started in India by NACA through its STREAM Initiative, and the scheme has spread to Pakistan and Vietnam. OAS providesthe following benefits:
■ Serves as local contact points for rural banks, aquaculture suppliers, andfisheries departments and helps to introduce aquaculture through self-help groups
■ Provides information about supplies and prices; information about fish-eries department schemes; and advice, information, and applicationforms for microcredit from rural banks
■ Assists in establishing links with villagers■ Provides information about aquaculture activities of different countries
and how this information can best be used locally■ Organizes exposure visits and training programs for interested people
who want to do aquaculture■ Provides fisheries materials to people, including fishing nets, pitchers,
fingerlings, and feed
Source: STREAM Initiative. Accessed 2006 (available at: http://www.streaminitiative.org/).
Box 3.2 Benefits of One-Stop Aqua Shops
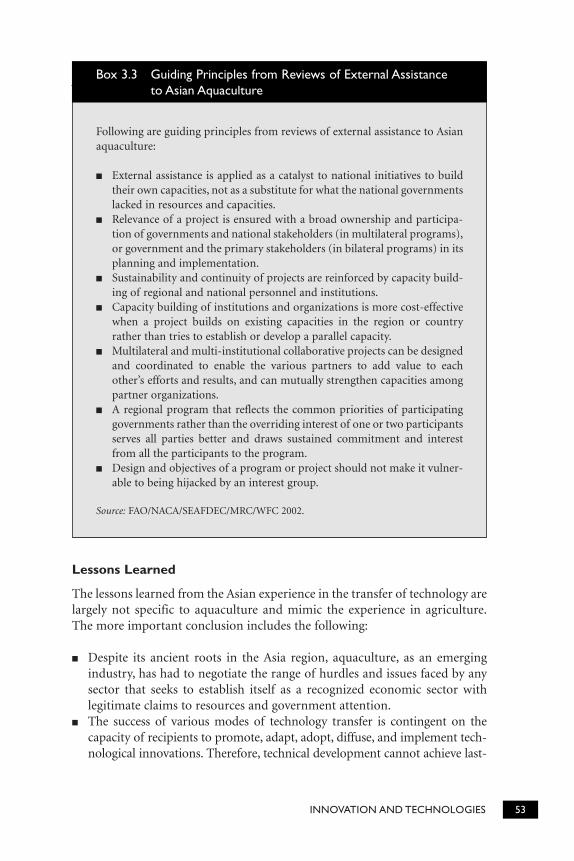
Lessons Learned
The lessons learned from the Asian experience in the transfer of technology arelargely not specific to aquaculture and mimic the experience in agriculture.The more important conclusion includes the following:
■ Despite its ancient roots in the Asia region, aquaculture, as an emergingindustry, has had to negotiate the range of hurdles and issues faced by anysector that seeks to establish itself as a recognized economic sector withlegitimate claims to resources and government attention.
■ The success of various modes of technology transfer is contingent on thecapacity of recipients to promote, adapt, adopt, diffuse, and implement tech-nological innovations. Therefore, technical development cannot achieve last-
INNOVATION AND TECHNOLOGIES 53
Following are guiding principles from reviews of external assistance to Asianaquaculture:
■ External assistance is applied as a catalyst to national initiatives to buildtheir own capacities, not as a substitute for what the national governmentslacked in resources and capacities.
■ Relevance of a project is ensured with a broad ownership and participa-tion of governments and national stakeholders (in multilateral programs),or government and the primary stakeholders (in bilateral programs) in itsplanning and implementation.
■ Sustainability and continuity of projects are reinforced by capacity build-ing of regional and national personnel and institutions.
■ Capacity building of institutions and organizations is more cost-effectivewhen a project builds on existing capacities in the region or countryrather than tries to establish or develop a parallel capacity.
■ Multilateral and multi-institutional collaborative projects can be designedand coordinated to enable the various partners to add value to eachother’s efforts and results, and can mutually strengthen capacities amongpartner organizations.
■ A regional program that reflects the common priorities of participatinggovernments rather than the overriding interest of one or two participantsserves all parties better and draws sustained commitment and interestfrom all the participants to the program.
■ Design and objectives of a program or project should not make it vulner-able to being hijacked by an interest group.
Source: FAO/NACA/SEAFDEC/MRC/WFC 2002.
Box 3.3 Guiding Principles from Reviews of External Assistanceto Asian Aquaculture
ing effect unless due consideration is given to the supporting institutionalarchitecture. In Asia, the early development of institutions, together with sub-sequent technological advances, is credited with the successful and rapidgrowth of the industry.
■ The most effective mechanisms for the transfer and diffusion of technologyin the region have so far been as follows: (1) national will and commitment and development strategies with a long-term view combined with appropri-ate institutional arrangements; (2) regional intergovernmental indigenousorganizations, particularly NACA and FAO’s Technical Cooperation betweenDeveloping Countries Programme; (3) recent innovative extension methods,establishment of producers’ associations, and emerging contract farming; and(4) long-term regional and inter-regional programs like FAO’s AquacultureDevelopment and Coordination Programme (ADCP) and the Asian Instituteof Technology (AIT) Outreach Program. Private sector joint venture enter-prises, although successful, are less effective in the diffusion of technology.
■ Diffusion of transferred technologies has been a problem. As in agriculture,the slow transfer and adoption of modern science and technology which isa basis for knowledge-intensive aquaculture constitute a critical bottleneck.The fragmented nature of the production sector defeats traditional exten-sion systems and makes it difficult to expand the use of new technologies.There is need to document and scale up successful alternative approaches,pilot new approaches, and create partnerships among technology-generat-ing institutions, private sector industrial/marketing concerns, and clustersof small farmers, especially for the purpose of increasing rural incomes.
■ The establishment of regional intergovernmental organizations is a long-termphased process and requires sustained support, before and after formaliza-tion, until the organization attains functional stability. This has been the expe-rience with NACA and other regional organizations in Asia and elsewhere.
■ Lack of interdonor coordination and multiple projects caused wasteful over-lap and taxed the resources of host developing countries. Partnerships andcoordination among donors would render the external assistance more effec-tive. Links between donor partnerships and NACA-type network organiza-tions would increase efficiency and strengthen these regional bodies andtheir national lead centers. Such partnerships seem to be on the increaseamong donors.
■ Aquaculture draws on the expertise, technology, and infrastructure of otherrelated and mature sectors. Therefore, the state of development of these sec-tors should receive special attention in development planning.
■ The aquaculture experience in technology transfer and capacity developmentrepeats the experience of agriculture. As aquaculture shares the use of landand water with agriculture, it presents a good case for intersectoralcollaboration at the national and institutional levels with a focus on increasedproductivity, use of limited resources, and poverty reduction.
54 CHANGING THE FACE OF THE WATERS
Possible Lessons for Africa and Latin America
On the basis of the Asian experience, the establishment of an international col-laborative mechanism offers many advantages. This need not necessarily be aclone of NACA,11 but it would possess the same core attribute of enabling col-lective commitment and action with extreme cost-effectiveness. A broad-basedregional program on one or more carefully selected priority topics of regionalimportance could be a catalyst to closer government, private sector, industry,and NGO participation; stimulate technically efficient and responsible produc-tion and processing; and draw interest and assistance from developed countrytrading partners. Because of common regional interests, this could be the coreprogram or launching platform of any regional network organization.12
The establishment of an interregional Technical Cooperation among Devel-oping Countries (TCDC) fund would considerably strengthen and facilitatethe current TCDC activities among African and Latin American aquacultureinstitutions (and link to Asian institutions) through an exchange of expertiseand training of personnel, and could complement small-farmer to small-farmer exchanges in the region and to other regions. This form of collabora-tion could extend to the establishment of joint venture enterprises, possiblyreducing investor risks by accessing investment insurance facilities.
Lack of access to all types of information is a serious bottleneck in Africaand to small and subsistence farmers everywhere. A mechanism to collate,screen, and disseminate proven and appropriate technology is a priority. TheOASs, based on Internet technology when possible, is a possible model thatcould facilitate the flow of knowledge and diffusion of technology at regional,national, and local levels, especially for new entrants. The feedback from a net-work of such shops could also serve to inform policy decisions, market andtrade initiatives, extension strategies, and training and education content.
Although the focus of this section has been on the transfer and dissemina-tion of technology in Asia, many key innovations occurred in Norway and theUnited States. Catalytic breakthroughs in breeding, nutrition, vaccines, anddisease-free strains of shrimp all originated in these countries and were subse-quently transferred to Asia and elsewhere. A further range of science-basedmanagement measures have also become part of industry practice in devel-oped countries. Many of these softer innovations still need to be suitablyadapted and mainstreamed into practice in developing countries.
In summary, modern aquaculture is knowledge based, moving rapidlytoward intensification and productivity gains and countering resource con-straints with knowledge-based advances. With a focus on proven fish culturesystems, developing countries can harness this knowledge in a cost-effectivemanner through regional networks, through both south-south and north-south cooperation, and by establishing a favorable investment climate for FDI.
INNOVATION AND TECHNOLOGIES 55
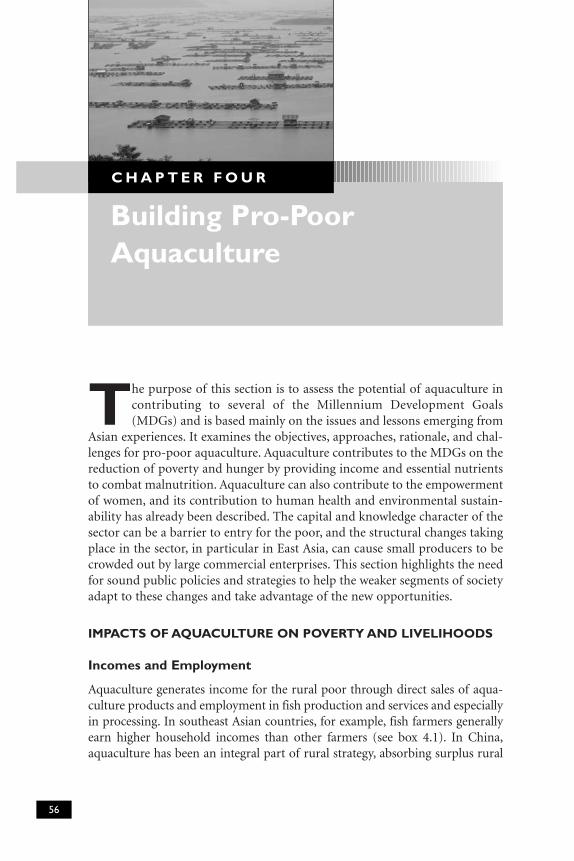
The purpose of this section is to assess the potential of aquaculture incontributing to several of the Millennium Development Goals(MDGs) and is based mainly on the issues and lessons emerging from
Asian experiences. It examines the objectives, approaches, rationale, and chal-lenges for pro-poor aquaculture. Aquaculture contributes to the MDGs on thereduction of poverty and hunger by providing income and essential nutrientsto combat malnutrition. Aquaculture can also contribute to the empowermentof women, and its contribution to human health and environmental sustain-ability has already been described. The capital and knowledge character of thesector can be a barrier to entry for the poor, and the structural changes takingplace in the sector, in particular in East Asia, can cause small producers to becrowded out by large commercial enterprises. This section highlights the needfor sound public policies and strategies to help the weaker segments of societyadapt to these changes and take advantage of the new opportunities.
IMPACTS OF AQUACULTURE ON POVERTY AND LIVELIHOODS
Incomes and Employment
Aquaculture generates income for the rural poor through direct sales of aqua-culture products and employment in fish production and services and especiallyin processing. In southeast Asian countries, for example, fish farmers generallyearn higher household incomes than other farmers (see box 4.1). In China,aquaculture has been an integral part of rural strategy, absorbing surplus rural
Building Pro-PoorAquaculture
C H A P T E R F O U R
56
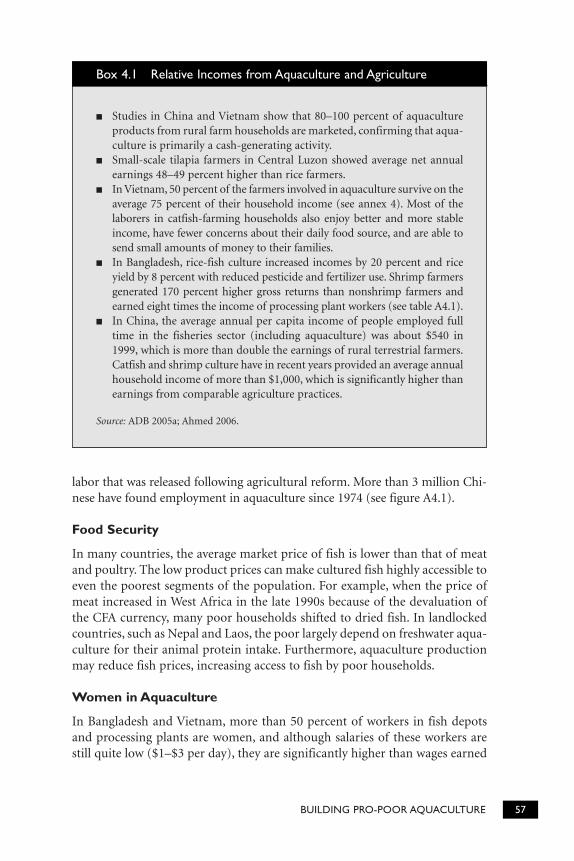
labor that was released following agricultural reform. More than 3 million Chi-nese have found employment in aquaculture since 1974 (see figure A4.1).
Food Security
In many countries, the average market price of fish is lower than that of meatand poultry. The low product prices can make cultured fish highly accessible toeven the poorest segments of the population. For example, when the price ofmeat increased in West Africa in the late 1990s because of the devaluation ofthe CFA currency, many poor households shifted to dried fish. In landlockedcountries, such as Nepal and Laos, the poor largely depend on freshwater aqua-culture for their animal protein intake. Furthermore, aquaculture productionmay reduce fish prices, increasing access to fish by poor households.
Women in Aquaculture
In Bangladesh and Vietnam, more than 50 percent of workers in fish depotsand processing plants are women, and although salaries of these workers arestill quite low ($1–$3 per day), they are significantly higher than wages earned
BUILDING PRO-POOR AQUACULTURE 57
■ Studies in China and Vietnam show that 80–100 percent of aquacultureproducts from rural farm households are marketed, confirming that aqua-culture is primarily a cash-generating activity.
■ Small-scale tilapia farmers in Central Luzon showed average net annualearnings 48–49 percent higher than rice farmers.
■ In Vietnam, 50 percent of the farmers involved in aquaculture survive on theaverage 75 percent of their household income (see annex 4). Most of thelaborers in catfish-farming households also enjoy better and more stableincome, have fewer concerns about their daily food source, and are able tosend small amounts of money to their families.
■ In Bangladesh, rice-fish culture increased incomes by 20 percent and riceyield by 8 percent with reduced pesticide and fertilizer use. Shrimp farmersgenerated 170 percent higher gross returns than nonshrimp farmers andearned eight times the income of processing plant workers (see table A4.1).
■ In China, the average annual per capita income of people employed fulltime in the fisheries sector (including aquaculture) was about $540 in1999, which is more than double the earnings of rural terrestrial farmers.Catfish and shrimp culture have in recent years provided an average annualhousehold income of more than $1,000, which is significantly higher thanearnings from comparable agriculture practices.
Source: ADB 2005a; Ahmed 2006.
Box 4.1 Relative Incomes from Aquaculture and Agriculture
from agricultural activities. Shrimp seed collection and fish marketing areimportant sources of employment for rural women. Aquaculture in the Mekongdelta has contributed to a decrease in urban migration by young women andprevented women from being forced into prostitution, reducing the risks ofspreading HIV/AIDS. Projects that targeted women and poor households haveprovided access to land, water, credit, and extension that otherwise would notbe affordable; however, in a number of cases, the poor lost control of the landand water resources after withdrawal of project support.13
LESSONS FROM ASIA
The development of Asian aquaculture, with its major structural changes drivenby trade and technology, provides many lessons on implementing pro-pooraquaculture. Aquaculture has taken three distinct development pathways thathave merged and overlapped as social and economic conditions have changed(see table 4.1).
■ Static model. The static model centers on the poorer fish farmer who makesa modest investment and reaps a significant benefit, but a benefit that isoften insufficient to lift the household out of the poverty trap. For example,in a World Bank project in Bangladesh, 16,000 of the poorest householdswere targeted. Although livelihoods improved, the increment was consid-ered inadequate to prevent a slide into poverty. This model can improvelivelihoods and open opportunities to graduate to the transition pathwaythrough modest and gradual investment leading to diversified farming sys-tems, improved cash flow, and net household income. Nevertheless, experi-ence shows that many farmers do not transition—implying that the sectoris largely driven by dynamic and profit-oriented producers.
■ Transition pathway. The transition pathway depicts the more advantagedfarmer or small enterprise. Access to knowledge, markets, and capitalunderpins investment and a scale of production that generates a significantsurplus and offers a way out of poverty for the household.
■ Consolidation pathway. The consolidation pathway embraces both corpo-rate and community models of industrial agribusiness. Corporate invest-ment, often in vertically integrated farms, generates employment along thevalue chain from feed supply to processing plants. A community of well-organized small farmers can benefit from economies of scale in joint activi-ties, while retaining the flexibility to adapt to change. For example, in Thai-land, the average area of shrimp farms is 2.7 ha, while in the Philippines thevast majority of brackish-water fishponds are more than 10 ha. In Thailand,farms are substantially more productive, largely intensive, and owner oper-ated; in the Philippines, many farms are semi-intensive and often managedby corporate caretakers.
58 CHANGING THE FACE OF THE WATERS
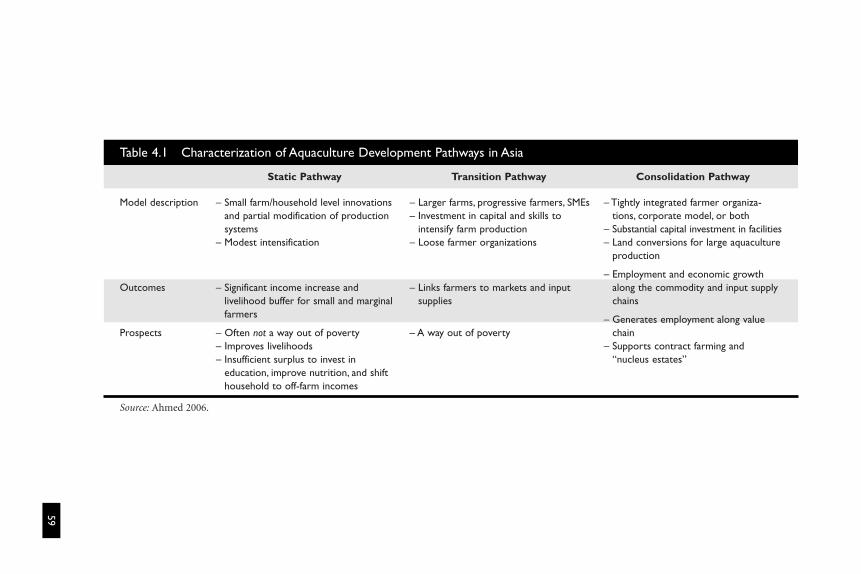
59
Table 4.1 Characterization of Aquaculture Development Pathways in Asia
Static Pathway Transition Pathway Consolidation Pathway
Model description
Outcomes
Prospects
Source: Ahmed 2006.
– Small farm/household level innovationsand partial modification of productionsystems
– Modest intensification
– Significant income increase andlivelihood buffer for small and marginalfarmers
– Often not a way out of poverty– Improves livelihoods– Insufficient surplus to invest in
education, improve nutrition, and shifthousehold to off-farm incomes
– Larger farms, progressive farmers, SMEs– Investment in capital and skills to
intensify farm production– Loose farmer organizations
– Links farmers to markets and inputsupplies
– A way out of poverty
– Tightly integrated farmer organiza-tions, corporate model, or both
– Substantial capital investment in facilities– Land conversions for large aquaculture
production
– Employment and economic growthalong the commodity and input supplychains
– Generates employment along valuechain
– Supports contract farming and“nucleus estates”
Aquaculture’s contribution to poverty reduction in Asia has evolved alongall three pathways. For example, in the Mekong delta, catfish culture graduallyevolved from subsistence family-based systems through Vietnam’s VAC systemto more commercialized agribusiness.
Asian experience shows that success in pro-poor aquaculture requires anenabling environment (box 4.3), which includes the following key elements:
■ Land use and incentive policies. In China and Vietnam, liberalizing landuse policies, in particular, the rezoning of rice land for aquaculture, allowedsubstantial increases in incomes. By limiting commercial shrimp farm sizeto 20–50 ha, Indonesia created a basis for nucleus estate shrimp farms. Cre-ating opportunities for the landless to lease unused public water bodies,such as drainage canals, for aquaculture provided an entry point for thepoor (see box 4.2). In West Bengal, a shift in economic policy to export-ledgrowth opened the way for what is now a major shrimp culture industry(Chopra and Kumar 2005).
■ Access to knowledge and technology. Dissemination of knowledge onproven technologies combined with credit has fostered huge growth in pro-ductivity. Through adaptive research and extension of improved technolo-gies, pond productivity in China grew from 765 kg/ha in 1980 to 4,900kg/ha in 2000—an increase of some 640 percent. Similarly, rice-fish cultureproduction rose more than four times by adapting technologies from pondaquaculture (Xiuzhen 2003). In 22 Indian states, Fish Farmers’ Develop-ment Agencies trained more than 550,000 farmers, improved technologies,introduced carp polyculture in more than 450,000 ha of fishponds, andincreased pond production of Indian carps from 50 kg/ha to about 2,200kg/ha in the 1974–99 period.
■ Integrated farming systems and plans. Adapting polyculture technology,Chinese, Vietnamese, and Bangladesh rice farmers have extended aquacul-ture into their rice paddies, increasing fish production by fourfold in lessthan a decade and earning a net income of about $1,800 per ha per year inChina. Technically, this could be emulated in millions of hectares of rice-growing areas of Asia and Africa (Xiuzhen 2003; Halwart and Gupta 2004;Akteruzzaman 2005).
■ Community-based aquaculture. Community participation in the alloca-tion of leases over public waters is a widespread practice; community guar-antees facilitate long-term pond leases (Radheyshyam 2001). Equitable dis-tribution of benefits and strong leadership are among the success factors.For example, in Bangladesh, a combination of group leasing of ponds andmicro-credit empowered women in 175 groups by providing income andincreased household food security.
■ Organizing producer groups. This is a classical strategy common to small-holder producers. In Tamil Nadu (India), a shrimp farmers’ association hasa voluntary code of conduct, it controls the quality of inputs, monitors
60 CHANGING THE FACE OF THE WATERS
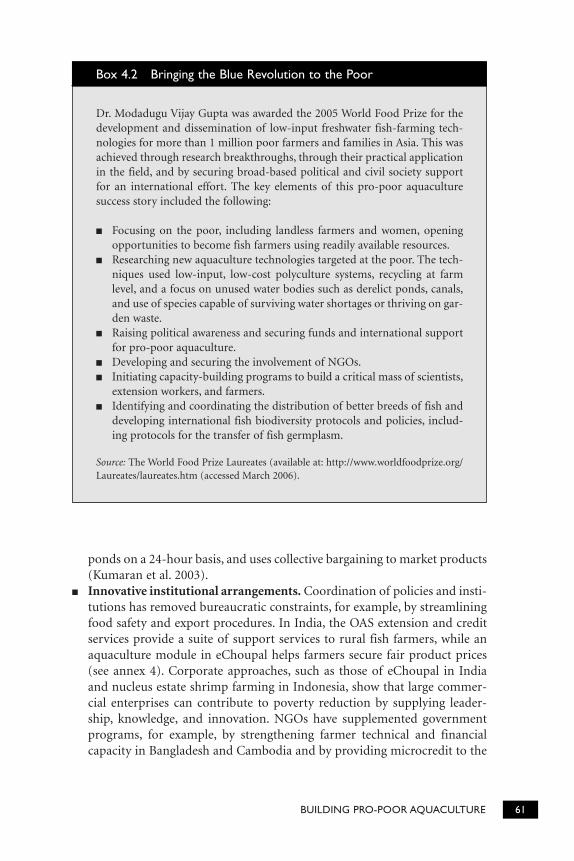
ponds on a 24-hour basis, and uses collective bargaining to market products(Kumaran et al. 2003).
■ Innovative institutional arrangements. Coordination of policies and insti-tutions has removed bureaucratic constraints, for example, by streamliningfood safety and export procedures. In India, the OAS extension and creditservices provide a suite of support services to rural fish farmers, while anaquaculture module in eChoupal helps farmers secure fair product prices(see annex 4). Corporate approaches, such as those of eChoupal in Indiaand nucleus estate shrimp farming in Indonesia, show that large commer-cial enterprises can contribute to poverty reduction by supplying leader-ship, knowledge, and innovation. NGOs have supplemented governmentprograms, for example, by strengthening farmer technical and financialcapacity in Bangladesh and Cambodia and by providing microcredit to the
BUILDING PRO-POOR AQUACULTURE 61
Dr. Modadugu Vijay Gupta was awarded the 2005 World Food Prize for thedevelopment and dissemination of low-input freshwater fish-farming tech-nologies for more than 1 million poor farmers and families in Asia. This wasachieved through research breakthroughs, through their practical applicationin the field, and by securing broad-based political and civil society supportfor an international effort. The key elements of this pro-poor aquaculturesuccess story included the following:
■ Focusing on the poor, including landless farmers and women, openingopportunities to become fish farmers using readily available resources.
■ Researching new aquaculture technologies targeted at the poor. The tech-niques used low-input, low-cost polyculture systems, recycling at farmlevel, and a focus on unused water bodies such as derelict ponds, canals,and use of species capable of surviving water shortages or thriving on gar-den waste.
■ Raising political awareness and securing funds and international supportfor pro-poor aquaculture.
■ Developing and securing the involvement of NGOs.■ Initiating capacity-building programs to build a critical mass of scientists,
extension workers, and farmers.■ Identifying and coordinating the distribution of better breeds of fish and
developing international fish biodiversity protocols and policies, includ-ing protocols for the transfer of fish germplasm.
Source: The World Food Prize Laureates (available at: http://www.worldfoodprize.org/Laureates/laureates.htm (accessed March 2006).
Box 4.2 Bringing the Blue Revolution to the Poor
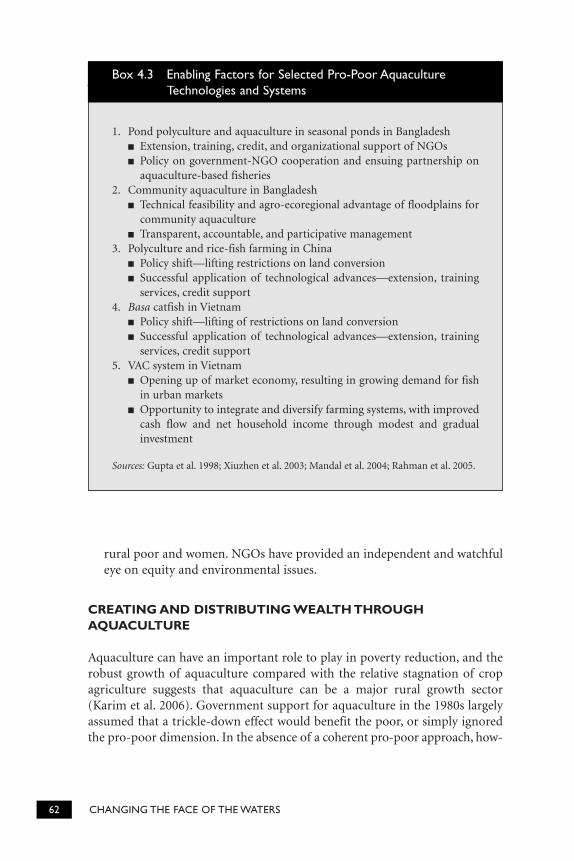
rural poor and women. NGOs have provided an independent and watchfuleye on equity and environmental issues.
CREATING AND DISTRIBUTING WEALTH THROUGHAQUACULTURE
Aquaculture can have an important role to play in poverty reduction, and therobust growth of aquaculture compared with the relative stagnation of cropagriculture suggests that aquaculture can be a major rural growth sector(Karim et al. 2006). Government support for aquaculture in the 1980s largelyassumed that a trickle-down effect would benefit the poor, or simply ignoredthe pro-poor dimension. In the absence of a coherent pro-poor approach, how-
62 CHANGING THE FACE OF THE WATERS
1. Pond polyculture and aquaculture in seasonal ponds in Bangladesh■ Extension, training, credit, and organizational support of NGOs■ Policy on government-NGO cooperation and ensuing partnership on
aquaculture-based fisheries2. Community aquaculture in Bangladesh
■ Technical feasibility and agro-ecoregional advantage of floodplains forcommunity aquaculture
■ Transparent, accountable, and participative management3. Polyculture and rice-fish farming in China
■ Policy shift—lifting restrictions on land conversion■ Successful application of technological advances—extension, training
services, credit support4. Basa catfish in Vietnam
■ Policy shift—lifting of restrictions on land conversion■ Successful application of technological advances—extension, training
services, credit support5. VAC system in Vietnam
■ Opening up of market economy, resulting in growing demand for fishin urban markets
■ Opportunity to integrate and diversify farming systems, with improvedcash flow and net household income through modest and gradualinvestment
Sources: Gupta et al. 1998; Xiuzhen et al. 2003; Mandal et al. 2004; Rahman et al. 2005.
Box 4.3 Enabling Factors for Selected Pro-Poor AquacultureTechnologies and Systems
ever, too often aquaculture benefited the upper strata of the society at theexpense of the poor, generated negative externalities, created conflicts over rightsto land and water, and even evicted poor people from public land or waters onwhich their livelihoods were based (Hagler 1997; Edwards 2000). Rising knowl-edge and capital requirements in aquaculture may be major barriers to entry forthe poor. Three questions emerge:
■ Can aquaculture help the poorest? Experience shows that even the landlesscan find an entry point through rehabilitation of unused sodic lands orlease of public waters. Moreover, those lacking entrepreneurship, motiva-tion, and persistence can benefit through employment creation. While somestudies indicate that poorer households may benefit more (in relativeterms) than the richer ones (Irz et al. n.d.), other studies suggest that thebetter-off households tend to be the main beneficiaries of projects targetingthe poor (see, for example, Hallman, Lewis, and Begum 2003). In eithercase, the most disadvantaged groups require sustained and comprehensivesupport to benefit from aquaculture.
■ Does smallholder aquaculture have a future? Given the trend toward con-solidation and vertical integration, changing markets, and conditions oftrade, smallholders face an array of challenges. Only in 2004, followingmassive industry consolidation, have corporate salmon farms in Norwaydemonstrated significantly higher returns to labor than smaller owner-operated farms (Fiskeridirektoratet 2004), indicating that the owner-operated farms retained advantages in adaptability over several decades.This and similar experiences in Asia indicate that well-organized and well-informed smallholder producers can thrive, and that the establishment ofa critical mass of self-sustaining smallholder aquaculture requires sus-tained nurturing and public support linked to progressive rural and agri-cultural development policies.
■ Is low-value food fish production a viable strategy? Where favorable cir-cumstances exist, this strategy is viable and sustainable. In many areas, it is amainstay of local economies—more than 40 percent of global food fish pro-duction is composed of low-value herbivores, omnivores, and filter-feedingfish. Despite the poor record of subsistence aquaculture in some regions, acompelling policy argument can be made to support the production of low-cost food fish. Low prices infer low returns and extensive culture systems totake advantage of natural foods and wastes, and extensive culture requirescapital such as ponds—capital the poor may not have. Under conditions inwhich land, water, and labor have limited alternative uses, extensive culturerequiring modest capital and knowledge (for example, culture of carps andomnivores) can be an attractive pro-poor production model.
■ A strong counterargument can also be made for poor producers to growhigh-value species, which may require less capital and generate higher
BUILDING PRO-POOR AQUACULTURE 63
returns—but only in cases in which there is access to the markets forsuch species and risks are manageable. Thus, coherency between twinobjectives—production of cheap food fish and reduction of poverty throughrural fish farming—requires an astute balance of policies and incentives.Production of low-value fish may deliver more benefits to the poor con-sumer than to the poor producer. Gradual intensification, taking full advan-tage of natural productivity, may help increase supplies, while moderate pro-duction costs keep fish prices within the purchasing power of the poor.
As a first step, the IFIs and other donors, working with their partners, can (1)raise awareness of client countries on the value of aquaculture in poverty allevi-ation and wealth creation, (2) advise on sector diagnostics and policyapproaches, (3) illustrate how aquaculture can complement national rural devel-opment and environmental strategies, and (4) seek to integrate appropriate pro-poor aquaculture into CASs, PRSPs, and other policy and planning instruments.
Policies and AwarenessAwareness and Mainstreaming
Aquaculture can be mainstreamed into the policy and planning matrix alongseveral complementary axes: growth and employment, equity and poverty alle-viation, and food security. There are some good examples in Asia. For exam-ple, in the Philippines the latest Medium Term Development Plan (MTDP)and the Fisheries Code targets modernization of aquaculture technology forthe poor.14 In Vietnam, the government’s aquaculture development programfor 1999–2010 sets out the country’s vision to prioritize aquaculture develop-ment for reducing hunger and poverty.15 In Bangladesh, the national PRSPidentifies a clear link between aquaculture and rural economic growth.16 How-ever, aquaculture receives scant recognition in Thailand’s policy and planningdocuments, underlining the fact that mainstreaming of aquaculture remains a“work in progress.”
Enabling Policies
Application of pro-poor enabling policies, such as those described previouslyand in annex 4 (Philippines, China, Vietnam, and Indonesia) require politicalwill. Ideally, the policy instruments will provide a favorable investment climate,establish aquaculture’s claim as a legitimate user of resources, and provide forenvironmental safeguards. A pro-poor policy framework will define the rightsand obligations of producers and allocate preferential rights to the poor foraquaculture in public waters (Cullinan and van Houtte 1997). It will facilitatewater and land tenure for aquaculture purposes and deliver access to knowl-edge and technology. An effective framework is likely to establish participatoryprocesses to guide sustainable aquaculture development and serve as a plat-form for cooperation among public agencies. A comprehensive national aqua-
64 CHANGING THE FACE OF THE WATERS
culture plan can provide a road map for public and private sectors, financialinstitutions, and the international community. Clarity in the respective roles ofthe public and private sectors transmits clear signals to investors, while estab-lishing a basis for cooperation, synergy, and public-private partnerships. Thepolicy framework will build bridges to other sectors so that farmers can bene-fit from road and infrastructure development, and access finance and domes-tic and export markets. These policies need to be developed by national deci-sion makers, based on the participation of all national stakeholders.International partners can support this process by brokering knowledge andexperiences from other countries and sectors and by supporting training andother facilitating activities.
Coordination and Sustained Public SupportCoordination
Coordination between institutions is fundamental to the delivery of pro-poorpolicies and, more generally, to the emerging aquaculture industry. Usually aplethora of institutions is involved in land and water lease, environmental con-trol, sanitary measures, pro-poor programs, and trade; responsibilities andjurisdiction may be split between federal/central and state/local authorities.Coordination among agencies is improving—for example, specific spatialregimes have been created for aquaculture in Malaysia (aquaculture invest-ment zones); the Philippines (mariculture parks); and Indonesia (aquaculturezones, targeting nucleus-estate-type export aquaculture). To serve the poor,this coordination must penetrate to the district, village, and farm level—this iswhere the benefits of such models as the OAS (see box 3.2) are most evident.The international community can support the coordination process by sharingexperiences from other countries and supporting investments (for example,for infrastructure or improved spatial regimes).
Sustained Public Sector Support
A key to pro-poor aquaculture is sustained public support with a particularemphasis on measures to ensure that less-advantaged producers have access toland and water, technology, credit, markets, and a fair share of benefits fromthe production chain. China, Bangladesh, and India have delivered this sus-tained support for more than two decades, particularly for the following:
■ Production and supply of quality seeds where the private sector cannoteffectively deliver
■ Investment in human capital (Dey et al. 2004) through training and provi-sion of advice to farmers, including operation of demonstration farms
■ Extension services to provide knowledge and access to new technologies andto organize producers
BUILDING PRO-POOR AQUACULTURE 65
■ Applied research to develop low-cost culture systems and improved strainswith higher growth rates or disease resistance
■ Provision of key infrastructure, such as roads or markets
■ Regional cooperation for the exchange of information, capacity building,and transfer of technologies
Some of these functions may be most efficiently undertaken through con-tracts with and incentives to the private sector; through NGOs, producer asso-ciations, and specialized agencies; or through strategic alliances between keyactors. Public support to aquaculture requires monitoring to ensure that itdoes not subsidize large capital-intensive operations at the expense of tradi-tional fish farmers (Ahmed 1997, 2004). The international community cansupport the investments required to produce these public goods, underpinningthem with poverty assessments to ensure that they effectively benefit the poor.
Equitable Trade and Poverty Alleviation
Tariffs and nontariff barriers (NTBs) such as excessive sanitary restrictionshave affected trade in aquaculture products, both for developed and develop-ing countries. Such trade distortions and disputes (box 4.4) are likely toincrease as more cost-effective aquaculture in the developing world capturesmarket share from traditional developed country suppliers.
Tariff Barriers
Tariffs for fish products remain high and are characterized by “tariff peaks” and“tariff escalation”17 on the more profitable value added products produced bydeveloping countries. Tariffs on fish products in developing countries alsoremain relatively high, constraining south-south trade. While many developedcountries have reduced or eliminated import tariffs, there are indications thatcountries are using antidumping measures as an excuse for the protection ofthe domestic industry.18
Nontariff Barriers
NTBs, such as technical and sanitary standards, labeling, and traceabilityrequirements to ensure food safety may be deployed to protect domestic pro-ducers. The cost of compliance with increasingly stringent food safety regula-tions also tends to exclude small producers and processors from export mar-kets (Dey et al. 2004). Additional costs can be envisaged in the future as someimporting countries move to screen products for bacteria resistance to anti-microbials.
Developing country negotiators at the Doha Round underlined the impor-tance of providing technical assistance and capacity building to developingcountries to adjust to WTO rules, implement existing obligations, and fully
66 CHANGING THE FACE OF THE WATERS
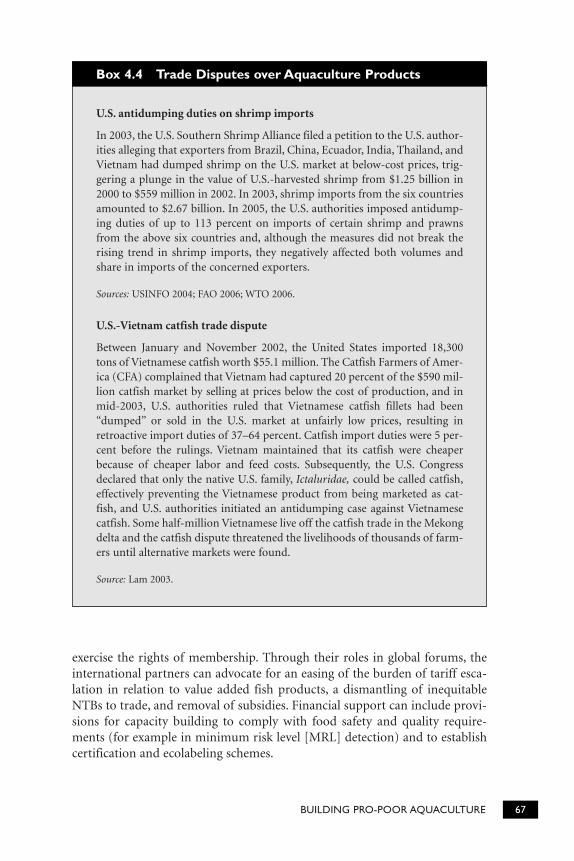
exercise the rights of membership. Through their roles in global forums, theinternational partners can advocate for an easing of the burden of tariff esca-lation in relation to value added fish products, a dismantling of inequitableNTBs to trade, and removal of subsidies. Financial support can include provi-sions for capacity building to comply with food safety and quality require-ments (for example in minimum risk level [MRL] detection) and to establishcertification and ecolabeling schemes.
BUILDING PRO-POOR AQUACULTURE 67
U.S. antidumping duties on shrimp imports
In 2003, the U.S. Southern Shrimp Alliance filed a petition to the U.S. author-ities alleging that exporters from Brazil, China, Ecuador, India, Thailand, andVietnam had dumped shrimp on the U.S. market at below-cost prices, trig-gering a plunge in the value of U.S.-harvested shrimp from $1.25 billion in2000 to $559 million in 2002. In 2003, shrimp imports from the six countriesamounted to $2.67 billion. In 2005, the U.S. authorities imposed antidump-ing duties of up to 113 percent on imports of certain shrimp and prawnsfrom the above six countries and, although the measures did not break therising trend in shrimp imports, they negatively affected both volumes andshare in imports of the concerned exporters.
Sources: USINFO 2004; FAO 2006; WTO 2006.
U.S.-Vietnam catfish trade dispute
Between January and November 2002, the United States imported 18,300tons of Vietnamese catfish worth $55.1 million. The Catfish Farmers of Amer-ica (CFA) complained that Vietnam had captured 20 percent of the $590 mil-lion catfish market by selling at prices below the cost of production, and inmid-2003, U.S. authorities ruled that Vietnamese catfish fillets had been“dumped” or sold in the U.S. market at unfairly low prices, resulting inretroactive import duties of 37–64 percent. Catfish import duties were 5 per-cent before the rulings. Vietnam maintained that its catfish were cheaperbecause of cheaper labor and feed costs. Subsequently, the U.S. Congressdeclared that only the native U.S. family, Ictaluridae, could be called catfish,effectively preventing the Vietnamese product from being marketed as cat-fish, and U.S. authorities initiated an antidumping case against Vietnamesecatfish. Some half-million Vietnamese live off the catfish trade in the Mekongdelta and the catfish dispute threatened the livelihoods of thousands of farm-ers until alternative markets were found.
Source: Lam 2003.
Box 4.4 Trade Disputes over Aquaculture Products
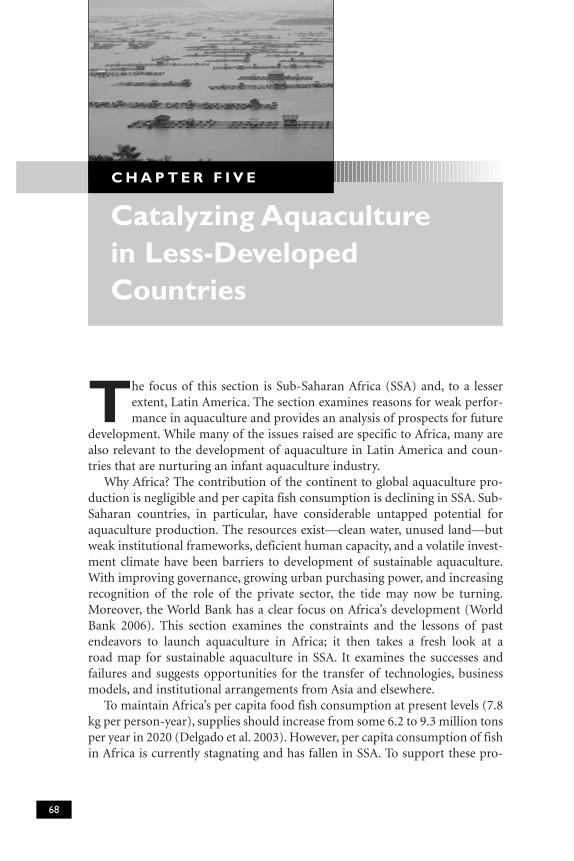
The focus of this section is Sub-Saharan Africa (SSA) and, to a lesserextent, Latin America. The section examines reasons for weak perfor-mance in aquaculture and provides an analysis of prospects for future
development. While many of the issues raised are specific to Africa, many arealso relevant to the development of aquaculture in Latin America and coun-tries that are nurturing an infant aquaculture industry.
Why Africa? The contribution of the continent to global aquaculture pro-duction is negligible and per capita fish consumption is declining in SSA. Sub-Saharan countries, in particular, have considerable untapped potential foraquaculture production. The resources exist—clean water, unused land—butweak institutional frameworks, deficient human capacity, and a volatile invest-ment climate have been barriers to development of sustainable aquaculture.With improving governance, growing urban purchasing power, and increasingrecognition of the role of the private sector, the tide may now be turning.Moreover, the World Bank has a clear focus on Africa’s development (WorldBank 2006). This section examines the constraints and the lessons of pastendeavors to launch aquaculture in Africa; it then takes a fresh look at aroad map for sustainable aquaculture in SSA. It examines the successes andfailures and suggests opportunities for the transfer of technologies, businessmodels, and institutional arrangements from Asia and elsewhere.
To maintain Africa’s per capita food fish consumption at present levels (7.8kg per person-year), supplies should increase from some 6.2 to 9.3 million tonsper year in 2020 (Delgado et al. 2003). However, per capita consumption of fishin Africa is currently stagnating and has fallen in SSA. To support these pro-
Catalyzing Aquaculture in Less-DevelopedCountries
C H A P T E R F I V E
68
jected future needs, capture fisheries will need to be sustained and, if possible,enhanced; by 2020, aquaculture would have to increase by more than 260 per-cent (an annual average of more than 8.3 percent) in SSA alone.
There are no physical and technological barriers to a major expansion ofsustainable aquaculture in SSA. Many parts of SSA have the basic physicalrequirements—ample land and water. It is estimated that more than 30 percentof the land area (9.2 million km2) in SSA is suitable for smallholder fish farm-ing. In theory, if yields (1–2 tons/ha per year) from recent smallholder projectscould be replicated, then less than 1 percent of this area would be required toproduce 35 percent of the region’s increased requirements to 2010 (Kapetsky1995; Aguilar-Manjarrez and Nath 1998).
Numerous national and regional efforts have been made to launch aqua-culture using a wide range of production models and approaches. Numerousprojects have demonstrated this potential, but when scaled up, the results havegenerally been poor. In spite of decades of investment and technical input,aquaculture has failed to thrive where expected, and in many cases remainsprecarious and marginal. The reasons vary widely from country to country, butseveral common themes emerge from the portfolio analysis and other reviews.This section explores the lessons from past endeavors to launch aquacultureand takes a fresh look at the road map for sustainable aquaculture in SSA.
THE STATUS OF AQUACULTURE IN AFRICA
Fisheries make vital contributions to food and nutrition security of 200 mil-lion people in Africa and provide income and livelihoods for more than 10 million engaged in fish production, processing, and trade. Fish has become aleading export commodity, with an export value on the order of $2.7 billionper year.
Of the 7.88 million tons of fish produced in Africa in 2004, 93 percent orig-inated from capture fisheries. Since the 1990s, recorded output in capture fish-eries has stagnated, rising slightly to 7.31 million tons in 2004. In contrast,aquaculture has produced about five times the volume produced a decade ear-lier. However, at just over 0.5 million tons, this was insignificant in global terms(less than 1 percent) and the contribution to gross domestic product (GDP) isnegligible. In a selection of 17 SSA countries, aquaculture contributes on aver-age only 0.9 percent of total animal protein supply (10.1 kg fish and 12.4 kg ofmeat per capita).
The three top producers were Egypt, alone accounting for 85.6 percent ofthe total; Nigeria with 6.5 percent; and Madagascar with 1.8 percent. Produc-tion has increased, but much more slowly than elsewhere. Only in Egypt hasdevelopment been notable, from 72,000 tons in 1995 to more than 470,000tons in 2004, an average annual growth of 26 percent. If Egypt is excluded, theregion’s compound annual rate of growth from 1990 to 2000 was 17.2 percent,
CATALYZING AQUACULTURE IN LESS-DEVELOPED COUNTRIES 69
but from an extremely low base. Both growth rates and output levels remainvery low and many countries produce negligible quantities. In 2004, the mostimportant Sub-Saharan producers were Nigeria, Madagascar, and South Africa(table A5.8). Sub-Saharan aquaculture exports are dominated by shrimp andabalone, and exports of seaweed, crocodile skins, and ornamental fish have alsoshown growth. The production systems used in Africa are described in annex6, Aquaculture Production Systems in Africa.
DIAGNOSIS FOR SUB-SAHARAN AFRICA
Several reviews of aquaculture in SSA concluded that physical potential aloneis not sufficient; development investment was largely wasted; and centralhatcheries and extension services did not work (Harrison et al. 1994; Moehl,Halwart, and Brummett 2005). Although projects succeeded for short periods,there are few examples of sustainability. Many investment programs have hadrather indifferent results, with limited sustainability of production after centralsupport is reduced. There have been few examples of internally generatedgrowth that is typical of profitable and attractive sectors. As a consequence,donors became increasingly skeptical and disaffected with the sector, increas-ingly convinced that issues of development of aquaculture were more relatedto markets, policies, and institutions, and that without suitable conditions,investment was likely to be ineffective.
Characteristics of Past Programs
Some common characteristics of these programs included the following:
■ An expectation that available water and land resources could, by themselves,lead to natural exploitable potential and create a new option for ruralpeople. The social and institutional contexts in which people engage in aqua-culture and issues such as resource access, equity, and policy support receivedlittle attention.
■ An emphasis on public-sector support usually was linked with the develop-ment of aquaculture extension capability within fisheries administrations,many of which have suffered budget cuts and lacked staff salary incentives.The use of state or parastatal agents for broodstock development and hatch-ery supply had variable and often disappointing results. Intermittent sup-plies of seeds and feeds also undermined farmer confidence.
■ There was an emphasis on small-scale integrated aquaculture, in whichfreshwater fish farming in ponds is linked with a range of primarily family-supported mixed farming activities. This was coupled with a poor under-standing of markets, market margins, and logistics and real returns availableto producers. Programs were not market driven but often based on notionsof local food security and self-sufficiency. The target groups chosen in early
70 CHANGING THE FACE OF THE WATERS
attempts to foster aquaculture development in SSA often concentrated onsubsistence farmers who had little surplus labor or other resources to investin aquaculture. Participatory approaches to program design were rare.
■ There were poor strategic approaches to pooling knowledge in developingseed supply, fertility and feed inputs, environmental aquatic health, andfood safety issues, and a limited knowledge of risk issues or appropriatemanagement responses.
■ Aquaculture rarely attained the critical mass needed to support segmenta-tion (for example, specialized seed producers) and the rise of service sup-pliers. Individual farmers were thus often dependent either on weak exten-sion services, or more frequently, on their own efforts for seeds, feeds, andtechnical and market advice.
■ Development banks and suppliers of financial services were not involved inprogram design and remain largely unfamiliar with the sector, thus con-straining private investment.
■ Program objectives focused on food supply, supplementary cash income,and integration of ponds into farms rather than on the creation of a com-mercially viable sector backed by sustainable public and private services.
There was also a failure to learn from earlier mistakes:
few donors have a well-articulated policy for their technical assistance inaquaculture. This is reflected, on occasion, in hasty and uncriticalattempts to transfer technology, often not suitable to the needs of therecipient country . . . few analyses were made of the reasons for the col-lapse . . . to draw lessons for the design of future projects. No analysis hasever been published. (FAO/UNDP/Norway 1987)
Many of the projects launched in Africa replicated or were based on thesame premises as projects of colonial times but lacked the supporting analysisto relate the activities and expected results to emerging national programs andpriorities. In many cases, personnel from colonial services were employed ondevelopment projects in the newly independent nations. They rehabilitated oldstations and tried to reestablish what had already failed.
The main exceptions to this pattern are the isolated examples of (usually)large commercial development. These developments include shrimp farms inMadagascar and Mozambique, cage culture in Zimbabwe, and several farmsin Ghana, Nigeria, and Malawi.19 The IFC has financed successful shrimpfarms in Madagascar. Aquaculture has been successful in situations in whichdomestic markets, resources, and available technologies have combined to pro-mote steady and substantial growth, as in Egypt and Nigeria. African countrieshave repeatedly identified the key constraints as the supply of seeds and feedsand producers’ access to technical information.
CATALYZING AQUACULTURE IN LESS-DEVELOPED COUNTRIES 71
UNLOCKING THE POTENTIAL
Several of the experiences described above demonstrate possible futureapproaches in African aquaculture development. Although starting from a lowbase, some countries have experienced a remarkable growth rate in aqua-culture. Uganda has had almost a 3,000 percent increase since 1994 and many others have experienced high growth (table A5.8). Growing urbanization,expanding markets and services, improved skills, opportunities for private sector development, and new production technologies are all playing a role.Productivity gains have contributed by lowering prices and expanding the con-sumer base. In Egypt, for example, following a drop in the growth rate frommore than 60 percent in 1999 to 1 percent in 2001, productivity gains are againdriving increased production (6 percent growth in 2003–04).
The NEPAD Fish for All Summit has already raised awareness of the poten-tial of aquaculture and aquaculture is featured in many Sub-Saharan PRSPs.At a global level, the Code of Conduct for Responsible Fisheries, the Bang-kok Declaration and Strategy for Aquaculture Development Beyond 2000,the Nairobi Declaration on Conservation of Aquatic Biodiversity and Use ofGenetically Improved and Alien Species for Aquaculture in Africa 2002, andnumerous BMPs provide further guidance regarding policy and practice (seeannex 2).
A concerted effort is required if aquaculture is to be mainstreamed intoagriculture and rural development plans, into coastal zone management, intoindustrial planning, and into water resource allocation.
Enabling Conditions
Some of the enabling conditions for sustainable aquaculture in Africa are asfollows:
Awareness and Perception
Awareness of aquaculture as a viable commercial undertaking in the publicand private sector and among financial institutions improves access to land,water, and financial resources. Recent experiences in Asia and Africa also indi-cate that farmers adopt aquaculture where certain predisposing conditions aremet: (1) perception of the value of fish as food and for generating income; (2)land ownership, ability to rent agriculture land, or in case of the landless poor,secure access to common property resources (water bodies, floodplains, irri-gation canals, and/or coastal waters); (3) knowledge of technologies suited toavailable resources and conditions; (4) a supply of seed; and (5) institutionalsupport, in terms of initial support to new entrant farmers through advice andinputs—for example, extension, seed supply (Van der Mheen 1998; Edwards2000).
72 CHANGING THE FACE OF THE WATERS
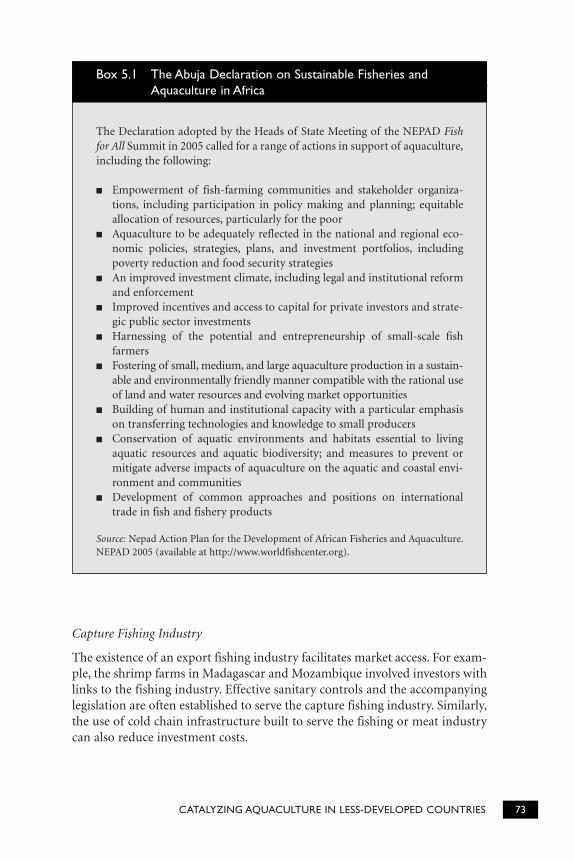
Capture Fishing Industry
The existence of an export fishing industry facilitates market access. For exam-ple, the shrimp farms in Madagascar and Mozambique involved investors withlinks to the fishing industry. Effective sanitary controls and the accompanyinglegislation are often established to serve the capture fishing industry. Similarly,the use of cold chain infrastructure built to serve the fishing or meat industrycan also reduce investment costs.
CATALYZING AQUACULTURE IN LESS-DEVELOPED COUNTRIES 73
The Declaration adopted by the Heads of State Meeting of the NEPAD Fishfor All Summit in 2005 called for a range of actions in support of aquaculture,including the following:
■ Empowerment of fish-farming communities and stakeholder organiza-tions, including participation in policy making and planning; equitableallocation of resources, particularly for the poor
■ Aquaculture to be adequately reflected in the national and regional eco-nomic policies, strategies, plans, and investment portfolios, includingpoverty reduction and food security strategies
■ An improved investment climate, including legal and institutional reformand enforcement
■ Improved incentives and access to capital for private investors and strate-gic public sector investments
■ Harnessing of the potential and entrepreneurship of small-scale fish farmers
■ Fostering of small, medium, and large aquaculture production in a sustain-able and environmentally friendly manner compatible with the rational useof land and water resources and evolving market opportunities
■ Building of human and institutional capacity with a particular emphasison transferring technologies and knowledge to small producers
■ Conservation of aquatic environments and habitats essential to livingaquatic resources and aquatic biodiversity; and measures to prevent ormitigate adverse impacts of aquaculture on the aquatic and coastal envi-ronment and communities
■ Development of common approaches and positions on internationaltrade in fish and fishery products
Source: Nepad Action Plan for the Development of African Fisheries and Aquaculture.NEPAD 2005 (available at http://www.worldfishcenter.org).
Box 5.1 The Abuja Declaration on Sustainable Fisheries andAquaculture in Africa
A Developed Livestock Industry
A developed livestock industry enables spin off of a wide range of skills andexperiences, ranging from animal health to effluent control and EIA to the useof feed mills and training institutions.
Urban Markets
Major urban markets, such as Kinshasa and Accra, and those in Nigeria,Egypt, and East African countries offer major opportunities for stable markets(for example, contracts with supermarkets, hospitals, and restaurants). Inturn, stable markets allow planned production and create a basis for furtherinvestment.
Peri-urban Commerce
The peri-urban zones offer particular opportunities for aquaculture (Rana etal. n.d.). They have easy access to the urban markets or export channels. Wastesgenerated by other industries, such as breweries or abattoirs, may be recycled.Labor and service industries are available. Access to government services forextension or permits is easier. Infrastructure such as power, water, and trans-port networks are available. In Uganda, 43 percent of peri-urban fish farmershave a tertiary education (Rana et al. 2005); in the Central African Republic,successful fish farming correlated strongly with proximity to an urban centerand level of farmers’ education (Kelleher 1974).
Critical Mass
The vertically integrated commercial shrimp farms in Madagascar and Mozam-bique assume a large part of the risk of the venture. A mature industry has thecritical mass to benefits from economies of scale, to spread risk to the serviceindustries and specialist providers. Lower risks means investors can acceptlower returns, allowing product price reductions and further market penetra-tion. Building critical mass in an infant aquaculture industry can be acceler-ated by forging links to the fishing or livestock industry, to farmer or exporterorganizations, and to education and scientific institutions. Dispersed subsis-tence fish farming rarely achieves this critical mass.
Farmer Associations
Strong farmer or fishing industry organizations can provide a platform for fishfarmers. Experiences with contract farming, particularly for perishable exportcrops, may also provide a useful business model, while established ruralfinance mechanisms can facilitate farmer credit.
74 CHANGING THE FACE OF THE WATERS
National Aquaculture Development Plans
National aquaculture development plans exist in several countries such asAngola, Cameroon, and Malawi. In other countries, aquaculture policies havebeen formulated and specific legislation enacted. For example, commercialshrimp culture was identified as a target industry in Mozambique’s FDI policyfor fisheries during the transition to a market economy.
Stable Institutional Arrangements
In one SSA country, institutional responsibility for aquaculture moved min-istries five times in three years, dissipating institutional memory and under-mining career paths (Hecht 2006). The institutional arrangements for such anindustry require stability, a permanent institutional home, or coordinatingmechanism. The OASs described in box 3.2 underline this need at the level offarmer operations.
Keys to Sustainable Aquaculture
On the basis of the experiences in SSA, and in Asia, certain key elements in anational aquaculture development program can be identified:
Sector Analysis and Policy Development
A thorough analysis of the sector, its potential, and its constraints forms thebasis for a realistic aquaculture policy and strategic plan to be developedthrough a participatory process. The strategy will define a policy and institu-tional framework. It is likely to achieve the following:
■ Provide clarity on sector objectives (for example, a focus on export-drivencommercial aquaculture, subsistence aquaculture directed at social objec-tives, or some combination of objectives).
■ Describe key policy principles.■ Identify the respective roles of the public and private sectors, and the role of
and opportunities for FDI (particularly for export products).■ Identify a participatory framework for development, including the means of
setting common objectives, coordinating and mutually reinforcing activi-ties, and structuring public-private partnerships.
■ Describe the coordination mechanisms in the public sector, includingmeans of resolving jurisdictional overlap.
■ Outline a legal and regulatory framework that ensures environmental safe-guards without imposing unnecessary restrictions on development, includ-ing means of internalizing environmental costs.
CATALYZING AQUACULTURE IN LESS-DEVELOPED COUNTRIES 75
■ Establish clear principles for resource allocation, including zoning for aqua-culture.
■ Identify sources of finance for aquaculture—from public and private sources,from internal and external sources—and seek to match those sources with therespective tasks.
■ Learn the lessons of the past and focus public interventions on catalyticactions, core regulatory activities, and essential tasks unattractive to the pri-vate sector.
The strategy is likely to be implemented through an enabling framework witha number of mutually supportive components.
A Conducive Investment Climate
An investment climate suitable for an infant industry is highly desirable. Goodgovernance, rule of law, and a clear vision of the role of the state all contribute.A favorable investment climate requires a coherent policy framework; attentionto issues of tenure; coordination among public bodies and with private stake-holders; and support for science, technology, and capacity building. A suite ofpublic policies such as those introduced in China (see annex 4, National PolicyInterventions and Pro-Poor Aquaculture) or Indonesia’s regulations that fostera nucleus estate model for shrimp farming provides examples of such environ-ments. Private investment, including FDI, has proven to be a major engine ofgrowth during the startup phase for new aquaculture industries. Special condi-tions, such as those created for free trade zones, may be appropriate. Incentivesmay be required to ensure supplies of key inputs. For example, removal ofimport tariffs on raw materials for fish feeds may provide the incentives feedmills require to manufacture these special rations. Financial institutions, suchas development banks, may need government assurances of support during thehigh-risk startup phase. Similarly, approaches to rural finance already proven inlivestock or agriculture may be adapted to aquaculture.
Tenure
In Africa and elsewhere, land and water rights are often complex and poorlydefined; lease arrangements are frequently informal and insecure. Aquaculturerequires a policy and legal framework that creates clear title (for example, long-term lease) over land and water. Titles need to be protected and freely trans-ferable so that new investors can purchase established fish farms and so thattitles can serve as collateral. Excessive bureaucratic process in title emission andtransfer creates opportunities for corruption while overlapping jurisdictioncreates further hurdles—for example, jurisdiction over mangroves and inter-tidal zones or over public reservoirs. To provide the incentives to invest inrestocking aquatic commons, community or individual rights may need to becreated for fish harvesting in lakes and reservoirs.
76 CHANGING THE FACE OF THE WATERS
The Business ModelsA Focus on Market-Driven Commercial Aquaculture
Experience shows that successful aquaculture development in Africa and else-where has been driven largely by domestic and export market demand. Risingincomes in urban Africa and international demand for shrimp and whitefish,such as tilapia and catfish, create further opportunities.
Poverty Focus
The strategies employed to bootstrap aquaculture through market-drivencommercial production must not lose sight of the poverty focus. In otherwords, commercial aquaculture can provide leadership and build the criticalmass necessary to raise the profile of the sector, achieve economies of scale, andcreate opportunities for the emergence of segmentation and service providers.However, public policy and support is required to ensure that the smaller pro-ducers have access to the technologies, markets, and finance for aquaculture.The balance and trade-offs between high-value intensive aquaculture and cul-ture of lower-value herbivorous or omnivorous species will need analysis andinformed public scrutiny.
Asia provides a number of lessons. The choice of business model is not nec-essarily between commercial culture of high-value carnivorous species andsmall-scale culture of herbivorous or omnivorous species providing food secu-rity and household and local consumption. Rather, pro-poor fish cultureshould be a viable commercial undertaking, whether the product has a social(food security) or commercial objective. Poor people should not necessarilygrow low-value fish. Culture of freshwater shrimp in rice paddies; polycultureof higher-value snakehead or catfish with tilapia; and contract farming ofshrimp are examples of successful pro-poor business models. As already noted,leasing of public water bodies for restocking or cage culture can provide anentry point for the landless.
Proven Technologies
Use of proven technologies reduces the costs of adaptation and innovation.Public support will be required for pro-poor aquaculture, but it can draw onproven models. Capacity building and institutional development will alsorequire public support. Creation of public private partnerships, leasing of gov-ernment fish stations, broad stakeholder participation in design of nationalcodes of practice, and BMPs and training programs can reduce costs and makethe best use of available expertise and donor support.
Networks
As demonstrated by NACA (see chapter 3, Technology Transfer and CapacityBuilding), regional networks can have a catalytic action driving dissemination
CATALYZING AQUACULTURE IN LESS-DEVELOPED COUNTRIES 77
of technologies, building human capacity, reinforcing institutions, and reduc-ing development costs. A network can be a focus for donor interventions andarticulate common concerns at global or regional forums. Networks can be mal-leable, adapting to opportunity, structured at regional or subregional levels, orlinked to regional economic commissions for greater political traction.
International Financial Organizations
As shown in chapter 1, The Role of External Assistance and the InternationalFinancial Institutions, the IFIs have been of crucial importance—accountingfor 92 percent of developing country aquaculture project investment in 1995.The IFIs, including the World Bank, can continue to play a key role throughassistance with sector analyses and master plans, building good governance ofnatural resources, fostering a favorable investment climate, and building aqua-culture into country portfolios. The World Bank Group can help reduceinvestor risk, help align development assistance, and explore partnershipopportunities at the regional level. Aquaculture can be a valuable componentin a wide range of projects, whether in rural development, livelihood diversifi-cation, or land and water management.
CATALYZING SUSTAINABLE AQUACULTURE IN LATIN AMERICA
Key aquaculture developments in the past decade included the spectaculargrowth of salmon farming in Chile, substantial domestic and foreign invest-ment in shrimp culture and processing in several countries (for example,Ecuador, Brazil, Colombia, and Mexico), regular use of water reservoirs foraquaculture, an evolution to more commercial scale rural aquaculture, andprogress in culturing of various native species. Providing less than 3 percent ofglobal aquaculture production, Latin America has vast underused potential.Many Latin American countries have a favorable investment climate and suit-able land, water, and environmental conditions. They benefit from proactiveproducers’ associations, relatively low-cost labor, an expanding market foraquaculture products, and availability of raw materials (fish meal and soy-beans) for feed production.
The Status of Aquaculture in Latin America and the Caribbean
Total production from aquaculture in the region in 2004 was 1.3 million tons(worth $5 billion), or 6.3 percent of total national fish production.20 Duringthe same period, output from capture fisheries declined by 18.5 percent, from24 to 20 million tons. New technologies and production systems have increasedoutput by 235 percent since 1994—an average annual growth rate of 13 per-cent. However, the combined contribution of aquaculture and fisheries to the
78 CHANGING THE FACE OF THE WATERS
region’s GDP is modest—about 3 percent. Fish accounts for only about 5percent of the total animal protein intake; because of a lack of a fish-eating tra-dition, the higher price of fish, and thriving livestock and poultry industries,consumers generally favor meat over fish (FAO 2005b). Nevertheless, therecent surge of developments in aquaculture has created a greater awareness ofthe sector’s growth potential among investors and planners.
With the notable exception of white leg shrimp, production is based mostlyon a small number of introduced species, such as Atlantic salmon and tilapia,and most of the production is from marine and brackish-water culture. Diver-sification is under way in some countries in an effort to provide a safety netfrom the boom and bust effects of the shrimp-farming industry. In the past 10years, this diversification has been evidenced by noticeable increases in the production of other species, such as mollusks and native freshwater fishes(characids and catfish), and the introduction of a number of exotic marinespecies on an experimental basis. The production systems used are describedin annex 6, Production Systems and Cultured Species in Latin America.
Commercial farming dominates export-led production of salmon, tilapia,oysters, and scallops destined for the United States, Canada, Europe, and Japan.In 2003, exports were valued at $4.6 billion, which were contributed to bysalmon, shrimp, and tilapia (in that order). The economic impact of export-driven aquaculture is most evident in Chile, Ecuador, Mexico, and Colombia,where the industry has provided significant rural employment in productionand processing. In common with the experience in Africa, however, the bene-fits of aquaculture have not accrued widely to the small-scale and subsistencefish farmers.
The main industry trends include (1) improving production efficiency toreduce costs and maintain market share; (2) expanding the export-driven pro-cessing industry; (3) diversifying to reduce risk and target new markets; (4)expanding marine aquaculture (including R&D investment in farming newmarine species); (5) increasing production from freshwater aquaculture and ofendemic species (characids) feeding low on the food chain; (6) expanding fishconsumption in urban and rural areas; (7) allowing greater concern about sus-tainable practices; and (8) supporting regional cooperation.
Diagnosis
The diagnosis for Latin America shows similarities with that for Africa, but alsoshows some distinct differences:
■ Aquaculture has undergone a significant recent development through theuse of new technologies and commercial production systems. Commercialproduction is based largely on introduced species and technologies trans-ferred through joint ventures or foreign expertise.
CATALYZING AQUACULTURE IN LESS-DEVELOPED COUNTRIES 79
■ Fish culture has not had a sustained impact on the livelihoods of impover-ished farmers. As in Africa, subsistence aquaculture systems have had littlesustainability, largely for the same reasons as in Africa, and because of lowconsumer demand for fish.
■ Rapid growth followed the shift of development focus from the rural poorto middle-income and high-income (large-scale) farmers and to farming ofspecies for export. SMEs benefited less from export-oriented growth, buttheir impact on domestic sales is increasing.
■ Similar to the experience in Asia, commercial aquaculture succeeded first incountries with the institutional capacity to absorb and apply advanced tech-nologies, and with supportive public policies (including for foreign invest-ment) and proactive private sectors.
■ The industry is a modest contributor to GDP, with economic impact mostevident in Chile, Ecuador, Mexico, and Colombia. The main impact of theindustry on rural livelihoods has been the direct and indirect generation ofemployment. The contribution to food fish supplies and local consumptionis modest but rising. Supplies from capture fisheries have declined and thereis a projected need for supply of an additional 2–3 million tons by 2020(Delgado et al. 2003).
■ The focus on foreign markets has accelerated the adoption of proceduresand standards to guarantee quality and safety, and encouraged greaterattention to environmental issues and production efficiency.
■ Concentration on a few species and export markets makes the industry sus-ceptible to price fluctuations, changes in currency exchange, economic sit-uations in importing countries, competition and trade barriers, and devel-opments in trade agreements. There is a need for diversification of speciesand markets to reduce risk.
■ Prospects for growth are good, particularly in Brazil, because of the avail-ability of natural resources (land and water), feed ingredients (fish meal andsoybean), relatively cheap labor, supportive government policies, an inter-ested private sector, and a thriving livestock industry.
■ Main technical problems affecting the development of aquaculture are dis-eases, feed and seed availability, genetic deterioration of introduced species,and environmental issues.
■ Aquaculture investment and expansion are constrained by complex lawsand regulations and institutional bottlenecks. Enforcement is weak anddevelopment of information systems and capacity building is needed tosupport farmers and investors.
Regional Cooperation
The establishment of a regional aquaculture cooperative mechanism hasreceived growing attention, and a feasibility study on the establishment of asingle intergovernmental cooperation network is under examination.
80 CHANGING THE FACE OF THE WATERS
The Case of Chile
Chile is an exception to much of the preceding description of aquaculture inLatin America. Chile is one of the largest world producers of salmon withexports worth $1.2 billion in 2003, accounting for about 6 percent of the coun-try’s exports. The seeding of a nascent sector by some foreign firms was rein-forced by a strategic public-private partnership,21 which facilitated the adapta-tion of superior foreign technologies and led to the development of a dynamicworld-class export industry. Although half of the production capacity is nowcontrolled by leading global firms, dependence on foreign materials and ser-vices has decreased with the growth of the industry and the evolution of localservice industries.
As more firms entered the industry, the government’s role changed fromfacilitator to regulator. Government organizations provide the regulatoryframework for the issuance of permits, evaluation of EIAs, and surveillance ofimported eggs based on a regulatory framework developed in the 1980s. Thepublic sector continues to fund R&D, support local firms to keep abreast ofglobal developments, and promote local knowledge to maintain a competitiveedge. Annual research expenditure is about $10 million, a quarter of whichcomes from private firms (World Bank 2005).
The success of the salmon industry in Chile has been founded on severalstrategic advantages, including the following:
■ A wide geographic range of farming locations and climatic conditions
■ Pristine waters
■ Low input and operational costs
■ Stable economic policies
■ Awareness, transfer, and adaptation of a proven superior technology
■ Public-private partnerships
■ Public policies and development services that attracted foreign investmentfrom Norway, Japan, the United Kingdom, and elsewhere
CATALYZING AQUACULTURE IN LESS-DEVELOPED COUNTRIES 81
In comparison to other sectors of the world food economy . . . the fisheriesand aquaculture sectors are poorly planned, inadequately funded, and ne-glected by all levels of government. [. . . yet . . .] fishing is the largest extrac-tive use of wildlife in the world; and aquaculture is the most rapidly growingsector of the global agricultural economy.
—USAID SPARE Fisheries and Aquaculture Panel n.d.
CONCLUSIONS
For more than two decades, aquaculture has grown at an average annualrate of 10 percent, confirming its claim as the global food productionsector with the highest growth rate and filling a growing fish food sup-
ply gap that depleted wild fisheries are unable to bridge.
Importance
Aquaculture is important for numerous reasons, including the following:
■ It accounts for 43 percent of the global fish food supply and is consideredto be the primary source of any future increases in supply.
■ More than 12 million people are directly employed in aquaculture, whichreached 59.4 million tons with a farmgate value of $70.3 billion in 2004.
Conclusions andRecommendations
C H A P T E R S I X
82
■ Developing countries account for 90 percent of global aquaculture produc-tion.
■ Aquaculture products are capturing an increasing share of the global fishtrade, worth $71 billion in 2004, and more than 48 percent of the globalfish trade is from developing countries.
■ Aquaculture has a demonstrated capability to reduce poverty, improvelivelihoods, and be a significant engine of growth.
■ Unbridled aquaculture contributes to environmental degradation.■ Farming of aquatic species is inherently more efficient than livestock and
has a smaller environmental footprint.■ Aquaculture provides a range of environmental services, has the potential to
provide many more, and complements and integrates with rural develop-ment and coastal management.
Issues
Like any infant industry diversifying and expanding its horizons, the aqua-culture sector competes with traditional users of land, water, and resources. Itstrains against traditional regulatory frameworks, designed without aqua-culture in mind, and aggressively invades traditional markets for fish, provok-ing trade disputes and protectionism. In some respects, aquaculture is tracingthe evolution of agriculture and livestock, intensifying and applying scienceand technology to increase productivity. Many of the issues confronting live-stock and aquaculture are similar. These include the following:
■ The framework for aquaculture governance is often deficient—policies, leg-islation, and strategic and physical plans often lag behind the investments—and expansion and adoption of BMPs is often sluggish.
■ Pro-poor aquaculture policies and programs are emerging, but the pace ofadoption remains slow.
■ There are increasingly stringent environmental and sanitary standards, butenforcement of environmental regulations is often lax.
■ There is a shortage of suitable sites and growing competition for water andscarce public goods, leading to conflicts among resource users in some cul-ture systems.
■ Access to technologies that enhance productivity (for example, disease con-trol, feed industry, breeding programs) is often poor, largely as a result ofhuman capacity and institutional deficiencies.
■ Extension systems and services for smallholders are poorly supported anddelivery mechanisms for pro-poor aquaculture are weak.
■ Consumer demand is driving improved quality and food safety, whilechanging import standards and trade disputes limit the entry of aqua-culture products into some of the more lucrative markets and distort mar-kets and supplies.
CONCLUSIONS AND RECOMMENDATIONS 83
■ Civil society questions the impact of aquaculture on biodiversity and theenvironment.
■ There is a body of disinformation on aquaculture, including on the nutri-tional quality of farmed fish.
Key Trends
Some key characteristics of modern aquaculture include:
■ An aggressive market-driven expansion
■ Increasing productivity based on intensification and structural change
■ Emergence of a knowledge-based industry
■ Competition for scarce water and land resources with other sectors
■ Increasing environmental impacts (both positive and negative)
Chasing Changing Markets
The defining characteristics of the markets for aquaculture products include ashortened and more efficient production chain compared with capture fish-eries; a convergence between domestic and export market standards; trade dis-putes; and industry consolidation and the weak market power of many small-scale producers. Timely delivery of standard products, vertical integration, anda more favorable cost structure makes aquaculture production increasinglymore efficient than many capture fisheries. While the product chain is short-ened through direct sales agreements between producers and giant retailers,the base is widened by development of specialized service providers, alteringthe patterns of value capture.
An Institutional Home
Because of its relative novelty as an economic sector, aquaculture lags behindother sectors in terms of policies, appropriate institutional and regulatoryframeworks, and integration into development planning. While generally con-sidered as a subsector of fisheries, aquaculture has far more in common withlivestock and agriculture. Thus, institutionally, aquaculture often lies un-comfortably with capture fisheries, while fish, seaweed, and aquatic ecology lieequally uncomfortably with cattle, grains, and land management. The search foran institutional home for a complex and rapidly evolving sector that straddles adiversity of habitats, institutions, sciences, tenures, and production systems isamong the many challenges facing development of sustainable aquaculture.
Science and Technology
Only in the last three decades have the concerted efforts of science and tech-nology been directed toward improving productivity and management. Aqua-
84 CHANGING THE FACE OF THE WATERS
culture lags well behind agriculture and livestock in this respect. This presentsimportant opportunities, but demands an institutional framework to nurturethe investments required to realize sustainable benefits. Rapid developments inseed production, fish feed technology and disease control, and the integrationof aquaculture in both urban and rural economies are among the innovationdomains driving aquaculture expansion. Recognition of the potential contri-bution of aquaculture to ecosystem services and the emergence of national andinternational norms, codes of practice, and standards for environmentallyfriendly aquaculture and healthy fish products are creating further opportuni-ties for expansion.
Diversity and Productivity
An increasing number of aquatic species are being domesticated and culturedunder increasingly diverse production systems. Although much attention hasfocused on intensive production of high-value species such as shrimp andsalmon, the vast majority of aquaculture takes place at lower trophic levels witha small environmental footprint—such as plankton and plant feeders. There isa continuum from low-trophic level to high-trophic level production systems;for example, tilapia can be raised intensively and finds its way onto the menusof the finest restaurants, but it will yield modest returns from a backyard pondfertilized with garden compost.
Poor Infrastructure
The infrastructure needed to bring high-value, highly perishable products tomarkets, often from relatively isolated aquafarms, is frequently deficient. Thisinfrastructure includes not only the transport “hardware,” but also a suite ofinformation and communications infrastructure providing traceability, mar-ket price information, and information on disease outbreaks and changingaquatic environmental conditions, such as red tides or impending floods.
Opportunities
Outside the nexus of Asian aquaculture, vast areas in coastal regions and riverbasins are suitable for aquaculture, particularly in SSA and Latin America. Pastdevelopment efforts have, at best, yielded mixed results. A new chapter in aqua-culture development will need to take full account of the lessons of past fail-ures and apply the lessons learned in Asia and elsewhere in terms of businessmodels and knowledge transfer. These lessons include building awareness ofthe need for: (1) effective public policies, planning, and governance; (2) afavorable investment climate; (3) involvement of stakeholders, enforcement ofenvironmental controls, and transfer of technologies and skills; and (4) mea-sures to mitigate negative externalities and unwanted social impacts.
CONCLUSIONS AND RECOMMENDATIONS 85
International Demand
Developing countries have expressed the demand for aquaculture developmentin a range of forums, such as the FAO Committee on Fisheries, and in interna-tional and regional declarations—for example, the recent NEPAD Fish for AllSummit Declaration and Plan of Action and the Resolution and Plan of Actionof the Association of Southeast Asian Nations (ASEAN)/SEAFDEC Conferenceon Sustainable Fisheries for Food Security in the New Millennium.
The Pillars of Sustainable Aquaculture
Where aquaculture is already a robust and expanding sector, the challenges arethose of equity, environmental sustainability, and trade. Where aquaculture isstill an embryonic industry, the creation of an enabling environment is a fur-ther challenge. The road map for sustainable aquaculture is built on three mainpillars, each of which is discussed in some detail in the following sections:
■ Good governance, including establishment of an enabling environment foraquaculture investment through policies and practices, facilitating equitableaccess to water, land, resources, and markets
■ A commitment to environmentally sustainable and healthy aquaculture
■ Creation of the human and institutional capacity and knowledge requiredfor management, innovation, and building of aquaculture infrastructure
Public and Private Sector Roles
The public sector has a vital role to play in creating an attractive investment cli-mate, establishing a framework for disease control, monitoring transfer of livefish across boundaries, overseeing water management and environmental pro-tection, ensuring the quality of feeds and seeds, and certifying the health andsafety of aquaculture food products. Functions undertaken by the public sec-tor may vary widely between countries, but include the following:
■ The physical and environmental planning for coastal zones, wetlands, riverbasins, and water use
■ Monitoring and enforcement of regulations and operation, or oversight ofsanitary controls
■ Allocation of leases over public waters in a transparent and equitable man-ner and arbitration on competing resource use
■ Coordination of a participatory planning and policy review processes
■ Interagency/ministry (and state/federal) coordination and policy coherence
■ Support for core training and knowledge acquisition and innovation
■ Provision of key infrastructure
86 CHANGING THE FACE OF THE WATERS
Functions that may require public involvement include seed productionand supply, maintenance of broodstock quality, and extension and certificationschemes. Engagement of NGOs in the provision of microfinance, extension,and independent oversight of environmental and equity issues may be benefi-cial. Suitable incentives can enlist the private sector in the creation and opera-tion of infrastructure, such as those for fish food safety and sanitary control,adapting proven technologies and pro-poor sustainable aquaculture modelsand encouraging partnerships in applied research among industry, govern-ment, and research institutions.
Environmental Sustainability
Introduction and continuance of environmentally friendly aquaculture systemsis vital. Development assistance can foster adoption and application of codesand best practices for environmentally friendly aquaculture, which will increaseeconomic returns while providing effective environmental stewardship andproducing healthy products. A wide range of codes and best practices exist (seeannex 2, Selected Codes, Instruments, and Tools for Responsible Aqua-culture) setting out norms, standards, and guidelines in all major areas of con-cern, ranging from fish health to mangrove forest management. These knowl-edge items can be tailored to national needs, as undertaken recently in Vietnamwith World Bank assistance. Among the actions required are the following:
■ Provisions for undertaking the required environmental and social impactassessments
■ Zoning of aquaculture and integration with coastal and river basin planning
■ Measures to replace collection of wild seedstock
■ Incentives to use processed feeds to reduce harvesting of trash fish for feedsand to use alternatives such as lysine-rich yeast and plant sources of essen-tial nutrients
■ Rigorous evaluation, risk assessment, and monitoring and control of speciestransfers and introductions between river basins, countries, and regions
■ Provisions for monitoring of testing of water quality, and if necessary,preparation of the relevant water and product standards and developmentof human capacity in this field
■ Use of ecolabels and certification systems, particularly to capture exportmarkets
■ Internalizing the environmental costs of aquaculture through fiscal andother measures
Knowledge and Human Capacity
Knowledge and human caacity are fundamental and investment in human andintangible capital is perhaps the highest priority for sustainable aquaculture.
CONCLUSIONS AND RECOMMENDATIONS 87
This capital can be cost-effectively generated in developing countries throughthe use of networks and south-south cooperation backed by sustained supportfrom the international community. The initiatives and approaches include jointventures, formal and vocational and informal training, applied researchalliances, and establishment of producer organizations. Investment in socialcapital through community-based management approaches and corporatelinks such as eChoupal in India provides access to financial capital, supportinfrastructure, and markets.
Public Interventions and Entry Points for Development Assistance
Many entry points for public interventions and development assistance havebeen illustrated in the preceding sections. The following examples are selectedfrom this broad array.
Good Governance
In China and India, success was due to strategic planning and long-term effortsby government, including special institutional arrangements, supporting lawsand regulations, and access to inputs, credit, and markets. Initiatives can includethe following:
■ Participatory preparation of a national aquaculture policy, developmentstrategy and plan, and integration of the process with national economicplans, poverty reduction plans, environmental management plans, develop-ment assistance programs, and similar instruments
■ Development of guidelines on process aspects of the multiagency andmultistakeholder cooperation and cross-sector coordination in aquaculture
■ Revision of aquaculture legislation, including land and water tenure rights,and policies to make it possible for the poor to engage in aquaculture pro-duction; for example, opening the way for leasing public land and waterbodies to poor households
■ Development of safeguards for community waters, wetlands, and similarcommon property
■ Integration of aquaculture into coastal and river basin management plans
Economic Growth and Investment
Sector support can be considered along the entire supply and product valuechain from underpinning knowledge industry and services to infrastructureand processing through the following:
■ Preparing guidelines for private investment in aquaculture, including FDI
88 CHANGING THE FACE OF THE WATERS
■ Building incentives and processes for cooperation and partnerships amonggovernment agencies, private sector, producer groups, and NGOs for sus-tainable aquaculture development
■ Mobilizing institutional credits for investment by poor people and womenin aquaculture
■ Designing incentives to stimulate aquaculture development in remote areas
■ Facilitating reduction of risks through special provisions for infant industry
Corporate Aquaculture
Successful smallholder aquaculture is often built on the pioneering efforts ofthe larger entrepreneurs. The larger enterprises have the economies of scale toovercome logistics problems, can access finance and markets, and can securethe political patronage to reduce risk and cut through bureaucratic knots. Byvirtue of its access to knowledge on codes of responsible aquaculture, corpo-rate aquaculture also has the obligation to implement industry norms andbest practices. Similarly, banks and corporate sources of aquaculture financehave an obligation to ensure that corporate clients engage in responsibleaquaculture practices, while the engagement of major food retailers in certifi-cation and ecolabeling schemes can reinforce and reward socially and envi-ronmentally responsible corporate aquaculture. Establishment of partner-ships among major stakeholders at national and international levels wouldhelp create a level playing field for corporate producers and curtail incentivesto “race to the bottom” in terms of environmental or social sustainability.Such partnerships could include IFIs, major wholesale or retailers, and custo-dians of codes of conduct for sustainable aquaculture, linking both the accessto capital and revenues from production to the application of designatednorms.
Poverty Reduction
A variety of pro-poor approaches have been illustrated in the preceding sec-tions. A first step is to raise awareness among decision makers and interna-tional agencies with a view to include aquaculture in rural development andpoverty reduction strategies. Additional specific pro-poor interventions canthen be explored, such as:
■ Creating diagnostics to design effective interventions
■ Piloting proven approaches in other developing countries
■ Integrating aquaculture into community development and rural develop-ment projects
■ Fostering producer organizations
CONCLUSIONS AND RECOMMENDATIONS 89
Environmental Management
The existing codes and guidelines can be blended into the development agenda,for example, by establishing specific safeguard policies for aquaculture invest-ment to be used by client countries, development agencies, and commercialbanks. Other interventions can include the following:
■ Include aquaculture in improved land-use plans, water management, andirrigation and drainage projects to reduce risks like salinization, diseaseincidence, loss of biodiversity, and threats to wildlife populations.
■ Where uncertainty and risk is high due to lack of information, support pilotprojects to provide information to improve the information base, assessenvironmental effects, create stakeholder understanding, and support envi-ronmental protection.
■ Create capacity and processes for effective monitoring and enforcement,including capacity to assess EIAs, and apply a precautionary approach basedon risk assessment.
■ Support processes for adoption of BMPs, development of certification,traceability, and ecolabeling schemes.
■ Design environmental accounting systems for aquaculture and the accom-panying fiscal measures to internalize social and environmental costs.
Trade
Aquaculture requires substantial public support to meet the stringent qualityand safety standards of aquaculture products traded internationally. Establish-ment of veterinary controls, advisory services, and support for participation intrade fairs are among the public goods needed. International cooperation canhelp avert trade disputes and promote equitable trade.
Knowledge and Capacity Building
The lessons learned from technology transfer and capacity building in Asiadescribed above can be applied in other regions. A key factor was the regionalcooperation in training and knowledge sharing, providing a cost-effectivesolution through networks and processes without duplicating costly facilitiesand research in each country. The NACA model described above and detailedin annex 4 can be adapted and molded to meet the requirements of otherregions.
Infrastructure
Providing for aquaculture in the design of rural road networks, flood controlsystems, and irrigation and drainage infrastructure will contribute to an effec-tive enabling environment, reducing costs of water and resource management,
90 CHANGING THE FACE OF THE WATERS
creating the environmental space for aquaculture development, and engagingaquaculture as a contributor to environmental services. The infrastructurerequirement includes not only roads, water control systems, and energy, butalso a suite of information and communications infrastructure providingtraceability, market price information, or information on disease outbreaksand changing aquatic environmental conditions, such as red tides, or impend-ing floods.
RECOMMENDATIONS
Following is a summary of recommendations made for actions by client coun-tries and the development community:
1. Raise awareness of the potential of aquaculture for economic growth,poverty alleviation, food security, and environmental services. Concur-rently stress the need for good governance to counter the threats posed tothe environment and the poor by unsustainable aquaculture practices.
2. Improve aquaculture governance through informed policies based on science-based diagnostics and coordinated public and private activities andworking from a plan formulated through participation and consultation.
3. Create an enabling environment for private sector investment, innova-tion, and expansion at both corporate and smallholder levels.
4. Adopt and apply recognized codes of responsible aquaculture and bestpractices to ensure environmental sustainability of aquaculture, takemeasures to internalize the environmental costs, and use market mecha-nisms such as certification and ecolabeling to forge an economic back-bone for and social awareness of environmentally friendly and healthyaquaculture.
5. Provide sustained public support for pro-poor aquaculture usingproven models adapted to local realities with a focus on commerciallyviable culture systems, or integration into rural livelihoods and agricul-tural practices.
6. Create national and regional knowledge networks to transfer and adaptproven technologies, to cost-effectively build human and institutionalcapacity and support south-south technology transfer and investment.
7. Create aquaculture infrastructure, not only in terms of roads and other“hardware,” but also in terms of communications, institutions, and sup-port services.
8. Assess the increasing threat to biodiversity, including loss of wild germ-plasm, posed by aquaculture and consider means of countering thesethreats, including the rigorous application of core biodiversity-relatedguidelines.
CONCLUSIONS AND RECOMMENDATIONS 91
9. Through collaboration between client countries and development part-ners, prepare specific safeguard policies and guidelines for aquaculturefor consideration by international financial institutions with a view toextending such norms through the Equator Principles.
10. Establish institutional and informal partnerships to support agreed agen-das for sustainable aquaculture in developing countries, including initia-tives to avert trade disputes and address biodiversity loss.
92 CHANGING THE FACE OF THE WATERS
Annex 1 Definitions of Aquaculture Production Systems 94
Annex 2 Selected Codes, Instruments, and Tools for Responsible Aquaculture 97
Annex 3 Portfolio Analysis 103
Annex 4 Wealth Creation and Poverty Alleviation—The Asian Experiences 110Aquaculture for Rural Livelihoods 110National Policy Interventions and Pro-Poor Aquaculture 123The Regional Framework for Science and Technology
Transfer in Asia 126International Centers and Programs 130NACA and Associated Initiatives 131Other Contributing Institutions 133
Annex 5 Supplementary Statistical Information 135
Annex 6 The Diversity of Aquaculture Production Systems and Business Models 146Selected Models 146Footprints of Production Systems 148Aquaculture Production Systems in Africa 148The Case of Shrimp Culture in Madagascar 152Production Systems and Cultured Species in Latin America 153
Annex 7 Guidelines for the Preparation and Implementation of Aquaculture Projects 156Introduction 156Project Preparation and Identification 156Project Design 159Project Implementation 161
93
A N N E X E S

Barrages: Semipermanent or seasonal enclosures formed by impervious man-made barriers and appropriate natural features.
Cages: Open or covered enclosed structures constructed with net, mesh, or anyporous material allowing natural water interchange. These structures may befloating, suspended, or fixed to the substrate but still permitting water inter-change from below.
Capture-based aquaculture: The practice of collecting “seed” material—fromearly life stages to adults—from the wild, and its subsequent on-growing incaptivity to marketable size, using aquaculture techniques.
Enclosures and pens: Water areas confined by net, mesh, and other barriersallowing uncontrolled water interchange and distinguished by the fact thatenclosures occupy the full water column between substrate and surface; pensand enclosures will generally enclose a relatively large volume of water.
Enhancement: Any activity aimed at supplementing or sustaining the recruit-ment of, or improving the survival and growth of, one or more aquatic organ-isms, or at raising the total production or the production of selected elementsof the fishery beyond a level that is sustainable by natural processes. It mayinvolve stocking, habitat modification, elimination of unwanted species, fertil-ization, or combinations of any of these practices.
Extensive: Production system characterized by (1) a low degree of control (forexample, of environment, nutrition, predators, competitors, disease agents);
Definitions of AquacultureProduction Systems
A N N E X O N E
94
(2) low initial costs, low-level technology, and low production efficiency (yield-ing no more than 500 kg/ha/yr); (3) high dependence on local climate andwater quality; and (4) use of natural water bodies (for example, lagoons, bays,embayments) and of natural, often unspecified, food organisms.
Hatcheries: Installations for housing facilities for breeding, nursing, and rear-ing seed of fish, invertebrates, or aquatic plants to fry, fingerlings, or juvenilestages.
Hyperintensive: System of culture characterized by a production averagingmore than 200 tons/ha/yr, by the use of a complete (processed) fully formu-lated feed to meet all diet requirements of the species, stocking with hatchery-reared fry, no fertilizers used, full predator and antitheft precautions taken,highly co-coordinated and controlled regimes, usually pumped or gravity-supplied water or cage-based, full use of water exchange and aeration withincreasing levels of control over supply and quality, usually in flowing waterponds, cage systems, or tanks and raceways.
Integrated agriculture-aquaculture (IAA): Semi-intensive aquaculture sys-tems in synergy with agriculture (including animal husbandry), in which anoutput from one subsystem, which otherwise may be wasted, is used as aninput to another subsystem, resulting in a greater efficiency of output ofdesired products from the land/water farm area. Other forms of integrationusing the same principle of waste recycling include intensive marine cocultureof fish/shrimp-shellfish-seaweeds, aquaculture in heated effluents, sewage-fedaquaculture, and integrated mangrove-shrimp farming.
Intensive: System of culture characterized by (1) a production of up to 200 tons/ha/yr; (2) a high degree of control; (3) high initial costs, high-level technology,and high production efficiency; (4) tendency toward increased independenceof local climate and water quality; (5) use of manmade culture systems.
Nurseries: Refer generally to the second phase in the rearing process of aquaticorganisms and to small, mainly outdoor ponds and tanks.
Polyculture: The rearing of two or more noncompetitive species in the sameculture unit.
Ponds and tanks: Artificial units of varying sizes constructed above or belowground level capable of holding and interchanging water. Rate of exchange ofwater is usually low, that is, not exceeding 10 changes per day.
Raceways and silos: Artificial units constructed above or below ground levelcapable of high rates of water interchange in excess of 20 changes per day.
Rafts, ropes, and stakes: The culture of shellfish, notably mussels, and sea-weeds usually conducted in open waters using rafts, long lines, or stakes. Thestakes are impaled in the seabed in intertidal areas and ropes are suspended indeeper waters from rafts or buoys.
DEFINITIONS OF AQUACULTURE PRODUCTION SYSTEMS 95
Rice-cum-fish paddies: Paddy fields used for the culture of rice and aquaticorganisms; rearing them in rice paddies to any marketable size.
Sea-ranching: The harvest of enhanced capture fisheries, that is, the raising ofaquatic animals, mainly for human consumption, under extensive productionsystems, in open space (oceans, lakes) where they grow using natural food sup-plies. These animals may be released by national authorities and recaptured byfishermen as wild animals, either when they return to the release site (salmon),or elsewhere (seabreams, flatfishes).
Semi-intensive: Systems of culture characterized by a production of 2 to 20tons/ha/yr, which are dependent largely on natural food, which is augmentedby fertilization or complemented by the use of supplementary feed, stockingwith hatchery-reared fry, regular use of fertilizers, some water exchange or aer-ation, and often pumped or gravity-supplied water, and normally in improvedponds, some enclosures, or simple cage systems.
Semi-extensive: System of culture characterized by a production of 0.5–5tons/ha/yr, possibly supplementary feeding with low-grade feeds, stockingwith wild-caught or hatchery-reared fry, regular use of organic or inorganicfertilizers, rain or tidal water supply, and/or some water exchange, and simplemonitoring of water quality, and normally in traditional or improved ponds;also some cage systems, for example, with zooplankton feeding for fry.
Source: FAO 1990; FAO Aquaculture Glossary http://www.fao.org/fi/glossary/aquaculture/.
96 CHANGING THE FACE OF THE WATERS
INTERNATIONAL AND REGIONAL CODES
FAO Code and Technical Guidelines
FAO Code of Conduct for Responsible Fisheries. Available at http://www.fao.org/documents/show_cdr.asp?url_file=/DOCREP/005/v9878e/v9878e00.htm
FAO Technical Guidelines for Responsible Fisheries:
■ Aquaculture Development, 1997. Available at ftp://ftp.fao.org/docrep/fao/003/W4493e/W4493e00.pdf
■ Aquaculture Development 1. Good Aquaculture Feed Practice, 2001. Avail-able at ftp://ftp.fao.org/docrep/fao/005/y1453e/y1453e00.pdf
■ Integration of Fisheries into Coastal Area Management, 1996. Available atftp://ftp.fao.org/docrep/fao/003/W3593e/W3593e00.pdf
■ Precautionary Approach to Capture Fisheries and Species Introductions,1996. Available at http://www.fao.org/documents/show_cdr.asp?url_file=/DOCREP/003/W3592E/W3592E00.htm
Responsible Fish Utilization, 1998. Available at ftp://ftp.fao.org/docrep/fao/003/w9634e/w9634e00.pdf
Guidelines on the Collection of Structural Aquaculture Statistics, 1997
Species Introductions and Biodiversity
Cartagena Protocol on Biosafety. Available at http://www.biodiv.org/biosafety/protocol.asp
97
Selected Codes,Instruments, and Tools forResponsible Aquaculture
A N N E X T W O
Convention on Biological Diversity (CBD), 1992. Available at http://www.biodiv.org /convention/articles.asp
Convention on International Trade in Endangered Species of Wild Fauna andFlora (CITES), 1973. Available at http://www.cites.org/
EIFAC Code of Practice and Manual of Processes for Consideration of Intro-ductions and Transfers of Marine and Freshwater Organisms, 1988, Euro-pean Inland Fisheries Advisory. Available at http://cdserver2.ru.ac.za/cd/011120_1/Aqua/ SSA/codes.htm
FAO Technical Paper, International Introductions of Inland Aquatic Species,1988. Available at http://www.fao.org/docrep/x5628E/x5628e00.htm#Contents
International Council for the Exploration of the Seas (ICES)/ European InlandFisheries Advisory Commission (EIFAC) Code of Practice on the Introduc-tions and Transfers of Marine Organisms, 2004. Available at http://www.ices.dk/reports/general/2004/ICESCOP2004.pdf
Health Management and Best Practice
Better-Practice Approaches for Culture-Based Fisheries Development in Asia,2006. Available at http://www.aciar.gov.au/web.nsf/att/ACIA-6M98FT/$file/CBF_manual.pdf
CODEX Alimentarius. Available at http://www.codexalimentarius.net/web/standard_list.do?lang=en
Development of HARP Guidelines. Harmonised Quantification and ReportingProcedures for Nutrients. SFT Report 1759/2000. TA-1759/2000. ISBN 82-7655-401-6. Available at http://www.sft.no/publikasjoner/vann/1759/ta1759.pdf
FAO/NACA Asia Diagnostic Guide to Aquatic Animal Diseases, 2001. Availableat http://www.fao.org/documents/show_cdr.asp?url_file=/DOCREP/005/Y1679E/Y1679E00.HTM
FAO/NACA Asia Regional Technical Guidelines on Health Management forthe Responsible Movement of Live Aquatic Animals and the Beijing Con-sensus and Implementation Strategy, 2000. Available at http://www.fao.org/documents/ show_cdr.asp?url_file=/DOCREP/005/X8485E/x8485e02.htm
FAO/NACA Manual of Procedures for the Implementation of the Asia RegionalTechnical Guidelines on Health Management for the Responsible Movementof Live Aquatic Animals. 2001. Available at http://www.fao.org/documents/show_ cdr.asp?url_file=/DOCREP/005/Y1238E/Y1238E00.HTM
Holmenkollen Guidelines for Sustainable Aquaculture, 1998. Available at http://www.ntva.no/rapport/aqua.htm
International Aquatic Animal Health Code, 2005. Available at http://www.oie.int/ eng/normes/fcode/a_summry.htm
98 CHANGING THE FACE OF THE WATERS
Shrimp Culture
Bangkok FAO Technical Consultation on Policies for Sustainable Shrimp Cul-ture, Bangkok, Thailand, December 8–11, 1997. Available at http://www.fao.org/documents/show_cdr.asp?url_file=/DOCREP/006/x0570t/x0570t00.HTM
Codes of Practice and Conduct for Marine Shrimp Aquaculture, 2002. Avail-able at http://www.fw.vt.edu/fisheries/Aquaculture_Center/ Power_Point_Presentations/FIW%204514/Lecture%209.1%20-%20aquaculture%20and%20environment/shrimpCOP.pdf
Codes of Practice for Responsible Shrimp Farming. Available at http://www.gaalliance.org/code.html#CODES
Code of Practice for Sustainable Use of Mangrove Ecosystems for Aquaculturein Southeast Asia, 2005. Available at http://www.ices.dk/reports/ general/2004/ICESCOP2004.pdf
The International Principles for Responsible Shrimp Farming, in preparation.Available at http://www.enaca.org/modules/mydownloads/singlefile.php?cid=19&lid=755
Report of the Ad-hoc Expert Meeting on Indicators and Criteria of SustainableShrimp Culture, Rome, Italy. April 28–30, 1998. Available at http://www.fao.org/ documents/show_cdr.asp?url_file=/DOCREP/006/x0570t/x0570t00.HTM
NATIONAL CODES AND BEST PRACTICES
Canada: National Code on Introductions and Transfers of Aquatic Animals,2003. Department of Fisheries and Oceans, Government of Canada. Avail-able at http://www.dfo-mpo.gc.ca/science/aquaculture/code/Code2003_e.pdf
Chile: Code of Good Environmental Practices (CGEP) for Well-ManagedSalmonoids Farms, 2003. Available at http://library.enaca.org/certification/publications /Code_2003_ENGLISH.pdf
India: Guidelines for Sustainable Development and Management of BrackishWater Aquaculture, 1995. Available at http://www.mpeda.com/
Japan: Basic Guidelines to Ensure Sustainable Aquaculture Production, 1999.
Philippines: Fisheries Code, 1998. Available at http://www.da.gov.ph/ FishCode/ra8550a.html
Scotland: Code of Practice to Avoid and Minimise the Impact of InfectiousSalmon Anaemia (ISA), 2002. Available at http://www.marlab.ac.uk/FRS.Web/Uploads/ Documents/ISACodeofPractice.pdf
Sri Lanka: Best Aquaculture Practices (BAP) for Shrimp Framing Industry in Sri Lanka. Available at http://www.naqda.gov.lk/pages/BestAquaculturePractice Methods.htm
CODES, INSTRUMENTS,AND TOOLS FOR RESPONSIBLE AQUACULTURE 99
Thailand: Thailand Code of Conduct for Shrimp Farming (in Thai). Availableat http://www.thaiqualityshrimp.com/coc/home.asp
United States: Code of Conduct for Responsible Aquaculture Development inthe U.S. Exclusive Economic Zone, 2002. Available at http://www.nmfs.noaa.gov /trade/AQ/AQCode.pdf
Guidance Relative to Development of Responsible Aquaculture Activities inAtlantic Coast States, 2002. Available at http://www.asmfc.org/publications/special Reports/aquacultureGuidanceDocument.pdf
Guidelines for Ecological Risk Assessment of Marine Fish Aquaculture, 2005.NOAA Technical Memorandum NMFS-NWFSC-71. Available at http://www.nwfsc.noaa.gov/assets/25/6450_01302006_155445_NashFAOFinalTM71.pdf
U.S. Department of Agriculture Aquaculture Best Management PracticesIndex, 2004. Available at http://efotg.nrcs.usda.gov/references/public/AL/INDEX.pdf
INDUSTRY/ORGANIZATION CODES
Australian Aquaculture Code of Conduct Available at http://www.pir.sa.gov.au/ byteserve/aquaculture/farm_practice/code_of_conduct.pdf
British Columbia Salmon Farmers Association (BCSFA) Code of Practice,2005. Available at http://www.salmonfarmers.org/pdfs/codeofpractice1.pdf
A Code of Conduct for European Aquaculture. Available at http://www.feap.info/FileLibrary/6/CodeFinalD.PDF
Draft Protocol for Sustainable Shrimp Production, in preparation. Available athttp://www.ntva.no/rapport/aqua.htm
Environmental Code of Practice for Australian Prawn Farmers, 2001. Availableat http://www.apfa.com.au/prawnfarmers.cfm?inc=environment
Judicious Antimicrobial Use in U.S. Aquaculture: Principles and Practices,2003. Available at http://www.nationalaquaculture.org/pdf/Judicious%20Antimicrobial%20Use.pdf
New Zealand Mussel Industry Environmental Codes of Practice, 2002. MusselIndustry Council Ltd., Blenheim.
ENVIRONMENT AND SOCIAL SAFEGUARD POLICIES AND GUIDELINES
World Bank Group
Environmental Assessment Sourcebook, 1991. Available at http://web.worldbank.org/WBSITE/EXTERNAL/TOPICS/ENVIRONMENT/EXTENVASS/0,,contentMDK:20282864~pagePK:148956~piPK:216618~theSitePK:407988,00.html
100 CHANGING THE FACE OF THE WATERS
The Environmental and Social Review Procedure (ESRP), 2006. Gives direc-tion to IFC officers in implementing the Policy on Social and Environmen-tal Sustainability and reviewing compliance and implementation by privatesector projects. Available at http://www.ifc.org/ifcext/enviro.nsf/ AttachmentsByTitle/pol_ESRP2006/$FILE/ESRP2006.pdf
Fish Processing Guideline, 1998. Available at http://www.ifc.org/ifcext/enviro.nsf/AttachmentsByTitle/gui_fishproc/$FILE/fishprocessing.pdf
General Environmental Guideline, 1998. Available at http://www.ifc.org/ ifcext/enviro.nsf/AttachmentsByTitle/gui_genenv_WB/$FILE/genenv_PPAH.pdf
The Policy on Social and Environmental Sustainability, 2006. Defines IFC’sresponsibility for supporting project performance in partnership with clients.Available at http://www.ifc.org/ifcext/enviro.nsf/Content /SustainabilityPolicy
Pollution Prevention and Abatement Handbook (PPAH), 1998. Available athttp://www.ifc.org/ifcext/enviro.nsf/Content/PPAH
World Bank’s 10 Environment and Social Safeguard Policies, designed to assistBank staff as they apply the safeguard policies and procedures. Available athttp://web.worldbank.org/WBSITE/EXTERNAL/PROJECTS/EXTPOLICIES/EXTSAFEPOL/0,,menuPK:584441~pagePK:64168427~piPK:64168435~theSitePK:584435,00.html
Inter-American Development Bank
Environment and Social Safeguard Compliance Policies, 2006. Available at http://www.iadb.org/IDBDocs.cfm?docnum=665902
Procedure for Environmental and Labor Review of IIC Projects by the Inter-American Investment Corporation (IIC), 1999. Available at http://www.iic.int/Policies/gn1293.ASP
Asian Development Bank
Environment Assessment Guidelines, 2003. Available at http://www.adb.org/Documents/Guidelines/Environmental_Assessment/default.asp
Environment Policy, 2002. Available at http://www.adb.org/Environment/default.asp
Indigenous Peoples (IP) Policy, 1998. Available at http://www.adb.org/IndigenousPeoples/default.asp
Involuntary Resettlement (IR) Policy, 1995. Available at http://www.adb.org/Resettlement/default.asp
Import Risk Analysis
Asia-Pacific Economic Cooperation: Capacity and Awareness Building onImport Risk Analysis (IRA) for Aquatic Animals. Proceedings of the work-
CODES, INSTRUMENTS,AND TOOLS FOR RESPONSIBLE AQUACULTURE 101
shops held April 1–6, 2002, in Bangkok, Thailand, and August 12–17, 2002,in Mazatlan, Mexico. APEC FWG 01/2002, NACA, Bangkok. Available at http://www.enaca.org/modules/mydownloads/visit.php?cid=21&lid=528&PHPSESSID=f0138bb49acd5570e224a09e9e808cea
Manual on Risk Analysis for the Safe Movement of Aquatic Animals, 2002.Available at http://www.apec.org/apec/publications/all_publications/fisheries_working.MedialibDownload.v1.html?url=/etc/medialib/apec_media_library/downloads/workinggroups/fwg/pubs/2004.Par.0001.File.v1.1
Australia: Generic Import Risk Analysis (IRA) of Non-viable Non-salmonidFreshwater Finfish, 2002. Available at http://www.daff.gov.au/corporate_docs/publications /pdf/market_access/biosecurity/animal/2002/2002-19a.pdf
Import Risk Analysis Handbook, 2003. Available at http://www.affa.gov.au/corporate_docs/publications/pdf/market_access/biosecurity/bde/ira_handbook_revised.pdf
102 CHANGING THE FACE OF THE WATERS

103
Portfolio AnalysisA N N E X T H R E E
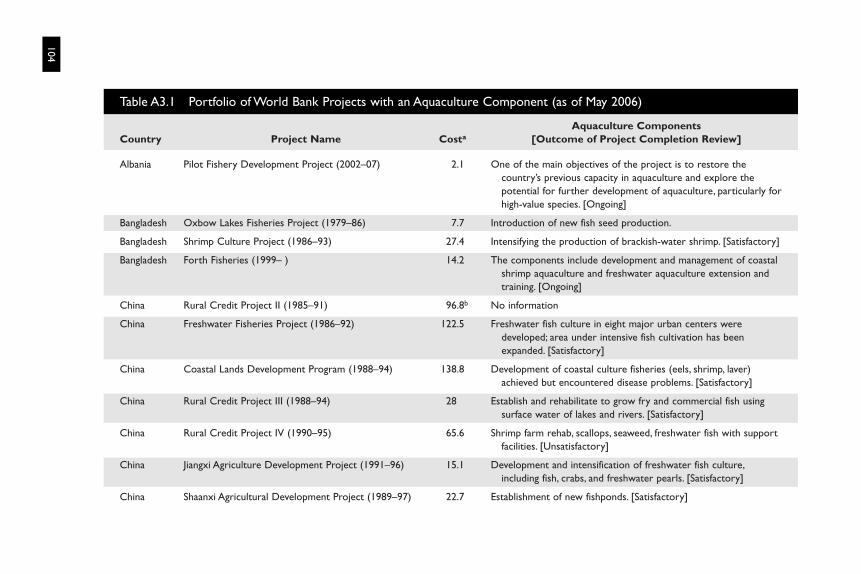
104
Table A3.1 Portfolio of World Bank Projects with an Aquaculture Component (as of May 2006)
Aquaculture ComponentsCountry Project Name Costa [Outcome of Project Completion Review]
Albania Pilot Fishery Development Project (2002–07) 2.1 One of the main objectives of the project is to restore the country’s previous capacity in aquaculture and explore the potential for further development of aquaculture, particularly forhigh-value species. [Ongoing]
Bangladesh Oxbow Lakes Fisheries Project (1979–86) 7.7 Introduction of new fish seed production.
Bangladesh Shrimp Culture Project (1986–93) 27.4 Intensifying the production of brackish-water shrimp. [Satisfactory]
Bangladesh Forth Fisheries (1999– ) 14.2 The components include development and management of coastal shrimp aquaculture and freshwater aquaculture extension and training. [Ongoing]
China Rural Credit Project II (1985–91) 96.8b No information
China Freshwater Fisheries Project (1986–92) 122.5 Freshwater fish culture in eight major urban centers were developed; area under intensive fish cultivation has been expanded. [Satisfactory]
China Coastal Lands Development Program (1988–94) 138.8 Development of coastal culture fisheries (eels, shrimp, laver) achieved but encountered disease problems. [Satisfactory]
China Rural Credit Project III (1988–94) 28 Establish and rehabilitate to grow fry and commercial fish using surface water of lakes and rivers. [Satisfactory]
China Rural Credit Project IV (1990–95) 65.6 Shrimp farm rehab, scallops, seaweed, freshwater fish with support facilities. [Unsatisfactory]
China Jiangxi Agriculture Development Project (1991–96) 15.1 Development and intensification of freshwater fish culture,including fish, crabs, and freshwater pearls. [Satisfactory]
China Shaanxi Agricultural Development Project (1989–97) 22.7 Establishment of new fishponds. [Satisfactory]
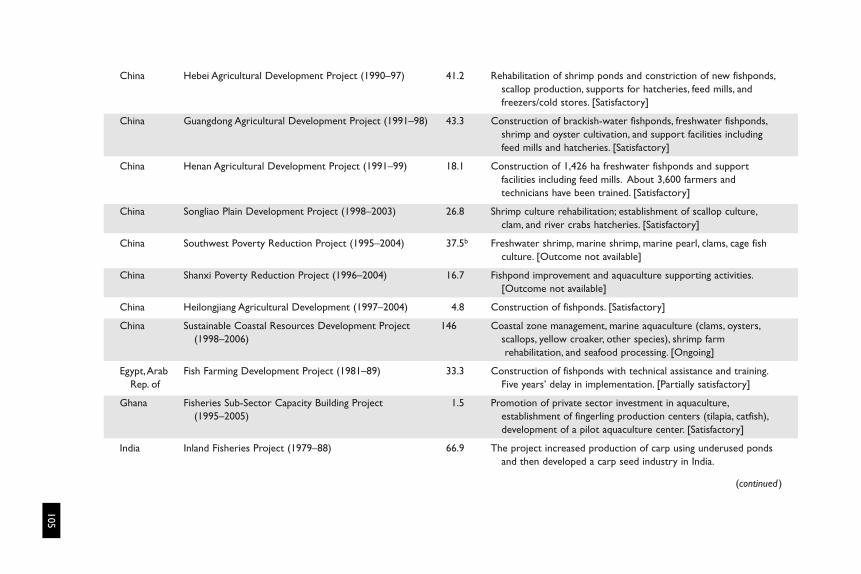
105
China Hebei Agricultural Development Project (1990–97) 41.2 Rehabilitation of shrimp ponds and constriction of new fishponds,scallop production, supports for hatcheries, feed mills, and freezers/cold stores. [Satisfactory]
China Guangdong Agricultural Development Project (1991–98) 43.3 Construction of brackish-water fishponds, freshwater fishponds,shrimp and oyster cultivation, and support facilities including feed mills and hatcheries. [Satisfactory]
China Henan Agricultural Development Project (1991–99) 18.1 Construction of 1,426 ha freshwater fishponds and support facilities including feed mills. About 3,600 farmers and technicians have been trained. [Satisfactory]
China Songliao Plain Development Project (1998–2003) 26.8 Shrimp culture rehabilitation; establishment of scallop culture,clam, and river crabs hatcheries. [Satisfactory]
China Southwest Poverty Reduction Project (1995–2004) 37.5b Freshwater shrimp, marine shrimp, marine pearl, clams, cage fish culture. [Outcome not available]
China Shanxi Poverty Reduction Project (1996–2004) 16.7 Fishpond improvement and aquaculture supporting activities.[Outcome not available]
China Heilongjiang Agricultural Development (1997–2004) 4.8 Construction of fishponds. [Satisfactory]
China Sustainable Coastal Resources Development Project 146 Coastal zone management, marine aquaculture (clams, oysters,(1998–2006) scallops, yellow croaker, other species), shrimp farm
rehabilitation, and seafood processing. [Ongoing]
Egypt,Arab Fish Farming Development Project (1981–89) 33.3 Construction of fishponds with technical assistance and training.Rep. of Five years’ delay in implementation. [Partially satisfactory]
Ghana Fisheries Sub-Sector Capacity Building Project 1.5 Promotion of private sector investment in aquaculture,(1995–2005) establishment of fingerling production centers (tilapia, catfish),
development of a pilot aquaculture center. [Satisfactory]
India Inland Fisheries Project (1979–88) 66.9 The project increased production of carp using underused ponds and then developed a carp seed industry in India.
(continued )
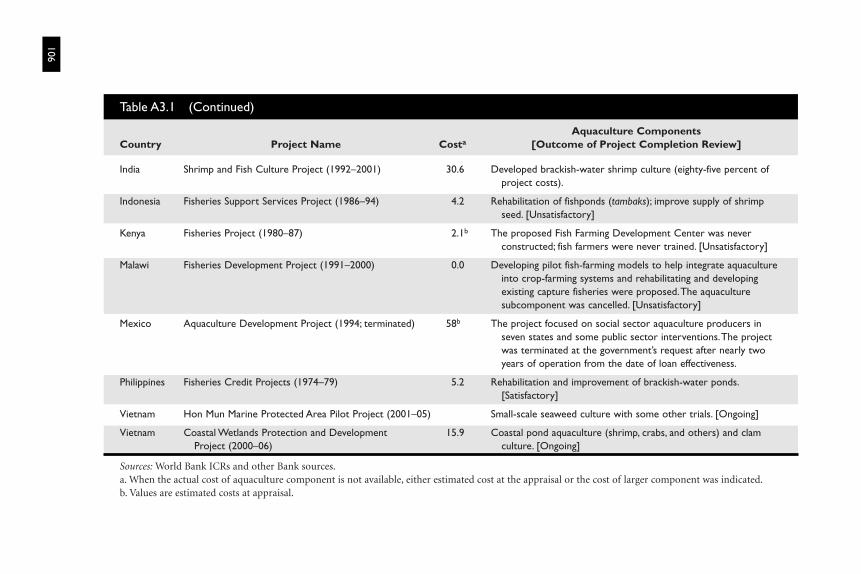
106
India Shrimp and Fish Culture Project (1992–2001) 30.6 Developed brackish-water shrimp culture (eighty-five percent of project costs).
Indonesia Fisheries Support Services Project (1986–94) 4.2 Rehabilitation of fishponds (tambaks); improve supply of shrimp seed. [Unsatisfactory]
Kenya Fisheries Project (1980–87) 2.1b The proposed Fish Farming Development Center was never constructed; fish farmers were never trained. [Unsatisfactory]
Malawi Fisheries Development Project (1991–2000) 0.0 Developing pilot fish-farming models to help integrate aquaculture into crop-farming systems and rehabilitating and developing existing capture fisheries were proposed.The aquaculture subcomponent was cancelled. [Unsatisfactory]
Mexico Aquaculture Development Project (1994; terminated) 58b The project focused on social sector aquaculture producers in seven states and some public sector interventions.The project was terminated at the government’s request after nearly two years of operation from the date of loan effectiveness.
Philippines Fisheries Credit Projects (1974–79) 5.2 Rehabilitation and improvement of brackish-water ponds.[Satisfactory]
Vietnam Hon Mun Marine Protected Area Pilot Project (2001–05) Small-scale seaweed culture with some other trials. [Ongoing]
Vietnam Coastal Wetlands Protection and Development 15.9 Coastal pond aquaculture (shrimp, crabs, and others) and clamProject (2000–06) culture. [Ongoing]
Sources: World Bank ICRs and other Bank sources.a. When the actual cost of aquaculture component is not available, either estimated cost at the appraisal or the cost of larger component was indicated.b. Values are estimated costs at appraisal.
Table A3.1 (Continued)
Aquaculture ComponentsCountry Project Name Costa [Outcome of Project Completion Review]
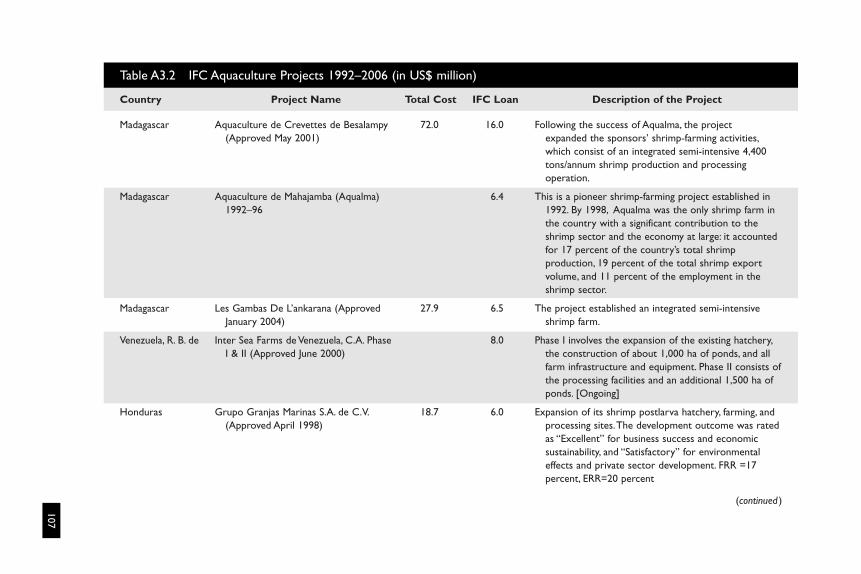
107
Table A3.2 IFC Aquaculture Projects 1992–2006 (in US$ million)
Country Project Name Total Cost IFC Loan Description of the Project
Madagascar Aquaculture de Crevettes de Besalampy 72.0 16.0 Following the success of Aqualma, the project(Approved May 2001) expanded the sponsors’ shrimp-farming activities,
which consist of an integrated semi-intensive 4,400 tons/annum shrimp production and processing operation.
Madagascar Aquaculture de Mahajamba (Aqualma) 6.4 This is a pioneer shrimp-farming project established in1992–96 1992. By 1998, Aqualma was the only shrimp farm in
the country with a significant contribution to the shrimp sector and the economy at large: it accounted for 17 percent of the country’s total shrimp production, 19 percent of the total shrimp export volume, and 11 percent of the employment in the shrimp sector.
Madagascar Les Gambas De L’ankarana (Approved 27.9 6.5 The project established an integrated semi-intensiveJanuary 2004) shrimp farm.
Venezuela, R. B. de Inter Sea Farms de Venezuela, C.A. Phase 8.0 Phase I involves the expansion of the existing hatchery,I & II (Approved June 2000) the construction of about 1,000 ha of ponds, and all
farm infrastructure and equipment. Phase II consists of the processing facilities and an additional 1,500 ha of ponds. [Ongoing]
Honduras Grupo Granjas Marinas S.A. de C.V. 18.7 6.0 Expansion of its shrimp postlarva hatchery, farming, and(Approved April 1998) processing sites.The development outcome was rated
as “Excellent” for business success and economic sustainability, and “Satisfactory” for environmental effects and private sector development. FRR =17 percent, ERR=20 percent
(continued )
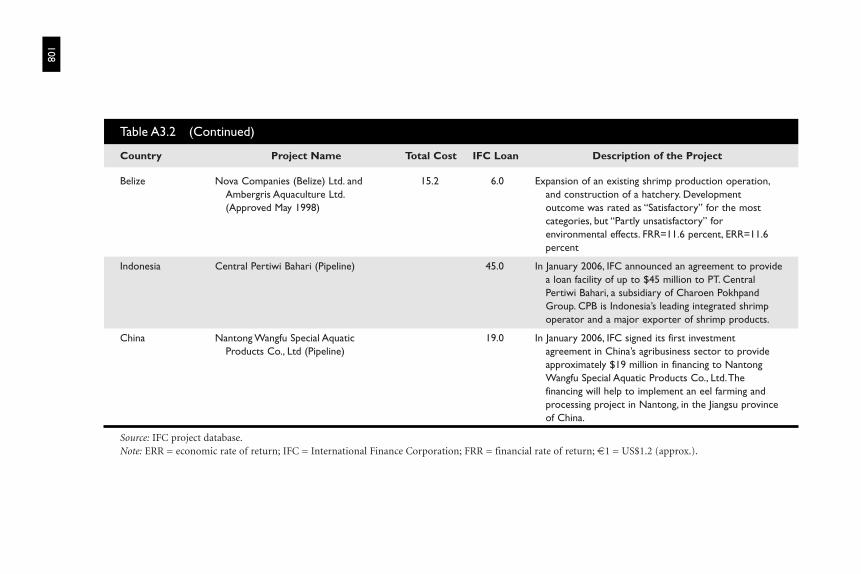
108
Belize Nova Companies (Belize) Ltd. and 15.2 6.0 Expansion of an existing shrimp production operation,Ambergris Aquaculture Ltd. and construction of a hatchery. Development (Approved May 1998) outcome was rated as “Satisfactory” for the most
categories, but “Partly unsatisfactory” for environmental effects. FRR=11.6 percent, ERR=11.6 percent
Indonesia Central Pertiwi Bahari (Pipeline) 45.0 In January 2006, IFC announced an agreement to providea loan facility of up to $45 million to PT. Central Pertiwi Bahari, a subsidiary of Charoen Pokhpand Group. CPB is Indonesia’s leading integrated shrimp operator and a major exporter of shrimp products.
China Nantong Wangfu Special Aquatic 19.0 In January 2006, IFC signed its first investmentProducts Co., Ltd (Pipeline) agreement in China’s agribusiness sector to provide
approximately $19 million in financing to Nantong Wangfu Special Aquatic Products Co., Ltd.The financing will help to implement an eel farming and processing project in Nantong, in the Jiangsu province of China.
Source: IFC project database.Note: ERR = economic rate of return; IFC = International Finance Corporation; FRR = financial rate of return; €1 = US$1.2 (approx.).
Table A3.2 (Continued)
Country Project Name Total Cost IFC Loan Description of the Project
Development agency aquaculture portfolios: In addition to the examinationof the World Bank Group portfolio, lessons and experiences were drawn fromevaluations, completions reports, and ongoing projects by the African Devel-opment Bank, European Union, Food and Agriculture Organization, UnitedNations Development Programme, World Wildlife Fund, UD Department forInternational Development, Danish International Development Agency, JapanInternational Cooperation Agency, German Agency for Technical Coopera-tion, Norwegian Agency for Development Cooperation, Canadian Interna-tional Development Agency, Belgium Aid (DGCI), Swedish InternationalDevelopment Cooperation Authority, Finnish International DevelopmentAgency (FINNIDA), U.S. Peace Corps, Centre d’excellence-production, inno-vation et développement / Institut de recherche agricole pour le développe-ment, CCTA (Netherlands), International Food Policy Research Institute,International Fund for Agriculture Development, U.S. Agency for Interna-tional Development, International Center for Living Aquatic Resource Man-agement Global Environmental Facility, Network of Aquaculture Centers inAsia-Pacific, Collaborative Research Support Program, Australian Centre forInternational Agricultural Research, Australian Government Overseas Aid Pro-gram, Association for the Development of Fish-farming and Fishing in Rhône-Alpes, European Commission, and Norwegian College of Fishery Science. Twostudies were of particular note: ADB 2004 and Braga and Zweig 1998. Theportfolio review included examination of case studies and documents onaquaculture and coastal management in African countries that include docu-ments about and from the Arab Republic of Egypt, Nigeria, Madagascar,Mozambique, Tanzania, Ghana, Zambia, South Africa, the Democratic Repub-lic of Congo, Cameroon, Côte d’Ivoire, The Gambia, Uganda, Zimbabwe,Tunisia, and Brazil.
PORTFOLIO ANALYSIS 109
This annex reviews selected pro-poor aquaculture and communityaquaculture-based fisheries initiatives, projects, programs and sup-porting policies in several Asian countries.
AQUACULTURE FOR RURAL LIVELIHOODS
Drivers of change—markets for high-value fish. Export-led demand haschanged the structure of Asia’s aquaculture. Trade has focused on three majormarkets: the United States, Japan, and the European Union; but it is projectedto shift to increasing south-south trade (Delgado et al. 2003), particularlyamong Asian countries. Species and culture systems have changed to meetchanging export and domestic consumer preferences. Not only have the tradi-tionally fish-eating Asian countries, such as China, Bangladesh, Vietnam, andThailand, increased and diversified aquaculture production, but countries witha relatively low level of fish consumption, such as India, have joined the ranksof major producers and exporters.
Trade disputes. Trade remains a volatile area of tension between developedand developing countries, and between the rich and the poor. The complexi-ties of food safety and public health concerns and other technical barriers havehad dramatic effects on market access for Asian countries. The impacts havehad a disproportionate effect on small producers and smaller economiesbecause of economies of scale in the cost structure of HACCP and SPS com-pliance regimes (Ahmed 2005). Conversely, the elimination of harmful tariffs
Wealth Creation andPoverty Alleviation—The Asian Experiences
A N N E X F O U R
110
(tariff escalation and tariff peaks), such as tariffs that escalate with the level ofprocessing, can result in important gains for poor people involved in inputsupply value added activities (Ahmed 2004).
Technology. Technology has transformed Asian aquaculture from a subsis-tence food production system to a major agribusiness industry. Hatchery tech-nology, pelleted feeds, and disease control have fostered intensification. On-farm fish production is only one link in the aquaculture value chain, accountingfor perhaps less than one-half of the total value added by industry. Modernfish-farming technology has expanded beyond the traditional ponds to ricefields, floodplains, rivers, and coastal waters, supplying vast quantities of foodfish to growing domestic and international markets.
There has been a growing coordination of private sector input and outputchains, including formal and informal links between smallholder producersand large processing companies, leading the industry toward greater efficiency,better quality assurance, secure margins for producers, and competitive pricesfor products. Export certification schemes have further streamlined produc-tion, processing, distribution, and retail chains. For one species after another(shrimp, catfish, tilapia), the product chains are increasingly molded by urbanconsumption behavior, as supermarket chains force the timely supply of qual-ity products in domestic and export markets. The growing appetite for newcultured species (grouper, seabass, and Nile perch) means that it is probablyonly a matter of time and technology before these species follow the route ofsalmon in terms of productivity, price, and production.
Economic and social transformation. The combined effects of marketdemand, technological innovations, and infusions of corporate capital con-tributed to changes in the scale and business models in aquaculture operations.The new trends have given rise to more intensive production practices, forcingchanges in the industrial organization of aquaculture. As individual farmslinked to more organized input and output markets, consolidation occurredalong the entire supply chain. In the Mekong delta, for example, this consoli-dation delivered economies of scale, greater efficiency, and major increases incatfish production as well as in the number of households involved in aqua-culture (Monti and Crumlish n.d.).
China
Since the liberalization of the economy in the mid-1980s, aquaculture devel-opment has played a significant role in increasing the income of millions ofpoor farmers, and has worked as an engine for rural economic growth. Inpoor and remote provinces of China, initial adoption and benefits of aqua-culture came through investment in integrated farming of fish in rice paddiesto produce staple fish, such as Chinese carp, followed by gradual intensifica-tion and changes in the combination of species cultured to supply diversify-ing markets.
WEALTH CREATION AND POVERTY ALLEVIATION 111
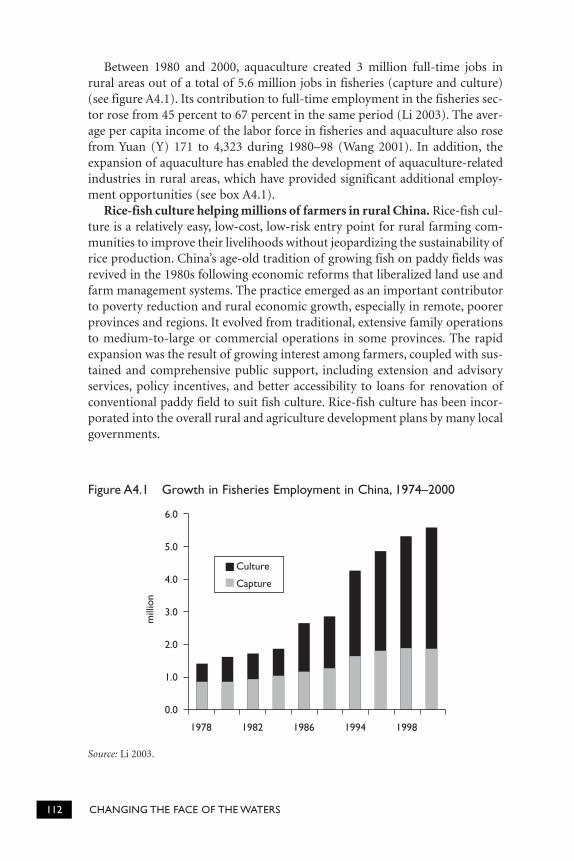
Between 1980 and 2000, aquaculture created 3 million full-time jobs inrural areas out of a total of 5.6 million jobs in fisheries (capture and culture)(see figure A4.1). Its contribution to full-time employment in the fisheries sec-tor rose from 45 percent to 67 percent in the same period (Li 2003). The aver-age per capita income of the labor force in fisheries and aquaculture also rosefrom Yuan (Y) 171 to 4,323 during 1980–98 (Wang 2001). In addition, theexpansion of aquaculture has enabled the development of aquaculture-relatedindustries in rural areas, which have provided significant additional employ-ment opportunities (see box A4.1).
Rice-fish culture helping millions of farmers in rural China. Rice-fish cul-ture is a relatively easy, low-cost, low-risk entry point for rural farming com-munities to improve their livelihoods without jeopardizing the sustainability ofrice production. China’s age-old tradition of growing fish on paddy fields wasrevived in the 1980s following economic reforms that liberalized land use andfarm management systems. The practice emerged as an important contributorto poverty reduction and rural economic growth, especially in remote, poorerprovinces and regions. It evolved from traditional, extensive family operationsto medium-to-large or commercial operations in some provinces. The rapidexpansion was the result of growing interest among farmers, coupled with sus-tained and comprehensive public support, including extension and advisoryservices, policy incentives, and better accessibility to loans for renovation ofconventional paddy field to suit fish culture. Rice-fish culture has been incor-porated into the overall rural and agriculture development plans by many localgovernments.
112 CHANGING THE FACE OF THE WATERS
6.0
5.0
4.0
3.0
2.0
1.0
0.0
mill
ion
1978 1998199419861982
Culture
Capture
Figure A4.1 Growth in Fisheries Employment in China, 1974–2000
Source: Li 2003.
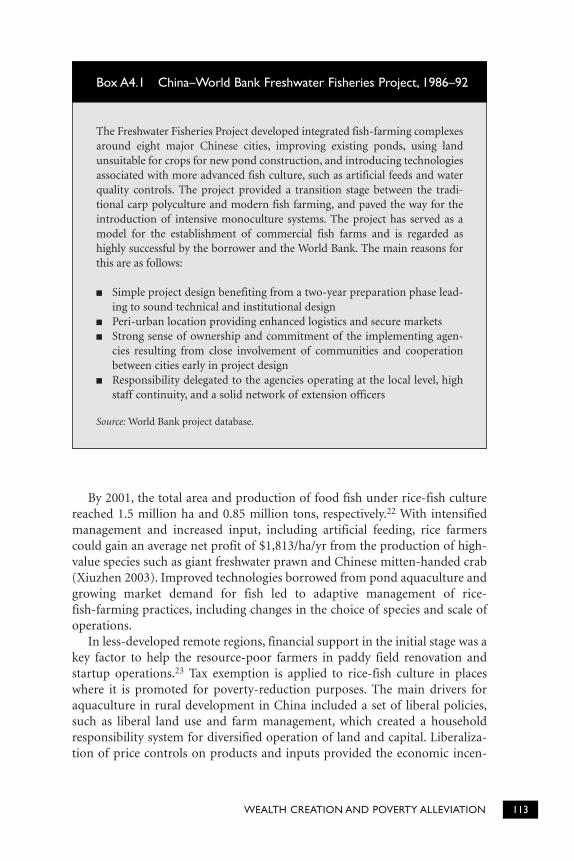
By 2001, the total area and production of food fish under rice-fish culturereached 1.5 million ha and 0.85 million tons, respectively.22 With intensifiedmanagement and increased input, including artificial feeding, rice farmerscould gain an average net profit of $1,813/ha/yr from the production of high-value species such as giant freshwater prawn and Chinese mitten-handed crab(Xiuzhen 2003). Improved technologies borrowed from pond aquaculture andgrowing market demand for fish led to adaptive management of rice-fish-farming practices, including changes in the choice of species and scale ofoperations.
In less-developed remote regions, financial support in the initial stage was akey factor to help the resource-poor farmers in paddy field renovation andstartup operations.23 Tax exemption is applied to rice-fish culture in placeswhere it is promoted for poverty-reduction purposes. The main drivers foraquaculture in rural development in China included a set of liberal policies,such as liberal land use and farm management, which created a householdresponsibility system for diversified operation of land and capital. Liberaliza-tion of price controls on products and inputs provided the economic incen-
WEALTH CREATION AND POVERTY ALLEVIATION 113
The Freshwater Fisheries Project developed integrated fish-farming complexesaround eight major Chinese cities, improving existing ponds, using landunsuitable for crops for new pond construction, and introducing technologiesassociated with more advanced fish culture, such as artificial feeds and waterquality controls. The project provided a transition stage between the tradi-tional carp polyculture and modern fish farming, and paved the way for theintroduction of intensive monoculture systems. The project has served as amodel for the establishment of commercial fish farms and is regarded ashighly successful by the borrower and the World Bank. The main reasons forthis are as follows:
■ Simple project design benefiting from a two-year preparation phase lead-ing to sound technical and institutional design
■ Peri-urban location providing enhanced logistics and secure markets■ Strong sense of ownership and commitment of the implementing agen-
cies resulting from close involvement of communities and cooperationbetween cities early in project design
■ Responsibility delegated to the agencies operating at the local level, highstaff continuity, and a solid network of extension officers
Source: World Bank project database.
Box A4.1 China–World Bank Freshwater Fisheries Project, 1986–92
tives to adopt aquaculture on rural farms (Wang 2001). Government invest-ment in aquaculture research and development (R&D) benefited farmers byprioritizing and diversifying species combinations and improving farm man-agement, leading to huge growth in pond productivity from 750 kg/ha in 1980to 4,500 kg/ha in 1998.
Despite the huge leap in productivity growth, China’s aquaculture hasshown declining profitability because of increased production costs, declininggenetic quality, and higher incidence of diseases. To improve productivity andsustainability, government policies encourage vertical integration of aqua-culture production in fish-growing areas, while supporting diversification ofspecies, disease control, development of standards, and improved quality ofaquaculture products.
India
Rice-fish farms are a low-cost alternative for poor farmers in India. India hasrice-fish farms covering 2 million hectares, the largest reported area for suchproduction in a single country (Halwart and Gupta 2004). The practice cutsacross different ecosystems, from the terraced rice fields in the hilly terrain inthe north to pokhali plots and deepwater rice fields on the coasts. In betweenare the mountain valley plots of northeastern India and the rain-fed or irri-gated lowland rice fields scattered all over the country. The species grown arejust as diverse, with more than 30 species of finfish and some 16 species ofshrimps listed. Most of the noncarp species and penaeid shrimp species arefrom natural stocks entering the rice fields with the floodwaters. Productionrates vary from 3 kg/ha/yr in deepwater rice plots relying on natural stock ofmixed species to more than 2 tons/ha/yr of tiger shrimps (Penaeus monodon)in shallow brackish-water rice fields.
Opportunities and challenges for poor people in community-based aqua-culture projects. Fish farming in leased public water bodies through commu-nity-based approaches has given a promising alternative to poor farmers inhundreds of villages in Orissa, Jarkhand, and West Bengal (STREAM 2005).Despite the constraints (see box A4.2), by applying pond polyculture technol-ogy through credit and extension support, substantial additional income isearned by members of groups organized under community-based fish farming.
Indonesia
Integrated livestock-fish farming in rice-based system is profitable, yetuptake is low. Integrated livestock-fish farming provides a viable option topoor rice farmers in Indonesia, earning them a higher net income than an aver-age government officer. Combining chicken raising with fish culture in earthenponds on rice farms allowed farmers to optimize the utilization of on-farmwastes and supplement feed and fertilizer inputs to increase farm productionand net household income (box A4.3). Although this is a relatively low-cost
114 CHANGING THE FACE OF THE WATERS
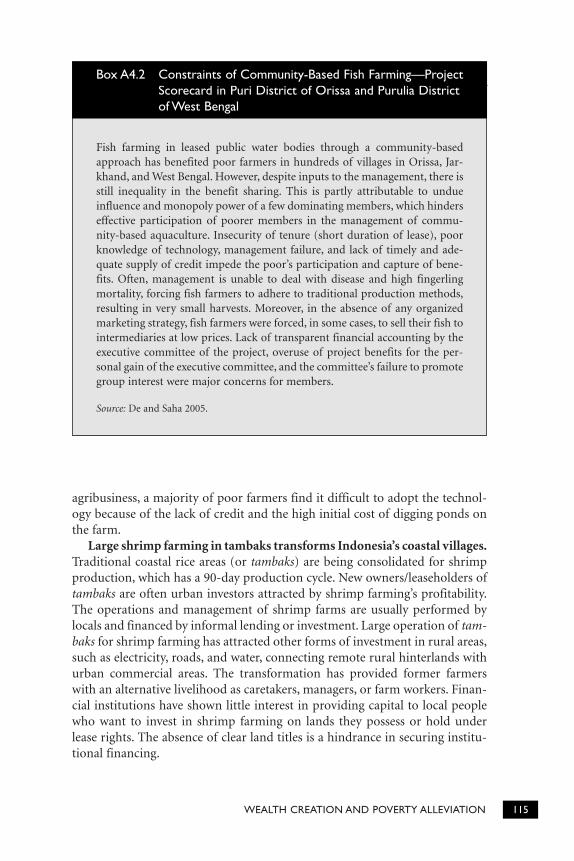
agribusiness, a majority of poor farmers find it difficult to adopt the technol-ogy because of the lack of credit and the high initial cost of digging ponds onthe farm.
Large shrimp farming in tambaks transforms Indonesia’s coastal villages.Traditional coastal rice areas (or tambaks) are being consolidated for shrimpproduction, which has a 90-day production cycle. New owners/leaseholders oftambaks are often urban investors attracted by shrimp farming’s profitability.The operations and management of shrimp farms are usually performed bylocals and financed by informal lending or investment. Large operation of tam-baks for shrimp farming has attracted other forms of investment in rural areas,such as electricity, roads, and water, connecting remote rural hinterlands withurban commercial areas. The transformation has provided former farmerswith an alternative livelihood as caretakers, managers, or farm workers. Finan-cial institutions have shown little interest in providing capital to local peoplewho want to invest in shrimp farming on lands they possess or hold underlease rights. The absence of clear land titles is a hindrance in securing institu-tional financing.
WEALTH CREATION AND POVERTY ALLEVIATION 115
Fish farming in leased public water bodies through a community-basedapproach has benefited poor farmers in hundreds of villages in Orissa, Jar-khand, and West Bengal. However, despite inputs to the management, there isstill inequality in the benefit sharing. This is partly attributable to undueinfluence and monopoly power of a few dominating members, which hinderseffective participation of poorer members in the management of commu-nity-based aquaculture. Insecurity of tenure (short duration of lease), poorknowledge of technology, management failure, and lack of timely and ade-quate supply of credit impede the poor’s participation and capture of bene-fits. Often, management is unable to deal with disease and high fingerlingmortality, forcing fish farmers to adhere to traditional production methods,resulting in very small harvests. Moreover, in the absence of any organizedmarketing strategy, fish farmers were forced, in some cases, to sell their fish tointermediaries at low prices. Lack of transparent financial accounting by theexecutive committee of the project, overuse of project benefits for the per-sonal gain of the executive committee, and the committee’s failure to promotegroup interest were major concerns for members.
Source: De and Saha 2005.
Box A4.2 Constraints of Community-Based Fish Farming—ProjectScorecard in Puri District of Orissa and Purulia Districtof West Bengal
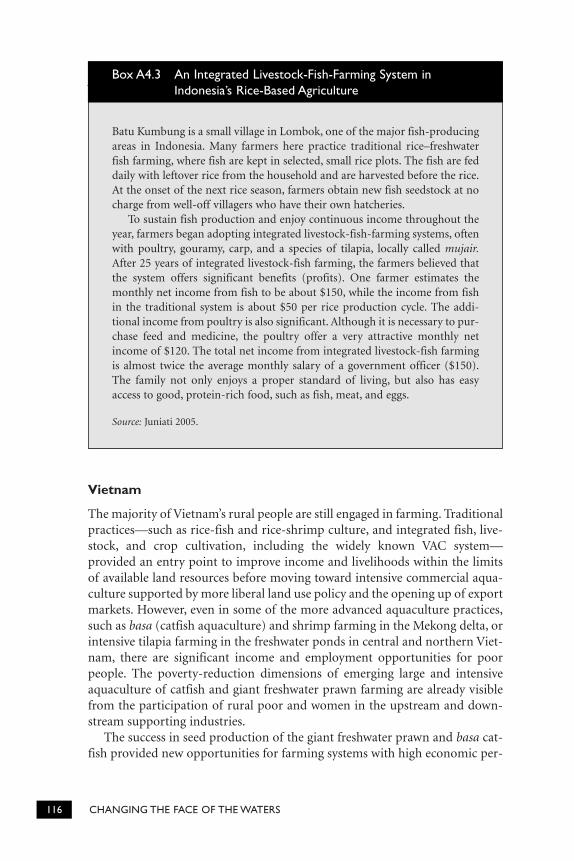
Vietnam
The majority of Vietnam’s rural people are still engaged in farming. Traditionalpractices—such as rice-fish and rice-shrimp culture, and integrated fish, live-stock, and crop cultivation, including the widely known VAC system—provided an entry point to improve income and livelihoods within the limitsof available land resources before moving toward intensive commercial aqua-culture supported by more liberal land use policy and the opening up of exportmarkets. However, even in some of the more advanced aquaculture practices,such as basa (catfish aquaculture) and shrimp farming in the Mekong delta, orintensive tilapia farming in the freshwater ponds in central and northern Viet-nam, there are significant income and employment opportunities for poorpeople. The poverty-reduction dimensions of emerging large and intensiveaquaculture of catfish and giant freshwater prawn farming are already visiblefrom the participation of rural poor and women in the upstream and down-stream supporting industries.
The success in seed production of the giant freshwater prawn and basa cat-fish provided new opportunities for farming systems with high economic per-
116 CHANGING THE FACE OF THE WATERS
Batu Kumbung is a small village in Lombok, one of the major fish-producingareas in Indonesia. Many farmers here practice traditional rice–freshwaterfish farming, where fish are kept in selected, small rice plots. The fish are feddaily with leftover rice from the household and are harvested before the rice.At the onset of the next rice season, farmers obtain new fish seedstock at nocharge from well-off villagers who have their own hatcheries.
To sustain fish production and enjoy continuous income throughout theyear, farmers began adopting integrated livestock-fish-farming systems, oftenwith poultry, gouramy, carp, and a species of tilapia, locally called mujair.After 25 years of integrated livestock-fish farming, the farmers believed thatthe system offers significant benefits (profits). One farmer estimates themonthly net income from fish to be about $150, while the income from fishin the traditional system is about $50 per rice production cycle. The addi-tional income from poultry is also significant. Although it is necessary to pur-chase feed and medicine, the poultry offer a very attractive monthly netincome of $120. The total net income from integrated livestock-fish farmingis almost twice the average monthly salary of a government officer ($150).The family not only enjoys a proper standard of living, but also has easyaccess to good, protein-rich food, such as fish, meat, and eggs.
Source: Juniati 2005.
Box A4.3 An Integrated Livestock-Fish-Farming System inIndonesia’s Rice-Based Agriculture
formance, such as culture in rice fields (either integrated or alternative) and inponds and garden canals (Wilder and Phuong 2002). Basa catfish is mostlyreared in cages in the Mekong River, and its production in ponds together withtra catfish has been growing. There are 83 fish hatcheries and 32 giant fresh-water prawn hatcheries in the Mekong delta area, and five processing andexport factories operate in An Giang, the main catfish-producing province inVietnam. These facilities provide significant rural employment opportunities.
The VAC farming system improved income and livelihoods in the earlydays of economic liberalization. The VAC, which is a totally family-managedfarming system, can be found in irrigated lowlands, rain-fed uplands, and peri-urban areas of Vietnam. The system is a mix of annual and perennial crops,including fruits and vegetables, cattle, pigs, and poultry, with several species ofChinese and Indian carps grown in ponds. Annual yields of 2–3 tons/ha arecommonly achieved while semi-intensive systems, especially with tilapia, mayreach 4.5–5 tons/ha (Luu 1992). Since 1989, the Vietnamese government hasdistributed land for farmers and encouraged the development of the familyeconomy not only by growing rice but also through diversified agriculture. Inmany Red River delta communities, VAC farming constitutes 50–70 percent offarmers’ annual income, which can be three to five times higher than that fromgrowing two rice crops per year (VACVINA 1995). The system is labor inten-sive and affords productive employment for people of all ages. The system alsohelps protect the production environment and improve family health andnutrition. Today, in Vietnam, the VAC system is considered to be an effectivesolution for poverty alleviation, dietary improvement, and prevention of mal-nutrition (Le Thi Hop 2003).
Aquaculture in the Mekong delta revolutionizing rural farms—employ-ment and wage benefits. The Mekong delta is now home to Vietnam’s inten-sive aquaculture, accounting for 85 percent of national aquaculture produc-tion. Intensive catfish (Pangasius spp.) culture in the Mekong delta started incage culture in the 1960s and has occurred in ponds since 1999. These speciesare mostly destined for export to international markets. Cage and pond cultureof catfish provides employment for over 11,000 households who operate theirown aquafarms. Considering that each household hired two laborers to workin fish feeding, about 30,000 poor landless people were estimated to be work-ing in catfish farming. On average, each hired laborer working on fish cagesand ponds earns approximately $36–40 per month, or less than $2 per day. In2003, there were also 5,300 workers with a salary income of less than $2 per dayin five catfish export-processing factories based in An Giang province. About3,000 people work in fish processing in Dong Thap, Vinh Long, and other partsof the Mekong delta. Poor women make up a high proportion of workers(more than 70 percent) in the processing factories. Several thousand people arealso employed in related services sectors (for example, finance and creditorganizations, fish feed and seed producers, and traders, veterinary services,storage, and transportation). The antidumping case (box 10) and the resulting
WEALTH CREATION AND POVERTY ALLEVIATION 117
measures brought by the United States led to the loss of employment amongsmall-scale catfish-farming households, laborers, and people working in sup-porting industries (Bostock, Greenhalgh, and Kleih 2004).
Bangladesh
The potential of aquaculture for poverty reduction has attracted the attention ofpolicy makers in Bangladesh (Bangladesh Planning Commission 2005). A strik-ingly high proportion of rural households (73 percent) are already engaged insome form of freshwater aquaculture (Mazid 1999). Considering the role aqua-culture has played in providing employment and improving the livelihood of therural poor (see table A4.1), a much greater contribution from aquaculture can beobtained if future government policies encourage improvement of productivity,expansion of aquaculture, and implementation of a workable strategy to encour-age further gainful participation of the poor. At current market prices, aqua-culture provides a more lucrative use of land than alternative activities; for exam-ple, a hectare of land devoted to aquaculture (carp) would generate at least 43percent higher income for all factors engaged directly or indirectly in fish pro-duction than would a hectare of land under crop cultivation (Talukder 2004).
Two aquaculture models contributed to the success of aquaculture in tar-geting the poor in Bangladesh: (1) the provision of access to technology andtraining to directly transfer the benefits of technology to smallholders; and (2)the promotion of group- and community-based aquaculture. A wide range oftechnologies and farming models have proved relevant to the poor, includingpond fish culture, rice-cum-fish culture, enhanced inland fisheries, floodplainaquaculture, and brackish- and freshwater shrimp culture. The economic ben-efits have accrued through direct fish production, employment on farms andin processing, service industries, enhanced food supplies, and on-farm fishconsumption.
Pond fish culture is increasing local demand for labor. Over the past years,many underused water bodies and low-lying areas have been turned into pri-vate fishponds or community-based aquaculture. Even the upland rice fieldsare being converted into fishponds. All these changes suggest that fish cultureis a relatively profitable activity. Based on a survey of 366 fish farmers, the aver-age benefit-cost ratio in four major fish-growing districts (Mymensingh,Comilla, Bogra, and Jessore) showed that per hectare gross return from pondfish culture was taka (Tk) 115,788, representing a 1.89 return per taka of invest-ment (Karim, Ahmed, Talukder, Taslim, and Rahman 2006). The major costitems in pond fish culture are human labor, fish seed, feed, and land usecharges. Total labor requirement for culture of a 1-ha pond was 247 person-days for a one-year cycle of culture. Labor cost constituted about 30 percent ofthe total cost, of which 57 percent was hired labor.
Rice-cum-fish culture and floodplain aquaculture is raising productionand farm income. Although cultivation of fish in irrigated rice fields has been
118 CHANGING THE FACE OF THE WATERS
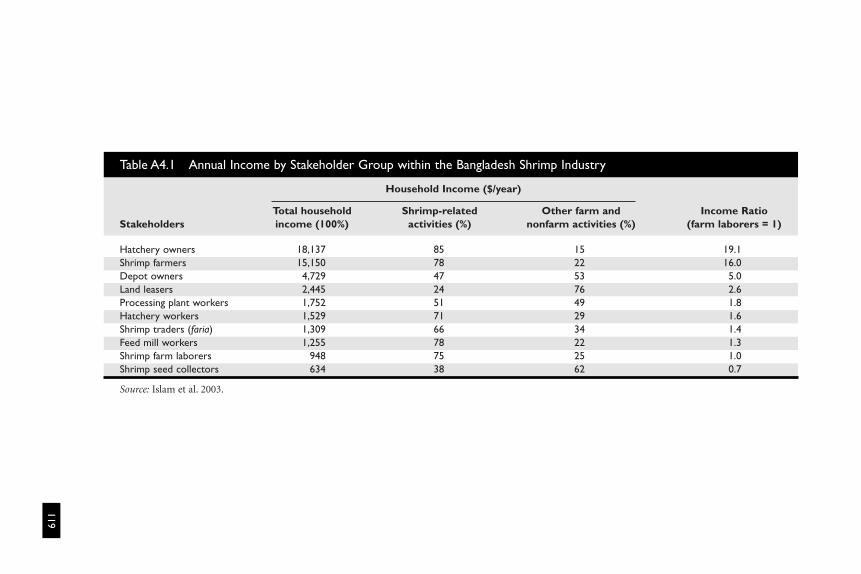
119
Table A4.1 Annual Income by Stakeholder Group within the Bangladesh Shrimp Industry
Household Income ($/year)
Total household Shrimp-related Other farm and Income RatioStakeholders income (100%) activities (%) nonfarm activities (%) (farm laborers = 1)
Hatchery owners 18,137 85 15 19.1Shrimp farmers 15,150 78 22 16.0Depot owners 4,729 47 53 5.0Land leasers 2,445 24 76 2.6Processing plant workers 1,752 51 49 1.8Hatchery workers 1,529 71 29 1.6Shrimp traders (faria) 1,309 66 34 1.4Feed mill workers 1,255 78 22 1.3Shrimp farm laborers 948 75 25 1.0Shrimp seed collectors 634 38 62 0.7
Source: Islam et al. 2003.
widely practiced by rural farmers in Bangladesh for several decades, one of theearliest efforts in rice-fish farming was made by the Noakhali Rural Develop-ment Program in 1989. Through low-cost rural experiments, the programincreased the production of cultured fish from 223 kg/ha to 700 kg/ha in 50fields planted with local rice varieties. Results from comparative researchbetween double-cropped rice culture and year-round fish culture showed thatthe net return for fish culture was more than four times the net return fromdouble-cropped rice culture (Anik 2003; Rahim 2004; Talukder 2004; Akteruz-zaman 2005; Karim et al. 2006). Today, rice and carp polyculture as well as carpwith galda (freshwater prawn, Macrobrachium sp.) culture in rice fields aregaining popularity among farmers in the country (Mandal et al. 2004), con-tributing to on- and off-farm employment, income generation, and exportearnings.
Direct benefits to poor and smallholders through access to technologyand training. Since the early 1980s, a number of projects and programs thatprovided targeted extension and training services with or without creditfacilities have had a major influence in accelerating technology adoption bysmallholder and marginal farmers, and by increasing on-farm production,income and consumption rose several fold. Examples of projects include theDepartment of Fisheries (DOF)-DANIDA Greater Mymensingh AquacultureExtension Project; DOF-DFID Northwest Fisheries Extension Project; Gov-ernment of Bangladesh-ICLARM-IFAD Fish Culture Extension EvaluationProject; and WFC-USAID-DSAP Project (box A4.4) (Griffiths n.d.; Lewis,Wood, and Gregory 1996; Edwards 2000; Mandal et al. 2004; Thompson,Sultana, and Khan 2005). The World Bank and Asian Development Bank, thetwo largest multilateral donors in the country, have implemented fisheriesand aquaculture projects to increase the participation of poor peoplethrough community-based and nongovernmental organization (NGO)mechanisms.
The direct beneficiaries of conventional aquaculture technologies and tar-geted extension services in Bangladesh have largely been small (0.5–1 ha) andmedium (1–2 ha) landholders rather than the landless, or “functionally land-less” (less than 0.2 ha) households (Edwards 2005). A significant proportion ofsmall (34 percent) and medium (25 percent) landholding households werebelow the poverty line in 1995/96, the time period of most of these projects.These two landless groups did not have access to land and water resources orto the capital for adopting polyculture-based semi-intensive aquaculture,unless they were directly targeted by the projects for credit support and exten-sion services. Leasing of village ponds through NGO credit support providedthe poor with an initial entry into fish farming. Over time, competition fromrich entrepreneurs pushed up the lease value and reduced their profitability.As a result, the poor lost their competitive advantage and often abandoned thepractice.
120 CHANGING THE FACE OF THE WATERS
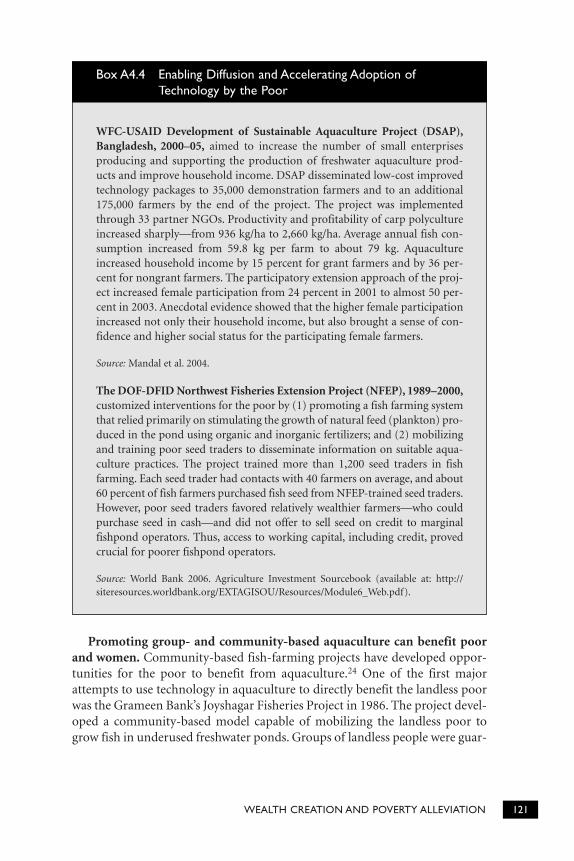
Promoting group- and community-based aquaculture can benefit poorand women. Community-based fish-farming projects have developed oppor-tunities for the poor to benefit from aquaculture.24 One of the first majorattempts to use technology in aquaculture to directly benefit the landless poorwas the Grameen Bank’s Joyshagar Fisheries Project in 1986. The project devel-oped a community-based model capable of mobilizing the landless poor togrow fish in underused freshwater ponds. Groups of landless people were guar-
WEALTH CREATION AND POVERTY ALLEVIATION 121
WFC-USAID Development of Sustainable Aquaculture Project (DSAP),Bangladesh, 2000–05, aimed to increase the number of small enterprisesproducing and supporting the production of freshwater aquaculture prod-ucts and improve household income. DSAP disseminated low-cost improvedtechnology packages to 35,000 demonstration farmers and to an additional175,000 farmers by the end of the project. The project was implementedthrough 33 partner NGOs. Productivity and profitability of carp polycultureincreased sharply—from 936 kg/ha to 2,660 kg/ha. Average annual fish con-sumption increased from 59.8 kg per farm to about 79 kg. Aquacultureincreased household income by 15 percent for grant farmers and by 36 per-cent for nongrant farmers. The participatory extension approach of the proj-ect increased female participation from 24 percent in 2001 to almost 50 per-cent in 2003. Anecdotal evidence showed that the higher female participationincreased not only their household income, but also brought a sense of con-fidence and higher social status for the participating female farmers.
Source: Mandal et al. 2004.
The DOF-DFID Northwest Fisheries Extension Project (NFEP), 1989–2000,customized interventions for the poor by (1) promoting a fish farming systemthat relied primarily on stimulating the growth of natural feed (plankton) pro-duced in the pond using organic and inorganic fertilizers; and (2) mobilizingand training poor seed traders to disseminate information on suitable aqua-culture practices. The project trained more than 1,200 seed traders in fishfarming. Each seed trader had contacts with 40 farmers on average, and about60 percent of fish farmers purchased fish seed from NFEP-trained seed traders.However, poor seed traders favored relatively wealthier farmers—who couldpurchase seed in cash—and did not offer to sell seed on credit to marginalfishpond operators. Thus, access to working capital, including credit, provedcrucial for poorer fishpond operators.
Source: World Bank 2006. Agriculture Investment Sourcebook (available at: http://siteresources.worldbank.org/EXTAGISOU/Resources/Module6_Web.pdf).
Box A4.4 Enabling Diffusion and Accelerating Adoption ofTechnology by the Poor
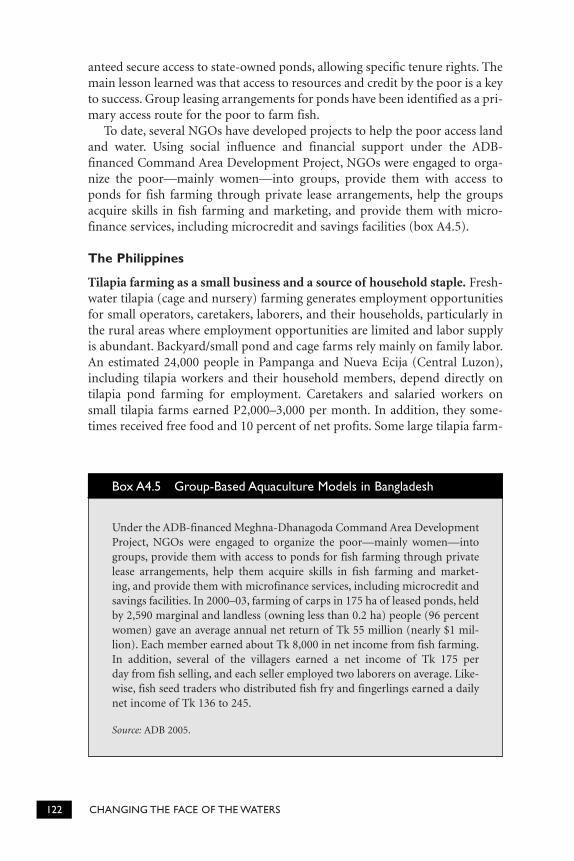
anteed secure access to state-owned ponds, allowing specific tenure rights. Themain lesson learned was that access to resources and credit by the poor is a keyto success. Group leasing arrangements for ponds have been identified as a pri-mary access route for the poor to farm fish.
To date, several NGOs have developed projects to help the poor access landand water. Using social influence and financial support under the ADB-financed Command Area Development Project, NGOs were engaged to orga-nize the poor—mainly women—into groups, provide them with access toponds for fish farming through private lease arrangements, help the groupsacquire skills in fish farming and marketing, and provide them with micro-finance services, including microcredit and savings facilities (box A4.5).
The Philippines
Tilapia farming as a small business and a source of household staple. Fresh-water tilapia (cage and nursery) farming generates employment opportunitiesfor small operators, caretakers, laborers, and their households, particularly inthe rural areas where employment opportunities are limited and labor supplyis abundant. Backyard/small pond and cage farms rely mainly on family labor.An estimated 24,000 people in Pampanga and Nueva Ecija (Central Luzon),including tilapia workers and their household members, depend directly ontilapia pond farming for employment. Caretakers and salaried workers onsmall tilapia farms earned P2,000–3,000 per month. In addition, they some-times received free food and 10 percent of net profits. Some large tilapia farm-
122 CHANGING THE FACE OF THE WATERS
Under the ADB-financed Meghna-Dhanagoda Command Area DevelopmentProject, NGOs were engaged to organize the poor—mainly women—intogroups, provide them with access to ponds for fish farming through privatelease arrangements, help them acquire skills in fish farming and market-ing, and provide them with microfinance services, including microcredit andsavings facilities. In 2000–03, farming of carps in 175 ha of leased ponds, heldby 2,590 marginal and landless (owning less than 0.2 ha) people (96 percentwomen) gave an average annual net return of Tk 55 million (nearly $1 mil-lion). Each member earned about Tk 8,000 in net income from fish farming.In addition, several of the villagers earned a net income of Tk 175 perday from fish selling, and each seller employed two laborers on average. Like-wise, fish seed traders who distributed fish fry and fingerlings earned a dailynet income of Tk 136 to 245.
Source: ADB 2005.
Box A4.5 Group-Based Aquaculture Models in Bangladesh
ers hired caretakers at P3,000 per month and gave them 15–20 percent of netprofits. Thus, tilapia pond farming provided employment and income benefitsto poorer workers who were not in a position to establish their own ponds.
Fish consumption increased significantly in farming households in Taal,Batangas. On average, tilapia was consumed four to five times a week by cage-farming households and at least four times a week by tilapia nursery house-holds. The supply of tilapia from cage farming in Lake Taal has helped keeptilapia prices stable, making tilapia more affordable to lower-income con-sumers (ADB 2005).
NATIONAL POLICY INTERVENTIONS AND PRO-POOR AQUACULTURE
China
In China, the main focus of aquaculture policies is as follows:
■ Guarantee the supply of fish products and hence, food security.■ Absorb and use surplus rural labor, encourage women and young people to
be engaged in production activities, increase farmers’ income, and assist inpoverty alleviation.
■ Improve environmental and social awareness of aquaculture.■ Increase export earnings.
To foster rapid development of sustainable aquaculture, the State Council in1997 issued the “Directive Notice on the Approval and Implementation of theInstruction of the Ministry of Agriculture to Further Expedite the Develop-ment of the Fishery Sector” (Hishamunda and Subasinghe 2003). This noticereformed and liberalized aquaculture and set the following additional guide-lines to further develop the sector:
■ Productivity improvement or higher output per unit of input will be themajor effort to further develop the aquaculture sector. This can be achievedby improving the technology employed, promoting the use of high-valuespecies and adjusting species mix or choice of the species cultured on thebasis of market conditions.
■ Strong efforts will be exerted to step up the greater and wider cultivation ofthe under- or unused “three uncultivated lands” (that is, water surface,mudflat, and flooded land suitable or fit for aquaculture) to make full useof the “cultivable” aquatic lands.
■ Aquaculture licenses for newly cultivated aquaculture lands can be given tolocal collectives or villages. These licenses can be distributed to producerson a “production-by-production” contract basis, rental basis or temporarylease transfer basis, and even by auction.
WEALTH CREATION AND POVERTY ALLEVIATION 123
■ The Chinese aquaculture industry should be further liberalized and marketregulations should be enacted and enhanced to promote large industrydevelopment.
■ Aquaculture and the other agricultural industries should be equally developedin all possible regions of the country. Ecologically sound or ecosystem-basedagriculture systems like integrated fish–livestock–silkworm–mulberry bushfarming systems or fish culture in paddy fields should be actively promoted.
■ In regions where the incidence of poverty is high or where poverty isendemic, especially in the midwest region of China, that are rich in or wellendowed with aquaculture resources, aquaculture should be adopted notonly as the source and means of livelihood and food security, but also as themain engine to drive the economy of the region in the fight against povertyand malnutrition.
■ Enterprises, either public or private sector businesses engaged in aqua-culture in the newly cultivated lands from the “three uncultivated lands,” orin education or research in aquaculture, such as in the production or devel-opment of aquatic seed and new species, should be exempted from the agri-cultural special product taxes as an incentive.
■ Available fiscal support and other assistance from all levels of governmentfor developing aquaculture should be kept and/or even increased, if neces-sary to promote aquaculture investments.
■ Because aquaculture production bases in suburban areas are the main sup-pliers of aquatic products for the cities, the acquisition and requisition ofland for aquaculture should be prioritized and conversely denied or disal-lowed, if aquaculture land is being taken out of aquaculture for other non-aquaculture use, unless such requisition is in the national interests or for thecommon good of all citizens in the area.
■ More investments should be made in the production of quality seed andfish health management to promote sustainable aquaculture developmentand management.
■ Aquaculture health management problems (in particular, the treatment offish diseases) should be solved by the guiding principle of “prevention first,prevention and treatment combined” through the establishment of a networkfor fish disease protection at different levels throughout the whole country.
Valuable lessons can be learned from the Chinese experience, including thefollowing:
■ Aquaculture can be developed in a sustainable manner to generate employ-ment, improve income and livelihoods of rural and urban populations, andproduce food.
■ The engine for an economically resilient and sustainable aquaculture is thegovernment’s will and determination to establish sound policies and recog-nize the market will determine demand for the products.
124 CHANGING THE FACE OF THE WATERS
■ Several factors will strengthen aquaculture and ensure its sustainability andcontribution to overall economic growth. These include rational use of avail-able factors of production, improvements in legal and regulatory framework,and scientific breakthroughs in production technologies (Hishamunda andSubasinghe 2003).
Vietnam
Vietnam’s Sustainable Aquaculture for Poverty Alleviation (SAPA 2000) strat-egy recognized the need for raising awareness on aquaculture opportunities,improving participatory approaches, and encouraging institutional capacity. Italso recognized the gap between the needs of farmers and the services offeredby extension institutions and issues of access to markets and financial servicesby the rural poor. The SAPA strategy aims to achieve the following:
■ Enhance the capacities of poor people in rural areas to improve livelihoodsthrough awareness raising and improved aquatic resources managementand aquaculture.
■ Strengthen the capabilities of institutions, and particularly local institutions,to understand and support the objectives of poor people in inland andcoastal communities who depend on, or could benefit from, aquaculture.
■ Share environmentally sound, low-risk, low-cost aquaculture technologiesand aquatic resources management practices.
■ Develop national policy based on lessons and experience from local pilotsand intersectoral collaboration on strategies for addressing poverty.
Bangladesh
Bangladesh’s plans25 and strategic fisheries goals explicitly refer to aquaculture’srole in poverty alleviation:
■ Increasing productivity in inland aquaculture and in inland capture fisheries
■ Raising income of poor fishers
■ Promoting rice-cum-fish culture
■ Strengthening fisheries research and extension
Planners in Bangladesh recommend the development of NGO extensionservices to relieve pressure on government budgets and continued collabora-tion with the private sector in pro-poor endeavors, and specify the following:
■ Public-private partnership should be formed through government design ofconcessions that call for bidders to provide services in situations in whichthe government will not otherwise provide for the poor.
WEALTH CREATION AND POVERTY ALLEVIATION 125
■ Private utilities should be effectively regulated to ensure that the poor getbetter access to services at fairer prices.
■ Responsible corporate citizenship must be encouraged.■ Privatization and divestiture should be linked to poverty reduction.
THE REGIONAL FRAMEWORK FOR SCIENCE ANDTECHNOLOGY TRANSFER IN ASIA
Technology transfer and capacity building in Asia must be seen in the contextof the drivers of investment and development of science-based aquaculture.
Market-driven development. Market forces were the primary driver ofexpansion and modernization of aquaculture in the region. The traditionalpreference for fish, a high population density, and a long-standing tradition ofaquaculture moderated the perception of risk and encouraged investment.This, in turn, drove development and its attendant acquisition and evolutionof technology. Competition and the drive for greater efficiency have resulted indevelopment and adoption of more efficient production and managementtechnologies and have stimulated consolidation and integration in the pro-duction chain. The combined pressures of the NGO conservation lobbies andinternational trade have driven the sector to be more competitive and envi-ronmentally friendly and to resolve environment-related trade constraints.This has hastened the transfer and diffusion of technologies and capacitybuilding in policy, regulatory mechanisms, extension, training, and farm man-agement, as well as in processing and marketing.
Investment in aquaculture development. The private sector in Asia drove theearly development of commercial aquaculture and continues to do so. It hasplayed a major role in acquiring technologies and transferring species and theirculture technology in the region, initiating culture trials of new species, and driv-ing technology development for commercial aquaculture. Private investment inhigh-value, high-risk aquaculture, for example, for grouper, crab, or abalone,proceeded even in the absence of public support (Aquaculture Asia 1997).
Nonetheless, national and international development banks and donoragencies played an important role in financing aquaculture. Technology trans-fer and capacity building were usually embedded in loan projects. Total officialdevelopment assistance to aquaculture research and development in 1988–95was about $995 million (in 1997 value terms), or the average annual input wasabout $124 million per year. During the period, the Asian region received 65percent of commitments (Shehadeh and Orzeszk 1997). National investmentsmore than matched this amount over the same period (Pillay 2001). Develop-ment banks were consistently the main source of such external funding,accounting for 69 percent of the total and in 1995, because of a drop in bi-lateral and multilateral assistance, they provided 92 percent of funding. Theinvestment during 1987–97 required to achieve the global increase in annual
126 CHANGING THE FACE OF THE WATERS
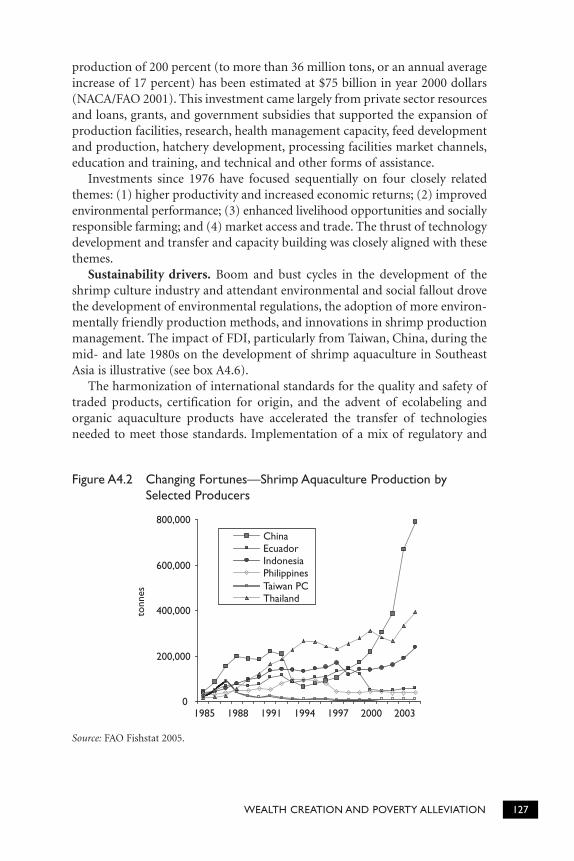
production of 200 percent (to more than 36 million tons, or an annual averageincrease of 17 percent) has been estimated at $75 billion in year 2000 dollars(NACA/FAO 2001). This investment came largely from private sector resourcesand loans, grants, and government subsidies that supported the expansion ofproduction facilities, research, health management capacity, feed developmentand production, hatchery development, processing facilities market channels,education and training, and technical and other forms of assistance.
Investments since 1976 have focused sequentially on four closely relatedthemes: (1) higher productivity and increased economic returns; (2) improvedenvironmental performance; (3) enhanced livelihood opportunities and sociallyresponsible farming; and (4) market access and trade. The thrust of technologydevelopment and transfer and capacity building was closely aligned with thesethemes.
Sustainability drivers. Boom and bust cycles in the development of theshrimp culture industry and attendant environmental and social fallout drovethe development of environmental regulations, the adoption of more environ-mentally friendly production methods, and innovations in shrimp productionmanagement. The impact of FDI, particularly from Taiwan, China, during themid- and late 1980s on the development of shrimp aquaculture in SoutheastAsia is illustrative (see box A4.6).
The harmonization of international standards for the quality and safety oftraded products, certification for origin, and the advent of ecolabeling andorganic aquaculture products have accelerated the transfer of technologiesneeded to meet those standards. Implementation of a mix of regulatory and
WEALTH CREATION AND POVERTY ALLEVIATION 127
0
200,000
400,000
600,000
800,000
1985 1988 1991 1994 1997 2000 2003
tonn
es
ChinaEcuadorIndonesiaPhilippinesTaiwan PCThailand
Figure A4.2 Changing Fortunes—Shrimp Aquaculture Production bySelected Producers
Source: FAO Fishstat 2005.
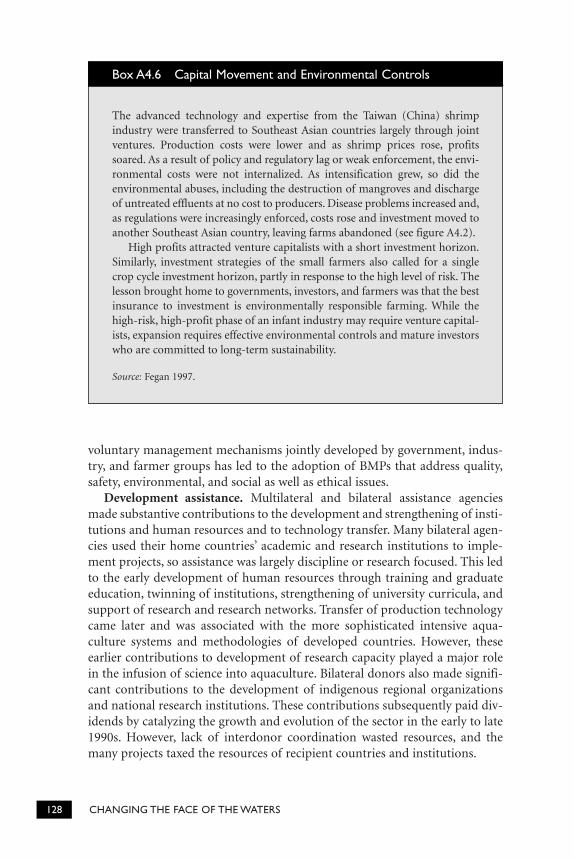
voluntary management mechanisms jointly developed by government, indus-try, and farmer groups has led to the adoption of BMPs that address quality,safety, environmental, and social as well as ethical issues.
Development assistance. Multilateral and bilateral assistance agenciesmade substantive contributions to the development and strengthening of insti-tutions and human resources and to technology transfer. Many bilateral agen-cies used their home countries’ academic and research institutions to imple-ment projects, so assistance was largely discipline or research focused. This ledto the early development of human resources through training and graduateeducation, twinning of institutions, strengthening of university curricula, andsupport of research and research networks. Transfer of production technologycame later and was associated with the more sophisticated intensive aqua-culture systems and methodologies of developed countries. However, theseearlier contributions to development of research capacity played a major rolein the infusion of science into aquaculture. Bilateral donors also made signifi-cant contributions to the development of indigenous regional organizationsand national research institutions. These contributions subsequently paid div-idends by catalyzing the growth and evolution of the sector in the early to late1990s. However, lack of interdonor coordination wasted resources, and themany projects taxed the resources of recipient countries and institutions.
128 CHANGING THE FACE OF THE WATERS
The advanced technology and expertise from the Taiwan (China) shrimpindustry were transferred to Southeast Asian countries largely through jointventures. Production costs were lower and as shrimp prices rose, profitssoared. As a result of policy and regulatory lag or weak enforcement, the envi-ronmental costs were not internalized. As intensification grew, so did theenvironmental abuses, including the destruction of mangroves and dischargeof untreated effluents at no cost to producers. Disease problems increased and,as regulations were increasingly enforced, costs rose and investment moved toanother Southeast Asian country, leaving farms abandoned (see figure A4.2).
High profits attracted venture capitalists with a short investment horizon.Similarly, investment strategies of the small farmers also called for a singlecrop cycle investment horizon, partly in response to the high level of risk. Thelesson brought home to governments, investors, and farmers was that the bestinsurance to investment is environmentally responsible farming. While thehigh-risk, high-profit phase of an infant industry may require venture capital-ists, expansion requires effective environmental controls and mature investorswho are committed to long-term sustainability.
Source: Fegan 1997.
Box A4.6 Capital Movement and Environmental Controls
The Kyoto Declaration—a turning point. The Kyoto Declaration onAquaculture of 1976 marked a turning point in raising the profile of aqua-culture and its recognition as a distinct sector with high potential and inattracting the support of donors and national governments (FAO 1976).The Kyoto Strategy set a target of a fivefold increase in aquaculture produc-tion in three decades (Bangkok Declaration and Strategy for AquacultureDevelopment Beyond 2000–2001), based on the following: (1) technicalcooperation in the dissemination and use of known improved technologyamong developing countries; and (2) the development of new technologies.The Aquaculture Development and Coordination Programme ofFAO/UNDP (ADCP), established to assist in this task, adopted a networkapproach using regional centers linked to national lead centers to addressthe issues posed by a diversity of aquaculture systems and species, andsimultaneously promoted regional cooperation and strengthened nationalinstitutions. NACA, the Network of Aquaculture Centers in Asia-Pacific,became the hub of the Asian network. Ten years after its establishmentunder the ADCP, it evolved into a regional intergovernmental body withtotal regional ownership.
The ADCP approach was more broadly based and industry oriented thanthe bilateral projects at the time, with an aim to increase productivity. Itincorporated development of a regional research network, capacity buildingin aquaculture policy and development, training of trainers on advancedtechnology, development of university curricula and regional research agen-das, establishment of government stations for technology transfer, andfunding of pilot demonstration projects. In the two decades that followed,the demonstrable increase in national outputs drove policy makers to allo-cate additional R&D funds to the sector. The investment in R&D generatedproduction and productivity gains and further funding for R&D. The nine-fold increase in global aquaculture production achieved by 2003 (89 percentof which derived from Asia) exceeded the strategy’s targeted fivefoldincrease. FAO’s program of Technical Cooperation among DevelopingCountries later provided a cost-effective mechanism for technology transferfrom more advanced developing countries to others in the same region andelsewhere.
A diverse suite of initiatives and institutional arrangements at national,regional, and international levels evolved in Asia to provide a fertile institu-tional terrain for aquaculture technology transfer and capacity building. Numer-ous regional organizations have contributed to Asian aquaculture development,including the following: APEC, Association of Southeast Asian Nations(ASEAN), Intergovernmental Organization for Marketing Information andTechnical Advisory Services for Fishery Products in the Asia-Pacific Region(INFOFISH), Mekong River Commission (MRC), NACA, South Asian Associa-tion for Regional Cooperation (SAARC), Southeast Asia Fisheries Develop-ment Center (SEAFDEC), and the South Pacific Forum. The regional financial
WEALTH CREATION AND POVERTY ALLEVIATION 129
institutions, education and training institutions (such as the Asian Institute of Technology), farmers’ federations, and agribusiness alliances have all con-tributed in various forms. SEAFDEC and NACA provide technical advice toinform the development agenda of ASEAN. The following sections describeseveral of these institutions and their experiences, with a particular focus onNACA.
INTERNATIONAL CENTERS AND PROGRAMS
CGIAR and WFC. CGIAR and WFC have provided extremely important tech-nology transfer links between formal agricultural research and diffusion effortsamong countries and between countries and the National AgriculturalResearch Systems. Probably the two most valuable contributions of the CGIARcenters to technology transfer and capacity building are (1) supporting thetransfer of genetic material and (2) transforming research results into usabletechnologies. A key contribution to aquaculture development in Asia was thedevelopment of the GIFT program by WFC (ADB 2005).
International Network on Genetics in Aquaculture. INGA (www.worldfishcenter.org/inga), which is hosted by the WFC, strengthened national researchcapacities for the application of genetics in aquaculture, fostered regional andinternational cooperation, and assisted the development of national fish-breeding programs with an emphasis on tilapias and carps. INGA has providedinternational partnerships and links for the dissemination, informationexchange, and further development of GIFT, and has assisted its members andother countries in sharing GIFT and other farmed fish germplasm for research,use in national breeding programs, and dissemination to farmers. It facilitatedthe formation of national networks for genetics in aquaculture. Limited finan-cial and human resources are now constraining INGA’s operations. WFC cur-rently supports INGA from its core funds.
International Foundation for Science. IFS (www.ifs.se) has helped build amass of highly trained aquaculture scientists in the region by supporting youngresearchers to pursue and use their research effectively, bringing togetheryoung scientists in small and focused workshops, and enabling young scientiststo take part in international science symposia. The program has helped to pre-vent brain-drain for as little as $10,000 to $12,000 per grantee to supportyoung researchers who have returned to their home countries after completingpostgraduate studies.
ASEAN-EC Aquaculture Development Coordinating Program. TheAADCP operated from 1988 to 1994 and made a significant impact oncapacity building (of scientific manpower) and technology transfer by “twin-ning” EC and ASEAN institutions. Although continuation of the twinningactivities has been constrained by the cessation of external funding, alumniof the program continue to serve as focal points for subsequent EC-supported projects.
130 CHANGING THE FACE OF THE WATERS
NACA AND ASSOCIATED INITIATIVES
NACA began operating as a project in August 1980 and became an indepen-dent organization in January 1990. Its rationale, based on the Kyoto Strategy,was that sharing resources and responsibilities among institutions (and coun-tries) is a practical and cost-effective means for addressing the diverse prob-lems arising from a diversity of species, farming systems, and environments,and varying levels of development that the countries of the vast Asia-Pacificregion face in modernizing, expanding, and sustaining aquaculture. The net-working (and sharing) approach was also in line with the policy of govern-ments to promote regional self-reliance through technical cooperation.
As an indication of cost-efficiency, the total cash input over 11 years fromdonor and government funding to NACA was $9 million, including the four-year UNDP/FAO Seafarming Development Project managed by NACA, whichterminated in 1991 (Kongkeo 2001). While not directly attributable to NACA,aquaculture growth in the target countries between 1988 and 1997 was 11 per-cent by quantity—from 13.4 to 34 million tons and 9 percent by value—from$19.3 billion to $42 billion.
When NACA became an independent intergovernmental body, it adopted amajor change in operational strategy. It had to (1) become self-sustaining tofinance core activities (such as technical advice, information exchange, andnetwork coordination and administration); (2) generate revenues by providingservices against payments and developing programs and projects for collabo-rative assistance; and (3) forge partnerships with other institutions. Thesemeasures made it possible for NACA to continue as a focal point for imple-menting multilaterally and bilaterally funded regional and national projects.As an independent organization, the total government core (obligatory) con-tribution to NACA from 1991 to 2005 was $4.42 million, which leveraged anadditional $10.53 million from external and other noncore sources of funding.
The in-kind contribution of members has not been quantified, but can beillustrated: China, starting in 1992, took over and funded under its TCDC pro-gram the annual three-month training course on integrated fish farming (IFF)in the NACA Regional Lead Centre in Wuxi. The course intake is usually 40people from Asia-Pacific, Latin America, Africa, the Middle East, and EasternEurope, and over 25 years, nearly 1,000 personnel have been trained. Centersin Thailand, Indonesia, and India offer or host regular and periodic courses forpersonnel from government, industry, farmer associations, and NGOs. Theircourses are partially supported by the governments. Regional projects requirenational coordinators and on a no-fee basis, the governments and universitiesprovide the institutional focal point for these regional projects.
When requested, NACA also manages national projects, for example, inVietnam (donor funded) and in India (government funded for shrimp healthmanagement for small farmers). The results of these national projects areshared among countries through NACA’s networking and TCDC activities.
WEALTH CREATION AND POVERTY ALLEVIATION 131
The experiences in India have informed work in Vietnam and Iran on shrimphealth management. In turn, these have benefited from the results of Aus-tralian Centre for International Agricultural Research (ACIAR)-assisted proj-ects (in which NACA is also involved) on shrimp diseases in Thailand andIndonesia. ACIAR (www.aciar.gov.au/) has embedded a research and capacity-building component in the project in India. External expert assistance is keptto a minimum—a cadre of young local professionals and technicians is trainedto provide the technical assistance to the farmers. Capacity-building activitiesinclude the farmers’ associations and the institutions providing farm services.
The capacity-building and technology development/transfer achievementsthrough NACA’s coordinating role and collaborative work program can besummarized as follows:
■ NACA has catalyzed broad-based support from various donors, pooled thescarce resources of national governments into a considerable regional resource,and coordinated the application in well-targeted collaborative and partici-patory regional and subregional projects.
■ In terms of results, the broad-based collaboration on specific programs hasinvolved numerous institutions and multiplied benefits to the institutions,governments, and industry. Cooperation in areas of mutual interests hasmustered resources, expertise, and institutional support for regional proj-ects, promoting synergy, avoiding duplication of activities, and expandingthe range of beneficiaries. NACA has generated support for major regionaland national activities from bilateral, multilateral, and investment agencies.Since 1990, there have been more than 65 such collaborative projects, work-shops, training, assessments, and information activities of regional, sub-regional, and national as well as interregional scope.
■ From the capacity-building perspective, training of national personnel andupgrading of facilities has created a multiplier effect for various assistanceprograms. The improved regional and national capacities brokered by NACA(for example, trained people, more efficient operating and management systems, and upgraded facilities) have facilitated implementation of donorassistance programs. The multiplier effects included the following: (1) widerdissemination of results; (2) assurance of follow-up activities within gov-ernments, thus ensuring continuity of project-initiated activities in the NACAwork program; (3) use of strengthened national institutions by various assis-tance programs; and (4) building of formal intergovernmental processes.
■ Cooperation and commitment are the basic forces that bind and moveNACA. However, contributions to the management and operation of theorganization are also essential. This is achieved through an agreed institu-tionalized arrangement as provided in the NACA Agreement, to whichmember governments accede and abide.
132 CHANGING THE FACE OF THE WATERS
STREAM Initiative. Under STREAM (Support to Regional AquaticResources Management), a DFID livelihoods and poverty-oriented project inSoutheast Asia (the Aquatic Resources Management Program) was sustained,institutionalized, and expanded in coverage by being incorporated into theregional program of NACA (www.streaminitiative.org). The STREAM initia-tive was established in 2001 as a NACA primary program element with multi-agency collaboration. Essentially, STREAM brought to aquaculture a greaterunderstanding and use of the livelihoods approach developed by DFID andothers. The initiative piloted these approaches in a range of Southeast Asiancountries. STREAM fostered capacity development in public institutions,farmer groups, and NGOs and installed a regional communications mecha-nism to support the livelihoods approach and share expertise in pro-poorlivelihoods projects. Central and state governments are incorporating thelivelihoods approach in national policies and antipoverty fisheries programs.
Consortium on Shrimp Aquaculture and the Environment. The consor-tium, whose membership consists of FAO, NACA, WB, WWF, and recentlyUNEP, demonstrates the effectiveness of having a commonly agreed programwith a focal point (that is, NACA) that does not have to deal with institutionalbureaucracies (www.enaca.org/shrimp). The basic achievement of the consor-tium was developing a body of knowledge from a comprehensive worldwidestudy of the policies and practices in shrimp aquaculture and transformingthat information into a set of broadly acceptable principles and guidelines forresponsible shrimp farming by all stakeholders. Each partner brings its ownfunding and other resources into the program; in many cases, the individualpartners have, individually or collaboratively, developed projects funded byfoundations and other source of grants. The process demonstrates the cost-effectiveness of a consortium arrangement, and its institutional arrangementand working mechanism illustrate the potential role of a consortium in tech-nology transfer and capacity building.
OTHER CONTRIBUTING INSTITUTIONS
Southeast Asian Fisheries Development Centre (SEAFDEC). SEAFDEC’sAquaculture Department (AQD) focused on the domestication of milkfish andthe farming of penaeid shrimp, and through assistance mostly from the Interna-tional Development Research Center (IDRC) and JICA, scientific manpower andfacilities were upgraded (www.seafdec.org.ph/index.php). Additionally, technol-ogy products and capacity building were shared with other SEAFDEC membercountries under its training and information program. When AQD became theregional lead center of NACA in the Philippines, its R&D program was expandedto several other species, its capacities further upgraded, and its regional outreachprogram strengthened and widened to include other Asian countries.
WEALTH CREATION AND POVERTY ALLEVIATION 133
Asian Institute of Technology. The AIT, located in Thailand, is one of thekey institutions in capacity building and technology transfer and diffusion inthe region. Under its Aquatic Resources System Program, it trained many Asiansin aquatic sciences and had fellowship programs for Bangladesh, Cambodia,China, India, Lao People’s Democratic Republic, Myanmar, Nepal, the Philip-pines, Sri Lanka, and Vietnam. It also introduced farming systems research andextension (FSR&E) into the fishery extension programs of the lower MekongRiver basin countries. The technology and skills were transferred from coun-tries such as the United Kingdom and Denmark through its instruction andresearch programs. Donor assistance of DFID, DANIDA, the Swedish Interna-tional Development Cooperation Authority (Sida), and USAID, as well as JICAand CIDA, supported the fellowship, research, and pilot outreach program onFSR&E. Alumni have become facilitators of AIT-initiated technology develop-ment, transfer, and diffusion programs in their home countries.
Other networks and societies. Networks and societies have had mixed suc-cess. Some have encountered sustainability difficulties. The Asia-Pacific MarineFinfish Aquaculture Network is an example of an institutional and people network with a coordinated well-structured R&D program that is partly sup-ported by private industry.
NGOs. Civil society organizations have been active in a number of coun-tries in the region. The delivery of assistance through NGOs is a response tothe perception that, in certain circumstances, they are better able to deliver ser-vices at the local level or when state-to-state initiatives cannot be carried out.There has been an increasing reliance on the civil society sector in informinggovernments of gaps, problems, and needs related to development assistance.The technical expertise of sector institutions can complement the broader-based, people-oriented competence of NGOs. In addition to their advocacyand social organizing roles in Cambodia, NGOs, such as the Partnership forDevelopment in Kampuchea (PADEK) and SAO Cambodia Integrated Aqua-culture on Low Expenditure (SCALE), have undertaken capacity developmentand technology transfer. The apparent success of NGOs is based largely onanecdotal evidence; there is a lack of an empirical assessment of their perfor-mance (Simpson 2006).
134 CHANGING THE FACE OF THE WATERS
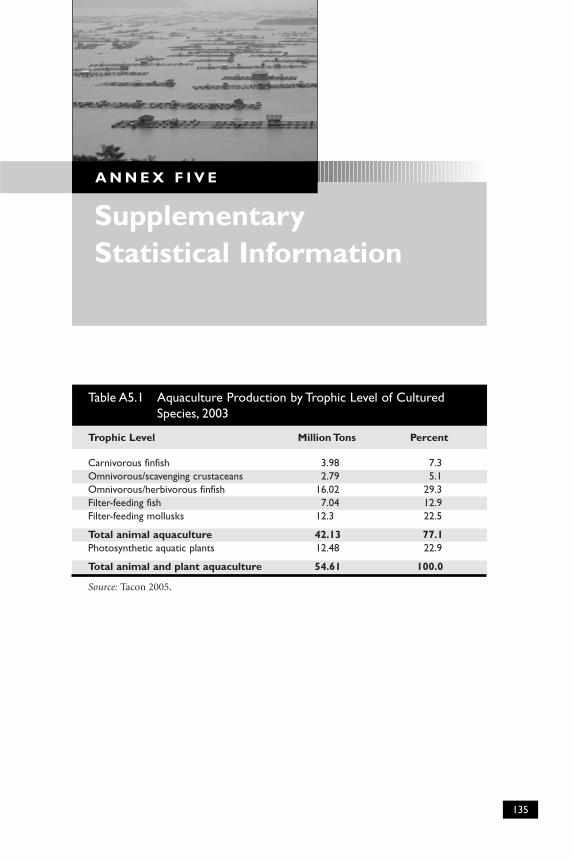
135
Supplementary Statistical Information
A N N E X F I V E
Table A5.1 Aquaculture Production by Trophic Level of CulturedSpecies, 2003
Trophic Level Million Tons Percent
Carnivorous finfish 3.98 7.3Omnivorous/scavenging crustaceans 2.79 5.1Omnivorous/herbivorous finfish 16.02 29.3Filter-feeding fish 7.04 12.9Filter-feeding mollusks 12.3 22.5
Total animal aquaculture 42.13 77.1Photosynthetic aquatic plants 12.48 22.9
Total animal and plant aquaculture 54.61 100.0
Source: Tacon 2005.
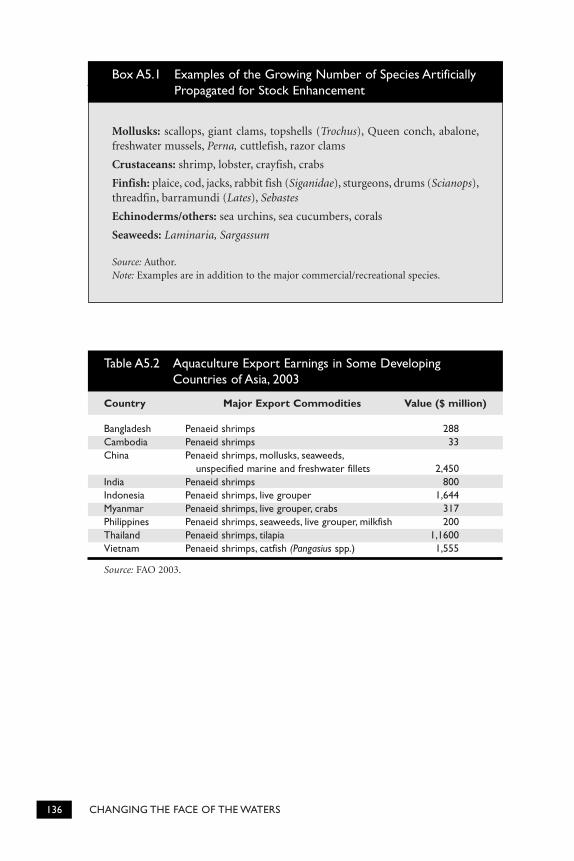
136
Table A5.2 Aquaculture Export Earnings in Some DevelopingCountries of Asia, 2003
Country Major Export Commodities Value ($ million)
Bangladesh Penaeid shrimps 288Cambodia Penaeid shrimps 33China Penaeid shrimps, mollusks, seaweeds,
unspecified marine and freshwater fillets 2,450India Penaeid shrimps 800Indonesia Penaeid shrimps, live grouper 1,644Myanmar Penaeid shrimps, live grouper, crabs 317Philippines Penaeid shrimps, seaweeds, live grouper, milkfish 200Thailand Penaeid shrimps, tilapia 1,1600Vietnam Penaeid shrimps, catfish (Pangasius spp.) 1,555
Source: FAO 2003.
Mollusks: scallops, giant clams, topshells (Trochus), Queen conch, abalone,freshwater mussels, Perna, cuttlefish, razor clams
Crustaceans: shrimp, lobster, crayfish, crabs
Finfish: plaice, cod, jacks, rabbit fish (Siganidae), sturgeons, drums (Scianops),threadfin, barramundi (Lates), Sebastes
Echinoderms/others: sea urchins, sea cucumbers, corals
Seaweeds: Laminaria, Sargassum
Source: Author.Note: Examples are in addition to the major commercial/recreational species.
Box A5.1 Examples of the Growing Number of Species ArtificiallyPropagated for Stock Enhancement
CHANGING THE FACE OF THE WATERS
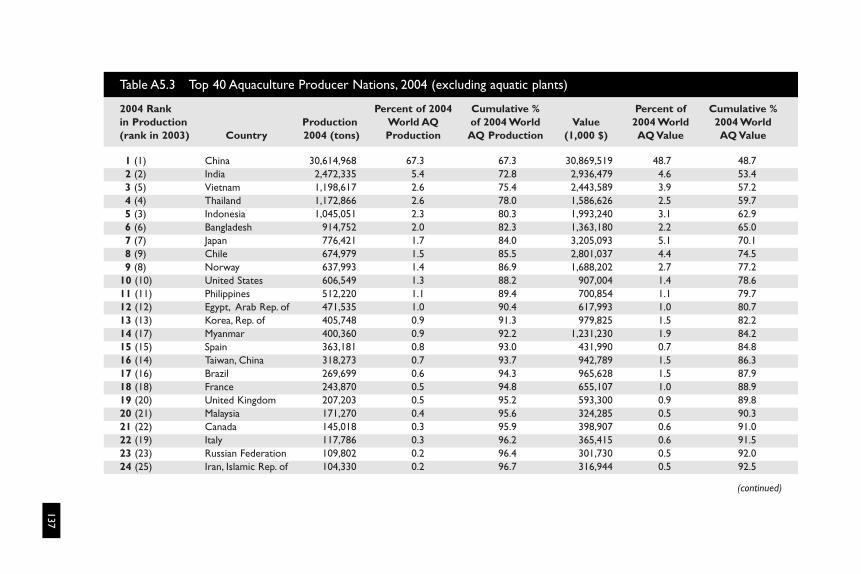
137
Table A5.3 Top 40 Aquaculture Producer Nations, 2004 (excluding aquatic plants)
2004 Rank Percent of 2004 Cumulative % Percent of Cumulative %in Production Production World AQ of 2004 World Value 2004 World 2004 World(rank in 2003) Country 2004 (tons) Production AQ Production (1,000 $) AQ Value AQ Value
1 (1) China 30,614,968 67.3 67.3 30,869,519 48.7 48.72 (2) India 2,472,335 5.4 72.8 2,936,479 4.6 53.43 (5) Vietnam 1,198,617 2.6 75.4 2,443,589 3.9 57.24 (4) Thailand 1,172,866 2.6 78.0 1,586,626 2.5 59.75 (3) Indonesia 1,045,051 2.3 80.3 1,993,240 3.1 62.96 (6) Bangladesh 914,752 2.0 82.3 1,363,180 2.2 65.07 (7) Japan 776,421 1.7 84.0 3,205,093 5.1 70.18 (9) Chile 674,979 1.5 85.5 2,801,037 4.4 74.59 (8) Norway 637,993 1.4 86.9 1,688,202 2.7 77.2
10 (10) United States 606,549 1.3 88.2 907,004 1.4 78.611 (11) Philippines 512,220 1.1 89.4 700,854 1.1 79.712 (12) Egypt, Arab Rep. of 471,535 1.0 90.4 617,993 1.0 80.713 (13) Korea, Rep. of 405,748 0.9 91.3 979,825 1.5 82.214 (17) Myanmar 400,360 0.9 92.2 1,231,230 1.9 84.215 (15) Spain 363,181 0.8 93.0 431,990 0.7 84.816 (14) Taiwan, China 318,273 0.7 93.7 942,789 1.5 86.317 (16) Brazil 269,699 0.6 94.3 965,628 1.5 87.918 (18) France 243,870 0.5 94.8 655,107 1.0 88.919 (20) United Kingdom 207,203 0.5 95.2 593,300 0.9 89.820 (21) Malaysia 171,270 0.4 95.6 324,285 0.5 90.321 (22) Canada 145,018 0.3 95.9 398,907 0.6 91.022 (19) Italy 117,786 0.3 96.2 365,415 0.6 91.523 (23) Russian Federation 109,802 0.2 96.4 301,730 0.5 92.024 (25) Iran, Islamic Rep. of 104,330 0.2 96.7 316,944 0.5 92.5
(continued)
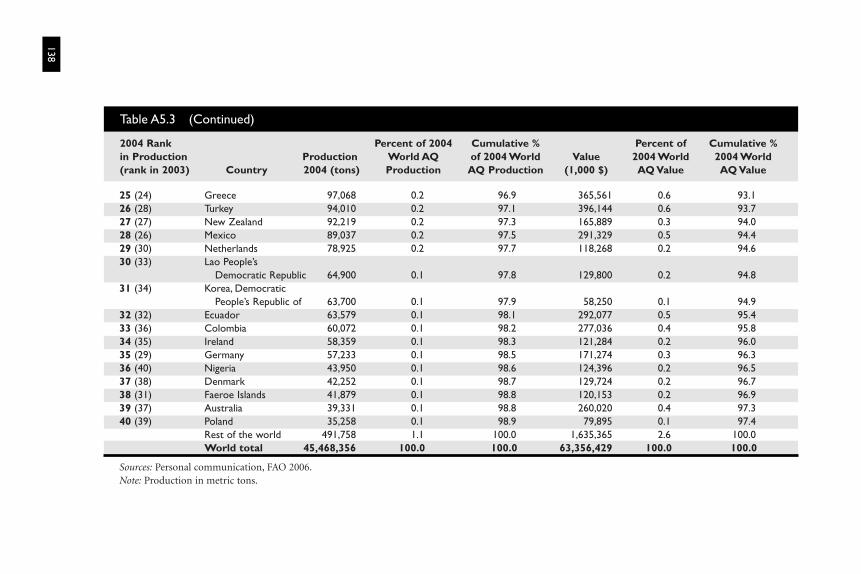
138
25 (24) Greece 97,068 0.2 96.9 365,561 0.6 93.126 (28) Turkey 94,010 0.2 97.1 396,144 0.6 93.727 (27) New Zealand 92,219 0.2 97.3 165,889 0.3 94.028 (26) Mexico 89,037 0.2 97.5 291,329 0.5 94.429 (30) Netherlands 78,925 0.2 97.7 118,268 0.2 94.630 (33) Lao People’s
Democratic Republic 64,900 0.1 97.8 129,800 0.2 94.831 (34) Korea, Democratic
People’s Republic of 63,700 0.1 97.9 58,250 0.1 94.932 (32) Ecuador 63,579 0.1 98.1 292,077 0.5 95.433 (36) Colombia 60,072 0.1 98.2 277,036 0.4 95.834 (35) Ireland 58,359 0.1 98.3 121,284 0.2 96.035 (29) Germany 57,233 0.1 98.5 171,274 0.3 96.336 (40) Nigeria 43,950 0.1 98.6 124,396 0.2 96.537 (38) Denmark 42,252 0.1 98.7 129,724 0.2 96.738 (31) Faeroe Islands 41,879 0.1 98.8 120,153 0.2 96.939 (37) Australia 39,331 0.1 98.8 260,020 0.4 97.340 (39) Poland 35,258 0.1 98.9 79,895 0.1 97.4
Rest of the world 491,758 1.1 100.0 1,635,365 2.6 100.0World total 45,468,356 100.0 100.0 63,356,429 100.0 100.0
Sources: Personal communication, FAO 2006.Note: Production in metric tons.
Table A5.3 (Continued)
2004 Rank Percent of 2004 Cumulative % Percent of Cumulative %in Production Production World AQ of 2004 World Value 2004 World 2004 World(rank in 2003) Country 2004 (tons) Production AQ Production (1,000 $) AQ Value AQ Value
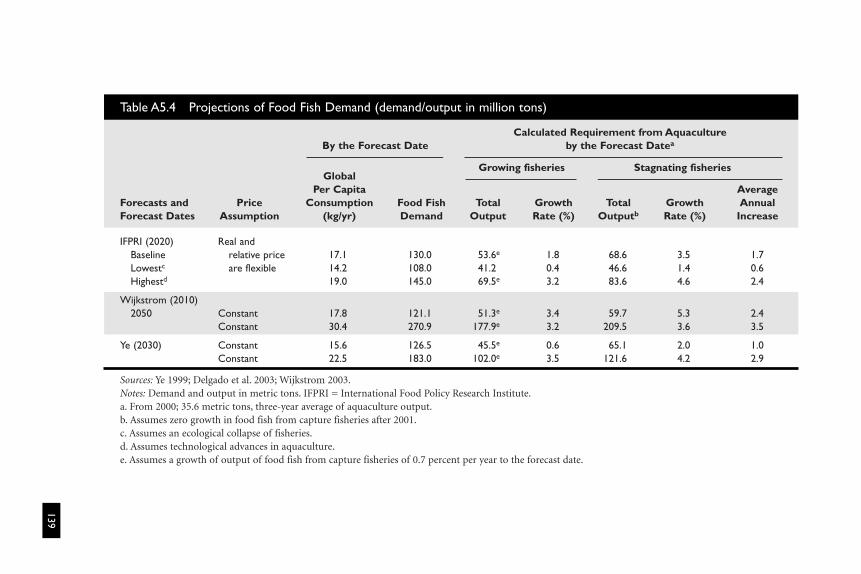
139
Table A5.4 Projections of Food Fish Demand (demand/output in million tons)
GlobalPer Capita Average
Forecasts and Price Consumption Food Fish Total Growth Total Growth AnnualForecast Dates Assumption (kg/yr) Demand Output Rate (%) Outputb Rate (%) Increase
IFPRI (2020) Real and Baseline relative price 17.1 130.0 53.6e 1.8 68.6 3.5 1.7Lowestc are flexible 14.2 108.0 41.2 0.4 46.6 1.4 0.6Highestd 19.0 145.0 69.5e 3.2 83.6 4.6 2.4
Wijkstrom (2010)2050 Constant 17.8 121.1 51.3e 3.4 59.7 5.3 2.4
Constant 30.4 270.9 177.9e 3.2 209.5 3.6 3.5
Ye (2030) Constant 15.6 126.5 45.5e 0.6 65.1 2.0 1.0Constant 22.5 183.0 102.0e 3.5 121.6 4.2 2.9
Sources: Ye 1999; Delgado et al. 2003; Wijkstrom 2003.Notes: Demand and output in metric tons. IFPRI = International Food Policy Research Institute.a. From 2000; 35.6 metric tons, three-year average of aquaculture output.b. Assumes zero growth in food fish from capture fisheries after 2001.c. Assumes an ecological collapse of fisheries.d. Assumes technological advances in aquaculture.e. Assumes a growth of output of food fish from capture fisheries of 0.7 percent per year to the forecast date.
Calculated Requirement from AquacultureBy the Forecast Date by the Forecast Datea
Growing fisheries Stagnating fisheries
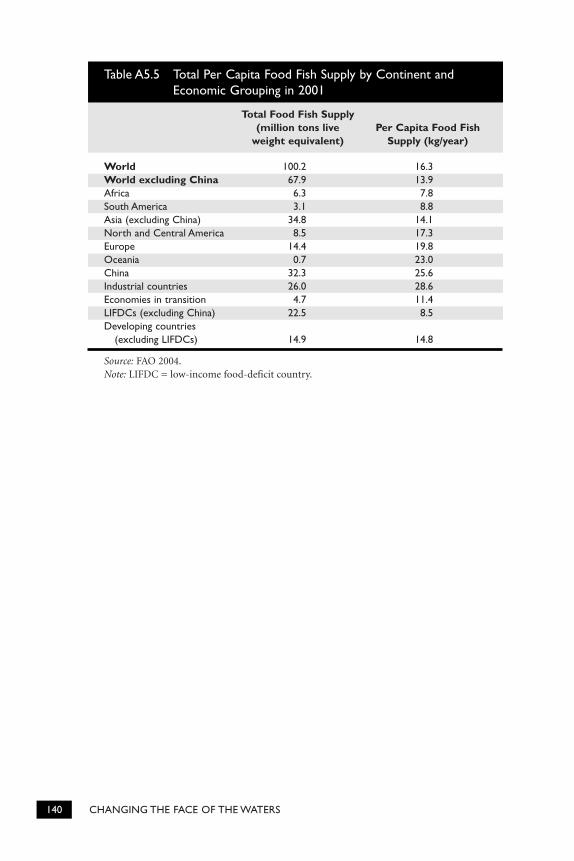
140 CHANGING THE FACE OF THE WATERS
Table A5.5 Total Per Capita Food Fish Supply by Continent andEconomic Grouping in 2001
Total Food Fish Supply(million tons live Per Capita Food Fish
weight equivalent) Supply (kg/year)
World 100.2 16.3World excluding China 67.9 13.9Africa 6.3 7.8South America 3.1 8.8Asia (excluding China) 34.8 14.1North and Central America 8.5 17.3Europe 14.4 19.8Oceania 0.7 23.0China 32.3 25.6Industrial countries 26.0 28.6Economies in transition 4.7 11.4LIFDCs (excluding China) 22.5 8.5Developing countries
(excluding LIFDCs) 14.9 14.8
Source: FAO 2004.Note: LIFDC = low-income food-deficit country.
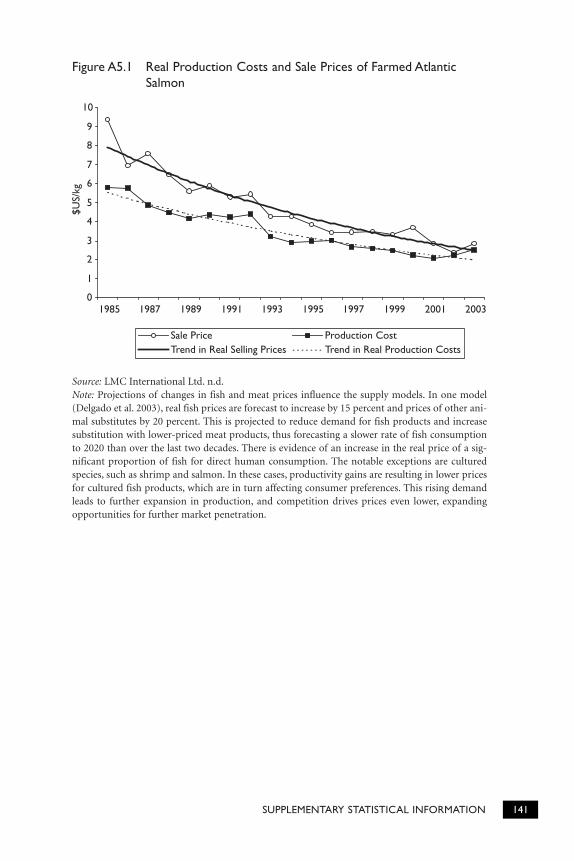
SUPPLEMENTARY STATISTICAL INFORMATION 141
0
1
2
3
4
5
6
7
8
9
10
1985 1987 1989 1991 1993 1995 1997 1999 2001 2003
$US/
kg
Sale Price Production CostTrend in Real Selling Prices Trend in Real Production Costs
Figure A5.1 Real Production Costs and Sale Prices of Farmed AtlanticSalmon
Source: LMC International Ltd. n.d.Note: Projections of changes in fish and meat prices influence the supply models. In one model(Delgado et al. 2003), real fish prices are forecast to increase by 15 percent and prices of other ani-mal substitutes by 20 percent. This is projected to reduce demand for fish products and increasesubstitution with lower-priced meat products, thus forecasting a slower rate of fish consumptionto 2020 than over the last two decades. There is evidence of an increase in the real price of a sig-nificant proportion of fish for direct human consumption. The notable exceptions are culturedspecies, such as shrimp and salmon. In these cases, productivity gains are resulting in lower pricesfor cultured fish products, which are in turn affecting consumer preferences. This rising demandleads to further expansion in production, and competition drives prices even lower, expandingopportunities for further market penetration.
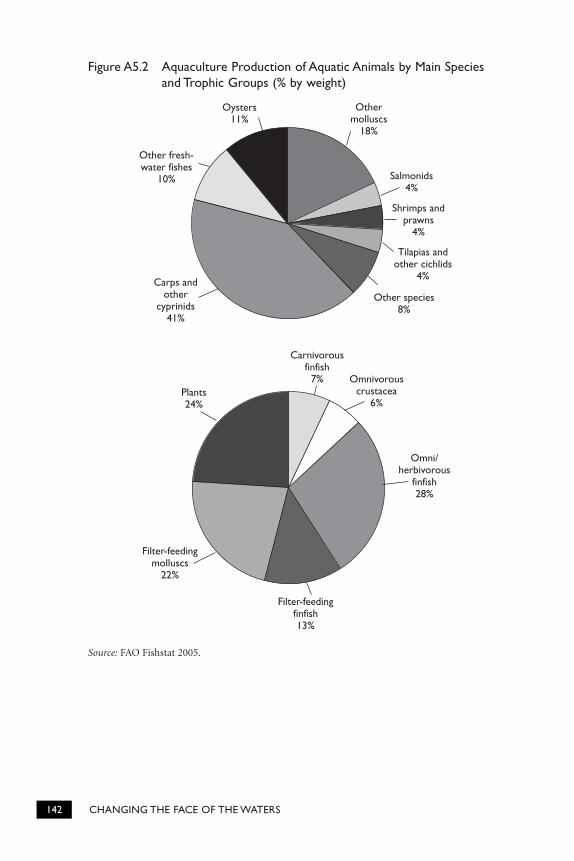
142 CHANGING THE FACE OF THE WATERS
Oysters11%
Other fresh-water fishes
10%
Carps andother
cyprinids41%
Othermolluscs
18%
Salmonids4%
Shrimps andprawns
4%
Tilapias andother cichlids
4%
Other species8%
Carnivorousfinfish
7% Omnivorouscrustacea
6%
Omni/herbivorous
finfish28%
Plants24%
Filter-feedingmolluscs
22%
Filter-feedingfinfish13%
Figure A5.2 Aquaculture Production of Aquatic Animals by Main Speciesand Trophic Groups (% by weight)
Source: FAO Fishstat 2005.
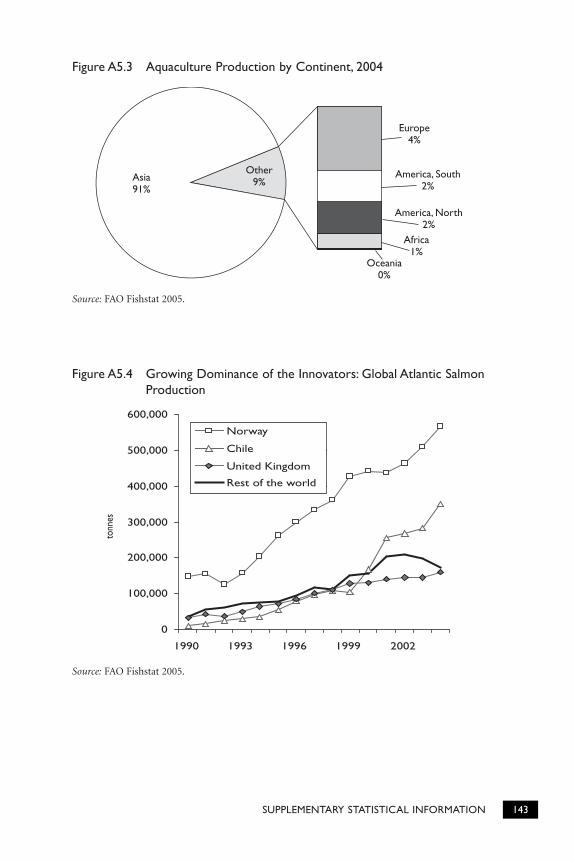
SUPPLEMENTARY STATISTICAL INFORMATION 143
Asia91%
Other9%
Europe4%
America, South2%
America, North2%
Africa1%
Oceania0%
Figure A5.3 Aquaculture Production by Continent, 2004
Source: FAO Fishstat 2005.
0
100,000
200,000
300,000
400,000
500,000
600,000
1990 1993 1996 1999 2002
tonn
es
Norway
Chile
United Kingdom
Rest of the world
Figure A5.4 Growing Dominance of the Innovators: Global Atlantic SalmonProduction
Source: FAO Fishstat 2005.
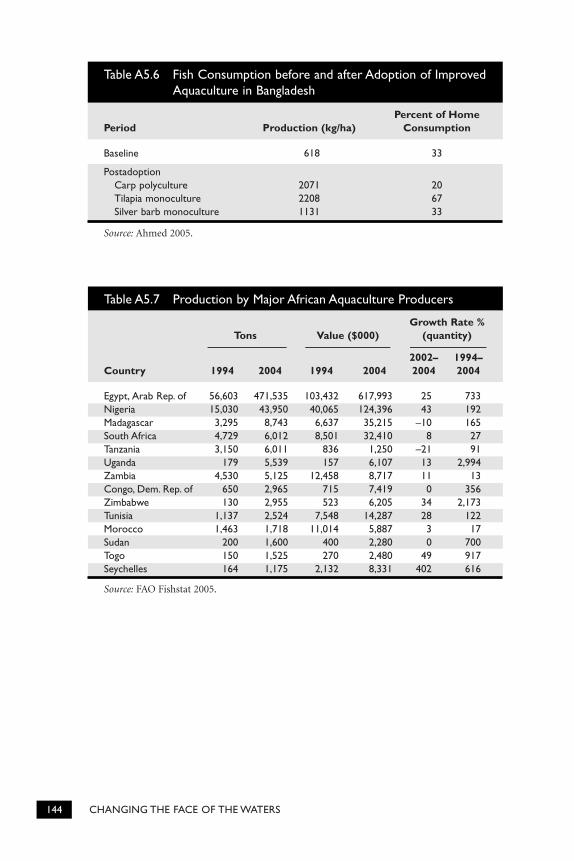
144
Table A5.6 Fish Consumption before and after Adoption of ImprovedAquaculture in Bangladesh
Percent of Home Period Production (kg/ha) Consumption
Baseline 618 33
PostadoptionCarp polyculture 2071 20Tilapia monoculture 2208 67Silver barb monoculture 1131 33
Source: Ahmed 2005.
Table A5.7 Production by Major African Aquaculture Producers
Growth Rate %Tons Value ($000) (quantity)
2002– 1994–Country 1994 2004 1994 2004 2004 2004
Egypt, Arab Rep. of 56,603 471,535 103,432 617,993 25 733Nigeria 15,030 43,950 40,065 124,396 43 192Madagascar 3,295 8,743 6,637 35,215 –10 165South Africa 4,729 6,012 8,501 32,410 8 27Tanzania 3,150 6,011 836 1,250 –21 91Uganda 179 5,539 157 6,107 13 2,994Zambia 4,530 5,125 12,458 8,717 11 13Congo, Dem. Rep. of 650 2,965 715 7,419 0 356Zimbabwe 130 2,955 523 6,205 34 2,173Tunisia 1,137 2,524 7,548 14,287 28 122Morocco 1,463 1,718 11,014 5,887 3 17Sudan 200 1,600 400 2,280 0 700Togo 150 1,525 270 2,480 49 917Seychelles 164 1,175 2,132 8,331 402 616
Source: FAO Fishstat 2005.
CHANGING THE FACE OF THE WATERS
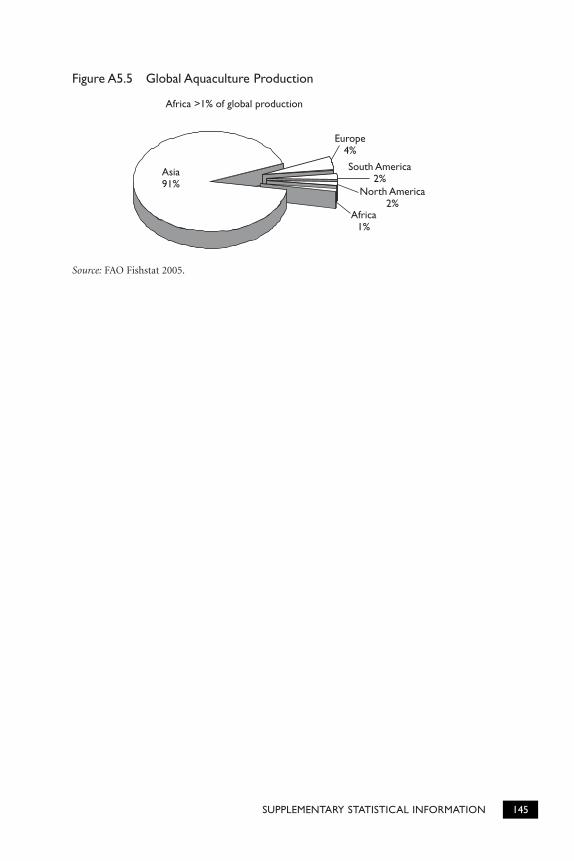
SUPPLEMENTARY STATISTICAL INFORMATION 145
Africa >1% of global production
Asia91%
Europe4%
South America2%
North America2%
Africa1%
Figure A5.5 Global Aquaculture Production
Source: FAO Fishstat 2005.
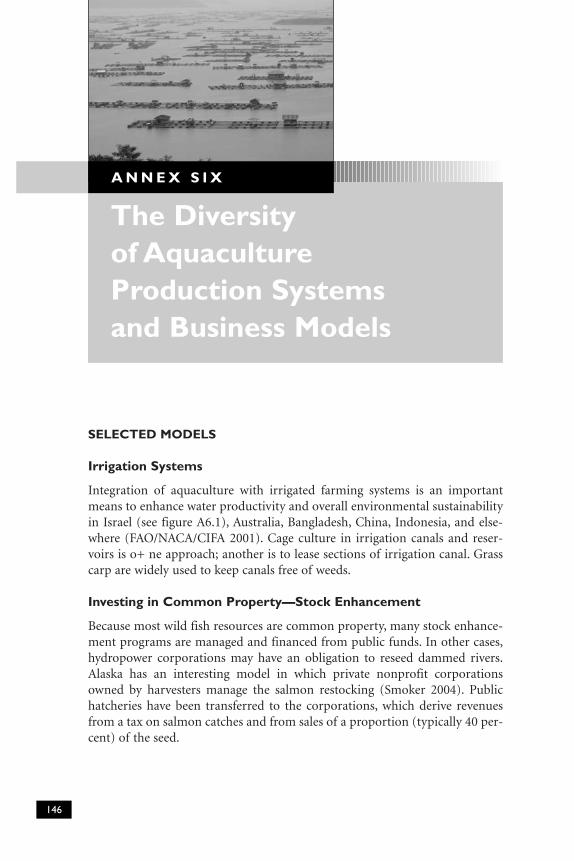
SELECTED MODELS
Irrigation Systems
Integration of aquaculture with irrigated farming systems is an importantmeans to enhance water productivity and overall environmental sustainabilityin Israel (see figure A6.1), Australia, Bangladesh, China, Indonesia, and else-where (FAO/NACA/CIFA 2001). Cage culture in irrigation canals and reser-voirs is o+ ne approach; another is to lease sections of irrigation canal. Grasscarp are widely used to keep canals free of weeds.
Investing in Common Property—Stock Enhancement
Because most wild fish resources are common property, many stock enhance-ment programs are managed and financed from public funds. In other cases,hydropower corporations may have an obligation to reseed dammed rivers.Alaska has an interesting model in which private nonprofit corporationsowned by harvesters manage the salmon restocking (Smoker 2004). Publichatcheries have been transferred to the corporations, which derive revenuesfrom a tax on salmon catches and from sales of a proportion (typically 40 per-cent) of the seed.
The Diversity of Aquaculture Production Systems and Business Models
A N N E X S I X
146
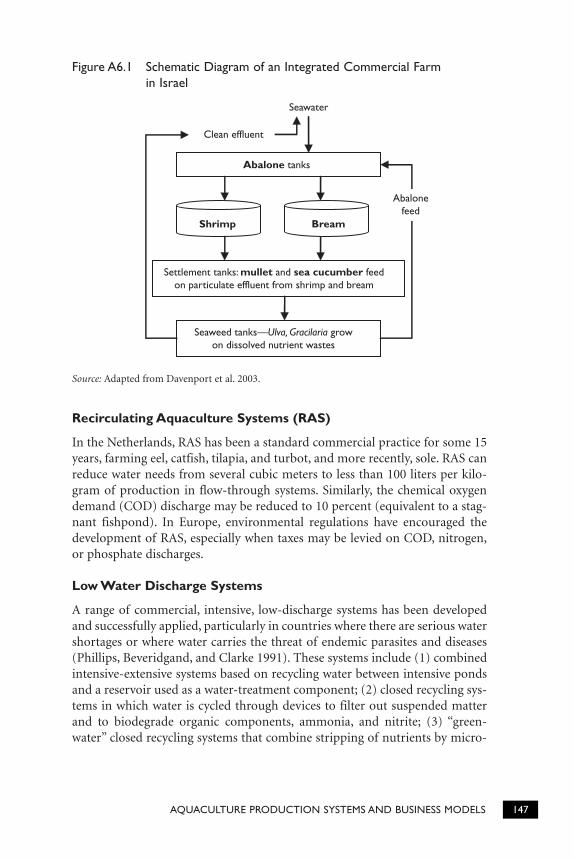
Recirculating Aquaculture Systems (RAS)
In the Netherlands, RAS has been a standard commercial practice for some 15years, farming eel, catfish, tilapia, and turbot, and more recently, sole. RAS canreduce water needs from several cubic meters to less than 100 liters per kilo-gram of production in flow-through systems. Similarly, the chemical oxygendemand (COD) discharge may be reduced to 10 percent (equivalent to a stag-nant fishpond). In Europe, environmental regulations have encouraged thedevelopment of RAS, especially when taxes may be levied on COD, nitrogen,or phosphate discharges.
Low Water Discharge Systems
A range of commercial, intensive, low-discharge systems has been developedand successfully applied, particularly in countries where there are serious watershortages or where water carries the threat of endemic parasites and diseases(Phillips, Beveridgand, and Clarke 1991). These systems include (1) combinedintensive-extensive systems based on recycling water between intensive pondsand a reservoir used as a water-treatment component; (2) closed recycling sys-tems in which water is cycled through devices to filter out suspended matterand to biodegrade organic components, ammonia, and nitrite; (3) “green-water” closed recycling systems that combine stripping of nutrients by micro-
AQUACULTURE PRODUCTION SYSTEMS AND BUSINESS MODELS 147
Abalone tanks
Shrimp
Settlement tanks: mullet and sea cucumber feedon particulate effluent from shrimp and bream
Seaweed tanks—Ulva, Gracilaria growon dissolved nutrient wastes
Seawater
Bream
Clean effluent
Abalonefeed
Figure A6.1 Schematic Diagram of an Integrated Commercial Farm in Israel
Source: Adapted from Davenport et al. 2003.
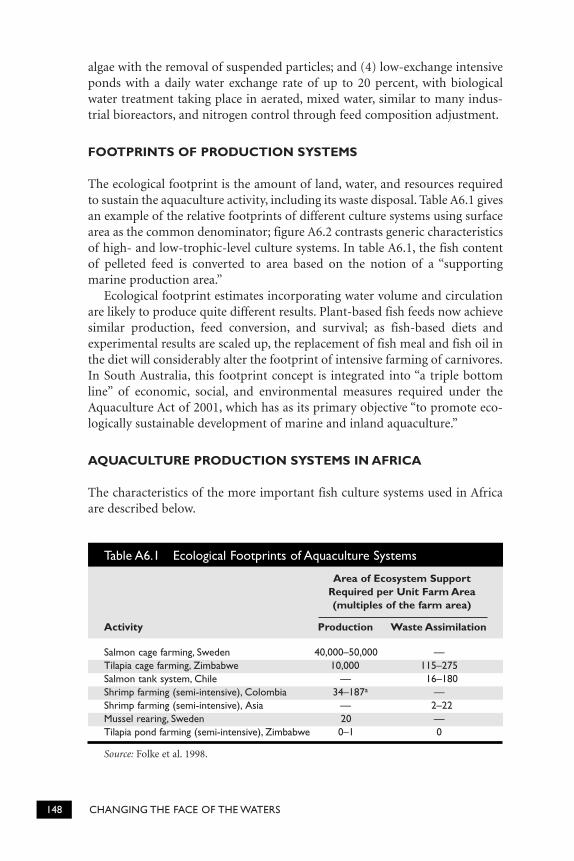
algae with the removal of suspended particles; and (4) low-exchange intensiveponds with a daily water exchange rate of up to 20 percent, with biologicalwater treatment taking place in aerated, mixed water, similar to many indus-trial bioreactors, and nitrogen control through feed composition adjustment.
FOOTPRINTS OF PRODUCTION SYSTEMS
The ecological footprint is the amount of land, water, and resources requiredto sustain the aquaculture activity, including its waste disposal. Table A6.1 givesan example of the relative footprints of different culture systems using surfacearea as the common denominator; figure A6.2 contrasts generic characteristicsof high- and low-trophic-level culture systems. In table A6.1, the fish contentof pelleted feed is converted to area based on the notion of a “supportingmarine production area.”
Ecological footprint estimates incorporating water volume and circulationare likely to produce quite different results. Plant-based fish feeds now achievesimilar production, feed conversion, and survival; as fish-based diets andexperimental results are scaled up, the replacement of fish meal and fish oil inthe diet will considerably alter the footprint of intensive farming of carnivores.In South Australia, this footprint concept is integrated into “a triple bottomline” of economic, social, and environmental measures required under theAquaculture Act of 2001, which has as its primary objective “to promote eco-logically sustainable development of marine and inland aquaculture.”
AQUACULTURE PRODUCTION SYSTEMS IN AFRICA
The characteristics of the more important fish culture systems used in Africaare described below.
148 CHANGING THE FACE OF THE WATERS
Table A6.1 Ecological Footprints of Aquaculture Systems
Area of Ecosystem Support Required per Unit Farm Area(multiples of the farm area)
Activity Production Waste Assimilation
Salmon cage farming, Sweden 40,000–50,000 —Tilapia cage farming, Zimbabwe 10,000 115–275Salmon tank system, Chile — 16–180Shrimp farming (semi-intensive), Colombia 34–187a —Shrimp farming (semi-intensive), Asia — 2–22Mussel rearing, Sweden 20 —Tilapia pond farming (semi-intensive), Zimbabwe 0–1 0
Source: Folke et al. 1998.
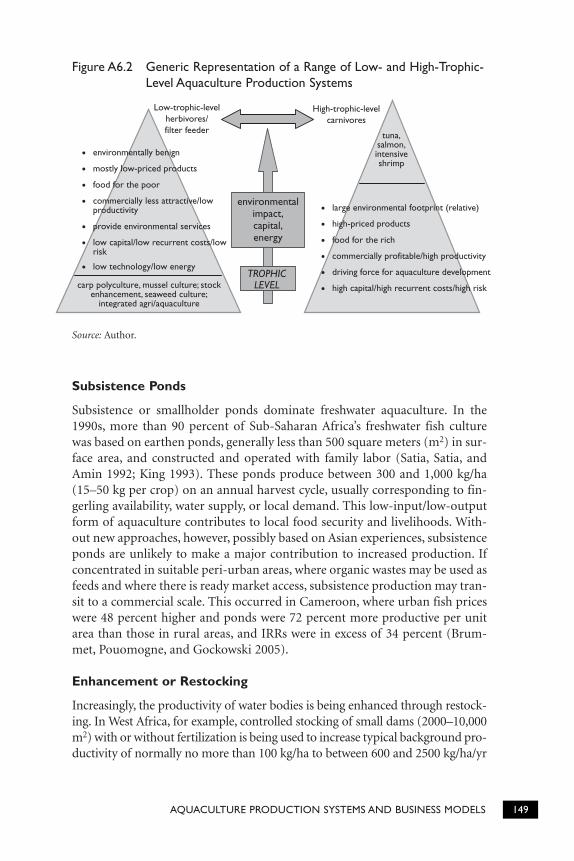
Subsistence Ponds
Subsistence or smallholder ponds dominate freshwater aquaculture. In the1990s, more than 90 percent of Sub-Saharan Africa’s freshwater fish culturewas based on earthen ponds, generally less than 500 square meters (m2) in sur-face area, and constructed and operated with family labor (Satia, Satia, andAmin 1992; King 1993). These ponds produce between 300 and 1,000 kg/ha(15–50 kg per crop) on an annual harvest cycle, usually corresponding to fin-gerling availability, water supply, or local demand. This low-input/low-outputform of aquaculture contributes to local food security and livelihoods. With-out new approaches, however, possibly based on Asian experiences, subsistenceponds are unlikely to make a major contribution to increased production. Ifconcentrated in suitable peri-urban areas, where organic wastes may be used asfeeds and where there is ready market access, subsistence production may tran-sit to a commercial scale. This occurred in Cameroon, where urban fish priceswere 48 percent higher and ponds were 72 percent more productive per unitarea than those in rural areas, and IRRs were in excess of 34 percent (Brum-met, Pouomogne, and Gockowski 2005).
Enhancement or Restocking
Increasingly, the productivity of water bodies is being enhanced through restock-ing. In West Africa, for example, controlled stocking of small dams (2000–10,000m2) with or without fertilization is being used to increase typical background pro-ductivity of normally no more than 100 kg/ha to between 600 and 2500 kg/ha/yr
AQUACULTURE PRODUCTION SYSTEMS AND BUSINESS MODELS 149
• environmentally benign
• mostly low-priced products
• food for the poor
• commercially less attractive/lowproductivity
• provide environmental services
• low capital/low recurrent costs/lowrisk
• low technology/low energy
carp polyculture, mussel culture; stockenhancement, seaweed culture;
integrated agri/aquaculture
High-trophic-levelcarnivores
• large environmental footprint (relative)
• high-priced products
• food for the rich
• commercially profitable/high productivity
• driving force for aquaculture development
• high capital/high recurrent costs/high risk
tuna,salmon,intensiveshrimp
environmentalimpact,capital,energy
TROPHICLEVEL
Low-trophic-levelherbivores/filter feeder
Figure A6.2 Generic Representation of a Range of Low- and High-Trophic-Level Aquaculture Production Systems
Source: Author.
(Halwart and van Dam 2006; Oswald, Copin, and Montferrer 1996). In the LowerShire River Valley of Malawi, local communities stock temporary waterbodies, orthamandas, with fingerling tilapias and catfishes, producing an average of 600kg/ha (range 300–1,575 kg/ha) in a two- to three-month growing season (Chika-fumbwa, Katambalika, and Brummett 1998). In Niger and Burkina Faso, tradi-tional reservoir management systems have evolved in the direction of restockingafter the annual drying. The fingerlings of O. niloticus, Labeo coubie, and C.gariepinus are produced through artificial reproduction of adults captured at har-vest and held over the dry season. This restocking increases productivity from50–100 kg/ha/yr to more than 600 kg/ha/yr (Baijot, Moreau, and Bouda 1994).
Integrated Agriculture-Aquaculture (IAA)
Malawi provides an example of IAA. These farms produce almost six times thereturns generated by the typical Malawian smallholder (Scholz and Chimatiro1996). The integrated pond–vegetable garden is the economic engine on thesefarms, generating almost three times the annual net income from the staplemaize crop and the homestead combined. The vegetable-fish component con-tributes, on average, 72 percent of annual cash income (Brummett and Noble1995). On a per-unit-area basis, the vegetable garden/pond resource systemgenerates almost $14 per 100 m2 per year, compared with $1 and $2 for themaize crop and homestead, respectively. By retaining water on the land, pondsenabled farms to sustain their food production and balance their losses on sea-sonal crop lands during severe droughts from 1991 through 1995. For exam-ple, in the 1993–94 drought season, when only 60 percent of normal rain fell,the average net cash income of a study group of rain-fed IAA farms was 18 per-cent higher than non-IAA farmers in an area with some of Malawi’s severestpoverty (Brummett and Chikafumbwa, 1995). Existing technologies for IAAmay need to be further adapted to African conditions (IIRR and ICLARM2001; Swick and Cremer 2001).
Rice-Fish Culture
In the 1990s, Madagascar undertook the privatization of its government fishstations, ceding or leasing these to private farmers or farmer associations. Theoperators are known as Producteurs Privé d’Alevins (private fingerling produc-ers, or PPAs). A decade after divestment, the PPAs and their hatcheries are gen-erally functioning well. They have lost their local monopoly over a supply zoneand compete openly with each other in a profitable seed market. The Mada-gascar program is now experiencing new challenges from possible in-breedingof carp, and the program is examining options to improve extension supportat the farm level and coordinate the large number of stakeholders, includingmany community-level NGOs (FAO Regional Office for Africa 1999.). Effortsto establish sustainable private hatcheries or nurseries as viable small busi-nesses are also ongoing in eastern Uganda. However, in many Sub-Saharan
150 CHANGING THE FACE OF THE WATERS
countries, government seed supply stations built in the 1970s and 1980s aredefunct and reliable seed supply remains a common problem.
Seaweed Culture
Tanzania produces 7,000 tons of Eucheuma cultured by an estimated 20,000small growers. Using technology and seedstock imported from the Philippines,the growers depend on two large exporting companies (King 1992). Produc-tion technology is relatively simple and environmentally friendly, based onalgae seedlings attached to a network of monofilament lines anchored towooden stakes on tidal flats. Under contractual arrangements with the buyers,producers can earn about twice the average income of an entry-level civil ser-vant. However, producers, mostly women, are also price takers and subject toexploitation as indicated by a major market maker.
As a potential seaweed supplier trying to find the best village to work in,you should be delighted to find a village populated by consumers withno or little livelihood options. In this case we call [seaweed] farming thelivelihood of last resort. Today we find the most productive and consis-tent farmers from villages like these. . . . In these places it is too arid tofarm or the soil is unsuitable and the reefs have been destroyed and fishstocks decimated. . . . Your ultimate goal is to make seaweed farmingbecome a way of life for the villagers. This happens after five or so years.At this stage people don’t think too much about price, they just farmbecause they have always farmed. Their children will follow them. (FMCBiopolymer [USA] cited by Bryceson 2002)
Industrial seaweed is a highly consolidated industry—a few global corpora-tions dominate the processing and distribution of nonfood products. However,farming and primary processing can be widely dispersed in rural and poorercommunities and new niche markets for innovative products are emerging.
Small and Medium Enterprises
Aquaculture SMEs are expanding in Nigeria where the large government-funded Aquaculture and Inland Fisheries Project has targeted technical assis-tance and capacity building at this segment since 2003.26 At least 100 farmswith an estimated 60,000 ha under water produce 25,000–30,000 tons per year,mostly of catfish, which are highly prized in the Nigerian market (Moehl2003). Grouped under the Aquaculture Association of Southern Africa (www.aasa-aqua.co.za), SMEs in South Africa are also making progress with a rangeof production systems (including freshwater crayfish, abalone, and ornamen-tal fish). With the traditional focus on subsistence aquaculture, SMEs probablyhave not received the attention they merit because they have not been per-ceived to represent “the poor.”
AQUACULTURE PRODUCTION SYSTEMS AND BUSINESS MODELS 151
Large Commercial Aquaculture
There are an increasing number and range of successful large commercialaquaculture investments in Africa, and the commercial subsector is now esti-mated to account for approximately 65 percent of the total freshwater andbrackish-water production and almost 100 percent of the mariculture produc-tion (Hecht 2006). The most notable include shrimp farms in Madagascar andMozambique (export); tilapia in Zambia (ponds, local markets); Zimbabwe(cages, export); and Ghana (cages, local markets). New investments are com-ing in Uganda (cages, tilapia, export) and Kenya (cages, tilapia, local markets).Most of these investments involve foreign capital and rely on foreign or foreign-trained technical expertise and target growing urban African markets or inter-national trade. All are vertically integrated to one extent or another, includingfeed manufacture, fingerling production, selective breeding programs, process-ing plants, and local and export market arrangements. The import of feeds,technology, and services compounds the relatively high investment risk withhigher costs (compared with Asia),27 and exporters rely on preferential tariffsfor profit margins. Supply of feeds, both pelleted and low-cost wastes for sub-sistence ponds, is a major limiting factor on aquaculture expansion through-out the region.
Market-Driven Aquaculture
In Africa and elsewhere, domestic and export markets are driving aquacultureproduction. In Malawi, fish prices have increased by more than 350 percent inthe 1999–2003 period, while improving national sanitary control systems haveincreased market access to the European Union. Madagascar, Mozambique,and Nigeria provide other examples of market-driven production. Privatecommercial tilapia farms are showing promise in Zambia, Zimbabwe, Ghana,Nigeria, and Malawi (Roderick 2002). The reviews of past aquaculture inAfrica and recent success stories suggest that creation of wealth through a mar-ket-driven aquaculture strategy is more effective than a strategy with a socialobjective, such as food security (Hecht 2006). It can be argued, however, thatthe target groups of past failures in aquaculture development in Sub-SaharanAfrica (the landless, or subsistence farmers) are less disposed to adopt aqua-culture than are entrepreneurs and SMEs—the target group for market-drivenaquaculture.
THE CASE OF SHRIMP CULTURE IN MADAGASCAR
Starting with an FAO project in the 1990s, Madagascar now has seven shrimpfarms producing more than 8,000 tons per year on 2,250 ha. By 2002, theindustry had created more than 4,000 jobs, contributing 5.9 percent of fiscalreceipts and 6.9 percent of GDP. By constituting large farms as “duty-free
152 CHANGING THE FACE OF THE WATERS
zones” in relatively remote areas, the investments created new communitiescomplete with infrastructure and services. How was this achieved?
Madagascar has good natural conditions for shrimp aquaculture and alreadyhad a well-developed shrimp trawl fishery. The FAO project helped build capac-ity and a basic shrimp culture strategy, implant sound environmental practices,and develop legislation. FDI worked through joint ventures to build the initialfarms. Many of these investors had links to the existing shrimp-fishing industry.The chosen farm sites were free from land and resource disputes.
For environmental reasons and by agreement with the IFC, which financedsome farms, only 3 percent of the concession area was used for shrimp farm-ing. This was monitored by satellite mapping. Initial production systems werelargely semi-intensive (2–7 tons/ha/yr), which helps avoid disease, and stock-ing densities were linked to the carrying capacity of the site. In practice, thismeans that for each 1 ha of shrimp pond, 2–3 ha of mangrove is required toremove nitrogen and phosphates from the effluent. Only indigenous speciesare cultured and these disease-free strains grow to exceptionally large sizes andcommand the highest prices. Investors must prepare an EIA. Confidentialannual farm audits help enforce a code of conduct and promote mitigationmeasures with respect to environmental measures that are required as a resultof the EIA.
More recently, other production systems are being used: family/artisanalshrimp farms using extensive production (less than 300 kg/ha/yr), “industrial”intensive farms (more than 7 tons/ha/yr), and a nucleus estate/contract farm-ing model (under consideration). An aquaculture master plan helps guidedevelopment, while policy checks help ensure that only qualified investors(that is, those with expertise, capital, access to markets, and demonstrated bonafides) are granted concessions. An annual economic assessment of the shrimpculture industry is undertaken to monitor its contribution to the nation’s eco-nomic development. The assessment tracks such key indicators as net foreignexchange, employment, and fiscal receipts.
PRODUCTION SYSTEMS AND CULTURED SPECIES IN LATIN AMERICA
Subsistence Aquaculture
Although in principle aquaculture is an effective means of improving rurallivelihoods, it has shown little progress and a trend toward abandonment. Theactivity remains dependent on public and international support. Production isdone in private or communal ponds, with about 85 percent of subsistence farmsbeing family enterprises. Extensive, culture systems are widely practiced, gener-ally using natural (primary) production and agricultural by-products for feeds.As in Africa, this involves mainly freshwater culture (mostly tilapia in combina-tion with silver and common carp, pacu, and catfish), with some involvement in
AQUACULTURE PRODUCTION SYSTEMS AND BUSINESS MODELS 153
coastal culture of mollusks (oysters) and macroalgae. The family is in charge ofpond management and the culture of the fish, while technical advice is providedby government agencies, albeit infrequently. Products from this sector are con-sumed by the family or sold locally. In Chile, culture of macroalgae is managedprimarily by private companies and unions. The unions include artisanal fish-ermen who produce and market their products within one group. Artisanalproducers live at low economic, social, and cultural levels, conditions that donot allow access to technology, information, markets, or credit. This situationseverely limits the artisanal producer from further development.
Restocking of Inland Waters
Information on restocking of natural waters and artificial impoundments (forsport fishing and capture fisheries) is scarce, but Cuba, Mexico, and Brazil arethe leading producers of fingerlings for stocking. Species stocked include trout,carp, catfish, tilapia, and silverside. Starting in the 1960s, Cuba had developedthe extensive culture of tilapia and carp in large and small water bodies. Hybridcatfish was introduced recently and stocked in reservoirs with good results. Inthe northeast of Brazil, traditional culture of native species has been developedin many small and medium reservoirs.
Intensive Industrial Aquaculture
These large enterprises are usually incorporated as share capital companies. Jointventures are common. Characteristically, they use intensive production systems(cages, ponds, raceways, tanks), sophisticated technology, and high expenditurein infrastructure and operating costs. They have large-volume production ofsalmon, tilapia, and shrimp. They have better access to national and interna-tional credit than do SMEs. There has been considerable vertical integration inthese companies, both in freshwater (tilapia) and marine farming (salmon, mol-lusks). In Chile, more than half the industry is integrated with companies thatsupply materials and services. The main objective in recent years has been forcompanies to optimize their production processes and increase productivity byadopting new technologies and management procedures.
SMEs
Semi-intensive culture systems, particularly in freshwater farming, are the usualchoice for the semi-industrial producer group, which is also characterized byowner management. Technical direction and management advice is usually pro-vided by outside specialists. The farmed species include tilapia, shrimp, trout,and mollusks.
Main Species Groups
Aquaculture production from the region has been expanding at an averageannual rate of about 13 percent during 1994–2004. The main produced species
154 CHANGING THE FACE OF THE WATERS
by volume are salmonids, mainly Atlantic salmon (44 percent); shrimp (23percent); freshwater fish, mostly tilapia (23 percent); and mollusks (22 per-cent). Atlantic and Pacific salmon are farmed exclusively in Chile. The threemajor species groups are showing healthy growth rates. Details of the producedspecies are as follows:
■ Salmon. Atlantic and Pacific salmon are cultured exclusively in Chile. Thereare 60 commercial salmon farms and 1,400 hatcheries. Between 1994 and2004, production increased more than fivefold, from 109,000 tons to586,000 tons—an average annual growth rate of about 19 percent. Untilrecently, salmon and trout farming had depended on the importation ofeyed eggs (from the United States, United Kingdom, Norway, and Ireland).
■ Shrimp. Shrimp farming started in 1968 and was decimated by diseases dur-ing 1998–99, particularly in Ecuador. It has been associated with negativeenvironmental impact in coastal areas. With the adoption of BMPs andbiosecurity measures, production has recovered from 153,731 tons in 2000to 289,330 tons in 2004 (average annual growth of 7 percent). There arecommercial farms (SMEs and large enterprises) in 20 countries of theregion, and the industry has generated 750,000 direct and indirect jobs inthe region. Governments perceive the industry as an engine for diversifica-tion of the economy, job creation in depressed areas, and earning of foreignexchange. The top five producers are Ecuador, Mexico, Honduras, Panama,and Colombia.
■ Tilapia. Tilapia culture increased rapidly from 29,040 tons to 145,904 tonsduring 1994–2004, with an average annual growth rate of 18 percent. Growthwas driven by the diversification trend in some countries combined withincreased demand in foreign and intraregional markets. More than 90 per-cent of tilapia is produced by six countries: Cuba, Colombia, Mexico, Brazil,Jamaica, and Costa Rica.
■ Mollusks. Mollusks were first cultured in Chile in 1921, having been devel-oped mostly in the northernmost and southernmost countries of LatinAmerica. Chile accounts for the bulk of production; other producers areBrazil, Mexico, Cuba, and Peru.
■ Macroalgae. Macroalgae, such as Gracilaria sp., are produced in extensivesystems in estuarine or marine environments. Algae are produced in Chile,República Bolivariana de Venezuela, and Peru, while experiments are beingcarried out in Panama and in Brazil.
■ Endemic fish species. The culture of such endemic species as Colosomas andPiaractus (characids) is more common in Brazil, Argentina, Colombia, Peru,República Bolivariana de Venezuela, and Uruguay. Cultivation is generally inponds under semi-intensive conditions, often in polyculture with tilapias.
AQUACULTURE PRODUCTION SYSTEMS AND BUSINESS MODELS 155
INTRODUCTION
The following guidelines were formulated on the basis of experience fromcompleted Bank aquaculture projects and on the most recently identified bestpractices in the field of aquaculture (adapted from Braga and Zweig 1998). Thegoal of these guidelines is to facilitate the evaluation, preparation, and imple-mentation of future aquaculture projects.
The actions and procedures recommended in these guidelines relate to thepreparation and identification or the implementation phases of the projectcycle. The recommendations are presented in italics. Examples and technicalexplanations from Bank projects in support of each recommendation are avail-able in the Review of Completed Bank Aquaculture Projects.
PROJECT PREPARATION AND IDENTIFICATION
The first and most important step in achieving a successful project is to identifylocal needs properly and design a project that will fulfill those needs in the mostefficient way. To achieve this, it is necessary to consult with the local communityand, whenever possible, involve it from the initial stages of the project cycle.
It is important to allow enough time to complete every required step ofproject identification and preparation; these steps include thorough water and
Guidelines for thePreparation andImplementation ofAquaculture Projects
A N N E X S E V E N
156
soil quality analysis, assessment of possible environmental impacts, identifica-tion of market conditions, preparation of well-defined technical designs, anddetailed studies of the institutional arrangement and local capacity available toimplement the project.
Finally, the preparation team should define how the project would fit inwith other development initiatives taking place in the project area and shouldresolve any possible real or perceived conflicts.
Recommended Procedure
Projects should be based on sound and simple concepts, and use an already suc-cessfully tested technology and institutional framework. Aquaculture projects mustbe designed on the basis of well-founded market analysis and technical informa-tion about the basic fish resources, environmental conditions and legislation, suit-able technology, and prevailing marketing practices.
Projects often suffer from being too ambitious and complex for the existingsituation, introducing several new concepts and technologies at one time,without the institutional and community support necessary to successfullyimplement such complex projects. Successful projects are more straightfor-ward and based on concepts and institutions that already have some history ofexistence in the community.
Recommended Procedures
Demonstration projects should be modest, simple, closely monitored, and involveonly proven technologies.
A pilot phase should be mandatory for projects introducing new technologies orcredit and institutional arrangements.
All communities affected by the project should be involved in the preparationprocess from the beginning.
Project preparation and appraisal are fundamental stages for successful imple-mentation; they should not be skipped or shortened, particularly for large proj-ects covering diverse areas.
There is no substitute for devoting adequate resources and time to carefulproject preparation and appraisal, and the failure to do so carries heavy risks.28
Recommended Procedures
Projects must incorporate some degree of flexibility to be able to adjust to changesin market and environmental conditions, development of better technologies, andappearance of disease. Attention should be paid to possible shifts in governmentapproaches, particularly during long preparation and implementation periods. Asa rule, the more complex the project, the more difficult it is to respond to changingconditions.
GUIDELINES FOR AQUACULTURE PROJECTS 157
It is often difficult or impossible to foresee all that can happen during orafter a project’s implementation. As a consequence, projects should be struc-tured with some degree of flexibility to be able to adapt to unexpected events.
To keep as many options as possible open for the future, when preparing aproject, the following questions should be explored:
■ What is the impact on project management and sustainability in the eventof changes in government approaches or market conditions?
■ How would the project be affected by significant changes in foreign exchangerates or in prices of raw materials and services needed for project management?
Answering such risk scenario questions may help design a project thatwould be more resilient to changes in the prevailing conditions.
Socioeconomic Issues
Among their primary goals, most aquaculture projects include the productionof high-quality protein for human consumption and an increase in incomeand economic activity in the community. Because human activity is deeplyinterrelated with these projects, all forms of interactions between the projectand the local communities must be thoroughly investigated. This can be bestdone by involving local people from the initial stages of project identificationand preparation; local communities should be consulted on their ideas aboutthe project, how it might affect their lifestyles, and how the community seesitself interacting with it.
Recommended Procedure
A good understanding of the socioeconomic and environmental characteristics ofthe project area is fundamental, especially of the land ownership and titles in areasinvolving small landholders.
Socioeconomic issues must be thoroughly reviewed during project prepara-tion, including fishing and eating habits of local populations, existing relation-ships among local groups, and opportunities for private involvement in theproject.
Recommended Procedure
Private sector participation should not only be anticipated but also encouraged,and whenever possible it should be specified in the original project design.
Environmental IssuesRecommended Procedure
Possible environmental impacts, both positive and negative, must be thoroughlyaddressed in all phases of aquaculture projects.
158 CHANGING THE FACE OF THE WATERS
Sustainability IssuesRecommended Procedure
Sustainability is highly correlated with overall project quality, including technicaland institutional aspects, and more specifically with whether farmers have accessto credit and good extension support to ensure adequate managerial and techni-cal capabilities of pond operators.
Financial IssuesRecommended Procedures
The project needs to make sure that farmers will have access to credit.
Cost recovery mechanisms should be introduced in projects showing high prof-itability.
PROJECT DESIGN
Technical AspectsRecommended Procedure
A primary requirement for a successful aquaculture project is a reliable supply ofsuitable quality water.
The usual sources for water in aquaculture projects are as follows:
■ Groundwater. Generally more dependable and uniform than surface waterand usually less polluted, although that is rapidly changing. Its major dis-advantage is being devoid of oxygen, and it must be aerated before use; itmay also contain toxic gases and high concentrations of certain dissolvedions and minerals.
■ Surface waters. Should be carefully evaluated because they are subject tocontamination, often carry high silt loads, and may contain wild fish, para-sites, predators, or disease organisms. Will frequently require pumping, butthe cost is usually less than pumping water from wells. Surface waters areoften subject to environmental regulations that may change without muchadvance warning.
■ Alternative sources. Include rainwater, saltwater wells, and water recycledafter some other use, such as irrigation tailwater and cooling water fromindustrial processes.
Water needs vary greatly with the aquaculture system being used, and proj-ects need different amounts of suitable water at specific stages of operation.Well water is the desired water supply for hatcheries; for culture ponds, eco-nomic considerations play an important role in choosing the water source andshould not be ignored. Once water reaches the project area, one of two basic
GUIDELINES FOR AQUACULTURE PROJECTS 159
channel configurations is usually chosen to direct water in and out of ponds.The first uses a single channel for both functions; the other, which is moreexpensive, allows for separate inlet and outlet channels.
Recommended Procedure
The choice of site for project development must consider technical, managerial,marketing, and social constraints.
A range of variables must be considered when choosing the site for projectdevelopment: proximity to water source and markets, topography and soil type,the landholding situation, and possible constraints resulting from the socialstructure and culture of local communities.
Recommended Procedure
Aquaculture projects should avoid dependence on wild caught seed supply.Project performance can be hindered by the unreliability of wild seed supply.
Recommended Procedure
Projects must carefully plan and monitor the stocking densities used in cultureponds and lakes because high densities can be conducive to disease outbreaks.
Mortality caused by disease is one of the main problems encountered in themanagement of aquaculture schemes, especially in shrimp culture.
Recommended Procedure
The bidding process for equipment acquisition should give more weight to techni-cal considerations and quality of equipment, and less to price.
Specifications and compatibility must be thoroughly checked for all pro-posed equipment; an exaggerated emphasis on low prices can contribute to theacquisition of low-quality or outdated equipment.
Recommended Procedure
When using private parties in project implementation, the selection should care-fully consider both competence and experience in the type of work to be done.
Ensure that all hired parties have previous experience with the technologyand the physical and social conditions prevailing in the project area.
Recommended Procedure
Plan for adequate time to complete civil works and contract awards, and allow forunexpected events.
After project implementation has started, changes in the original plansoften prevent the engineering work from being completed within the allottedtime. Careful project preparation, including pilot phase trials of new concepts
160 CHANGING THE FACE OF THE WATERS
and technologies, is essential to accurately predict the time required to com-plete civil works.
Institutional Aspects
The institutional framework for a project is as essential to its success as are eco-nomic, financial, and technical considerations.
Recommended Procedures
Keep project organization as simple as possible and clearly define the roles andresponsibilities of people and agencies involved in the project, both existing andnewly required. There must be a clear consensus among the Bank and all partiesinvolved about the nature (public or private), objectives, organization, financing,and operating principles of the institutions involved.
It is highly recommended that, as much as possible, projects should workwithin the country’s existing institutional framework; any eventual majorinnovation should first be tested in a pilot phase. Too many people involved inthe decision-making process, as well as poor communication among theinvolved parties, can cause considerable delays in project implementation.
Recommended Procedure
Project agencies tend to work closer together at lower levels of government; placingresponsibility at the district level rather than at the central level usually improvesperformance.
Agencies operating at the local level will usually have a better “one-on-one”relationship with the farmers than agencies operating at the central level, whichcan contribute significantly to project success.
Recommended Procedures
The agencies responsible for the technical aspects of the project should work closelywith those responsible for giving out credit for project implementation.
Informing the local lending institutions about the technical and managerialaspects of aquaculture projects can significantly improve their willingness toprovide credit for such initiatives.
PROJECT IMPLEMENTATION
Many problems can arise during project implementation, mostly because ofinsufficient preparation or a poor set of initial designs. Frequent Bank super-vision missions that include the technical expertise needed by the project areessential for successful implementation; these missions can identify problemssoon after, or even before, they appear, greatly reducing the time and cost of theimplementation phase. When problems appear, stop and reevaluate.
GUIDELINES FOR AQUACULTURE PROJECTS 161
Recommended Procedures
Thorough project preparation, including a good set of initial technical designs anddetailed soil analysis, is the best insurance against the occurrence of technicalproblems during project implementation.
The most frequent technical problems encountered during project imple-mentation were caused by one of the following factors: poor or incomplete ini-tial designs, poor quality of engineering work, or unsuitability of soils for theproposed work.
Recommended Procedures
Appraisal and supervision missions should not be carried out with the same expertsevery time, although there should be at least one team member who will follow theproject from beginning to end.
Some variety in the supervising group allows a project to be analyzed fromdifferent points of view; however, a degree of constancy is required to ensurecontinuity and a full understanding of all aspects of the project.
Recommended Procedures
Governments need to provide adequate incentives to keep staff and newly trainedpersonnel in the project for long periods of time.
Borrowers should appoint and train enough staff as soon as the project is approved.
Good training of extension officers is essential.
A high degree of staff continuity during project implementation usuallyprovides a strong sense of ownership and commitment from the implement-ing agencies and contributes to overall project success. It is common to under-estimate the time required to appoint and train the staff needed to implementand manage aquaculture projects. This process should start as soon as the proj-ect is approved for implementation.
162 CHANGING THE FACE OF THE WATERS
1. Consider the diversity of aquaculture systems. Species: An estimated 230 commercialspecies of finfish, mollusks, crustaceans, aquatic plants, turtles, and frogs out of atotal of 442 cultured species (not counting ornamental fish), compared with 73species in 1950. However, 25 species account for 90 percent of global production.Aquaculture environments: freshwater, brackish-water, marine; inland, coastal, andoceanic. Production systems: rain-fed ponds; irrigated or flow-through systems; tanksand raceways; sea ranching; closed recycling systems; pond-based recirculation;monoculture and polyculture systems; integrated livestock-fish farming; integratedagriculture-aquaculture. Scale and intensity: small, backyard ponds and hatcheries;industrial commercial operations; extensive, semi-intensive, and intensive.
2. There are some indications that Chinese production statistics for both capture fish-eries and aquaculture may be overestimated.
3. Selected countries are as follows: (1) Asia: India, Indonesia, Japan, Thailand, Bangla-desh, Vietnam, and the Philippines; (2) Africa: the Arab Republic of Egypt, Nigeria,and Madagascar; (3) Latin/South America: Chile, Brazil, Mexico, Ecuador, andColombia; (4) North America: the United States and Canada; and (5) Europe: Nor-way, Spain, France, Italy, the United Kingdom, and Greece (Brugere and Ridler 2004).
4. Including ongoing and completed projects. Some projects had planned aquaculturecomponents at the appraisal stage (an additional $194 million has been approved),but the investments did not occur, or outcomes of aquaculture components werenot documented in Project Completion Reports (PCRs) or Implementation Com-pletion Reports (ICRs).
5. Excluding a major study on Vietnam completed in 2005.
6. Removes three-quarters of total phosphorus and 96 percent of suspended solids.
7. See, for example, Article 9.3 of the FAO Code of Conduct for Responsible Fisheries(1995b).
8. Australia’s Commonwealth Scientific and Industrial Research Organisation
163
N OT E S
(CSIRO) has begun research on a transgenic technology that creates functionalsterility, so stocks can only complete their life cycle under culture conditions andany escapees are unable to breed or produce viable offspring.
9. See, for example, http://www.ifoam.org.10. See various reports of the OIE Aquatic Animal Health Standards Commission.11. The Network of Aquaculture Centres in Central and Eastern Europe (NACEE) is an
interesting model. There is no agreement among governments but only among theparticipating R&D institutions (see http://www.agrowebcee.net/subnetwork/nacee/).
12. In Latin America, some initiatives have already taken place in this regard. See AquaticAnimal Pathogen and Quarantine Information System (AAPQIS) at http://www.aapqis.org/main/main.asp.
13. Projects include the Development of Sustainable Aquaculture Project (DSAP)-WorldFish; DANIDA-Mymenshingh Aquaculture; CBFM Projects; IFAD-OxbowLake; and the Care Cage Aquaculture Project.
14. Cambodia (PRSP), Oman (sixth Five-year Development Plan), and Malaysia (foodsecurity in a five-year plan) all make reference to aquaculture in national policy orplanning documents.
15. Decision No. 224/1999/QD-TTG, December 1999 (Escober 2004).16. Bangladesh Planning Commission 2005.17. Fish exporters still face very high tariffs for selected species (“tariff peaks”) and
higher tariffs for processed or value added products (“tariff escalation”) than rawmaterials.
18. According to WTO, antidumping initiations rose from 157 in 1995 to 364 in 2001(down to 213 in 2004).
19. For example, Aqualma (Madagascar), Kafue Fish Farm (Zambia), and Lake Harvest(Zimbabwe).
20. The top producers in 2004 were Chile (52 percent), Brazil (20 percent), Mexico (7percent), Ecuador (5 percent), and Colombia (4 percent).
21. The government established the first salmon farm in collaboration with Corpora-tion de Fomento, a public development agency, and Fundacion Chile, a privateorganization created to facilitate technology transfer.
22. Compared with a total area of 0.85 million ha and food fish production of 207,000tons in 1994.
23. Support from the government is usually delivered in the form of constructionmaterials and seeds.
24. For example, the Grameen model (Watanabe 1993), or group-based fishpond lease-holding (for example, ADB’s Meghna-Dhanagoda Command Area DevelopmentProject) or Daudkandi Community-Based Floodplain Aquaculture (Morshed 2004;Rahman et al. 2005) or DFID’s Northwest Aquaculture Project (Lewis, Wood, andGregory 1996).
25. See the Policy Matrix 4 on Agricultural Growth toward Poverty Reduction (Bangla-desh Planning Commission 2005).
26. The AIFP was originally funded at $7 million, which was substantially reduced in2005.
27. Recent work by the OECD’s Sahel and West Africa Club indicates production costsfor shrimp production in West Africa, which are well in excess of Asian costs.
28. A Review of Completed Aquaculture Projects (Braga and Zweig 1998) provides sev-eral examples of problems resulting from hurried preparation and appraisal phases.
164 NOTES
Ackefors, H., and M. Enell. 1994. “The Release of Nutrients and Organic Matter fromAquaculture Systems in Nordic Countries.” Journal of Applied Ichthyology 10 (4):225–41.
Aerni, P. 2001. “Aquatic Resources and Technology: Evolutionary, Legal and Develop-mental Aspects.” Science, Technology, and Innovation Discussion Paper 13. Centerfor International Development, Cambridge, MA.
Aguilar-Manjarrez, J., and S. S. Nath. 1998. “A Strategic Reassessment of Fish FarmingPotential in Africa.” CIFA Technical Paper 32. Rome, FAO. 1998.
Ahmed, M. 2006.“Review of Pro-Poor Aquaculture Development in Asia.” Unpublishedreport prepared for the World Bank.
———. 1997. “Fish for the Poor under a Rising Global Demand and Changing FisheryRegime.” NAGA Supplement (July–December): 4–7.
———. 2004. “Outlook for Fish to 2020: A Win-Win for Oceans, Fisheries and thePoor?” In record of a conference conducted by the Australia Academy of Technolog-ical Sciences and Engineering (ATSE) Crawford Fund, “Fish, Aquaculture and FoodSecurity: Sustaining Fish as a Food Supply,” ed. A. G. Brown. Canberra, Australia:Crawford Fund. August 11, 2004.
———. 2005. “Trends and Prospects for Aquaculture in Developing Countries: Driversof Demand and Supply in Changing Global Markets.” PowerPoint presentation atthe FAME workshop, University of Southern Denmark.
Ahmed, M. V., and M. H. Lorica. 2002. “Improving Developing Country Food Securitythrough Aquaculture Development: Lessons from Asia.” Food Policy 27: 125–41.
Akteruzzaman, M. 2005. “From Rice to Fish Culture: Process, Conflicts and Impacts.”Unpublished. A report submitted to the WorldFish Center, South Asia Office,Dhaka, Bangladesh.
Allan, G. 2004. “Fish for Feed vs. Fish for Food.” In record of a conference conducted bythe ATSE Crawford Fund, “Fish, Aquaculture and Food Supply: Sustaining Fish as a
165
R E F E R E N C E S
Food Supply,” ed. A. G. Brown, 20–26. Crawford Fund: Canberra, Australia. August11, 2004.
Anik, A. R. 2003. “Economic and Financial Profitability of Aromatic and Fine Rice Pro-duction in Bangladesh.” M.S. thesis. Department of Agricultural Economics,Bangladesh Agricultural University, Mymensingh, Bangladesh.
Anonymous. 1997. Holmenkollen Guidelines for Sustainable Aquaculture. Oslo, Norway.
Aquaculture Asia. 1997. “The Rewards of Inefficiency.” 2 (3): 1–2.
Aquaculture Association of Southern Africa Web site. 2006. Available at http://www.aasa-aqua.co.za (accessed 2006).
Argue, B. J., S. M. Arce, J. M. Lotz, and S. M. Moss. 2002. “Selective Breeding of PacificWhite Shrimp (Litopenaeus vannamei) for Growth and Resistance to Taura Syn-drome Virus.” Aquaculture 204 (3): 447–60.
Asian Development Bank (ADB). 2005a. An Evaluation of Small-Scale Freshwater RuralAquaculture Development for Poverty Reduction.
———. 2005b. An Impact Evaluation on the Development of Genetically ImprovedFarmed Tilapia and Their Dissemination in Selected Countries. ADB, Manila, Octo-ber 2005. Available at http://www.adb.org/publications (accessed 2006).
Australian Centre for International Agricultural Research Web site. 2006. Available athttp://www.aciar.gov.au/ (accessed 2006).
Baijot, E., J. Moreau, and S. Bouda, ed. 1994.“Aspects Hydrobiologiques et Piscicoles desretenues d’eau en Zone Soudano-Saheliene.” Centre Technique de CooperationAgricole et Rurale ACP/CEE, Wageningen, The Netherlands.
Bangkok Declaration and Strategy for Aquaculture Development Beyond 2000. 2001. InAquaculture in the Third Millennium, ed. R. Subasinghe, P. Bueno, M. J. Phillips,C. Hough, S. E. McGladdery, and J. R. Arthur, Technical Proceedings of the Confer-ence on Aquaculture in the Third Millennium, Bangkok, Thailand. 463–71. Febru-ary 20–25, 2000. Bangkok: NACA; Rome: FAO.
Bangladesh Planning Commission. 2005. “Unlocking the Potential: National Strategyfor Accelerated Poverty Reduction.” GED, Government of People’s Republic ofBangladesh. Planning Commission, Bangladesh. Unpublished.
Bartley, D. M., R. Subasinghe, and D. Coates. 1996. “Framework for the Responsible Useof Introduced Species.” EIFAC /XIX/96/inf.8 Report of the Ninth Session of theEuropean Inland Fisheries Advisory Commission, Dublin, Ireland.
Bisharat, N., and R. Raz. 1996. “Vibrio Infection in Israel Due to Changes in Fish Mar-keting.” Lancet 348: 1585–86.
Bondad-Reantaso, M. G. 2004. “Development of National Strategy on Aquatic AnimalHealth Management in Asia.” In Capacity and Awareness Building on Import RiskAnalysis for Aquatic Animals, ed. J. R. Arthur and M. G. Bondad-Reantaso, 103–08.Proceedings of the Workshop held in Bangkok, Thailand, April 1–6, 2002, andMazatlan, Mexico, August, 12–17, 2002. APEC FWG 01/2002; Bangkok: NACA.
Bondad-Reantaso, M. G., R. P. Subasinghe, J. R. Arthur, K. Ogawa, S. Chinabut,R. Adlard, T. Zilong, and M. Shariff. 2005. “Diseases and Health Management inAsian Aquaculture.” Veterinary Parasitology 132 (3-4): 249–72.
Bostock, T., P. Greenhalgh, and U. Kleih. 2004. “Policy Research—Implications for Lib-eralisation of Fish Trade for Developing Countries.” Synthesis Report. Chatham,UK: Natural Resources Institute.
Boyd, C. E., and W. Clay. 1998. “Shrimp Aquaculture and the Environment.” ScienceAmerica 58: 59–65.
166 REFERENCES
Braga, M. I. J., and R. Zweig. 1998. “A Review of Completed Aquaculture Projects.”Draft. World Bank, Washington, DC.
Brummett, R. E., and F. J. K. Chikafumbwa. 1995.“Management of Rainfed Aquacultureon Malawian Smallholdings.” Paper presented at the PACON Conference on Sus-tainable Aquaculture, Honolulu, Hawaii. June 11–14. Pacific Congress on MarineScience and Technology, Honolulu, Hawaii.
Brummett, R. E., and R. P. Noble. 1995. “Farmer-Scientist Research Partnerships andSmallholder Integrated Aquaculture in Malawi.” In The Management of IntegratedFreshwater Agro-Piscicultural Ecosystems in Tropical Areas, ed. J.-J. Symoens and J-C.Micha. Wageningen, The Netherlands: Technical Centre for Agricultural and RuralCooperation; Brussels, Belgium: Royal Academy of Overseas Sciences.
Brummett, R. E., V. Pouomogne, and J. Gockowski. 2005. “Development of IntegratedAquaculture-Agriculture Systems for Small-Scale Farmers in the Forest Margins ofCameroon.” WorldFish Center, Yaoundé, Cameroon.
Buras, N. 1990. “Bacteriological Guidelines for Sewage-fed Fish Culture, in Wastewater-fed Aquaculture.” In Proceedings of the International Seminar on Wastewater Recla-mation and Reuse for Aquaculture, ed. P. Edwards and R. S. V. Pullin, 223–36. Cal-cutta, India, December 6–9, 1988. Bangkok: ENSIC, AIT.
Chesapeake Bay Net. 2006. Available at http://www.chesapeakebay.net (accessed 2006).
Chikafumbwa, F. J., K. L. Katambalika, and R. E. Brummett. 1998. “Community Man-aged Thamandas for Aquaculture in Malawi.” World Aquaculture 29 (3): 54–59.
Chilaud, T. 1996.“The World Trade Organization Agreement on the Application of San-itary and Phytosanitary Measures.” Scientific and Technical Review—InternationalOffice of Epizootics 15: 733–41.
Cho, C. Y., J. D. Hynes, K. R. Wood, and K. Yoshida. 1994. “Development of High-Nutrient-Dense, Low-Pollution Diets and Prediction of Aquaculture Wastes UsingBiological Approaches.” Aquaculture 124 (1-4): 293–305.
Chobanian, E. 2006. “Aquaculture and Coastal Management Portfolio Review. LessonsLearned.” Unpublished draft report. World Bank, Washington, DC.
Chopra, K., and P. Kumar in collaboration with P. Kapuria and N. A. Khan. 2005.“Trade, Rural Poverty and the Environment: A Study in Eastern India.” Institute ofEconomic Growth, Delhi, India.
Convention on Biological Diversity. 1992. Available at http://www.biodiv.org/convention/articles.asp (accessed 2006).
Cullinan, C., and A. van Houtte. 1997. “Development of Regulatory Frameworks.” InReview of the State of World Aquaculture 75–79. Rome: FAO.
Dallimore, J. 2004. “Traceability in Aquaculture.” The INFOSAMAK Buyer-Seller Meet-ing. Edition 2004 and The First Value-Added Seafood Conference, Cairo, Egypt.April 26–28, 2004. Cairo: INFOSAMAK.
Davenport, J., G. Burnell, T. Cross, S. Culloty, S. S. Ekaratne, B. Furness, M. Mulcahy,and H. Thetmeyer. 2003. “Aquaculture: The Ecological Issues.” The British Ecologi-cal Society Ecological Issues Series. Oxford, UK: Blackwell.
De, H. K., and G. S. Saha. 2005. “Community Based Aquaculture—Issues and Chal-lenges.” Aquaculture Asia X (4). October–December 2005.
De Silva, S. S. 2001. “A Global Perspective of Aquaculture in the New Millennium.” InAquaculture in the Third Millennium, ed. R. Subasinghe, P. Bueno, M. J. Phillips,C. Hough, S. E. McGladdery, and J. R. Arthur. Bangkok: NACA; Rome: FAO. Tech-nical Proceedings of the Conference on Aquaculture in the Third Millennium,Bangkok, Thailand. February 20–25, 2000.
REFERENCES 167
Delgado, C. L., N. Wada, M. W. Rosegrant, S. Meijer, and M. Ahmed. 2003.“Fish to 2020:Supply and Demand in Changing Global Markets.” International Food PolicyResearch Institute, Washington, DC, and WorldFish Center, Penang, Malaysia.
Dey, M. M. 2000. “The Impact of Genetically Improved Farmed Tilapia in Asia.” Aqua-culture Economics and Management 4 (1-2): 107–24.
Dey, M. M., F. J. Paraguas, N. Srichantuk, Y. Xinhua, R. . Bhtta, and L. T. C. Dung. 2005.“Technical Efficiency of Freshwater Pond Polyculture Production in Selected AsianCountries: Estimation and Implications.” Aquaculture Economics and Management 9(1-2): 39–63.
Dey, M. M., M. A. Rab, K. M. Jahan, A. Nisapa, A. A. Kumar, and M. Ahmed. 2004.“FoodSafety Standards and Regulatory Measures: Implications for Selected Fish ExportingAsian Countries.” Aquaculture Economics and Management 8 (3-4): 217–36.
Dunham, R. A., K. Majumdar, E. Hallerman, D. Bartley, G. Mair, G. Hulata, Z. Liu,N. Pongthana, J. Bakos, D. Penman, M. Gupta, P. Rothlisberg, and G. Hoerstgen-Schwark. 2001. “Review of the Status of Aquaculture Genetics.” In Aquaculture in theThird Millennium, ed. R. Subasinghe, P. Bueno, M. J. Phillips, C. Hough, S. E.McGladdery, and J. R. Arthur, 137–66. Bangkok: NACA; Rome: FAO.
The Economist. 2006. “The Omega Point.” The Economist Newspaper and The Econo-mist Group. January 19.
Edwards, P. 2000. “Aquaculture, Poverty Impacts and Livelihoods.” Natural ResourcesPerspectives 56. June 2000. Available online at http://www. odi.org.uk/nrp/56.html.
———. 2005. “Small-Scale Pond Aquaculture in Bangladesh.” Aquaculture Asia X (4):5–7.
EIFAC/FAO (European Inland Fisheries Advisory Commission/Food and AgricultureOrganization). 1998. Report of the Symposium on Water for Sustainable InlandFisheries and Aquaculture held in connection with the European Inland FisheriesCommission, 20th session, Praia do Caroveiro, Portugal. June 23–July 1. FAO Fish-eries Report 580 (Suppl.). FAO, Rome.
Eurofish. 2004. “Does Farmed Salmon Cause Cancer?” 1: 62–65.
FAO (Food and Agriculture Organization of the United Nations). 1976. Report of theFAO Technical Conference on Aquaculture. Kyoto, Japan, May 26–June 2. FAO, Rome.
———. 1990. “CWP Handbook of Fishery Statistical Standards—Section J: Aqua-culture.” FIGIS Ontology Sheets. FAO, Rome. Available at: http://www.fao.org/figis/servlet/static?dom=ontology&xml=sectionJ.xml.
———. 1995a. “Precautionary Approach to Capture Fisheries and Species Introduc-tions.” FAO Technical Guidelines for Responsible Fisheries, No. 2. FAO, Rome.
———. 1995b. “Code of Conduct for Responsible Fisheries.” FAO, Rome.———. 1996. “Fisheries Department.” FAO Technical Guidelines for Responsible Fish-
eries, No. 2. FAO, Rome.———. 1997a. “Aquaculture Development.” FAO Technical Guidelines for Responsible
Fisheries, No. 5. FAO, Rome.———. 1997b. “Review of the State of World Aquaculture.” FAO Fisheries Circular No.
886, Rev 1. FAO, Rome.———. 1999. “The State of World Fisheries and Aquaculture 1998.” FAO, Rome.———. 2000. “The State of World Fisheries and Aquaculture 2000.” FAO, Rome.———. 2003. “Asia-Pacific Aquaculture Sector Reviews: A Regional Synthesis.” Unpub-
lished Report. FAO, Rome.———. 2004. “The State of Fisheries and Aquaculture 2004.” FAO, Rome.
168 REFERENCES
———. 2005a.“Regional Review on Aquaculture Development, 3. Asia and the Pacific.”FAO Fisheries Circular 1017/3. FAO, Rome.
———. 2005b. “Regional Review of Aquaculture Development in Latin America andthe Caribbean.” Unpublished draft. FAO, Rome.
———. 2006. “Asia Pacific Regional Aquaculture Review—A Regional Synthesis.” FAO,Rome.
———. In press. “Regional Review on Aquaculture Development. Africa.” FAO Fish-eries Circular. FAO, Rome.
———. In press. Draft Synthesis Report on Global Aquaculture. FAO Fisheries Depart-ment, Inland Water Resources, and Aquaculture Service (FIRI), Rome.
FAO Aquaculture Glossary. Available at http://www.fao.org/fi/glossary/aquaculture/(accessed 2006).
FAO Fishstat. 2005. Available at http://www.fao.org/fi/statist/FISOFT/FISHPLUS.asp(databases downloaded May 2006).
FAO/NACA. 2000. “Asia Regional Technical Guidelines on Health Management for theResponsible Movement of Live Aquatic Animals and the Beijing Consensus andImplementation Strategy.” FAO Fisheries Technical Paper 402. FAO, Rome.
———. 2001. “Manual of Procedures for the Implementation of the Asia RegionalTechnical Guidelines on Health Management for the Responsible Movement of LiveAquatic Animals.” FAO Fisheries Technical Paper 402 (Suppl. 1). FAO, Rome.
FAO/NACA/CIFA. 2003. “Report of the FAO/NACA/CIFA Expert Consultation on theIntensification of Food Production in Low Income Food Deficit Countries throughAquaculture.” Bhubaniswar, India, October 16–19, 2001. FAO Fisheries Report 718.FAO, Rome.
FAO/NACA/SEAFDEC/MRC/WFC. 2002.“The Role of Aquaculture and Living AquaticResources: Priorities for Support and Networking.” Report of a regional donor con-sultation. Manila, November 27–28, 2002. FAO RAP, Bangkok.
FAO Regional Office for Africa. 1999. “Africa Regional Aquaculture Review.” Proceed-ings of a Workshop held in Accra, Ghana, September 22–24, 1999. CIFA OccasionalPaper 24. Accra: FAO.
———. 2005. Report of the Twenty-Sixth Session of the Committee on Fisheries.Rome, March 7–11, 2005. FAO Fisheries Report 780. FIPL/R780 (En). FAO,Rome.
FAO, UNDP, and Norway. 1987. “Thematic Evaluation of Aquaculture.” Joint study byUnited Nations Development Programme, Norwegian Ministry of DevelopmentCooperation and the Food and Agriculture Organization of the United Nations.Rome: FAO.
Feare, C. J. 2006. “Fish Farming and the Risk of Spread of Avian Influenza.” Wild WingsBird Management, March. Available at: http://www.birdlife.org/action/science/species/avian_flu/index.html.
Fegan, D. 1996. “Sustainable Shrimp Farming in Asia: Vision or Pipe Dream?” Aqua-culture Asia 1 (2): 22–28.
Fiskeridirektoratet. 2004. “Lønnsomhetsundersøkelse for matfiskproduksjon Laks ogØrret. Omfatter selskaper med produksjon av laks og ørret i saltvann.” Fiskeridirek-toratet, Bergen.
FMC Biopolymer (USA) cited by I. Bryceson. 2005. Fishery Forum for DevelopmentCooperation Annual Meeting, Bergen, 2005. (PowerPoint.)
Folke, C., N. Kautsky, H. Berg, Å. Jansson, and M. Troell. 1998. “The Ecological Foot-print Concept for Sustainable Seafood Production—A Review.” Ecological Applica-tions 8 (1): 63–71.
REFERENCES 169
Forster, J. 1999.“Aquaculture Chickens, Salmon: A Case Study.” World Aquaculture Mag-azine 30 (3): 33, 35–38, 40, 69–70.
Freshwater Fisheries Research Centre (Wuxi, China). 2001. “Studies on the Recent Status of the Genetic Quality of the Major Chinese Farmed Fishes.” Unpublishedreport. World Bank, Washington, DC.
Furedy, C. 1990.“Social Aspects of Human Excreta Reuse: Implications for AquaculturalProjects in Asia.” In Wastewater-Fed Aquaculture, ed. P. Edwards and R. S. V. Pullin,251–66. Proceedings of the International Seminar on Wastewater Reclamation andReuse for Aquaculture, Calcutta, India, December 6–9, 1988. xxix. EnvironmentalSanitation Information Center, Asian Institute of Technology, Bangkok, Thailand.
Gjedrem, T. 1997.“Selective Breeding to Improve Aquaculture Production.” World Aqua-culture (March): 33–45.
———. 2000. “Genetic Improvement of Coldwater Fish.” Aquaculture Research 31 (1):25–33.
———. 2006. Personal communication.
Goldburg, R. J., M. S. Elliot, and R. L. Naylor. 2001. “Marine Aquaculture in the UnitedStates: Environmental Impacts and Policy Options.” Arlington, VA: Pew OceanCommission.
Gregussen, O. 2005. “Aquaculture—the Norwegian Experience.” Presentation at theconference, “The Role of Aquaculture in Meeting Global Food Demand,” Seattle,WA. June 20, 2005.
Griffiths, D. n.d. Poverty and Livelihoods: Field experiences from Bangladesh, Cam-bodia and Viet Nam. Available at http://www.streaminitiative.org/Library/pdf/pdf-FAO-Poverty/Don_Griffiths.pdf.
Gu, H. X., S. L. Hu, and Z. G. Yang. 1996. “The Relationship between Integrated FishFarming and Human Influenza Pandemic.” Zhonghua Liu Xing Bing Xue Za Zhi 17(1): 29–32 (in Chinese).
Gupta, M. V., J. D. Sollows, M. A. Mazid, A. Rahman, M. G. Hussain, and M. M. Dey, ed.1998. “Integrating Aquaculture with Rice Farming in Bangladesh: Feasibility andEconomic Viability, Its Adoption and Impact.” ICLARM Technical Report 55.ICLARM, Manila.
Hagler, M. 1997. “The Social Damage Caused by Shrimp Farming.” In Shrimp: TheDevastating Delicacy, A Greenpeace Report. Available at: http://archive.greenpeace.org/oceans/.
Hallman K., D. J. Lewis, and S. Begum. 2003. “An Integrated Economic and SocialAnalysis to Assess the Impact of Vegetable and Fishpond Technologies on Poverty inRural Bangladesh.” Food Consumption and Nutrition Division Discussion Paper163. International Food Policy Research Institute, Washington, DC.
Halwart, M., and A. A. van Dam, ed. 2006. “Integrated Irrigation and Aquaculture inWest Africa: Concepts, Practices and Potential.” Rome, FAO.
Halwart, M., and M. V. Gupta, ed. 2004. Culture of Fish in Rice Fields. FAO and TheWorldFish Center. Rome and Penang.
Hardy, R. W., and D. Gatlin. 2002. “Nutritional Strategies to Reduce Nutrient Losses inIntensive Aquaculture.” In Avances en Nutrición Acuícola VI, ed. L. E. Cruz-Suárez,D. Ricque-Marie, M. Tapia-Salazar, M. Gaxiola-Cortés, and N. Simoes. Memorias delVI Simposium Internacional de Nutrición Acuícola. Septiembre 3–6, 2002. Cancún,Quintana Roo, México.
Harrison, E., J. A. Stewart, R. L. Stirrat, and J. Muir. 1994. Fish Farming in Africa. What’sthe Catch? London: Overseas Development Administration.
170 REFERENCES
Hecht, T. 2006. “A Synopsis of Sub-Saharan African Aquaculture.” A report prepared forthe Fisheries Department Group (RAFI-FIRI) of the FAO Regional Office for Africa(draft). Grahamstown, South Africa.
Hishamunda, N., and R. Subasinghe. 2003. “Aquaculture Development in China: TheRole of Public Policies. FAO Fisheries Technical Paper 427. FAO, Rome.
Hites, R. A., J. A. Foran, D. O. Carpenter, M. Coreen Hamilton, B. A. Knuth, S. J. Schwa-ger. 2004.“Global Assessment of Organic Contaminants in Farmed Salmon.” Science303 (5655): 226–29.
Hop, L. T. 2003. “Program to Improve Production and Consumption of Animal SourceFoods and Malnutrition in Vietnam.” Journal of Nutrition 133: 4006S–4009S.
Hulata, G. 2001. “Genetic Manipulations in Aquaculture: A Review of Stock Improve-ment by Classical and Modern Technologies.” Genetica 111 (1-3): 155–73.
ICES. 2003. Report of the Working Group on Marine Shellfish Culture, Trondheim,Norway. August 13–15. Mariculture Committee ICES CM 2003/F:05 Ref. ACME.ICES, Copenhagen.
———. 2005. Report of the Working Group on Environmental Interactions of Maricul-ture. ICES Mariculture Committee. April 11–15, 2005. Ottawa, Canada. CM 2005/F:04. Ref. I, ACME.
International Council for the Exploration of the Seas (ICES). 1995. “ICES Code ofPractice on the Introduction and Transfers of Marine Organisms—1994.” ICES Co-operative Research Report 204. ICES, Copenhagen.
International Finance Corporation Web site. 2006. Available at http://www.ifc.org/ifcext/agribusiness.nsf/Content/Aquaculture (accessed 2006).
International Foundation for Science Web site. 2006. Available at http://www.ifs.se/(accessed 2006).
International Institute of Rural Reconstruction and International Center for LivingAquatic Resource Management, ed. 2001. “Integrated Agriculture-Aquaculture: APrimer.” FAO Fisheries Technical Paper 407. FAO, Rome.
International Network on Genetics in Aquaculture Web site. 2006. Available at http://www.worldfishcenter.org/inga/ (accessed 2006).
International Organization for Standardization. ISO 9000. Available at http://www.iso.org/iso/en/iso9000-14000/certification/index_two.html (accessed 2006).
Irz, X., J. R. Stevenson, A. Tanoy, P. Villarante, and P. Morissens. n.d. “Aquaculture andPoverty—A Case Study of Five Coastal Communities in the Philippines.” Researchproject R8288 DFID AFGRP: Assessing the Sustainability of Brackish Water Aqua-culture Systems in the Philippines. Working Paper 4.
Islam, M. S., M. A. Wahab, A. A. Miah, and A. H. M. Mustafa Kamal. 2003. “Impacts ofShrimp Farming on the Socioeconomic and Environmental Conditions in theCoastal Regions of Bangladesh.” Pakistan Journal of Biological Sciences 6 (24): 2058–2067.
Josupeit, H. 1985. “A Survey of External Assistance to the Fisheries Sector in Develop-ing Countries, 1978–1984.” FAO Fisheries Circular 755. FAO, Rome.
Josupeit, H., A. Lem, and H. Lupin. 2001. “Aquaculture Products: Quality, Safety, Mar-keting and Trade.” In Aquaculture in the Third Millennium, ed. R. Subasinghe,P. Bueno, M. J. Phillips, C. Hough, S. E. McGladdery, and J. R. Arthur. Bangkok:NACA; Rome: FAO. Technical Proceedings of the Conference on Aquaculture in theThird Millennium, Bangkok, Thailand. February 20–25, 2000.
Juniati. 2005. “An Integrated Livestock-Fish Farming System.” LEISA Magazine on LowExternal Input and Sustainable Agriculture 21 (3): 29.
REFERENCES 171
Kapetsky, J. M. 1994. “A Strategic Assessment of Warm-Water Fish Farming Potential inAfrica.” CIFA Technical Paper 27. FAO, Rome.
———. 1995. A First Look at the Potential Ccontribution of Warm Water Fish Farm-ing to Food Security in Africa. In Proceedings of the Seminar on the Management ofIntegrated Freshwater Agro-Piscicultural Ecosystems in Tropical Areas, ed. J.-J.Symoens and J.-C. Micha, 547–592. Brussels, Belgium, May 16–19, 1994. TechnicalCentre for Rural Cooperation (CTA), Wageningen, the Netherlands.
Kapuscinski, A. R. 2005. “Current Scientific Understanding of the Environmental Bio-safety of Transgenic Fish and Shellfish.” Rev. Sci. SciTech. Off. Int. Epiz. 2005, 24 (1):309–322.
Karim, M., M. Ahmed, R. K. Talukder, M. A. Taslim, and H. Z. Rahman. 2006. “DynamicAgribusiness-Focused Aquaculture for Poverty Reduction and Economic Growth inBangladesh.” WorldFish Center Discussion Series Policy Working Paper. 1.44. Min-istry of Fisheries and Livestock, Bangladesh, The WorldFish Center, and BangladeshShrimp and Fish Foundation, Penang.
Kaspar, H. F., P. A. Gillespie, I. C. Boyer, and A. L. MacKenzie. 1985. “Effects of MusselAquaculture on the Nitrogen Cycle and Benthic Communities in Kenepuru Sound,Marlborough Sounds, New Zealand.” Marine Biology 85: 127–36.
Kelleher, K. 1974. “An Analysis and Evaluation of Subsistence-Level Tilapia Culture inthe Central African Republic.” Project report. FAO UNDP Bangui.
———. 2005. “Discards in the World’s Marine Fisheries. An Update.” FAO FisheriesTechnical Paper 470. FAO, Rome.
King, H. R. 1993. “Aquaculture Development and Environmental Issues in Africa.” InEnvironment and Aquaculture in Developing Countries, ed. R. S. V. Pullin, H. Rosen-thal, and J. L. Maclean, 116–124. ICLARM Conference Proceedings 31, WorldFishCenter, Penang, Malaysia.
King, J. 1992. “Aquaculture in southern Africa.” Food and Agriculture Organization ofthe United Nations, Harare, Zimbabwe.
Konde, V. 2006. “Africa in the Global Flows of Technology: An Overview.” African Tech-nology Development Forum (ATDF) Journal 3 (1). Available at www.atdforum.org(accessed 2006).
Kongkeo, H. 2001. “Current Status and Development Trends of Aquaculture in theAsian Region.” In Aquaculture in the Third Millennium, ed. R. Subasinghe, P. Bueno,M. J. Phillips, C. Hough, S. E. McGladdery, and J. R. Arthur, 267–93. Bangkok:NACA; and Rome: FAO. Technical Proceedings of the Conference on Aquaculture inthe Third Millennium, Bangkok, Thailand, February 20–25, 2000.
Kumaran, M., N. Kalaimani, K. Ponnusamy, V. S. Chandrasekaran, and D. DeboralVimala. 2003. “A Case of Informal Shrimp Farmers’ Association and Its Role in Sus-tainable Shrimp Farming in Tamil Nadu.” Aquaculture Asia 7 (2): 10–12.
Lam, T. D. T. 2003. “US ‘catfish war’ defeat stings Vietnam.” Asia Times online. July 31.
Le, Than Luu. 2001. “Sustainable Aquaculture for Poverty Alleviation (SAPA): A NewRural Development Strategy for Viet Nam—Part I.” FAO Aquaculture Newsletter 27.July.
Lewis, D. J., G. D. Wood, and R. Gregory. 1996. Trading the Silver Seed, Local Knowledgeand Market Moralities in Aquaculture Development. Dhaka: University Press Limited.
Li, S. F. 2003. “Aquaculture Research and Its Relationship to Development in China.” InAgricultural Development and the Opportunities for Aquatic Resources Research inChina. WorldFish Center, Penang.
172 REFERENCES
Little, D. C., and P. Edwards. 2003. “Integrated Livestock-Fish Farming Systems.” InlandWater Resources and Aquaculture Service. Animal Production Service. FAO, Rome.
LMC International Ltd. n.d. As cited in A. G. J. Tacon, “State of Information on SalmonAquaculture Feed and the Environment.” Available at http://www.westcoastaquatic.ca/Aquaculture_feed_environment.pdf (accessed 2).
Lowther, A. 2005. “Highlights from the FAO Database on Aquaculture Production Sta-tistics.” FAO Aquaculture Newsletter 33 (July): 22–24. FAO, Rome.
Luu, L. T. 1992. “The VAC System in Northern Vietnam.” In: FAO/ICLARM/IIRR. Inte-grated Agriculture-Aquaculture: A Primer. FAO Fisheries Technical Paper 407.Rome, FAO. 2001.
MacAlister, Elliott, and Partners. 1999. “Forward Study of Community Aquaculture.Summary Report.” European Commission, Fisheries Directorate General.
Mair, G. C., and P. A. Tuan. 2002. “Vietnam: Stock Comparisons for Polyculture andNational Breeding Programmes.” In proceedings of a workshop on “Genetic Man-agement and Improvement Strategies for Exotic Carps in Asia.” ed. D. J. Penman, M.G. Hussain, B. J. McAndrew, and M. A. Mazid, 37–42. Dhaka, Bangladesh.February 12–14, 2002. Bangladesh Fisheries Research Institute, Mymensingh,Bangladesh.
Mandal, S. A., G. Chowhan, G. Sarwar, A. Begum, and A. N. M. Rokon Uddin. 2004.Mid-term Review Report on Development of Sustainable Aquaculture ProjectCDSAP. Dhaka, Bangladesh: WorldFish Center, South Asia Office.
Mazid, M., ed. 1999. Rural and Coastal Aquaculture in Poverty Reduction. Proceedingsof a seminar organized on the occasion of Fish Week 1999. Ministry of Fisheries andLivestock, Bangladesh.
Moehl, J. 2003. “Africa Regional Activities.” FAO Aquaculture Newsletter 29 (July).
Moehl, J., M. Halwart, and R. Brummett. 2005. “Report of the FAO-WorldFish CenterWorkshop on Small-Scale Aquaculture in Sub-Saharan Africa: Revisiting the Aqua-culture Target Group Paradigm.” Limbé, Cameroon, March 23–26, 2004. CIFAOccasional Paper 25. FAO, Rome.
Monfort, M. C. 2006. “Markets and Marketing of Aquaculture Finfish in Europe Focuson the Mediterranean Basin.” FAO Fisheries Division. April 2006.
Monti, G., and M. Crumlish. n.d. “The Importance of Pangasius Farming in theMekong Delta, Vietnam.” AquaNews. Available at http://www.aquaculture.stir.ac/uk/AquaNews/32P18_20.pdf (accessed 2006).
Myrseth, B. In press. What We Have Learned from Fish Farming and How Can We ApplyThis for Future Developments. Norway: Marine Farms ASA.
NACA/FAO, ed. 2001. “Aquaculture Development: Financing and Institutional Sup-port.” In Aquaculture in the Third Millennium, ed. R. Subasinghe, P. Bueno, M. J.Phillips, C. Hough, S. E. McGladdery, and J. R. Arthur. Bangkok: NACA; Rome: FAO.
Nairobi Declaration on Conservation of Aquatic Biodiversity and Use of GeneticallyImproved and Alien Species for Aquaculture in Africa. 2002. ICLARM/CTA/ FAO/IUCN/UNEP/CBD. Nairobi, Kenya.
Nash, C. E., P. R. Burbridge, and J. K. Volkman, ed., 2005.“Guidelines for Ecological RiskAssessment of Marine Aquaculture.” Prepared at the NOAA Fisheries Service Man-chester Research Station International Workshop, April 11–14, 2005. U.S. Depart-ment of Commerce, National Oceanic and Atmospheric Agency (NOAA), NationalMarine Fisheries Service. Tech. Memo. NMFS-NWFSC-71.
REFERENCES 173
National Research Council (NRC). 1999. “Clean Coastal Waters: Understanding andReducing the Effects of Nutrient Pollution.” National Academy Press, Washington, DC.
Naylor, R., R. J. Goldburg, H. Mooney, M. Beveridge, J. Clay, C. Folke, N. Kautsky,J. Lubchenco, J. Primavera, and M. Williams. 1998. “Nature’s Subsidies to Shrimpand Salmon Farming.” Science 282 (5390): 883.
Naylor, R., K. Hindar, I. A. Fleming, R. Goldburg, S. Williams, J. Volpe, F. Whoriskey,J. Eagle, D. Kelso, and M. Mangel. 2005. “Fugitive Salmon: Assessing the Risks ofEscaped Fish from Net-Pen Aquaculture.” BioScience 55 (5): 427–37.
Naylor, R. L., R. J. Goldburg, J. H. Primavera, N. Kautsky, M. C. M. Beveridge, J. Clay,C. Folke, J. Lubchenco, H. Mooney, and M. Troell. 2000. “Effects of Aquaculture onWorld Fish Supplies.” Nature 405: 1017–024.
Network of Aquaculture Centers in Asia-Pacific (NACA). 2006. “Thailand, ShrimpFarming and the Environment.” Available at http://www.enaca.org/modules/tinyd2/index.php?id=1 (accessed 2006).
OIE. 2005. Aquatic Animal Health Code, 8th edition. Available at http://www.oie.int/eng/normes/fcode/A_summry.htm (accessed April 2006).
Olesen, I., T. Gjedrem, H. B. Bentsen, B. B. Gjerde, and M. Rye. 2003. “Breeding Pro-grams for Sustainable Aquaculture.” Journal of Applied Aquaculture 13 (3-4):179–204.
Oswald, M., Y. Copin, and D. Montferrer. 1996. “Peri-urban Aquaculture in MidwesternCôteô d’Ivoire.” ICLARM Conf. Proc. 41: 525–536.
Ottolenghi, F., C. Silvestri, P. Giordano, A. Lovatelli, and M. B. New. 2004. “Capture-Based Aquaculture, the Fattening of Eels, Groupers, Tunas and Yellowtails.” FAO,Rome.
Pauly, D., E. Froese, L. Y. Liu, and P. Tyedmers. 2001. “Down with Fisheries, Up withAquaculture: Implications of Global Trends in the Mean Trophic Levels of Fish.”Paper presented at American Association for the Advancement of Science-sponsored mini-symposium, The Aquaculture Paradox: Does Fish Farming Supple-ment or Deplete World Fisheries, San Francisco, California. February 18, 2001.
Penamn, D. J. 2005. “Progress in Carp Genetics Research.” In Carp Genetic Resources forAquaculture in Asia, ed. D. J. Penman, M. V. Gupta, and M. M. Dey. WorldFish Cen-ter Technical Report 65. WorldFish Center, Penang.
Phillips, M. J., M. C. M. Beveridgand, and R. M. Clarke. 1991. “Impact of Aquacultureon Water Resources.” In Advances in Aquaculture 3, ed. D. E. Brune and J. R.Tomasso, 568–91. Baton Rouge, LA: World Aquaculture Society.
Pillay, T. V. R. 2001. “Aquaculture Development: From Kyoto 1976 to Bangkok 2000.” InAquaculture in the Third Millennium, ed. R. Subasinghe, P. B. Bueno, M. J. Philipps,C. Hough, S. E. McGladdery, and J. R. Arthur. Bangkok: NACA; Rome: FAO.
Plan of Implementation of the World Summit on Sustainable Development. 2002.Available at: http://www.un.org/esa/sustdev/documents/WSSD_POI_PD/English/POIToc.htm.
Pongthanapanich, T. 2005. “Thai Shrimp Farming. How Much Should Be Taxed?”PowerPoint presentation at the FAME workshop, University of Southern Denmark.
Radheyshyam, M. 2001. “Community-Based Aquaculture in India—Strengths, Weak-nesses, Opportunities, Threats.” Naga: The ICLARM Quarterly 24 (1-2).
Rahim, M. R. 2004. “Profitability of Some Newly Introduced Rice Varieties in SelectedLocations of Bangladesh.” M.S. thesis. Department of Agricultural Economics,Bangladesh Agricultural University, Mymensingh, Bangladesh.
Rahman, H. Z., M. Nuruzzaman, S. Z. Ahmed, M. Z. Rahman, and M. B. Hossain. 2005.“The Interface of Community Approaches and Agri-Business: Insights from Flood-
174 REFERENCES
plain Aquaculture in Daudkandi.” Draft final report. Power and ParticipationResearch Centre, House 79, Road 12/A, Dhanmondi, Dhaka 1209, Bangladesh.
Rana, K., J. Anyila, K. Salie, C. Mahika, S. Heck, and J. Young. n.d. “The Role of AquaFarming in Feeding African Cities.” Urban Agriculture 14: 36–38.
Rana, K., J. Anyila, K. Salie, C. Mahika, S. Heck, J. Young, and G. Monti. 2005. “Aqua-farming in Urban and Peri-urban Zones in Sub-Saharan Africa.” Presentation at the7th Bi-annual Conference of the Aquaculture Association of southern Africa, Gra-hamstown. September 12–14.
Redding, T. A., and A. B. Midlen. 1990.“Fish Production in Irrigation Canals. A Review.”FAO Fisheries Technical Paper 317. FAO, Rome.
Rijsberman, F. R., ed. 2000. “World Water Scenarios: Analyses.” Draft. Earthscan, Lon-don. Feb. 25.
Roderick, E. 2002.“Food of Kings Now Feeding the Masses!” Fish Farming International,29 (9): 32–34.
Satia, B. P., P. N. Satia, and A. Amin. 1992. “Large-scale Reconnaissance Survey ofSocioeconomic Conditions of Fish Farmers and Aquaculture Practices in the Westand Northwest Provinces of Cameroon.” Aquaculture Research Systems in Africa.64–90. IDRC-MR308e.f., International Development Research Centre, Ottawa,Ontario, Canada.
Scholz, U., and S. Chimatiro. 1996. “The Promotion of Small-Scale Aquaculture in theSouthern Region of Malawi, a Reflection of Extension Approaches and TechnologyPackages Used by the Malawi-German Fisheries and Aquaculture Development Pro-ject (MAGFAD).” In Vieh und Fisch. Fachliche Beiträge über Viehwirtschaft, Veter-inärwesen und Fischerei aus Projekten und der Zentrale. GTZ Publication:Eschborn, Germany.
Shehadeh, Z. H., and J. Orzeszk. 1997. “External Assistance.” In Review of the State ofWorld Aquaculture. FAO Fisheries Circular 886. FAO, Rome.
Shepherd, J. 2005. “Sustainability and World Market Prospects.” IFFO presentation.Learning Conference on the Sustainability of Peruvian Industrial Anchoveta Indus-try, Lima, Peru. August 31–September 2.
Shilu, L., and H. Linhau. 1999. “Key Issues in Aquaculture Development in China in the21st Century.” INFOFISH International 1: 42–45.
Simpson, B. 2006. “The Transfer and Dissemination of Agricultural Technologies:Issues, Lessons and Opportunities.” African Technology Development Forum(ATDF) Journal 3 (1): 10–17. Available at http://www.atdforum.org (accessed 2006).
Skladany, M. 1996. “Fish, Pigs, Poultry and Pandora’s Box: Integrated Aquaculture andHuman Influenza.” In Aquaculture Development, Social Dimensions of an EmergingIndustry, ed. C. Bailey, S. Jentoft, and P. Sinclair, 267–85. Boulder, CO: Westview Press.
Smoker, W. W. 2004. “Regional Non-Profit Corporations—An Institutional Model forStock Enhancement.” In Stock Enhancement and Sea Ranching. Developments, Pitfallsand Opportunities, ed. K. M. Leber, S. Kitada, T. Svasand, and H. L. Blankenship.Oxford, U.K.: Blackwell.
STREAM [Support to Regional Aquatic Resources Management] Initiative. 2005. “One-Stop Aqua Shops” Better-Practice Guidelines No. 19.
Subasinghe, R. P., and M. J. Phillips. 2002. “Aquatic Animal Health Management:Opportunities and Challenges for Rural, Small-Scale Aquaculture and EnhancedFisheries Development: Workshop Introductory Remarks.” In Primary Aquatic Ani-mal Health Care in Rural, Small-Scale Aquaculture Development, ed. J. R. Arthur,M. J. Phillips, R. P. Subasinghe, M. B. Reantaso, and I. H. MacRae, 1–5. FAO FisheriesTechnical Paper 406. FAO, Rome.
REFERENCES 175
Subasinghe, R. P., J. R. Arthur, and M. Shariff, ed. 1996. “Health Management in AsianAquaculture.” Proceedings of the Regional Expert Consultation on AquacultureHealth Management in Asia and the Pacific Serdang, Malaysia. May 22–24, 1995.FAO Fisheries Technical Paper 360. FAO, Rome.
Subasinghe, R. P., M. G. Bondad-Reantaso, and S. E. McGladdery. 2001. “AquacultureDevelopment, Health and Wealth.” In Aquaculture in the Third Millennium, ed.R. Subasinghe, P. Bueno, M. J. Philips, C. Hough, S. E. McGladdery, and J. R. Arthur,167–91. Bangkok: NACA; Rome: FAO. Technical Proceedings of the Conference onAquaculture in the Third Millennium, Bangkok, Thailand. February 20–25, 2000.
Support to Regional Aquatic Resources Management (STREAM) Initiative. 2005.Available at http://www.streaminitiative.org/Library/pdf/bpg/worlp/19WBPG.pdf(accessed 2006).
Sustainable Aquaculture for Poverty Alleviation (SAPA). 2000. Proceedings of the Scop-ing Meeting for Development of the Sustainable Aquaculture for Poverty Alleviation(SAPA), Ministry of Fisheries, Hanoi. May 23–25.
Swick, R. A., and M. C. Cremer. 2001. “Livestock Production: A Model for Aqua-culture?” In Aquaculture in the Third Millennium, ed. R. Subasinghe, P. Bueno,M. J. Philips, C. Hough, S. E. McGladdery, and J. R. Arthur, 49–60. Bangkok: NACA;Rome: FAO.
Szuster, B. W. 2003. “Shrimp Farming in Thailand’s Chao Prayha Delta.” Pelawatte, SriLanka: International Water Management Institute.
Tacon, A. G. J. 2003. “Global Trends in Aquaculture and Compound Aquafeed Produc-tion: A Review.” International Aquafeed Directory and Buyers’ Guide 8–23.
———. 2005. “Salmon Aquaculture Dialogue. State of Information on: Salmon Aqua-culture Feed and the Environment.” La Sostenibilidad de la Pesca Industrial de laAnchoveta en el Perú. Lima, Peru. PowerPoint presentation.
———. 2006. “Trash Fish Fisheries, Aquaculture, Pellets and Fishmeal Substitutes.”Asia-Pacific Fisheries Commission. Regional Consultative Forum, Meeting, KualaLumpur. August.
Talukder, R. K. 2004. “Socioeconomic Profiles of the Stakeholders of the AquacultureSector in Bangladesh.” Paper presented at the Final Workshop on Strategies andOptions for Increasing and Sustaining Fisheries and Aquaculture Production toBenefit Poor Households in Bangladesh, Manila, Philippines. March 17–20.
Thompson, P., P. Sultana, and A. K. M. Firoz Khan. 2005. “Aquaculture ExtensionImpacts in Bangladesh: A Case Study from Kapasia, Gazipur.” WorldFish CenterTechnical Report 63. WorldFish Center, Penang.
U.S. Agency for International Development (USAID) SPARE Fisheries and AquaculturePanel. n.d. “Review of the Status, Trends and Issues in Global Fisheries and Aqua-culture, with Recommendations for USAID Investments.” Available at http://pdacrsp.oregonstate.edu/miscellaneous/F%26A_Subsector_Final_Rpt.pdf (accessed2006).
U.S. Department of Commerce. 2005. “Guidelines for Ecological Risk Management ofMarine Fish Aquaculture.” NOAA Technical Memorandum NMFS-NWFSC-71.NOAA, Silver Spring, MD.
USINFO (International Information Programs) Web site. 2004. Available at http://usinfo.state.gov/ (accessed 2006).
VACVINA. 1995. “Intensive Small-Scale Farming in Vietnam.” ILEIA Newsletter 11 (1):4. Available at http://www.metafro.be/leisa/1995/11-1-4.pdf (accessed 2006).
176 REFERENCES
Van der Mheen, H. 1998. “Achievements of Smallholder Aquaculture Development inSouthern Africa.” Experiences from the ALCOM Aquaculture Programme. FAO,Harare, Zimbabwe.
Walker, P. J. 2004. “Disease Emergence and Food Security: Global Impact of Pathogenson Sustainable Aquaculture Production.” In Fish, Aquaculture and Food Supply: Sus-taining Fish as a Food Supply, ed. I. Brown, 44–50. Record of a conference conductedby the ATSE Crawford Fund, Canberra, Australia. August 11.
Wang, Y. 2001. “China P. R.: A Review of National Aquaculture Development.” In Aqua-culture in the Third Millennium, ed. R. Subasinghe, P. Bueno, M. J. Phillips,C. Hough, S. E. McGladdery, and J. R. Arthur, 307–16. Bangkok: NACA; Rome: FAO.Technical Proceedings of the Conference on Aquaculture in the Third Millennium,Bangkok, Thailand. February 20–25, 2000.
Weber, J. T., E. D. Mintz, R. Canizares, A. Semiglia, I. Gomez, R. Sempertegui, A. Davila,K. D. Greene, N. D. Puhr, D. N. Cameron, F. C. Tenover, T. J. Barrett, N. H. Bean,C. Ivey, R.V. Tauxe, and P. A. Blake. 1994. “Epidemic Cholera in Ecuador: Multidrug-Resistance and Transmission by Water and Seafood.” Epidemiology and Infection(112): 1–11.
Weinstein M. R., M. Litt, D. A. Kertesz, P. Wyper, D. Ross, M. Coulter, A. McGreer,R. Facklam, C. Ostach, B. M. Willey, A. Borczyk, D. E. Low, and the InvestigativeTeam. 1997. “Invasive Infection Due to a Fish Pathogen: Streptococcus iniae.” NewEngland Journal of Medicine 33 (7): 589–94.
WHO [World Health Organization]. 1999. “Food Safety Issues Associated with Productfrom Aquaculture, Report of a joint FOA/NACA/WHO study group. Geneva.
Wijkstrom, U. N. 2003. “Some Long-Term Prospects for Consumption of Fish.” Veteri-nary Research Communications 27 (Suppl. 1): 461–68.
Wilder, M., and N. T. Phuong. 2002. “The Status of Aquaculture in the Mekong DeltaRegion of Vietnam: Sustainable Production and Combined Farming Systems.” Pro-ceedings of International Commemorative Symposium: 70th Anniversary of theJapanese Society of Fisheries Science. Fisheries Science 68 (Suppl. I).
World Bank, Center for Development and Integration (CDI), and Vietnam Institute ofEconomics (VIE). 2006.“Vietnam: Engagement of Poor Fishing Communities in theIdentification of Resource Management and Investment Need.” The World Bank andCDI in collaboration with VIE. June.
World Bank. 2005. “Technology and Growth Series: Chilean Salmon Exports.” PREMNotes 103. Available at http://www.enaca.org/shrimp (accessed 2006).
———. 2006. “Meeting the Challenge of Africa’s Development: A World BankGroup Action Plan.” Available at http://siteresources.worldbank.org/INTAFRICA/Resources/aap_final.pdf (accessed 2006).
———. 2006. “Agriculture Investment Sourcebook” Available at: http://siteresources.worldbank.org/EXTAGISOU/Resources/Module6_Web.pdf. (accessed 2006).
World Organization for Animal Health (OIE). 2003. Aquatic Animal Health Code, sixthed. Office International des Epizooties, Paris. Available at http://www.oie.int/eng/normes/ fcode/a_summary.htm (accessed 2006).
Xiuzhen, F. 2003. “Rice-Fish Culture in China.” Aquaculture Asia 8 (4): 44–46.
Yap, W. G. 2004. “Policies and Strategies in the Commercialization of AquacultureDevelopment in SE Asia.” FAO/NACA/SEAFDEC Aquaculture Department, Ilo-Ilo.
Ye, Y. 1999. “Historical Consumption and Future Demand for Fish and Fishery Prod-ucts: Exploratory Calculations for the Years 2015–2030.” FAO Fisheries Circular 946,FAO, Rome.
Zweig, R. 2006. Personal communication (e-mail).
REFERENCES 177
SELECTED BIBLIOGRAPHY
Ahmed, M., M. A. Rab, and M. A. P. Bimbao. 1995. “Aquaculture Technology Adoptionin Kapasia Thana Bangladesh: Some Preliminary Results from Farm Record-Keeping Data.” ICLARM Technical Report 44. International Center for Living AquaticResources Management, Manila, Philippines.
Ali, A. B. 1992. “Rice-Fish Integration in Malaysia: Present Status and Future Prospects.”In proceedings of the FAO/IPT Workshop on Integrated Livestock-Fish ProductionsSystems, “Integrated Livestock-Fish Production Systems,” Kuala Lumpur, Malaysia.December 16–20, 1991.
Ayyapan, S. 1999. “Status and Role of Aquaculture in Rural Development in India.”Paper presented at the FAO/NACA Consultation on Aquaculture for SustainableRural Development, Changrai, Thailand. March 29–31.
Boyd, C. E., and A. Gross. 2000. “Water Use and Conservation for Inland AquaculturePonds.” Fisheries Management and Ecology 7 (1-1): 55–63.
Brugere, C., and N. Ridler. 2004. “Global Aquaculture Outlook in the Next Decades: AnAnalysis of National Aquaculture Production Forecasts to 2030.” FAO Fisheries Cir-cular 1001. FAO, Rome.
Brummett, R. E., and B. A. Costa-Pierce. 2002. “Village-Based Aquaculture Ecosystemsas a Model for Sustainable Aquaculture Development in Sub-Saharan Aquaculture.”In Ecological Aquaculture: The Evolution of the Blue Revolution, ed. B. A. Costa-Pierce, 145–60. Oxford, UK: Blackwell Science.
Bueno, P. 1999. “Small-Scale Aquaculture in Rural Development: Issues, Directions andLessons.” Unpublished. A synthesis of national reports presented at the FAO/NACA expert consultation on sustainable aquaculture for rural development, ChiengRai, Thailand. March 29–31.
Funge-Smith, S., and M. J. Phillips. 2001. “Aquaculture Systems and Species.” In Aqua-culture in the Third Millennium, ed. R. Subasinghe, P. Bueno, M. J. Phillips,C. Hough, S. E. McGladdery, and J. R. Arthur, 129–35. Bangkok: NACA; Rome: FAO.Technical Proceedings of the Conference on Aquaculture in the Third Millennium,Bangkok, Thailand. February 20–25, 2000.
Morshed, S. M. 2004. Community Based Aquaculture in Flood Plains ImplementationGuidelines (in Bangla), trans. Muhammad Muzaffar Hussain. Dhaka: SHISUK.
Muir, J. F. 1995. “Aquaculture Development Trends: Perspectives for Food Security.”KC/FI/95/TECH/4. Paper presented at the International Conference on SustainableContribution of Fisheries to Food Security, Kyoto, Japan. December 4–9, 1995.
National Committee for Research Ethics in Science and Technology, Norwegian Acad-emy of Sciences and Centre for Technology and Culture. 1998. HolmenkollenGuidelines for Sustainable Aquaculture (adopted 1998). Trondheim.
New, M., A. G. J. Tacon, and I. Csavas, ed. 1994. “Farm-made Aquafeeds.” FAO FisheriesTechnical Paper 343. FAO, Rome.
Phillips, M. J. 1998. “Tropical Mariculture and Coastal Environmental Management.” InTropical Mariculture, ed. S. S. De Silva, 38–69. New York: Academic Press.
Purwanto, E. 1999. “Status and Role of Aquaculture in Rural Development in Indo-nesia.” Paper presented at the FAO/NACA Consultation on Aquaculture for Sustain-able Rural Development, Changrai, Thailand. March 29–31.
Riggs, F. 1996. “Consumer Awareness of Environmental Protection Needs in the ShrimpCulture Industry: Marketing for Sustainability.” Paper presented at World Aqua-culture 1996, World Aquaculture Society, Bangkok, Thailand. January 29–February 2.
178 REFERENCES
Rijsberman, F., N. Manning, and S. de Silva. 2006. “Increasing Green and Blue WaterProductivity to Balance Water for Food and Environment.” 4th World Water Forum,Mexico, March 2006. Food and Environment baseline paper. Available athttp://www.iwmi.cgiar.org/WWF4/html/action_1.htm (accessed 2006).
Roberts, R. J., and J. F. Muir. 1995. “25 Years of World Aquaculture Sustainability, aGlobal Problem.” In Sustainable Fish Farming, Proceeding of the First InternationalSymposium on Sustainable Fish Farming, ed. H. Reinertsen and H. Haaland, 167–81.Rotterdam: A. A. Balkema. First International Symposium on Sustainable FishFarming, Oslo, Norway. August 28–31.
Ruddle, K. 1993. “The Impacts of Aquaculture Development on Socioeconomic Envi-ronments in Developing Countries: Toward a Paradigm for Assessment.” In Envi-ronment and Aquaculture in Developing Countries, ed. R. S. V. Pullin, H. Rosenthal,and J. L. Maclean, 20–41. ICLARM Conf. Proc. 31.
Stickney, R. R., and J. P. McVey. 2002. Responsible Marine Aquaculture. Wallingford:CABI Publishing.
Tacon, A. G. J. 2001. “Increasing the Contribution of Aquaculture for Food Security andPoverty Alleviation.” In Aquaculture in the Third Millennium, ed. R. Subasinghe,P. Bueno, M. J. Philips, C. Hough, S. E. McGladdery, and J. R. Arthur, 63–72.Bangkok: NACA; Rome: FAO. Technical Proceedings of the Conference on Aqua-culture in the Third Millennium, Bangkok, Thailand. February 20–25, 2000.
Tidwell, J. H., and G. L. Allan. 2001. “Fish as Food: Aquaculture’s Contribution.” EMBOReports 21 (11): 103–08.
Turner, G., ed. 1988. “Codes of Practice and Manual of Procedures for Consideration ofIntroductions and Transfers of Marine and Freshwater Organisms.” EIFAC Occa-sional Paper 23. European Inland Fisheries Advisory Commission. FAO, Rome.
Watanabe, T. 1993. The Ponds and the Poor. The Story of Grameen Bank’s Initiative.Dhaka: Grameen Bank.
REFERENCES 179
180
Abuja Declaration on SustainableFisheries and Aquaculture, 73b
administrative policies, 5–6Africa, 11, 55, 68–9, 70–1, 148–52agriculture, 15, 26, 52, 57bAIFP, 164nAl campo, 36tAlaska, 146Albania, 104talgae filtration, 37algal blooms, 31Ambergris Aquaculture Ltd., 108tamnesiac shellfish disease, 31antibiotics, 32, 34fantidumping, 67b, 117–8, 164naquaculture, 3, 4, 13, 38, 55, 63, 94, 152,
163n, x–xicommunity-based, 60, 114, 115b,
118, 121–2, 122bcorporate, 61, 89freshwater, 17, 49importance of, 82–3integrated, 25–6pro-poor, 7–9, 118
projects, 104t–108tsector support, 88–9subsistence, 80, 153–4
Aquaculture Act, South Australia, 148Aquaculture Association of Southern
Africa, 151Aquaculture de Crevettes de Besalampy,
107tAquaculture de Mahajamba, 107tAquaculture Development and
Coordination Programme(ADCP), 54, 129
Aquaculture Development Project, 106tAquatic Resources Management
Program, 133Aquatic Resources System Program,
134artificial propagation, 45, 136tASEAN-EC Aquaculture Development
Coordinating Program, 130Asia, 16, 19, 55, 59t, 136t
pro-poor aquaculture, 7, 58, 59t,60–2
science and technology, 53–4, 126–30
I N D E X
The letters b, f, t, and n indicate boxes, figures, tables, and notes.
INDEX 181
Asia-Pacific Fishery Commission(APFIC), 42
Asia-Pacific Marine FinfishAquaculture Network, 134
Asian Development Bank, 101, 120Asian Institute of Technology, 54, 134Australia, 16t, 102, 138tAustralia’s Commonwealth Scientific
and Industrial ResearchOrganisation, 163n–164n
Australian Centre for InternationalAgricultural Research, 132
awareness of aquaculture, 64–5, 72, 91
bacteria, 30Bangkok Declaration and Strategy for
Aquaculture DevelopmentBeyond 2000, 72
Bangladesh, 8, 60, 61, 64, 118, 120–1,122b, 136t, 144t
enabling factors, 62bincomes, 57b, 119tpro-poor and policy interventions,
125production, 16t, 137tprojects, 104tstatic model, 58women, 57
barrages, 94Belize, 22, 108tbest management practices (BMPs), 5,
48, 72best practices, 87, 99–100biodiversity, 6–7, 73b, 91, 97–8bivalves, 31, 44tBrazil, 16t, 137tbreeding programs, 9, 27, 43, 44, 46bbroodstock, 45, 46bBurkina Faso, 150business models, 77–8
cages, 27, 94Cambodia, 61, 136tCanada, 99, 137tcapacity building, 8, 10, 49–51, 53b, 54,
90, 132capture fisheries, 3, 15, 18, 29, 69, 73,
78–9
carbon sequestration, 37, 38bcarnivorous fish, 17carp, 44tCarrefour, 36tcatalysts, 51–2catfish, 37, 44t, 116–7Catfish Farmers of America, 67bCCRF. See Code of Conduct for
Responsible FisheriesCentral African Republic, 74certification, 26, 34–5, 36t, 127certified emission reduction credits
(CERs), 38CGIAR. See Consultative Group on
International AgricultureResearch
challenges, 1–2, 4, 83–4Charoen Pokphand Group, 14chemical oxygen demand (COD), 147chemicals, 25, 31chicken raising, 114children, 32bChile, 16t, 81, 99, 137t, 143f, 164China, 46b, 57b, 88, 111–4, 127f, 131,
136tenabling factors, 62blessons learned, 124–5pro-poor and policy interventions,
123–5production, 3, 16, 16t, 18, 137tprojects, 33b, 104t–105t, 108t, 113b
cholera, 30civil society, 134clams, 44tclimate change, 38bCoastal Lands Development Program,
104tCoastal Wetlands Protection and
Development Project, 106tCOD. See chemical oxygen demandCode of Conduct for Responsible
Fisheries (CCRF), 5, 72codes of practice, 5, 87, 99–100Codex Alimentarius Commission, 35Colombia, 16t, 138tCommand Area Development Project,
122, 122bcommercial farms, 71, 79, 113, 152
182 INDEX
Committee on Fisheries, xicommon property, 146Congo, Democratic Republic of, 144tconservation, 73bconsolidation, 3, 63consolidation pathway, 58, 59tConsortium on Shrimp Aquaculture
and the Environment, 133Consultative Group on International
Agriculture Research (CGIAR),21, 130
consumption, 11, 17–8, 68, 79, 141fnBangladesh, 121b, 144tnutritional benefits, 31, 32bprojections, 139t
contamination, 30Coop Italia, 36tcoordination, 50–1, 55, 65–6, 80, 132Cora, 36t
demand, 19–20, 83Denmark, 138tdevelopment agency portfolios, 104t–
108t, 109development agenda, 54, 90, 130development assistance, 2, 126, 128Development of Sustainable
Aquaculture Project (DSAP),121b
development opportunities, 85–6development pathways, 58, 59tdiarrhetic shellfish poisoning (DSP), 31diffusion, 51, 54, 121bdisease, 10, 28, 37, 46–9, 147
human, 6, 30diversification, 79, 80, 85donor coordination, lack of, 54drugs, 25, 31
ecolabeling, 26, 127ecological footprints, 148, 148teconomic transformation, 110economies of scale, 74Ecuador, 16t, 127f, 138tEgypt, Arab Republic of, 69, 105t
production, 72, 137t, 144temployment, 3, 17, 29, 56–7, 82
Bangladesh, 118
China, 112, 112fthe Philippines, 122Vietnam, 117
endemic species, 155enhancement, 94, 149–50environment, enabling, 4–5, 6, 72–5, 91environmental impacts, 6–7, 15, 24t
production systems, 149frestocking and introductions, 26shrimp farming, 153
environmental issues for projectpreparation, 158
environmental management, 90environmental policies and guidelines,
100–2environmental services from
aquaculture, 35, 37environmental sustainability, 36t, 37–9,
87, 91, 128bequipment acquisition, 160escapes, 27, 28Esselunga, 36tEucheuma, 151export earnings, 136texports, 69, 79, 164nextension services, 51, 120, 125extensive systems, 94–5, 96external assistance, 52, 53b
Faeroe Islands, 138tfarmer organizations, 74farmers, 58, 60, 61farming systems research and extension
(FSR&E), 134fatty acids, 32bfeed conversion ratio, 41feed supplies, 40–3feeds, 9–10, 26fertilizers, 25filtering algae, 37financial capacity, 61–2financial institutions, 76financial services, 11–2, 71, 113, 126,
159financial sources, 89fish as fish food, 41–2Fish Culture Extension Evaluation
Project, 120
INDEX 183
Fish Farmers’ Development Agencies, 60Fish Farming Development Project, 105tfish farming technologies, 61bfish feed categories, 40–1fish feed supply, 43, 82fish food production, 18, 18fFish for All Declaration and Action
Plan, 11Fish for All Summit, 72, 73bfish nutrition, 9–10, 26, 41fish oil and meal, 42fish supply, 3fish value, high vs. low, 63–4fish, nutritional value, 42Fisheries Development Project, 106tfisheries, projections for, 139tfloodplain aquaculture, 118Food and Agriculture Organization
(FAO), 97, xifood fish, 113food fish demand projections, 139tfood fish production, low value, 63food fish supply by continent and
economy, 140tfood safety, 38, 66, 127–8food security, 57food web changes, 24Forth Fisheries, 104tfossil fuels, 38bFrance, 137tfreshwater, 17, 49Freshwater Fisheries Project, 104t, 113b
genetic biodiversity, loss of, 27genetic improvements, 27, 41t, 43–4, 45Genetically Improved Farmed Tilapia
(GIFT), 8, 9, 43Germany, 138tGhana, 105tglobalization, 2, 14, 145fgovernance, 4–6, 88–1, 91government, 81, 114. See also public
sectorGrameen Bank, 121Greater Mymensingh Aquaculture
Extension Project, 120Greece, 16t, 138tgroundwater, 159
growth, 3–4, 16, 16t, 20, 80, 88–9, 131growth rate, 44t, 70, 82Grupo Granjas Marinas S. A. de C.V.,
107tGuangdong Agricultural Development
Project, 105tguidelines, 97–9, 156–62Gupta, Modadugu Vijay, 61b
habitats, 23–4, 73bhatcheries, 95Hazard Analysis and Critical Control
Point (HACCP), 32, 34, 35health management guidelines, 98Hebei Agricultural Development
Project, 105tHeilongjiang Agricultural
Development, 105tHenan Agricultural Development
Project, 105tHolmenkollen Guidelines, 5Hon Mun Marine Protected Area Pilot
Project, 106tHonduras, 21, 107thuman capacity, 87–8human health, 29–30, 32bhyperintensive system, 95
IAA. See integrated agriculture-aquaculture
IFIs. See international financeinstitutions
Import Risk Analysis, 101–2incentive policies, 60incomes, 56–7, 57b, 116b, 118, 119t,
120, 122India, 51, 88, 99, 114, 136t
producer groups, 60–1production, 16t, 137tprojects, 105t–106t
Indonesia, 22, 114–5, 116b, 136tproduction, 16t, 137tprojects, 106t, 108tshrimp industry, 127f
industry codes, 100industry transformation, 110industry trends, Latin America, 79industry, knowledge based, 4
184 INDEX
information, lack of, 55, 90infrastructure, 8, 85, 90–1INGA. See International Network on
Genetics in AquacultureInland Fisheries Project, 105tinnovations, 10, 19institutional capacity, 75, 80, 129–30institutional framework, 61–2, 75, 84,
161integrated agriculture-aquaculture
(IAA), 95, 150integrated coastal zone management, 23integrated farming systems, 25–6, 60,
114, 116b, 131, 147intelligence, 32bintensive systems, 95, 96, 154Inter Sea Farms de Venezuela, C.A.
Phase, 107tInter-American Bank, 101Inter-marché, 36tintergovernmental organizations, 54International Aquatic Animal Health
Code, 5international codes, 97–9international collaboration, 55International Finance Corporation
(IFC), 21, 22t, 107t–108tinternational finance institutions (IFIs),
11–2, 20–2, 78International Foundation for Science,
130International Network on Genetics in
Aquaculture (INGA), 46, 130International Principles for Responsible
Shrimp Farming, 5, 8International Standard Industrial
Classification of All EconomicActivities, xi
intersectoral catalysis, 51–2introductions of fish, 26–9, 97–8investment, 11–2, 20, 88–9, 114, 126–7
corporate, 58Latin America, 80public, 39
investment climate, 73b, 76Iran, Islamic Republic of, 137tIreland, 138tiron filings, 38b
irrigation systems, 37, 146Israel, 147Italy, 16t, 137t
Japan, 16t, 34, 99, 137tJiangxi Agriculture Development
Project, 104tJohannesburg Plan of Action, 3Joyshagar Fisheries Project, 121
Kenya, 106tknowledge, 60, 71, 87–8, 90
expanding, 28–9generation, 8, 9–11
Korea, Democratic People’s Republicof, 138t
Korea, Republic of, 137tKyoto Declaration, 129–30Kyoto Protocol, 38
labor demand, 118labor incomes, 119tLake Victoria, 27land alteration, 23–4land rights, 76land use policies, 60landless, 120, 121–2, 122bLao People’s Democratic Republic, 138tLatin America, 55, 78–81leasing of water, 120Les Gambas De L’ankarana, 107tlessons learned, China, 124–5livestock industry, 52, 74livestock-fish farming, 114, 116bloans, 22tlow-income food-deficit countries
(LIFDCs), 16, 18, 19
macroalgae, 155Madagascar, 21, 69, 70, 107t, 144t
rice-fish-shrimp culture, 150–1,152–3
Malawi, 106t, 150, 152Malaysia, 137tmangroves, 23Marine Products Export Development
Authority, 51markets, 14, 73, 74, 84, 110, 126
INDEX 185
Meghna-Dhanagoda Command AreaDevelopment Project, 122b
Mekong delta, 60, 117Métro, 36tMexico, 16t, 106t, 138tMillennium Development Goals
(MDGs), 56models, 58, 77–8mollusks, 155monitoring, 90Morocco, 144tmovement, 128bmussel rearing, ecological footprint, 148tMyanmar, 136t, 137t
Nairobi Declaration on Conservationof Aquatic Biodiversity, 72
Nantong Wangfu Special QuaticProducts Co. Ltd., 108t
national codes, 99–100national development plans, 75national strategies, 5, 48–9Netherlands, the, 138t, 147Network of Aquaculture Centers in
Asia-Pacific (NACA), 10, 51, 54,129, 131, 133
Network of Aquaculture Centres inCentral and Eastern Europe,164n
networks, 77–8, 91, 129, 131, 134New Zealand, 138tNiger, 150Nigeria, 69, 70, 138t, 144t, 151Nile perch, 27Noakhali Rural Development Program,
120nongovernmental organizations
(NGOs), 134nontariff barriers (NTBs), 66, 67Northwest Fisheries Extension Project,
120, 121bNorway, 16t, 24, 32, 137t
salmon, 9, 34f, 143fNorwegian Salmon National Breeding
Program, 43Nova Companies Ltd., 108tnurseries, 95nutrients and wastes, 37
nutritional benefits of fish consump-tion, 31, 32b
nutritional value of fish, 42
OIE. See World Organization forAnimal Health
omega-3, 32bOne-Stop Aqua Shops (OASs), 10, 52b,
55oysters, 33b, 44t
Pacific white leg shrimp, 41tPan Fish, 14paralytic shellfish poisoning, 31Partnership for Development in
Kampuchea, 134partnerships, 11–2, 89, 92pathogens, 30pesticides, 31Philippines, the, 64, 99, 122–3, 127f,
136t, 137tFisheries Credit Project, 106t
Pilot Fishery Development Project, 104tpiscicides, 31Poland, production rank, 138tpolicies, 4–5, 65, 92, 113
development, 75–6interventions, 123–6pro-poor, 60, 64protecting wild stock, 28
polyculture, 60, 95, 121bpond fish culture, 118pond-vegetable garden, 150ponds, 95poorest, the, 63, 120, 121–2, 121b, 122bpoverty impacts, 56–8poverty reduction, 29, 60, 62, 64, 82
and trade, 66–7Bangladesh, 118, 125China, 112pro-poor approaches, 77, 89
pregnancy, 32bprices, 19, 40, 41t, 141fprivate fingerling producers (PPAs),
150private sector, 6, 8, 76, 87, 110, 160pro-poor approaches, 7, 58, 60–2, 77,
89, 91, 118, 123–6
186 INDEX
pro-poor policy framework, 64pro-poor technologies, 62bproducer groups, 60–1producers, by country, 144tproducers, top, 164nproduct quality, 32, 34–5production, 2, 3, 13–4, 17f, 69, 78, 82,
114, 144tby continent, 143f, 145fby country, 137t–138tby species and trophic level, 142fby trophic level, 135tcosts, 141f, 164ndiversification, 85genetic improvements, 43growth, 15, 16t, 118, 120, 129low value food fish, 63projections, 19–20top 10 countries, 16t
production systems, 94–5, 96, 163nAfrica, 148–52ecological footprint, 148Latin America, 153, 155low and high trophic, 149f
programs, 130project preparation, design, and
implementation, 156–62project successes and failures, 21, 71projects, institutions’ portfolios of,
104t–108tproperty rights, 7protein efficiency, 42public perception, 39public sector, 46b, 48, 65–6, 70, 86–7, 91public waters, 8, 114, 115b, 120
raceways, 95rafts, 95ranching, 27, 96recirculating aquaculture systems (RAS),
147recycling, 35, 37regional coordination, 50–1, 55, 80regional intergovernmental organiza-
tions, 54regulatory policies, 5–6, 83, 84research, 52, 61b, 126, 128, 129
FSR&E, 134INGA, 130transgenic, 164n
restocking, 26–9, 149–50, 154rice farmers, 60rice-fish culture, 37, 96, 113, 120, 150–1
Bangladesh, 118, 120China, 112India, 114Vietnam, 116
risk, 45, 74ropes, 95Rural Credit Projects II–IV, 104tRussian Federation, 137t
safety requirements, food, 38salinization, 24salmon, 6–7, 27, 31, 34f, 41t, 141f, 146,
155Chile, 81production, 143f
salmon farming, 148tsalmonids, 44tsanitary and phytosanitary (SPS)
measures, 35, 66SAO Cambodia Integrated Aquaculture
on Low Expenditure, 134SAPA. See Sustainable Aquaculture for
Poverty Alleviationscallops, 44tscience, 39, 50, 84–5, 126–30, 128scientists, 130Scotland, best practices, 99sea-ranching, 96Seafarming Development Project, 131SEAFDEC. See Southeast Asian
Fisheries Development Centerseaweed culture, 151sector development, 75–6, 88–9, 123seeds, 9, 43, 44–5, 46bsegmentation, 71selection of species to farm, 8Seychelles, 144tShaanxi Agricultural Development
Project, 104tShanxi Poverty Reduction Project, 105tshellfish, 30, 31
INDEX 187
shrimp, 41t, 44t, 67b, 133, 155Shrimp and Fish Culture Project, 106tshrimp culture, 23–4, 152–3
ecological footprint, 148tguidelines, 99incomes in Bangladesh, 119tIndonesia, 115production costs, 164nsustainability, 127, 127f
Shrimp Culture Project, 104tsilos, 95site selection, 160small and medium enterprises (SMEs),
151, 154smallholders, 63, 70, 120socioeconomic issues, 158Songliao Plain Development Project,
105tSouth Africa, 70, 144tSouth Australia, 148Southeast Asia Fisheries Development
Center (SEAFDEC), 10, 133Southwest Poverty Reduction Project,
105tSpain, 137tspecies, 8, 17, 41t, 154–5SPS. See sanitary and phytosanitarySri Lanka, best practices, 99stakes, 95standards, 32, 34–5, 66, 87
fish feed, 43harmonization of, 127–8meeting, 90
static model, 58, 59tsterility, 164nstock enhancement, 136t, 146stocking densities, 160strategies, 5, 48–9STREAM Initiative (Support to
Regional Aquatic ResourcesManagement), 52b, 133
Sub-Saharan Africa. See Africasubsistence ponds, 149Sudan, 144tsupermarkets, 36tsupply. See productionsurface waters, 159
sustainability, 73b, 75–6, 86–8, 91, 125,159
drivers, 127–8environmental degradation, 128bLatin America, 78–81
Sustainable Aquaculture for PovertyAlleviation (SAPA), 125
Sustainable Coastal ResourcesDevelopment Project, China,33b, 105t
Taiwan, China, 127f, 137ttambaks, 115tanks, 95Tanzania, 144t, 151tariffs, 66, 67, 164ntax exemption, China, 113Technical Cooperation between
Developing CountriesProgramme (TCDC), 54, 55
technical standards, 66technology, 4, 40, 60, 61b, 77, 84–5,
164ndiffusion, 51industry transformation, 110pro-poor, 62b, 120
technology transfer, 49–52, 71, 90,129–30
Asia, 53–4, 126–30Bangladesh, 118diffusion, 54to poor, 121b
tenure, 76Thailand, 16t, 100, 127f, 136t, 137ttilapia, 19, 37, 44t, 155tilapia farming, ecological footprint,
148ttitle protection, 76Togo, 144ttoxins, 31traceability, 34, 36ttrade, 14, 19, 66–7, 82, 90
disputes, 67b, 110training, 10, 120, 130, 132transgenic fish, 27transition pathway, 58, 59ttrash fish, 42
trends, 84–6trophic levels, 8Tunisia, 144tTurkey, production, 16t, 138t
U.S. Agency for InternationalDevelopment SPARE Fisheriesand Aquaculture Panel, 82
U.S. Southern Shrimp Alliance, 67bUganda, 74, 144tUnited Kingdom, 137t, 143fUnited States, 16t, 33b, 100, 137t
shrimp dispute, 67b, 117–8urban commerce, 74
VAC farming system, 117Venezuela, R. B. de, 107tVietnam, 57, 57b, 106t, 116–8, 136t
catfish dispute, 67benabling factors, 62bpro-poor and policy interventions,
64, 125production, 16t, 137tseed development, 46b
waste, 25, 26, 35, 37, 42, 43water discharge systems, 147
water management, 37, 49water pollution, 25water rights, 76water shortages, 147water supply and sources, 159water use, 114weak performance, 68–9West Africa, 149–50West Bengal, 23, 60, 115bWhirling and White Spot disease, 28wild populations, threats to, 47wild seed dependence, 29wild stock integrity, 28women, 57–8, 121–2, 121b, 122bworker incomes, 119tWorld Bank, 33b, 78, 100–2
investment projects, 20, 21, 21t,104t–106t, 120
World Food Prize (2005), 61bWorld Organization for Animal Health
(OIE), 5World Wildlife Fund (WWF), 35WorldFish Center (WFC), 11, 130
Zambia, 144tZimbabwe, 144t
188 INDEX

E C O - A U D I TEnvironmental Benefits Statement
Saved:• 6 trees
• 5 million BTUs of totalenergy
• 569 pounds (CO2
equivalent) ofgreenhouse gases
• 2,363 gallons of wastewater
• 303 pounds of solidwaste
The World Bank is committed to pre-serving endangered forests and naturalresources. This book, Changing the Faceof the Waters: The Promise and Challengeof Sustainable Aquaculture, is printed onrecycled paper with 30% post-consumerwaste. The Office of the Publisherfollows the recommended standards forpaper usage set by the Green PressInitiative, a nonprofit program support-ing publishers in using fiber that is notsourced from endangered forests. Formore information, visit www.greenpressinitiative.org.
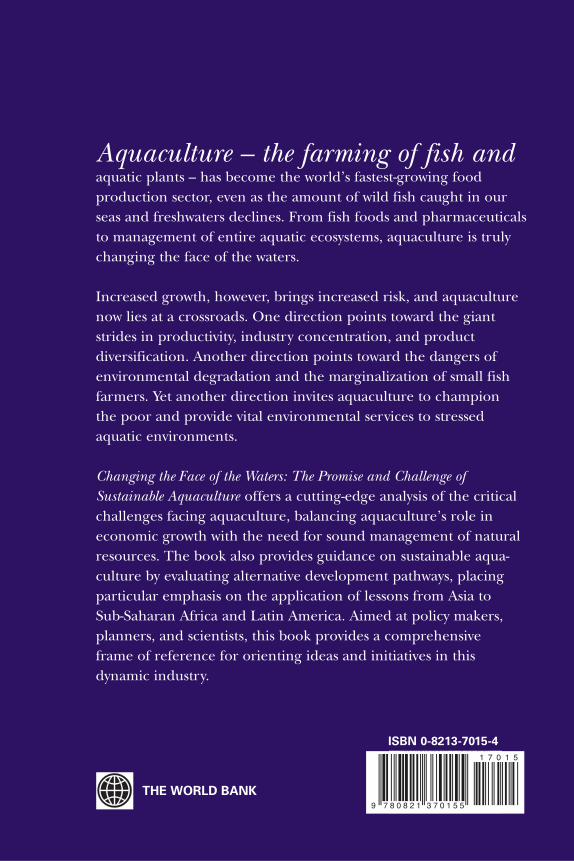
Aquaculture – the farming of fish andaquatic plants – has become the world’s fastest-growing food production sector, even as the amount of wild fish caught in ourseas and freshwaters declines. From fish foods and pharmaceuticalsto management of entire aquatic ecosystems, aquaculture is trulychanging the face of the waters.
Increased growth, however, brings increased risk, and aquaculturenow lies at a crossroads. One direction points toward the giantstrides in productivity, industry concentration, and product diversification. Another direction points toward the dangers ofenvironmental degradation and the marginalization of small fishfarmers. Yet another direction invites aquaculture to champion the poor and provide vital environmental services to stressedaquatic environments.
Changing the Face of the Waters: The Promise and Challenge ofSustainable Aquaculture offers a cutting-edge analysis of the criticalchallenges facing aquaculture, balancing aquaculture’s role in economic growth with the need for sound management of naturalresources. The book also provides guidance on sustainable aqua-culture by evaluating alternative development pathways, placingparticular emphasis on the application of lessons from Asia to Sub-Saharan Africa and Latin America. Aimed at policy makers,planners, and scientists, this book provides a comprehensive frame of reference for orienting ideas and initiatives in this dynamic industry.
ISBN 0-8213-7015-4