Embed Size (px)
Citation preview
Computational modelling of genome-scale metabolic
networks and its application to CHO cell cultures
Ziva Rejc Ia, Lidija Magdevska Ib, Tilen Trselic Ia, Timotej Osolinb, RokVodopivecb, Jakob Mrazc, Eva Pavlihac, Nikolaj Zimicb, Tanja Cvitanovicd,
Damjana Rozmand, Miha Moskonb,∗, Miha Mrazb
aFaculty of Chemistry and Chemical Technology, University of Ljubljana, Ljubljana,Slovenia
bFaculty of Computer and Information Science, University of Ljubljana, Ljubljana,Slovenia
cBiotechnical Faculty, University of Ljubljana, Ljubljana, SloveniadCentre for Functional Genomics and Bio-Chips, Institute of Biochemistry, Faculty of
Medicine, University of Ljubljana, Ljubljana, Slovenia
Abstract
Genome-scale metabolic models (GEMs) have become increasingly impor-tant in recent years. Currently, GEMs are the most accurate in silico repre-sentation of the genotype-phenotype link. They allow us to study complexnetworks from the systems perspective. Their application may drastically re-duce the amount of experimental and clinical work, improve diagnostic toolsand increase our understanding of complex biological phenomena. GEMshave also demonstrated high potential for the optimisation of bio-based pro-duction of recombinant proteins.
Herein, we review the basic concepts, methods, resources and softwaretools used for the reconstruction and application of GEMs. We overview theevolution of the modelling efforts devoted to the metabolism of Chinese Ham-ster Ovary (CHO) cells. We present a case study on CHO cell metabolismunder different amino acid depletions. This leads us to the identification ofthe most influential as well as essential amino acids in selected CHO celllines.
Keywords: metabolic networks, genome-scale metabolic models, Chinese
IAuthors contributed equally to this work.∗Corresponding authorEmail address: [email protected] (Miha Moskon)
Preprint submitted to Computers in Biology and Medicine July 4, 2017
This article has been accepted for the publication in Computers in Biology and Medicine, Volume 88, 1 September 2017, Pages 150-160, https://doi.org/10.1016/j.compbiomed.2017.07.005
hamster ovary cells, flux balance analysis, modelling and analysis
1. Introduction
Ongoing development of systems biology in recent years derives mainlyfrom the successful integration of many computational approaches into theexperimental work. One of the most successful applications of computer sci-ence in biology is in the annotation of genomes from the vast data generatedby DNA sequencing experiments. Here, the computational approaches havebeen essential for the analysis of large amounts of sequenced data as well asfor their presentation and applications. The success stories of the annotationof genomes of different simple organisms [1] as well as of the human genome[2] were followed by the establishment of the first genome-scale metabolicmodels (GEM) [3].
GEMs are the most accurate in silico representation of the genotype-phenotype link [4]. These models are continously improved with the accu-racy of their descriptions as well as the strength of the predictions they make.For example, Recon, the GEM describing human metabolism, was first pub-lished in 2007 but it has now gone through six iterations of improvements[5, 6]. These improvements are a consequence of the evolution of experimen-tal and computational approaches used in systems biology. They result fromthe publicly available large scale data through the literature and throughdifferent general as well as specific web databases, such as KEGG (KyotoEncyclopaedia of Genes and Genomes)[7], BRENDA (BRaunschweig EN-zyme DAtabase)[8] and BioCyc [9]. Publicly available computational modelsthrough databases such as BioModels [10] and BiGG Models [11] present anadditional driving force for exchangeability of knowledge and computationaltools. The main motivation towards the continuous development of GEMs isa vast scope of their applications. These range from (1) the design and opti-misation of environmentally friendly bio-based production of fine chemicalswith simple organisms [12], and so called genome-scale synthetic biology [13]to (2) the optimisation of biopharmaceutical manufacturing cell lines andprocesses in non-mammalian cells, such as Pichia pastoris [14], as well as inmammalian cells [15], such as Chinese Hamster Ovary (CHO) cells [16], andfinally to (3) the identification and analysis of possible biomarkers of complexdiseases, such as non-alcoholic fatty liver disease (NAFLD) [17, 18, 19] andcancer [20, 21].
2
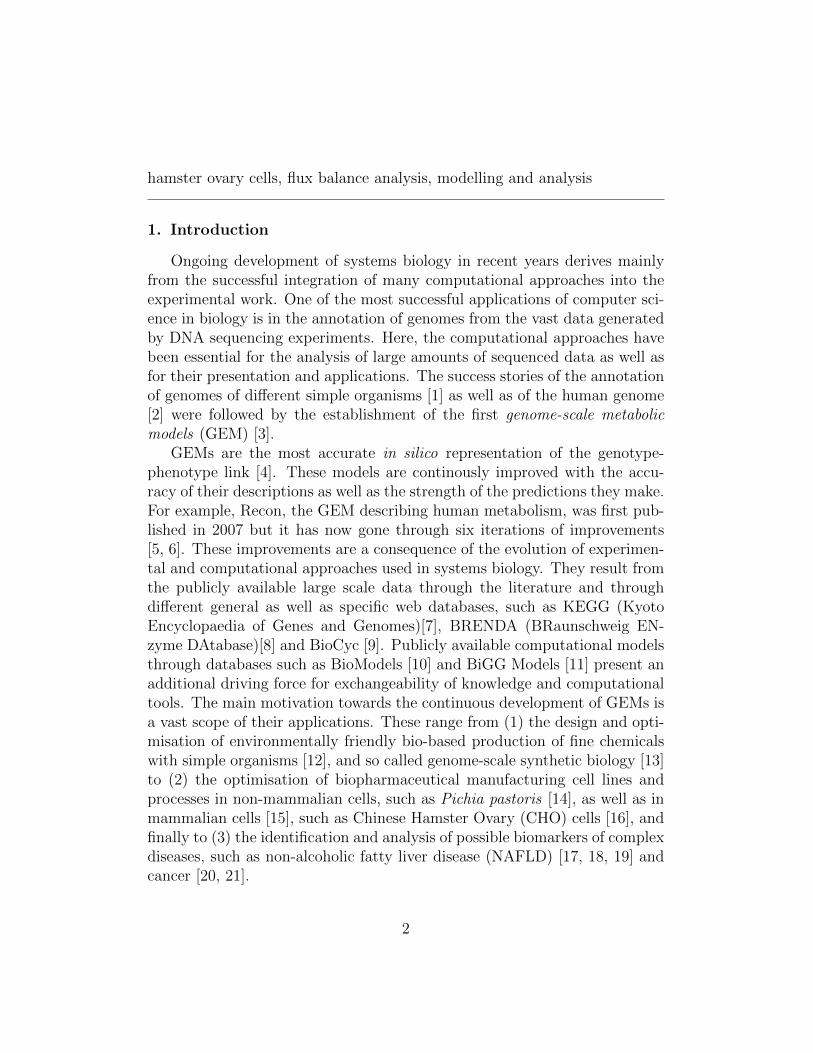
Computational models can be used to identify the segments that need tobe explained more accurately to obtain a valid representation of the system’sresponse. This allows us to systematically increase the knowledge describ-ing biological mechanisms governing complex networks. Integration of dataobtained from experiments, literature and databases into metabolic computa-tional models can be described with a circular iteration scheme of knowledgeacquisition and model improvements as shown in Fig. 1. It consists of (1)data acquisition and refinement through experimental work, literature andpublicly available databases; (2) establishment and optimisation of compu-tational models using the acquired data; and (3) analysis and validation ofcomputational models and their potential refinement through another iter-ation of the cycle. The computational approaches are essential in all threesteps described in the scheme. Novel computational approaches, which can beused in the reconstruction, analysis, refinement and visualisation of metabolicmodels, are therefore vital for the continuous progress of systems biology.
Numerous computational methods are available in the field of metabolicmodelling and analysis. Majority of these are derived from the constraint-based analysis. The development and application of these methods is drivenby the publicly available toolboxes, such as Pathway Tools [22], RAVEN(Reconstruction, Analysis, and Visualisation of mEtabolic Networks)[23] andprobably the most popular COBRA (COnstraint-Based Reconstruction andAnalysis) toolbox [24, 25]. These toolboxes implement the majority of theavailable computational methods. They follow open source concepts and areeasy to update with novel methods. Computational methods applied to theanalysis of metabolic networks include basic analyses, which can predict thereaction fluxes that bring the network to its optimal state (for example fluxbalance analysis - FBA)[26]. Implemented methods can be used to tailor themetabolic model with a specific context (see for example [27, 28]), and auto-matic identification of reactions, which need to be blocked in order to achievethe optimal state of the metabolic network, for example the state in whichthe production of selected metabolite is optimal [29, 30]. Large attention hasalso been devoted to the development of different visualisation approaches(see for example Escher [31]). Visualisation is, however, still mostly per-formed manually (see for example ReconMap [32] for the visualisation ofhuman metabolism model).
In the following chapters the review of the state-of-the-art methods for theanalysis, reconstruction and visualisation of metabolic networks is described.We begin with the description of some general approaches for the modelling
3
Figure 1: Circular iteration scheme describing the integration of experimental work withcomputational models. Data acquisition through the execution of new experiments, appli-cation of publicly available databases and literature is followed by the establishment andoptimisation of computational models. These have to be sufficiently validated before theirpractical application. Validation is usually successful only after several iterations of modelrefinements and extensions. These usually require additional experiments and acquisitionof supplementary data.
4
and analysis of biological systems with the emphasis on the GEMs (see Sec-tion 2). Furthermore, we describe the most comprehensive publicly availabledatabases containing large experimental datasets and computational models(see Section 3). We comment on the approaches that can be used in the pro-cess of the reconstruction and visualisation of GEMs (see Sections 4 and 5).We overview the progress in the development of CHO GEMs in recent years(see Section 6). We demonstrate the application of selected computationalmethods on the analysis of the most recent and most complete CHO GEM,i.e. iCHO1766 [33] (see Section 7).
2. Constraint-based methods for the analysis of metabolic net-works
Numerous computational methods have been developed for the compu-tational reconstruction and analysis of metabolic networks in recent years.Most of these approaches have been integrated within different publicly avail-able computational toolboxes, such as COBRA [24, 25] and RAVEN [23].
Computational analysis of molecular networks is usually performed on thebasis of their stoichiometric description [34]. Here, each reaction is describedwith its stoichiometric coefficients [35]. Stoichiometric description can beused to establish a set of ordinary differential equations (ODEs), which aresolved numerically to compute the changes in metabolite concentration overtime. Dynamical approaches, such as numerical integration of ODEs, canbe applied only when reaction kinetics and parameters are known for thewhole system. This is usually not the case for the large-scale metabolicnetworks. Steady-state assumption can be applied to the analysis of theorganisms living in a constant environment that are in exponential or logphase of growth [26, 36]. This assumption transforms the systems of ODEsto a system of linear equations with infinite solutions. The solution spacecan be reduced to a single solution with the flux balance analysis (FBA) [26].
FBA defines the optimal flux through the observed reactions with addi-tional constraints. These constraints define the lower and the upper bound ofthe reaction fluxes. They are derived from different properties of the system,such as the availability of enzymes catalysing observed metabolic reactionsand the reversibility of reactions. Additional information can be encodedwithin the flux boundaries. These include cell line specific parameters andproperties of its environment, compartmentalisation of the metabolic reac-tions and their regulation by signalling or gene regulatory networks [37, 38].
5
The optimal flux is evaluated on the basis of the optimisation criterion.The optimization criterion defines a biological objective that is relevant tothe problem being studied [26]. It is modelled as a linear function, which de-scribes the reactions’ contributions to the specific phenotype of the observedsystem. Examples of optimisation criteria are maximal cell growth or maxi-mal production of a recombinant protein [26]. The optimal flux distributionwithin the reconstructed metabolic network can be acquired with the max-imization (sometimes also minimization) of this criterion. The constraintsand the objective criterion constitute the general form of a linear program.This can be solved as linear programming problem [37]. An example of anFBA application to the analysis of a metabolic network can be found insection 7.
Several extensions of FBA have been developed in recent years. Theseinclude dynamic flux balance analysis (dFBA) [39] and miniFBA [40], whichincorporate rate of change of flux constraints. Regulatory flux balance anal-ysis (rFBA) [41] incorporates regulatory constraint in the analysis. Anotherexample is parsimonious or parsimonious enzyme usage FBA (pFBA), whichclassifies genes according to their contribution to the optimal solution [42].The repertoire of constraint-based methods currently includes more than 100methods. Further information regarding other extensions of the FBA methodcan be found in references [30], [43] and [44].
3. Biological databases
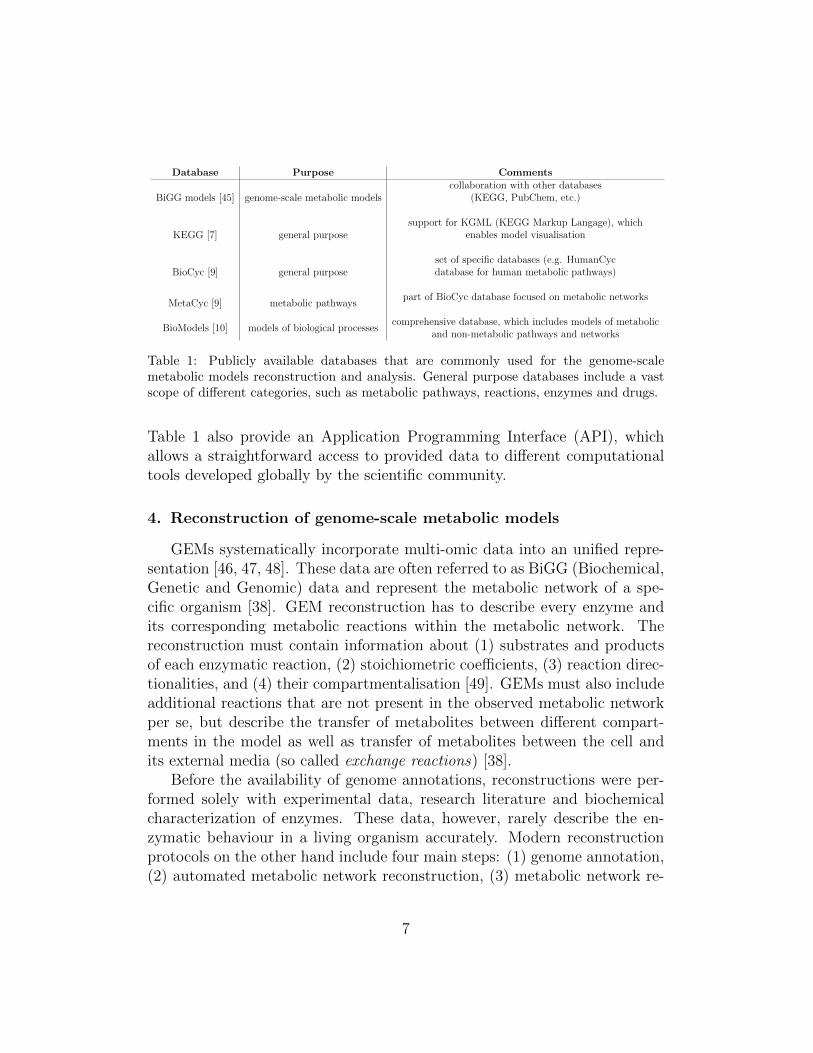
Large experimental datasets together with different computational mod-els have been made available in the form of publicly available databases inrecent years. Some of these cover metabolic pathways for different organisms(e.g. KEGG [7] and MetaCyc [9]), while others focus on experimental dataor computational implementations of different metabolic models (e.g. BiGGModels [45] and BioModels [10]). Table 1 lists some of the commonly useddatabases in the field of GEMs reconstruction and analysis, and describestheir intended purpose. Databases have a significant impact on the analysisof biological systems. They provide data for the reconstruction, improve-ment and validation of metabolic networks, and serve as a repository for thestorage of knowledge that has been obtained with different experimental andcomputational approaches. Data that are deposited in the form of databaseentries need to fulfil several formal and informal standards. This contributesto both human and computer readability. Most of the databases listed in
6
Database Purpose Comments
BiGG models [45] genome-scale metabolic modelscollaboration with other databases
(KEGG, PubChem, etc.)
KEGG [7] general purposesupport for KGML (KEGG Markup Langage), which
enables model visualisation
BioCyc [9] general purposeset of specific databases (e.g. HumanCycdatabase for human metabolic pathways)
MetaCyc [9] metabolic pathwayspart of BioCyc database focused on metabolic networks
BioModels [10] models of biological processescomprehensive database, which includes models of metabolic
and non-metabolic pathways and networks
Table 1: Publicly available databases that are commonly used for the genome-scalemetabolic models reconstruction and analysis. General purpose databases include a vastscope of different categories, such as metabolic pathways, reactions, enzymes and drugs.
Table 1 also provide an Application Programming Interface (API), whichallows a straightforward access to provided data to different computationaltools developed globally by the scientific community.
4. Reconstruction of genome-scale metabolic models
GEMs systematically incorporate multi-omic data into an unified repre-sentation [46, 47, 48]. These data are often referred to as BiGG (Biochemical,Genetic and Genomic) data and represent the metabolic network of a spe-cific organism [38]. GEM reconstruction has to describe every enzyme andits corresponding metabolic reactions within the metabolic network. Thereconstruction must contain information about (1) substrates and productsof each enzymatic reaction, (2) stoichiometric coefficients, (3) reaction direc-tionalities, and (4) their compartmentalisation [49]. GEMs must also includeadditional reactions that are not present in the observed metabolic networkper se, but describe the transfer of metabolites between different compart-ments in the model as well as transfer of metabolites between the cell andits external media (so called exchange reactions) [38].
Before the availability of genome annotations, reconstructions were per-formed solely with experimental data, research literature and biochemicalcharacterization of enzymes. These data, however, rarely describe the en-zymatic behaviour in a living organism accurately. Modern reconstructionprotocols on the other hand include four main steps: (1) genome annotation,(2) automated metabolic network reconstruction, (3) metabolic network re-
7
finement and, (4) evaluation and validation of metabolic reconstruction withadditional experimental data [38, 46, 47, 49].
4.1. Genome annotation
Annotation defines biological functions of certain parts of genome se-quences and classifies them into standardized gene ontology classes [38, 47].Automated gene search algorithms are used to annotate a specific genomesequence. These algorithms often search for sequence homology to other,already defined and characterized genes, and consequently proteins [50]. An-notations are later verified manually with the goal to define unknown genesand their functions. This is achieved with different sequence alignment toolssuch as BLAST and other phylogenetic grouping tools [47]. Annotations withlow confidence values can be verified by performing additional experiments[38]. Many annotated genomes are publicly available in the web databases,such as CHOGenome [51].
4.2. Automated metabolic network reconstruction
Using annotated genome as an input, tools like Pathway tools [22] andmetaSHARK [52] can automatically generate GEMs [38], which can be repre-sented by a list of genes, reactions and enzymes [47]. Furthermore, cell-line-and tissue-specific metabolic models can be obtained from GEMs using modelextraction methods, such as GIMME [27]. Two recent surveys of reconstruc-tion and model extraction methods together with their systematic evaluationare available in [53] and [28]. Even though these algorithms are able to dras-tically enhance the reconstruction process, the reconstructed networks maystill contain numerous errors. They may include genes that do not partici-pate in a given metabolic pathway, while omit genes that present importantconnections between metabolic pathways.
4.3. Metabolic network refinements
Manual refinements of the reconstructed network need to be performedadditionally to obtain a valid in silico representation of metabolic networks.Automatically generated GEMs have to be refined with the potential cor-rections of reaction stoichiometries, thermodynamics and energy constraints[38, 49, 50]. Refinements are performed in a systematic order. A confidencevalue is assigned to every gene in the network [47]. This is followed by thereaction analysis, which is the most time consuming and critical process. Itsmain goal is to verify the occurrence and the parameters describing specific
8
reactions within the cell. In order to obtain a high quality metabolic re-construction, organism compartmentalisation and exchange reactions, geneprocessing, and thermodynamic and biomass accuracy are being emphasised[38, 47, 48].
4.4. Evaluation and validation of metabolic reconstruction
Validation methods compare the experimental results with the data ob-tained from the metabolic reconstruction. Metabolic reconstructions can beto some extent validated with additional in vivo and in vitro experiments.Here, we are often limited to the observation of phenotype and cell growth.Phenotype of cells can be observed in different conditions. The observationsare performed together with additional measurements of, e.g. energy sourcesuptake and secretion, and excretion of metabolic products into the media[47]. Modern approaches are able to asses the distribution of metabolitesand estimate the reaction fluxes in vivo using methods, such as fluorescentor 13C labelling [36, 47]. There are many studies that try to validate themetabolic reconstruction making comparison among in silico predictions andin vivo results of specific gene knock-outs [38, 50]. GEMs can also be val-idated by observing if they correctly predict known auxotrophic features ofthe cell as well. In this case the organic compounds that the organism isable to synthetize by its own are observed. For example, a known featureof CHO cell lines is that they are unable to synthetize cysteine and arginineon their own, thus making these two amino acids essential [33]. Anotherexample of computational approaches that can be applied during the pro-cess of validation are gap filling algorithms. Missing metabolic functions areusually caused by blocked metabolic reactions, which are caused by miss-ing metabolic reactions, i.e. gaps. These gaps may be to some extent filledin automatically with algorithms, such as fastGapFill [54], Meneco [55] andGAUGE [56].
5. Model visualisation
Visualisation of metabolic networks is important for the interpretationand understanding of their composition and comparison with similar net-works. Visualisation is included within the majority of the existing pathwaydatabases such as KEGG [7]. Visualised metabolic pathways and networksare however mostly manually drawn and stored in a static form [57]. Duringdata updates, these images have to be modified manually. Moreover, manual
9
r2cr1
a
b
c
d
er1
b
a
e
c
d
r2
(b) (c) (d)
a
b
c
d
e
(a)
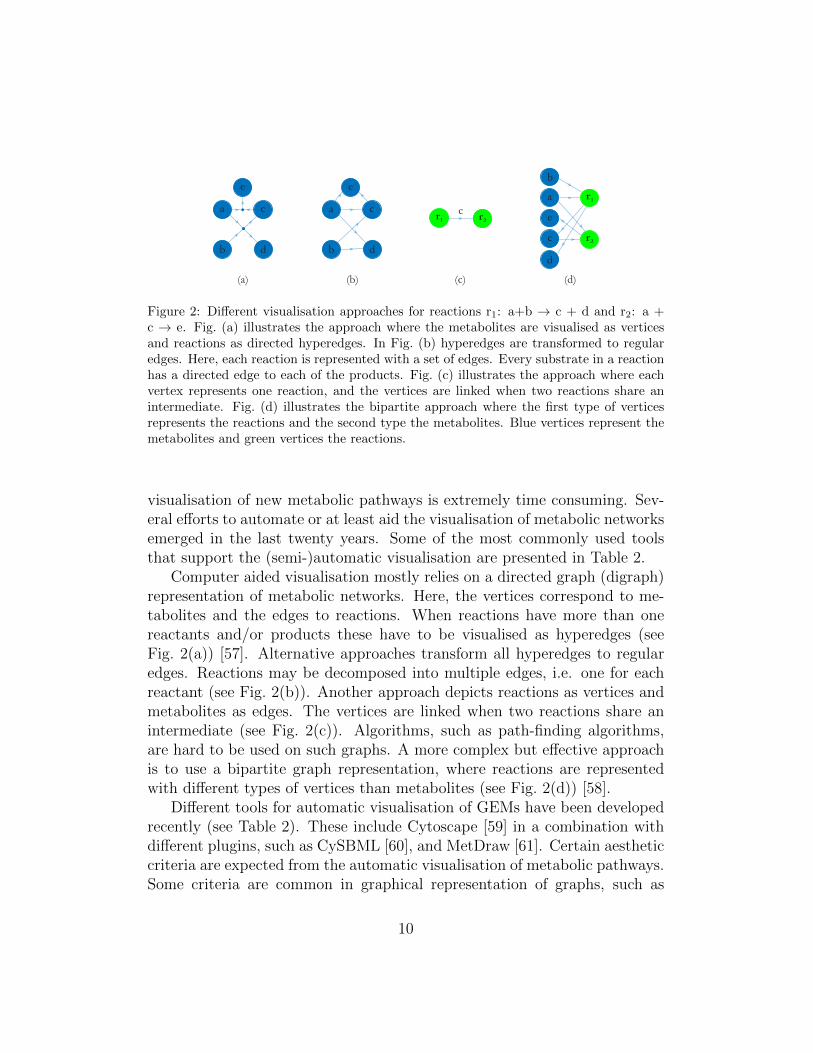
Figure 2: Different visualisation approaches for reactions r1: a+b → c + d and r2: a +c → e. Fig. (a) illustrates the approach where the metabolites are visualised as verticesand reactions as directed hyperedges. In Fig. (b) hyperedges are transformed to regularedges. Here, each reaction is represented with a set of edges. Every substrate in a reactionhas a directed edge to each of the products. Fig. (c) illustrates the approach where eachvertex represents one reaction, and the vertices are linked when two reactions share anintermediate. Fig. (d) illustrates the bipartite approach where the first type of verticesrepresents the reactions and the second type the metabolites. Blue vertices represent themetabolites and green vertices the reactions.
visualisation of new metabolic pathways is extremely time consuming. Sev-eral efforts to automate or at least aid the visualisation of metabolic networksemerged in the last twenty years. Some of the most commonly used toolsthat support the (semi-)automatic visualisation are presented in Table 2.
Computer aided visualisation mostly relies on a directed graph (digraph)representation of metabolic networks. Here, the vertices correspond to me-tabolites and the edges to reactions. When reactions have more than onereactants and/or products these have to be visualised as hyperedges (seeFig. 2(a)) [57]. Alternative approaches transform all hyperedges to regularedges. Reactions may be decomposed into multiple edges, i.e. one for eachreactant (see Fig. 2(b)). Another approach depicts reactions as vertices andmetabolites as edges. The vertices are linked when two reactions share anintermediate (see Fig. 2(c)). Algorithms, such as path-finding algorithms,are hard to be used on such graphs. A more complex but effective approachis to use a bipartite graph representation, where reactions are representedwith different types of vertices than metabolites (see Fig. 2(d)) [58].
Different tools for automatic visualisation of GEMs have been developedrecently (see Table 2). These include Cytoscape [59] in a combination withdifferent plugins, such as CySBML [60], and MetDraw [61]. Certain aestheticcriteria are expected from the automatic visualisation of metabolic pathways.Some criteria are common in graphical representation of graphs, such as
10
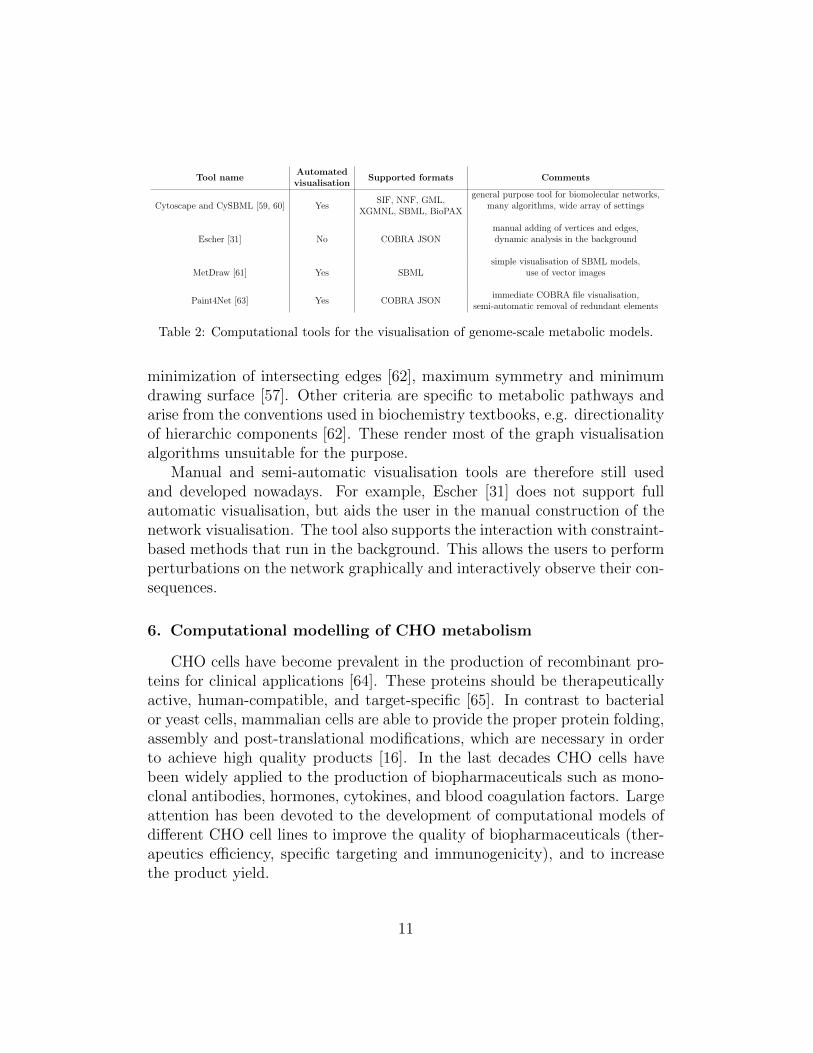
Tool nameAutomatedvisualisation
Supported formats Comments
Cytoscape and CySBML [59, 60] YesSIF, NNF, GML,
XGMNL, SBML, BioPAX
general purpose tool for biomolecular networks,many algorithms, wide array of settings
Escher [31] No COBRA JSONmanual adding of vertices and edges,dynamic analysis in the background
MetDraw [61] Yes SBMLsimple visualisation of SBML models,
use of vector images
Paint4Net [63] Yes COBRA JSONimmediate COBRA file visualisation,
semi-automatic removal of redundant elements
Table 2: Computational tools for the visualisation of genome-scale metabolic models.
minimization of intersecting edges [62], maximum symmetry and minimumdrawing surface [57]. Other criteria are specific to metabolic pathways andarise from the conventions used in biochemistry textbooks, e.g. directionalityof hierarchic components [62]. These render most of the graph visualisationalgorithms unsuitable for the purpose.
Manual and semi-automatic visualisation tools are therefore still usedand developed nowadays. For example, Escher [31] does not support fullautomatic visualisation, but aids the user in the manual construction of thenetwork visualisation. The tool also supports the interaction with constraint-based methods that run in the background. This allows the users to performperturbations on the network graphically and interactively observe their con-sequences.
6. Computational modelling of CHO metabolism
CHO cells have become prevalent in the production of recombinant pro-teins for clinical applications [64]. These proteins should be therapeuticallyactive, human-compatible, and target-specific [65]. In contrast to bacterialor yeast cells, mammalian cells are able to provide the proper protein folding,assembly and post-translational modifications, which are necessary in orderto achieve high quality products [16]. In the last decades CHO cells havebeen widely applied to the production of biopharmaceuticals such as mono-clonal antibodies, hormones, cytokines, and blood coagulation factors. Largeattention has been devoted to the development of computational models ofdifferent CHO cell lines to improve the quality of biopharmaceuticals (ther-apeutics efficiency, specific targeting and immunogenicity), and to increasethe product yield.
11
1999 2001 2004 2006 2010 2011 2012 2013 2014 2015 2016
Nyberg et al.Provost and Bastin
Altamirano et al.
Provost et al.
Goudar et al.
Xing et al
Goudar et al.
Zamorano et al.
Wilkens et al.
Naderi et al.
Sengupta et al.
Ahn and Antoniewicz
Zamorano et al.
Selvarasu et al.
Ghorbaniaghdam et al.
Sheikholeslami et al.
Templeton et al.
Ahn and Antoniewicz
Martinez et al.
Chen et al.
Sheikholeslami et al.
Nicolae et al.
Wahrheit et al.
Lee et al. Hefzi et al.
Altamirano et al.
10 reactions
100 reactions
1000 reactions
model size
modelling type
dynamical
Xing et al.
Nolan and Lee
constraint basedapproaches
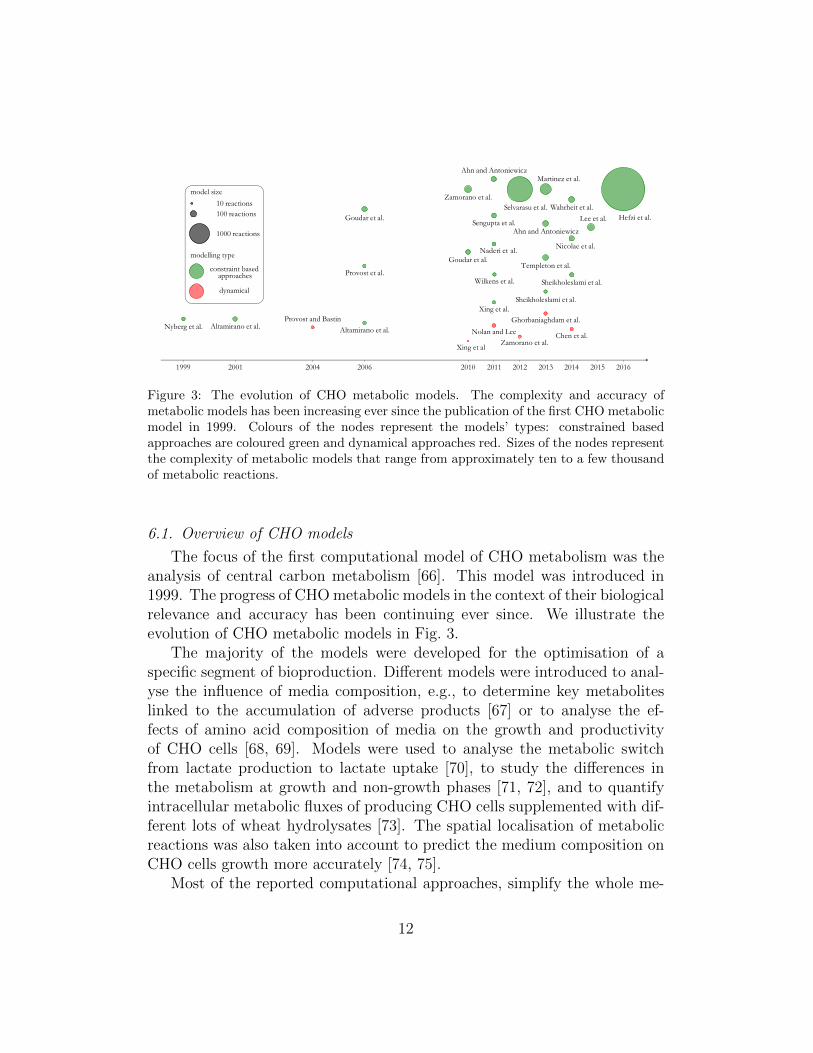
Figure 3: The evolution of CHO metabolic models. The complexity and accuracy ofmetabolic models has been increasing ever since the publication of the first CHO metabolicmodel in 1999. Colours of the nodes represent the models’ types: constrained basedapproaches are coloured green and dynamical approaches red. Sizes of the nodes representthe complexity of metabolic models that range from approximately ten to a few thousandof metabolic reactions.
6.1. Overview of CHO models
The focus of the first computational model of CHO metabolism was theanalysis of central carbon metabolism [66]. This model was introduced in1999. The progress of CHO metabolic models in the context of their biologicalrelevance and accuracy has been continuing ever since. We illustrate theevolution of CHO metabolic models in Fig. 3.
The majority of the models were developed for the optimisation of aspecific segment of bioproduction. Different models were introduced to anal-yse the influence of media composition, e.g., to determine key metaboliteslinked to the accumulation of adverse products [67] or to analyse the ef-fects of amino acid composition of media on the growth and productivityof CHO cells [68, 69]. Models were used to analyse the metabolic switchfrom lactate production to lactate uptake [70], to study the differences inthe metabolism at growth and non-growth phases [71, 72], and to quantifyintracellular metabolic fluxes of producing CHO cells supplemented with dif-ferent lots of wheat hydrolysates [73]. The spatial localisation of metabolicreactions was also taken into account to predict the medium composition onCHO cells growth more accurately [74, 75].
Most of the reported computational approaches, simplify the whole me-
12
tabolism to specific metabolic pathways, such as central carbon metabolism[66, 76, 77], or lump the pathways to a small set of reactions which prove tosignificantly affect the analysed segment of the system [78]. Constraint-basedapproaches based on FBA and its derivations have enabled us to reconstructlarge-scale metabolic models even in the case of missing quantitative data[64]. These approaches still require genome annotation data to perform theGEM reconstruction. The CHO cells genome was not annotated until 2011[79]. The first GEM model of CHO cells was reconstructed in 2012 by usingthe mouse GEM as template [67]. Recently, several research groups combinedefforts to construct the first consensus GEM of CHO cell metabolism, namelyiCHO1766 [33]. We describe this model in more details in section 6.2.
CHO GEMs are not only used to predict the cell growth and the yieldof recombinant protein production, but can also be used to determine thedifferences between different cell lines. Yusufi et al. identified the changes inmetabolism between the wild and the recombinant antibody-producing CHOcell lines with the integration of transcriptomics data into the iCHO1766GEM [80]. They used the upgraded models to analyse the differences inmetabolic pathways and to identify the transcriptional hotspots. Moreover,omics-based GEMs can be used to discover new potential biomarkers forselecting CHO clones with stable genomes and high productivity, and thusto improve current selection methods such as DHFR amplification process[80].
Even though CHO GEMs have a vast scope of successful applications inthe field of biopharmaceutical production, there are still several drawbacksthat need to be addressed in the future [33]. (1) GEMs need to describecompartmentalisation of metabolic reactions more accurately, whereas reac-tion directionalities may differ in different compartments [67]. Moreover, theexchange reactions between compartments can play a vital role in the cellmetabolism and can even present a rate-limiting step. (2) The natural selec-tion and genetic drift need to be regarded. The accuracy of the models canbe strongly diminished by the accumulated mutations in the cell lines. (3)Accurate measurements of metabolite concentrations are required in orderto predict accurate protein yield and cell growth. Due to large amount ofdifferent metabolites within various compartments, such measurements areyet to be improved. (4) We are still unable to completely understand themammalian metabolism. Various connections between metabolic pathwaysthat may be vital are consequently still missing. (5) Biomass objective func-tions are based on experimental measurements and usually presume static
13
environment. In reality this is not the case as biomass composition differsunder different conditions. The models are also currently unable to predictthe dynamics of the cell growth. (6) The models are not able to account forthe influence of inhibitory metabolites (such as lactate or ammonia in the cellmedium) on the cell growth. (7) Finally, the metabolism is just a part of thewhole system that controls the production of recombinant proteins. GEMswould need to be integrated with other models, such as secretory pathwaysand glycosylation models. A lot of effort has been devoted to the construc-tion of such models, but none have been sufficiently integrated with CHOGEMs up to date [33].
6.2. iCHO1766 model
The iCHO1766 model was reconstructed on the basis of the annotationof Cricetulus griseus (the Chinese hamster) genome [79]. The model rep-resents to date the most accurate computational prediction of the growthrate and the rate of recombinant protein production. The whole model andits reconstruction together with the reference data for genes, reactions andmetabolites is available in the BiGG database [45].
The establishment of the model followed a community approach. Dif-ferent research groups independently reconstructed GEMs, which they inte-grated into a consensus model. They established initial models on the basisof experimental results (transcriptomic and proteomic data) and literaturedata [67, 71, 81, 82, 83]. Models were also partially derived from the GEMRecon [5, 6, 84, 85] on the basis of CHO homologies to human genes. Thecommunity built three cell line specific GEMs, namely for CHO-K1, -S and-DG44 producing cell lines, with the GIMME (Gene Inactivity Moderated byMetabolism and Expression) algorithm [27]. They generated CHO-K1 and-S models with the RNA sequencing and proteomic data. Microarray datawere used for the establishment of CHO-DG44 model [33].
In order to accurately describe the cell growth and protein productionin silico, it is necessary to determine the relative amounts of metabolitesneeded by the cell to synthesise all cellular components and recombinantproteins. These data were obtained from Feist et al. [86]. The literaturedata for recombinant erythropoietin (EPO) and immunoglobulin G (IgG)production were used to find the difference between calculated values in non-producing cell lines and measured values for IgG-producing hybridoma celllines. Thereafter, two biomass reactions were formulated and included intothe model [33].
14
The iCHO1766 computational models accurately predict the growth phe-notypes and known auxotrophies. They are able to predict the protein syn-thesis capacities and to quantify a potential increase in product yield afterspecific perturbations are introduced. They were used to show that the cellengineering may affect the product yield more significantly than bioprocess-ing treatments. Furthermore, the cell growth and product yield were shownnot to be proportionally related [33].
7. Case study: computational analysis of iCHO1766 model
We can use the FBA and its alternatives to predict the optimal cell growthand optimal product formation in dependency of different conditions. Theseinclude cell culture media composition and activity of enzymes catalysing themetabolic reactions within the network. Here we demonstrate the applica-tion of constraint-based approaches on three different analyses of iCHO1766model, namely (1) basic FBA of metabolic network to assess the referencestate of the network, (2) qualitative perturbation analysis to assess the activ-ity of selected biosynthesis reactions before and after the perturbations, and(3) medium analysis to assess the effects of amino acid medium compositionon cell growth. We performed the analyses on the CHO-S cell line model[33].
We visualised the metabolic reactions with the software developed byour group, which we made publicly available at http://lrss.fri.uni-lj.
si/bio/material/viz_tool_matlab_v02.zip. The software is written inMatlab and supports the automatic visualisation of GEMs using bipartitegraph approach. The visualisation is performed in the neighbourhood of themetabolites of interest that are specified by the user. Size of the neighbour-hood is defined with the maximal distance from the specified metabolites.User can also specify compartments, which should be included in the visu-alisation. The software runs FBA in the background, which allows the userto visualise only the reactions with certain flux values. Moreover, user cantrigger perturbations with the modification of flux boundaries. The visuali-sation of the results of the specified perturbations can be performed in threedifferent ways, i.e. (1) visualisation of reactions that become active afterthe perturbations, (2) visualisation of reactions that become inactive afterthe perturbations, and (3) visualisation of reactions that remain active, butchange reaction fluxes after the perturbations.
15
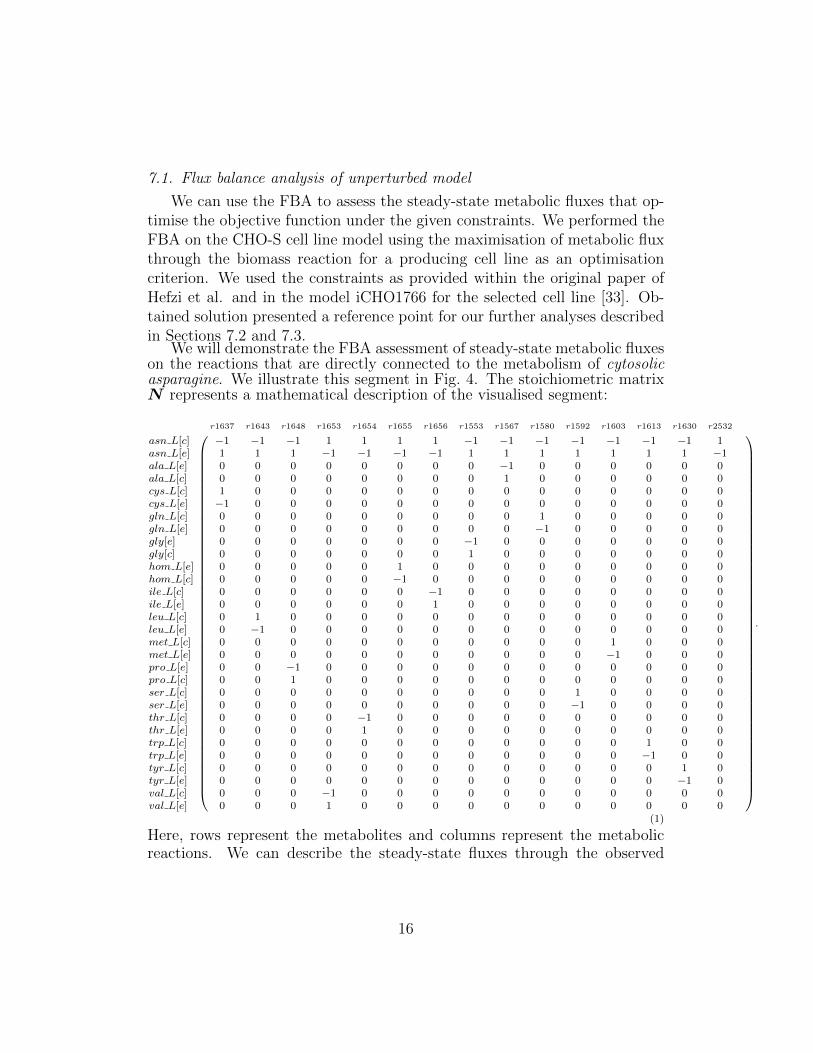
7.1. Flux balance analysis of unperturbed model
We can use the FBA to assess the steady-state metabolic fluxes that op-timise the objective function under the given constraints. We performed theFBA on the CHO-S cell line model using the maximisation of metabolic fluxthrough the biomass reaction for a producing cell line as an optimisationcriterion. We used the constraints as provided within the original paper ofHefzi et al. and in the model iCHO1766 for the selected cell line [33]. Ob-tained solution presented a reference point for our further analyses describedin Sections 7.2 and 7.3.
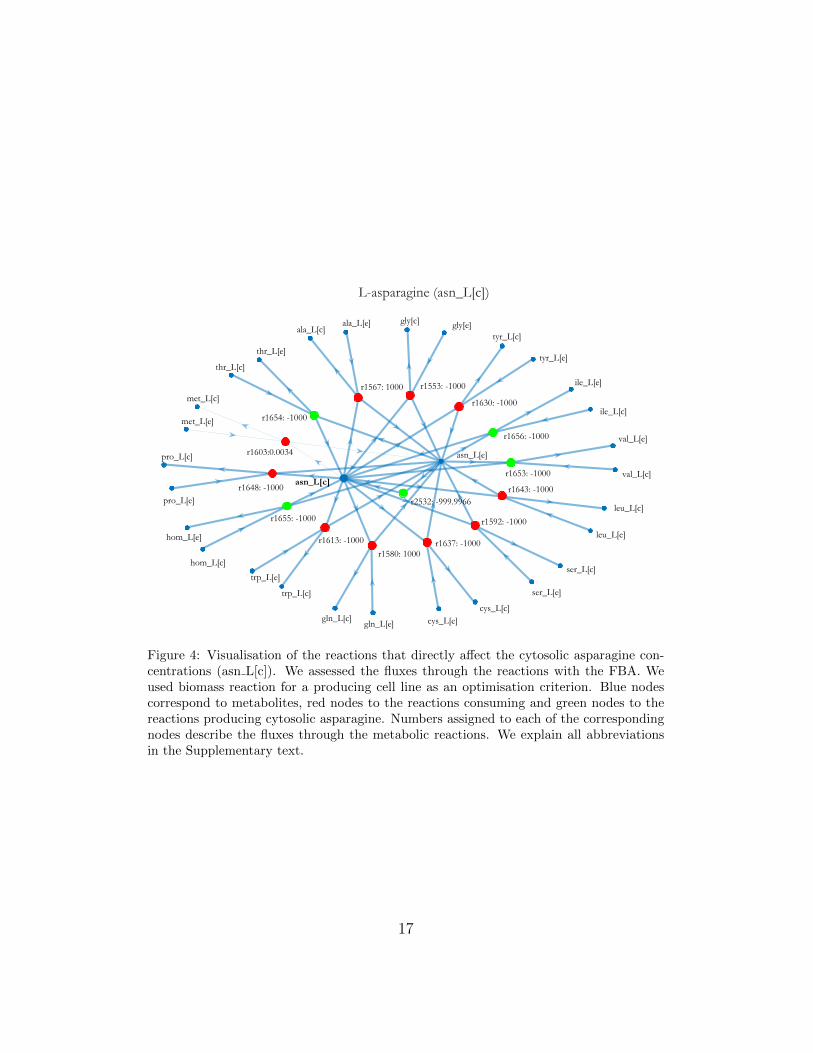
We will demonstrate the FBA assessment of steady-state metabolic fluxeson the reactions that are directly connected to the metabolism of cytosolicasparagine. We illustrate this segment in Fig. 4. The stoichiometric matrixN represents a mathematical description of the visualised segment:
r1637 r1643 r1648 r1653 r1654 r1655 r1656 r1553 r1567 r1580 r1592 r1603 r1613 r1630 r2532
asn L[c] −1 −1 −1 1 1 1 1 −1 −1 −1 −1 −1 −1 −1 1asn L[e] 1 1 1 −1 −1 −1 −1 1 1 1 1 1 1 1 −1ala L[e] 0 0 0 0 0 0 0 0 −1 0 0 0 0 0 0ala L[c] 0 0 0 0 0 0 0 0 1 0 0 0 0 0 0cys L[c] 1 0 0 0 0 0 0 0 0 0 0 0 0 0 0cys L[e] −1 0 0 0 0 0 0 0 0 0 0 0 0 0 0gln L[c] 0 0 0 0 0 0 0 0 0 1 0 0 0 0 0gln L[e] 0 0 0 0 0 0 0 0 0 −1 0 0 0 0 0gly[e] 0 0 0 0 0 0 0 −1 0 0 0 0 0 0 0gly[c] 0 0 0 0 0 0 0 1 0 0 0 0 0 0 0hom L[e] 0 0 0 0 0 1 0 0 0 0 0 0 0 0 0hom L[c] 0 0 0 0 0 −1 0 0 0 0 0 0 0 0 0ile L[c] 0 0 0 0 0 0 −1 0 0 0 0 0 0 0 0ile L[e] 0 0 0 0 0 0 1 0 0 0 0 0 0 0 0leu L[c] 0 1 0 0 0 0 0 0 0 0 0 0 0 0 0leu L[e] 0 −1 0 0 0 0 0 0 0 0 0 0 0 0 0met L[c] 0 0 0 0 0 0 0 0 0 0 0 1 0 0 0met L[e] 0 0 0 0 0 0 0 0 0 0 0 −1 0 0 0pro L[e] 0 0 −1 0 0 0 0 0 0 0 0 0 0 0 0pro L[c] 0 0 1 0 0 0 0 0 0 0 0 0 0 0 0ser L[c] 0 0 0 0 0 0 0 0 0 0 1 0 0 0 0ser L[e] 0 0 0 0 0 0 0 0 0 0 −1 0 0 0 0thr L[c] 0 0 0 0 −1 0 0 0 0 0 0 0 0 0 0thr L[e] 0 0 0 0 1 0 0 0 0 0 0 0 0 0 0trp L[c] 0 0 0 0 0 0 0 0 0 0 0 0 1 0 0trp L[e] 0 0 0 0 0 0 0 0 0 0 0 0 −1 0 0tyr L[c] 0 0 0 0 0 0 0 0 0 0 0 0 0 1 0tyr L[e] 0 0 0 0 0 0 0 0 0 0 0 0 0 −1 0val L[c] 0 0 0 −1 0 0 0 0 0 0 0 0 0 0 0val L[e] 0 0 0 1 0 0 0 0 0 0 0 0 0 0 0
.
(1)
Here, rows represent the metabolites and columns represent the metabolicreactions. We can describe the steady-state fluxes through the observed
16
r1637: -1000
r1643: -1000 r1648: -1000
r1653: -1000
r1654: -1000
r1655: -1000
r1656: -1000
r1553: -1000 r1567: 1000
r1580: 1000
r1592: -1000
r1603:0.0034
r1613: -1000
r1630: -1000
r2532: -999.9966
pro_L[c]
met_L[c]
gly[c] ala_L[e] ala_L[c]
asn_L[c]
asn_L[e]
cys_L[c]
cys_L[e] gln_L[c] gln_L[e]
ser_L[c]
ser_L[e]
thr_L[c]
thr_L[e]
pro_L[e]
gly[e]
hom_L[e]
hom_L[c]
leu_L[c]
ile_L[e]
leu_L[e]
ile_L[c] met_L[e]
val_L[c]
val_L[e]
trp_L[c]
trp_L[e]
tyr_L[c]
tyr_L[e]
L-asparagine (asn_L[c])
Figure 4: Visualisation of the reactions that directly affect the cytosolic asparagine con-centrations (asn L[c]). We assessed the fluxes through the reactions with the FBA. Weused biomass reaction for a producing cell line as an optimisation criterion. Blue nodescorrespond to metabolites, red nodes to the reactions consuming and green nodes to thereactions producing cytosolic asparagine. Numbers assigned to each of the correspondingnodes describe the fluxes through the metabolic reactions. We explain all abbreviationsin the Supplementary text.
17
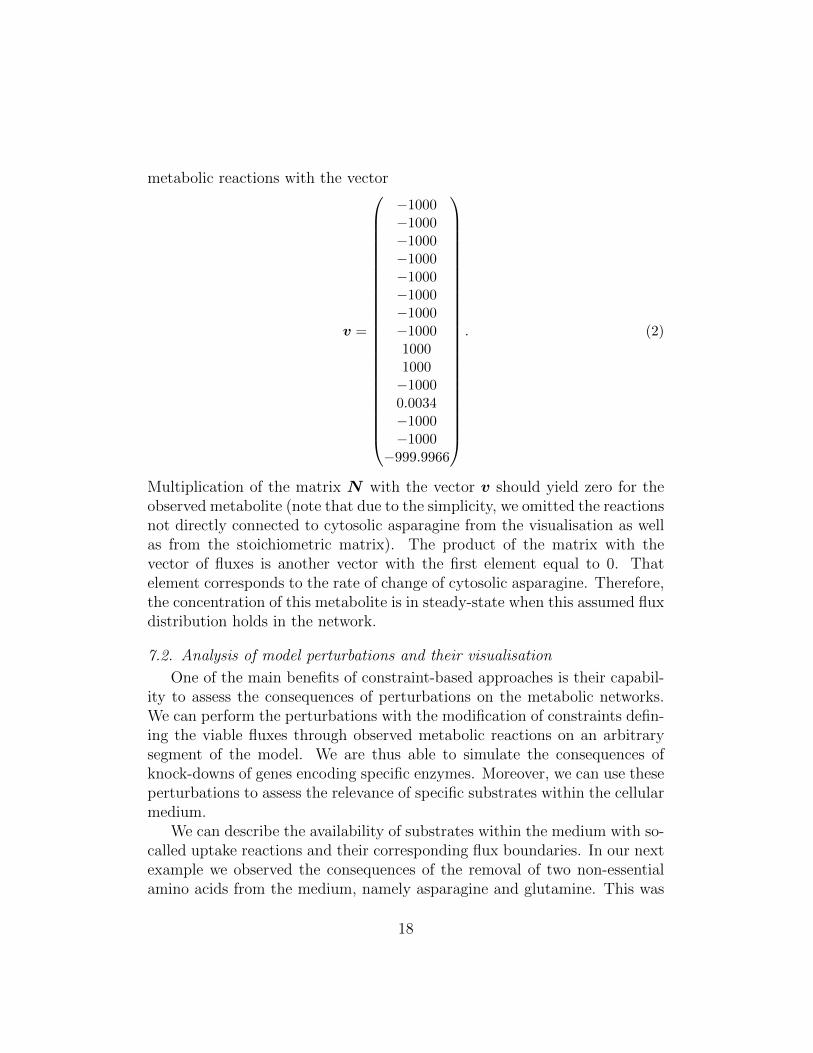
metabolic reactions with the vector
v =
−1000−1000−1000−1000−1000−1000−1000−100010001000−10000.0034−1000−1000−999.9966
. (2)
Multiplication of the matrix N with the vector v should yield zero for theobserved metabolite (note that due to the simplicity, we omitted the reactionsnot directly connected to cytosolic asparagine from the visualisation as wellas from the stoichiometric matrix). The product of the matrix with thevector of fluxes is another vector with the first element equal to 0. Thatelement corresponds to the rate of change of cytosolic asparagine. Therefore,the concentration of this metabolite is in steady-state when this assumed fluxdistribution holds in the network.
7.2. Analysis of model perturbations and their visualisation
One of the main benefits of constraint-based approaches is their capabil-ity to assess the consequences of perturbations on the metabolic networks.We can perform the perturbations with the modification of constraints defin-ing the viable fluxes through observed metabolic reactions on an arbitrarysegment of the model. We are thus able to simulate the consequences ofknock-downs of genes encoding specific enzymes. Moreover, we can use theseperturbations to assess the relevance of specific substrates within the cellularmedium.
We can describe the availability of substrates within the medium with so-called uptake reactions and their corresponding flux boundaries. In our nextexample we observed the consequences of the removal of two non-essentialamino acids from the medium, namely asparagine and glutamine. This was
18
achieved by setting the upper and lower flux boundaries through the corre-sponding uptake reactions to zero. FBA was performed on the additionallyconstrained model and the results obtained were compared with the resultsof the reference analysis (see Section 7.1). We observed the consequencesof the perturbations in a qualitative manner with the visualisation of thereactions that became active after a perturbation was introduced.
Asparagine and glutamine serve as important sources of nitrogen andenergy in the mammalian cells. They highly affect the cell growth, proteinproduction, by-product release and energy metabolism [87]. CHO cells arehowever able to synthesize these two amino acids when in demand [33].
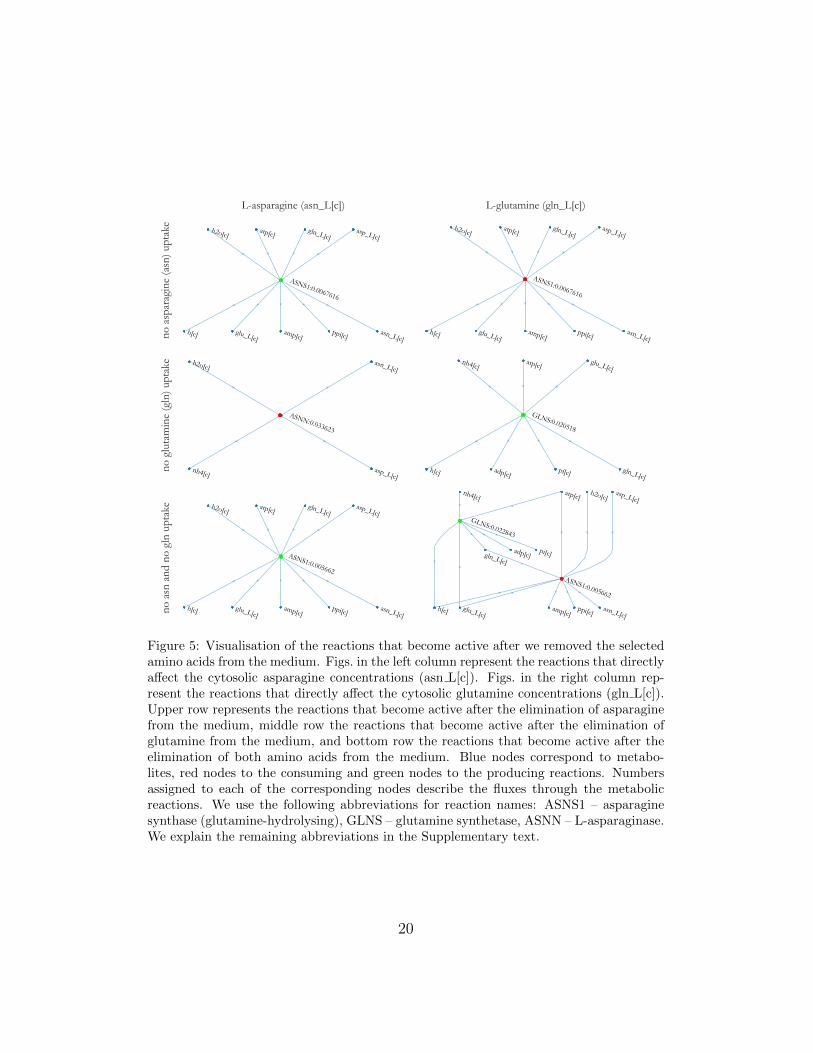
Asparagine and glutamine biosynthesis reactions are inactive when as-paragine and glutamine are available in the medium. We observed this insilico with the FBA on the unperturbed GEM (see Section 7.1). In ourfirst perturbation analysis we simulated the removal of asparagine from themedium. This caused the activation of asparagine biosynthesis reaction (seeupper left Fig. 5). Obtained results correspond with the experimental resultsreported in the literature [88]. Asparagine is synthesized from aspartate withthe reaction catalysed by the asparagine synthase. When asparagine is notpresent in the medium, the asparagine synthase gene expression is increased.In our second perturbation analysis we simulated the removal of glutaminefrom the medium. In this case two reactions became active, i.e. asparaginedegradation which presents an additional source of ammonia (see middle leftFig. 5) and glutamine biosynthesis, which consumes ammonia and glutamate,and is catalysed by the glutamine synthetase (see midle right Fig. 5). Thisagain corresponds with the experimental results reported in the literature[89]. When cells are exposed to growth in medium without glutamine, theglutamine synthetase gene expression is increased. In our third perturbationanalysis both amino acids were removed. In this case, asparagine as well asglutamine biosynthesis reactions were active (see bottom row in Fig. 5).
7.3. Evaluating the effects of medium composition on cell growth
The optimisation of amino acid composition of CHO cell culture mediais important for optimal cell growth and efficient production of recombinantproteins [68]. We quantified the influence of selected amino acids on cellgrowth. We perturbed the original iCHO1766 CHO-S cell line model [33]with the constraints that reduce the uptake of selected amino acids. Theoriginal model presumes the medium availability of arginine, asparagine, as-partate, cysteine, glutamine, histidine, isoleucine, leucine, lysine, methionine,
19
no
asp
arag
ine
(asn
) up
take
no
glu
tam
ine
(gln
) up
take
ASNS1:0.0067616
h[c]
h2o[c] atp[c]
glu_L[c] amp[c]
ppi[c] asn_L[c]
gln_L[c] asp_L[c]
ASNS1:0.0067616
h[c]
h2o[c] atp[c]
glu_L[c] amp[c]
ppi[c] asn_L[c]
gln_L[c] asp_L[c]
ASNN:0.033623
nh4[c]
h2o[c] asn_L[c]
asp_L[c]
GLNS:0.020518
nh4[c]
h[c]
atp[c]
adp[c] pi[c]
glu_L[c]
gln_L[c]
ASNS1:0.005662
h[c]
h2o[c] atp[c]
glu_L[c] amp[c]
ppi[c] asn_L[c]
gln_L[c] asp_L[c]
GLNS:0.022843
ASNS1:0.005662
nh4[c]
h[c]
h2o[c] atp[c]
adp[c] pi[c]
glu_L[c] amp[c]
ppi[c] asn_L[c]
gln_L[c]
asp_L[c]
no
asn
an
d n
o g
ln u
pta
ke
L-asparagine (asn_L[c]) L-glutamine (gln_L[c])
Figure 5: Visualisation of the reactions that become active after we removed the selectedamino acids from the medium. Figs. in the left column represent the reactions that directlyaffect the cytosolic asparagine concentrations (asn L[c]). Figs. in the right column rep-resent the reactions that directly affect the cytosolic glutamine concentrations (gln L[c]).Upper row represents the reactions that become active after the elimination of asparaginefrom the medium, middle row the reactions that become active after the elimination ofglutamine from the medium, and bottom row the reactions that become active after theelimination of both amino acids from the medium. Blue nodes correspond to metabo-lites, red nodes to the consuming and green nodes to the producing reactions. Numbersassigned to each of the corresponding nodes describe the fluxes through the metabolicreactions. We use the following abbreviations for reaction names: ASNS1 – asparaginesynthase (glutamine-hydrolysing), GLNS – glutamine synthetase, ASNN – L-asparaginase.We explain the remaining abbreviations in the Supplementary text.
20
asparagine
amin
o a
cid
up
take
rea
ctio
n
log 10 fold change
0 -1 -2
aspartate
log 10 fold change
0 -1 -2
log 10 fold change
0 -1 -2
glucosis uptake fold change = 1
glucosis uptake fold change = 0.1
glucosis uptake fold change = 0.01
normalisedcell growth
1
0
0.5
arginine
cysteineglutamine
histidineisoleucine
leucinelysine
methioninephenylalanine
prolineserine
threoninetryptophan
tyrosinevaline
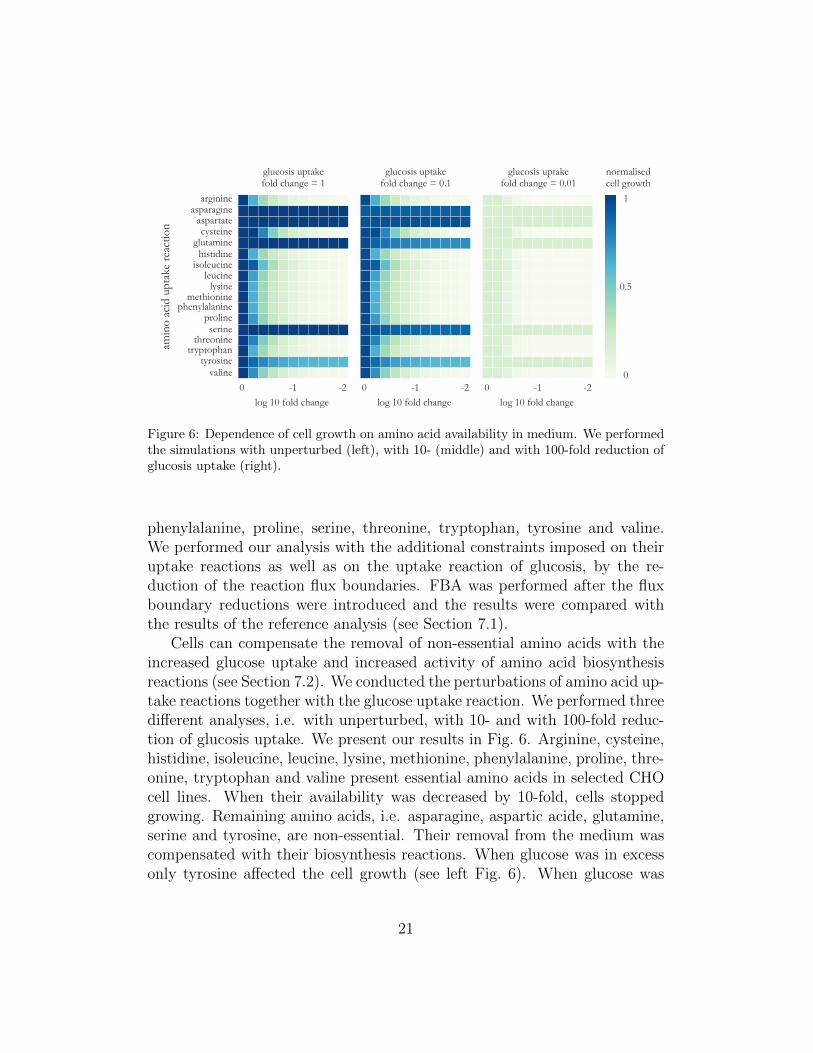
Figure 6: Dependence of cell growth on amino acid availability in medium. We performedthe simulations with unperturbed (left), with 10- (middle) and with 100-fold reduction ofglucosis uptake (right).
phenylalanine, proline, serine, threonine, tryptophan, tyrosine and valine.We performed our analysis with the additional constraints imposed on theiruptake reactions as well as on the uptake reaction of glucosis, by the re-duction of the reaction flux boundaries. FBA was performed after the fluxboundary reductions were introduced and the results were compared withthe results of the reference analysis (see Section 7.1).
Cells can compensate the removal of non-essential amino acids with theincreased glucose uptake and increased activity of amino acid biosynthesisreactions (see Section 7.2). We conducted the perturbations of amino acid up-take reactions together with the glucose uptake reaction. We performed threedifferent analyses, i.e. with unperturbed, with 10- and with 100-fold reduc-tion of glucosis uptake. We present our results in Fig. 6. Arginine, cysteine,histidine, isoleucine, leucine, lysine, methionine, phenylalanine, proline, thre-onine, tryptophan and valine present essential amino acids in selected CHOcell lines. When their availability was decreased by 10-fold, cells stoppedgrowing. Remaining amino acids, i.e. asparagine, aspartic acide, glutamine,serine and tyrosine, are non-essential. Their removal from the medium wascompensated with their biosynthesis reactions. When glucose was in excessonly tyrosine affected the cell growth (see left Fig. 6). When glucose was
21
decreased by 10-fold, cell growth was still comparable to the unperturbedgrowth. In this scenario only glutamine and tyrosine showed to noticeablyinfluence the cell growth (see middle Fig. 6), which coincides with the liter-ature data [87]. When glucose was decreased by 100-fold, cell growth wasdecreased more drastically. Cells were, however, still able to grow withoutnon-essential amino acids (see right Fig. 6).
8. Conclusion
Although the response of metabolic networks is mainly derived from sim-ple enzymatic reactions, they possess complex and rich dynamical proper-ties. Their study requires complex systems approaches. The dynamics ofmetabolic networks can be partially reproduced with the GEMs in combina-tion with computational approaches we described. Even though the accuracyof these reconstructions are far from being perfect, our journey does not stopwith the flawless GEMs. Combining computational models of metabolic net-works with gene regulatory, protein interaction and signalling networks (forexample, see [90, 91]) as well as with other cellular processes into whole-cellmodels [92] promises a whole new perspective. This will bring us to the capa-bilities of building representative virtual tissues and virtual organs with thelong term goal to computationally reconstruct the whole human body [93].Even though a perfect in silico reconstruction of the human body currentlyseems very far from the reality, different state-of-the-art computational mod-els already serve as an excellent basis for the extraction of novel knowledge.In many cases they drastically reduce the amount of experimental and clini-cal work, improve diagnostic tools and increase our understanding of complexbiological phenomena [94, 95].
Here we described some of these approaches that have been vastly appliedin recent years to the fields not directly related to computational modelling,such as metabolic engineering, systems medicine and production of biophar-maceuticals. Even though many details are omitted, this review should serveas a good introduction to the computational reconstruction and analysis ofGEMs.
Acknowledgements
The research was partially supported by the scientific-research programmePervasive Computing (P2-0359) financed by the Slovenian Research Agencyin the years from 2009 to 2017 and by the basic research and application
22
project Designed cellular logic (J1-6740) financed by the Slovenian ResearchAgency in the years from 2014 to 2017. We acknowledge also resourcesof FP7 CASyM (Coordinating Action Systems Medicine Europe, Grant no.305033), and the Slovenian Research Agency grants P1-0390 and the infras-tructure grant ELIXIR.
[1] F. R. Blattner, The complete genome sequence of escherichia coli K-12,Science 277 (5331) (1997) 1453–1462.
[2] E. S. Lander, L. M. Linton, B. Birren, C. Nusbaum, M. C. Zody, J. Bald-win, K. Devon, K. Dewar, M. Doyle, W. FitzHugh et al., Initial se-quencing and analysis of the human genome, Nature 409 (6822) (2001)860–921.
[3] D. McCloskey, B. O. Pallson, A. M. Feist, Basic and applied usesof genome-scale metabolic network reconstructions of Escherichia coli,Molecular Systems Biology 9 (661) (2013).
[4] E. J. OBrien, J. M. Monk, B. O. Palsson, Using genome-scale models topredict biological capabilities, Cell 161 (5) (2015) 971–987.
[5] N. C. Duarte, S. A. Becker, N. Jamshidi, I. Thiele, M. L. Mo, T. D. Vo,R. Srivas, B. Ø. Palsson, Global reconstruction of the human metabolicnetwork based on genomic and bibliomic data, Proceedings of the Na-tional Academy of Sciences 104 (6) (2007) 1777–1782.
[6] N. Swainston, K. Smallbone, H. Hefzi, P. D. Dobson, J. Brewer, M. Han-scho, D. C. Zielinski, K. S. Ang, N. J. Gardiner, J. M. Gutierrez,et al., Recon 2.2: from reconstruction to model of human metabolism,Metabolomics 12 (7) (2016) 1–7.
[7] M. Kanehisa, S. Goto, M. Hattori, K. F. Aoki-Kinoshita, M. Itoh,S. Kawashima, T. Katayama, M. Araki, M. Hirakawa, From genomicsto chemical genomics: new developments in KEGG, Nucleic Acids Re-search 1 (34) (2006) D354–7.
[8] J. Barthelmes, C. Ebeling, A. Chang, I. Schomburg, D. Schomburg,BRENDA, AMENDA and FRENDA: the enzyme information systemin 2007, Nucleic Acids Research 35 (2007) D511–4.
23
[9] R. Caspi, R. Billington, L. Ferrer, H. Foerster, C. A. Fulcher, I. M.Keseler, A. Kothari, M. Krummenacker, M. Latendresse, L. A. Mueller,Q. Ong, S. Paley, P. Subhraveti, D. S. Weaver, P. D. Karp, The MetaCycdatabase of metabolic pathways and enzymes and the BioCyc collectionof pathway/genome databases, Nucleic Acids Research 44 (D1) (2016)D471–D480.
[10] N. Juty, R. Ali, M. Glont, S. Keating, N. Rodriguez, M. J. Swat, S. M.Wimalaratne, H. Hermjakob, N. Le Novere, C. Laibe, V. Chelliah,BioModels: Content, features, functionality and use., CPT: Pharma-cometrics & Systems Pharmacology 4 (2) (2015) 55–68.
[11] Z. A. King, J. Lu, A. Drager, P. Miller, S. Federowicz, J. A. Lerman,A. Ebrahim, B. O. Palsson, N. E. Lewis, BiGG models: A platformfor integrating, standardizing and sharing genome-scale models, NucleicAcids Research 44 (D1) (2015) D515–D522.
[12] D. Jullesson, F. David, B. Pfleger, J. Nielsen, Impact of synthetic biologyand metabolic engineering on industrial production of fine chemicals,Biotechnology Advances 33 (7) (2015) 1395–1402.
[13] C. L. Barrett, T. Y. Kim, H. U. Kim, B. O. Palsson, S. Y. Lee, Sys-tems biology as a foundation for genome-scale synthetic biology, CurrentOpinion in Biotechnology 17 (5) (2006) 488–492.
[14] Z. A. Irani, E. J. Kerkhoven, S. A. Shojaosadati, J. Nielsen, Genome-scale metabolic model of Pichia pastoris with native and humanizedglycosylation of recombinant proteins, Biotechnology and Bioengineer-ing 113 (5) (2016) 961–969.
[15] C. Chen, H. Le, C. T. Goudar, Integration of systems biology in cellline and process development for biopharmaceutical manufacturing, Bio-chemical Engineering Journal 107 (2016) 11–17.
[16] K. P. Jayapal, K. Wlaschin, W. Hu, M. G. S. Yap, Recombinant pro-tein therapeutics from CHO cells – 20 years and counting, ChemicalEngineering Progress 103 (10) (2007) 40–47.
[17] A. Naik, D. Rozman, A. Belic, SteatoNet: The first integrated hu-man metabolic model with multi-layered regulation to investigate liver-
24
associated pathologies, PLoS Computational Biology 10 (12) (2014)e1003993.
[18] A. Mardinoglu, R. Agren, C. Kampf, A. Asplund, M. Uhlen, J. Nielsen,Genome-scale metabolic modelling of hepatocytes reveals serine defi-ciency in patients with non-alcoholic fatty liver disease, Nature Com-munications 5 (2014).
[19] T. Cvitanovic, M. C. Reichert, M. Moskon, M. Mraz, F. Lammert,D. Rozman, Large-scale computational models of liver metabolism: Howfar from the clinics?, Hepatology (2017).
[20] F. Gatto, H. Miess, A. Schulze, J. Nielsen, Flux balance analysis predictsessential genes in clear cell renal cell carcinoma metabolism, ScientificReports 5 (2015) 10738.
[21] P. Ghaffari, A. Mardinoglu, J. Nielsen, Cancer metabolism: A modelingperspective, Frontiers in Physiology 6 (2015).
[22] P. Karp, M. Latendresse, S. M. Paley, M. Krummenacker, Q. Ong, ,R. Billington, A. Kothari, D. Weaver, T. Lee, P. Subhraveti, A. Spauld-ing, C. Fulcher, I. Keseler, R. Caspi, Pathway Tools version 19.0: Inte-grated software for pathway/genome informatics and systems biology,,Briefings in Bioinformatics 17 (5) (2016) 877–890.
[23] R. Agren, L. Liu, S. Shoaie, W. Vongsangnak, I. Nookaew, J. Nielsen,The RAVEN toolbox and its use for generating a genome-scale metabolicmodel for Penicillium chrysogenum, PLoS Computational Biology 9 (3)(2013) e1002980.
[24] S. A. Becker, A. M. Feist, M. L. Mo, G. Hannum, B. O. Palsson,M. J. Herrgard, Quantitative prediction of cellular metabolism withconstraint-based models: the COBRA toolbox, Nature Protocols 2(2007) 727–738.
[25] J. Schellenberger, R. Que, R. M. Fleming, I. Thiele, J. Orth, A. M. Feist,D. C. Zielinski, A. Bordbar, N. E. Lewis, S. Rahmanian, J. Kang, D. Hy-duke, B. O. Palsson, Quantitative prediction of cellular metabolism withconstraint-based models: the COBRA Toolbox v2.0, Nature protocols6 (9) (2011) 1290–1307.
25
[26] J. D. Orth, I. Thiele, B. O. Palsson, What is flux balance analysis?,Nature Biotechnology 28 (3) (2010) 245–248.
[27] S. A. Becker, B. O. Palsson, Context-specific metabolic networks areconsistent with experiments, PLoS Comput Biol 4 (5) (2008) e1000082.
[28] S. Opdam, A. Richelle, B. Kellman, S. Li, D. C. Zielinski, N. E. Lewis,A systematic evaluation of methods for tailoring genome-scale metabolicmodels, Cell Systems 4 (3) (2017) 318–329.
[29] A. P. Burgard, P. Pharkya, C. D. Maranas, Optknock: A bilevel pro-gramming framework for identifying gene knockout strategies for micro-bial strain optimization, Biotechnol. Bioeng. 84 (6) (2003) 647–657.
[30] N. E. Lewis, H. Nagarajan, B. O. Palsson, Constraining the metabolicgenotype-phenotype relationship using a phylogeny of in silico methods,Nature Reviews Microbiology 10 (4) (2012) 291–305.
[31] Z. A. King, A. Drager, A. Ebrahim, N. Sonnenschein, N. E. Lewis, B. O.Palsson, Escher: A web application for building, sharing, and embeddingdata-rich visualizations of biological pathways, PLOS ComputationalBiology 11 (8) (2015) e1004321.
[32] A. Noronha, A. D. Danielsdottir, P. Gawron, F. Johannsson, S. Jons-dottir, S. Jarlsson, J. P. Gunnarsson, S. Brynjolfsson, R. Schneider,I. Thiele et al., ReconMap: an interactive visualization of humanmetabolism, Bioinformatics 33 (4) (2017) 605–607.
[33] H. Hefzi, K. S. Ang, M. Hanscho, A. Bordbar, D. Ruckerbauer, M. Lak-shmanan, C. A. Orellana, D. Baycin-Hizal, Y. Huang, D. Ley, et al.,A consensus genome-scale reconstruction of chinese hamster ovary cellmetabolism, Cell Systems 3 (5) (2016) 434–443.
[34] N. Le Novere, Quantitative and logic modelling of molecular and genenetworks, Nat. Rev. Genet. 16 (3) (2015) 146–158.
[35] B. Palsson, Systems Biology: Properties of Reconstructed Networks,Cambridge University Press, 2006.
[36] N. Zamboni, S.-M. Fendt, M. Ruhl, U. Sauer, 13C-based metabolic fluxanalysis, Nature Protocols 4 (6) (2009) 878–892.
26
[37] N. D. Price, J. L. Reed, B. Ø. Palsson, Genome-scale models of micro-bial cells: evaluating the consequences of constraints, Nature ReviewsMicrobiology 2 (11) (2004) 886–897.
[38] I. Thiele, B. O. Pallson, A protocol for generating a high-quality genome-scale metabolic reconstruction, Nature Protocols 5 (2010) 93–121.
[39] R. Mahadevan, J. S. Edwards, F. J. Doyle, Dynamic flux balance anal-ysis of diauxic growth in Escherichia coli, Biophysical journal 83 (3)(2002) 1331–1340.
[40] X. Feng, Y. Xu, Y. Chen, Y. J. Tang, Integrating flux balance analysisinto kinetic models to decipher the dynamic metabolism of Shewanellaoneidensis MR-1, PLOS Computational Biology 8 (3) (2012).
[41] M. W. Covert, C. H. Schilling, B. O. Palsson, Regulation of gene ex-pression in flux balance models of metabolism, Journal of TheoreticalBiology 213 (1) (2001) 73–88.
[42] N. E. Lewis, K. K. Hixson, T. M. Conrad, J. A. Lerman, P. Charu-santi, A. D. Polpitiya, J. N. Adkins, G. Schramm, S. O. Purvine, D.Lopez-Ferrer et al., Omic data from evolved E. coli are consistent withcomputed optimal growth from genome-scale models, Molecular SystemsBiology 6 (390) (2010).
[43] M. Lakshmanan, G. Koh, B. K. S. Chung, D.-Y. Lee, Software applica-tions for flux balance analysis, Briefings in Bioinformatics 15 (1) (2014)108–122.
[44] E. Klipp, W. Liebermeister, C. Wierling, A. Kowald, Systems Biology:A Textbook, 2nd Edition, Wiley, 2016.
[45] Z. A. King, J. Lu, A. Drager, P. Miller, S. Federowicz, J. A. Lerman,A. Ebrahim, B. O. Palsson, N. E. Lewis, BiGG models: A platformfor integrating, standardizing and sharing genome-scale models, Nucleicacids research 44 (D1) (2016) D515–D522.
[46] O. Rolfsson, B. O. Palsson, Decoding the jargon of bottom-up metabolicsystems biology, BioEssays 37 (6) (2015) 588–591.
27
[47] C. R. Haggart, J. A. Bartell, J. J. Saucerman, J. A. Papin, Whole-genome metabolic network reconstruction and constraint-based model-ing?, Methods in Enzymology 500 (2011) 411–433.
[48] G. J. Baart, D. E. Martens, Genome-scale metabolic models: recon-struction and analysis, Neisseria meningitidis: Advanced Methods andProtocols (2012) 107–126.
[49] A. M. Feist, M. J. Herrgard, I. Thiele, J. L. Reed, B. Ø. Palsson, Recon-struction of biochemical networks in microorganisms, Nature ReviewsMicrobiology 7 (2) (2009) 129–143.
[50] M. Durot, P.-Y. Bourguignon, V. Schachter, Genome-scale models ofbacterial metabolism: reconstruction and applications, FEMS Microbi-ology Reviews 33 (1) (2009) 164–190.
[51] B. G. Kremkow, J. Y. Baik, M. L. MacDonald, K. H. Lee, CHOgenome.org 2.0: Genome resources and website updates, Biotechnology journal10 (7) (2015) 931–938.
[52] J. W. Pinney, metaSHARK: software for automated metabolic networkprediction from DNA sequence and its application to the genomes ofPlasmodium falciparum and Eimeria tenella, Nucleic Acids Research33 (4) (2005) 1399–1409.
[53] M. P. Pacheco, T. Pfau, T. Sauter, Benchmarking procedures forhigh-throughput context specific reconstruction algorithms, Frontiers inPhysiology 6 (2016).
[54] I. Thiele, N. Vlassis, R. M. T. Fleming, fastGapFill: efficient gap fillingin metabolic networks, Bioinformatics 30 (17) (2014) 2529–2531.
[55] S. Prigent, C. Frioux, S. M. Dittami, S. Thiele, A. Larhlimi, G. Col-let, F. Gutknecht, J. Got, D. Eveillard, J. Bourdon et al., Meneco,a topology-based gap-filling tool applicable to degraded genome-widemetabolic networks, PLOS Computational Biology 13 (1) (2017)e1005276.
[56] Z. Hosseini, S.-A. Marashi, Discovering missing reactions of metabolicnetworks by using gene co-expression data, Scientific Reports 7 (2017)41774.
28
[57] M. Y. Becker, I. Rojas, A graph layout algorithm for drawing metabolicpathways, Bioinformatics 17 (5) (2001) 461–467.
[58] J. van Helden, L. Wernisch, D. Gilbert, S. Wodak, Graph-based anal-ysis of metabolic networks, in: Bioinformatics and genome analysis,Springer, 2002, pp. 245–274.
[59] P. Shannon, A. Markiel, O. Ozier, N. S. Baliga, J. T. Wang, D. Ramage,N. Amin, B. Schwikowski, T. Ideker, Cytoscape: a software environmentfor integrated models of biomolecular interaction networks, Genome re-search 13 (11) (2003) 2498–2504.
[60] M. Konig, A. Drager, H.-G. Holzhutter, CySBML: a Cytoscape pluginfor SBML, Bioinformatics 28 (18) (2012) 2402–2403.
[61] P. A. Jensen, J. A. Papin, MetDraw: automated visualization ofgenome-scale metabolic network reconstructions and high-throughputdata, Bioinformatics 30 (9) (2014) 1327–1328.
[62] R. Bourqui, L. Cottret, V. Lacroix, D. Auber, P. Mary, M.-F. Sagot,F. Jourdan, Metabolic network visualization eliminating node redun-dance and preserving metabolic pathways, BMC systems biology 1 (29)(2007).
[63] A. Kostromins, E. Stalidzans, Paint4net: COBRA toolbox extension forvisualization of stoichiometric models of metabolism, Biosystems 109 (2)(2012) 233–239.
[64] S. N. Galleguillos, D. Ruckerbauer, M. P. Gerstl, N. Borth, M. Han-scho, J. Zanghellini, What can mathematical modelling say about CHOmetabolism and protein glycosylation?, Computational and StructuralBiotechnology Journal 15 (2017) 212–221.
[65] H. F. Kildegaard, D. Baycin-Hizal, N. E. Lewis, M. J. Betenbaugh, Theemerging CHO systems biology era: harnessing the omics revolutionfor biotechnology, Current opinion in biotechnology 24 (6) (2013) 1102–1107.
[66] G. B. Nyberg, R. R. Balcarcel, B. D. Follstad, G. Stephanopoulos,D. I. C. Wang, Metabolism of peptide amino acids by Chinese hamster
29
ovary cells grown in a complex medium, Biotechnology and bioengineer-ing 62 (3) (1999) 324–335.
[67] S. Selvarasu, Y. S. Ho, W. P. K. Chong, N. S. C. Wong, F. N. K.Yusufi, Y. Y. Lee, M. G. S. Yap, D.-Y. Lee, Combined in silico modelingand metabolomics analysis to characterize fed-batch CHO cell culture,Biotechnology and Bioengineering 109 (6) (2012) 1415–1429.
[68] Z. Xing, B. Kenty, I. Koyrakh, M. Borys, S.-H. Pan, Z. J. Li, Optimizingamino acid composition of CHO cell culture media for a fusion proteinproduction, Process Biochemistry 46 (7) (2011) 1423–1429.
[69] Z. Sheikholeslami, M. Jolicoeur, O. Henry, Elucidating the effects ofpostinduction glutamine feeding on the growth and productivity of CHOcells, Biotechnology Progress 30 (3) (2014) 535–546.
[70] V. S. Martnez, S. Dietmair, L.-E. Quek, M. P. Hodson, P. Gray, L. K.Nielsen, Flux balance analysis of CHO cells before and after a metabolicswitch from lactate production to consumption, Biotechnology and Bio-engineering 110 (2) (2013) 660–666.
[71] W. S. Ahn, M. R. Antoniewicz, Metabolic flux analysis of CHO cellsat growth and non-growth phases using isotopic tracers and mass spec-trometry, Metabolic engineering 13 (5) (2011) 598–609.
[72] N. Templeton, J. Dean, P. Reddy, J. D. Young, Peak antibody produc-tion is associated with increased oxidative metabolism in an industriallyrelevant fed-batch CHO cell culture, Biotechnology and bioengineering110 (7) (2013) 2013–24.
[73] H. W. Lee, A. Christie, J. A. Starkey, E. K. Read, S. Yoon, Intracel-lular metabolic flux analysis of CHO cells supplemented with wheathydrolysates for improved mAb production and cell-growth, Journal ofChemical Technology and Biotechnology 90 (2) (2015) 291–302.
[74] A. Nicolae, J. Wahrheit, J. Bahnemann, A.-P. Zeng, E. Heinzle, Non-stationary 13C metabolic flux analysis of Chinese hamster ovary cells inbatch culture using extracellular labeling highlights metabolic reversibil-ity and compartmentation, BMC Systems Biology 8 (1) (2014) 50.
30
[75] J. Wahrheit, J. Niklas, E. Heinzle, Metabolic control at the cytosolmi-tochondria interface in different growth phases of CHO cells, MetabolicEngineering 23 (2014) 9–21.
[76] N. Chen, M. H. Bennett, C. Kontoravdi, Analysis of Chinese hamsterovary cell metabolism through a combined computational and experi-mental approach, Cytotechnology 66 (6) (2014) 945–966.
[77] A. Ghorbaniaghdam, O. Henry, M. Jolicoeur, A kinetic-metabolic modelbased on cell energetic state: study of CHO cell behavior under Na-butyrate stimulation, Bioprocess and Biosystems Engineering 36 (4)(2013) 469–487.
[78] R. P. Nolan, K. Lee, Dynamic model of CHO cell metabolism, Metabolicengineering 13 (1) (2011) 108–124.
[79] X. Xu, H. Nagarajan, N. E. Lewis, S. Pan, Z. Cai, X. Liu, W. Chen,M. Xie, W. Wang, S et al. Hammond, The genomic sequence of theChinese hamster ovary (CHO)-K1 cell line, Nature Biotechnology 29 (8)(2011) 735–741.
[80] F. N. K. Yusufi, M. Lakshmanan, Y. S. Ho, B. L. W. Loo, P. Ariyaratne,Y. Yang, S. K. Ng, T. R. M. Tan, H. C. Yeo, H. L. Lim et al., Mam-malian systems biotechnology reveals global cellular adaptations in arecombinant CHO cell line, Cell Systems 4 (5) (2017) 530–542.e6.
[81] W. S. Ahn, M. R. Antoniewicz, Parallel labeling experiments with [1,2-13C]glucose and [U-13C]glutamine provide new insights into CHO cellmetabolism, Metabolic engineering 15 (2013) 34–47.
[82] N. Carinhas, T. M. Duarte, L. C. Barreiro, M. J. Carrondo, P. M. Alves,A. P. Teixeira, Metabolic signatures of GS-CHO cell clones associatedwith butyrate treatment and culture phase transition, Biotechnologyand bioengineering 110 (12) (2013) 3244–3257.
[83] V. S. Martınez, M. Buchsteiner, P. Gray, L. K. Nielsen, L.-E. Quek,Dynamic metabolic flux analysis using B-splines to study the effectsof temperature shift on CHO cell metabolism, Metabolic EngineeringCommunications 2 (2015) 46–57.
31
[84] L.-E. Quek, S. Dietmair, M. Hanscho, V. S. Martınez, N. Borth, L. K.Nielsen, Reducing Recon 2 for steady-state flux analysis of HEK cellculture, Journal of biotechnology 184 (2014) 172–178.
[85] I. Thiele, N. Swainston, R. M. Fleming, A. Hoppe, S. Sahoo, M. K.Aurich, H. Haraldsdottir, M. L. Mo, O. Rolfsson, M. D. Stobbe, et al., Acommunity-driven global reconstruction of human metabolism, Naturebiotechnology 31 (5) (2013) 419–425.
[86] A. M. Feist, B. O. Palsson, The biomass objective function, Currentopinion in microbiology 13 (3) (2010) 344–349.
[87] L.-X. Zhang, W.-Y. Zhang, C. Wang, J.-T. Liu, X.-C. Deng, X.-P. Liu,L. Fan, W.-S. Tan, Responses of CHO-DHFR cells to ratio of asparagineto glutamine in feed media: cell growth, antibody production, metabolicwaste, glutamate, and energy metabolism, Bioresources and Bioprocess-ing 3 (1) (2016) 5.
[88] S. M. Arfin, D. R. Simpson, C. Chiang, I. L. Andrulis, G. W. Hatfield, Arole for asparaginyl-tRNA in the regulation of asparagine synthetase ina mammalian cell line, Proceedings of the National Academy of Sciences74 (6) (1977) 2367–2369.
[89] A. Sanfeliu, G. Stephanopoulos, Effect of glutamine limitation on thedeath of attached Chinese hamster ovary cells, Biotechnology and bio-engineering 64 (1) (1999) 46–53.
[90] S. Lee, C. Zhang, M. Kilicarslan, B. Piening, E. Bjornson, B. Hallstrm,A. Groen, E. Ferrannini, M. Laakso, M. Snyder et al., Integrated net-work analysis reveals an association between plasma mannose levels andinsulin resistance, Cell Metabolism 24 (1) (2016) 172–184.
[91] S. Lee, A. Mardinoglu, C. Zhang, D. Lee, J. Nielsen, Dysregulated sig-naling hubs of liver lipid metabolism reveal hepatocellular carcinomapathogenesis, Nucleic Acids Research 44 (12) (2016) 5529–5539.
[92] J. R. Karr, K. Takahashi, A. Funahashi, The principles of whole-cellmodeling, Current Opinion in Microbiology 27 (2015) 18–24.
[93] P. Kohl, D. Noble, Systems biology and the virtual physiological human,Molecular Systems Biology 5 (292) (2009).
32
[94] H. Fouladiha, S.-A. Marashi, Biomedical applications of cell- and tissue-specific metabolic network models, Journal of Biomedical Informatics 68(2017) 35–49.
[95] J. Y. Ryu, H. U. Kim, S. Y. Lee, Reconstruction of genome-scale humanmetabolic models using omics data., Integrative Biology 7 (8) (2015)859–68.
33