Embed Size (px)
Citation preview
POLICY RESEARCH
WORKING PAPER 1215
How Much Do Distortions Contrary to the traditonaview that distorions of
Affect Growth? relative prices have modest
effects, Easterly finds that
Wil'liam Easterly distortions can greatly affectgrowth and welfare.
The World BankPolicy Research DepartrnentMacroecononmics and Growth DiviLsionI November 1993
Pub
lic D
iscl
osur
e A
utho
rized
Pub
lic D
iscl
osur
e A
utho
rized
Pub
lic D
iscl
osur
e A
utho
rized
Pub
lic D
iscl
osur
e A
utho
rized
Pub
lic D
iscl
osur
e A
utho
rized
Pub
lic D
iscl
osur
e A
utho
rized
Pub
lic D
iscl
osur
e A
utho
rized
Pub
lic D
iscl
osur
e A
utho
rized
PouIcy RESEARC(H WORKIN(. PAI'ER 1215
Summary findings
Fasterly prsecrits a simple encogcnoos growth moiodel are hiwnired, no mnatter how highl the -att of'(with two tYpes of capital) that showss the sizable long. distortion.runi effects on growth of distortionary policies. 'the Suobssidizing inp uts and investment goods canir
model afpplies to manly dLifferent types of distortions of incrcase gro .th, even thxotughi it worsenis wclfarv. But a
relative prices conimmon in developinig cotiintries tor suhsidy to witt capit;ul gookl fintauncetd hy a 1t x o
exanipe, price coritrols, black market exchange )ratcs another capiral good ainahmbiguously redixc growthi
and differential taxes and tariffs. Inopirical resuilts show strong negative effects f'ro
'I'he mnodel shows that distortions of relative input variance in thle relative prices of insestniniit goodsprices can greatly affect growth and welfare. I'hl across sectors, shile also cotifiriniig and extenrdingmagnitude of tht eCffect dCepends on the plroduLctionl earlier result. showing tihat penalizing investment
elasticity of substittition. With high -UsStitUtabiliry, te g)ods and disituorting finatncial markets reduce growth,
effects on growth and welfare, although possibly large,
This paper- a producr of the Macroeconomics antid Growth D)iv ision, Policy vResea rc h )epartrmienrt-- is pa t of a larger
effort in the department to rclate long-riun growth to national policies. 'I'h stIdy was funLded hy the Bank's Research
Support B3udget under the researclh project "How Do National PoliciCs Affect Long-Run Growth?" (RPO 67f-66).
Copies of this pa!per are available free from thb World Batik. 181 8 H Street NWV, Washington, DC '20433. Please contact
Rebecca Martin, room N1 1-0.35, extensiol 39065 (3() pages). NoVemrber 1 99 3.
Fe'o Plwc Research ,W rking Paper Sf'ies Jisss -inate5 tle tind;ogs , ' in pk mi . s tu e'nc' ,ofa tlr efxcht aec -, ileas ca b,it
development issues. An objective oftthe series is ,., get the lindvigs out 1i4i, kl) cu ie'i i thc 1/"esentations are les1 tOwn ul//v polisred, I h,e
papers carry the nates of the authors and s*ou,l ble used and cited accordlingI. he fndings, interpretations, ,7nd con(lusi 'ns are the|
authors' own and should not be attributed to the World Bank, its F-cecuti:e Board o! I)!rtr tors, or an) of !ts memb cr countries J
IProduced by the Policy Research Dissemination Center

torthcoming, Journal of Monetary Economics
HOW MUCH DO DISTORTIONS AWECT GROWTH?
William Easterly
World Bank. Washington DC 20433
correcpondence to: William Easterly, Room N-I 1-043, World Bank, 1818 H St. NW, WashingtonDC 20433 USA
'I am grateful to participants in presentations at the NBER Workshop on Economic Growth and at theWorld Bank and to an anonymous referee for useful comments.
1. INTRODUCTION
The economic literature on developing countries has long contained arguments that the large
growth differentials among these countries could be explained by policy differences. Policies that
directly distort relative prices and resource allocation - such as tariffs, import quotas, controls on
prices and interest rates, and discriminatory taxes - have been particularly singled out to explain
differential perforrnance of developing countries (Balassa (1985), Krueger (1978, 1983), Chenery et
al. (1986)).
However, according to the standard neoclassical growth model due to Solow (1956),
distortionary policie- affect only the level of income (and that modestly as dramatized by the famous
Harberger triangles) and not its rate of growth. The alleged long-run growth effects of distortionar
policy have also been dismissed in some "new" growth models (Lucas (1988) and Young (1991)).
The natural conclusion is that distortionary policies are not that imnportant in explairing large
differences in economic performance (Rodrik (1991), Sachs (1987)).'
In contrast, authors such as Romer (1986, 1989), Barro (1990), Barro and Sala-i-Martin
(1993), Jones and Manuelli (1990), and Rebelo (1991) have presented models in which policies have
significant effects on long-run growth. For example, in the area of fiscal policy, Barro (1990) has
discussed how tax rates can distort savings decisions and lower growth, while government se-vices
financed bv those taxes can potentially raise private productivitv and increase growth. A recent body
of work has calculated the quantitative impact of tax policy on growth rates. with results that range
from small (Lucas (;990)) to large (King and Rebelo (1990), Rebelo and Stokey (1993)) to very large
(Jones. Ma.nuelli. and Rossi (1993)).
However, the endogenous growth literature has so far not given much attention to the
distortions of resource allocation commonly induced by policies in developing countries. including
The growth effects of distorionary policies could be preserved in the Solow model if we focused on the trnsition to the stdy state.However, King and Rebelo (1993) have convsncingly demcnstrated that the Solow traition can explain very l1t1. of the long-run growthrate without generating counterfactual implications for the interet rte. Mankiw. Romer, end Weil (IM) genete a larger role fortransitional dynamics by rupposing a high capital share including human capital.

2
both tax and nontax policies.' Tax systems in developing countries often have a very narrow base,
because of widespread tax evasion and the small size of the formal sector (World Bank (1988)).
Generation of revenue from this narrow base often implies very high tax rates. A few examples help
illustrate this. More than 80 percent of income is .id to go unrepo.ted in Argentina (ibid.).
Employment in the privat^ formal sector in Cote d'Ivoire amounts to only 1.4 percent of the
population. Repeated attempts to increase tax revenue from the formal sector in Cote d'Ivoire have
:net with failure, as there is large-scale evasion of taxes - which have an average effective tax rate of
48 percent (Chamley and Ghanem (1991)). Reliance on taxes on international trade is heavy in
developing countries (particularly in Africa where it amounts to 35 percent of revenues), implying
that the tax system penalizes the use of imporLed inputs in production (World Bank (1988)). Although
tax distortions are also significant in industrial countries (King and Fullerton (1984)), these examples
suggest another order of magnitude for deveioping country distortions.
Besides explicit fear'ires of the tax system, there are numerous oth ways that governments in
developing countries intervene to create large distortions o. resource allocation. In addition to explicit
taxes on trade, there are a host of other trade interventions frequently used, such as import quotas and
licenses and multiple exchange rates, which imply distortions of prices of domestic versus foreign
goods, as well as among different types of foreign goods (World Bank (1987)). Foreign exchange
controls lead to the creation of blacK markets in foreign exchange, where the exchange rate is a large
multiple of the official exchange rate. Prior to reforms in Ghana in 1983. for example. the black
market exchange rate was 44 times the official rate (Islam and Wetzel (1991)). Government
marketing boards pay prices to domestic producers of export commodities that are a small fraction of
the international price.
:An exception is Murphy, Shleifer, and Vishny ( 1991), which shows how rent-seekng in the presence of distortions can significantlylower growth
3
Controls on nominal interest rates often result in large negative real interest rates, while
quantitative credit allocation rules imply large subsidies for some types of capital and heavy implicit
taxes on others. For example, credit for mortgage lending in Turkey was neavily subsidized in the
early 1980s, so that these borrowers paid highly negative real interest rates, while commercial credits
for other types of loans carried real in!erest rates as high as 50 percent (World Bank (1989b)).
However, a large informal sector has sprung up side by side with the formal economy in
many developing countries in response to distortionary government policies. De Snto (1989) has
convincingly shown how government regulation led to a thriving informal sector in Peru. Over half
of urban employment in Africa is said to be in the int.-,rmal sector (World Bank (1989a)). The illegal
economy in Ghana in 1982 was estimated to have accounted for 32 percent of GDP (Islam and Wetzel
(1991)) The informal sector often seems to provide a cushion to soften the impact of even the most
extreme govermment policies. The depredations of the Amir. government in Uganda caused formal
sector output to fall at 2 percent per year in 1970-78, but subsistence producticn continued to grow at
3.4 percent per year (Reynolds (1985)).
The multiple distortions described here cften cause severe misalignment of relative prices. For
example domestic prices of some goods will be driven up through exorbitant tariffs or restrictive
quotas while others receive preferential tariff or quota treatment, or are held down by domestic price
controls. The model in this paper will show that the distortion of composition of the aggregate capital
stock resulting from such interventions can have large growth effects, just as the tax-induced
distortion of the ratio of physical to iiulnan capital affe.cts growth in Jones, Manuelli, and Rossi
(1993) and Rebelo and Stokey (1993). The price distortions can be measured di-ectly with the
commodity-by-comnodity price data collected by Summers and Heston (1988). This paper will
propose a measure of relative price distortion relevant to long-run growth determination. and
empirically examine its effects on growth.

4
The paper is organized as follows. Section II will present the basic model relating distortions
to growth, and show how it covers a variety of common distortionary policies. Section m will present
empirical testing of some of the implications of the mode', deriving a new measure of the severity of
distortion of the price system. Section IV cancludes.
[I. A MODEL OF ENDOGENOUS GROWTH WITH DISTORTIONARY POLICEES
This section presents an endogenous growth model that attempts to capture some of the
special features of distortionar:, government policy in developing countries. It postulates a model of
constant returns to scale in reproducible capital, as in Rebelo (1991) and Barro (1990).3 Canital is
broadly defined to include both physical and human capital. Two generic types of capital are defined
io produce the single output - the types will be initially interpreted as formal and informal stor
capital. The distortion will be defined initially as a sales tax on investment purchases in the formal
sector. The relationship between this distortion rate and growth will then be discussed. Applications
to other policies will then be considered. Throughout the paper, we assume that the economy is
insulated from international financial markets, although trade in goods is considered. While the
model is highiy stylized, the results seem to give insight into some of the developing country
characteristics discussed above.
The Model
Equation (1) shows the production function for our analysis:
1
(1) Y = A (y K1 + (1 -y) K2 )
'Tis type of model can also be seen as a converuent approximaution to a Solow model with a very high share of capital includinghnan capital), i:l which policies have such large level effects that they appear to be growth effects. Consunt returns in reproduciblecapita. allows the denvaton of a rteadv state that approximatea the transcuional behavior of a Solow model with high capital share.

5
Output is a CES function of the two generic types of capital, with elasticity of substitution l/(e-1).
For simplicity, we assume population to be fixed throughout the analysis.
.aitially we interpret the two types of capital as being formal and informal sector capitil,
which are defined in terms of their location, ownership, and visibility to the tax authorities. We
assume that the two types of capital can both be formed fTom the domestic good with zero installation
cost, and that the economy is closed both to foreign trade and capital flows (in the next section, we
will show how some alternative interpretations ao not change the model). The distortion is a sales tax
on formal sector investmenm purchases, which informal sector investment purchases evade.
We assume that ideritical, infinitely-lived dynasties of producer-consumers maximize the
present discounted value of the utility of future consumption:
(2) e -Pt cl -a
Utility is given as an isoelastic function of total consumption C where the intertemporal elasticity of
substitution is I/a.
Consumption is given by the excess of income over investment spending:
(3) C = Y - (1+r) I12 - 12 + T
where r is the rate of sales tax on purchases of investment goods of the first type. The variable T is
the lump-sum transfer of tax revenues back to consumers, ex-post equal to -r1, but treated by the
consumer as fixed. Growth is unaffect, !, however, if the revenues are not rebated to the consumer.
The equations of accumulation of capital are:
(4) K 1 = I- 6K
(5) K 2 = 12 - 2
where 6 is the rate of depreciation, ass_med equal across capital types to simplify the algebra. We do
not explicitly impose the condition that investment is irreversible.

6
The t. t-order conditions imply rhat the distortion will act as a wedge between the marginal
products of the two types of capital, as follows:
(6)+76) = ~1 4 7
2
where T is the rate u.ax on investment in type I capital. This implies the following ratio of type 2
to type 1 capital (denoted '1), from (1) and (6):
K2 (1*Y) (1+7) 1
KI =
The distortion r induces more of type 2 cnpital to be held relative to type 1 capital than is socially
optimal. The elasticity of subs.itution (1/(e-1)) determines how strongly the ratio of capital inputs will
respond to increases in the distortion.
In steady state, consumption and output will grow at the same rate, which will be given by:
r2 -j_p
(8) g --
where r, is the marginal product of type 2 capital, given by the following:
(9) r = A (I-y) (y 4 6+ 1-Y)
and 4) is the ratio of K. to K, given by (7). Growth is giver. by the familiar condition that optial
growth of consumption is equal to the difference between the net marginal product of capital and the
rate of time preference. times the intertemporal elasticity of substitution. Since the marginal product
of type 2 capital goes down when the ratio of type 2 to typt I capital increases, which occurs when
type I capital is taxed more heavily, growth is unambiguouslv a negative function of the tax rate r.
A policy equivalence that follows immediately is that between a sales tax and an income tax.
An income tax on the income from formal sector capital that is evaded by holders of informal sector
7
capital will enter in an exactly analogous way as above (the income tax rate t equivalent Lo a sales tax
7 is t = r/(l +r)).'
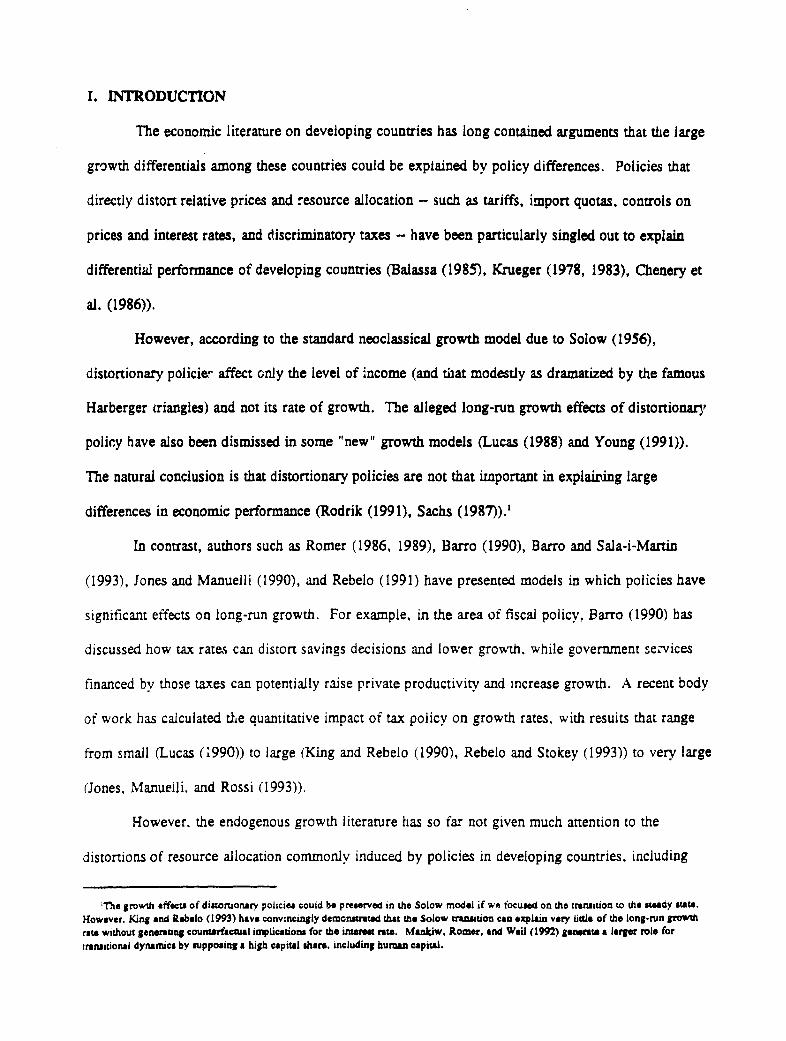
The nature of lie relationship betweei. growth and distortion depends on the production
elasticity of substitution between the two types of capita'. Figure 1 shows a simulation of growth rates
for plausible parameter values with alternative production elasticities.5 The graphs are shown in terrms
^f the equivalent income tax. With a high elasticity of substitution in prudaction, even an income tax
rate close to unity could still permit positive per capita growth. This is because when the elasticity of
substitution is greater than one, neither input is essential to production. As the tax rate approaches
one, investrnent in typu I capital asymptotically approaches zero. However, production is still
possible relying only on type 2 capital, and so the rate of return to type 2 capital remains positive.
W'hile a high elasticity of substitution may seem implausible ir a model with only two inputs, it is
more prlausible in a multiple input production function where many types of taxed capital goods will
have close substitutes in the informal sectoe. A high elasticity of subsLitution between informal and
fcrmal capital could give insight into why even highly distorted economies could have less than
catastrophic growth performancc (such as Amin's Uganda, as cited earlier).
If the elastic..y of production is less than or equal to one, then the level of output and the rate
of return to type 2 capital go to zero as the tax rate approaches one. As the tax rate goes to unity,
economic agents will decumulate capital (assuming no irreversibility in investment) at a rate
((6 +p)/a). Growth also falls off more steeply at lower levels of the tax rate, as shown in figure 1.
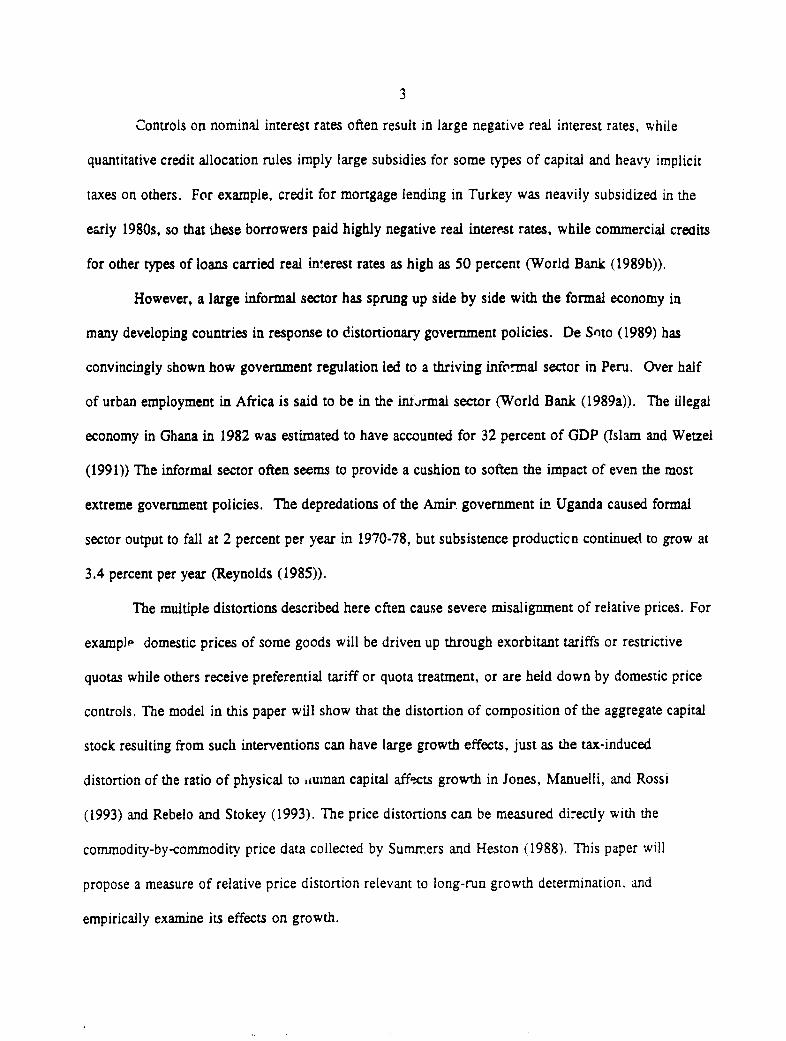
There is an analogous effect of the elasticity of substitution on the welfare loss associated with
the distortionary tax. Figure 2 shows how the welfare loss is small at first, regardless of the
'this equivalence is noted in another context by Atkinson and Stiglitz (1980).
nThe parameter values used for the simulation are A= .5. d .05. y = .5, =2/3 = 2. and a = I. These values are arbitrarilychosen to reproduce plausible ranges of growth rates for illustrative purposes. The shape of the growth-distortion relationship is robust tochanges in these parameers except for the production elasticity of subsitution (as discussed in the text) and the intertemporml elasticitv ofsubritution (not discussed here, since it is well known to control the str-ngth of the saving respons. t t.L changes).

8
elasticity.' This follows from the fact that a laissez-faire zero tax policy is first-bes,z which must
imply that the der,vative of welfare with respect to the tax rate is zero at a zero tax rate. As the tax
rate increases, welfare 'ils off more sharply in the high elasticity case, then bottoms out at a finite
level as the tax rate goes to one. This occurs because the taxed input is inessential, so even
eiirrmination of the input's use only leads tO a finite, albeit substantial, welfare loss. As the use of the
input apprcaches zero, the marginal welfare loss of a higher tax cn that input is minimal. In the low
substitutability case, the welfaru loss is not bounded since the taxed input is essential for production.
This idealized framework suggest that one's strategy in a highly distorted economy should be
influenced by one's assumption about substitutability of inputs in the production function. If one
believes substitutability is high, one should concentrate on large reductions in large distortions, sincz
moderate reductions have little benefit - a "Big Bailg" is needed. If one believes substitutability is
low, then any reduction in a large distortion will be beneficial - "gradualism" is a viable strategy.
It is also apparent from the maximization problem above that a sales tax that applies only to
consumption purchases will have no effect on growth.7 With exogenous labor supply, investment
price distortions lower growth, but consumption price distortions do not. Since this result will be
tested in the empirical analysis, it is worth examining how it compares with others iL the literature.
Consumption taxes that are rebated lump-sum to consumers affect growth in the endogenous labor
supply models oi Rebelo and Stokey (1993) and Jones, Manuelli, and Rossi (1993) (with Lucas
'Welfare in steady t can be calculated as:
1 - a Ip-g(i-a)
where K, is the iniual level of the total capital stock and 4 is the ratio of consurnption to total capital stock, given as:
C, + K_ (a a
It can be shown, however, that taxes on intermediste goods act much like taxes on investment goods and ao de affect ::rowth.
9
(1988, 1990) "effective labor"). However, Rebelo and Stokey (1993) show that consumption taxes do
not affect growth if they are not rebated to consumers.'
The fall in growth as a result of the tax on capital is similar to results obtained by Barro
(1990), King and Rebelo.(1990), and Jones and Manuelli (1990). What is different here is that the
fall in growth occurs not only through a fall in ; vestment, but also in the efficiency of investment.
An increase in the distortionary tax rate will lower growth even for a fixed rate of total investment to
output (defined as the sum of the two types of investment as a ratio to output). Rebelo and Stokey
(1993) and Jones, Manuelli, and Rossi (1993) show related compositioncl e&fects of tax policy on the
rat ios of human to physical capital.
It is also apparent from (7)-(9) that a negative value of r, i.e. a subsidy to investment in type
I capital financed by lunp-sumn taation, will raise growth. Although lump-sum taxation is unrealistic,
this result would also occur with a subsidy to one type of investment financed by a tax on
consumption, since the latter has no growth effect. This is an example of the well-known possibility
of imrniserizing growth,.since welfare is worsened but growth increases due to the subsidy. It is still
true, however, that a higher subsidy will lower growth for a given rate of saving and in,,tsnment; the
increase in growth comes about through higher investment, partially offset by lower efficiency of
investment.
Self-financing subsidy and tax schemes
Thus far we have considered only policies that implicitly tax one form of capital. assuming
the proceeds are dissipated in lump-sum transfers. Other policies have the character of taxing one
'This result is a consequence of the restrictions on the utility funcuon rcquired to generte a tAdy oute growth path with a constntfraction of time devoted to leisure, which requires that income and substitution effects of wage changes cancel out, as pointed out earliie byKing, Plosser, and Rebelo (1988). Rebelo and Stokey (1993) also show that if leisure is *quality-adjuated (i.e. multiplied by the level ofhuman capital), then consumptiousixes do not affect growth regardless of whether the taxes are rebated or not.

10
type of capital and using the proceeds to subsidize another. For example, price controls act as a
subsidy to the use of the controlled-price goods, implicitly financed by taxes on other goods.9
Using the framework of the previous section, we now assume investment in capital type I is
taxed at rate r, and that the proceeds are used to finance a subsidy to capital type 2 at rate s. The
first-order condition (7) for the allocation of capital will be modified to be:
(II) 1. = .. ~ 1= 1( ) r1~K [ [ ry- I I I, sl I]
The requirement that the scheme be self-financing imposes the condition:
(12) 2=
For a given subsidy rate s, (11) determines the allocation of capital between types and (12) determines
the tax rate necessary to finance the subsidy. The growth rate expression (8) will now be modified to
be:
:2 - 8 -p
(13) 1= ls
An increase in the self-financing subsidy will have two offsetting effects on the growth rate.
The increase in the subsidy makes accumulation of type 2 capital more attractive. and tends to raise
growth, as in the previous section. However, the before-subsidy marginal product cf type 2 capital
will fal: because of the substitution from type 1 to type 2 capital, which is induced by the subsidy and
by the tax necescary to finance the subsidy. Appendix I shows that the second effect always
outweighs the first: the net effect is that growth unambiguously falls with an increase in the rate of
subsidy financed by a tax on capital.
'Mis is presumrng that the pnce controls are accompanued by budgetary transfers to compensate the producer for the lower pnce.Otherwise, shorages and black market pnces anse. Just as in the case of foreign exchange controls (6ee below).

11
Other policy applications
The analysis has been presented thus far in terms of a sales tax or subsidy (or equivalent
income tax) on formal sector capital in the presence of an informal sector. We now show some other
examples of policies that give similar results, illustrating that the framework is general enough to
consider a range of distortionary policies.
1. Financial repression
Controls on interest rates below market levels generally lead to quantitative credit allocation
by the formal financial system, combined with a flourishing "curb" market formed by consumers or
producers who lend to each other at market rates. The quantitative credit allocation rules are of en
designed to promote certain kinds of activities, for example, small-scale enterprises or agriculture
(World Bank (1989b)). In terms of this model, we can ti 'k of a credit subsidy being given to all
who invest in a particular kind of capital goods (type 2 capital). We can assume that the subsidy is
financed by an implicit tax on the non-subsidized capital (type 1 capital).
2. Trade policy
We could next redefine the two types of capital to be imported capital (K,) and domestically
produced capital (KY), and redefine the tax rate r as a tariff on imported goods. We assume that the
domestic good is also traded internationally and that the country is a price-taker (the international
price ratio of the two goods is fixed at unity for convenience). The tariff then acts as a tax on type I
investment goods. Equaily, both types of goods could be imported, and the tariff structure imply a
tax-cum-subsidy scheme in favor of some types of investment goods. Thus, both a higher level and a
greater dispersion of tariffs (or equivalent quotas) will result in lower growth according to this model.
3. Exchange rate policy
When exchange rate controls in developing countries lead to black markets in foreign
exchange, foreign exchange is typically allocated at the official rate so as to favor certain activities.

12
In terms of this model, a foreign exchange allocation that grants foreign exchange at the official rates
for goods that make up capital type 2, and does not grant any for investment in type 1 goods, will
imply a tax-cum-subsidy scheme with the wedge between the two goods equal to the black rnarket
exchange rate premium.
4. Price controls
Price controls on particular goods are a common feature of developing country policies. For
example, coal prices are often controlled to be below international levels in many countries (World
Bank (1988)). The coal subsidy is financed by other revenues fror- the govemment budget. This is
equivalent to the tax cum subsidy scheme discussed in the previous section. Since distortions 2. and
3. above also affect the price system, this suggests that a comprehensive measure is needed to capture
all of the complicated and possibly offsetting relative price distortions inherent in government
policies.
M. EMPIRICAL RESULTS
Although a large literature exists relating policy variables to growth, there have been few
attempts to measure price distortions directly. This section proposes a new measure of relative price
distortion and tests its relation to growth, along with other distortion measures used in other studies.
We discuss first the variables, and then discuss the results.
Variables
1. Price distortions
One way to measure indirect distortions of prices, like those analyzed in the previous section,
would be to look directly at observed retail prices across countries. Summers and Heston (1988)
collected data on 1980 benchmark prices relative to the U.S. for 57 countries and 151 commodities.

13
We construct a measure of the variance of relative prices across commodities for each country and
interpret this as a measure of overall distortion of the p;ice system. There are two adjustments that
need to be made. First, the variance of each commodity's price across countries due to differences in
natural resource endowments needs to be removed. Although theoretically this is necessary only for
nontraded commodities, even traded commodities' domestic price may contain a nontraded component
due to retailing and transportation costs. This is done by isolating the orthogonal component of each
of the log of the 151 prices with respect to per capita income. Secondly, the ii.; predicts that only
distortions in prices of intermediate inputs and investment goods matter. We i implication of
the theory by computing separately cross-commodity variances for consumptioL ,oc ' and for
investment/intermediate goods (human capital inputs such as health and education were al'o included
under investment - Appendix m contains the list of commodities). We use the same data to compute
the expenditure-weighted mean of the orthogonalized logs of relative input/investment prices. We
then compute for each country the expenditure-weighted sum of squared deviations of each
commodity's orthogonalized log price from the log mean.'0
Appendix II shows the variance and mean of input prices for each country. The countries
with the highest variance of relative input prices in 1980 are Sri Lanka, Venezuela, Peru, Bolivia, and
Indonesia. All of these countries partially compensate with cheap prices for inputs and investment
goods. Cote d'Ivc.re, Nigeria, Senegal, and Carneroon have the highest average input prices.
Industrial countries generally have low distortions of relative input prices, and neither very high nor
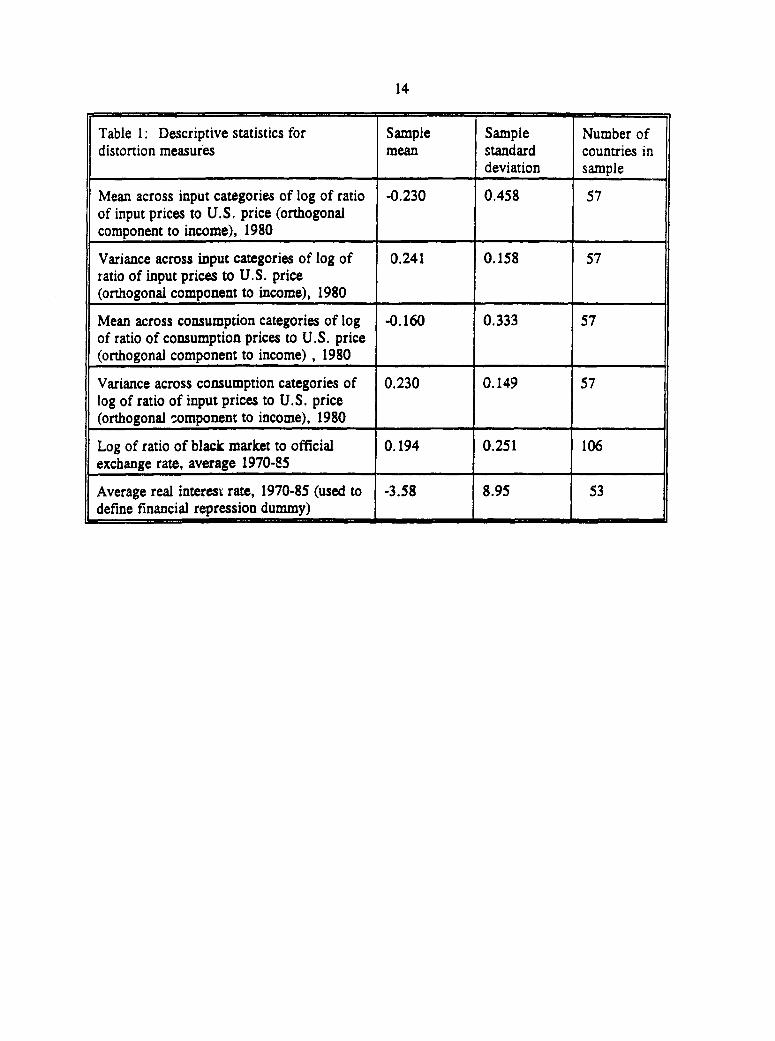
very low average input prices. Table I shows the mean and variance of these and the other distortion
measures.
°This is aimrilar to the clever procedure followed by Aitken ( 1991) to compute a measure of distoruon. However, Aitken aggregates
commodities into 16 categones before computing cross-commodity vanances, he does not distinguish between congumpuon and investment
goods. and he does not relate his index to growth. I am grsteful to Brian Aitken for supplying the Summers-Heston price data in convenient
format.
14
Table 1: Descriptive statistics for Sample Sample Number ofdistortion measures mean standard countries in
deviation sample
Mean across input categories of log of ratio -0.230 0.458 57of input prices to U.S. price (orthogonalcomponent to income), 1980
Variance across input categories of log of 0.241 0.158 57ratio of input prices to U.S. price(orthogonal component to income), 1980 _
Mean across consumption categories of log -0.160 0.333 57of ratio of consumption prices to U.S. price(orthogonal component to income) , 1980
Variance across consumption categories of 0.230 0.149 57log of ratio of input prices to U.S. price(orthogonal component to income), 1980
Log of ratio of black market to official 0.194 0.251 106exchange rate, average 1970-85
Average real interest rate, 1970-85 (used to -3.58 8.95 53define financial repression dummy)

15
Earlier results for growth using the Summers and Heston price data were found by Dollar
(1992) and De Long and Sumners (1991). Dollar tested a measure of exchange rate overvaluation
constructed as the average price level in each country relative to the US, corrected for differences in
resource endowments, and found overvaluation to significantly lower gru. .th. De Long and Summers
found that high relative equipment prices significantly lower growth.
2. Financial distortions
We extend a dataset from Gelb (1989) of real interest rates for developing countries, adding
observations for developed countries. A highly negative real interest rate is interpreted to imply the
existence of nominal interest rate controls (moderately negative real interest rates have been observed
for reasonably long periods even in countries with uncontrolled interest rates). We follow World
Bank (1989b) in defining "financial repression" as an average real interest rate below -5 percent over
1970-85 'period varies depending on data availability) - there are 14 such countries (out of 53). We
will examine robustness to other cutoff points as well as to the use of a continuous variable. Gelb
(1989) found real interest rates to be significantly correlated with growth. Fischer (1983, 1991) and
Kormendi and Meguire (1985) report a possibly related finding of a negative effect of inflation on
growth.
3. Black market premium
The black market premium is defined as the log of the ratio of the black market to the official
rate over roughly 1970-85 (period varies with data availability), based on data from Pick's Currency
Yearbook and the World Bank. Levine and Renelt (1992) found this variable to have a significant
effect on investment, although not on growth, Easterly (1991) found it to be a good predictor of
whether countries are caught in a low-level equilibrium trap.
16
4. Government conswnpnon
Government consumption has been found to be negatively related to growth by Barro (1991),
Grier and Tullock (1989), Landau (1986), and Murphy, Shleifer, and Vishny (1991). In terms of the
model in section II, govermnent consumption is an indicator of high taxes on the formal sector.
5. Barro correlates
In addition to these measures of distortion of resource allocation, we also test for correlates
reported by other studies, taking Barro (1991) as the benchmark study. We focus on initial income,
primary enrollment, and secondary enrollment. We also use the same dependent variable (per capita
growth 1970-85 from Summers and Heston (1988)) as Barro for ease of comparison. Finally, the
investment rate (also from Barro/Summers and Heston) is added to the equation to test the implication
of the model that distortions lower growth concrolling for investment.
Empirical result
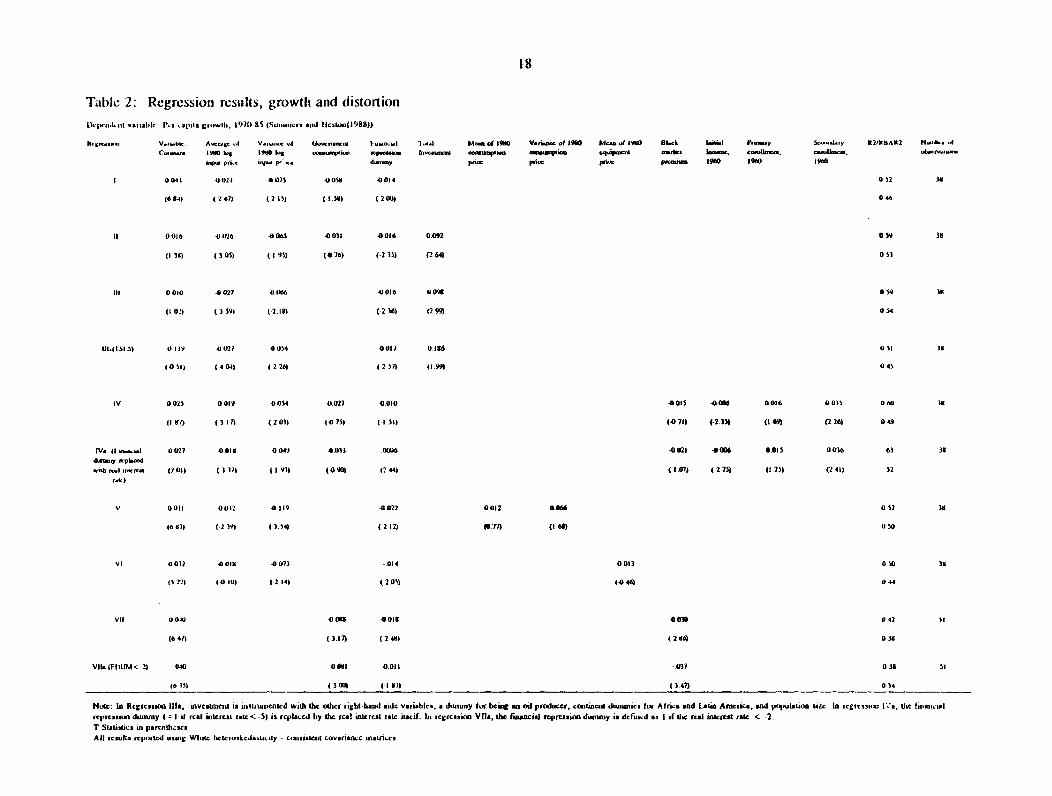
Table 2 shows the results. Both the mean input price and the variance of input prices across
commodities are significant. The variance result is consistent with the prediction of the model in
section II - in a multiple input world, distortions of relative prices away from world prices will lower
growth. The magnitude of the variance coefficient is such that increasing the variance of relative
prices from the sample mean of .24 bv one standard deviation to .40 will lower growth by 1.2
percentage points.
The significance of the mean input price is reminiscent of the De Long and Summers (1991)
finding that cheap investment equipment is good for growth. Here we find more generally that cheap
inputs -- including intermediate inputs, education, health, buildings and equipment investment - are
good for growth. This result confirms the prediction of the model that subsidizing inputs is a feasible
way to raise growth (although irnmiserizing unless there are externalities). When the equipment price
17
variable is added, neither price is significant -- we cannot distinguish between the two - but the
v?riance of input prices continues to be significant (regression VI).
The financial repression dummy is also highly significant, with a coefficient indicating a loss
of about 1.5 percentage points in growth due to financial repression. Th does not appear to be a
proxy for high inflation, which was insignificant when tested separately. The implicit taxes from
highly negative real interest rates apparently fall on productive investment. If we accept regression I
as a valid reduced form, these three distortion variables (with government consumption) explain half
of the cross-section var dz,.e in growth rates.
The financial repression dummy, and the mean and variance of input prices continue to be
significant when investment is added (regressions II and EII). Growth falls for a given rate of
investment falls when relative input prices are heavily distorted, when inputs are expensive, and when
interest rates are repressed. The significance of the financial repression dummy and the variance of
input prices confirms the efficiency effects predicted by the model in section II. The significance of
mean input prices does not at first seem to conform to the prediction of the model that a uniform tax
on all inputs should affect the level of investment, but not the efficiency of investment. However,
since investment here includes only physical capital, the result may reflect higher productivity of
physical capital with cheaper intermediate and human capital inputs.
Because investment is likely endogenous, we show also a regression (Ia) with an
instrumental variables estimator, using as instruments for investment the other right-hand side
variables as well as continent dummies for Africa and Latin America, a dummy variable for oil
producers, and the population size in 1960. The coefficient on investrnent is increased, but the
coefficients on the other variables are roughly unchanged.
18
Table 2: Regression resulls, growth and distortionLkp.nkll oAruabk P.. 'ap,il rr.,*, 9 rss85 (Srunwis. IudJ l*cskail(
988))
V-r.bk A-, .4 V-e.e .4 U-n-,e hn-... 37-. M-eo *9*0 V.16 of *90 ?A M .. *91100 a".e *a.1.1 *nn .. o- y *)Yh(*AI2 N-..rA,.4H, ~~.... ISS le *60k.g owsr.c .. 1 Vsjinumr' be.uml or.ass.. wymqopel aMe IYttO Vao*o.a d 19YOIddIYO O. -a-V. P.- 3 Psz9eIO
P- p UUSA Clow bt. iftorepr -. pn.e o. ph l C C mo
pDC S p.ewml IYeO 140 1940I 0041 -0024 0a071 4-04 -014
01 2 3*(6 14) (2 67) (-2 I5) (-1.3) ( 2 00)
0 46
I0 0016 0026 a0065 .0301 0016 0092 059 3i
(I 3) ( 305) (-I 91) (076) (231) (264) 0s3
III 0 010 ~ -0024 -0066 4)016 0046 W3Vio 4n 40641 0010
05^4 38(I 0Ž) ( 3 19 (2.18) (2 36) (2 993
0$4
1l)(14SiS) 0i1Y -0021 a034 4-0017 016 035 30
(a51) (404M) (226 (2571) 499) 045
IV 0023 O 009 4-004 -021 40 00 4005 -0006 0036a 0035 a00 3
( 47 ( 3 11 ( 2 0) (0 75) (I I5) (0 7*) (-23)1 (l 6 (2 26) 0 49
Iv. (I l .* 0027 -01 -04 -0131 iu)6 4021 4).006 0.01 0036 63 36
4u' cpi.-d.uh . m (201) (331) (1Y1) (499) (244)
(107) (-275) (175) (241) 52
V 0O2l 0032 4a 19 a022 0012 0066 0 57 36
(61) (-2 19) (-3 54) (2*2) (071) (I 61) 050
VI 00)2 a00ld 4073 -014 0013
050I(O22) (o 0)) (2.14) (205)
(4046)4
VIl 0040 10 -0-0 4030 012 3
(6 47 (-3 1(7) (2 4) ( 2 6) 038
VIb (FI1L1L1 < 2) 040 10O* -00oil -077 038 51
(6 65) ( 30 O) (-I I1) 1 47) 0 14
Note. In Rcgresssos life. isvest*rl is islilumcnlcd with thc odler tight hand asdc variabics. a dummy flo being an oil produccr. conieacsa dwunics fos Ainca and Latin America. and po7pulaIon sit CL icgiersstur (va dic fincia*lrtprcsarn dummy (- I t r*al iuterecst itac<-S) is Fcprocd by the CLaL .cfcst rate iscltc. In rcgession Vila, the fiuancial prepssios duinmy is dcIfirid s I df Me rcal iboCcrt rate < -2.T Statistcs in parcfnih.ca
All esuhlE r,pomtcd using Wltc hcIcsvskceJ.l,.ity - cohiuisst covaranoc iIlaiaccs

19
Table 2 Variable definitions:
Average input price: Expenditure-weighted average across categories of inputs and investment goodslisted in Appendix III for 1980 orthogonalized log of dolhar price relative to the U.S.
Variance of input prices: Expenditure weighted variance across input and investment good categoriesfor 1980 orthogonalized log of dollar price relative to the US.
Government consumption: Summers and Heston ratio of real government consumption to GDP,1970-85 (Barro variable HSGOV)
Financial repression dummy: 1 if country has average real interest rate for 1970-85 less than -5percent, 0 otherwise (periods of average may vary depending on data availability) [From Gelb (1989)and World Bank datal In regression IVa, the dummy variable is replaced by the actual average realinterest rate over 1970-85 (notice interpretation of the sign of coefficient will be reversed); inregression Vila, the dumnmy variable is replaced by a dummy variable where the dummy is equal toone if the average reai interest rate is less than -2 over 1970-85
Total investment: Summers and Heston ratio of real investment to GDP (Barro variable HSINV)
Mean consumption price: Exper-diture-weighted average across categories of consumption goodslisted in Appendix II for 1980 orthogonalized log of dollar price relative to the U.S.
Variance of consumption price: Expenditure-weighted variance across categories of consumptiongoods for 1980 orthogonalized log of dollar price relative to the U.S.
Mean of equipment price: Expenditure-weighted average across categories of equipment investmentfor 1980 orthogonalized log of dollar price relative to the U.S.
Black market premium: Log of ratio of black market to official exchange rate [World Bank data]
Initial income: Summers and Heston real per capita GDP in 1960 (Barro variable GDP60)
Primary enrollment: Barro variable PRIM60
Secondary enrollment: Barro variable SEC60
Note: orthogonalization is with respect to log of per capita income.
20
When we add the analogous measures of the mean and cross-commodity variance of
consumption good prices, we find that they are insignificant, while the mean and variance of input
prices continue to be significant (regression V). This is consistent with the prediction of the model
that consumption price distortions do not matter but input price distortions do.'"
The significance of the mean and variance of input prices is robust to the inclusion of
correlates reported by Barro (regression IV). The same cannot be said for the financial repression
dummy, whose significance is weakened when the Barro correlate,s are added.
We also examine the robustness of the resu!i on the financial repression variable by
considering alternative definitions of "repression". Redefining repression as less than a -2 percent real
rate of interest increases the number of repression cases from 11 to 19 countries in the sample of 51
(regression VIla). The redefined repression variable has the same sign but generally falls short of
significance. On the other hand, a continuous varia3le for the real interest rate is still significant at
roughly the same or higher level as the current dummy variable. The continuous variable retains
significance in the Barro regression (regression IVa). Note that because of the redefinition of the
variable, the sign here is the opposite of the dummy vaziable but still has the interpretation that
negative real interest rates are bad for growth. The continuous variable may be more likely than the
dummy variable to capture other sources of variation than just the degree of financial repression,
however. We conclude the evidence for effects of financial distortions on growth is suggestive, but
far from conclusive.
There is some evidence for effects of other distortion variables on growth. The black market
premium is significant in an equation with financial repression and governrment spending (regression
VlT), but its significance disappears when the mean and variance of relative input prices (and the
"We also tried Dollar's (1992) measure of exchange rate overvaluation, which is closely related to the mean consumption price, andfound it to be inuignaicant.
21
Barro correlates) are added (regression IV). The same is true for the share of governrnent, whose
significance also disappears when investment is added (regression O).
The strongest results are those for the new measures of price distortion. The results can be
illustrated by looking at three data points: Ch!le. Korea, and Zambia, using regression m as the
benchmark. All three had roughly the same investment rates, around 27 percent of GDP, but Korea
had high growth (6%) and Chile (0%) and Zambia (-2%) had low growth. A significant portion of
the difference in growth rates can be explained by regression IH. Chile and Zambia both had high
negative real interest rates (in Chile's case, mainly during the 70-73 Allende regime and its
aftermath), which itself lowers growth by 1.6 percentage points. Korea and Chile both implicitly
subsidized input investment goods heavily on averaig, while Zambia implicitly taxed them - this
explains over 2 percentage points of Zambia's lower growth compared to Korea. On the other hand,
while Korea and Zambia only had moderately distorted prices between types of inputs, Chile's were
heavily distorted. The high variance of input prices cost Chile 1.6 percentage points of growth
compared to Korea. It is interesting that Korea was not a case of "getting prices right", but rather
one of heavy subsidization of inputs, which implies growth was "too high" by about one and a half
percentage points if no externalities are assumed.
V. CONCLUSIONS
A simple model of endogenous growth with two types of capital shows that distortions of
relative input prices can have large effects on growth and welfare. The magnitude of the effect
depends on the production elasticity of substitution. With high substitutability, the effects on growth
and welfare are bounded -- albeit possibly large -- no matter how high the rate of distortion.
Subsidization of inputs and investment goods can raise growth, even though they worsen welfare. But
a subsidy to one capital good financed by a tax on another capital good unambiguously lowers

22
growth. Empirical results show strong negative effects of the variance of relative prices of investment
goods across sector, while also confirming and extending earlier results that penalizing investment
goods and distorting ;.nancial markets lowers growth.

23
APPENDEI I: effect on growth of a self-rinancirng subsidy-cum-tax policy
As outlined in the text, an increase in a subsidy to type II capital financed by an increased tax rate ontype I capital always lowers growth. To show this, it is sufficient to s'"ow that the tax increasenecessary to finance the increased subsidy is greater than the tax increase that would just maintain thegrowth rate fixed (since a tax increase by itself unambiguously lowers growth,. From (11) and (12)in the text, the balanced budget requirement means that s and 7 must satisfy:
(A. 1)
The derivative of r with respect to s from (A. 1) (using (A. 1) itself to simplify) is:
(A.2) d.r a s (A) i-)(I'S _( )(t)
Note th it it -0 (elasticity of substitution > 1), then as the tax rate approaches (1-e)/e, the furtherincrease is= rate necessary to finance the subsidy goes to infinity. With elastic substitutionpossibilities, i,h!'re is a limit on the subsidy rate that is feasible under a subsidy-cum-tax scheme. If. s 0, then any subsidy rate less than one is financeable.
From (3) in the text, the combination of 7 and s that yield a constant growth rate g is given by:
(A.3) E 2k (t ts} 8 +prg
where the {} denotes "function of ". The right-hand side of (A.3) is constant by assumption; g is thegrowth rate cnsistent with the initial J and s. The derivative of T with respect to s from (A.3) can beradically simplified to:
(A.4) dt t ds s
where we use the fact that k2 = /s at the initial point. Comparing the derivatives in (A.2) andk'
(A.4), we see that (A.2) is unambiguously larger. This says that the tax increase necessary to raisethe revenue to finance a given subsidy rate increase is larger than the tax rate increase that would justmaintain the growth rate constant. Since an increase in the tax rate for a given rate of subsidy alwayslowers growti. this says that an increase in the subsidy rate on type II capital financed by an increasein the tax rate on type I capital unambiguously lowers growth.

24
Appendix 11 Measur of distorton by countryCountry Code Di my for mal infgrt rats < -5 pereerl VAannce of log input pnice acrerw c0todiues Averqe of log mput pnrc
AXO l.= 0.30340 0.11346AUS O.OCOO
AVT O.OC 0.11637 02121BEL 0.C 022637 0our62BCD O.OODO
SOL 1.00 0A.M 040131SRA O.OODO 0.2090 4.0741BWA 0 29419 437146CAN 0.0OO OM.Ml7.1EC1L l.COD 0.449D 40.9X0clv O.OOD 0.24175 0.51117
CMX 0.339 03477COL 0.om 02746 4. 9CR 0.21J177 4.54929DEU 0.OO O.m=24 0.21025DNK 0.wOD 0.0 02mDOM oM7e 4oJ717
Wu l.OODO 0.26l91 .0.7EOY
ESP O.OX 0.10100 4£7400Er 0.0913ii 4019
FIN 0.CX 0.1541 4.12514FtA 0.0m 0.01334 0.16t2GOX 0.OOC O.OC92 0.14W
OKA l.OXCRC 0.00 0.11019 .O.1I0SurM 0.25904 40.7559
KKO 0.3ut 4.34221HND 0.0CO 0.21711 -0.49242
HVO O.OCCO
mm 0.D 0.45X4 4.74D11tND O.OXO 02197 .0.43C
rrA 0.om 0.11 4.61162IAM LammmD 0.= 0.I41 4.1s3)ax 0.0Z20 0.12181 0ff"KOCt 0.00 0.21275 43329LKA O.OD o g.sw *.729LSO
LUX 0.06M 0m07541.Ait O.OCO 0.24763 OIM
Moo 0.2X91i 4.14Mt# I.000
MU 0 am 0.19"31MWm 0.o 0.19747 4AM4
MYS OODONOA 1.01 0.211W 0M3 4NLD 0.000 0.ml13 0.23171NOR O.DDD 0.18O 0.1539
OMN O.OOCO
PAK 0.Ww 0J8I39 L12
PAN 0.22161 4.40PER l.OODO 0.5377 4.9179PfL O.0OO 0360 41m9OPOL I.ODPIT 0.102 40323PRY 0 3757 4.32105SEN 0 17139 0.46117SCP
SLE I MM
SLV 0 0946 4.71495SWE O ODDO
rro 0O.ODDO
T1N 0.23726 4.11C9inm 1.0=77A 032011 022443
UiRY 0 221:1 4354USA OOD 0 04179 4 044VEN 0.om 0 7DI 4.01041
ZAR I.a=ZMs I, o.mm 0.24114ZW!E 0om 022341 0.16105

25
.kppendix m Goods for Calculation of consumotion cnd input price averates and varisenceConsumnpDoo Goods
lnatenediast laput and Lnveazmeat Goods
Rice Drugs, medical prepanrioosMeal, ither cereals Medical cuppLieaBread Therapeuuc equipmentBiscuits. cakes. etc. Physicians' equipmentCerel preparation Denutu' servic4mMc.aroru. spaghetti Nurses' serviceFresh beaf, veal HogpitAleFresh lanb, munon Personal automobilesFresh pork Other peron traportFreah poultry Til". tub"s, aiessoriesOther fresh meat Automobile puairsFrozen and alted meat Gasolne, oil. gpea.Freah and frozen fiah Pc.rking, 'olls, ec.Canned fish Local uansportFreh milk RAil tranportMilk producu Bus tranpornEggs, egg producta Air tasportButuer Posal communicationMargerine, edible oil Telephone. telegrnphLArd, edible fat Books, paper. magazinFresh tropical fruita SutioneryOther fresh fruits Fun and econd-level teachersFresh vegetAblea College teachersFruit other than freh Physical facilities for educationVegetables other than fresh Educational books, suppliesTubers, including pocAtoes Other oduca ocAl expendituresCoffee HotelsTeA Industrial butidingsCocoa Commercial buildingsSugar Ofice buildinglam, syrup, honey Educanonal buildingsChocolate, ice cream Hospital buildingsSalt, spices, sauces Agricultuml buildinpgNon-alcoholic bevergea Other buildingvSpirits Roadc, suee, highwaysWine, cider Truport and udlizy linesBeer Other conauctionCigarettes LAnd improvementCigars, tobacco, *nuff LocomotivesClothing mntariala Other railway vehiceMen's clothing Pasenger aut4mobileWomen's clothing Trucks, buse, trilersBoys' and girls' clothing AircftMen's and boys' urderwear Ships, boatsWomen's and girOs' underwear Other trranport equipenentHaberdashery, millinery Engine, turbinesClothing renta nd repair TractorMen's foorwear Other agriculturaL machineryWomen's footwear Offic machineryChildren's footwear Metalworking machineyFoorwear, repain Conatrucuon. mining machineryFurniure Fixzures Special industnsl machineryFloor coverings Electrical tranamission equipmentHousehold texules, etc. Commurncations equipmentRefrigerators, freiere Other electrical equipmentWashing appLiance InrumentsCooking Appliances Furdtutre., ExuresHeating appliances Other durable goodsCleaning rpplianceOther household appLiuncesHousehold utensilsNondurable household goodsDomestic servicesHousehold setvicesBarber and beaury shopsToilet artclesOthc: :;:z:.-. -oodsRestaurants. tafeaHotels, lodgingsOther servicesExpendicurea of resident ebroadOno and tw'--family dwellingsMultifamily dwellings
26
REFERENCES
Aitken, B., 1991, Measuring Trade Policy Intervention: A Cross-Country Index of Relative PriceDistortion, Working Paper 838, World Bank.
Atkinson, A., and J. E. Stiglitz, 1980, Lectures on Public Economics (McGraw-Hill, New York)
Balassa, B., 1985, Exports, Policy Choices, and Economic Growth in Developing Countries After the1973 Oil Shock, Journal of Development Economics 18, 23-35.
Barro, R. J., 1991, Econormic Growth in a Cross Section of Countries, Quarterly Joumal ofEconomics 106, 407A44.
_____, 1990, Government Spending in a Simple Model of Endogenous Growth, Journal of PoliticalEconomy 98, 5103-5125.
_______ and Sala-i-Martin, X., 1993, Public Finance in Models of Economic Growth, Review ofEconomic Studies, forthcoming.
Chamley, C. and H. Ghanem, 1991, Fiscal Policy with Fixed Nominal Exchange Rates: Coted'Ivoire, Working Paper 658, World Bank.
Chenery, H., S. Robinson, and M. Syrquin, 1986, Industrialization and Growth: A ComparativeStudy (Oxford University Press, New York)
De Long, J. B. and L. H. Summers, 1991, Equipment Investment and Economic Growth, QuarterlyJournal of Economics 106, 407 444.
de Soto, H., 1989, The Other Path: the Invisible Revolution in the Third World, (Harper and Row,New Yo-k)
Dollar, D., 1992 Outward-Oriented Developing Economies Really Do Grow More Rapidly:Evidence from 95 LDCs, 1976-85, Economic Development and Cultural Change 40, 523-544
Easterly, W., 1991, Economic Stagnation, Fixed Factors, and Policy Thresholds, mimeo, WorldBank
Fischer, S., 1983, Inflation and Growth, NBER Working Paper No. 1235, Cambridge, MA: NBER.
______ 1991, Growth, Macroeconomics, and Development, in: S. Fischer and 0. Blanchard, eds.,NBER Macroeconomics Annual 1991 (MIT Press, Cambridge)
Gelb, A., 1989, A Cross-Section Analysis of Financial Policies, Efficiency and Growth. WorkingPaper 202, World Bank.
Grier, K. and G. Tullock, 1989, An Empirical Analysis of Cror<-National Economic Growth, 1951-1980, Journal of Monetary Economics 24, 259-974.
27
Islam, R. and D. Wetzel. 1991, Macroeconomics of the Public Sector Deficit: the Case of Ghana,Working Paper 672, World Bank
Jones, L. and R. Manuelli, 1990, A Convex Model of Equilibrium Growth. Journal of PoliticalEconomy 78, 1008-38.
Jones, L., R.E. Manuelli, and P.E. RoSsi. 1993. Optimal Taxation in Models of Endogenous Growth,Journal of Political Economv 101 (forthconing)
King, M. A. and Fullerton, D., eds, 1984, The Taxation of Income from Capital: A ComparativeStudy of the U.S., U.K., Sweden aad West Germany, Chicago: University of Chicago Press.
King, R. and S. Rebelo, 1990, Public Policy and Economic Growth: Developing Neoclass.calImplications, Journal of Political Economy 98, S126-S150.
and _ _, 1993, Transitional Dvnamics and Economic Growth in the NeoclassicalMkdel, American Economic Review, forthcoming.
King, R., C. Plosser, and S. Rebelo, 1988, Production, Growth and Business Cycles f. The BasicNeoclassical Model, Journal of Monetary Economics 21, 195-232.
Kormendi R. and P. Meguire, 1985, Macroeconomic Determinants of Growth: Cross- CountryEvidence, Journal of Monetary Economics 16, 141-163.
Krueger, A. O., 1978, Foreign trade Regimes and Economic Development: Liberalization Attemptsand Consequences (NBER, Cambridge, MA)
______ 1983, Trade and Employment in Developing Countries, 3. Synthesis and Conclusions(University of Chicago Press, Chicago)
Landau. D., 1986, Government and Economic Growth in the Less Developed Countries: AnEmpirical Study for 1960-80, Economic Development and Cultural Change 35, 35-75.
Levine, R. and D. Renelt, 1992, A Sensitivity Analysis of Cross-Countrv Growth Regressions,Anierican Economic Review 82, 942-63.
Lucas, R. E., 1988, On the Mechanics of Economic Development, Journal of Monetary Economics22, 342.
,1990, Supply-side Economics: an Analytical Review, Oxford Economic Papers 42, 293-316.
Manrkiw, N. G., D. Romer, and D.Weil, 1992, A Contribution to the Empirics of Economic Growth,Quarterly Journal of Economics 107, 407438.
Murphy, K., A. Shleifer, and R. Vishny, 1991, The Allocation of Talent: Implications for Growth,Quarterly Journal of Economics 106, 503-530.
28
Rebelo. S, 1991, Long Run Policy Analysis and Long Run Growth, Journal of Political Economv 99,500-521.
and N. Stokey, 1993, Growth Effects of Flat-rate Taxes, mimeo, University of Chicago.
Reynolds, L. G, 1985, Economic Growth in the Third World, 1850-1980, (Yale University Press,New Haven)
Rodrik, D., 1991, Closing the Productivity Gap: Does Trade Liberalization Really Help?, in: G.Helleiner, ed., Trade Policy, Industrialization, and Development: A Reconsideration (OxfordUniversity Press, New York)
Romer, P, M, 1986, Increasing Returns and Long-Run Growth, Journal of Political Econo y 94,1002-1037.
______ 1989, Capital Accumulation in the Theory of Long-Run Growth, In R. Barro, ed., ModernBusiness Cycle Theory (Harvard University, Cambridge MA)
Sachs, J. D, 1987, Trade and exchange rate policies in growth-oriented adjustrnent programs, In V.Corbo, M. Goldstein, and M. Xhan, eds., Growth-oriented Adjustment Programs (IMF andWorld Bank, Washington, D.C.)
Solow, R., 1956, A Contribution to the Theory of Economic Growth, Quarterly Journal ofEconomics 70, February 1956, 65-94.
Summers, R. and A. Heston, 1988, A New Set of International Comparisons of Real Product andPrice Level Estimates for 130 Countries, 1950-85, Review of Income and Wealth 34 , 1-25.
Young, A, 1991, Learning by Doing and the Dynamic Effects of International Trade, QuarterlyJournal of Economics 106, 369406.
World Bank, 1987, World Development Report i987, Oxford University Press.
, 1988, World Development Report 1988, Oxford University Press.
, 1989a, Sub-Saharan Africa: From Crisis to Sustainable Growth, Washington: the WorldBank, 1989.
______ 1989b, World Development Report 1989, Oxford University Press.
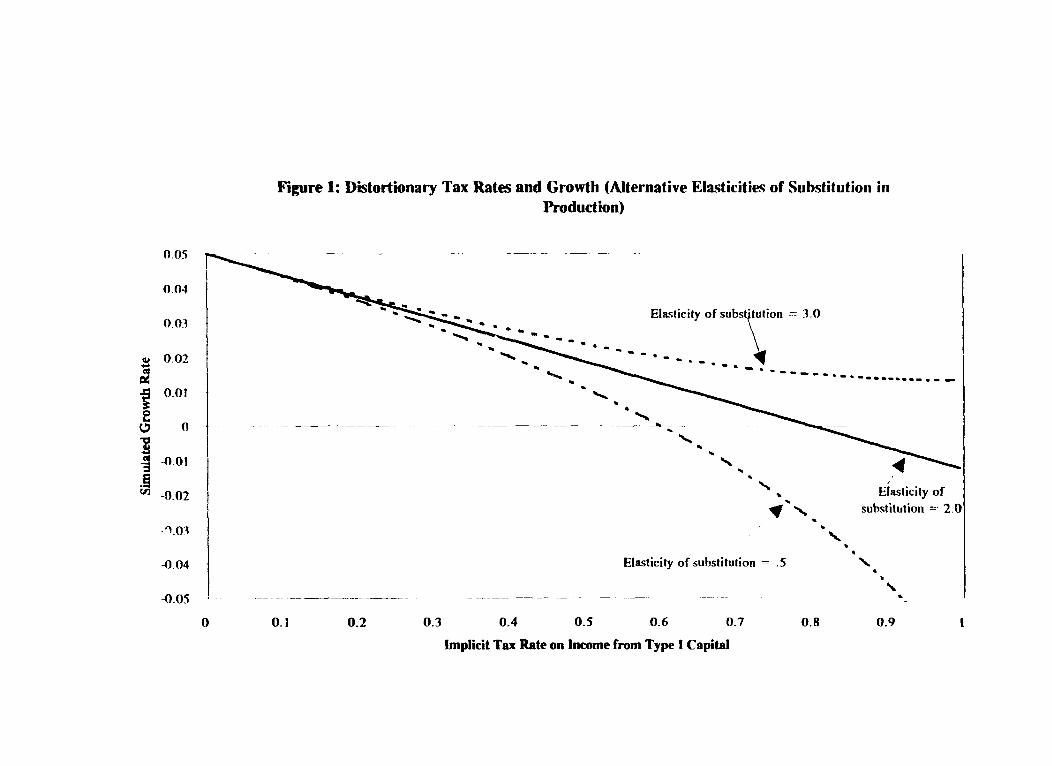
Figure 1: Distortionary Tax Rates and Growth (Alternative Elasticities of Substitution inProduction)
0.05 _ __'v
0.04
0.01
0 0 _
-~-0.01
-0S).02 > s Elasticity oft N - substitution= 2.0
-0.04 Elasticity of substitution = .5
-0.05 .__ - _ _ _ - - -. ___- - -
0 0.1 0.2 0.3 0.4 0.5 0.6 0.7 0.8 0.9 l
Implicit Tax Rate on Income from Type I Capital
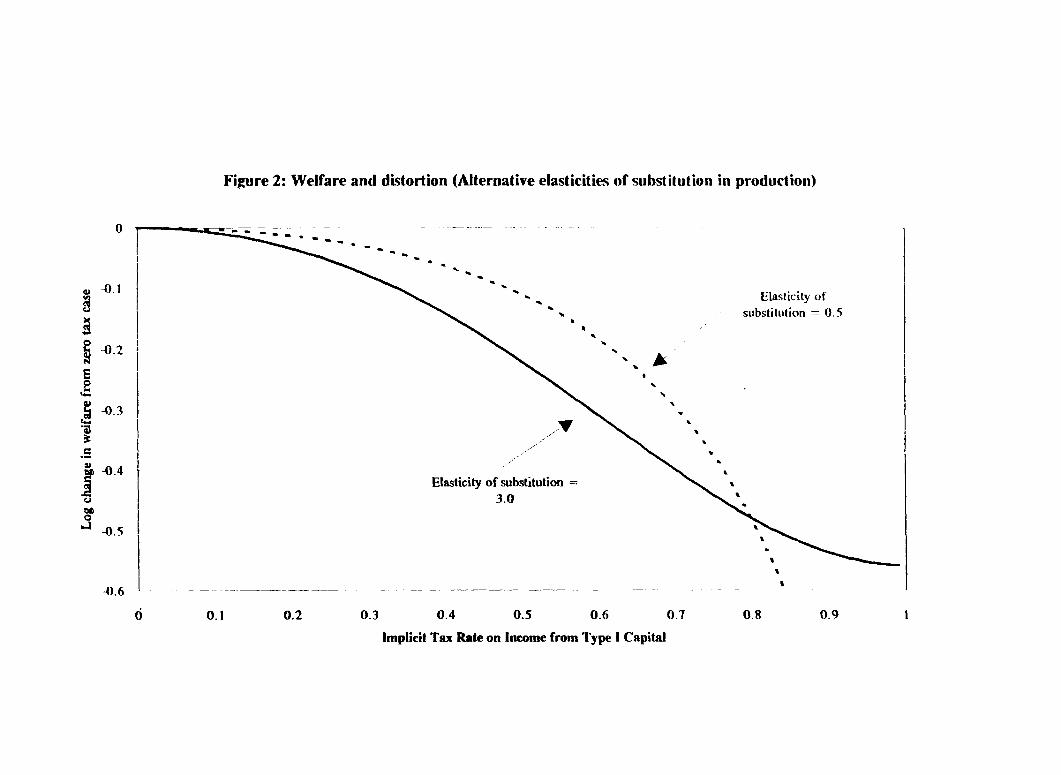
Figure 2: Welfare and distortion (Alternative elasticities of substitution in production)
0 _
CD~~~~~~~~~~~~~~~~~ Elasticity ofsubstitution 0.5
.413
Elasticity of substitution0i 3.0
-0.5
-0 .6 - - - - - - - - - - - - ---- - - - - - - -
0 0.1 0.2 0.3 0.4 0.5 0.6 0.7 0.8 0.9
Implicit Tax Rate on Income from Type I Capital

Pollcy Research Working Paper Series
ContactTitle Author Date for paper
WPS1 194 How Fast Has Chinese Industry Tom Rawski September 1993 E. KhineGrown? 37471
WPS1195 The Enterprise Sector and Mark Schatter September 1993 E. KhineEmergence of the Polish Fiscal 37471Crisis, 1990-91
WPS1 196 Corporate Tax Structure and Joffrey Bernstein September 1993 C. JonesProduction Anwar Shati 37754
WPS1197 Determinants of Inflation among Bruno Boccara September 1993 C. JonesFranc Zone Countries in Africa Shantayanan Devarajan 37754
WPS1 198 Enterprise Reform in China: The Natalie Lichtenstein September 1993 M. RangarajanEvolving Legal Framework 81710
WPS1199 Public Pension Governance and Olivia Mitchell October 1993 D. EvansPerformance: Lessons for Developing 37496Countries
WPS1200 The Life-Cycle Distributional Jane Falkingham October 1993 D. EvansConsequences of Pay-As-You-Go Paul Johnson 37496and Funded Pension Systems
WPS1201 Five Criteria for Choosing among Margaret E. Grosh October 1993 M. QuinteroPoverty Programs 37792
WPS1202 Privatization and Foreign Investment Frank Sader October 1993 Rose Voin the Developing World, 1988-92 33722
WPS1203 Determinants of Value-Added Tax Zeljko Bcgetic October 1993 F. SmithRevenue A Cross-Section Analysis Fareed Hassan 36072
WPS1204 Structural Adjustment, Economic Nisha Agrawal October 1993 K. RiveraPerformance, and AiJ Dependency Zafar Ahmed 34141in Tanzania Michael Mered
Roger Nord
WPS1205 Wage and Employment Decisions Simon Commander October 1993 0. del Cidin the Russian Economy: An Analysis Leonid Liberman 35195of Developments in 1992 Ruslan Yemtsov
WPS1206 Empirical Perspectives on National Isnac Diwan October 1993 A. YideruIndex Funds Vihang Errunza 36067
Lemma W. Senbet
WPS1207 Characteristics and Performance Bill H. Kinsey October 1993 H. Binswangerof Settlement Programs: A Review Hans P. Binswanger 31871

Policy Research Working Paper Serles
ContactTitle Author Date for paper
WPS1208 Primary School Achievement in Levi M. Nyagura October 1993 I. ConachyEnglish and Mathematics in Abby Riddell 33669Zimbabwe: A Multi-Level Analysis
WPS1209 Should East Asia Go Regional? Arvind Panagariya October 1993 D. BallantyneNo, No, and Maybe 37947
WPS1210 The Taxation of Natural Resources: Robin Boadway October 1993 C. JonesPrinciples and Policy Issues Frank Flatters 37699
WPS1211 Savings-Investment Correlations Nlandu Mamingi October 1993 R. Voand Capital Mobility in Developing Countries 31047
WPS1212 The Links between Economic Policy Rsvi Kanbur October 1993 P. Attipoeand Research: Three Examples from 526-3003Ghana and Some Gereral Thoughts
WPS1213 Japanese Foreign Direct Investment: Kwang W. Jun November 1993 S. King-WatsonRecent Trends, Determinants, and Frank Sader 33730Prospects Haruo Horaguchi
Hyuntai Kwak
WPS1214 Trade, Aid, and Investment in Sub- Ishrat Husain November 1993 M. YoussefSaharan Africa 34637
WPS1215 How Much Do Distortions Affect William Easterly November 1993 R. MartinGrowth? 39065
WPS1216 Regulation, Institutions, and Alice Hill November 1993 D. EvansCommitment: Privatization and Manuel Angel Abdala 38526Regulation in the ArgentineTelecommunications Sector
WPS1 217 Unitary versus Collective Models Pierre-Andre Chiappori November 1993 P. Attipoeof the Household: Time to Shift the Lawrence Haddad 526-3002Burden of Proof? John Hoddinott
Ravi Kanbur


![Research Article Bovine Papillomavirus Type 2 Infection ...downloads.hindawi.com/journals/bmri/2013/814635.pdf · as well [ ]. On the contrary, in cattle with bovine enzootic hematuria,thiswasthemostcommonso](https://img.pdfslide.fr/doc/110x75/601172268e28ec18161b0c88/research-article-bovine-papillomavirus-type-2-infection-as-well-on-the.jpg)


![[hal-00479532, v1] HOW CEO ATTRIBUTES AFFECT …1 HOW CEO ATTRIBUTES AFFECT FIRM R&D SPENDING? NEW EVIDENCE FROM A PANEL OF FRENCH FIRMS Basma Sellami Mezghanni University of Toulouse](https://img.pdfslide.fr/doc/110x75/5ec6a2810dbd4d54f536c95d/hal-00479532-v1-how-ceo-attributes-affect-1-how-ceo-attributes-affect-firm-rd.jpg)