Embed Size (px)
Citation preview
UNIVERSITÉ DU QUÉBEC EN OUTAOUAIS
EFFETS DE LA DIVERSITÉ SUR LA CROISSANCE DE JEUNES ARBRES DE
LA FORÊT TEMPÉRÉE : RÔLE DE LA LUMIÈRE ET STRATÉGIES DE
DISTRIBUTION DE LA BIOMASSE
MÉMOIRE
PRÉSENTÉ
COMME EXIGENCE PARTIELLE
DE LA MAÎTRISE EN BIOLOGIE
EXTENSIONNÉE
DE
L'UNIVERSITÉ DU QUÉBEC À MONTRÉAL
PAR
MARC-OLIVIER MARTIN-GUA Y
JANVIER 2017
UNIVERSITÉ DU QUÉBEC À MONTRÉAL Service des bibliothèques
Avertissement
La diffusion de ce mémoire se fait dans le respect des droits de son auteur, qui a signé le formulaire Autorisation de reproduire et de diffuser un travail de recherche de cycles supérieurs (SDU-522 - Rév.07 -2011). Cette autorisation stipule que «conformément à l'article 11 du Règlement no 8 des études de cycles supérieurs, [l'auteur] concède à l'Université du Québec à Montréal une licence non exclusive d'utilisation et de publication de la totalité ou d'une partie importante de [son] travail de recherche pour des fins pédagogiques et non commerciales. Plus précisément, [l 'auteur] autorise l'Université du Québec à Montréal à reproduire, diffuser, prêter, distribuer ou vendre des copies de [son] travail de recherche à des fins non commerciales sur quelque support que ce soit, y compris l'Internet. Cette licence et cette autorisation n'entraînent pas une renonciation de [la] part [de l'auteur] à [ses] droits moraux ni à [ses] droits de propriété intellectuelle. Sauf entente contraire, [l'auteur] conserve la liberté de diffuser et de commercialiser ou non ce travail dont [il] possède un exemplaire.»
AVANT-PROPOS
Le développement de mon mémoire sera présenté sous la forme de deux articles
scientifiques. Dans le chapitre II, les résultats de cinq années d'échantillonnage de la
lumière sont présentés. Le chapitre III traite de l'intégration des données racinaires
aux analyses de l'ED en 2012. J'ai réalisé l'ensemble du traitement des données, des
analyses statistiques et de l'écriture pour les deux manuscrits, sous la supervision de
mon directeur, le Pr Christian Messier (UQO, UQÀM), et de mon codirecteur, le Pr
Alain Paquette (UQÀM). Le premier article (Chapitre II) est une deuxième version
d'un travail récemment complété. Le deuxième article (Chapitre III) a déjà connu une
révision informelle par les pairs à travers le réseau IDENT. De ces révisions, une
seule mènera potentiellement à une qualité de coauteur pour le contributeur, i.e. celle
du Pr Peter B. Reich (University of Minnesota) sur une modification des analyses
reliées aux Figures 3.1 et 3.4.
Ma participation pour la récolte de données au site montréalais d'IDENT a été
importante de l'automne 2014 à l'automne 2015 . Cela inclut deux inventaires de fin de
saison de croissance, i.e. diamètres de tous les arbres les deux fois et une fois toutes
les hauteurs; un inventaire des dommages et de la mortalité; un échantillonnage de
l'humidité du sol; et un échantillonnage du pourcentage de lumière transmis au sol.
Pour tous ces inventaires, j'ai assuré la coordination du travail de terrain et supervisé
des équipes de stagiaires. Ce sont surtout ces derniers qui ont rendu ce travail
possible. Je tiens personnellement à les remercier pour tous les efforts qu'ils ont
déployés.
111
J'aimerais aussi remercier le Fonds de recherche du Québec- Nature et technologies
(FRQNT) et le programme en Modélisation de la complexité de la forêt (MCF) pour
leur soutien financier.
Finalement, je me dois de noter la chance incroyable que j'ai eue de travailler avec les
gens, autant compétents que sympathiques, qui arpentent les corridors de l'Institut des
Sciences de la Forêt tempérée (ISFORT).
TABLE DES MATIÈRES
AVANT-PROPOS ................... ................................ .. .................... ..... ... .. .. ....... ........... ii
LISTE DES FIGURES ..................................................................... ............... ........... vii
LISTE DES TABLEAUX ........................................................................ .. ... ..... ......... ix
LISTE DES ABRÉVIATIONS, SIGLES ET ACRONYMES .. ................................ .. x
RÉSUMÉ .......................................... ............................................................ ...... ....... xii
CHAPITRE I INTRODUCTION .. ... ..... .. ... .. ........ ... .... .. ... ....... ...... .... ...... .... ........ ................ .. ...... ....... 1
1.1 Problématique ................. ................ .. ............................ ..... ................................. ... . 1
1.2. État des connaissances .. ........................ .. .. .. ........... .. .... ... .. ..................................... 4
1.2.1 Diversité et productivité chez les arbres ...... .. ........ ...... .................. .. .............. .. 4
1.2.2 Diversité et interception de la lumière ........ .... .......... .. ...... .... ...... .. .. .. .... .. ......... 8
1.2.3 Stratégie d'allocation du carbone aux racines .. ...... ........ .. ...... .. .. ...... .. .. .. .. .. .... 10
1.2.4 Croissance et diversité au site montréalais d'IDENT ...................... .......... .... 12
1.3 Objectifs et hypothèses de travail .................................................................... .. ... 16
CHAPITRE II DIVERSE COMMUNITIES OF YOUNG TREES CAPTURE MORE LIGHT BUT THIS DOES NOT REFLECT ON THE IR BIOMASS ........ .. .................. .... .... 18
Authors ............................. .................................... ..... ..... ....... ........ .... .... .... .... ....... ....... 18
Abstract ......... ................................................................................ ..... ........... ... .. ...... ... 19
2.1 Introduction ........ .. .............. ..................................................... ..... .. ..... .. .. .... ... .... ... 20
2.2 Methods ...................................................... ........ .... .. ...... ... .................. .............. .... 23

1
l_
v
2.2.1 Experimental design and location .. ......... ... .............. ... ... ..... ..... .................... .. 23
2.2.2 Light capture and biomass surveys ... ..... ...... .. .... ......... .. .... .... .... ..... ... .. ... ...... .. 24
2.2.3 Statistical analyses ......... .... ... ..... ........ .................... ... .... .. ...... oo ....... .... .... . ··oo· ·· 25
2.3 Results ........ .... ...... ....... .. .... ........ .... ...... ..... .... .......... ........ ..... .. ... ...... .... .... ........ ... .... 30
2.4 Discussion .. .... ..... .. ...... .. .... .. ... ........ ... ... ... ..... .... ...... ... ....... ........ ...... .... .... ... .. ....... ... 32
Acknowledgement. ... ......... .. ......... ........ ... .... .. ..... .. ... .. ... ....... .. .. ... ...... ... ......... .... .... ....... 35
References ................... .... ................ ... ......... .. ... ............ .......... ... .......... .. .. ... .. ......... ...... 3 6
Supporting information .. ... ..... .. .... ...... ... ......... ... ...... ................. ... ... ......... .... .. .............. 40
CHAPITRE III INCLUDING BOTH ABOYE- AND BELOW-GROUND BIOMASS IN A DIVERSITY EXPERIMENT WITH TREES REVEALS A GREA TER IMPORTANCE OF COMPLEMENTARITY .. .. .. ... ...... .. .... ....... ... .. ... .. ..... .. ............. . 51
Authors ... ... ..... ... .............. .. ..... ....... .... ................ ..... .... oo ............. .... .............................. 51
Abstract ......... .... .......... ... ..... .......... .... ... .. ... ..... ...... ....................................................... 52
3.1 Introduction .... .... ...... .. .... 00 •• 00 • •••• • • • ••• • ••• • • ••• • • ••••••• • • •• • •••• ••••• 00 •••• 00 ••••••• • ••• ••• ••• •• • • •••••••• • 54
3.2 Methods ........... ... ........... ..................... .......... ... ....... ... ........ ......... .. ..... .. ... ....... ... ..... 56
3.2.1 Experimental design and location ........................................... ...... ... ...... ...... .. 56
3.2.2 Below-ground and above-ground biomass assessment ................................. 58
3.2.3 Statistical analysis ... ... ... ... .... ........ ... oo···· ········oo· ···· ·· ····· ······ ·················· ·········· · 59
3.3 Results .... ...... .. .. .. ..... ... .... .. ..... ... ....... ..... ....... ..... ...... .. ...... ..... .............. ..... .... .. .. .. .... . 62
3.4 Discussion ............. ··oo·· ... ... ..... ....................................... .... oo .. ..... ... ... .... ................ . 63
Acknowledgements ................ ......... ... .......... ... .... ... ....... ........... ................................... 66
References ...... ... ....... .. ....... ...... .... ......... .. ..... ........ .......... ... ................ ... ..... ........ ...... ..... 67
Supporting information .... ......... .. ....... .... .... ....... .... ... ....... ......... ... .... ..... .. ..... .. ....... ...... . 71

VI
CHAPITRE IV CONCLUSION ...... .. ....... ..... ... ......... ... ........ .. ... ..... .. ..... ........ ...................................... 78
BIBLIOGRAPHIE .. .. .. .. ............ ... ..... ........ ......... ..... ............... .... ....... ....... .. ..... ....... .... 83
Figure
1.1
1.2
2.1
2.2
LISTE DES FIGURES
Effet de diversité net sur la biomasse aérienne au terme de la quatrième saison de croissance pour chacun des mélanges au site montréalais d'IDENT en 2012 ......... .. ....... .......................................... .
Déviation proportionnelle de la biomasse en racines fines pour toutes les communautés de deux et quatre espèces au site montréalais d'IDENT en 2012 ......... ............. ...... ........... ................... .. .
Relation between fraction of absorbed photosynthetically active radiation and basal area in a plot for each species richness lev el... .....
Relation between fraction of absorbed photosynthetically active radiation and basal area in a plot for different values of the principal components comrnunity weighted means ...... ....... ...... ....... ............. ... . .
2.3 Net effects on the fraction of absorbed photosynthetically active radiation and their annual responses to: already existing biodiversity effects on basal area; and functional dispersion in above-ground
Page
13
15
41
42
traits........ ........... ....................................... .... ........ .... .............. ............. 43
2.4
2.5
2.6
LI-191 line quantum sensor (LI-COR) sampling locations in plots for the two first surveys oflight capture (2011 and 2012) ................. .
Relations between fraction of absorbed photosynthetically active radiation and basal area for each monoculture and mixture separately ........... ........................ .............. ...... .. ............... .. ............... ... .
Both principal components kept in the principal component analysis of the height above-ground traits ............... ............. .. ................ ..... ..... .
46
47
48

2.7
3.1
3.2
3.3
3.4
3.5
3.6
Simulations of net effects on fraction of absorbed photosynthetically active radiation following null hypothesis ... ... .... .. .... ... ..... ........... .. ... .. .
Proportional deviation on below- vs. above-ground biomass and on total vs. above-ground biomass in the 24 mixtures where roots were sampled .. ... ..... .. ......... .. ...... ... .. ...... ... ... ... ..... .. ... ..... ........... .......... ........ .. .
Mean net effects (Observed - Expected) on belowground to aboveground biomass ratios for each tree species mixtures .... .... ....... .
Structural equation model of the direct and indirect effects of microtopography on overyielding in total biomass and on response of below-ground to above-ground ratios ... ............ .... .. .... ... ... .. .. .... .. ........ .
Comparison of complementarity effects and selection effects on below- vs. above-ground biomass in the 7 two-species mixtures where roots were identified at the species lev el.. .... ... .. .. .. .. ....... ... ..... . .
A priori structural equation model from which relationship are removed un til all remaining causal links are significant. ..... .... ...... ... . .
Example of biodiversity effects calculations with and without consideration of belowground parts .. .. ...... ........... .... ... ... ..... ......... ....... .
Vlll
49
71
72
73
74
75
76
LISTE DES TABLEAUX
Tableau Page
2.1 Variables in the models explaining light capture, net effect on light capture and annual increase in biodiversity effects on biomass .... ... . 40
2.2 Species present in the experiment and their respective trait values used in analyses .. .. ..... ... ... ... ..... ....................... .... ..... .... ..... .......... ... ... . 44
LISTE DES ABRÉVIATIONS, SIGLES ET ACRONYMES
AIC Critère d'information d'Akaike (« Akaike Information Criterion »)
AP AR PAR absorbés ( « Absorbed PAR »)
B:A Ratio entre biomasse souterraine et aérienne (« Below- to Above
ground »)
BEF Biodiversité et fonctionnement de l'écosystème (« Biodiversity and
Eco system Functioning »)
BIODEPTH Biodiversité et processus écologiques dans les écosystèmes herbacés
terrestres(« BIODiversity and Ecological Processes in Terrestrial
Herbaceous eco systems »)
CE
CWM
Dr
ED
fAPAR
FD
FDis
G
IDENT
LAI
Effet de la complémentarité ( « Complementarity Effect »)
Moyenne pondérée de la population(« Community Weighted Mean »)
Déviation proportionnelle ( « proportional Deviation »)
Effet de la diversité ( « Diversity Effect »)
Fraction d'AP AR ( fraction of AP AR »)
Diversité fonctionnelle(« Functional Diversity »)
Dispersion fonctionnelle ( « Functional Dispersion »)
Surface terrière ( « basal area »)
Réseau international d'expériences sur la diversité avec des arbres
(« International Diversity Experiment Network with Trees »)
Indice de surface foliaire ( « Leaf Area Index »)
Xl
LDMC Teneur foliaire en matière sèche ( « Leaf Dry Matter Content »)
LUE Efficacité d'utilisation de la lumière(« Light Use Efficiency »)
NE Effet net de la diversité(« Net Effect »)
PAR Rayons photosynthétiquement actifs ( « Photosynthetically Active Radiation »)
PCA Analyse en composantes principales ( « Principal Component Analysis »)
RGR Taux relative de croissance ( « Relative Growth Rate »)
R Y Rendement relatif ( « Relative Yield »)
SE Effet de sélection ( « Selection Effect »)
SLA Surface spécifique foliaire ( « Specifie Leaf Area »)
SR Richesse spécifique ( « Species Richness »)
TPO Théorie du partitionnement optimal(« Optimal Partitioning Theory »)
----------- ------ -- - - ---
RÉSUMÉ
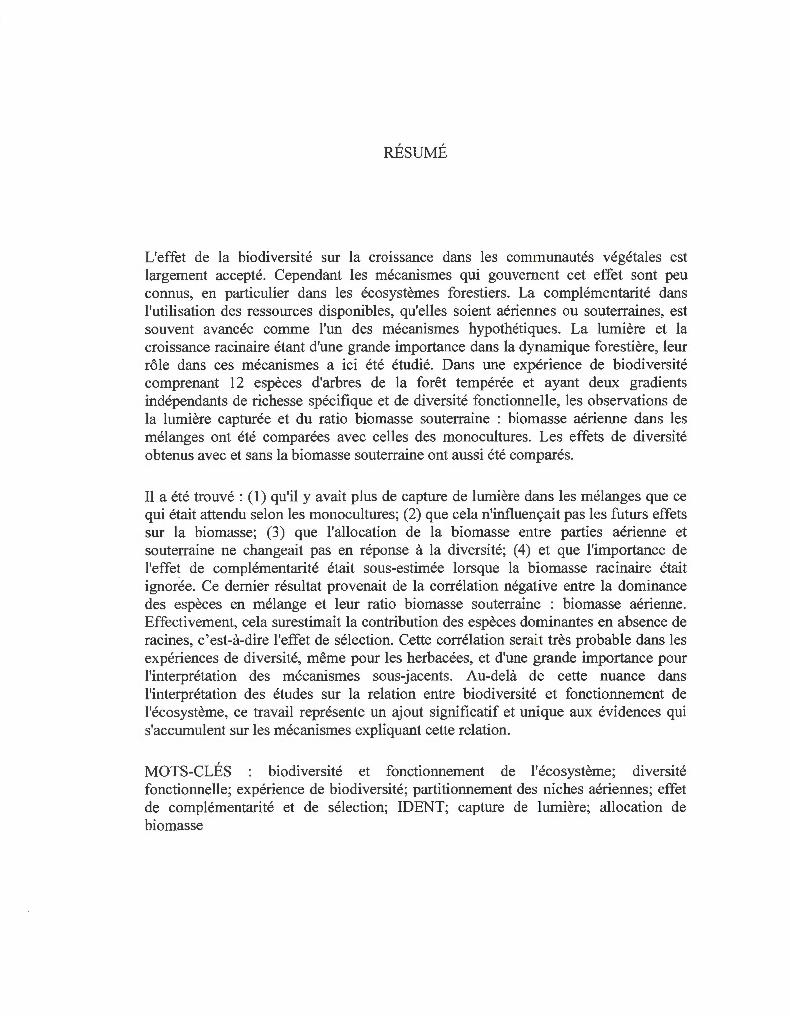
L'effet de la biodiversité sur la croissance dans les communautés végétales est largement accepté. Cependant les mécanismes qui gouvernent cet effet sont peu connus, en particulier dans les écosystèmes forestiers . La complémentarité dans l'utilisation des ressources disponibles, qu'elles soient aériennes ou souterraines, est souvent avancée comme l'un des mécanismes hypothétiques. La lumière et la croissance racinaire étant d'une grande importance dans la dynamique forestière, leur rôle dans ces mécanismes a ici été étudié. Dans une expérience de biodiversité comprenant 12 espèces d'arbres de la forêt tempérée et ayant deux gradients indépendants de richesse spécifique et de diversité fonctionnelle, les observations de la lumière capturée et du ratio biomasse souterraine : biomasse aérienne dans les mélanges ont été comparées avec celles des monocultures. Les effets de diversité obtenus avec et sans la biomasse souterraine ont aussi été comparés.
Il a été trouvé : (1) qu'il y avait plus de capture de lumière dans les mélanges que ce qui était attendu selon les monocultures; (2) que cela n'influençait pas les futurs effets sur la biomasse; (3) que l'allocation de la biomasse entre parties aérienne et souterraine ne changeait pas en réponse à la diversité; (4) et que l'importance de l'effet de complémentarité était sous-estimée lorsque la biomasse racinaire était ignorée. Ce dernier résultat provenait de la corrélation négative entre la dominance des espèces en mélange et leur ratio biomasse souterraine : biomasse aérienne. Effectivement, cela surestimait la contribution des espèces dominantes en absence de racines, c'est-à-dire l'effet de sélection. Cette corrélation serait très probable dans les expériences de diversité, même pour les herbacées, et d'une grande importance pour l'interprétation des mécanismes sous-jacents. Au-delà de cette nuance dans l'interprétation des études sur la relation entre biodiversité et fonctionnement de l'écosystème, ce travail représente un ajout significatif et unique aux évidences qui s'accumulent sur les mécanismes expliquant cette relation.
MOTS-CLÉS biodiversité et fonctionnement de l'écosystème; diversité fonctionnelle; expérience de biodiversité; partitionnement des niches aériennes; effet de complémentarité et de sélection; IDENT; capture de lumière; allocation de biomasse
CHAPITRE I
INTRODUCTION
1.1 Problématique
Traditionnellement, en écologie, la biodiversité a été considérée comme un
épiphénomène engendrée par des facteurs abiotiques, que ce soit directement ou
indirectement par la voie de changement dans des processus écosystémiques (Loreau,
201 0). Toutefois, la préoccupation grandissante face à la perte globale de biodiversité
a obligé la communauté scientifique à évaluer l'impact d'une telle perte sur le
fonctionnement des écosystèmes. Cela a amené le développement d'une nouvelle
discipline qui consacre un rôle à la biodiversité dans l'écosystème, un concept en voie
de devenir un nouveau paradigme selon certains (Caliman et al. , 201 0; Naeem, 2002),
soit l' études de la biodiversité et du fonctionnement de l'écosystème (BEF pour
« Biodiversity and Ecosystem Functioning » ). Dans les deux dernières décennies,
près de 600 expériences manipulant le plus souvent la richesse spécifique (SR pour
« Species Richness »), ont permis l'émergence de consensus à propos de l'effet de la
diversité (ED) sur différentes fonctions écosystémiques, notamment la croissance des
producteurs primaires (Cardinale et al., 2011 ). Cette prolifération de connaissances a
généré une prise de conscience de l'importance de la biodiversité dans le bon
fonctionnement des écosystèmes et dans leur capacité à fournir des services
écosystémiques (Millenium Ecosystem Assessment, 2005). Bien que le sujet soit
encore ouvert au débat (Ricketts et al. , 20 16), Cardinale et al. (20 12) ont démontré le
caractère crucial de la biodiversité pour une panoplie de ces services, dont les
services d'approvisionnement comme la production de bois.
2
Certains ont discuté de la pertinence des études BEF comme argument pour la
conservation de la biodiversité, critiquant la simplicité des dispositifs expérimentaux
alors que la réalité est beaucoup plus complexe, avec des extinctions non-aléatoires et
des communautés à plusieurs niveaux trophiques (Cal iman et al., 201 0; Srivastava et
Vellend, 2005; Wardle, 2016). De plus, la majorité des études BEF ont été réalisées à
l'échelle locale alors que la perte de biodiversité globale ne s'observerait pas à cette
échelle selon certains (Vellend et al. , 2013). Au contraire, en comparant des
écosystèmes perturbés par l'activité humaine et des points de référence sans
perturbation, d'autres ont observé une perte de biodiversité à cette même échelle
(Murphy et Romanuk, 2014 ), suggérant une potentielle perte de fonctions dans ces
systèmes. Srivastava et Vellend (2005) notent tout de même que les connaissances
sur la relation BEF permettent de faire des choix de gestion éclairés afin de restaurer
certaines fonctions écosystémiques altérées. Cela s'applique selon moi dans tous les
cas où nous façonnons la composition en espèce d'un écosystème, y compris dans le
cas des plantations forestières (voir Hartley, 2002).
Malgré l'importance écologique et socio-économique des écosystèmes forestiers , peu
d'expériences manipulant la diversité des arbres au-delà de deux espèces existent
(Scherer-Lorenzen et al., 2007; Tobner et al. , 2014), la majorité des expériences BEF
sur les producteurs primaires ayant été réalisées avec des herbacées (Cardinale et al. ,
2011). Une analyse des quelques résultats accumulés dans la littérature permet
néanmoins d'identifier un effet positif de la diversité des arbres sur la productivité des
forêts (Nadrowski et al. , 201 0; Zhang et al., 20 12). En prenant compte des conditions
climatiques et environnementales, Paquette et Messier (20 11) ont eux aussi trouvé un
ED positif sur la productivité dans leur analyse des parcelles forestières permanentes
québécoises, un effet qui se manifestait avec plus grande force en forêt boréale
comparativement à la forêt tempérée. La fonction de productivité est évidemment
importante pour l'industrie forestière par son lien direct avec les services
d'approvisionnement, mais elle est aussi intrinsèquement reliée à d'autres services de
3
régulation comme la séquestration du carbone atmosphérique (e.g. lsbell et al., 2014).
Dès lors, cet ED observé de la forêt tempérée à la forêt boréale (Paquette et Messier,
2011) doit être décortiqué afin de mettre en lumière la mécanique des processus qui
mènerait ultimement à ces services améliorés.
Loreau et Hector (200 1) ont d'ailleurs m1s au point une méthode statistique
permettant, avec la connaissance des performances en monoculture, le
partitionnement de l'ED net (NE) en effet de sélection (SE) et effet de
complémentarité (CE). Tandis que le SE s'explique par l'identité des espèces
présentes dans le mélange, la mécanique de la complémentarité est plus complexe,
car elle peut agir sous différentes formes d'interactions positives et de
partitionnements des niches (Loreau et Hector, 2001). Ce partitionnement des niches
pourrait se faire au niveau aérien avec la lumière, et/ou au niveau du sol avec l'eau et
les nutriments. Il n'y a cependant qu'un nombre limité d'études BEF qui vont au-delà
de cette séparation statistique des NE et qui analysent les mécanismes sous-jacents au
CE (Sapijanskas et al. , 2014).
Bien que la production de biomasse souterraine d'un peuplement puisse représenter
50% de sa production totale (e.g. Helmisaari et al. , 2002), la majorité des études BEF
ne prend pas en compte l'influence de la biodiversité sur celle-ci et sur la biomasse
racinaire résultante suite au renouvellement des racines fines (Brassard et al. , 2011;
Lei et al., 20 12). Et pourtant, des stratégies différentes de distribution de la biomasse
existent entre les différentes espèces, étant potentiellement plastiques pour certaines
(Poorter et al., 20 12), ce qui pourrait biaiser les conclusions obtenues en étudiant
l'une ou l'autre des fractions de la biomasse séparément. L'influence de la biodiversité
sur la distribution de la biomasse peut également être étudié en soi (Bessler et al.,
2009), ce qui donne un indice de la qualité du milieu. En effet, selon la théorie
d'optimalité de Bloom et al. (1985), l'allocation du carbone devrait se faire
préférentiellement vers les organes acquérant la ressource limitant le plus la
4
cr01ssance, e.g. vers les racines en condition de stress hydrique. Cela dit, l'étude de
l'ED sur un service de régulation comme la séquestration du carbone profitera d'une
connaissance plus détaillée de l'ED sur la biomasse totale et son allocation.
C'est dans l'objectif de répondre à ces diverses lacunes dans nos connaissances
fondamentales que le présent travail a été entrepris, et cela, dans le cadre d'une
expérience de biodiversité établie il y a sept ans avec des semis d'arbres de la forêt
tempérée. Les potentiels mécanismes responsables des ED y étant observés ont été
investigués. L'accent a d'abord été mis sur les ED sur l'interception de la lumière,
dont l'importance dans les ED annuels sur la croissance a été évaluée. En second lieu,
l'intégration de la biomasse souterraine aux calculs d'ED a permis de caractériser les
potentiels changements dans la stratégie de distribution de la biomasse des arbres.
Cette intégration a aussi rendu possible le calcul d'ED sur la biomasse totale et
l'évaluation de la validité du partitionnement statistique des NE.
1.2. État des connaissances
1.2.1 Diversité et productivité chez les arbres
Dès le début du XIXe siècle, on a évoqué l'idée que les arbres d'espèces variées
pourraient utiliser les ressources de manières différentes et que plus de productivité
serait ainsi engendrée dans les mélanges (von Cotta, 1828 dans Pretzsch, 2005). Les
résultats des premières expériences à long terme en foresterie ont cependant montré
que pour plusieurs sites, les monocultures d'espèces très productives (comme
Pseudotsuga menziesii ou Picea abies en Europe) ne sont jamais surpassées par les
mélanges en termes de production de biomasse sèche (Pretzsch, 2005). Il y aurait
donc rarement des rendements supérieurs transgressifs (« transgressive overyielding »
tel que discuté dans Schmid et al. (2008), i.e. quand le rendement d'un mélange est
5
plus élevé que celui de la monoculture la plus productive). Pretzsch (2005) a tout de
même noté des exemples où les mélanges de deux espèces sont jusqu'à 30% plus
productifs comparativement à la moyenne pondérée de leurs monocultures
respectives. Il attribue ce résultat aux différences entre les niches écologiques des
espèces, e.g. la tolérance à l'ombre ou l'ontogénie de la croissance. Au contraire, des
réductions en productivité allant jusqu'à 30 % ont été observées dans d'autres cas. Ces
réductions résulteraient d'un chevauchement de ces niches et d'une grande
compétition interspécifique. En excluant les études ne comprenant que des mélanges
à deux espèces, Nadrowski et al. (2010) ont quant à eux trouvé, dans leur revue de la
littérature, des relations constamment positives entre productivité et SR. Ils ont
cependant noté une influence plus importante de l'identité plutôt que de la SR dans les
études l'ayant prise en compte.
Dans des études basées sur des observations en milieu naturel, ce même patron d'ED
positif se manifeste, et ce, en contrôlant pour l'influence des conditions climatiques
sur la productivité (Paquette et Messier, 2011; Vilà et al., 2013; Zhang et al. , 2012).
Pour certaines études de moins grande envergure, l'absence d'ED ou même un ED
négatif ont cependant été observés (Jacob et al. , 201 0; Vil à et al. , 2003 ). Il est
intéressant de noter que, comme proposé dans Pretzsch (2005), Zhang et al. (2012)
ont démontré, dans leur méta-analyse, l'importance de la présence d'espèces avec des
tolérances à l'ombre contrastées pour l'obtention d'un ED positif
Les études observationnelles n'arrivent toutefois pas à clairement mettre en lumière
les mécanismes sous-jacents aux ED. Par exemple, elles n'arrivent souvent pas à
comparer des peuplements mélangés avec des monocultures et à isoler l'effet associé
à l'identité des espèces. Ces études peinent aussi à séparer l'effet de la diversité
fonctionnelle (FD) de celui de la SR, toutes deux naturellement corrélées (Tobner et
al. , 2014). Les premières études BEF ont en effet été critiquées à cause de la forte
probabilité de trouver des espèces très productives dans leurs assemblages
'---------- ----------- - - --- - ------- ----- --
6
synthétiques riches en espèces et de leur incapacité à séparer cet effet
d'échantillonnage (« sampling effect »; Huston, 1997). En connaissant les
performances en monoculture, la méthode statistique de Loreau et Hector (2001)
permet de séparer le SE du reste de l'ED net (NE, soit la biomasse observée -
biomasse attendue), un indice qui généralise ce concept d'effet d'échantillonnage à
toutes espèces dont la performance en monoculture est corrélée à son niveau de
dominance dans les mélanges. La partie restante du NE est associée à la facilitation
et/ou au partitionnement des niches, englobés tous deux dans le CE (Loreau et
Hector, 2001 ). Ce partitionnement des niches peut agir potentiellement au niveau de
n'importe quelle ressource pour laquelle des stratégies différentes d'acquisition entre
les espèces réduisent la compétition pour l'obtenir. Ultimement, le partitionnement
des niches peut augmenter l'acquisition de cette ressource à l'échelle de la
communauté et sa productivité.
Ces niches peuvent être spatiales. C'est le cas par exemple quand des stratégies
différentes de répartition verticale des racines engendrent une utilisation améliorée de
l'espace du sol dans le mélange ( e.g. Bol te et Villanueva, 2006; Brassard et al., 2011 );
ou quand l'architecture des canopées de différentes espèces s'agencent d'une manière
telle qu'il y a plus d'interception de la lumière (e.g. Sapijanskas et al., 2014). Ces
niches peuvent aussi être temporelles. Par exemple, Sapijanskas et al. (2014) ont
trouvé que des phénologies foliaires complémentaires étaient plus importantes que
des architectures complémentaires pour l'interception de la lumière dans leur système
tropical saisonnier. Lang et al. (2014) ont suggéré quant à eux que l'augmentation de
l'ED sur l'acquisition de l'azote qu'ils ont observé provenait fort probablement de
phénologies différentes dans l'acquisition de cet élément. Ces niches pourraient
également être associées à la forme sous laquelle sont acquises les ressources. Par
contre, dans les projets de Sardinilla (Oelmann et al. , 2010; Zeugin et al. , 2010) et de
BEF China (Lang et al. , 2014), même s'il y avait des ED positifs sur les stocks d'azote
dans certains de leurs mélanges, il a été difficile d'attribuer clairement ces résultats à
7
une utilisation différentielle des formes d'azote (Trogisch, 20 12). Il existe du moins
un potentiel pour un tel partitionnement des niches dans nos forêts tempérées (e.g.
Templer et Dawson, 2004). Un autre aspect non négligeable quand il est question de
niches souterraines est l'expansion de celles-ci à la mycorhizosphère. La symbiose
avec les mycorhizes et leur diversité peuvent en effet influencer la relation entre
diversité et productivité chez les arbres (Lovelock et Ewel, 2005) et les herbacées
(Klironomos et al., 2000; Rudgers et al., 2004 ).
En se basant sur l'équation écologique de production (productivité primaire brute =
ressources disponibles x proportions capturées x efficacités d'utilisation) développée
par Monteith (1977), Richards et al. (20 1 0) ont fait la revue des effets des
peuplements mixtes sur la nutrition des arbres. Ils ont donc exploré l'influence de la
diversité non seulement sur l'acquisition et l'efficacité de l'utilisation des ressources,
mais aussi la disponibilité des ressources. Une rétroaction entre la diversité et les
réserves disponibles de ressources cadre parfaitement avec le concept de réciprocité
entre biodiversité et fonctionnement de l'écosystème intégrée dans la nouvelle
discipline BEF (Loreau, 2010). Que ce soit pour la lumière ou les ressources du sol, il
ne faut donc pas se limiter à l'idée que des plantes de formes différentes occuperont
les niches disponibles plus efficacement. Il faut aussi prendre en considération que les
plantes influenceront avec le temps la qualité de ces niches. Dans l'expérience de
Sardinilla, Sapij anskas et al. (20 13) ont d'ailleurs trouvé que les interactions causées
par la litière de leurs arbres étaient le plus important facteur dans l'explication de la
variation résiduelle de la croissance, i.e. celle non-expliquée par la compétition pour
la lumière. Ils ont suggéré que l'augmentation temporelle des ED trouvée dans cette
expérience serait conforme avec une rétroaction interspécifique positive de la litière
sur la nutrition des individus. Un autre phénomène similaire et largement étudié est
celui de l'apport en azote par les symbiotes fixateurs de certains arbres, ce qui
augmente la productivité des mélanges qu'ils occupent (Binkley, 2003; Forrester et
8
al. , 2006). Ces deux derniers exemples mettent en évidence la présence de facilitation
dans certains écosystèmes forestiers.
1.2.2 Diversité et interception de la lumière
La compétition pour la lumière est reconnue comme étant un déterminant majeur de
la dynamique de succession forestière (Purves et Pacala, 2008). Avec les simulations
d'un modèle de succession effectuées avec un gradient de diversité, Morin et al.
(20 11) ont découvert un ED positif sur la productivité induit seulement que par cette
compétition asymétrique pour la lumière. C'était principalement des CE qui étaient en
cause. Le mécanisme principal expliquant les CE aurait été une réponse plus rapide à
un évènement de mortalité avec une diversité plus élevée en tolérance à l'ombre et en
capacité de croissance. Cela concorde avec l'importance de l'hétérogénéité en
tolérance à l'ombre trouvée dans la méta-analyse de Zhang et al. (2012).
Les observations dans les études BEF pointent généralement vers une interception de
la lumière augmentée par la diversité. Par exemple, dans le réseau BIODEPTH, les
communautés d'herbacées les plus riches en espèce étaient celles qui capturaient le
plus de lumière (Spehn et al. , 2005), une tendance retrouvée dans certaines forêts
(DeClerck et al., 2005; Unger et al., 2013 ). Comme pour la biomasse, cet ED sur
l'interception de la lumière peut découler de la présence d'espèces très efficaces dans
cette interception, donc de SE. En accord avec ce point, certains auteurs ont trouvé
que l'identité était un déterminant important de l'interception de la lumière (DeClerck
et al., 2005; Seide! et al. , 2013). Dans leurs mélanges d'Abies alba et de Picea abies,
F orres ter et Al brecht (20 14) ont mesuré une augmentation dans les AP AR
(« Absorbed Photosynthetically Active Radiation ») relativement aux monocultures,
mais ils ont aussi utilisé une autre approche en quantifiant l'efficacité de l'utilisation
de la lumière (LUE pour « Light Use Efficiency »), défini comme la croissance en
9
surface terrière par unité d'AP AR. Ils ont associé l'augmentation en LUE d'A. alba
dans les mélanges avec une diminution de la compétition interspécifique,
comparativement à une intense compétition intraspécifique en monoculture. Cette
notion de LUE fait directement référence à l'efficacité d'utilisation des ressources
dans l'équation écologique de production (Monteith, 1977) et peut être liée à des ED
positifs.
Bien que toutes ces observations sur des NE dans l'interception de la lumière
apportent une information intéressante en soi, elles ne permettent pas de conclure si
ces effets résultent d'un partitionnement des niches aériennes ou de mécanismes
souterrains augmentant la biomasse foliaire . Tout en contrôlant pour la biomasse
aérienne déjà présente et grâce à des simulations réalisées à l'aide d'un modèle calibré
d'interception de la lumière, Sapijanskas et al. (20 14) ont testé plusieurs hypothèses
qui ont révélé les différents mécanismes sous-jacents au partitionnement des niches
aériennes dans l'étude BEF de Sardinilla. Ils ont découvert une complémentarité des
niches spatiales et temporelles, ainsi qu'une plasticité architecturale augmentant
l'efficacité du partitionnement des niches spatiales. Les simulations théoriques de
Yachi et Loreau (2007) démontrent aussi une complémentarité dans l'architecture,
engendrant une «relaxation compétitive». Cependant, un autre facteur associé au
caractère asymétrique de la compétition pour la lumière ressort de leur modèle
théorique, soit un débalancement compétitif. Celui-ci peut amener des NE négatifs
sur la biomasse si la relaxation compétitive moyenne de toutes les espèces, i.e.
lorsque la compétition intraspécifique est supérieure à la compétition interspécifique,
ne compense pas pour la dominance compétitive de certaines espèces dans un
mélange.
Suite à ces avancées théoriques, Yachi et Loreau (2007) ont aussi créé un modèle
empiriquement applicable avec la connaissance des intensités lumineuses au-dessus et
au sol des parcelles, et des LAI (« Leaf Area Index »). Ils font appel à une notion
10
d'efficacité pour quantifier un indice de complémentarité indépendant de la biomasse
foliaire présente. En appliquant ce modèle sur des herbacées, Vojtech et al. (2008)
ont trouvé que l'indice de complémentarité expliquait presque toute la variation du
NE sur l'interception de la lumière. Par contre, ni le NE sur l'interception ni la
complémentarité architecturale n'arrivaient à expliquer les quelques NE positifs sur la
biomasse qu'ils ont observés.
1.2.3 Stratégie d'allocation du carbone aux racines
Bloom et al. (1985) ont aidé au développement de la théorie du partitionnement
optimal (TPO) en appliquant des concepts économiques à l'utilisation des ressources.
La théorie prédit que l'allocation des ressources internes ou déjà acquises devrait se
faire préférentiellement vers là où la plante acquiert la ou les ressources qui limitent
le plus la croissance (e.g. vers les parties aériennes dans des conditions de haute
fertilité édaphique et/ou d'ombrage). Près de 20 ans plus tard, Reich (2002) a fait la
thèse que les études sur l'allocation, ou plus précisément la distribution de biomasse,
étaient peu concluantes, car une mauvaise interprétation était souvent faite en
l'absence de contrôle pour les changements ontogéniques dans la distribution. Il a
même suggéré de discuter de la pertinence de la TPO.
La tendance ontogénique générale chez les espèces ligneuses est une augmentation de
la biomasse de la tige au détriment des feuilles et racines (Poorter et al. , 20 12). Par
exemple, des expériences en serre ont permis d'observer qu'après une période de
temps fixe , les semis d'érable rouge et de pin blanc avaient alloué moins de biomasse
aux racines avec un ajout d'azote ou d'eau au sol, tandis qu'aucun changement dans la
distribution n'a été observé pour l'érable à sucre et le chêne rouge (Canham et al. ,
1996). Il faut considérer que, dans une certaine mesure, des changements
ontogéniques peuvent biaiser ces résultats si le développement est plus rapide dans
11
certaines conditions, comme pour le pin blanc qui passe de 25 à 69 % de biomasse
totale allouée à la tige entre 2 et 65 ans (Peichl et Arain, 2007). Un autre exemple
plus direct est celui des forêts de Pinus conforta étudiées par Litton et al. (2003), où
une densité élevée en surface terrière donnait une allocation racinaire élevée, ce à
quoi l'on s'attend avec une compétition plus élevée pour les ressources du sol.
Cependant, cette conclusion aurait été biaisée. En effet, ce changement d'allocation
était une simple conséquence ontogénique, les arbres étant plus petits dans les
peuplements à haute densité (Litton et al., 2003 ).
En contrôlant pour l'ontogénie cette fois , i.e. en comparant des semis de biomasses
similaires, Reich et al. (1998) n'ont pas réussi à trouver d'effet du régime d'intensité
lumineuse sur la fraction de biomasse foliaire pour des espèces de la forêt boréale. La
biomasse allouée à la tige à faible intensité lumineuse était néanmoins augmentée au
détriment de la fraction racinaire, soutenant partiellement la TPO. Comme cela
n'affecte pas directement la surface foliaire, les auteurs ont tout de même jugé que les
changements de traits morphologiques, comme l'augmentation du SLA avec la
diminution de l'intensité lumineuse, étaient les processus de plasticité les plus
importants pour s'acclimater aux conditions de lumière. On peut soutenir du moins
que la biomasse de plus allouée à la tige était une stratégie à plus long terme pour
atteindre des zones de plus grande disponibilité photonique.
Les méta-analyses de McCarthy et Enquist (2007) et de Poorter et al. (2012) ont
intégré des relations allométriques pour la croissance des différentes fractions de la
biomasse afin de contrôler le facteur ontogénique. Malgré le fait que les auteurs ne
soient pas arrivés à trouver un patron interspécifique qui confirmerait la TPO, ils ont
noté que plusieurs espèces avaient des réponses plastiques consistantes avec ses
prédictions. En accord avec Reich (2002), ils ont suggéré que la plasticité
morphologique est plus importante pour s'adapter à l'environnement. Il faudrait donc
12
s'assurer de nuancer l'interprétation de résultats montrant une réponse de la
distribution de biomasse à l'aide des changements dans les traits fonctionnels.
Si les disponibilités en lumière et azote peuvent toutes deux influencer la distribution
en biomasse de semis (Kobe et al. , 201 0; Reich et al. , 1998), un ED sur ces
disponibilités par le mécanisme du partitionnement des niches pourrait en toute
logique entraîner des changements dans cette distribution. Dans BIODEPTH, Spehn
et al. (2005) ont d'ailleurs fait l'observation que la biomasse racinaire était affectée de
manière moindre que la biomasse aérienne par la diversité. De manière semblable,
Nadrowski et al. (2010) ont trouvé des ED majoritairement positifs sur la biomasse
aérienne dans les peuplements intégrés à leur revue, mais des ED sur la biomasse
racinaire tendant à être nuls ou inconsistants. Bessler et al. (2009) ont quant à eux
spécifiquement testé l'hypothèse d'un ED sur cette distribution dans l'expérience BEF
de Jena. Leurs communautés d'herbacées avec plus de SR et/ou comprenant plus de
groupes fonctionnels avaient une croissance aérienne plus élevée pour une croissance
racinaire équivalente aux communautés moins riches, donc des ratios de biomasse.
souterraine : aérienne (B :A pour « below- to above-ground ») plus bas. Cependant, ils
n'ont pas contrôlé pour la taille finale des plantes dans leurs communautés.
1.2.4 Croissance et diversité au site montréalais d'IDENT
Le réseau international d'expériences sur la diversité avec des arbres (!DENT pour
« International Diversity Experiment Network with Trees ») est l'un des différents
efforts mis en place pour combler le manque d'études BEF réalisées avec des
systèmes arborés (Tobner et al., 2014). Ses designs expérime.ntaux à haute densité et
petites surfaces de plantation favorisent la formation rapide d'interactions entre les
arbres, tout en permettant la diminution des effets confondants abiotiques. De plus,
leur approche à deux gradients orthogonaux permet une séparation de l'effet de la SR
13
et de la FD (Tobner et al. , 2014), ce qui n'est pas possible dans les analyses basées sur
des observations étant donné leur forte corrélation naturelle (e.g. Paquette et Messier,
2011).
i NE = • sE + CE
* 2-species mixtures 4-spec!es mixtures
*
* * *
e 2 "' a. "' {2 i o. "'
-10 2 ~ " a. ~ {t ~ 'à 1- Cl "" a. "
0 0.. è: a. a. 2 ~ :l là ,à {2 {). ,E. tt ~ 0 " < 0 a. "" ·~ ,à
~. o.
"' ~ "' i: < "' a. k: 0: '!! <{ a. Il) a:l
;;: .. ii 'i a. tf "' 0 n " ;;, "' "' "' < <(
. .., " !k J{ 1/} (( <{ < :J rn < <: ro _; «) < "' <{ <{ «) ..J <{
· 2()
Tree community
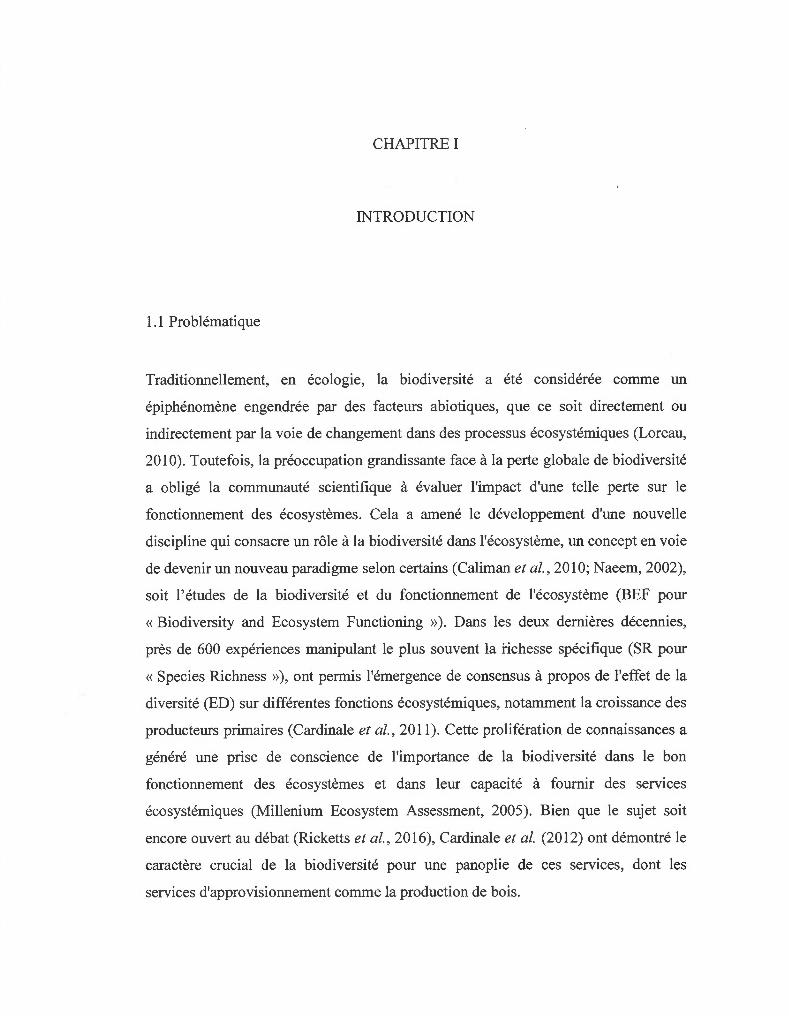
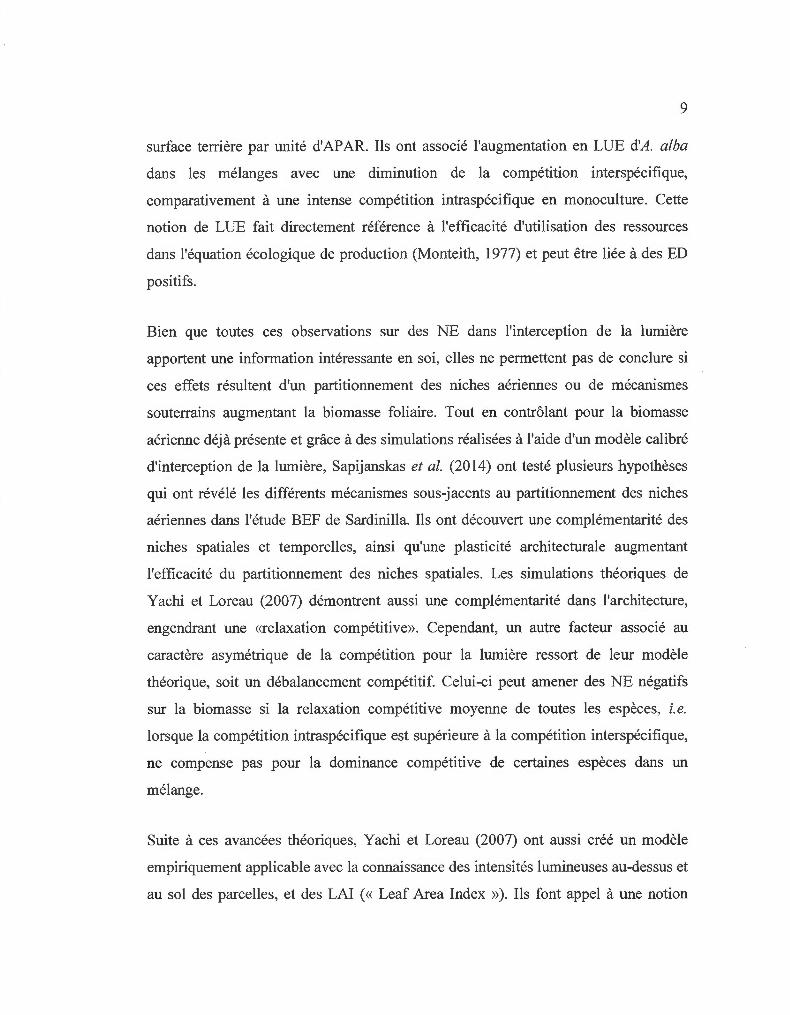
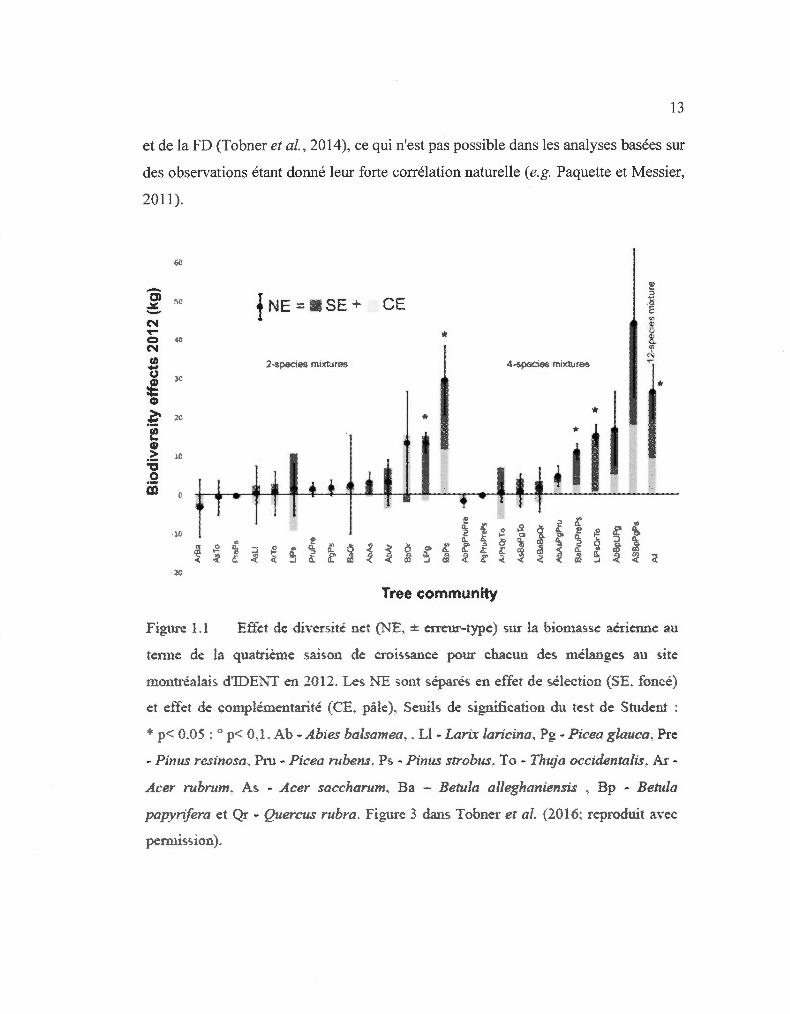
Figure 1.1 Effet de diversité net (NE, ± emtur-type) sur la biomasse aérienne an
tetme de la quatrième saison de croissance pour chacun des mélanges au site
mout1·éalais d'IDE"N1 en 2012 . Les NE sont séparés en effet de sélection (SE. foncé)
et effet de complémentarité (CE. pâle), Seuils de signification du test de Student :
* p< 0.05 : " p< 0,1. Ab - Abies balsamea .. Ll - Lmix laricina, Pg - Picea glauca, Pre
- Pinus resinosa. Pru - Picea rubens. Ps - Pinus strobus. To - Thuja occidentalis. A .. r
Acer rubrum. As - Acer saccharum. Ba - Betula alleghaniensis , Bp - Betula
papyrifera et Qr - Quercus rubra . Figure 3 dans Tobner et al. (2016: reproduit avec
permission).
14
Les résultats des quatre premières années de croissance au site montréalais d'IDENT
ont montré un SE, tel que statistiquement défini par Loreau et Hector (200 1 ),
prépondérant dans le NE sur la biomasse aérienne (Tobner et al. , 2016). Les parcelles
les plus productives en moyenne étaient celles de Larix laricina en monoculture. Il y
avait donc absence d'un rendement supérieur transgressif significatif. Plus
précisément, les NE positifs observés dans 19 des 25 communautés sont expliqués à
70 % par le SE tandis que le reste est attribuable au CE (Fig. 1.1; Tobner et al.,
20 16). Ce résultat concorde avec l'observation de Nadrowski et al. (20 1 0) sur
l'importance de l'identité. Par contre, une des tendances émergente des résultats des
études BEF serait l'augmentation des ED avec le temps (Cardinale et al., 2012; e.g.
Sapijanskas et al. , 2013). Par ailleurs, la méta-analyse de Cardinale et al. (2007)
démontre que le CE serait le principal responsable de l'augmentation des ED. La
persistance de l'importance du SE dans le temps devrait donc être vérifiée idéalement
pour s'assurer de la validité de cette observation, en particulier pour un système
arboré évoluant à plus long terme et cumulant les effets dans sa biomasse à travers le
temps.
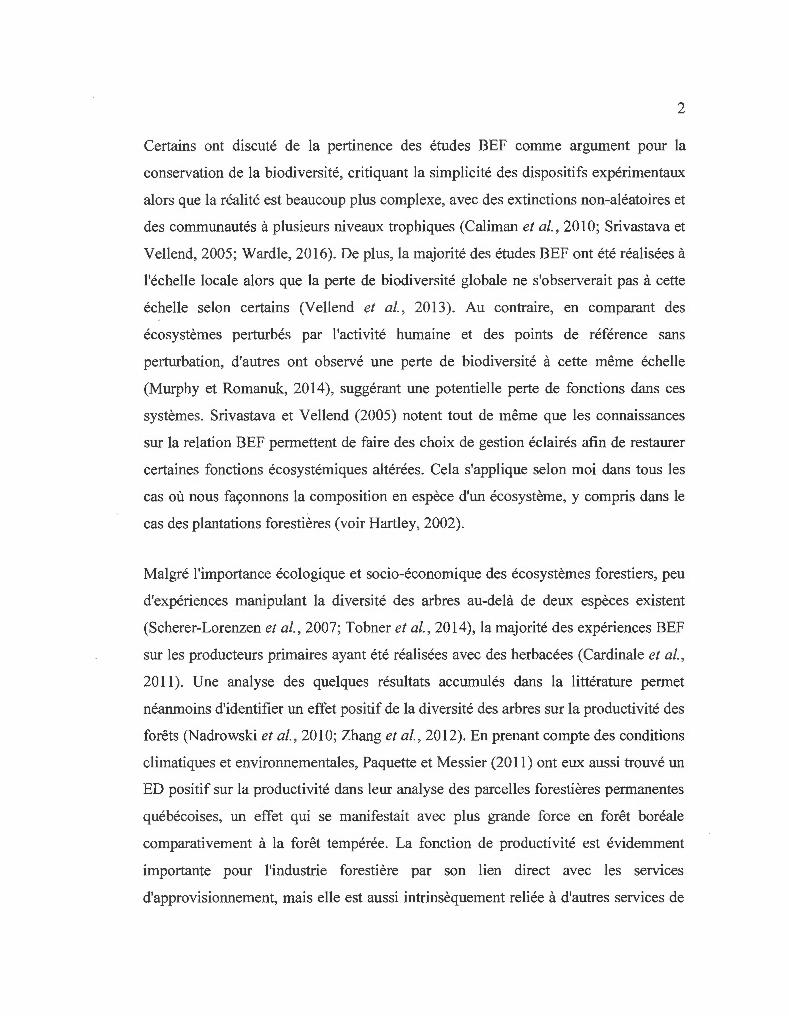
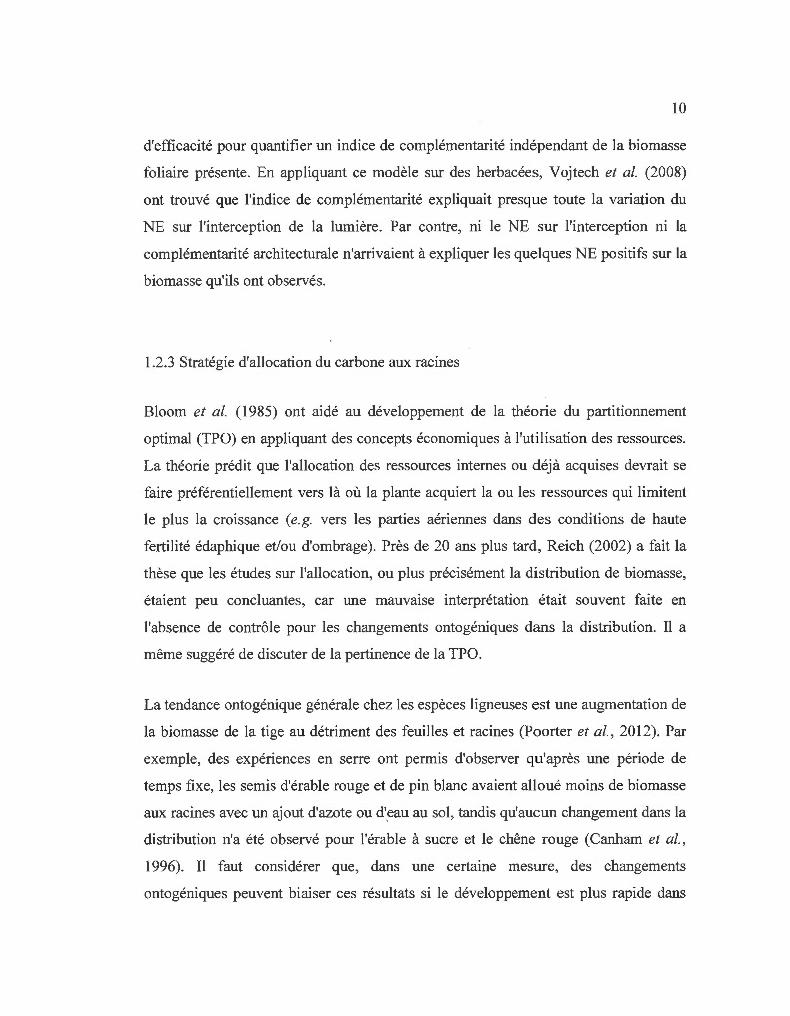
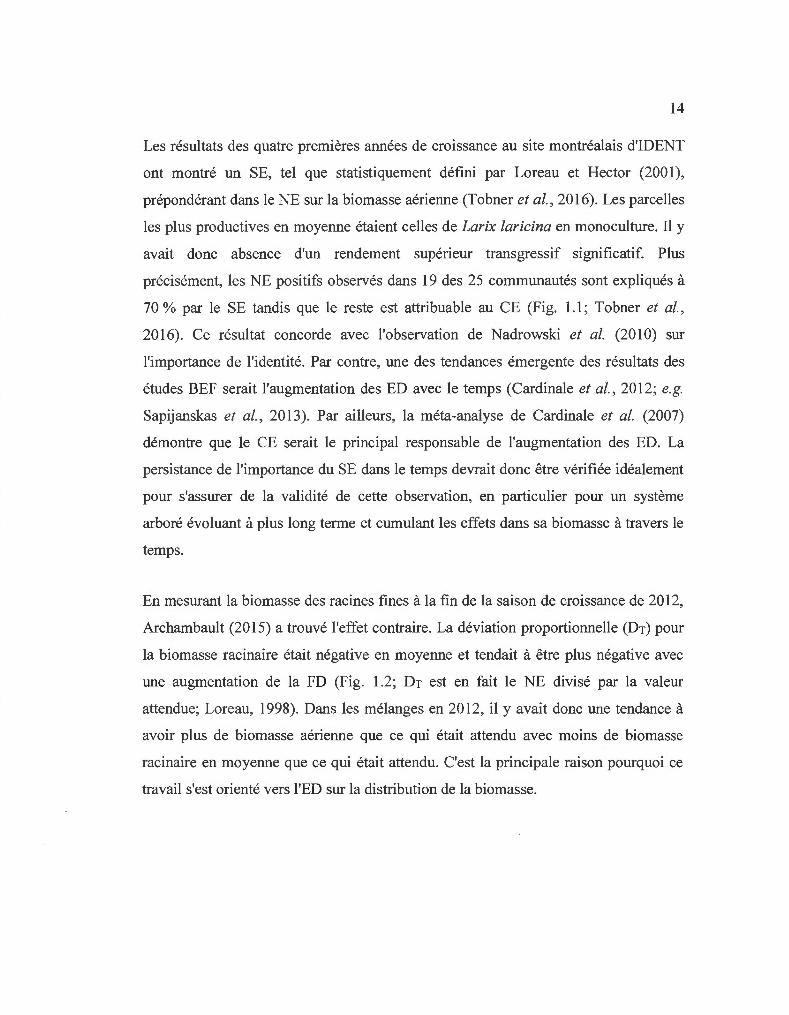
En mesurant la biomasse des racines fines à la fin de la saison de croissance de 2012,
Archambault (20 15) a trouvé l'effet contraire. La déviation proportionnelle (Dr) pour
la biomasse racinaire était négative en moyenne et tendait à être plus négative avec
une augmentation de la FD (Fig. 1.2; Dr est en fait le NE divisé par la valeur
attendue; Loreau, 1998). Dans les mélanges en 2012, il y avait donc une tendance à
avoir plus de biomasse aérienne que ce qui était attendu avec moins de biomasse
racinaire en moyenne que ce qui était attendu. C'est la principale raison pourquoi ce
travail s'est orienté vers l'ED sur la distribution de la biomasse.
1-0
01 4
o .~
0,2
O, J
·0,1
0,2.
·0,3
Figure 1.2
15
0
0
Déviation proportionnelle (Dr. ± écart-type) de la biomasse en racines.
fines (0 - 40 cm pour toutes les communautés de deux et quatre espèces. ordonnées
de gauche à droite par indice de FD (index 1-8 au site montréalais d'IDEN T en 2012.
Seuils-de signification pour le te-;t de:: Studenr : ** p < 0.01 : * p < 0.05 : ., p < 0.1 .
ABBA - Abies balsamea . . LALA - Lanx lmicina. PIGL - P icea glauca. PIRE -
Pinus resinosa. PIRU - Picea mbens. PIST - Pinus sn·obus. THOC - Tlwja
occidentahs. ACRU - Acer mbrum. ACSA - Acer saccharum. BEAL - Betula
alleghaniensis . BEPA - Betula papyrifera et QT.JRU - QuerctJs rubra . Figure 1. 7
dan-, .-'\ rchambault (20 15: reproduit a\·ec pemùs-,ion).
En analysant la performance de chaque espèce individuellement, Tobner et al. (2016)
font remarquer que les quatre conifères sempervirents ayant des rendements relatifs
(RY pour « relative yield ») significativement inférieurs à 1 pour la biomasse en tige
dans les mélanges (Abies balsamea, Picea glauca, Pinus strobus et Thuja
occidentalis; Fig. 6 dans Tobner et al., 2016), sont parmi les espèces qui ont produit
le plus de biomasse racinaire en monoculture (Fig. 1.6 dans Archambault, 20 15).
16
L'inverse est aussi vrai, les espèces ayant des R Y significativement supérieur à 1
(Betula alleghaniensis, Betula papyrifera, Larix laricina et Quercus rubra) sont de
celles ayant produit très peu de biomasse racinaire en monoculture. Si en se basant
sur la biomasse aérienne, la biomasse des espèce dominante a été surestimée, et
inversement pour les espèces dominées, le SE calculé sur la biomasse totale pourrait
donc être moins nuancé que celui obtenu avec la biomasse aérienne seule.
1.3 Objectifs et hypothèses de travail
L'objectif principal de ce travail était de comprendre les processus menant à des ED
sur la biomasse dans les écosystèmes forestiers avec comme système d'étude, une
expérience de biodiversité comprenant de jeunes arbres d'espèces de la forêt
tempérée. (a) En premier lieu, les ED sur l'interception de la lumière ont été
quantifiés afin de mettre à jour le rôle de la lumière dans les ED positif sur la
biomasse, la compétition pour la lumière étant reconnue comme un déterminant
majeur de la dynamique forestière. (b) En second lieu, l'ED sur la distribution de la
biomasse entre ses parties aérienne et souterraine a été établi pour 2012.
(c) Finalement, une biomasse totale sera estimée pour la même année, ce qui
permettra d'évaluer si les stratégies différentes de distribution de la biomasse
engendrent des erreurs dans l'interprétation des ED sur la croissance basés
uniquement sur la biomasse aérienne.
Les hypothèses spécifiques qu'il a fallu tester afin de répondre à ces objectifs
sont les suivantes :
(al) Il y a un ED positif sur l'interception de la lumière indépendant de la biomasse
aérienne déjà présente.
17
(a2) Ces ED sur l'interception de la lumière expliquent en partie les ED
subséquents observés pour la biomasse aérienne.
(b 1) Il y a un ED négatif sur le ratio biomasse souterraine : biomasse aérienne.
(b2) Les mélanges qui ont cet ED en (b 1) le plus prononcé, ce qui représente
potentiellement une forte complémentarité souterraine, ont aussi des ED très élevés
sur la biomasse totale.
( c 1) Les ED sur la biomasse totale sont plus bas que ceux obtenus à partir de la
biomasse aérienne seule, concordant avec l'hypothèse (b 1 ).
( c2) La contribution relative dù SE dans le NE est moindre lorsque ces deux effets
sont calculés avec la biomasse totale plutôt qu'avec la biomasse aérienne, indiquant
par le fait même, une plus grande importance du CE.
Si certains voient une contradiction entre l'hypothèse (al) et (b 1 ), il faut expliquer
pourquoi il en est ainsi. Effectivement, une augmentation de l'interception de la
lumière par complémentarité signifie théoriquement plus de biomasse souterraine afin
de permettre une acquisition des ressources du sol en équilibre avec l'augmentation en
carbone fixé. Cependant, si ces deux hypothèses étaient robustes aux tests
statistiques, une interprétation très intéressante pourrait être faite. Cela signifierait
que la complémentarité dans l'acquisition des ressources du sol, qui ne sera pas
étudiée ici, jouerait un rôle assez important pour que la lumière devienne la ressource
qui limite le plus la croissance, et ce, malgré la présence d'un partitionnement des
niches aériennes augmentant l'efficacité d'absorption de la lumière.
CHAPITRE II
DIVERSE COMMUNITIES OF YOUNG TREES CAPTURE MORE LIGHT BUT THIS DOES NOT REFLECT ON THEIR BIOMASS
Authors
Marc-Olivier Martin-Guay* 1, Alain Paquette2 and Christian Messier1' 2
1 Institut des sciences de la forêt tempérée (ISFORT), Université du Québec en
Outaouais (UQO), 58 rue Principale, Ripon, QC, Canada, JOV 1 VO
2 Center for Forest Research, Université du Québec à Montréal, PO Box 8888,
Centre-Ville Station, Montréal, QC H3C 3P8, Canada
* Corresponding author: [email protected]
Other emails (in order of appearance ):
messier .christian@uqam. ca
19
Abstract
Although the body of evidence about a positive effect of biodiversity in forests is growing, studies directly tackling the mechanism behind these effects remain scarce. A long-standing hypothesis is that mixed stands would benefit from increased light capture through complementarity between, for example, shade tolerant and intolerant species. Its theoretical foundations have been already proven sound, but it has rarely been demonstrated empirically. Here we use five years of light capture and biomass data at the Montreal site of the International Diversity Experiments Network with Trees (!DENT) to make that demonstration. The temporal nature of the data permitted us to control for previous diversity effects on biomass which can be confounding with respect to the origin of diversity-enhanced light capture.
There was no effect of species richness on light capture, but great variability originated from differences in composition. When light capture in mixtures was compared to expected values from the corresponding monocultures, positive diversity effects on light capture were found, which increased with time. Functional diversity played a small but positive role that increased in importance through time, while functional identity was the least relevant variable. However, these light capture responses to diversity were not correlated to the annual responses in biomass. This result challenges the meaning of the observed diversity effects on light capture.
KEYWORDS: biodiversity and ecosystem functioning; light partitioning; tree diversity experiment; functional diversity; IDENT
20
Résumé
Bien que les évidences s'accumulent en ce qui a trait à l'influence positive de la biodiversité en forêt, les études qui examinent les mécanismes sous-jacents à ces effets restent peu nombreuses. Depuis longtemps, il est soutenu que les peuplements mixtes bénéficieraient d'une capture de la lumière améliorée à travers une complémentarité entre, par exemple, des espèces tolérantes et intolérantes à l'ombre. Les études théoriques ont confirmé le bien-fondé de cette hypothèse, mais rare ont été les tentatives de le faire empiriquement. Les données de capture de lumière et de biomasse du site montréalais du « International Diversity Experiments Network with Trees » (IDENT) seront utilisé à cette fin. La qualité temporelle des données nous a permis de contrôler pour les effets antérieurs sur la biomasse qui peuvent être confondant lorsqu'il s'agit de l'origine des effets de la diversité sur la capture de la lumière.
Aucun effet de la richesse spécifique sur la capture n'a été détecté, mais une grande variabilité était associée aux différentes compositions. Quand les captures de la lumière en mélange étaient comparées aux valeurs attendues selon leurs monocultures correspondantes, des effets positifs de la diversité ont été observés, ces derniers augmentant dans le temps. La diversité fonctionnelle jouait un petit rôle positif qui semblait aussi grandir en importance dans le temps, tandis que l'identité fonctionnelle était la variable avec le plus faible pouvoir prédictif. Cependant, cette réponse positive de la capture à la diversité n'était pas corrélée à l'accroissement annuel dans la réponse de la biomasse. Ce dernier résultat réduisait la portée de tous ceux obtenus précédemment.
MOTS-CLÉS : biodiversité et fonctionnement de l'écosystème; partitionnement des niches aérienne; expérience de diversité avec des arbres; diversité fonctionnelle; IDENT
21
2.1 Introduction
In a world where timber demand is more and more met through forest plantations,
most! y monocultures, a more profound knowledge of the role of biodiversity in these
large-scale novel ecosystems is needed (Verheyen et al. , 20 16). lt has already been
shown that tree species diversity was more than a mere result of environmental filters
in natural forests, influencing positive! y productivity (Liang et al. , 20 16; Paquette &
Messier, 2011; Vilà et al. , 2013; Zhang et al. , 2012), but the mechanisms responsible
for these effects are still scarcely studied (Sapijanskas et al. , 2014). Zhang et al.
(2012) found an interesting avenue in their global meta-analysis, where heterogeneity
in shade tolerance explained more of these positive effects than species richness (SR).
This sustains an old and widespread hypothesis, that mixed stands would benefit from
a complementarity between canopy shade-intolerant and understory shade-tolerant
tree species (Pretzsch, 2005).
The asymmetric competition for light is considered one of the most influencing force
driving forest dynamics, and its interaction with biodiversity could be highly relevant
in predictive models at the global scale (Purves & Pacala, 2008). A forest succession
mode! has shown that SR could enhance productivity through variability in shade
tolerance and growth capacity (Morin et al. , 2011). More directly, biodiversity
ecosystem functioning (BEF) experiments with grasslands systems have shown that
light capture can be enhanced with SR (Spehn et al. , 2005; Vojtech et al. , 2008). This
effect has been found in forests as weil, through light capture (DeClerck et al., 2005;
Unger et al. , 2013), but also in the use of spatial (Seide! et al. , 2013) and temporal
niches (Sapijanskas et al., 2014).
While light transmittance and its response to diversity can be of interest by
themselves, they fall short to investigate the mechanisms behind biodiversity effects
on biomass. This is because enhanced light capture can also be an effect of enhanced
22
biomass with diversity, and not its cause (Sapijanskas et al. , 2014 ). A net effect on
light capture efficiency was proposed to answer this issue for herbaceous
communities (Yachi & Loreau, 2007). Even though it was possible to link this new
metric to energy absorption, no relationship with biomass overyielding was found
(Vojtech et al., 2008). Sapijanskas et al. (2014) were weil aware of this issue in the
Sardinilla experiment. They used simulations of a calibrated mode! as a workaround,
and found that temporal niche complementarity was probably the strongest
mechanism explaining light partitioning in their tropical dry forest system.
Using only data from the seven years old Montreal experiment part of the
International Diversity Ëxperiments Network with Trees (IDENT; Tobner et al.
2014 ), we have undertaken to validate the implication of light partitioning in the
positive effects on biomass observed in the experiment's mixtures (Tobner et al.,
20 16). Although, SR had no effect on biomass after the fourth year of growth in this
experiment, 19 out of the 25 mixtures presented overyielding (Tobner et al. , 2016).
At each step, potentially confounding biodiversity effects on above-ground biomass
originating from other mechanisms, e.g. below-ground niche complementarity, had to
be taken into account. Basal area ( G) was used as a pro x y for above-ground biomass
and as a way to control for other biomass-enhancing mechanisms. Light capture and
stem dimension measurements over five consecutive years offered a unique
opportunity to control for anterior diversity effects on biomass and their legacy
effects on light capture. Four distinct hypotheses were tested:
i) Species richness (SR) will not increase light capture when comparing plots
with similar G.
ii) Light capture in mixtures will be larger than expected from monocultures,
independently or not from previous biodiversity effect on G.
23
iii) Functional diversity will increase differences between light captures in
mixtures and their expected values from monocultures, and this effect will increase
through time.
iv) Biodiversity effects will increase annually according with observed NE on
light capture in the same year.
2.2 Methods
2.2.1 Experimental design and location
The experimental site 1s located on the Macdonald Research Farm at McGill
University (Sainte-Anne-de-Bellevue, Quebec, Canada, 45°28' N, 73°45' W,
36 rn a.s.l.). The soil is a Typic Endoaquent (Humic Gleysol) with a pHwater of 6.3 in
the 0- to 20- cm sandy loam layer (containing, on average, 78 % sand, 6% silt, 16%
clay; Rivest et al. , 2015). The experiment, part of IDENT (see
www.treedivnet.ugent.be/ExpiDENT.html) was established in the spring of 2009
when nearly 14 000 trees were planted on less than 1 ha formerly used for agriculture.
They were distributed in Cartesian grid plots containing 64 individuals (8 x 8 rows;
50-cm spacing) and separated from each other by ~ 1.25 rn corridors to reduce
interactions between tree plots and allow movement of personnel and equipment
without disturbing the plots. These corridors were trenched with a 30 cm incision
during the summer in 2011 and 20 12 to prevent roots from neighbouring tree
communities from interacting.
The treatments investigated here are twelve monocultures, fourteen two-species, ten
four-species and one twelve-species mixtures of randomly distributed species (with
restrictions to prevent dumping) from North American temperate forests , i.e. 5
24
broadleaf species: Acer rubrum L., Acer saccharum Marsh. , Betula alleghaniensis
Britten, Betula papyrifera Marsh. and Quercus rubra L.; and 7 coniferous species:
Abies balsamea (L.) Mill., Larix laricina (DuRoi) K. Koch, Picea glauca (Moench)
Voss, Picea rubens Sarg., Pinus resinosa Aiton., Pinus strobus L. and Thuja
occidentalis L. . Each treatment was replicated in four randomized blocks. For each
species richness (SR) level, mixtures compositions were randomly selected from all
possible combinations of those species and placed along a functional diversity (FD)
gradient. This gradient was based on twelve functional traits and a multidimensional
functional dispersion index (Laliberté & Legendre, 201 0) with which it was possible
to form the eight FD classes used to draw mixtures (for more detailed information on
the design, see Tobner et al. 2014).
2.2.2 Light capture and biomass surveys
Understory light availability surveys took place during five summers when trees were
fully foliated (July and August of2011; July 21th to August_17th in 2012; July 9th to
25th in 2013; August 19th to 25th in 2014; July 28th to August 7th in 2015). The first
two surveys were performed with LI -191 line quantum sensors (LI -COR), and LI -190
quantum sensors (LI-COR) as above-canopy references. To correct for discrepancies
between LI -190 and LI -191 , corrections were applied using regressions of
measurements by both sensor types under identical light conditions. For both under
and above canopy measurements, all subsequent surveys were carried out using BF
Sunshine sensors (Delta-T Deviees; models 2, 3 and 5; Paquette, Bouchard &
Cogliastro 2007). All three types of sensors evaluate the amount of photosynthetically
active radiation (PAR; ).!mol s-1 m-2). The BF Sunshine sensors output global and
diffuse PAR, the latter being obtained by an internai shading system permitting to
annul the effect of direct radiation on the deviee. The LI -19011 do es not discriminate
between both types of radiation, but was used under uniformly cloudy conditions
25
when alllight is diffuse. For sake of simplicity, PAR will always mean diffuse PAR
from this point forward.
In each plot, PAR was measured at ground level at five different locations (Supp. Fig.
2.4). At the same time, above-canopy PAR was measured with tripods on the study
site until impossible because of canopy height, then reference points were placed in
an open field adjacent to the study site (Paquette, Bouchard & Cogliastro, 2007).
With these two sets of data, fractions of absorbed PAR (fAPAR) were calculated
following this equation:
f AP AR = 1 - (in situ PAR/ ab ove canopy PAR at the sa me ti me) [Eq. 2.1]
Growth surveys took place during every fall from 2010 to 2015. Every tree in the
plots had their diameter measured at 5 cm from the ground. Total basal area in a plot
(G; cm2) was obtained by summing all the individual basal areas from living trees
inside it (:L[Diameter /\ 2 * O. 7854 ]).
2.2.3 Statistical analyses
To test for the effect of SR in light capture, fAPAR was used as response variable.
The proxy for above-ground biomass was G. Previous examination of the relations
between fAP AR and G for each monoculture and mixture separately (Supp. Fig. 2.5)
made it obvious that composition was an influential factor of this relation. Therefore,
functional identity was used as a confounding variable in the hope it would allow
greater statistical power for disceming the effect of SR. Functional identity was
assessed using eight above-ground traits, i.e. leaf N concentration, leaf longevity,
specifie lead area (SLA), leaf dry matter content (LDMC), wood density, shade
tolerance, drought toferance and relative growth rate (RGR), from which only SLA,
26
LDMC and RGR were obtained in situ while al! the others were obtained from the
literature (see Supp. Table 2.2 for details).
To avoid testing for the influence of al! individual traits separately, and potential
problems of multicolinearity, a principal component analysis (PCA) was performed
to reduce these eight traits to two principal components (PC 1 and PC2) explaining
together 78 % ( 49 and 29 % respective! y) of the variability in these traits (Supp. Fig.
2.6) . The scores of our 12 tree species on PC1 and PC2, were used to compute two
different community weighted means (CWM1 and CWM2), which were weighted by
relative abundances in terms of G at the end of the previous year. PC1 was largely
mediated by differences between deciduous and evergreen trees in leaf economie
traits but also wood density; while PC2 was representative of differences between
slow- and fast-growing trees . Larger values of CWM1 and CWM2 represented
respectively, larger abundance of deciduous trees and larger abundance of fast
growing/shade-intolerant trees (Supp. Fig. 2.6).
For modelling fAPAR, a special distribution was needed. Indeed, this continuous
variable is bounded between zero and one, and includes values of one. Such values
were possible because of plots with canopies so dense that sensors resolutions did not
permit to detect any PAR at ground leve!. A one-inflated beta distribution is adapted
for this purpose (Ospina & Ferrari, 2009). So using al! available data (N= 3670; each
point representing a single measurement at a specifie location in a plot and during a
specifie survey) we tested the following mode!:
fAPAR ~ random(Block) + (SR + CWMl + CWM2) x G + G + E [Eq. 2.2]
where al! terms in parentheses were tested alone and in interaction with G, and ~.> is an
error term following a one-inflated beta distribution.
27
To evaluate if mixtures captured more light than expected from monocultures each
year, the first step was to obtain a plausible expected value. Since G seemed to be an
important driver of the fAP AR (Fig. 2.1 ), species proportions of G in the mixtures in
the previous year were used to weight the expected values. The fAP AR having a
distribution skewed to the left, the use of an arithmetic weighted mean directly would
have been inappropriate. Indeed, it would have underestimated the expected values in
fAP AR by giving more importance to the smallest values located in the stretched tail
of the distribution. Instead, we first transformed all the fAP AR so that values of one
would be reduced, using the transformation fAPAR'= (fAPAR (N - 1) + 0.5) 1 N
where N is the sample size (Smithson & Verkuilen, 2006); and secondly, we
normalized the distribution using a logit transformation, i.e. log( x 1 (1 - x)). These
logit-transformed values were then used to compute expected values for each yearj:
Expected1 = l:(logit(fAPAR')i x Gi;j-1
) 20 X Gj-1
[Eq. 2.3]
where every species i measurements in logit-transformed fAP AR in monoculture are
weighted by their relative abundance in G in the mixture in the previous year
( Gi;j-1
) . Monocultures from all the blocks were used since the blocks were not 20XGj_1
informative in terms of fAP AR (Table 2.1 a), which ex plains wh y the weight had to
be divided by 20 (5 measurements x 4 replicates). Net effects (NE; observed -
expected) were obtained for each mixture measurement in light capture by subtracting
the logit-transformed fAPAR with its expected value (N~ 492 per annual survey). To
test whether or not light capture was enhanced in mixtures, we assessed whether these
NE on fAP AR were different from zero using a non-parametric Wilcoxon signed
rank test.
28
When one compares observed and expected fAPAR, the possibility of already
existing biodiversity effects is problematic because they could have created
differences in G between the mixtures and their corresponding monocultures. To
address this problem, biodiversity effects on G at the end of the previous year were
used as a confounding variable, in the form of proportional deviation (Dr; Loreau
1998), which can be obtained with:
[Eq. 2.4]
where Oris the observed Gin a mixture and Er is its expected value, i.e. the average
G of the component species in monocultures weighted by their initial relative
abundances in number ofindividuals in 2009. To match NE on fAPAR calculations,
monocultures across all blocks were used in Dr calculations. To attain normality, Dr
values were log-transformed, or more precisely, the transformation was applied to a
metric with the same properties as Dr named relative land output (Dr+ 1 = Or 1 Er;
Jolliffe 1997; Loreau 1998). This last metric has a null hypothesis, meaning no
biodiversity effect, centered on one. Because it is strictly positive, it permits the log
transformation, which results in the more intuitive centered on zero null hypothesis
familiar to NE and Dr. Since the spatial structure assumptions presented by Joliffe
(1997) were not respected, from here on, we will refer to log-transformed Dr instead
of log-transformed relative land output.
The NE on fAP AR was then explained through a linear mixed model following :
NEfAPAR- random(MixturefPlot) + (FDis + Dprev.) x Year + Year +
CWMl + CWM2 + E [Eq. 2.5]
where the random effect for intra-plot correlation (five measurements per survey) was
nested in the mixture (four replicates) random effect; both terms in parentheses were
29
tested alone and for an interaction with Year; FDis is the functional dispersion in
above-ground traits using our twelve species scores on both PCA axes together
weighted by the axes importance in explaining traits variability (Supp. Fig. 2.6); Dprev
is log-transformed DT on G at the end of the previous year; and e is an error term
following a normal distribution. Ali variables in this mode!, except for Dprev. were
scaled and centered before fitting. This permitted to have an intercept corresponding
to the average functional identity (both CWMs) and FDis, but most importantly, to an
absence of previous effects on biomass, because as mentioned above, Dprev. is
centered on zero. With the variables present in the selected mode! (selection method
further down), five different models, each one centered on a different annual survey,
were fitted. We then used differences in Akaike information criterion (L\AIC)
between the selected models with and without intercept to assess if these different
intercepts were informative. In the eventuality that an intercept was positive and
informative at the same time for a specifie survey, NE on light capture were
considered positive, and this, independently of previous effects on biomass.
To validate the implication of NE on light capture for biodiversity effects on G, the
following linear mixed mode! was used (N::::: 98 plots per survey):
lncrease in DT on G- random(MixturefPlot) + (NEfAPAR + FDis + CWMl +
CWM2) x Year + Year + E [Eq. 2.6]
where the dependent variable is annual increase in DT on G; random effects
correspond to those in Eq. 2.5; aU terms in parentheses were tested alone and for an
interaction with Year; NE on fAPAR is the mean of the logit-transformed observed
values in a mixture minus the expected values following Eq. 2.3; and e is an error
term following a normal distribution.
30
Backward stepwise selections were used to eliminate variables in all models (Eq. 2.2,
2.5 and 2.6). When differences in Akaike information criterion (AIC; generalized
AIC for the model with a one-inflated beta distribution) between a reduced model and
the initial model were larger than two, the contribution of the removed variable or
interaction was considered significant. All analyses were do ne using R version 3 .1.3
(R Core Team 2015) with packages vegan (Oksanen et al., 2015) for the PCA, FD
(Laliberté & Legendre 201 0) for the FDis and CWMs calculations, gamlss (Rigby,
Stasinopoulos & Lane, 2005) for the beta-distributed model, and lme4 (Bates,
Maechler, Bolker & Walker, 2014) for the linear mixed models.
2.3 Results
The selected model explaining light capture was significantly more informative than (
the null model (Table 2.1a; pseudo R2= 0.46). All the variables presented in Eq. 2.2
were kept in the selected model although not all contained the same amount of
information. Using a model with all variables, but no interaction, it is possible to see
in Table 2.1 the effect of removing a variable or adding an interaction on generalized
Akaike information criterion (GAIC). Two terms seemed to be substantially more
important with regards to GAIC, i.e. effect of total basal area (G) on the fraction of
absorbed PAR (fAPAR), and its interaction with the CWM obtained from the first
principal component ofthe above-ground traits PCA (Table 2.la).
The only reason why SR was kept as an explanatory variable in the selected mode! is
because four tree species mixtures closed their canopy slightly more slowly compared
to monocultures, which can be seen through a steeper slope (p< 0.001) with a lower
intercept (p< 0.001) in the relation between fAPAR and G (Fig. 2.1). This effect has
little importance compared to the extent with which fAP AR is affected by CWM 1,
31
and relates more to the effect of CWM2 in terms of information (Fig. 2.2; Table
2.1 a). Indeed, we see that plots containing larger abundance of deciduous trees (larger
values of CWMl ; Supp. Fig. 2.6) closed their canopies faster than those with larger
abundance of evergreen trees, but from 400 cm2 and above in G per plot (25 m2/ha),
captured less PAR (Fig. 2.2).
Net effects (NE) on light capture were significantly superior to zero, meaning more
light was being captured in mixtures than expected from monocultures (Wilcoxon
signed-rank test: V= 2.0 E06, p< 0.001). The selected model explaining NE on light
capture was significantly more informative than the null model (Table 2.1 b; pseudo
R2= 0.25). Ali the variables presented in Eq. 2.5 were kept in the selected model,
except for CWM2. As in the model explaining light capture, Table 2.1 shows that not
ali variables are equivalent in terms of information. Previous biodiversity effects
(Dprev; log-transformed proportional deviation on G at the end of the previous year)
and the interaction of this variable with time were the most informative variables
(Table 2.1 b ). The relation of Dprev with NE on light capture was positive but
decreased with time (Fig. 2.3). Time was most important through its interaction with
the other variables but also had a positive effect on light capture NE (Table 2.1 b ).
FDis had a positive effect on light capture, which was not apparent in the first survey,
but grew in importance over the years (Fig. 2.3). Even though it was the least
informative factor, functional identity was represented in the model by a positive
relation between CWMl , i. e. deciduous trees abundance, and NE on light capture.
Using the selected model variables in five different quasi identical models with the
time variable centered on different surveys (meaning for example that a model
centered for the 2012 survey will have the Y ear set to zero for ali 2012 data, other
surveys data being adjusted in consequence); it was found that ali surveys, except the
first one, had a positive and informative intercept (L1AIC being -0.2, 5.3 , 12.3, 18.9
32
and 24.3 for 2011 to 2015 surveys respectively). This indicates positive NE on light
capture for these four surveys independent of previous effects of diversity on G.
The selected mode! for annual increase in biodiversity effect on G explained about
15 % of its variability. Only the interaction of CWM1 with time was significantly
informative (Table 2.1c), meaning that this variable did not have a consistent impact
across the years on annual increase in biodiversity effects (Table 2.1 c ).
2.4 Discussion
A potential for increased light capture in mixed forests with species of varying life
history strategies is a long-standing idea (Pretzsch, 2005). Using light-competition
based models, theoretical studies have shown that forest (Morin et al. , 2011;
Sapijanskas et al. , 2014) and herbaceous communities (Yachi & Loreau, 2007) can
benefit from functional diversity in above-ground traits, creating temporal and spatial
complementarity between species. But light competition is asymmetric, and there is
always a possibility for competitive exclusion through imbalance in the competitive
ability of species which can ultimately be detrimental to productivity in a community
(Yachi & Loreau, 2007).
A recurnng problem we face when trying to validate the hypothesized light
partitioning mechanism in BEF experiments, IS the confounding effect of other
mechanisms enhancing leaf area with biodiversity, hence light capture (Sapijanskas et
al., 2014 ). So, although light capture was enhanced with species richness (SR) in
BIODEPTH grasslands (Spehn et al. , 2005), and in sorne forest BEF studies
(DeClerck et al. , 2005 ; Unger et al., 2013), these studies could not conclude on the
nature of this effect, specifically whether it was a cause or an effect of growth
33
positive response to diversity. Our temporal data set permitted to control for prior
biodiversity effects on growth before each of the five surveys on light capture.
As expected from the absence of a species richness effect on biomass (Tobner et al.,
20 16), there was no important change in light capture depending on SR levels (Fig.
2.1 ), which confirmed our first hypothesis. The four-species mixtures captured
slightly less light when plots with low basal area (G) were compared, but the
relevance of this effect was negligible compared to those of the abundance in
deciduous trees (CWM1), Gand their interaction (Table 2.1a). When plots with low
G were compared, plots with deciduous trees captured more light than plots
containing mainly evergreen species, but from 400 cm2 in G and above, plots with
larger abundances of evergreen species captured more light on average than where
deciduous trees dominated the plots (Fig. 2.2). Keeping G constant, plots dominated
by fast-growing strategists (large CWM2) captured less light (Fig. 2.2). This
importance of functional identity put the emphasis on the need to control for
composition in our evaluation of biodiversity effects on light capture.
As stated in our second hypothesis, the observed proportions of light captured in
mixtures were generally larger than expected from their monocultures (p< 0.001 ).
However, this observation is not independent of other potential growth-enhancing
mechanisms like below-ground complementarity. Using the selected model
explaining net effects (NE; observed - expected) on light capture, it was shown that
NE on light capture were positive for ali surveys except the first one, and this, while
controlling for previous diversity effects on G. This graphically means that the model
predictions for the intercept, i.e. with previous diversity effect on G set at zero, was
considered significantly different from zero for surveys from 2012 to 2015 (Fig. 2.3;
left column).
34
Functional diversity was the most important variable explaining NE on light capture
after previous year diversity effect and time (Table 2.1 b ). NE on light capture
increased from survey to survey, with functional dispersion in traits (FDis) having a
positive effect growing slowly in importance through time (Fig. 2.3, right colurnn) as
predicted by our third hypothesis. Assuming the observed effects of FDis and time
concur with increased diversity effects on biomass, it would be supportive of the
emerging trend in BEF affirming that biodiversity effects increase with time through
complementarity (Cardinale et al. , 2007, 2012; Reich et al. , 2012). This increase with
time could follow the slow build-up of a stratified canopy between fast- and slow
growing tree species (Williams et al., in review). An important caveat to keep in mind
is that the fAP AR values were transformed prior to NE calculations. This
transformation could potentially make obtaining higher NE on logit-transformed
values easier when the fAPAR get closer to one, or more precisely, when there is a
large amount of values of one because of the sensors resolution (see Supp. Fig. 2.7).
This reduces the previous confidence gained in support of our third hypothesis.
Inversely, differences in G between the mixtures and their corresponding
monocultures at the beginning of a year were less and less important for explaining
NE on light capture. This may be because once the canopy is closed in all the plots,
these differences in G become less important for light capture, as it can be seen from
the saturating curved lines of Fig. 2.1.
In the final analysis, we attempted to link these NE on light capture with the annual
increases in biodiversity effects on G. NE on light capture was removed in the model
selection process, indicating a poor relationship or no relationship at all between G
and light responses to diversity, infirming our fourth hypothesis . This selected model
was the !east informative of all three (Table 2.1; pseudo R2= 0.15), with the only
variable conserved being the abundance of deciduous trees (CWM1), which had an
inconsistent effect through time.
35
The fact that the data supported our first three hypotheses can seem irrelevant without
being able to link these effects with future growth response to diversity. Although
statistical power could certainly not be blamed, with approximately 98 mixtures and
five replicates over the years, it is possible that the annual increases in biodiversity
effects were too subtle to be correctly assessed with our basal diameters surveys. This
means that the metric obtained from these year to year comparisons could have been
influenced by methodological errors noise (probably similar in size to diameter
increments of slow-growing trees). A solution would be to assess these biodiversity
effects over longer period of time, but this would only bring back the problem about
the nature of light capture response to diversity, i.e. whether it is a cause or an effect
of the biomass response to diversity.
As Vojtech et al. (2008) with their herbaceous communities, we were able to show a
positive effect of diversity on light capture which is independent from basal area, but•
unable to establish a link between these effects and growth response to diversity.
Species richness did not influence light capture in a consistent manner, but functional
diversity had a positive effect which grew in importance over the years. This
interaction with time was coupled with increasing NE on light capture through time,
and could potentially be linked to shifts in dynamic important in maintaining
biodiversity effects through time.
Acknowledgement
We would like to thank everybody who participated in growth and light capture
surveys.
36
References
Bates, D. , Maechler, M., Bolker, B. & Walker, S. (2014) . Fitting linear mixed-effects models using lme4. Journal of Statistical Software, arXiv, 1406.5823. doi: 1 0.18637/jss.v067.i01
Cardinale, B. J. , Wright, J. P., Cadotte, M. W., Carroll, I. T., Hector, A., Srivastava, D. S., . .. Weis, J. J. (2007). Impacts of plant diversity on biomass production increase through time because of species complementarity. Proceedings of the National Academy of Sciences of the United States of America, 1 04( 46), 18123-18128. doi: 10.1 073/pnas.07090691 04
Cardinale, B. J. , Duffy, J. E. , Gonzalez, A., Hooper, D. U., Perrings, C., Venail, P., . .. Naeem, S. (2012). Biodiversity loss and its impact on humanity. Nature, 489, 326-326. doi:10.1038/nature11373
DeClerck, F. A. J. , Barbour, M. G. & Sawyer, J. O. (2005). Resource use efficiency as a function of species richness and stand composition in upper montane conifer forests of the Sierra Nevada. Journal of Vegetation Science, 16(4), 443-452. doi: 1 0.1111 /j.1654-11 03.2005.tb02384.x
Hartley, M. (2002). Rationale and methods for conservating biodiversity in plantation forests. Forest Ecology and Management, 155, 81-95.
Laliberté, E. & Legendre, P. (201 0). A distance-based framework for measuring functional diversity from multiple traits. Ecology, 91 (1 ), 299-305. doi: 10.1890/08-2244.1
Liang, J. , Crowther, T. W., Picard, N. , Wiser, S., Zhou, M., Alberti, G. , ... Reich, P. B. (20 16). Positive biodiversity-productivity relationship predominant in global forests. Science, 354(6309), aaf8957-aaf8957. doi:10.1126/science.aaf8957
Loreau, M. (20 1 0). Linking biodiversity and ecosystems: towards a unifying ecological theory. Philosophical transactions of the Royal Society of London. Series B, Biological Sciences, 365 , 49-60. doi: 10.1 098/rstb.2009.0 155
Morin, X., Fahse, L. , Scherer-Lorenzen, M. & Bugmann, H. (2011) . Tree species richness promotes productivity m temperate forests through strong complementarity between spec1es. Ecology Letters, 14, 1211-1219.
37
doi:10.1111/j.1461-0248.2011.01691.x
Oksanen, J., Blanchet, F. G. , Kindt, R., Legendre, P. , Minchin, P. R., O' Hara, R. B., Simpson, G. L., Solymos, P., Stevens, M. H. & Wagner, H. (2015). vegan: community ecology package. R package version 2.2-1. http://CRAN.Rproject.org/package=vegan
Ospina, R. & Ferrari, S. L. P. (2009). Inflated beta distributions. Statistical Papers, 51(1), 111-126. doi:10.1007/s00362-008-0125-4
Paquette, A., Bouchard, A. & Cogliastro, A. (2007). A less restrictive technique for the estimation of understory light under variable weather conditions. Forest Ecology and Management, 242(2-3), 800-804. doi : 10.1016/j.foreco.2007.01.067
Paquette, A. & Messier, C. (2011). The effect of biodiversity on tree productivity: from temperate to boreal forests . Global Ecology and Biogeography, 20, 170-180. doi: 1 0.1111/j .1466-8238.201 0.00592.x
Pretzsch, H. (2005). Diversity and productivity in forests : evidence from long-term experimental plots. Forest Diversity and Function: Temperate and Boreal systems, 176, 41-64. doi: 10.1 007/3-540-26599-6_3
Purves, D. & Pacala, S. (2008). Predictive models of forest dynamics. Science, 320(5882), 1452-1453. doi:l0.1126/science.ll55359
R Core Team (2015). R: a language and environment for statistical computing. R Foundation for Statistical Computing, Vienna, Austria. URL:http://www.Rproject.org/.
Reich, P. B. , Tilman, D., Isbell, F. , Mueller, K. , Hobbie, S. E. , Flynn, D. F. B. & Eisenhauer, N. (2012). Impacts of biodiversity loss escalate through time as redundancy fades. Science, 336(6081), 589-592. doi: 1 0.1126/science.1217909
Rigby, R. A., Stasinopoulos, D. M. & Lane, P. W. (2005). Generalized additive models for location, scale and shape. Journal of the Royal Statistical Society. Series C: Applied Statistics, 54(3), 507-554. doi:10.1111/j.l467-9876.2005.0051 O.x
Rivest, D. , Paquette, A. , Shipley, B. , Reich, P. B. & Messier, C. (2015). Tree
38
communities rapidly alter soil microbial resistance and resilience to drought. Functional Ecology, 29(4), 570-578. doi:10.1 111/1365-2435 .12364
Sapijanskas, J. , Paquette, A., Potvin, C. , Kunert, N. & Loreau, M. (2014). Tropical tree diversity enhances light capture through crown plasticity and spatial and temporal niche differences. Ecology, 95(9), 2479-2492. doi:10.1890113-1366.1
Scherer-Lorenzen, M. , Schulze, E. D. , Don, A. , Schumacher, J. & Weller, E. (2007). Exploring the functional significance of forest diversity: a new long-term experiment with temperate tree species (BIOTREE). Perspectives in Plant Ecology, Evolution and Systematics, 9, 53 -70. doi: 10.1 016/j.ppees.2007.08.002
Seidel, D. , Leuschner, C., Scherber, C. , Beyer, F., Wommelsdorf, T. , Cashman, M. J. & Fehrmann, L. (2013). The relationship between tree species richness, canopy space exploration and productivity in a temperate broad-leaf mixed forest. Forest Ecology and Management, 310, 366-374. doi:10.1016/j.foreco.2013 .08 .058
Smithson, M. & Verkuilen, J. (2006). A better lemon squeezer? Maximum-likelihood regression with beta-distributed dependent variables. Psychological methods, 11 (1 ), 54-71. doi: 10.103 711 082-989X.11.1.54
Spehn, A. E. M. , Hector, A. , Joshi, J ., Schmid, B., Beierkuhnlein, C. , Caldeira, M. C., . . . Schul, E. (2005). Ecosystem effects of biodiversity manipulations in european grasslands. Ecological Monographs, 75(1), 37-63.
Srivastava, D. S. & Vellend, M. (2005). Biodiversity-ecosystem function research: is it relevant to conservation? Annual Review of Ecology, Evolution, and Systematics, 36(2005), 267-294. doi: 1 0.1146/annurev.ecolsys.36.1 02003.152636
Tobner, C. M., Paquette, A. , Reich, P. B., Gravel, D. & Messier, C. (2014) . Advancing biodiversity-ecosystem functioning science using high-density treebased experiments over functional diversity gradients. Oecologia, 174, 609-621. doi:l 0.1007 /s00442-0 13-2815-4
Tobner, C. M. , Paquette, A. , Gravel, D., Reich, P. B., Williams, L. J. & Messier, C. (20 16). Functional identity is the main driver of diversity effects in young tree communities. Ecology Letters, 19(6), 638-647. doi: 1 0.1111/ele.12600
Unger, M., Homeier, J. & Leuschner, C. (20 13). Relationships among leaf area index,
39
below-canopy light availability and tree diversity along a transect from tropical lowland to montane forests in NE Ecuador. Tropical Ecology, 54(1), 33 -45 .
Vilà, M. , Carrillo-Gavilan, A. , Vayreda, J. , Bugmann, H. , Fridman, J. , Grodzki, W., ... Trasobares, A. (2013). Disentangling biodiversity and climatic determinants of wood production. PLoS ONE, 8(2). doi:10.1371/joumal.pone.0053530
Vojtech, E., Loreau, M. , Yachi, S. , Spehn, E. M. & Hector, A. (2008). Light partitioning in experimental grass communities. Oikos, 117, 1351 -1361. doi:10.1111 /j .2008.0030-1299. 16700.x
Will iams, L., Paquette, A. , Cavender-Bares, J., Messier, C. & Reich, P.B. (in review) Spatial complementarity in tree crowns drives overyielding in species mixtures.
Yachi, S. & Loreau, M. (2007). Does complementary resource use enhance ecosystem functioning? A model of light competition in plant communities. Ecology Letters, 10, 54-62. doi: 1 0.1111/j.1461 -0248.2006.00994.x
Zhang, Y. , Chen, H. Y. H. & Reich, P. B. (2012) . Forest productivity increases with evenness, species richness and trait variation: a global meta-analysis. Journal of Ecology, 100, 742-749. doi : 1 0.1111 /j .1365-2745.20 11.01944.x
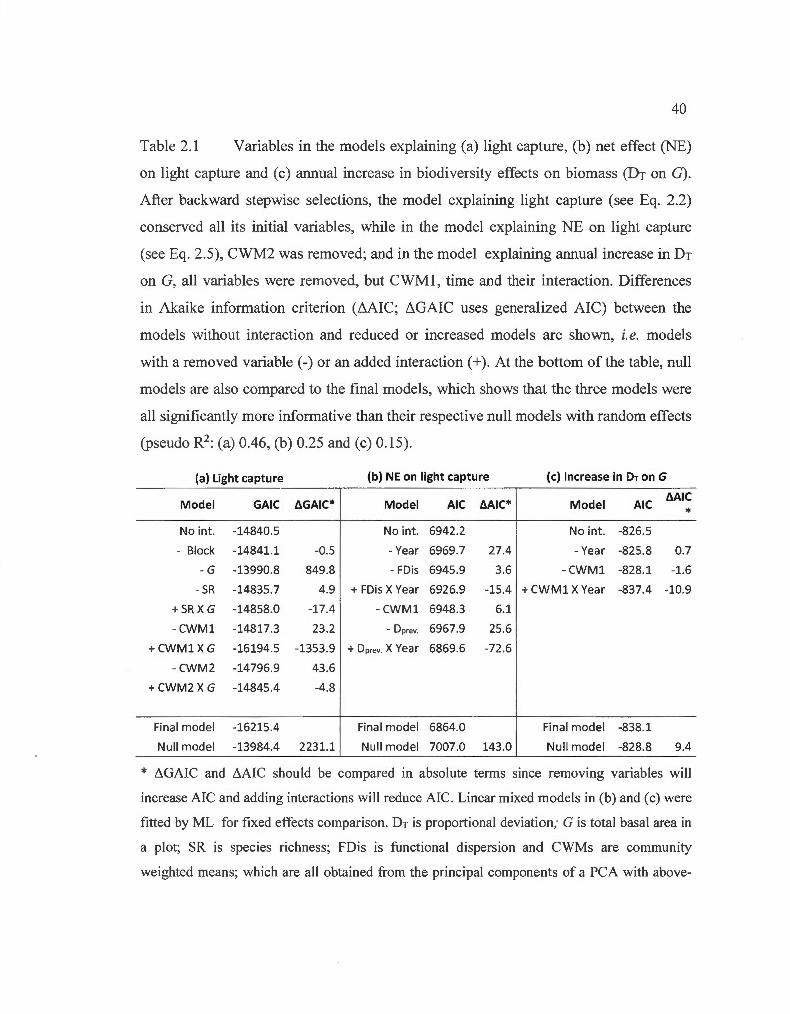
40
Table 2.1 Variables in the models explaining (a) light capture, (b) net effect (NE)
on light capture and ( c) annual increase in biodiversity effects on biomass (Dr on G).
After backward stepwise selections, the model explaining light capture (see Eq. 2.2)
conserved all its initial variables, while in the model explaining NE on light capture
(see Eq. 2.5), CWM2 was removed; and in the model explaining annual increase in Dr
on G, all variables were removed, but CWM1 , time and their interaction. Differences
in Akaike information criterion (6AIC; 6GAIC uses generalized AIC) between the
models without interaction and reduced or increased models are shown, i.e. models
with a removed variable (-) or an added interaction ( + ). At the bottom of the table, null
models are also compared to the final models, which shows that the three models were
all significantly more informative than their respective null models with random effects
(pseudo R2: (a) 0.46, (b) 0.25 and (c) 0.15).
(a) Light captu re (b) NE on light capture (c) lncrease in DT on G
Model GAIC LlGAIC* Model AIC LlAIC* Model AIC LlAIC
* No int. -14840.5 No int. 6942.2 No int. -826.5
- Black -14841.1 -0.5 - Year 6969.7 27.4 - Year -825.8 0.7
-G -13990.8 849.8 - FDis 6945.9 3.6 -CWM1 -828.1 -1.6
-SR -14835.7 4.9 + FDis X Year 6926.9 -15.4 + CWM 1 X Year -837.4 -10.9
+ SRX G -14858.0 -17.4 -CWM1 6948.3 6.1
-CWM1 -14817.3 23 .2 - Dprev. 6967.9 25.6
+ CWM1 X G -16194.5 -1353.9 + Dprev. X Year 6869.6 -72.6
-CWM2 -14796.9 43.6
+ CWM2 X G -14845.4 -4.8
Final madel -16215.4 Final madel 6864.0 Final madel -838.1
Null madel -13984.4 2231.1 Nu ll madel 7007.0 143 .0 Null madel -828.8 9.4
* LlGAIC and LlAIC should be compared in absolute terms since removing variables will
increase AIC and adding interactions will reduce AIC. Linear mixed models in (b) and (c) were
fitted by ML for fixed effects comparison . DT is proportional deviation; G is total basal area in
a plot; SR is species richness; FOis is functional dispersion and CWMs are community
weighted means; which are ali obtained from the principal components of a PCA with above-
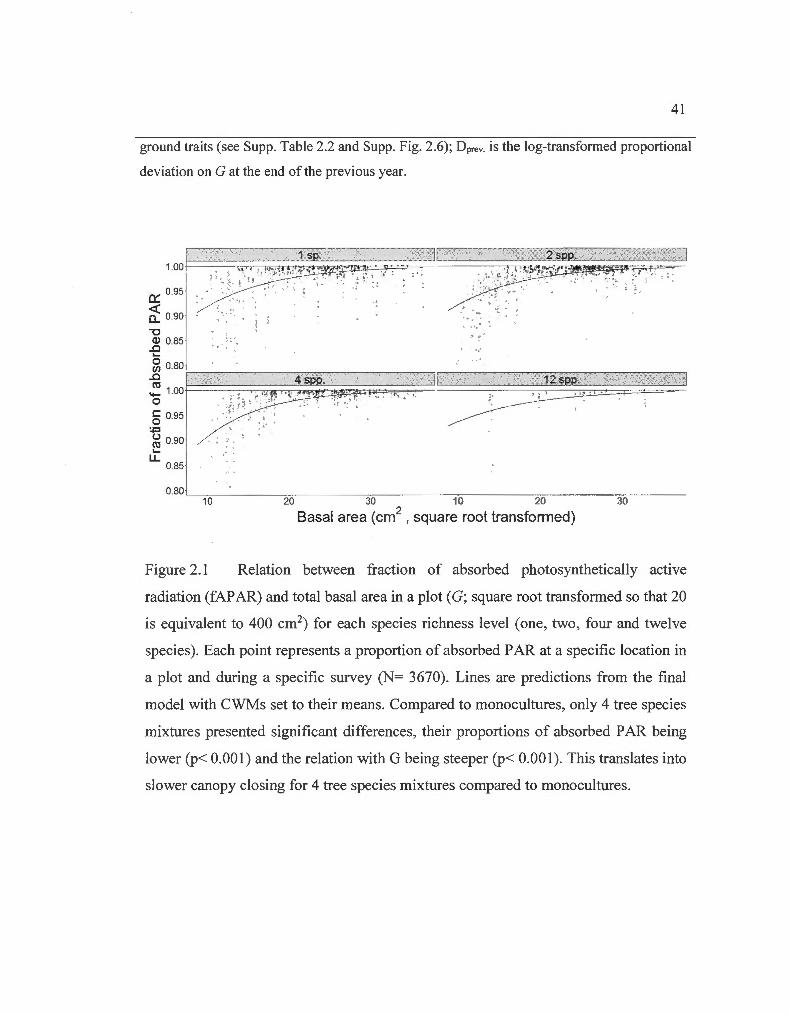
41
ground traits (see Supp . Tab le 2.2 and Supp. Fig. 2.6); O prev is the log-transformed proportional
deviation on Gat the end of the previous year.
2 spp. 1.00
f:\ ( • • f. t · ,· :
0:::: 0.95 ..
<( 0.. 0.90
"'C Q) 0.85
.J:l ..... ~ 0.80
.J:l
! 1.00 0
• ' ... .. · •. 12 spp.
§ 0.95 :;:::
.. ·,, .
~ 0.90 .....
u... 0.85
0.80 10 20 30 10 20 30
Basal area (cm2 , square root transformed)
Figure 2.1 Relation between fraction of absorbed photosynthetically active
radiation (fAP AR) and total basal area in a plot ( G; square root transformed so that 20
is equivalent to 400 cm2) for each species richness leve! (one, two, four and twelve
species). Each point represents a proportion of absorbed PAR at a specifie location in
a plot and during a specifie survey (N= 3670). Lines are predictions from the final
model with CWMs set to their means. Compared to monocultures, only 4 tree species
mixtures presented significant differences, their proportions of absorbed PAR being
lower (p< 0.001) and the relation with G being steeper (p< 0.001). This translates into
slower canopy closing for 4 tree species mixtures compared to monocultures.
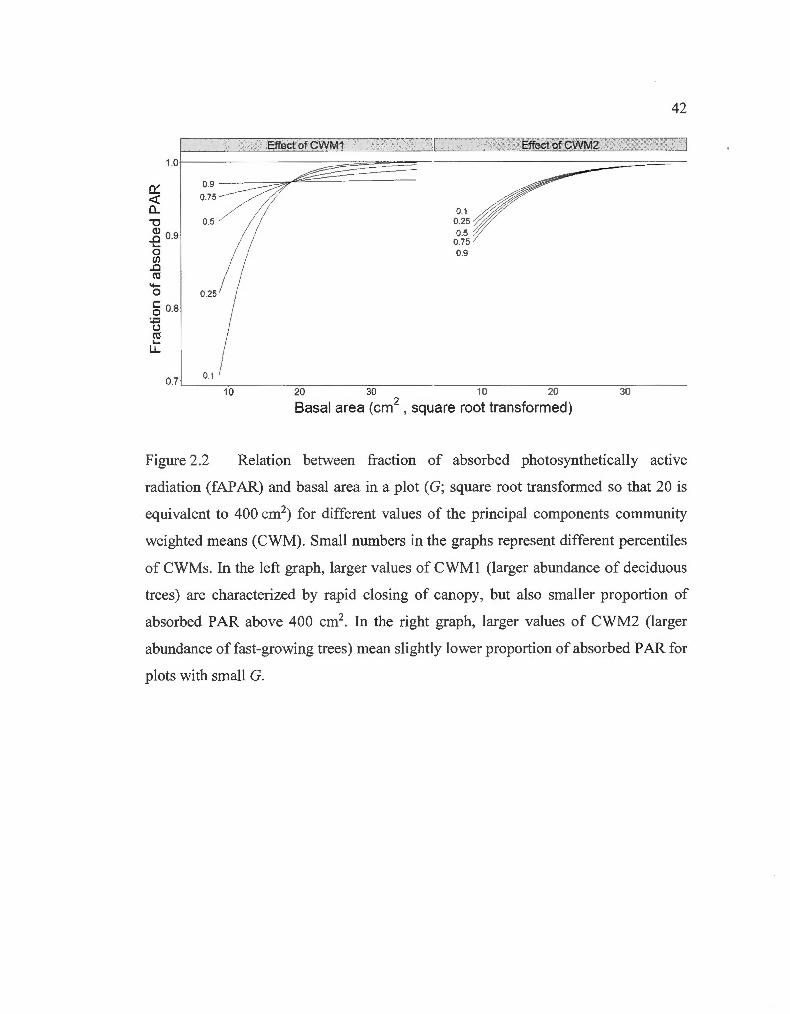
42
Effect of CWM1 Effect of CWM2
,., 1 .0r~:==:::::~~~~===-u.. 0.9 <( 0.75
a.. "'0 15 0.9 ..... 0 (/) .0 ro -0
§ 0.8 :;::; (.) ro .....
LJ._
0.5
0.25
0.1 0.25 0.5
0.75 0.9
0.1 0.7 '--------:-::--------c:-::------==---- - ---:-:::------:::-::------;:-::----10 20 30 10 20 30
Basal area (cm2 , square root transformed)
Figure 2.2 Relation between fraction of absorbed photosynthetically active
radiation (fAP AR) and basal area in a plot ( G; square root transformed so that 20 is
equivalent to 400 cm2) for different values of the principal components community
weighted means (CWM). Small numbers in the graphs represent different percentiles
of CWMs. In the left graph, larger values of CWMl (larger abundance of deciduous
trees) are characterized by rapid closing of canopy, but also smaller proportion of
absorbed PAR above 400 cm2. In the right graph, larger values of CWM2 (larger
abundance offast-growing trees) mean slightly lower proportion of absorbed PAR for
plots with small G.
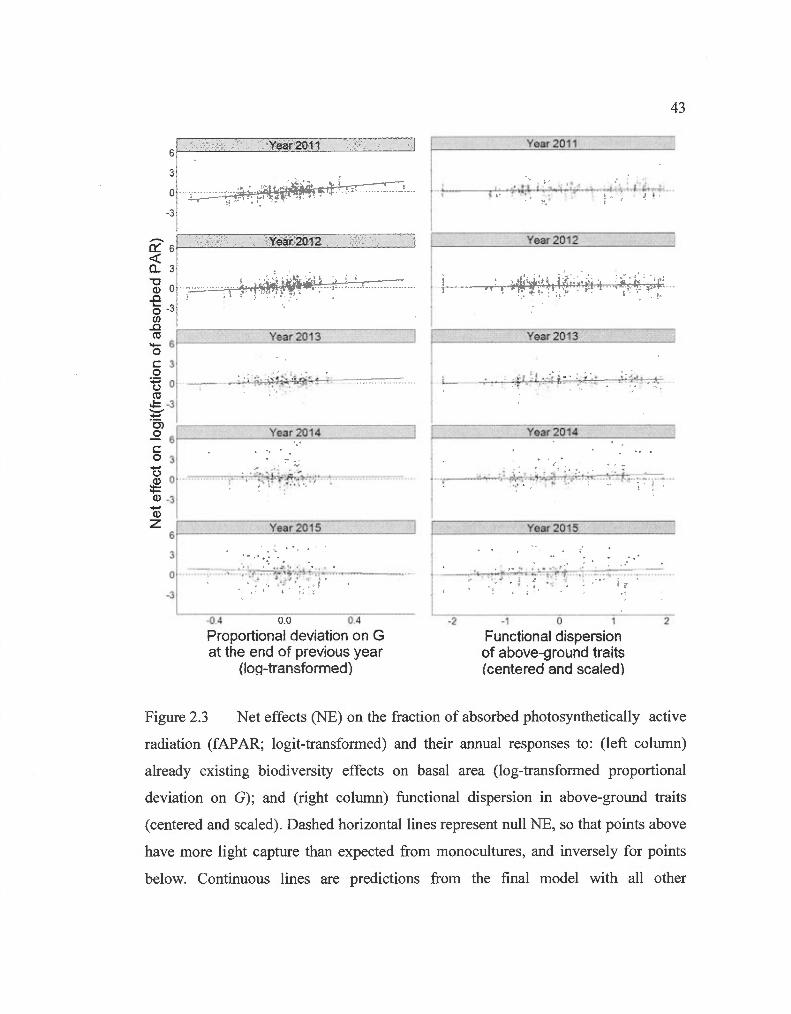
43
Year 2011 1 6~----------~~~~--------~
,-------------Year 20"1_1 __________ _
3
o - - ::.:;~?~-::'-~~~~i:':"-:<7:-:-:-:~::-:::~~,- L~-~.c-'-'~ .~+..::t---L_~ ... ;;.r~l-'-t-· :-·:·:~.l -~::~-- --3
6 ___________ Yc..::e=a"-"r.~0 1 ~---------__)
3 . ·. .. . 0 -. -~~--:::-::::-:·:~-:;;~ ; ·: ~- ;~~~~:~:i:;j .. _ -~ "',
-3
~4 ~0 ~4
Proportional deviation on G at the end of previous year
(loÇJ-transformed)
Year 2012
! . r····
Year 2013 · 10
j
1- -:----~.L*':~~~;- · .;::*~--~: ·--L--:-=- 1 --~---l . .
1
Year 2015
! .. . l ---~---;. ., , ,,; ;~ ::\_;,~ ·- ::-:7:.~.::..;!------ --,,..,-.. ~---~-··· : ··········~· J •
1
-2 ~ 0 1
Functional dispersion of above-ground traits (centered and scaled)
2
Figure 2.3 Net effects (NE) on the fraction of absorbed photosynthetically active
radiation (fAPAR; logit-transformed) and their annual responses to: (left column)
already existing biodiversity effects on basal area (log-transformed proportional
deviation on G); and (right column) functional dispersion in above-ground traits
( centered and scaled). Dashed horizontallines represent null NE, so that points above
have more light capture than expected from monocultures, and inversely for points
below. Continuous lines are predictions from the final madel with all other
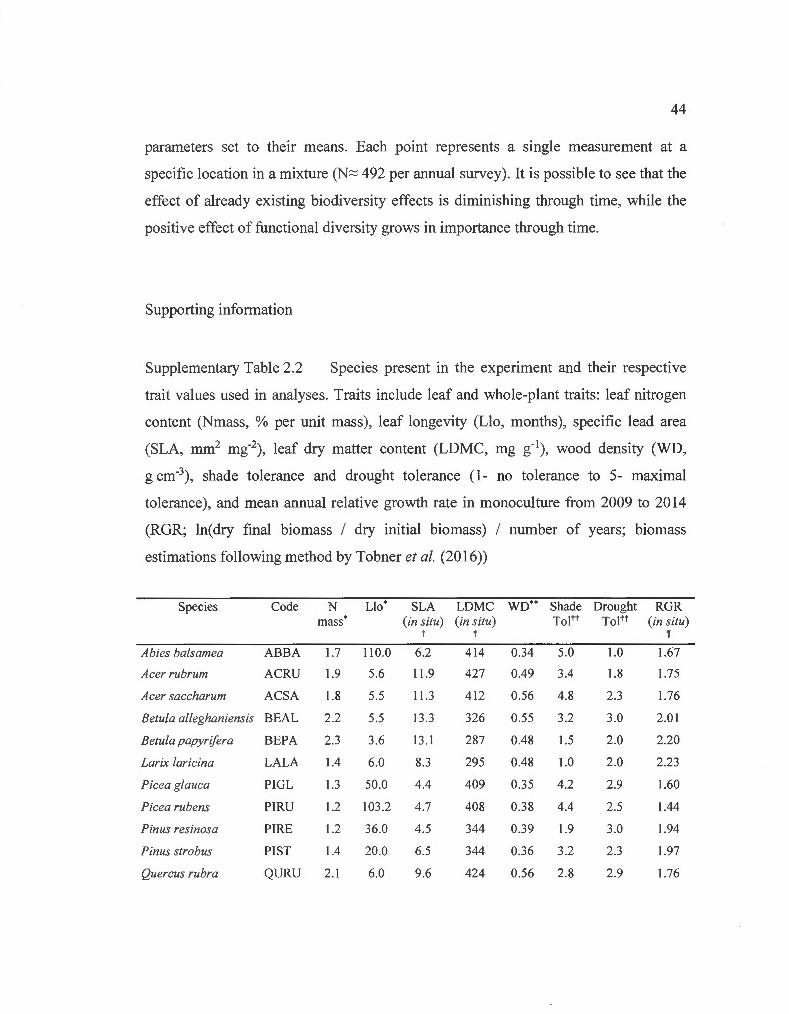
44
parameters set to their means . Each point represents a single measurement at a
specifie location in a mixture (N::::; 492 per annual survey) . It is possible to see that the
effect of already existing biodiversity effects is diminishing through time, while the
positive effect offunctional diversity grows in importance through time.
Supporting information
Supplementary Table 2.2 Species present in the experiment and their respective
trait values used in analyses. Traits include leaf and whole-plant traits: leaf nitrogen
content (Nmass, % per unit mass), leaf longevity (Llo, months), specifie lead area
(SLA, mm2 mg-2), leaf dry matter content (LDMC, mg g- 1) , wood density (WD,
g cm-3), shade tolerance and drought tolerance (1- no tolerance to 5- maximal
tolerance), and mean annual relative growth rate in monoculture from 2009 to 2014
(RGR; ln(dry final biomass 1 dry initial biomass) 1 number of years; biomass
estimations following method by Tobner et al. (2016))
Species Code N Llo* SLA LDMC wo·· Shade Drought RGR . (in situ) (in situ) Tol +t Toit+ (in situ) mass t
Abies balsamea ABBA 1.7 110.0 6.2 414 0.34 5.0 1.0 1.67
Acer rubrum ACRU 1.9 5.6 11.9 427 0.49 3.4 1.8 1.75
Acer saccharum ACSA 1.8 5.5 11.3 412 0.56 4.8 2.3 1.76
Betula alleghaniensis BEAL 2.2 5.5 13 .3 326 0.55 3.2 3.0 2.01
Betula papyrifera BEPA 2.3 3.6 13. 1 287 0.48 1.5 2.0 2.20
Larix laricina LALA 1.4 6.0 8.3 295 0.48 1.0 2.0 2.23
Picea glauca PIGL 1.3 50.0 4.4 409 0.35 4.2 2.9 1.60
Picea rubens PIRU 1.2 103 .2 4.7 408 0.38 4.4 2.5 1.44
Pinus resinosa PIRE 1.2 36.0 4.5 344 0.39 1.9 3.0 1.94
Pinus strobus PIST 1.4 20.0 6.5 344 0.36 3.2 2.3 1.97
Quercus rubra QURU 2.1 6.0 9.6 424 0.56 2.8 2.9 1.76
45
Thuja occidentalis THOC !.0 33.0 5.4 275 0.30 3.5 2.7 2.12
Trait data sources: *GLOPNET (Wright et al., 2004), ttraits measured in monocultures of the
experiment (Jewell, 2013), **(Forest Products Laboratory- USDA, 1999), ttNiinemets &
Valladares (2006), ~trait measured in monocultures of the experiment by the authors and
others (Tobner et al., 20 16).
Forest Products Laboratory - USD A. ( 1999). Wood handbook - Wood as an engineering material. General Technical Report FPL-GTR-190.
Jewell , M. D. (20 13). Tree diversity, above-below ground interactions and leaf litter decomposition. Master's thesis, Université de Sherbrooke.
Niinemets, Ü. & Yalladares, F. (2006). Tolerance to shade, drought, and waterlogging of tempe rate northern hemisphere trees and shrubs. Ecological Monographs, 76( 4 ), 521 -547. doi : 1 0.1890/0012-9615(2006)076[0521 :TTSDA W]2.0.C0;2
Tobner, C. M., Paquette, A., Grave! , D., Reich, P. B. , Williams, L. J. & Messier, C. (2016). Functional identity is the main driver of diversity effects in young tree communities, Ecolo gy Letters. doi: 10.1111 /ele.12600
Wright, 1. J., Reich, P. B., Westoby, M., Ackerly, D. D., Baruch, Z ., Bongers, F. , ... Villar, R. (2004). The worldwide leaf economies spectrum. Nature, 428(6985), 821-827. doi: 10.1 038/nature02403
----------------Raad----------------00000000 000 @0000 0 @000 @00 00000000 00000000 000 @0000 00000000 00000000
46
Supplementary Figure 2.4 LI-191 line quantum sensor (LI-COR) sampling
locations in plots for the two first surveys of light capture (20 11 and 20 12). Black
lines represent the locations and circles represent trees in a single plot. For the first
two year, a LI -190 quantom sensor (LI -COR) was used as an above-canopy
reference. For subsequent surveys (2013 to 2015), BF Sunshine sensors (Delta-T
Deviees) were located always with the same orientation at the center of these lines.
Above-canopy reference measurements were also done by BF Sunshine sensors for
these surveys (Delta-T Deviees).
- - --- --- - -
47
2spp. 1.0
0:: 0.9 <( o... "'0 0.8 Q)
...c 0 07 (/)
...c ~ 1.0
12 spp.
0 c 0 0.9
:;:::; ü
~ 0.8 L.L
0.7
10 20 30 10 20 30
Basal area (cm2, square root transformed)
Supplementary Figure 2.5 Relations between fraction of absorbed
photosynthetically active radiation (fAPAR) and basal area (square root transformed
so that 20 is equivalent to 400 cm2) for each monoculture and mixture separately. A
one-inflated beta distribution was assumed for each regression. twelve different
monocultures, fourteen two-species mixtures ten four-species mixtures and one
twelve-species mixtures are represented. Each regression had between 85 and 100
data points, each data point representing a single measurement of fAP AR for a
specifie annual survey and at a specifie location inside one of the four replicates.
N 0 Q_
1
-1 .5
PCA · scaling 1
-0.5 0.5 1.0 1.5
N 0 Q_
PCA · scaling 2
ID - THOC
0 - PIRE LAL4
ID : / RGR
~ -="~:~~~é'" 9 4ol' • N~ss 0 ABBA / ; QURU "';"" - L)M~ ACRU
ACSA 1 r 1 r 1 1 1
-1.5 -1.0 -0.5 0.0 0.5 1.0 1.5
PC1 PC1
48
Supplementary Figure 2.6 Both principal components (PC) kept in the principal
component analysis (PCA) of above-ground traits, explaining respectively 49 and
29 % of the variability in these eight traits. Left graph is scaled in a way to represent
unbiased correlations of traits with PC (traits vectors of length exceeding the red
circle are important for PCl and/or PC2). Right graph is scaled to preserve distance
between objects, i.e. our twelve different tree species. Traits abbreviations, mean
traits values obtained from literature, and species codes are ail presented in Supp.
Table 2.2.
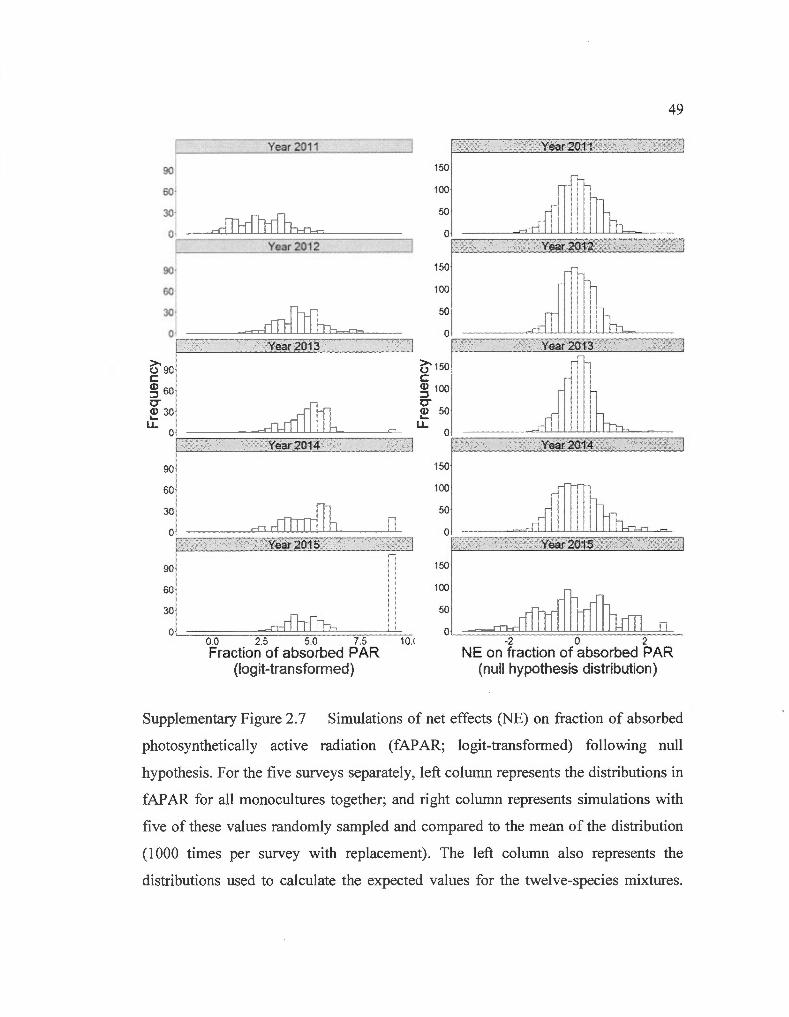
90
60
90
60
Year 2011
30 _lh-n 0 --------=::d1tllli>L, -"=
·----------------··veâr''2o13-----------··------
90
60
30
0
Year2014
Year 2015
90
60
30
.-~~r0J{l-,-h 0~~~==~~==~~==~~==~ 0 0 2.5 5.0 7.5 10.1
Fraction of absorbed PAR (log it -transfo rmed)
150
150
100
50
t) 150 c ~ 100 0' <P 50 ~
u..
150
100
50
49
Year 2011
Year2014
~mfiltnD hm o~==~~====~~======~~--2 0 2
NE on fraction of absorbed PAR (null hypothesis distribution)
Supplementary Figure 2. 7 Simulations of net effects (NE) on fraction of absorbed
photosynthetically active radiation ( fAP AR; logit-transformed) following null
hypothesis. For the five surveys separately, left colurnn represents the distributions in
fAP AR for ali monocultures together; and right column represents simulations with
five of these values randomly sampled and compared to the mean of the distribution
(1 000 times per survey with replacement). The left column also represents the
distributions used to calculate the expected values for the twelve-species mixtures.

50
Distribution of NE for 2014 and 20 15 surveys are more variable because of the larger
masses of points at the maximal value in terms of fAP AR. This could also be the case
in our analysis, where the larger presence of maximal values in recent surveys could
have led to the belief that NE on light capture increase with time, while this was only
a null-expectation increase in NE variability.
CHAPITRE III
INCLUDING BOTH ABOYE- AND BELOW-GROUND BIOMASS IN A DIVERSITY EXPERIMENT WITH TREES REVEALS A GREA TER
IMPORTANCE OF COMPLEMENTARITY
Authors
Marc-Olivier Martin-Guay* 1, Alain Paquette2 and Christian Messier1• 2
1 Institut des sciences de la forêt tempérée (ISFORT), Université du Québec en
Outaouais (UQO), 58 rue Principale, Ripon, QC, Canada, JOV 1 VO
2 Center for Forest Research, Université du Québec à Montréal, PO Box 8888,
Centre-Ville Station, Montréal, QC H3C 3P8, Canada
* Corresponding author: [email protected]
Other emails (in order of appearance):
alain.paquette@gmail .com
messier .christian@uqam. ca
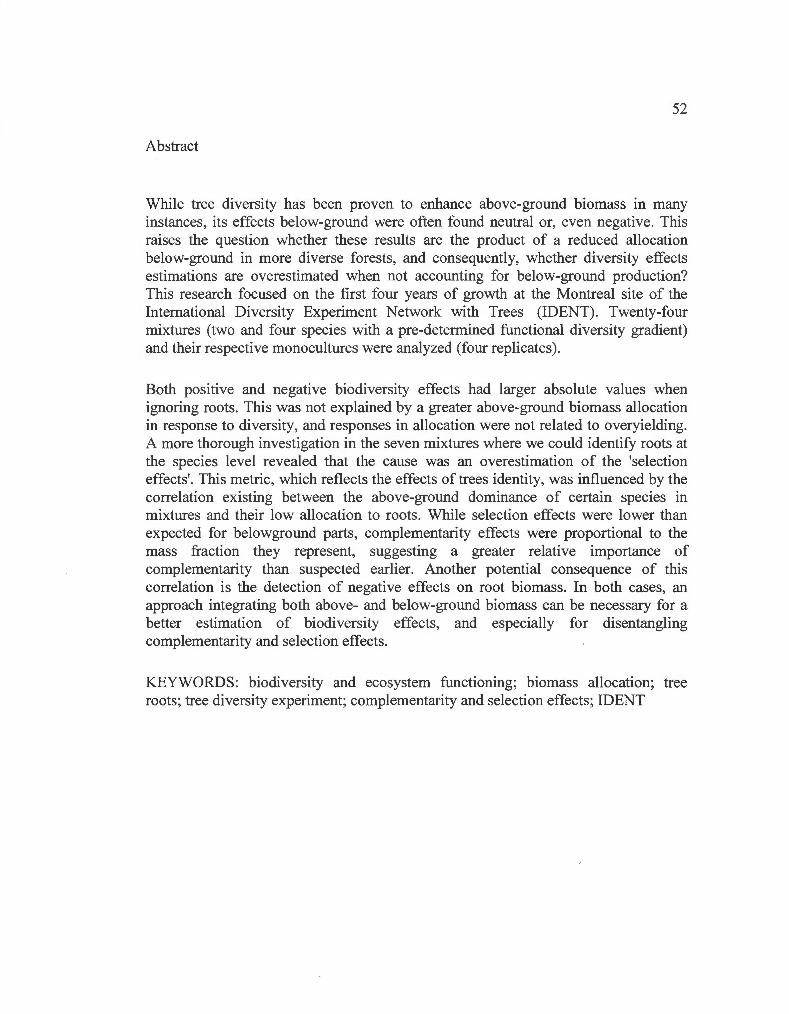
52
Abstract
While tree diversity has been proven to enhance above-ground biomass in many instances, its effects below-ground were often found neutral or, even negative. This raises the question whether these results are the product of a reduced allocation below-ground in more diverse forests , and consequently, whether diversity effects estimations are overestimated when not accounting for below-ground production? This research focused on the first four years of growth at the Montreal site of the International Diversity Experiment Network with Trees (IDENT). Twenty-four mixtures (two and four species with a pre-determined functional diversity gradient) and their respective monocultures were analyzed (four replicates).
Both positive and negative biodiversity effects had larger absolute values when ignoring roots. This was not explained by a greater above-ground biomass allocation in response to diversity, and responses in allocation were not related to overyielding. A more thorough investigation in the seven mixtures where we could identify roots at the species level revealed that the cause was an overestimation of the 'selection effects'. This metric, which reflects the effects oftrees identity, was influenced by the correlation existing between the above-ground dominance of certain species in mixtures and their low allocation to roots. While selection effects were lower than expected for belowground parts, complementarity effects were proportional to the mass fraction they represent, suggesting a greater relative importance of complementarity than suspected earlier. Another potential consequence of this correlation is the detection of negative effects on root biomass. In both cases, an approach integrating both above- and below-ground biomass can be necessary for a better estimation of biodiversity effects, and especially for disentangling complementarity and selection effects.
KEYWORDS: biodiversity and ecosystem functioning; biomass allocation; tree roots; tree diversity experiment; complementarity and selection effects; IDENT
53
Résumé
Alors que la diversité en arbre s'est avérée avoir un effet bénéfique sur la biomasse aérienne dans plusieurs cas, ses effets sur la biomasse souterraine ont souvent été trouvés neutres, ou même négatifs. Se pourrait-il que la diversité entraîne moins d'allocation à la biomasse souterraine et, en conséquence, des effets surestimés de la diversité lorsque la biomasse souterraine est ignorée? Cette recherche se concentre sur les quatre premières années de croissance au site montréalais du « International Diversity Experiment Network with Trees » (!DENT). Vingt-quatre mélanges (deux et quatre espèces avec un gradient prédéterminé de diversité fonctionnelle) et leurs monocultures correspondantes ont été analysés (répliqués dans quatre blocs).
Les effets de la diversité, qu'ils soient positifs ou négatifs, étaient plus élevés en termes absolus lorsque les racines étaient ignorées. Cette observation ne s'expliquait pas par une allocation augmentée vers la biomasse aérienne, et la réponse de l'allocation à la diversité ne corrélait pas avec la réponse de la biomasse. Une analyse plus approfondie des sept mélanges où les racines ont pu être identifiées à l'espèce, a révélé que la cause était plutôt une surestimation de l'effet de sélection. Cette mesure, qui capture les effets associés à l'identité spécifique des arbres, était influencée par la corrélation existante entre la dominance aérienne de certaines espèces dans les mélanges et leur faible allocation aux racines. Alors que les effets de sélection étaient plus petits qu'attendus pour la biomasse souterraine, les effets de complémentarité étaient proportionnelles à la biomasse représentée par ce compartiment. Cela suggère une importance relative plus importante des effets de complémentarité que précédemment pensé. Une autre conséquence potentielle de cette corrélation est la détection d'effets de la diversité négatifs sur la biomasse racinaire. Dans les deux cas, une approche intégrant les deux compartiments de la biomasse peut être nécessaire pour une meilleure estimation des effets de la diversité, et spécialement pour décortiquer les effets de complémentarité et de sélection.
MOTS-CLÉS : biodiversité et fonctionnement de l'écosystème; allocation de la biomasse; racines; expérience de diversité avec des arbres; effet de complémentarité et de sélection; IDENT
54
3 .1 Introduction
In the last two decades, there has been exponential growth in biodiversity-ecosystem
functioning (BEF) research (Caliman et al., 2010), which helped build a new
paradigm for biodiversity, from mere epiphenomenon to key element m many
ecosystem processes (Loreau, 201 0). Indeed, a positive relationship between
biodiversity and ecosystem functioning was demonstrated in several ecosystems
(Cardinale et al. , 2011 ; Hooper et al. , 2012). These findings are highly relevant in
novel ecosystems where anthropogenic disturbances and management practices
influence strongly species compositions (e.g. in forest plantations; Verheyen et al. ,
2016).
Even though forest ecosystems are of great importance for many ecosystem services
(Millennium Ecosystem Assessment, 2005), all potentially influenced by diversity
(Cardinale et al. , 20 12), these eco systems have been little studied in BEF research
due to the duration necessary to obtain results (Scherer-Lorenzen et al. , 2007; Tobner
et al. , 2014 ). Y et, biodiversity has been shown to influence positively above-ground
productivity in natural and planted forests (Liang et al. , 2016; Nadrowski et al. , 2010;
Paquette & Messier, 2011; Zhang et al. , 2012).
However these BEF studies using trees have often not included the below-ground part
(Meinen, Hertel & Leuschner, 2009), which can represent 50 % of the biomass
production in sorne cases (Cairns et al. , 1997; Helmisaari et al. , 2002). Indeed,
omitting differences in biomass allocation strategies between species, and a further
potential effect of diversity on species above-ground : below-ground ratio, could
change estimations of mixtures productivity and the resulting diversity effects.
According to the optimal partitioning theory (Bloom et al. , 1985), these allocation
strategies can be plastic depending on resources availabilities (Poorter et al. , 20 12),
which in turn can be improved through complementarity mechanisms. For example,
55
if two or more species use distinct spatial (or temporal) root niches, they would have
access to a greater quantity of nutrients in a mixture due to a decrease in conspecific
competition. Consequently, the resulting gain in resource acquisition efficiency could
reduce the need for below-ground biomass allocation. In accordance with this
hypothesis, in the Jena Experiment manipulating herbaceous plant diversity,
overyielding was found to be associated with greater allocation to above-ground parts
relatively to below-ground parts (Bessler et al. , 2009). Shifts in allocation following
limitations in certain resources have been well documented in the past (e.g. Canham
et al. 1996; Reich et al. 1998), but further discussions led to the realisation that
ontogeny is also an important driver to take into account for biomass allocation
(Reich, 2002). For most tree, this effect of ontogeny translates into an accumulating
allocation to stems with development at the expense of roots and leaves (Poorter et
al. , 2012).
Having an estimate oftotal productivity, i.e. productivity in both below- and above
ground biomass together, is important when trying to uncover the mechanisms
leading to biodiversity effects on growth. This is because through better resource
acquisition, complementarity mechanisms can increase the total amount of carbon
uptake. But this carbon is allocated to both above- and below-ground parts, making
total productivity more suitable for the evaluation of these mechanisms. Loreau and
Hector (200 1) have proposed a metric to partition the net effects (NE) into selection
and complementarity effects (SE and CE respectively). This method assumes that the
proxy for the function of interest is equally representative for all species; if this
assumption is not met, this would influence SE and CE estimations and the relative
importance we give them. For example, if dominant species have overestimated
biomasses, and dominated species are underestimated, SE which is mainly associated
with dominance (Fox, 2005) will be overestimated (Supp. Fig. 3.6).
--- ---- -
56
Contrasting results from two separate studies on above- and below-ground biomass at
the Montreal site of the International Diversity Experiment Network with Trees
(IDENT) convinced us to investigate both biomass compartments together. While
above-ground biomass in 2012 was generally larger in mixtures than expected from
monocultures after four years of growth (Tobner et al., 2016), standing fine root
biomass was smaller than expected (Archambault, 2016). This result is not new to
BEF literature where we find examples of smaller or null effects of diversity on
below-ground biomass joined to positive responses in above-ground biomass, e.g. in
BIODEPTH grasslands (Spehn et al., 2005) and in forests (Nadrowski et al. , 2010).
Using the 2012 data from this experiment, we first assessed if biodiversity effects
were different when considering below-ground parts compared to when they were
ignored. We then attempted to explain this difference with the following hypotheses:
i) below-ground to above-ground ratios (B:A) were lower in mixtures than expected
from monocultures, which means a shift toward greater above-ground biomass
allocation; ii) this shift was positively correlated to overyielding in total biomass,
reflecting below-ground complementarity; and iii) SE importance was overestimated
when not accounting for below-ground parts which originated from the dominance of
low B:A species in mixtures.
3.2 Methods
3 .2.1 Experimental design and location
The experimental site 1s located on the Macdonald Research Farm at McGill
University (Sainte-Anne-de-Bellevue, Quebec, Canada, 45°28' N, 73°45' W,
36 rn a.s.l.). The soil is a Typic Endoaquent (Humic Gleysol) with a pHwater of 6.3 in
the 0- to 20-cm sandy loam layer ( containing, on average, 78 % sand, 6 % silt, 16%
l
57
clay; Rivest et al. , 2015). The experiment, part of IDENT (see
www.treedivnet.ugent.be/ExpiDENT.html) was established in the spring of 2009
when nearly 14 000 trees were planted on less than 1 ha formerly used for agriculture.
They were distributed in Cartesian grid plots containing 64 individuals (8 x 8 rows;
50-cm spacing) and separated from each other by -1 .25 rn corridors to reduce
interactions between tree plots and allow movement of personnel and equipment
without disturbing the plots. These corridors were trenched with a 30 cm incision
during the summer in 2011 and 2012 to prevent roots from neighbouring tree
communities from interacting. The area is relatively flat and precise elevation was
measured (micro-topography) at the plot level using standard surveying equipment
(cm; total station theodolite) to account for minor depressions and bumps. Four soil
moisture surveys were performed previous to fall of 2012; three in the summer of
2011 (June 271\ July 21 51 and August 161
h) and one in the summer of2012 (July 201h).
They were carried out using FieldScout TDR 300 with 12-cm rods at five different
locations in each plot for the first one, and at nine locations for the remaining three.
The treatments investigated here were twelve monocultures, fourteen two-species and
ten four-species mixtures of randomly distributed species (with restrictions to prevent
dumping) from North American temperate forests, i.e. five broadleaf species: Acer
rubrum L. , Acer saccharum Marsh., Betula alleghaniensis Britton, Betula papyrifera
Marsh. and Quercus rubra L.; and seven coniferous species: Abies balsamea (L.)
Mill. , Larix laricina (DuRoi) K. Koch, Picea glauca (Moench) Voss, Picea rubens
Sarg., Pinus resinosa Aiton. , Pinus strobus L. and Thuja occidentalis L.. Each
treatment was replicated in four randomized blocks. For each species richness (SR)
level, mixtures compositions were randomly selected from ali possible combinations
of those species and placed along a functional diversity (FD) gradient. This gradient
was based on twelve functional traits and a multidimensional functional dispersion
index (Laliberté & Legendre, 201 0) with which it was possible to form the eight FD
58
classes used to draw mixtures (For more detailed information on the design, see
Tobner et al. 2014).
3.2.2 Below-ground and above-ground biomass assessment
In 2012, roots were sampled from October 2nd to October 181h at five different
locations in mixtures, and three in monocultures (see Archambault 2016 for details).
Custom-made soil augers with a sharpened edge were used to extract soil cores (inner
diameter= 7 cm) to a depth of 40 cm. Soil cores were immediately put into plastic
bags and stored in a cold room after sampling, and then frozen at -25 oc until within a
few days until further processing (7 to 14 months later). Once samples were thawed,
fine and coarse roots were manually removed from the soil with a 4 mm sieve stacked
over a 1 mm sieve (Fisher Brand). All recovered roots (dead or alive) were then
washed two times to remove any residues, first with clean and then with distilled
water. To obtain root biomass, roots were then dried at 60 oc in an oven for 72 hours
and weighted (0.001 g). In seven of the fourteen two-species mixtures, roots were
identified at the species leve! and separated using morphological characteristics
specifie to coniferous and broadleaves species. It is only for those seven mixtures that
we were able to make inference on CE or SE estimations differences between with
and without roots, while all the other analyses were conducted using all twenty-four
mixtures. Also in the fall of 2012, the inventory of every stem diameter at 5 cm from
ground and height were carried out using digital callipers and graduated telescopic
pol es.
Below-ground biomass was estimated by upscaling mean core biomass (1 .539 L) to
the volume of a plot at 40 cm depth (4900 L). Only the inside area (350 cm square)
was used, allowing for a one-row buffer around the edges to avoid border effects.
Above-ground biomass was also assessed using only the inner 6X6 individuals of
59
each plot. Individuals above-ground biomass was approximated usmg stem
dimensions and wood density (Diamete~ x Height x wood density; Forest Products
Laboratory - USDA (1999) for wood densities). To join both fractions together,
sensitivity analyses were done to verify if the relative importance given to below
ground biomass in total biomass estimations could influence qualitatively the results
(estimations of below-ground biomass were doubled or halved).
3.2.3 Statistical analysis
Comparing biodiversity effects between below- and above-ground biomass required
an independent metric with regards to absolute values. The proportional deviation
(DT; Loreau, 1998) is weil suited for this purpose. It is obtained by dividing net
effects (NE; observed-expected) by expected values as follows:
[Eq. 3.1]
where ÜT is the observed biomass in a mixture and ET is its expected value, i.e. the
average yield of the component species in monocultures weighted by their initial
relative abundance in nurnber of individuals. These DT had to be log-transformed to
achieve normality (ln(DT + 1)). A paired t-test was then performed to assess
difference between DT on below-ground biomass and DT on above-ground biomass.
The same transformation and test were applied to assess the difference between DT on
total biomass and DT on above-ground biomass.
Response of below-ground to above-ground ratio (B:A) to biodiversity was obtained
by calculation of NE on B:A. Expected B:A in a mixture had to take into account
differences in productivity between species. These differences can indeed influence
observed B:A by giving more importance to B:A of the most productive species in a
60
mixture. For example, assuming no shift in allocation with diversity, if a species Ais
more productive than a species B in a two-species mixture and is characterized by a
smaller B:A, and if expected B:A from monocultures is weighted by their initial
relative abundances, then observed B:A will necessarily be smaller than expected
B:A while no real shift in allocation took place. This can be achieved by:
B . A _ "n (B· A Ai,mix) · E - L...i=l · i,mono X -
Amix [Eq. 3.2]
where B: AE is the expected B:A obtained by the average of B:A in monoculture
(B: Ai,mono) for every species i in the mixture weighted by their relative abundance in
above-ground biomass (Ai,mix ) (Bessler et al. , 2009). Student t-tests were performed to Am ix
verify NE differences with zero, for all mixtures together (n= 96) and separately
(n= 4).
It is difficult to identify the correct causallink between effects on B:A and effects on
total biomass. This is because overyielding in total biomass could influence B:A
through an ontogenetic shift, i.e. a larger allocation to stems with tree development
(Poorter et al. , 2012), but in tum, a response of B:A to diversity could reflect below
ground complementarity, leading to overyielding. Both causal hypotheses were tested
with structural equation models with log-transformed DT on total biomass as
overyielding, and NE on B:A as response of B:A to diversity. The a priori mode!
(supp. Fig. 3.5) also contained the effects of the difference in elevation between the
mixture and corresponding monoculture on overyielding and B:A response to
diversity, either directly or through soi! moisture difference between mixture and
respective monocultures. The mode! was reduced to a plausible causal structure by
removing the least non-significant causallink until none remained.
61
For the seven mixtures (x4 replicates) where roots could be separated to species, NE
on above- and below-ground biomass were partitioned into complementarity (CE)
and selection effects (SE), following these equations:
NE= CE+ SE= N !J.RY M + N cov(!J.RY,M) [Eq. 3.3]
where !J.RY is the difference between relative yield and initial planted proportion (P;
equivalent to the expected relative yield) expressed as:
!J.RY = yield in mixture
yield in monoculture -P [Eq. 3.4]
; and where N is the number of species and M their yields in monoculture (M Loreau
& Hector, 2001). To compare these CE and SE obtained with above- and below
ground biomass, we used the null hypothesis that the ratio of these effects should
correspond to the mean B:A observed in these 7 mixtures. Mean B:A was obtained by
the ratio of means (mean below-ground biomass 1 mean above-ground biomass). For
both CE and SE, the distribution of differences between ratios of effects and mean
B:A was not normal, thus Wilcoxon signed rank tests were used to test against the
null hypothesis. To determine if !J.RY of species in mixtures was correlated to
observed B:A in their respective monocultures, a Kendall's rank correlation test was
performed.
All expected values used in the calculations of diversity effects (DT, NE on B:A, CE
and SE) were obtained with data from monocultures within the same block. All
analyses were done using R version 3.1.3 (R Core Team, 2015) with package lavaan
for SEM parameterization (Rosseel, 2012).
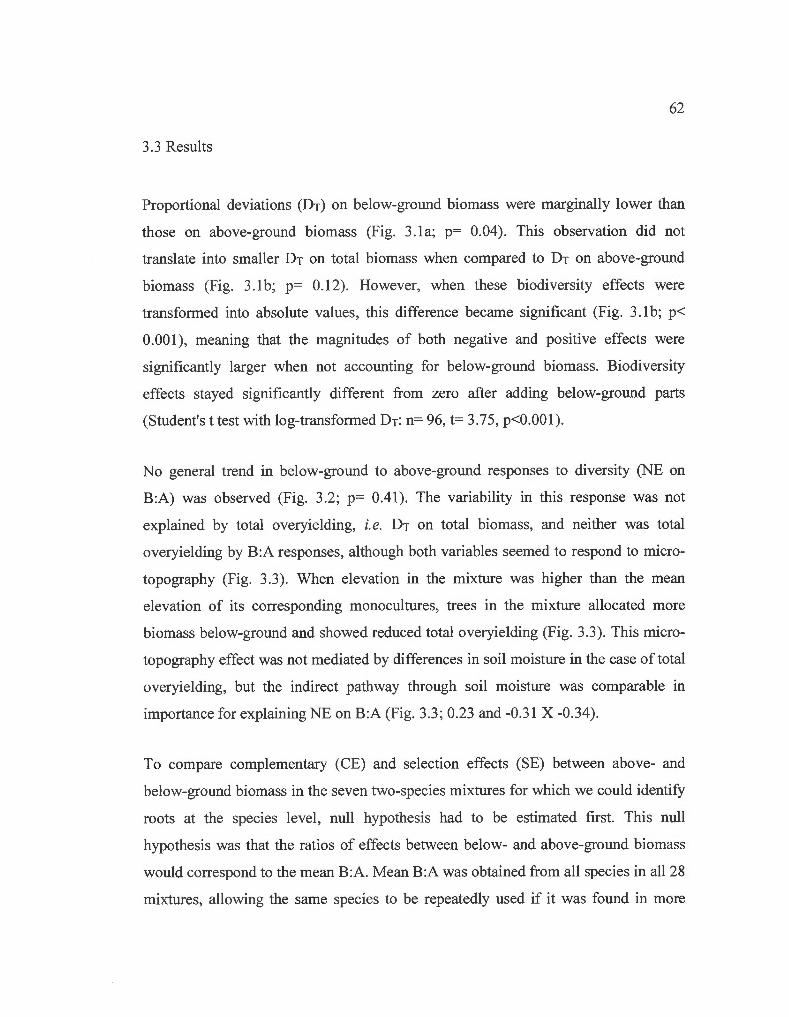
62
3.3 Results
Proportional deviations (DT) on below-ground biomass were marginally lower than
those on above-ground biomass (Fig. 3.1a; p= 0.04). This observation did not
translate into smaller DT on total biomass when compared to DT on above-ground
biomass (Fig. 3.1 b; p= 0.12). However, when these biodiversity effects were
transformed into absolute values, this difference became significant (Fig. 3.1 b; p<
0.001), meaning that the magnitudes of both negative and positive effects were
significantly larger when not accounting for below-ground biomass. Biodiversity
effects stayed significantly different from zero after adding below-ground parts
(Student's t test with log-transformed Dr: n= 96, t= 3.75, p<0.001).
No general trend in below-ground to above-ground responses to diversity (NE on
B:A) was observed (Fig. 3.2; p= 0.41). The variability in this response was not
explained by total overyielding, i.e. DT on total biomass, and neither was total
overyielding by B:A responses, although both variables seemed to respond to micro
topography (Fig. 3.3). When elevation in the mixture was higher than the mean
elevation of its corresponding monocultures, trees in the mixture allocated more
biomass below-ground and showed reduced total overyielding (Fig. 3.3). This micro
topography effect was not mediated by differences in soil moi sture in the case of total
overyielding, but the indirect pathway through soil moisture was comparable m
importance for explaining NE on B:A (Fig. 3.3; 0.23 and -0.31 X -0.34).
To compare complementary (CE) and selection effects (SE) between above- and
below-ground biomass in the seven two-species mixtures for which we could identify
roots at the species level, null hypothesis had to be estimated first. This null
hypothesis was that the ratios of effects between below- and above-ground biomass
would correspond to the mean B:A. Mean B:A was obtained from all species in all28
mixtures, allowing the same species to be repeatedly used if it was found in more
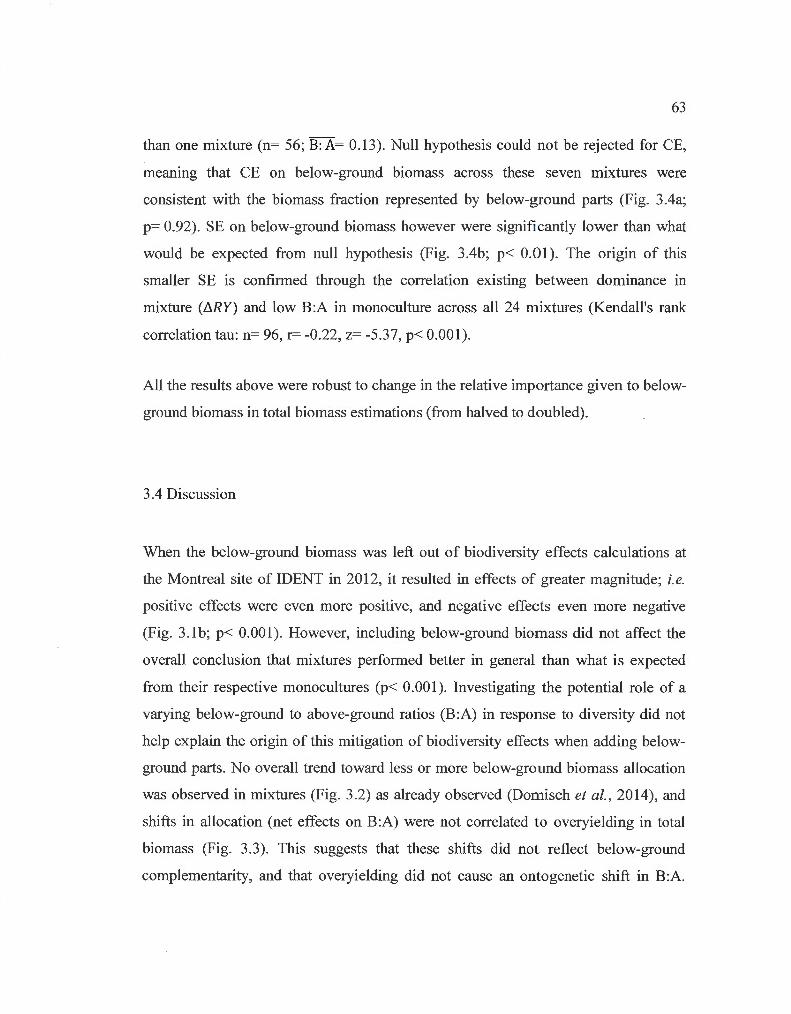
63
than one mixture (n= 56; B: A= 0.13). Null hypothesis could not be rejected for CE,
meaning that CE on below-ground biomass across these seven mixtures were
consistent with the biomass fraction represented by below-ground parts (Fig. 3.4a;
p= 0.92). SE on below-ground biomass however were significantly lower than what
would be expected from null hypothesis (Fig. 3.4b; p< 0.01). The origin of this
smaller SE is confirmed through the correlation existing between dominance in
mixture (L1RY) and low B:A in monoculture across all 24 mixtures (Kendall's rank
correlation tau: n= 96, r= -0.22, z= -5.37, p< 0.001).
All the results above were robust to change in the relative importance given to below
ground biomass in total biomass estimations (from halved to doubled).
3.4 Discussion
When the below-ground biomass was left out of biodiversity effects calculations at
the Montreal site of IDENT in 2012, it resulted in effects of greater magnitude; i.e.
positive effects were even more positive, and negative effects even more negative
(Fig. 3.1b; p< 0.001). However, including below-ground biomass did not affect the
overall conclusion that mixtures performed better in general than what is expected
from their respective monocultures (p< 0.001). Investigating the potential role of a
varying below-ground to above-ground ratios (B:A) in response to diversity did not
help explain the origin of this mitigation of biodiversity effects when adding below
ground parts. No overall trend toward Jess or more below-ground biomass allocation
was observed in mixtures (Fig. 3.2) as already observed (Domisch et al. , 2014), and
shifts in allocation (net effects on B:A) were not correlated to overyielding in total
biomass (Fig. 3.3). This suggests that these shifts did not reflect below-ground
complementarity, and that overyielding did not cause an ontogenetic shift in B:A.
64
This absence of correlation is shown by structural equation modelling, even though
both variables are partly explained by the same confounding variable, i.e. micro
topography (Fig. 3.3).
Indeed, plots lower in elevation also had higher soil moisture content, and
consequently, lower B:A than what would be expected from monocultures (Fig. 3.3).
This results is in accordance with the optimal partitioning theory which predicts less
biomass allocation below-ground when a limiting resource like water is improved
(Poorter et al., 20 12). It is important to consider that this theory also predicts that
changes in above-ground resource use efficiency will affect biomass allocation, most
probably light (Bloom et al. , 1985). For example, it has been shown that light
limitation enhanced biomass allocation to stems at the expense of roots for sorne tree
species at the seedling stage while controlling for ontogenetic shift (Reich et al. ,
1998). Hence, it would be erroneous to conclude that, combined to evidences of
biomass allocation being responsive to changes in soil moisture content, the absence
of a shift in biomass allocation is evidence for the absence of below-ground
complementarity in water use. lt is also possible that above-ground complementarity
took place (Williams et al., in review), which complicates interpretation of B:A
response to diversity.
It is important to acknowledge the fact that estimates of biodiversity effects on stems,
whose dimensions served to estimate above-ground biomass, have for many
stakeholders a greater importance for obvious economical reasons. But this
observation of overestimated selection effects without accounting for roots is also
important if, for example, a global carbon budget is considered (Isbell et al. , 2014).
This comparison is also of great importance when one wants to untangle the
mechanisms responsible for overyielding.
65
In only one occurrence known to us, did researchers assess a potential bias of Loreau
and Hector (2001) partitioning method when omitting below-ground biomass (Polley,
Wilsey & Derner, 2003). Although no result was shown, they reported not finding
any significant difference. Partitioning NE in the mixtures where roots could be
identified at the species level (in 28 out of the 96 plots in the experiment), we show
that the origin of this difference between effects on above-ground biomass and effects
on total biomass is most probably due to the overestimation of selection effects (SE)
when omitting below-ground biomass. Whereas complementarity effects (CE) on
below-ground biomass seemed to follow what is expected from mean B:A in these
seven mixtures (Fig. 3.4a), SE on below-ground biomass were generally lower than
expected from mean B:A (Fig. 3 .4b ). This result shows a non-independence between
SE calculations and B:A inter-specifie pattern. An unambiguous explanation to this
overestimated SE would be a lower contribution of «selected» or dominant species in
mixtures than what was earlier estimated when considering below-ground biomass
due to their low B:A, and inversely for dominated species. This is confirmed through
the negative correlation between the difference in relative yield (J1RY) and B:A in
monoculture for all the species in all 96 mixtures (p< 0.001). Indeed, examining
Eq. 3.3, we find that if differences between competitive (elevated J1RY) and less
competitive (low J1RY) species is reduced by adding below-ground parts to biomass
estimations, covariance values between relative performance (J1RY) and performance
in monoculture (M), which represent SE, would be diminished (see supp. Fig. 3.6 for
an example).
Another ramification of this correlation is the possibility to detect positive or negative
net effects of biodiversity on below-ground biomass when analyzing them without
considering above-ground parts. For example, there was early fine root overyielding
in the BIOTREE experiment (Lei et al., 2012) which could be due to dominance in
mixtures of species having large B:A. Negative NE on fine roots in our experiment
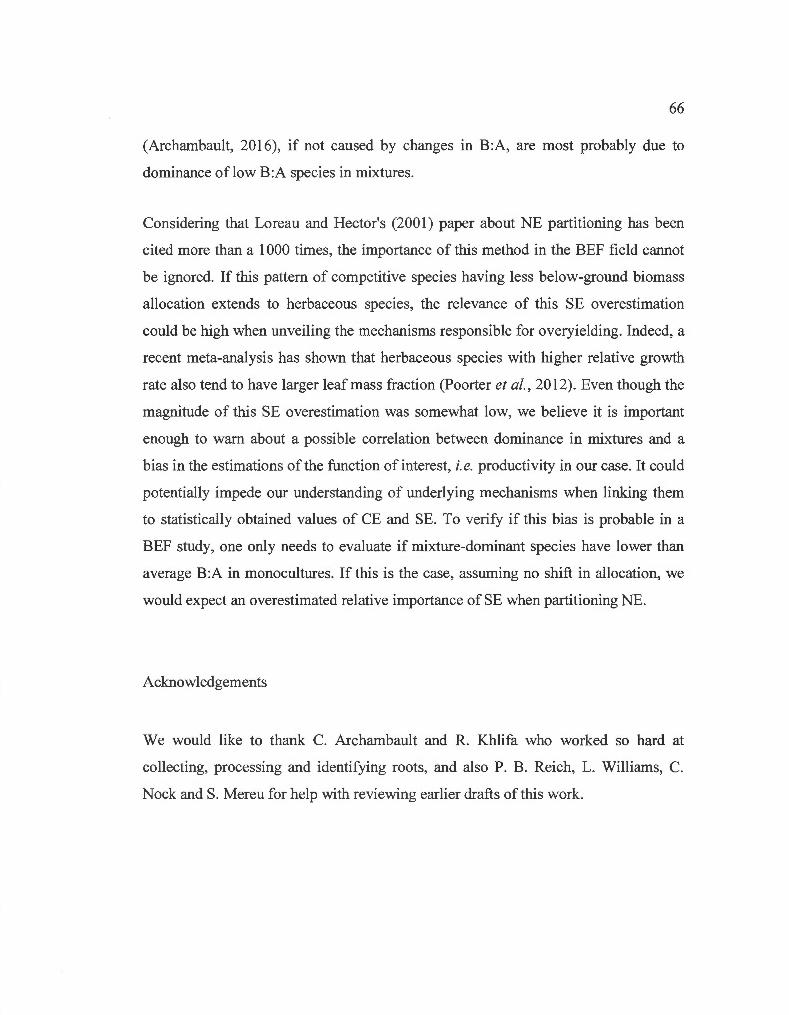
66
(Archambault, 20 16), if not caused by changes in B :A, are most probably due to
dominance of low B:A species in mixtures.
Considering that Loreau and Hector's (200 1) paper about NE partitioning has been
cited more than a 1 000 times, the importance of this method in the BEF field cannot
be ignored. If this pattern of competitive species having less below-ground biomass
allocation extends to herbaceous species, the relevance of this SE overestimation
could be high when unveiling the mechanisms responsible for overyielding. Indeed, a
recent meta-analysis has shown that herbaceous species with higher relative growth
rate also tend to have larger leaf mass fraction (Poorter et al. , 20 12). Even though the
magnitude of this SE overestimation was somewhat low, we believe it is important
enough to wam about a possible correlation between dominance in mixtures and a
bias in the estimations of the function of interest, i.e. productivity in our case. lt could
potentially impede our understanding of underlying mechanisms when linking them
to statistically obtained values of CE and SE. To verify if this bias is probable in a
BEF study, one only needs to evaluate if mixture-dominant species have lower than
average B:A in monocultures. If this is the case, assuming no shift in allocation, we
would expect an overestimated relative importance of SE when partitioning NE.
Acknowledgements
We would like to thank C. Archambault and R. Khlifa who worked so hard at
collecting, processing and identifying roots, and also P. B. Reich, L. Williams, C.
Nock and S. Mereu for help with reviewing earlier drafts of this work.
67
References
Archambault C. (20 16). Effet de la diversité spécifique et fonctionnelle des arbres sur la densité et profondeur d ' enracinement. Mémoire de maîtrise, Université du Québec à Montréal. 87 p.
Bessler, H. , Temperton, V. M. , Roscher, C. , Buchmann, N. , Schmid, B. , Schulze, E., . . . Engels, C. (2009) . Aboveground overyielding in grassland mixtures is associated with reduced biomass partitioning to belowground organs. Ecology, 90(6), 1520-1530. doi:10.1890/08-0867.1
Bloom, A. J. , Chapin, F. S. & Mooney, H. A. (1985). Ressource limitation in plantsan economie analogy. Annual Review ofEcology and Systematics, 16, 363-392.
Cairns, M. A. , Brown, S. , Helmer, E. H., Baumgardner, G. A. , Cairns, M. A. , Brown, S. , . . . Baumgardner, G. A. (1997). Root biomass allocation in the world ' s upland forests. Oecologia, 111 (1 ), 1-11. doi : 10.1 007/s00442005020 1
Caliman, A. , Pires, A. F. , Esteves, F. A. , Bozelli, R. L. & Farjalla, V. F. (2010). The prominence of and biases in biodiversity and ecosystem functioning research. Biodiversity and Conservation, 19, 651-664. doi : 10.1 007/s 10531-009-9725-0
Canham, C. D., Berkowitz, A. R. , Kelly, V. R. , Lovett, G. M. , Ollinger, S. V. & Schnurr, J. (1996). Biomass allocation and multiple resource limitation in tree seedlings. Canadian Journal of Forest Research, 26(9), 1521-1530. doi: 1 0.1139/x26-171
Cardinale, B. J. , Matulich, K. L. , Hooper, D. U. , Byrnes, J. E ., Duffy, E., Gamfeldt, L. , . . . Gonzalez, A. (20 11). The functional role of producer diversity in ecosystems. American Journal of Botany, 98(3), 572-592. doi:1 0.3732/ajb.1 000364
Cardinale, B. J. , Duffy, J. E. , Gonzalez, A. , Hooper, D. U., Perrings, C. , Venail, P. , . .. Naeem, S. (2012). Biodiversity loss and its impact on humanity. Nature, 489, 326-326. doi:10.1038/nature11373
Domisch, T. , Finér, L. , Dawud, S. M. , Vesterdal, L. & Raulund-Rasmussen, K. (2014) . Does species richness affect fine root biomass and production in young forest plantations? Oecologia, 177, 581-594. doi:10 .1007/s00442-014-3107-3
68
Forest Products Laboratory - USDA. (1999) . Wood handbook - Wood as an engineering material. General Technical Report FPL-GTR-190.
Fox, J. W. (2005). Interpreting the « selection effect » of biodiversity on ecosystem function. Ecology Letters, 8(8), 846-856. doi:10.1111/j.1461-0248 .2005.00795.x
Helmisaari, H. S. , Makkonen, K., Kellomaki, S. , Valtonen, E. & Malkonen, E. (2002) . Below- and above-ground biomass, production and nitrogen use in Scots pine stands in eastern Finland. Forest Ecology and Management, 165, 317-326. doi:16/S0378-1127(01)00648-X
Hooper, D. U. , Adair, E. C., Cardinale, B. J., Bymes, J. E . K., Hungate, B. A., Matulich, K. L., . . . 0 /'Connor, M. I. (2012) . A global synthesis reveals biodiversity loss as a major driver of ecosystem change. Nature, 486(7401), 105-108. doi:10.1038/nature11118
Isbell, F., Tilman, D. , Polasky, S. & Loreau, M. (2014) . The biodiversity-dependent ecosystem service debt. Ecology Letters, 18(2), 1-26. doi: 1 0 .1111/ele.12393
Laliberté, E. & Legendre, P. (20 1 0). A distance-based framework for measuring functional diversity from multiple traits. Ecology, 91(1), 299-305. doi: 10.1890/08-2244.1
Lei, P., Scherer-Lorenzen, M. & Bauhus, J. (2012). The effect of tree species diversity on fine-root production in a young temperate forest. Oecologia, 169, 1105-1115. doi:10.1007/s00442-012-2259-2
Liang, J. , Crowther, T. W., Picard, N. , Wiser, S., Zhou, M. , Alberti, G. , ... Reich, P. B. (20 16). Positive biodiversity-productivity relationship predominant in global forests. Science, 354(6309), aaf8957-aaf8957. doi:10.1126/science.aaf8957
Loreau, M. (1998). Separating sampling and other effects in biodiversity experiments. Oikos, 82, 600-602. doi: 10.2307/3546381
\
Loreau, M. & Hector, A. (2001). Partitioning selection and complementarity in biodiversity experiments. Nature, 412(6842), 72-76. doi:10 .1038/35083573
Loreau, M. (20 1 0). Linking biodiversity and ecosystems: towards a unifying ecological theory. Philosophical transactions of the Royal Society of London.
69
Series B, Biological Sciences, 365, 49-60. doi:l0.1098/rstb.2009.0155
Meinen, C., Hertel, D. & Leuschner, C. (2009). Biomass and morphology of fine roots in temperate broad-leaved forests differing in tree species diversity: is there evidence of below-ground overyielding? Oecologia, 161, 99-111. doi: 10.1 007/s00442-009-1352-7
Millennium Ecosystem Assessment. (2005). Ecosystems and human well-being: synthesis (vol. 5). Island Press, Washington, DC. URL:http://www.who.int/entity/globalchange/ecosystems/ecosys.pdf\nhttp://ww w.loc.gov/catdir/toc/ecip0512/20050 13229.html
Nadrowski, K. , Wirth, C. & Scherer-Lorenzen, M. (20 1 0) . Is forest diversity driving ecosystem function and service? Current Opinion in Environmental Sustainability, 2(1-2), 75-79. doi:10.1016/j.cosust.2010.02.003
Paquette, A. & Messier, C. (2011). The effect of biodiversity on tree productivity: from temperate to boreal forests. Global Ecology and Biogeography, 20, 170-180. doi:10.1111 /j.1466-8238.2010.00592.x
Polley, H. W., Wilsey, B. J. & Derner, J. D. (2003). Do species evenness and plant density influence the magnitude of selection and complementarity effects in annual plant species mixtures? Ecology Letters, 6(3), 248-256. doi: 10.1 046/j.1461 -0248.2003.00422.x
Poorter, H., Niklas, K. J. , Reich, P. B. , Oleksyn, J. , Poot, P. & Mommer, L. (2012). Biomass allocation to leaves, stems and roots : meta-analysis of interspecific variation and environmental control. New Phytologist, 193, 30-50. doi: 1 0.1111/j.1469-8137.2011.03952.x
R Core Team (2015). R: a language and environment for statistical computing. R Foundation for Statistical Computing, Vienna, Austria. URL:http://www.Rproject.org/.
Reich, P. B., Tjoelker, M. G. , Walters, M. B:, Vanderklein, D. W. & Buschena, C. (1998) . Close association of RGR, leaf and root morphology, seed mass and shade tolerance in seedlings of nine boreal tree species grown in high and low light. Functional Ecology, 12(3), 327-338. doi:10.1046/j.l365-2435.1998.00208.x
70
Reich, P. B. (2002). Root-shoot relations: optimality in acclimitization and adaptation or the « Emperor' s new clothes »?Plant Roots: the hidden half (pp. 205-220).
Rivest, D. , Paquette, A., Shipley, B. , Reich, P. B. & Messier, C. (2015) . Tree communities rapidly alter soi! microbial resistance and resilience to drought. Functional Ecology, 29(4), 570-578. doi:10.111111365-2435.12364
Rossee!, Y. (2012). lavaan: an R package for structural equation modeling. Journal of Statistical Software, 48(2), 1-36. URL:http://www.jstatsoft.org/v48/i02/
Scherer-Lorenzen, M. , Schulze, E. D. , Don, A. , Schumacher, J. & Weiler, E. (2007) . Exploring the functional significance of forest diversity: a new long-term experiment with temperate tree species (BIOTREE). Perspectives in Plant Ecology, Evolution and Systematics, 9, 53-70. doi:10.1016/j.ppees.2007.08.002
Spehn, A. E. M., Hector, A., Joshi, J. , Schrnid, B., Beierkuhnlein, C. , Caldeira, M. C., . . . Schul, E. (2005). Ecosystem effects of biodiversity manipulations in european grasslands. Ecological Monographs, 75(1), 37-63. doi:10.1890/03 -4101
Tobner, C. M. , Paquette, A., Reich, P. B. , Gravel, D. & Messier, C. (2014) . Advancing biodiversity-ecosystem functioning science using high-density treebased experiments over functional diversity gradients. Oecologia, 174, 609-621. doi : 10.1007 /s00442-013-2815-4
Tobner, C. M. , Paquette, A., Grave!, D. , Reich, P. B., Williams, L. J. & Messier, C. (20 16). Functional identity is the main driver of diversity effects in young tree communities, Ecolo gy Letters. doi: 1 0.1111/ele.12600
Verheyen, K. , Vanhellemont, M. , Auge, H. , Baeten, L. , Baraloto, C., Barsoum, N ., ... Scherer-Lorenzen, M. (20 16). Contributions of a global network of tree diversity experiments to sustainable forest plantations. Am bio, 45(1 ), 29-41. doi: 10.1007 /s13280-0 15-0685-1
Williams, L. , Paquette, A., Cavender-Bares, J. , Messier, C. & Reich, P.B. (in review) Spatial complementarity in tree crowns drives overyielding in species mixtures.
Zhang, Y. , Chen, H. Y. H. & Reich, P. B. (2012). Forest productivity increases with evenness, species richness and trait variation: a global meta-analysis. Journal of Ecology, 100, 742-749. doi: 1 0.1111 /j.1365-2745.2011.01944.x
+ rn rn ('IJ
E 0 0.5 :0 "'0 c ::J 0 0, 0.0 ..
3 0 (!)
.0
§ -0.5 ' 1-
0 -c
(a) ,'
.. .• , . ..
: .
-0.5 0.0 0.5 1 .0
ln( Dr on above-ground biomass + 1)
~ 1.0 rn ('IJ
E 0 :0 0.5
('IJ ...... .s c 0 0.0 1-
0 -c
(b)
'' •• •"' : . . ,; : "'~
71
' .
.. : ::~~. ··· · ·· ···· - ~· -·· · ·············· ········ ·· · · · · · · · · ·· · ····· · · ··· ... ' ·~ ........ . . '• ... .. .... ,
~" -0.5 ,''
-0.5 0.0 0.5 1.0
ln( Dr on above-ground biomass + 1)
Figure 3.1 Proportional deviation (Dr; transformed to achieve normality) (a) on
below- vs. above-ground biomass and (b) on total vs. above-ground biomass in the 24
mixtures (x4 replicates) where roots were sampled. Red dashed lines are 1:1 lines.
Dotted !ines separate positive from negative diversity effects on both axes. (a) No
correlation exists between Dr on below- and above-ground biomass. A paired t-test
reveals that Dr on below-ground biomass were marginally smaller than Dr on above
ground biomass, i.e. below 1:1 line (n= 96, t= -2.04, p= 0.04). (b) Diversity effects
are neither smaller nor larger when considering total biomass (paired t-test: t= -1 .59,
p= 0.12). However, positive diversity effects are generally smaller when considering
total biomass, and the same is true in absolute terms for negative effects (more points
in shaded area; paired t-test with absolute values: t= -3.81 , p< 0.001), meaning that
adding below-ground parts reduces the magnitude of both negative and positive
diversity effects.
72
0.2
0.1
<(
CCl §o o ~~~~rlr~~~~rlr~~~~~r+T-~~ddL-~--+;~~~~~~~
w z
-0.1
-0.2
Figure 3.2
lncreasing overyielding in total biomass
Mean net effects (Observed - Expected; NE) on belowground to
aboveground biomass ratios (B:A) for each tree species mixtures. Mixtures (orange
filled bars) are ordered by increasing overyielding on total biomass (proportional
deviation) from left to right, with the average value across all mixtures (white bar)
represented at the right end. Error bars are standard deviations. Student's t-test for all
tree species mixtures together showed there was no general trend (n= 96, t= 0.82,
p= 0.41). Individual mixture Student's t-test (n=4) : * p< 0.05 (*) p< 0.1. Species
codes are: Ab - Abies balsamea, Ar - Acer rubrum, As - Acer saccharum, Ba -
Betula alleghaniensis, Bp - Betula papyrifera, L1- Larix laricina, Pg - Picea glauca,
Pru- Picea rubens, Pre- Pinus resinosa, Ps- Pinus strobus, Qr- Quercus rubra
and To- Thuja occidentalis.
-Difference in
elevation between mixture
and corresponding monocultures
-- -0.43*** __ .... ----
-0.31 ** ---....;>
Difference in sail moisture
between mixture and corresponding
monocultures
Overyielding (log-t ransformed Dr on total biomass)
Response of below-ground to
above-ground ratio (NE on B:A)
73
Figure 3.3 Structural equation model of the direct and indirect effects of micro-
topography on overyielding in total biomass (log-transformed proportional
deviation) and on response of below-ground to above-ground ratios (Net effect on
B:A) (n= 96; x2= 1.493; p= 0.222; df= 1). Differences between tree species mixture
elevation and mean elevation in corresponding monocultures is used as exogenous
variable. Soil moi sture is expressed in the same way. Model exp lain 18.4 % of
variances in overyielding, 21.6 % for B:A, and 9.3 %for soil moisture. Significance
levels ofpath coefficients are: * p< 0.05 ; ** p< 0.01 ; *** p< 0.001. Continuous and
dashed arrows represent positive and negative relationships, respectively.
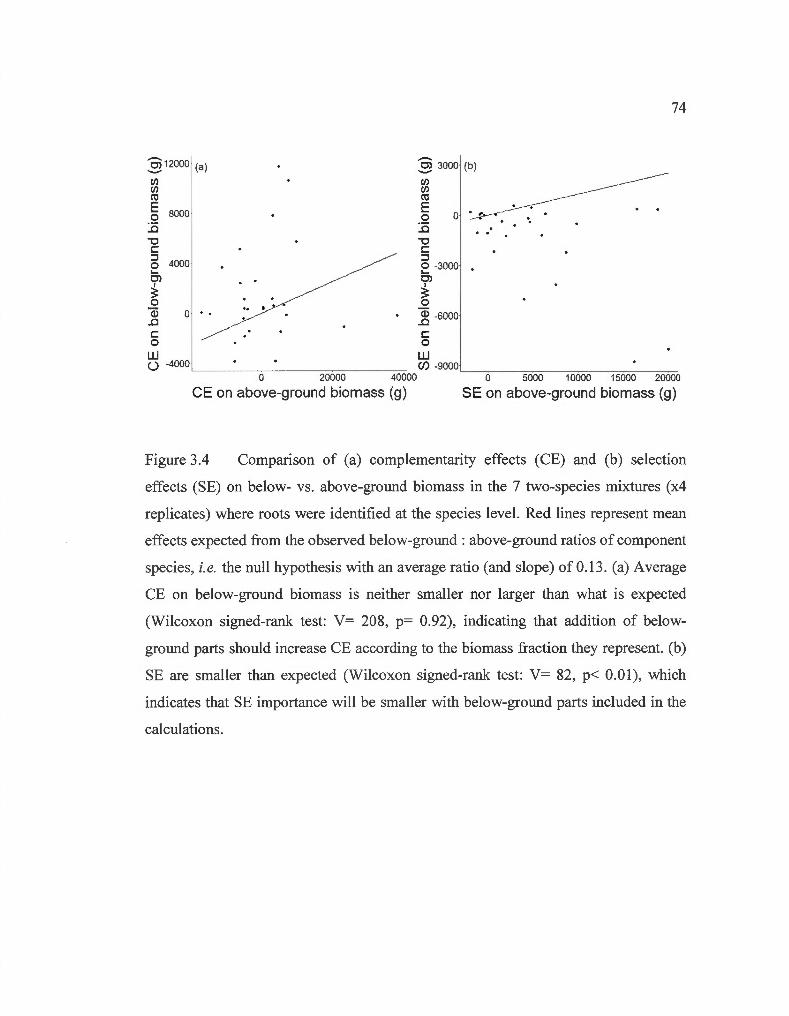
Ô) 12000 -(/) (/) ro E 0
:.0 "C c :::l 0 .._ 0)
1
3 0 Q)
..0 c 0
w
8000
4000
0
(a)
.. .. •
Ô) 3000 (b ) -(/) (/) ro E 0
:.0 "C c :::l 0 -3000 "-0)
~ 0 Q) -6000
..0 c 0
w
74
u -4000 '--------=---------=~-=-------:-:-::- Cf) -9000 o 2oooo 4oooo '-------:::-o - ----::5'""'oo;:-;;o--1:-:::o::-;oo:::-o- -:-:15;:-;:o""'ooo---::2:::coo=oo
CE on above-ground biomass (g) SE on above-ground biomass (g)
Figure 3.4 Comparison of (a) complementarity effects (CE) and (b) selection
effects (SE) on below- vs. above-ground biomass in the 7 two-species mixtures (x4
replicates) where roots were identified at the species lev el. Red lin es represent mean
effects expected from the observed below-ground : above-ground ratios of component
species, i.e. the null hypothesis with an average ratio (and slope) of0.13 . (a) Average
CE on below-ground biomass is neither smaller nor larger than what is expected
(Wilcoxon signed-rank test: V= 208, p= 0.92), indicating that addition of below
ground parts should increase CE according to the biomass fraction they represent. (b)
SE are smaller than expected (Wilcoxon signed-rank test: V= 82, p< 0.01), which
indicates that SE importance will be smaller with below-ground parts included in the
calculations.
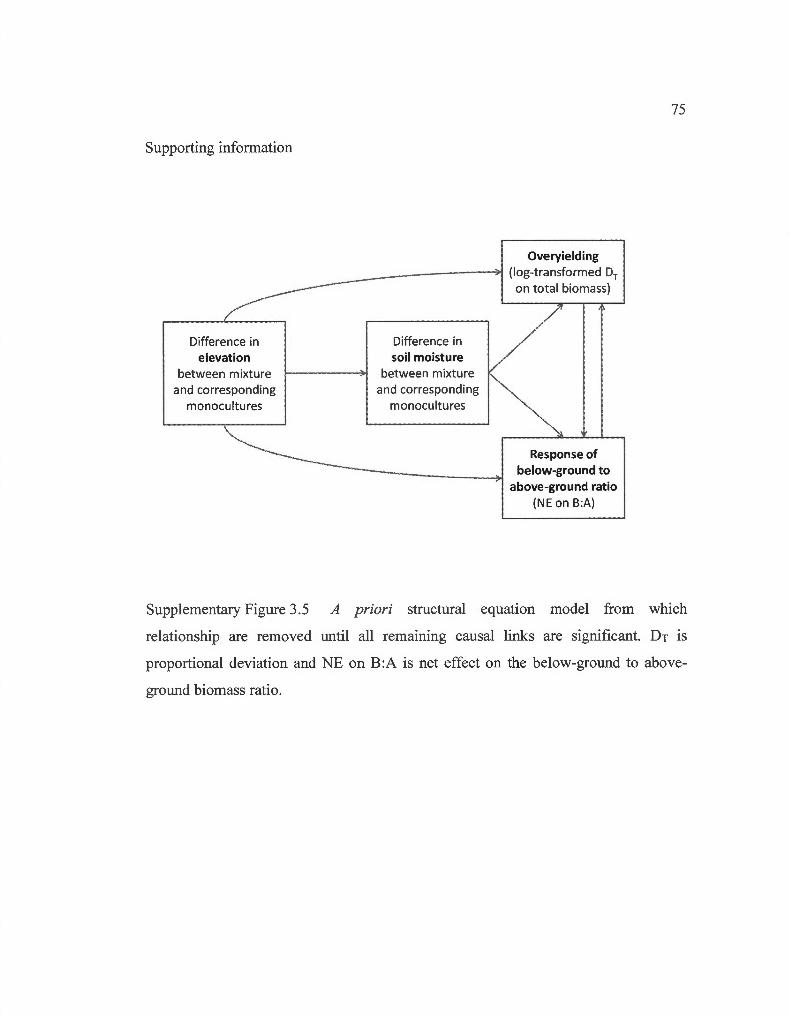
Supporting information
Difference in elevation
between mixture and corresponding
monocultures
Difference in soil moisture
between mixture and corresponding
monocultures
Overyielding (log-transformed Dr on total biomass)
Response of below-ground to
above-ground ratio (NE on B:A)
75
Supplementary Figure 3.5 A priori structural equation model from which
relationship are removed until all remaining causal links are significant. DT is
proportional deviation and NE on B:A is net effect on the below-ground to above
ground biomass ratio.
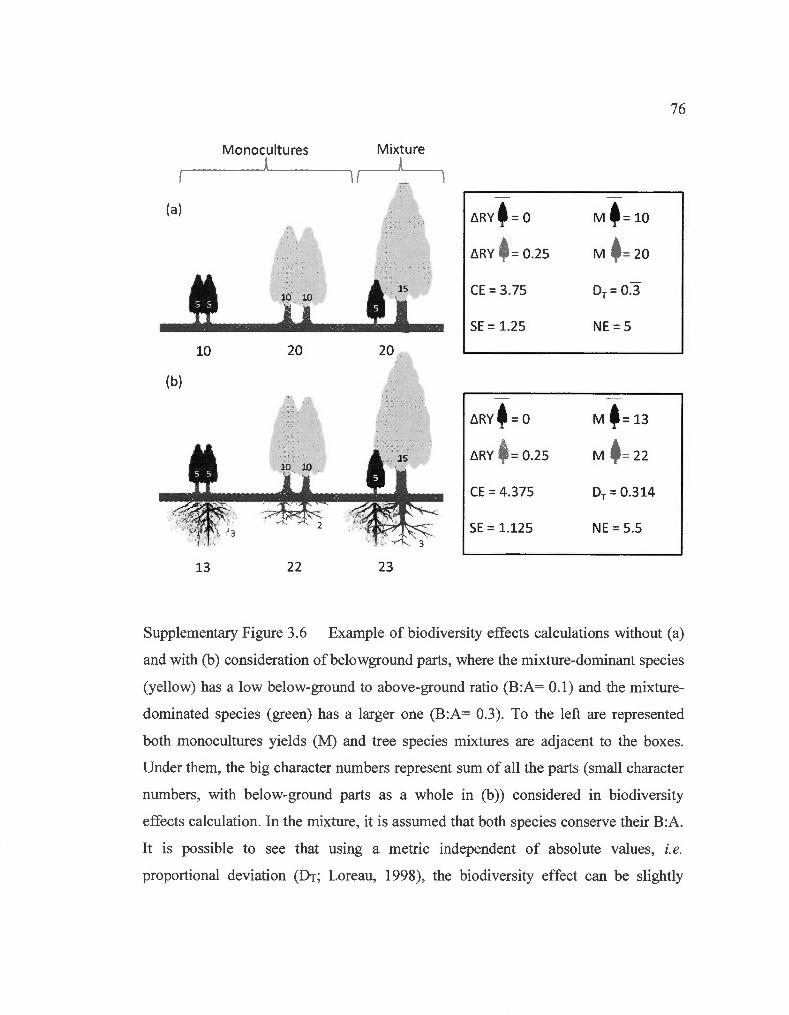
Monocultures
13 22
Mixture
1~
23
LlRYt = 0
LlRY ~ = 0.25
CE= 3.75
SE= 1.25
LlRYt = 0
LlRY ~ = 0.25
CE= 4.375
SE= 1.125
Mt= 10 M ~=20
Dr= 0.3
NE= 5
Mt= 13
M ~=22
Dr= 0.314
NE= 5.5
76
Supplementary Figure 3.6 Example of biodiversity effects calculations without (a)
and with (b) consideration of belowground parts, where the mixture-dominant species
(yellow) has a low below-ground to above-ground ratio (B:A= 0.1) and the mixture
dominated species (green) has a larger one (B:A= 0.3). To the left are represented
both monocultures yields (M) and tree species mixtures are adjacent to the boxes.
Under them, the big character numbers represent sum of all the parts (small character
numbers, with below-ground parts as a whole in (b)) considered in biodiversity
effects calculation. In the mixture, it is assumed that both species conserve their B:A.
It is possible to see that using a metric independent of absolute values, i.e.
proportional deviation (DT; Loreau, 1998), the biodiversity effect can be slightly
77
overestimated without below-ground biomass. After partitioning the net effect (NE)
into complementarity and selection effects (CE and SE; Loreau & Hector, 2001), we
can also see that CE increase accordingly to below-ground biomass addition (CE with
B 1 CE without B= 1.167; mean B 1 mean A= 0.167), while SE is slightly lower with
below-ground biomass than without them. This diminution is explained by smalle[
covariance value between difference in relative yield observed and expected (llRY)
and M due to below-ground biomass addition.
Loreau, M. (1998). Separating sampling and other effects in biodiversity experiments. Oikos, 82, 600-602. doi:10.2307/3546381
Loreau, M. & Hector, A. (200 1 ). Partitioning selection and complementarity m biodiversity experiments. Nature, 412(6842), 72-76. doi:10.1038/35083573
CHAPITRE IV
CONCLUSION
Les mécanismes potentiels qui mèneraient à une productivité améliorée dans les
communautés diverses d'arbres sont nombreux et peu étudiés. L'objectif de ce
mémoire était de vérifier la validité de certains d'entre eux dans une expérience de
biodiversité composée de jeunes arbres provenant d'espèces de la forêt tempérée
québécoise. Il a d'abord été question dans le chapitre II des effets de la diversité (ED)
sur l'interception de lumière et de leur rôle dans les ED observés sur la biomasse.
Dans le chapitre III, les données des biomasses racinaire et aérienne ont été intégrées
ensemble afin d'établir le potentiel ED sur les stratégies d'allocation des arbres. Cette
intégration a aussi permis de confirmer et de nuancer certaines des interprétations
faites à partir des ED obtenus sur la biomasse aérienne seule.
Les hypothèses de ce mémoire étaient : (al) qu'il y aurait plus de lumière capturée
que ce que l'on s'attend dans les mélanges et (a2) que cela expliquerait les futurs ED
observés sur la croissance; (b 1) que les mélanges alloueraient plus de biomasse à leur
partie aérienne et (b2) que cette réponse à la diversité corrélerait positivement avec la
réponse de la biomasse; (cl) qu'en concordance avec (bl), les ED sur la biomasse
serait plus grands avec la biomasse aérienne seule qu'avec la biomasse incluant les
parties souterraines; et finalement, ( c2) que les différences interspécifiques en termes
de stratégies de distribution de la biomasse créeraient une surestimation des effets de
sélection (SE) lorsqu'il n'y a uniquement que la biomasse aérienne qui est prise en
compte.
79
Le premier article de ce mémoire représente une rare tentative empirique à confirmer
une hypothèse prononcée par maints auteurs au cours des années, i.e. la présence d'un
partitionnement des niches aériennes relié à l'interception de la lumière en
peuplement mixte. Un problème méthodologique récurrent à cette hypothèse est le
contrôle de l'effet confondant amené par des ED antérieurs sur la biomasse aérienne.
En effet, ces derniers pourraient potentiellement provenir de mécanismes autres que
la complémentarité aérienne. La qualité temporelle des données récoltées au site
montréalais du « International Diversity Experiment Network with Trees » (IDENT)
présentait une opportunité unique de contrôler d'année en année cet effet confondant.
Les pourcentages d'AP AR ( « Absorbed Photosynthetically Active Radiation »)
observés en mélange se sont révélés plus élevés que leurs valeurs attendues selon les
monocultures, et cela, indépendamment des ED sur la biomasse aérienne au début de
l'année. Ce résultat soutient l'hypothèse (al) de ce mémoire.
Bien que le temps semblait jouer un rôle déterminant dans ce résultat, l'ED sur la
capture de lumière augmentant avec celui-ci, il y aurait possibilité que cet effet ne soit
qu'un artefact statistique créé par la transformation des données d'APAR, effectuée
afin atteindre la normalité. Mais le résultat qui a confronté le plus mes idées, rendant
impossible un quelconque support pour l'hypothèse (a2) de ce mémoire, est
l'impossibilité de lier ces ED sur la capture de lumière aux futurs ED sur la croissance
en surface terrière. Il est discuté qu'une trop grande variabilité dans les mesures de la
dimension des tiges a peut-être rendu impossible d'établir la relation avec les
accroissements annuels en ED sur la croissance. Ce résultat réduit grandement la
portée de cette première étude. Il faut dire que même si l'interception de lumière peut
être intéressante en soi à d'autres niveaux écologiques, comme pour la diversité en
plantes de sous-bois, cela ne cadrait pas avec le principal objectif de ce mémoire.
Les quatre hypothèses subséquentes étaient évaluées dans le second article de ce
mémoire. L'hypothèse (b 1) et (b2) n'ont pas été supportées par les résultats. Le fait
80
qu'il y ait eu des résultats contrastés entre les ED sur la biomasse aérienne et
souterraine lorsqu'analysées séparément ne tirait pas son origine d'un changement
dans l'allocation de la biomasse. L'équation utilisée pour évaluer l'ED sur l'allocation
contrôlait pour l'identité des espèces et pour leurs contributions au ratio entre
biomasse souterraine et aérienne (B:A) observé en mélange. Ce contraste serait plutôt
dû au fait que les espèces dominant les mélanges avaient un B:A plus bas que celles y
étant dominées.
Cette dernière observation fait directement référence à l'hypothèse ( c2) qm est
supportée par les évidences. Il a été démontré que les plus petites valeurs de B:A pour
les espèces dominantes, et inversement pour les espèces dominées, était la cause très
probable d'une surestimation des SE. Comme il a été mentionné dans l'introduction,
les SE sont une mesure de la contribution de l'identité des espèces dans les ED nets
(NE). Autrement dit, si les espèces qui dominent un mélange, i.e. qui ont des
rendements relatifs supérieurs aux autres, ont à la base une très grande productivité en
monoculture, les NE calculés seront supérieurs de ce simple fait. Cependant, si, à
l'ajout de la biomasse souterraine, la différence de la productivité entre les espèces
dominées et les espèces dominantes se révèle plus petite, les SE se révèleraient plus
petits en réalité. Il est très intéressant de noter que ce phénomène n'affectait pas les
effets de complémentarité (CE), qui s'avéraient être plus importants que
précédemment établi avec la biomasse aérienne seule. Cette surestimation des SE ne
changeait pas la conclusion initiale de la présence de NE généralement positifs dans
les mélanges. L'inclusion des racines aux calculs d'ED affectait autrement ces NE. Ils
n'étaient pas plus petits avec cette inclusion, infirmant l'hypothèse ( c 1 ), mais étaient
affectés différemment selon s'ils étaient positifs ou négatifs, les NE positifs étant
moins positifs et les négatifs moins négatifs. Cet effet de mitigation concorde avec
l'atténuation des différences interspécifiques en termes de biomasse à l'ajout de la
partie souterraine.
81
Suite aux divers résultats présentés dans ce mémoire, il demeure tout de même
difficile d'identifier clairement les mécanismes derrière les ED positifs observés au
site montréalais d'IDENT. La lumière semblait une piste prometteuse jusqu'au
moment où les ED sur l'interception se sont avérés insignifiants dans l'explication des
futurs ED sur la croissance. L'allocation de la biomasse étant inaffectée par la
diversité, aucune conclusion sur la complémentarité souterraine n'a pu être tirée. Le
résultat qui aura le plus de portée à mon avis est celui sur la surestimation des SE. Il
est mentionné dans l'article du troisième chapitre que le patron qui cause ce biais, i.e.
les espèces avec une grande vitesse de croissance et ayant des B:A peu élevés, est
aussi commun aux plantes herbacées. Ce patron rend possible la surestimation des SE
et, par le fait même, la sous-estimation de l'importance de la complémentarité, dans
beaucoup d'études BEF. Sans avoir de racines identifiées à l'espèce, mais seulement
une idée du B:A pour les espèces en monocultures, il suffit aux chercheurs de vérifier
si la dominance en mélange est corrélée aux B:A des espèces en monoculture pour
évaluer le risque d'un tel biais.
Plusieurs pistes potentielles restent à explorer pour décortiquer les ED sur la
biomasse dans une telle expérience. Bien que les données de lumière utilisées ont
l'avantage de représenter directement la réalité sur le terrain, il n'en reste pas moins
qu'un modèle d'interception aurait pu être calibré et utilisé dans des simulations. La
tentative de faire des inférences sur la complémentarité souterraine à partir d'un
changement d'allocation a été vaine, mais des moyens plus directs s'offrent aux futurs
chercheurs. Que ce soit très directement à l'aide de méthodes utilisant des isotopes, ou
un peu moins directement avec l'échantillonnage des racines à différentes strates.
Finalement, ce travail est un ajout au grandissant volume d'évidences positives et
négatives existant sur la relation BEF. Bien qu'aucun processus de complémentarité
entre les espèces n'ait clairement été mis à jour, il a été possible de voir que la lumière
est potentiellement l'un d'entre eux. Il permet aussi d'émettre un avertissement sur

82
l'utilisation du partitionnement du NE de Loreau et Hector (2001), une méthode
largement utilisée dans le domaine.
BIBLIOGRAPHIE
Archambault C. (2016). Effet de la diversité spécifique et fonctionnelle des arbres sur la densité et profondeur d'enracinement. Mémoire de maîtrise, Université du Québec à Montréal. 87 p.
Bates, D., Maechler, M., Bolker, B. et Walker, S. (2014). Fitting linear mixed-effects models using lme4. Journal of Statistical Software, arXiv, 1406.5823 . doi: 1 0.18637/jss.v067.i01
Bessler, H. , Temperton, V. M. , Roscher, C., Buchmann, N. , Schrnid, B. , Schulze, E., . . . Engels, C. (2009). Aboveground overyielding in grassland mixtures is associated with reduced biomass partitioning to belowground organs. Ecology, 90(6), 1520-1530. doi:10.1890/08-0867.1
Binkley, D. (2003). Seven decades of stand development in mixed and pure stands of conifers and nitrogen-fixing red aider. Canadian Journal of Forest Research, 33, 2274-2279. doi:10 .1139/x03-158
Bloom, A. J. , Chapin, F. S. et Mooney, H. A. (1985). Ressource limitation in plantsan economie analogy. Annual Review ofEcology and Systematics, 16, 363-392.
Boite, A. et Villanueva, I. (2006). Interspecific competition impacts on the morphology and distribution of fine roots in European beech (Fagus sylvatica L.) and Norway spruce (Picea abies (L.) karst.) . European Journal of Forest Research, 125, 15-26. doi:10.1007/s10342-005-0075-5
Brassard, B. W., Chen, H. Y. H., Bergeron, Y. et Paré, D. (2011). Differences in fine root productivity between mixed- and single-species stands. Functional Ecology, 25 , 238-246. doi:10.1111 /j.1365-2435.2010.01769.x
Cairns, M. A., Brown, S. , Helmer, E. H. , Baumgardner, G. A. , Cairns, M. A. , Brown, S. , .. . Baumgardner, G. A. (1997). Root biomass allocation in the world ' s upland forests . Oecologia, 111 (1 ), 1-11. doi : 10.1 007/s00442005020 1
Caliman, A. , Pires, A. F. , Esteves, F. A. , Bozelli, R. L. et Farjalla, V. F. (2010) . The
84
prominence of and biases in biodiversity and ecosystem functioning research. Biodiversity and Conservation, 19,651 -664. doi:10.1007/s10531-009-9725-0
Canham, C. D. , Berkowitz, A. R. , Kelly, V. R. , Lovett, G. M., Ollinger, S. V. et Schnurr, J. (1996). Biomass allocation and multiple resource limitation in tree seedlings. Canadian Journal of Forest Research, 26(9), 1521 -1530. doi: 10.1139/x26-171
Cardinale, B. J ., Wright, J. P. , Cadotte, M. W., Carroll, 1. T., Hector, A. , Srivastava, D. S., . . . Weis, J. J. (2007) . Impacts of plant diversity on biomass production increase through time because of species complementarity. Proceedings of the National Academy of Sciences of the United States of America, 1 04( 46), 18123-18128. doi: 10.1 073/pnas.07090691 04
Cardinale, B. J., Matulich, K. L., Hooper, D. U., Byrnes, J. E., Duffy, E., Gamfeldt, L. , . .. Gonzalez, A. (2011). The functional role of producer diversity in ecosystems. American Journal of Botany, 98(3), 572-592. doi: 1 0.3732/ajb.1 000364
Cardinale, B. J., Duffy, J. E. , Gonzalez, A. , Hooper, D. U., Perrings, C., Venail, P., . .. Naeem, S. (2012) . Biodiversity loss and its impact on humanity. Nature, 489, 326-326. doi:10.1038/nature11373
DeClerck, F. A. J. , Barbour, M. G. et Sawyer, J. O. (2005). Resource use efficiency as a function of species richness and stand composition in upper montane conifer forests of the Sierra Nevada. Journal of Vegetation Science, 16(4), 443 -452. doi: 1 0.1111/j.1654-11 03.2005 .tb02384.x
Domisch, T., Finér, L. , Dawud, S. M. , Vesterdal, L. et Raulund-Rasmussen, K. (2014). Does species richness affect fine root biomass and production in young forest plantations? Oecologia, 177, 581-594. doi: 10.1007 /s00442-014-31 07-3
Forest Products Laboratory - USDA. (1999). Wood handbook - Wood as an engineering material. General Technical Report FPL-GTR-190.
Forrester, D. 1. , Bauhus, J. , Cowie, A. L. et Vanclay, J. K. (2006) . Mixed-species plantations of Eucalyptus with nitrogen-fixing trees: a review. Forest Ecology and Management, 233,211-230. doi :10.1016/j.foreco.2006.05 .012
Forrester, D. 1. et Albrecht, A. T. (2014). Light absorption and light-use efficiency in
85
mixtures of Abies alba and Picea abies along a productivity gradient. Forest Ecology and Management, 328, 94-102. doi:10.1016/j.foreco.2014.05 .026
Fox, J. W. (2005). Interpreting the « selection effect » of biodiversity on ecosystem function. Ecology Letters, 8(8), 846-856. doi:10.1111 /j.1461-0248.2005 .00795.x
Hartley, M. (2002). Rationale and methods for conservating biodiversity in plantation forests. Forest Ecology and Management, 155, 81-95 .
Helmisaari, H. S. , Makkonen, K. , Kellomaki, S., Valtonen, E. et Malkonen, E. (2002). Below- and above-ground biomass, production and nitrogen use in Scots pine stands in eastern Finland. Forest Ecology and Management, 165, 317-326. doi:16/S0378-1127(01)00648-X
Hooper, D. U. , Adair, E. C. , Cardinale, B. J. , Bymes, J. E. K., Hungate, B. A., Matulich, K. L. , ... 0 / ' Connor, M. 1. (2012) . A global synthesis reveals biodiversity loss as a major driver of ecosystem change. Nature, 486(7401), 105-108. doi: 10.1 038/nature 11118
Huston, M. a. (1997). Hidden treatments in ecological experiments: re-evalutating the ecosystem function of biodiverstiy. Oecologia, 110, 449-460.
Isbell, F., Tilman, D. , Polasky, S. et Loreau, M. (2014). The biodiversity-dependent ecosystem service debt. Ecology Letters, 18(2), 1-26. doi: 1 0.1111 /ele.12393
Jacob, M., Leuschner, C. et Thomas, F. M. (201 0). Productivity of temperate broadleaved forest stands differing in tree species diversity. Annals of Forest Science, 67, 503-503 . doi:10.1051 /forest/2010005
Jewell, M. D. (2013). Tree diversity, above-below ground interactions and leaf litter decomposition. Mémoire de maîtrise, Université de Sherbrooke.
Klironomos, J. N. , McCune, J. , Hart, M. et Neville, J. (2000). The influence of arbuscular mycorrhizae on the relationship between plant diversity and productivity. Ecology Letters, 3, 137-141. doi:10.1046/j.1461 -0248 .2000.00131.x
Kobe, R. K. , lyer, M. et Walters, M. B. (2010). Optimal partitioning theory revisited: nonstructural carbohydrates dominate root mass responses to nitrogen. Ecology,
86
91(1), 166-179. doi:10.1890/09-0027.1
Laliberté, E. et Legendre, P. (20 1 0). A distance-based framework for measuring functional diversity from multiple traits. Ecology, 91(1), 299-305 . doi: 10.1890/08-2244.1
Lang, A. C., von Oheimb, G. , Scherer-Lorenzen, M. , Yang, B. , Trogisch, S., Bruelheide, H., . .. Hardtle, W. (2014) . Mixed afforestation of young subtropical trees promotes nitrogen acquisition and retention. Journal of Applied Ecology, 51 , 224-233. doi:lO.llll/1365-2664.12157
Lei, P. , Scherer-Lorenzen, M. et Bauhus, J. (2012). The effect of tree species diversity on fine-root production in a young temperate forest. Oecologia, 169, 1105-1115 . doi :10.1007/s00442-012-2259-2
Liang, J. , Crowther, T. W., Picard, N. , Wiser, S., Zhou, M. , Alberti , G. , . . . Reich, P. B. (20 16). Positive biodiversity-productivity relationship predominant in global forests . Science, 354(6309), aaf8957-aaf8957. doi:10.1126/science.aaf8957
Litton, C. M., Ryan, M. G., Tinker, D. B. et Knight, D. H. (2003). Belowground and aboveground biomass in young postfire lodgepole pi ne forests of contrasting tree density. Canadian Journal of Forest Research, 33 , 351 -363 . doi:10.1139/x02-181
Loreau, M. (1998). Separating sampling and other effects in biodiversity experiments. Oikos, 82, 600-602. doi:10 .2307/3546381
Loreau, M. et Hector, A. (2001). Partitioning selection and complementarity in biodiversity experiments. Nature, 412(6842), 72-76. doi:10.1038/35083573
Loreau, M. (20 1 0). Linking biodiversity and eco systems: towards a unifying ecological theory. Philosophical transactions of the Royal Society of London. Series B, Biological Sciences, 365, 49-60. doi : 10.1 098/rstb.2009 .0155
Lovelock, C. E. et Ewel, J. J. (2005). Links between tree species, symbiotic fungal diversity and ecosystem functionng in simplified tropical ecosystems. New Phytologist, 167, 219-228 .
McCarthy, M. C. et Enquist, B. J. (2007). Consistency between an allometric approach and optimal partitioning theory in global patterns of plant biomass
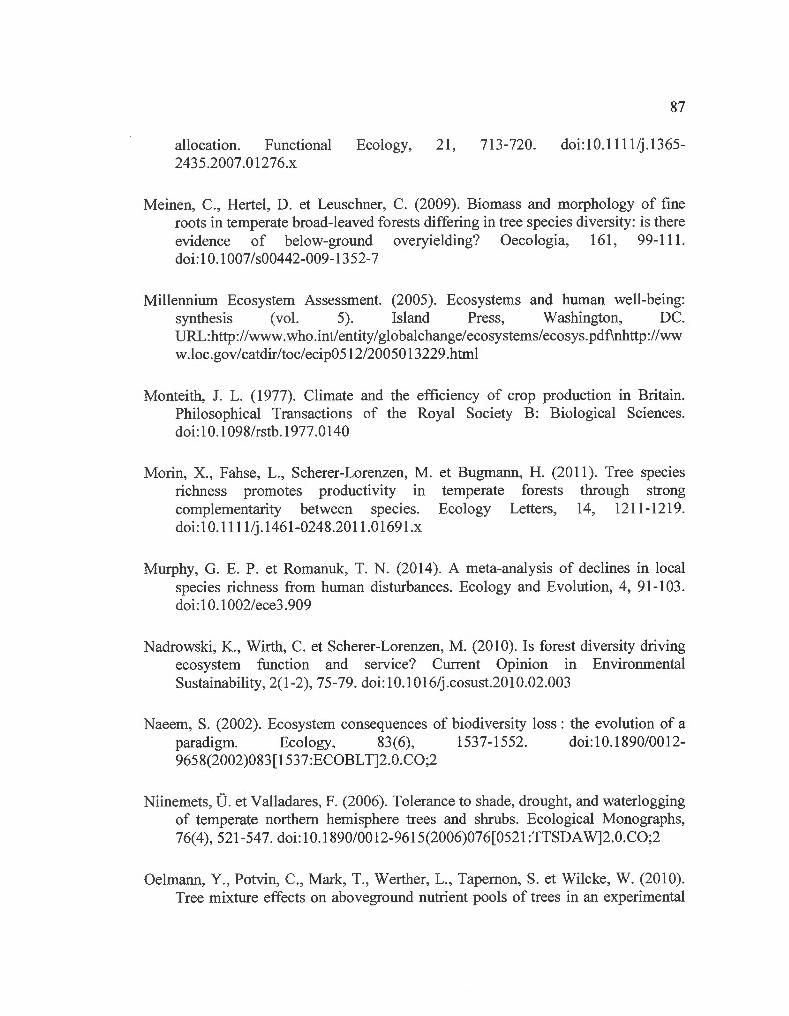
87
allocation. Functional Ecology, 21 , 713 -720. doi:10.1111 /j.1365-2435.2007.01276.x
Meinen, C., Hertel, D. et Leuschner, C. (2009). Biomass and morphology of fine roots in temperate broad-leaved forests differing in tree species diversity: is there evidence of below-ground overyielding? Oecologia, 161 , 99-111. doi: 10.1007 /s00442-009-1352-7
Millennium Ecosystem Assessment. (2005) . Ecosystems and human well-being: synthesis (vol. 5). Island Press, Washington, DC. URL:http: //www.who.int/entity/globalchange/ecosystems/ecosys.pdf\nhttp://ww w.loc.gov/catdir/toc/ecip0512/20050 13229 .html
Monteith, J. L. (1977) . Climate and the efficiency of crop production in Britain. Philosophical Transactions of the Royal Society B: Biological Sciences. doi: 10.1 098/rstb.1977.0 140
Morin, X., Fahse, L. , Scherer-Lorenzen, M. et Bugmann, H. (2011). Tree species richness promotes productivity m complementarity between species. doi:10.1111 /j.1461-0248.2011.01691.x
temperate forests Ecology Letters,
through strong 14, 1211 -1219.
Murphy, G. E. P. et Romanuk, T. N. (2014). A meta-analysis of declines in local species richness from human disturbances. Ecolo gy and Evolution, 4, 91-103 . doi: 10.1 002/ece3 .909
Nadrowski, K. , Wirth, C. et Scherer-Lorenzen, M. (20 1 0). Is forest diversity driving ecosystem function and service? Current Opinion in Environmental Sustainability, 2(1-2), 75 -79. doi: 10.1 016/j .cosust.201 0.02.003
Naeem, S. (2002) . Ecosystem consequences of biodiversity loss: the evolution of a paradigm. Ecology, 83(6), 1537-1552. doi:10.1890/0012-9658(2002)083[1537:ECOBLT]2.0.C0;2
Niinemets, Ü. et Valladares, F. (2006). Tolerance to shade, drought, and waterlogging of temperate northem hemisphere trees and shrubs. Ecological Monographs, 76( 4), 521-547. doi:l 0.1890/0012-9615(2006)076[0521 :TTSDA W]2.0.C0;2
Oelmann, Y., Potvin, C., Mark, T. , Werther, L. , Tapemon, S. et Wilcke, W. (2010) . Tree mixture effects on aboveground nutrient pools of trees in an experimental
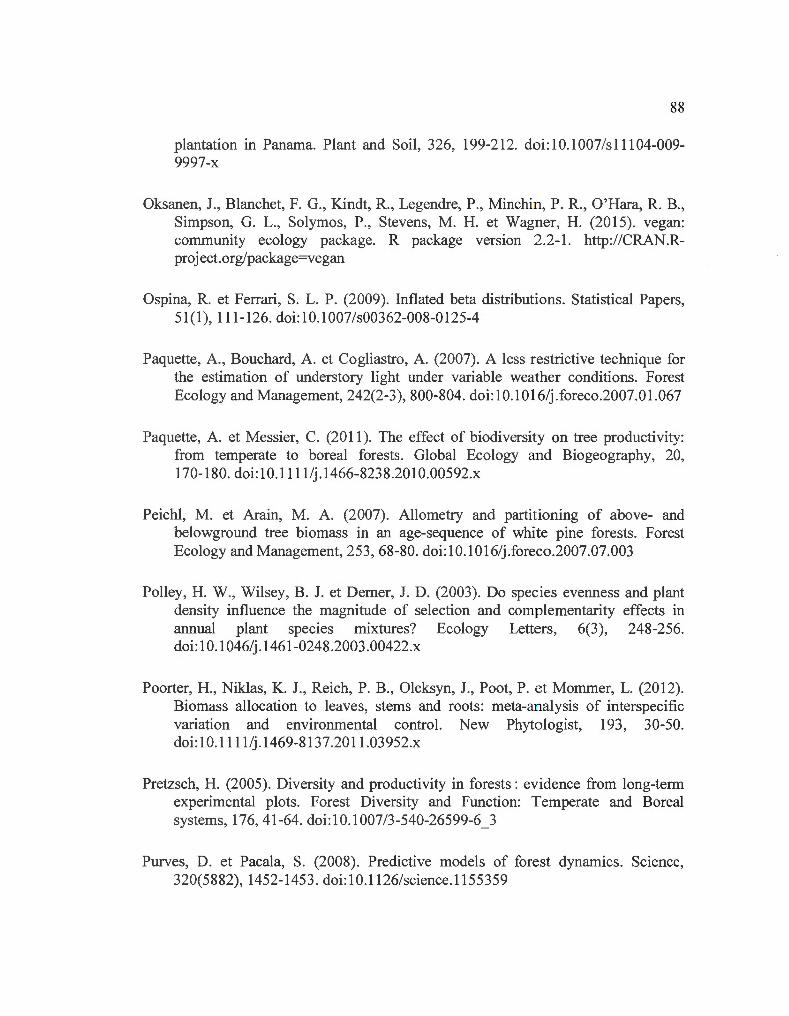
88
plantation in Panama. Plant and Soil, 326, 199-212. doi:10.1007/s11104-009-9997-x
Oksanen, J. , Blanchet, F. G. , Kindt, R. , Legendre, P. , Minchin, P. R., O 'Hara, R. B. , Simpson, G. L. , Solymos, P. , Stevens, M. H. et Wagner, H. (2015). vegan: community ecology package. R package version 2.2-1. http://CRAN.Rproject.org/package=vegan
Ospina, R. et Ferrari, S. L. P. (2009). Inflated beta distributions. Statistical Papers, 51(1), 111-126. doi:10.1007/s00362-008-0125-4
Paquette, A. , Bouchard, A. et Cogliastro, A. (2007). A less restrictive technique for the estimation of understory light under variable weather conditions. Forest Ecology and Management, 242(2-3), 800-804. doi:10.1016/j.foreco.2007.01.067
Paquette, A. et Messier, C. (2011). The effect of biodiversity on tree productivity: from temperate to boreal forests . Global Ecology and Biogeography, 20, 170-180. doi:10.1111 /j.1466-8238.2010.00592.x
Peichl, M. et Arain, M. A. (2007). Allometry and partltwning of above- and belowground tree biomass in an age-sequence of white pine forests. Forest Ecology and Management, 253 , 68-80. doi:10.1016/j.foreco.2007.07.003
Polley, H. W., Wilsey, B. J. et Demer, J. D. (2003). Do species evenness and plant density influence the magnitude of selection and complementarity effects in annual plant species mixtures? Ecology Letters, 6(3), 248-256. doi: 1 0.1046/j.1461-0248.2003 .00422.x
Poorter, H., Niklas, K. J. , Reich, P. B. , Oleksyn, J. , Poot, P. et Mommer, L. (2012). Biomass allocation to leaves, stems and roots: meta-analysis of interspecific variation and environmental control. New Phytologist, 193, 30-50. doi:10.1111/j.1469-8137.2011.03952.x
Pretzsch, H. (2005). Diversity and productivity in forests: evidence from long-term experimental plots. Forest Diversity and Function: Temperate and Boreal systems, 176, 41-64. doi: 10.1 007/3-540-26599-6_3
Purves, D. et Pacala, S. (2008). Predictive models of forest dynamics. Science, 320(5882), 1452-1453 . doi:10.1126/science.1155359
89
R Core Team (20 15). R: a language and environment for statistical computing. R Foundation fot Statistical Computing, Vienna, Austria. URL:http://www.Rproject.org/.
Reich, P. B. , Tjoelker, M. G. , Walters, M. B. , Vanderklein, D. W. et Buschena, C. (1998) . Close association of RGR, leaf and root morphology, seed mass and shade tolerance in seedlings of nine boreal tree species grown in high and low light. Functional Ecology, 12(3), 327-338. doi:10.1046/j.1365-2435 .1998.00208.x
Reich, P. B. (2002) . Root-shoot relations: optimality in acclimitization and adaptation or the « Emperor' s new clothes »? Plant Roots: the hidden half (pp. 205-220).
Reich, P. B. , Tilman, D. , Isbell, F. , Mueller, K. , Hobbie, S. E., Flynn, D. F. B. et Eisenhauer, N. (2012) . Impacts of biodiversity Joss escalate through time as redundancy fades. Science, 336(6081), 589-592. doi:10.1126/science.1217909
Richards, A. E., Forrester, D. 1. , Bauhus, J. et Scherer-Lorenzen, M. (201 0). The influence of mixed tree plantations on the nutrition of individual species: a review. Tree Physiology, 30, 1192-1208. doi: 10.1 093/treephys/tpq035
Ricketts, T. H., Watson, K. B., Koh, 1. , Ellis, A. M., Nicholson, C. C., Posner, S. , . . . Sonter, L. J. (20 16). Disaggregating the evidence linking biodiversity and ecosystem services. Nature Communications, 7, 13106. doi: 10.1 038/ncomms13106
Rigby, R. A., Stasinopoulos, D. M. et Lane, P. W. (2005). Generalized additive models for location, scale and shape. Journal of the Royal Statistical Society. Series C: Applied Statistics, 54(3), 507-554. doi:10.1111 /j .1467-9876.2005.00510.x
Rivest, D. , Paquette, A., Shipley, B. , Reich, P. B. et Messier, C. (2015). Tree communities rapidly alter soi! microbial resistance and resilience to drought. Functional Ecology, 29(4), 570-578. doi:10.111111365 -2435.12364
Rossee!, Y. (2012). lavaan: an R package for structural equation modeling. Journal of Statistical Software, 48(2), 1-36. URL:http://www.jstatsoft.org/v48/i02/
Rudgers, J. A. , Koslow, J . M. et Clay, K. (2004). Endophytic fungi alter relationships between diversity and ecosystem properties. Ecology Letters, 7, 42-51.
_j
90
doi: 10.1 046/j .1461-0248.2003.00543.x
Sapijanskas, J. , Potvin, C. et Loreau, M. (2013). Beyond shading: litter production by neighbours contributes to overyielding in tropical trees. Ecology, 94( 4), 941-952. doi: 10.1890112-0337.1
Sapijanskas, J. , Paquette, A. , Potvin, C. , Kunert, N. et Loreau, M. (2014). Tropical tree diversity enhances light capture through crown plasticity and spatial and temporal niche differences. Ecology, 95(9), 2479-2492. doi:10.1890113-1366.1
Scherer-Lorenzen, M. , Schulze, E . D. , Don, A. , Schumacher, J. et Weiler, E. (2007). Exploring the functional significance of forest diversity: a new long-term experiment with temperate tree species (BIOTREE). Perspectives in Plant Ecology, Evolution and Systematics, 9, 53-70. doi:10.1016/j.ppees.2007.08.002
Schmid, B. , Hector, A. , Saha, P. et Loreau, M. (2008) . Biodiversity effects and transgressive overyielding. Journal of Plant Ecology, 1(2), 95-102. doi: 10.1 093/jpe/rtn011
Seide!, D. , Leuschner, C. , Scherber, C., Beyer, F. , Wommelsdorf, T., Cashman, M. J. et Fehrmann, L. (2013). The relationship between tree species richness, canopy space exploration and productivity in a temperate broad-leaf mixed forest. Forest Ecology and Management, 310, 366-374. doi:10.1016/j.foreco.2013.08.058
Smithson, M. et Verkuilen, J. (2006). A better lemon squeezer? Maximum-likelihood regression with beta-distributed dependent variables. Psychological methods, 11 (1 ), 54-71. doi: 10.103711 082-989X.11.1.54
Spehn, A. E. M., Hector, A. , Joshi, J. , Schmid, B. , Beierkuhnlein, C. , Caldeira, M. C. , . . . Schul, E. (2005). Ecosystem effects of biodiversity manipulations in european grasslands. Ecological Monographs, 75(1), 37-63 . doi: 10.1890/03-4101
Srivastava, D. S. et Vellend, M. (2005). Biodiversity-ecosystem function research: is it relevant to conservation? Annual Review of Ecology, Evolution, and Systematics, 36(2005), 267-294. doi: 1 0.1146/annurev.ecolsys.36.1 02003.152636
Templer, P. H. et Dawson, T. E. (2004). Nitrogen uptake by four tree species of the Catskill Mountains, New York: implications for forest N dynamics. Plant and
91
Soil, 262, 251-261. doi:10 .1023/B:PLS0.0000037047.16616.98
Tobner, C. M. , Paquette, A. , Reich, P. B. , Gravel, D . et Messier, C. (2014) . Advancing biodiversity-ecosystem functioning science using high-density treebased experiments over functional diversity gradients. Oecologia, 17 4, 609-621. doi: 10.1007 /s00442-0 13-2815-4
Tobner, C. M., Paquette, A. , Gravel, D. , Reich, P. B. , Williams, L. J. et Messier, C. (20 16). Functional identity is the main driver of diversity effects in young tree communities, Ecology Letters. doi: 1 0.1111 /ele.12600
Trogisch, S. (2012). The functional significance oftree diversity for soil N-pools, leaf litter decomposition and N-uptake complementarity in subtropical forests in China. Thèse de doctorat, ETH Zurich. 136 p.
Unger, M. , Homeier, J. et Leuschner, C. (2013). Relationships among leafarea index, below-canopy light availability and tree diversity along a transect from tropical lowland to montane forests in NE Ecuador. Tropical Ecology, 54(1), 33-45.
Vellend, M. , Baeten, L. , Myers-Smith, I. H. , Elmendorf, S. C., Beauséjour, R., Brown, C. D. , . . . Wipf, S. (2013) . Global meta-analysis reveals no net change in local-scale plant biodiversity over time. Proceedings of the National Academy of Sciences of the United States of America, 110(48), 19456-9. doi: 10.1 073/pnas.131277911 0
Verheyen, K. , Vanhellemont, M. , Auge, H. , Baeten, L. , Baraloto, C ., Barsoum, N. , .. . Scherer-Lorenzen, M. (2016). Contributions of a global network oftree diversity experiments to sustainable forest plantations. Am bio, 45(1 ), 29-41. doi: 10.1007 /s 13280-015-0685-1
Vilà, M., Vayreda, J. , Gracia, C. et lbafiez, J. J. (2003). Does tree diversity increase wood production in pine forests? Oecologia, 135, 299-303 . doi :10.1007/s00442-003-1182-y
Vilà, M., Carrillo-Gavilan, A., Vayreda, J., Bugmann, H. , Fridman, J., Grodzki, W., . .. Trasobares, A. (2013). Disentangling biodiversity and climatic determinants of wood production. PLoS ONE, 8(2). doi :10.1371/joumal.pone.0053530
Vojtech, E., Loreau, M. , Yachi , S. , Spehn, E. M. et Hector, A. (2008). Light partitioning in experimental grass communities. Oikos, 117, 1351-1361.
---------------------- --- ------- --- - ----- --------- - --------------------- !
92
doi:10.1111 /j .2008.0030-1299.16700.x
Wardle, D. A. (2016). Do functioning relationships ecosystems? Journal doi :10.1111/jvs.12399
experiments exploring plant diversity-ecosystem inform how biodiversity loss impacts natural of Vegetation Science, 27(3), 646-653.
Williams, L. , Paquette, A. , Cavender-Bares, J., Messier, C. & Reich, P.B. (sous révision) Spatial complementarity in tree crowns drives overyielding in species mixtures.
Wright, I. J., Reich, P. B., Westoby, M. , Ackerly, D. D. , Baruch, Z. , Bongers, F., ... Villar, R. (2004) . The worldwide leaf economies spectrum. Nature, 428(6985), 821-827. doi: 10.103 8/nature02403
Yachi, S. et Loreau, M. (2007). Does complementary resource use enhance ecosystem functioning? A model of light competition in plant communities. Ecology Letters, 10, 54-62. doi:10.1111/j.1461-0248.2006.00994.x
Zeugin, F. , Potvin, C., Jansa, J. et Scherer-Lorenzen, M. (2010) . Is tree diversity an important driver for phosphorus and nitrogen acquisition of a young tropical plantation? Forest Ecology and Management, 260(9), 1424-1433. doi: 10.10 16/j .foreco.201 0.07.020
Zhang, Y. , Chen, H. Y. H. et Reich, P. B. (2012). Forest productivity increases with evenness, species richness and trait variation: a global meta-analysis. Journal of Ecology, 100, 742-749. doi: 1 0.1111 /j.1365-2745.20 11.0 1944.x