Embed Size (px)
Citation preview

D. Moretti, A. Garenne, F. Poulletier de Gannes, E. Haro, I. Lagroye, P. Levêque, B. Veyret & N. Lewis
Effets de signaux RF GSM-1800 sur l’activité électrique de réseaux de neurones en culture
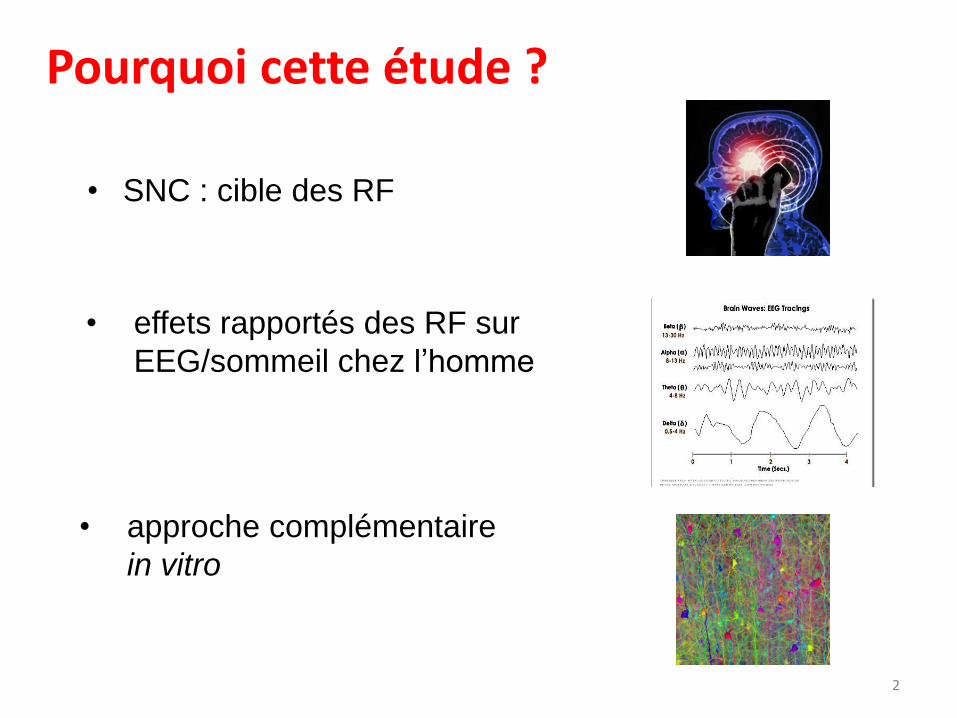
Pourquoi cette étude ?
• SNC : cible des RF
2
• effets rapportés des RF sur
EEG/sommeil chez l’homme
• approche complémentaire
in vitro
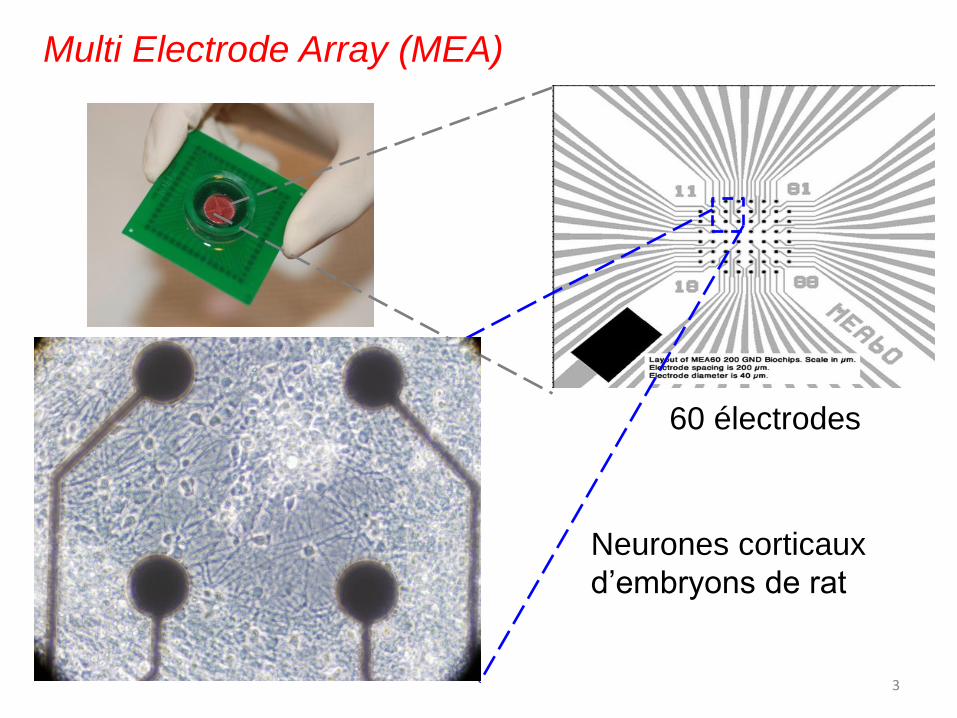
Multi Electrode Array (MEA)
3
60 électrodes
Neurones corticaux
d’embryons de rat
4
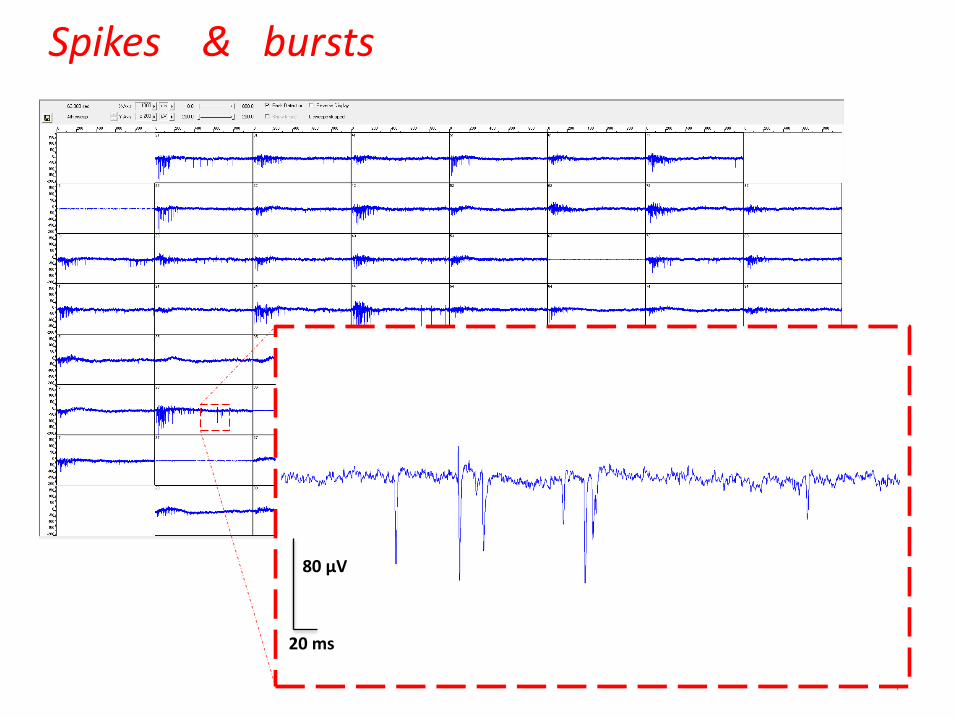
20 ms
80 μV
Spikes & bursts
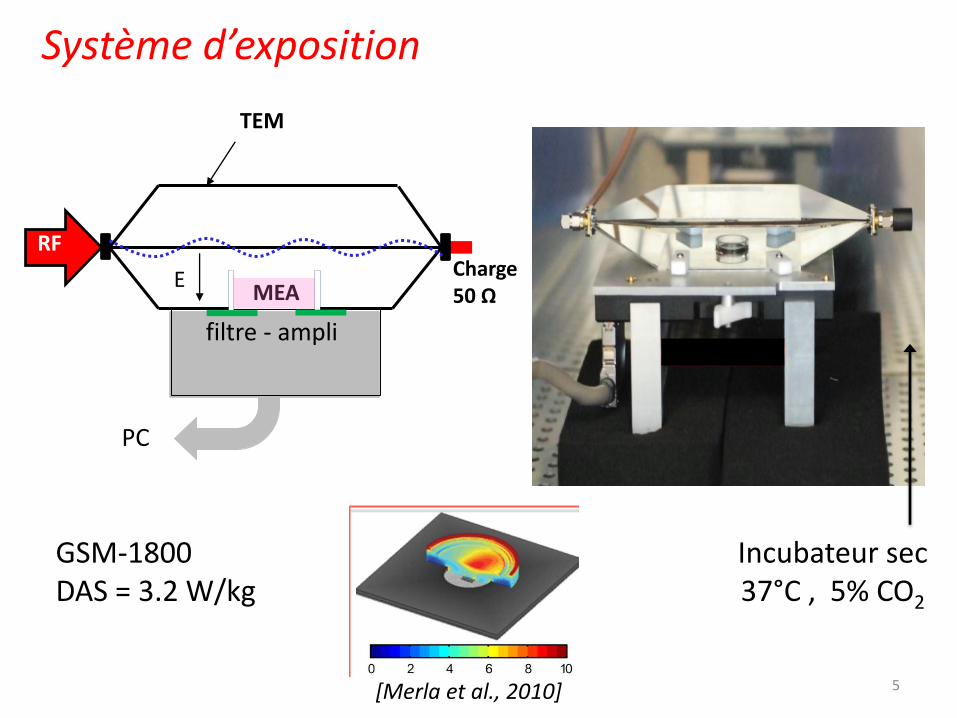
Système d’exposition
GSM-1800 DAS = 3.2 W/kg
Incubateur sec 37°C , 5% CO2
RF Charge 50 Ω
TEM
filtre - ampli
PC
MEA E
758 IEEE TRANSACTIONS ON MICROWAVE THEORY AND TECHNIQUES, VOL. 59, NO. 3, MARCH 2011
Fig. 5. Diagram of the setup used for temperature measurements. The Luxtronprobe positioning within the MEA resin holder is also shown in the figure inset.
respectively). The measurements were carried out both on an
empty TEM cell and on a MEA equipped one.
2) Temperature Measurements and SAR Evaluation: The
measurements were performed using a nonperturbing thermo-
metric method [28] with a Luxtron One version 2.82 probe
(uncertainty 0.1 C). The TEM cell equipped with MEA
and the sample holder filled with 3-mL RPMI solution was
exposed at an input power of 6.6 W delivered by a Rohde
& Schwarz signal generator (10 MHz-20 GHz) at 1.8 GHz
connected to an RFPA 8502000-10 power amplifier for 60 s,
as described in [27]. The measurement protocol included two
further dwell times before and after the MW exposure to guar-
antee temperature stability at the beginning of exposure, and
to verify temperature decay once the MW power was turned
off. A Labview code enabled a PC with an RS-232 interface to
automatically acquire temperature. Power monitoring during
exposure was performed using an HP33120A power meter
fitted with HPE4412A probes. A 5-mm-diameter hole was
made on the top and central TEM cell plates to enable probe
insertion without modifying system performance. The mea-
surement setup and Luxtron probe positioning within the MEA
resin holder are schematically depicted in Fig. 5.
Five consecutive temperature acquisitions were performed
on a single point on the center of the chip (see Fig. 5) where
the recording electrodes are positioned and neuron activity
takes place. As this region is very small (dimensions reported
in Section II-B) compared with the probe measurement volume
(about 1 mm ), temperature recordings on multiple points were
not feasible. The temperature measurements during exposure
(60 s) were interpolated using a linear regression method. The
slope of the straight line represents the term at , as
reported in the well-known equation (1), necessary to calculate
the SAR
(1)
The term is the sample specific heat, equal to
0.95 cal kg C and 4186 is the specific heat scale
factor.
To determine the thermal behaviors of the target in actual bi-
ological experiments, a set of temperature measurements within
an incubator at 37 C, 95% humidity (Binder APT line C 150)
was carried out using the same measurements setup (Fig. 5).
Since the open TEM cell presents slight EM fringe effects [26],
Fig. 6. SAR distribution in the whole biological sample volume obtained withelectrodes (80 and 40 m) and without them (SAR visualized in the half ofstructure). (a) In the case of isolated electrodes. (b) In the case of the metal-connected electrodes.
foam absorbers were used to cover the metallic walls of the incu-
bator to avoid any interference during MW exposure. A different
protocol was used, which includes 4-h MW exposure, with two
2-h periods of sham exposure both before and after. An input
power of 2.3 W was used during MW exposure.
III. RESULTS
A. Numerical Dosimetry
SAR distribution at 1.8 GHz is illustrated in Fig. 6 for both
modeling strategies (i.e., isolated electrodes and metal-con-
nected electrodes, see Fig. 4). This was calculated within the
whole biological sample using 80- and 40- m recording elec-
trodes and also without electrodes (Fig. 4). The SAR statistical
analyses are reported in Table III. In all cases, the mean SAR
values (with a maximum variability of only 15%) did not
depend on the presence and size of electrodes (Table III). This
result is understandable, as the contact volume of the electrodes
with the biological solution is very small.
Furthermore, in simulations using isolated electrodes, SAR
inhomogeneity, quantified as the coefficient of variation ( ,
i.e., the percentage ratio between the standard deviation and the
mean value, , reached a max-
imum of 67.5% when the recording electrodes were completely
5 [Merla et al., 2010]
Système d’exposition : Réseaux de neurones
Acquisition et Traitement du Signal
Matériels et Méthodes
Résultats
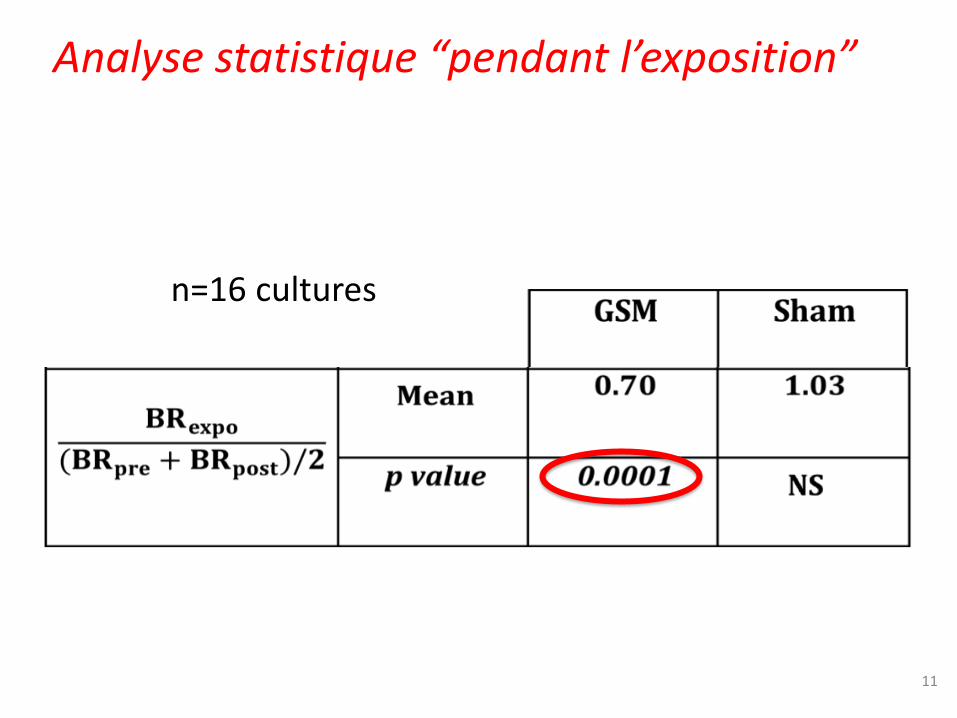
Réduction de 30% du nombre de spikes sur
3 min pendant l’exposition (p expo= 0,0003)
• Amplitude de l’effet en fonction des paramètres de
l’exposition RF (puissance, durée, modulation,
etc.)
• Effets sur la plasticité (pharmacologique, électrique)
• Mécanismes d’interaction
Sig
na
l
t
4,6 ms
1/8 7/8
0,57 ms
Signal utilisé pour
l’exposition:
GSM 1800 MHz
MEA
amplificateur
50!
charge
RF
TEM
signaux
neuronaux
Perspectives
No
mb
re d
e s
pik
es s
ur
3 m
in.
0
2
4
6
8
10
12
15 15 15 15 15 18 18 18 18 18 19 21
EXPOSUREBEFORE
EXPO
AFTER
DIV
MF
R [
Hz]
0
2
4
6
8
10
12
14 14 14 14 14 17 17 17 17 17 18 20
SHAM EXPOSURE
DIV
MF
R [
Hz]
Exposition réelle
Exposition fictive
Jours de cultures
Jours de cultures
Cellule Transversale Electromagnétique (TEM)
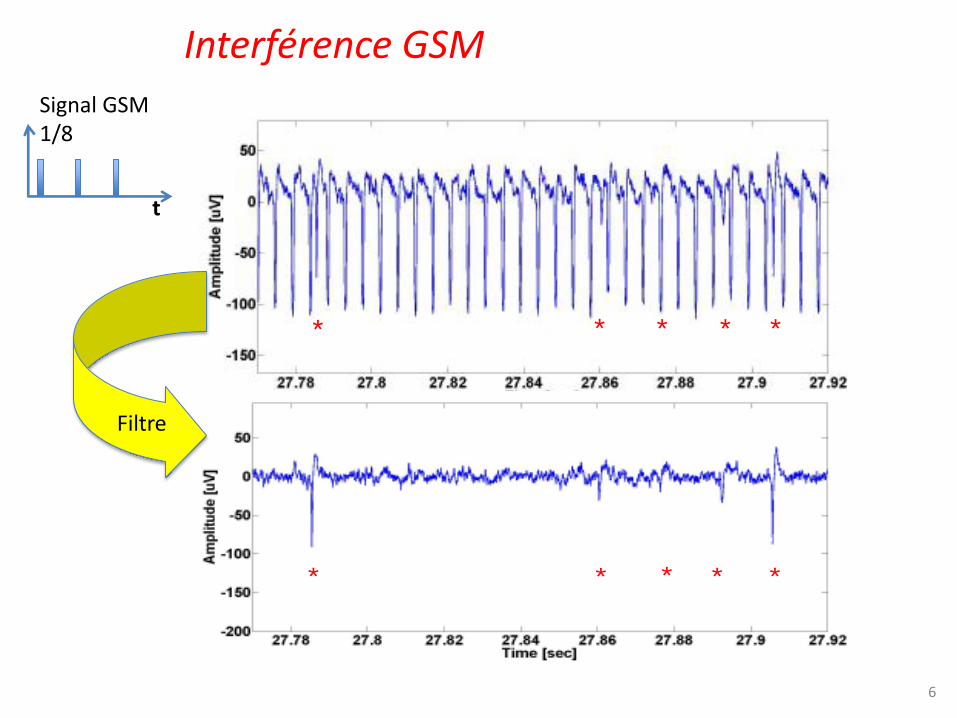
Signal composé : activité spontanée + interférence GSM
Protocole
Signal composé après filtre fréquentiel
* * * * *
* * * * *
AVANT
EXPO
APRES
Interférence GSM
Système d’exposition : Réseaux de neurones
Acquisition et Traitement du Signal
Matériels et Méthodes
Résultats
Réduction de 30% du nombre de spikes sur
3 min pendant l’exposition (p expo= 0,0003)
• Amplitude de l’effet en fonction des paramètres de
l’exposition RF (puissance, durée, modulation,
etc.)
• Effets sur la plasticité (pharmacologique, électrique)
• Mécanismes d’interaction
Sig
na
l
t
4,6 ms
1/8 7/8
0,57 ms
Signal utilisé pour
l’exposition:
GSM 1800 MHz
MEA
amplificateur
50!
charge
RF
TEM
signaux
neuronaux
Perspectives
No
mb
re d
e s
pik
es
sur
3 m
in.
0
2
4
6
8
10
12
15 15 15 15 15 18 18 18 18 18 19 21
EXPOSUREBEFORE
EXPO
AFTER
DIV
MF
R [
Hz]
0
2
4
6
8
10
12
14 14 14 14 14 17 17 17 17 17 18 20
SHAM EXPOSURE
DIV
MF
R [
Hz]
Exposition réelle
Exposition fictive
Jours de cultures
Jours de cultures
Cellule Transversale Electromagnétique (TEM)
Signal composé : activité spontanée + interférence GSM
Protocole
Signal composé après filtre fréquentiel
* * * * *
* * * * *
AVANT
EXPO
APRES
Filtre
6
t
Signal GSM 1/8
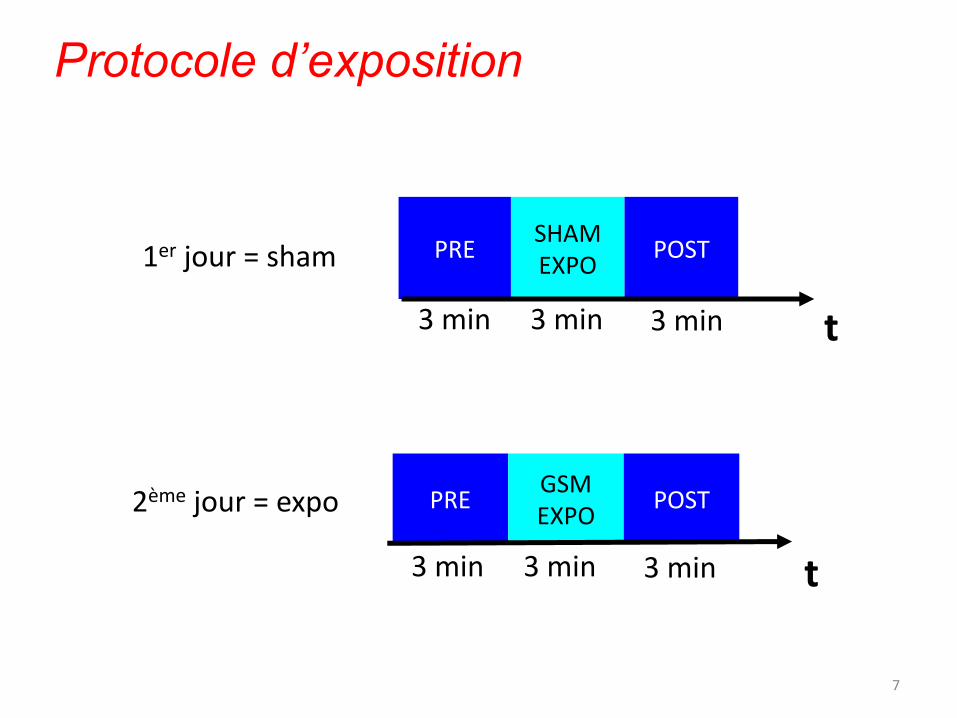
Protocole d’exposition
PRE SHAM EXPO
POST
3 min 3 min t 3 min
PRE GSM EXPO
POST
t
1er jour = sham
3 min 3 min 3 min
2ème jour = expo
7
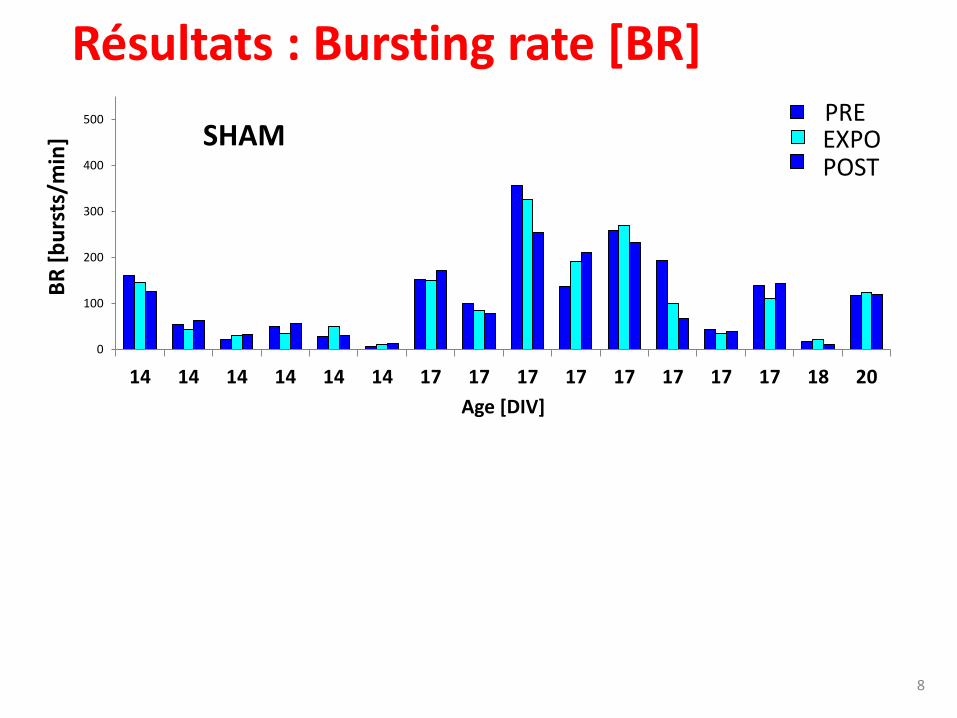
0
100
200
300
400
500
14 14 14 14 14 14 17 17 17 17 17 17 17 17 18 20
BR
[b
urs
ts/m
in]
Age [DIV]
SHAM PRE EXPO POST
8
Résultats : Bursting rate [BR]
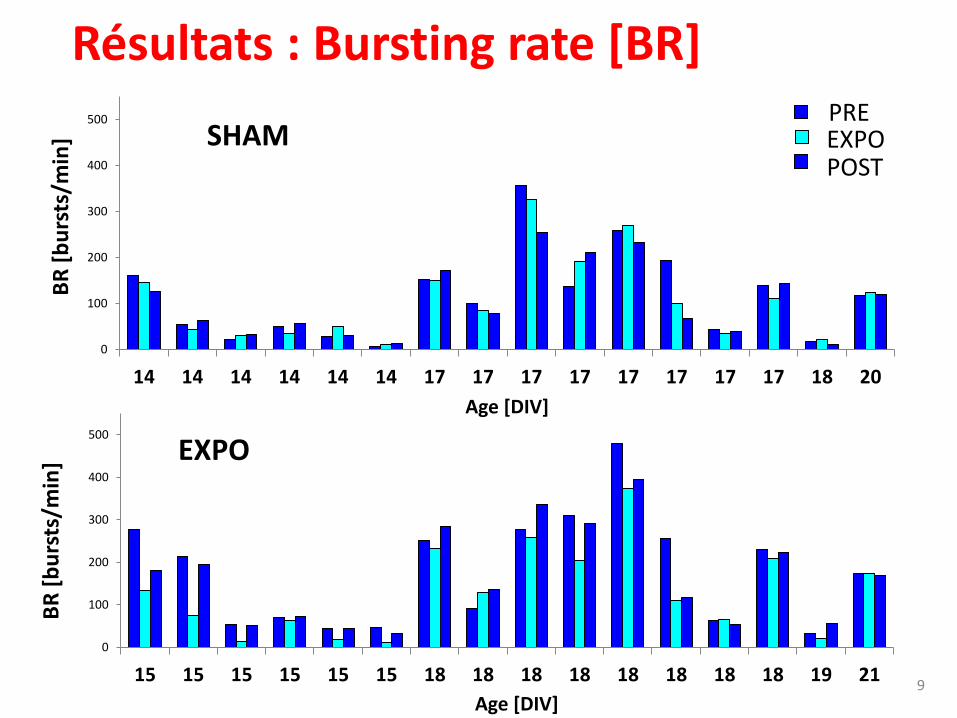
0
100
200
300
400
500
15 15 15 15 15 15 18 18 18 18 18 18 18 18 19 21
BR
[b
urs
ts/m
in]
Age [DIV]
EXPO
0
100
200
300
400
500
14 14 14 14 14 14 17 17 17 17 17 17 17 17 18 20
BR
[b
urs
ts/m
in]
Age [DIV]
SHAM PRE EXPO POST
9
Résultats : Bursting rate [BR]
10
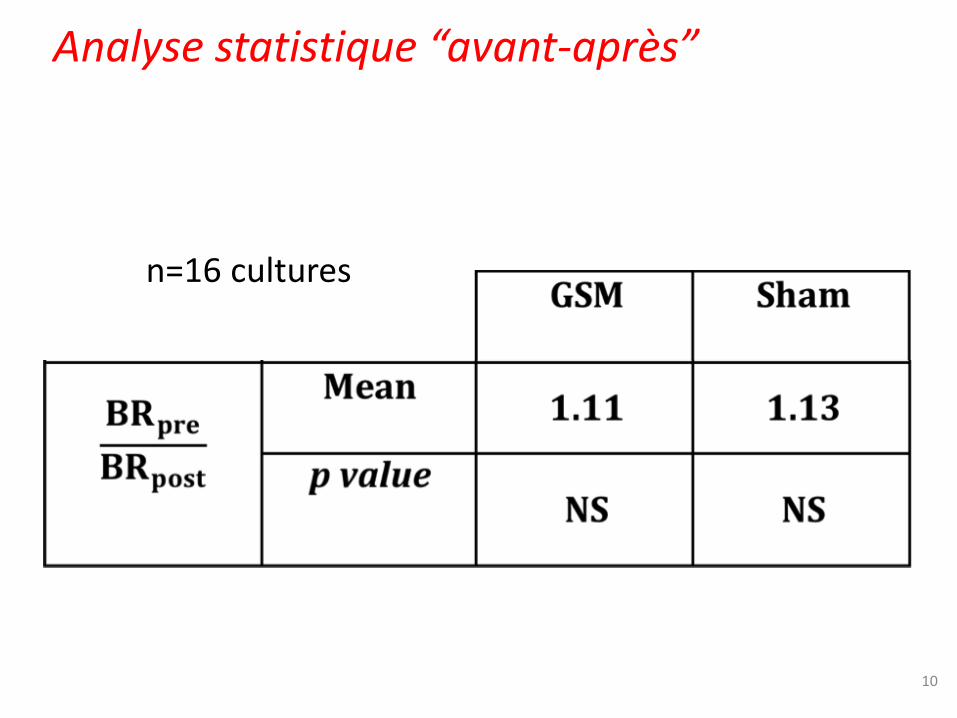
Analyse statistique “avant-après”
n=16 cultures
11
Analyse statistique “pendant l’exposition”
n=16 cultures
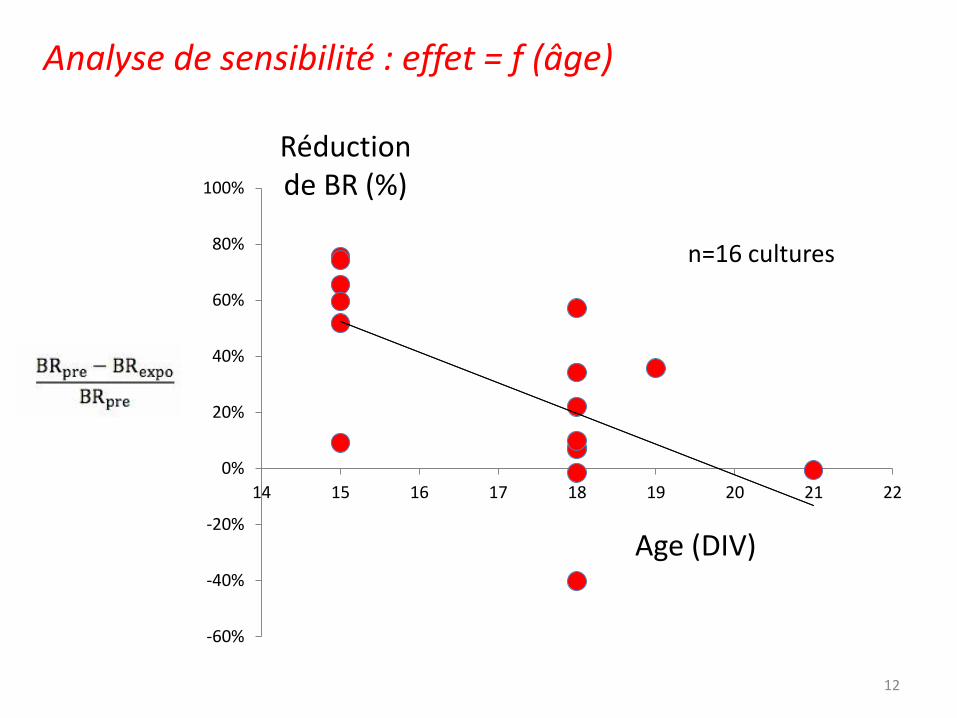
Analyse de sensibilité : effet = f (âge)
12
-60%
-40%
-20%
0%
20%
40%
60%
80%
100%
14 15 16 17 18 19 20 21 22
Age (DIV)
Réduction de BR (%)
n=16 cultures
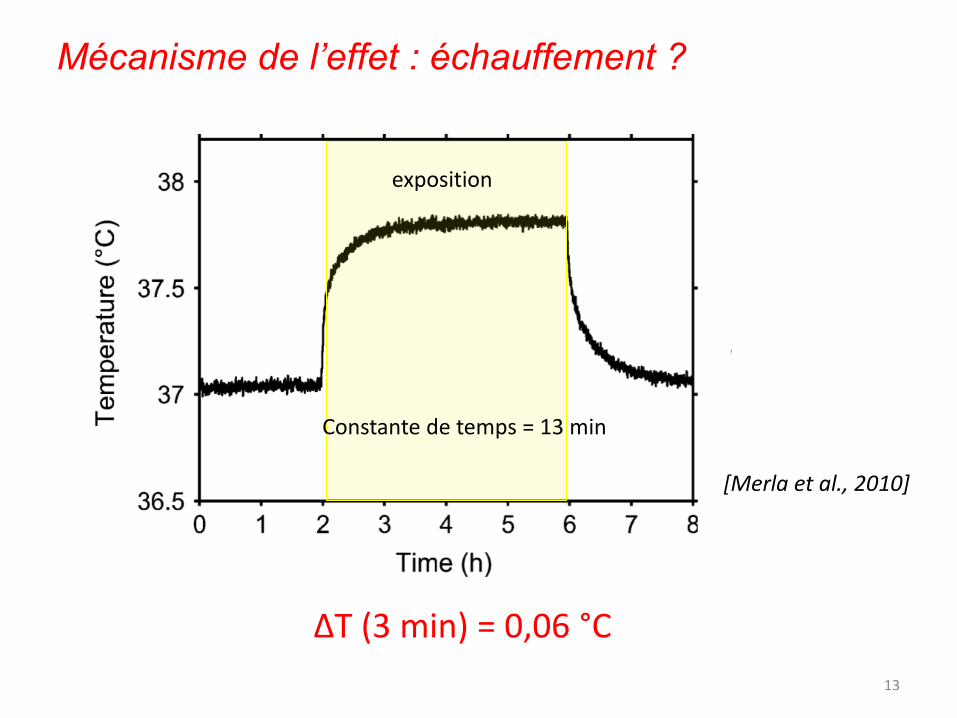
ΔT (3 min) = 0,06 °C
Mécanisme de l’effet : échauffement ?
13
Constante de temps = 13 min
exposition
[Merla et al., 2010]
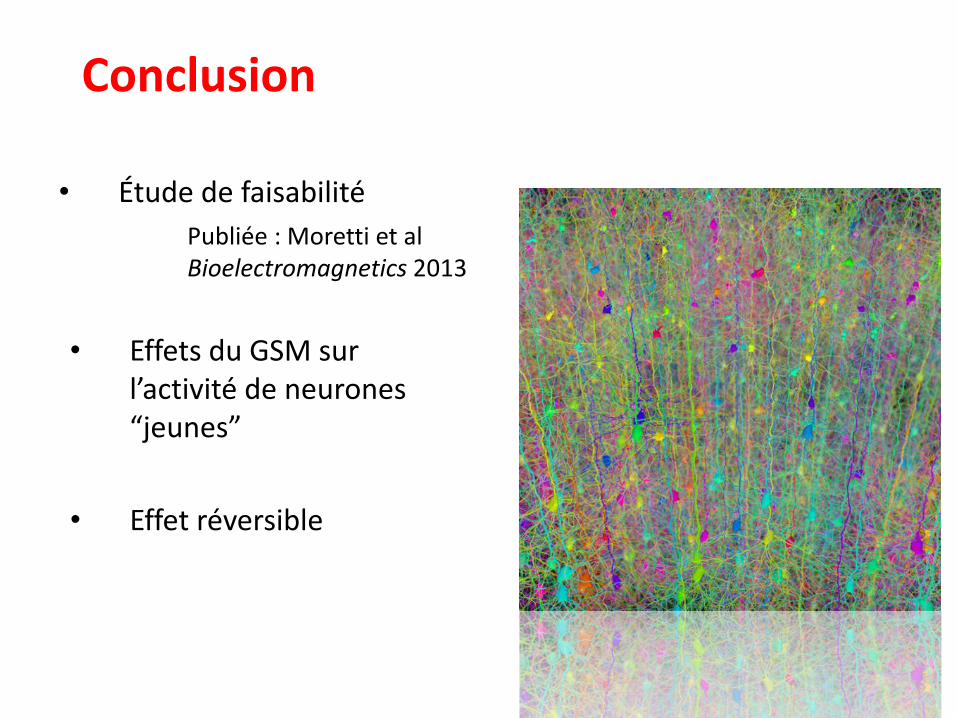
• Étude de faisabilité
Publiée : Moretti et al Bioelectromagnetics 2013
Conclusion
• Effets du GSM sur l’activité de neurones “jeunes”
• Effet réversible
15
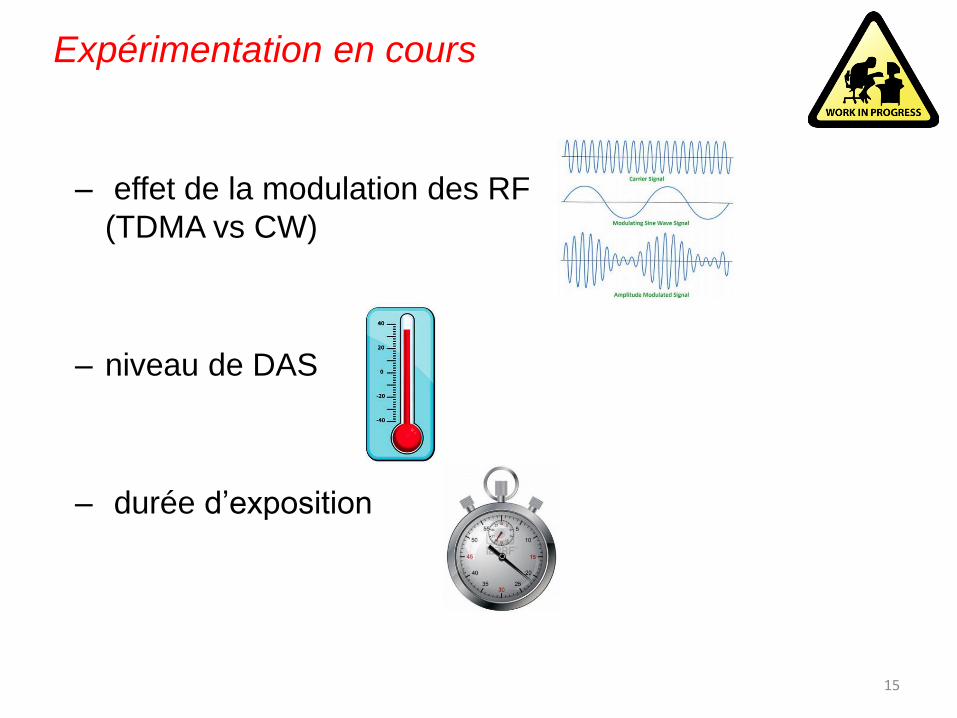
Expérimentation en cours
– effet de la modulation des RF
(TDMA vs CW)
– niveau de DAS
– durée d’exposition
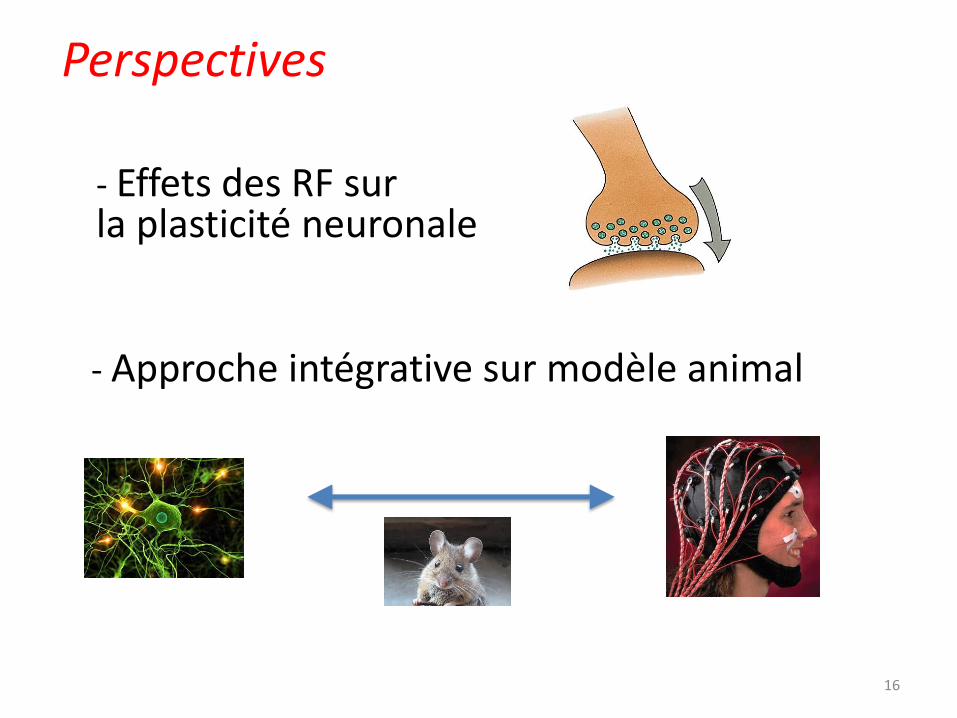
Perspectives
16
- Approche intégrative sur modèle animal
D!DE+($F(, ; $G$C#, (2, &$C&9#2#; #+$" :$7+3. &" ("8) $HCC7I$G$J +K, 0#* +&#$" :$6+; 0"932+&3+$, &5$F0, 2&$7+3. &" ("82+9$H6F7I$G$L&, M(2&8$7+3. &" ("82+9$:"0$6+; 0"932+&3+$G$NNNO22#O2#$G$, E+(OM(, ; P 22#O2#$
L(+3#0"5+9$"&$#. +$93, (K$0+3"05$3. , &8+9$2&$#. +$+(+3#023, ($:2+(5$5; +$#"$M0, 2&4N25+$, 3#2%2#) $"932((, #2"&9O$
_` RY$
a* 9b$
L(+3#0"+&3+K. , ("80, K. ) $HLL/ I$D&, () 929$" :$("3, ($+(+3#023, ($:2+(5$K"#+, (9$
- Effets des RF sur la plasticité neuronale

Michela Chiappalone
17
Financement : Université Bordeaux 1, CNRS et Bouygues Telecom
Noëlle Lewis
Philippe Lévêque Emmanuelle Haro
Florence Poulletier de Gannes
Isabelle Lagroye
André Garenne
Daniela Moretti