Embed Size (px)
Citation preview

P1: OTE/SPH P2: OTESVNY317-Bibette February 6, 2007 20:4
Emulsion Science
Second Edition
i
P1: OTE/SPH P2: OTESVNY317-Bibette February 6, 2007 20:4
Fernando Leal-CalderonVéronique SchmittJerome Bibette
Emulsion ScienceBasic Principles
Second Edition
iii
P1: OTE/SPH P2: OTESVNY317-Bibette February 6, 2007 20:4
Fernando Leal-CalderonISTAB, Universite Bordeaux 1Avenue des facultes33405 [email protected]
Veronique SchmittCentre de Recherche Paul Pascal, CNRS33600 [email protected]
Jerome BibetteESPCI, Laboratoire Colloıdes
et Materiaux Divises10 rue Vauquelin75231 [email protected]
Library of Congress Control Number: 2007921974
ISBN-10: 0-387-39682-9 e-ISBN-10: 0-387-39683-7ISBN-13: 978-0-387-39682-8 e-ISBN-13: 978-0-387-39683-5
Printed on acid-free paper.
C© 2007 Springer Science+Business Media, LLCAll rights reserved. This work may not be translated or copied in whole or in part without the writtenpermission of the publisher (Springer Science+Business Media, LLC, 233 Spring Street, New York,NY 10013, USA), except for brief excerpts in connection with reviews or scholarly analysis. Usein connection with any form of information storage and retrieval, electronic adaptation, computersoftware, or by similar or dissimilar methodology now known or hereafter developed is forbidden.The use in this publication of trade names, trademarks, service marks, and similar terms, even if theyare not identified as such, is not to be taken as an expression of opinion as to whether or not they aresubject to proprietary rights.
9 8 7 6 5 4 3 2 1
springer.com
iv
P1: OTE/SPH P2: OTESVNY317-Bibette February 6, 2007 20:4
Contents
Preface ................................................................................... ix
Acknowledgments ..................................................................... xi
Introduction ............................................................................ 1
1. Emulsification ...................................................................... 51.1. Introduction.................................................................... 51.2. High-Pressure Homogenization............................................ 51.3. Membrane Emulsification................................................... 61.4. Microchannel Emulsification............................................... 71.5. Spontaneous Emulsification ................................................ 101.6. Phase Inversion ............................................................... 11
1.6.1. PIT Method ........................................................... 111.6.2. Generalization ........................................................ 141.6.3. Examples .............................................................. 16
1.7. Application of a Controlled Shear......................................... 181.7.1. Emulsion Preparation and Characterization..................... 201.7.2. Fragmentation Kinetics of Model Emulsions................... 211.7.3. Breaking Mechanisms .............................................. 211.7.4. Generalization ........................................................ 251.7.5. Parameters Governing the Rayleigh Instability ................ 261.7.6. Examples of Monodisperse Materials............................ 32
1.8. Conclusion..................................................................... 40
2. Force Measurements.............................................................. 522.1. Introduction.................................................................... 522.2. Long-Range Forces .......................................................... 52
2.2.1. Techniques for Surface Force Measurements................... 532.2.2. Recent Advances..................................................... 57
v
P1: OTE/SPH P2: OTESVNY317-Bibette February 6, 2007 20:4
vi Contents
2.3. Short-Range Forces and Adhesion BetweenEmulsion Droplets............................................................ 892.3.1. Energy of Adhesion and Contact Angles ........................ 892.3.2. Experimental Measurements of the Adhesive Energy ........ 93
2.4. Conclusion..................................................................... 97
3. Phase Transitions.................................................................. 1053.1. Introduction .................................................................. 1053.2. Weak Attractive Interactions and Equilibrium
Phase Transitions............................................................ 1053.2.1. Experimental Observations....................................... 1053.2.2. Models for Phase Transitions .................................... 118
3.3. Gelation and Kinetically Induced Ordering............................ 1203.4. Conclusion ................................................................... 123
4. Compressibility and Elasticity of Concentrated Emulsions ............ 1264.1. Introduction .................................................................. 1264.2. Basic Concepts .............................................................. 1274.3. Experimental Techniques.................................................. 128
4.3.1. Elasticity Measurements .......................................... 1284.3.2. Compressibility Measurements .................................. 128
4.4. Compressibility and Elasticity of Surfactant-StabilizedEmulsions .................................................................... 1294.4.1. Experimental Results .............................................. 1294.4.2. Theoretical Approaches ........................................... 132
4.5. Compressibility and Elasticity of Solid-Stabilized Emulsions ..... 1354.5.1. Osmotic Stress Resistance Measurements ..................... 1364.5.2. Surface Properties: Elasticity and Plasticity................... 137
4.6. Conclusion ................................................................... 140
5. Stability of Concentrated Emulsions ......................................... 1435.1. Introduction .................................................................. 1435.2. Ostwald Ripening........................................................... 1445.3. Coalescence.................................................................. 146
5.3.1. General Phenomenology and MicroscopicDescription .......................................................... 146
5.4. Measurements of the Coalescence Frequency ......................... 1505.4.1. Simple Emulsions Stabilized by Surfactants .................. 1515.4.2. Double Emulsions Stabilized by Surfactants.................. 1575.4.3. Simple Emulsions Stabilized by Solid Particles .............. 159
5.5. Gelation and Homothetic Contraction .................................. 1635.6. Partial Coalescence in Emulsions Comprising
Partially Crystallized Droplets............................................ 1675.7. Conclusion ................................................................... 168
P1: OTE/SPH P2: OTESVNY317-Bibette February 6, 2007 20:4
Contents vii
6. Double Emulsions ................................................................. 1736.1. Introduction .................................................................. 1736.2. W/O/W Surfactant-Stabilized Emulsions............................... 174
6.2.1. Emulsion Preparation.............................................. 1746.2.2. General Phenomenology.......................................... 1766.2.3. Role of the Hydrophilic Surfactant in
Inducing Coalescence ............................................. 1786.2.4. Kinetics of Release................................................. 1826.2.5. Water Transport Under Osmotic Pressure Mismatch ........ 187
6.3. W/O/W Polymer-Stabilized Emulsions................................. 1886.3.1. Phenomenological Model for Compositional Ripening..... 1916.3.2. Microscopic Approaches of the Permeability: State of
the Art ................................................................ 1926.3.3. Influence of Temperature on Compositional Ripening ...... 193
6.4. Solid-Stabilized Double Emulsions ..................................... 1946.5. Conclusion ................................................................... 196
7. New Challenges for Emulsions: Biosensors, Nano-reactors,and Templates ...................................................................... 2007.1. Introduction .................................................................. 2007.2. Emulsions as Biosensors .................................................. 200
7.2.1. Emulsions for Homogeneous Assays........................... 2017.2.2. Emulsions for Single Immunocomplex Micromechanics... 206
7.3. Emulsions as Nano-reactors .............................................. 2107.3.1. Screening of Large Libraries and Directed
Enzyme Evolution.................................................. 2117.4. Emulsions as Microtemplates............................................. 214
7.4.1. Colloidal Clusters and Micro-optics ............................ 214
General Conclusion ................................................................... 223
Index...................................................................................... 225
P1: OTE/SPH P2: OTESVNY317-Bibette February 6, 2007 20:4
Preface
Emulsions and Common Sense
Droplets of oil in water allow us to transport oil soluble materials (in a non viscousform) and ultimately to release them on a chosen target. Cosmetics, paints, foods,are often based on these “emulsions”.
But the droplets are fragile, and must be lucidly protected. Formulating an in-dustrial emulsion implies numerous conditions: stability, efficiency, easy delivery,price, … This is an art, and like all forms of art it requires experience and imagi-nation. The present book provides both. It describes basic experiments on realisticmodel systems. I like this matter of fact approach. For instance, instead of begin-ning by formal discussions on interaction energies, the book starts with methodsof fabrication. And, all along the text, the theoretical aspects are restricted to basicneeds.
Of course (as always in a delicate subject like the present one) I have myown critiques on certain points in the presentation: for instance, in Section 5.3.1,coalescence is attributed to the thermal nucleation of a pore between two adjacentdroplets. For me, discussing this channel is like discussing the sex of angels.Nucleation, in most physical systems, does not occur via plain thermal fluctuations.It involves external defects: a cosmic ray in a bubble chamber, or a dust particle ina condenser. I believe that the same holds for emulsions: dust particles (or smallsurfactant aggregates) control coalescence.
But these byzantine discussions on mechanism are beyond the point. This bookis based on experiments. It does not claim to solve all problems (e.g: what is the realorigin of Bancroft’s rule) but it presents them with common sense and precision.I am convinced that it will be of great help.
P.-G. de GennesJanuary 2007
ix
P1: OTE/SPH P2: OTESVNY317-Bibette February 6, 2007 20:4
Acknowledgments
The authors thank S. Abramson, S. Arditty, P. Aronson, J. Baudry, E. Bertrand,L. Bressy, M. Chamerois, L. Cohen-Tannoudji, A. Colin, B. Deminiere,T. Dimitrova, R. Dreyfus, J. Fattaciolli, M.-F. Ficheux, P.-G. de Gennes, J.Giermanska-Kahn, P. Gorria, C. Goubault, A. Griffith, J. Guery, F. Guimberteau,A. Koenig, C. Keichinger, C. Mabille, T. Mason, O. Mondain-Monval, P. Omarjee-Riviere, P. Pays, J. Philip, F. Placin, B. Pouligny, P. Poulin, V. Ravaine, A. Royere,T. Stora, J. Sylvestre, F. Thivilliers, G. Vetter, D.A. Weitz, and D. Zerrouki fortheir contributions.
xi
P1: GFZSVNY317-Bibette February 1, 2007 18:26
Introduction
Colloids comprise a very broad class of materials. Their basic structure consists ofa dispersion of one phase into another one, in which the dispersed phase possesses atypical length scale ranging from a few molecular sizes up to several microns. Somecolloids are thermodynamically stable and generally form spontaneously, whereasothers are metastable, requiring energy for preparation and specific propertiesto persist. Metastable colloids are obtained by two main distinct routes: one isnucleation and growth, including precipitation, and the other is fragmentation. Inboth cases, as a consequence of the intrinsic off-equilibrium nature of this class ofcolloids, specific surface properties are required to prevent recombination. Surface-active species are generally employed to stabilize freshly formed fragments orgrowing nuclei, as they are expected to provide sufficient colloidal repulsive forces.
Emulsions are one example of metastable colloids. They are generally madeout of two immiscible fluids, one being dispersed in the other, in the presence ofsurface-active agents. They are obtained by shearing two immiscible fluids, lead-ing to the fragmentation of one phase into the other. Emulsion droplets exhibitall classical behaviors of metastable colloids: Brownian motion, reversible phasetransitions as a result of droplet interactions, and irreversible transitions that gener-ally involve the destruction of the emulsion. The droplet volume fraction may varyfrom zero to almost one: dense emulsions are sometimes called biliquid foamssince their structure is very similar to the cellular structure of air–liquid foamsfor which the continuous phase is very minor. From dilute to highly concentrated,emulsions exhibit very different internal dynamics and mechanical properties.When the emulsion is strongly diluted, droplets are agitated by Brownian motion[1,2], and the emulsion behaves as a viscous Newtonian fluid. When the emulsionis concentrated, namely above the random-close-packing volume fraction, whichis 64% for monodisperse droplets, the internal dynamics are severely restrictedand the emulsion behaves as a viscoelastic solid [3,4]. Simple direct emulsions arecomposed of oil droplets dispersed in water (O/W), while inverse emulsions arecomposed of water droplets dispersed in an oil continuous phase (W/O). Emul-sions are in general made of two immiscible phases for which the surface tensionis nonzero, and may in principle involve other hydrophilic-like or lipophilic-likefluids in the presence of suitable surface-active species, each phase being possibly
1
P1: GFZSVNY317-Bibette February 1, 2007 18:26
2 Introduction
composed of numerous components. As an example, simple emulsions may alsocontain smaller droplets of the continuous phase dispersed within each droplet ofthe dispersed phase. Such systems are called double emulsions or multiple emul-sions [5]. Simple emulsions may also contain solid dispersion within each droplet,as a possible route to produce magnetic colloids [6].
The destruction of emulsions may proceed through two distinct mechanisms.One, called Ostwald ripening, is due to the diffusion of the dispersed phase throughthe continuous phase. This mechanism does not involve any film rupture; instead,there is a continuous exchange of matter through the continuous phase, whichincreases the average droplets diameter while reducing their number. The othermechanism, called coalescence, consists of the rupture of the thin liquid film thatforms between two adjacent droplets. This rupture requires the formation of ahole within the thin film which then grows, resulting in the fusion of two adjacentdroplets. This ultimately leads to a total destruction of the dispersed system, sincetwo macroscopic immiscible phases are recovered. The lifetime of emulsions isincreased by the presence of surface-active species, which are known to cover theinterfaces and to delay both coalescence and Ostwald ripening. As a matter offact, the metastability of emulsions is strongly correlated to the presence of thesesurface-active species at their interfaces. Because the lifetime of these materialsmay become significant (longer than one year) they become good candidates forvarious commercial applications.
Emulsions are widely used in a variety of applications because of their abilityto transport or solubilize hydrophobic substances in a water continuous phase. Allkinds of surface treatments will take advantage of emulsion technology: painting,paper coating, road surfacing, and lubricating. Because homogeneous mixtures oftwo immiscible fluids may be obtained, organic solvents may be avoided when sol-ubilizing hydrophobic substances into water. When the mixture is applied, waterevaporates and is safely released into the atmosphere, while the dispersed phaseconcentrates and ultimately leads to the formation of a hydrophobic film (painting,paper coating, lubricating). Moreover, emulsion technology drastically simplifiesthe pourability of many hydrophobic substances. Indeed, at ambient temperaturesome material may be almost solid whereas by dispersing it within small dropletsin water it remains fluid at room temperature. One famous example is bitumen usedfor road surfacing. Emulsions are also involved in the food and cosmetic indus-tries because of their rheological properties which may vary from an essentiallyNewtonian liquid to an elastic solid. Moreover, they are also efficient drug carriers(medicines, food, and pesticides) for various types of targets. Indeed, double di-rect emulsions will allow transporting a water soluble molecule within the internalwater droplets throughout a water continuous phase.
All these applications have already led to an important empirical control of thesematerials, from their formation to their destruction. Besides this empirical back-ground which is considerably widespread among the various specific applications,the basic science of emulsions is certainly progressing and we aim within this bookto give an overview of the most recent advances.
P1: GFZSVNY317-Bibette February 1, 2007 18:26
Introduction 3
The production of emulsions is certainly one of the most important aspectsrelated to the industrial use of these materials. After a review of the availableand currently employed techniques, this book aims to present advances in makingcontrolled size emulsions at a large scale and rate production. It will be shownthat controlled shear applied to a polydisperse emulsion can transform it into amonodispersed one through Rayleigh instability (Chapter 1). Interdroplet forces,from long range to very short range, are of prime importance in understanding thecollective behavior of emulsion droplets. A variety of interactions that occur be-tween these liquid colloids are described. Repulsive interactions between dropletsare directly measured by using the magnetic chaining technique, providing de-tailed descriptions of steric and electrostatic forces (Chapter 2). Soft attractionsand particularly the depletion induced interactions are described, as well as theresulting equilibrium phase transitions that can also be used to fractionate poly-disperse emulsions. Strong adhesion is also explored through the measurement ofcontact angles, for a variety of interfaces and compositions, as well as the verycharacteristic gelation transition that takes place in the regime of deep attractiveinteraction quench (Chapter 3). Because emulsion droplets are deformable theycan span droplet volume fraction from zero to almost one. We present the basicphysics that governs both compressibility and shear elasticity of dense emulsionsas a function of droplet packing and the nature of adsorbed species from shortsurfactants to macromolecules and solid particles. When droplets are still capableto slip under stress, the role of disorder has been revealed to be of most impor-tance and to dictate the subtle scaling of the shear elastic modulus (Chapter 4).Understanding the lifetime and destruction of emulsions is obviously a crucialaspect. The various scenarios of destruction are reviewed and correlated to the twowell accepted limiting mechanisms: coalescence and diffusion or permeation. Thebasic understanding of thermally activated hole nucleation, which is responsiblefor coalescence, is presented, in close relation with the nature of the adsorbedspecies (Chapter 5). The very rich domain of double emulsion is discussed. Adetailed description of these materials is presented owing to their very promisingpotential in various applications, in addition to their remarkable contribution inunderstanding the metastability of thin films (Chapter 6). At that stage of under-standing, the scientific background about emulsions can direct their potential useto new fields of applications: droplets can act either as minute substrates or reser-voirs. They can also be manipulated by applying external forces to selectively sortdesirable products, or to create local stress-controlled conditions. Liquid dropletscan compartmentalize minute amounts of defined reactants, either to screen a largecompound library or parallelize a directed process imposed by confinement. Wepresent in Chapter 7 some particularly promising examples of new applications ofemulsions in nano or microtechnologies, related to biotechnologies, biophysics,and processing of high-tech materials for micro-optics.
P1: GFZSVNY317-Bibette February 1, 2007 18:26
4 Introduction
References
[1] J. Perrin: “ La Loi de Stockes et le Mouvement Brownien.” C. R. Acad. Sci. 147, 475(1908).
[2] J. Perrin: In: Felix Alean (ed): “Mouvement Brownien—Emulsions.” Les Atomes.Gallimard PUF, Paris (1913).
[3] H.M. Princen: “Rheology of Foams and Highly Concentrated Emulsions I. ElasticProperties and Yield Stress of a Cylindrical Model System.” J. Colloid Interface Sci.91, 160 (1983).
[4] T.G. Mason, J. Bibette, and D.A. Weitz: “Elasticity of Compressed Emulsions.” Phys.Rev. Lett. 75, 2051 (1995).
[5] S.S. Davis, J. Hadgraft, and K.J. Palin: In: P. Becher (ed): “Medical and PharmaceuticalApplications of Emulsions.” Encyclopedia of Emulsion Technology, Vol. 2. MarcelDekker New York (1985).
[6] J. Bibette: “Monodisperse Ferrofluid Emulsions.” J. Magn. Magn. Mater. 122, 37(1993).
P1: GFZ
SVNY317-Bibette February 5, 2007 17:12
1Emulsification
1.1. Introduction
Emulsification consists of dispersing one fluid into another, nonmiscible one, viacreation of an interface. Properties of emulsions (e.g., stability, rheological prop-erties) and their industrial uses are governed not only by variables such as temper-ature and composition but also by the droplet size distribution. The highest levelof control consists of producing “monodisperse,” that is, narrow size distributedemulsions with a tunable mean size. From a fundamental perspective, monodis-persity has allowed significant progress in emulsion science as will be shownthroughout this book. Monodispersity also opens perspectives for new technolog-ical applications that are reviewed in Chapter 7. Usually, industrial emulsificationis empirically controlled and the purpose of this chapter is to provide fundamentalconcepts that support such empirical knowledge.
In the first part, we briefly review some possible routes to fabricate emulsionssuch as high-pressure homogenization and membrane, microchannel and sponta-neous emulsification. Then, the basic principles of the phase inversion temperature(PIT) method are presented and the influence of different parameters such as sur-factant concentration and stirring intensity is discussed. The following section isdevoted to emulsification via application of a controlled shear. The mechanism ofdrop rupturing and the conditions leading to monodispersity are described. Fromfundamental studies on shear emulsification, some useful strategies for formula-tors can be proposed and we shall explain how they can be exploited to producemonodisperse materials of technological interest.
1.2. High-Pressure Homogenization
High-pressure homogenization (microfluidization) is widely used for producingdairy and food emulsions. It consists of forcing the two fluids or a coarse premixto flow through an inlet valve, into a mixing chamber, under the effect of a veryhigh pressure. The fluids undergo a combination of elongation and shear flows,impacts, and cavitations. Despite the complexity of the mechanisms involved [1],
5
P1: GFZ
SVNY317-Bibette February 1, 2007 16:45
6 1. Emulsification
the size distributions are usually reproducible with a mean size ranging from 50 nmto 5 μm.
Emulsification by high-pressure homogenization results from a dynamical equi-librium between breakup promoted by drop deformation resulting from the highspeed flow and of recombination (coalescence) promoted by collisions. Numer-ous studies have been performed [2–6] to determine the effect of stabilizing agentconcentration (protein or surfactant), applied pressure, number of cycles on thedroplets size and emulsion stability. Taisne and Cabane [6] have developed arefractive index contrast matching technique allowing the determination of oilexchange between the droplets. They were able to distinguish two regimes ofemulsification in a high-pressure homogenizer depending on the surfactant con-centration Csurf. In the “surfactant-poor” regime (Csurf < CMC/10 where CMC isthe critical micellar concentration), the average drop size, d, only weakly dependson the applied pressure. Lobo and co-workers [7] have elaborated a quantitativemethod based on the dilution of a fluorescent excimer signal during oil exchange todetermine the number of coalescence events during emulsification. They showed[8] that a high level of coalescence leads to emulsions with average diametersranging from 0.3 to 2 μm depending on the surfactant concentration. Drops arefirst fragmented at a low size and then coalesce because of insufficient interfacialcoverage. In the “surfactant-rich” regime (Csurf > 10 CMC), the average dropletdiameter d is lower, typically varying from 50 to 350 nm, and is almost indepen-dent of the surfactant concentration [6, 8, 9]. Even though coalescence can not becompletely arrested in a high-pressure homogenizer, a low level of recombinationis attained [6, 8]. Hence, the size is determined mainly by droplet fragmentationand scales with the applied pressure Ph as:
d ∝ P−αh (1.1)
where the power law α typically varies between 0.6 and 0.9 [6,10,11]. Brosel andSchubert [4] showed that during the deformation and breakup of a single drop,almost no surfactant molecules adsorb at the new interface because the adsorbingtime is larger than that of disruption. Surfactant adsorbs between two breakupevents, thus lowering the interfacial tension and facilitating further rupturing. Theexistence of two regimes can be generalized to protein-stabilized emulsions: largersizes are obtained by drop coalescence for low protein concentrations [2]. Otherparameters may influence the final droplet size distribution: (1) an increasingnumber of passes reduces the size distribution width [12,13], (2) whatever theemulsifier (surfactant or proteins), large dispersed phase volume fractions favorcollisions and recombinations but the droplet volume fraction φ has little influenceon the average size for φ < 30%.
1.3. Membrane Emulsification
Membrane emulsification [14] consists of forcing the dispersed phase to per-meate into the continuous phase through a membrane having a uniform pore
P1: GFZ
SVNY317-Bibette February 1, 2007 16:45
1.4. Microchannel Emulsification 7
Dispersed phase
Continuous phase containing surfactant
Pressure applied on the dispersed phase
Flux of continuous phaseMembrane
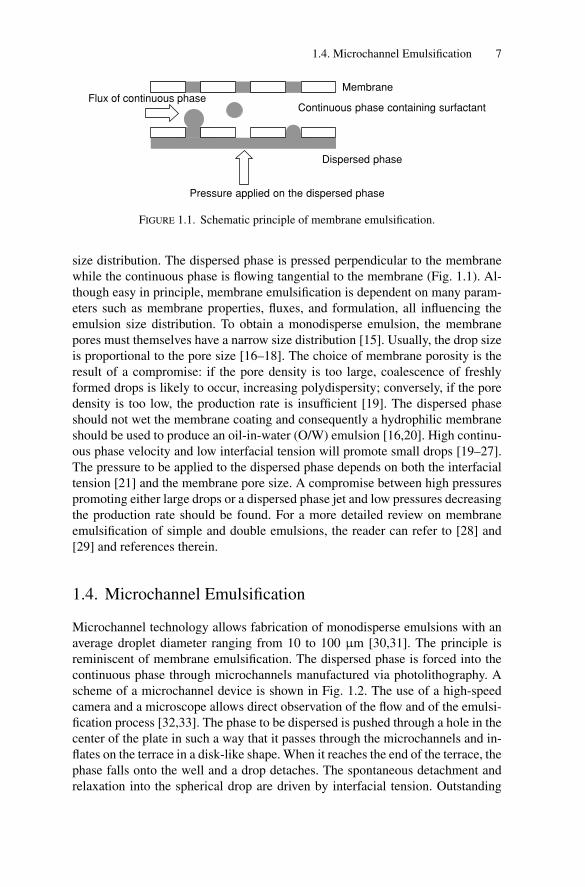
FIGURE 1.1. Schematic principle of membrane emulsification.
size distribution. The dispersed phase is pressed perpendicular to the membranewhile the continuous phase is flowing tangential to the membrane (Fig. 1.1). Al-though easy in principle, membrane emulsification is dependent on many param-eters such as membrane properties, fluxes, and formulation, all influencing theemulsion size distribution. To obtain a monodisperse emulsion, the membranepores must themselves have a narrow size distribution [15]. Usually, the drop sizeis proportional to the pore size [16–18]. The choice of membrane porosity is theresult of a compromise: if the pore density is too large, coalescence of freshlyformed drops is likely to occur, increasing polydispersity; conversely, if the poredensity is too low, the production rate is insufficient [19]. The dispersed phaseshould not wet the membrane coating and consequently a hydrophilic membraneshould be used to produce an oil-in-water (O/W) emulsion [16,20]. High continu-ous phase velocity and low interfacial tension will promote small drops [19–27].The pressure to be applied to the dispersed phase depends on both the interfacialtension [21] and the membrane pore size. A compromise between high pressurespromoting either large drops or a dispersed phase jet and low pressures decreasingthe production rate should be found. For a more detailed review on membraneemulsification of simple and double emulsions, the reader can refer to [28] and[29] and references therein.
1.4. Microchannel Emulsification
Microchannel technology allows fabrication of monodisperse emulsions with anaverage droplet diameter ranging from 10 to 100 μm [30,31]. The principle isreminiscent of membrane emulsification. The dispersed phase is forced into thecontinuous phase through microchannels manufactured via photolithography. Ascheme of a microchannel device is shown in Fig. 1.2. The use of a high-speedcamera and a microscope allows direct observation of the flow and of the emulsi-fication process [32,33]. The phase to be dispersed is pushed through a hole in thecenter of the plate in such a way that it passes through the microchannels and in-flates on the terrace in a disk-like shape. When it reaches the end of the terrace, thephase falls onto the well and a drop detaches. The spontaneous detachment andrelaxation into the spherical drop are driven by interfacial tension. Outstanding
P1: GFZ
SVNY317-Bibette February 1, 2007 16:45
8 1. Emulsification
(a)
(b)
Dispersed phase
Continuous phase
Microchannels
Well
Terrace
Channel walls
TerraceMicrochannel
Well
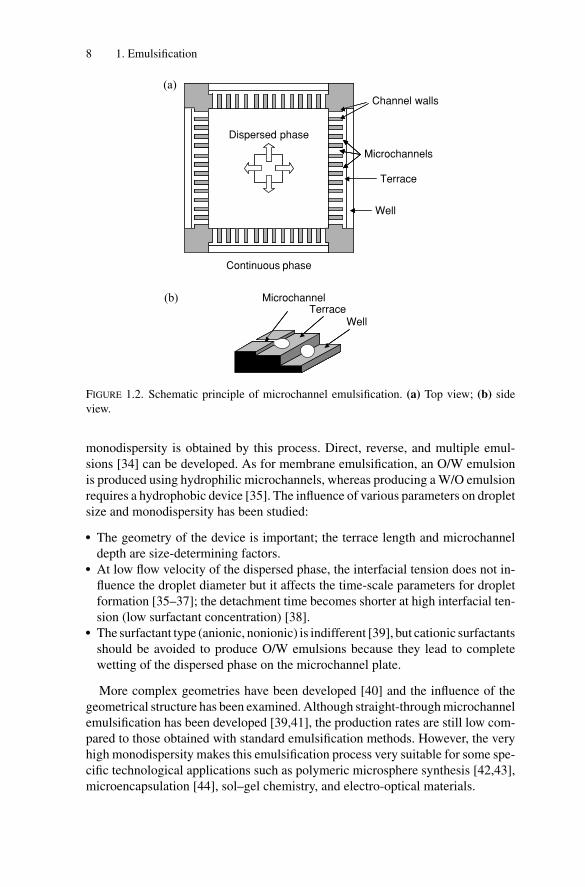
FIGURE 1.2. Schematic principle of microchannel emulsification. (a) Top view; (b) side
view.
monodispersity is obtained by this process. Direct, reverse, and multiple emul-sions [34] can be developed. As for membrane emulsification, an O/W emulsionis produced using hydrophilic microchannels, whereas producing a W/O emulsionrequires a hydrophobic device [35]. The influence of various parameters on dropletsize and monodispersity has been studied:
� The geometry of the device is important; the terrace length and microchanneldepth are size-determining factors.
� At low flow velocity of the dispersed phase, the interfacial tension does not in-fluence the droplet diameter but it affects the time-scale parameters for dropletformation [35–37]; the detachment time becomes shorter at high interfacial ten-sion (low surfactant concentration) [38].
� The surfactant type (anionic, nonionic) is indifferent [39], but cationic surfactantsshould be avoided to produce O/W emulsions because they lead to completewetting of the dispersed phase on the microchannel plate.
More complex geometries have been developed [40] and the influence of thegeometrical structure has been examined. Although straight-through microchannelemulsification has been developed [39,41], the production rates are still low com-pared to those obtained with standard emulsification methods. However, the veryhigh monodispersity makes this emulsification process very suitable for some spe-cific technological applications such as polymeric microsphere synthesis [42,43],microencapsulation [44], sol–gel chemistry, and electro-optical materials.
P1: GFZ
SVNY317-Bibette February 1, 2007 16:45
1.4. Microchannel Emulsification 9
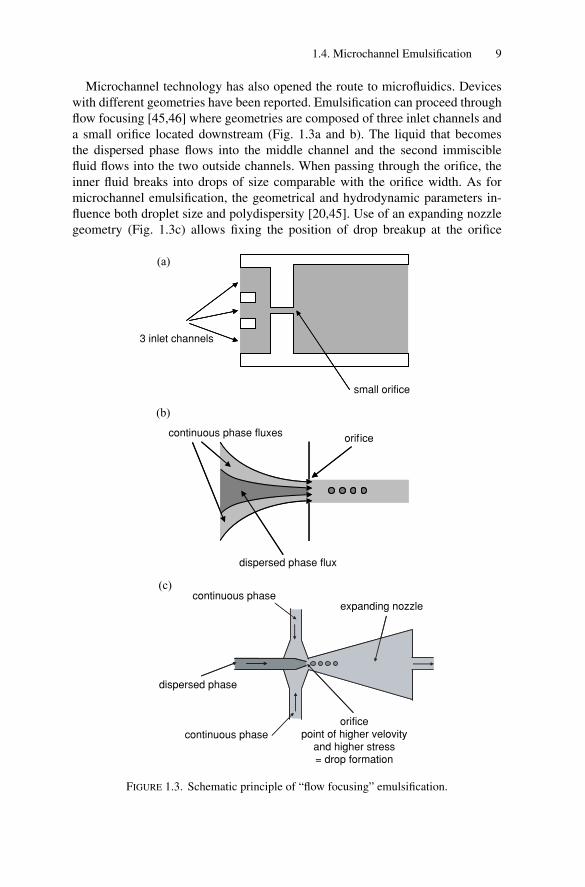
Microchannel technology has also opened the route to microfluidics. Deviceswith different geometries have been reported. Emulsification can proceed throughflow focusing [45,46] where geometries are composed of three inlet channels anda small orifice located downstream (Fig. 1.3a and b). The liquid that becomesthe dispersed phase flows into the middle channel and the second immisciblefluid flows into the two outside channels. When passing through the orifice, theinner fluid breaks into drops of size comparable with the orifice width. As formicrochannel emulsification, the geometrical and hydrodynamic parameters in-fluence both droplet size and polydispersity [20,45]. Use of an expanding nozzlegeometry (Fig. 1.3c) allows fixing the position of drop breakup at the orifice
(a)
(b)
small orifice
3 inlet channels
orificecontinuous phase fluxes
dispersed phase flux
(c)
dispersed phase
continuous phase
continuous phase
expanding nozzle
orificepoint of higher velovity
and higher stress= drop formation
FIGURE 1.3. Schematic principle of “flow focusing” emulsification.
P1: GFZ
SVNY317-Bibette February 1, 2007 16:45
10 1. Emulsification
where the shear force is the highest [47]. Emulsification can also be inducedby a junction [48–50] defined as the intersection of two microchannels, wherethe shear is locally highest [49]. Using a two-step method and both hydrophilicand hydrophobic junctions, double emulsions can be obtained [50]. Microfluidicemulsification is suitable for certain specific applications such as in microactu-ators, allowing rapid manipulation of microdroplets [51], or in microreactors,where it is useful for screening of protein crystallization conditions [52–54], glu-cose detection in clinical diagnostic [55], and controlling a reaction or mixing[56,57].
1.5. Spontaneous Emulsification
Spontaneous emulsification is a process that occurs without external energy supplywhen two immiscible fluids with very low interfacial tension are brought in contact.The most famous example of spontaneous emulsification is the famous “pastis”beverage put in contact with water. Without stirring, the blend becomes turbid. Be-cause increasing the interfacial area generally requires energy input, spontaneousemulsification is an intriguing phenomenon, as revealed by the abundant literaturedevoted to it. It is worth noting that in industrial processes, the kinetics of thiskind of emulsification, also termed self-emulsification, is accelerated by an energysupply [58]. Spontaneous emulsification was reported for the first time in 1878 byJoahnnes Gad [59]. Although observed a long time ago, this phenomenon is stillnot fully understood. So far, different mechanisms have been proposed and someof them are described hereafter.
Interfacial turbulence [60]: Due to a nonuniform distribution of surfactantmolecules at the interface or to local convection currents close to the interface,interfacial tension gradients lead to a mechanical instability of the interface andtherefore to production of small drops.
Negative interfacial tension [58,61–66]: Due to adsorption of surfactants orcosurfactant molecules, the interfacial tension can become extremely low (lessthan 1 mN/m) and eventually transiently negative. Therefore, the interface canincrease and any fluctuation can break it.
The two aforementioned mechanisms involve a mechanical instability of theinterface that breaks up and produces small droplets.
Diffusion and stranding [61,67–70]: In this case, emulsification has a chemi-cal origin and can take place even for quite high interfacial tensions. This kind ofspontaneous emulsification often occurs when a cosolvent, soluble in both phases,is present. For example, if a mixture of alcohol and oil is brought in contact withwater, the alcohol diffuses from the oil to the water phase, carrying with it someoil that can be “stranded” in fine drops as soon as water becomes supersaturatedin oil. Although emulsification is an out-of-equilibrium process, phase diagramscoupled with the diffusion path theory [67–69] can be used to predict the phasesthat are likely to form when the two fluids are brought in contact and to determinethe phase in which spontaneous emulsification will take place. More recently, other
P1: GFZ
SVNY317-Bibette February 1, 2007 16:45
1.6. Phase Inversion 11
mechanisms have been proposed to explain spontaneous emulsification owing tothe development of new experimental techniques [71–77]. Among others, one canmention the formation and swelling of water/surfactant aggregates at the vicinityof the interface. The structural change and the swelling can be driven by tempera-ture, osmotic, or concentration gradients. In addition to the amazing and spectac-ular nature of this phenomenon, spontaneous emulsification is attractive becauseof the numerous potential applications in various fields such as agriculture (emul-sifiable concentrates for insecticides, pesticides, and herbicides), pharmaceutics,cosmetics, oil recovery, and all applications in which nanometric emulsions arerequired. For a more complete review of spontaneous emulsification, the readercan refer to the reviews of Miller [67] and Lopez-Montilla et al. [78]. Despitethe ease of production (no or low energy input) and the diversity of applications,spontaneous emulsification applies only to moderate dispersed volume fractions(less than 10%).
1.6. Phase Inversion
Emulsification through “phase inversion” is also often considered as a spontaneousemulsification process because it requires low energy input. Its advantage residesin the possibility of producing concentrated emulsions. Emulsification throughphase inversion is often used industrially, especially in cosmetics [79,80]. Its in-terest lies in the low energy input required and the emulsions obtained are usuallyfine (average diameter of the order or lower than 1 μm) and monodisperse. Un-derstanding the mechanism of phase inversion still remains a challenge; however,several studies provide some insight into this amazing and sometimes spectacularphenomenon. Phase inversion is said to occur when the structure of the emul-sion inverts, that is, when the continuous phase becomes the internal phase orvice versa. This may happen with a change of any variable such as temperature,pressure, salinity, use of a cosurfactant, or the proportion of oil and water.
1.6.1. PIT Method
The most frequent emulsification using phase inversion is known as the PIT (PhaseInversion Temperature) method [81–83] and occurs through a temperature quench.This method is based on the phase behavior of nonionic surfactants and the cor-relation existing between the so-called surfactant spontaneous curvature and thetype of emulsion obtained.
The well-known empirical Bancroft’s rule [84] states that the phase in whichthe surfactant is preferentially soluble tends to become the continuous phase. Ananalogous empirical correlation has been reported by Shinoda and Saito [85]. Fora nonionic surfactant of the polyethoxylated type [R-(CH2-CH2-O)n-OH, whereR is an alkyl chain], as temperature increases, the surfactant head group becomesless hydrated and hence the surfactant becomes less soluble in water and moresoluble in oil. Its phase diagram evolves as schematically shown in Fig. 1.4. At low
P1: GFZ
SVNY317-Bibette February 1, 2007 16:45
12 1. Emulsification
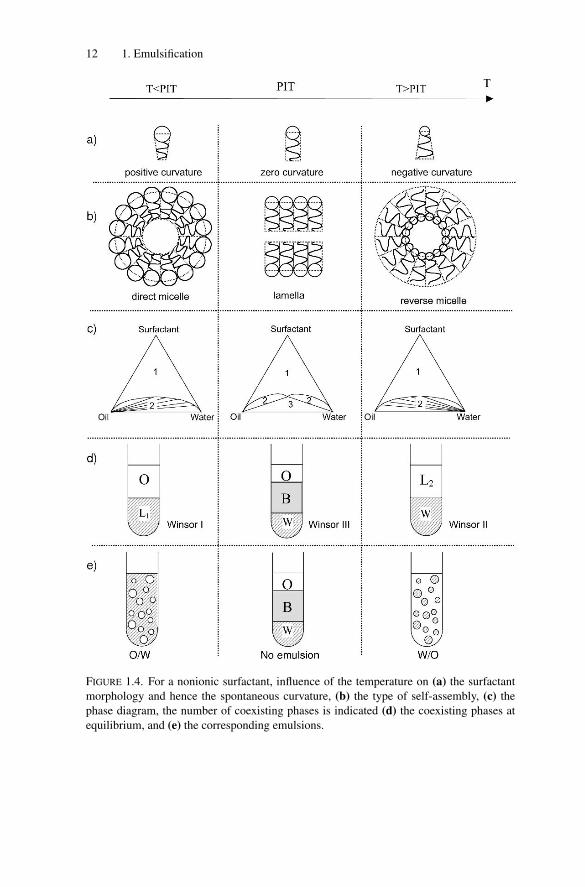
FIGURE 1.4. For a nonionic surfactant, influence of the temperature on (a) the surfactant
morphology and hence the spontaneous curvature, (b) the type of self-assembly, (c) the
phase diagram, the number of coexisting phases is indicated (d) the coexisting phases at
equilibrium, and (e) the corresponding emulsions.
P1: GFZ
SVNY317-Bibette February 1, 2007 16:45
1.6. Phase Inversion 13
temperatures, the surfactant is preferentially soluble in water and a ternary mix-ture of oil, water, and surfactant will phase separate into a surfactant-rich aqueousphase and almost pure oil (Winsor I). The surfactant-rich aqueous phase, referredto as L1, is made of direct micelles swollen by oil. The surfactant is said to havea positive spontaneous curvature. Under stirring, an O/W emulsion is obtained.At high temperatures, the surfactant polar head is dehydrated and the surfactantbecomes preferentially oil-soluble. Its spontaneous curvature is negative and itself-assembles into reverse micelles. A ternary mixture of oil, water, and surfac-tant will phase separate into an oil phase containing the surfactant, referred to asL2, in coexistence with almost pure water (Winsor II). On stirring, a W/O emulsionis obtained. At the PIT, the surfactant is “equilibrated” and its spontaneous curva-ture is close to zero. A ternary mixture of oil, water, and surfactant will separateinto three phases: a bicontinuous or liquid crystalline phase (referred to as B inFigure 1.4d and e) in equilibrium with oil and water phases (Winsor III). At thistemperature, both O/W and W/O emulsions are immediately destroyed throughcoalescence (for a better comprehension of the stability of emulsions related to thespontaneous curvature, the reader can refer to Chapter 5).
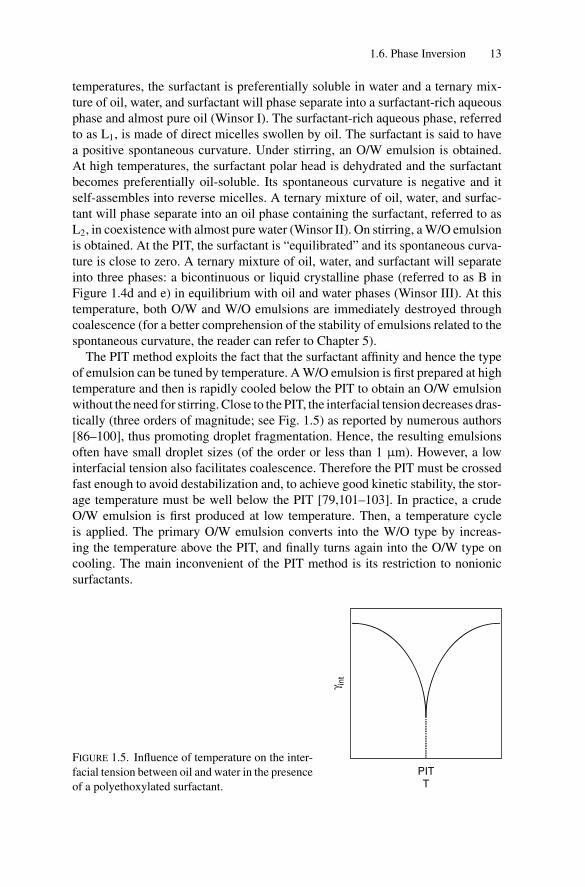
The PIT method exploits the fact that the surfactant affinity and hence the typeof emulsion can be tuned by temperature. A W/O emulsion is first prepared at hightemperature and then is rapidly cooled below the PIT to obtain an O/W emulsionwithout the need for stirring. Close to the PIT, the interfacial tension decreases dras-tically (three orders of magnitude; see Fig. 1.5) as reported by numerous authors[86–100], thus promoting droplet fragmentation. Hence, the resulting emulsionsoften have small droplet sizes (of the order or less than 1 μm). However, a lowinterfacial tension also facilitates coalescence. Therefore the PIT must be crossedfast enough to avoid destabilization and, to achieve good kinetic stability, the stor-age temperature must be well below the PIT [79,101–103]. In practice, a crudeO/W emulsion is first produced at low temperature. Then, a temperature cycleis applied. The primary O/W emulsion converts into the W/O type by increas-ing the temperature above the PIT, and finally turns again into the O/W type oncooling. The main inconvenient of the PIT method is its restriction to nonionicsurfactants.
γ int
PITT
FIGURE 1.5. Influence of temperature on the inter-
facial tension between oil and water in the presence
of a polyethoxylated surfactant.
P1: GFZ
SVNY317-Bibette February 1, 2007 16:45
14 1. Emulsification
1.6.2. Generalization
Emulsification through phase inversion is based on a change in the surfactant spon-taneous curvature induced by temperature. This concept can be generalized con-sidering any parameter influencing the spontaneous curvature of a surfactant, forexample, salinity, pH, presence of a cosurfactant, and nature of the oil. The conceptof inversion has often been reported in the literature by means of a formulation–composition map. In the following, we shall sum up this empirical approach whichcan be useful for formulators.
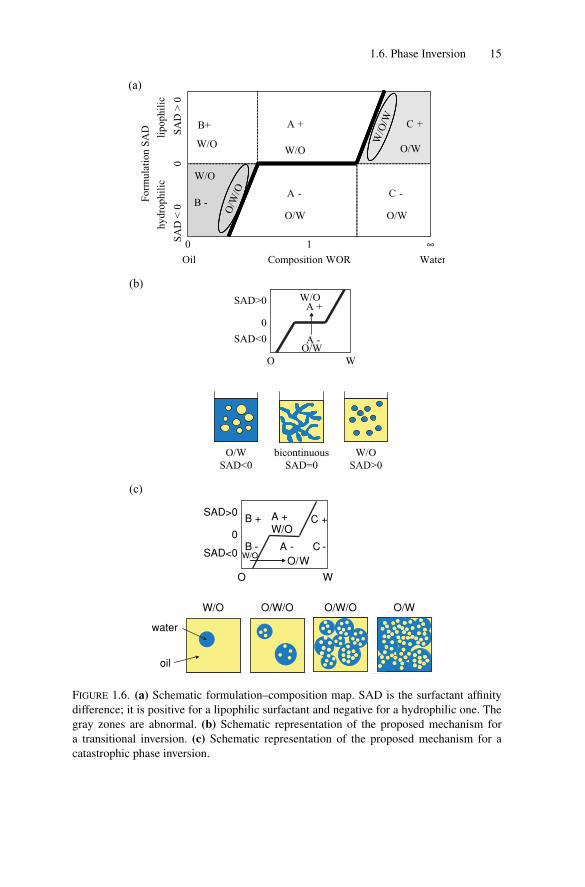
To take into account physicochemical parameters (salinity, temperature, pH) theSurfactant Affinity Difference (SAD), also named Hydrophilic–Lipophilic Differ-ence (HLD), has been introduced [104–106]. It is an empirical number taking intoaccount the surfactant type and its environment. The case SAD = 0 correspondsto a formulation in which the surfactant has the same affinity for both aqueous andoil phases. It corresponds to a surfactant spontaneous curvature close to zero andthe phase behavior is of the Winsor III type. It is also called optimal formulation,the interfacial tension being close to zero. When SAD is negative (respectivelypositive), the surfactant has more affinity for the aqueous (respectively oil) phase,the phase behavior is of the Winsor I (respectively Winsor II) type, and the spon-taneous curvature is positive (respectively negative). The emulsion is of the O/Wtype (respectively W/O) when SAD is negative (respectively positive). This phe-nomenology is expected if equivalent amounts of water and oil are present. Thetype of emulsion is also dependent on the composition defined by the water-to-oilvolume ratio (WOR). Very high water (respectively oil) contents correspondingto diverging values of WOR (respectively close to zero) favor O/W (respectivelyW/O) emulsions. A schematic map is shown in Fig. 1.6a. Six different regionscan be distinguished denoted by a letter and a sign. In − regions, SAD is negativeand formulation favors O/W emulsions, whereas in + regions, SAD is positiveand W/O emulsions are favored. The A letter corresponds to a WOR close to 1 andthe type of emulsion is governed only by formulation. The B letter corresponds tosamples in which the amount of oil exceeds that of water and where compositionfavors W/O emulsions. Finally, the C letter corresponds to samples in which wateris more abundant than oil so that composition favors O/W emulsions. Among thesix regions, four of them (A−, A+, B+ and C−) are referred to as normal regionsbecause the composition preference agrees with formulation and two of them (B−and C+, in gray) are considered abnormal because they are in agreement with thevolumetric requirements and in opposition with formulation ones. Because of theconflict between formulation and composition, close to the oblique lines in regionsB− and C+, double emulsions can be present. The inner emulsion is thought tobe governed by formulation whereas the outer emulsion is governed by composi-tion; in the B− region, the double emulsion should be of the O/W/O type and ofthe W/O/W type in the C+ region. The bold black line represents the inversionlocus.
Two kinds of transitions are generally distinguished in the literature. Theemulsion can be inverted by crossing the bold line from A+ to A− or vice versa.
P1: GFZ
SVNY317-Bibette February 1, 2007 16:45
1.6. Phase Inversion 15
(b)
(c)
Form
ula
tion S
AD
0
Oil Water
0S
AD
< 0
SA
D >
0
hydro
phil
icli
pophil
ic
1 ∞
A +
A -B -
B+
W/OW/O
O/W
C -
C +
O/W
O/W
W/O
O/W
/O
W/O
/W
Composition WOR
O W
A -
A +SAD>0
SAD<0
0
W/O
O/W
O/WSAD<0
W/OSAD>0
bicontinuousSAD=0
(a)
water
oil
W/O O/WO/W/O O/W/O
O
A -B -
B +
C -
C +
SAD<0
SAD>0
0
A +W/O
O/WW/O
W
FIGURE 1.6. (a) Schematic formulation–composition map. SAD is the surfactant affinity
difference; it is positive for a lipophilic surfactant and negative for a hydrophilic one. The
gray zones are abnormal. (b) Schematic representation of the proposed mechanism for
a transitional inversion. (c) Schematic representation of the proposed mechanism for a
catastrophic phase inversion.
P1: GFZ
SVNY317-Bibette February 1, 2007 16:45
16 1. Emulsification
In this case, the inversion is said to be transitional, with an almost horizontalline; the inversion is governed by the formulation, with almost no dependence oncomposition. The inversion is characterized by a dramatic decrease of interfacialtension. Many authors have reported that emulsification via transitional inversion,involves passage through a bicontinuous microemulsion phase or a lamellar liquidcrystalline phase [107–113] (Fig. 1.6b). If the bold line is crossed by a change incomposition, the transition is said to be catastrophic. This happens when the typeof emulsion is first governed by the composition and then by the formulation or viceversa. In catastrophic phase inversion, a region where the type of emulsion is notwell defined is passed through and formation of temporary multiple emulsions hasoften been reported [102,114–116]. The proposed mechanism is as follows (Fig.1.6c): during stirring, droplets of the continuous phase can be entrapped in the dis-persed droplets, increasing the effective internal volume fraction until reaching therequired value for inversion. Because the spontaneous curvature of the surfactant isfrustrated at the interface of the external drops, coalescence occurs [117,118] witha high frequency leading to a rapid inversion. Once the required volume fraction isreached, the inversion phenomenon is rapid and often dramatic. For catastrophicinversion, no decrease of the interfacial tension is observed. The inversion locuscan also be crossed at the intersections of the horizontal and oblique lines; both for-mulation and composition favor the inversion that is called “combined inversion”[119–123]. This allows production of emulsions with low average droplet size.The formulation–composition map is only a qualitative tool since it is well knownthat transient effects give rise to hysteresis in catastrophic inversion, dependingon the emulsification protocol [116,123–126]. An increase of the surfactantconcentration enlarges both the central region and the transition zones, whereasstirring has the opposite influence. An increase in the oil phase viscosity shrinksthe A+ region, favoring the catastrophic inversion from A+ to C+. In a similarway, an increase of the aqueous phase viscosity makes the region A- narrowerpromoting inversion from the A− to B− region. As a consequence, catastrophicinversion is well adapted for emulsifying viscous phases (see example later).
To sum up, it is commonly accepted that transitional inversion likely happensthrough a bicontinuous or a liquid crystalline phase characterized by a very lowinterfacial tension, whereas catastrophic inversion proceeds through the formationof multiple emulsions. Although pedagogic, this picture is probably oversimplifiedsince some papers [113,127] have revealed a correlation between the possibilityof forming nano-emulsions via the emulsion inversion method and the presenceof lamellar phases. Only direct investigations [128] and especially the promisingobservation using nonintrusive dye tracing techniques [129] will provide an answerto the strenuous question of inversion mechanism and dynamics.
1.6.3. Examples
1.6.3.1. Emulsification of Very Concentrated Emulsions Using the PIT Method
Phase inversion may be used as an emulsification method for systems with a veryhigh internal phase content [130–133]. The process is illustrated in Fig. 1.7 for
P1: GFZ
SVNY317-Bibette February 1, 2007 16:45
1.6. Phase Inversion 17
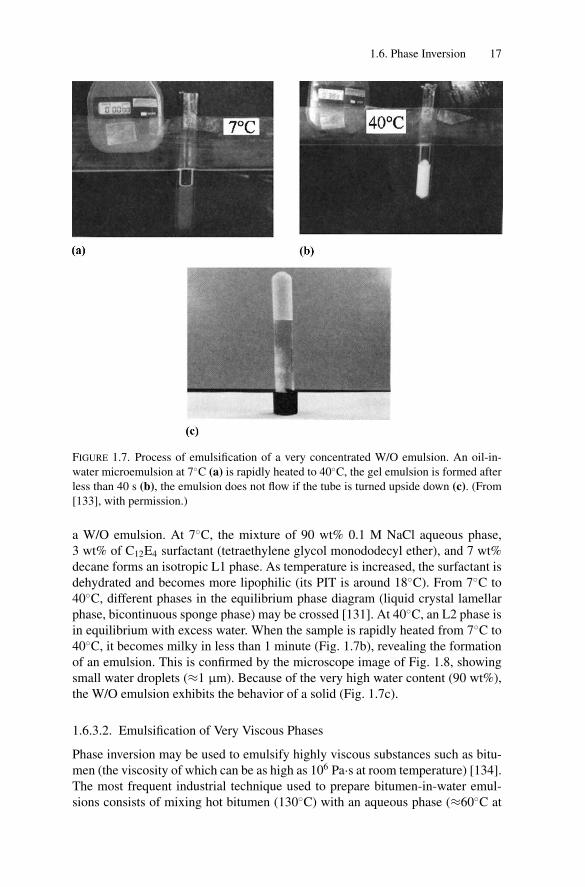
FIGURE 1.7. Process of emulsification of a very concentrated W/O emulsion. An oil-in-
water microemulsion at 7◦C (a) is rapidly heated to 40◦C, the gel emulsion is formed after
less than 40 s (b), the emulsion does not flow if the tube is turned upside down (c). (From
[133], with permission.)
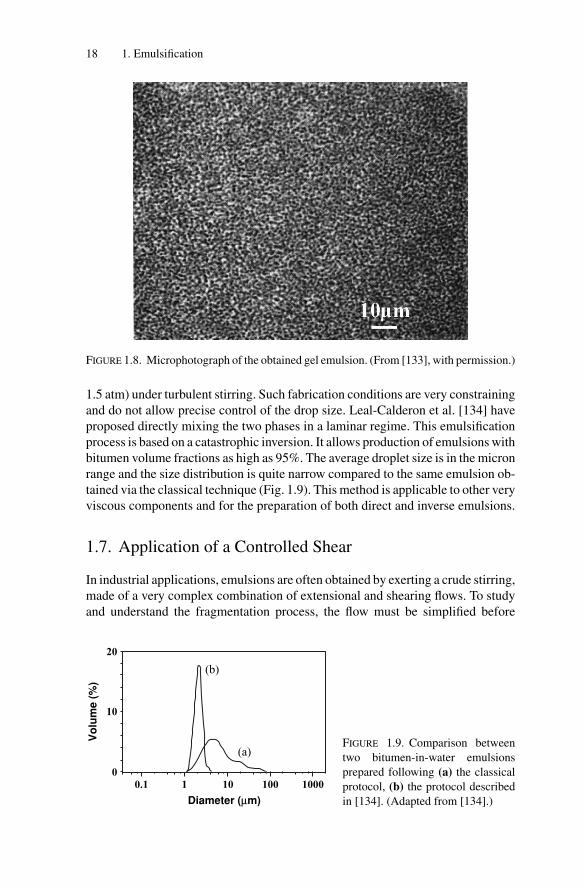
a W/O emulsion. At 7◦C, the mixture of 90 wt% 0.1 M NaCl aqueous phase,3 wt% of C12E4 surfactant (tetraethylene glycol monododecyl ether), and 7 wt%decane forms an isotropic L1 phase. As temperature is increased, the surfactant isdehydrated and becomes more lipophilic (its PIT is around 18◦C). From 7◦C to40◦C, different phases in the equilibrium phase diagram (liquid crystal lamellarphase, bicontinuous sponge phase) may be crossed [131]. At 40◦C, an L2 phase isin equilibrium with excess water. When the sample is rapidly heated from 7◦C to40◦C, it becomes milky in less than 1 minute (Fig. 1.7b), revealing the formationof an emulsion. This is confirmed by the microscope image of Fig. 1.8, showingsmall water droplets (≈1 μm). Because of the very high water content (90 wt%),the W/O emulsion exhibits the behavior of a solid (Fig. 1.7c).
1.6.3.2. Emulsification of Very Viscous Phases
Phase inversion may be used to emulsify highly viscous substances such as bitu-men (the viscosity of which can be as high as 106 Pa·s at room temperature) [134].The most frequent industrial technique used to prepare bitumen-in-water emul-sions consists of mixing hot bitumen (130◦C) with an aqueous phase (≈60◦C at
P1: GFZ
SVNY317-Bibette February 1, 2007 16:45
18 1. Emulsification
FIGURE 1.8. Microphotograph of the obtained gel emulsion. (From [133], with permission.)
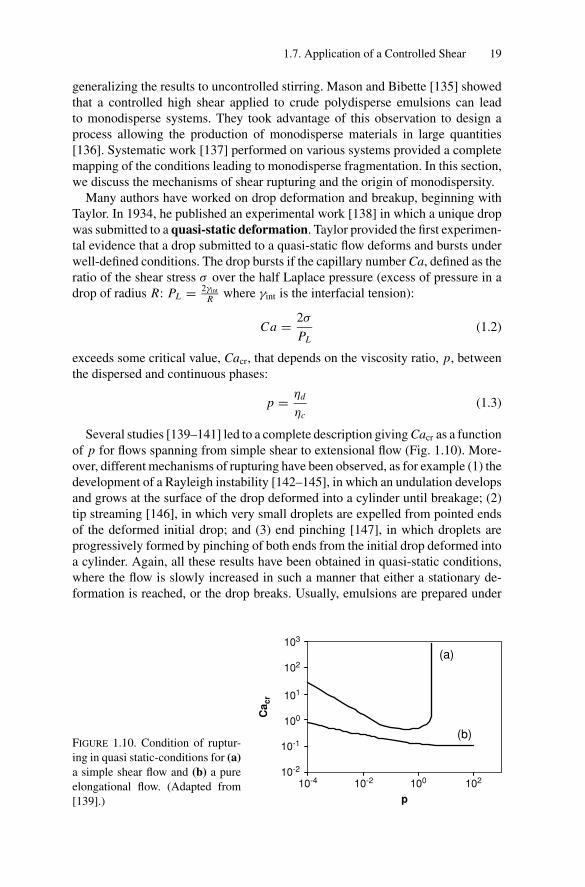
1.5 atm) under turbulent stirring. Such fabrication conditions are very constrainingand do not allow precise control of the drop size. Leal-Calderon et al. [134] haveproposed directly mixing the two phases in a laminar regime. This emulsificationprocess is based on a catastrophic inversion. It allows production of emulsions withbitumen volume fractions as high as 95%. The average droplet size is in the micronrange and the size distribution is quite narrow compared to the same emulsion ob-tained via the classical technique (Fig. 1.9). This method is applicable to other veryviscous components and for the preparation of both direct and inverse emulsions.
1.7. Application of a Controlled Shear
In industrial applications, emulsions are often obtained by exerting a crude stirring,made of a very complex combination of extensional and shearing flows. To studyand understand the fragmentation process, the flow must be simplified before
00.1 1 10 100 1000
10
20
Vo
lum
e (
%)
(a)
(b)
Diameter (μm)
FIGURE 1.9. Comparison between
two bitumen-in-water emulsions
prepared following (a) the classical
protocol, (b) the protocol described
in [134]. (Adapted from [134].)
P1: GFZ
SVNY317-Bibette February 1, 2007 16:45
1.7. Application of a Controlled Shear 19
generalizing the results to uncontrolled stirring. Mason and Bibette [135] showedthat a controlled high shear applied to crude polydisperse emulsions can leadto monodisperse systems. They took advantage of this observation to design aprocess allowing the production of monodisperse materials in large quantities[136]. Systematic work [137] performed on various systems provided a completemapping of the conditions leading to monodisperse fragmentation. In this section,we discuss the mechanisms of shear rupturing and the origin of monodispersity.
Many authors have worked on drop deformation and breakup, beginning withTaylor. In 1934, he published an experimental work [138] in which a unique dropwas submitted to a quasi-static deformation. Taylor provided the first experimen-tal evidence that a drop submitted to a quasi-static flow deforms and bursts underwell-defined conditions. The drop bursts if the capillary number Ca, defined as theratio of the shear stress σ over the half Laplace pressure (excess of pressure in adrop of radius R: PL = 2γint
R where γint is the interfacial tension):
Ca = 2σ
PL(1.2)
exceeds some critical value, Cacr, that depends on the viscosity ratio, p, betweenthe dispersed and continuous phases:
p = ηd
ηc(1.3)
Several studies [139–141] led to a complete description giving Cacr as a functionof p for flows spanning from simple shear to extensional flow (Fig. 1.10). More-over, different mechanisms of rupturing have been observed, as for example (1) thedevelopment of a Rayleigh instability [142–145], in which an undulation developsand grows at the surface of the drop deformed into a cylinder until breakage; (2)tip streaming [146], in which very small droplets are expelled from pointed endsof the deformed initial drop; and (3) end pinching [147], in which droplets areprogressively formed by pinching of both ends from the initial drop deformed intoa cylinder. Again, all these results have been obtained in quasi-static conditions,where the flow is slowly increased in such a manner that either a stationary de-formation is reached, or the drop breaks. Usually, emulsions are prepared under
10-410-2
10-1
100
101
102
103
10-2 100 102
p
Ca
cr
(a)
(b)FIGURE 1.10. Condition of ruptur-
ing in quasi static-conditions for (a)a simple shear flow and (b) a pure
elongational flow. (Adapted from
[139].)
P1: GFZ
SVNY317-Bibette February 1, 2007 16:45
20 1. Emulsification
conditions far away from ideal quasi-static deformation, changing radically the ac-cessible states and hence the rupturing conditions as showed by Hinch and Acrivos[148]. Hereafter, we describe in more detail the work of Mabille et al. [149,150]on fragmentation under non quasi-static conditions.
1.7.1. Emulsion Preparation and Characterization
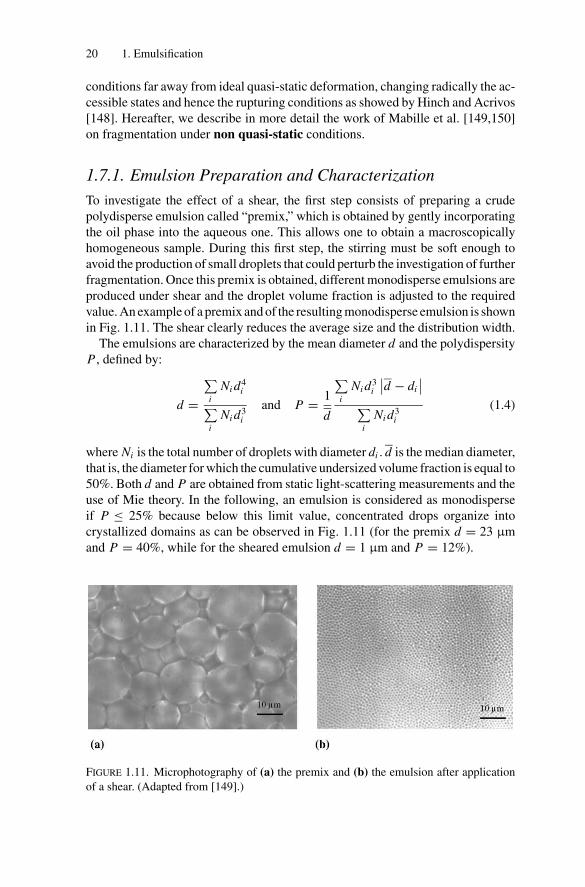
To investigate the effect of a shear, the first step consists of preparing a crudepolydisperse emulsion called “premix,” which is obtained by gently incorporatingthe oil phase into the aqueous one. This allows one to obtain a macroscopicallyhomogeneous sample. During this first step, the stirring must be soft enough toavoid the production of small droplets that could perturb the investigation of furtherfragmentation. Once this premix is obtained, different monodisperse emulsions areproduced under shear and the droplet volume fraction is adjusted to the requiredvalue. An example of a premix and of the resulting monodisperse emulsion is shownin Fig. 1.11. The shear clearly reduces the average size and the distribution width.
The emulsions are characterized by the mean diameter d and the polydispersityP , defined by:
d =∑
iNi d4
i∑i
Ni d3i
and P = 1
d
∑i
Ni d3i
∣∣d − di
∣∣∑
iNi d3
i
(1.4)
where Ni is the total number of droplets with diameter di . d is the median diameter,that is, the diameter for which the cumulative undersized volume fraction is equal to50%. Both d and P are obtained from static light-scattering measurements and theuse of Mie theory. In the following, an emulsion is considered as monodisperseif P ≤ 25% because below this limit value, concentrated drops organize intocrystallized domains as can be observed in Fig. 1.11 (for the premix d = 23 μmand P = 40%, while for the sheared emulsion d = 1 μm and P = 12%).
FIGURE 1.11. Microphotography of (a) the premix and (b) the emulsion after application
of a shear. (Adapted from [149].)
P1: GFZ
SVNY317-Bibette February 1, 2007 16:45
1.7. Application of a Controlled Shear 21
2
4
6
8
10
12
0 500 1000 1500
Time (s)
3
4
5
6
0 500 1500
Time (s)
1000
Dia
met
er (
μm)
Dia
met
er (
μm)
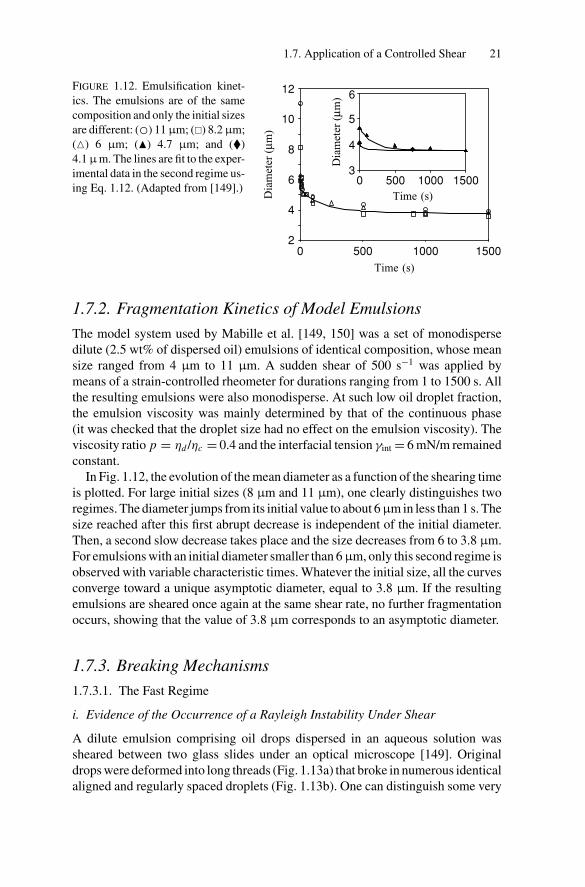
FIGURE 1.12. Emulsification kinet-
ics. The emulsions are of the same
composition and only the initial sizes
are different: (◦) 11 μm; (�) 8.2 μm;
(�) 6 μm; (�) 4.7 μm; and (�)
4.1 μ m. The lines are fit to the exper-
imental data in the second regime us-
ing Eq. 1.12. (Adapted from [149].)
1.7.2. Fragmentation Kinetics of Model Emulsions
The model system used by Mabille et al. [149, 150] was a set of monodispersedilute (2.5 wt% of dispersed oil) emulsions of identical composition, whose meansize ranged from 4 μm to 11 μm. A sudden shear of 500 s−1 was applied bymeans of a strain-controlled rheometer for durations ranging from 1 to 1500 s. Allthe resulting emulsions were also monodisperse. At such low oil droplet fraction,the emulsion viscosity was mainly determined by that of the continuous phase(it was checked that the droplet size had no effect on the emulsion viscosity). Theviscosity ratio p = ηd /ηc = 0.4 and the interfacial tension γint = 6 mN/m remainedconstant.
In Fig. 1.12, the evolution of the mean diameter as a function of the shearing timeis plotted. For large initial sizes (8 μm and 11 μm), one clearly distinguishes tworegimes. The diameter jumps from its initial value to about 6 μm in less than 1 s. Thesize reached after this first abrupt decrease is independent of the initial diameter.Then, a second slow decrease takes place and the size decreases from 6 to 3.8 μm.For emulsions with an initial diameter smaller than 6 μm, only this second regime isobserved with variable characteristic times. Whatever the initial size, all the curvesconverge toward a unique asymptotic diameter, equal to 3.8 μm. If the resultingemulsions are sheared once again at the same shear rate, no further fragmentationoccurs, showing that the value of 3.8 μm corresponds to an asymptotic diameter.
1.7.3. Breaking Mechanisms
1.7.3.1. The Fast Regime
i. Evidence of the Occurrence of a Rayleigh Instability Under Shear
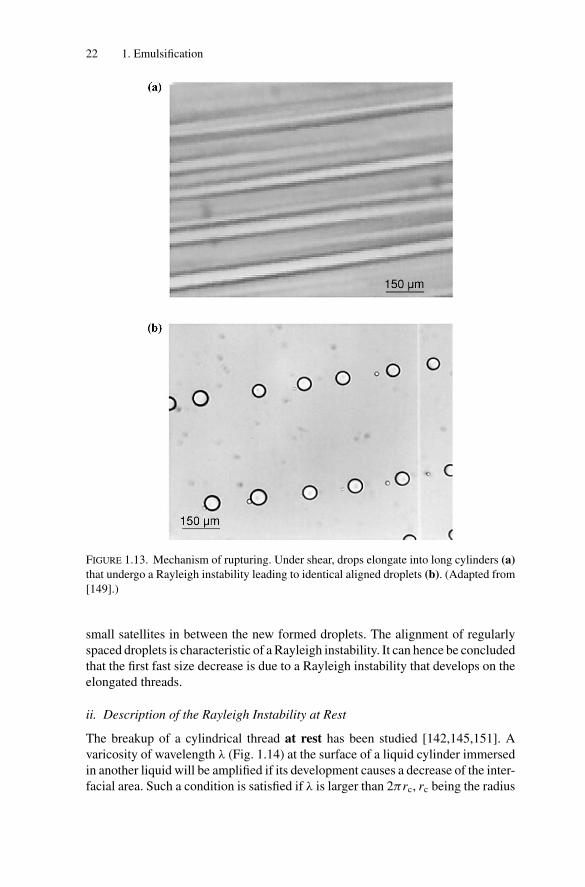
A dilute emulsion comprising oil drops dispersed in an aqueous solution wassheared between two glass slides under an optical microscope [149]. Originaldrops were deformed into long threads (Fig. 1.13a) that broke in numerous identicalaligned and regularly spaced droplets (Fig. 1.13b). One can distinguish some very
P1: GFZ
SVNY317-Bibette February 1, 2007 16:45
22 1. Emulsification
FIGURE 1.13. Mechanism of rupturing. Under shear, drops elongate into long cylinders (a)that undergo a Rayleigh instability leading to identical aligned droplets (b). (Adapted from
[149].)
small satellites in between the new formed droplets. The alignment of regularlyspaced droplets is characteristic of a Rayleigh instability. It can hence be concludedthat the first fast size decrease is due to a Rayleigh instability that develops on theelongated threads.
ii. Description of the Rayleigh Instability at Rest
The breakup of a cylindrical thread at rest has been studied [142,145,151]. Avaricosity of wavelength λ (Fig. 1.14) at the surface of a liquid cylinder immersedin another liquid will be amplified if its development causes a decrease of the inter-facial area. Such a condition is satisfied if λ is larger than 2πrc, rc being the radius
P1: GFZ
SVNY317-Bibette February 1, 2007 16:45
1.7. Application of a Controlled Shear 23
α(z,t)z
λm
rc
dR
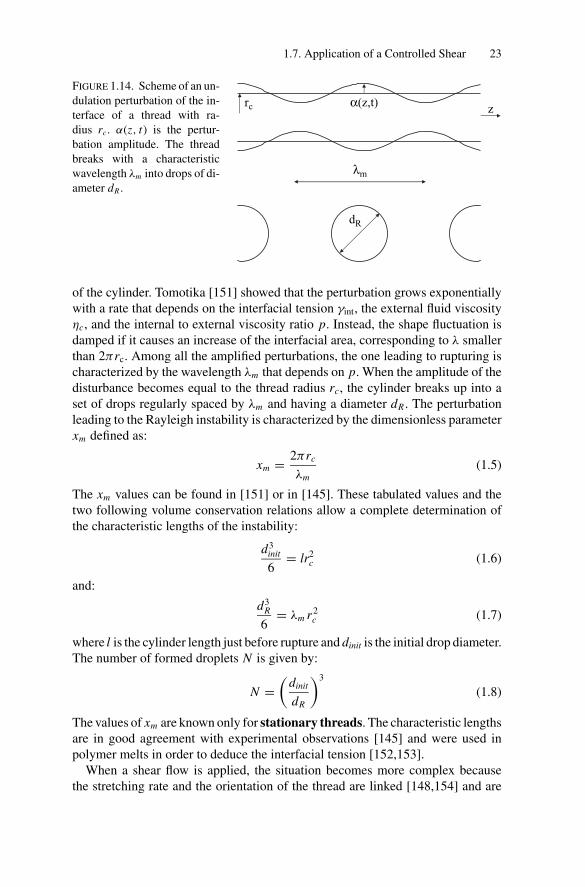
FIGURE 1.14. Scheme of an un-
dulation perturbation of the in-
terface of a thread with ra-
dius rc. α(z, t) is the pertur-
bation amplitude. The thread
breaks with a characteristic
wavelength λm into drops of di-
ameter dR .
of the cylinder. Tomotika [151] showed that the perturbation grows exponentiallywith a rate that depends on the interfacial tension γint, the external fluid viscosityηc, and the internal to external viscosity ratio p. Instead, the shape fluctuation isdamped if it causes an increase of the interfacial area, corresponding to λ smallerthan 2πrc. Among all the amplified perturbations, the one leading to rupturing ischaracterized by the wavelength λm that depends on p. When the amplitude of thedisturbance becomes equal to the thread radius rc, the cylinder breaks up into aset of drops regularly spaced by λm and having a diameter dR . The perturbationleading to the Rayleigh instability is characterized by the dimensionless parameterxm defined as:
xm = 2πrc
λm(1.5)
The xm values can be found in [151] or in [145]. These tabulated values and thetwo following volume conservation relations allow a complete determination ofthe characteristic lengths of the instability:
d3init
6= lr2
c (1.6)
and:
d3R
6= λm r2
c (1.7)
where l is the cylinder length just before rupture and dinit is the initial drop diameter.The number of formed droplets N is given by:
N =(
dinit
dR
)3
(1.8)
The values of xm are known only for stationary threads. The characteristic lengthsare in good agreement with experimental observations [145] and were used inpolymer melts in order to deduce the interfacial tension [152,153].
When a shear flow is applied, the situation becomes more complex becausethe stretching rate and the orientation of the thread are linked [148,154] and are
P1: GFZ
SVNY317-Bibette February 1, 2007 16:45
24 1. Emulsification
continuously evolving. Moreover a comparison of an analytical description withexperimental results requires knowledge of the cylinder radius and orientation justbefore the instability develops. Because these two quantities are not accessible, acomplete description of the Rayleigh instability under shear is not possible.
iii. Rayleigh Instability in Non-stationary Conditions
In the experiments of Mabille et al. [149,150],only the resulting size dR was ac-cessible. Because dR was independent of the initial size and because of the volumeconservation condition, the product r2
c λm remained constant. By shearing viscouspolymer blends, Rusu et al. [155] have directly examined the fragmentation of longcylinders. They observed that the larger the initial drop, the longer the cylindersbut one and the same final diameter was obtained after rupturing. Moreover, theyprovided experimental evidence for the existence of a unique cylinder diameterbefore breakup. Such results suggest that the criterion for the Rayleigh instabil-ity to occur is linked only to the diameter of the threads and is independent oftheir lengths. Because nonmiscible polymer blends are quite similar to oil-watermixtures, it is likely that a unique critical value of the threads radius rc and conse-quently a unique value of λm for the instability development [149,150] also existsduring emulsion fragmentation. The uniqueness of rc and λm with respect to theinitial drop size explains the fact that a polydisperse emulsion, made of a mixtureof different initial sizes, is fragmented into a monodisperse one.
1.7.3.2. The Slow Regime
In the second regime, by considering that one drop breaks into ν + 1 droplets perunit time, the increase in the number of drops per unit time can be written as:
∂ N (t)
∂t= νN (t) (1.9)
Volume conservation provides a relation between the diameter d(t) and the numberof droplets N (t) at time t . As a consequence, the differential equation governingthe size evolution is:
∂d(t)
∂t= −ν
3d(t) (1.10)
The parameter ν can also be seen as a probability of rupture. Because the sizesaturates at a value d f , ν must depend on the size. A linear dependence of ν withd can be assumed: {
ν = ν0d − d f
d fi f d > d f
ν = 0 i f d ≤ d f
(1.11)
Taking into account that the initial size of this second regime, d0, is either theemulsion initial size or the size after the first regime, that is, dR , the expression ofd(t) can be derived:
d(t) = d f
1 − d0 − d fd0
exp(−ν0t/3)
(1.12)
P1: GFZ
SVNY317-Bibette February 1, 2007 16:45
1.7. Application of a Controlled Shear 25
The data of Fig. 1.12 were fitted using ν0 as the unique fitting parameter. One andthe same value was obtained for all sets of point, ν0 = 0.015 drops per second,indicating that the drop production rate is very low and that this second regime hasonly little efficiency in comparison with the first one.
1.7.4. Generalization
The observations of model systems made of monodisperse dilute emulsions canbe generalized to polydisperse and concentrated emulsions.
1.7.4.1. Polydisperse Emulsion
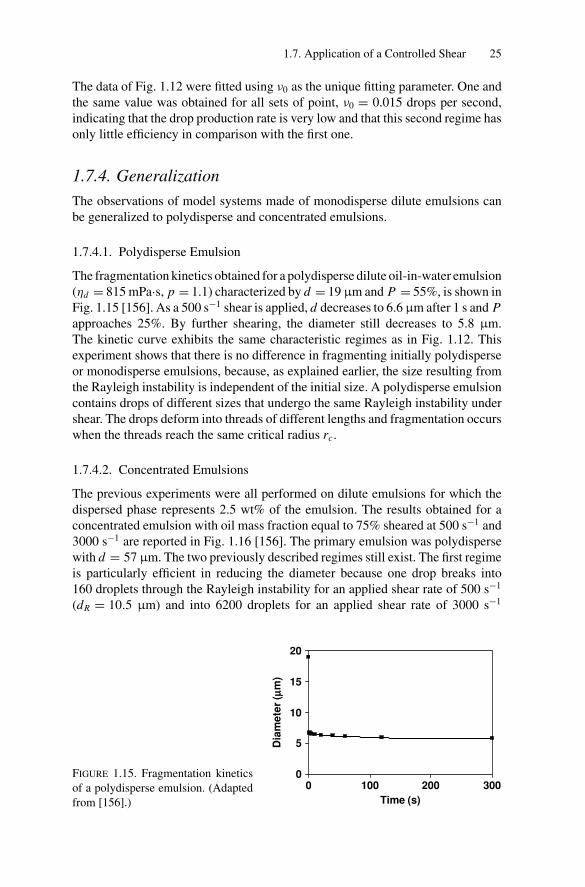
The fragmentation kinetics obtained for a polydisperse dilute oil-in-water emulsion(ηd = 815 mPa·s, p = 1.1) characterized by d = 19 μm and P = 55%, is shown inFig. 1.15 [156]. As a 500 s−1 shear is applied, d decreases to 6.6 μm after 1 s and Papproaches 25%. By further shearing, the diameter still decreases to 5.8 μm.The kinetic curve exhibits the same characteristic regimes as in Fig. 1.12. Thisexperiment shows that there is no difference in fragmenting initially polydisperseor monodisperse emulsions, because, as explained earlier, the size resulting fromthe Rayleigh instability is independent of the initial size. A polydisperse emulsioncontains drops of different sizes that undergo the same Rayleigh instability undershear. The drops deform into threads of different lengths and fragmentation occurswhen the threads reach the same critical radius rc.
1.7.4.2. Concentrated Emulsions
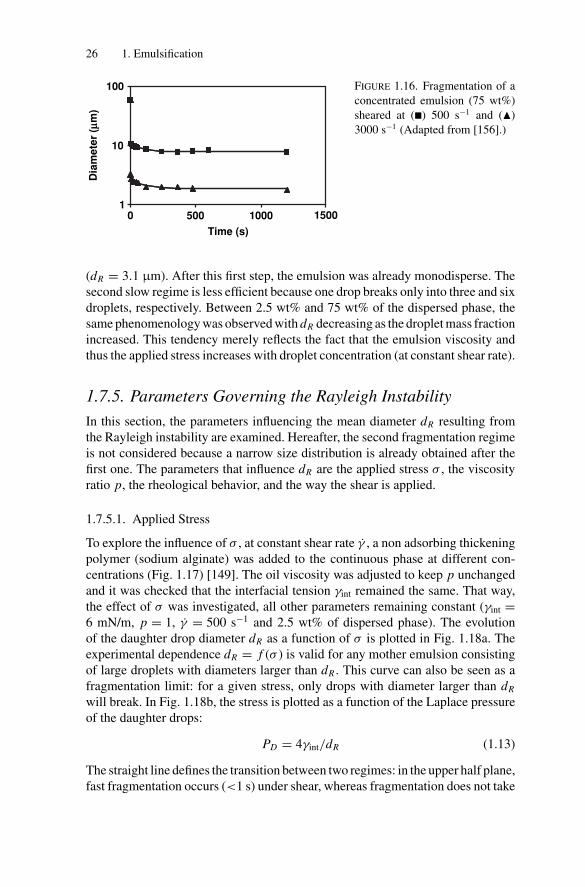
The previous experiments were all performed on dilute emulsions for which thedispersed phase represents 2.5 wt% of the emulsion. The results obtained for aconcentrated emulsion with oil mass fraction equal to 75% sheared at 500 s−1 and3000 s−1 are reported in Fig. 1.16 [156]. The primary emulsion was polydispersewith d = 57 μm. The two previously described regimes still exist. The first regimeis particularly efficient in reducing the diameter because one drop breaks into160 droplets through the Rayleigh instability for an applied shear rate of 500 s−1
(dR = 10.5 μm) and into 6200 droplets for an applied shear rate of 3000 s−1
0
5
10
15
20
0 100 200 300
Time (s)
Dia
mete
r (μμ
m)
FIGURE 1.15. Fragmentation kinetics
of a polydisperse emulsion. (Adapted
from [156].)
P1: GFZ
SVNY317-Bibette February 1, 2007 16:45
26 1. Emulsification
1
10
100
0 500 1000 1500
Time (s)
Dia
mete
r (μμ
m)
FIGURE 1.16. Fragmentation of a
concentrated emulsion (75 wt%)
sheared at (�) 500 s−1 and (�)
3000 s−1 (Adapted from [156].)
(dR = 3.1 μm). After this first step, the emulsion was already monodisperse. Thesecond slow regime is less efficient because one drop breaks only into three and sixdroplets, respectively. Between 2.5 wt% and 75 wt% of the dispersed phase, thesame phenomenology was observed with dR decreasing as the droplet mass fractionincreased. This tendency merely reflects the fact that the emulsion viscosity andthus the applied stress increases with droplet concentration (at constant shear rate).
1.7.5. Parameters Governing the Rayleigh Instability
In this section, the parameters influencing the mean diameter dR resulting fromthe Rayleigh instability are examined. Hereafter, the second fragmentation regimeis not considered because a narrow size distribution is already obtained after thefirst one. The parameters that influence dR are the applied stress σ , the viscosityratio p, the rheological behavior, and the way the shear is applied.
1.7.5.1. Applied Stress
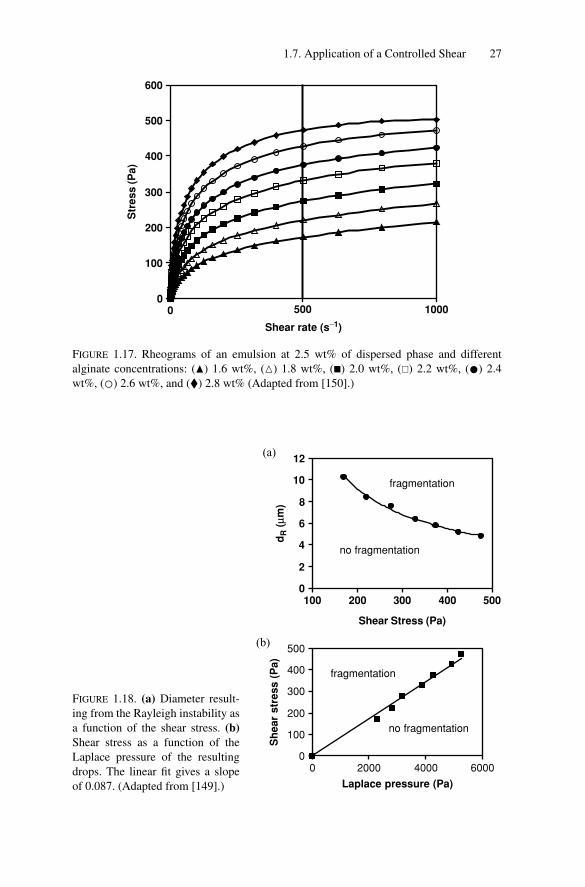
To explore the influence of σ , at constant shear rate γ , a non adsorbing thickeningpolymer (sodium alginate) was added to the continuous phase at different con-centrations (Fig. 1.17) [149]. The oil viscosity was adjusted to keep p unchangedand it was checked that the interfacial tension γint remained the same. That way,the effect of σ was investigated, all other parameters remaining constant (γint =6 mN/m, p = 1, γ = 500 s−1 and 2.5 wt% of dispersed phase). The evolutionof the daughter drop diameter dR as a function of σ is plotted in Fig. 1.18a. Theexperimental dependence dR = f (σ ) is valid for any mother emulsion consistingof large droplets with diameters larger than dR . This curve can also be seen as afragmentation limit: for a given stress, only drops with diameter larger than dR
will break. In Fig. 1.18b, the stress is plotted as a function of the Laplace pressureof the daughter drops:
PD = 4γint/dR (1.13)
The straight line defines the transition between two regimes: in the upper half plane,fast fragmentation occurs (<1 s) under shear, whereas fragmentation does not take
P1: GFZ
SVNY317-Bibette February 1, 2007 16:45
1.7. Application of a Controlled Shear 27
0
100
200
300
400
500
600
0 500 1000
Shear rate (s−1)
Str
ess (
Pa)
FIGURE 1.17. Rheograms of an emulsion at 2.5 wt% of dispersed phase and different
alginate concentrations: (�) 1.6 wt%, (�) 1.8 wt%, (�) 2.0 wt%, (�) 2.2 wt%, (•) 2.4
wt%, (◦) 2.6 wt%, and (�) 2.8 wt% (Adapted from [150].)
0
2
4
6
8
10
12
100 200 300 400 500
Shear Stress (Pa)
dR (
μm)
fragmentation
no fragmentation
0
100
200
300
400
500
0 2000 4000 6000
Laplace pressure (Pa)
Sh
ear
str
ess (
Pa)
no fragmentation
fragmentation
(a)
(b)
FIGURE 1.18. (a) Diameter result-
ing from the Rayleigh instability as
a function of the shear stress. (b)Shear stress as a function of the
Laplace pressure of the resulting
drops. The linear fit gives a slope
of 0.087. (Adapted from [149].)
P1: GFZ
SVNY317-Bibette February 1, 2007 16:45
28 1. Emulsification
1
10
100
0.01 0.1 1 10 100 1000
p = ηd/ηc
d R (μ
m)
FIGURE 1.19. Effect of the vis-
cosity ratio p on the diame-
ter after breakup (Adapted from
[149].)
place in the lower half plane. The experiments also provide an empirical law thatcan be used to predict the droplet size resulting from monodisperse fragmentation:
dR = α4γint
σ(1.14)
where α is a dimensionless constant that should essentially depend on p(α ≈ 0.1for p = 1). For p = 1, the critical capillary number for droplet rupturing Cacr,determined in quasi-static conditions is of the order of 0.5 [139,140,158]. Whenthe shear stress is applied suddenly, the stress and Laplace pressure are found tobe proportional and from the slope of the experimental curve, it can be deducedthat Cacr is of the order of 0.2 (Cacr ≈ 2α = 0.2), a value that is quite comparableto the one obtained in quasi-static conditions.
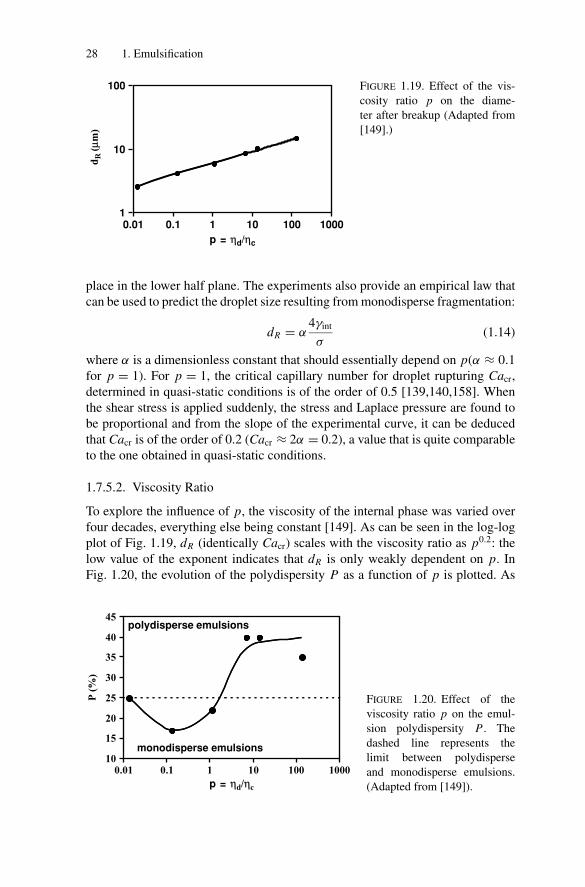
1.7.5.2. Viscosity Ratio
To explore the influence of p, the viscosity of the internal phase was varied overfour decades, everything else being constant [149]. As can be seen in the log-logplot of Fig. 1.19, dR (identically Cacr) scales with the viscosity ratio as p0.2: thelow value of the exponent indicates that dR is only weakly dependent on p. InFig. 1.20, the evolution of the polydispersity P as a function of p is plotted. As
10
15
20
25
30
35
40
45
0.01 0.1 1 10 100 1000
polydisperse emulsions
p = ηd/ηc
P (
%)
monodisperse emulsions
FIGURE 1.20. Effect of the
viscosity ratio p on the emul-
sion polydispersity P . The
dashed line represents the
limit between polydisperse
and monodisperse emulsions.
(Adapted from [149]).
P1: GFZ
SVNY317-Bibette February 1, 2007 16:45
1.7. Application of a Controlled Shear 29
10−2
10−1
100
101
102
103
10−410−6 10−2 100 102
p
Ca
cr
Quasi-static
Shear step
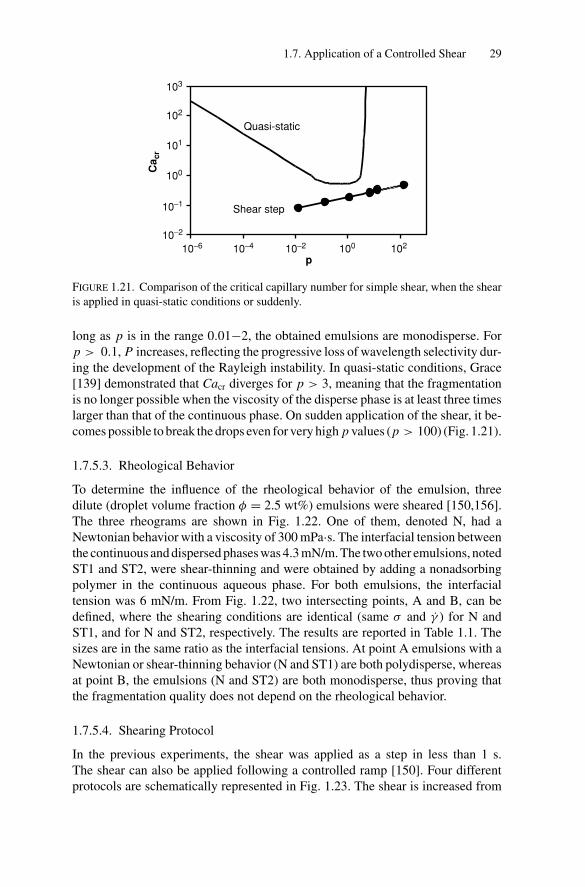
FIGURE 1.21. Comparison of the critical capillary number for simple shear, when the shear
is applied in quasi-static conditions or suddenly.
long as p is in the range 0.01−2, the obtained emulsions are monodisperse. Forp > 0.1, P increases, reflecting the progressive loss of wavelength selectivity dur-ing the development of the Rayleigh instability. In quasi-static conditions, Grace[139] demonstrated that Cacr diverges for p > 3, meaning that the fragmentationis no longer possible when the viscosity of the disperse phase is at least three timeslarger than that of the continuous phase. On sudden application of the shear, it be-comes possible to break the drops even for very high p values (p > 100) (Fig. 1.21).
1.7.5.3. Rheological Behavior
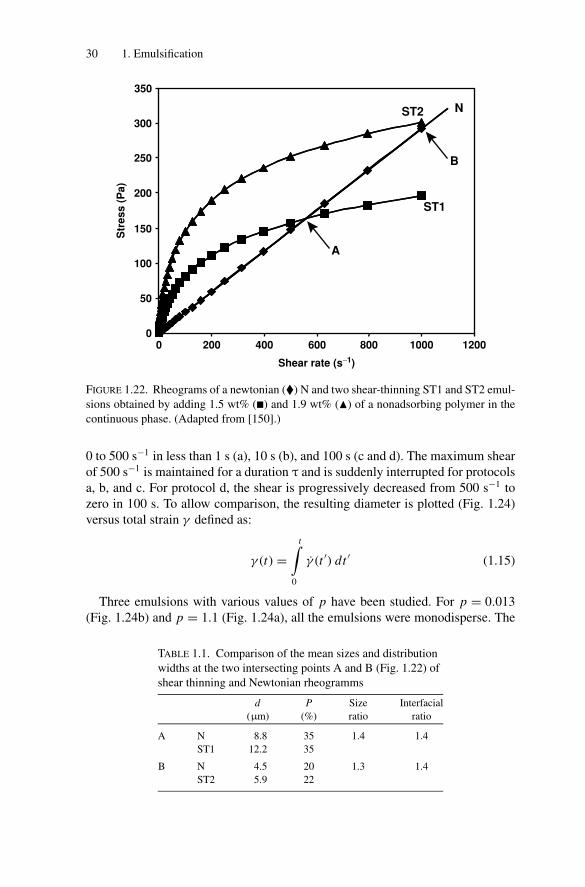
To determine the influence of the rheological behavior of the emulsion, threedilute (droplet volume fraction φ = 2.5 wt%) emulsions were sheared [150,156].The three rheograms are shown in Fig. 1.22. One of them, denoted N, had aNewtonian behavior with a viscosity of 300 mPa·s. The interfacial tension betweenthe continuous and dispersed phases was 4.3 mN/m. The two other emulsions, notedST1 and ST2, were shear-thinning and were obtained by adding a nonadsorbingpolymer in the continuous aqueous phase. For both emulsions, the interfacialtension was 6 mN/m. From Fig. 1.22, two intersecting points, A and B, can bedefined, where the shearing conditions are identical (same σ and γ ) for N andST1, and for N and ST2, respectively. The results are reported in Table 1.1. Thesizes are in the same ratio as the interfacial tensions. At point A emulsions with aNewtonian or shear-thinning behavior (N and ST1) are both polydisperse, whereasat point B, the emulsions (N and ST2) are both monodisperse, thus proving thatthe fragmentation quality does not depend on the rheological behavior.
1.7.5.4. Shearing Protocol
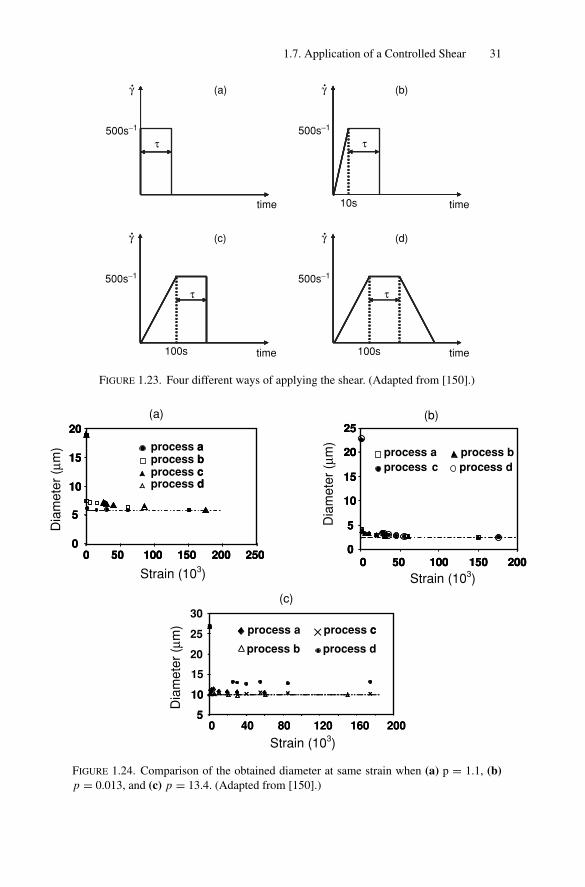
In the previous experiments, the shear was applied as a step in less than 1 s.The shear can also be applied following a controlled ramp [150]. Four differentprotocols are schematically represented in Fig. 1.23. The shear is increased from
P1: GFZ
SVNY317-Bibette February 1, 2007 16:45
30 1. Emulsification
50
100
150
200
250
300
350
00 200 400 600 800 1000
A
1200
Shear rate (s−1)
Str
ess (
Pa)
B
N
ST1
ST2
FIGURE 1.22. Rheograms of a newtonian (�) N and two shear-thinning ST1 and ST2 emul-
sions obtained by adding 1.5 wt% (�) and 1.9 wt% (�) of a nonadsorbing polymer in the
continuous phase. (Adapted from [150].)
0 to 500 s−1 in less than 1 s (a), 10 s (b), and 100 s (c and d). The maximum shearof 500 s−1 is maintained for a duration τ and is suddenly interrupted for protocolsa, b, and c. For protocol d, the shear is progressively decreased from 500 s−1 tozero in 100 s. To allow comparison, the resulting diameter is plotted (Fig. 1.24)versus total strain γ defined as:
γ (t) =t∫
0
γ (t ′) dt ′ (1.15)
Three emulsions with various values of p have been studied. For p = 0.013(Fig. 1.24b) and p = 1.1 (Fig. 1.24a), all the emulsions were monodisperse. The
TABLE 1.1. Comparison of the mean sizes and distribution
widths at the two intersecting points A and B (Fig. 1.22) of
shear thinning and Newtonian rheogramms
d P Size Interfacial
(μm) (%) ratio ratio
A N 8.8 35 1.4 1.4
ST1 12.2 35
B N 4.5 20 1.3 1.4
ST2 5.9 22
P1: GFZ
SVNY317-Bibette February 1, 2007 16:45
1.7. Application of a Controlled Shear 31
time
time time
time
τ500s−1
500s−1 500s−1
500s−1
τ
100s
(a)
(c)
τ
10s
100s
(d)
(b)
τ
γ γ
γγ
FIGURE 1.23. Four different ways of applying the shear. (Adapted from [150].)
0
5
10
15
20
25
0 50 100 150 200
process a process bprocess c process d
0
5
10
15
20
25
0
5
10
15
20
25
0 50 100 150 2000 50 100 150 200
Strain (103)
Dia
mete
r (μ
m)
0 40 80 120 160 200
process a
process b
process c
process d
5
10
5
10
15
20
25
30
0 40 80 120 160 200
c
Strain (103)
Dia
mete
r (μ
m)
0
5
10
15
20
0 50 100 150 200 250
Strain (103)
process aprocess bprocess cprocess d
0
5
10
15
20
0
5
10
15
20
0 50 100 150 200 2500 50 100 150 200 250
abcd
Dia
mete
r (μ
m)
(b)
(c)
(a)
FIGURE 1.24. Comparison of the obtained diameter at same strain when (a) p = 1.1, (b)p = 0.013, and (c) p = 13.4. (Adapted from [150].)
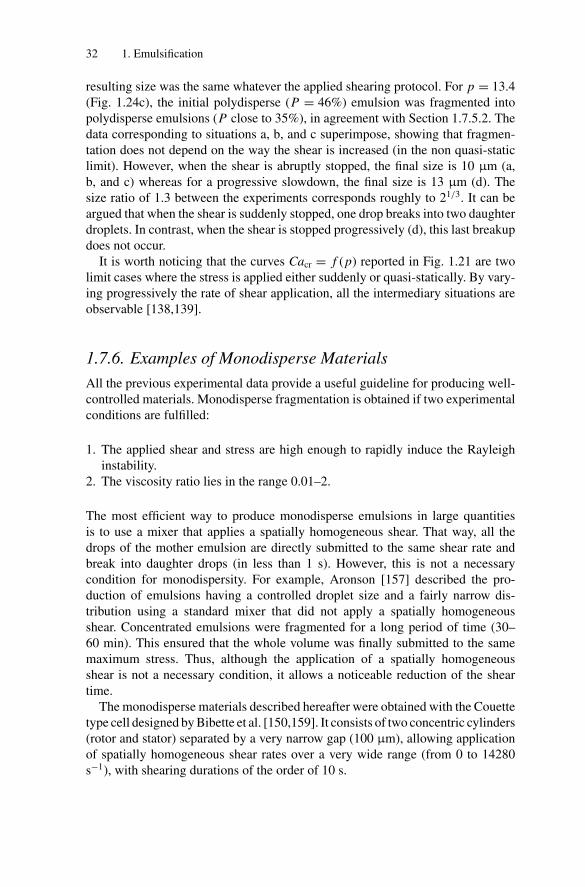
P1: GFZ
SVNY317-Bibette February 1, 2007 16:45
32 1. Emulsification
resulting size was the same whatever the applied shearing protocol. For p = 13.4(Fig. 1.24c), the initial polydisperse (P = 46%) emulsion was fragmented intopolydisperse emulsions (P close to 35%), in agreement with Section 1.7.5.2. Thedata corresponding to situations a, b, and c superimpose, showing that fragmen-tation does not depend on the way the shear is increased (in the non quasi-staticlimit). However, when the shear is abruptly stopped, the final size is 10 μm (a,b, and c) whereas for a progressive slowdown, the final size is 13 μm (d). Thesize ratio of 1.3 between the experiments corresponds roughly to 21/3. It can beargued that when the shear is suddenly stopped, one drop breaks into two daughterdroplets. In contrast, when the shear is stopped progressively (d), this last breakupdoes not occur.
It is worth noticing that the curves Cacr = f (p) reported in Fig. 1.21 are twolimit cases where the stress is applied either suddenly or quasi-statically. By vary-ing progressively the rate of shear application, all the intermediary situations areobservable [138,139].
1.7.6. Examples of Monodisperse Materials
All the previous experimental data provide a useful guideline for producing well-controlled materials. Monodisperse fragmentation is obtained if two experimentalconditions are fulfilled:
1. The applied shear and stress are high enough to rapidly induce the Rayleighinstability.
2. The viscosity ratio lies in the range 0.01–2.
The most efficient way to produce monodisperse emulsions in large quantitiesis to use a mixer that applies a spatially homogeneous shear. That way, all thedrops of the mother emulsion are directly submitted to the same shear rate andbreak into daughter drops (in less than 1 s). However, this is not a necessarycondition for monodispersity. For example, Aronson [157] described the pro-duction of emulsions having a controlled droplet size and a fairly narrow dis-tribution using a standard mixer that did not apply a spatially homogeneousshear. Concentrated emulsions were fragmented for a long period of time (30–60 min). This ensured that the whole volume was finally submitted to the samemaximum stress. Thus, although the application of a spatially homogeneousshear is not a necessary condition, it allows a noticeable reduction of the sheartime.
The monodisperse materials described hereafter were obtained with the Couettetype cell designed by Bibette et al. [150,159]. It consists of two concentric cylinders(rotor and stator) separated by a very narrow gap (100 μm), allowing applicationof spatially homogeneous shear rates over a very wide range (from 0 to 14280s−1), with shearing durations of the order of 10 s.
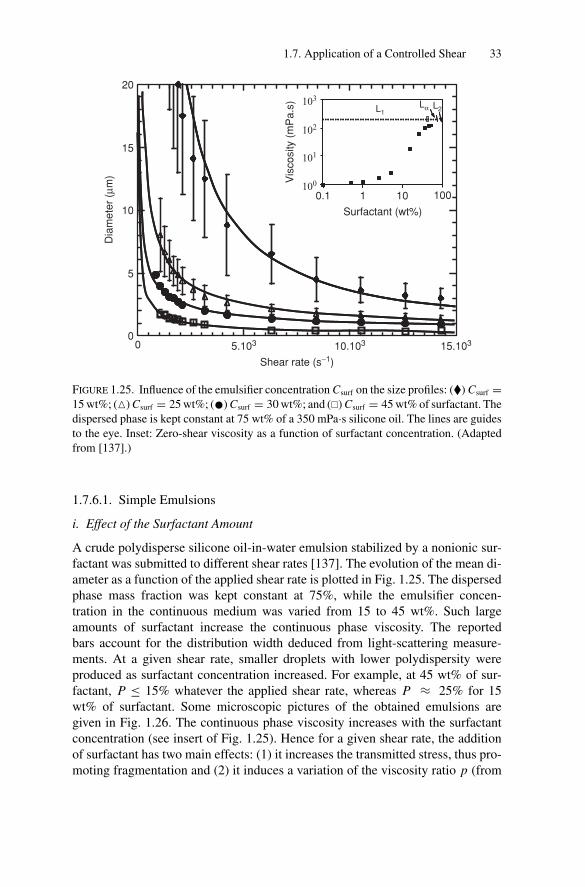
P1: GFZ
SVNY317-Bibette February 1, 2007 16:45
1.7. Application of a Controlled Shear 33
20
15
10
5
00 5.103 10.103 15.103
103
102
101
100
0.1 1 10 100
L1Lα L2
Surfactant (wt%)
Vis
cosi
ty (
mP
a.s
)
Shear rate (s−1)
Dia
mete
r (μ
m)
FIGURE 1.25. Influence of the emulsifier concentration Csurf on the size profiles: (�) Csurf =15 wt%; (�) Csurf = 25 wt%; (•) Csurf = 30 wt%; and (�) Csurf = 45 wt% of surfactant. The
dispersed phase is kept constant at 75 wt% of a 350 mPa·s silicone oil. The lines are guides
to the eye. Inset: Zero-shear viscosity as a function of surfactant concentration. (Adapted
from [137].)
1.7.6.1. Simple Emulsions
i. Effect of the Surfactant Amount
A crude polydisperse silicone oil-in-water emulsion stabilized by a nonionic sur-factant was submitted to different shear rates [137]. The evolution of the mean di-ameter as a function of the applied shear rate is plotted in Fig. 1.25. The dispersedphase mass fraction was kept constant at 75%, while the emulsifier concen-tration in the continuous medium was varied from 15 to 45 wt%. Such largeamounts of surfactant increase the continuous phase viscosity. The reportedbars account for the distribution width deduced from light-scattering measure-ments. At a given shear rate, smaller droplets with lower polydispersity wereproduced as surfactant concentration increased. For example, at 45 wt% of sur-factant, P ≤ 15% whatever the applied shear rate, whereas P ≈ 25% for 15wt% of surfactant. Some microscopic pictures of the obtained emulsions aregiven in Fig. 1.26. The continuous phase viscosity increases with the surfactantconcentration (see insert of Fig. 1.25). Hence for a given shear rate, the additionof surfactant has two main effects: (1) it increases the transmitted stress, thus pro-moting fragmentation and (2) it induces a variation of the viscosity ratio p (from
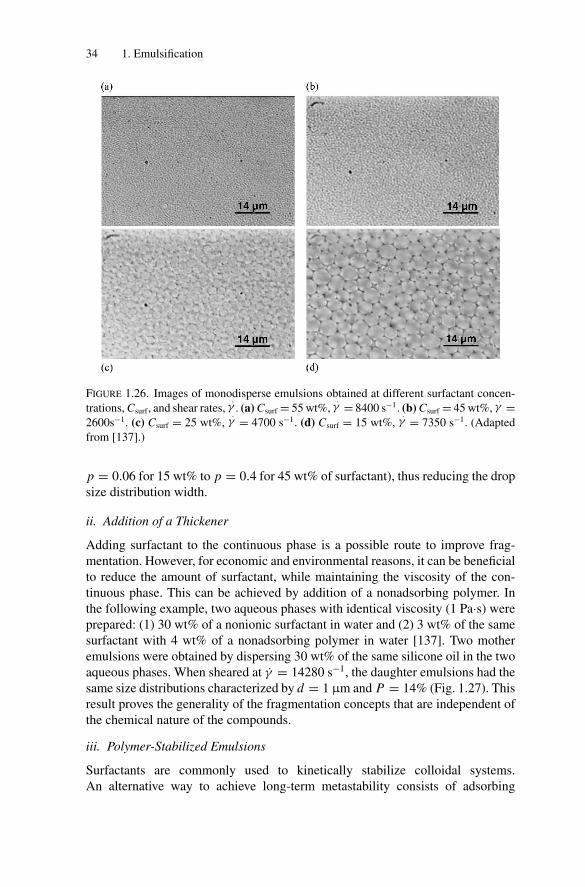
P1: GFZ
SVNY317-Bibette February 1, 2007 16:45
34 1. Emulsification
FIGURE 1.26. Images of monodisperse emulsions obtained at different surfactant concen-
trations, Csurf, and shear rates,.γ . (a) Csurf = 55 wt%,
.γ = 8400 s−1. (b) Csurf = 45 wt%,
.γ =
2600s−1. (c) Csurf = 25 wt%,.γ = 4700 s−1. (d) Csurf = 15 wt%,
.γ = 7350 s−1. (Adapted
from [137].)
p = 0.06 for 15 wt% to p = 0.4 for 45 wt% of surfactant), thus reducing the dropsize distribution width.
ii. Addition of a Thickener
Adding surfactant to the continuous phase is a possible route to improve frag-mentation. However, for economic and environmental reasons, it can be beneficialto reduce the amount of surfactant, while maintaining the viscosity of the con-tinuous phase. This can be achieved by addition of a nonadsorbing polymer. Inthe following example, two aqueous phases with identical viscosity (1 Pa·s) wereprepared: (1) 30 wt% of a nonionic surfactant in water and (2) 3 wt% of the samesurfactant with 4 wt% of a nonadsorbing polymer in water [137]. Two motheremulsions were obtained by dispersing 30 wt% of the same silicone oil in the twoaqueous phases. When sheared at γ = 14280 s−1, the daughter emulsions had thesame size distributions characterized by d = 1 μm and P = 14% (Fig. 1.27). Thisresult proves the generality of the fragmentation concepts that are independent ofthe chemical nature of the compounds.
iii. Polymer-Stabilized Emulsions
Surfactants are commonly used to kinetically stabilize colloidal systems.An alternative way to achieve long-term metastability consists of adsorbing
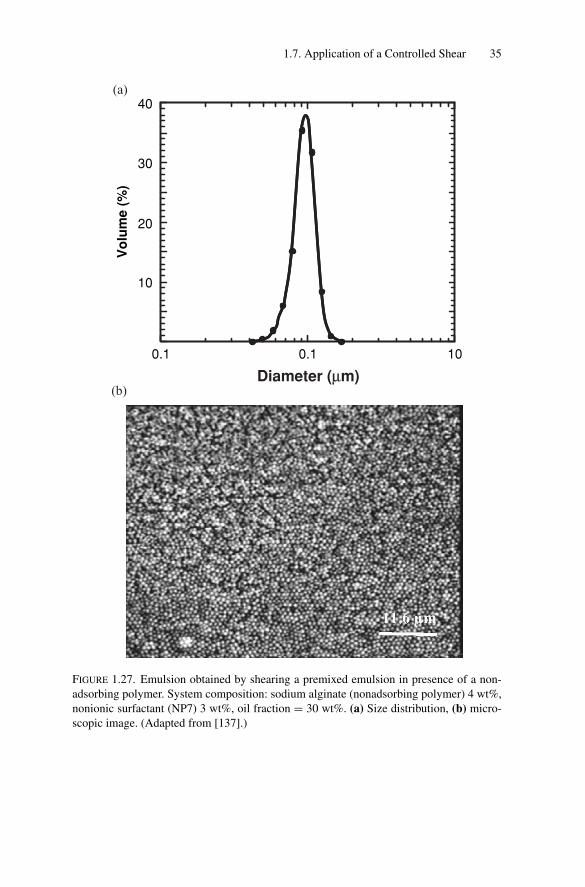
P1: GFZ
SVNY317-Bibette February 1, 2007 16:45
1.7. Application of a Controlled Shear 35
Diameter (μm)
20
30
40
Vo
lum
e (
%)
10
0.1 0.1 10
(a)
(b)
FIGURE 1.27. Emulsion obtained by shearing a premixed emulsion in presence of a non-
adsorbing polymer. System composition: sodium alginate (nonadsorbing polymer) 4 wt%,
nonionic surfactant (NP7) 3 wt%, oil fraction = 30 wt%. (a) Size distribution, (b) micro-
scopic image. (Adapted from [137].)
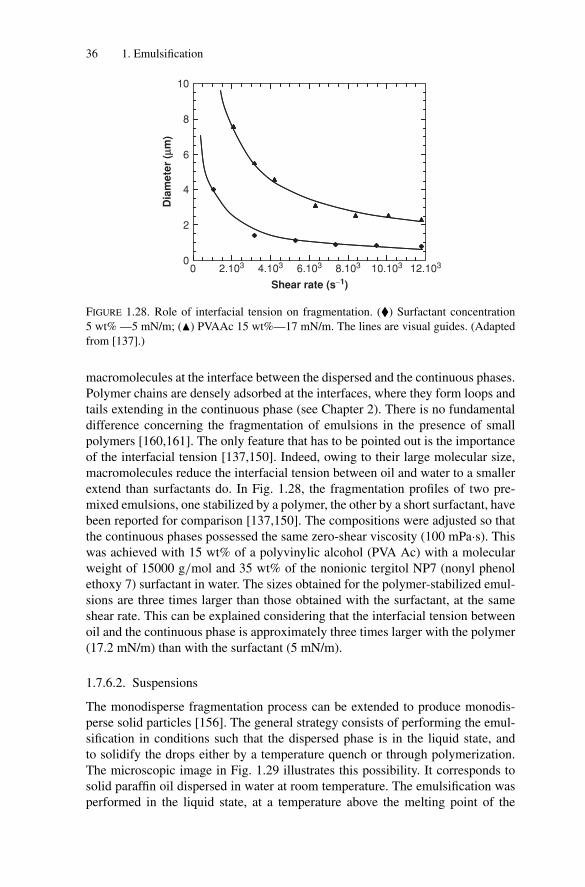
P1: GFZ
SVNY317-Bibette February 1, 2007 16:45
36 1. Emulsification
10
8
6
4
2
00 2.103 4.103 6.103 8.103 10.103 12.103
Shear rate (s−1)
Dia
mete
r (μ
m)
FIGURE 1.28. Role of interfacial tension on fragmentation. (�) Surfactant concentration
5 wt% —5 mN/m; (�) PVAAc 15 wt%—17 mN/m. The lines are visual guides. (Adapted
from [137].)
macromolecules at the interface between the dispersed and the continuous phases.Polymer chains are densely adsorbed at the interfaces, where they form loops andtails extending in the continuous phase (see Chapter 2). There is no fundamentaldifference concerning the fragmentation of emulsions in the presence of smallpolymers [160,161]. The only feature that has to be pointed out is the importanceof the interfacial tension [137,150]. Indeed, owing to their large molecular size,macromolecules reduce the interfacial tension between oil and water to a smallerextend than surfactants do. In Fig. 1.28, the fragmentation profiles of two pre-mixed emulsions, one stabilized by a polymer, the other by a short surfactant, havebeen reported for comparison [137,150]. The compositions were adjusted so thatthe continuous phases possessed the same zero-shear viscosity (100 mPa·s). Thiswas achieved with 15 wt% of a polyvinylic alcohol (PVA Ac) with a molecularweight of 15000 g/mol and 35 wt% of the nonionic tergitol NP7 (nonyl phenolethoxy 7) surfactant in water. The sizes obtained for the polymer-stabilized emul-sions are three times larger than those obtained with the surfactant, at the sameshear rate. This can be explained considering that the interfacial tension betweenoil and the continuous phase is approximately three times larger with the polymer(17.2 mN/m) than with the surfactant (5 mN/m).
1.7.6.2. Suspensions
The monodisperse fragmentation process can be extended to produce monodis-perse solid particles [156]. The general strategy consists of performing the emul-sification in conditions such that the dispersed phase is in the liquid state, andto solidify the drops either by a temperature quench or through polymerization.The microscopic image in Fig. 1.29 illustrates this possibility. It corresponds tosolid paraffin oil dispersed in water at room temperature. The emulsification wasperformed in the liquid state, at a temperature above the melting point of the
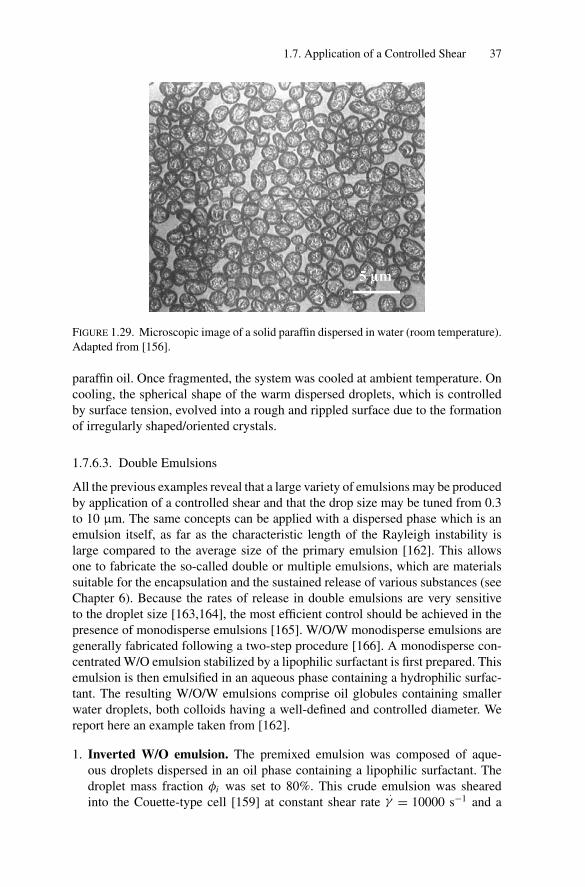
P1: GFZ
SVNY317-Bibette February 1, 2007 16:45
1.7. Application of a Controlled Shear 37
FIGURE 1.29. Microscopic image of a solid paraffin dispersed in water (room temperature).
Adapted from [156].
paraffin oil. Once fragmented, the system was cooled at ambient temperature. Oncooling, the spherical shape of the warm dispersed droplets, which is controlledby surface tension, evolved into a rough and rippled surface due to the formationof irregularly shaped/oriented crystals.
1.7.6.3. Double Emulsions
All the previous examples reveal that a large variety of emulsions may be producedby application of a controlled shear and that the drop size may be tuned from 0.3to 10 μm. The same concepts can be applied with a dispersed phase which is anemulsion itself, as far as the characteristic length of the Rayleigh instability islarge compared to the average size of the primary emulsion [162]. This allowsone to fabricate the so-called double or multiple emulsions, which are materialssuitable for the encapsulation and the sustained release of various substances (seeChapter 6). Because the rates of release in double emulsions are very sensitiveto the droplet size [163,164], the most efficient control should be achieved in thepresence of monodisperse emulsions [165]. W/O/W monodisperse emulsions aregenerally fabricated following a two-step procedure [166]. A monodisperse con-centrated W/O emulsion stabilized by a lipophilic surfactant is first prepared. Thisemulsion is then emulsified in an aqueous phase containing a hydrophilic surfac-tant. The resulting W/O/W emulsions comprise oil globules containing smallerwater droplets, both colloids having a well-defined and controlled diameter. Wereport here an example taken from [162].
1. Inverted W/O emulsion. The premixed emulsion was composed of aque-ous droplets dispersed in an oil phase containing a lipophilic surfactant. Thedroplet mass fraction φi was set to 80%. This crude emulsion was shearedinto the Couette-type cell [159] at constant shear rate
.γ = 10000 s−1 and a
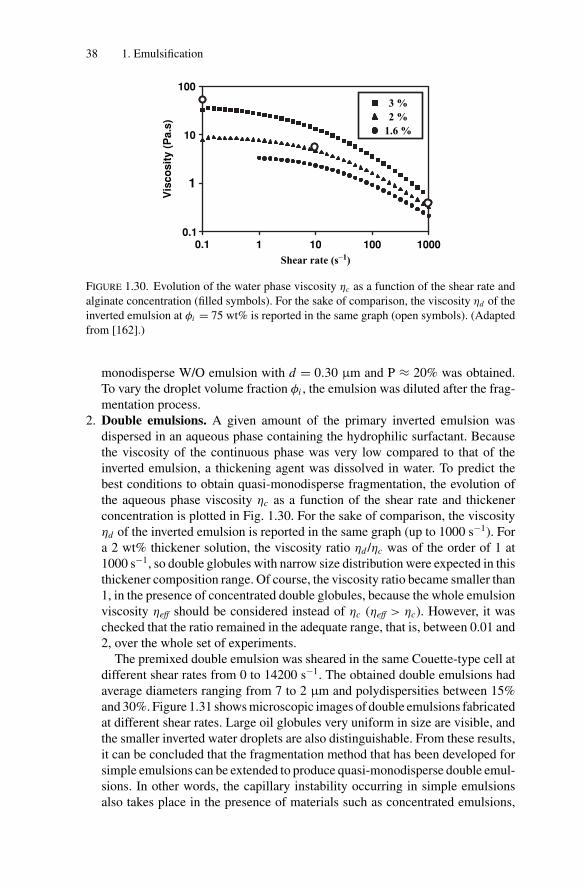
P1: GFZ
SVNY317-Bibette February 1, 2007 16:45
38 1. Emulsification
0.10.1
1
10
100
1 10 100 1000
3 %2 %
1.6 %
Shear rate (s−1)
Vis
co
sit
y (
Pa.s
)
FIGURE 1.30. Evolution of the water phase viscosity ηc as a function of the shear rate and
alginate concentration (filled symbols). For the sake of comparison, the viscosity ηd of the
inverted emulsion at φi = 75 wt% is reported in the same graph (open symbols). (Adapted
from [162].)
monodisperse W/O emulsion with d = 0.30 μm and P ≈ 20% was obtained.To vary the droplet volume fraction φi , the emulsion was diluted after the frag-mentation process.
2. Double emulsions. A given amount of the primary inverted emulsion wasdispersed in an aqueous phase containing the hydrophilic surfactant. Becausethe viscosity of the continuous phase was very low compared to that of theinverted emulsion, a thickening agent was dissolved in water. To predict thebest conditions to obtain quasi-monodisperse fragmentation, the evolution ofthe aqueous phase viscosity ηc as a function of the shear rate and thickenerconcentration is plotted in Fig. 1.30. For the sake of comparison, the viscosityηd of the inverted emulsion is reported in the same graph (up to 1000 s−1). Fora 2 wt% thickener solution, the viscosity ratio ηd /ηc was of the order of 1 at1000 s−1, so double globules with narrow size distribution were expected in thisthickener composition range. Of course, the viscosity ratio became smaller than1, in the presence of concentrated double globules, because the whole emulsionviscosity ηeff should be considered instead of ηc (ηeff > ηc). However, it waschecked that the ratio remained in the adequate range, that is, between 0.01 and2, over the whole set of experiments.
The premixed double emulsion was sheared in the same Couette-type cell atdifferent shear rates from 0 to 14200 s−1. The obtained double emulsions hadaverage diameters ranging from 7 to 2 μm and polydispersities between 15%and 30%. Figure 1.31 shows microscopic images of double emulsions fabricatedat different shear rates. Large oil globules very uniform in size are visible, andthe smaller inverted water droplets are also distinguishable. From these results,it can be concluded that the fragmentation method that has been developed forsimple emulsions can be extended to produce quasi-monodisperse double emul-sions. In other words, the capillary instability occurring in simple emulsionsalso takes place in the presence of materials such as concentrated emulsions,
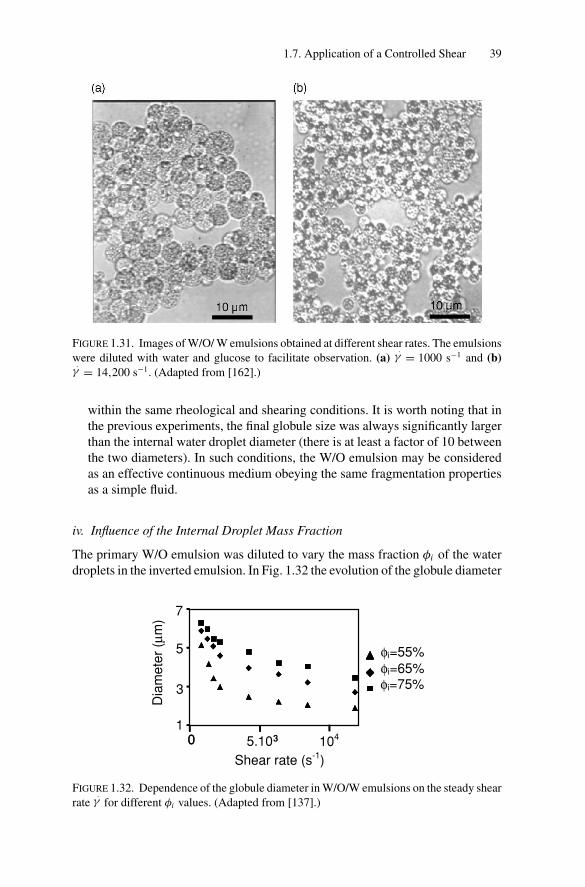
P1: GFZ
SVNY317-Bibette February 1, 2007 16:45
1.7. Application of a Controlled Shear 39
FIGURE 1.31. Images of W/O/ W emulsions obtained at different shear rates. The emulsions
were diluted with water and glucose to facilitate observation. (a).γ = 1000 s−1 and (b)
.γ = 14,200 s−1. (Adapted from [162].)
within the same rheological and shearing conditions. It is worth noting that inthe previous experiments, the final globule size was always significantly largerthan the internal water droplet diameter (there is at least a factor of 10 betweenthe two diameters). In such conditions, the W/O emulsion may be consideredas an effective continuous medium obeying the same fragmentation propertiesas a simple fluid.
iv. Influence of the Internal Droplet Mass Fraction
The primary W/O emulsion was diluted to vary the mass fraction φi of the waterdroplets in the inverted emulsion. In Fig. 1.32 the evolution of the globule diameter
1
3
5
7
0 5.103 104
Shear rate (s-1)
φi=55%
φi=75%φi=65%
0
Dia
me
ter
(μm
)
FIGURE 1.32. Dependence of the globule diameter in W/O/W emulsions on the steady shear
rate.γ for different φi values. (Adapted from [137].)
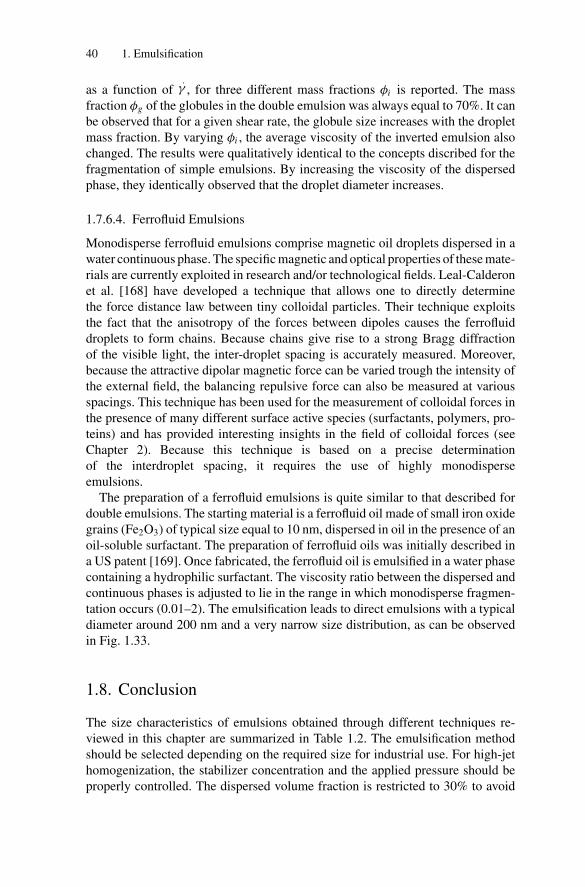
P1: GFZ
SVNY317-Bibette February 1, 2007 16:45
40 1. Emulsification
as a function of.γ , for three different mass fractions φi is reported. The mass
fraction φg of the globules in the double emulsion was always equal to 70%. It canbe observed that for a given shear rate, the globule size increases with the dropletmass fraction. By varying φi , the average viscosity of the inverted emulsion alsochanged. The results were qualitatively identical to the concepts discribed for thefragmentation of simple emulsions. By increasing the viscosity of the dispersedphase, they identically observed that the droplet diameter increases.
1.7.6.4. Ferrofluid Emulsions
Monodisperse ferrofluid emulsions comprise magnetic oil droplets dispersed in awater continuous phase. The specific magnetic and optical properties of these mate-rials are currently exploited in research and/or technological fields. Leal-Calderonet al. [168] have developed a technique that allows one to directly determinethe force distance law between tiny colloidal particles. Their technique exploitsthe fact that the anisotropy of the forces between dipoles causes the ferrofluiddroplets to form chains. Because chains give rise to a strong Bragg diffractionof the visible light, the inter-droplet spacing is accurately measured. Moreover,because the attractive dipolar magnetic force can be varied trough the intensity ofthe external field, the balancing repulsive force can also be measured at variousspacings. This technique has been used for the measurement of colloidal forces inthe presence of many different surface active species (surfactants, polymers, pro-teins) and has provided interesting insights in the field of colloidal forces (seeChapter 2). Because this technique is based on a precise determinationof the interdroplet spacing, it requires the use of highly monodisperseemulsions.
The preparation of a ferrofluid emulsions is quite similar to that described fordouble emulsions. The starting material is a ferrofluid oil made of small iron oxidegrains (Fe2O3) of typical size equal to 10 nm, dispersed in oil in the presence of anoil-soluble surfactant. The preparation of ferrofluid oils was initially described ina US patent [169]. Once fabricated, the ferrofluid oil is emulsified in a water phasecontaining a hydrophilic surfactant. The viscosity ratio between the dispersed andcontinuous phases is adjusted to lie in the range in which monodisperse fragmen-tation occurs (0.01–2). The emulsification leads to direct emulsions with a typicaldiameter around 200 nm and a very narrow size distribution, as can be observedin Fig. 1.33.
1.8. Conclusion
The size characteristics of emulsions obtained through different techniques re-viewed in this chapter are summarized in Table 1.2. The emulsification methodshould be selected depending on the required size for industrial use. For high-jethomogenization, the stabilizer concentration and the applied pressure should beproperly controlled. The dispersed volume fraction is restricted to 30% to avoid
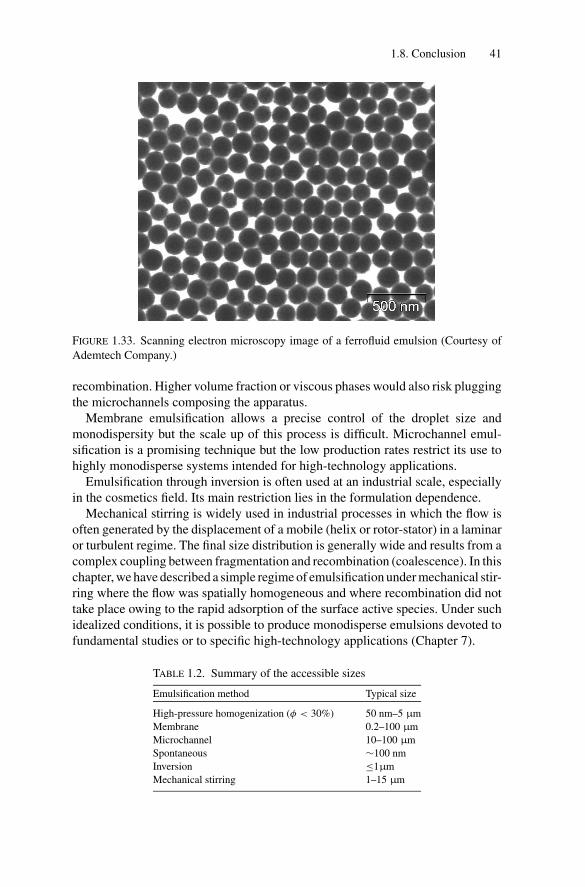
P1: GFZ
SVNY317-Bibette February 1, 2007 16:45
1.8. Conclusion 41
FIGURE 1.33. Scanning electron microscopy image of a ferrofluid emulsion (Courtesy of
Ademtech Company.)
recombination. Higher volume fraction or viscous phases would also risk pluggingthe microchannels composing the apparatus.
Membrane emulsification allows a precise control of the droplet size andmonodispersity but the scale up of this process is difficult. Microchannel emul-sification is a promising technique but the low production rates restrict its use tohighly monodisperse systems intended for high-technology applications.
Emulsification through inversion is often used at an industrial scale, especiallyin the cosmetics field. Its main restriction lies in the formulation dependence.
Mechanical stirring is widely used in industrial processes in which the flow isoften generated by the displacement of a mobile (helix or rotor-stator) in a laminaror turbulent regime. The final size distribution is generally wide and results from acomplex coupling between fragmentation and recombination (coalescence). In thischapter, we have described a simple regime of emulsification under mechanical stir-ring where the flow was spatially homogeneous and where recombination did nottake place owing to the rapid adsorption of the surface active species. Under suchidealized conditions, it is possible to produce monodisperse emulsions devoted tofundamental studies or to specific high-technology applications (Chapter 7).
TABLE 1.2. Summary of the accessible sizes
Emulsification method Typical size
High-pressure homogenization (φ < 30%) 50 nm–5 μm
Membrane 0.2–100 μm
Microchannel 10–100 μm
Spontaneous ∼100 nm
Inversion ≤1μm
Mechanical stirring 1–15 μm
P1: GFZ
SVNY317-Bibette February 1, 2007 16:45
42 1. Emulsification
References
[1] S.Y. Soon, J. Harbidge, N.J. Titchener-Hooker, and P.A. Shamlou: “Prediction of
Drop Breakage in an Ultra Velocity Jet Homogenizer.” J. Chem. Eng. Jpn. 34, 640
(2001).
[2] S. Mohan and G. Narsimham: “Coalescence of Protein-Stabilized Emulsions in a
High-Pressure Homogenizer.” J. Colloid Interface Sci. 192, 1 (1997).
[3] P. Paquin: “Technological Properties of High-Pressure Homogenizers: The Effect
of Fat Globules, Milk Proteins, and Polysachharides.” Int. Dairy J. 9, 329 (1999).
[4] S. Brosel and H. Schubert: “Investigation of the Role of Surfactants in Mechanical
Emulsification Using a High-Pressure Homogenizer with an Orifice Valve.” Chem.
Eng. Process. 38, 533 (1999).
[5] G. Narsimham and P. Goel: “Drop Coalescence During Emulsion Formation in
a High-Pressure Homogenizer for Tetradecane-in-Water Emulsion Stabilized by
Sodium Dodecyl Sulfate.” J. Colloid Interface Sci. 238, 420 (2001).
[6] L. Taisne, P. Walstra, and B. Cabane: “Transfer of Oil Between Emulsion Droplets.”
J. Colloid Interface Sci. 184, 378 (1996).
[7] L. Lobo, A. Svereika, and M. Nair: “Coalescence During Emulsification. 1. Method
Development.” J. Colloid Interface Sci. 253, 409 (2002).
[8] L. Lobo and A. Svereika: “Coalescence During Emulsification. 2. Role of Small
Molecule Surfactants.” J. Colloid Interface Sci. 261, 498 (2003).
[9] P. Marie, J.M. Perrier-Cornet, and P. Gervais: “Influence of Major Parameters in
Emulsification Mechanisms Using a High-Pressure Jet.” J. Food Eng. 53, 43 (2002).
[10] P. Walstra: “Formation of Emulsions.” In P. Belcher (ed), Encyclopedia of EmulsionTechnology, Basic Theory, Marcel Dekker, New York (1983).
[11] P. Walstra and P.E.A. Smulders: “Emulsion Formation.” In B.P. Binks (ed), ModernAspects of Emulsion Science.The Royal Society of Chemistry Cambridge, UK,
1998.
[12] J. Floury, A. Desrumaux, and J. Lardieres: “Effect of High-Pressure Homogeniza-
tion on Droplet Size Distributions and Rheological Properties of Model Oil-in-Water
Emulsions.” Innovat. Food Sci. Emergi. Technol. 1, 127 (2000).
[13] E. Tornberg: “Functional Characterization of Protein Stabilized Emulsions: Emul-
sifying Behavior of Proteins in a Valve Homogenizer.” J. Sci. Food Agric. 29, 867
(1978).
[14] K. Kandori: “Application of Microporous Glass Membranes: Membrane Emulsifi-
cation.” In A.G. Gaonkar (ed), Food Processing: Recent Developments” Elsevier,
Amsterdam (1995).
[15] R.A. Williams, S.J. Peng, D.A. Wheeler, N.C. Morley, D. Taylor, M. Whalley,
and D.W. Houldsworth: “Controlled Production of Emulsions Using Crossflow
Membrane Part II. Industrial Scale Manufacture.” Chem. Eng. Res. Des. 76 A, 902
(1998).
[16] S.J. Peng and R.A. Williams: “Controlled Production of Emulsions Using a Cross-
flow Membrane.” Part. Part. Syst. Charact. 15, 21 (1998).
[17] R. Katoh, Y. Asano, A. Furuya, K. Sotoyama, and M. Tomita: “Preparation of Food
Emulsions Using Membrane Emulsification System.” Proceedings of the 7th Inter-
national Symposium on Synthetic Membranes in Science 407, Tubingen, Germany
(1994).
[18] Y. Mine, M. Shimizu, and T. Nakashima: “Preparation and Stabilization of Simple
and Multiple Emulsions Using Microporous Glass Membrane.” Colloid Surfaces B
Biointerfaces 6, 261 (1996).
P1: GFZ
SVNY317-Bibette February 1, 2007 16:45
References 43
[19] V. Schroder, O. Behrend, and H. Schubert: “Effect of Dynamic Interfacial Tension
on the Emulsification Process Using Microporous Ceramic Membranes.” J. Colloid
Interface Sci. 202, 334 (1998).
[20] T. Nakashima, M. Shimizu, and M. Kukizaki: “Membrane Emulsification by Mi-
croporous Glass.” Key Eng. Mater. 61/62, 513 (1991).
[21] V. Schroder and H. Schubert: “Emulsification Using Microporous Ceramic Mem-
branes.” In Proceedings of the First European Congress on Chemical Engineering
(ECCE 1) 2491, Florence Italy (1997).
[22] V. Schroder, Z. Wang, and H. Schubert: “Production of Oil-in-Water Emulsions
by Microporous Membranes.” In Proceedings of the Third International Sympo-
sium on Progress in Membrane Science and Technology, Euromembrane 1997 439,
University of Twente (1997).
[23] G. Muschiolik and S. Drager: “Emulsionbildung Mittels Mikroporosen Glas.”
Deutsche Milchwirtsch. 46, 1041 (1995).
[24] R. Katoh, Y. Asano, A. Furuya, K. Sotoyama, and M. Tomita: “Preparation of Food
Emulsions Using a Membrane Emulsification System.” J. Membr. Sci. 113, 131
(1996).
[25] R. Katoh, Y. Asano, A. Furuya, and M. Tomita: “Conditions for Preparation of O/W
Food Emulsions Using a Membrane Emulsification System.” Nippon Shokuhin
Kagaku Kogaku Kaishi 42, 548 (1995).
[26] S. Ban, M. Kitana, and A. Yamasaki: “Preparation of O/W Emulsions with
Poly(Oxyethylene) Hydrogenated Castor Oil by Using Spg Membrane Emulsifi-
cation.” Nippon Kagaku Kogaku Kaishi 8, 737 (1994).
[27] K. Kandori, K. Kishi, and T. Ishikawa: “Preparation of Monodispersed W/O Emul-
sions by Shirasu-Porous-Glass Filter Emulsification Technique.” Colloid Surfaces
55, 73 (1991).
[28] S.M. Joscelyne and G. Tragardh: “Membrane Emulsification—a Literature
Review.” J. Membr. Sci. 169, 107 (2000).
[29] S. Van der Graaf, C.G.P.H. Schroen, and R.M. Boom: “Preparation of Dou-
ble Emulsions by Membrane Emulsification—a Review.” J. Membr. Sci. 251, 7
(2005).
[30] T. Kawakatsu, Y. Kikuchi, and M. Nakajima: “Regular-Sized Cell Creation in
Micro-Channel Emulsification by Visual Microprocessing Method.” JAOCS 74,
317 (1997).
[31] T. Kawakatsu, H. Komori, M. Nakajima, Y. Kikuchi, and T. Yonemoto: “Produc-
tion of Monodispersed Oil-in-Water Emulsion Using Crossflow-Type Silicon Mi-
crochannel Plate.” J. Chem. Eng. Jpn 32, 241 (1999).
[32] S. Sugiura, M. Nakajima, S. Iwamoto, and M. Seki: “Interfacial Tension Driven
Monodispersed Droplet Formation from Microfabricated Channel Array.” Langmuir
17, 5562 (2001).
[33] S. Sugiura, M. Nakajima, N. Kumazawa, S. Iwamoto, and M. Seki: “Characteriza-
tion of Spontaneous Transformation-Based Droplet Formation During Microchan-
nel Emulsification.” J. Phys. Chem. B 106, 9405 (2002).
[34] S. Sugiura, M. Nakajima, K. Yamamoto, S. Iwamoto, T. Oda, M. Satake, and M.
Seki: “Prepartion Characteristics of Water-in-Oil-in-Water Multiple Emulsions Us-
ing Microchannel Emulsification.” J. Colloid Interface Sci. 270, 221 (2004).
[35] T. Kawakatsu, G. Tragardh, C. Tragardh, M. Nakajima, N. Oda, and T. Yonemoto:
“The Effect of Hydrophobicity of Microchannels and Components in Water and
Oil Phases on Droplet Formation in Microchannel Water-in-Oil Emulsification.”
Colloid and Surfaces A Physicochem. Eng. Aspects 179, 29 (2001).
P1: GFZ
SVNY317-Bibette February 1, 2007 16:45
44 1. Emulsification
[36] S. Sugiura, M. Nakajima, and M. Seki: “Effect of Channel Structure on Microchan-
nel Emulsification.” Langmuir 18, 5708 (2002).
[37] S. Sugiura, M. Nakajima, and M. Seki: “Prediction of Droplet Diameter for Mi-
crochannel Emulsification.” Langmuir 18, 3854 (2002).
[38] S. Sugiura, M. Nakajima, T. Oda, M. Satake, and M. Seki: “Effect of Interfa-
cial Tension on the Dynamic Behavior of Droplet Formation During Microchannel
Emulsification.” J. Colloid Interface Sci. 269, 178 (2004).
[39] I. Kobayashi, M. Nakajima, and S. Mukataka: “Preparation Characteristics of
Oil-in-Water Emulsion Using Differently Charged Surfactants in Straight-Through
Microchannel Emulsification.” Colloid Surfaces A Physicochem. Eng. Aspects 229,
33 (2003).
[40] S. Sugiura, M. Nakajima, and M. Seki: “Prediction of Droplet Diameter for
Microchannel Emulsification: Prediction Model for Complicated Microchannel
Geometries.” Ind. Eng. Chem. Res. 43, 8233 (2004).
[41] I. Kobayashi, and M. Nakajima: “Effect of Emulsifiers on the Preparation of Food-
Grade Oil-in-Water Emulsions Using a Straight-through Extrusion Filter.” Eur. J.
Lipid Sci. Technol. 104, 720 (2002).
[42] S. Sugiura, M. Nakajima, H. Itou, and M. Seki: “Synthesis of Polymeric Micro-
spheres with Narrow Size Distributions Employing Microchannel Emulsification.”
Macromol. Rapid Commun. 22, 773 (2001).
[43] S. Sugiura, M. Nakajima, and M. Seki: “Prepartion of Monodispersed Polymeric Mi-
crospheres over 50 μm Employing Microchannel Emulsification.” Ind. Eng. Chem.
Res. 41, 4043 (2002).
[44] K. Nakagawa, S. Iwamoto, M. Nakajima, A. Shono, and K. Satoh: “Microchannel
Emulsification Using Gelation and Surfactant-Free Coacervate Microencapsula-
tion.” J. Colloid Interface Sci. 278, 198 (2004).
[45] S.L. Anna, N. Bontoux, and H.A. Stone: “Formation of Dispersions Using Flow
Focusing in Microchannels.” Appl. Phys. Lett. 82, 364 (2003).
[46] Q. Xu and M. Nakajima: “The Generation of Highly Monodisperse Droplets through
the Breakup of Hydrodynamically Focused Microthread in a Microfluidic Device.”
Appl. Phys. Lett. 85, 3726 (2004).
[47] Y. Tan, V. Cristini, and A.P. Lee: “Monodispersed Microfluidic Droplet Generation
by Shear Focusing Microfluidic Device.” Sensors and Actuactors B: Chem. 144,
350 (2006).
[48] J.D. Tice, A.D. Lyon, and R.F. Ismagilov: “Effects of Viscosity on Droplet Formation
and Mixing in Microfluidic Channels.” Anal. Chim. Acta 507, 73 (2004).
[49] D.R. Link, S.L. Anna, D.A. Weitz, and H.A. Stone: “Geometrically Mediated
Breakup of Drops in Microfluidic Devices.” Phys. Rev. Lett 92, 054503 (2004).
[50] S. Okushima, T. Nisisako, T. Torii, and T. Higuchi: “Controlled Production of
Monodisperse Double Emulsions by Two-Step Droplet Breakup in Microfluidic
Devices.” Langmuir 20, 9905 (2004).
[51] M. Pollack, R.B. Fair, and A.D. Shenderov: “Electrowetting-Based Actuation of
Liquid Droplets for Microfluidic Applications.” Appl. Phys. Lett. 77(11), 1725
(2000).
[52] B. Zheng, L.S. Roach, and R.F. Ismagilov: “Screening of Protein Crystallization
Conditions on a Microfluidic Chip Using Nanoliter-Size Droplets.” J. Am. Chem.
Soc. 125, 11170 (2003).
[53] B. Zheng, J.D. Tice, and R.F. Ismagilov: “Formation of Droplets of Alternating
Composition in Microfluidic Channels and Applications to Indexing of Concentra-
tions in Droplets-Based Assays.” Anal. Chem. 76, 4977 (2004).
P1: GFZ
SVNY317-Bibette February 1, 2007 16:45
References 45
[54] B. Zheng, J.D. Tice, L.S. Roach, and R.F. Ismagilov: “A Droplet-Based, Compos-
ite PDMS/Glass Capillary Microfluidic System for Evaluating Protein Crystalliza-
tion Conditions by Microbatch and Vapor-Diffusion Methods with on-Chip X-Ray
Diffraction.” Angew. Chem. Int. Ed. 43, 2508 (2004).
[55] V. Srinivasan, V.K. Pamula, and R.B. Fair: “Droplet-Based Microfluidic Lab-on-a-
Chip for Glucose Detection.” Anal. Chim. Acta 507, 145 (2004).
[56] H. Song, J.D. Tice, and R.F. Ismagilov: “A Mocrofluidic System for Controlling
Reaction Networks in Time.” Angew. Chem. Int. Ed. 42, 767 (2003).
[57] H. Song, M.R. Bringer, J.D. Tice, C.J. Gerdts, and R.F. Ismagilov: “Experimen-
tal Test of Scaling of Mixing by Chaotic Advection in Droplets Moving through
Microfluidics Channels.” Appl. Phys. Lett. 83, 4664 (2003).
[58] M.J. Groves: “Spontaneous Emulsification.” Chem. Indust. 12, 417 (1978).
[59] G. Quincke: “Ueber Emulsionbildung Und Den Einfluss Der Galle Bei Der Ver-
dauung.” Pluger Arch. Physiol. 19, 129 (1879).
[60] G. Quincke: “Ueber Periodische Ausbreitung an Flussigkeitsoberflachen Und
Dadurch Hervorgerufene Bewegungserscheinungen.” Wiedemanss Annalen der
Physik und Chemie. Neue Folge 35, 580 (1888).
[61] J.T. Davies and E.K. Rideal: “Diffusion Through Interfaces.” In H. Willmer (ed),
Interfacial Phenomena. Academic Press, New York (1961).
[62] J.T. Davies and D.A. Haydon: “Spontaneous Emulsification.” In Proceedings of the
International Congress of Surfactants Act. 2nd 1, 417, (1957).
[63] J.W. McBain and T.M. Woo: “Spontaneous Emulsification and Reactions Over-
shooting Equilibrium.” Proc. Roy. Soc. A163, 182 (1937).
[64] J. Schulman and E.G. Cockbain: “Molecular Interactions at Oil/Water Interfaces.
Part I. Molecular Complex Formation and the Stability of Oil in Water Emulsions.”
Transact. Faraday Soc. 36, 651 (1940).
[65] R.E.S. Gopal: “Principles of Emulsion Formation.” In P. Sherman (ed), EmulsionScience, Academic Press, London (1968).
[66] C.A. Miller, R.-N. Hwan, W.J. Benton, and T.J. Fort: “Ultralow Interfacial Tensions
and Their Relation to Phase Separation in Micellar Solutions.” J. Colloid Interface
Sci. 61, 554 (1977).
[67] C.A. Miller: “Spontaneous Emulsification Produced by Diffusion—a Review.” Col-
loid Surfaces 29, 89 (1988).
[68] K.J. Ruschak and C.A. Miller: “Spontaneous Emulsification in Ternary Systems
with Mass Transfer.” Ind. Eng. Chem. Fundam. 11, 534 (1972).
[69] M.J. Rang and C.A. Miller: “Emulsions and Microemulsions—Spontaneous Emul-
sification of Oil Drops Containing Surfactants and Medium-Chain Alcohols.” Prog.
Colloid Polym. Sci. 109, 101 (1998).
[70] M.J. Rang and C.A. Miller: “Spontaneous Emulsification of Oils Containing Hy-
drocarbon, Nonionic Surfactant, and Oleyl Alcohol.” J. Colloid Interface Sci. 209,
179 (1999).
[71] J.T. Davies and E.K. Rideal: “Disperse Systems and Adhesion.” In H. Willmer (ed),
Interfacial Phenomena. Academic Press, New York (1961).
[72] N. Shahidzadeh, D. Bonn, and J. Meunier: “A New Mechanism of Spontaneous
Emulsification: Relation to Surfactant Properties.” Europhys. Lett 40, 459 (1997).
[73] R.W. Greiner and D.F. Evans: “Spontaneous Formation of a Water-Continuous
Emulsion from a W/O Microemulsion.” Langmuir 6, 1793 (1990).
[74] J.J. Rang, C.A. Miller, H.H. Hoffmann, and C. Thunig: “Behavior of Hydrocar-
bon/Alcohol Drops Injected into Dilute Solutions of an Amine Oxide Surfactant.”
Ind. Eng. Chem. Res. 35, 3233 (1996).
P1: GFZ
SVNY317-Bibette February 1, 2007 16:45
46 1. Emulsification
[75] J.C. Lopez-Montilla, P.E. Herrera-Morales, and D.O. Shah: “New Method to Quan-
titatively Determine Spontaneity of Emulsification Process.” Langmuir 18, 4258
(2002).
[76] Y.A. Shchipunov and P. Schmiedel: “Phase Behavior of Lecithin at the Oil/Water
Interface.” Langmuir 12, 6443 (1996).
[77] M.G. Wakerly, C.W. Pouton, B.J. Meakin, and F.S. Morton: “Self emulsification of
vegetable oil non-ionic mixtures: a proposed mechanism of action.” In Phenomenain Mixed Surfactant Systems. American Chemical Society, Washington, DC (1986).
[78] J.C. Lopez-Montilla, P.E. Herrera-Morales, S. Pandey, and D.O. Shah: “Sponta-
neous Emulsification: Mechanisms, Physicochemical Aspects, Modeling and Ap-
plications.” J. Dispersion Sci. Technol. 23, 219 (2002).
[79] T. Forster, W. Von Rybinski, H. Tesmann, and A. Wadle: “Calculation of Optimum
Emulsifier Mixtures for Phase Inversion Emulsification.” Int. J. Cosmet. Sci. 16, 84
(1994).
[80] D.J. Miller, T. Henning, and W. Grubein: “Phase Inversion of W/O Emulsions by
Adding Hydrophilic Surfactant—a Technique for Making Cosmetics Products.”
Colloids Surfaces 183–185, 681 (2001).
[81] K. Shinoda and H. Arai: “The Correlation between Phase Inversion Temperature in
Emulsion and Cloud Point in Solution of Nonionic Emulsifier.” J. Phys. Chem. 68,
3485 (1964).
[82] K. Shinoda and H. Saito: “The Stability of O/W Type Emulsions as a Function of
Temperature and the HLB of Emulsifiers: The Emulsification by PIT Method.” J.
Colloid Interface Sci. 30, 258 (1969).
[83] K. Shinoda and H. Kunieda: “Conditions to Produce So-Called Microemulsions:
Factors to Increase the Mutual Solubility of Oil and Water by Solubilizer.” J. Colloid
Interface Sci. 42, 381 (1973).
[84] W.D. Bancroft: “The Theory of Emulsification, V.” J. Phys. Chem. 17, 501 (1913).
[85] K. Shinoda and H. Saito: “The Effect of Temperature on the Phase Equilibrium and
the Types of Dispersions of the Ternary System Composed of Water, Cyclohexane
and Nonionic Surfactant.” J. Colloid Interface Sci. 26, 70 (1968).
[86] V.E. Wellman and H.V. Tartar: “The Factors Controlling Type of Water-Soap-Oil
Emulsions.” J. Phys. Chem. 34, 379 (1930).
[87] H. Saito and K. Shinoda: “The Stability of W/O Type Emulsions as a Function of
Temperature and of the Hydrophilic Chain Length of the Emulsifier.” J. Colloid
Interface Sci. 32, 647 (1970).
[88] H. Kunieda and K. Shinoda: “Phase Behavior in Systems of Nonionic Surfac-
tant/Water/Oil Around the Hydrophilic-Lypophilic-Balance-Temperature.” J. Dis-
persion Sci. Technol. 3, 233 (1982).
[89] K. Shinoda: “Solution Behavior of Surfactants: The Importance of Surfactant Phase
and the Continuous Change in HLB of Surfactant.” Prog. Colloid Polymer Sci. 68,
1 (1983).
[90] R. Aveyard, B.P. Binks, T.A. Lawless, and J. Mead: “Interfacial Tension Minima
in Oil + Water + Surfactant Systems. Effects of Salt and Temperature in Systems
Containing Nonionic Surfactants.” J. Chem. Soc. Faraday Trans. 1 81, 2155 (1985).
[91] R. Aveyard and T.A. Lawless: “Interfacial Tension Minima in Oil-Water-Surfactant
Systems. Systems Containing Pure Nonionic Surfactants, Alkanes, and Inorganic
Salts.” J. Chem. Soc. Faraday Trans. 1 82, 2951 (1986).
[92] R. Aveyard, B.P. Binks, S. Clark, and J. Mead: “Interfacial Tension Minima in Oil-
Water-Surfactant Systems. Behavior of Alkane-Aqueous Sodium Chloride Systems
Containing Aerosol OT.” J. Chem. Soc. Faraday Trans. I 82, 125 (1986).
P1: GFZ
SVNY317-Bibette February 1, 2007 16:45
References 47
[93] R. Aveyard, B. Binks, T.A. Lawless, and J. Mead: “Nature of the Oil/Water Interface
and Equilibrium Surfactant Aggregates in Systems Exhibiting Low Tensions.” Can.
J. Chem. 66, 3031 (1988).
[94] P.D.I. Fletcher and D.I. Horsup: “Droplet Dynamics in Water-in-Oil Microemul-
sions and Macroemulsions Stabilized by Non-Ionic Surfactants.” J. Chem. Soc.
Faraday Trans. I 88, 855 (1992).
[95] L.T. Lee, D. Langevin, J. Meunier, K. Wong, and B. Cabane: “Film Bending Elas-
ticity in Microemulsions Made with Nonionic Surfactants.” Prog. Colloid Polymer
Sci. 81, 209 (1990).
[96] D. Langevin: In S.-H. Chen, J. S. Huang, and P. Tartaglia (eds), “Low interfacial ten-
sions in microemulsion systems.” Structure and Dynamics of Strongly InteractingColloids and Supramolecular Aggregates in Solution. 325. p. Kluwer, Dordrecht
(1992).
[97] R. Strey: “Microemulsion, Microstructure and Interfacial Curvature.” Colloid
Polym. Sci. 272, 1005 (1994).
[98] T. Sottmann and R. Strey: “Shape Similarities of Ultra-Low Interfacial Tension
Curves in Ternary Microemulsion Systems of the Water-Alkane-CiEj Type.” Ber.
Bunsenges Phys. Chem. 100, 237 (1996).
[99] T. Sottmann and R. Strey: “Ultralow Interfacial Tension in Water-N-Alkane-
Surfactant Systems.” J. Chem. Phys. 106, 8606 (1997).
[100] M. Kahlweit, R. Strey, and G. Busse: “Weakly to Strongly Structured Mixtures.”
Phys. Rev. E 47, 4197 (1993).
[101] K. Shinoda: “The Correlation between the Dissolution State of Nonionic Surfactant
and the Type of Dispersion Stabilized with the Surfactant.” J. Colloid Interface Sci.
24, 4 (1967).
[102] F. Groeneweg, W.G.M. Agterof, P. Jaeger, J.J.M. Janssen, J.A. Wieringa, and J.K.
Klahn: “On the Mechanism of the Inversion of Emulsions.” Chem. Eng. Res. Des.
76, 55 (1998).
[103] B.W. Brooks and H.N. Richmond: “Phase Inversion in Non-Ionic Surfactant-Oil-
Water Systems, I. The Effect of Transitional Inversion on Emulsion Drop Size.”
Chem. Eng. Sci. 49, 1053 (1994).
[104] J.L. Salager: “Phase Transformation and Emulsion Inversion on the Basis of Catas-
trophe Theory.” In P. Becher (ed), Encyclopedia of Emulsion Technology. Vol. 3.
Basic Theory. Measurement. Applications. Marcel Dekker, New York (1988).
[105] J.L. Salager, M. Perez-Sanchez, and Y. Garcia: “Physicochemical Parameters In-
fluencing the Emulsion Drop Size.” Colloid Polym. Sci. 274, 81 (1996).
[106] P. Izquierdo, J. Esquena, T.F. Tadros, J.C. Dederen, M.J. Garcia, N. Azemar, and
C. Solans: “Formation and Stability of Nano-Emulsions Prepared Using the Phase
Inversion Method.” Langmuir 18, 26 (2002).
[107] T. Forster, F. Schambil, and W. Von Rybinski: “Production of Fine Dispersion and
Long-Term Stable Oil-in-Water Emulsions by the Phase Inversion Temperature
Method.” J. Dispersion Sci. Technol. 13, 183 (1992).
[108] A. Wadle, T. Forster, and W. Von Rybinski: “Influence of the Microemulsion Phase
Structure on the Phase Inversion Temperature Emulsification of Polar Oils.” Colloid
and Surfaces A Physicochem. Eng. Aspects 76, 51 (1993).
[109] L. Taisne and B. Cabane: “Emulsification and Ripening Following a Temperature
Quench.” Langmuir 14, 4744 (1998).
[110] J.L. Salager: “Macro Emulsions Stabilized by an Ethoxylated Fatty Alcohol and
an Alkyl Quat: Emulsion Type and Stability in View of the Phase Behavior.” In
Proceedings of the 3rd World Congress on Emulsions 1-F-107, Lyon, France (2001).
P1: GFZ
SVNY317-Bibette February 1, 2007 16:45
48 1. Emulsification
[111] J.L. Salager: “Evolution of Emulsion Properties Along a Transitional Inversion
Produced by a Temperature Variation.” In Proceedings of the 3rd Word Congress
on Emulsions 1-F-094, Lyon, France (2001).
[112] P. Izquierdo, J. Esquena, T.F. Tadros, J.C. Dederen, J. Feng, J. Garcia-Celma, N.
Azemar, and C. Solans: “Phase Behavior and Nano-Emulsion Formation by the
Phase Inversion Temperature Method.” Langmuir 20, 6594 (2004).
[113] P. Fernandez, V. Andre, J. Rieger, and A. Kuhnle: “Nano-Emulsion Formation by
Emulsion Phase Inversion.” Colloid and Surfaces A Physicochem. Eng. Aspects
251, 53 (2004).
[114] J.K. Klahn, J.J.M. Janssen, G.E.J. Vaessen, R. de Swart, and W.G.M. Agterof: “On
the Escape Process During Phase Inversion of an Emulsion.” Colloid and Surfaces
A: Physicochem. Eng. Aspects 210, 167 (2002).
[115] J.L. Salager: “Properties of Emulsions at the Onset of Catastrophic Phase Inversion
in the Normal to Abnormal Inversion.” In Proceedings of the 3rd World Congress
on Emulsions 1-F-185, Lyon, France (2001).
[116] N. Zambrano, E. Tyrode, I. Mira, L. Marquez, M.-P. Rodriguez, and J.L. Salager:
“Emulsion Catastrophic Inversion from Abnormal to Normal Morphology. 1. Effect
of the Water-to-Oil Ratio Rate of Change on the Dynamic Inversion Frontier.” Ind.
Eng. Chem. Res. 42, 50 (2003).
[117] A.S. Kabalnov and H. Wennerstrom: “Macroemulsion Stability : The Oriented
Wedge Theory Revisited.” Langmuir 12, 276 (1996).
[118] A.W. Nienow: “Breakup, Coalescence and Catastrophic Phase Inversion in Turbu-
lent Contactors.” Adv. Coll. Int. Sci. 108–109, 95 (2004).
[119] A. Wadle, H. Tesmann, M. Leonard, and T. Forster: “Phase Inversion in Emul-
sions: Capico-Concept and Application.” Surfactant Science Series 68, 207
(1997).
[120] T. Iwanaga, M. Suzuki, and H. Kunieda “Effect of Added Salts or polyols on
the Liquid Crystolline Structures of Polyesayethylene-Type Nonionic Surfactants”
Langmuir 14, 5775 (1998).
[121] J.L. Salager: “A 3rd Type of Emulsion Inversion Attained by Overlapping the Two
Classical Methods: Combined Inversion.” In Proceedings of the 3rd Word Congress
on Emulsions 1-F-180, Lyon, France (2001).
[122] M. Perez, N. Zambrano, M. Ramirez, E. Tyrode, and J.L. Salager: “Surfactant-Oil-
Water System near the Affinity Inversion. XII. Emulsion Drop Size Formulation
and Composition.” J. Dispersion Sci. Technol. 23, 55 (2002).
[123] J.L. Salager, A. Forgiarini, L. Marquez, A. Pena, A. Pizzino, M.-P. Rodriguez, and
M. Rondon-Gonzalez: “Using Emulsion Inversion in Inductrial Processes.” Adv.
Coll. Int. Sci. 108–109, 259 (2004).
[124] J.L. Salager, M. Minana-Perez, M. Perez-Sanchez, M. Ramirez-Gouveia, and C.I.
Rojas: “Surfactant-Oil-Water Systems near the Affinity Inversion. Part III: The Two
Kinds of Emulsion Inversion.” J. Dispersion Sci. Technol. 4, 313 (1983).
[125] I. Mira, N. Zambrano, E. Tyrode, L. Marquez, A.A. Pena, A. Pizzino, and J.L.
Salager: “Emulsion Catastrophic Inversion from Abnormal to Normal Morphology.
2. Effect of the Stirring Intensity on the Dynamic Inversion Frontier.” Ind. Eng.
Chem. Res. 42, 57 (2003).
[126] S. Sajjadi, F. Jahanzad, and M. Yianneskis: “Catastrophic Phase Inversion of Ab-
normal Emulsions in the Vicinity of the Locus of Transitional Inversion.” Colloid
and Surfaces A Physicochem. Eng. Aspects 240, 149 (2004).
P1: GFZ
SVNY317-Bibette February 1, 2007 16:45
References 49
[127] N. Uson, M.J. Garcia, and C. Solans: “Formation of Water-in-Oil (W/O) Nano-
Emulsions in a Water/Mixed Non-Ionic Surfactant/Oil Systems Prepared by a Low-
Energy Emulsification Method.” Colloid and Surfaces A Physicochem. Eng. As-
pects 250, 415 (2004).
[128] J. Allouche, E. Tyrode, V. Sadtler, L. Choplin, and J.L. Salager: “Simultaneous Con-
ductivity and Viscosity Measurements as a Technique to Track Emulsion Inversion
by the Phase-Inversion-Temperature Method.” Langmuir 20, 2134 (2004).
[129] L. Liu, O.K. Matar, E.S. Perez de Ortiz, and G.F. Hewitt: “Experimental Investi-
gation of Phase Inversion in a Strirred Vessel Using Lif.” Chem. Eng. Sci. 60, 85
(2005).
[130] R. Pons, I. Carrera, P. Erra, H. Kunieda, and C. Solans: “Novel Preparation Methods
for Highly Concentrated Water-in-Oil Emulsions.” Colloids Surf., A Physicochem.
Eng. Asp. 91, 259 (1994).
[131] H. Kunieda, Y. Fukui, H. Uchiyama, and C. Solans: “Spontaneous Formation of
Highly Concentrated Water-in-Oil Emulsions (Gel-Emulsions).” Langmuir 12, 2136
(1996).
[132] K. Ozawa, C. Solans, and H. Kunieda: “Spontaneous Formation of Highly Concen-
trated Oil-in-Water Emulsions.” J. Colloid Interface Sci. 188, 275 (1997).
[133] C. Solans, R. Pons, and H. Kunieda: “Gel Emulsions - Relationship between Phase
Behaviour and Formation.” In B.P. Binks (ed), Modern Aspects of Emulsion Science.
The Royal Society of Chemistry, Cambridge (1998).
[134] F. Leal Calderon, J. Bibette, and F. Guimberteau: “Method for Preparing Concen-
trated and Calibrated Emulsions in a Highly Viscous Phase, in Particular Bitumen
Emulsions.” US Patent 6602917 (1998).
[135] T.G. Mason and J. Bibette: “Emulsification in Viscoelastic Media.” Phys. Rev. Let
77, 3481 (1996).
[136] J. Bibette and T.G. Mason: “Procede de Preparation d’une Emulsion.” French Patent
96 04736 PCT SR97/00690 (1996).
[137] C. Mabille, V. Schmitt, P. Gorria, F. Leal Calderon, V. Faye, and B. Deminiere: “Rhe-
ological and Shearing Conditions for the Preparation of Monodisperse Emulsions.”
Langmuir 16, 422 (2000).
[138] G.I. Taylor: “The Formation of Emulsions in Definable Fields of Flow.” Proc. R.
Soc. A146, 501 (1934).
[139] H.P. Grace: “Dispersion Phenomena in High Viscosity Immiscible Fluid Systems
and Application of Static Mixers as Dispersion Devices in Such Systems.” Chem.
Eng. Commun 14, 225 (1982).
[140] R.A. De Bruijn: “Deformation and Breakup of Drops in Simple Shear Flows.” Ph.
D. Thesis Eindhoven University of Technology (1989).
[141] B.J. Bentley and L.G. Leal: “An Experimental Investigation of Drop Deformation
and Breakup in Steady Two-Dimensional Linear Flows.” J. Fluid. Mech. 167, 241
(1986).
[142] J.W.S. Rayleigh: “On the Instability of Jets.” Proc. London Math. Soc. 10, 4 (1878).
[143] J.W.S. Rayleigh: “On the Capillary Phenomena of Jets.” Proc. Roy. Soc. 29, 71
(1879).
[144] J.W.S. Rayleigh: “On the Instability of a Cylinder of Viscous Liquid Under Capillary
Force.” Philos. Mag. 34, 145 (1892).
[145] F.D. Rumscheidt and S.G. Mason: “Breakup of Stationary Liquid Threads.” J. Col-
loid Sci. 17, 260 (1962).
P1: GFZ
SVNY317-Bibette February 1, 2007 16:45
50 1. Emulsification
[146] R.A. De Bruijn: “Tip Streaming of Drops in Simple Shear Flow.” Chem. Eng. Sci.
48, 277 (1993).
[147] H.A. Stone, B.J. Bentley, and L.G. Leal: “An Experimental Study of Transient
Effects in the Breakup of Viscous Drops.” J. Fluid Mech. 173, 131 (1986).
[148] E.J. Hinch and A. Acrivos: “Long Slender Drops in a Simple Shear Flow.” J. Fluid.
Mech. 98, 305 (1980).
[149] C. Mabille, F. Leal-Calderon, J. Bibette, and V. Schmitt: “Monodisperse Frag-
mentation in Emulsions: Mechanisms and Kinetics.” Europhys. Lett 61, 708
(2003).
[150] C. Mabille: “Fragmentation in Emulsions Submitted to a Simple Shear.” Ph.D
Thesis, Bordeaux I University (2000).
[151] T. Tomotika: “On the Instability of a Cylindrical Thread of a Viscous Fluid.” Proc.
Roy. Soc. (Lond.) A150, 322 (1935).
[152] D.C. Chappelear: “Interfacial Tension between Molten Polymers.” Polym. Prep. 5,
363 (1964).
[153] P.H.M. Elemans, J.M.H. Janssen, and H.E.H. Meier: “The Measurement of Interfa-
cial Tension in Polymer/Polymer Systems: The Breaking Thread Method.” J. Rheol.
34, 1311 (1990).
[154] D.V. Khakhar and J.M. Otino: “Deformation and Breakup of Slender Drops in
Linear Flows.” J. Fluid Mech. 166, 265 (1986).
[155] D. Rusu: “Etude in-Situ, Par Diffusion De La Lumiere, De La Morphologie De
Melanges De Polymeres Immiscibles Durant Un Cisaillement.” These de l’ecole
des Mines de Paris, Sophia Antipolis (1997).
[156] V. Schmitt, F. Leal-Calderon, and J. Bibette: “Preparation of Monodisperse Particles
and Emulsions by Controlled Shear.” In M. Antonietti (ed), Colloid Chemistry II.Springer-Verlag, Berlin (2003).
[157] M.P. Aronson: “The Role of Free Surfactant in Destabilizing Oil-in-Water Emul-
sions.” Langmuir 5, 494 (1989).
[158] G.I. Taylor: “The Viscosity of a Fluid Containing Small Drops of Another Fluid.”
Proc. R. Soc. A138, 41 (1932).
[159] J. Bibette and T.G. Mason: “Emulsion Manufacturing Process.” US Patent 5,938,581
(1999).
[160] P. Perrin: “Amphiphilic Copolymers: A New Route to Prepare Ordered Monodis-
perse Emulsions.” Langmuir 14, 5977 (1998).
[161] P. Perrin and F. Lafuma: “Low Hydrophobically Modified Poly (Acrylic Acid) Stabi-
lizing Macroemulsions: Relationship Between Copolymer Structure and Emulsions
Properties.” J. Colloid Interface Sci. 197, 317 (1998).
[162] C. Goubault, K. Pays, D. Olea, J. Bibette, V. Schmitt, and F. Leal-Calderon:
“Shear Rupturing of Complex Fluids: Application to the Preparation of Quasi-
Monodisperse W/O/W Double Emulsions.” Langmuir 17, 5184 (2001).
[163] K. Pays, J. Giermanska-Kahn, P. Pouligny, J. Bibette, and F. Leal-Calderon: “Double
Emulsions: A Tool for Probing Thin Film Metastability.” Phys. Rev. Lett. 87, 178304
(2001).
[164] K. Pays, J. Kahn, B. Pouligny, J. Bibette, and F. Leal-Calderon: “Coalescence in
Surfactant-Stabilized Double Emulsions.” Langmuir 17, 7758 (2001).
[165] J. Bibette, F. Leal-Calderon, and P. Gorria: “Polydisperse Double Emulsion, Corre-
sponding Monodisperse Double Emulsion and Process to Fabricate the Monodis-
perse Emulsion.” Patent WO0121297 (1999).
P1: GFZ
SVNY317-Bibette February 1, 2007 16:45
References 51
[166] K. Pays, F. Leal Calderon, and J. Bibette: “Method to Produce a Monodisperse
Double Emulsion.” French Patent 00 05880 (2000).
[167] T.G. Mason and J. Bibette: “Shear Rupturing of Droplets in Complex Fluids.”
Langmuir 13, 4600 (1997).
[168] F. Leal-Calderon, T. Stora, O. Mondain Monval, P. Poulin, and J. Bibette: “Direct
Measurement of Colloidal Forces.” Phys. Rev. Lett. 72, 2959 (1994).
[169] G. Reimers and S. Khalafalla: “Production of Magnetic Fluids by Peptization Tech-
niques.” US Patent 38,435,40 (1974).
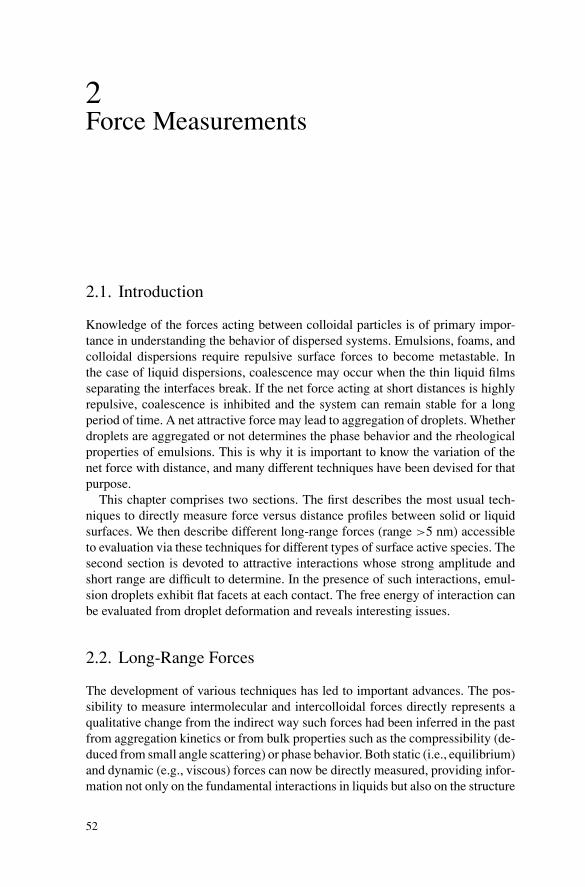
P1: GFZSVNY317-Bibette February 1, 2007 16:43
2Force Measurements
2.1. Introduction
Knowledge of the forces acting between colloidal particles is of primary impor-tance in understanding the behavior of dispersed systems. Emulsions, foams, andcolloidal dispersions require repulsive surface forces to become metastable. Inthe case of liquid dispersions, coalescence may occur when the thin liquid filmsseparating the interfaces break. If the net force acting at short distances is highlyrepulsive, coalescence is inhibited and the system can remain stable for a longperiod of time. A net attractive force may lead to aggregation of droplets. Whetherdroplets are aggregated or not determines the phase behavior and the rheologicalproperties of emulsions. This is why it is important to know the variation of thenet force with distance, and many different techniques have been devised for thatpurpose.
This chapter comprises two sections. The first describes the most usual tech-niques to directly measure force versus distance profiles between solid or liquidsurfaces. We then describe different long-range forces (range >5 nm) accessibleto evaluation via these techniques for different types of surface active species. Thesecond section is devoted to attractive interactions whose strong amplitude andshort range are difficult to determine. In the presence of such interactions, emul-sion droplets exhibit flat facets at each contact. The free energy of interaction canbe evaluated from droplet deformation and reveals interesting issues.
2.2. Long-Range Forces
The development of various techniques has led to important advances. The pos-sibility to measure intermolecular and intercolloidal forces directly represents aqualitative change from the indirect way such forces had been inferred in the pastfrom aggregation kinetics or from bulk properties such as the compressibility (de-duced from small angle scattering) or phase behavior. Both static (i.e., equilibrium)and dynamic (e.g., viscous) forces can now be directly measured, providing infor-mation not only on the fundamental interactions in liquids but also on the structure
52
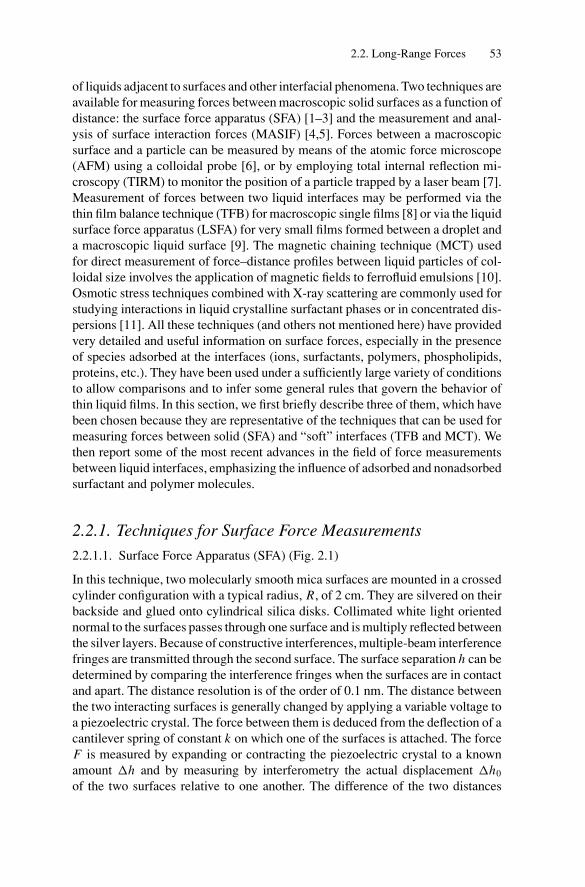
P1: GFZSVNY317-Bibette February 1, 2007 16:43
2.2. Long-Range Forces 53
of liquids adjacent to surfaces and other interfacial phenomena. Two techniques areavailable for measuring forces between macroscopic solid surfaces as a function ofdistance: the surface force apparatus (SFA) [1–3] and the measurement and anal-ysis of surface interaction forces (MASIF) [4,5]. Forces between a macroscopicsurface and a particle can be measured by means of the atomic force microscope(AFM) using a colloidal probe [6], or by employing total internal reflection mi-croscopy (TIRM) to monitor the position of a particle trapped by a laser beam [7].Measurement of forces between two liquid interfaces may be performed via thethin film balance technique (TFB) for macroscopic single films [8] or via the liquidsurface force apparatus (LSFA) for very small films formed between a droplet anda macroscopic liquid surface [9]. The magnetic chaining technique (MCT) usedfor direct measurement of force–distance profiles between liquid particles of col-loidal size involves the application of magnetic fields to ferrofluid emulsions [10].Osmotic stress techniques combined with X-ray scattering are commonly used forstudying interactions in liquid crystalline surfactant phases or in concentrated dis-persions [11]. All these techniques (and others not mentioned here) have providedvery detailed and useful information on surface forces, especially in the presenceof species adsorbed at the interfaces (ions, surfactants, polymers, phospholipids,proteins, etc.). They have been used under a sufficiently large variety of conditionsto allow comparisons and to infer some general rules that govern the behavior ofthin liquid films. In this section, we first briefly describe three of them, which havebeen chosen because they are representative of the techniques that can be used formeasuring forces between solid (SFA) and “soft” interfaces (TFB and MCT). Wethen report some of the most recent advances in the field of force measurementsbetween liquid interfaces, emphasizing the influence of adsorbed and nonadsorbedsurfactant and polymer molecules.
2.2.1. Techniques for Surface Force Measurements
2.2.1.1. Surface Force Apparatus (SFA) (Fig. 2.1)
In this technique, two molecularly smooth mica surfaces are mounted in a crossedcylinder configuration with a typical radius, R, of 2 cm. They are silvered on theirbackside and glued onto cylindrical silica disks. Collimated white light orientednormal to the surfaces passes through one surface and is multiply reflected betweenthe silver layers. Because of constructive interferences, multiple-beam interferencefringes are transmitted through the second surface. The surface separation h can bedetermined by comparing the interference fringes when the surfaces are in contactand apart. The distance resolution is of the order of 0.1 nm. The distance betweenthe two interacting surfaces is generally changed by applying a variable voltage toa piezoelectric crystal. The force between them is deduced from the deflection of acantilever spring of constant k on which one of the surfaces is attached. The forceF is measured by expanding or contracting the piezoelectric crystal to a knownamount �h and by measuring by interferometry the actual displacement �h0
of the two surfaces relative to one another. The difference of the two distances
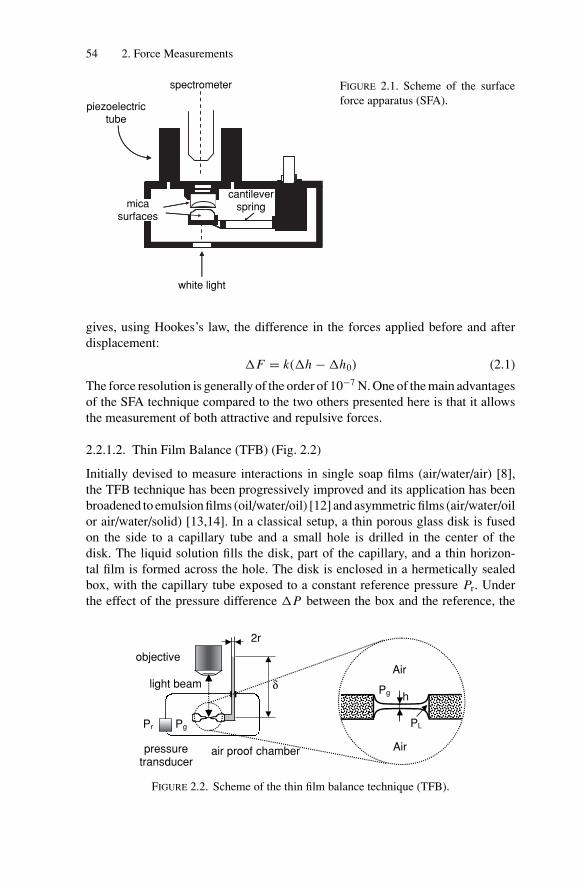
P1: GFZSVNY317-Bibette February 1, 2007 16:43
54 2. Force Measurements
white light
cantileverspringmica
surfaces
spectrometer
piezoelectrictube
FIGURE 2.1. Scheme of the surfaceforce apparatus (SFA).
gives, using Hookes’s law, the difference in the forces applied before and afterdisplacement:
�F = k(�h − �h0) (2.1)
The force resolution is generally of the order of 10−7 N. One of the main advantagesof the SFA technique compared to the two others presented here is that it allowsthe measurement of both attractive and repulsive forces.
2.2.1.2. Thin Film Balance (TFB) (Fig. 2.2)
Initially devised to measure interactions in single soap films (air/water/air) [8],the TFB technique has been progressively improved and its application has beenbroadened to emulsion films (oil/water/oil) [12] and asymmetric films (air/water/oilor air/water/solid) [13,14]. In a classical setup, a thin porous glass disk is fusedon the side to a capillary tube and a small hole is drilled in the center of thedisk. The liquid solution fills the disk, part of the capillary, and a thin horizon-tal film is formed across the hole. The disk is enclosed in a hermetically sealedbox, with the capillary tube exposed to a constant reference pressure Pr. Underthe effect of the pressure difference �P between the box and the reference, the
Pr Pg
pressuretransducer
air proof chamber
δ
2r
objective
light beamh
Air
Air
Pg
PL
FIGURE 2.2. Scheme of the thin film balance technique (TFB).
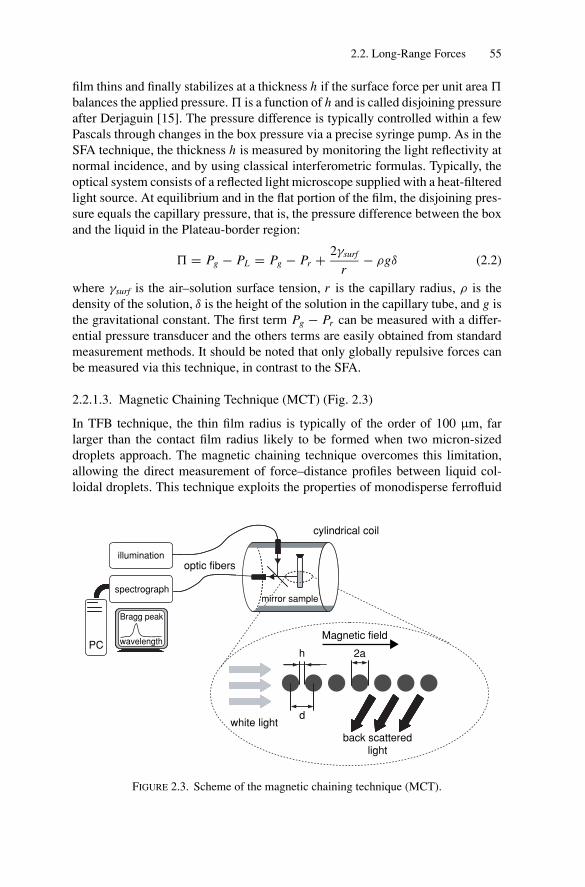
P1: GFZSVNY317-Bibette February 1, 2007 16:43
2.2. Long-Range Forces 55
film thins and finally stabilizes at a thickness h if the surface force per unit area �
balances the applied pressure. � is a function of h and is called disjoining pressureafter Derjaguin [15]. The pressure difference is typically controlled within a fewPascals through changes in the box pressure via a precise syringe pump. As in theSFA technique, the thickness h is measured by monitoring the light reflectivity atnormal incidence, and by using classical interferometric formulas. Typically, theoptical system consists of a reflected light microscope supplied with a heat-filteredlight source. At equilibrium and in the flat portion of the film, the disjoining pres-sure equals the capillary pressure, that is, the pressure difference between the boxand the liquid in the Plateau-border region:
� = Pg − PL = Pg − Pr + 2γsurf
r− ρgδ (2.2)
where γsurf is the air–solution surface tension, r is the capillary radius, ρ is thedensity of the solution, δ is the height of the solution in the capillary tube, and g isthe gravitational constant. The first term Pg − Pr can be measured with a differ-ential pressure transducer and the others terms are easily obtained from standardmeasurement methods. It should be noted that only globally repulsive forces canbe measured via this technique, in contrast to the SFA.
2.2.1.3. Magnetic Chaining Technique (MCT) (Fig. 2.3)
In TFB technique, the thin film radius is typically of the order of 100 μm, farlarger than the contact film radius likely to be formed when two micron-sizeddroplets approach. The magnetic chaining technique overcomes this limitation,allowing the direct measurement of force–distance profiles between liquid col-loidal droplets. This technique exploits the properties of monodisperse ferrofluid
optic fibersillumination
PC
spectrograph
Bragg peak
wavelength
d
h 2a
white light
back scatteredlight
Magnetic field
cylindrical coil
mirror sample
Bragg peak
wavelength
Bragg peak
wavelength
Bragg peak
wavelength
FIGURE 2.3. Scheme of the magnetic chaining technique (MCT).
P1: GFZSVNY317-Bibette February 1, 2007 16:43
56 2. Force Measurements
emulsions. The dispersed phase of a ferrofluid emulsion is an octane ferrofluid,that is, octane containing small ferrimagnetic oxide grains (Fe2O3, 100 A in size).Highly Monodisperse oil-in-water emulsions are obtained using the fragmenta-tion method described in Chapter 1 (Section 1.7.6.4) followed by the fractionatedcrystallization technique described in Chapter 3 (Section 3.2.1.2).
At very low droplet volume fractions (φ < 0.1%) and on application of anexternal field, the droplets form chains that are only one droplet thick and thatremain well separated. If the sample is illuminated by a white light source, theemulsion appears beautifully colored in the back-scattering direction. These colorsoriginate from Bragg diffraction and provide a straightforward measure of thespacing between droplets within the chains. For perfectly aligned particles with aseparation d , illuminated by incident white light parallel to the chains, the first-order Bragg condition reduces to:
2d = λ0/n (2.3)
where n is the refractive index of the suspending medium (n = 1.33 for water), andλ0 is the wavelength of the light Bragg-scattered at an angle of 180◦ with respectto the incident beam direction. The wavelength of the Bragg peak provides a directmeasure of the spacing between the drops, through Eq. (2.3). Because the drops aremonodisperse and negligibly deformable owing to their large capillary pressure(∼1 atm), it is possible to determine the interfacial separation, h = d − 2a, where ais the droplet radius. The average interfacial separation is resolved with a precisionof about 1.5 nm.
The repulsive force, Fr , between the droplets must exactly balance the attractiveforce, Fm , between the dipoles induced by the applied magnetic field. Since thedipoles are aligned parallel to the field, this force can be calculated exactly and isgiven by [16]:
Fr (d) = Fm(d) = − 1.202
2π μ0∗ 3 m2
d4 (2.4)
where μ0 is the magnetic permeability of free space and m is the induced mag-netic moment of each drop. The induced magnetic moment must be determinedself-consistently from the susceptibility of the ferrofluid, and the presence of theneighboring droplets. Thus,
m = μ04
3π a3 χs HT (2.5)
where HT is the total magnetic field acting on each drop, and χs is the susceptibilityof a spherical droplet. The total applied field, HT , is given by the sum of theexternal applied field and the field from the induced magnetic moments in all theneighboring drops in the chain. This can easily be calculated for an infinite chain,assuming point dipoles, giving:
HT = Hext +2∗1.202∗ 2m
4π μ0 d3 (2.6)
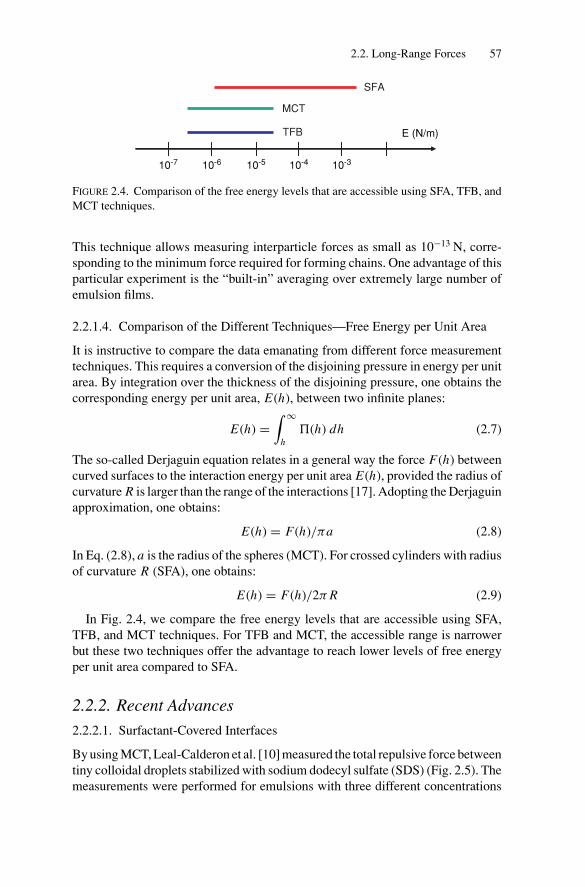
P1: GFZSVNY317-Bibette February 1, 2007 16:43
2.2. Long-Range Forces 57
E (N/m)
10-7 10-6 10-5 10-4 10-3
TFB
MCT
SFA
FIGURE 2.4. Comparison of the free energy levels that are accessible using SFA, TFB, andMCT techniques.
This technique allows measuring interparticle forces as small as 10−13 N, corre-sponding to the minimum force required for forming chains. One advantage of thisparticular experiment is the “built-in” averaging over extremely large number ofemulsion films.
2.2.1.4. Comparison of the Different Techniques—Free Energy per Unit Area
It is instructive to compare the data emanating from different force measurementtechniques. This requires a conversion of the disjoining pressure in energy per unitarea. By integration over the thickness of the disjoining pressure, one obtains thecorresponding energy per unit area, E(h), between two infinite planes:
E(h) =∫ ∞
h�(h) dh (2.7)
The so-called Derjaguin equation relates in a general way the force F(h) betweencurved surfaces to the interaction energy per unit area E(h), provided the radius ofcurvature R is larger than the range of the interactions [17]. Adopting the Derjaguinapproximation, one obtains:
E(h) = F(h)/πa (2.8)
In Eq. (2.8), a is the radius of the spheres (MCT). For crossed cylinders with radiusof curvature R (SFA), one obtains:
E(h) = F(h)/2π R (2.9)
In Fig. 2.4, we compare the free energy levels that are accessible using SFA,TFB, and MCT techniques. For TFB and MCT, the accessible range is narrowerbut these two techniques offer the advantage to reach lower levels of free energyper unit area compared to SFA.
2.2.2. Recent Advances
2.2.2.1. Surfactant-Covered Interfaces
By using MCT, Leal-Calderon et al. [10] measured the total repulsive force betweentiny colloidal droplets stabilized with sodium dodecyl sulfate (SDS) (Fig. 2.5). Themeasurements were performed for emulsions with three different concentrations
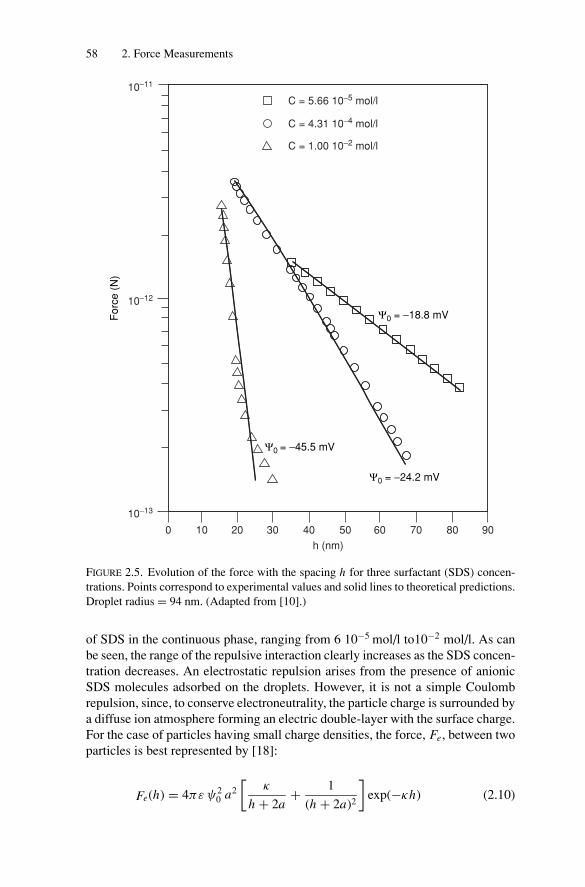
P1: GFZSVNY317-Bibette February 1, 2007 16:43
58 2. Force Measurements
Forc
e (
N)
Ψ0 = −45.5 mV
Ψ0 = −24.2 mV
Ψ0 = −18.8 mV
10−13
10−12
10−11
0 10 20 30 40 50 60 70 80 90
C = 5.66 10−5 mol/l
C = 4.31 10−4 mol/l
C = 1.00 10−2 mol/l
h (nm)
FIGURE 2.5. Evolution of the force with the spacing h for three surfactant (SDS) concen-trations. Points correspond to experimental values and solid lines to theoretical predictions.Droplet radius = 94 nm. (Adapted from [10].)
of SDS in the continuous phase, ranging from 6 10−5 mol/l to10−2 mol/l. As canbe seen, the range of the repulsive interaction clearly increases as the SDS concen-tration decreases. An electrostatic repulsion arises from the presence of anionicSDS molecules adsorbed on the droplets. However, it is not a simple Coulombrepulsion, since, to conserve electroneutrality, the particle charge is surrounded bya diffuse ion atmosphere forming an electric double-layer with the surface charge.For the case of particles having small charge densities, the force, Fe, between twoparticles is best represented by [18]:
Fe(h) = 4πε ψ20 a2
[κ
h + 2a+ 1
(h + 2a)2
]exp(−κh) (2.10)
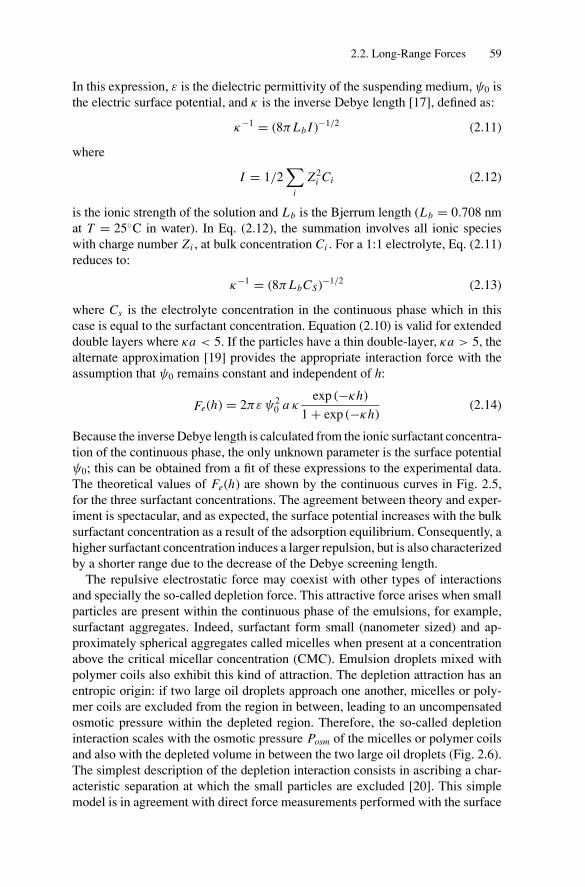
P1: GFZSVNY317-Bibette February 1, 2007 16:43
2.2. Long-Range Forces 59
In this expression, ε is the dielectric permittivity of the suspending medium, ψ0 isthe electric surface potential, and κ is the inverse Debye length [17], defined as:
κ−1 = (8π Lb I )−1/2 (2.11)
where
I = 1/2∑
i
Z2i Ci (2.12)
is the ionic strength of the solution and Lb is the Bjerrum length (Lb = 0.708 nmat T = 25◦C in water). In Eq. (2.12), the summation involves all ionic specieswith charge number Zi , at bulk concentration Ci . For a 1:1 electrolyte, Eq. (2.11)reduces to:
κ−1 = (8π LbCS)−1/2 (2.13)
where Cs is the electrolyte concentration in the continuous phase which in thiscase is equal to the surfactant concentration. Equation (2.10) is valid for extendeddouble layers where κa < 5. If the particles have a thin double-layer, κa > 5, thealternate approximation [19] provides the appropriate interaction force with theassumption that ψ0 remains constant and independent of h:
Fe(h) = 2πε ψ20 a κ
exp (−κh)
1 + exp (−κh)(2.14)
Because the inverse Debye length is calculated from the ionic surfactant concentra-tion of the continuous phase, the only unknown parameter is the surface potentialψ0; this can be obtained from a fit of these expressions to the experimental data.The theoretical values of Fe(h) are shown by the continuous curves in Fig. 2.5,for the three surfactant concentrations. The agreement between theory and exper-iment is spectacular, and as expected, the surface potential increases with the bulksurfactant concentration as a result of the adsorption equilibrium. Consequently, ahigher surfactant concentration induces a larger repulsion, but is also characterizedby a shorter range due to the decrease of the Debye screening length.
The repulsive electrostatic force may coexist with other types of interactionsand specially the so-called depletion force. This attractive force arises when smallparticles are present within the continuous phase of the emulsions, for example,surfactant aggregates. Indeed, surfactant form small (nanometer sized) and ap-proximately spherical aggregates called micelles when present at a concentrationabove the critical micellar concentration (CMC). Emulsion droplets mixed withpolymer coils also exhibit this kind of attraction. The depletion attraction has anentropic origin: if two large oil droplets approach one another, micelles or poly-mer coils are excluded from the region in between, leading to an uncompensatedosmotic pressure within the depleted region. Therefore, the so-called depletioninteraction scales with the osmotic pressure Posm of the micelles or polymer coilsand also with the depleted volume in between the two large oil droplets (Fig. 2.6).The simplest description of the depletion interaction consists in ascribing a char-acteristic separation at which the small particles are excluded [20]. This simplemodel is in agreement with direct force measurements performed with the surface
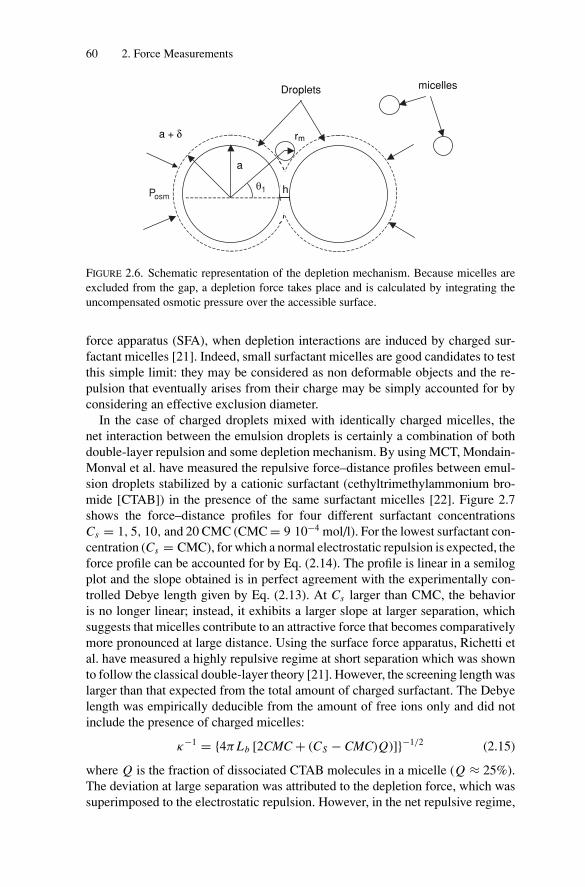
P1: GFZSVNY317-Bibette February 1, 2007 16:43
60 2. Force Measurements
a
a + δ rm
Droplets micelles
hPosmθ1
FIGURE 2.6. Schematic representation of the depletion mechanism. Because micelles areexcluded from the gap, a depletion force takes place and is calculated by integrating theuncompensated osmotic pressure over the accessible surface.
force apparatus (SFA), when depletion interactions are induced by charged sur-factant micelles [21]. Indeed, small surfactant micelles are good candidates to testthis simple limit: they may be considered as non deformable objects and the re-pulsion that eventually arises from their charge may be simply accounted for byconsidering an effective exclusion diameter.
In the case of charged droplets mixed with identically charged micelles, thenet interaction between the emulsion droplets is certainly a combination of bothdouble-layer repulsion and some depletion mechanism. By using MCT, Mondain-Monval et al. have measured the repulsive force–distance profiles between emul-sion droplets stabilized by a cationic surfactant (cethyltrimethylammonium bro-mide [CTAB]) in the presence of the same surfactant micelles [22]. Figure 2.7shows the force–distance profiles for four different surfactant concentrationsCs = 1, 5, 10, and 20 CMC (CMC = 9 10−4 mol/l). For the lowest surfactant con-centration (Cs = CMC), for which a normal electrostatic repulsion is expected, theforce profile can be accounted for by Eq. (2.14). The profile is linear in a semilogplot and the slope obtained is in perfect agreement with the experimentally con-trolled Debye length given by Eq. (2.13). At Cs larger than CMC, the behavioris no longer linear; instead, it exhibits a larger slope at larger separation, whichsuggests that micelles contribute to an attractive force that becomes comparativelymore pronounced at large distance. Using the surface force apparatus, Richetti etal. have measured a highly repulsive regime at short separation which was shownto follow the classical double-layer theory [21]. However, the screening length waslarger than that expected from the total amount of charged surfactant. The Debyelength was empirically deducible from the amount of free ions only and did notinclude the presence of charged micelles:
κ−1 = {4π Lb [2CMC + (CS − CMC)Q)]}−1/2 (2.15)
where Q is the fraction of dissociated CTAB molecules in a micelle (Q ≈ 25%).The deviation at large separation was attributed to the depletion force, which wassuperimposed to the electrostatic repulsion. However, in the net repulsive regime,
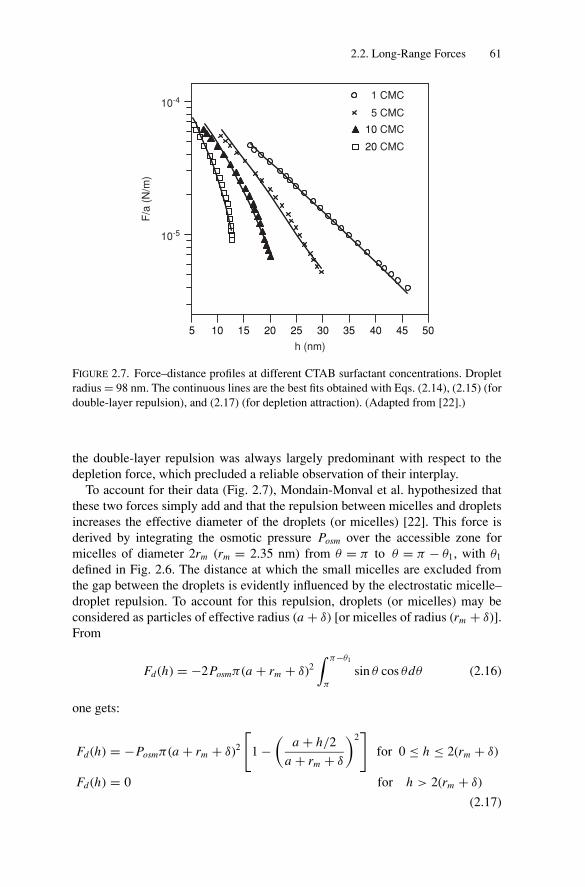
P1: GFZSVNY317-Bibette February 1, 2007 16:43
2.2. Long-Range Forces 61
5 10 15 20 25 30 35 40 45 50
10 CMC
20 CMC
10-5
10-4
F/a
(N
/m)
h (nm)
1 CMC
5 CMC
FIGURE 2.7. Force–distance profiles at different CTAB surfactant concentrations. Dropletradius = 98 nm. The continuous lines are the best fits obtained with Eqs. (2.14), (2.15) (fordouble-layer repulsion), and (2.17) (for depletion attraction). (Adapted from [22].)
the double-layer repulsion was always largely predominant with respect to thedepletion force, which precluded a reliable observation of their interplay.
To account for their data (Fig. 2.7), Mondain-Monval et al. hypothesized thatthese two forces simply add and that the repulsion between micelles and dropletsincreases the effective diameter of the droplets (or micelles) [22]. This force isderived by integrating the osmotic pressure Posm over the accessible zone formicelles of diameter 2rm (rm = 2.35 nm) from θ = π to θ = π − θ1, with θ1
defined in Fig. 2.6. The distance at which the small micelles are excluded fromthe gap between the droplets is evidently influenced by the electrostatic micelle–droplet repulsion. To account for this repulsion, droplets (or micelles) may beconsidered as particles of effective radius (a + δ) [or micelles of radius (rm + δ)].From
Fd (h) = −2Posmπ (a + rm + δ)2∫ π−θ1
π
sin θ cos θdθ (2.16)
one gets:
Fd (h) = −Posmπ (a + rm + δ)2
[1 −
(a + h/2
a + rm + δ
)2]
for 0 ≤ h ≤ 2(rm + δ)
Fd (h) = 0 for h > 2(rm + δ)
(2.17)
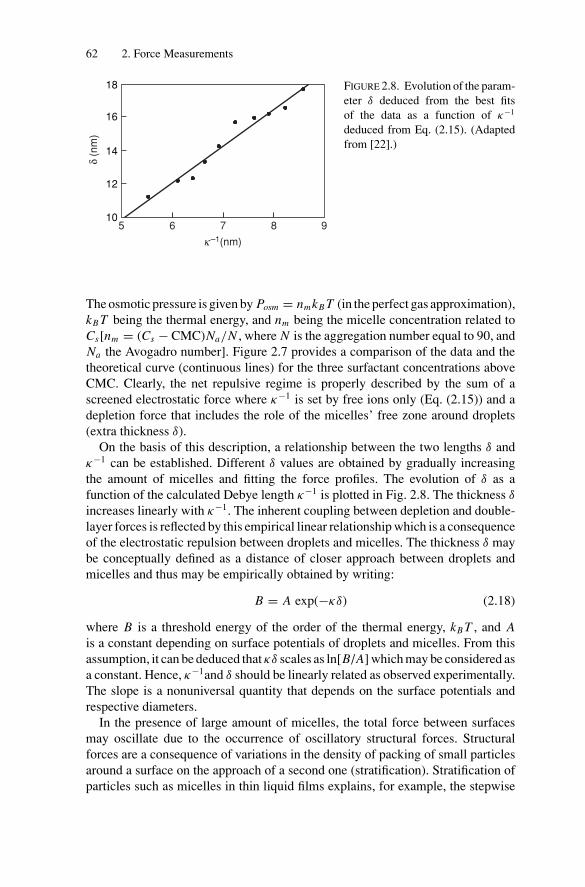
P1: GFZSVNY317-Bibette February 1, 2007 16:43
62 2. Force Measurements
10
12
14
16
18
k–1(nm)
5 6 7 8 9
δ (n
m)
FIGURE 2.8. Evolution of the param-eter δ deduced from the best fitsof the data as a function of κ−1
deduced from Eq. (2.15). (Adaptedfrom [22].)
The osmotic pressure is given by Posm = nmkB T (in the perfect gas approximation),kB T being the thermal energy, and nm being the micelle concentration related toCs[nm = (Cs − CMC)Na/N , where N is the aggregation number equal to 90, andNa the Avogadro number]. Figure 2.7 provides a comparison of the data and thetheoretical curve (continuous lines) for the three surfactant concentrations aboveCMC. Clearly, the net repulsive regime is properly described by the sum of ascreened electrostatic force where κ−1 is set by free ions only (Eq. (2.15)) and adepletion force that includes the role of the micelles’ free zone around droplets(extra thickness δ).
On the basis of this description, a relationship between the two lengths δ andκ−1 can be established. Different δ values are obtained by gradually increasingthe amount of micelles and fitting the force profiles. The evolution of δ as afunction of the calculated Debye length κ−1 is plotted in Fig. 2.8. The thickness δ
increases linearly with κ−1. The inherent coupling between depletion and double-layer forces is reflected by this empirical linear relationship which is a consequenceof the electrostatic repulsion between droplets and micelles. The thickness δ maybe conceptually defined as a distance of closer approach between droplets andmicelles and thus may be empirically obtained by writing:
B = A exp(−κδ) (2.18)
where B is a threshold energy of the order of the thermal energy, kB T , and Ais a constant depending on surface potentials of droplets and micelles. From thisassumption, it can be deduced that κδ scales as ln[B/A] which may be considered asa constant. Hence, κ−1and δ should be linearly related as observed experimentally.The slope is a nonuniversal quantity that depends on the surface potentials andrespective diameters.
In the presence of large amount of micelles, the total force between surfacesmay oscillate due to the occurrence of oscillatory structural forces. Structuralforces are a consequence of variations in the density of packing of small particlesaround a surface on the approach of a second one (stratification). Stratification ofparticles such as micelles in thin liquid films explains, for example, the stepwise
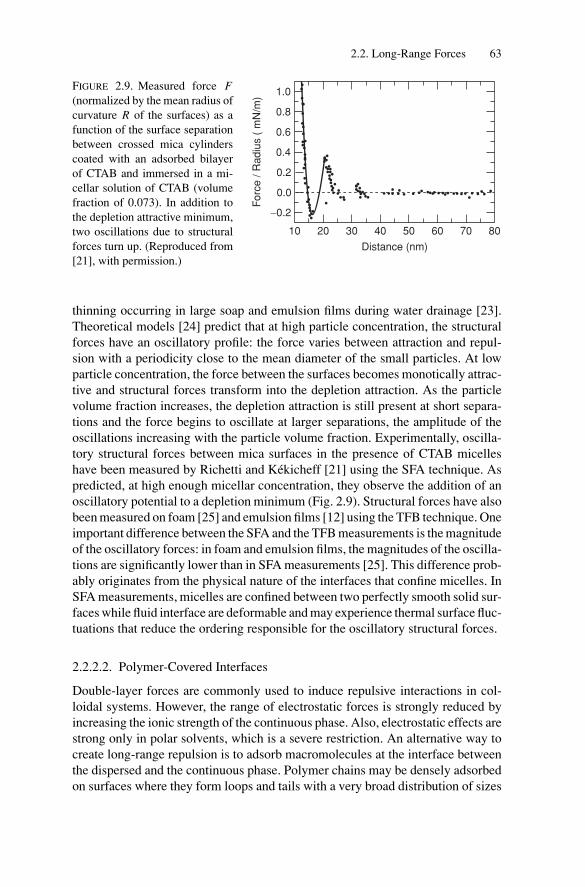
P1: GFZSVNY317-Bibette February 1, 2007 16:43
2.2. Long-Range Forces 63
−0.2
1.0
0.8
0.6
0.4
0.2
0.0
10 20 30 40 50 60 70 80
Distance (nm)F
orc
e / R
adiu
s (
mN
/m)
FIGURE 2.9. Measured force F(normalized by the mean radius ofcurvature R of the surfaces) as afunction of the surface separationbetween crossed mica cylinderscoated with an adsorbed bilayerof CTAB and immersed in a mi-cellar solution of CTAB (volumefraction of 0.073). In addition tothe depletion attractive minimum,two oscillations due to structuralforces turn up. (Reproduced from[21], with permission.)
thinning occurring in large soap and emulsion films during water drainage [23].Theoretical models [24] predict that at high particle concentration, the structuralforces have an oscillatory profile: the force varies between attraction and repul-sion with a periodicity close to the mean diameter of the small particles. At lowparticle concentration, the force between the surfaces becomes monotically attrac-tive and structural forces transform into the depletion attraction. As the particlevolume fraction increases, the depletion attraction is still present at short separa-tions and the force begins to oscillate at larger separations, the amplitude of theoscillations increasing with the particle volume fraction. Experimentally, oscilla-tory structural forces between mica surfaces in the presence of CTAB micelleshave been measured by Richetti and Kekicheff [21] using the SFA technique. Aspredicted, at high enough micellar concentration, they observe the addition of anoscillatory potential to a depletion minimum (Fig. 2.9). Structural forces have alsobeen measured on foam [25] and emulsion films [12] using the TFB technique. Oneimportant difference between the SFA and the TFB measurements is the magnitudeof the oscillatory forces: in foam and emulsion films, the magnitudes of the oscilla-tions are significantly lower than in SFA measurements [25]. This difference prob-ably originates from the physical nature of the interfaces that confine micelles. InSFA measurements, micelles are confined between two perfectly smooth solid sur-faces while fluid interface are deformable and may experience thermal surface fluc-tuations that reduce the ordering responsible for the oscillatory structural forces.
2.2.2.2. Polymer-Covered Interfaces
Double-layer forces are commonly used to induce repulsive interactions in col-loidal systems. However, the range of electrostatic forces is strongly reduced byincreasing the ionic strength of the continuous phase. Also, electrostatic effects arestrong only in polar solvents, which is a severe restriction. An alternative way tocreate long-range repulsion is to adsorb macromolecules at the interface betweenthe dispersed and the continuous phase. Polymer chains may be densely adsorbedon surfaces where they form loops and tails with a very broad distribution of sizes
P1: GFZSVNY317-Bibette February 1, 2007 16:43
64 2. Force Measurements
and extending in the continuous phase [26]. The repulsive forces between adsorbedpolymer layers are essentially due to steric effects between the two layers whenthey overlap.
i. Dilute Regime
The structure, the thickness, and the interactions generated by the presence ofthe adsorbed polymer layers have been extensively studied [17]. In particular, theforce between two polymer-covered mica sheets in various solvency conditionshas been probed via the SFA technique [27,28]. The force is purely repulsive ina good solvent and becomes attractive as the solvent gets poorer. However, thesestudies concern only a regime of large interaction compared to the thermal energyand are restricted to interactions between solid surfaces.
Following the pioneering experiments of Lyklema and van Vliet [29], Mondain-Monval et al. [30,31] have measured the repulsive forces between polymer-coveredliquid interfaces in the low interaction regime (force/radius ≤10−4 N/m). They usedtwo different force measurement techniques, i.e., MCT and TFB techniques. All theexperiments were performed in the dilute regime (φb � φ∗
b , where φ∗b is the dilute
to semidilute bulk polymer volume fraction). The force–distance profiles betweenthe ferrofluid droplets and the air–water films are displayed for three molecularweights for PVA–Vac polymer (statistical copolymer of vinyl alcohol [88%] andvinyl acetate [12%]) on Fig. 2.10a. The disjoining pressure � measured via theTFB technique was transformed into a force through the Derjaguin approximation[17] (Eqs. (2.7) and (2.8)). The two profiles are qualitatively similar and show a lin-ear decay with the same slope on a semilogarithmic scale. However, the distancescorresponding to equal forces are very different in the two experiments (theyare larger in the air–liquid films). The force as a function of the distance may bewritten as:
Fs(h) = α h exp(−h/λ) (2.19)
where λ is a characteristic decay length and α is a constant prefactor. Theseexponentially decaying profiles are insensitive to the presence of electrolytesand thus cannot be attributed to an electrostatic repulsion that could exist if, forexample, some parasitic charges were present at the interface. In both techniques,the thickness λ is of the order of the radius of gyration of the chains in solutiondespite the fact that the interaction that drives the adsorption can be very differentfrom one interface to the other. Using a different polymer, it can be shown thatthis exponential behavior is not specific to PVA–Vac. A second set of experimentshas been performed with a weak polyelectrolyte (polyacrylic acid [PAA]) insolutions of high ionic strength and low pH (Fig. 2.10b). The presence of saltensures that any long-range repulsion is not due to electrostatics. Here also,exponentially decaying profiles were measured with characteristic distancesvarying with molecular weight. The polymer radius of gyration Rg may be variedby increasing the temperature from 20◦C to 80◦C, i.e., in a regime in which the
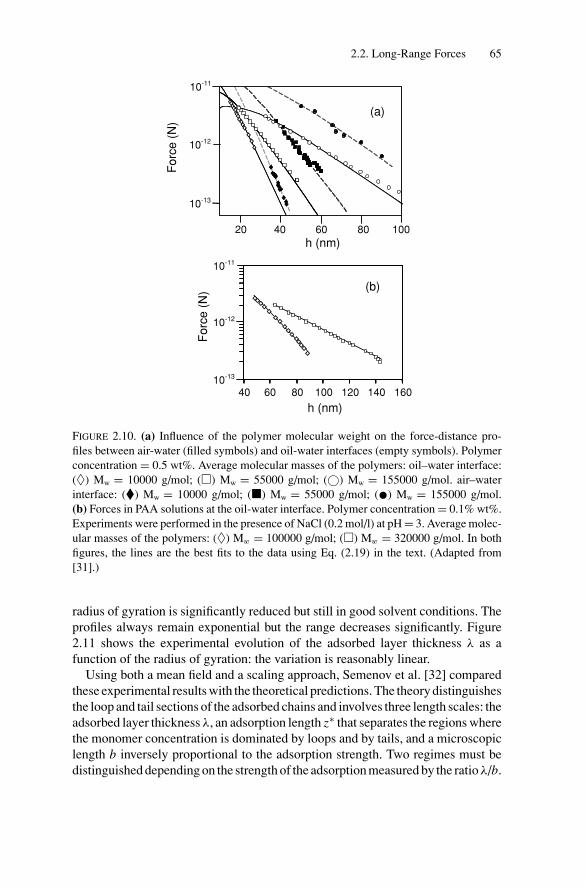
P1: GFZSVNY317-Bibette February 1, 2007 16:43
2.2. Long-Range Forces 65
20 40 60 80 100
10-13
10-12
10-11
(a)
h (nm)
Forc
e (
N)
(b)
40 60 80 100 120 140 16010-13
10-12
10-11
h (nm)
Forc
e (
N)
FIGURE 2.10. (a) Influence of the polymer molecular weight on the force-distance pro-files between air-water (filled symbols) and oil-water interfaces (empty symbols). Polymerconcentration = 0.5 wt%. Average molecular masses of the polymers: oil–water interface:(♦) Mw = 10000 g/mol; (�) Mw = 55000 g/mol; (©) Mw = 155000 g/mol. air–waterinterface: (�) Mw = 10000 g/mol; (�) Mw = 55000 g/mol; (•) Mw = 155000 g/mol.(b) Forces in PAA solutions at the oil-water interface. Polymer concentration = 0.1% wt%.Experiments were performed in the presence of NaCl (0.2 mol/l) at pH = 3. Average molec-ular masses of the polymers: (♦) Mw = 100000 g/mol; (�) Mw = 320000 g/mol. In bothfigures, the lines are the best fits to the data using Eq. (2.19) in the text. (Adapted from[31].)
radius of gyration is significantly reduced but still in good solvent conditions. Theprofiles always remain exponential but the range decreases significantly. Figure2.11 shows the experimental evolution of the adsorbed layer thickness λ as afunction of the radius of gyration: the variation is reasonably linear.
Using both a mean field and a scaling approach, Semenov et al. [32] comparedthese experimental results with the theoretical predictions. The theory distinguishesthe loop and tail sections of the adsorbed chains and involves three length scales: theadsorbed layer thickness λ, an adsorption length z∗ that separates the regions wherethe monomer concentration is dominated by loops and by tails, and a microscopiclength b inversely proportional to the adsorption strength. Two regimes must bedistinguished depending on the strength of the adsorption measured by the ratio λ/b.
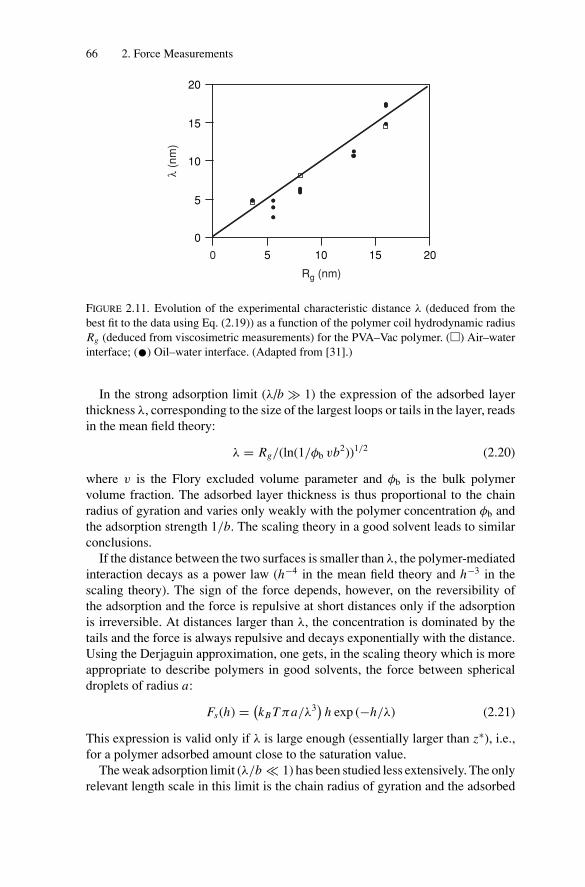
P1: GFZSVNY317-Bibette February 1, 2007 16:43
66 2. Force Measurements
5 10 15 20
5
0
10
15
20
0
λ (n
m)
Rg (nm)
FIGURE 2.11. Evolution of the experimental characteristic distance λ (deduced from thebest fit to the data using Eq. (2.19)) as a function of the polymer coil hydrodynamic radiusRg (deduced from viscosimetric measurements) for the PVA–Vac polymer. (�) Air–waterinterface; (•) Oil–water interface. (Adapted from [31].)
In the strong adsorption limit (λ/b 1) the expression of the adsorbed layerthickness λ, corresponding to the size of the largest loops or tails in the layer, readsin the mean field theory:
λ = Rg/(ln(1/φb vb2))1/2 (2.20)
where v is the Flory excluded volume parameter and φb is the bulk polymervolume fraction. The adsorbed layer thickness is thus proportional to the chainradius of gyration and varies only weakly with the polymer concentration φb andthe adsorption strength 1/b. The scaling theory in a good solvent leads to similarconclusions.
If the distance between the two surfaces is smaller than λ, the polymer-mediatedinteraction decays as a power law (h−4 in the mean field theory and h−3 in thescaling theory). The sign of the force depends, however, on the reversibility ofthe adsorption and the force is repulsive at short distances only if the adsorptionis irreversible. At distances larger than λ, the concentration is dominated by thetails and the force is always repulsive and decays exponentially with the distance.Using the Derjaguin approximation, one gets, in the scaling theory which is moreappropriate to describe polymers in good solvents, the force between sphericaldroplets of radius a:
Fs(h) = (kB T πa/λ3) h exp (−h/λ) (2.21)
This expression is valid only if λ is large enough (essentially larger than z∗), i.e.,for a polymer adsorbed amount close to the saturation value.
The weak adsorption limit (λ/b � 1) has been studied less extensively. The onlyrelevant length scale in this limit is the chain radius of gyration and the adsorbed
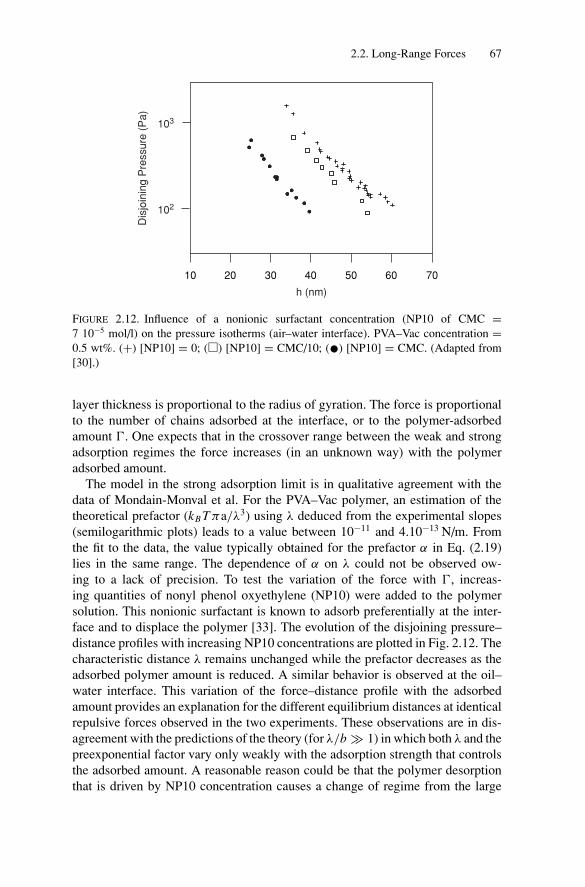
P1: GFZSVNY317-Bibette February 1, 2007 16:43
2.2. Long-Range Forces 67
10 20 30 50 60 7040
Dis
join
ing P
ress
ure
(P
a)
h (nm)
102
103
FIGURE 2.12. Influence of a nonionic surfactant concentration (NP10 of CMC =7 10−5 mol/l) on the pressure isotherms (air–water interface). PVA–Vac concentration =0.5 wt%. (+) [NP10] = 0; (�) [NP10] = CMC/10; (•) [NP10] = CMC. (Adapted from[30].)
layer thickness is proportional to the radius of gyration. The force is proportionalto the number of chains adsorbed at the interface, or to the polymer-adsorbedamount �. One expects that in the crossover range between the weak and strongadsorption regimes the force increases (in an unknown way) with the polymeradsorbed amount.
The model in the strong adsorption limit is in qualitative agreement with thedata of Mondain-Monval et al. For the PVA–Vac polymer, an estimation of thetheoretical prefactor (kB T πa/λ3) using λ deduced from the experimental slopes(semilogarithmic plots) leads to a value between 10−11 and 4.10−13 N/m. Fromthe fit to the data, the value typically obtained for the prefactor α in Eq. (2.19)lies in the same range. The dependence of α on λ could not be observed ow-ing to a lack of precision. To test the variation of the force with �, increas-ing quantities of nonyl phenol oxyethylene (NP10) were added to the polymersolution. This nonionic surfactant is known to adsorb preferentially at the inter-face and to displace the polymer [33]. The evolution of the disjoining pressure–distance profiles with increasing NP10 concentrations are plotted in Fig. 2.12. Thecharacteristic distance λ remains unchanged while the prefactor decreases as theadsorbed polymer amount is reduced. A similar behavior is observed at the oil–water interface. This variation of the force–distance profile with the adsorbedamount provides an explanation for the different equilibrium distances at identicalrepulsive forces observed in the two experiments. These observations are in dis-agreement with the predictions of the theory (for λ/b 1) in which both λ and thepreexponential factor vary only weakly with the adsorption strength that controlsthe adsorbed amount. A reasonable reason could be that the polymer desorptionthat is driven by NP10 concentration causes a change of regime from the large
P1: GFZSVNY317-Bibette February 1, 2007 16:43
68 2. Force Measurements
(for the lowest NP10 concentrations) to the weak adsorption limit (at high NP10concentrations).
Omarjee et al. [34] have measured and compared the forces between differentpolymers adsorbed at different surfaces, as determined by three different methodsinvolving liquid–liquid (MCT), liquid–air (TFB), and solid–solid (SFA) interfaces.In the distal regime (weak interactions at the onset of overlap), the forces areexponentially decaying with characteristic distances depending linearly on thepolymer chain gyration radius. Such qualitative behavior is very general and isnot expected to depend on the type of interfaces or details of the polymer–goodsolvent system. In contrast, the preexponential factors or absolute magnitudesare strongly system-dependent. The differences in the prefactor are attributableto the different adsorption abilities of the polymers at the different interfaces.A higher absorbance leads to higher segment concentration in the overlappingregions and therefore stronger repulsion. The mobility of the adsorbed polymeron the highly curved fluid emulsion surfaces may also result in some reductionof the absolute repulsion when the layers are compressed (as chains can respondby moving sideways). All these effects would result in a lower absolute repulsionbetween the fluid-adsorbed compared to the solid-adsorbed polymers.
If the surfaces are not fully covered by polymers, an attraction can occur evenin good solvent. In this case, polymer coils can extend from one surface to theother and make molecular contacts on both sides. One surface then provides themissing polymer to the other, resulting in an attractive interaction usually calledbridging. At equilibrium adsorption, polymers are used to stabilize colloids, sincethe steric repulsions exceed the bridging attractions at all separations. Reducing theadsorption to less than its equilibrium value can therefore change the net repulsionto a net bridging attraction [35,36]. To study the kinetics of polymer bridging,Cohen-Tannoudji et al. [37] have developed a new tool based on the self-assemblingproperties of superparamagnetic beads under a field. It consists of following thekinetics of formation of permanents links between self-organized magnetic beadswith optical microscopy. It has been shown that polymer bridging is activated bytemperature but it cannot be understood simply in terms of an Arrhenius model.Indeed, a more precise approach is required that takes into account the necessaryremoval of adsorbed polymer from the near-contact region and the slowdown ofthe dynamics in the near-surface layer, owing to the proximity of a surface glassystate. This difficulty to induce bridging at equilibrium adsorbance explains theefficiency of adsorbing polymers at the surface of colloids to improve their kineticstability.
The magnetic beads were spherical, monodisperse, strongly magnetic, andBrownian. They consisted of calibrated emulsion droplets of diameter 800 nmof an organic ferrofluid in water. The method to follow the kinetics of bridging isbased on the formation of magnetic chains that persist after removal of the field.A colloidal sample was introduced by capillarity into a square tube of 50 μm(Fig. 2.13). The tube was submitted to a given field, at a controlled temperature,for a given incubation time. After the field was removed, the sample was observedvia optical microscopy and photographs of different parts of the tube were taken.
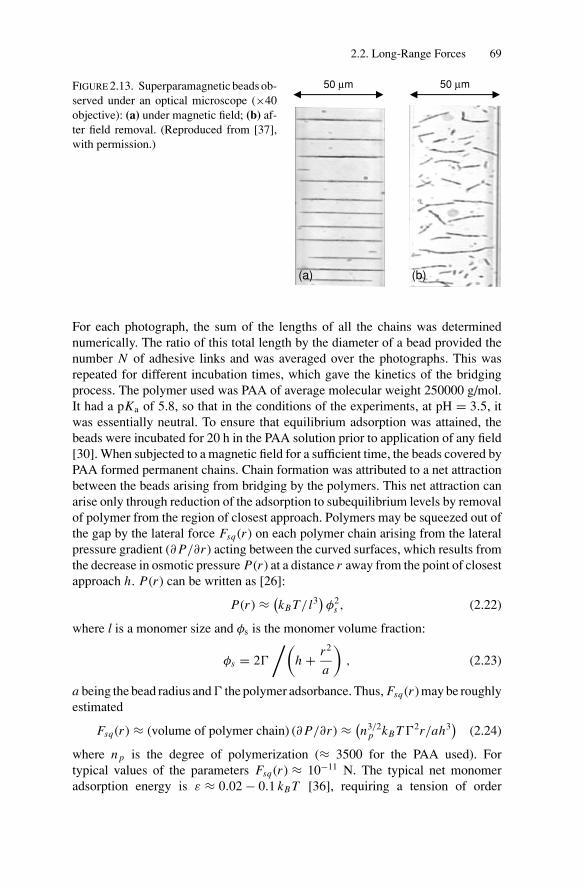
P1: GFZSVNY317-Bibette February 1, 2007 16:43
2.2. Long-Range Forces 69
50 μm 50 μm
(a) (b)
FIGURE 2.13. Superparamagnetic beads ob-served under an optical microscope (×40objective): (a) under magnetic field; (b) af-ter field removal. (Reproduced from [37],with permission.)
For each photograph, the sum of the lengths of all the chains was determinednumerically. The ratio of this total length by the diameter of a bead provided thenumber N of adhesive links and was averaged over the photographs. This wasrepeated for different incubation times, which gave the kinetics of the bridgingprocess. The polymer used was PAA of average molecular weight 250000 g/mol.It had a pKa of 5.8, so that in the conditions of the experiments, at pH = 3.5, itwas essentially neutral. To ensure that equilibrium adsorption was attained, thebeads were incubated for 20 h in the PAA solution prior to application of any field[30]. When subjected to a magnetic field for a sufficient time, the beads covered byPAA formed permanent chains. Chain formation was attributed to a net attractionbetween the beads arising from bridging by the polymers. This net attraction canarise only through reduction of the adsorption to subequilibrium levels by removalof polymer from the region of closest approach. Polymers may be squeezed out ofthe gap by the lateral force Fsq (r ) on each polymer chain arising from the lateralpressure gradient (∂ P/∂r ) acting between the curved surfaces, which results fromthe decrease in osmotic pressure P(r ) at a distance r away from the point of closestapproach h. P(r ) can be written as [26]:
P(r ) ≈ (kB T/ l3) φ2
s , (2.22)
where l is a monomer size and φs is the monomer volume fraction:
φs = 2�
/(h + r2
a
), (2.23)
a being the bead radius and � the polymer adsorbance. Thus, Fsq (r ) may be roughlyestimated
Fsq (r ) ≈ (volume of polymer chain) (∂ P/∂r ) ≈ (n3/2
p kB T �2r/ah3) (2.24)
where n p is the degree of polymerization (≈ 3500 for the PAA used). Fortypical values of the parameters Fsq (r ) ≈ 10−11 N. The typical net monomeradsorption energy is ε ≈ 0.02 − 0.1 kB T [36], requiring a tension of order
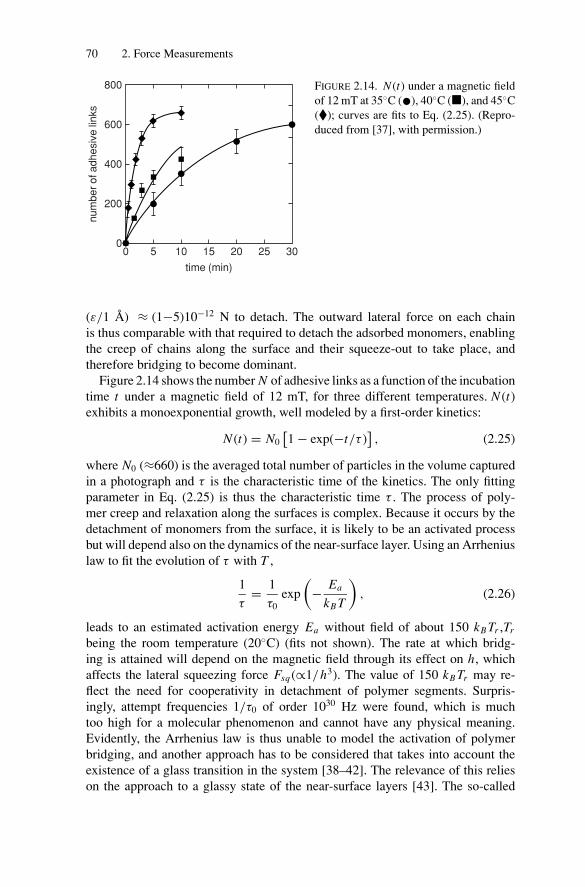
P1: GFZSVNY317-Bibette February 1, 2007 16:43
70 2. Force Measurements
800
600
400
200
num
ber
of a
dhesi
ve li
nks
05 10 15
time (min)
20 25 300
FIGURE 2.14. N (t) under a magnetic fieldof 12 mT at 35◦C (•), 40◦C (�), and 45◦C(�); curves are fits to Eq. (2.25). (Repro-duced from [37], with permission.)
(ε/1 A) ≈ (1−5)10−12 N to detach. The outward lateral force on each chainis thus comparable with that required to detach the adsorbed monomers, enablingthe creep of chains along the surface and their squeeze-out to take place, andtherefore bridging to become dominant.
Figure 2.14 shows the number N of adhesive links as a function of the incubationtime t under a magnetic field of 12 mT, for three different temperatures. N (t)exhibits a monoexponential growth, well modeled by a first-order kinetics:
N (t) = N0[1 − exp(−t/τ )
], (2.25)
where N0 (≈660) is the averaged total number of particles in the volume capturedin a photograph and τ is the characteristic time of the kinetics. The only fittingparameter in Eq. (2.25) is thus the characteristic time τ . The process of poly-mer creep and relaxation along the surfaces is complex. Because it occurs by thedetachment of monomers from the surface, it is likely to be an activated processbut will depend also on the dynamics of the near-surface layer. Using an Arrheniuslaw to fit the evolution of τ with T ,
1
τ= 1
τ0exp
(− Ea
kB T
), (2.26)
leads to an estimated activation energy Ea without field of about 150 kB Tr ,Tr
being the room temperature (20◦C) (fits not shown). The rate at which bridg-ing is attained will depend on the magnetic field through its effect on h, whichaffects the lateral squeezing force Fsq (∝1/h3). The value of 150 kB Tr may re-flect the need for cooperativity in detachment of polymer segments. Surpris-ingly, attempt frequencies 1/τ0 of order 1030 Hz were found, which is muchtoo high for a molecular phenomenon and cannot have any physical meaning.Evidently, the Arrhenius law is thus unable to model the activation of polymerbridging, and another approach has to be considered that takes into account theexistence of a glass transition in the system [38–42]. The relevance of this relieson the approach to a glassy state of the near-surface layers [43]. The so-called
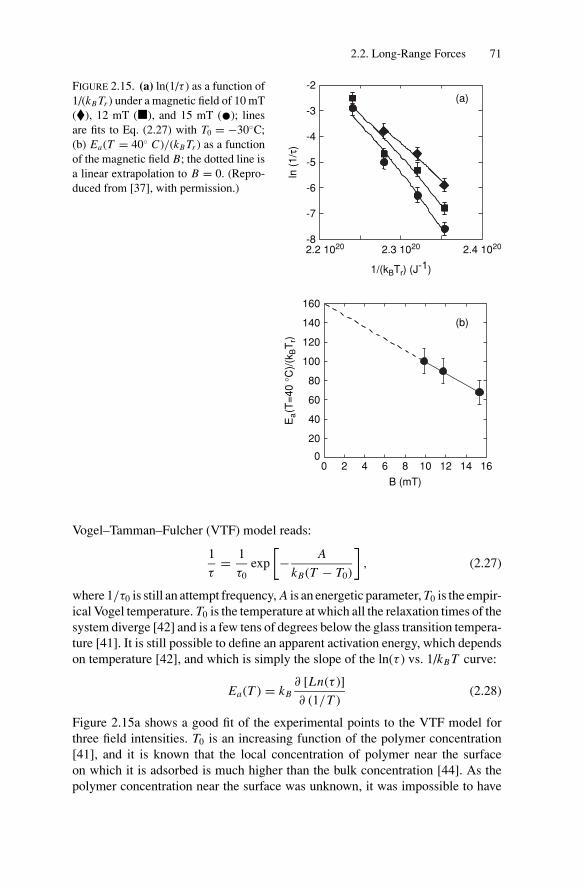
P1: GFZSVNY317-Bibette February 1, 2007 16:43
2.2. Long-Range Forces 71
0 2 4 6 8 10 12 14 16
Ea(T
=40 °
C)/
(kBT
r)
B (mT)
0
20
40
60
80
100
120
140
160
-82.2 1020 2.3 1020 2.4 1020
-7
-6
-5
-4
-3
-2
ln (
1/τ
)
1/(kBTr) (J-1)
(a)
(b)
FIGURE 2.15. (a) ln(1/τ ) as a function of1/(kB Tr ) under a magnetic field of 10 mT(�), 12 mT (�), and 15 mT (•); linesare fits to Eq. (2.27) with T0 = −30◦C;(b) Ea(T = 40◦ C)/(kB Tr ) as a functionof the magnetic field B; the dotted line isa linear extrapolation to B = 0. (Repro-duced from [37], with permission.)
Vogel–Tamman–Fulcher (VTF) model reads:
1
τ= 1
τ0exp
[− A
kB(T − T0)
], (2.27)
where 1/τ0 is still an attempt frequency, A is an energetic parameter, T0 is the empir-ical Vogel temperature. T0 is the temperature at which all the relaxation times of thesystem diverge [42] and is a few tens of degrees below the glass transition tempera-ture [41]. It is still possible to define an apparent activation energy, which dependson temperature [42], and which is simply the slope of the ln(τ ) vs. 1/kB T curve:
Ea(T ) = kB∂ [Ln(τ )]
∂ (1/T )(2.28)
Figure 2.15a shows a good fit of the experimental points to the VTF model forthree field intensities. T0 is an increasing function of the polymer concentration[41], and it is known that the local concentration of polymer near the surfaceon which it is adsorbed is much higher than the bulk concentration [44]. As thepolymer concentration near the surface was unknown, it was impossible to have
P1: GFZSVNY317-Bibette February 1, 2007 16:43
72 2. Force Measurements
any precision on the value of T0.T0 ≈ −120◦C for dilute solutions of PAA in water(less than 1 wt%) [45] and T0 ≈ 0◦C for 75% wt% PAA in water [46]. The adsorbedpolymers involved in the bridging should thus have a Vogel temperature rangingroughly between −70◦C and 0◦C. Since the choice of T0 had almost no influenceon the apparent activation energy deduced from the fit, T0 was arbitrarily fixed at−30◦C in Fig. 2.15. A value of 160 kB Tr for Ea(40◦C) was obtained at zero field(Fig. 2.15b), which compares very well with the value of 150 kB Tr found with theArrhenius law. In contrast, the frequency 1/τ0 determined by the VTF fit is verysensitive to T0. It ranges from 100 Hz for T0 = 0◦C to 1010 Hz for T0 = −70◦C,which is physically reasonable. This proves that the VTF model for the thermalactivation of polymer bridging is a much better description than the Arrhenius law.
As mentioned earlier, the squeezing away of the polymer is due to the osmoticoutward lateral force Fsq (r ), which is an increasing function of the degree n p ofpolymerization of the considered polymer. Experimentally, this implies that thebridging phenomenon should be faster when the adsorbed polymer is longer. Someexperiments were carried out at 45◦C under a magnetic field of 11 mT with threePAA of different average n p. For n p of about 28, 1400, and 3500, the characteristictimes τ were equal to 1800, 74, and 54 s, respectively. This confirms the roleof the squeezing out of polymer in the bridging process. The interpretation ofpolymer bridging was also confirmed by performing measurements at 25◦C undera magnetic field of 12 mT after different equilibration times of the beads with thepolymer. Whereas a characteristic time τ ≈ 12 min was found if the adsorptionequilibrium was reached (after 20 h), the kinetics is much more rapid (τ ≈ 0.9 min)if the PAA had only 10 min to adsorb prior to application of the field. When the timewas insufficient for the polymer to be completely adsorbed, bridging dominancerequired less polymer to be squeezed away.
Magnetically induced bridging by adsorbed polymers has been exploited byGoubault et al. [47] to produce long filaments with an extremely uniform diameterof one particle and lengths of several hundreds of micrometers as can be observed inFig. 2.16. Such filaments can find numerous applications in chemistry and biology.Self-organized in a microchip, they provide a new promising sewing matrix thatcan be exploited for rare cells sorting.
ii. Semi-dilute Regime
The stability of films in the presence of polymers (adsorbed or nonadsorbed)in a semidilute regime (φb > φ∗
b ) has also been investigated. In addition to theeventual steric interaction (in the case of adsorbing polymers), depletion forces areexpected due to the exclusion of the polymer chains. However, polymer moleculesin the semidilute regime can no longer be treated as hard spheres and the simplepicture given for micelles (total exclusion when surface separation is lower thanthe micellar effective diameter) is no longer valid. Instead, in the semidilute regimethe polymer solution may be regarded as an entangled network of flexible chainswith average mesh size ξ [26]. Owing to their flexibility, the polymer moleculesconfined between two walls will not totally vacate the confined region and there
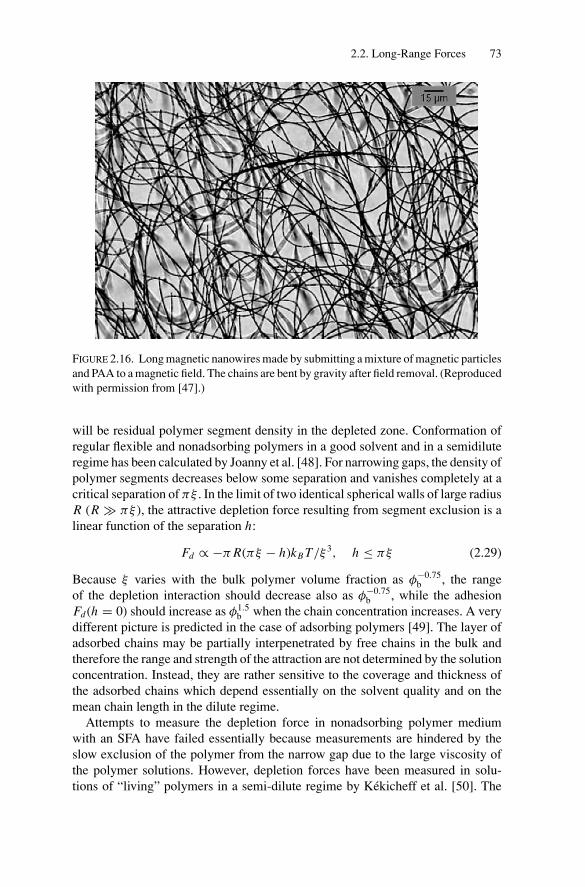
P1: GFZSVNY317-Bibette February 1, 2007 16:43
2.2. Long-Range Forces 73
FIGURE 2.16. Long magnetic nanowires made by submitting a mixture of magnetic particlesand PAA to a magnetic field. The chains are bent by gravity after field removal. (Reproducedwith permission from [47].)
will be residual polymer segment density in the depleted zone. Conformation ofregular flexible and nonadsorbing polymers in a good solvent and in a semidiluteregime has been calculated by Joanny et al. [48]. For narrowing gaps, the density ofpolymer segments decreases below some separation and vanishes completely at acritical separation of πξ . In the limit of two identical spherical walls of large radiusR (R πξ ), the attractive depletion force resulting from segment exclusion is alinear function of the separation h:
Fd ∝ −π R(πξ − h)kB T/ξ 3, h ≤ πξ (2.29)
Because ξ varies with the bulk polymer volume fraction as φ−0.75b , the range
of the depletion interaction should decrease also as φ−0.75b , while the adhesion
Fd (h = 0) should increase as φ1.5b when the chain concentration increases. A very
different picture is predicted in the case of adsorbing polymers [49]. The layer ofadsorbed chains may be partially interpenetrated by free chains in the bulk andtherefore the range and strength of the attraction are not determined by the solutionconcentration. Instead, they are rather sensitive to the coverage and thickness ofthe adsorbed chains which depend essentially on the solvent quality and on themean chain length in the dilute regime.
Attempts to measure the depletion force in nonadsorbing polymer mediumwith an SFA have failed essentially because measurements are hindered by theslow exclusion of the polymer from the narrow gap due to the large viscosity ofthe polymer solutions. However, depletion forces have been measured in solu-tions of “living” polymers in a semi-dilute regime by Kekicheff et al. [50]. The
P1: GFZSVNY317-Bibette February 1, 2007 16:43
74 2. Force Measurements
measured evolution of the range and strength of the depletion attraction roughlyfollow the model of Joanny et al. [48]. “Living” polymers are linear and flexibleelongated micelles that can break and recombine. Owing to their labile nature, suchsystems can adapt to release any conformation restriction induced by confinementand so any equilibrium is more rapidly achieved than for regular polymers. Thedepletion interaction between a sphere and a plane in the presence of nonadsorbingpolymers has been measured via AFM [51]. Adhesive energy measurements be-tween lipid bilayer membranes induced by concentrated solutions of nonadsorbingpolymer are also reported and show good agreement with mean field theory [52].By using the TFB technique, Asnacios et al. have studied thin liquid films madefrom semidilute polyelectrolytes [53]. The TFB method does not allow measuringattraction and therefore no depletion minimum was observed. However, an inter-esting result is that they have measured oscillatory forces, likely to be structuralforces associated with the polymer mesh structure. Indeed, film stratification is ob-served, with a strata thickness strictly corresponding to the theoretical mesh sizeξ of semidilute polyelectrolyte solution. These oscillatory forces are particular topolyelectrolytes and disappear when the electrostatic forces are screened with salt.
2.2.2.3. Interfaces Covered by Polymer–Surfactant Complexes
The ability of polymer–surfactant complexes to alter rheological properties andstability of colloidal formulations has been exploited in oil recovery operationsas well as in various industrial products such as paints, detergents, cosmetics,pharmaceuticals, etc. While polyelectrolytes are mainly used for their unique rhe-ological properties, surfactants are usually employed for their ability to adsorband lower surface energy. Once added to the same solution, polyelectrolytes andcharged surfactants can have strong interactions, which affect both bulk and sur-face properties of the solution. In particular, it is well known that polyelectrolytesand surfactants of opposite charge form hydrophobic complexes at surfactant con-centrations lower than the critical micelle concentration, owing to the strong elec-trostatic interaction between the surfactant head group and the polymer backbone.Bulk interactions and phase behavior [54–56] of polyelectrolytes and surfactants ofopposite charge have been studied via several techniques, including turbidimetry[57], fluorescence [56,58], viscometry [59,60], dynamic and static light-scattering[60,61], small-angle neutron scattering [62], small angle X-ray scattering [63],electrophoresis [60], and potentiometric measurements using ion-specific elec-trodes [64,65]. These techniques have led to estimates of the type of interactions,the aggregation numbers, and the structure of the complexes formed by surfactantsand polyelectrolyte molecules. Micelles are bound to the polyelectrolyte chains,their aggregation numbers being in general smaller than that for the free micelles.The concentration of surfactant needed to measure significant aggregation be-tween the polymer and the surfactant is generally called the critical aggregationconcentration (CAC).
In addition to the studies in the volume, the adsorption properties of thepolyelectrolyte–surfactant complexes at the air–water interface have also been
P1: GFZSVNY317-Bibette February 1, 2007 16:43
2.2. Long-Range Forces 75
investigated using surface tension measurements [59,66–71] and neutron or X-rayreflectometry [68–71]. Recently, Claesson et al. [72] have introduced the conceptof a surface critical aggregation concentration for adsorption onto solid surfaces,to underline the differences seen between bulk and surface behavior. Monteuxet al. [73] also show that aggregates can form at the air–water surface at surfac-tant concentrations different than that seen for solution aggregation. In addition,surface aggregates can form interfacial gels. Surface gelation is identified by apronounced increase in surface rheological properties which are detected by thin-film drainage studies. Evidence of this phenomenon was obtained by systematicinvestigation of the air–water surface properties for mixtures of an anionic poly-electrolyte (100% charged sodium polystyrene sulfonate [PSS]) with a cationicsurfactant (dodecyltrimethylammonium bromide [DTAB]). By combining surfacetension measurements with ellipsometry studies, it was possible to monitor theadsorption at the air–water interface. At the same time, polyelectrolyte–surfactantinteractions in the bulk solution were evaluated by measurements of the solutionconductivities with ion-specific electrodes.
The formation of complexes is not restricted to mixtures of polyectrolytes andsurfactants of opposite charge. Neutral polymers and ionic surfactants can also formbulk and/or surface complexes. Philip et al. [74] have studied the colloidal forcesin presence of neutral polymer/ionic surfactant mixtures in the case where bothspecies can adsorb at the interface of oil droplets dispersed in an aqueous phase. Themolecules used in their studies are a neutral PVA–Vac copolymer (vinyl alcohol[88%] and vinyl acetate [12%]), with average molecular weight Mw = 155000g/mol, and ionic surfactants such as SDS. The force measurements were performedusing MCT. The force profiles were always roughly linear in semilogarithmic scaleand were fitted by a simple exponential function:
F(h) ∝ exp(−h/λ) (2.30)
The authors deduce the decay length (λ) from the slope and the first interactionlength or onset of repulsion (2L0) defined as the distance at which the magnitudeof force is 2 10−13 N . One of the main findings of this study is that the force profilesare strongly dependent upon the sequence of adsorption of polymer and surfactantand three cases are envisaged.
Case I (see Fig. 2.17) corresponds to the situation such that the emulsion isinitially stabilized with SDS at 8 10−3 mol/l (CMC). The repulsive force as afunction of distance between the ferrofluid droplets, stabilized with SDS aloneis referred as “0% PVA.” Then, PVA–Vac is introduced at different concentra-tions varying from 0.002 to 0.5 wt%. After each addition, the emulsion is incu-bated for 48 h to reach equilibrium. It can be seen that the force profiles remainalmost the same as in the case of 0% PVA. As the surfactant concentration isequal to CMC, the expected decay length is 3.4 nm. The experimental value ofthe decay length obtained from the force profile, 2.9 nm (solid line), is in goodagreement with the predicted value. Thus, if the emulsion is preadsorbed with sur-factant molecules, the introduction of polymer does not influence the force profilesignificantly.
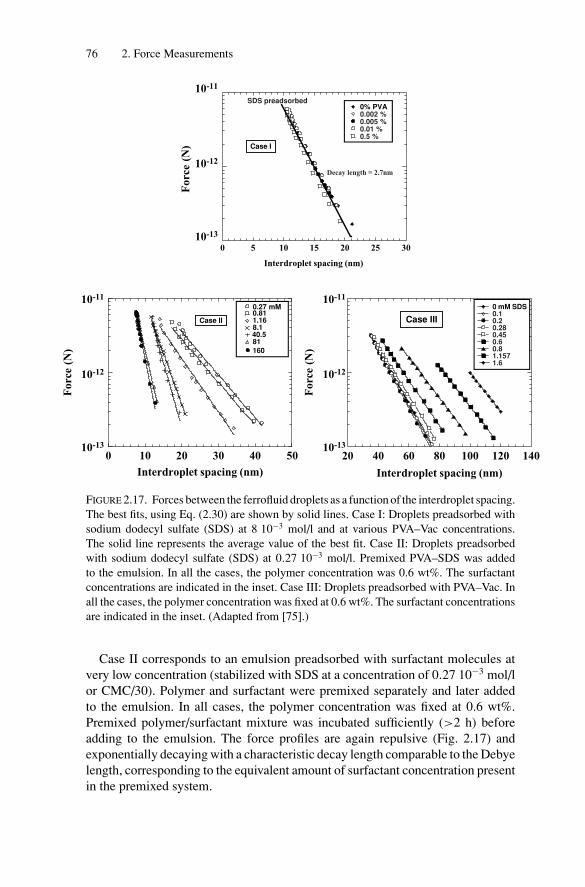
P1: GFZSVNY317-Bibette February 1, 2007 16:43
76 2. Force Measurements
0 5 10 15 20 25 30
For
ce (
N)
10-11
10-12
10-13
10-11
10-12
10-13
For
ce (
N)
10-11
10-12
10-13
For
ce (
N)
Interdroplet spacing (nm)
0 5040302010
0.27 mM0.811.168.140.581160
Interdroplet spacing (nm) Interdroplet spacing (nm)
20 40 60 80 100 120 140
Case I
Case II Case III
SDS preadsorbed
Decay length = 2.7nm
0% PVA0.002 %0.005 %0.01 %0.5 %
0 mM SDS0.10.20.280.450.60.81.1571.6
FIGURE 2.17. Forces between the ferrofluid droplets as a function of the interdroplet spacing.The best fits, using Eq. (2.30) are shown by solid lines. Case I: Droplets preadsorbed withsodium dodecyl sulfate (SDS) at 8 10−3 mol/l and at various PVA–Vac concentrations.The solid line represents the average value of the best fit. Case II: Droplets preadsorbedwith sodium dodecyl sulfate (SDS) at 0.27 10−3 mol/l. Premixed PVA–SDS was addedto the emulsion. In all the cases, the polymer concentration was 0.6 wt%. The surfactantconcentrations are indicated in the inset. Case III: Droplets preadsorbed with PVA–Vac. Inall the cases, the polymer concentration was fixed at 0.6 wt%. The surfactant concentrationsare indicated in the inset. (Adapted from [75].)
Case II corresponds to an emulsion preadsorbed with surfactant molecules atvery low concentration (stabilized with SDS at a concentration of 0.27 10−3 mol/lor CMC/30). Polymer and surfactant were premixed separately and later addedto the emulsion. In all cases, the polymer concentration was fixed at 0.6 wt%.Premixed polymer/surfactant mixture was incubated sufficiently (>2 h) beforeadding to the emulsion. The force profiles are again repulsive (Fig. 2.17) andexponentially decaying with a characteristic decay length comparable to the Debyelength, corresponding to the equivalent amount of surfactant concentration presentin the premixed system.
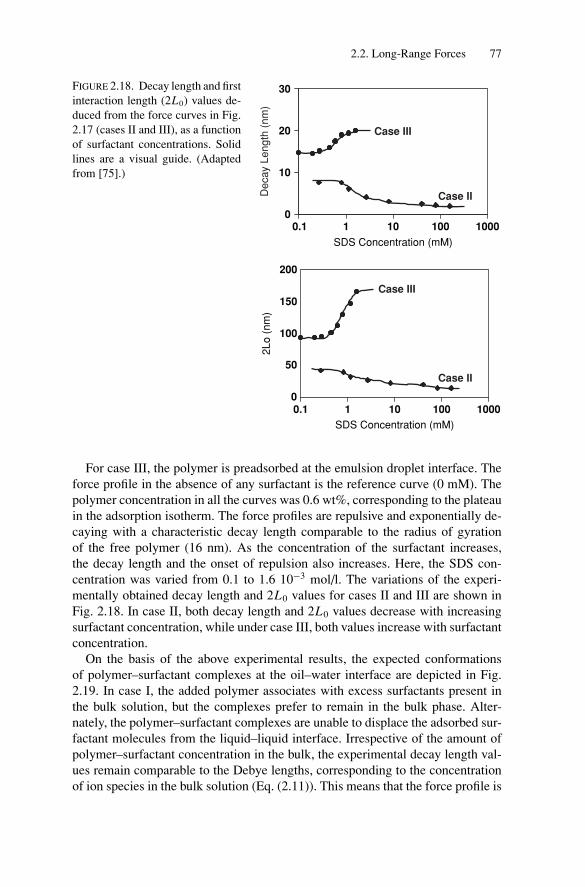
P1: GFZSVNY317-Bibette February 1, 2007 16:43
2.2. Long-Range Forces 77
0
10
20
SDS Concentration (mM)
30
0
50
100
150
2002Lo (
nm
)
0.1 1 10 100 1000
SDS Concentration (mM)
0.1 1 10 100 1000
Case III
Case III
Case II
Case II
Deca
y Length
(nm
)
FIGURE 2.18. Decay length and firstinteraction length (2L0) values de-duced from the force curves in Fig.2.17 (cases II and III), as a functionof surfactant concentrations. Solidlines are a visual guide. (Adaptedfrom [75].)
For case III, the polymer is preadsorbed at the emulsion droplet interface. Theforce profile in the absence of any surfactant is the reference curve (0 mM). Thepolymer concentration in all the curves was 0.6 wt%, corresponding to the plateauin the adsorption isotherm. The force profiles are repulsive and exponentially de-caying with a characteristic decay length comparable to the radius of gyrationof the free polymer (16 nm). As the concentration of the surfactant increases,the decay length and the onset of repulsion also increases. Here, the SDS con-centration was varied from 0.1 to 1.6 10−3 mol/l. The variations of the experi-mentally obtained decay length and 2L0 values for cases II and III are shown inFig. 2.18. In case II, both decay length and 2L0 values decrease with increasingsurfactant concentration, while under case III, both values increase with surfactantconcentration.
On the basis of the above experimental results, the expected conformationsof polymer–surfactant complexes at the oil–water interface are depicted in Fig.2.19. In case I, the added polymer associates with excess surfactants present inthe bulk solution, but the complexes prefer to remain in the bulk phase. Alter-nately, the polymer–surfactant complexes are unable to displace the adsorbed sur-factant molecules from the liquid–liquid interface. Irrespective of the amount ofpolymer–surfactant concentration in the bulk, the experimental decay length val-ues remain comparable to the Debye lengths, corresponding to the concentrationof ion species in the bulk solution (Eq. (2.11)). This means that the force profile is
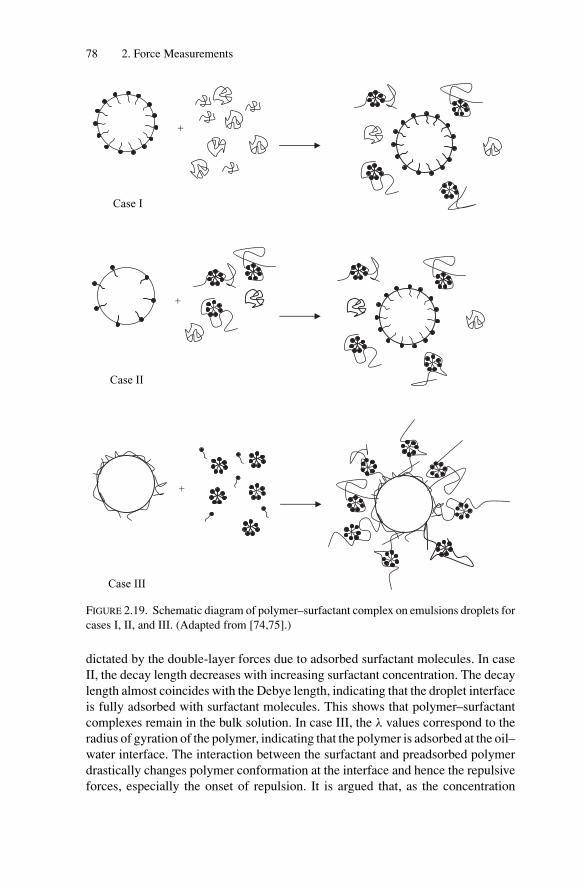
P1: GFZSVNY317-Bibette February 1, 2007 16:43
78 2. Force Measurements
Case I
+
+
Case II
+
Case III
FIGURE 2.19. Schematic diagram of polymer–surfactant complex on emulsions droplets forcases I, II, and III. (Adapted from [74,75].)
dictated by the double-layer forces due to adsorbed surfactant molecules. In caseII, the decay length decreases with increasing surfactant concentration. The decaylength almost coincides with the Debye length, indicating that the droplet interfaceis fully adsorbed with surfactant molecules. This shows that polymer–surfactantcomplexes remain in the bulk solution. In case III, the λ values correspond to theradius of gyration of the polymer, indicating that the polymer is adsorbed at the oil–water interface. The interaction between the surfactant and preadsorbed polymerdrastically changes polymer conformation at the interface and hence the repulsiveforces, especially the onset of repulsion. It is argued that, as the concentration
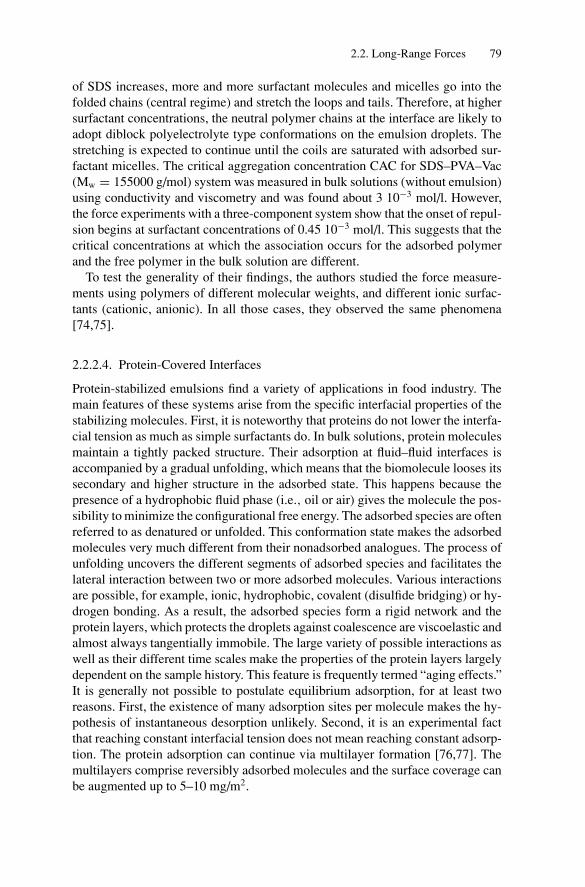
P1: GFZSVNY317-Bibette February 1, 2007 16:43
2.2. Long-Range Forces 79
of SDS increases, more and more surfactant molecules and micelles go into thefolded chains (central regime) and stretch the loops and tails. Therefore, at highersurfactant concentrations, the neutral polymer chains at the interface are likely toadopt diblock polyelectrolyte type conformations on the emulsion droplets. Thestretching is expected to continue until the coils are saturated with adsorbed sur-factant micelles. The critical aggregation concentration CAC for SDS–PVA–Vac(Mw = 155000 g/mol) system was measured in bulk solutions (without emulsion)using conductivity and viscometry and was found about 3 10−3 mol/l. However,the force experiments with a three-component system show that the onset of repul-sion begins at surfactant concentrations of 0.45 10−3 mol/l. This suggests that thecritical concentrations at which the association occurs for the adsorbed polymerand the free polymer in the bulk solution are different.
To test the generality of their findings, the authors studied the force measure-ments using polymers of different molecular weights, and different ionic surfac-tants (cationic, anionic). In all those cases, they observed the same phenomena[74,75].
2.2.2.4. Protein-Covered Interfaces
Protein-stabilized emulsions find a variety of applications in food industry. Themain features of these systems arise from the specific interfacial properties of thestabilizing molecules. First, it is noteworthy that proteins do not lower the interfa-cial tension as much as simple surfactants do. In bulk solutions, protein moleculesmaintain a tightly packed structure. Their adsorption at fluid–fluid interfaces isaccompanied by a gradual unfolding, which means that the biomolecule looses itssecondary and higher structure in the adsorbed state. This happens because thepresence of a hydrophobic fluid phase (i.e., oil or air) gives the molecule the pos-sibility to minimize the configurational free energy. The adsorbed species are oftenreferred to as denatured or unfolded. This conformation state makes the adsorbedmolecules very much different from their nonadsorbed analogues. The process ofunfolding uncovers the different segments of adsorbed species and facilitates thelateral interaction between two or more adsorbed molecules. Various interactionsare possible, for example, ionic, hydrophobic, covalent (disulfide bridging) or hy-drogen bonding. As a result, the adsorbed species form a rigid network and theprotein layers, which protects the droplets against coalescence are viscoelastic andalmost always tangentially immobile. The large variety of possible interactions aswell as their different time scales make the properties of the protein layers largelydependent on the sample history. This feature is frequently termed “aging effects.”It is generally not possible to postulate equilibrium adsorption, for at least tworeasons. First, the existence of many adsorption sites per molecule makes the hy-pothesis of instantaneous desorption unlikely. Second, it is an experimental factthat reaching constant interfacial tension does not mean reaching constant adsorp-tion. The protein adsorption can continue via multilayer formation [76,77]. Themultilayers comprise reversibly adsorbed molecules and the surface coverage canbe augmented up to 5–10 mg/m2.
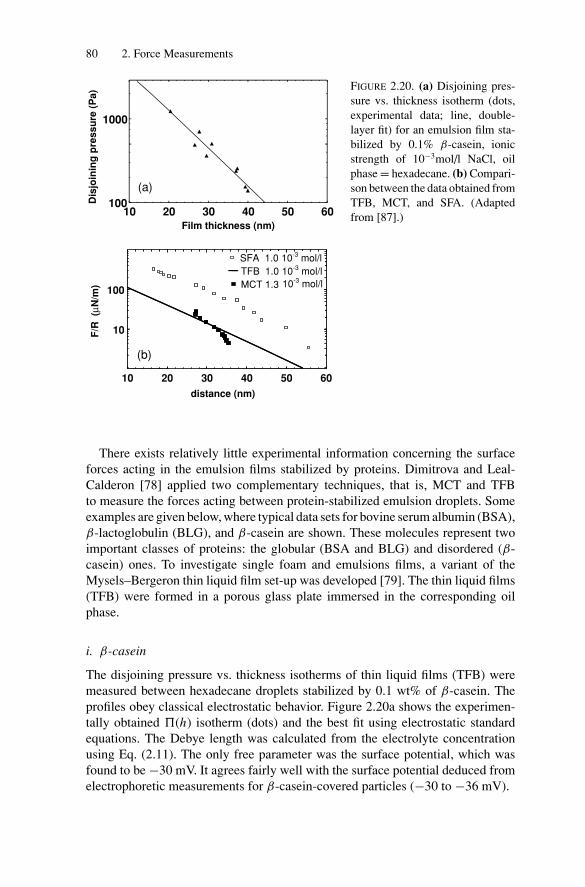
P1: GFZSVNY317-Bibette February 1, 2007 16:43
80 2. Force Measurements
Dis
join
ing
pre
ss
ure
(P
a)
100
1000
10 20 30 40 50 60
(a)
(b)
Film thickness (nm)
(a)
(b)(b)
10
100
10 20 30 40 50 60
10-3 mol/lTFB 1.0 10-3 mol/lMCT 1.3 10-3 mol/l
distance (nm)
F/R
(μ
N/m
)
SFA 1.0
FIGURE 2.20. (a) Disjoining pres-sure vs. thickness isotherm (dots,experimental data; line, double-layer fit) for an emulsion film sta-bilized by 0.1% β-casein, ionicstrength of 10−3mol/l NaCl, oilphase = hexadecane. (b) Compari-son between the data obtained fromTFB, MCT, and SFA. (Adaptedfrom [87].)
There exists relatively little experimental information concerning the surfaceforces acting in the emulsion films stabilized by proteins. Dimitrova and Leal-Calderon [78] applied two complementary techniques, that is, MCT and TFBto measure the forces acting between protein-stabilized emulsion droplets. Someexamples are given below, where typical data sets for bovine serum albumin (BSA),β-lactoglobulin (BLG), and β-casein are shown. These molecules represent twoimportant classes of proteins: the globular (BSA and BLG) and disordered (β-casein) ones. To investigate single foam and emulsions films, a variant of theMysels–Bergeron thin liquid film set-up was developed [79]. The thin liquid films(TFB) were formed in a porous glass plate immersed in the corresponding oilphase.
i. β-casein
The disjoining pressure vs. thickness isotherms of thin liquid films (TFB) weremeasured between hexadecane droplets stabilized by 0.1 wt% of β-casein. Theprofiles obey classical electrostatic behavior. Figure 2.20a shows the experimen-tally obtained �(h) isotherm (dots) and the best fit using electrostatic standardequations. The Debye length was calculated from the electrolyte concentrationusing Eq. (2.11). The only free parameter was the surface potential, which wasfound to be −30 mV. It agrees fairly well with the surface potential deduced fromelectrophoretic measurements for β-casein-covered particles (−30 to −36 mV).
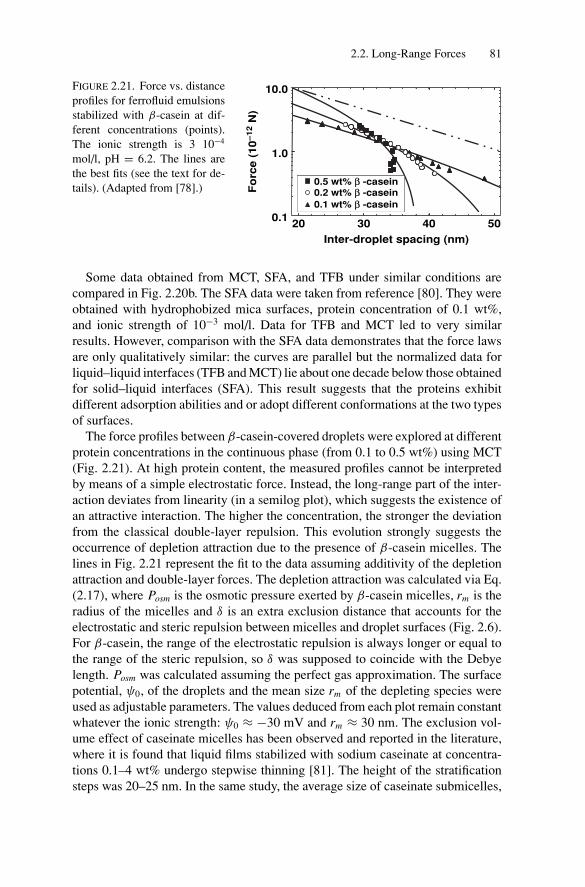
P1: GFZSVNY317-Bibette February 1, 2007 16:43
2.2. Long-Range Forces 81
Fo
rce (
10
–12 N
)
0.1
1.0
10.0
20 30 40 50
Inter-droplet spacing (nm)
0.5 wt% β -casein0.2 wt% β -casein0.1 wt% β -casein
FIGURE 2.21. Force vs. distanceprofiles for ferrofluid emulsionsstabilized with β-casein at dif-ferent concentrations (points).The ionic strength is 3 10−4
mol/l, pH = 6.2. The lines arethe best fits (see the text for de-tails). (Adapted from [78].)
Some data obtained from MCT, SFA, and TFB under similar conditions arecompared in Fig. 2.20b. The SFA data were taken from reference [80]. They wereobtained with hydrophobized mica surfaces, protein concentration of 0.1 wt%,and ionic strength of 10−3 mol/l. Data for TFB and MCT led to very similarresults. However, comparison with the SFA data demonstrates that the force lawsare only qualitatively similar: the curves are parallel but the normalized data forliquid–liquid interfaces (TFB and MCT) lie about one decade below those obtainedfor solid–liquid interfaces (SFA). This result suggests that the proteins exhibitdifferent adsorption abilities and or adopt different conformations at the two typesof surfaces.
The force profiles between β-casein-covered droplets were explored at differentprotein concentrations in the continuous phase (from 0.1 to 0.5 wt%) using MCT(Fig. 2.21). At high protein content, the measured profiles cannot be interpretedby means of a simple electrostatic force. Instead, the long-range part of the inter-action deviates from linearity (in a semilog plot), which suggests the existence ofan attractive interaction. The higher the concentration, the stronger the deviationfrom the classical double-layer repulsion. This evolution strongly suggests theoccurrence of depletion attraction due to the presence of β-casein micelles. Thelines in Fig. 2.21 represent the fit to the data assuming additivity of the depletionattraction and double-layer forces. The depletion attraction was calculated via Eq.(2.17), where Posm is the osmotic pressure exerted by β-casein micelles, rm is theradius of the micelles and δ is an extra exclusion distance that accounts for theelectrostatic and steric repulsion between micelles and droplet surfaces (Fig. 2.6).For β-casein, the range of the electrostatic repulsion is always longer or equal tothe range of the steric repulsion, so δ was supposed to coincide with the Debyelength. Posm was calculated assuming the perfect gas approximation. The surfacepotential, ψ0, of the droplets and the mean size rm of the depleting species wereused as adjustable parameters. The values deduced from each plot remain constantwhatever the ionic strength: ψ0 ≈ −30 mV and rm ≈ 30 nm. The exclusion vol-ume effect of caseinate micelles has been observed and reported in the literature,where it is found that liquid films stabilized with sodium caseinate at concentra-tions 0.1–4 wt% undergo stepwise thinning [81]. The height of the stratificationsteps was 20–25 nm. In the same study, the average size of caseinate submicelles,
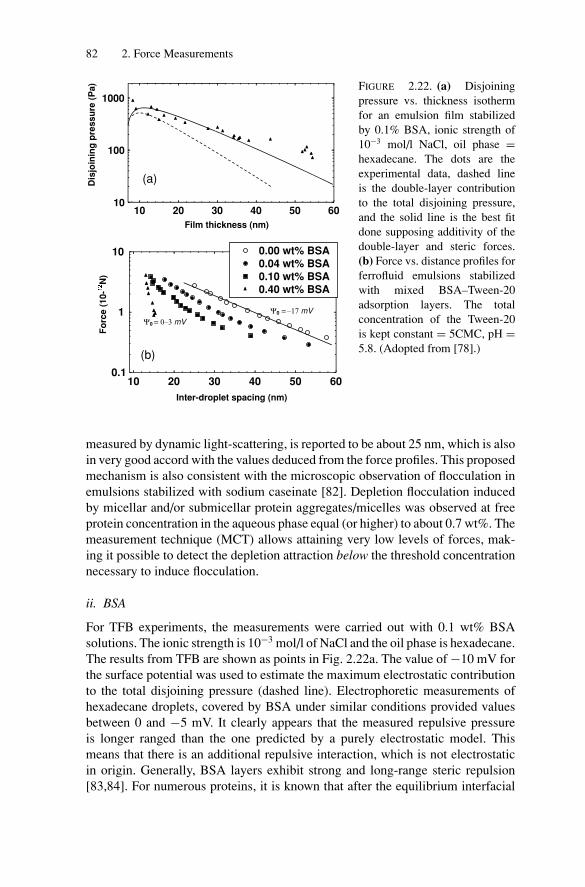
P1: GFZSVNY317-Bibette February 1, 2007 16:43
82 2. Force Measurements
Figure 2.22
(a)
(b)
Film thickness (nm)
Dis
join
ing
pre
ssu
re (
Pa)
10
100
1000
10 20 30 40 50 60
(a)
Inter-droplet spacing (nm)
Fo
rce (
10-
N)
0.1
1
10
10 20 30 40 50 60
0.00 wt% BSA0.04 wt% BSA0.10 wt% BSA0.40 wt% BSA
Ψ0 = 0–3 mV
Ψ0 = –17 mV
(b)
FIGURE 2.22. (a) Disjoiningpressure vs. thickness isothermfor an emulsion film stabilizedby 0.1% BSA, ionic strength of10−3 mol/l NaCl, oil phase =hexadecane. The dots are theexperimental data, dashed lineis the double-layer contributionto the total disjoining pressure,and the solid line is the best fitdone supposing additivity of thedouble-layer and steric forces.(b) Force vs. distance profiles forferrofluid emulsions stabilizedwith mixed BSA–Tween-20adsorption layers. The totalconcentration of the Tween-20is kept constant = 5CMC, pH =5.8. (Adopted from [78].)
measured by dynamic light-scattering, is reported to be about 25 nm, which is alsoin very good accord with the values deduced from the force profiles. This proposedmechanism is also consistent with the microscopic observation of flocculation inemulsions stabilized with sodium caseinate [82]. Depletion flocculation inducedby micellar and/or submicellar protein aggregates/micelles was observed at freeprotein concentration in the aqueous phase equal (or higher) to about 0.7 wt%. Themeasurement technique (MCT) allows attaining very low levels of forces, mak-ing it possible to detect the depletion attraction below the threshold concentrationnecessary to induce flocculation.
ii. BSA
For TFB experiments, the measurements were carried out with 0.1 wt% BSAsolutions. The ionic strength is 10−3 mol/l of NaCl and the oil phase is hexadecane.The results from TFB are shown as points in Fig. 2.22a. The value of −10 mV forthe surface potential was used to estimate the maximum electrostatic contributionto the total disjoining pressure (dashed line). Electrophoretic measurements ofhexadecane droplets, covered by BSA under similar conditions provided valuesbetween 0 and −5 mV. It clearly appears that the measured repulsive pressureis longer ranged than the one predicted by a purely electrostatic model. Thismeans that there is an additional repulsive interaction, which is not electrostaticin origin. Generally, BSA layers exhibit strong and long-range steric repulsion[83,84]. For numerous proteins, it is known that after the equilibrium interfacial
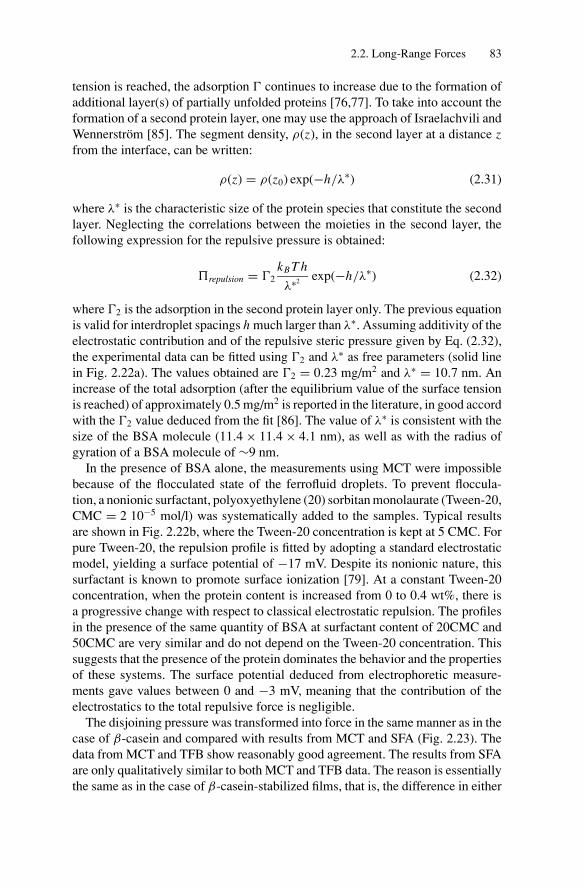
P1: GFZSVNY317-Bibette February 1, 2007 16:43
2.2. Long-Range Forces 83
tension is reached, the adsorption � continues to increase due to the formation ofadditional layer(s) of partially unfolded proteins [76,77]. To take into account theformation of a second protein layer, one may use the approach of Israelachvili andWennerstrom [85]. The segment density, ρ(z), in the second layer at a distance zfrom the interface, can be written:
ρ(z) = ρ(z0) exp(−h/λ∗) (2.31)
where λ∗ is the characteristic size of the protein species that constitute the secondlayer. Neglecting the correlations between the moieties in the second layer, thefollowing expression for the repulsive pressure is obtained:
�repulsion = �2kB T h
λ∗2 exp(−h/λ∗) (2.32)
where �2 is the adsorption in the second protein layer only. The previous equationis valid for interdroplet spacings h much larger than λ∗. Assuming additivity of theelectrostatic contribution and of the repulsive steric pressure given by Eq. (2.32),the experimental data can be fitted using �2 and λ∗ as free parameters (solid linein Fig. 2.22a). The values obtained are �2 = 0.23 mg/m2 and λ∗ = 10.7 nm. Anincrease of the total adsorption (after the equilibrium value of the surface tensionis reached) of approximately 0.5 mg/m2 is reported in the literature, in good accordwith the �2 value deduced from the fit [86]. The value of λ∗ is consistent with thesize of the BSA molecule (11.4 × 11.4 × 4.1 nm), as well as with the radius ofgyration of a BSA molecule of ∼9 nm.
In the presence of BSA alone, the measurements using MCT were impossiblebecause of the flocculated state of the ferrofluid droplets. To prevent floccula-tion, a nonionic surfactant, polyoxyethylene (20) sorbitan monolaurate (Tween-20,CMC = 2 10−5 mol/l) was systematically added to the samples. Typical resultsare shown in Fig. 2.22b, where the Tween-20 concentration is kept at 5 CMC. Forpure Tween-20, the repulsion profile is fitted by adopting a standard electrostaticmodel, yielding a surface potential of −17 mV. Despite its nonionic nature, thissurfactant is known to promote surface ionization [79]. At a constant Tween-20concentration, when the protein content is increased from 0 to 0.4 wt%, there isa progressive change with respect to classical electrostatic repulsion. The profilesin the presence of the same quantity of BSA at surfactant content of 20CMC and50CMC are very similar and do not depend on the Tween-20 concentration. Thissuggests that the presence of the protein dominates the behavior and the propertiesof these systems. The surface potential deduced from electrophoretic measure-ments gave values between 0 and −3 mV, meaning that the contribution of theelectrostatics to the total repulsive force is negligible.
The disjoining pressure was transformed into force in the same manner as in thecase of β-casein and compared with results from MCT and SFA (Fig. 2.23). Thedata from MCT and TFB show reasonably good agreement. The results from SFAare only qualitatively similar to both MCT and TFB data. The reason is essentiallythe same as in the case of β-casein-stabilized films, that is, the difference in either
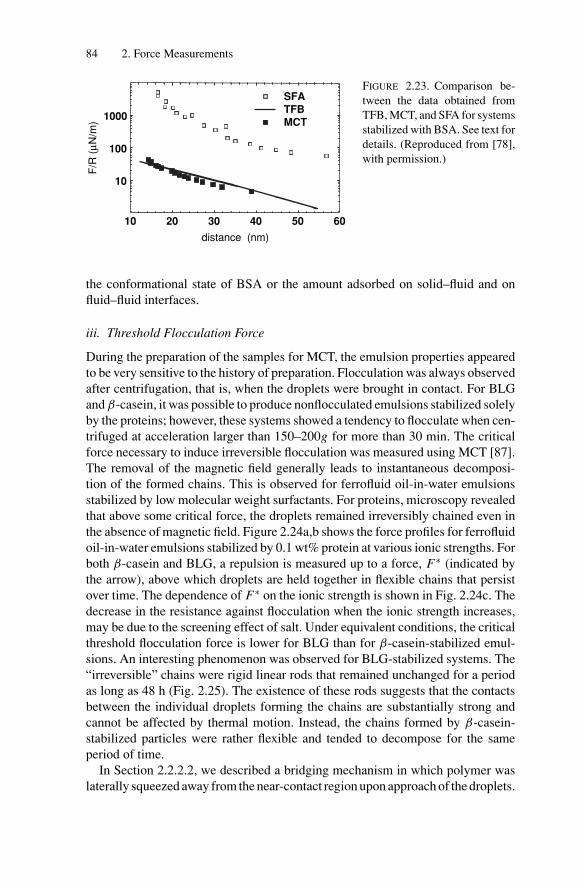
P1: GFZSVNY317-Bibette February 1, 2007 16:43
84 2. Force Measurements
distance (nm)
F/R
(μN
/m)
10
100
1000
10 20 30 40 50 60
SFATFBMCT
FIGURE 2.23. Comparison be-tween the data obtained fromTFB, MCT, and SFA for systemsstabilized with BSA. See text fordetails. (Reproduced from [78],with permission.)
the conformational state of BSA or the amount adsorbed on solid–fluid and onfluid–fluid interfaces.
iii. Threshold Flocculation Force
During the preparation of the samples for MCT, the emulsion properties appearedto be very sensitive to the history of preparation. Flocculation was always observedafter centrifugation, that is, when the droplets were brought in contact. For BLGand β-casein, it was possible to produce nonflocculated emulsions stabilized solelyby the proteins; however, these systems showed a tendency to flocculate when cen-trifuged at acceleration larger than 150–200g for more than 30 min. The criticalforce necessary to induce irreversible flocculation was measured using MCT [87].The removal of the magnetic field generally leads to instantaneous decomposi-tion of the formed chains. This is observed for ferrofluid oil-in-water emulsionsstabilized by low molecular weight surfactants. For proteins, microscopy revealedthat above some critical force, the droplets remained irreversibly chained even inthe absence of magnetic field. Figure 2.24a,b shows the force profiles for ferrofluidoil-in-water emulsions stabilized by 0.1 wt% protein at various ionic strengths. Forboth β-casein and BLG, a repulsion is measured up to a force, F∗ (indicated bythe arrow), above which droplets are held together in flexible chains that persistover time. The dependence of F∗ on the ionic strength is shown in Fig. 2.24c. Thedecrease in the resistance against flocculation when the ionic strength increases,may be due to the screening effect of salt. Under equivalent conditions, the criticalthreshold flocculation force is lower for BLG than for β-casein-stabilized emul-sions. An interesting phenomenon was observed for BLG-stabilized systems. The“irreversible” chains were rigid linear rods that remained unchanged for a periodas long as 48 h (Fig. 2.25). The existence of these rods suggests that the contactsbetween the individual droplets forming the chains are substantially strong andcannot be affected by thermal motion. Instead, the chains formed by β-casein-stabilized particles were rather flexible and tended to decompose for the sameperiod of time.
In Section 2.2.2.2, we described a bridging mechanism in which polymer waslaterally squeezed away from the near-contact region upon approach of the droplets.
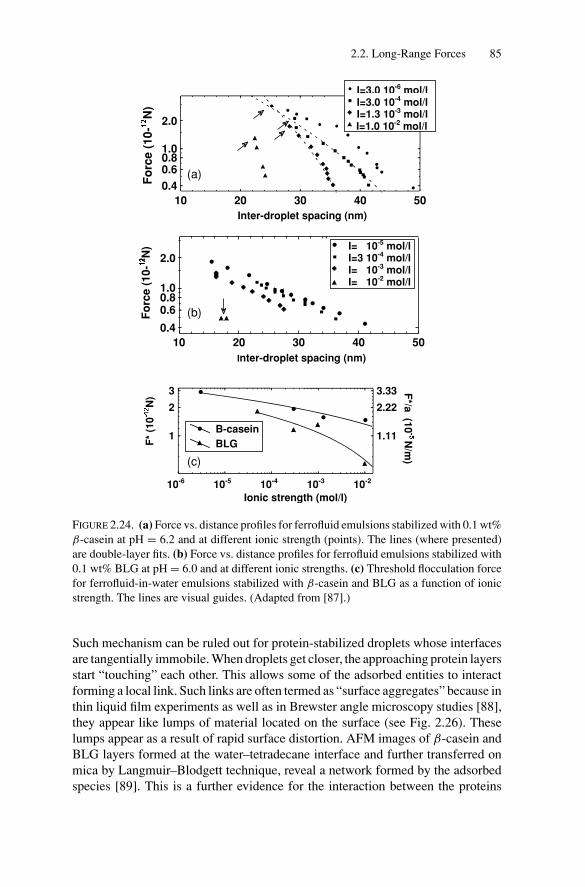
P1: GFZSVNY317-Bibette February 1, 2007 16:43
2.2. Long-Range Forces 85
Inter-droplet spacing (nm)
Fo
rce
(1
0-
N)
0.4
0.60.81.0
2.0
10 20 30 40 50
I=3.0 10-6 mol/lI=3.0 10-4 mol/lI=1.3 10-3 mol/lI=1.0 10-2 mol/l
0.4
0.60.81.0
2.0
10 20 30 40 50
I= 10-5 mol/l I=3 10-4 mol/l I= 10-3 mol/l I= 10-2 mol/l
F*
(10
N)
F*/a
(10
N/m
)
1.11
2.22
3.33
1
2
3
10-6 10-5 10-4 10-3 10-2
B-casein
BLG
Fo
rce (
10-
N)
Inter-droplet spacing (nm)
Ionic strength (mol/l)
(b)
(a)
(c)
FIGURE 2.24. (a) Force vs. distance profiles for ferrofluid emulsions stabilized with 0.1 wt%β-casein at pH = 6.2 and at different ionic strength (points). The lines (where presented)are double-layer fits. (b) Force vs. distance profiles for ferrofluid emulsions stabilized with0.1 wt% BLG at pH = 6.0 and at different ionic strengths. (c) Threshold flocculation forcefor ferrofluid-in-water emulsions stabilized with β-casein and BLG as a function of ionicstrength. The lines are visual guides. (Adapted from [87].)
Such mechanism can be ruled out for protein-stabilized droplets whose interfacesare tangentially immobile. When droplets get closer, the approaching protein layersstart “touching” each other. This allows some of the adsorbed entities to interactforming a local link. Such links are often termed as “surface aggregates” because inthin liquid film experiments as well as in Brewster angle microscopy studies [88],they appear like lumps of material located on the surface (see Fig. 2.26). Theselumps appear as a result of rapid surface distortion. AFM images of β-casein andBLG layers formed at the water–tetradecane interface and further transferred onmica by Langmuir–Blodgett technique, reveal a network formed by the adsorbedspecies [89]. This is a further evidence for the interaction between the proteins
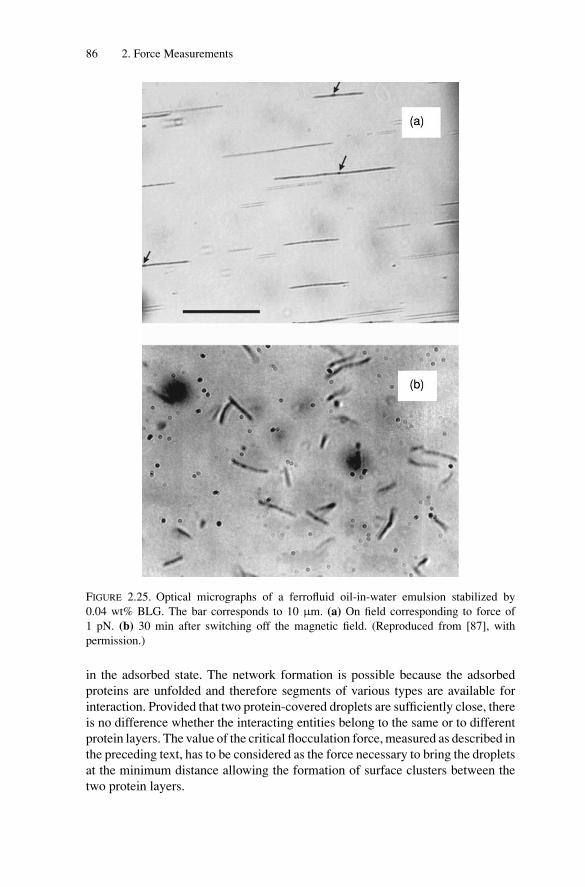
P1: GFZSVNY317-Bibette February 1, 2007 16:43
86 2. Force Measurements
FIGURE 2.25. Optical micrographs of a ferrofluid oil-in-water emulsion stabilized by0.04 wt% BLG. The bar corresponds to 10 μm. (a) On field corresponding to force of1 pN. (b) 30 min after switching off the magnetic field. (Reproduced from [87], withpermission.)
in the adsorbed state. The network formation is possible because the adsorbedproteins are unfolded and therefore segments of various types are available forinteraction. Provided that two protein-covered droplets are sufficiently close, thereis no difference whether the interacting entities belong to the same or to differentprotein layers. The value of the critical flocculation force, measured as described inthe preceding text, has to be considered as the force necessary to bring the dropletsat the minimum distance allowing the formation of surface clusters between thetwo protein layers.
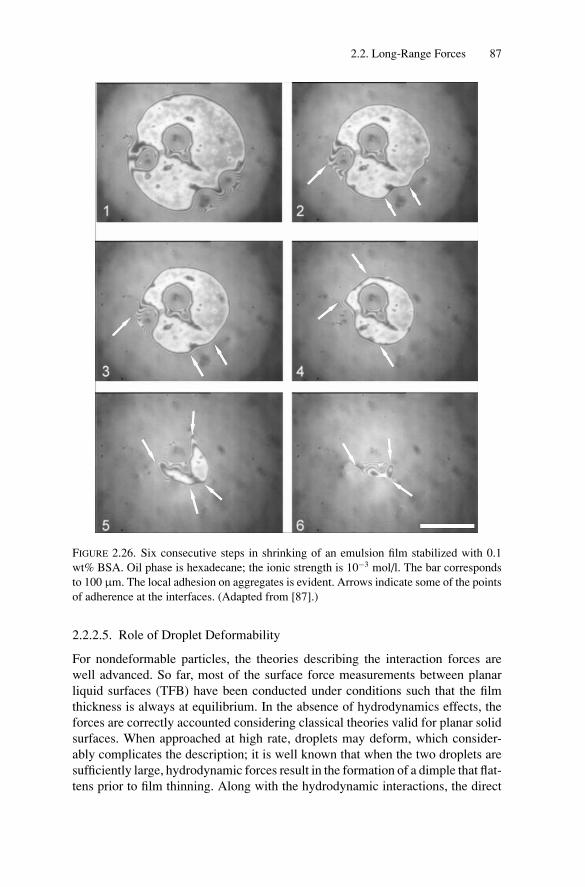
P1: GFZSVNY317-Bibette February 1, 2007 16:43
2.2. Long-Range Forces 87
FIGURE 2.26. Six consecutive steps in shrinking of an emulsion film stabilized with 0.1wt% BSA. Oil phase is hexadecane; the ionic strength is 10−3 mol/l. The bar correspondsto 100 μm. The local adhesion on aggregates is evident. Arrows indicate some of the pointsof adherence at the interfaces. (Adapted from [87].)
2.2.2.5. Role of Droplet Deformability
For nondeformable particles, the theories describing the interaction forces arewell advanced. So far, most of the surface force measurements between planarliquid surfaces (TFB) have been conducted under conditions such that the filmthickness is always at equilibrium. In the absence of hydrodynamics effects, theforces are correctly accounted considering classical theories valid for planar solidsurfaces. When approached at high rate, droplets may deform, which consider-ably complicates the description; it is well known that when the two droplets aresufficiently large, hydrodynamic forces result in the formation of a dimple that flat-tens prior to film thinning. Along with the hydrodynamic interactions, the direct
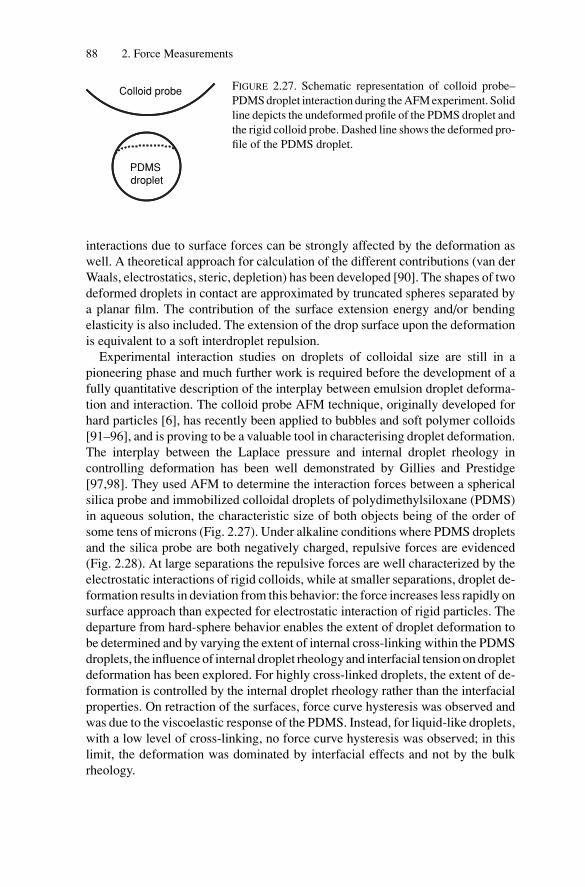
P1: GFZSVNY317-Bibette February 1, 2007 16:43
88 2. Force Measurements
Colloid probe
PDMS droplet
FIGURE 2.27. Schematic representation of colloid probe–PDMS droplet interaction during the AFM experiment. Solidline depicts the undeformed profile of the PDMS droplet andthe rigid colloid probe. Dashed line shows the deformed pro-file of the PDMS droplet.
interactions due to surface forces can be strongly affected by the deformation aswell. A theoretical approach for calculation of the different contributions (van derWaals, electrostatics, steric, depletion) has been developed [90]. The shapes of twodeformed droplets in contact are approximated by truncated spheres separated bya planar film. The contribution of the surface extension energy and/or bendingelasticity is also included. The extension of the drop surface upon the deformationis equivalent to a soft interdroplet repulsion.
Experimental interaction studies on droplets of colloidal size are still in apioneering phase and much further work is required before the development of afully quantitative description of the interplay between emulsion droplet deforma-tion and interaction. The colloid probe AFM technique, originally developed forhard particles [6], has recently been applied to bubbles and soft polymer colloids[91–96], and is proving to be a valuable tool in characterising droplet deformation.The interplay between the Laplace pressure and internal droplet rheology incontrolling deformation has been well demonstrated by Gillies and Prestidge[97,98]. They used AFM to determine the interaction forces between a sphericalsilica probe and immobilized colloidal droplets of polydimethylsiloxane (PDMS)in aqueous solution, the characteristic size of both objects being of the order ofsome tens of microns (Fig. 2.27). Under alkaline conditions where PDMS dropletsand the silica probe are both negatively charged, repulsive forces are evidenced(Fig. 2.28). At large separations the repulsive forces are well characterized by theelectrostatic interactions of rigid colloids, while at smaller separations, droplet de-formation results in deviation from this behavior: the force increases less rapidly onsurface approach than expected for electrostatic interaction of rigid particles. Thedeparture from hard-sphere behavior enables the extent of droplet deformation tobe determined and by varying the extent of internal cross-linking within the PDMSdroplets, the influence of internal droplet rheology and interfacial tension on dropletdeformation has been explored. For highly cross-linked droplets, the extent of de-formation is controlled by the internal droplet rheology rather than the interfacialproperties. On retraction of the surfaces, force curve hysteresis was observed andwas due to the viscoelastic response of the PDMS. Instead, for liquid-like droplets,with a low level of cross-linking, no force curve hysteresis was observed; in thislimit, the deformation was dominated by interfacial effects and not by the bulkrheology.
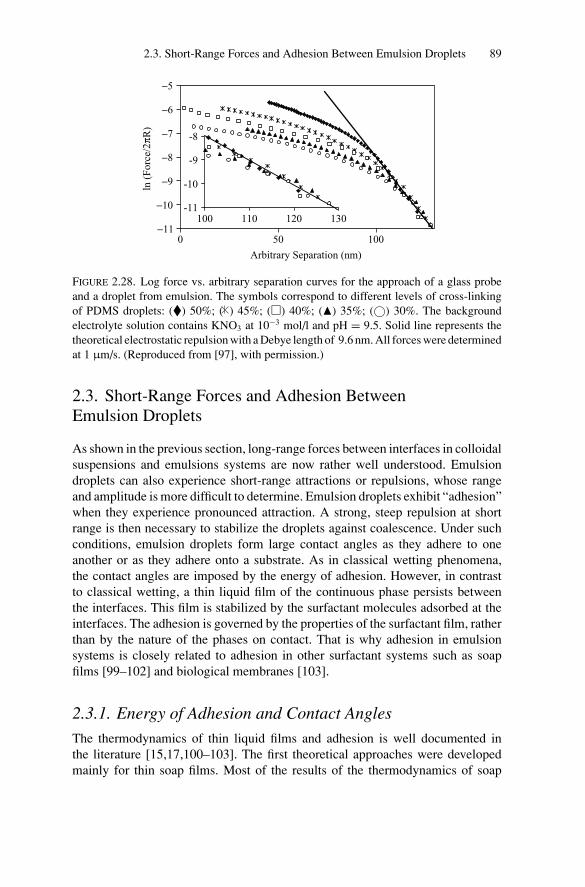
P1: GFZSVNY317-Bibette February 1, 2007 16:43
2.3. Short-Range Forces and Adhesion Between Emulsion Droplets 89
−11
−10
−9
−8
−7
−6
−5
0 50 100
Arbitrary Separation (nm)
ln (
Forc
e/2πR
)
-11
-10
-9
-8
100 110 120 130
FIGURE 2.28. Log force vs. arbitrary separation curves for the approach of a glass probeand a droplet from emulsion. The symbols correspond to different levels of cross-linkingof PDMS droplets: (�) 50%; ( ) 45%; (�) 40%; (�) 35%; (©) 30%. The backgroundelectrolyte solution contains KNO3 at 10−3 mol/l and pH = 9.5. Solid line represents thetheoretical electrostatic repulsion with a Debye length of 9.6 nm. All forces were determinedat 1 μm/s. (Reproduced from [97], with permission.)
2.3. Short-Range Forces and Adhesion BetweenEmulsion Droplets
As shown in the previous section, long-range forces between interfaces in colloidalsuspensions and emulsions systems are now rather well understood. Emulsiondroplets can also experience short-range attractions or repulsions, whose rangeand amplitude is more difficult to determine. Emulsion droplets exhibit “adhesion”when they experience pronounced attraction. A strong, steep repulsion at shortrange is then necessary to stabilize the droplets against coalescence. Under suchconditions, emulsion droplets form large contact angles as they adhere to oneanother or as they adhere onto a substrate. As in classical wetting phenomena,the contact angles are imposed by the energy of adhesion. However, in contrastto classical wetting, a thin liquid film of the continuous phase persists betweenthe interfaces. This film is stabilized by the surfactant molecules adsorbed at theinterfaces. The adhesion is governed by the properties of the surfactant film, ratherthan by the nature of the phases on contact. That is why adhesion in emulsionsystems is closely related to adhesion in other surfactant systems such as soapfilms [99–102] and biological membranes [103].
2.3.1. Energy of Adhesion and Contact Angles
The thermodynamics of thin liquid films and adhesion is well documented inthe literature [15,17,100–103]. The first theoretical approaches were developedmainly for thin soap films. Most of the results of the thermodynamics of soap
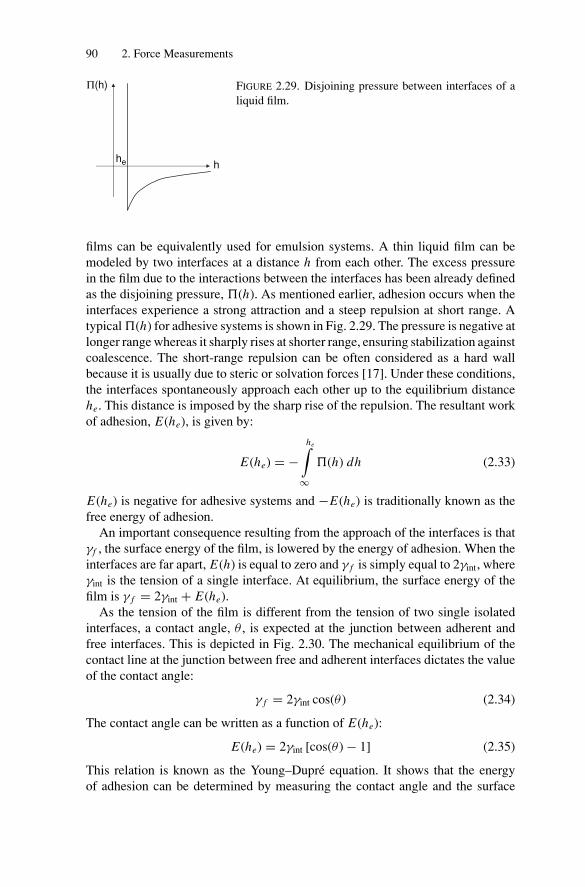
P1: GFZSVNY317-Bibette February 1, 2007 16:43
90 2. Force Measurements
Π(h)
hhe
FIGURE 2.29. Disjoining pressure between interfaces of aliquid film.
films can be equivalently used for emulsion systems. A thin liquid film can bemodeled by two interfaces at a distance h from each other. The excess pressurein the film due to the interactions between the interfaces has been already definedas the disjoining pressure, �(h). As mentioned earlier, adhesion occurs when theinterfaces experience a strong attraction and a steep repulsion at short range. Atypical �(h) for adhesive systems is shown in Fig. 2.29. The pressure is negative atlonger range whereas it sharply rises at shorter range, ensuring stabilization againstcoalescence. The short-range repulsion can be often considered as a hard wallbecause it is usually due to steric or solvation forces [17]. Under these conditions,the interfaces spontaneously approach each other up to the equilibrium distancehe. This distance is imposed by the sharp rise of the repulsion. The resultant workof adhesion, E(he), is given by:
E(he) = −he∫
∞�(h) dh (2.33)
E(he) is negative for adhesive systems and −E(he) is traditionally known as thefree energy of adhesion.
An important consequence resulting from the approach of the interfaces is thatγf , the surface energy of the film, is lowered by the energy of adhesion. When theinterfaces are far apart, E(h) is equal to zero and γ f is simply equal to 2γint, whereγint is the tension of a single interface. At equilibrium, the surface energy of thefilm is γ f = 2γint + E(he).
As the tension of the film is different from the tension of two single isolatedinterfaces, a contact angle, θ , is expected at the junction between adherent andfree interfaces. This is depicted in Fig. 2.30. The mechanical equilibrium of thecontact line at the junction between free and adherent interfaces dictates the valueof the contact angle:
γ f = 2γint cos(θ ) (2.34)
The contact angle can be written as a function of E(he):
E(he) = 2γint [cos(θ ) − 1] (2.35)
This relation is known as the Young–Dupre equation. It shows that the energyof adhesion can be determined by measuring the contact angle and the surface
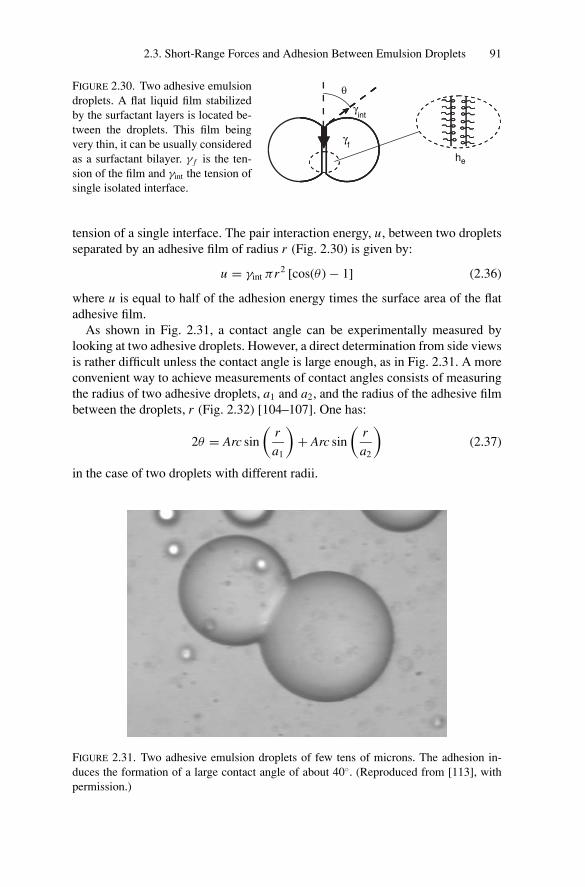
P1: GFZSVNY317-Bibette February 1, 2007 16:43
2.3. Short-Range Forces and Adhesion Between Emulsion Droplets 91
he
γint
γf
θFIGURE 2.30. Two adhesive emulsiondroplets. A flat liquid film stabilizedby the surfactant layers is located be-tween the droplets. This film beingvery thin, it can be usually consideredas a surfactant bilayer. γ f is the ten-sion of the film and γint the tension ofsingle isolated interface.
tension of a single interface. The pair interaction energy, u, between two dropletsseparated by an adhesive film of radius r (Fig. 2.30) is given by:
u = γint πr2 [cos(θ ) − 1] (2.36)
where u is equal to half of the adhesion energy times the surface area of the flatadhesive film.
As shown in Fig. 2.31, a contact angle can be experimentally measured bylooking at two adhesive droplets. However, a direct determination from side viewsis rather difficult unless the contact angle is large enough, as in Fig. 2.31. A moreconvenient way to achieve measurements of contact angles consists of measuringthe radius of two adhesive droplets, a1 and a2, and the radius of the adhesive filmbetween the droplets, r (Fig. 2.32) [104–107]. One has:
2θ = Arc sin
(r
a1
)+ Arc sin
(r
a2
)(2.37)
in the case of two droplets with different radii.
FIGURE 2.31. Two adhesive emulsion droplets of few tens of microns. The adhesion in-duces the formation of a large contact angle of about 40◦. (Reproduced from [113], withpermission.)
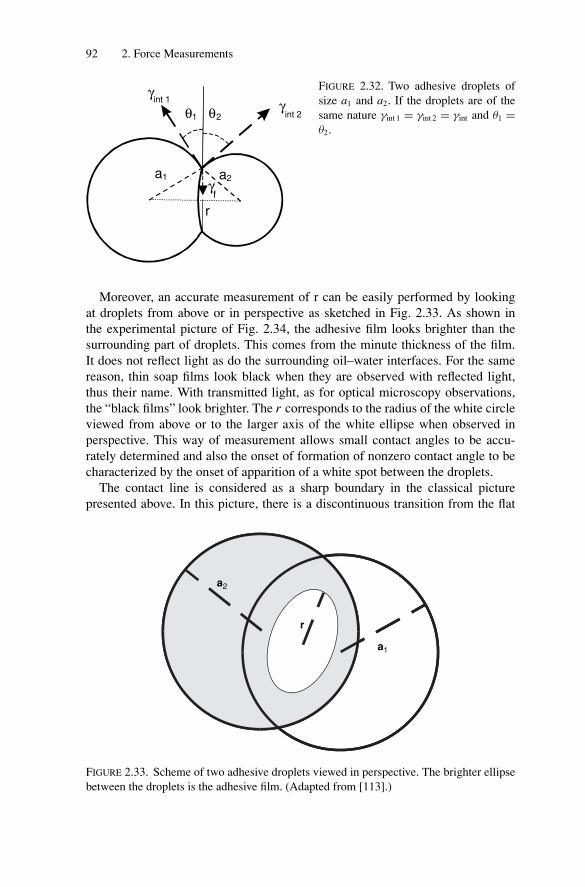
P1: GFZSVNY317-Bibette February 1, 2007 16:43
92 2. Force Measurements
a1
θ1 θ2
a2
γint 1
r
γ
int 2
f
γFIGURE 2.32. Two adhesive droplets ofsize a1 and a2. If the droplets are of thesame nature γint 1 = γint 2 = γint and θ1 =θ2.
Moreover, an accurate measurement of r can be easily performed by lookingat droplets from above or in perspective as sketched in Fig. 2.33. As shown inthe experimental picture of Fig. 2.34, the adhesive film looks brighter than thesurrounding part of droplets. This comes from the minute thickness of the film.It does not reflect light as do the surrounding oil–water interfaces. For the samereason, thin soap films look black when they are observed with reflected light,thus their name. With transmitted light, as for optical microscopy observations,the “black films” look brighter. The r corresponds to the radius of the white circleviewed from above or to the larger axis of the white ellipse when observed inperspective. This way of measurement allows small contact angles to be accu-rately determined and also the onset of formation of nonzero contact angle to becharacterized by the onset of apparition of a white spot between the droplets.
The contact line is considered as a sharp boundary in the classical picturepresented above. In this picture, there is a discontinuous transition from the flat
r
a1
a2
FIGURE 2.33. Scheme of two adhesive droplets viewed in perspective. The brighter ellipsebetween the droplets is the adhesive film. (Adapted from [113].)
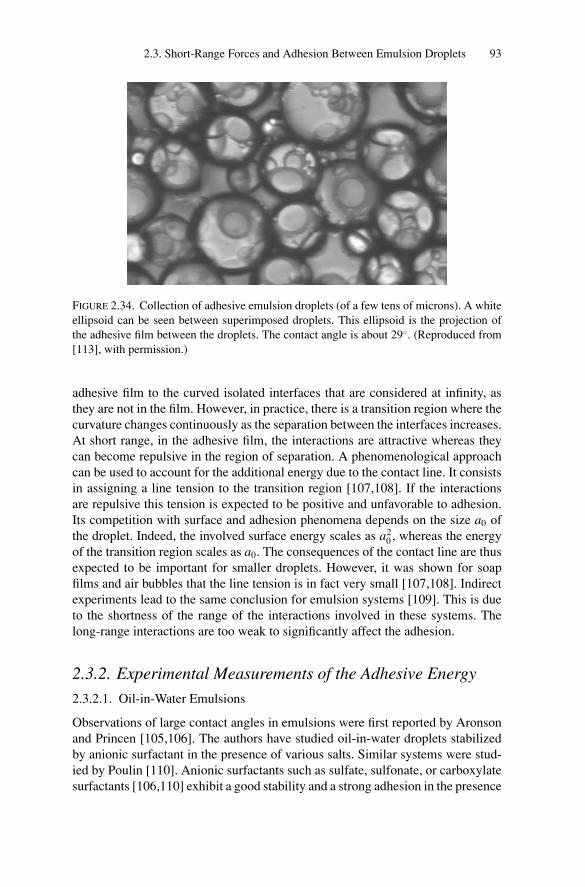
P1: GFZSVNY317-Bibette February 1, 2007 16:43
2.3. Short-Range Forces and Adhesion Between Emulsion Droplets 93
FIGURE 2.34. Collection of adhesive emulsion droplets (of a few tens of microns). A whiteellipsoid can be seen between superimposed droplets. This ellipsoid is the projection ofthe adhesive film between the droplets. The contact angle is about 29◦. (Reproduced from[113], with permission.)
adhesive film to the curved isolated interfaces that are considered at infinity, asthey are not in the film. However, in practice, there is a transition region where thecurvature changes continuously as the separation between the interfaces increases.At short range, in the adhesive film, the interactions are attractive whereas theycan become repulsive in the region of separation. A phenomenological approachcan be used to account for the additional energy due to the contact line. It consistsin assigning a line tension to the transition region [107,108]. If the interactionsare repulsive this tension is expected to be positive and unfavorable to adhesion.Its competition with surface and adhesion phenomena depends on the size a0 ofthe droplet. Indeed, the involved surface energy scales as a2
0 , whereas the energyof the transition region scales as a0. The consequences of the contact line are thusexpected to be important for smaller droplets. However, it was shown for soapfilms and air bubbles that the line tension is in fact very small [107,108]. Indirectexperiments lead to the same conclusion for emulsion systems [109]. This is dueto the shortness of the range of the interactions involved in these systems. Thelong-range interactions are too weak to significantly affect the adhesion.
2.3.2. Experimental Measurements of the Adhesive Energy
2.3.2.1. Oil-in-Water Emulsions
Observations of large contact angles in emulsions were first reported by Aronsonand Princen [105,106]. The authors have studied oil-in-water droplets stabilizedby anionic surfactant in the presence of various salts. Similar systems were stud-ied by Poulin [110]. Anionic surfactants such as sulfate, sulfonate, or carboxylatesurfactants [106,110] exhibit a good stability and a strong adhesion in the presence
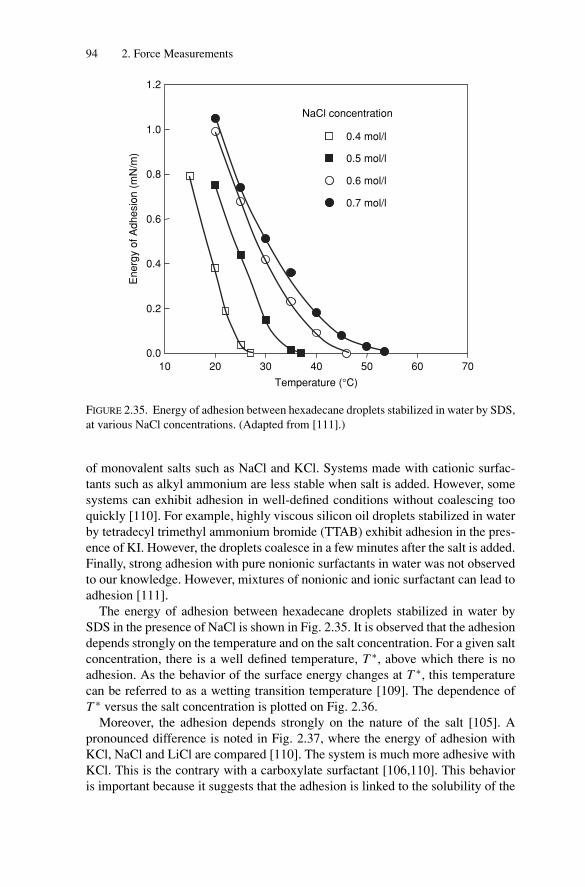
P1: GFZSVNY317-Bibette February 1, 2007 16:43
94 2. Force Measurements
10 20 30 40 50 60 700.0
0.2
0.4
0.6
0.8
1.0
1.2
NaCl concentration
0.4 mol/l
0.5 mol/l
0.6 mol/l
0.7 mol/l
Energ
y of
Adhesi
on (
mN
/m)
Temperature (°C)
FIGURE 2.35. Energy of adhesion between hexadecane droplets stabilized in water by SDS,at various NaCl concentrations. (Adapted from [111].)
of monovalent salts such as NaCl and KCl. Systems made with cationic surfac-tants such as alkyl ammonium are less stable when salt is added. However, somesystems can exhibit adhesion in well-defined conditions without coalescing tooquickly [110]. For example, highly viscous silicon oil droplets stabilized in waterby tetradecyl trimethyl ammonium bromide (TTAB) exhibit adhesion in the pres-ence of KI. However, the droplets coalesce in a few minutes after the salt is added.Finally, strong adhesion with pure nonionic surfactants in water was not observedto our knowledge. However, mixtures of nonionic and ionic surfactant can lead toadhesion [111].
The energy of adhesion between hexadecane droplets stabilized in water bySDS in the presence of NaCl is shown in Fig. 2.35. It is observed that the adhesiondepends strongly on the temperature and on the salt concentration. For a given saltconcentration, there is a well defined temperature, T ∗, above which there is noadhesion. As the behavior of the surface energy changes at T ∗, this temperaturecan be referred to as a wetting transition temperature [109]. The dependence ofT ∗ versus the salt concentration is plotted on Fig. 2.36.
Moreover, the adhesion depends strongly on the nature of the salt [105]. Apronounced difference is noted in Fig. 2.37, where the energy of adhesion withKCl, NaCl and LiCl are compared [110]. The system is much more adhesive withKCl. This is the contrary with a carboxylate surfactant [106,110]. This behavioris important because it suggests that the adhesion is linked to the solubility of the
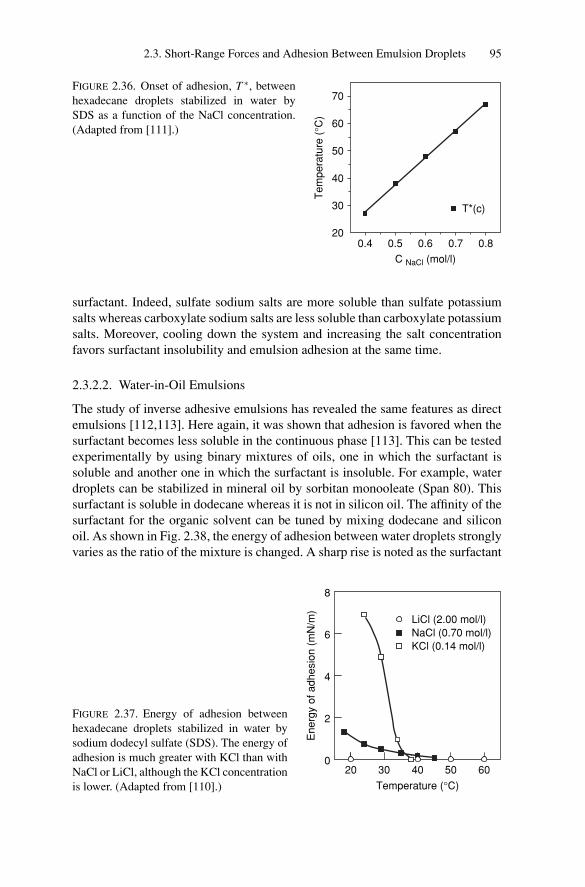
P1: GFZSVNY317-Bibette February 1, 2007 16:43
2.3. Short-Range Forces and Adhesion Between Emulsion Droplets 95
0.4 0.5 0.6 0.7 0.820
30
40
50
60
70
T*(c)
Tem
pera
ture
(°C
)
C NaCl (mol/l)
FIGURE 2.36. Onset of adhesion, T ∗, betweenhexadecane droplets stabilized in water bySDS as a function of the NaCl concentration.(Adapted from [111].)
surfactant. Indeed, sulfate sodium salts are more soluble than sulfate potassiumsalts whereas carboxylate sodium salts are less soluble than carboxylate potassiumsalts. Moreover, cooling down the system and increasing the salt concentrationfavors surfactant insolubility and emulsion adhesion at the same time.
2.3.2.2. Water-in-Oil Emulsions
The study of inverse adhesive emulsions has revealed the same features as directemulsions [112,113]. Here again, it was shown that adhesion is favored when thesurfactant becomes less soluble in the continuous phase [113]. This can be testedexperimentally by using binary mixtures of oils, one in which the surfactant issoluble and another one in which the surfactant is insoluble. For example, waterdroplets can be stabilized in mineral oil by sorbitan monooleate (Span 80). Thissurfactant is soluble in dodecane whereas it is not in silicon oil. The affinity of thesurfactant for the organic solvent can be tuned by mixing dodecane and siliconoil. As shown in Fig. 2.38, the energy of adhesion between water droplets stronglyvaries as the ratio of the mixture is changed. A sharp rise is noted as the surfactant
20 30 40 50 600
2
4
6
8
LiCl (2.00 mol/l)NaCl (0.70 mol/l)KCl (0.14 mol/l)
Energ
y of
adhesi
on (
mN
/m)
Temperature (°C)
FIGURE 2.37. Energy of adhesion betweenhexadecane droplets stabilized in water bysodium dodecyl sulfate (SDS). The energy ofadhesion is much greater with KCl than withNaCl or LiCl, although the KCl concentrationis lower. (Adapted from [110].)
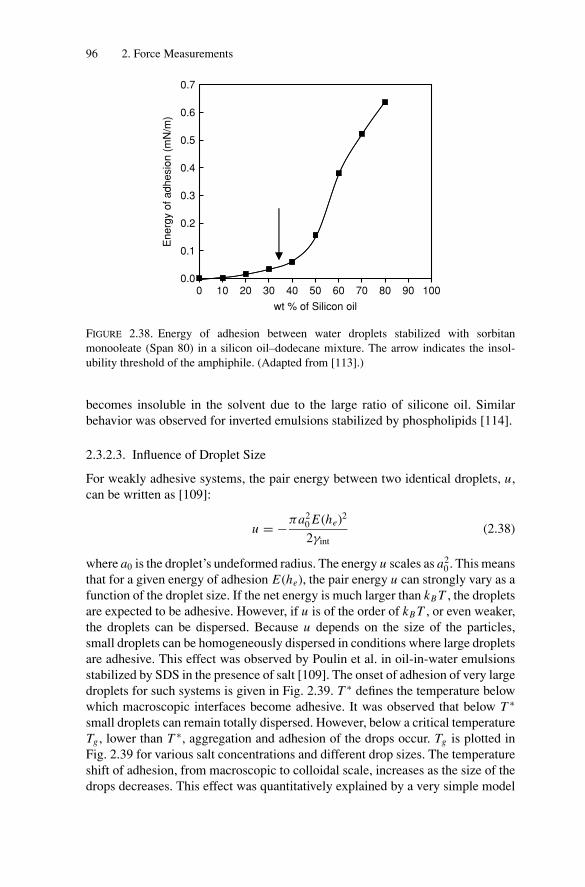
P1: GFZSVNY317-Bibette February 1, 2007 16:43
96 2. Force Measurements
Energ
y of
adhesi
on (
mN
/m)
0.2
0.3
0.4
0.5
0.6
0.7
0.1
0.00 10 20 30 40 50 60 70 80 90 100
wt % of Silicon oil
FIGURE 2.38. Energy of adhesion between water droplets stabilized with sorbitanmonooleate (Span 80) in a silicon oil–dodecane mixture. The arrow indicates the insol-ubility threshold of the amphiphile. (Adapted from [113].)
becomes insoluble in the solvent due to the large ratio of silicone oil. Similarbehavior was observed for inverted emulsions stabilized by phospholipids [114].
2.3.2.3. Influence of Droplet Size
For weakly adhesive systems, the pair energy between two identical droplets, u,can be written as [109]:
u = −πa20 E(he)2
2γint(2.38)
where a0 is the droplet’s undeformed radius. The energy u scales as a20 . This means
that for a given energy of adhesion E(he), the pair energy u can strongly vary as afunction of the droplet size. If the net energy is much larger than kB T , the dropletsare expected to be adhesive. However, if u is of the order of kB T , or even weaker,the droplets can be dispersed. Because u depends on the size of the particles,small droplets can be homogeneously dispersed in conditions where large dropletsare adhesive. This effect was observed by Poulin et al. in oil-in-water emulsionsstabilized by SDS in the presence of salt [109]. The onset of adhesion of very largedroplets for such systems is given in Fig. 2.39. T ∗ defines the temperature belowwhich macroscopic interfaces become adhesive. It was observed that below T ∗
small droplets can remain totally dispersed. However, below a critical temperatureTg , lower than T ∗, aggregation and adhesion of the drops occur. Tg is plotted inFig. 2.39 for various salt concentrations and different drop sizes. The temperatureshift of adhesion, from macroscopic to colloidal scale, increases as the size of thedrops decreases. This effect was quantitatively explained by a very simple model
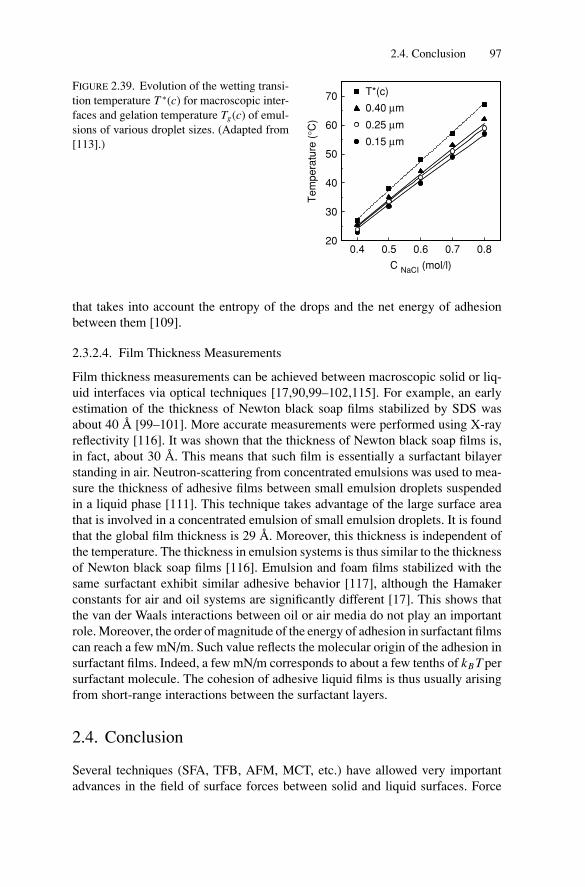
P1: GFZSVNY317-Bibette February 1, 2007 16:43
2.4. Conclusion 97
200.4
C NaCI (mol/l)
0.5 0.6 0.7 0.8
30
40
50
60
70
Tem
pera
ture
(°C
)
T*(c)
0.15 μm
0.25 μm
0.40 μm
FIGURE 2.39. Evolution of the wetting transi-tion temperature T ∗(c) for macroscopic inter-faces and gelation temperature Tg(c) of emul-sions of various droplet sizes. (Adapted from[113].)
that takes into account the entropy of the drops and the net energy of adhesionbetween them [109].
2.3.2.4. Film Thickness Measurements
Film thickness measurements can be achieved between macroscopic solid or liq-uid interfaces via optical techniques [17,90,99–102,115]. For example, an earlyestimation of the thickness of Newton black soap films stabilized by SDS wasabout 40 A [99–101]. More accurate measurements were performed using X-rayreflectivity [116]. It was shown that the thickness of Newton black soap films is,in fact, about 30 A. This means that such film is essentially a surfactant bilayerstanding in air. Neutron-scattering from concentrated emulsions was used to mea-sure the thickness of adhesive films between small emulsion droplets suspendedin a liquid phase [111]. This technique takes advantage of the large surface areathat is involved in a concentrated emulsion of small emulsion droplets. It is foundthat the global film thickness is 29 A. Moreover, this thickness is independent ofthe temperature. The thickness in emulsion systems is thus similar to the thicknessof Newton black soap films [116]. Emulsion and foam films stabilized with thesame surfactant exhibit similar adhesive behavior [117], although the Hamakerconstants for air and oil systems are significantly different [17]. This shows thatthe van der Waals interactions between oil or air media do not play an importantrole. Moreover, the order of magnitude of the energy of adhesion in surfactant filmscan reach a few mN/m. Such value reflects the molecular origin of the adhesion insurfactant films. Indeed, a few mN/m corresponds to about a few tenths of kB T persurfactant molecule. The cohesion of adhesive liquid films is thus usually arisingfrom short-range interactions between the surfactant layers.
2.4. Conclusion
Several techniques (SFA, TFB, AFM, MCT, etc.) have allowed very importantadvances in the field of surface forces between solid and liquid surfaces. Force
P1: GFZSVNY317-Bibette February 1, 2007 16:43
98 2. Force Measurements
measurements offer insight into interaction of emulsion droplets and have impli-cations when considering the stability and processing of emulsions. So far most ofthe studies have concerned equilibrium forces. Additional effects occur when thedroplets move relative to one another. Two kinds of dynamical effects can be distin-guished. The most obvious occurs when droplets move so rapidly that there is notenough time for equilibrating. For example, the ions of the electric double-layercan be left slightly behind when a charged droplet moves. Identically, for dropletscovered with adsorbed polymer, the rearrangements at the surface are often slow,causing the force between two such surfaces to depend on the rate of the relativemotion. The second, dynamical effect arises when droplets or aggregates move inthe liquid medium. As a big unit moves, it creates a flow in the surrounding incom-pressible liquid. The presence of a second particle will influence the flow patternsin the liquid and will result in the two particles “seeing” each other trough the flowof the intervening fluid. This effect is called hydrodynamic interaction. So far it isdifficult to state general rules concerning dynamic effects and it seems likely thatdynamic measurements of hydrodynamic and viscous forces will receive increasedattention in the near future.
References
[1] D. Tabor and R.H.S. Wintertor: “Direct Measurement of Normal and Retarded VanDer Waals Forces.” Proc. R. Soc. Lond. A312, 435 (1969).
[2] J.N. Israelachvili and D. Tabor: “Measurement of Van Der Waals Dispersion Forcesin the Range 1.5 to 130 Nm.” Proc. R. Soc. Lond. A331, 19 (1972).
[3] J.N. Israelachvili and G.E. Adams: “Measurement of Forces between Two MicaSurfaces in Aqueous Electrolyte Solutions in the Range 0-100 Nm.” J. Chem. Soc.Faraday Trans. I 74, 975 (1978).
[4] J.L. Parker: “A Novel Method for Measuring the Force Between Two Surfaces in aSurface Force Apparatus.” Langmuir 8, 551 (1992).
[5] J.L. Parker: “Surface Force Measurements in Surfactant Systems.” Prog. Surf. Sci.47, 205 (1994).
[6] W.A. Ducker, T.S. Senden, and R.M. Pashley: “Direct Measurement of ColloidalForces Using an Atomic Force Microscope.” Nature 353, 239 (1991).
[7] D.C. Prieve and N.A. Frej: “Total Internal Reflection Microscopy: A QuantitativeTool for the Measurement of Colloidal Forces.” Langmuir 6, 396 (1990).
[8] A. Scheludko and D. Exerowa: “Flow of Liquids from Soap Films.” Kolloids Z.155, 39 (1957).
[9] R. Aveyard, B.P. Binks, W.G. Cho, L.R. Fisher, P.D.I. Fletcher, and F. Klinkham-mer: “Investigation of the Force-Distance Relationship for a Small Liquid DropApproaching a Liquid-Liquid Interface.” Langmuir 12, 6561 (1996).
[10] F. Leal-Calderon, T. Stora, O. Mondain Monval, P. Poulin, and J. Bibette: “DirectMeasurement of Colloidal Forces.” Phys. Rev. Lett. 72, 2959 (1994).
[11] D.M. LeNeveu, R.P. Rand, and V.A. Parsegian: “Measurement of Forces BetweenLecithin Bilayers.” Nature 259, 601 (1976).
[12] V. Bergeron: “Stability of Emulsion Films.” In Proceedings of the Second WorldCongress of Emulsions 4, 247, Bordeaux, France (1997).
P1: GFZSVNY317-Bibette February 1, 2007 16:43
References 99
[13] V. Bergeron, M.E. Fagan, and C.J. Radke: “Criterion for Foam Stability AgainstOil in Porous Media.” Langmuir 9, 1704 (1993).
[14] T. Tchaliovska, P. Herder, R. Pugh, P. Stenius, and J.C. Ericksson: “Studies ofthe Contact Interaction Between an Air Bubble and a Mica Surface Submerged inDodecylammonium Chloride Solution.” Langmuir 6, 1535 (1990).
[15] B.V. Derjaguin, N.V. Churaev, and V.M. Muller: Surface Forces. ConsultantsBureau, New York (1987).
[16] H. Zhang and M. Widom: “Field-Induced Forces in Colloidal Particle Chains.”Phys. Rev. E 51, 2099 (1995).
[17] J.N. Israelachvili: Intermolecular and Surface Forces. Academic Press, San Diego(1985).
[18] E.J.W. Verwey and J.T.H. Overbeek: Theory of the Stability of Lypophobic Colloids.Elsevier, Amsterdam (1948).
[19] S. Levine and A. Suddaby: “Simplified Forms for Free Energy of the Double-Layersof Two Plates in a Symmetrical Electrolyte.” Proc. Phys. Soc. A 64, 287 (1951).
[20] S. Asakura and J. Oosawa: “Interaction Between Particles Suspended in Solutionsof Macromolecules.” J. Polym. Sci. 32, 183 (1958).
[21] P. Richetti and P. Kekicheff: “Direct Measurement of Depletion and StructuralForces in a Micellar System.” Phys. Rev. Lett. 68, 1951 (1992).
[22] O. Mondain-Monval, F. Leal-Calderon, J. Phillip, and J. Bibette: “Depletion Forcesin the Presence of Electrostatic Double-Layer Repulsion.” Phys. Rev. lett. 75, 3364(1995).
[23] E.D. Manev, S.V. Sazdanova, and D.T. Wasan: “Stratification in Emulsion Films.”J. Dispersion Sci. Technol. 5, 111 (1984).
[24] P.A. Kralchevsky and N.D. Denkov: “Analytical Expression for the OscillatoryStructural Surface Force.” Chem. Phys. Lett. 240, 385 (1995).
[25] V. Bergeron and C.J. Radke: “Equilibrium Measurements of Oscillatory DisjoiningPressures in Aqueous Foam Films.” Langmuir 8, 3020 (1992).
[26] P.G. De Gennes: Scaling Concepts in Polymer Physics. Cornell University PressLondon (1979).
[27] G. Fleer, M. Cohen Stuart, J. Scheutjens, T. Cosgrove, and B. Vincent: Polymers atInterfaces. Chapman and Hall, London (1993).
[28] S.S. Patel and M. Tirrell: “Measurement of Forces Between Surfaces in PolymerFluids.” Annu. Rev. Phys. Chem. 40, 597 (1989).
[29] J. Lyklema and T. Van Vliet: “Polymer-Stabilized Free Liquid Films.” Faraday Disc.Chem. Soc. 65, 26 (1978).
[30] O. Mondain-Monval, A. Espert, P. Omarjee, J. Bibette, F. Leal-Calderon, J. Phillip,and J.F. Joanny: “Polymer Induced Repulsive Forces: An Exponential Scaling.”Phys. Rev. Lett. 80, 1778 (1998).
[31] P. Omarjee: “Direct Force Measurements Between Polymer Stabilized Colloids.”Ph.D thesis, Bordeaux I University (1999).
[32] A.N. Semenov, J. Bonet-Avalos, A. Johner, and J.F. Joanny: “Adsorption of PolymerSolutions onto a Flat Surface.” Macromolecules 29, 2179 (1996).
[33] H. Sonntag, B. Unterberger, and S. Zimontkowski: “Experimental Investigation ofthe Steric Stabilization of Emulsions by (Poly)Vinyl Alcohol.” Colloid Polym. Sci.257, 286 (1979).
[34] P. Omarjee, A. Espert, and O. Mondain Monval: “Polymer-Induced Repul-sive Forces at Solid-Liquid and Liquid-Liquid Interfaces.” Langmuir 17, 5693(2001).
P1: GFZSVNY317-Bibette February 1, 2007 16:43
100 2. Force Measurements
[35] J. Klein and P.F. Luckham: “Long-Range Attractive Forces Between Two MicaSurfaces in an Aqueous Polymer Solution.” Nature 308, 836 (1984).
[36] J. Klein and G. Rossi: “Analysis of the Experimental Implications of the ScalingTheory of Polymer Adsorption.” Macromolecules 31, 1979 (1998).
[37] L. Cohen-Tannoudji, E. Bertrand, L. Bressy, C. Goubault, J. Baudry, J. Klein, J.-F.Joanny, and J. Bibette: “Polymer Bridging Probed by Magnetic Colloids.” Phys.Rev. Lett. 94, 038301 (2005).
[38] H. Vogel: “The Law of the Relation Between the Viscosity of Liquids and theTemperature.” Physik. Z. 22, 645 (1921).
[39] G.S. Fulcher: “Analysis of Recent Measurements of the Viscosity of Glasses. II.” J.Am. Ceram. Soc. 8, 789 (1925).
[40] G. Tammann and W. Hesse: “The Dependence of Viscosity Upon the Temperatureof Supercooled Liquids.” Z. Anorg. Allg. Chem. 156, 245 (1926).
[41] M.L. Williams, R.F. Landel, and J.D. Ferry: “The Temperature Dependence of Re-laxation Mechanisms in Amorphous Polymers and Other Glass-Forming Liquids.”J. Am. Chem. Soc. 77, 3701 (1955).
[42] M.D. Ediger, C.A. Angell, and S.R. Nagel: “Supercooled Liquids and Glasses.” J.Phys. Chem. 100, 13200 (1996).
[43] K. Kremer: “Glassy States of Adsorbed Flexible Polymers and Spread Polymer“Monolayers.” J. Phys. (Paris) 47, 1269 (1986).
[44] J.B. Avalos, J.-F. Joanny, A. Johner, and A.N. Semenov: “Equilibrium InteractionBetween Adsorbed Polymer Layers.” Europhys. Lett. 35, 97 (1996).
[45] G.D.J. Phillies, D. Rostcheck, and S. Ahmed: “Probe Diffusion in IntermediateMolecular Weight Polyelectrolytes: Temperature Dependence.” Macromolecules25, 3689 (1992).
[46] D.W. Krevelen: Properties of Polymers. Elsevier, Philadelphia (1997).[47] C. Goubault, F. Leal-Calderon, J.-L. Viovy, and J. Bibette: “Self-Assembled Mag-
netic Nanowires Made Irreversible by Polymer Bridging.” Langmuir 21, 3725(2005).
[48] J.-F. Joanny, L. Leibler, and P.G. de Gennes: “Effects of Polymer Solutions andColloid Stability.” J. Polym. Sci. Polym. Phys. 17, 1073 (1979).
[49] J.M. Scheutjens and G.J. Fleer: “Interaction Between Two Adsorbed Polymer Lay-ers.” Macromolecules 18, 1882 (1985).
[50] P. Kekicheff, F. Nallet, and P. Richetti: “Measurement of Depletion Interaction inSemi-Dilute Solutions of Worm-Like Surfactant Aggregates.” J. Phys. II France 4,735 (1994).
[51] A. Milling and S. Biggs: “Direct Measurement of the Depletion Force Using anAtomic Force Microscope.” J. Colloid Interface Sci. 170, 604 (1995).
[52] E. Evans and D. Needham: “Attraction Between Lipid Bilayer Membranes in Con-centrated Solutions of Nonadsorbing Polymers: Comparison of Mean-Field Theorywith Measurements of Adhesion Energy.” Macromolecules 21, 1822 (1988).
[53] A. Asnacios, A. Espert, A. Colin, and D. Langevin: “Structural Forces in Thin FilmsMade from Polyelectrolyte Solutions.” Phys. Rev. Lett. 78, 4974 (1997).
[54] K. Thalberg, B. Lindman, and G. Karlstrom: “Phase Behavior of Cationic Surfactantand Anionic Polyelectrolyte: Influence of Surfactant Chain Length and Polyelec-trolyte Molecular Weight.” J. Phys. Chem. 95, 3370 (1991).
[55] K. Thalberg, B. Lindman, and G. Karlstrom: “Phase Behavior of a System ofCationic Surfactant and Anionic Polyelectrolyte: The Effect of Salt.” J. Phys. Chem.95, 6004 (1991).
P1: GFZSVNY317-Bibette February 1, 2007 16:43
References 101
[56] P. Hansson and M. Almgren: “Interaction of Alkyltrimethylammonium Surfactantswith Polyacrylate and Poly(Styrenesulfonate) in Aqueous Solution: Phase Behaviorand Surfactant Aggregation Numbers.” Langmuir 10, 2115 (1994).
[57] P.L. Dubin, D.R. Rigsbee, L.M. Gan, and M.A. Fallon: “Equilibrium Binding ofMixed Micelles to Oppositely Charged Polyelectrolytes.” Macromolecules 21, 2555(1988).
[58] M. Almgren, P. Hansson, E. Mukhtar, and S. van Stam: “Aggregation ofAlkyltrimethylammonium Surfactants in Aqueous Poly(Styrenesulfonate) Solu-tions.” Langmuir 8, 2405 (1992).
[59] A. Asnacios, D. Langevin, and J.-F. Argillier: “Complexation of Cationic Surfac-tant and Anionic Polymer at the Air-Water Interface.” Macromolecules 29, 7412(1996).
[60] A.V. Gorelov, E.D. Kudryashov, J.C. Jacquier, D.M. McLoughlin, and K.A. Daw-son: “Complex Formation Between DNA and Cationic Surfactant.” Physica A 249,216 (1998).
[61] Y. Li, J. Xia, and P.L. Dubin: “Complex Formation Between Polyelectrolyte and Op-positely Charged Mixed Micelles: Static and Dynamic Light Scattering. Study of theEffect of Polyelectrolyte Molecular Weight and Concentration.” Macromolecules27, 7049 (1994).
[62] P.M. Claesson, M. Bergstrom, A. Dedinaite, M. Kjellin, J.F. Legrand, and I. Grillo:“Mixtures of Cationic Polyelectrolyte and Anionic Surfactant Studied with SmallAngle Neutron Scattering.” J. Phys. Chem. B 104, 11689 (2000).
[63] A. Svensson, L. Picullel, B. Cabane, and P.A. Ilekti: “New Approach to the PhaseBehavior of Oppositely Charged Polymers and Surfactants.” J. Phys. Chem. B 106,1013 (2002).
[64] K. Hayakawa, J.P. Santerre, and J.C.T. Kwak: “Study of Surfactant-PolyelectrolyteInteractions. Binding of Dodecyl-and Tetradecyltrimethylammonium Bromide bySome Carboxylic Polyelectrolytes.” Macromolecules 16, 1642 (1983).
[65] K. Hayakawa and J.C.T. Kwak: “Surfacatant-Polyelectrolyte Interactions. 4. Sur-factant Chain Length Dependence on the Binding of Alkylpyridinium Cations toDextran Sulfate.” J. Phys. Chem. 88, 1930 (1984).
[66] J. Lucassen, F. Hollway, and J.H. Buckingham: “Surface Properties of Mixed Solu-tions of Poly-Lysine and Sodium Dodecyl Sulfate. 2. Dynamic Surface Properties.”J. Colloid Interface Sci. 67, 432 (1978).
[67] A. Asnacios, R. Kitzling, and D. Langevin: “Mixed Monolayers of Polyelectrolytesand Surfactants at the Air-Water Interface.” Colloid Surf. A 167, 189 (2000).
[68] D.J.F. Taylor, R.K. Thomas, and J. Penfold: “The Adsorption of Oppositely ChargedPolyelectrolyte/Surfactant Mixtures: Neutron Reflection from Dodecyl Trimethy-lammonium Bromide and Sodium Poly(Styrene Sulfonate) at the Air/Water Inter-face.” Langmuir 18, 4748 (2002).
[69] E. Staples, I. Tucker, J. Penfold, R.K. Thomas, and D.J.F. Taylor: “Organization ofPolymer-Surfactant Mixtures at the Air-Water Interface: Sodium Dodecyl Sulfateand Poly Dimethyldiallylammonium Chloride.” Langmuir 18, 5147 (2002).
[70] C. Stubenrauch, P.A. Albouy, R. Kitzling, and D. Langevin: “Polymer/SurfactantComplexes at the Water/Air Interface: A Surface Tension and X-Ray ReflectivityStudy.” Langmuir 16, 3206 (2000).
[71] H. Ritacco, P.A. Albouy, A. Bhattacharyya, and D. Langevin: “Influence of the Poly-mer Backbone Rigidity on Polyelectrolyte-Surfactant Complexes at the Air/WaterInterface.” Phys. Chem. Chem. Phys. 2, 5243 (2000).
P1: GFZSVNY317-Bibette February 1, 2007 16:43
102 2. Force Measurements
[72] P.M. Claesson, A. Dedinaite, M. Fielden, M. Kjellin, and R. Audebert:“Polyelectrolyte-Surfactant Interactions at Interfaces.” Prog. Colloid Polym. Sci.106, 24 (1997).
[73] C. Monteux, C.E. Williams, J. Meunier, O. Anthony, and V. Bergeron: “Adsorp-tion of Oppositely Charged Polyelectrolyte/Surfactant Complexes at the Air/WaterInterface : Formation of Interfacial Gels.” Langmuir 20, 57 (2004).
[74] J. Philip, G. Gnana Prakash, T. Jayakumar, P. Kalyanasundaram, and B. Raj:“Stretching and Collapse of Neutral Polymer Layers Under Association with IonicSurfactants.” Phys. Rev. Lett. 89, 268301 (2002).
[75] J. Philip, G. Gnana Prakash, T. Jayakumar, P. Kalyanasundaram, and B. Raj: “ThreeDistinct Scenarios under Polymer, Surfactant and Colloidal Interaction.” Macro-molecules 36, 9230 (2003).
[76] D.E. Graham and M.C. Phillips: “Proteins at Liquid Interfaces: II. AdsorptionIsotherms.” J. Colloid Interface Sci. 70, 415 (1979).
[77] T. Sengupta, L. Razumovsky, and S. Damodaran: “Energetics of Protein-InterfaceInteractions and its Effect on Protein Adsorption.” Langmuir 15, 6991 (1999).
[78] T.D. Dimitrova and F. Leal-Calderon: “Forces Between Emulsion Droplets Stabi-lized with Tween 20 and Proteins.” Langmuir 15, 8813 (1999).
[79] T.D. Dimitrova, F. Leal-Calderon, T.D. Gurkov, and B. Campbell “Disjoining Pres-sure vs. Thickness Isotherms of Thin Emulsion Films Stabilized by Proteins.”Langmuir 17, 8069 (2001).
[80] T. Nylander and M.N. Wahlgren: “Forces Between Adsorbed Layers of β-Casein.”Langmuir 13, 6219 (1997).
[81] K. Kozco, A.D. Nikolov, D.T. Wasan, R.P. Borwankar, and A. Gonsalves: “Layeringof Sodium Caseinate Submicelles in Thin Liquid Films–A New Stability Mechanismfor Food Dispersions.” J. Colloid Interface Sci. 178, 694 (1996).
[82] E. Dickinson, M. Golding, and M.J.W. Povey: “Creaming and Flocculation of Oil-in-Water Emulsions Containing Sodium Caseinate.” J. Colloid Interface Sci. 185,515 (1997).
[83] J.P. Gallinet and B. Gauthier-Manuel: “Adsorption–Desorption of Serum Albuminon Bare Mica Surfaces.” Colloid Surfaces 68, 189 (1992).
[84] G. Narsimham: “Maximum Disjoining Pressure in Protein-Stabilized ConcentratedOil-in-Water Emulsions.” Colloid Surfaces 62, 31 (1992).
[85] J.N. Israelachvili and H. Wennerstrom: “Entropic Forces Between AmphiphilicSurfaces in Liquids.” J. Phys. Chem. 96, 520 (1992).
[86] J.R. Lu, T.J. Su, and R.K. Thomas: “Structural Conformation of Bovine Serum Al-bumin Layers at the Air–Water Interface Studied by Neutron Reflection.” J. ColloidInterface Sci. 213, 426 (1999).
[87] T.D. Dimitrova, F. Leal-Calderon, T.D. Gurkov, and B. Campbell: “Surface Forcesin Model Oil-in-Water Emulsions Stabilized by Proteins.” Adv. Colloid InterfaceSci. 108–109, 73 (2004).
[88] B.S. Murray, B. Cattin, E. Schuler, and Z.O. Sonmez: “Response of AdsorbedProtein Films to Rapid Expansion.” Langmuir 18, 9476 (2002).
[89] A.R. Mackie, P. Gunning, P. Wilde, and V. Morris: “Orogenic Displacement ofProtein from the Oil/Water Interface.” Langmuir 16, 2242 (2000).
[90] N.D. Denkov, N.D. Petsev, and K.D. Danov: “Interaction Between DeformableBrownian Droplets.” Phys. Rev. Lett. 71, (1993).
[91] W.A. Ducker, Z. Xu, and J.N. Israelachvili: “Measurements of Hydrophobic andDLVO Forces in Bubble-Surface Interactions in Aqueous Solutions.” Langmuir 10,3279 (1994).
P1: GFZSVNY317-Bibette February 1, 2007 16:43
References 103
[92] M.L. Fielden, R.A. Hayes, and J. Ralston: “Surface and Capillary Forces Affect-ing Air Bubble-Particle Interactions in Aqueous Electrolyte.” Langmuir 12, 3721(1996).
[93] M. Preuss and H.-J. Butt: “Direct Measurement of Particle-Bubble Interactions inAqueous Electrolyte: Dependence on Surfactant.” Langmuir 14, 3164 (1998).
[94] G. Gillies, C.A. Prestidge, and P. Attard: “An AFM Study of the Deformation andNanorheology of Cross-Linked PDMS Droplets.” Langmuir 18, 1674 (2002).
[95] G. Gillies, C.A. Prestidge, and P. Attard: “Determination of the Separation in Col-loid Probe Atomic Force Microscopy of Deformable Bodies.” Langmuir 17, 7955(2001).
[96] I. Vakarelski, A. Toritani, M. Nakayama, and Higashitani: “Effects of ParticleDeformability on Interaction Between Surfaces in Solutions.” Langmuir 19, 110(2003).
[97] G. Gillies and C.A. Prestidge: “Interaction Forces, Deformation and Nano-Rheologyof Emulsion Droplets as Determined by Colloid Probe AFM.” Adv. Colloid InterfaceSci. 108–109, 197 (2004).
[98] G. Gillies and C.A. Prestidge: “Colloid Probe AFM Investigation of the Influenceof Cross-Linking on the Interaction Behavior and Nano-Rheology of ColloidalDroplets.” Langmuir 21, 12342 (2005).
[99] J.A. De Feijter, B. Rijnbout, and A. Vrij: “Contact Angles in Thin Films. I. Ther-modynamic Description.” J. Colloid Interface Sci. 64, 258 (1978).
[100] J.A. De Feijter and A. Vrij: “Contact Angles in Thin Films. II. Contact AngleMeasurements in Newton Black Soap Films.” J. Colloid Interface Sci. 64, 269(1978).
[101] J.A. De Feijter and A. Vrij: “Contact Angles in Thin Films. III. Interaction Forcesin Newton Black Soap Films.” J. Colloid Interface Sci. 70, 456 (1979).
[102] I.B. Ivanov (ed): “Thin Liquid Films. Fundamentals and Applications.” MarcelDekker, New York (1988).
[103] R.B. Gennis: Biomembranes. Springer-Verlag, New York (1989).[104] M.P. Aronson and H.M. Princen: “Contact Angles in Oil-in-Water Emulsions Sta-
bilized by Ionic Surfactants.” Nature 286, 370 (1980).[105] M.P. Aronson and H.M. Princen: “Geometry of Clusters of Strongly Coagulated
Fluid Drops and the Occurence of Collapsed Plateau Borders.” Colloids Surfaces4, 173 (1982).
[106] H. Princen: “Geometry of Clusters of Strongly Coagulated Fluid Drops and theOccurence of Collapsed Plateau Borders.” Colloids Surfaces 9, 47 (1984).
[107] I.B. Ivanov, A.S. Dimitrov, A.D. Nikolov, N.D. Denkov, and P.A. Kralchevsky:“Contact Angle Film and Line Tension of Foam Films. II. Film and Line TensionMeasurements.” J. Colloid Interface Sci. 151, 446 (1992).
[108] A.S. Dimitrov, A.D. Nikolov, P.A. Kralchevsky, and I.B. Ivanov: “Wetting of Emul-sions Droplets: From Macroscopic to Colloidal Scale.” J. Colloid Interface Sci. 151,462 (1992).
[109] P. Poulin and J. Bibette: “Interaction Between Deformable Brownian Droplets.”Phys. Rev. Lett. 79, 3290 (1997).
[110] P. Poulin: “Adhesion d’interfaces Fluides et Agregation Colloıdale dans lesEmulsions.” Ph.D thesis, Bordeaux I University (1995).
[111] P. Poulin and J. Bibette: “Influence of the Alkyl Surfactant Tail on the AdhesionBetween Emulsion Drops.” Langmuir 15, 4731 (1999).
[112] F.A.M. Leermarkers, Y.S. Sdranis, J. Lyklema, and R.D. Groot: “Adhesion of WaterDroplets in Organic Solvent.” Colloids Surfaces 85, 135 (1994).
P1: GFZSVNY317-Bibette February 1, 2007 16:43
104 2. Force Measurements
[113] P. Poulin and J. Bibette: “Stability and Permeability of Amphiphile Bilayers.” Lang-muir 14, 6341 (1998).
[114] P. Poulin, W. Essafi, and J. Bibette: “On the Colloidal Stability of Water-in-OilEmulsions. A Self-Consistent Field Approach.” J. Chem. Phys. B 103, 5157 (1999).
[115] D. Exerowa, D. Kashiev, and D. Platikanov: “Structural Properties of Soap BlackFilms Investigated by X-Ray Reflectivity.” Adv. Colloid Interface Sci. 40, 201(1992).
[116] O. Belorgey, and J. Benattar: “Wetting: Statistics and Dynamics.” Phys. Rev. Lett.66, (1991).
[117] P. Poulin, F. Nallet, B. Cabane, and J. Bibette: “Evidence for Newton Black FilmsBetween Adhesive Emulsion Droplets.” Phys. Rev. Lett. 77, 3248 (1996).
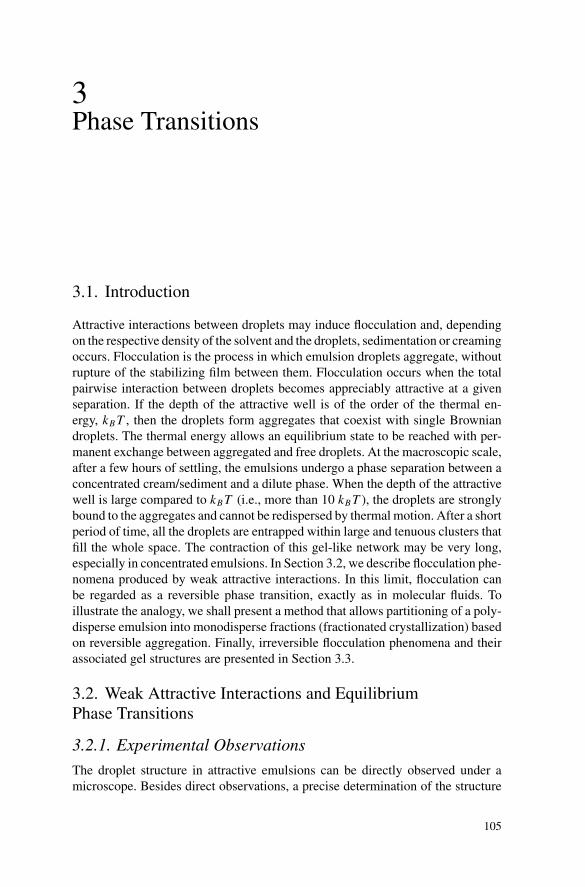
P1: GFZ
SVNY317-Bibette February 1, 2007 16:46
3Phase Transitions
3.1. Introduction
Attractive interactions between droplets may induce flocculation and, dependingon the respective density of the solvent and the droplets, sedimentation or creamingoccurs. Flocculation is the process in which emulsion droplets aggregate, withoutrupture of the stabilizing film between them. Flocculation occurs when the totalpairwise interaction between droplets becomes appreciably attractive at a givenseparation. If the depth of the attractive well is of the order of the thermal en-ergy, kB T , then the droplets form aggregates that coexist with single Browniandroplets. The thermal energy allows an equilibrium state to be reached with per-manent exchange between aggregated and free droplets. At the macroscopic scale,after a few hours of settling, the emulsions undergo a phase separation between aconcentrated cream/sediment and a dilute phase. When the depth of the attractivewell is large compared to kB T (i.e., more than 10 kB T ), the droplets are stronglybound to the aggregates and cannot be redispersed by thermal motion. After a shortperiod of time, all the droplets are entrapped within large and tenuous clusters thatfill the whole space. The contraction of this gel-like network may be very long,especially in concentrated emulsions. In Section 3.2, we describe flocculation phe-nomena produced by weak attractive interactions. In this limit, flocculation canbe regarded as a reversible phase transition, exactly as in molecular fluids. Toillustrate the analogy, we shall present a method that allows partitioning of a poly-disperse emulsion into monodisperse fractions (fractionated crystallization) basedon reversible aggregation. Finally, irreversible flocculation phenomena and theirassociated gel structures are presented in Section 3.3.
3.2. Weak Attractive Interactions and EquilibriumPhase Transitions
3.2.1. Experimental Observations
The droplet structure in attractive emulsions can be directly observed under amicroscope. Besides direct observations, a precise determination of the structure
105
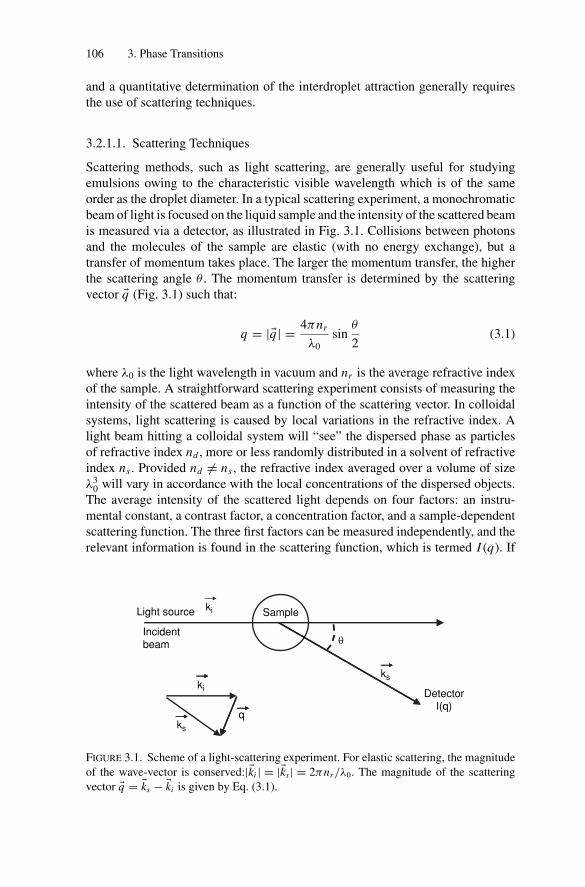
P1: GFZ
SVNY317-Bibette February 1, 2007 16:46
106 3. Phase Transitions
and a quantitative determination of the interdroplet attraction generally requiresthe use of scattering techniques.
3.2.1.1. Scattering Techniques
Scattering methods, such as light scattering, are generally useful for studyingemulsions owing to the characteristic visible wavelength which is of the sameorder as the droplet diameter. In a typical scattering experiment, a monochromaticbeam of light is focused on the liquid sample and the intensity of the scattered beamis measured via a detector, as illustrated in Fig. 3.1. Collisions between photonsand the molecules of the sample are elastic (with no energy exchange), but atransfer of momentum takes place. The larger the momentum transfer, the higherthe scattering angle θ . The momentum transfer is determined by the scatteringvector �q (Fig. 3.1) such that:
q = |�q| = 4πnr
λ0
sinθ
2(3.1)
where λ0 is the light wavelength in vacuum and nr is the average refractive indexof the sample. A straightforward scattering experiment consists of measuring theintensity of the scattered beam as a function of the scattering vector. In colloidalsystems, light scattering is caused by local variations in the refractive index. Alight beam hitting a colloidal system will “see” the dispersed phase as particlesof refractive index nd , more or less randomly distributed in a solvent of refractiveindex ns . Provided nd �= ns , the refractive index averaged over a volume of sizeλ3
0 will vary in accordance with the local concentrations of the dispersed objects.The average intensity of the scattered light depends on four factors: an instru-mental constant, a contrast factor, a concentration factor, and a sample-dependentscattering function. The three first factors can be measured independently, and therelevant information is found in the scattering function, which is termed I (q). If
DetectorI(q)
Incidentbeam
Sampleki
ki
ks
ks
q
Light source
θ
FIGURE 3.1. Scheme of a light-scattering experiment. For elastic scattering, the magnitude
of the wave-vector is conserved:|�ki | = |�ks | = 2πnr/λ0. The magnitude of the scattering
vector �q = �ks − �ki is given by Eq. (3.1).
P1: GFZ
SVNY317-Bibette February 1, 2007 16:46
3.2. Weak Attractive Interactions and Equilibrium Phase Transitions 107
the intra- and interparticle interferences are independent, the scattering functionbecomes a product of a form factor P(q) and a structure factor S(q):
I (q) = P(q)S(q) (3.2)
The form factor depends only on intraparticle interferences and is independentof concentration as long as the particles remain unchanged. For example, for auniform sphere of radius a comparable to λ0:
P(q) =[
3 (sin qa − qa cos qa)
(qa)3
]2
(3.3)
The structure factor accounts for interparticle interferences. It relates to the so-called pair distribution function, g(r ), of particles through:
S(q) = 1 + 3φ
qa3
∫ ∞
0
[g(r ) − 1]r sin (qr ) dr (3.4)
where φ is the particle volume fraction. The function g(r ) describes the probabilityto find one particle at center-to-center distance r from a test particle (at the origin).Thus, if we know the particle size, we can calculate P(q), measure I (q), and thendetermine the particle distribution g(r ). Knowing the radial distribution function,one may calculate all the macroscopic properties of suspended colloidal particlesas the osmotic pressure, the isothermal compressibility, and so forth [1]. Theradial distribution function is influenced by the many-body interactions that existbetween the dispersed particles. Describing the radial distribution function for amultiparticle system is not simple. The reason is that the interactions between eachtwo particles is affected by the presence of all others in the ensemble. This is why allequations for determining the radial distribution function introduce assumptionsand approximations [1]. For example, for very dilute colloidal dispersions withshort-range interparticle interactions, many-body correlations (i.e., more than twoparticles) can be neglected, and g(r ) can be expressed as a function of the two-body(pair) interaction energy, u(r ):
g(r ) ≈ exp[−u(r )/kB T ] (3.5)
Hence, by adopting the appropriate approximation, it is possible to obtain quanti-tative information about the pair interaction energy from scattering experiments,over a wide variety of systems and particle concentrations.
3.2.1.2. Oil-in-Water Emulsions
We first consider emulsion droplets submitted to attractive interactions of theorder of kB T . Reversible flocculation may be simply produced by adding excesssurfactant in the continuous phase of emulsions. As already mentioned in Chapter2, micelles may induce an attractive depletion interaction between the disperseddroplets. For equal spheres of radius a at center-to-center separation r , the depletion
P1: GFZ
SVNY317-Bibette February 1, 2007 16:46
108 3. Phase Transitions
energy may be written as [2]:
ud =∫ r
∞Fd (r ′)dr ′
= −4π
3(a + �)3 Posm
[1 − 3r
4(a + �)+ r3
16(a + �)3
](3.6)
where Fd is the depletion force defined in Chapter 2, � is the exclusion charac-teristic length which is comparable to the micellar radius, and Posm is the mi-cellar osmotic pressure. This potential decreases monotonically, from zero atr = 2(a + �), to a minimum value udc at contact (r = 2a):
udc = −4π�3
3
(1 + 3a
2�
)Posm (3.7)
The first observation of depletion flocculation by surfactant micelles was reportedby Aronson [3]. Bibette et al. [4] have studied the behavior of silicone-in-wateremulsions stabilized by sodium dodecyl sulfate (SDS). They have exploited theattractive depletion interaction to size fractionate a crude polydisperse emulsion[5]. Because the surfactant volume fraction necessary to induce flocculation isalways lower than 5%, the micelle osmotic pressure can be taken to be the ideal-gas value:
Posm ≈ nmkB T = φm
4
3π�3
kB T (3.8)
where nm and φm are the micelle concentration and volume fraction, respectively.Moreover, because silicone oil droplets have a size ranging from 0.1 μm to a fewmicrons, the ratio a/� is very large and Eq. (3.7) can be approximated by:
udc ≈ −3
2kB T φm
a
�(3.9)
This equation predicts a simple linear dependence of the contact potential onthe micelle volume fraction and on the ratio a/�. For example, for φm = 2% and� = 5 nm (typical effective micelle radius), Eq. (3.9) predicts that the pair contactenergy between droplets having a radius of 1 μm is equal to −6 kB T , an attractionthat is in principle sufficient to produce flocculation. By adjusting the amount ofsurfactant above its critical micellar concentration (CMC), the volume fractionof micelles can be easily controlled. This type of interaction can be exploited tosize fractionate a primary polydisperse emulsion [5]. To produce monodispersefractions, a crude polydisperse emulsion is diluted to a droplet volume fraction ofφ ≈ 10% According to Eq. (3.9), for or any given micelle volume fraction φm , theabsolute value of the depletion attraction will be greater than kB T for oil dropletslarger than some radius and will cause these larger droplets to flocculate. Thedensity mismatch between the oil and the water will cause these flocs to creamafter approximately 12 h of settling. The creamed droplets can be removed fromthe initial emulsion and redispersed at φ ≈ 10% in a separate suspension. By this
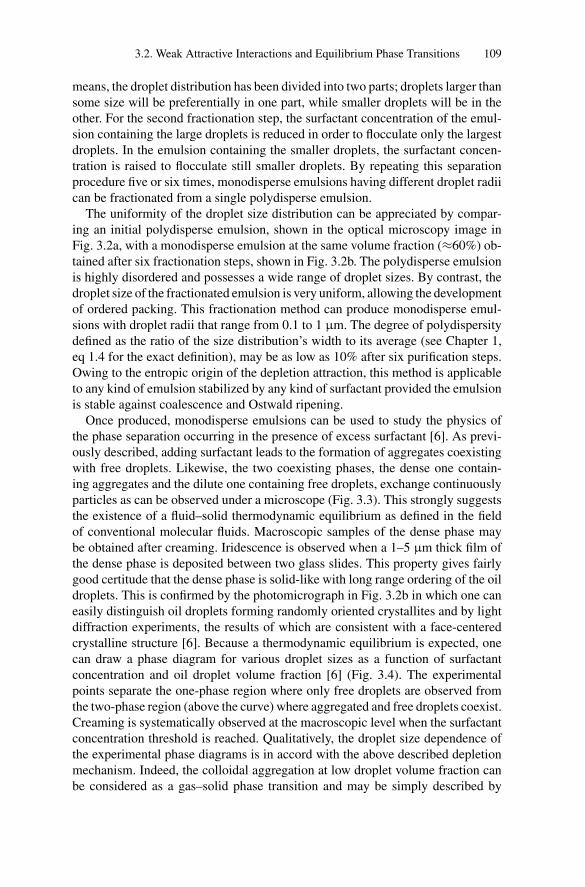
P1: GFZ
SVNY317-Bibette February 1, 2007 16:46
3.2. Weak Attractive Interactions and Equilibrium Phase Transitions 109
means, the droplet distribution has been divided into two parts; droplets larger thansome size will be preferentially in one part, while smaller droplets will be in theother. For the second fractionation step, the surfactant concentration of the emul-sion containing the large droplets is reduced in order to flocculate only the largestdroplets. In the emulsion containing the smaller droplets, the surfactant concen-tration is raised to flocculate still smaller droplets. By repeating this separationprocedure five or six times, monodisperse emulsions having different droplet radiican be fractionated from a single polydisperse emulsion.
The uniformity of the droplet size distribution can be appreciated by compar-ing an initial polydisperse emulsion, shown in the optical microscopy image inFig. 3.2a, with a monodisperse emulsion at the same volume fraction (≈60%) ob-tained after six fractionation steps, shown in Fig. 3.2b. The polydisperse emulsionis highly disordered and possesses a wide range of droplet sizes. By contrast, thedroplet size of the fractionated emulsion is very uniform, allowing the developmentof ordered packing. This fractionation method can produce monodisperse emul-sions with droplet radii that range from 0.1 to 1 μm. The degree of polydispersitydefined as the ratio of the size distribution’s width to its average (see Chapter 1,eq 1.4 for the exact definition), may be as low as 10% after six purification steps.Owing to the entropic origin of the depletion attraction, this method is applicableto any kind of emulsion stabilized by any kind of surfactant provided the emulsionis stable against coalescence and Ostwald ripening.
Once produced, monodisperse emulsions can be used to study the physics ofthe phase separation occurring in the presence of excess surfactant [6]. As previ-ously described, adding surfactant leads to the formation of aggregates coexistingwith free droplets. Likewise, the two coexisting phases, the dense one contain-ing aggregates and the dilute one containing free droplets, exchange continuouslyparticles as can be observed under a microscope (Fig. 3.3). This strongly suggeststhe existence of a fluid–solid thermodynamic equilibrium as defined in the fieldof conventional molecular fluids. Macroscopic samples of the dense phase maybe obtained after creaming. Iridescence is observed when a 1–5 μm thick film ofthe dense phase is deposited between two glass slides. This property gives fairlygood certitude that the dense phase is solid-like with long range ordering of the oildroplets. This is confirmed by the photomicrograph in Fig. 3.2b in which one caneasily distinguish oil droplets forming randomly oriented crystallites and by lightdiffraction experiments, the results of which are consistent with a face-centeredcrystalline structure [6]. Because a thermodynamic equilibrium is expected, onecan draw a phase diagram for various droplet sizes as a function of surfactantconcentration and oil droplet volume fraction [6] (Fig. 3.4). The experimentalpoints separate the one-phase region where only free droplets are observed fromthe two-phase region (above the curve) where aggregated and free droplets coexist.Creaming is systematically observed at the macroscopic level when the surfactantconcentration threshold is reached. Qualitatively, the droplet size dependence ofthe experimental phase diagrams is in accord with the above described depletionmechanism. Indeed, the colloidal aggregation at low droplet volume fraction canbe considered as a gas–solid phase transition and may be simply described by
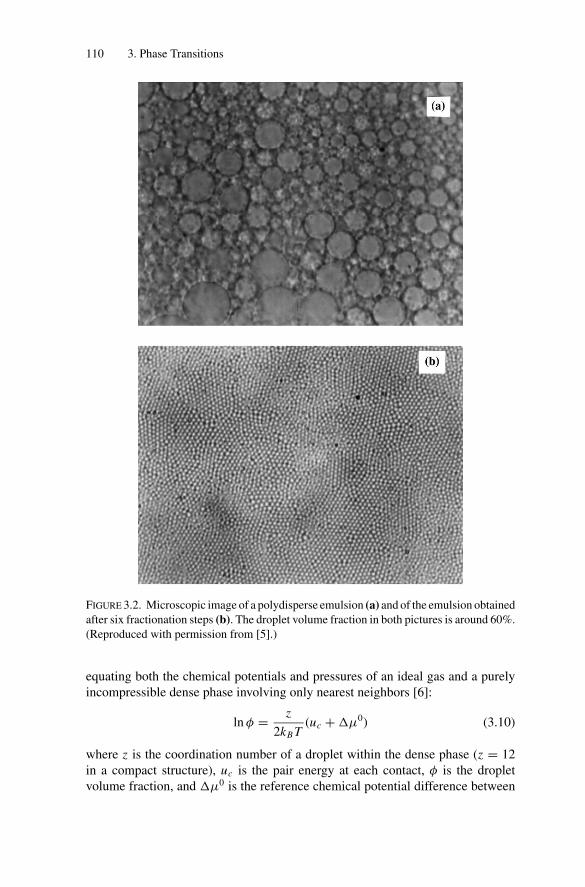
P1: GFZ
SVNY317-Bibette February 1, 2007 16:46
110 3. Phase Transitions
FIGURE 3.2. Microscopic image of a polydisperse emulsion (a) and of the emulsion obtained
after six fractionation steps (b). The droplet volume fraction in both pictures is around 60%.
(Reproduced with permission from [5].)
equating both the chemical potentials and pressures of an ideal gas and a purelyincompressible dense phase involving only nearest neighbors [6]:
ln φ = z
2kB T(uc + �μ0) (3.10)
where z is the coordination number of a droplet within the dense phase (z = 12in a compact structure), uc is the pair energy at each contact, φ is the dropletvolume fraction, and �μ0 is the reference chemical potential difference between
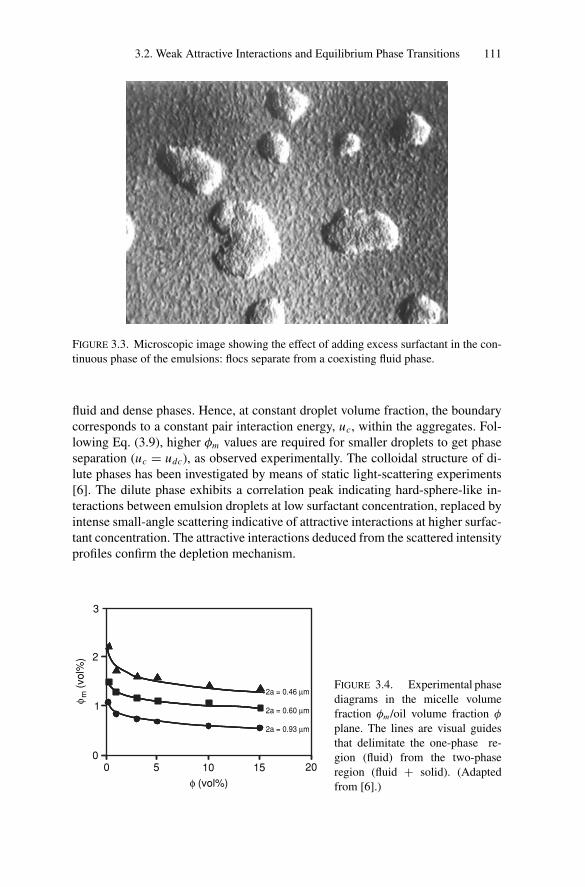
P1: GFZ
SVNY317-Bibette February 1, 2007 16:46
3.2. Weak Attractive Interactions and Equilibrium Phase Transitions 111
FIGURE 3.3. Microscopic image showing the effect of adding excess surfactant in the con-
tinuous phase of the emulsions: flocs separate from a coexisting fluid phase.
fluid and dense phases. Hence, at constant droplet volume fraction, the boundarycorresponds to a constant pair interaction energy, uc, within the aggregates. Fol-lowing Eq. (3.9), higher φm values are required for smaller droplets to get phaseseparation (uc = udc), as observed experimentally. The colloidal structure of di-lute phases has been investigated by means of static light-scattering experiments[6]. The dilute phase exhibits a correlation peak indicating hard-sphere-like in-teractions between emulsion droplets at low surfactant concentration, replaced byintense small-angle scattering indicative of attractive interactions at higher surfac-tant concentration. The attractive interactions deduced from the scattered intensityprofiles confirm the depletion mechanism.
φ (vol%)
φ m (v
ol%
)
0 5 10 15 200
1
2
3
2a = 0.46 μm
2a = 0.60 μm
2a = 0.93 μm
FIGURE 3.4. Experimental phase
diagrams in the micelle volume
fraction φm /oil volume fraction φ
plane. The lines are visual guides
that delimitate the one-phase re-
gion (fluid) from the two-phase
region (fluid + solid). (Adapted
from [6].)
P1: GFZ
SVNY317-Bibette February 1, 2007 16:46
112 3. Phase Transitions
As described in Chapter 2, depletion attraction may also arise from the presenceof free polymer coils in the continuous phase of emulsions. Meller and Stavanshave investigated the effect of nonadsorbing hydrophilic polymers (poly[ethyleneoxide]) on the stability of monodisperse oil-in-water emulsions [7]. Above somethreshold polymer concentration, the polymer coils induce a fluid–solid equilib-rium due to depletion effects. Indeed, in the dilute regime, macromolecules may beregarded as hard spheres whose radius is comparable to the radius of gyration Rg .Polymer coils are thus excluded when droplet surface separation becomes lowerthan � = Rg . Steiner et al. have investigated the phase behavior of mixtures ofemulsion droplets, covering a large range of relative compositions and size ratios[8]. Their results confirm the general phenomenology of phase separation inducedby osmotic depletion forces due to the smaller droplets. From their study it maybe concluded that polydispersity in itself may induce aggregation.
Many different types of interaction can induce reversible phase transitions. Forinstance, weak flocculation has been observed in emulsions stabilized by nonionicsurfactants by increasing the temperature. It is well known that many nonionic sur-factants dissolved in water undergo a phase separation: above a critical temperature,an initially homogeneous surfactant solution separates into two micellar phases ofdifferent composition. This demixtion is generally termed as “cloud point transi-tion.” Identically, oil droplets covered by the same surfactants molecules becomeattractive within the same temperature range and undergo a reversible fluid–solidphase separation [9].
3.2.1.3. Water-in-Oil Emulsions
Inverse emulsions are generally made of water droplets covered by a layer ofshort, aliphatic chains adsorbed at the oil–water interface. Because the dropletsare not charged and ions do not form easily in the low-dielectric-constant organicsolvents, electrostatic interaction can be neglected. Hence, the interaction betweenthe droplets depends essentially on the London-van-der Waals forces between thedroplet cores and on the quality of the solvent with regard to the stabilizing chains.A rough approximation of the van der Waals potential between spherical particlesat contact is given by [10]:
uVdW = − Aa
24δ(3.11)
where A is the Hamaker constant and δ is the thickness of the surfactant stabilizinglayer. To impart stability against van der Waals attraction, the absolute value ofthis interaction potential must be of the order or lower than the thermal energy,kB T . For this to be the case, the stabilizing thickness δ must satisfy the condition:
δ
a≥ A
24kB T(3.12)
The interaction that arises from the overlapping of the surfactant chains is due toa complex interplay between enthalpic and entropic effects involving surfactantchain segments (monomer units) and solvent molecules. The enthalpic part of the
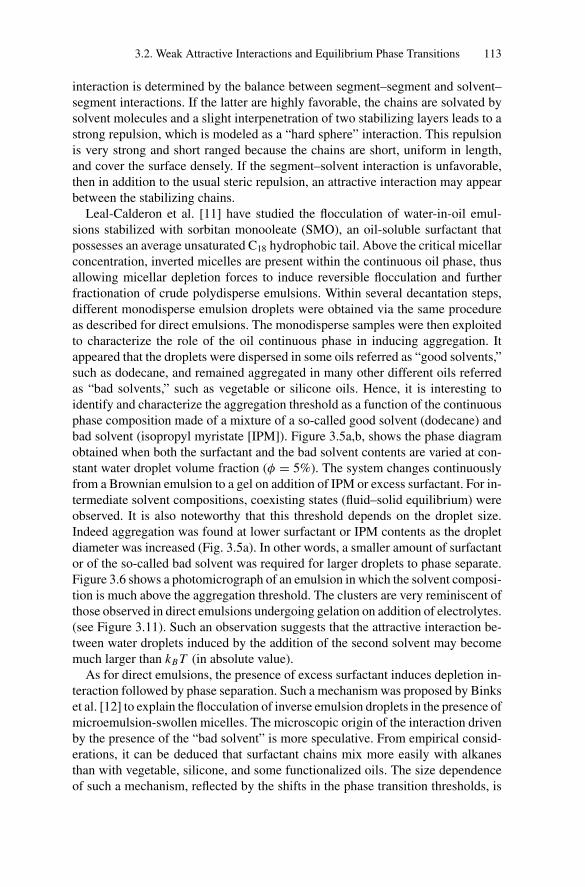
P1: GFZ
SVNY317-Bibette February 1, 2007 16:46
3.2. Weak Attractive Interactions and Equilibrium Phase Transitions 113
interaction is determined by the balance between segment–segment and solvent–segment interactions. If the latter are highly favorable, the chains are solvated bysolvent molecules and a slight interpenetration of two stabilizing layers leads to astrong repulsion, which is modeled as a “hard sphere” interaction. This repulsionis very strong and short ranged because the chains are short, uniform in length,and cover the surface densely. If the segment–solvent interaction is unfavorable,then in addition to the usual steric repulsion, an attractive interaction may appearbetween the stabilizing chains.
Leal-Calderon et al. [11] have studied the flocculation of water-in-oil emul-sions stabilized with sorbitan monooleate (SMO), an oil-soluble surfactant thatpossesses an average unsaturated C18 hydrophobic tail. Above the critical micellarconcentration, inverted micelles are present within the continuous oil phase, thusallowing micellar depletion forces to induce reversible flocculation and furtherfractionation of crude polydisperse emulsions. Within several decantation steps,different monodisperse emulsion droplets were obtained via the same procedureas described for direct emulsions. The monodisperse samples were then exploitedto characterize the role of the oil continuous phase in inducing aggregation. Itappeared that the droplets were dispersed in some oils referred as “good solvents,”such as dodecane, and remained aggregated in many other different oils referredas “bad solvents,” such as vegetable or silicone oils. Hence, it is interesting toidentify and characterize the aggregation threshold as a function of the continuousphase composition made of a mixture of a so-called good solvent (dodecane) andbad solvent (isopropyl myristate [IPM]). Figure 3.5a,b, shows the phase diagramobtained when both the surfactant and the bad solvent contents are varied at con-stant water droplet volume fraction (φ = 5%). The system changes continuouslyfrom a Brownian emulsion to a gel on addition of IPM or excess surfactant. For in-termediate solvent compositions, coexisting states (fluid–solid equilibrium) wereobserved. It is also noteworthy that this threshold depends on the droplet size.Indeed aggregation was found at lower surfactant or IPM contents as the dropletdiameter was increased (Fig. 3.5a). In other words, a smaller amount of surfactantor of the so-called bad solvent was required for larger droplets to phase separate.Figure 3.6 shows a photomicrograph of an emulsion in which the solvent composi-tion is much above the aggregation threshold. The clusters are very reminiscent ofthose observed in direct emulsions undergoing gelation on addition of electrolytes.(see Figure 3.11). Such an observation suggests that the attractive interaction be-tween water droplets induced by the addition of the second solvent may becomemuch larger than kB T (in absolute value).
As for direct emulsions, the presence of excess surfactant induces depletion in-teraction followed by phase separation. Such a mechanism was proposed by Binkset al. [12] to explain the flocculation of inverse emulsion droplets in the presence ofmicroemulsion-swollen micelles. The microscopic origin of the interaction drivenby the presence of the “bad solvent” is more speculative. From empirical consid-erations, it can be deduced that surfactant chains mix more easily with alkanesthan with vegetable, silicone, and some functionalized oils. The size dependenceof such a mechanism, reflected by the shifts in the phase transition thresholds, is
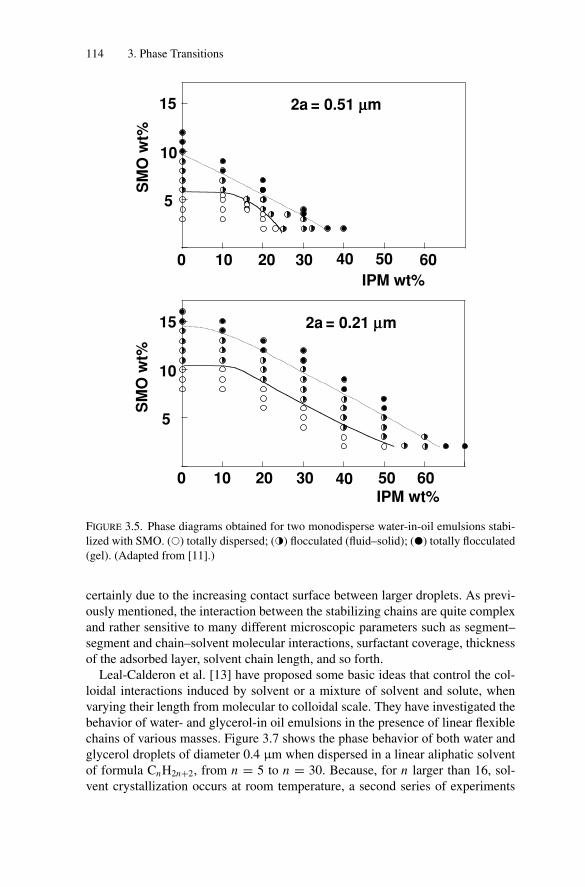
P1: GFZ
SVNY317-Bibette February 1, 2007 16:46
114 3. Phase Transitions
0 10 20 30 40 50 60
5
10
15
SM
O w
t%
IPM wt%
2a = 0.51 μμm
0 10 20 30 40
5
10
15 2a = 0.21 μμm
IPM wt%
SM
O w
t%
50 60
FIGURE 3.5. Phase diagrams obtained for two monodisperse water-in-oil emulsions stabi-
lized with SMO. (�) totally dispersed; (�) flocculated (fluid–solid); (�) totally flocculated
(gel). (Adapted from [11].)
certainly due to the increasing contact surface between larger droplets. As previ-ously mentioned, the interaction between the stabilizing chains are quite complexand rather sensitive to many different microscopic parameters such as segment–segment and chain–solvent molecular interactions, surfactant coverage, thicknessof the adsorbed layer, solvent chain length, and so forth.
Leal-Calderon et al. [13] have proposed some basic ideas that control the col-loidal interactions induced by solvent or a mixture of solvent and solute, whenvarying their length from molecular to colloidal scale. They have investigated thebehavior of water- and glycerol-in oil emulsions in the presence of linear flexiblechains of various masses. Figure 3.7 shows the phase behavior of both water andglycerol droplets of diameter 0.4 μm when dispersed in a linear aliphatic solventof formula CnH2n+2, from n = 5 to n = 30. Because, for n larger than 16, sol-vent crystallization occurs at room temperature, a second series of experiments
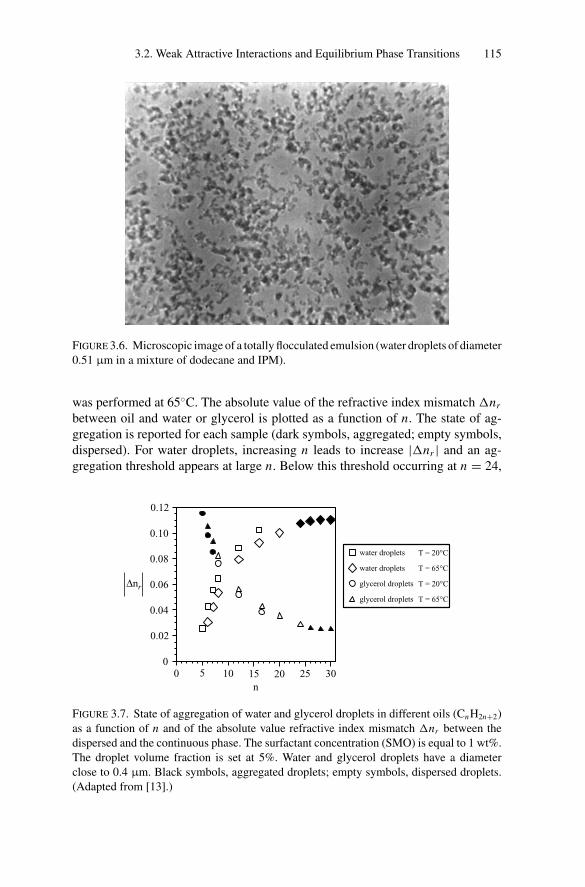
P1: GFZ
SVNY317-Bibette February 1, 2007 16:46
3.2. Weak Attractive Interactions and Equilibrium Phase Transitions 115
FIGURE 3.6. Microscopic image of a totally flocculated emulsion (water droplets of diameter
0.51 μm in a mixture of dodecane and IPM).
was performed at 65◦C. The absolute value of the refractive index mismatch �nr
between oil and water or glycerol is plotted as a function of n. The state of ag-gregation is reported for each sample (dark symbols, aggregated; empty symbols,dispersed). For water droplets, increasing n leads to increase |�nr | and an ag-gregation threshold appears at large n. Below this threshold occurring at n = 24,
0
0.02
0.04
0.06
0.08
0.10
0.12
5 10 15 20 25 30
water droplets T = 20°C
water droplets T = 65°C
glycerol droplets T = 20°C
glycerol droplets T = 65°C
n
Δnr
0
FIGURE 3.7. State of aggregation of water and glycerol droplets in different oils (CnH2n+2)
as a function of n and of the absolute value refractive index mismatch �nr between the
dispersed and the continuous phase. The surfactant concentration (SMO) is equal to 1 wt%.
The droplet volume fraction is set at 5%. Water and glycerol droplets have a diameter
close to 0.4 μm. Black symbols, aggregated droplets; empty symbols, dispersed droplets.
(Adapted from [13].)
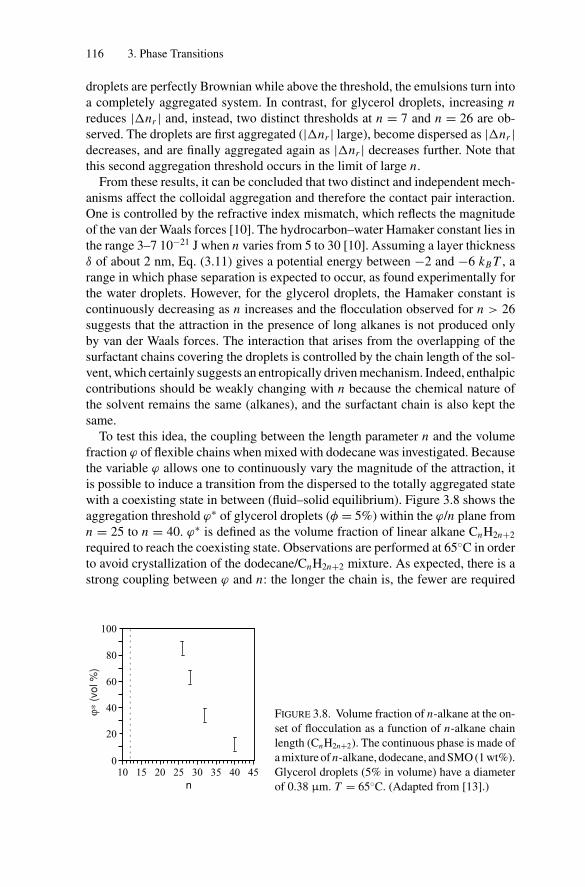
P1: GFZ
SVNY317-Bibette February 1, 2007 16:46
116 3. Phase Transitions
droplets are perfectly Brownian while above the threshold, the emulsions turn intoa completely aggregated system. In contrast, for glycerol droplets, increasing nreduces |�nr | and, instead, two distinct thresholds at n = 7 and n = 26 are ob-served. The droplets are first aggregated (|�nr | large), become dispersed as |�nr |decreases, and are finally aggregated again as |�nr | decreases further. Note thatthis second aggregation threshold occurs in the limit of large n.
From these results, it can be concluded that two distinct and independent mech-anisms affect the colloidal aggregation and therefore the contact pair interaction.One is controlled by the refractive index mismatch, which reflects the magnitudeof the van der Waals forces [10]. The hydrocarbon–water Hamaker constant lies inthe range 3–7 10−21 J when n varies from 5 to 30 [10]. Assuming a layer thicknessδ of about 2 nm, Eq. (3.11) gives a potential energy between −2 and −6 kB T , arange in which phase separation is expected to occur, as found experimentally forthe water droplets. However, for the glycerol droplets, the Hamaker constant iscontinuously decreasing as n increases and the flocculation observed for n > 26suggests that the attraction in the presence of long alkanes is not produced onlyby van der Waals forces. The interaction that arises from the overlapping of thesurfactant chains covering the droplets is controlled by the chain length of the sol-vent, which certainly suggests an entropically driven mechanism. Indeed, enthalpiccontributions should be weakly changing with n because the chemical nature ofthe solvent remains the same (alkanes), and the surfactant chain is also kept thesame.
To test this idea, the coupling between the length parameter n and the volumefraction ϕ of flexible chains when mixed with dodecane was investigated. Becausethe variable ϕ allows one to continuously vary the magnitude of the attraction, itis possible to induce a transition from the dispersed to the totally aggregated statewith a coexisting state in between (fluid–solid equilibrium). Figure 3.8 shows theaggregation threshold ϕ∗ of glycerol droplets (φ = 5%) within the ϕ/n plane fromn = 25 to n = 40. ϕ∗ is defined as the volume fraction of linear alkane CnH2n+2
required to reach the coexisting state. Observations are performed at 65◦C in orderto avoid crystallization of the dodecane/CnH2n+2 mixture. As expected, there is astrong coupling between ϕ and n: the longer the chain is, the fewer are required
0
20
40
60
80
100
10 15 20 25 30 35 40 45
n
ϕ∗ (v
ol %
)
FIGURE 3.8. Volume fraction of n-alkane at the on-
set of flocculation as a function of n-alkane chain
length (CnH2n+2). The continuous phase is made of
a mixture of n-alkane, dodecane, and SMO (1 wt%).
Glycerol droplets (5% in volume) have a diameter
of 0.38 μm. T = 65◦C. (Adapted from [13].)
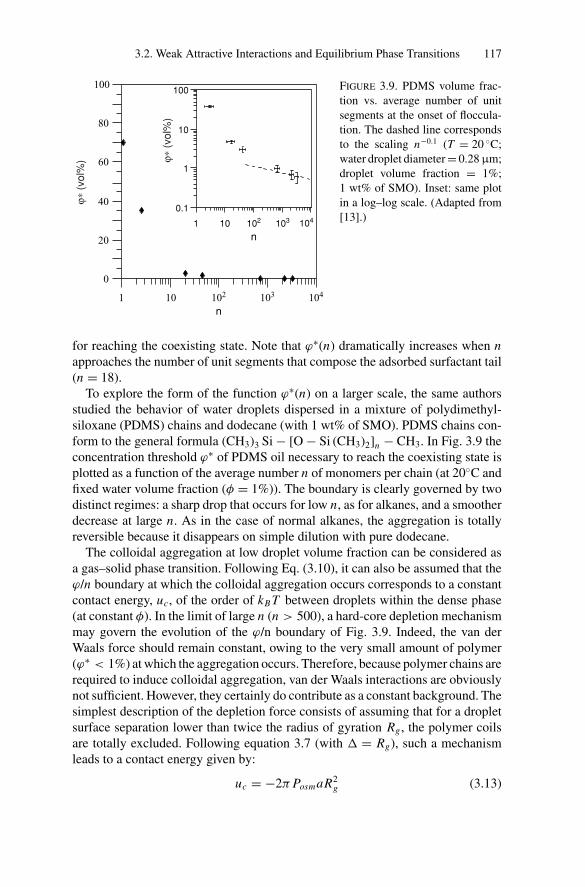
P1: GFZ
SVNY317-Bibette February 1, 2007 16:46
3.2. Weak Attractive Interactions and Equilibrium Phase Transitions 117
80
60
40
20
0
100
1 10 102 103 104
1 10 102 103 104
0.1
1
10
100
n
n
ϕ∗ (v
ol%
) ϕ∗ (v
ol%
)
FIGURE 3.9. PDMS volume frac-
tion vs. average number of unit
segments at the onset of floccula-
tion. The dashed line corresponds
to the scaling n−0.1 (T = 20 ◦C;
water droplet diameter = 0.28 μm;
droplet volume fraction = 1%;
1 wt% of SMO). Inset: same plot
in a log–log scale. (Adapted from
[13].)
for reaching the coexisting state. Note that ϕ∗(n) dramatically increases when napproaches the number of unit segments that compose the adsorbed surfactant tail(n = 18).
To explore the form of the function ϕ∗(n) on a larger scale, the same authorsstudied the behavior of water droplets dispersed in a mixture of polydimethyl-siloxane (PDMS) chains and dodecane (with 1 wt% of SMO). PDMS chains con-form to the general formula (CH3)3 Si − [O − Si (CH3)2]n − CH3. In Fig. 3.9 theconcentration threshold ϕ∗ of PDMS oil necessary to reach the coexisting state isplotted as a function of the average number n of monomers per chain (at 20◦C andfixed water volume fraction (φ = 1%)). The boundary is clearly governed by twodistinct regimes: a sharp drop that occurs for low n, as for alkanes, and a smootherdecrease at large n. As in the case of normal alkanes, the aggregation is totallyreversible because it disappears on simple dilution with pure dodecane.
The colloidal aggregation at low droplet volume fraction can be considered asa gas–solid phase transition. Following Eq. (3.10), it can also be assumed that theϕ/n boundary at which the colloidal aggregation occurs corresponds to a constantcontact energy, uc, of the order of kB T between droplets within the dense phase(at constant φ). In the limit of large n (n > 500), a hard-core depletion mechanismmay govern the evolution of the ϕ/n boundary of Fig. 3.9. Indeed, the van derWaals force should remain constant, owing to the very small amount of polymer(ϕ∗ < 1%) at which the aggregation occurs. Therefore, because polymer chains arerequired to induce colloidal aggregation, van der Waals interactions are obviouslynot sufficient. However, they certainly do contribute as a constant background. Thesimplest description of the depletion force consists of assuming that for a dropletsurface separation lower than twice the radius of gyration Rg , the polymer coilsare totally excluded. Following equation 3.7 (with � = Rg), such a mechanismleads to a contact energy given by:
uc = −2π PosmaR2g (3.13)
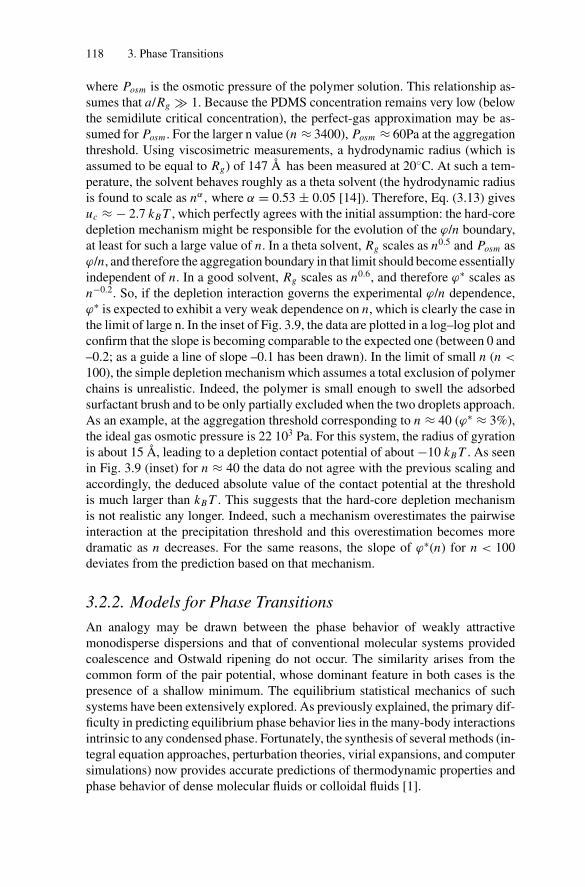
P1: GFZ
SVNY317-Bibette February 1, 2007 16:46
118 3. Phase Transitions
where Posm is the osmotic pressure of the polymer solution. This relationship as-sumes that a/Rg 1. Because the PDMS concentration remains very low (belowthe semidilute critical concentration), the perfect-gas approximation may be as-sumed for Posm . For the larger n value (n ≈ 3400), Posm ≈ 60Pa at the aggregationthreshold. Using viscosimetric measurements, a hydrodynamic radius (which isassumed to be equal to Rg) of 147 A has been measured at 20◦C. At such a tem-perature, the solvent behaves roughly as a theta solvent (the hydrodynamic radiusis found to scale as nα, where α = 0.53 ± 0.05 [14]). Therefore, Eq. (3.13) givesuc ≈ − 2.7 kB T , which perfectly agrees with the initial assumption: the hard-coredepletion mechanism might be responsible for the evolution of the ϕ/n boundary,at least for such a large value of n. In a theta solvent, Rg scales as n0.5 and Posm asϕ/n, and therefore the aggregation boundary in that limit should become essentiallyindependent of n. In a good solvent, Rg scales as n0.6, and therefore ϕ∗ scales asn−0.2. So, if the depletion interaction governs the experimental ϕ/n dependence,ϕ∗ is expected to exhibit a very weak dependence on n, which is clearly the case inthe limit of large n. In the inset of Fig. 3.9, the data are plotted in a log–log plot andconfirm that the slope is becoming comparable to the expected one (between 0 and–0.2; as a guide a line of slope –0.1 has been drawn). In the limit of small n (n <
100), the simple depletion mechanism which assumes a total exclusion of polymerchains is unrealistic. Indeed, the polymer is small enough to swell the adsorbedsurfactant brush and to be only partially excluded when the two droplets approach.As an example, at the aggregation threshold corresponding to n ≈ 40 (ϕ∗ ≈ 3%),the ideal gas osmotic pressure is 22 103 Pa. For this system, the radius of gyrationis about 15 A, leading to a depletion contact potential of about −10 kB T . As seenin Fig. 3.9 (inset) for n ≈ 40 the data do not agree with the previous scaling andaccordingly, the deduced absolute value of the contact potential at the thresholdis much larger than kB T . This suggests that the hard-core depletion mechanismis not realistic any longer. Indeed, such a mechanism overestimates the pairwiseinteraction at the precipitation threshold and this overestimation becomes moredramatic as n decreases. For the same reasons, the slope of ϕ∗(n) for n < 100deviates from the prediction based on that mechanism.
3.2.2. Models for Phase Transitions
An analogy may be drawn between the phase behavior of weakly attractivemonodisperse dispersions and that of conventional molecular systems providedcoalescence and Ostwald ripening do not occur. The similarity arises from thecommon form of the pair potential, whose dominant feature in both cases is thepresence of a shallow minimum. The equilibrium statistical mechanics of suchsystems have been extensively explored. As previously explained, the primary dif-ficulty in predicting equilibrium phase behavior lies in the many-body interactionsintrinsic to any condensed phase. Fortunately, the synthesis of several methods (in-tegral equation approaches, perturbation theories, virial expansions, and computersimulations) now provides accurate predictions of thermodynamic properties andphase behavior of dense molecular fluids or colloidal fluids [1].
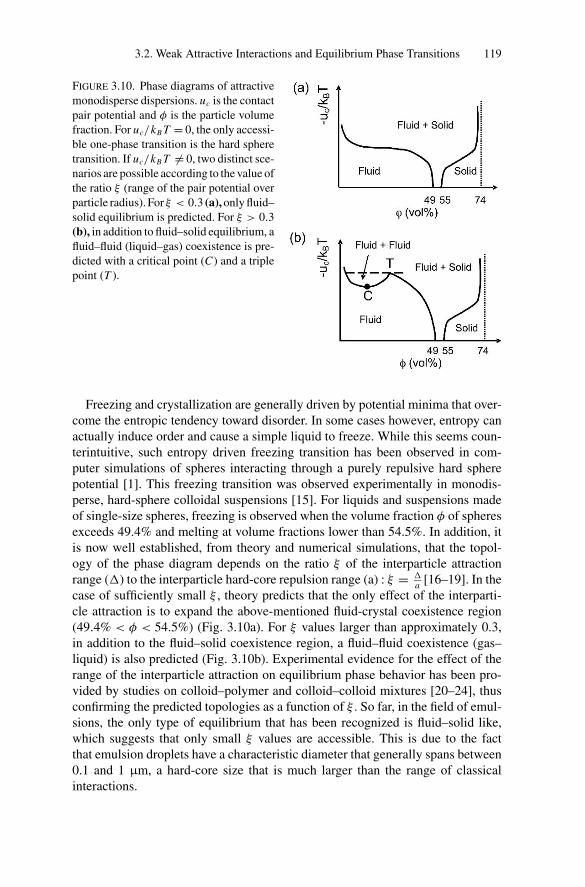
P1: GFZ
SVNY317-Bibette February 1, 2007 16:46
3.2. Weak Attractive Interactions and Equilibrium Phase Transitions 119
FIGURE 3.10. Phase diagrams of attractive
monodisperse dispersions. uc is the contact
pair potential and φ is the particle volume
fraction. For uc/kB T = 0, the only accessi-
ble one-phase transition is the hard sphere
transition. If uc/kB T �= 0, two distinct sce-
narios are possible according to the value of
the ratio ξ (range of the pair potential over
particle radius). For ξ < 0.3 (a), only fluid–
solid equilibrium is predicted. For ξ > 0.3
(b), in addition to fluid–solid equilibrium, a
fluid–fluid (liquid–gas) coexistence is pre-
dicted with a critical point (C) and a triple
point (T ).
Freezing and crystallization are generally driven by potential minima that over-come the entropic tendency toward disorder. In some cases however, entropy canactually induce order and cause a simple liquid to freeze. While this seems coun-terintuitive, such entropy driven freezing transition has been observed in com-puter simulations of spheres interacting through a purely repulsive hard spherepotential [1]. This freezing transition was observed experimentally in monodis-perse, hard-sphere colloidal suspensions [15]. For liquids and suspensions madeof single-size spheres, freezing is observed when the volume fraction φ of spheresexceeds 49.4% and melting at volume fractions lower than 54.5%. In addition, itis now well established, from theory and numerical simulations, that the topol-ogy of the phase diagram depends on the ratio ξ of the interparticle attractionrange (�) to the interparticle hard-core repulsion range (a) : ξ = �
a [16–19]. In thecase of sufficiently small ξ , theory predicts that the only effect of the interparti-cle attraction is to expand the above-mentioned fluid-crystal coexistence region(49.4% < φ < 54.5%) (Fig. 3.10a). For ξ values larger than approximately 0.3,in addition to the fluid–solid coexistence region, a fluid–fluid coexistence (gas–liquid) is also predicted (Fig. 3.10b). Experimental evidence for the effect of therange of the interparticle attraction on equilibrium phase behavior has been pro-vided by studies on colloid–polymer and colloid–colloid mixtures [20–24], thusconfirming the predicted topologies as a function of ξ . So far, in the field of emul-sions, the only type of equilibrium that has been recognized is fluid–solid like,which suggests that only small ξ values are accessible. This is due to the factthat emulsion droplets have a characteristic diameter that generally spans between0.1 and 1 μm, a hard-core size that is much larger than the range of classicalinteractions.
P1: GFZ
SVNY317-Bibette February 1, 2007 16:46
120 3. Phase Transitions
FIGURE 3.11. Emulsion gel. The droplets are about 0.5 μm in diameter. They form large
and ramified aggregates.
3.3. Gelation and Kinetically Induced Ordering
If the attractive energy between the droplets is around −10 kB T , equilibriumphase behavior is no longer possible. Strongly attractive emulsion droplets irre-versibly stick to one another, as they collide owing to their diffusive motion. Asshown in Fig. 3.11, the resultant bonds can be sufficiently strong to prevent furtherrearrangements, leading to highly disordered and tenuous clusters, whose structurecan be well described as fractal [25]. In contrast to a compact aggregate in whichthe mass M and the radius R are related as M ∝ R3, the radius of a fractal objectdepends more strongly on M . By definition, if M and R are related through:
M ∝ Rd f (3.14)
we are dealing with a fractal object. The exponent d f represents the fractal di-mension, which is a rational number less than 3; the smaller d f , the less compactthe aggregate. If there is no repulsive barrier preventing clusters from stickingupon collision, the aggregation is driven solely by the diffusion-induced collisionsbetween the growing clusters. This regime, called diffusion-limited cluster aggre-gation (DLCA), is amenable to detailed theoretical analysis, and has become animportant base case on which understanding of other kinetic growth processes canbe built. At long times, DLCA must produce a gel that spans the system, prevent-ing further coarsening. DLCA is completely random; nevertheless, experimentsperformed with concentrated suspensions, have shown that a surprising order candevelop, manifested by a pronounced peak in the small angle scattering intensityI (q) as a function of wave vector, which reflects the development of a characteristiclength scale in the suspension [26,27].
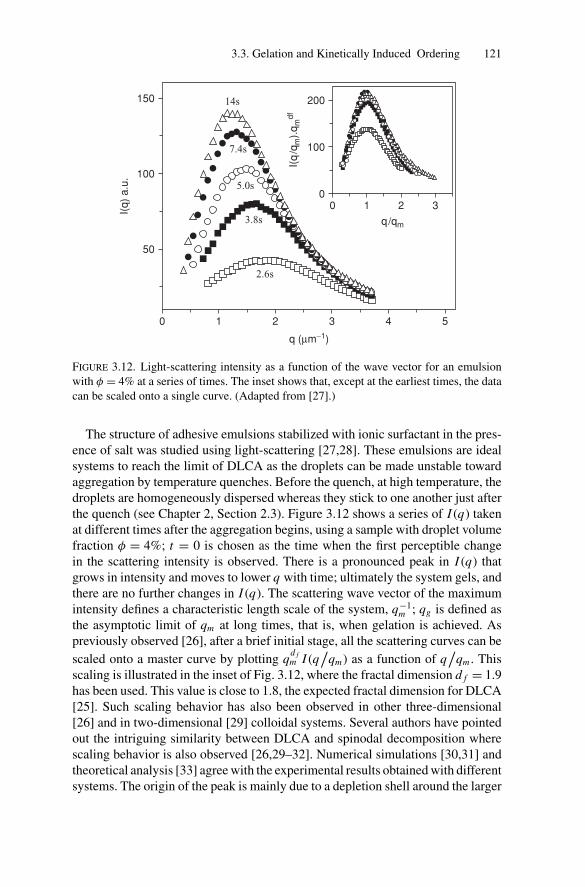
P1: GFZ
SVNY317-Bibette February 1, 2007 16:46
3.3. Gelation and Kinetically Induced Ordering 121
150
100
50
0 1 2 3 4 5
q (μm−1)
I(q)
a.u
.
200
100
00 1 2 3
q/qm
I(q
/qm
).q
mdf
14s
7.4s
5.0s
3.8s
2.6s
FIGURE 3.12. Light-scattering intensity as a function of the wave vector for an emulsion
with φ = 4% at a series of times. The inset shows that, except at the earliest times, the data
can be scaled onto a single curve. (Adapted from [27].)
The structure of adhesive emulsions stabilized with ionic surfactant in the pres-ence of salt was studied using light-scattering [27,28]. These emulsions are idealsystems to reach the limit of DLCA as the droplets can be made unstable towardaggregation by temperature quenches. Before the quench, at high temperature, thedroplets are homogeneously dispersed whereas they stick to one another just afterthe quench (see Chapter 2, Section 2.3). Figure 3.12 shows a series of I (q) takenat different times after the aggregation begins, using a sample with droplet volumefraction φ = 4%; t = 0 is chosen as the time when the first perceptible changein the scattering intensity is observed. There is a pronounced peak in I (q) thatgrows in intensity and moves to lower q with time; ultimately the system gels, andthere are no further changes in I (q). The scattering wave vector of the maximumintensity defines a characteristic length scale of the system, q−1
m ; qg is defined asthe asymptotic limit of qm at long times, that is, when gelation is achieved. Aspreviously observed [26], after a brief initial stage, all the scattering curves can be
scaled onto a master curve by plotting qd fm I (q
/qm) as a function of q
/qm . This
scaling is illustrated in the inset of Fig. 3.12, where the fractal dimension d f = 1.9has been used. This value is close to 1.8, the expected fractal dimension for DLCA[25]. Such scaling behavior has also been observed in other three-dimensional[26] and in two-dimensional [29] colloidal systems. Several authors have pointedout the intriguing similarity between DLCA and spinodal decomposition wherescaling behavior is also observed [26,29–32]. Numerical simulations [30,31] andtheoretical analysis [33] agree with the experimental results obtained with differentsystems. The origin of the peak is mainly due to a depletion shell around the larger
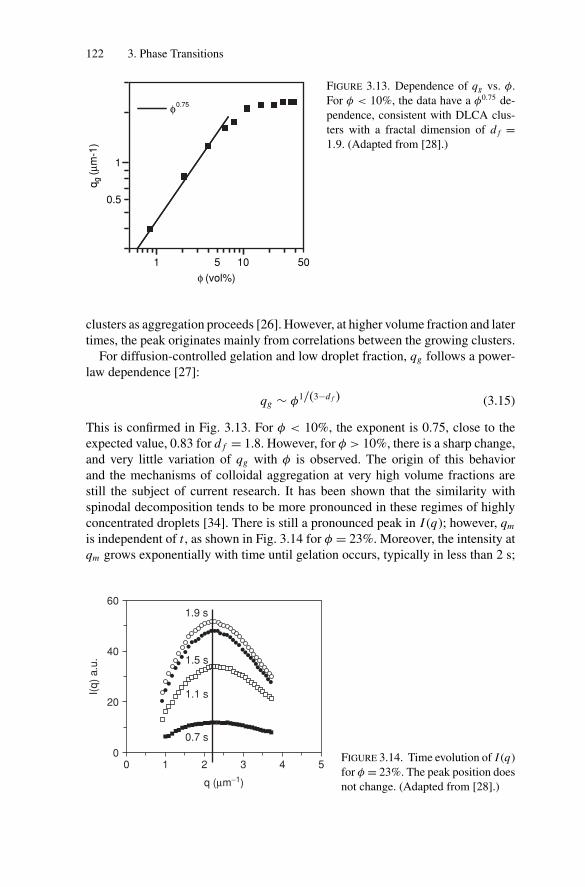
P1: GFZ
SVNY317-Bibette February 1, 2007 16:46
122 3. Phase Transitions
1 5 10 50
1
0.5
qg (
μm-1
)
φ
φ (vol%)
0.75
FIGURE 3.13. Dependence of qg vs. φ.
For φ < 10%, the data have a φ0.75 de-
pendence, consistent with DLCA clus-
ters with a fractal dimension of d f =1.9. (Adapted from [28].)
clusters as aggregation proceeds [26]. However, at higher volume fraction and latertimes, the peak originates mainly from correlations between the growing clusters.
For diffusion-controlled gelation and low droplet fraction, qg follows a power-law dependence [27]:
qg ∼ φ1/(3−d f ) (3.15)
This is confirmed in Fig. 3.13. For φ < 10%, the exponent is 0.75, close to theexpected value, 0.83 for d f = 1.8. However, for φ > 10%, there is a sharp change,and very little variation of qg with φ is observed. The origin of this behaviorand the mechanisms of colloidal aggregation at very high volume fractions arestill the subject of current research. It has been shown that the similarity withspinodal decomposition tends to be more pronounced in these regimes of highlyconcentrated droplets [34]. There is still a pronounced peak in I (q); however, qm
is independent of t , as shown in Fig. 3.14 for φ = 23%. Moreover, the intensity atqm grows exponentially with time until gelation occurs, typically in less than 2 s;
60
40
20
00 1 2 3 4 5
q (μm−1)
I(q)
a.u
.
1.9 s
1.5 s
1.1 s
0.7 s
FIGURE 3.14. Time evolution of I (q)
for φ = 23%. The peak position does
not change. (Adapted from [28].)
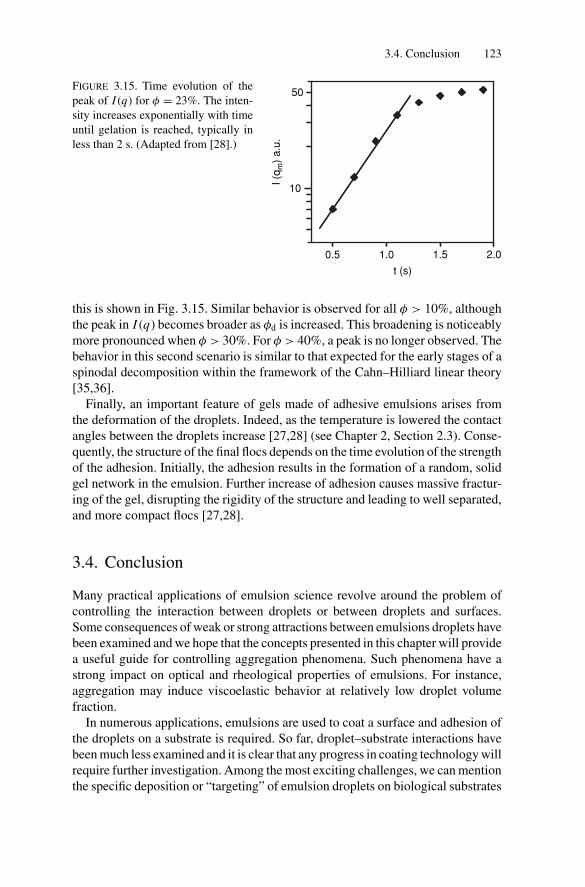
P1: GFZ
SVNY317-Bibette February 1, 2007 16:46
3.4. Conclusion 123
t (s)
0.5 1.0 1.5 2.0
10
50
I (q
m)
a.u
.
FIGURE 3.15. Time evolution of the
peak of I (q) for φ = 23%. The inten-
sity increases exponentially with time
until gelation is reached, typically in
less than 2 s. (Adapted from [28].)
this is shown in Fig. 3.15. Similar behavior is observed for all φ > 10%, althoughthe peak in I (q) becomes broader as φd is increased. This broadening is noticeablymore pronounced when φ > 30%. For φ > 40%, a peak is no longer observed. Thebehavior in this second scenario is similar to that expected for the early stages of aspinodal decomposition within the framework of the Cahn–Hilliard linear theory[35,36].
Finally, an important feature of gels made of adhesive emulsions arises fromthe deformation of the droplets. Indeed, as the temperature is lowered the contactangles between the droplets increase [27,28] (see Chapter 2, Section 2.3). Conse-quently, the structure of the final flocs depends on the time evolution of the strengthof the adhesion. Initially, the adhesion results in the formation of a random, solidgel network in the emulsion. Further increase of adhesion causes massive fractur-ing of the gel, disrupting the rigidity of the structure and leading to well separated,and more compact flocs [27,28].
3.4. Conclusion
Many practical applications of emulsion science revolve around the problem ofcontrolling the interaction between droplets or between droplets and surfaces.Some consequences of weak or strong attractions between emulsions droplets havebeen examined and we hope that the concepts presented in this chapter will providea useful guide for controlling aggregation phenomena. Such phenomena have astrong impact on optical and rheological properties of emulsions. For instance,aggregation may induce viscoelastic behavior at relatively low droplet volumefraction.
In numerous applications, emulsions are used to coat a surface and adhesion ofthe droplets on a substrate is required. So far, droplet–substrate interactions havebeen much less examined and it is clear that any progress in coating technology willrequire further investigation. Among the most exciting challenges, we can mentionthe specific deposition or “targeting” of emulsion droplets on biological substrates
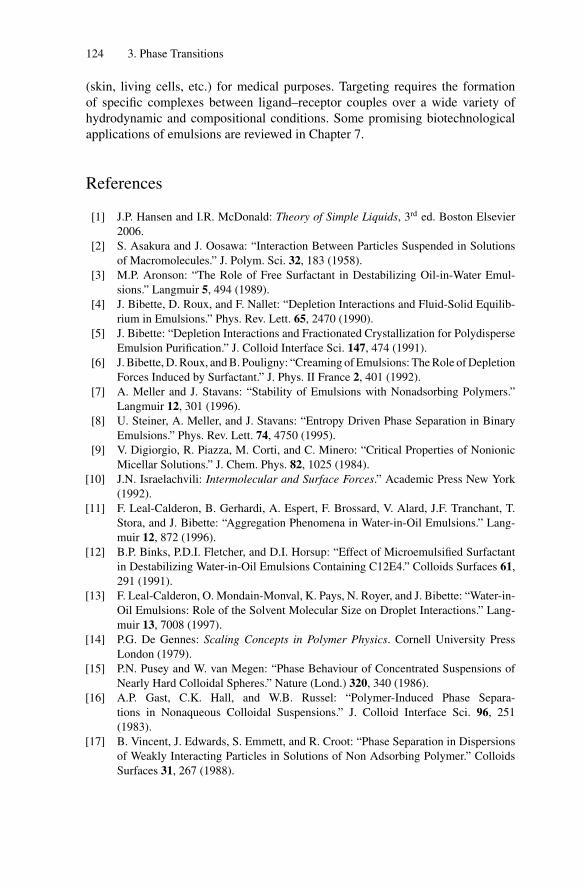
P1: GFZ
SVNY317-Bibette February 1, 2007 16:46
124 3. Phase Transitions
(skin, living cells, etc.) for medical purposes. Targeting requires the formationof specific complexes between ligand–receptor couples over a wide variety ofhydrodynamic and compositional conditions. Some promising biotechnologicalapplications of emulsions are reviewed in Chapter 7.
References
[1] J.P. Hansen and I.R. McDonald: Theory of Simple Liquids, 3rd ed. Boston Elsevier
2006.
[2] S. Asakura and J. Oosawa: “Interaction Between Particles Suspended in Solutions
of Macromolecules.” J. Polym. Sci. 32, 183 (1958).
[3] M.P. Aronson: “The Role of Free Surfactant in Destabilizing Oil-in-Water Emul-
sions.” Langmuir 5, 494 (1989).
[4] J. Bibette, D. Roux, and F. Nallet: “Depletion Interactions and Fluid-Solid Equilib-
rium in Emulsions.” Phys. Rev. Lett. 65, 2470 (1990).
[5] J. Bibette: “Depletion Interactions and Fractionated Crystallization for Polydisperse
Emulsion Purification.” J. Colloid Interface Sci. 147, 474 (1991).
[6] J. Bibette, D. Roux, and B. Pouligny: “Creaming of Emulsions: The Role of Depletion
Forces Induced by Surfactant.” J. Phys. II France 2, 401 (1992).
[7] A. Meller and J. Stavans: “Stability of Emulsions with Nonadsorbing Polymers.”
Langmuir 12, 301 (1996).
[8] U. Steiner, A. Meller, and J. Stavans: “Entropy Driven Phase Separation in Binary
Emulsions.” Phys. Rev. Lett. 74, 4750 (1995).
[9] V. Digiorgio, R. Piazza, M. Corti, and C. Minero: “Critical Properties of Nonionic
Micellar Solutions.” J. Chem. Phys. 82, 1025 (1984).
[10] J.N. Israelachvili: Intermolecular and Surface Forces.” Academic Press New York
(1992).
[11] F. Leal-Calderon, B. Gerhardi, A. Espert, F. Brossard, V. Alard, J.F. Tranchant, T.
Stora, and J. Bibette: “Aggregation Phenomena in Water-in-Oil Emulsions.” Lang-
muir 12, 872 (1996).
[12] B.P. Binks, P.D.I. Fletcher, and D.I. Horsup: “Effect of Microemulsified Surfactant
in Destabilizing Water-in-Oil Emulsions Containing C12E4.” Colloids Surfaces 61,
291 (1991).
[13] F. Leal-Calderon, O. Mondain-Monval, K. Pays, N. Royer, and J. Bibette: “Water-in-
Oil Emulsions: Role of the Solvent Molecular Size on Droplet Interactions.” Lang-
muir 13, 7008 (1997).
[14] P.G. De Gennes: Scaling Concepts in Polymer Physics. Cornell University Press
London (1979).
[15] P.N. Pusey and W. van Megen: “Phase Behaviour of Concentrated Suspensions of
Nearly Hard Colloidal Spheres.” Nature (Lond.) 320, 340 (1986).
[16] A.P. Gast, C.K. Hall, and W.B. Russel: “Polymer-Induced Phase Separa-
tions in Nonaqueous Colloidal Suspensions.” J. Colloid Interface Sci. 96, 251
(1983).
[17] B. Vincent, J. Edwards, S. Emmett, and R. Croot: “Phase Separation in Dispersions
of Weakly Interacting Particles in Solutions of Non Adsorbing Polymer.” Colloids
Surfaces 31, 267 (1988).
P1: GFZ
SVNY317-Bibette February 1, 2007 16:46
References 125
[18] H.N.W. Lekkerkerker, W.C.K. Poon, P.N. Pusey, A. Stroobants, and P.B. War-
ren: “Phase Behaviour of Colloid + Polymer Mixtures.” Europhys. Lett. 20, 59
(1992).
[19] M.H.J. Hagen and D. Frenkel: “Determination of Phase Diagrams for the Hard-Core
Attractive Yukawa System.” J. Chem. Phys. 101, 4093 (1994).
[20] P.R. Sperry: “Morphology and Mechanism in Latex Flocculated by Volume Restric-
tion.” J. Colloid Interface Sci. 99, 97 (1984).
[21] B. Vincent: “The Stability of Non-Aqueous Dispersions of Weakly Interacting Par-
ticles.” Colloids Surfaces 24, 269 (1987).
[22] F. Leal-Calderon, J. Bibette, and J. Biais: “Experimental Phase Diagrams of Polymer
and Colloid Mixtures.” Europhys. Lett. 23, 653 (1993).
[23] S.M. Illet, A. Orrock, W.C.K. Poon, and P.N. Pusey: “Phase Behavior of a Model
Colloid-Polymer Mixture.” Phys. Rev. E 51, 1344 (1995).
[24] S. Sanyal, N. Easwear, S. Ramaswamy, and A.K. Sood: “Phase Separation in Binary
Nearly-Hard-Sphere Colloids: Evidence for the Depletion Force.” Europhys. Lett.
18, 107 (1993).
[25] R. Jullien and R. Botet: Aggregation and Fractal Aggregates. World Scientific, ISBN
9971502488, Singapore (1987).
[26] M. Carpineti and M. Giglio: “Spinodal-Type Dynamics in Fractal Aggregation of
Colloidal Clusters.” Phys. Rev. Lett 68, 3327 (1992).
[27] J. Bibette, T.G. Mason, H. Gang, and D.A. Weitz: “Kinetically Induced Ordering in
Gelation of Emulsions.” Phys. Rev. Lett 69, 981 (1992).
[28] J. Bibette, T.G. Mason, H. Gang, D.A. Weitz, and P. Poulin: “Structure of Adhesive
Emulsions.” Langmuir 9, 3352 (1993).
[29] D.J. Robinson and J.C. Earnshaw: “Long Range Order in Two Dimensional Fractal
Aggregation.” Phys. Rev. Lett 71, 715 (1993).
[30] A. Hasmy, E. Anglaret, M. Foret, J. Pellous, and R. Jullien: “Small-Angle Neutron-
Scattering Investigation of Long-Range Correlations in Silica Aerogels: Simulations
and Experiments.” Phys. Rev. B 50, 6006 (1994).
[31] A. Hasmy and R. Jullien: “Sol-Gel Process Simulation by Cluster-Cluster Aggrega-
tion.” J. Non-Crystalline Solids 186, 352 (1995).
[32] A.E. Gonzalez and G. Ramirez-Santiago: “Spatial Ordering and Structure Factor
Scaling in the Simulations of Colloid Aggregation.” Phys. Rev. Lett 74, 1238 (1995).
[33] F. Sciortino and P. Tartaglia: “Structure Factor Scaling During Irreversible Cluster-
Cluster Aggregation.” Phys. Rev. Lett 74, 282 (1995).
[34] P. Poulin, J. Bibette, and D.A. Weitz: “From Colloidal Aggregation to Spinodal
Decomposition in Sticky Emulsions.” Eur. J. Physics B 9, 3352 (1999).
[35] Domb C. and Lebowitz J.L. (eds.): Phase Transition and Critical Phenomena.
vol. 8. Academic Press, London (1983).
[36] J.W. Cahn and J.E. Hilliard: “Free Energy of a Nonuniform System. I. Interfacial
Free Energy.” J. Chem. Phys. 28, 258 (1958).
P1: GFZSVNY317-Bibette February 1, 2007 16:52
4Compressibility and Elasticityof Concentrated Emulsions
4.1. Introduction
Emulsions are dispersions of deformable droplets that can therefore span dropletvolume fractions from zero to almost one. Much effort has been spent in studyingthe rheology of relatively diluted emulsions (oil volume fraction φ below 40%)([1], and references therein, [2,3]). At low volume fraction, nonadhesive emulsionsconsist of unpacked spherical droplets; such samples generally show a Newtonianbehavior, while flocculated emulsions show shear-thinning behavior. A significantchange in the rheological behavior is observed if the droplets are concentrated upto volume fractions higher than the volume fraction φ∗ corresponding to the ran-dom close packing of hard spheres. For randomly packed monodisperse spheres,φ∗ = 64%. Above φ∗, the droplets can no longer pack without deforming; al-though being composed of fluids only, emulsions resemble a solid. The elasticityexists only because the repulsive droplets have been concentrated up to a suffi-ciently large volume fraction, φ, which permits the storage of interfacial energy.As pointed out by Princen and Kiss [4,5], the considerable elasticity of concen-trated emulsions exists because the repulsive droplets have been compressed byan external osmotic pressure. Two compressed droplets will begin to deform be-fore their interfaces actually touch, owing to the intrinsic repulsive interactionsbetween them. Emulsions minimize their total free energy by reducing the repul-sion (which may have different origins) at the expense of creating some additionalsurface area by deforming the droplet interfaces. The necessary work to deformthe droplets arises from the application (by any means) of an external osmoticpressure, �, and the excess surface area of the droplets determines the equilibriumelastic energy stored at a given osmotic pressure. The additional excess surfacearea created by shear deformation determines the elastic shear modulus, G(φ).Although � and G represent fundamentally different properties, they both de-pend on the degree of droplet deformation and therefore on φ. This chapter aimsto describe the basic physics of compressibility and elasticity of concentratedemulsions.
126
P1: GFZSVNY317-Bibette February 1, 2007 16:52
4.2. Basic Concepts 127
4.2. Basic Concepts
Let us first consider interfaces at equilibrium. Any stress (osmotic or shear stress)imposed to the emulsion increases the amount of interface, leading to a modifica-tion of the free energy. For a monodisperse collection of N droplets of radius a, thetotal interfacial area of the undeformed droplets is S0 = 4πNa2. If the emulsion iscompressed up to φ > φ∗, each droplet is pressing against its neighbors throughflat facets. As a consequence, the total surface area, S, becomes larger than S0.The osmotic pressure is defined as the derivative of the free energy F with respectto the total volume V, at constant number of droplets:
� = −(
∂ F
∂V
)N
= −(
∂ F
∂S
)N
(∂S
∂V
)N
(4.1)
The derivative of F with respect to S,
σ =(
∂ F
∂S
)N
(4.2)
characterizes the mechanical behavior of the surface and is equal to the interfa-cial tension, γ int, in the case of a surfactant-covered interface.
(∂S∂V
)N
is a purelygeometrical term that represents the excess surface due to compression.
A similar approach can be adopted for the bulk shear modulus. When a smallstrain is applied to a solid, the latter is stressed, and one can measure the resultingstress. At low deformation, the bulk shear stress, τ , is proportional to the strain,, following Hooke’s law:
τ = G (4.3)
where G is the elastic shear modulus. For materials that do not store perfectly theelastic energy (i.e., materials that exhibit some viscous loss), G can be generalizedconsidering that the stress varies linearly with the strain. Thus G is transformed intoa complex value that is frequency-dependent. If the emulsion—already compressedto a surface S—experiences a small shear strain , the total interface increasesquadratically with the strain, as shown by Princen [6]. The total droplet surfacearea thus increases as:
S = 1
22
(∂2S
∂2
)(4.4)
The bulk stress can be expressed as:
τ = 1
V
(∂ F
∂
)N
=
V
(∂ F
∂S
)N
(∂2S
∂2
)(4.5)
The shear modulus is then given by:
G = τ
= 1
V
(∂ F
∂S
)N
(∂2S
∂2
)(4.6)
P1: GFZSVNY317-Bibette February 1, 2007 16:52
128 4. Compressibility and Elasticity of Concentrated Emulsions
4.3. Experimental Techniques
4.3.1. Elasticity Measurements
G is measured by means of a rheometer. The shear modulus is a complex numberthat has a phase and a magnitude, because the viscous dissipation causes a lag(i.e., a phase shift) between the resulting stress and the applied strain. The realpart of G is related to the energy storage, while the imaginary part is related tothe viscous loss. In a real measurement, a sinusoidal strain or stress is applied ata given frequency. The response of the system (i.e., the time-dependent stress orstrain) is measured. In the linear regime, the response of the studied material isalso sinusoidal. Considering a periodic strain, with an amplitude 0 and pulsationω, one writes:
(t) = 0 cos(ωt)
τ (t) = τ0 cos(ωt + ϕ) (4.7)
where ϕ is the phase shift due to dissipation. Equations (4.6) and (4.7) yield:
G ′ = τ0
0cos ϕ(ω)
G ′′ = τ0
0sin ϕ(ω) (4.8)
where G ′ and G ′′ are the real and imaginary part, respectively, of G. Hereafter, G ′
is called elastic modulus, and G ′′ loss modulus.
4.3.2. Compressibility Measurements
At least two different techniques are available to compress an emulsion at a givenosmotic pressure �. One technique consists of introducing the emulsion into asemipermeable dialysis bag and to immerse it into a large reservoir filled witha stressing polymer solution. This latter sets the osmotic pressure �. The per-meability of the dialysis membrane is such that only solvent molecules from thecontinuous phase and surfactant are exchanged across the membrane until the os-motic pressure in the emulsion becomes equal to that of the reservoir. The dialysisbag is then removed and the droplet volume fraction at equilibrium is measured.
Another technique consists of submitting the emulsion to centrifugation anddetermining the droplet volume fraction φf at the top (bottom) of the cream (sedi-ment). The centrifugation typically takes several hours until the equilibrium volumefraction is achieved. After equilibration, if the droplets occupy a distance muchless than that of the centrifuge lever arm, the spatial gradient in the accelerationcan be neglected, and the osmotic pressure can be determined (see Fig. 4.1):
� = | ρ| �2φ f
(dc H ± H 2
2
)(4.9)
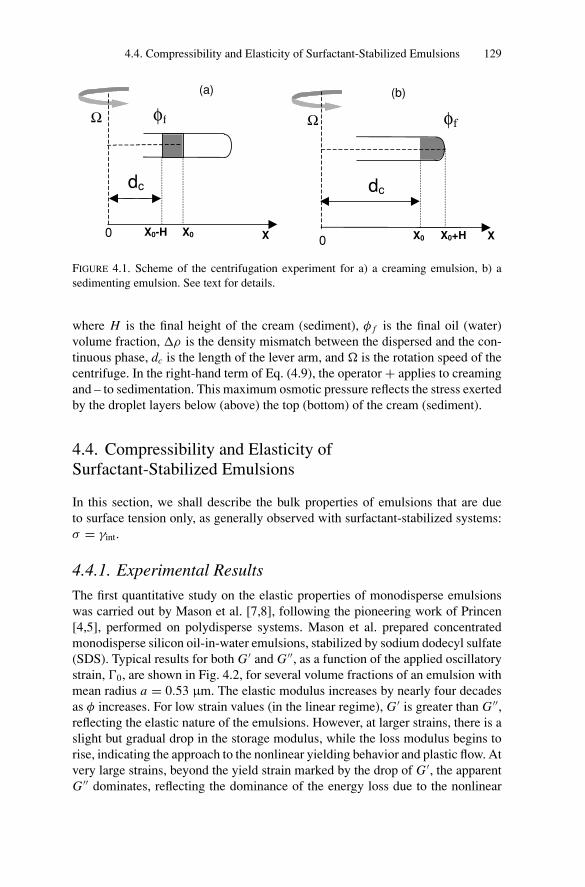
P1: GFZSVNY317-Bibette February 1, 2007 16:52
4.4. Compressibility and Elasticity of Surfactant-Stabilized Emulsions 129
Ω
X0-H0 X
dc
φf
X0
Ω
X0+H0 X
φf
X0
dc
(a) (b)
FIGURE 4.1. Scheme of the centrifugation experiment for a) a creaming emulsion, b) asedimenting emulsion. See text for details.
where H is the final height of the cream (sediment), φ f is the final oil (water)volume fraction, ρ is the density mismatch between the dispersed and the con-tinuous phase, dc is the length of the lever arm, and � is the rotation speed of thecentrifuge. In the right-hand term of Eq. (4.9), the operator + applies to creamingand – to sedimentation. This maximum osmotic pressure reflects the stress exertedby the droplet layers below (above) the top (bottom) of the cream (sediment).
4.4. Compressibility and Elasticity ofSurfactant-Stabilized Emulsions
In this section, we shall describe the bulk properties of emulsions that are dueto surface tension only, as generally observed with surfactant-stabilized systems:σ = γint.
4.4.1. Experimental Results
The first quantitative study on the elastic properties of monodisperse emulsionswas carried out by Mason et al. [7,8], following the pioneering work of Princen[4,5], performed on polydisperse systems. Mason et al. prepared concentratedmonodisperse silicon oil-in-water emulsions, stabilized by sodium dodecyl sulfate(SDS). Typical results for both G ′ and G ′′, as a function of the applied oscillatorystrain, 0, are shown in Fig. 4.2, for several volume fractions of an emulsion withmean radius a = 0.53 μm. The elastic modulus increases by nearly four decadesas φ increases. For low strain values (in the linear regime), G ′ is greater than G ′′,reflecting the elastic nature of the emulsions. However, at larger strains, there is aslight but gradual drop in the storage modulus, while the loss modulus begins torise, indicating the approach to the nonlinear yielding behavior and plastic flow. Atvery large strains, beyond the yield strain marked by the drop of G ′, the apparentG ′′ dominates, reflecting the dominance of the energy loss due to the nonlinear
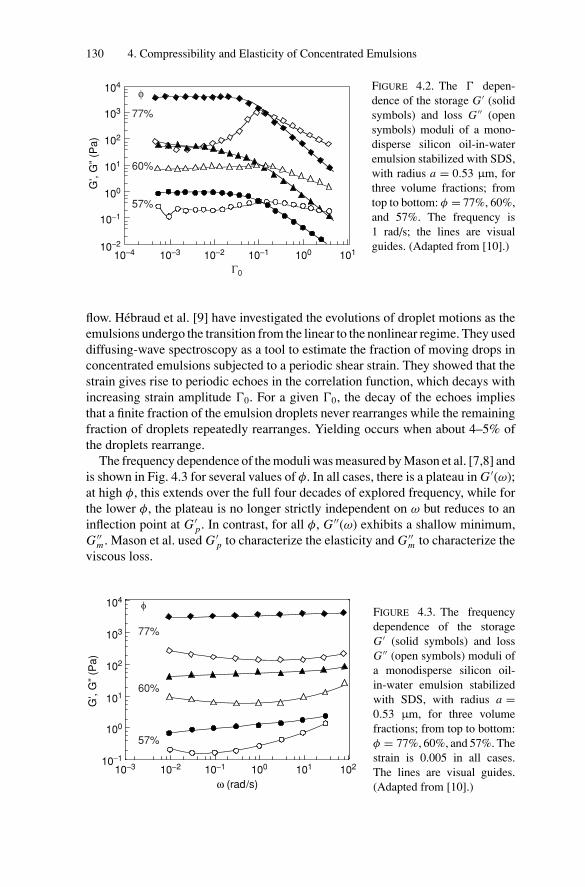
P1: GFZSVNY317-Bibette February 1, 2007 16:52
130 4. Compressibility and Elasticity of Concentrated Emulsions
10−2
10−1
100
101
102
103
104
10−4 10−3 10−2 10−1 100 101
G’,
G”
(Pa)
φ
Γ0
57%
60%
77%
FIGURE 4.2. The depen-dence of the storage G ′ (solidsymbols) and loss G ′′ (opensymbols) moduli of a mono-disperse silicon oil-in-wateremulsion stabilized with SDS,with radius a = 0.53 μm, forthree volume fractions; fromtop to bottom: φ = 77%, 60%,and 57%. The frequency is1 rad/s; the lines are visualguides. (Adapted from [10].)
flow. Hebraud et al. [9] have investigated the evolutions of droplet motions as theemulsions undergo the transition from the linear to the nonlinear regime. They useddiffusing-wave spectroscopy as a tool to estimate the fraction of moving drops inconcentrated emulsions subjected to a periodic shear strain. They showed that thestrain gives rise to periodic echoes in the correlation function, which decays withincreasing strain amplitude 0. For a given 0, the decay of the echoes impliesthat a finite fraction of the emulsion droplets never rearranges while the remainingfraction of droplets repeatedly rearranges. Yielding occurs when about 4–5% ofthe droplets rearrange.
The frequency dependence of the moduli was measured by Mason et al. [7,8] andis shown in Fig. 4.3 for several values of φ. In all cases, there is a plateau in G ′(ω);at high φ, this extends over the full four decades of explored frequency, while forthe lower φ, the plateau is no longer strictly independent on ω but reduces to aninflection point at G ′
p. In contrast, for all φ, G ′′(ω) exhibits a shallow minimum,G ′′
m . Mason et al. used G ′p to characterize the elasticity and G ′′
m to characterize theviscous loss.
ω (rad/s)
10−310−1
100
101
102
103
104
10−2 10−1 100 101 102
G’,
G”
(Pa)
57%
60%
77%
FIGURE 4.3. The frequencydependence of the storageG ′ (solid symbols) and lossG ′′ (open symbols) moduli ofa monodisperse silicon oil-in-water emulsion stabilizedwith SDS, with radius a =0.53 μm, for three volumefractions; from top to bottom:φ = 77%, 60%, and 57%. Thestrain is 0.005 in all cases.The lines are visual guides.(Adapted from [10].)
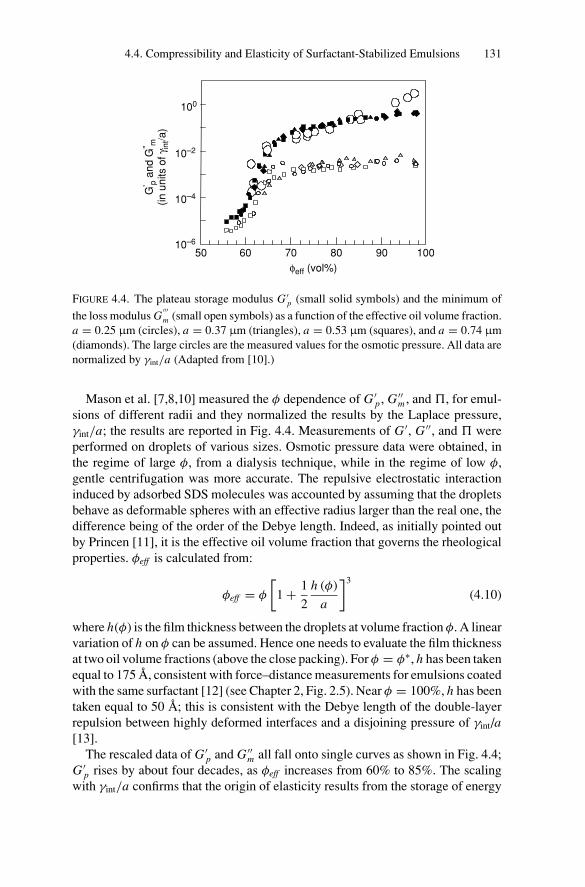
P1: GFZSVNY317-Bibette February 1, 2007 16:52
4.4. Compressibility and Elasticity of Surfactant-Stabilized Emulsions 131
100908070605010–6
10–4
10–2
100
φeff (vol%)
G' p
and G
" m(in u
nits
of
γ int/a)
FIGURE 4.4. The plateau storage modulus G ′p (small solid symbols) and the minimum of
the loss modulus G′′′m (small open symbols) as a function of the effective oil volume fraction.
a = 0.25 μm (circles), a = 0.37 μm (triangles), a = 0.53 μm (squares), and a = 0.74 μm(diamonds). The large circles are the measured values for the osmotic pressure. All data arenormalized by γint/a (Adapted from [10].)
Mason et al. [7,8,10] measured the φ dependence of G ′p, G ′′
m , and �, for emul-sions of different radii and they normalized the results by the Laplace pressure,γint/a; the results are reported in Fig. 4.4. Measurements of G ′, G ′′, and � wereperformed on droplets of various sizes. Osmotic pressure data were obtained, inthe regime of large φ, from a dialysis technique, while in the regime of low φ,gentle centrifugation was more accurate. The repulsive electrostatic interactioninduced by adsorbed SDS molecules was accounted by assuming that the dropletsbehave as deformable spheres with an effective radius larger than the real one, thedifference being of the order of the Debye length. Indeed, as initially pointed outby Princen [11], it is the effective oil volume fraction that governs the rheologicalproperties. φeff is calculated from:
φeff = φ
[1 + 1
2
h (φ)
a
]3
(4.10)
where h(φ) is the film thickness between the droplets at volume fraction φ. A linearvariation of h on φ can be assumed. Hence one needs to evaluate the film thicknessat two oil volume fractions (above the close packing). For φ = φ∗, h has been takenequal to 175 A, consistent with force–distance measurements for emulsions coatedwith the same surfactant [12] (see Chapter 2, Fig. 2.5). Near φ = 100%, h has beentaken equal to 50 A; this is consistent with the Debye length of the double-layerrepulsion between highly deformed interfaces and a disjoining pressure of γint/a[13].
The rescaled data of G ′p and G ′′
m all fall onto single curves as shown in Fig. 4.4;G ′
p rises by about four decades, as φeff increases from 60% to 85%. The scalingwith γint/a confirms that the origin of elasticity results from the storage of energy
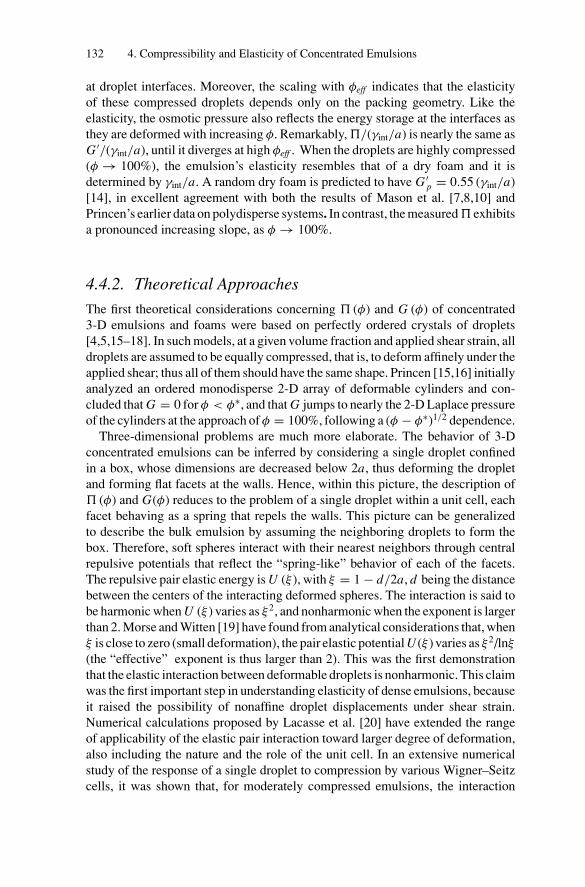
P1: GFZSVNY317-Bibette February 1, 2007 16:52
132 4. Compressibility and Elasticity of Concentrated Emulsions
at droplet interfaces. Moreover, the scaling with φeff indicates that the elasticityof these compressed droplets depends only on the packing geometry. Like theelasticity, the osmotic pressure also reflects the energy storage at the interfaces asthey are deformed with increasing φ. Remarkably, �/(γint/a) is nearly the same asG ′/(γint/a), until it diverges at high φeff . When the droplets are highly compressed(φ → 100%), the emulsion’s elasticity resembles that of a dry foam and it isdetermined by γint/a. A random dry foam is predicted to have G ′
p = 0.55 (γint/a)[14], in excellent agreement with both the results of Mason et al. [7,8,10] andPrincen’s earlier data on polydisperse systems. In contrast, the measured � exhibitsa pronounced increasing slope, as φ → 100%.
4.4.2. Theoretical Approaches
The first theoretical considerations concerning � (φ) and G (φ) of concentrated3-D emulsions and foams were based on perfectly ordered crystals of droplets[4,5,15–18]. In such models, at a given volume fraction and applied shear strain, alldroplets are assumed to be equally compressed, that is, to deform affinely under theapplied shear; thus all of them should have the same shape. Princen [15,16] initiallyanalyzed an ordered monodisperse 2-D array of deformable cylinders and con-cluded that G = 0 for φ < φ∗, and that G jumps to nearly the 2-D Laplace pressureof the cylinders at the approach of φ = 100%, following a (φ − φ∗)1/2 dependence.
Three-dimensional problems are much more elaborate. The behavior of 3-Dconcentrated emulsions can be inferred by considering a single droplet confinedin a box, whose dimensions are decreased below 2a, thus deforming the dropletand forming flat facets at the walls. Hence, within this picture, the description of� (φ) and G(φ) reduces to the problem of a single droplet within a unit cell, eachfacet behaving as a spring that repels the walls. This picture can be generalizedto describe the bulk emulsion by assuming the neighboring droplets to form thebox. Therefore, soft spheres interact with their nearest neighbors through centralrepulsive potentials that reflect the “spring-like” behavior of each of the facets.The repulsive pair elastic energy is U (ξ ), with ξ = 1 − d/2a, d being the distancebetween the centers of the interacting deformed spheres. The interaction is said tobe harmonic when U (ξ ) varies as ξ 2, and nonharmonic when the exponent is largerthan 2. Morse and Witten [19] have found from analytical considerations that, whenξ is close to zero (small deformation), the pair elastic potential U (ξ ) varies as ξ 2/lnξ
(the “effective” exponent is thus larger than 2). This was the first demonstrationthat the elastic interaction between deformable droplets is nonharmonic. This claimwas the first important step in understanding elasticity of dense emulsions, becauseit raised the possibility of nonaffine droplet displacements under shear strain.Numerical calculations proposed by Lacasse et al. [20] have extended the rangeof applicability of the elastic pair interaction toward larger degree of deformation,also including the nature and the role of the unit cell. In an extensive numericalstudy of the response of a single droplet to compression by various Wigner–Seitzcells, it was shown that, for moderately compressed emulsions, the interaction
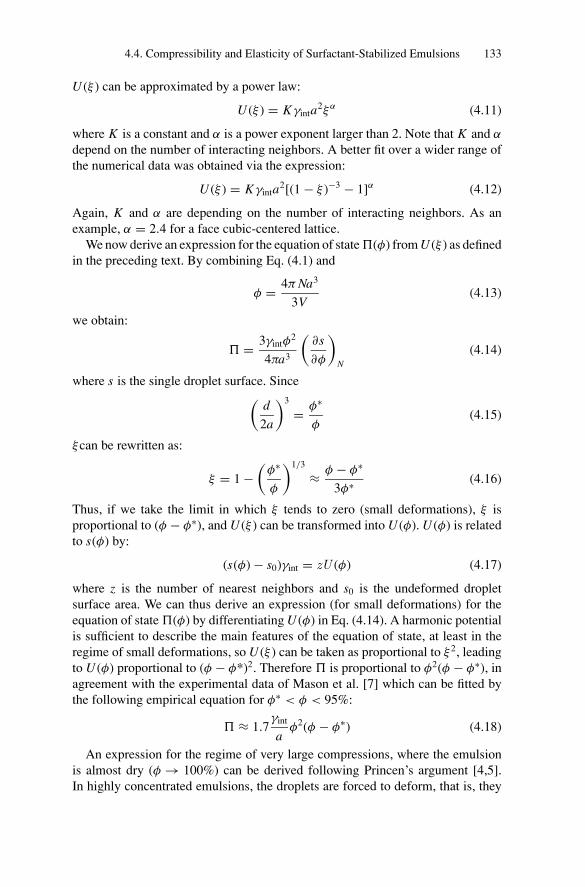
P1: GFZSVNY317-Bibette February 1, 2007 16:52
4.4. Compressibility and Elasticity of Surfactant-Stabilized Emulsions 133
U (ξ ) can be approximated by a power law:
U (ξ ) = Kγinta2ξα (4.11)
where K is a constant and α is a power exponent larger than 2. Note that K and α
depend on the number of interacting neighbors. A better fit over a wider range ofthe numerical data was obtained via the expression:
U (ξ ) = Kγinta2[(1 − ξ )−3 − 1]α (4.12)
Again, K and α are depending on the number of interacting neighbors. As anexample, α = 2.4 for a face cubic-centered lattice.
We now derive an expression for the equation of state �(φ) from U (ξ ) as definedin the preceding text. By combining Eq. (4.1) and
φ = 4π Na3
3V(4.13)
we obtain:
� = 3γintφ2
4πa3
(∂s
∂φ
)N
(4.14)
where s is the single droplet surface. Since(d
2a
)3
= φ∗
φ(4.15)
ξcan be rewritten as:
ξ = 1 −(
φ∗
φ
)1/3
≈ φ − φ∗
3φ∗ (4.16)
Thus, if we take the limit in which ξ tends to zero (small deformations), ξ isproportional to (φ − φ∗), and U (ξ ) can be transformed into U (φ). U (φ) is relatedto s(φ) by:
(s(φ) − s0)γint = zU (φ) (4.17)
where z is the number of nearest neighbors and s0 is the undeformed dropletsurface area. We can thus derive an expression (for small deformations) for theequation of state �(φ) by differentiating U (φ) in Eq. (4.14). A harmonic potentialis sufficient to describe the main features of the equation of state, at least in theregime of small deformations, so U (ξ ) can be taken as proportional to ξ 2, leadingto U (φ) proportional to (φ − φ*)2. Therefore � is proportional to φ2(φ − φ∗), inagreement with the experimental data of Mason et al. [7] which can be fitted bythe following empirical equation for φ∗ < φ < 95%:
� ≈ 1.7γint
aφ2(φ − φ∗) (4.18)
An expression for the regime of very large compressions, where the emulsionis almost dry (φ → 100%) can be derived following Princen’s argument [4,5].In highly concentrated emulsions, the droplets are forced to deform, that is, they
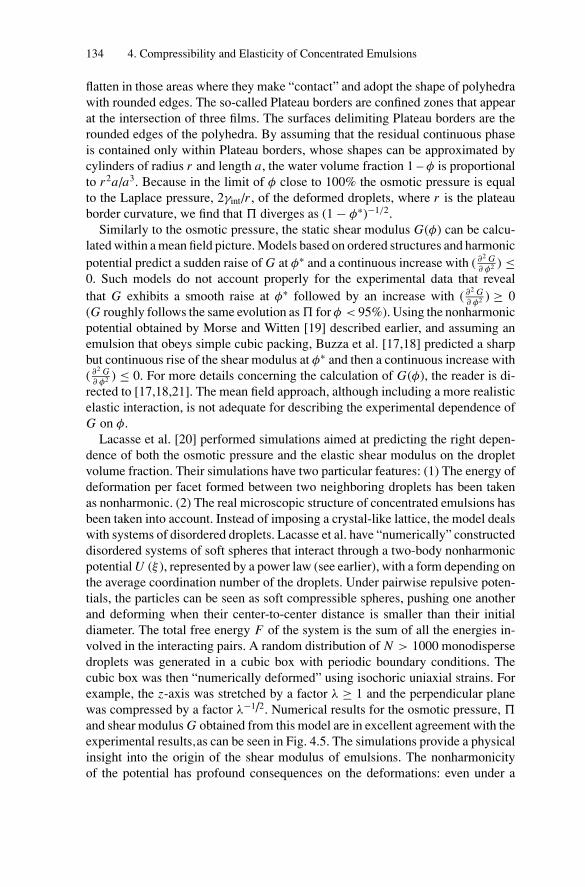
P1: GFZSVNY317-Bibette February 1, 2007 16:52
134 4. Compressibility and Elasticity of Concentrated Emulsions
flatten in those areas where they make “contact” and adopt the shape of polyhedrawith rounded edges. The so-called Plateau borders are confined zones that appearat the intersection of three films. The surfaces delimiting Plateau borders are therounded edges of the polyhedra. By assuming that the residual continuous phaseis contained only within Plateau borders, whose shapes can be approximated bycylinders of radius r and length a, the water volume fraction 1 – φ is proportionalto r2a/a3. Because in the limit of φ close to 100% the osmotic pressure is equalto the Laplace pressure, 2γint/r , of the deformed droplets, where r is the plateauborder curvature, we find that � diverges as (1 − φ∗)−1/2.
Similarly to the osmotic pressure, the static shear modulus G(φ) can be calcu-lated within a mean field picture. Models based on ordered structures and harmonicpotential predict a sudden raise of G at φ∗ and a continuous increase with ( ∂2 G
∂ φ2 ) ≤0. Such models do not account properly for the experimental data that revealthat G exhibits a smooth raise at φ∗ followed by an increase with ( ∂2 G
∂ φ2 ) ≥ 0(G roughly follows the same evolution as � for φ < 95%). Using the nonharmonicpotential obtained by Morse and Witten [19] described earlier, and assuming anemulsion that obeys simple cubic packing, Buzza et al. [17,18] predicted a sharpbut continuous rise of the shear modulus at φ∗ and then a continuous increase with( ∂2 G
∂ φ2 ) ≤ 0. For more details concerning the calculation of G(φ), the reader is di-rected to [17,18,21]. The mean field approach, although including a more realisticelastic interaction, is not adequate for describing the experimental dependence ofG on φ.
Lacasse et al. [20] performed simulations aimed at predicting the right depen-dence of both the osmotic pressure and the elastic shear modulus on the dropletvolume fraction. Their simulations have two particular features: (1) The energy ofdeformation per facet formed between two neighboring droplets has been takenas nonharmonic. (2) The real microscopic structure of concentrated emulsions hasbeen taken into account. Instead of imposing a crystal-like lattice, the model dealswith systems of disordered droplets. Lacasse et al. have “numerically” constructeddisordered systems of soft spheres that interact through a two-body nonharmonicpotential U (ξ ), represented by a power law (see earlier), with a form depending onthe average coordination number of the droplets. Under pairwise repulsive poten-tials, the particles can be seen as soft compressible spheres, pushing one anotherand deforming when their center-to-center distance is smaller than their initialdiameter. The total free energy F of the system is the sum of all the energies in-volved in the interacting pairs. A random distribution of N > 1000 monodispersedroplets was generated in a cubic box with periodic boundary conditions. Thecubic box was then “numerically deformed” using isochoric uniaxial strains. Forexample, the z-axis was stretched by a factor λ ≥ 1 and the perpendicular planewas compressed by a factor λ−1/2. Numerical results for the osmotic pressure, �
and shear modulus G obtained from this model are in excellent agreement with theexperimental results,as can be seen in Fig. 4.5. The simulations provide a physicalinsight into the origin of the shear modulus of emulsions. The nonharmonicityof the potential has profound consequences on the deformations: even under a
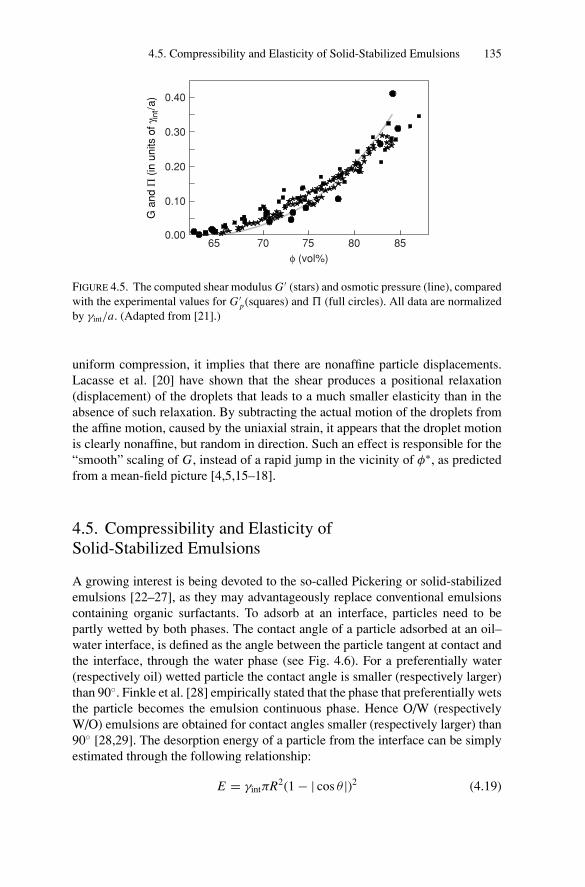
P1: GFZSVNY317-Bibette February 1, 2007 16:52
4.5. Compressibility and Elasticity of Solid-Stabilized Emulsions 135
G a
nd Π
(in
un
its o
f γ in
t/a)
85807570650.00
0.10
0.20
0.30
0.40
φ (vol%)
FIGURE 4.5. The computed shear modulus G ′ (stars) and osmotic pressure (line), comparedwith the experimental values for G ′
p(squares) and � (full circles). All data are normalizedby γint/a. (Adapted from [21].)
uniform compression, it implies that there are nonaffine particle displacements.Lacasse et al. [20] have shown that the shear produces a positional relaxation(displacement) of the droplets that leads to a much smaller elasticity than in theabsence of such relaxation. By subtracting the actual motion of the droplets fromthe affine motion, caused by the uniaxial strain, it appears that the droplet motionis clearly nonaffine, but random in direction. Such an effect is responsible for the“smooth” scaling of G, instead of a rapid jump in the vicinity of φ∗, as predictedfrom a mean-field picture [4,5,15–18].
4.5. Compressibility and Elasticity ofSolid-Stabilized Emulsions
A growing interest is being devoted to the so-called Pickering or solid-stabilizedemulsions [22–27], as they may advantageously replace conventional emulsionscontaining organic surfactants. To adsorb at an interface, particles need to bepartly wetted by both phases. The contact angle of a particle adsorbed at an oil–water interface, is defined as the angle between the particle tangent at contact andthe interface, through the water phase (see Fig. 4.6). For a preferentially water(respectively oil) wetted particle the contact angle is smaller (respectively larger)than 90◦. Finkle et al. [28] empirically stated that the phase that preferentially wetsthe particle becomes the emulsion continuous phase. Hence O/W (respectivelyW/O) emulsions are obtained for contact angles smaller (respectively larger) than90◦ [28,29]. The desorption energy of a particle from the interface can be simplyestimated through the following relationship:
E = γintπR2(1 − | cos θ |)2 (4.19)
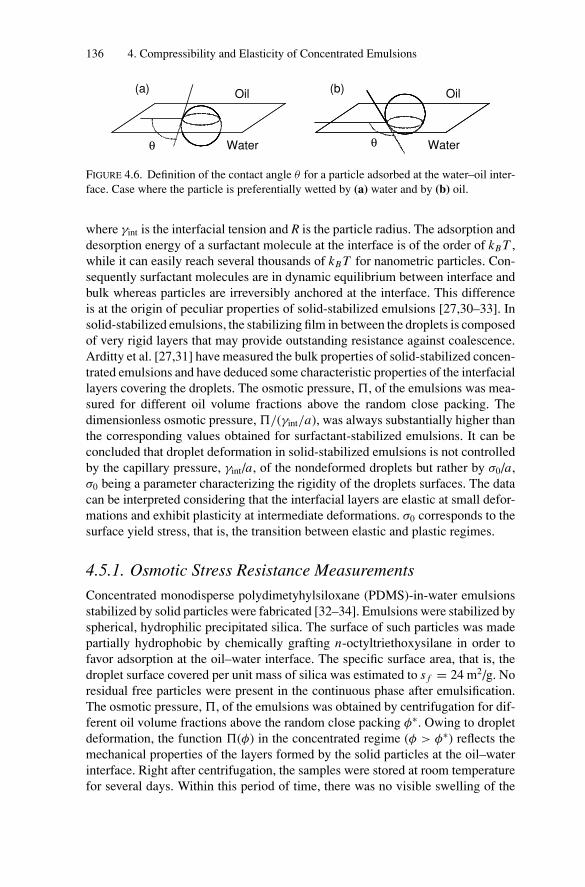
P1: GFZSVNY317-Bibette February 1, 2007 16:52
136 4. Compressibility and Elasticity of Concentrated Emulsions
Water
Oil
Water
Oil
θ θ
(a) (b)
FIGURE 4.6. Definition of the contact angle θ for a particle adsorbed at the water–oil inter-face. Case where the particle is preferentially wetted by (a) water and by (b) oil.
where γint is the interfacial tension and R is the particle radius. The adsorption anddesorption energy of a surfactant molecule at the interface is of the order of kB T ,while it can easily reach several thousands of kB T for nanometric particles. Con-sequently surfactant molecules are in dynamic equilibrium between interface andbulk whereas particles are irreversibly anchored at the interface. This differenceis at the origin of peculiar properties of solid-stabilized emulsions [27,30–33]. Insolid-stabilized emulsions, the stabilizing film in between the droplets is composedof very rigid layers that may provide outstanding resistance against coalescence.Arditty et al. [27,31] have measured the bulk properties of solid-stabilized concen-trated emulsions and have deduced some characteristic properties of the interfaciallayers covering the droplets. The osmotic pressure, �, of the emulsions was mea-sured for different oil volume fractions above the random close packing. Thedimensionless osmotic pressure, �/(γint/a), was always substantially higher thanthe corresponding values obtained for surfactant-stabilized emulsions. It can beconcluded that droplet deformation in solid-stabilized emulsions is not controlledby the capillary pressure, γint/a, of the nondeformed droplets but rather by σ0/a,σ0 being a parameter characterizing the rigidity of the droplets surfaces. The datacan be interpreted considering that the interfacial layers are elastic at small defor-mations and exhibit plasticity at intermediate deformations. σ0 corresponds to thesurface yield stress, that is, the transition between elastic and plastic regimes.
4.5.1. Osmotic Stress Resistance Measurements
Concentrated monodisperse polydimetyhylsiloxane (PDMS)-in-water emulsionsstabilized by solid particles were fabricated [32–34]. Emulsions were stabilized byspherical, hydrophilic precipitated silica. The surface of such particles was madepartially hydrophobic by chemically grafting n-octyltriethoxysilane in order tofavor adsorption at the oil–water interface. The specific surface area, that is, thedroplet surface covered per unit mass of silica was estimated to s f = 24 m2/g. Noresidual free particles were present in the continuous phase after emulsification.The osmotic pressure, �, of the emulsions was obtained by centrifugation for dif-ferent oil volume fractions above the random close packing φ∗. Owing to dropletdeformation, the function �(φ) in the concentrated regime (φ > φ∗) reflects themechanical properties of the layers formed by the solid particles at the oil–waterinterface. Right after centrifugation, the samples were stored at room temperaturefor several days. Within this period of time, there was no visible swelling of the
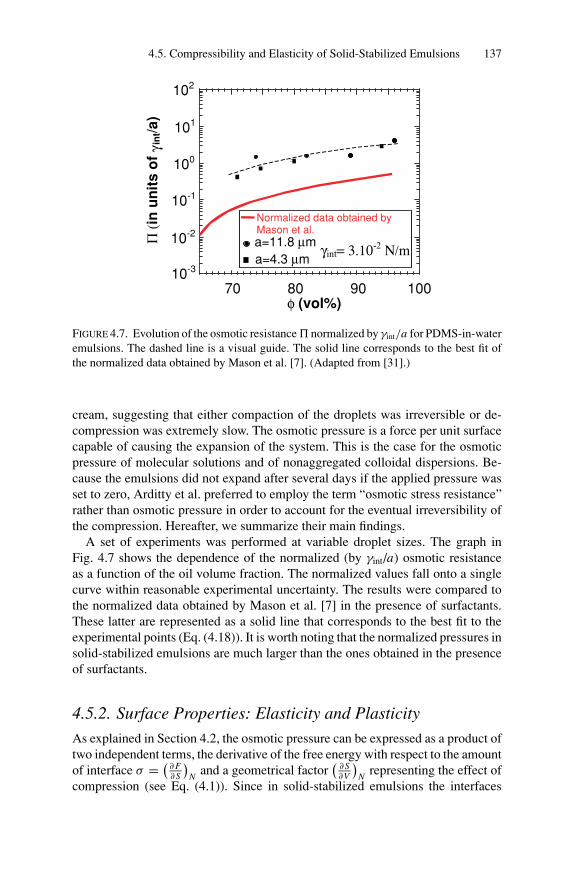
P1: GFZSVNY317-Bibette February 1, 2007 16:52
4.5. Compressibility and Elasticity of Solid-Stabilized Emulsions 137
10-3
10-2
10-1
101
70 80 90 100
100
102
φ (vol%)
a=11.8 μma=4.3 μm
Normalized data obtained byMason et al.
γint= 3.10-2 Ν/m
Π (i
n u
nit
s o
f γi
nt/a
)
FIGURE 4.7. Evolution of the osmotic resistance � normalized by γint/a for PDMS-in-wateremulsions. The dashed line is a visual guide. The solid line corresponds to the best fit ofthe normalized data obtained by Mason et al. [7]. (Adapted from [31].)
cream, suggesting that either compaction of the droplets was irreversible or de-compression was extremely slow. The osmotic pressure is a force per unit surfacecapable of causing the expansion of the system. This is the case for the osmoticpressure of molecular solutions and of nonaggregated colloidal dispersions. Be-cause the emulsions did not expand after several days if the applied pressure wasset to zero, Arditty et al. preferred to employ the term “osmotic stress resistance”rather than osmotic pressure in order to account for the eventual irreversibility ofthe compression. Hereafter, we summarize their main findings.
A set of experiments was performed at variable droplet sizes. The graph inFig. 4.7 shows the dependence of the normalized (by γint/a) osmotic resistanceas a function of the oil volume fraction. The normalized values fall onto a singlecurve within reasonable experimental uncertainty. The results were compared tothe normalized data obtained by Mason et al. [7] in the presence of surfactants.These latter are represented as a solid line that corresponds to the best fit to theexperimental points (Eq. (4.18)). It is worth noting that the normalized pressures insolid-stabilized emulsions are much larger than the ones obtained in the presenceof surfactants.
4.5.2. Surface Properties: Elasticity and Plasticity
As explained in Section 4.2, the osmotic pressure can be expressed as a product oftwo independent terms, the derivative of the free energy with respect to the amountof interface σ = (
∂ F∂S
)N
and a geometrical factor(
∂S∂V
)N
representing the effect ofcompression (see Eq. (4.1)). Since in solid-stabilized emulsions the interfaces
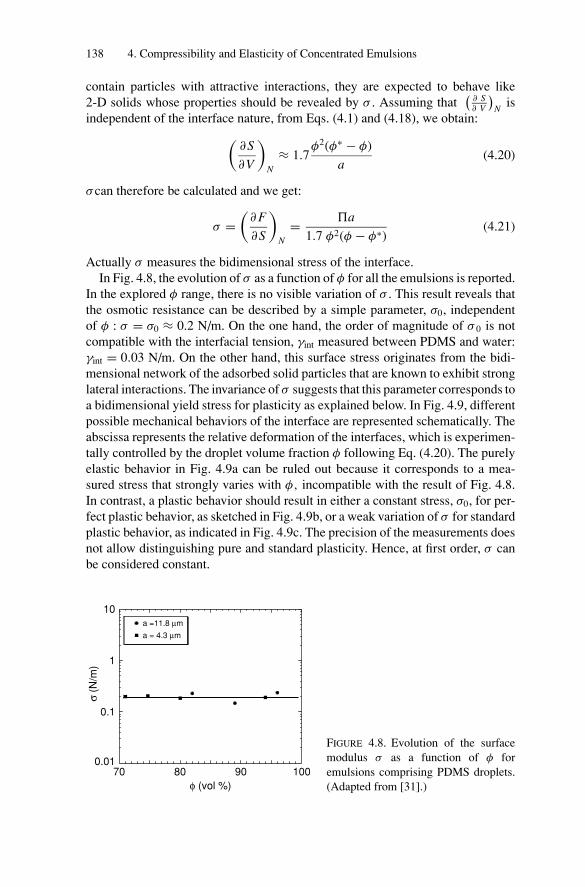
P1: GFZSVNY317-Bibette February 1, 2007 16:52
138 4. Compressibility and Elasticity of Concentrated Emulsions
contain particles with attractive interactions, they are expected to behave like2-D solids whose properties should be revealed by σ . Assuming that
(∂ S∂ V
)N
isindependent of the interface nature, from Eqs. (4.1) and (4.18), we obtain:(
∂S
∂V
)N
≈ 1.7φ2(φ∗ − φ)
a(4.20)
σcan therefore be calculated and we get:
σ =(
∂ F
∂S
)N
= �a
1.7 φ2(φ − φ∗)(4.21)
Actually σ measures the bidimensional stress of the interface.In Fig. 4.8, the evolution of σ as a function of φ for all the emulsions is reported.
In the explored φ range, there is no visible variation of σ . This result reveals thatthe osmotic resistance can be described by a simple parameter, σ0, independentof φ : σ = σ0 ≈ 0.2 N/m. On the one hand, the order of magnitude of σ 0 is notcompatible with the interfacial tension, γint measured between PDMS and water:γint = 0.03 N/m. On the other hand, this surface stress originates from the bidi-mensional network of the adsorbed solid particles that are known to exhibit stronglateral interactions. The invariance of σ suggests that this parameter corresponds toa bidimensional yield stress for plasticity as explained below. In Fig. 4.9, differentpossible mechanical behaviors of the interface are represented schematically. Theabscissa represents the relative deformation of the interfaces, which is experimen-tally controlled by the droplet volume fraction φ following Eq. (4.20). The purelyelastic behavior in Fig. 4.9a can be ruled out because it corresponds to a mea-sured stress that strongly varies with φ, incompatible with the result of Fig. 4.8.In contrast, a plastic behavior should result in either a constant stress, σ0, for per-fect plastic behavior, as sketched in Fig. 4.9b, or a weak variation of σ for standardplastic behavior, as indicated in Fig. 4.9c. The precision of the measurements doesnot allow distinguishing pure and standard plasticity. Hence, at first order, σ canbe considered constant.
10
1009080700.01
0.1
1
a =11.8 μm
a = 4.3 μm
σ (N
/m)
φ (vol %)
FIGURE 4.8. Evolution of the surfacemodulus σ as a function of φ foremulsions comprising PDMS droplets.(Adapted from [31].)
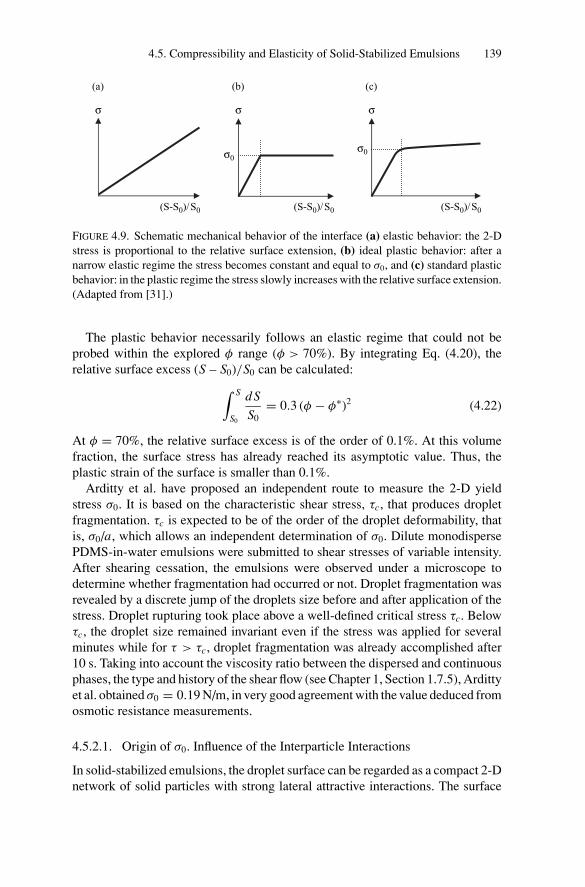
P1: GFZSVNY317-Bibette February 1, 2007 16:52
4.5. Compressibility and Elasticity of Solid-Stabilized Emulsions 139
(S-S0)/S0 (S-S0)/S0 (S-S0)/S0
σ0σ0
σ σ σ
(c)(b)(a)
FIGURE 4.9. Schematic mechanical behavior of the interface (a) elastic behavior: the 2-Dstress is proportional to the relative surface extension, (b) ideal plastic behavior: after anarrow elastic regime the stress becomes constant and equal to σ0, and (c) standard plasticbehavior: in the plastic regime the stress slowly increases with the relative surface extension.(Adapted from [31].)
The plastic behavior necessarily follows an elastic regime that could not beprobed within the explored φ range (φ > 70%). By integrating Eq. (4.20), therelative surface excess (S – S0)/S0 can be calculated:∫ S
S0
d S
S0= 0.3 (φ − φ∗)2 (4.22)
At φ = 70%, the relative surface excess is of the order of 0.1%. At this volumefraction, the surface stress has already reached its asymptotic value. Thus, theplastic strain of the surface is smaller than 0.1%.
Arditty et al. have proposed an independent route to measure the 2-D yieldstress σ0. It is based on the characteristic shear stress, τc, that produces dropletfragmentation. τc is expected to be of the order of the droplet deformability, thatis, σ0/a, which allows an independent determination of σ0. Dilute monodispersePDMS-in-water emulsions were submitted to shear stresses of variable intensity.After shearing cessation, the emulsions were observed under a microscope todetermine whether fragmentation had occurred or not. Droplet fragmentation wasrevealed by a discrete jump of the droplets size before and after application of thestress. Droplet rupturing took place above a well-defined critical stress τc. Belowτc, the droplet size remained invariant even if the stress was applied for severalminutes while for τ > τc, droplet fragmentation was already accomplished after10 s. Taking into account the viscosity ratio between the dispersed and continuousphases, the type and history of the shear flow (see Chapter 1, Section 1.7.5), Ardittyet al. obtained σ0 = 0.19 N/m, in very good agreement with the value deduced fromosmotic resistance measurements.
4.5.2.1. Origin of σ0. Influence of the Interparticle Interactions
In solid-stabilized emulsions, the droplet surface can be regarded as a compact 2-Dnetwork of solid particles with strong lateral attractive interactions. The surface
P1: GFZSVNY317-Bibette February 1, 2007 16:52
140 4. Compressibility and Elasticity of Concentrated Emulsions
stress tensor σ is defined as
σ =⟨−→r ⊗ −→
f⟩
S(4.23)
where ⊗ is the tensorial product, r and f are the position and force vectors, respec-tively. At the onset of the plastic regime, surface clusters start to be dissociated andthe yield stress σ0 corresponds to the tangential component σ12. If ea is the pairinteraction energy of the adsorbed particles, then the yield stress can be estimated:
σ0 � nsz
2ea (4.24)
where z is the coordination number (z = 6 for a 2-D hexagonal packing), and ns
is the particle density at the interface. From s f = 24 m2/g, it can be deduced thatns = 2.4 1015 particles/m2. The pair energy corresponding to the experimentallymeasured value σ0 = 0.2 N/m is then: ea ≈ 7 103kB T . Arditty et al. argue thatsuch high attractive energy mainly results from capillary forces [35,36] and fromthe interpenetration of the octyl layers in a bad solvent [37]. The magnitude ofsuch interactions was evaluated and is of the same order than the total interactionenergy deduced from σ0.
The surface rigidity in solid-stabilized emulsions certainly determines the re-markable resistance of concentrated droplets against coalescence. A recent articlereports that some oil-in-water solid-stabilized emulsions can even be dried withoutbeing destroyed until almost all the water is evaporated [30]. The original shapeof the sample is preserved during the drying process, with absolutely no oil leak-age, confirming the existence of a strong protective layer around the oil droplets.The resistance to coalescence is certainly determined by particle interactions, ascan be inferred from the general phenomenology established in the field of solid-stabilized emulsions: the most stable emulsions are very often obtained with solidparticles that are weakly or strongly aggregated in the bulk continuous phase [24].However, this correlation has to be handled with care, as lateral interactions atthe oil–water interface may be different from bulk interactions in the continuousphase. More experimental and theoretical work is needed to consolidate (or refute)the validity of this empirical link.
4.6. Conclusion
As reported in this chapter, the microscopic origin of both compressibilityand elasticity of dense emulsions is rather well understood. Emulsions haveelastic properties arising from either surface tension or surface elasticity andplasticity. Some protein-stabilized emulsions obey the same phenomenology assolid-stabilized emulsions: they exhibit substantially higher osmotic resistancesand higher shear moduli than surfactant-stabilized emulsions [38–40]. Moreover,they are strongly resistant to water evaporation. Proteins possess the ability to form
P1: GFZSVNY317-Bibette February 1, 2007 16:52
References 141
rigid interfacial aggregates (see Chapter 2) and it is likely that the same descriptionof the interface in terms of elasticity and plasticity can be applied to these systems.
References
[1] J.W. Goodwin and W.B. Russel: “Rheology and Rheological Techniques.” Curr. Opin.Colloidal Interface Sci. 2, 409 and references therein (1997).
[2] E. Dickinson and M. Golding: “Influence of Alcohol on Stability of Oil-in-WaterEmulsions Containing Sodium Caseinate.” J. Colloid Interface Sci. 197, 133 (1998).
[3] E. Dickinson and J. Chen: “Viscoelastic Properties of Protein-Stabilized Emulsions:Effect of Protein-Surfactant Interactions.” J. Agric. Food Chem. 46, 91 (1998).
[4] H.M. Princen and A.D. Kiss: “Osmotic Pressure of Foams and Highly ConcentratedEmulsions. 2. Determination from the Variation in Volume Fraction with Height inan Equilibrated Column.” Langmuir 3, 36 (1987).
[5] H.M. Princen and A.D. Kiss: “Rheology of Foams and Highly Concentrated Emul-sions: III. Static Shear Modulus.” J. Colloid Interface Sci. 112, 427 (1986).
[6] H.M. Princen: “Osmotic Pressure of Foams and Highly Concentrated Emulsions. I.Theoretical Considerations.” Langmuir 2, 519 (1986).
[7] T.M. Mason, J. Bibette, and D.A. Weitz: “Elasticity of Compressed Emulsions.”Phys. Rev. Lett. 75, 2051 (1995).
[8] T.G. Mason, A.H. Krall, H. Gang, J. Bibette, and D.A. Weitz: “Monodisperse Emul-sions: Properties and uses.” P. Becher (ed), Encyclopaedia of Emulsion Technology,Ch. 6, p. 299, Marcel Dekker, New York, Basel, Hong Kong (1996).
[9] P. Hebraud, F. Lequeux, J.-P. Munch, and D.J. Pine: “Yielding and Rearrangementsin Disordered Emulsions.” Phys. Rev. Lett. 78, 4657 (1997).
[10] T. Mason: “Rheology of Monodisperse Emulsions.” Ph.D Thesis, Princeton Univer-sity (1995).
[11] H.M. Princen, M.P. Aronson, and J.C. Moser: “Highly Concentrated Emulsions.II Real Systems. The Effect of Film Thickness and Contact Angle on the VolumeFraction in Creamed Emulsions.” J. Colloid Interface Sci. 75, 246 (1980).
[12] F. Leal-Calderon, T. Stora, O. Mondain Monval, P. Poulin, and J. Bibette: “DirectMeasurement of Colloidal Forces.” Phys. Rev. Lett 72, 2959 (1994).
[13] P.M. Kruglyakov, D. Exerowa, and K. Khristov: “New Possibilities for Foam Inves-tigation: Creating a Pressure Difference in the Foam Liquid Phase.” Adv. ColloidInterface Sci. 40, 257 (1992).
[14] D.J. Stamenovic: “A Model of Foam Elasticity Based Upon the Laws of Plateau.” J.Colloid Interface Sci. 145, 255 (1991).
[15] H.M. Princen: “Highly Concentrated Emulsions. I Cylindrical Systems.” J. ColloidInterface Sci. 71, 55 (1979).
[16] H.M. Princen: “Rheology of Foams and Highly Concentrated Emulsions I. ElasticProperties and Yield Stress of a Cylindrical Model System.” J. Colloid Interface Sci.91, 160 (1983).
[17] D.M.A. Buzza and M.E. Cates: “Uniaxial Elastic Modulus of Concentrated Emul-sions.” Langmuir 10, 4503 (1994).
[18] D.M.A. Buzza, C.-Y.D. Lu, and M.E. Cates: “Linear Shear Rheology of Incompress-ible Foams.” J. Phys. France II 5, 37 (1995).
[19] D.C. Morse and T.A. Witten: “Droplet Elasticity in Weakly Compressed Emulsions.”Europhys. Lett. 22, 549 (1993).
P1: GFZSVNY317-Bibette February 1, 2007 16:52
142 4. Compressibility and Elasticity of Concentrated Emulsions
[20] M.-D. Lacasse, G.S. Grest, D. Levine, T.G. Mason, and D.A. Weitz: “Model for theElasticity of Compressed Emulsions.” Phys. Rev. Lett 76, 3448 (1996).
[21] T.G. Mason, M.-D. Lacasse, G.S. Grest, D. Levine, J. Bibette, and D.A. Weitz:“Osmotic Pressure and Viscoelastic Shear Moduli of Concentrated Emulsions.” Phys.Rev. E 56, 3150 (1997).
[22] W. Ramsden: “Separation of Solids in the Surface-Layers of Solutions and“Suspensions”—Preliminary Account.” Proc. R. Soc. 72, 156 (1903).
[23] S.U. Pickering: “Emulsions.” J. Chem. Soc. 91, 2001 (1907).[24] R. Aveyard, B.P. Binks, and J.H. Clint: “Emulsions Stabilized Solely by Colloidal
Particles.” Adv. Colloid Interface Sci. 100–102, 503 (2003).[25] B. Binks and S.O. Lumsdon: “Stability of Oil-in-Water Emulsions Stabilised by
Silica Particles.” Phys. Chem. Chem. Phys. 1, 3007 (1999).[26] B.P. Binks: “Particles as Surfactants—Similarities and Differences.” Curr. Opin. Col-
loid Interface Sci. 7, 21 (2002).[27] S. Arditty: “Fabrication, Stability and Rheological Properties of Solid-Stabilzed
Emulsions.” Ph.D thesis, Bordeaux I University (2004).[28] P. Finkle, H.D. Draper, and J.H. Hildebrand: “The Theory of Emulsification.” J. Am.
Chem. Soc. 45, 2780 (1923).[29] B.P. Binks and S.O. Lumsdon: “Influence of Particle Wettability on the Type and
Stability of Surfactant-Free Emulsions.” Langmuir 16, 8622 (2000).[30] S. Arditty, J. Kahn-Giermanska, V. Schmitt, and F. Leal-Calderon: “Materials Based
on Solid-Stabilized Emulsions.” J. Colloid Interface Sci. 275, 659 (2004).[31] S. Arditty, V. Schmitt, F. Lequeux, and F. Leal-Calderon: “Interfacial Properties in
Solid-Stabilized Emulsions.” Eur. Phys. J. B 44, 381 (2005).[32] S. Arditty, C.P. Whitby, B.P. Binks, V. Schmitt, and F. Leal-Calderon: “Erratum—
Some General Features of Limited Coalescence in Solid-Stabilized Emulsions.” Eur.Phys. J. E 12, 355 (2003).
[33] S. Arditty, C.P. Whitby, B.P. Binks, V. Schmitt, and F. Leal-Calderon: “Some GeneralFeatures of Limited Coalescence in Solid-Stabilized Emulsions.” Eur. Phys. J. E 11,273 (2003).
[34] T.H. Whitesides and D.S. Ross: “Experimental and Theoretical Analysis of the Lim-ited Coalescence Process: Stepwise Limited Coalescence.” J. Colloid Interface Sci.169, 48 (1995).
[35] P.A. Kralchevsky and K. Nagayama: “Capillary Interactions Between Particles Boundto Interfaces, Liquid Films and Biomembranes.” Adv. Colloid Interface Sci. 85, 145(2000).
[36] P.A. Kralchevsky and N.D. Denkov: “Capillary Forces and Structuring in Layers ofColloid Particles.” Curr. Opin. Colloid Interface Sci. 6, 383 (2001).
[37] S.R. Raghavan, J. Hou, G.L. Baker, and S.A. Kahn: “Colloidal Interactions betweenParticles with Tethered Nonpolar Chains Dispersed in Polar Media: Direct Correla-tion Between Dynamic Rheology and Interaction Parameters.” Langmuir 16, 1066(2000).
[38] T.D. Dimitrova and F. Leal Calderon: “Bulk Elasticity of Concentrated Protein-Stabilized Emulsions.” Langmuir 17, 3235 (2001).
[39] T.D. Dimitrova and F. Leal Calderon: “Rheological Properties of Highly ConcentratedProtein-Stabilized Emulsions.” Adv. Colloid Interface Sci. 108–109, 49 (2004).
[40] L. Bressy, P. Hebraud, V. Schmitt, and J. Bibette: “Rheology of Emulsions Stabilizedby Solid Interfaces.” Langmuir 19, 598 (2003).
P1: GFZ
SVNY317-Bibette February 1, 2007 16:55
5Stability of Concentrated Emulsions
5.1. Introduction
The lifetime of emulsions may vary considerably from one system to another; itcan change from minutes to many years, depending on the nature of the surfac-tants, the nature of both phases, and their volume ratio. Despite the large amountof work devoted to this issue, predicting the destruction scenario and the emulsionlifetime still raises challenging questions, especially with regard to concentratedemulsions. Irreversible coarsening of emulsions may proceed through two distinctmechanisms. The first mechanism, known as Ostwald ripening [1], is driven bythe difference in Laplace pressure between droplets having different radii: thedispersed phase is transferred from the smaller to the larger droplets. The rateof droplet growth may be determined by the molecular diffusion across the con-tinuous phase and/or by the permeation across the surfactant films. The secondmechanism, known as coalescence, consists of the rupture of the thin film thatforms between droplets, leading them to fuse into a single one. At a microscopicscale, a coalescence event proceeds through the nucleation of a thermally activatedhole that reaches a critical size above which it becomes unstable and grows.
In principle, understanding the metastability of emulsions requires two types ofinformation that account for two distinct phenomena. The first one concerns themicroscopic mechanism of the instabilities. The second one concerns the scenarioof destruction, that is, the time and space distributions of the coarsening events.Generally, the destruction scenario of emulsions results from the interplay betweencoalescence and Ostwald ripening. For the sake of simplicity, most studies havebeen performed under conditions such that one type of instability is dominatingthe other one, enabling one to monitor its progress quite precisely. In this limit,theoretical models as well as experiments have revealed that Ostwald ripening gen-erates emulsions with narrow size distributions in the asymptotic regime [2–7].In contrast, coalescence favors the diverging growth of large droplets that rapidlyform a free layer at the top or the bottom of the sample [8,9]. Owing to theirdifferent consequences on the droplet evolution and size distribution, coalescenceand Ostwald ripening can be easily identified: a system evolving under the effectof Ostwald ripening alone exhibits a narrow size distribution with a droplet growth
143
P1: GFZ
SVNY317-Bibette February 1, 2007 16:55
144 5. Stability of Concentrated Emulsions
rate that progressively vanishes; instead, coalescence events increase the polydis-persity and accelerate the rate of coarsening as a result of the divergent growth oflarge nuclei.
In this chapter, we review some results in the field of emulsion metastabil-ity, emphasizing the destruction of concentrated emulsions (droplet volume frac-tion φ > 70%) through coalescence. The review concerning Oswald ripening(Section 5.2) is more concise, as this mechanism is fairly well understood and hasbeen extensively documented in the literature. So far, the destruction of concen-trated emulsions through coalescence is much less understood and has motivatedmany recent studies and developments that we summarize (Sections 5.3 to 5.6).
5.2. Ostwald Ripening
Ostwald ripening consists of a diffusive transfer of the dispersed phase from smallerto larger droplets. Ostwald ripening is characterized by either a constant volumerate �3 [4,5] (diffusion-controlled ripening) or a constant surface rate �2 [6](surface-controlled ripening), depending on the origin of the transfer mechanism:
dDα
dt= �α (5.1)
where D is the average droplet diameter. Diffusion-controlled ripening (α = 3)has been recognized in submicron diluted emulsions stabilized by ionic or non-ionic surfactants [4,5]; so far, permeation-controlled ripening (α = 2), has beenproposed to account for the coarsening of concentrated air foams [6].
If the ripening is controlled by diffusion across the continuous phase, then thecube of the diameter increases linearly with time (α = 3) and the ripening rate �3
can be derived using the Lifshitz and Slyozov theory [2,3]:
�3 = 64γint Diff SVm
9RT(5.2)
where S is the molecular solubility, Vm is the molar volume, Diff is the moleculardiffusion coefficient of the dispersed phase in the continuous one, γint is the interfa-cial tension of the oil–water interface, and R is the molar gas constant. The theory[2,3] also predicts that the size distribution becomes quite narrow and asymptot-ically self-similar, in agreement with experiments [4,5]. In principle, Eq. (5.2) isvalid in the limit of very dilute emulsions. In general, it is expected that emulsionswith higher volume fractions of disperse phase will have faster absolute growthrates than those predicted by the Lifshitz and Slyozov model. The theoretical rate ofripening must therefore be corrected by a factor f (φ) that reflects the dependenceof the coarsening rate on the dispersed phase volume fraction φ [10–14].
Kabalnov [15] and Taylor [16] found that the presence of ionic micelles in thecontinuous phase had a surprisingly small effect on the rate of ripening, despitethe fact that the solubility of the dispersed phase is largely enhanced. It was arguedthat owing to electrostatic repulsion, ionic micelles cannot absorb oil directly fromemulsion drops. In the presence of nonionic surfactants, much larger increases in
P1: GFZ
SVNY317-Bibette February 1, 2007 16:55
5.2. Ostwald Ripening 145
the rate of ripening are expected owing to larger solubilization capacities and tothe absence of electrostatic repulsion between droplets and micelles. Weiss et al.[17] showed that a significant increase in average diameter can be achieved fortetradecane-in-water emulsions diluted with a fresh solution of nonionic surfactant.In their experiments, the variation of droplet diameter resulted from a complexinterplay between oil solubilization by the micelles, which tended to reduce dropletdiameter, and Ostwald ripening, which tended to increase it.
When the dispersed phase is composed of a binary mixture, growth may be ar-rested if one component is almost insoluble in the continuous phase, thereforeretaining the soluble one, owing to the gradual loss of mixing entropy [18]. Theosmotic pressure of the trapped species within the droplets can overcome theLaplace pressure differences that drive the coarsening and “osmotically stabilize”the emulsions. Webster and Cates [19] gave rigorous criteria (in terms of osmoticpressure within the droplets) for stabilization of monodisperse and polydisperseemulsions in the dilute regime. The same authors [20] also examined the concen-trated regime in which the droplets are strongly deformed and therefore possess ahigh Laplace pressure. These authors conclude that osmotic stabilization of denseemulsions requires a pressure of trapped molecules in each droplet which is com-parable to the Laplace pressure that the droplets would have if they were spherical,as opposed to the much larger pressures actually present in the system.
Mass transfers in emulsions may be driven not only by differences in dropletcurvatures but also by differences in their compositions. This is observed when, forexample, two chemically different oils are emulsified separately and the resultingemulsions are mixed. This phenomenon is called composition ripening [21,22].Mass transfer from one emulsion to the other is controlled by the entropy ofmixing and proceeds until the compositions of the droplets become identical.The most spectacular evidence of composition ripening comes from the so-calledreverse recondensation that occurs when the two emulsions differ significantlyboth in their initial droplet size and in their rate of molecular diffusion. If the largersized emulsion is composed of the faster diffusing oil, then molecular diffusionoccurs in the “reverse” direction, that is, from large to small droplets [23].
Most experimental studies concerning Ostwald ripening have been performed inthe limit of highly dilute emulsions (φ < 1%), in conditions such that the dropletsare not in permanent contact. Ostwald ripening is then preferentially controlled bythe molecular diffusion of the dispersed molecules across the continuous phase,as deduced from experimental measurements [4,5,17,24,25]. Taisne and Cabane[26] have examined the coarsening of concentrated alkane-in-water droplets (φ ≈20–40%) stabilized by a nonionic poly(ethoxylated) surfactant, following a tem-perature quench. Because the rate of ripening does not depend on the alkanechain length, they conclude that the transfer of oil from the smaller drops to thelarger ones does not occur by diffusion across the continuous phase but ratherthrough the direct contact of the droplets (permeation) as observed in concentratedfoams [6]. A similar conclusion was drawn by Schmitt et al. [27]. These authorsproduce different alkane-in-water concentrated emulsions (φ ≈ 80%) stabilizedby a nonionic surfactant and follow the kinetic evolution by granulometry usingstatic light-scattering. The size distribution becomes remarkably narrow during the
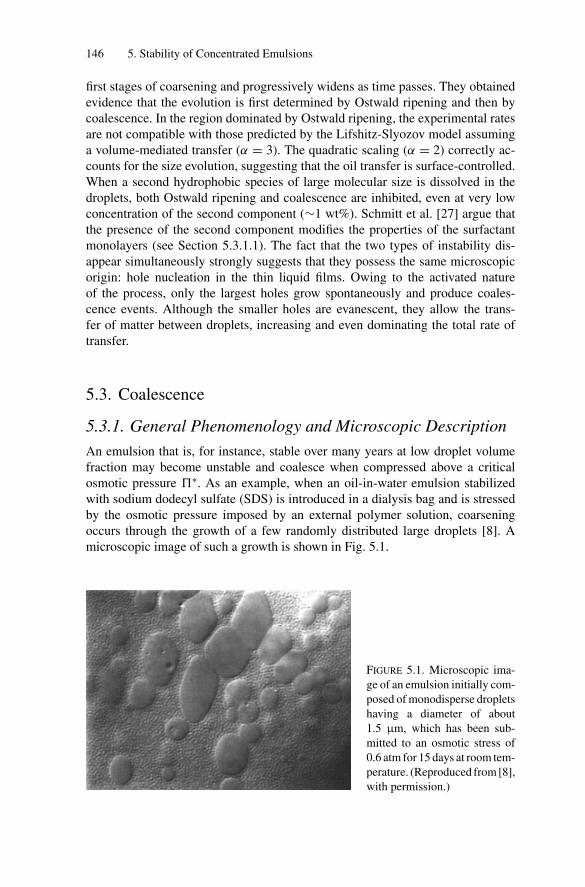
P1: GFZ
SVNY317-Bibette February 1, 2007 16:55
146 5. Stability of Concentrated Emulsions
first stages of coarsening and progressively widens as time passes. They obtainedevidence that the evolution is first determined by Ostwald ripening and then bycoalescence. In the region dominated by Ostwald ripening, the experimental ratesare not compatible with those predicted by the Lifshitz-Slyozov model assuminga volume-mediated transfer (α = 3). The quadratic scaling (α = 2) correctly ac-counts for the size evolution, suggesting that the oil transfer is surface-controlled.When a second hydrophobic species of large molecular size is dissolved in thedroplets, both Ostwald ripening and coalescence are inhibited, even at very lowconcentration of the second component (∼1 wt%). Schmitt et al. [27] argue thatthe presence of the second component modifies the properties of the surfactantmonolayers (see Section 5.3.1.1). The fact that the two types of instability dis-appear simultaneously strongly suggests that they possess the same microscopicorigin: hole nucleation in the thin liquid films. Owing to the activated natureof the process, only the largest holes grow spontaneously and produce coales-cence events. Although the smaller holes are evanescent, they allow the trans-fer of matter between droplets, increasing and even dominating the total rate oftransfer.
5.3. Coalescence
5.3.1. General Phenomenology and Microscopic Description
An emulsion that is, for instance, stable over many years at low droplet volumefraction may become unstable and coalesce when compressed above a criticalosmotic pressure �∗. As an example, when an oil-in-water emulsion stabilizedwith sodium dodecyl sulfate (SDS) is introduced in a dialysis bag and is stressedby the osmotic pressure imposed by an external polymer solution, coarseningoccurs through the growth of a few randomly distributed large droplets [8]. Amicroscopic image of such a growth is shown in Fig. 5.1.
FIGURE 5.1. Microscopic ima-
ge of an emulsion initially com-
posed of monodisperse droplets
having a diameter of about
1.5 μm, which has been sub-
mitted to an osmotic stress of
0.6 atm for 15 days at room tem-
perature. (Reproduced from [8],
with permission.)
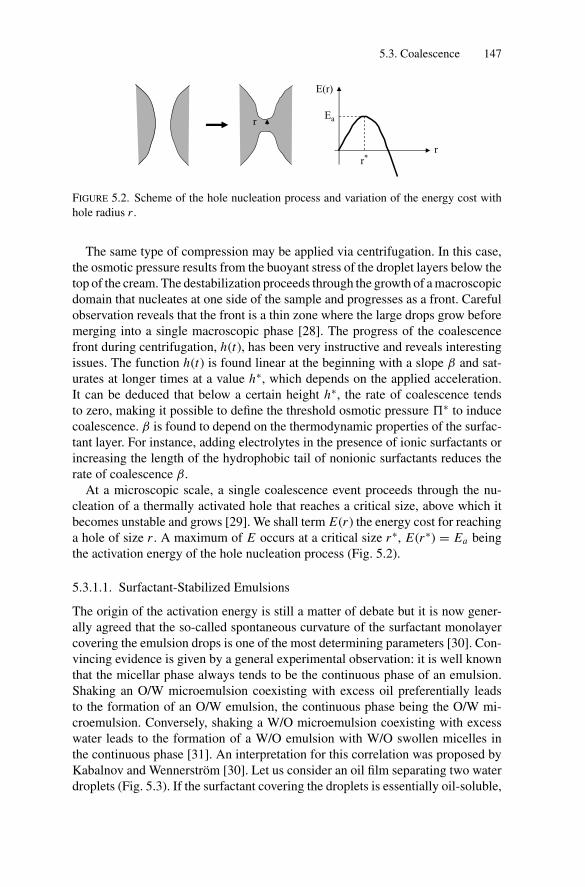
P1: GFZ
SVNY317-Bibette February 1, 2007 16:55
5.3. Coalescence 147
Ea
E(r)
rr*
r
FIGURE 5.2. Scheme of the hole nucleation process and variation of the energy cost with
hole radius r .
The same type of compression may be applied via centrifugation. In this case,the osmotic pressure results from the buoyant stress of the droplet layers below thetop of the cream. The destabilization proceeds through the growth of a macroscopicdomain that nucleates at one side of the sample and progresses as a front. Carefulobservation reveals that the front is a thin zone where the large drops grow beforemerging into a single macroscopic phase [28]. The progress of the coalescencefront during centrifugation, h(t), has been very instructive and reveals interestingissues. The function h(t) is found linear at the beginning with a slope β and sat-urates at longer times at a value h∗, which depends on the applied acceleration.It can be deduced that below a certain height h∗, the rate of coalescence tendsto zero, making it possible to define the threshold osmotic pressure �∗ to inducecoalescence. β is found to depend on the thermodynamic properties of the surfac-tant layer. For instance, adding electrolytes in the presence of ionic surfactants orincreasing the length of the hydrophobic tail of nonionic surfactants reduces therate of coalescence β.
At a microscopic scale, a single coalescence event proceeds through the nu-cleation of a thermally activated hole that reaches a critical size, above which itbecomes unstable and grows [29]. We shall term E(r ) the energy cost for reachinga hole of size r . A maximum of E occurs at a critical size r∗, E(r∗) = Ea beingthe activation energy of the hole nucleation process (Fig. 5.2).
5.3.1.1. Surfactant-Stabilized Emulsions
The origin of the activation energy is still a matter of debate but it is now gener-ally agreed that the so-called spontaneous curvature of the surfactant monolayercovering the emulsion drops is one of the most determining parameters [30]. Con-vincing evidence is given by a general experimental observation: it is well knownthat the micellar phase always tends to be the continuous phase of an emulsion.Shaking an O/W microemulsion coexisting with excess oil preferentially leadsto the formation of an O/W emulsion, the continuous phase being the O/W mi-croemulsion. Conversely, shaking a W/O microemulsion coexisting with excesswater leads to the formation of a W/O emulsion with W/O swollen micelles inthe continuous phase [31]. An interpretation for this correlation was proposed byKabalnov and Wennerstrom [30]. Let us consider an oil film separating two waterdroplets (Fig. 5.3). If the surfactant covering the droplets is essentially oil-soluble,
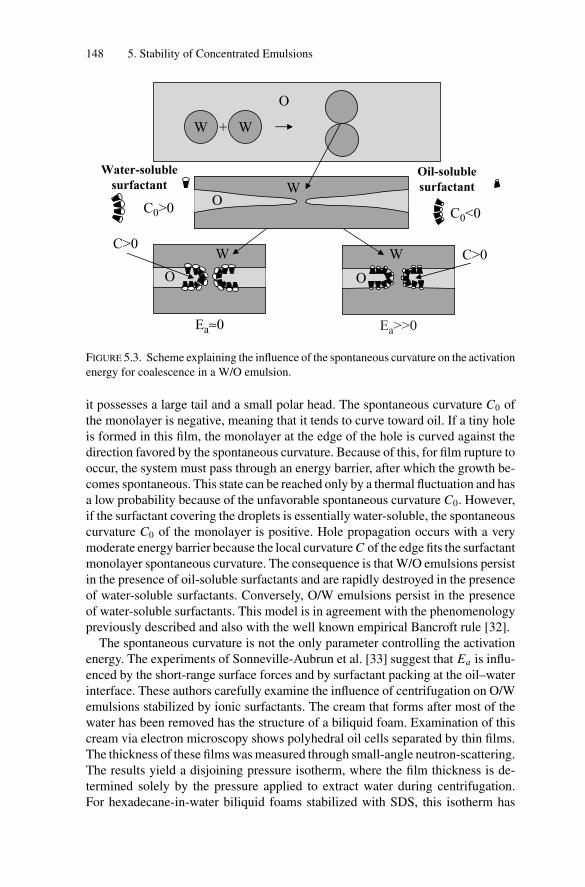
P1: GFZ
SVNY317-Bibette February 1, 2007 16:55
148 5. Stability of Concentrated Emulsions
Water-solublesurfactant
C0>0
W
O
Ea>>0Ea≈0
C>0W
O
W
O
+
WO
Oil-solublesurfactant
C0<0
C>0
W
FIGURE 5.3. Scheme explaining the influence of the spontaneous curvature on the activation
energy for coalescence in a W/O emulsion.
it possesses a large tail and a small polar head. The spontaneous curvature C0 ofthe monolayer is negative, meaning that it tends to curve toward oil. If a tiny holeis formed in this film, the monolayer at the edge of the hole is curved against thedirection favored by the spontaneous curvature. Because of this, for film rupture tooccur, the system must pass through an energy barrier, after which the growth be-comes spontaneous. This state can be reached only by a thermal fluctuation and hasa low probability because of the unfavorable spontaneous curvature C0. However,if the surfactant covering the droplets is essentially water-soluble, the spontaneouscurvature C0 of the monolayer is positive. Hole propagation occurs with a verymoderate energy barrier because the local curvature C of the edge fits the surfactantmonolayer spontaneous curvature. The consequence is that W/O emulsions persistin the presence of oil-soluble surfactants and are rapidly destroyed in the presenceof water-soluble surfactants. Conversely, O/W emulsions persist in the presenceof water-soluble surfactants. This model is in agreement with the phenomenologypreviously described and also with the well known empirical Bancroft rule [32].
The spontaneous curvature is not the only parameter controlling the activationenergy. The experiments of Sonneville-Aubrun et al. [33] suggest that Ea is influ-enced by the short-range surface forces and by surfactant packing at the oil–waterinterface. These authors carefully examine the influence of centrifugation on O/Wemulsions stabilized by ionic surfactants. The cream that forms after most of thewater has been removed has the structure of a biliquid foam. Examination of thiscream via electron microscopy shows polyhedral oil cells separated by thin films.The thickness of these films was measured through small-angle neutron-scattering.The results yield a disjoining pressure isotherm, where the film thickness is de-termined solely by the pressure applied to extract water during centrifugation.For hexadecane-in-water biliquid foams stabilized with SDS, this isotherm has
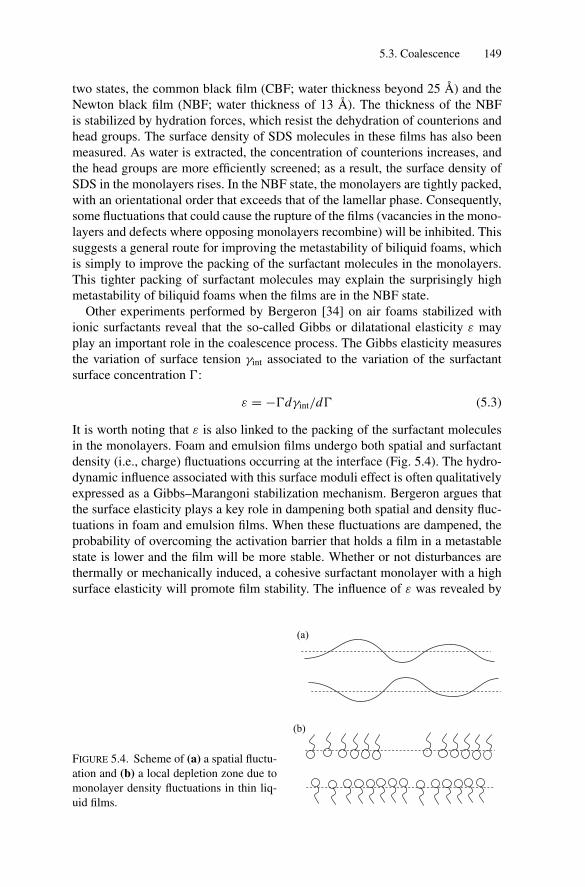
P1: GFZ
SVNY317-Bibette February 1, 2007 16:55
5.3. Coalescence 149
two states, the common black film (CBF; water thickness beyond 25 A) and theNewton black film (NBF; water thickness of 13 A). The thickness of the NBFis stabilized by hydration forces, which resist the dehydration of counterions andhead groups. The surface density of SDS molecules in these films has also beenmeasured. As water is extracted, the concentration of counterions increases, andthe head groups are more efficiently screened; as a result, the surface density ofSDS in the monolayers rises. In the NBF state, the monolayers are tightly packed,with an orientational order that exceeds that of the lamellar phase. Consequently,some fluctuations that could cause the rupture of the films (vacancies in the mono-layers and defects where opposing monolayers recombine) will be inhibited. Thissuggests a general route for improving the metastability of biliquid foams, whichis simply to improve the packing of the surfactant molecules in the monolayers.This tighter packing of surfactant molecules may explain the surprisingly highmetastability of biliquid foams when the films are in the NBF state.
Other experiments performed by Bergeron [34] on air foams stabilized withionic surfactants reveal that the so-called Gibbs or dilatational elasticity ε mayplay an important role in the coalescence process. The Gibbs elasticity measuresthe variation of surface tension γint associated to the variation of the surfactantsurface concentration :
ε = −dγint/d (5.3)
It is worth noting that ε is also linked to the packing of the surfactant moleculesin the monolayers. Foam and emulsion films undergo both spatial and surfactantdensity (i.e., charge) fluctuations occurring at the interface (Fig. 5.4). The hydro-dynamic influence associated with this surface moduli effect is often qualitativelyexpressed as a Gibbs–Marangoni stabilization mechanism. Bergeron argues thatthe surface elasticity plays a key role in dampening both spatial and density fluc-tuations in foam and emulsion films. When these fluctuations are dampened, theprobability of overcoming the activation barrier that holds a film in a metastablestate is lower and the film will be more stable. Whether or not disturbances arethermally or mechanically induced, a cohesive surfactant monolayer with a highsurface elasticity will promote film stability. The influence of ε was revealed by
(a)
(b)
FIGURE 5.4. Scheme of (a) a spatial fluctu-
ation and (b) a local depletion zone due to
monolayer density fluctuations in thin liq-
uid films.
P1: GFZ
SVNY317-Bibette February 1, 2007 16:55
150 5. Stability of Concentrated Emulsions
comparing the relative coalescence rate of foams stabilized by ionic surfactants(alkyltrimethylammonium bromides) with the same polar head but different alkylchain lengths: the resistance to coalescence was clearly correlated to ε, which wasan increasing function of the alkyl chain length.
5.3.1.2. Surfactant-Free Emulsions
In the absence of surfactants, it is well known that hydrocarbon (alkane)-in-wateremulsions coalesce and are totally destroyed after several hours of storage. How-ever, Pashley et al. [35,36] were able to fabricate surfactant-free, alkane-in-wateremulsions (φ < 6%) with remarkable kinetic stability after almost completelyremoving the dissolved gases. The reintroduction of dissolved gases did not desta-bilize already-formed emulsions. In addition, a systematic trend was found be-tween the molecular chain length of the alkane and the lifetime of the degassed oildroplets in water: the larger the alkane chain length, the more stable the emulsion.
Considering the measured electrostatic surface potential of the bare hydro-carbon–water interface and the Hamaker constant for that system, the emulsionsstudied by Pashley et al. should resist coalescence for a long period of time (sev-eral weeks) owing to the high electrostatic barrier. The failure of double-layer(DLVO) theory to predict the behavior of nondegassed emulsions raises the issueof whether additional forces might be involved. To account for their observations,Pashley et al. discuss the potential role of a long-range attractive force, calledthe “hydrophobic interaction.” Such interaction acts over relatively large distances(>10 nm) between hydrophobic surfaces in water [37] and is sensitive to dissolvedgases [38]. The results of Pashley et al. [36,37] have confirmed the importanceof dissolved gas, but a complete explanation for the effect of degassing on thehydrophobic dispersion still cannot be provided.
5.4. Measurements of the Coalescence Frequency
The evolution of emulsions through coalescence can be characterized by a kineticparameter, ω, describing the number of coalescence events per unit time and perunit surface area of the drops. Following the mean field description of Arrhenius,ω can be expressed as:
ω = ω0 exp(−Ea/kB T ) (5.4)
In this expression, kB T is the thermal energy and ω0 is the attempt frequency of thehole nucleation process. Assuming the existence of a unique rupturing frequencyω per unit film area, numerical simulations performed on a 2-D cellular material[9], reveal that the scenario of destruction through coalescence is intrinsicallyinhomogeneous with a few giant cells growing much more rapidly than the average,in qualitative agreement with the experimental observations previously described.Owing to the intrinsic complexity of the destruction scenario, the measurementsof ω0 and Ea are scarce. However, any progress in understanding the metastability
P1: GFZ
SVNY317-Bibette February 1, 2007 16:55
5.4. Measurements of the Coalescence Frequency 151
of emulsions is possible only through a quantitative determination of ω. Hereafter,we describe some attempts to measure ω for three different systems.
5.4.1. Simple Emulsions Stabilized by Surfactants
In the pioneering work of Deminiere et al. [39], the emulsion is modeled as a stackof monodisperse cells with characteristic size D. The total number of drops perunit volume, n, is related to the volume fraction φ of the dispersed phase throughthe following relationship:
φ = nπ D3/6 (5.5)
Because coalescence is a completely random process, the total number of coales-cence events per unit time is assumed to be proportional to the total surface areaA of the droplets:
−dn
dt= ωA = ωnπ D2 (5.6)
In Eq. (5.6), ω is defined as a coalescence frequency per unit surface area ofthe droplets. Considering Eqs. (5.5) and (5.6) and assuming that ω is constant(independent of D), it can be concluded that the mean size in the emulsion increaseswith time according the following law:
1
D20
− 1
D2= 2π
3ωt (5.7)
where D0 is the initial droplet diameter. This model predicts a divergence of thediameter after a finite time τ given by:
τ = 3
2 πωD20
(5.8)
The first kinetics measurements about coalescence were reported by Kabalnov andWeers in water-in-oil emulsions [40]. These authors measured the characteristictime at which the layer of free water formed at the bottom of the emulsions corre-sponded approximately to half of the volume of the dispersed phase. This time wasassumed to be equal to τ . By measuring τ at different temperatures, the activationenergy was deduced from an Arrhenius plot. Kabalnov and Weers were able toobtain the activation energy for a water-in-octane emulsion at φ ≈ 50%, stabilizedby the nonionic surfactant C12E5 (pentaethylene glycol mono n-dodecyl ether),above the phase inversion temperature (PIT), and found a value of 47 kB Tr , Tr
being the room temperature.The above-mentioned method is based on a mean-field description that assumes
spatially homogeneous monodisperse growth and constant coalescence frequency.The first assumption poorly agrees with experiments that reveal that the size distri-bution becomes not only extremely wide but also spatially inhomogeneous duringthe destruction process. At φ ≈ 50%, the emulsion viscosity is quite low and localrearrangements take place: the larger drops can migrate and concentrate at the
P1: GFZ
SVNY317-Bibette February 1, 2007 16:55
152 5. Stability of Concentrated Emulsions
top (or bottom) of the samples under the effect of buoyancy (or gravity). Becausethe biggest drops become progressively predominant in the cream (or sediment),coalescence is locally accelerated. Indeed, neighboring drops are in permanentcontact and larger drops will grow faster because they exhibit a larger surfacecontact area with their neighbors. Instead, in highly concentrated emulsions (φ >
75%), rearrangements due to creaming are quite slow and the size distributionremains spatially homogeneous for a long period of time. In this limit, it has beenshown that the average droplet size does not exhibit the diverging growth pre-dicted by Eq. (5.7) [41]. The mean-field model assuming a time-independent coa-lescence frequency provides a useful but oversimplified picture of the destructionprocess.
A different approach has been proposed by Schmitt et al. [42]. They producedO/W emulsions at φ = 78%, stabilized by ionic and nonionic surfactants. Theemulsions were stored in that concentrated state at 20◦C. The droplet size dis-tribution was measured at regular time intervals via static light-scattering us-ing Mie theory. Starting from the volume distribution, a little bit of algebraallowed a straightforward calculation of the average diameter D[p, q] definedas:
D[p, q] =
⎛⎜⎝
∑i
Ni D pi∑
iNi Dq
i
⎞⎟⎠
1p−q
(5.9)
where Ni is the total number of droplets with diameter Di . The emulsions werecharacterized in terms of their surface-averaged diameter Ds = D[3, 2] and poly-dispersity:
P = 1
D
∑i
Ni D3i
∣∣D − Di
∣∣∑
iNi D3
i
(5.10)
where D is the median diameter for which the cumulative undersized volumefraction is equal to 50%.
For all the emulsions under study, the size distribution follows the same qual-itative evolution as the one reported in Fig. 5.5 for octane-in-water droplets sta-bilized with SDS. In Fig. 5.6, the evolutions of Ds , and P as a function of timefor the same emulsion are reported. The time interval where the polydispersity islower than 20% has been shaded: in terms of droplet diameter, the interval liesbetween lower and upper limits, denoted Ds1 and Ds2, respectively (Fig. 5.6b).Initially, the polydispersity is of the order of 40–50%. As time passes, Ds in-creases until reaching Ds1 and P decreases to around 13–20%, a low value in-dicating the formation of an emulsion with high degree of monodispersity. ForDs < Ds2, P stays at a low level and the diameter growth rate is continuouslydecreasing (d2 Ds/dt2 ≤ 0). These two observations reveal that Ostwald ripeningis the rate-determining mechanism. Indeed, theoretical calculations predict that therate is self-saturating and that polydispersity is lower than 20% in the asymptotic
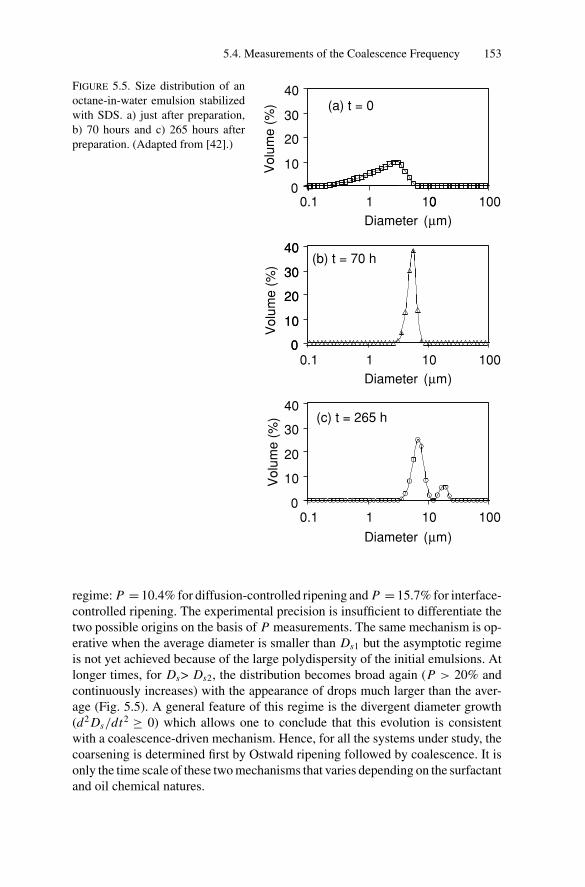
P1: GFZ
SVNY317-Bibette February 1, 2007 16:55
5.4. Measurements of the Coalescence Frequency 153
0
10
20
30
40
0.1 1 10 100
(a) t = 0
Diameter (μm)
0
Vo
lum
e (
%)
0
10
20
30
40
0.1 1 10 100
(c) t = 265 h
Diameter (μm)
Vo
lum
e (
%)
0
10
20
30
40
0.1 1 10 100
(b) t = 70 h
Diameter (μm)
0
10
20
30
40
Vo
lum
e (
%)
FIGURE 5.5. Size distribution of an
octane-in-water emulsion stabilized
with SDS. a) just after preparation,
b) 70 hours and c) 265 hours after
preparation. (Adapted from [42].)
regime: P = 10.4% for diffusion-controlled ripening and P = 15.7% for interface-controlled ripening. The experimental precision is insufficient to differentiate thetwo possible origins on the basis of P measurements. The same mechanism is op-erative when the average diameter is smaller than Ds1 but the asymptotic regimeis not yet achieved because of the large polydispersity of the initial emulsions. Atlonger times, for Ds> Ds2, the distribution becomes broad again (P > 20% andcontinuously increases) with the appearance of drops much larger than the aver-age (Fig. 5.5). A general feature of this regime is the divergent diameter growth(d2 Ds/dt2 ≥ 0) which allows one to conclude that this evolution is consistentwith a coalescence-driven mechanism. Hence, for all the systems under study, thecoarsening is determined first by Ostwald ripening followed by coalescence. It isonly the time scale of these two mechanisms that varies depending on the surfactantand oil chemical natures.
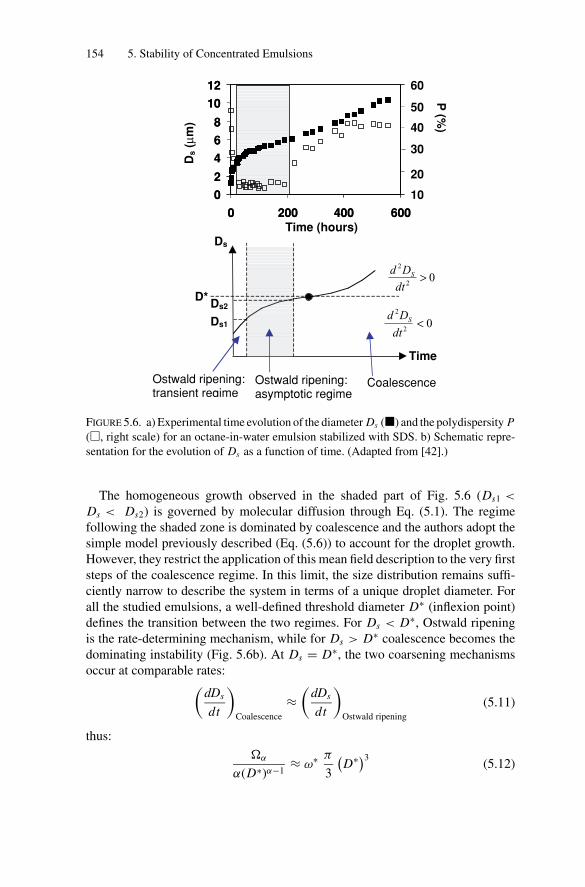
P1: GFZ
SVNY317-Bibette February 1, 2007 16:55
154 5. Stability of Concentrated Emulsions
0
2
4
6
8
10
12
0 200 400 600
10
30
40
60
0
2
4
6
8
10
12
0 200 400 600
20
50
Time (hours)
Ds (
μm)
P (%
)
D*
Ds1
Ds2
Ostwald ripening:transient regime
CoalescenceOstwald ripening:asymptotic regime
Time
02
2
<dt
Dd S
02
2
>dt
Dd S
Ds
FIGURE 5.6. a) Experimental time evolution of the diameter Ds (�) and the polydispersity P(�, right scale) for an octane-in-water emulsion stabilized with SDS. b) Schematic repre-
sentation for the evolution of Ds as a function of time. (Adapted from [42].)
The homogeneous growth observed in the shaded part of Fig. 5.6 (Ds1 <
Ds < Ds2) is governed by molecular diffusion through Eq. (5.1). The regimefollowing the shaded zone is dominated by coalescence and the authors adopt thesimple model previously described (Eq. (5.6)) to account for the droplet growth.However, they restrict the application of this mean field description to the very firststeps of the coalescence regime. In this limit, the size distribution remains suffi-ciently narrow to describe the system in terms of a unique droplet diameter. Forall the studied emulsions, a well-defined threshold diameter D∗ (inflexion point)defines the transition between the two regimes. For Ds < D∗, Ostwald ripeningis the rate-determining mechanism, while for Ds > D∗ coalescence becomes thedominating instability (Fig. 5.6b). At Ds = D∗, the two coarsening mechanismsoccur at comparable rates:(
dDs
dt
)Coalescence
≈(
dDs
dt
)Ostwald ripening
(5.11)
thus:
�α
α(D∗)α−1≈ ω∗ π
3
(D∗)3
(5.12)
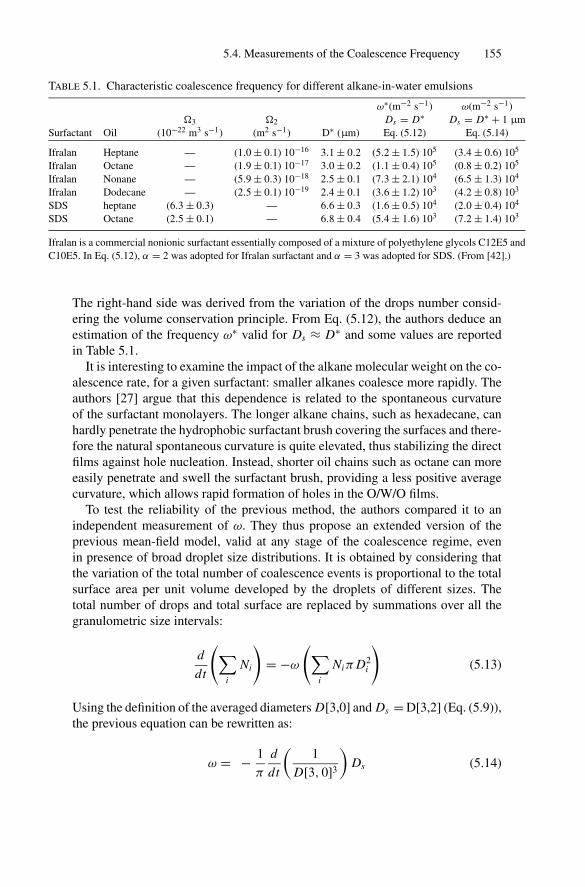
P1: GFZ
SVNY317-Bibette February 1, 2007 16:55
5.4. Measurements of the Coalescence Frequency 155
TABLE 5.1. Characteristic coalescence frequency for different alkane-in-water emulsions
ω∗(m−2 s−1) ω(m−2 s−1)
�3 �2 Ds = D∗ Ds = D∗ + 1 μm
Surfactant Oil (10−22 m3 s−1) (m2 s−1) D∗ (μm) Eq. (5.12) Eq. (5.14)
Ifralan Heptane — (1.0 ± 0.1) 10−16 3.1 ± 0.2 (5.2 ± 1.5) 105 (3.4 ± 0.6) 105
Ifralan Octane — (1.9 ± 0.1) 10−17 3.0 ± 0.2 (1.1 ± 0.4) 105 (0.8 ± 0.2) 105
Ifralan Nonane — (5.9 ± 0.3) 10−18 2.5 ± 0.1 (7.3 ± 2.1) 104 (6.5 ± 1.3) 104
Ifralan Dodecane — (2.5 ± 0.1) 10−19 2.4 ± 0.1 (3.6 ± 1.2) 103 (4.2 ± 0.8) 103
SDS heptane (6.3 ± 0.3) — 6.6 ± 0.3 (1.6 ± 0.5) 104 (2.0 ± 0.4) 104
SDS Octane (2.5 ± 0.1) — 6.8 ± 0.4 (5.4 ± 1.6) 103 (7.2 ± 1.4) 103
Ifralan is a commercial nonionic surfactant essentially composed of a mixture of polyethylene glycols C12E5 and
C10E5. In Eq. (5.12), α = 2 was adopted for Ifralan surfactant and α = 3 was adopted for SDS. (From [42].)
The right-hand side was derived from the variation of the drops number consid-ering the volume conservation principle. From Eq. (5.12), the authors deduce anestimation of the frequency ω∗ valid for Ds ≈ D∗ and some values are reportedin Table 5.1.
It is interesting to examine the impact of the alkane molecular weight on the co-alescence rate, for a given surfactant: smaller alkanes coalesce more rapidly. Theauthors [27] argue that this dependence is related to the spontaneous curvatureof the surfactant monolayers. The longer alkane chains, such as hexadecane, canhardly penetrate the hydrophobic surfactant brush covering the surfaces and there-fore the natural spontaneous curvature is quite elevated, thus stabilizing the directfilms against hole nucleation. Instead, shorter oil chains such as octane can moreeasily penetrate and swell the surfactant brush, providing a less positive averagecurvature, which allows rapid formation of holes in the O/W/O films.
To test the reliability of the previous method, the authors compared it to anindependent measurement of ω. They thus propose an extended version of theprevious mean-field model, valid at any stage of the coalescence regime, evenin presence of broad droplet size distributions. It is obtained by considering thatthe variation of the total number of coalescence events is proportional to the totalsurface area per unit volume developed by the droplets of different sizes. Thetotal number of drops and total surface are replaced by summations over all thegranulometric size intervals:
d
dt
(∑i
Ni
)= −ω
(∑i
Niπ D2i
)(5.13)
Using the definition of the averaged diameters D[3,0] and Ds = D[3,2] (Eq. (5.9)),the previous equation can be rewritten as:
ω = − 1
π
d
dt
(1
D[3, 0]3
)Ds (5.14)
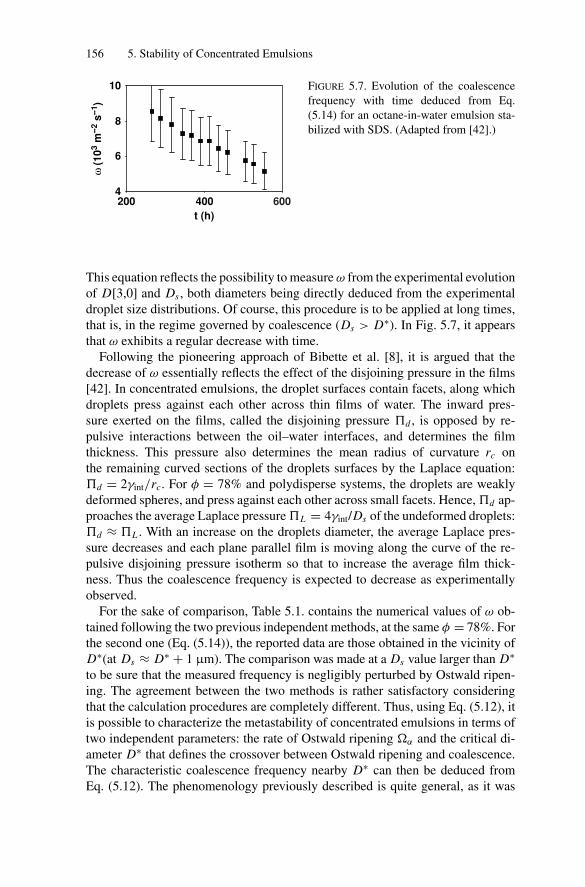
P1: GFZ
SVNY317-Bibette February 1, 2007 16:55
156 5. Stability of Concentrated Emulsions
600400
t (h)
200
8
4
6
ω (1
03 m
--2 s
--1)
10 FIGURE 5.7. Evolution of the coalescence
frequency with time deduced from Eq.
(5.14) for an octane-in-water emulsion sta-
bilized with SDS. (Adapted from [42].)
This equation reflects the possibility to measure ω from the experimental evolutionof D[3,0] and Ds , both diameters being directly deduced from the experimentaldroplet size distributions. Of course, this procedure is to be applied at long times,that is, in the regime governed by coalescence (Ds > D∗). In Fig. 5.7, it appearsthat ω exhibits a regular decrease with time.
Following the pioneering approach of Bibette et al. [8], it is argued that thedecrease of ω essentially reflects the effect of the disjoining pressure in the films[42]. In concentrated emulsions, the droplet surfaces contain facets, along whichdroplets press against each other across thin films of water. The inward pres-sure exerted on the films, called the disjoining pressure �d , is opposed by re-pulsive interactions between the oil–water interfaces, and determines the filmthickness. This pressure also determines the mean radius of curvature rc onthe remaining curved sections of the droplets surfaces by the Laplace equation:�d = 2γint/rc. For φ = 78% and polydisperse systems, the droplets are weaklydeformed spheres, and press against each other across small facets. Hence, �d ap-proaches the average Laplace pressure �L = 4γint/Ds of the undeformed droplets:�d ≈ �L . With an increase on the droplets diameter, the average Laplace pres-sure decreases and each plane parallel film is moving along the curve of the re-pulsive disjoining pressure isotherm so that to increase the average film thick-ness. Thus the coalescence frequency is expected to decrease as experimentallyobserved.
For the sake of comparison, Table 5.1. contains the numerical values of ω ob-tained following the two previous independent methods, at the same φ = 78%. Forthe second one (Eq. (5.14)), the reported data are those obtained in the vicinity ofD∗(at Ds ≈ D∗ + 1 μm). The comparison was made at a Ds value larger than D∗
to be sure that the measured frequency is negligibly perturbed by Ostwald ripen-ing. The agreement between the two methods is rather satisfactory consideringthat the calculation procedures are completely different. Thus, using Eq. (5.12), itis possible to characterize the metastability of concentrated emulsions in terms oftwo independent parameters: the rate of Ostwald ripening �α and the critical di-ameter D∗ that defines the crossover between Ostwald ripening and coalescence.The characteristic coalescence frequency nearby D∗ can then be deduced fromEq. (5.12). The phenomenology previously described is quite general, as it was
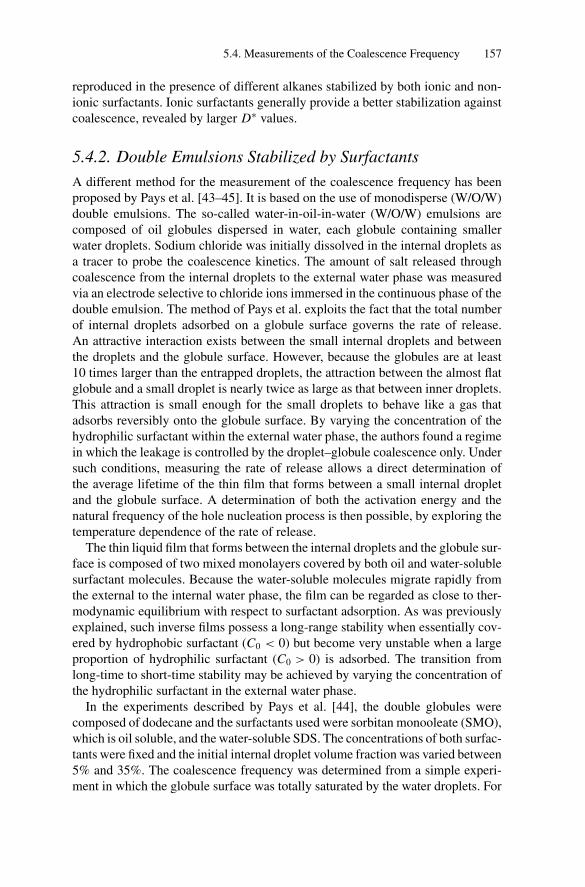
P1: GFZ
SVNY317-Bibette February 1, 2007 16:55
5.4. Measurements of the Coalescence Frequency 157
reproduced in the presence of different alkanes stabilized by both ionic and non-ionic surfactants. Ionic surfactants generally provide a better stabilization againstcoalescence, revealed by larger D∗ values.
5.4.2. Double Emulsions Stabilized by Surfactants
A different method for the measurement of the coalescence frequency has beenproposed by Pays et al. [43–45]. It is based on the use of monodisperse (W/O/W)double emulsions. The so-called water-in-oil-in-water (W/O/W) emulsions arecomposed of oil globules dispersed in water, each globule containing smallerwater droplets. Sodium chloride was initially dissolved in the internal droplets asa tracer to probe the coalescence kinetics. The amount of salt released throughcoalescence from the internal droplets to the external water phase was measuredvia an electrode selective to chloride ions immersed in the continuous phase of thedouble emulsion. The method of Pays et al. exploits the fact that the total numberof internal droplets adsorbed on a globule surface governs the rate of release.An attractive interaction exists between the small internal droplets and betweenthe droplets and the globule surface. However, because the globules are at least10 times larger than the entrapped droplets, the attraction between the almost flatglobule and a small droplet is nearly twice as large as that between inner droplets.This attraction is small enough for the small droplets to behave like a gas thatadsorbs reversibly onto the globule surface. By varying the concentration of thehydrophilic surfactant within the external water phase, the authors found a regimein which the leakage is controlled by the droplet–globule coalescence only. Undersuch conditions, measuring the rate of release allows a direct determination ofthe average lifetime of the thin film that forms between a small internal dropletand the globule surface. A determination of both the activation energy and thenatural frequency of the hole nucleation process is then possible, by exploring thetemperature dependence of the rate of release.
The thin liquid film that forms between the internal droplets and the globule sur-face is composed of two mixed monolayers covered by both oil and water-solublesurfactant molecules. Because the water-soluble molecules migrate rapidly fromthe external to the internal water phase, the film can be regarded as close to ther-modynamic equilibrium with respect to surfactant adsorption. As was previouslyexplained, such inverse films possess a long-range stability when essentially cov-ered by hydrophobic surfactant (C0 < 0) but become very unstable when a largeproportion of hydrophilic surfactant (C0 > 0) is adsorbed. The transition fromlong-time to short-time stability may be achieved by varying the concentration ofthe hydrophilic surfactant in the external water phase.
In the experiments described by Pays et al. [44], the double globules werecomposed of dodecane and the surfactants used were sorbitan monooleate (SMO),which is oil soluble, and the water-soluble SDS. The concentrations of both surfac-tants were fixed and the initial internal droplet volume fraction was varied between5% and 35%. The coalescence frequency was determined from a simple experi-ment in which the globule surface was totally saturated by the water droplets. For
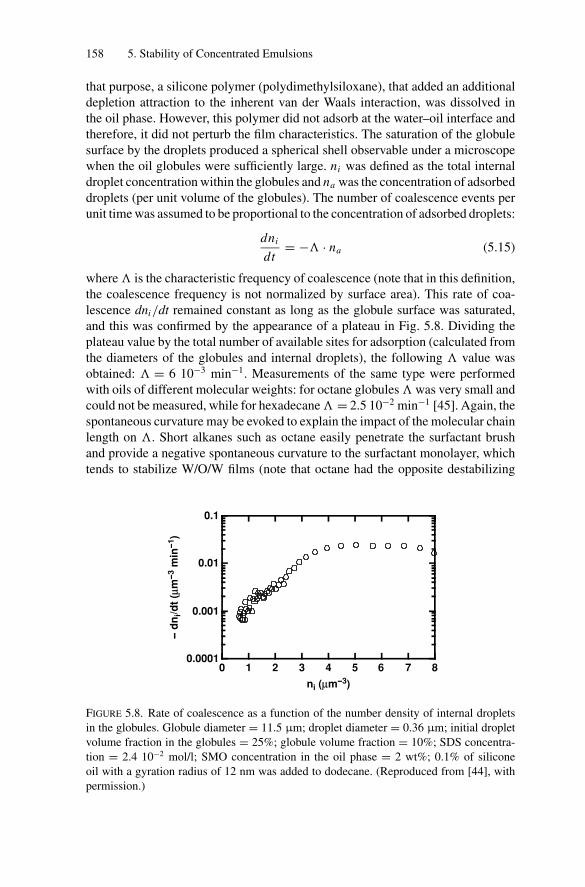
P1: GFZ
SVNY317-Bibette February 1, 2007 16:55
158 5. Stability of Concentrated Emulsions
that purpose, a silicone polymer (polydimethylsiloxane), that added an additionaldepletion attraction to the inherent van der Waals interaction, was dissolved inthe oil phase. However, this polymer did not adsorb at the water–oil interface andtherefore, it did not perturb the film characteristics. The saturation of the globulesurface by the droplets produced a spherical shell observable under a microscopewhen the oil globules were sufficiently large. ni was defined as the total internaldroplet concentration within the globules and na was the concentration of adsorbeddroplets (per unit volume of the globules). The number of coalescence events perunit time was assumed to be proportional to the concentration of adsorbed droplets:
dni
dt= − · na (5.15)
where is the characteristic frequency of coalescence (note that in this definition,the coalescence frequency is not normalized by surface area). This rate of coa-lescence dni/dt remained constant as long as the globule surface was saturated,and this was confirmed by the appearance of a plateau in Fig. 5.8. Dividing theplateau value by the total number of available sites for adsorption (calculated fromthe diameters of the globules and internal droplets), the following value wasobtained: = 6 10−3 min−1. Measurements of the same type were performedwith oils of different molecular weights: for octane globules was very small andcould not be measured, while for hexadecane = 2.5 10−2 min−1 [45]. Again, thespontaneous curvature may be evoked to explain the impact of the molecular chainlength on . Short alkanes such as octane easily penetrate the surfactant brushand provide a negative spontaneous curvature to the surfactant monolayer, whichtends to stabilize W/O/W films (note that octane had the opposite destabilizing
0.0001
0.001
0.01
0.1
876543210
-- d
ni/d
t (μ
m--
3 m
in--
1)
ni (μm--3)
FIGURE 5.8. Rate of coalescence as a function of the number density of internal droplets
in the globules. Globule diameter = 11.5 μm; droplet diameter = 0.36 μm; initial droplet
volume fraction in the globules = 25%; globule volume fraction = 10%; SDS concentra-
tion = 2.4 10−2 mol/l; SMO concentration in the oil phase = 2 wt%; 0.1% of silicone
oil with a gyration radius of 12 nm was added to dodecane. (Reproduced from [44], with
permission.)
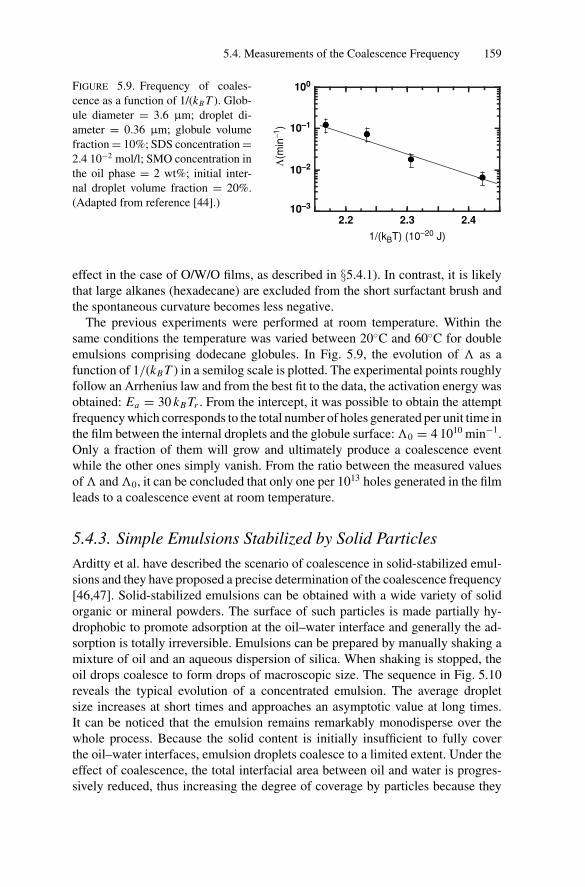
P1: GFZ
SVNY317-Bibette February 1, 2007 16:55
5.4. Measurements of the Coalescence Frequency 159
10–3
10–2
10–1
100
2.42.32.2
1/(kBT) (10−20 J)
Λ(m
in−1
)
FIGURE 5.9. Frequency of coales-
cence as a function of 1/(kB T ). Glob-
ule diameter = 3.6 μm; droplet di-
ameter = 0.36 μm; globule volume
fraction = 10%; SDS concentration =2.4 10−2 mol/l; SMO concentration in
the oil phase = 2 wt%; initial inter-
nal droplet volume fraction = 20%.
(Adapted from reference [44].)
effect in the case of O/W/O films, as described in §5.4.1). In contrast, it is likelythat large alkanes (hexadecane) are excluded from the short surfactant brush andthe spontaneous curvature becomes less negative.
The previous experiments were performed at room temperature. Within thesame conditions the temperature was varied between 20◦C and 60◦C for doubleemulsions comprising dodecane globules. In Fig. 5.9, the evolution of as afunction of 1/(kB T ) in a semilog scale is plotted. The experimental points roughlyfollow an Arrhenius law and from the best fit to the data, the activation energy wasobtained: Ea = 30 kB Tr . From the intercept, it was possible to obtain the attemptfrequency which corresponds to the total number of holes generated per unit time inthe film between the internal droplets and the globule surface: 0 = 4 1010 min−1.Only a fraction of them will grow and ultimately produce a coalescence eventwhile the other ones simply vanish. From the ratio between the measured valuesof and 0, it can be concluded that only one per 1013 holes generated in the filmleads to a coalescence event at room temperature.
5.4.3. Simple Emulsions Stabilized by Solid Particles
Arditty et al. have described the scenario of coalescence in solid-stabilized emul-sions and they have proposed a precise determination of the coalescence frequency[46,47]. Solid-stabilized emulsions can be obtained with a wide variety of solidorganic or mineral powders. The surface of such particles is made partially hy-drophobic to promote adsorption at the oil–water interface and generally the ad-sorption is totally irreversible. Emulsions can be prepared by manually shaking amixture of oil and an aqueous dispersion of silica. When shaking is stopped, theoil drops coalesce to form drops of macroscopic size. The sequence in Fig. 5.10reveals the typical evolution of a concentrated emulsion. The average dropletsize increases at short times and approaches an asymptotic value at long times.It can be noticed that the emulsion remains remarkably monodisperse over thewhole process. Because the solid content is initially insufficient to fully coverthe oil–water interfaces, emulsion droplets coalesce to a limited extent. Under theeffect of coalescence, the total interfacial area between oil and water is progres-sively reduced, thus increasing the degree of coverage by particles because they
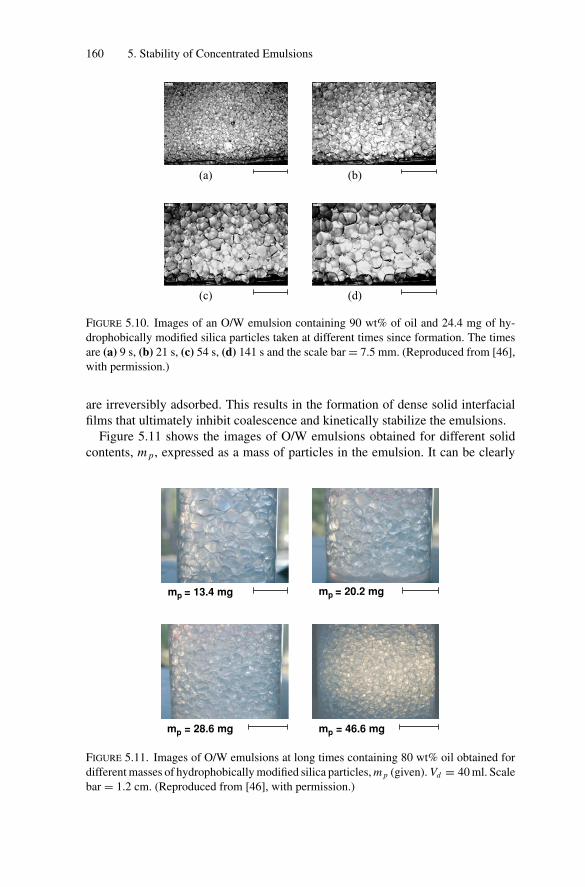
P1: GFZ
SVNY317-Bibette February 1, 2007 16:55
160 5. Stability of Concentrated Emulsions
(a)
(c) (d)
(b)
FIGURE 5.10. Images of an O/W emulsion containing 90 wt% of oil and 24.4 mg of hy-
drophobically modified silica particles taken at different times since formation. The times
are (a) 9 s, (b) 21 s, (c) 54 s, (d) 141 s and the scale bar = 7.5 mm. (Reproduced from [46],
with permission.)
are irreversibly adsorbed. This results in the formation of dense solid interfacialfilms that ultimately inhibit coalescence and kinetically stabilize the emulsions.
Figure 5.11 shows the images of O/W emulsions obtained for different solidcontents, m p, expressed as a mass of particles in the emulsion. It can be clearly
mp = 13.4 mg
mp = 46.6 mg
mp = 20.2 mg
mp = 28.6 mg
FIGURE 5.11. Images of O/W emulsions at long times containing 80 wt% oil obtained for
different masses of hydrophobically modified silica particles, m p (given). Vd = 40 ml. Scale
bar = 1.2 cm. (Reproduced from [46], with permission.)
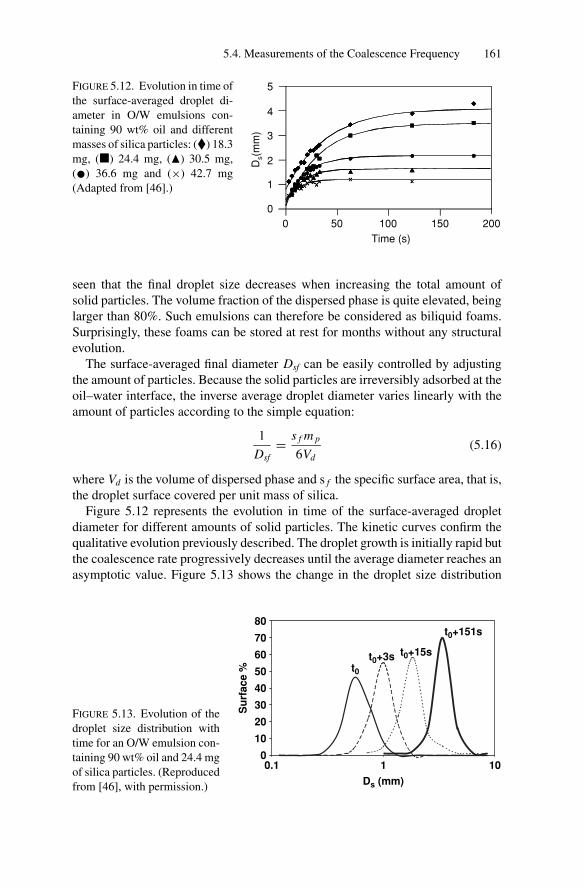
P1: GFZ
SVNY317-Bibette February 1, 2007 16:55
5.4. Measurements of the Coalescence Frequency 161
0 100 20050 150
0
1
2
3
4
5
Time (s)
Ds(
mm
)
FIGURE 5.12. Evolution in time of
the surface-averaged droplet di-
ameter in O/W emulsions con-
taining 90 wt% oil and different
masses of silica particles: (�) 18.3
mg, (�) 24.4 mg, (�) 30.5 mg,
(•) 36.6 mg and (×) 42.7 mg
(Adapted from [46].)
seen that the final droplet size decreases when increasing the total amount ofsolid particles. The volume fraction of the dispersed phase is quite elevated, beinglarger than 80%. Such emulsions can therefore be considered as biliquid foams.Surprisingly, these foams can be stored at rest for months without any structuralevolution.
The surface-averaged final diameter Dsf can be easily controlled by adjustingthe amount of particles. Because the solid particles are irreversibly adsorbed at theoil–water interface, the inverse average droplet diameter varies linearly with theamount of particles according to the simple equation:
1
Dsf= s f m p
6Vd(5.16)
where Vd is the volume of dispersed phase and s f the specific surface area, that is,the droplet surface covered per unit mass of silica.
Figure 5.12 represents the evolution in time of the surface-averaged dropletdiameter for different amounts of solid particles. The kinetic curves confirm thequalitative evolution previously described. The droplet growth is initially rapid butthe coalescence rate progressively decreases until the average diameter reaches anasymptotic value. Figure 5.13 shows the change in the droplet size distribution
0
10
20
30
40
50
60
70
80
0.1 10
Ds (mm)
t0
t0+3s t0+15s
t0+151s
1
Su
rface %
FIGURE 5.13. Evolution of the
droplet size distribution with
time for an O/W emulsion con-
taining 90 wt% oil and 24.4 mg
of silica particles. (Reproduced
from [46], with permission.)
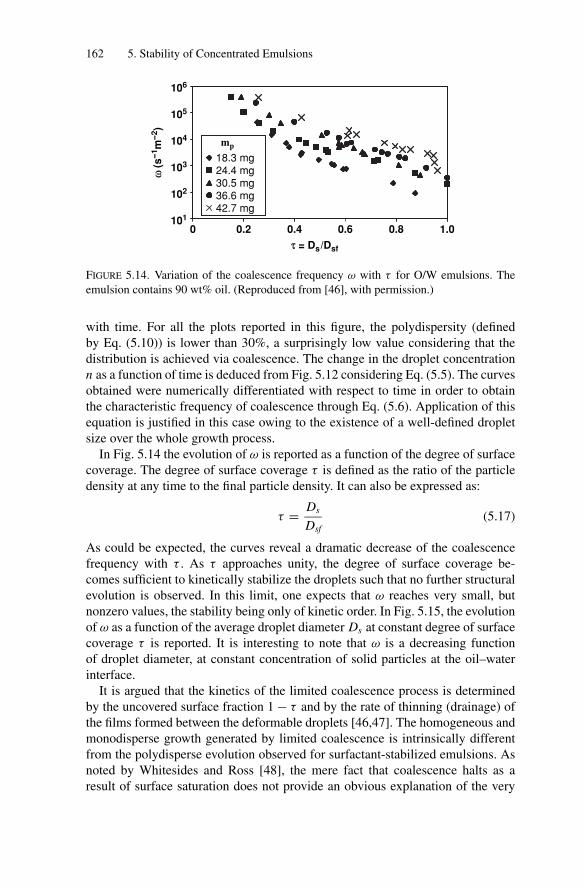
P1: GFZ
SVNY317-Bibette February 1, 2007 16:55
162 5. Stability of Concentrated Emulsions
0
102
103
104
105
106
101
0.2 0.4 0.6 0.8 1.0
τ = Ds/Dsf
18.3 mg24.4 mg30.5 mg36.6 mg42.7 mg
ω (s
--1m
--2)
mp
FIGURE 5.14. Variation of the coalescence frequency ω with τ for O/W emulsions. The
emulsion contains 90 wt% oil. (Reproduced from [46], with permission.)
with time. For all the plots reported in this figure, the polydispersity (definedby Eq. (5.10)) is lower than 30%, a surprisingly low value considering that thedistribution is achieved via coalescence. The change in the droplet concentrationn as a function of time is deduced from Fig. 5.12 considering Eq. (5.5). The curvesobtained were numerically differentiated with respect to time in order to obtainthe characteristic frequency of coalescence through Eq. (5.6). Application of thisequation is justified in this case owing to the existence of a well-defined dropletsize over the whole growth process.
In Fig. 5.14 the evolution of ω is reported as a function of the degree of surfacecoverage. The degree of surface coverage τ is defined as the ratio of the particledensity at any time to the final particle density. It can also be expressed as:
τ = Ds
Dsf(5.17)
As could be expected, the curves reveal a dramatic decrease of the coalescencefrequency with τ . As τ approaches unity, the degree of surface coverage be-comes sufficient to kinetically stabilize the droplets such that no further structuralevolution is observed. In this limit, one expects that ω reaches very small, butnonzero values, the stability being only of kinetic order. In Fig. 5.15, the evolutionof ω as a function of the average droplet diameter Ds at constant degree of surfacecoverage τ is reported. It is interesting to note that ω is a decreasing functionof droplet diameter, at constant concentration of solid particles at the oil–waterinterface.
It is argued that the kinetics of the limited coalescence process is determinedby the uncovered surface fraction 1 − τ and by the rate of thinning (drainage) ofthe films formed between the deformable droplets [46,47]. The homogeneous andmonodisperse growth generated by limited coalescence is intrinsically differentfrom the polydisperse evolution observed for surfactant-stabilized emulsions. Asnoted by Whitesides and Ross [48], the mere fact that coalescence halts as aresult of surface saturation does not provide an obvious explanation of the very
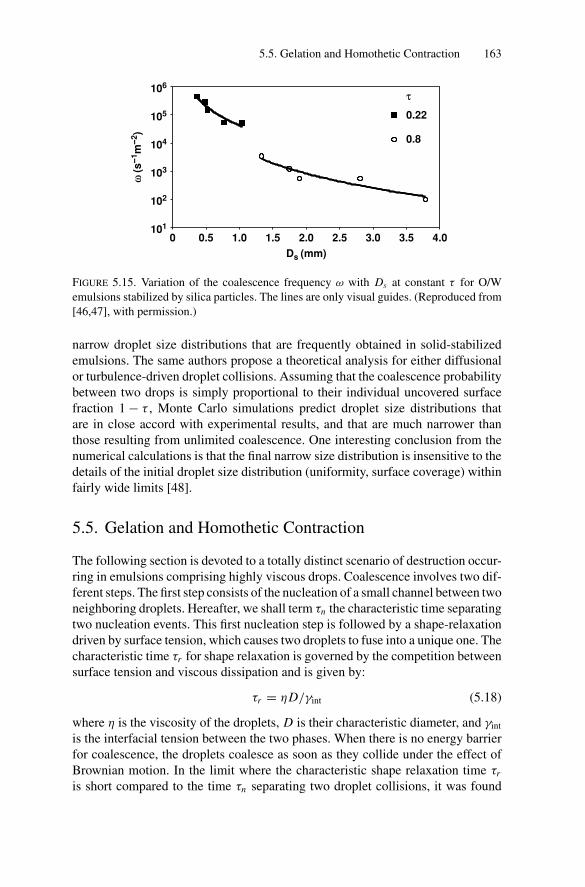
P1: GFZ
SVNY317-Bibette February 1, 2007 16:55
5.5. Gelation and Homothetic Contraction 163
4.03.5
0.8
0.22
3.02.52.01.51.00.50
102
103
104
105
106
101
Ds (mm)
ω (s
--1m
--2)
τ
FIGURE 5.15. Variation of the coalescence frequency ω with Ds at constant τ for O/W
emulsions stabilized by silica particles. The lines are only visual guides. (Reproduced from
[46,47], with permission.)
narrow droplet size distributions that are frequently obtained in solid-stabilizedemulsions. The same authors propose a theoretical analysis for either diffusionalor turbulence-driven droplet collisions. Assuming that the coalescence probabilitybetween two drops is simply proportional to their individual uncovered surfacefraction 1 − τ , Monte Carlo simulations predict droplet size distributions thatare in close accord with experimental results, and that are much narrower thanthose resulting from unlimited coalescence. One interesting conclusion from thenumerical calculations is that the final narrow size distribution is insensitive to thedetails of the initial droplet size distribution (uniformity, surface coverage) withinfairly wide limits [48].
5.5. Gelation and Homothetic Contraction
The following section is devoted to a totally distinct scenario of destruction occur-ring in emulsions comprising highly viscous drops. Coalescence involves two dif-ferent steps. The first step consists of the nucleation of a small channel between twoneighboring droplets. Hereafter, we shall term τn the characteristic time separatingtwo nucleation events. This first nucleation step is followed by a shape-relaxationdriven by surface tension, which causes two droplets to fuse into a unique one. Thecharacteristic time τr for shape relaxation is governed by the competition betweensurface tension and viscous dissipation and is given by:
τr = ηD/γint (5.18)
where η is the viscosity of the droplets, D is their characteristic diameter, and γint
is the interfacial tension between the two phases. When there is no energy barrierfor coalescence, the droplets coalesce as soon as they collide under the effect ofBrownian motion. In the limit where the characteristic shape relaxation time τr
is short compared to the time τn separating two droplet collisions, it was found
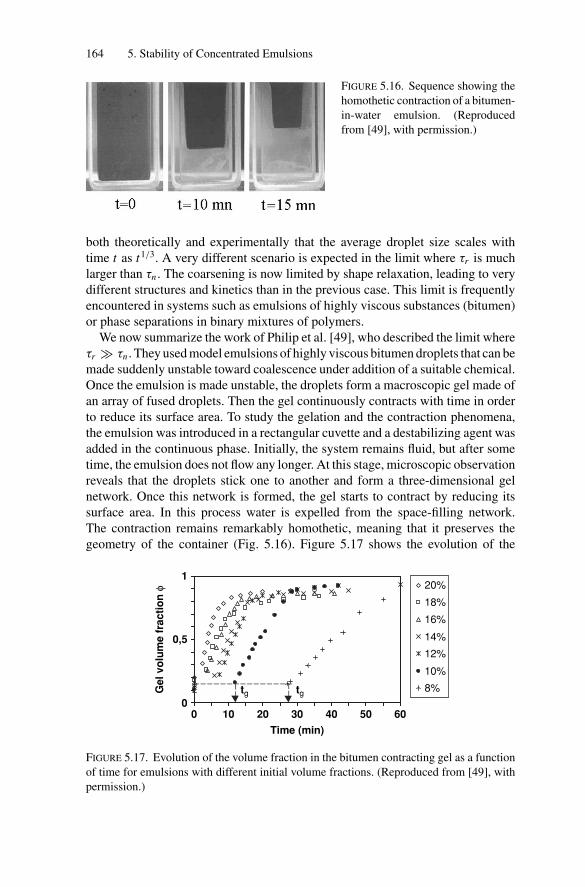
P1: GFZ
SVNY317-Bibette February 1, 2007 16:55
164 5. Stability of Concentrated Emulsions
FIGURE 5.16. Sequence showing the
homothetic contraction of a bitumen-
in-water emulsion. (Reproduced
from [49], with permission.)
both theoretically and experimentally that the average droplet size scales withtime t as t1/3. A very different scenario is expected in the limit where τr is muchlarger than τn . The coarsening is now limited by shape relaxation, leading to verydifferent structures and kinetics than in the previous case. This limit is frequentlyencountered in systems such as emulsions of highly viscous substances (bitumen)or phase separations in binary mixtures of polymers.
We now summarize the work of Philip et al. [49], who described the limit whereτr � τn . They used model emulsions of highly viscous bitumen droplets that can bemade suddenly unstable toward coalescence under addition of a suitable chemical.Once the emulsion is made unstable, the droplets form a macroscopic gel made ofan array of fused droplets. Then the gel continuously contracts with time in orderto reduce its surface area. To study the gelation and the contraction phenomena,the emulsion was introduced in a rectangular cuvette and a destabilizing agent wasadded in the continuous phase. Initially, the system remains fluid, but after sometime, the emulsion does not flow any longer. At this stage, microscopic observationreveals that the droplets stick one to another and form a three-dimensional gelnetwork. Once this network is formed, the gel starts to contract by reducing itssurface area. In this process water is expelled from the space-filling network.The contraction remains remarkably homothetic, meaning that it preserves thegeometry of the container (Fig. 5.16). Figure 5.17 shows the evolution of the
0 10 20 30 40 50 60
Time (min)
0
0,5
120%
18%
16%
14%
12%
10%
8%tgtgGel vo
lum
e f
rac
tio
n φ
FIGURE 5.17. Evolution of the volume fraction in the bitumen contracting gel as a function
of time for emulsions with different initial volume fractions. (Reproduced from [49], with
permission.)
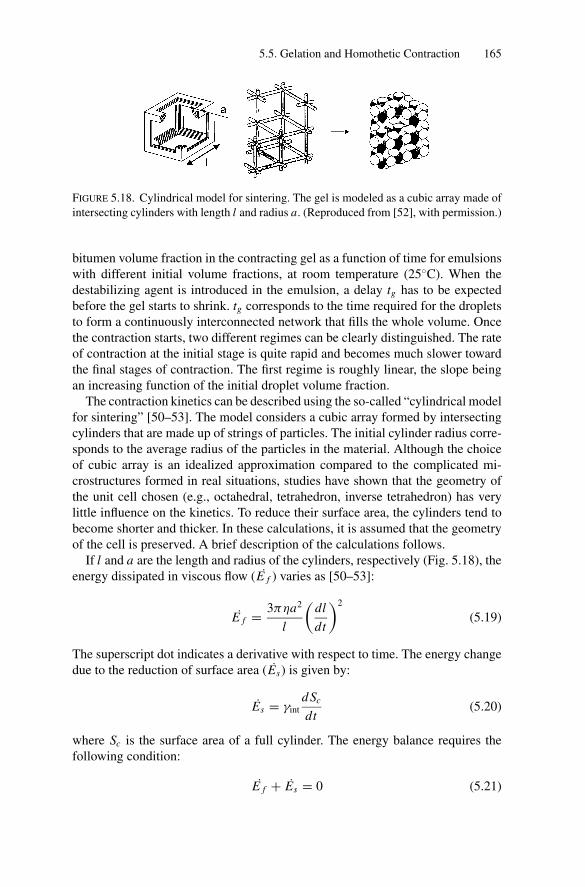
P1: GFZ
SVNY317-Bibette February 1, 2007 16:55
5.5. Gelation and Homothetic Contraction 165
FIGURE 5.18. Cylindrical model for sintering. The gel is modeled as a cubic array made of
intersecting cylinders with length l and radius a. (Reproduced from [52], with permission.)
bitumen volume fraction in the contracting gel as a function of time for emulsionswith different initial volume fractions, at room temperature (25◦C). When thedestabilizing agent is introduced in the emulsion, a delay tg has to be expectedbefore the gel starts to shrink. tg corresponds to the time required for the dropletsto form a continuously interconnected network that fills the whole volume. Oncethe contraction starts, two different regimes can be clearly distinguished. The rateof contraction at the initial stage is quite rapid and becomes much slower towardthe final stages of contraction. The first regime is roughly linear, the slope beingan increasing function of the initial droplet volume fraction.
The contraction kinetics can be described using the so-called “cylindrical modelfor sintering” [50–53]. The model considers a cubic array formed by intersectingcylinders that are made up of strings of particles. The initial cylinder radius corre-sponds to the average radius of the particles in the material. Although the choiceof cubic array is an idealized approximation compared to the complicated mi-crostructures formed in real situations, studies have shown that the geometry ofthe unit cell chosen (e.g., octahedral, tetrahedron, inverse tetrahedron) has verylittle influence on the kinetics. To reduce their surface area, the cylinders tend tobecome shorter and thicker. In these calculations, it is assumed that the geometryof the cell is preserved. A brief description of the calculations follows.
If l and a are the length and radius of the cylinders, respectively (Fig. 5.18), theenergy dissipated in viscous flow (E f ) varies as [50–53]:
E f = 3πηa2
l
(dl
dt
)2
(5.19)
The superscript dot indicates a derivative with respect to time. The energy changedue to the reduction of surface area (Es) is given by:
Es = γint
d Sc
dt(5.20)
where Sc is the surface area of a full cylinder. The energy balance requires thefollowing condition:
E f + Es = 0 (5.21)
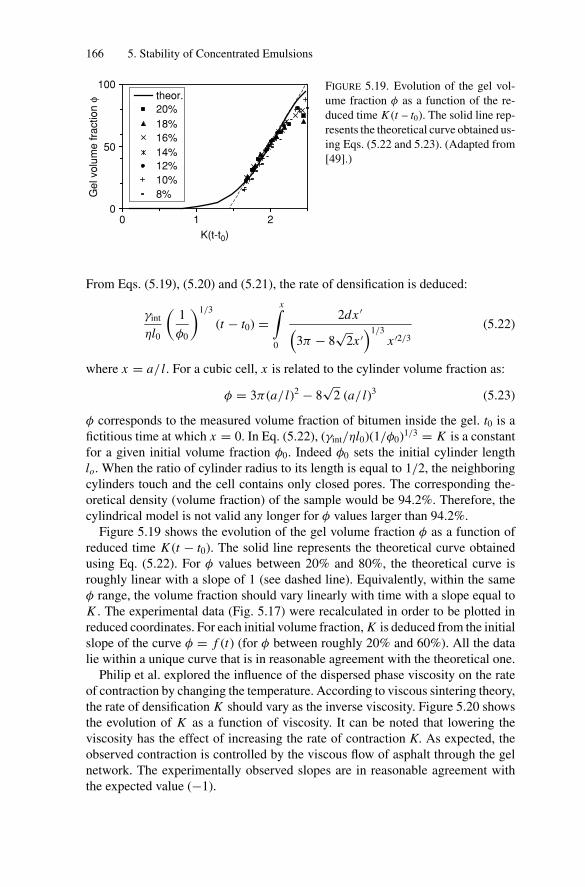
P1: GFZ
SVNY317-Bibette February 1, 2007 16:55
166 5. Stability of Concentrated Emulsions
00
50
100
1
K(t-t0)
2
Gel v
olu
me f
ract
ion φ theor.
20%
18%16%
14%12%10%8%
FIGURE 5.19. Evolution of the gel vol-
ume fraction φ as a function of the re-
duced time K (t – t0). The solid line rep-
resents the theoretical curve obtained us-
ing Eqs. (5.22 and 5.23). (Adapted from
[49].)
From Eqs. (5.19), (5.20) and (5.21), the rate of densification is deduced:
γint
ηl0
(1
φ0
)1/3
(t − t0) =x∫
0
2dx ′(3π − 8
√2x ′
)1/3
x ′2/3
(5.22)
where x = a/ l. For a cubic cell, x is related to the cylinder volume fraction as:
φ = 3π (a/ l)2 − 8√
2 (a/ l)3 (5.23)
φ corresponds to the measured volume fraction of bitumen inside the gel. t0 is afictitious time at which x = 0. In Eq. (5.22), (γint/ηl0)(1/φ0)1/3 = K is a constantfor a given initial volume fraction φ0. Indeed φ0 sets the initial cylinder lengthlo. When the ratio of cylinder radius to its length is equal to 1/2, the neighboringcylinders touch and the cell contains only closed pores. The corresponding the-oretical density (volume fraction) of the sample would be 94.2%. Therefore, thecylindrical model is not valid any longer for φ values larger than 94.2%.
Figure 5.19 shows the evolution of the gel volume fraction φ as a function ofreduced time K (t − t0). The solid line represents the theoretical curve obtainedusing Eq. (5.22). For φ values between 20% and 80%, the theoretical curve isroughly linear with a slope of 1 (see dashed line). Equivalently, within the sameφ range, the volume fraction should vary linearly with time with a slope equal toK . The experimental data (Fig. 5.17) were recalculated in order to be plotted inreduced coordinates. For each initial volume fraction, K is deduced from the initialslope of the curve φ = f (t) (for φ between roughly 20% and 60%). All the datalie within a unique curve that is in reasonable agreement with the theoretical one.
Philip et al. explored the influence of the dispersed phase viscosity on the rateof contraction by changing the temperature. According to viscous sintering theory,the rate of densification K should vary as the inverse viscosity. Figure 5.20 showsthe evolution of K as a function of viscosity. It can be noted that lowering theviscosity has the effect of increasing the rate of contraction K. As expected, theobserved contraction is controlled by the viscous flow of asphalt through the gelnetwork. The experimentally observed slopes are in reasonable agreement withthe expected value (−1).
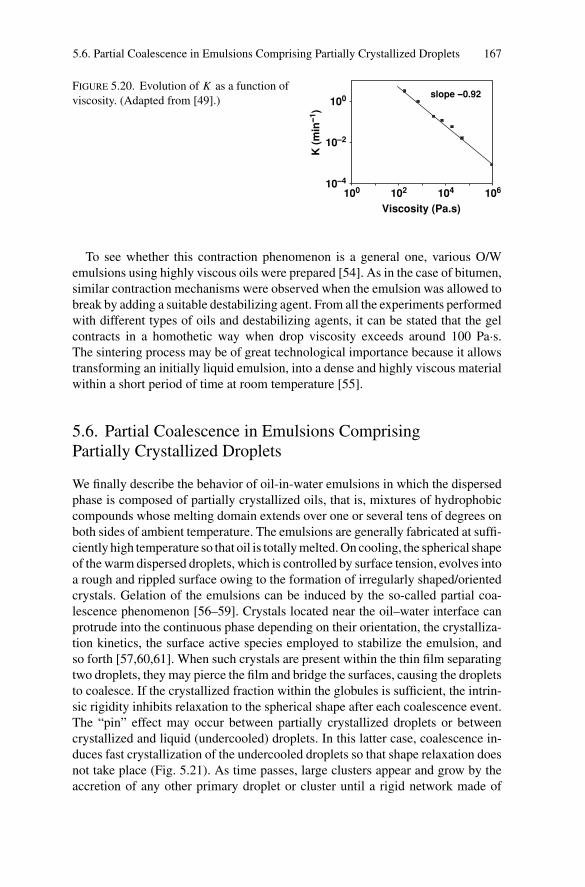
P1: GFZ
SVNY317-Bibette February 1, 2007 16:55
5.6. Partial Coalescence in Emulsions Comprising Partially Crystallized Droplets 167
102100 104 10610–4
100
10–2
Viscosity (Pa.s)
slope --0.92
K (
min
--1)
FIGURE 5.20. Evolution of K as a function of
viscosity. (Adapted from [49].)
To see whether this contraction phenomenon is a general one, various O/Wemulsions using highly viscous oils were prepared [54]. As in the case of bitumen,similar contraction mechanisms were observed when the emulsion was allowed tobreak by adding a suitable destabilizing agent. From all the experiments performedwith different types of oils and destabilizing agents, it can be stated that the gelcontracts in a homothetic way when drop viscosity exceeds around 100 Pa·s.The sintering process may be of great technological importance because it allowstransforming an initially liquid emulsion, into a dense and highly viscous materialwithin a short period of time at room temperature [55].
5.6. Partial Coalescence in Emulsions ComprisingPartially Crystallized Droplets
We finally describe the behavior of oil-in-water emulsions in which the dispersedphase is composed of partially crystallized oils, that is, mixtures of hydrophobiccompounds whose melting domain extends over one or several tens of degrees onboth sides of ambient temperature. The emulsions are generally fabricated at suffi-ciently high temperature so that oil is totally melted. On cooling, the spherical shapeof the warm dispersed droplets, which is controlled by surface tension, evolves intoa rough and rippled surface owing to the formation of irregularly shaped/orientedcrystals. Gelation of the emulsions can be induced by the so-called partial coa-lescence phenomenon [56–59]. Crystals located near the oil–water interface canprotrude into the continuous phase depending on their orientation, the crystalliza-tion kinetics, the surface active species employed to stabilize the emulsion, andso forth [57,60,61]. When such crystals are present within the thin film separatingtwo droplets, they may pierce the film and bridge the surfaces, causing the dropletsto coalesce. If the crystallized fraction within the globules is sufficient, the intrin-sic rigidity inhibits relaxation to the spherical shape after each coalescence event.The “pin” effect may occur between partially crystallized droplets or betweencrystallized and liquid (undercooled) droplets. In this latter case, coalescence in-duces fast crystallization of the undercooled droplets so that shape relaxation doesnot take place (Fig. 5.21). As time passes, large clusters appear and grow by theaccretion of any other primary droplet or cluster until a rigid network made of
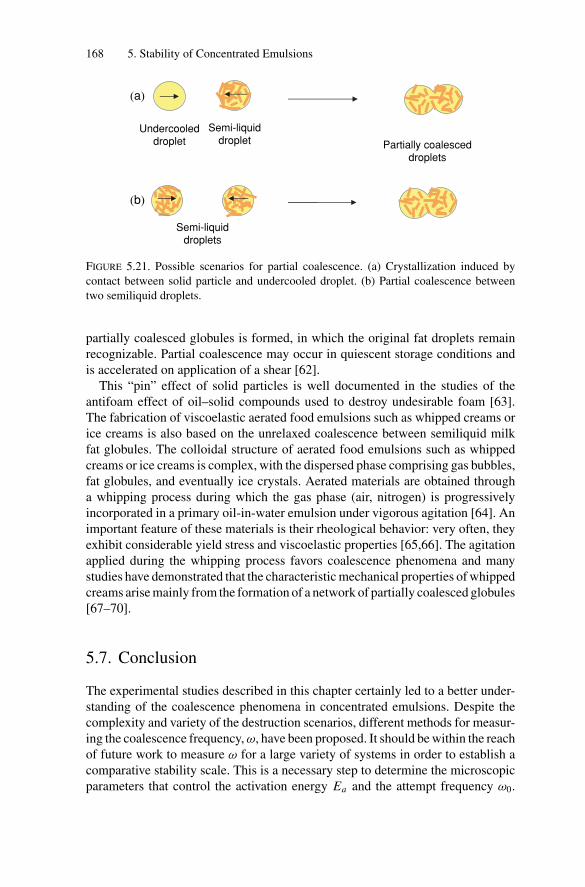
P1: GFZ
SVNY317-Bibette February 1, 2007 16:55
168 5. Stability of Concentrated Emulsions
Undercooleddroplet
(a)
Semi-liquiddroplet
(b)
Semi-liquiddroplets
Partially coalesceddroplets
FIGURE 5.21. Possible scenarios for partial coalescence. (a) Crystallization induced by
contact between solid particle and undercooled droplet. (b) Partial coalescence between
two semiliquid droplets.
partially coalesced globules is formed, in which the original fat droplets remainrecognizable. Partial coalescence may occur in quiescent storage conditions andis accelerated on application of a shear [62].
This “pin” effect of solid particles is well documented in the studies of theantifoam effect of oil–solid compounds used to destroy undesirable foam [63].The fabrication of viscoelastic aerated food emulsions such as whipped creams orice creams is also based on the unrelaxed coalescence between semiliquid milkfat globules. The colloidal structure of aerated food emulsions such as whippedcreams or ice creams is complex, with the dispersed phase comprising gas bubbles,fat globules, and eventually ice crystals. Aerated materials are obtained througha whipping process during which the gas phase (air, nitrogen) is progressivelyincorporated in a primary oil-in-water emulsion under vigorous agitation [64]. Animportant feature of these materials is their rheological behavior: very often, theyexhibit considerable yield stress and viscoelastic properties [65,66]. The agitationapplied during the whipping process favors coalescence phenomena and manystudies have demonstrated that the characteristic mechanical properties of whippedcreams arise mainly from the formation of a network of partially coalesced globules[67–70].
5.7. Conclusion
The experimental studies described in this chapter certainly led to a better under-standing of the coalescence phenomena in concentrated emulsions. Despite thecomplexity and variety of the destruction scenarios, different methods for measur-ing the coalescence frequency, ω, have been proposed. It should be within the reachof future work to measure ω for a large variety of systems in order to establish acomparative stability scale. This is a necessary step to determine the microscopicparameters that control the activation energy Ea and the attempt frequency ω0.
P1: GFZ
SVNY317-Bibette February 1, 2007 16:55
References 169
It is probable that numerous interfacial parameters are involved (surface tension,spontaneous curvature, Gibbs elasticity, surface forces) and differ from one systemto the other, according the nature of the surfactants and of the dispersed phase.Only systematic measurements of ω will allow going beyond empirics. Besides thenumerous fundamental questions, it is also necessary to measure ω for an evidentpractical reason, which is predicting the emulsion lifetime. This remains a seriouschallenge for anyone working in the field of emulsions because of the polydisperseand complex evolution of the droplet size distribution. Finally, it is clear that themean-field approaches adopted to measure ω are acceptable as long as the dropletpolydispersity remains quite low (P < 50%) and that more elaborate models arerequired for very polydisperse systems to account for the spatial fluctuations inthe droplet distribution.
References
[1] W. Ostwald: In “Die Wissenschaptlichen grundlegen der analytischen Chemie.”
Analytisch Chemi, 221 pp. 3rd Ed. Wilhelm, Ingelmann, Leipzig (1901).
[2] I.M. Lifshitz and V.V. Slyozov: “Kinetics of Diffuse Decomposition of Supersaturated
Solid Solutions.” Soviet Physics JETP 35, 331 (1959).
[3] I.M. Lifshitz and V.V. Slyozov: “The Kinetics of Precipitation from Supersaturated
Solid Solutions.” J. Phys. Chem. Solids 19, 35 (1961).
[4] A.S. Kabalnov, A.V. Pertzov, and E.D. Shchukin: “Ostwald Ripening in Emulsions
1. Direct Observations of Ostwald Ripening in Emulsions.” J. Colloid Interface Sci.
118, 590 (1987).
[5] A.S. Kabalnov, K.N. Makarov, A.V. Pertzov, and E.D. Shchukin: “Ostwald Ripening
in Emulsions 2. Ostwald Ripening in Hydrocarbon Emulsions: Experimental Verifi-
cation of Equation for Absolute Rates.” J. Colloid Interface Sci. 138, 98 (1990).
[6] D.J. Durian, D.A. Weitz, and D.J. Pine: “Scaling Behavior in Shaving Cream.” Phys.
Rev. A 44, R7902 (1991).
[7] C. Wagner: “Theory for the Coarsening of Solid Precipitates Caused by Ostwald
Ripening.” Z. Elektrochem. 65, 581 (1961).
[8] J. Bibette, D.C. Morse, T.A. Witten, and D.A. Weitz: “Stability Criteria for Emul-
sions.” Phys. Rev. Lett. 69, 2439 (1992).
[9] A. Hasmy, R. Paredes, O. Sonnneville-Aubrun, B. Cabane, and R. Botet: “Dynamical
Transition in a Model for Dry Foams.” Phys. Rev. Lett. 82, 3368 (1999).
[10] R. Lemlich: “Prediction of Changes in Bubble Size Distribution Due to Interbubble
Gas Diffusion in Foam.” Ind. Eng. Chem. Fund. 17, 89 (1978).
[11] M. Tokuyama and K. Kawasaki: “Statistical-Mechanical Theory of Coarsening of
Spherical Droplets.” Physica A 123, 386 (1984).
[12] Y. Enomoto, K. Kawasaki, and M. Tokuyama: “Computer Modelling of Ostwald
Ripening.” Acta Metall. 35, 907 (1987).
[13] T.W. Patzek: “Self-Similar Collapse of Stationary Bulk Foams.” AIChE J. 39, 1697
(1993).
[14] S.P. Marsh and M.E. Glicksman: “Kinetics of Phase Coarsening in Dense Systems.”
Acta Mater. 44, 3761 (1996).
[15] A.S. Kabalnov: “Can Micelles Mediate a Mass Transfer Between Oil Droplets?”
Langmuir 10, 680 (1994).
P1: GFZ
SVNY317-Bibette February 1, 2007 16:55
170 5. Stability of Concentrated Emulsions
[16] P. Taylor: “Ostwald Ripening in Emulsions.” Colloids Surfaces 99, 175 (1995).
[17] J. Weiss, N. Herrmann, and D.J. McClements: “Ostwald Ripening of Hydrocarbon
Emulsion Droplets in Surfactant Solutions.” Langmuir 15, 6652 (1999).
[18] W.I. Higuchi and J. Misra: “Physical Degradation of Emulsions via the Molecular
Diffusion Route and Its Possible Prevention.” J. Pharm. Sci. 51, 459 (1962).
[19] A.J. Webster and M.E. Cates: “Stabilization of Emulsions by Trapped Species.”
Langmuir 14, 2068 (1998).
[20] A.J. Webster and M.E. Cates: “Osmotic Stabilization of Concentrated Emulsions and
Foams.” Langmuir 17, 595 (2001).
[21] A.S. Kabalnov, A.V. Pertsov and E.D. Shchukin: “Ostwald Ripening in Two-
Component Disperse Phase Systems: Application to Emulsion Stability.” Colloid
Surfaces 24, 19 (1987).
[22] L. Taisne, P. Walstra, and B. Cabane: “Transfer of Oil Between Emulsion Droplets.”
J. Colloid Interface Sci. 184, 378 (1996).
[23] R.A. Arlauskas and J.G. Weers: “Sedimentation Field Flow Fractionation Studies of
Composition Ripening in Emulsions.” Langmuir 12, 1923 (1996).
[24] J. Weiss, J.N. Coupland, D. Brathwaite, and D.J. McClements: “Influence of Molecu-
lar Structure of Hydrocarbon Emulsion Droplets on Their Solubilization in Nonionic
Surfactant Micelles.” Colloids Surfaces A 121, 53 (1997).
[25] N. Hedin and I. Furo: “Ostwald Ripening of an Emulsion Monitored by PGSE NMR.”
Langmuir 17, 4746 (2001).
[26] L. Taisne and B. Cabane: “Emulsification and Ripening Following a Temperature
Quench.” Langmuir 14, 4744 (1998).
[27] V. Schmitt, C. Cattelet, and F. Leal-Calderon: “Coarsening of Alkane-in-Water Emul-
sions Stabilized by Nonionic Poly(Oxyethylene) Surfactants: The Role of Molecular
Permeation and Coalescence.” Langmuir 20, 46 (2004).
[28] O. Sonneville: “Biliquid Foams.” Ph.D thesis, Paris VI University (1997).
[29] A.J. de Vries: “Foam Stability. IV. Kinetics and Activation Energy of Film Rupture.”
Rec. Trav. Chim. Pays-Bas Belgique 77, 383 (1958).
[30] A.S. Kabalnov and H. Wennerstrom: “Macroemulsion Stability: The Oriented Wedge
Theory Revisited.” Langmuir 12, 276 (1996).
[31] K. Shinoda and H. Saito: “The Effect of Temperature on the Phase Equilibrium and
the Types of Dispersions of the Ternary System Composed of Water, Cyclohexane
and Nonionic Surfactant.” J. Colloid Interface Sci. 26, 70 (1968).
[32] W.D. Bancroft: “The Theory of Emulsification, V.” J. Phys. Chem. 17, 501
(1913).
[33] O. Sonneville-Aubrun, V. Bergeron, T. Gulik-Krzywicki, B. Jonsson, H. Wenner-
strom, P. Lindner, and B. Cabane: “Surfactant Films in Biliquid Foams.” Langmuir
16, 1566 (2000).
[34] V. Bergeron: “Disjoining Pressures and Film Stability of Alkyltrimethylammonium
Bromide Foam Films.” Langmuir 13, 3474 (1997).
[35] R.M. Pashley: “Effect of Degassing on the Formation and Stability of Surfactant-
Free Emulsions and Fine Teflon Dispersions.” J. Phys. Chem. B 107, 1714
(2003).
[36] N. Maeda, K.J. Rosenberg, J.N. Israelachvili, and R.M. Pashley: “Further Studies on
the Effect of Degassing on the Dispersion and Stability of Surfactant Free Emulsions.”
Langmuir 20, 3129 (2004).
[37] J.N. Israelachvili and R.M. Pashley: “The Hydrophobic Interaction is Long Range,
Decaying Exponentially with Distance.” Nature 300, 341 (1982).
P1: GFZ
SVNY317-Bibette February 1, 2007 16:55
References 171
[38] M.E. Karaman, B.W. Ninham, and R.M. Pashley: “Effects of Dissolved Gas on
Emulsions, Emulsions Polymerization, and Surfactant Aggregation.” J. Phys. Chem.
100, 15503 (1996).
[39] B. Deminiere, A. Colin, F. Leal-Calderon, J.F. Muzy, and J. Bibette: “Cell Growth
in a 3d Cellular System Undergoing Coalescence.” Phys. Rev. Lett. 82, 229
(1999).
[40] A.S. Kabalnov and J. Weers: “Macroemulsion Stability Within the Winsor III Region:
Theory Versus Experiment.” Langmuir 12, 1931 (1996).
[41] V. Carrier: “Compared Stability of Aqueous Foams and Emulsions.” Ph.D thesis,
Bordeaux I University (2001).
[42] V. Schmitt, C. Cattelet, and F. Leal-Calderon: “Measurement of the Coalescence
Frequency in Concentrated Emulsions.” Europhys. Lett. 67, 662 (2004).
[43] K. Pays: “Double Emulsions: Coalescence and Compositional Ripening.” Ph.D
thesis, Bordeaux I University (2000).
[44] K. Pays, J. Kahn, P. Pouligny, J. Bibette, and F. Leal-Calderon: “Double Emulsions:
A Tool for Probing Thin Film Metastability.” Phys. Rev. Lett. 87, 178304 (2001).
[45] K. Pays, J. Kahn, B. Pouligny, J. Bibette, and F. Leal-Calderon: “Coalescence in
Surfactant-Stabilized Double Emulsions.” Langmuir 17, 7758 (2001).
[46] S. Arditty, C.P. Whitby, B.P. Binks, V. Schmitt, and F. Leal-Calderon: “Some General
Features of Limited Coalescence in Solid-Stabilized Emulsions.” Eur. Phys. J. E 11,
273 (2003).
[47] S. Arditty, C.P. Whitby, B.P. Binks, V. Schmitt, and F. Leal-Calderon: “Erratum—
Some General Features of Limited Coalescence in Solid-Stabilized Emulsions.” Eur.
Phys. J. E 12, 355 (2003).
[48] T.H. Whitesides and D.S. Ross: “Experimental and Theoretical Analysis of the Lim-
ited Coalescence Process: Stepwise Limited Coalescence.” J. Colloid Interface Sci.
169, 48 (1995).
[49] P. Philip, L. Bonakdar, P. Poulin, J. Bibette, and F. Leal-Calderon: “Viscous Sintering
Phenomena in Liquid-Liquid Dispersions.” Phys. Rev. Lett. 84, 2018 (2000).
[50] G.W. Scherer: “Sintering of Low-Density Glasses: I. Theory.” J. Am. Ceram. Soc.
60, 236 (1977).
[51] G.W. Scherer and D.L. Bachman: “Sintering of Low-Density Glasses: II. Experi-
mental Study.” J. Am. Ceram. Soc. 60, 239 (1977).
[52] G.W. Scherer: “Sintering of Low-Density Glasses: III. Effect of a Distribution of
Pore Sizes.” J. Am. Ceram. Soc. 60, 243 (1977).
[53] G.W. Scherer: “Viscous Sintering in Inorganic Gels.” Colloid Surface Sci. 14, 265
(1987).
[54] J. Philip, J.E. Poirier, J. Bibette, and F. Leal-Calderon: “Gelation and Coarsening in
Dispersions of Highly Viscous Droplets.” Langmuir 17, 3545 (2001).
[55] F. Placin, M. Feder, and F. Leal-Calderon: “Viscous Sintering Phenomena in Liquid-
Liquid Dispersions: Application to the Preparation of Silicone Macroporous Aero-
gels.” J. Phys. Chem. B 107, 9179 (2003).
[56] K. Boode and P. Walstra: “Partial Coalescence in Oil-in-Water Emulsions 1: Nature
of the Aggregation.” Colloids and Surfaces A : Physicochem. Eng. Aspects 81, 121
(1993).
[57] K. Boode, P. Walstra, and A.E.A. de Groot-Mostert: “Partial Coalescence in Oil-
in-Water Emulsions 2. Influence of the Properties of the Fat.” Colloids Surfaces A
Physicochem. Eng. Aspects 81, 139 (1993).
[58] D. Rousseau: “Fat Crystals and Emulsion Stability.” Food Res. Int. 33, 3 (2000).
P1: GFZ
SVNY317-Bibette February 1, 2007 16:55
172 5. Stability of Concentrated Emulsions
[59] M.A.J.S. van Boekel and P. Walstra: “Stability of Oil-in-Water Emulsions with Crys-
tals in the Dispersed Phase.” Colloids Surfaces 3, 109 (1981).
[60] B.E. Brooker: “The Adsoprtion of Crystalline Fat to Air-Water Interface of Whipped
Cream.” Food Struct. 9, 223 (1990).
[61] K. Golemanov, S. Tcholakova, N.D. Denkov, and T.D. Gurkov “Selection of Surfac-
tants for Stable Paraffin-in-Water Dispersions, Undergoing Solid-Liquid Transition
of the Dispersed Particles.” Langmuir 22, 3560 (2006).
[62] E. Davies, E. Dickinson, and R. Bee: “Shear Stability of Sodium Caseinate Emulsions
Containing Monoglyceride and Triglyceride Crystals.” Food Hydrocolloids 14, 145
(2000).
[63] N.D. Denkov: “Oil Based Antifoams.” Langmuir 20, 9463 (2004).
[64] G.A. van Aken: “Aeration of Emulsions by Whipping.” Colloids Surfaces A Physic-
ochem. Eng. Aspects 190, 333 (2001).
[65] A.K. Smith, H.D. Goff, and Y. Kakuda: “Microstructure and Rheological Properties
of Whipped Cream as Affected by Heat Treatment and Addition of Stabilizer.” Int.
Dairy J. 10, 295 (2000).
[66] D.W. Stanley, H.D. Goff, and A.K. Smith: “Texture-Structure Relationships in
Foamed Dairy Emulsions.” Food Res. Int. 29, 1 (1996).
[67] B.E. Brooker: “The Stabilization of Air in Foods Containing Fat. A Review.” Food
Struct. 12, 115 (1993).
[68] B.E. Brooker, M. Anderson, and A.T. Andrews: “The Development of Structure in
Whipped Cream.” Food Microstruct. 5, 277 (1986).
[69] H.D. Goff: “Instability and Partial Coalescence in Whippable Dairy Emulsions.” J.
Dairy Sci. 80, 2620 (1997).
[70] H.D. Goff: “Formation and Stabilization of Structure in Ice-Cream and Related Prod-
ucts.” Curr. Opin. Colloid Interface Sci. 7, 432 (2002).
P1: GFZ
SVNY317-Bibette February 2, 2007 16:59
6Double Emulsions
6.1. Introduction
Double emulsions may be either of the water-in-oil-in-water type (W/O/W) (withdispersed oil globules containing smaller aqueous droplets) or of the oil-in-water-in-oil type (O/W/O) (with dispersed aqueous globules containing smaller oilydispersed droplets). Increasing attention has been devoted to these systems withthe aim of taking advantage of their double (or multiple) compartment structure.Indeed, double emulsions present many interesting possibilities for the controlledrelease of chemical substances initially entrapped in the internal droplets. Variousindustries, including foods and cosmetics, are showing clear interest in the techno-logical development of such complex systems. The field of human pharmaceuticalsis the major area of application; W/O/W emulsions have been investigated mostlyas potential vehicles for various hydrophilic drugs (vaccines, vitamins, enzymes,hormones) that would be then slowly released. Active substances may also mi-grate from the outer to the inner phase of multiple emulsions, providing in thatcase a kind of reservoir particularly suitable for detoxification (overdose treat-ment) or, in a different domain, for the removal of toxic materials from wastewater. In any case, the impact of double emulsions designed as drug deliverysystems would be of significant importance in the controlled release field, pro-vided that the stability and release mechanisms were more clearly understood andmonitored.
The problems associated with the stability of multiple emulsions have been ex-tensively studied and one can find a rather large literature about the subject [1–3and references therein]. Double emulsions are generally prepared with two emulsi-fiers of opposite solubility (water-soluble and oil-soluble). Both emulsifiers mix atthe interfaces and the stability of the films with respect to coalescence is governedby the composition of the binary mixture. Coalescence in multiple emulsions canoccur at several levels: (1) between small inner droplets, (2) between large glob-ules, and (3) between the globule and the small droplets dispersed within it. Theglobules are also permeable to many different chemical species that can migratefrom the internal phase to the external one or vice versa, without film rupturing.Diffusion processes have been investigated as a possible mechanism for transport
173
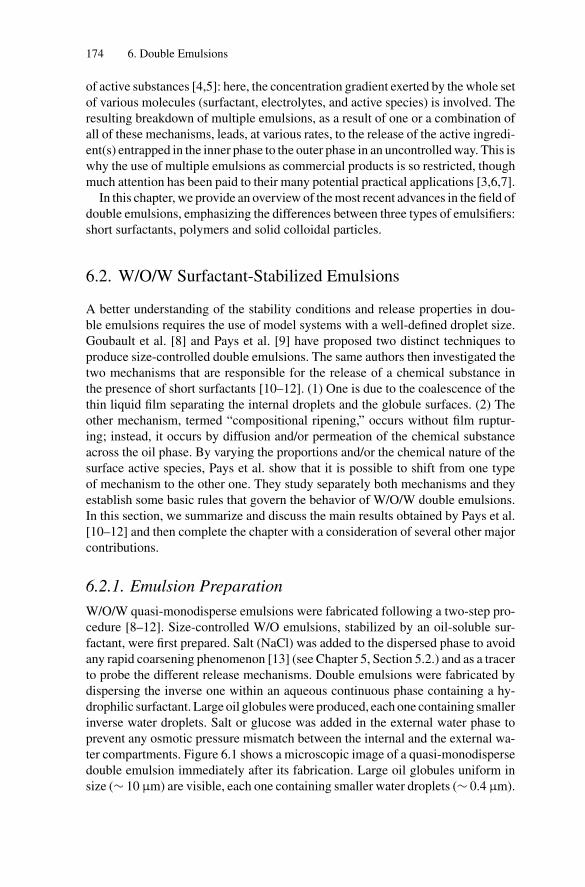
P1: GFZ
SVNY317-Bibette February 2, 2007 16:59
174 6. Double Emulsions
of active substances [4,5]: here, the concentration gradient exerted by the whole setof various molecules (surfactant, electrolytes, and active species) is involved. Theresulting breakdown of multiple emulsions, as a result of one or a combination ofall of these mechanisms, leads, at various rates, to the release of the active ingredi-ent(s) entrapped in the inner phase to the outer phase in an uncontrolled way. This iswhy the use of multiple emulsions as commercial products is so restricted, thoughmuch attention has been paid to their many potential practical applications [3,6,7].
In this chapter, we provide an overview of the most recent advances in the field ofdouble emulsions, emphasizing the differences between three types of emulsifiers:short surfactants, polymers and solid colloidal particles.
6.2. W/O/W Surfactant-Stabilized Emulsions
A better understanding of the stability conditions and release properties in dou-ble emulsions requires the use of model systems with a well-defined droplet size.Goubault et al. [8] and Pays et al. [9] have proposed two distinct techniques toproduce size-controlled double emulsions. The same authors then investigated thetwo mechanisms that are responsible for the release of a chemical substance inthe presence of short surfactants [10–12]. (1) One is due to the coalescence of thethin liquid film separating the internal droplets and the globule surfaces. (2) Theother mechanism, termed “compositional ripening,” occurs without film ruptur-ing; instead, it occurs by diffusion and/or permeation of the chemical substanceacross the oil phase. By varying the proportions and/or the chemical nature of thesurface active species, Pays et al. show that it is possible to shift from one typeof mechanism to the other one. They study separately both mechanisms and theyestablish some basic rules that govern the behavior of W/O/W double emulsions.In this section, we summarize and discuss the main results obtained by Pays et al.[10–12] and then complete the chapter with a consideration of several other majorcontributions.
6.2.1. Emulsion Preparation
W/O/W quasi-monodisperse emulsions were fabricated following a two-step pro-cedure [8–12]. Size-controlled W/O emulsions, stabilized by an oil-soluble sur-factant, were first prepared. Salt (NaCl) was added to the dispersed phase to avoidany rapid coarsening phenomenon [13] (see Chapter 5, Section 5.2.) and as a tracerto probe the different release mechanisms. Double emulsions were fabricated bydispersing the inverse one within an aqueous continuous phase containing a hy-drophilic surfactant. Large oil globules were produced, each one containing smallerinverse water droplets. Salt or glucose was added in the external water phase toprevent any osmotic pressure mismatch between the internal and the external wa-ter compartments. Figure 6.1 shows a microscopic image of a quasi-monodispersedouble emulsion immediately after its fabrication. Large oil globules uniform insize (∼ 10 μm) are visible, each one containing smaller water droplets (∼ 0.4 μm).
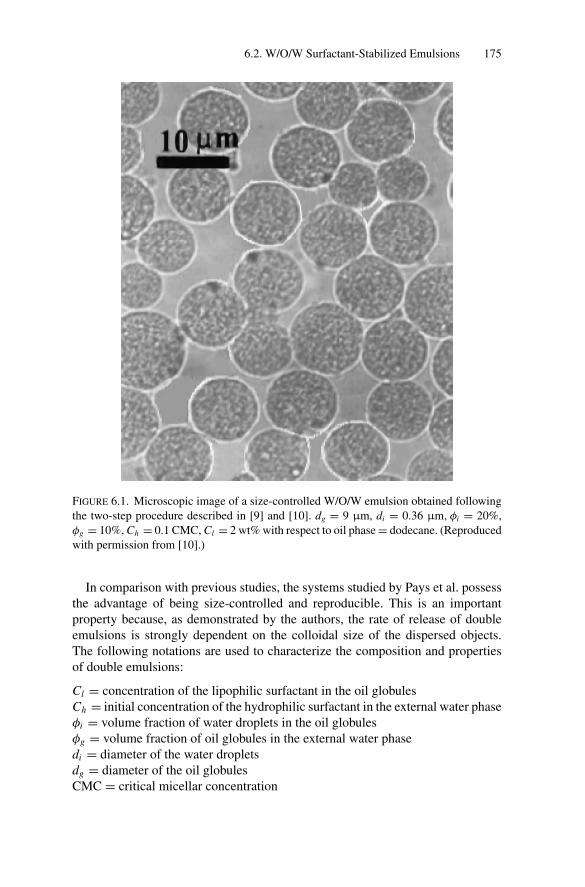
P1: GFZ
SVNY317-Bibette February 2, 2007 16:59
6.2. W/O/W Surfactant-Stabilized Emulsions 175
FIGURE 6.1. Microscopic image of a size-controlled W/O/W emulsion obtained following
the two-step procedure described in [9] and [10]. dg = 9 μm, di = 0.36 μm, φi = 20%,
φg = 10%, Ch = 0.1 CMC, Cl = 2 wt% with respect to oil phase = dodecane. (Reproduced
with permission from [10].)
In comparison with previous studies, the systems studied by Pays et al. possessthe advantage of being size-controlled and reproducible. This is an importantproperty because, as demonstrated by the authors, the rate of release of doubleemulsions is strongly dependent on the colloidal size of the dispersed objects.The following notations are used to characterize the composition and propertiesof double emulsions:
Cl = concentration of the lipophilic surfactant in the oil globulesCh = initial concentration of the hydrophilic surfactant in the external water phaseφi = volume fraction of water droplets in the oil globulesφg = volume fraction of oil globules in the external water phasedi = diameter of the water dropletsdg = diameter of the oil globulesCMC = critical micellar concentration
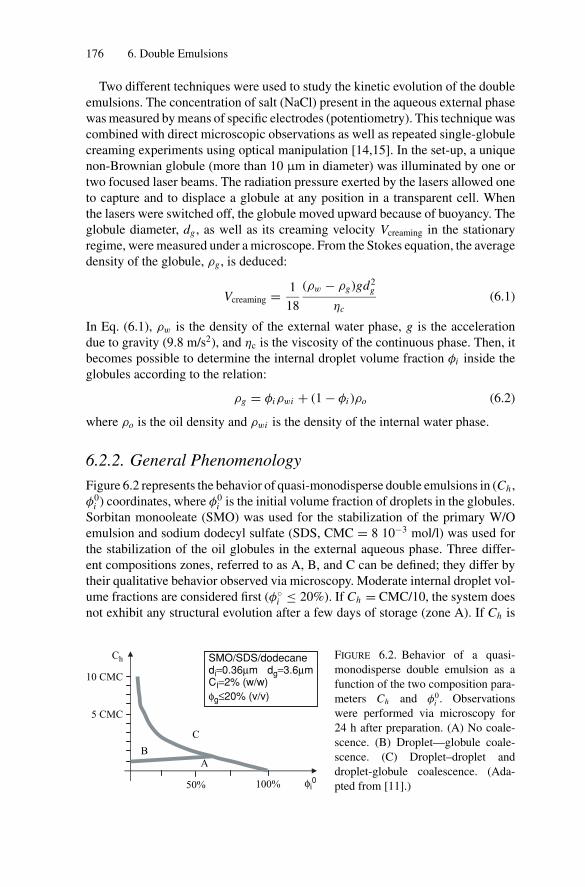
P1: GFZ
SVNY317-Bibette February 2, 2007 16:59
176 6. Double Emulsions
Two different techniques were used to study the kinetic evolution of the doubleemulsions. The concentration of salt (NaCl) present in the aqueous external phasewas measured by means of specific electrodes (potentiometry). This technique wascombined with direct microscopic observations as well as repeated single-globulecreaming experiments using optical manipulation [14,15]. In the set-up, a uniquenon-Brownian globule (more than 10 μm in diameter) was illuminated by one ortwo focused laser beams. The radiation pressure exerted by the lasers allowed oneto capture and to displace a globule at any position in a transparent cell. Whenthe lasers were switched off, the globule moved upward because of buoyancy. Theglobule diameter, dg , as well as its creaming velocity Vcreaming in the stationaryregime, were measured under a microscope. From the Stokes equation, the averagedensity of the globule, ρg , is deduced:
Vcreaming = 1
18
(ρw − ρg)gd2g
ηc(6.1)
In Eq. (6.1), ρw is the density of the external water phase, g is the accelerationdue to gravity (9.8 m/s2), and ηc is the viscosity of the continuous phase. Then, itbecomes possible to determine the internal droplet volume fraction φi inside theglobules according to the relation:
ρg = φiρwi + (1 − φi )ρo (6.2)
where ρo is the oil density and ρwi is the density of the internal water phase.
6.2.2. General Phenomenology
Figure 6.2 represents the behavior of quasi-monodisperse double emulsions in (Ch ,φ0
i ) coordinates, where φ0i is the initial volume fraction of droplets in the globules.
Sorbitan monooleate (SMO) was used for the stabilization of the primary W/Oemulsion and sodium dodecyl sulfate (SDS, CMC = 8 10−3 mol/l) was used forthe stabilization of the oil globules in the external aqueous phase. Three differ-ent compositions zones, referred to as A, B, and C can be defined; they differ bytheir qualitative behavior observed via microscopy. Moderate internal droplet vol-ume fractions are considered first (φ◦
i ≤ 20%). If Ch = CMC/10, the system doesnot exhibit any structural evolution after a few days of storage (zone A). If Ch is
Ch
50% 100%
5 CMC
10 CMC
AB
C
SMO/SDS/dodecanedi=0.36μmCI=2% (w/w)φg≤20% (v/v)
dg=3.6μm
φi0
FIGURE 6.2. Behavior of a quasi-
monodisperse double emulsion as a
function of the two composition para-
meters Ch and φ0i . Observations
were performed via microscopy for
24 h after preparation. (A) No coale-
scence. (B) Droplet—globule coale-
scence. (C) Droplet–droplet and
droplet-globule coalescence. (Ada-
pted from [11].)
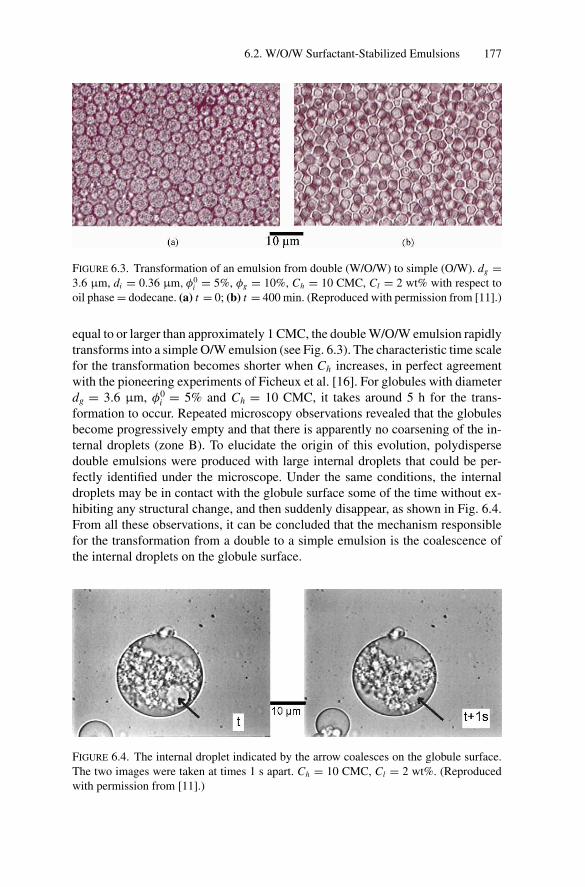
P1: GFZ
SVNY317-Bibette February 2, 2007 16:59
6.2. W/O/W Surfactant-Stabilized Emulsions 177
FIGURE 6.3. Transformation of an emulsion from double (W/O/W) to simple (O/W). dg =3.6 μm, di = 0.36 μm, φ0
i = 5%, φg = 10%, Ch = 10 CMC, Cl = 2 wt% with respect to
oil phase = dodecane. (a) t = 0; (b) t = 400 min. (Reproduced with permission from [11].)
equal to or larger than approximately 1 CMC, the double W/O/W emulsion rapidlytransforms into a simple O/W emulsion (see Fig. 6.3). The characteristic time scalefor the transformation becomes shorter when Ch increases, in perfect agreementwith the pioneering experiments of Ficheux et al. [16]. For globules with diameterdg = 3.6 μm, φ0
i = 5% and Ch = 10 CMC, it takes around 5 h for the trans-formation to occur. Repeated microscopy observations revealed that the globulesbecome progressively empty and that there is apparently no coarsening of the in-ternal droplets (zone B). To elucidate the origin of this evolution, polydispersedouble emulsions were produced with large internal droplets that could be per-fectly identified under the microscope. Under the same conditions, the internaldroplets may be in contact with the globule surface some of the time without ex-hibiting any structural change, and then suddenly disappear, as shown in Fig. 6.4.From all these observations, it can be concluded that the mechanism responsiblefor the transformation from a double to a simple emulsion is the coalescence ofthe internal droplets on the globule surface.
FIGURE 6.4. The internal droplet indicated by the arrow coalesces on the globule surface.
The two images were taken at times 1 s apart. Ch = 10 CMC, Cl = 2 wt%. (Reproduced
with permission from [11].)
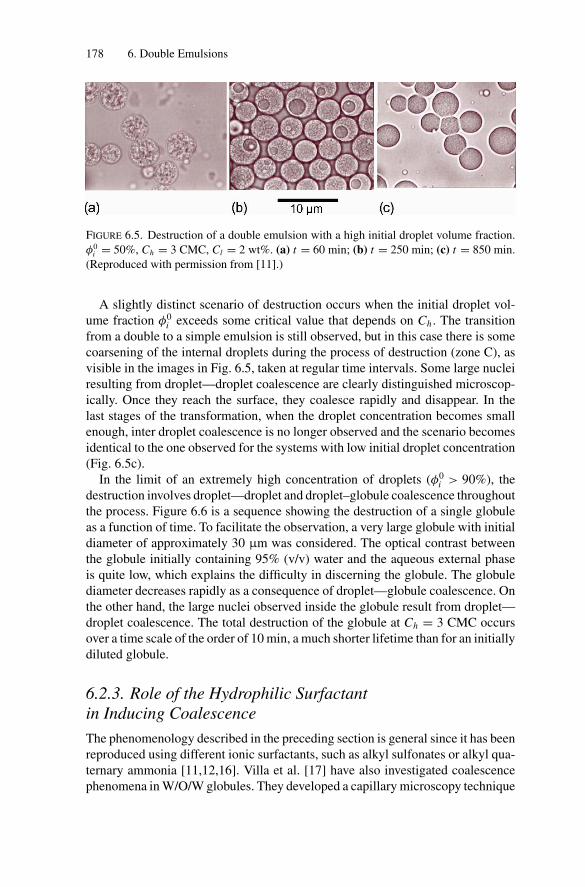
P1: GFZ
SVNY317-Bibette February 2, 2007 16:59
178 6. Double Emulsions
FIGURE 6.5. Destruction of a double emulsion with a high initial droplet volume fraction.
φ0i = 50%, Ch = 3 CMC, Cl = 2 wt%. (a) t = 60 min; (b) t = 250 min; (c) t = 850 min.
(Reproduced with permission from [11].)
A slightly distinct scenario of destruction occurs when the initial droplet vol-ume fraction φ0
i exceeds some critical value that depends on Ch . The transitionfrom a double to a simple emulsion is still observed, but in this case there is somecoarsening of the internal droplets during the process of destruction (zone C), asvisible in the images in Fig. 6.5, taken at regular time intervals. Some large nucleiresulting from droplet—droplet coalescence are clearly distinguished microscop-ically. Once they reach the surface, they coalesce rapidly and disappear. In thelast stages of the transformation, when the droplet concentration becomes smallenough, inter droplet coalescence is no longer observed and the scenario becomesidentical to the one observed for the systems with low initial droplet concentration(Fig. 6.5c).
In the limit of an extremely high concentration of droplets (φ0i > 90%), the
destruction involves droplet—droplet and droplet–globule coalescence throughoutthe process. Figure 6.6 is a sequence showing the destruction of a single globuleas a function of time. To facilitate the observation, a very large globule with initialdiameter of approximately 30 μm was considered. The optical contrast betweenthe globule initially containing 95% (v/v) water and the aqueous external phaseis quite low, which explains the difficulty in discerning the globule. The globulediameter decreases rapidly as a consequence of droplet—globule coalescence. Onthe other hand, the large nuclei observed inside the globule result from droplet—droplet coalescence. The total destruction of the globule at Ch = 3 CMC occursover a time scale of the order of 10 min, a much shorter lifetime than for an initiallydiluted globule.
6.2.3. Role of the Hydrophilic Surfactantin Inducing Coalescence
The phenomenology described in the preceding section is general since it has beenreproduced using different ionic surfactants, such as alkyl sulfonates or alkyl qua-ternary ammonia [11,12,16]. Villa et al. [17] have also investigated coalescencephenomena in W/O/W globules. They developed a capillary microscopy technique
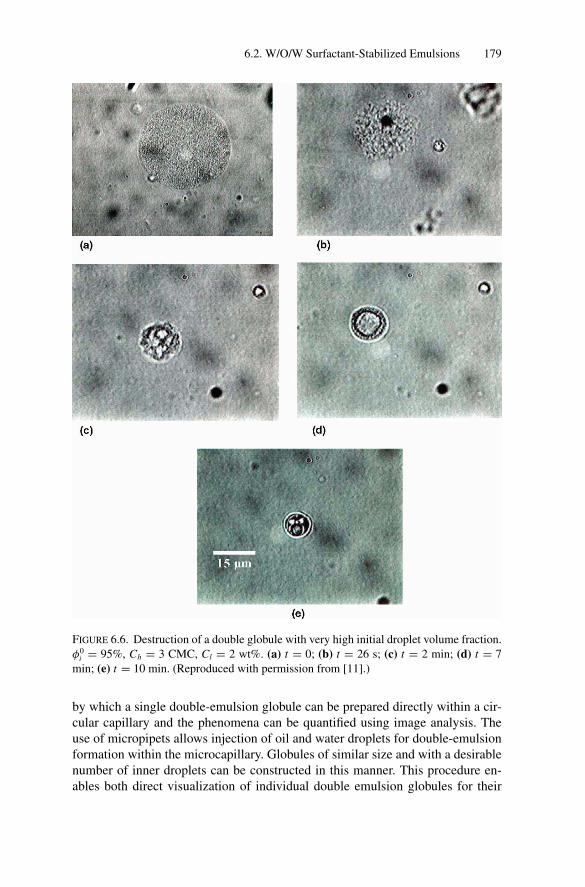
P1: GFZ
SVNY317-Bibette February 2, 2007 16:59
6.2. W/O/W Surfactant-Stabilized Emulsions 179
FIGURE 6.6. Destruction of a double globule with very high initial droplet volume fraction.
φ0i = 95%, Ch = 3 CMC, Cl = 2 wt%. (a) t = 0; (b) t = 26 s; (c) t = 2 min; (d) t = 7
min; (e) t = 10 min. (Reproduced with permission from [11].)
by which a single double-emulsion globule can be prepared directly within a cir-cular capillary and the phenomena can be quantified using image analysis. Theuse of micropipets allows injection of oil and water droplets for double-emulsionformation within the microcapillary. Globules of similar size and with a desirablenumber of inner droplets can be constructed in this manner. This procedure en-ables both direct visualization of individual double emulsion globules for their
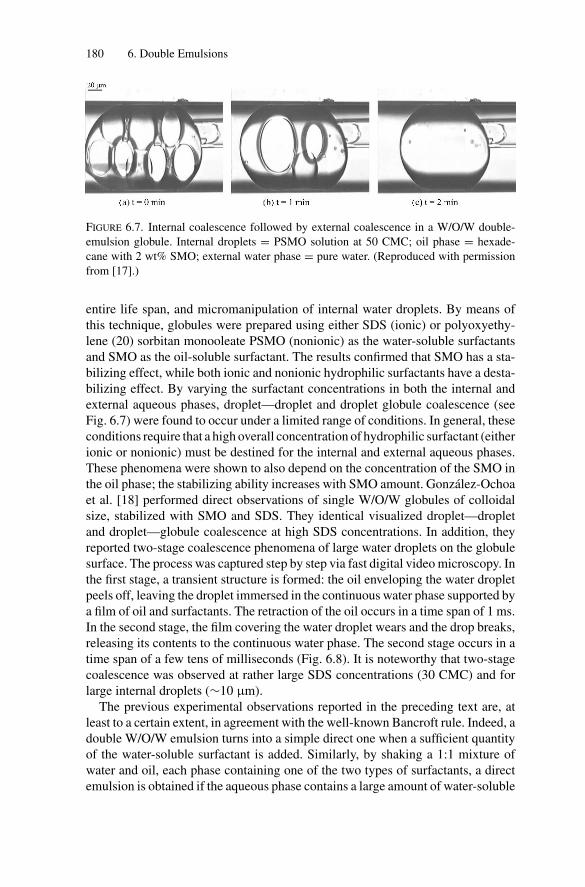
P1: GFZ
SVNY317-Bibette February 2, 2007 16:59
180 6. Double Emulsions
FIGURE 6.7. Internal coalescence followed by external coalescence in a W/O/W double-
emulsion globule. Internal droplets = PSMO solution at 50 CMC; oil phase = hexade-
cane with 2 wt% SMO; external water phase = pure water. (Reproduced with permission
from [17].)
entire life span, and micromanipulation of internal water droplets. By means ofthis technique, globules were prepared using either SDS (ionic) or polyoxyethy-lene (20) sorbitan monooleate PSMO (nonionic) as the water-soluble surfactantsand SMO as the oil-soluble surfactant. The results confirmed that SMO has a sta-bilizing effect, while both ionic and nonionic hydrophilic surfactants have a desta-bilizing effect. By varying the surfactant concentrations in both the internal andexternal aqueous phases, droplet—droplet and droplet globule coalescence (seeFig. 6.7) were found to occur under a limited range of conditions. In general, theseconditions require that a high overall concentration of hydrophilic surfactant (eitherionic or nonionic) must be destined for the internal and external aqueous phases.These phenomena were shown to also depend on the concentration of the SMO inthe oil phase; the stabilizing ability increases with SMO amount. Gonzalez-Ochoaet al. [18] performed direct observations of single W/O/W globules of colloidalsize, stabilized with SMO and SDS. They identical visualized droplet—dropletand droplet—globule coalescence at high SDS concentrations. In addition, theyreported two-stage coalescence phenomena of large water droplets on the globulesurface. The process was captured step by step via fast digital video microscopy. Inthe first stage, a transient structure is formed: the oil enveloping the water dropletpeels off, leaving the droplet immersed in the continuous water phase supported bya film of oil and surfactants. The retraction of the oil occurs in a time span of 1 ms.In the second stage, the film covering the water droplet wears and the drop breaks,releasing its contents to the continuous water phase. The second stage occurs in atime span of a few tens of milliseconds (Fig. 6.8). It is noteworthy that two-stagecoalescence was observed at rather large SDS concentrations (30 CMC) and forlarge internal droplets (∼10 μm).
The previous experimental observations reported in the preceding text are, atleast to a certain extent, in agreement with the well-known Bancroft rule. Indeed, adouble W/O/W emulsion turns into a simple direct one when a sufficient quantityof the water-soluble surfactant is added. Similarly, by shaking a 1:1 mixture ofwater and oil, each phase containing one of the two types of surfactants, a directemulsion is obtained if the aqueous phase contains a large amount of water-soluble
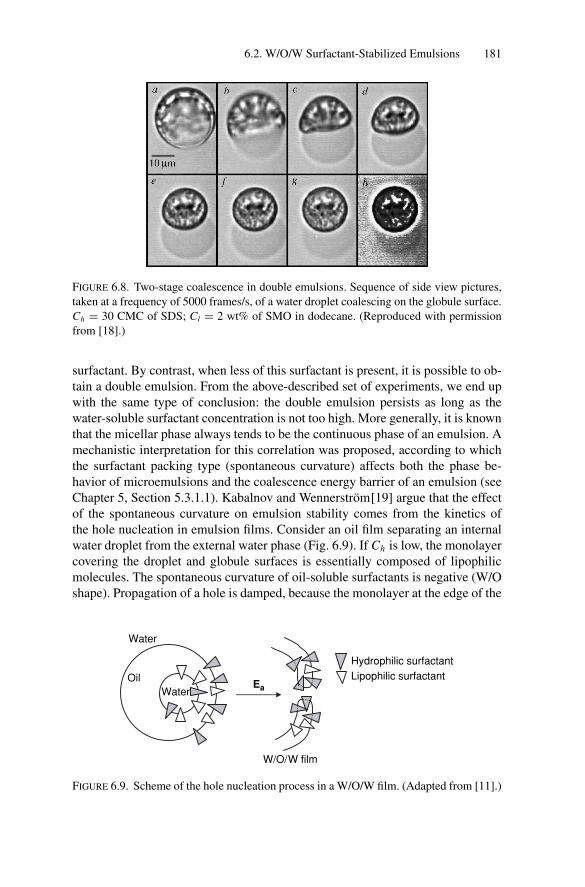
P1: GFZ
SVNY317-Bibette February 2, 2007 16:59
6.2. W/O/W Surfactant-Stabilized Emulsions 181
FIGURE 6.8. Two-stage coalescence in double emulsions. Sequence of side view pictures,
taken at a frequency of 5000 frames/s, of a water droplet coalescing on the globule surface.
Ch = 30 CMC of SDS; Cl = 2 wt% of SMO in dodecane. (Reproduced with permission
from [18].)
surfactant. By contrast, when less of this surfactant is present, it is possible to ob-tain a double emulsion. From the above-described set of experiments, we end upwith the same type of conclusion: the double emulsion persists as long as thewater-soluble surfactant concentration is not too high. More generally, it is knownthat the micellar phase always tends to be the continuous phase of an emulsion. Amechanistic interpretation for this correlation was proposed, according to whichthe surfactant packing type (spontaneous curvature) affects both the phase be-havior of microemulsions and the coalescence energy barrier of an emulsion (seeChapter 5, Section 5.3.1.1). Kabalnov and Wennerstrom[19] argue that the effectof the spontaneous curvature on emulsion stability comes from the kinetics ofthe hole nucleation in emulsion films. Consider an oil film separating an internalwater droplet from the external water phase (Fig. 6.9). If Ch is low, the monolayercovering the droplet and globule surfaces is essentially composed of lipophilicmolecules. The spontaneous curvature of oil-soluble surfactants is negative (W/Oshape). Propagation of a hole is damped, because the monolayer at the edge of the
Water
WaterOil
W/O/W film
Lipophilic surfactant
Hydrophilic surfactant
Ea
FIGURE 6.9. Scheme of the hole nucleation process in a W/O/W film. (Adapted from [11].)
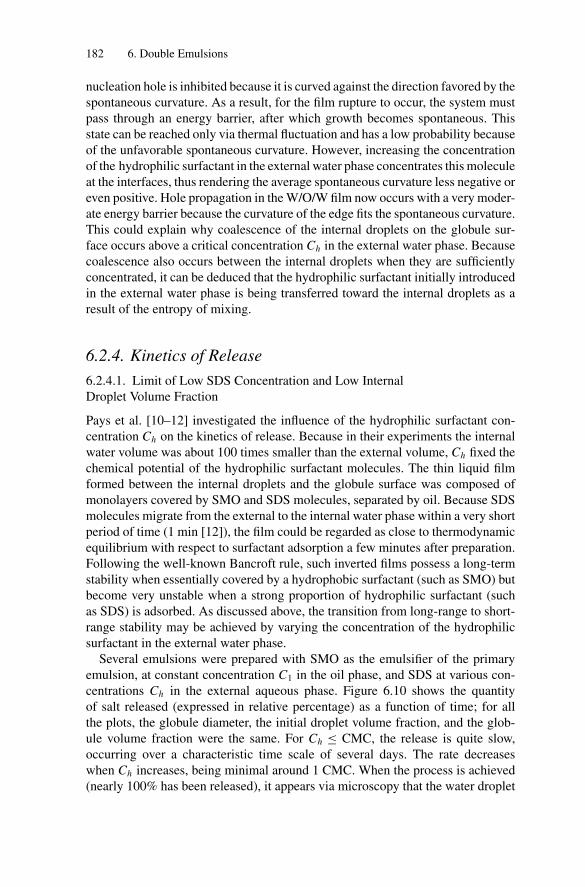
P1: GFZ
SVNY317-Bibette February 2, 2007 16:59
182 6. Double Emulsions
nucleation hole is inhibited because it is curved against the direction favored by thespontaneous curvature. As a result, for the film rupture to occur, the system mustpass through an energy barrier, after which growth becomes spontaneous. Thisstate can be reached only via thermal fluctuation and has a low probability becauseof the unfavorable spontaneous curvature. However, increasing the concentrationof the hydrophilic surfactant in the external water phase concentrates this moleculeat the interfaces, thus rendering the average spontaneous curvature less negative oreven positive. Hole propagation in the W/O/W film now occurs with a very moder-ate energy barrier because the curvature of the edge fits the spontaneous curvature.This could explain why coalescence of the internal droplets on the globule sur-face occurs above a critical concentration Ch in the external water phase. Becausecoalescence also occurs between the internal droplets when they are sufficientlyconcentrated, it can be deduced that the hydrophilic surfactant initially introducedin the external water phase is being transferred toward the internal droplets as aresult of the entropy of mixing.
6.2.4. Kinetics of Release
6.2.4.1. Limit of Low SDS Concentration and Low InternalDroplet Volume Fraction
Pays et al. [10–12] investigated the influence of the hydrophilic surfactant con-centration Ch on the kinetics of release. Because in their experiments the internalwater volume was about 100 times smaller than the external volume, Ch fixed thechemical potential of the hydrophilic surfactant molecules. The thin liquid filmformed between the internal droplets and the globule surface was composed ofmonolayers covered by SMO and SDS molecules, separated by oil. Because SDSmolecules migrate from the external to the internal water phase within a very shortperiod of time (1 min [12]), the film could be regarded as close to thermodynamicequilibrium with respect to surfactant adsorption a few minutes after preparation.Following the well-known Bancroft rule, such inverted films possess a long-termstability when essentially covered by a hydrophobic surfactant (such as SMO) butbecome very unstable when a strong proportion of hydrophilic surfactant (suchas SDS) is adsorbed. As discussed above, the transition from long-range to short-range stability may be achieved by varying the concentration of the hydrophilicsurfactant in the external water phase.
Several emulsions were prepared with SMO as the emulsifier of the primaryemulsion, at constant concentration C1 in the oil phase, and SDS at various con-centrations Ch in the external aqueous phase. Figure 6.10 shows the quantityof salt released (expressed in relative percentage) as a function of time; for allthe plots, the globule diameter, the initial droplet volume fraction, and the glob-ule volume fraction were the same. For Ch ≤ CMC, the release is quite slow,occurring over a characteristic time scale of several days. The rate decreaseswhen Ch increases, being minimal around 1 CMC. When the process is achieved(nearly 100% has been released), it appears via microscopy that the water droplet
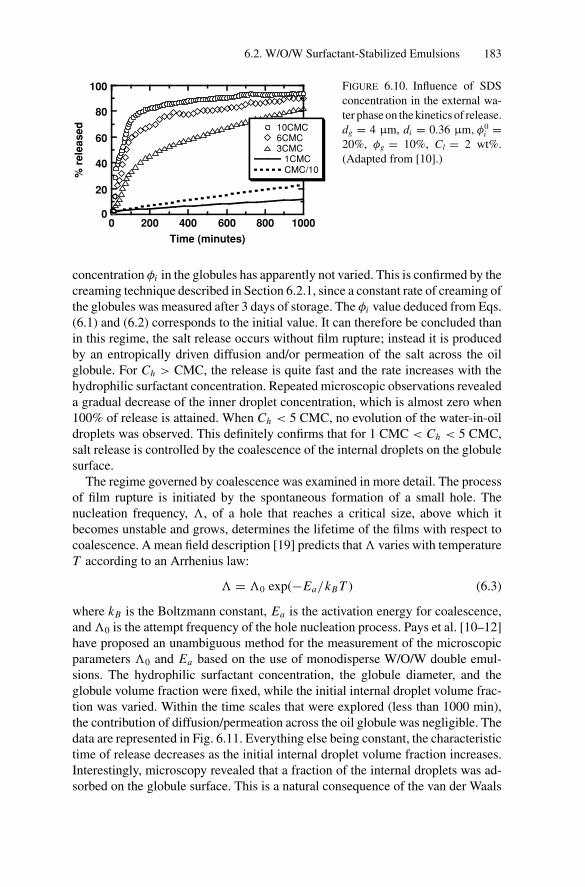
P1: GFZ
SVNY317-Bibette February 2, 2007 16:59
6.2. W/O/W Surfactant-Stabilized Emulsions 183
0
20
40
60
80
100
0200 400 600 800 1000
10CMC6CMC3CMC
1CMCCMC/10%
rele
ased
Time (minutes)
FIGURE 6.10. Influence of SDS
concentration in the external wa-
ter phase on the kinetics of release.
dg = 4 μm, di = 0.36 μm, φ0i =
20%, φg = 10%, Cl = 2 wt%.
(Adapted from [10].)
concentration φi in the globules has apparently not varied. This is confirmed by thecreaming technique described in Section 6.2.1, since a constant rate of creaming ofthe globules was measured after 3 days of storage. The φi value deduced from Eqs.(6.1) and (6.2) corresponds to the initial value. It can therefore be concluded thanin this regime, the salt release occurs without film rupture; instead it is producedby an entropically driven diffusion and/or permeation of the salt across the oilglobule. For Ch > CMC, the release is quite fast and the rate increases with thehydrophilic surfactant concentration. Repeated microscopic observations revealeda gradual decrease of the inner droplet concentration, which is almost zero when100% of release is attained. When Ch < 5 CMC, no evolution of the water-in-oildroplets was observed. This definitely confirms that for 1 CMC < Ch < 5 CMC,salt release is controlled by the coalescence of the internal droplets on the globulesurface.
The regime governed by coalescence was examined in more detail. The processof film rupture is initiated by the spontaneous formation of a small hole. Thenucleation frequency, �, of a hole that reaches a critical size, above which itbecomes unstable and grows, determines the lifetime of the films with respect tocoalescence. A mean field description [19] predicts that � varies with temperatureT according to an Arrhenius law:
� = �0 exp(−Ea/kB T ) (6.3)
where kB is the Boltzmann constant, Ea is the activation energy for coalescence,and �0 is the attempt frequency of the hole nucleation process. Pays et al. [10–12]have proposed an unambiguous method for the measurement of the microscopicparameters �0 and Ea based on the use of monodisperse W/O/W double emul-sions. The hydrophilic surfactant concentration, the globule diameter, and theglobule volume fraction were fixed, while the initial internal droplet volume frac-tion was varied. Within the time scales that were explored (less than 1000 min),the contribution of diffusion/permeation across the oil globule was negligible. Thedata are represented in Fig. 6.11. Everything else being constant, the characteristictime of release decreases as the initial internal droplet volume fraction increases.Interestingly, microscopy revealed that a fraction of the internal droplets was ad-sorbed on the globule surface. This is a natural consequence of the van der Waals
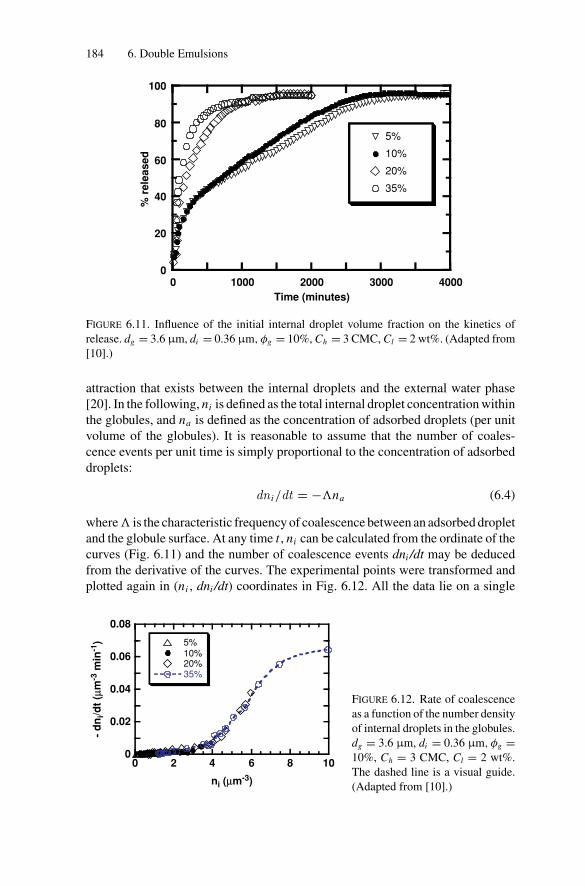
P1: GFZ
SVNY317-Bibette February 2, 2007 16:59
184 6. Double Emulsions
400030002000100000
20
40
60
80
100
5%
10%
20%
35%
% r
ele
ased
Time (minutes)
FIGURE 6.11. Influence of the initial internal droplet volume fraction on the kinetics of
release. dg = 3.6 μm, di = 0.36 μm, φg = 10%, Ch = 3 CMC, Cl = 2 wt%. (Adapted from
[10].)
attraction that exists between the internal droplets and the external water phase[20]. In the following, ni is defined as the total internal droplet concentration withinthe globules, and na is defined as the concentration of adsorbed droplets (per unitvolume of the globules). It is reasonable to assume that the number of coales-cence events per unit time is simply proportional to the concentration of adsorbeddroplets:
dn i/dt = −�na (6.4)
where � is the characteristic frequency of coalescence between an adsorbed dropletand the globule surface. At any time t , ni can be calculated from the ordinate of thecurves (Fig. 6.11) and the number of coalescence events dni /dt may be deducedfrom the derivative of the curves. The experimental points were transformed andplotted again in (ni , dni /dt) coordinates in Fig. 6.12. All the data lie on a single
108640
0.08
0.06
0.04
0.02
02
5%10%20%35%
- d
ni/d
t (μ
m-3
min
-1)
ni (μm-3)
FIGURE 6.12. Rate of coalescence
as a function of the number density
of internal droplets in the globules.
dg = 3.6 μm, di = 0.36 μm, φg =10%, Ch = 3 CMC, Cl = 2 wt%.
The dashed line is a visual guide.
(Adapted from [10].)
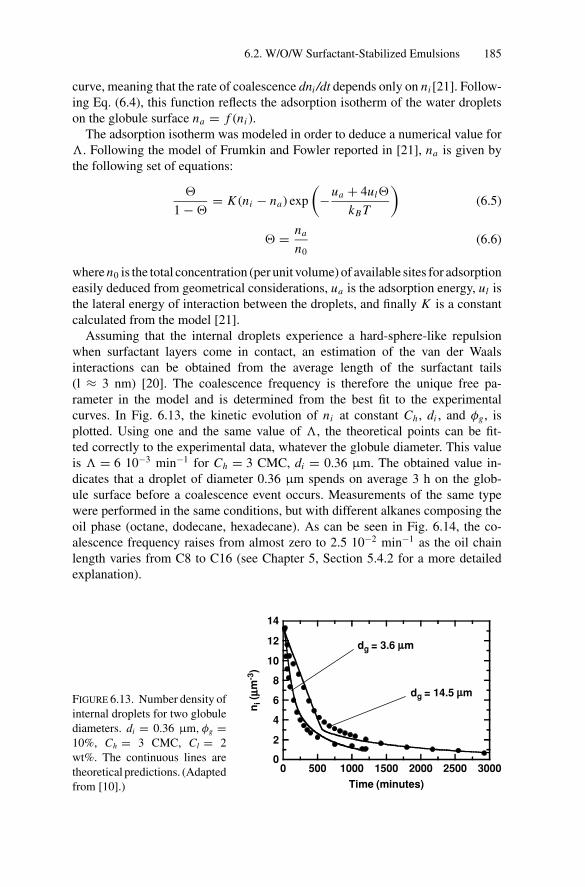
P1: GFZ
SVNY317-Bibette February 2, 2007 16:59
6.2. W/O/W Surfactant-Stabilized Emulsions 185
curve, meaning that the rate of coalescence dni /dt depends only on ni [21]. Follow-ing Eq. (6.4), this function reflects the adsorption isotherm of the water dropletson the globule surface na = f (ni ).
The adsorption isotherm was modeled in order to deduce a numerical value for�. Following the model of Frumkin and Fowler reported in [21], na is given bythe following set of equations:
�
1 − �= K (ni − na) exp
(−ua + 4ul�
kB T
)(6.5)
� = na
n0
(6.6)
where n0 is the total concentration (per unit volume) of available sites for adsorptioneasily deduced from geometrical considerations, ua is the adsorption energy, ul isthe lateral energy of interaction between the droplets, and finally K is a constantcalculated from the model [21].
Assuming that the internal droplets experience a hard-sphere-like repulsionwhen surfactant layers come in contact, an estimation of the van der Waalsinteractions can be obtained from the average length of the surfactant tails(l ≈ 3 nm) [20]. The coalescence frequency is therefore the unique free pa-rameter in the model and is determined from the best fit to the experimentalcurves. In Fig. 6.13, the kinetic evolution of ni at constant Ch , di , and φg , isplotted. Using one and the same value of �, the theoretical points can be fit-ted correctly to the experimental data, whatever the globule diameter. This valueis � = 6 10−3 min−1 for Ch = 3 CMC, di = 0.36 μm. The obtained value in-dicates that a droplet of diameter 0.36 μm spends on average 3 h on the glob-ule surface before a coalescence event occurs. Measurements of the same typewere performed in the same conditions, but with different alkanes composing theoil phase (octane, dodecane, hexadecane). As can be seen in Fig. 6.14, the co-alescence frequency raises from almost zero to 2.5 10−2 min−1 as the oil chainlength varies from C8 to C16 (see Chapter 5, Section 5.4.2 for a more detailedexplanation).
3000250020001500100050000
2
4
6
8
10
12
14
ni (
m
-3)
Time (minutes)
dg = 14.5 m
dg = 3.6 m
FIGURE 6.13. Number density of
internal droplets for two globule
diameters. di = 0.36 μm, φg =10%, Ch = 3 CMC, Cl = 2
wt%. The continuous lines are
theoretical predictions. (Adapted
from [10].)
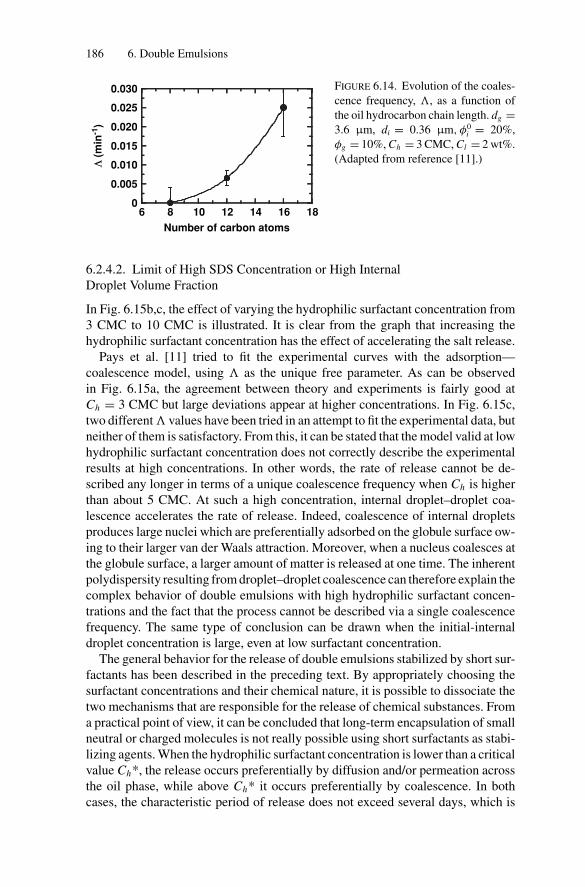
P1: GFZ
SVNY317-Bibette February 2, 2007 16:59
186 6. Double Emulsions
0
0.005
0.010
0.015
0.020
0.025
0.030
6 8 10 12 14 16 18
Number of carbon atoms
Λ (m
in-1
)FIGURE 6.14. Evolution of the coales-
cence frequency, �, as a function of
the oil hydrocarbon chain length. dg =3.6 μm, di = 0.36 μm, φ0
i = 20%,
φg = 10%, Ch = 3 CMC, Cl = 2 wt%.
(Adapted from reference [11].)
6.2.4.2. Limit of High SDS Concentration or High InternalDroplet Volume Fraction
In Fig. 6.15b,c, the effect of varying the hydrophilic surfactant concentration from3 CMC to 10 CMC is illustrated. It is clear from the graph that increasing thehydrophilic surfactant concentration has the effect of accelerating the salt release.
Pays et al. [11] tried to fit the experimental curves with the adsorption—coalescence model, using � as the unique free parameter. As can be observedin Fig. 6.15a, the agreement between theory and experiments is fairly good atCh = 3 CMC but large deviations appear at higher concentrations. In Fig. 6.15c,two different � values have been tried in an attempt to fit the experimental data, butneither of them is satisfactory. From this, it can be stated that the model valid at lowhydrophilic surfactant concentration does not correctly describe the experimentalresults at high concentrations. In other words, the rate of release cannot be de-scribed any longer in terms of a unique coalescence frequency when Ch is higherthan about 5 CMC. At such a high concentration, internal droplet–droplet coa-lescence accelerates the rate of release. Indeed, coalescence of internal dropletsproduces large nuclei which are preferentially adsorbed on the globule surface ow-ing to their larger van der Waals attraction. Moreover, when a nucleus coalesces atthe globule surface, a larger amount of matter is released at one time. The inherentpolydispersity resulting from droplet–droplet coalescence can therefore explain thecomplex behavior of double emulsions with high hydrophilic surfactant concen-trations and the fact that the process cannot be described via a single coalescencefrequency. The same type of conclusion can be drawn when the initial-internaldroplet concentration is large, even at low surfactant concentration.
The general behavior for the release of double emulsions stabilized by short sur-factants has been described in the preceding text. By appropriately choosing thesurfactant concentrations and their chemical nature, it is possible to dissociate thetwo mechanisms that are responsible for the release of chemical substances. Froma practical point of view, it can be concluded that long-term encapsulation of smallneutral or charged molecules is not really possible using short surfactants as stabi-lizing agents. When the hydrophilic surfactant concentration is lower than a criticalvalue Ch*, the release occurs preferentially by diffusion and/or permeation acrossthe oil phase, while above Ch* it occurs preferentially by coalescence. In bothcases, the characteristic period of release does not exceed several days, which is
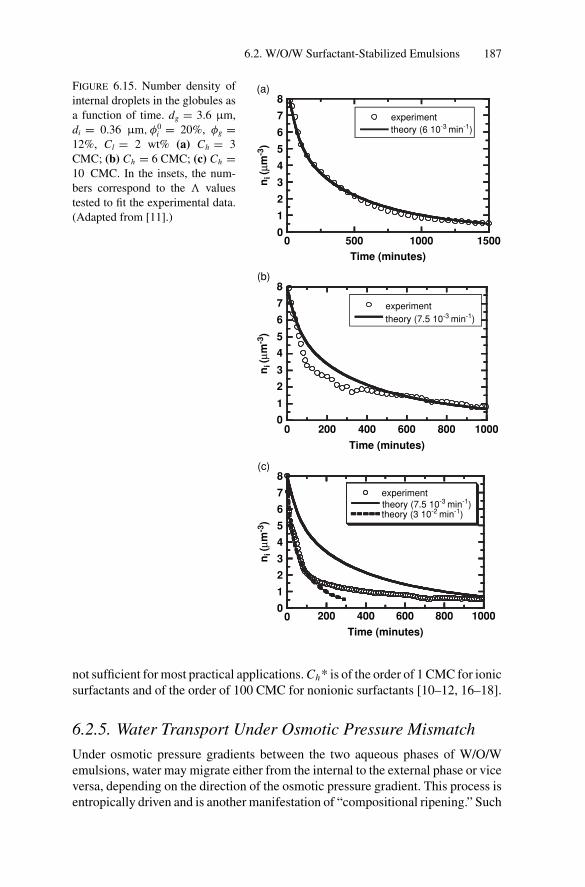
P1: GFZ
SVNY317-Bibette February 2, 2007 16:59
6.2. W/O/W Surfactant-Stabilized Emulsions 187
(a)
0
1
2
3
4
5
6
7
8
0 500 1000 1500
experiment
ni (μ
m-3
)Time (minutes)
(b)
0
1
2
3
4
5
6
7
8
0 200 400 600 800 1000
experiment
theory (7.5 10-3 min-1)
theory (6 10-3 min-1)
ni (μ
m-3
)
Time (minutes)
(c)
0
1
2
3
4
5
6
7
8
0 200 400 600 800 1000
experimenttheory (7.5 10-3 min-1)theory (3 10-2 min-1)
ni (μ
m-3
)
Time (minutes)
FIGURE 6.15. Number density of
internal droplets in the globules as
a function of time. dg = 3.6 μm,
di = 0.36 μm, φ0i = 20%, φg =
12%, Cl = 2 wt% (a) Ch = 3
CMC; (b) Ch = 6 CMC; (c) Ch =10 CMC. In the insets, the num-
bers correspond to the � values
tested to fit the experimental data.
(Adapted from [11].)
not sufficient for most practical applications. Ch* is of the order of 1 CMC for ionicsurfactants and of the order of 100 CMC for nonionic surfactants [10–12, 16–18].
6.2.5. Water Transport Under Osmotic Pressure Mismatch
Under osmotic pressure gradients between the two aqueous phases of W/O/Wemulsions, water may migrate either from the internal to the external phase or viceversa, depending on the direction of the osmotic pressure gradient. This process isentropically driven and is another manifestation of “compositional ripening.” Such
P1: GFZ
SVNY317-Bibette February 2, 2007 16:59
188 6. Double Emulsions
water transport may be critical in the various applications of multiple emulsions.For instance, swelling of the internal droplets may increase the effective globulefraction and produce significant changes in the rheological properties of doubleemulsions. In some cases, swelling is used as a way to press the internal dropletsone against each other at a point that droplet—droplet and droplet—globule coales-cence occurs, thus facilitating the release of a water-soluble encapsulated species.Water transport rates are affected by the magnitude of the osmotic pressure gra-dients between the water phases, the nature and concentration of the surfactantsused for the preparation of the emulsions, the nature and viscosity of the oil phase,and so forth [22–29]. In their work on the water permeability of the oil phase inW/O/W emulsions under osmotic pressure gradients, Kita et al. [30] proposed twopossible mechanisms for the permeation of water and water-soluble materials: wa-ter molecules (1) pass through the thin liquid film formed by the internal dropletsin contact with the globule surface or (2) diffuse across the oil phase by beingincorporated in “reverse micelles,” while Colinart et al. [31] had earlier suggestedreverse-micellar water transport as well as via hydrated surfactants as the two pos-sible means of water migration. Garti et al. [27] and Jager-Lezer et al. [29] haveestablished that oil-soluble surfactant is a major factor for water migration in mul-tiple emulsions and that water transport rates increase with increasing oil-solublesurfactant concentration.
Wen and Papadopoulos [32] reported a visualization study of the water trans-port in W/O/W single globules under osmotic pressure mismatch. By using mi-cropipettes, they could prepare a small oil compartment confined between twolarge water drops (W2) in a microcapillary tube. A unique aqueous drop (W1)was inserted into the oil compartment at a different position each time an ex-periment was conducted (Fig. 6.16). Two limiting conditions were examined: (1)the internal water droplet is in contact with the oil boundary and (2) there ex-ists a visible minimum distance of separation between W1 and W2. Using videomicroscopy, the radius R = dg/2 of W1 was measured at regular time intervals,making it possible to calculate the rate of radius change —dR/dt. Rates were foundto rise linearly with increasing oil-soluble surfactant concentration in the oil phase,though the effects were more pronounced when W1 and W2 were in visual con-tact (Fig. 6.17). In the latter case, it was suggested that the variation of radiuswas controlled mainly by water diffusion or permeation across the thin liquidfilm separating W1 and W2. In the case of visually non contacting W1 and W2,spontaneous emulsification occurred and was revealed by the formation of smallsatellites around the large mother droplet (see Fig. 6.17b). In this limit, dR/dt wasmost probably controlled by spontaneous emulsification and water solubilizationin reverse micelles.
6.3. W/O/W Polymer-Stabilized Emulsions
The lifetime of double emulsions is considerably shortened by the rapid diffu-sion of the water-soluble small-molecule surfactants toward the droplet interface.
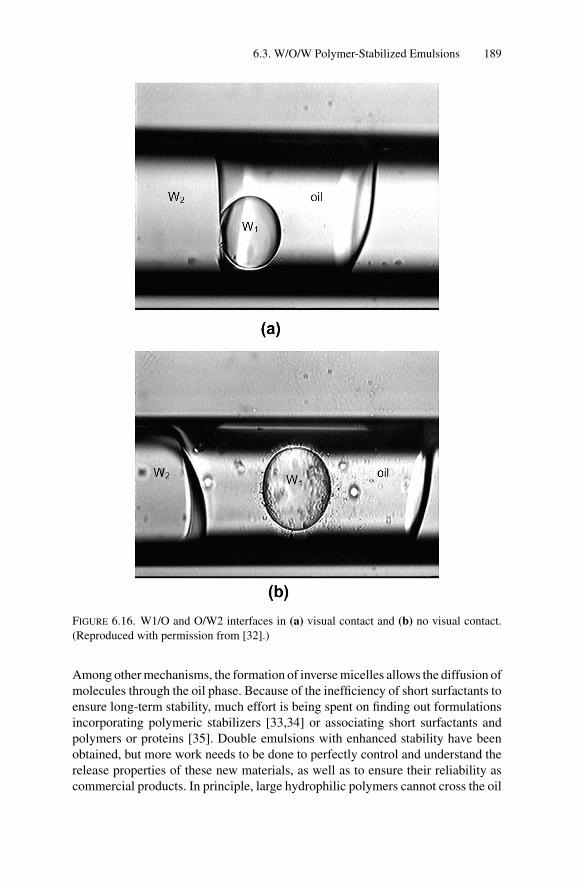
P1: GFZ
SVNY317-Bibette February 2, 2007 16:59
6.3. W/O/W Polymer-Stabilized Emulsions 189
FIGURE 6.16. W1/O and O/W2 interfaces in (a) visual contact and (b) no visual contact.
(Reproduced with permission from [32].)
Among other mechanisms, the formation of inverse micelles allows the diffusion ofmolecules through the oil phase. Because of the inefficiency of short surfactants toensure long-term stability, much effort is being spent on finding out formulationsincorporating polymeric stabilizers [33,34] or associating short surfactants andpolymers or proteins [35]. Double emulsions with enhanced stability have beenobtained, but more work needs to be done to perfectly control and understand therelease properties of these new materials, as well as to ensure their reliability ascommercial products. In principle, large hydrophilic polymers cannot cross the oil
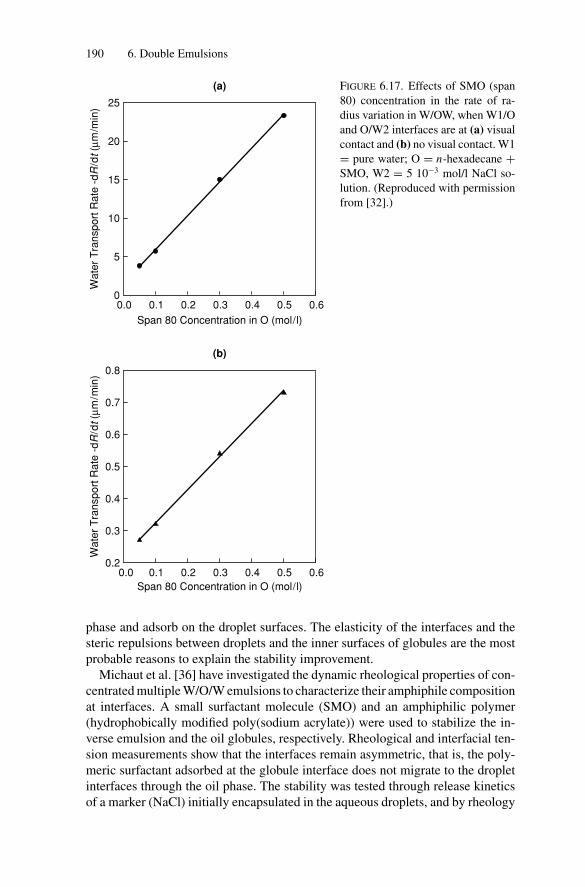
P1: GFZ
SVNY317-Bibette February 2, 2007 16:59
190 6. Double Emulsions
(a)
Span 80 Concentration in O (mol/l)
0.0 0.1 0.2 0.3 0.4 0.5 0.6
Wate
r T
ransp
ort
Rate
-dR
/dt (μ
m/m
in)
0
5
10
15
20
25
(b)
Span 80 Concentration in O (mol/l)0.0 0.1 0.2 0.3 0.4 0.5 0.6
Wate
r T
ransp
ort
Rate
-dR
/dt (μ
m/m
in)
0.2
0.3
0.4
0.5
0.6
0.7
0.8
FIGURE 6.17. Effects of SMO (span
80) concentration in the rate of ra-
dius variation in W/OW, when W1/O
and O/W2 interfaces are at (a) visual
contact and (b) no visual contact. W1
= pure water; O = n-hexadecane +SMO, W2 = 5 10−3 mol/l NaCl so-
lution. (Reproduced with permission
from [32].)
phase and adsorb on the droplet surfaces. The elasticity of the interfaces and thesteric repulsions between droplets and the inner surfaces of globules are the mostprobable reasons to explain the stability improvement.
Michaut et al. [36] have investigated the dynamic rheological properties of con-centrated multiple W/O/W emulsions to characterize their amphiphile compositionat interfaces. A small surfactant molecule (SMO) and an amphiphilic polymer(hydrophobically modified poly(sodium acrylate)) were used to stabilize the in-verse emulsion and the oil globules, respectively. Rheological and interfacial ten-sion measurements show that the interfaces remain asymmetric, that is, the poly-meric surfactant adsorbed at the globule interface does not migrate to the dropletinterfaces through the oil phase. The stability was tested through release kineticsof a marker (NaCl) initially encapsulated in the aqueous droplets, and by rheology
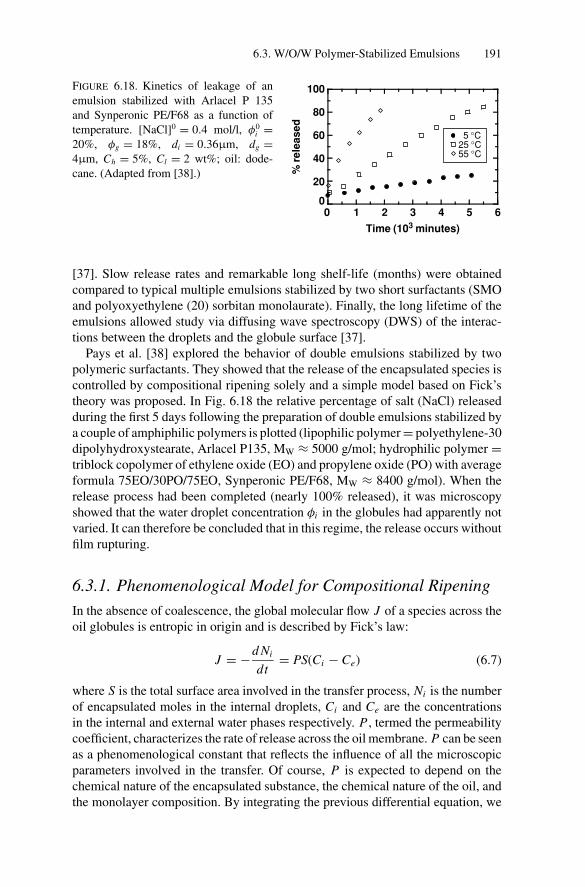
P1: GFZ
SVNY317-Bibette February 2, 2007 16:59
6.3. W/O/W Polymer-Stabilized Emulsions 191
0
20
40
60
80
100
0 1 2 3 4 5 6
5 °C25 °C55 °C
% r
ele
ased
Time (103 minutes)
FIGURE 6.18. Kinetics of leakage of an
emulsion stabilized with Arlacel P 135
and Synperonic PE/F68 as a function of
temperature. [NaCl]0 = 0.4 mol/l, φ0i =
20%, φg = 18%, di = 0.36μm, dg =4μm, Ch = 5%, Cl = 2 wt%; oil: dode-
cane. (Adapted from [38].)
[37]. Slow release rates and remarkable long shelf-life (months) were obtainedcompared to typical multiple emulsions stabilized by two short surfactants (SMOand polyoxyethylene (20) sorbitan monolaurate). Finally, the long lifetime of theemulsions allowed study via diffusing wave spectroscopy (DWS) of the interac-tions between the droplets and the globule surface [37].
Pays et al. [38] explored the behavior of double emulsions stabilized by twopolymeric surfactants. They showed that the release of the encapsulated species iscontrolled by compositional ripening solely and a simple model based on Fick’stheory was proposed. In Fig. 6.18 the relative percentage of salt (NaCl) releasedduring the first 5 days following the preparation of double emulsions stabilized bya couple of amphiphilic polymers is plotted (lipophilic polymer = polyethylene-30dipolyhydroxystearate, Arlacel P135, MW ≈ 5000 g/mol; hydrophilic polymer =triblock copolymer of ethylene oxide (EO) and propylene oxide (PO) with averageformula 75EO/30PO/75EO, Synperonic PE/F68, MW ≈ 8400 g/mol). When therelease process had been completed (nearly 100% released), it was microscopyshowed that the water droplet concentration φi in the globules had apparently notvaried. It can therefore be concluded that in this regime, the release occurs withoutfilm rupturing.
6.3.1. Phenomenological Model for Compositional Ripening
In the absence of coalescence, the global molecular flow J of a species across theoil globules is entropic in origin and is described by Fick’s law:
J = −d Ni
dt= PS(Ci − Ce) (6.7)
where S is the total surface area involved in the transfer process, Ni is the numberof encapsulated moles in the internal droplets, Ci and Ce are the concentrationsin the internal and external water phases respectively. P , termed the permeabilitycoefficient, characterizes the rate of release across the oil membrane. P can be seenas a phenomenological constant that reflects the influence of all the microscopicparameters involved in the transfer. Of course, P is expected to depend on thechemical nature of the encapsulated substance, the chemical nature of the oil, andthe monolayer composition. By integrating the previous differential equation, we
P1: GFZ
SVNY317-Bibette February 2, 2007 16:59
192 6. Double Emulsions
obtain:
Ni = N 0i
1 + α
[α + exp
(−PS
1 + α
Vit
)](6.8)
where N 0i is the initial number of encapsulated moles and α = Vi/Ve, Vi and Ve
being the internal and external water volumes, respectively, which are assumed toremain constant in time.
Combining Eq. (6.8) and the conservation condition, the following expressionfor the relative percentage of release is derived:
%released(t) = 100Ce(t)
C∞= 100
[1 − exp
(−PS
1 + α
Vit
)](6.9)
where
C∞ = N 0i
Vi + Ve= φgφi C0
i(1 − φg
) + φiφg(6.10)
Here C0i is the initial concentration of the encapsulated species in the internal
droplets. The model predicts an exponential leakage as a function of time. If Sis assumed to be equal to the total globule surface area, P can be numericallydeduced from the initial slope p0 of the experimental curves:
P = p0
100
dg
6
φi(1 − φg
)(1 − φg
) + φiφg(6.11)
6.3.2. Microscopic Approaches of the Permeability:State of the Art
Compositional ripening in double emulsions is reminiscent of the so-called“passive” leakage measured across phospholipid bilayers and is partially respon-sible for chemical exchange across biological membranes. At a microscopic level,several models to explain the permeation phenomenon have been developed [39],all of them in agreement with Fick’s law. Some models propose that permeationacross the membranes results from a solubilization process followed by diffu-sion across the hydrophobic part of the phospholipid membrane. For hydrophilicsubstances, the rate-determining parameter is the so-called Born energy, whichrepresents the energy cost for the transfer of a hydrophilic species from a mediumof high dielectric constant to one of low dielectric. Other models describe thepermeation as a passage through reversible and thermally activated holes that arepermanently formed in the bilayer. The transient holes may be large enough to al-low the passage of small hydrophilic substances. The rate of transfer is controlledby the energy cost for hole formation, which includes surface tension and curvatureeffects (see Section 6.2.3). Although they involve different microscopic mecha-nisms, these limiting models lead to quite similar expressions for the permeationcoefficient. In all cases, P is predicted to follow an effective Arrhenius law:
P = P0 exp (−εa/kB T ) (6.12)
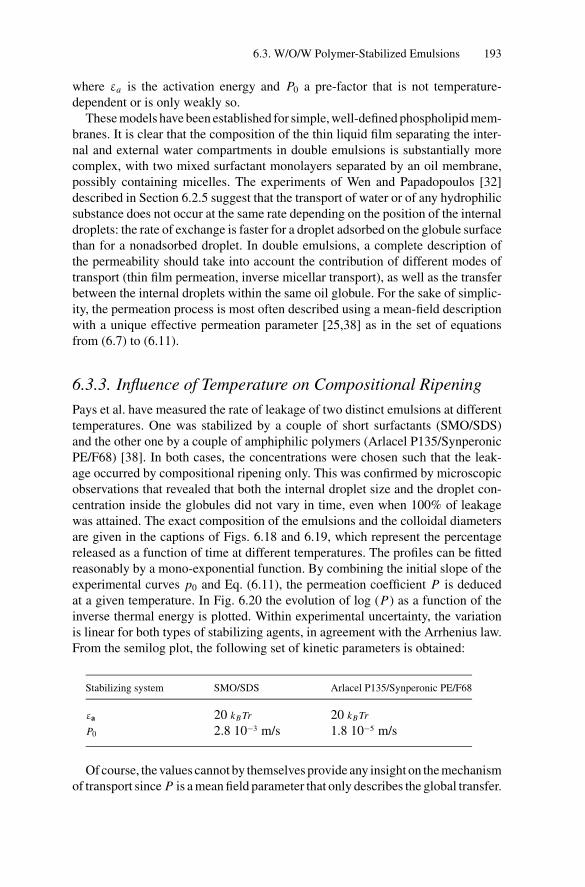
P1: GFZ
SVNY317-Bibette February 2, 2007 16:59
6.3. W/O/W Polymer-Stabilized Emulsions 193
where εa is the activation energy and P0 a pre-factor that is not temperature-dependent or is only weakly so.
These models have been established for simple, well-defined phospholipid mem-branes. It is clear that the composition of the thin liquid film separating the inter-nal and external water compartments in double emulsions is substantially morecomplex, with two mixed surfactant monolayers separated by an oil membrane,possibly containing micelles. The experiments of Wen and Papadopoulos [32]described in Section 6.2.5 suggest that the transport of water or of any hydrophilicsubstance does not occur at the same rate depending on the position of the internaldroplets: the rate of exchange is faster for a droplet adsorbed on the globule surfacethan for a nonadsorbed droplet. In double emulsions, a complete description ofthe permeability should take into account the contribution of different modes oftransport (thin film permeation, inverse micellar transport), as well as the transferbetween the internal droplets within the same oil globule. For the sake of simplic-ity, the permeation process is most often described using a mean-field descriptionwith a unique effective permeation parameter [25,38] as in the set of equationsfrom (6.7) to (6.11).
6.3.3. Influence of Temperature on Compositional Ripening
Pays et al. have measured the rate of leakage of two distinct emulsions at differenttemperatures. One was stabilized by a couple of short surfactants (SMO/SDS)and the other one by a couple of amphiphilic polymers (Arlacel P135/SynperonicPE/F68) [38]. In both cases, the concentrations were chosen such that the leak-age occurred by compositional ripening only. This was confirmed by microscopicobservations that revealed that both the internal droplet size and the droplet con-centration inside the globules did not vary in time, even when 100% of leakagewas attained. The exact composition of the emulsions and the colloidal diametersare given in the captions of Figs. 6.18 and 6.19, which represent the percentagereleased as a function of time at different temperatures. The profiles can be fittedreasonably by a mono-exponential function. By combining the initial slope of theexperimental curves p0 and Eq. (6.11), the permeation coefficient P is deducedat a given temperature. In Fig. 6.20 the evolution of log (P) as a function of theinverse thermal energy is plotted. Within experimental uncertainty, the variationis linear for both types of stabilizing agents, in agreement with the Arrhenius law.From the semilog plot, the following set of kinetic parameters is obtained:
Stabilizing system SMO/SDS Arlacel P135/Synperonic PE/F68
εa 20 kB Tr 20 kB Tr
P0 2.8 10−3 m/s 1.8 10−5 m/s
Of course, the values cannot by themselves provide any insight on the mechanismof transport since P is a mean field parameter that only describes the global transfer.
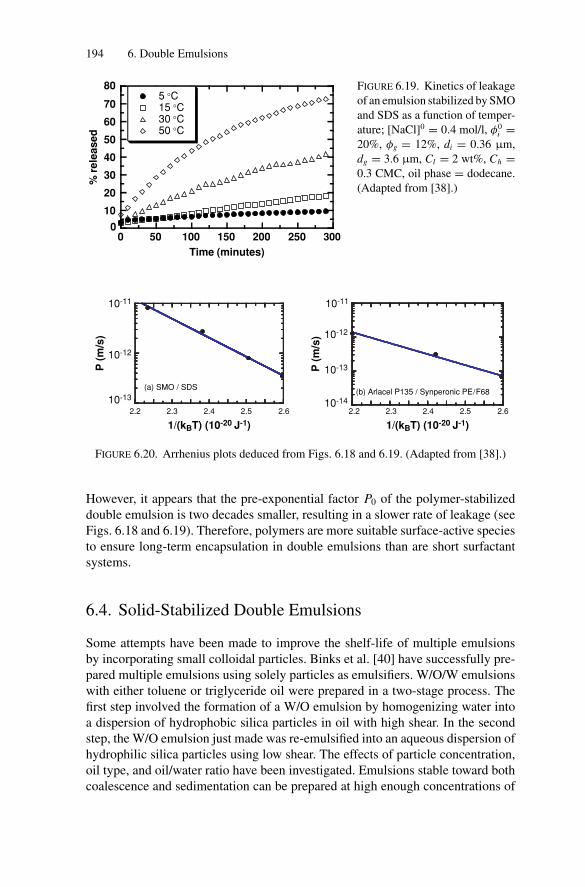
P1: GFZ
SVNY317-Bibette February 2, 2007 16:59
194 6. Double Emulsions
0
10
20
30
40
50
60
70
80
0 50 100 150 200 250 300
5 °C15 °C30 °C50 °C
% r
ele
ased
Time (minutes)
FIGURE 6.19. Kinetics of leakage
of an emulsion stabilized by SMO
and SDS as a function of temper-
ature; [NaCl]0 = 0.4 mol/l, φ0i =
20%, φg = 12%, di = 0.36 μm,
dg = 3.6 μm, Cl = 2 wt%, Ch =0.3 CMC, oil phase = dodecane.
(Adapted from [38].)
10-13
10-12
10-11
P (
m//s
)
10-13
10-14
10-12
10-11
P (
m//s
)
2.2 2.3 2.4 2.5 2.6
1/(kBT) (10-20 J-1) 1/(kBT) (10-20 J-1)
2.2 2.3 2.4 2.5 2.6
(a) SMO / SDS(b) Arlacel P135 / Synperonic PE/F68
FIGURE 6.20. Arrhenius plots deduced from Figs. 6.18 and 6.19. (Adapted from [38].)
However, it appears that the pre-exponential factor P0 of the polymer-stabilizeddouble emulsion is two decades smaller, resulting in a slower rate of leakage (seeFigs. 6.18 and 6.19). Therefore, polymers are more suitable surface-active speciesto ensure long-term encapsulation in double emulsions than are short surfactantsystems.
6.4. Solid-Stabilized Double Emulsions
Some attempts have been made to improve the shelf-life of multiple emulsionsby incorporating small colloidal particles. Binks et al. [40] have successfully pre-pared multiple emulsions using solely particles as emulsifiers. W/O/W emulsionswith either toluene or triglyceride oil were prepared in a two-stage process. Thefirst step involved the formation of a W/O emulsion by homogenizing water intoa dispersion of hydrophobic silica particles in oil with high shear. In the secondstep, the W/O emulsion just made was re-emulsified into an aqueous dispersion ofhydrophilic silica particles using low shear. The effects of particle concentration,oil type, and oil/water ratio have been investigated. Emulsions stable toward bothcoalescence and sedimentation can be prepared at high enough concentrations of
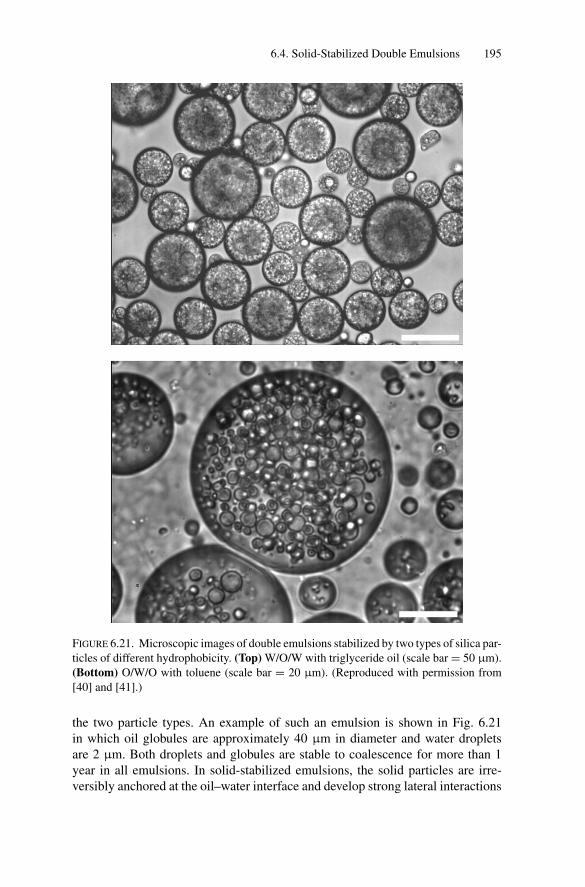
P1: GFZ
SVNY317-Bibette February 2, 2007 16:59
6.4. Solid-Stabilized Double Emulsions 195
FIGURE 6.21. Microscopic images of double emulsions stabilized by two types of silica par-
ticles of different hydrophobicity. (Top) W/O/W with triglyceride oil (scale bar = 50 μm).
(Bottom) O/W/O with toluene (scale bar = 20 μm). (Reproduced with permission from
[40] and [41].)
the two particle types. An example of such an emulsion is shown in Fig. 6.21in which oil globules are approximately 40 μm in diameter and water dropletsare 2 μm. Both droplets and globules are stable to coalescence for more than 1year in all emulsions. In solid-stabilized emulsions, the solid particles are irre-versibly anchored at the oil–water interface and develop strong lateral interactions
P1: GFZ
SVNY317-Bibette February 2, 2007 16:59
196 6. Double Emulsions
[41], forming a kind of rigid membrane that mechanically protects the dropletsagainst coalescence. Binks et al. have also studied the kinetics of release of elec-trolyte from inner drops to the outer aqueous phase under isotonic conditions inW/O/W emulsions of toluene using conductivity [40]. A model in which the dif-fusion of salt through the oil membrane including its partitioning between waterand oil has been proposed [40]. The calculated rate constant for release, how-ever, is much larger than the experimental one, suggesting that either an energybarrier to the interfacial transport of salt is present or that counter transport ofglucose (required to maintain isotonicity) from outer to inner aqueous phases issignificant.
In a similar manner, O/W/O emulsions were prepared by first emulsifying oilinto an aqueous dispersion of hydrophilic silica particles, and then gently re-emulsifying the O/W emulsion so formed into an oil dispersion of hydrophobicsilica particles. Figure 6.21 shows a typical microscopic image of a double emul-sion with toluene as oil.
6.5. Conclusion
In this chapter, we have examined separately the two mechanisms that are respon-sible for the leakage of encapsulated substances in double emulsions: coalescenceand compositional ripening. This study was possible after finding experimentalconditions in which the two mechanisms occur over timescales that are suffi-ciently distinct to be decoupled. So far, the mechanism of compositional ripeningis still controversial and requires further investigations. From a practical aspect,technological applications were first envisaged in the presence of short surfac-tants. The intrinsic instability (fast coalescence and compositional ripening) ofsuch materials discouraged technologists and the promising formulation of doubleemulsions was almost abandoned. Studies using amphiphilic polymers, proteins,natural polyelectrolytes, and solid colloidal particles [36–38,40,42] reveal that co-alescence can be inhibited and that compositional ripening may be extremely slow.In addition, several methods are now available for the preparation of size-controlled(monodisperse) double emulsions. Among the most efficient technologies are theuse of specific porous membranes [43] or highly viscous media [44]. All theseadvances are quite encouraging for the prospects of fabricating materials withreproducible properties (size-controlled emulsions) and performing long-term en-capsulation of active species.
References
[1] A.T. Florence and D. Whitehill: “The Formulation and Stability of Multiple Emul-
sions.” Int. J. Pharm. 11, 277 (1982).
[2] A.T. Florence, T.K. Law, and T.L. Wateley: “Nonaqueous Foam Structures from
Osmotically Swollen W/O/W Emulsion Droplets.” J. Colloid Interface Sci. 107, 584
(1982).
P1: GFZ
SVNY317-Bibette February 2, 2007 16:59
References 197
[3] N. Garti: “Double Emulsions: Progress and Applications.” Curr. Opin. Colloid Inter-
face Sci. 3, 657 (1998).
[4] C. Chiang, G.C. Fuller, J.W. Frankenfeld, and C.T. Rhodes: “Potential of Liquid
Membranes for Drug Overdose Treatment: In Vitro Studies.” J. Pharm. Sci. 67, 63
(1978).
[5] S. Matsumoto and W.W. Kang: “Formation and Applications of Multiple Emulsions.”
J. Dispersion Sci. Technol. 10, 455 (1989).
[6] N. Garti, M. Frenkel, and R. Schwartz: “Multiple Emulsions II. Proposed Tech-
nique to Overcome Unpleasant Taste of Drugs.” J. Dispersion Sci. Technol. 4, 237
(1983).
[7] P. Becher, S.S. Davis, J.D. Hadgrapt, K.J. Palin: “Medical and Pharmaceutical Appli-
cations of Emulsions.” Encyclopedia of Emulsion Technology, vol. 2, Marcel Dekker
New York (1985).
[8] C. Goubault, K. Pays, D. Olea, J. Bibette, V. Schmitt, and F. Leal-Calderon: “Shear
Rupturing of Complex Fluids: Application to the Preparation of Quasi-Monodisperse
W/O/W Double Emulsions.” Langmuir 17, 5184 (2001).
[9] K. Pays, F. Leal Calderon, and J. Bibette: “Method to Produce a Monodisperse Double
Emulsion.” French Patent 00 05880 (2000).
[10] K. Pays, J. Giermanska-Kahn, P. Pouligny, J. Bibette, and F. Leal-Calderon: “Double
Emulsions: A Tool for Probing Thin Film Metastability.” Phys. Rev. Lett. 87, 178304
(2001).
[11] K. Pays, J. Kahn, B. Pouligny, J. Bibette, and F. Leal-Calderon: “Coalescence in
Surfactant-Stabilized Double Emulsions.” Langmuir 17, 7758 (2001).
[12] K. Pays: “Double Emulsions: Coalescence and Compositional Ripening.” Ph.D
thesis, Bordeaux I University (2000).
[13] M.P. Aronson and M.F. Petko: “Highly Concentrated Water-in-Oil Emulsions: Influ-
ence of Electrolyte on Their Properties and Stability.” J. Colloid Interface Sci. 159,134 (1993).
[14] A. Ashkin: “Acceleration and Trapping of Particles by Radiation Pressure.” Phys.
Rev. Lett. 24, 156 (1970).
[15] M.I. Angelova and B. Pouligny: “Trapping and Levitation of a Dielectric Sphere with
off-Centered Gaussian Beams: I Experimental.” Pure Appl. Optics 2, 261 (1993).
[16] M.F. Ficheux, F. Leal-Calderon, L. Bonakdar, and J. Bibette: “Some Stability Criteria
for Double Emulsions.” Langmuir 14, 2702 (1998).
[17] C.H. Villa, L.B. Lawson, Y. Li, and K.D. Papadopoulos: “Internal Coalescence as
a Mechanism of Instability in Water-in-Oil-in-Water Double-Emulsion Globules.”
Langmuir 19, 244 (2003).
[18] H. Gonzalez-Ochoa, L. Ibarra-Bracamontes, and J.L. Arauz-Lara: “Two-Stage Coa-
lescence in Double Emulsions.” Langmuir 19, 7837 (2003).
[19] A.S. Kabalnov and H. Wennerstrom: “Macroemulsion Stability : The Oriented Wedge
Theory Revisited.” Langmuir 12, 276 (1996).
[20] J.N. Israelachvili: Intermolecular and Surface Forces. Academic Press, New York
(1992).
[21] R.H. Fowler and A. Guggenheim: Statistical Thermodynamics. Cambridge Univer-
sity Press, Cambridge, UK (1939).
[22] S. Matsumoto and M. Kohda: “The Viscosity of W/O/W Emulsions: An Attempt
to Estimate the Water Permeation Coefficient of the Oil Layer from the Viscosity
Changes in Diluted Systems on Aging under Osmotic Pressure Gradients.” J. Colloid
Interface Sci. 73, 13 (1980).
P1: GFZ
SVNY317-Bibette February 2, 2007 16:59
198 6. Double Emulsions
[23] S. Matsumoto, T. Inoue, Masanori Kohda, and K. Ikura: “Water Permeability of Oil
Layers in W/O/W Emulsions under Osmotic Pressure Gradients.” J. Colloid Interface
Sci. 77, 555 (1980).
[24] S. Magdassi and N. Garti: “Release of Electrolytes in Multiple Emulsions: Coa-
lescence and Breakdown or Diffusion Through Oil Phase?” Collois Surf. 12, 367
(1984).
[25] S. Magdassi and N. Garti: “A Kinetic Model for Release of Electrolytes from W/O/W
Multiple Emulsions.” J. Controlled Release 3, 273 (1986).
[26] J.A. Omotosho, T.L. Whateley, and A.T. Florence: “Methotrexate Transport from
the Internal Phase of Multiple W/O/W Emulsions.” J. Microencapsul. 6, 183
(1989).
[27] N. Garti, S. Magdassi, and D. Whitehill: “Transfer Phenomena Across the Oil Phase
in Water-Oil-Water Multiple Emulsions Evaluated by Coulter Counter : 1. Effect of
Emulsifier 1 on Water Permeability.” J. Colloid Interface Sci. 104, 587 (1985).
[28] N. Garti, A. Romano-Pariente, and A. Aserin: “The Effect of Additives on Release
from W/O/W Emulsions.” Colloid Surf. 24, 83 (1987).
[29] N. Jager-Lezer, I. Terrisse, F. Bruneau, S. Tokgoz, L. Ferreira, D. Clausse, M. Seiller,d
and J.L. Grossiord: “Influence of Lipophilic Surfactant on the Release Kinetics of
Water-Soluble Molecules Entrapped in a W/O/W Multiple Emulsion.” J. Controlled
Release 45, 1 (1997).
[30] Y. Kita, S. Matsumoto, and D. Yonezawa: “Permeation of Water Through the Oil
Layer in W/O/W-Type Multiple-Phase Emulsions.” Nippon Kagaku Kaishi 1, 11
(1978).
[31] P. Colinart, S. Delepine, G. Trouve, and H. Renon: “Water Transfer in Emulsified
Liquid Membrane Processes.” J. Membr. Sci. 20, 167 (1984).
[32] L. Wen and K.D. Papadopoulos: “Effects of Surfactants on Water Transport in
W1/O/W2 Emulsions.” Langmuir 16, 7612 (2000).
[33] Y. Sela, Y. Magdassi, and N. Garti: “Polymeric Surfactants Based on Polysiloxanes-
Graft-Poly(Oxyethylene) for Stabilization of Multiple Emulsions.” Colloids Surfaces
83, 143 (1993).
[34] Y. Sela, Y. Magdassi, and N. Garti: “Release of Markers from the Inner Water Phase
of W/O/W Emulsions Stabilized by Silicone Based Polymeric Surfactants.” J. Con-
trolled Release 33, 1 (1995).
[35] Y. Sela, S. Magdassi, and N. Garti: “Newly Designed Polysiloxane-Graft-Poly
(Oxyethylene) Copolymeric Surfactants: Preparation, Surface Activity and Emul-
sification Properties.” Colloid Polym. Sci. 272, 684 (1994).
[36] F. Michaut, P. Perrin, and P. Hebraud: “Interface Composition of Multiple Emulsions:
Rheology as a Probe.” Langmuir 20, 8576 (2004).
[37] F. Michaut, P. Hebraud, and P. Perrin: “Amphiphilic Polyelectrolyte for Stabilization
of Multiple Emulsions.” Polym. Int. 52, 594 (2003).
[38] K. Pays, J. Giermanska-Kahn, P. Pouligny, J. Bibette, and F. Leal-Calderon: “Double
Emulsions: How Does Release Occur?” J. Controlled Release 79, 193 (2002).
[39] R.T. Hamilton and E.W. Kaler: “Alkali Metal Ion Transport Through Thin Bilayers.”
J. Phys. Chem. 94, 2560 (1990).
[40] B.P. Binks, A.K.F. Dyab, and P.D.I. Fletcher: “Multiple Emulsions Stabilised Solely
by Nanoparticles.” In Proceedings of the 3rd World Congress on Emulsions, Lyon,
France (2002).
[41] R. Aveyard, B.P. Binks, and J.H. Clint: “Emulsions Stabilized Solely by Colloidal
Particles.” Adv. Colloid Interface Sci. 100–102, 503 (2003).
P1: GFZ
SVNY317-Bibette February 2, 2007 16:59
References 199
[42] N. Garti and R. Lutz: “Recent Progress in Double Emulsions.” In: D.N. Petsev
(ed), Emulsions: Structure, Stability and Interactions. Elsevier, Amsterdam, Boston,
Heidelberg (2004).
[43] S.M. Joscelyne and G. Tragardh: “Membrane Emulsification—a Literature Review.”
J. Membr. Sci. 169, (2000).
[44] J.M.J. Bibette, F. Leal-Calderon, and P. Gorria: “Polydisperse Double Emulsion, Cor-
responding Monodisperse Double Emulsion and Method for Preparing the Monodis-
perse Emulsion.” Patent WO 2001021297 (2001).
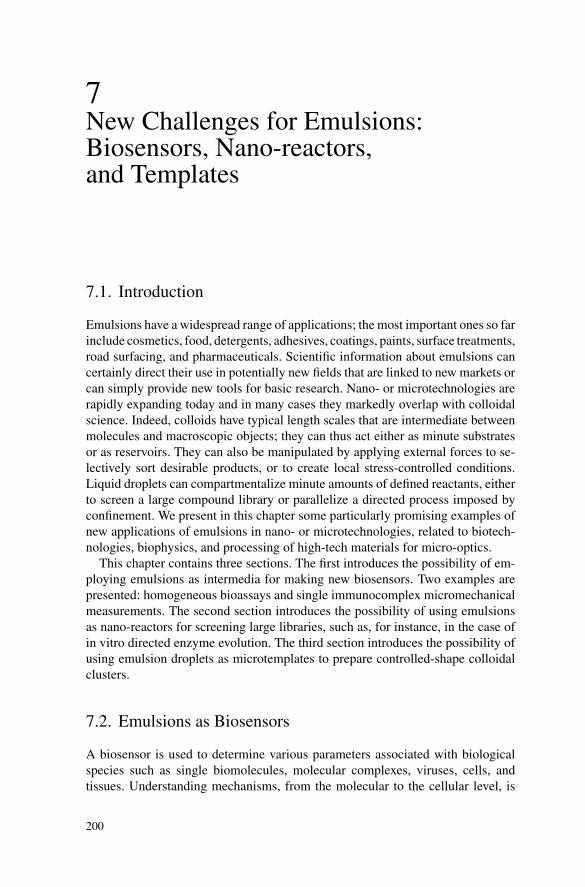
P1: GFZ
SVNY317-Bibette February 1, 2007 16:58
7New Challenges for Emulsions:Biosensors, Nano-reactors,and Templates
7.1. Introduction
Emulsions have a widespread range of applications; the most important ones so farinclude cosmetics, food, detergents, adhesives, coatings, paints, surface treatments,road surfacing, and pharmaceuticals. Scientific information about emulsions cancertainly direct their use in potentially new fields that are linked to new markets orcan simply provide new tools for basic research. Nano- or microtechnologies arerapidly expanding today and in many cases they markedly overlap with colloidalscience. Indeed, colloids have typical length scales that are intermediate betweenmolecules and macroscopic objects; they can thus act either as minute substratesor as reservoirs. They can also be manipulated by applying external forces to se-lectively sort desirable products, or to create local stress-controlled conditions.Liquid droplets can compartmentalize minute amounts of defined reactants, eitherto screen a large compound library or parallelize a directed process imposed byconfinement. We present in this chapter some particularly promising examples ofnew applications of emulsions in nano- or microtechnologies, related to biotech-nologies, biophysics, and processing of high-tech materials for micro-optics.
This chapter contains three sections. The first introduces the possibility of em-ploying emulsions as intermedia for making new biosensors. Two examples arepresented: homogeneous bioassays and single immunocomplex micromechanicalmeasurements. The second section introduces the possibility of using emulsionsas nano-reactors for screening large libraries, such as, for instance, in the case ofin vitro directed enzyme evolution. The third section introduces the possibility ofusing emulsion droplets as microtemplates to prepare controlled-shape colloidalclusters.
7.2. Emulsions as Biosensors
A biosensor is used to determine various parameters associated with biologicalspecies such as single biomolecules, molecular complexes, viruses, cells, andtissues. Understanding mechanisms, from the molecular to the cellular level, is
200
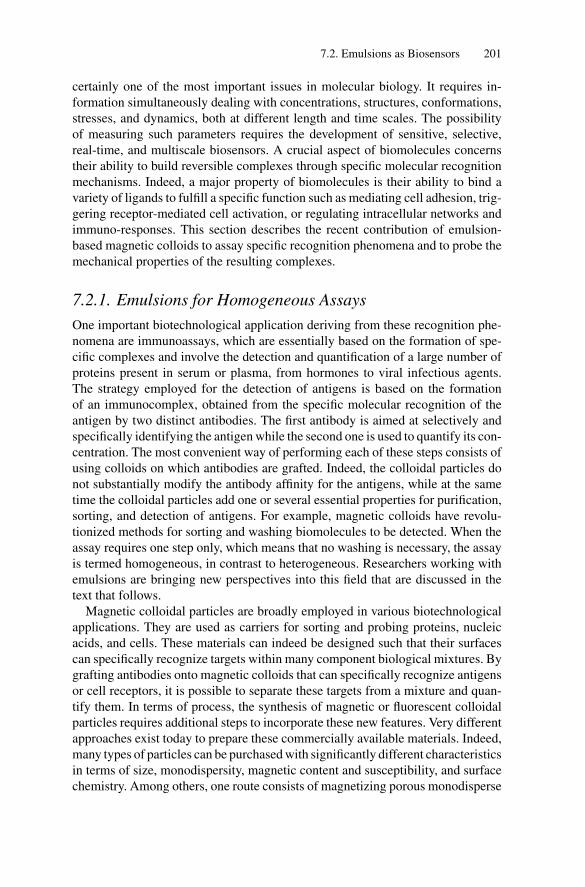
P1: GFZ
SVNY317-Bibette February 1, 2007 16:58
7.2. Emulsions as Biosensors 201
certainly one of the most important issues in molecular biology. It requires in-formation simultaneously dealing with concentrations, structures, conformations,stresses, and dynamics, both at different length and time scales. The possibilityof measuring such parameters requires the development of sensitive, selective,real-time, and multiscale biosensors. A crucial aspect of biomolecules concernstheir ability to build reversible complexes through specific molecular recognitionmechanisms. Indeed, a major property of biomolecules is their ability to bind avariety of ligands to fulfill a specific function such as mediating cell adhesion, trig-gering receptor-mediated cell activation, or regulating intracellular networks andimmuno-responses. This section describes the recent contribution of emulsion-based magnetic colloids to assay specific recognition phenomena and to probe themechanical properties of the resulting complexes.
7.2.1. Emulsions for Homogeneous Assays
One important biotechnological application deriving from these recognition phe-nomena are immunoassays, which are essentially based on the formation of spe-cific complexes and involve the detection and quantification of a large number ofproteins present in serum or plasma, from hormones to viral infectious agents.The strategy employed for the detection of antigens is based on the formationof an immunocomplex, obtained from the specific molecular recognition of theantigen by two distinct antibodies. The first antibody is aimed at selectively andspecifically identifying the antigen while the second one is used to quantify its con-centration. The most convenient way of performing each of these steps consists ofusing colloids on which antibodies are grafted. Indeed, the colloidal particles donot substantially modify the antibody affinity for the antigens, while at the sametime the colloidal particles add one or several essential properties for purification,sorting, and detection of antigens. For example, magnetic colloids have revolu-tionized methods for sorting and washing biomolecules to be detected. When theassay requires one step only, which means that no washing is necessary, the assayis termed homogeneous, in contrast to heterogeneous. Researchers working withemulsions are bringing new perspectives into this field that are discussed in thetext that follows.
Magnetic colloidal particles are broadly employed in various biotechnologicalapplications. They are used as carriers for sorting and probing proteins, nucleicacids, and cells. These materials can indeed be designed such that their surfacescan specifically recognize targets within many component biological mixtures. Bygrafting antibodies onto magnetic colloids that can specifically recognize antigensor cell receptors, it is possible to separate these targets from a mixture and quan-tify them. In terms of process, the synthesis of magnetic or fluorescent colloidalparticles requires additional steps to incorporate these new features. Very differentapproaches exist today to prepare these commercially available materials. Indeed,many types of particles can be purchased with significantly different characteristicsin terms of size, monodispersity, magnetic content and susceptibility, and surfacechemistry. Among others, one route consists of magnetizing porous monodisperse
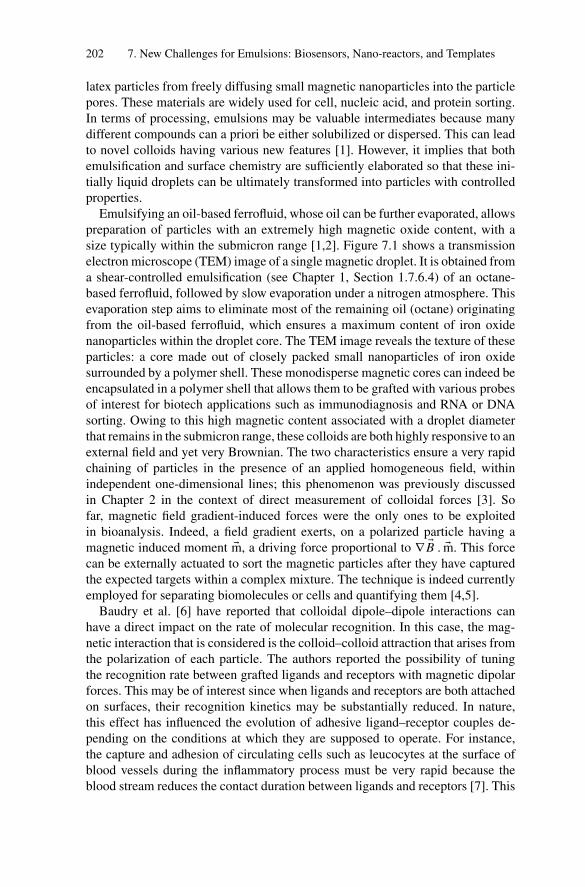
P1: GFZ
SVNY317-Bibette February 1, 2007 16:58
202 7. New Challenges for Emulsions: Biosensors, Nano-reactors, and Templates
latex particles from freely diffusing small magnetic nanoparticles into the particlepores. These materials are widely used for cell, nucleic acid, and protein sorting.In terms of processing, emulsions may be valuable intermediates because manydifferent compounds can a priori be either solubilized or dispersed. This can leadto novel colloids having various new features [1]. However, it implies that bothemulsification and surface chemistry are sufficiently elaborated so that these ini-tially liquid droplets can be ultimately transformed into particles with controlledproperties.
Emulsifying an oil-based ferrofluid, whose oil can be further evaporated, allowspreparation of particles with an extremely high magnetic oxide content, with asize typically within the submicron range [1,2]. Figure 7.1 shows a transmissionelectron microscope (TEM) image of a single magnetic droplet. It is obtained froma shear-controlled emulsification (see Chapter 1, Section 1.7.6.4) of an octane-based ferrofluid, followed by slow evaporation under a nitrogen atmosphere. Thisevaporation step aims to eliminate most of the remaining oil (octane) originatingfrom the oil-based ferrofluid, which ensures a maximum content of iron oxidenanoparticles within the droplet core. The TEM image reveals the texture of theseparticles: a core made out of closely packed small nanoparticles of iron oxidesurrounded by a polymer shell. These monodisperse magnetic cores can indeed beencapsulated in a polymer shell that allows them to be grafted with various probesof interest for biotech applications such as immunodiagnosis and RNA or DNAsorting. Owing to this high magnetic content associated with a droplet diameterthat remains in the submicron range, these colloids are both highly responsive to anexternal field and yet very Brownian. The two characteristics ensure a very rapidchaining of particles in the presence of an applied homogeneous field, withinindependent one-dimensional lines; this phenomenon was previously discussedin Chapter 2 in the context of direct measurement of colloidal forces [3]. Sofar, magnetic field gradient-induced forces were the only ones to be exploitedin bioanalysis. Indeed, a field gradient exerts, on a polarized particle having amagnetic induced moment �m, a driving force proportional to ∇ �B . �m. This forcecan be externally actuated to sort the magnetic particles after they have capturedthe expected targets within a complex mixture. The technique is indeed currentlyemployed for separating biomolecules or cells and quantifying them [4,5].
Baudry et al. [6] have reported that colloidal dipole–dipole interactions canhave a direct impact on the rate of molecular recognition. In this case, the mag-netic interaction that is considered is the colloid–colloid attraction that arises fromthe polarization of each particle. The authors reported the possibility of tuningthe recognition rate between grafted ligands and receptors with magnetic dipolarforces. This may be of interest since when ligands and receptors are both attachedon surfaces, their recognition kinetics may be substantially reduced. In nature,this effect has influenced the evolution of adhesive ligand–receptor couples de-pending on the conditions at which they are supposed to operate. For instance,the capture and adhesion of circulating cells such as leucocytes at the surface ofblood vessels during the inflammatory process must be very rapid because theblood stream reduces the contact duration between ligands and receptors [7]. This
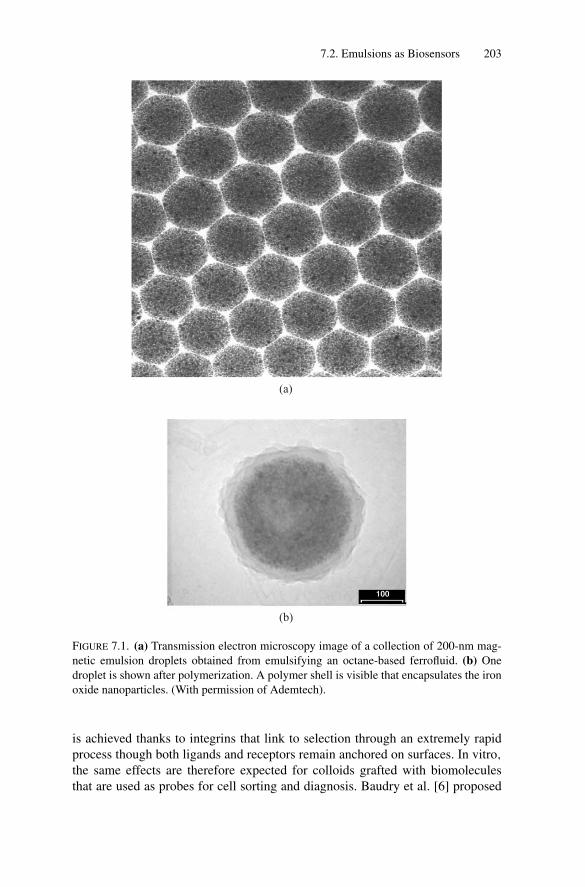
P1: GFZ
SVNY317-Bibette February 1, 2007 16:58
7.2. Emulsions as Biosensors 203
(a)
(b)
FIGURE 7.1. (a) Transmission electron microscopy image of a collection of 200-nm mag-
netic emulsion droplets obtained from emulsifying an octane-based ferrofluid. (b) One
droplet is shown after polymerization. A polymer shell is visible that encapsulates the iron
oxide nanoparticles. (With permission of Ademtech).
is achieved thanks to integrins that link to selection through an extremely rapidprocess though both ligands and receptors remain anchored on surfaces. In vitro,
the same effects are therefore expected for colloids grafted with biomoleculesthat are used as probes for cell sorting and diagnosis. Baudry et al. [6] proposed
P1: GFZ
SVNY317-Bibette February 1, 2007 16:58
204 7. New Challenges for Emulsions: Biosensors, Nano-reactors, and Templates
using Brownian magnetic colloids that self-assemble into linear chains to improveconsiderably the rate of recognition between grafted receptors and their ligands, es-sentially via the one-dimensional restriction that augments the colliding frequencyand in turn increases the recognition rate.
Diagnosis techniques are generally based on building a specific immunocomplexstructure in which the antigen to be detected is recognized by two antibodies [4,8,9].Early immunochemistry was based on precipitation of large complexes composedof antibodies and antigens. Following the same track, the use of Brownian particles,which quickly find their target, had significantly improved the detection sensitivity,because of the increase in scattered light when aggregation between grafted colloidstakes place. As the most simple but very generic example, let us consider an antigen(Ag) having two epitopes for two antibodies A and B. To reveal the presence of suchan antigen, particles grafted with A and B antibodies and the sample are mixed.The formation of small clusters is then expected, the rate of which depends onmany factors. Change in light-scattering due to the presence of these small clusterswill reveal the existence of sandwich-like structures: A–Ag–B (latex agglutinationimmunoassay). These homogeneous assays, as opposed to heterogeneous assaysin which washing steps are necessary before detection, are today by far the mostsimple and straightforward: they were introduced in 1956 [8,10] and today severalhundreds of different tests based on this principle can be found on the market,mainly for detection of infectious diseases and protein quantification [11].
The rate for building the complex sets the time scale of an assay. Meanwhile, inmany diagnostic assays the antigen concentration is in the picomolar range. At theseconcentrations, the encounter frequency between species becomes a critical issueto consider, as low encounter frequencies increase the time required to completethe assay. More rapid homogeneous assays would be of great benefit both forincreasing throughput and in medical emergencies where nearly instantaneoustests are required. It is worth noting here that microfluidic devices can certainlybe one potential answer to this problem; indeed the controlled flow of minutevolumes provides an efficient means to augment encounter events between antigenand their immobilized probes [12]. However, it brings new constraints for reliablymanipulating and sampling such small volumes.
Because the emulsion-based particles are superparamagnetic with a high sus-ceptibility, the resulting magnetic colloidal forces induce a fast chaining process[13]: the time scale for bringing two colloidal particles into contact in the presenceof a magnetic field H , and at an initial volume fraction φ, is given by
τ = 6η
φ μ0χ2 H 2(7.1)
where η is the viscosity of the surrounding fluid, μ0 is the vacuum magneticpermeability, φ is the particle volume fraction, and χ is the magnetic susceptibilityof the particles [3,14]. For B = μ0 H = 20 mT, χ = 0.1, φ = 0.03%, and η =0.001 Pa·s, the time τ to nucleate chains is less than 1 s. These chains persist as longas the field is maintained, which allows for a rapid formation of ligand–receptor–ligand links between pairs of particles within the chain. To quantify the influence of
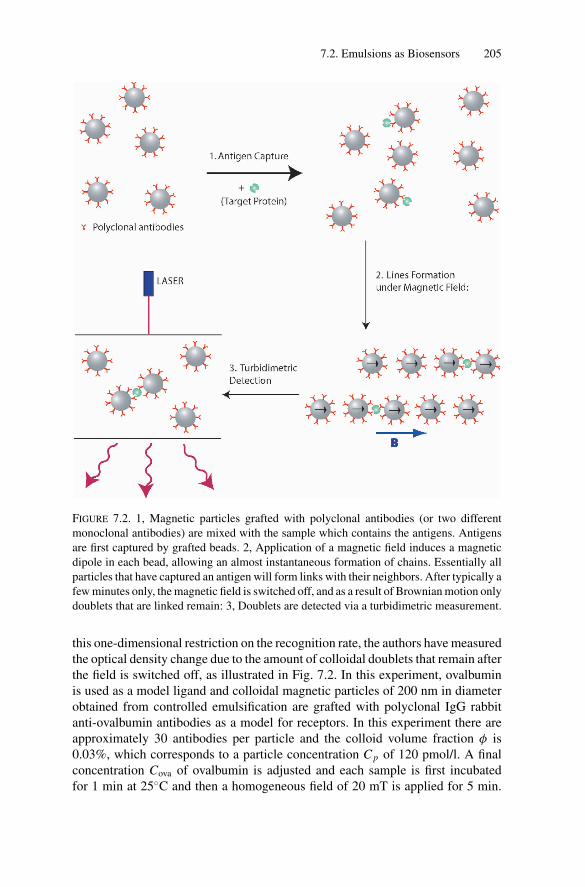
P1: GFZ
SVNY317-Bibette February 1, 2007 16:58
7.2. Emulsions as Biosensors 205
FIGURE 7.2. 1, Magnetic particles grafted with polyclonal antibodies (or two different
monoclonal antibodies) are mixed with the sample which contains the antigens. Antigens
are first captured by grafted beads. 2, Application of a magnetic field induces a magnetic
dipole in each bead, allowing an almost instantaneous formation of chains. Essentially all
particles that have captured an antigen will form links with their neighbors. After typically a
few minutes only, the magnetic field is switched off, and as a result of Brownian motion only
doublets that are linked remain: 3, Doublets are detected via a turbidimetric measurement.
this one-dimensional restriction on the recognition rate, the authors have measuredthe optical density change due to the amount of colloidal doublets that remain afterthe field is switched off, as illustrated in Fig. 7.2. In this experiment, ovalbuminis used as a model ligand and colloidal magnetic particles of 200 nm in diameterobtained from controlled emulsification are grafted with polyclonal IgG rabbitanti-ovalbumin antibodies as a model for receptors. In this experiment there areapproximately 30 antibodies per particle and the colloid volume fraction φ is0.03%, which corresponds to a particle concentration C p of 120 pmol/l. A finalconcentration Cova of ovalbumin is adjusted and each sample is first incubatedfor 1 min at 25◦C and then a homogeneous field of 20 mT is applied for 5 min.
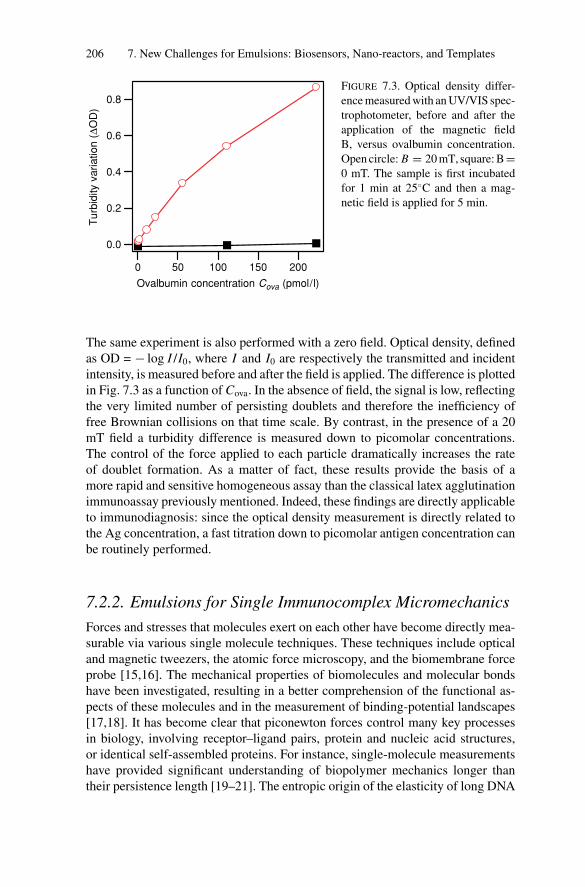
P1: GFZ
SVNY317-Bibette February 1, 2007 16:58
206 7. New Challenges for Emulsions: Biosensors, Nano-reactors, and Templates
0.8
0.6
0.4
0.2
0.0
Turb
idity
variatio
n (
ΔOD
)
200150100500
Ovalbumin concentration Cova (pmol/l)
FIGURE 7.3. Optical density differ-
ence measured with an UV/VIS spec-
trophotometer, before and after the
application of the magnetic field
B, versus ovalbumin concentration.
Open circle: B = 20 mT, square: B=0 mT. The sample is first incubated
for 1 min at 25◦C and then a mag-
netic field is applied for 5 min.
The same experiment is also performed with a zero field. Optical density, definedas OD = − log I /I0, where I and I0 are respectively the transmitted and incidentintensity, is measured before and after the field is applied. The difference is plottedin Fig. 7.3 as a function of Cova. In the absence of field, the signal is low, reflectingthe very limited number of persisting doublets and therefore the inefficiency offree Brownian collisions on that time scale. By contrast, in the presence of a 20mT field a turbidity difference is measured down to picomolar concentrations.The control of the force applied to each particle dramatically increases the rateof doublet formation. As a matter of fact, these results provide the basis of amore rapid and sensitive homogeneous assay than the classical latex agglutinationimmunoassay previously mentioned. Indeed, these findings are directly applicableto immunodiagnosis: since the optical density measurement is directly related tothe Ag concentration, a fast titration down to picomolar antigen concentration canbe routinely performed.
7.2.2. Emulsions for Single Immunocomplex Micromechanics
Forces and stresses that molecules exert on each other have become directly mea-surable via various single molecule techniques. These techniques include opticaland magnetic tweezers, the atomic force microscopy, and the biomembrane forceprobe [15,16]. The mechanical properties of biomolecules and molecular bondshave been investigated, resulting in a better comprehension of the functional as-pects of these molecules and in the measurement of binding-potential landscapes[17,18]. It has become clear that piconewton forces control many key processesin biology, involving receptor–ligand pairs, protein and nucleic acid structures,or identical self-assembled proteins. For instance, single-molecule measurementshave provided significant understanding of biopolymer mechanics longer thantheir persistence length [19–21]. The entropic origin of the elasticity of long DNA
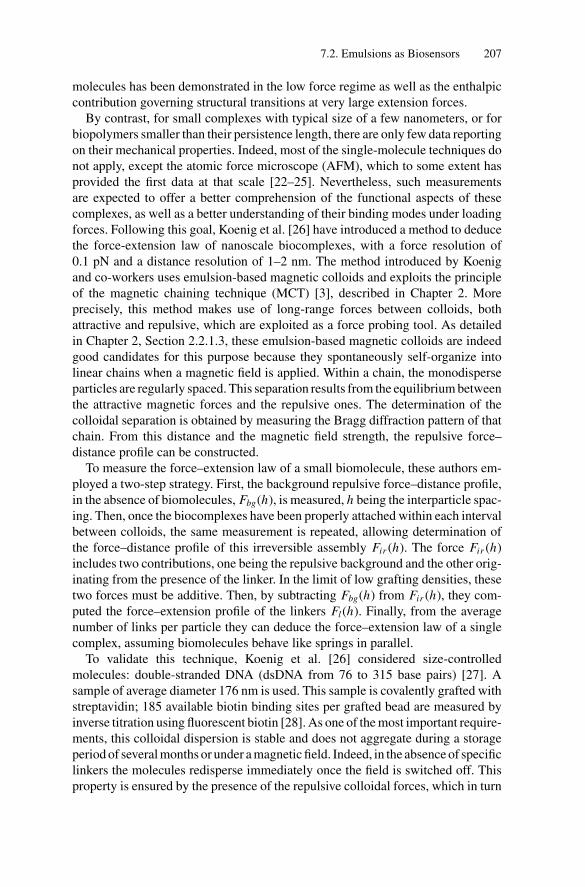
P1: GFZ
SVNY317-Bibette February 1, 2007 16:58
7.2. Emulsions as Biosensors 207
molecules has been demonstrated in the low force regime as well as the enthalpiccontribution governing structural transitions at very large extension forces.
By contrast, for small complexes with typical size of a few nanometers, or forbiopolymers smaller than their persistence length, there are only few data reportingon their mechanical properties. Indeed, most of the single-molecule techniques donot apply, except the atomic force microscope (AFM), which to some extent hasprovided the first data at that scale [22–25]. Nevertheless, such measurementsare expected to offer a better comprehension of the functional aspects of thesecomplexes, as well as a better understanding of their binding modes under loadingforces. Following this goal, Koenig et al. [26] have introduced a method to deducethe force-extension law of nanoscale biocomplexes, with a force resolution of0.1 pN and a distance resolution of 1–2 nm. The method introduced by Koenigand co-workers uses emulsion-based magnetic colloids and exploits the principleof the magnetic chaining technique (MCT) [3], described in Chapter 2. Moreprecisely, this method makes use of long-range forces between colloids, bothattractive and repulsive, which are exploited as a force probing tool. As detailedin Chapter 2, Section 2.2.1.3, these emulsion-based magnetic colloids are indeedgood candidates for this purpose because they spontaneously self-organize intolinear chains when a magnetic field is applied. Within a chain, the monodisperseparticles are regularly spaced. This separation results from the equilibrium betweenthe attractive magnetic forces and the repulsive ones. The determination of thecolloidal separation is obtained by measuring the Bragg diffraction pattern of thatchain. From this distance and the magnetic field strength, the repulsive force–distance profile can be constructed.
To measure the force–extension law of a small biomolecule, these authors em-ployed a two-step strategy. First, the background repulsive force–distance profile,in the absence of biomolecules, Fbg(h), is measured, h being the interparticle spac-ing. Then, once the biocomplexes have been properly attached within each intervalbetween colloids, the same measurement is repeated, allowing determination ofthe force–distance profile of this irreversible assembly Fir (h). The force Fir (h)includes two contributions, one being the repulsive background and the other orig-inating from the presence of the linker. In the limit of low grafting densities, thesetwo forces must be additive. Then, by subtracting Fbg(h) from Fir (h), they com-puted the force–extension profile of the linkers Fl(h). Finally, from the averagenumber of links per particle they can deduce the force–extension law of a singlecomplex, assuming biomolecules behave like springs in parallel.
To validate this technique, Koenig et al. [26] considered size-controlledmolecules: double-stranded DNA (dsDNA from 76 to 315 base pairs) [27]. Asample of average diameter 176 nm is used. This sample is covalently grafted withstreptavidin; 185 available biotin binding sites per grafted bead are measured byinverse titration using fluorescent biotin [28]. As one of the most important require-ments, this colloidal dispersion is stable and does not aggregate during a storageperiod of several months or under a magnetic field. Indeed, in the absence of specificlinkers the molecules redisperse immediately once the field is switched off. Thisproperty is ensured by the presence of the repulsive colloidal forces, which in turn
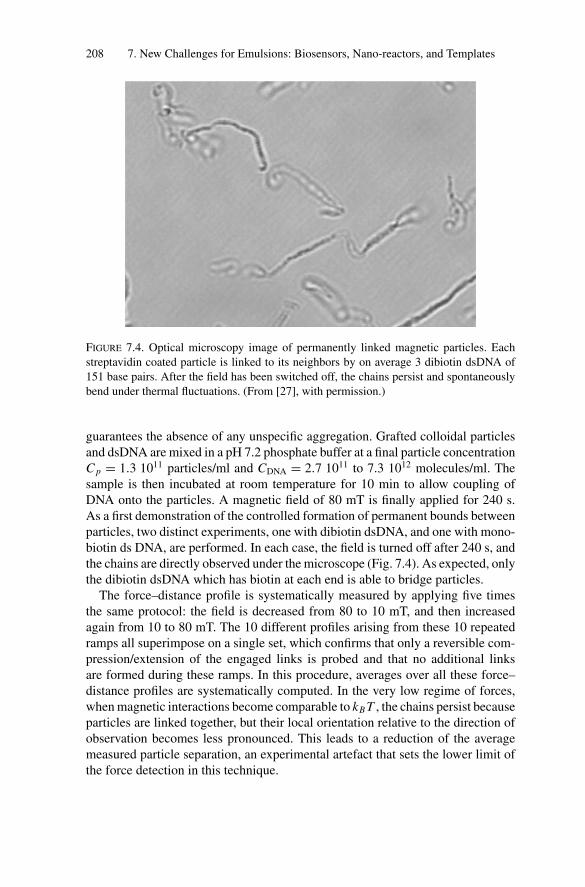
P1: GFZ
SVNY317-Bibette February 1, 2007 16:58
208 7. New Challenges for Emulsions: Biosensors, Nano-reactors, and Templates
FIGURE 7.4. Optical microscopy image of permanently linked magnetic particles. Each
streptavidin coated particle is linked to its neighbors by on average 3 dibiotin dsDNA of
151 base pairs. After the field has been switched off, the chains persist and spontaneously
bend under thermal fluctuations. (From [27], with permission.)
guarantees the absence of any unspecific aggregation. Grafted colloidal particlesand dsDNA are mixed in a pH 7.2 phosphate buffer at a final particle concentrationC p = 1.3 1011 particles/ml and CDNA = 2.7 1011 to 7.3 1012 molecules/ml. Thesample is then incubated at room temperature for 10 min to allow coupling ofDNA onto the particles. A magnetic field of 80 mT is finally applied for 240 s.As a first demonstration of the controlled formation of permanent bounds betweenparticles, two distinct experiments, one with dibiotin dsDNA, and one with mono-biotin ds DNA, are performed. In each case, the field is turned off after 240 s, andthe chains are directly observed under the microscope (Fig. 7.4). As expected, onlythe dibiotin dsDNA which has biotin at each end is able to bridge particles.
The force–distance profile is systematically measured by applying five timesthe same protocol: the field is decreased from 80 to 10 mT, and then increasedagain from 10 to 80 mT. The 10 different profiles arising from these 10 repeatedramps all superimpose on a single set, which confirms that only a reversible com-pression/extension of the engaged links is probed and that no additional linksare formed during these ramps. In this procedure, averages over all these force–distance profiles are systematically computed. In the very low regime of forces,when magnetic interactions become comparable to kB T , the chains persist becauseparticles are linked together, but their local orientation relative to the direction ofobservation becomes less pronounced. This leads to a reduction of the averagemeasured particle separation, an experimental artefact that sets the lower limit ofthe force detection in this technique.
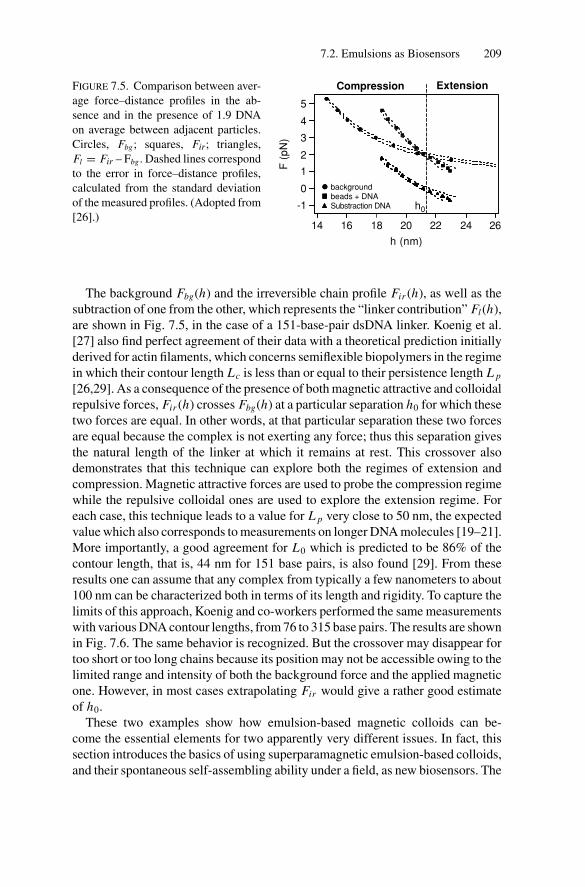
P1: GFZ
SVNY317-Bibette February 1, 2007 16:58
7.2. Emulsions as Biosensors 209
Compression Extension
5
4
3
2
1
0
-1
F (
pN
)
262422
h0
20181614
h (nm)
backgroundbeads + DNASubstraction DNA
FIGURE 7.5. Comparison between aver-
age force–distance profiles in the ab-
sence and in the presence of 1.9 DNA
on average between adjacent particles.
Circles, Fbg; squares, Fir; triangles,
Fl = Fir – Fbg . Dashed lines correspond
to the error in force–distance profiles,
calculated from the standard deviation
of the measured profiles. (Adopted from
[26].)
The background Fbg(h) and the irreversible chain profile Fir (h), as well as thesubtraction of one from the other, which represents the “linker contribution” Fl(h),are shown in Fig. 7.5, in the case of a 151-base-pair dsDNA linker. Koenig et al.[27] also find perfect agreement of their data with a theoretical prediction initiallyderived for actin filaments, which concerns semiflexible biopolymers in the regimein which their contour length Lc is less than or equal to their persistence length L p
[26,29]. As a consequence of the presence of both magnetic attractive and colloidalrepulsive forces, Fir (h) crosses Fbg(h) at a particular separation h0 for which thesetwo forces are equal. In other words, at that particular separation these two forcesare equal because the complex is not exerting any force; thus this separation givesthe natural length of the linker at which it remains at rest. This crossover alsodemonstrates that this technique can explore both the regimes of extension andcompression. Magnetic attractive forces are used to probe the compression regimewhile the repulsive colloidal ones are used to explore the extension regime. Foreach case, this technique leads to a value for L p very close to 50 nm, the expectedvalue which also corresponds to measurements on longer DNA molecules [19–21].More importantly, a good agreement for L0 which is predicted to be 86% of thecontour length, that is, 44 nm for 151 base pairs, is also found [29]. From theseresults one can assume that any complex from typically a few nanometers to about100 nm can be characterized both in terms of its length and rigidity. To capture thelimits of this approach, Koenig and co-workers performed the same measurementswith various DNA contour lengths, from 76 to 315 base pairs. The results are shownin Fig. 7.6. The same behavior is recognized. But the crossover may disappear fortoo short or too long chains because its position may not be accessible owing to thelimited range and intensity of both the background force and the applied magneticone. However, in most cases extrapolating Fir would give a rather good estimateof h0.
These two examples show how emulsion-based magnetic colloids can be-come the essential elements for two apparently very different issues. In fact, thissection introduces the basics of using superparamagnetic emulsion-based colloids,and their spontaneous self-assembling ability under a field, as new biosensors. The
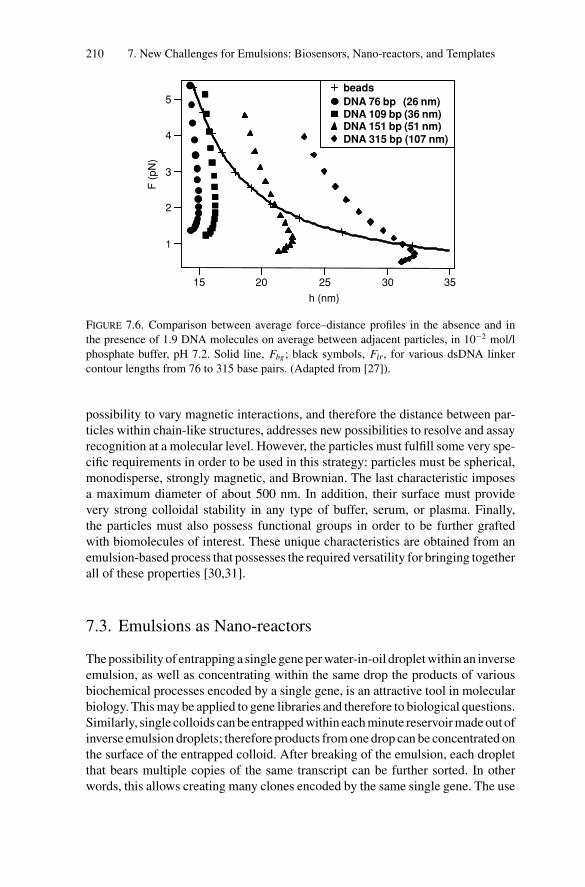
P1: GFZ
SVNY317-Bibette February 1, 2007 16:58
210 7. New Challenges for Emulsions: Biosensors, Nano-reactors, and Templates
5
4
3
2
1
F (
pN
)
3530252015
h (nm)
beadsDNA 76 bp (26 nm)DNA 109 bp (36 nm)DNA 151 bp (51 nm)DNA 315 bp (107 nm)
FIGURE 7.6. Comparison between average force–distance profiles in the absence and in
the presence of 1.9 DNA molecules on average between adjacent particles, in 10−2 mol/l
phosphate buffer, pH 7.2. Solid line, Fbg; black symbols, Fir, for various dsDNA linker
contour lengths from 76 to 315 base pairs. (Adapted from [27]).
possibility to vary magnetic interactions, and therefore the distance between par-ticles within chain-like structures, addresses new possibilities to resolve and assayrecognition at a molecular level. However, the particles must fulfill some very spe-cific requirements in order to be used in this strategy: particles must be spherical,monodisperse, strongly magnetic, and Brownian. The last characteristic imposesa maximum diameter of about 500 nm. In addition, their surface must providevery strong colloidal stability in any type of buffer, serum, or plasma. Finally,the particles must also possess functional groups in order to be further graftedwith biomolecules of interest. These unique characteristics are obtained from anemulsion-based process that possesses the required versatility for bringing togetherall of these properties [30,31].
7.3. Emulsions as Nano-reactors
The possibility of entrapping a single gene per water-in-oil droplet within an inverseemulsion, as well as concentrating within the same drop the products of variousbiochemical processes encoded by a single gene, is an attractive tool in molecularbiology. This may be applied to gene libraries and therefore to biological questions.Similarly, single colloids can be entrapped within each minute reservoir made out ofinverse emulsion droplets; therefore products from one drop can be concentrated onthe surface of the entrapped colloid. After breaking of the emulsion, each dropletthat bears multiple copies of the same transcript can be further sorted. In otherwords, this allows creating many clones encoded by the same single gene. The use
P1: GFZ
SVNY317-Bibette February 1, 2007 16:58
7.3. Emulsions as Nano-reactors 211
of emulsions or double emulsions as micro-reservoirs provides a straightforwardway of miniaturizing very large libraries. Indeed, an emulsion (inverse or double)can be viewed as a collection of minute aqueous reservoirs able to entrap separatedsingle molecules originating from a large library. This section particularly focuseson the use of emulsion drops as single gene reservoirs and reactors as a tool todirect in vitro enzyme evolution.
7.3.1. Screening of Large Libraries and DirectedEnzyme Evolution
Evolution, as postulated by Darwin in 1880, is a powerful process that is basedon natural selection. Genes, which make up the blueprints for living things, arepassed from one generation to the next. However, the genes can pick up mistakes,mutations, resulting in variations in the molecules they encode. Genes carryingmutations that encode “better” molecules, which increase the chances that theorganism will survive and reproduce, are more likely to be transmitted to the nextgeneration. Over many generations, this continual process of optimization as aresult of repeated rounds of mutation and selection has resulted in the vast rangeof organisms we see today.
Life is sustained by a complex web of chemical reactions. Catalysts, moleculesthat accelerate the rate of a chemical reaction but that are unchanged by the overallreaction, are essential for life as most reactions would otherwise occur far tooslowly. Indeed, it can be argued that the evolution of life is essentially the story ofthe evolution of catalysis. In nature, most catalysts are proteins and these catalyticproteins, or enzymes, are one of the most remarkable classes of molecules tohave been generated during evolution. Enzymes catalyze an enormous range ofdifferent reactions and their performances typically far exceed those of man-madecatalysts. They can accelerate reactions by anything up to 1017-fold relative to theuncatalyzed reaction, enabling reactions that would otherwise have half-lives oftens of millions of years to be performed in milliseconds.
All evolutionary systems require a link between genotype (a nucleic acid thatcan be replicated) and phenotype (a functional trait such as binding or catalyticactivity), whether in nature or in the laboratory. We recall that the genotype refersto the DNA sequence while the phenotype refers to its function in relation to en-vironment; the same concept can be used at the level of a single gene encodingfor a single protein, but in this case the phenotype is restricted to a binding or aparticular catalytic activity. Evolution becomes possible if a physical link betweengenotype and phenotype exists in order for a particular phenotype to further trans-mit its genotype to the next generation. Completely in vitro selection systems area highly advantageous means of investigating directed evolution, as they allow se-lection of larger repertoires and much greater control than in vivo systems. Directselection for all enzymatic properties can be achieved by compartmentalization incells (as in nature). Unfortunately, in vivo selections are virtually always restrictedto functions that affect the viability of the organism and are often complicated by
P1: GFZ
SVNY317-Bibette February 1, 2007 16:58
212 7. New Challenges for Emulsions: Biosensors, Nano-reactors, and Templates
the complex intracellular environment and the need to transform the gene library.More commonly, 103–105 clone libraries are screened (rather than selected) ina plate assay using a fluorogenic or chromogenic substrate. However, crossinglong evolutionary distances, and evolving completely novel proteins and activi-ties, requires much larger libraries, for which selection rather than screening ispreferable.
When subjected to selection pressure, genes evolve through a series of muta-tions that modify the function of the enzymes they encode. New enzymes canbe produced in the laboratory via a process of “directed evolution” [32–47]. Fol-lowing this strategy, selection pressure can be focused on a single enzyme ratherthan on a whole organism. In this context, Tawfik and Griffiths have developed acompletely in vitro system for the selection of enzymes, based on linking geno-type and phenotype, not by compartmentalization of genes in cells as in nature,but by in vitro compartmentalisation (IVC) in aqueous microdroplets in water-in-oil emulsions [39]. IVC can be used to select nucleic acids and proteins and canselect for binding [41,42,46] as well as catalysis [39,43–46]. Each microdropletis ∼2 μm in diameter and only ∼5 femtolitre volume (about the same size as abacterial cell), which means that a 50-μl aqueous reaction mixture is dispersedinto ∼1010 microdroplets. This is equivalent to more than 106 1536-well plates! Ina typical IVC experiment, the mutated genes are compartmentalized into aqueousmicrodroplets dispersed in mineral oil, with the concentration of DNA set suchthat the majority of droplets contain no more than one gene per droplet. Accordingto the Poisson distribution,
P(x) = e−m
(mx
x!
)(7.2)
where m = 0.1 is the mean number of genes per droplet, and P(x) is the prob-ability of finding x genes per droplet. According to Eq. (7.2), 90.5% of dropletscontain no gene, 9.05% contain one gene, 0.45% contain two genes, and 0.016%contain more than two genes. In addition, each droplet contains an in vitro tran-scription/translation system. Tawfick and Griffiths [39] and Bernath et al. [47]have pioneered various approaches to sort the active enzymes coupled to theirgenotypes. In all cases, the fluorescence activated cell sorter (FACS) technique isemployed. One version consists of breaking the inverse emulsion; however, thisrequires some manipulation to keep the link between genotypes and phenotypesafter the emulsion is broken. One example of this approach is detailed in Fig. 7.7.Another version that avoids any restrictions imposed by the requirement of physi-cally linking the phenotype to the genotype consists of making a water continuousdouble emulsion of the initial inverse emulsion containing the gene library. Thisversion of IVC indeed requires fluorogenic substrates to allow the selection ofenzymes. This approach can directly flow sort fluorescent double microdropletscontaining genes that encode active enzymes (at up to 105 droplets/s) once con-version of the original water-in-oil emulsion into a water-in-oil-in-water doubleemulsion [47] is not spoiled by leakage from inner aqueous droplets toward the
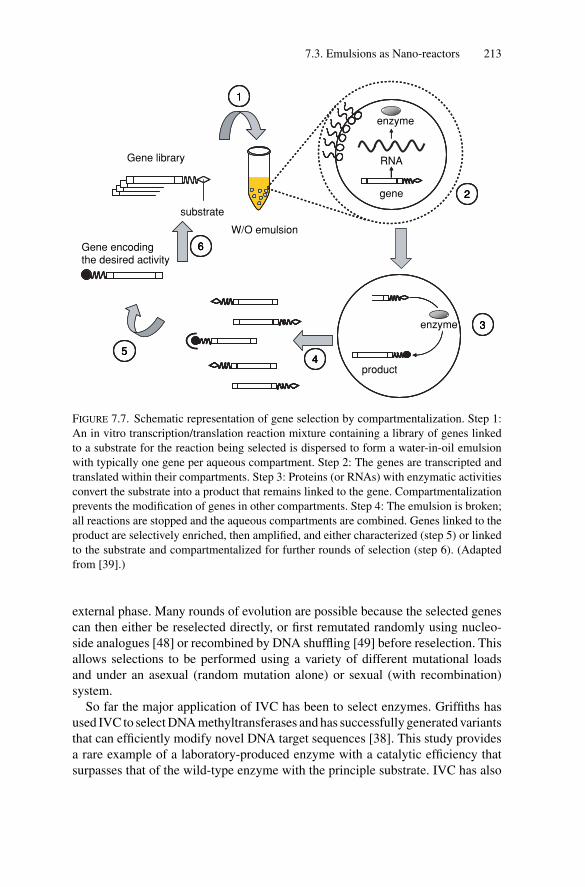
P1: GFZ
SVNY317-Bibette February 1, 2007 16:58
7.3. Emulsions as Nano-reactors 213
substrate
Gene library
1
W/O emulsion
enzyme
gene 2
enzyme
product
3
Gene encodingthe desired activity
45
6
11
RNA
22
33
4455
66
FIGURE 7.7. Schematic representation of gene selection by compartmentalization. Step 1:
An in vitro transcription/translation reaction mixture containing a library of genes linked
to a substrate for the reaction being selected is dispersed to form a water-in-oil emulsion
with typically one gene per aqueous compartment. Step 2: The genes are transcripted and
translated within their compartments. Step 3: Proteins (or RNAs) with enzymatic activities
convert the substrate into a product that remains linked to the gene. Compartmentalization
prevents the modification of genes in other compartments. Step 4: The emulsion is broken;
all reactions are stopped and the aqueous compartments are combined. Genes linked to the
product are selectively enriched, then amplified, and either characterized (step 5) or linked
to the substrate and compartmentalized for further rounds of selection (step 6). (Adapted
from [39].)
external phase. Many rounds of evolution are possible because the selected genescan then either be reselected directly, or first remutated randomly using nucleo-side analogues [48] or recombined by DNA shuffling [49] before reselection. Thisallows selections to be performed using a variety of different mutational loadsand under an asexual (random mutation alone) or sexual (with recombination)system.
So far the major application of IVC has been to select enzymes. Griffiths hasused IVC to select DNA methyltransferases and has successfully generated variantsthat can efficiently modify novel DNA target sequences [38]. This study providesa rare example of a laboratory-produced enzyme with a catalytic efficiency thatsurpasses that of the wild-type enzyme with the principle substrate. IVC has also
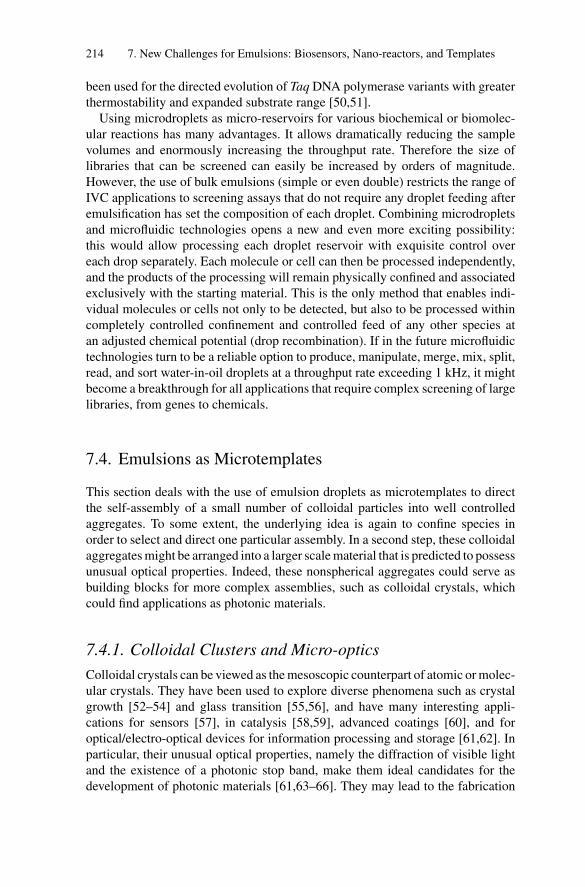
P1: GFZ
SVNY317-Bibette February 1, 2007 16:58
214 7. New Challenges for Emulsions: Biosensors, Nano-reactors, and Templates
been used for the directed evolution of Taq DNA polymerase variants with greaterthermostability and expanded substrate range [50,51].
Using microdroplets as micro-reservoirs for various biochemical or biomolec-ular reactions has many advantages. It allows dramatically reducing the samplevolumes and enormously increasing the throughput rate. Therefore the size oflibraries that can be screened can easily be increased by orders of magnitude.However, the use of bulk emulsions (simple or even double) restricts the range ofIVC applications to screening assays that do not require any droplet feeding afteremulsification has set the composition of each droplet. Combining microdropletsand microfluidic technologies opens a new and even more exciting possibility:this would allow processing each droplet reservoir with exquisite control overeach drop separately. Each molecule or cell can then be processed independently,and the products of the processing will remain physically confined and associatedexclusively with the starting material. This is the only method that enables indi-vidual molecules or cells not only to be detected, but also to be processed withincompletely controlled confinement and controlled feed of any other species atan adjusted chemical potential (drop recombination). If in the future microfluidictechnologies turn to be a reliable option to produce, manipulate, merge, mix, split,read, and sort water-in-oil droplets at a throughput rate exceeding 1 kHz, it mightbecome a breakthrough for all applications that require complex screening of largelibraries, from genes to chemicals.
7.4. Emulsions as Microtemplates
This section deals with the use of emulsion droplets as microtemplates to directthe self-assembly of a small number of colloidal particles into well controlledaggregates. To some extent, the underlying idea is again to confine species inorder to select and direct one particular assembly. In a second step, these colloidalaggregates might be arranged into a larger scale material that is predicted to possessunusual optical properties. Indeed, these nonspherical aggregates could serve asbuilding blocks for more complex assemblies, such as colloidal crystals, whichcould find applications as photonic materials.
7.4.1. Colloidal Clusters and Micro-optics
Colloidal crystals can be viewed as the mesoscopic counterpart of atomic or molec-ular crystals. They have been used to explore diverse phenomena such as crystalgrowth [52–54] and glass transition [55,56], and have many interesting appli-cations for sensors [57], in catalysis [58,59], advanced coatings [60], and foroptical/electro-optical devices for information processing and storage [61,62]. Inparticular, their unusual optical properties, namely the diffraction of visible lightand the existence of a photonic stop band, make them ideal candidates for thedevelopment of photonic materials [61,63–66]. They may lead to the fabrication
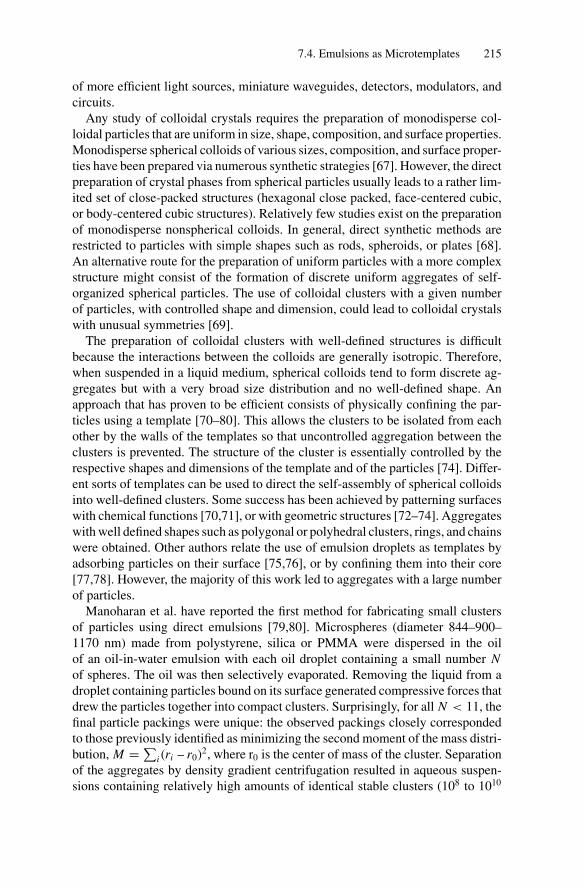
P1: GFZ
SVNY317-Bibette February 1, 2007 16:58
7.4. Emulsions as Microtemplates 215
of more efficient light sources, miniature waveguides, detectors, modulators, andcircuits.
Any study of colloidal crystals requires the preparation of monodisperse col-loidal particles that are uniform in size, shape, composition, and surface properties.Monodisperse spherical colloids of various sizes, composition, and surface proper-ties have been prepared via numerous synthetic strategies [67]. However, the directpreparation of crystal phases from spherical particles usually leads to a rather lim-ited set of close-packed structures (hexagonal close packed, face-centered cubic,or body-centered cubic structures). Relatively few studies exist on the preparationof monodisperse nonspherical colloids. In general, direct synthetic methods arerestricted to particles with simple shapes such as rods, spheroids, or plates [68].An alternative route for the preparation of uniform particles with a more complexstructure might consist of the formation of discrete uniform aggregates of self-organized spherical particles. The use of colloidal clusters with a given numberof particles, with controlled shape and dimension, could lead to colloidal crystalswith unusual symmetries [69].
The preparation of colloidal clusters with well-defined structures is difficultbecause the interactions between the colloids are generally isotropic. Therefore,when suspended in a liquid medium, spherical colloids tend to form discrete ag-gregates but with a very broad size distribution and no well-defined shape. Anapproach that has proven to be efficient consists of physically confining the par-ticles using a template [70–80]. This allows the clusters to be isolated from eachother by the walls of the templates so that uncontrolled aggregation between theclusters is prevented. The structure of the cluster is essentially controlled by therespective shapes and dimensions of the template and of the particles [74]. Differ-ent sorts of templates can be used to direct the self-assembly of spherical colloidsinto well-defined clusters. Some success has been achieved by patterning surfaceswith chemical functions [70,71], or with geometric structures [72–74]. Aggregateswith well defined shapes such as polygonal or polyhedral clusters, rings, and chainswere obtained. Other authors relate the use of emulsion droplets as templates byadsorbing particles on their surface [75,76], or by confining them into their core[77,78]. However, the majority of this work led to aggregates with a large numberof particles.
Manoharan et al. have reported the first method for fabricating small clustersof particles using direct emulsions [79,80]. Microspheres (diameter 844–900–1170 nm) made from polystyrene, silica or PMMA were dispersed in the oilof an oil-in-water emulsion with each oil droplet containing a small number Nof spheres. The oil was then selectively evaporated. Removing the liquid from adroplet containing particles bound on its surface generated compressive forces thatdrew the particles together into compact clusters. Surprisingly, for all N < 11, thefinal particle packings were unique: the observed packings closely correspondedto those previously identified as minimizing the second moment of the mass distri-bution, M = ∑
i (ri – r0)2, where r0 is the center of mass of the cluster. Separationof the aggregates by density gradient centrifugation resulted in aqueous suspen-sions containing relatively high amounts of identical stable clusters (108 to 1010
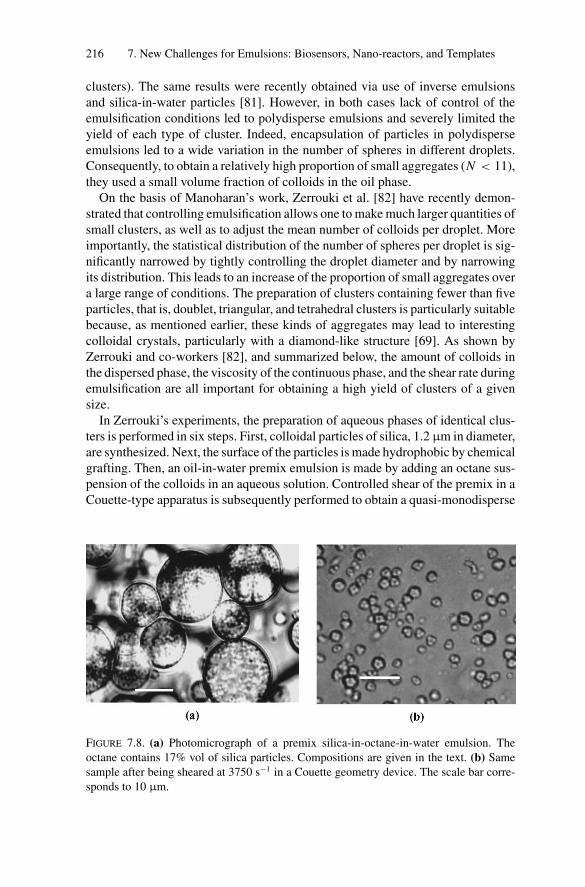
P1: GFZ
SVNY317-Bibette February 1, 2007 16:58
216 7. New Challenges for Emulsions: Biosensors, Nano-reactors, and Templates
clusters). The same results were recently obtained via use of inverse emulsionsand silica-in-water particles [81]. However, in both cases lack of control of theemulsification conditions led to polydisperse emulsions and severely limited theyield of each type of cluster. Indeed, encapsulation of particles in polydisperseemulsions led to a wide variation in the number of spheres in different droplets.Consequently, to obtain a relatively high proportion of small aggregates (N < 11),they used a small volume fraction of colloids in the oil phase.
On the basis of Manoharan’s work, Zerrouki et al. [82] have recently demon-strated that controlling emulsification allows one to make much larger quantities ofsmall clusters, as well as to adjust the mean number of colloids per droplet. Moreimportantly, the statistical distribution of the number of spheres per droplet is sig-nificantly narrowed by tightly controlling the droplet diameter and by narrowingits distribution. This leads to an increase of the proportion of small aggregates overa large range of conditions. The preparation of clusters containing fewer than fiveparticles, that is, doublet, triangular, and tetrahedral clusters is particularly suitablebecause, as mentioned earlier, these kinds of aggregates may lead to interestingcolloidal crystals, particularly with a diamond-like structure [69]. As shown byZerrouki and co-workers [82], and summarized below, the amount of colloids inthe dispersed phase, the viscosity of the continuous phase, and the shear rate duringemulsification are all important for obtaining a high yield of clusters of a givensize.
In Zerrouki’s experiments, the preparation of aqueous phases of identical clus-ters is performed in six steps. First, colloidal particles of silica, 1.2 μm in diameter,are synthesized. Next, the surface of the particles is made hydrophobic by chemicalgrafting. Then, an oil-in-water premix emulsion is made by adding an octane sus-pension of the colloids in an aqueous solution. Controlled shear of the premix in aCouette-type apparatus is subsequently performed to obtain a quasi-monodisperse
FIGURE 7.8. (a) Photomicrograph of a premix silica-in-octane-in-water emulsion. The
octane contains 17% vol of silica particles. Compositions are given in the text. (b) Same
sample after being sheared at 3750 s−1 in a Couette geometry device. The scale bar corre-
sponds to 10 μm.
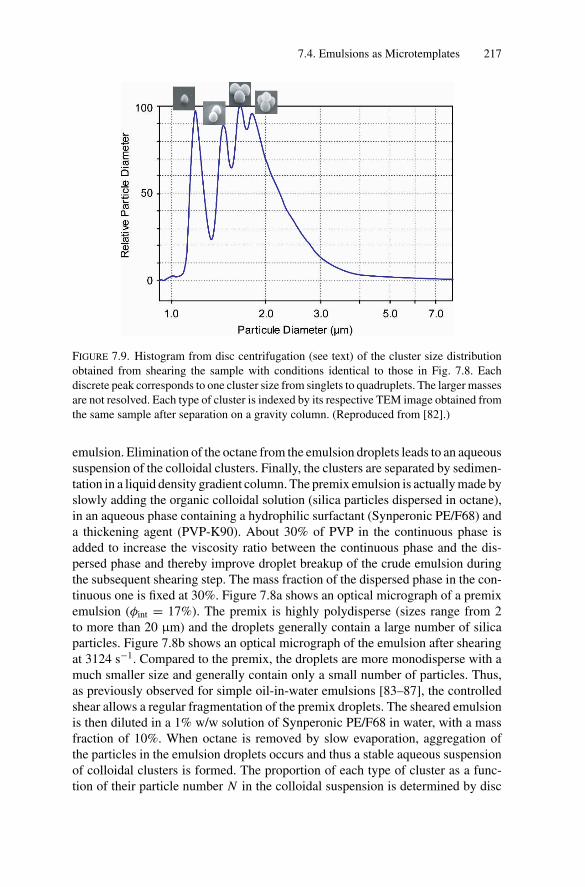
P1: GFZ
SVNY317-Bibette February 1, 2007 16:58
7.4. Emulsions as Microtemplates 217
FIGURE 7.9. Histogram from disc centrifugation (see text) of the cluster size distribution
obtained from shearing the sample with conditions identical to those in Fig. 7.8. Each
discrete peak corresponds to one cluster size from singlets to quadruplets. The larger masses
are not resolved. Each type of cluster is indexed by its respective TEM image obtained from
the same sample after separation on a gravity column. (Reproduced from [82].)
emulsion. Elimination of the octane from the emulsion droplets leads to an aqueoussuspension of the colloidal clusters. Finally, the clusters are separated by sedimen-tation in a liquid density gradient column. The premix emulsion is actually made byslowly adding the organic colloidal solution (silica particles dispersed in octane),in an aqueous phase containing a hydrophilic surfactant (Synperonic PE/F68) anda thickening agent (PVP-K90). About 30% of PVP in the continuous phase isadded to increase the viscosity ratio between the continuous phase and the dis-persed phase and thereby improve droplet breakup of the crude emulsion duringthe subsequent shearing step. The mass fraction of the dispersed phase in the con-tinuous one is fixed at 30%. Figure 7.8a shows an optical micrograph of a premixemulsion (φint = 17%). The premix is highly polydisperse (sizes range from 2to more than 20 μm) and the droplets generally contain a large number of silicaparticles. Figure 7.8b shows an optical micrograph of the emulsion after shearingat 3124 s−1. Compared to the premix, the droplets are more monodisperse with amuch smaller size and generally contain only a small number of particles. Thus,as previously observed for simple oil-in-water emulsions [83–87], the controlledshear allows a regular fragmentation of the premix droplets. The sheared emulsionis then diluted in a 1% w/w solution of Synperonic PE/F68 in water, with a massfraction of 10%. When octane is removed by slow evaporation, aggregation ofthe particles in the emulsion droplets occurs and thus a stable aqueous suspensionof colloidal clusters is formed. The proportion of each type of cluster as a func-tion of their particle number N in the colloidal suspension is determined by disc
P1: GFZ
SVNY317-Bibette February 1, 2007 16:58
218 7. New Challenges for Emulsions: Biosensors, Nano-reactors, and Templates
centrifugation. Figure 7.9 shows an example of the cluster size distribution in asuspension, each peak corresponding to a cluster with a given number of particles(%(PVP) = 30%, φint = 17%, shear rate 3124 s−1). From right to left, the fourwell-defined peaks correspond respectively to single particles, doublets, triplets,and quadruplets. The maximum achieved yield with respect to the initial amountof silica in the crude suspension is about 13% for doublets, 15% for triplets, and14% for quadruplets.
At this stage, Zerrouki et al. [82] obtained about 100 mg for each type of clus-ter (about 1011 in number); however, since this process can easily be scaled upto several grams of silica, it could be used to prepare several grams of identicalclusters. Emulsions as templates are therefore likely to become a propitious strat-egy to make sufficient amounts of these controlled clusters to further use them asbuilding blocks for performing a larger scale material. It is also likely that com-partmentalization into oil or water droplets may offer quite soon the right solutionto create the necessary reactive patches onto particles within clusters to promoteself-assembly with the correct symmetry.
References
[1] S.K. Mandal, N. Lequeux, B. Rotenberg, M. Tramier, J. Fattaccioli, J. Bibette, and B.
Dubertret: “Encapsulation of Magnetic and Fluorescent Nanoparticles in Emulsion
Droplets.” Langmuir 21, 4175 (2005).
[2] J. Bibette: “Monodisperse Ferrofluid Emulsions.” J. Magn. Magn. Mater. 122, 37
(1993).
[3] F. Leal-Calderon, T. Stora, O. Mondain Monval, P. Poulin, and J. Bibette: “Direct
Measurement of Colloidal Forces.” Phys. Rev. Lett. 72, 2959 (1994).
[4] C.P. Price and D.J. Newman: in “Principles and Practices of Immunoassay.”
Macmillan, London (1997).
[5] G.U. Lee, S. Metzger, M. M. Natesan, C. Yanavich, and Y.F. Dufrene: “Implementa-
tion of Force Differentiation in the Immunoassay.” Anal. Biochem. 287, 261 (2000).
[6] J. Baudry, C. Rouzeau, C. Goubault, C. Robic, L. Cohen-Tannoudji, A. Koenig, E.
Bertrand, and J. Bibette: “Tuning the Recognition Rate between Grafted Ligands
and Receptors with Magnetic Forces.” Proc. Natl. Acad. Sci. USA, vol. 103 pp.
16076–16078.
[7] S. Chesla, P. Selvaraj, and C. Zhu: “Measuring Two-Dimensional Receptor-Ligand
Binding Kinetics by Micropipette.” Biophys. J. 75, 1553 (1998).
[8] J.M. Singer and C.M. Plotz: “The Latex Fixation Test : I. Application to the Serologic
Diagnosis of Rheumatoid Arthritis.” Am. J. Med. 21, 888 (1956).
[9] B.K. Van Weemen and A.H.W.M. Schuurs: “Immunoassay Using Antigen—Enzyme
Conjugates.” FEBS Lett. 15, 232 (1971).
[10] J.M. Singer and C.M. Plotz: “The Latex Fixation Test : II. Results in Rheumatoid
Arthritis.” Am. J. Med. 21, 893 (1956).
[11] Immunological Applications 1999, Bangs Labs Technotes, www.Bangslabs.Com.
[12] K. Sato, M. Tokeshi, T. Odake, H. Kimura, T. Ooi, N. M. and T. Kitamori: “Integration
of an Immunosorbent Assay System: Analysis of Secretory Human Immunoglobulin
a on Polystyrene Beads in a Microchip.” Anal. Chem. 72, 1144 (2000).
P1: GFZ
SVNY317-Bibette February 1, 2007 16:58
References 219
[13] J.H.E. Promislow, A.P. Gast, and M. Fermigier: “Aggregation Kinetics of Paramag-
netic Colloidal Particles.” J. Chem. Phys. 102, 5492 (1995).
[14] R. Dreyfus: “Magnetic Filaments: Application to the Conception of Force Sensor
and Artificial Microscopic Swimmers.” Ph.D thesis, Paris VI University (2005).
[15] C. Bustamante, J.C. Macosko, and G.J.L. Wuite: “Grabbing the Cat by the Tail:
Manipulating Molecules One by One.” Nat. Rev. Mol. Cell. Biol. 1, (2000).
[16] C. Bustamante, Z. Bryant, and S.B. Smith: “Ten Years of Tension: Single-Molecule
DNA Mechanics.” Nature 421, 423427 (2003).
[17] A.F. Oberhauser, P.E. Marszalek, H.P. Erickson, and J.M. Fernandez: “The Molec-
ular Elasticity of the Extracellular Matrix Protein Tenascin.” Nature 393, 181
(1998).
[18] R. Merkel, P. Nassoy, A. Leung, K. Ritchie, and E. Evans: “Energy Landscapes of
Receptor-Ligand Bonds Explored with Dynamic Force Spectroscopy.” Nature 397,
50 (1999).
[19] S. Smith, Y. Cui, and C. Bustamante: “Overstretching B-DNA: The Elastic Response
of Individual Double-Stranded and Single-Stranded DNA Molecules.” Science 271,
795 (1996).
[20] P. Cluzel, A. Lebrun, C. Heller, R. Lavery, J.-L. Viovy, D. Chatenay, and F. Caron:
“DNA: An Extensible Molecule.” Science 271, 792 (1996).
[21] C. Bouchiat, M.D. Wang, J.-F. Allemand, T. Strick, S.M. Block, and V. Croquette:
“Estimating the Persistence Length of a Worm-Like Chain Molecule from Force-
Extension Measurements.” Biophys. J. 76, 409 (1999).
[22] H. Clausen-Schaumann, M. Rief, C. Tolksdorf, and H.E. Gaub: “Mechanical Stability
of Single DNA Molecules.” Biophys. J. 78, 1997 (2000).
[23] H. Dietz and M. Rief: “Exploring the Energy Landscape of GFP by Single-Molecule
Mechanical Experiments.” Proc. Natl. Acad. Sci. USA 101, 16192 (2004).
[24] M. Rief, M. Gautel, F. Oesterhelt, M. Fernandez, and H.E. Gaub: “Reversible Un-
folding of Individual Titin Immunoglobulin Domains by Afm.” Science 276, 1109
(1997).
[25] M.S.Z. Kellermayer, S.B. Smith, H.L. Granzier, and C. Bustamante: “Elastic Prop-
erties of the Titin Molecule Measured Using an Optical Trap.” Biophys. J. 72, A2
(1997).
[26] A. Koenig, P. Hebraud, C. Gosse, R. Dreyfus, J. Baudry, E. Bertrand, and J. Bibette:
“Magnetic Force Probe for Nanoscale Biomolecules.” Phys. Rev. Lett. 95, 128301
(2005).
[27] A. Koenig: “Study of a Semi-Flexible Polymer with Magnetic Colloids.” Ph.D thesis,
Paris VI University (2005).
[28] L. Dorgan, R. Magnotti, J. Hou, T. Engle, K. Ruley, and B. Shull: “Methods to
Determine Biotin-Binding Capacity of Streptavidin-Coated Magnetic Particles.” J.
Magn. Magn. Mater. 194, 69 (1999).
[29] F. MacKintosh, J.J. Kas, and P. Janmey: “Elasticity of Semiflexible Biopolymer
Networks.” Phys. Rev. Lett. 75, 4425 (1995).
[30] J. Baudry, E. Bertrand, N. Lequeux, and J. Bibette: “Colloidal Assemblinfg as Bio-
Sensors.” J. Phys. Condens. Matter 16, R469 (2004).
[31] B. Grillet, M. Gaboyard, J. Baudry, and J. Bibette: “A New Magnetic Agglutination
Assay for Detection of the Hepatitis B Surface Antigen.” Clin. Chem. 50, A152
(2004).
[32] P. Soumillion and J. Fastrez: “Novel Concepts for Selection of Catalytic Activity.”
Curr. Opin. Biotechnol. 12, 387 (2001).
P1: GFZ
SVNY317-Bibette February 1, 2007 16:58
220 7. New Challenges for Emulsions: Biosensors, Nano-reactors, and Templates
[33] I.P. Petrounia and F.H. Arnold: “Designed Evolution of Enzymatic Properties.” Curr.
Opin. Biotechnol. 11, 325 (2000).
[34] G. Georgiou: “Analysis of Large Libraries of Protein Mutants Using Flow Cytome-
try.” Adv. Protein Chem. 55, 293 (2000).
[35] J.E. Ness, S.B. Del Cardayre, J. Minshull, and W.P. Stemmer: “Molecular Breed-
ing: The Natural Approach to Protein Design.” Adv Protein Chem 55, 261
(2000).
[36] A. Pluckthun, C. Schaffitzel, J. Hanes, and L. Jermutus: “In Vitro Selection and
Evolution of Proteins.” Adv. Protein Chem. 55, 367 (2000).
[37] D. Wahler and J.L. Reymond: “Novel Methods for Biocatalyst Screening.” Curr.
Opin. Chem. Biol. 5, 152 (2001).
[38] A.D. Griffiths and D.S. Tawfik: “Man-Made Enzymes—from Design to In Vitro
Compartmentalisation.” Curr. Opin. Biotechnol. 11, 338 (2000).
[39] D.S. Tawfik and A.D. Griffiths: “Man-Made Cell-Like Compartments for Molecular
Evolution.” Nat. Biotechnol. 16, 652 (1998).
[40] N. Doi and H. Yanagawa: “Stable: Protein-DNA Fusion System for Screening of
Combinatorial Protein Libraries In Vitro.” FEBS Lett. 457, 227 (1999).
[41] A. Sepp, D.S. Tawfik, and A.D. Griffiths: “Microbead Display by In Vitro Compart-
mentalisation: Selection for Binding Using Flow Cytometry.” FEBS Lett. 532, 455
(2002).
[42] M. Yonezawa, N. Doi, Y. Kawahashi, T. Higashinakagawa, and H. Yanagawa: “DNA
Display for In Vitro Selection of Diverse Peptide Libraries.” Nucleic Acids Res. 31,
e118 (2003).
[43] Y.F. Lee, D.S. Tawfik, and A.D. Griffiths: “Investigating the Target Recognition
of DNA Cytosine-5 Methyltransferase Hhai by Library Selection Using In Vitro
Compartmentalisation.” Nucleic Acids Res. 30, 4937 (2002).
[44] A.D. Griffiths and D.S. Tawfik: “Directed Evolution of an Extremely Fast Phospho-
triesterase by In Vitro Compartmentalization.” Embo J. 22, 24 (2003).
[45] H.M. Cohen, D.S. Tawfik, and A.D. Griffiths: “Altering the Sequence Specificity of
Haeiii Methyltransferase by Directed Evolution Using In Vitro Compartmentalisa-
tion.” Prot. Eng. Des. Sel. 17, 3 (2004).
[46] N. Doi, S. Kumadaki, Y. Oishi, N. Matsumura, and H. Yanagawa: “In Vitro Selection
of Restriction Endonucleases by In Vitro Compartmentalization.” Nucleic Acids Res.
32, e95 (2004).
[47] K. Bernath, M. Hai, E. Mastrobattista, A.D. Griffiths, S. Magdassi, and D.S. Tawfik:
“In Vitro Compartmentalization by Double Emulsions: Sorting and Gene Enrichment
by Fluorescence Activated Cell Sorting.” Anal. Biochem. 325, 151 (2004).
[48] M. Zaccolo, D.M. Williams, D.M. Brown, and E. Gherardi: “An Approach to Random
Mutagenesis of DNA Using Mixtures of Triphosphate Derivatives of Nucleoside
Analogues.” J. Mol. Biol. 255, 589 (1996).
[49] W.P. Stemmer: “Rapid Evolution of a Protein In Vitro by DNA Shuffling.” Nature
370, 389 (1994).
[50] F.J. Ghadessy, J.L. Ong, and P. Holliger: “Directed Evolution of Polymerase Function
by Compartmentalized Self-Replication.” Proc. Natl. Acad. Sci. USA 98, 4552
(2001).
[51] F.J. Ghadessy, N. Ramsay, F.F. Boudsocq, D. Loakes, A. Brown, S. Iwai, A. Vaisman,
W.R., and P. Holliger: “Generic Expansion of the Substrate Spectrum of a DNA
Polymerase by Directed Evolution.” Nat. Biotechnol. 22, 755 (2004).
P1: GFZ
SVNY317-Bibette February 1, 2007 16:58
References 221
[52] P.N. Pusey, W. Van Megen, P. Bartlett, B.J. Ackerson, J.G. Rarity, and S.M. Under-
wood: “Structure of Crystals of Hard Colloidal Spheres.” Phys. Rev. Lett. 63, 2753
(1989).
[53] U. Gasser, E. Weeks, A. Schofield, P.N. Pusey, and D.A. Weitz: “Real-Space Imaging
of Nucleation and Growth in Colloidal Crystallization.” Science 292, 258 (2001).
[54] H. Miguez, F. Meseguer, C. Lopez, A. Mifsud, J.S. Moya, and L. Vazquez: “Evidence
of FCC Crystallization of SiO2 Nanospheres.” Langmuir 13, 6009 (1997).
[55] A. Van Blaaderen and P. Wiltzius: “Real-Space Structure of Colloidal Hard-Sphere
Glasses.” Science 270, 1177 (1995).
[56] A. Yetrihaj and A. Van Blaaderen: “A Colloidal Model System with an Interaction
Tunable from Hard Sphere to Soft and Dipolar.” Nature (2003).
[57] J.H. Holtz and S.A. Asher: “Polymerized Colloidal Crystal Hydrogel Films as Intel-
ligent Chemical Sensing Materials.” Nature 389, 829 (1997).
[58] R. Schroden, C. Blanford, B. Melde, B.J.S. Johnson, and A. Stein: “Direct Synthe-
sis of Ordered Macroporous Silica Materials Functionalized with Polyoxometalate
Clusters.” Chem. Mater. 13, 1074 (2001).
[59] B.J.S. Johnson and A. Stein: “Surface Modification of Mesoporous, Macroporous,
and Amorphous Silica with Catalytically Active Polyoxometalate Clusters.” Inorg.
Chem. 40, 801 (2001).
[60] S. Matsushita, T. Miwa, T. D. and A. Fujishima: “New Mesostructured Porous TiO2
Surface Prepared Using a Two-Dimensional Array-Based Template of Silica Parti-
cles.” Langmuir 14, 6441 (1998).
[61] O. Velev and E. Kaler: “Structured Porous Materials Via Colloidal Crystal Templat-
ing: From Inorganic Oxides to Metals.” Adv. Mater. 12, 531 (2000).
[62] J. Veinot, H. Yan, S. Smith, J. Cui, Q. Huang, and T.J. Mark: “Fabrication and
Properties of Organic Light-Emitting “Nanodiode” Arrays.” Nano Lett. 2, 333 (2002).
[63] Y. Xia, B. Gates, and Z.-Y. Li: “Self-Assembly Approaches to Three-Dimensional
Photonic Crystals.” Adv. Mater. 13, 409 (2001).
[64] D. Norris and Y. Vlasov: “Chemical Approaches to Three-Dimensional Semicon-
ductor Photonic Crystals.” Adv. Mater. 13, 371 (2001).
[65] Y. Vlasov, X. Bo, J. Sturm, and D.J. Norris: “On-Chip Natural Assembly of Silicon
Photonic Bandgap Crystals.” Nature 414, 289 (2001).
[66] W. Wang, B.H. Gu, L. Y. Liang, and W.A. Hamilton: “Fabrication of near-Infrared
Photonic Crystals Using Highly-Monodispersed Submicrometer SiO2 Spheres.” J.
Phys. Chem. B 107, 12113 (2003).
[67] Y. Xia, B. Gates, Y. Yin, and Y. Lu: “Monodispersed Colloidal Spheres: Old Materials
with New Applications.” Adv. Mater. 12, 693 (2000).
[68] Y. Lu, Y. Yin, and Y. Xia: “Three-Dimensional Photonic Crystals with Non-Spherical
Colloids as Building Blocks.” Adv. Mater. 13, 415 (2001).
[69] A. Van Blaaderen: “Colloidal Molecules and Beyond.” Nature 301, 470 (2003).
[70] J. Aizenberg, P.V. Braun, and P. Wiltzius: “Patterned Colloidal Deposition Con-
trolled by Electrostatic and Capillary Forces.” Phys. Rev. Lett. 84, 2997–3000
(2000).
[71] K. Chen, X. Jiang, L. Kimerling, and P.T. Hammond: “Selective Self-Organization
of Colloids on Patterned Polyelectrolyte Templates.” Langmuir 16, 7825 (2000).
[72] Y. Yin and Y. Xia: “Self-Assembly of Monodispersed Spherical Colloids into Com-
plex Aggregates with Well-Defined Sizes, Shapes, and Structures.” Adv. Mater. 13,
267 (2001).
P1: GFZ
SVNY317-Bibette February 1, 2007 16:58
222 7. New Challenges for Emulsions: Biosensors, Nano-reactors, and Templates
[73] Y. Yin, Y. Lu, B. Gates, and Y. Xia: “Template-Assisted Self Assembly: A Practical
Route to Complex Aggregates of Monodispersed Colloids with Well-Defined Sizes,
Shapes and Structures.” J. Am. Chem. Soc. 123, 8718 (2001).
[74] Y. Xia, Y. Yin, Y. Lu, and J. Mc Lellan: “Template-Assisted Self-Assembly of Spher-
ical Colloids into Complex and Controllable Structures.” Adv. Funct. Mater. 13, 907
(2003).
[75] O. Velev, K. Furusawa, and K. Nagayama: “Assembly of Latex Particles by Using
Emulsion Droplets as Templates.1. Microstructured Hollow Spheres.” Langmuir 12,
2374 (1996).
[76] A. Dinsmore, M. Hsu, M. Nikolaides, M. Marquez, A.R. Bausch, and D.A. Weitz:
“Colloidosomes: Selectively Permeable Capsules Composed of Colloidal Particles.”
Science 298, 1006 (2002).
[77] O.D. Velev, K. Furusawa, and K. Nagayama: “Assembly of Latex Particles by Using
Emulsion Droplets as Templates. 2. Ball-Like and Composite Aggregates.” Langmuir
12, 2385 (1996).
[78] O. Velev, A. Lenhoff, and E.W. Kaler: “A Class of Microstructured Particles Through
Colloidal Crystallization.” Science 287, 2240 (2000).
[79] V. Manoharan, M. Elsesser, and D.J. Pine: “Dense Packing and Symmetry in Small
Clusters of Microspheres.” Science 301, 483 (2003).
[80] G.-R. Yi, V. Manoharan, E. Michel, M.T. Elsesser, S.-M. Yang, and D.J. Pine: “Col-
loidal Clusters of Silica or Polymer Microspheres.” Adv. Mater. 16, 1204 (2004).
[81] Y.-S. Cho, G.-R. Yi, S.-H. Kim, D.J. Pine, and S.-M. Yang: “Colloidal Clusters of
Microspheres from Water-in-Oil Emulsions.” Chem. Mater. 17, 5006 (2005).
[82] D. Zerrouki, B. Rotenberg, S. Abramson, J. Baudry, C. Goubault, F. Leal-Calderon,
D.J. Pine, and J. Bibette: “Preparation of Doublet, Triangular, and Tetrahedral Col-
loidal Clusters by Controlled Emulsification.” Langmuir 22, 57 (2006).
[83] C. Goubault, K. Pays, D. Olea, J. Bibette, V. Schmitt, and F. Leal-Calderon: “Shear
Rupturing of Complex Fluids: Application to the Preparation of Quasi-Monodisperse
W/O/W Double Emulsions.” Langmuir 17, 5184 (2001).
[84] T.G. Mason and J. Bibette: “Shear Rupturing of Droplets in Complex Fluids.” Lang-
muir 13, 4600 (1997).
[85] C. Mabille, V. Schmitt, P. Gorria, F. Leal Calderon, V. Faye, and B. Deminiere: “Rhe-
ological and Shearing Conditions for the Preparation of Monodisperse Emulsions.”
Langmuir 16, 422 (2000).
[86] C. Mabille: “Fragmentation in Emulsions Submitted to a Simple Shear.” Ph.D thesis,
Bordeaux I University (2000).
[87] C. Mabille, F. Leal-Calderon, J. Bibette, and V. Schmitt: “Monodisperse Fragmen-
tation in Emulsions: Mechanisms and Kinetics.” Europhys. Lett 61, 708 (2003).
P1: GFZSVNY317-Bibette February 2, 2007 17:2
General Conclusion
Technical progress is driven by the in-depth knowledge and control of materialproperties at the very smallest scale. While nanosciences are set to change ourfuture, our daily life has already been transformed by the use of micrometric ob-jects such as the droplets present in emulsions. The wide range of processes andproducts that involve emulsions requires command over the phenomena governingtheir behavior. The scientific background of emulsions has reached some matu-rity which allows today to envision more audacious applications. In particular,nano or micro-technologies are more and more benefiting from this backgroundthough the relatively new input of emulsions and this adventure is just at its earlystage. Indeed, because of the very large versatility offered by fragmentation tech-niques, emulsions as intermediary materials are providing unique advantages fordesigning multi-function colloidal particles. For instance as described in this book,this has given access to Brownian and highly super-paramagnetic colloids, whichbecause of their self and reversible assembling ability, can enter into new strate-gies in diagnostic, and biophysics. Liquid droplets can compartmentalize minuteamounts of defined reactants and can modify their concentration from slight dif-fusion through the continuous phase. As femtoliter reservoirs, emulsions allowscreening a large compound library and as semi-permeable reservoirs they allowparallelizing a directed process imposed by confinement. As substrates, reservoirs,reactors, templates, or simply intermediaries, emulsions seem to have successfullymet the nano and micro-technologies adventure.
On a scientific point of view, numerous questions relative to emulsions remainunanswered. For instance, the origin of coalescence is not fully understood. Thisphenomenon has a strong impact on the emulsion lifetime, as discussed in this bookand is certainly at the origin of the well known empirical Bancroft rule. It is increas-ingly clear that there is not just one, but several coalescence mechanisms, each ofthem involving different sets of microscopic parameters (surface forces, interfacialtension, surface elasticity, surfactant spontaneous curvature, defects, etc.). Under-standing the role of the microscopic parameters controlling film rupturing shouldsignificantly consolidate the fundamental knowledge of emulsions and should fur-ther allow one to monitor their kinetic evolution. In the same vein, the mechanismof destabilization under high shear, though being a very important phenomenon,
223
P1: GFZSVNY317-Bibette February 2, 2007 17:2
224 General Conclusion
still raises challenging questions. Protein or solid-stabilized emulsions are knownto be very sensitive to shear and would be very interesting candidates for eluci-dating these questions. Clarifying this matter would certainly make more precisethe understanding of the coupling between thin-film metastability and shear. Thepossibility of making emulsions out of crystallizable oils is reinforcing the rangeof applications of emulsions and opens interesting perspectives for the processingof solid colloids or the for the preparation of materials with tuneable rheologicalproperties and structures. However, the link between surface properties in boththe liquid and the solid states, and stability is still obscure. The knowledge ofemulsification methods that lead to concentrated, controlled materials has beenprogressing, but understanding the phase inversion mechanism, which is very use-ful in the case of highly viscous dispersed phases, requires further investigations.
To conclude, research, applications and expectations with regard to emulsionsare permanently evolving. Changes in the macro-economic context along withvarious political decisions (e.g., sustainable development, Registration, Evalua-tion and Authorisation of Chemicals (REACH) directive for the European Union)are factors which influence the conditions in which emulsion-based products arefabricated and used. It is probable that these changes will motivate technologicaldevelopments and new advances in emulsion science.
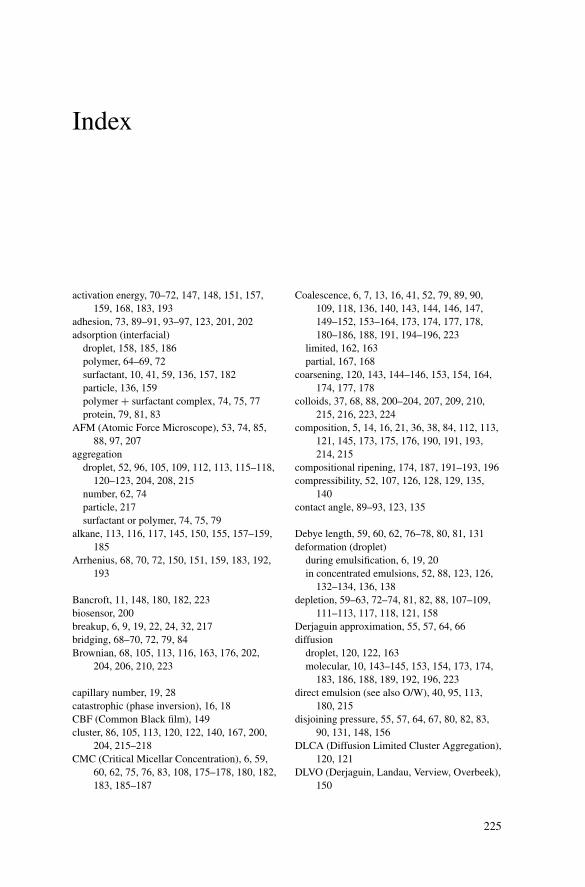
P1: GFZ
SVNY317-Bibette January 24, 2007 15:3
Index
activation energy, 70–72, 147, 148, 151, 157,
159, 168, 183, 193
adhesion, 73, 89–91, 93–97, 123, 201, 202
adsorption (interfacial)
droplet, 158, 185, 186
polymer, 64–69, 72
surfactant, 10, 41, 59, 136, 157, 182
particle, 136, 159
polymer + surfactant complex, 74, 75, 77
protein, 79, 81, 83
AFM (Atomic Force Microscope), 53, 74, 85,
88, 97, 207
aggregation
droplet, 52, 96, 105, 109, 112, 113, 115–118,
120–123, 204, 208, 215
number, 62, 74
particle, 217
surfactant or polymer, 74, 75, 79
alkane, 113, 116, 117, 145, 150, 155, 157–159,
185
Arrhenius, 68, 70, 72, 150, 151, 159, 183, 192,
193
Bancroft, 11, 148, 180, 182, 223
biosensor, 200
breakup, 6, 9, 19, 22, 24, 32, 217
bridging, 68–70, 72, 79, 84
Brownian, 68, 105, 113, 116, 163, 176, 202,
204, 206, 210, 223
capillary number, 19, 28
catastrophic (phase inversion), 16, 18
CBF (Common Black film), 149
cluster, 86, 105, 113, 120, 122, 140, 167, 200,
204, 215–218
CMC (Critical Micellar Concentration), 6, 59,
60, 62, 75, 76, 83, 108, 175–178, 180, 182,
183, 185–187
Coalescence, 6, 7, 13, 16, 41, 52, 79, 89, 90,
109, 118, 136, 140, 143, 144, 146, 147,
149–152, 153–164, 173, 174, 177, 178,
180–186, 188, 191, 194–196, 223
limited, 162, 163
partial, 167, 168
coarsening, 120, 143, 144–146, 153, 154, 164,
174, 177, 178
colloids, 37, 68, 88, 200–204, 207, 209, 210,
215, 216, 223, 224
composition, 5, 14, 16, 21, 36, 38, 84, 112, 113,
121, 145, 173, 175, 176, 190, 191, 193,
214, 215
compositional ripening, 174, 187, 191–193, 196
compressibility, 52, 107, 126, 128, 129, 135,
140
contact angle, 89–93, 123, 135
Debye length, 59, 60, 62, 76–78, 80, 81, 131
deformation (droplet)
during emulsification, 6, 19, 20
in concentrated emulsions, 52, 88, 123, 126,
132–134, 136, 138
depletion, 59–63, 72–74, 81, 82, 88, 107–109,
111–113, 117, 118, 121, 158
Derjaguin approximation, 55, 57, 64, 66
diffusion
droplet, 120, 122, 163
molecular, 10, 143–145, 153, 154, 173, 174,
183, 186, 188, 189, 192, 196, 223
direct emulsion (see also O/W), 40, 95, 113,
180, 215
disjoining pressure, 55, 57, 64, 67, 80, 82, 83,
90, 131, 148, 156
DLCA (Diffusion Limited Cluster Aggregation),
120, 121
DLVO (Derjaguin, Landau, Verview, Overbeek),
150
225
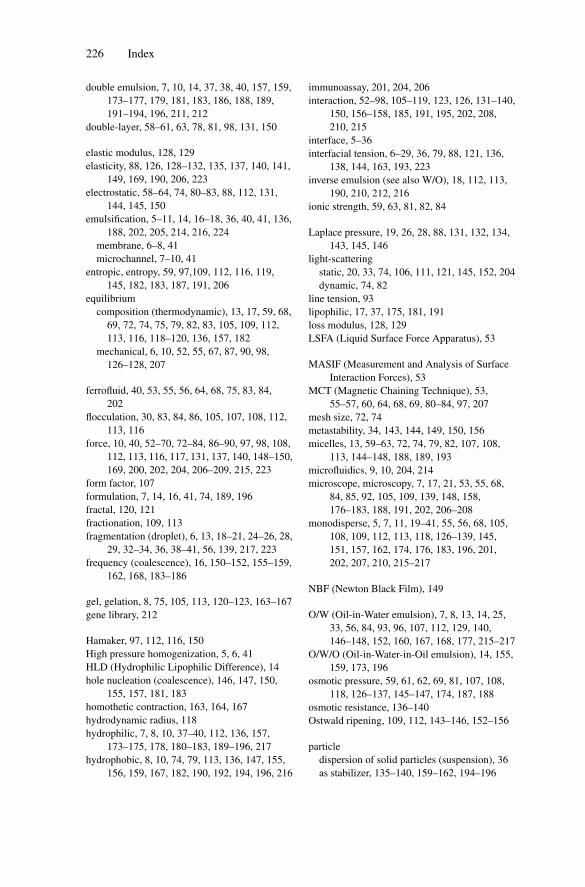
P1: GFZ
SVNY317-Bibette January 24, 2007 15:3
226 Index
double emulsion, 7, 10, 14, 37, 38, 40, 157, 159,
173–177, 179, 181, 183, 186, 188, 189,
191–194, 196, 211, 212
double-layer, 58–61, 63, 78, 81, 98, 131, 150
elastic modulus, 128, 129
elasticity, 88, 126, 128–132, 135, 137, 140, 141,
149, 169, 190, 206, 223
electrostatic, 58–64, 74, 80–83, 88, 112, 131,
144, 145, 150
emulsification, 5–11, 14, 16–18, 36, 40, 41, 136,
188, 202, 205, 214, 216, 224
membrane, 6–8, 41
microchannel, 7–10, 41
entropic, entropy, 59, 97,109, 112, 116, 119,
145, 182, 183, 187, 191, 206
equilibrium
composition (thermodynamic), 13, 17, 59, 68,
69, 72, 74, 75, 79, 82, 83, 105, 109, 112,
113, 116, 118–120, 136, 157, 182
mechanical, 6, 10, 52, 55, 67, 87, 90, 98,
126–128, 207
ferrofluid, 40, 53, 55, 56, 64, 68, 75, 83, 84,
202
flocculation, 30, 83, 84, 86, 105, 107, 108, 112,
113, 116
force, 10, 40, 52–70, 72–84, 86–90, 97, 98, 108,
112, 113, 116, 117, 131, 137, 140, 148–150,
169, 200, 202, 204, 206–209, 215, 223
form factor, 107
formulation, 7, 14, 16, 41, 74, 189, 196
fractal, 120, 121
fractionation, 109, 113
fragmentation (droplet), 6, 13, 18–21, 24–26, 28,
29, 32–34, 36, 38–41, 56, 139, 217, 223
frequency (coalescence), 16, 150–152, 155–159,
162, 168, 183–186
gel, gelation, 8, 75, 105, 113, 120–123, 163–167
gene library, 212
Hamaker, 97, 112, 116, 150
High pressure homogenization, 5, 6, 41
HLD (Hydrophilic Lipophilic Difference), 14
hole nucleation (coalescence), 146, 147, 150,
155, 157, 181, 183
homothetic contraction, 163, 164, 167
hydrodynamic radius, 118
hydrophilic, 7, 8, 10, 37–40, 112, 136, 157,
173–175, 178, 180–183, 189–196, 217
hydrophobic, 8, 10, 74, 79, 113, 136, 147, 155,
156, 159, 167, 182, 190, 192, 194, 196, 216
immunoassay, 201, 204, 206
interaction, 52–98, 105–119, 123, 126, 131–140,
150, 156–158, 185, 191, 195, 202, 208,
210, 215
interface, 5–36
interfacial tension, 6–29, 36, 79, 88, 121, 136,
138, 144, 163, 193, 223
inverse emulsion (see also W/O), 18, 112, 113,
190, 210, 212, 216
ionic strength, 59, 63, 81, 82, 84
Laplace pressure, 19, 26, 28, 88, 131, 132, 134,
143, 145, 146
light-scattering
static, 20, 33, 74, 106, 111, 121, 145, 152, 204
dynamic, 74, 82
line tension, 93
lipophilic, 17, 37, 175, 181, 191
loss modulus, 128, 129
LSFA (Liquid Surface Force Apparatus), 53
MASIF (Measurement and Analysis of Surface
Interaction Forces), 53
MCT (Magnetic Chaining Technique), 53,
55–57, 60, 64, 68, 69, 80–84, 97, 207
mesh size, 72, 74
metastability, 34, 143, 144, 149, 150, 156
micelles, 13, 59–63, 72, 74, 79, 82, 107, 108,
113, 144–148, 188, 189, 193
microfluidics, 9, 10, 204, 214
microscope, microscopy, 7, 17, 21, 53, 55, 68,
84, 85, 92, 105, 109, 139, 148, 158,
176–183, 188, 191, 202, 206–208
monodisperse, 5, 7, 11, 19–41, 55, 56, 68, 105,
108, 109, 112, 113, 118, 126–139, 145,
151, 157, 162, 174, 176, 183, 196, 201,
202, 207, 210, 215–217
NBF (Newton Black Film), 149
O/W (Oil-in-Water emulsion), 7, 8, 13, 14, 25,
33, 56, 84, 93, 96, 107, 112, 129, 140,
146–148, 152, 160, 167, 168, 177, 215–217
O/W/O (Oil-in-Water-in-Oil emulsion), 14, 155,
159, 173, 196
osmotic pressure, 59, 61, 62, 69, 81, 107, 108,
118, 126–137, 145–147, 174, 187, 188
osmotic resistance, 136–140
Ostwald ripening, 109, 112, 143–146, 152–156
particle
dispersion of solid particles (suspension), 36
as stabilizer, 135–140, 159–162, 194–196
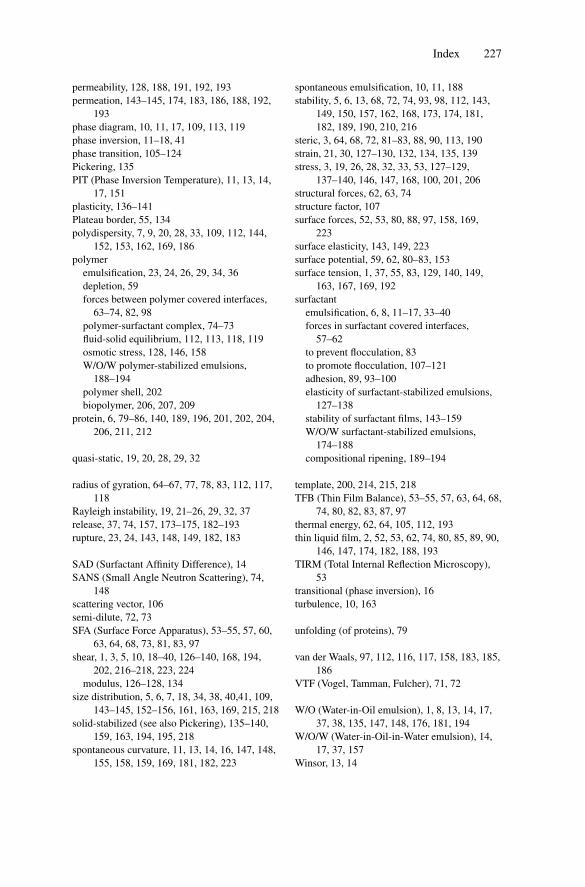
P1: GFZ
SVNY317-Bibette January 24, 2007 15:3
Index 227
permeability, 128, 188, 191, 192, 193
permeation, 143–145, 174, 183, 186, 188, 192,
193
phase diagram, 10, 11, 17, 109, 113, 119
phase inversion, 11–18, 41
phase transition, 105–124
Pickering, 135
PIT (Phase Inversion Temperature), 11, 13, 14,
17, 151
plasticity, 136–141
Plateau border, 55, 134
polydispersity, 7, 9, 20, 28, 33, 109, 112, 144,
152, 153, 162, 169, 186
polymer
emulsification, 23, 24, 26, 29, 34, 36
depletion, 59
forces between polymer covered interfaces,
63–74, 82, 98
polymer-surfactant complex, 74–73
fluid-solid equilibrium, 112, 113, 118, 119
osmotic stress, 128, 146, 158
W/O/W polymer-stabilized emulsions,
188–194
polymer shell, 202
biopolymer, 206, 207, 209
protein, 6, 79–86, 140, 189, 196, 201, 202, 204,
206, 211, 212
quasi-static, 19, 20, 28, 29, 32
radius of gyration, 64–67, 77, 78, 83, 112, 117,
118
Rayleigh instability, 19, 21–26, 29, 32, 37
release, 37, 74, 157, 173–175, 182–193
rupture, 23, 24, 143, 148, 149, 182, 183
SAD (Surfactant Affinity Difference), 14
SANS (Small Angle Neutron Scattering), 74,
148
scattering vector, 106
semi-dilute, 72, 73
SFA (Surface Force Apparatus), 53–55, 57, 60,
63, 64, 68, 73, 81, 83, 97
shear, 1, 3, 5, 10, 18–40, 126–140, 168, 194,
202, 216–218, 223, 224
modulus, 126–128, 134
size distribution, 5, 6, 7, 18, 34, 38, 40,41, 109,
143–145, 152–156, 161, 163, 169, 215, 218
solid-stabilized (see also Pickering), 135–140,
159, 163, 194, 195, 218
spontaneous curvature, 11, 13, 14, 16, 147, 148,
155, 158, 159, 169, 181, 182, 223
spontaneous emulsification, 10, 11, 188
stability, 5, 6, 13, 68, 72, 74, 93, 98, 112, 143,
149, 150, 157, 162, 168, 173, 174, 181,
182, 189, 190, 210, 216
steric, 3, 64, 68, 72, 81–83, 88, 90, 113, 190
strain, 21, 30, 127–130, 132, 134, 135, 139
stress, 3, 19, 26, 28, 32, 33, 53, 127–129,
137–140, 146, 147, 168, 100, 201, 206
structural forces, 62, 63, 74
structure factor, 107
surface forces, 52, 53, 80, 88, 97, 158, 169,
223
surface elasticity, 143, 149, 223
surface potential, 59, 62, 80–83, 153
surface tension, 1, 37, 55, 83, 129, 140, 149,
163, 167, 169, 192
surfactant
emulsification, 6, 8, 11–17, 33–40
forces in surfactant covered interfaces,
57–62
to prevent flocculation, 83
to promote flocculation, 107–121
adhesion, 89, 93–100
elasticity of surfactant-stabilized emulsions,
127–138
stability of surfactant films, 143–159
W/O/W surfactant-stabilized emulsions,
174–188
compositional ripening, 189–194
template, 200, 214, 215, 218
TFB (Thin Film Balance), 53–55, 57, 63, 64, 68,
74, 80, 82, 83, 87, 97
thermal energy, 62, 64, 105, 112, 193
thin liquid film, 2, 52, 53, 62, 74, 80, 85, 89, 90,
146, 147, 174, 182, 188, 193
TIRM (Total Internal Reflection Microscopy),
53
transitional (phase inversion), 16
turbulence, 10, 163
unfolding (of proteins), 79
van der Waals, 97, 112, 116, 117, 158, 183, 185,
186
VTF (Vogel, Tamman, Fulcher), 71, 72
W/O (Water-in-Oil emulsion), 1, 8, 13, 14, 17,
37, 38, 135, 147, 148, 176, 181, 194
W/O/W (Water-in-Oil-in-Water emulsion), 14,
17, 37, 157
Winsor, 13, 14