Embed Size (px)
Citation preview
1
Florian Leblanc
www.centre-cired.fr
ENGREF
16 Novembre 2016
Semaine Athens
Energie, économie et climat :Les enjeux des nouveaux hydrocarbures
non-conventionnels
Points abordés
Le pétrole et le gaz dans le mix énergétique mondiale
L’exploitation du pétrole
Notion de ressource – réserve
La théorie du peak oil
Scénarios sur la stratégie du Moyen-Orient
Les nouveaux hydrocarbures non-conventionnels
Impacts environnementaux
Cas des émissions fugitives de méthane
Nouvelle abondance énergétique ? Le cas US
2
Généralités : le pétrole et le gaz dans le mix énergétique mondiale
3
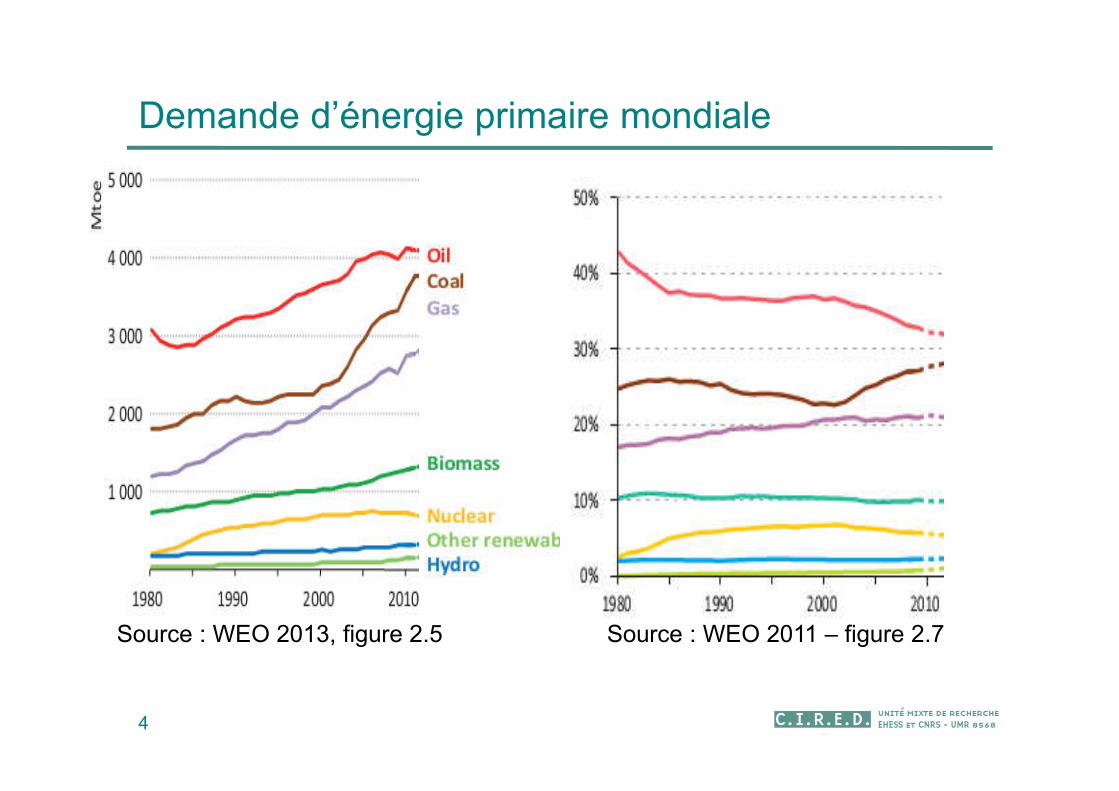
Demande d’énergie primaire mondiale
4
Source : WEO 2013, figure 2.5 Source : WEO 2011 – figure 2.7
0
2000
4000
6000
8000
10000
12000
14000
Mto
e
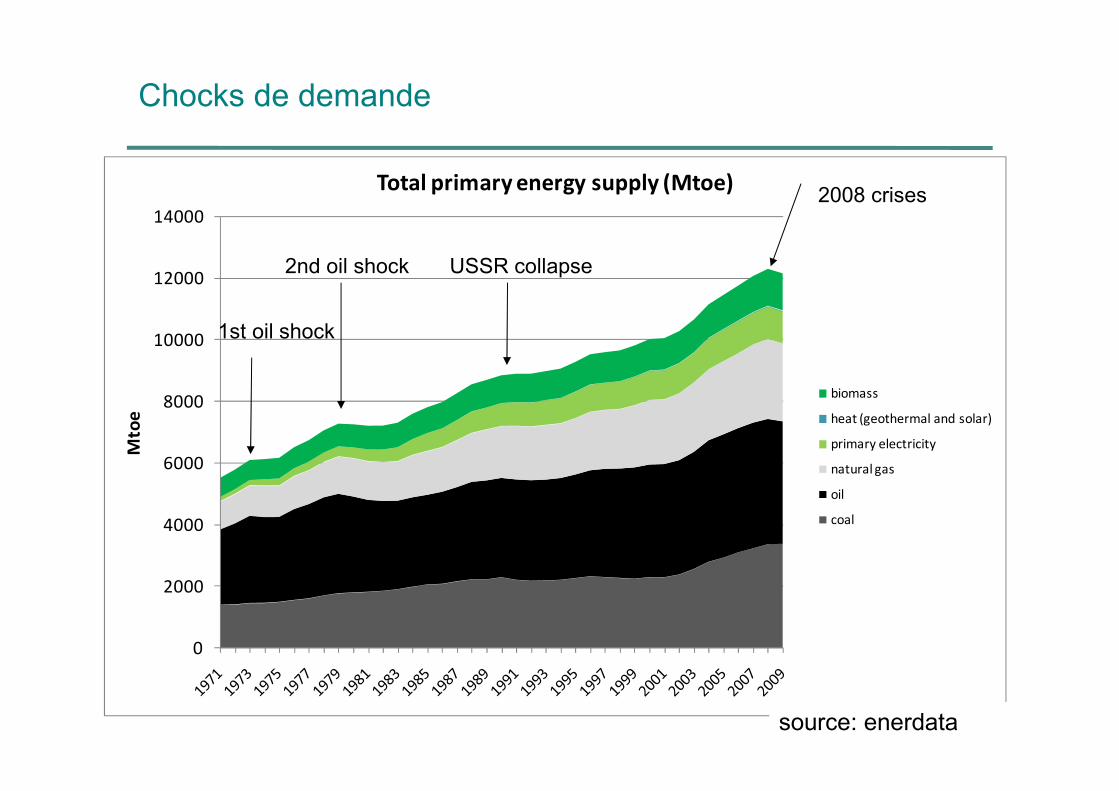
Total primary energy supply (Mtoe)
biomass
heat (geothermal and solar)
primary electricity
natural gas
oil
coal
1st oil shock
2nd oil shock USSR collapse
source: enerdata
Chocks de demande
2008 crises
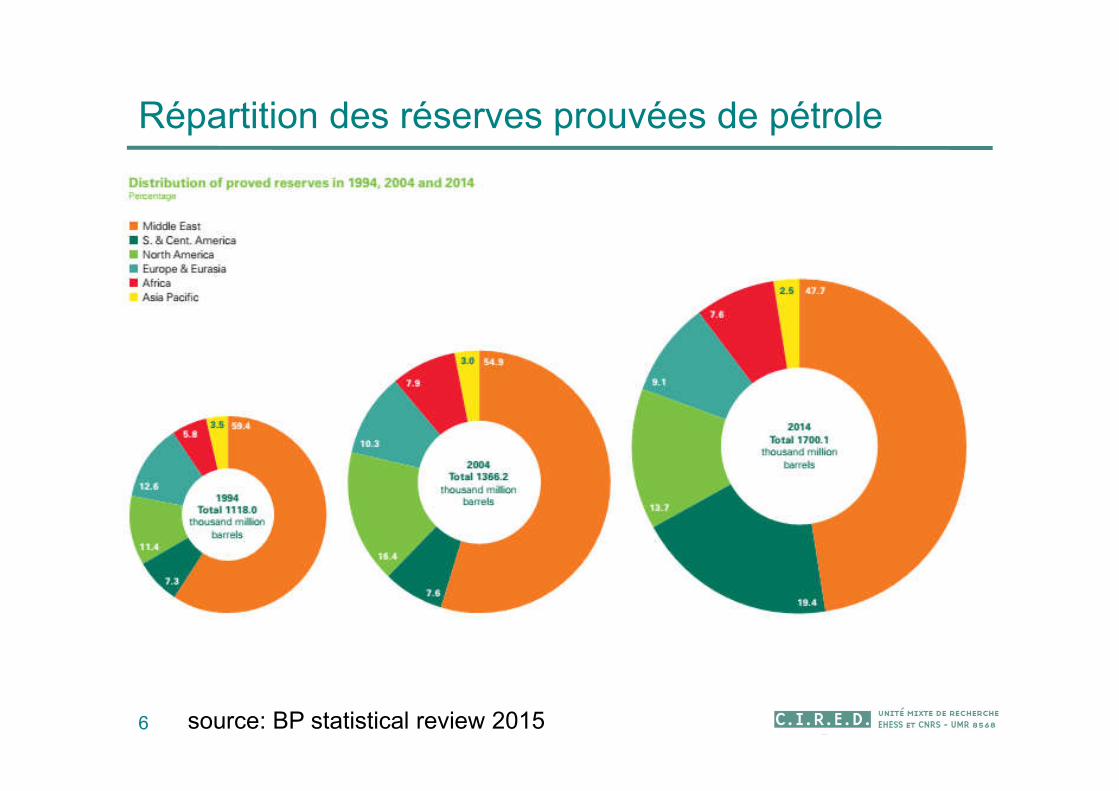
Répartition des réserves prouvées de pétrole
6 source: BP statistical review 2015
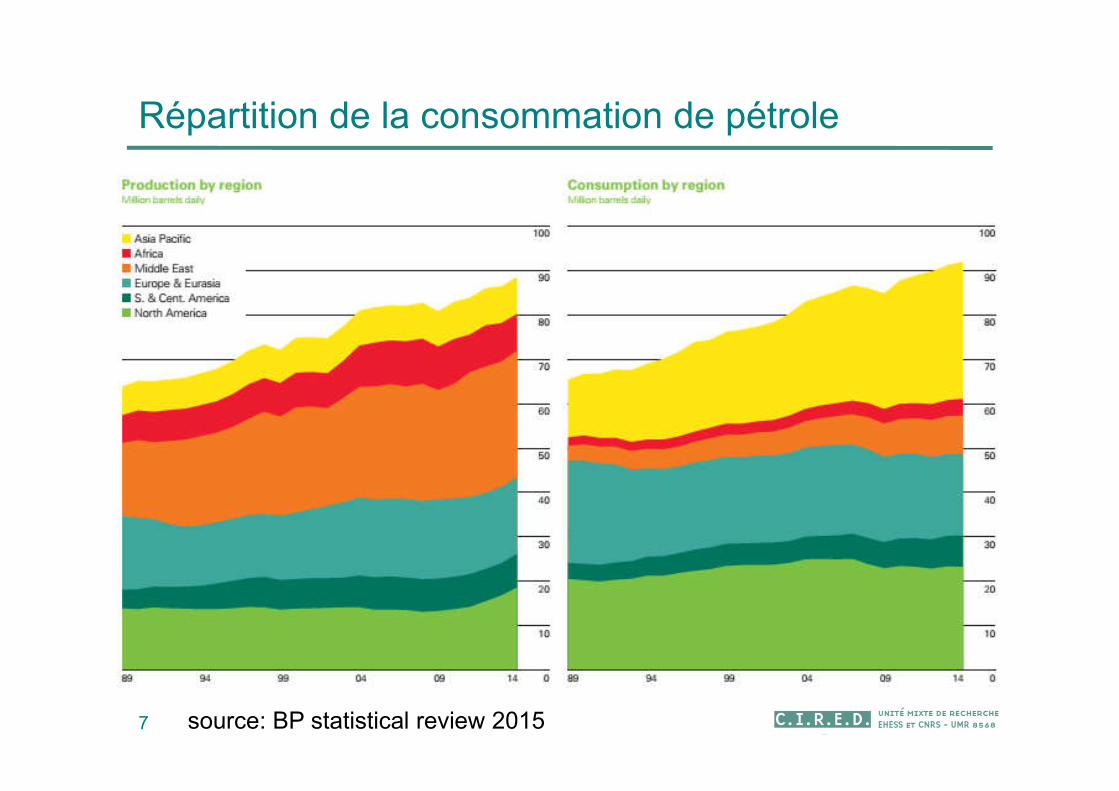
Répartition de la consommation de pétrole
7 source: BP statistical review 2015
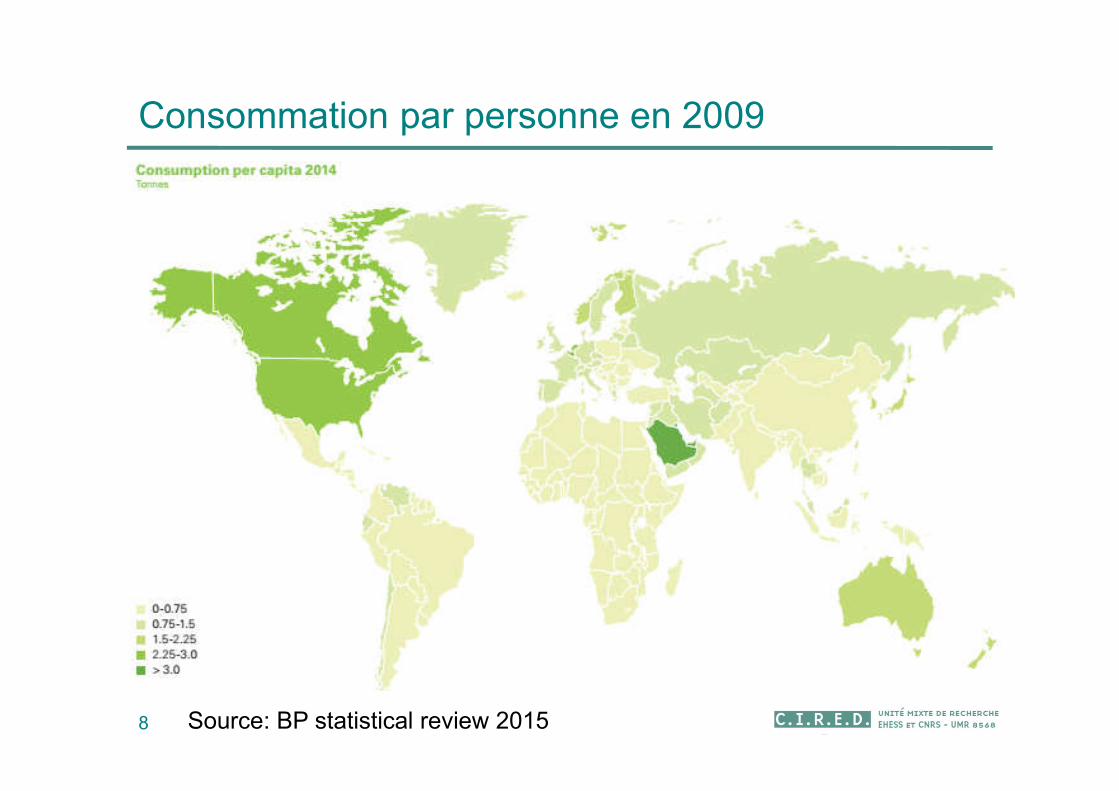
Consommation par personne en 2009
8 Source: BP statistical review 2015
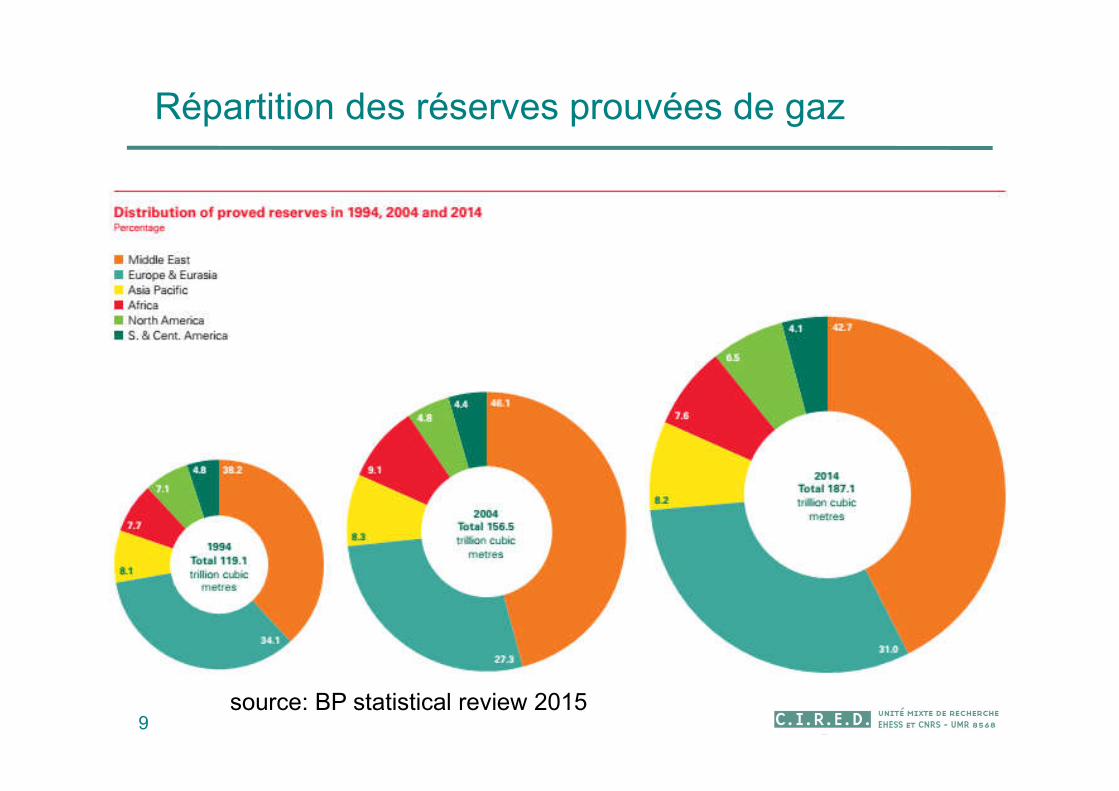
9source: BP statistical review 2015
Répartition des réserves prouvées de gaz
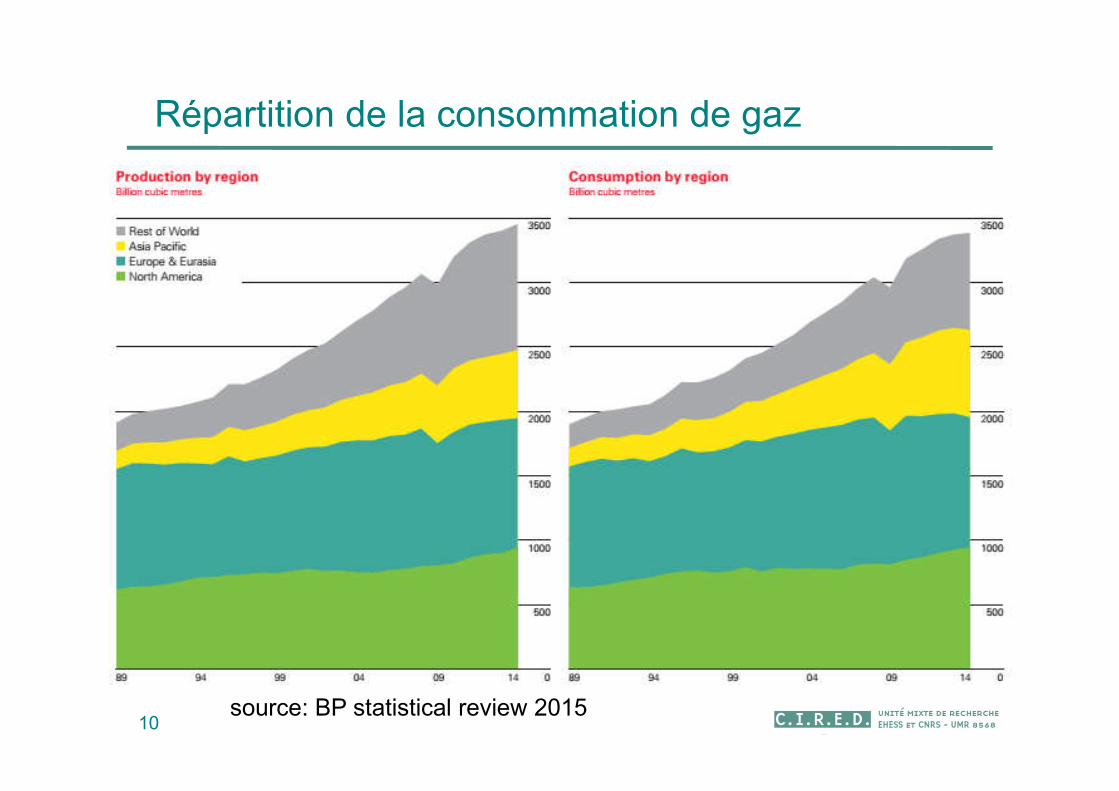
10source: BP statistical review 2015
Répartition de la consommation de gaz
11
Liens entre pétrole et gaz
12
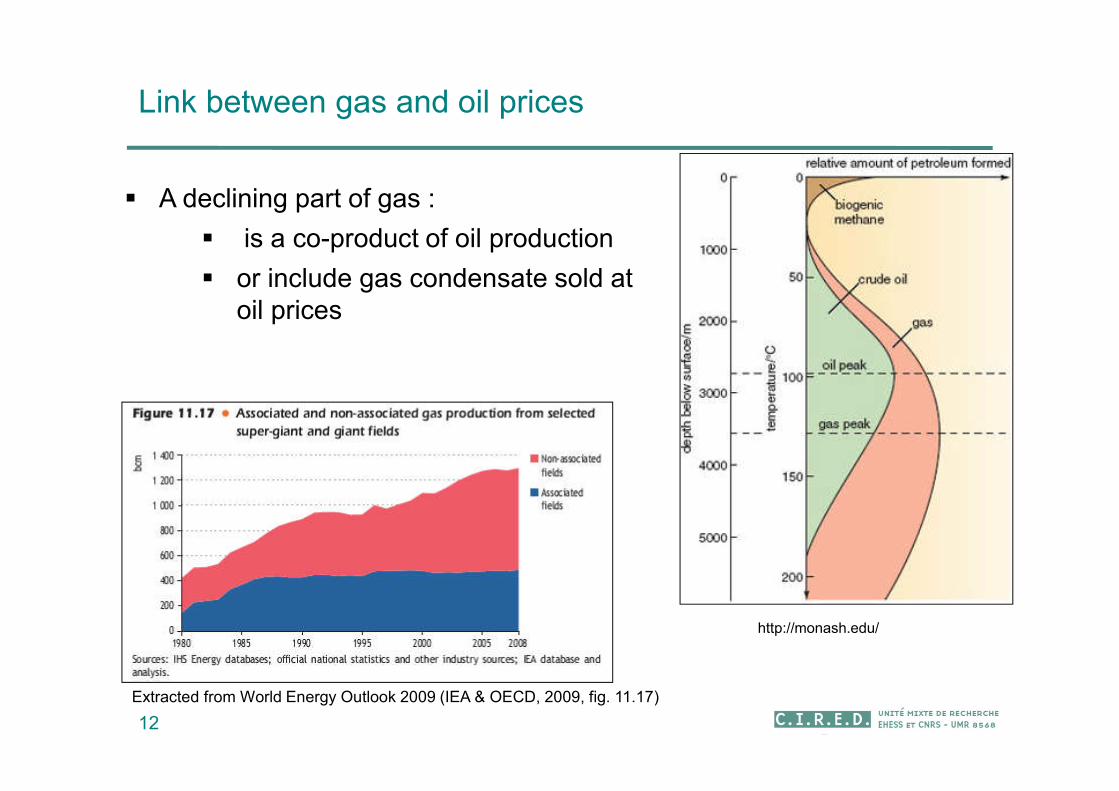
Link between gas and oil prices
A declining part of gas :
is a co-product of oil production
or include gas condensate sold at oil prices
Extracted from World Energy Outlook 2009 (IEA & OECD, 2009, fig. 11.17)
http://monash.edu/
13
Link between gas and oil prices
Strong substitutions but with uncertainties :
long-term gas prices elasticity to oil prices : between 0.14 (Brown and Yücel, 2008) and 0.924 (Asche et al., 2012).
14
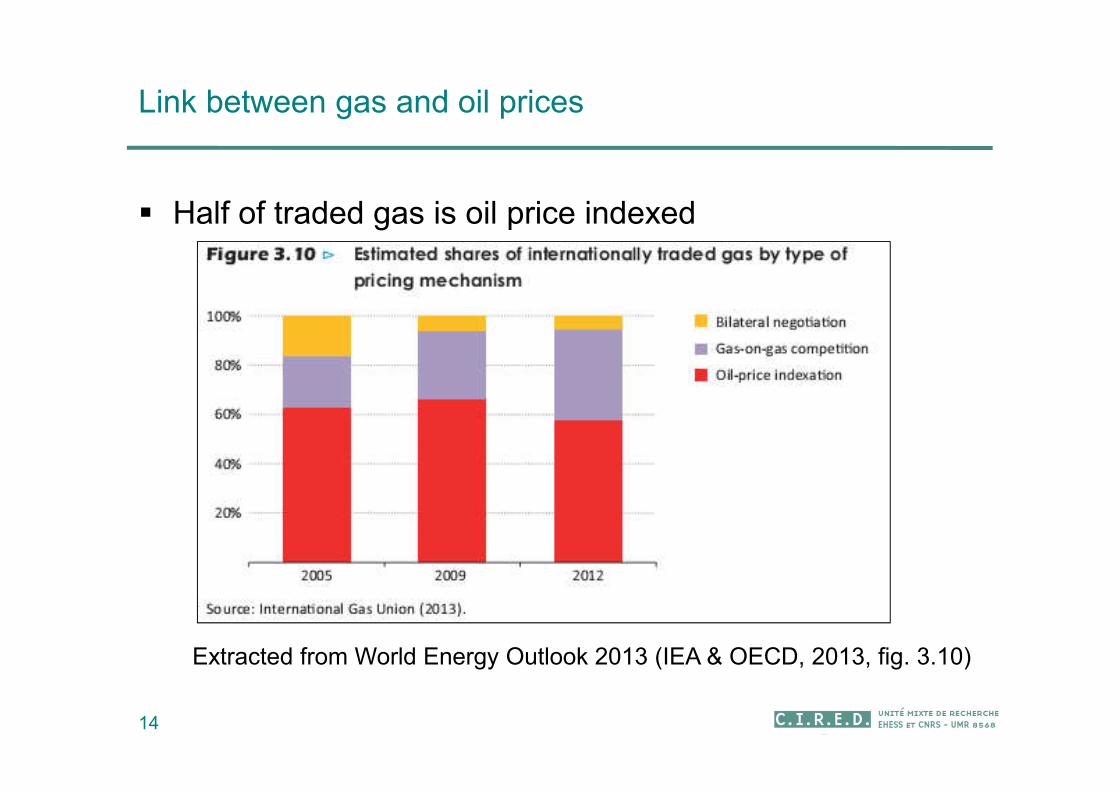
Link between gas and oil prices
Half of traded gas is oil price indexed
Extracted from World Energy Outlook 2013 (IEA & OECD, 2013, fig. 3.10)
Dynamique d’exploitation du pétrole
15
Citations
« aucune chance pour que l’humanité s’autolimite, à mon avis … Tout ce qui pourra être extrait, transformé, brulé, le sera .. après, on verra »
(commentaire, blog the Oil Man)
16
Citations
« Les hydrocarbures sont bien trop précieux pour qu’ils ne soient pas exploités jusqu’à la dernière goutte de pétrole, au dernier mètre cube de gaz naturel et même à la dernière tonne de charbon économiquement accessibles. »
(Christian Gérondeau, ParisTechReview, 15 octobre 2010)
17

Différence entre réserves et ressources
18
Limite économique
PossiblesProbablesProuvées
Réserves
Source : Global Energy Assessement, fig. 7.1
Ressource
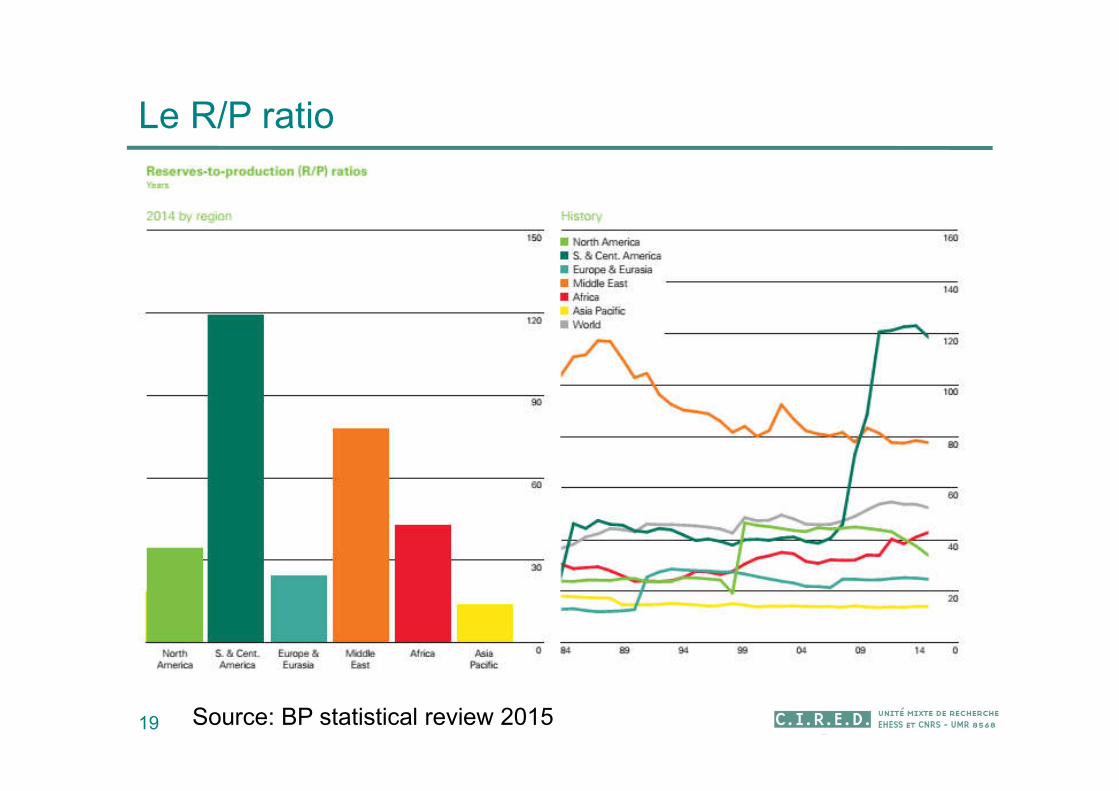
Le R/P ratio
19 Source: BP statistical review 2015
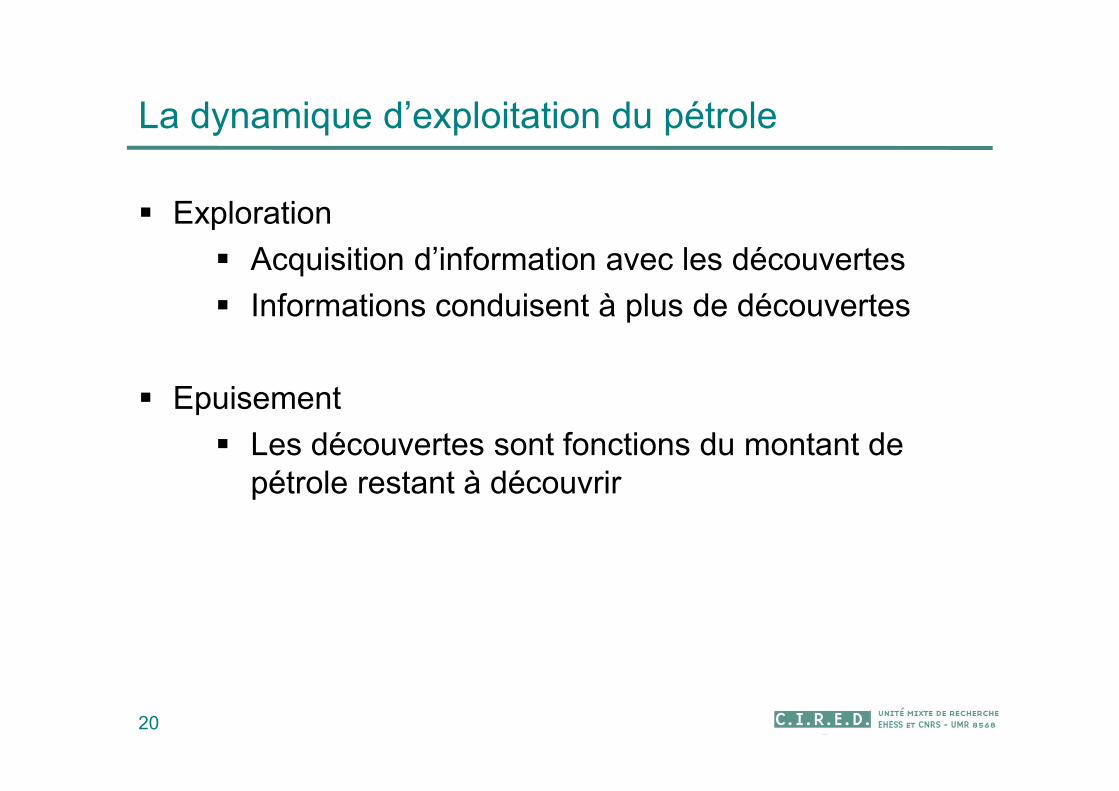
La dynamique d’exploitation du pétrole
20
Exploration
Acquisition d’information avec les découvertes
Informations conduisent à plus de découvertes
Epuisement
Les découvertes sont fonctions du montant de pétrole restant à découvrir
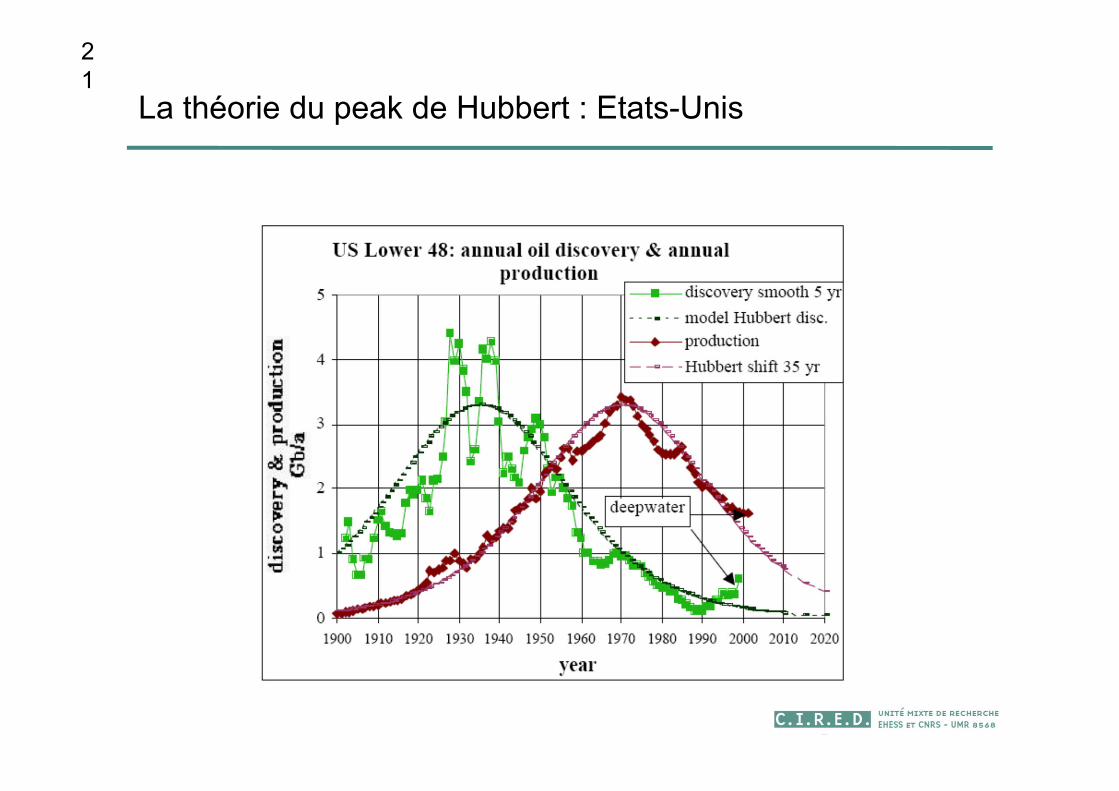
La théorie du peak de Hubbert : Etats-Unis
21
Source: Laherrere, 2003
Oil discoveries shifted 35 years and United States production (without Alaska)
Les courbes de Hubbert
Avantages :
Prise en compte des contraintes géologiques
Inconvénients
Plus difficilement extrapolable à une échelle globale
22
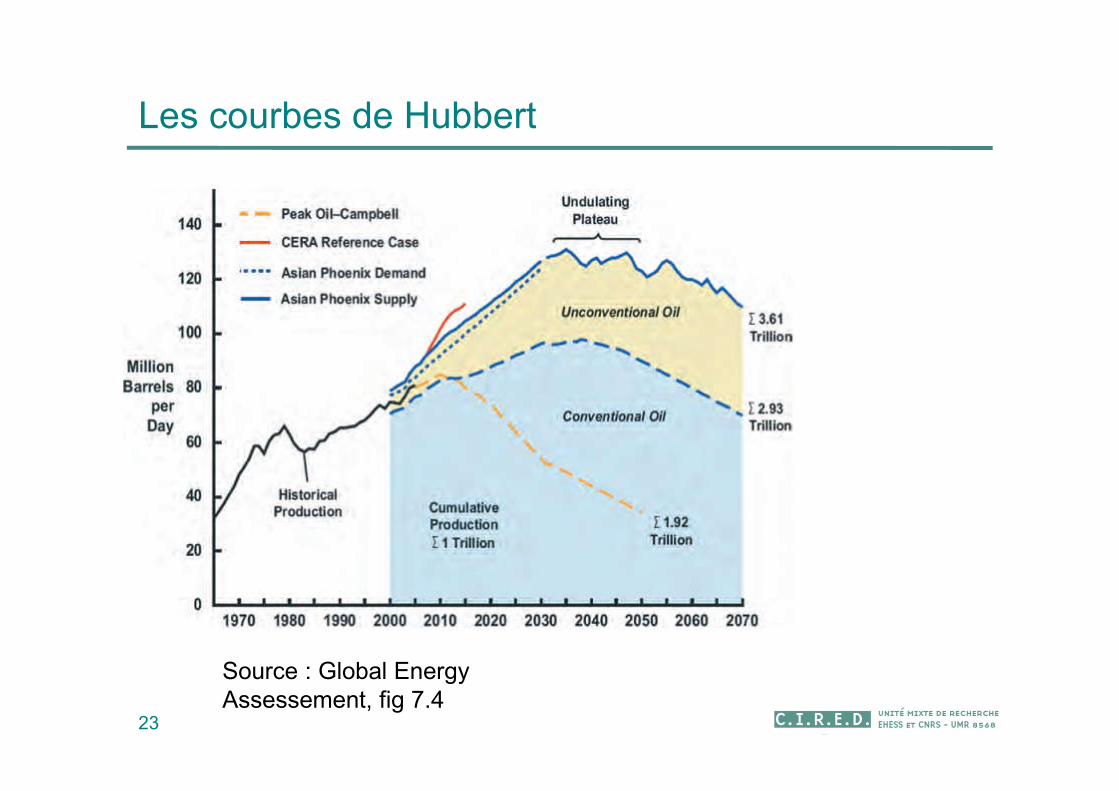
Les courbes de Hubbert
23
Source : Global Energy Assessement, fig 7.4
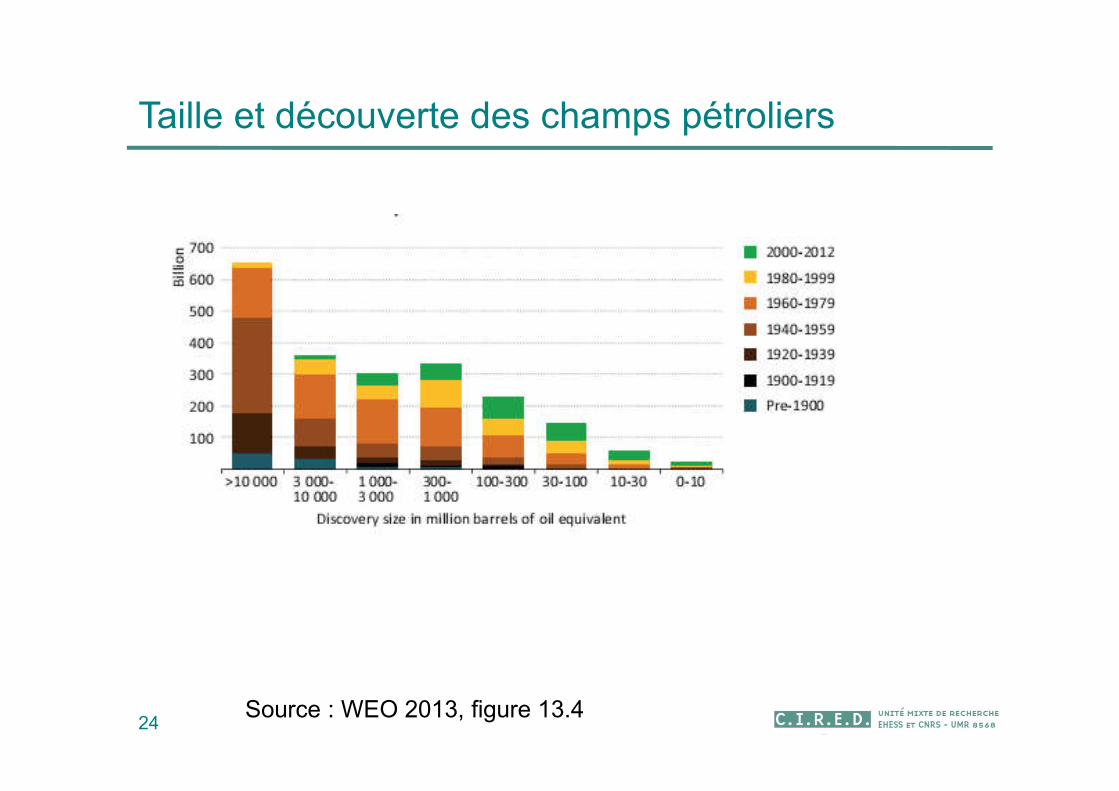
Taille et découverte des champs pétroliers
24Source : WEO 2013, figure 13.4
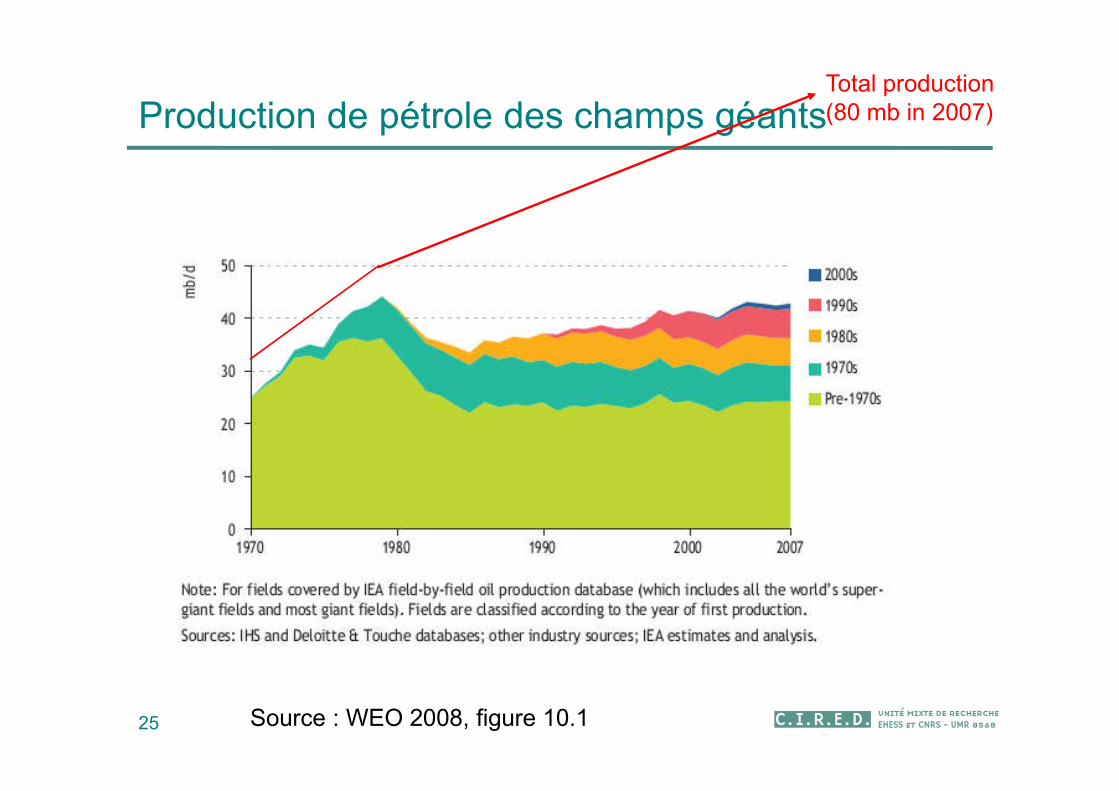
Production de pétrole des champs géants
25 Source : WEO 2008, figure 10.1
Total production(80 mb in 2007)
Dynamique d’exploitation du pétrole
et politiques climatiques
26
Modèle et scénarios
Le modèle Imaclim-R
Scénarios prospectifs
Rôles des scenarios
Let’s test the consequences of the three hypothesis
Assessment of the macroeconomic cost of oil scarcity
Impact of climate policies
All the following results are obtained with the IMACLIM-R model.
http://www.imaclim.centre-cired.fr/
28
29
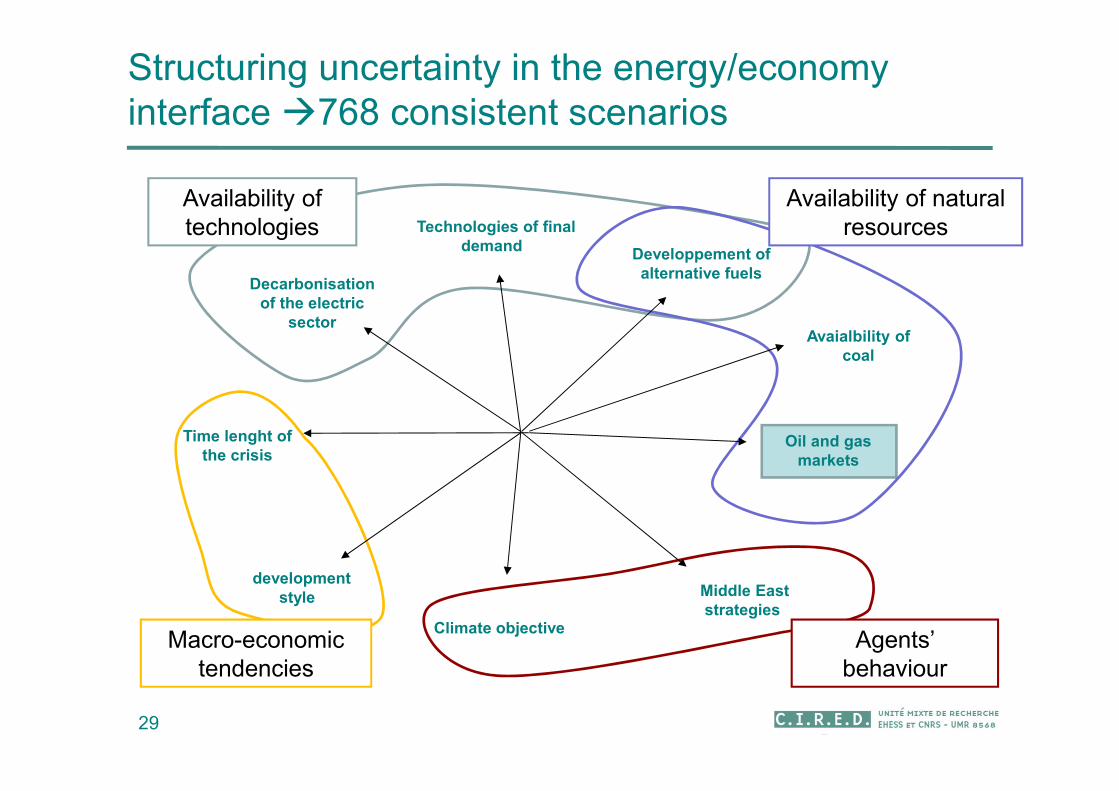
Availability of technologies
Availability of natural resources
Agents’ behaviour
Macro-economictendencies
Avaialbility of coal
Climate objective
Technologies of final demand
Developpement of alternative fuels
Oil and gas markets
developmentstyle Middle East
strategies
Time lenght of the crisis
Decarbonisation of the electric
sector
Structuring uncertainty in the energy/economy interface 768 consistent scenarios
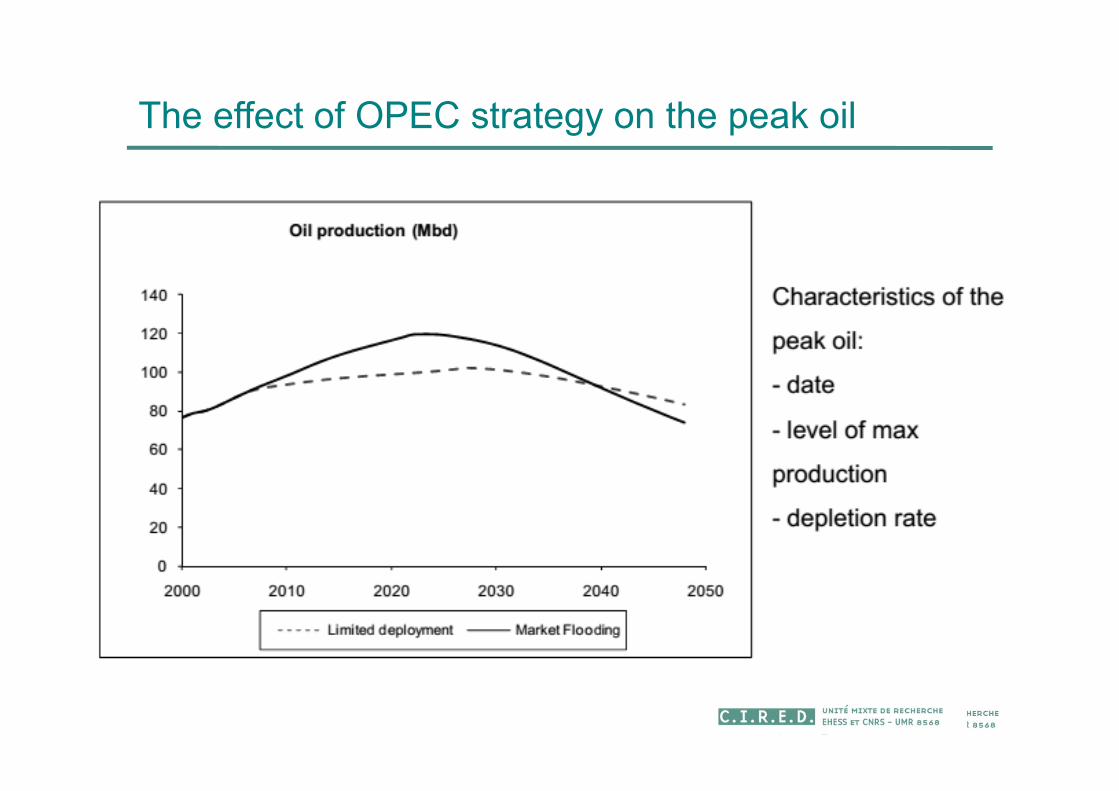
The effect of OPEC strategy on the peak oil
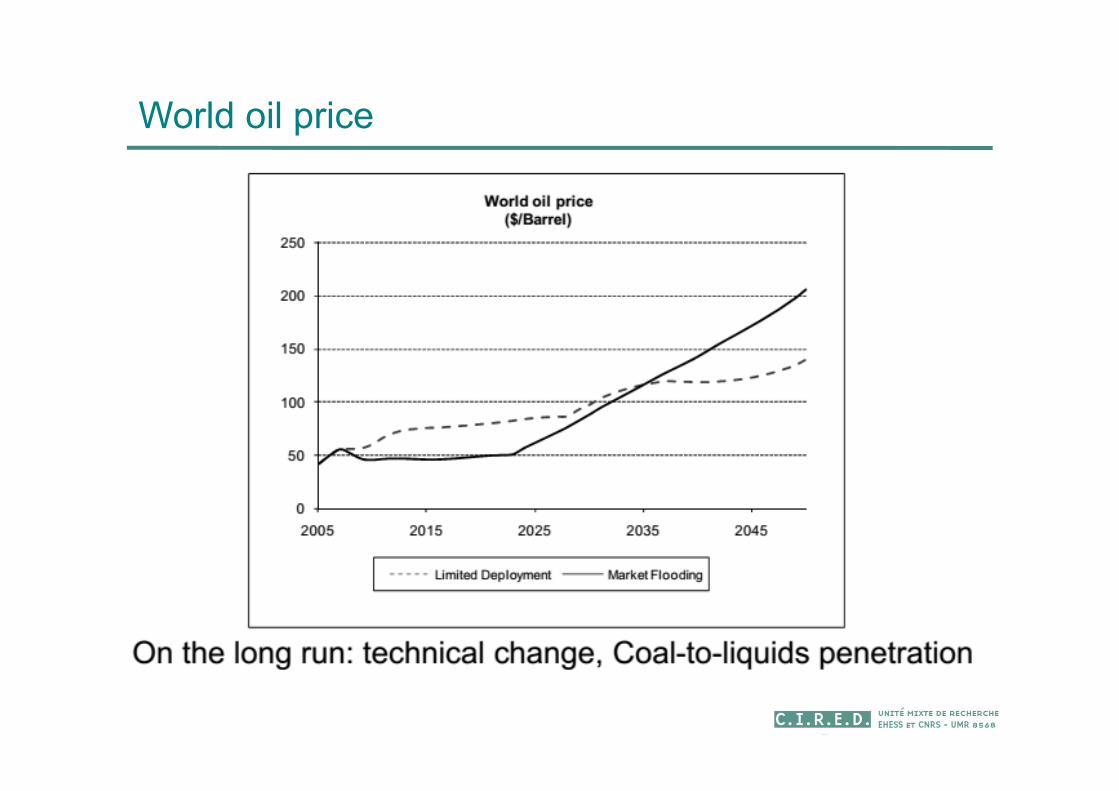
World oil price
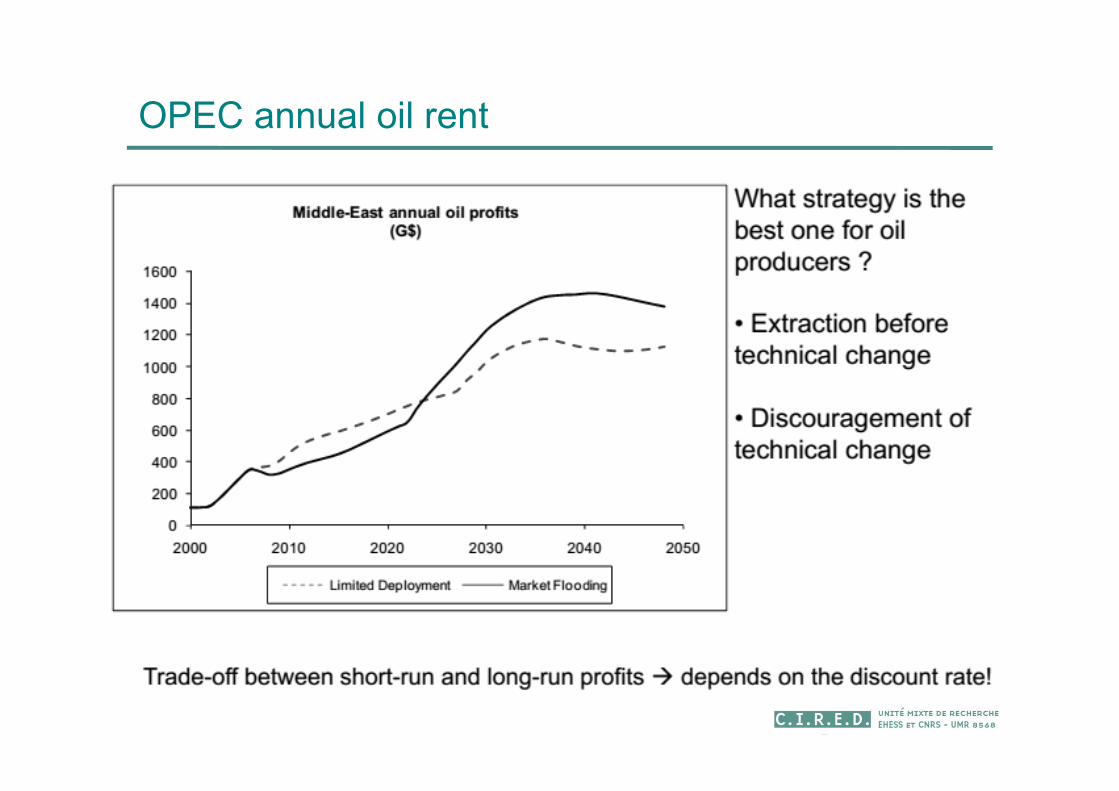
OPEC annual oil rent
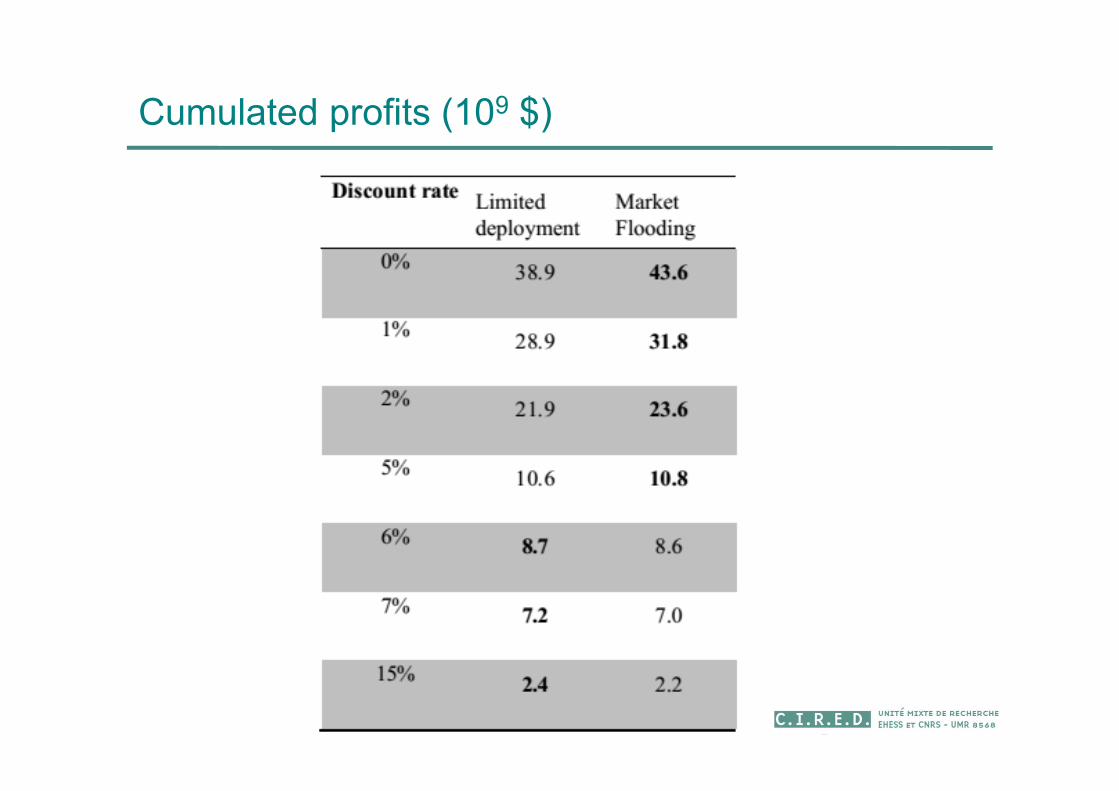
Cumulated profits (109 $)
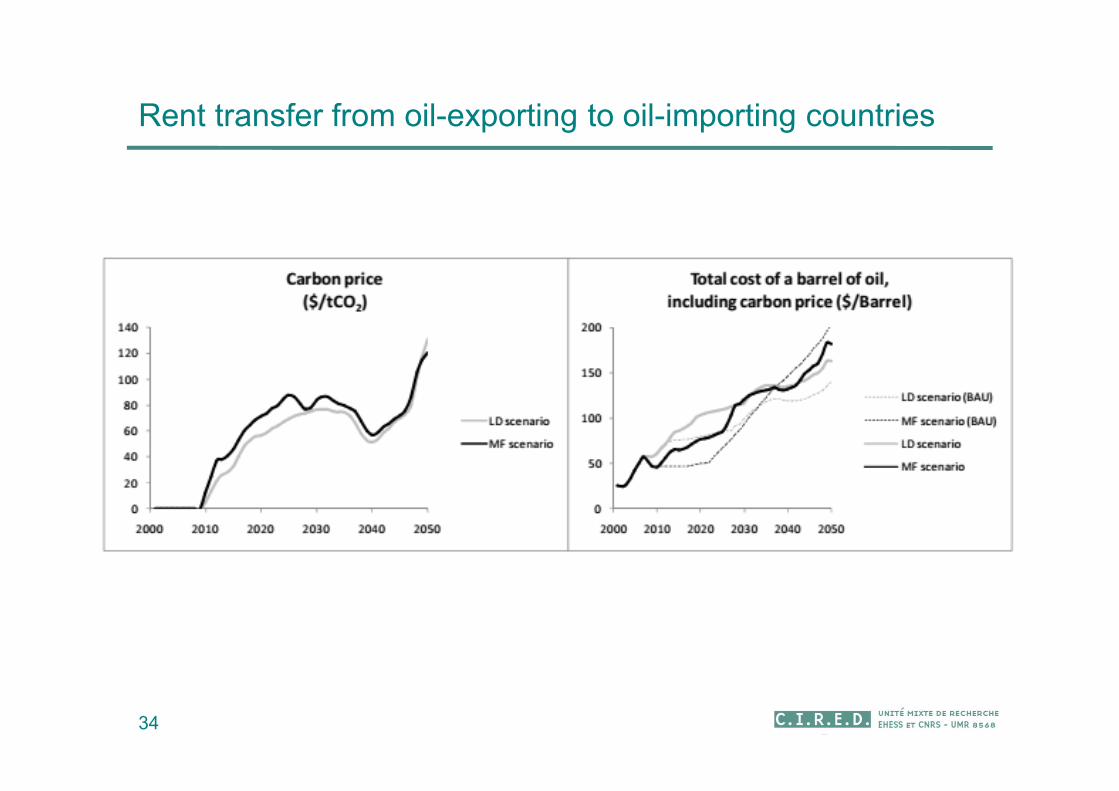
Rent transfer from oil-exporting to oil-importing countries
34
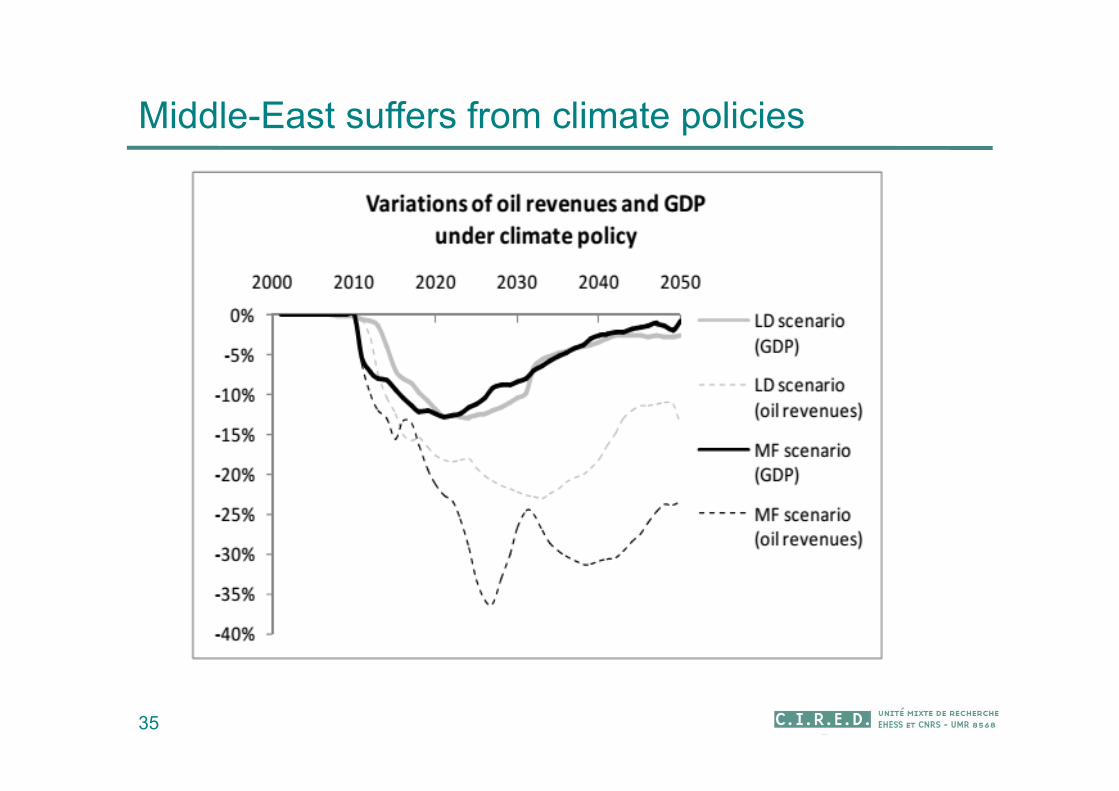
Middle-East suffers from climate policies
35
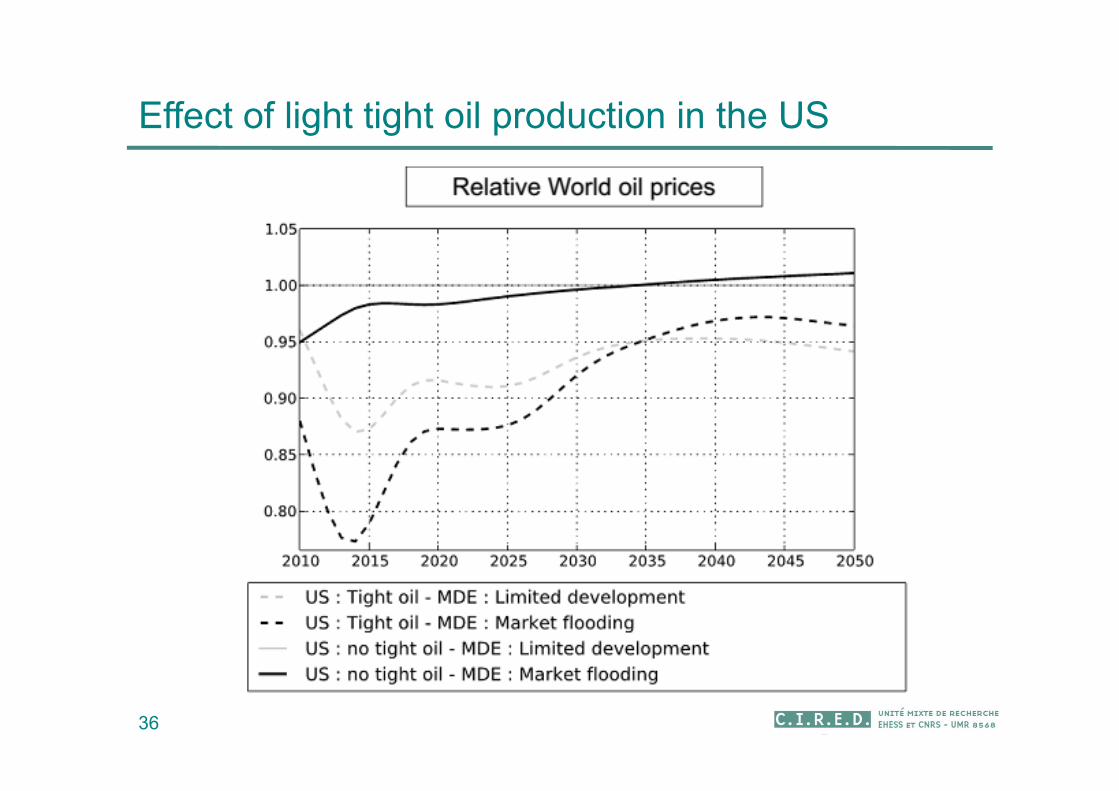
Effect of light tight oil production in the US
36
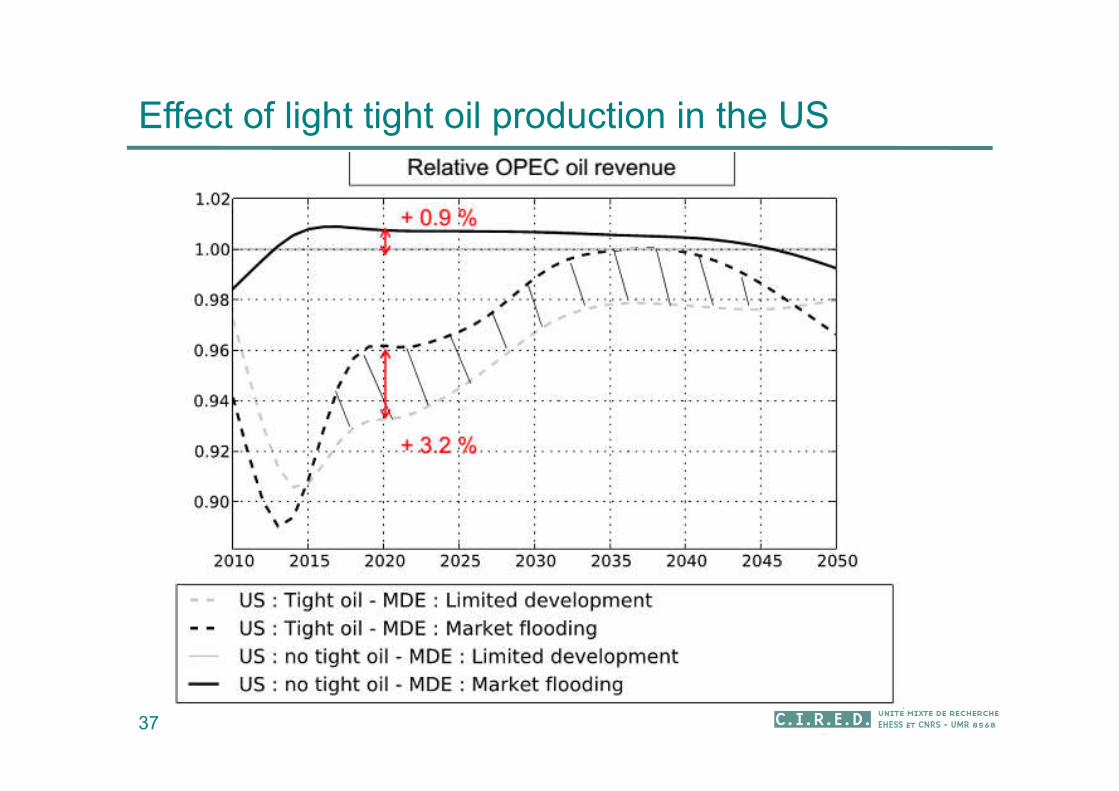
37
Effect of light tight oil production in the US
Les nouveaux hydrocarbures non-conventionnels
38
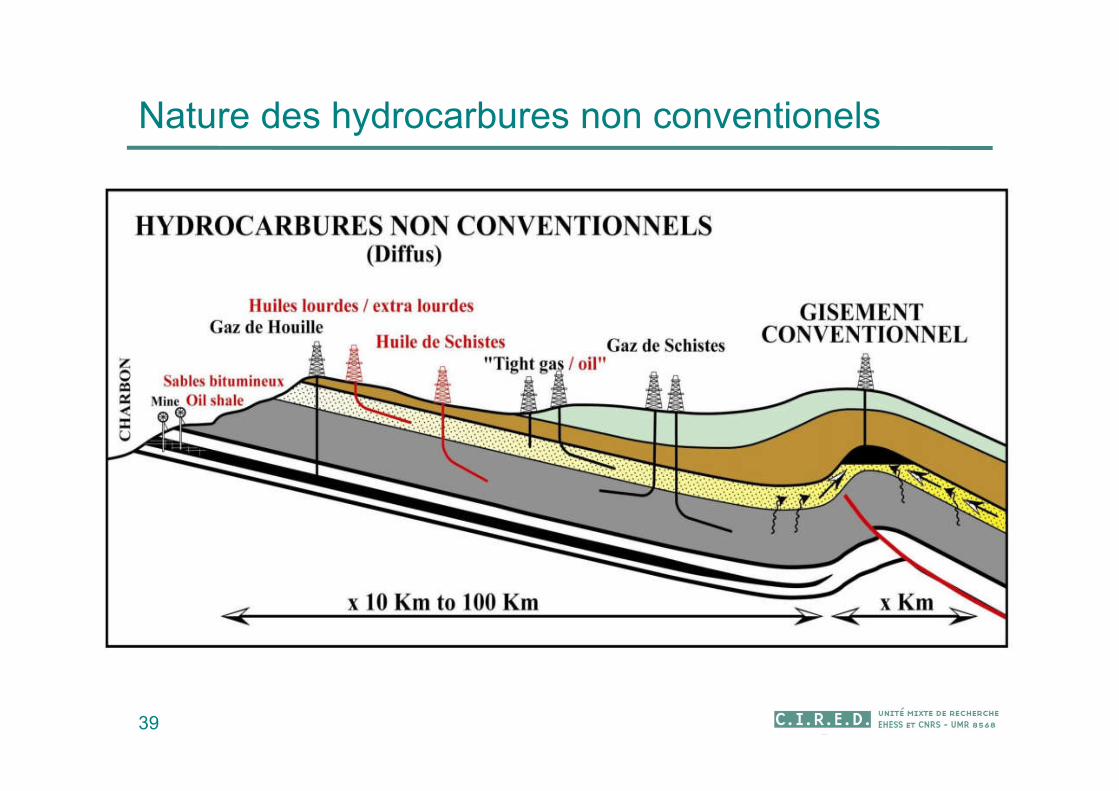
Nature des hydrocarbures non conventionels
39
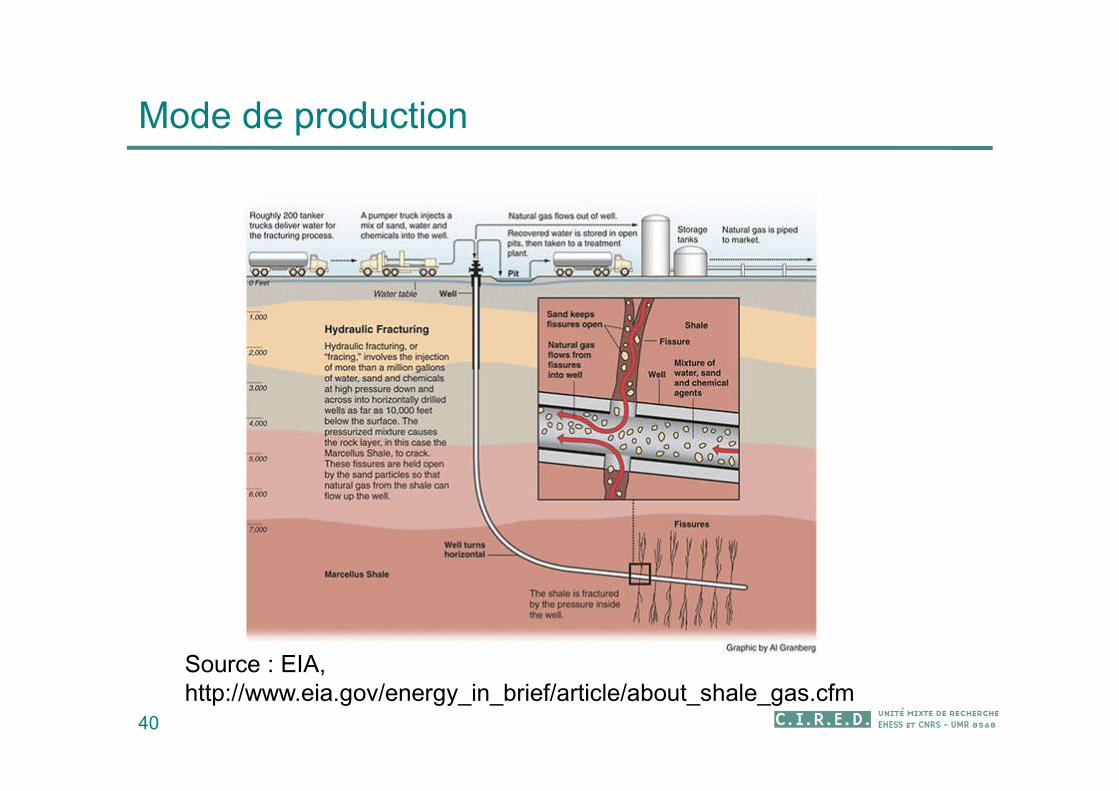
Mode de production
40
Source : EIA, http://www.eia.gov/energy_in_brief/article/about_shale_gas.cfm
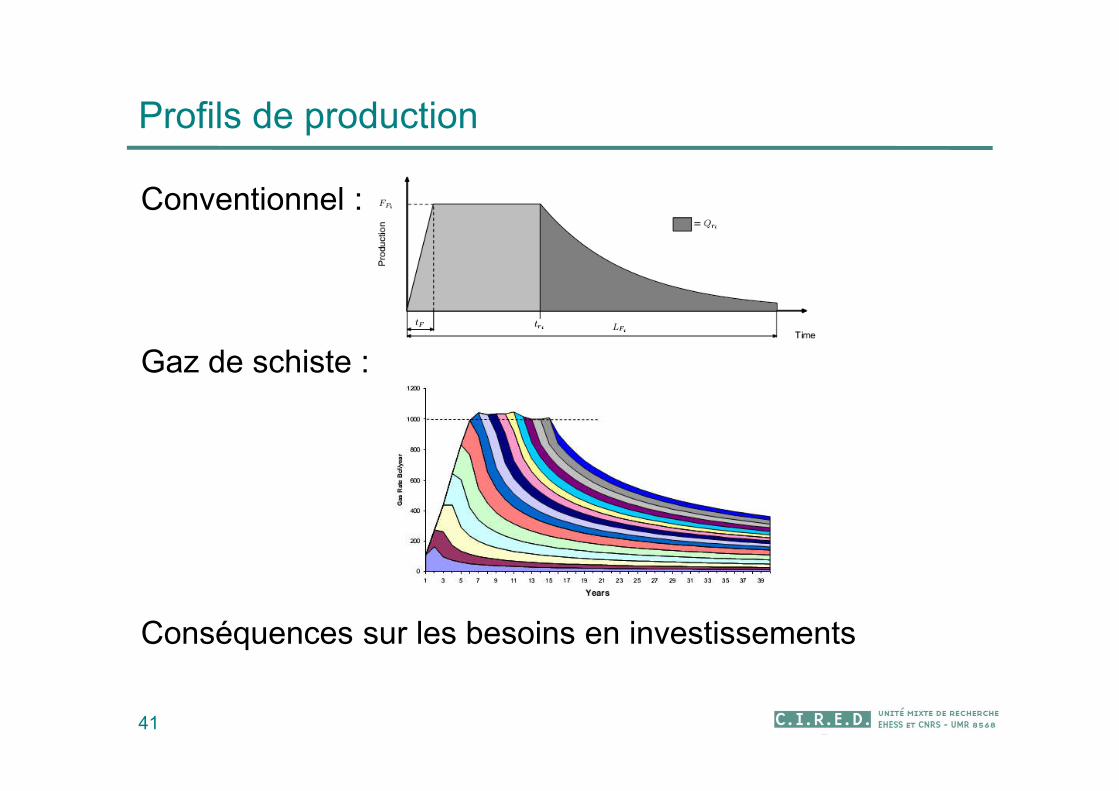
Profils de production
41
Conventionnel :
Gaz de schiste :
Conséquences sur les besoins en investissements
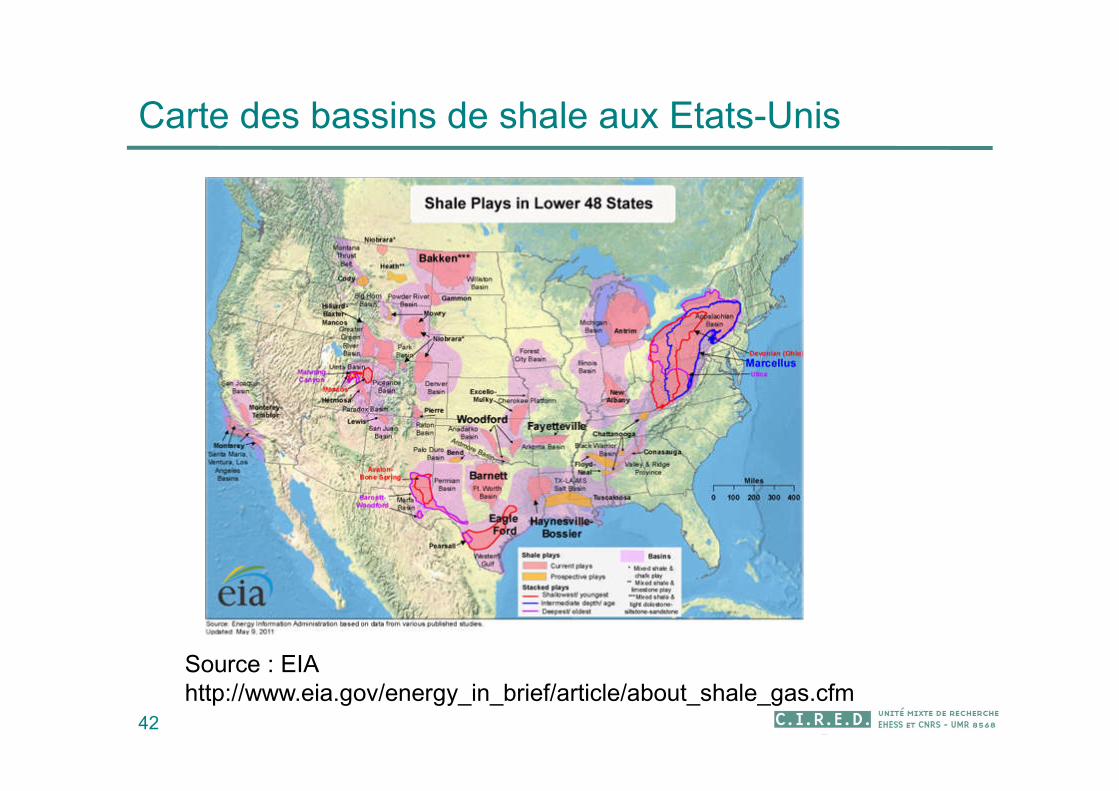
Carte des bassins de shale aux Etats-Unis
42
Source : EIA http://www.eia.gov/energy_in_brief/article/about_shale_gas.cfm
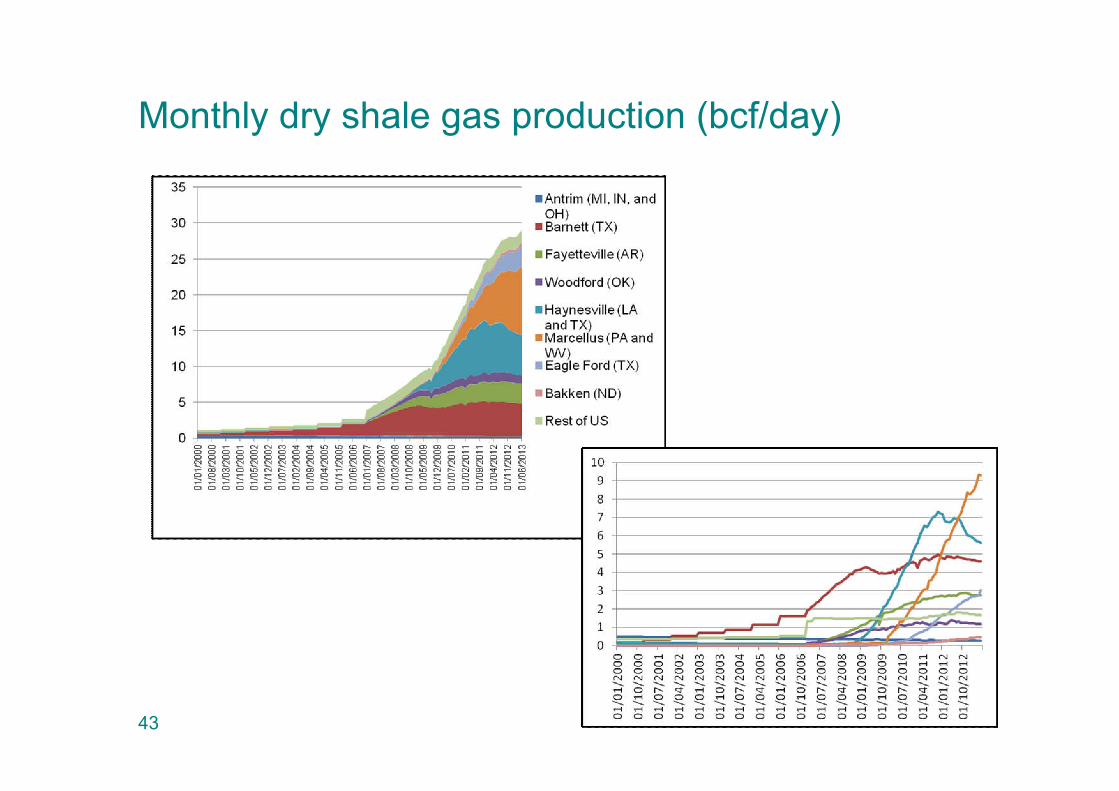
Monthly dry shale gas production (bcf/day)
43
44
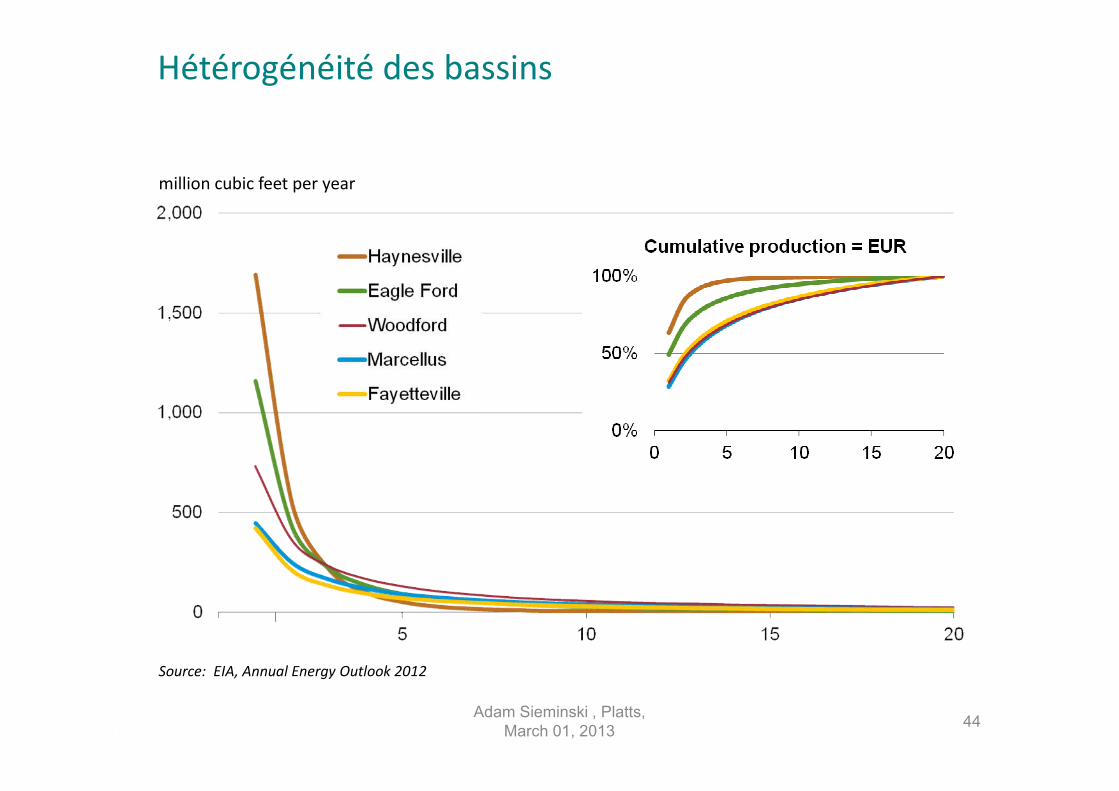
million cubic feet per year
Source: EIA, Annual Energy Outlook 2012
1
Adam Sieminski , Platts, March 01, 2013
Hétérogénéité des bassins
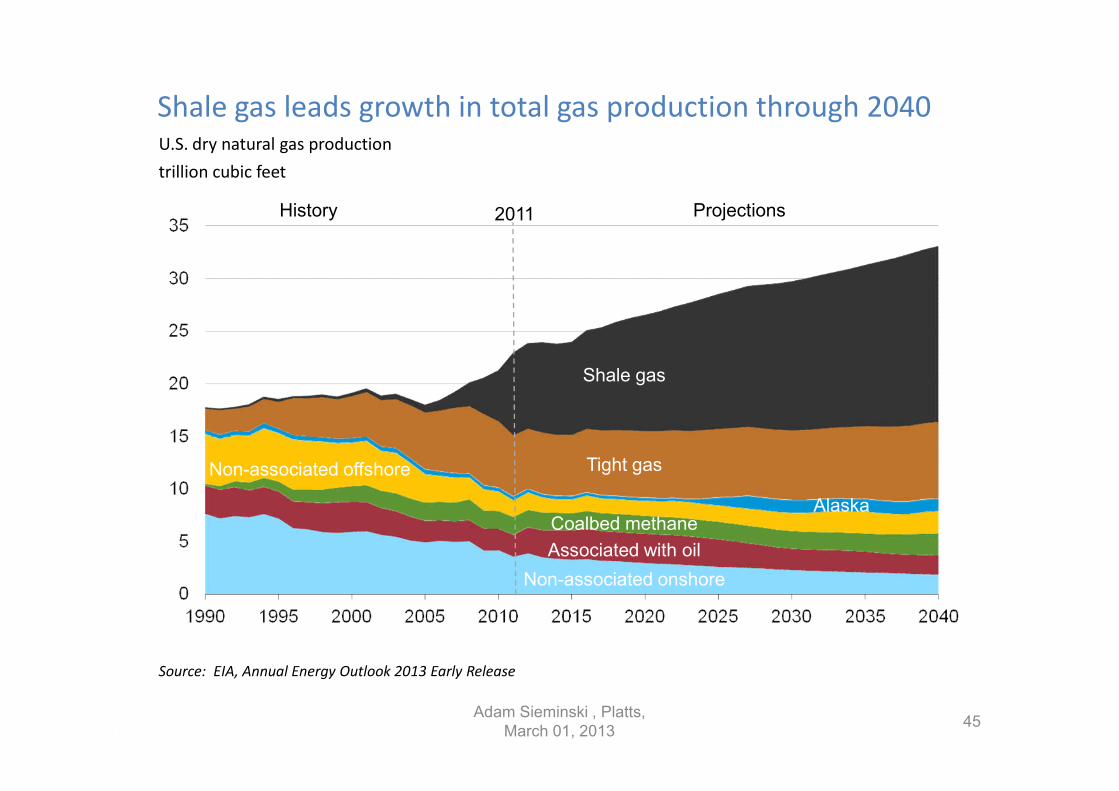
Shale gas leads growth in total gas production through 2040
45
U.S. dry natural gas production
trillion cubic feet
Source: EIA, Annual Energy Outlook 2013 Early Release
Associated with oil
Coalbed methane
Tight gas
Shale gas
Alaska
Non-associated onshore
Non-associated offshore
ProjectionsHistory 2011
Adam Sieminski , Platts, March 01, 2013
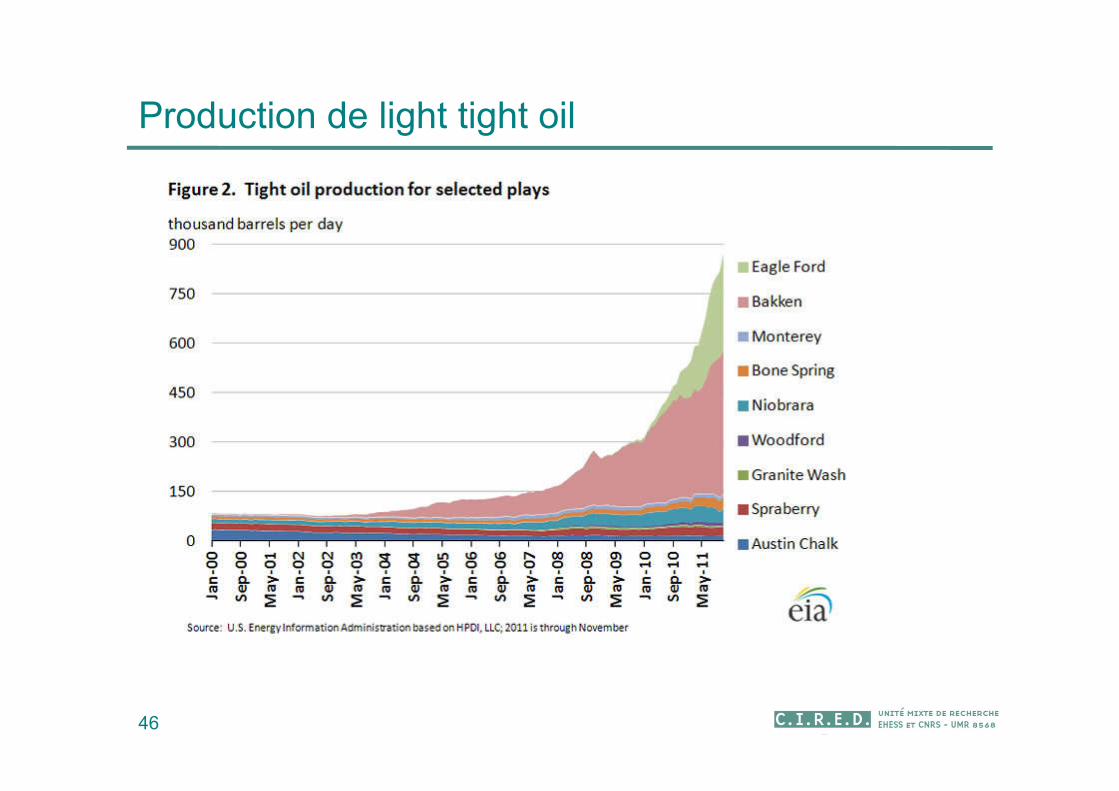
Production de light tight oil
46
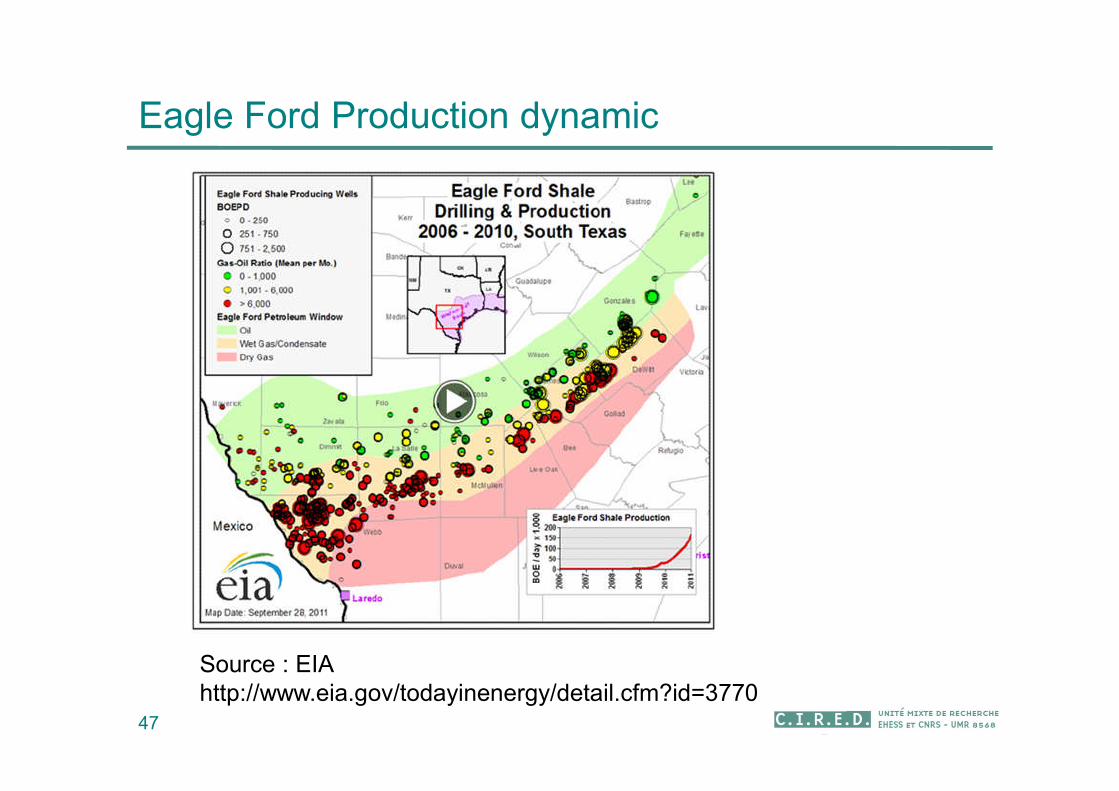
Eagle Ford Production dynamic
47
Source : EIA http://www.eia.gov/todayinenergy/detail.cfm?id=3770
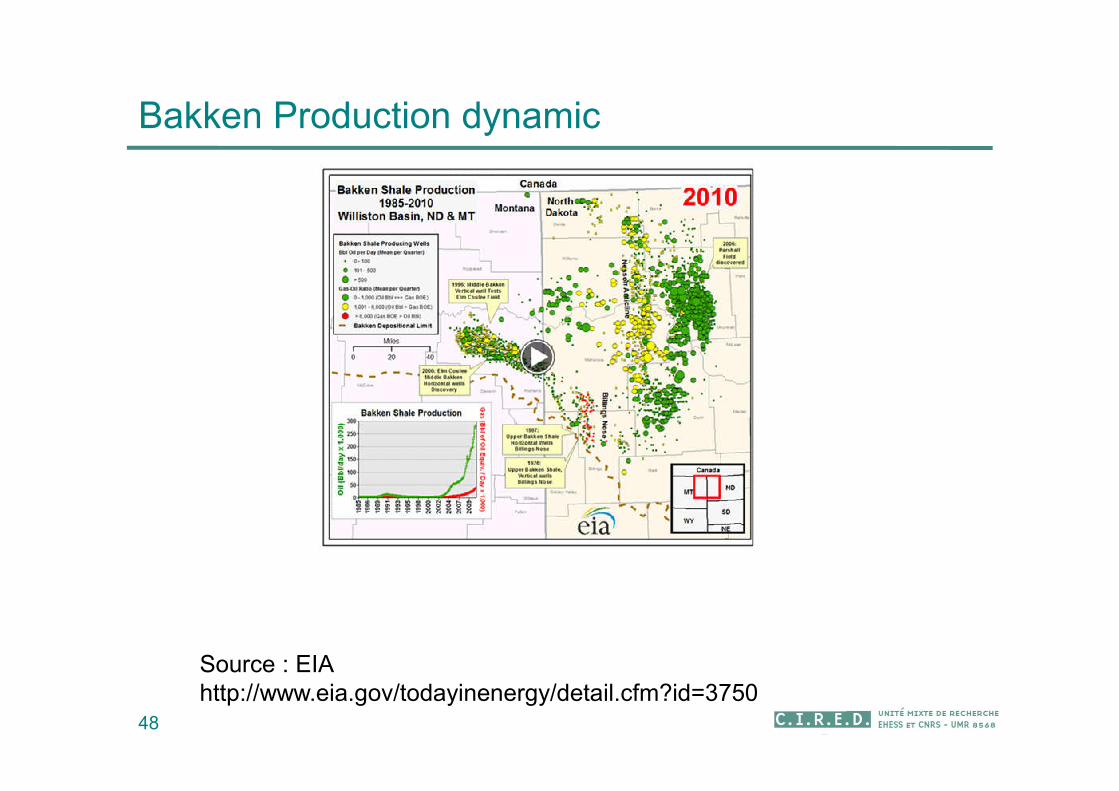
48
Source : EIA http://www.eia.gov/todayinenergy/detail.cfm?id=3750
Bakken Production dynamic
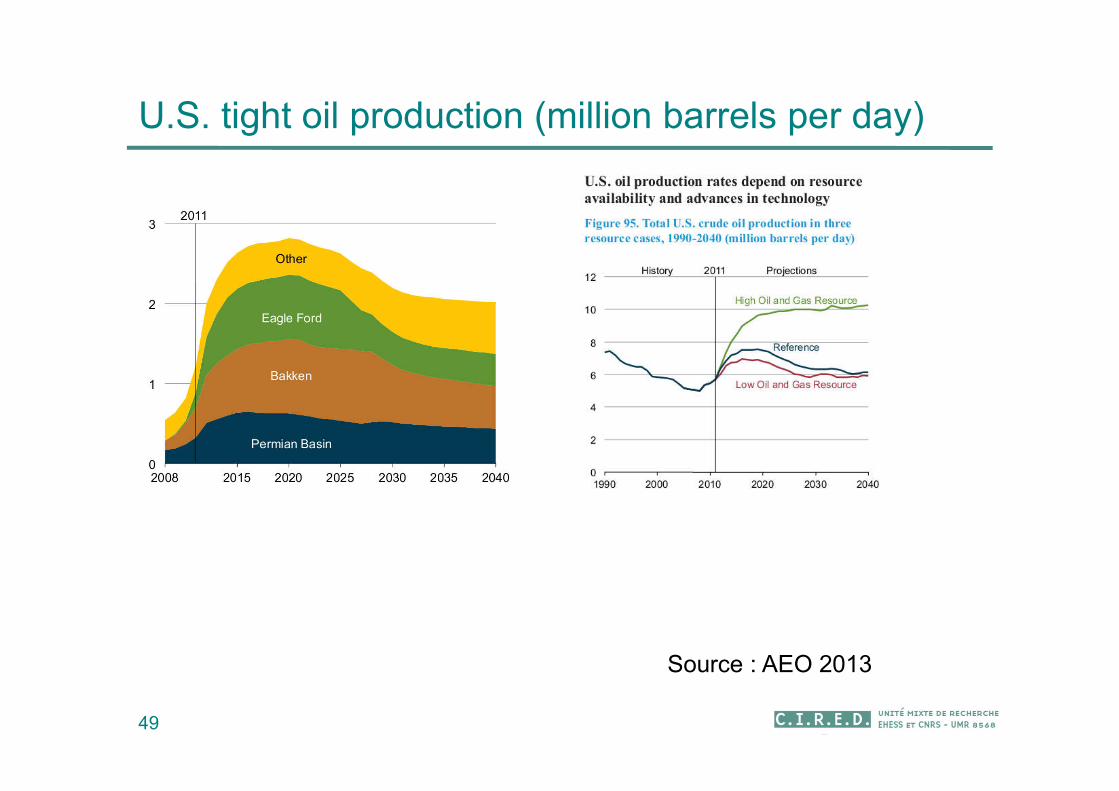
U.S. tight oil production (million barrels per day)
49
Source : AEO 2013
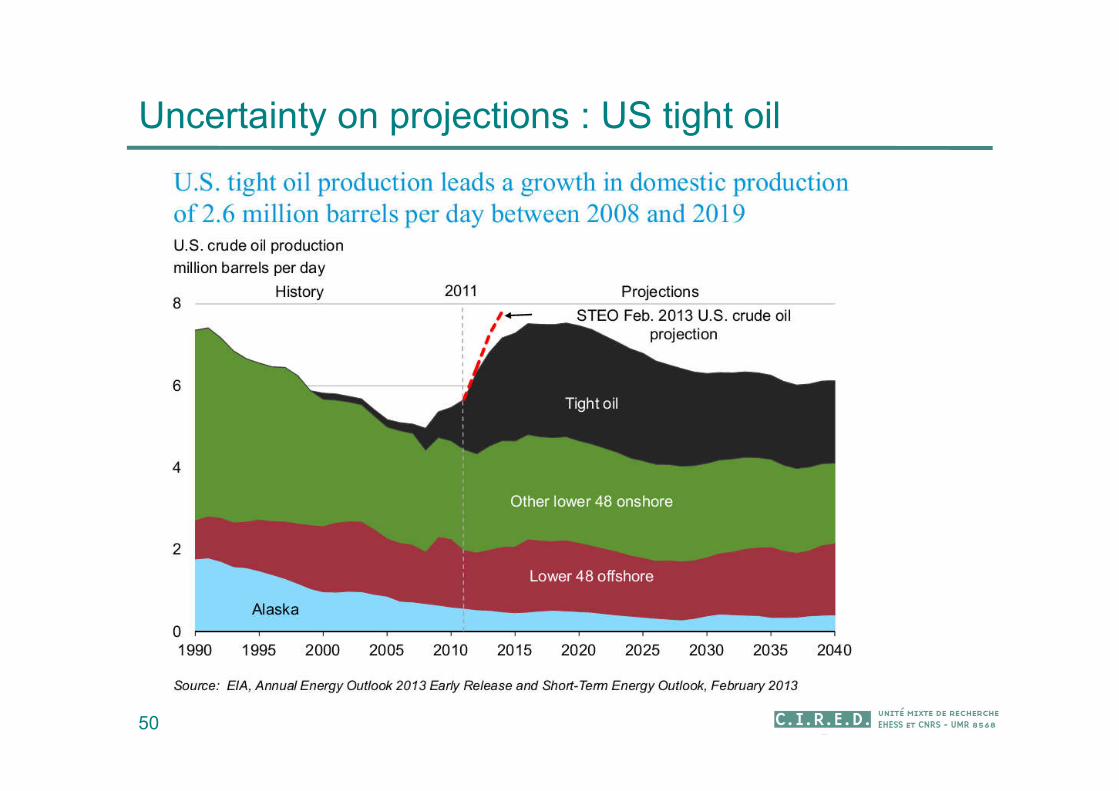
Uncertainty on projections : US tight oil
50
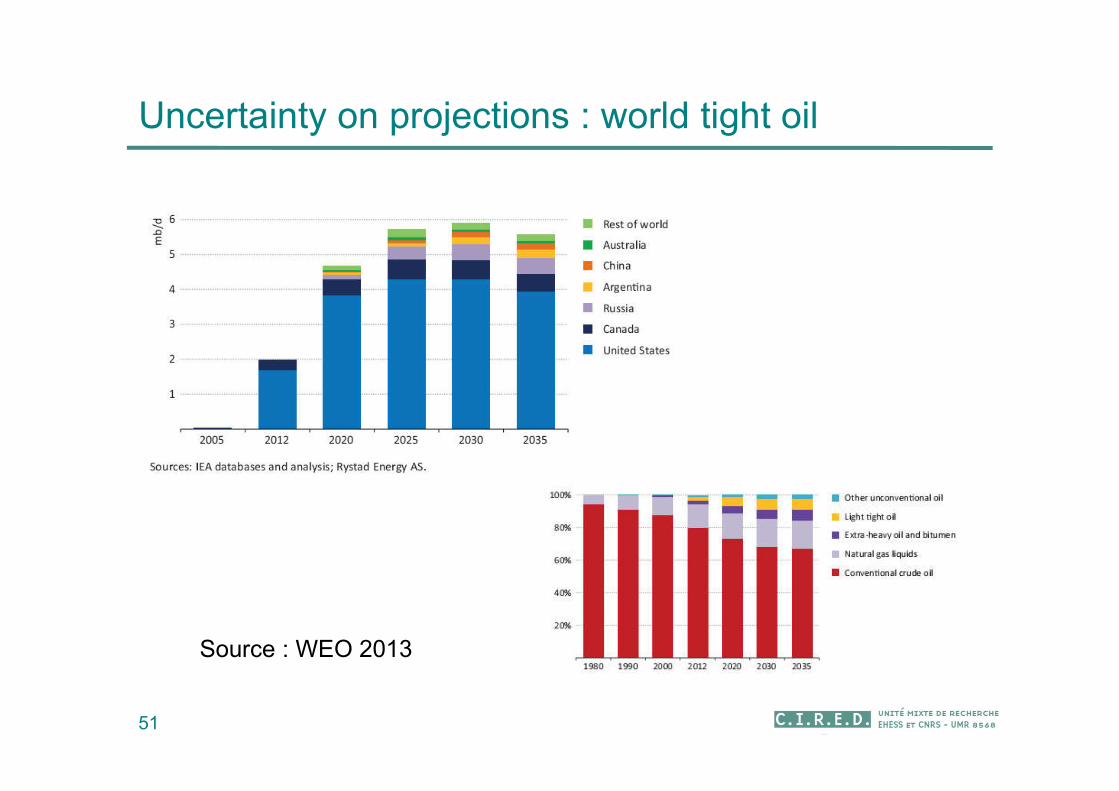
Uncertainty on projections : world tight oil
51
Source : WEO 2013
Evaluation des ressources
52
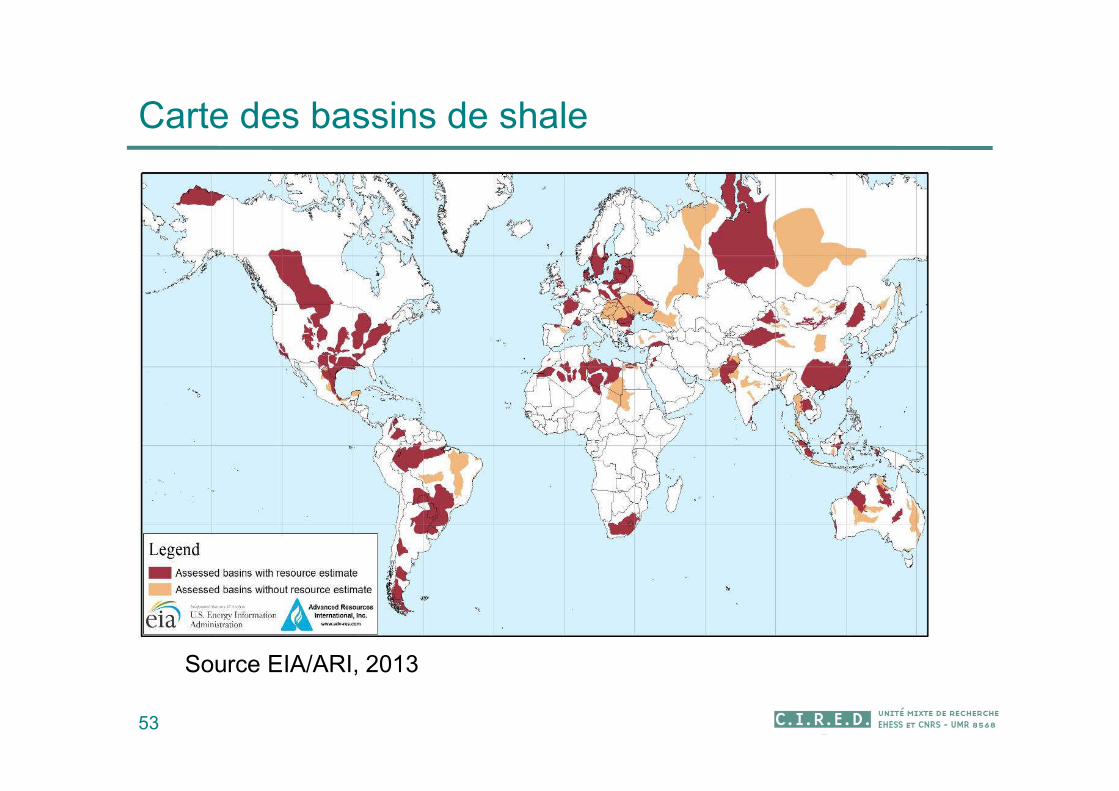
Carte des bassins de shale
53
Source EIA/ARI, 2013
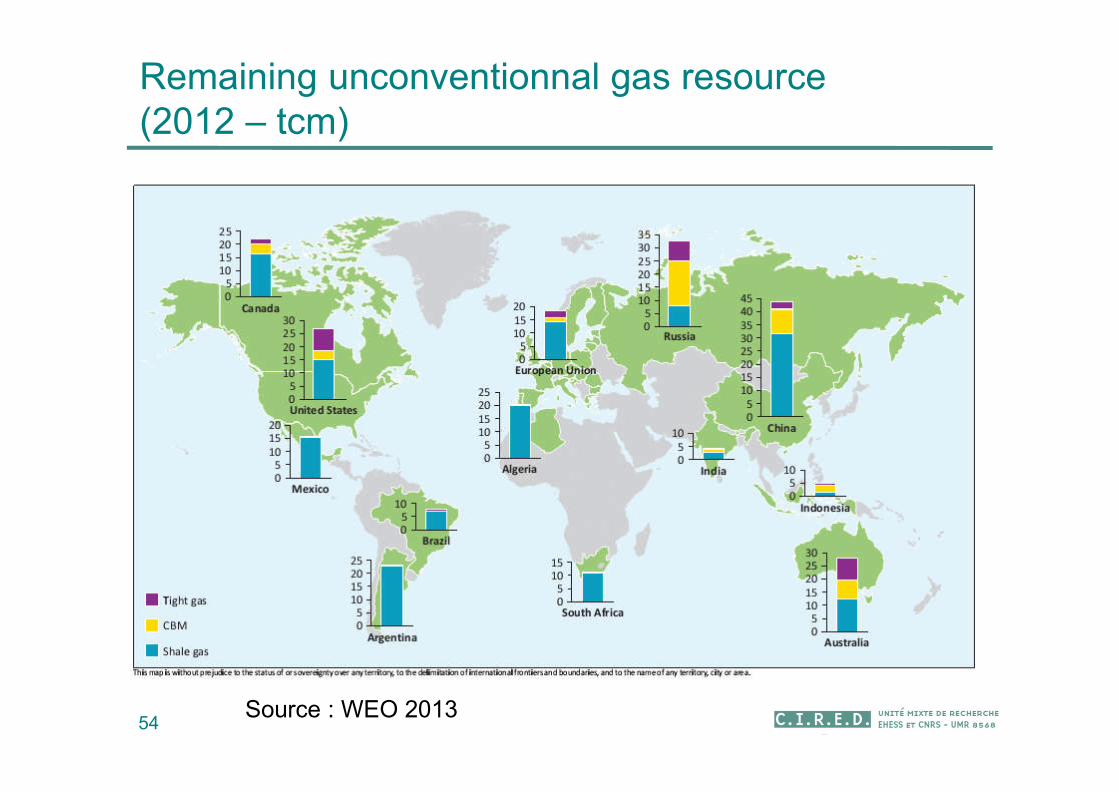
Remaining unconventionnal gas resource (2012 – tcm)
54Source : WEO 2013
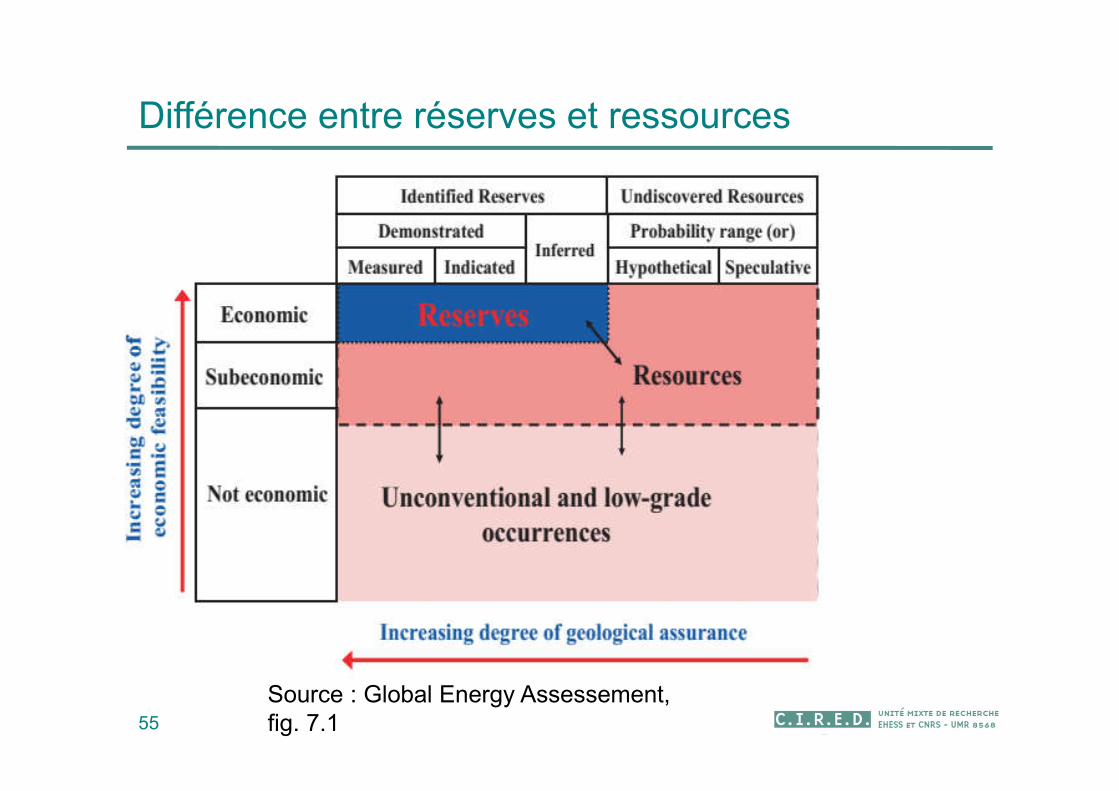
Différence entre réserves et ressources
55
Limite économique
PossiblesProbablesProuvées
Réserves
Source : Global Energy Assessement, fig. 7.1
Ressource
Shale gas resources estimation methods (McGlade 2013)
56
Literature review ( subjective choice of study, no uncertainty)
Bottom-up analysis of geological parameters
Extrapolation of production experience
Problem : sweet spots versus non
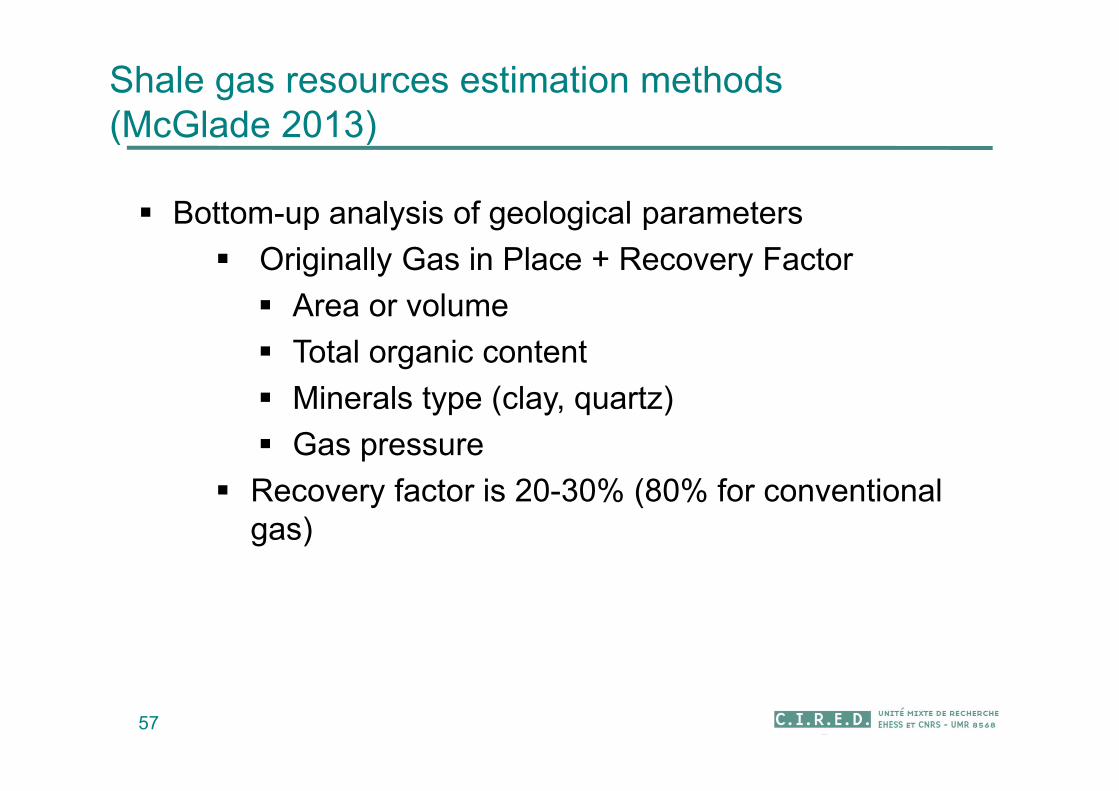
Shale gas resources estimation methods (McGlade 2013)
57
Bottom-up analysis of geological parameters
Originally Gas in Place + Recovery Factor
Area or volume
Total organic content
Minerals type (clay, quartz)
Gas pressure
Recovery factor is 20-30% (80% for conventional gas)
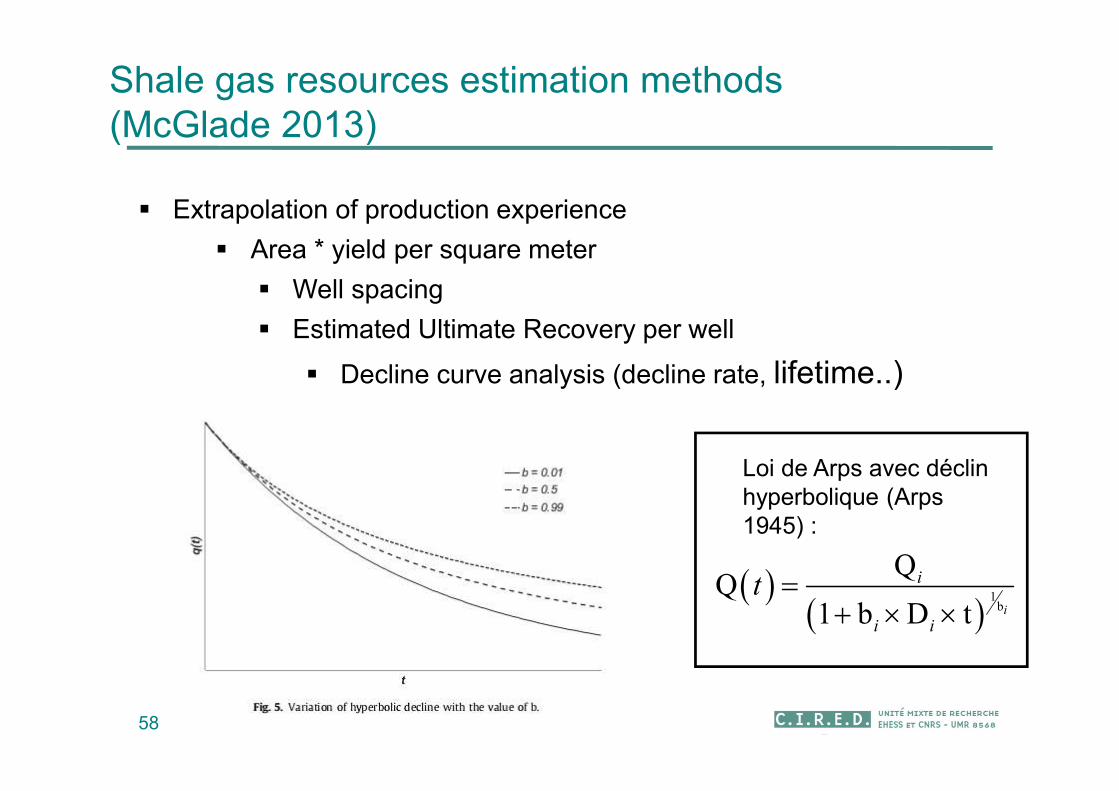
Shale gas resources estimation methods (McGlade 2013)
58
Extrapolation of production experience
Area * yield per square meter
Well spacing
Estimated Ultimate Recovery per well
Decline curve analysis (decline rate, lifetime..)
1b
1 b D t i
i
i i
t
Loi de Arps avec déclin hyperbolique (Arps 1945) :
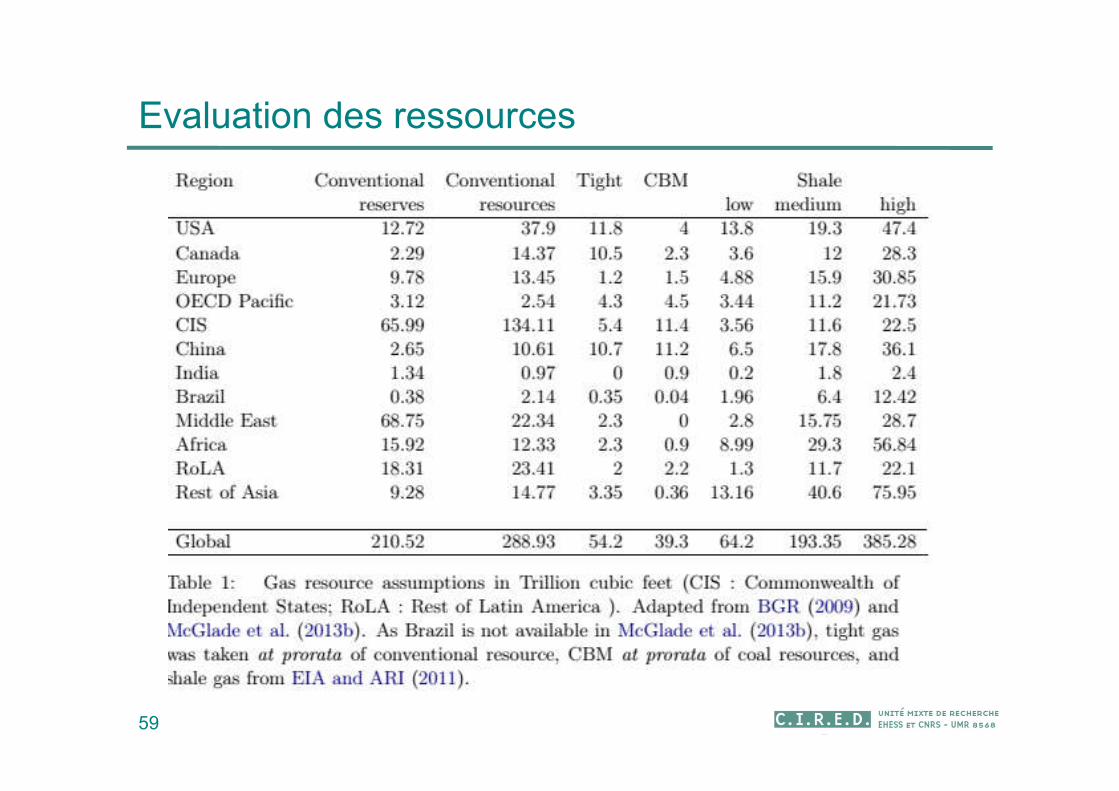
Evaluation des ressources
59
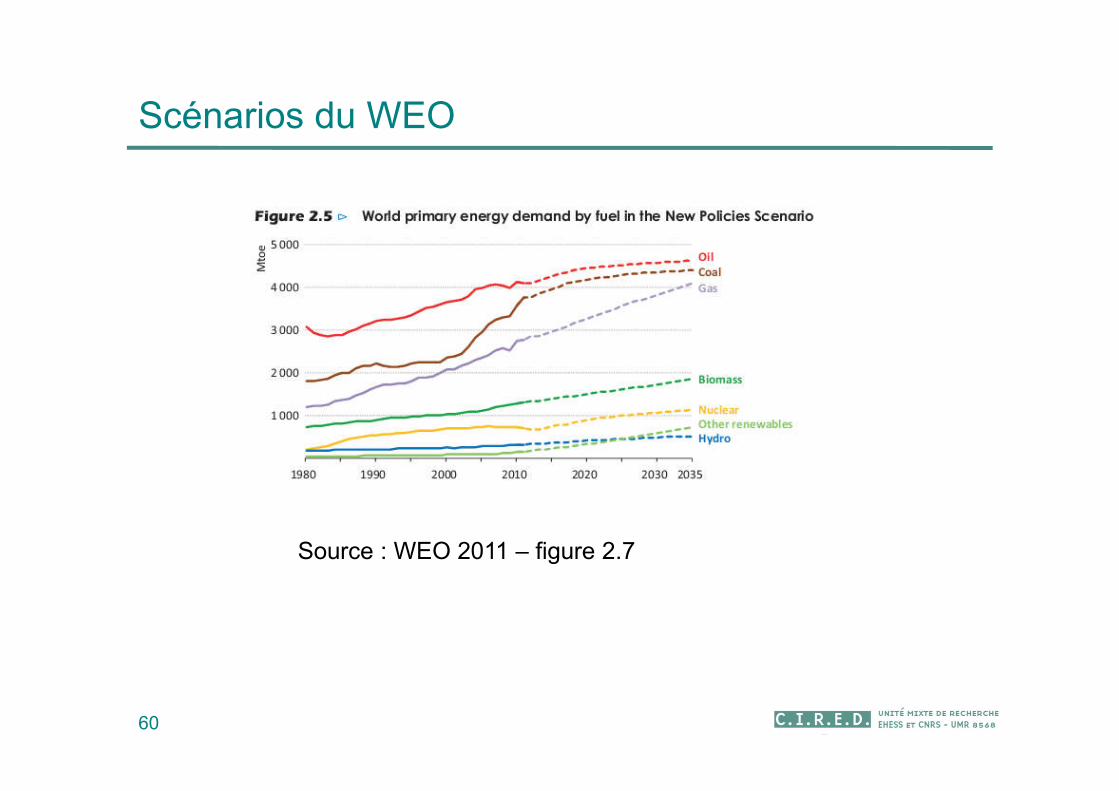
Scénarios du WEO
60
Source : WEO 2011 – figure 2.7
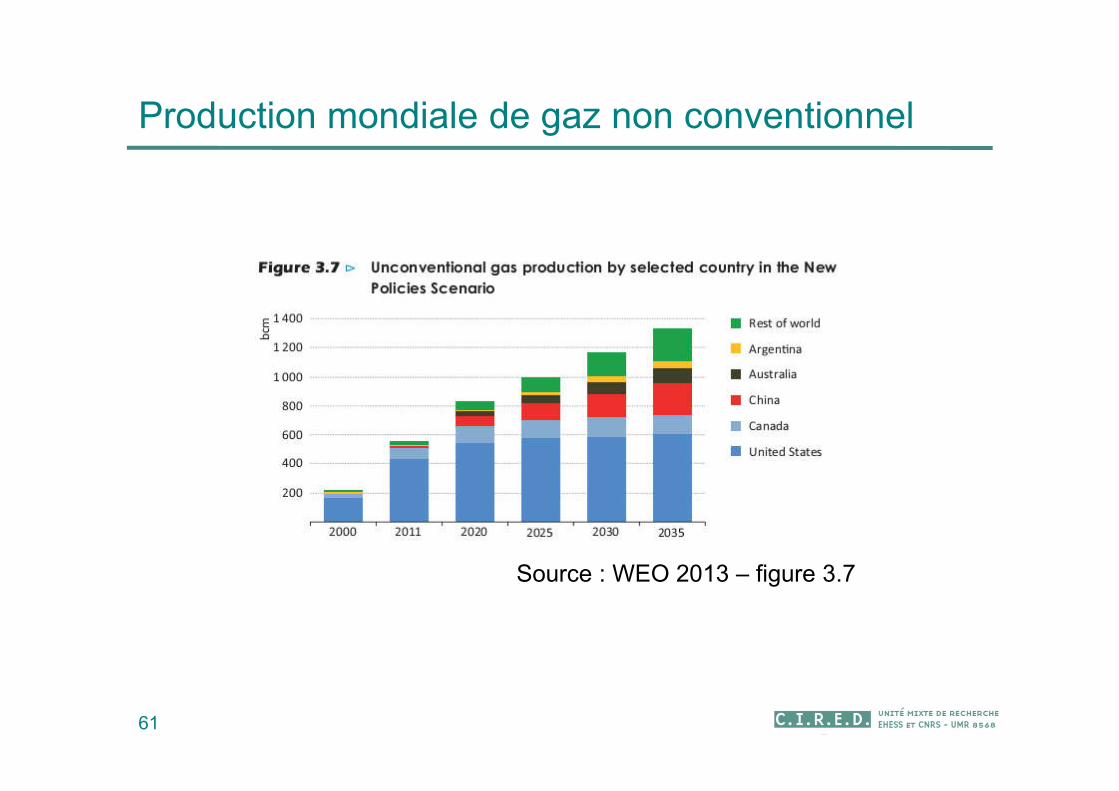
Production mondiale de gaz non conventionnel
61
Source : WEO 2013 – figure 3.7
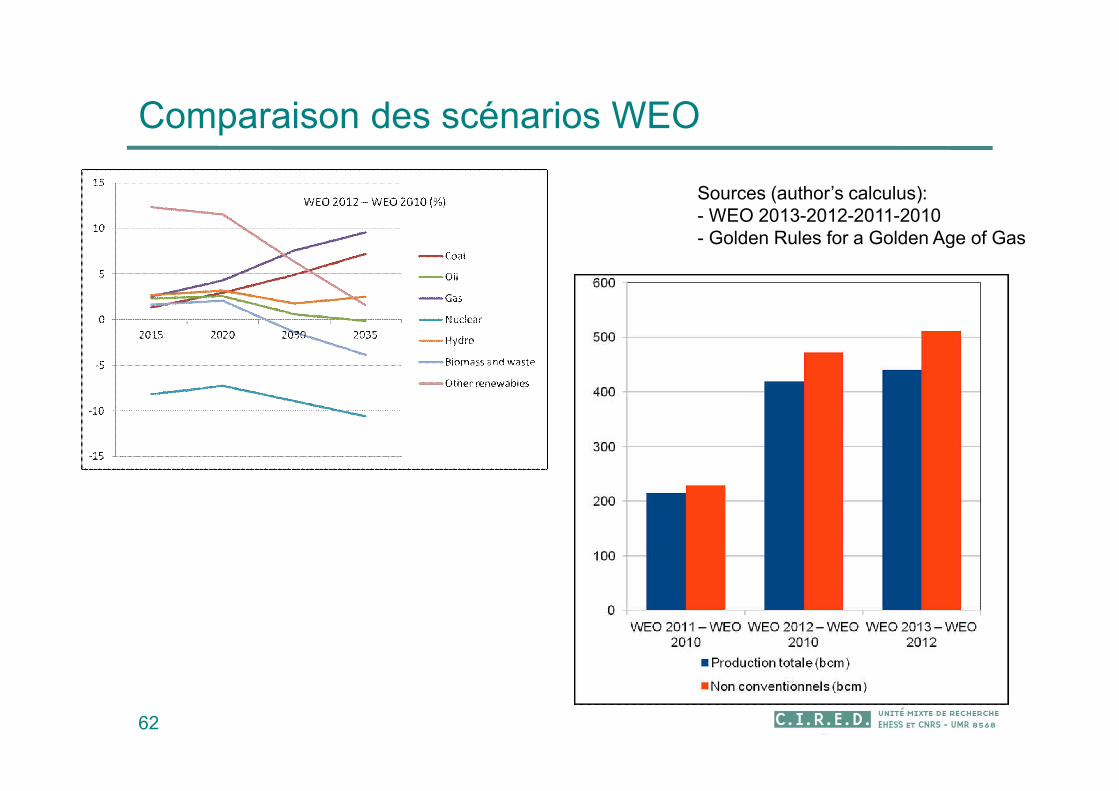
Comparaison des scénarios WEO
62
Sources (author’s calculus): - WEO 2013-2012-2011-2010- Golden Rules for a Golden Age of Gas

Impacts environnementaux
63
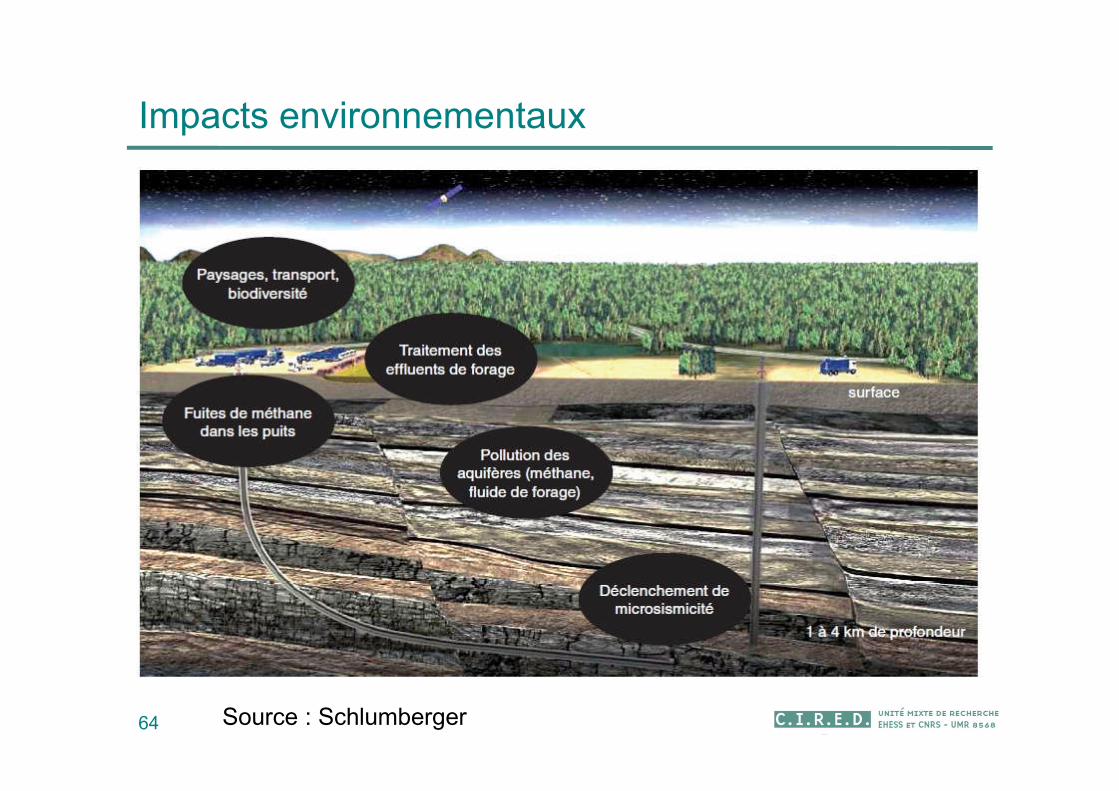
Impacts environnementaux
64 Source : Schlumberger
Impacts environnementaux
65
Différentes echelles
Quels problèmes peuvent être réglés par la technologie ?
Quid du surcouts de la qualité des forages, des institutions ?
Importation de gaz de schiste US : Nimby ?
GdS en Algérie : Nimby ?
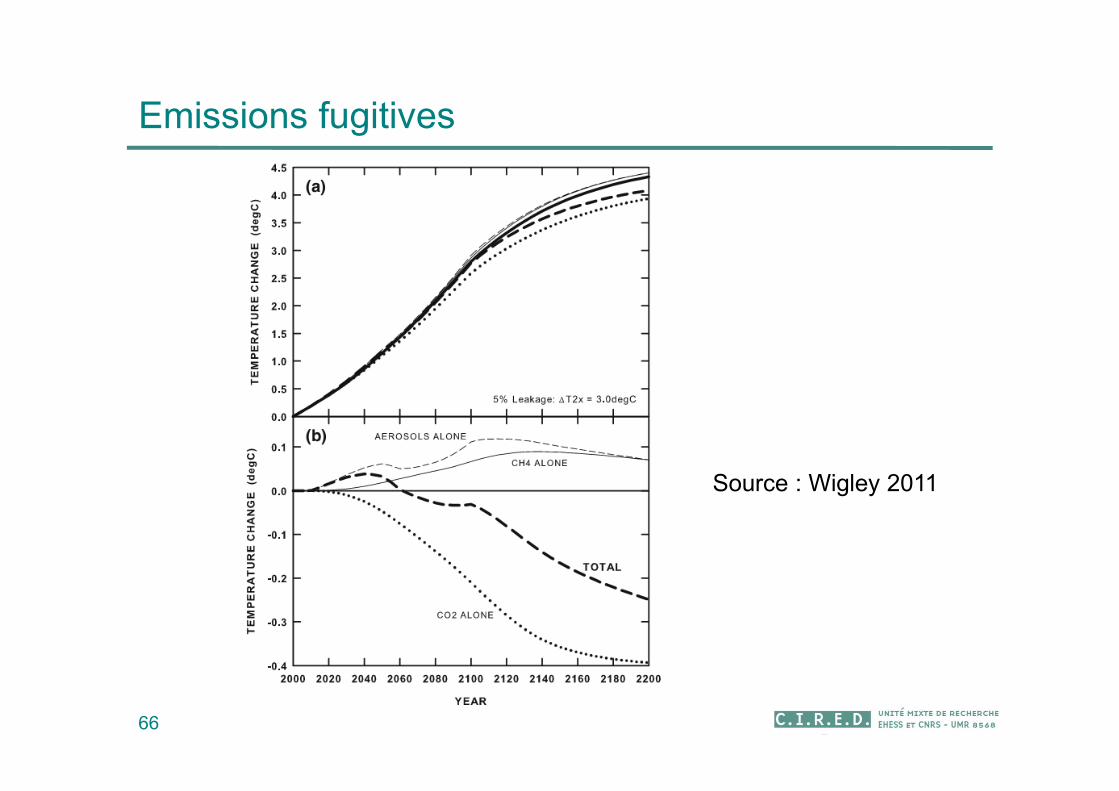
Emissions fugitives
66
Source : Wigley 2011
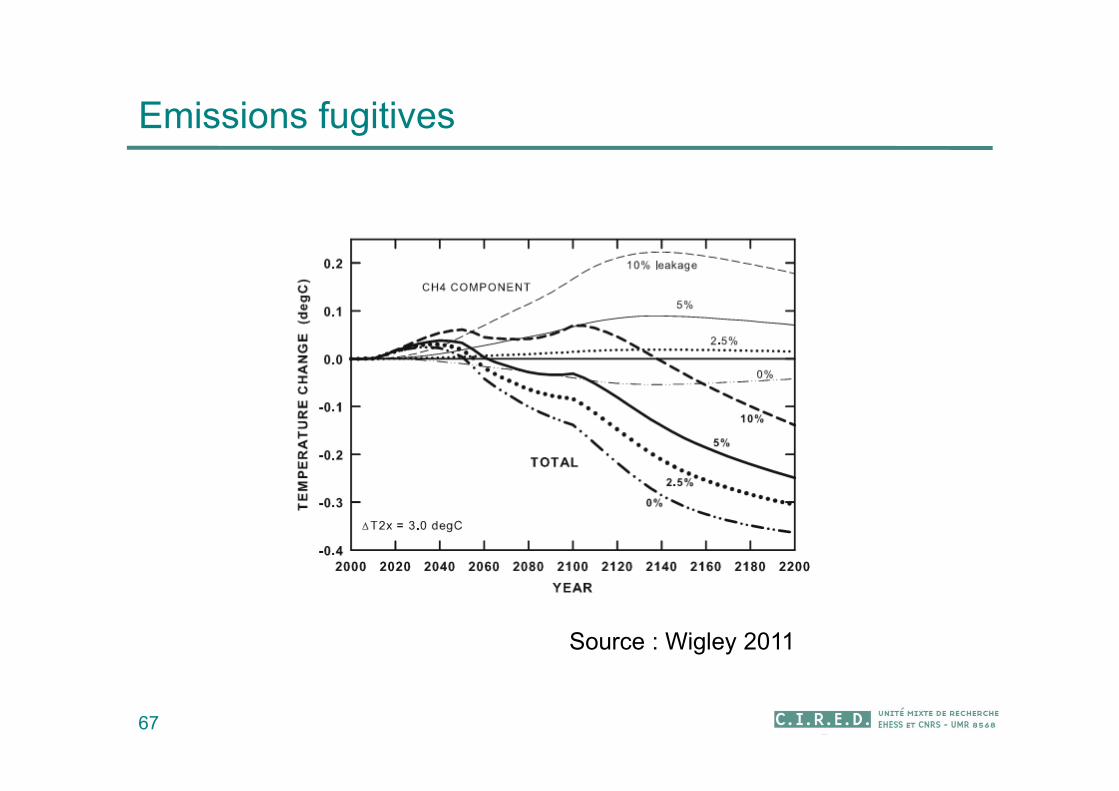
Emissions fugitives
67
Source : Wigley 2011
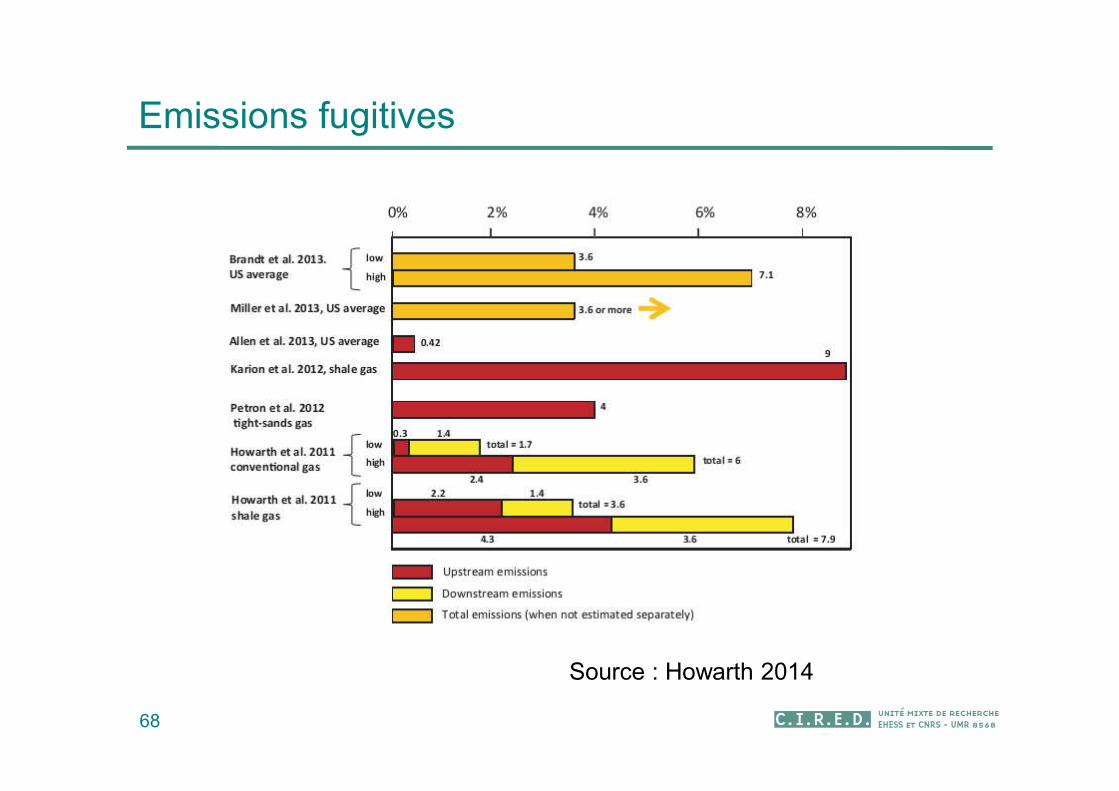
Emissions fugitives
68
Source : Howarth 2014
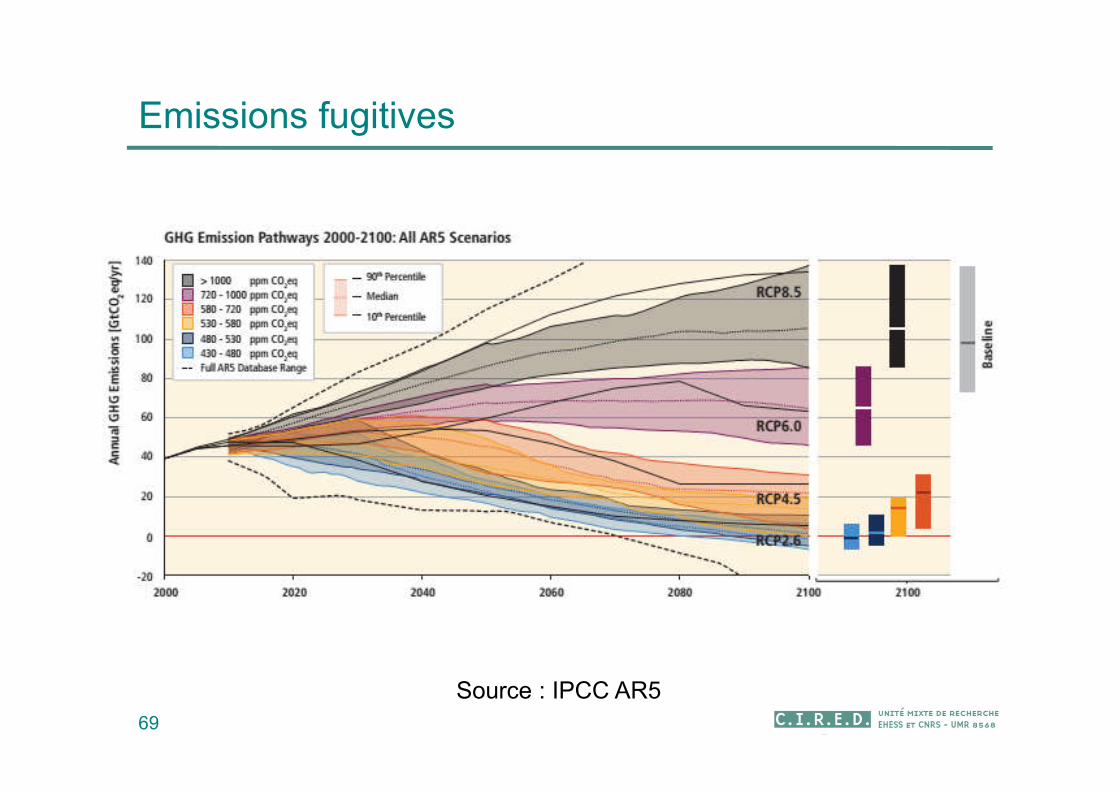
Emissions fugitives
69
Source : IPCC AR5
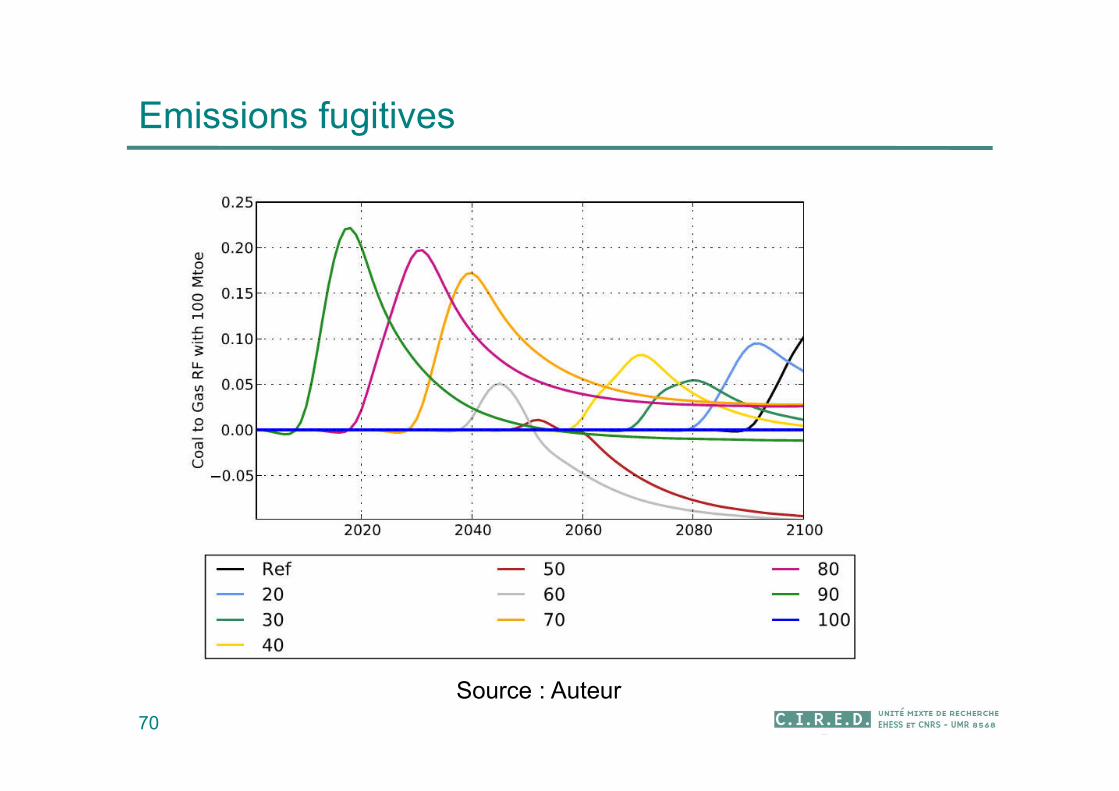
Emissions fugitives
70
Source : Auteur
Le gaz de Lacq
71
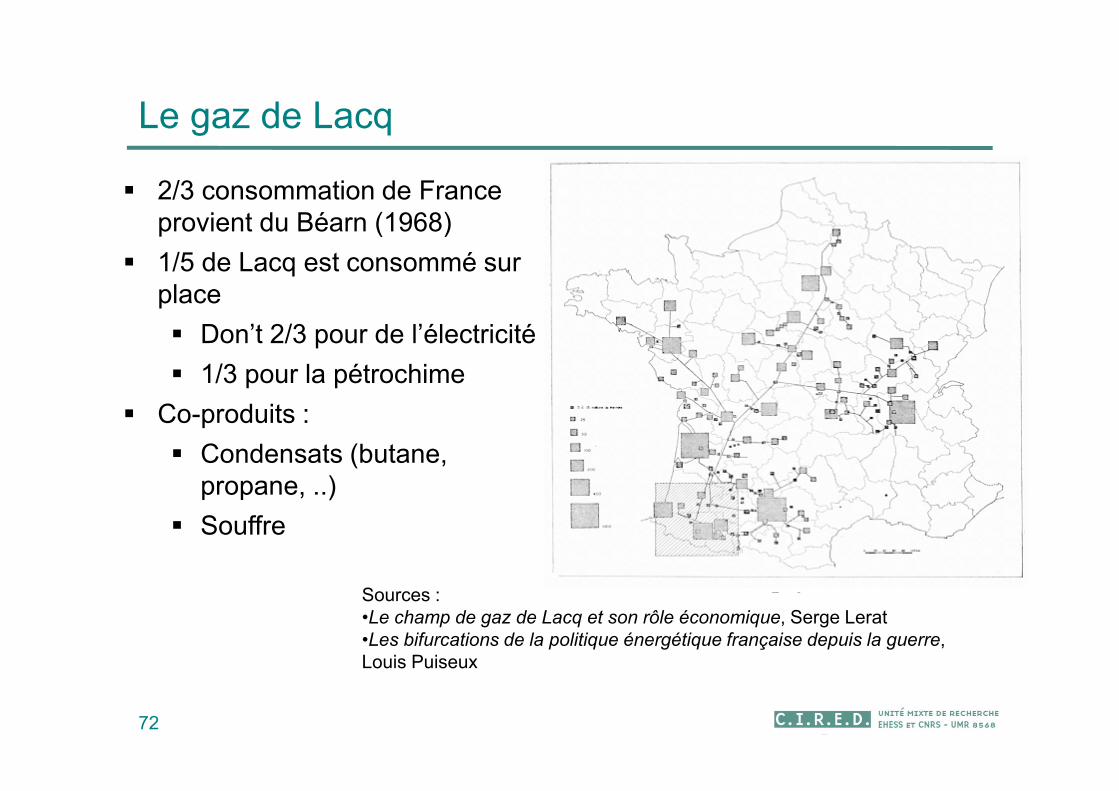
Le gaz de Lacq
72
2/3 consommation de France provient du Béarn (1968)
1/5 de Lacq est consommé sur place
Don’t 2/3 pour de l’électricité
1/3 pour la pétrochime
Co-produits :
Condensats (butane, propane, ..)
Souffre
Sources :•Le champ de gaz de Lacq et son rôle économique, Serge Lerat•Les bifurcations de la politique énergétique française depuis la guerre, Louis Puiseux
Le principe de précaution
73
Le principe de précaution
74
« l'absence de certitudes, compte tenu des connaissances scientifiques et
techniques du moment, ne doit pas retarder l'adoption de mesures effectives et
proportionnées visant à prévenir un risque de dommages graves et
irréversibles à l'environnement à un coût économiquement acceptable »
(source : loi Barnier de 1995)
« compatibles avec l'idée de progrès scientifique et technique, avec l'activité de
recherche et avec le développement d'activités économiques, pour autant que
ces dernières soient conçues et menées avec suffisamment de prudence. Il
s'agit d'accompagner l'innovation et la prise de risque et pas de les empêcher
»
(source : Gaz de schiste: faut-il se débarrasser du principe de précaution?, Olivier Godard, Huffington
Post)

Scénarios prospectifs :GdS et LTO aux US : le
paradoxe de la compétitivité
75
Succès US : causes
76
Couplage de technologies
Géologie favorable – densité de population
Propriété du sol
Degré de libéralisation du marché gazier, étendu du réseau
Culture du pétrole, tissu denses de sociétés spécialisées
Réglementation favorable (notamment sur l’eau)
Succès US
77
Chute du prix du gaz
Prix spot /3 depuis 2008, prix industriel 3-4 fois moins cher qu’en Europe
Nombreuses retombées économiques
Revenus des ménages - emplois
Prix de l’électricité (2-3 fois moins cher /Europe)
Investissements en prétrochimie
Projets d’exporation
Plutôt vers le marché asiatique
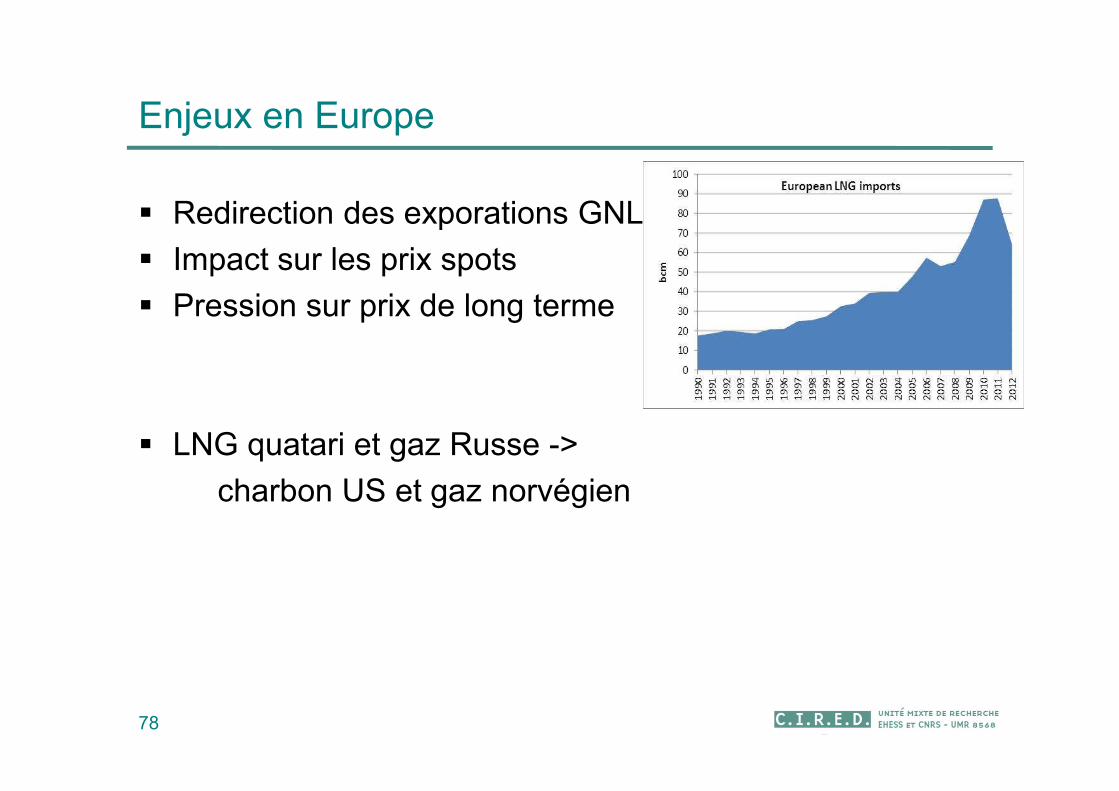
Enjeux en Europe
Redirection des exporations GNL
Impact sur les prix spots
Pression sur prix de long terme
LNG quatari et gaz Russe ->
charbon US et gaz norvégien
78
The economic impact of shale gas in the literature
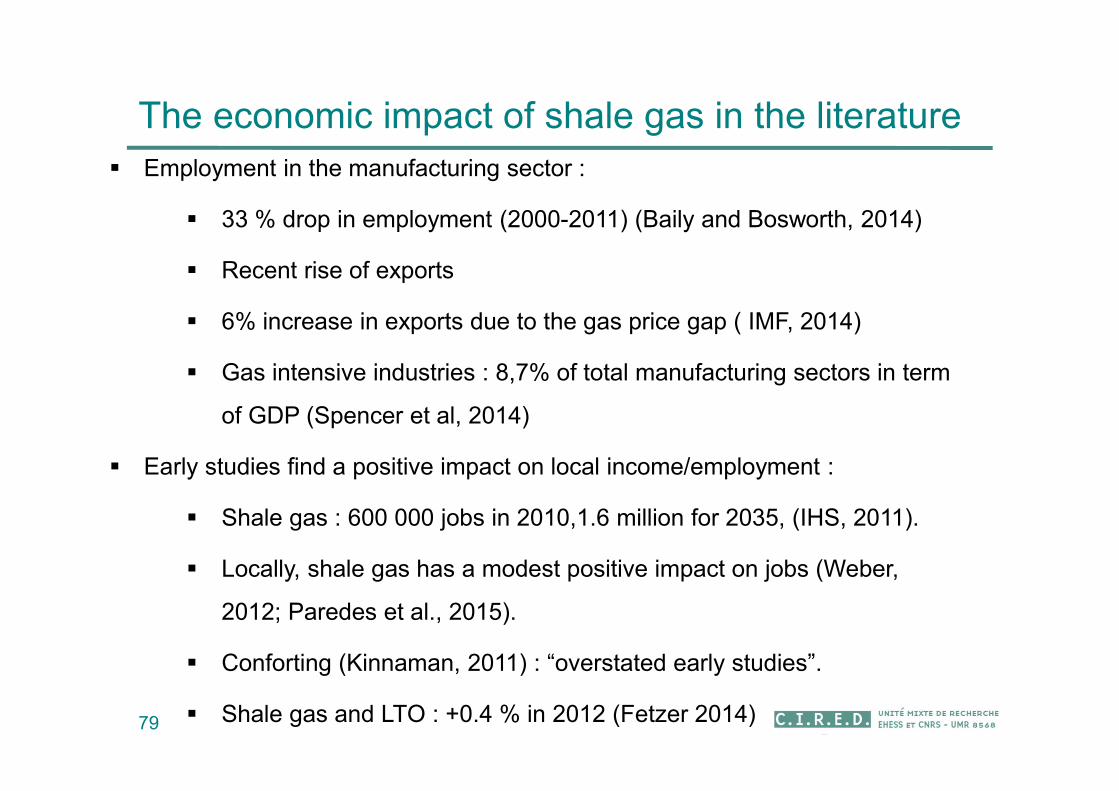
Employment in the manufacturing sector :
33 % drop in employment (2000-2011) (Baily and Bosworth, 2014)
Recent rise of exports
6% increase in exports due to the gas price gap ( IMF, 2014)
Gas intensive industries : 8,7% of total manufacturing sectors in term
of GDP (Spencer et al, 2014)
Early studies find a positive impact on local income/employment :
Shale gas : 600 000 jobs in 2010,1.6 million for 2035, (IHS, 2011).
Locally, shale gas has a modest positive impact on jobs (Weber,
2012; Paredes et al., 2015).
Conforting (Kinnaman, 2011) : “overstated early studies”.
Shale gas and LTO : +0.4 % in 2012 (Fetzer 2014)79
80
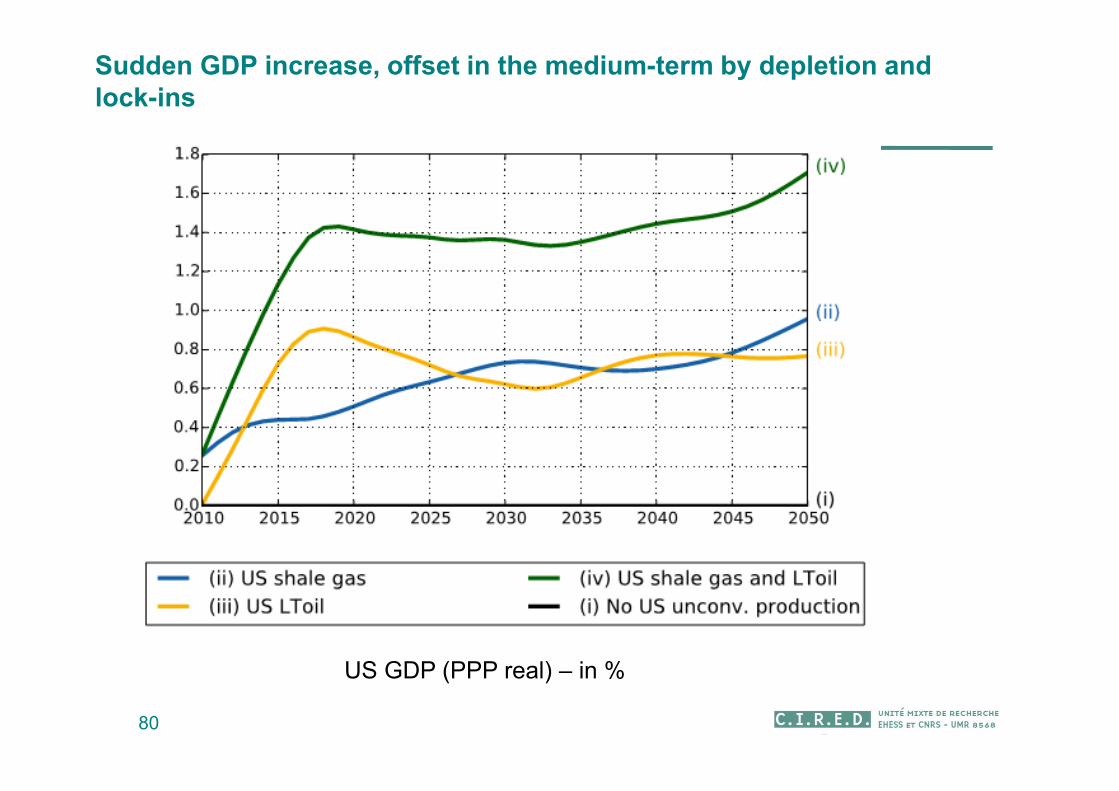
Sudden GDP increase, offset in the medium-term by depletion and lock-ins
US GDP (PPP real) – in %
81
Main results GDP in 2050 :
1 % (shale gas), 0.7% (Lto), 1.7% (both)
Similar studies
1.5% GDP increase for of both resources production (Hunt et al., 2015)
0.84% GDP increase for shale gas only (Spencer et al., 2014)
Energy account for 5,4% in US GDP (2050), this share increase by 11.8% because of
unconv. resource production :
-> The direct effect of the energy boom accounts for a third of the 1.7% increase
Indirect mechanisms :
+1% increase of investments
+1.9% of households and public expenditures
-0.2% decrease of exports
-1.5% of non-energy exports in the medium-term (2030)
82
The medium-term (2030) effect on exports
Term of trade increase
+0.5% for energy intensive industries’ production costs relatively to world prices
+1.1% for non-energy intensive industries’ production costs relatively to world prices
Despite lower energy costs
-3% for electricity, -8% for gas
Because of higher wages (+4%) : unemployment reduced in a more domestic-
oriented economy :
Exp -, Imp +
Non-energy intensive industries and services : more labor intensive
Non-energy exports decrease (52% share for energy intensive industries, 26% for
non-energy intensive industries)
More than offset the rise of energy exports
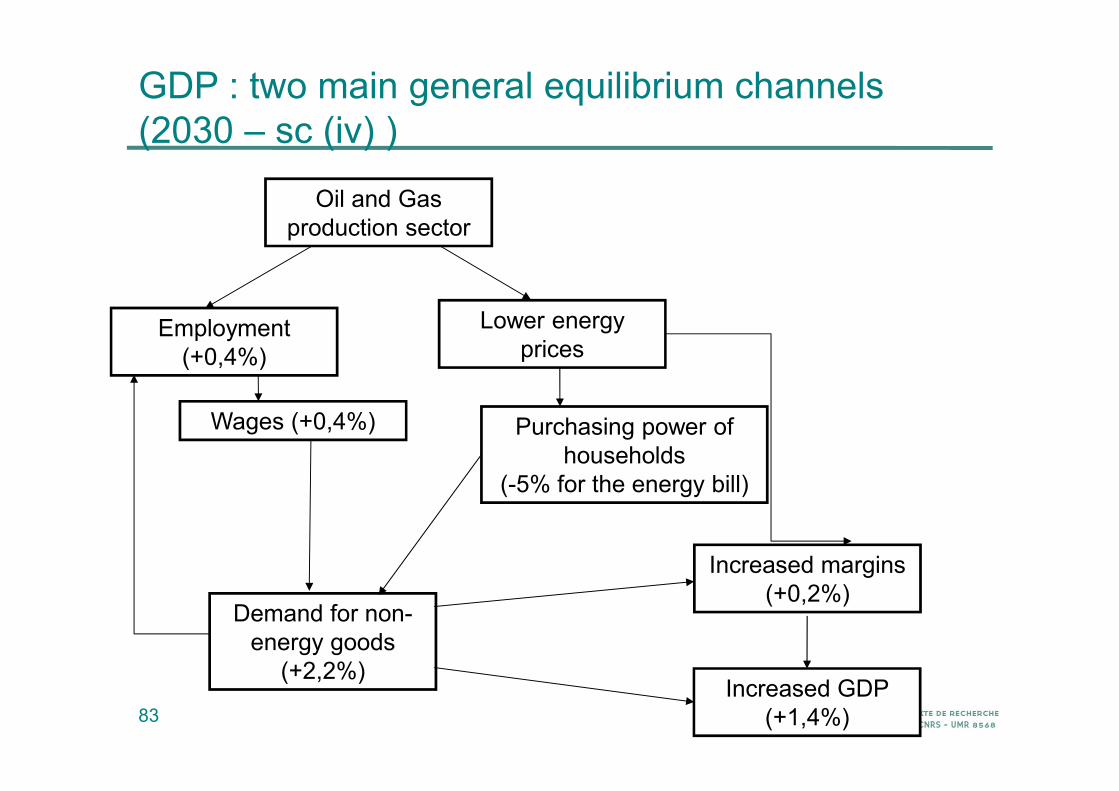
GDP : two main general equilibrium channels (2030 – sc (iv) )
83
Purchasing power of households
(-5% for the energy bill)
Lower energy prices
Demand for non-energy goods
(+2,2%)
Employment (+0,4%)
Oil and Gas production sector
Wages (+0,4%)
Increased margins (+0,2%)
Increased GDP (+1,4%)
84
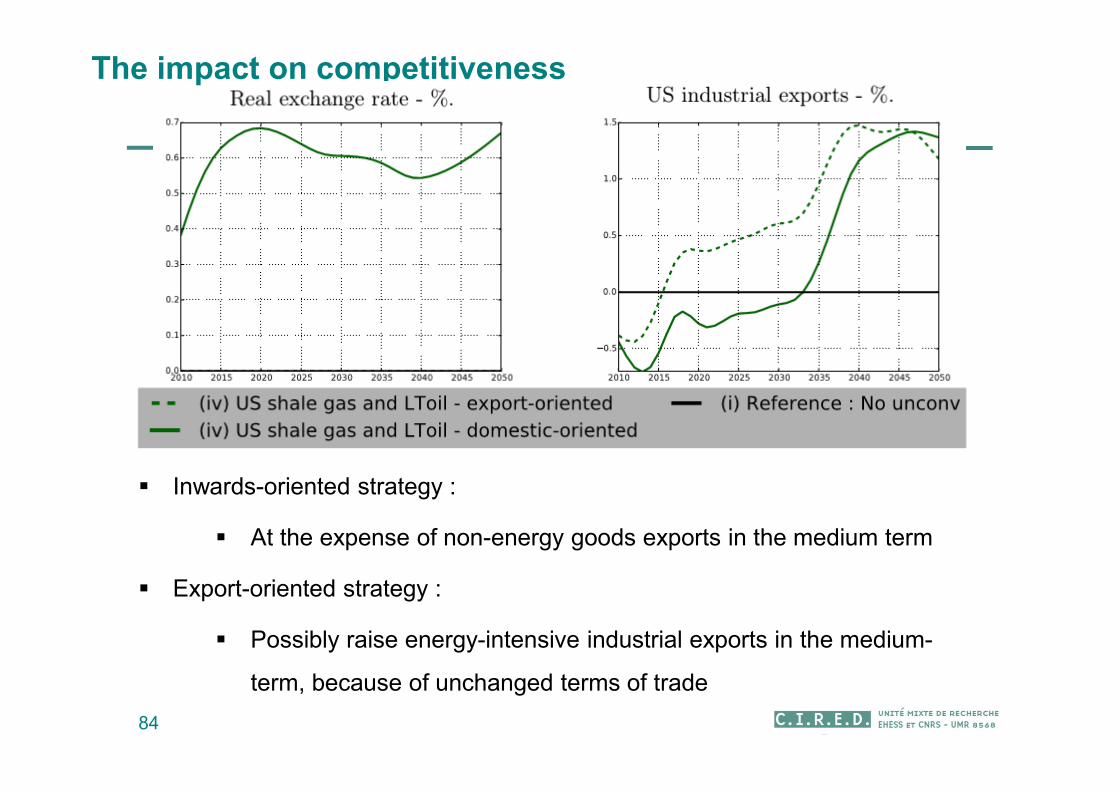
The impact on competitiveness
Inwards-oriented strategy :
At the expense of non-energy goods exports in the medium term
Export-oriented strategy :
Possibly raise energy-intensive industrial exports in the medium-
term, because of unchanged terms of trade
85
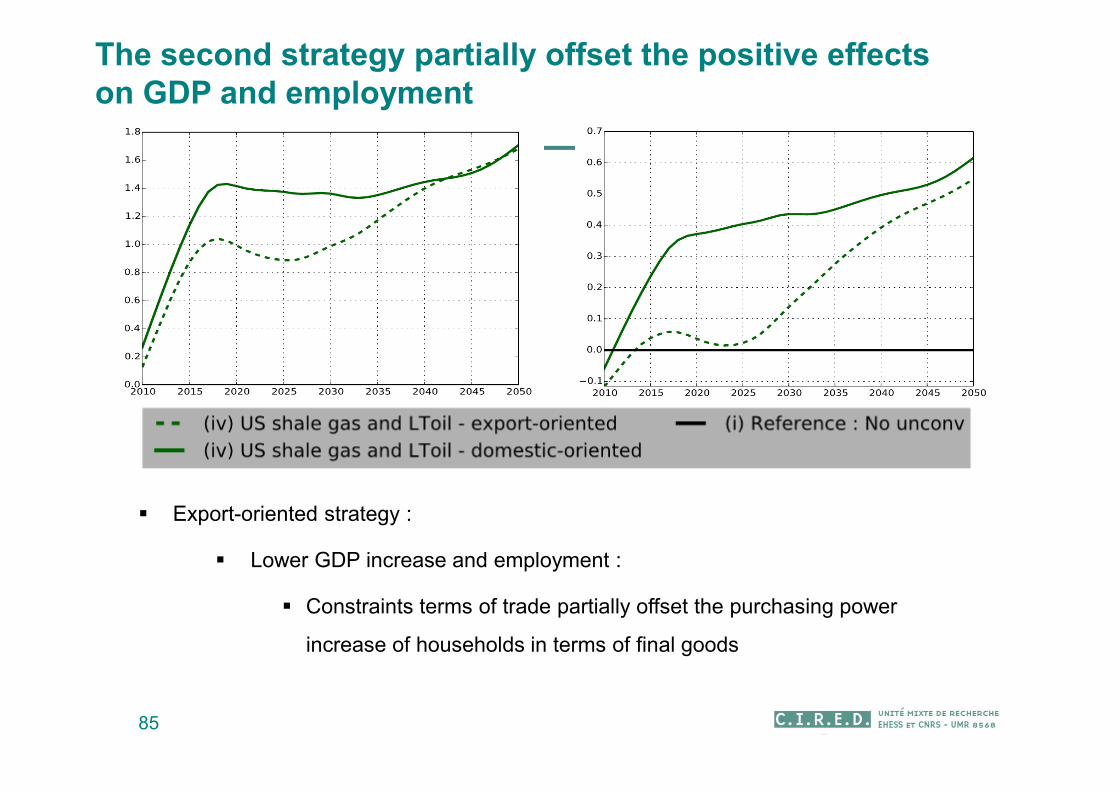
The second strategy partially offset the positive effects on GDP and employment
Export-oriented strategy :
Lower GDP increase and employment :
Constraints terms of trade partially offset the purchasing power
increase of households in terms of final goods
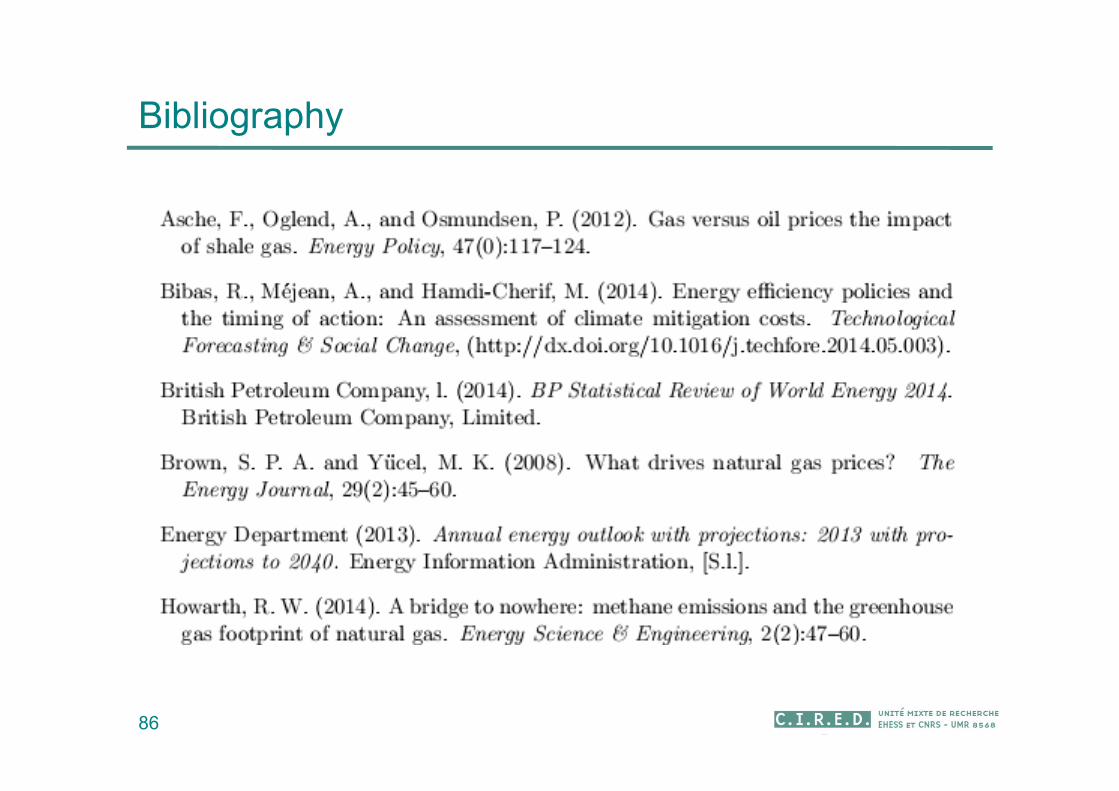
Bibliography
86
Bibliography
87
Bibliography
88

Merci pour votre attention !
89
Contact :
Présentation :
http://www.imaclim.centre-cired.fr/-> Equipe-> Christophe Cassen
Annexe 1Dynamique d’exploitation du
pétrole et politiques climatiques
90
91
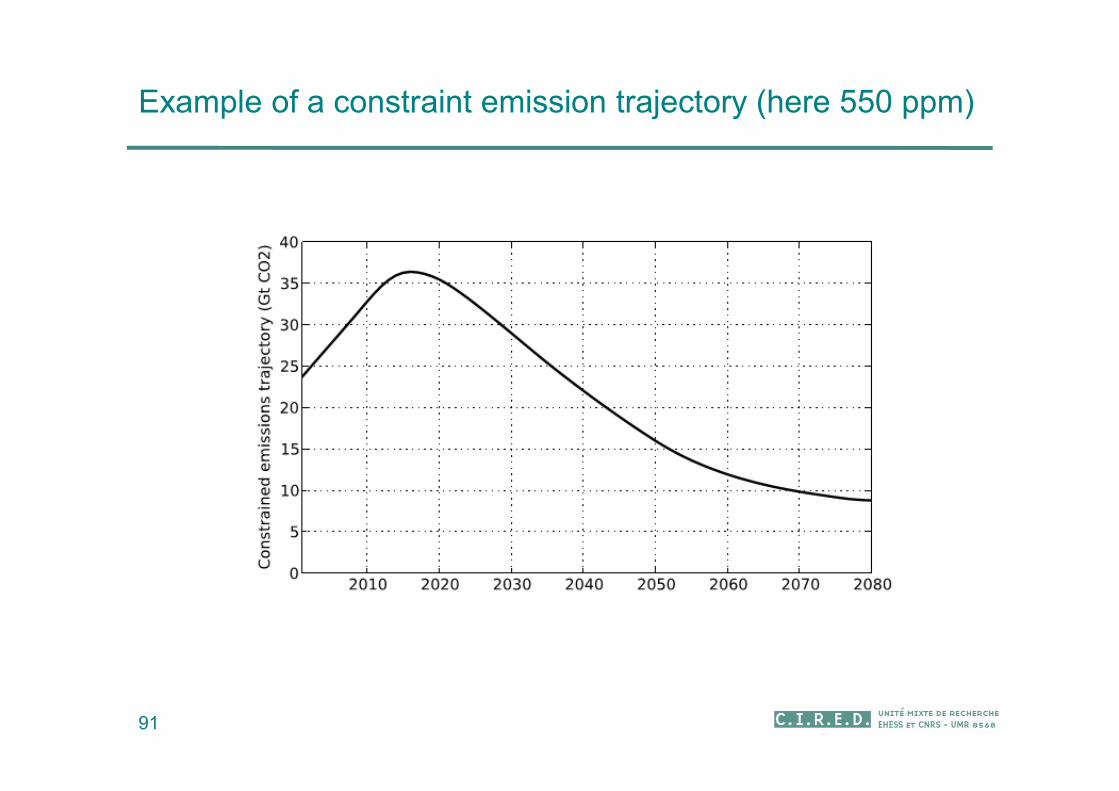
Example of a constraint emission trajectory (here 550 ppm)
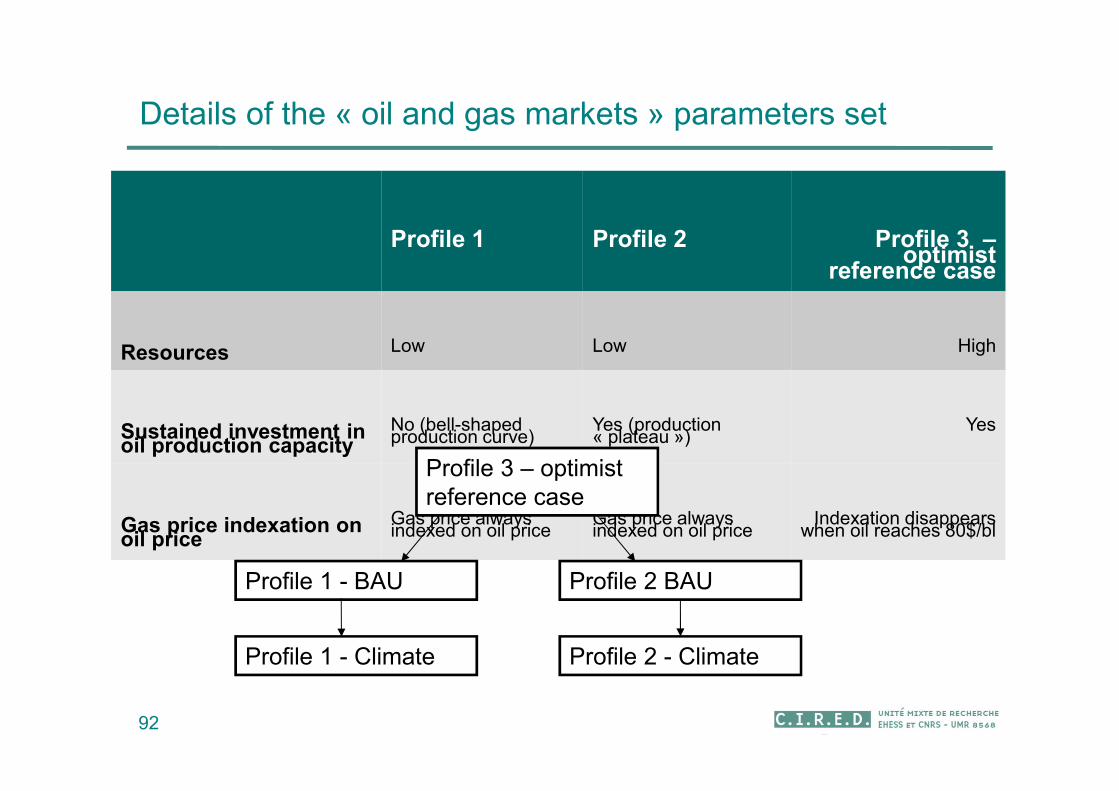
Details of the « oil and gas markets » parameters set
92
Profile 1 Profile 2 Profile 3 –optimist
reference case
Resources Low Low High
Sustained investment in oil production capacity
No (bell-shaped production curve)
Yes (production « plateau »)
Yes
Gas price indexation on oil price
Gas price always indexed on oil price
Gas price always indexed on oil price
Indexation disappears when oil reaches 80$/bl
Profile 3 – optimist reference case
Profile 1 - BAU Profile 2 BAU
Profile 1 - Climate Profile 2 - Climate
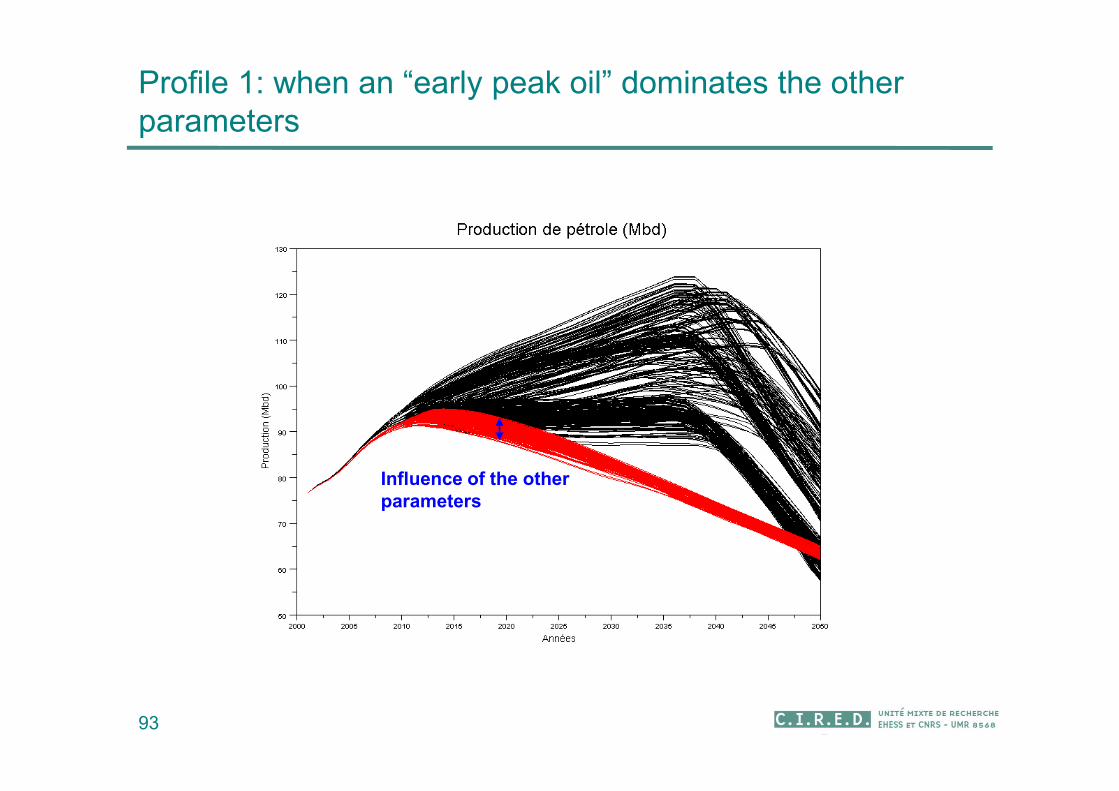
Influence of the other parameters
93
Profile 1: when an “early peak oil” dominates the other parameters
94
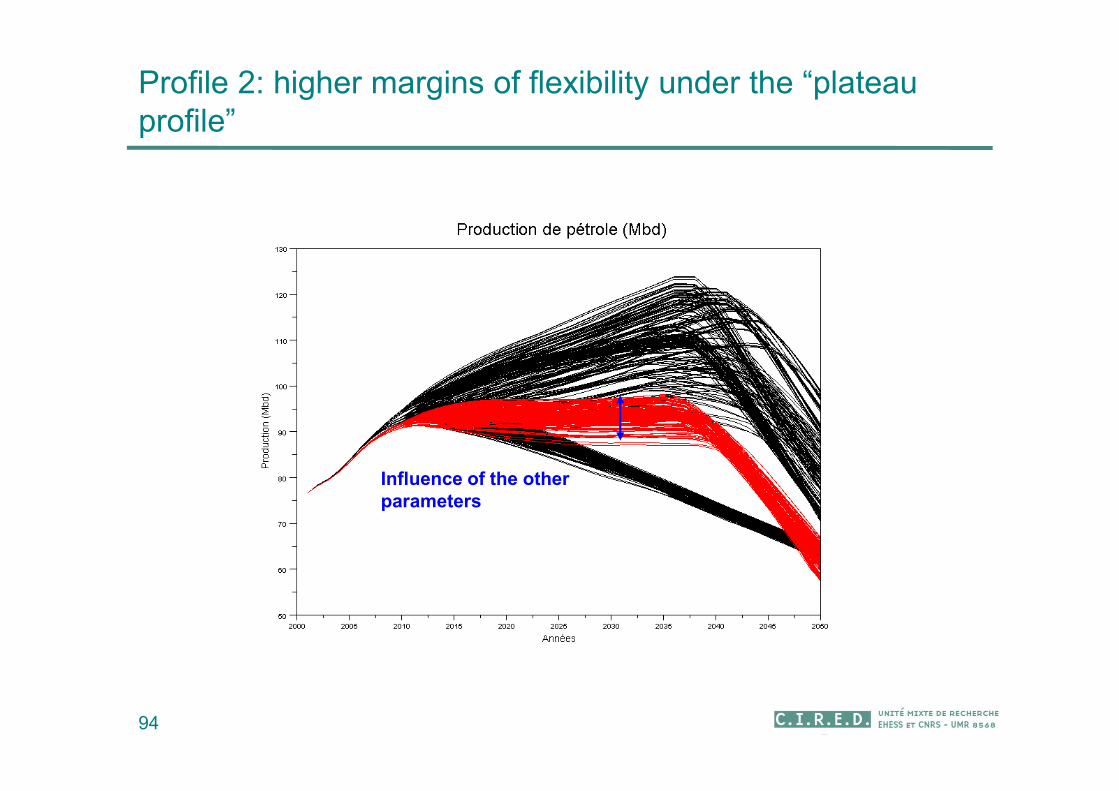
Influence of the other parameters
Profile 2: higher margins of flexibility under the “plateau profile”
95
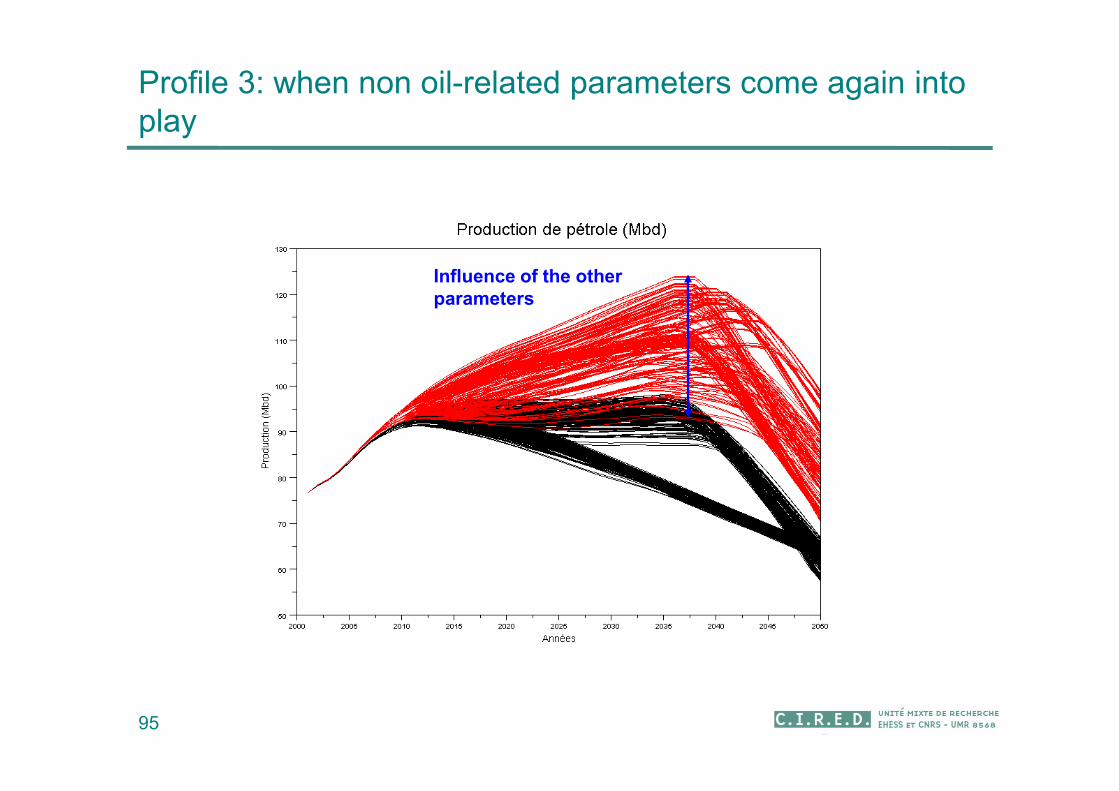
Influence of the other parameters
Profile 3: when non oil-related parameters come again into play
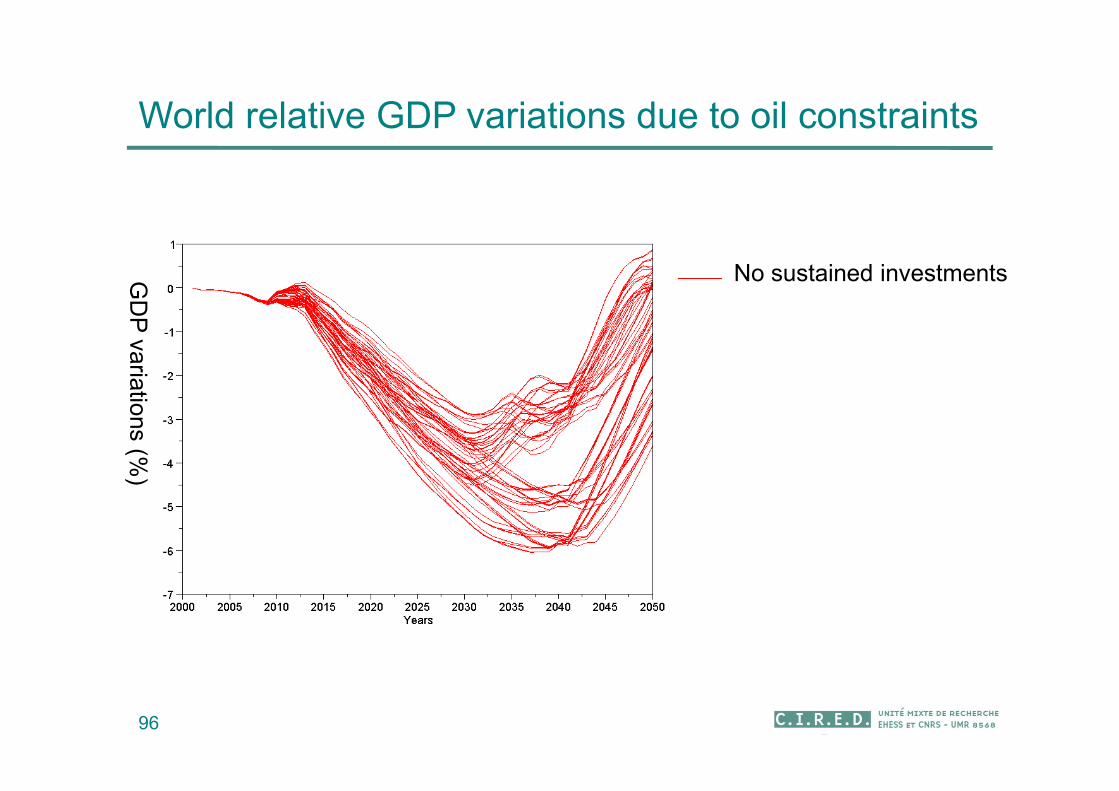
World relative GDP variations due to oil constraints
96
No sustained investmentsGD
P va
riatio
ns (%
)
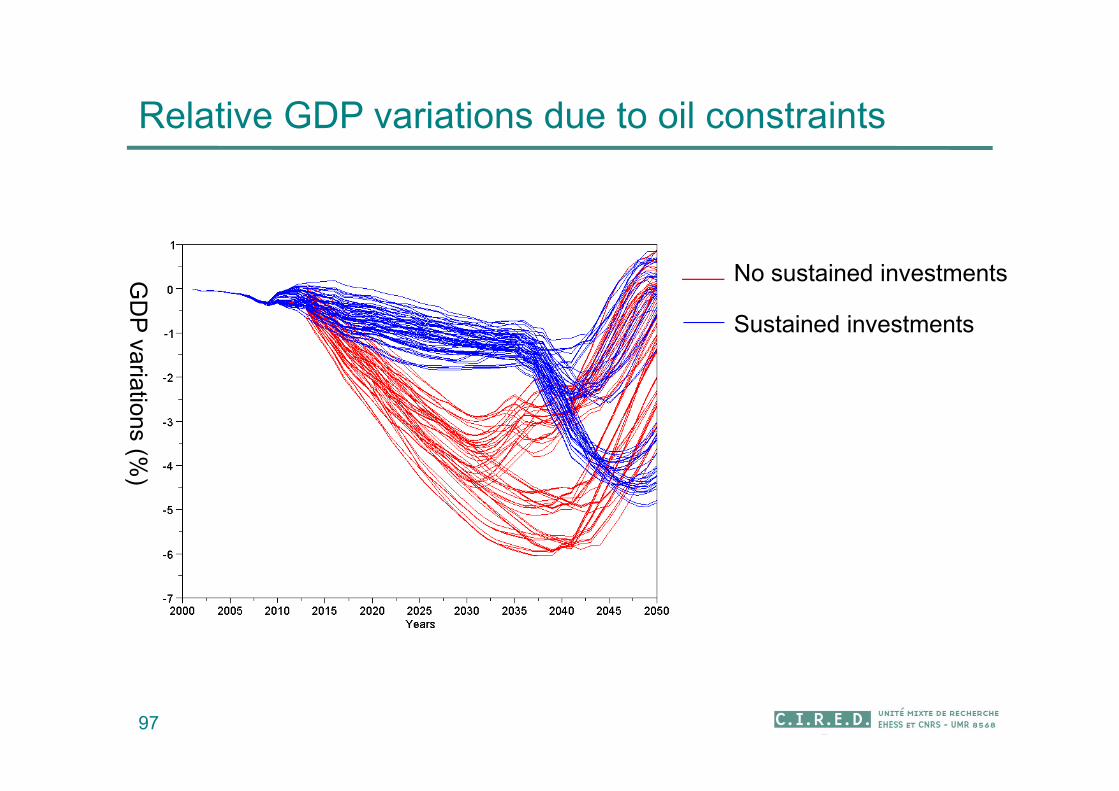
Relative GDP variations due to oil constraints
97
No sustained investmentsGD
P va
riatio
ns (%
)
Sustained investments
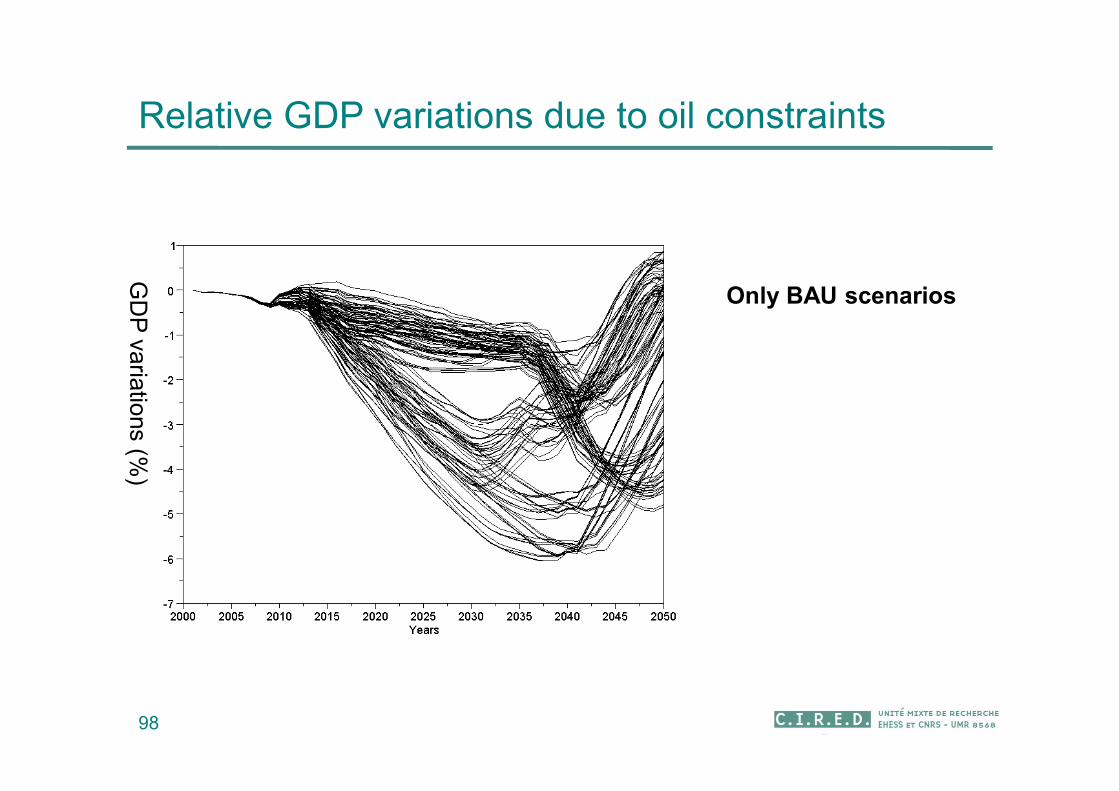
Relative GDP variations due to oil constraints
98
GD
P va
riatio
ns (%
)
Only BAU scenarios
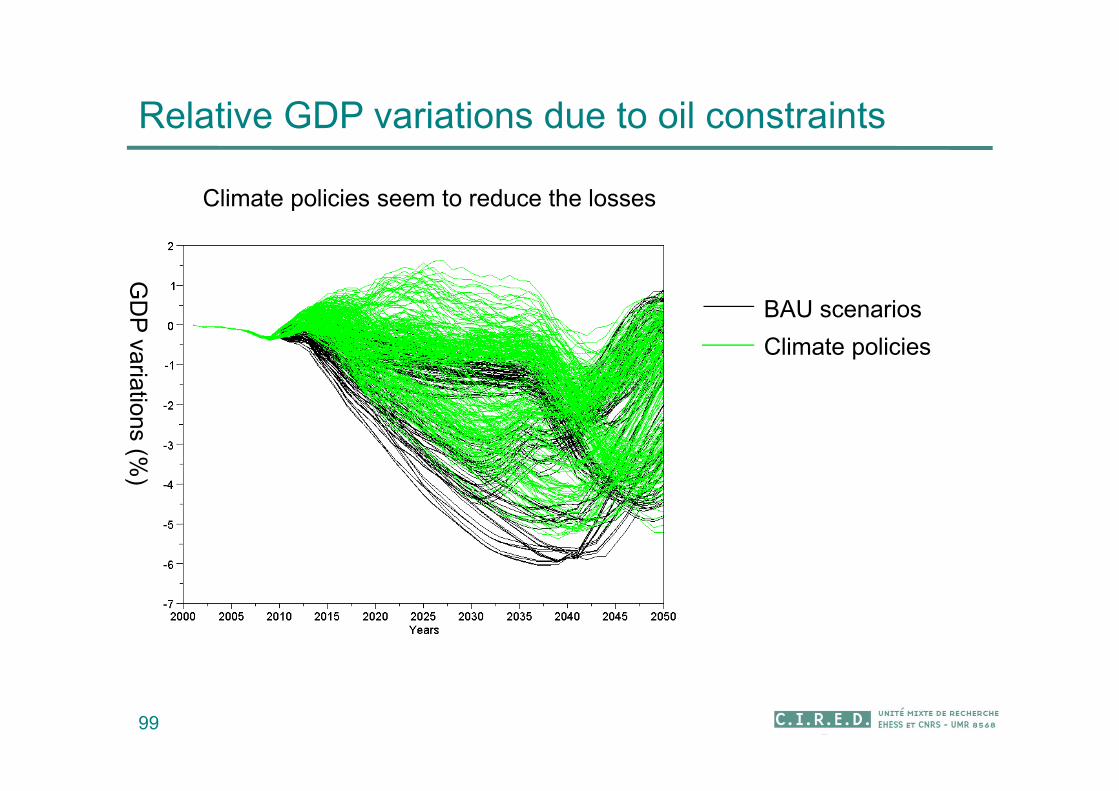
Relative GDP variations due to oil constraints
99
BAU scenarios
GD
P va
riatio
ns (%
)
Climate policies
Climate policies seem to reduce the losses
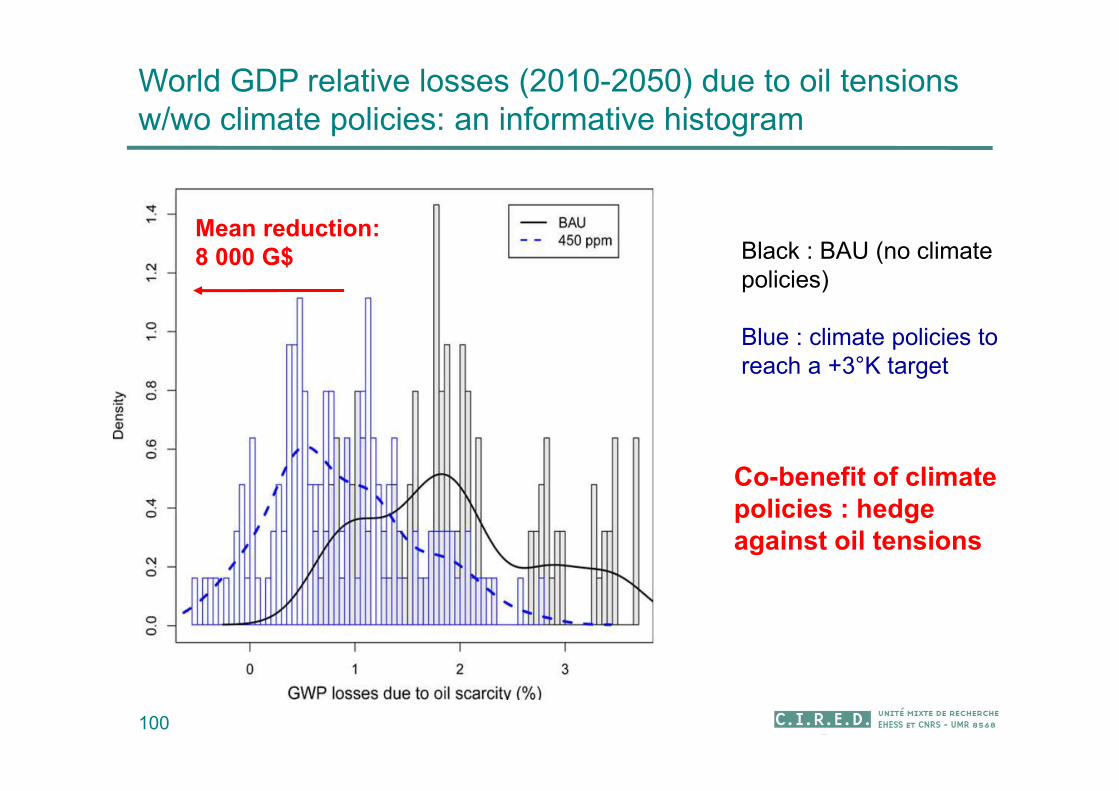
World GDP relative losses (2010-2050) due to oil tensions w/wo climate policies: an informative histogram
100
Black : BAU (no climate policies)
Blue : climate policies to reach a +3°K target
Mean reduction: 8 000 G$
Co-benefit of climate policies : hedge against oil tensions

World GDP relative losses (2010-2050) due to oil tensions w/wo climate policies: an informative histogram
101
Black : BAU (no climate policies)
Blue : climate policies to reach a +3°K target
Mean reduction: 8 000 G$
Co-benefit of climate policies : hedge against oil tensions