Embed Size (px)
Citation preview
Energy efficient trace removal by extractive distillation
Citation for published version (APA):Jongmans, M. T. G. (2012). Energy efficient trace removal by extractive distillation. Eindhoven: TechnischeUniversiteit Eindhoven. https://doi.org/10.6100/IR732573
DOI:10.6100/IR732573
Document status and date:Published: 01/01/2012
Document Version:Publisher’s PDF, also known as Version of Record (includes final page, issue and volume numbers)
Please check the document version of this publication:
• A submitted manuscript is the version of the article upon submission and before peer-review. There can beimportant differences between the submitted version and the official published version of record. Peopleinterested in the research are advised to contact the author for the final version of the publication, or visit theDOI to the publisher's website.• The final author version and the galley proof are versions of the publication after peer review.• The final published version features the final layout of the paper including the volume, issue and pagenumbers.Link to publication
General rightsCopyright and moral rights for the publications made accessible in the public portal are retained by the authors and/or other copyright ownersand it is a condition of accessing publications that users recognise and abide by the legal requirements associated with these rights.
• Users may download and print one copy of any publication from the public portal for the purpose of private study or research. • You may not further distribute the material or use it for any profit-making activity or commercial gain • You may freely distribute the URL identifying the publication in the public portal.
If the publication is distributed under the terms of Article 25fa of the Dutch Copyright Act, indicated by the “Taverne” license above, pleasefollow below link for the End User Agreement:www.tue.nl/taverne
Take down policyIf you believe that this document breaches copyright please contact us at:[email protected] details and we will investigate your claim.
Download date: 16. Mar. 2020
Energy Efficient Trace Removal
by Extractive Distillation
M.T.G. Jongmans
Doctoral Committee
Chairman prof. dr. J. Meuldijk Eindhoven University of Technology
Promoter prof. dr. ir. A.B. de Haan Eindhoven University of Technology
Assistant promoter dr. ir. B. Schuur Eindhoven University of Technology
Examiners prof. dr. ir. M.C. Kroon Eindhoven University of Technology
prof. dr. ir. G.J. Witkamp Delft University of Technology
dr. ir. D.C. Nijmeijer University of Twente
prof. dr. ir. A. Nijmeijer University of Twente
ir. G. Bargeman AkzoNobel Chemicals B.V.
This project was an ISPT project (Institute for Sustainable Process Technology, The
Netherlands).
Energy Efficient Trace Removal by Extractive Distillation
Jongmans, M.T.G.
ISBN: 978-90-386-3148-6
A catalogue record is available from the Eindhoven University of Technology Library.
Printed by Gildeprint, Enschede, The Netherlands.
Copyright © M.T.G. Jongmans. The Netherlands, 2012.
All rights reserved.
Energy Efficient Trace Removal by Extractive Distillation
PROEFSCHRIFT
ter verkrijging van de graad van doctor aan de
Technische Universiteit Eindhoven, op gezag van de
rector magnificus, prof.dr.ir. C.J. van Duijn, voor een
commissie aangewezen door het College voor
Promoties in het openbaar te verdedigen
op woensdag 20 juni 2012 om 16.00 uur
door
Mark Theodorus Gerardus Jongmans
geboren te Standdaarbuiten

Dit proefschrift is goedgekeurd door de promotor:
prof.dr.ir. A.B. de Haan
Copromotor:
dr.ir. B. Schuur
Summary
I
Summary
Separation processes contribute for about 40–70 % to the total energy requirements of the
chemical process industry. Especially when trace removal is required to manufacture high
purity products, traditional separation technologies become extremely expensive and are
not providing satisfying solutions. In this work, trace removal is defined as the separation
of impurities or (by) products at a level of 100–1000 ppm. The main reason for trace
removal separation is the need to meet the purity demanded by customers further
processing and/or legislation.
Distillation is currently used to conduct 90–95 % of all separations in the chemical process
industry. The drawbacks of distillation are the poor energy efficiency and selectivity. These
drawbacks are above all applicable to cases where impurities have to be removed with
molecular structures closely resembling the main component (and hence, having similar
boiling points) and are present at ppm level in a highly concentrated, organic stream. Two
representative industrial examples are the separation of ethylbenzene traces (~100 ppm)
from styrene and dichloroacetic acid (DCA) traces (~1000 ppm) from monochloroacetic
acid (MCA). Both are examples of close-boiling mixtures (= low relative volatility).
A well-established technology to separate close-boiling mixtures is extractive distillation.
In extractive distillation, a solvent is added to a distillation column to alter the relative
volatility of the system to be separated, and, thereby, to reduce the capital and operational
expenditures (OPEX and CAPEX). Nowadays, extractive distillation is already applied to
produce high purity products in benzene, toluene, xylene processes with purities up to
99.995 wt%. Therefore, the main objective of the research described in this thesis was to
investigate whether extractive distillation could be a promising technology to obtain high
purity products for the two representative industrial examples. For both cases, the trace
removal and bulk separation were both performed by extractive distillation processes to be
able to replace the current separation processes, and thus also achieving process
intensification. Sulfolane, which is a commonly applied organic solvent, and a wide range
of ionic liquids (ILs) were investigated for the separation of ethylbenzene from styrene to
obtain ethylbenzene impurity levels lower than 10 ppm in styrene. Complexing agents
(extractants) were studied to separate DCA from MCA to obtain high purity MCA (wDCA <
50 ppm).
First, a solvent/extractant screening study was performed for both industrial cases followed
by the measurement of binary and ternary liquid–liquid and vapor–liquid equilibrium data
for the selected solvents and the regression of these data by thermodynamic models.
Subsequently, the parameters obtained from the regressions were used in equilibrium stage
process models to setup a conceptual process design for the extractive distillation processes
Summary
II
including solvent regeneration. The conceptual process models that were developed using
Aspen Plus®, were applied for the calculation of the energy requirements, leading to the
operational expenditures (OPEX). The capital expenditures (CAPEX) were estimated using
the Aspen Process Economic Analyzer®, and finally the total annual costs (TAC) were
estimated from the OPEX and CAPEX. The current distillation unit was used as the
benchmark process for the ethylbenzene/styrene system. The extractive distillation process
for the MCA/DCA system could not be compared to the current separation process,
because no process data is available about this process. Therefore, the added production
costs per tonne of MCA product were calculated and compared to the current high purity
MCA market price.
Ethylbenzene/styrene
A proper solvent should have a high selectivity as well as a high solvent capacity for the
mixture to be separated by extractive distillation. Preferably, the solvent is even fully
miscible with the ethylbenzene/styrene system, which was observed for the benchmark
solvent sulfolane, whereas from the IL screening study it was found that ILs form multiple
liquid phases with the ethylbenzene/styrene system. However, several ILs outperformed the
benchmark solvent sulfolane with selectivities up to 2.5, whereas sulfolane displayed a
solvent selectivity of about 1.6. Furthermore, it was observed from the IL screening study
that a clear trade-off exists between the solvent capacity and selectivity. The ILs 3-methyl-
N-butylpyridinium tetracyanoborate ([3-mebupy][B(CN)4]), 4-methyl-N-butylpyridinium
tetrafluoroborate ([4-mebupy][BF4]), and 1-ethyl-3-methylimidazolium thiocyanate
([EMIM][SCN]) were selected as promising candidates to study in more detail. The solvent
capacities for ethylbenzene and styrene increase in the order of [EMIM][SCN] > [4-
mebupy][BF4] > [3-mebupy][B(CN)4]. The selectivity for the ethylbenzene/styrene system
decreases in the same order. Binary and ternary phase equilibrium data were obtained for
the systems ethylbenzene + styrene + selected ILs, and ethylbenzene + styrene + sulfolane.
The NRTL model was able to correlate the phase equilibrium data adequately, and the
parameters that were obtained by regression of the experimental data were used in the
following chapters in the process simulations.
A very important factor in extractive distillation processes is the recovery of the solvent. If
that cannot be done adequately and cost effectively, the process cannot be competitive.
Therefore, a screening of several IL recovery technologies was performed, for which the IL
[4-mebupy][BF4] was taken as a model IL. It was found that this IL should be purified to at
least 99.6 wt% in the regeneration section to maintain the distillate and bottom purity
requirements for the primary separation of ethylbenzene and styrene in the extractive
distillation column. From the TAC, the overall conclusion can be drawn that evaporation
using very low pressures (P < 10 mbar) and ethylbenzene stripping, both in combination
with an evaporator operating at mild conditions (T = 130 oC, Tcondenser = 20 oC), are the most
Summary
III
promising technologies to recover styrene monomer from ILs, although the differences in
TAC compared to stripping with nitrogen for example are rather small.
The conceptual design study of the total extractive distillation process showed that the IL
[4-mebupy][BF4] outperforms the other two selected ILs [3-mebupy][B(CN)4] and
[EMIM][SCN] with up to 11.5 % lower energy requirements. The OPEX of the [4-
mebupy][BF4] process are 43.2 % lower than the current distillation process and 5 % lower
than the extractive distillation process using sulfolane. However, the CAPEX were about
23 % higher for the [4-mebupy][BF4] process compared to the sulfolane process. Finally,
from the TAC, the conclusion can be drawn that all extractive distillation processes clearly
outperform the current distillation process to obtain high purity styrene with up to 40 %
lower TAC, but that ILs do not perform better than sulfolane.
MCA/DCA
An adequate extractant should enhance the relative volatility of the MCA/DCA system to a
value above 1.8 to obtain an energy efficient extractive distillation process, and the formed
complex between the extractant and the solute should be reversible to regenerate the
solvent. Moreover, the extractant should be thermally/chemically stable in the strongly
acidic environment to avoid irreversible extractant loss and considerable by-product
formation, and the extractant should have a sufficiently high boiling point to facilitate easy
regeneration. The extractant screening study showed that many extractants outperform the
benchmark extractant sulfolane with relative volatilities of the MCA/DCA mixture up to
5.9, whereas sulfolane displays a relative volatility of 1.6. There is, however, a clear trade-
off between the effect of the extractant on the relative volatility of the MCA/DCA system
and the regeneration ability of the extractant. Extractants with high effect on the relative
volatility of the MCA/DCA system appeared to be difficult to regenerate in the
regeneration column. Moreover, only the tested ethers, phosphine oxides, ketones, and the
benchmark extractant sulfolane were found to be stable in the strongly acidic MCA/DCA
environment. Finally, the extractant diethylene glycol dipentyl ether (DGDP) was selected,
which improves the relative volatility of the MCA/DCA system up to 2.1–2.4 at a
DCA/extractant mole ratio of 1. Moreover, DGDP could easily be regenerated using
distillation and it was found to be thermally and chemically stable.
After succeeding in finding a promising extractant, binary and ternary VLE data were
determined for the system MCA + DCA + DGDP at 5, 7.5, and 10 kPa to be able to
simulate the extractive distillation process. The non-ideal behavior in the liquid and vapor
phase were well correlated with the NRTL and Hayden-O’Connell (HOC) model,
respectively.
Summary
IV
The conceptual design study showed that the TAC for the extractive distillation process are
1.6 M€/year for a 70.000 metric tonnes annually MCA plant. The addition to the MCA
production costs are 23 €/tonne MCA product that is rather low compared to the current
(high purity) MCA price of 1500 €/tonne. Therefore, the conclusion can be drawn that
extractive distillation using DGDP as extractant is a promising technology to obtain high
purity MCA.
Overall conclusion and outlook
From both industry cases, the conclusion can be drawn that extractive distillation is a very
promising concept to obtain high purity products from close-boiling mixtures by replacing
the currently applied separation technology. For the ethylbenzene/styrene separation,
sulfolane slightly outperformed the ILs, and since sulfolane is already applied on industrial
scale it is easier to implement this solvent on short term. However, for implementation on
industrial scale, still some further research needs to be performed.
The polymerization rate of styrene in sulfolane requires attention, because some solvents
can enhance polymerization rates, which affects the required inhibitor flow. Moreover, it is
crucial to find a separation method to effectively separate heavies, like styrene polymers,
from ILs. Adding an antisolvent like methanol was tried and seems promising. Finally,
pilot plant experiments needs to be performed, because mass transfer efficiency influences
the required packing height and the hydrodynamic capacity of a packing depends strongly
on the system to be separated. On the long term, the energy efficiency of the
ethylbenzene/styrene separation by extractive distillation using ILs can be improved by
screening for an IL, which has a high solvent capacity as well as high selectivity for the
ethylbenzene/styrene system. Furthermore, finding more possibilities for solvent heat
recovery in the styrene production process can also improve the energy efficiency
significantly.
For the MCA/DCA separation, the possible savings in OPEX and CAPEX by the
application of the extractive distillation process in the current production process should be
investigated. Furthermore, the thermal/chemical degradation of the extractant DGDP in the
strongly acidic environment needs to be studied in more detail, because it is essential to
determine the required extractant make-up flow. Furthermore, it is very important to
determine which degradation products are formed and where these products will end up.
Next to that, the effect of impurities in the extractant recycle requires further investigation
as well. Also for this case, pilot plant experiments should be carried out to determine the
mass transfer efficiency and the hydrodynamic capacity.
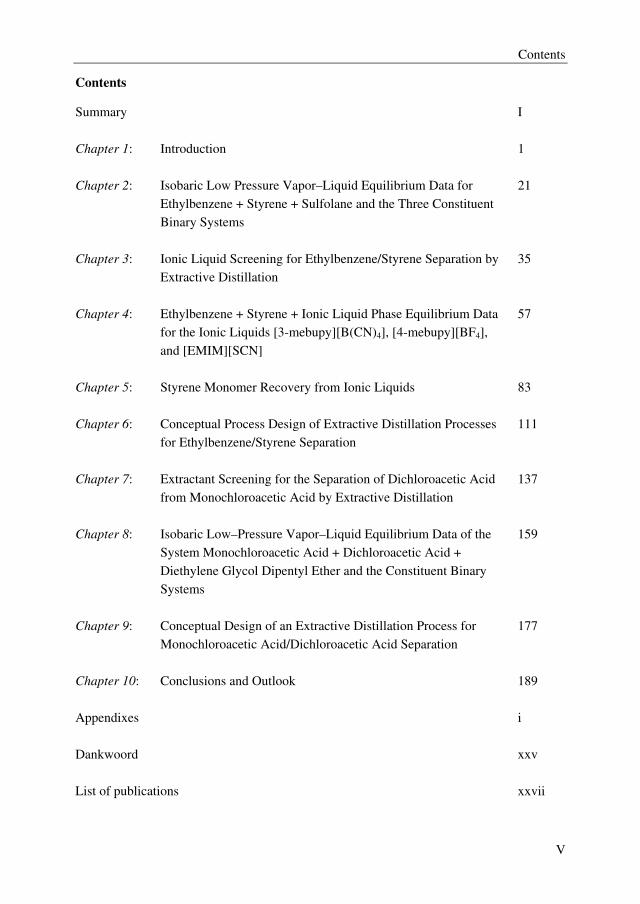
Contents
V
Contents
Summary
I
Chapter 1: Introduction
1
Chapter 2: Isobaric Low Pressure Vapor–Liquid Equilibrium Data for
Ethylbenzene + Styrene + Sulfolane and the Three Constituent
Binary Systems
21
Chapter 3: Ionic Liquid Screening for Ethylbenzene/Styrene Separation by
Extractive Distillation
35
Chapter 4: Ethylbenzene + Styrene + Ionic Liquid Phase Equilibrium Data
for the Ionic Liquids [3-mebupy][B(CN)4], [4-mebupy][BF4],
and [EMIM][SCN]
57
Chapter 5: Styrene Monomer Recovery from Ionic Liquids
83
Chapter 6: Conceptual Process Design of Extractive Distillation Processes
for Ethylbenzene/Styrene Separation
111
Chapter 7: Extractant Screening for the Separation of Dichloroacetic Acid
from Monochloroacetic Acid by Extractive Distillation
137
Chapter 8: Isobaric Low–Pressure Vapor–Liquid Equilibrium Data of the
System Monochloroacetic Acid + Dichloroacetic Acid +
Diethylene Glycol Dipentyl Ether and the Constituent Binary
Systems
159
Chapter 9: Conceptual Design of an Extractive Distillation Process for
Monochloroacetic Acid/Dichloroacetic Acid Separation
177
Chapter 10: Conclusions and Outlook
189
Appendixes
i
Dankwoord xxv
List of publications xxvii

VI
1
Introduction
Extractive distillation is a promising technology to separate close-boiling mixtures to obtain
high purity chemicals. Extractive distillation is a hybrid technology, which combines an
energy separating agent (heat) with an affinity separating agent (solvent). Examples of
novel liquid affinity separation agents are ionic liquids (ILs) and complexing agents.
Hybrid technologies require in general lower investment and operating costs compared to
traditional separation technologies. Although extractive distillation is a promising
technology and already applied at large scale, it is still too often overlooked. Therefore, the
aim of this thesis was to investigate whether extractive distillation with affinity solvents can
be used to obtain high purity products.
Chapter 1
2
In the introduction chapter of this thesis, the background of this project is given, followed
by a description of two representative industrial cases. Hereafter, the extractive distillation
concept will be explained along with an overview of the reported solvents in literature to
use in extractive distillation for the two industry cases. Moreover, a description about ILs
and complexing agents will be given and how they can be applied in extractive distillation.
In the last section, the scope and outline of this thesis are presented.
1.1. General
1.1.1. Role of Separation Technology in Total Energy Consumption in the Netherlands
The Dutch government wants to decrease the total primary energy requirements in 2020 by
30 % [1]. The primary energy requirements in the Netherlands are approximately 2500 PJ
from which 30 % are allocated to the process industry [2]. One of the ways to achieve the
goal of 30 % decrease in energy requirements, is to decrease the energy requirements for
separation technology, which contribute about 40–70 % to the total energy requirements of
the process industry [3]. The energy requirements can decrease by 225–393 PJ if the energy
requirements for separation technology decrease by 75 %.
1.1.2. Trace Removal
The operational and capital expenditures (OPEX and CAPEX) of a separation process
increase if higher purities are required for a chemical product. Especially when trace
removal is required to manufacture high purity products, traditional separation technologies
become extremely expensive and are not providing satisfying solutions. In this work, trace
removal is defined as the separation of impurities or (by)products present at 100–1000 ppm.
Trace removal is a problem for which the existing separation technologies are not providing
satisfying solutions. The main reason for trace removal separations is the need to meet the
purity demanded by customers/further processing and/or legislation.
Distillation is currently used to conduct 90–95 % of all separations in the chemical process
industry, because it is known to be a reliable and robust unit operation [3,4]. The drawbacks
of distillation are the poor energy efficiency and selectivity [5]. These drawbacks are above
all applicable to cases where impurities have to be removed with molecular structures
closely resembling the main component and present at ppm level in a highly concentrated,
organic stream. Especially if a high purity of the desired component has to be achieved,
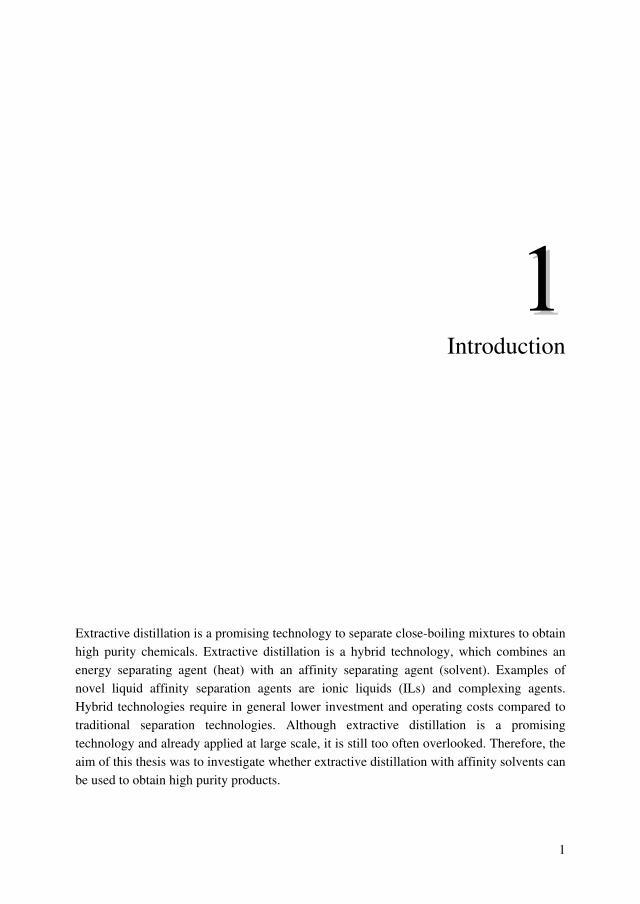
many equilibrium stages are required, which can be derived from the Fenske equation [6]:
αln
11ln
min
−
−=
b
b
d
d
x
x
x
x
N (1-1)
Chapter 1
3
In Equation 1-1, xd and xb are the mole fractions of the most volatile component in the
distillate and the bottoms, respectively. Nmin is the minimum number of equilibrium stages,
and α is the relative volatility, which is defined by:
o
jj
o
ii
j
j
i
i
ijPγ
Pγ
x
y
xy
α == (1-2)
where y and x are the mole fractions of the components in the vapor and liquid phases,
respectively, γi is the liquid phase activity coefficient, Po is the vapor pressure, and the
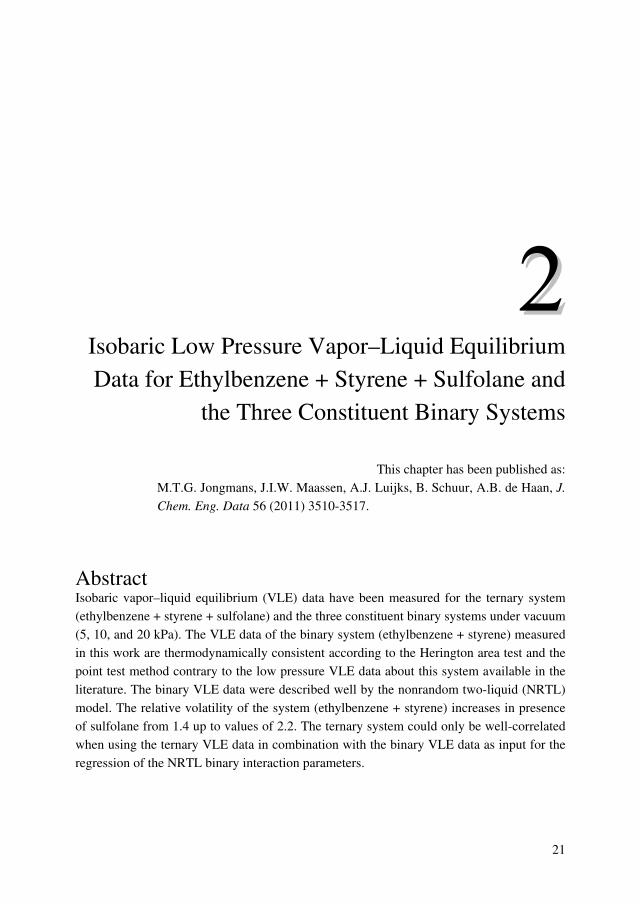
subscript i and j correspond to the components i and j. Figure 1-1 illustrates the required
number of equilibrium stages as function of the impurity level in the top product for several
values of the relative volatility at a fixed bottom purity (xb = 0.01). The conclusion can be
drawn that if the relative volatility of the mixture is rather low (α = 1.2–1.4), relatively
more minimum equilibrium stages, and thus CAPEX, are required if the required impurity
level decreases. So, especially for mixtures with a low relative volatility, the CAPEX will
be high if a low impurity level is required.
1 10 100 1000 10000
10
20
30
40
50
60
70
80
90
100
110
α = 2.0
α = 1.6
α = 1.4
α = 1.2
Nm
in [
stag
es]
Impurity level [ppm]
Figure 1-1: Minimum number of required separation stages (Nmin) as function of
impurity level for several values of the relative volatility (α).
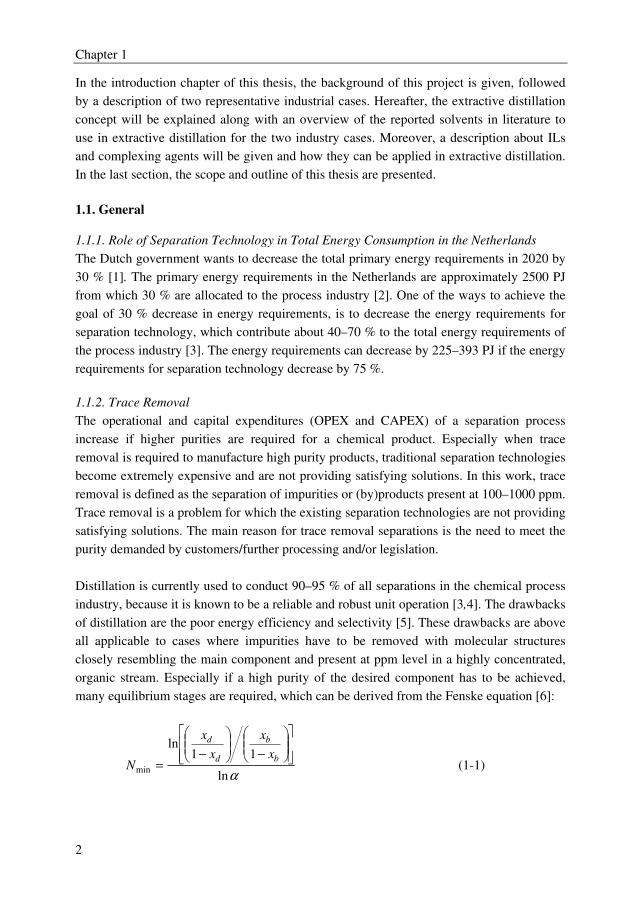
A high reflux ratio is required for mixtures with low relative volatility as can be derived
from the Underwood expression [7]:
1
1
1
min−
−
−−
=α
αf
d
f
d
x
x
x
x
R (1-3)
Chapter 1
4
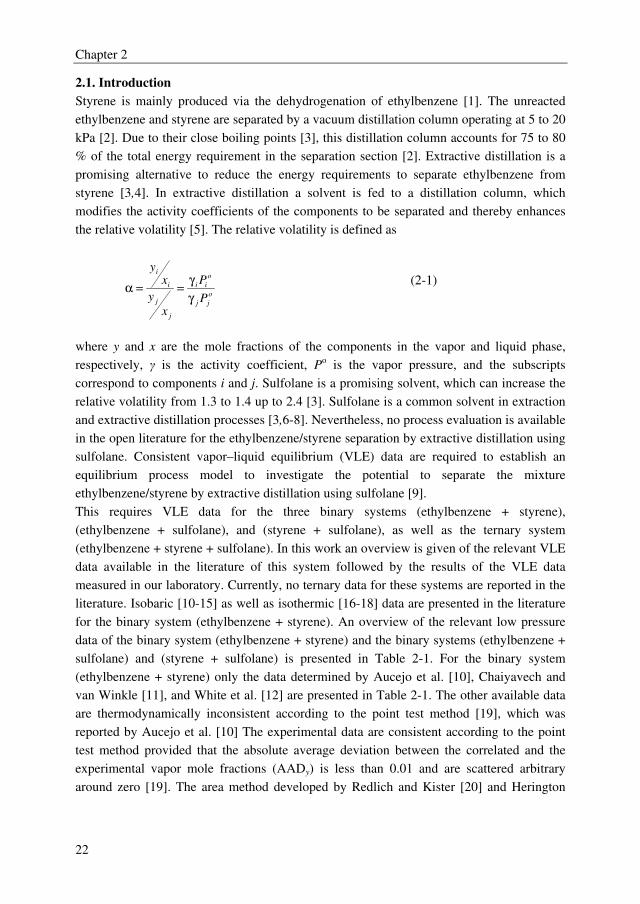
In Equation 1-3, Rmin refers to the minimum required reflux ratio, and xf to the fraction of
the most volatile component in the feed. In Figure 1-2, the minimum reflux ratio is shown
as function of the relative volatility. It is clearly shown that if the relative volatility
increases, the minimum required reflux ratio largely decreases. Since the OPEX are mainly
dependent on the reflux ratio, the OPEX decreases with increasing relative volatility.
1.2 1.4 1.6 1.8 2.0 2.2 2.4 2.6 2.8 3.0
0
2
4
6
8
10
12
14
Rm
in
α
Figure 1-2: Minimum required reflux ratio as function of relative volatility (α) for high purity distillate (xd = 1).
Two challenging representative industrial examples are the separation of ethylbenzene
traces from styrene and dichloroacetic acid traces from monochloroacetic acid. Both are
examples of close-boiling mixtures, since the molecular structures of the trace components
are similar to the main component. This requires high CAPEX due to the large minimum
number of equilibrium stages required and high OPEX, because of the high reflux ratio if
distillation would be used as separation technology. Both production processes are
described in the following paragraph in which the disadvantages of their current separation
processes and possible improvement opportunities are described.
1.2. Production Processes and Improvement Opportunities
1.2.1. Styrene Production
Styrene is the simplest and by far the most important member of a series of aromatic
monomers that is used in the plastics industry. Styrene is produced in large quantities with
an annual global production in 2009 of about 23 million metric tons [8]. It is a versatile
monomer extensively used for the manufacture of plastics [9]. Nearly 90 % of the
worldwide produced styrene is manufactured by the dehydrogenation of ethylbenzene [9].
The other 10 % is obtained from the coproduction of propylene oxide and styrene, which is
a more complex and capital-intensive route compared to the ethylbenzene dehydrogenation
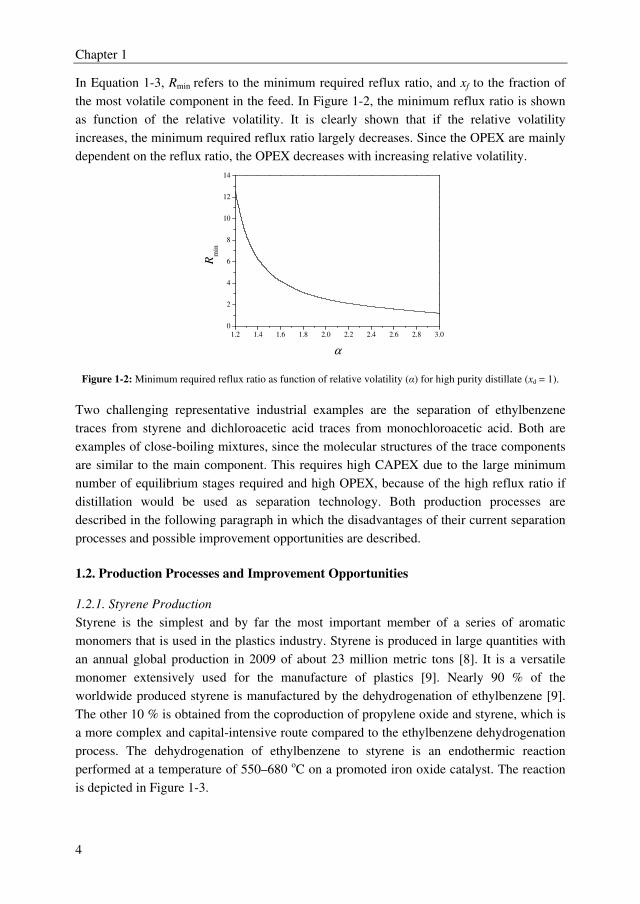
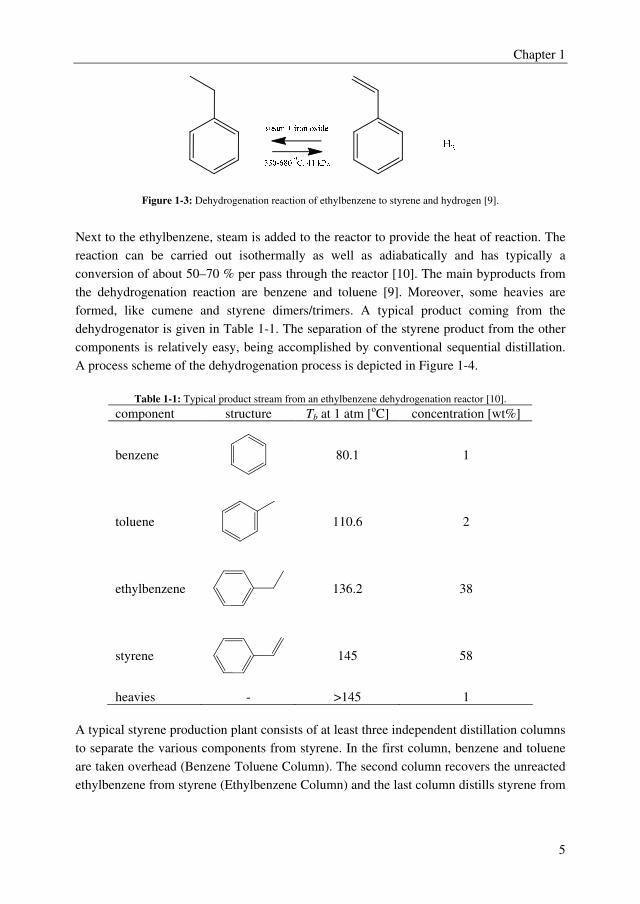
process. The dehydrogenation of ethylbenzene to styrene is an endothermic reaction
performed at a temperature of 550–680 oC on a promoted iron oxide catalyst. The reaction
is depicted in Figure 1-3.
Chapter 1
5
Figure 1-3: Dehydrogenation reaction of ethylbenzene to styrene and hydrogen [9].
Next to the ethylbenzene, steam is added to the reactor to provide the heat of reaction. The
reaction can be carried out isothermally as well as adiabatically and has typically a
conversion of about 50–70 % per pass through the reactor [10]. The main byproducts from
the dehydrogenation reaction are benzene and toluene [9]. Moreover, some heavies are
formed, like cumene and styrene dimers/trimers. A typical product coming from the
dehydrogenator is given in Table 1-1. The separation of the styrene product from the other
components is relatively easy, being accomplished by conventional sequential distillation.
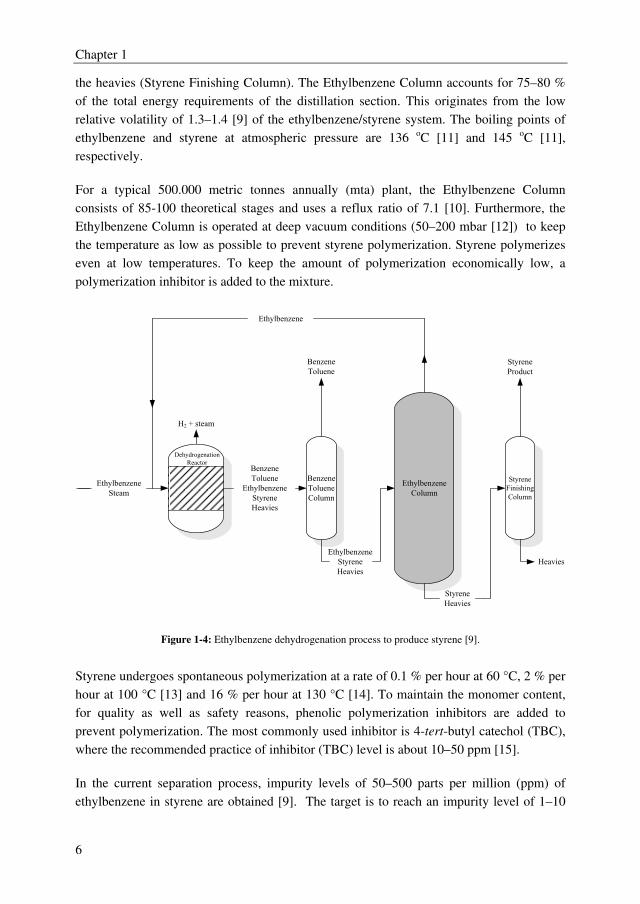
A process scheme of the dehydrogenation process is depicted in Figure 1-4.
Table 1-1: Typical product stream from an ethylbenzene dehydrogenation reactor [10].
component structure Tb at 1 atm [oC] concentration [wt%]
benzene
80.1 1
toluene
110.6 2
ethylbenzene
136.2 38
styrene
145 58
heavies - >145 1
A typical styrene production plant consists of at least three independent distillation columns
to separate the various components from styrene. In the first column, benzene and toluene
are taken overhead (Benzene Toluene Column). The second column recovers the unreacted
ethylbenzene from styrene (Ethylbenzene Column) and the last column distills styrene from
Chapter 1
6
the heavies (Styrene Finishing Column). The Ethylbenzene Column accounts for 75–80 %
of the total energy requirements of the distillation section. This originates from the low
relative volatility of 1.3–1.4 [9] of the ethylbenzene/styrene system. The boiling points of
ethylbenzene and styrene at atmospheric pressure are 136 oC [11] and 145 oC [11],
respectively.
For a typical 500.000 metric tonnes annually (mta) plant, the Ethylbenzene Column
consists of 85-100 theoretical stages and uses a reflux ratio of 7.1 [10]. Furthermore, the
Ethylbenzene Column is operated at deep vacuum conditions (50–200 mbar [12]) to keep
the temperature as low as possible to prevent styrene polymerization. Styrene polymerizes
even at low temperatures. To keep the amount of polymerization economically low, a
polymerization inhibitor is added to the mixture.
Ethylbenzene
Steam
H2 + steam
Benzene
Toluene
Ethylbenzene
Styrene
Heavies
Benzene
Toluene
Ethylbenzene
Styrene
Heavies
Styrene
Heavies
Styrene
Product
Heavies
Ethylbenzene
Benzene
Toluene
Column
Ethylbenzene
Column
Styrene
Finishing
Column
Dehydrogenation
Reactor
Figure 1-4: Ethylbenzene dehydrogenation process to produce styrene [9].
Styrene undergoes spontaneous polymerization at a rate of 0.1 % per hour at 60 °C, 2 % per
hour at 100 °C [13] and 16 % per hour at 130 °C [14]. To maintain the monomer content,
for quality as well as safety reasons, phenolic polymerization inhibitors are added to
prevent polymerization. The most commonly used inhibitor is 4-tert-butyl catechol (TBC),
where the recommended practice of inhibitor (TBC) level is about 10–50 ppm [15].
In the current separation process, impurity levels of 50–500 parts per million (ppm) of
ethylbenzene in styrene are obtained [9]. The target is to reach an impurity level of 1–10
Chapter 1
7
ppm of ethylbenzene in styrene. One of the options is to remove ethylbenzene traces from
the final styrene product. However, the Ethylbenzene Column is still required for the
ethylbenzene/styrene bulk separation. Therefore, it was decided to search for a new
technology to replace the current Ethylbenzene column. Thereby not only high purity
styrene can be obtained, but also process intensification can be achieved by reducing the
energy consumption.
1.2.2. Monochloroacetic Acid Production
Chlorinated acetic acids are important intermediates in organic synthesis, because of the
ease of substitution of the chlorine atoms [16]. The major industrial use (30–40 %) of
monochloroacetic acid is in the manufacture of carboxymethyl cellulose (CMC) and
pharmaceuticals [17]. The worldwide production of monochloroacetic acid is 500.000 mta.
Monochloroacetic acid is mainly produced by the chlorination of acetic acid using acetic
anhydride as a catalyst [18]. The main disadvantage of this chlorination process is the
overchlorination to the undesired dichloroacetic acid [16]. The monochloroacetic acid
leaving the reactor typically contains 5 wt% dichloroacetic acid [19]. Both reactions are
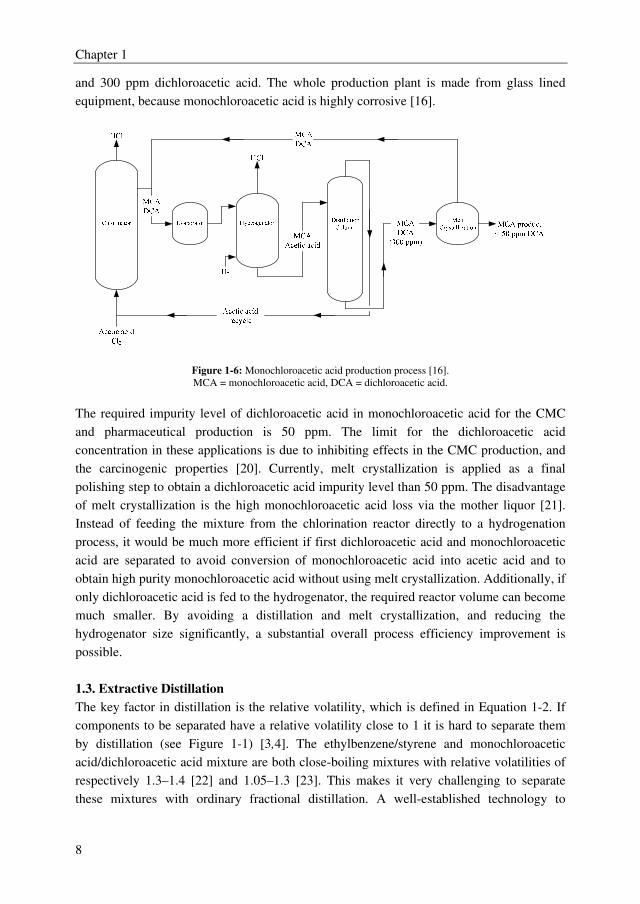
illustrated in Figure 1-5. An overview of the process is depicted in Figure 1-6.
Figure 1-5: Chlorination reactions of acetic and monochloroacetic acid [17].
The product mixture from the chlorination reactor consists of mainly monochloroacetic
acid, dichloroacetic acid and minor amounts of acetic acid. Because dichloroacetic acid is
an undesired intermediate chemical, the product mixture from the first reactor is vaporized
and fed to the hydrogenation reactor. In this reactor, dichloroacetic acid is converted to
monochloroacetic acid using a catalyst (e.g. palladium). However, part of the
monochloroacetic acid is converted to acetic acid because of the high concentration of
monochloroacetic acid in the feed stream to the hydrogenation reactor. A distillation
column is used to separate the acetic acid from the final monochloroacetic acid product.
The product mixture from the distillation column consists of mainly monochloroacetic acid
Chapter 1
8
and 300 ppm dichloroacetic acid. The whole production plant is made from glass lined
equipment, because monochloroacetic acid is highly corrosive [16].
Figure 1-6: Monochloroacetic acid production process [16].
MCA = monochloroacetic acid, DCA = dichloroacetic acid.
The required impurity level of dichloroacetic acid in monochloroacetic acid for the CMC
and pharmaceutical production is 50 ppm. The limit for the dichloroacetic acid
concentration in these applications is due to inhibiting effects in the CMC production, and
the carcinogenic properties [20]. Currently, melt crystallization is applied as a final
polishing step to obtain a dichloroacetic acid impurity level than 50 ppm. The disadvantage
of melt crystallization is the high monochloroacetic acid loss via the mother liquor [21].
Instead of feeding the mixture from the chlorination reactor directly to a hydrogenation
process, it would be much more efficient if first dichloroacetic acid and monochloroacetic
acid are separated to avoid conversion of monochloroacetic acid into acetic acid and to
obtain high purity monochloroacetic acid without using melt crystallization. Additionally, if
only dichloroacetic acid is fed to the hydrogenator, the required reactor volume can become
much smaller. By avoiding a distillation and melt crystallization, and reducing the
hydrogenator size significantly, a substantial overall process efficiency improvement is
possible.
1.3. Extractive Distillation
The key factor in distillation is the relative volatility, which is defined in Equation 1-2. If
components to be separated have a relative volatility close to 1 it is hard to separate them
by distillation (see Figure 1-1) [3,4]. The ethylbenzene/styrene and monochloroacetic
acid/dichloroacetic acid mixture are both close-boiling mixtures with relative volatilities of
respectively 1.3–1.4 [22] and 1.05–1.3 [23]. This makes it very challenging to separate
these mixtures with ordinary fractional distillation. A well-established technology to
Chapter 1
9
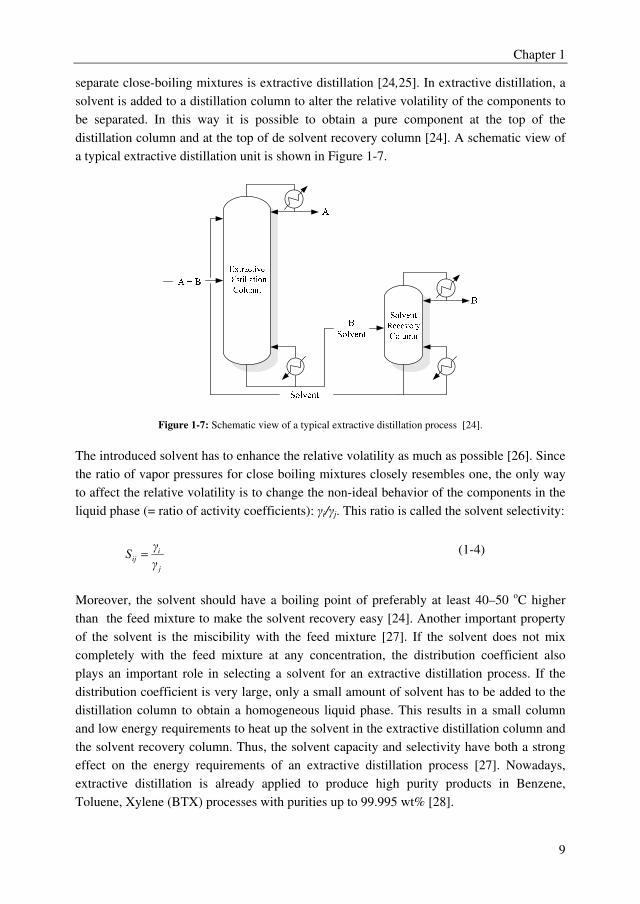
separate close-boiling mixtures is extractive distillation [24,25]. In extractive distillation, a
solvent is added to a distillation column to alter the relative volatility of the components to
be separated. In this way it is possible to obtain a pure component at the top of the
distillation column and at the top of de solvent recovery column [24]. A schematic view of
a typical extractive distillation unit is shown in Figure 1-7.
Figure 1-7: Schematic view of a typical extractive distillation process [24].
The introduced solvent has to enhance the relative volatility as much as possible [26]. Since
the ratio of vapor pressures for close boiling mixtures closely resembles one, the only way
to affect the relative volatility is to change the non-ideal behavior of the components in the
liquid phase (= ratio of activity coefficients): γi/γj. This ratio is called the solvent selectivity:
j
iij
γ
γS = (1-4)
Moreover, the solvent should have a boiling point of preferably at least 40–50 oC higher
than the feed mixture to make the solvent recovery easy [24]. Another important property
of the solvent is the miscibility with the feed mixture [27]. If the solvent does not mix
completely with the feed mixture at any concentration, the distribution coefficient also
plays an important role in selecting a solvent for an extractive distillation process. If the
distribution coefficient is very large, only a small amount of solvent has to be added to the
distillation column to obtain a homogeneous liquid phase. This results in a small column
and low energy requirements to heat up the solvent in the extractive distillation column and
the solvent recovery column. Thus, the solvent capacity and selectivity have both a strong
effect on the energy requirements of an extractive distillation process [27]. Nowadays,
extractive distillation is already applied to produce high purity products in Benzene,
Toluene, Xylene (BTX) processes with purities up to 99.995 wt% [28].
Chapter 1
10
1.4. Ethylbenzene/Styrene Separation
1.4.1 Literature Overview
Several articles and patents have been published about the ethylbenzene/styrene separation
by extractive distillation. In all cases, the solvent has more affinity with styrene, which
originates from the double bond in the side chain of the benzene ring in styrene. This
double bond gives the molecule a flat structure and enables the π-electrons to be distributed
in a uniform way above and below the plane of the molecule (π-clouds) [29]. Therefore, the
polarity of the styrene molecule is higher compared to ethylbenzene, resulting in more
affinity for polar solvents. An overview of the reported solvents for the
ethylbenzene/styrene separation by extractive distillation is shown in Table 1-2. From this
table, the conclusion can be drawn that sulfolane is the most promising solvent to use in an
extractive distillation process, because it has the largest effect on the relative volatility.
However, no process design of the ethylbenzene/styrene separation by extractive distillation
with sulfolane has been reported yet in the literature. One of the disadvantages of sulfolane
is its relatively low decomposition temperature [30] and the decomposition product SO2
[31], which causes erosion of equipment [32].
Table 1-2: Reported solvents for the ethylbenzene/styrene separation by extractive distillation.
Solvent type α [-] Reference
Tetramethyl urea 1.4 [33]
Styrene tar residue 1.42 [34]
Nitro compounds 1.4-1.9 [33]
Nitriles 1.5-2.1 [33]
Esters 1.6-2.3 [35]
NMP 2.2 [36]
Sulfolane 2.4 [28,36]
1.4.2. Alternative Solvents
An alternative for commonly applied organic solvents are ionic liquids (ILs), which have
recently been reported as promising solvents to apply in extractive distillation processes
[24,37]. The extractive distillation with an IL as a separation agent integrates the advantage
of a liquid solvent (easy operation) and solid salt (high separation ability) [24]. Moreover,
ILs can improve the extractive distillation process due to their interesting properties like
negligible vapor pressure [38,39], higher affinity towards one of the components in a
mixture due to possibilities of tailoring properties [39], and the high solvent capacities ILs
have towards aromatic components [40,41]. The separation of two aromatics, for which the
ethylbenzene/styrene mixture is representative, by extractive distillation with ILs has not
been reported yet in the open literature.
Chapter 1
11
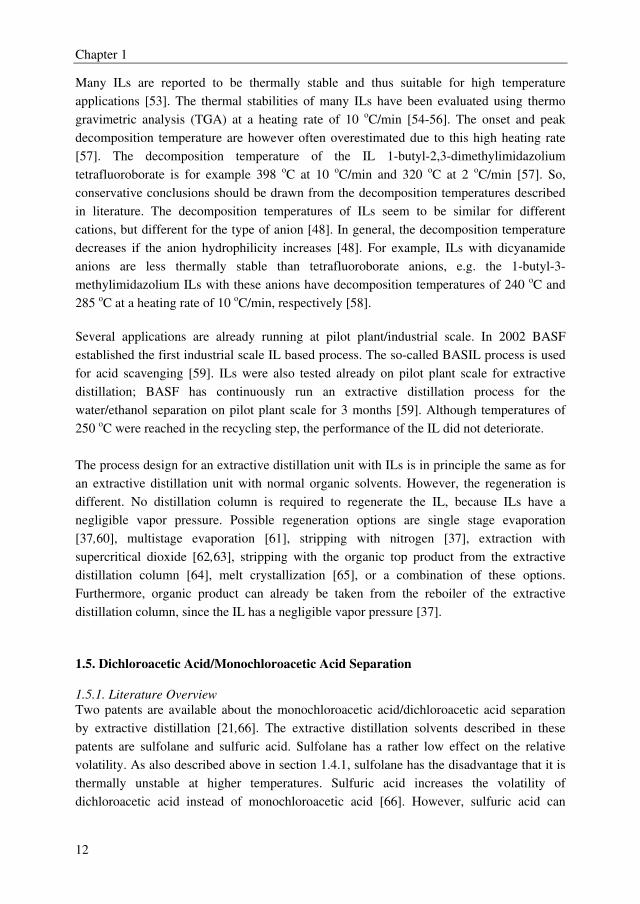
1.4.3. Ionic Liquids
ILs are low-melting salts (<100 oC) [42] composed entirely of ions and are a class of novel
solvents with very interesting properties [42]. Current interest in ILs is driven mainly by
their proven or potential applications as “green solvents” due to their negligible vapor
pressure [43]. ILs are extensively studied for use as solvents in separation technology
[37,44] and reaction processes [45,46]. Next to the negligible vapor pressure, ILs have
many other attractive properties, which are reported over conventional organic solvents like
high chemical and thermal stability, and they exhibit a broad liquid range [39,47,48].
Moreover, ILs are called designer solvents [44,49]. The properties of an IL are determined
by the cation-anion combination. A specific IL can be made for a certain separation due to
the large number of cations and anions available. Commonly reported cations and anions
are shown in Figure 1-8.
Commonly used cations:
1-alkyl-3-methyl
imidazolium
N-alkyl
pyridinium
Tetraalkyl
phosphonium
N,N-Dialkyl
pyrrolidinium
R1,2,3,4 = CH3(CH2)n (n = 0, 1, 3, 5, 7, 9); aryl; etc
Some possible anions:
Water immiscible Water miscible
[PF6]-
[NTf2]-
[BR1R2R3R4]-
[BF4]-
[OTf]-
[N(CN)2]-
[CH3CO2]-
[CF3CO2]-, [NO3]
-
Br-, Cl-, I-
Figure 1-8: Commonly reported cations and anions in ionic liquid systems [43].
One of the largest barriers to the large scale application of ILs is their relatively high
viscosity, which is normally two to three orders of magnitude larger than common organic
solvents [39], which negatively affects the mass transfer rate. The viscosity of ILs is mainly
determined by hydrogen bonding and van der Waals forces, being strongly dependent on
the anion type [50]. It is observed that with an increasing temperature the viscosity
decreases exponentially [51]. A positive finding is that the viscosity of ILs drops
dramatically in the presence of other molecular solvents, like aromatics and aliphatics [52].
Chapter 1
12
Many ILs are reported to be thermally stable and thus suitable for high temperature
applications [53]. The thermal stabilities of many ILs have been evaluated using thermo
gravimetric analysis (TGA) at a heating rate of 10 oC/min [54-56]. The onset and peak
decomposition temperature are however often overestimated due to this high heating rate
[57]. The decomposition temperature of the IL 1-butyl-2,3-dimethylimidazolium
tetrafluoroborate is for example 398 oC at 10 oC/min and 320 oC at 2 oC/min [57]. So,
conservative conclusions should be drawn from the decomposition temperatures described
in literature. The decomposition temperatures of ILs seem to be similar for different
cations, but different for the type of anion [48]. In general, the decomposition temperature
decreases if the anion hydrophilicity increases [48]. For example, ILs with dicyanamide
anions are less thermally stable than tetrafluoroborate anions, e.g. the 1-butyl-3-
methylimidazolium ILs with these anions have decomposition temperatures of 240 oC and
285 oC at a heating rate of 10 oC/min, respectively [58].
Several applications are already running at pilot plant/industrial scale. In 2002 BASF
established the first industrial scale IL based process. The so-called BASIL process is used
for acid scavenging [59]. ILs were also tested already on pilot plant scale for extractive
distillation; BASF has continuously run an extractive distillation process for the
water/ethanol separation on pilot plant scale for 3 months [59]. Although temperatures of
250 oC were reached in the recycling step, the performance of the IL did not deteriorate.
The process design for an extractive distillation unit with ILs is in principle the same as for
an extractive distillation unit with normal organic solvents. However, the regeneration is
different. No distillation column is required to regenerate the IL, because ILs have a
negligible vapor pressure. Possible regeneration options are single stage evaporation
[37,60], multistage evaporation [61], stripping with nitrogen [37], extraction with
supercritical dioxide [62,63], stripping with the organic top product from the extractive
distillation column [64], melt crystallization [65], or a combination of these options.
Furthermore, organic product can already be taken from the reboiler of the extractive
distillation column, since the IL has a negligible vapor pressure [37].
1.5. Dichloroacetic Acid/Monochloroacetic Acid Separation
1.5.1. Literature Overview
Two patents are available about the monochloroacetic acid/dichloroacetic acid separation
by extractive distillation [21,66]. The extractive distillation solvents described in these
patents are sulfolane and sulfuric acid. Sulfolane has a rather low effect on the relative
volatility. As also described above in section 1.4.1, sulfolane has the disadvantage that it is
thermally unstable at higher temperatures. Sulfuric acid increases the volatility of
dichloroacetic acid instead of monochloroacetic acid [66]. However, sulfuric acid can
Chapter 1
13
decompose to sulfur dioxide, water and oxygen [67]. Thus new solvents are required to
make the monochloroacetic acid/dichloroacetic acid separation by extractive distillation
feasible.
1.5.2. Alternative
There is a large difference in the acid dissociation constants (pKa) of both acids. The pKa of
monochloroacetic acid and dichloroacetic acid are 2.87 and 1.25, respectively [68]. The pKa
of dichloroacetic acid is lower, which means that dichloroacetic acid is a stronger acid than
monochloroacetic acid, which can be explained by the electron-withdrawing character of
chlorine. If this atom is placed on the carbon next to the carboxylic acid group, the acidity
increases [29]. Since dichloroacetic acid has two chlorines, it is a stronger acid than
monochloroacetic acid.
The difference in acidity between monochloroacetic acid and dichloroacetic acid can be
used to form complexes via hydrogen bonding/proton transfer with e.g. tertiary amines,
trialkylphosphates, and other compounds [69]. This principle is often used to separate
organic acids from water (reactive extraction) [70,71]. The complexation constant as
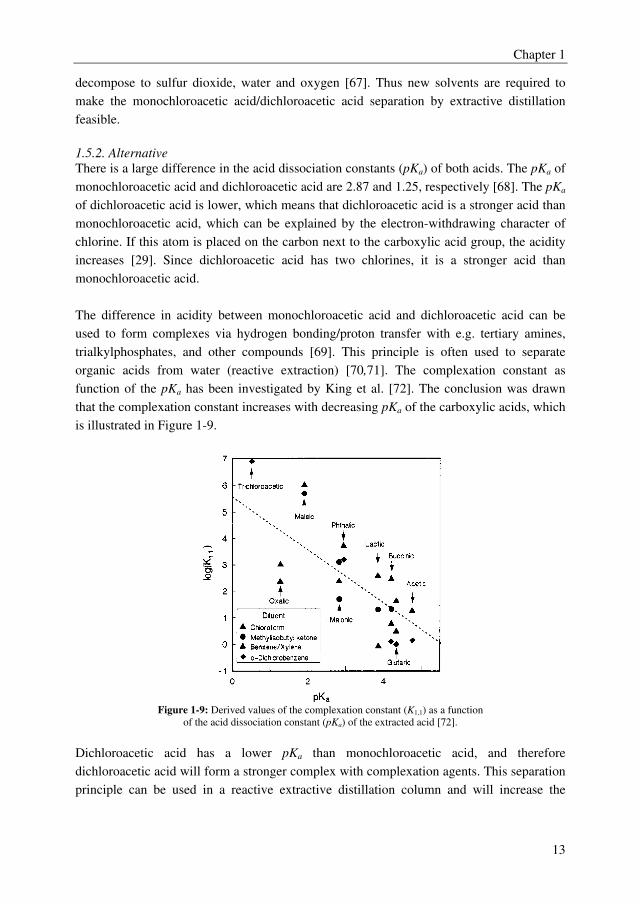
function of the pKa has been investigated by King et al. [72]. The conclusion was drawn
that the complexation constant increases with decreasing pKa of the carboxylic acids, which
is illustrated in Figure 1-9.
Figure 1-9: Derived values of the complexation constant (K1,1) as a function
of the acid dissociation constant (pKa) of the extracted acid [72].
Dichloroacetic acid has a lower pKa than monochloroacetic acid, and therefore
dichloroacetic acid will form a stronger complex with complexation agents. This separation
principle can be used in a reactive extractive distillation column and will increase the
Chapter 1
14
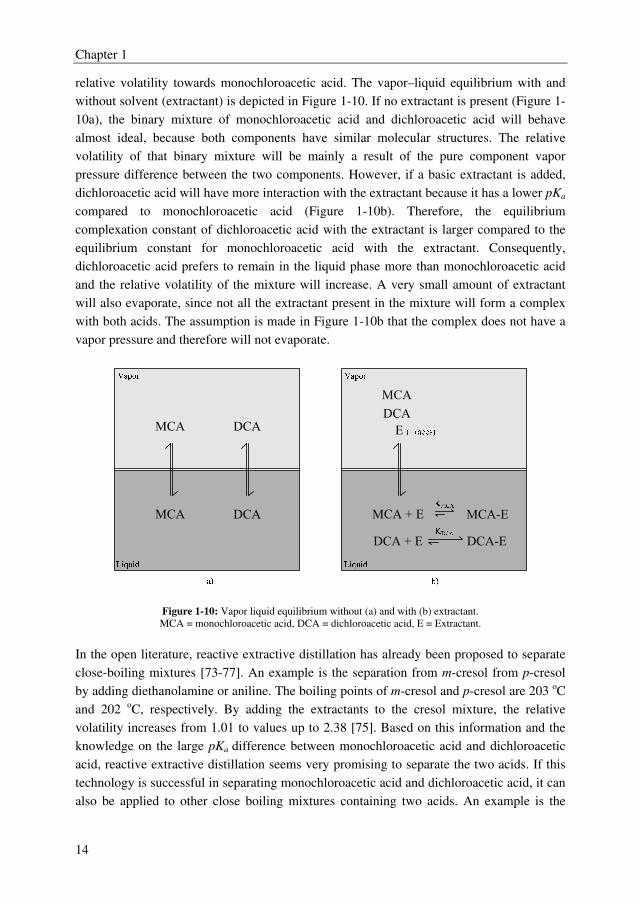
relative volatility towards monochloroacetic acid. The vapor–liquid equilibrium with and
without solvent (extractant) is depicted in Figure 1-10. If no extractant is present (Figure 1-
10a), the binary mixture of monochloroacetic acid and dichloroacetic acid will behave
almost ideal, because both components have similar molecular structures. The relative
volatility of that binary mixture will be mainly a result of the pure component vapor
pressure difference between the two components. However, if a basic extractant is added,
dichloroacetic acid will have more interaction with the extractant because it has a lower pKa
compared to monochloroacetic acid (Figure 1-10b). Therefore, the equilibrium
complexation constant of dichloroacetic acid with the extractant is larger compared to the
equilibrium constant for monochloroacetic acid with the extractant. Consequently,
dichloroacetic acid prefers to remain in the liquid phase more than monochloroacetic acid
and the relative volatility of the mixture will increase. A very small amount of extractant
will also evaporate, since not all the extractant present in the mixture will form a complex
with both acids. The assumption is made in Figure 1-10b that the complex does not have a
vapor pressure and therefore will not evaporate.
Figure 1-10: Vapor liquid equilibrium without (a) and with (b) extractant.
MCA = monochloroacetic acid, DCA = dichloroacetic acid, E = Extractant.
In the open literature, reactive extractive distillation has already been proposed to separate
close-boiling mixtures [73-77]. An example is the separation from m-cresol from p-cresol
by adding diethanolamine or aniline. The boiling points of m-cresol and p-cresol are 203 oC
and 202 oC, respectively. By adding the extractants to the cresol mixture, the relative
volatility increases from 1.01 to values up to 2.38 [75]. Based on this information and the
knowledge on the large pKa difference between monochloroacetic acid and dichloroacetic
acid, reactive extractive distillation seems very promising to separate the two acids. If this
technology is successful in separating monochloroacetic acid and dichloroacetic acid, it can
also be applied to other close boiling mixtures containing two acids. An example is the
Chapter 1
15
separation of acrylic acid from propionic acid, which have boiling points of respectively
141 and 141.2 oC. The pKa difference between these two components is also quite large
with pKa values of 4.25 and 4.88, correspondingly [68].
1.5.3. Reactive Extractants
Reactive extractants, also called complexation agents, can be implemented in many
different separation processes like solvent extraction, distillative processes, adsorption and
liquid membranes [69,71]. Complexation is already applied at large scale, mainly for gas
absorption [78] and hydrometallurgical refining [79]. The complexation agent is chosen as
to give a strong, specific, yet reversible reaction with the solute [69]. In a process in which
a reversible chemical reaction is applied, the desired component is in the first step separated
from the feed mixture. A second process step is required to reverse the reaction to recover
the extractant and the desired component in its original form [24]. In order for the reaction
to be reversible, it must have a relative low bond energy. Complexation reactions with bond
energies above 50 kJ/mol tend to be difficult to reverse [69]. An equilibrium reaction is
normally expressed as follows:
m · solute + n · complexing agent [(solute)m(complexing agent)n]
An equilibrium reaction is always described by an equilibrium constant Kc, which is shown
in Equation 1-5.
[ ]
[ ] [ ]nmcagentcomplexingsolute
complexK = (1-5)
In extractive distillation, the complexation agent is added to modify the liquid-phase
activity coefficients and thereby increasing the selectivity/relative volatility of the mixture
[69]. The main criteria by which potential chemical-complexation agents can be evaluated
[24,69]:
1. The complexation bond energy should be large enough to give a substantial
improvement (higher selectivity) over conventional mass separation agents.
2. The complexation bond energy must be low enough so that the complexation is
reversible.
3. There should be no side reactions to avoid irreversible loss.
4. The complexing agent should be thermally stable to prevent extractant loss.
5. The complexation reaction should have sufficiently fast kinetics in both directions
so that equipment sizes do not become very large.
Other important factors are the vapor pressure [80] and viscosity [61]. A successful
example was demonstrated by Lei et al. on bench scale [74]. They were able to separate
Chapter 1
16
acetic acid from water by using tri-n-butyl amine as a extractant. The bench scale extractive
distillation unit consisted of an extractive distillation column (complexation column) and a
regeneration column (decomplexation column). Distillation is the preferred regeneration
technology to separate dichloroacetic acid from the extractant since this mixture contains
two components with a relatively high boiling point difference. Evaporation or stripping for
example are not feasible options, because the extractant used to separate monochloroacetic
acid from dichloroacetic acid also has a volatility. Another option is the extraction of
dichloroacetic acid from the extractant with an aqueous sodium hydroxide solution [81].
However, this is an undesirable method since it degrades dichloroacetic acid to its sodium
salt.
1.6. Scope and Outline
The scope of this thesis was to investigate whether close boiling mixtures can be separated
via extractive distillation to obtain high purity products. The close-boiling mixtures
ethylbenzene/styrene and monochloroacetic acid/dichloroacetic acid were investigated as
representative examples from the chemical industry. Sulfolane and ILs were investigated as
the solvents in the extractive distillation process for the separation of ethylbenzene from
styrene to obtain high purity styrene. The current distillation unit was used as the
benchmark process. The IL process was also compared to the sulfolane process to
investigate if ILs can outperform this commonly applied organic solvent in this particular
extractive distillation. Complexing agents were used to separate dichloroacetic acid from
monochloroacetic acid via extractive distillation to obtain high purity monochloroacetic
acid. The extractive distillation for the monochloroacetic acid/dichloroacetic acid
separation could not be compared to the current separation process, because no process data
is available about this process. Therefore, the added production costs per tonne of
monochloroacetic acid product were calculated and compared to the current high purity
monochloroacetic acid market price.
Process models were required to setup the conceptual design for the extractive distillation
processes. Equilibrium stage models were used in this thesis to provide the necessary
thermodynamic parameters for the process models in order to make cost calculations and to
determine the savings in OPEX and CAPEX. Parameters for the equilibrium stage models
that were not available from the literature were regressed from experimental data.
The results for the ethylbenzene/styrene system are presented in Chapters 2 to 6. In Chapter
2, a vapor–liquid equilibrium model is presented for the ternary (benchmark) system
ethylbenzene + styrene + sulfolane. Subsequently, these results were required in Chapter 3,
which provides the results for the IL screening study. In Chapter 4, phase equilibrium data
are presented for the selected ILs including the regression of the data by a thermodynamic
model. In Chapter 5, the screening of several IL recovery technologies is provided. Chapter
Chapter 1
17
6 presents the results for the process models of the extractive distillation processes with
sulfolane and selected ILs and the comparison to the benchmark distillation process.
The results for the monochloroacetic acid/dichloroacetic acid mixture are described in
Chapters 7, 8, and 9. The screening of an adequate complexing agent is presented in
Chapter 7. Vapor–liquid equilibrium data are presented in Chapter 8 for the selected
complexing agent. In Chapter 9, the process model is presented for the extractive
distillation process to separate dichloroacetic acid from monochloroacetic. The overall
conclusions from this research and outlook are presented in Chapter 10.
1.7. Nomenclature
E extractant
Kc complexation constant mol/L
N number of stages
pKa acid dissociation constant
Po pure component vapor pressure Pa
R reflux ratio
S solvent selectivity
Tb boiling point oC
x mole fraction in the liquid phase
y mole fraction in the vapor phase
Greek symbols
α relative volatility
γ activity coefficient
Subscripts
b bottom
d distillate
f feed
i component i
j component j
min minimum
Superscripts
m stoichiometry coefficient complexation
n stoichiometry coefficient complexation
Abbreviations
BTX benzene, toluene, xylene
Chapter 1
18
CAPEX capital expenditures
IL ionic liquid
mta metric tonnes annually
OPEX operational expenditures
ppm parts per million
TBC 4-tert-butyl catechol
TGA thermogravimetric analysis
1.8. Refenences
[1] Duurzaamnieuws, Nederlandse procesindustrie kan twee keer zoveel energie
besparen, 2010, http://www.duurzaamnieuws.nl/bericht.rxml?id=61081, Cited:
December 20, 2010.
[2] ECN, Why Industrial Energy Savings?, 2006, www.ecn.nl, Cited: July 2006,
2010.
[3] J.L. Humpfrey, G.E. Keller, Separation Process Technology ed., McGraw-Hill,
New York, 1997.
[4] A.B. Haan, H. Bosch, Fundamentals of Industrial Separations, 1st ed., 2006.
[5] J. L. Humpfrey, A. F. Seibert, R. A. Koort, Separation Technologies Advances
and Priorities, U.S. Department of Energy Final Report, 12920-1, 1991.
[6] M.R. Fenske, Ind. Eng. Chem. 24 (1932) 482-485.
[7] A.J.V. Underwood, Transactions of the American Institute of Chemical
Engineers 10 (1932) 112-112.
[8] SRI Consulting (SRIC), WP Report Styrene, 2010,
www.sriconsulting.com/WP/Public/Reports/styrene/, Cited: July 27, 2010.
[9] S. Chen, in: Arza Seidel (Ed.), Kirk-Othmer Encyclopedia of Chemical
Technology, John Wiley & Sons, New Yersey, 2000.
[10] V.A.Welch, US 6171449 B1, 2001.
[11] D.R. Lide, W.M. Haynes, Handbook of Chemistry and Physics, 87th ed., Taylor
and Francis group LLC, London, 2009.
[12] V.A. Welch, US 6171449 B1, 2001.
[13] Faessler, W. J., Design Guidelines for Distillation Columns in Ethylbenzene and
Styrene Monomer Service, 2010, kolmetz.com/pdf/SMrev9.pdf, Cited: July 31,
2010.
[14] G. Moad, D.H. Solomon, The chemistry of free radical polymerization, 1st ed.,
Pergamon, Oxford, 1995.
[15] C. Kotoulas, A. Krallis, P. Pladis, C. Kiparissides, Macromol. Chem. Physic.
204 (2003) 1305-1314.
[16] G. Koenig, E. Lohmar, N. Rupprich, in: Ullmann's Encyclopedia of Industrial
Chemistry, Wiley-VCH Verlag GmbH & Co, 2000.
[17] Chemical Associates, Monochloroacetic acid, 2010, www.chemical-
associates.co.uk/CaseStudies/MonochloroaceticAcid, Cited: July 28, 2010.
[18] W. Richarz, A. Mathey, Chimia 21 (1967) 388-395.
[19] J. Crouzen, J.J. Gorissen, and C.J.G. Van Strien, US 7,135,597 B2, 2009.
[20] A.B. DeAngelo, F.B. Daniel, B.M. Most, G.R. Olson, Toxicology 114 (1996)
207-221.
[21] R. Fujiware and H. Ohira, JP 72,229,886, 1970.
Chapter 1
19
[22] M.T.G. Jongmans, J.I.W. Maassen, A.J. Luijks, B. Schuur, A.B. de Haan, J.
Chem. Eng. Data 56 (2011) 3510-3517.
[23] A. Londono, M.T.G. Jongmans, B. Schuur, A.B. de Haan, Fluid Phase Equilibr.
313 (2011) 97-101.
[24] Z. Lei, B. Chen, Z. Ding, in: Special Distillation Processes, Elsevier,
Amsterdam, 2005, pp. 59-144.
[25] I. Sucksmith, Chem. Eng. 89 (1982) 91-95.
[26] S.O. Momoh, Sep. Sci. Technol. 26 (1991) 729-742.
[27] S. Kossack, K. Kraemer, R. Gani, W. Marquardt, Chem. Eng. Res. Des. 86
(2008) 781-792.
[28] J.C. Gentry, S. Kumar, R. Wright-Wytcherley, Hydrocarb. Process. 93 (2004)
62-66.
[29] R.T. Morrison, R.N. Boyd, Organic Chemistry ed., Prentice hall, New Yersey,
1992.
[30] Material Safety Data Sheet, Sulfolane, 2010,
www.sigmaaldrich.com/catalog/DisplayMSDSContent.do, Cited: 30 july 2010.
[31] D. Cornell, W. Tsang, Int. J. Chem. Kin. 12 (1975) 799-806.
[32] N.G. Vannerberg, Pure Appl. Chem. 60 (1988) 1831-1840.
[33] L. Berg, US 4,959,128, 10-1-1990.
[34] N.B. King, US 3,904,484, 10-1-1975.
[35] L. Berg, US 4,966,656, 11-1-1990.
[36] F.M. Lee, J.C. Gentry, and R.W. Wytcherley, US 5,849,982, 12-1-1998.
[37] Y. Beste, M. Eggersmann, H. Schoenmakers, Chem. Ing. Tech. 77 (2005) 1800-
1808.
[38] Y. Zhao, S. Xia, Journal of Chemical Technology and Biotechnology 80 (2005)
1089-1096.
[39] K.N. Marsh, J.A. Boxall, R. Lichtenthaler, Fluid Phase Equilibr. 219 (2004) 93-
98.
[40] G.W. Meindersma, A.J.G. Podt, A.B. de Haan, Fluid Phase Equilibr. 247 (2006)
158-168.
[41] A.R. Hansmeier, M.T.G. Jongmans, G.W. Meindersma, A.B. de Haan, J. Chem.
Thermodyn. 42 (2010) 484-490.
[42] P. Wasserscheid, T. Welton, in: P. Wasserscheid, T. Welton (Eds.), Ionic
Liquids in Synthesis, Wiley-VCH, Weinheim, 2008, pp. 1-6.
[43] A. Stark, K.R. Seddon, in: Kirk-Othmer Encyclopedia of Chemical Technology,
John Wiley & Sons, New York, 2007.
[44] G.W. Meindersma, L.M. Galan Sanchez, A.R. Hansmeier, A.B. de Haan,
Monatsh. Chem. 138 (2007) 1125-1136.
[45] I. Correia, T. Welton, Dalton Trans. (2009) 4115-4121.
[46] S. Hayaki, K. Kido, D. Yokogawa, H. Sato, S. Sakaki, J. Phys. Chem. B 113
(2009) 8227-8230.
[47] X. Han, D.W. Armstrong, Accounts. Chem. Res. 40 (2007) 1079-1086.
[48] C. Chiappe, D. Pieraccini, J. Phys. Org. Chem. 18 (2004) 275-297.
[49] R. Giernoth, Angew. Chem. Int. Ed. 49 (2010) 2834-2839.
[50] N. Jain, A. Kumar, S. Chauhan, S.M.S. Chauhan, Tetrahedron 61 (2005) 1015-
1060.
[51] K. Tochigi, H. Yamamoto, J. Phys. Chem. C 111 (2007) 15989-15994.
[52] N. Khupse, A. Kumar, J. Solution Chem. 38 (2009) 589-600.
Chapter 1
20
[53] X. Han, D.W. Armstrong, Org. Lett. 7 (2005) 4205-4208.
[54] H.L. Ngo, K. LeCompte, L. Hargens, A.B. McEwen, Thermochim. Acta 357-
358 (2000) 97-102.
[55] J.D. Holbrey, W.M. Reichert, R.P. Swatloski, G.A. Broker, W.R. Pitner, K.R.
Seddon, R.D. Rogers, Green Chem. 4 (2002) 407-413.
[56] D.R. MacFarlane, S.A. Forsyth, J. Golding, G.B. Deacon, Green Chem. 4
(2002) 444-448.
[57] D.M. Fox, J.W. Gilman, H.C. De Long, P.C. Trulove, J. Chem. Thermodyn. 37
(2005) 900-905.
[58] C.P. Fredlake, J.M. Crosthwaite, D.G. Hert, S.N.V.K. Aki, J.F. Brennecke, J.
Chem. Eng. Data 49 (2004) 954-964.
[59] M. Matthias, in: P. Wasserscheid, T. Welton (Eds.), Ionic liquids in synthesis,
Wiley-VCH, Weinheim, 2008, pp. 663-687.
[60] A.B. Pereiro, A. Rodriguez, Chem. Eng. J. 153 (2009) 80-85.
[61] J.F. Richarson, J.H. Harker, J.R. Backhurst, Coulson & Richarson's Chemical
Engineering, 5th ed., Butterworth Heinneman, Oxford, 2002.
[62] L.A. Blanchard, J.F. Brennecke, Ind. Eng. Chem. Res. 40 (2000) 287-292.
[63] M.C. Kroon, J. van Spronsen, C.J. Peters, R.A. Sheldon, G.J. Witkamp, Green
Chem. 8 (2006) 246-249.
[64] Y. Beste, H. Schoenmakers, W. Arlt, M. Seiler, and C. Jork, 016484 A1, 2005.
[65] A. Konig, M. Stepanski, A. Kuszlik, P. Keil, C. Weller, Chem. Eng. Res. Des.
86 (2008) 775-780.
[66] R. Fujiware and H. Ohira, JP 7,230,165, 1970.
[67] A.A. Panteleimonova, Int. J. Hydrogen Energ. 20 (1995) 429-433.
[68] D.R. Lide, W.M. Haynes, Handbook of chemistry and physics ed., Taylor and
Francis group LLC, London, 2009.
[69] C.J. King, in: R. W. Rousseau (Ed.), Handbook of Separation Process
Technology, 1987, pp. 760-774.
[70] J. Martak, S. Schlosser, Chem. Pap. 54 (2000) 413-422.
[71] C.J. King, Chemtech (1992) 285-291.
[72] J.A. Tamada, C.J. King, Ind. Eng. Chem. Res. 29 (1990) 1327-1333.
[73] F. Duprat, G. Gau, Can. J. Chem. Eng. 69 (1991) 1320-1326.
[74] Z. Lei, C. Li, Y. Li, B. Chen, Sep. Purif. Technol. 36 (2004) 131-138.
[75] S.R. Ningoo, V.G. Gaikar, Separ. Technol. 4 (1994) 249-251.
[76] A.E. Wentink, N.J.M. Kuipers, A.B. de Haan, J. Scholtz, H. Mulder, Chem.
Eng. Proc. 46 (2007) 800-809.
[77] V.G. Gaikar, G.K. Sau, Sep. Sci. Technol. 31 (1996) 1979-1988.
[78] A.L. Kohl, in: R. W. Rousseau (Ed.), Handbook of Separation Process
Technology, John Wiley & Sons, New York, 1987, pp. 340-404.
[79] T.W. Chapman, in: R. W. Rousseau (Ed.), Handbook of Separation Process
Technology, John Wiley & Sons, New York, 1987, pp. 467-499.
[80] B.G. Kyle, D.E. Leng, Ind. Eng. Chem. 57 (1965) 43-48.
[81] C.J. King, in: T. C. Lo, M. H. I. Baird, C. Hanson (Eds.), Handbook of solvent
extraction, Wiley Interscience, 1983, pp. 567-573.
21
Isobaric Low Pressure Vapor–Liquid Equilibrium
Data for Ethylbenzene + Styrene + Sulfolane and
the Three Constituent Binary Systems
This chapter has been published as:
M.T.G. Jongmans, J.I.W. Maassen, A.J. Luijks, B. Schuur, A.B. de Haan, J.
Chem. Eng. Data 56 (2011) 3510-3517.
Abstract Isobaric vapor–liquid equilibrium (VLE) data have been measured for the ternary system
(ethylbenzene + styrene + sulfolane) and the three constituent binary systems under vacuum
(5, 10, and 20 kPa). The VLE data of the binary system (ethylbenzene + styrene) measured
in this work are thermodynamically consistent according to the Herington area test and the
point test method contrary to the low pressure VLE data about this system available in the
literature. The binary VLE data were described well by the nonrandom two-liquid (NRTL)
model. The relative volatility of the system (ethylbenzene + styrene) increases in presence
of sulfolane from 1.4 up to values of 2.2. The ternary system could only be well-correlated
when using the ternary VLE data in combination with the binary VLE data as input for the
regression of the NRTL binary interaction parameters.
Chapter 2
22
2.1. Introduction
Styrene is mainly produced via the dehydrogenation of ethylbenzene [1]. The unreacted
ethylbenzene and styrene are separated by a vacuum distillation column operating at 5 to 20
kPa [2]. Due to their close boiling points [3], this distillation column accounts for 75 to 80
% of the total energy requirement in the separation section [2]. Extractive distillation is a
promising alternative to reduce the energy requirements to separate ethylbenzene from
styrene [3,4]. In extractive distillation a solvent is fed to a distillation column, which
modifies the activity coefficients of the components to be separated and thereby enhances
the relative volatility [5]. The relative volatility is defined as
o
jj
o
ii
j
j
i
i
P
P
x
y
xy
γ
γ==α
(2-1)
where y and x are the mole fractions of the components in the vapor and liquid phase,
respectively, γ is the activity coefficient, Po is the vapor pressure, and the subscripts
correspond to components i and j. Sulfolane is a promising solvent, which can increase the
relative volatility from 1.3 to 1.4 up to 2.4 [3]. Sulfolane is a common solvent in extraction
and extractive distillation processes [3,6-8]. Nevertheless, no process evaluation is available
in the open literature for the ethylbenzene/styrene separation by extractive distillation using
sulfolane. Consistent vapor–liquid equilibrium (VLE) data are required to establish an
equilibrium process model to investigate the potential to separate the mixture
ethylbenzene/styrene by extractive distillation using sulfolane [9].
This requires VLE data for the three binary systems (ethylbenzene + styrene),
(ethylbenzene + sulfolane), and (styrene + sulfolane), as well as the ternary system
(ethylbenzene + styrene + sulfolane). In this work an overview is given of the relevant VLE
data available in the literature of this system followed by the results of the VLE data
measured in our laboratory. Currently, no ternary data for these systems are reported in the
literature. Isobaric [10-15] as well as isothermic [16-18] data are presented in the literature
for the binary system (ethylbenzene + styrene). An overview of the relevant low pressure
data of the binary system (ethylbenzene + styrene) and the binary systems (ethylbenzene +
sulfolane) and (styrene + sulfolane) is presented in Table 2-1. For the binary system
(ethylbenzene + styrene) only the data determined by Aucejo et al. [10], Chaiyavech and
van Winkle [11], and White et al. [12] are presented in Table 2-1. The other available data
are thermodynamically inconsistent according to the point test method [19], which was
reported by Aucejo et al. [10] The experimental data are consistent according to the point
test method provided that the absolute average deviation between the correlated and the
experimental vapor mole fractions (AADy) is less than 0.01 and are scattered arbitrary
around zero [19]. The area method developed by Redlich and Kister [20] and Herington
Chapter 2
23
[21] was applied to the available binary VLE data of the system (ethylbenzene + styrene)
using the Aspen Plus Data Regression tool to determine the thermodynamic consistency. In
the area method log(γ1/γ2) is plotted as function of the liquid mole fraction. The areas above
and below the horizontal axis should be equal, where a maximum deviation of 10 % is
allowed. Later, this method was extended by Herington to be able to apply it also to
isobaric data [22], since the influence of temperature on the activity coefficients was
ignored in the original method.
Table 2-1: Overview of reported binary vapor-liquid equilibrium data for the system
(ethylbenzene + styrene + sulfolane).
Source Isobaric/
isothermal P [kPa]
Area consistency
[%] AADy1
a
Ethylbenzene (1) + styrene (2) Aucejo et al. [10] isobaric 5 68.1 0.003
isobaric 15 21.3 0.001
Chaiyavech et al. [11] isobaric 6.7 55.0 0.005
isobaric 13.3 51.7 0.004
isobaric 26.7 93.2 0.008
White et al. [12] isobaric 13.3 51.9 0.01
Ethylbenzene (1) + sulfolane (2)
Yu et al. [23] isobaric 101.3 - 0.002
Styrene (1) + sulfolane (2)
Chen et al. [24] isothermal 0.04-5 - - aAverage absolute deviation in vapor mole fraction: ∑ =
−=N
iy yy)N/(1
cal
1
exp
11 1AAD (N, number of data
points).
From the Herington area consistency test, the conclusion can be drawn that the available
low pressure (ethylbenzene + styrene) data are thermodynamically inconsistent. To
determine the consistency of the VLE data, the experimental data of both the liquid and the
vapor phase have to be known [19,20]. It was not possible to determine the consistency of
the available (ethylbenzene + sulfolane) and (styrene + sulfolane) data, because the vapor
phase compositions in these VLE data had to be calculated due to the large volatility
difference between ethylbenzene/styrene and sulfolane [23]. The binary VLE data of the
systems (ethylbenzene + sulfolane) and (styrene + sulfolane) were both not determined in
the required pressure range of 5 to 20 kPa. To obtain a good calculation of the ternary VLE
data from the binary VLE data sets, it is moreover recommendable to obtain all VLE data
with the same experimental procedure in the same laboratory [9]. Thus, the three binaries
and the ternary system were measured to obtain complete and consistent data in the
required pressure range.
Chapter 2
24
2.2. Experimental Section
2.2.1. Materials
Acetone (≥99.5 %) was obtained from VWR, cyclohexane (≥99 %) and styrene (≥99.5 %)
from Merck, and ethylbenzene (≥99 %), sulfolane (≥98 %) and 4-tert-butylcatechol (≥98
%) from Fluka. All chemicals were used without further purification.
2.2.2. Apparatus and Procedure
All experimental VLE data were measured with an all-glass ebulliometer (Fischer VLE
602D). The equilibrium chamber in this device is a dynamic recirculating still, equipped
with a Cottrell circulation pump. A control unit (Fischer VLE 2+) was used to control the
pressure and immersion heater. The speed of vapor condensation was kept constant at 1
drop per second. Equilibrium was reached in 30-45 minutes, when the condensation rate
and equilibrium temperature were constant. The pressure of this apparatus could be
determined with an accuracy of ± 0.01 kPa. The equilibrium temperature was measured
with an accuracy of ± 0.1 K. Isobaric VLE data for the binaries (ethylbenzene + styrene),
(ethylbenzene + sulfolane), and (styrene + sulfolane) as well as the ternary system
(ethylbenzene + styrene + sulfolane) were determined at 5, 10, and 20 kPa. The VLE data
for the ternary system was determined at 4 mass based solvent-to-feed (S/F = mass
solvent/mass feed) ratios; 1, 2, 3, and 4, and three ethylbenzene/styrene mass ratios; 20/80,
50/50, and 80/20. 4-tert-butylcatechol (0.005 wt%) was added as an inhibitor to prevent
polymerization to the mixtures containing styrene.
2.2.3. Analysis
To determine the equilibrium compositions, samples of 20 µL were taken from the liquid
and condensed vapor phases with a 100 µL syringe. Samples of 120 µL of acetone and 10
µL of cyclohexane were added as diluent and internal standard, respectively. The
compositions were determined with a gas chromatograph (Varian CP-3800) equipped with
a flame ionization detector and a Varian CP-SIL 5CB column (25 m · 1.2 µm). The split
ratio of the gas chromatograph was 50 and the injection volume 0.5 µL. The oven
temperature program was 100 oC for 1 min to 300 oC at 40 oC/min. The temperature of 300 oC was kept constant for two minutes. The concentrations of the components in the vapor
and liquid phases could be determined with an average deviation in mole fraction of 0.002.
2.3. Results and Discussion
2.3.1. Pure Component Vapor Pressures
The pure component vapor pressures of ethylbenzene and styrene were determined in the
relevant temperature range to validate the experimental method and are shown in Appendix
A. The Antoine equation was used to correlate the vapor pressures of ethylbenzene and
styrene in Aspen Plus, which is defined as:
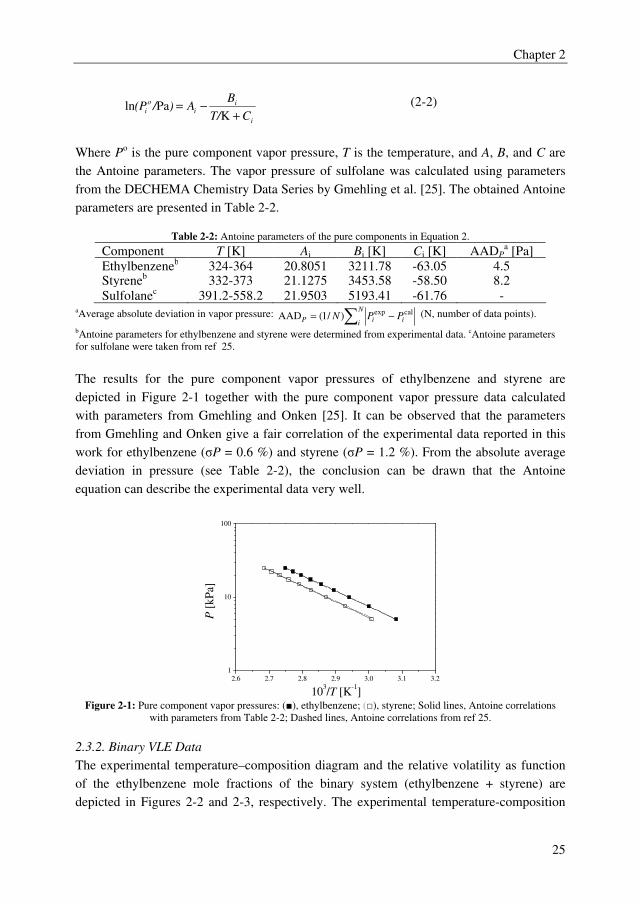
Chapter 2
25
i
ii
o
iCT/
BA)/(P
+−=
KPaln (2-2)
Where Po is the pure component vapor pressure, T is the temperature, and A, B, and C are
the Antoine parameters. The vapor pressure of sulfolane was calculated using parameters
from the DECHEMA Chemistry Data Series by Gmehling et al. [25]. The obtained Antoine
parameters are presented in Table 2-2.
Table 2-2: Antoine parameters of the pure components in Equation 2.
Component T [K] Ai Bi [K] Ci [K] AADPa [Pa]
Ethylbenzeneb 324-364 20.8051 3211.78 -63.05 4.5 Styreneb 332-373 21.1275 3453.58 -58.50 8.2
Sulfolanec 391.2-558.2 21.9503 5193.41 -61.76 - aAverage absolute deviation in vapor pressure: ∑ −=
N
iiiP PPNcalexp)/1(AAD (N, number of data points).
bAntoine parameters for ethylbenzene and styrene were determined from experimental data. cAntoine parameters
for sulfolane were taken from ref 25.
The results for the pure component vapor pressures of ethylbenzene and styrene are
depicted in Figure 2-1 together with the pure component vapor pressure data calculated
with parameters from Gmehling and Onken [25]. It can be observed that the parameters
from Gmehling and Onken give a fair correlation of the experimental data reported in this
work for ethylbenzene (σP = 0.6 %) and styrene (σP = 1.2 %). From the absolute average
deviation in pressure (see Table 2-2), the conclusion can be drawn that the Antoine
equation can describe the experimental data very well.
2.6 2.7 2.8 2.9 3.0 3.1 3.2
1
10
100
P [
kP
a]
103/T [K
-1]
Figure 2-1: Pure component vapor pressures: (■), ethylbenzene; (□), styrene; Solid lines, Antoine correlations
with parameters from Table 2-2; Dashed lines, Antoine correlations from ref 25.
2.3.2. Binary VLE Data
The experimental temperature–composition diagram and the relative volatility as function
of the ethylbenzene mole fractions of the binary system (ethylbenzene + styrene) are
depicted in Figures 2-2 and 2-3, respectively. The experimental temperature-composition
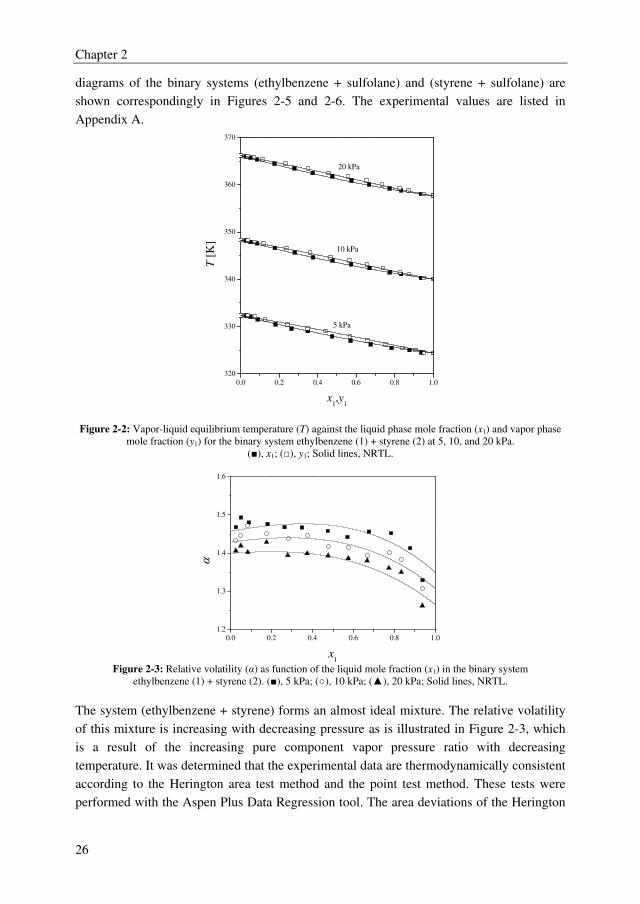
Chapter 2
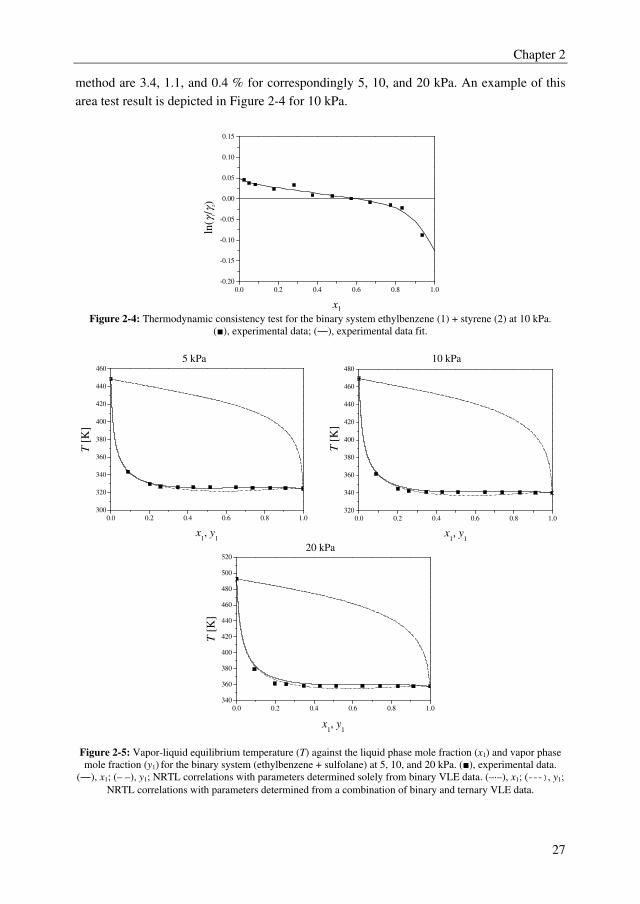
26
diagrams of the binary systems (ethylbenzene + sulfolane) and (styrene + sulfolane) are
shown correspondingly in Figures 2-5 and 2-6. The experimental values are listed in
Appendix A.
0.0 0.2 0.4 0.6 0.8 1.0
320
330
340
350
360
370
5 kPa
10 kPa
20 kPa
T [
K]
x1,y
1
Figure 2-2: Vapor-liquid equilibrium temperature (T) against the liquid phase mole fraction (x1) and vapor phase
mole fraction (y1) for the binary system ethylbenzene (1) + styrene (2) at 5, 10, and 20 kPa.
(■), x1; (□), y1; Solid lines, NRTL.
0.0 0.2 0.4 0.6 0.8 1.0
1.2
1.3
1.4
1.5
1.6
α
x1
Figure 2-3: Relative volatility (α) as function of the liquid mole fraction (x1) in the binary system
ethylbenzene (1) + styrene (2). (■), 5 kPa; (○), 10 kPa; (▲), 20 kPa; Solid lines, NRTL.
The system (ethylbenzene + styrene) forms an almost ideal mixture. The relative volatility
of this mixture is increasing with decreasing pressure as is illustrated in Figure 2-3, which
is a result of the increasing pure component vapor pressure ratio with decreasing
temperature. It was determined that the experimental data are thermodynamically consistent
according to the Herington area test method and the point test method. These tests were
performed with the Aspen Plus Data Regression tool. The area deviations of the Herington
Chapter 2
27
method are 3.4, 1.1, and 0.4 % for correspondingly 5, 10, and 20 kPa. An example of this
area test result is depicted in Figure 2-4 for 10 kPa.
0.0 0.2 0.4 0.6 0.8 1.0
-0.20
-0.15
-0.10
-0.05
0.00
0.05
0.10
0.15
ln(γ
1/γ
2)
x1 Figure 2-4: Thermodynamic consistency test for the binary system ethylbenzene (1) + styrene (2) at 10 kPa.
(■), experimental data; (―), experimental data fit.
5 kPa 10 kPa
0.0 0.2 0.4 0.6 0.8 1.0
300
320
340
360
380
400
420
440
460
T [
K]
x1, y
1
0.0 0.2 0.4 0.6 0.8 1.0
320
340
360
380
400
420
440
460
480
T [
K]
x1, y
1 20 kPa
0.0 0.2 0.4 0.6 0.8 1.0
340
360
380
400
420
440
460
480
500
520
T [
K]
x1, y
1
Figure 2-5: Vapor-liquid equilibrium temperature (T) against the liquid phase mole fraction (x1) and vapor phase
mole fraction (y1) for the binary system (ethylbenzene + sulfolane) at 5, 10, and 20 kPa. (■), experimental data.
(―), x1; (– –), y1; NRTL correlations with parameters determined solely from binary VLE data. (–·–), x1; (---), y1;
NRTL correlations with parameters determined from a combination of binary and ternary VLE data.
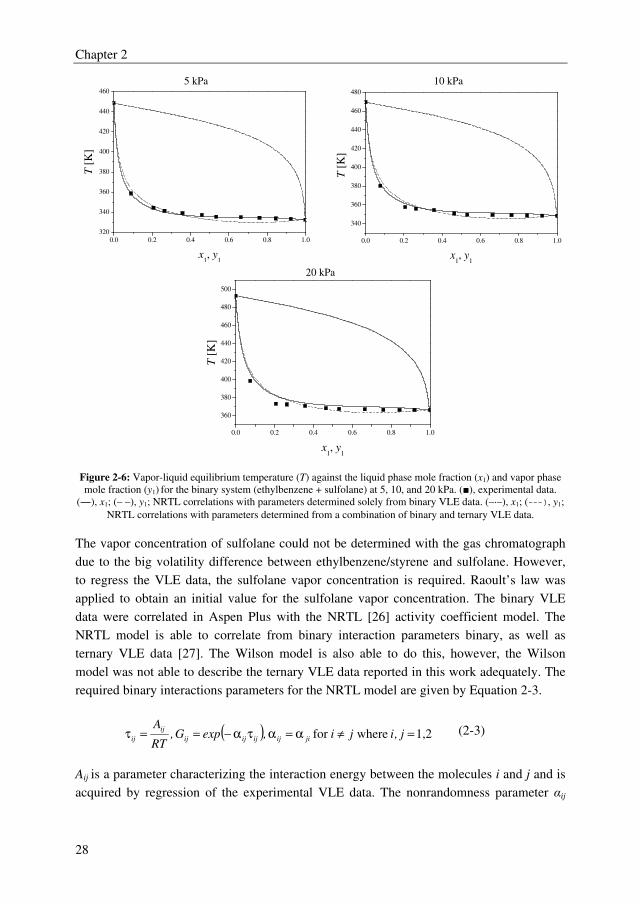
Chapter 2
28
5 kPa 10 kPa
0.0 0.2 0.4 0.6 0.8 1.0
320
340
360
380
400
420
440
460
T [
K]
x1, y
1
0.0 0.2 0.4 0.6 0.8 1.0
340
360
380
400
420
440
460
480
T [
K]
x1, y
1 20 kPa
0.0 0.2 0.4 0.6 0.8 1.0
360
380
400
420
440
460
480
500
T [
K]
x1, y
1
Figure 2-6: Vapor-liquid equilibrium temperature (T) against the liquid phase mole fraction (x1) and vapor phase
mole fraction (y1) for the binary system (ethylbenzene + sulfolane) at 5, 10, and 20 kPa. (■), experimental data.
(―), x1; (– –), y1; NRTL correlations with parameters determined solely from binary VLE data. (–·–), x1; (---), y1;
NRTL correlations with parameters determined from a combination of binary and ternary VLE data.
The vapor concentration of sulfolane could not be determined with the gas chromatograph
due to the big volatility difference between ethylbenzene/styrene and sulfolane. However,
to regress the VLE data, the sulfolane vapor concentration is required. Raoult’s law was
applied to obtain an initial value for the sulfolane vapor concentration. The binary VLE
data were correlated in Aspen Plus with the NRTL [26] activity coefficient model. The
NRTL model is able to correlate from binary interaction parameters binary, as well as
ternary VLE data [27]. The Wilson model is also able to do this, however, the Wilson
model was not able to describe the ternary VLE data reported in this work adequately. The
required binary interactions parameters for the NRTL model are given by Equation 2-3.
( ) 1,2wherefor =≠α=ατα−==τ j,iji,expG,RT
Ajiijijijij
ij
ij (2-3)
Aij is a parameter characterizing the interaction energy between the molecules i and j and is
acquired by regression of the experimental VLE data. The nonrandomness parameter αij
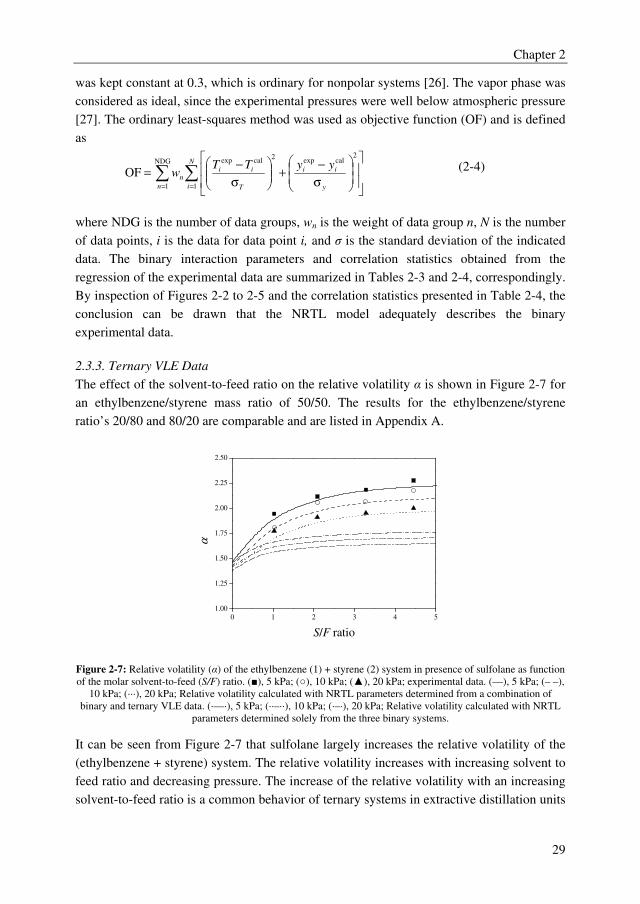
Chapter 2
29
was kept constant at 0.3, which is ordinary for nonpolar systems [26]. The vapor phase was
considered as ideal, since the experimental pressures were well below atmospheric pressure
[27]. The ordinary least-squares method was used as objective function (OF) and is defined
as
∑∑==
σ
−+
σ
−=
N
i y
ii
T
ii
n
n
yyTTw
1
2calexp
2calexpNDG
1
OF (2-4)
where NDG is the number of data groups, wn is the weight of data group n, N is the number
of data points, i is the data for data point i, and σ is the standard deviation of the indicated
data. The binary interaction parameters and correlation statistics obtained from the
regression of the experimental data are summarized in Tables 2-3 and 2-4, correspondingly.
By inspection of Figures 2-2 to 2-5 and the correlation statistics presented in Table 2-4, the
conclusion can be drawn that the NRTL model adequately describes the binary
experimental data.
2.3.3. Ternary VLE Data
The effect of the solvent-to-feed ratio on the relative volatility α is shown in Figure 2-7 for
an ethylbenzene/styrene mass ratio of 50/50. The results for the ethylbenzene/styrene
ratio’s 20/80 and 80/20 are comparable and are listed in Appendix A.
0 1 2 3 4 5
1.00
1.25
1.50
1.75
2.00
2.25
2.50
α
S/F ratio
Figure 2-7: Relative volatility (α) of the ethylbenzene (1) + styrene (2) system in presence of sulfolane as function
of the molar solvent-to-feed (S/F) ratio. (■), 5 kPa; (○), 10 kPa; (▲), 20 kPa; experimental data. (—), 5 kPa; (– –),
10 kPa; (···), 20 kPa; Relative volatility calculated with NRTL parameters determined from a combination of
binary and ternary VLE data. (·—·), 5 kPa; (··–··), 10 kPa; (·–·), 20 kPa; Relative volatility calculated with NRTL
parameters determined solely from the three binary systems.
It can be seen from Figure 2-7 that sulfolane largely increases the relative volatility of the
(ethylbenzene + styrene) system. The relative volatility increases with increasing solvent to
feed ratio and decreasing pressure. The increase of the relative volatility with an increasing
solvent-to-feed ratio is a common behavior of ternary systems in extractive distillation units
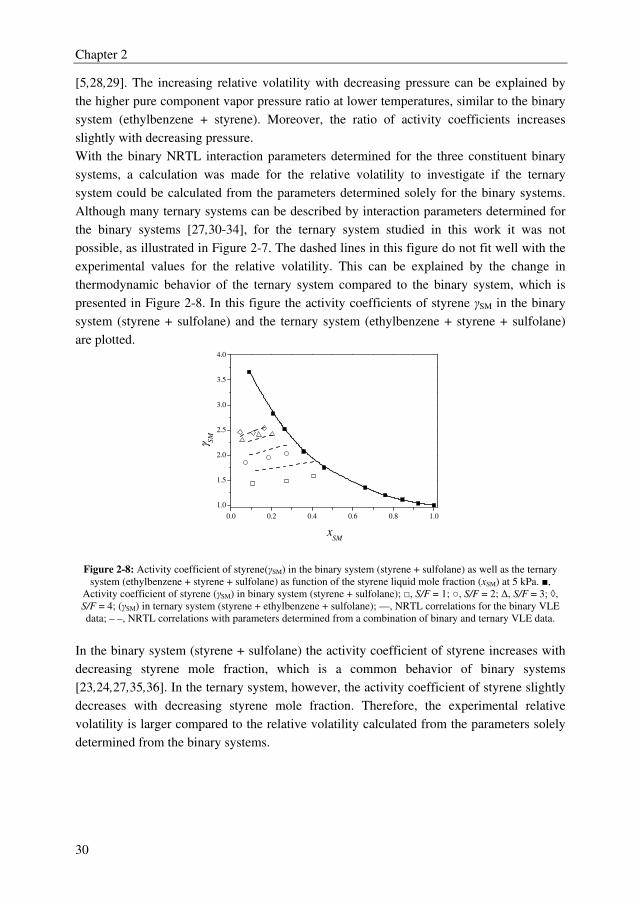
Chapter 2
30
[5,28,29]. The increasing relative volatility with decreasing pressure can be explained by
the higher pure component vapor pressure ratio at lower temperatures, similar to the binary
system (ethylbenzene + styrene). Moreover, the ratio of activity coefficients increases
slightly with decreasing pressure.
With the binary NRTL interaction parameters determined for the three constituent binary
systems, a calculation was made for the relative volatility to investigate if the ternary
system could be calculated from the parameters determined solely for the binary systems.
Although many ternary systems can be described by interaction parameters determined for
the binary systems [27,30-34], for the ternary system studied in this work it was not
possible, as illustrated in Figure 2-7. The dashed lines in this figure do not fit well with the
experimental values for the relative volatility. This can be explained by the change in
thermodynamic behavior of the ternary system compared to the binary system, which is
presented in Figure 2-8. In this figure the activity coefficients of styrene γSM in the binary
system (styrene + sulfolane) and the ternary system (ethylbenzene + styrene + sulfolane)
are plotted.
0.0 0.2 0.4 0.6 0.8 1.0
1.0
1.5
2.0
2.5
3.0
3.5
4.0
γ SM
xSM
Figure 2-8: Activity coefficient of styrene(γSM) in the binary system (styrene + sulfolane) as well as the ternary
system (ethylbenzene + styrene + sulfolane) as function of the styrene liquid mole fraction (xSM) at 5 kPa. ■,
Activity coefficient of styrene (γSM) in binary system (styrene + sulfolane); □, S/F = 1; ○, S/F = 2; ∆, S/F = 3; ◊,
S/F = 4; (γSM) in ternary system (styrene + ethylbenzene + sulfolane); —, NRTL correlations for the binary VLE
data; – –, NRTL correlations with parameters determined from a combination of binary and ternary VLE data.
In the binary system (styrene + sulfolane) the activity coefficient of styrene increases with
decreasing styrene mole fraction, which is a common behavior of binary systems
[23,24,27,35,36]. In the ternary system, however, the activity coefficient of styrene slightly
decreases with decreasing styrene mole fraction. Therefore, the experimental relative
volatility is larger compared to the relative volatility calculated from the parameters solely
determined from the binary systems.
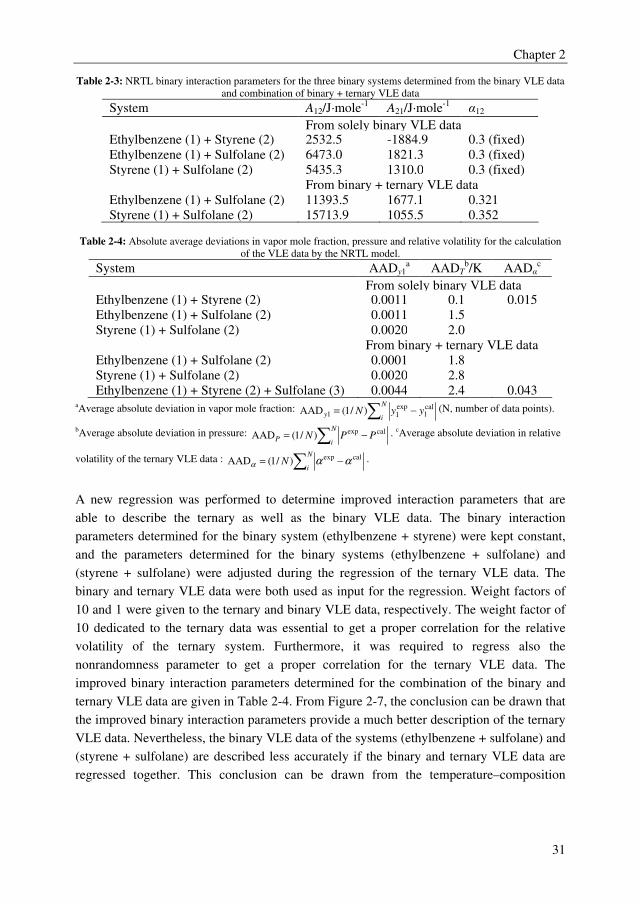
Chapter 2
31
Table 2-3: NRTL binary interaction parameters for the three binary systems determined from the binary VLE data
and combination of binary + ternary VLE data
System A12/J·mole-1 A21/J·mole-1
α12
From solely binary VLE data Ethylbenzene (1) + Styrene (2) 2532.5 -1884.9 0.3 (fixed)
Ethylbenzene (1) + Sulfolane (2) 6473.0 1821.3 0.3 (fixed)
Styrene (1) + Sulfolane (2) 5435.3 1310.0 0.3 (fixed)
From binary + ternary VLE data
Ethylbenzene (1) + Sulfolane (2) 11393.5 1677.1 0.321
Styrene (1) + Sulfolane (2) 15713.9 1055.5 0.352
Table 2-4: Absolute average deviations in vapor mole fraction, pressure and relative volatility for the calculation
of the VLE data by the NRTL model.
System AADy1a AADT
b/K AADαc
From solely binary VLE data Ethylbenzene (1) + Styrene (2) 0.0011 0.1 0.015
Ethylbenzene (1) + Sulfolane (2) 0.0011 1.5
Styrene (1) + Sulfolane (2) 0.0020 2.0
From binary + ternary VLE data
Ethylbenzene (1) + Sulfolane (2) 0.0001 1.8
Styrene (1) + Sulfolane (2) 0.0020 2.8
Ethylbenzene (1) + Styrene (2) + Sulfolane (3) 0.0044 2.4 0.043 aAverage absolute deviation in vapor mole fraction: ∑ −=
N
iy yyN
cal1
exp11 )/1(AAD (N, number of data points).
bAverage absolute deviation in pressure: ∑ −=N
iP PPN
calexp)/1(AAD . cAverage absolute deviation in relative
volatility of the ternary VLE data : ∑ −=N
iN
calexp)/1(AAD ααα.
A new regression was performed to determine improved interaction parameters that are
able to describe the ternary as well as the binary VLE data. The binary interaction
parameters determined for the binary system (ethylbenzene + styrene) were kept constant,
and the parameters determined for the binary systems (ethylbenzene + sulfolane) and
(styrene + sulfolane) were adjusted during the regression of the ternary VLE data. The
binary and ternary VLE data were both used as input for the regression. Weight factors of
10 and 1 were given to the ternary and binary VLE data, respectively. The weight factor of
10 dedicated to the ternary data was essential to get a proper correlation for the relative
volatility of the ternary system. Furthermore, it was required to regress also the
nonrandomness parameter to get a proper correlation for the ternary VLE data. The
improved binary interaction parameters determined for the combination of the binary and
ternary VLE data are given in Table 2-4. From Figure 2-7, the conclusion can be drawn that
the improved binary interaction parameters provide a much better description of the ternary
VLE data. Nevertheless, the binary VLE data of the systems (ethylbenzene + sulfolane) and
(styrene + sulfolane) are described less accurately if the binary and ternary VLE data are
regressed together. This conclusion can be drawn from the temperature–composition
Chapter 2
32
diagrams depicted in Figures 2-5 and 2-6 and from the correlation statistics shown in Table
2-4.
2.4. Conclusions
In this work, isobaric binary and ternary VLE data were determined for the system
(ethylbenzene + styrene + sulfolane) under vacuum (5, 10, and 20 kPa). The measured
binary VLE data of the system (ethylbenzene + styrene) is thermodynamically consistent in
contrast to the available data in literature. All binary experimental VLE data could be well-
correlated by the NRTL model. It was not possible to adequately correlate the experimental
ternary VLE data with the binary interaction parameters determined for the binary systems,
since the activity coefficient of styrene slightly decreases with decreasing mole fraction in
the ternary system, unlike in the binary system. The ternary system (ethylbenzene + styrene
+ sulfolane) can only be described well if the ternary data are also included in the
regression of the binary interaction parameters.
2.5. Nomenclature
aij binary interaction parameter J/mole
A Antoine parameter
B,C Antoine parameters ` K
F feed
G coefficient as defined in Equation (2-3)
n data group
N number of data points
p total pressure Pa
po pure component vapor pressure Pa
S solvent
T temperature K
w weight of data group
x mole fraction in the liquid phase
y mole fraction in the vapor phase
Greek symbols
α relative volatility
αij nonrandomness constant
τ coefficient as defined in Equation (2-3)
γ activity coefficient
σ standard deviation
Chapter 2
33
Subscripts
cal calculated
exp experimental
i component i
j component j
Abbreviations
AAD absolute average deviation
EB ethylbenzene
NDG number of data groups
NRTL nonrandom two-liquid
OF objective function
SM styrene monomer
VLE vapor–liquid equilibrium
2.6. References
[1] A.L. Ward, W.J. Robert, in: Arza Seidel (Ed.), Kirk-Othmer Encyclopedia of
Chemical Technology, John Wiley & Sons, New York, 2000.
[2] US 6171449 B1, V.A. Welch, 2001.
[3] J.C. Gentry, S. Kumar, R. Wright-Wytcherley, Hydrocarb. Process. 93 (2004) 62-
66.
[4] I. Sucksmith, Chem. Eng. 89 (1982) 91-95.
[5] Z. Lei, B. Chen, Z. Ding, in: Special Distillation Processes, Elsevier, Amsterdam,
2005, pp. 59-144.
[6] P.J. Bailes, C. Hanson, M.A. Hughes, Chem. Eng. 83 (1976) 115-120.
[7] B. Allison, R.P. Brown, in: J. J. McKetta (Ed.), Encyclopedia of chemical
processing and design, Dekker, New York, 1977.
[8] Y.J. Choi, K.W. Cho, B.W. Cho, Y.K. Yeo, Ind. Eng. Chem. Res. 41 (2002) 5504-
5509.
[9] P. Gierycz, J. Rauk, Thermochim. Acta 170 (1990) 263-268.
[10] A. Aucejo, S. Loras, V. Martinez-Soria, N. Becht, G. Del Rio, J. Chem. Eng. Data
51 (2006) 1051-1055.
[11] P. Chaiyavech, M. Van Winkle, J. Chem. Eng. Data 4 (1959) 53-56.
[12] W.S. White, M. Winkle van, Ind. Eng. Chem. 46 (1954) 1284-1285.
[13] J. Jakubicek, V. Fried, J. Vahala, Chem. Listy 51 (1957) 1422-1428.
[14] V.A. Malyusov, N.A. Malafeev, N.M. Zhavoronkov, Zhur. Fiz. Khim. 31 (1957)
699-703.
[15] E.M. Smirnov, A.F. Frolova, O.N. Dyment, V.A. Goncharov, E.B. Chizhov, E.S.
Nikolaev, Khim. Tekhnol. (1974) 104-109.
[16] W. Junghans, U. von Weber, Journal fur Praktische Chemie 2 (1955) 265-273.
[17] V.S. Smirnov, M.I. Volkova, L.A. Oparine, V.I. Shishkin, Promst Sint. Kauch 11
(1979) 2-3.
[18] O. Vilim, E. Hala, J. Pick, V. Fried, Chem. Listy 48 (1954) 989-995.
[19] H.C. Van Ness, S.M. Byer, R.E. Gibbs, AIChE J. 19 (1973) 238-244.
[20] O. Redlich, A.T. Kister, Ind. Eng. Chem. 40 (1948) 345-348.
Chapter 2
34
[21] E.F.G. Herington, Nature 160 (1947) 610-611.
[22] E.F.G. Herington, J. Ins. Petrol. 37 (1951) 457-470.
[23] Y.X. Yu, M.Y. He, G.H. Gao, Z.C. Li, Fluid Phase Equilibr. 190 (2001) 61-71.
[24] M. Chen, G. Zheng, Lanzhou Daxue Xuebao, Ziran Kexueban 2 (1981) 93-99.
[25] J. Gmehling, U. Onken, Vapor-liquid equilibrium data collection ed., DECHEMA,
Frankfurt 1977.
[26] H. Renon, J.M. Prausnitz, AIChE J. 14 (1968) 135-144.
[27] B.E. Poling, J.M. Prausnitz, J.P. O'Connell, The properties of gases and liquids,
Fifth ed., McGraw Hill, Singapore 2007.
[28] M.F. Doherty, J.P. Knapp, Distillation, Azeotropic, and Extractive ed., John Wiley
& Sons, Inc., 2000.
[29] W. Yin, S. Ding, S. Xia, P. Ma, X. Huang, Z. Zhu, J. Chem. Eng. Data 55 (2010)
3274-3277.
[30] C.D. Larson, D.P. Tassios, Ind. Eng. Chem. Proc. D. D. 11 (1972) 35-38.
[31] K. Kurihara, M. Nakamichi, K. Kojima, J. Chem. Eng. Data 38 (1993) 446-449.
[32] V.G. Gaikar, G.K. Sau, Sep. Sci. Technol. 31 (1996) 1979-1988.
[33] S.R. Ningoo, V.G. Gaikar, Separ. Technol. 4 (1994) 249-251.
[34] S.K. Gupta, B.S. Rawat, J. Chem. Eng. Data 37 (1992) 139-140.
[35] S.J. Ashcroft, A.D. Clayton, R.B. Shearn, J. Chem. Eng. Data 24 (2002) 195-199.
[36] U. Domanska, A. Sporzynski, W.C. Moollan, T.M. Letcher, J. Chem. Eng. Data
41 (1996) 624-628.
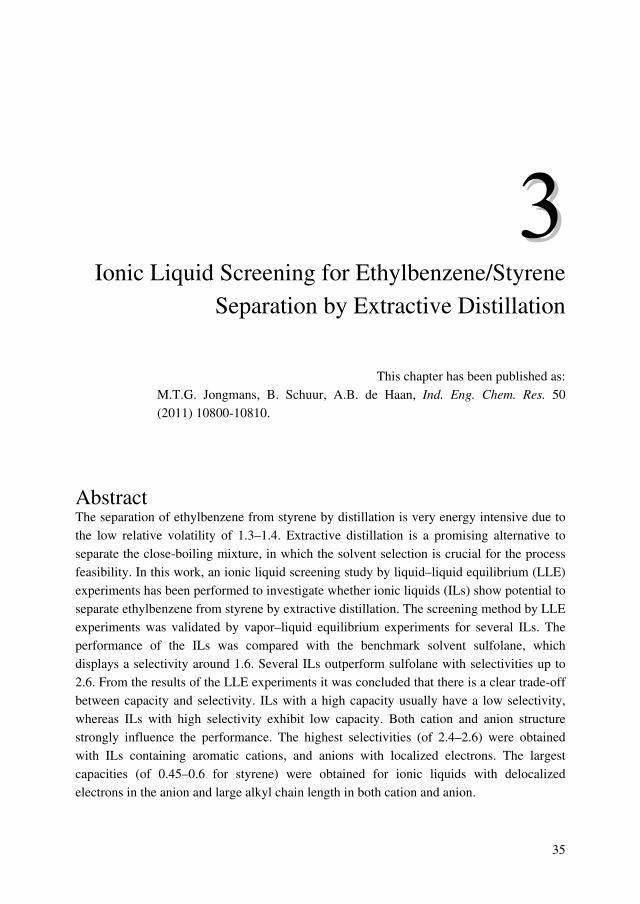
35
Ionic Liquid Screening for Ethylbenzene/Styrene
Separation by Extractive Distillation
This chapter has been published as:
M.T.G. Jongmans, B. Schuur, A.B. de Haan, Ind. Eng. Chem. Res. 50
(2011) 10800-10810.
Abstract The separation of ethylbenzene from styrene by distillation is very energy intensive due to
the low relative volatility of 1.3–1.4. Extractive distillation is a promising alternative to
separate the close-boiling mixture, in which the solvent selection is crucial for the process
feasibility. In this work, an ionic liquid screening study by liquid–liquid equilibrium (LLE)
experiments has been performed to investigate whether ionic liquids (ILs) show potential to
separate ethylbenzene from styrene by extractive distillation. The screening method by LLE
experiments was validated by vapor–liquid equilibrium experiments for several ILs. The
performance of the ILs was compared with the benchmark solvent sulfolane, which
displays a selectivity around 1.6. Several ILs outperform sulfolane with selectivities up to
2.6. From the results of the LLE experiments it was concluded that there is a clear trade-off
between capacity and selectivity. ILs with a high capacity usually have a low selectivity,
whereas ILs with high selectivity exhibit low capacity. Both cation and anion structure
strongly influence the performance. The highest selectivities (of 2.4–2.6) were obtained
with ILs containing aromatic cations, and anions with localized electrons. The largest
capacities (of 0.45–0.6 for styrene) were obtained for ionic liquids with delocalized
electrons in the anion and large alkyl chain length in both cation and anion.
Chapter 3
36
3.1. Introduction
Styrene is most commonly produced via the catalytic dehydrogenation of ethylbenzene [1].
Deep vacuum distillation in the pressure range of 5–20 kPa is generally used in this process
to separate the unreacted ethylbenzene from styrene. Due to the low relative volatility of
1.3–1.4 [2], the distillation of ethylbenzene from styrene accounts for 75–80 % of the total
energy use in the distillation section of a typical styrene production plant [3]. A dramatic
reduction in both capital and energy expenses may be obtained when the traditional
distillation is replaced by extractive distillation [2]. In extractive distillation, the relative
volatility is enhanced by feeding a solvent to the column that modifies the activity
coefficients of the components to be separated [4]. Typical organic solvents used in
extractive distillation are sulfolane, n-methyl pyrrolidone and n-formyl morpholine [4-8].
Sulfolane is known to have a large effect on the relative volatility of an
ethylbenzene/styrene mixture [2,9]. The solvent selectivity of sulfolane towards styrene in
this mixture is around 1.6 [9]. However, the disadvantage of sulfolane is its low
decomposition temperature [10].
An alternative with large potential is to use ionic liquids (ILs), which have recently been
reported as promising solvents for extractive distillation processes [4,11,12], as well as in
other separation technologies [11,13]. In separation technology, ILs are mainly used to
separate aromatics from aliphatics [14-17], olefins from aliphatics [18,19], alkynes from
olefins [20,21], sulfur and nitrogen containing compounds from aromatics/aliphatics
[15,22-24], and alcohols/aldehydes/ketones/ethers from aliphatics/aromatics [16,25]. ILs
are low melting salts (< 100 oC) [26], composed entirely of ions and are a class of solvents
with very interesting properties [26]. The current interest in ILs is mainly driven by their
proven or potential applications as “green solvents” due to their negligible vapor pressure
[27,28]. An IL in an extractive distillation process integrates the advantages of a liquid
solvent (easy operation) and a solid salt (high separation ability) [4,19]. In order to optimize
the properties of ILs, regarding the requirements of the extractive distillation process, the
cation-anion combination can be varied (for this reason, ILs are designer solvents) [29,30].
With respect to the ethylbenzene/styrene separation by extractive distillation, the high
chemical and thermal stability [31], the broad liquid range [32], and the high capacity of
ILs for aromatic compounds [17,33] are advantageous properties.
To the best of our knowledge, the separation of close-boiling aromatic mixtures using ILs
has not been reported yet. Because of the industrial relevance [1], the separation of
ethylbenzene from styrene has been chosen as a model system for close-boiling aromatic
mixtures. The aim of the study reported here was to find an IL with a high selectivity for
the ethylbenzene/styrene separation, in combination with an as high as possible solvent
capacity. These features (selectivity and capacity) are crucial for the capital and operational
expenditures of an extractive distillation process [34,35]. Momoh et al. [34] investigated the
effect of the solvent selectivity on the total annual costs of an extractive distillation unit.
The main conclusion of Momoh et al. [34] was that the larger the selectivity of the solvent,
Chapter 3
37
the lower the annual costs. This can be explained by the fact that if the selectivity of the
solvent increases, the relative volatility of the mixture to be separated also increases,
resulting in a reduction in the number of equilibrium stages and the reflux ratio. This
decreases the operational as well as the capital expenditures. Kossack et al. [35] determined
that the capacity of the solvent also has a significant effect on the total annual costs for
systems in which the solvent has a miscibility gap with the feed mixture. The main
conclusion from their work was that next to the selectivity, also the capacity should be
sufficiently high to keep the total costs of an extractive distillation unit economical. If the
solvent capacity is large, less solvent is required to obtain a homogeneous liquid phase in
the extractive distillation column. If less solvent is needed, the required energy for heating
up the solvent in the extractive distillation and solvent recovery column decreases. Because
of the low solubility of ILs in aromatics [36], many ILs do not form a homogeneous liquid
phase with many aromatics over the full composition range [25,37,38]. Therefore it is
important to look at the capacity as well.
Because of the relevance of the selectivity as well as the capacity, these two features were
investigated for a range of 37 ILs using liquid–liquid equilibrium (LLE) measurements.
LLE measurements were performed, because from vapor–liquid equilibrium (VLE)
experiments only the selectivity can be determined. The selectivities obtained from the LLE
experiments were subsequently validated by performing VLE measurements for three ILs.
The relation between the LLE and VLE selectivity is presented in section 2 of this chapter
along with the procedure of the IL screening. In section 3 the syntheses of several non-
commercially available ILs are described. Moreover, the experimental procedure of the
LLE and VLE experiments are given in this section. The validation of the LLE experiments
by the VLE experiments are presented first in section 4 followed by the influence of the
temperature on the styrene and ethylbenzene capacity, and thereby the solvent selectivity.
Next, the influence of the different cation and anion structures on the capacity and
selectivity is shown. The results section ends with the main conclusions obtained from this
work and a comparison of the IL performance with the benchmark solvent sulfolane by
showing the effect of the selectivity on the required reflux ratio in the extractive distillation
column.
3.2. Theory and Procedure for Ionic Liquids Screening
3.2.1. Theory: Liquid–Liquid and Vapor–Liquid Selectivity
The primary screening of ILs for the ethylbenzene/styrene separation was done using LLE
experiments, because from VLE experiments only the selectivity can be obtained.
Moreover, LLE experiments are easier to perform and far less labor intensive than VLE
experiments. The data from the LLE experiments can subsequently be used to ensure a
homogeneous liquid phase in VLE experiments. From the LLE experiments, the solvent
Chapter 3
38
selectivity S can be calculated from the ratio of the solvent capacities D, which can be
calculated from the mole fractions x of the components in the IL and organic phase [39]:
IL
EB
Org
EB
Org
SM
IL
SM
Org
EB
IL
EB
Org
SM
IL
SM
EB
SMLLE
SM/EBx
x
x
x
x
x
x
x
D
DS ===
(3-1)
In Equation 3-1, SM, EB, and IL represent styrene, ethylbenzene, and ionic liquid. In
extractive distillation, the relative volatility is important [4]:
o
SMSM
o
EBEB
SM
SM
EB
EB
EB/SMP
P
xy
xy
γ
γ==α
(3-2)
where y and x are the mole fractions of the components in the vapor and liquid phase,
respectively. γ Is the activity coefficient, and Po is the pure component vapor pressure. To
be able to calculate the relative volatility directly from the LLE experiments, it is better to
replace the ratio of activity coefficients in Equation 3-2 by the solvent selectivity. At
equilibrium, thermodynamics requires the activity of each component to be equal in both
liquid phases [39]:
OrgOrg
i
ILIL
iii xx γ=γ (3-3)
Replacing the mole fractions with the activity coefficients yields for the selectivity and
neglecting the solubility of ILs in the organic phase [36]:
IL
SM
IL
EB
Org
EB
Org
SM
IL
SM
IL
EBLLE
SM/EBγ
γ=
γ
γ
γ
γ=S (3-4)
Assuming a negligible solubility of the ILs in the ethylbenzene/styrene mixture, the organic
phase consists of only ethylbenzene and styrene. Because the ethylbenzene/styrene mixture
behaves nearly ideal [9], the assumption was made that the ratio of activity coefficients in
the organic phase is equal to one. The equation for the selectivity can be combined with
Equation 3-2:
o
SM
o
EBLLE
SM/EBo
SM
o
EB
IL
SM
IL
EB
SM
SM
EB
EB
EB/SMP
PS
P
P
xy
xy
=γ
γ==α
(3-5)
Chapter 3
39
The selectivities obtained from the LLE experiments were compared with the selectivities
from the VLE experiments, to validate if the observed selectivities from the LLE
experiments are reliable for the estimation of the relative volatility, and thus for the
screening procedure.
3.2.2. Procedure IL Screening
There is no data available in the literature about the screening of ILs for the separation of
close-boiling aromatic mixtures with ILs. However, many data is already available for
several other hydrocarbon/hydrocarbon separations [14-25]. The reported solvent capacities
and selectivities for those separations were used to make a first estimate on promising
cation-anion combinations. For example it is known that ILs containing anions with large
electron delocalization, like [N(CN)2]- and [B(CN)4]
- have a high solvent capacity for
aromatics [40]. A total of 37 ILs were thus proposed, which are listed in Table 3-1.
ILs with six different types of cations were examined in this study, based on promising
results in other hydrocarbon separations. Cations can be roughly divided in aromatic and
aliphatic cations. ILs with aromatic cations studied in this work were imidazolium and
pyridinium-based. ILs with aliphatic cations were pyrrolidinium, phosphonium,
ammonium, and sulfonium-based.
Imidazolium-based ILs are the most commonly applied in separation technology, and have
a large affinity towards aromatic components [14,15,25]. The alkyl chain length of the
imidazolium cation was varied from ethyl to hexyl. Besides the commonly used alkyl
groups as a side chain, three other imidazolium-based ILs with different type of side chains
were investigated. One with a hydroxyethyl group to study the effect of a polar group in the
side chain. Another with an allyl group, because this gives the imidazolium cation a flat
structure, just like styrene, which could increase the capacity as well as selectivity. The last
one is an imidazolium cation with a benzyl group as a side chain, which increases the
aromaticity [41].
Pyridinium-based ILs with alkyl chains are also commonly used for aromatics extraction
[40]. One pyridinium-based IL contained a nitrile group in the side chain of the pyridinium
ring. Other cations studied that are less commonly reported in hydrocarbon/hydrocarbon
separations are based on pyrrolidinium [42], phosphonium [43], ammonium [44], and
sulfonium [45].
Several anions were tested to investigate the effect of the anion structure on the capacity
and selectivity. Anions can be divided in three categories [46,47]: a) spherical anions,
anions with a spherical shape like [BF4]- for example, without charge distribution; b)
spherical anions with linear chains and slight charge distribution; c) small linear anions
with explicit charge distribution. The performance of all anion structures were studied with
the [EMIM]+ cation to be able to compare the different anion structures with each other. No
ILs were investigated with the anions [PF6]-, Cl- and I-. The anion [PF6]- can decompose to
HF [48], and ILs containing anions like Cl- and I- show strong corrosion behavior [14,49].
Chapter 3
40
Moreover, both anions have high melting points (> 80 oC) [47], which makes them
unsuitable for the separation of ethylbenzene from styrene by deep vacuum extractive
distillation.
The ILs 1–7, 9–19, 21–29, and 31–37 were obtained commercially, the ILs 8, 20, 29, and
30 were not available commercially, and therefore synthesized in our lab. All ILs were
liquid at room temperature except for the ILs 8 and 12.
3.3. Experimental Section
3.3.1. Chemicals
Acetone (≥99.5%) was obtained from VWR, cyclohexane (≥99%) and styrene (≥99.5%)
from Merck, ethylbenzene (≥99%) and 4-tert-butylcatechol (≥98%) from Fluka, acetone-d6
(99.96 at.% D), sodium dicyanamide (≥96%), and potassium methyltrifluoroborate (≥98%)
from Aldrich. The purities in weight percentage were provided by the suppliers. The ILs
and some key intermediates used in this study along with their abbreviation, supplier and
purity are listed in Table 3-1. The synthesized ILs are described in the following section.
All ILs were dried in a rotary evaporator (Büchi Rotavapor R-200) and stored under
vacuum in a desiccator filled with molecular sieves. All chemicals were used without
further purification.
3.3.2. Ionic Liquid Syntheses
Anion exchange (metathesis) is a common procedure to prepare ILs [50-52]. The ILs 3-
cyano-N-butylpyridinium dicyanamide,1-ethyl-3-methylimidazolium methyltrifluoroborate,
1-allyl-3-methylimidazolium dicyanamide, and 1-benzyl-3-methylimidazolium
dicyanamide were all prepared using the anion exchange procedure, stirring a mixture of a
sodium or potassium salt with the desired anion together with a chloride of the desired
cation in 500 mL acetone for 60 h at room temperature. During the reaction, the formed
NaCl or KCl precipitated, and was filtered off. After evaporation of the acetone, the
completeness of the reactions was verified with 1H-NMR (Varian Oxford NMR 200MHz,
using acetone-d6 as solvent).
3-cyano-N-butylpyridinium dicyanamide
The reaction of 3-cyanobutylpyridinium chloride (34.6 g, 0.176 mole) and sodium
dicyanamide (16.2 g, 0.182 mole) yielded 38.4 g (0.169 mole, 96 % yield) of 3-cyano-N-
butylpyridinium dicyanamide, appearing as a dark reddish brown solid. 1H-NMR (200
MHz, acetone-d6): 9.91 (s, 1H), 9.57 (m, 1H), 9.17 (m, 1H), 8.54 (m, 1H), 4.97 (m, 2H),
2.16 (m, 2H), 1.5 (m, 2H), 0.98 (m, 3H).
Chapter 3
41
1-ethyl-3-methylimidazolium methyltrifluoroborate
The reaction of 1-ethyl-3-methylimidazolium chloride (11.4 g, 0.078 mole) and potassium
methyltrifluoroborate (10.3 g, 0.084 mole) yielded 15.6 g (0.080 mole, 95 % yield) 1-ethyl-
3-methylimidazolium methyltrifluoroborate, a viscous yellow liquid. 1H-NMR (200 MHz,
acetone-d6): 9.28 (s, 1H), 7.80 (s, 1H), 7.72 (s, 1H), 4.4 (m, 2H), 4.01 (s, 3H), 1.52 (m, 3H),
-0.41 (s, 3H).
1-allyl-3-methylimidazolium dicyanamide
The reaction between 1-allyl-3-methylimidazolium chloride (22.4 g, 0.141 mole) and
sodium dicyanamide (13.8 g, 0.155 mole) yielded 23.65 g (0.135 mole, 96 % yield) 1-allyl-
3-methylimidazolium dicyanamide, a viscous liquid of light yellow color. 1H-NMR (200
MHz, acetone-d6): 9.1 (s, 1H), 7.73 (m, 2H), 6.25-6.02 (m, 1H), 5.5-5.36 (m, 2H), 5.03-
4.95 (m, 2H), 4.05 (s, 3H).
1-benzyl-3-methylimidazolium dicyanamide
The reaction between 1-benzyl-3-methylimidazolium chloride (22.0 g, 0.105 mole) and
sodium dicyanamide (10.73 g, 0.121 mole) yielded 23.7 g (0.099 mole, 94 % yield) 1-
benzyl-3-methylimidazolium dicyanamide, a viscous yellow liquid. 1H-NMR (200 MHz,
acetone-d6): 9.21 (s, 1H), 7.77 (m, 2H), 7.47 (m, 5H), 5.59 (s, 2H), 4.06 (s, 3H).
3.3.3. Experimental Procedure of Phase Equilibria
Liquid–Liquid Equilibrium Experiments
The LLE experiments were performed by mixing 20 mL of the feed mixture with 10 mL IL
in 70 mL jacketed glass vessels. The vessels were equipped with a double impeller on a
single axis, powered by an electronic stirrer (IKA Eurostar powercontrol-visc P1). The
impellers were placed at the interface between the solvent and the feed to provide a good
mixing. The double walled vessels were thermostatted using a thermostatic bath (Julabo
F25). The extraction experiments were performed at 313.2 and 348.2 K ± 0.1 K. The
ethylbenzene/styrene mass ratio in the feed was 40/60, which is representative for the feed
to the current distillation column. Since the behavior between ethylbenzene and styrene is
nearly ideal [9], it is expected that other ethylbenzene/styrene ratio’s will give similar
results. 4-tert-butylcatechol (0.005 wt%) was added as a polymerization inhibitor. The time
to equilibration was typically 5 min at 1300 rpm. In order to ensure equilibrium,
experiments were run for 20 minutes, after which the two phases were allowed to settle for
two hours. Samples for analysis (0.2 mL) were taken from both extract and raffinate phase
using a 2 mL syringe. Since water has an influence on the extraction performance, the water
content in the ILs was measured before and after the experiments with Karl Fischer titration
and was in all cases determined to be lower than 0.2 wt%.
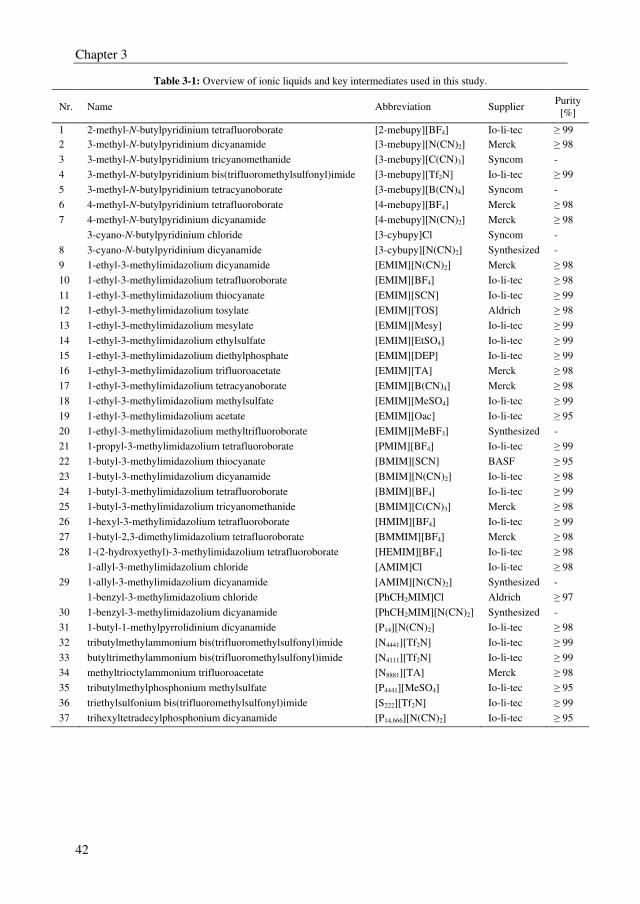
Chapter 3
42
Table 3-1: Overview of ionic liquids and key intermediates used in this study.
Nr. Name Abbreviation Supplier Purity
[%]
1 2-methyl-N-butylpyridinium tetrafluoroborate [2-mebupy][BF4] Io-li-tec ≥ 99
2 3-methyl-N-butylpyridinium dicyanamide [3-mebupy][N(CN)2] Merck ≥ 98
3 3-methyl-N-butylpyridinium tricyanomethanide [3-mebupy][C(CN)3] Syncom -
4 3-methyl-N-butylpyridinium bis(trifluoromethylsulfonyl)imide [3-mebupy][Tf2N] Io-li-tec ≥ 99
5 3-methyl-N-butylpyridinium tetracyanoborate [3-mebupy][B(CN)4] Syncom -
6 4-methyl-N-butylpyridinium tetrafluoroborate [4-mebupy][BF4] Merck ≥ 98
7 4-methyl-N-butylpyridinium dicyanamide [4-mebupy][N(CN)2] Merck ≥ 98
3-cyano-N-butylpyridinium chloride [3-cybupy]Cl Syncom -
8 3-cyano-N-butylpyridinium dicyanamide [3-cybupy][N(CN)2] Synthesized -
9 1-ethyl-3-methylimidazolium dicyanamide [EMIM][N(CN)2] Merck ≥ 98
10 1-ethyl-3-methylimidazolium tetrafluoroborate [EMIM][BF4] Io-li-tec ≥ 98
11 1-ethyl-3-methylimidazolium thiocyanate [EMIM][SCN] Io-li-tec ≥ 99
12 1-ethyl-3-methylimidazolium tosylate [EMIM][TOS] Aldrich ≥ 98
13 1-ethyl-3-methylimidazolium mesylate [EMIM][Mesy] Io-li-tec ≥ 99
14 1-ethyl-3-methylimidazolium ethylsulfate [EMIM][EtSO4] Io-li-tec ≥ 99
15 1-ethyl-3-methylimidazolium diethylphosphate [EMIM][DEP] Io-li-tec ≥ 99
16 1-ethyl-3-methylimidazolium trifluoroacetate [EMIM][TA] Merck ≥ 98
17 1-ethyl-3-methylimidazolium tetracyanoborate [EMIM][B(CN)4] Merck ≥ 98
18 1-ethyl-3-methylimidazolium methylsulfate [EMIM][MeSO4] Io-li-tec ≥ 99
19 1-ethyl-3-methylimidazolium acetate [EMIM][Oac] Io-li-tec ≥ 95
20 1-ethyl-3-methylimidazolium methyltrifluoroborate [EMIM][MeBF3] Synthesized -
21 1-propyl-3-methylimidazolium tetrafluoroborate [PMIM][BF4] Io-li-tec ≥ 99
22 1-butyl-3-methylimidazolium thiocyanate [BMIM][SCN] BASF ≥ 95
23 1-butyl-3-methylimidazolium dicyanamide [BMIM][N(CN)2] Io-li-tec ≥ 98
24 1-butyl-3-methylimidazolium tetrafluoroborate [BMIM][BF4] Io-li-tec ≥ 99
25 1-butyl-3-methylimidazolium tricyanomethanide [BMIM][C(CN)3] Merck ≥ 98
26 1-hexyl-3-methylimidazolium tetrafluoroborate [HMIM][BF4] Io-li-tec ≥ 99
27 1-butyl-2,3-dimethylimidazolium tetrafluoroborate [BMMIM][BF4] Merck ≥ 98
28 1-(2-hydroxyethyl)-3-methylimidazolium tetrafluoroborate [HEMIM][BF4] Io-li-tec ≥ 98
1-allyl-3-methylimidazolium chloride [AMIM]Cl Io-li-tec ≥ 98
29 1-allyl-3-methylimidazolium dicyanamide [AMIM][N(CN)2] Synthesized -
1-benzyl-3-methylimidazolium chloride [PhCH2MIM]Cl Aldrich ≥ 97
30 1-benzyl-3-methylimidazolium dicyanamide [PhCH2MIM][N(CN)2] Synthesized -
31 1-butyl-1-methylpyrrolidinium dicyanamide [P14][N(CN)2] Io-li-tec ≥ 98
32 tributylmethylammonium bis(trifluoromethylsulfonyl)imide [N4441][Tf2N] Io-li-tec ≥ 99
33 butyltrimethylammonium bis(trifluoromethylsulfonyl)imide [N4111][Tf2N] Io-li-tec ≥ 99
34 methyltrioctylammonium trifluoroacetate [N8881][TA] Merck ≥ 98
35 tributylmethylphosphonium methylsulfate [P4441][MeSO4] Io-li-tec ≥ 95
36 triethylsulfonium bis(trifluoromethylsulfonyl)imide [S222][Tf2N] Io-li-tec ≥ 99
37 trihexyltetradecylphosphonium dicyanamide [P14,666][N(CN)2] Io-li-tec ≥ 95
Chapter 3
43
Vapor–Liquid Equilibrium Experiments
The VLE measurements were all measured with an all glass ebulliometer (Fischer VLE
602/D), in which the equilibrium vessel is a dynamic recirculating still, equipped with a
Cottrell circulation pump. The heating capacity and pressure were controlled using a
control unit (Fischer VLE 2+). The vapor condensation rate was kept constant at one drop
per second. The condensor was operating at 288.2 K. The pressure was maintained constant
at 5 kPa ± 0.01 kPa by using a vacuum pump and pressure control system. These vacuum
conditions were used to keep the temperatures low to prevent styrene polymerization. The
equilibrium temperature was measured with an accuracy of ± 0.1 K. Equilibrium was
reached after approximately 30–45 minutes, when the vapor temperature and the distillation
rate were both constant. The ethylbenzene/styrene mass ratio was 40/60. Mass based
solvent to feed ratios of 1.2, 5.5 and 12 were used for the ionic liquids [3-
mebupy][B(CN)4], [4-mebupy][BF4], and [EMIM][SCN], respectively, in the VLE
experiments. 4-tert-butylcatechol (0.005 wt%) was added as a polymerization inhibitor. In
order to determine the equilibrium compositions, samples of 20 µL were taken from both
the liquid and condensed vapor phase using a 100 µL syringe.
3.3.4 Analysis
The samples taken from the LLE experiments for analysis were diluted with 1.2 mL of
acetone and 0.1 mL of cyclohexane was added as internal standard. The samples from the
VLE-experiments were diluted with 120 µL of acetone and 10 µL of cyclohexane was
added as internal standard. The samples were then analyzed using a gas chromatograph
(Varian CP-3800) equipped with a flame ionization detector and a Varian CP-SIL 5CB
column (25 m · 1.2 µm). The split ratio was 50 and the injection volume 0.5 µL. The
amount of IL could not be analyzed with gas chromatography due to their negligible vapor
pressure, but was calculated by means of a mass balance. The IL was collected in a pre-
column (cup liner) to avoid contamination of the analytical column. The pre-column was
replaced after 80–100 injections. The concentration of the components could be determined
with an average deviation in mole fraction of 0.002.
3.4. Results and Discussion
All experimental results from the LLE and VLE experiments are depicted in Appendix B.
The LLE results for the ILs [N8881][TA] and [P14,666][N(CN)2] are not reported, because a
homogeneous liquid phase appeared after stirring these two ILs with the
ethylbenzene/styrene feed mixture. Consequently, no capacity and selectivity could be
determined with LLE experiments. VLE experiments could be done to determine the
selectivity, but based on the results with other ILs containing quaternary ammonium and
phosphonium cations, the selectivity is expected to be low, and therefore these laborious
experiments were not done for these ILs. Both ILs are highly nonpolar due to the large
alkyl chains in their cations and therefore completely miscible with both aromatics.
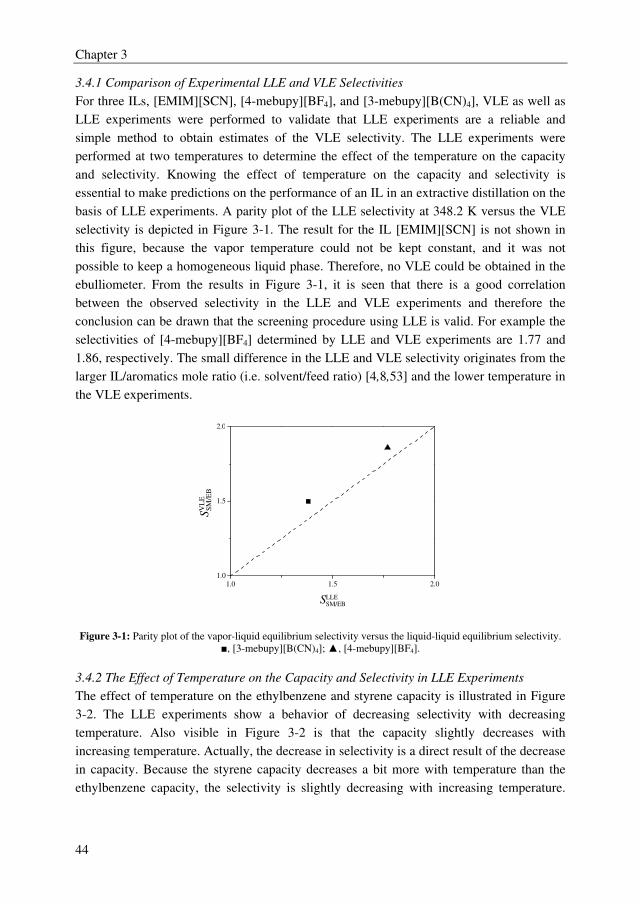
Chapter 3
44
3.4.1 Comparison of Experimental LLE and VLE Selectivities
For three ILs, [EMIM][SCN], [4-mebupy][BF4], and [3-mebupy][B(CN)4], VLE as well as
LLE experiments were performed to validate that LLE experiments are a reliable and
simple method to obtain estimates of the VLE selectivity. The LLE experiments were
performed at two temperatures to determine the effect of the temperature on the capacity
and selectivity. Knowing the effect of temperature on the capacity and selectivity is
essential to make predictions on the performance of an IL in an extractive distillation on the
basis of LLE experiments. A parity plot of the LLE selectivity at 348.2 K versus the VLE
selectivity is depicted in Figure 3-1. The result for the IL [EMIM][SCN] is not shown in
this figure, because the vapor temperature could not be kept constant, and it was not
possible to keep a homogeneous liquid phase. Therefore, no VLE could be obtained in the
ebulliometer. From the results in Figure 3-1, it is seen that there is a good correlation
between the observed selectivity in the LLE and VLE experiments and therefore the
conclusion can be drawn that the screening procedure using LLE is valid. For example the
selectivities of [4-mebupy][BF4] determined by LLE and VLE experiments are 1.77 and
1.86, respectively. The small difference in the LLE and VLE selectivity originates from the
larger IL/aromatics mole ratio (i.e. solvent/feed ratio) [4,8,53] and the lower temperature in
the VLE experiments.
1.0 1.5 2.0
1.0
1.5
2.0
SV
LE
SM
/EB
SLLESM/EB
Figure 3-1: Parity plot of the vapor-liquid equilibrium selectivity versus the liquid-liquid equilibrium selectivity.
■, [3-mebupy][B(CN)4]; ▲, [4-mebupy][BF4].
3.4.2 The Effect of Temperature on the Capacity and Selectivity in LLE Experiments
The effect of temperature on the ethylbenzene and styrene capacity is illustrated in Figure
3-2. The LLE experiments show a behavior of decreasing selectivity with decreasing
temperature. Also visible in Figure 3-2 is that the capacity slightly decreases with
increasing temperature. Actually, the decrease in selectivity is a direct result of the decrease
in capacity. Because the styrene capacity decreases a bit more with temperature than the
ethylbenzene capacity, the selectivity is slightly decreasing with increasing temperature.
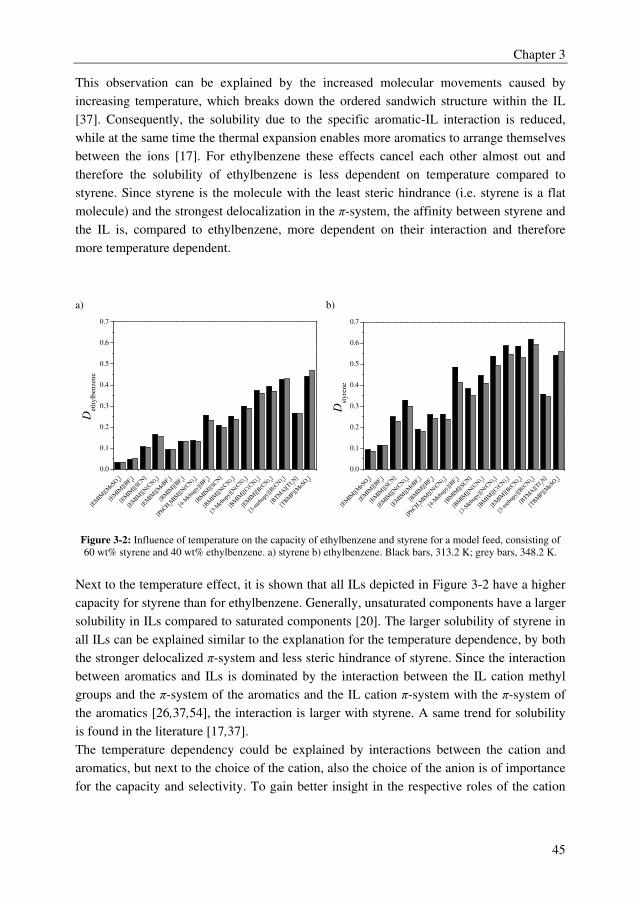
Chapter 3
45
This observation can be explained by the increased molecular movements caused by
increasing temperature, which breaks down the ordered sandwich structure within the IL
[37]. Consequently, the solubility due to the specific aromatic-IL interaction is reduced,
while at the same time the thermal expansion enables more aromatics to arrange themselves
between the ions [17]. For ethylbenzene these effects cancel each other almost out and
therefore the solubility of ethylbenzene is less dependent on temperature compared to
styrene. Since styrene is the molecule with the least steric hindrance (i.e. styrene is a flat
molecule) and the strongest delocalization in the π-system, the affinity between styrene and
the IL is, compared to ethylbenzene, more dependent on their interaction and therefore
more temperature dependent.
a) b)
[EM
IM][M
eSO 4
]
[EM
IM][BF 4
]
[EM
IM][SC
N]
[EM
IM][N(C
N) 2]
[EM
IM][M
eBF 3
]
[BM
IM][BF 4
]
[PhC
H 2M
IM][N(C
N) 2]
[4-M
ebup
y][B
F 4]
[BM
IM][SC
N]
[BM
IM][N(C
N) 2]
[3-M
ebup
y][N
(CN) 2]
[BM
IM][C(C
N) 3]
[EM
IM][B(C
N) 4]
[3-m
ebup
y][B
(CN) 4]
[BTM
A][Tf 2
N]
[TBM
P][M
eSO 4
]
0.0
0.1
0.2
0.3
0.4
0.5
0.6
0.7
Det
hy
lben
zene
[E
MIM
][M
eSO 4
]
[EM
IM][BF 4
]
[EM
IM][SC
N]
[EM
IM][N(C
N) 2]
[EM
IM][M
eBF 3
]
[BM
IM][BF 4
]
[PhC
H 2M
IM][N(C
N) 2]
[4-M
ebup
y][B
F 4]
[BM
IM][SC
N]
[BM
IM][N(C
N) 2]
[3-M
ebup
y][N
(CN) 2]
[BM
IM][C(C
N) 3]
[EM
IM][B(C
N) 4]
[3-m
ebup
y][B
(CN) 4]
[BTM
A][Tf 2
N]
[TBM
P][M
eSO 4
]
0.0
0.1
0.2
0.3
0.4
0.5
0.6
0.7
Dst
yre
ne
Figure 3-2: Influence of temperature on the capacity of ethylbenzene and styrene for a model feed, consisting of
60 wt% styrene and 40 wt% ethylbenzene. a) styrene b) ethylbenzene. Black bars, 313.2 K; grey bars, 348.2 K.
Next to the temperature effect, it is shown that all ILs depicted in Figure 3-2 have a higher
capacity for styrene than for ethylbenzene. Generally, unsaturated components have a larger
solubility in ILs compared to saturated components [20]. The larger solubility of styrene in
all ILs can be explained similar to the explanation for the temperature dependence, by both
the stronger delocalized π-system and less steric hindrance of styrene. Since the interaction
between aromatics and ILs is dominated by the interaction between the IL cation methyl
groups and the π-system of the aromatics and the IL cation π-system with the π-system of
the aromatics [26,37,54], the interaction is larger with styrene. A same trend for solubility
is found in the literature [17,37].
The temperature dependency could be explained by interactions between the cation and
aromatics, but next to the choice of the cation, also the choice of the anion is of importance
for the capacity and selectivity. To gain better insight in the respective roles of the cation
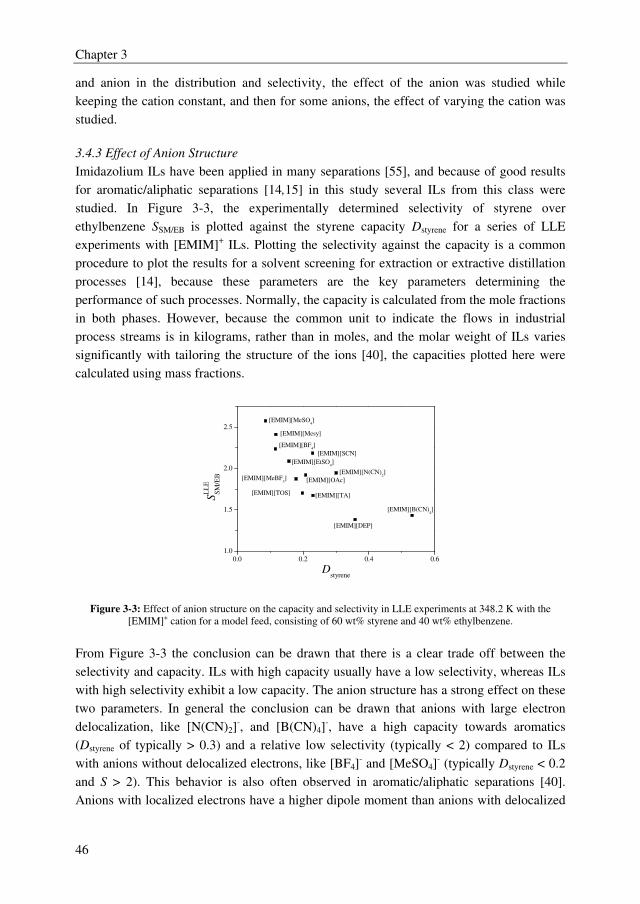
Chapter 3
46
and anion in the distribution and selectivity, the effect of the anion was studied while
keeping the cation constant, and then for some anions, the effect of varying the cation was
studied.
3.4.3 Effect of Anion Structure
Imidazolium ILs have been applied in many separations [55], and because of good results
for aromatic/aliphatic separations [14,15] in this study several ILs from this class were
studied. In Figure 3-3, the experimentally determined selectivity of styrene over
ethylbenzene SSM/EB is plotted against the styrene capacity Dstyrene for a series of LLE
experiments with [EMIM]+ ILs. Plotting the selectivity against the capacity is a common
procedure to plot the results for a solvent screening for extraction or extractive distillation
processes [14], because these parameters are the key parameters determining the
performance of such processes. Normally, the capacity is calculated from the mole fractions
in both phases. However, because the common unit to indicate the flows in industrial
process streams is in kilograms, rather than in moles, and the molar weight of ILs varies
significantly with tailoring the structure of the ions [40], the capacities plotted here were
calculated using mass fractions.
0.0 0.2 0.4 0.6
1.0
1.5
2.0
2.5
[EMIM][B(CN)4]
[EMIM][DEP]
[EMIM][TA][EMIM][TOS]
[EMIM][MeBF3] [EMIM][OAc]
[EMIM][N(CN)2]
[EMIM][EtSO4]
[EMIM][SCN]
[EMIM][BF4]
[EMIM][Mesy]
[EMIM][MeSO4]
SL
LE
SM
/EB
Dstyrene
Figure 3-3: Effect of anion structure on the capacity and selectivity in LLE experiments at 348.2 K with the
[EMIM]+ cation for a model feed, consisting of 60 wt% styrene and 40 wt% ethylbenzene.
From Figure 3-3 the conclusion can be drawn that there is a clear trade off between the
selectivity and capacity. ILs with high capacity usually have a low selectivity, whereas ILs
with high selectivity exhibit a low capacity. The anion structure has a strong effect on these
two parameters. In general the conclusion can be drawn that anions with large electron
delocalization, like [N(CN)2]-, and [B(CN)4]
-, have a high capacity towards aromatics
(Dstyrene of typically > 0.3) and a relative low selectivity (typically < 2) compared to ILs
with anions without delocalized electrons, like [BF4]- and [MeSO4]
- (typically Dstyrene < 0.2
and S > 2). This behavior is also often observed in aromatic/aliphatic separations [40].
Anions with localized electrons have a higher dipole moment than anions with delocalized
Chapter 3
47
electrons [54]. Charge localization facilitates stronger Coulombic interactions between the
ions, and thereby creating more cation-anion affinity [54]. Nonpolar molecules, like
ethylbenzene and styrene, also tend to reside in the nonpolar domains of an IL [54]. Since
ILs which contain anions with many localized electrons have more polar regions, there are
less domains for the aromatics available. Because of these two reasons, the capacity
decreases and selectivity increases.
The capacity and selectivity are also dependent on the alkyl chain length of the anion. The
capacity increases and selectivity decreases when the alkyl chain length of the anion
increases. This conclusion can be drawn by comparing the ILs with the anions [MeSO4]-
and [EtSO4]-. This trend for anion alkyl chain length was also observed by Garcia et al.
[56].
3.4.4 Effect of Cation Structure
In this section the effect of cation structure on the capacity and selectivity is discussed. The
anions [BF4]-, [Tf2N]-, and [N(CN)2]
- were selected as counter ions, because many different
ILs are commercially available with these types of anions. Some additional ILs with
[N(CN)2]- anion were custom synthesized (see section 3.3.2). The results are displayed in
Figure 3-4. This figure illustrates that pyridinium based ILs have a higher capacity and only
a slightly lower selectivity for styrene compared to imidazolium ILs. This conclusion was
drawn by comparing the results for [4-mebupy][BF4] (Dstyrene = 0.414, S = 1.77) and
[BMIM][BF4] (Dstyrene = 0.243, S =1.82), and may be explained by the pyridinium cation
having a slightly larger π-system and, therefore, has a stronger π-π interaction with
aromatics [57]. This trend is also known for aromatics/aliphatics separations [46].
The attachment of an extra methyl group to an imidazolium cation does not have a positive
influence on the extraction performance, which can be derived from the results for
[BMMIM][BF4] (Dstyrene = 0.239, S = 1.92) and [BMIM][BF4]. An extra methyl group
attached to an imidazolium cation should enhance the interaction of the cation methyl
groups with the π-system of the aromatics [37]. However, the extra methyl group makes the
[BMMIM]+-cation more ionic because the positive charge is more localized than in a
[BMIM]+-cation [58]. Charge localization facilitates stronger Coulombic interactions, and
thereby more cation-anion interaction. This explains the lower distribution coefficient for
aromatics if an extra methyl group is added to an imidazolium cation. Moreover, an extra
methyl group also causes more steric hindrance for aromatics [59].
The attachment of a benzyl-group to an imidazolium cation also does not positively
influence the aromatic capacity. In general a more extended π-electron ring system should
have stronger π-π interaction with aromatics [57]. However, in the case of ILs, most
probably only one aromatic moiety will take part in the π-π interaction [57]. Moreover, the
benzyl group can cause, just like an extra methyl group, steric hindrance.
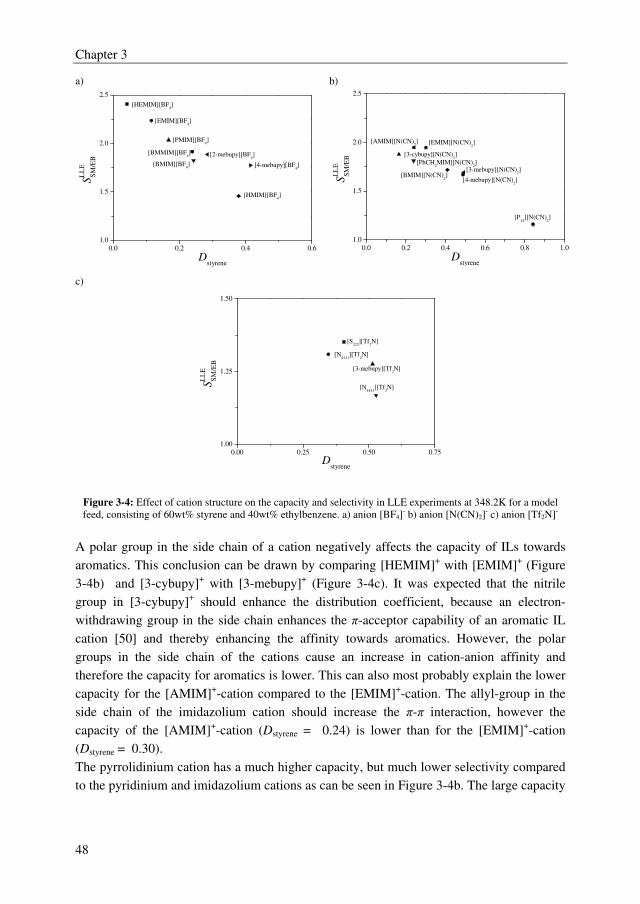
Chapter 3
48
a) b)
0.0 0.2 0.4 0.6
1.0
1.5
2.0
2.5
[BMMIM][BF4] [2-mebupy][BF
4]
[4-mebupy][BF4]
[HMIM][BF4]
[BMIM][BF4]
[PMIM][BF4]
[EMIM][BF4]
[HEMIM][BF4]
SL
LE
SM
/EB
Dstyrene
0.0 0.2 0.4 0.6 0.8 1.0
1.0
1.5
2.0
2.5
[P14
][N(CN)2]
[4-mebupy][N(CN)2]
[3-mebupy][N(CN)2]
[BMIM][N(CN)2]
[3-cybupy][N(CN)2]
[PhCH2MIM][N(CN)
2]
[EMIM][N(CN)2][AMIM][N(CN)
2]
SL
LE
SM
/EB
Dstyrene
c)
0.00 0.25 0.50 0.75
1.00
1.25
1.50
[N4441
][Tf2N]
[3-mebupy][Tf2N]
[N4111
][Tf2N]
[S222
][Tf2N]
SL
LE
SM
/EB
Dstyrene
Figure 3-4: Effect of cation structure on the capacity and selectivity in LLE experiments at 348.2K for a model
feed, consisting of 60wt% styrene and 40wt% ethylbenzene. a) anion [BF4]- b) anion [N(CN)2]
- c) anion [Tf2N]-
A polar group in the side chain of a cation negatively affects the capacity of ILs towards
aromatics. This conclusion can be drawn by comparing [HEMIM]+ with [EMIM]+ (Figure
3-4b) and [3-cybupy]+ with [3-mebupy]+ (Figure 3-4c). It was expected that the nitrile
group in [3-cybupy]+ should enhance the distribution coefficient, because an electron-
withdrawing group in the side chain enhances the π-acceptor capability of an aromatic IL
cation [50] and thereby enhancing the affinity towards aromatics. However, the polar
groups in the side chain of the cations cause an increase in cation-anion affinity and
therefore the capacity for aromatics is lower. This can also most probably explain the lower
capacity for the [AMIM]+-cation compared to the [EMIM]+-cation. The allyl-group in the
side chain of the imidazolium cation should increase the π-π interaction, however the
capacity of the [AMIM]+-cation (Dstyrene = 0.24) is lower than for the [EMIM]+-cation
(Dstyrene = 0.30).
The pyrrolidinium cation has a much higher capacity, but much lower selectivity compared
to the pyridinium and imidazolium cations as can be seen in Figure 3-4b. The large capacity
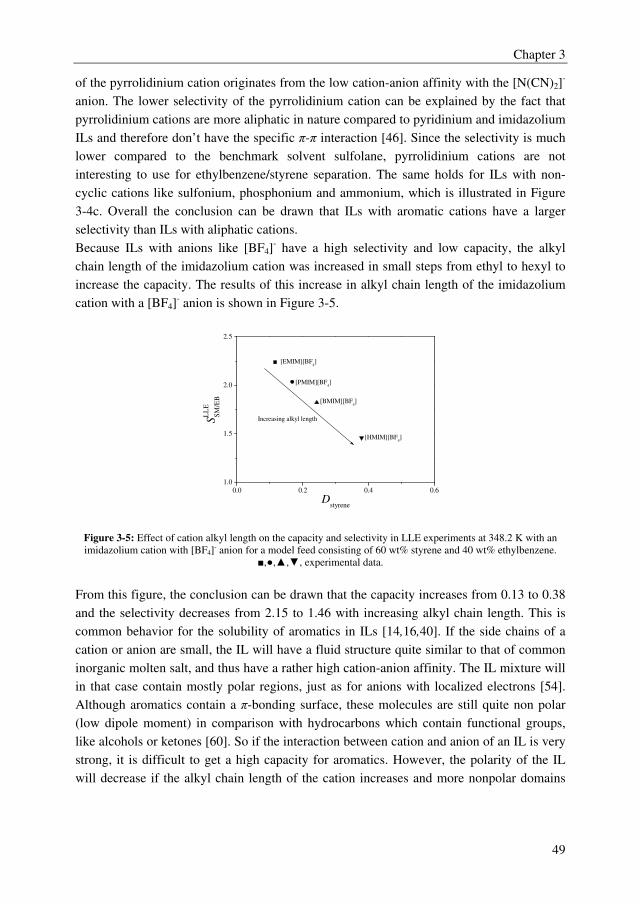
Chapter 3
49
of the pyrrolidinium cation originates from the low cation-anion affinity with the [N(CN)2]-
anion. The lower selectivity of the pyrrolidinium cation can be explained by the fact that
pyrrolidinium cations are more aliphatic in nature compared to pyridinium and imidazolium
ILs and therefore don’t have the specific π-π interaction [46]. Since the selectivity is much
lower compared to the benchmark solvent sulfolane, pyrrolidinium cations are not
interesting to use for ethylbenzene/styrene separation. The same holds for ILs with non-
cyclic cations like sulfonium, phosphonium and ammonium, which is illustrated in Figure
3-4c. Overall the conclusion can be drawn that ILs with aromatic cations have a larger
selectivity than ILs with aliphatic cations.
Because ILs with anions like [BF4]- have a high selectivity and low capacity, the alkyl
chain length of the imidazolium cation was increased in small steps from ethyl to hexyl to
increase the capacity. The results of this increase in alkyl chain length of the imidazolium
cation with a [BF4]- anion is shown in Figure 3-5.
0.0 0.2 0.4 0.6
1.0
1.5
2.0
2.5
Increasing alkyl length
[HMIM][BF4]
[BMIM][BF4]
[PMIM][BF4]
[EMIM][BF4]
SL
LE
SM
/EB
Dstyrene
Figure 3-5: Effect of cation alkyl length on the capacity and selectivity in LLE experiments at 348.2 K with an
imidazolium cation with [BF4]- anion for a model feed consisting of 60 wt% styrene and 40 wt% ethylbenzene.
■,●,▲,▼, experimental data.
From this figure, the conclusion can be drawn that the capacity increases from 0.13 to 0.38
and the selectivity decreases from 2.15 to 1.46 with increasing alkyl chain length. This is
common behavior for the solubility of aromatics in ILs [14,16,40]. If the side chains of a
cation or anion are small, the IL will have a fluid structure quite similar to that of common
inorganic molten salt, and thus have a rather high cation-anion affinity. The IL mixture will
in that case contain mostly polar regions, just as for anions with localized electrons [54].
Although aromatics contain a π-bonding surface, these molecules are still quite non polar
(low dipole moment) in comparison with hydrocarbons which contain functional groups,
like alcohols or ketones [60]. So if the interaction between cation and anion of an IL is very
strong, it is difficult to get a high capacity for aromatics. However, the polarity of the IL
will decrease if the alkyl chain length of the cation increases and more nonpolar domains
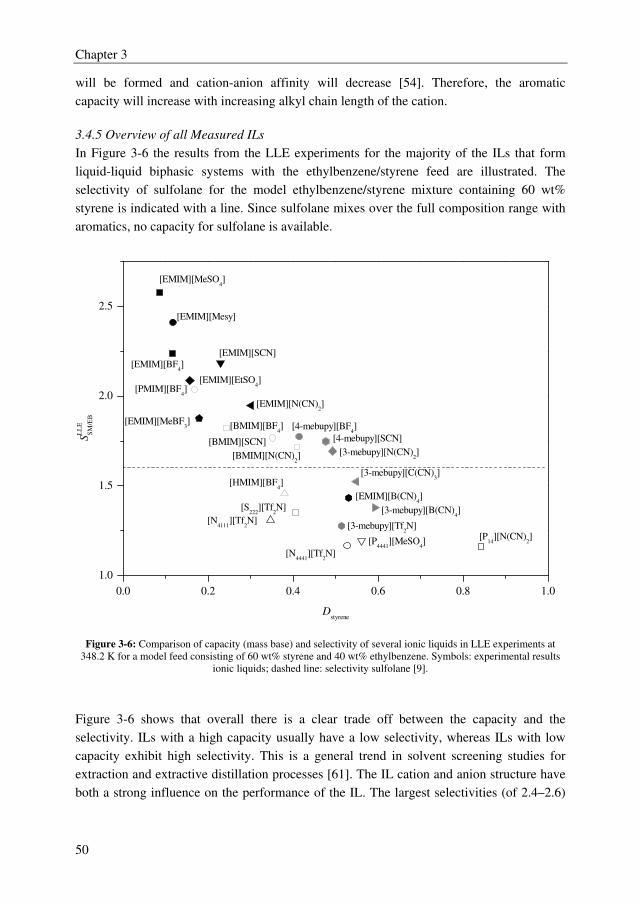
Chapter 3
50
will be formed and cation-anion affinity will decrease [54]. Therefore, the aromatic
capacity will increase with increasing alkyl chain length of the cation.
3.4.5 Overview of all Measured ILs
In Figure 3-6 the results from the LLE experiments for the majority of the ILs that form
liquid-liquid biphasic systems with the ethylbenzene/styrene feed are illustrated. The
selectivity of sulfolane for the model ethylbenzene/styrene mixture containing 60 wt%
styrene is indicated with a line. Since sulfolane mixes over the full composition range with
aromatics, no capacity for sulfolane is available.
0.0 0.2 0.4 0.6 0.8 1.0
1.0
1.5
2.0
2.5
[4-mebupy][SCN]
[N4441
][Tf2N]
[P4441
][MeSO4]
[P14
][N(CN)2]
[3-mebupy][Tf2N]
[N4111
][Tf2N]
[S222
][Tf2N] [3-mebupy][B(CN)
4]
[EMIM][B(CN)4]
[HMIM][BF4]
[3-mebupy][C(CN)3]
[3-mebupy][N(CN)2][BMIM][N(CN)
2]
[BMIM][SCN]
[4-mebupy][BF4][BMIM][BF
4]
[EMIM][MeBF3]
[EMIM][N(CN)2]
[PMIM][BF4]
[EMIM][EtSO4]
[EMIM][SCN]
[EMIM][BF4]
[EMIM][Mesy]
[EMIM][MeSO4]
SL
LE
SM
/EB
Dstyrene
Figure 3-6: Comparison of capacity (mass base) and selectivity of several ionic liquids in LLE experiments at
348.2 K for a model feed consisting of 60 wt% styrene and 40 wt% ethylbenzene. Symbols: experimental results
ionic liquids; dashed line: selectivity sulfolane [9].
Figure 3-6 shows that overall there is a clear trade off between the capacity and the
selectivity. ILs with a high capacity usually have a low selectivity, whereas ILs with low
capacity exhibit high selectivity. This is a general trend in solvent screening studies for
extraction and extractive distillation processes [61]. The IL cation and anion structure have
both a strong influence on the performance of the IL. The largest selectivities (of 2.4–2.6)
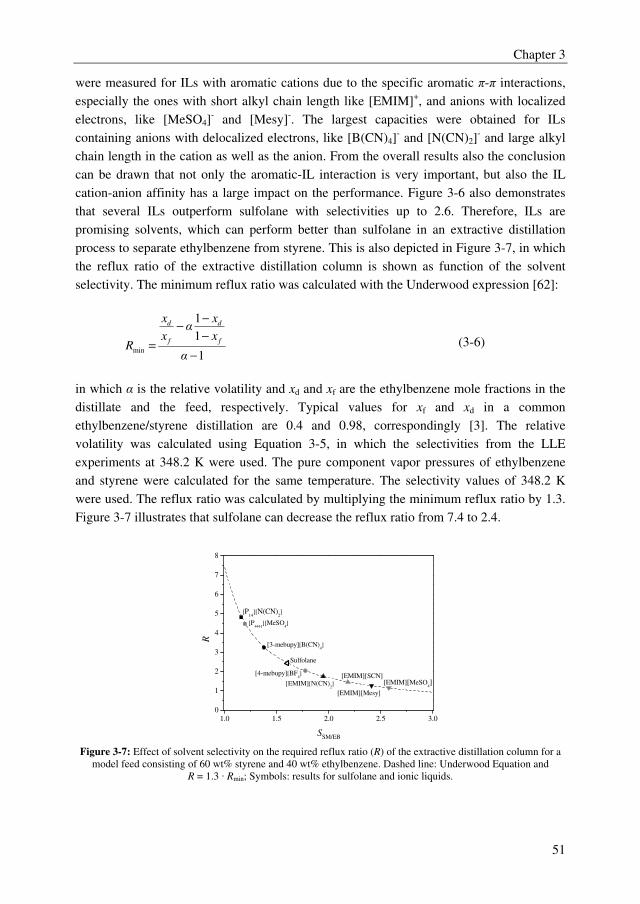
Chapter 3
51
were measured for ILs with aromatic cations due to the specific aromatic π-π interactions,
especially the ones with short alkyl chain length like [EMIM]+, and anions with localized
electrons, like [MeSO4]- and [Mesy]-. The largest capacities were obtained for ILs
containing anions with delocalized electrons, like [B(CN)4]- and [N(CN)2]
- and large alkyl
chain length in the cation as well as the anion. From the overall results also the conclusion
can be drawn that not only the aromatic-IL interaction is very important, but also the IL
cation-anion affinity has a large impact on the performance. Figure 3-6 also demonstrates
that several ILs outperform sulfolane with selectivities up to 2.6. Therefore, ILs are
promising solvents, which can perform better than sulfolane in an extractive distillation
process to separate ethylbenzene from styrene. This is also depicted in Figure 3-7, in which
the reflux ratio of the extractive distillation column is shown as function of the solvent
selectivity. The minimum reflux ratio was calculated with the Underwood expression [62]:
1
1
1
min−
−
−−
=α
x
xα
x
x
Rf
d
f
d
(3-6)
in which α is the relative volatility and xd and xf are the ethylbenzene mole fractions in the
distillate and the feed, respectively. Typical values for xf and xd in a common
ethylbenzene/styrene distillation are 0.4 and 0.98, correspondingly [3]. The relative
volatility was calculated using Equation 3-5, in which the selectivities from the LLE
experiments at 348.2 K were used. The pure component vapor pressures of ethylbenzene
and styrene were calculated for the same temperature. The selectivity values of 348.2 K
were used. The reflux ratio was calculated by multiplying the minimum reflux ratio by 1.3.
Figure 3-7 illustrates that sulfolane can decrease the reflux ratio from 7.4 to 2.4.
1.0 1.5 2.0 2.5 3.0
0
1
2
3
4
5
6
7
8
[P14
][N(CN)2]
[EMIM][N(CN)2]
[3-mebupy][B(CN)4]
[P4441
][MeSO4]
Sulfolane
[4-mebupy][BF4] [EMIM][SCN]
[EMIM][Mesy]
R
SSM/EB
[EMIM][MeSO4]
Figure 3-7: Effect of solvent selectivity on the required reflux ratio (R) of the extractive distillation column for a
model feed consisting of 60 wt% styrene and 40 wt% ethylbenzene. Dashed line: Underwood Equation and
R = 1.3 · Rmin; Symbols: results for sulfolane and ionic liquids.
Chapter 3
52
Several ILs with a larger selectivity than sulfolane, like [EMIM][SCN] and
[EMIM][CH3SO4], can decrease the reflux ratio even more to values of 1.1–1.5. This can
result in a lower energy requirement for the IL extractive distillation process compared to
the sulfolane process. However, the selectivity and thereby the reflux ratio only give a first
indication about possible energy requirements. The solvent capacity also influences the
performance of the extractive distillation process as discussed in the introduction.
Therefore, a detailed process evaluation should confirm whether ILs are indeed more
promising than a conventional organic solvent like sulfolane.
3.5. Conclusions
An IL screening study by LLE experiments has been performed to investigate whether ILs
are promising solvents in an extractive distillation to separate ethylbenzene from styrene. It
was demonstrated that LLE experiments are a reliable and simple method to obtain
estimates for the VLE selectivity. The temperature only slightly influences the
performance, with a small decrease in selectivity with increasing temperature. The results
of all ILs were compared to the benchmark solvent sulfolane, which has a selectivity of 1.6.
For the IL selectivities, it was observed that there is a trade off between the capacity and
selectivity. ILs with high capacity usually have a low selectivity, whereas ILs with high
selectivity exhibit low capacity. Several ILs outperform sulfolane with selectivities up to
2.6. Therefore ILs can be promising solvents in an extractive distillation unit to separate
ethylbenzene from styrene. A detailed process evaluation should confirm whether ILs are
indeed more promising.
3.6. Nomenclature
D solvent capacity
Po pure component vapor pressure Pa
R reflux ratio
S selectivity
x mole fraction in the liquid phase
y mole fraction in the vapor phase
Greek symbols
α relative volatility
γ activity coefficient
Super- and subscripts
d distillate
f feed
min minimum
Chapter 3
53
org organic phase
Abbreviations
EB ethylbenzene
GC gas chromatography
IL ionic liquid
LLE liquid–liquid equilibrium
NMR nuclear magnetic resonance
rpm rotations per minute
SM styrene monomer
VLE vapor–liquid equilibrium
3.7. References
[1] A.L. Ward, W.J. Robert, in: Arza Seidel (Ed.), Kirk-Othmer Encyclopedia of
Chemical Technology, John Wiley & Sons, New York, 2000.
[2] J.C. Gentry, S. Kumar, R. Wright-Wytcherley, Hydrocarb. Process. 93 (2004) 62-
66.
[3] V.A. Welch, US 6171449 B1, 2001.
[4] Z. Lei, B. Chen, Z. Ding, in: Special Distillation Processes, Elsevier, Amsterdam,
2005, pp. 59-144.
[5] A. Vega, F. Diez, R. Esteban, J. Coca, Ind. Eng. Chem. Res. 36 (1997) 803-807.
[6] P. Steltenpohl, M. Chlebovec, E. Graczova, Chem. Pap. 59 (2005) 421-427.
[7] B. Chen, Z. Lei, Q. Li, C. Li, AIChE J. 51 (2005) 3114-3121.
[8] W. Yin, S. Ding, S. Xia, P. Ma, X. Huang, Z. Zhu, J. Chem. Eng. Data 55 (2010)
3274-3277.
[9] M.T.G. Jongmans, J.I.W. Maassen, A.J. Luijks, B. Schuur, A.B. de Haan, J.
Chem. Eng. Data 56 (2011) 3510-3517.
[10] Material Safety Data Sheet, Sulfolane, 2010,
www.sigmaaldrich.com/catalog/DisplayMSDSContent.do, Cited: 30 july 2010.
[11] Y. Beste, M. Eggersmann, H. Schoenmakers, Chem. Ing. Tech. 77 (2005) 1800-
1808.
[12] H.J. Huang, S. Ramaswamy, U.W. Tschirner, B.V. Ramarao, Sep. Purif. Technol.
62 (2008) 1-21.
[13] G.W. Meindersma, L.M. Galan Sanchez, A.R. Hansmeier, A.B. de Haan,
Monatsh. Chem. 138 (2007) 1125-1136.
[14] G.W. Meindersma, A. Podt, A.B. de Haan, Fuel Process. Technol. 87 (2005) 59-
70.
[15] A.L. Revelli, F. Mutelet, J.N. Jaubert, J. Phys. Chem. B 114 (2010) 4600-4608.
[16] M. Krummen, P. Wasserscheid, J. Gmehling, J. Chem. Eng. Data 47 (2002) 1411-
1417.
[17] A.R. Hansmeier, M.T.G. Jongmans, G.W. Meindersma, A.B. de Haan, J. Chem.
Thermodyn. 42 (2010) 484-490.
[18] G.J. Belluomini, J.G. Pendergast, C.H. Domke, B.R. Ussing, Ind. Eng. Chem. Res.
48 (2009) 11168-11174.
[19] Z. Lei, W. Arlt, P. Wasserscheid, Fluid Phase Equilibr. 241 (2006) 290-299.
Chapter 3
54
[20] J.M. Lee, J. Palgunadi, J.H. Kim, S. Jung, Y.s. Choi, M. Cheong, H.S. Kim, Phys.
Chem. Chem. Phys. 12 (2010) 1812-1816.
[21] J. Palgunadi, H.S. Kim, J.M. Lee, S. Jung, Chem. Eng. Proc. Proc. Int. 49 (2010)
192-198.
[22] N. Likhanova, D. Guzman-Lucero, E. Flores, P. Garcia, M. Dominguez-Aguilar, J.
Palomeque, R. Martinez-Palou, Mol. Divers. 14 (2010) 777-787.
[23] Y. Wang, H. Li, W. Zhu, X. Jiang, L. He, J. Lu, Y. Yan, Petrol. Sci. Technol. 28
(2010) 1203-1210.
[24] E. Ito, J.A.R. van Veen, Catal. Today 116 (2006) 446-460.
[25] U. Domanska, M. Laskowska, A. Marciniak, J. Chem. Eng. Data 53 (2008) 498-
502.
[26] P. Wasserscheid, T. Welton, in: P. Wasserscheid, T. Welton (Eds.), Ionic Liquids
in Synthesis, Wiley-VCH, Weinheim, 2008, pp. 1-6.
[27] A. Stark, K.R. Seddon, in: Kirk-Othmer Encyclopedia of Chemical Technology,
John Wiley & Sons, New York, 2007.
[28] Y. Zhao, S. Xia, J. Chem. Technol. Biot. 80 (2005) 1089-1096.
[29] K.N. Marsh, J.A. Boxall, R. Lichtenthaler, Fluid Phase Equilibr. 219 (2004) 93-98.
[30] R. Giernoth, Angew. Chem. Int. Ed. 49 (2010) 2834-2839.
[31] K.N. Marsh, J.A. Boxall, R. Lichtenthaler, Fluid Phase Equilibr. 219 (2004) 93-98.
[32] X. Han, D.W. Armstrong, Accounts. Chem. Res. 40 (2007) 1079-1086.
[33] T.M. Letcher, N. Deenadayalu, B. Soko, D. Ramjugernath, P.K. Naicker, J. Chem.
Eng. Data 48 (2003) 904-907.
[34] S.O. Momoh, Sep. Sci. Technol. 26 (1991) 729-742.
[35] S. Kossack, K. Kraemer, R. Gani, W. Marquardt, Chem. Eng. Res. Des. 86 (2008)
781-792.
[36] S.A.F. Onink, G.H.F. Aerts, B. Burghoff, G.W. Meindersma, A.B. de Haan, J. Liq.
chromatogr. r. t. (2011) Submitted.
[37] J.D. Holbrey, W.M. Reichert, M. Nieuwenhuyzen, O. Sheppard, C. Hardacre, R.D.
Rogers, Chem. Commun. (2003) 476-477.
[38] Y. Huo, S. Xia, P. Ma, J. Chem. Eng. Data 53 (2008) 2535-2539.
[39] Handbook of Solvent Extraction ed., John Wiley & Sons, New York, 1983.
[40] G.W. Meindersma, A.R. Hansmeier, A.B. de Haan, Ind. Eng. Chem. Res. 49
(2010) 7530-7540.
[41] L. Leclercq, A.R. Schmitzer, J. Phys. Chem. B 112 (2008) 11064-11070.
[42] A. Marciniak, E. Karczemna, J. Phys. Chem. B 114 (2010) 5470-5474.
[43] T. Banerjee, A. Khanna, J. Chem. Eng. Data 51 (2006) 2170-2177.
[44] U. Domanska, I. BakaIa, J. Pernak, J. Chem. Eng. Data 52 (2006) 309-314.
[45] A.L. Revelli, F. Mutelet, J.N. Jaubert, Ind. Eng. Chem. Res. 49 (2010) 3883-3892.
[46] A. R. Hansmeier, Eindhoven University of Technology (2010).
[47] J.D. Holbrey, R.D. Rogers, in: P. Wasserscheid, T. Welton (Eds.), Ionic liquid in
synthesis, Wiley-VCH, Weinheim, 2008, pp. 57-88.
[48] R.P. Swatloski, J.D. Holbrey, R.D. Rogers, Green Chem. 5 (2003) 361-363.
[49] M.F. Arenas, R.G. Reddy, J. Min. Metal. 39 (2003) 81-91.
[50] C. Hardacre, J.D. Holbrey, C.L. Mullan, M. Nieuwenhuyzen, W.M. Reichert, K.R.
Seddon, S.J. Teat, New J. Chem. 32 (2008) 1953-1967.
[51] C. Jork, C. Kristen, D. Pieraccini, A. Stark, C. Chiappe, Y.A. Beste, W. Arlt, J.
Chem. Thermodyn. 37 (2005) 537-558.
Chapter 3
55
[52] N. Papaiconomou, N. Yakelis, J. Salminen, R. Bergman, J.M. Prausnitz, J. Chem.
Eng. Data 51 (2006) 1389-1393.
[53] M.F. Doherty, J.P. Knapp, Distillation, Azeotropic, and Extractive ed., John Wiley
& Sons, Inc., 2000.
[54] A.A.H. Padua, M.F. Costa Gomes, J.N.A. Canongia Lopes, Accounts. Chem. Res.
40 (2007) 1087-1096.
[55] C.C. Cassol, A.P. Umpierre, G. Ebeling, B. Ferrera, S.S.X. Chiaro, J. Dupont, Int.
J. Mol. Sci. 8 (2007) 593-605.
[56] J. Garcia, J.S. Torrecilla, A. Fernandez, M. Oliet, F. Rodriguez, J. Chem.
Thermodyn. 42 (2010) 144-150.
[57] P. Stepnowski, J. Nichthauser, W. Mrozik, B. Buszewski, Anal. Bioanal. Chem.
385 (2006) 1483-1491.
[58] T. Gutel et al., J. Phys. Chem. B 113 (2008) 170-177.
[59] P.A. Hunt, B. Kirchner, T. Welton, Chem. –Eur. J. 12 (2006) 6762-6775.
[60] D.R. Lide, W.M. Haynes, Handbook of chemistry and physics ed., Taylor and
Francis group LLC, London, 2009.
[61] F.M. Lee, J.C. Gentry, Chem. Eng. Process 93 (1997) 56-64.
[62] A.J.V. Underwood, Transactions of the American Institute of Chemical Engineers
10 (1932) 112-112.

56
57
Ethylbenzene + Styrene + Ionic Liquid Phase
Equilibrium Data for the Ionic Liquids
[3-mebupy][B(CN)4], [4-mebupy][BF4], and
[EMIM][SCN]
Parts of this chapter have been published as:
M.T.G. Jongmans, E. Hermens, B. Schuur, A.B. de Haan, Fluid Phase
Equilibr. 315 (2011) 99-106.
M.T.G. Jongmans, M. Raijmakers, B. Schuur, A.B. de Haan, J. Chem. Eng.
Data 57 (2012) 626-633.
M.T.G. Jongmans, B. Schuur, A.B. de Haan, J. Chem. Thermodyn. 47
(2012) 234-240.
Abstract Extractive distillation with ionic liquids (ILs) is a promising technology to separate the
close-boiling mixture ethylbenzene/styrene. Three promising ILs were identified from the
IL screening study; [3-mebupy][B(CN)4], [4-mebupy][BF4], and [EMIM][SCN]. The aim
of this study was to determine the non-ideal behavior of styrene and ethylbenzene in these
ILs. In this work, binary liquid–liquid equilibrium (LLE) data at 313.2, 333.2, and 353.2 K,
binary vapor–liquid equilibrium (VLE) data in the pressure range 3–30 kPa, and ternary
VLE data at 5, 10, and 15 kPa have been determined for the systems (ethylbenzene +
styrene + [3-mebupy][B(CN)4]/[4-mebupy][BF4]). Binary VLE data in the pressure range
3–20 kPa for the system (styrene + [EMIM][SCN]), and binary and ternary LLE data at
313.2, 333.2, and 353.2 K have been measured for the system (ethylbenzene + styrene +
[EMIM][SCN]). The NRTL model can properly describe the binary and ternary phase
equilibrium data. It was not possible to get a proper description of the ternary equilibrium
data with the NRTL parameters determined solely from the binary systems.
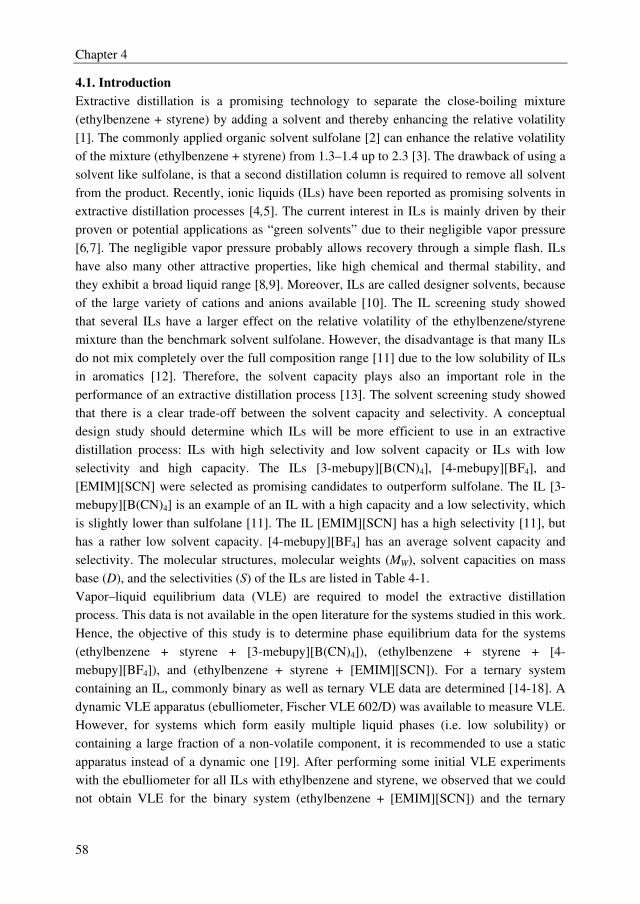
Chapter 4
58
4.1. Introduction
Extractive distillation is a promising technology to separate the close-boiling mixture
(ethylbenzene + styrene) by adding a solvent and thereby enhancing the relative volatility
[1]. The commonly applied organic solvent sulfolane [2] can enhance the relative volatility
of the mixture (ethylbenzene + styrene) from 1.3–1.4 up to 2.3 [3]. The drawback of using a
solvent like sulfolane, is that a second distillation column is required to remove all solvent
from the product. Recently, ionic liquids (ILs) have been reported as promising solvents in
extractive distillation processes [4,5]. The current interest in ILs is mainly driven by their
proven or potential applications as “green solvents” due to their negligible vapor pressure
[6,7]. The negligible vapor pressure probably allows recovery through a simple flash. ILs
have also many other attractive properties, like high chemical and thermal stability, and
they exhibit a broad liquid range [8,9]. Moreover, ILs are called designer solvents, because
of the large variety of cations and anions available [10]. The IL screening study showed
that several ILs have a larger effect on the relative volatility of the ethylbenzene/styrene
mixture than the benchmark solvent sulfolane. However, the disadvantage is that many ILs
do not mix completely over the full composition range [11] due to the low solubility of ILs
in aromatics [12]. Therefore, the solvent capacity plays also an important role in the
performance of an extractive distillation process [13]. The solvent screening study showed
that there is a clear trade-off between the solvent capacity and selectivity. A conceptual
design study should determine which ILs will be more efficient to use in an extractive
distillation process: ILs with high selectivity and low solvent capacity or ILs with low
selectivity and high capacity. The ILs [3-mebupy][B(CN)4], [4-mebupy][BF4], and
[EMIM][SCN] were selected as promising candidates to outperform sulfolane. The IL [3-
mebupy][B(CN)4] is an example of an IL with a high capacity and a low selectivity, which
is slightly lower than sulfolane [11]. The IL [EMIM][SCN] has a high selectivity [11], but
has a rather low solvent capacity. [4-mebupy][BF4] has an average solvent capacity and
selectivity. The molecular structures, molecular weights (MW), solvent capacities on mass
base (D), and the selectivities (S) of the ILs are listed in Table 4-1.
Vapor–liquid equilibrium data (VLE) are required to model the extractive distillation
process. This data is not available in the open literature for the systems studied in this work.
Hence, the objective of this study is to determine phase equilibrium data for the systems
(ethylbenzene + styrene + [3-mebupy][B(CN)4]), (ethylbenzene + styrene + [4-
mebupy][BF4]), and (ethylbenzene + styrene + [EMIM][SCN]). For a ternary system
containing an IL, commonly binary as well as ternary VLE data are determined [14-18]. A
dynamic VLE apparatus (ebulliometer, Fischer VLE 602/D) was available to measure VLE.
However, for systems which form easily multiple liquid phases (i.e. low solubility) or
containing a large fraction of a non-volatile component, it is recommended to use a static
apparatus instead of a dynamic one [19]. After performing some initial VLE experiments
with the ebulliometer for all ILs with ethylbenzene and styrene, we observed that we could
not obtain VLE for the binary system (ethylbenzene + [EMIM][SCN]) and the ternary
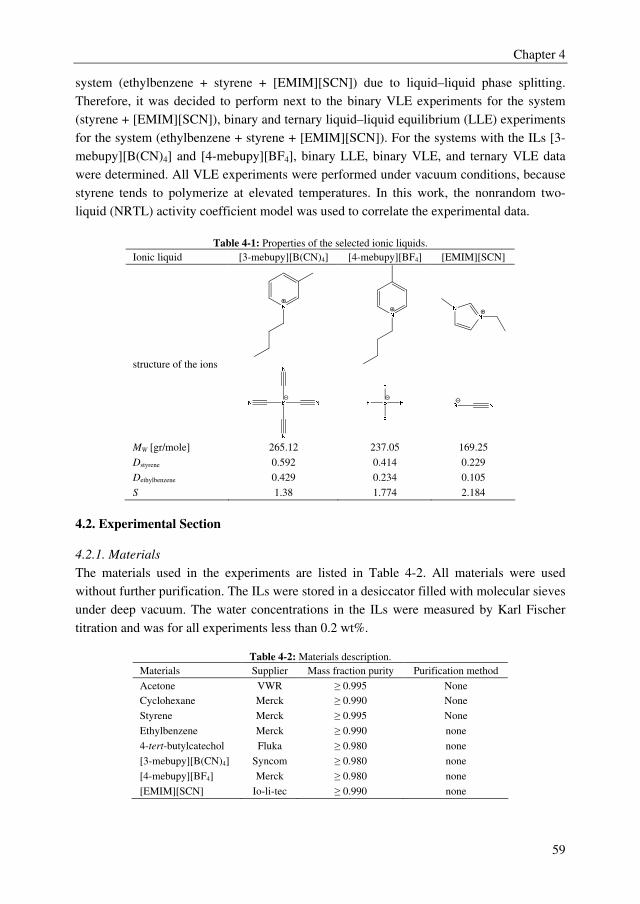
Chapter 4
59
system (ethylbenzene + styrene + [EMIM][SCN]) due to liquid–liquid phase splitting.
Therefore, it was decided to perform next to the binary VLE experiments for the system
(styrene + [EMIM][SCN]), binary and ternary liquid–liquid equilibrium (LLE) experiments
for the system (ethylbenzene + styrene + [EMIM][SCN]). For the systems with the ILs [3-
mebupy][B(CN)4] and [4-mebupy][BF4], binary LLE, binary VLE, and ternary VLE data
were determined. All VLE experiments were performed under vacuum conditions, because
styrene tends to polymerize at elevated temperatures. In this work, the nonrandom two-
liquid (NRTL) activity coefficient model was used to correlate the experimental data.
Table 4-1: Properties of the selected ionic liquids.
Ionic liquid [3-mebupy][B(CN)4] [4-mebupy][BF4] [EMIM][SCN]
structure of the ions
MW [gr/mole] 265.12 237.05 169.25
Dstyrene 0.592 0.414 0.229
Dethylbenzene 0.429 0.234 0.105
S 1.38 1.774 2.184
4.2. Experimental Section
4.2.1. Materials
The materials used in the experiments are listed in Table 4-2. All materials were used
without further purification. The ILs were stored in a desiccator filled with molecular sieves
under deep vacuum. The water concentrations in the ILs were measured by Karl Fischer
titration and was for all experiments less than 0.2 wt%.
Table 4-2: Materials description.
Materials Supplier Mass fraction purity Purification method
Acetone VWR ≥ 0.995 None
Cyclohexane Merck ≥ 0.990 None
Styrene Merck ≥ 0.995 None
Ethylbenzene Merck ≥ 0.990 none
4-tert-butylcatechol Fluka ≥ 0.980 none
[3-mebupy][B(CN)4] Syncom ≥ 0.980 none
[4-mebupy][BF4] Merck ≥ 0.980 none
[EMIM][SCN] Io-li-tec ≥ 0.990 none
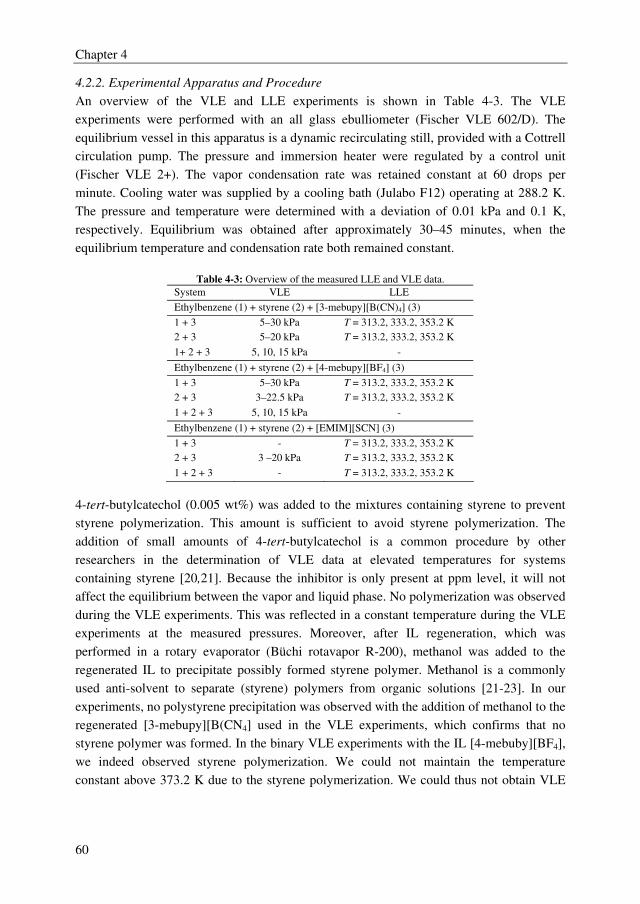
Chapter 4
60
4.2.2. Experimental Apparatus and Procedure
An overview of the VLE and LLE experiments is shown in Table 4-3. The VLE
experiments were performed with an all glass ebulliometer (Fischer VLE 602/D). The
equilibrium vessel in this apparatus is a dynamic recirculating still, provided with a Cottrell
circulation pump. The pressure and immersion heater were regulated by a control unit
(Fischer VLE 2+). The vapor condensation rate was retained constant at 60 drops per
minute. Cooling water was supplied by a cooling bath (Julabo F12) operating at 288.2 K.
The pressure and temperature were determined with a deviation of 0.01 kPa and 0.1 K,
respectively. Equilibrium was obtained after approximately 30–45 minutes, when the
equilibrium temperature and condensation rate both remained constant.
Table 4-3: Overview of the measured LLE and VLE data.
System VLE LLE
Ethylbenzene (1) + styrene (2) + [3-mebupy][B(CN)4] (3)
1 + 3 5–30 kPa T = 313.2, 333.2, 353.2 K
2 + 3 5–20 kPa T = 313.2, 333.2, 353.2 K
1+ 2 + 3 5, 10, 15 kPa -
Ethylbenzene (1) + styrene (2) + [4-mebupy][BF4] (3)
1 + 3 5–30 kPa T = 313.2, 333.2, 353.2 K
2 + 3 3–22.5 kPa T = 313.2, 333.2, 353.2 K
1 + 2 + 3 5, 10, 15 kPa -
Ethylbenzene (1) + styrene (2) + [EMIM][SCN] (3)
1 + 3 - T = 313.2, 333.2, 353.2 K
2 + 3 3 –20 kPa T = 313.2, 333.2, 353.2 K
1 + 2 + 3 - T = 313.2, 333.2, 353.2 K
4-tert-butylcatechol (0.005 wt%) was added to the mixtures containing styrene to prevent
styrene polymerization. This amount is sufficient to avoid styrene polymerization. The
addition of small amounts of 4-tert-butylcatechol is a common procedure by other
researchers in the determination of VLE data at elevated temperatures for systems
containing styrene [20,21]. Because the inhibitor is only present at ppm level, it will not
affect the equilibrium between the vapor and liquid phase. No polymerization was observed
during the VLE experiments. This was reflected in a constant temperature during the VLE
experiments at the measured pressures. Moreover, after IL regeneration, which was
performed in a rotary evaporator (Büchi rotavapor R-200), methanol was added to the
regenerated IL to precipitate possibly formed styrene polymer. Methanol is a commonly
used anti-solvent to separate (styrene) polymers from organic solutions [21-23]. In our
experiments, no polystyrene precipitation was observed with the addition of methanol to the
regenerated [3-mebupy][B(CN4] used in the VLE experiments, which confirms that no
styrene polymer was formed. In the binary VLE experiments with the IL [4-mebuby][BF4],
we indeed observed styrene polymerization. We could not maintain the temperature
constant above 373.2 K due to the styrene polymerization. We could thus not obtain VLE
Chapter 4
61
for this IL above this temperature. Indeed, styrene polymer precipitation was observed with
the addition of methanol to this IL after a VLE experiment was attempted.
The amount of ethylbenzene and styrene in the binary VLE experiments were varied from
low concentrations (approximately 10 mL aromatics per 80 mL of IL) up till their
maximum solubility in the ILs. It was not possible to measure concentrations above their
maximum solubility due to liquid–liquid phase splitting. The ternary VLE experiments with
the IL [3-mebupy][B(CN)4] were performed for the solvent-to-feed (S/F) ratio’s of 1 and 3,
both on volume base. The ethylbenzene/styrene ratios were varied to both diluted ends. The
ternary VLE experiments for the IL [4-mebupy][BF4] were carried out at a S/F ratio of 4 on
volume base. It was not possible to measure VLE of mixtures with lower S/F ratios for this
IL due to liquid-liquid phase splitting, nor with higher S/F ratios due to the higher
equilibrium temperature at higher IL content (polymerization > 373.2 K).
Samples of 20 µL were taken using a 100 µL syringe from the liquid phase. No samples
from the vapor phase were taken for the binary systems, because the IL has negligible
vapor pressure.
The LLE experiments were carried out with the same experimental procedure and apparatus
as described by Hansmeier et al. [24]. For the binary LLE experiments, 25 and 15 mL of
organic feed (ethylbenzene/styrene) and IL, respectively, were added to 70 mL double
walled vessels. 20 mL of organic feed mixture and 10 mL of [EMIM][SCN] were used for
the binary and ternary LLE experiments of the system (ethylbenzene + styrene +
[EMIM][SCN]). The vessels were equipped with two impellors on a stainless steel axis,
driven by an electronic stirrer (IKA Eurostar powercontrol-visc P1). The impellors were
placed at the interface between the organic feed and IL to ensure good contact between the
two phases. The LLE experiments were performed at 313.2, 333.2 and 353.2 K ± 0.1 K. For
the LLE experiments also 0.005 wt% 4-tert-butylcatechol was added to overcome styrene
polymerization. Intense mixing at 1300 rpm ensured that the phases were completely
dispersed, and equilibrium was obtained after 5 minutes [25]. Experiments were run for 20
minutes to ensure equilibrium. Settling of the organic and IL phases was allowed for 2 hrs.
Samples of 0.2 mL from the organic and IL phase were taken using a 2 mL syringe. Only
samples from the IL phase were taken for the binary LLE experiments.
4.2.3. Analysis
To the samples from the LLE experiments, 1.2 mL of acetone and 0.1 mL of the internal
standard cyclohexane was added. The samples from the VLE experiments were diluted with
120 µL of acetone and 10 µL of cyclohexane. The equilibrium concentrations were
determined by a gas chromatograph (Varian CP-3800) equipped with a flame ionization
detector (FID) and a Varian CP-SIL 5CB column (50m · 1.2 µm). The split ratio was 50
and the injection volume 0.5 µL. All samples were injected three times to eliminate
analytical errors. The amount of IL was estimated by means of a mass balance, because ILs
have a negligible vapor pressure and can therefore not be detected by gas chromatography.
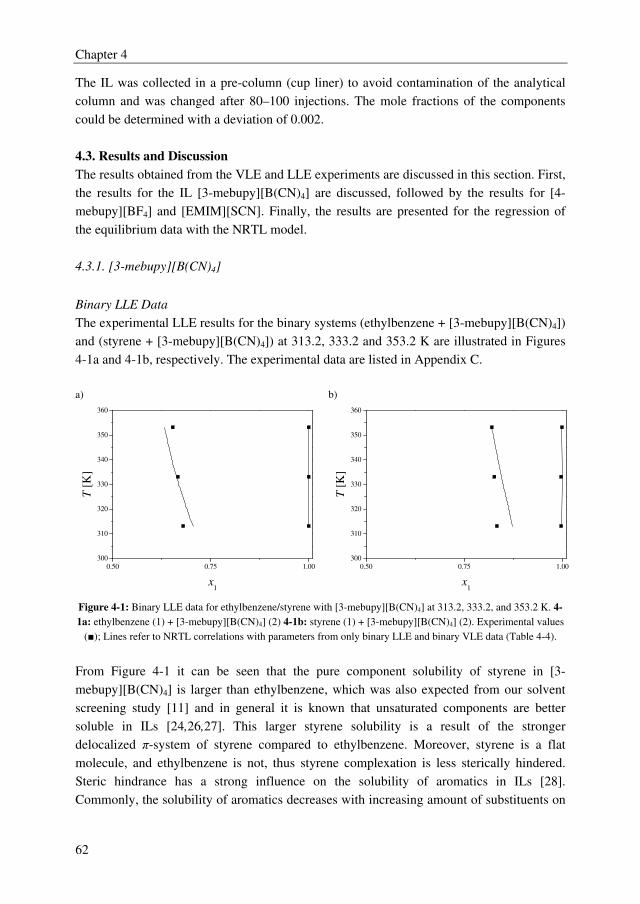
Chapter 4
62
The IL was collected in a pre-column (cup liner) to avoid contamination of the analytical
column and was changed after 80–100 injections. The mole fractions of the components
could be determined with a deviation of 0.002.
4.3. Results and Discussion
The results obtained from the VLE and LLE experiments are discussed in this section. First,
the results for the IL [3-mebupy][B(CN)4] are discussed, followed by the results for [4-
mebupy][BF4] and [EMIM][SCN]. Finally, the results are presented for the regression of
the equilibrium data with the NRTL model.
4.3.1. [3-mebupy][B(CN)4]
Binary LLE Data
The experimental LLE results for the binary systems (ethylbenzene + [3-mebupy][B(CN)4])
and (styrene + [3-mebupy][B(CN)4]) at 313.2, 333.2 and 353.2 K are illustrated in Figures
4-1a and 4-1b, respectively. The experimental data are listed in Appendix C.
a) b)
0.50 0.75 1.00
300
310
320
330
340
350
360
T [
K]
x1
0.50 0.75 1.00
300
310
320
330
340
350
360
T [
K]
x1
Figure 4-1: Binary LLE data for ethylbenzene/styrene with [3-mebupy][B(CN)4] at 313.2, 333.2, and 353.2 K. 4-
1a: ethylbenzene (1) + [3-mebupy][B(CN)4] (2) 4-1b: styrene (1) + [3-mebupy][B(CN)4] (2). Experimental values
(■); Lines refer to NRTL correlations with parameters from only binary LLE and binary VLE data (Table 4-4).
From Figure 4-1 it can be seen that the pure component solubility of styrene in [3-
mebupy][B(CN)4] is larger than ethylbenzene, which was also expected from our solvent
screening study [11] and in general it is known that unsaturated components are better
soluble in ILs [24,26,27]. This larger styrene solubility is a result of the stronger
delocalized π-system of styrene compared to ethylbenzene. Moreover, styrene is a flat
molecule, and ethylbenzene is not, thus styrene complexation is less sterically hindered.
Steric hindrance has a strong influence on the solubility of aromatics in ILs [28].
Commonly, the solubility of aromatics decreases with increasing amount of substituents on
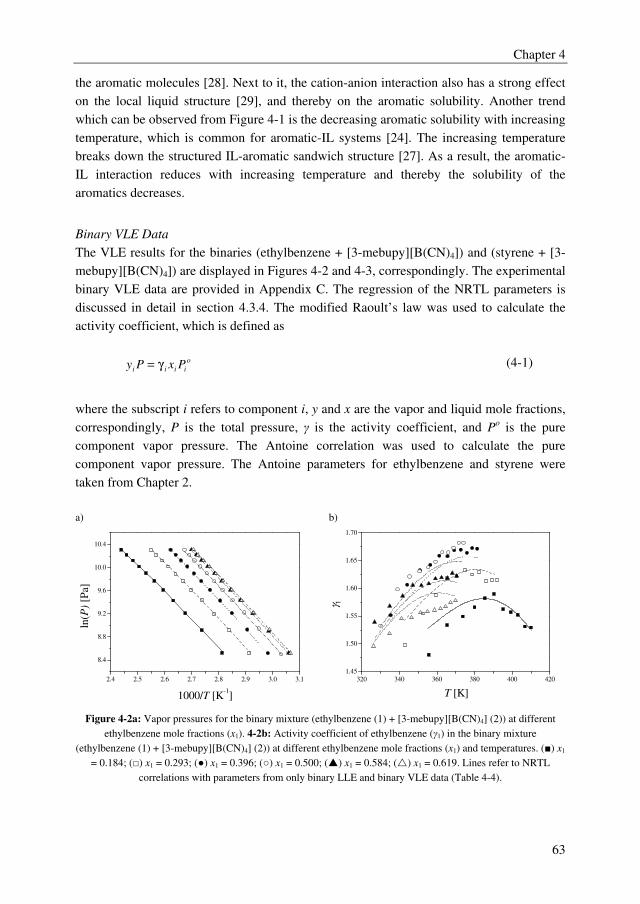
Chapter 4
63
the aromatic molecules [28]. Next to it, the cation-anion interaction also has a strong effect
on the local liquid structure [29], and thereby on the aromatic solubility. Another trend
which can be observed from Figure 4-1 is the decreasing aromatic solubility with increasing
temperature, which is common for aromatic-IL systems [24]. The increasing temperature
breaks down the structured IL-aromatic sandwich structure [27]. As a result, the aromatic-
IL interaction reduces with increasing temperature and thereby the solubility of the
aromatics decreases.
Binary VLE Data
The VLE results for the binaries (ethylbenzene + [3-mebupy][B(CN)4]) and (styrene + [3-
mebupy][B(CN)4]) are displayed in Figures 4-2 and 4-3, correspondingly. The experimental
binary VLE data are provided in Appendix C. The regression of the NRTL parameters is
discussed in detail in section 4.3.4. The modified Raoult’s law was used to calculate the
activity coefficient, which is defined as
o
iiii PxPy γ= (4-1)
where the subscript i refers to component i, y and x are the vapor and liquid mole fractions,
correspondingly, P is the total pressure, γ is the activity coefficient, and Po is the pure
component vapor pressure. The Antoine correlation was used to calculate the pure
component vapor pressure. The Antoine parameters for ethylbenzene and styrene were
taken from Chapter 2.
a) b)
2.4 2.5 2.6 2.7 2.8 2.9 3.0 3.1
8.4
8.8
9.2
9.6
10.0
10.4
ln(P
) [P
a]
1000/T [K-1]
320 340 360 380 400 420
1.45
1.50
1.55
1.60
1.65
1.70
γ 1
T [K]
Figure 4-2a: Vapor pressures for the binary mixture (ethylbenzene (1) + [3-mebupy][B(CN)4] (2)) at different
ethylbenzene mole fractions (x1). 4-2b: Activity coefficient of ethylbenzene (γ1) in the binary mixture
(ethylbenzene (1) + [3-mebupy][B(CN)4] (2)) at different ethylbenzene mole fractions (x1) and temperatures. (■) x1
= 0.184; (□) x1 = 0.293; (●) x1 = 0.396; (○) x1 = 0.500; (�) x1 = 0.584; (�) x1 = 0.619. Lines refer to NRTL
correlations with parameters from only binary LLE and binary VLE data (Table 4-4).
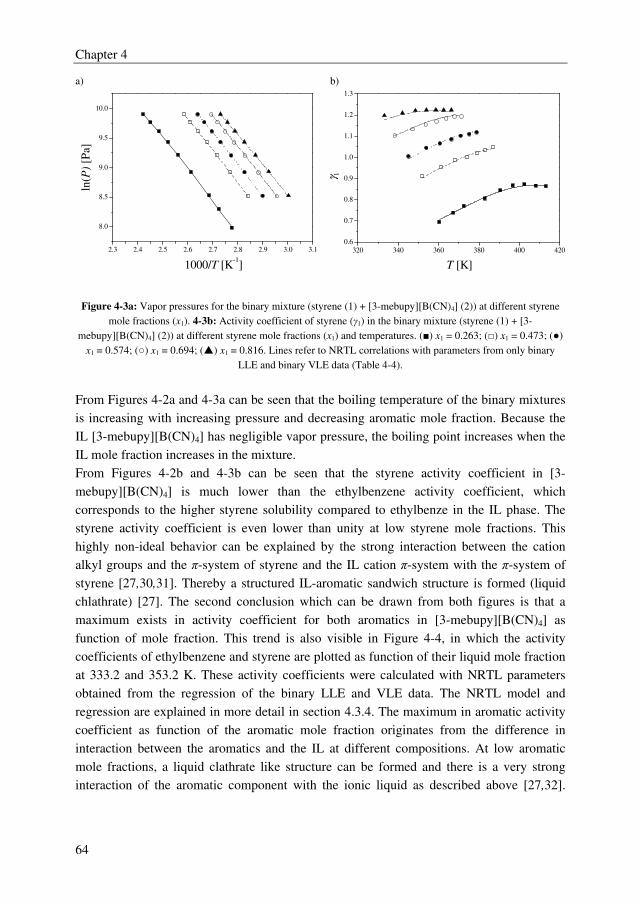
Chapter 4
64
a) b)
2.3 2.4 2.5 2.6 2.7 2.8 2.9 3.0 3.1
8.0
8.5
9.0
9.5
10.0
ln(P
) [P
a]
1000/T [K-1]
320 340 360 380 400 420
0.6
0.7
0.8
0.9
1.0
1.1
1.2
1.3
γ 1
T [K]
Figure 4-3a: Vapor pressures for the binary mixture (styrene (1) + [3-mebupy][B(CN)4] (2)) at different styrene
mole fractions (x1). 4-3b: Activity coefficient of styrene (γ1) in the binary mixture (styrene (1) + [3-
mebupy][B(CN)4] (2)) at different styrene mole fractions (x1) and temperatures. (■) x1 = 0.263; (□) x1 = 0.473; (●)
x1 = 0.574; (○) x1 = 0.694; (�) x1 = 0.816. Lines refer to NRTL correlations with parameters from only binary
LLE and binary VLE data (Table 4-4).
From Figures 4-2a and 4-3a can be seen that the boiling temperature of the binary mixtures
is increasing with increasing pressure and decreasing aromatic mole fraction. Because the
IL [3-mebupy][B(CN)4] has negligible vapor pressure, the boiling point increases when the
IL mole fraction increases in the mixture.
From Figures 4-2b and 4-3b can be seen that the styrene activity coefficient in [3-
mebupy][B(CN)4] is much lower than the ethylbenzene activity coefficient, which
corresponds to the higher styrene solubility compared to ethylbenze in the IL phase. The
styrene activity coefficient is even lower than unity at low styrene mole fractions. This
highly non-ideal behavior can be explained by the strong interaction between the cation
alkyl groups and the π-system of styrene and the IL cation π-system with the π-system of
styrene [27,30,31]. Thereby a structured IL-aromatic sandwich structure is formed (liquid
chlathrate) [27]. The second conclusion which can be drawn from both figures is that a
maximum exists in activity coefficient for both aromatics in [3-mebupy][B(CN)4] as
function of mole fraction. This trend is also visible in Figure 4-4, in which the activity
coefficients of ethylbenzene and styrene are plotted as function of their liquid mole fraction
at 333.2 and 353.2 K. These activity coefficients were calculated with NRTL parameters
obtained from the regression of the binary LLE and VLE data. The NRTL model and
regression are explained in more detail in section 4.3.4. The maximum in aromatic activity
coefficient as function of the aromatic mole fraction originates from the difference in
interaction between the aromatics and the IL at different compositions. At low aromatic
mole fractions, a liquid clathrate like structure can be formed and there is a very strong
interaction of the aromatic component with the ionic liquid as described above [27,32].
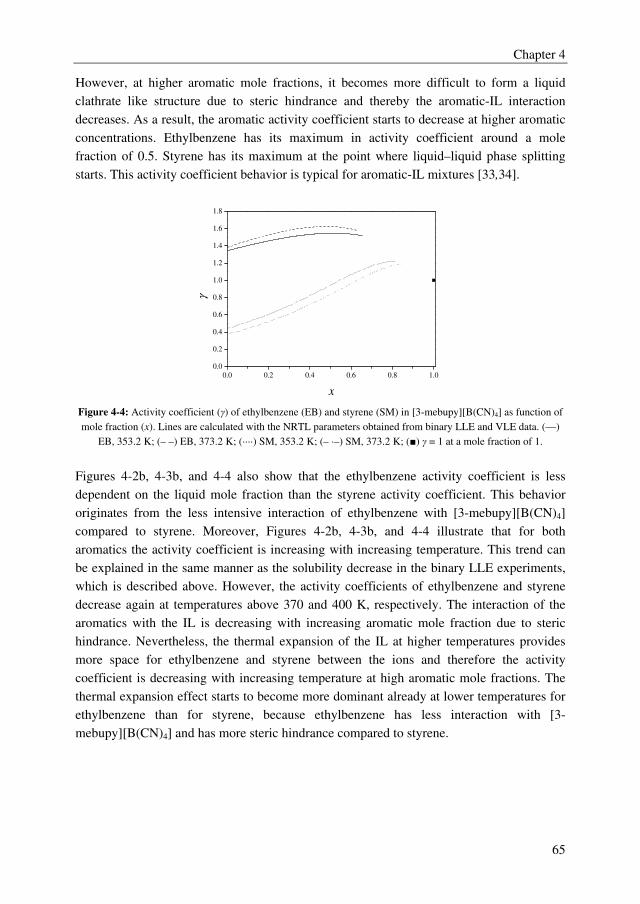
Chapter 4
65
However, at higher aromatic mole fractions, it becomes more difficult to form a liquid
clathrate like structure due to steric hindrance and thereby the aromatic-IL interaction
decreases. As a result, the aromatic activity coefficient starts to decrease at higher aromatic
concentrations. Ethylbenzene has its maximum in activity coefficient around a mole
fraction of 0.5. Styrene has its maximum at the point where liquid–liquid phase splitting
starts. This activity coefficient behavior is typical for aromatic-IL mixtures [33,34].
0.0 0.2 0.4 0.6 0.8 1.0
0.0
0.2
0.4
0.6
0.8
1.0
1.2
1.4
1.6
1.8
γ
x
Figure 4-4: Activity coefficient (γ) of ethylbenzene (EB) and styrene (SM) in [3-mebupy][B(CN)4] as function of
mole fraction (x). Lines are calculated with the NRTL parameters obtained from binary LLE and VLE data. (—)
EB, 353.2 K; (– –) EB, 373.2 K; (····) SM, 353.2 K; (– ·–) SM, 373.2 K; (■) γ = 1 at a mole fraction of 1.
Figures 4-2b, 4-3b, and 4-4 also show that the ethylbenzene activity coefficient is less
dependent on the liquid mole fraction than the styrene activity coefficient. This behavior
originates from the less intensive interaction of ethylbenzene with [3-mebupy][B(CN)4]
compared to styrene. Moreover, Figures 4-2b, 4-3b, and 4-4 illustrate that for both
aromatics the activity coefficient is increasing with increasing temperature. This trend can
be explained in the same manner as the solubility decrease in the binary LLE experiments,
which is described above. However, the activity coefficients of ethylbenzene and styrene
decrease again at temperatures above 370 and 400 K, respectively. The interaction of the
aromatics with the IL is decreasing with increasing aromatic mole fraction due to steric
hindrance. Nevertheless, the thermal expansion of the IL at higher temperatures provides
more space for ethylbenzene and styrene between the ions and therefore the activity
coefficient is decreasing with increasing temperature at high aromatic mole fractions. The
thermal expansion effect starts to become more dominant already at lower temperatures for
ethylbenzene than for styrene, because ethylbenzene has less interaction with [3-
mebupy][B(CN)4] and has more steric hindrance compared to styrene.
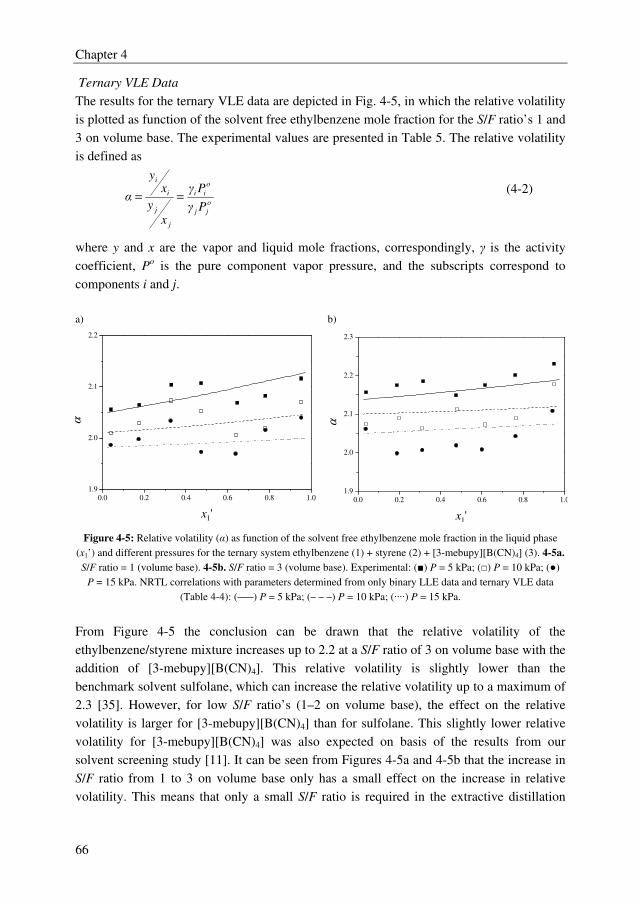
Chapter 4
66
Ternary VLE Data
The results for the ternary VLE data are depicted in Fig. 4-5, in which the relative volatility
is plotted as function of the solvent free ethylbenzene mole fraction for the S/F ratio’s 1 and
3 on volume base. The experimental values are presented in Table 5. The relative volatility
is defined as
o
jj
o
ii
j
j
i
i
Pγ
Pγ
x
y
xy
α == (4-2)
where y and x are the vapor and liquid mole fractions, correspondingly, γ is the activity
coefficient, Po is the pure component vapor pressure, and the subscripts correspond to
components i and j.
a) b)
0.0 0.2 0.4 0.6 0.8 1.0
1.9
2.0
2.1
2.2
α
x1'
0.0 0.2 0.4 0.6 0.8 1.0
1.9
2.0
2.1
2.2
2.3
α
x1'
Figure 4-5: Relative volatility (α) as function of the solvent free ethylbenzene mole fraction in the liquid phase
(x1’) and different pressures for the ternary system ethylbenzene (1) + styrene (2) + [3-mebupy][B(CN)4] (3). 4-5a.
S/F ratio = 1 (volume base). 4-5b. S/F ratio = 3 (volume base). Experimental: (■) P = 5 kPa; (□) P = 10 kPa; (●)
P = 15 kPa. NRTL correlations with parameters determined from only binary LLE data and ternary VLE data
(Table 4-4): (—–) P = 5 kPa; (– – –) P = 10 kPa; (····) P = 15 kPa.
From Figure 4-5 the conclusion can be drawn that the relative volatility of the
ethylbenzene/styrene mixture increases up to 2.2 at a S/F ratio of 3 on volume base with the
addition of [3-mebupy][B(CN)4]. This relative volatility is slightly lower than the
benchmark solvent sulfolane, which can increase the relative volatility up to a maximum of
2.3 [35]. However, for low S/F ratio’s (1–2 on volume base), the effect on the relative
volatility is larger for [3-mebupy][B(CN)4] than for sulfolane. This slightly lower relative
volatility for [3-mebupy][B(CN)4] was also expected on basis of the results from our
solvent screening study [11]. It can be seen from Figures 4-5a and 4-5b that the increase in
S/F ratio from 1 to 3 on volume base only has a small effect on the increase in relative
volatility. This means that only a small S/F ratio is required in the extractive distillation
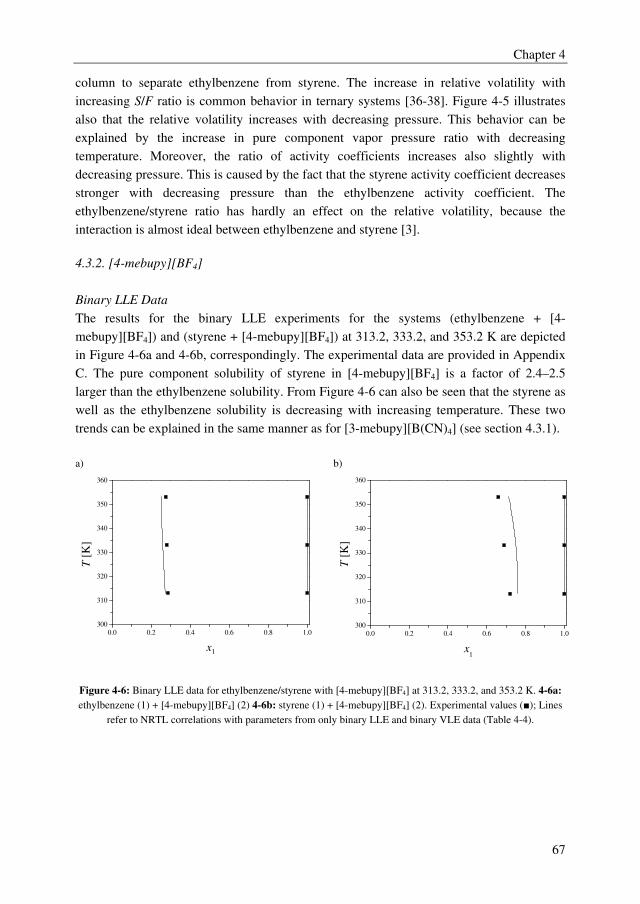
Chapter 4
67
column to separate ethylbenzene from styrene. The increase in relative volatility with
increasing S/F ratio is common behavior in ternary systems [36-38]. Figure 4-5 illustrates
also that the relative volatility increases with decreasing pressure. This behavior can be
explained by the increase in pure component vapor pressure ratio with decreasing
temperature. Moreover, the ratio of activity coefficients increases also slightly with
decreasing pressure. This is caused by the fact that the styrene activity coefficient decreases
stronger with decreasing pressure than the ethylbenzene activity coefficient. The
ethylbenzene/styrene ratio has hardly an effect on the relative volatility, because the
interaction is almost ideal between ethylbenzene and styrene [3].
4.3.2. [4-mebupy][BF4]
Binary LLE Data
The results for the binary LLE experiments for the systems (ethylbenzene + [4-
mebupy][BF4]) and (styrene + [4-mebupy][BF4]) at 313.2, 333.2, and 353.2 K are depicted
in Figure 4-6a and 4-6b, correspondingly. The experimental data are provided in Appendix
C. The pure component solubility of styrene in [4-mebupy][BF4] is a factor of 2.4–2.5
larger than the ethylbenzene solubility. From Figure 4-6 can also be seen that the styrene as
well as the ethylbenzene solubility is decreasing with increasing temperature. These two
trends can be explained in the same manner as for [3-mebupy][B(CN)4] (see section 4.3.1).
a) b)
0.0 0.2 0.4 0.6 0.8 1.0
300
310
320
330
340
350
360
T [
K]
x1
0.0 0.2 0.4 0.6 0.8 1.0
300
310
320
330
340
350
360
T [
K]
x1
Figure 4-6: Binary LLE data for ethylbenzene/styrene with [4-mebupy][BF4] at 313.2, 333.2, and 353.2 K. 4-6a:
ethylbenzene (1) + [4-mebupy][BF4] (2) 4-6b: styrene (1) + [4-mebupy][BF4] (2). Experimental values (■); Lines
refer to NRTL correlations with parameters from only binary LLE and binary VLE data (Table 4-4).
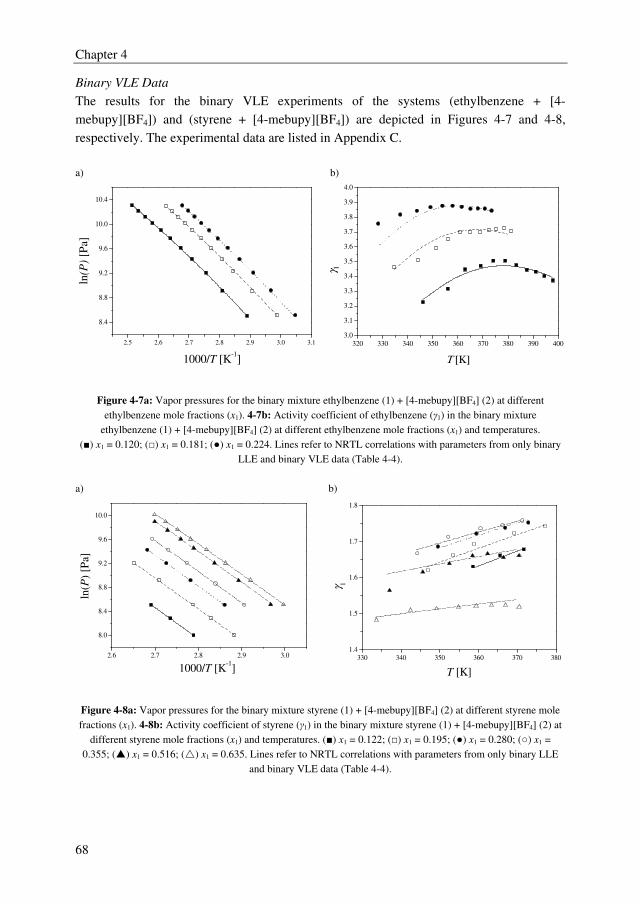
Chapter 4
68
Binary VLE Data
The results for the binary VLE experiments of the systems (ethylbenzene + [4-
mebupy][BF4]) and (styrene + [4-mebupy][BF4]) are depicted in Figures 4-7 and 4-8,
respectively. The experimental data are listed in Appendix C.
a) b)
2.5 2.6 2.7 2.8 2.9 3.0 3.1
8.4
8.8
9.2
9.6
10.0
10.4
ln(P
) [P
a]
1000/T [K-1]
320 330 340 350 360 370 380 390 400
3.0
3.1
3.2
3.3
3.4
3.5
3.6
3.7
3.8
3.9
4.0
γ 1
Τ [Κ]
Figure 4-7a: Vapor pressures for the binary mixture ethylbenzene (1) + [4-mebupy][BF4] (2) at different
ethylbenzene mole fractions (x1). 4-7b: Activity coefficient of ethylbenzene (γ1) in the binary mixture
ethylbenzene (1) + [4-mebupy][BF4] (2) at different ethylbenzene mole fractions (x1) and temperatures.
(■) x1 = 0.120; (□) x1 = 0.181; (●) x1 = 0.224. Lines refer to NRTL correlations with parameters from only binary
LLE and binary VLE data (Table 4-4).
a) b)
2.6 2.7 2.8 2.9 3.0
8.0
8.4
8.8
9.2
9.6
10.0
ln(P
) [P
a]
1000/T [K-1]
330 340 350 360 370 380
1.4
1.5
1.6
1.7
1.8
γ 1
T [K]
Figure 4-8a: Vapor pressures for the binary mixture styrene (1) + [4-mebupy][BF4] (2) at different styrene mole
fractions (x1). 4-8b: Activity coefficient of styrene (γ1) in the binary mixture styrene (1) + [4-mebupy][BF4] (2) at
different styrene mole fractions (x1) and temperatures. (■) x1 = 0.122; (□) x1 = 0.195; (●) x1 = 0.280; (○) x1 =
0.355; (�) x1 = 0.516; (�) x1 = 0.635. Lines refer to NRTL correlations with parameters from only binary LLE
and binary VLE data (Table 4-4).
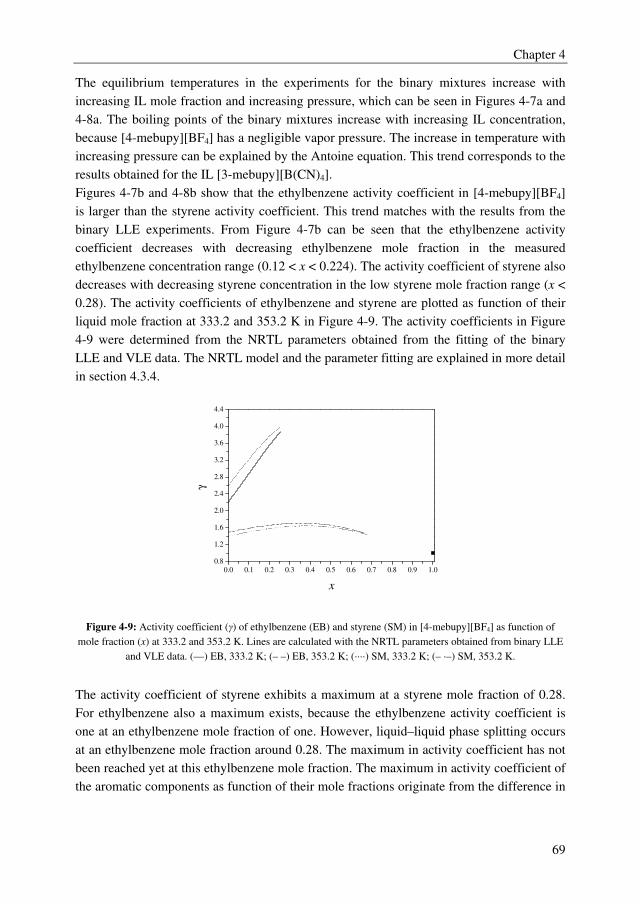
Chapter 4
69
The equilibrium temperatures in the experiments for the binary mixtures increase with
increasing IL mole fraction and increasing pressure, which can be seen in Figures 4-7a and
4-8a. The boiling points of the binary mixtures increase with increasing IL concentration,
because [4-mebupy][BF4] has a negligible vapor pressure. The increase in temperature with
increasing pressure can be explained by the Antoine equation. This trend corresponds to the
results obtained for the IL [3-mebupy][B(CN)4].
Figures 4-7b and 4-8b show that the ethylbenzene activity coefficient in [4-mebupy][BF4]
is larger than the styrene activity coefficient. This trend matches with the results from the
binary LLE experiments. From Figure 4-7b can be seen that the ethylbenzene activity
coefficient decreases with decreasing ethylbenzene mole fraction in the measured
ethylbenzene concentration range (0.12 < x < 0.224). The activity coefficient of styrene also
decreases with decreasing styrene concentration in the low styrene mole fraction range (x <
0.28). The activity coefficients of ethylbenzene and styrene are plotted as function of their
liquid mole fraction at 333.2 and 353.2 K in Figure 4-9. The activity coefficients in Figure
4-9 were determined from the NRTL parameters obtained from the fitting of the binary
LLE and VLE data. The NRTL model and the parameter fitting are explained in more detail
in section 4.3.4.
0.0 0.1 0.2 0.3 0.4 0.5 0.6 0.7 0.8 0.9 1.0
0.8
1.2
1.6
2.0
2.4
2.8
3.2
3.6
4.0
4.4
γ
x
Figure 4-9: Activity coefficient (γ) of ethylbenzene (EB) and styrene (SM) in [4-mebupy][BF4] as function of
mole fraction (x) at 333.2 and 353.2 K. Lines are calculated with the NRTL parameters obtained from binary LLE
and VLE data. (—) EB, 333.2 K; (– –) EB, 353.2 K; (····) SM, 333.2 K; (– ·–) SM, 353.2 K.
The activity coefficient of styrene exhibits a maximum at a styrene mole fraction of 0.28.
For ethylbenzene also a maximum exists, because the ethylbenzene activity coefficient is
one at an ethylbenzene mole fraction of one. However, liquid–liquid phase splitting occurs
at an ethylbenzene mole fraction around 0.28. The maximum in activity coefficient has not
been reached yet at this ethylbenzene mole fraction. The maximum in activity coefficient of
the aromatic components as function of their mole fractions originate from the difference in
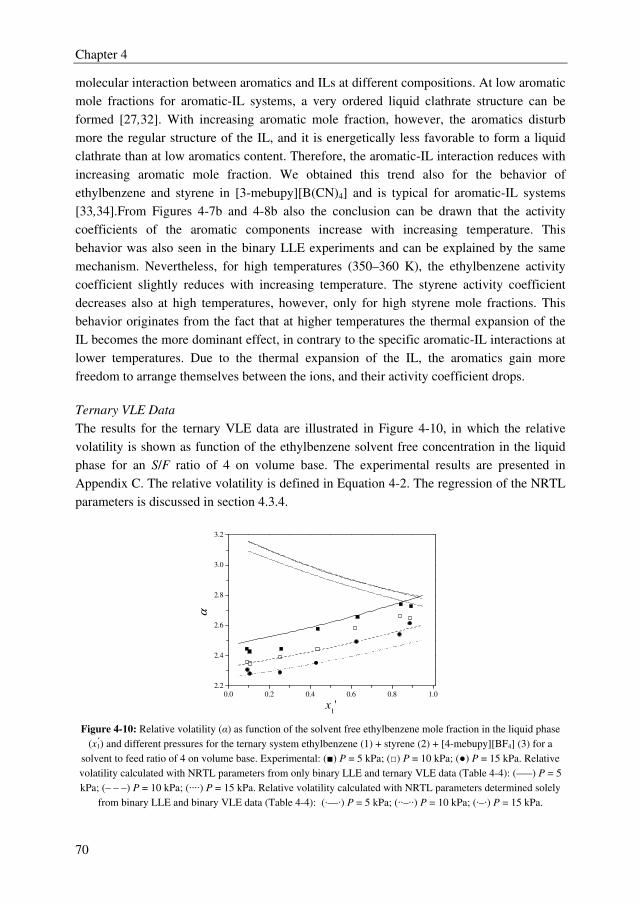
Chapter 4
70
molecular interaction between aromatics and ILs at different compositions. At low aromatic
mole fractions for aromatic-IL systems, a very ordered liquid clathrate structure can be
formed [27,32]. With increasing aromatic mole fraction, however, the aromatics disturb
more the regular structure of the IL, and it is energetically less favorable to form a liquid
clathrate than at low aromatics content. Therefore, the aromatic-IL interaction reduces with
increasing aromatic mole fraction. We obtained this trend also for the behavior of
ethylbenzene and styrene in [3-mebupy][B(CN)4] and is typical for aromatic-IL systems
[33,34].From Figures 4-7b and 4-8b also the conclusion can be drawn that the activity
coefficients of the aromatic components increase with increasing temperature. This
behavior was also seen in the binary LLE experiments and can be explained by the same
mechanism. Nevertheless, for high temperatures (350–360 K), the ethylbenzene activity
coefficient slightly reduces with increasing temperature. The styrene activity coefficient
decreases also at high temperatures, however, only for high styrene mole fractions. This
behavior originates from the fact that at higher temperatures the thermal expansion of the
IL becomes the more dominant effect, in contrary to the specific aromatic-IL interactions at
lower temperatures. Due to the thermal expansion of the IL, the aromatics gain more
freedom to arrange themselves between the ions, and their activity coefficient drops.
Ternary VLE Data
The results for the ternary VLE data are illustrated in Figure 4-10, in which the relative
volatility is shown as function of the ethylbenzene solvent free concentration in the liquid
phase for an S/F ratio of 4 on volume base. The experimental results are presented in
Appendix C. The relative volatility is defined in Equation 4-2. The regression of the NRTL
parameters is discussed in section 4.3.4.
0.0 0.2 0.4 0.6 0.8 1.0
2.2
2.4
2.6
2.8
3.0
3.2
α
x1'
Figure 4-10: Relative volatility (α) as function of the solvent free ethylbenzene mole fraction in the liquid phase
(x1�) and different pressures for the ternary system ethylbenzene (1) + styrene (2) + [4-mebupy][BF4] (3) for a
solvent to feed ratio of 4 on volume base. Experimental: (■) P = 5 kPa; (□) P = 10 kPa; (●) P = 15 kPa. Relative
volatility calculated with NRTL parameters from only binary LLE and ternary VLE data (Table 4-4): (—–) P = 5
kPa; (– – –) P = 10 kPa; (····) P = 15 kPa. Relative volatility calculated with NRTL parameters determined solely
from binary LLE and binary VLE data (Table 4-4): (·—·) P = 5 kPa; (··–··) P = 10 kPa; (·–·) P = 15 kPa.
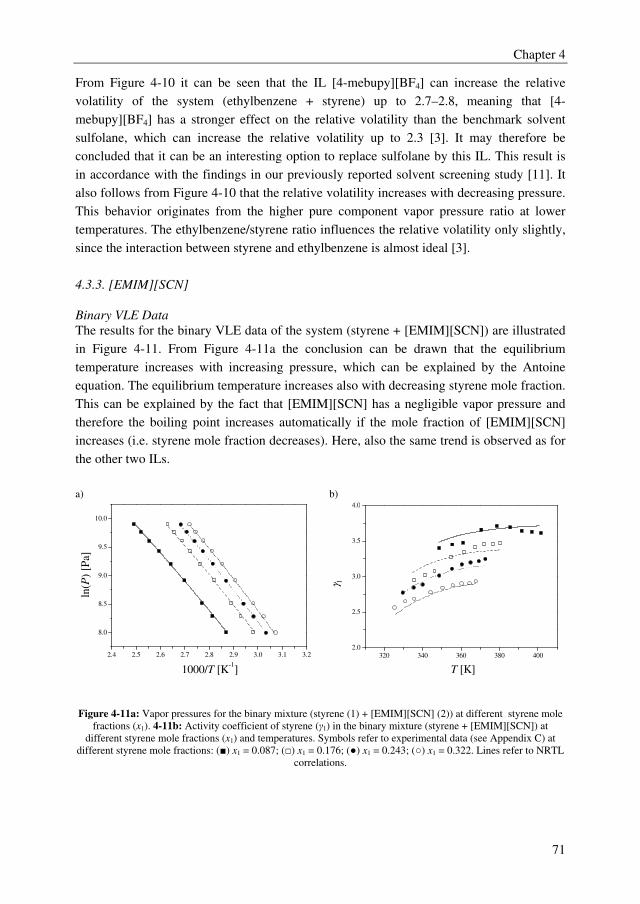
Chapter 4
71
From Figure 4-10 it can be seen that the IL [4-mebupy][BF4] can increase the relative
volatility of the system (ethylbenzene + styrene) up to 2.7–2.8, meaning that [4-
mebupy][BF4] has a stronger effect on the relative volatility than the benchmark solvent
sulfolane, which can increase the relative volatility up to 2.3 [3]. It may therefore be
concluded that it can be an interesting option to replace sulfolane by this IL. This result is
in accordance with the findings in our previously reported solvent screening study [11]. It
also follows from Figure 4-10 that the relative volatility increases with decreasing pressure.
This behavior originates from the higher pure component vapor pressure ratio at lower
temperatures. The ethylbenzene/styrene ratio influences the relative volatility only slightly,
since the interaction between styrene and ethylbenzene is almost ideal [3].
4.3.3. [EMIM][SCN]
Binary VLE Data
The results for the binary VLE data of the system (styrene + [EMIM][SCN]) are illustrated
in Figure 4-11. From Figure 4-11a the conclusion can be drawn that the equilibrium
temperature increases with increasing pressure, which can be explained by the Antoine
equation. The equilibrium temperature increases also with decreasing styrene mole fraction.
This can be explained by the fact that [EMIM][SCN] has a negligible vapor pressure and
therefore the boiling point increases automatically if the mole fraction of [EMIM][SCN]
increases (i.e. styrene mole fraction decreases). Here, also the same trend is observed as for
the other two ILs.
a) b)
2.4 2.5 2.6 2.7 2.8 2.9 3.0 3.1 3.2
8.0
8.5
9.0
9.5
10.0
ln(P
) [P
a]
1000/T [K-1]
320 340 360 380 400
2.0
2.5
3.0
3.5
4.0
γ1
T [K]
Figure 4-11a: Vapor pressures for the binary mixture (styrene (1) + [EMIM][SCN] (2)) at different styrene mole
fractions (x1). 4-11b: Activity coefficient of styrene (γ1) in the binary mixture (styrene + [EMIM][SCN]) at
different styrene mole fractions (x1) and temperatures. Symbols refer to experimental data (see Appendix C) at
different styrene mole fractions: (■) x1 = 0.087; (□) x1 = 0.176; (●) x1 = 0.243; (○) x1 = 0.322. Lines refer to NRTL
correlations.
Chapter 4
72
As can be seen from Figure 4-11b, the styrene activity coefficient increases with decreasing
mole fraction and increasing temperature. The relatively low capacity [39] and the positive
correlation between the temperature and the activity coefficient indicate that liquid clathrate
formation is the dominating solvation mechanism [27,32]. Because of the higher kinetic
energy of the molecules at higher temperature, their entrapment in a liquid clathrate
becomes less favorable at increasing temperature [27]. However, at higher temperature (T >
380–390 K), the activity coefficient decreases slightly again for low styrene mole fractions
in [EMIM][SCN]. This can be explained by the thermal expansion of the IL with increasing
temperature, which enables more aromatics to arrange themselves between the ions [24].
This effect becomes more dominant at higher temperatures.
From Figure 4-11b can also be seen that the styrene activity coefficient increases with
decreasing mole fraction. This behavior is uncommon for aromatic-IL systems. The
contrary trend is usually observed, i.e. a decrease in aromatic component activity
coefficient with a decreasing aromatic mole fraction in an IL [33,34], which we also
measured for the ILs [3-mebupy][B(CN)4] and [4-mebupy][BF4]. From the increase in
activity coefficient in combination with the relatively low styrene solubility in
[EMIM][SCN], it may be concluded that the cation-anion interactions in pure
[EMIM][SCN] are strong and are more dominant than the cation-π interactions. If an
aromatic molecule dissolves in an IL, the nature of the cation-anion interaction remains the
same[40], however, the cation-anion packing becomes less dense if an aromatic molecule
dissolves in an IL [40], and thereby the cation-anion affinity decreases. The cation-π
interaction for the system (styrene + [EMIM][SCN]) is hardly dependent on the styrene
concentration in [EMIM][SCN]. The cation-anion affinity is the dominant interaction and,
therefore, the styrene activity coefficient is decreasing with increasing styrene
concentration.
Ternary LLE Data
The experimental LLE data for the system (ethylbenzene + styrene + [EMIM][SCN]) at
313.2, 333.2, and 353.2 K are given in Appendix C. Furthermore, the solvent capacity and
selectivity are provided in Appendix C. These two parameters are widely used to determine
if a solvent is suitable for a liquid–liquid extraction or an extractive distillation process. The
solvent capacities for ethylbenzene (1) and styrene (2) can be calculated from the ratio of
the mole fractions of a component in the raffinate (organic phase) and extract phase (ionic
liquid phase):
IIIIIIxxD,xxD 222111 == (4-3)
The symbols I and II represent the raffinate and extract phase, respectively.
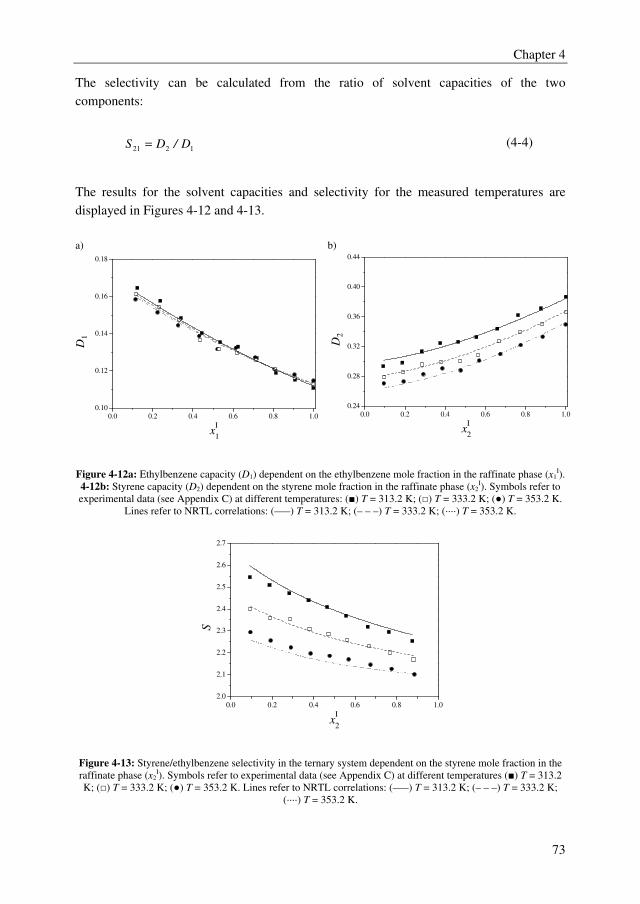
Chapter 4
73
The selectivity can be calculated from the ratio of solvent capacities of the two
components:
1221 D/DS = (4-4)
The results for the solvent capacities and selectivity for the measured temperatures are
displayed in Figures 4-12 and 4-13.
a) b)
0.0 0.2 0.4 0.6 0.8 1.0
0.10
0.12
0.14
0.16
0.18
xI
1
D1
0.0 0.2 0.4 0.6 0.8 1.0
0.24
0.28
0.32
0.36
0.40
0.44
D2
xI
2
Figure 4-12a: Ethylbenzene capacity (D1) dependent on the ethylbenzene mole fraction in the raffinate phase (x1
I).
4-12b: Styrene capacity (D2) dependent on the styrene mole fraction in the raffinate phase (x2I). Symbols refer to
experimental data (see Appendix C) at different temperatures: (■) T = 313.2 K; (□) T = 333.2 K; (●) T = 353.2 K.
Lines refer to NRTL correlations: (—–) T = 313.2 K; (– – –) T = 333.2 K; (····) T = 353.2 K.
0.0 0.2 0.4 0.6 0.8 1.0
2.0
2.1
2.2
2.3
2.4
2.5
2.6
2.7
S
xI
2
Figure 4-13: Styrene/ethylbenzene selectivity in the ternary system dependent on the styrene mole fraction in the
raffinate phase (x2I). Symbols refer to experimental data (see Appendix C) at different temperatures (■) T = 313.2
K; (□) T = 333.2 K; (●) T = 353.2 K. Lines refer to NRTL correlations: (—–) T = 313.2 K; (– – –) T = 333.2 K;
(····) T = 353.2 K.
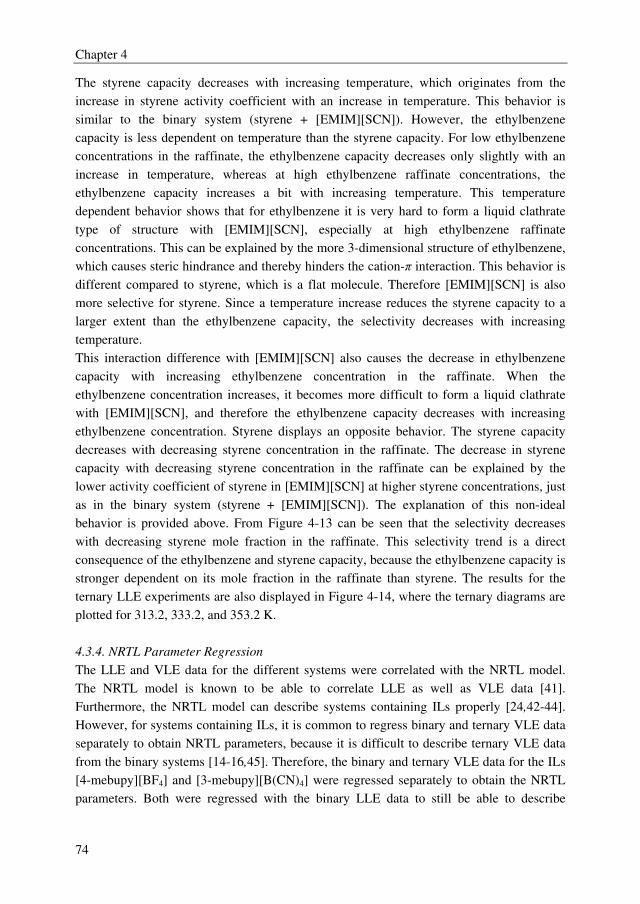
Chapter 4
74
The styrene capacity decreases with increasing temperature, which originates from the
increase in styrene activity coefficient with an increase in temperature. This behavior is
similar to the binary system (styrene + [EMIM][SCN]). However, the ethylbenzene
capacity is less dependent on temperature than the styrene capacity. For low ethylbenzene
concentrations in the raffinate, the ethylbenzene capacity decreases only slightly with an
increase in temperature, whereas at high ethylbenzene raffinate concentrations, the
ethylbenzene capacity increases a bit with increasing temperature. This temperature
dependent behavior shows that for ethylbenzene it is very hard to form a liquid clathrate
type of structure with [EMIM][SCN], especially at high ethylbenzene raffinate
concentrations. This can be explained by the more 3-dimensional structure of ethylbenzene,
which causes steric hindrance and thereby hinders the cation-π interaction. This behavior is
different compared to styrene, which is a flat molecule. Therefore [EMIM][SCN] is also
more selective for styrene. Since a temperature increase reduces the styrene capacity to a
larger extent than the ethylbenzene capacity, the selectivity decreases with increasing
temperature.
This interaction difference with [EMIM][SCN] also causes the decrease in ethylbenzene
capacity with increasing ethylbenzene concentration in the raffinate. When the
ethylbenzene concentration increases, it becomes more difficult to form a liquid clathrate
with [EMIM][SCN], and therefore the ethylbenzene capacity decreases with increasing
ethylbenzene concentration. Styrene displays an opposite behavior. The styrene capacity
decreases with decreasing styrene concentration in the raffinate. The decrease in styrene
capacity with decreasing styrene concentration in the raffinate can be explained by the
lower activity coefficient of styrene in [EMIM][SCN] at higher styrene concentrations, just
as in the binary system (styrene + [EMIM][SCN]). The explanation of this non-ideal
behavior is provided above. From Figure 4-13 can be seen that the selectivity decreases
with decreasing styrene mole fraction in the raffinate. This selectivity trend is a direct
consequence of the ethylbenzene and styrene capacity, because the ethylbenzene capacity is
stronger dependent on its mole fraction in the raffinate than styrene. The results for the
ternary LLE experiments are also displayed in Figure 4-14, where the ternary diagrams are
plotted for 313.2, 333.2, and 353.2 K.
4.3.4. NRTL Parameter Regression
The LLE and VLE data for the different systems were correlated with the NRTL model.
The NRTL model is known to be able to correlate LLE as well as VLE data [41].
Furthermore, the NRTL model can describe systems containing ILs properly [24,42-44].
However, for systems containing ILs, it is common to regress binary and ternary VLE data
separately to obtain NRTL parameters, because it is difficult to describe ternary VLE data
from the binary systems [14-16,45]. Therefore, the binary and ternary VLE data for the ILs
[4-mebupy][BF4] and [3-mebupy][B(CN)4] were regressed separately to obtain the NRTL
parameters. Both were regressed with the binary LLE data to still be able to describe
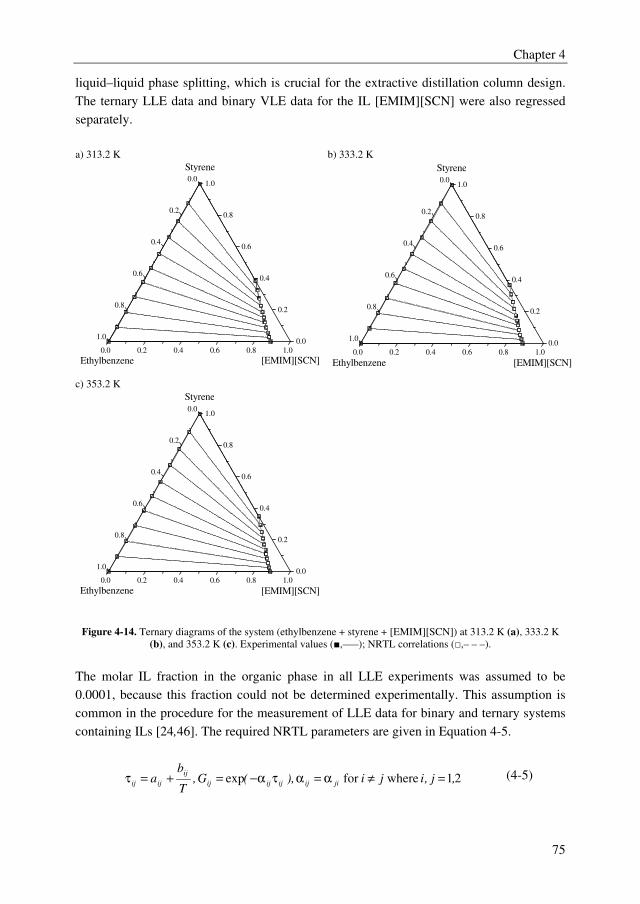
Chapter 4
75
liquid–liquid phase splitting, which is crucial for the extractive distillation column design.
The ternary LLE data and binary VLE data for the IL [EMIM][SCN] were also regressed
separately.
a) 313.2 K b) 333.2 K
0.0 0.2 0.4 0.6 0.8 1.0
0.0
0.2
0.4
0.6
0.8
1.00.0
0.2
0.4
0.6
0.8
1.0
Ethylbenzene [EMIM][SCN]
Styrene
0.0 0.2 0.4 0.6 0.8 1.0
0.0
0.2
0.4
0.6
0.8
1.00.0
0.2
0.4
0.6
0.8
1.0
Ethylbenzene [EMIM][SCN]
Styrene
c) 353.2 K
0.0 0.2 0.4 0.6 0.8 1.0
0.0
0.2
0.4
0.6
0.8
1.00.0
0.2
0.4
0.6
0.8
1.0
Ethylbenzene [EMIM][SCN]
Styrene
Figure 4-14. Ternary diagrams of the system (ethylbenzene + styrene + [EMIM][SCN]) at 313.2 K (a), 333.2 K
(b), and 353.2 K (c). Experimental values (■,—–); NRTL correlations (□,– – –).
The molar IL fraction in the organic phase in all LLE experiments was assumed to be
0.0001, because this fraction could not be determined experimentally. This assumption is
common in the procedure for the measurement of LLE data for binary and ternary systems
containing ILs [24,46]. The required NRTL parameters are given in Equation 4-5.
21whereforexp ,j,iji),(G,T
ba jiijijijij
ij
ijij =≠α=ατα−=+=τ (4-5)
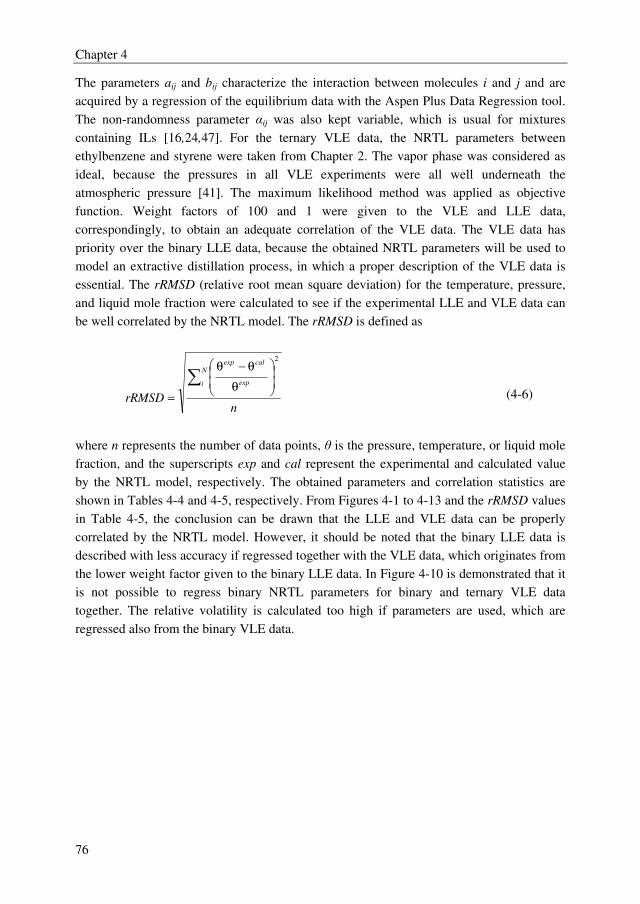
Chapter 4
76
The parameters aij and bij characterize the interaction between molecules i and j and are
acquired by a regression of the equilibrium data with the Aspen Plus Data Regression tool.
The non-randomness parameter αij was also kept variable, which is usual for mixtures
containing ILs [16,24,47]. For the ternary VLE data, the NRTL parameters between
ethylbenzene and styrene were taken from Chapter 2. The vapor phase was considered as
ideal, because the pressures in all VLE experiments were all well underneath the
atmospheric pressure [41]. The maximum likelihood method was applied as objective
function. Weight factors of 100 and 1 were given to the VLE and LLE data,
correspondingly, to obtain an adequate correlation of the VLE data. The VLE data has
priority over the binary LLE data, because the obtained NRTL parameters will be used to
model an extractive distillation process, in which a proper description of the VLE data is
essential. The rRMSD (relative root mean square deviation) for the temperature, pressure,
and liquid mole fraction were calculated to see if the experimental LLE and VLE data can
be well correlated by the NRTL model. The rRMSD is defined as
nrRMSD
N
i exp
calexp2
∑
θ
θ−θ
= (4-6)
where n represents the number of data points, θ is the pressure, temperature, or liquid mole
fraction, and the superscripts exp and cal represent the experimental and calculated value
by the NRTL model, respectively. The obtained parameters and correlation statistics are
shown in Tables 4-4 and 4-5, respectively. From Figures 4-1 to 4-13 and the rRMSD values
in Table 4-5, the conclusion can be drawn that the LLE and VLE data can be properly
correlated by the NRTL model. However, it should be noted that the binary LLE data is
described with less accuracy if regressed together with the VLE data, which originates from
the lower weight factor given to the binary LLE data. In Figure 4-10 is demonstrated that it
is not possible to regress binary NRTL parameters for binary and ternary VLE data
together. The relative volatility is calculated too high if parameters are used, which are
regressed also from the binary VLE data.
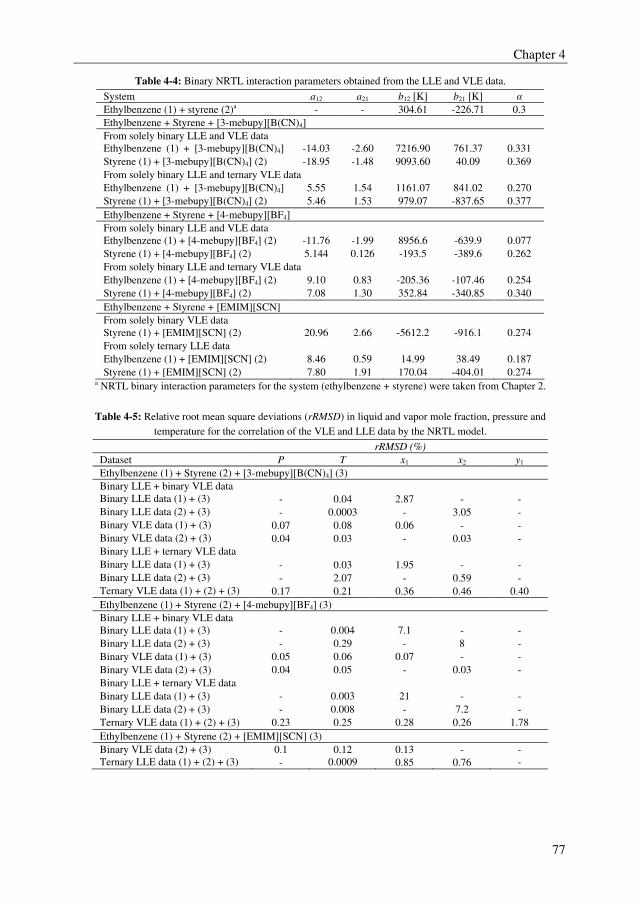
Chapter 4
77
Table 4-4: Binary NRTL interaction parameters obtained from the LLE and VLE data.
System a12 a21 b12 [K] b21 [K] α
Ethylbenzene (1) + styrene (2)a - - 304.61 -226.71 0.3
Ethylbenzene + Styrene + [3-mebupy][B(CN)4]
From solely binary LLE and VLE data
Ethylbenzene (1) + [3-mebupy][B(CN)4] -14.03 -2.60 7216.90 761.37 0.331
Styrene (1) + [3-mebupy][B(CN)4] (2) -18.95 -1.48 9093.60 40.09 0.369
From solely binary LLE and ternary VLE data
Ethylbenzene (1) + [3-mebupy][B(CN)4] 5.55 1.54 1161.07 841.02 0.270
Styrene (1) + [3-mebupy][B(CN)4] (2) 5.46 1.53 979.07 -837.65 0.377
Ethylbenzene + Styrene + [4-mebupy][BF4]
From solely binary LLE and VLE data
Ethylbenzene (1) + [4-mebupy][BF4] (2) -11.76 -1.99 8956.6 -639.9 0.077
Styrene (1) + [4-mebupy][BF4] (2) 5.144 0.126 -193.5 -389.6 0.262
From solely binary LLE and ternary VLE data
Ethylbenzene (1) + [4-mebupy][BF4] (2) 9.10 0.83 -205.36 -107.46 0.254
Styrene (1) + [4-mebupy][BF4] (2) 7.08 1.30 352.84 -340.85 0.340
Ethylbenzene + Styrene + [EMIM][SCN]
From solely binary VLE data
Styrene (1) + [EMIM][SCN] (2) 20.96 2.66 -5612.2 -916.1 0.274
From solely ternary LLE data
Ethylbenzene (1) + [EMIM][SCN] (2) 8.46 0.59 14.99 38.49 0.187
Styrene (1) + [EMIM][SCN] (2) 7.80 1.91 170.04 -404.01 0.274 a NRTL binary interaction parameters for the system (ethylbenzene + styrene) were taken from Chapter 2.
Table 4-5: Relative root mean square deviations (rRMSD) in liquid and vapor mole fraction, pressure and
temperature for the correlation of the VLE and LLE data by the NRTL model.
rRMSD (%)
Dataset P T x1 x2 y1
Ethylbenzene (1) + Styrene (2) + [3-mebupy][B(CN)4] (3)
Binary LLE + binary VLE data
Binary LLE data (1) + (3) - 0.04 2.87 - -
Binary LLE data (2) + (3) - 0.0003 - 3.05 -
Binary VLE data (1) + (3) 0.07 0.08 0.06 - -
Binary VLE data (2) + (3) 0.04 0.03 - 0.03 -
Binary LLE + ternary VLE data
Binary LLE data (1) + (3) - 0.03 1.95 - -
Binary LLE data (2) + (3) - 2.07 - 0.59 -
Ternary VLE data (1) + (2) + (3) 0.17 0.21 0.36 0.46 0.40
Ethylbenzene (1) + Styrene (2) + [4-mebupy][BF4] (3)
Binary LLE + binary VLE data
Binary LLE data (1) + (3) - 0.004 7.1 - -
Binary LLE data (2) + (3) - 0.29 - 8 -
Binary VLE data (1) + (3) 0.05 0.06 0.07 - -
Binary VLE data (2) + (3) 0.04 0.05 - 0.03 -
Binary LLE + ternary VLE data
Binary LLE data (1) + (3) - 0.003 21 - -
Binary LLE data (2) + (3) - 0.008 - 7.2 -
Ternary VLE data (1) + (2) + (3) 0.23 0.25 0.28 0.26 1.78
Ethylbenzene (1) + Styrene (2) + [EMIM][SCN] (3)
Binary VLE data (2) + (3) 0.1 0.12 0.13 - -
Ternary LLE data (1) + (2) + (3) - 0.0009
0.85 0.76 -
Chapter 4
78
4.4. Conclusions
In this work, binary LLE data at 313.2, 333.3, and 353.2 K, binary VLE data in the pressure
range of 3–30 kPa, and ternary VLE data at 5, 10, and 15 kPa have been determined for the
systems (ethylbenzene + styrene + [3-mebupy][B(CN)4]) and (ethylbenzene + styrene + [4-
mebupy][BF4]). For the system (ethylbenzene + styrene + [EMIM][SCN]), binary VLE
data in the pressure range of 3–20 kPa for the system (styrene + [EMIM][SCN]), and binary
and ternary LLE data at 313.2, 333.2, and 353.2 K have been measured. From the binary
VLE data with the ILs [3-mebupy][B(CN)4] and [4-mebupy][BF4] was observed that there
is a maximum in aromatic activity coefficient as function the aromatic mole fraction. An
opposite behavior was measured for the IL [EMIM][SCN] due its higher cation-anion
affinity. From the ternary equilibrium data, the conclusion can be drawn that the selectivity
for the ethylbenzene/styrene mixture decreases in the order of [EMIM][SCN] > [4-
mebupy][BF4] > [3-mebupy][B(CN)4], which correspond to the findings from the IL
screening study. The NRTL model can properly describe the binary and ternary phase
equilibrium data. It was not possible to get a proper description of the ternary VLE data
with the NRTL parameters determined solely from the binary systems.
4.5. Nomenclature
a binary interaction parameter
b binary interaction parameter K
D solvent capacity
F feed
G coefficient as defined in Equation (4-5)
n number of data points
N number of data points
P total pressure Pa
Po pure component vapor pressure Pa
S solvent
S21 selectivity
T temperature K
x mole fraction in the liquid phase
x’ mole fraction on solvent free basis
y mole fraction in the vapor phase
Greek symbols
α relative volatility
αij nonrandomness constant
τ coefficient as defined in Equation (4-5)
γ activity coefficient
Chapter 4
79
σ Standard deviation
θ measured variable (temperature, pressure, mole fraction)
Superscripts
I organic phase
II ionic liquid phase
Subscripts
cal calculated
exp experimental
i component i
j component j
Abbreviations
EB ethylbenzene
[EMIM][SCN] 1-ethyl-3-methylimidazolium thiocyanate
FID flame ionization detector
IL ionic liquid
LLE liquid–liquid equilibrium
[3-mebupy][B(CN)4] 3-methyl-N-butylpyridinium tetracyanoborate
[4-mebupy][BF4] 4-methyl-N-butylpyridinium tetrafluoroborate
NRTL nonrandom two-liquid
ppm parts per million
rpm rotations per minute
rRMSD relative root mean square deviation
SM styrene monomer
VLE vapor–liquid equilibrium
4.6. References
[1] F.M. Lee, J.C. Gentry, Chem. Eng. Process 93 (1997) 56-64.
[2] J.C. Gentry, S. Kumar, R. Wright-Wytcherley, Hydrocarb. Process. 93 (2004) 62-
66.
[3] M.T.G. Jongmans, J.I.W. Maassen, A.J. Luijks, B. Schuur, A.B. de Haan, J.
Chem. Eng. Data 56 (2011) 3510-3517.
[4] Y. Beste, M. Eggersmann, H. Schoenmakers, Chem. Ing. Tech. 77 (2005) 1800-
1808.
[5] H.J. Huang, S. Ramaswamy, U.W. Tschirner, B.V. Ramarao, Sep. Purif. Technol.
62 (2008) 1-21.
[6] Y. Zhao, S. Xia, J. Chem. Technol. Biot. 80 (2005) 1089-1096.
[7] S.T.Anjan, Chem. Eng. Prog 102 (2006) 30-39.
[8] X. Han, D.W. Armstrong, Accounts. Chem. Res. 40 (2007) 1079-1086.
Chapter 4
80
[9] C.F. Poole, in: M. Cooke (Ed.), Encyclopedia of Separation Science, Elsevier,
Detroit, 2010, p.II-1-II-8.
[10] R. Giernoth, Angew. Chem. Int. Ed. 49 (2010) 2834-2839.
[11] M.T.G. Jongmans, B. Schuur, A.B. de Haan, Ind. Eng. Chem. Res. 50 (2011)
10800-10810.
[12] S.A.F. Onink, G.H.F. Aerts, B. Burghoff, G.W. Meindersma, A.B. de Haan, J. Liq.
chromatogr. r. t. (2011) Submitted.
[13] S. Kossack, K. Kraemer, R. Gani, W. Marquardt, Chem. Eng. Res. Des. 86 (2008)
781-792.
[14] N. Calvar, B. Gonzalez, E. Gomez, A. Dominguez, J. Chem. Eng. Data 51 (2006)
2178-2181.
[15] N. Calvar, B. Gonzalez, E. Gomez, A. Dominguez, J. Chem. Eng. Data 53 (2008)
820-825.
[16] X.C. Jiang, J.F. Wang, C.X. Li, L.M. Wang, Z.H. Wang, J. Chem. Thermodyn. 39
(2007) 841-846.
[17] J.F. Wang, C.X. Li, Z.H. Wang, J. Chem. Eng. Data 52 (2007) 1307-1312.
[18] J. Zhao, X.C. Jiang, C.X. Li, Z.H. Wang, Fluid Phase Equilibr. 247 (2006) 190-
198.
[19] J.D. Raal, A.L. Muhlbauer, Phase equilibria; Measurement and Computation ed.,
Taylor & Francis, Washington 1998.
[20] A. Aucejo, S. Loras, V. Martinez-Soria, N. Becht, G. Del Rio, J. Chem. Eng. Data
51 (2006) 1051-1055.
[21] P. Chaiyavech, M. Van Winkle, J. Chem. Eng. Data 4 (1959) 53-56.
[22] D.J. Dixon, K.P. Johnston, J. Appl. Polym. Sci. 50 (1993) 1929-1942.
[23] J. Liu, B. Han, Z. Liu, J. Wang, Q. Huo, The Journal of Supercritical Fluids 20
(2001) 171-176.
[24] A.R. Hansmeier, M.T.G. Jongmans, G.W. Meindersma, A.B. de Haan, J. Chem.
Thermodyn. 42 (2010) 484-490.
[25] G.W. Meindersma, A. Podt, A.B. de Haan, Fuel Process. Technol. 87 (2005) 59-
70.
[26] J.M. Lee, J. Palgunadi, J.H. Kim, S. Jung, Y.s. Choi, M. Cheong, H.S. Kim, Phys.
Chem. Chem. Phys. 12 (2010) 1812-1816.
[27] J.D. Holbrey, W.M. Reichert, M. Nieuwenhuyzen, O. Sheppard, C. Hardacre, R.D.
Rogers, Chem. Commun. (2003) 476-477.
[28] C.C. Cassol, A.P. Umpierre, G. Ebeling, B. Ferrera, S.S.X. Chiaro, J. Dupont, Int.
J. Mol. Sci. 8 (2007) 593-605.
[29] J.B. Harper, R.M. Lynden-Bell, Mol. Phys. 102 (2004) 85-94.
[30] P. Wasserscheid, T. Welton, in: P. Wasserscheid, T. Welton (Eds.), Ionic Liquids
in Synthesis, Wiley-VCH, Weinheim, 2008, pp. 1-6.
[31] A.A.H. Padua, M.F. Costa Gomes, J.N.A. Canongia Lopes, Accounts. Chem. Res.
40 (2007) 1087-1096.
[32] C. Hardacre, J.D. Holbrey, M. Nieuwenhuyzen, T.G.A. Youngs, Accounts. Chem.
Res. 40 (2007) 1146-1155.
[33] S.P. Verevkin, J. Safarov, E. Bich, E. Hassel, A. Heintz, Fluid Phase Equilibr. 236
(2005) 222-228.
[34] J. Safarov, S.P. Verevkin, E. Bich, A. Heintz, J. Chem. Eng. Data 51 (2006) 518-
525.
Chapter 4
81
[35] M. T. G. Jongmans, A. J. Luijks, J. I. W. Maassen, B. Schuur, A. B. de Haan,
Extractive distillation of ethylbenzene and styrene using sulfolane as solvent: low
pressure isobaric VLE data, Eds.,A. B. de Haan, H. Kooijman, A. Górak,
Distillation and Absorption 2010, 2010, 337-342.
[36] Z. Lei, B. Chen, Z. Ding, in: Special Distillation Processes, Elsevier, Amsterdam,
2005, pp. 59-144.
[37] M.F. Doherty, J.P. Knapp, Distillation, Azeotropic, and Extractive ed., John Wiley
& Sons, Inc., 2000.
[38] W. Yin, S. Ding, S. Xia, P. Ma, X. Huang, Z. Zhu, J. Chem. Eng. Data 55 (2010)
3274-3277.
[39] M.T.G. Jongmans, B. Schuur, A.B. de Haan, Ind. Eng. Chem. Res. (2011)
Submitted.
[40] M. Deetlefs, C. Hardacre, M. Nieuwenhuyzen, O. Sheppard, A.K. Soper, J. Phys.
Chem. B 109 (2004) 1593-1598.
[41] B.E. Poling, J.M. Prausnitz, J.P. O'Connell, The properties of gases and liquids,
Fifth ed., McGraw Hill, Singapore 2007.
[42] M. Doker, J. Gmehling, Fluid Phase Equilibr. 227 (2005) 255-266.
[43] U. Domanska, M. Laskowska, A. Marciniak, J. Chem. Eng. Data 53 (2008) 498-
502.
[44] J. Garcia, J.S. Torrecilla, A. Fernandez, M. Oliet, F. Rodriguez, J. Chem.
Thermodyn. 42 (2010) 144-150.
[45] J.F. Wang, C.X. Li, Z.H. Wang, Z.J. Li, Y.B. Jiang, Fluid Phase Equilibr. 255
(2007) 186-192.
[46] M.B. Shiflett, A.M. Niehaus, J. Chem. Eng. Data 55 (2009) 346-353.
[47] A.V. Orchilles, P.J. Miguel, E. Vercher, A. Martinez-Andreu, J. Chem. Eng. Data
52 (2006) 141-147.

82
83
Styrene Monomer Recovery from Ionic Liquids
Submitted as:
M.T.G. Jongmans, J. Trampé, B. Schuur, A.B. de Haan, Chem. Eng.
Process.
Abstract Extractive distillation using common organic solvents or ionic liquids (ILs) is a promising
technology to separate the close-boiling mixture ethylbenzene/styrene. A proper solvent
regeneration is crucial to obtain a technical and economic feasible process. In this chapter, a
study to investigate which regeneration technology is the most promising option to recover
styrene from the IL [4-mebupy][BF4] is presented. Stripping with a hot gas (N2 or
ethylbenzene), supercritical CO2 extraction, distillation by adding a co-solvent, and
evaporation were investigated as recovery technologies. Equilibrium stage models using
previously determined activity coefficient models (the NRTL model was used to describe
the vapor–liquid equilibrium data) were used in Aspen Plus to model the extractive
distillation column and to evaluate the regeneration technologies. An optimal solvent-to-
feed ratio of 3.8 on mass base and 45 theoretical equilibrium stages were obtained from the
optimization of the extractive distillation column. It was found that the IL that was fed to
the extractive distillation column should have a purity of at least 99.6 wt% to maintain the
purities of the top and bottom products from the extractive distillation column. This purity
could not be obtained with an evaporator using mild conditions (T = 130 oC, Tcondenser ≥ 20 oC). From the process models and the total annual costs, all calculated for a typical
production capacity of 500.000 mta, the conclusion can be drawn that evaporation using
very low pressures (P < 10 mbar) and stripping with ethylbenzene are the most promising
technologies to recover styrene monomer from the IL [4-mebupy][BF4].
Chapter 5
84
5.1. Introduction
The close-boiling mixture ethylbenzene/styrene is currently industrially separated by
distillation [1]. Due to the low relative volatility of the ethylbenzene/styrene mixture, this
distillation requires a large reflux of 7.1 and 70 equilibrium stages [1]. A typical production
capacity of a styrene production plant is 500.000 metric tonnes annually (mta). Extractive
distillation is a promising technology to reduce the capital and operational expenditures
(CAPEX and OPEX) to separate close-boiling mixtures [2]. A commonly applied organic
solvent in extractive distillation processes is sulfolane [3], which can increase the relative
volatility of the ethylbenzene/styrene mixture up to 2.3 [2,4]. A promising alternative to
traditional organic solvents are ionic liquids (ILs), which can decrease the OPEX and
CAPEX to an even larger extent [5]. An IL integrates the advantages of a liquid solvent
(easy operation) and a solid salt (high separation ability) and is reported as a “green
solvent”, because of its negligible vapor pressure [6,7]. The other reported advantageous
properties of ILs over commonly applied organic solvents are their designer solvent
properties by changing the cation-anion combination [8,9], high chemical and thermal
stability [8], broad liquid range [10], and the high capacity of ILs for aromatic components
[11]. Moreover, in our ionic liquid screening study (see Chapter 3) we have demonstrated
that many ILs have a larger selectivity than sulfolane for separating the
ethylbenzene/styrene mixture [12]. Consequently, a lower reflux ratio can be used in the
extractive distillation column using ILs. A process design should indicate whether the
extractive distillation processes are beneficial compared to the current distillation process
from OPEX and CAPEX perspective and whether ILs can outperform sulfolane.
A proper solvent regeneration is crucial to obtain a technically and economically feasible
extractive distillation process [3,5]. For the extractive distillation process with sulfolane, a
distillation column is used for the solvent regeneration [2]. Because ILs have a negligible
vapor pressure, other regeneration technologies can be applied, e.g. a simple evaporation
[5,13,14]. However, although often mentioned as an advantage, the negligible vapor
pressure of the ILs might also be a disadvantage, because relatively extreme conditions in
terms of temperature and pressure are required in an evaporator to obtain high IL purities.
High temperatures are undesired, because styrene tends to polymerize at elevated
temperatures. A restriction in temperature for styrene of 130 oC is often used as a standard
[1]. Therefore, there is a need to investigate alternative regeneration technologies to use in
combination with evaporation or as a single regeneration technology.
Reported alternatives are stripping with a hot gas, like nitrogen (N2) [5] or the top product
from the extractive distillation column [15], and supercritical carbon dioxide (scCO2)
extraction [16-18]. These three recovery options are typically used in combination with an
evaporator and have the advantage that usually no extreme conditions are required [5]. A
characteristic of a stripping process with N2 is that commonly low temperatures (T < 0 oC)
are required to condense the stripped product from N2 [19]. This means that refrigerant has
to be used as a coolant, which can increase the OPEX and CAPEX significantly. This
Chapter 5
85
drawback can be overcome by applying the top product from the extractive distillation
column as a stripping gas. ScCO2 extraction of a solute from the IL has the advantage that
CO2 is a “green solvent” as well [16,17], and has already proven to be a viable solvent in
coffee decaffeination and dry cleaning industries [16]. The main drawbacks of scCO2
extraction are the large OPEX to pressurize the CO2 to supercritical conditions [20], and
that the recovery of styrene from CO2 might also require low temperatures (T < 0 oC).
Distillation is another option to recover organics from ILs by the addition of a low volatile
organic co-solvent to the IL. Thereby, the extreme conditions in the styrene recovery from
the IL could be avoided due to the small vapor pressure of the co-solvent. The co-
solvent/IL blend will be recycled to the extractive distillation column, where the bottleneck
of applying this recovery technology lays. The organic co-solvent will lower the selectivity
of the IL for the ethylbenzene/styrene mixture and some extra stages should be added to the
top of the column to avoid contamination of the top product. In this study, sulfolane and n-
methylpyrrolidinone (NMP) have been selected as co-solvents, because sulfolane and NMP
increase the relative volatility of the ethylbenzene/styrene mixture up to 2.3 [4] and 1.8–2
[21], respectively. Therefore, both co-solvents do not strongly influence the selectivity of
the IL for the ethylbenzene/styrene mixture.
Another reported technology to purify ILs is melt crystallization [22]. Melt crystallization
has the advantage that very high IL purities (wIL > 99.99 % [22]) can be obtained. However,
the ILs investigated in this work have melting points below 0 oC, which would require
tremendous amounts of refrigerant. Therefore, melt crystallization was not studied in detail
in the work that is described in this chapter.
The objective of the work described in this chapter was to investigate which regeneration
technology is the best option to recover styrene monomer from ILs. The research was
conducted for the IL 4-methyl-N-butylpyridinium tetrafluoroborate ([4-mebupy][BF4]),
because this IL can increase the relative volatility of the ethylbenzene/styrene mixture up to
2.8 and is thus more selective than the benchmark solvent sulfolane. In the approach of this
study, the extractive distillation column was optimized first. Next, the effect of different
styrene concentrations in the IL recycle was examined on the required reflux ratio and
reboiler heat duty of the extractive distillation column. The results from this sensitivity
analysis were required to find the minimum purity of the IL recycle. Subsequently, it was
investigated which purity can be obtained by an evaporator using mild conditions (T < 130 oC, Tcondenser ≥ 20 oC), after which the other regeneration technologies were modeled.
Finally, an analysis was made of the OPEX and CAPEX to determine which regeneration
technology is the most promising option to recover styrene from the IL [4-mebupy][BF4].
5.2. Process Descriptions Regeneration Technologies
In this section, the final process schemes and their descriptions of the different regeneration
technologies in combination with the extractive distillation column are provided. The
process schemes of the regeneration processes are illustrated in Figures 5-1 to 5-6.
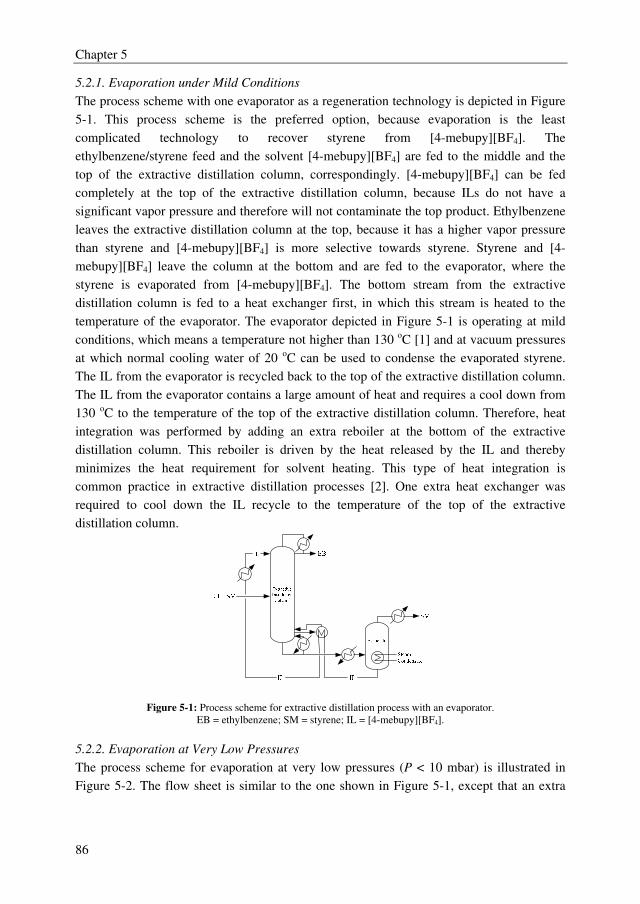
Chapter 5
86
5.2.1. Evaporation under Mild Conditions
The process scheme with one evaporator as a regeneration technology is depicted in Figure
5-1. This process scheme is the preferred option, because evaporation is the least
complicated technology to recover styrene from [4-mebupy][BF4]. The
ethylbenzene/styrene feed and the solvent [4-mebupy][BF4] are fed to the middle and the
top of the extractive distillation column, correspondingly. [4-mebupy][BF4] can be fed
completely at the top of the extractive distillation column, because ILs do not have a
significant vapor pressure and therefore will not contaminate the top product. Ethylbenzene
leaves the extractive distillation column at the top, because it has a higher vapor pressure
than styrene and [4-mebupy][BF4] is more selective towards styrene. Styrene and [4-
mebupy][BF4] leave the column at the bottom and are fed to the evaporator, where the
styrene is evaporated from [4-mebupy][BF4]. The bottom stream from the extractive
distillation column is fed to a heat exchanger first, in which this stream is heated to the
temperature of the evaporator. The evaporator depicted in Figure 5-1 is operating at mild
conditions, which means a temperature not higher than 130 oC [1] and at vacuum pressures
at which normal cooling water of 20 oC can be used to condense the evaporated styrene.
The IL from the evaporator is recycled back to the top of the extractive distillation column.
The IL from the evaporator contains a large amount of heat and requires a cool down from
130 oC to the temperature of the top of the extractive distillation column. Therefore, heat
integration was performed by adding an extra reboiler at the bottom of the extractive
distillation column. This reboiler is driven by the heat released by the IL and thereby
minimizes the heat requirement for solvent heating. This type of heat integration is
common practice in extractive distillation processes [2]. One extra heat exchanger was
required to cool down the IL recycle to the temperature of the top of the extractive
distillation column.
Figure 5-1: Process scheme for extractive distillation process with an evaporator.
EB = ethylbenzene; SM = styrene; IL = [4-mebupy][BF4].
5.2.2. Evaporation at Very Low Pressures
The process scheme for evaporation at very low pressures (P < 10 mbar) is illustrated in
Figure 5-2. The flow sheet is similar to the one shown in Figure 5-1, except that an extra
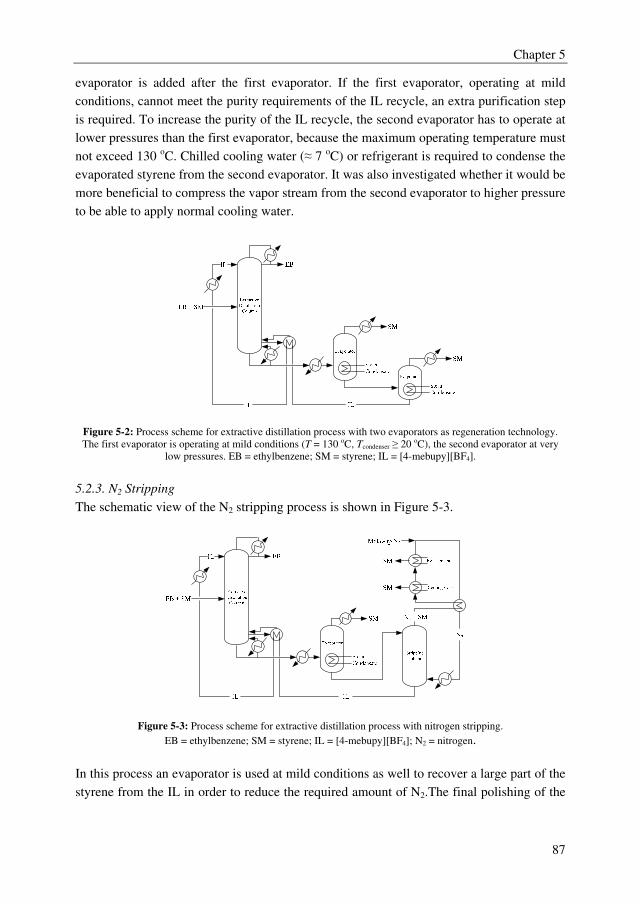
Chapter 5
87
evaporator is added after the first evaporator. If the first evaporator, operating at mild
conditions, cannot meet the purity requirements of the IL recycle, an extra purification step
is required. To increase the purity of the IL recycle, the second evaporator has to operate at
lower pressures than the first evaporator, because the maximum operating temperature must
not exceed 130 oC. Chilled cooling water (≈ 7 oC) or refrigerant is required to condense the
evaporated styrene from the second evaporator. It was also investigated whether it would be
more beneficial to compress the vapor stream from the second evaporator to higher pressure
to be able to apply normal cooling water.
Figure 5-2: Process scheme for extractive distillation process with two evaporators as regeneration technology.
The first evaporator is operating at mild conditions (T = 130 oC, Tcondenser ≥ 20 oC), the second evaporator at very
low pressures. EB = ethylbenzene; SM = styrene; IL = [4-mebupy][BF4].
5.2.3. N2 Stripping
The schematic view of the N2 stripping process is shown in Figure 5-3.
Figure 5-3: Process scheme for extractive distillation process with nitrogen stripping.
EB = ethylbenzene; SM = styrene; IL = [4-mebupy][BF4]; N2 = nitrogen.
In this process an evaporator is used at mild conditions as well to recover a large part of the
styrene from the IL in order to reduce the required amount of N2.The final polishing of the
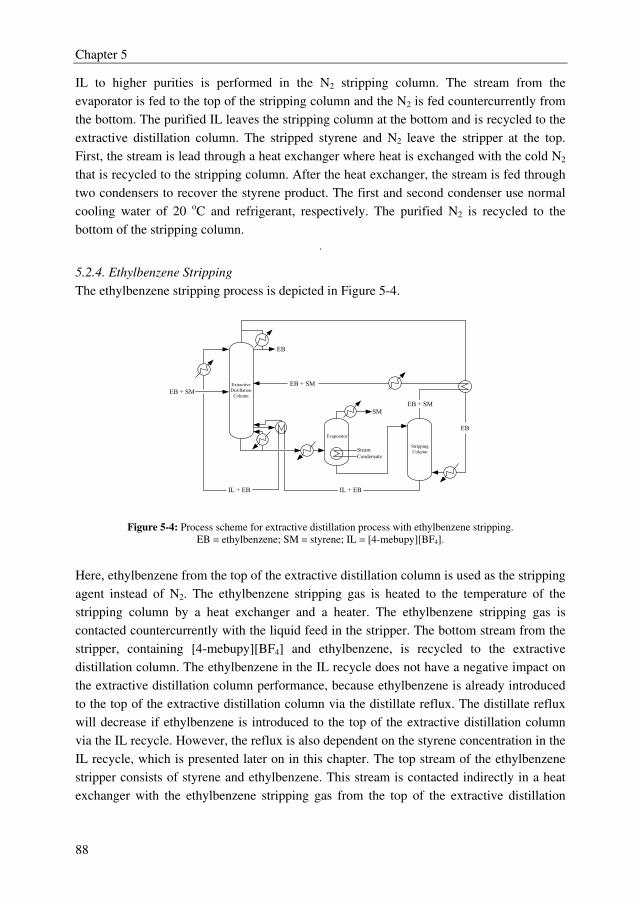
Chapter 5
88
IL to higher purities is performed in the N2 stripping column. The stream from the
evaporator is fed to the top of the stripping column and the N2 is fed countercurrently from
the bottom. The purified IL leaves the stripping column at the bottom and is recycled to the
extractive distillation column. The stripped styrene and N2 leave the stripper at the top.
First, the stream is lead through a heat exchanger where heat is exchanged with the cold N2
that is recycled to the stripping column. After the heat exchanger, the stream is fed through
two condensers to recover the styrene product. The first and second condenser use normal
cooling water of 20 oC and refrigerant, respectively. The purified N2 is recycled to the
bottom of the stripping column.
.
5.2.4. Ethylbenzene Stripping
The ethylbenzene stripping process is depicted in Figure 5-4.
Extractive
Distillation
ColumnEB + SM
SM
EB
IL + EB
Evaporator
Steam
Condensate
Stripping
Column
EB
EB + SM
EB + SM
IL + EB
Figure 5-4: Process scheme for extractive distillation process with ethylbenzene stripping.
EB = ethylbenzene; SM = styrene; IL = [4-mebupy][BF4].
Here, ethylbenzene from the top of the extractive distillation column is used as the stripping
agent instead of N2. The ethylbenzene stripping gas is heated to the temperature of the
stripping column by a heat exchanger and a heater. The ethylbenzene stripping gas is
contacted countercurrently with the liquid feed in the stripper. The bottom stream from the
stripper, containing [4-mebupy][BF4] and ethylbenzene, is recycled to the extractive
distillation column. The ethylbenzene in the IL recycle does not have a negative impact on
the extractive distillation column performance, because ethylbenzene is already introduced
to the top of the extractive distillation column via the distillate reflux. The distillate reflux
will decrease if ethylbenzene is introduced to the top of the extractive distillation column
via the IL recycle. However, the reflux is also dependent on the styrene concentration in the
IL recycle, which is presented later on in this chapter. The top stream of the ethylbenzene
stripper consists of styrene and ethylbenzene. This stream is contacted indirectly in a heat
exchanger with the ethylbenzene stripping gas from the top of the extractive distillation
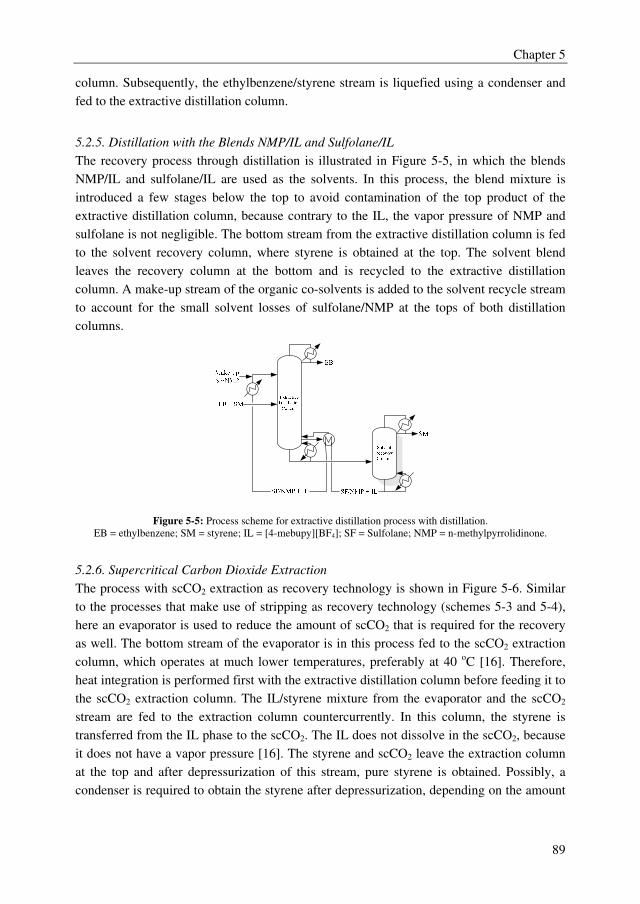
Chapter 5
89
column. Subsequently, the ethylbenzene/styrene stream is liquefied using a condenser and
fed to the extractive distillation column.
5.2.5. Distillation with the Blends NMP/IL and Sulfolane/IL
The recovery process through distillation is illustrated in Figure 5-5, in which the blends
NMP/IL and sulfolane/IL are used as the solvents. In this process, the blend mixture is
introduced a few stages below the top to avoid contamination of the top product of the
extractive distillation column, because contrary to the IL, the vapor pressure of NMP and
sulfolane is not negligible. The bottom stream from the extractive distillation column is fed
to the solvent recovery column, where styrene is obtained at the top. The solvent blend
leaves the recovery column at the bottom and is recycled to the extractive distillation
column. A make-up stream of the organic co-solvents is added to the solvent recycle stream
to account for the small solvent losses of sulfolane/NMP at the tops of both distillation
columns.
Figure 5-5: Process scheme for extractive distillation process with distillation.
EB = ethylbenzene; SM = styrene; IL = [4-mebupy][BF4]; SF = Sulfolane; NMP = n-methylpyrrolidinone.
5.2.6. Supercritical Carbon Dioxide Extraction
The process with scCO2 extraction as recovery technology is shown in Figure 5-6. Similar
to the processes that make use of stripping as recovery technology (schemes 5-3 and 5-4),
here an evaporator is used to reduce the amount of scCO2 that is required for the recovery
as well. The bottom stream of the evaporator is in this process fed to the scCO2 extraction
column, which operates at much lower temperatures, preferably at 40 oC [16]. Therefore,
heat integration is performed first with the extractive distillation column before feeding it to
the scCO2 extraction column. The IL/styrene mixture from the evaporator and the scCO2
stream are fed to the extraction column countercurrently. In this column, the styrene is
transferred from the IL phase to the scCO2. The IL does not dissolve in the scCO2, because
it does not have a vapor pressure [16]. The styrene and scCO2 leave the extraction column
at the top and after depressurization of this stream, pure styrene is obtained. Possibly, a
condenser is required to obtain the styrene after depressurization, depending on the amount
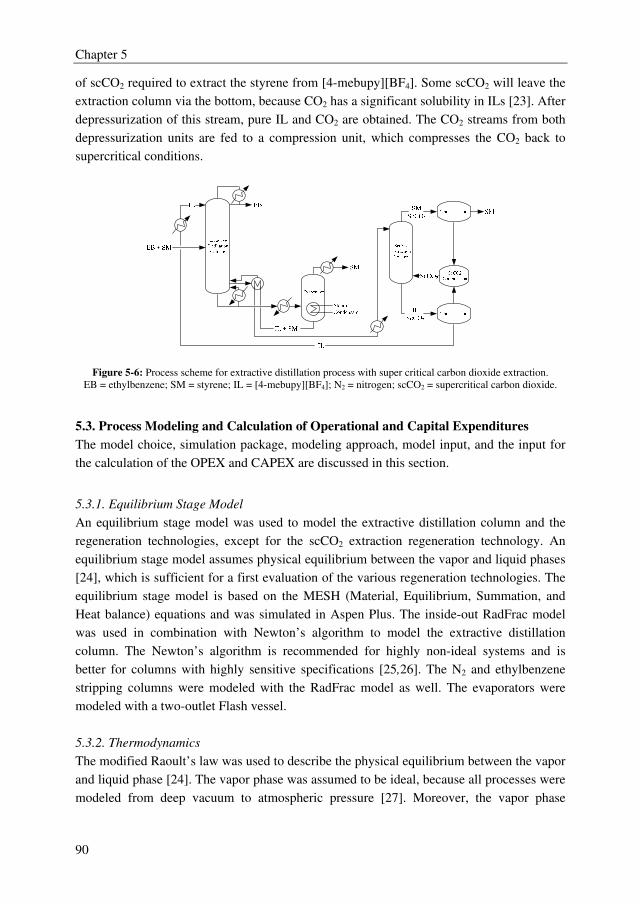
Chapter 5
90
of scCO2 required to extract the styrene from [4-mebupy][BF4]. Some scCO2 will leave the
extraction column via the bottom, because CO2 has a significant solubility in ILs [23]. After
depressurization of this stream, pure IL and CO2 are obtained. The CO2 streams from both
depressurization units are fed to a compression unit, which compresses the CO2 back to
supercritical conditions.
Figure 5-6: Process scheme for extractive distillation process with super critical carbon dioxide extraction.
EB = ethylbenzene; SM = styrene; IL = [4-mebupy][BF4]; N2 = nitrogen; scCO2 = supercritical carbon dioxide.
5.3. Process Modeling and Calculation of Operational and Capital Expenditures
The model choice, simulation package, modeling approach, model input, and the input for
the calculation of the OPEX and CAPEX are discussed in this section.
5.3.1. Equilibrium Stage Model
An equilibrium stage model was used to model the extractive distillation column and the
regeneration technologies, except for the scCO2 extraction regeneration technology. An
equilibrium stage model assumes physical equilibrium between the vapor and liquid phases
[24], which is sufficient for a first evaluation of the various regeneration technologies. The
equilibrium stage model is based on the MESH (Material, Equilibrium, Summation, and
Heat balance) equations and was simulated in Aspen Plus. The inside-out RadFrac model
was used in combination with Newton’s algorithm to model the extractive distillation
column. The Newton’s algorithm is recommended for highly non-ideal systems and is
better for columns with highly sensitive specifications [25,26]. The N2 and ethylbenzene
stripping columns were modeled with the RadFrac model as well. The evaporators were
modeled with a two-outlet Flash vessel.
5.3.2. Thermodynamics
The modified Raoult’s law was used to describe the physical equilibrium between the vapor
and liquid phase [24]. The vapor phase was assumed to be ideal, because all processes were
modeled from deep vacuum to atmospheric pressure [27]. Moreover, the vapor phase
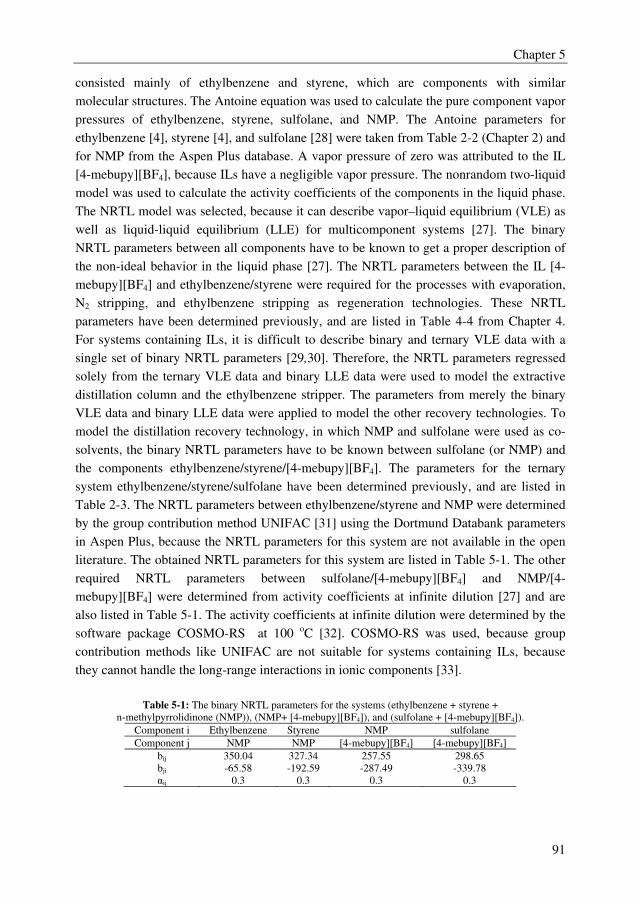
Chapter 5
91
consisted mainly of ethylbenzene and styrene, which are components with similar
molecular structures. The Antoine equation was used to calculate the pure component vapor
pressures of ethylbenzene, styrene, sulfolane, and NMP. The Antoine parameters for
ethylbenzene [4], styrene [4], and sulfolane [28] were taken from Table 2-2 (Chapter 2) and
for NMP from the Aspen Plus database. A vapor pressure of zero was attributed to the IL
[4-mebupy][BF4], because ILs have a negligible vapor pressure. The nonrandom two-liquid
model was used to calculate the activity coefficients of the components in the liquid phase.
The NRTL model was selected, because it can describe vapor–liquid equilibrium (VLE) as
well as liquid-liquid equilibrium (LLE) for multicomponent systems [27]. The binary
NRTL parameters between all components have to be known to get a proper description of
the non-ideal behavior in the liquid phase [27]. The NRTL parameters between the IL [4-
mebupy][BF4] and ethylbenzene/styrene were required for the processes with evaporation,
N2 stripping, and ethylbenzene stripping as regeneration technologies. These NRTL
parameters have been determined previously, and are listed in Table 4-4 from Chapter 4.
For systems containing ILs, it is difficult to describe binary and ternary VLE data with a
single set of binary NRTL parameters [29,30]. Therefore, the NRTL parameters regressed
solely from the ternary VLE data and binary LLE data were used to model the extractive
distillation column and the ethylbenzene stripper. The parameters from merely the binary
VLE data and binary LLE data were applied to model the other recovery technologies. To
model the distillation recovery technology, in which NMP and sulfolane were used as co-
solvents, the binary NRTL parameters have to be known between sulfolane (or NMP) and
the components ethylbenzene/styrene/[4-mebupy][BF4]. The parameters for the ternary
system ethylbenzene/styrene/sulfolane have been determined previously, and are listed in
Table 2-3. The NRTL parameters between ethylbenzene/styrene and NMP were determined
by the group contribution method UNIFAC [31] using the Dortmund Databank parameters
in Aspen Plus, because the NRTL parameters for this system are not available in the open
literature. The obtained NRTL parameters for this system are listed in Table 5-1. The other
required NRTL parameters between sulfolane/[4-mebupy][BF4] and NMP/[4-
mebupy][BF4] were determined from activity coefficients at infinite dilution [27] and are
also listed in Table 5-1. The activity coefficients at infinite dilution were determined by the
software package COSMO-RS at 100 oC [32]. COSMO-RS was used, because group
contribution methods like UNIFAC are not suitable for systems containing ILs, because
they cannot handle the long-range interactions in ionic components [33].
Table 5-1: The binary NRTL parameters for the systems (ethylbenzene + styrene +
n-methylpyrrolidinone (NMP)), (NMP+ [4-mebupy][BF4]), and (sulfolane + [4-mebupy][BF4]).
Component i Ethylbenzene Styrene NMP sulfolane
Component j NMP NMP [4-mebupy][BF4] [4-mebupy][BF4]
bij 350.04 327.34 257.55 298.65
bji -65.58 -192.59 -287.49 -339.78
αij 0.3 0.3 0.3 0.3
Chapter 5
92
The liquid heat capacity is another important property to model the extractive distillation
processes. The DIPPR (Design Institute for Physical Property Data) equation was used to
calculate the specific liquid heat capacity of the different components. The parameters to
calculate the specific heat capacity for ethylbenzene, styrene, NMP, and sulfolane were
taken from the Aspen Plus databank. The DIPPR parameters for [4-mebupy][BF4] were
taken from Bandres and co-workers [34].
5.3.3. Model Input
Feed Conditions and Purity Requirements
The ethylbenzene/styrene feed to the extractive distillation column was 100 metric
tonnes/hr, with a styrene concentration of 60 mole% [1]. The feed entered the column at its
boiling point. The required ethylbenzene purity at the top of the extractive distillation
column was 98.3 mole% [1]. The ethylbenzene impurity level in the final styrene product
was set to 100 ppm. The top and bottom flows were calculated by a mass balance. The
temperature of the IL was set to its feed tray temperature.
Extractive Distillation Column
The condenser pressure was set to 50 mbar to keep low temperatures in the extractive
distillation column, and thereby minimizing the amount of styrene polymerization. The
structured packing Mellapak 250X, which is often applied for ethylbenzene/styrene splitters
due to its low pressure drop[1,35], was chosen as internal. A thermosyphon reboiler, which
is often applied to distill thermally sensitive components [1,36], was used in the model. The
IL was fed to the top stage of the extractive distillation column. The ethylbenzene/styrene
feed entered the column at the stage where the ethylbenzene/styrene ratio was similar to the
ethylbenzene/styrene feed ratio. An optimization of the extractive distillation column was
done to find the optimal solvent-to-feed (S/F) ratio, number of equilibrium stages (NTS),
and reflux ratio. These three parameters have the largest influence on the performance of an
extractive distillation column [3,37]. First, the minimum required S/F ratio was determined
to avoid multiple liquid phases in the extractive distillation column, because [4-
mebupy][BF4] is not fully miscible with ethylbenzene and styrene [12]. Multiple liquid
phases in an extractive distillation process should be avoided, because it decreases the
process efficiency [37,38]. Subsequently, the S/F ratio was varied up to 7 on mass base, and
the number of theoretical stages was varied from 35–60 with a step change of 5. The reflux
ratio was calculated by a design spec in Aspen Plus, in which the required ethylbenzene
impurity level of 100 ppm in the styrene bottoms product was set as the target. The
regeneration technologies were modeled all together with the extractive distillation column.
The recycling streams from the regeneration technologies differ in composition and
therefore have different effects on the extractive distillation performance.
Chapter 5
93
Purity requirement IL recycle
The effect of the styrene concentration in the IL recycle on the extractive distillation
column performance was investigated to determine up to which purity the IL needs to be
purified. This was done for the optimal S/F ratio and NTS. The styrene concentration in the
IL recycle was varied from 0 to 0.5 wt%. The reflux ratio was varied by a design spec in
Aspen Plus to meet the purity requirements of the top and bottom products.
Evaporation
First, the minimum vacuum pressure in the evaporator was determined to still be able to
condense the evaporated styrene with normal cooling water of 20 oC. A temperature
difference of 10 oC over the condenser was used [19], meaning that the minimum allowable
vacuum pressure was determined at 30 oC. Next, the pressure and temperature of the
evaporator were varied to determine the IL purity, which can be obtained at mild
conditions.
Evaporation at Very Low Pressure
Very low pressures are required if the IL purity specification cannot be obtained using an
evaporator at mild conditions. The required pressures were determined for several purities
of the IL recycle using a design spec in Aspen Plus. These IL purities were determined,
because it was expected that a higher IL purity would require more heating/cooling in the
regeneration section, but would have a beneficial effect on the extractive distillation column
performance.
N2 Stripping
The N2 stripping column was modeled at a pressure of 1 atm and a temperature of 130 oC.
The NTS and N2 flow are the two parameters, which have the largest influence on a
stripping process [39]. The NTS were varied and via a design spec the optimal N2 flow was
determined for several IL purities. Subsequently, the total stripping process was modeled
including the extractive distillation column for several IL recycle purities.
Ethylbenzene Stripping
The ethylbenzene stripping column was simulated at a temperature of 130 oC as well. The
pressure in the ethylbenzene stripping column was varied from 16.8 to 40 mbar. 16.8 mbar
was determined as the minimum allowable vacuum pressure for the stripping column,
because at this pressure ethylbenzene can still be condensed using normal cooling water of
20 oC. A pressure of 40 mbar was used as the highest pressure, because this avoids the need
for a compressor to transport the ethylbenzene from the extractive distillation, which
operates at 50 mbar, to the ethylbenzene stripping column. The optimal ethylbenzene flow
Chapter 5
94
was determined in the same manner as for N2 stripping and finally the total process was
modeled including the extractive distillation column.
Distillation with NMP/IL and sulfolane/IL Blend
First, the effect of several NMP/IL and sulfolane/IL mass ratios on the relative volatility of
the ethylbenzene/styrene mixture was determined. This effect was determined by a Flash
vessel in Aspen Plus at 50 mbar. The optimal S/F ratio from the optimization of the
extractive distillation column was applied. The ethylbenzene/styrene mass ratio was 40/60.
Based on these results, the optimal NMP/IL and sulfolane/IL ratios were selected and used
as input for the model of the extractive distillation column. Next, the amount of stages
which needed to be added to the top of the extractive distillation column was determined to
avoid contamination of the ethylbenzene top product (wSF/NMP < 1 ppm). Subsequently, the
optimal NTS for the regeneration column was determined, which was followed by the
model of the total process. The purity of the blend to be recycled to the extractive
distillation column was set to 99.9 wt% (i.e. 0.1 wt% styrene). The regeneration columns
were both modeled at 11.1 mbar, to keep the temperatures in the reboiler as low as possible.
The NTS was varied to determine the optimal reflux ratio and thereby also the optimal
reboiler heat duty.
ScCO2 Extraction
The regeneration process using scCO2 extraction was not modeled in Aspen Plus, because
there were no interaction parameters available for this system in the open literature or in the
Aspen Plus data base. Moreover, Aspen Plus has difficulties to calculate the power required
to compress CO2 to supercritical conditions properly [40]. Therefore, a process design was
made using literature data by Blanchard and co-workers [16] about the recovery of organic
products, like benzene, from the IL 1-butyl-3-methylimidazolium hexafluorophosphate
([BMIM][PF6]) using scCO2 extraction. The systems studied by Blanchard et al. are similar
to the system studied in this work. Benzene and styrene are both aromatic components
having a flat molecular structure [41]. The ILs [BMIM][PF6] and [4-mebupy][BF4] both
have an aromatic cation containing a butyl and a methyl group as side chains. Moreover,
both of them have a spherical anion. Therefore, a first estimate can be made about the
OPEX using the LLE data of Blanchard et al.. In their manuscript, the organic product
recovery percentage as function of the scCO2/organic product ratio is reported. From the
LLE data for the system (benzene + [BMIM][PF6] + scCO2), the solvent capacity was
calculated using a mass balance over the extraction experiment. With the solvent capacity,
the minimum required solvent flow for our system could be calculated. The required
solvent flow was corrected by the molecular weight difference between styrene (Mw =
104.2 g/mole) and benzene (Mw = 78.1 g/mole). The CO2 solubility in [4-mebupy][BF4]
was also taken into account using another article published by Blanchard et al. [23]. Finally,
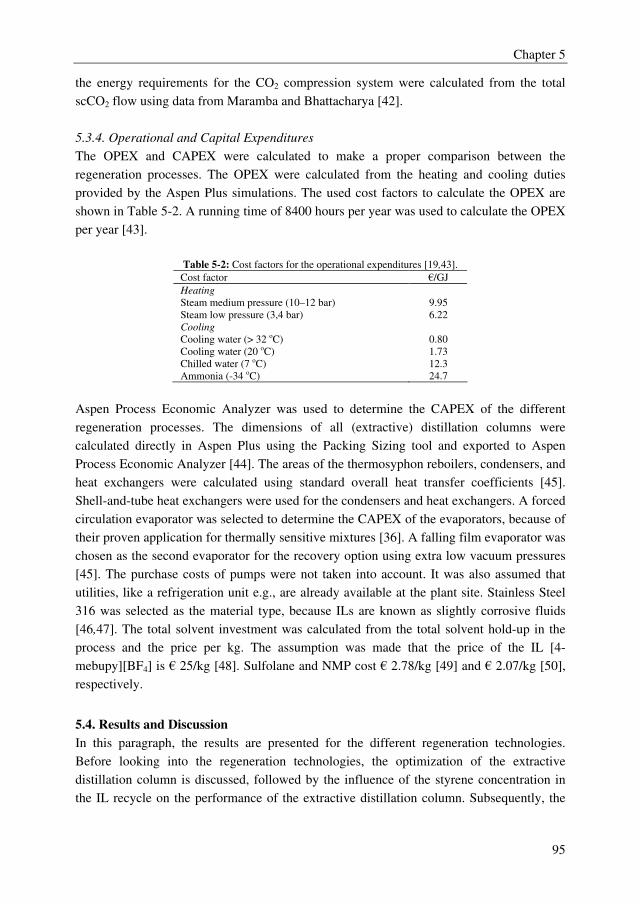
Chapter 5
95
the energy requirements for the CO2 compression system were calculated from the total
scCO2 flow using data from Maramba and Bhattacharya [42].
5.3.4. Operational and Capital Expenditures
The OPEX and CAPEX were calculated to make a proper comparison between the
regeneration processes. The OPEX were calculated from the heating and cooling duties
provided by the Aspen Plus simulations. The used cost factors to calculate the OPEX are
shown in Table 5-2. A running time of 8400 hours per year was used to calculate the OPEX
per year [43].
Table 5-2: Cost factors for the operational expenditures [19,43].
Cost factor €/GJ
Heating
Steam medium pressure (10–12 bar) 9.95
Steam low pressure (3,4 bar) 6.22
Cooling
Cooling water (> 32 oC) 0.80
Cooling water (20 oC) 1.73
Chilled water (7 oC) 12.3
Ammonia (-34 oC) 24.7
Aspen Process Economic Analyzer was used to determine the CAPEX of the different
regeneration processes. The dimensions of all (extractive) distillation columns were
calculated directly in Aspen Plus using the Packing Sizing tool and exported to Aspen
Process Economic Analyzer [44]. The areas of the thermosyphon reboilers, condensers, and
heat exchangers were calculated using standard overall heat transfer coefficients [45].
Shell-and-tube heat exchangers were used for the condensers and heat exchangers. A forced
circulation evaporator was selected to determine the CAPEX of the evaporators, because of
their proven application for thermally sensitive mixtures [36]. A falling film evaporator was
chosen as the second evaporator for the recovery option using extra low vacuum pressures
[45]. The purchase costs of pumps were not taken into account. It was also assumed that
utilities, like a refrigeration unit e.g., are already available at the plant site. Stainless Steel
316 was selected as the material type, because ILs are known as slightly corrosive fluids
[46,47]. The total solvent investment was calculated from the total solvent hold-up in the
process and the price per kg. The assumption was made that the price of the IL [4-
mebupy][BF4] is € 25/kg [48]. Sulfolane and NMP cost € 2.78/kg [49] and € 2.07/kg [50],
respectively.
5.4. Results and Discussion
In this paragraph, the results are presented for the different regeneration technologies.
Before looking into the regeneration technologies, the optimization of the extractive
distillation column is discussed, followed by the influence of the styrene concentration in
the IL recycle on the performance of the extractive distillation column. Subsequently, the
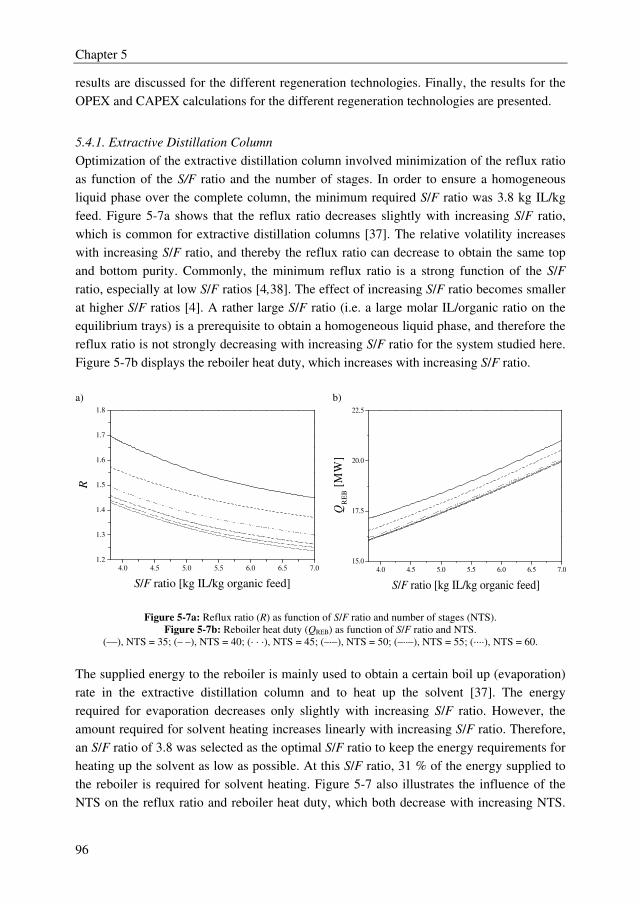
Chapter 5
96
results are discussed for the different regeneration technologies. Finally, the results for the
OPEX and CAPEX calculations for the different regeneration technologies are presented.
5.4.1. Extractive Distillation Column
Optimization of the extractive distillation column involved minimization of the reflux ratio
as function of the S/F ratio and the number of stages. In order to ensure a homogeneous
liquid phase over the complete column, the minimum required S/F ratio was 3.8 kg IL/kg
feed. Figure 5-7a shows that the reflux ratio decreases slightly with increasing S/F ratio,
which is common for extractive distillation columns [37]. The relative volatility increases
with increasing S/F ratio, and thereby the reflux ratio can decrease to obtain the same top
and bottom purity. Commonly, the minimum reflux ratio is a strong function of the S/F
ratio, especially at low S/F ratios [4,38]. The effect of increasing S/F ratio becomes smaller
at higher S/F ratios [4]. A rather large S/F ratio (i.e. a large molar IL/organic ratio on the
equilibrium trays) is a prerequisite to obtain a homogeneous liquid phase, and therefore the
reflux ratio is not strongly decreasing with increasing S/F ratio for the system studied here.
Figure 5-7b displays the reboiler heat duty, which increases with increasing S/F ratio.
a) b)
4.0 4.5 5.0 5.5 6.0 6.5 7.0
1.2
1.3
1.4
1.5
1.6
1.7
1.8
R
S/F ratio [kg IL/kg organic feed]
4.0 4.5 5.0 5.5 6.0 6.5 7.0
15.0
17.5
20.0
22.5
QR
EB [
MW
]
S/F ratio [kg IL/kg organic feed]
Figure 5-7a: Reflux ratio (R) as function of S/F ratio and number of stages (NTS).
Figure 5-7b: Reboiler heat duty (QREB) as function of S/F ratio and NTS.
(—), NTS = 35; (– –), NTS = 40; (· · ·), NTS = 45; (–·–), NTS = 50; (–··–), NTS = 55; (····), NTS = 60.
The supplied energy to the reboiler is mainly used to obtain a certain boil up (evaporation)
rate in the extractive distillation column and to heat up the solvent [37]. The energy
required for evaporation decreases only slightly with increasing S/F ratio. However, the
amount required for solvent heating increases linearly with increasing S/F ratio. Therefore,
an S/F ratio of 3.8 was selected as the optimal S/F ratio to keep the energy requirements for
heating up the solvent as low as possible. At this S/F ratio, 31 % of the energy supplied to
the reboiler is required for solvent heating. Figure 5-7 also illustrates the influence of the
NTS on the reflux ratio and reboiler heat duty, which both decrease with increasing NTS.
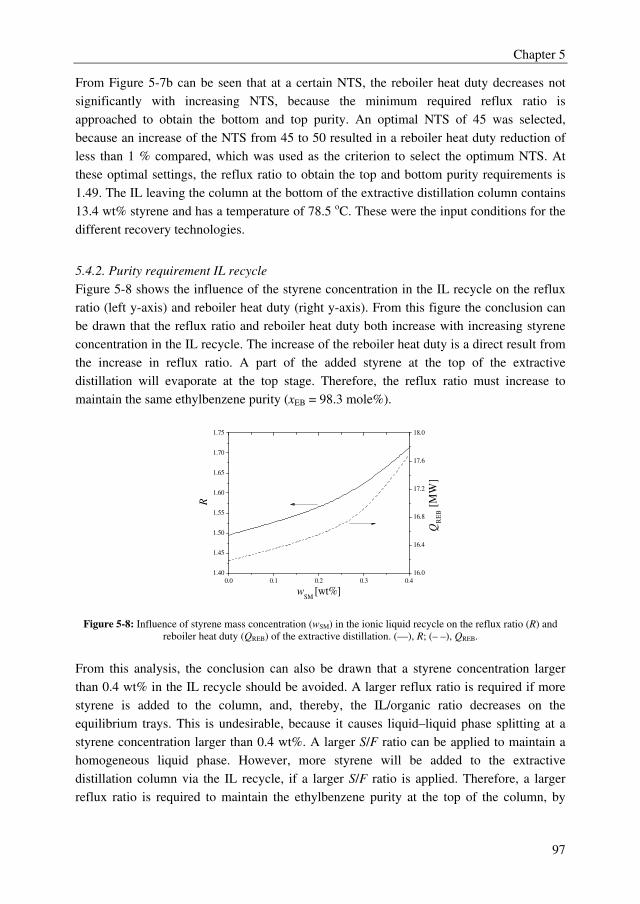
Chapter 5
97
From Figure 5-7b can be seen that at a certain NTS, the reboiler heat duty decreases not
significantly with increasing NTS, because the minimum required reflux ratio is
approached to obtain the bottom and top purity. An optimal NTS of 45 was selected,
because an increase of the NTS from 45 to 50 resulted in a reboiler heat duty reduction of
less than 1 % compared, which was used as the criterion to select the optimum NTS. At
these optimal settings, the reflux ratio to obtain the top and bottom purity requirements is
1.49. The IL leaving the column at the bottom of the extractive distillation column contains
13.4 wt% styrene and has a temperature of 78.5 oC. These were the input conditions for the
different recovery technologies.
5.4.2. Purity requirement IL recycle
Figure 5-8 shows the influence of the styrene concentration in the IL recycle on the reflux
ratio (left y-axis) and reboiler heat duty (right y-axis). From this figure the conclusion can
be drawn that the reflux ratio and reboiler heat duty both increase with increasing styrene
concentration in the IL recycle. The increase of the reboiler heat duty is a direct result from
the increase in reflux ratio. A part of the added styrene at the top of the extractive
distillation will evaporate at the top stage. Therefore, the reflux ratio must increase to
maintain the same ethylbenzene purity (xEB = 98.3 mole%).
0.0 0.1 0.2 0.3 0.4
1.40
1.45
1.50
1.55
1.60
1.65
1.70
1.75
wSM
[wt%]
R
16.0
16.4
16.8
17.2
17.6
18.0Q
RE
B [
MW
]
Figure 5-8: Influence of styrene mass concentration (wSM) in the ionic liquid recycle on the reflux ratio (R) and
reboiler heat duty (QREB) of the extractive distillation. (—), R; (– –), QREB.
From this analysis, the conclusion can also be drawn that a styrene concentration larger
than 0.4 wt% in the IL recycle should be avoided. A larger reflux ratio is required if more
styrene is added to the column, and, thereby, the IL/organic ratio decreases on the
equilibrium trays. This is undesirable, because it causes liquid–liquid phase splitting at a
styrene concentration larger than 0.4 wt%. A larger S/F ratio can be applied to maintain a
homogeneous liquid phase. However, more styrene will be added to the extractive
distillation column via the IL recycle, if a larger S/F ratio is applied. Therefore, a larger
reflux ratio is required to maintain the ethylbenzene purity at the top of the column, by
Chapter 5
98
which the IL/organic ratio decreases, etc. It is not possible to get out of this loop. The
maximum styrene concentration in the IL recycle is thus 0.4 wt%, meaning a minimum IL
purity of 99.6 wt%. This criterion was used to explore if the regeneration technologies can
meet this purity specification, which is explained in the next section. However, higher IL
purities (> 99.6 wt%) are preferred, because it clearly gives a lower reboiler heat duty.
5.4.3. Evaporation
The proposed process scheme using a single evaporator as the regeneration technology is
shown in Figure 5-1. The pure component vapor pressure curve of styrene is depicted in
Figure 5-9a. The dotted line in Figure 5-9a indicates the pressure at which normal cooling
water of 20 oC can be applied to condense the styrene vapor from the evaporator. From this
analysis, the conclusion can be drawn that a minimum vacuum pressure of 11.1 mbar can
be applied.
a) b)
10 20 30 40 50
0
5
10
15
20
25
30
35
P [
mbar
]
T [oC]
80 90 100 110 120 130 140 150
95
96
97
98
99
100
wIL
[w
t%]
T [oC]
Figure 5-9a: Pure component vapor pressure of styrene. The dotted line indicates the styrene pressure at which
normal cooling water of 20oC could still be used to condensate styrene, assuming a ∆T of 10K over the heat
exchanger. Figure 5-9b: Ionic liquid purity (wIL), which can be obtained by evaporation as function of pressure
(P) and temperature (T). The straight short dotted line is the minimum required IL purity by evaporation at mild
conditions. (—–), P = 11.1 mbar; (– – –), P = 20 mbar; (····), P = 30 mbar; (–·–), P = 40 mbar; (–··–), P = 50 mbar.
In Figure 5-9b the obtained IL mass fraction is shown as function of temperature and
pressure using an evaporator. The IL mass fraction increases with increasing temperature
and decreasing pressure. This relation can be derived from the modified Raoult’s law. The
straight short dotted line in Figure 5-9b illustrates the minimum required purity for the IL
recycle. A maximum temperature of 130 oC was selected for the recovery technologies to
keep the formation of styrene polymer low. An IL recycle purity of 99.5 wt% was obtained
at this temperature and the minimum pressure of 11.1 mbar, which corresponds to a styrene
recovery of 97 %. The use of an evaporator using these conditions is thus not sufficient to
obtain the minimum required IL recycle purity. Therefore, many other regeneration
technologies were explored, which are discussed in the following sections. The other
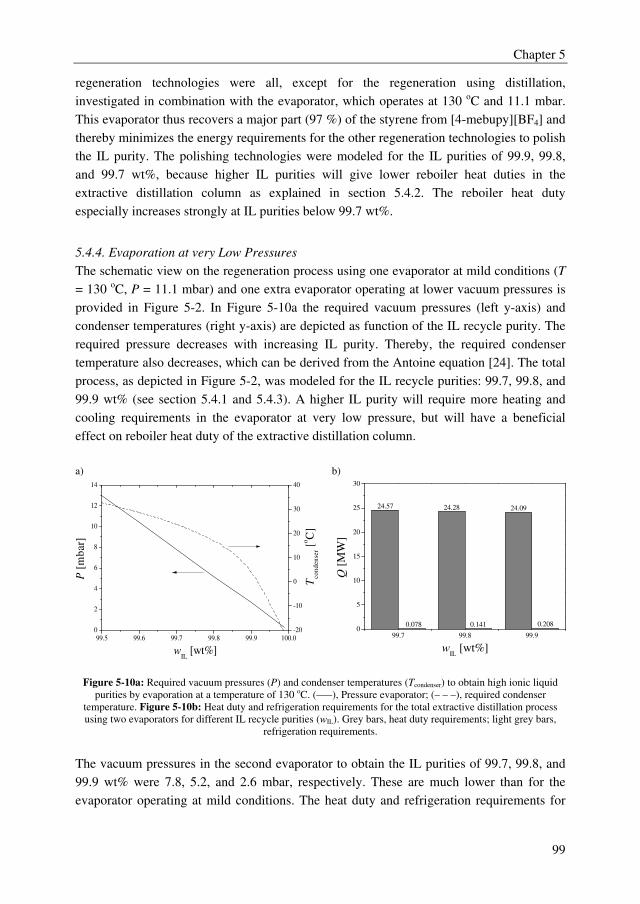
Chapter 5
99
regeneration technologies were all, except for the regeneration using distillation,
investigated in combination with the evaporator, which operates at 130 oC and 11.1 mbar.
This evaporator thus recovers a major part (97 %) of the styrene from [4-mebupy][BF4] and
thereby minimizes the energy requirements for the other regeneration technologies to polish
the IL purity. The polishing technologies were modeled for the IL purities of 99.9, 99.8,
and 99.7 wt%, because higher IL purities will give lower reboiler heat duties in the
extractive distillation column as explained in section 5.4.2. The reboiler heat duty
especially increases strongly at IL purities below 99.7 wt%.
5.4.4. Evaporation at very Low Pressures
The schematic view on the regeneration process using one evaporator at mild conditions (T
= 130 oC, P = 11.1 mbar) and one extra evaporator operating at lower vacuum pressures is
provided in Figure 5-2. In Figure 5-10a the required vacuum pressures (left y-axis) and
condenser temperatures (right y-axis) are depicted as function of the IL recycle purity. The
required pressure decreases with increasing IL purity. Thereby, the required condenser
temperature also decreases, which can be derived from the Antoine equation [24]. The total
process, as depicted in Figure 5-2, was modeled for the IL recycle purities: 99.7, 99.8, and
99.9 wt% (see section 5.4.1 and 5.4.3). A higher IL purity will require more heating and
cooling requirements in the evaporator at very low pressure, but will have a beneficial
effect on reboiler heat duty of the extractive distillation column.
a) b)
99.5 99.6 99.7 99.8 99.9 100.0
0
2
4
6
8
10
12
14
wIL
[wt%]
P [
mb
ar]
-20
-10
0
10
20
30
40
Tco
nd
ense
r [oC
]
99.7 99.8 99.90
5
10
15
20
25
30
0.141 0.2080.078
24.0924.28
Q [
MW
]
wIL
[wt%]
24.57
Figure 5-10a: Required vacuum pressures (P) and condenser temperatures (Tcondenser) to obtain high ionic liquid
purities by evaporation at a temperature of 130 oC. (—–), Pressure evaporator; (– – –), required condenser
temperature. Figure 5-10b: Heat duty and refrigeration requirements for the total extractive distillation process
using two evaporators for different IL recycle purities (wIL). Grey bars, heat duty requirements; light grey bars,
refrigeration requirements.
The vacuum pressures in the second evaporator to obtain the IL purities of 99.7, 99.8, and
99.9 wt% were 7.8, 5.2, and 2.6 mbar, respectively. These are much lower than for the
evaporator operating at mild conditions. The heat duty and refrigeration requirements for
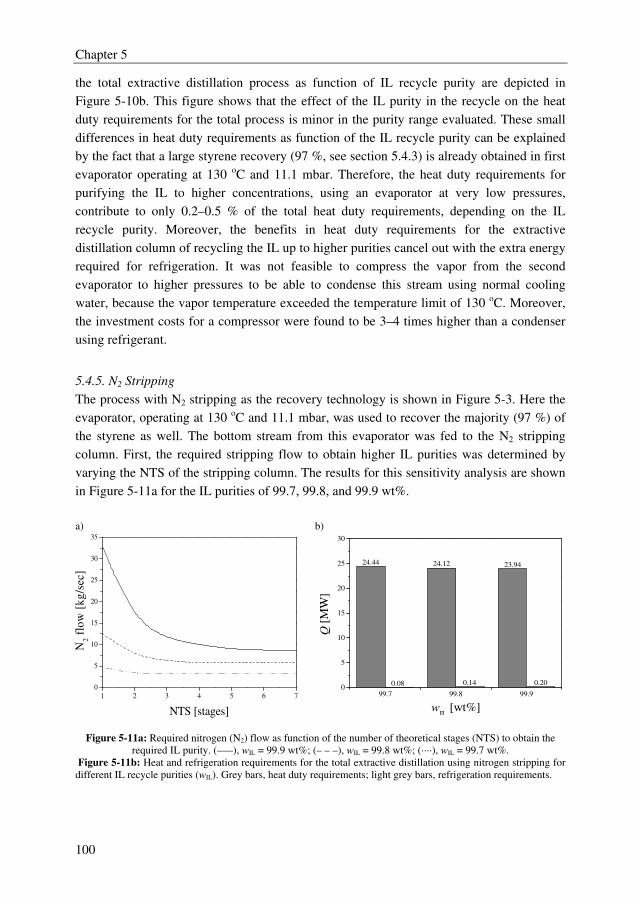
Chapter 5
100
the total extractive distillation process as function of IL recycle purity are depicted in
Figure 5-10b. This figure shows that the effect of the IL purity in the recycle on the heat
duty requirements for the total process is minor in the purity range evaluated. These small
differences in heat duty requirements as function of the IL recycle purity can be explained
by the fact that a large styrene recovery (97 %, see section 5.4.3) is already obtained in first
evaporator operating at 130 oC and 11.1 mbar. Therefore, the heat duty requirements for
purifying the IL to higher concentrations, using an evaporator at very low pressures,
contribute to only 0.2–0.5 % of the total heat duty requirements, depending on the IL
recycle purity. Moreover, the benefits in heat duty requirements for the extractive
distillation column of recycling the IL up to higher purities cancel out with the extra energy
required for refrigeration. It was not feasible to compress the vapor from the second
evaporator to higher pressures to be able to condense this stream using normal cooling
water, because the vapor temperature exceeded the temperature limit of 130 oC. Moreover,
the investment costs for a compressor were found to be 3–4 times higher than a condenser
using refrigerant.
5.4.5. N2 Stripping
The process with N2 stripping as the recovery technology is shown in Figure 5-3. Here the
evaporator, operating at 130 oC and 11.1 mbar, was used to recover the majority (97 %) of
the styrene as well. The bottom stream from this evaporator was fed to the N2 stripping
column. First, the required stripping flow to obtain higher IL purities was determined by
varying the NTS of the stripping column. The results for this sensitivity analysis are shown
in Figure 5-11a for the IL purities of 99.7, 99.8, and 99.9 wt%.
a) b)
1 2 3 4 5 6 7
0
5
10
15
20
25
30
35
N2 f
low
[k
g/s
ec]
NTS [stages]
99.7 99.8 99.90
5
10
15
20
25
30
0.08 0.14 0.20
24.44 24.12
Q [
MW
]
wIL
[wt%]
23.94
Figure 5-11a: Required nitrogen (N2) flow as function of the number of theoretical stages (NTS) to obtain the
required IL purity. (—–), wIL = 99.9 wt%; (– – –), wIL = 99.8 wt%; (····), wIL = 99.7 wt%.
Figure 5-11b: Heat and refrigeration requirements for the total extractive distillation using nitrogen stripping for
different IL recycle purities (wIL). Grey bars, heat duty requirements; light grey bars, refrigeration requirements.
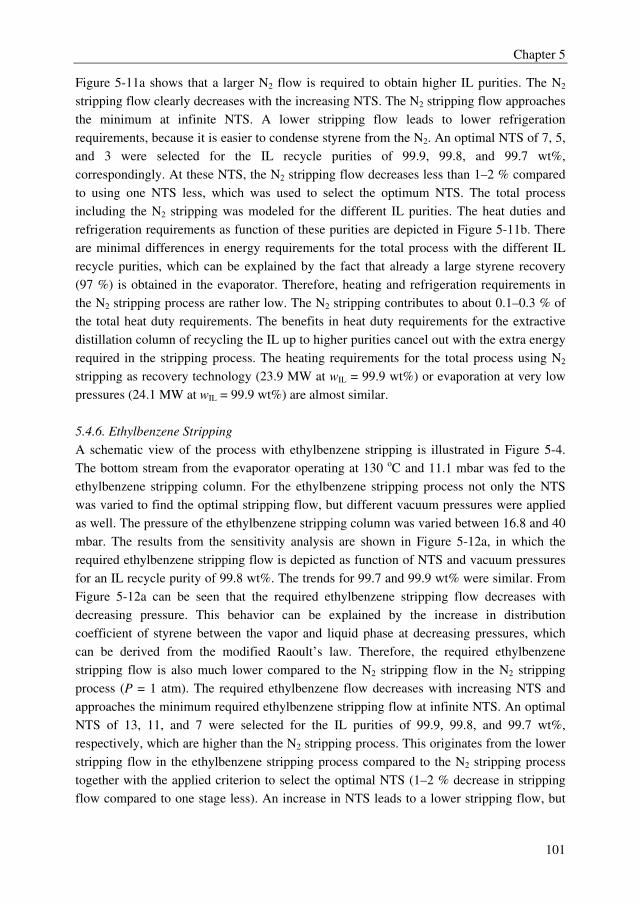
Chapter 5
101
Figure 5-11a shows that a larger N2 flow is required to obtain higher IL purities. The N2
stripping flow clearly decreases with the increasing NTS. The N2 stripping flow approaches
the minimum at infinite NTS. A lower stripping flow leads to lower refrigeration
requirements, because it is easier to condense styrene from the N2. An optimal NTS of 7, 5,
and 3 were selected for the IL recycle purities of 99.9, 99.8, and 99.7 wt%,
correspondingly. At these NTS, the N2 stripping flow decreases less than 1–2 % compared
to using one NTS less, which was used to select the optimum NTS. The total process
including the N2 stripping was modeled for the different IL purities. The heat duties and
refrigeration requirements as function of these purities are depicted in Figure 5-11b. There
are minimal differences in energy requirements for the total process with the different IL
recycle purities, which can be explained by the fact that already a large styrene recovery
(97 %) is obtained in the evaporator. Therefore, heating and refrigeration requirements in
the N2 stripping process are rather low. The N2 stripping contributes to about 0.1–0.3 % of
the total heat duty requirements. The benefits in heat duty requirements for the extractive
distillation column of recycling the IL up to higher purities cancel out with the extra energy
required in the stripping process. The heating requirements for the total process using N2
stripping as recovery technology (23.9 MW at wIL = 99.9 wt%) or evaporation at very low
pressures (24.1 MW at wIL = 99.9 wt%) are almost similar.
5.4.6. Ethylbenzene Stripping
A schematic view of the process with ethylbenzene stripping is illustrated in Figure 5-4.
The bottom stream from the evaporator operating at 130 oC and 11.1 mbar was fed to the
ethylbenzene stripping column. For the ethylbenzene stripping process not only the NTS
was varied to find the optimal stripping flow, but different vacuum pressures were applied
as well. The pressure of the ethylbenzene stripping column was varied between 16.8 and 40
mbar. The results from the sensitivity analysis are shown in Figure 5-12a, in which the
required ethylbenzene stripping flow is depicted as function of NTS and vacuum pressures
for an IL recycle purity of 99.8 wt%. The trends for 99.7 and 99.9 wt% were similar. From
Figure 5-12a can be seen that the required ethylbenzene stripping flow decreases with
decreasing pressure. This behavior can be explained by the increase in distribution
coefficient of styrene between the vapor and liquid phase at decreasing pressures, which
can be derived from the modified Raoult’s law. Therefore, the required ethylbenzene
stripping flow is also much lower compared to the N2 stripping flow in the N2 stripping
process (P = 1 atm). The required ethylbenzene flow decreases with increasing NTS and
approaches the minimum required ethylbenzene stripping flow at infinite NTS. An optimal
NTS of 13, 11, and 7 were selected for the IL purities of 99.9, 99.8, and 99.7 wt%,
respectively, which are higher than the N2 stripping process. This originates from the lower
stripping flow in the ethylbenzene stripping process compared to the N2 stripping process
together with the applied criterion to select the optimal NTS (1–2 % decrease in stripping
flow compared to one stage less). An increase in NTS leads to a lower stripping flow, but
Chapter 5
102
since the flow in the ethylbenzene stripping column is already rather low, more stages are
required to reach the criterion of 1 %.
a) b)
2 4 6 8 10 12
0.0
0.2
0.4
0.6
0.8
1.0
1.2
1.4
1.6
EB
str
ipp
ing
flo
w [
kg
/sec
]
NTS [stages]
16.8 20 30 400
5
10
15
20
25
30
Q [
MW
]
P [mbar]
Figure 5-12a: Required ethylbenzene (EB) stripping flow as function of the number of theoretical equilibrium
stages (NTS) for the ionic liquid recycle purity of 99.8 wt%. (—–), P = 16.8 mbar; (– – –), P = 20 mbar; (····), P =
30 mbar; (–·–), P = 40 mbar. Figure 5-12b: Heat duty requirements for the extractive distillation process including
ethylbenzene stripping for different pressures (P) of the ethylbenzene stripping column and purity of the ionic
liquid recycle (wIL). Black bars, wIL = 99.7 wt%; dark grey bars, wIL = 99.8 wt%; light grey bars, wIL = 99.9 wt%.
From the sensitivity analysis was also found that the required NTS was hardly dependent
on the applied vacuum pressure. The total process was modeled for the different IL recycle
purities and different pressures of the ethylbenzene stripping column. The heat duty
requirements were calculated from the model results, and are illustrated in Figure 5.12b.
This figure demonstrates that the heat duty requirements of the total process (24.2–24.6
MW) are hardly dependent on the applied vacuum pressure of the ethylbenzene stripping
column and the IL recycle purity. This can also be explained by the fact that 97 % of the
styrene is already recovered in the evaporator operating at mild conditions. Therefore, the
ethylbenzene stripping process does not contribute significantly to the total heat duty
requirements (0.5–1 %), which was observed for the other recovery processes too. The
heating requirements for the total process are thus also similar compared to the total energy
requirements for the processes using N2 stripping (section 5.4.5) or evaporation at very low
pressures (section 5.4.4).
5.4.7. Distillation with NMP/IL and Sulfolane/IL Blend
The process scheme for the extractive distillation process using distillation as the recovery
technology is shown in Figure 5-5. The influence of the mass ratio organic solvent/IL on
the relative volatility of the ethylbenzene/styrene mixture is depicted in Figure 5-13. The
relative volatility of the ethylbenzene/styrene mixture decreases with increasing organic
solvent/IL ratio for both co-solvents, which can be explained by the lower selectivity of the
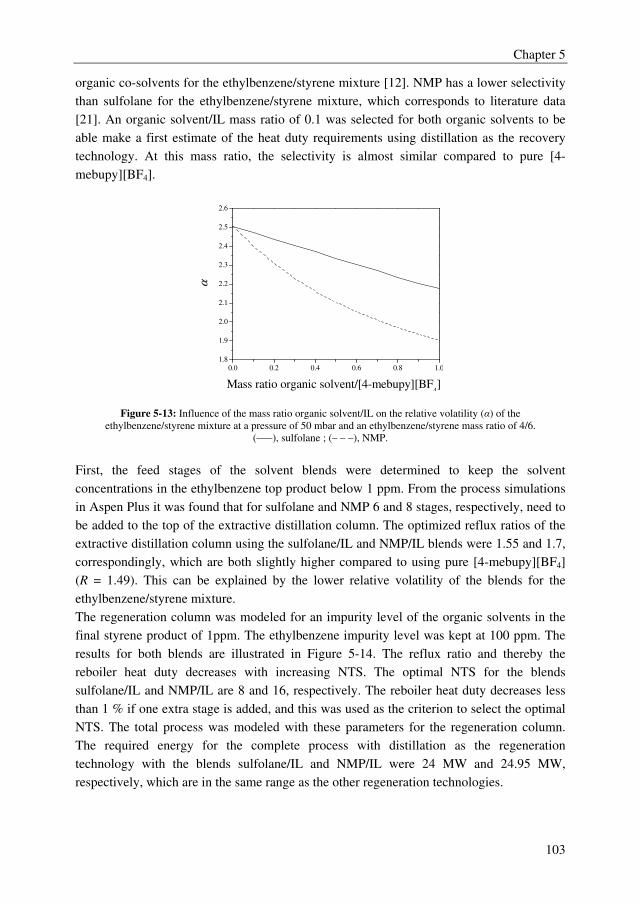
Chapter 5
103
organic co-solvents for the ethylbenzene/styrene mixture [12]. NMP has a lower selectivity
than sulfolane for the ethylbenzene/styrene mixture, which corresponds to literature data
[21]. An organic solvent/IL mass ratio of 0.1 was selected for both organic solvents to be
able make a first estimate of the heat duty requirements using distillation as the recovery
technology. At this mass ratio, the selectivity is almost similar compared to pure [4-
mebupy][BF4].
0.0 0.2 0.4 0.6 0.8 1.0
1.8
1.9
2.0
2.1
2.2
2.3
2.4
2.5
2.6α
Mass ratio organic solvent/[4-mebupy][BF4]
Figure 5-13: Influence of the mass ratio organic solvent/IL on the relative volatility (α) of the
ethylbenzene/styrene mixture at a pressure of 50 mbar and an ethylbenzene/styrene mass ratio of 4/6.
(—–), sulfolane ; (– – –), NMP.
First, the feed stages of the solvent blends were determined to keep the solvent
concentrations in the ethylbenzene top product below 1 ppm. From the process simulations
in Aspen Plus it was found that for sulfolane and NMP 6 and 8 stages, respectively, need to
be added to the top of the extractive distillation column. The optimized reflux ratios of the
extractive distillation column using the sulfolane/IL and NMP/IL blends were 1.55 and 1.7,
correspondingly, which are both slightly higher compared to using pure [4-mebupy][BF4]
(R = 1.49). This can be explained by the lower relative volatility of the blends for the
ethylbenzene/styrene mixture.
The regeneration column was modeled for an impurity level of the organic solvents in the
final styrene product of 1ppm. The ethylbenzene impurity level was kept at 100 ppm. The
results for both blends are illustrated in Figure 5-14. The reflux ratio and thereby the
reboiler heat duty decreases with increasing NTS. The optimal NTS for the blends
sulfolane/IL and NMP/IL are 8 and 16, respectively. The reboiler heat duty decreases less
than 1 % if one extra stage is added, and this was used as the criterion to select the optimal
NTS. The total process was modeled with these parameters for the regeneration column.
The required energy for the complete process with distillation as the regeneration
technology with the blends sulfolane/IL and NMP/IL were 24 MW and 24.95 MW,
respectively, which are in the same range as the other regeneration technologies.
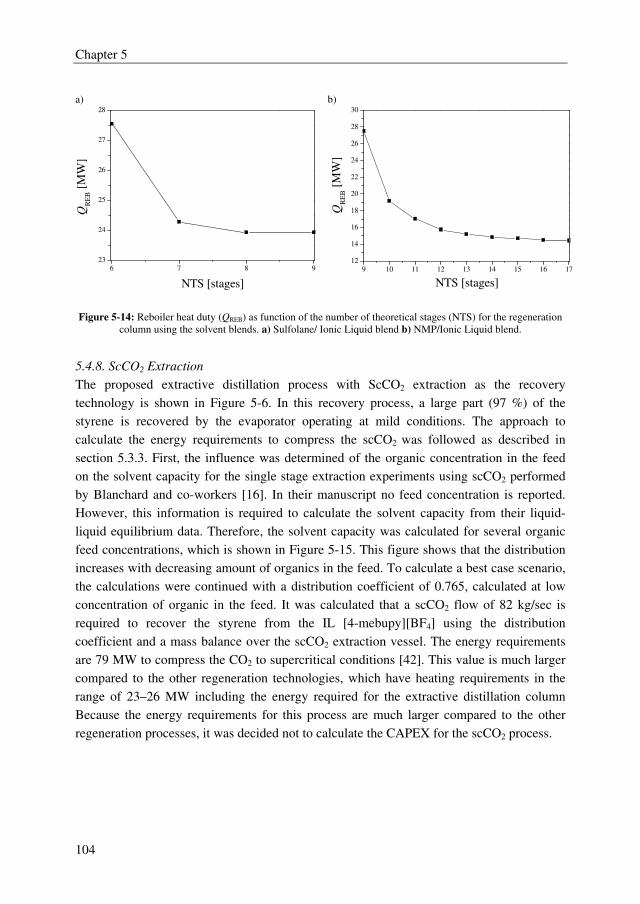
Chapter 5
104
a) b)
6 7 8 9
23
24
25
26
27
28
QR
EB [
MW
]
NTS [stages]
9 10 11 12 13 14 15 16 17
12
14
16
18
20
22
24
26
28
30
QR
EB [
MW
]
NTS [stages]
Figure 5-14: Reboiler heat duty (QREB) as function of the number of theoretical stages (NTS) for the regeneration
column using the solvent blends. a) Sulfolane/ Ionic Liquid blend b) NMP/Ionic Liquid blend.
5.4.8. ScCO2 Extraction
The proposed extractive distillation process with ScCO2 extraction as the recovery
technology is shown in Figure 5-6. In this recovery process, a large part (97 %) of the
styrene is recovered by the evaporator operating at mild conditions. The approach to
calculate the energy requirements to compress the scCO2 was followed as described in
section 5.3.3. First, the influence was determined of the organic concentration in the feed
on the solvent capacity for the single stage extraction experiments using scCO2 performed
by Blanchard and co-workers [16]. In their manuscript no feed concentration is reported.
However, this information is required to calculate the solvent capacity from their liquid-
liquid equilibrium data. Therefore, the solvent capacity was calculated for several organic
feed concentrations, which is shown in Figure 5-15. This figure shows that the distribution
increases with decreasing amount of organics in the feed. To calculate a best case scenario,
the calculations were continued with a distribution coefficient of 0.765, calculated at low
concentration of organic in the feed. It was calculated that a scCO2 flow of 82 kg/sec is
required to recover the styrene from the IL [4-mebupy][BF4] using the distribution
coefficient and a mass balance over the scCO2 extraction vessel. The energy requirements
are 79 MW to compress the CO2 to supercritical conditions [42]. This value is much larger
compared to the other regeneration technologies, which have heating requirements in the
range of 23–26 MW including the energy required for the extractive distillation column
Because the energy requirements for this process are much larger compared to the other
regeneration processes, it was decided not to calculate the CAPEX for the scCO2 process.
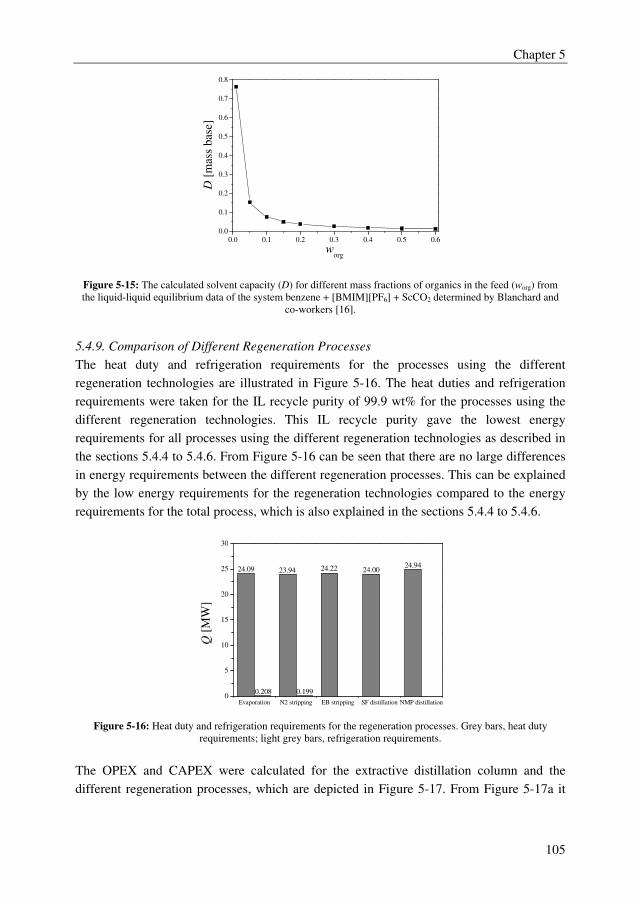
Chapter 5
105
0.0 0.1 0.2 0.3 0.4 0.5 0.6
0.0
0.1
0.2
0.3
0.4
0.5
0.6
0.7
0.8
D [
mas
s b
ase]
worg
Figure 5-15: The calculated solvent capacity (D) for different mass fractions of organics in the feed (worg) from
the liquid-liquid equilibrium data of the system benzene + [BMIM][PF6] + ScCO2 determined by Blanchard and
co-workers [16].
5.4.9. Comparison of Different Regeneration Processes
The heat duty and refrigeration requirements for the processes using the different
regeneration technologies are illustrated in Figure 5-16. The heat duties and refrigeration
requirements were taken for the IL recycle purity of 99.9 wt% for the processes using the
different regeneration technologies. This IL recycle purity gave the lowest energy
requirements for all processes using the different regeneration technologies as described in
the sections 5.4.4 to 5.4.6. From Figure 5-16 can be seen that there are no large differences
in energy requirements between the different regeneration processes. This can be explained
by the low energy requirements for the regeneration technologies compared to the energy
requirements for the total process, which is also explained in the sections 5.4.4 to 5.4.6.
Evaporation N2 stripping EB stripping SF distillation NMP distillation0
5
10
15
20
25
30
0.1990.208
24.9424.0024.2223.94
Q [
MW
]
24.09
Figure 5-16: Heat duty and refrigeration requirements for the regeneration processes. Grey bars, heat duty
requirements; light grey bars, refrigeration requirements.
The OPEX and CAPEX were calculated for the extractive distillation column and the
different regeneration processes, which are depicted in Figure 5-17. From Figure 5-17a it
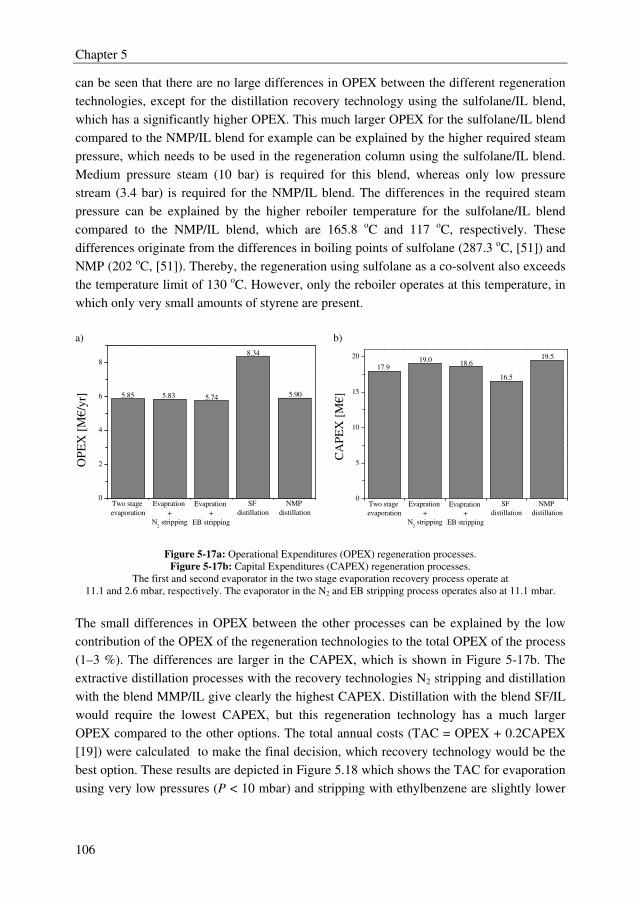
Chapter 5
106
can be seen that there are no large differences in OPEX between the different regeneration
technologies, except for the distillation recovery technology using the sulfolane/IL blend,
which has a significantly higher OPEX. This much larger OPEX for the sulfolane/IL blend
compared to the NMP/IL blend for example can be explained by the higher required steam
pressure, which needs to be used in the regeneration column using the sulfolane/IL blend.
Medium pressure steam (10 bar) is required for this blend, whereas only low pressure
stream (3.4 bar) is required for the NMP/IL blend. The differences in the required steam
pressure can be explained by the higher reboiler temperature for the sulfolane/IL blend
compared to the NMP/IL blend, which are 165.8 oC and 117 oC, respectively. These
differences originate from the differences in boiling points of sulfolane (287.3 oC, [51]) and
NMP (202 oC, [51]). Thereby, the regeneration using sulfolane as a co-solvent also exceeds
the temperature limit of 130 oC. However, only the reboiler operates at this temperature, in
which only very small amounts of styrene are present.
a) b)
0
2
4
6
8
NMP
distillation
SF
distillation
Evapration
+
EB stripping
Evapration
+
N2 stripping
OP
EX
[M
€/y
r] 5.90
8.34
5.745.83
5.85
Two stage
evaporation
0
5
10
15
20
19.5
16.5
18.619.0
CA
PE
X [
M€]
17.9
Two stage
evaporation
Evapration
+
N2 stripping
Evapration
+
EB stripping
SF
distillation
NMP
distillation
Figure 5-17a: Operational Expenditures (OPEX) regeneration processes.
Figure 5-17b: Capital Expenditures (CAPEX) regeneration processes.
The first and second evaporator in the two stage evaporation recovery process operate at
11.1 and 2.6 mbar, respectively. The evaporator in the N2 and EB stripping process operates also at 11.1 mbar.
The small differences in OPEX between the other processes can be explained by the low
contribution of the OPEX of the regeneration technologies to the total OPEX of the process
(1–3 %). The differences are larger in the CAPEX, which is shown in Figure 5-17b. The
extractive distillation processes with the recovery technologies N2 stripping and distillation
with the blend MMP/IL give clearly the highest CAPEX. Distillation with the blend SF/IL
would require the lowest CAPEX, but this regeneration technology has a much larger
OPEX compared to the other options. The total annual costs (TAC = OPEX + 0.2CAPEX
[19]) were calculated to make the final decision, which recovery technology would be the
best option. These results are depicted in Figure 5.18 which shows the TAC for evaporation
using very low pressures (P < 10 mbar) and stripping with ethylbenzene are slightly lower
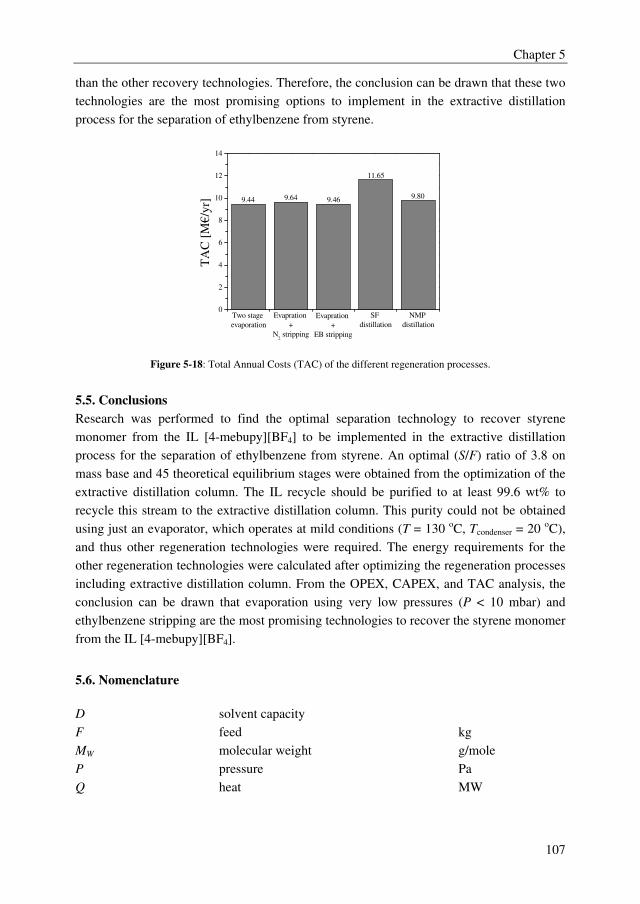
Chapter 5
107
than the other recovery technologies. Therefore, the conclusion can be drawn that these two
technologies are the most promising options to implement in the extractive distillation
process for the separation of ethylbenzene from styrene.
0
2
4
6
8
10
12
14
9.80
11.65
9.469.64
T
AC
[M
€/y
r]
Evapration
+
N2 stripping
Two stage
evaporation
Evapration
+
EB stripping
SF
distillation
NMP
distillation
9.44
Figure 5-18: Total Annual Costs (TAC) of the different regeneration processes.
5.5. Conclusions
Research was performed to find the optimal separation technology to recover styrene
monomer from the IL [4-mebupy][BF4] to be implemented in the extractive distillation
process for the separation of ethylbenzene from styrene. An optimal (S/F) ratio of 3.8 on
mass base and 45 theoretical equilibrium stages were obtained from the optimization of the
extractive distillation column. The IL recycle should be purified to at least 99.6 wt% to
recycle this stream to the extractive distillation column. This purity could not be obtained
using just an evaporator, which operates at mild conditions (T = 130 oC, Tcondenser = 20 oC),
and thus other regeneration technologies were required. The energy requirements for the
other regeneration technologies were calculated after optimizing the regeneration processes
including extractive distillation column. From the OPEX, CAPEX, and TAC analysis, the
conclusion can be drawn that evaporation using very low pressures (P < 10 mbar) and
ethylbenzene stripping are the most promising technologies to recover the styrene monomer
from the IL [4-mebupy][BF4].
5.6. Nomenclature
D solvent capacity
F feed kg
MW molecular weight g/mole
P pressure Pa
Q heat MW
Chapter 5
108
R reflux ratio
S solvent kg
T temperature K
x mole fraction
w weight fraction
Greek symbols
α relative volatility
Subscripts
REB reboiler
Abbreviations
CAPEX capital expenditures
DIPPR design institute for physical property data
EB ethylbenzene
IL ionic liquid
LLE liquid–liquid equilibrium
[4-mebupy][BF4] 4-methyl-N-butylpyridinium tetrafluoroborate
mta metric tonnes annually
MESH material equilibrium summation heat
NMP N-methyl-2-pyrrolidinone
NRTL nonrandom two-liquid
NTS number of theoretical stages
OPEX operational expenditures
ppm parts per million
ScCO2 supercritical carbon dioxide
SM styrene monomer
SF sulfolane
TAC total annual costs
VLE vapor–liquid equilibrium
5.6. References
[1] V.A. Welch, US 6171449 B1, 2001.
[2] J.C. Gentry, S. Kumar, R. Wright-Wytcherley, Hydrocarb. Process. 93 (2004)
62-66.
[3] Z. Lei, B. Chen, Z. Ding, in: Special Distillation Processes, Elsevier,
Amsterdam, 2005, pp. 59-144.
[4] M.T.G. Jongmans, J.I.W. Maassen, A.J. Luijks, B. Schuur, A.B. de Haan, J.
Chem. Eng. Data 56 (2011) 3510-3517.
Chapter 5
109
[5] Y. Beste, M. Eggersmann, H. Schoenmakers, Chem. Ing. Tech. 77 (2005) 1800-
1808.
[6] A. Stark, K.R. Seddon, in: Kirk-Othmer Encyclopedia of Chemical Technology,
John Wiley & Sons, New York, 2007.
[7] Y. Zhao, S. Xia, J. Chem. Technol. Biot. 80 (2005) 1089-1096.
[8] K.N. Marsh, J.A. Boxall, R. Lichtenthaler, Fluid Phase Equilibr. 219 (2004) 93-
98.
[9] R. Giernoth, Angew. Chem. Int. Ed. 49 (2010) 2834-2839.
[10] X. Han, D.W. Armstrong, Accounts. Chem. Res. 40 (2007) 1079-1086.
[11] A.R. Hansmeier, M.T.G. Jongmans, G.W. Meindersma, A.B. de Haan, J. Chem.
Thermodyn. 42 (2010) 484-490.
[12] M.T.G. Jongmans, B. Schuur, A.B. de Haan, Ind. Eng. Chem. Res. 50 (2011)
10800-10810.
[13] G.W. Meindersma, A.B. de Haan, Chem. Eng. Res. Des. 86 (2008) 745-752.
[14] A.B. Pereiro, A. Rodriguez, Chem. Eng. J. 153 (2009) 80-85.
[15] Y. Beste, H. Schoenmakers, W. Arlt, M. Seiler, and C. Jork, 016484 A1, 2005.
[16] L.A. Blanchard, J.F. Brennecke, Ind. Eng. Chem. Res. 40 (2000) 287-292.
[17] M.C. Kroon, J. van Spronsen, C.J. Peters, R.A. Sheldon, G.J. Witkamp, Green
Chem. 8 (2006) 246-249.
[18] M. Roth, J. Chromatogr. A 1216 (2009) 1861-1880.
[19] W.D. Seider, J.D. Seader, D.R. Lewin, Product & Process Design Principles,
Second ed., John Wiley & Sons, New York, 2004.
[20] H.J. Herzog, Environ. Sci. Technol. 35 (2001) 148A-153A.
[21] F.M. Lee, J.C. Gentry, and R.W. Wytcherley, US 5,849,982, 12-1-1998.
[22] A. Konig, M. Stepanski, A. Kuszlik, P. Keil, C. Weller, Chem. Eng. Res. Des.
86 (2008) 775-780.
[23] L.A. Blanchard, Z. Gu, J.F. Brennecke, J. Phys. Chem. B 105 (2001) 2437-
2444.
[24] B.E. Poling, J.M. Prausnitz, J.P. O'Connell, The Properties of Gases and
Liquids, Fifth ed., McGraw Hill, Singapore, 2007.
[25] ASPEN Plus V7.2, User Guide ed., 2011.
[26] R. Baur, A.P. Higler, R. Taylor, R. Krishna, Chem. Eng. J. 76 (2000) 33-47.
[27] B.E. Poling, J.M. Prausnitz, J.P. O'Connell, The properties of gases and liquids,
Fifth ed., McGraw Hill, Singapore, 2007.
[28] J. Gmehling, U. Onken, Vapor-liquid equilibrium data collection ed.,
DECHEMA, Frankfurt, 1977.
[29] M.T.G. Jongmans, M. Raijmakers, B. Schuur, A.B. de Haan, J. Chem. Eng.
Data (2012) http://dx.doi.org/10.1021/je201205t-.
[30] N. Calvar, B. Gonzalez, E. Gomez, A. Dominguez, J. Chem. Eng. Data 53
(2008) 820-825.
[31] A. Fredenslund, R.L. Jones, J.M. Prausnitz, AIChE J. 21 (1975) 1086-1099.
[32] A. Klamt, J. Phys. Chem. 99 (1995) 2224-2235.
[33] M. Diedenhofen, F. Eckert, A. Klamt, J. Chem. Eng. Data 48 (2003) 475-479.
[34] I. Bandres, B. Giner, H. Artigas, F.M. Royo, C. Lafuente, J. Phys. Chem. B 112
(2008) 3077-3084.
[35] A.L. Ward, W.J. Robert, in: Arza Seidel (Ed.), Kirk-Othmer Encyclopedia of
Chemical Technology, John Wiley & Sons, New York, 2000.
Chapter 5
110
[36] R.H. Perry, D.W. Green, Perry's Chemical Engineers Handbook, 7 ed.,
McGraw-Hill, New York, 1997.
[37] I. Sucksmith, Chem. Eng. 89 (1982) 91-95.
[38] M. Souders, Chem. Eng. Prog 60 (1964) 75-82.
[39] A.B. Haan, H. Bosch, Fundamentals of Industrial Separations, 1st ed., 2006.
[40] C. Oh, T. Lillo, W. Windes, T. Totemeier, R. Moore, Development of a
Supercritical Carbon Dioxide Brayton Cycle: Improving PBR Efficiency and
Testing Material Compatibility ed., Idaho National Engineering and
Environmental Laboratory, Idaho, 2004.
[41] R.T. Morrison, R.N. Boyd, Organic Chemistry ed., Prentice hall, New Yersey,
1992.
[42] T. Maramba, D. Bhattacharya, CO2 Compression and Dehydration for Carbon
Capture and Sequestration ed., Bechtel Technology Journal, 2011.
[43] Dutch Association of Cost Engineers, DACE Prijzenboekje, 28th ed., Reed
Business, Doetinchem, 2011.
[44] ASPEN Plus V7.2, User Guide, 1st ed., 2011.
[45] J.F. Richarson, J.H. Harker, J.R. Backhurst, Coulson & Richarson's Chemical
Engineering, 5th ed., Butterworth Heinneman, Oxford, 2002.
[46] M.F. Arenas, R.G. Reddy, J. Min. Metal. 39 (2003) 81-91.
[47] M. Uerdingen, C. Treber, M. Balser, G. Schmitt, C. Werner, Green Chem. 7
(2005) 321-325.
[48] P. Wasserscheid, T. Welton, in: P. Wasserscheid, T. Welton (Eds.), Ionic
Liquids in Synthesis, Wiley-VCH, Weinheim, 2008, pp. 1-6.
[49] DIY Trade, http://www.diytrade.com/china/4/products/3196215/sulfolane.html,
2011.
[50] Shangdong Qingyun Changxin Chemcal Science-Tech Co.,
http://www.alibaba.com/product-
gs/453796310/high_purity_n_methyl_pyrrolidone_nmp_.html, 2011.
[51] D.R. Lide, W.M. Haynes, Handbook of Chemistry and Physics, 87th ed., Taylor
and Francis group LLC, London, 2009.
111
Conceptual Process Design of
Extractive Distillation Processes
for Ethylbenzene/Styrene Separation
Submitted as:
M.T.G. Jongmans, J.I.W. Maassen, E. Hermans, M. Raijmakers, B. Schuur,
A.B. de Haan, Chem. Eng. Res. Des.
Abstract In the current styrene production process the distillation of the ethylbenzene/styrene
mixture to obtain an ethylbenzene impurity level of 100 ppm in styrene accounts for 75–80
% of the energy requirements. The future target is to reach a level of 1–10 ppm, which will
increase the energy requirements for the distillation even further. Extractive distillation is a
well-known technology to separate close-boiling mixtures up to high purities. The objective
of this study was to investigate whether extractive distillation using ionic liquids (ILs) is a
promising alternative to obtain high purity styrene. Three ILs were studied: [3-
mebupy][B(CN)4], [4-mebupy][BF4], and [EMIM][SCN]. Extractive distillation with
sulfolane and the current conventional distillation process were used as benchmark
processes. The IL [4-mebupy][BF4] is expected to outperform the other two ILs with up to
11.5 % lower energy requirements. The operational expenditures of the [4-mebupy][BF4]
process are found to be 43.2 % lower than the current distillation process and 5 % lower
than extractive distillation with sulfolane extractive distillations. However, the capital
expenditures for the sulfolane process will be about 23 % lower than those for the [4-
mebupy][BF4] process. Finally, the conclusion can be drawn from the total annual costs that
all studied extractive distillation processes outperform the current distillation process to
obtain high purity styrene, but that the ILs evaluated will not perform better than sulfolane.
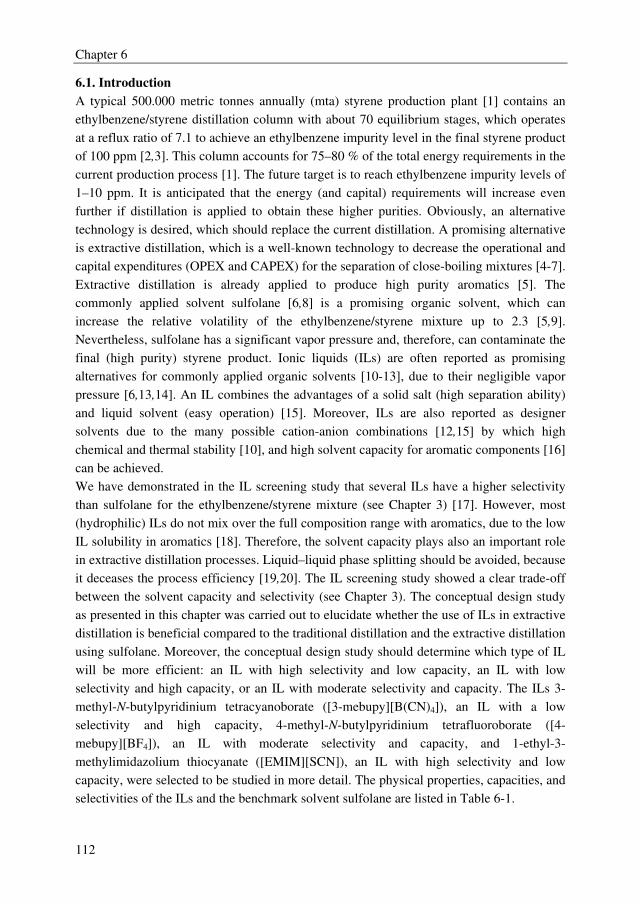
Chapter 6
112
6.1. Introduction
A typical 500.000 metric tonnes annually (mta) styrene production plant [1] contains an
ethylbenzene/styrene distillation column with about 70 equilibrium stages, which operates
at a reflux ratio of 7.1 to achieve an ethylbenzene impurity level in the final styrene product
of 100 ppm [2,3]. This column accounts for 75–80 % of the total energy requirements in the
current production process [1]. The future target is to reach ethylbenzene impurity levels of
1–10 ppm. It is anticipated that the energy (and capital) requirements will increase even
further if distillation is applied to obtain these higher purities. Obviously, an alternative
technology is desired, which should replace the current distillation. A promising alternative
is extractive distillation, which is a well-known technology to decrease the operational and
capital expenditures (OPEX and CAPEX) for the separation of close-boiling mixtures [4-7].
Extractive distillation is already applied to produce high purity aromatics [5]. The
commonly applied solvent sulfolane [6,8] is a promising organic solvent, which can
increase the relative volatility of the ethylbenzene/styrene mixture up to 2.3 [5,9].
Nevertheless, sulfolane has a significant vapor pressure and, therefore, can contaminate the
final (high purity) styrene product. Ionic liquids (ILs) are often reported as promising
alternatives for commonly applied organic solvents [10-13], due to their negligible vapor
pressure [6,13,14]. An IL combines the advantages of a solid salt (high separation ability)
and liquid solvent (easy operation) [15]. Moreover, ILs are also reported as designer
solvents due to the many possible cation-anion combinations [12,15] by which high
chemical and thermal stability [10], and high solvent capacity for aromatic components [16]
can be achieved.
We have demonstrated in the IL screening study that several ILs have a higher selectivity
than sulfolane for the ethylbenzene/styrene mixture (see Chapter 3) [17]. However, most
(hydrophilic) ILs do not mix over the full composition range with aromatics, due to the low
IL solubility in aromatics [18]. Therefore, the solvent capacity plays also an important role
in extractive distillation processes. Liquid–liquid phase splitting should be avoided, because
it deceases the process efficiency [19,20]. The IL screening study showed a clear trade-off
between the solvent capacity and selectivity (see Chapter 3). The conceptual design study
as presented in this chapter was carried out to elucidate whether the use of ILs in extractive
distillation is beneficial compared to the traditional distillation and the extractive distillation
using sulfolane. Moreover, the conceptual design study should determine which type of IL
will be more efficient: an IL with high selectivity and low capacity, an IL with low
selectivity and high capacity, or an IL with moderate selectivity and capacity. The ILs 3-
methyl-N-butylpyridinium tetracyanoborate ([3-mebupy][B(CN)4]), an IL with a low
selectivity and high capacity, 4-methyl-N-butylpyridinium tetrafluoroborate ([4-
mebupy][BF4]), an IL with moderate selectivity and capacity, and 1-ethyl-3-
methylimidazolium thiocyanate ([EMIM][SCN]), an IL with high selectivity and low
capacity, were selected to be studied in more detail. The physical properties, capacities, and
selectivities of the ILs and the benchmark solvent sulfolane are listed in Table 6-1.
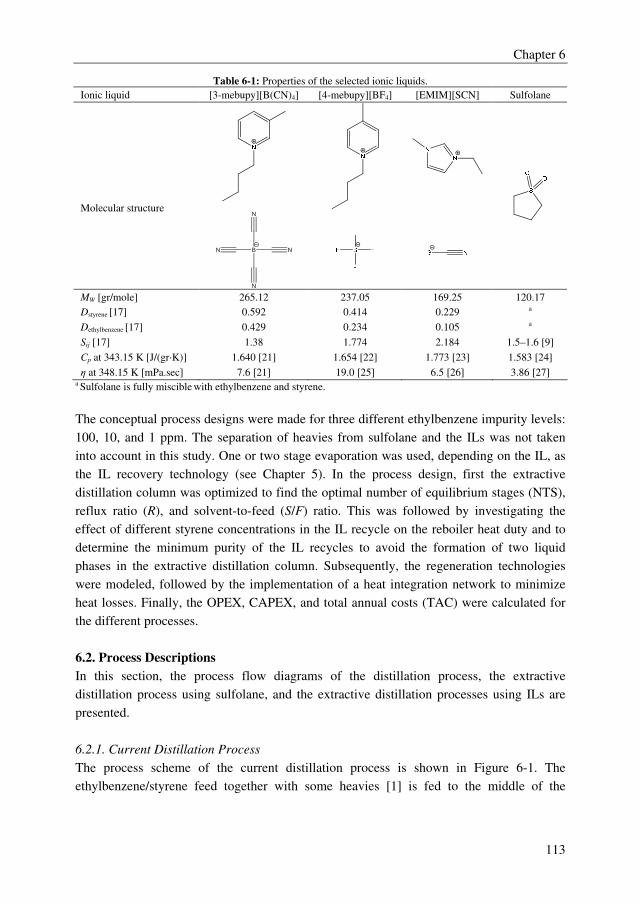
Chapter 6
113
Table 6-1: Properties of the selected ionic liquids.
Ionic liquid [3-mebupy][B(CN)4] [4-mebupy][BF4] [EMIM][SCN] Sulfolane
Molecular structure
B N
N
N
N
MW [gr/mole] 265.12 237.05 169.25 120.17
Dstyrene [17] 0.592 0.414 0.229 a
Dethylbenzene [17] 0.429 0.234 0.105 a
Sij [17] 1.38 1.774 2.184 1.5–1.6 [9]
Cp at 343.15 K [J/(gr·K)] 1.640 [21] 1.654 [22] 1.773 [23] 1.583 [24]
η at 348.15 K [mPa.sec] 7.6 [21] 19.0 [25] 6.5 [26] 3.86 [27] a Sulfolane is fully miscible with ethylbenzene and styrene.
The conceptual process designs were made for three different ethylbenzene impurity levels:
100, 10, and 1 ppm. The separation of heavies from sulfolane and the ILs was not taken
into account in this study. One or two stage evaporation was used, depending on the IL, as
the IL recovery technology (see Chapter 5). In the process design, first the extractive
distillation column was optimized to find the optimal number of equilibrium stages (NTS),
reflux ratio (R), and solvent-to-feed (S/F) ratio. This was followed by investigating the
effect of different styrene concentrations in the IL recycle on the reboiler heat duty and to
determine the minimum purity of the IL recycles to avoid the formation of two liquid
phases in the extractive distillation column. Subsequently, the regeneration technologies
were modeled, followed by the implementation of a heat integration network to minimize
heat losses. Finally, the OPEX, CAPEX, and total annual costs (TAC) were calculated for
the different processes.
6.2. Process Descriptions
In this section, the process flow diagrams of the distillation process, the extractive
distillation process using sulfolane, and the extractive distillation processes using ILs are
presented.
6.2.1. Current Distillation Process
The process scheme of the current distillation process is shown in Figure 6-1. The
ethylbenzene/styrene feed together with some heavies [1] is fed to the middle of the
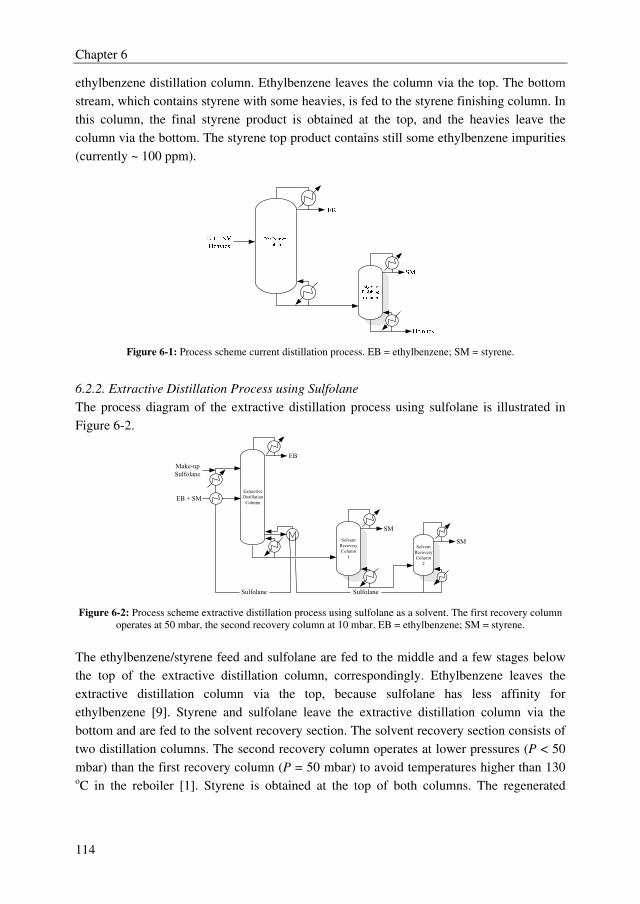
Chapter 6
114
ethylbenzene distillation column. Ethylbenzene leaves the column via the top. The bottom
stream, which contains styrene with some heavies, is fed to the styrene finishing column. In
this column, the final styrene product is obtained at the top, and the heavies leave the
column via the bottom. The styrene top product contains still some ethylbenzene impurities
(currently ~ 100 ppm).
Figure 6-1: Process scheme current distillation process. EB = ethylbenzene; SM = styrene.
6.2.2. Extractive Distillation Process using Sulfolane
The process diagram of the extractive distillation process using sulfolane is illustrated in
Figure 6-2.
Extractive
Distillation
Column
Solvent
Recovery
Column
1
EB + SM
SM
EB
Make-up
Sulfolane
Sulfolane
Solvent
Recovery
Column
2
SM
Sulfolane
Figure 6-2: Process scheme extractive distillation process using sulfolane as a solvent. The first recovery column
operates at 50 mbar, the second recovery column at 10 mbar. EB = ethylbenzene; SM = styrene.
The ethylbenzene/styrene feed and sulfolane are fed to the middle and a few stages below
the top of the extractive distillation column, correspondingly. Ethylbenzene leaves the
extractive distillation column via the top, because sulfolane has less affinity for
ethylbenzene [9]. Styrene and sulfolane leave the extractive distillation column via the
bottom and are fed to the solvent recovery section. The solvent recovery section consists of
two distillation columns. The second recovery column operates at lower pressures (P < 50
mbar) than the first recovery column (P = 50 mbar) to avoid temperatures higher than 130 oC in the reboiler [1]. Styrene is obtained at the top of both columns. The regenerated
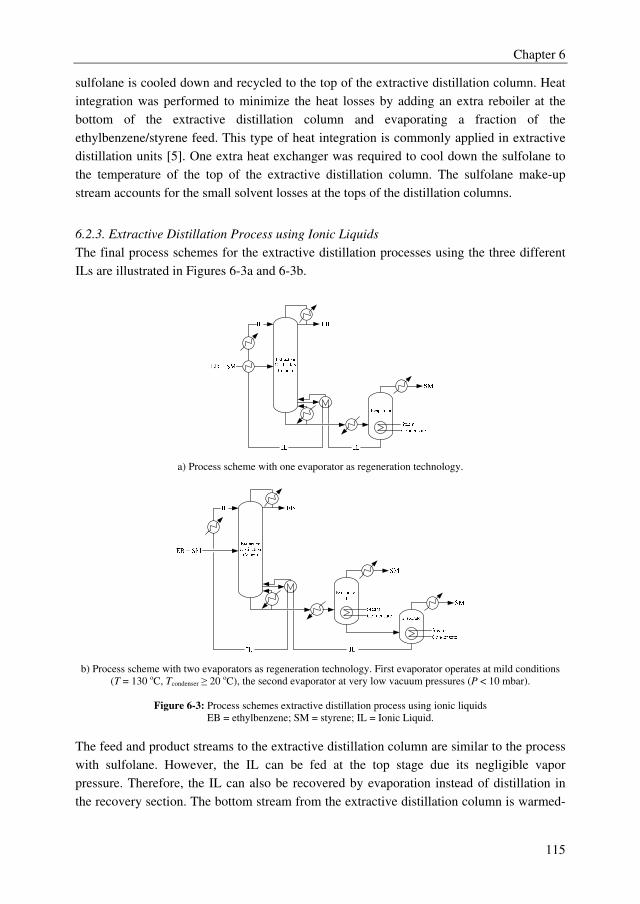
Chapter 6
115
sulfolane is cooled down and recycled to the top of the extractive distillation column. Heat
integration was performed to minimize the heat losses by adding an extra reboiler at the
bottom of the extractive distillation column and evaporating a fraction of the
ethylbenzene/styrene feed. This type of heat integration is commonly applied in extractive
distillation units [5]. One extra heat exchanger was required to cool down the sulfolane to
the temperature of the top of the extractive distillation column. The sulfolane make-up
stream accounts for the small solvent losses at the tops of the distillation columns.
6.2.3. Extractive Distillation Process using Ionic Liquids
The final process schemes for the extractive distillation processes using the three different
ILs are illustrated in Figures 6-3a and 6-3b.
a) Process scheme with one evaporator as regeneration technology.
b) Process scheme with two evaporators as regeneration technology. First evaporator operates at mild conditions
(T = 130 oC, Tcondenser ≥ 20 oC), the second evaporator at very low vacuum pressures (P < 10 mbar).
Figure 6-3: Process schemes extractive distillation process using ionic liquids
EB = ethylbenzene; SM = styrene; IL = Ionic Liquid.
The feed and product streams to the extractive distillation column are similar to the process
with sulfolane. However, the IL can be fed at the top stage due its negligible vapor
pressure. Therefore, the IL can also be recovered by evaporation instead of distillation in
the recovery section. The bottom stream from the extractive distillation column is warmed-
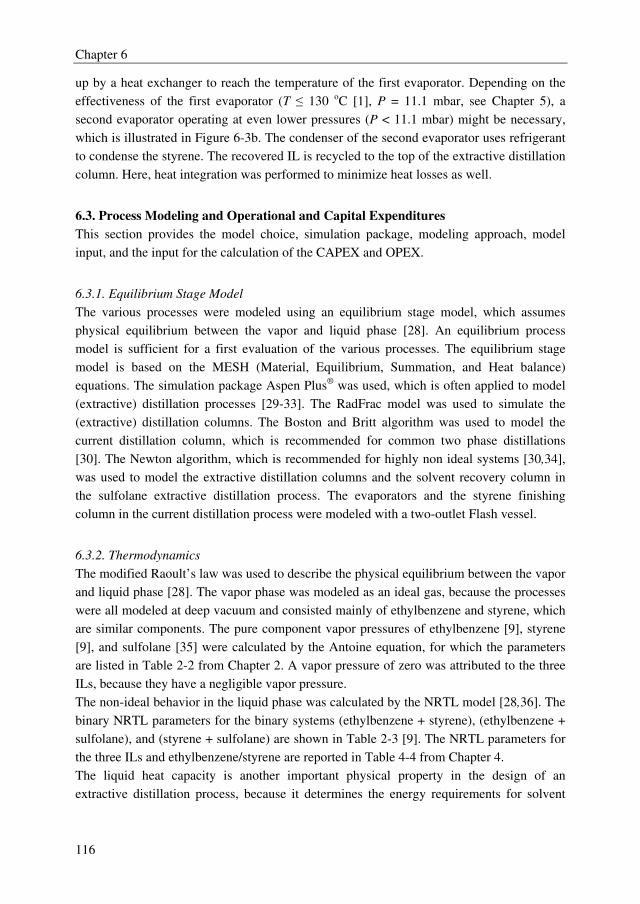
Chapter 6
116
up by a heat exchanger to reach the temperature of the first evaporator. Depending on the
effectiveness of the first evaporator (T ≤ 130 oC [1], P = 11.1 mbar, see Chapter 5), a
second evaporator operating at even lower pressures (P < 11.1 mbar) might be necessary,
which is illustrated in Figure 6-3b. The condenser of the second evaporator uses refrigerant
to condense the styrene. The recovered IL is recycled to the top of the extractive distillation
column. Here, heat integration was performed to minimize heat losses as well.
6.3. Process Modeling and Operational and Capital Expenditures
This section provides the model choice, simulation package, modeling approach, model
input, and the input for the calculation of the CAPEX and OPEX.
6.3.1. Equilibrium Stage Model
The various processes were modeled using an equilibrium stage model, which assumes
physical equilibrium between the vapor and liquid phase [28]. An equilibrium process
model is sufficient for a first evaluation of the various processes. The equilibrium stage
model is based on the MESH (Material, Equilibrium, Summation, and Heat balance)
equations. The simulation package Aspen Plus® was used, which is often applied to model
(extractive) distillation processes [29-33]. The RadFrac model was used to simulate the
(extractive) distillation columns. The Boston and Britt algorithm was used to model the
current distillation column, which is recommended for common two phase distillations
[30]. The Newton algorithm, which is recommended for highly non ideal systems [30,34],
was used to model the extractive distillation columns and the solvent recovery column in
the sulfolane extractive distillation process. The evaporators and the styrene finishing
column in the current distillation process were modeled with a two-outlet Flash vessel.
6.3.2. Thermodynamics
The modified Raoult’s law was used to describe the physical equilibrium between the vapor
and liquid phase [28]. The vapor phase was modeled as an ideal gas, because the processes
were all modeled at deep vacuum and consisted mainly of ethylbenzene and styrene, which
are similar components. The pure component vapor pressures of ethylbenzene [9], styrene
[9], and sulfolane [35] were calculated by the Antoine equation, for which the parameters
are listed in Table 2-2 from Chapter 2. A vapor pressure of zero was attributed to the three
ILs, because they have a negligible vapor pressure.
The non-ideal behavior in the liquid phase was calculated by the NRTL model [28,36]. The
binary NRTL parameters for the binary systems (ethylbenzene + styrene), (ethylbenzene +
sulfolane), and (styrene + sulfolane) are shown in Table 2-3 [9]. The NRTL parameters for
the three ILs and ethylbenzene/styrene are reported in Table 4-4 from Chapter 4.
The liquid heat capacity is another important physical property in the design of an
extractive distillation process, because it determines the energy requirements for solvent
Chapter 6
117
heating/cooling [7]. The specific heat capacity for the components was calculated by the
DIPPR (Design Institute for Physical Properties) equation. The parameters for
ethylbenzene, styrene, and sulfolane were taken from the Aspen Plus databank. The DIPPR
parameters for the ILs [3-mebupy][B(CN)4] [21], [4-mebupy][BF4] [22], and
[EMIM][SCN] [23] were taken from the open literature.
6.3.3. Model Input
Feed Conditions, Purity Requirements, and Process Conditions
The data provided in the patent of Welch [1] were used as input for the model of the current
distillation process. The ethylbenzene/styrene feed to the distillation and extractive
distillation processes was 100 metric tonnes/hr, with a styrene concentration of 60 mole%
[1]. The feed entered the columns in all processes as a saturated liquid. The ethylbenzene
product obtained at the top of the distillation/extractive distillation columns was set to 98.3
mole% [1]. The final styrene product was modeled for several ethylbenzene impurity
levels: 100, 10, and 1 ppm. A mass balance was applied to calculate the top and bottom
flows of the columns. The temperature at which sulfolane and the three ILs enter the
extractive distillation column were set to the temperature of the tray at which they are fed.
The condenser pressures in the distillation/extractive distillation columns were set to 50
mbar to keep the temperature in the column low, thereby minimizing styrene
polymerization. The first recovery column in the sulfolane process was modeled at 50
mbar. A pressure of 10 mbar was used in the second recovery column to keep the reboiler
temperature below 130 oC The Sulzer structured packing Mellapak 250X was selected as
internal, because of its low pressure drop. This packing type is often applied in
ethylbenzene/styrene splitters [1,37]. A thermosyphon reboiler was used in the model,
which is often applied to distill thermally sensitive components [1,38].
Current Distillation Process
The reflux ratio and number of theoretical stages (NTS) both have a strong effect on the
performance of a distillation column [38,39]. Both were varied to obtain the desired
ethylbenzene impurity levels of 100, 10, and 1 ppm in the final styrene product. First, the
reflux ratio was kept constant and the NTS were varied by a design spec in Aspen Plus.
This was followed by keeping the NTS constant and varying the reflux ratio. The
ethylbenzene impurity levels in the bottom were set as the target. Finally, the energy
requirements were calculated for the different scenarios.
Extractive Distillation using Sulfolane
First, the sulfolane feed stage was set to keep the sulfolane concentration in the
ethylbenzene top stream below 1 ppm. The organic feed was set manually at the stage
Chapter 6
118
where the ethylbenzene/styrene ratio was similar to the ethylbenzene/styrene feed ratio
(40/60). The extractive distillation column was optimized by varying the S/F ratio, NTS,
and reflux ratio [6,40]. For each S/F ratio (range 1–5), the NTS was varied from 50–85 with
a step change of 5, and the minimum required reflux ratio to obtain the desired purity of
styrene in the bottom stream was calculated by a design spec.
Subsequently, the bottom stream from the extractive distillation was used as feed stream in
the optimization of the solvent recovery columns. This was done by varying the NTS in the
range 8–18 with a step change of 1 and by calculating the required reflux ratio via a design
spec for both recovery columns. Here, the impurity levels of ethylbenzene and sulfolane in
the styrene exit stream were set as the target. The sums of these ethylbenzene and sulfolane
concentrations was set at either 100, 10, or 1 ppm, according to the desired purity. This
implies that the sulfolane concentration in the final styrene product was almost negligible
(< 10 ppb) in all cases. The styrene mass fraction in the bottom stream of the first recovery
column was set at 0.0175 to keep the reboiler temperature below 130 oC. The styrene mass
fraction in the bottom stream of the second solvent recovery column was set at 0.001,
because low styrene concentrations in the recycle to the extractive distillation column are
preferred (see Chapter 5). Finally, the total model was simulated by closing the sulfolane
recycle and applying a heat integration. For the heat integration, a logarithmic temperature
difference of 10 K was assumed between the hot and cold stream [41].
Extractive Distillation using Ionic Liquids
The same parameters were varied as for the extractive distillation process with sulfolane to
find the optimized settings. However, due to the miscibility gap between the ILs and the
ethylbenzene/styrene [17], first the minimum required S/F ratio was determined for the
three different ILs to avoid multiple liquid phases at any stage in the extractive distillation
column. Subsequently, the S/F ratio was varied from the determined minimum required S/F
ratio up to 1.5–2.5 times the minimum required S/F ratio, depending on the IL. The NTS
were varied in the range 35–70 with a step change of 5. The reflux ratio was calculated by a
design spec as well, to obtain the desired purity of styrene in the bottom stream.
After finding the optimal settings for the extractive distillation columns for the three ILs,
the effect of the styrene concentration in the IL recycle on the extractive distillation was
examined. This sensitivity analysis was required to find the minimum IL purity, which
needs to be obtained in the IL regeneration section. The styrene concentration in the IL
recycle was varied from 0 to 1.5 wt %, depending on the IL. The reflux ratio was varied in
order to minimize the energy consumption of the process, while still fulfilling the purity
requirements with respect to the top and bottom products using a design spec.
Next, the maximum purity that can be obtained with an evaporator using mild conditions (P
= 11.1 mbar, T = 130 oC, see Chapter 5) was determined. An extra evaporator using very
low vacuum pressures (P < 10 mbar) was modeled, when the IL purity specification could
Chapter 6
119
not be reached by the evaporator using mild conditions. Finally, the whole process was
modeled by closing the IL recycle and applying a heat integration.
6.3.4. OPEX, CAPEX, and TAC
The OPEX, CAPEX, and TAC were determined to compare the different processes. The
OPEX were calculated from the energy requirements provided by the Aspen Plus
simulations using a running time of 8400 hrs per year [42]. The applied cost factors to
estimate the OPEX are shown in Table 6-2. The plant location and (possible) solvent purge
costs were not taken into account.
Table 6-2: Cost factors for the operational expenditures [41,42].
Cost factor €/GJ
Heating
Steam medium pressure (10–12 bar) 9.95
Steam low pressure (3,4 bar) 6.22
Cooling
Cooling water (> 32 oC) 0.80
Cooling water (20 oC) 1.73
Chilled water (7 oC) 12.3
Ammonia (-34 oC) 24.7
The Aspen Plus Economic Analyzer was applied to calculate the CAPEX. The diameter
and column heights of the (extractive) distillation columns were calculated in Aspen Plus
using the Packing Sizing tool [30]. Standard overall heat transfer coefficients [43] were
used to calculate the areas of the shell-and-tube heat exchangers. A forced circulation and
falling film evaporator were selected for the first and second evaporator in the IL recovery
process, correspondingly, which are both often applied for thermally sensitive components
[38]. The purchase costs of pumps were not taken into account. It was assumed that
refrigerant, steam, etc. are already available at the plant location. Stainless Steel 316 was
selected as the material, because ILs are known to be slightly corrosive fluids [44,45].
Aromatics and sulfolane were both considered as non-corrosive fluids [46]. Therefore,
ordinary carbon steel was selected as the material to evaluate the current distillation process
and the process using sulfolane. The total solvent investment was calculated from the total
solvent hold-up and the price per kg. The assumption was made that the ILs cost 25 €/kg
[47,48], but the price was also varied up to 200 €/kg to investigate the contribution of the IL
price to the total CAPEX. A price of 2.78 €/kg was taken for sulfolane [49]. The TAC were
calculated by summing up the OPEX and 20 % of the CAPEX [41].
6.4. Results
The results from the process models of the different processes are presented in this section.
First the results for the current distillation process are discussed, followed by the extractive
distillation process using sulfolane. Next, the results are discussed for the extractive
distillation processes using the different ILs. Finally, an overview is provided of the
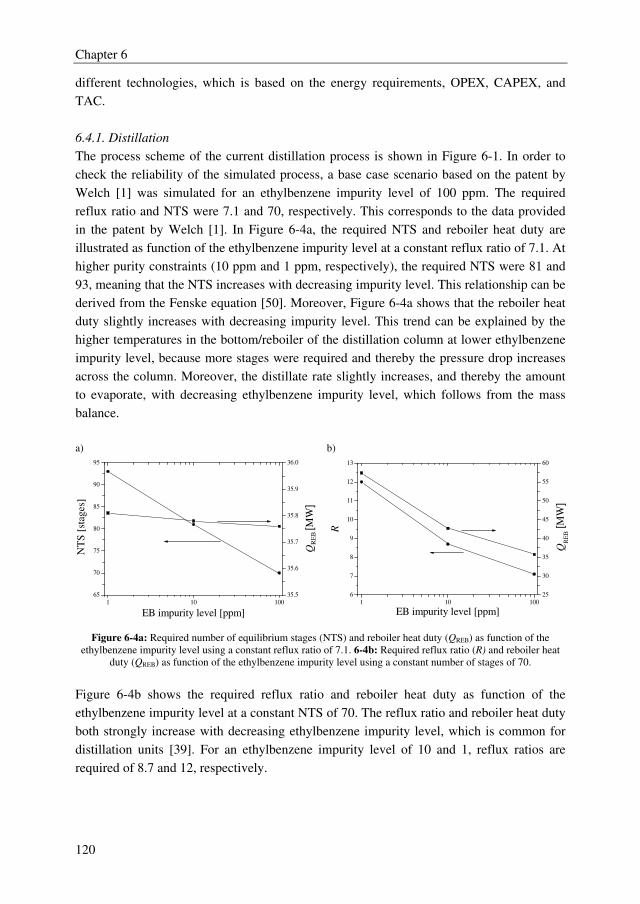
Chapter 6
120
different technologies, which is based on the energy requirements, OPEX, CAPEX, and
TAC.
6.4.1. Distillation
The process scheme of the current distillation process is shown in Figure 6-1. In order to
check the reliability of the simulated process, a base case scenario based on the patent by
Welch [1] was simulated for an ethylbenzene impurity level of 100 ppm. The required
reflux ratio and NTS were 7.1 and 70, respectively. This corresponds to the data provided
in the patent by Welch [1]. In Figure 6-4a, the required NTS and reboiler heat duty are
illustrated as function of the ethylbenzene impurity level at a constant reflux ratio of 7.1. At
higher purity constraints (10 ppm and 1 ppm, respectively), the required NTS were 81 and
93, meaning that the NTS increases with decreasing impurity level. This relationship can be
derived from the Fenske equation [50]. Moreover, Figure 6-4a shows that the reboiler heat
duty slightly increases with decreasing impurity level. This trend can be explained by the
higher temperatures in the bottom/reboiler of the distillation column at lower ethylbenzene
impurity level, because more stages were required and thereby the pressure drop increases
across the column. Moreover, the distillate rate slightly increases, and thereby the amount
to evaporate, with decreasing ethylbenzene impurity level, which follows from the mass
balance.
a) b)
1 10 100
65
70
75
80
85
90
95
EB impurity level [ppm]
NT
S [
stag
es]
35.5
35.6
35.7
35.8
35.9
36.0
QR
EB
[MW
]
1 10 100
6
7
8
9
10
11
12
13
EB impurity level [ppm]
R
25
30
35
40
45
50
55
60
QR
EB [
MW
]
Figure 6-4a: Required number of equilibrium stages (NTS) and reboiler heat duty (QREB) as function of the
ethylbenzene impurity level using a constant reflux ratio of 7.1. 6-4b: Required reflux ratio (R) and reboiler heat
duty (QREB) as function of the ethylbenzene impurity level using a constant number of stages of 70.
Figure 6-4b shows the required reflux ratio and reboiler heat duty as function of the
ethylbenzene impurity level at a constant NTS of 70. The reflux ratio and reboiler heat duty
both strongly increase with decreasing ethylbenzene impurity level, which is common for
distillation units [39]. For an ethylbenzene impurity level of 10 and 1, reflux ratios are
required of 8.7 and 12, respectively.
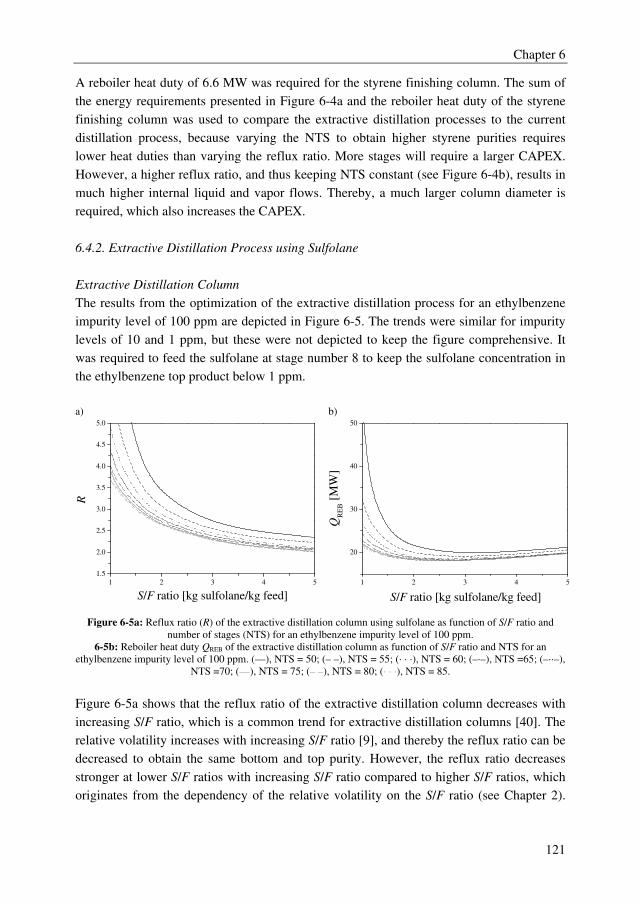
Chapter 6
121
A reboiler heat duty of 6.6 MW was required for the styrene finishing column. The sum of
the energy requirements presented in Figure 6-4a and the reboiler heat duty of the styrene
finishing column was used to compare the extractive distillation processes to the current
distillation process, because varying the NTS to obtain higher styrene purities requires
lower heat duties than varying the reflux ratio. More stages will require a larger CAPEX.
However, a higher reflux ratio, and thus keeping NTS constant (see Figure 6-4b), results in
much higher internal liquid and vapor flows. Thereby, a much larger column diameter is
required, which also increases the CAPEX.
6.4.2. Extractive Distillation Process using Sulfolane
Extractive Distillation Column
The results from the optimization of the extractive distillation process for an ethylbenzene
impurity level of 100 ppm are depicted in Figure 6-5. The trends were similar for impurity
levels of 10 and 1 ppm, but these were not depicted to keep the figure comprehensive. It
was required to feed the sulfolane at stage number 8 to keep the sulfolane concentration in
the ethylbenzene top product below 1 ppm.
a) b)
1 2 3 4 5
1.5
2.0
2.5
3.0
3.5
4.0
4.5
5.0
R
S/F ratio [kg sulfolane/kg feed]
1 2 3 4 5
20
30
40
50
QR
EB [
MW
]
S/F ratio [kg sulfolane/kg feed]
Figure 6-5a: Reflux ratio (R) of the extractive distillation column using sulfolane as function of S/F ratio and
number of stages (NTS) for an ethylbenzene impurity level of 100 ppm.
6-5b: Reboiler heat duty QREB of the extractive distillation column as function of S/F ratio and NTS for an
ethylbenzene impurity level of 100 ppm. (—), NTS = 50; (– –), NTS = 55; (· · ·), NTS = 60; (–·–), NTS =65; (–··–),
NTS =70; (—), NTS = 75; (– –), NTS = 80; (· · ·), NTS = 85.
Figure 6-5a shows that the reflux ratio of the extractive distillation column decreases with
increasing S/F ratio, which is a common trend for extractive distillation columns [40]. The
relative volatility increases with increasing S/F ratio [9], and thereby the reflux ratio can be
decreased to obtain the same bottom and top purity. However, the reflux ratio decreases
stronger at lower S/F ratios with increasing S/F ratio compared to higher S/F ratios, which
originates from the dependency of the relative volatility on the S/F ratio (see Chapter 2).
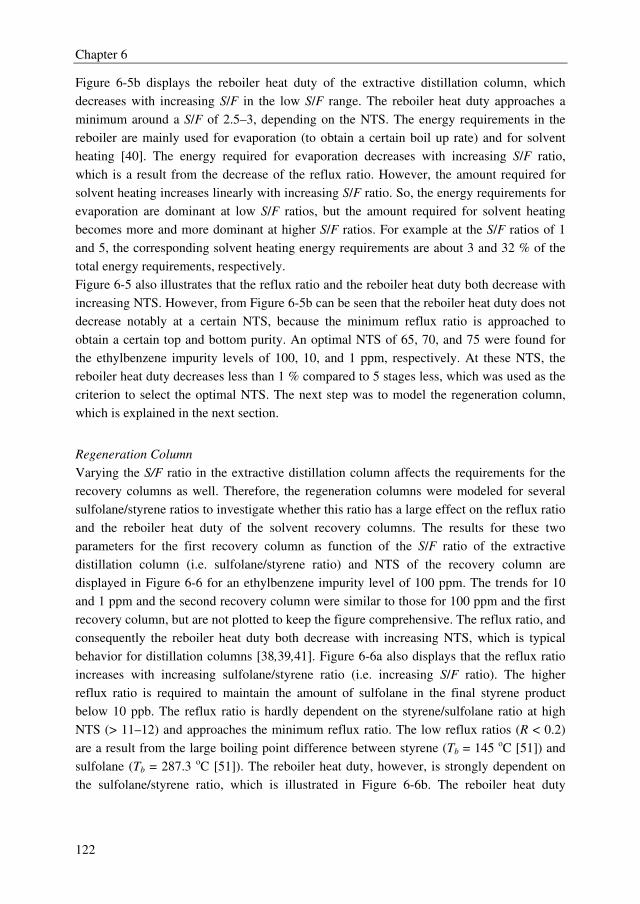
Chapter 6
122
Figure 6-5b displays the reboiler heat duty of the extractive distillation column, which
decreases with increasing S/F in the low S/F range. The reboiler heat duty approaches a
minimum around a S/F of 2.5–3, depending on the NTS. The energy requirements in the
reboiler are mainly used for evaporation (to obtain a certain boil up rate) and for solvent
heating [40]. The energy required for evaporation decreases with increasing S/F ratio,
which is a result from the decrease of the reflux ratio. However, the amount required for
solvent heating increases linearly with increasing S/F ratio. So, the energy requirements for
evaporation are dominant at low S/F ratios, but the amount required for solvent heating
becomes more and more dominant at higher S/F ratios. For example at the S/F ratios of 1
and 5, the corresponding solvent heating energy requirements are about 3 and 32 % of the
total energy requirements, respectively.
Figure 6-5 also illustrates that the reflux ratio and the reboiler heat duty both decrease with
increasing NTS. However, from Figure 6-5b can be seen that the reboiler heat duty does not
decrease notably at a certain NTS, because the minimum reflux ratio is approached to
obtain a certain top and bottom purity. An optimal NTS of 65, 70, and 75 were found for
the ethylbenzene impurity levels of 100, 10, and 1 ppm, respectively. At these NTS, the
reboiler heat duty decreases less than 1 % compared to 5 stages less, which was used as the
criterion to select the optimal NTS. The next step was to model the regeneration column,
which is explained in the next section.
Regeneration Column
Varying the S/F ratio in the extractive distillation column affects the requirements for the
recovery columns as well. Therefore, the regeneration columns were modeled for several
sulfolane/styrene ratios to investigate whether this ratio has a large effect on the reflux ratio
and the reboiler heat duty of the solvent recovery columns. The results for these two
parameters for the first recovery column as function of the S/F ratio of the extractive
distillation column (i.e. sulfolane/styrene ratio) and NTS of the recovery column are
displayed in Figure 6-6 for an ethylbenzene impurity level of 100 ppm. The trends for 10
and 1 ppm and the second recovery column were similar to those for 100 ppm and the first
recovery column, but are not plotted to keep the figure comprehensive. The reflux ratio, and
consequently the reboiler heat duty both decrease with increasing NTS, which is typical
behavior for distillation columns [38,39,41]. Figure 6-6a also displays that the reflux ratio
increases with increasing sulfolane/styrene ratio (i.e. increasing S/F ratio). The higher
reflux ratio is required to maintain the amount of sulfolane in the final styrene product
below 10 ppb. The reflux ratio is hardly dependent on the styrene/sulfolane ratio at high
NTS (> 11–12) and approaches the minimum reflux ratio. The low reflux ratios (R < 0.2)
are a result from the large boiling point difference between styrene (Tb = 145 oC [51]) and
sulfolane (Tb = 287.3 oC [51]). The reboiler heat duty, however, is strongly dependent on
the sulfolane/styrene ratio, which is illustrated in Figure 6-6b. The reboiler heat duty
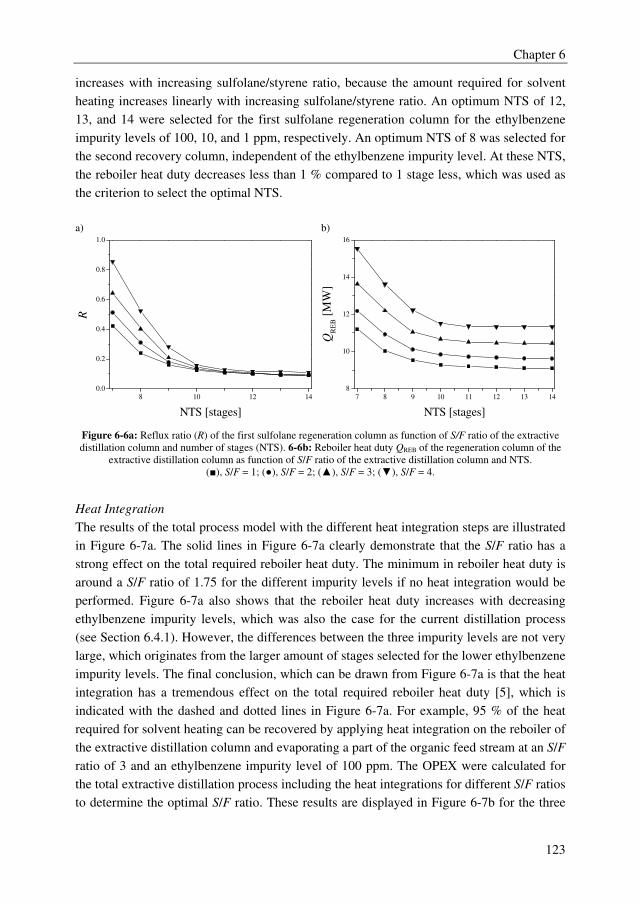
Chapter 6
123
increases with increasing sulfolane/styrene ratio, because the amount required for solvent
heating increases linearly with increasing sulfolane/styrene ratio. An optimum NTS of 12,
13, and 14 were selected for the first sulfolane regeneration column for the ethylbenzene
impurity levels of 100, 10, and 1 ppm, respectively. An optimum NTS of 8 was selected for
the second recovery column, independent of the ethylbenzene impurity level. At these NTS,
the reboiler heat duty decreases less than 1 % compared to 1 stage less, which was used as
the criterion to select the optimal NTS.
a) b)
8 10 12 14
0.0
0.2
0.4
0.6
0.8
1.0
R
NTS [stages]
7 8 9 10 11 12 13 14
8
10
12
14
16
QR
EB [
MW
]
NTS [stages]
Figure 6-6a: Reflux ratio (R) of the first sulfolane regeneration column as function of S/F ratio of the extractive
distillation column and number of stages (NTS). 6-6b: Reboiler heat duty QREB of the regeneration column of the
extractive distillation column as function of S/F ratio of the extractive distillation column and NTS.
(■), S/F = 1; (●), S/F = 2; (▲), S/F = 3; (▼), S/F = 4.
Heat Integration
The results of the total process model with the different heat integration steps are illustrated
in Figure 6-7a. The solid lines in Figure 6-7a clearly demonstrate that the S/F ratio has a
strong effect on the total required reboiler heat duty. The minimum in reboiler heat duty is
around a S/F ratio of 1.75 for the different impurity levels if no heat integration would be
performed. Figure 6-7a also shows that the reboiler heat duty increases with decreasing
ethylbenzene impurity levels, which was also the case for the current distillation process
(see Section 6.4.1). However, the differences between the three impurity levels are not very
large, which originates from the larger amount of stages selected for the lower ethylbenzene
impurity levels. The final conclusion, which can be drawn from Figure 6-7a is that the heat
integration has a tremendous effect on the total required reboiler heat duty [5], which is
indicated with the dashed and dotted lines in Figure 6-7a. For example, 95 % of the heat
required for solvent heating can be recovered by applying heat integration on the reboiler of
the extractive distillation column and evaporating a part of the organic feed stream at an S/F
ratio of 3 and an ethylbenzene impurity level of 100 ppm. The OPEX were calculated for
the total extractive distillation process including the heat integrations for different S/F ratios
to determine the optimal S/F ratio. These results are displayed in Figure 6-7b for the three
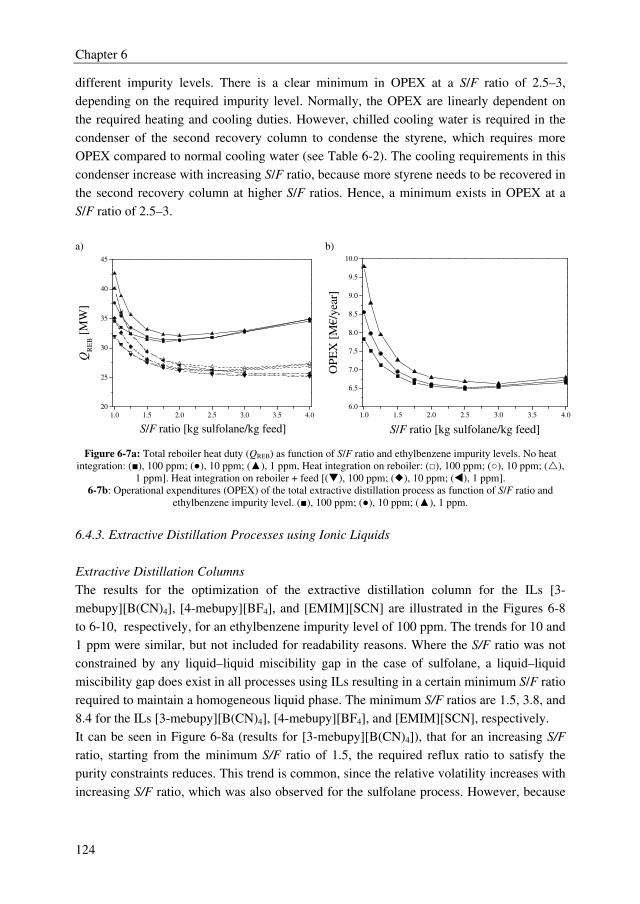
Chapter 6
124
different impurity levels. There is a clear minimum in OPEX at a S/F ratio of 2.5–3,
depending on the required impurity level. Normally, the OPEX are linearly dependent on
the required heating and cooling duties. However, chilled cooling water is required in the
condenser of the second recovery column to condense the styrene, which requires more
OPEX compared to normal cooling water (see Table 6-2). The cooling requirements in this
condenser increase with increasing S/F ratio, because more styrene needs to be recovered in
the second recovery column at higher S/F ratios. Hence, a minimum exists in OPEX at a
S/F ratio of 2.5–3.
a) b)
1.0 1.5 2.0 2.5 3.0 3.5 4.0
20
25
30
35
40
45
S/F ratio [kg sulfolane/kg feed]
QR
EB [
MW
]
1.0 1.5 2.0 2.5 3.0 3.5 4.0
6.0
6.5
7.0
7.5
8.0
8.5
9.0
9.5
10.0
O
PE
X [
M€/y
ear]
S/F ratio [kg sulfolane/kg feed]
Figure 6-7a: Total reboiler heat duty (QREB) as function of S/F ratio and ethylbenzene impurity levels. No heat
integration: (■), 100 ppm; (●), 10 ppm; (▲), 1 ppm, Heat integration on reboiler: (□), 100 ppm; (○), 10 ppm; (�),
1 ppm]. Heat integration on reboiler + feed [(�), 100 ppm; (�), 10 ppm; (⊳), 1 ppm].
6-7b: Operational expenditures (OPEX) of the total extractive distillation process as function of S/F ratio and
ethylbenzene impurity level. (■), 100 ppm; (●), 10 ppm; (▲), 1 ppm.
6.4.3. Extractive Distillation Processes using Ionic Liquids
Extractive Distillation Columns
The results for the optimization of the extractive distillation column for the ILs [3-
mebupy][B(CN)4], [4-mebupy][BF4], and [EMIM][SCN] are illustrated in the Figures 6-8
to 6-10, respectively, for an ethylbenzene impurity level of 100 ppm. The trends for 10 and
1 ppm were similar, but not included for readability reasons. Where the S/F ratio was not
constrained by any liquid–liquid miscibility gap in the case of sulfolane, a liquid–liquid
miscibility gap does exist in all processes using ILs resulting in a certain minimum S/F ratio
required to maintain a homogeneous liquid phase. The minimum S/F ratios are 1.5, 3.8, and
8.4 for the ILs [3-mebupy][B(CN)4], [4-mebupy][BF4], and [EMIM][SCN], respectively.
It can be seen in Figure 6-8a (results for [3-mebupy][B(CN)4]), that for an increasing S/F
ratio, starting from the minimum S/F ratio of 1.5, the required reflux ratio to satisfy the
purity constraints reduces. This trend is common, since the relative volatility increases with
increasing S/F ratio, which was also observed for the sulfolane process. However, because
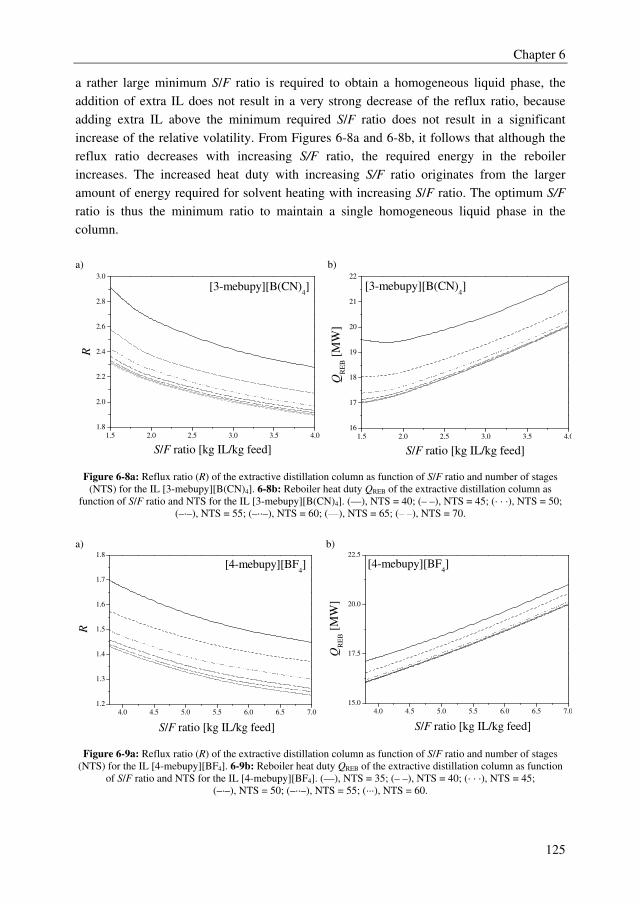
Chapter 6
125
a rather large minimum S/F ratio is required to obtain a homogeneous liquid phase, the
addition of extra IL does not result in a very strong decrease of the reflux ratio, because
adding extra IL above the minimum required S/F ratio does not result in a significant
increase of the relative volatility. From Figures 6-8a and 6-8b, it follows that although the
reflux ratio decreases with increasing S/F ratio, the required energy in the reboiler
increases. The increased heat duty with increasing S/F ratio originates from the larger
amount of energy required for solvent heating with increasing S/F ratio. The optimum S/F
ratio is thus the minimum ratio to maintain a single homogeneous liquid phase in the
column.
a) b)
1.5 2.0 2.5 3.0 3.5 4.0
1.8
2.0
2.2
2.4
2.6
2.8
3.0
R
S/F ratio [kg IL/kg feed]
[3-mebupy][B(CN)4]
1.5 2.0 2.5 3.0 3.5 4.0
16
17
18
19
20
21
22
[3-mebupy][B(CN)4]
QR
EB [
MW
]
S/F ratio [kg IL/kg feed]
Figure 6-8a: Reflux ratio (R) of the extractive distillation column as function of S/F ratio and number of stages
(NTS) for the IL [3-mebupy][B(CN)4]. 6-8b: Reboiler heat duty QREB of the extractive distillation column as
function of S/F ratio and NTS for the IL [3-mebupy][B(CN)4]. (—), NTS = 40; (– –), NTS = 45; (· · ·), NTS = 50;
(–·–), NTS = 55; (–··–), NTS = 60; (—), NTS = 65; (– –), NTS = 70.
a) b)
4.0 4.5 5.0 5.5 6.0 6.5 7.0
1.2
1.3
1.4
1.5
1.6
1.7
1.8
[4-mebupy][BF4]
R
S/F ratio [kg IL/kg feed]
4.0 4.5 5.0 5.5 6.0 6.5 7.0
15.0
17.5
20.0
22.5
[4-mebupy][BF4]
QR
EB [
MW
]
S/F ratio [kg IL/kg feed]
Figure 6-9a: Reflux ratio (R) of the extractive distillation column as function of S/F ratio and number of stages
(NTS) for the IL [4-mebupy][BF4]. 6-9b: Reboiler heat duty QREB of the extractive distillation column as function
of S/F ratio and NTS for the IL [4-mebupy][BF4]. (—), NTS = 35; (– –), NTS = 40; (· · ·), NTS = 45;
(–·–), NTS = 50; (–··–), NTS = 55; (···), NTS = 60.
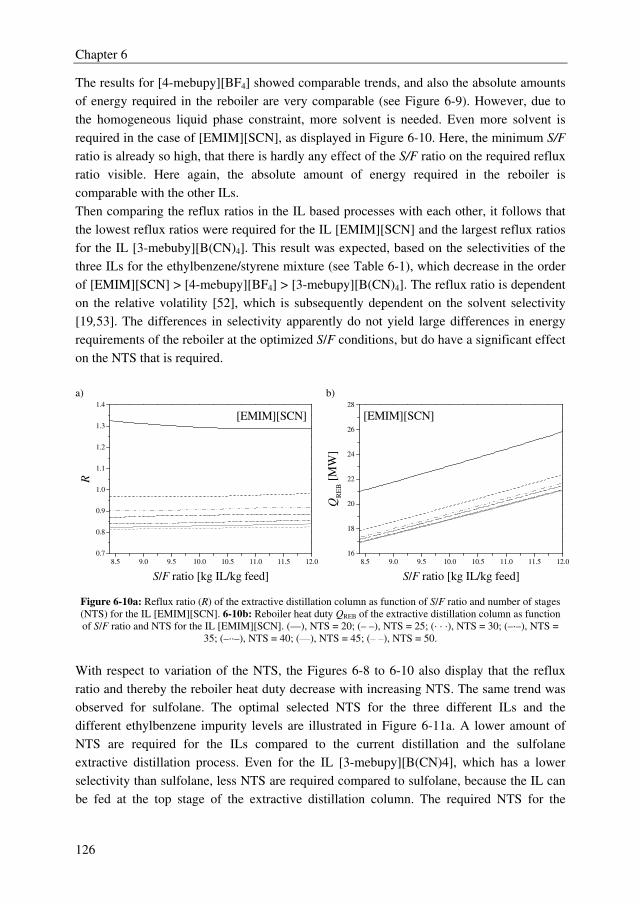
Chapter 6
126
The results for [4-mebupy][BF4] showed comparable trends, and also the absolute amounts
of energy required in the reboiler are very comparable (see Figure 6-9). However, due to
the homogeneous liquid phase constraint, more solvent is needed. Even more solvent is
required in the case of [EMIM][SCN], as displayed in Figure 6-10. Here, the minimum S/F
ratio is already so high, that there is hardly any effect of the S/F ratio on the required reflux
ratio visible. Here again, the absolute amount of energy required in the reboiler is
comparable with the other ILs.
Then comparing the reflux ratios in the IL based processes with each other, it follows that
the lowest reflux ratios were required for the IL [EMIM][SCN] and the largest reflux ratios
for the IL [3-mebuby][B(CN)4]. This result was expected, based on the selectivities of the
three ILs for the ethylbenzene/styrene mixture (see Table 6-1), which decrease in the order
of [EMIM][SCN] > [4-mebupy][BF4] > [3-mebupy][B(CN)4]. The reflux ratio is dependent
on the relative volatility [52], which is subsequently dependent on the solvent selectivity
[19,53]. The differences in selectivity apparently do not yield large differences in energy
requirements of the reboiler at the optimized S/F conditions, but do have a significant effect
on the NTS that is required.
a) b)
8.5 9.0 9.5 10.0 10.5 11.0 11.5 12.0
0.7
0.8
0.9
1.0
1.1
1.2
1.3
1.4
[EMIM][SCN]
R
S/F ratio [kg IL/kg feed]
8.5 9.0 9.5 10.0 10.5 11.0 11.5 12.0
16
18
20
22
24
26
28
[EMIM][SCN]
QR
EB [
MW
]
S/F ratio [kg IL/kg feed]
Figure 6-10a: Reflux ratio (R) of the extractive distillation column as function of S/F ratio and number of stages
(NTS) for the IL [EMIM][SCN]. 6-10b: Reboiler heat duty QREB of the extractive distillation column as function
of S/F ratio and NTS for the IL [EMIM][SCN]. (—), NTS = 20; (– –), NTS = 25; (· · ·), NTS = 30; (–·–), NTS =
35; (–··–), NTS = 40; (—), NTS = 45; (– –), NTS = 50.
With respect to variation of the NTS, the Figures 6-8 to 6-10 also display that the reflux
ratio and thereby the reboiler heat duty decrease with increasing NTS. The same trend was
observed for sulfolane. The optimal selected NTS for the three different ILs and the
different ethylbenzene impurity levels are illustrated in Figure 6-11a. A lower amount of
NTS are required for the ILs compared to the current distillation and the sulfolane
extractive distillation process. Even for the IL [3-mebupy][B(CN)4], which has a lower
selectivity than sulfolane, less NTS are required compared to sulfolane, because the IL can
be fed at the top stage of the extractive distillation column. The required NTS for the
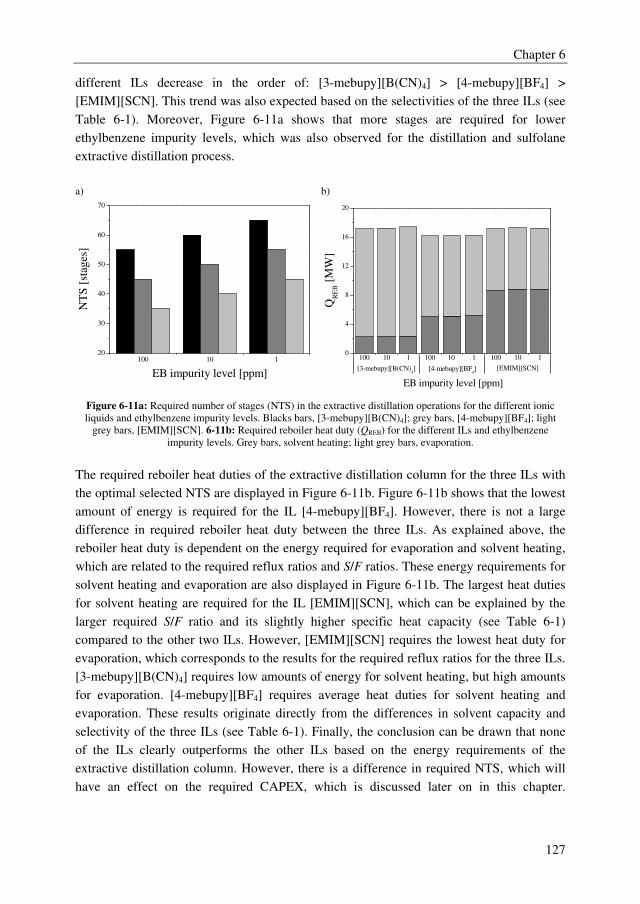
Chapter 6
127
different ILs decrease in the order of: [3-mebupy][B(CN)4] > [4-mebupy][BF4] >
[EMIM][SCN]. This trend was also expected based on the selectivities of the three ILs (see
Table 6-1). Moreover, Figure 6-11a shows that more stages are required for lower
ethylbenzene impurity levels, which was also observed for the distillation and sulfolane
extractive distillation process.
a) b)
100 10 120
30
40
50
60
70
NT
S [
stag
es]
EB impurity level [ppm]
0
4
8
12
16
20
[EMIM][SCN][4-mebupy][BF4][3-mebupy][B(CN)
4]
EB impurity level [ppm]
QR
EB [
MW
]
100 10 1 100 10 1
100 10 1
Figure 6-11a: Required number of stages (NTS) in the extractive distillation operations for the different ionic
liquids and ethylbenzene impurity levels. Blacks bars, [3-mebupy][B(CN)4]; grey bars, [4-mebupy][BF4]; light
grey bars, [EMIM][SCN]. 6-11b: Required reboiler heat duty (QREB) for the different ILs and ethylbenzene
impurity levels. Grey bars, solvent heating; light grey bars, evaporation.
The required reboiler heat duties of the extractive distillation column for the three ILs with
the optimal selected NTS are displayed in Figure 6-11b. Figure 6-11b shows that the lowest
amount of energy is required for the IL [4-mebupy][BF4]. However, there is not a large
difference in required reboiler heat duty between the three ILs. As explained above, the
reboiler heat duty is dependent on the energy required for evaporation and solvent heating,
which are related to the required reflux ratios and S/F ratios. These energy requirements for
solvent heating and evaporation are also displayed in Figure 6-11b. The largest heat duties
for solvent heating are required for the IL [EMIM][SCN], which can be explained by the
larger required S/F ratio and its slightly higher specific heat capacity (see Table 6-1)
compared to the other two ILs. However, [EMIM][SCN] requires the lowest heat duty for
evaporation, which corresponds to the results for the required reflux ratios for the three ILs.
[3-mebupy][B(CN)4] requires low amounts of energy for solvent heating, but high amounts
for evaporation. [4-mebupy][BF4] requires average heat duties for solvent heating and
evaporation. These results originate directly from the differences in solvent capacity and
selectivity of the three ILs (see Table 6-1). Finally, the conclusion can be drawn that none
of the ILs clearly outperforms the other ILs based on the energy requirements of the
extractive distillation column. However, there is a difference in required NTS, which will
have an effect on the required CAPEX, which is discussed later on in this chapter.
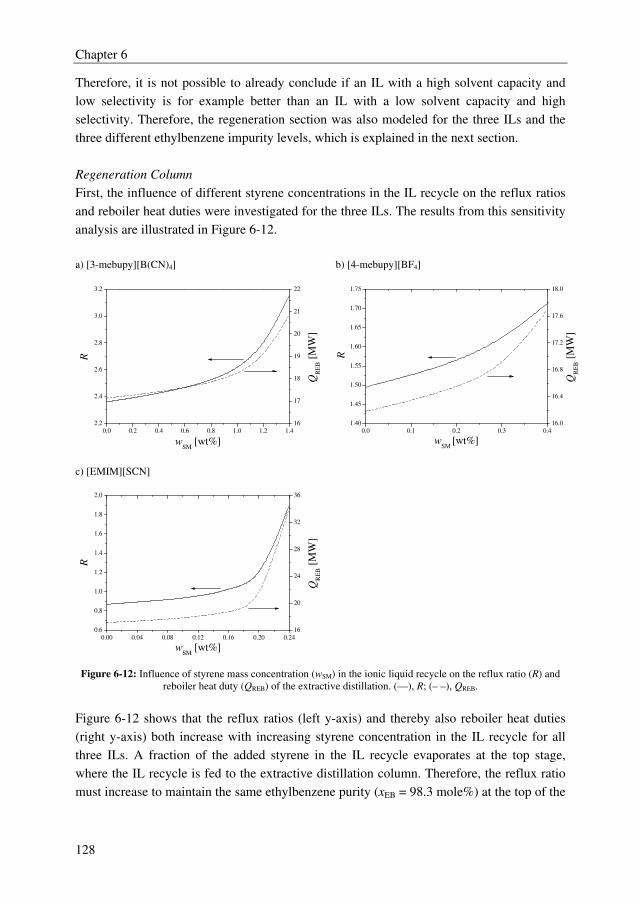
Chapter 6
128
Therefore, it is not possible to already conclude if an IL with a high solvent capacity and
low selectivity is for example better than an IL with a low solvent capacity and high
selectivity. Therefore, the regeneration section was also modeled for the three ILs and the
three different ethylbenzene impurity levels, which is explained in the next section.
Regeneration Column
First, the influence of different styrene concentrations in the IL recycle on the reflux ratios
and reboiler heat duties were investigated for the three ILs. The results from this sensitivity
analysis are illustrated in Figure 6-12.
a) [3-mebupy][B(CN)4]
b) [4-mebupy][BF4]
0.0 0.2 0.4 0.6 0.8 1.0 1.2 1.4
2.2
2.4
2.6
2.8
3.0
3.2
wSM
[wt%]
R
16
17
18
19
20
21
22
QR
EB [
MW
]
0.0 0.1 0.2 0.3 0.4
1.40
1.45
1.50
1.55
1.60
1.65
1.70
1.75
wSM
[wt%]
R
16.0
16.4
16.8
17.2
17.6
18.0
QR
EB [
MW
]
c) [EMIM][SCN]
0.00 0.04 0.08 0.12 0.16 0.20 0.24
0.6
0.8
1.0
1.2
1.4
1.6
1.8
2.0
wSM
[wt%]
R
16
20
24
28
32
36
QR
EB [
MW
]
Figure 6-12: Influence of styrene mass concentration (wSM) in the ionic liquid recycle on the reflux ratio (R) and
reboiler heat duty (QREB) of the extractive distillation. (—), R; (– –), QREB.
Figure 6-12 shows that the reflux ratios (left y-axis) and thereby also reboiler heat duties
(right y-axis) both increase with increasing styrene concentration in the IL recycle for all
three ILs. A fraction of the added styrene in the IL recycle evaporates at the top stage,
where the IL recycle is fed to the extractive distillation column. Therefore, the reflux ratio
must increase to maintain the same ethylbenzene purity (xEB = 98.3 mole%) at the top of the
Chapter 6
129
extractive distillation column. From the sensitivity analysis, the conclusion can be drawn
that a styrene concentration in the IL recycle higher than 1.4, 0.4, and 0.24 wt% should be
avoided for the ILs [3-mebupy][B(CN)4], [4-mebupy][BF4], and [EMIM][SCN],
respectively. When styrene is added via the recycle, a higher reflux ratio is required to
maintain the top purity of the extractive distillation column. This will decrease the
IL/organic ratio in the column, and will lead to liquid–liquid phase splitting. This cannot be
avoided when even more IL is recycled. The maximum allowable styrene concentrations in
the IL recycles can be translated to the minimum IL purity, which needs to be at least 98.6,
99.6, and 99.76 wt% for the ILs [3-mebupy][B(CN)4], [4-mebupy][BF4], and
[EMIM][SCN], respectively.
Subsequently, it was explored if these IL purities can be obtained using an evaporator
which operates at mild conditions (T = 130 oC, P = 11.1 mbar, see Section 6.3). Using these
conditions, IL purities of 99.0, 99.5, and 99.7 wt% can be obtained for the ILs [3-
mebupy][B(CN)4], [4-mebupy][BF4], and [EMIM][SCN], respectively. It follows that the
IL purity constraint for the [3-mebupy][B(CN)4] can easily be satisfied with an evaporator
operating at mild conditions, but not for the other ILs. However, a large part of the styrene
could already be recovered using an evaporator at mild conditions; 97 % for [4-
mebupy][BF4] and 96 % for [EMIM][SCN]. Hence, a second evaporator at lower pressures
is required to further purify the ILs [4-mebupy][BF4] and [EMIM][SCN]. Both ILs were
regenerated to a purity of 99.9 wt%, because previous work on the IL regeneration (Chapter
5) showed that purifying the IL to a slightly higher purity than the minimum required
purity, lowers the energy requirements in the reboiler of the extractive distillation. Vacuum
pressures of 2.64 and 4.43 mbar were required for the ILs [4-mebupy][BF4] and
[EMIM][SCN], correspondingly.
Heat Integration
Finally, the total extractive distillation process was modeled for the three ILs by closing the
IL recycle and applying heat integration. The final process scheme for the IL [3-
mebupy][B(CN)4] is shown in Figure 6-3a. The process diagrams for the ILs [4-
mebupy][BF4] and [EMIM][SCN] are depicted in Figure 6-3b. It was not possible for the
ILs [4-mebupy][BF4] and [EMIM][SCN] to apply heat integration by evaporating part of
the organic feed stream. The reflux ratio increases if part of the feed stream is evaporated.
Thereby, the IL/organic ratio in the top of the column reduces, which causes liquid–liquid
phase splitting. The total energy requirements are depicted in Figure 6-13 for the different
ILs. The total energy requirements are a summation of the energies required for solvent
heating, evaporation, and refrigeration. The latter is required in the processes for the ILs [4-
mebupy][BF4] and [EMIM][SCN] to condense the evaporated styrene in the second
evaporator.
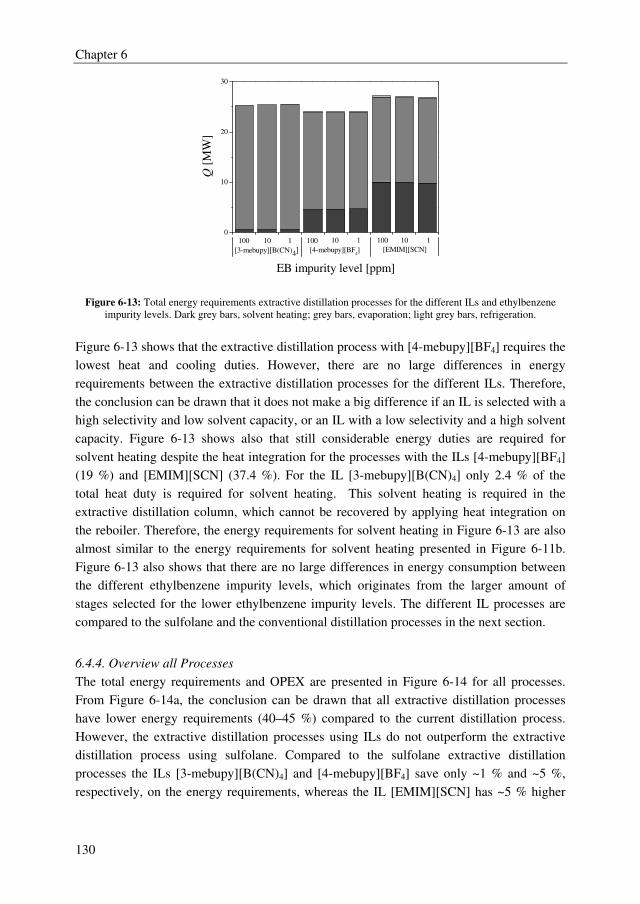
Chapter 6
130
0
10
20
30
Q [
MW
]
[EMIM][SCN][4-mebupy][BF4][3-mebupy][B(CN)4]
110
EB impurity level [ppm]
100 100 10 1 100 10 1
Figure 6-13: Total energy requirements extractive distillation processes for the different ILs and ethylbenzene
impurity levels. Dark grey bars, solvent heating; grey bars, evaporation; light grey bars, refrigeration.
Figure 6-13 shows that the extractive distillation process with [4-mebupy][BF4] requires the
lowest heat and cooling duties. However, there are no large differences in energy
requirements between the extractive distillation processes for the different ILs. Therefore,
the conclusion can be drawn that it does not make a big difference if an IL is selected with a
high selectivity and low solvent capacity, or an IL with a low selectivity and a high solvent
capacity. Figure 6-13 shows also that still considerable energy duties are required for
solvent heating despite the heat integration for the processes with the ILs [4-mebupy][BF4]
(19 %) and [EMIM][SCN] (37.4 %). For the IL [3-mebupy][B(CN)4] only 2.4 % of the
total heat duty is required for solvent heating. This solvent heating is required in the
extractive distillation column, which cannot be recovered by applying heat integration on
the reboiler. Therefore, the energy requirements for solvent heating in Figure 6-13 are also
almost similar to the energy requirements for solvent heating presented in Figure 6-11b.
Figure 6-13 also shows that there are no large differences in energy consumption between
the different ethylbenzene impurity levels, which originates from the larger amount of
stages selected for the lower ethylbenzene impurity levels. The different IL processes are
compared to the sulfolane and the conventional distillation processes in the next section.
6.4.4. Overview all Processes
The total energy requirements and OPEX are presented in Figure 6-14 for all processes.
From Figure 6-14a, the conclusion can be drawn that all extractive distillation processes
have lower energy requirements (40–45 %) compared to the current distillation process.
However, the extractive distillation processes using ILs do not outperform the extractive
distillation process using sulfolane. Compared to the sulfolane extractive distillation
processes the ILs [3-mebupy][B(CN)4] and [4-mebupy][BF4] save only ~1 % and ~5 %,
respectively, on the energy requirements, whereas the IL [EMIM][SCN] has ~5 % higher
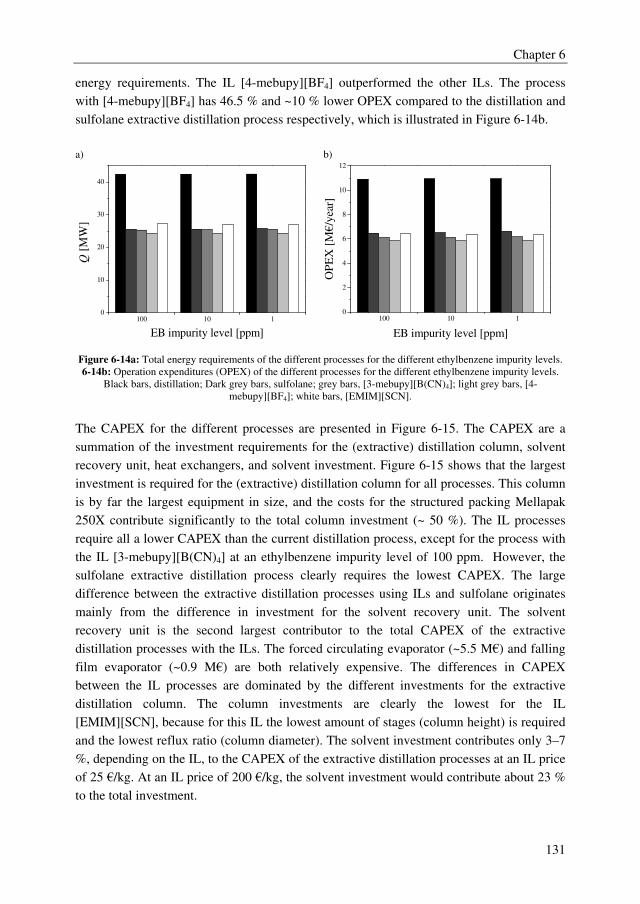
Chapter 6
131
energy requirements. The IL [4-mebupy][BF4] outperformed the other ILs. The process
with [4-mebupy][BF4] has 46.5 % and ~10 % lower OPEX compared to the distillation and
sulfolane extractive distillation process respectively, which is illustrated in Figure 6-14b.
a) b)
100 10 10
10
20
30
40
Q [
MW
]
EB impurity level [ppm]
100 10 10
2
4
6
8
10
12
O
PE
X [
M€/y
ear]
EB impurity level [ppm]
Figure 6-14a: Total energy requirements of the different processes for the different ethylbenzene impurity levels.
6-14b: Operation expenditures (OPEX) of the different processes for the different ethylbenzene impurity levels.
Black bars, distillation; Dark grey bars, sulfolane; grey bars, [3-mebupy][B(CN)4]; light grey bars, [4-
mebupy][BF4]; white bars, [EMIM][SCN].
The CAPEX for the different processes are presented in Figure 6-15. The CAPEX are a
summation of the investment requirements for the (extractive) distillation column, solvent
recovery unit, heat exchangers, and solvent investment. Figure 6-15 shows that the largest
investment is required for the (extractive) distillation column for all processes. This column
is by far the largest equipment in size, and the costs for the structured packing Mellapak
250X contribute significantly to the total column investment (~ 50 %). The IL processes
require all a lower CAPEX than the current distillation process, except for the process with
the IL [3-mebupy][B(CN)4] at an ethylbenzene impurity level of 100 ppm. However, the
sulfolane extractive distillation process clearly requires the lowest CAPEX. The large
difference between the extractive distillation processes using ILs and sulfolane originates
mainly from the difference in investment for the solvent recovery unit. The solvent
recovery unit is the second largest contributor to the total CAPEX of the extractive
distillation processes with the ILs. The forced circulating evaporator (~5.5 M€) and falling
film evaporator (~0.9 M€) are both relatively expensive. The differences in CAPEX
between the IL processes are dominated by the different investments for the extractive
distillation column. The column investments are clearly the lowest for the IL
[EMIM][SCN], because for this IL the lowest amount of stages (column height) is required
and the lowest reflux ratio (column diameter). The solvent investment contributes only 3–7
%, depending on the IL, to the CAPEX of the extractive distillation processes at an IL price
of 25 €/kg. At an IL price of 200 €/kg, the solvent investment would contribute about 23 %
to the total investment.
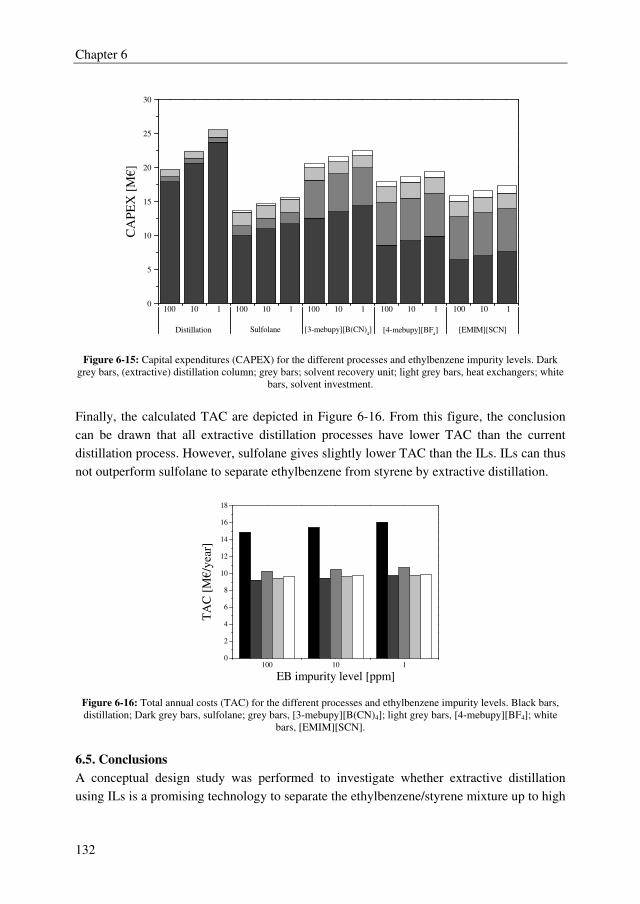
Chapter 6
132
0
5
10
15
20
25
30
[EMIM][SCN][4-mebupy][BF4][3-mebupy][B(CN)
4]Sulfolane
C
AP
EX
[M
€]
110100110100 100 10 1
Distillation
100 10 1100 10 1
Figure 6-15: Capital expenditures (CAPEX) for the different processes and ethylbenzene impurity levels. Dark
grey bars, (extractive) distillation column; grey bars; solvent recovery unit; light grey bars, heat exchangers; white
bars, solvent investment.
Finally, the calculated TAC are depicted in Figure 6-16. From this figure, the conclusion
can be drawn that all extractive distillation processes have lower TAC than the current
distillation process. However, sulfolane gives slightly lower TAC than the ILs. ILs can thus
not outperform sulfolane to separate ethylbenzene from styrene by extractive distillation.
100 10 10
2
4
6
8
10
12
14
16
18
TA
C [
M€
/yea
r]
EB impurity level [ppm]
Figure 6-16: Total annual costs (TAC) for the different processes and ethylbenzene impurity levels. Black bars,
distillation; Dark grey bars, sulfolane; grey bars, [3-mebupy][B(CN)4]; light grey bars, [4-mebupy][BF4]; white
bars, [EMIM][SCN].
6.5. Conclusions
A conceptual design study was performed to investigate whether extractive distillation
using ILs is a promising technology to separate the ethylbenzene/styrene mixture up to high
Chapter 6
133
styrene purities. Extractive distillation with sulfolane and the current distillation process
were taken as the benchmark processes. Three ILs were studied: [3-mebupy][B(CN)4], [4-
mebupy][BF4], and [EMIM][SCN]. The IL [4-mebupy][BF4] slightly outperformed the
other two ILs with up to 11.5 % lower energy requirements. The operational expenditures
of the [4-mebupy][BF4] process are 43.2 % lower than the current distillation process and 5
% lower than extractive distillation with sulfolane extractive distillations. However, the
capital expenditures were about 23 % lower for the sulfolane process compared to the [4-
mebupy][BF4] process. Finally, from the total annual costs, the conclusion can be drawn
that all extractive distillation processes outperform the current distillation process to obtain
high purity styrene, but that ILs do not perform better than sulfolane.
6.6. Nomenclature
Cp specific heat capacity J/(gr·K)
D solvent capacity
F feed kg
MW molecular weight g/mole
P pressure Pa
Q heat MW
R reflux ratio
S solvent kg
Sij selectivity
T temperature K
w weight fraction
x mole fraction
Greek symbols
α relative volatility
η viscosity Pa·sec
Subscripts
REB reboiler
Abbreviations
CAPEX capital expenditures
DIPPR design institute for physical property data
EB ethylbenzene
[EMIM][SCN] 1-ethyl-3-methylimidazolium thiocyanate
IL ionic liquid
LLE liquid–liquid equilibrium
Chapter 6
134
[3-mebupy][B(CN)4] 3-methyl-N-butylpyridinium tetracyanoborate
[4-mebupy][BF4] 4-methyl-N-butylpyridinium tetrafluoroborate
mta metric tonnes annually
MESH material equilibrium summation heat
NRTL nonrandom two-liquid
NTS number of theoretical stages
OPEX operational expenditures
ppb parts per billion
ppm parts per million
SM styrene monomer
VLE vapor–liquid equilibrium
References
[1] V.A. Welch, US 6171449 B1, 2001.
[2] S. Chen, in: Arza Seidel (Ed.), Kirk-Othmer Encyclopedia of Chemical
Technology, John Wiley & Sons, New Yersey, 2000.
[3] World Health Organization, Iarc monographs on the evaluation of carcinogenic
risks to humans, IARC Press, Lyon, 2002.
[4] F.M. Lee, J.C. Gentry, Chem. Eng. Process 93 (1997) 56-64.
[5] J.C. Gentry, S. Kumar, R. Wright-Wytcherley, Hydrocarb. Process. 93 (2004)
62-66.
[6] Z. Lei, B. Chen, Z. Ding, in: Special Distillation Processes, Elsevier,
Amsterdam, 2005, pp. 59-144.
[7] M. Souders, Chem. Eng. Prog 60 (1964) 75-82.
[8] P. Steltenpohl, M. Chlebovec, E. Graczova, Chem. Pap. 59 (2005) 421-427.
[9] M.T.G. Jongmans, J.I.W. Maassen, A.J. Luijks, B. Schuur, A.B. de Haan, J.
Chem. Eng. Data 56 (2011) 3510-3517.
[10] K.N. Marsh, J.A. Boxall, R. Lichtenthaler, Fluid Phase Equilibr. 219 (2004) 93-
98.
[11] G.W. Meindersma, L.M. Galan Sanchez, A.R. Hansmeier, A.B. de Haan,
Monatsh. Chem. 138 (2007) 1125-1136.
[12] R. Giernoth, Angew. Chem. Int. Ed. 49 (2010) 2834-2839.
[13] Y. Beste, M. Eggersmann, H. Schoenmakers, Chem. Ing. Tech. 77 (2005) 1800-
1808.
[14] C. Jork, C. Kristen, D. Pieraccini, A. Stark, C. Chiappe, Y.A. Beste, W. Arlt, J.
Chem. Thermodyn. 37 (2005) 537-558.
[15] Z. Lei, W. Arlt, P. Wasserscheid, Fluid Phase Equilibr. 260 (2007) 29-35.
[16] A.R. Hansmeier, M.T.G. Jongmans, G.W. Meindersma, A.B. de Haan, J. Chem.
Thermodyn. 42 (2010) 484-490.
[17] M.T.G. Jongmans, B. Schuur, A.B. de Haan, Ind. Eng. Chem. Res. 50 (2011)
10800-10810.
[18] S.A.F. Onink, G.H.F. Aerts, B. Burghoff, G.W. Meindersma, A.B. de Haan, J.
Liq. chromatogr. r. t. (2011) Submitted.
[19] B.G. Kyle, D.E. Leng, Ind. Eng. Chem. 57 (1965) 43-48.
Chapter 6
135
[20] S. Kossack, K. Kraemer, R. Gani, W. Marquardt, Chem. Eng. Res. Des. 86
(2008) 781-792.
[21] G.W. Meindersma, B.T.J. Simons, A.B. de Haan, J. Chem. Thermodyn. 43
(2011) 1628-1640.
[22] I. Bandres, B. Giner, H. Artigas, F.M. Royo, C. Lafuente, J. Phys. Chem. B 112
(2008) 3077-3084.
[23] L.E. Ficke, R.R. Novak, J.F. Brennecke, J. Chem. Eng. Data 55 (2010) 4946-
4950.
[24] M. Castagnolo, A. Inglese, G. Petrella, A. Sacco, Thermochim. Acta 44 (1981)
67-76.
[25] L.G. Sanchez, J.R. Espel, F. Onink, G.W. Meindersma, A.B. de Haan, J. Chem.
Eng. Data 54 (2009) 2803-2812.
[26] U. Domanska, M. Krolikowska, M. Krolikowski, Fluid Phase Equilibr. 294
(2010) 72-83.
[27] S.F. Al-Azzawi, A.M. Awwad, J. Chem. Eng. Data 35 (1990) 411-414.
[28] B.E. Poling, J.M. Prausnitz, J.P. O'Connell, The Properties of Gases and
Liquids, Fifth ed., McGraw Hill, Singapore, 2007.
[29] P. Gomez, I. Gil, Proceedings of european congress of chemical engineering (
2007), 1-19.
[30] ASPEN Plus V7.2, User Guide, 1st ed., 2011.
[31] U. Hömmerich, R. Rautenbach, J. Membrane Sci. 146 (1998) 53-64.
[32] W. HOU, H. SU, Y. HU, J. CHU, Chin. J. Chem. Eng. 14 (2006) 584-591.
[33] R.T.P. Pinto, M.R. Wolf-Maciel, L. Lintomen, Computers & Chemical
Engineering 24 (2000) 1689-1694.
[34] R. Baur, A.P. Higler, R. Taylor, R. Krishna, Chem. Eng. J. 76 (2000) 33-47.
[35] J. Gmehling, U. Onken, Vapor-liquid equilibrium data collection ed.,
DECHEMA, Frankfurt, 1977.
[36] H. Renon, J.M. Prausnitz, AIChE J. 14 (1968) 135-144.
[37] A.L. Ward, W.J. Robert, in: Arza Seidel (Ed.), Kirk-Othmer Encyclopedia of
Chemical Technology, John Wiley & Sons, New York, 2000.
[38] R.H. Perry, D.W. Green, Perry's Chemical Engineers Handbook, 7 ed.,
McGraw-Hill, New York, 1997.
[39] M.F. Doherty, J.P. Knapp, Distillation, Azeotropic, and Extractive ed., John
Wiley & Sons, Inc., 2000.
[40] I. Sucksmith, Chem. Eng. 89 (1982) 91-95.
[41] W.D. Seider, J.D. Seader, D.R. Lewin, Product & Process Design Principles,
Second ed., John Wiley & Sons, New York, 2004.
[42] Dutch Association of Cost Engineers, DACE Prijzenboekje, 28th ed., Reed
Business, Doetinchem, 2011.
[43] J.F. Richarson, J.H. Harker, J.R. Backhurst, Coulson & Richarson's Chemical
Engineering, 5th ed., Butterworth Heinneman, Oxford, 2002.
[44] M.F. Arenas, R.G. Reddy, J. Min. Metal. 39 (2003) 81-91.
[45] M. Uerdingen, C. Treber, M. Balser, G. Schmitt, C. Werner, Green Chem. 7
(2005) 321-325.
[46] O. Stewart, L. Minnear, Sulfolane Technical Assistance and Evaluation Report,
Oasis Environmental, 2011.
[47] P. Wasserscheid, T. Welton, in: P. Wasserscheid, T. Welton (Eds.), Ionic
Liquids in Synthesis, Wiley-VCH, Weinheim, 2008, pp. 1-6.
Chapter 6
136
[48] G.W. Meindersma, A.B. de Haan, Chem. Eng. Res. Des. 86 (2008) 745-752.
[49] DIY Trade, http://www.diytrade.com/china/4/products/3196215/sulfolane.html,
2011.
[50] M.R. Fenske, Ind. Eng. Chem. 24 (1932) 482-485.
[51] D.R. Lide, W.M. Haynes, Handbook of Chemistry and Physics, 87th ed., Taylor
and Francis group LLC, London, 2009.
[52] A.J.V. Underwood, Transactions of the American Institute of Chemical
Engineers 10 (1932) 112-112.
[53] W. Yin, S. Ding, S. Xia, P. Ma, X. Huang, Z. Zhu, J. Chem. Eng. Data 55
(2010) 3274-3277.
137
Extractant Screening for the Separation of
Dichloroacetic Acid from Monochloroacetic Acid
by Extractive Distillation
Submitted as:
M.T.G. Jongmans, A. Londoño, S. Mamilla, B. Schuur, A.B. de Haan, Sep.
Pur. Technol.
Abstract Monochloroacetic acid (MCA) is produced via the chlorination of acetic acid, in which a
part is overchlorinated to the undesired dichloroacetic acid (DCA). The separation of DCA
from MCA by distillation is highly energy intensive, because the relative volatility (α)
approaches unity. Extractive distillation is a promising technology to separate close boiling
mixtures. The benchmark extractant sulfolane is known to increase the α of the MCA/DCA
mixture only slightly. By applying basic complexing agents, the large difference in the acid
dissociation constant between MCA (pKa = 2.87) and DCA (pKa = 1.25) can be exploited to
further enhance the α of the MCA/DCA mixture. The aim of this study was to select a
proper complexing agent. Such a complexing agent should not only enhance the α more
than obtained with sulfolane, but also be stable in the presence of MCA and DCA, and the
complexation should be reversible. Many extractants were found that improve the α more
than sulfolane, with values for α up to 5.9. There is, however, a clear trade-off between the
effect of the extractant on the α of the MCA/DCA mixture and the regeneration ability of
the extractant. Complexation agents from the classes of ethers, ketones, and phosphine
oxides, and the benchmark extractant sulfolane were the only extractants that demonstrated
to be thermally/chemically stable in the strongly acidic environment. With regard to the α,
the regeneration ability, and the stability of the extractants, it was concluded that glymes,
e.g. diethylene glycol dipentyl ether are the most promising extractants, improving the α of
the MCA/DCA system up to 2.1–2.4.
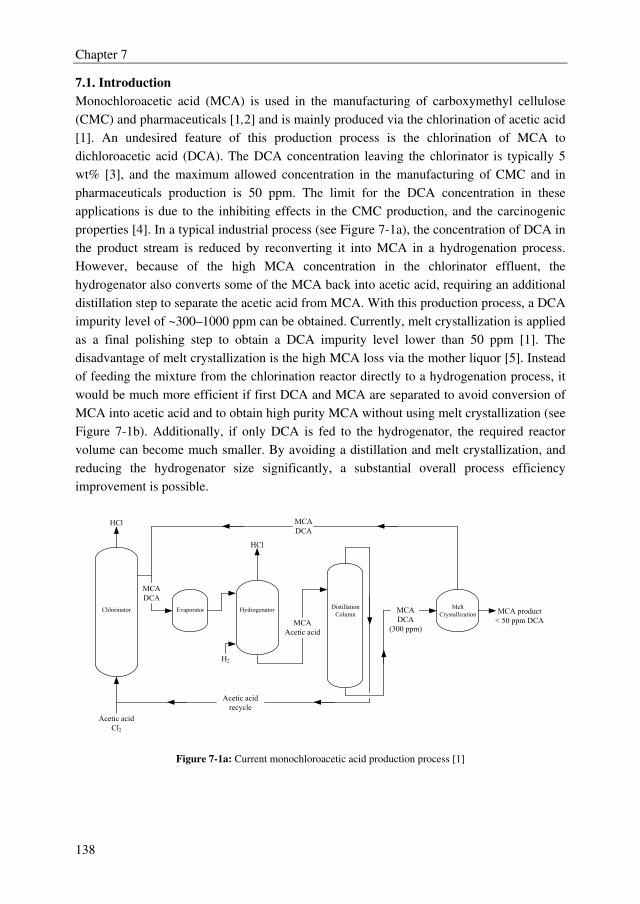
Chapter 7
138
7.1. Introduction
Monochloroacetic acid (MCA) is used in the manufacturing of carboxymethyl cellulose
(CMC) and pharmaceuticals [1,2] and is mainly produced via the chlorination of acetic acid
[1]. An undesired feature of this production process is the chlorination of MCA to
dichloroacetic acid (DCA). The DCA concentration leaving the chlorinator is typically 5
wt% [3], and the maximum allowed concentration in the manufacturing of CMC and in
pharmaceuticals production is 50 ppm. The limit for the DCA concentration in these
applications is due to the inhibiting effects in the CMC production, and the carcinogenic
properties [4]. In a typical industrial process (see Figure 7-1a), the concentration of DCA in
the product stream is reduced by reconverting it into MCA in a hydrogenation process.
However, because of the high MCA concentration in the chlorinator effluent, the
hydrogenator also converts some of the MCA back into acetic acid, requiring an additional
distillation step to separate the acetic acid from MCA. With this production process, a DCA
impurity level of ~300–1000 ppm can be obtained. Currently, melt crystallization is applied
as a final polishing step to obtain a DCA impurity level lower than 50 ppm [1]. The
disadvantage of melt crystallization is the high MCA loss via the mother liquor [5]. Instead
of feeding the mixture from the chlorination reactor directly to a hydrogenation process, it
would be much more efficient if first DCA and MCA are separated to avoid conversion of
MCA into acetic acid and to obtain high purity MCA without using melt crystallization (see
Figure 7-1b). Additionally, if only DCA is fed to the hydrogenator, the required reactor
volume can become much smaller. By avoiding a distillation and melt crystallization, and
reducing the hydrogenator size significantly, a substantial overall process efficiency
improvement is possible.
HCl
Acetic acid
Cl2
Chlorinator
MCA
DCA
Evaporator Hydrogenator
H2
HCl
MCA
Acetic acid
Distillation
ColumnMCA
DCA
(300 ppm)
Acetic acid
recycle
Melt
Crystallization MCA product
< 50 ppm DCA
MCA
DCA
Figure 7-1a: Current monochloroacetic acid production process [1]
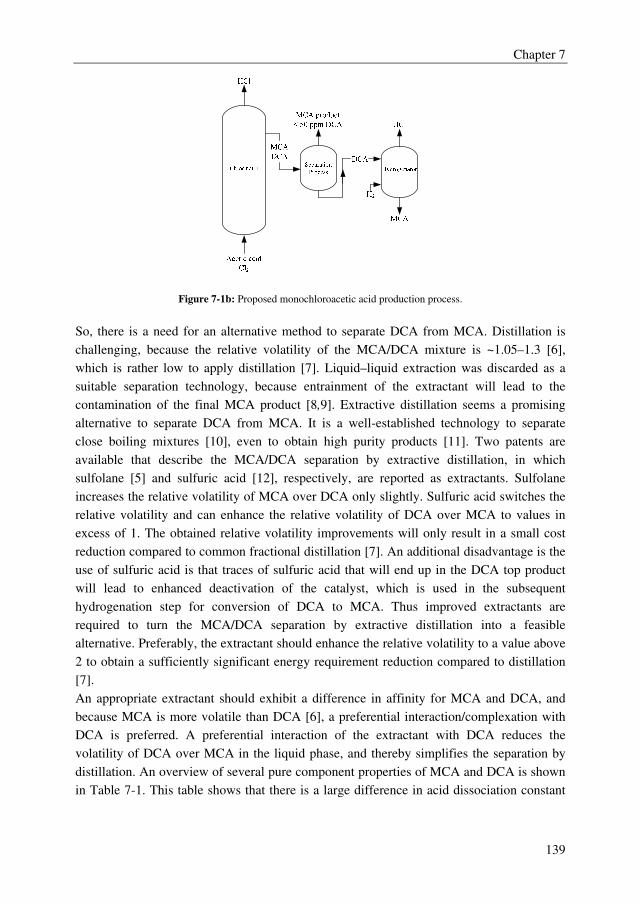
Chapter 7
139
Figure 7-1b: Proposed monochloroacetic acid production process.
So, there is a need for an alternative method to separate DCA from MCA. Distillation is
challenging, because the relative volatility of the MCA/DCA mixture is ~1.05–1.3 [6],
which is rather low to apply distillation [7]. Liquid–liquid extraction was discarded as a
suitable separation technology, because entrainment of the extractant will lead to the
contamination of the final MCA product [8,9]. Extractive distillation seems a promising
alternative to separate DCA from MCA. It is a well-established technology to separate
close boiling mixtures [10], even to obtain high purity products [11]. Two patents are
available that describe the MCA/DCA separation by extractive distillation, in which
sulfolane [5] and sulfuric acid [12], respectively, are reported as extractants. Sulfolane
increases the relative volatility of MCA over DCA only slightly. Sulfuric acid switches the
relative volatility and can enhance the relative volatility of DCA over MCA to values in
excess of 1. The obtained relative volatility improvements will only result in a small cost
reduction compared to common fractional distillation [7]. An additional disadvantage is the
use of sulfuric acid is that traces of sulfuric acid that will end up in the DCA top product
will lead to enhanced deactivation of the catalyst, which is used in the subsequent
hydrogenation step for conversion of DCA to MCA. Thus improved extractants are
required to turn the MCA/DCA separation by extractive distillation into a feasible
alternative. Preferably, the extractant should enhance the relative volatility to a value above
2 to obtain a sufficiently significant energy requirement reduction compared to distillation
[7].
An appropriate extractant should exhibit a difference in affinity for MCA and DCA, and
because MCA is more volatile than DCA [6], a preferential interaction/complexation with
DCA is preferred. A preferential interaction of the extractant with DCA reduces the
volatility of DCA over MCA in the liquid phase, and thereby simplifies the separation by
distillation. An overview of several pure component properties of MCA and DCA is shown
in Table 7-1. This table shows that there is a large difference in acid dissociation constant
Chapter 7
140
(pKa) between MCA (2.87) and DCA (1.25) [13]. The large pKa difference can be exploited
by applying basic complexing agents, to change the non-ideal behavior of the liquid phase.
DCA is a stronger acid than MCA, because it has a lower pKa and therefore will form a
stronger complex with a basic complexing agent. Acid extractions from aqueous solutions
using basic complexing extractants in organic diluents have extensively been investigated,
e.g. by King and co-workers [14,15], Prochazka [16], Wasewar [17,18], and Krzyzaniak
[19]. Based on the difference in the complexation strength due to the difference in acidity, a
separation of multiple acids is possible in liquid–liquid systems [14,15], but this principle
may also be applied to vapor–liquid systems. When applied to the MCA/DCA system,
DCA, which is already the least volatility component, is also stronger bound to the basic
extractant, and thus even more retained in the liquid phase, hence the relative volatility is
expected to increase. The use of such extractants, that form complexes with the solutes in a
distillation column, is also known as reactive extractive distillation [20-23].
Table 7-1: Properties of monochloroacetic acid (MCA) and dichloroacetic acid (DCA).
Property MCA DCA Reference
Mw [g mol-1] 94.5 128.9 [13]
Tm [oC] 63 13.5 [13]
Tb [oC] 189.3 194 [13]
pKa 2.87 1.25 [13]
H2O solubility [g/100g H2O] 421 miscible [1]
µ [Debye] 2.308 1.090 MCA [24], DCA [25]
ω 0.546 0.555 [24]
Similar to a normal extractive distillation process a reactive extractive distillation process
typically consists of a complexation and regeneration column [21]. The proper selection of
the extractant is crucial for the technical feasibility, and the operational and capital
expenditures [26]. The extractant should give a strong and specific complex in the
complexation column to have a significant effect on the relative volatility. However, the
complex between the extractant and the solute should be reversible to regenerate the
extractant in the regeneration column [27]. The basicity of the extractant strongly
influences the strength of the complex between the extractant and both acids. The Lewis
basicity, also called donor number, is a well-known property to determine the basicity of a
component [28]. Next to the effect on the non-ideal behavior in both columns, a
complexing agent should not form any side products to avoid irreversible extractant and
product loss, should be thermally stable, and should have sufficiently fast kinetics in both
directions [29]. Moreover, the extractant should have a sufficiently high boiling point to
facilitate easy regeneration [27].
The objective of this study was to find a basic complexing agent, which fulfills the above
criteria for the separation of DCA from MCA in a reactive extractive distillation process. In
total, 15 basic complexing agents were investigated by performing vapor–liquid
Chapter 7
141
equilibrium (VLE) experiments, and by determining the chemical and thermal stability. The
VLE data of the newly tested extractants were compared to the benchmark extractant
sulfolane, and a qualitative relation between the performance of the extractants and the
Lewis basicity was proposed. The extractants were selected based on their Lewis basicity
(see theory of Lewis basicity section). A priori, several extractant classes that solely based
on their Lewis basicity could be promising, were excluded based on relevant literature, e.g.
primary and secondary amines, which form irreversible complexes with carboxylic acids
[21]. Moreover, at high temperatures they can form amides through dehydration of the alkyl
ammonium carboxylate salt [14]. Tertiary amine oxides [30] were discarded because there
are only stable up to ~125 oC [31]. Alcohols were also not considered as suitable
extractants, because alcohols can react with acids to form esters and water [32].
The following extractant classes were investigated in this study as promising candidates to
separate DCA from MCA by extractive distillation: tertiary amines [33,34], trialkyl
phosphates [35,36], trialkyl phospine oxides [37], ethers [38-40], ketones [41], nitriles
[42,43], pyridines [44], and amides [45]. All selected extractants have a boiling point
difference compared to DCA of at least 30 oC to facilitate the extractant recovery. The
selected extractants are listed in Table 7-2.
7.2. Theory of Lewis Basicity
The strength of an acid-base complex is determined by the dissociation constant of the acid
(pKa) [14,46], the Lewis basicity of the extractant [37,39], temperature [47] and the
concentrations of the components [22,35]. The selected extractants in this work differ in
Lewis basicity and boiling point. A quantitative measure for the Lewis basicity is the donor
number [28]. The donor numbers of many Lewis bases have been measured [28]. One of
the scales used to express the donor number is the boron trifluoride (BF3, a Lewis acid)
affinity scale. The BF3 affinity scale, collected by Laurence and Gal [28], reports the
formation enthalpy of a 1:1 complex between BF3 and a Lewis base in a solution of
dichloromethane (CH2Cl2) for many Lewis bases. For the extractants used in this work, the
BF3 affinities were in most instances directly taken from Laurence and Gal [28], and in
some specific cases (e.g. di-n-hexyl ether) the BF3 affinity was estimated from the BF3
affinities available for other, similar components. The use of similar components is
possible, since the BF3 affinity is hardly dependent on the alkyl chain length [28]. In this
specific example, the BF3 affinity for di-n-butyl ether can be used to express the BF3
affinity of di-n-hexyl ether. The values for the BF3 affinity for the selected extractants used
in this work are reported in Table 7-2. For the extractants for which no BF3 affinity was
available or could be derived from other extractants with reasonable resemblance in
molecular structure, no BF3 affinity is listed.
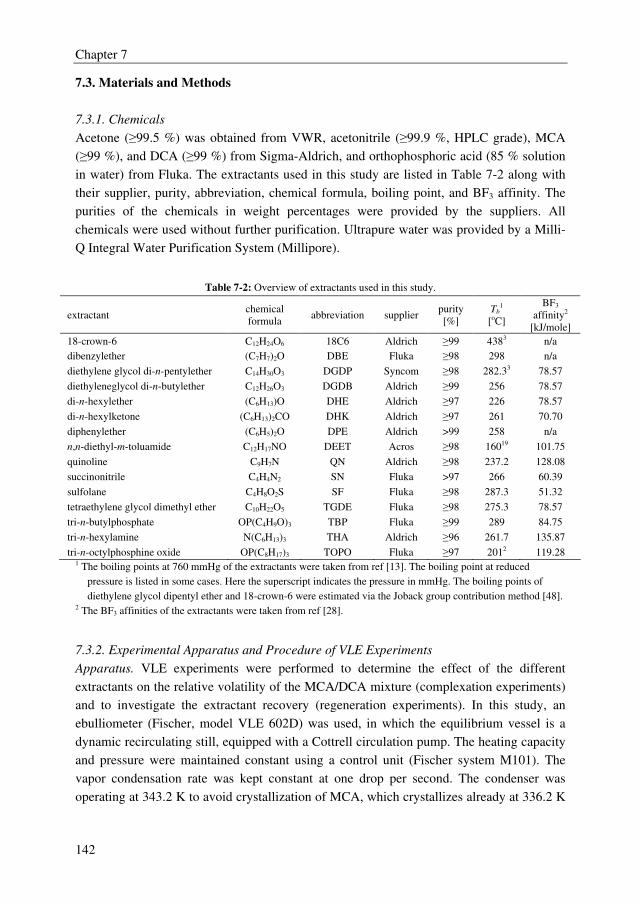
Chapter 7
142
7.3. Materials and Methods
7.3.1. Chemicals
Acetone (≥99.5 %) was obtained from VWR, acetonitrile (≥99.9 %, HPLC grade), MCA
(≥99 %), and DCA (≥99 %) from Sigma-Aldrich, and orthophosphoric acid (85 % solution
in water) from Fluka. The extractants used in this study are listed in Table 7-2 along with
their supplier, purity, abbreviation, chemical formula, boiling point, and BF3 affinity. The
purities of the chemicals in weight percentages were provided by the suppliers. All
chemicals were used without further purification. Ultrapure water was provided by a Milli-
Q Integral Water Purification System (Millipore).
Table 7-2: Overview of extractants used in this study.
extractant chemical
formula abbreviation supplier
purity
[%]
Tb1
[oC]
BF3
affinity2
[kJ/mole]
18-crown-6 C12H24O6 18C6 Aldrich ≥99 4383 n/a
dibenzylether (C7H7)2O DBE Fluka ≥98 298 n/a
diethylene glycol di-n-pentylether C14H30O3 DGDP Syncom ≥98 282.33 78.57
diethyleneglycol di-n-butylether C12H26O3 DGDB Aldrich ≥99 256 78.57
di-n-hexylether (C6H13)O DHE Aldrich ≥97 226 78.57
di-n-hexylketone (C6H13)2CO DHK Aldrich ≥97 261 70.70
diphenylether (C6H5)2O DPE Aldrich >99 258 n/a
n,n-diethyl-m-toluamide C12H17NO DEET Acros ≥98 16019 101.75
quinoline C9H7N QN Aldrich ≥98 237.2 128.08
succinonitrile C4H4N2 SN Fluka >97 266 60.39
sulfolane C4H8O2S SF Fluka ≥98 287.3 51.32
tetraethylene glycol dimethyl ether C10H22O5 TGDE Fluka ≥98 275.3 78.57
tri-n-butylphosphate OP(C4H9O)3 TBP Fluka ≥99 289 84.75
tri-n-hexylamine N(C6H13)3 THA Aldrich ≥96 261.7 135.87
tri-n-octylphosphine oxide OP(C8H17)3 TOPO Fluka ≥97 2012 119.28 1 The boiling points at 760 mmHg of the extractants were taken from ref [13]. The boiling point at reduced
pressure is listed in some cases. Here the superscript indicates the pressure in mmHg. The boiling points of
diethylene glycol dipentyl ether and 18-crown-6 were estimated via the Joback group contribution method [48]. 2 The BF3 affinities of the extractants were taken from ref [28].
7.3.2. Experimental Apparatus and Procedure of VLE Experiments
Apparatus. VLE experiments were performed to determine the effect of the different
extractants on the relative volatility of the MCA/DCA mixture (complexation experiments)
and to investigate the extractant recovery (regeneration experiments). In this study, an
ebulliometer (Fischer, model VLE 602D) was used, in which the equilibrium vessel is a
dynamic recirculating still, equipped with a Cottrell circulation pump. The heating capacity
and pressure were maintained constant using a control unit (Fischer system M101). The
vapor condensation rate was kept constant at one drop per second. The condenser was
operating at 343.2 K to avoid crystallization of MCA, which crystallizes already at 336.2 K
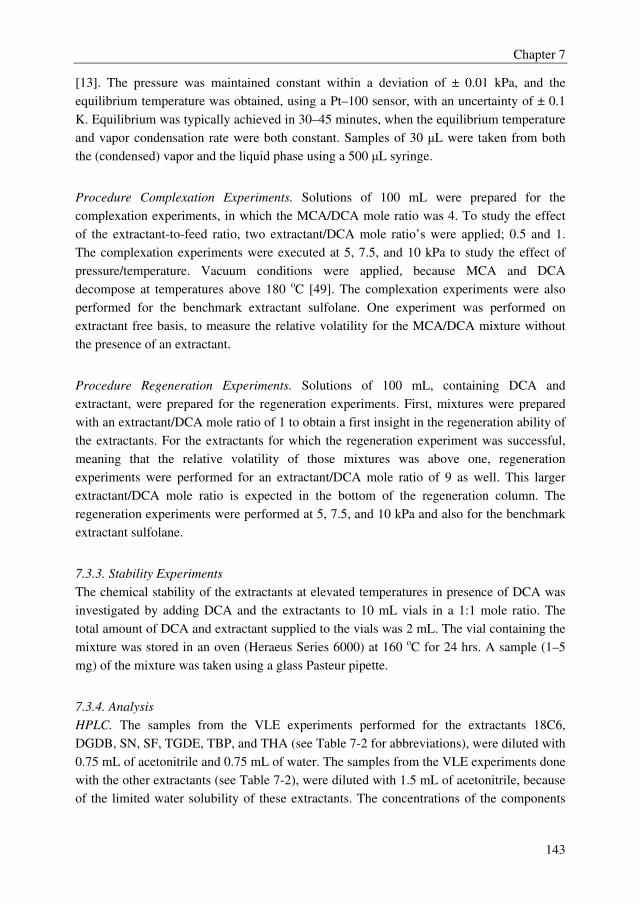
Chapter 7
143
[13]. The pressure was maintained constant within a deviation of ± 0.01 kPa, and the
equilibrium temperature was obtained, using a Pt–100 sensor, with an uncertainty of ± 0.1
K. Equilibrium was typically achieved in 30–45 minutes, when the equilibrium temperature
and vapor condensation rate were both constant. Samples of 30 µL were taken from both
the (condensed) vapor and the liquid phase using a 500 µL syringe.
Procedure Complexation Experiments. Solutions of 100 mL were prepared for the
complexation experiments, in which the MCA/DCA mole ratio was 4. To study the effect
of the extractant-to-feed ratio, two extractant/DCA mole ratio’s were applied; 0.5 and 1.
The complexation experiments were executed at 5, 7.5, and 10 kPa to study the effect of
pressure/temperature. Vacuum conditions were applied, because MCA and DCA
decompose at temperatures above 180 oC [49]. The complexation experiments were also
performed for the benchmark extractant sulfolane. One experiment was performed on
extractant free basis, to measure the relative volatility for the MCA/DCA mixture without
the presence of an extractant.
Procedure Regeneration Experiments. Solutions of 100 mL, containing DCA and
extractant, were prepared for the regeneration experiments. First, mixtures were prepared
with an extractant/DCA mole ratio of 1 to obtain a first insight in the regeneration ability of
the extractants. For the extractants for which the regeneration experiment was successful,
meaning that the relative volatility of those mixtures was above one, regeneration
experiments were performed for an extractant/DCA mole ratio of 9 as well. This larger
extractant/DCA mole ratio is expected in the bottom of the regeneration column. The
regeneration experiments were performed at 5, 7.5, and 10 kPa and also for the benchmark
extractant sulfolane.
7.3.3. Stability Experiments
The chemical stability of the extractants at elevated temperatures in presence of DCA was
investigated by adding DCA and the extractants to 10 mL vials in a 1:1 mole ratio. The
total amount of DCA and extractant supplied to the vials was 2 mL. The vial containing the
mixture was stored in an oven (Heraeus Series 6000) at 160 oC for 24 hrs. A sample (1–5
mg) of the mixture was taken using a glass Pasteur pipette.
7.3.4. Analysis
HPLC. The samples from the VLE experiments performed for the extractants 18C6,
DGDB, SN, SF, TGDE, TBP, and THA (see Table 7-2 for abbreviations), were diluted with
0.75 mL of acetonitrile and 0.75 mL of water. The samples from the VLE experiments done
with the other extractants (see Table 7-2), were diluted with 1.5 mL of acetonitrile, because
of the limited water solubility of these extractants. The concentrations of the components
Chapter 7
144
were analyzed using High Pressure Liquid Chromatography (HPLC, Varian Prostar). A
silica-based Grace PrevailTM Organic Acid column (250mm x 4.6 mm) with a particle size
of 5 µm was used. The temperature of the column was kept constant in an oven (Varian
Prostar Model 510) at 313.2 K for all measurements. Detection of MCA and DCA was
done using a UV detector (Varian Prostar model 310) at 210 nm. The concentrations of the
extractants were calculated by means of a mass balance over the sample. The eluent flow
was 1 mL/min, and consisted of acetonitrile (5 vol%), and an orthophosphoric acid solution
(19 g/L) in Milli-Q water (95 vol%) to analyze the samples with the extractants 18C6,
DGDB, SN, SF, TGDE, TBP, and THA. The eluent consisted of 15 vol% acetonitrile, and
85 vol% orthophosphoric acid solution to analyze the samples with the other extractants.
The column was regenerated after each injection with pure acetonitrile. Each sample was
injected twice. The mole fractions of the components in both phases could be obtained
within an accuracy of 0.001 in mole fraction.
GC-MS. The samples from the stability experiments were diluted with 1.5 mL of acetone.
The samples were then analyzed using a gas chromatograph (Shimadzu GC-17A Gas
Chromatograph) equipped with a flame ionization detector, a mass spectrometer (Shimadzu
GC MS-QP5000 Detector MS), and a Chrompack VF-1ms column (25 m × 0.4 µm). The
split ratio was 10, and the injection volume 1 µL. The carrier (helium) flow was 0.8
mL/min. The column starting and end temperatures were 50 oC and 290 oC, respectively,
with a heating rate of 10 oC/min. The mass spectrometer was set from 35 g/mole to 400
g/mole and the interface temperature at 250 oC.
7.4. Results and Discussion
In this section, the results on the effect of the various extractants on the VLE of the
MCA/DCA mixture in the complexation experiments, the VLE of the extractant/DCA
mixtures in the regeneration experiments and the thermal/chemical stability experiments are
discussed. First the results from the complexation experiments are presented, in which the
effects of the extractants’ molecular structure, pressure/temperature, and extractant-to-feed
ratio on the relative volatility of the MCA/DCA mixture are discussed. Moreover, a
qualitative relation between extractant performance and the Lewis basicity is proposed.
These results are followed by the results from the regeneration experiments. Here, also the
effect of the molecular structure of the extractant and pressure/temperature are discussed.
Finally, the results from the stability experiments are provided.
Chapter 7
145
7.4.1. Complexation Experiments
The complexation experiments were performed as described in section 7.3.2. The results
from the complexation experiments are listed in Appendix D. The VLE data for the
extractant quinoline are not reported here, because no VLE could be obtained for this
extractant, neither for the complexation, nor for the regeneration experiments. After the
mixtures containing this extractant were supplied to the ebulliometer, the color changed
very rapidly from colorless to dark brownish and a black solid substance was formed when
heating. Quinoline is a pyridine-derivative, and pyridines are known for their reactivity in
nucleophilic substitutions, especially at higher temperatures and in the presence of acids
they are very reactive [50], which in this example resulted in a chemically instable mixture.
The relative volatility, as defined in Equation 7-1, was determined at 5, 7.5, and 10 kPa,
and extractant/DCA mole ratios of 0.5 and 1. A comparison of the relative volatilities at 5
kPa is depicted in Figure 7-2.
o
o
P
P
xy
xy
αDCADCA
MCAMCA
DCA
DCA
MCA
MCA
γ
γ==
(7-1)
THA
TOPO
18C6
TGD
E
DGDP
DGDB
DEET
TBPDHEDHKDBE SF
DPE
SN1
2
3
4
5
6
α
Figure 7-2: Experimental relative volatilities (Equation 7-1) of the MCA/DCA mixture in the presence of the
extractants at 5 kPa, MCA/DCA mole ratio of 4, and extractant/DCA mole ratio’s of 0.5 and 1. Black bars denote
extractant/DCA mole ratio of 0.5; gray bars denote extractant/DCA mole ratio of 1; the line indicates the relative
volatility of the extractant free mixture.
Figure 7-2 shows that all extractants increase the relative volatility of the MCA/DCA
mixture. Moreover, many extractants outperform sulfolane (α ~ 1.5–1.6 at an
extractant/DCA ratio of 1), except the extractants DPE and SN. The different extractants
can be divided into three classes based on the results from the complexation experiments at
Chapter 7
146
an extractant/DCA mole ratio of 1: strong complexing agents (α ≥ 2.5), moderate
complexing agents (2.5 ≥ α ≥ 1.8), and weak complexing agents (α ≤ 1.8).
Strong Complexing Agents
The extractants THA, TOPO, and 18C6 were identified as strong complexing agents (α ≥
2.5). From Figure 7-2 the conclusion can be drawn that THA has the largest effect on the
relative volatility of the MCA/DCA mixture with values up to 5.9. This can be explained by
the strong basicity of this extractant. Tertiary amines are much stronger bases than alcohols,
ethers, esters, etc. [50], which is confirmed by the BF3 affinities of the extractants listed in
Table 7-2 [28]. This behavior is also in accordance with the behavior reported in the open
literature about LLE extraction of carboxylic acids from water. Tertiary amines form a
stronger complex with carboxylic acids than extractants like trialkyl phosphine oxides
(TOPO), and trialkyl phosphates (TBP) [33,36,37]. TOPO was also identified as a strong
complexing agent, whereas TBP is only a moderate complexing agent. The difference
between TOPO and TBP is explained by the electron withdrawing behavior of the oxygen
atoms in the alkoxy groups of TBP, while in TOPO the alkyl chains do not withdraw
electron density from the phosphoryl functional group (P=O) [33]. Thus, in TBP the
oxygen is less available for sharing [50], resulting in a lower basicity. This is also
confirmed by the Lewis basicities listed in Table 7-2. The crown ether 18C6 is also a strong
complexing agent. No BF3 affinity is available in the open literature of this component. The
larger relative volatility of 18C6 over the other ethers can be explained by the amount of
ether bonds available to accept hydrogen bonds. 18C6 contains six ether bonds, which is
larger than the moderate complexing extractants TGDE and DGDP for example, which
contain five and three ether bonds, correspondingly.
Moderate Complexing Agents
The glymes TGDE, DGDP, and DGDB, the toluamide DEET, the ether DHE, the ketone
DHK, and the phosphate TBP were identified as moderate complexing agents (2.5 ≥ α ≥ 1.8
at an extractant/DCA mole ratio of 1). These extractants are less selective than the strong
complexing agents, which can be explained by the lower Lewis basicities of these moderate
complexing agents (see Table 7-2). The much lower basicity of the toluamide DEET
compared to THA results from the electron withdrawing nature of the carbonyl group [45].
The lower effect on the relative volatility of TBP compared to DEET can also be explained
by its lower Lewis basicity (see Table 7-2). Despite the fact that the glymes have a lower
Lewis basicity than the toluamide and the phosphate extractants, they have a slightly larger
effect on the relative volatility. This is explained by cooperative hydrogen bonding that is
possible because of the multiple ether groups in the glymes. TGDE has a stronger effect on
the relative volatility compared to DGDB and DGDP, because TGDE contains more ether
groups. Therefore, DHE also gives a lower relative volatility than TDGE and DGDB for
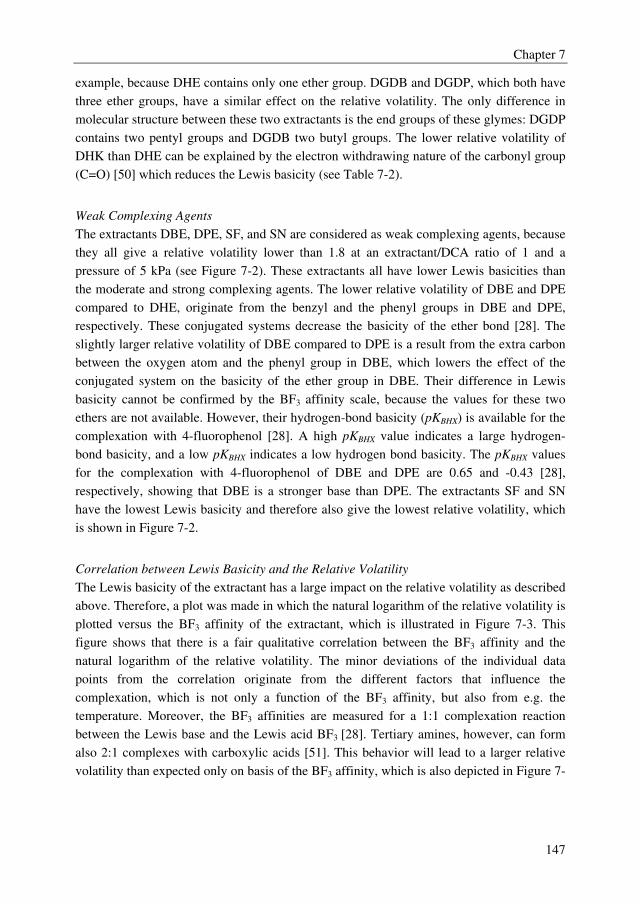
Chapter 7
147
example, because DHE contains only one ether group. DGDB and DGDP, which both have
three ether groups, have a similar effect on the relative volatility. The only difference in
molecular structure between these two extractants is the end groups of these glymes: DGDP
contains two pentyl groups and DGDB two butyl groups. The lower relative volatility of
DHK than DHE can be explained by the electron withdrawing nature of the carbonyl group
(C=O) [50] which reduces the Lewis basicity (see Table 7-2).
Weak Complexing Agents
The extractants DBE, DPE, SF, and SN are considered as weak complexing agents, because
they all give a relative volatility lower than 1.8 at an extractant/DCA ratio of 1 and a
pressure of 5 kPa (see Figure 7-2). These extractants all have lower Lewis basicities than
the moderate and strong complexing agents. The lower relative volatility of DBE and DPE
compared to DHE, originate from the benzyl and the phenyl groups in DBE and DPE,
respectively. These conjugated systems decrease the basicity of the ether bond [28]. The
slightly larger relative volatility of DBE compared to DPE is a result from the extra carbon
between the oxygen atom and the phenyl group in DBE, which lowers the effect of the
conjugated system on the basicity of the ether group in DBE. Their difference in Lewis
basicity cannot be confirmed by the BF3 affinity scale, because the values for these two
ethers are not available. However, their hydrogen-bond basicity (pKBHX) is available for the
complexation with 4-fluorophenol [28]. A high pKBHX value indicates a large hydrogen-
bond basicity, and a low pKBHX indicates a low hydrogen bond basicity. The pKBHX values
for the complexation with 4-fluorophenol of DBE and DPE are 0.65 and -0.43 [28],
respectively, showing that DBE is a stronger base than DPE. The extractants SF and SN
have the lowest Lewis basicity and therefore also give the lowest relative volatility, which
is shown in Figure 7-2.
Correlation between Lewis Basicity and the Relative Volatility
The Lewis basicity of the extractant has a large impact on the relative volatility as described
above. Therefore, a plot was made in which the natural logarithm of the relative volatility is
plotted versus the BF3 affinity of the extractant, which is illustrated in Figure 7-3. This
figure shows that there is a fair qualitative correlation between the BF3 affinity and the
natural logarithm of the relative volatility. The minor deviations of the individual data
points from the correlation originate from the different factors that influence the
complexation, which is not only a function of the BF3 affinity, but also from e.g. the
temperature. Moreover, the BF3 affinities are measured for a 1:1 complexation reaction
between the Lewis base and the Lewis acid BF3 [28]. Tertiary amines, however, can form
also 2:1 complexes with carboxylic acids [51]. This behavior will lead to a larger relative
volatility than expected only on basis of the BF3 affinity, which is also depicted in Figure 7-
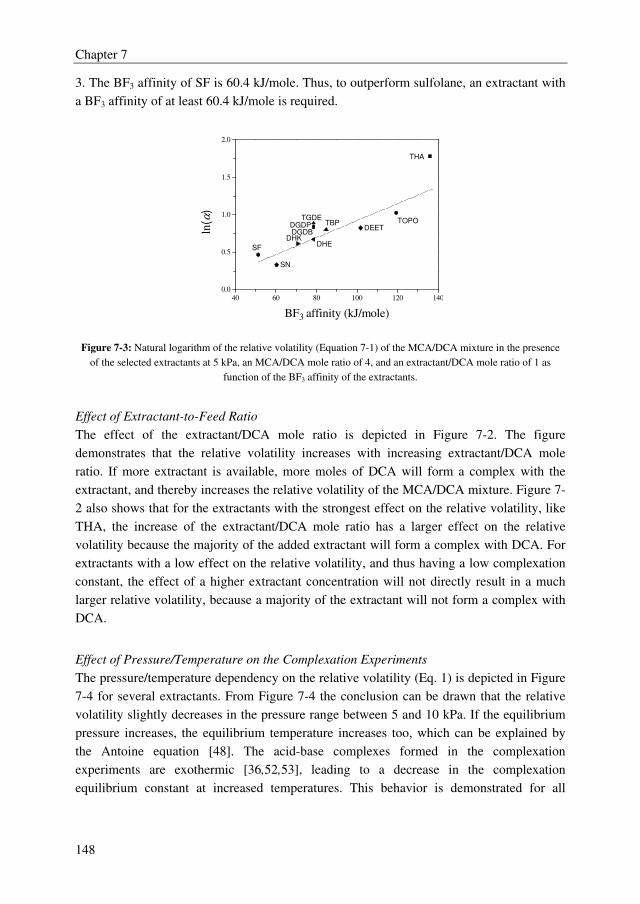
Chapter 7
148
3. The BF3 affinity of SF is 60.4 kJ/mole. Thus, to outperform sulfolane, an extractant with
a BF3 affinity of at least 60.4 kJ/mole is required.
40 60 80 100 120 140
0.0
0.5
1.0
1.5
2.0
DGDPDGDB
TGDE
ln(α
)
SF
SN
DHKDHE
DEETTBP TOPO
BF3 affinity (kJ/mole)
THA
Figure 7-3: Natural logarithm of the relative volatility (Equation 7-1) of the MCA/DCA mixture in the presence
of the selected extractants at 5 kPa, an MCA/DCA mole ratio of 4, and an extractant/DCA mole ratio of 1 as
function of the BF3 affinity of the extractants.
Effect of Extractant-to-Feed Ratio
The effect of the extractant/DCA mole ratio is depicted in Figure 7-2. The figure
demonstrates that the relative volatility increases with increasing extractant/DCA mole
ratio. If more extractant is available, more moles of DCA will form a complex with the
extractant, and thereby increases the relative volatility of the MCA/DCA mixture. Figure 7-
2 also shows that for the extractants with the strongest effect on the relative volatility, like
THA, the increase of the extractant/DCA mole ratio has a larger effect on the relative
volatility because the majority of the added extractant will form a complex with DCA. For
extractants with a low effect on the relative volatility, and thus having a low complexation
constant, the effect of a higher extractant concentration will not directly result in a much
larger relative volatility, because a majority of the extractant will not form a complex with
DCA.
Effect of Pressure/Temperature on the Complexation Experiments
The pressure/temperature dependency on the relative volatility (Eq. 1) is depicted in Figure
7-4 for several extractants. From Figure 7-4 the conclusion can be drawn that the relative
volatility slightly decreases in the pressure range between 5 and 10 kPa. If the equilibrium
pressure increases, the equilibrium temperature increases too, which can be explained by
the Antoine equation [48]. The acid-base complexes formed in the complexation
experiments are exothermic [36,52,53], leading to a decrease in the complexation
equilibrium constant at increased temperatures. This behavior is demonstrated for all
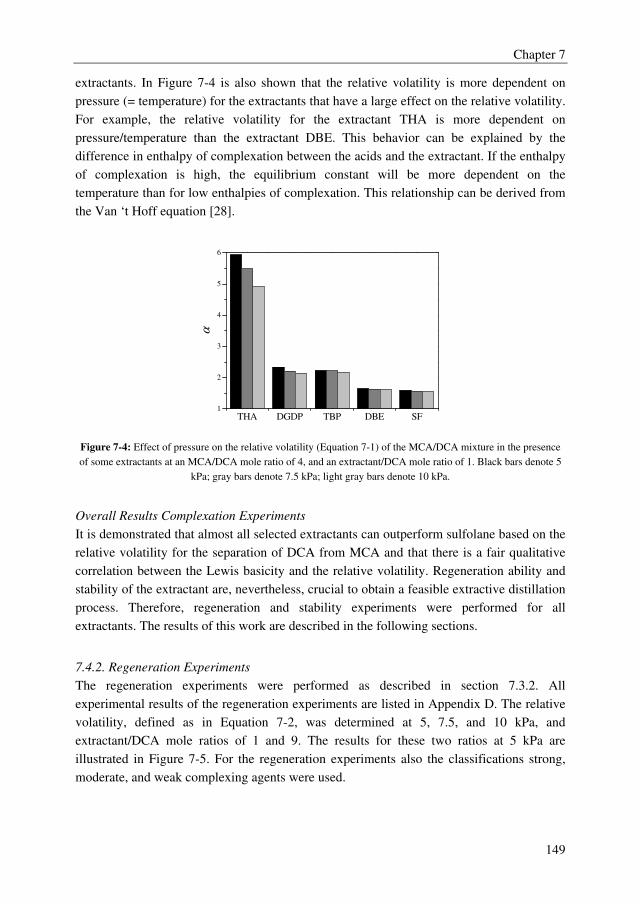
Chapter 7
149
extractants. In Figure 7-4 is also shown that the relative volatility is more dependent on
pressure (= temperature) for the extractants that have a large effect on the relative volatility.
For example, the relative volatility for the extractant THA is more dependent on
pressure/temperature than the extractant DBE. This behavior can be explained by the
difference in enthalpy of complexation between the acids and the extractant. If the enthalpy
of complexation is high, the equilibrium constant will be more dependent on the
temperature than for low enthalpies of complexation. This relationship can be derived from
the Van ‘t Hoff equation [28].
THA DGDP TBP DBE SF1
2
3
4
5
6
α
Figure 7-4: Effect of pressure on the relative volatility (Equation 7-1) of the MCA/DCA mixture in the presence
of some extractants at an MCA/DCA mole ratio of 4, and an extractant/DCA mole ratio of 1. Black bars denote 5
kPa; gray bars denote 7.5 kPa; light gray bars denote 10 kPa.
Overall Results Complexation Experiments
It is demonstrated that almost all selected extractants can outperform sulfolane based on the
relative volatility for the separation of DCA from MCA and that there is a fair qualitative
correlation between the Lewis basicity and the relative volatility. Regeneration ability and
stability of the extractant are, nevertheless, crucial to obtain a feasible extractive distillation
process. Therefore, regeneration and stability experiments were performed for all
extractants. The results of this work are described in the following sections.
7.4.2. Regeneration Experiments
The regeneration experiments were performed as described in section 7.3.2. All
experimental results of the regeneration experiments are listed in Appendix D. The relative
volatility, defined as in Equation 7-2, was determined at 5, 7.5, and 10 kPa, and
extractant/DCA mole ratios of 1 and 9. The results for these two ratios at 5 kPa are
illustrated in Figure 7-5. For the regeneration experiments also the classifications strong,
moderate, and weak complexing agents were used.
Chapter 7
150
o
o
P
P
xy
xy
EXTEXT
DCADCA
EXT
EXT
DCA
DCA
γ
γ==α
(7-2)
DBE DHK DGDP DPE SF DGDB TGDE DHE0
10
20
30
40
50
α
Figure 7-5: Experimental relative volatilities (Equation 7-2) of the DCA/extractant mixtures at a pressure of 5
kPa, and extractant/DCA mole ratio’s of 1 and 9. Black bars denote an extractant/DCA mole ratio of 1; gray bars
denote an extractant/DCA mole ratio of 9.
Strong Complexing Agents
No VLE could be obtained in the ebulliometer for the extractants THA, TOPO, and 18C6,
because the complex between these extractants and DCA appeared too strong. Therefore,
no vapor phase was formed for these extractants in the ebulliometer in contrast to the VLE
experiments in the complexation experiments where the extractant concentration was much
lower than in the regeneration experiments. Thereby, still free MCA and DCA was
available to form a vapor phase in the complexation experiments. Furthermore, MCA forms
a weaker complex with the extractant, due to its lower acidity than DCA. Very high
temperatures are required to break the complexes between DCA and the strong complexing
agents, because of the strength of complexation. The regeneration experiments with THA,
TOPO, and 18C6 were stopped after reaching a temperature of 250 oC, because this is the
temperature limit of the ebulliometer. Moreover, the mixture containing the extractant THA
started to change color rapidly from transparent colourless/pink to dark brownish above
150–180 oC, which indicated possible degradation of the extractant and/or DCA, which will
be explained further in the stability experiments results section. The extractants THA,
TOPO, and 18C6 are not considered as promising extractants to separate DCA from MCA
by extractive distillation, because they could not be regenerated.
Moderate Complexing Agents
The regeneration experiments for the moderate complexation agents could be performed for
DGDP, DGDB, TGDE, DHE, and DHK. The extractants DEET and TBP were found to be
Chapter 7
151
unstable in the concentrated DCA environment, which is further discussed in the results
section about the stability experiments. The extractants DGDP, DGDB, TGDE, and DHE
gave a relative volatility above unity in the regeneration experiments at an extractant/DCA
ratio of 1. However, a relative volatility below unity was determined for the extractants
DGDB, TGDE, and DHE at an extractant/DCA mole ratio of 9. These results indicate that
these three extractants form an azeotrope with DCA, and can therefore only be purified up
to the azeotropic composition by distillation. The relative volatility is determined by the
ratio of the activity coefficients and the pure component vapor pressures of DCA and the
extractant (Equation 7-2) [27]. The activity coefficient of a component decreases with
decreasing mole fraction for mixtures in which the components can form hydrogen bonds
with sufficient strength [22]. Thus, the activity coefficient of DCA will be low at low DCA
concentrations, because all DCA will be bonded by the extractant. Furthermore, the activity
coefficient of the extractant will be around unity at low DCA concentration (i.e. high
extractant concentration) [22]. If the ratio of the pure component vapor pressures between
the extractant and DCA is smaller than the ratio of the two activity coefficients, an
azeotrope will form. However, DHE does not form a strong complex with DCA (see Figure
7-2.), but it has a small boiling point difference with DCA, and therefore forms an
azeotrope. The boiling point of the extractant has thus also a large effect on the extractant
recovery, which was also observed from the results for the extractants DGDP and DGDB.
Since the boiling point of DGDP is higher than DGDB, due to its higher molecular weight,
it forms no azeotrope with DCA, and therefore can be regenerated by distillation up to
higher purities. The relative volatilities at an extractant/DCA mole ratio of 9 for the
extractants DGDP and DGDB are 2.4 and 0.7, respectively.
Weak Complexing Agents
The weak complexing agents DBE, DPE, and the benchmark extractant SF gave all a
relative volatility above one for both extractant/DCA ratios (see Figure 7-5) in the
regeneration experiments and, therefore, can be regenerated by distillation up to high
purities. The extractants DBE and DPE both give a relative volatility larger than 10. These
two extractants do not only form a weak complex with DCA (see Figure 7-2), but also have
a much higher boiling point than DCA (see Table 7-2). The extractant DPE forms such a
weak complex with DCA that the activity coefficient of DCA increases with decreasing
DCA concentration, which is typical behavior for systems that do not form complexes [54].
Therefore, the relative volatility is higher at an extractant/DCA mole ratio of 9 compared to
the mole ratio of 1. The extractant SN was found to be unstable in the DCA environment
and therefore no regeneration experiment could be performed for this extractant. The
degradation of SN is further explained in the section stability experiments.
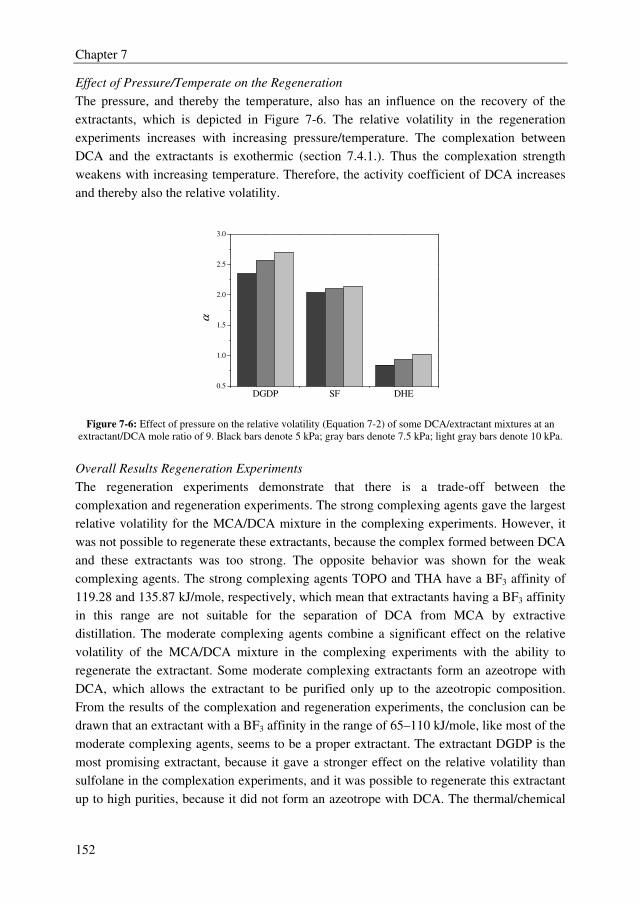
Chapter 7
152
Effect of Pressure/Temperate on the Regeneration
The pressure, and thereby the temperature, also has an influence on the recovery of the
extractants, which is depicted in Figure 7-6. The relative volatility in the regeneration
experiments increases with increasing pressure/temperature. The complexation between
DCA and the extractants is exothermic (section 7.4.1.). Thus the complexation strength
weakens with increasing temperature. Therefore, the activity coefficient of DCA increases
and thereby also the relative volatility.
DGDP SF DHE0.5
1.0
1.5
2.0
2.5
3.0
α
Figure 7-6: Effect of pressure on the relative volatility (Equation 7-2) of some DCA/extractant mixtures at an
extractant/DCA mole ratio of 9. Black bars denote 5 kPa; gray bars denote 7.5 kPa; light gray bars denote 10 kPa.
Overall Results Regeneration Experiments
The regeneration experiments demonstrate that there is a trade-off between the
complexation and regeneration experiments. The strong complexing agents gave the largest
relative volatility for the MCA/DCA mixture in the complexing experiments. However, it
was not possible to regenerate these extractants, because the complex formed between DCA
and these extractants was too strong. The opposite behavior was shown for the weak
complexing agents. The strong complexing agents TOPO and THA have a BF3 affinity of
119.28 and 135.87 kJ/mole, respectively, which mean that extractants having a BF3 affinity
in this range are not suitable for the separation of DCA from MCA by extractive
distillation. The moderate complexing agents combine a significant effect on the relative
volatility of the MCA/DCA mixture in the complexing experiments with the ability to
regenerate the extractant. Some moderate complexing extractants form an azeotrope with
DCA, which allows the extractant to be purified only up to the azeotropic composition.
From the results of the complexation and regeneration experiments, the conclusion can be
drawn that an extractant with a BF3 affinity in the range of 65–110 kJ/mole, like most of the
moderate complexing agents, seems to be a proper extractant. The extractant DGDP is the
most promising extractant, because it gave a stronger effect on the relative volatility than
sulfolane in the complexation experiments, and it was possible to regenerate this extractant
up to high purities, because it did not form an azeotrope with DCA. The thermal/chemical
Chapter 7
153
stability of the extractant is crucial to obtain a feasible extractive distillation process. The
results of the stability experiments are discussed in the next section.
7.4.3. Stability Experiments
The stability experiments were performed as discussed in section 7.3.3. During the
regeneration experiments it was observed that several extractants were not stable in the
presence of the strong acid DCA. The temperature could not be kept constant, which
implies the formation of degradation products, and the color changed for some mixtures
from colorless to dark brownish rapidly. The extractants were classified as stable and
unstable extractants.
Unstable Extractants
The extractants THA, TBP, DEET, DBE, and SN were found to be unstable in the presence
of DCA at elevated temperatures and are therefore not considered as promising extractants
to separate MCA from DCA by extractive distillation. The degradation of THA in DCA
environment was observed already in the regeneration experiments and was confirmed by
the GC-MS analysis of the stability experiments. Dichloroacetic acid hexyl ester was
detected as the main degradation product from the stability experiments with THA. The
hexyl group was dealkylated from THA and was exchanged with the proton from DCA.
Several amides were the other degradation products detected by GC-MS. From trialkyl
amines, it is reported that they can degrade in the presence of acids and a strong acid even
can catalyze this degradation reaction [55]. DCA is most probably a too strong acid,
because a much weaker acid like acetic acid (pKa = 4.76) can be easily regenerated from the
extractant tri-n-butylamine without any degradation [21]. Dealkylation was for TBP also
the main degradation mechanism. TBP dealkylated very fast during the stability
experiments, and mainly the products dichloroacetic acid butyl ester and dibutyl phosphoric
acid were detected by GC-MS. Pure TBP starts to decompose at a temperature of 150 oC or
higher [56]. But, Higgins and co-workers found that in the presence of an acid, the kinetics
of decomposition increases even at temperatures below 150 oC [57]. They also found that
replacing the alkoxy bonds by carbon-to-phosphorus bonds, thus changing from alkyl
phosphates to alkyl phosphine oxides, the stability increased remarkably to even a larger
degree than expected [57].
In the open literature not much is known about the stability of SN, DEET, and DBE in the
presence of (strong) acidic components. However, in the material safety data sheets of SN
and DEET is mentioned that they are incompatible with strong acids. The double bond in
DEET and the triple bond in SN can undergo or catalyze electrophilic addition or
substitution [50], because the double and triple bond serve as a source of electrons. These
double and triple bonds make them therefore unstable in an acid environment. The detected
impurities by GC-MS were mainly amides and methyl benzoic acid for the stability
Chapter 7
154
experiment of the extractant DEET. The latter is the starting material to produce DEET
[58]. Since methyl benzoic acid was detected in a very large amount and hardly any DEET
was detected, it was assumed that the majority of DEET was degraded to methyl benzoic
acid. For the extractant SN also a large impurity peak was detected by GC-MS, however,
no component could be allocated by the MS detector to this peak but several suggestions
were given, like 4–methyl–1H–imidazole for example. For the extractant DBE, mainly the
benzyl ester of DCA was detected as impurity.
Stable Extractants
The ethers, TOPO, SF, and DHK showed stable behavior in the presence of DCA. For
TOPO no impurities were detected by GC-MS analysis. For trialkyl phosphine oxides is
reported that they exhibit high thermal and chemical stability [57,59]. For DHK, only very
small amounts of impurities, mainly dichloroacetic acid tridecylester, were detected and for
SF no impurity was detected. For the ethers only very small amounts of impurities were
detected by GC-MS. A typical small impurity detected for all ethers was the DCA ester.
The butyl ester of DCA was detected in the stability experiment with DGDB for example.
Thus DCA can cleave off the end alkyl groups of ethers. Ethers are reported as stable
components in acid environment and cleavage takes commonly only place in the presence
of really strong acids like HI, HBr, and HCl and at elevated temperatures [50]. Because the
degradation rate was almost negligible, equilibrium could be obtained in the ebulliometer
for the regeneration experiments for all ethers. The negligible degradation rate of the ethers
was confirmed by analyzing also the samples from the VLE experiments by GC-MS, in
which no impurities were detected. For 18C6 and DPE, no impurities were detected by GC-
MS analysis. From the stability experiments, the conclusion can be drawn that only
extractants from the classes of the ethers, ketones, and phosphine oxides, and the
benchmark extractant sulfolane are stable in the presence of DCA at elevated temperatures.
7.5. Conclusions
An extractant screening study has been performed to investigate whether extractants that
can form complexes by hydrogen bonds/proton transfer are promising to separate DCA
from MCA by extractive distillation. VLE and thermal/chemical stability experiments have
been performed to select a proper extractant and the results from these experiments have
been compared to the benchmark extractant sulfolane. It has been demonstrated that many
extractants can outperform sulfolane with relative volatilites of the MCA/DCA mixture up
to 5.9, whereas sulfolane displays a relative volatility of 1.6. There is, however, a clear
trade-off between the effect of the extractant on the relative volatility of the MCA/DCA
mixture in the complexation experiments and the regeneration ability of the extractant.
Extractants with a high effect on the relative volatility in the complexation experiments are
difficult to regenerate in the regeneration column. Moreover, only ethers, phosphine oxides,
Chapter 7
155
ketones, and the benchmark extractant sulfolane were stable in the strongly acidic
environment. Glymes, having three ether bonds and a sufficient boiling point difference
with both chlorinated acetic acids, are the most promising extractants. A detailed process
evaluation should confirm whether these extractants are indeed promising to separate the
close boiling acid mixture by extractive distillation and if process intensification can be
achieved.
7.6. Nomenclature
Mw molecular weight g mole-1
Po pure component vapor pressure Pa
pKa acid dissociation constant
pKHBX hydrogen bond basicity constant
Tb boiling point oC
Tm melting point oC
x mole fraction in the liquid phase
y mole fraction in the vapor phase
Greek symbols
α relative volatility
γ activity coefficient
µ dipole moment Debye
ω acentric factor
Abbreviations
DCA dichloroacetic acid
EXT extractant
GC gas chromatography
MCA monochloroacetic acid
MS mass spectroscopy
VLE vapor–liquid equilibrium
7.7. References
[1] G. Koenig, E. Lohmar, N. Rupprich, in: Ullmann's Encyclopedia of Industrial
Chemistry, Wiley-VCH Verlag GmbH & Co, 2000.
[2] AkzoNobel, Monochloroacetic acid, 2010,
www.chemiepark.nl/Nl/Ondernemingen/MCA.htm, Cited: July 28, 2010.
[3] J. Crouzen, J.J. Gorissen, and C.J.G. Van Strien, US 7,135,597 B2, 2009.
[4] A.B. DeAngelo, F.B. Daniel, B.M. Most, G.R. Olson, Toxicology 114 (1996) 207-
221.
Chapter 7
156
[5] R. Fujiware and H. Ohira, JP 72,229,886, 1970.
[6] A. Londono, M.T.G. Jongmans, B. Schuur, A.B. de Haan, Fluid Phase Equilibr.
313 (2011) 97-101.
[7] M. Souders, Chem. Eng. Prog 60 (1964) 75-82.
[8] T. Misek, in: J. C. Godfrey, M. J. Slater (Eds.), Liquid-liquid extraction
equipment, John Wiley & Sons, Chisester, 1994.
[9] J.M. Ritcey, in: J. Rydberg, C. Musikas, G. R. Choppin (Eds.), Principles and
practices of solvent extraction, Marcel Dekker, New Yrok, 1992, pp. 281-337.
[10] F.M. Lee, J.C. Gentry, Chem. Eng. Process 93 (1997) 56-64.
[11] J.C. Gentry, S. Kumar, R. Wright-Wytcherley, Hydrocarb. Process. 93 (2004) 62-
66.
[12] R. Fujiware and H. Ohira, JP 7,230,165, 1970.
[13] D.R. Lide, W.M. Haynes, Handbook of chemistry and physics ed., Taylor and
Francis group LLC, London, 2009.
[14] C.J. King, Chemtech (1992) 285-291.
[15] J.A. Tamada, C.J. King, Ind. Eng. Chem. Res. 29 (1990) 1327-1333.
[16] J. Prochazka, A. Heyber, E. Volaufová, Separation Science and Technology 39
(2004) 1073-1091.
[17] K.L. Wasewar, A.A. Yawalkar, J.A. Moulijn, V.G. Pangarkar, Ind. Eng. Chem.
Res. 43 (2004) 5969-5982.
[18] A. Keshav, K.L. Wasewar, S. Chand, Ind. Eng. Chem. Res. 48 (2008) 888-893.
[19] A. Krzyzaniak, B. Schuur, M. Sukumaran, H. Zuilhof, A.B. de Haan, Chemical
Engineering Transactions 24 (2011) 709-714.
[20] F. Duprat, G. Gau, Can. J. Chem. Eng. 69 (1991) 1320-1326.
[21] Z. Lei, C. Li, Y. Li, B. Chen, Sep. Purif. Technol. 36 (2004) 131-138.
[22] S.R. Ningoo, V.G. Gaikar, Separ. Technol. 4 (1994) 249-251.
[23] A.E. Wentink, N.J.M. Kuipers, A.B. de Haan, J. Scholtz, H. Mulder, Chem. Eng.
Proc. 46 (2007) 800-809.
[24] Aspen Plus Properties PURE 22 databank (2011) .
[25] L.M. Babkow, V.V. Vashchinskaya, M.A. Kovner, G.A. Puchkovskaya, Y.
Fialkov, Spectrochimica Acta Part A: Molecular Spectroscopy 32 (1976) 1379-
1382.
[26] S. Kossack, K. Kraemer, R. Gani, W. Marquardt, Chem. Eng. Res. Des. 86 (2008)
781-792.
[27] Z. Lei, B. Chen, Z. Ding, in: Special Distillation Processes, Elsevier, Amsterdam,
2005, pp. 59-144.
[28] C. Laurence, J.-F. Gal, Lewis Basicity and Affinity Scales, First ed., John Wiley &
Sons Ltd, Chishester, 2010.
[29] C.J. King, in: R. W. Rousseau (Ed.), Handbook of Separation Process Technology,
1987, pp. 760-774.
[30] B. Burghoff, R. Cuypers, M. van Ettinger, E.J.R. Sudhölter, H. Zuilhof, A.B. de
Haan, Sep. Purif. Technol. 67 (2009) 117-120.
[31] M. Ejaz, Anal. Chim. Acta 71 (1974) 383-391.
[32] Y.S. Mahajan, A.K. Shah, R.S. Kamath, N.B. Salve, S.M. Mahajani, Sep. Purif.
Technol. 59 (2008) 58-66.
[33] M.A. Fahim, A. Qader, M.A. Hughes, Separation Science and Technology 27
(1992) 1809-1821.
[34] W. Qin, Z. Li, Y. Dai, Ind. Eng. Chem. Res. 42 (2003) 6196-6204.
Chapter 7
157
[35] A.F. Morales, J. Albet, G. Kyuchoukov, G. Malmary, J. Molinier, J. Chem. Eng.
Data 48 (2003) 874-886.
[36] M. Matsumoto, T. Otono, K. Kondo, Sep. Purif. Technol. 24 (2001) 337-342.
[37] X. Shan, W. Qin, Y. Dai, Chem. Eng. Sci. 61 (2006) 2574-2581.
[38] D.G. Lee, M.H. Sadar, J. Am. Chem. Soc. 96 (1974) 2862-2867.
[39] M. Berthelot, F. Besseau, C. Laurence, Eur. J. Org. Chem. 1998 (1998) 925-931.
[40] M. Calleja, K. Johnson, W.J. Belcher, J.W. Steed, Inorg. Chem. 40 (2001) 4978-
4985.
[41] M.F. Hegazi, J. Chem. Tech. Biotechnol. 34 (1984) 251-256.
[42] M. Berthelot, M. Helbert, C. Laurence, J.Y.L. Questel, J. Phys. Org. Chem. 6
(1993) 302-306.
[43] A.M. Saum, J. Polym. Sci. 42 (1960) 57-66.
[44] H. Takahashi, K. Mamola, E.K. Plyler, Journal of Molecular Spectroscopy 21
(1966) 217-230.
[45] N.E. Triggs, J.J. Valentini, J. Phys. Chem. 96 (1992) 6922-6931.
[46] A.M. Eyal, R. Canari, Ind. Eng. Chem. Res. 34 (1995) 1789-1798.
[47] J.A. Tamada, C.J. King, Ind. Eng. Chem. Res. 29 (1990) 1333-1338.
[48] B.E. Poling, J.M. Prausnitz, J.P. O'Connell, The properties of gases and liquids,
Fifth ed., McGraw Hill, Singapore, 2007.
[49] H. Euler, H. Cassel, Arkiv fur Kemi, Menralogi Och Geologi 4 (1913) 1-10.
[50] R.T. Morrison, R.N. Boyd, Organic Chemistry ed., Prentice hall, New Yersey,
1992.
[51] M. Wierzejewska-Hnat, Z. Mielke, H. Ratajczak, J. Chem. Soc. , Faraday Trans. 2
76 (1980) 834-843.
[52] H.G. Joglekar, I. Rahman, S. Babu, B.D. Kulkarni, A. Joshi, Sep. Purif. Technol.
52 (2006) 1-17.
[53] P.W. Ayers, J. Chem. Phys. 122 (2005) 141102-1-141102-3.
[54] B.E. Poling, J.M. Prausnitz, J.P. O'Connell, The Properties of Gases and Liquids,
Fifth ed., McGraw Hill, Singapore, 2007.
[55] Y. Ogata, Y. Sawaki, Y. Kuriyama, Tetrahedron 24 (1968) 3425-3435.
[56] H.R. Gamrath, R.E. Hatton, W.E. Weesner, Ind. Eng. Chem. 46 (1954) 208-212.
[57] C.E. Higgins, W.H. Baldwin, J. Org. Chem. 26 (1961) 846-850.
[58] B.J.S. Wang, J. Chem. Educ. 51 (1974) 631-631.
[59] W.J. Bailey, W.M. Muir, F. Marktscheffel, J. Org. Chem. 27 (1962) 4404-4408.

158
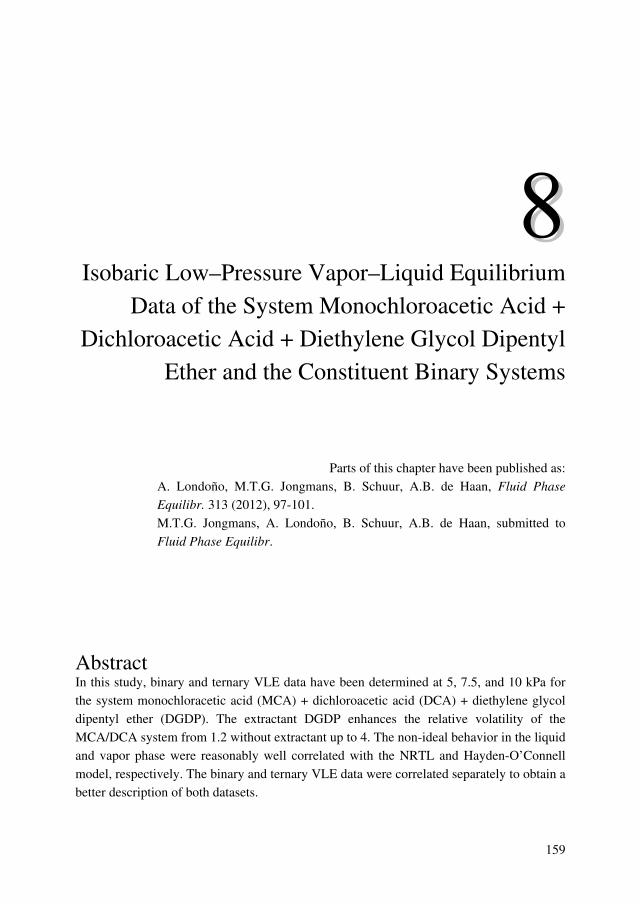
159
Isobaric Low–Pressure Vapor–Liquid Equilibrium
Data of the System Monochloroacetic Acid +
Dichloroacetic Acid + Diethylene Glycol Dipentyl
Ether and the Constituent Binary Systems
Parts of this chapter have been published as:
A. Londoño, M.T.G. Jongmans, B. Schuur, A.B. de Haan, Fluid Phase
Equilibr. 313 (2012), 97-101.
M.T.G. Jongmans, A. Londoño, B. Schuur, A.B. de Haan, submitted to
Fluid Phase Equilibr.
Abstract In this study, binary and ternary VLE data have been determined at 5, 7.5, and 10 kPa for
the system monochloracetic acid (MCA) + dichloroacetic acid (DCA) + diethylene glycol
dipentyl ether (DGDP). The extractant DGDP enhances the relative volatility of the
MCA/DCA system from 1.2 without extractant up to 4. The non-ideal behavior in the liquid
and vapor phase were reasonably well correlated with the NRTL and Hayden-O’Connell
model, respectively. The binary and ternary VLE data were correlated separately to obtain a
better description of both datasets.
Chapter 8
160
8.1. Introduction
Monochloroacetic acid (MCA) is produced via the chlorination of acetic acid using the
catalyst acetic anhydride [1]. Part of the produced MCA is chlorinated to the undesired
dichloroacetic acid (DCA), which is typically present about 5 wt% [2]. In a typical MCA
process, the concentration of DCA in the product stream is reduced by reconverting it into
MCA in a hydrogenation process. However, because of the high MCA concentration in the
chlorinator effluent, the hydrogenator also converts some of the MCA back into acetic acid.
Subsequently, MCA and acetic acid are separated by distillation [1]. Process intensification
can be achieved if the produced MCA is separated from DCA directly after the chlorinator,
and before the stream is fed to the hydrogenator to avoid conversion of MCA into acetic
acid. The MCA/acetic acid distillation is thus avoided, and the hydrogenator size can be
reduced substantially. Distillation of MCA/DCA is challenging, because the relative
volatility of the MCA/DCA mixture is ~1.05–1.3 [3], depending on the mixture
composition, which is rather low to apply distillation [4]. Extractive distillation is a
promising alternative, which is a well-established technology to separate close-boiling
mixtures [5-7]. At present, sulfolane [8] and sulfuric acid [9] are reported as extractants for
the separation of the MCA/DCA mixture by extractive distillation. However, both
extractants enhance the relative volatility of the MCA/DCA mixture only slightly resulting
in only a small cost reduction compared to distillation. We identified in Chapter 7 that by
applying basic complexing agents, the large difference in acid dissociation constant
between MCA (pKa = 2.87 [10]) and DCA (pKa = 1.25 [10]) can be exploited to further
enhance the relative volatility. DCA forms a stronger complex with basic complexing
agents via hydrogen bonding/proton transfer, because it has a lower pKa than MCA. As a
result, DCA is more retained in the liquid phase, and the relative volatility increases [11].
The application of complexing agents in distillation columns is also often reported as
reactive extractive distillation or complex extractive distillation [12-15]. From our
extractant screening study, diethylene glycol dipentyl ether (DGDP, see Figure 8-1) was
identified as a promising extractant for this specific separation, improving the relative
volatility of the MCA/DCA system up to 2.1–2.4 at a DCA/extractant mole ratio of 1. It
was furthermore shown that DGDP can be easily regenerated using distillation, and that the
extractant is thermally and chemically stable in the strongly acidic environment [11].
Figure 8-1: Molecular structures of monochloroacetic acid, dichloroacetic acid,
and diethylene glycol dipentyl ether.
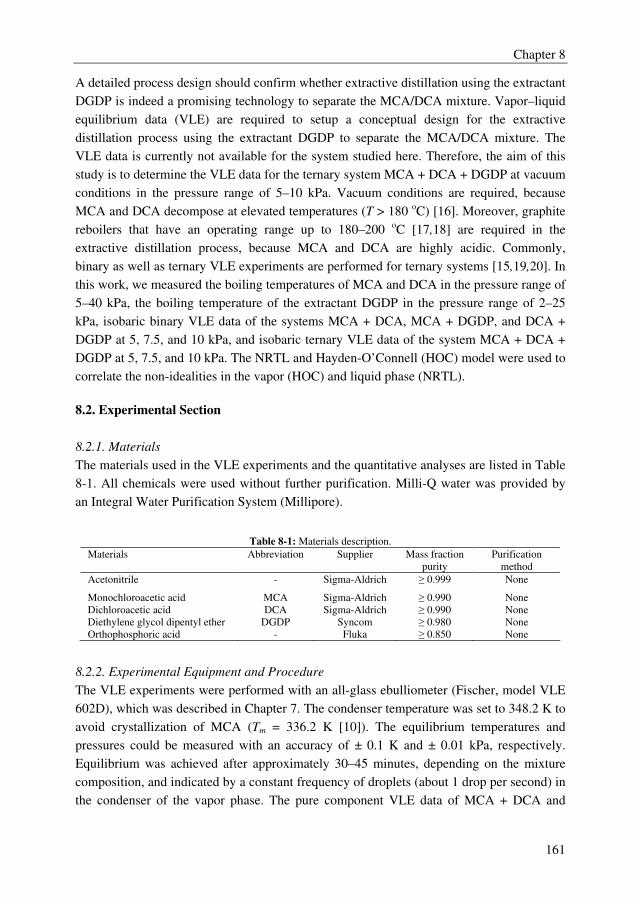
Chapter 8
161
A detailed process design should confirm whether extractive distillation using the extractant
DGDP is indeed a promising technology to separate the MCA/DCA mixture. Vapor–liquid
equilibrium data (VLE) are required to setup a conceptual design for the extractive
distillation process using the extractant DGDP to separate the MCA/DCA mixture. The
VLE data is currently not available for the system studied here. Therefore, the aim of this
study is to determine the VLE data for the ternary system MCA + DCA + DGDP at vacuum
conditions in the pressure range of 5–10 kPa. Vacuum conditions are required, because
MCA and DCA decompose at elevated temperatures (T > 180 oC) [16]. Moreover, graphite
reboilers that have an operating range up to 180–200 oC [17,18] are required in the
extractive distillation process, because MCA and DCA are highly acidic. Commonly,
binary as well as ternary VLE experiments are performed for ternary systems [15,19,20]. In
this work, we measured the boiling temperatures of MCA and DCA in the pressure range of
5–40 kPa, the boiling temperature of the extractant DGDP in the pressure range of 2–25
kPa, isobaric binary VLE data of the systems MCA + DCA, MCA + DGDP, and DCA +
DGDP at 5, 7.5, and 10 kPa, and isobaric ternary VLE data of the system MCA + DCA +
DGDP at 5, 7.5, and 10 kPa. The NRTL and Hayden-O’Connell (HOC) model were used to
correlate the non-idealities in the vapor (HOC) and liquid phase (NRTL).
8.2. Experimental Section
8.2.1. Materials
The materials used in the VLE experiments and the quantitative analyses are listed in Table
8-1. All chemicals were used without further purification. Milli-Q water was provided by
an Integral Water Purification System (Millipore).
Table 8-1: Materials description.
Materials Abbreviation Supplier Mass fraction
purity
Purification
method
Acetonitrile - Sigma-Aldrich ≥ 0.999 None
Monochloroacetic acid MCA Sigma-Aldrich ≥ 0.990 None
Dichloroacetic acid DCA Sigma-Aldrich ≥ 0.990 None
Diethylene glycol dipentyl ether DGDP Syncom ≥ 0.980 None
Orthophosphoric acid - Fluka ≥ 0.850 None
8.2.2. Experimental Equipment and Procedure
The VLE experiments were performed with an all-glass ebulliometer (Fischer, model VLE
602D), which was described in Chapter 7. The condenser temperature was set to 348.2 K to
avoid crystallization of MCA (Tm = 336.2 K [10]). The equilibrium temperatures and
pressures could be measured with an accuracy of ± 0.1 K and ± 0.01 kPa, respectively.
Equilibrium was achieved after approximately 30–45 minutes, depending on the mixture
composition, and indicated by a constant frequency of droplets (about 1 drop per second) in
the condenser of the vapor phase. The pure component VLE data of MCA + DCA and
Chapter 8
162
DGDP were determined in the pressure range of 5–40 kPa and 2–25 kPa, respectively. The
binary VLE of the systems MCA + DCA, MCA + DGDP, and DCA + DGDP, and the
ternary VLE data of the system MCA + DCA + DGDP were determined at 5, 7.5, and 10
kPa. The ternary VLE were determined at 6 mole based extractant-to-feed (E/F, feed =
MCA + DCA) ratios in the range of 0.1–1 and three MCA/DCA mole ratios; 0.25, 1, and 4.
Samples of 30 µL were taken from the (condensed) vapor and liquid phase using a 500 µL
syringe to determine the equilibrium compositions.
8.2.3. Analysis
The samples from the binary VLE experiments for the system MCA + DCA were diluted
with 750 µL of acetonitrile and 750 µL of Milli-Q water. The samples from the other binary
and ternary VLE experiments were diluted with 1500 µL of acetonitrile. The concentrations
of MCA and DCA were analyzed using High Pressure Liquid Chromatography (HPLC,
Varian Prostar). The HPLC was equipped with a silica-based Grace PrevailTM Organic Acid
column (250 mm x 4.6 mm) with a particle size of 5 µm, which was placed in an oven
(Varian Prostar Model 510) at a temperature of 313.2 K for all measurements. MCA and
DCA were detected with an UV detector (Varian Prostar model 310) operating at a
wavelength of 210 nm. The concentration of DGDP was calculated by a mass balance over
the sample. The eluent flow was 1 mL/min, which consisted of 5 vol% acetonitrile and 95
vol% orthophosphoric acid solution in Milli-Q water (19 g H3PO4/L, 0.194 mol/L) for the
analysis of the samples from the binary VLE experiments of the system MCA + DCA. The
eluent consisted of 15 vol% acetonitrile and 85 vol% orthophosphoric acid solution for the
analysis of the samples from the other binary and ternary VLE experiments. Each sample
was injected twice. After each injection, the analytical column was regenerated with pure
acetonitrile. The concentrations of the components in the vapor and liquid phases could be
measured with an accuracy of ± 0.001 in mole fraction.
8.3. Results and Discussion
8.3.1. Pure Component Vapor Pressure
The pure component vapor pressures of MCA, DCA, and DGDP were all determined using
an ebulliometer, and are depicted in Figure 8-2. The pure component vapor pressure data of
MCA and DCA were measured to validate the equipment. The experimental pure
component vapor pressure data of the three components are listed in Appendix E. The
extended Antoine equation [21], which is given in Eq. 8-1, was used to describe the pure
component vapor pressures of MCA and DCA, using the parameters from the Aspen
Properties® PURE22 databank (see Table 8-3). The Wagner equation (Eq. 8-2) was used to
describe the pure component vapor pressure data of DGDP, because it was desired to
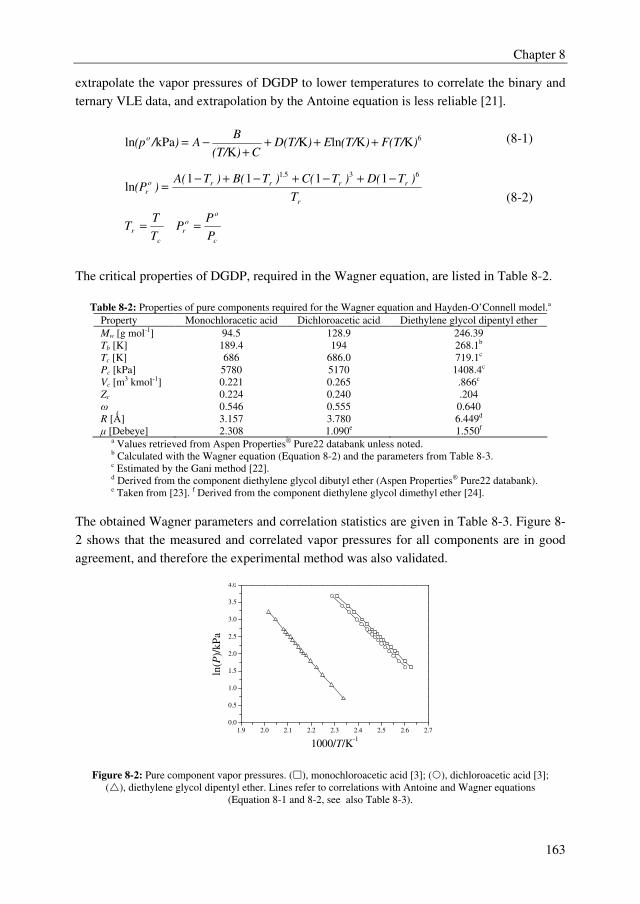
Chapter 8
163
extrapolate the vapor pressures of DGDP to lower temperatures to correlate the binary and
ternary VLE data, and extrapolation by the Antoine equation is less reliable [21].
6KKlnK
KkPaln )F(T/)(T/E)D(T/
C)(T/
BA)/(p
o+++
+−=
(8-1)
c
oo
r
c
r
r
rr
.
rro
r
P
PP
T
TT
T
)TD()TC()TB()TA()(P
==
−+−+−+−=
6351 1111ln
(8-2)
The critical properties of DGDP, required in the Wagner equation, are listed in Table 8-2.
Table 8-2: Properties of pure components required for the Wagner equation and Hayden-O’Connell model.a
Property Monochloracetic acid Dichloroacetic acid Diethylene glycol dipentyl ether
Mw [g mol-1] 94.5 128.9 246.39
Tb [K] 189.4 194 268.1b
Tc [K] 686 686.0 719.1c
Pc [kPa] 5780 5170 1408.4c
Vc [m3 kmol-1] 0.221 0.265 .866c
Zc 0.224 0.240 .204
ω 0.546 0.555 0.640
R [Ǻ] 3.157 3.780 6.449d
µ [Debeye] 2.308 1.090e 1.550f a Values retrieved from Aspen Properties® Pure22 databank unless noted. b Calculated with the Wagner equation (Equation 8-2) and the parameters from Table 8-3. c Estimated by the Gani method [22]. d Derived from the component diethylene glycol dibutyl ether (Aspen Properties® Pure22 databank). e Taken from [23]. f Derived from the component diethylene glycol dimethyl ether [24].
The obtained Wagner parameters and correlation statistics are given in Table 8-3. Figure 8-
2 shows that the measured and correlated vapor pressures for all components are in good
agreement, and therefore the experimental method was also validated.
1.9 2.0 2.1 2.2 2.3 2.4 2.5 2.6 2.7
0.0
0.5
1.0
1.5
2.0
2.5
3.0
3.5
4.0
ln(P
)/kP
a
1000/T/K-1
Figure 8-2: Pure component vapor pressures. (�), monochloroacetic acid [3]; (), dichloroacetic acid [3];
(�), diethylene glycol dipentyl ether. Lines refer to correlations with Antoine and Wagner equations
(Equation 8-1 and 8-2, see also Table 8-3).
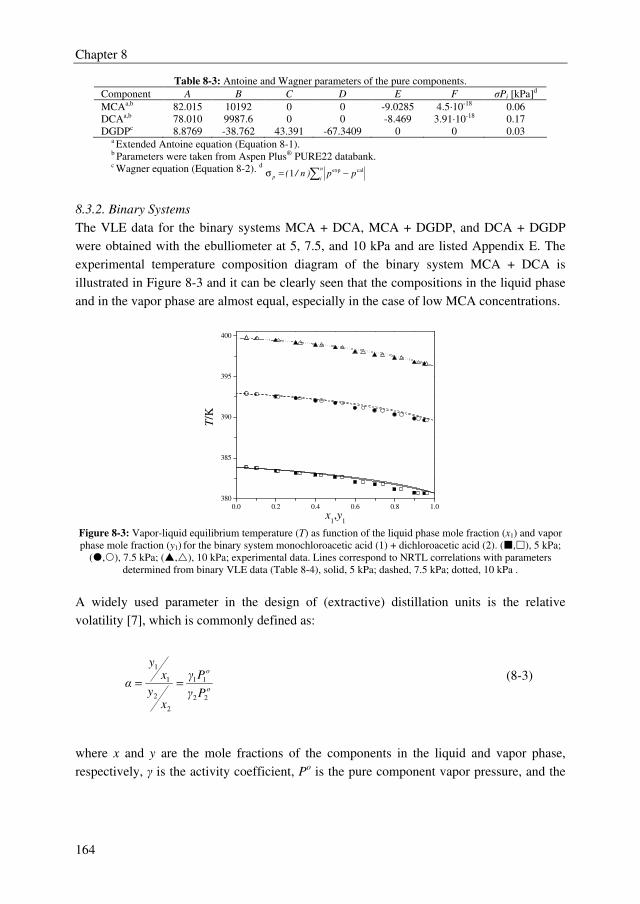
Chapter 8
164
Table 8-3: Antoine and Wagner parameters of the pure components.
Component A B C D E F σPi [kPa]d
MCAa,b 82.015 10192 0 0 -9.0285 4.5·10-18 0.06
DCAa,b 78.010 9987.6 0 0 -8.469 3.91·10-18 0.17
DGDPc 8.8769 -38.762 43.391 -67.3409 0 0 0.03 a Extended Antoine equation (Equation 8-1).
b Parameters were taken from Aspen Plus® PURE22 databank.
c Wagner equation (Equation 8-2). d
∑ −=σn
ip pp)n/(calexp1
8.3.2. Binary Systems
The VLE data for the binary systems MCA + DCA, MCA + DGDP, and DCA + DGDP
were obtained with the ebulliometer at 5, 7.5, and 10 kPa and are listed Appendix E. The
experimental temperature composition diagram of the binary system MCA + DCA is
illustrated in Figure 8-3 and it can be clearly seen that the compositions in the liquid phase
and in the vapor phase are almost equal, especially in the case of low MCA concentrations.
0.0 0.2 0.4 0.6 0.8 1.0
380
385
390
395
400
T/K
x1,y
1 Figure 8-3: Vapor-liquid equilibrium temperature (T) as function of the liquid phase mole fraction (x1) and vapor
phase mole fraction (y1) for the binary system monochloroacetic acid (1) + dichloroacetic acid (2). (�,�), 5 kPa;
(�,), 7.5 kPa; (�,�), 10 kPa; experimental data. Lines correspond to NRTL correlations with parameters
determined from binary VLE data (Table 8-4), solid, 5 kPa; dashed, 7.5 kPa; dotted, 10 kPa .
A widely used parameter in the design of (extractive) distillation units is the relative
volatility [7], which is commonly defined as:
o
o
Pγ
Pγ
xy
xy
α22
11
2
2
1
1
== (8-3)
where x and y are the mole fractions of the components in the liquid and vapor phase,
respectively, γ is the activity coefficient, Po is the pure component vapor pressure, and the
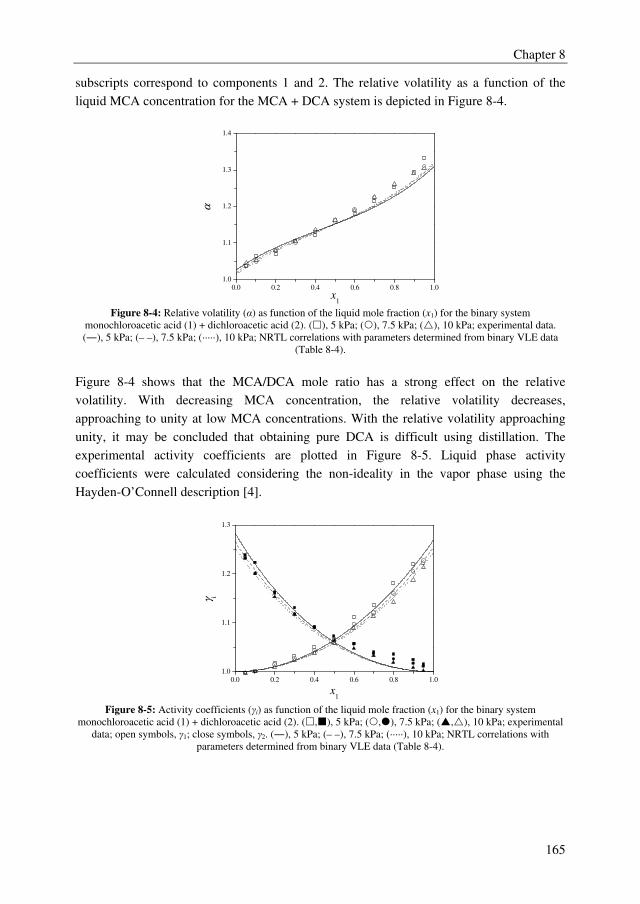
Chapter 8
165
subscripts correspond to components 1 and 2. The relative volatility as a function of the
liquid MCA concentration for the MCA + DCA system is depicted in Figure 8-4.
0.0 0.2 0.4 0.6 0.8 1.0
1.0
1.1
1.2
1.3
1.4
α
x1
Figure 8-4: Relative volatility (α) as function of the liquid mole fraction (x1) for the binary system
monochloroacetic acid (1) + dichloroacetic acid (2). (�), 5 kPa; (), 7.5 kPa; (�), 10 kPa; experimental data.
(―), 5 kPa; (– –), 7.5 kPa; (·····), 10 kPa; NRTL correlations with parameters determined from binary VLE data
(Table 8-4).
Figure 8-4 shows that the MCA/DCA mole ratio has a strong effect on the relative
volatility. With decreasing MCA concentration, the relative volatility decreases,
approaching to unity at low MCA concentrations. With the relative volatility approaching
unity, it may be concluded that obtaining pure DCA is difficult using distillation. The
experimental activity coefficients are plotted in Figure 8-5. Liquid phase activity
coefficients were calculated considering the non-ideality in the vapor phase using the
Hayden-O’Connell description [4].
0.0 0.2 0.4 0.6 0.8 1.0
1.0
1.1
1.2
1.3
γ i
x1
Figure 8-5: Activity coefficients (γi) as function of the liquid mole fraction (x1) for the binary system
monochloroacetic acid (1) + dichloroacetic acid (2). (�,�), 5 kPa; (,�), 7.5 kPa; (�,�), 10 kPa; experimental
data; open symbols, γ1; close symbols, γ2. (―), 5 kPa; (– –), 7.5 kPa; (·····), 10 kPa; NRTL correlations with
parameters determined from binary VLE data (Table 8-4).
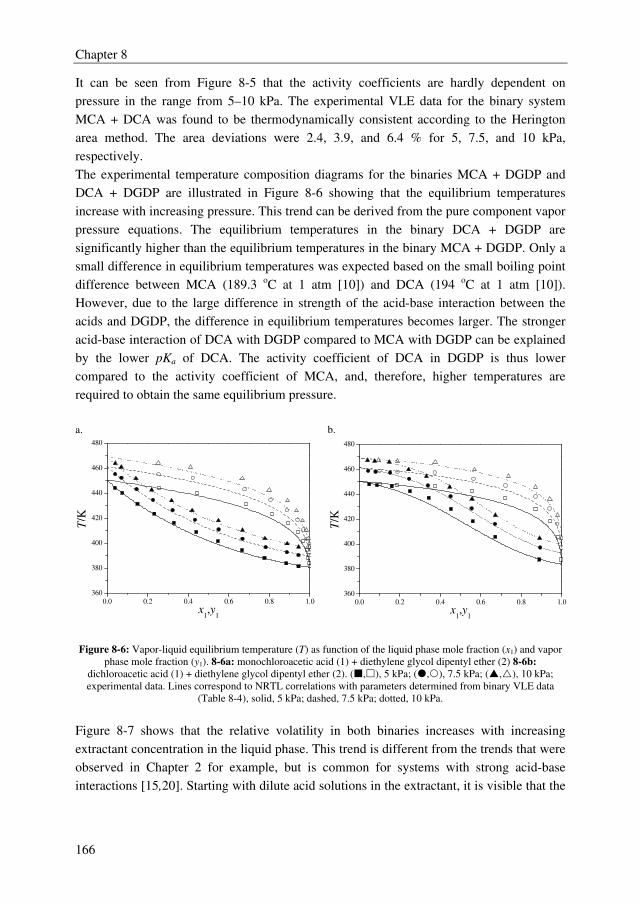
Chapter 8
166
It can be seen from Figure 8-5 that the activity coefficients are hardly dependent on
pressure in the range from 5–10 kPa. The experimental VLE data for the binary system
MCA + DCA was found to be thermodynamically consistent according to the Herington
area method. The area deviations were 2.4, 3.9, and 6.4 % for 5, 7.5, and 10 kPa,
respectively.
The experimental temperature composition diagrams for the binaries MCA + DGDP and
DCA + DGDP are illustrated in Figure 8-6 showing that the equilibrium temperatures
increase with increasing pressure. This trend can be derived from the pure component vapor
pressure equations. The equilibrium temperatures in the binary DCA + DGDP are
significantly higher than the equilibrium temperatures in the binary MCA + DGDP. Only a
small difference in equilibrium temperatures was expected based on the small boiling point
difference between MCA (189.3 oC at 1 atm [10]) and DCA (194 oC at 1 atm [10]).
However, due to the large difference in strength of the acid-base interaction between the
acids and DGDP, the difference in equilibrium temperatures becomes larger. The stronger
acid-base interaction of DCA with DGDP compared to MCA with DGDP can be explained
by the lower pKa of DCA. The activity coefficient of DCA in DGDP is thus lower
compared to the activity coefficient of MCA, and, therefore, higher temperatures are
required to obtain the same equilibrium pressure.
a. b.
0.0 0.2 0.4 0.6 0.8 1.0
360
380
400
420
440
460
480
T/K
x1,y
1
0.0 0.2 0.4 0.6 0.8 1.0
360
380
400
420
440
460
480
T/K
x1,y
1
Figure 8-6: Vapor-liquid equilibrium temperature (T) as function of the liquid phase mole fraction (x1) and vapor
phase mole fraction (y1). 8-6a: monochloroacetic acid (1) + diethylene glycol dipentyl ether (2) 8-6b:
dichloroacetic acid (1) + diethylene glycol dipentyl ether (2). (�,�), 5 kPa; (�,), 7.5 kPa; (�,�), 10 kPa;
experimental data. Lines correspond to NRTL correlations with parameters determined from binary VLE data
(Table 8-4), solid, 5 kPa; dashed, 7.5 kPa; dotted, 10 kPa.
Figure 8-7 shows that the relative volatility in both binaries increases with increasing
extractant concentration in the liquid phase. This trend is different from the trends that were
observed in Chapter 2 for example, but is common for systems with strong acid-base
interactions [15,20]. Starting with dilute acid solutions in the extractant, it is visible that the
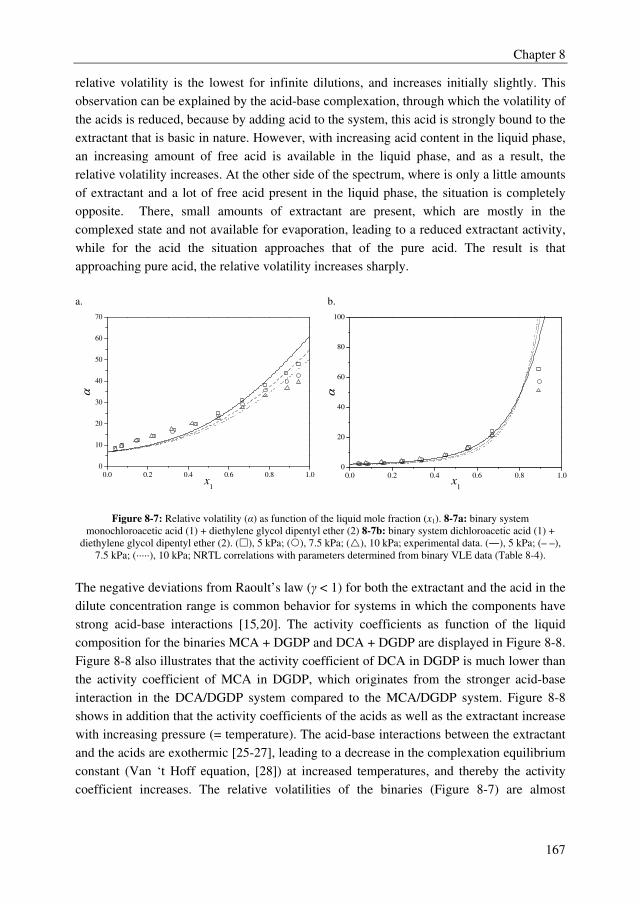
Chapter 8
167
relative volatility is the lowest for infinite dilutions, and increases initially slightly. This
observation can be explained by the acid-base complexation, through which the volatility of
the acids is reduced, because by adding acid to the system, this acid is strongly bound to the
extractant that is basic in nature. However, with increasing acid content in the liquid phase,
an increasing amount of free acid is available in the liquid phase, and as a result, the
relative volatility increases. At the other side of the spectrum, where is only a little amounts
of extractant and a lot of free acid present in the liquid phase, the situation is completely
opposite. There, small amounts of extractant are present, which are mostly in the
complexed state and not available for evaporation, leading to a reduced extractant activity,
while for the acid the situation approaches that of the pure acid. The result is that
approaching pure acid, the relative volatility increases sharply.
a. b.
0.0 0.2 0.4 0.6 0.8 1.0
0
10
20
30
40
50
60
70
α
x1
0.0 0.2 0.4 0.6 0.8 1.0
0
20
40
60
80
100
α
x1
Figure 8-7: Relative volatility (α) as function of the liquid mole fraction (x1). 8-7a: binary system
monochloroacetic acid (1) + diethylene glycol dipentyl ether (2) 8-7b: binary system dichloroacetic acid (1) +
diethylene glycol dipentyl ether (2). (�), 5 kPa; (), 7.5 kPa; (�), 10 kPa; experimental data. (―), 5 kPa; (– –),
7.5 kPa; (·····), 10 kPa; NRTL correlations with parameters determined from binary VLE data (Table 8-4).
The negative deviations from Raoult’s law (γ < 1) for both the extractant and the acid in the
dilute concentration range is common behavior for systems in which the components have
strong acid-base interactions [15,20]. The activity coefficients as function of the liquid
composition for the binaries MCA + DGDP and DCA + DGDP are displayed in Figure 8-8.
Figure 8-8 also illustrates that the activity coefficient of DCA in DGDP is much lower than
the activity coefficient of MCA in DGDP, which originates from the stronger acid-base
interaction in the DCA/DGDP system compared to the MCA/DGDP system. Figure 8-8
shows in addition that the activity coefficients of the acids as well as the extractant increase
with increasing pressure (= temperature). The acid-base interactions between the extractant
and the acids are exothermic [25-27], leading to a decrease in the complexation equilibrium
constant (Van ‘t Hoff equation, [28]) at increased temperatures, and thereby the activity
coefficient increases. The relative volatilities of the binaries (Figure 8-7) are almost
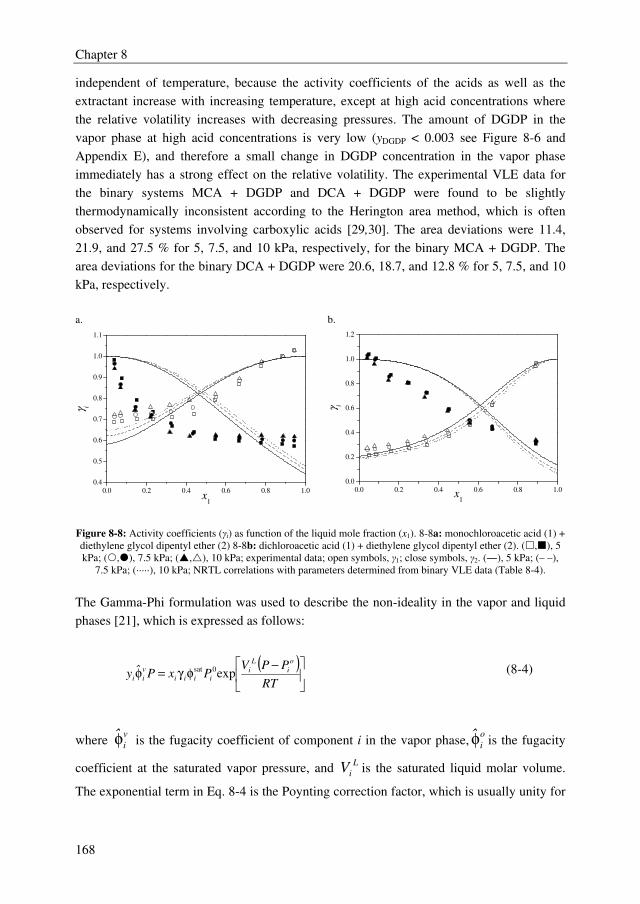
Chapter 8
168
independent of temperature, because the activity coefficients of the acids as well as the
extractant increase with increasing temperature, except at high acid concentrations where
the relative volatility increases with decreasing pressures. The amount of DGDP in the
vapor phase at high acid concentrations is very low (yDGDP < 0.003 see Figure 8-6 and
Appendix E), and therefore a small change in DGDP concentration in the vapor phase
immediately has a strong effect on the relative volatility. The experimental VLE data for
the binary systems MCA + DGDP and DCA + DGDP were found to be slightly
thermodynamically inconsistent according to the Herington area method, which is often
observed for systems involving carboxylic acids [29,30]. The area deviations were 11.4,
21.9, and 27.5 % for 5, 7.5, and 10 kPa, respectively, for the binary MCA + DGDP. The
area deviations for the binary DCA + DGDP were 20.6, 18.7, and 12.8 % for 5, 7.5, and 10
kPa, respectively.
a. b.
0.0 0.2 0.4 0.6 0.8 1.0
0.4
0.5
0.6
0.7
0.8
0.9
1.0
1.1
γ i
x1
0.0 0.2 0.4 0.6 0.8 1.0
0.0
0.2
0.4
0.6
0.8
1.0
1.2
γ i
x1
Figure 8-8: Activity coefficients (γi) as function of the liquid mole fraction (x1). 8-8a: monochloroacetic acid (1) +
diethylene glycol dipentyl ether (2) 8-8b: dichloroacetic acid (1) + diethylene glycol dipentyl ether (2). (�,�), 5
kPa; (,�), 7.5 kPa; (�,�), 10 kPa; experimental data; open symbols, γ1; close symbols, γ2. (―), 5 kPa; (– –),
7.5 kPa; (·····), 10 kPa; NRTL correlations with parameters determined from binary VLE data (Table 8-4).
The Gamma-Phi formulation was used to describe the non-ideality in the vapor and liquid
phases [21], which is expressed as follows:
( )
−φγ=φ
RT
PPVPxPˆy
o
i
L
iiiii
v
ii exp0sat (8-4)
where v
iφ̂ is the fugacity coefficient of component i in the vapor phase,o
iφ̂ is the fugacity
coefficient at the saturated vapor pressure, and L
iV is the saturated liquid molar volume.
The exponential term in Eq. 8-4 is the Poynting correction factor, which is usually unity for
Chapter 8
169
low to atmospheric pressures [21]. However, for mixtures which contain (self-)associating
molecules, like carboxylic acids, this assumption is not valid [31]. The saturated liquid
molar volume was calculated by the modified Rackett equation [32]. The vapor phase
fugacity coefficients were estimated considering non-ideal behavior. Carboxylic acids form
(homo)dimers in the vapor phase by means of hydrogen bonds between two molecules [33-
35]. The dimerization of acids in the vapor phase is often described by the Hayden-
O’Connell (HOC) equation [31,34,36]. The chemical bonding term in the HOC model
depends strongly on the association parameter, which was set to a value of 4.5 for the acid
dimerization [3,31,34,36-39]. Ethers, like DGDP, do not form homodimers and do also not
form heterodimers with carboxylic acids in the vapor phase [29]. Therefore, the association
parameters in the HOC-model for the ether dimerization and the ether/acid association were
set to zero [29]. The non-ideality in the liquid phase was correlated using the NRTL model.
The NRTL model is able to describe binary as well as ternary VLE data [19,21] and can
easily be applied in simulation software like Aspen Plus to design an extractive distillation
unit. The NRTL model is an activity coefficient model that has already been applied to
systems in which chemical interactions occur [15,20,29]. The activity coefficients in the
NRTL model are defined as:
∑∑
∑
∑∑
∑
−τ+=γN
j
N
k
kkj
N
k
kjkjk
ijN
k
kkj
ijj
N
k
kki
N
j
jjiji
i
xG
Gτx
xG
Gx
xG
xGτ
ln (8-5)
Where the following parameters are used:
jiαα),τα(G,T
baτ jiijijijij
ij
ijij ≠=−=+= forexp (8-6)
The parameters aij, bij, and αij characterize the interaction between the molecules i and j and
were all obtained by a regression of the binary VLE data, which is a common procedure for
mixtures containing carboxylic acids [29,30]. The activity coefficient method was applied
as the objective function, which is common for systems involving carboxylic acids
[36,40,41]. The absolute average deviations in vapor mole fraction and temperature were
calculated to determine if the experimental binary VLE data can be well correlated with the
NRTL-HOC model. The obtained NRTL parameters and correlation statistics are shown in
Tables 8-4 and 8-5, correspondingly. Figures 8-3 to 8-8 and Table 8-5 show that the binary
VLE data can be fitted satisfactory with the NRTL-HOC model. The temperature
deviations between the NRTL-HOC model and experimental data for the binaries MCA +
DGDP and DCA + DGDP mainly originate from the deviation in correlation of the activity
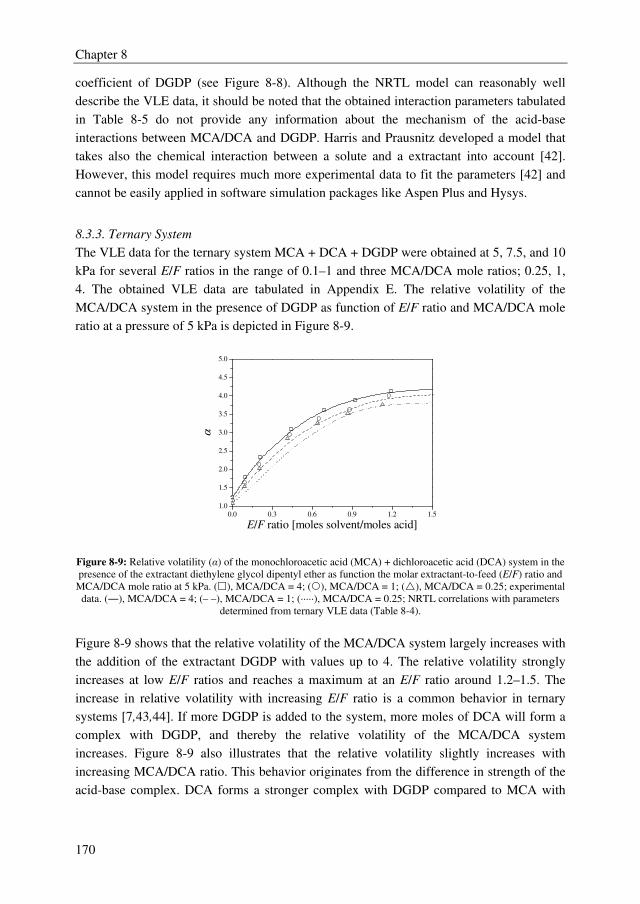
Chapter 8
170
coefficient of DGDP (see Figure 8-8). Although the NRTL model can reasonably well
describe the VLE data, it should be noted that the obtained interaction parameters tabulated
in Table 8-5 do not provide any information about the mechanism of the acid-base
interactions between MCA/DCA and DGDP. Harris and Prausnitz developed a model that
takes also the chemical interaction between a solute and a extractant into account [42].
However, this model requires much more experimental data to fit the parameters [42] and
cannot be easily applied in software simulation packages like Aspen Plus and Hysys.
8.3.3. Ternary System
The VLE data for the ternary system MCA + DCA + DGDP were obtained at 5, 7.5, and 10
kPa for several E/F ratios in the range of 0.1–1 and three MCA/DCA mole ratios; 0.25, 1,
4. The obtained VLE data are tabulated in Appendix E. The relative volatility of the
MCA/DCA system in the presence of DGDP as function of E/F ratio and MCA/DCA mole
ratio at a pressure of 5 kPa is depicted in Figure 8-9.
0.0 0.3 0.6 0.9 1.2 1.5
1.0
1.5
2.0
2.5
3.0
3.5
4.0
4.5
5.0
α
E/F ratio [moles solvent/moles acid]
Figure 8-9: Relative volatility (α) of the monochloroacetic acid (MCA) + dichloroacetic acid (DCA) system in the
presence of the extractant diethylene glycol dipentyl ether as function the molar extractant-to-feed (E/F) ratio and
MCA/DCA mole ratio at 5 kPa. (�), MCA/DCA = 4; (), MCA/DCA = 1; (�), MCA/DCA = 0.25; experimental
data. (―), MCA/DCA = 4; (– –), MCA/DCA = 1; (·····), MCA/DCA = 0.25; NRTL correlations with parameters
determined from ternary VLE data (Table 8-4).
Figure 8-9 shows that the relative volatility of the MCA/DCA system largely increases with
the addition of the extractant DGDP with values up to 4. The relative volatility strongly
increases at low E/F ratios and reaches a maximum at an E/F ratio around 1.2–1.5. The
increase in relative volatility with increasing E/F ratio is a common behavior in ternary
systems [7,43,44]. If more DGDP is added to the system, more moles of DCA will form a
complex with DGDP, and thereby the relative volatility of the MCA/DCA system
increases. Figure 8-9 also illustrates that the relative volatility slightly increases with
increasing MCA/DCA ratio. This behavior originates from the difference in strength of the
acid-base complex. DCA forms a stronger complex with DGDP compared to MCA with
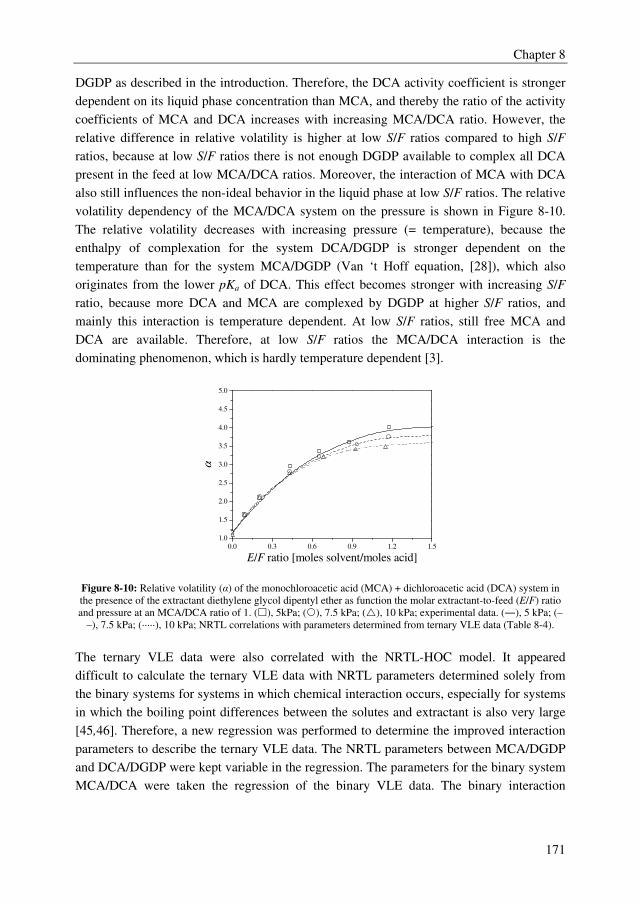
Chapter 8
171
DGDP as described in the introduction. Therefore, the DCA activity coefficient is stronger
dependent on its liquid phase concentration than MCA, and thereby the ratio of the activity
coefficients of MCA and DCA increases with increasing MCA/DCA ratio. However, the
relative difference in relative volatility is higher at low S/F ratios compared to high S/F
ratios, because at low S/F ratios there is not enough DGDP available to complex all DCA
present in the feed at low MCA/DCA ratios. Moreover, the interaction of MCA with DCA
also still influences the non-ideal behavior in the liquid phase at low S/F ratios. The relative
volatility dependency of the MCA/DCA system on the pressure is shown in Figure 8-10.
The relative volatility decreases with increasing pressure (= temperature), because the
enthalpy of complexation for the system DCA/DGDP is stronger dependent on the
temperature than for the system MCA/DGDP (Van ‘t Hoff equation, [28]), which also
originates from the lower pKa of DCA. This effect becomes stronger with increasing S/F
ratio, because more DCA and MCA are complexed by DGDP at higher S/F ratios, and
mainly this interaction is temperature dependent. At low S/F ratios, still free MCA and
DCA are available. Therefore, at low S/F ratios the MCA/DCA interaction is the
dominating phenomenon, which is hardly temperature dependent [3].
0.0 0.3 0.6 0.9 1.2 1.5
1.0
1.5
2.0
2.5
3.0
3.5
4.0
4.5
5.0
α
E/F ratio [moles solvent/moles acid]
Figure 8-10: Relative volatility (α) of the monochloroacetic acid (MCA) + dichloroacetic acid (DCA) system in
the presence of the extractant diethylene glycol dipentyl ether as function the molar extractant-to-feed (E/F) ratio
and pressure at an MCA/DCA ratio of 1. (�), 5kPa; (), 7.5 kPa; (�), 10 kPa; experimental data. (―), 5 kPa; (–
–), 7.5 kPa; (·····), 10 kPa; NRTL correlations with parameters determined from ternary VLE data (Table 8-4).
The ternary VLE data were also correlated with the NRTL-HOC model. It appeared
difficult to calculate the ternary VLE data with NRTL parameters determined solely from
the binary systems for systems in which chemical interaction occurs, especially for systems
in which the boiling point differences between the solutes and extractant is also very large
[45,46]. Therefore, a new regression was performed to determine the improved interaction
parameters to describe the ternary VLE data. The NRTL parameters between MCA/DGDP
and DCA/DGDP were kept variable in the regression. The parameters for the binary system
MCA/DCA were taken the regression of the binary VLE data. The binary interaction
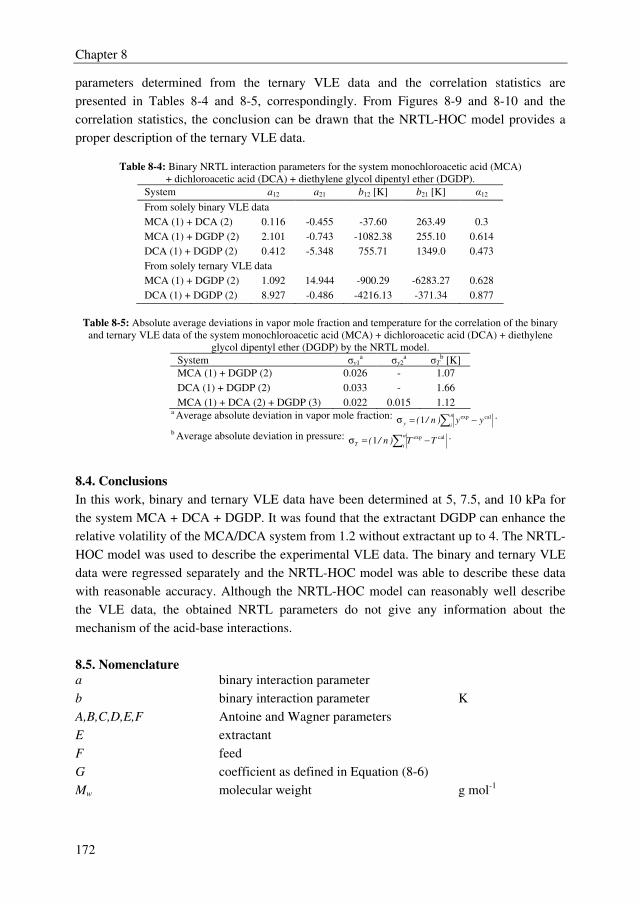
Chapter 8
172
parameters determined from the ternary VLE data and the correlation statistics are
presented in Tables 8-4 and 8-5, correspondingly. From Figures 8-9 and 8-10 and the
correlation statistics, the conclusion can be drawn that the NRTL-HOC model provides a
proper description of the ternary VLE data.
Table 8-4: Binary NRTL interaction parameters for the system monochloroacetic acid (MCA)
+ dichloroacetic acid (DCA) + diethylene glycol dipentyl ether (DGDP).
System a12 a21 b12 [K] b21 [K] α12
From solely binary VLE data
MCA (1) + DCA (2) 0.116 -0.455 -37.60 263.49 0.3
MCA (1) + DGDP (2) 2.101 -0.743 -1082.38 255.10 0.614
DCA (1) + DGDP (2) 0.412 -5.348 755.71 1349.0 0.473
From solely ternary VLE data
MCA (1) + DGDP (2) 1.092 14.944 -900.29 -6283.27 0.628
DCA (1) + DGDP (2) 8.927 -0.486 -4216.13 -371.34 0.877
Table 8-5: Absolute average deviations in vapor mole fraction and temperature for the correlation of the binary
and ternary VLE data of the system monochloroacetic acid (MCA) + dichloroacetic acid (DCA) + diethylene
glycol dipentyl ether (DGDP) by the NRTL model.
System σy1a σy2
a σTb [K]
MCA (1) + DGDP (2) 0.026 - 1.07
DCA (1) + DGDP (2) 0.033 - 1.66
MCA (1) + DCA (2) + DGDP (3) 0.022 0.015 1.12 a Average absolute deviation in vapor mole fraction: ∑ −=σ
n
iy yy)n/(calexp1 .
b Average absolute deviation in pressure: ∑ −=σn
iT TT)n/(calexp
1 .
8.4. Conclusions
In this work, binary and ternary VLE data have been determined at 5, 7.5, and 10 kPa for
the system MCA + DCA + DGDP. It was found that the extractant DGDP can enhance the
relative volatility of the MCA/DCA system from 1.2 without extractant up to 4. The NRTL-
HOC model was used to describe the experimental VLE data. The binary and ternary VLE
data were regressed separately and the NRTL-HOC model was able to describe these data
with reasonable accuracy. Although the NRTL-HOC model can reasonably well describe
the VLE data, the obtained NRTL parameters do not give any information about the
mechanism of the acid-base interactions.
8.5. Nomenclature
a binary interaction parameter
b binary interaction parameter K
A,B,C,D,E,F Antoine and Wagner parameters
E extractant
F feed
G coefficient as defined in Equation (8-6)
Mw molecular weight g mol-1
Chapter 8
173
n number of data points
N number of components
P pressure Pa
Pc critical pressure Pa
Po pure component vapor pressure Pa
Pr reduced pressure
pKa dissociation constant
r radius of gyration Ǻ
R gas constant J mol-1 K-1
T temperature K
Tb boiling point K
Tr reduced temperature
Tc critical temperature K
Tm melting point K
VL saturated liquid molar volume m3 mol-1
Vc critical volume m3 mol-1
x mole fraction in the liquid phase
y mole fraction in the vapor phase
Zc critical compressibility factor
Greek
α relative volatility
αij nonrandomness constant
τ coefficient as defined in Equation (8-6)
µ dipole moment Debye
ω acentric factor
γ activity coefficicient v
φ̂ fugacity coefficient vapor phase
oφ̂ fugacity coefficient at saturated vapor phase
Super/subscripts
cal calculated
exp experimental
i component i
j component j
k component k
Abbreviations
DCA dichloroacetic acid
DGDP diethylene glycol dipentyl ether
Chapter 8
174
HOC Hayden-O’Connell
HPLC high pressure liquid chromatography
MCA monochloroacetic acid
NRTL nonrandom two-liquid
UV ultraviolet
VLE vapor–liquid equilibrium
8.6. References
[1] G. Koenig, E. Lohmar, N. Rupprich, in: Ullmann's Encyclopedia of Industrial
Chemistry, Wiley-VCH Verlag GmbH & Co, 2000.
[2] J. Crouzen, J.J. Gorissen, and C.J.G. Van Strien, US 7,135,597 B2, 2009.
[3] A. Londono, M.T.G. Jongmans, B. Schuur, A.B. de Haan, Fluid Phase Equilibr.
313 (2011) 97-101.
[4] M. Souders, Chem. Eng. Prog 60 (1964) 75-82.
[5] J.C. Gentry, S. Kumar, R. Wright-Wytcherley, Hydrocarb. Process. 93 (2004) 62-
66.
[6] F.M. Lee, J.C. Gentry, Chem. Eng. Process 93 (1997) 56-64.
[7] Z. Lei, B. Chen, Z. Ding, in: Special Distillation Processes, Elsevier, Amsterdam,
2005, pp. 59-144.
[8] R. Fujiware and H. Ohira, JP 72,229,886, 1970.
[9] R. Fujiware and H. Ohira, JP 7,230,165, 1970.
[10] D.R. Lide, W.M. Haynes, Handbook of Chemistry and Physics, 87th ed., Taylor
and Francis group LLC, London, 2009.
[11] M.T.G. Jongmans et al., Sep. Purif. Technol. (2012) Submitted-.
[12] A.E. Wentink, N.J.M. Kuipers, A.B. de Haan, J. Scholtz, H. Mulder, Chem. Eng.
Proc. 46 (2007) 800-809.
[13] F. Duprat, G. Gau, Can. J. Chem. Eng. 69 (1991) 1320-1326.
[14] Z. Lei, C. Li, Y. Li, B. Chen, Sep. Purif. Technol. 36 (2004) 131-138.
[15] S.R. Ningoo, V.G. Gaikar, Separ. Technol. 4 (1994) 249-251.
[16] H. Euler, H. Cassel, Arkiv fur Kemi, Menralogi Och Geologi 4 (1913) 1-10.
[17] Dutch Association of Cost Engineers, DACE Prijzenboekje, 28th ed., Reed
Business, Doetinchem, 2011.
[18] R.H. Perry, D.W. Green, Perry's Chemical Engineers Handbook, 7 ed., McGraw-
Hill, New York, 1997.
[19] M.T.G. Jongmans, J.I.W. Maassen, A.J. Luijks, B. Schuur, A.B. de Haan, J.
Chem. Eng. Data 56 (2011) 3510-3517.
[20] V.G. Gaikar, G.K. Sau, Sep. Sci. Technol. 31 (1996) 1979-1988.
[21] B.E. Poling, J.M. Prausnitz, J.P. O'Connell, The Properties of Gases and Liquids,
Fifth ed., McGraw Hill, Singapore, 2007.
[22] L. Constantinou, R. Gani, AIChE J. 40 (1994) 1697-1710.
[23] L.M. Babkow, V.V. Vashchinskaya, M.A. Kovner, G.A. Puchkovskaya, Y.
Fialkov, Spectrochimica Acta Part A: Molecular Spectroscopy 32 (1976) 1379-
1382.
[24] C.L. Yaws, Thermophysical Properties of Chemicals and Hydrocarbons ed.,
Knovel, New York, 2010.
[25] M. Matsumoto, T. Otono, K. Kondo, Sep. Purif. Technol. 24 (2001) 337-342.
Chapter 8
175
[26] H.G. Joglekar, I. Rahman, S. Babu, B.D. Kulkarni, A. Joshi, Sep. Purif. Technol.
52 (2006) 1-17.
[27] P.W. Ayers, J. Chem. Phys. 122 (2005) 141102-1-141102-3.
[28] C. Laurence, J.-F. Gal, Lewis Basicity and Affinity Scales, First ed., John Wiley &
Sons Ltd, Chishester, 2010.
[29] S. Miyamoto, S. Nakamura, Y. Iwai, Y. Arai, J. Chem. Eng. Data 46 (2001) 1225-
1230.
[30] S. Miyamoto, S. Nakamura, Y. Iwai, Y. Arai, J. Chem. Eng. Data 46 (2001) 405-
409.
[31] J.G. Hayden, J.P. O'Connell, Ind. Eng. Chem. Proc. D. D. 14 (1975) 209-216.
[32] C.F. Spencer, R.P. Danner, J. Chem. Eng. Data 17 (1972) 236-241.
[33] A.C. Vawdrey, J.L. Oscarson, R.L. Rowley, W. Vincent Wilding, Fluid Phase
Equilibr. 222−223 (2004) 239-245.
[34] Z. Zhu, Y. Ma, J. Gao, J. Chem. Eng. Data 55 (2010) 3387-3390.
[35] J.A. Faniran, K.S. Patel, L.O. Nelson, Journal of Physical Chemistry 82 (1978)
1018-1021.
[36] Y. Peng, L. Ping, S. Lu, J. Mao, Fluid Phase Equilibr. 275 (2009) 27-32.
[37] F.P. Stein, E.J. Miller, Ind. Eng. Chem. Proc. D. D. 19 (1980) 123-128.
[38] ASPEN Plus 21.0, User Guide, Regression property data, 1st ed., 2009.
[39] H.J. Huang, I.L. Chien, Journal of the Chinese Institute of Chemical Engineers 39
(2008) 503-517.
[40] W. Chang, H. Wan, G. Guan, H. Yao, Fluid Phase Equilibr. 242 (2006) 204-209.
[41] C. Zhang, H. Wan, L. Xue, G. Guan, Fluid Phase Equilibr. 305 (2011) 68-75.
[42] H.G. Harris, J.M. Prausnitz, Ind. Eng. Chem. Fund. 8 (1969) 180-188.
[43] M.F. Doherty, J.P. Knapp, Distillation, Azeotropic, and Extractive ed., John Wiley
& Sons, Inc., 2000.
[44] W. Yin, S. Ding, S. Xia, P. Ma, X. Huang, Z. Zhu, J. Chem. Eng. Data 55 (2010)
3274-3277.
[45] M.T.G. Jongmans, B. Schuur, A.B. de Haan, Ind. Eng. Chem. Res. 50 (2011)
10800-10810.
[46] N. Calvar, B. Gonzalez, E. Gomez, A. Dominguez, J. Chem. Eng. Data 54 (2009)
1004-1008.

176
177
Conceptual Design of
an Extractive Distillation Process for
Monochloroacetic Acid/Dichloroacetic Acid
Separation
Abstract In the current monochloroacetic acid (MCA) production process, the separation process of
MCA from dichloroacetic acid (DCA) is very capital and energy intensive, because the
undesired DCA is converted to MCA in a hydrogenation process followed by a distillation
and crystallization to obtain high purity MCA. The traditional distillation of MCA and
DCA is challenging due to the low relative volatility of ~1.05–1.3 of the MCA/DCA
mixture. Extractive distillation is generally recognized as a hybrid separation technology
that may be used to separate close-boiling mixtures up to high purities energy effectively.
However, adding an extractant requires a new process concept, including an extractant
regeneration unit. Therefore, the aim of this study was to make a conceptual design of an
extractive distillation process to separate MCA up to high purities from DCA (wDCA < 50
ppm) using the previously selected extractant diethylene glycol dipentyl ether. For a 70.000
mta MCA plant, the total annual costs for such a process were estimated to be 1.6 M€ per
year. Thus, the added production costs are 23 €/tonne MCA product, which is rather low
compared to the current (high purity) MCA price of 1500 €/tonne. Therefore, the
conclusion can be drawn that extractive distillation is a promising technology to obtain high
purity MCA.
Chapter 9
178
9.1. Introduction
Monochloroacetic acid (MCA) is manufactured via the chlorination of acetic acid, and is
mainly used in the production of carboxymethyl cellulose (CMC, used as thickener and
emulsion stabilizer) and pharmaceuticals [1,2]. In the chlorinator, part of the MCA is
chlorinated to the undesired dichloroacetic acid (DCA), which is typically present for about
5 wt% [3]. To fabricate CMC and pharmaceuticals, the upper DCA concentration limit in
MCA is 50 ppm, a level that is difficult to obtain with the current production process [1].
Therefore, a producer can secure their supply by producing high purity MCA. Currently, an
energy and capital intensive hydrogenation process is applied to convert the undesired DCA
to MCA [1]. However, during this conversion, also part of the MCA is converted to acetic
acid. Subsequently, distillation is applied to separate acetic acid from the final MCA
product, which still contains about 300 ppm of DCA. Melt crystallization is currently
applied to further purify the MCA to obtain the high purity MCA [1]. Process
intensification can be achieved if the produced MCA is separated from DCA up to high
purities directly after the chlorinator. The acetic acid/MCA distillation and crystallization
process can be avoided, and the hydrogenator size can be reduced substantially.
Distillation of the MCA/DCA mixture is challenging, because of the low relative volatility
of ~1.05–1.3 [4]. Extractive distillation was recognized as a promising alternative, which is
a well-established technology to separate close-boiling mixtures [5,6]. We identified in our
extractant screening study that exploiting the large difference in acid dissociation constant
between MCA (pKa = 2.87 [7]) and DCA (pKa = 1.25 [7]) by applying basic extractants is a
very effective method to enhance the relative volatility of the MCA/DCA system [8]. DCA
forms a stronger complex with the base via hydrogen bonding/proton transfer, because it
has a lower pKa than MCA [9], and is therefore more retained in the liquid phase. From our
extractant screening study, diethylene glycol dipentyl ether (DGDP) was identified as the
most promising extractive agent, which improves the relative volatility to values up to 4
[10] and clearly outperforms other extractants commonly used in extractive distillation, like
sulfolane [11]. Moreover, DGDP could easily be regenerated and is thermally and
chemically stable in the strong acid environment [8]. However, the extra energy required
for the regeneration of the extractant should be balanced against the savings in the primary
separation.
A process design should confirm whether extractive distillation using the extractant DGDP
is indeed a promising technology. Therefore, the aim of this chapter was to setup a
conceptual design for the extractive distillation process to separate MCA up to high purities
from DCA for a typical 70,000 metric tonnes annually (mta) production plant [12]. First,
the extractive distillation column was optimized to determine the optimal number of
equilibrium stages (NTS), reflux ratio (R), and extractant-to-feed (E/F = mass
extractant/mass feed) ratio. The term extractant-to-feed ratio was used in this chapter
contrary to solvent-to-feed ratio in Chapters 2-6, because components that form complexes
with the solutes are often called extractants [13,14]. This was followed by an analysis of the
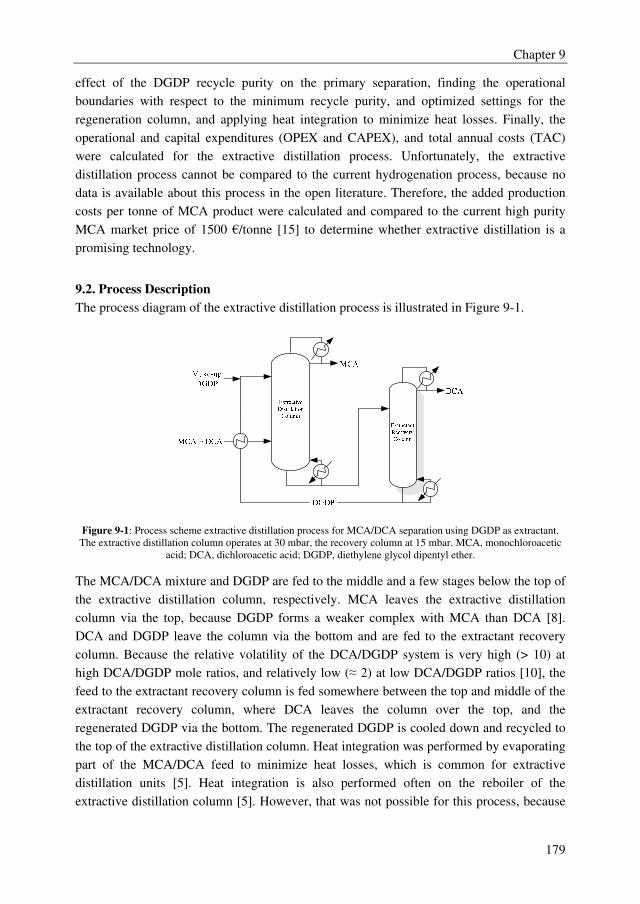
Chapter 9
179
effect of the DGDP recycle purity on the primary separation, finding the operational
boundaries with respect to the minimum recycle purity, and optimized settings for the
regeneration column, and applying heat integration to minimize heat losses. Finally, the
operational and capital expenditures (OPEX and CAPEX), and total annual costs (TAC)
were calculated for the extractive distillation process. Unfortunately, the extractive
distillation process cannot be compared to the current hydrogenation process, because no
data is available about this process in the open literature. Therefore, the added production
costs per tonne of MCA product were calculated and compared to the current high purity
MCA market price of 1500 €/tonne [15] to determine whether extractive distillation is a
promising technology.
9.2. Process Description
The process diagram of the extractive distillation process is illustrated in Figure 9-1.
Figure 9-1: Process scheme extractive distillation process for MCA/DCA separation using DGDP as extractant.
The extractive distillation column operates at 30 mbar, the recovery column at 15 mbar. MCA, monochloroacetic
acid; DCA, dichloroacetic acid; DGDP, diethylene glycol dipentyl ether.
The MCA/DCA mixture and DGDP are fed to the middle and a few stages below the top of
the extractive distillation column, respectively. MCA leaves the extractive distillation
column via the top, because DGDP forms a weaker complex with MCA than DCA [8].
DCA and DGDP leave the column via the bottom and are fed to the extractant recovery
column. Because the relative volatility of the DCA/DGDP system is very high (> 10) at
high DCA/DGDP mole ratios, and relatively low (≈ 2) at low DCA/DGDP ratios [10], the
feed to the extractant recovery column is fed somewhere between the top and middle of the
extractant recovery column, where DCA leaves the column over the top, and the
regenerated DGDP via the bottom. The regenerated DGDP is cooled down and recycled to
the top of the extractive distillation column. Heat integration was performed by evaporating
part of the MCA/DCA feed to minimize heat losses, which is common for extractive
distillation units [5]. Heat integration is also performed often on the reboiler of the
extractive distillation column [5]. However, that was not possible for this process, because
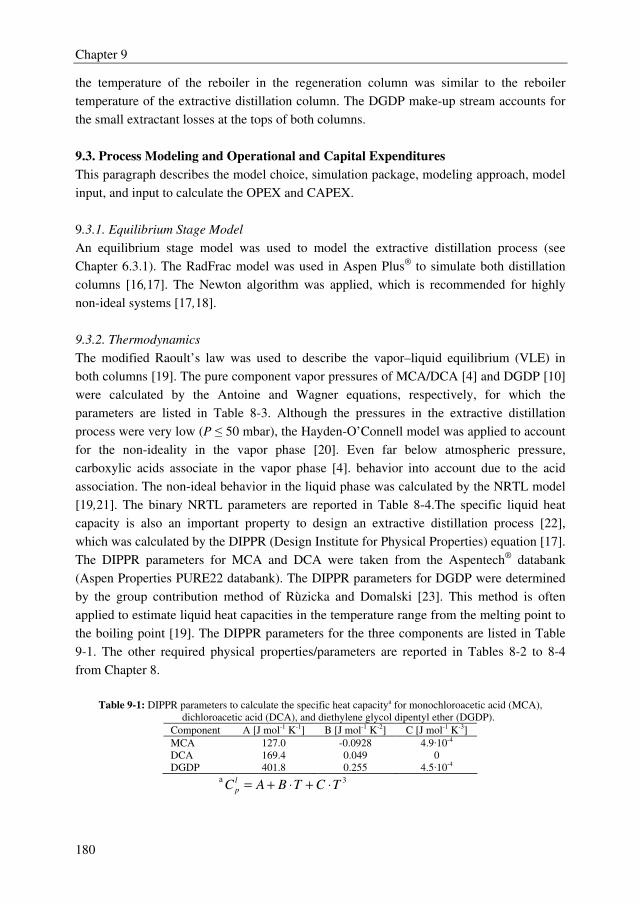
Chapter 9
180
the temperature of the reboiler in the regeneration column was similar to the reboiler
temperature of the extractive distillation column. The DGDP make-up stream accounts for
the small extractant losses at the tops of both columns.
9.3. Process Modeling and Operational and Capital Expenditures
This paragraph describes the model choice, simulation package, modeling approach, model
input, and input to calculate the OPEX and CAPEX.
9.3.1. Equilibrium Stage Model
An equilibrium stage model was used to model the extractive distillation process (see
Chapter 6.3.1). The RadFrac model was used in Aspen Plus® to simulate both distillation
columns [16,17]. The Newton algorithm was applied, which is recommended for highly
non-ideal systems [17,18].
9.3.2. Thermodynamics
The modified Raoult’s law was used to describe the vapor–liquid equilibrium (VLE) in
both columns [19]. The pure component vapor pressures of MCA/DCA [4] and DGDP [10]
were calculated by the Antoine and Wagner equations, respectively, for which the
parameters are listed in Table 8-3. Although the pressures in the extractive distillation
process were very low (P ≤ 50 mbar), the Hayden-O’Connell model was applied to account
for the non-ideality in the vapor phase [20]. Even far below atmospheric pressure,
carboxylic acids associate in the vapor phase [4]. behavior into account due to the acid
association. The non-ideal behavior in the liquid phase was calculated by the NRTL model
[19,21]. The binary NRTL parameters are reported in Table 8-4.The specific liquid heat
capacity is also an important property to design an extractive distillation process [22],
which was calculated by the DIPPR (Design Institute for Physical Properties) equation [17].
The DIPPR parameters for MCA and DCA were taken from the Aspentech® databank
(Aspen Properties PURE22 databank). The DIPPR parameters for DGDP were determined
by the group contribution method of Rùzicka and Domalski [23]. This method is often
applied to estimate liquid heat capacities in the temperature range from the melting point to
the boiling point [19]. The DIPPR parameters for the three components are listed in Table
9-1. The other required physical properties/parameters are reported in Tables 8-2 to 8-4
from Chapter 8.
Table 9-1: DIPPR parameters to calculate the specific heat capacitya for monochloroacetic acid (MCA),
dichloroacetic acid (DCA), and diethylene glycol dipentyl ether (DGDP).
Component A [J mol-1 K-1] B [J mol-1 K-2] C [J mol-1 K-3]
MCA 127.0 -0.0928 4.9·10-4
DCA 169.4 0.049 0
DGDP 401.8 0.255 4.5·10-4 a 3
TCTBACl
p ⋅+⋅+=
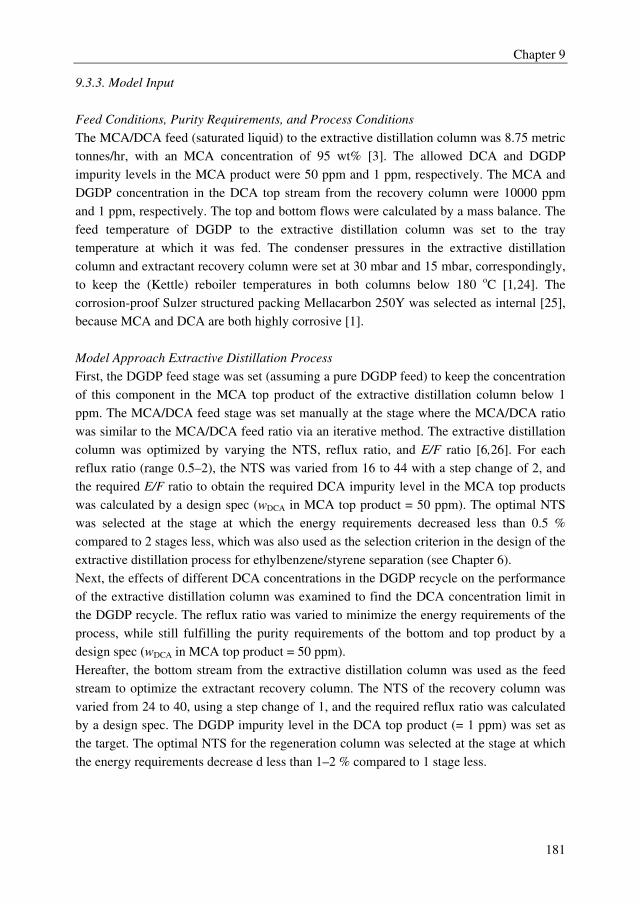
Chapter 9
181
9.3.3. Model Input
Feed Conditions, Purity Requirements, and Process Conditions
The MCA/DCA feed (saturated liquid) to the extractive distillation column was 8.75 metric
tonnes/hr, with an MCA concentration of 95 wt% [3]. The allowed DCA and DGDP
impurity levels in the MCA product were 50 ppm and 1 ppm, respectively. The MCA and
DGDP concentration in the DCA top stream from the recovery column were 10000 ppm
and 1 ppm, respectively. The top and bottom flows were calculated by a mass balance. The
feed temperature of DGDP to the extractive distillation column was set to the tray
temperature at which it was fed. The condenser pressures in the extractive distillation
column and extractant recovery column were set at 30 mbar and 15 mbar, correspondingly,
to keep the (Kettle) reboiler temperatures in both columns below 180 oC [1,24]. The
corrosion-proof Sulzer structured packing Mellacarbon 250Y was selected as internal [25],
because MCA and DCA are both highly corrosive [1].
Model Approach Extractive Distillation Process
First, the DGDP feed stage was set (assuming a pure DGDP feed) to keep the concentration
of this component in the MCA top product of the extractive distillation column below 1
ppm. The MCA/DCA feed stage was set manually at the stage where the MCA/DCA ratio
was similar to the MCA/DCA feed ratio via an iterative method. The extractive distillation
column was optimized by varying the NTS, reflux ratio, and E/F ratio [6,26]. For each
reflux ratio (range 0.5–2), the NTS was varied from 16 to 44 with a step change of 2, and
the required E/F ratio to obtain the required DCA impurity level in the MCA top products
was calculated by a design spec (wDCA in MCA top product = 50 ppm). The optimal NTS
was selected at the stage at which the energy requirements decreased less than 0.5 %
compared to 2 stages less, which was also used as the selection criterion in the design of the
extractive distillation process for ethylbenzene/styrene separation (see Chapter 6).
Next, the effects of different DCA concentrations in the DGDP recycle on the performance
of the extractive distillation column was examined to find the DCA concentration limit in
the DGDP recycle. The reflux ratio was varied to minimize the energy requirements of the
process, while still fulfilling the purity requirements of the bottom and top product by a
design spec (wDCA in MCA top product = 50 ppm).
Hereafter, the bottom stream from the extractive distillation column was used as the feed
stream to optimize the extractant recovery column. The NTS of the recovery column was
varied from 24 to 40, using a step change of 1, and the required reflux ratio was calculated
by a design spec. The DGDP impurity level in the DCA top product (= 1 ppm) was set as
the target. The optimal NTS for the regeneration column was selected at the stage at which
the energy requirements decrease d less than 1–2 % compared to 1 stage less.
Chapter 9
182
Finally, the total extractive distillation process was modeled by closing the DGDP recycle
and applying heat integration on the MCA/DCA feed. A logarithmic temperature difference
of 10 K was assumed between the hot and cold stream [27].
9.3.4. OPEX, CAPEX, and TAC
The OPEX were calculated from the process energy requirements using a running time of
8400 hrs per year [28] and the cost factors supplied in Table 9-2.
Table 9-2: Cost factors for the operational expenditures [27,28].
Cost factor €/GJ
Heating
Steam medium pressure (10–12 bar) 9.95
Cooling
Cooling water (> 32 oC) 0.80
Cooling water (20 oC) 1.73
The Aspen Process Economic Analyzer® was applied to calculate the CAPEX. The
diameter and column heights of the (extractive) distillation columns were calculated in
Aspen Plus using the Packing Sizing tool [17]. Standard overall heat transfer coefficients
[29] were used to calculated the heat exchanger areas. Glass lined carbon steel and graphite
were selected as the materials for the distillation columns and heat exchangers, because
MCA and DCA are highly corrosive [1]. It was assumed that utilities, like steam, cooling
water, etcetera, are already available at the plant location. The purchase costs of pumps
were not taken into account. The total extractant investment was calculated from the
extractant hold-up in the process and the extractant price. A price of 6 €/kg was assumed
for DGDP [30], which is the current price for diethylene glycol dibutyl ether. Because
DGDP is a custom-synthesized extractant, the price was also varied up to 100 €/kg to
determine the contribution of the extractant price to the total CAPEX. The TAC were
calculated by summing up the OPEX and 20 % of the CAPEX [27].
9.4. Results
The results from the process model are presented in this section. First the results from the
optimization of the extractive distillation column are discussed, followed by the influence
of DCA in the DGDP recycle on the extractive distillation column. Next, the results are
discussed for the extractant recovery column. Finally, the results are provided for the total
extractive distillation process including OPEX, CAPEX, and TAC.
9.4.1. Extractive Distillation Column
The results from the optimization of the extractive distillation column are illustrated in
Figure 9-2.
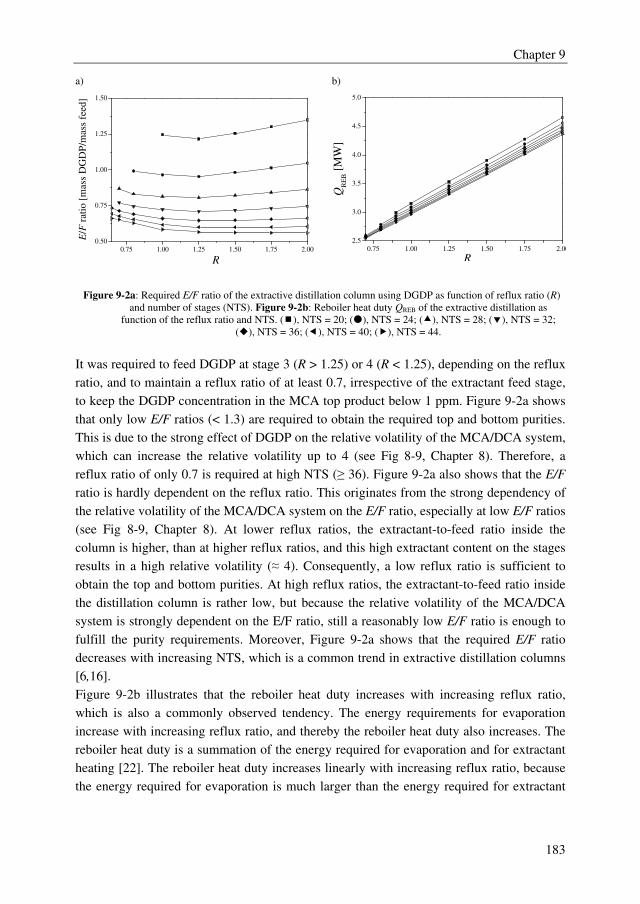
Chapter 9
183
a) b)
0.75 1.00 1.25 1.50 1.75 2.00
0.50
0.75
1.00
1.25
1.50
E
/F r
atio
[m
ass
DG
DP
/mas
s fe
ed]
R 0.75 1.00 1.25 1.50 1.75 2.00
2.5
3.0
3.5
4.0
4.5
5.0
QR
EB [
MW
]
R
Figure 9-2a: Required E/F ratio of the extractive distillation column using DGDP as function of reflux ratio (R)
and number of stages (NTS). Figure 9-2b: Reboiler heat duty QREB of the extractive distillation as
function of the reflux ratio and NTS. (�), NTS = 20; (�), NTS = 24; (�), NTS = 28; (�), NTS = 32;
(�), NTS = 36; (�), NTS = 40; (�), NTS = 44.
It was required to feed DGDP at stage 3 (R > 1.25) or 4 (R < 1.25), depending on the reflux
ratio, and to maintain a reflux ratio of at least 0.7, irrespective of the extractant feed stage,
to keep the DGDP concentration in the MCA top product below 1 ppm. Figure 9-2a shows
that only low E/F ratios (< 1.3) are required to obtain the required top and bottom purities.
This is due to the strong effect of DGDP on the relative volatility of the MCA/DCA system,
which can increase the relative volatility up to 4 (see Fig 8-9, Chapter 8). Therefore, a
reflux ratio of only 0.7 is required at high NTS (≥ 36). Figure 9-2a also shows that the E/F
ratio is hardly dependent on the reflux ratio. This originates from the strong dependency of
the relative volatility of the MCA/DCA system on the E/F ratio, especially at low E/F ratios
(see Fig 8-9, Chapter 8). At lower reflux ratios, the extractant-to-feed ratio inside the
column is higher, than at higher reflux ratios, and this high extractant content on the stages
results in a high relative volatility (≈ 4). Consequently, a low reflux ratio is sufficient to
obtain the top and bottom purities. At high reflux ratios, the extractant-to-feed ratio inside
the distillation column is rather low, but because the relative volatility of the MCA/DCA
system is strongly dependent on the E/F ratio, still a reasonably low E/F ratio is enough to
fulfill the purity requirements. Moreover, Figure 9-2a shows that the required E/F ratio
decreases with increasing NTS, which is a common trend in extractive distillation columns
[6,16].
Figure 9-2b illustrates that the reboiler heat duty increases with increasing reflux ratio,
which is also a commonly observed tendency. The energy requirements for evaporation
increase with increasing reflux ratio, and thereby the reboiler heat duty also increases. The
reboiler heat duty is a summation of the energy required for evaporation and for extractant
heating [22]. The reboiler heat duty increases linearly with increasing reflux ratio, because
the energy required for evaporation is much larger than the energy required for extractant
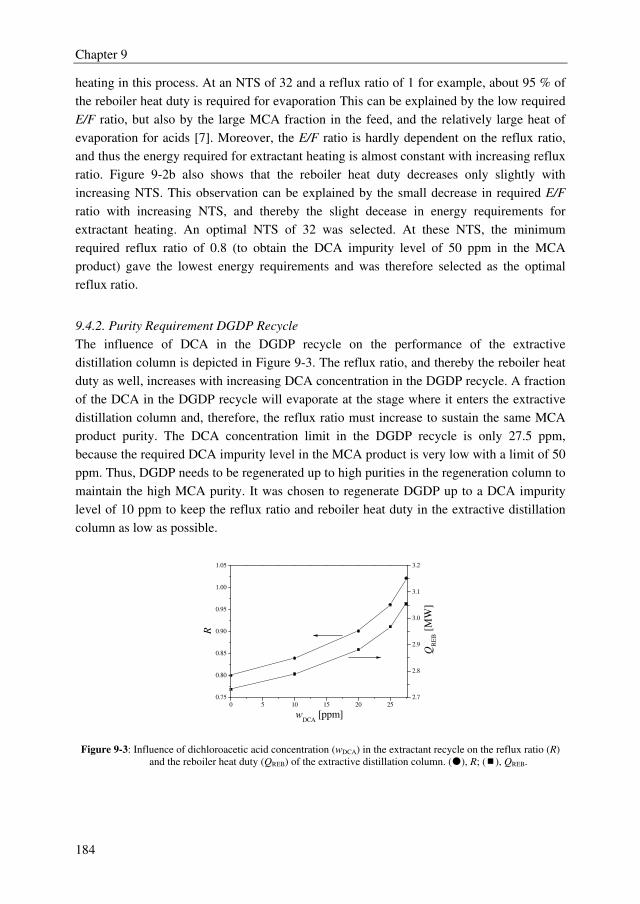
Chapter 9
184
heating in this process. At an NTS of 32 and a reflux ratio of 1 for example, about 95 % of
the reboiler heat duty is required for evaporation This can be explained by the low required
E/F ratio, but also by the large MCA fraction in the feed, and the relatively large heat of
evaporation for acids [7]. Moreover, the E/F ratio is hardly dependent on the reflux ratio,
and thus the energy required for extractant heating is almost constant with increasing reflux
ratio. Figure 9-2b also shows that the reboiler heat duty decreases only slightly with
increasing NTS. This observation can be explained by the small decrease in required E/F
ratio with increasing NTS, and thereby the slight decease in energy requirements for
extractant heating. An optimal NTS of 32 was selected. At these NTS, the minimum
required reflux ratio of 0.8 (to obtain the DCA impurity level of 50 ppm in the MCA
product) gave the lowest energy requirements and was therefore selected as the optimal
reflux ratio.
9.4.2. Purity Requirement DGDP Recycle
The influence of DCA in the DGDP recycle on the performance of the extractive
distillation column is depicted in Figure 9-3. The reflux ratio, and thereby the reboiler heat
duty as well, increases with increasing DCA concentration in the DGDP recycle. A fraction
of the DCA in the DGDP recycle will evaporate at the stage where it enters the extractive
distillation column and, therefore, the reflux ratio must increase to sustain the same MCA
product purity. The DCA concentration limit in the DGDP recycle is only 27.5 ppm,
because the required DCA impurity level in the MCA product is very low with a limit of 50
ppm. Thus, DGDP needs to be regenerated up to high purities in the regeneration column to
maintain the high MCA purity. It was chosen to regenerate DGDP up to a DCA impurity
level of 10 ppm to keep the reflux ratio and reboiler heat duty in the extractive distillation
column as low as possible.
0 5 10 15 20 25
0.75
0.80
0.85
0.90
0.95
1.00
1.05
wDCA
[ppm]
R
2.7
2.8
2.9
3.0
3.1
3.2
QR
EB [
MW
]
Figure 9-3: Influence of dichloroacetic acid concentration (wDCA) in the extractant recycle on the reflux ratio (R)
and the reboiler heat duty (QREB) of the extractive distillation column. (�), R; (�), QREB.
Chapter 9
185
9.4.3. Extractant Recovery Column
The results for the optimization of the regeneration column are illustrated in Figure 9-4.
24 26 28 30 32 34 36 38 40
9
10
11
12
13
14
15
16
17
NTS [stages]
R
0.50
0.55
0.60
0.65
0.70
0.75
0.80
QR
EB [
MW
]
Figure 9-4: Reflux ratio (R) and reboiler heat duty (QREB) of the regeneration column
as function of the number of theoretical stages (NTS). (�), R; (�), QREB.
The reflux ratio and the reboiler heat duty both decrease with increasing NTS, which is a
typical trend in the design of distillation columns [27,31]. The relatively high reflux ratios
originate from the high top and bottom purity requirements, the low DCA mass fraction of
0.063 in the feed to the regeneration column, and the rather low relative volatility of the
DCA/DGDP system at low DCA concentration (α ≈ 2, see Figure 8-7). An optimum NTS
of 31 was selected, at which a reflux ratio of 11 is required.
9.4.4. Total Extractive Distillation Process
Finally, the total process was modeled and heat integration was applied on the MCA/DCA
feed stream. The total reboiler heat duty for the extractive distillation process is 3.1 MW.
The energy required for extractant heating (~ 0.25 MW) could be recovered. The total
OPEX were estimated to be 1.0 M€/yr, which were mainly dominated by the OPEX for the
heat requirements (0.92 M€/yr). The costs for extractant losses were minimal with only 100
€/yr, due to the low DGDP concentration of 1 ppm in the top products of both distillation
columns. However, it is possible that due to temperature/chemical degradation [8] some
extra DGDP make-up is required, which was not taken into account in this evaluation.
The CAPEX were also calculated, which are a summation of the investments for the
(extractive) distillation columns, heat exchangers, and extractant investment. The CAPEX
were estimated to be 2.9 M€, from which 68 % is required for the investment in the
columns. The extractant investment contributes to about 1 % of the total CAPEX at the
extractant price of 6 €/kg. At a price of 100 €/kg, the extractant investment contributes to
about 13 % of the total CAPEX. Thus, the contribution of the extractant investment to the
total CAPEX is rather low. Finally, the calculated TAC are 1.6 M€/year. This means an
addition to the production costs of 23 €/tonne MCA product for a 70.000 mta MCA plant,
which is rather low compared to the current (high purity) MCA price of 1500 €/tonne [15].
Chapter 9
186
Moreover, the acetic acid/MCA distillation and crystallization step can be avoided, and the
hydrogenator size might be substantially reduced, which will decrease the total annual
costs. Therefore, the conclusion can be drawn that extractive distillation is a promising
technology to separate MCA from DCA up to high purities.
9.5. Conclusions
A conceptual design study was performed to investigate whether extractive distillation
using the extractant DGDP is a promising technology to separate MCA and DCA to obtain
highly pure MCA (wDCA < 50 ppm). In the extractive distillation column, a reflux ratio of
0.7 and an E/F ratio of 0.75 were selected as the optimal conditions, at an NTS of 32. In the
regeneration column, a reflux ratio of 11 is required at an NTS of 31. For a 70.000 mta
MCA plant, the TAC were estimated to be 1.6 M€/year. The addition to the MCA
production costs are 23 €/tonne MCA product, which is rather low compared to the current
(high purity) MCA price of 1500 €/tonne. Therefore, the conclusion can be drawn that
extractive distillation is a promising technology to obtain high purity MCA.
9.6. Nomenclature
A DIPPR liquid heat capacity parameter J mol-1 K-1
B DIPPR liquid heat capacity parameter J mol-1 K-2
Cpl liquid heat capacity J mol-1 K-1
E extractant
F feed
pKa acid dissociation constant
Q heat duty MW
R reflux ratio
w mass fraction
Greek symbols
α relative volatility
Subscripts
REB reboiler
Abbreviations
CAPEX capital expenditures
CMC carboxymethyl cellulose
DCA dichloroacetic acid
DGDP diethylene glycol dipentyl ether
Chapter 9
187
DIPPR design institute for physical properties
MCA monochloroacetic acid
mta metric tonnes annually
NRTL nonrandom two-liquid
NTS number of theoretical stages
OPEX operational expenditures
ppm parts per million
TAC total annual costs
VLE vapor–liquid equilibrium
9.7. References
[1] G. Koenig, E. Lohmar, N. Rupprich, in: Ullmann's Encyclopedia of Industrial
Chemistry, Wiley-VCH Verlag GmbH & Co, 2000.
[2] AkzoNobel, Monochloroacetic acid, 2010,
www.chemiepark.nl/Nl/Ondernemingen/MCA.htm, Cited: July 28, 2010.
[3] J. Crouzen, J.J. Gorissen, and C.J.G. Van Strien, US 7,135,597 B2, 2009.
[4] A. Londono, M.T.G. Jongmans, B. Schuur, A.B. de Haan, Fluid Phase Equilibr.
313 (2011) 97-101.
[5] J.C. Gentry, S. Kumar, R. Wright-Wytcherley, Hydrocarb. Process. 93 (2004) 62-
66.
[6] Z. Lei, B. Chen, Z. Ding, in: Special Distillation Processes, Elsevier, Amsterdam,
2005, pp. 59-144.
[7] D.R. Lide, W.M. Haynes, Handbook of Chemistry and Physics, 87th ed., Taylor
and Francis group LLC, London, 2009.
[8] M.T.G. Jongmans et al., Sep. Purif. Technol. (2012) Submitted-.
[9] C.J. King, in: R. W. Rousseau (Ed.), Handbook of Separation Process Technology,
1987, pp. 760-774.
[10] M.T.G. Jongmans, A. Londono, B. Schuur, A.B. de Haan, Fluid Phase Equilibr.
(2012) Submitted-.
[11] R. Fujiware and H. Ohira, JP 72,229,886, 1970.
[12] Chemical Associates, Monochloroacetic acid, 2010, www.chemical-
associates.co.uk/CaseStudies/MonochloroaceticAcid, Cited: July 28, 2010.
[13] A. Keshav, K.L. Wasewar, S. Chand, H. Uslu, Fluid Phase Equilibr. 275 (2009)
21-26.
[14] J.A. Tamada, C.J. King, Ind. Eng. Chem. Res. 29 (1990) 1327-1333.
[15] www.alibaba.com, Price chloroacetic acid, 2012, Cited: 20 jan 2012.
[16] P. Gomez, I. Gil, Proceedings of european congress of chemical engineering (
2007), 1-19.
[17] ASPEN Plus V7.2, User Guide, 1st ed., 2011.
[18] R. Baur, A.P. Higler, R. Taylor, R. Krishna, Chem. Eng. J. 76 (2000) 33-47.
[19] B.E. Poling, J.M. Prausnitz, J.P. O'Connell, The Properties of Gases and Liquids,
Fifth ed., McGraw Hill, Singapore, 2007.
[20] J.G. Hayden, J.P. O'Connell, Ind. Eng. Chem. Proc. D. D. 14 (1975) 209-216.
[21] H. Renon, J.M. Prausnitz, AIChE J. 14 (1968) 135-144.
[22] M. Souders, Chem. Eng. Prog 60 (1964) 75-82.
Chapter 9
188
[23] V. Ruzicka, E.S. Domalski, Journal of Physical and Chemical Reference Data 22
(1993) 597-657.
[24] H. Euler, H. Cassel, Arkiv fur Kemi, Menralogi Och Geologi 4 (1913) 1-10.
[25] Sulzer Chemtech, Structured packing for Distillation, Absorption, and Reactive
Distillation, 2010, Cited: 26 Jan 2012.
[26] I. Sucksmith, Chem. Eng. 89 (1982) 91-95.
[27] W.D. Seider, J.D. Seader, D.R. Lewin, Product & Process Design Principles,
Second ed., John Wiley & Sons, New York, 2004.
[28] Dutch Association of Cost Engineers, DACE Prijzenboekje, 28th ed., Reed
Business, Doetinchem, 2011.
[29] J.F. Richarson, J.H. Harker, J.R. Backhurst, Coulson & Richarson's Chemical
Engineering, 5th ed., Butterworth Heinneman, Oxford, 2002.
[30] www.alibaba.com, Price diethylene glycol dibutyl ether, 2012, Cited: 25 jan 2012.
[31] M.F. Doherty, J.P. Knapp, Distillation, Azeotropic, and Extractive ed., John Wiley
& Sons, Inc., 2000.
189
Conclusions and Outlook
The main objective of this thesis was to investigate whether extractive distillation is a
promising technology to separate close-boiling systems to obtain high purity products. The
close-boiling mixtures ethylbenzene/styrene and monochloroacetic acid
(MCA)/dichloroacetic acid (DCA) were investigated as representative examples from the
chemical industry. The solvents sulfolane (the benchmark industrial solvent for this
separation) and a wide range of ionic liquids (ILs) were investigated to obtain ethylbenzene
impurity levels lower than 10 ppm in styrene. A wide range of agents were studied aiming
at selective complexation with DCA to obtain high purity MCA (wDCA < 50 ppm).
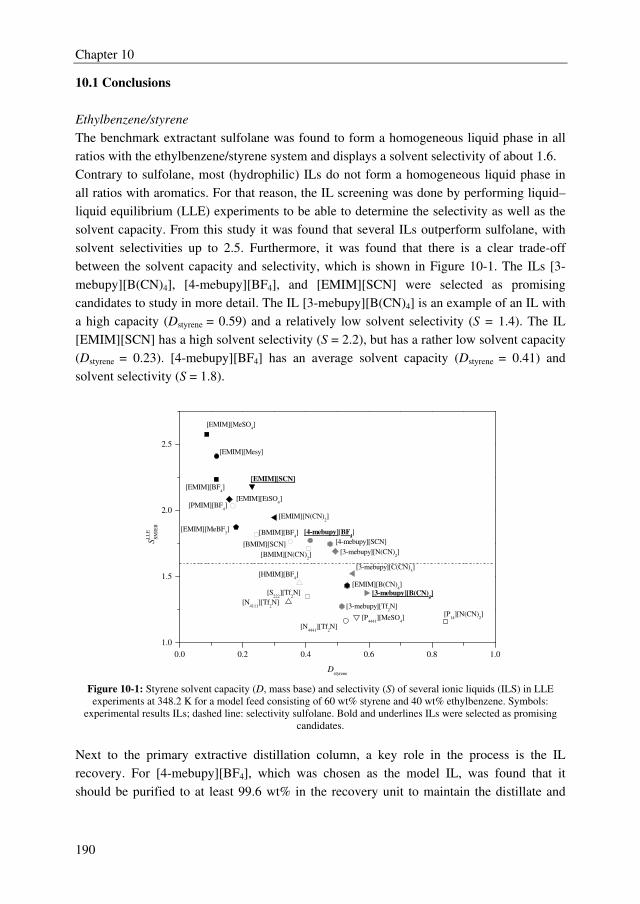
Chapter 10
190
10.1 Conclusions
Ethylbenzene/styrene
The benchmark extractant sulfolane was found to form a homogeneous liquid phase in all
ratios with the ethylbenzene/styrene system and displays a solvent selectivity of about 1.6.
Contrary to sulfolane, most (hydrophilic) ILs do not form a homogeneous liquid phase in
all ratios with aromatics. For that reason, the IL screening was done by performing liquid–
liquid equilibrium (LLE) experiments to be able to determine the selectivity as well as the
solvent capacity. From this study it was found that several ILs outperform sulfolane, with
solvent selectivities up to 2.5. Furthermore, it was found that there is a clear trade-off
between the solvent capacity and selectivity, which is shown in Figure 10-1. The ILs [3-
mebupy][B(CN)4], [4-mebupy][BF4], and [EMIM][SCN] were selected as promising
candidates to study in more detail. The IL [3-mebupy][B(CN)4] is an example of an IL with
a high capacity (Dstyrene = 0.59) and a relatively low solvent selectivity (S = 1.4). The IL
[EMIM][SCN] has a high solvent selectivity (S = 2.2), but has a rather low solvent capacity
(Dstyrene = 0.23). [4-mebupy][BF4] has an average solvent capacity (Dstyrene = 0.41) and
solvent selectivity (S = 1.8).
0.0 0.2 0.4 0.6 0.8 1.0
1.0
1.5
2.0
2.5
[4-mebupy][SCN]
[N4441
][Tf2N]
[P4441
][MeSO4]
[P14
][N(CN)2]
[3-mebupy][Tf2N]
[N4111
][Tf2N]
[S222
][Tf2N] [3-mebupy][B(CN)
4]
[EMIM][B(CN)4]
[HMIM][BF4]
[3-mebupy][C(CN)3]
[3-mebupy][N(CN)2][BMIM][N(CN)
2]
[BMIM][SCN]
[4-mebupy][BF4][BMIM][BF
4]
[EMIM][MeBF3]
[EMIM][N(CN)2]
[PMIM][BF4]
[EMIM][EtSO4]
[EMIM][SCN]
[EMIM][BF4]
[EMIM][Mesy]
[EMIM][MeSO4]
SL
LE
SM
/EB
Dstyrene
Figure 10-1: Styrene solvent capacity (D, mass base) and selectivity (S) of several ionic liquids (ILS) in LLE
experiments at 348.2 K for a model feed consisting of 60 wt% styrene and 40 wt% ethylbenzene. Symbols:
experimental results ILs; dashed line: selectivity sulfolane. Bold and underlines ILs were selected as promising
candidates.
Next to the primary extractive distillation column, a key role in the process is the IL
recovery. For [4-mebupy][BF4], which was chosen as the model IL, was found that it
should be purified to at least 99.6 wt% in the recovery unit to maintain the distillate and
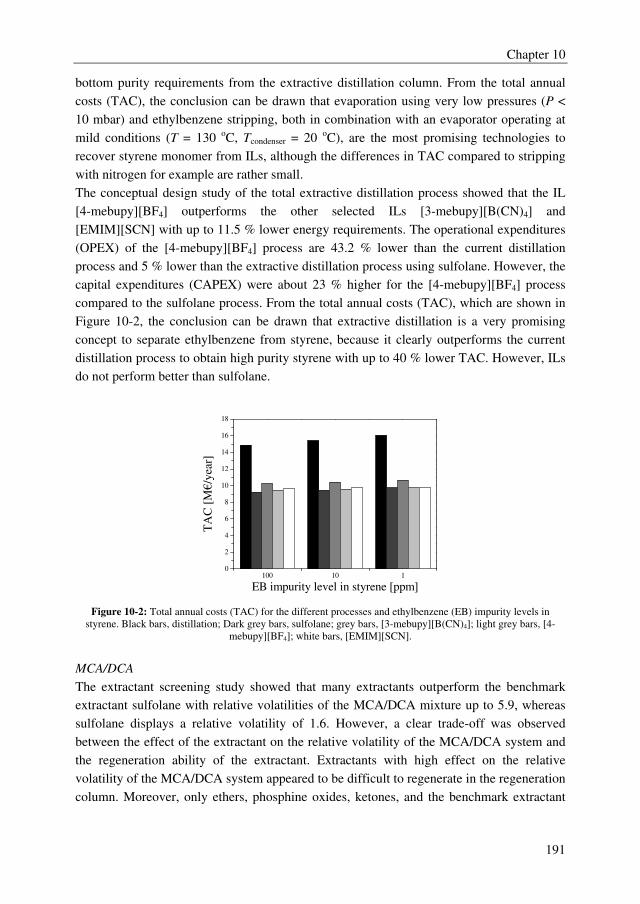
Chapter 10
191
bottom purity requirements from the extractive distillation column. From the total annual
costs (TAC), the conclusion can be drawn that evaporation using very low pressures (P <
10 mbar) and ethylbenzene stripping, both in combination with an evaporator operating at
mild conditions (T = 130 oC, Tcondenser = 20 oC), are the most promising technologies to
recover styrene monomer from ILs, although the differences in TAC compared to stripping
with nitrogen for example are rather small.
The conceptual design study of the total extractive distillation process showed that the IL
[4-mebupy][BF4] outperforms the other selected ILs [3-mebupy][B(CN)4] and
[EMIM][SCN] with up to 11.5 % lower energy requirements. The operational expenditures
(OPEX) of the [4-mebupy][BF4] process are 43.2 % lower than the current distillation
process and 5 % lower than the extractive distillation process using sulfolane. However, the
capital expenditures (CAPEX) were about 23 % higher for the [4-mebupy][BF4] process
compared to the sulfolane process. From the total annual costs (TAC), which are shown in
Figure 10-2, the conclusion can be drawn that extractive distillation is a very promising
concept to separate ethylbenzene from styrene, because it clearly outperforms the current
distillation process to obtain high purity styrene with up to 40 % lower TAC. However, ILs
do not perform better than sulfolane.
100 10 10
2
4
6
8
10
12
14
16
18
TA
C [
M€/y
ear]
EB impurity level in styrene [ppm]
Figure 10-2: Total annual costs (TAC) for the different processes and ethylbenzene (EB) impurity levels in
styrene. Black bars, distillation; Dark grey bars, sulfolane; grey bars, [3-mebupy][B(CN)4]; light grey bars, [4-
mebupy][BF4]; white bars, [EMIM][SCN].
MCA/DCA
The extractant screening study showed that many extractants outperform the benchmark
extractant sulfolane with relative volatilities of the MCA/DCA mixture up to 5.9, whereas
sulfolane displays a relative volatility of 1.6. However, a clear trade-off was observed
between the effect of the extractant on the relative volatility of the MCA/DCA system and
the regeneration ability of the extractant. Extractants with high effect on the relative
volatility of the MCA/DCA system appeared to be difficult to regenerate in the regeneration
column. Moreover, only ethers, phosphine oxides, ketones, and the benchmark extractant
Chapter 10
192
sulfolane were stable in the strongly acidic environment. Finally, the extractant diethylene
glycol dipentyl ether was selected, which improves the relative volatility of the MCA/DCA
system up to 2.1–2.4 at a DCA/extractant mole ratio of 1. Moreover, this extractant could
easily be regenerated using distillation and it is thermally and chemically stable in the harsh
acidic environment.
The conceptual design study showed that the TAC for the extractive distillation process are
1.6 M€/year for a 70.000 mta MCA plant. The addition to the MCA production costs were
calculated, which are 23 €/tonne MCA product. This is rather low compared to the current
(high purity) MCA price of 1500 €/tonne. Therefore, the conclusion can be drawn that
extractive distillation is a promising concept to obtain high purity MCA.
10.2. Outlook
Ethylbenzene/styrene
The sulfolane process slightly outperformed the IL processes. Furthermore, sulfolane is
already applied on industrial scale and therefore easier to implement on short term.
However, still research has to be performed to scale up the extractive distillation process
using sulfolane to industrial scale.
Some styrene polymerization was observed in the vapor–liquid equilibrium experiments for
the benchmark solvent sulfolane. Therefore, the polymerization rate of styrene in sulfolane
has to be investigated. It is crucial to know the styrene polymerization rate, because it
determines the inhibitor/retarder flow to the extractive distillation process. We observed
also styrene polymerization in the phase equilibrium measurements for the IL [4-
mebupy][BF4], but not for the ILs [3-mebupy][B(CN)4] and [EMIM][SCN]. Apparently,
some solvents/ILs can enhance polymerization rates, which was confirmed by a literature
study [1,2].
Since some styrene will polymerize, and other heavies like cumene (Tb = 152 oC) are
present in the ethylbenzene/styrene feed, the separation of heavies from sulfolane needs to
be investigated. These components will accumulate in the solvent recycle in time, which is
undesired. Therefore, a bleed stream is required in combination with a separation method to
purify the solvent. For example, an antisolvent like methanol can be added to precipitate the
formed styrene polymer, which is a commonly applied method in polymer chemistry to
separate apolar polymers from organic solutions [3,4].
Finally, pilot plant experiments need to be performed to investigate whether the extractive
distillation process using sulfolane can be scaled up to industrial scale. These experiments
are required, because mass transfer efficiency influences the required packing height and
the hydrodynamic capacity depends strongly on the system to be separated. The current
process evaluation is based primarily on equilibrium stage process models.
For the long term, there are several opportunities to improve the energy efficiency of the
extractive distillation process using ILs. The first opportunity is to screen for a better IL,
Chapter 10
193
which has a high solvent capacity as well as a high selectivity (ending up at the upper right
corner of Figure 10-1). An IL with a high solvent capacity hardly requires energy for
solvent heating, which was observed for the IL [3-mebupy][B(CN)4] (~2 %). By having an
IL which has a high selectivity too, the heat duty required for evaporation remains low as
well. The second method is to find extra possibilities for heat recovery to minimize the heat
duties for solvent heating. For the IL [EMIM][SCN] for example, 37 % of the total heat
duty is required for solvent heating. The heat can possibly be recovered somewhere else in
the styrene production process. If the energy efficiency of the IL extractive distillation
process can be improved, and thereby outperforms the sulfolane process, the steps describe
above to scale-up the sulfolane process needs be performed for the IL process too.
MCA/DCA
In the process evaluation performed in this work, it was not possible to compare the
extractive distillation process to the currently applied MCA/DCA separation process.
Therefore, the possible savings in OPEX and CAPEX in the current MCA production
process by applying extractive distillation to obtain high purity MCA should be
investigated to complete the process evaluation.
When it turns out that applying the extractive distillation process is very beneficial, one of
the next research steps is to determine the required make-up flow, which affects the OPEX.
Although very small, some degradation was observed in the extractant stability experiments
for the selected extractant DGDP. Therefore, the thermal/chemical degradation rate of the
extractant DGDP in the harsh acidic environment should be investigated into more detail.
Moreover, it is very important to determine which degradation products are formed and
where these products will go.
Next to the extractant degradation, it is furthermore important to study the effect of
impurities present in the effluent from the chlorinator, like trichloroacetic acid for example
[5], on the extractive distillation process. These impurities might end up in the extractant
recycle, and thereby a bleed and extra purification method are required to purify the
extractant that will increase the OPEX.
Last, pilot plant experiments should be performed for this case as well to determine the
mass transfer efficiency and the hydrodynamic capacity.
References
[1] K. Hong et al., Chem. Commun. (2002) 1368-1369.
[2] R. Vijayaraghavan, D.R. MacFarlane, Chem. Commun. (2004) 700-701.
[3] D.J. Dixon, K.P. Johnston, J. Appl. Polym. Sci. 50 (1993) 1929-1942.
[4] J. Liu, B. Han, Z. Liu, J. Wang, Q. Huo, J. Supercrit. Fluids 20 (2001) 171-176.
[5] G. Koenig, E. Lohmar, N. Rupprich, in: Ullmann's Encyclopedia of Industrial
Chemistry, Wiley-VCH Verlag GmbH & Co, 2000.

194
i
Appendix
Isobaric Low Pressure Vapor–Liquid Equilibrium
Data for Ethylbenzene + Styrene + Sulfolane and
the Three Constituent Binary Systems
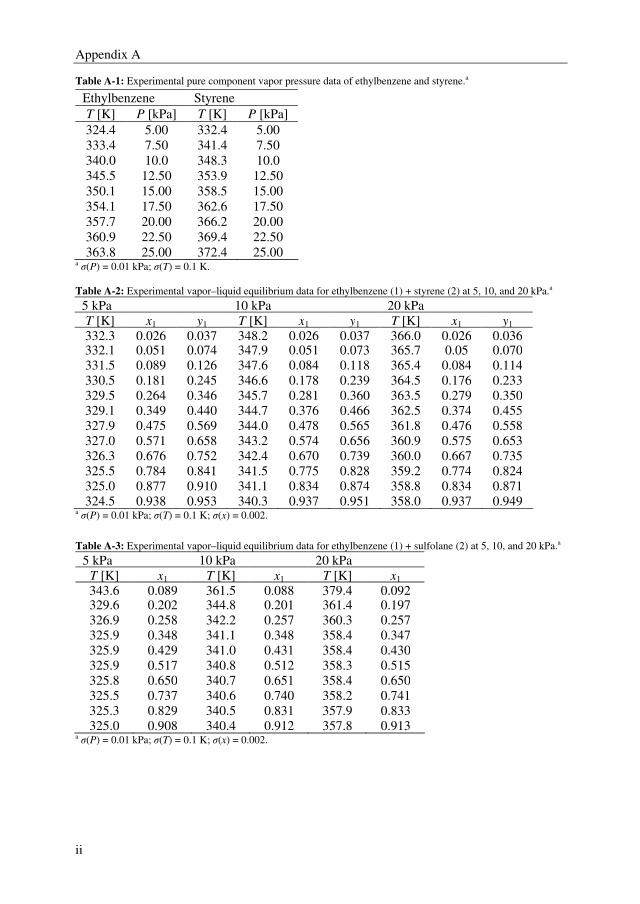
Appendix A
ii
Table A-1: Experimental pure component vapor pressure data of ethylbenzene and styrene.a
Ethylbenzene Styrene
T [K] P [kPa] T [K] P [kPa]
324.4 5.00 332.4 5.00
333.4 7.50 341.4 7.50
340.0 10.0 348.3 10.0
345.5 12.50 353.9 12.50
350.1 15.00 358.5 15.00
354.1 17.50 362.6 17.50
357.7 20.00 366.2 20.00
360.9 22.50 369.4 22.50
363.8 25.00 372.4 25.00 a σ(P) = 0.01 kPa; σ(T) = 0.1 K.
Table A-2: Experimental vapor–liquid equilibrium data for ethylbenzene (1) + styrene (2) at 5, 10, and 20 kPa.a
5 kPa 10 kPa 20 kPa
T [K] x1 y1 T [K] x1 y1 T [K] x1 y1
332.3 0.026 0.037 348.2 0.026 0.037 366.0 0.026 0.036 332.1 0.051 0.074 347.9 0.051 0.073 365.7 0.05 0.070
331.5 0.089 0.126 347.6 0.084 0.118 365.4 0.084 0.114
330.5 0.181 0.245 346.6 0.178 0.239 364.5 0.176 0.233
329.5 0.264 0.346 345.7 0.281 0.360 363.5 0.279 0.350
329.1 0.349 0.440 344.7 0.376 0.466 362.5 0.374 0.455
327.9 0.475 0.569 344.0 0.478 0.565 361.8 0.476 0.558
327.0 0.571 0.658 343.2 0.574 0.656 360.9 0.575 0.653
326.3 0.676 0.752 342.4 0.670 0.739 360.0 0.667 0.735
325.5 0.784 0.841 341.5 0.775 0.828 359.2 0.774 0.824
325.0 0.877 0.910 341.1 0.834 0.874 358.8 0.834 0.871
324.5 0.938 0.953 340.3 0.937 0.951 358.0 0.937 0.949 a σ(P) = 0.01 kPa; σ(T) = 0.1 K; σ(x) = 0.002.
Table A-3: Experimental vapor–liquid equilibrium data for ethylbenzene (1) + sulfolane (2) at 5, 10, and 20 kPa.a
5 kPa 10 kPa 20 kPa
T [K] x1 T [K] x1 T [K] x1
343.6 0.089 361.5 0.088 379.4 0.092 329.6 0.202 344.8 0.201 361.4 0.197
326.9 0.258 342.2 0.257 360.3 0.257
325.9 0.348 341.1 0.348 358.4 0.347
325.9 0.429 341.0 0.431 358.4 0.430
325.9 0.517 340.8 0.512 358.3 0.515
325.8 0.650 340.7 0.651 358.4 0.650
325.5 0.737 340.6 0.740 358.2 0.741
325.3 0.829 340.5 0.831 357.9 0.833
325.0 0.908 340.4 0.912 357.8 0.913 a σ(P) = 0.01 kPa; σ(T) = 0.1 K; σ(x) = 0.002.
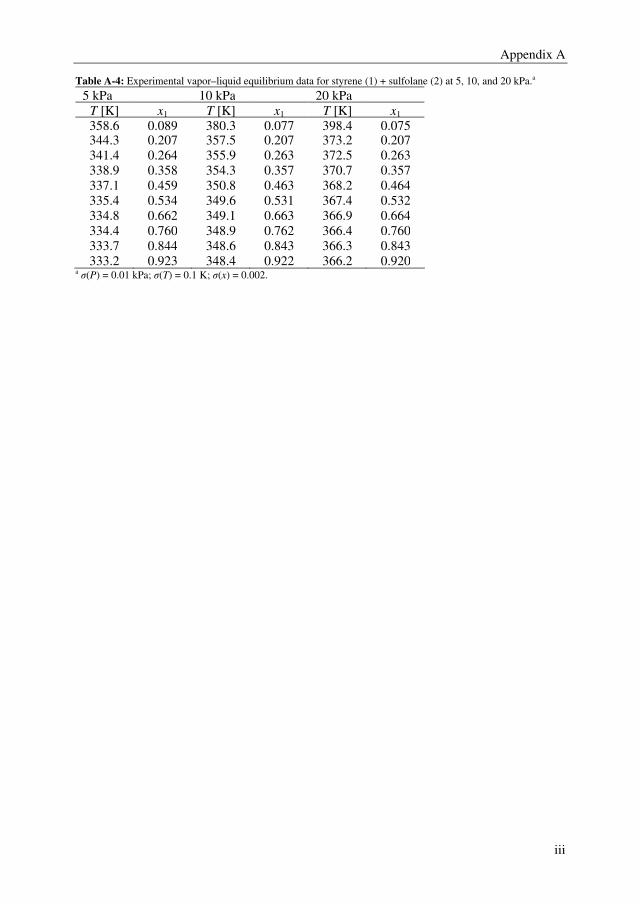
Appendix A
iii
Table A-4: Experimental vapor–liquid equilibrium data for styrene (1) + sulfolane (2) at 5, 10, and 20 kPa.a
5 kPa 10 kPa 20 kPa
T [K] x1 T [K] x1 T [K] x1
358.6 0.089 380.3 0.077 398.4 0.075 344.3 0.207 357.5 0.207 373.2 0.207
341.4 0.264 355.9 0.263 372.5 0.263
338.9 0.358 354.3 0.357 370.7 0.357
337.1 0.459 350.8 0.463 368.2 0.464
335.4 0.534 349.6 0.531 367.4 0.532
334.8 0.662 349.1 0.663 366.9 0.664
334.4 0.760 348.9 0.762 366.4 0.760
333.7 0.844 348.6 0.843 366.3 0.843
333.2 0.923 348.4 0.922 366.2 0.920 a σ(P) = 0.01 kPa; σ(T) = 0.1 K; σ(x) = 0.002.
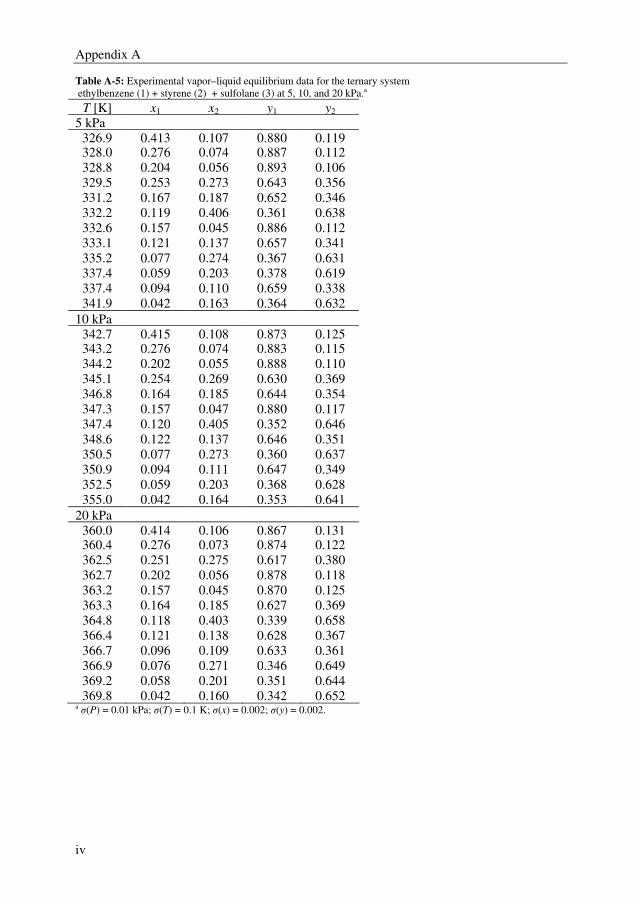
Appendix A
iv
Table A-5: Experimental vapor–liquid equilibrium data for the ternary system
ethylbenzene (1) + styrene (2) + sulfolane (3) at 5, 10, and 20 kPa.a
T [K] x1 x2 y1 y2
5 kPa
326.9 0.413 0.107 0.880 0.119 328.0 0.276 0.074 0.887 0.112
328.8 0.204 0.056 0.893 0.106
329.5 0.253 0.273 0.643 0.356
331.2 0.167 0.187 0.652 0.346
332.2 0.119 0.406 0.361 0.638
332.6 0.157 0.045 0.886 0.112
333.1 0.121 0.137 0.657 0.341
335.2 0.077 0.274 0.367 0.631
337.4 0.059 0.203 0.378 0.619
337.4 0.094 0.110 0.659 0.338
341.9 0.042 0.163 0.364 0.632
10 kPa
342.7 0.415 0.108 0.873 0.125 343.2 0.276 0.074 0.883 0.115
344.2 0.202 0.055 0.888 0.110
345.1 0.254 0.269 0.630 0.369
346.8 0.164 0.185 0.644 0.354
347.3 0.157 0.047 0.880 0.117
347.4 0.120 0.405 0.352 0.646
348.6 0.122 0.137 0.646 0.351
350.5 0.077 0.273 0.360 0.637
350.9 0.094 0.111 0.647 0.349
352.5 0.059 0.203 0.368 0.628
355.0 0.042 0.164 0.353 0.641
20 kPa
360.0 0.414 0.106 0.867 0.131 360.4 0.276 0.073 0.874 0.122
362.5 0.251 0.275 0.617 0.380
362.7 0.202 0.056 0.878 0.118
363.2 0.157 0.045 0.870 0.125
363.3 0.164 0.185 0.627 0.369
364.8 0.118 0.403 0.339 0.658
366.4 0.121 0.138 0.628 0.367
366.7 0.096 0.109 0.633 0.361
366.9 0.076 0.271 0.346 0.649
369.2 0.058 0.201 0.351 0.644
369.8 0.042 0.160 0.342 0.652 a σ(P) = 0.01 kPa; σ(T) = 0.1 K; σ(x) = 0.002; σ(y) = 0.002.
v
Appendix
Ionic Liquid Screening for Ethylbenzene/Styrene
Separation by Extractive Distillation
Appendix B
vi
Table B-1: Capacities and selectivities at 313.2 K and 348.2 K. The distribution coefficients
and selectivities were calculated according to Eq.3-1.
T = 313.2 K T = 348.2 K Nr. Ionic Liquid
Dstyrene Dethylbenzene S Dstyrene Dethylbenzene S
1 [2-mebupy][BF4] 0.323 0.159 2.036 0.284 0.150 1.886
2 [3-mebupy][N(CN)2] 0.538 0.300 1.793 0.493 0.291 1.693
3 [3-mebupy][ C(CN)3] 0.621 0.392 1.585 0.549 0.360 1.523
4 [3-mebupy][Tf2N] 0.521 0.391 1.332 0.514 0.403 1.276
5 [3-mebupy][B(CN)4] 0.619 0.426 1.453 0.592 0.429 1.378
6 [4-mebupy][BF4] 0.486 0.257 1.894 0.414 0.234 1.774
7 [4-mebupy][N(CN)2] 0.575 0.325 1.768 0.488 0.292 1.670
8 [3-cybupy][N(CN)2] a a a 0.165 0.088 1.88
9 [EMIM][N(CN)2] 0.329 0.165 1.989 0.301 0.155 1.947
10 [EMIM][BF4] 0.115 0.047 2.435 0.134 0.062 2.150
11 [EMIM][SCN] 0.241 0.103 2.344 0.229 0.105 2.184
12 [EMIM][TOS] 0.218 0.115 1.891 0.198 0.117 1.701
13 [EMIM][Mesy] 0.122 0.044 2.757 0.117 0.048 2.411
14 [EMIM][EtSO4] 0.170 0.075 2.260 0.157 0.075 2.086
15 [EMIM][DEP] 0.372 0.256 1.456 0.358 0.259 1.382
16 [EMIM][TA] 0.243 0.141 1.725 0.230 0.138 1.673
17 [EMIM][B(CN)4] 0.586 0.393 1.490 0.531 0.371 1.433
18 [EMIM][MeSO4] 0.093 0.032 2.917 0.086 0.034 2.577
19 [EMIM][Oac] 0.217 0.129 1.683 0.208 0.108 1.921
20 [EMIM][MeBF3] 0.191 0.094 2.022 0.179 0.095 1.876
21 [PMIM][BF4] 0.183 0.085 2.142 0.168 0.083 2.036
22 [BMIM][SCN] 0.383 0.208 1.839 0.351 0.199 1.767
23 [BMIM][N(CN)2] 0.446 0.252 1.772 0.409 0.238 1.717
24 [BMIM][BF4] 0.260 0.134 1.938 0.243 0.133 1.822
25 [BMIM][C(CN)3] 0.587 0.374 1.569 0.547 0.362 1.509
26 [HMIM][BF4] 0.417 0.274 1.522 0.379 0.260 1.457
27 [BMMIM][BF4] 0.257 0.123 2.096 0.239 0.125 1.915
28 [HEMIM][BF4] 0.038 0.015 2.538 0.042 0.018 2.406
29 [AMIM][N(CN)2] 0.269 0.128 2.099 0.240 0.123 1.946
30 [PhCH2MIM][N(CN)2] 0.263 0.137 1.912 0.239 0.132 1.811
31 [P14][N(CN)2] 0.688 0.575 1.198 0.713 0.614 1.160
32 [N4441][Tf2N] 0.542 0.441 1.229 0.527 0.451 1.168
33 [N4111][Tf2N] 0.497 0.419 1.186 0.346 0.264 1.309
34 [N8881][TA] b b b b b b
35 [P4441][MeSO4] 0.358 0.267 1.338 0.560 0.469 1.194
36 [S222][Tf2N] 0.416 0.297 1.401 0.405 0.300 1.352
37 [P14,666][N(CN)2] b b b b b b
a The melting point of [3-cybupy][N(CN)2] is above 313.2 K and therefore no capacity and selectivity could be
measured at this temperature for this ionic liquid. b No capacity and selectivity could be measured, because a
homogeneous liquid phase was obtained after extraction.
Appendix B
vii
Table B-2: Relative volatility, selectivity and temperature results from the VLE experiments at 5 kPa.
Nr. Ionic Liquid α SVLEa T [K]
4 [3-mebupy][B(CN)4] 2.16 1.5 332.0 6 [4-mebupy][BF4] 2.63 1.86 339.1
aThe selectivity was calculated from Eq. 5 using the Antoine parameters
to calculate the pure component vapor pressure from Ref. [9] from Chapter 3.

viii
ix
Appendix
Phase Equilibrium Data for the Systems
(Ethylbenzene + Styrene + [EMIM][SCN]/
[4-mebupy][BF4]/[3-mebupy][B(CN)4])
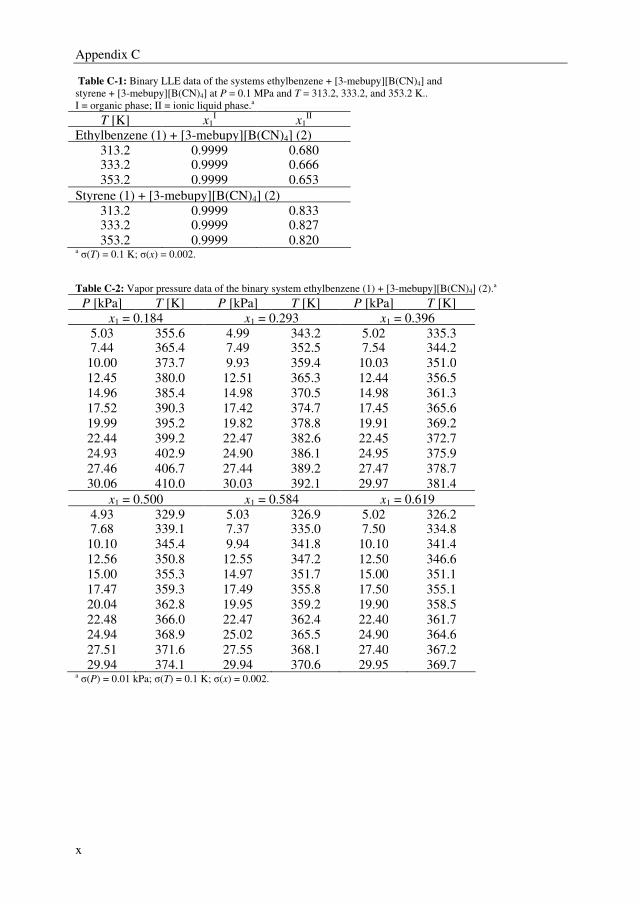
Appendix C
x
Table C-1: Binary LLE data of the systems ethylbenzene + [3-mebupy][B(CN)4] and
styrene + [3-mebupy][B(CN)4] at P = 0.1 MPa and T = 313.2, 333.2, and 353.2 K..
I = organic phase; II = ionic liquid phase.a
T [K] x1I
x1II
Ethylbenzene (1) + [3-mebupy][B(CN)4] (2)
313.2 0.9999 0.680 333.2 0.9999 0.666
353.2 0.9999 0.653
Styrene (1) + [3-mebupy][B(CN)4] (2)
313.2 0.9999 0.833 333.2 0.9999 0.827
353.2 0.9999 0.820 a σ(T) = 0.1 K; σ(x) = 0.002.
Table C-2: Vapor pressure data of the binary system ethylbenzene (1) + [3-mebupy][B(CN)4] (2).a
P [kPa] T [K] P [kPa] T [K] P [kPa] T [K]
x1 = 0.184 x1 = 0.293 x1 = 0.396
5.03 355.6 4.99 343.2 5.02 335.3 7.44 365.4 7.49 352.5 7.54 344.2
10.00 373.7 9.93 359.4 10.03 351.0
12.45 380.0 12.51 365.3 12.44 356.5
14.96 385.4 14.98 370.5 14.98 361.3
17.52 390.3 17.42 374.7 17.45 365.6
19.99 395.2 19.82 378.8 19.91 369.2
22.44 399.2 22.47 382.6 22.45 372.7
24.93 402.9 24.90 386.1 24.95 375.9
27.46 406.7 27.44 389.2 27.47 378.7
30.06 410.0 30.03 392.1 29.97 381.4
x1 = 0.500 x1 = 0.584 x1 = 0.619
4.93 329.9 5.03 326.9 5.02 326.2 7.68 339.1 7.37 335.0 7.50 334.8
10.10 345.4 9.94 341.8 10.10 341.4
12.56 350.8 12.55 347.2 12.50 346.6
15.00 355.3 14.97 351.7 15.00 351.1
17.47 359.3 17.49 355.8 17.50 355.1
20.04 362.8 19.95 359.2 19.90 358.5
22.48 366.0 22.47 362.4 22.40 361.7
24.94 368.9 25.02 365.5 24.90 364.6
27.51 371.6 27.55 368.1 27.40 367.2
29.94 374.1 29.94 370.6 29.95 369.7 a σ(P) = 0.01 kPa; σ(T) = 0.1 K; σ(x) = 0.002.
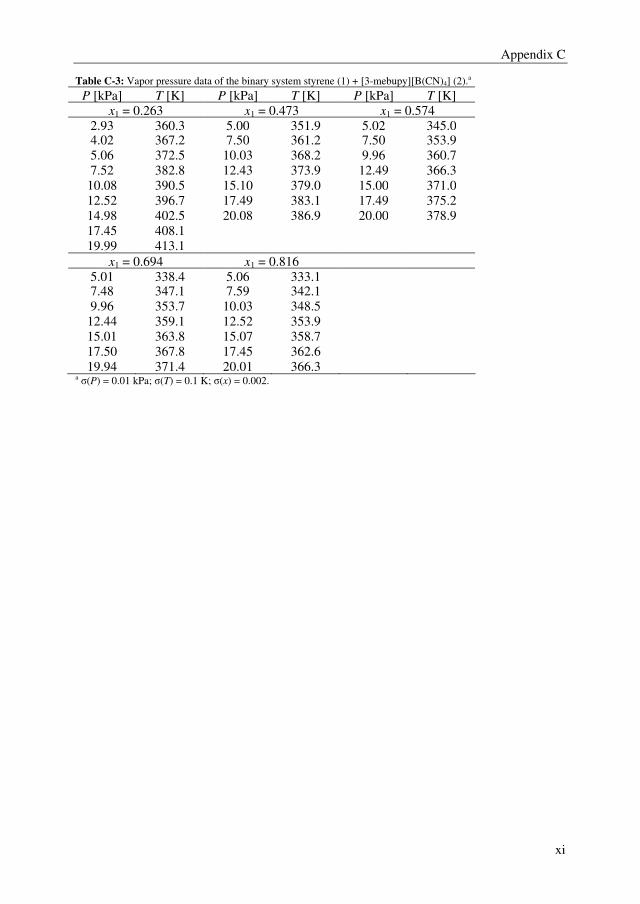
Appendix C
xi
Table C-3: Vapor pressure data of the binary system styrene (1) + [3-mebupy][B(CN)4] (2).a
P [kPa] T [K] P [kPa] T [K] P [kPa] T [K]
x1 = 0.263 x1 = 0.473 x1 = 0.574
2.93 360.3 5.00 351.9 5.02 345.0 4.02 367.2 7.50 361.2 7.50 353.9
5.06 372.5 10.03 368.2 9.96 360.7
7.52 382.8 12.43 373.9 12.49 366.3
10.08 390.5 15.10 379.0 15.00 371.0
12.52 396.7 17.49 383.1 17.49 375.2
14.98 402.5 20.08 386.9 20.00 378.9
17.45 408.1
19.99 413.1
x1 = 0.694 x1 = 0.816
5.01 338.4 5.06 333.1 7.48 347.1 7.59 342.1
9.96 353.7 10.03 348.5
12.44 359.1 12.52 353.9
15.01 363.8 15.07 358.7
17.50 367.8 17.45 362.6
19.94 371.4 20.01 366.3 a σ(P) = 0.01 kPa; σ(T) = 0.1 K; σ(x) = 0.002.
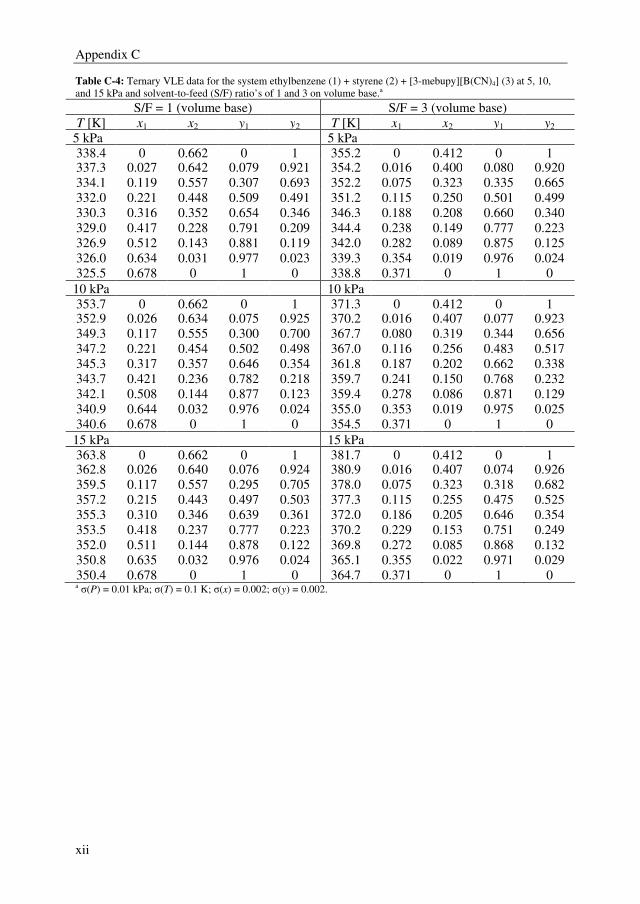
Appendix C
xii
Table C-4: Ternary VLE data for the system ethylbenzene (1) + styrene (2) + [3-mebupy][B(CN)4] (3) at 5, 10,
and 15 kPa and solvent-to-feed (S/F) ratio’s of 1 and 3 on volume base.a
S/F = 1 (volume base) S/F = 3 (volume base)
T [K] x1 x2 y1 y2 T [K] x1 x2 y1 y2
5 kPa 5 kPa
338.4 0 0.662 0 1 355.2 0 0.412 0 1 337.3 0.027 0.642 0.079 0.921 354.2 0.016 0.400 0.080 0.920
334.1 0.119 0.557 0.307 0.693 352.2 0.075 0.323 0.335 0.665
332.0 0.221 0.448 0.509 0.491 351.2 0.115 0.250 0.501 0.499
330.3 0.316 0.352 0.654 0.346 346.3 0.188 0.208 0.660 0.340
329.0 0.417 0.228 0.791 0.209 344.4 0.238 0.149 0.777 0.223
326.9 0.512 0.143 0.881 0.119 342.0 0.282 0.089 0.875 0.125
326.0 0.634 0.031 0.977 0.023 339.3 0.354 0.019 0.976 0.024
325.5 0.678 0 1 0 338.8 0.371 0 1 0
10 kPa 10 kPa
353.7 0 0.662 0 1 371.3 0 0.412 0 1 352.9 0.026 0.634 0.075 0.925 370.2 0.016 0.407 0.077 0.923
349.3 0.117 0.555 0.300 0.700 367.7 0.080 0.319 0.344 0.656
347.2 0.221 0.454 0.502 0.498 367.0 0.116 0.256 0.483 0.517
345.3 0.317 0.357 0.646 0.354 361.8 0.187 0.202 0.662 0.338
343.7 0.421 0.236 0.782 0.218 359.7 0.241 0.150 0.768 0.232
342.1 0.508 0.144 0.877 0.123 359.4 0.278 0.086 0.871 0.129
340.9 0.644 0.032 0.976 0.024 355.0 0.353 0.019 0.975 0.025
340.6 0.678 0 1 0 354.5 0.371 0 1 0
15 kPa 15 kPa
363.8 0 0.662 0 1 381.7 0 0.412 0 1 362.8 0.026 0.640 0.076 0.924 380.9 0.016 0.407 0.074 0.926
359.5 0.117 0.557 0.295 0.705 378.0 0.075 0.323 0.318 0.682
357.2 0.215 0.443 0.497 0.503 377.3 0.115 0.255 0.475 0.525
355.3 0.310 0.346 0.639 0.361 372.0 0.186 0.205 0.646 0.354
353.5 0.418 0.237 0.777 0.223 370.2 0.229 0.153 0.751 0.249
352.0 0.511 0.144 0.878 0.122 369.8 0.272 0.085 0.868 0.132
350.8 0.635 0.032 0.976 0.024 365.1 0.355 0.022 0.971 0.029
350.4 0.678 0 1 0 364.7 0.371 0 1 0 a σ(P) = 0.01 kPa; σ(T) = 0.1 K; σ(x) = 0.002; σ(y) = 0.002.
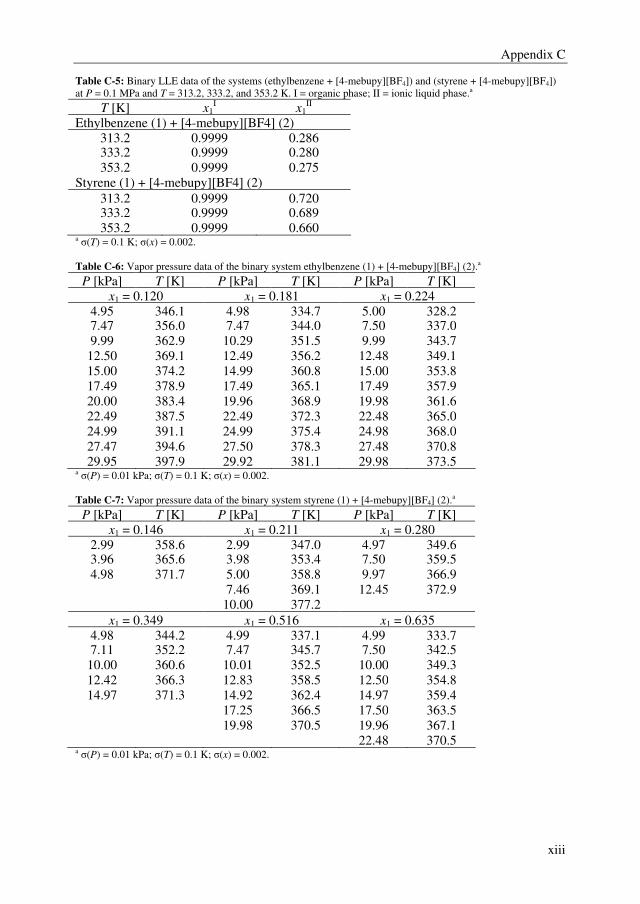
Appendix C
xiii
Table C-5: Binary LLE data of the systems (ethylbenzene + [4-mebupy][BF4]) and (styrene + [4-mebupy][BF4])
at P = 0.1 MPa and T = 313.2, 333.2, and 353.2 K. I = organic phase; II = ionic liquid phase.a
T [K] x1I x1
II
Ethylbenzene (1) + [4-mebupy][BF4] (2)
313.2 0.9999 0.286 333.2 0.9999 0.280
353.2 0.9999 0.275
Styrene (1) + [4-mebupy][BF4] (2)
313.2 0.9999 0.720 333.2 0.9999 0.689
353.2 0.9999 0.660 a σ(T) = 0.1 K; σ(x) = 0.002.
Table C-6: Vapor pressure data of the binary system ethylbenzene (1) + [4-mebupy][BF4] (2).a
P [kPa] T [K] P [kPa] T [K] P [kPa] T [K]
x1 = 0.120 x1 = 0.181 x1 = 0.224
4.95 346.1 4.98 334.7 5.00 328.2 7.47 356.0 7.47 344.0 7.50 337.0
9.99 362.9 10.29 351.5 9.99 343.7
12.50 369.1 12.49 356.2 12.48 349.1
15.00 374.2 14.99 360.8 15.00 353.8
17.49 378.9 17.49 365.1 17.49 357.9
20.00 383.4 19.96 368.9 19.98 361.6
22.49 387.5 22.49 372.3 22.48 365.0
24.99 391.1 24.99 375.4 24.98 368.0
27.47 394.6 27.50 378.3 27.48 370.8
29.95 397.9 29.92 381.1 29.98 373.5 a σ(P) = 0.01 kPa; σ(T) = 0.1 K; σ(x) = 0.002.
Table C-7: Vapor pressure data of the binary system styrene (1) + [4-mebupy][BF4] (2).a
P [kPa] T [K] P [kPa] T [K] P [kPa] T [K]
x1 = 0.146 x1 = 0.211 x1 = 0.280
2.99 358.6 2.99 347.0 4.97 349.6 3.96 365.6 3.98 353.4 7.50 359.5
4.98 371.7 5.00 358.8 9.97 366.9
7.46 369.1 12.45 372.9
10.00 377.2
x1 = 0.349 x1 = 0.516 x1 = 0.635
4.98 344.2 4.99 337.1 4.99 333.7 7.11 352.2 7.47 345.7 7.50 342.5
10.00 360.6 10.01 352.5 10.00 349.3
12.42 366.3 12.83 358.5 12.50 354.8
14.97 371.3 14.92 362.4 14.97 359.4
17.25 366.5 17.50 363.5
19.98 370.5 19.96 367.1
22.48 370.5 a σ(P) = 0.01 kPa; σ(T) = 0.1 K; σ(x) = 0.002.
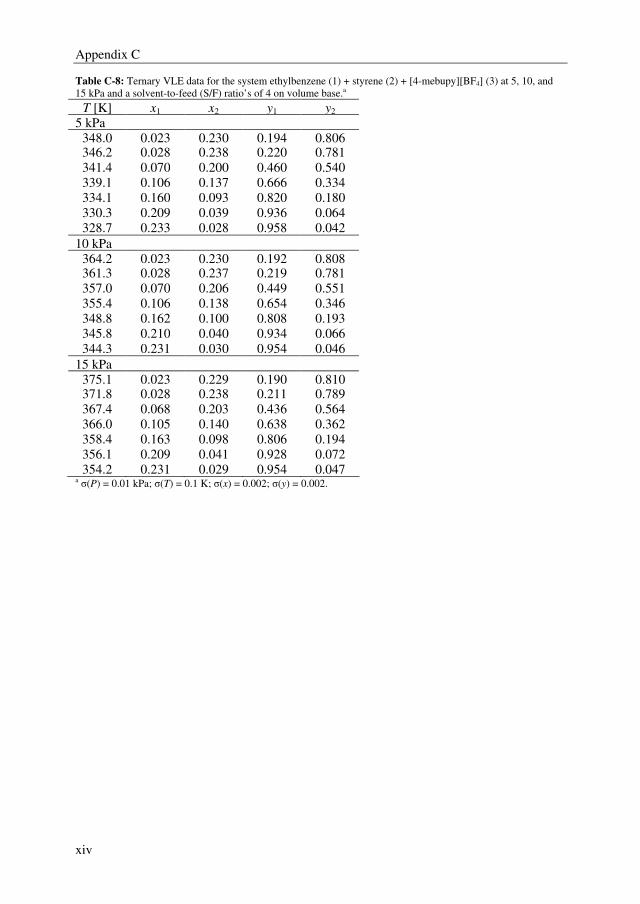
Appendix C
xiv
Table C-8: Ternary VLE data for the system ethylbenzene (1) + styrene (2) + [4-mebupy][BF4] (3) at 5, 10, and
15 kPa and a solvent-to-feed (S/F) ratio’s of 4 on volume base.a
T [K] x1 x2 y1 y2
5 kPa
348.0 0.023 0.230 0.194 0.806 346.2 0.028 0.238 0.220 0.781
341.4 0.070 0.200 0.460 0.540
339.1 0.106 0.137 0.666 0.334
334.1 0.160 0.093 0.820 0.180
330.3 0.209 0.039 0.936 0.064
328.7 0.233 0.028 0.958 0.042
10 kPa
364.2 0.023 0.230 0.192 0.808 361.3 0.028 0.237 0.219 0.781
357.0 0.070 0.206 0.449 0.551
355.4 0.106 0.138 0.654 0.346
348.8 0.162 0.100 0.808 0.193
345.8 0.210 0.040 0.934 0.066
344.3 0.231 0.030 0.954 0.046
15 kPa
375.1 0.023 0.229 0.190 0.810 371.8 0.028 0.238 0.211 0.789
367.4 0.068 0.203 0.436 0.564
366.0 0.105 0.140 0.638 0.362
358.4 0.163 0.098 0.806 0.194
356.1 0.209 0.041 0.928 0.072
354.2 0.231 0.029 0.954 0.047 a σ(P) = 0.01 kPa; σ(T) = 0.1 K; σ(x) = 0.002; σ(y) = 0.002.
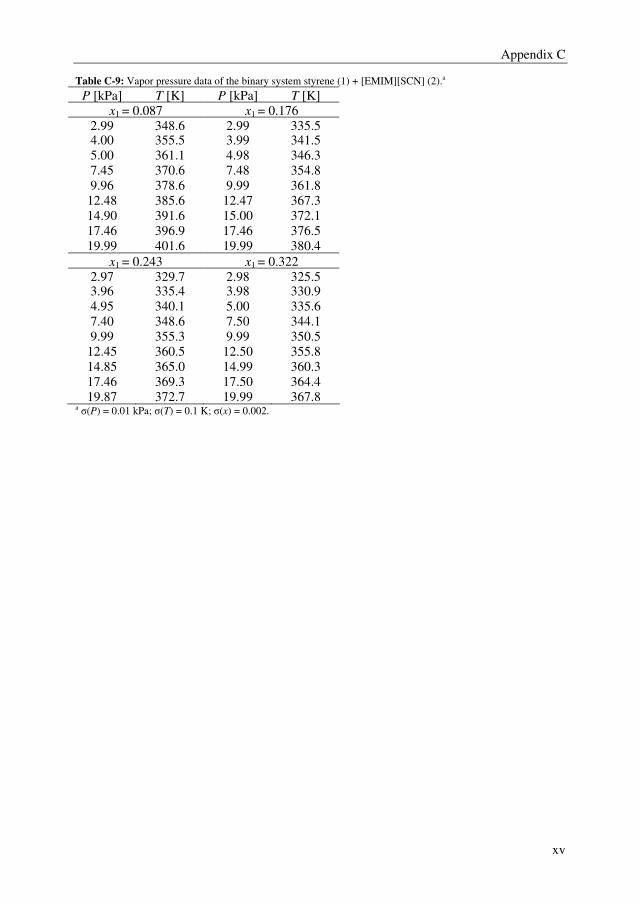
Appendix C
xv
Table C-9: Vapor pressure data of the binary system styrene (1) + [EMIM][SCN] (2).a
P [kPa] T [K] P [kPa] T [K]
x1 = 0.087 x1 = 0.176
2.99 348.6 2.99 335.5 4.00 355.5 3.99 341.5
5.00 361.1 4.98 346.3
7.45 370.6 7.48 354.8
9.96 378.6 9.99 361.8
12.48 385.6 12.47 367.3
14.90 391.6 15.00 372.1
17.46 396.9 17.46 376.5
19.99 401.6 19.99 380.4
x1 = 0.243 x1 = 0.322
2.97 329.7 2.98 325.5 3.96 335.4 3.98 330.9
4.95 340.1 5.00 335.6
7.40 348.6 7.50 344.1
9.99 355.3 9.99 350.5
12.45 360.5 12.50 355.8
14.85 365.0 14.99 360.3
17.46 369.3 17.50 364.4
19.87 372.7 19.99 367.8 a σ(P) = 0.01 kPa; σ(T) = 0.1 K; σ(x) = 0.002.
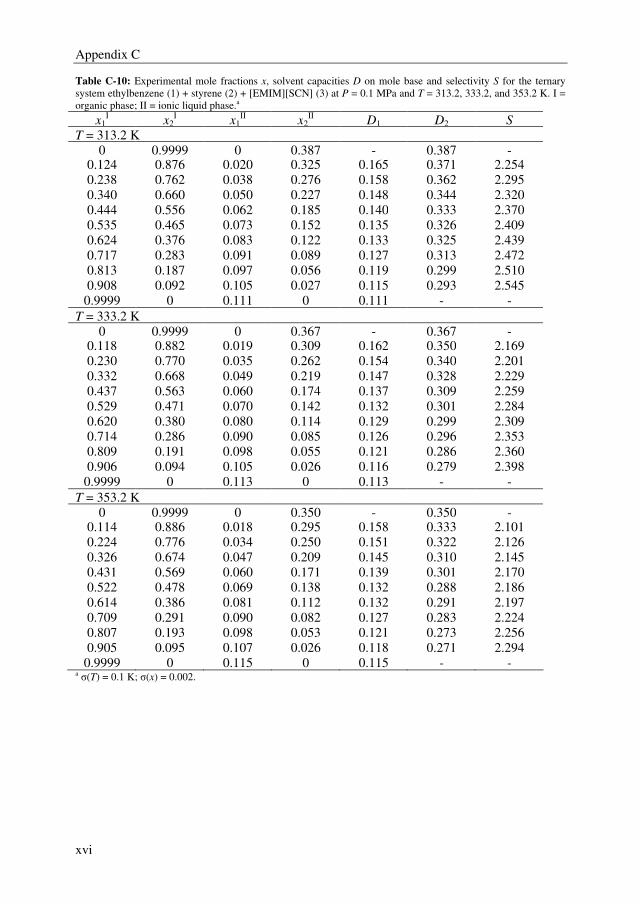
Appendix C
xvi
Table C-10: Experimental mole fractions x, solvent capacities D on mole base and selectivity S for the ternary
system ethylbenzene (1) + styrene (2) + [EMIM][SCN] (3) at P = 0.1 MPa and T = 313.2, 333.2, and 353.2 K. I =
organic phase; II = ionic liquid phase.a
x1I
x2I x1
II x2
II D1 D2 S
T = 313.2 K
0 0.9999 0 0.387 - 0.387 - 0.124 0.876 0.020 0.325 0.165 0.371 2.254
0.238 0.762 0.038 0.276 0.158 0.362 2.295
0.340 0.660 0.050 0.227 0.148 0.344 2.320
0.444 0.556 0.062 0.185 0.140 0.333 2.370
0.535 0.465 0.073 0.152 0.135 0.326 2.409
0.624 0.376 0.083 0.122 0.133 0.325 2.439
0.717 0.283 0.091 0.089 0.127 0.313 2.472
0.813 0.187 0.097 0.056 0.119 0.299 2.510
0.908 0.092 0.105 0.027 0.115 0.293 2.545
0.9999 0 0.111 0 0.111 - -
T = 333.2 K
0 0.9999 0 0.367 - 0.367 - 0.118 0.882 0.019 0.309 0.162 0.350 2.169
0.230 0.770 0.035 0.262 0.154 0.340 2.201
0.332 0.668 0.049 0.219 0.147 0.328 2.229
0.437 0.563 0.060 0.174 0.137 0.309 2.259
0.529 0.471 0.070 0.142 0.132 0.301 2.284
0.620 0.380 0.080 0.114 0.129 0.299 2.309
0.714 0.286 0.090 0.085 0.126 0.296 2.353
0.809 0.191 0.098 0.055 0.121 0.286 2.360
0.906 0.094 0.105 0.026 0.116 0.279 2.398
0.9999 0 0.113 0 0.113 - -
T = 353.2 K
0 0.9999 0 0.350 - 0.350 - 0.114 0.886 0.018 0.295 0.158 0.333 2.101
0.224 0.776 0.034 0.250 0.151 0.322 2.126
0.326 0.674 0.047 0.209 0.145 0.310 2.145
0.431 0.569 0.060 0.171 0.139 0.301 2.170
0.522 0.478 0.069 0.138 0.132 0.288 2.186
0.614 0.386 0.081 0.112 0.132 0.291 2.197
0.709 0.291 0.090 0.082 0.127 0.283 2.224
0.807 0.193 0.098 0.053 0.121 0.273 2.256
0.905 0.095 0.107 0.026 0.118 0.271 2.294
0.9999 0 0.115 0 0.115 - - a σ(T) = 0.1 K; σ(x) = 0.002.
xvii
Appendix
Extractant screening for the separation of
dichloroacetic acid from monochloroacetic acid
by extractive distillation
Appendix D
xviii
Table D-1: Relative volatilities of the monochloroacetic acid/dichloroacetic acid system for the complexation
experiments at 5, 7.5, and 10 kPa and extractant/DCA mole ratios of 0.5 and 1.a
P = 5 kPa P = 7.5 kPa P = 10 kPa Extractant
Extractant/DCA
mole ratio α T [K] α T [K] α T [K]
solvent - 1.25 381.2 1.26 390.4 1.26 397.3 18C6 0.5 1.93 384.8 1.86 393.7 1.72 400.4
1 2.47 392.8 2.37 401.8 2.36 408.4
DBE 0.5 1.47 385.0 1.46 392.7 1.45 398.6
1 1.65 387.6 1.63 395.0 1.62 400.7
DGDP 0.5 1.80 384.8 1.76 394.0 1.73 400.8
1 2.34 388.8 2.21 398.1 2.14 405.0
DGDB 0.5 1.79 383.6 1.78 392.8 1.71 399.8
1 2.29 387.4 2.23 396.6 2.18 403.6
DHE 0.5 1.63 386.9 1.63 393.6 1.60 399.4
1 1.96 389.4 1.97 396.0 1.96 400.9
DHK 0.5 1.57 388.4 1.56 395.4 1.55 401.2
1 1.85 391.3 1.82 397.6 1.82 403.2
DPE 0.5 1.37 384.9 1.36 392.9 1.35 399.1
1 1.44 386.1 1.43 393.8 1.43 399.9
DEET 0.5 1.75 383.9 1.73 393.5 1.71 400.6
1 2.28 388.3 2.22 397.7 2.23 405.0
SN 0.5 1.33 382.2 1.31 392.3 1.28 400.1
1 1.39 385.6 1.38 396.2 1.35 403.8
SF 0.5 1.44 381.9 1.42 391.1 1.41 398.1
1 1.59 385.8 1.57 395.2 1.56 402.6
TGDE 0.5 1.88 385.3 1.86 394.4 1.82 401.6
1 2.44 391.6 2.34 400.9 2.30 408.1
TBP 0.5 1.76 382.2 1.73 391.5 1.71 398.5
1 2.23 386.0 2.22 395.5 2.17 402.9
THA 0.5 2.94 386.1 2.87 395.6 2.81 402.7
1 5.93 398.8 5.49 409.4 4.92 419.1
TOPO 0.5 2.00 381.9 1.94 391.1 1.93 398.1
1 2.79 385.8 2.71 395.2 2.62 402.6 a σ(P) = 0.01 kPa; σ(T) = 0.1 K; σ(x) = 0.001; σ(y) = 0.001.
Appendix D
xix
Table D-2. Relative volatilities of the dichloroacetic acid/solvent systems for the regeneration experiments at 5,
7.5, and 10 kPa and extractant/DCA mole ratios of 1 and 9.a
P = 5 kPa P = 7.5 kPa P = 10 kPa Extractant
Extractant/DCA
mole ratio α T [K] α T [K] α T [K]
DBE 1 47.9 411.2 31.6 421.2 21.0 423.8 9 13.7 464.1 18.8 469.1 14.2 472.9
DGDP 1 10.9 428.2 10.3 438.4 11.5 445.8
9 2.35 448.3 2.57 459.1 2.71 467.2
DGDB 1 2.37 429.1 2.34 439.4 2.03 446.9
9 0.71 429.1 0.76 439.4 0.81 446.9
DHE 1 2.08 401.0 2.25 409.8 2.26 416.4
9 0.85 403.3 0.94 413.1 1.03 420.3
DHK 1 14.8 411.1 12.4 420.2 11.1 427.0
9 2.58 431.0 2.7 441.4 2.6 448.8
DPE 1 9.52 394.6 8.9 403.4 9.7 410.3
9 14.2 410.8 13.8 421.2 13.8 428.8
SF 1 7.5 416.9 7.5 426.8 7.6 434.8
9 2.04 441.2 2.10 452.4 2.14 462.3
TGDE 1 2.30 443.4 2.21 452.0 2.01 458.2
9 0.68 448.6 0.70 458.7 0.73 466.1 a σ(P) = 0.01 kPa; σ(T) = 0.1 K; σ(x) = 0.001; σ(y) = 0.001.

xx
xxi
Appendix
Isobaric Low Pressure Vapor–Liquid Equilibrium
Data for Monochloroacetic Acid + Dichloroacetic
Acid + Diethylene Glycol Dipentyl Ether and the
Three Constituent Binary Systems
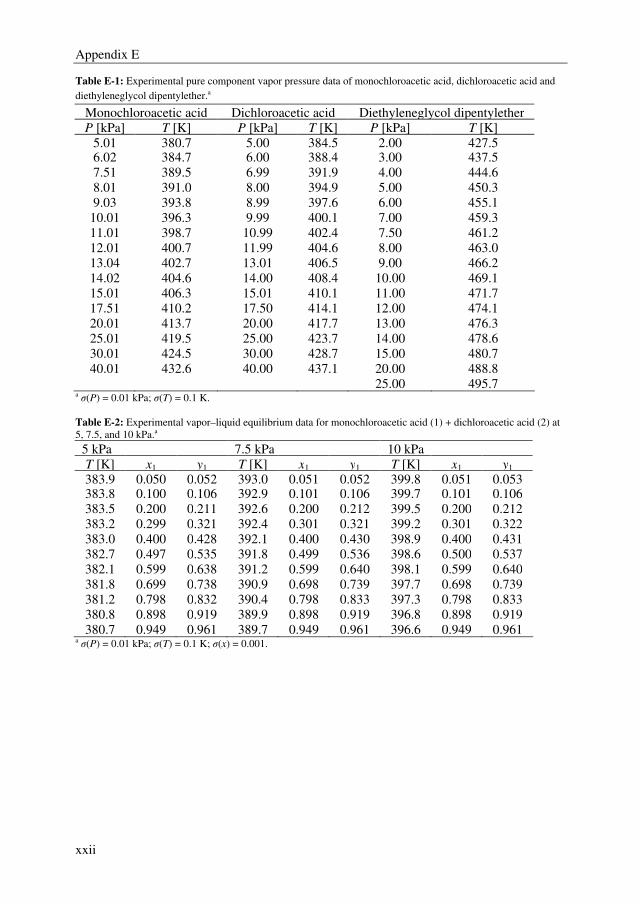
Appendix E
xxii
Table E-1: Experimental pure component vapor pressure data of monochloroacetic acid, dichloroacetic acid and
diethyleneglycol dipentylether.a
Monochloroacetic acid Dichloroacetic acid Diethyleneglycol dipentylether
P [kPa] T [K] P [kPa] T [K] P [kPa] T [K]
5.01 380.7 5.00 384.5 2.00 427.5 6.02 384.7 6.00 388.4 3.00 437.5
7.51 389.5 6.99 391.9 4.00 444.6
8.01 391.0 8.00 394.9 5.00 450.3
9.03 393.8 8.99 397.6 6.00 455.1
10.01 396.3 9.99 400.1 7.00 459.3
11.01 398.7 10.99 402.4 7.50 461.2
12.01 400.7 11.99 404.6 8.00 463.0
13.04 402.7 13.01 406.5 9.00 466.2
14.02 404.6 14.00 408.4 10.00 469.1
15.01 406.3 15.01 410.1 11.00 471.7
17.51 410.2 17.50 414.1 12.00 474.1
20.01 413.7 20.00 417.7 13.00 476.3
25.01 419.5 25.00 423.7 14.00 478.6
30.01 424.5 30.00 428.7 15.00 480.7
40.01 432.6 40.00 437.1 20.00 488.8
25.00 495.7 a σ(P) = 0.01 kPa; σ(T) = 0.1 K.
Table E-2: Experimental vapor–liquid equilibrium data for monochloroacetic acid (1) + dichloroacetic acid (2) at
5, 7.5, and 10 kPa.a
5 kPa 7.5 kPa 10 kPa
T [K] x1 y1 T [K] x1 y1 T [K] x1 y1
383.9 0.050 0.052 393.0 0.051 0.052 399.8 0.051 0.053 383.8 0.100 0.106 392.9 0.101 0.106 399.7 0.101 0.106
383.5 0.200 0.211 392.6 0.200 0.212 399.5 0.200 0.212
383.2 0.299 0.321 392.4 0.301 0.321 399.2 0.301 0.322
383.0 0.400 0.428 392.1 0.400 0.430 398.9 0.400 0.431
382.7 0.497 0.535 391.8 0.499 0.536 398.6 0.500 0.537
382.1 0.599 0.638 391.2 0.599 0.640 398.1 0.599 0.640
381.8 0.699 0.738 390.9 0.698 0.739 397.7 0.698 0.739
381.2 0.798 0.832 390.4 0.798 0.833 397.3 0.798 0.833
380.8 0.898 0.919 389.9 0.898 0.919 396.8 0.898 0.919
380.7 0.949 0.961 389.7 0.949 0.961 396.6 0.949 0.961 a σ(P) = 0.01 kPa; σ(T) = 0.1 K; σ(x) = 0.001.
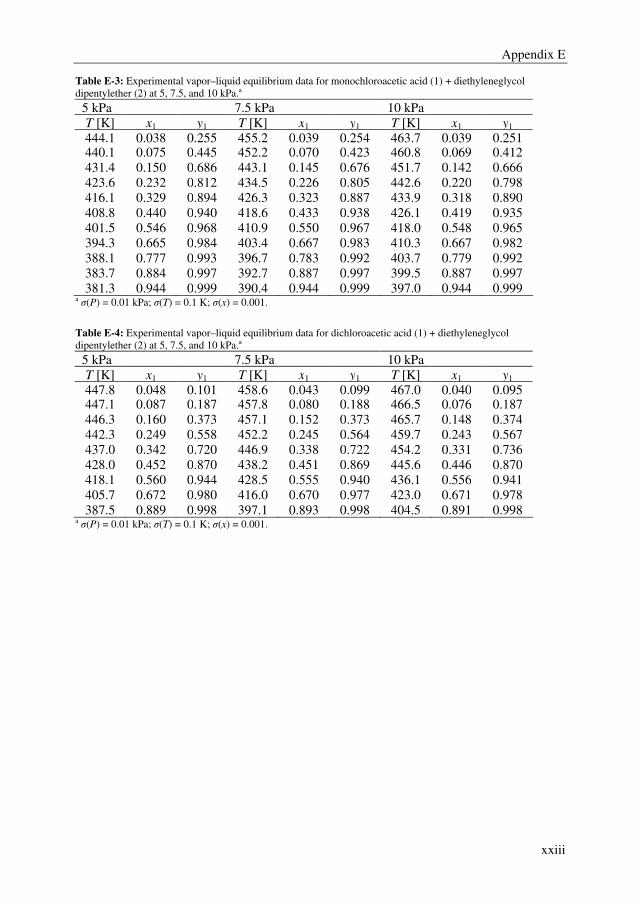
Appendix E
xxiii
Table E-3: Experimental vapor–liquid equilibrium data for monochloroacetic acid (1) + diethyleneglycol
dipentylether (2) at 5, 7.5, and 10 kPa.a
5 kPa 7.5 kPa 10 kPa
T [K] x1 y1 T [K] x1 y1 T [K] x1 y1
444.1 0.038 0.255 455.2 0.039 0.254 463.7 0.039 0.251 440.1 0.075 0.445 452.2 0.070 0.423 460.8 0.069 0.412
431.4 0.150 0.686 443.1 0.145 0.676 451.7 0.142 0.666
423.6 0.232 0.812 434.5 0.226 0.805 442.6 0.220 0.798
416.1 0.329 0.894 426.3 0.323 0.887 433.9 0.318 0.890
408.8 0.440 0.940 418.6 0.433 0.938 426.1 0.419 0.935
401.5 0.546 0.968 410.9 0.550 0.967 418.0 0.548 0.965
394.3 0.665 0.984 403.4 0.667 0.983 410.3 0.667 0.982
388.1 0.777 0.993 396.7 0.783 0.992 403.7 0.779 0.992
383.7 0.884 0.997 392.7 0.887 0.997 399.5 0.887 0.997
381.3 0.944 0.999 390.4 0.944 0.999 397.0 0.944 0.999 a σ(P) = 0.01 kPa; σ(T) = 0.1 K; σ(x) = 0.001.
Table E-4: Experimental vapor–liquid equilibrium data for dichloroacetic acid (1) + diethyleneglycol
dipentylether (2) at 5, 7.5, and 10 kPa.a
5 kPa 7.5 kPa 10 kPa
T [K] x1 y1 T [K] x1 y1 T [K] x1 y1
447.8 0.048 0.101 458.6 0.043 0.099 467.0 0.040 0.095 447.1 0.087 0.187 457.8 0.080 0.188 466.5 0.076 0.187
446.3 0.160 0.373 457.1 0.152 0.373 465.7 0.148 0.374
442.3 0.249 0.558 452.2 0.245 0.564 459.7 0.243 0.567
437.0 0.342 0.720 446.9 0.338 0.722 454.2 0.331 0.736
428.0 0.452 0.870 438.2 0.451 0.869 445.6 0.446 0.870
418.1 0.560 0.944 428.5 0.555 0.940 436.1 0.556 0.941
405.7 0.672 0.980 416.0 0.670 0.977 423.0 0.671 0.978
387.5 0.889 0.998 397.1 0.893 0.998 404.5 0.891 0.998 a σ(P) = 0.01 kPa; σ(T) = 0.1 K; σ(x) = 0.001.
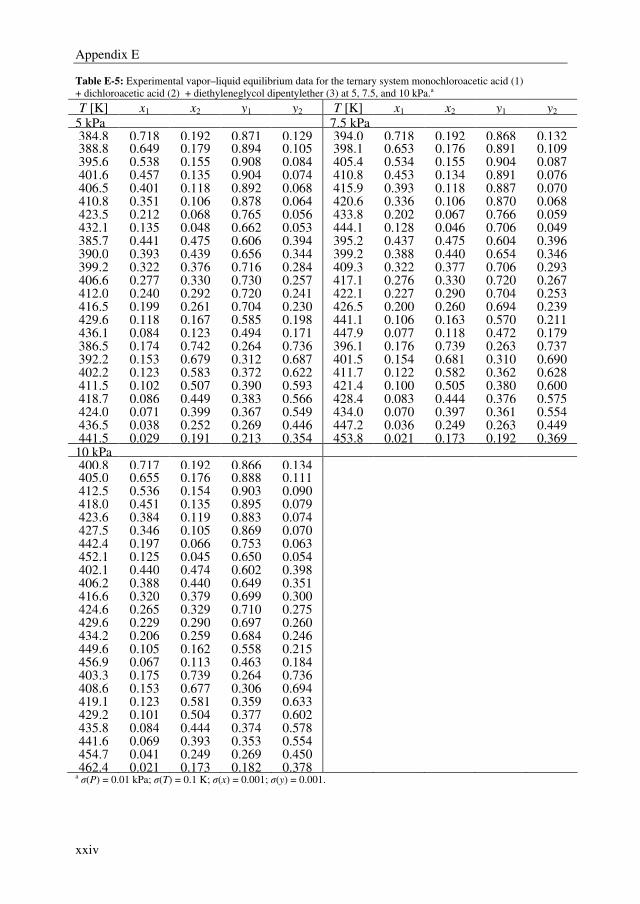
Appendix E
xxiv
Table E-5: Experimental vapor–liquid equilibrium data for the ternary system monochloroacetic acid (1)
+ dichloroacetic acid (2) + diethyleneglycol dipentylether (3) at 5, 7.5, and 10 kPa.a
a σ(P) = 0.01 kPa; σ(T) = 0.1 K; σ(x) = 0.001; σ(y) = 0.001.
T [K] x1 x2 y1 y2 T [K] x1 x2 y1 y2
5 kPa 7.5 kPa 384.8 0.718 0.192 0.871 0.129 394.0 0.718 0.192 0.868 0.132 388.8 0.649 0.179 0.894 0.105 398.1 0.653 0.176 0.891 0.109 395.6 0.538 0.155 0.908 0.084 405.4 0.534 0.155 0.904 0.087 401.6 0.457 0.135 0.904 0.074 410.8 0.453 0.134 0.891 0.076 406.5 0.401 0.118 0.892 0.068 415.9 0.393 0.118 0.887 0.070 410.8 0.351 0.106 0.878 0.064 420.6 0.336 0.106 0.870 0.068 423.5 0.212 0.068 0.765 0.056 433.8 0.202 0.067 0.766 0.059 432.1 0.135 0.048 0.662 0.053 444.1 0.128 0.046 0.706 0.049 385.7 0.441 0.475 0.606 0.394 395.2 0.437 0.475 0.604 0.396 390.0 0.393 0.439 0.656 0.344 399.2 0.388 0.440 0.654 0.346 399.2 0.322 0.376 0.716 0.284 409.3 0.322 0.377 0.706 0.293 406.6 0.277 0.330 0.730 0.257 417.1 0.276 0.330 0.720 0.267 412.0 0.240 0.292 0.720 0.241 422.1 0.227 0.290 0.704 0.253 416.5 0.199 0.261 0.704 0.230 426.5 0.200 0.260 0.694 0.239 429.6 0.118 0.167 0.585 0.198 441.1 0.106 0.163 0.570 0.211 436.1 0.084 0.123 0.494 0.171 447.9 0.077 0.118 0.472 0.179 386.5 0.174 0.742 0.264 0.736 396.1 0.176 0.739 0.263 0.737 392.2 0.153 0.679 0.312 0.687 401.5 0.154 0.681 0.310 0.690 402.2 0.123 0.583 0.372 0.622 411.7 0.122 0.582 0.362 0.628 411.5 0.102 0.507 0.390 0.593 421.4 0.100 0.505 0.380 0.600 418.7 0.086 0.449 0.383 0.566 428.4 0.083 0.444 0.376 0.575 424.0 0.071 0.399 0.367 0.549 434.0 0.070 0.397 0.361 0.554 436.5 0.038 0.252 0.269 0.446 447.2 0.036 0.249 0.263 0.449 441.5 0.029 0.191 0.213 0.354 453.8 0.021 0.173 0.192 0.369 10 kPa 400.8 0.717 0.192 0.866 0.134 405.0 0.655 0.176 0.888 0.111 412.5 0.536 0.154 0.903 0.090 418.0 0.451 0.135 0.895 0.079 423.6 0.384 0.119 0.883 0.074 427.5 0.346 0.105 0.869 0.070 442.4 0.197 0.066 0.753 0.063 452.1 0.125 0.045 0.650 0.054 402.1 0.440 0.474 0.602 0.398 406.2 0.388 0.440 0.649 0.351 416.6 0.320 0.379 0.699 0.300 424.6 0.265 0.329 0.710 0.275 429.6 0.229 0.290 0.697 0.260 434.2 0.206 0.259 0.684 0.246 449.6 0.105 0.162 0.558 0.215 456.9 0.067 0.113 0.463 0.184 403.3 0.175 0.739 0.264 0.736 408.6 0.153 0.677 0.306 0.694 419.1 0.123 0.581 0.359 0.633 429.2 0.101 0.504 0.377 0.602 435.8 0.084 0.444 0.374 0.578 441.6 0.069 0.393 0.353 0.554 454.7 0.041 0.249 0.269 0.450 462.4 0.021 0.173 0.182 0.378
xxv
Dankwoord
In december 2007 vroeg André of ik even binnen wilde komen. De vraag was of ik
interesse had om vier jaar langer door te willen brengen op de universiteit, maar dan als
promovendus. Tijdens mijn studie had ik nog nooit echt serieus nagedacht of ik wilde gaan
promoveren, maar het afstuderen, en daarmee het werken in een onderzoeksomgeving,
beviel me erg goed. Na enige bedenktijd was mijn antwoord dus ja. Een keus waarvan ik tot
op heden nog zeker geen spijt heb gekregen.
André, voor deze aanbieding en het vertrouwen de afgelopen 4-5 jaar wil ik je hartelijk
bedanken. Ik heb de samenwerking met jou altijd als zeer prettig ervaren! Na een
voortgangsbespreking of een kort gesprek tijdens de koffiepauze kon ik altijd weer vol
goede zin verder met het project. Daarnaast ben ik altijd onder de indruk geweest van de
snelheid waarmee artikelen/hoofdstukken gecorrigeerd werden en de strakke wijze waarop
je georganiseerd was, vooral in de tijd dat je een parttime aanstelling in Eindhoven had en
deels in Gorinchem. Deze verandering halverwege het project heb ik dan ook nooit als een
belemmering ervaren om het project goed af te kunnen ronden. Je was altijd bereikbaar
indien er zich obstakels aandienden tijdens de promotie. Naast André ben ik ook mijn
dagelijkse begeleider en co-promotor Boelo erg dankbaar. Boelo, doordat jij niet alleen veel
kennis hebt van procestechnologie maar ook op het gebied van chemie, kwam je vaak weer
op nieuwe ideeën. Deze brede achtergrond hielp ook erg bij het schrijven van artikelen en
het verklaren van de experimentele resultaten. Hiervan heb ik ontzettend veel geleerd!
Prof. Maaike Kroon, prof. Geert Jan Witkamp, dr. Kitty Nijmeijer, prof. Arian Nijmeijer en
ir. Gerrald Bargeman wil ik hartelijk bedanken voor de bereidheid om plaats te nemen in
mijn promotiecommissie. De leden van de kerncommissie in het bijzonder voor het
goedkeuren van het proefschrift en het aandragen van suggesties om het proefschrift te
verbeteren.
Daarnaast heb ik het voorrecht gehad om met veel afstudeerders te mogen samenwerken.
Dit vond ik één van de leukste aspecten tijdens mijn promotietijd. Adriaan, Jenny, Mark,
Eline en Jorg, hartelijk dank voor jullie inzet! Het uitstekende werk dat jullie verricht
hebben de afgelopen jaren heeft als resultaat dat jullie allemaal coauteur zijn in één of
meerdere publicaties. Ook wil ik graag Hans Heuts, Johan Wijers en Krzysztof Ptasinski
bedanken voor het plaatsnemen in de afstudeercommissies. I also worked together with two
engineers from the Process and Product Design program. Alex, Sekhar, I would like to
thank you both very much for the work you have done for the project. Moreover, it was for
me very learn full to cooperate with people from other cultures.
Een project heeft uiteraard ook financiering nodig en hiervoor ben ik ISPT erg dankbaar.
Daarnaast heeft ISPT me ook de gelegenheid gegeven om in contact te komen met vele
promovendi van andere universiteiten en mensen uit het bedrijfsleven en kennisinstituten.
Ook werden er vele cursussen en workshops georganiseerd. Dit heb ik altijd zeer
gewaardeerd. In het bijzonder wil ik de vele mensen bedanken die direct betrokken waren
xxvi
bij het ISPT Trace Removal project. Ik heb veel geleerd van de inhoudelijke discussies
tijdens de vele projectvergaderingen, wat ook zeker heeft bijgedragen aan het uiteindelijke
projectresultaat.
Niet alleen vanuit ISPT, maar ook vanuit de universiteit was er veel ondersteuning. Graag
wil ik Wilko en Wouter bedanken voor hun hulp op het laboratorium. Dolf, jij bedankt voor
het altijd snel en vakbekwaam repareren van mijn opstellingen. Pleunie en Caroline, jullie
allebei hartelijk dank voor de secretariële ondersteuning en de gezellige gesprekken. Bij
jullie twee kan je altijd terecht. Naast het vaste personeel ben ik vanzelfsprekend ook alle
(oud)promovendi erg dankbaar voor de goede en leuke tijd aan de universiteit. Niet alleen
voor de inhoudelijke discussies, maar ook voor de vele leuke groepsactiviteiten en de altijd
gezellige koffiepauzes. Vooral Miran, Antje en Agnieszka wil ik bedanken, omdat zij allen
fantastische kamergenoten waren die altijd tijd hadden voor een goed gesprek. Natuurlijk
wil ik ook graag alle andere mensen buiten de SPS vakgroep bedanken die op wat voor
manier dan ook hebben bijgedragen aan mijn leuke promotietijd in Eindhoven.
Als laatste wil ik graag mijn vrienden en familie bedanken. Naast werk is er ook nog een
sociaal leven en ik ben erg blij dat ik zulke goede vrienden heb waarmee ik mijn vrije tijd
kan doorbrengen. Pa, ma, en Niels, jullie bedankt voor de onvoorwaardelijk steun waar ik
altijd op kan rekenen. Niet alleen voor mijn promotietijd in Eindhoven, maar ook voor het
leven daarvoor en daarna.
Mark
xxvii
List of publications JOURNAL PUBLICATIONS
M.T.G. Jongmans, J.I.W. Maassen, A.J. Luijks, B. Schuur, A.B. de Haan, Isobaric low pressure vapor-liquid equilibrium data for ethylbenzene + styrene + sulfolane and the three constituent binary systems. J. Chem. Eng. Data 56 (2011) 3510-3517. M.T.G. Jongmans, B. Schuur, A.B. de Haan, Ionic liquid screening for ethylbenzene/styrene separation by extractive distillation, Ind. Eng. Chem. Res. 50 (2011) 10800-10810. M.T.G. Jongmans, B. Schuur, A.B. de Haan, Binary and ternary LLE data of the system (ethylbenzene + styrene + 1-ethyl-3-methylimidazolium thiocyanate) and binary VLE data of the system (styrene + 1-ethyl-3-methylimidazolium thiocyanate), J. Chem. Thermodyn. 47 (2012) 234-240. M.T.G. Jongmans, E. Hermans, B. Schuur, A.B. de Haan, Binary and ternary vapor-liquid equilibrium data of the system ethylbenzene + styrene + 3-methyl-N-butylpyridinium tetracyanoborate at vacuum conditions and liquid-liquid equilibrium data of their binary systems, Fluid Phase Equilibr. 315 (2012) 99-106. A. Londoño, M.T.G. Jongmans, B. Schuur, A.B. de Haan, Isobaric low pressure vapor-liquid equilibrium data for the binary system monochloroacetic acid + dichloroacetic acid, Fluid Phase Equilibr. 313 (2012) 97-101. M.T.G. Jongmans, M. Raijmakers, B. Schuur, A.B. de Haan, Binary and ternary vapor-liquid equilibrium data of the system (ethylbenzene + styrene + 4-methyl-N-butylpyridinium tetrafluoroborate) at vacuum conditions and liquid-liquid equilibrium data of their binary systems, J. Chem. Eng. Data 57 (2012) 626-633. M.T.G. Jongmans, A. Londoño, S. Mamilla, B. Schuur, A.B. de Haan, Extractant screening for the separation of dichloroacetic acid from monochloroacetic acid by extractive distillation, submitted to Sep. Purif. Technol. M.T.G. Jongmans, J. Trampé, B. Schuur, A.B. de Haan, Styrene monomer recovery from ionic liquids, submitted to Chem. Eng. Process. M.T.G. Jongmans, J.I.W. Maassen, E. Hermans, M. Raijmakers, B. Schuur, A.B. de Haan, Conceptual process design of extractive distillation processes for ethylbenzene/styrene separation, submitted to Chem. Eng. Res. Des. M.T.G. Jongmans. A. Londoño, B. Schuur, A.B. de Haan, Isobaric low-pressure vapor-liquid equilibrium data of the system monochloroacetic acid + dichloroacetic acid + diethylene glycol dipentyl ether and the constituent binary systems, submitted to Fluid Phase Equilibr.
xxviii
JOURNAL PUBLICATION PRIOR TO THE PHD THESIS
A.R. Hansmeier, M.T.G. Jongmans, G.W. Meindersma, A.B. de Haan, LLE data for the ionic liquid 3-methyl-N-butylpyridinium dicyanamide with several aromatic and aliphatic hydrocarbons, J. Chem. Thermodyn. 42 (2010), 484-490. PEER REVIEWED CONFERENCE PROCEEDINGS
M.T.G. Jongmans, J.I.W. Maassen, A.J. Luijks, B. Schuur, A.B. de Haan, Extractive distillation of ethylbenzene and styrene using sulfolane as solvent: low pressure isobaric VLE data, Eds., A.B. de Haan, H. Kooijman, A. Górak, Distillation and Absorption 2010, 2010, 337-342. ORAL CONFERENCE PRESENTATIONS
M.T.G. Jongmans, J.I.W. Maassen, A.J. Luijks, B. Schuur, A.B. de Haan, ‘Ethylbenzene/styrene separation by extractive distillation with sulfolane’, DSTI congress, Amersfoort, The Netherlands, 2010. M.T.G. Jongmans, J.I.W. Maassen, A.J. Luijks, B. Schuur, A.B. de Haan, ‘Isobaric Low Pressure Vapor-Liquid Equilibrium Data for Ethylbenzene + Styrene + Sulfolane and the Three Constituent Binary Systems’, NPS10, Veldhoven, The Netherlands, 2010. M.T.G. Jongmans, J.I.W. Maassen, A.J. Luijks, B. Schuur, A.B. de Haan, ‘Extractive distillation of ethylbenzene and styrene using sulfolane as solvent: low pressure isobaric VLE data’, Distillation and Absorption 2010, Eindhoven, The Netherlands, 2010. M.T.G. Jongmans, B. Schuur, A.B. de Haan, ‘Ethylbenzene/styrene separation by extractive distillation: Solvent Screening’, International Conference on Ionic Liquids in Separation and Purification Technology, Sitges, Spain, 2011. POSTER CONFERENCE PRESENTATIONS
M.T.G. Jongmans, B. Schuur, A.B. de Haan, ‘Trace component removal by affinity solvent based technologies’, NPS8, Veldhoven, The Netherlands, 2008. M.T.G. Jongmans, A.L. Londoño, S. Mamilla, B. Schuur, A.B. de Haan, ‘Separation of close-boiling acids with extractive distillation by exploiting pKa difference’, NPS11, Veldhoven, The Netherlands, 2011.
xxix
Curriculum vitae
Mark Jongmans was born on 24 July 1983 in Noordhoek, the Netherlands. After finishing his secondary school, he studied Chemical Engineering at the Avans Hogeschool in Breda, where he received his BSc degree in July 2005. He continued studying Chemical Engineering at Eindhoven University of Technology, where he obtained his MSc degree in December 2007. From March 2008 until March 2012 he was employed at the group of Prof. A.B. de Haan, Process Systems Engineering, Eindhoven University of Technology as a PhD student, focusing on the research topic presented in this thesis ‘Energy Efficient Trace Removal by Extractive Distillation’. On 1st of March 2012 he joined AkzoNobel Chemicals B.V., Deventer, The Netherlands.