Embed Size (px)
Citation preview
ESTIMATING THE VOLUME OF ICE LOSS USING LANDSAT IMAGERIES: A CASE STUDY OF RIKHASAMBHA GLACIER, NEPAL
S. Sapkota1, N. R. Bhatt1, D. P. Bhatt1, A. Bist1, S. Thapa1, R. B. Kayastha1
1Department of Geomatics Engineering, Kathmandu University, Dhulikhel, Nepal - [email protected], [email protected], [email protected], [email protected], [email protected],
Commission V, WG V/7 and Commission IV, WG IV/6
KEY WORDS: Glaciers, Remote Sensing, NDSI, Ice Velocity, Ice Loss
ABSTRACT: Nepal being a part of Hindu Kush Himalayan Region is one of the largest concentration of glaciers. The loss of ice on that region reflects the climate change resulting devastating consequences on billions of people living downstream. This is why regular monitoring of the glaciers on that region is important not only to have insight into the glacier change but also to mitigate the effect of it. The satellite image as an alternate to ground based approach provides much more flexibility for monitoring in a regular basis. Therefore, this research aimed to map the decadal changes in glacier extent followed by estimating volume of ice loss of Rikha Samba Glacier located in Mustang district of Nepal. Multitemporal Landsat satellite images dating back from 1995 to 2015 were utilized in the study. The current research involved the calculation of snow index like NDSI on the radiometrically corrected satellite imageries. An open source GIS software package was used to automatically delineate the boundary of glacier based on the NDSI. It has been revealed that the glacier area shrunk by 2.608
on an average over the period. The ice velocity of the glacier was estimated. Laminar flow approach (Cuffey and Paterson, 2010) was utilized to find the ice thickness of glacier based on the evaluated velocity information. The utilization of thus computed ice thickness gave the volume of ice loss during the study period (i.e. 310000 ). In addition, 0.69km glacier retreat was observed over the period.
1. INTRODUCTION
Climate is usually defined as the "average weather" in a place. It includes patterns of temperature, precipitation (rain or snow), humidity, wind and seasons. Climate patterns play a fundamental role in shaping natural ecosystems, and the human economies and cultures that depend on them. But the climate come to expect is not what it used to be, because the past is no longer a reliable predictor of the future. Glaciers are regarded as natural elements documenting climate change most clearly to a wide public (Lemke et al., 2007). Climate is rapidly changing with disruptive impacts, and that change is progressing faster than any seen in the last 2,000 years (Gantayat.,2014). For this and further reasons glaciers are considered as one of the terrestrial essential climate variables by the Global Climate Observing System. In the last century, glaciers worldwide experienced a strong decline (retreat and mass loss) with only a few local exceptions (Bajracharya et al,. 2014).
According to the report Team (2000), rising levels of carbon dioxide and other heat-trapping gases in the atmosphere have warmed the Earth and are causing wide-ranging impacts, including rising sea levels; melting snow and ice; more extreme heat events, fires and drought; and more extreme storms, rainfall and floods. Scientists project that these trends will continue and, in some cases, accelerate, posing significant risks to human health, our forests, agriculture, freshwater supplies, coastlines, and other natural resources that are vital to Washington state’s economy, environment, and our quality of life.
Earth's average temperature is expected to rise even if the amount of greenhouse gases in the atmosphere decreases (Fujita et al,. 2001). But the rise would be less if greenhouse gas amount remain
the same or increase. Some impacts already are occurring. For example, sea levels are rising, and snow and ice cover is decreasing. Rainfall patterns and growing seasons are changing. Further sea-level rise and melting of snow and ice are likely as Earth warms. The warming climate likely will cause more floods, droughts and heat waves. The heat waves may get hotter, and hurricanes may get stronger.
Despite the relatively small area, Nepal has very diverse climatic conditions, ranging from tropical in the south to alpine in the north. The country's three distinct geographies-the snow-covered mountains, the mid hills and the Terai (plains)-embodies this diversity. Its hydrology is fed largely by the South Asian monsoon system (SAM), but the relationship between the timing, volume of ice loss in glacier and the mountain landscape is poorly understood. The dramatic variation in altitude over a short distance has resulted in pronounced orographic effects, effects which severely limit our ability to explain precipitation dynamics in Nepal.
This study aims to monitor the Rikhasamba glacier for the period of 1995-2016 utilising the Landsat imageries with the objective of evaluating the volume of ice loss throughout the period.
2. STUDY AREA
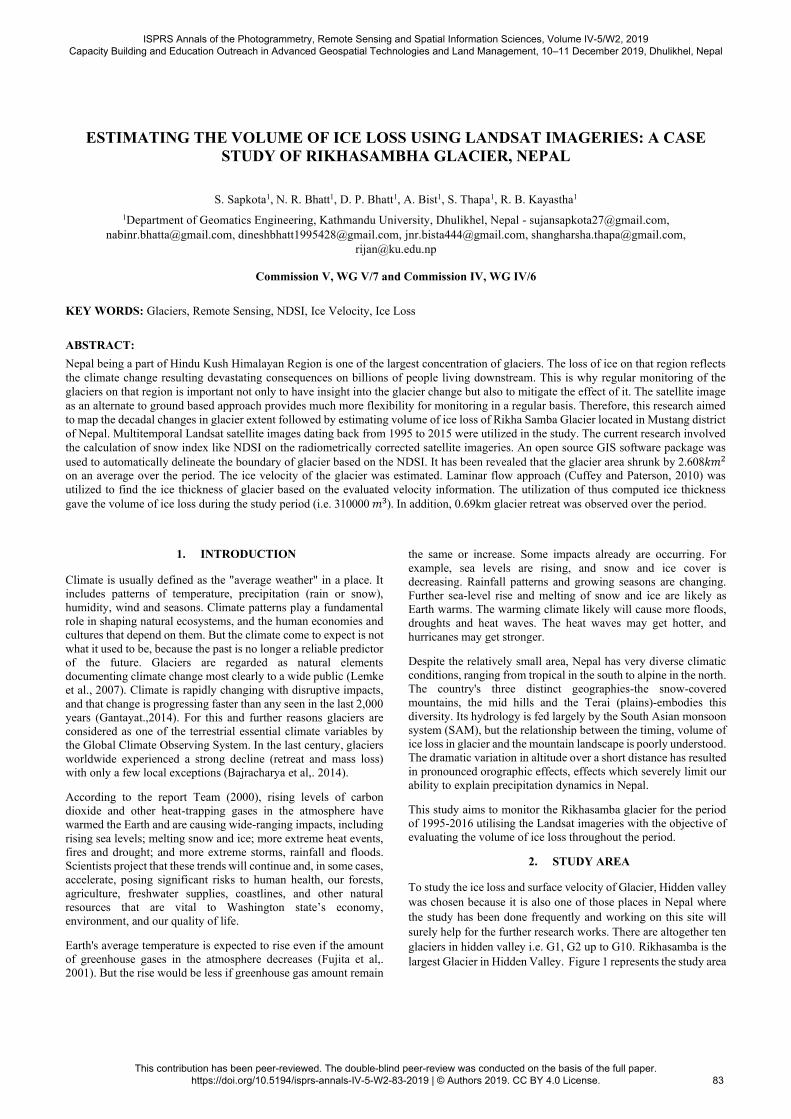
To study the ice loss and surface velocity of Glacier, Hidden valley was chosen because it is also one of those places in Nepal where the study has been done frequently and working on this site will surely help for the further research works. There are altogether ten glaciers in hidden valley i.e. G1, G2 up to G10. Rikhasamba is the largest Glacier in Hidden Valley. Figure 1 represents the study area
ISPRS Annals of the Photogrammetry, Remote Sensing and Spatial Information Sciences, Volume IV-5/W2, 2019 Capacity Building and Education Outreach in Advanced Geospatial Technologies and Land Management, 10–11 December 2019, Dhulikhel, Nepal
This contribution has been peer-reviewed. The double-blind peer-review was conducted on the basis of the full paper. https://doi.org/10.5194/isprs-annals-IV-5-W2-83-2019 | © Authors 2019. CC BY 4.0 License.
83
of Rikha samba Glacier which extends from 5421 meters to 6507 meters above sea level with a total length of 5.5 kilometers.
Figure 1. Study Area (Rikhasambha Glacier, Nepal)
3. METHODOLOGY
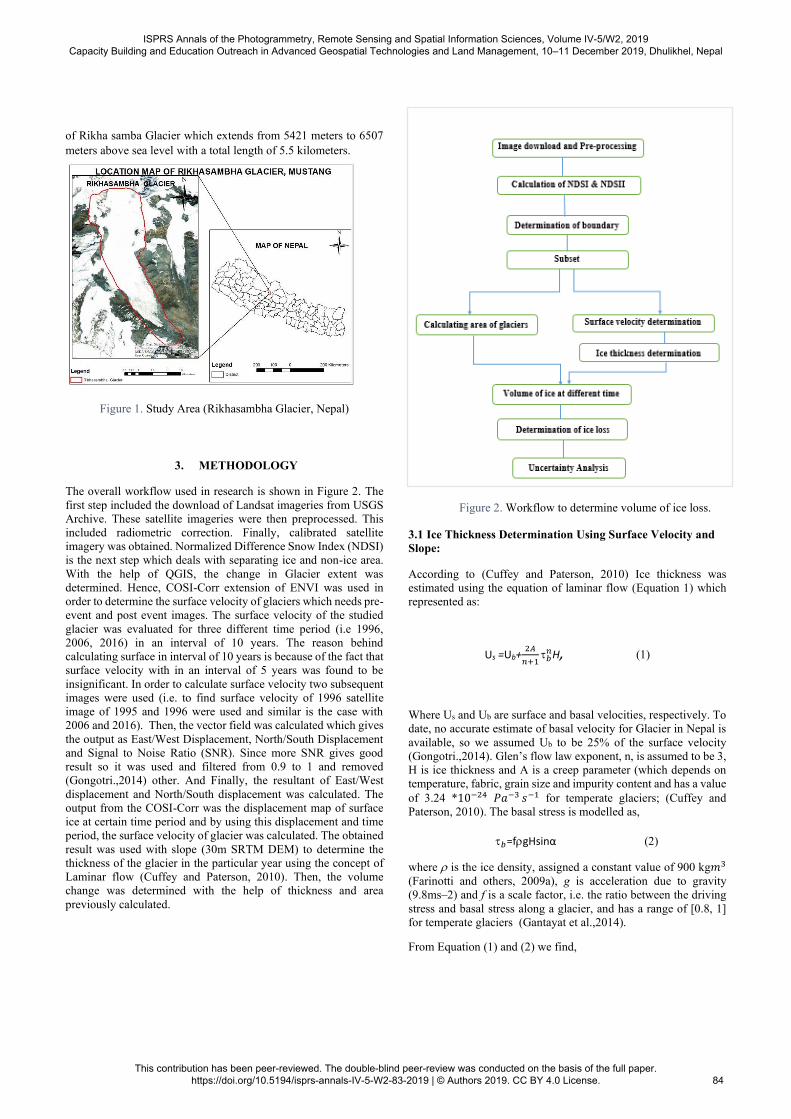
The overall workflow used in research is shown in Figure 2. The first step included the download of Landsat imageries from USGS Archive. These satellite imageries were then preprocessed. This included radiometric correction. Finally, calibrated satellite imagery was obtained. Normalized Difference Snow Index (NDSI) is the next step which deals with separating ice and non-ice area. With the help of QGIS, the change in Glacier extent was determined. Hence, COSI-Corr extension of ENVI was used in order to determine the surface velocity of glaciers which needs pre-event and post event images. The surface velocity of the studied glacier was evaluated for three different time period (i.e 1996, 2006, 2016) in an interval of 10 years. The reason behind calculating surface in interval of 10 years is because of the fact that surface velocity with in an interval of 5 years was found to be insignificant. In order to calculate surface velocity two subsequent images were used (i.e. to find surface velocity of 1996 satellite image of 1995 and 1996 were used and similar is the case with 2006 and 2016). Then, the vector field was calculated which gives the output as East/West Displacement, North/South Displacement and Signal to Noise Ratio (SNR). Since more SNR gives good result so it was used and filtered from 0.9 to 1 and removed (Gongotri.,2014) other. And Finally, the resultant of East/West displacement and North/South displacement was calculated. The output from the COSI-Corr was the displacement map of surface ice at certain time period and by using this displacement and time period, the surface velocity of glacier was calculated. The obtained result was used with slope (30m SRTM DEM) to determine the thickness of the glacier in the particular year using the concept of Laminar flow (Cuffey and Paterson, 2010). Then, the volume change was determined with the help of thickness and area previously calculated.
Figure 2. Workflow to determine volume of ice loss.
3.1 Ice Thickness Determination Using Surface Velocity and Slope:
According to (Cuffey and Paterson, 2010) Ice thickness was estimated using the equation of laminar flow (Equation 1) which represented as:
Us =Ub+ H, (1)
Where Us and Ub are surface and basal velocities, respectively. To date, no accurate estimate of basal velocity for Glacier in Nepal is available, so we assumed Ub to be 25% of the surface velocity (Gongotri.,2014). Glen’s flow law exponent, n, is assumed to be 3, H is ice thickness and A is a creep parameter (which depends on temperature, fabric, grain size and impurity content and has a value of 3.24 *10 for temperate glaciers; (Cuffey and Paterson, 2010). The basal stress is modelled as,
=f gHsinα (2)
where is the ice density, assigned a constant value of 900 kg (Farinotti and others, 2009a), g is acceleration due to gravity (9.8ms–2) and f is a scale factor, i.e. the ratio between the driving stress and basal stress along a glacier, and has a range of [0.8, 1] for temperate glaciers (Gantayat et al.,2014).
From Equation (1) and (2) we find,
ISPRS Annals of the Photogrammetry, Remote Sensing and Spatial Information Sciences, Volume IV-5/W2, 2019 Capacity Building and Education Outreach in Advanced Geospatial Technologies and Land Management, 10–11 December 2019, Dhulikhel, Nepal
This contribution has been peer-reviewed. The double-blind peer-review was conducted on the basis of the full paper. https://doi.org/10.5194/isprs-annals-IV-5-W2-83-2019 | © Authors 2019. CC BY 4.0 License.
84
= .( ) (3)
4. RESULT AND DISCUSSION
4.1 Area of Rikha samba Glacier (G5) at different time
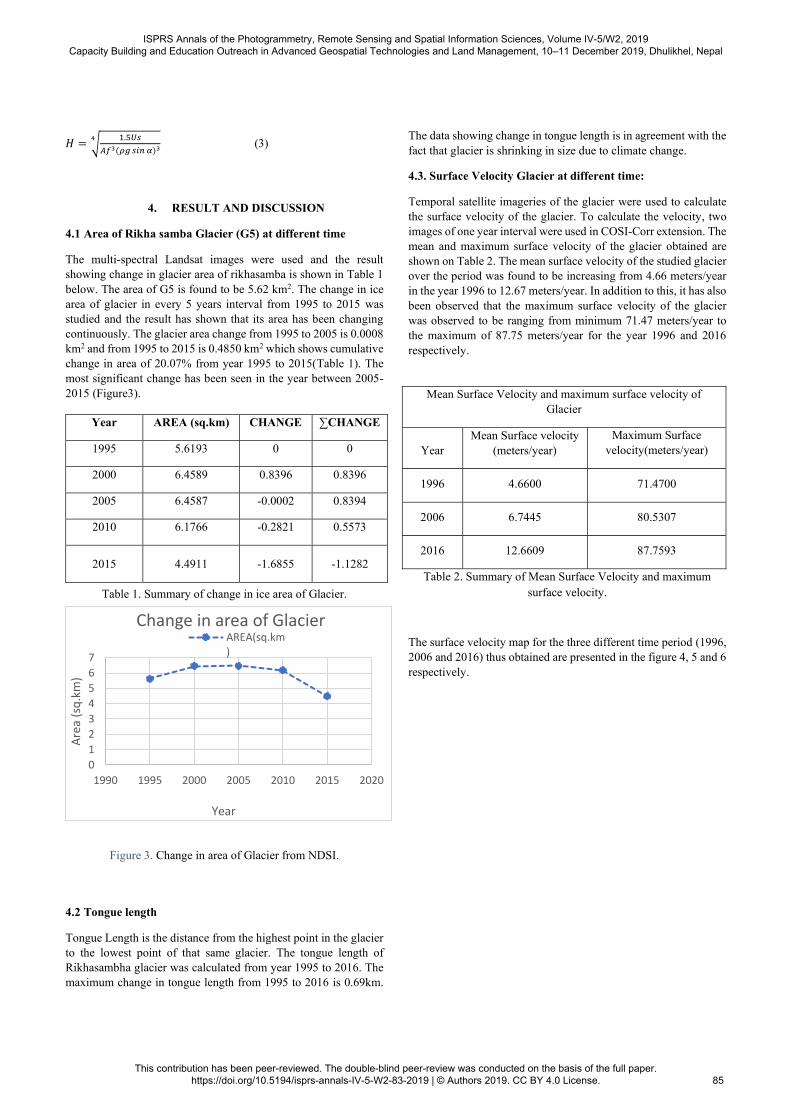
The multi-spectral Landsat images were used and the result showing change in glacier area of rikhasamba is shown in Table 1 below. The area of G5 is found to be 5.62 km2. The change in ice area of glacier in every 5 years interval from 1995 to 2015 was studied and the result has shown that its area has been changing continuously. The glacier area change from 1995 to 2005 is 0.0008 km2 and from 1995 to 2015 is 0.4850 km2 which shows cumulative change in area of 20.07% from year 1995 to 2015(Table 1). The most significant change has been seen in the year between 2005-2015 (Figure3).
Table 1. Summary of change in ice area of Glacier.
Figure 3. Change in area of Glacier from NDSI.
4.2 Tongue length
Tongue Length is the distance from the highest point in the glacier to the lowest point of that same glacier. The tongue length of Rikhasambha glacier was calculated from year 1995 to 2016. The maximum change in tongue length from 1995 to 2016 is 0.69km.
The data showing change in tongue length is in agreement with the fact that glacier is shrinking in size due to climate change.
4.3. Surface Velocity Glacier at different time:
Temporal satellite imageries of the glacier were used to calculate the surface velocity of the glacier. To calculate the velocity, two images of one year interval were used in COSI-Corr extension. The mean and maximum surface velocity of the glacier obtained are shown on Table 2. The mean surface velocity of the studied glacier over the period was found to be increasing from 4.66 meters/year in the year 1996 to 12.67 meters/year. In addition to this, it has also been observed that the maximum surface velocity of the glacier was observed to be ranging from minimum 71.47 meters/year to the maximum of 87.75 meters/year for the year 1996 and 2016 respectively.
Table 2. Summary of Mean Surface Velocity and maximum surface velocity.
The surface velocity map for the three different time period (1996, 2006 and 2016) thus obtained are presented in the figure 4, 5 and 6 respectively.
01234567
1990 1995 2000 2005 2010 2015 2020
Area
(sq.
km)
Year
Change in area of Glacier AREA(sq.km)
Year AREA (sq.km) CHANGE ∑CHANGE
1995 5.6193 0 0
2000 6.4589 0.8396 0.8396
2005 6.4587 -0.0002 0.8394
2010 6.1766 -0.2821 0.5573
2015 4.4911 -1.6855 -1.1282
Mean Surface Velocity and maximum surface velocity of Glacier
Year Mean Surface velocity
(meters/year) Maximum Surface
velocity(meters/year)
1996 4.6600 71.4700
2006 6.7445 80.5307
2016 12.6609 87.7593
ISPRS Annals of the Photogrammetry, Remote Sensing and Spatial Information Sciences, Volume IV-5/W2, 2019 Capacity Building and Education Outreach in Advanced Geospatial Technologies and Land Management, 10–11 December 2019, Dhulikhel, Nepal
This contribution has been peer-reviewed. The double-blind peer-review was conducted on the basis of the full paper. https://doi.org/10.5194/isprs-annals-IV-5-W2-83-2019 | © Authors 2019. CC BY 4.0 License.
85
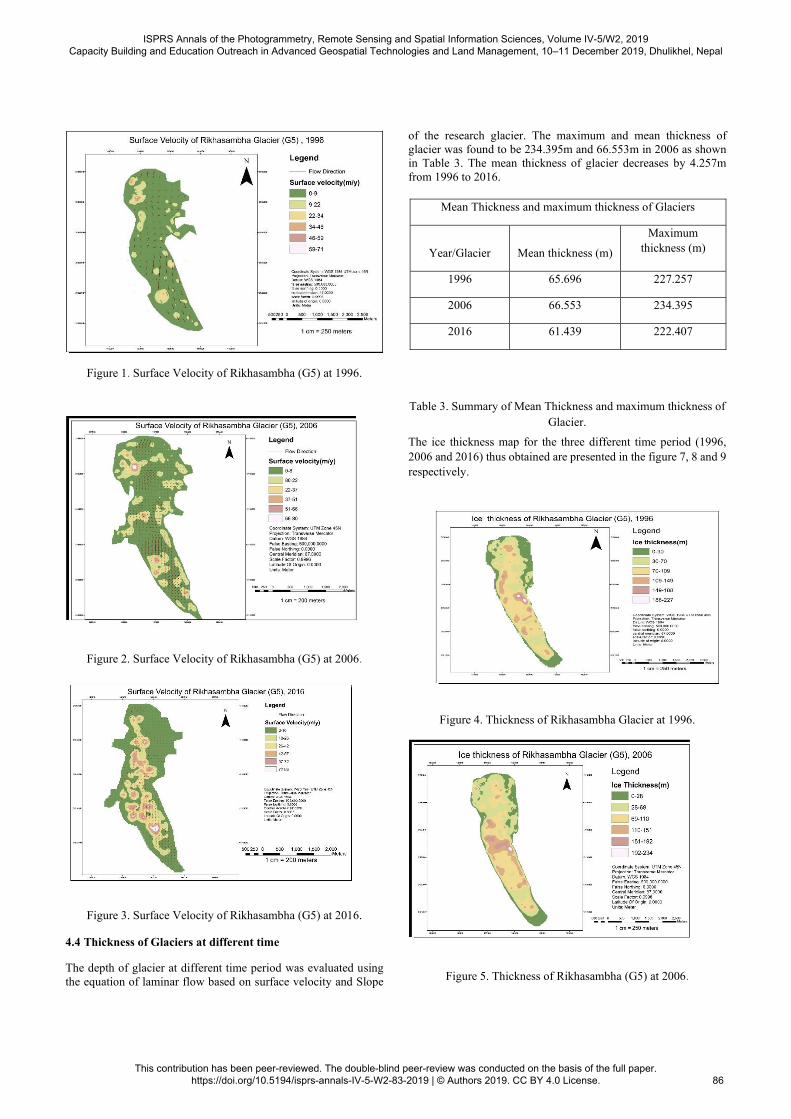
Figure 1. Surface Velocity of Rikhasambha (G5) at 1996.
Figure 2. Surface Velocity of Rikhasambha (G5) at 2006.
Figure 3. Surface Velocity of Rikhasambha (G5) at 2016.
4.4 Thickness of Glaciers at different time
The depth of glacier at different time period was evaluated using the equation of laminar flow based on surface velocity and Slope
of the research glacier. The maximum and mean thickness of glacier was found to be 234.395m and 66.553m in 2006 as shown in Table 3. The mean thickness of glacier decreases by 4.257m from 1996 to 2016.
Table 3. Summary of Mean Thickness and maximum thickness of Glacier.
The ice thickness map for the three different time period (1996, 2006 and 2016) thus obtained are presented in the figure 7, 8 and 9 respectively.
Figure 4. Thickness of Rikhasambha Glacier at 1996.
Figure 5. Thickness of Rikhasambha (G5) at 2006.
Mean Thickness and maximum thickness of Glaciers
Year/Glacier Mean thickness (m)
Maximum thickness (m)
1996 65.696 227.257
2006 66.553 234.395
2016 61.439 222.407
ISPRS Annals of the Photogrammetry, Remote Sensing and Spatial Information Sciences, Volume IV-5/W2, 2019 Capacity Building and Education Outreach in Advanced Geospatial Technologies and Land Management, 10–11 December 2019, Dhulikhel, Nepal
This contribution has been peer-reviewed. The double-blind peer-review was conducted on the basis of the full paper. https://doi.org/10.5194/isprs-annals-IV-5-W2-83-2019 | © Authors 2019. CC BY 4.0 License.
86
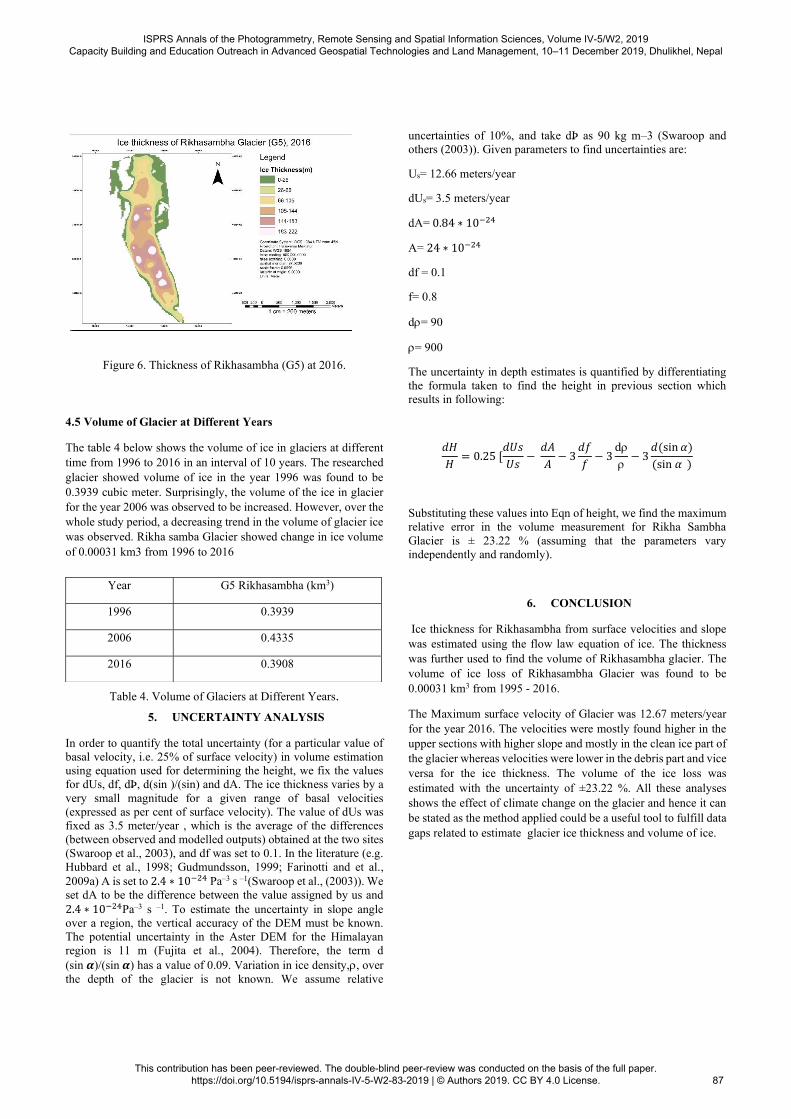
Figure 6. Thickness of Rikhasambha (G5) at 2016.
4.5 Volume of Glacier at Different Years
The table 4 below shows the volume of ice in glaciers at different time from 1996 to 2016 in an interval of 10 years. The researched glacier showed volume of ice in the year 1996 was found to be 0.3939 cubic meter. Surprisingly, the volume of the ice in glacier for the year 2006 was observed to be increased. However, over the whole study period, a decreasing trend in the volume of glacier ice was observed. Rikha samba Glacier showed change in ice volume of 0.00031 km3 from 1996 to 2016
Table 4. Volume of Glaciers at Different Years.
5. UNCERTAINTY ANALYSIS
In order to quantify the total uncertainty (for a particular value of basal velocity, i.e. 25% of surface velocity) in volume estimation using equation used for determining the height, we fix the values for dUs, df, dꝦ, d(sin )/(sin) and dA. The ice thickness varies by a very small magnitude for a given range of basal velocities (expressed as per cent of surface velocity). The value of dUs was fixed as 3.5 meter/year , which is the average of the differences (between observed and modelled outputs) obtained at the two sites (Swaroop et al., 2003), and df was set to 0.1. In the literature (e.g. Hubbard et al., 1998; Gudmundsson, 1999; Farinotti and et al., 2009a) A is set to 2.4 ∗ 10 Pa–3 s –1(Swaroop et al., (2003)). We set dA to be the difference between the value assigned by us and 2.4 ∗ 10 Pa–3 s –1. To estimate the uncertainty in slope angle over a region, the vertical accuracy of the DEM must be known. The potential uncertainty in the Aster DEM for the Himalayan region is 11 m (Fujita et al., 2004). Therefore, the term d (sin )/(sin ) has a value of 0.09. Variation in ice density, , over the depth of the glacier is not known. We assume relative
uncertainties of 10%, and take dꝦ as 90 kg m–3 (Swaroop and others (2003)). Given parameters to find uncertainties are:
Us= 12.66 meters/year
dUs= 3.5 meters/year
dA= 0.84 ∗ 10
A= 24 ∗ 10
df = 0.1
f= 0.8
d = 90
= 900
The uncertainty in depth estimates is quantified by differentiating the formula taken to find the height in previous section which results in following:
= 0.25 [ − − 3 − 3 d − 3 (sin )(sin )
Substituting these values into Eqn of height, we find the maximum relative error in the volume measurement for Rikha Sambha Glacier is ± 23.22 % (assuming that the parameters vary independently and randomly).
6. CONCLUSION
Ice thickness for Rikhasambha from surface velocities and slope was estimated using the flow law equation of ice. The thickness was further used to find the volume of Rikhasambha glacier. The volume of ice loss of Rikhasambha Glacier was found to be 0.00031 km3 from 1995 - 2016.
The Maximum surface velocity of Glacier was 12.67 meters/year for the year 2016. The velocities were mostly found higher in the upper sections with higher slope and mostly in the clean ice part of the glacier whereas velocities were lower in the debris part and vice versa for the ice thickness. The volume of the ice loss was estimated with the uncertainty of ±23.22 %. All these analyses shows the effect of climate change on the glacier and hence it can be stated as the method applied could be a useful tool to fulfill data gaps related to estimate glacier ice thickness and volume of ice.
Year G5 Rikhasambha (km3)
1996 0.3939
2006 0.4335
2016 0.3908
ISPRS Annals of the Photogrammetry, Remote Sensing and Spatial Information Sciences, Volume IV-5/W2, 2019 Capacity Building and Education Outreach in Advanced Geospatial Technologies and Land Management, 10–11 December 2019, Dhulikhel, Nepal
This contribution has been peer-reviewed. The double-blind peer-review was conducted on the basis of the full paper. https://doi.org/10.5194/isprs-annals-IV-5-W2-83-2019 | © Authors 2019. CC BY 4.0 License.
87
7. REFERENCES
Lemke, P., Ren, J., Alley, R.B., Allison, I., Carrasco, J., Flato, G., Fujii, Y., Kaser, G., Mote, P., Thomas, R.H. and Zhang, T., 2007. Observations: changes in snow, ice and frozen ground. Gantayat, P., Kulkarni, A.V. and Srinivasan, J., 2014. Estimation of ice thickness using surface velocities and slope: case study at Gangotri Glacier, India. Journal of Glaciology, 60(220), pp.277-282. Bajracharya, S.R., Maharjan, S.B. and Shrestha, F., 2014. The status and decadal change of glaciers in Bhutan from the 1980s to 2010 based on satellite data. Annals of Glaciology, 55(66), pp.159-166. Fujita, K., Nakazawa, F. and Rana, B., 2001. Glaciological observations on Rikha Samba Glacier in Hidden Valley, Nepal Himalayas, 1998 and 1999. Bulletin of Glaciological Research, 18(5). Nakawo, M., Fujii, Y. and Shrestha, M.L., 1976. Flow of glaciers in hidden valley, Mukut Himal. Journal of the Japanese Society of Snow and Ice, 38(Special), pp.39-43 Racoviteanu, A.E., Paul, F., Raup, B., Khalsa, S.J.S. and Armstrong, R., 2009. Challenges and recommendations in mapping of glacier parameters from space: results of the 2008 Global Land Ice Measurements from Space (GLIMS) workshop, Boulder, Colorado, USA. Annals of Glaciology, 50(53), pp.53-69. Ren, J., Jing, Z., Pu, J. and Qin, X., 2006. Glacier variations and climate change in the central Himalaya over the past few decades. Annals of Glaciology, 43, pp.218-222. Wagnon, P., Vincent, C., Arnaud, Y., Berthier, E., Vuillermoz, E., Gruber, S., Ménégoz, M., Gilbert, A., Dumont, M., Shea, J.M. and Stumm, D., 2013. Seasonal and annual mass balances of Mera and Pokalde glaciers (Nepal Himalaya) since 2007. Kulkarni, A.V., Rathore, B.P., Singh, S.K. and Bahuguna, I.M., 2011. Understanding changes in the Himalayan cryosphere using remote sensing techniques. International journal of remote sensing, 32(3), pp.601-615. Lama, L.A.K.S.H.M.A.N., Kayastha, R.B., Maharjan, S.B., Bajracharya, S.R., Chand, M.B. and Mool, P.K., 2015. Glacier area and volume changes of Hidden Valley, Mustang, Nepal from~ 1980s to 2010 based on remote sensing. Proceedings of the International Association of Hydrological Sciences, 368, pp.57-62.
ISPRS Annals of the Photogrammetry, Remote Sensing and Spatial Information Sciences, Volume IV-5/W2, 2019 Capacity Building and Education Outreach in Advanced Geospatial Technologies and Land Management, 10–11 December 2019, Dhulikhel, Nepal
This contribution has been peer-reviewed. The double-blind peer-review was conducted on the basis of the full paper. https://doi.org/10.5194/isprs-annals-IV-5-W2-83-2019 | © Authors 2019. CC BY 4.0 License.
88