Embed Size (px)
Citation preview
7/24/2019 ET ZC362-L1
http://slidepdf.com/reader/full/et-zc362-l1 1/46
BITS PilaniPilani Campus
Environmental Pollution Control
ET ZC362
M K HamirwasiaB.I.T.S, Pilani

7/24/2019 ET ZC362-L1
http://slidepdf.com/reader/full/et-zc362-l1 2/46
BITS PilaniPilani Campus
Introduction
Lecture - 1
7/24/2019 ET ZC362-L1
http://slidepdf.com/reader/full/et-zc362-l1 3/46
BITS Pilani, Pilani Campus
ET ZC362 Environmental Pollution Control
• Systematic pollution of our environment is one of the
biggest hazards faced by humanity today
• Task of preserving the purity of environment is of utmost
significance
• Two most pressing demands are (1) protection of
environment (2) efficient use of natural resources
• There is need of technical manpower who could develop
and implement effective means for protecting the
environment
Introduction
39 February 2016
7/24/2019 ET ZC362-L1
http://slidepdf.com/reader/full/et-zc362-l1 4/46
BITS Pilani, Pilani Campus
ET ZC362 Environmental Pollution Control
• The application of science and engineering principles,
under constraint, to the protection and enhancement of
the quality of the environment and to the enhancement
and protection of public health and welfare.
Environmental Engineering
49 February 2016
7/24/2019 ET ZC362-L1
http://slidepdf.com/reader/full/et-zc362-l1 5/46
BITS Pilani, Pilani Campus
ET ZC362 Environmental Pollution Control
The Biosphere
The Hydrologic Cycle
The Nutrient Cycles – Carbon, Nitrogen, Phosphorus,Sulphur
Consequences of Population Growth – Exponential Growth
Impact of Man on theEnvironment: An Overview
59 February 2016
7/24/2019 ET ZC362-L1
http://slidepdf.com/reader/full/et-zc362-l1 6/46
BITS Pilani, Pilani Campus
ET ZC362 Environmental Pollution Control
• The Environment which Supports Life and sustains
various human activities is known as biosphere
• Extends to about 20 km from the bottom of ocean to the
highest point in the atmosphere where life can be
sustained without protective devices
• Essentials for Life: Air, light, heat, water, food and
habitats are supplied by the biosphere
• Biosphere is divided into smaller units or ecosystems
• All ecosystems can be divided into two parts
• Biotic (living) and Abiotic (non-living) components
BIOSPHERE
69 February 2016
7/24/2019 ET ZC362-L1
http://slidepdf.com/reader/full/et-zc362-l1 7/46BITS Pilani, Pilani Campus
ET ZC362 Environmental Pollution Control
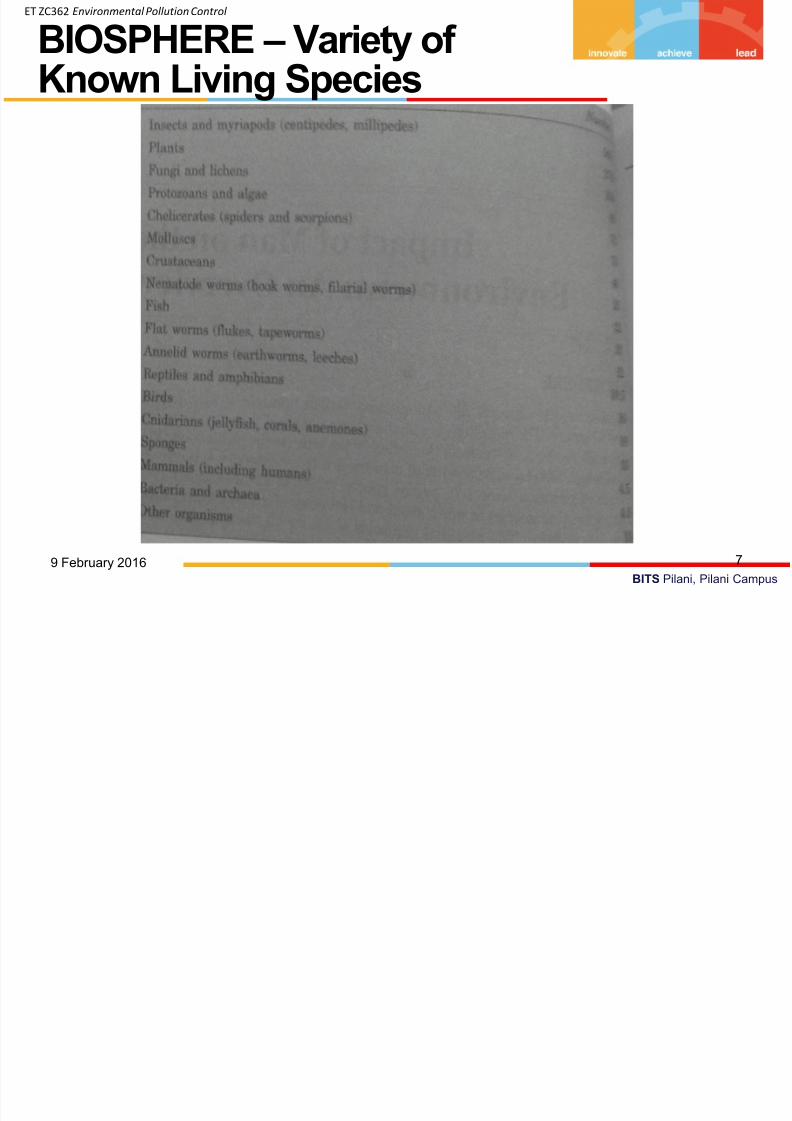
BIOSPHERE –Variety ofKnown Living Species
79 February 2016
7/24/2019 ET ZC362-L1
http://slidepdf.com/reader/full/et-zc362-l1 8/46BITS Pilani, Pilani Campus
ET ZC362 Environmental Pollution Control
• The biotic category is subdivided into three functional
groups• Producers (autotrophic – self-nourishing): Green Plants and Algae
• Consumers (heterotrophic – other-nourishing): animal life; mammals, fish,
insects, birds – they depend on consumption of Producers
• Decomposers (heterotrophic organisms): bacteria, fungi that break downcomplex compounds from waste materials
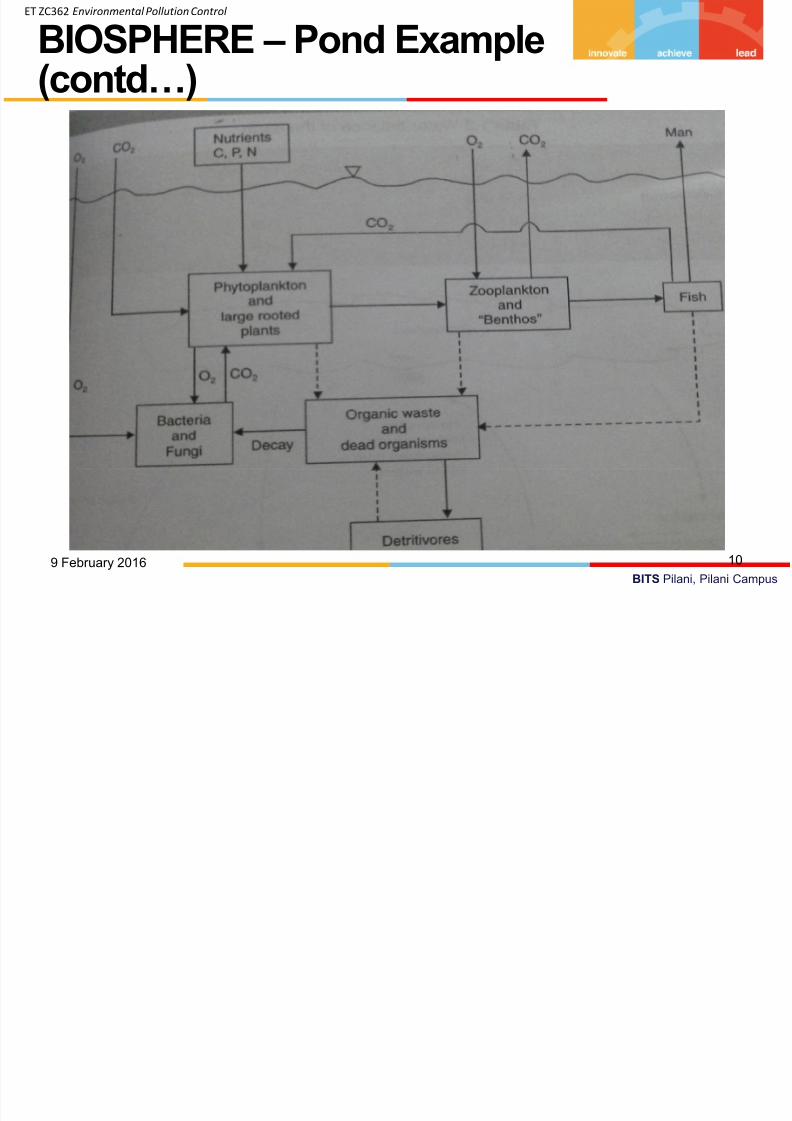
• Example : Operating ecosystem: Pond• Abiotic substances – water, nutrients, oxygen and CO2
• Producers: large rooted plants and free floating minute plants (store energy and
liberate O2)• Primary Consumers: Benthos or bottom forms and zooplankton with little or no
swimming ability. Phytoplankton are consumed by zooplankton which in turn
eaten by large aquatic life such as fish.
BIOSPHERE
89 February 2016
7/24/2019 ET ZC362-L1
http://slidepdf.com/reader/full/et-zc362-l1 9/46BITS Pilani, Pilani Campus
ET ZC362 Environmental Pollution Control
• Other consumers are insects, frogs and man
• All these forms produce organic waste and dead organisms.
• The decomposers bacteria and fungi utilize organic carbon and generate CO2Used By Algae
• The availability of the Nutrients carbon, phosphorus and nitrogen is sufficientlysmall so as to limit the production of algae and maintain dynamic equilibrium.
• The chemical elements circulate between the organisms and the environmentthrough pathways comprising of the natural cycles
• 1) Hydrologic cycle
• 2) Biogeochemical cycles
• Carbon
• Phosphorus
• Nitrogen and• Sulphur
• These cycles operate in a balanced state with little variation thereby contributingto the stability of the biosphere.
BIOSPHERE –Pond Example(contd…)
99 February 2016
7/24/2019 ET ZC362-L1
http://slidepdf.com/reader/full/et-zc362-l1 10/46BITS Pilani, Pilani Campus
ET ZC362 Environmental Pollution Control
BIOSPHERE –Pond Example(contd…)
109 February 2016
7/24/2019 ET ZC362-L1
http://slidepdf.com/reader/full/et-zc362-l1 11/46BITS Pilani, Pilani Campus
ET ZC362 Environmental Pollution Control
• Natural cycle : More than 97% of water in biosphere is in oceans, the remaining
3% is found in continents and atmosphere• More than 70% of this is in glaciers and icecaps
• Water on which human depend such as lakes, streams and ground wateraccounts for less than 1% of total supply
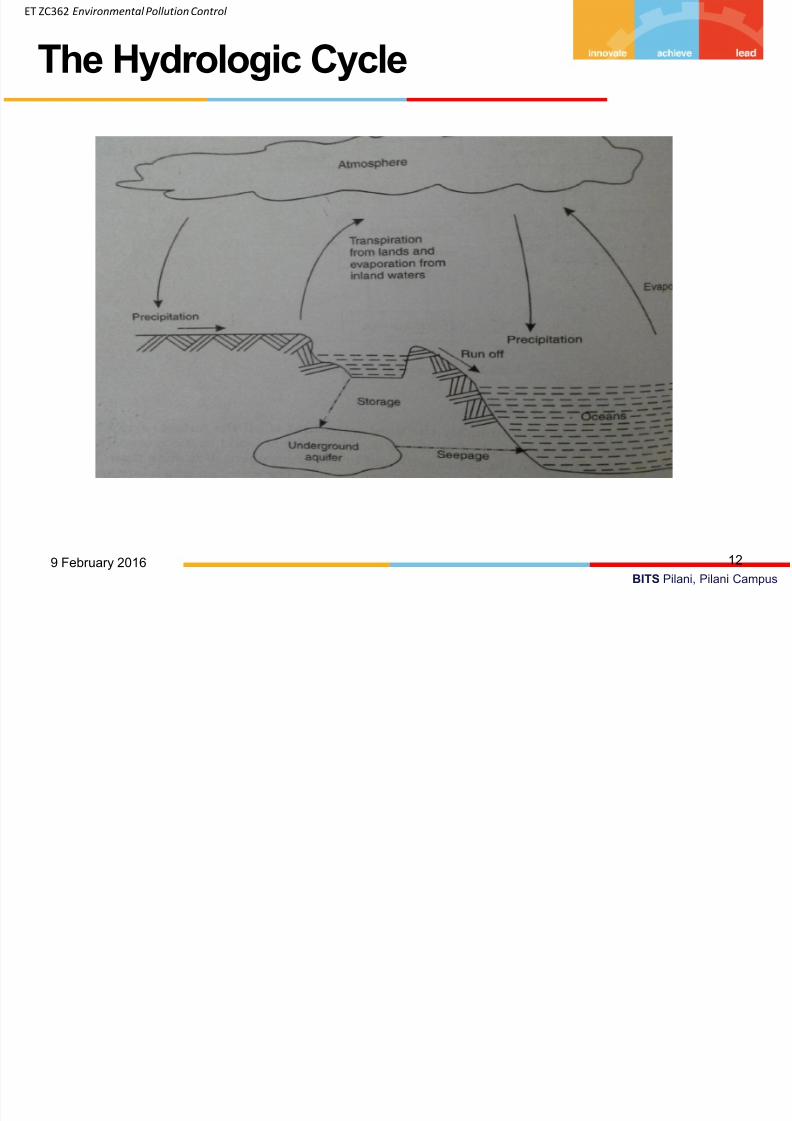
• The hydrologic cycle of the biosphere depends on the reciprocity of evaporationand precipitation. Liquid water on earth goes to the atmosphere as vapor byevaporation and transpiration of the plants. The vapor is returned to Earth as
rain or snow over the oceans and oceans lose more water by evaporation thanthey gain by precipitation. The difference is made up by runoff and seepagefrom the continents, over which there is more precipitation than evaporation.Continents lose more than 50% of the precipitation through evaporation andremainder is stored in lakes, rivers or ground water which is later dischargedinto oceans.
• Each year 4,23,000 km3 water is evaporated, same quantity precipitated
• Amount of water temporarily stored & later discharged is 37000 km3
• This water is available for human use
• Minor modification by diverting or regulating the runoff and storage
Hydrologic Cycle
119 February 2016
7/24/2019 ET ZC362-L1
http://slidepdf.com/reader/full/et-zc362-l1 12/46BITS Pilani, Pilani Campus
ET ZC362 Environmental Pollution Control
The Hydrologic Cycle
129 February 2016
i l ll i C l
7/24/2019 ET ZC362-L1
http://slidepdf.com/reader/full/et-zc362-l1 13/46BITS Pilani, Pilani Campus
ET ZC362 Environmental Pollution Control
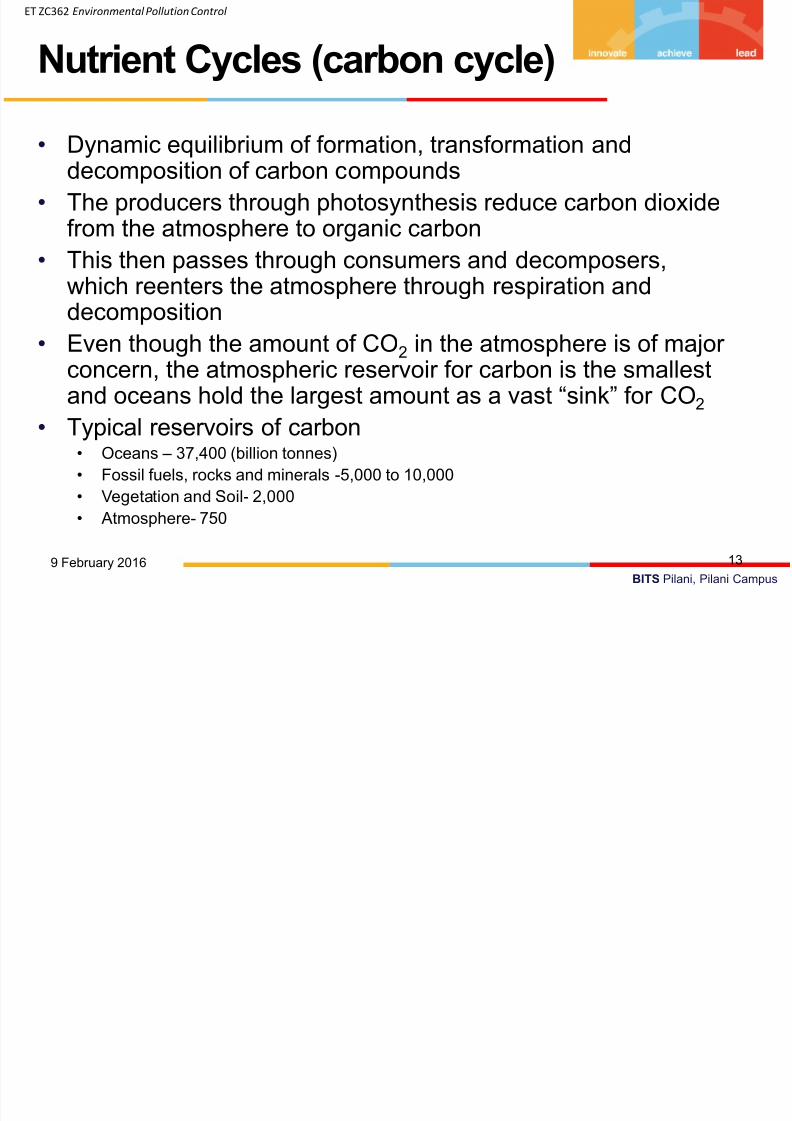
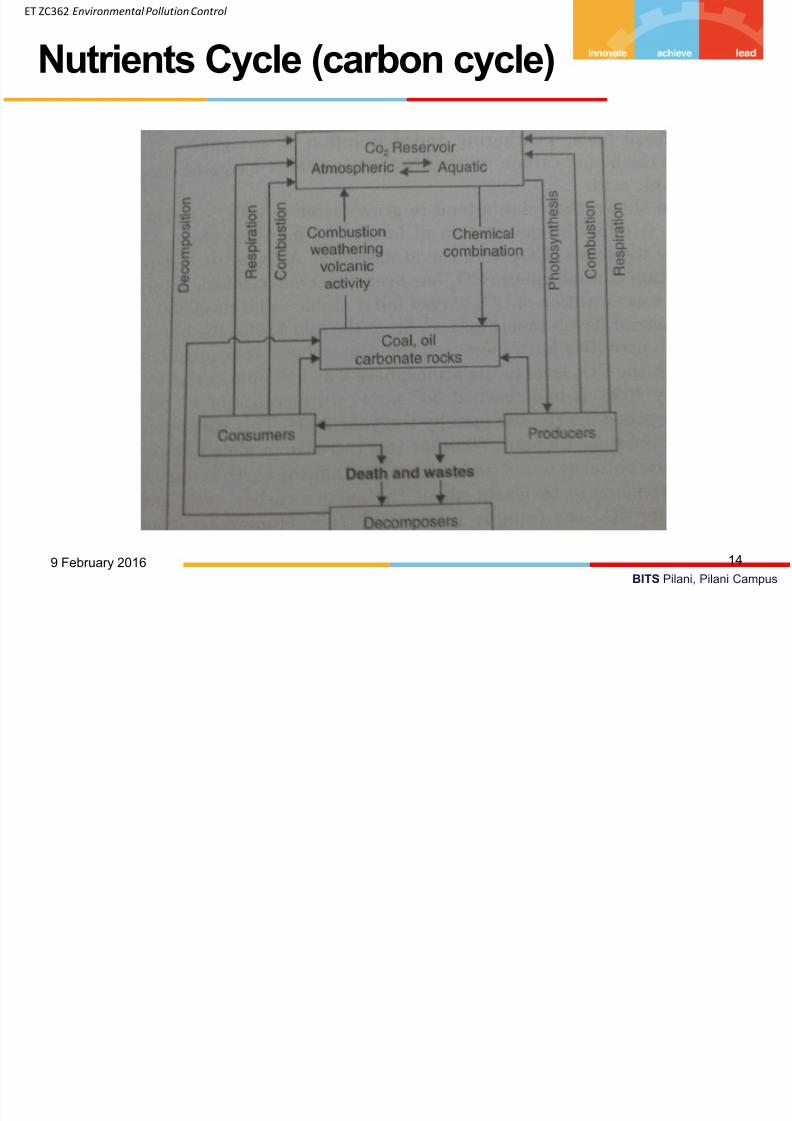
• Dynamic equilibrium of formation, transformation anddecomposition of carbon compounds
• The producers through photosynthesis reduce carbon dioxidefrom the atmosphere to organic carbon
• This then passes through consumers and decomposers,which reenters the atmosphere through respiration anddecomposition
• Even though the amount of CO2 in the atmosphere is of majorconcern, the atmospheric reservoir for carbon is the smallestand oceans hold the largest amount as a vast “sink” for CO2
• Typical reservoirs of carbon• Oceans – 37,400 (billion tonnes)
• Fossil fuels, rocks and minerals -5,000 to 10,000
• Vegetation and Soil- 2,000
• Atmosphere- 750
Nutrient Cycles (carbon cycle)
139 February 2016
ET ZC362 E i t l P ll ti C t l
7/24/2019 ET ZC362-L1
http://slidepdf.com/reader/full/et-zc362-l1 14/46BITS Pilani, Pilani Campus
ET ZC362 Environmental Pollution Control
Nutrients Cycle (carbon cycle)
149 February 2016
ET ZC362 E i t l P ll ti C t l
7/24/2019 ET ZC362-L1
http://slidepdf.com/reader/full/et-zc362-l1 15/46BITS Pilani, Pilani Campus
ET ZC362 Environmental Pollution Control
• Oceans store 50 times as much as the atmosphere i.e. 750• Human activity releases roughly 11 billion tonnes of carbon
• Out of 11 billion tonnes 50% accumulates in the atmosphere and therest is taken up by ocean and terrestrial plants
• The exact mechanism by which the sea water interacts with the air
above it to remove CO2 is not clearly understood but the oceanicreservoir tends to regulate the CO2 concentration.
• Even though the 5.5 billion tonnes added to the atmosphere eachyear is a tiny fraction of the total held by the atmosphere, it assumessignificance because the natural processes and the environmentmaintain dynamic equilibrium whereas human activity puts extraburden. Any global event that alters the exchange of CO2 betweenthe atmosphere and the ocean can significantly affect theconcentration of CO2 in the atmosphere
Nutrients Cycle (carbon cycle)
159 February 2016
ET ZC362 Environmental Pollution Control
7/24/2019 ET ZC362-L1
http://slidepdf.com/reader/full/et-zc362-l1 16/46BITS Pilani, Pilani Campus
ET ZC362 Environmental Pollution Control
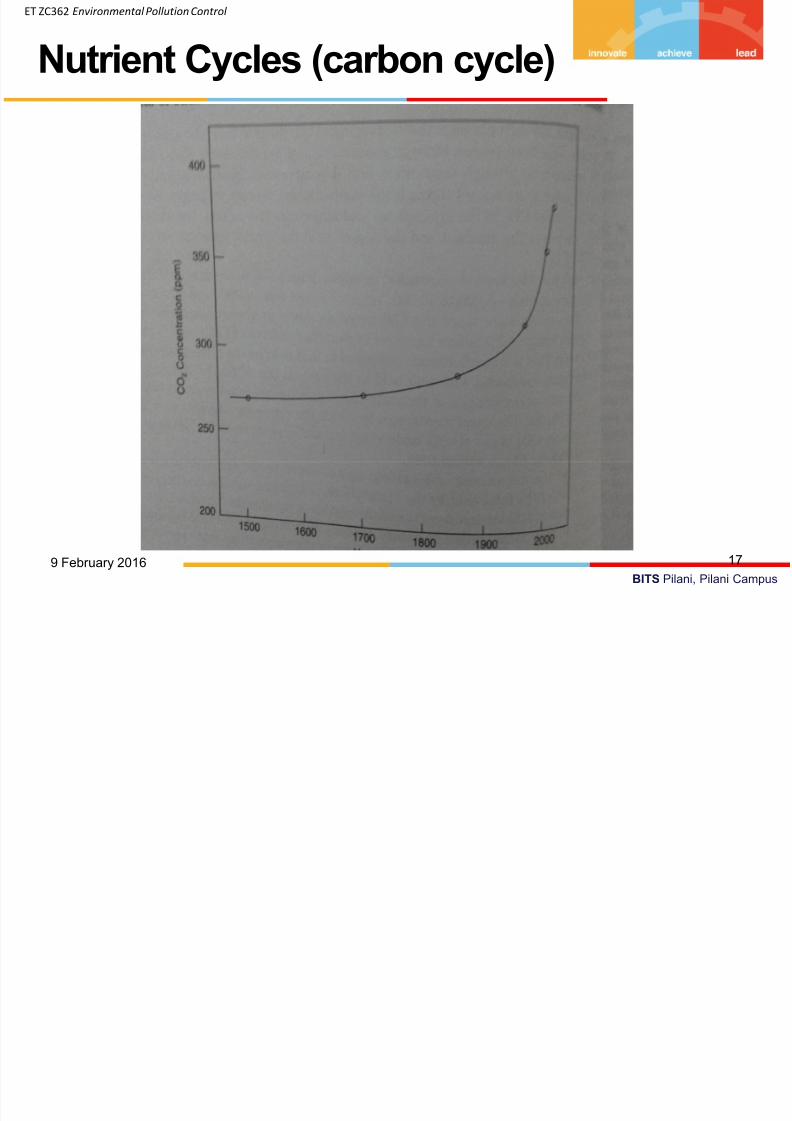
• Apart from daily consumption and production of carbon, earthhas significant reserves such as limestone and fossil fuels(coal and petroleum)
• Due of combustion some of bound carbon returns to theatmosphere as carbon dioxide or carbonic acid
• Plants grow faster in C02 enriched atmosphere but is offset bythe denudation of forests , as a result detectable increase ofC02 has been observed
• Atmospheric C02 concentration stable at 280 +/- 10 ppmtill onset of industrial revolution
• By 1959 C02 concentration reached 316 ppm, 1998: 367(17% increase) and has reached 380 ppm by 2004 . Humanactivities have disturbed the carbon cycle
Nutrients Cycle (carbon cycle)
169 February 2016
ET ZC362 Environmental Pollution Control
7/24/2019 ET ZC362-L1
http://slidepdf.com/reader/full/et-zc362-l1 17/46BITS Pilani, Pilani Campus
ET ZC362 Environmental Pollution Control
Nutrient Cycles (carbon cycle)
179 February 2016
ET ZC362 Environmental Pollution Control
7/24/2019 ET ZC362-L1
http://slidepdf.com/reader/full/et-zc362-l1 18/46BITS Pilani, Pilani Campus
ET ZC362 Environmental Pollution Control
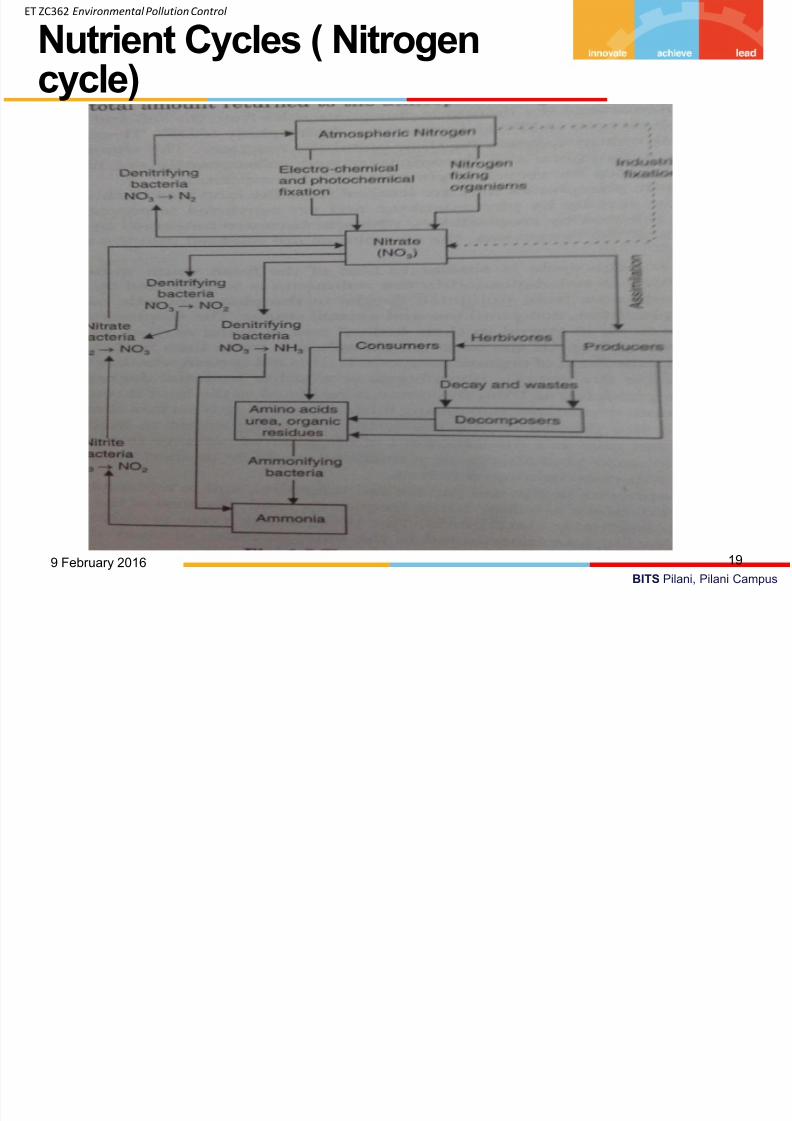
• Nitrogen is gaseous form – 78.05% in atmosphere
• Cannot be used directly by most forms of life
• It must be fixed before utilization by plants and animals
• By fixation, nitrogen is converted to nitrates and ammonia• Physicochemical and biological means
• Biological ( free living bacteria Azetobacter , Clostridium or leguminousplants like Rhizobium and blue-green algae)
• They are key for atmospheric movement nitrogen• The nitrates are assimilated to form amino acids , urea and other
organic residues in the producer, consumer and decomposer cycle.
• Amino acids and urea---converted to ammonia through“ammonification”
• To complete the cycle the denitrifying bacteria convert the ammonia into
nitrates and nitrates and then back to nitrogen• Thus Total amount of nitrogen= total amount required to the
atmosphere as gas
• Mans interference with the natural cycle by industrially fixingnitrogen(fertilizers)
Nutrient Cycles ( Nitrogencycle)
189 February 2016
ET ZC362 Environmental Pollution Control
7/24/2019 ET ZC362-L1
http://slidepdf.com/reader/full/et-zc362-l1 19/46BITS Pilani, Pilani Campus
ET ZC362 Environmental Pollution Control
Nutrient Cycles ( Nitrogencycle)
199 February 2016
ET ZC362 Environmental Pollution Control
7/24/2019 ET ZC362-L1
http://slidepdf.com/reader/full/et-zc362-l1 20/46BITS Pilani, Pilani Campus
ET ZC362 Environmental Pollution Control
• Phosphorus plays important role in the growth of living tissue
• Metabolic process of energy transfer does not form gaseous
compounds at normal T, P
• Reservoirs in land are, rock and natural phosphate deposits
• Much of it is fixed in soil or absorbed on to soil particles• Some of it lost to water bodies such as lake and streams and
eventually ends up in the ocean where phosphorus is
deposited partly in shallow sediments and partly in deep zone
• Land plants take up inorganic phosphate salts from soil andconvert them to adenosine triphosphate (ATP) and adenosine
diphosphate (ADP)
Nutrient Cycles (Phosphoruscycle)
209 February 2016
ET ZC362 Environmental Pollution Control
7/24/2019 ET ZC362-L1
http://slidepdf.com/reader/full/et-zc362-l1 21/46BITS Pilani, Pilani Campus
ET ZC362 Environmental Pollution Control
• ATP and ADP are utilized by plants as energy carriers for their metabolic
reactions• Organic phosphates are transferred to consumers and decomposers and
subsequently available as inorganic phosphates for recycling via bacterialdecomposition
• The inorganic phosphates that are leached from the land into the freshwater systems are taken up rather rapidly by phytoplankton and areconverted to organophosphates. The phosphorus is ingested byzooplankton which are consumed by other organisms . After the death thephosphates are released into water by bacterial decomposition.
• Ocean cycle-Phosphates from unlighted depths to the photosynthetic zonewhere it goes through phytoplankton, zooplankton and animal stages.Zooplankton-Excrete
• Of that half is in inorganic form and rest organic
• Some of the phosphorus returns to the land through fish harvesting. Morephosphorus is lost than it is being added. Some concern there. Growthdetermining nutrient.
• Lack of it caused infertility in soil , fertilizer is used frequently , therefore thephosphorous cycle is substantially affected
• Phosphorus pollution has contributed to the eutrophication of many waterbodies and may also affect natural food chains
Nutrient Cycles (Phosphoruscycle)
219 February 2016
ET ZC362 Environmental Pollution Control
7/24/2019 ET ZC362-L1
http://slidepdf.com/reader/full/et-zc362-l1 22/46BITS Pilani, Pilani Campus
ET ZC362 Environmental Pollution Control
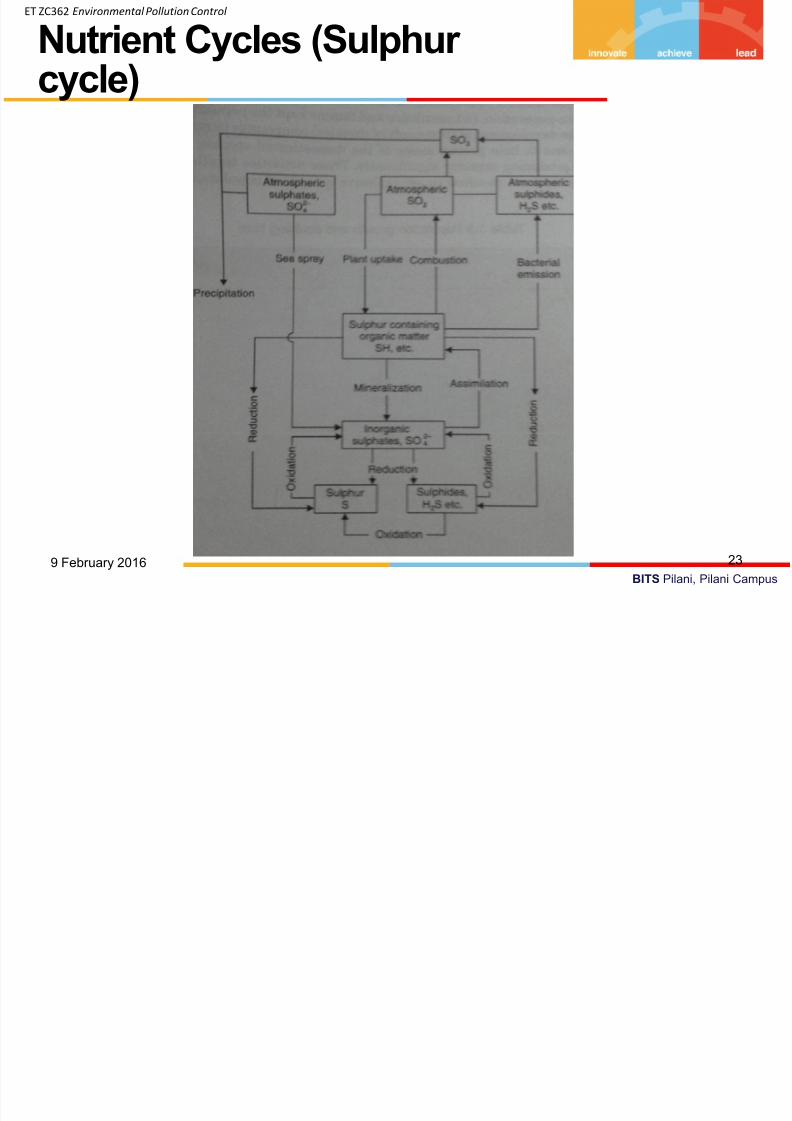
• Basic constituent of proteins in plants and animals• Sulphur dioxide (SO2)and hydrogen sulphide (H2S) are important gaseous forms
• Sulphate ion ( SO42-) is the common form found in water and soil
• Sulphate ion is reduced after being absorbed from the soil by plants and baceteriaand utimately incorporated as sulphydryl group (-SH) in proteins. Some sulphates arereduced under anaerobic conditions directly to sulphides, including H2S or toelemental sulphur by a class of baceteria known as desulfovibrio found in oceanbottom
• Thus the hydrogen sulphide (H2S) escapes as a gas into the atmosphere andreplenishes the sulphur lost as precipitaion.
• In the presence of oxygen H2S is rapidly oxidised to sulphates by bacteria of genusThiobacillus
• Even in absence of oxygen several types of bacteria oxidise H2S to elementalsulphur
• Atmosphere receives sulphur through bacterial emission (H2S), fossil fuel burning
(SO2), sea salts (SO42-) and some volcanic emissions ( H2S, SO2, SO42-)• Most of the Sulphur in the form of SO2 or H2S is converted to SO3 , which dissolves in water
droplets to form sulphuric acid.
• The sulphates and acid then precipitates with rain
• Sulphur cycle is overloaded due to burning of fossil fuels at an ever increasing rate
Nutrient Cycles (Sulphurcycle)
229 February 2016
ET ZC362 Environmental Pollution Control
7/24/2019 ET ZC362-L1
http://slidepdf.com/reader/full/et-zc362-l1 23/46
BITS Pilani, Pilani Campus
ET ZC362 Environmental Pollution Control
Nutrient Cycles (Sulphurcycle)
239 February 2016
ET ZC362 Environmental Pollution Control
7/24/2019 ET ZC362-L1
http://slidepdf.com/reader/full/et-zc362-l1 24/46
BITS Pilani, Pilani Campus
• Factor degrading environment is population growth
• Food- cultivating plants or taming animals (10000 years ago)
• Man life style significantly altered
• Famine and pestilence kept population under control
• With the advent of chemical compounds to restore andenhance soil fertility to help protect domesticated species man
was able to extend food producing capacity significantly
• Modern medicine have helped reduce mortality
• Therefore it is important to assess growth population tounderstand impact of population on environments – Reasons for lower death rate ( food production, cheap energy sources, industrial
revolution, advances in medicine)
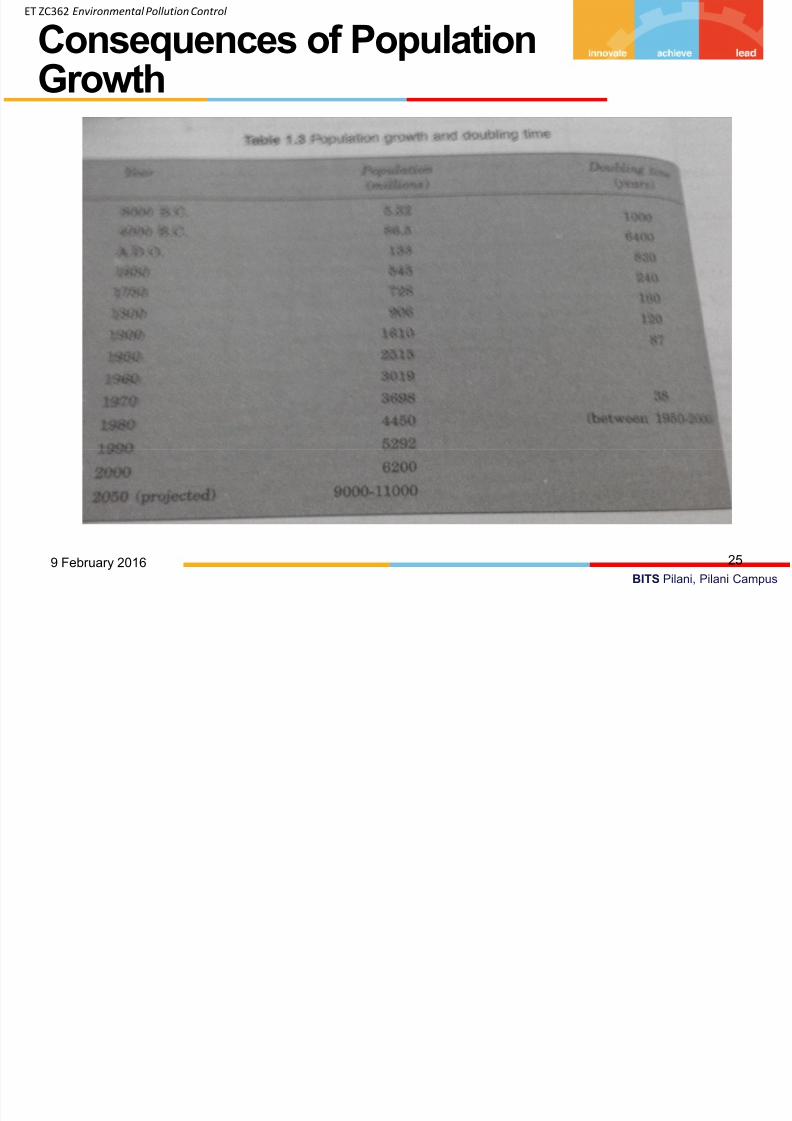
Consequences of PopulationGrowth
249 February 2016
ET ZC362 Environmental Pollution Control
7/24/2019 ET ZC362-L1
http://slidepdf.com/reader/full/et-zc362-l1 25/46
BITS Pilani, Pilani Campus
Consequences of PopulationGrowth
259 February 2016
ET ZC362 Environmental Pollution Control
7/24/2019 ET ZC362-L1
http://slidepdf.com/reader/full/et-zc362-l1 26/46
BITS Pilani, Pilani Campus
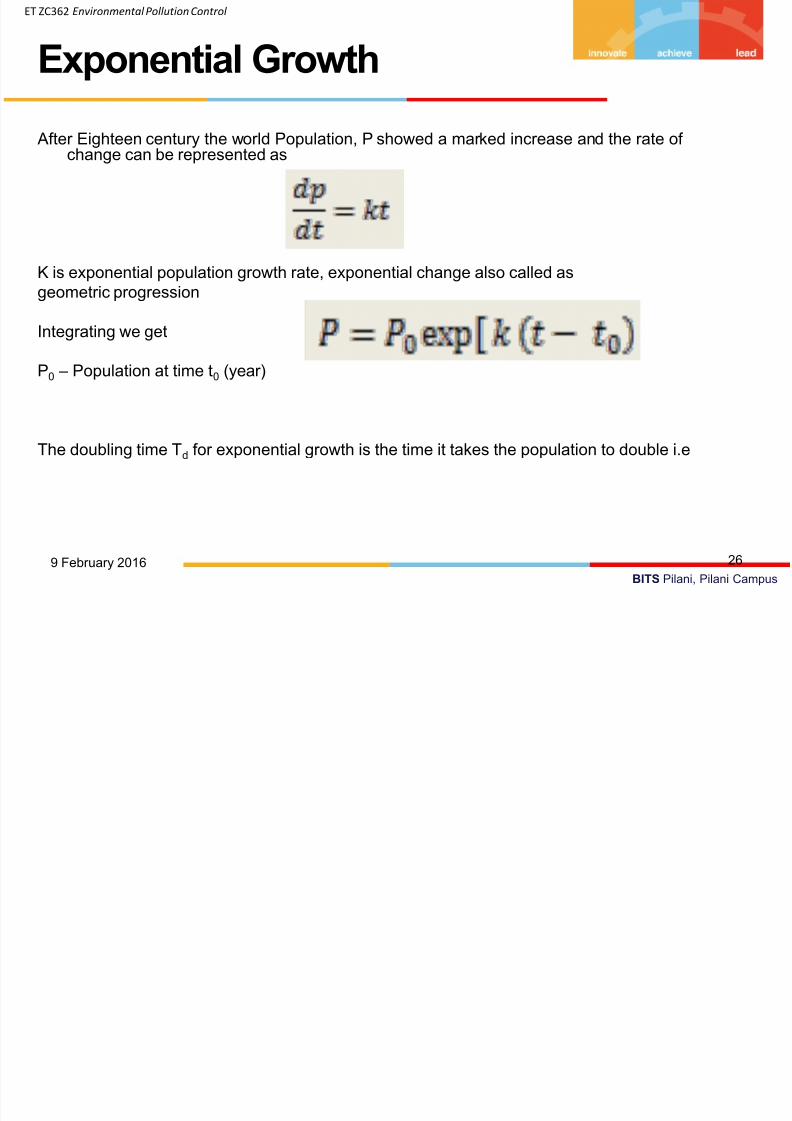
After Eighteen century the world Population, P showed a marked increase and the rate ofchange can be represented as
K is exponential population growth rate, exponential change also called asgeometric progression
Integrating we get
P0 – Population at time t0 (year)
The doubling time Td for exponential growth is the time it takes the population to double i.e
Exponential Growth
269 February 2016
ET ZC362 Environmental Pollution Control
7/24/2019 ET ZC362-L1
http://slidepdf.com/reader/full/et-zc362-l1 27/46
BITS Pilani, Pilani Campus
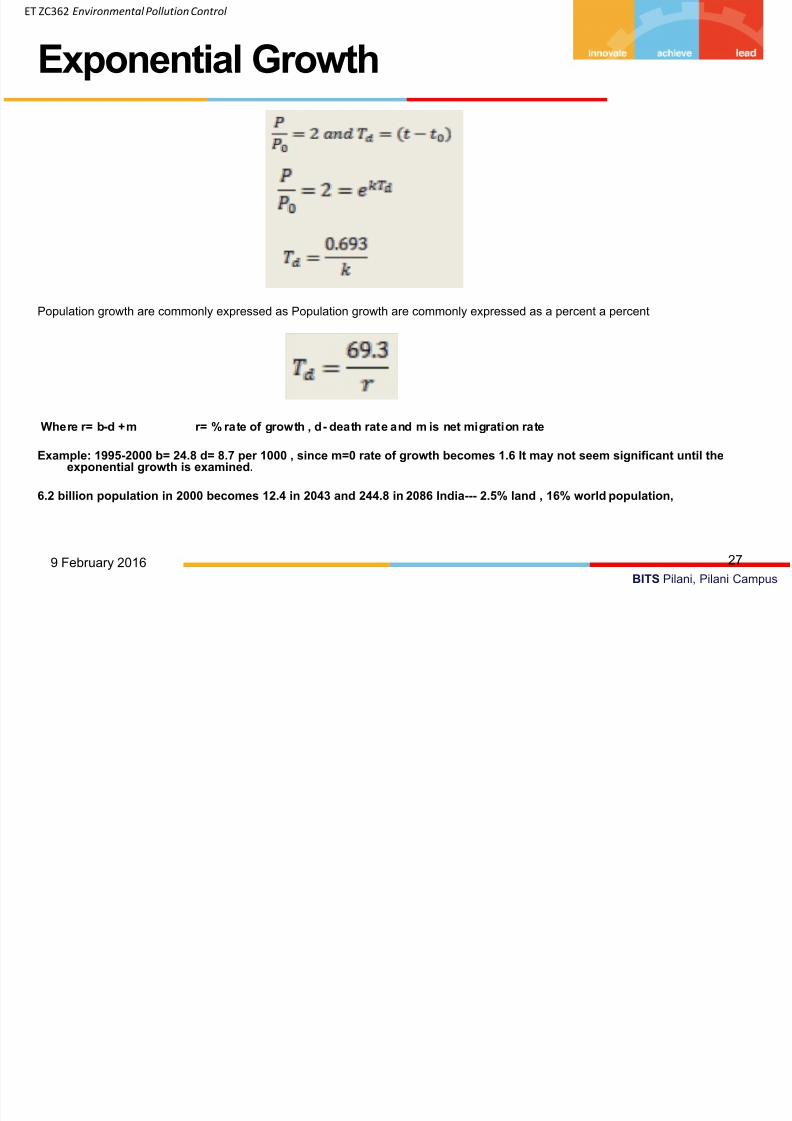
Population growth are commonly expressed as Population growth are commonly expressed as a percent a percent
Where r= b-d +m r= % rate of growth , d- death rate and m is net migration rate
Example: 1995-2000 b= 24.8 d= 8.7 per 1000 , since m=0 rate of growth becomes 1.6 It may not seem significant until theexponential growth is examined.
6.2 billion population in 2000 becomes 12.4 in 2043 and 244.8 in 2086 India--- 2.5% land , 16% world population,
Exponential Growth
279 February 2016
ET ZC362 Environmental Pollution Control
7/24/2019 ET ZC362-L1
http://slidepdf.com/reader/full/et-zc362-l1 28/46
BITS Pilani, Pilani Campus
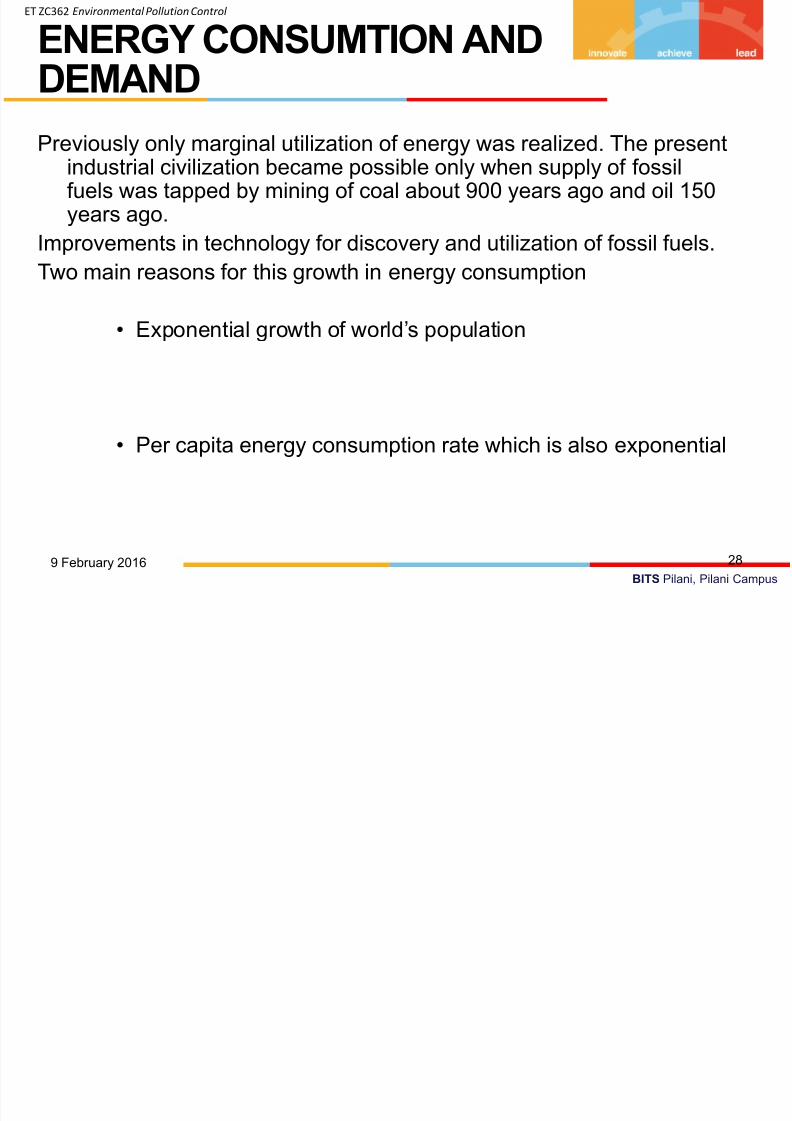
Previously only marginal utilization of energy was realized. The presentindustrial civilization became possible only when supply of fossilfuels was tapped by mining of coal about 900 years ago and oil 150years ago.
Improvements in technology for discovery and utilization of fossil fuels.
Two main reasons for this growth in energy consumption
• Exponential growth of world’s population
• Per capita energy consumption rate which is also exponential
ENERGY CONSUMTION ANDDEMAND
289 February 2016
ET ZC362 Environmental Pollution Control
7/24/2019 ET ZC362-L1
http://slidepdf.com/reader/full/et-zc362-l1 29/46
BITS Pilani, Pilani Campus
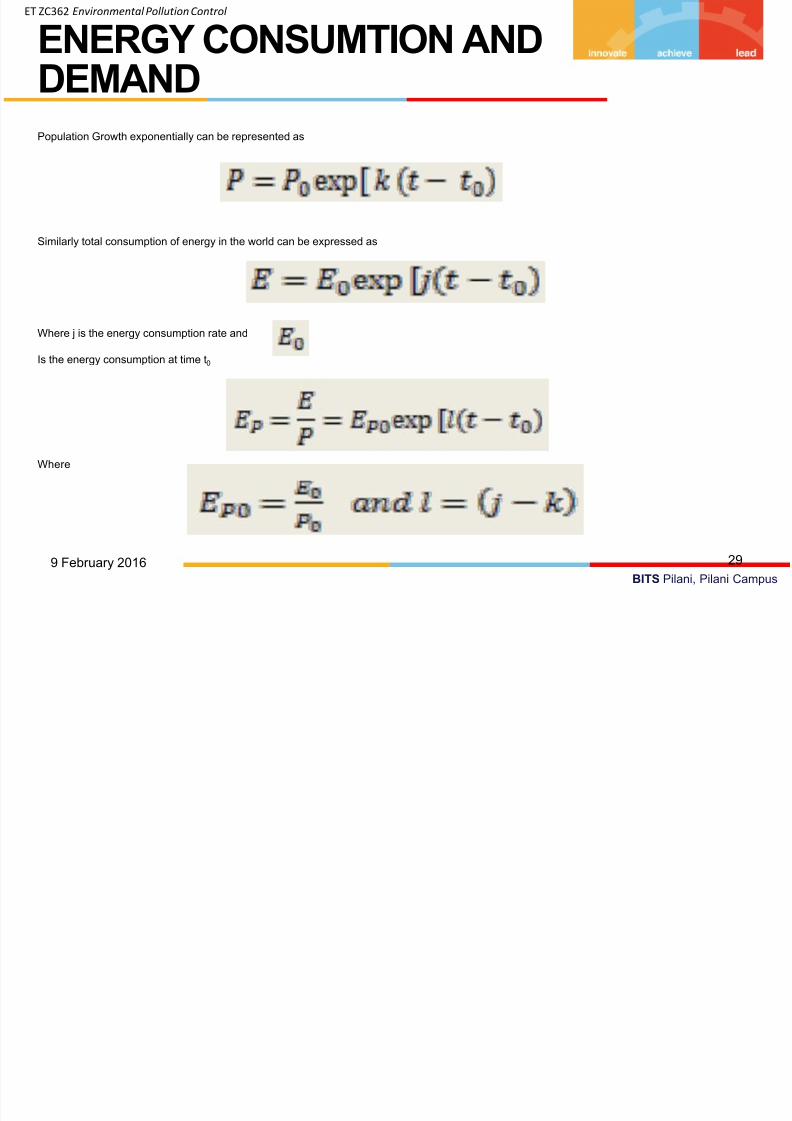
Population Growth exponentially can be represented as
Similarly total consumption of energy in the world can be expressed as
Where j is the energy consumption rate and
Is the energy consumption at time t0
Where
ENERGY CONSUMTION ANDDEMAND
299 February 2016
ET ZC362 Environmental Pollution Control
7/24/2019 ET ZC362-L1
http://slidepdf.com/reader/full/et-zc362-l1 30/46
BITS Pilani, Pilani Campus
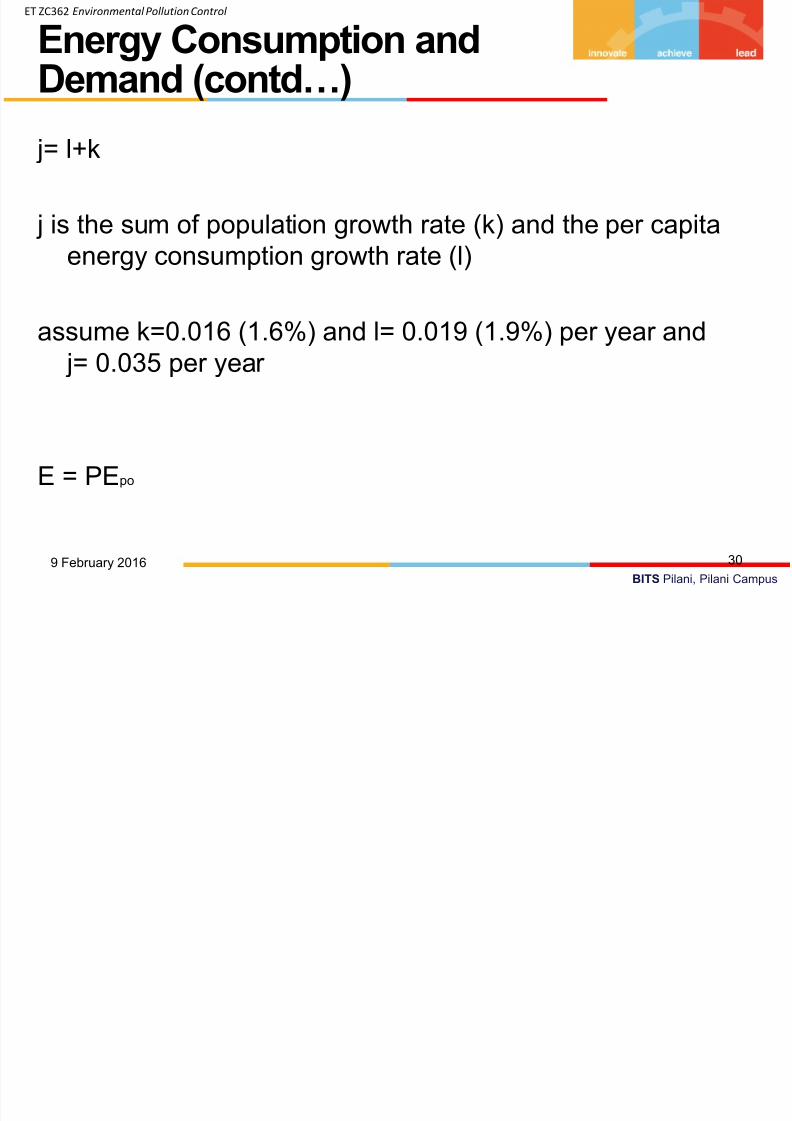
j= l+k
j is the sum of population growth rate (k) and the per capita
energy consumption growth rate (l)
assume k=0.016 (1.6%) and l= 0.019 (1.9%) per year and
j= 0.035 per year
E = PEpo
Energy Consumption andDemand (contd…)
309 February 2016
ET ZC362 Environmental Pollution Control
7/24/2019 ET ZC362-L1
http://slidepdf.com/reader/full/et-zc362-l1 31/46
BITS Pilani, Pilani Campus
Impact of Coal Mining
• Requires lot of land
• Open cast mine (75% of increased production)
• They pollute aquatic streams• Destroy large land areas
• Underground mining { acid mine drainage and healthand safety of miners}
• 80000 workers died in USA ---inhale coal dust ---result inpneumoconiosis –black lung
• 10-15% suffer from black lung
Pollution of Air, water and Soil
319 February 2016
ET ZC362 Environmental Pollution Control
7/24/2019 ET ZC362-L1
http://slidepdf.com/reader/full/et-zc362-l1 32/46
BITS Pilani, Pilani Campus
Acid rain" is a popular term referring to the deposition of wet (rain, snow, sleet, fog,cloud water, and dew) and dry (acidifying particles and gases) acidiccomponents.
Distilled water, once carbon dioxide is removed, has a neutral pH of 7. Liquids witha pH less than 7 are acidic, and those with a pH greater than 7 are alkaline.
"Clean" or unpolluted rain has an acidic pH, but usually no lower than 5.6,because carbon dioxide and water in the air react together to form carbonicacid, a weak acid according to the following reaction:
• H2O (l) + CO2 (g) H2CO3 (aq) H++ HCO3-
Carbonic acid is a weak acid and the acidity in rainwater can be quickly neutralized
in contact with materials. But the presence of sulphuric acid or nitric acid in theatmosphere can lower the pH of rain droplets below 5.6 and such rain isconsidered as acidic
Acid Rain
329 February 2016
ET ZC362 Environmental Pollution Control
7/24/2019 ET ZC362-L1
http://slidepdf.com/reader/full/et-zc362-l1 33/46
BITS Pilani, Pilani Campus
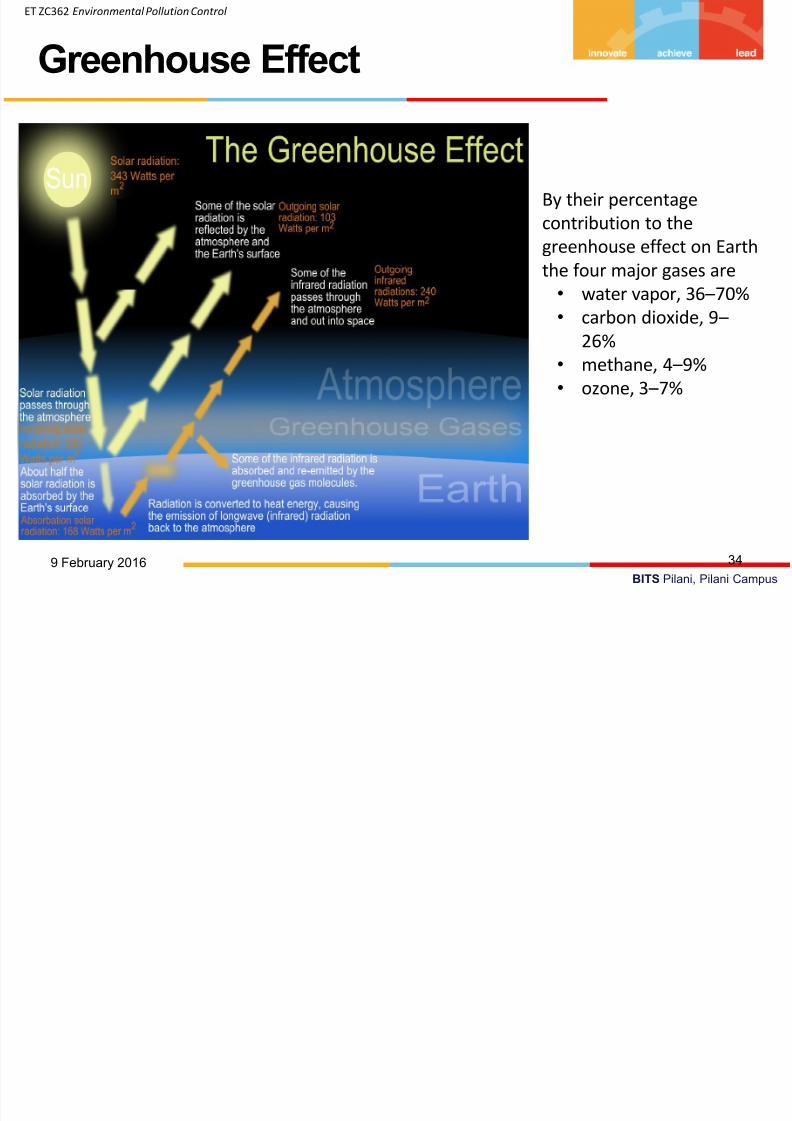
• The Earth receives energy from the Sun in the form UV, visible, andnear IR radiation
• most of the radiation passes through the atmosphere without beingabsorbed or reflected.
• Of the total amount of energy available at the top of the atmosphere(TOA), about 26% is reflected back out to space by the atmosphere
and clouds and 19% is absorbed by the atmosphere and clouds.Most of the remaining energy is absorbed at the Earth's surface.
• The surface radiates thermal radiation that consists of wavelengthsthat are much longer than the wavelengths that were absorbed
• Most of this thermal radiation is absorbed by the atmosphere,thereby warming it
• The atmosphere radiates energy both upwards and downwards; thepart radiated downwards is absorbed by the Earth's surface. Thisleads to a higher equilibrium temperature than if the atmospherewere absent.
Greenhouse Effect
339 February 2016
ET ZC362 Environmental Pollution Control
7/24/2019 ET ZC362-L1
http://slidepdf.com/reader/full/et-zc362-l1 34/46
BITS Pilani, Pilani Campus
Greenhouse Effect
349 February 2016
By their percentage
contribution to the
greenhouse effect on Earth
the four major gases are
• water vapor, 36 –70%
• carbon dioxide, 9 –
26%
• methane, 4 –9%
• ozone, 3 –7%
ET ZC362 Environmental Pollution Control
7/24/2019 ET ZC362-L1
http://slidepdf.com/reader/full/et-zc362-l1 35/46
BITS Pilani, Pilani Campus
Climate change and increasing concentrations of the so called greenhouse gases
• CO2, CH4 , N2O, O3 and chlorofluorocarbons (CFC’s ) in the atmosphere due tohuman activities are reasons for environmental problems
These gases magnify the natural green house effect and will increase the formationof water vapor thus enhancing the warming trend
Fossils fuels – 50%
Methane has cause- 16%
Ozone depleting CFCs are now banned by international treaty because of theirdamaging effect on earth’s protective ozone layer.E
Global warming – Energy and related activities contribute 50% and industry hasshare of 24%.
Carbon Emissions and GlobalWarming
359 February 2016
ET ZC362 Environmental Pollution Control
C G
7/24/2019 ET ZC362-L1
http://slidepdf.com/reader/full/et-zc362-l1 36/46
BITS Pilani, Pilani Campus
Impact :
Global avg tem to increase by 0.3 deg C per decade in next 100 yrsSevere climatological changes
Alter the sea level , ( thermal expansion of earth surface and rapid
melting of glaciers and ice caps)
Oceans will rise
Low lying countries such as Bangladesh and Netherlands would bedevastated by such rises. Eastern Himalayas’ glaciers will vanish by2035
Carbon Emissions and GlobalWarming
369 February 2016
ET ZC362 Environmental Pollution Control
R d i i C b
7/24/2019 ET ZC362-L1
http://slidepdf.com/reader/full/et-zc362-l1 37/46
BITS Pilani, Pilani Campus
Control strategy to reduce the emissions Carbon emissions: 1989- 5764 milliontonnes
Projected to double by 2020 if the current trend is maintained
To stabilize the Concentration of CO2
global emissions be cut to 2 billions tonnesannually
---Use of coal, cut by 90%
----Oil by 50%
Technologies to be used : Energy efficient technology, combined cycle (25%),switching to natural gas, forest related technologies, renewable energy sources
Reduction in CarbonEmissions
379 February 2016
ET ZC362 Environmental Pollution Control
I t f H d l t i
7/24/2019 ET ZC362-L1
http://slidepdf.com/reader/full/et-zc362-l1 38/46
BITS Pilani, Pilani Campus
Impact of Hydroelectric and Nuclear Energy:
World’s Hydroelectric power production is half that of produced by fossil fuels .
Industrially developing regions of Africa, South America and south east Asia whichrepresent 60% of world total
India potential – 41000 MW ( more than 50% of total potential realised)
Construction of large dams affects hydrology, terrestrial system and aquatic system.
Salinity increase, turbidity reduction lead to crop ruin.
Release of silt – serious depletion of fisheries due to weed formation.
Impact of HydroelectricEnergy
389 February 2016
ET ZC362 Environmental Pollution Control
7/24/2019 ET ZC362-L1
http://slidepdf.com/reader/full/et-zc362-l1 39/46
BITS Pilani, Pilani Campus
Nuclear Energy:
3 % of India Electricity generation
Ambitious plans to have installed nuclear capacity of 10,000 MW by year 2000 ( not realized)
Uranium reserves in India are 67000 tonnes of U3O8 and13000 present in monazite sands
Advantage: Air pollution is less, radioactive emissions can be kept very low
Land use optimum (1/17 of required for coal – Uranium )
Fear- Radiation hazard , inhalation of radon gas andits decay products, this causes cancer, genetic damage)
Waste Disposal!
Thermal Pollution – aquatic life!
Impact of Nuclear Energy
399 February 2016
ET ZC362 Environmental Pollution Control
7/24/2019 ET ZC362-L1
http://slidepdf.com/reader/full/et-zc362-l1 40/46
BITS Pilani, Pilani Campus
5 million chemicals have been synthesized in the world in last 40 years.They are synthesized without proper technological and toxicology reports.
Steel, non ferrous metals, fertilizers and petroleum are the sources of lead, zinc arsenic, nickel,beryllium and mercury. Greater threat to environment than SO2, etc.
Arsenic occurs in phosphate rocks (fertilizers and detergents). Ends up in water bodies.
Toxic substances like As and Hg slowly accumulate in the body, due to slow excretion. Build upof highly toxic levels.
Excess Zinc leads to iron deficiency – anemia.
Indiscriminate use of DDT…links to food chain and accumulates in human body. Pesticideresidues are in all varieties of food like milk fish fruits and vegetables
Chemical Pollution
409 February 2016
ET ZC362 Environmental Pollution Control
7/24/2019 ET ZC362-L1
http://slidepdf.com/reader/full/et-zc362-l1 41/46
BITS Pilani, Pilani Campus
Human activities account for 75% of marine pollution worldwideLand based sources for entry of pesticides, heavy metals, pathogens and thermal pollution,such as sewage, forestry n farming activities, industrial discharges into the sea.
50% of oil pollutions comes from land as runoff from cars, heavy machineries and industries.
25% - shipping of crude oil, off-shore drilling, oil spills
The dicharge of nutrients and sedminets into the sea causes algal blooms, deplete water ofoxygen, impede photosynthesis, destroy marine life
Spread diseases like cholera and typhoid. Pesticides cause disease in fish. DDT and other fatsoluble toxicants work their way up in the food chain and accumulate in the fat of marinemammals
Marine Pollution
419 February 2016
ET ZC362 Environmental Pollution Control
7/24/2019 ET ZC362-L1
http://slidepdf.com/reader/full/et-zc362-l1 42/46
BITS Pilani, Pilani Campus
Ozone layer in the stratosphere serves as a shield protecting theearth surface from the sun’s deadly ultraviolet radiation . Asozone absorbs UV radiation it is broken down into oxygenmolecule and an electronically excited oxygen radical. Theoxygen molecule and oxygen radical then recombine to form
a new ozone molecule available to absorb more UV radiation.Chlorofluorocarbons (CFCs) used in air conditioning and
refrigeration were valued for their stable and non toxicproperties. The highly stable CFC produced in lowertroposphere pass the zone without any change and reach
stratosphere. Here they are impacted by UV radiation andrelease destructive chlorine atoms.
Ozone Depletion
429 February 2016
ET ZC362 Environmental Pollution Control
7/24/2019 ET ZC362-L1
http://slidepdf.com/reader/full/et-zc362-l1 43/46
BITS Pilani, Pilani Campus
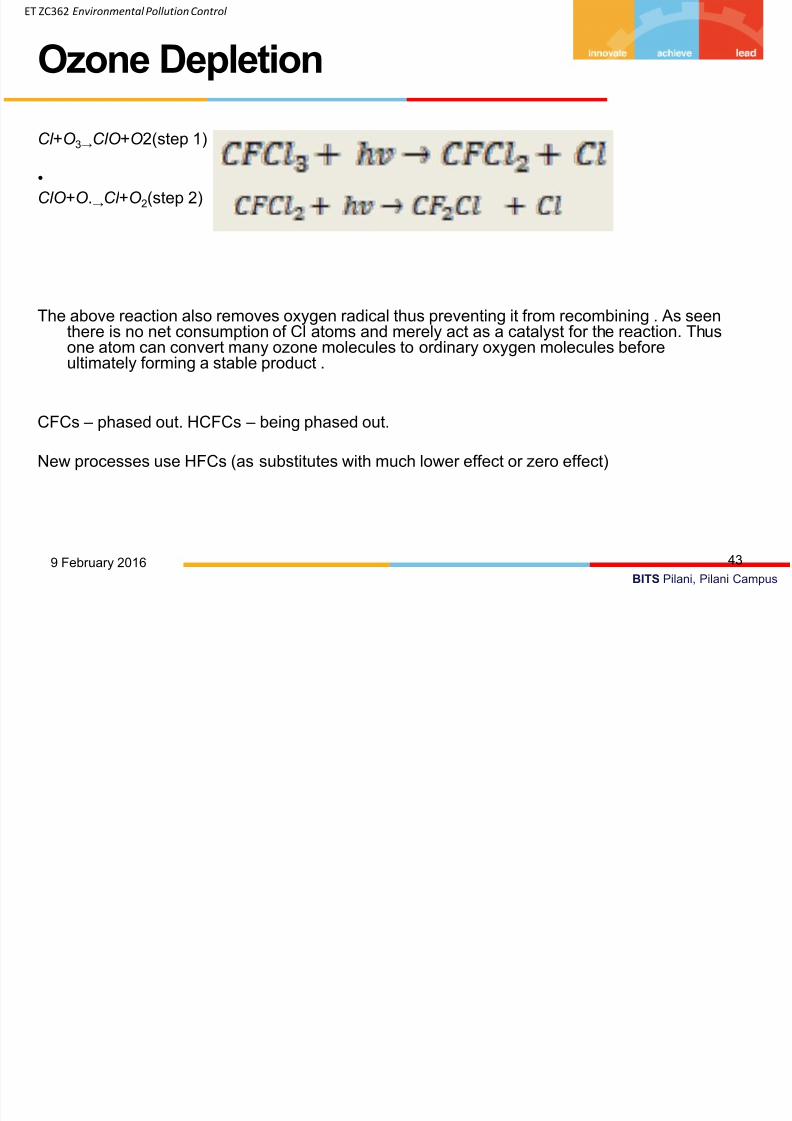
Cl +O
3→ClO
+O
2(step 1)
•
ClO+O.→Cl +O2(step 2)
The above reaction also removes oxygen radical thus preventing it from recombining . As seenthere is no net consumption of Cl atoms and merely act as a catalyst for the reaction. Thusone atom can convert many ozone molecules to ordinary oxygen molecules beforeultimately forming a stable product .
CFCs – phased out. HCFCs – being phased out.
New processes use HFCs (as substitutes with much lower effect or zero effect)
Ozone Depletion
439 February 2016
ET ZC362 Environmental Pollution Control
7/24/2019 ET ZC362-L1
http://slidepdf.com/reader/full/et-zc362-l1 44/46
BITS Pilani, Pilani Campus
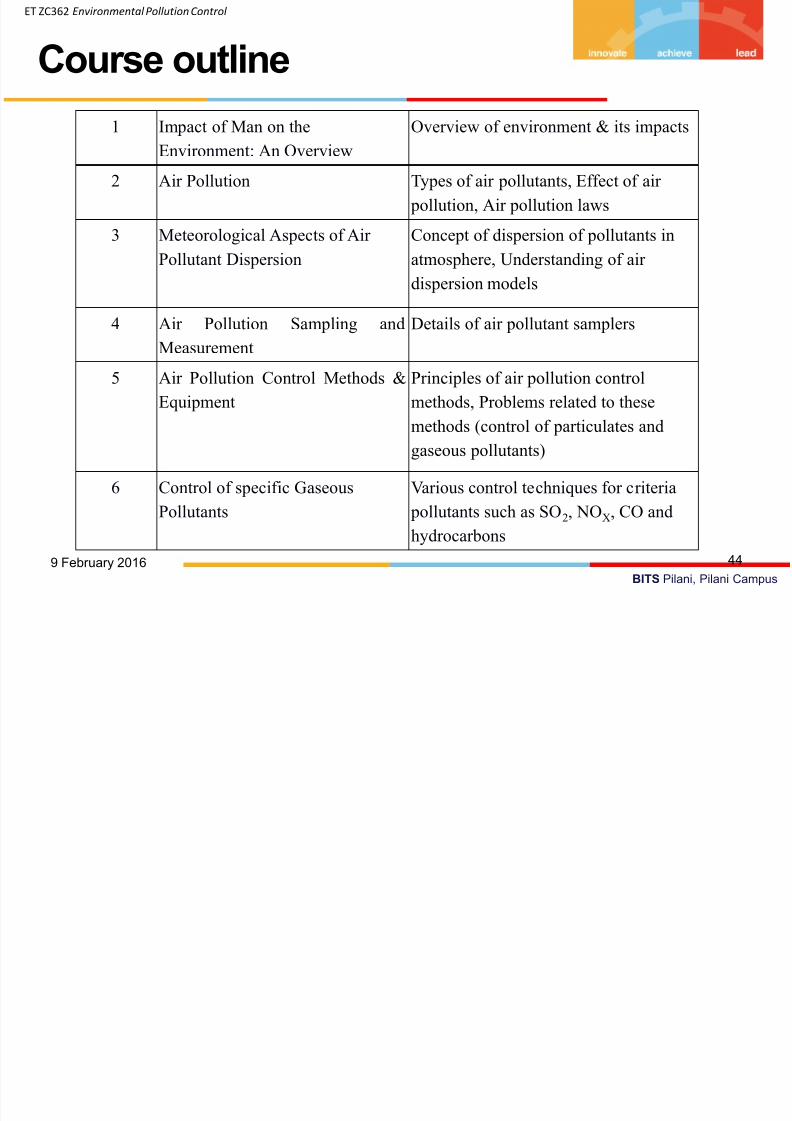
1 Impact of Man on the
Environment: An Overview
Overview of environment & its impacts
2 Air Pollution Types of air pollutants, Effect of air
pollution, Air pollution laws
3 Meteorological Aspects of Air
Pollutant Dispersion
Concept of dispersion of pollutants in
atmosphere, Understanding of air
dispersion models
4 Air Pollution Sampling and
Measurement
Details of air pollutant samplers
5 Air Pollution Control Methods &
Equipment
Principles of air pollution control
methods, Problems related to these
methods (control of particulates and
gaseous pollutants)
6 Control of specific Gaseous
Pollutants
Various control techniques for criteria
pollutants such as SO2, NOX, CO and
hydrocarbons
Course outline
449 February 2016
ET ZC362 Environmental Pollution Control
7/24/2019 ET ZC362-L1
http://slidepdf.com/reader/full/et-zc362-l1 45/46
BITS Pilani, Pilani Campus
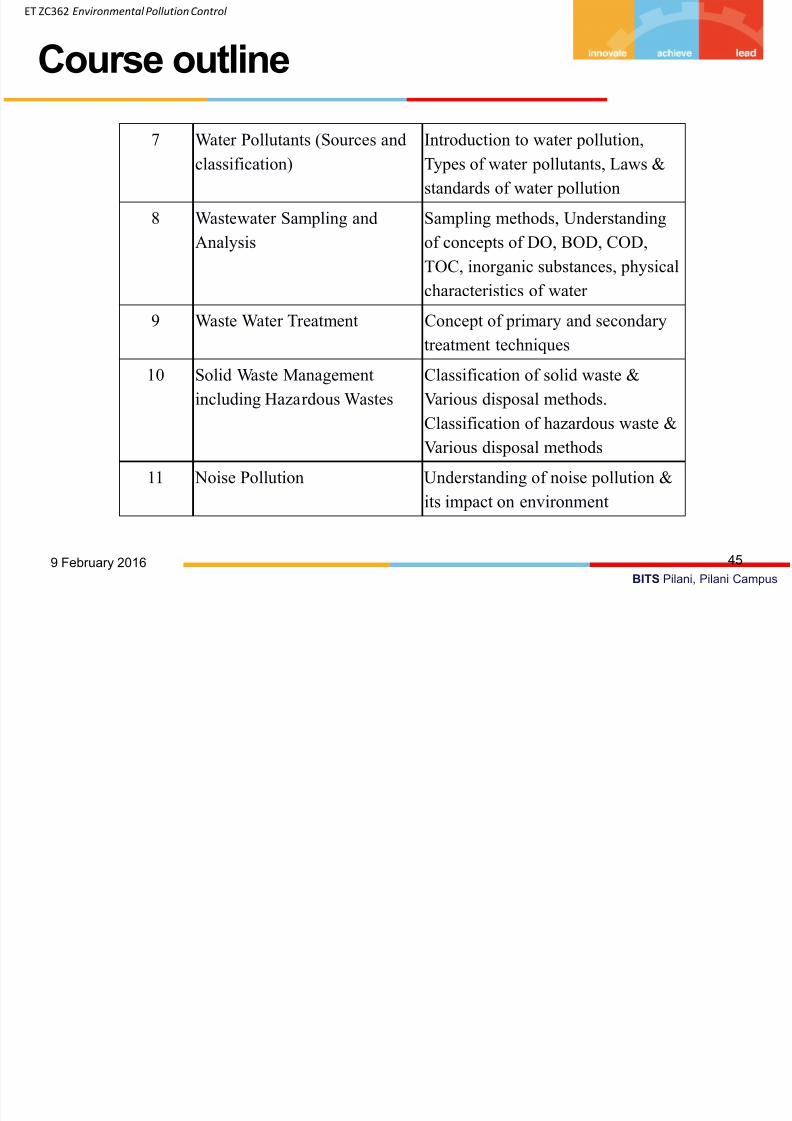
7 Water Pollutants (Sources andclassification)
Introduction to water pollution,Types of water pollutants, Laws &
standards of water pollution
8 Wastewater Sampling and
Analysis
Sampling methods, Understanding
of concepts of DO, BOD, COD,
TOC, inorganic substances, physical
characteristics of water
9 Waste Water Treatment Concept of primary and secondary
treatment techniques
10 Solid Waste Management
including Hazardous Wastes
Classification of solid waste &
Various disposal methods.
Classification of hazardous waste &Various disposal methods
11 Noise Pollution Understanding of noise pollution &
its impact on environment
Course outline
459 February 2016
ET ZC362 Environmental Pollution Control
E i t l P ll ti
7/24/2019 ET ZC362-L1
http://slidepdf.com/reader/full/et-zc362-l1 46/46
Environmental PollutionControl