Embed Size (px)
Citation preview
5
La présente recherche a été subventionnée par le ministère de l'Éducation dans le cadre du Programme d'aide à la recherche sur l'enseignement et l'apprentissage (PAREA). Le contenu du présent rapport n'engage que la responsabilité des auteures.
Final Report Presented to PAREARapport final présenté à PAREASpring / Printemps 2005
Authors / Auteures Catherine Fichten, Ph.D.Shirley Jorgensen, M.B.A.Alice Havel, Ph.D. Maria Barile, M.S.W.
Étudiant(e)s de niveau collégial ayant des incapacitésCollege Students with Disabilities
Adaptech Research Network - Dawson CollegeRéseau de Recherche Adaptech - Collège Dawson
With the Collaboration of / Avec la Collaboration deIris Alapin, M.A.Daniel Fiset, B.A.Jean-Pierre Guimont, M.Ed.Jean-Charles Juhel, M.Ed.
Crystal James Daniel Lamb, B.A.Mai N. Nguyen, B.Sc.
This page intentionally left blank.
Étudiant(e)s de niveau collégial ayant des incapacités College Students with Disabilities
Étudiant(e)s de niveau collégial ayant des incapacitésCollege students with disabilities
Adaptech Research Network - Dawson CollegeRéseau de Recherche Adaptech - Collège Dawson
Final Report Presented to PAREARapport final présenté à PAREAPrintemps / Spring 2005
Authors / AuteuresCatherine Fichten, Ph.D.Shirley Jorgensen, M.B.A.Alice Havel, Ph.D. Maria Barile, M.S.W.
With the collaboration of / Avec la collaboration de Iris Alapin, M.A.Daniel Fiset, B.A.Jean-Pierre Guimont, M.Ed.Crystal JamesJean-Charles Juhel, M.Ed.Daniel Lamb, B.A.Mai N. Nguyen, B.Sc.
La présente recherche a été subventionnée par le ministère de l'Éducation dans le cadre du Programme d'aide à la recherche sur l'enseignement et l'apprentissage (PAREA). Le contenu du présent rapport n'engage que la responsabilité des auteures.
Dépôt légal — Bibliothèque nationale du Québec, 2005Dépôt légal — Bibliothèque nationale du Canada, 2005
ISBN 1-55016-433-3
Étudiant(e)s de niveau collégial ayant des incapacités College Students with Disabilities
4 4
Table of Contents
ACKNOWLEDGEMENTS................................................................................................................................................................5EXECUTIVE SUMMARY.................................................................................................................................................................6
ABSTRACT..........................................................................................................................................................................................6GOALS................................................................................................................................................................................................7METHOD.............................................................................................................................................................................................7FINDINGS AND CONCLUSIONS............................................................................................................................................................8
Sample Characteristics...................................................................................................................................................................8What Factors Make Cegep Studies Easier? Harder? Analysis of Open-Ended "Easier and Harder" Question Responses..........8Development of the Cegep Experiences Questionnaire: Psychometric Evaluations And Hypothesis Testing.............................9Conclusions..................................................................................................................................................................................10
CONTACT INFORMATION..................................................................................................................................................................10SOMMAIRE.......................................................................................................................................................................................11
RÉSUMÉ............................................................................................................................................................................................11OBJECTIFS.........................................................................................................................................................................................12MÉTHODOLOGIE...............................................................................................................................................................................12RÉSULTATS ET CONCLUSIONS..........................................................................................................................................................13
Caractéristiques de l'échantillon..................................................................................................................................................13Quels facteurs facilitent les études au Cégep? Lesquels rendent ces études plus difficiles? Questions non-dirigées.................14L’élaboration du Questionnaire sur les expériences au Cégep : Évaluations psychométriques et vérification des hypothèses..14Conclusions..................................................................................................................................................................................16
INFORMATION POUR NOUS REJOINDRE.............................................................................................................................................16INTRODUCTION..............................................................................................................................................................................17
GOALS..............................................................................................................................................................................................17BACKGROUND..................................................................................................................................................................................17CONCEPTUAL FRAMEWORK: PPH MODEL (PROCESSUS DE PRODUCTION DU HANDICAP)...............................................................19SPECIFIC OBJECTIVES OF THE PRESENT INVESTIGATION.................................................................................................................20
METHODOLOGY............................................................................................................................................................................22OVERVIEW........................................................................................................................................................................................22PARTICIPANTS...................................................................................................................................................................................22MEASURES........................................................................................................................................................................................26
Focus Group Questions................................................................................................................................................................26Questionnaire Study: Current Cegep Students And Cegep Graduates........................................................................................27
PROCEDURE......................................................................................................................................................................................28RESULTS...........................................................................................................................................................................................30
OPEN-ENDED "EASIER AND HARDER" QUESTIONS..........................................................................................................................30PSYCHOMETRIC ANALYSES OF THE CEGEP EXPERIENCES QUESTIONNAIRE: QUESTIONNAIRE STUDY...........................................37
Temporal Stability: Test-Retest Reliability.................................................................................................................................38Internal Consistency Reliability: Cegep Experiences Questionnaire Conceptual Subscale and Total Scale Scores..................44Relationships Between Cegep Experiences Questionnaire Scores And Other Variables: Validity............................................46Similarities And Differences Between Students / Graduates With And Without Disabilities: Validity.....................................50Similarities And Differences Between Students With Different Disabilities: Validity...............................................................59"Success" And Current Dawson Students' Scores On The Cegep Experiences Questionnaire: Validity....................................60
SUMMARY AND DISCUSSION.....................................................................................................................................................63SAMPLE CHARACTERISTICS..............................................................................................................................................................63WHAT FACTORS MAKE CEGEP STUDIES EASIER? HARDER? ANALYSIS OF OPEN-ENDED RESPONSES...........................................64DEVELOPING THE CEGEP EXPERIENCES QUESTIONNAIRE: PSYCHOMETRIC EVALUATIONS AND HYPOTHESIS TESTING................66
Reliability.....................................................................................................................................................................................66Relationships Between Cegep Experiences Questionnaire Scores And Other Variables: Preliminary Validity Data................67
CONCLUSIONS...................................................................................................................................................................................69REFERENCES...................................................................................................................................................................................70APPENDIX - CEGEP EXPERIENCES QUESTIONNAIRE: CURRENT ENGLISH AND FRENCH VERSIONS.............73
ENGLISH VERSION: CEGEP EXPERIENCES QUESTIONNAIRE – V2004...............................................................................................73French version: Questionnaire sur les expériences au Cégep – V2004...........................................................................................73
Étudiant(e)s de niveau collégial ayant des incapacités College Students with Disabilities
5 5
Étudiant(e)s de niveau collégial ayant des incapacités College Students with Disabilities
6 6
Étudiant(e)s de niveau collégial ayant des incapacités College Students with Disabilities
7 7
Acknowledgements
We would like to thank Dawson College and the funding agency, PAREA, for making this project possible.
Étudiant(e)s de niveau collégial ayant des incapacités College Students with Disabilities
8 8
Executive Summary - College Students with Disabilities
Final Report Presented to PAREASpring, 2005
Catherine Fichten, Ph.D., Shirley Jorgensen, M.B.A., Alice Havel, Ph.D., Maria Barile, M.S.W.With the Collaboration of
Iris Alapin, M.A., Daniel Fiset, B.A., Jean-Pierre Guimont, M.Ed. Crystal James, Jean-Charles Juhel, M.Ed., Daniel Lamb, B.A., Mai N. Nguyen, B.Sc.
Adaptech Research Network - Dawson College, Montréal
Executive Summary
Abstract
The objective of the research reported here was to start the process of developing a measure that explores self-perceived individual and environmental correlates of successful and unsuccessful academic outcomes for Cegep (junior/community college) students with disabilities. The intent was to provide a measure for general use in all Cegep institutional evaluation activities.
Here we summarize the findings related to the development of such a measure. This involved compiling and evaluating both French and English versions of the 31 item “Cegep Experiences Questionnaire.” The measure uses 6-point Likert-type scaling and evaluates personal and environmental factors (both within and outside the Cegep) that students with disabilities may view as facilitating and/or hindering their academic progress. It is based on the PPH model (Processus de production du handicap). The current version of the measure is provided in the Appendix of the full report.
The following activities were carried out: focus groups, analysis of open-ended questions, and psychometric analyses, including comparisons of scores of students with and without disabilities. The sample involved 138 current Cegep students and recent Cegep graduates with disabilities and 670 nondisabled Cegep students and recent graduates.
We found that the Cegep Experiences Questionnaire has good reliability. Validation was not part of the scope of this research and sample sizes did not permit most such analyses. The validation that was carried out suggests that the items and the total score have good validity, although there may be problems with the item content of some of the PPH based subscales. A larger study that builds on the present findings is currently ongoing in our laboratory to establish validity and further refine the measure.
Part of the process involved analysis of students’ responses to the questions: What factors have made your Cegep studies easier? Harder? The findings on the facilitators and obstacles they listed in response to these questions are interesting in their own right. Among the highlights is the finding that students with disabilities indicated that disability-related accommodations were important facilitators. Nevertheless, about half of the most frequently cited facilitators noted by these students were not specifically disability related and are shared by nondisabled students. In general, obstacles noted by most students with disabilities are the same as those noted by nondisabled students, although some disability related issues also posed important obstacles. In particular, students noted that their disability and health adversely affect their studies. These results affirm the importance of providing adequate disability related services to students with disabilities in the Cegep.
Another part of the process was examining whether the item scores of students who re-enrolled or graduated (i.e., students who were retained in the two semesters following the administration of the questionnaire) differed from those who left their studies. When students with and without disabilities were compared, there were no significant differences in the retention rate into either the first or second semesters. When item scores between the retained and non-retained groups were compared, there was some suggestion that students who were retained had higher item scores (i.e., scores toward the facilitative end the scale). These positive findings highlight the success of students with disabilities at Cegep and emphasize the importance of providing adequate disability related services.
Étudiant(e)s de niveau collégial ayant des incapacités College Students with Disabilities
9 9
Goals
The objective of the research reported here was to start the process of developing a measure that explores self-perceived individual and environmental correlates of successful and unsuccessful academic outcomes for students with disabilities. The intent was to develop a measure for general use in Cegep institutional evaluation activities. Use of the measure, once it is fully developed, will provide answers to the questions, "What are the obstacles that make Cegep studies more difficult for students with disabilities?" "What are the facilitators that make Cegep studies easier for these students? "What can students, Cegeps, government and community based organizations do to facilitate successful academic outcomes for these students?"
We summarize the findings related to the development of such a measure below. This involved compiling and evaluating both French and English versions of the 31 item “Cegep Experiences Questionnaire.” It uses 6-point Likert-type scaling and evaluates personal and environmental factors (both within and outside the Cegep) that students with disabilities may view as facilitating and/or hindering their academic progress. The measure is based on Fougeyrollas et al.’s PPH model (Processus de production du handicap). Once it is fully validated, the measure will have the potential to be used to facilitate planning, enhance and evaluate services, improve pedagogy, and ameliorate student retention and success. The current revision of the measure is provided in the Appendix of the full report.
The intent of the present research was to provide the item content and format and to ensure usability and reliability. Validation requires much larger samples than those of the research originally proposed. The full validation of the Cegep Experiences Questionnaire is part of a larger study that builds on the present findings and is currently ongoing in our laboratory. Method
To develop the Cegep Experiences Questionnaire / Questionnaire sur les expériences au Cégep we prepared content that was both theoretically and empirically based. In addition, we formulated questions so as to allow both item-by-item evaluation as well as evaluation using subscales and the total score. Of the 31 items on the scale, 25 are applicable to both students with and without disabilities and 6 are applicable only to students with disabilities. Because the measure was designed to reflect both the key concepts of the PPH model (i.e., personal and environmental obstacles and facilitators) as well as the realities of Cegep students, who encounter obstacles and facilitators of their academic success both within the Cegep as well as in the community, we grouped items into three conceptual subscales:
Personal Situation (9 items including 1 that is applicable to students with disabilities only) Cegep Situation (13 items including 1 that is applicable to students with disabilities only) Community Situation (9 items including 4 that are applicable to students with disabilities only) and a Total Scale score (25 items are common to students with and without disabilities, 6 are applicable only to students
with disabilities).
To determine reliability and test hypotheses we held three focus groups with 18 francophone and anglophone Cegep students to help define the content of the measure formulated and pre-tested multiple preliminary versions of the Cegep Experiences Questionnaire and other related
questions and scales translated, "back translated," and pretested English and French versions of the final questionnaire in regular print and
alternate formats (e.g., large print, Word) administered the measure to
o 74 Dawson College (an anglophone Cegep that enrolls primarily English speaking students) and 25 francophone Cegep (primarily French speaking) current students who had a disability (students who had only a learning disability and/or ADD were not part of this investigation)
o 154 Dawson College current nondisabled students o 516 Dawson College recent nondisabled graduates and 21 recent graduates who had a disability (other than only
a learning disability) administered the measure a second time, six weeks later, to 27 Dawson and 25 francophone Cegep current students with a
disability and to 64 current Dawson nondisabled students to determine test-retest reliability formulated a 60 item coding manual of facilitators and obstacles and used this to evaluate open-ended questions about
factors that made Cegep studies easier and harder for students
Étudiant(e)s de niveau collégial ayant des incapacités College Students with Disabilities
10 10
conducted statistical tests on Cegep Experiences Questionnaire items to determine psychometric properties and to test hypotheses
Findings and Conclusions
Sample Characteristics
The mean age of current students from all three samples was very similar, 20 to 21 years, with a range of 17 - 44 years. Approximately 1/3 of all samples were male and 2/3 female. Eighty-two percent of Dawson nondisabled students and 70% of Dawson students with disabilities in our samples were enrolled in a two-year pre-university program, while the remaining students were enrolled predominantly in three-year career/technical programs. Forty percent of the students with disabilities from francophone Cegeps were enrolled in two-year pre-university programs, while the remaining students were enrolled predominantly in three-year career/technical programs. The great majority of students were enrolled in diploma (DEC) programs.
Dawson graduates with disabilities were approximately 1 year older than nondisabled graduates (23 and 22, respectively). Approximately 1/3 of both samples were males and 2/3 females. Graduates with disabilities were slightly more likely to have graduated from a pre-university program (81%) than were nondisabled graduates (72%).
Most current students with disabilities had only one disability/impairment (56% Dawson, 59% francophone Cegep), with almost a third having 2 impairments (32% in both samples), and the rest having 3 or more impairments (8% Dawson, 12% francophone Cegep). Among Dawson graduates, a much larger proportion had a single impairment (90%). It is noteworthy that even though we deliberately excluded students who indicated that their only impairment was a learning disability and/or ADD, almost a third of current students with other disabilities (31% Dawson, 32% francophone Cegep) indicated that they also had a learning disability. The most common impairments that current students reported were health/medically related impairments and psychological/ psychiatric disabilities. The next most common disability was a visual impairment followed by hearing and mobility impairments. The graduate sample reported no psychiatric/psychological impairments. Otherwise, the distribution of disabilities for graduates was similar to that of currently enrolled students.
To make the Cegep Experiences Questionnaire comprehensive we included items that are likely to be important obstacles or facilitators to students with specific disabilities. In certain cases this has meant very small numbers of students answering certain questions. A study with larger samples which extends and builds on the present findings is currently ongoing in our laboratory.
What Factors Make Cegep Studies Easier? Harder? Analysis of Open-Ended "Easier and Harder" Question Responses
Part of the process of determining the psychometric properties of the Cegep Experiences Questionnaire involved analysis of students’ responses to the open-ended questions: What factors have made your make Cegep studies easier? Harder? The findings are interesting in their own right. It should be noted that depending on the specific student's situation and on the specifics of the environmental conditions, the same topic can be either an obstacle or a facilitator.
Facilitators. Students with disabilities were most likely to indicate that disability-related accommodations were important facilitators. These included: services for students with disabilities in general and specific disability related accommodations at Dawson College such as the opportunity to pre-register for courses, having a quiet place to take exams, extended time for exams and assignments, having a note taker in class, and policies which permit students with disabilities to take a reduced number of courses and still be considered "full time students."
About half of the facilitators cited most frequently by students with disabilities were not disability related and were shared by students without disabilities. These include: good teachers, the overall Cegep environment, availability of computers on campus, availability of support and help, and the Dawson Learning Center. This Center provides tutoring and assists with studying, writing, and exam taking skills. Important items noted by nondisabled students, but not by students with disabilities, were the facilitating role of: friends, the library, having a good schedule, a variety of courses to choose from, their financial situation, and good study skills.
Obstacles. In general, obstacles noted by most students with disabilities are the same as those noted by nondisabled students: bad teachers, too many and difficult courses, bad schedules, poor study skills, the Cegep environment, and language issues such as not being sufficiently fluent in the language of instruction and professors with heavy accents. For students with disabilities, again, disability related issues also posed important obstacles. For example, they noted that their disability and their health were
Étudiant(e)s de niveau collégial ayant des incapacités College Students with Disabilities
11 11
obstacles, that there were problems related to the accessibility of their courses, and that the nature of accommodations and services for students with disabilities also caused difficulties. Nondisabled students noted a variety of obstacles including: difficulties with finances, holding a job, transportation problems, personal issues, high stress, and poor exam or assignment schedules.
Development of the Cegep Experiences Questionnaire: Psychometric Evaluations And Hypothesis Testing
Reliability. Two kinds of reliability were evaluated: temporal stability (test-retest) of single items, conceptual subscale, and total scale scores and internal consistency evaluations of subscale scores. In general, test-retest reliability for all items, subscales, and total scores was good, suggesting that scores on the Cegep Experiences Questionnaire have good temporal stability. The same is true for evaluations of the internal consistency of subscales.
Relationships between Cegep Experiences Questionnaire scores and other variables. Even though validation was not part of the original scope of the present project we did conduct some preliminary validation and hypothesis testing. In general, individual items and total scale scores appear to have good validity. There are some difficulties with the validity of the conceptual subscales, however. We tried to use factor analysis to reformulate the content of the subscales. The findings on nondisabled graduates, the only sample large enough to permit this, suggest that only a minor adjustment to subscale composition is needed. We will examine the possibility of a different composition for subscales in the context of our ongoing study with larger samples.
Similarities and differences between students with and without disabilities on the Cegep Experiences Questionnaire. Results on the 25 items which were applicable to students and graduates with and without disabilities (on the total of 31 items, 6 of which are applicable only to students with disabilities) show that, as expected, both current students and graduates with disabilities indicated that their health posed obstacles for them. This item was also found to go a long way in predicting whether a student has a disability or not. Apart from health, there were no significant differences between items for either current students or graduates with or without disabilities. It should be noted, however, that differences may have been obscured by sample sizes that were often very small. Therefore, we also examined similarities and differences in the relative rankings of scores by students with and without disabilities.
We compared the ranking of Cegep Experiences Questionnaire mean scores of current students, with and without disabilities, to those of graduates with and without disabilities. In general, there was good consistency between the rank orders of items of current students and graduates with a disability as well as between the rank order of items of current nondisabled students and nondisabled graduates.
For both graduates and current students with disabilities, the availability of disability related services at the Cegep was ranked as the most important facilitator. The most important obstacle for both groups was the impact of their disability. Scheduling conflicts between disability-related support services, such as attendant care and adapted transport and school was also rated as a very important obstacle by both current students and graduates.
We also examined items where there were large differences in ranking (as measured by a minimum of 10 point differences in rank order) between students with and without disabilities. Only a single item emerged as a greater facilitator for both current students and graduates with disabilities relative to those without disabilities: private tutoring. Similarly, only one item emerged as a greater facilitator for graduates without disabilities: health.
Comparison of open-ended listings of facilitators and obstacles with Cegep Experiences Questionnaire results. Although a one-to-one comparison was not possible, examination of items with "facilitating" mean scores suggests that many of these items also appear on the open-ended listing of students. This is also true of obstacles, providing some evidence for the validity of the measure.
Number of students' impairments and Cegep Experiences Questionnaire results. We predicted that students with several different impairments would have higher obstacle scores than student with a single impairment. To test this hypothesis we correlated the number of students' impairments with their scores on all single items as well as on subscale and total scores. Taking into account the relatively few students with more than two impairment and the constricted range in the number of students' impairments, the finding that 1/3 of the 31 coefficients based on item-by-item correlations were significant and in the predicted direction is very impressive. It is also noteworthy that every single coefficient has the same sign, whether it was significant or not. In addition, all three subscale coefficients were significant as was the coefficient for the total scale score. This suggests that items, subscales, and total scale score are, indeed measuring obstacles and facilitators.
Étudiant(e)s de niveau collégial ayant des incapacités College Students with Disabilities
12 12
Successful and unsuccessful students and Cegep Experiences Questionnaire results. We expected that students who are "successful" would be more likely to have higher (more facilitating) scores than students who are "unsuccessful" at Cegep. For this comparison we defined success in terms of student retention and graduation. Students who graduated or continued their studies into the following two semesters were considered successful and those who failed to return or graduate were considered unsuccessful. It should be noted that results on “success” (i.e., retention rates) are consistent with our previous findings and show no significant difference between students with and without disabilities. The retention rate for students with disabilities into the semester following the administration of the survey was 93%, compared to 87% for students without disabilities. Retention into the second semester following the administration of the survey was 90% for students with disabilities and 80% for students without disabilities. These positive findings highlight the success of students with disabilities and underscore the importance of ensuring their presence in the Cegeps.
There were no significant differences in the mean scores on the test items between students who were "successful" and those who were "unsuccessful." However, the sizes of the "unsuccessful" groups were small and some large differences existed between the successful and unsuccessful groups. When Cegep Experiences Questionnaire items were examined for students without disabilities, 68% of the scores for successful students were higher (i.e., more facilitating) than those of the unsuccessful students. The corresponding percentage for students with disabilities was 81%, indicating that for both students with and without disabilities the majority of the differences favored (scores were more facilitating) the retained students.
Conclusions
We have developed the content of the 31 item closed-ended Cegep Experiences Questionnaire and established that it has good reliability. Validation was not part of the scope of this project and the sample sizes did not permit most such analyses. What validation we did carry out suggests that the items and the total score have good validity, although there may be problems with the item content of some of the PPH based conceptual subscales. A larger study, that builds on the present findings, is currently ongoing in our laboratory to establish validity and further refine the measure.
Contact Information
For additional information and the full report, consult the Adaptech Research Network web site (http://www.adaptech.org) or contact one of the principal investigators.
Catherine S. Fichten, [email protected]
Shirley Jorgensen, [email protected]
Alice Havel, [email protected]
Maria Barile, [email protected]
Adaptech Research Network Dawson College3040 Sherbrooke St. WestMontréal, QuébecCanada H3Z 1A4
Tel: (514) 931-8731Fax: (514) 931-3567www.adaptech.org
Étudiant(e)s de niveau collégial ayant des incapacités College Students with Disabilities
13 13
Étudiant(e)s de niveau collégial ayant des incapacités College Students with Disabilities
14 14
Sommaire - Étudiant(e)s de niveau collégial ayant des incapacités
Rapport final présenté à PAREAPrintemps 2005
Catherine Fichten, Ph.D., Shirley Jorgensen, M.B.A., Alice Havel, Ph.D., Maria Barile, M.S.W.Avec la Collaboration de :
Iris Alapin, M.A., Daniel Fiset, B.A., Jean-Pierre Guimont, M.Ed. Crystal James, Jean-Charles Juhel, M.Ed., Daniel Lamb, B.A., Mai N. Nguyen, B.Sc.
Réseau de Recherche Adaptech – Collège Dawson, Montréal
Sommaire
Résumé
L'objectif du projet de recherche décrit dans ce rapport était d'entamer le développement d'un instrument de mesure qui explore les variables individuelles et environnementales, subjectives, associées à la réussite et à l'échec académiques des étudiant(e)s de Cégep ayant des incapacités. L'intention était de fournir un instrument, de portée générale, qui puisse être employé dans le cadre d'activités d'évaluations institutionnelles dans tous les Cégeps.
Nous résumons ici les différentes étapes comprises dans le développement d’un tel instrument de mesure. Son élaboration a compris la compilation puis l'évaluation des versions françaises et anglaises des 31 items du Questionnaire sur les expériences au Cégep. Les items de ce questionnaire sont cotés sur des échelles de 6 points de type Likert et évaluent les facteurs individuels et environnementaux (à l'intérieur et à l'extérieur du Cégep) que les étudiant(e)s ayant des incapacités pourraient juger comme étant des facilitateurs et/ou des obstacles à leur progrès académique. Le questionnaire repose sur le modèle des Processus de production du handicap (PPH). La version actuelle de cet instrument se trouve à l'appendice du rapport intégral.
Les activités suivantes furent menées dans le cadre de cette investigation: des groupes de discussions, des analyses de questions non dirigées, et des analyses psychométriques, y compris la comparaison des réponses données par les étudiant(e)s avec et sans incapacités. Ces analyses portaient sur les réponses de 138 étudiant(e)s courants et récemment diplômés ayant des incapacités et de 670 étudiant(e)s et diplômés n’ayant pas d’incapacité.
Nous avons trouvé que le Questionnaire sur les expériences au Cégep a une bonne fiabilité. La validation de cet instrument de mesure dépassait la portée de la présente recherche et n'a pas été entièrement investiguée faute d'un échantillon suffisant pour mener de telles analyses à bout. Des analyses préliminaires suggèrent, cependant, qu'en général, les items du questionnaire et le score total présentent une bonne validité. Il semble cependant y avoir des problèmes avec le contenu des sous-échelles qui découlent du modèle des Processus de production du handicap (PPH). Une étude de plus grande envergure, s’appuyant largement sur les résultats de la présente investigation, est en cours dans notre laboratoire et vise à établir la validation du questionnaire ainsi qu’à perfectionner notre instrument.
Une étape impliquée dans cette étude était l’analyse des réponses données par les étudiant(e)s aux questions suivantes : Quels sont les facteurs qui ont facilité vos études au Cégep? Quels facteurs ont rendu vos études au Cégep plus difficiles? Les réponses obtenues à ces questions furent intéressantes en elles-mêmes. Parmi les points saillants, nous avons trouvé que les étudiant(e)s ayant des incapacités étaient susceptibles d’indiquer que les accommodements reliés à leurs incapacités présentaient d’importants facilitateurs à leurs études. Toutefois, près de la moitié des facilitateurs mentionnés par les étudiant(e)s ayant des incapacités ne portaient pas du tout sur leurs incapacités et étaient semblables à ceux identifiés par les étudiant(e)s sans incapacité. De manière générale, les obstacles énumérés par les étudiant(e)s ayant des incapacités étaient les mêmes que ceux notés par les étudiant(e)s sans incapacités. Ceci étant dit, certains problèmes associés à leur(s) handicap(s) présentaient des obstacles importants pour ces derniers. Plus précisément, ils/elles mentionnaient que leur(s) incapacité(s) et leur état de santé interféraient avec leurs études. Ces résultats appuient l’importance de fournir des services spécialisés adéquats dans les Cégeps aux étudiant(e)s ayant des incapacités.
Étudiant(e)s de niveau collégial ayant des incapacités College Students with Disabilities
15 15
Une autre démarche entreprise était de déterminer si les scores des étudiant(e)s qui s’étaient ré-inscrits ou qui étaient récemment diplômés (c-à-d. les étudiant(e)s qui avaient persévéré pendant les deux semestres suivant l’administration du questionnaire) se distinguaient des étudiant(e)s qui avaient abandonné leurs études. La comparaison des étudiant(e)s avec et sans incapacités a montré qu’il n’y avait pas de différence significative entre leurs taux respectifs de persévérance scolaire ni au premier ni au second semestre d’études. Une comparaison des scores aux items complétés par les étudiant(e)s qui avaient persévéré avec les items des étudiant(e)s qui avaient abandonné leurs études semble suggérer toutefois que les étudiant(e)s ayant persévéré académiquement obtiennent des scores plus élevés sur les items du questionnaire (c-à-d. des scores allant dans le sens des facilitateurs sur l’échelle). Ces résultats positifs mettent en relief le succès académique des étudiant(e)s ayant des incapacités et soulignent l’importance de leur assurer des services spécialisés adéquats.
Objectifs
L'objectif du projet de recherche décrit dans ce rapport était de commencer à élaborer un instrument de mesure explorant les variables individuelles et environnementales, subjectives, associées au succès et à l'échec académique des étudiant(e)s de Cégep ayant des incapacités. L'intention était de fournir un instrument général qui puisse être employé dans le cadre d'activités d'évaluations institutionnelles dans les Cégeps. L’utilisation de cet instrument, une fois complété, permettrait de répondre aux questions fondamentales suivantes : « Quels facteurs interfèrent avec les études des individus ayant des incapacités? » « Quelles variables facilitent leurs études? » « Que peuvent faire les étudiant(e)s, les Cégeps, les gouvernements et les organismes communautaires pour faciliter la réussite académique de ces étudiant(e)s? »
Nous résumons ici les différentes étapes comprises dans l’élaboration d’un tel instrument de mesure. Celle-ci a impliqué la compilation et l'évaluation des versions françaises et anglaises des 31 items du Questionnaire sur les expériences au Cégep. Les items de ce questionnaire sont cotés sur des échelles de 6 points de type Likert, et évaluent les facteurs individuels et environnementaux (à l'intérieur ainsi qu’à l'extérieur du Cégep) que les étudiant(e)s ayant des incapacités pourraient considérer comme étant des facilitateurs et/ou des obstacles à leur progrès académique. Le questionnaire repose sur le modèle des Processus de production du handicap (PPH). La version révisée de cet instrument est fournie à l'appendice du rapport intégral.
Le but de la présente recherche était de construire le contenu et le format des items du questionnaire et d’en assurer la fiabilité et la simplicité d’emploi. L’étude de la validité de l’instrument dépasse le cadre de cette investigation et requiert un échantillon beaucoup plus large que celui-ci. La validation complète du Questionnaire sur les expériences au Cégep, s’inscrit dans le cadre d’une étude de plus grande envergure présentement en cours dans notre laboratoire, qui s’appuie sur les résultats de la présente investigation.
Méthodologie
Pour développer les versions françaises et anglaises du Questionnaire sur les expériences au Cégep / Cegep Experiences Questionnaire, nous avons élaboré des items qui se basaient sur des données empiriques et théoriques. De plus, nous avons créé des questions qui nous permettraient divers types d'évaluations : des évaluations item par item, des évaluations usant les différentes sous-échelles et des évaluations utilisant le score total. Parmi les 31 items du questionnaire, 25 s’adressent aussi bien aux étudiant(e)s avec des incapacités qu’aux étudiant(e)s sans incapacité alors que 6 ne s’appliquent qu’aux étudiant(e)s ayant des incapacités. Dans la mesure où l'instrument a été conçu pour refléter les concepts fondamentaux du modèle PPH (c-à-d les obstacles et les facilitateurs personnels et environnementaux) ainsi que la réalité des étudiant(e)s qui font face à ces obstacles et à ces facilitateurs, aussi bien dans les Cégeps que dans la communauté, nous avons groupé les items selon trois sous-échelles conceptuellement distinctes:
Situation Personnelle (comprend 9 items y compris 1 item qui ne s'applique qu'aux étudiant(e)s ayant des incapacités) Situation au Cégep (comprend 13 items y compris 1 item qui ne s'applique qu'aux étudiant(e)s ayant des incapacités) Situation Communautaire ( comprend 9 items y compris 4 items qui ne s'appliquent qu'aux étudiant(e)s ayant des incapacités) Le Score Total (25 items sont les mêmes pour les étudiant(e)s avec et sans incapacités, 6 ne s’appliquent qu’aux étudiant(e)s
ayant des incapacités).
Pour déterminer si l’instrument de mesure est fiable et pour procéder à la vérification des hypothèses, nous avons : Mené 3 groupes de focus dont le but était de mieux cerner le contenu de l'instrument; ces groupes comptaient 18
étudiant(e)s de Cégeps francophones et anglophones Colligé des versions préliminaires du Questionnaire sur les expériences au Cégep et effectué des pré-enquêtes sur
plusieurs versions de cet instrument de mesure ainsi que sur d'autres échelles et questions pertinentes Traduit puis traduit "en retour" le questionnaire pour alors tester les versions françaises et anglaises du questionnaire final
en format régulier et en formats alternatifs (par ex., gros caractères, Word)
Étudiant(e)s de niveau collégial ayant des incapacités College Students with Disabilities
16 16
Administré l'instrument à o 74 étudiant(e)s du Collège Dawson (un Cégep anglophone où sont principalement inscrits des étudiant(e)s qui
parlent l'anglais) et 25 étudiant(e)s de Cégeps francophones (où sont principalement inscrits des étudiant(e)s qui parlent Français) ayant des incapacités (les étudiant(e)s qui avaient uniquement des troubles d'apprentissage et / ou des troubles d'attention ne participaient pas à cette démarche)
o 154 étudiant(e)s du Collège Dawson sans incapacitéo 516 individus sans incapacité et 21 individus ayant des incapacités récemment diplômés du Collège Dawson (à
l’exception des diplômés présentant seulement des troubles d'apprentissage) Administré l'instrument une seconde fois, six semaines plus tard, à 27 étudiant(e)s de Dawson et à 25 étudiant(e)s de
Cégeps francophones ayant des incapacités et à 64 étudiant(e)s du Collège Dawson sans incapacité pour établir le coefficient test-retest de l'instrument
Développé un manuel de codification de 60 items, portant sur les facilitateurs et les obstacles au succès académique, que nous avons alors employé pour évaluer les réponses obtenues aux questions non-dirigées sur les facteurs qui aident et/ou interfèrent avec les études collégiales
Mené des analyses statistiques sur les items du Questionnaire sur les expériences au Cégep pour établir les propriétés psychométriques de l'instrument et pour évaluer les hypothèses de cette étude
Résultats et Conclusions
Caractéristiques de l'échantillon
Les moyennes d'âge des étudiant(e)s, inscrits au Cégep, dans les trois échantillons étaient très similaires. Les étudiant(e)s avaient entre 20 et 21 ans, avec une étendue allant de 17 à 44 ans. L'échantillon comptait à peu près un tiers d'hommes et deux tiers de femmes. Quatre-vingt deux pour cent des étudiant(e)s du Collège Dawson sans incapacité et 70% des étudiant(e)s de Dawson ayant des incapacités étaient inscrits dans un programme d'études pré-universitaire d’une durée deux années. Les autres étudiant(e)s étaient principalement inscrits dans des programmes techniques et/ou professionnels de trois ans. Par contre, dans les Cégeps francophones, 40% des étudiant(e)s ayant des incapacités étaient inscrits dans des programmes d'étude pré-universitaire de deux années alors que les autres étaient inscrits dans des programmes techniques et/ou professionnels d’une durée de trois ans. La grande majorité des étudiant(e)s visaient l’obtention d’un Diplôme d’Études Collégiales (DEC).
Les étudiant(e)s ayant des incapacités récemment diplômés du Collège Dawson avaient à peu près un an de plus que les étudiant(e)s sans incapacité (ils avaient 23 et 22 ans, respectivement). Dans les deux échantillons retenus, un tiers des participants était masculin et deux tiers étaient féminin. Les diplômés ayant des incapacités étaient légèrement plus susceptibles d'avoir complété un programme d'études pré-universitaire (81%) que les étudiants diplômés sans incapacité (72%).
La majorité des étudiant(e)s ayant des incapacités inscrits au Cégep avait un(e) seul(e) type d’incapacité / handicap (56% au Collège Dawson et 59% dans les Cégeps francophones), un tiers en avait deux (32% dans chacun des deux échantillons) et le restant en avait trois ou plus (8% au Collège Dawson et 12% dans les Cégeps francophones). Parmi les diplômés du Collège Dawson, une proportion très substantielle n’avait qu’une seule incapacité (90%). Bien que nous ayons délibérément exclus de nos échantillons les étudiant(e)s qui indiquaient comme unique incapacité des troubles d’apprentissage / d’attention, il est important de noter que près du tiers des étudiant(e)s ayant d’autres types d'incapacités indiquaient qu’ils avaient également des troubles d’apprentissage (31% au Collège Dawson et 32% dans les Cégeps francophones).
En ordre d’importance, les incapacités les plus souvent rapportées par les étudiant(e)s de Cégep étaient de natures médicales et/ou psychologiques/ psychiatriques, celles-ci étaient suivies par des déficiences visuelles puis par des déficiences auditives et motrices. Notons que les individus récemment diplômés n’ont pas rapporté de troubles psychologiques ou psychiatriques. Mis à part cette différence, la distribution des incapacités parmi les diplômés était semblable à celle des étudiant(e)s présentement inscrits au Cégep.
Dans le but d’assurer que le Questionnaire sur les expériences au Cégep soit complet, nous avons inclus des items susceptibles de représenter des obstacles et/ou des facilitateurs aux étudiant(e)s ayant des types spécifiques d’incapacités. Dans certains cas, ceci voulait dire que très peu d’étudiant(e)s répondraient à ces questions. Une étude qui s’appuie sur les résultats de la présente investigation, et qui compte un échantillon beaucoup plus large, est présentement en cours dans notre laboratoire.
Étudiant(e)s de niveau collégial ayant des incapacités College Students with Disabilities
17 17
Quels facteurs facilitent les études au Cégep? Lesquels rendent ces études plus difficiles? Questions non-dirigées
Une des démarches employée pour établir les qualités psychométriques du Questionnaire sur les expériences au Cégep a été l’analyse des réponses offertes par les étudiant(e)s aux questions non-dirigées suivantes: Quels sont les facteurs qui ont facilité vos études au Cégep? Quels sont les facteurs qui ont rendu vos études au Cégep plus difficiles? Les réponses à ces questions furent pertinentes en elles-mêmes. Il est important de souligner que selon la situation spécifique de l’étudiant et selon ses conditions environnementales particulières, le même point pouvait présenter un obstacle ou un facilitateur.
Facilitateurs. Les étudiant(e)s ayant des incapacités étaient susceptibles d’indiquer que les accommodements reliés à leur(s) incapacité(s) étaient des facilitateurs importants pour eux. Ces accommodements comprenaient : des services offerts aux étudiant(e)s handicapés en général ainsi que des accommodements plus spécifiques au type d’incapacités offerts au Collège Dawson. En l’occurrence, certains des facilitateurs mentionnés par les étudiant(e)s furent : l’opportunité de s’inscrire à l’avance aux cours, de compléter les examens dans une pièce plus silencieuse, avoir davantage de temps pour compléter un examen ou pour remettre un travail, avoir un preneur de notes attitré, et des politiques qui permettent aux étudiant(e)s de diminuer leur charge de cours tout en maintenant leur statut « d’étudiant à temps plein. »
Parmi les facilitateurs les plus souvent cités par les étudiant(e)s ayant des incapacités, presque un tiers étaient les mêmes que ceux mentionnés par les étudiant(e)s sans incapacités et donc ne portaient pas sur leurs incapacités. Ces derniers sont: avoir de bons professeurs, un environnement collégial favorable, la disponibilité d’ordinateurs sur le campus, la disponibilité de support et d’aide au Cégep, ainsi que la présence du Centre d’apprentissage du Collège Dawson (« Dawson Learning Center »). Ce centre offre des services de tutorat et peut aider les étudiant(e)s à mieux apprendre, écrire et même à développer de meilleures habilités en terme de la prise d’examens. Des thèmes importants identifiés par les étudiant(e)s sans incapacités, et non soulevés par les étudiant(e)s ayant des incapacités, étaient les rôles de facilitation que peuvent avoir les amis, la bibliothèque, un horaire adéquat, une variété dans le choix de cours, une situation financière confortable et de bonnes habitudes de travail et de gestion du temps.
Obstacles. De manière générale, les obstacles notés par la majorité des étudiant(e)s ayant des incapacités étaient les mêmes que ceux mentionnés par les étudiant(e)s sans incapacité, soit : de mauvais professeurs, un nombre de cours trop élevé, des cours difficiles, un horaire inadéquat, une mauvaise gestion du temps et des problèmes organisationnels, un environnement au Cégep défavorable, et des problèmes de langage tels que ne pas parler couramment la langue d’enseignement ou encore un accent trop prononcé de la part des professeurs. Encore une fois, des problèmes liés à leur(s) incapacité(s) présentaient d’importants obstacles pour les étudiant(e)s ayant des handicaps. Ils ont noté, à titre d’exemples, leur(s) incapacité(s) et leur santé, des problèmes reliés à l’accessibilité de leurs cours, ainsi que la nature même des services et des accommodements octroyés aux étudiant(e)s ayant des incapacités comme présentant des obstacles à leur succès académique. Les étudiant(e)s sans incapacité ont également noté divers obstacles, y compris : des problèmes financiers, le fait de travailler, des problèmes de transport, des problèmes personnels, des niveaux élevés de stress ainsi que des horaires de remises de travaux et/ou d’examens conflictuels.
L’élaboration du Questionnaire sur les expériences au Cégep : Évaluations psychométriques et vérification des hypothèses
Fiabilité. Deux types distincts de fiabilité ont été évalués dans cette étude: la stabilité temporelle (coefficient test-retest) de chacun des items, des sous-échelles conceptuelles et du score total, et la cohérence interne des scores obtenus sur chacune des sous-échelles. De manière générale, les coefficients test-retest de chacun des items, des sous-échelles ainsi que de l’échelle globale étaient bons, ce qui suggère que les scores obtenus sur le Questionnaire des expériences au Cégep présentent une bonne stabilité temporelle. Les analyses suggèrent également une bonne cohérence interne pour les sous-échelles du questionnaire.
Corrélations entre les scores obtenus au Questionnaire sur les expériences au Cégep et d’autres variables. Bien que l’étude de la validité du questionnaire ait dépassé la portée du présent projet, nous avons mené quelques analyses préliminaires de validation et testé certaines hypothèses. De façon générale, les items pris individuellement et le score total semblent avoir une bonne validité. Il semble cependant y avoir des problèmes en ce qui a trait à la validité des sous-échelles conceptuelles. Nous avons tenté de performer une analyse factorielle pour reformuler le contenu des sous-échelles. Les résultats des analyses, utilisant l’échantillon des diplômés sans incapacité, qui par ailleurs était le seul échantillon assez grand pour nous permettre de telles analyses statistiques, ont suggéré qu’un ajustement assez mineur à l’agencement des sous-échelles serait nécessaire. Nous examinerons la possibilité de modifier la composition des sous-échelles dans le cadre d’une étude présentement en cours qui bénéficie d’échantillons plus larges.
Étudiant(e)s de niveau collégial ayant des incapacités College Students with Disabilities
18 18
Similitudes et différences entre les étudiant(e)s avec et sans incapacités sur le Questionnaire des expériences au Cégep. Tel que prévu, les résultats obtenus sur les 25 items qui s’adressaient aux étudiant(e)s présentement inscrits au Cégep et les nouveaux diplômés, avec et sans incapacités (25 items sur 31 items, dont 6 ne s’appliquaient qu’aux étudiant(e)s ayant des incapacités), ont montré que les étudiant(e)s inscrits au Cégep et les nouveaux diplômés estimaient que leur santé posait un obstacle à leur réussite académique. D’ailleurs, à lui seul, cet item permettait de prédire de manière assez juste quel étudiant avait ou non une incapacité. Mis à part cet item, nous n’avons pas trouvé de différence significative entre les réponses offertes par les étudiant(e)s inscrits au Cégep et les individus récemment diplômés, avec et/ou sans incapacités. Il est cependant important de souligner que certaines différences significatives ont pu être voilées par des échantillons souvent trop petits. Nous avons, par conséquent, décidé d’examiner les similitudes et les différences dans le classement des obstacles et facilitateurs sur le Questionnaire des expériences au Cégep des étudiant(e)s avec et sans incapacités.
Tel que mentionné ci-dessus, nous avons comparé l’ordre hiérarchique des scores obtenus sur le Questionnaire des expériences au Cégep des étudiant(e)s avec et sans incapacités présentement inscrits au Cégep au classement des scores des diplômés avec et sans incapacités. De manière générale, nous avons trouvé que les étudiant(e)s de Cégep ayant des incapacités et les nouveaux diplômés ayant des incapacités classaient les obstacles et les facilitateurs de manières similaires. De même, les étudiant(e)s sans incapacité inscrits au Cégep et les nouveaux diplômés n’ayant pas d’incapacité avaient tendance à classer les items de façon cohérente.
Pour les étudiant(e)s ayant des incapacités inscrits au Cégep aussi bien que pour les nouveaux diplômés, la disponibilité de services spécialisés pour les étudiant(e)s ayant des incapacités était considérée comme étant le facilitateur le plus important. Par ailleurs, les deux groupes citaient l’impact de leur incapacité comme étant l’obstacle le plus important à leurs études. Des conflits d’horaires entre les soutiens spécialisés, tels que l’aide des accompagnateurs et les transports adaptés et l’établissement d’enseignement, étaient également cotés comme présentant un obstacle très important pour ces étudiant(e)s.
Nous avons également examiné les items pour lesquels il y avait de grandes différences de classement entre les étudiant(e)s ayant des incapacités et les étudiant(e)s n’ayant pas d’incapacité (une « grande différence » correspondait à une différence minimale de 10 points dans leur classement). Seul un item est apparu comme étant un facilitateur de grande importance pour les étudiant(e)s inscrits et diplômés ayant des incapacités par rapport aux étudiant(e)s et aux diplômés sans incapacité : les cours particuliers. De même, un seul item a surgit comme étant un plus grand facilitateur pour les diplômés sans incapacités : la santé.
Comparaison des listes non-dirigées de facilitateurs et d’obstacles avec les résultats du Questionnaire sur les expériences au Cégep. Bien qu’une comparaison systématique des réponses n’ait pas été possible, l’examen de chacun des items avec les scores moyens des « facilitateurs » suggère qu’une bonne partie des items apparaissaient également sur les listes élaborées par les étudiant(e)s. Ceci s’applique également aux « obstacles ». Ces résultats semblent appuyer la validité de l’instrument de mesure.
Nombre d’incapacités des étudiant(e)s et résultats sur le Questionnaire des expériences au Cégep. Nous avons émis l’hypothèse que les étudiant(e)s ayant plusieurs types d’incapacités obtiendraient des scores plus élevés en termes d’obstacles sur le questionnaire que les étudiant(e)s ayant une seule incapacité. Pour tester cette hypothèse, nous avons mené une corrélation entre le nombre d’incapacités des étudiant(e)s et leurs scores à chacun des items, leurs scores aux sous-échelles ainsi qu’au score global. Si l’on prend en considération le nombre assez petit d’étudiant(e)s ayant plus de 2 incapacités et l’étendue assez restreinte du nombre possible d’incapacités, il est assez remarquable que le tiers des 31 coefficients de corrélation (basés sur des corrélations item par item) était significatif et ce, dans la direction anticipée. Il est pertinent de noter que chacun des coefficients de corrélation avait le même signe et ceci, qu’il soit ou non significatif. De plus, les coefficients de corrélation des trois sous-échelles avec les scores globaux étaient tous significatifs. Ces résultats laissent entendre que les items, les sous-échelles et les scores globaux mesurent, en effet, les obstacles et les facilitateurs.
Les étudiant(e)s qui réussissent et les étudiant(e)s qui ne réussissent pas et le Questionnaire sur les expériences au Cégep. Nous nous attendions à ce que les étudiant(e)s qui réussissent au Cégep obtiennent des scores plus élevés sur le Questionnaire (donc dans le sens des facilitateurs) que ceux qui ne réussissent pas. Pour les fins de cette comparaison, le terme « succès » était défini en fonction de la persévérance scolaire et du taux de diplomation. Les étudiant(e)s qui avaient complété leurs études ou qui avaient continué leur curriculum pendant les deux semestres suivants étaient considérés comme ayant réussi académiquement alors que ceux qui abandonnaient leurs études étaient classés comme n’ayant pas réussi.
Il est important de noter que les résultats sur le « succès » (c-à-d. sur le taux de persévérance) vont dans le même sens que nos résultats précédents et indiquent qu’il n’y a pas de différence significative entre les étudiant(e)s avec et sans incapacités sur cet indice. Le taux de persévérance scolaire pendant le semestre suivant l’administration du Questionnaire était de 93% pour les étudiant(e)s avec des incapacités et de 87% pour les étudiant(e)s sans incapacité. Le taux de persévérance scolaire pour le second
Étudiant(e)s de niveau collégial ayant des incapacités College Students with Disabilities
19 19
semestre suivant l’administration du Questionnaire était de 90% pour les étudiant(e)s ayant des incapacités et de 80% pour les étudiant(e)s n’ayant pas d’incapacité. Ces résultats positifs mettent en relief le succès des étudiant(e)s ayant des incapacités et ils soulignent l’importance d’assurer leur présence au sein des Cégeps.
Nous n’avons pas trouvé de différence significative entre les scores moyens aux items du Questionnaire des étudiant(e)s qui réussissaient et ceux des étudiant(e)s qui ne réussissaient pas académiquement. Il est important de noter, cependant, que le nombre d’étudiant(e)s dans les groupes qui ne réussissaient pas était très petit; de plus, il y avait des différences substantielles entre les groupes qui réussissaient et ceux qui ne réussissaient pas. En effet, lorsque les items du Questionnaire sur les expériences au Cégep des étudiant(e)s sans incapacités furent examinés, 68% des scores obtenus par les étudiant(e)s qui avaient réussi étaient plus élevés (donc dans le sens des éléments facilitateurs) que ceux des étudiant(e)s qui n’avaient pas réussi. Le pourcentage correspondant pour les étudiant(e)s ayant des incapacités s’élevait à 81%. Ces chiffres indiquent que pour les étudiant(e)s ayant des incapacités aussi bien que pour ceux qui n’en ont pas, la majorité des différences favorisait les étudiant(e)s qui avaient persévéré académiquement (les scores étant davantage dans le sens des facilitateurs).
Conclusions
Nous avons développé le contenu des 31 items du Questionnaire sur les expériences au Cégep et nous sommes parvenus à établir que cet instrument est fiable. Une analyse exhaustive de la validité du Questionnaire dépassait les objectifs de la présente étude; d’ailleurs, la taille restreinte de nos échantillons ne nous permettait pas de telles analyses. Des analyses préliminaires sur la validité suggèrent toutefois que les items individuels et le score total sur l’échelle présentent une bonne validité mais qu’il pourrait y avoir des problèmes avec les sous-échelles conceptuelles découlant du modèle des Processus de production du handicap (PPH). Une étude de plus grande envergure, s’appuyant largement sur les résultats de la présente investigation, est en cours dans notre laboratoire et vise à établir la validation du questionnaire ainsi qu’à perfectionner notre instrument.
Information pour nous rejoindre
Pour de plus amples informations et pour obtenir le texte intégral du rapport, veuillez consulter le site Web du Réseau de Recherche Adaptech (http://www.adaptech.org ) ou contacter l’une des chercheures principales.
Catherine S. Fichten, [email protected]
Shirley Jorgensen, [email protected]
Alice Havel, [email protected]
Maria Barile, [email protected]
Réseau de Recherche Adaptech Collège Dawson3040, rue Sherbrooke OuestMontréal (Québec)H3Z 1A4 Canada
Tél.: (514) 931-8731Téléc.: (514) 931-3567www.adaptech.org
Étudiant(e)s de niveau collégial ayant des incapacités College Students with Disabilities
20 20
Introduction
Goals
The overall goal of this research is to provide an evaluation tool that will help increase the success outcomes of Cegep (junior/community college) students with disabilities and improve their academic lives by providing a variety of data to Cegep administrations and student services personnel. This report deals with the first stage of this process: development of item content and format and reliability testing. Once it is fully validated, feedback from the evaluation tool will highlight factors that contribute to successes as well as to problems for Cegep students with disabilities. On an individual basis, this tool might be useful to evaluate obstacles and facilitators for students with different disabilities. What is needed to assist Cegeps to find out about these factors is a brief, valid measure that is easy-to-use is relevant to both current and former Cegep students with disabilities is applicable to all Cegeps and can be administered as a stand-alone tool or included in ongoing institutional research
The objective of the research reported here was to start the process of developing a measure that explores self-perceived individual and environmental correlates of successful and unsuccessful academic outcomes for students with disabilities. The intent was to develop a measure for general use in Cegep institutional evaluation activities. Use of the measure, once it is fully developed, will provide answers to the questions, "What are the obstacles that make Cegep studies more difficult for students with disabilities?" "What are the facilitators that make Cegep studies easier for these students? "What can students, Cegeps, government and community based organizations do to facilitate successful academic outcomes for these students?"
Here we report the findings related to the development of French and English versions of the 31 item “Cegep Experiences Questionnaire / Questionnaire sur les expériences au Cégep.” It uses 6-point Likert-type scaling and evaluates personal and environmental factors (both within and outside the Cegep) that students with disabilities may view as facilitating and/or hindering their academic progress. The measure is based on Fougeyrollas et al.’s (Fougeyrollas & Beauregard, 2001; Fougeyrollas, Lippel, St-Onge, Gervais, Boucher, Bernard, & Lavoie, 1999; RIPPH, undated) PPH model (Processus de production du handicap). Once it is fully validated, the measure will have the potential to be used to facilitate planning, enhance and evaluate services, improve pedagogy, and ameliorate student satisfaction, retention and success. The current version of the measure is provided in the Appendix.
To develop the measure we also prepared questions about demographic and disability related aspects, information about the respondent's Cegep studies, as well as open and closed-ended information on factors that students felt made their Cegep studies easier and harder.
Background
Our previous data show that Cegep students with disabilities who are registered to receive disability related services do just as well as their nondisabled peers in terms of grades, proportion of courses passed, and graduation rates, although they take an average of one semester longer to graduate (Jorgensen, Fichten, Havel, Lamb, James, & Barile, 2003, 2005 ). This suggests that investment in ensuring that students with disabilities have the accommodations they need is money and effort that is well spent. To assure the success of Cegep students with disabilities, a key goal of our programme of research has been, and continues to be, to develop and validate tools that can be used in the Cegeps to facilitate the success of students with disabilities.
As the numbers of students with disabilities in postsecondary education continue to rise (Bouchard & Veillette, with the collaboration of Beaupré, Brassard, Fichten, Fiset, Havel, Juhel, Pelletier, & Roy, 2005; CADSPPE, 1999; Fournier & Tremblay, 2003, Tremblay, Gagné, & Le May, 2004; Tremblay & Le May, 2005), demands on disability service providers and disability related services will escalate (Asuncion, Fichten, Barile, Fossey, & Robillard, 2004; Fichten, Asuncion, Barile, Fossey, Robillard, Judd, Wolforth, Senécal, Généreux, Guimont, Lamb, & Juhel, 2004). It is important that decision makers associated with budget allocations are provided with evidence based research that shows how investment in disability support services results in improvements in graduation and retention rates. Better system-wide collection of data on facilitators and obstacles to students with disabilities is required in order to achieve this.
Étudiant(e)s de niveau collégial ayant des incapacités College Students with Disabilities
21 21
The public Cegeps provided postsecondary education to approximately 143,000 students in 2003 (Ministère de l'éducation du Québec, 2004), the last year for which data are available. As Québec moves increasingly toward a knowledge-based, technology-driven economy, people with disabilities will have an unprecedented opportunity to participate fully in the social and economic life of their communities. The 10% of Québec residents over the age of 15 who have some level of disabilities (Statistics Canada, 2002) will have promising new possibilities in an environment where valuable commodities are no longer physical goods and services but information and knowledge (e.g., Loewen & Tomassetti, 2002; Wolfe & Gertler, 2001). However, this will only become a reality when they have the same opportunities to succeed in postsecondary education as their nondisabled peers.
In the past two decades Cegeps and other postsecondary educational institutions have increasingly recognized the need to grant accommodations to people with disabilities (Bouchard et al., 2005; Fichten, Bourdon, Creti, & Martos, 1987; Leblanc, 1999). During this time, the number of people with disabilities in postsecondary education has increased dramatically, both in Québec (e.g., Bouchard et al., 2005; Fournier & Tremblay, 2003; Tremblay, Gagnon & Le May, 2003; Tremblay, Gagné, & Le May, 2004; Tremblay, Gagnon, & Le May, 2003) and elsewhere in North America (e.g., CADSPPE, 1999; Clermont, 1995; Harris Interactive, 2000; Tousignant, 1995; Wolforth, 1995).
In Canada, a substantially smaller proportion of individuals with disabilities (35%) than those without disabilities (49%) have some postsecondary education (Statistics Canada, 1992). Data from the comprehensive PALS 2001 Statistics Canada survey show that for Canadian youth aged 15 to 24, 7% of individuals with disabilities and 10% of nondisabled individuals have completed college. The figures for university graduation are 3% and 7%, respectively (Human Resources Development Canada. (2003). When it comes to working age Canadians, in 2001 a substantially smaller proportion of Canadians with disabilities (38%) than those without disabilities (48%) had some post-secondary education (Statistics Canada, 2003). Although the percentages of Canadians with and without disabilities who obtained junior/community college qualifications were similar (i.e., 16% vs. 17%), only 11% of working age Canadians with disabilities graduated from university compared to 20% of those without disabilities.
The percentages of college and university graduates with disabilities in Québec are likely to be considerably lower than those in the rest of Canada; our data show that Quebec has a smaller proportion of both college (0.6% vs. 6%) and university (0.4% vs. 2-1/2%) students with disabilities than the rest of Canada (Fichten, et al., 2003). These dismal results were recently replicated in 2004 for the Cegeps (Fichten, Amsel, Barile, Fiset, Havel, Huard, James, Jorgensen, Juhel, Lamb, Landry, & Tétreault, 2004) and are not explained solely by the lack of recognition of learning disabilities in Québec.
Data from the United States (e.g., Horn & Berktold, 1999; Miller, 2001) and from both selected Canadian universities (Outcomes Group, 1998) and Cegeps (Jorgensen, et al., 2005) show that postsecondary students with disabilities who receive accommodation services persist in their studies and graduate at similar rates to their nondisabled peers. The low number of postsecondary students as well as of workers with disabilities in Québec compared to the rest of Canada (i.e., in the 2001 PALS survey, of working age adults aged 15-64, only 33% of Quebeckers with disabilities were employed compared to 42% for the totality of Canada - Statistics Canada, 2003a, 2003b) makes it especially important to know about factors that facilitate or impede their academic and vocational accomplishments. It is only in this way that we can improve pedagogical and student services to assist in their success.
A concerted search of databases such as ERIC and PsycINFO, the resources of specialized libraries such as that of the Centre de documentation of the OPHQ and the Centre de documentation collégiale CDC, and consultation with our collaborators, the coordinators of services to ALL Cegep students with disabilities (i.e., Jean-Charles Juhel of Cégep de Sainte-Foy and Daniel Fiset of Cégep du Vieux Montréal) revealed surprisingly little recent research and no appropriate tools or instruments which investigate students' beliefs about what factors made their studies easier or harder. A marked growth in the number of students receiving disability related services at Cegeps during the 1990s and in recent years makes it critical to revisit this subject and evaluate students' perceptions of factors that make it easier and harder for them to succeed at Cegep over a decade later. This is one of the goals of the proposed project.
To enhance opportunities for Cegep students with disabilities and to enable them to succeed it is vital that reliable and valid information on facilitators and obstacles to student success are available. These data then need to be accessible to those who are involved in planning curriculum development policy and procedures as well as to those overseeing the delivery of disability related services. This means following up with current students as well as with those who have graduated or have failed to complete their studies. For example, when it comes to making computer equipment available to students with disabilities on campus, the Cegeps' centralized adaptive equipment loan bank system (SAIDE at Cégep du Vieux Montréal and les Services adaptés of the Cégep de Ste-Foy) is not only innovative but also, as shown by our findings, a huge success (Fichten, Barile, Robillard, Fossey, Asuncion, Généreux, Judd, & Guimont, 2000). Clearly this is one aspect of services for students with disabilities that is a facilitator and needs
Étudiant(e)s de niveau collégial ayant des incapacités College Students with Disabilities
22 22
to be retained. It is vital to obtain information about what aspects of services for students with disabilities are linked to success and failure. It is only by knowing this that favorable aspects can be retained and unsuccessful ones eliminated or improved.
When it comes to students with disabilities, neither Cegeps nor most other postsecondary institutions in Québec and the rest of North America have a well-established program of evaluation. Although some studies have been carried out, these generally use "home-made" instruments (e.g., Roessler & Kirk, 1998 for the University of Arkansas, Wolfe & Stokley, 1998, for Auburn University) that (1) have not been subjected to psychometric evaluation and consist of measures and items for which reliability and validity are unknown, and (2) were designed to answer specific questions related to a specific institution's services for students with disabilities, and (3) fail to compare responses of students with disabilities to those of nondisabled students. In addition, a very recent survey was conducted by NEADS to evaluate the alternate formats needs of students with print impairments (Kilmurray & Faba, with the collaboration of Alphonse & Smith, 2005). However, although recent and comprehensive, this survey deals only with alternate formats and has a low participation rate from Cegep students. There is one measure prepared for a wide-based audience of Canadian students with disabilities (Killean & Hubka, 1999). This, however, is 11 dense pages long, making easy administration and high response rates unlikely. In addition, there are wide-ranging measures of student outcomes designed for American students with disabilities (e.g., Horn & Berktold, 1999) and there exists a Québec-based survey of students with disabilities who failed to complete high school (Charest, 1997). Perhaps most relevant is a measure prepared by André Leblanc (1999) for his thesis (co-supervised by Catherine Fichten) on the history of students with disabilities at Champlain College. Although Leblanc's research bears directly on Cegep related issues, he did not examine students' perceptions of individual and environmental obstacles and facilitators.
A variety of instruments have been used to follow-up nondisabled students in various programs. These exist both for Cegeps (e.g., D'Amours, 1992; Meunier, 1989) as well as for colleges, trade schools and universities (e.g., Little & Lapierre, 1996; Paju, 1997; Taillon & Paju, 1999). They have focused on students' post-college and university outcomes (e.g., continued schooling, working) as well as on their experiences and satisfaction while at the postsecondary institution (e.g., Meunier, 1989). Again, while many of these aspects are relevant to an evaluation of obstacles and facilitators for Cegep students with disabilities, many aspects are irrelevant to our research objectives.
Conceptual Framework: PPH Model (Processus de production du handicap)
Over 10 years ago, the Ministère de la Santé et des Services sociaux (MSSS, 1992) established goals for Québec society. Among these was the intention to, "diminuer les situations qui entraînaient un handicap." The first priority concerned school and vocational inclusion (MSSS, 1992, p. 128). One of our objectives is to explore this issue by examining the findings from the perspective of the conceptual framework dominant in Québec: Fougeyrollas et al.'s PPH model (Processus de production du handicap: Fougeyrollas & Beauregard, 2001; Fougeyrollas, Lippel, St-Onge, Gervais, Boucher, Bernard, & Lavoie, 1999; RIPPH, undated).
The PPH is a Québec based model which proposes that a “situation de handicap” (i.e., reduced ability to perform daily activities) is the result of the interaction between individual factors (i.e., impairments and disabilities - the biological factors) on the one hand, and the environment (which consists of obstacles and facilitators), on the other. According to the model, the goal is to reduce or eliminate the barriers that hinder participation. This can only happen if a person is able to perform daily activities required for specific tasks. It is important that both individual and environmental aspects be taken into consideration, « Les éléments forts du modèle conceptuel permettent ainsi de distinguer entre ce qui appartient à la personne (facteurs personnels) et ce qui appartient à l'environnement (facteurs environnementaux) faisant, de ce fait, du handicap un résultat situationnel et non plus une caractéristique personnelle » (RIPPH, undated).
In the context of the PPH model, "impairment" (déficience) refers to the degree to which a person is affected physiologically. "Disability" (incapacité) refers to a degree of reduction of ability. Of particular interest to this investigation are the notions of "situation de handicap" (a reduction in ability to perform daily activities) and "situation de participation sociale" (full participation). These are due to the interaction between personal factors and environmental obstacles (i.e., create barriers to access) and environmental facilitators (make execution of a task easier) (cf. Lemieux-Brassard, 2002). For example, certain pedagogical practices, such as talking while students are viewing a film in a darkened classroom, can create environmental obstacles for students with hearing impairments. On the other hand, when giving a lecture, having an interpreter in class or an FM system would be facilitators.
In the case of education, daily activities ("habitude de vie") involve attending college, studying, writing, and reading (cf. Lemieux-Brassard, 1996). This concept emphasizes the abilities of the individual as well as the activities it would take to eliminate the obstacles that the individual encounters. To better understand factors that facilitate success among students with disabilities in the proposed research we will examine the nature and the role of disability-related individual and environmental factors (facilitators as well as
Étudiant(e)s de niveau collégial ayant des incapacités College Students with Disabilities
23 23
obstacles) in the success outcomes of students with disabilities. We applied the PPH model to the construction of our measure and we planned to examine the nature and impact of disability related obstacles and facilitators in influencing how students with disabilities fare in Cegep. In general, the definition of disability will follow the PPH model's classificatory system. The PPH model's classification of impairment, disability and "situation de handicap / situation de participation sociale" were used to construct our measure and examine how disability related obstacles and facilitators influence Cegep students with disabilities.
Definitions of key PPH model concepts in the context of the present research. Personal situation (e.g., health, financial situation) Cegep environment (e.g., availability of needed disability related services, attitudes of professors) Community and government based environmental factors (e.g., availability of needed external support services such as
home-care or mobility training, availability of needed adapted transportation) Obstacles are factors that make Cegep studies more difficult Facilitators are factors that make Cegep studies easier
Specific Objectives of the Present Investigation
The measure developed in this investigation is based on the PPH (Processus de production du handicap) model and evaluates obstacles and facilitators from three vantagepoints: personal situation, Cegep situation (environmental - e.g., accessibility of classrooms and labs, availability of disability related services), and government and community supports and services (environmental - e.g., availably of training on computer technologies, adapted transport, financial aid). To develop the measure we undertook the following activities:
conducted focus groups with students with disabilities (to get a first-hand notion about students' views about obstacles and facilitators)
consulted with key informant Cegep-based disability service providers formulated equivalent English and French versions of the measure in a variety of alternate formats suitable for
administration to students with all types of disabilities pilot tested English and French versions of the measure in all alternate formats to ensure that items are not ambiguous and
to assure the usability and acceptability of the scale by respondents administered the measure to Cegep samples of current students and recent graduates with and without disabilities conducted reliability assessment conducted preliminary tests of validity
Basically, the intent of the present research was to provide the item content and format and to ensure usability and reliability. Validation requires much larger samples than those of the research originally proposed. The full validation of the Cegep Experiences Questionnaire is part of a larger study that builds on the present findings and is currently ongoing in our laboratory. Two kinds of reliability were evaluated: temporal stability and internal consistency. Temporal stability was evaluated by correlating test-retest scores (item-by-item, conceptual subscales, total scale score). Internal consistency was evaluated by conducting item-total and item-subscale correlations as well as by Cronbach's alpha.
Even though validation was not part of the original scope of the project we did conduct some preliminary validation and hypothesis testing in addition to ensuring face validity. We carried out the following tests.
1. Face validity: items seem to be evaluating obstacles and facilitators by examining scores of students with different disabilities (students with different impairments will have different
responses on disability specific items of the scale - for example, while factors such as accessibility of the class and coordination between needed external support services will elicit ratings by students who use a wheelchair, these will be answered "not applicable" by students with visual impairments)
2. Concurrent validity: comparisons with other measures of the construct with open-ended listings of facilitators and obstacles obtained before the questionnaire was completed
o we evaluated open-ended listings of facilitators an obstacles and examined the results in comparison with results on the Cegep Experiences Questionnaire (it should be noted that these open-ended listings are of interest in themselves as they tell us about the most important obstacles and facilitators for students)
o by conducting a discriminant analysis to see whether we can predict group membership based on scores
Étudiant(e)s de niveau collégial ayant des incapacités College Students with Disabilities
24 24
3. Construct validity by examining the relationship between scores on the Cegep Experiences Questionnaire with scores on another closed-
ended measure of the three key concepts: personal situation, Cegep situation, community situation by examining the relationships among the three conceptual subscales by evaluating similarities and differences between students with and without disabilities, including replication for
current students and graduates (known groups validity)o comparisons of scale means o examination of rankings of scale items to see if these make sense o examination of the nature and relative numbers of obstacles and facilitators for students with and without
disabilities by examining the relationship between the number of students' impairments and scale results (students with several
different impairments were expected to have higher obstacles scores than student with a single impairment)4. Predictive validity
by doing a preliminary evaluation of scores of current students who were subsequently successful or unsuccessful (we predicted that “successful" students / graduates with and without disabilities will be more likely to have scores in the facilitating range than those who are "unsuccessful" at Cegep)
Étudiant(e)s de niveau collégial ayant des incapacités College Students with Disabilities
25 25
Methodology
Overview
To develop the Cegep Experiences Questionnaire / Questionnaire sur les expériences au Cégep we prepared content that was both theoretically and empirically based. In addition, we formulated questions so as to allow both item-by-item evaluation as well as evaluation using subscales and the total score. Of the 31 items on the scale, 25 are applicable to both students with and without disabilities and 6 are applicable only to students with disabilities. Because the measure was designed to reflect both the key concepts of the PPH model (i.e., personal and environmental obstacles and facilitators) as well as the realities of Cegep students, who encounter obstacles and facilitators of their academic success both within the Cegep as well as in the community, we grouped items into three conceptual subscales:
Personal Situation (9 items including 1 that is applicable to students with disabilities only) Cegep Situation (13 items including 1 that is applicable to students with disabilities only) Community Situation (9 items including 4 that are applicable to students with disabilities only) and a Total Scale score. (31 items including 6 that are applicable only to students with disabilities)
To determine reliability and test hypotheses we held three focus groups with 18 francophone and anglophone Cegep students to help define the content of the measure formulated and pre-tested multiple preliminary versions of the Cegep Experiences Questionnaire and other related
questions and scales translated, "back translated," and pretested English and French versions of the final questionnaire in regular print and
alternate formats (e.g., large print, Word) administered the measure to
o 74 Dawson College (an anglophone Cegep that enrolls primarily English speaking students) and 25 francophone Cegep (primarily French speaking) current students who had a disability (students who had only a learning disability and/or ADD were not part of this investigation)
o 154 Dawson College current nondisabled students o 516 Dawson College recent nondisabled graduates and 21 recent graduates who had a disability (other than only
a learning disability) administered the measure a second time, six weeks later, to 27 Dawson and 25 francophone Cegep current students with a
disability and to 64 current Dawson nondisabled students to determine test-retest reliability formulated a 60 item coding manual of facilitators and obstacles and used this to evaluate open-ended questions about
factors that made Cegep studies easier and harder for students conducted statistical tests on Cegep Experiences Questionnaire items to determine psychometric properties and to test
hypotheses
Thus, the following activities were carried out: focus groups, analysis of open-ended questions, and psychometric analyses, including comparisons of scores of students with and without disabilities. The sample involved 138 current Cegep students and recent Cegep graduates with disabilities and 670 nondisabled Cegep students and recent graduates.
Participants
Focus group. Eighteen students with disabilities who were currently enrolled in continuing education or in the regular day division either in a 2 year pre-university program or in a 3 year career program and who were registered with their Cegep to receive disability related services participated: 7 females and 22 males. They were studying at two francophone colleges (Cégep du Vieux Montréal (n=5) and Cégep de Sainte-Foy (n=10)) and one anglophone college (John Abbott College (n=3)).
Current students. Two hundred and twenty-eight current students participated in the questionnaire phase of this research. Participants from the anglophone Cegep Dawson College included convenience samples of 154 nondisabled students (51 males and 103 females) and 74 students (30 males and 44 females) who had at least one disability other than a learning disability and/or attention deficit disorder and who were registered with their Cegep to receive disability related services. All were enrolled in continuing education or in the regular day division either in a 2 year pre-university program or in a 3 year career program. These samples represent 90% of students with disabilities and 84% of nondisabled students who were approached to complete the questionnaire. To ensure that the French version of the Cegep Experiences Questionnaire had similar psychometric properties to
Étudiant(e)s de niveau collégial ayant des incapacités College Students with Disabilities
26 26
the English version we also tested a convenience sample of 25 francophone students with disabilities (10 males and 15 females) who were registered with their Cegep to receive disability related services. They were enrolled in 10 different francophone Cegeps and all of them completed the measures twice to provide test-retest reliability data. Of the Dawson current students, 27 students with disabilities and 64 nondisabled students completed measures twice to provide test-retest reliability data. Demographic characteristics are provided in Table 1. It is noteworthy than more than 40% of students with disabilities had more than one impairment.
Students had a variety of impairments. These are detailed in Table 2. It should be noted that even though we deliberately excluded all students who indicated that their only impairment was a learning disability and/or attention deficit disorder, 23 of the 74 Dawson students with other disabilities (31%) and 8 of the 25 the francophone Cegep students with other disabilities (32%) indicated that they also had a learning disability.
Étudiant(e)s de niveau collégial ayant des incapacités College Students with Disabilities
27 27
Graduates. Of the 2016 recent Dawson graduates (received a diploma in the context of their studies either in a 2 year pre-university program or in a 3 year career program within the previous 10 months) who were sent questionnaires, a total of 537 returned usable responses. Because 3% of envelopes sent to graduates were returned "unknown," the final return rate was 27%. Twenty-one of the graduates responding reported a disability (other than solely a learning disability) and 516 did not report a disability. Demographic characteristics are provided in Table 3.
Étudiant(e)s de niveau collégial ayant des incapacités College Students with Disabilities
28 28
Graduates had a variety of impairments. These are detailed in Table 4 and show that most of the graduates had a health/medically related impairment or a visual or hearing impairment.
Étudiant(e)s de niveau collégial ayant des incapacités College Students with Disabilities
29 29
Measures
Focus Group Questions. Focus group questions were designed to obtain preliminary information from participants about individual and environmental factors related to obstacles and facilitators of academic success. Questions reflect Fougeyrollas' et al.'s (1999, 2001) PPH model and are based on Kruger's (1994) model. Although an animator posed the questions during sessions, these were also available to participants in print and alternate formats. The questions are available in Table 5 below.
Table 5
Focus Group Questions
We will be asking you questions in 3 different categories Please tell us if any of these played a role in making your postsecondary studies easier (+) or harder (-).
A. Personal situation Health related (e.g., my health was good while I was in school; my health got worse while I was in school) Intellectual demands of courses (e.g., my courses were exciting and challenging; my courses were too difficult) Found a job(e.g., I found a job which helps pay for my schooling; I found a job which leaves little time for school) Other interests Family situation Personal motivation Social aspects of college life Are there other categories or items that we have missed? Indicate whether this made your postsecondary studies easier (+) or harder (-)
B. Environment Internal to the Cegep Availability of disability related services (e.g., the college provided adequate note taking services to meet my disability related
needs; the college failed to provide adequate note taking services to meet my disability related needs) The courses/program (e.g., my courses/program were interesting; my courses/ program were boring) Professor and staff willingness to adapt courses to my disability related needs (e.g., my professors were willing to accommodate
my disability related needs by providing materials in electronic format; my professors continually forgot to accommodate my disability related needs)
Accessibility of course materials (e.g., textbooks) in meeting my disability related needs Accessibility of classrooms and labs in meeting my disability related needs Professor and staff attitudes Students' attitudes Accessibility of recreational services Are there other categories or items that we have missed? Indicate whether this made your postsecondary studies easier (+) or harder (-)
C. External Environment - Community and Government Accessibility of needed community resources (e.g., I can easily go to my neighbourhood library if I need course related
information; I have to go to a CLSC which is not accessible to me) External support services (e.g., my required reading materials were available on time; my required reading materials always
arrived several weeks behind the rest of the class) Links between 2 services (e.g., services from the CLSC and my study schedule work well together; the timing of my personal
attendant and the schedule of adapted transport often conflict) Economic factors Availability of needed accommodations at home Transportation to and from school Are there other categories or items that we have missed? Indicate whether this made your postsecondary studies easier (+) or harder (-)
D. Open-Ended Questions1. What would have made your postsecondary studies easier? 2. What would have made your postsecondary studies harder?3. In which semester did you experience the most difficulty? Explain why. 4. Did you receive services from Disabled Student Services at your educational institution? 5. How did these influence your postsecondary studies?6. Did you receive disability-related services outside of the educational institution? 7. What services? 8. How did these influence your postsecondary studies?9. What was the single most important thing that helped you to do well in school?10. What was the single most important obstacle to doing well in school?
Do you have other comments?
Étudiant(e)s de niveau collégial ayant des incapacités College Students with Disabilities
30 30
Questionnaire Study: Current Cegep Students And Cegep Graduates
Current students and recent Cegep graduates completed a two page questionnaire. The first page included a brief set of objective Demographic Questions, two Open-Ended Easier and Harder Questions where students indicated, in an open-ended manner, what factors made their studies easier and harder, and 3 Overall Items (objective) which indicate their evaluations of Personal, Cegep related, and Community related aspects that made their studies easier and more difficult. Page 2 was devoted to the 31 items of the newly developed College Experience Questionnaire whose items use 6-point Likert-type scaling (1 = major obstacle, 6 = major facilitator).
Demographic Questions. Pertinent objective demographic questions were included (e.g., sex, age, current Cegep program, nature of the student's disabilities/impairments).
Open-Ended Easier and Harder Questions. Two open-ended items were included. These asked, in an open ended manner: What factors have made your Cegep studies easier? What factors have made your Cegep studies harder?"
Overall Items. Before answering any other questions about obstacles and facilitators participants made ratings on three Overall Items that inquire about the respondent's evaluation of how well, overall, various dimensions of their experiences made their Cegep studies easier and harder. These used Likert-type scaling (1 = much harder, 6 = much easier). The three items, which were based on the PPH model (cf. Fougeyrollas et al., 1999, 2001), asked participants to complete the three sentences below by putting a number between 1 and 6.
My overall personal situation made my Cegep studies______. The overall environment of the Cegep I attended made my Cegep studies______. Overall, community supports made my Cegep studies______.
Cegep Experiences Questionnaire / Questionnaire sur les expériences au Cégep. This questionnaire was developed in the present study. It consists of 31 closed-ended questions utilizing a 6-point Likert-type scale (1 = Major Obstacle to 6 = Major Facilitator). We chose a response scale with an even number of points to avoid the conceptual difficulties with mid points and to force students to consider each question carefully (cf. Zimbardo, et al., 1977). Items were grouped into three Conceptual Subscales based on the PPH model (cf. Fougeyrollas et al., 1999, 2001): Personal Subscale, Cegep Subscale, Community Subscale. A Total Scale score is computed based on the mean of all items. The combination of Subscale, Total, and item-by-item analyses allows both overall evaluations of aspects of the student's experiences as well as detailed, fine-grained assessment of aspects that pose problems and things that are facilitators for students.
Once the content and format were finalized we translated the measure into French. Translations were done using the approved method of translation and "back translation" into the original language to detect discrepancies (Vallerand, 1989 - i.e., translation English to French by translator 1, "back-translation" to English by translator 2), pilot tested the French measure, adapted it to alternate formats (i.e., in addition to regular print, large print, Word version for print users, Word version for screen reader users). Fifteen current students with various disabilities and 10 nondisabled current students and graduates pilot tested English and French versions of the questionnaire in regular print or in the following alternate formats: large print, Word-regular (suitable for nondisabled students and for students with all other impairments other than being totally blind) or Word-specialized versions (suitable for students who have a severe visual impairment or are totally blind and use screen reading software such as Jaws).
Étudiant(e)s de niveau collégial ayant des incapacités College Students with Disabilities
31 31
Procedure
Ethics. Potential participants were informed about the nature and requirements of the research. They were told that participation is voluntary and that confidentiality will be maintained. They were assured that neither their campus based disability service provider nor any of the disability service provider team members (i.e., Havel, Fiset, Juhel) will be able to associate their responses with their names. They were told about the purpose of the project, risks and benefits envisaged, the task requirements, the right to withdraw at any time without penalty and measures taken to ensure confidentiality. They were informed that they may discuss any questions or concerns about this study with the principal investigator, Catherine Fichten (514-931-8731 #1546). Participants were provided with a detailed Information and Consent Form which is approved by Dawson's Institutional Ethics Committee.
Focus groups. We held focus groups with 18 students with disabilities (7 females, 22 males) at the francophone Cegeps of our collaborators, Daniel Fiset and Jean-Charles Juhel (i.e., Cégep du Vieux Montréal (n=5) and Cégep de Sainte-Foy (n=10), respectively), as well as at an anglophone Cegep: John Abbott College (n=3). The campus based disability service providers were provided with Invitation Forms. They contacted the students and made the physical arrangements. Participants were told that they would be reimbursed for any travel and related expenses and that they would be given an honorarium of $10 as a token of appreciation for participating. They were also provided with an Information and Consent Form prior to the beginning of the session.
After obtaining permission from the participants, focus groups were audiotaped. In addition, at least one note taker was present at the meeting. To respect the confidentiality of the participants their names were omitted from all reports. Furthermore, using “s/he” in the review protected any possible identification of the participants. Each group had an animator who read the rules to the group and posed the questions, which were also available to participants in print and alternate formats. To ensure participant confidentiality we used a numerical coding system based on our attendance sheets (see Morgan, 1988). Only the research team had access to the attendance sheets. The numerical code was used in all written materials.
The participants had a set time in which to answer each question. After the question period, we broadened the discussion into a “free-for-all” where participants were given the opportunity to share other experiences or ask questions of their own. Group sessions lasted approximately three hours. We looked for spontaneously emerging similarities and differences to obtain preliminary information about individual and environmental facilitators and obstacles for students with disabilities in the Cegeps for inclusion in the Cegep Experiences Questionnaire. Several research team members attended these group sessions and we have carefully examined the data from these focus groups. Although we were developing the measure only for students with physical disabilities, when conducting focus groups we found that students often had two or more types of impairments and that several students had both learning disabilities as well as physical disabilities. The information obtained was used in the development of the Cegep Experiences Questionnaire.
Questionnaire Study: Current Cegep Students. Current student participants with disabilities were recruited with the help of Cegep based disability service providers who either gave questionnaires to students as they were waiting to pre-register (Dawson College) or who contacted students with disabilities, asked them if they would be willing to participate, and distributed the questionnaire packages to them (francophone Cegeps). At Dawson College this was done in mid-December, 2003. In francophone Cegeps this was done in 2004. At Dawson College we also distributed questionnaire packages to a convenience sample of current nondisabled students who were standing in various line-ups in January at the start of the Winter 2004 semester (e.g., lockers, bookstore). A minimum of 4 weeks later we contacted all current students who completed the questionnaire as well as a detachable coupon (with their coordinates) to complete the measure a second time,
Students were informed that by completing the questionnaire and the attached coupon they would become eligible to win a $25 restaurant gift certificate. Dawson students were also told that they would receive a $5 voucher to the Dawson Cafeteria, and that if they completed the questionnaire a second time they would receive an additional $5 voucher. Francophone Cegep students were informed that we would send them $5 in the mail.
Questionnaire packages included an Information and Consent Form, the two page questionnaire, a stamped self-addressed envelope, and a Coupon (to allow students to indicate their coordinates so we could enter them in the draw for the $25 gift certificate, to deliver the $5 cafeteria voucher, and to invite them to complete the measure a second time for the test-retest evaluation 4 weeks later).
Étudiant(e)s de niveau collégial ayant des incapacités College Students with Disabilities
32 32
We telephoned those Dawson students with disabilities and those nondisabled students who had indicated that we may do so 4 weeks later. Those who indicated that they would be willing to complete the questionnaire a second time were sent the questionnaire package in the mail. Some packages (e.g., to students who are blind) were sent via email. Francophone Cegep students who had completed the coupon were mailed the questionnaire.
Questionnaire Study: Cegep Graduates. We also administered the measure to Dawson College two and three year diploma program graduates who were completing the measure in the context of Dawson's regular institutional follow-up of graduates. Questionnaires were sent in January and February 2004, approximately 10 months after graduation. Questionnaires were mailed to all students in January. As is customary at Dawson, two weeks later students who had not responded were sent the questionnaire package a second time. In both instances a stamped self-addressed envelope was enclosed.
Étudiant(e)s de niveau collégial ayant des incapacités College Students with Disabilities
33 33
Results
Open-Ended "Easier and Harder" Questions
Seventy of the 74 students Dawson current students with disabilities and 143 of the 154 nondisabled students answered the following two open-ended questions:
What factors have made your Cegep studies easier? What factors have made your Cegep studies harder?
A coding manual consisting of 60 categories of Facilitators and Obstacles was prepared based on responses of current students and graduates. Table 6 provides a listing. Two coders, trained to a minimum of 70% item-by-item inter-rater agreement (which required approximately 30 hours of training) who were blind to the participant's group, classified current Dawson students' responses to each question into the 60 Facilitator and 60 Obstacle content codes. Each of the 60 codes had both Facilitator and Obstacle definitions (e.g., family: one's family can be a facilitator or an obstacle, depending one the circumstances). Inter-rater agreement (%) is calculated as follows: 2 x Number of Agreements / (Number of codes recorded by Coder 1 + Number of codes recorded by Coder 2). Inter-rater agreements were assessed on 12 checks of reliability (6 checks of reliability on Obstacle and 6 on Facilitator questions for a total of 513 codes). Average inter-rater reliability for content was 76%. Two of the 12 checks of reliability fell below the target minimum of 70% (65% and 67%); in both instances the protocols coded since the last reliability calibration were redone. As an additional means of ensuring the integrity of coding, after all protocols were completed the two coders went back and jointly coded all instances of disagreement.
Étudiant(e)s de niveau collégial ayant des incapacités College Students with Disabilities
34 34
Étudiant(e)s de niveau collégial ayant des incapacités College Students with Disabilities
35 35
It should be noted that students with different impairments may require similar accommodations (e.g., extended time for exams) or disability specific accommodations (e.g., a sign language interpreter). Therefore, the percentage of responses that deal with accommodations should be interpreted in this light.
Facilitators. Results detailed in Figure 1 show that students with disabilities were most likely to indicate that disability-related accommodations were the most important Facilitators (ranked as part of the top 10-11 items). This includes: services for students with disabilities in general and specific disability related accommodations at Dawson College such as the opportunity to pre-register for courses (this occurs before courses are made available to other students), having a quiet place to take exams, extended time for exams and assignments, having a note taker in class, and the MEQ as well as college policies which permit students with disabilities to take a reduced number of courses and still be considered "full time students."
Five of the top 11 items are not specifically disability related and are shared by nondisabled students. These include: good teachers (this ranks in third place for students with disabilities and in first place for nondisabled students), the Cegep environment, the availability of computers on campus, and the Dawson Learning Center (which assists with studying, writing, and exam taking skills and provides tutoring), and the availability of support and help.
Important items unique to nondisabled students are the facilitating role of: friends, the library, having a good schedule, diversity of course offerings, their financial situation, and good study skills. These relationships are best seen in Table 7 below, where common items are highlighted.
Table 7
Top Ranked Facilitators For Current Students In Rank Order
Students with Disabilities Nondisabled Students
accommodations: services for students with disabilitiesaccommodations: pre-registrationteachers (good)accommodations: exam roomaccommodations: timeaccommodations: note takeravailability of computerscourses: fewCegep environmentlearning center - tutorsupport/help (good)
Note. Common items are boxed.
Étudiant(e)s de niveau collégial ayant des incapacités College Students with Disabilities
teachers (good)friendslibraryCegep environmentavailability of computersschedule (good)courses variety of offeringslearning center - tutorfinancesstudy skillssupport/help (good)
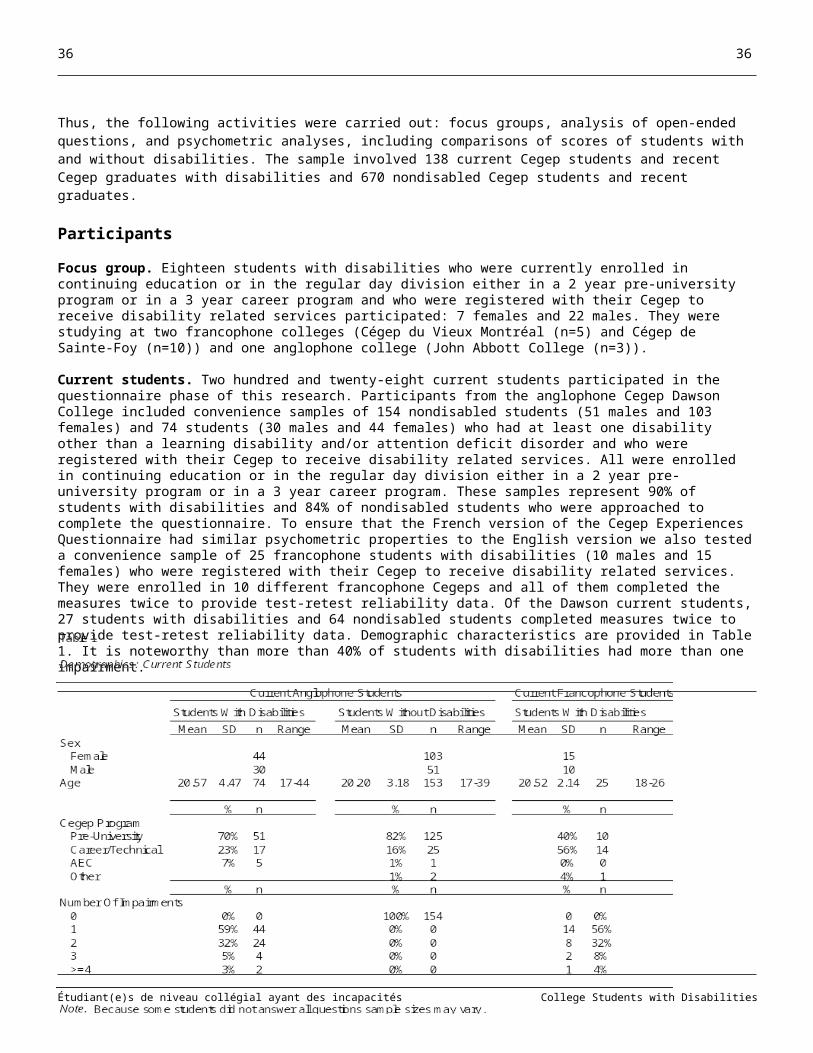
36 36
Étudiant(e)s de niveau collégial ayant des incapacités College Students with Disabilities
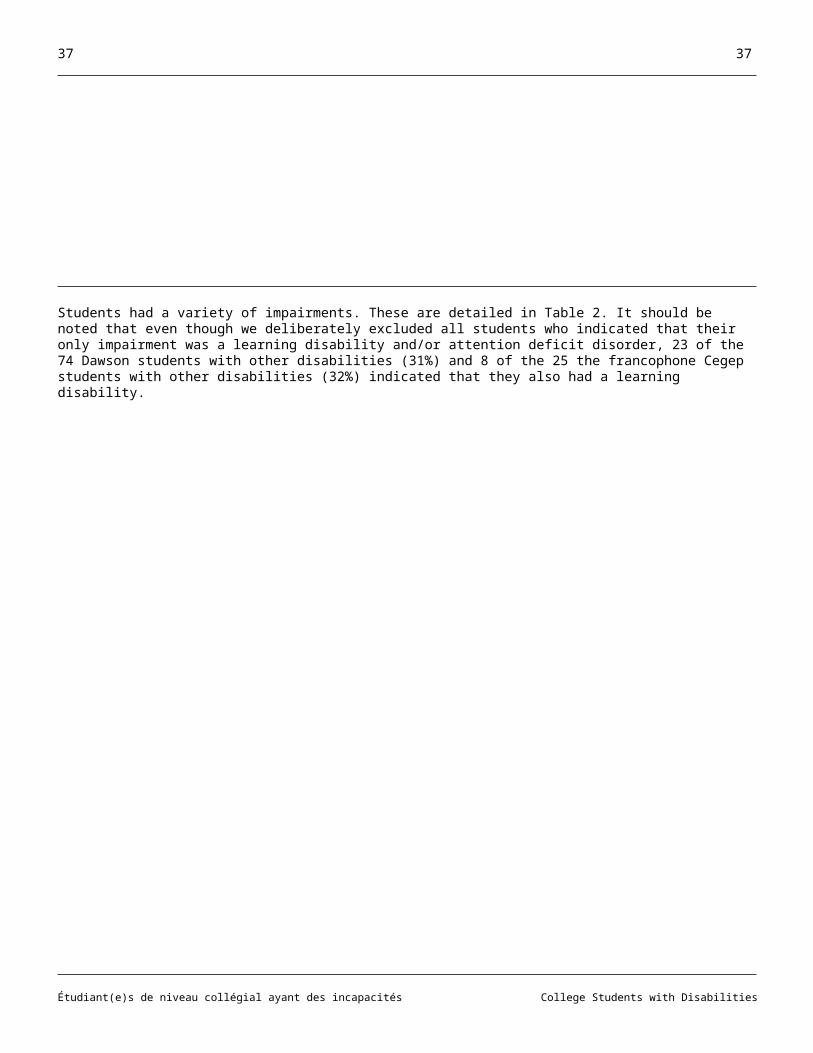
37 37
Obstacles. The obstacles noted by students with and without disabilities are detailed in Figure 2. This shows that, in general, the obstacles noted by most students with disabilities are the same as those noted by nondisabled students: too many and difficult courses, poor study skills, bad schedules, the Cegep environment, and language issues such as not being sufficiently fluent in the language of instruction and professors with heavy accents.
For students with disabilities, again, disability related issues also posed important obstacles. For example, they noted that their disability and their health were obstacles, that there were problems related to the accessibility of their courses, and that the nature of accommodations and services for students with disabilities also caused difficulties. Nondisabled students noted a variety of obstacles including: difficulties with finances, holding a job, transportation problems, personal issues, high stress, and poor exam or assignment schedules. These relationships are best seen in Table 8 below, where common items are highlighted.
Table 8
Top ranked obstacles for Current students in rank order
Students with Disabilities Nondisabled Students
teachers (bad)courses: many disability/impairmentcourses: difficultstudy skillsschedule (bad)otherhealthaccessibility: coursesaccommodations: services for students with disabilities Cegep environmentlanguage
Note. Common items are boxed.
Étudiant(e)s de niveau collégial ayant des incapacités College Students with Disabilities
teachers (bad)courses: many languageschedule (bad)financesjobcourses: difficultCegep environmentstudy skillstransportationpersonalstressexams/assignments schedule
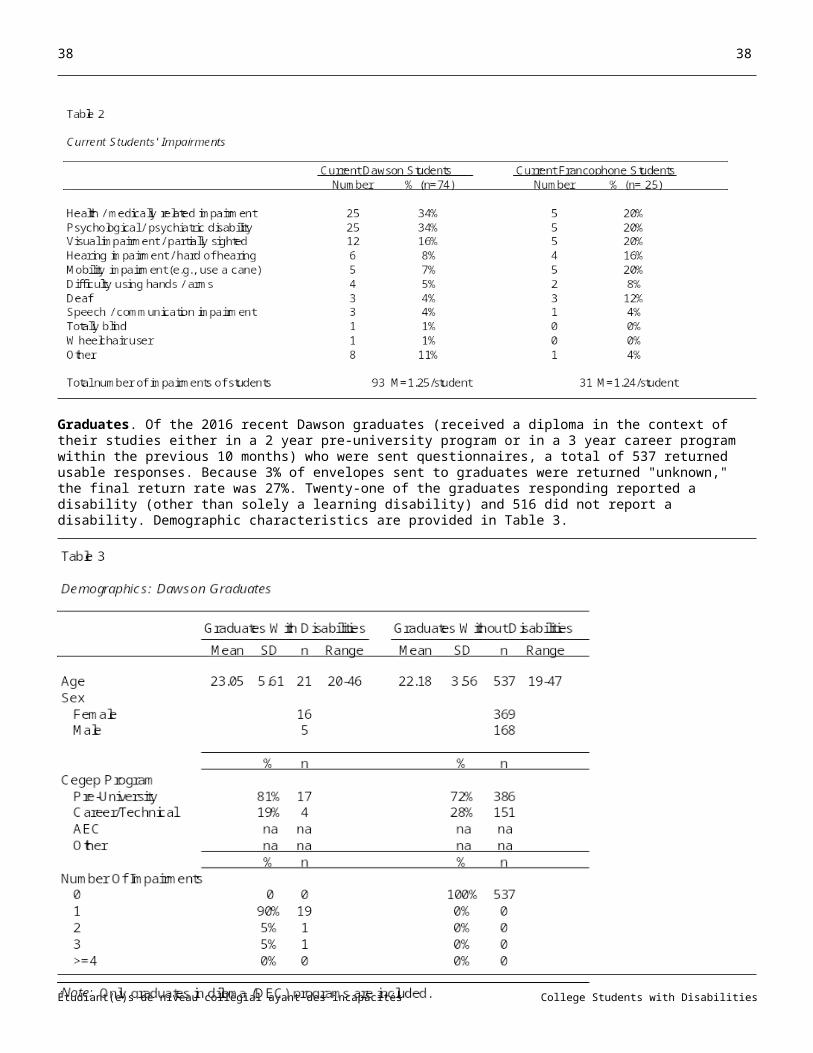
38 38
Étudiant(e)s de niveau collégial ayant des incapacités College Students with Disabilities
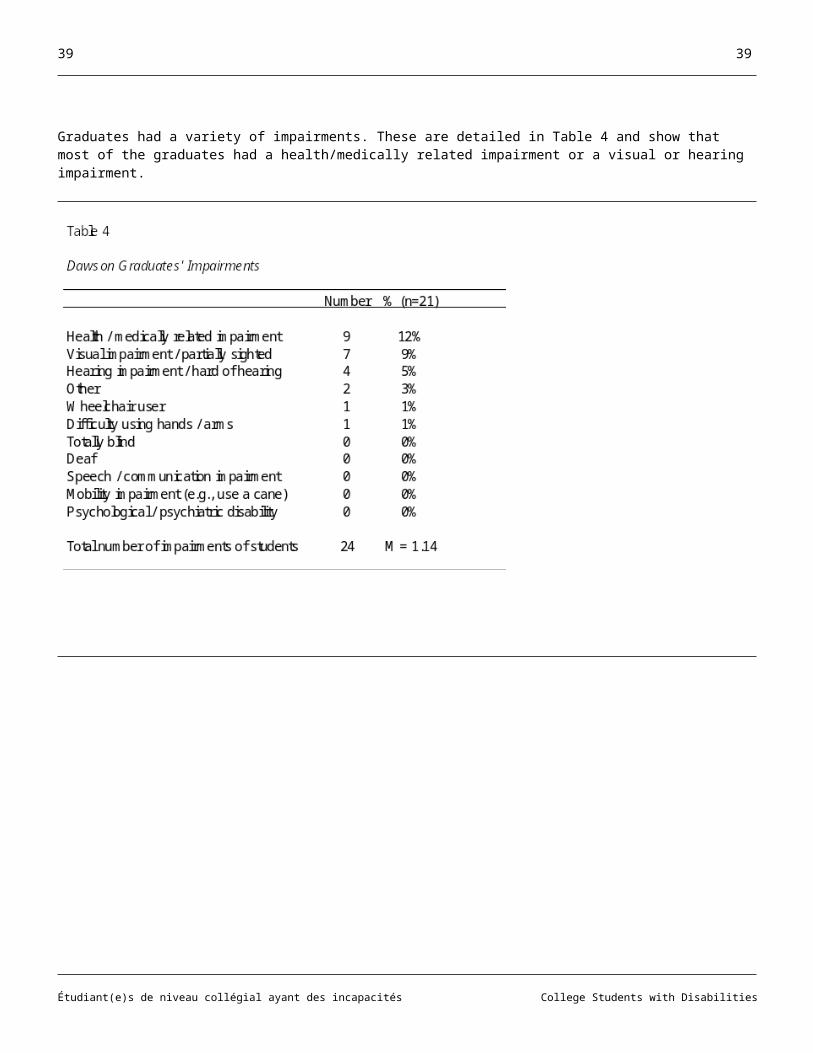
39 39
Commonalities between obstacles and facilitators. Some topics figured prominently as both an obstacle as well as a facilitator. For example, it can be seen in Table 9 that for both students with and without disabilities the environment of the Cegep, in this case Dawson College for all students, was seen both as a facilitator or an obstacle. The same is true of teachers. For students with disabilities, services for students with disabilities was also seen as both a facilitator and an obstacle. For nondisabled students this was true of study skills and finances.
Table 9
Commonalities Between Obstacles and Facilitators
Facilitators: Students With Disabilities Obstacles: Students With Disabilities
accommodations: services for students with disabilitiesaccommodations: pre-registrationteachers (good)accommodations: exam roomaccommodations: timeaccommodations: note takeravailability of computerscourses: fewCegep environmentlearning center - tutorsupport/help (good)
Facilitators: Nondisabled Students Obstacles: Nondisabled Students
teachers (good)friendslibraryCegep environmentavailability of computersschedule (good)course outlinelearning center - tutorfinancesstudy skillssupport/help (good)
Note. Boxed items are common to facilitators and obstacles.
Étudiant(e)s de niveau collégial ayant des incapacités College Students with Disabilities
teachers (bad)courses: many disability/impairmentcourses: difficultstudy skillsschedule (bad)otherhealthaccessibility: coursesaccommodations: services for students with disabilities Cegep environmentlanguage
teachers (bad)courses: many languageschedule (bad)financesjobcourses: difficultCegep environmentstudy skillstransportationpersonalstressexams/assignments schedule
40 40
Psychometric Analyses of the Cegep Experiences Questionnaire: Questionnaire Study
Two kinds of reliability were evaluated: temporal stability and internal consistency. Temporal stability was evaluated by correlating test-retest scores (both item-by-item and conceptual subscales). Internal consistency was evaluated by conducting item-total and item-subscale correlations as well as by Cronbach's alpha.
Even though validation was not part of the original scope of the project we did conduct some preliminary validation and hypothesis testing in addition to ensuring face validity.
Students made ratings on the 31 items of the Cegep Experiences Questionnaire using a 6-point Likert-type scale (1= major obstacle, 6=major facilitator). We grouped the 31 items based on face validity into three PPH model based conceptual subscales:
Personal Situation (9 items including 1 that is applicable to students with disabilities only) Cegep Situation (13 items including 1 that is applicable to students with disabilities only) Community Situation (9 items including 4 that are applicable to students with disabilities only) and a Total Scale (25 items are common to students with and without disabilities, 6 are applicable only to students with
disabilities).
To be consistent with the goals of providing a scale that can be used on an item-by-item basis as well as having subscales we computed subscale as well as total scores. Both were used in the analyses.
Étudiant(e)s de niveau collégial ayant des incapacités College Students with Disabilities
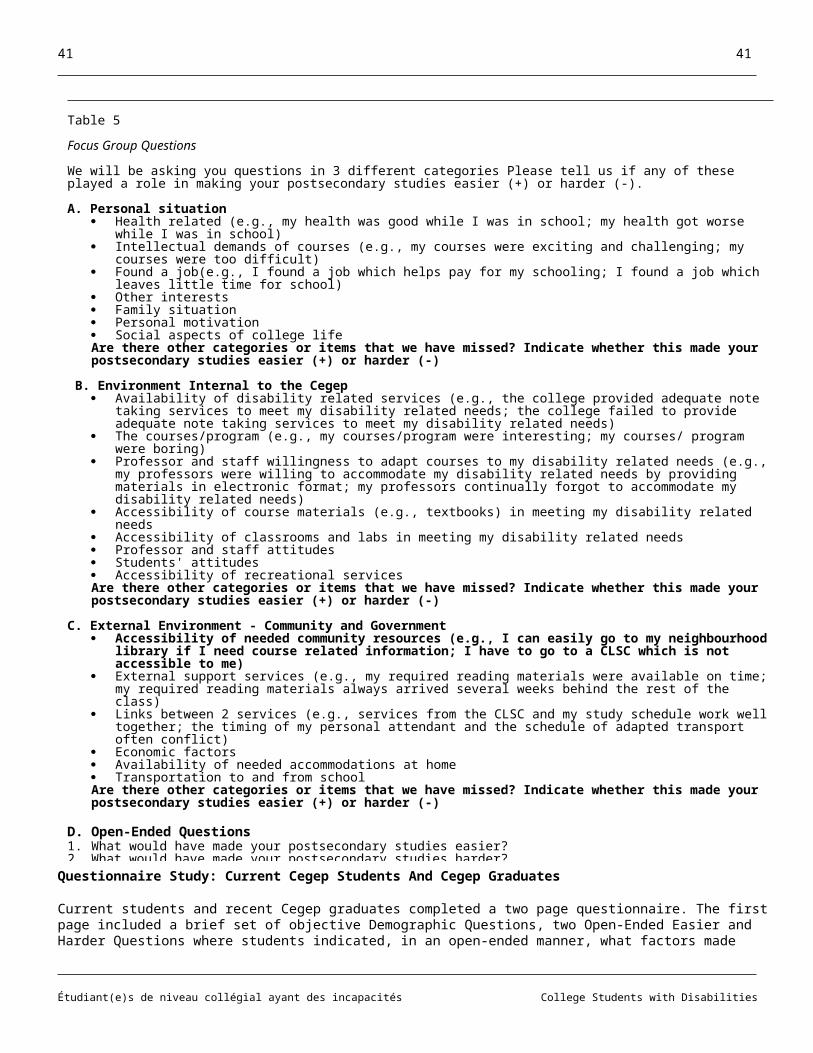
41 41
Temporal Stability: Test-Retest Reliability
To determine the temporal stability of items we performed Pearson product-moment correlations on the Test-Retest questionnaire scores of Dawson current students with (n= 27) and without (n=64) disabilities. Analyses were also conducted on the Cegep Experiences Questionnaire scores of francophone Cegep students with disabilities (n=25).
The results indicate that the Retest occurred approximately 6 weeks after the Test (Dawson students with disabilities M = 6 weeks, range = 4-31 weeks; Dawson students without disabilities M= 6 weeks, range 5-19 weeks; francophone Cegep students with disabilities M=6 weeks, range 5-9 weeks).
Overall Items. Scores of the Dawson current student samples were used to examine results on the three Overall Items: Personal situation, Cegep environment, and Community supports. These used Likert-type scaling (1 = much harder, 6 = much easier). The three items, which were based on the PPH model, asked participants to complete the three sentences below by putting a number between 1 and 6.
My overall personal situation made my Cegep studies______. The overall environment of the Cegep I attended made my Cegep studies______. Overall, community supports made my Cegep studies______.
Results presented in Table 10 show no significant differences between the two testing times for any of the questions for either sample. With the exception of one of the six coefficients (Community supports in the Nondisabled sample) the coefficients are highly significant and moderate to high in size (r vales range from .50 to .90). Since these are single items, which research has shown generally to have poor test-retest reliability, these findings indicate acceptable temporal stability for these items.
Étudiant(e)s de niveau collégial ayant des incapacités College Students with Disabilities
42 42
Étudiant(e)s de niveau collégial ayant des incapacités College Students with Disabilities
43 43
Cegep Experiences Questionnaire: Item-by-item evaluation. Data from all three samples of current students were used to examine the Test-Retest results for each of the 31 items. Results presented in Tables 11a, 11b and 11c show that the vast majority of correlation coefficients are of moderate to large size and highly significant. Moreover, of the myriad paired t-tests which compared Time 1 and Time 2 (i.e., Test-Retest) scores of Dawson and francophone Cegep students with disabilities, none was significant. In addition, while three comparisons on scores of Dawson Nondisabled students were significant before a Bonferroni adjustment to the alpha level was made, after the Bonferroni adjustment, none remained significant.
Étudiant(e)s de niveau collégial ayant des incapacités College Students with Disabilities
44 44
Étudiant(e)s de niveau collégial ayant des incapacités College Students with Disabilities
45 45
Étudiant(e)s de niveau collégial ayant des incapacités College Students with Disabilities
46 46
Cegep Experiences Questionnaire: Conceptual Subscale Scores. Only the Dawson samples were used to examine results on the three Conceptual Subscales that are comprised of Cegep Experiences Questionnaire items: Personal Subscale, Cegep Subscale, and Community Subscale. Items included in the Conceptual Subscales are indicated in Table 12 below (boxed items are part of the subscales for students with disabilities only). Total Scale scores are comprised of all items included in the three Subscales.
Table 12
Items Comprising the Conceptual Subscales
Personal Subscale
1. Financial situation2. Paid employment3. Family4. Friends5. Level of personal motivation6. Study habits7. Previous education experiences 8. Health9. Impact of my disability (if applicable)
Cegep Subscale
10. Difficulty of courses11. Course load12. Attitudes of professors13. Attitudes of non-teaching staff (e.g., registration, financial aid staff)14. Attitudes of fellow students15. Computers on campus16. Availability of course materials17. Accessibility of Cegep extracurricular activities 18. Willingness of professors to adapt courses to my needs 19. Accessibility of classrooms 20. Accessibility of labs 21. Accessibility of Cegep physical education courses22. Availability of disability related services at the Cegep (if applicable)
Community Subscale
23. Availability of financial aid24. Private tutoring25. Public transport26. Availability of computers off-campus 27. Computer technologies training off-campus28. Disability-related support services off-campus (if applicable)29. Availability of adapted transportation for people with disabilities (if applicable)30. Scheduling conflicts between disability-related support services (e.g., attendant, adapted transport) and school (if applicable)31. Availability of physical adaptations at home (e.g., ramp, lift) (if applicable)
Note. Boxed items are part of the subscales for students with disabilities only.
Étudiant(e)s de niveau collégial ayant des incapacités College Students with Disabilities
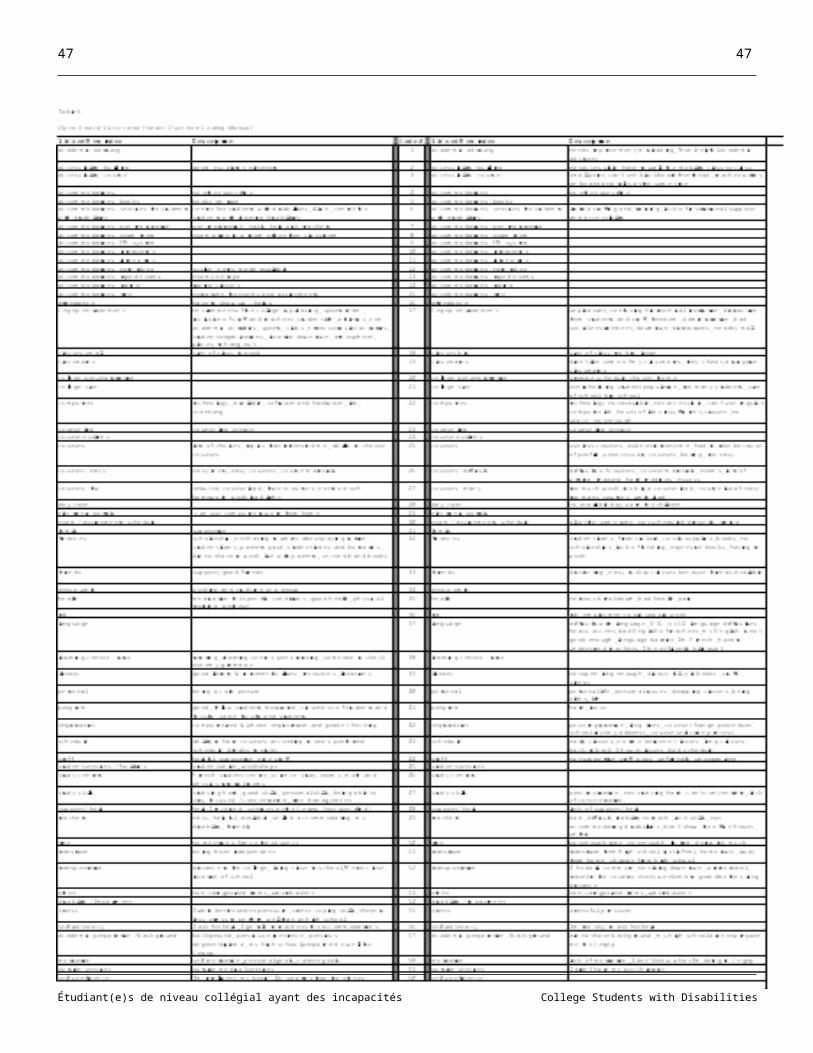
47 47
To compile Subscale scores, data from participants who answered a minimum of 50% of items on the Subscale in questions were used. This was also the case for Total Scale scores. Results presented in Table 13 show no significant differences between the two testing times for any of the questions for Dawson students with or without disabilities. All Test-Retest Pearson product-moment coefficients are moderate to large (r vales range from .52 to .80) and highly significant, indicating acceptable temporal stability for the Subscales.
Étudiant(e)s de niveau collégial ayant des incapacités College Students with Disabilities
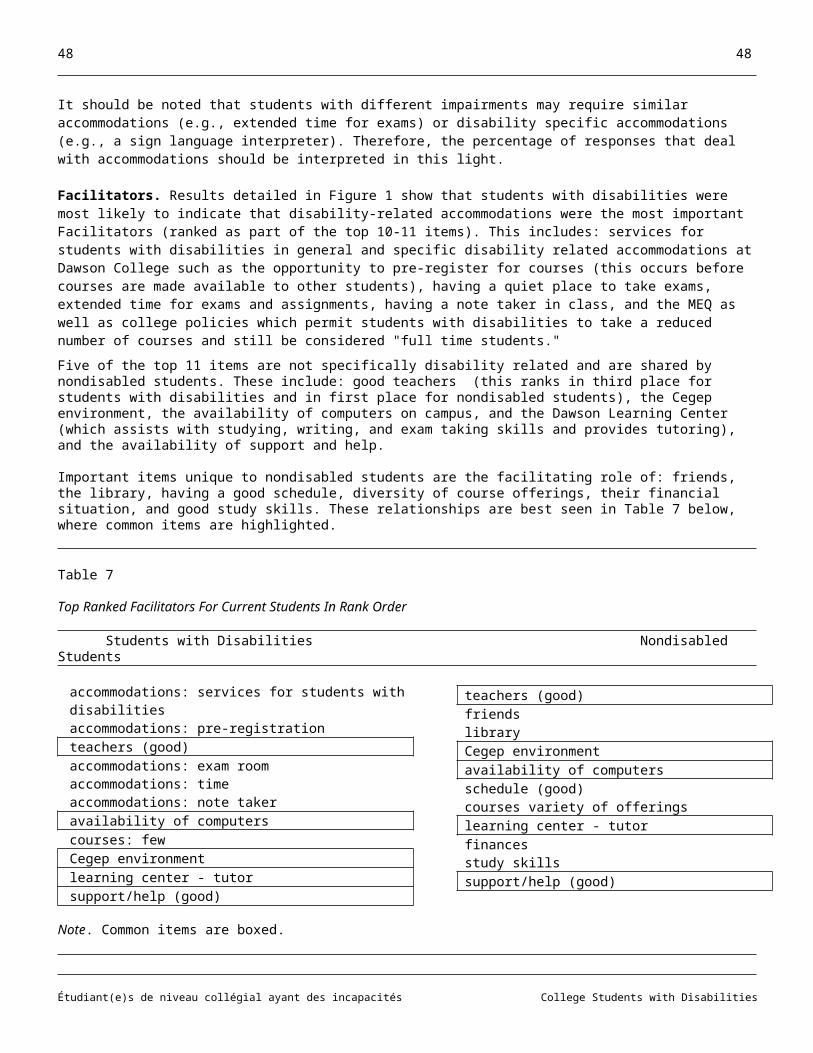
48 48
Internal Consistency Reliability: Cegep Experiences Questionnaire Conceptual Subscale and Total Scale Scores
Item:Total Correlations. Results on Item-Subscale correlations for current Dawson students with and without disabilities indicate that all items comprising the Subscales were significantly correlated with Conceptual Subscale totals. Table 14 presents the results.
Étudiant(e)s de niveau collégial ayant des incapacités College Students with Disabilities
Subscale-Total correlations for both Dawson Current Students With Disabilities (Personal, r(70) = .819, p = .000; Cegep, r(69) = .857, p = .000; Community, r(20)=.741, p=.000) as well as for Nondisabled Students show high and significant coefficients (Personal, r(151) = .799, p = .000; Cegep, r(152) = .856, p = .000; Community, r(109) = .714, p = .000).

49 49
Cronbach’s alpha. Cronbach’s alpha coefficients reported in Table 15 for all samples also indicate that the internal consistency of Conceptual Subscales is acceptable: scores range from .670 to. 973. Subscale scores for Students With Disabilities were calculated both including and excluding the disability specific items. Many of the items comprising the Community Subscale are disability specific. Because of the small sample of Dawson graduates with disabilities Cronbach's alpha for the Community Subscale for Dawson graduates could not be calculated.
Table 15
Internal Consistency of Conceptual Subscales and Total Scores for All Samples: Cronbach's Alpha
Current Students
Dawson Francophone Cegep n Alpha n Alpha
Students with Disabilities (common items: 25 items)Personal Subscale 32 .650 12 0.722Cegep Subscale 27 .897 7 0.811Community Subscale 15 .771 5 0.807
Students with Disabilities (disability specific items included: 31 items)Personal Subscale 31 0.716 12 0.670Cegep Subscale 27 0.904 7 0.875Community Subscale 6 0.973 5 0.846
Students Without Disabilities (common items: 25 items)Personal Subscale 97 0.769Cegep Subscale 95 0.789Community Subscale 57 0.707
Graduates
n Alpha
Graduates with Disabilities (common items: 25 items)Personal Subscale 11 .765Cegep Subscale 11 .889Community Subscale 0 n/a
Graduates with Disabilities (disability specific items included: 31 items)Personal Subscale 9 .750Cegep Subscale 5 .944Community Subscale 0 n/a
Graduates Without Disabilities (common items: 25 items)Personal Subscale 291 .744Cegep Subscale 274 .831Community Subscale 66 .801
Étudiant(e)s de niveau collégial ayant des incapacités College Students with Disabilities
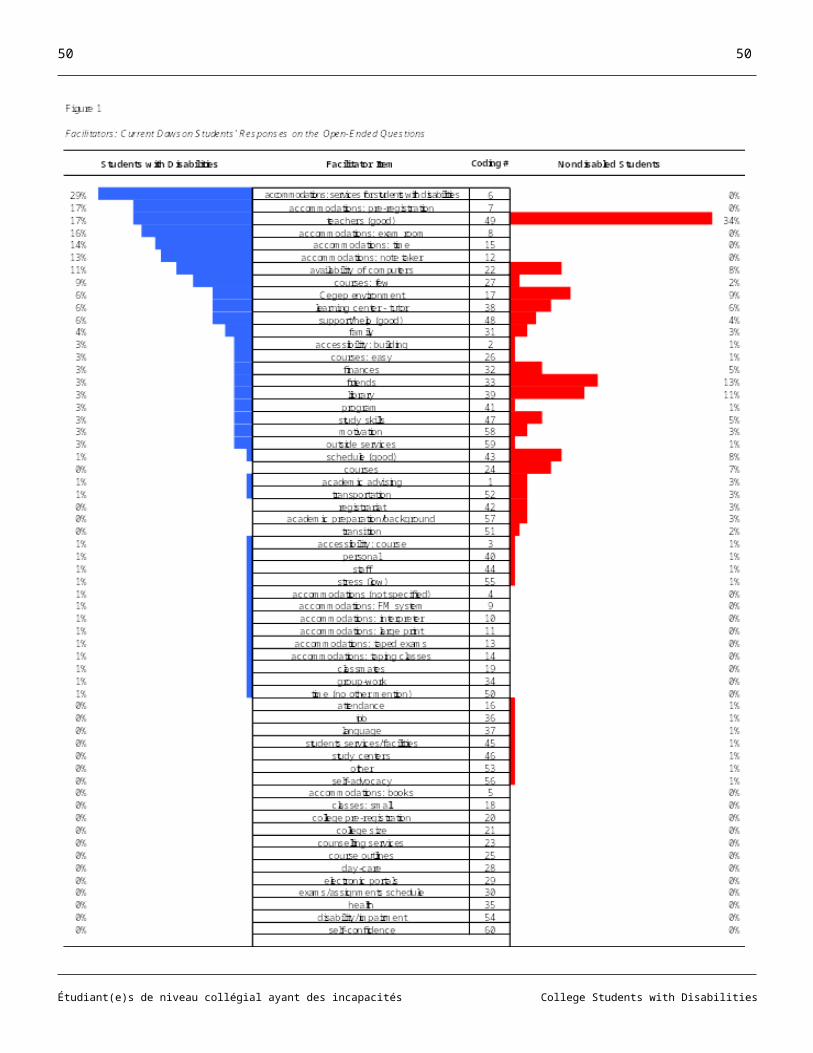
50 50
Relationships Between Cegep Experiences Questionnaire Scores And Other Variables: Validity
Relationships among subscales. Pearson product–moment correlation coefficients presented in Table 15 indicate modest significant correlations among Conceptual Subscales (these range from .365 to .469).
Table 16
Correlations Among Conceptual Subscales and Totals Scale Scores for Current Dawson Students
Nondisabled Students
Personal Subscale
Cegep Subscale
Community Subscale
Total Score
Personal Subscale Pearson rSignificance
NCegep Subscale Pearson r 0.440
Significance 0.000N 153
Community Subscale Pearson r 0.469 0.468Significance 0.000 0.000
N 111 111Total Score Pearson r 0.799 0.856 0.714
Significance 0.000 0.000 0.000N 153 154 111
Students with Disabilities
Personal Subscale
Cegep Subscale
Community Subscale
Total Score
Personal Subscale Pearson rSignificance
NCegep Subscale Pearson r 0.513
Significance 0.000N 70
Community Subscale Pearson r 0.664 0.365Significance 0.001 0.094
N 22 22 22Total Score Pearson r 0.819 0.857 0.741
Significance 0.000 0.000 0.000N 72 71 22
Étudiant(e)s de niveau collégial ayant des incapacités College Students with Disabilities
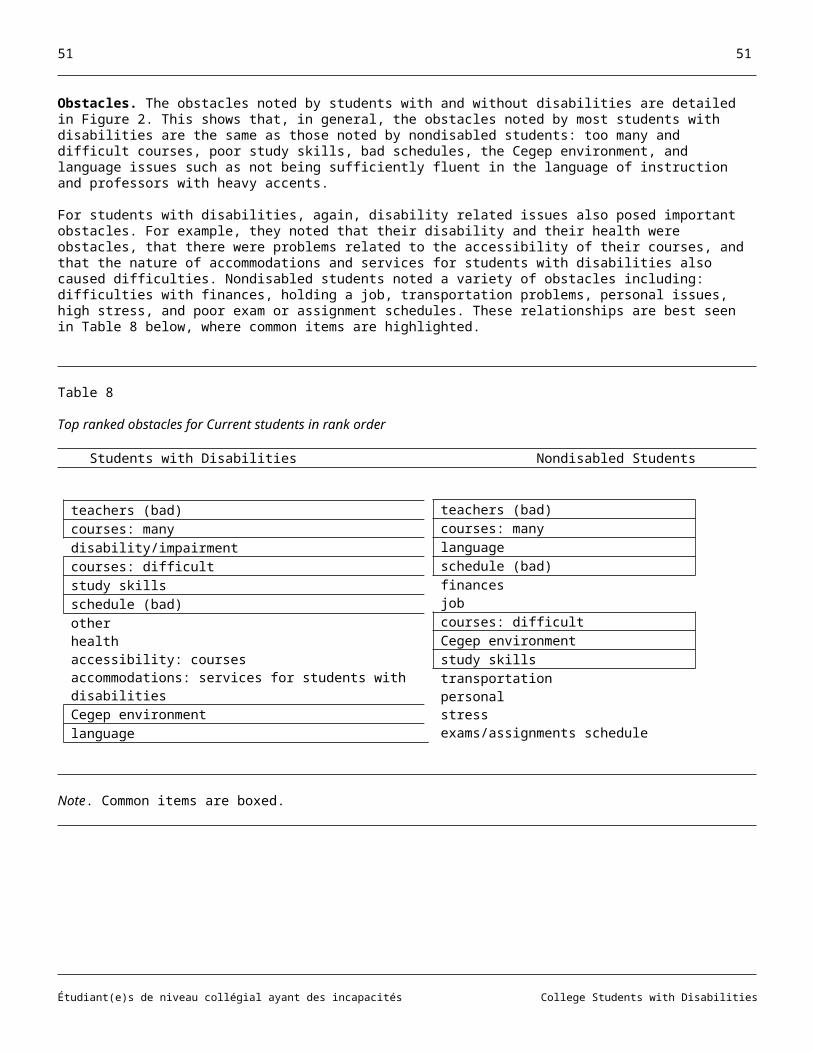
51 51
Overall Items. Conceptual Subscale and Total Scale scores were correlated with the three Overall Items. It can be seen in Table 17 that, with the possible exception of the Personal Subscale, Conceptual Subscale scores are not consistently related to Overall Item scores. Moreover, the Overall Item scores are related to each other, also suggesting that the three concepts: Personal Situation, Cegep Environment, and Government and Community Supports and Services are not independent. The significant correlations between Overall Item and Total Scale scores also suggest that this is true. Therefore, in subsequent analyses scores on individual items are examined. Although Conceptual Subscale scores are also included, these should be interpreted with caution.
Because of the difficulties noted above with the Conceptual Subscales, we conducted a principal components analysis on Dawson nondisabled graduates to validate the composition of the three Conceptual Subscales. Because of small sample sizes of participants with disabilities, both Current Students and Graduates, it was not appropriate to carry out analyses on their scores. Also, due to the small numbers responding to the items of the Community Subscale, items comprising this Subscale were omitted from the analysis. Thus, a principal components analysis was undertaken using the 20 common items that comprise the Personal and Cegep Subscales. Disability specific items were excluded. The results suggest that the Cegep Experience Scale has at least two Subscales. However Course load and Course difficulty loaded with the original Personal Subscale items rather than with the Cegep Subscale. The remaining items loaded, as expected, with the Cegep Subscale. Even though it was not possible to carry out a principal components analysis on scores of students with disabilities, nevertheless, the results of these analyses on nondisabled students are interesting and suggest that this approach may be followed using a larger sample of students.
Étudiant(e)s de niveau collégial ayant des incapacités College Students with Disabilities
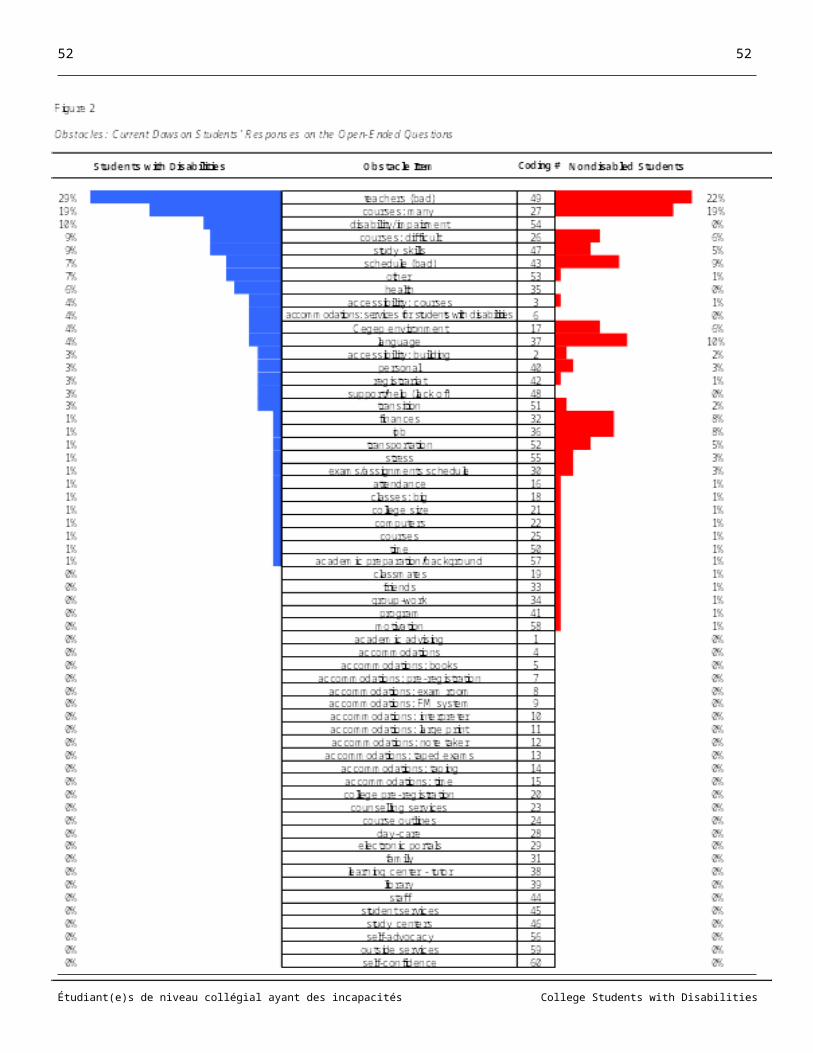
52 52
Table 17
Correlations Between Conceptual Subscales and Overall Items for Dawson Students
Personal Overall Cegep Overall Community Overall
Overall Scores Students with DisabilitiesPersonal Overall Pearson r
Significance
N
Cegep Overall Pearson r 0.396
Significance 0.001
N 70
Community Overall Pearson r 0.280 0.479
Significance 0.037 0.000
N 56 56
Conceptual SubscalesPersonal Subscale Pearson r 0.418 0.018 0.123
Significance 0.000 0.882 0.370
N 68 70 55
Cegep Subscale Pearson r 0.412 0.170 0.291
Significance 0.000 0.157 0.030
N 70 71 56
Community Subscale Pearson r 0.185 0.148 0.333
Significance 0.253 0.362 0.063
N 40 40 32
Total Scale Pearson r 0.443 0.053 0.262
Significance 0.000 0.666 0.056
N 68 68 54
Overall Scores Nondisabled StudentsPersonal Overall Pearson r
SignificanceN
Cegep Overall Pearson r 0.316
Significance 0.000N 140
Community Overall Pearson r 0.075 0.119
Significance 0.420 0.197N 119 119
Conceptual SubscalesPersonal Subscale Pearson r 0.431 0.337 0.339
Significance 0.000 0.000 0.000N 144 146 122
Cegep Subscale Pearson r 0.189 0.413 0.386
Significance 0.023 0.000 0.000N 144 146 123
Community Subscale Pearson r 0.225 0.138 0.302
Significance 0.021 0.160 0.003N 105 106 92
Total Pearson r 0.342 0.412 0.417
Significance 0.000 0.000 0.000N 144 146 122
Étudiant(e)s de niveau collégial ayant des incapacités College Students with Disabilities
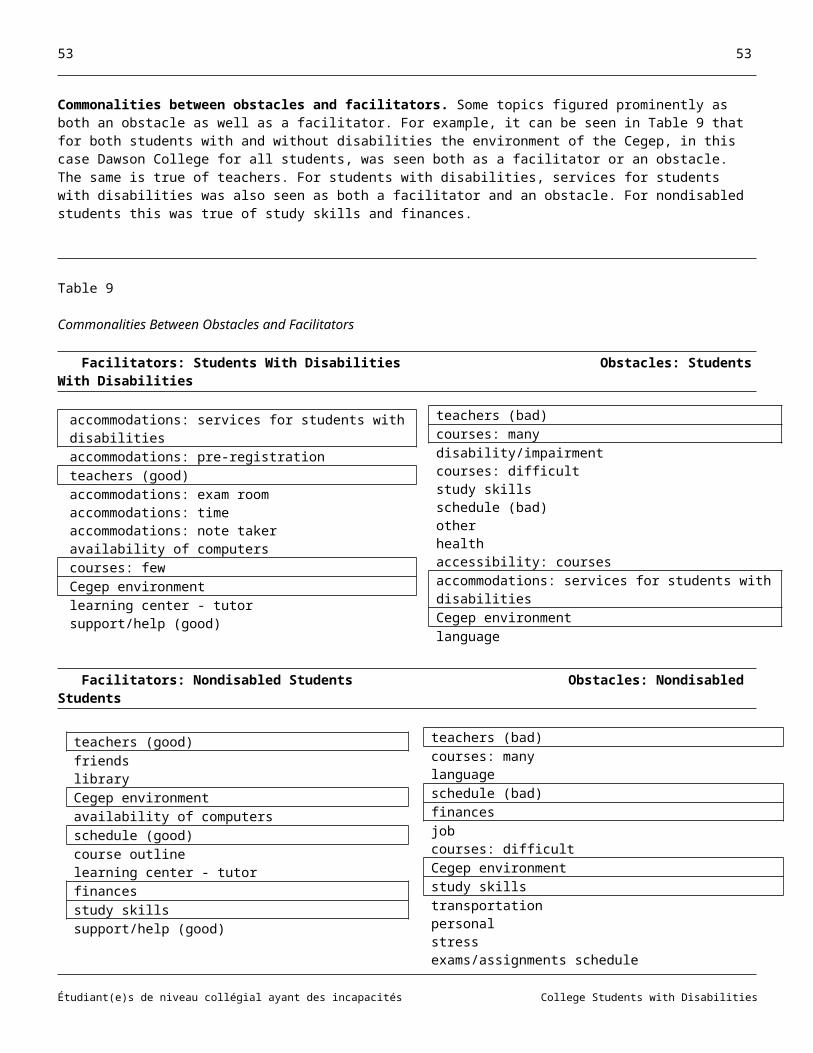
53 53
Note. Boxed items denote significant findings.Number of students' impairments. We expected that the more impairments students have, the more obstacles they would encounter. Correlations between the Number of Students' Impairments, Overall Items, and Cegep Experiences Questionnaire Conceptual Subscale and Item-By-Item scores for current Dawson Students With Disabilities are presented in Table 18. Results show that for all instances where there was a significant correlation, the more disabilities students had, the more likely they were to experience obstacles.
Étudiant(e)s de niveau collégial ayant des incapacités College Students with Disabilities
54 54
Similarities And Differences Between Students / Graduates With And Without Disabilities: Validity
We predicted that our samples with disabilities would differ from their nondisabled counterparts on several dimensions. To test the hypotheses, two types of analyses were carried out. First, we conducted a series of multivariate analysis of variance comparisons (MANOVAs) followed by analysis of variance comparisons (ANOVAs) and post hoc tests, as appropriate, on scores of Dawson Current Students and Dawson Graduates separately. Dependent variables were the three Overall Item scores and scores on all individual Cegep Experiences Questionnaire items. Disability specific items were not examined. The independent variable was Group (With or Without a Disability). Second, we conducted a series of discriminant analyses to determine whether item scores on the Cegep Experiences Questionnaire could predict group membership for Current Students and for Graduates With and Without Disabilities.
Overall Items. The MANOVA on the three Overall Items for Current Students was significant, Wilks’ λ = 0.877, F(3,68) = 7.84, p = 0.000. t-test results in Table 19 show a significant difference on the Overall Personal item only. In addition, there was a trend toward significance (i.e., p < .10) on the Community Overall item, suggesting that Students with Disabilities saw community and government supports and services to be more facilitating than did Nondisabled Students. The MANOVA on scores of Graduates was not significant (note that there were only 21 Graduates with Disabilities). Nevertheless, it is interesting that the pattern of the means in the two samples - Current Students and Graduates - are in the same direction, with Personal factors making studies less easy and Cegep and Community related factors making studies more easy for Students and Graduates with Disabilities compared to their Nondisabled peers.
Evaluation of the rankings of Overall Items indicate that current Students and Graduates, both those With and Without Disabilities, rated Community Supports as making their studies easier and their Personal Situations as being the least likely to do so. But Students With Disabilities had especially low scores compared to their Nondisabled peers on the Personal Overall item and especially high rating on the Community Overall item. To explore this issue further, a 2-way mixed design ANOVA was performed with Group (With Disabilities, Nondisabled) being the between groups variable and Overall Situation (Personal Overall, Cegep Overall, Community Overall) being the repeated measure. Test results revealed significant main effects for Group, F(1,170)=3716.16, p<.000, showing that Nondisabled Students had significantly higher scores than Students with Disabilities, and for Overall Situation, F(2,340)=43.39, p<.000, showing that the three contexts differ significantly. Paired comparisons show that students' Community Overall situation makes things significantly easier than students' Cegep Overall situation, which, in turn, makes things easier than students' Personal Overall situation (p<.05). The Group x Situation interaction was also significant, F(2,340)=13.25, p<.000. Best seen in Figure 3, this shows that the Overall Personal situation of Students With Disabilities makes it significantly, and substantially, harder for students to succeed in college. Overall Community and Government supports, however, make it easier for all students, but especially for Students With Disabilities, to succeed.
Étudiant(e)s de niveau collégial ayant des incapacités College Students with Disabilities
55 55
Cegep Experiences Questionnaire: Subscale scores. To evaluate whether Cegep Experiences Questionnaire subscales followed the same pattern as that on Overall Items we graphed the scores of Dawson Current students With and Without Disabilities as well as those of Graduates. Results in Figures 4a and 4b show a very similar pattern, both to each other and to the results on Overall Items, with Community Subscales always being highest and with differences between Community and Personal Subscales being greatest for Students With Disabilities. Thus, the similar and consistent patterns suggest that there are differences that are important. In particular, the graphs suggest that the Personal situation of individuals With Disabilities makes it harder for them to succeed in college. Community and Government supports, however, make it easier for everyone, but especially for those With Disabilities, to succeed.
Étudiant(e)s de niveau collégial ayant des incapacités College Students with Disabilities
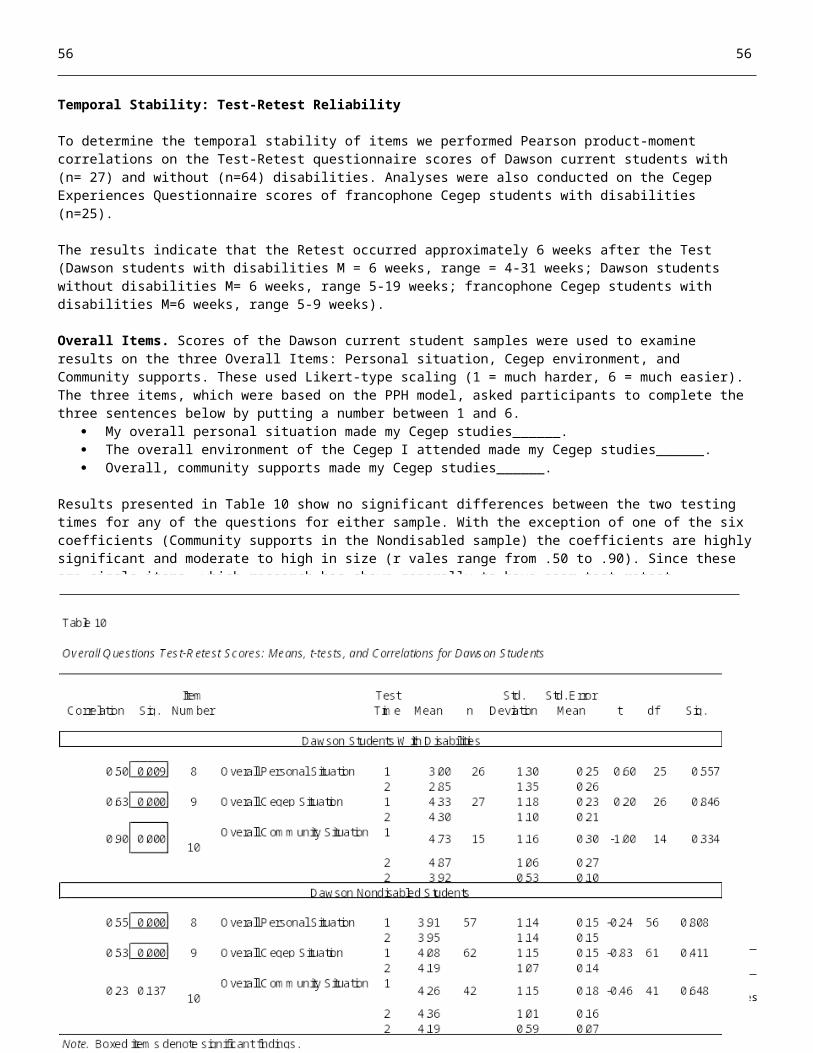
56 56
Cegep Experiences Questionnaire: Current Students. To evaluate similarities and differences between students with and without disabilities on Cegep Experiences Questionnaire items we conducted a series of multivariate analysis of variance comparisons (MANOVAs) followed by analysis of variance comparisons (ANOVAs) and post hoc tests, as appropriate, on scores of Dawson Current Students. Dependent variables were Cegep Experiences Questionnaire Personal, Cegep, and Community items
The MANOVA on Personal items was significant, Wilks’ λ = 0.611, F(8,120) = 9.56, p = 0.000. t-test results in Table 20 show that Students with Disabilities had significantly lower scores on the Health and Family items than their Nondisabled peers, indicating that Students with Disabilities are less likely to see their Families and their Health as facilitating their Cegep studies than did Nondisabled Students. Similarly, the t-test on Personal Subscale scores, too, was significant, showing lower scores for Students with Disabilities than for Nondisabled Students
The MANOVA on the Cegep items was not significant, Wilks’ λ = 0.856, F(12,109) = 1.53, p =.125. Nevertheless, because of the importance of knowing about similarities and differences, t-test were carried out. Results in Table 20 indicate significant (p<.05) differences on two items: Attitudes on nonteaching staff and Course load, with higher (more facilitating) scores on both for students with disabilities. However, once a Bonferroni correction was made to the alpha level, only the Course load item remained significant. The t-test on the Cegep Subscale was not significant.
The MANOVA on Community items was not significant, Wilks’ λ = 0.953, F(5,66) =.658, p =.657. Once more, t-test were performed nonetheless. Results in Table 20 indicate a significant (p<.05) difference on Private tutoring, with higher scores (more facilitating) for Students with Disabilities. After a Bonferroni adjustment, however, this item was no longer significant. The t-test on the Community Subscale was not significant.
It can also be seen in Table 20 that on the Overall Scale, t-test results show a significant difference, with Students with Disabilities having a lower score (less facilitating) that Nondisabled Students.
Étudiant(e)s de niveau collégial ayant des incapacités College Students with Disabilities
57 57
Étudiant(e)s de niveau collégial ayant des incapacités College Students with Disabilities
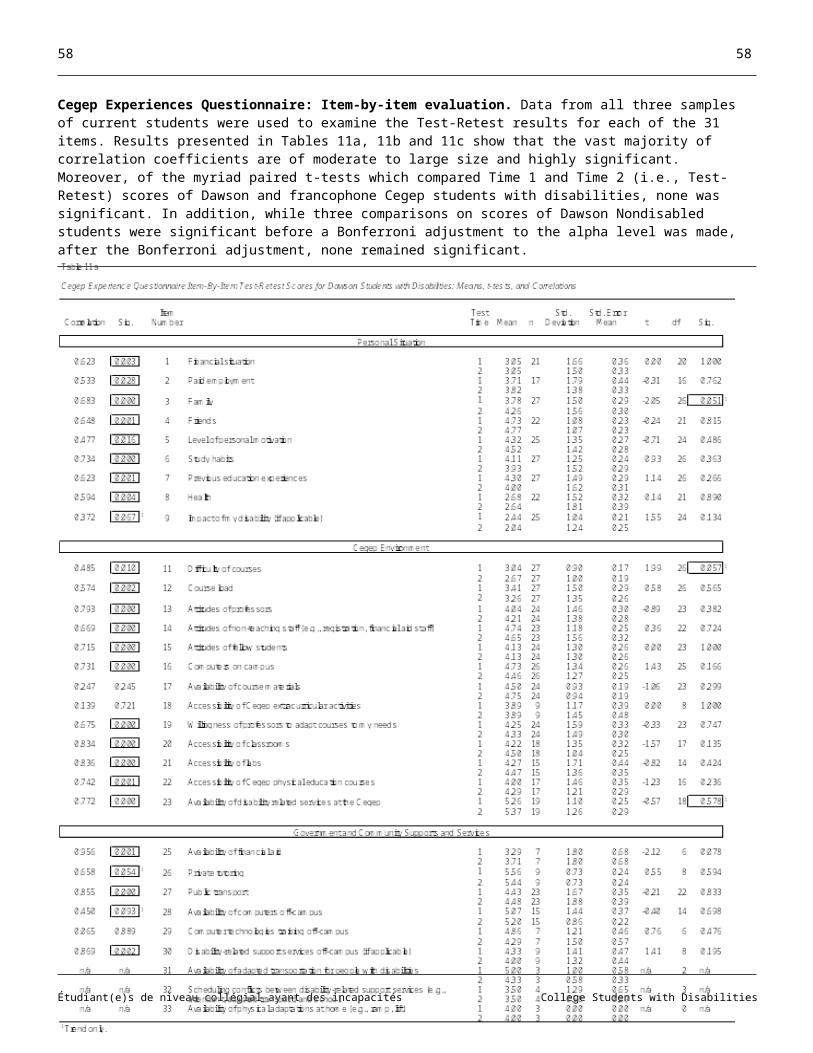
58 58
Cegep Experiences Questionnaire: Graduates. As was the case for Current Students, the MANOVA on Personal items was significant. Again, t-test results in Table 21 show that Students with Disabilities had significantly lower scores on the Health item than their Nondisabled peers, indicating that Students with Disabilities were more likely to see their Health as hampering their Cegep studies than were Nondisabled students. The t-test on the Personal Subscale was not significant.
The MANOVA on Cegep items was not significant, Nevertheless, because of the importance of knowing about similarities and differences, t-test were carried out. Results in Table 21 indicate significant (p<.05) differences on three items: Attitudes of professors, Willingness of professors to adapt courses to the student's needs, and Computers on campus. Computers on campus was scored lower by Graduates with Disabilities (less facilitating) while the two Professor items were scored higher (more facilitating) by Graduates with Disabilities than by Nondisabled Graduates. The t-test on the Cegep Subscale was not significant.
The MANOVA on Community items was also nonsignificant. Once more, t-tests were performed nonetheless. Results in Table 21 indicate a significant (p<.05) difference on Availability of financial aid, with higher scores (more facilitating) for Students with Disabilities. After a Bonferroni adjustment, however, this item was no longer significant. The t-test on the Community Subscale was not significant.
Étudiant(e)s de niveau collégial ayant des incapacités College Students with Disabilities
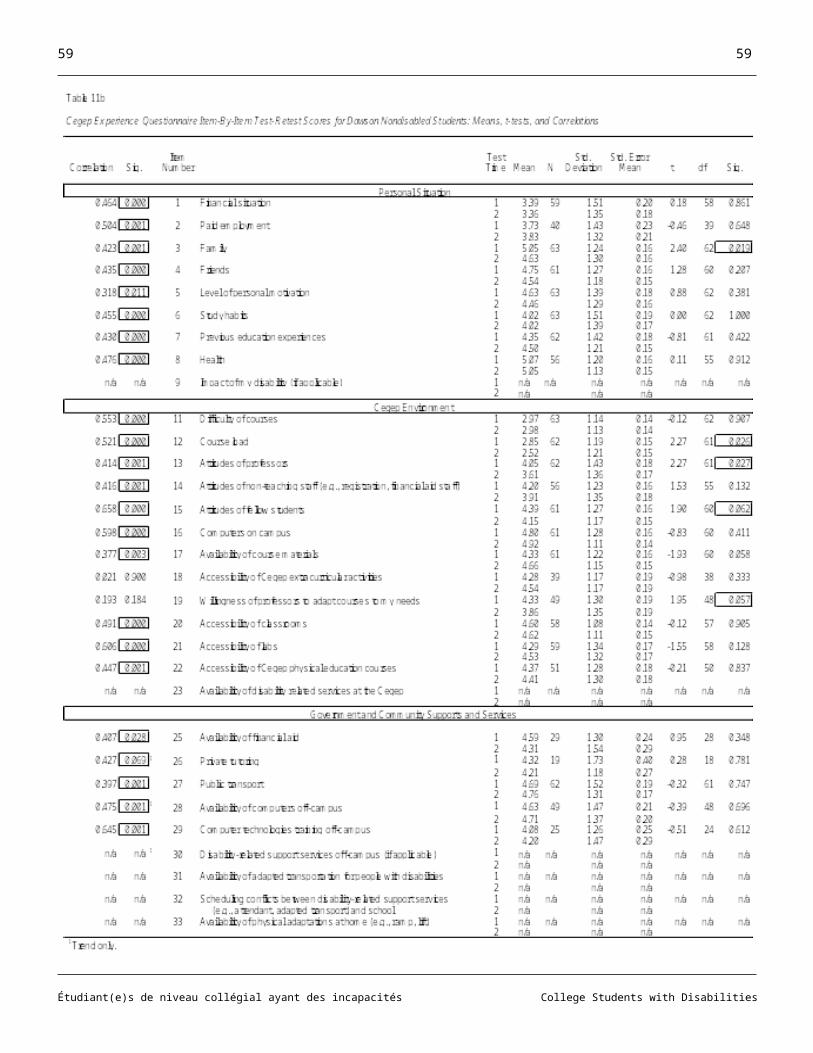
59 59
Facilitators and Obstacles Rankings: Validity
Current students. Table 22 shows the ranking of Obstacles and Facilitators for Current Dawson students. Results indicate that the availability of disability related services and accommodations was seen as the most important facilitator by students with disabilities. Scheduling conflicts between disability related support services, Health, and the impact of one's Disability were seen as the most important obstacles.
Although most items were seen as facilitating student success, the following were seen as obstacles by both Students With and Without Disabilities: Course load, Financial situation, and Difficulty of courses. Important facilitators for both groups were: Friends, Computers on campus, Availability of computers off-campus, Availability of course materials, Level of personal motivation, Accessibility of classrooms, and Accessibility of labs. Nondisabled students also saw Public transportation as a facilitator.
Although most topics had similar ranks for Students With and Without Disabilities, there were some discrepancies. These involve ratings of Private tutoring and the Attitudes of non-teaching staff being more likely to be seen as facilitators by Students with Disabilities than by Nondisabled Students, and Health being seen as more of an obstacle by them. Indeed, Health was the number one facilitator for Nondisabled Students, who also saw Family as a more important facilitator than did Students With Disabilities.
Étudiant(e)s de niveau collégial ayant des incapacités College Students with Disabilities
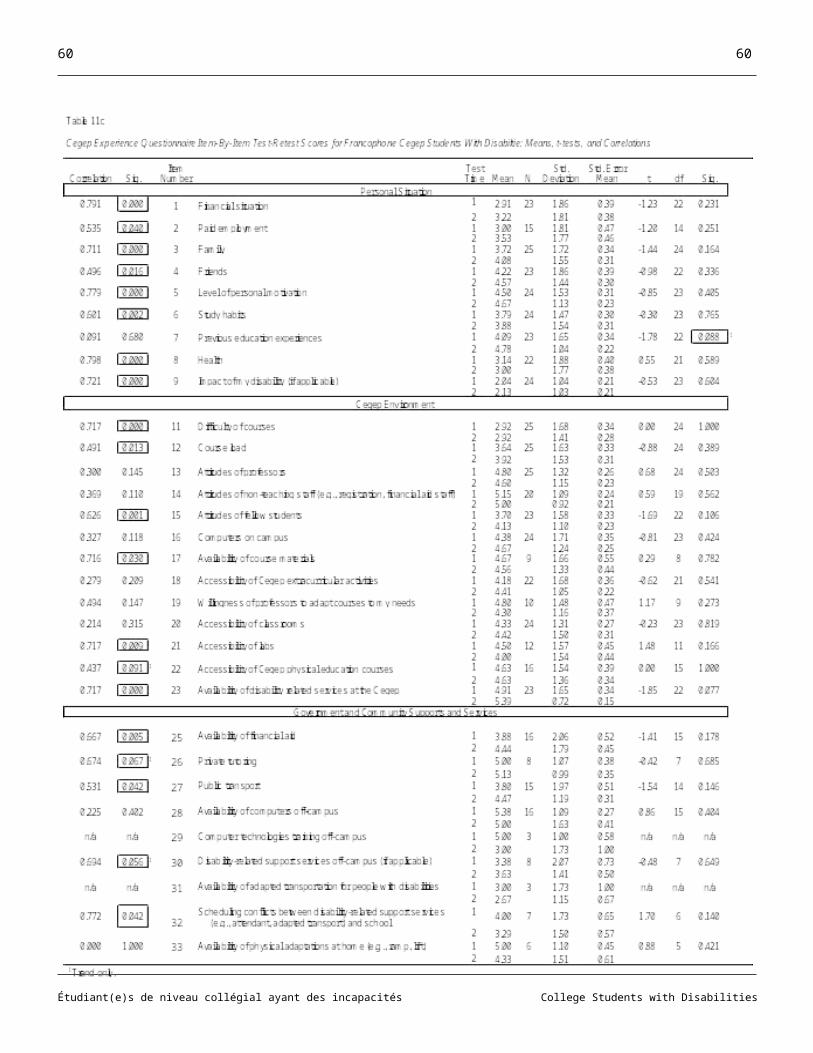
60 60
Graduates. When item means were ranked from highest (Facilitator) to lowest (Obstacle) based on mean scores, results in Table 23 show that, not surprisingly, the most important facilitator (i.e., ranked as number 1) reported by Graduates With Disabilities was the Availability of disability related services at the Cegep. This is similar to the ranking of Current Students With Disabilities.
It can also be seen in Table 23 that apart from the disability related items, Health ranked as the greatest Obstacle for Graduates With Disabilities whereas it ranked as one of the top three Facilitators for Nondisabled Graduates. Six of the 10 items with the lowest means for Graduates With Disabilities were also among the 10 with the lowest means for Nondisabled Graduates.
Most topics were seen as facilitating student success. Important Facilitators for both groups were: Availability of computers off-campus, Previous education experiences, Accessibility of classrooms, Friends, Availability of course materials, and Public transport. Nondisabled students also saw Family and the Accessibility of labs as important facilitators.
Although most topics had similar ranks for students With and Without disabilities here, too, there were some discrepancies. These involve ratings of Private tutoring, Availability of financial aid, and Willingness of professors to adapt their course to the student's needs being more likely to be seen as Facilitators by Students With Disabilities than by Students Without Disabilities, and Health being seen as more of an obstacle by them. On the other hand, Nondisabled Students saw Computers on campus as a more important Facilitator than did Students With Disabilities.
Étudiant(e)s de niveau collégial ayant des incapacités College Students with Disabilities
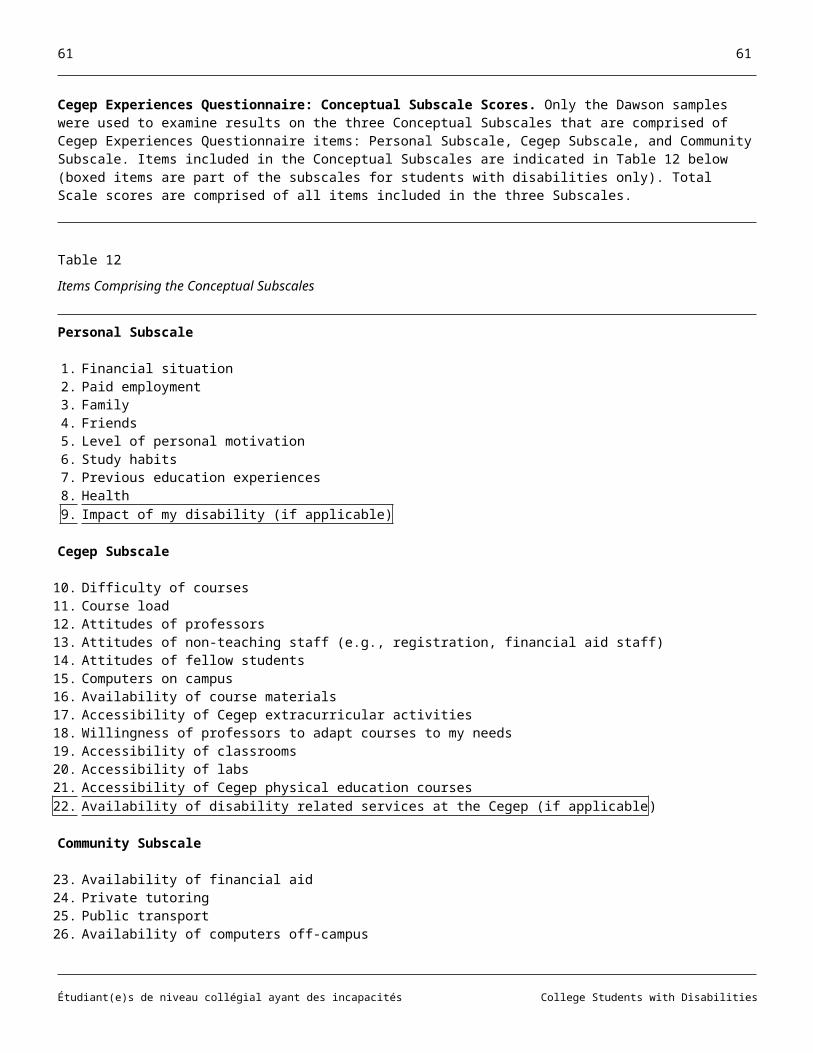
61 61
Percentages of Facilitators and Obstacles: Validity
We also examined the percentage of Obstacles (i.e., scores <3.5) and Facilitators (scores >3.5) noted by Current Dawson Students With and Without Disabilities. Results in Table 26 show that unlike Nondisabled Students, a larger percentage of Students With Disabilities saw aspects of their Personal Situation - in particular, their Health - a an Obstacle. For other items that are applicable to both groups, there were relatively few differences. Consistent with other analyses, both groups indicated that their Financial situation, the Difficulty of courses, and their Course load posed obstacles.
When it comes to disability specific items, data in Table 24 show that virtually all Students With Disabilities viewed the Availability of disability related services as a Facilitator, both on and off campus. They also saw the Availability of adapted transport as a facilitator as well as the Availability of physical adaptations at home. A large percentage of those students who require this indicated that Scheduling conflicts between disability related support services and school schedules are an Obstacle. Virtually all Students With Disabilities saw the Impact of their disability as an Obstacle.
Étudiant(e)s de niveau collégial ayant des incapacités College Students with Disabilities
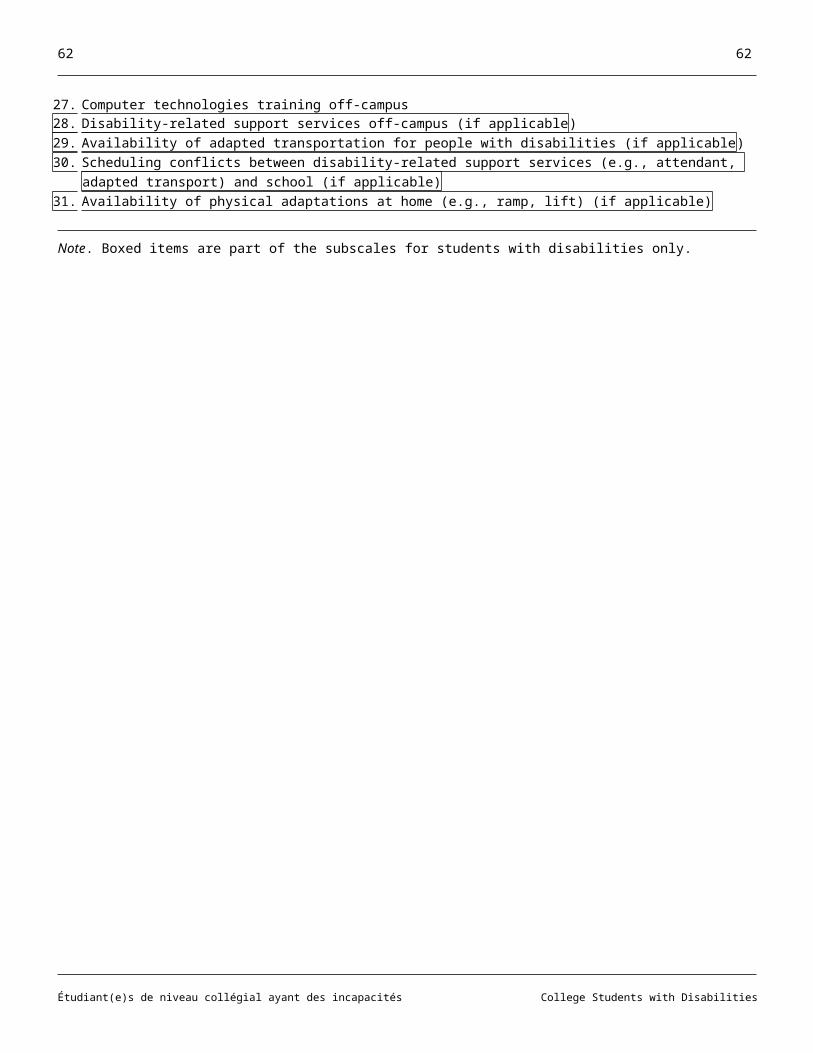
62 62
Discriminant Analysis: Cegep Experiences Questionnaire items. To evaluate whether Cegep Experiences Questionnaire items could predict Group membership (Student With and Without a Disability), a series of discriminant analysis evaluations were made; these were made separately for Dawson Current Students and for Graduates. Disability related items were excluded.
The analysis for Current Students showed that for Personal items, the overall Wilks’ lambda was significant, Wilks’ λ =.61, 2 (8, N = 127) = 60.65, p <.01), indicating that the predictors differentiated Students With and Without Disabilities. The discriminant analysis applied to Graduates produced a similar outcome (Wilks’ λ =.91, 2 (8, N = 302) = 29.40, p <.01). Table 25 shows the correlations between the predictor variables and the standardized weights for both Graduates and Current Students. It can be seen in Table 22 that the Health variable shows the strongest correlation with the discriminant function. This is consistent with the MANOVA analyses which showed a significant difference between scores of Students With and Without Disabilities on the Health item for both Graduates and Current Students. In order to take into account chance agreement, the Kappa coefficient was calculated. The following values were obtained: .59 (Current Students) and .34 (Graduates). These are moderate to low values, the value for a perfect classification being 1.
Table 25
Predicting Disability Status: Coefficients and Correlations with the Discriminant Function for Graduates and Current Students
Current Students GraduatesPredictors Correlation Coefficient Standardized Coefficient Correlation Coefficient Standardized CoefficientHealth .783 1.016 .725 .892Family .121 -.116 .209 .234Previous Education .032 -.086 -.218 -.388Paid Employment .022 .120 .174 .109Study Habits .009 .197 -.041 -.135Motivation -.018 -.454 .067 .209Financial Situation -.080 -.518 .090 -.058Friends -.148 -.274 -.290 -.645
The Wilks’ lambda was not significant for either the Cegep or the Community items for Current Students. The comparison was not possible for Graduates because of the small sample of Graduates With Disabilities.
Étudiant(e)s de niveau collégial ayant des incapacités College Students with Disabilities
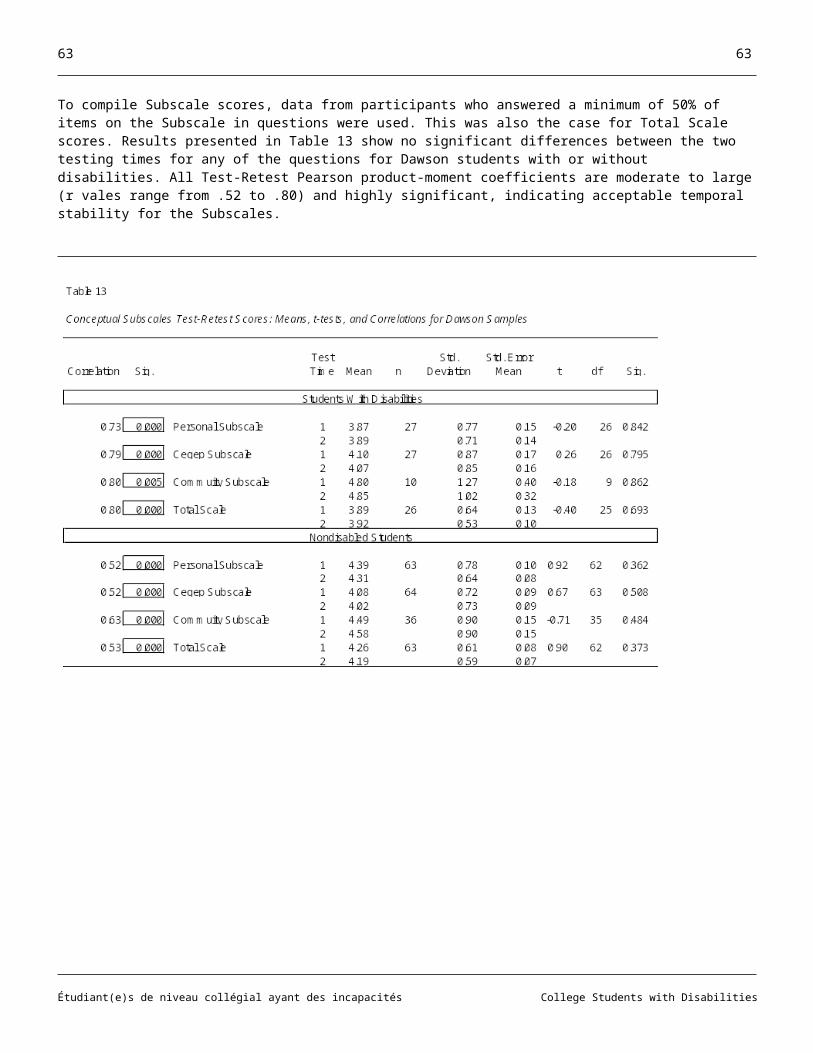
63 63
Similarities And Differences Between Students With Different Disabilities: Validity
In Table 26 Overall Situation scores and Cegep Experiences Questionnaire data are presented for students in each disability group. Because of small sample sizes, no inferential statistics could be computed.
Étudiant(e)s de niveau collégial ayant des incapacités College Students with Disabilities
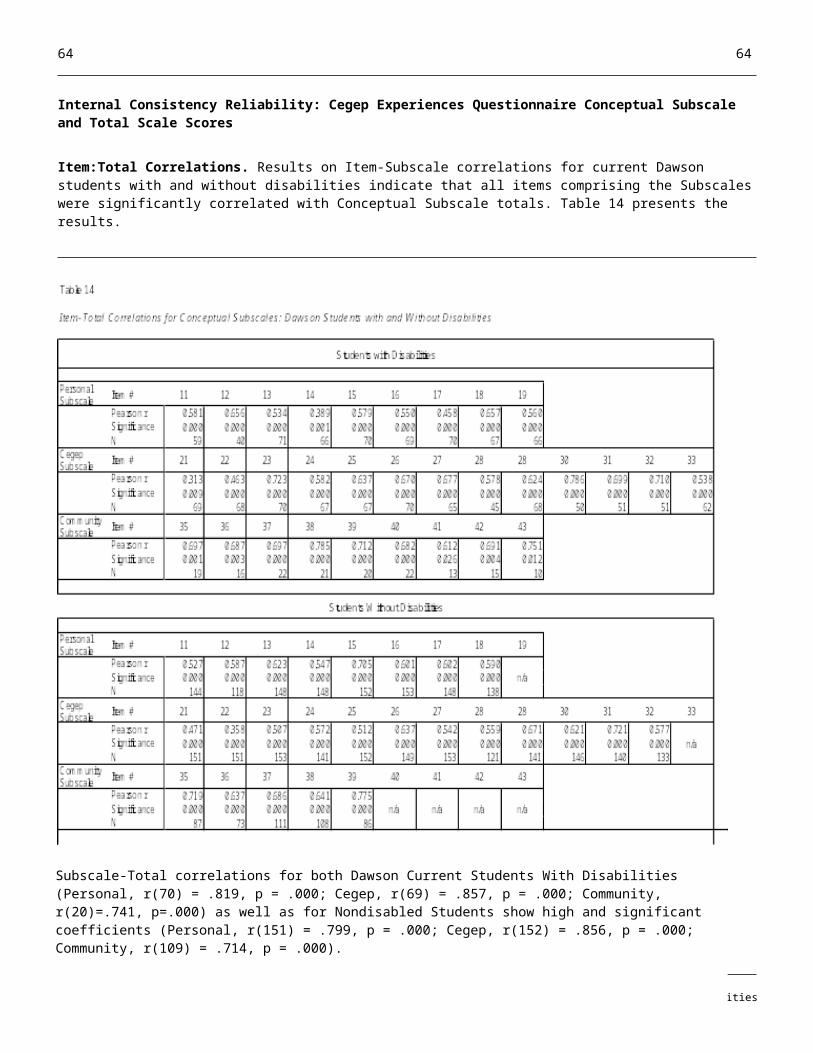
64 64
"Success" And Current Dawson Students' Scores On The Cegep Experiences Questionnaire: Validity
Retention rates. Dawson Current students who were enrolled in Winter 2004 were tracked to determine whether they had re-enrolled or graduated (i.e., were retained) in the following Autumn 2004 and Winter 2005 semesters. Students who were either still enrolled or who had graduated by the beginning of the Autumn 2004 semester were considered "successful." Thus, our measure used to determine success was retention rate, including graduations. Students who were no longer enrolled and had not graduated were considered "unsuccessful." Institutional data for 69 Current Students With Disabilities and for 149 Current Nondisabled Students were available for this analysis.
A Chi Square test was used to determine whether the retention rate of Students With Disabilities differed from that of students Without Disabilities. The Chi Square test and data in Table 27 show that there was no significant difference between the two groups for retention to either the Autumn 2004 or Winter 2005 semesters.
Table 27
Retention Rates Of Current Students With And Without Disabilities
Group
Enrolled in Winter 2004 Retained: Autumn 2004 Retained: Winter 2005
N Retained to Autumn 2004 (N)
% Retained to Autumn 2004
Retained toSpring 2005 (N)
% Retained to Spring 2005
Students with disabilities 69 64 92.8% 62 89.9%Students without disabilities 149 129 86.6% 119 79.9%Total 218 192 88.1% 182 83.0%
Comparisons of Successful and Unsuccessful participants' scores. To compare the Cegep Experiences Questionnaire scores of successful and unsuccessful students, single item scores of Dawson Current students were used to compare the group that was Retained (successful) and the group that was Not Retained (unsuccessful). This was done separately for the two groups: Students With and Without Disabilities.
Students with disabilities. A series of three MANOVAs on the Personal, Cegep, and Community item scores of Students With Disabilities who were Retained and Not Retained to the Winter 2005 term showed no significant differences. However, due to the relatively small sample size of the Not Retained group and the reduction in the sample size when a MANOVA is used, we conducted t-tests to compare the scores of Retained and Not Retained students. It can be seen in Table 28 that only two items were significantly different when this method was used: Health and Private Tutoring. However, neither of these items was significant after a Bonferroni adjustment was applied to the alpha level. Although not shown here, the pattern for the 2004 data was similar, with the exception that the comparisons on Previous educational experience, Accessibility of laboratories, and Computers off-campus were significant (p<.05 before a Bonferroni adjustment to the alpha level).
As can be seen from Table 28, the sample size for the group Not Retained is very small, in one case numbering only 2, and many large differences are not statistically significant. In this context, it should be noted that 80% of the differences favor (more facilitating) the Retained students and that the mean size of the difference for these items is .81, whereas the mean for items favoring the Not Retained group is only .24.
Étudiant(e)s de niveau collégial ayant des incapacités College Students with Disabilities
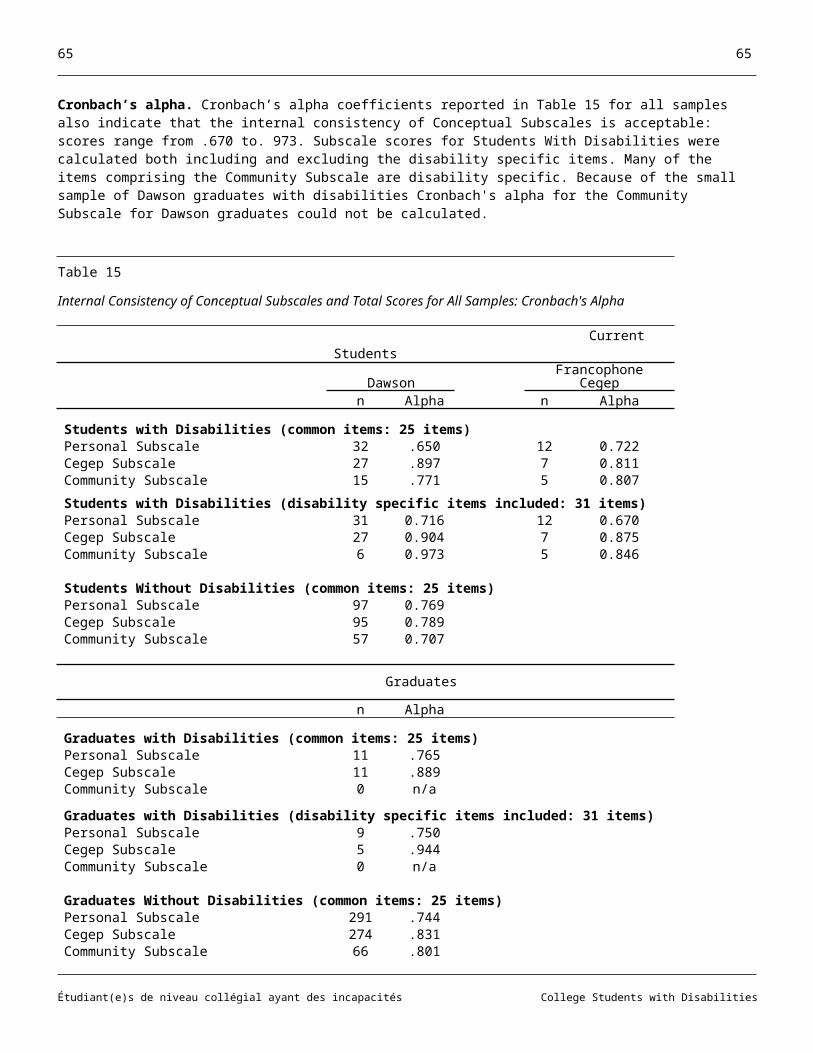
65 65
Étudiant(e)s de niveau collégial ayant des incapacités College Students with Disabilities
___________________________________________________________________________________________
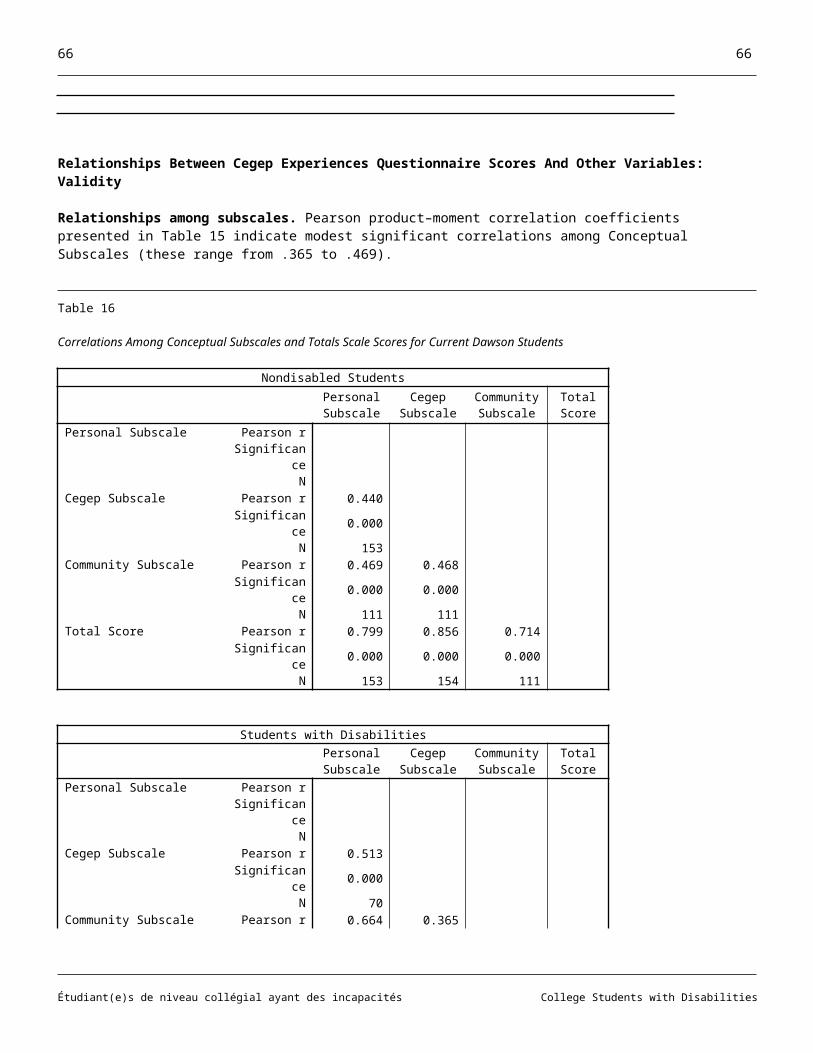
66 66
Nondisabled students. The three MANOVAs on the Personal, Cegep, and Community item scores of Nondisabled Students who were Retained and Not Retained showed no significant differences on either the 2004 or 2005 scores. However, due to the relatively small sample size of the Not Retained group and the reduction in the sample size when a MANOVA is used, we again conducted t-tests to compare the scores of Retained and Not Retained students. It can be seen in Table 29 that only two items were significantly different when this method was used: Accessibility of extracurricular activities and Public Transport. Although not shown here, the 2004 comparisons produced the same results with the exception that the Family item was significant (p =.007), with Retained students reporting that Family was more of a facilitator (M = 4.81, SD = 1.40 vs M = 3.84 SD = 1.61). However, none of these items remained significant after a Bonferroni adjustment was applied to the alpha level.
As can be seen from Table 29, the sample size for the group Not Retained is relatively small, and many large differences are not statistically significant. In this context, it should be noted that 68% of the differences favor (more facilitating) the Retained students and that the mean size of the difference for these items is .98, whereas the mean for items favoring the Not Retained group is only .22.
Étudiant(e)s de niveau collégial ayant des incapacités College Students with Disabilities
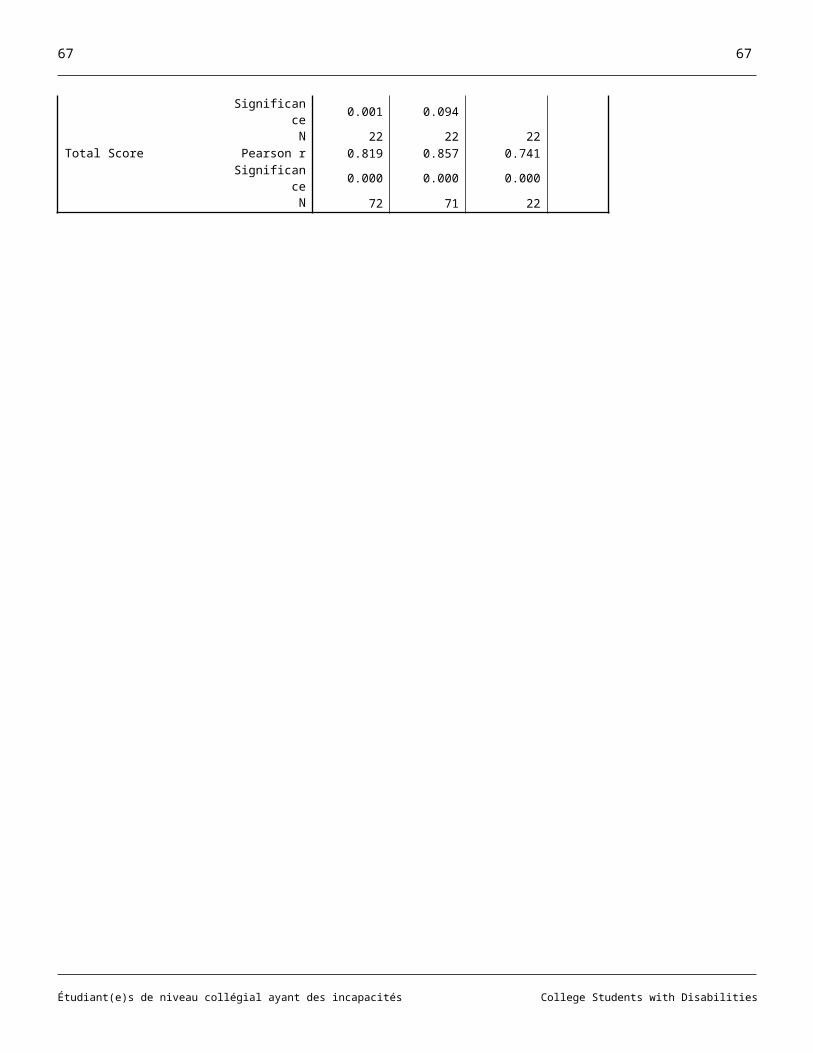
67 67
Summary and Discussion
Sample Characteristics
Before discussing the findings it is important to note that there were five distinct samples in this investigation. Different samples participated indifferent components of the research. The samples are
74 current Dawson students with disabilities 154 current Dawson nondisabled students 25 current francophone Cegep students 21 Dawson graduates with disabilities 537 Dawson graduates without disabilities
The mean age of current students from all three samples was very similar, 20 to 21 years, with a range of 17 - 44 years. Dawson graduates with disabilities were approximately 1 year older than nondisabled graduates (23 and 22, respectively). Approximately 1/3 of all five samples were male and 2/3 female. More than 2/3 of Dawson current students and graduates were enrolled in a two-year pre-university program, while the remaining students and graduates were enrolled predominantly in three-year career/technical programs. Slightly more than 1/3 of the students with disabilities from francophone Cegeps were enrolled in two-year pre-university programs, with the remaining students enrolled predominantly in three-year career/technical programs.
The most common impairments that current students reported were health/medically related impairments and psychological/ psychiatric disabilities. The next most common disability was a visual impairment followed by hearing and mobility impairments. The graduate sample reported no psychiatric/psychological impairments. Otherwise, the distribution of disabilities for graduates was similar to that of current students.
Slightly over ½ of the current students with disabilities had only one disability/impairment (56% Dawson, 59% francophone Cegep), with almost a third having 2 impairments (32% in both samples), and the rest having 3 or more impairments (8% Dawson, 12% francophone Cegep). Among Dawson graduates a much larger proportion had a single impairment (90%). It is noteworthy that even though we deliberately excluded students and graduates who indicated that their only impairment was a learning disability and/or ADD, almost a third of current students with other disabilities (31% Dawson, 32% francophone Cegep) indicated that they also had a learning disability and/or ADD.
Implications of the demographic findings for the interpretation of the results. While the demographic section serves to describe the samples, in the present context it also provides vital information that is needed to help interpret the results. First, there are numerous implications of the very small sample of graduates with disabilities. Our findings (Jorgensen et al., 2005) show that students with disabilities and nondisabled students graduate at the same rate. Nevertheless, the small proportion of students with disabilities in the Cegep system (Fichten et al., 2003, 2005) means very small samples for any one Cegep. Second, it is inappropriate to assume that the disability related obstacles and facilitators for students with one type of impairment are similar to those of students with a different impairment. For example, while most students with disabilities can benefit from lighter course loads and extended time for exams, it is primarily students with visual impairments and with learning disabilities who are likely to need materials in alternate formats. Students with psychiatric impairments and many medical conditions generally do not need this type of accommodation. Similarly, it is primarily students with mobility and neuromuscular impairments who need adapted transport, home care, and architectural modifications to their home. Students with many other impairments do not require this.
To make the Cegep Experiences Questionnaire comprehensive, we included items that are likely to be important obstacles or facilitators to students with specific disabilities (scores on each item for each disability group are available in the Results). This both increases certain types of validity (e.g., ecological validity, face validity) and complicates the evaluation of other types of validity because in certain cases this has meant very small numbers of students answering certain questions. It is party because of this phenomenon that we did not attempt to carry out a comprehensive evaluation of the validity of the measure. A study with larger samples which extends and builds on the present findings is currently ongoing in our laboratory (Fichten, Amsel, Barile, Fiset, Havel, Huard, James, Jorgensen, Juhel, Lamb, Landry, & Tétreault, 2004).
Étudiant(e)s de niveau collégial ayant des incapacités College Students with Disabilities
68 68
What Factors Make Cegep Studies Easier? Harder? Analysis of Open-Ended Responses
Part of the process of determining the psychometric properties of the Cegep Experiences Questionnaire involved analysis of the responses of current Dawson students with and without disabilities to the following two open-ended questions:
What factors have made your Cegep studies easier? What factors have made your Cegep studies harder?
The findings are interesting in their own right. It should be noted that depending on the specific student's situation and on the specifics of the environmental conditions, the same topic can be either an obstacle or a facilitator.
Facilitators. Consistent with reports by others (e.g., Skinner, 2004; Stewart & Morris-Wales, 2004), students with disabilities were most likely to indicate that disability-related accommodations were important facilitators. These included: services for students with disabilities in general and specific disability related accommodations at Dawson College such as the opportunity to pre-register for courses, having a quiet place to take exams, extended time for exams and assignments, having a note taker in class, and policies which permit students with disabilities to take a reduced number of courses and still be considered "full time students."
About half of the facilitators cited most frequently by students with disabilities were not disability related and were shared by students without disabilities. These include: good teachers, the overall Cegep environment, availability of computers on campus, availability of support and help, and the Dawson Learning Center. This Center provides tutoring and assists with studying, writing, and exam taking skills. Important items noted by nondisabled students, but not by students with disabilities, were the facilitating role of: friends, the library, having a good schedule, the variety of course offerings, their financial situation, and good study skills.
Obstacles. In general, obstacles noted by most students with disabilities are the same as those noted by nondisabled students: bad teachers, too many and difficult courses, poor study skills, bad schedules, the Cegep environment, and language issues such as not being sufficiently fluent in the language of instruction and professors with heavy accents. For students with disabilities, again, disability related issues also posed important obstacles. For example, they noted that their disability and their health were obstacles, that there were problems related to the accessibility of their courses, and that the nature of accommodations and services for students with disabilities also caused difficulties. Nondisabled students noted a variety of obstacles including: difficulties with finances, holding a job, transportation problems, personal issues, high stress, and poor exam or assignment schedules.
Commonalities between obstacles and facilitators. Depending on the student's situation and on the specifics of the environmental conditions, the same factor can be either an obstacle or a facilitator. For example, for both students with and without disabilities the environment of the Cegep, in this case Dawson College for all students, was highly ranked as both a facilitator and as an obstacle. The same was true for nondisabled students whose results show that study skills can be either a facilitator or an obstacle. The same was true for nondisabled students' finances as well as for services for students with disabilities for those students for whom this was relevant. Indeed, approximately half of all top ranked factors were also identified as obstacles (e.g., teachers, the Cegep environment, study skills).
The PPH model does not address the issues of a factor being both a facilitator and obstacle, nor does it specify that these can be. Although it does state that that factors are situational, in that it is the interaction between personal and environmental factors that create either barriers or facilitators. But one must note that the model addresses the issues from an individual rather than a group perspective.
It is these "common" frequently endorsed items that need to be paid special attention when trying to ensure that Cegeps provide a supportive environment to students. Future research needs to examine whether it is the same individual who has identified a particular item as both an obstacle and facilitators or whether it is different students who do this (e.g., designate the Cegep environment as a facilitator or an obstacle). Exploring this issue can help determine good student-Cegep environment fit, which may be especially important for students with disabilities. For example, if students who are blind typically indicate that the Cegep environment is an obstacle, while students with mobility impairments indicate that this is a facilitator, then the nature of environmental solutions to best resolve problems are likely to differ. In this instance the environment of the Cegep is a constant, so its evaluation as either an obstacle or a facilitator is the result of an interaction between individual student related aspects and the Cegep environment.
Étudiant(e)s de niveau collégial ayant des incapacités College Students with Disabilities
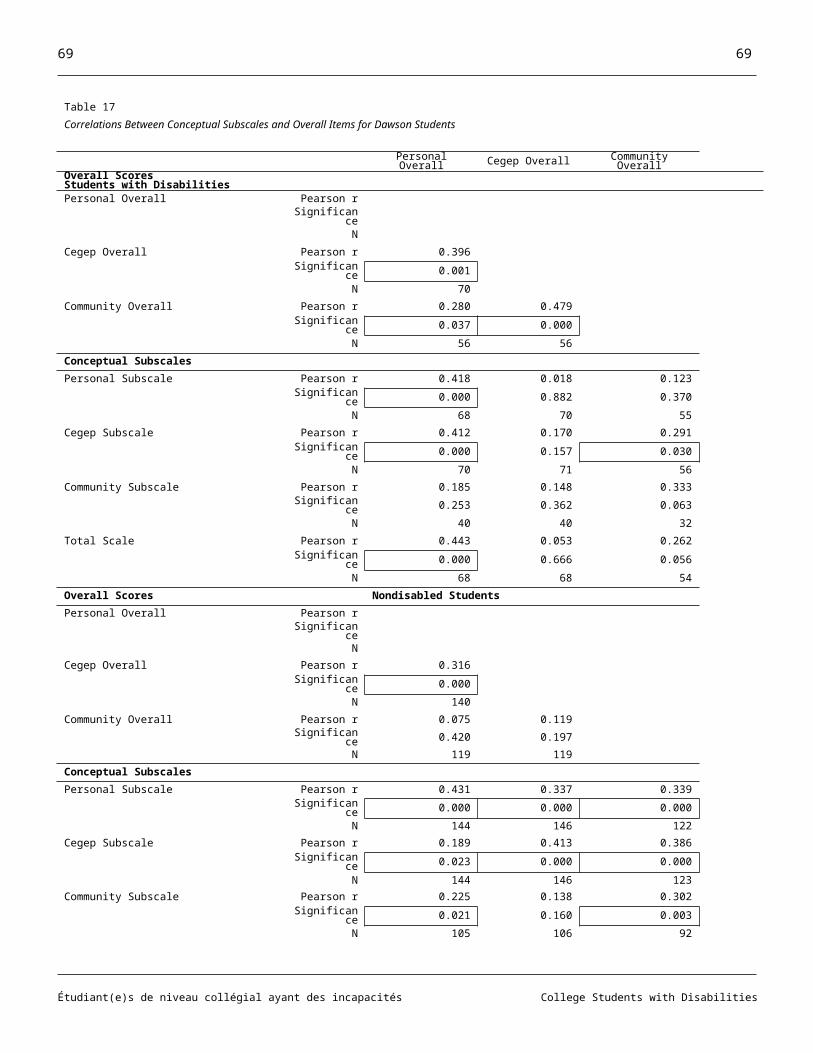
69 69
On the other hand, some obstacles and facilitators may not reflect a person-environment interaction, but, rather be exclusively based on the individual or exclusively be based on the environment. An example of an exclusively environmentally based evaluation would occur if virtually all students were to, for example, rate specific teachers as good and other teachers as bad. An exclusively individually based evaluation would mean that a single student evaluates specific teachers as good when most others evaluate the teacher as bad, or evaluates specific teachers as bad when most others evaluate them as good. That each of these situations can occur is evident from an examination of teacher ratings at RateMyTeachers.Ca (2005) and at RateMyProfessors.Com (2005).
Étudiant(e)s de niveau collégial ayant des incapacités College Students with Disabilities
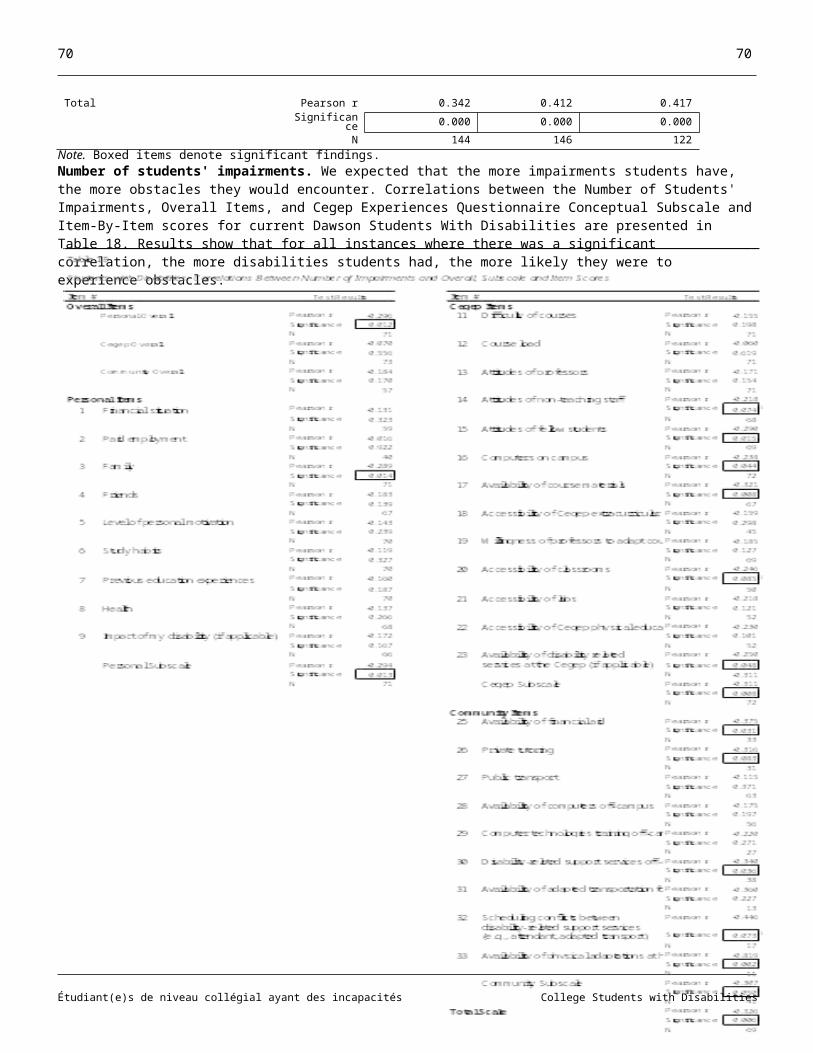
Developing the Cegep Experiences Questionnaire: Psychometric Evaluations and Hypothesis Testing
The measure we developed in this investigation is based on Fougeyrollas et al.'s (1999, 2001) PPH model. It evaluates obstacles and facilitators from three vantagepoints: (1) personal situation, (2) Cegep situation (environmental), and (3) government and community supports and services (environmental). Therefore, we grouped the 31 items of the Cegep Experiences Questionnaire based on face validity into three conceptual subscales and a total scale score:
Personal Situation (9 items including 1 that is applicable to students with disabilities only) Cegep Situation (13 items including 1 that is applicable to students with disabilities only) Community Situation (9 items including 4 that are applicable to students with disabilities only) Total Scale (31 items including 6 that are applicable to students with disabilities only; 25 items are common to both
students with and without disabilities)
To be consistent with the goals of providing a scale that can be used on an item-by-item basis as well as having subscales we computed subscale as well as total scores. Both were used in the analyses.
To develop the measure we undertook the following activities: conducted focus groups with students with different disabilities to obtain a first-hand notion about students' views about
obstacles and facilitators consulted with key informant disability service providers formulated equivalent English and French versions of the measure in a variety of alternate formats suitable for
administration to students with all types of disabilities pilot tested English and French versions of the measure in all alternate formats to ensure that items are not ambiguous and
to assure the usability and acceptability of the scale administered the measure to the five samples of current Cegep students and recent Cegep graduates with and without
disabilities described above conducted reliability assessment conducted preliminary tests of validity
The intent was to provide appropriate item content and format and to ensure the usability and reliability of the items. Validation, which requires much larger samples than those available in the present research, were planned for a future project.
Reliability
Two kinds of reliability were evaluated: temporal stability (test-retest) of single items, conceptual subscale, and total scale scores and internal consistency evaluations of subscale and total scale scores. For test-retest reliability, data from all three samples of current students were used: Dawson students with and without disabilities and current francophone Cegep students with disabilities. For internal consistency evaluations data from all five samples were used.
In general, test-retest reliability for all items, subscales, and total scores was good, suggesting that scores on the Cegep Experiences Questionnaire have good temporal stability. The same is true for evaluations of the internal consistency reliability of subscales and the total scores. Details are provided below.
Temporal stability. The mean test-retest interval was 6 weeks for all three groups of current students. Test-retest correlations were carried out and t-tests were used to assess differences between time 1 and time 2 scores. This was done separately for each of the three groups.
In general, test-retest correlations indicate good temporal stability for all items and subscales as well as for subscales and the total scale. The results show that the vast majority of correlation coefficients are of moderate to large size and highly significant and that none of the t-test showed significant differences on any of the variables evaluated. Of the six items that are related to students with disabilities, three community items relate to students with specific impairments; These items deal primarily with issues related to mobility impairments. Because there were few students with this disability in the sample, coefficients could not be calculated.
Research has shown that it is desirable to have scales and subscales because reliability of single items is generally poor. In our study, too, the test-retest results on subscale and total scale scores were more consistent, with correlations being higher for students with disabilities (range of coefficients for students with disabilities is .73 to .80, for nondisabled students it is .52 to .63). The better
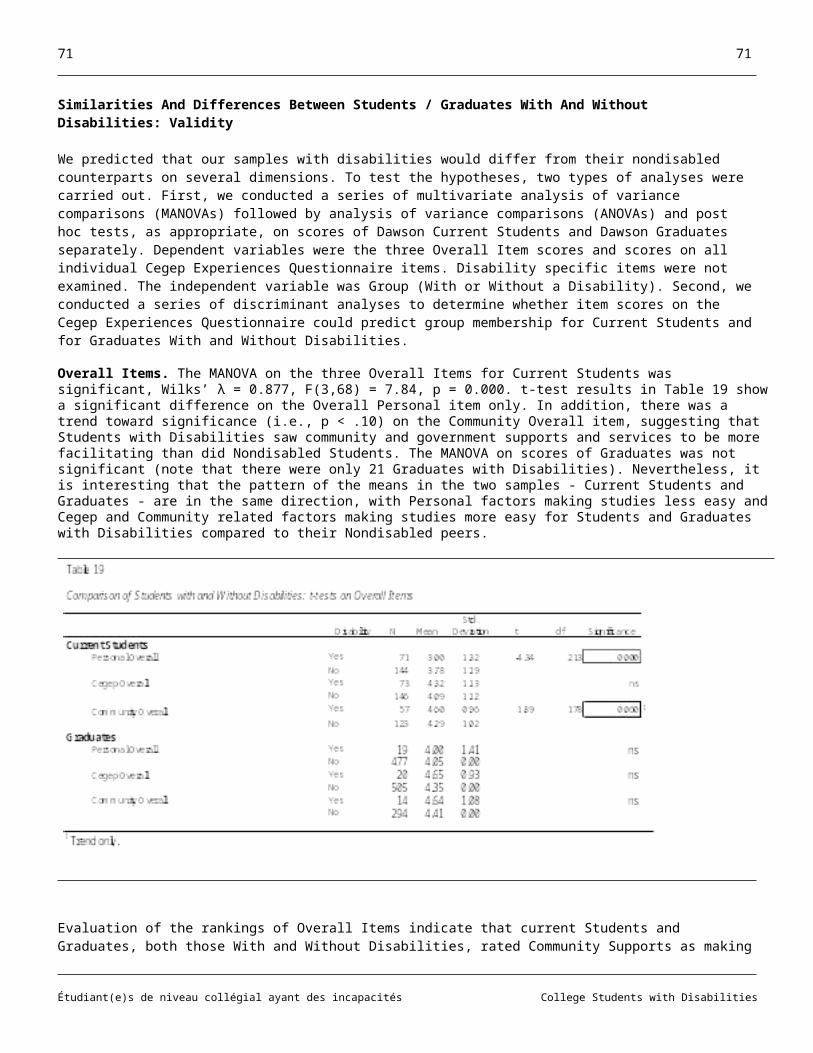
results for students with disabilities likely reflects the timing of test-retest evaluations: testing was done over the Christmas holidays for Dawson students with disabilities and during the course of the same semester for francophone Cegep students. Nondisabled students were tested first just before the start of classes in January, reflecting their experiences in the autumn term. Retest scores were obtained later during the semester.
Internal consistency. Internal consistency was evaluated by conducting item-total, item-subscale, and subscale-total correlations as well as by Cronbach's alpha. Results indicate good internal consistency for subscales and for the total score.
All item-subscale and subscale-total correlations were highly significant. It should be noted, however, that for some of the samples there were insufficient numbers of responses to compute scores for the community subscale. Coefficients for item-subscale scores range from a low of .313 to a high of .786. Subscale-total coefficients range from .714 to .857. Cronbach's alpha coefficients for subscales range from .670 to .973 and those for the total scale range from .744 to .889
Relationships Between Cegep Experiences Questionnaire Scores And Other Variables: Preliminary Validity Data
Even though validation was not part of the original scope of the present project we did conduct some preliminary validation and hypothesis testing. In general, individual items and total scale scores appear to have good validity. There are some difficulties with the validity of the conceptual subscales, however. We tried to use factor analysis to reformulate the content of the subscales. The findings on nondisabled graduates, the only sample large enough to permit this, suggest that only a minor adjustment to subscale composition is needed. We will examine the possibility of a different composition for subscales in the context of an ongoing study with larger samples (Fichten, Amsel, Barile, Fiset, Havel, Huard, James, Jorgensen, Juhel, Lamb, Landry, & Tétreault, 2004).
Cegep Experiences Questionnaire subscale scores and other measures of the constructs. First we examined the relationships among the three conceptual subscales. Results show moderate and significant correlations among subscales.
We also looked at the relationship between subscale scores and the equivalent scores from another measure administered just prior to the Cegep Experiences questionnaire: three single "overall items" which inquired about the role, overall, of personal, Cegep based, and community related supports in making students' Cegep studies easier or harder. Results show that, with the possible exception of the personal subscale, subscale scores were not consistently related to the corresponding overall item. Moreover, the overall items were significantly related to each other. This, too, suggests that the three concepts: personal situation, Cegep environment, and government and community supports and services may not be independent. Significant correlations between overall items and total scale scores also suggest that this is true. In summary, the composition of the subscales and the underlying basis both appear problematic.
On the other hand, the pattern of results on subscales is consistent with the pattern on overall items and shows, as did the findings on overall items, that the personal situation of students with disabilities makes it harder for these students to succeed in college than for nondisabled students. Community and government supports, however, make it easier for all students, but especially for students with disabilities, to succeed.
Students with and without disabilities. Although it may seem obvious, it nevertheless needs to be underscored that students with disabilities are, first and foremost, students. To the extent that they attend college they are subject to many of the same Cegep based obstacles and facilitators: good and poor teachers, library, cafeteria, etc. While we did expect to find differences between students with and without disabilities on certain items, such as health, in most cases we expected more similarities than differences.
Results on the 25 items which were applicable to students and graduates with and without disabilities (of the total of 31 items, 6 of which are applicable only to students with disabilities) show that, as expected, both current students and graduates with disabilities indicated that their health posed obstacles for them. This item was also found to go a long way in predicting whether a student has a disability or not. Apart from health, there were no significant differences between items for either current students or graduates with or without disabilities. It should be noted, however, that differences may have been obscured by sample sizes that were often very small, Therefore, we also examined similarities and differences in the relative rankings of scores by students with and without disabilities.
Comparison of open-ended listings of facilitators and obstacles with Cegep Experiences Questionnaire results. A one-to-one comparison of open-ended listings and Cegep Experiences Questionnaire scores is not possible. The open-ended listing looks at the frequency of how many students spontaneously indicated the item as a facilitator or an obstacle. The Questionnaire provides a mean score for students on the item. Nevertheless, examination of items with "facilitating" mean scores suggests that many of
these items also appear on the open-ended listings of students. This is also true of obstacles, providing some evidence for the validity of the measure.
Rank order of items on the Cegep Experiences Questionnaire. We compared the ranking of Cegep Experiences Questionnaire mean scores of current students and graduates, with and without disabilities, to those of students and graduates with and without disabilities. In general, there was good consistency between the rank orders of items of current students and graduates with a disability as well as between the rank order of items of current nondisabled students and nondisabled graduates.
For both graduates and current students with disabilities, the availability of disability related services at the Cegep was ranked as the most important facilitator. The most important obstacle for both groups was the impact of their disability. Scheduling conflicts between disability-related support services, such as attendant care and school was also rated as a very important obstacle by both current students and graduates.
We also examined items where there were large differences in ranking (as measured by a minimum of 10 point differences in rank order) between those with and without disabilities. Only a single item emerged as a greater facilitator for both current students and graduates with disabilities relative to those without disabilities: availability of private tutoring. Similarly, only one item emerged as a greater obstacle for graduates without disabilities: health.
Results on open-ended listings of facilitators and obstacles and on the Cegep Experiences Questionnaire. Although a one-to-one comparison was not possible, examination of Questionnaire items with "facilitating" mean scores suggests that many of these items also appear on the open-ended listing of students. First, for students with disabilities, disability related accommodations were the most frequently mentioned facilitator on the open-ended measure; this is also the top ranked item on the Questionnaire. Health and the impact of one’s impairment is the most frequently mentioned obstacle by students with disabilities: This is also the bottom ranked item on the Questionnaire. Also, as was the case for open-ended data, for both students and graduates with disabilities (but not for nondisabled students) tutoring and financial aid scores on the Questionnaire are part of the “top 10” of ranked items. Course load and difficulty of courses are on the “bottom 10” on the ranked items. Such information provides some evidence for the validity of the measure.
Data from the finings of others also provide confidence that the measure is measuring what it is supposed to measure. For example, several of the facilitator concepts were also reported by the sample of 71 individuals interviewed at Baylor University (Graham-Smith & Lafayette, 2004). Here, researchers found that of accommodations offered at the university, the largest percentage of responses dealt with the attitudes of the staff, a quiet place for exams, extended time for exams, and study skills training and tutoring. Similarly, in a study by Smith & Nelson (1993) the results show that the following were deemed important in influencing college studies: level of personal motivation, study habits, previous education experiences, attitudes of students, attitudes of professors, and disability related services at the college.
Number of students' impairments and Cegep Experiences Questionnaire results. We predicted that students with several different impairments would have higher obstacle scores than student with a single impairment. To test this hypothesis we correlated the number of students' impairments with their scores on all single items as well as on subscale and total scores. Taking into account the relatively few students with more than two impairments and the constricted range in the number of students' impairments, the finding that 1/3 of the 31 coefficients based on item-by-item correlations were significant and in the predicted direction is very impressive. It is also noteworthy that every single coefficient has the same sign, whether it was significant or not. In addition, all three subscale coefficients were significant as was the coefficient for the total scale score. This suggests that items, subscales, and total scale score are, indeed measuring obstacles and facilitators.
Nature of students' impairments and Cegep Experiences Questionnaire results. We tried to examine the scores of students with different disabilities as an additional check on the validity of the item content. Students with different impairments were expected to have different responses on disability specific items of the scale. For example, while factors such as accessibility of the class and coordination between needed external support services were expected to elicit ratings by students who use a wheelchair, these were expected to be answered "not applicable" by students with visual impairments, for example. However, the sample sizes are too small in most cases to do this.
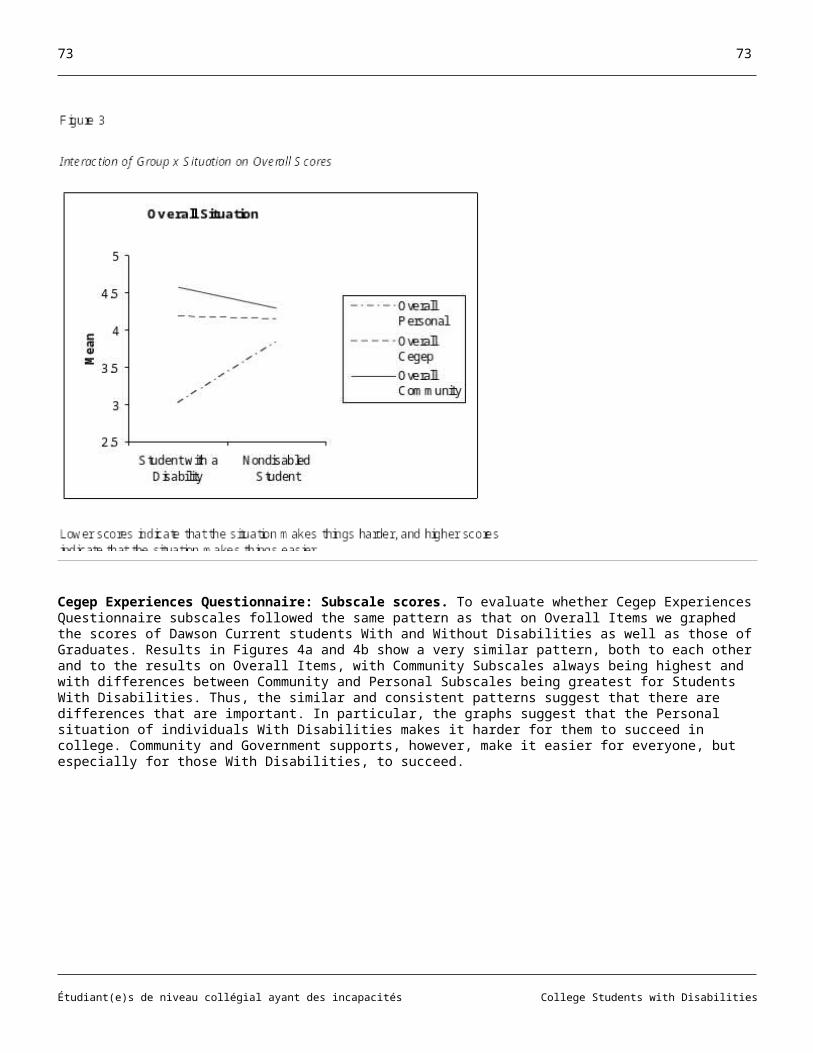
“Successful” and “unsuccessful” students and Cegep Experiences Questionnaire results. We expected that students who are "successful" would be more likely to have higher (more facilitating) scores than students who are "unsuccessful" at Cegep. For this comparison we defined success in terms of student retention and graduation. Students who graduated or continued their studies into the following two semesters were considered successful and those who failed to return or graduate were considered unsuccessful. Retention rates of students with and without disabilities. It should be noted that results on “success” (i.e., retention rates) are consistent with our previous findings and show no significant difference between students with and without disabilities. The retention rate for students with disabilities into the semester following the administration of the Questionnaire was 93% compared to 87% for students without disabilities. Retention into the second semester following the administration of the Questionnaire was 90% for students with disabilities and 80% for students without disabilities. These positive findings highlight the success of students with disabilities and underscore the importance of ensuring their presence in the Cegeps.
Similarities and differences. There were no significant differences in the mean scores on the test items between students who were "successful" and those who were "unsuccessful." However, the sizes of the “unsuccessful" groups were small and some large differences existed between the successful and unsuccessful groups. When Cegep Experiences Questionnaire items were examined for students with disabilities, 81% of the scores for successful students were higher (i.e., more facilitating) than those of the unsuccessful students. The corresponding percentage for nondisabled students was 68%, indicating that for both students with and without disabilities the majority of the differences favored (scores were more facilitating) the retained students.
Conclusions
We have developed the content of the 31 item closed-ended Cegep Experiences Questionnaire and established that it has good reliability. Validation was not part of the scope of this project and the sample sizes did not permit most such analyses. What validation we did carry out suggests that the items and the total score have good validity, although there may be problems with the item content of some of the PPH based conceptual subscales. A larger study, that builds on the present findings, is currently ongoing in our laboratory to establish validity and further refine the measure.
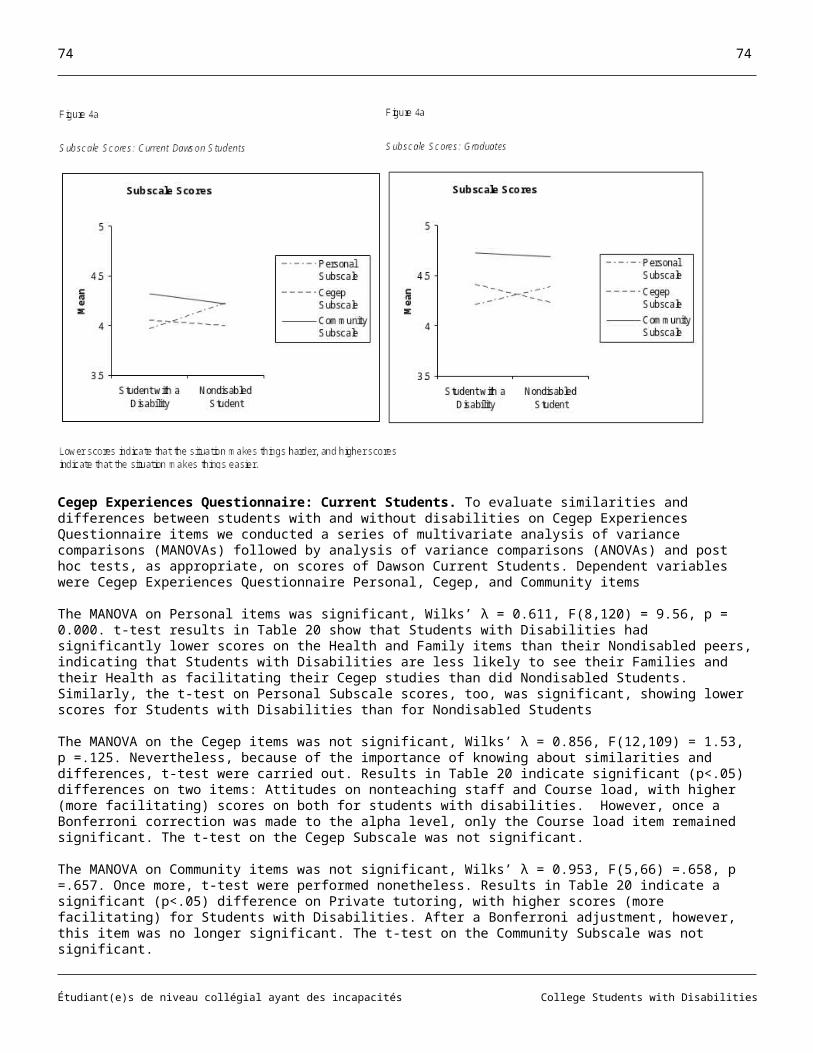
References
Adaptech Research Network. (2005). Adaptech Research Network web page. Retrieved June 20, 2005, from http://www.adaptech.org
Association des paraplégiques du Québec (1994, Janvier). La formation professionnelle des personnes handicapées: Intervention urgente. Québec.
Asuncion, J.V., Fichten, C.S., Barile, M., Fossey, M.E., & Robillard, C. (2004). Access to information and instructional technologies in higher education II: Practical recommendations for disability service providers. Journal of Postsecondary Education and Disability, 17(2), 134-137.
Bouchard, F., & Veillette, D. with the collaboration of: Arcand, G., Beaupré, A., Brassard, S., Fichten, C.S., Fiset, D., Havel, A., Juhel, J.C., & Pelletier, A. (2005). Situation des étudiants ayant des incapacités dans les Cégeps : Rapport des travaux du comité. Drummondville, Québec : Office des personnes handicapées du Québec.
CADSPPE/ACCSEHP. (1999). Towards developing professional standards of service: A report on support for students with disabilities in postsecondary education in Canada. Retrieved October 9, 1999, from http://www.cadsppe.cacuss.ca/english/CADSPPE-Standards/CADSPPE-Standards.html
Centre de documentation collégiale. (2002). Centre de documentation collégiale (CDC). Retrieved December 21, 2003 fromCharest, D. (1997, Septembre). L'insertion sociale et l’intégration professionnelle des jeunes handicapes. Résultats d'un sondage
apurés des jeunes handicapes non diplômés au secondaire. Ministère de l'éducation. Direction de la recherche. Direction de l'adaptation scolaire et des services complémentaires. Available from http://wwwmeq.gouv.qc.ca/drech/handic97.pdf.
Clermont, B. (1995). Portrait historique de la clientèle sourde et malentendant de l'ordre collégial: Région ouest du Québec - 1982 à 1994. Montréal: SAIDE, Cégep du Vieux Montréal.
D’Amours, Y. (1992). Une « cure de jeunesse » pour l’enseignement collégial. Avis. Conseil permanent de la jeunesse. (ISBN : 2-550-26798-2). Gouvernement du Québec : Ministère du conseil Exécutif.
Fichten, C. S., Bourdon, C. V., Creti, L., & Martos, J. G. (1987). Facilitation of teaching and learning: What professors, students with a physical disability and institutions of higher education can do. Natcon, 14, 45-69.
Fichten, C.S. & Landry, M.E. (2005, June). Survol des résultats de notre recherche sur les étudiants ayant des incapacités au niveau postsecondaire et facteurs à considérer dans une étude de relance auprès des diplômés / Overview of our findings on Cegep students with disabilities and factors to consider in a follow-up of graduates. Presentation at the Annual Colloque de l'Association Québécoise Inter-universitaire des Conseillers pour les Étudiants ayant des Besoins Spéciaux (AQICEBS), Québec, Québec.
Fichten, C.S., Amsel, R., Barile, M., Fiset, D., Havel, A., Huard, G., James, C., Jorgensen, S., Juhel, J.C., Lamb, D., Landry, M.E., & Tétreault, S. (2004, Dec.). Étudiants ayant des incapacités aux cégeps : réussite et avenir. Presentation at the FQRSC conference on Persévérance et réussite scolaire - Rencontre de suivi pour les projets regroupés : Enseignement collégial et universitaire, Sainte-Foy, Québec.
Fichten, C.S., Asuncion, J.V., Barile, M., Fossey, M.E., Robillard, C., Judd, D., Wolforth, J., Senécal, J., Généreux, C., Guimont, J.P., Lamb, D., & Juhel, J-C. (2004). Access to information and instructional technologies in higher education I: Disability service providers’ perspective. Journal of Postsecondary Education and Disability, 17(2), 114 - 133.
Fichten, C.S., Asuncion, J.V., Barile, M., Robillard, C., Fossey, M.E., & Lamb, D. (2003). Canadian postsecondary students with disabilities: Where are they? Canadian Journal of Higher Education, 33(3), 71-114.
Fichten, C.S., Barile, M., Robillard, C., Fossey, M., Asuncion, J., Généreux, C., Judd, D., & Guimont, J.P. (2000). Access to college for all: ITAC Project - Computer and adaptive computer technologies in the Cegeps for students with disabilities / L'accessibilité au cégep pour tous : Projet ITAC - informatique et technologies adaptées dans les cégeps pour les étudiants handicapés. Final report to PAREA. Québec: Ministère de l'Éducation.
Fougeyrollas P. & Beauregard L. (2001). Disability: A person/environment interaction social creation. In Albrecht, G.L., Seelman, K.D., and Bury, M. (Eds.). Handbook of disability studies. Thousand Oaks, CA: Sage.
Fougeyrollas, P., Lippel, St-Onge, Gervais, Boucher, Bernard, & Lavoie, (1999). Vers une indemnisation équitable des déficiences, des incapacités et des situations de handicap; document de réflexion. Présenté dans le cadre du colloque de l’Office des personnes handicapées du Québec "Après 20 ans, assurer l’avenir; vers une compensation équitable des besoins des personnes handicapées." Québec: IRDPQ.
Fournier, A. L., & Tremblay, D. (2003, October). Étude comparative de la clientèle étudiante ayant des besoins spéciaux dans les universités québécoises depuis 1994. Québec : AQICEBS, Université Laval.
Graham-Smith, S. & Lafayette, S. (2004) Quality disability support for promoting belonging and academic success within the college community. College Student Journal, 38(1), 90-99.
Harris Interactive Inc. (2000). 2000 N.O.D./Harris survey of Americans with disabilities. N.Y.: Harris Interactive. Horn, L., & Berktold, J. (1999). Students with disabilities in post-secondary education: a profile of preparation, participation and
outcomes. Washington DC: U.S. Department of Education - National Center for Education Statistics 1999-187.
Human Resources Development Canada. (2003). Disability in Canada: A 2001 profile. Human Resources Development Canada. Retrieved Dec 10, 2003, from http://www.hrdc-drhc.gc.ca/hrib/sdd-dds/odi/documents/pdfs/PALS.pdf
Jorgensen, S., Fichten, C.S., Havel, A., Lamb, D., James, C., & Barile, M. (2005). Academic performance of college students with and without disabilities: An archival study. Canadian Journal of Counselling, 39(2), 101-117.
Jorgensen, S., Fichten, C.S., Havel, A., Lamb, D., James, C., & Barile, M. (2003). Students with and without disabilities at Dawson College graduate at the same rate. The Journal for Vocational Special Needs Education, 25(2 & 3), 44-46. Retrieved August 2, 2004, from http://www.specialpopulations.org/By_Chapters/09Jorgensen.pdf
Killean, E., & Hubka, D. (1999, July). Student Survey. (Appendix to: Killean, E., & Hubka, D. (1999). Working towards a coordinated national approach to services, accommodations and policies for post-secondary students with disabilities. (pp. 407-413). Ottawa: NEADS.
Kilmurray, L., Faba, N., with the collaboration of Alphonse, L., & Smith, F. (2005). Access to Academic Materials for Post-Secondary Students with Print Disabilities. Ottawa: National Educational Association of Disabled Students (NEADS).Retrieved June 19, 2005, from http://www.neads.ca/en/about/projects/atam/atam_report_final_en.pdf
Kruger, R.A. (1994). A collaborative approach to focus groups. In Focus groups: A practical guide for applied research (pp. 187-209). London: Sage Publications.
Leblanc, A. (1999). Integration of students with disabilities in the CEGEP network of Québec: A historical overview and case study. M.Ed. thesis, Faculty of Education, Université de Sherbrooke, Sherbrooke, Québec.
Lemieux-Brassard, L. (2002, septembre). Les définitions et les grandes catégories dans les nomenclatures du processus de production du handicap. Document prepared for Réseau international sur le Processus de production du handicap.
Little, D. & Lapierre, L. (1996). The class of 90: A compendium of findings form the 1992 National Graduates Survey of 1990 Graduates. Ottawa: Statistics Canada. Available on the World Wide Web: <http://www.hrdc-drhc.gc.ca/arb/publications/books/class90/report1.pdf>.
Loewen, G., & Tomassetti, V. (2002). Fostering independence through refreshable Braille. Presentation at the Developing Skills for the New Economy: International Conference on Technical and Vocational Education and Training, Manitoba.
Meunier, N. (1989). Étude sur l’orientation des services aux étudiants par rapport aux attentes du Cégep de Trois-Rivières. Mémoire de maîtrise en éducation. Trois-Rivières, Québec: Université du Québec à Trois-Rivières.
Ministère de l'éducation du Québec. (2004). Nombre d'élèves inscrits au collégial à l'enseignement ordinaire et à temps plein, selon le type de formation et la classe Observations (1998-2003) et prévisions pour chacun des trimestres d'automne (2004-2013). Retrieved February 28, 2005, from http://www.meq.gouv.qc.ca/stat/Sipeec/donnees_2004/Reseau_public.pdf
Morgan, D.L. (1988). Focus groups as a qualitative method. London: Sage Publications.MSSS. (1992). La politique de la santé et du bien-être. Québec: Gouvernement du Québec.Office des personnes handicapées du Québec. Centre de documentation. Retrieved December 21, 2003 from
http://www.ophq.gouv.qc.ca/Documentation/M_Documentation.htmOutcomes Group. (1998). 1998 outcomes of former students with disabilities: BC college and institute student outcomes report.
Retrieved June 17, 2003, from http://outcomes.bcstats.gov.bc.ca/Publications/disabilities/Disabled.pdfPaju, M. (1997). The class of 90 revisited: Report of the 1995 follow-up survey of 1990 graduates. Ottawa: Statistics Canada.
Available on the World Wide Web: < http://www.hrdc-drhc.gc.ca/arb/publications/books/class90/report2.pdf>RateMyProfessors.Com. (2005). Retrieved June 18, 2005 from http://www.ratemyprofessors.com/index.jspRateMyTeachers.Ca. (2005). Retrieved June 18, 2005 from http://www.ratemyteachers.ca/RIPPH. (undated). Réseau international sur le processus de production du handicap (RIPPH). Retrieved June 23, 2005, from
http://www.med.univ-rennes1.fr/sisrai/cidih.htmlRoessler, R.T. & Kirk, H.M. (1998). Improving technology training services in postsecondary education: Perspectives of recent
college graduates with disabilities. Journal of Postsecondary Education and Disability, 13(3), 48-59.Skinner, M.E. (2004). College students with learning disabilities speak out: What it takes to be successful in postsecondary
education. Journal of Postsecondary Education and Disability, 17(2), 91-104.Smith, D.J. & Nelson, J.R. (1993, April). Factors that influence the academic success of college students with disabilities. Paper
prestned at the annual convention of the Council for Exceptional Children, San Antonio, Texas. Eric Document Reproduction Service (ED 363038).
Statistics Canada. (1992, October 13). 1991 Health and activity limitation survey. The Daily. Catalogue 11-001E. ISSN: 0827-0465. Available telephone number: 1-800-267-6677.
Statistics Canada. (2002). A profile of disability in Canada, 2001: Participation and Activity Limitation Survey (PALS). Catalogue no. 89-577-XIE. Available Dec 3, 2002 from http://www.statcan.ca/english/freepub/89-577-XIE/89-577-XIE01001.pdf
Statistics Canada. (2003). Census of population: Labour force activity, occupation, industry, class of worker, place of work, mode of transportation, language of work and unpaid work. The Daily, February 11, 2003. Retrieved June 17, 2003 from http://www.statcan.ca/Daily/English/030211/d030211a.htm
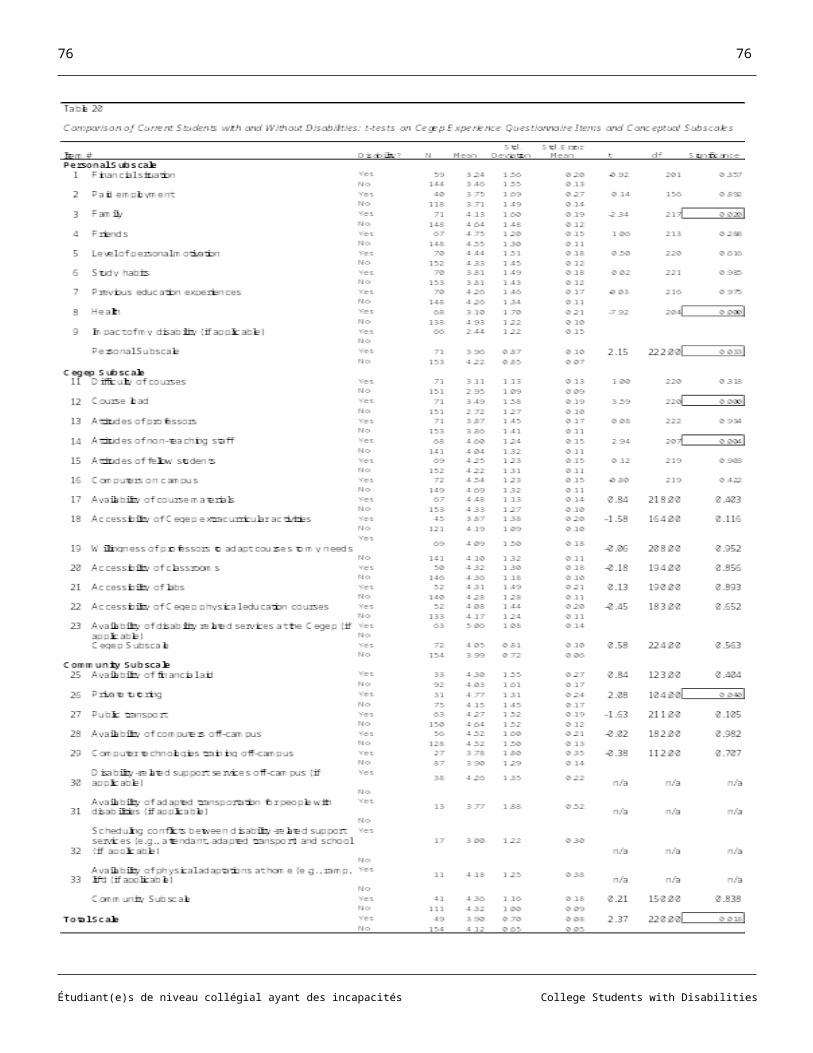
Statistics Canada. (2003). Participation and Activity Limitation Survey, 2001: Education, employment and income of adults with and without disabilities - Tables. (Catalogue no. 89-587-XIE). Retrieved Oct. 5, 2003, from http://www.statcan.ca/english/freepub/89-587-XIE/free.htm
Statistics Canada. (2003a). Education, employment and income of adults with and without disabilities - Tables: Table 3.1 - Labour force activity for adults with disabilities, by sex and age groups, Canada and provinces, 2001. Retrieved June 19, 2005, from http://www.statcan.ca/english/freepub/89-587-XIE/tables/csv/table3/can3.csv
Statistics Canada. (2003b). Education, employment and income of adults with and without disabilities - Tables: Table 3.6 - Labour force activity for adults with disabilities, by sex and age groups, Quebec, 2001. Retrieved June 19, 2005, from http://www.statcan.ca/english/freepub/89-587-XIE/tables/csv/table3/qc3.csv
Stewart, D.W., & Morris-Wales, J. (2004). Do accommodations improve the academic performance of students with learning disabilities? A complex answer to a simple question. Communiqué, 4(2), 8-11.
Taillon, J., & Paju, M. (1999). The class of '95: Report of the 1997 National Survey of 1995 Graduates. Ottawa: Statistics Canada. Retrieved June 17, 2003, from http://www.hrdc-drhc.gc.ca/arb/publications/books/class95/class95.pdf
Tousignant, J. (1995). La vie étudiante des personnes handicapées dans les etablissements d'enseignement universitaire Québécois (un bilan des années 1989 a 1995). Québec: Ministère de l'éducation: Direction générale des affaires universitaires et scientific.
Tremblay, D, Gagné, Y., & Le May, S. (2004). Statistiques concernant les étudiants ayant des besoins spéciaux dans les universités québécoises : 2003-2004 (sommaire). Québec : AQICEBS, Université Laval. Retrieved June 19, 2005, from http://www.aqicebs.qc.ca/documents/SOM_0304.pdf
Tremblay, D, Gagnon, C., & Le May, S. (2003). Statistiques concernant les étudiants ayant des besoins spéciaux dans les universités québécoises : 2002-2003 (version abrégé). Québec : AQICEBS, Université Laval. Retrieved June 19, 2005, from http://www.aqicebs.qc.ca/documents/STATS_0203_WEB.pdf
Tremblay, D. & Le May, S. (2005). Statistiques concernant les étudiants ayant des besoins spéciaux dans les universités québécoises : 2004-2005 (sommaire). Québec : AQICEBS, Université Laval. Retrieved June 21, 2005, from http://www.aqicebs.qc.ca/documents/SOMMAIRE_0405.pdf
Vallerand, R.J. (1989). Vers une méthodologie de validation transculturelle de questionnaires psychologiques: Implications pour la recherche en langue française. Psychologie Canadienne, 30(4), 662-680.
Vogel, S. A., & Adelman, P. B. (1992). The success of college students with learning disabilities: Factors related to educational attainment. Journal of Learning Disabilities 2(7), 430-461.
Wolfe, D.A., & Gertler, M.S. (2001). The new economy: An overview. Report for the Social Sciences and Humanities Research Council of Canada Toronto: Munk Centre for International Studies.
Wolfe, G., & Stokley, L. (1998). Where are they now? Post-school outcomes for college students with disabilities. Paper presented at the AHEAD Conference, Las Vegas, Nevada.
Wolforth, J. (1995). The provision of support services for students with disabilities in Canadian universities: The example of McGill University. Japanese Journal of Developmental Disabilities, 27, 20-28.
Zimbardo, P.G., Ebbesen, E.B., & Maslach, C. (1977). Techniques of attitude measurement. Influencing attitudes and changing behavior (pp. 213-221).Menlo Park, CA: Addison-Wesley Publishing.
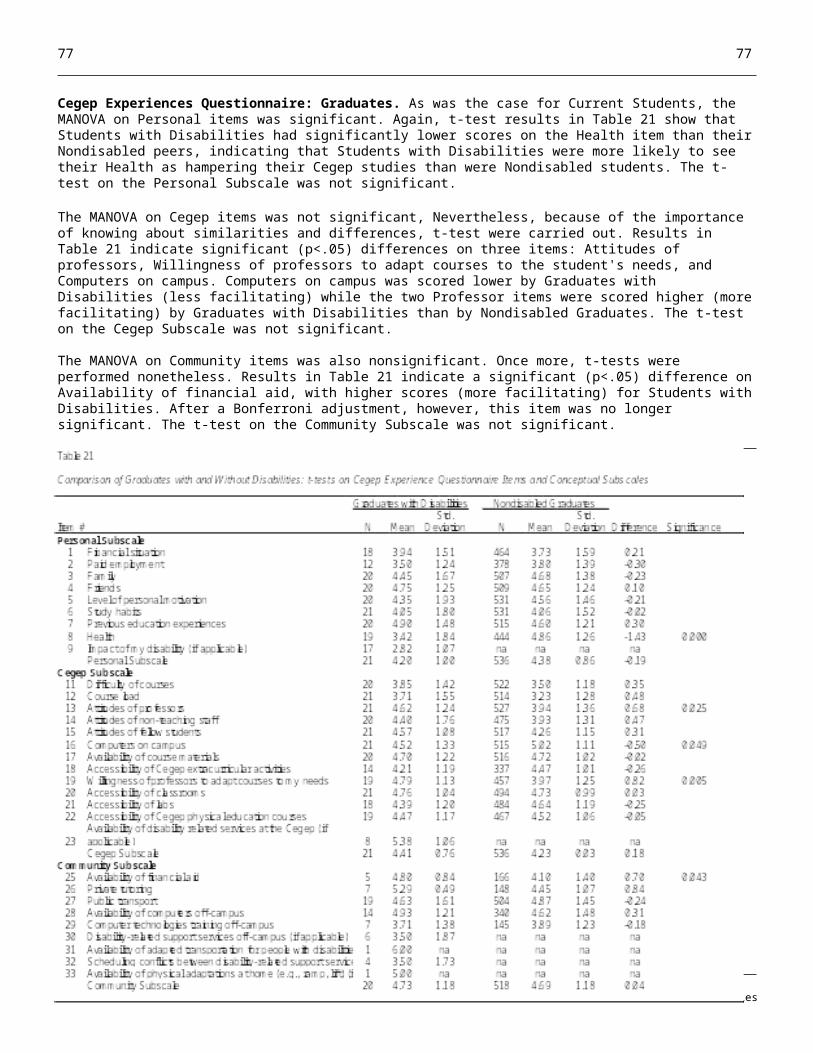
Appendix - Cegep Experiences Questionnaire: Current English and French Versions
English version: Cegep Experiences Questionnaire – V2004French version: Questionnaire sur les expériences au Cégep – V2004
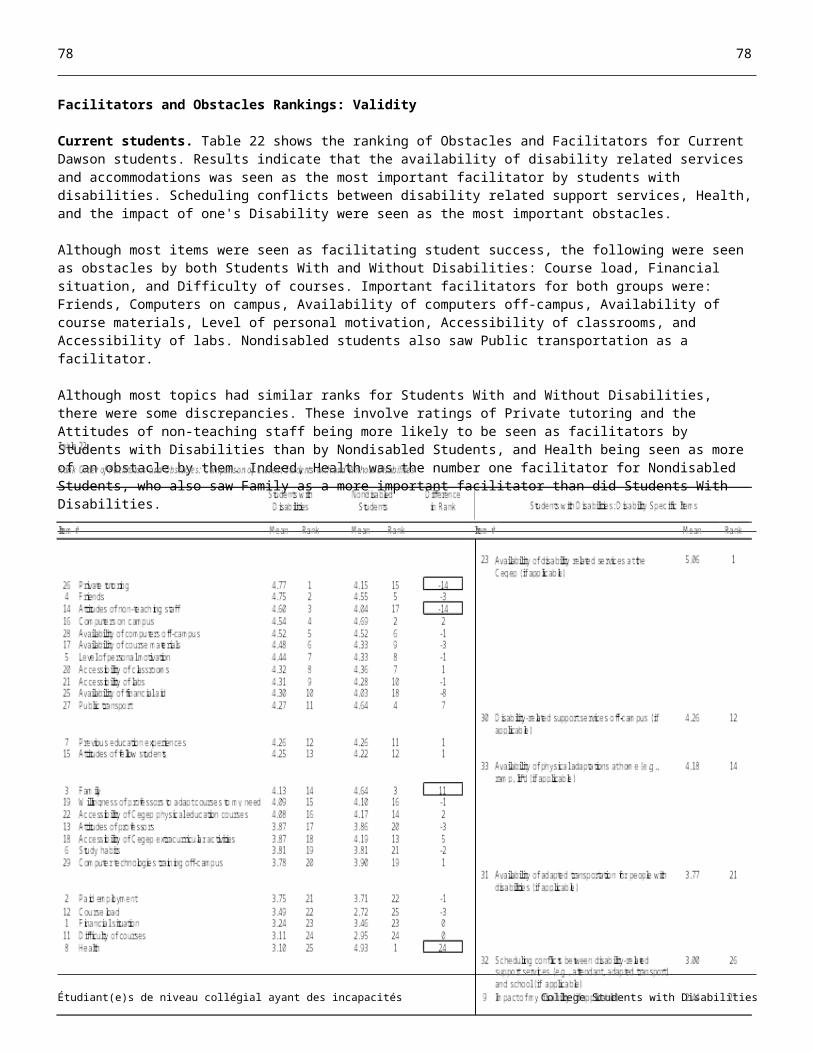
Cegep Experiences Questionnaire – V2004
Using the following scale, indicate in what way each of the items below has affected your Cegep studies by making them:
1 2 3 4 5 6 [ N/A ]
MuchHarder
Moderately Harder
SlightlyHarder
SlightlyEasier
Moderately Easier
MuchEasier
NotApplicable
Put a number beside all items. If an item is not applicable to you, respond with N/A (not applicable).
Personal Situation
______Financial situation
______Paid employment
______Family situation
______Friends
______Level of personal motivation
______Study habits
______Previous education experiences
______Health
______Impact of my disability
Cegep Environment
______Level of difficulty of courses
______Course load
______Course schedule
______Attitudes of professors
______Attitudes of non-teaching staff (e.g., registration staff, financial aid staff)
______Attitudes of students
______Availability of computers on campus
______Training on computer technologies on campus
______Availability of course materials
______Opportunity to participate in Cegep extracurricular activities (e.g., clubs, sports, social activities)
______Willingness of professors to adapt courses to my needs
______Accessibility of building facilities (e.g., doorways, classrooms, labs)
______Accessibility of Cegep physical education courses
______Availability of disability related services at the Cegep
Government and Community Supports and Services
______Availability of financial aid
______Availability of tutoring outside the Cegep
______Public transportation
______Availability of computers off-campus
______Training on computer technologies off-campus
______Disability-related support services off-campus
______Availability of adapted transport for student with disabilities
______Coordination between disability-related support services (e.g., attendant care, adapted transport) and school
______Availability of adaptations / technical aids at home (e.g., ramp, TDD)
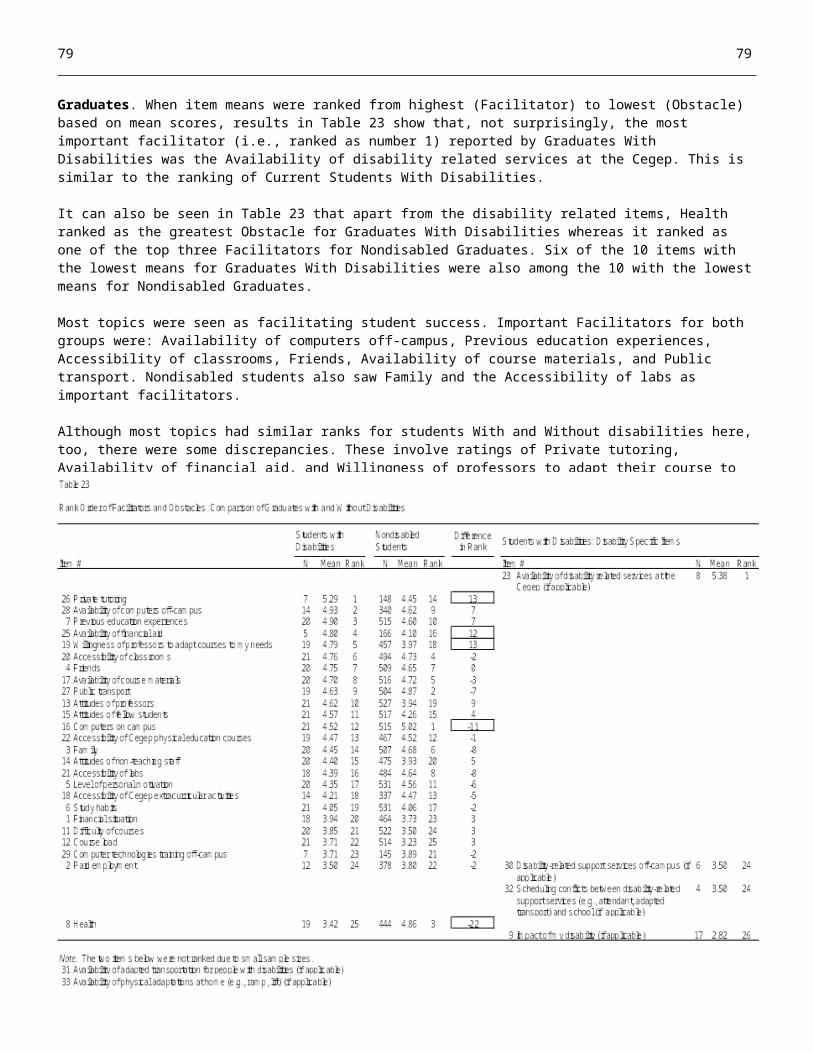
Questionnaire sur les expériences au Cégep – V2004
À l’aide de l’échelle suivante, indiquez comment chaque item a influencé vos études au Cégep en les rendant :
1 2 3 4 5 6 [ N/A ]Plus difficile Modérément plus
difficileLégèrement plus
difficileLégèrement plus facile
Modérément plus facile Plus facile Non
Applicable
Inscrivez le chiffre correspondant pour chaque item. Si un élément ne s’applique pas à votre situation, répondez par N/A (non applicable).
Situation personnelle
______Situation financière______Travail rémunéré ______Situation familiale ______Ami(es)______Degré de motivation personnelle ______Gestion du travail scolaire (méthode, organisation) ______Expériences scolaires antérieures ______État de santé______Impact de mon incapacité
Environnement du Cégep
______Degré de difficulté des cours______Charge reliée au nombre de cours ______Horaire des cours______Attitude des professeurs______Attitude du personnel non enseignant (ex. : personnel du registrariat /de l’aide financière)
______Attitude des étudiants______Disponibilité des ordinateurs dans le Cégep______Formation sur les technologies informatiques au Cégep______Disponibilité du matériel de cours______Opportunité de participer aux activités parascolaires au Cégep (ex. : clubs, sports, activités sociales) ______Ouverture des professeurs à adapter les cours en fonction de mes besoins ______Accessibilité des installations physiques (ex. : portes, salles de cours, laboratoires) ______Accessibilité aux cours d’éducation physique au Cégep______Disponibilité des services au Cégep pour les étudiants ayant des incapacités
Soutien et services de la communauté et du gouvernement
______Disponibilité d’une aide financière ______Disponibilité de tutorat à l’extérieur du Cégep______Service de transport public______Disponibilité des ordinateurs à l’extérieur du Cégep ______Formation sur les technologies informatiques à l’extérieur du Cégep______Services adaptés pour les étudiant(es) ayant des incapacités à l’extérieur du Cégep ______Disponibilité d’un moyen de transport adapté pour les étudiant(es) ayant des incapacités ______Coordination des horaires des services spécialisés pour les étudiant(es) ayant des incapacités (ex. : préposé(e)
aux soins, transport adapté) et du Cégep ______Disponibilité des adaptations / aides techniques à mon domicile (ex. : rampe d’accès, ATS)