Embed Size (px)
Citation preview
ÉCOLE DE TECHNOLOGIE SUPÉRIEURE UNIVERSITÉ DU QUÉBEC
THÈSE PAR ARTICLES PRÉSENTÉE À L’ÉCOLE DE TECHNOLOGIE SUPÉRIEURE
COMME EXIGENCE PARTIELLE À L’OBTENTION DU
DOCTORAT EN GÉNIE Ph. D.
PAR Georges EL-SAIKALY
ÉVALUATION DU COMPORTEMENT EN FATIGUE DES POUTRES EN BÉTON ARMÉ RENFORCÉES À L’EFFORT TRANCHANT À L'AIDE DE
POLYMÈRES RENFORCÉS DE FIBRES
MONTRÉAL, LE 6 JUILLET 2015
©Tous droits réservés, Georges El-Saikaly, 2015

©Tous droits réservés
Cette licence signifie qu’il est interdit de reproduire, d’enregistrer ou de diffuser en tout ou en partie, le
présent document. Le lecteur qui désire imprimer ou conserver sur un autre media une partie importante de
ce document, doit obligatoirement en demander l’autorisation à l’auteur.
PRÉSENTATION DU JURY
CETTE THÈSE A ÉTÉ ÉVALUÉE
PAR UN JURY COMPOSÉ DE : M. Omar Chaallal, directeur de recherche Département de Génie de la Construction à l’École de Technologie Supérieure M. Anh Dung Ngô, président du jury Département de Génie Mécanique à l’École de Technologie Supérieure Mme Marie-José Nollet, membre du jury Département de Génie de la Construction à l’École de Technologie Supérieure M. Radhouane Masmoudi, ing., Ph.D., membre externe indépendant Professeur titulaire, Département de Génie Civil, Université de Sherbrooke M. Munzer Hassan, ing., Ph.D., membre externe Ingénieur principal, CIMA+ Société d’ingénierie
IL A FAIT L’OBJET D’UNE SOUTENANCE DEVANT JURY ET PUBLIC
LE 11 JUIN 2015
À L’ÉCOLE DE TECHNOLOGIE SUPÉRIEURE


REMERCIEMENTS
La présente thèse n’aurait pas été possible sans la bienveillance de certaines personnes. Je
voudrais leur exprimer toute mon estime et ma sincère gratitude.
Je tiens tout d’abord à remercier mon directeur de thèse, le professeur Omar Chaallal, pour
toute la confiance qu'il m'a accordée en acceptant d'encadrer cette recherche doctorale, pour
ses multiples conseils et pour toutes les heures qu'il a consacrées à diriger cette étude. Je suis
ravi d’avoir travaillé à ses côtés car outre son appui scientifique, il a toujours été là pour me
soutenir et me conseiller dans l’élaboration de cette thèse. Sa disponibilité et son aide au
cours de certains moments difficiles ont été salutaires et d’un immense réconfort; merci
infiniment professeur Omar Chaallal.
Mes remerciements les plus respectueux vont également à tous les membres du jury qui me
font l’honneur d’évaluer cette thèse.
Ma reconnaissance va aussi aux messieurs John Lescelleur (technicien senior), Juan Mauricio
Rios (technicien) et Andres Barco (technicien) au laboratoire des structures lourdes pour leur
précieuse collaboration dans la réalisation de chaque étape du programme expérimental.
Enfin, ma gratitude va à ceux qui ont plus particulièrement assuré le soutien moral de cette
étude : ma famille et mes amis qui ont tout fait pour m’aider et m’appuyer dans tout ce que
j’ai entrepris jusqu’à ce jour.

ÉVALUATION DU COMPORTEMENT EN FATIGUE DES POUTRES EN BÉTON ARMÉ RENFORCÉES À L’EFFORT TRANCHANT À
L'AIDE DE POLYMÈRES RENFORCÉS DE FIBRES
Georges EL-SAIKALY
RÉSUMÉ
Le risque d’effondrement des poutres des ponts en béton armé (BA) sous chargement cyclique à long terme (fatigue) constitue un des problèmes majeurs auxquels fait face le patrimoine d’infrastructures des pays industrialisés dont le Canada. En Amérique du nord, le tiers des ponts sont identifiés comme étant déficients. Cependant les coûts élevés associés à l’entretien et à la mise en état de ces structures imposantes et importantes, les augmentations progressives et significatives des exigences des charges mobiles, et les inconvénients associés aux méthodes conventionnelles de renforcement posent des défis techniques et socio-économiques significatifs. Ceci a ouvert la porte au développement de nouvelles méthodes de réhabilitation plus efficaces, faciles à mettre en œuvre et durables. La technologie du renforcement à l’aide de polymères renforcés de fibres (PRF) est désormais établie comme étant une technique de réhabilitation structurale efficace et économiquement viable. Le renforcement des poutres en BA à l’aide de PRF sous charges statiques est bien documenté et plusieurs guides, normes et codes internationaux lui sont désormais dédiés. Ceci contraste avec le comportement des poutres renforcées sous charges cycliques, et plus particulièrement pour le renforcement à l’effort tranchant. Ceci s’explique par le fait que le comportement en fatigue est complexe en raison de la contribution de plusieurs paramètres d’influence majeure. On peut citer les conditions de chargement cyclique (amplitude, fréquence et nombre de cycles de contraintes), le caractère répétitif des charges cycliques qui peut accélérer l’endommagement de la structure dû à la dégradation accumulée par fatigue, ainsi que les problèmes de rupture prématurée en cisaillement. L’objectif de la présente recherche doctorale est de contribuer à combler ces lacunes et à mieux comprendre le comportement en fatigue des poutres en BA renforcées à l’aide de PRF. L’étude comprend des investigations théoriques et expérimentales. Le volet théorique vise à synthétiser l’état des connaissances consacrées à ce sujet. Le volet expérimental consiste à effectuer des essais exhaustifs sur des poutres en grandeur nature de section en Té en BA renforcées à l’effort tranchant à l’aide de PRF collés en surface. Les spécimens sont soumis à des charges cycliques jusqu’à 6 millions de cycles à une fréquence de 3 Hz. Ceux qui n’ont pas subi la rupture par fatigue sont ensuite testés sous charges statiques pour évaluer leur capacité résiduelle. Une comparaison avec les limites en fatigue recommandées par les normes et guides de conception est établie. Les résultats ont démontré l’efficacité des techniques de renforcement mises à l’essai, produisant ainsi des résultats probants qui peuvent s’avérer très utiles pour le renforcement des ponts en béton et pour l’industrie de la construction en général. Ces recherches ont fourni des conclusions concrètes, et ce grâce à la pertinence des variables examinées telles que l’amplitude de chargement cyclique, le système de renforcement en PRF et le taux des armatures d’acier transversales.

VIII
Mots-clés : poutres en béton, polymères renforcés de fibres (PRF), renforcement à l’effort tranchant, chargement cyclique de fatigue.
ASSESSMENT OF FATIGUE BEHAVIOR FOR REINFORCED CONCRETE BEAMS STRENGTHENED IN SHEAR WITH FIBER
REINFORCED POLYMER COMPOSITES
Georges EL-SAIKALY
ABSTRACT
The risk of collapse of reinforced concrete (RC) bridge girders under long-term cyclic loading (fatigue) is one of the major problems facing the existing infrastructure in modern world including Canada. In North America, one third of bridges are classified as structurally deficient or functionally obsolete. However, the authorities are faced with major economic and technical challenges due to high costs associated with the maintenance and retrofit of these important structures, the continuous increase in service loads and traffic volumes, and the major drawbacks associated to conventional strengthening methods. This highlights the need to develop innovative rehabilitation methods that are more effective, easy to implement, and viable. The use of fiber reinforced polymers (FRP) has attracted enormous interest and is now established as a structurally efficient and cost-effective strengthening technology. Strengthening RC beams with FRP under static loading is well documented and design guides are provided in many international standards and codes. In contrast, studies on the behavior of beams strengthened with FRP under cyclic loads are relatively few, especially with regard to shear strengthening. This is attributed to the fact that fatigue behavior is a complex issue due to the contribution of many variables, such as cyclic loading conditions (load range, frequency and number of applied cycles), the repetitive nature of cyclic loads that may increase the rate of damage due to cumulative fatigue degradation of the structure, as well as the premature shear failure problems. The objective of this doctoral research is to contribute to bridge these gaps and better understand the fatigue behavior of RC beams strengthened with FRP. The study includes theoretical and experimental investigations. The theoretical part aims to synthesize the state-of-the-art devoted to this subject. The experimental part involves exhaustive tests on full-scale RC T-section beams strengthened in shear with externally bonded (EB) FRP. The specimens are subjected to fatigue loading up to 6 million load cycles at a rate of 3 Hz. The specimens that did not fail in fatigue are then tested under static loading up to failure to evaluate their residual capacity. A comparison with the fatigue limits specified by standards and design guidelines is established. The test results demonstrated the effectiveness of the implemented shear strengthening techniques with EB FRP, thus producing significant results that might be useful for the strengthening of concrete bridges and for the construction industry in general. This undertaking has provided important conclusions, particularly due to the relevance of the examined variables such as the cyclic loading range, the FRP strengthening system, and ratio of the transverse steel internal reinforcement. Keywords: concrete beams, fiber reinforced polymers (FRP), shear strengthening, cyclic fatigue loading.

TABLE DES MATIÈRES
Page
CHAPITRE 1 INTRODUCTION .......................................................................................1 1.1 Contexte général ............................................................................................................1 1.2 Contextes de déficience des ponts existants ..................................................................2 1.3 Problématiques quant à la réhabilitation des poutres en béton à l’aide de PRF sous
charges cycliques ...........................................................................................................7 1.4 Objectifs de la thèse .......................................................................................................8 1.5 Approche Méthodologique ............................................................................................9 1.6 Retombées prévues (contributions originales) .............................................................12 1.7 Organisation de la thèse ...............................................................................................13
CHAPITRE 2 UTILISATION DES MATÉRIAUX COMPOSITES AVANCÉS POUR LE RENFORCEMENT DES STRUCTURES EN BÉTON – GÉNÉRALITÉS ........................................................................................15
2.1 Matériaux composites avancés (MCA) en polymères renforcés de fibres (PRF) ........15 2.1.1 Les constituants d’un composite PRF ....................................................... 15 2.1.2 Les fibres (renforts) ................................................................................... 16 2.1.3 Les résines polymères (matrice) ............................................................... 20 2.1.4 Propriétés mécaniques des composites PRF ............................................. 22 2.1.5 Comparaison des composites PRF ............................................................ 26
2.2 Généralités sur le renforcement des structures en béton à l’aide de PRF ....................27 2.2.1 Historique de l’évolution des normes en vigueur quant à
l’utilisation de PRF ................................................................................... 27 2.2.2 Systèmes de renforcement à l’aide de PRF ............................................... 31 2.2.3 Durabilité à long terme et en fatigue des composites PRF ....................... 37 2.2.4 Modes de rupture des poutres en béton renforcées en cisaillement
à l’aide de PRF .......................................................................................... 43
CHAPITRE 3 COMPORTEMENT EN FATIGUE DES POUTRES EN BÉTON RENFORCÉES À L’AIDE DE PRF COLLÉS EN SURFACE – REVUE DE LA LITTÉRATURE .............................................................49
3.1 Notions générales et définitions ...................................................................................49 3.2 Limites de contraintes recommandées par les normes en vigueur pour la
conception à l’état limite de fatigue (ÉLF) ..................................................................52 3.3 Durée de service en fatigue (relation S-N de Wöhler) .................................................56 3.4 Fatigue des matériaux : béton, armatures d’acier, béton armé et PRF ........................61 3.5 Analyse des recherches expérimentales antérieures - Revue documentaire
et bibliographique ........................................................................................................65 3.5.1 Paramètres d’étude en fatigue ................................................................... 69 3.5.2 Dégradation accumulée par fatigue .......................................................... 73 3.5.3 Modes de rupture ...................................................................................... 75 3.5.4 Poutres en BA renforcées en cisaillement à l’aide de
PRF collés en surface ................................................................................ 76
XII
3.6 Synthèses des résultats des recherches expérimentales antérieures ............................ 82 3.7 Les besoins en recherche ............................................................................................ 85
CHAPITRE 4 EXTENDING THE FATIGUE LIFE OF REINFORCED CONCRETE T-BEAMS STRENGTHENED IN SHEAR WITH EXTERNALLY BONDED FRP: UPGRADING VERSUS REPAIRING ......................... 87
4.1 Abstract ....................................................................................................................... 87 4.2 Introduction ................................................................................................................. 88 4.3 Experimental program ................................................................................................ 91
4.3.1 Description of specimens .......................................................................... 93 4.3.2 Properties of materials .............................................................................. 93 4.3.3 Variables examined ................................................................................... 95 4.3.4 Test setup and procedure .......................................................................... 95 4.3.5 Instrumentation ......................................................................................... 98
4.4 Analysis of test results .............................................................................................. 100 4.4.1 Overall response ...................................................................................... 100 4.4.2 Modes of failure ...................................................................................... 100 4.4.3 Fatigue test results ................................................................................... 105 4.4.4 Cumulative fatigue degradation .............................................................. 118 4.4.5 Test results for monotonic loading ......................................................... 123
4.5 Conclusions ............................................................................................................... 127 4.6 Acknowledgments ..................................................................................................... 128
CHAPITRE 5 FATIGUE BEHAVIOR OF RC T-BEAMS STRENGTHENED IN SHEAR WITH EB CFRP L-SHAPED LAMINATES ........................... 129
5.1 Abstract ..................................................................................................................... 129 5.2 Introduction ............................................................................................................... 130 5.3 Experimental program .............................................................................................. 133
5.3.1 Description of specimens ........................................................................ 134 5.3.2 Properties of materials and strengthening method .................................. 134 5.3.3 Test setup and procedure ........................................................................ 138 5.3.4 Instrumentation ....................................................................................... 139
5.4 Analysis of test results .............................................................................................. 142 5.4.1 Overall response ...................................................................................... 142 5.4.2 Modes of failure ...................................................................................... 142 5.4.3 Fatigue test results ................................................................................... 145
Deflection response ................................................................................. 145 Strain response ........................................................................................ 147
5.4.4 Cumulative fatigue degradation .............................................................. 156 5.4.5 Static test results (beams that underwent fatigue) ................................... 159
5.5 Conclusions ............................................................................................................... 161 5.6 Acknowledgments ..................................................................................................... 163
CHAPITRE 6 CYCLIC PERFORMANCE OF RC T-BEAMS STRENGTHENED IN SHEAR WITH FRP COMPOSITES: SHEETS VERSUS LAMINATES ......................................................................................... 165
XIII
6.1 Abstract ......................................................................................................................165 6.2 Introduction ................................................................................................................166 6.3 Experimental program ...............................................................................................168
6.3.1 Description of test specimens ................................................................. 169 6.3.2 Properties of materials and strengthening methods ................................ 171 6.3.3 Test setup and procedure ........................................................................ 172 6.3.4 Instrumentation ....................................................................................... 174
6.4 Experimental test results: analysis and discussion .....................................................176 6.4.1 Failure modes .......................................................................................... 176 6.4.2 Fatigue behavior under cyclic loading .................................................... 180 6.4.3 Post-fatigue behavior under monotonic loading ..................................... 192
6.5 Conclusions ................................................................................................................197 6.6 Acknowledgments......................................................................................................199
CHAPITRE 7 NEW ANCHORAGE TECHNIQUE FOR FRP SHEAR-STRENGTHENED RC T-BEAMS USING CFRP ROPE ......................201
7.1 Abstract ......................................................................................................................201 7.2 Introduction ................................................................................................................202 7.3 Experimental program ...............................................................................................205
7.3.1 Test specimens ........................................................................................ 205 7.3.2 Materials ................................................................................................. 209 7.3.3 Strengthening procedure ......................................................................... 211 7.3.4 Test setup ................................................................................................ 213
7.4 Results and discussion ...............................................................................................214 7.4.1 Ultimate load-carrying capacities and failure modes .............................. 214 7.4.2 Load-deflection behavior ........................................................................ 220 7.4.3 Strain response ........................................................................................ 223
7.5 Conclusions ................................................................................................................229 7.6 Acknowledgments......................................................................................................230
CONCLUSION ......................................................................................................................231
RECOMMANDATIONS ......................................................................................................237
ANNEXE I BASE DE DONNÉES DES RECHERCHES EXPÉRIMENTALES ANTÉRIEURES SUR LE COMPORTEMENT EN FATIGUE DES POUTRES EN BÉTON RENFORCÉES À L’AIDE DE PRF COLLÉS EN SURFACE .........................................................................239
BIBLIOGRAPHIE .................................................................................................................253

LISTE DES TABLEAUX
Page
Tableau 2.1 Propriétés typiques des fibres (renforts) ....................................................19
Tableau 2.2 Propriétés typiques des résines polymères (matrice) .................................22
Tableau 2.3 Propriétés typiques des composites PRF ...................................................24
Tableau 2.4 Comparaison qualitative des composites PRF ...........................................26
Tableau 3.1 Contraintes maximales dans les systèmes PRF .........................................55
Tableau 3.2 Sommaire des recherches expérimentales antérieures sous chargement de fatigue ................................................................................67
Table 4.1 Experimental program matrix ....................................................................92
Table 4.2 Mixture proportions and properties of concrete .........................................94
Table 4.3 Mechanical properties of internal steel reinforcement ...............................94
Table 4.4 Mechanical properties of CFRP .................................................................94
Table 4.5 Load conditions ..........................................................................................97
Table 4.6 Failure modes for fatigue and static tests .................................................101
Table 4.7 Deflection measurements at load point under fatigue loading .................106
Table 4.8 Strains under fatigue loading for the first cycle .......................................109
Table 4.9 Strains under fatigue loading for the last cycle ........................................110
Table 4.10 Increase in fatigue life after strengthening with FRP for series S1 .........123
Table 4.11 Static test results subsequent to fatigue loading ......................................124
Table 5.1 Experimental program matrix ..................................................................133
Table 5.2 Mixture proportions and properties of concrete .......................................135
Table 5.3 Mechanical properties of internal steel reinforcement .............................136
Table 5.4 Mechanical properties of CFRP composite materials ..............................136
Table 5.5 Load conditions ........................................................................................140
XVI
Table 5.6 Failure modes for fatigue and static tests .................................................144
Table 5.7 Deflection measurements at load point under fatigue loading .................146
Table 5.8 Strains under fatigue loading: (a) first cycle; (b) last cycle .....................148
Table 5.9 Increase in fatigue life after EB FRP strengthening ................................157
Table 5.10 Static test results subsequent to fatigue loading ......................................159
Table 6.1 Experimental test specimens ....................................................................169
Table 6.2 Mechanical properties of steel reinforcements ........................................171
Table 6.3 Mechanical properties of CFRP systems .................................................172
Table 6.4 Loading conditions ...................................................................................173
Table 6.5 Failure modes for fatigue and subsequent static tests ..............................176
Table 6.6 Deflection measurements at load point under fatigue loading .................182
Table 6.7 Increase in strains during fatigue tests for the maximum applied load Pmax ......................................................................................183
Table 6.8 Increase in strain and stress ranges corresponding to (Pmax-Pmin) during fatigue tests ...................................................................................184
Table 6.9 Post-fatigue static test results ...................................................................192
Table 7.1 Experimental Results ...............................................................................208
Table 7.2 Mechanical and Elastic Properties of CFRP L-Strips, Sheets and Rope ..................................................................................................210
Tableau-A I-1 Base de données des recherches expérimentales sous chargement de fatigue ..................................................................................................240
LISTE DES FIGURES
Page
Figure 1.1 Évolution de construction des ponts du RRS québécois, en pourcentage ...4
Figure 1.2 Évolution de construction des ponts aux États-Unis, en pourcentage .........4
Figure 1.3 Évolution de l’état de déficience des ponts, en pourcentage .......................5
Figure 1.4 Évolution des investissements sur la conservation des structures du réseau routier québécois ...............................................................................6
Figure 1.5 Évolution des investissements sur la réhabilitation des ponts aux États-Unis .....................................................................................................7
Figure 1.6 Méthodologie .............................................................................................11
Figure 2.1 Combinaison fibres et polymère d’un MCA ..............................................16
Figure 2.2 Courbes contrainte-déformation des différents types de fibres et d’armature d’acier ......................................................................................17
Figure 2.3 Courbes contrainte-déformation typiques des fibres, matrices et PRF ......25
Figure 2.4 Types de PRF : (a) tissus, (b) lamelles, et (c) barres .................................32
Figure 2.5 Rouleau de tissus en PRF à base de carbone .............................................33
Figure 2.6 Techniques de renforcement à l’aide de PRF collés en surface .................35
Figure 2.7 Configurations de renforcement en cisaillement des PRF : a) sur les faces latérales; b) en forme de U; c) en enveloppe complète ....................36
Figure 2.8 Renforcement en cisaillement des poutres à l’aide de PRF collés en surface : (a) enrobement à l’état liquide des tissus; (b) collage des lamelles pré-imprégnées ............................................................................37
Figure 2.9 Durabilité des PRF .....................................................................................38
Figure 2.10 Modes de rupture en cisaillement des poutres en BA : a) non-renforcée et b) renforcée à l’aide de PRF .......................................44
Figure 3.1 Définition d’un cycle de contrainte en fatigue ...........................................50
Figure 3.2 Courbe S-N ou Courbe de Wöhler .............................................................51
XVIII
Figure 3.3 Amplitude des moments appliqués à être utiliser pour vérifier les limites de contraintes des PRF ...................................................................54
Figure 3.4 Mécanismes de rupture par fatigue des PRF unidirectionnels ...................64
Figure 3.5 Limites d’endurance en fatigue des PRFC et PRFV ..................................65
Figure 3.6 Dégradation accumulée par fatigue ...........................................................74
Figure 4.1 Details of specimens: (a) elevation; (b) cross-sections (dimensions in mm) ...................................................................................92
Figure 4.2 Experimental setup and instrumentation of strain and crack gauges (dimensions in mm) ...................................................................................99
Figure 4.3 Crack pattern at failure and steel rupture under fatigue loading: a) CON-S1; b) EBS-S1-A; c) EBS-S3-A .................................................102
Figure 4.4 Common failure mode under monotonic loading: a) CON-S0; b) CON-S3; c) EBS-S0-A; d) EBS-S3-B; e&f) EBS-S1-B before and after removal of FRP sheet ................................................................103
Figure 4.5 Deflection at the load point versus number of cycles for Pmax: (a) control specimens; (b) strengthened specimens .................................107
Figure 4.6 Maximum strain in steel stirrups versus number of cycles for Pmax: (a) control specimens; (b) strengthened specimens (stirrup ST2) ...........111
Figure 4.7 Longitudinal steel strain at the load point versus number of cycles for Pmax: (a) control specimens; (b) strengthened specimens ...................115
Figure 4.8 Maximum CFRP strain versus number of cycles for Pmax .......................117
Figure 4.9 Concrete strut strain versus number of cycles for Pmax: (a) control specimens; (b) strengthened specimens ...................................................119
Figure 4.10 Deflection response at each 0.5M cycles: (a) CON-S1; (b) EBS-S1-A; (c) EBS-S1-B; (d) CON-S3; (e) EBS-S3-A; (f) EBS-S3-B .....................120
Figure 4.11 CFRP strain response - loading and unloading paths: (a) EBS-S1-A; (b) EBS-S1-B; (c) EBS-S3-A; (d) EBS-S3-B ..........................................122
Figure 4.12 Deflection at the load point under monotonic loading: (a) control specimens; (b) series S0; (c) series S1; (d) series S3 ...............................126
Figure 5.1 Details of specimens (dimensions in mm) ...............................................135
XIX
Figure 5.2 Step-by-step procedure for CFRP L-shaped laminates application .........137
Figure 5.3 Experimental setup and instrumentation of strain and crack gauges (dimensions in mm) .................................................................................141
Figure 5.4 Crack patterns at failure of test specimens ..............................................143
Figure 5.5 Deflection at the load point for Pmax ........................................................146
Figure 5.6 Maximum strain in steel stirrups for Pmax ................................................150
Figure 5.7 Longitudinal steel strain at the load point for Pmax ..................................152
Figure 5.8 Maximum CFRP strain versus number of cycles for Pmax .......................154
Figure 5.9 Concrete strut strain versus number of cycles for Pmax ............................155
Figure 5.10 Deflection response at each 0.5 million cycles for specimens: (a) CON-S1; (b) EBL-S1; (c) CON-S3; (d) EBL-S3 ...............................158
Figure 5.11 Deflection response for specimens under monotonic loadings ................160
Figure 6.1 Details of specimens: (a) specimen configuration with L-shaped laminates; (b) specimen configuration with U-wrapped sheets; (c) cross-section and strengthening schemes (dimensions in mm) ..........170
Figure 6.2 Test setup: (a) locations of steel-stirrups and strain gauges; (b) locations of crack gauges (dimensions in mm) ..................................175
Figure 6.3 Failure modes and crack patterns at rupture of test specimens ................177
Figure 6.4 Flexure fatigue failure of EBS-S1: (a) longitudinal steel rupture (after removal of concrete); (b) crack growth at load point before ultimate failure .........................................................................................179
Figure 6.5 Deflection at the load point for Pmax: EBS vs. EBL specimens ...............182
Figure 6.6 Strain response for Pmax: (a) in steel stirrups; (b) in longitudinal steel; (c) in CFRP ..............................................................................................185
Figure 6.7 Deflection response at each 0.5 million cycles for specimens: (a) EBS-S1; (b) EBL-S1; (c) EBS-S3; (d) EBL-S3 .................................191
Figure 6.8 Load-Deflection relationship under static loading ...................................193
Figure 6.9 Strain response under static loading: (a) in steel stirrups; (b) in CFRP ...195
Figure 7.1 Preparation of CFRP ropes into desired lengths ......................................204
XX
Figure 7.2 Specimen dimension and test setup: (a) arrangement of steel stirrups and location of strain gauges for the S3 series; (b) arrangement of steel stirrups and location of strain gauges for the S1 series; (c) specimen configuration with CFRP L-strips; (d) specimen configuration with CFRP sheet; (e) cross section; (f) cross-section of specimen strengthened with CFRP L-strips and anchored with CFRP rope (dimensions in mm) ................................207
Figure 7.3 Specimens anchored with CFRP rope: (a) surface preparation; (b) attachment of L-strips; (c) insertion of CFRP rope; (d) injection of epoxy inside the holes; (e) L-strips with CFRP rope; (f) instrumentation of an anchored specimen ...........................................212
Figure 7.4 Failure mode of strengthened specimens: (a) concrete crushing of anchored specimen; (b) debonding of overlapped L-strips legs and slippage of CFRP rope; (c) rupture of steel stirrups ................................217
Figure 7.5 Load versus deflection relationships: (a) S0 series; (b) S3 series; (c) S1 series ..............................................................................................222
Figure 7.6 Load versus strain in longitudinal steel reinforcement at load point for the anchored specimens ......................................................................224
Figure 7.7 Load versus strain in steel stirrups: (a) S3 series; (b) S1 series ...............225
Figure 7.8 Load versus FRP strain: (a) S0 series; (b) S3 series; (c) S1 series ..........228
LISTE DES ABRÉVIATIONS, SIGLES ET ACRONYMES AASHTO American Association of State Highway and Transportation Officials ACI American Concrete Institute ASCE American Society of Civil Engineers ASTM American Society for Testing and Materials BA / RC Béton armé / Reinforced concrete BS British Standards CAN/CSA Association Canadienne de Normalisation CIDAR Center for Infrastructure Diagnosis, Assessment and Rehabilitation CMD / DLA Coefficient de majoration dynamique / Dynamic load allowance CNR Conseil National de la Recherche EB Externally bonded ÉLF État limite de fatigue FHWA Federal Highway Administration FIB Fédération Internationale du Béton ISIS Intelligent Sensing for Innovative Structures JSCE Japan Society of Civil Engineers MCA Matériaux composites avancés MTQ Ministère des Transports du Québec NSM Near surface mounted PFR / FRP Polymères renforcés de fibres / Fiber reinforced polymers PRFC / CFRP Polymères renforcés de fibres de carbone / Carbon fiber reinforced
polymers
XXII
PRFV / GFRP Polymères renforcés de fibres de verre / Glass fiber reinforced polymers PRFA / AFRP Polymères renforcés de fibres d’aramide / Aramid fiber reinforced
polymers RRMUN Réseau routier municipal RRS Réseau routier supérieur
LISTE DES SYMBOLES ET UNITÉS DE MESURE a Longueur de cisaillement (mm) As Aire d’armature longitudinale (mm2) Av Aire d’armature transversale (mm2) bw Largeur de l’âme de la poutre (mm) CE Facteur de réduction environnemental CGi Position i de la jauge sur les tissus en PRF d Profondeur effective de la poutre (mm) EBLi Position i de la jauge sur les lamelles en PRF Ef Module d’élasticité des fibres (GPa) Efrp Module d’élasticité des PRF (GPa) Em Module d’élasticité de la matrice (GPa) Es Module d’élasticité de l’armature d’acier (GPa) f’c Résistance spécifiée en compression du béton (MPa) fc,s Contrainte en compression dans le béton (MPa) ff Résistance en tension des fibres (MPa) ffrp Contrainte en tension dans les PRF (MPa) ffrps Contrainte en tension dans les PRF sous charges de service (MPa) ffrpu Résistance ultime en tension des PRF (MPa) fm Résistance en tension de la matrice (MPa) fs,s Contrainte en tension dans l’armature d’acier sous charges de service (MPa) fy Contrainte limite élastique spécifiée en tension de l’armature d’acier (MPa) h Hauteur totale de la poutre (mm)
XXIV
hf Épaisseur de la semelle (dalle) de la poutre en Té L Longueur de la poutre (m) Le Longueur effective d’ancrage du renfort en PRF (mm) N Nombre de cycles de contraintes à la rupture P Résistance ultime statique de la poutre (kN) Pmax Charge cyclique maximale appliquée (kN) Pmin Charge cyclique minimale appliquée (kN) Pmoy / Pmean Charge cyclique moyenne appliquée / Mean applied cyclic load (kN) Rfrp Taux de rigidité du renfort en PRF s Espacement des étriers d’acier (mm) sfrp Espacement des bandes en PRF collés en surface (mm) S Amplitude maximale des contraintes dans les armatures longitudinales à la rupture sous chargement de fatigue (MPa) S0 Série de spécimens sans armature transversale (s = 0) S1 Série de spécimens avec étriers d’acier espacés de s = d/2 S3 Série de spécimens avec étriers d’acier espacés de s = 3d/4 STi Position i de la jauge sur les étriers d’acier tfrp Épaisseur d’une couche de renfort en PRF (mm) Tg Température de transition vitreuse (°C) Vc Résistance à l’effort tranchant du béton (kN) Vfrp Résistance à l’effort tranchant des PRF (kN) Vs Résistance à l’effort tranchant de l’armature d’acier transversale (kN) wfrp Largeur du renfort en PRF (mm)
XXV
αL Coefficient de dilatation thermique longitudinale (1/°C) αT Coefficient de dilatation thermique transversale (1/°C) εc Déformation dans les bielles comprimées du béton (με) εf Déformation à la rupture des fibres (με) εfrp Déformation dans les PRF (με) εfrpd Déformation de décollement des PRF (με) εfrpe Déformation effective des PRF (με) εfrpu Déformation ultime des PRF (με)) εm Déformation à la rupture de la matrice (με) εs Déformation dans les armatures longitudinales (με) εstr Déformation dans les étriers d’acier (με) εy Déformation à la plastification de l’armature d’acier (με) θ Angle d’inclinaison des fissures diagonales par rapport à l’axe de la poutre με Microdéformation (Microstrain) ρ Masse volumique (g/cm3) ρfrp Taux du renfort en PRF ρs Taux d’armature longitudinale σmax Contrainte maximale dans l’armature d’acier sous charges de fatigue (MPa) σmin Contrainte minimale dans l’armature d’acier sous charges de fatigue (MPa) ψfrp Facteur d’efficience du renfort en PRF ΔP Amplitude de chargement cyclique appliqué, ΔP = Pmax – Pmin (kN) Δδ Amplitude du déplacement (flèche) de la poutre (mm) Δεc Amplitude des déformations dans les bielles comprimées du béton (με)
XXVI
Δεfrp Amplitude des déformations dans les PRF (με) Δεs Amplitude des déformations dans les armatures longitudinales (με) Δεstr Amplitude des déformations dans les étriers d’acier (με) Δσs Amplitude des contraintes dans les armatures longitudinales (MPa) Δσstr Amplitude des contraintes dans les étriers d’acier (MPa)
CHAPITRE 1
INTRODUCTION 1.1 Contexte général
En Amérique du Nord, la plupart des ouvrages d’art, notamment les ponts en béton armé
(BA) présentement en service, ont été construits de 1960 à 1980. Plus du tiers de ces ponts
sont, de nos jours, considérés comme structuralement déficients ou fonctionnellement
obsolètes compte tenu des conditions des constituants de la structure et de la capacité des
ponts à répondre aux exigences des normes actuelles de conception. Ces critères sont établis
en référence à une méthode générale d’évaluation sous forme d’indices d’état et de
fonctionnalité.
Outre les paramètres couramment cités pour l’ensemble des structures tels que le
vieillissement, les erreurs de conception, l’exposition aux surcharges imprévues
(augmentation des surcharges règlementaires), le changement d’usage de la structure, les
effets environnementaux, le fluage, la corrosion des armatures d’acier, la dégradation
accumulée par fatigue est considérée comme un facteur majeur de détérioration rapide des
ouvrages d’art. En effet, bien que les ponts soient généralement soumis à des charges
cycliques bien en deçà de leurs capacités ultimes statiques, le caractère répétitif de
chargement cyclique peut augmenter le taux d’endommagement des structures en BA. On
observe alors une accélération dans la progression des fissures et une perte de rigidité accrue
dues à la dégradation accumulée de la résistance par fatigue qui peut compromettre la
stabilité, l’intégrité structurale et la sécurité de la structure. Ajoutons à cela les problèmes de
rupture prématurée associés à la complexité et l’incompréhension du comportement en
cisaillement des structures en BA, surtout sous chargement cyclique à long terme ou fatigue.
Ceci nécessite le recours à des techniques de réhabilitation rapides, efficaces et durables pour
prolonger la durée de service des structures déficientes.
2
Dès les années 1960, le renforcement des ponts à l’aide de plaques métalliques est utilisé
pour augmenter la résistance et la rigidité des poutres en BA, notamment en flexion. Au
cours des deux dernières décennies, une nouvelle technique de renforcement externe des
structures en BA (incluant les bâtiments et les ponts) à l’aide de matériaux composites
avancés (MCA) en polymères renforcés de fibres (PRF) a gagné en popularité grâce aux
nombreux avantages qu’offrent les composites PRF comparés aux plaques d’acier. On
souligne leur résistance plus élevée en tension et à la corrosion, une facilité d’installation,
une bonne durabilité, ainsi qu’un poids propre plus léger (ratio rigidité sur poids propre plus
élevé). L’utilisation de plus en plus répandue de cette technique de renforcement résulte
également des avancées de la recherche dans le domaine entrepris durant ces dernières
années. Ces efforts à l’échelle internationale ont traité de nombreux aspects de la technique,
qui ont mené à des résultats concluants rédigés sous forme de guides normatifs de
conception.
Cependant, la majorité des études disponibles évaluent le comportement des poutres en BA
renforcées à l’aide de PRF sous charges statiques; et ce volet de la recherche est relativement
bien documenté, que ce soit en flexion ou en cisaillement. En revanche, les études sur
l’évaluation du comportement en fatigue des poutres en BA renforcées sont à leur début avec
une plus grande concentration des efforts sur le renforcement en flexion. La présente thèse a
donc pour but de combler les lacunes et les besoins en recherche sur le renforcement en
cisaillement des poutres en BA sous charges cycliques, tout en contribuant à la banque de
données qui peuvent s’avérer utiles pour la communauté et pour l’industrie de la
construction. Compte tenu de la popularité du renforcement en cisaillement des poutres en
BA à l’aide de PRF sous charges statiques, la faisabilité du renforcement à l’aide de PRF
sous charges de fatigue mérite d’être étudiée plus en profondeur.
1.2 Contextes de déficience des ponts existants
Selon le Ministère des transports du Québec (MTQ), le réseau routier québécois comprend
près de 9600 structures réparties en deux grandes catégories:
3
- Les ponts du réseau routier supérieur (RRS), sous la responsabilité du MTQ, comprenant
plus de 5300 structures dont la portée minimale est de 4.5 m;
- Les ponts du réseau routier municipal (RRMUN), sous la surveillance des municipalités de
moins de 100000 habitants dont l’entretien a été repris par le Ministère en 2008. Cette
catégorie compte près de 4300 ponts.
À titre de comparaison, selon le FHWA (Federal Highway Administration – U.S. department
of transportation), le réseau routier aux États-Unis comprend environ 605000 ponts mais fait
face aux mêmes défis quant à l’entretien des structures, leur réhabilitation ou leur
remplacement et les investissements requis. L’état des structures fait l’objet de rapports
continus et les principales conclusions font état d’une situation critique en termes
d’investissements nécessaires pour le maintien des structures :
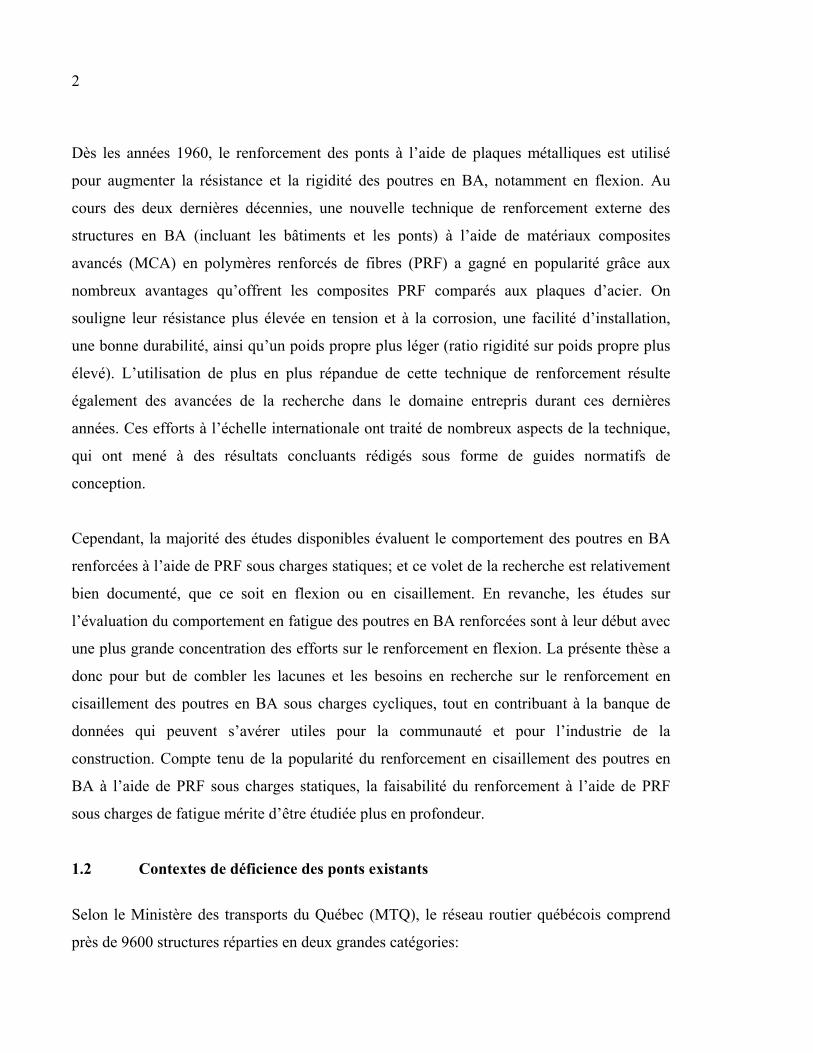
1. Plus de 70% des ponts du réseau routier québécois ont été construits entre les années 1960
et 1980 (Figure 1.1). L’âge moyen de service des ponts au Québec est d’environ 37 ans,
selon le bilan de l'état des structures du RRS québécois publié par le MTQ (2011). Ces
ponts s’approchent donc, sinon dépassent, de la fin de leur cycle de service prévu. Aux
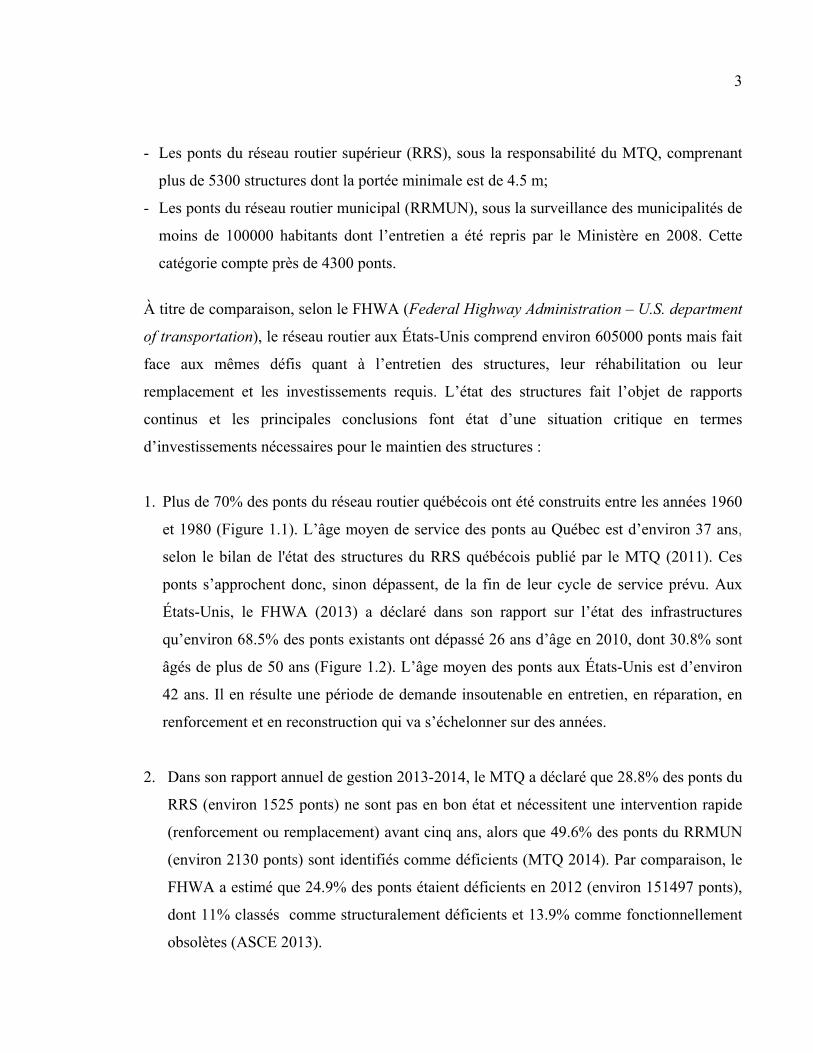
États-Unis, le FHWA (2013) a déclaré dans son rapport sur l’état des infrastructures
qu’environ 68.5% des ponts existants ont dépassé 26 ans d’âge en 2010, dont 30.8% sont
âgés de plus de 50 ans (Figure 1.2). L’âge moyen des ponts aux États-Unis est d’environ
42 ans. Il en résulte une période de demande insoutenable en entretien, en réparation, en
renforcement et en reconstruction qui va s’échelonner sur des années.
2. Dans son rapport annuel de gestion 2013-2014, le MTQ a déclaré que 28.8% des ponts du
RRS (environ 1525 ponts) ne sont pas en bon état et nécessitent une intervention rapide
(renforcement ou remplacement) avant cinq ans, alors que 49.6% des ponts du RRMUN
(environ 2130 ponts) sont identifiés comme déficients (MTQ 2014). Par comparaison, le
FHWA a estimé que 24.9% des ponts étaient déficients en 2012 (environ 151497 ponts),
dont 11% classés comme structuralement déficients et 13.9% comme fonctionnellement
obsolètes (ASCE 2013).
4
Figure 1.1 Évolution de construction des ponts du RRS québécois, en pourcentage Adaptée de MTQ (2011)
Figure 1.2 Évolution de construction des ponts aux États-Unis, en pourcentage
Adaptée de FHWA (2013)
0,4% 0,4% 0,6%2,3% 1,7%
6,0%
38,2%
32,7%
5,6%3,7%
6,0%
2,4%
0%
5%
10%
15%
20%
25%
30%
35%
40%
45%
1,7%
8,4%
20,7%
37,7%
20,4%
11,1%
0%
5%
10%
15%
20%
25%
30%
35%
40%
5
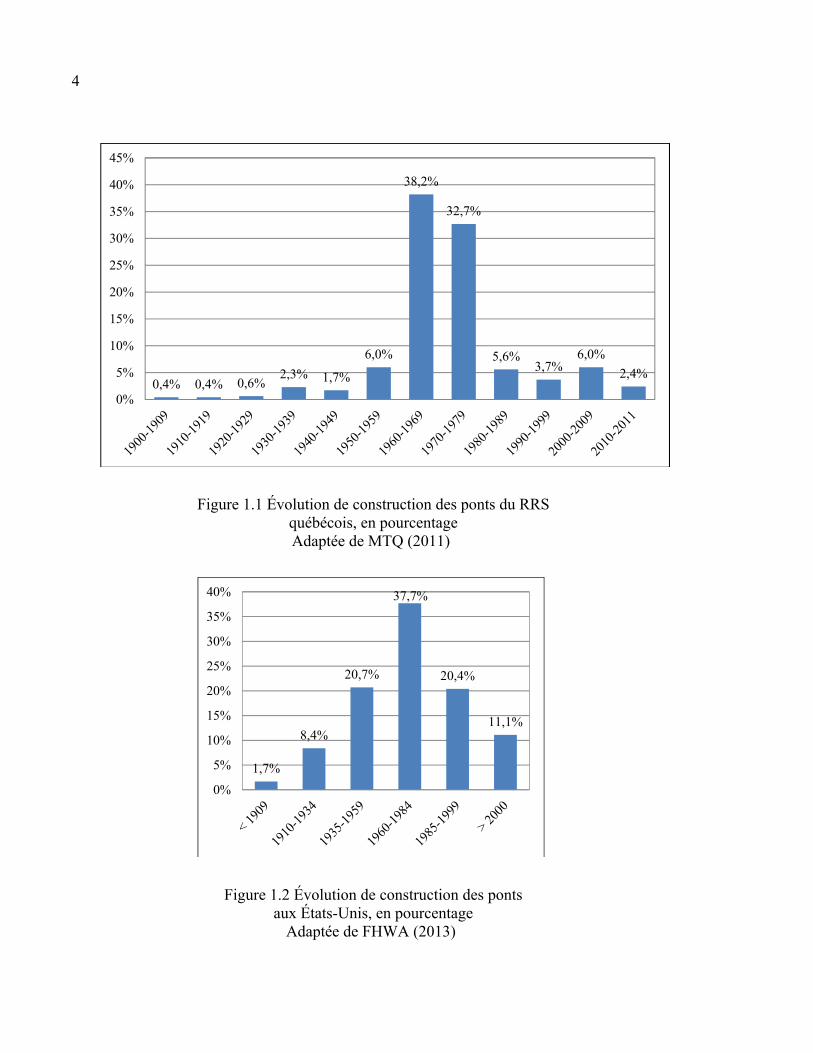
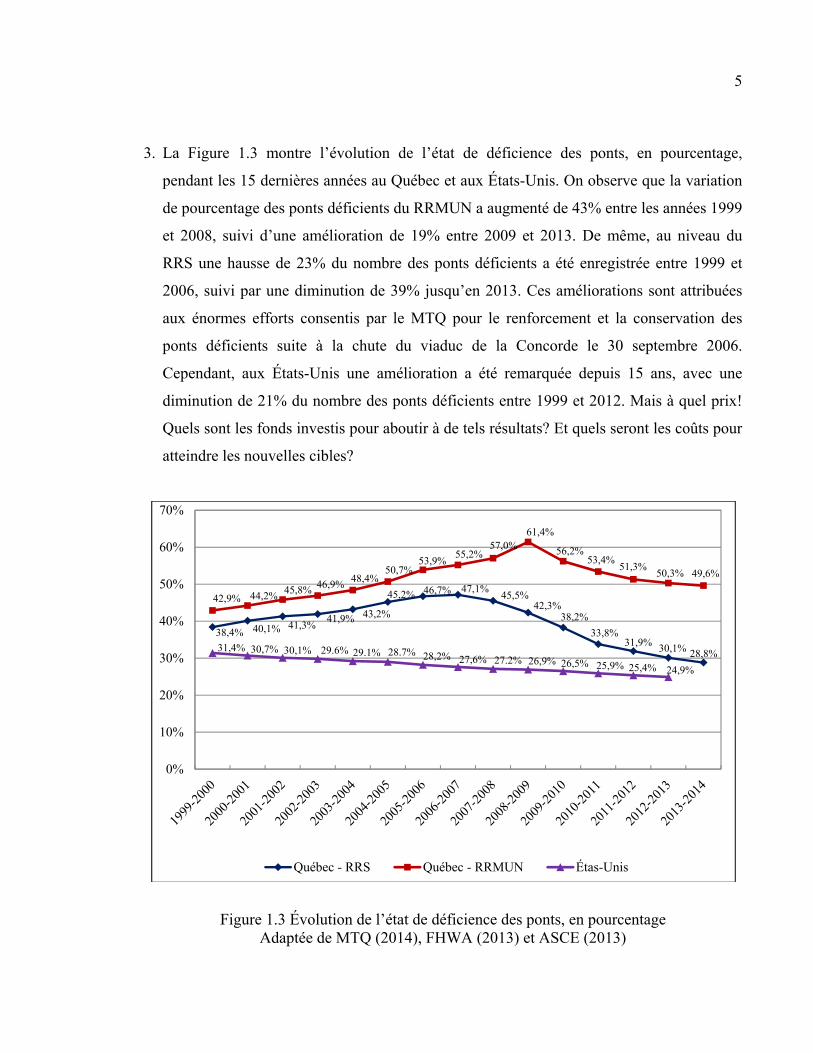
3. La Figure 1.3 montre l’évolution de l’état de déficience des ponts, en pourcentage,
pendant les 15 dernières années au Québec et aux États-Unis. On observe que la variation
de pourcentage des ponts déficients du RRMUN a augmenté de 43% entre les années 1999
et 2008, suivi d’une amélioration de 19% entre 2009 et 2013. De même, au niveau du
RRS une hausse de 23% du nombre des ponts déficients a été enregistrée entre 1999 et
2006, suivi par une diminution de 39% jusqu’en 2013. Ces améliorations sont attribuées
aux énormes efforts consentis par le MTQ pour le renforcement et la conservation des
ponts déficients suite à la chute du viaduc de la Concorde le 30 septembre 2006.
Cependant, aux États-Unis une amélioration a été remarquée depuis 15 ans, avec une
diminution de 21% du nombre des ponts déficients entre 1999 et 2012. Mais à quel prix!
Quels sont les fonds investis pour aboutir à de tels résultats? Et quels seront les coûts pour
atteindre les nouvelles cibles?
Figure 1.3 Évolution de l’état de déficience des ponts, en pourcentage Adaptée de MTQ (2014), FHWA (2013) et ASCE (2013)
38,4% 40,1% 41,3%41,9% 43,2%
45,2% 46,7% 47,1%45,5%
42,3%38,2%
33,8%31,9% 30,1% 28,8%
42,9% 44,2%45,8% 46,9%
48,4%50,7%
53,9%55,2%
57,0%61,4%
56,2%53,4%
51,3%50,3% 49,6%
31,4% 30,7% 30,1% 29.6% 29.1% 28.7% 28,2% 27,6% 27.2% 26,9% 26,5% 25,9% 25,4% 24,9%
0%
10%
20%
30%
40%
50%
60%
70%
Québec - RRS Québec - RRMUN Étas-Unis
6
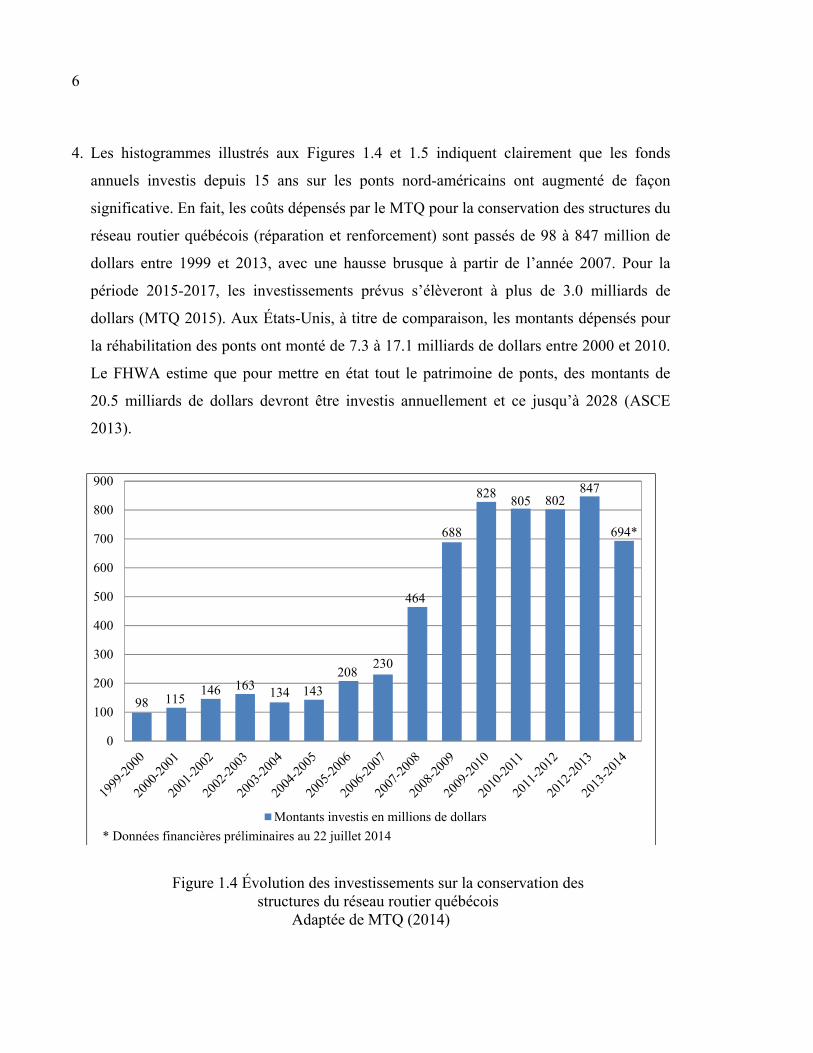
4. Les histogrammes illustrés aux Figures 1.4 et 1.5 indiquent clairement que les fonds
annuels investis depuis 15 ans sur les ponts nord-américains ont augmenté de façon
significative. En fait, les coûts dépensés par le MTQ pour la conservation des structures du
réseau routier québécois (réparation et renforcement) sont passés de 98 à 847 million de
dollars entre 1999 et 2013, avec une hausse brusque à partir de l’année 2007. Pour la
période 2015-2017, les investissements prévus s’élèveront à plus de 3.0 milliards de
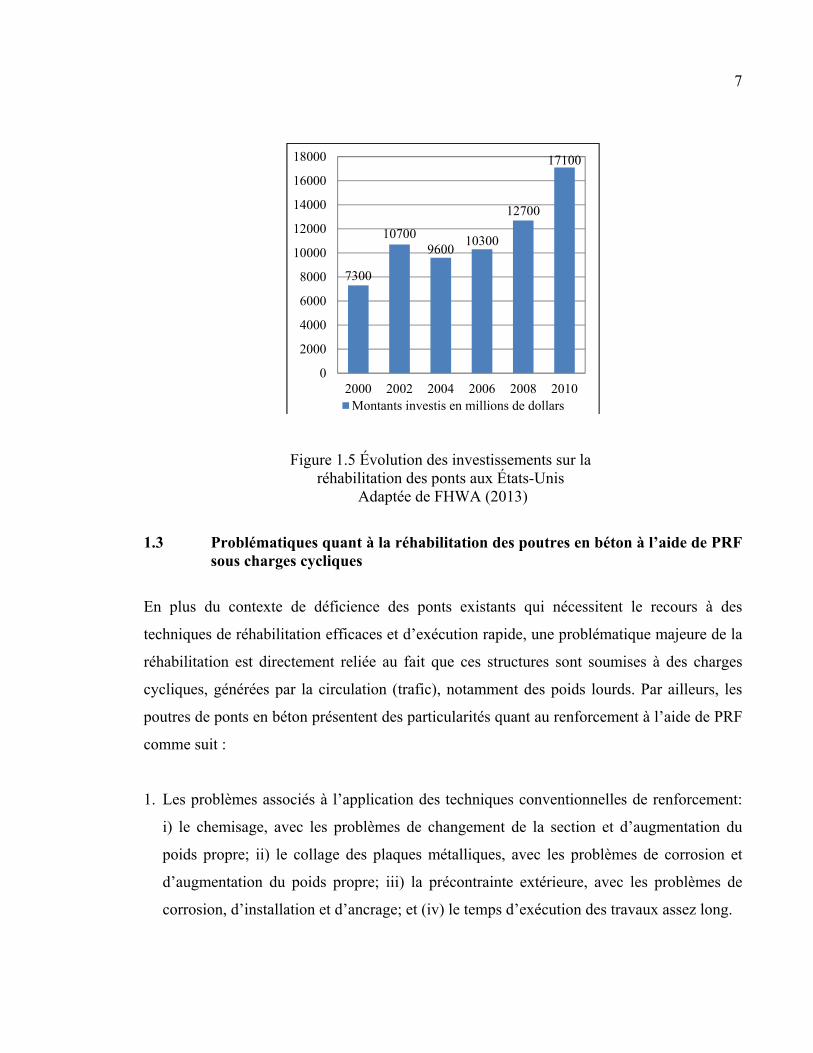
dollars (MTQ 2015). Aux États-Unis, à titre de comparaison, les montants dépensés pour
la réhabilitation des ponts ont monté de 7.3 à 17.1 milliards de dollars entre 2000 et 2010.
Le FHWA estime que pour mettre en état tout le patrimoine de ponts, des montants de
20.5 milliards de dollars devront être investis annuellement et ce jusqu’à 2028 (ASCE
2013).
Figure 1.4 Évolution des investissements sur la conservation des structures du réseau routier québécois
Adaptée de MTQ (2014)
98 115146 163 134 143
208230
464
688
828805 802
847
694*
0
100
200
300
400
500
600
700
800
900
* Données financières préliminaires au 22 juillet 2014
Montants investis en millions de dollars
7
Figure 1.5 Évolution des investissements sur la réhabilitation des ponts aux États-Unis
Adaptée de FHWA (2013)
1.3 Problématiques quant à la réhabilitation des poutres en béton à l’aide de PRF sous charges cycliques
En plus du contexte de déficience des ponts existants qui nécessitent le recours à des
techniques de réhabilitation efficaces et d’exécution rapide, une problématique majeure de la
réhabilitation est directement reliée au fait que ces structures sont soumises à des charges
cycliques, générées par la circulation (trafic), notamment des poids lourds. Par ailleurs, les
poutres de ponts en béton présentent des particularités quant au renforcement à l’aide de PRF
comme suit :
1. Les problèmes associés à l’application des techniques conventionnelles de renforcement:
i) le chemisage, avec les problèmes de changement de la section et d’augmentation du
poids propre; ii) le collage des plaques métalliques, avec les problèmes de corrosion et
d’augmentation du poids propre; iii) la précontrainte extérieure, avec les problèmes de
corrosion, d’installation et d’ancrage; et (iv) le temps d’exécution des travaux assez long.
7300
107009600
10300
12700
17100
0
2000
4000
6000
8000
10000
12000
14000
16000
18000
2000 2002 2004 2006 2008 2010Montants investis en millions de dollars
8
2. La plupart des poutres des ponts existants sont soit endommagées ou ne répondent plus
aux nouvelles exigences des surcharges règlementaires de circulation (charges mobiles),
compte tenu de l’évolution des normes de conception pendant ces dernières décennies.
3. Les problèmes de rupture prématurée associés à la complexité et à l’incompréhension du
comportement en cisaillement des structures en béton, surtout sous charge de fatigue. En
effet, les poutres sous charges cycliques peuvent subir différents modes de rupture en
cisaillement qui sont attribués à plusieurs paramètres d’influence majeure : le niveau
d’amplitude, la fréquence et le nombre de cycles de contraintes appliquées, le taux
d’endommagement et la perte de rigidité atteintes avant le renforcement, ainsi que la
dégradation accumulée par fatigue.
4. D’autres paramètres importants peuvent aussi contribuer à l’endommagement et donc
nécessiter un renforcement. On peut citer : les effets environnementaux (cycles gel-dégel,
haute température, rayonnement UV, humidité, acidité/alcalinité), la rupture par fluage, la
corrosion des aciers d’armature, les erreurs de conception, l’exposition aux surcharges
imprévues comme l’impact des tremblements de terre, ou encore le changement d’usage
de la structure.
1.4 Objectifs de la thèse
L’objectif principal de la présente thèse consiste à élucider, à l’aide des investigations
théoriques et expérimentales, le comportement en fatigue des poutres renforcées à l’aide de
PRF. Spécifiquement, il s’agit de :
1. Examiner la faisabilité et évaluer l’efficacité du renforcement en cisaillement des poutres
en BA sous charges cycliques, notamment les poutres de ponts, à l’aide de PRF collés en
surface.
2. Mettre en évidence et quantifier les mécanismes de résistance et de rupture par fatigue,
ainsi que les paramètres d’étude et leurs effets sur la performance des poutres en BA
9
renforcées en cisaillement à l’aide de PRF, afin d’augmenter leur résistance et prolonger
leur durée de service, tels que :
o les conditions de chargement cyclique (amplitude, fréquence et nombre de cycles
de contraintes appliquées);
o la présence d’armature d’acier transversale;
o l’espacement des étriers internes (taux d’armature en cisaillement);
o le système de renforcement et d’ancrage en PRF.
3. Comparer les résultats des essais obtenus avec les limites supérieures recommandées à
l’état-limite de fatigue (ÉLF) par les normes et guides de conception en vigueur.
1.5 Approche Méthodologique
Pour atteindre les objectifs visés, le programme de recherche est subdivisé en deux volets :
un théorique et l’autre expérimental (Figure 1.6), comme suit :
1. Le volet théorique consiste en une revue de la littérature qui traite de l’utilisation des PRF
pour le renforcement externe des structures en béton ainsi que les recommandations des
normes et guides de conception en vigueur consacrées à ce sujet. On s’intéressera
principalement aux recommandations des comités 215 et 440 de la norme américaine
ACI (ACI 215R 1974; ACI 440.2R 2008), des comités S6 et S806 des normes
canadiennes CSA sur le calcul des ponts routiers (CSA S6 2006) et sur la conception des
bâtiments (CSA S806 2012), et du comité TG9.3 de la Fédération internationale du béton
(FIB) en Europe (FIB TG9.3 2001). De plus, une revue documentaire et bibliographique
exhaustive est menée incluant toutes les recherches expérimentales antérieures dédiées à
la performance en fatigue des poutres en béton renforcées à l’aide de PRF.
2. Le volet expérimental vise à examiner le comportement en fatigue des poutres en BA
renforcées en cisaillement à l'aide de PRF collés en surface et à fournir des données qui
peuvent être utiles pour la conception des poutres à l’état limite de fatigue (ÉLF). Pour ce

10
faire, des essais expérimentaux exhaustifs sont effectués sur des poutres en BA, grandeur
nature, de section en Té représentatives des structures utilisées dans les ouvrages d’art.
Les spécimens d’essais sont renforcés en cisaillement à l’aide de différents systèmes de
PRF à base de carbone (PRFC) et sont soumis à des charges cycliques à long terme
(fatigue).
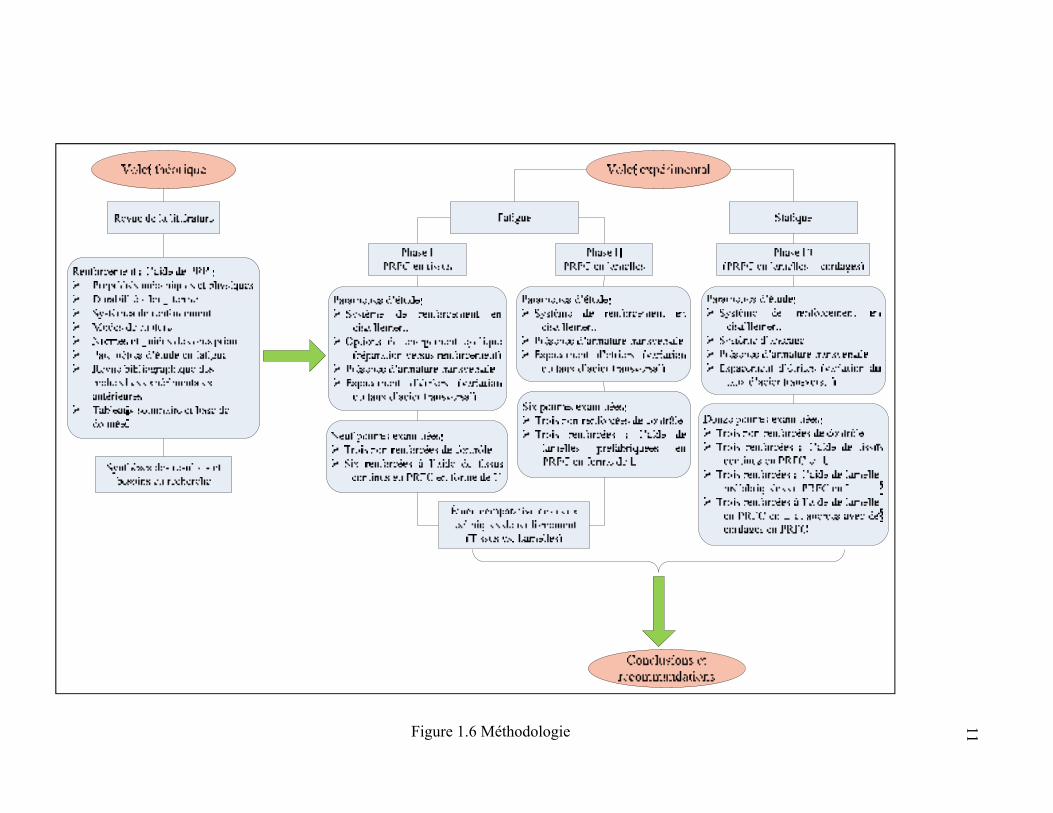
Figure 1.6 Méthodologie
11
12
1.6 Retombées prévues (contributions originales)
Les recherches expérimentales réalisées dans le cadre de la présente étude vont contribuer à
mieux comprendre l’évolution du comportement en fatigue des poutres en BA renforcées en
cisaillement à l’aide de PRF collés en surface. En effet, la revue de la littérature révèle
clairement que les recherches expérimentales et les études analytiques sur le comportement
en fatigue des poutres en BA renforcées à l’aide de PRF sont très limitées. La majorité de ces
études se rapportent au renforcement en flexion, tandis que très peu d’études ont été réalisées
sur le renforcement en cisaillement. Ainsi, l’état des connaissances actuelles n’enregistrent
pas assez d’études pour bien comprendre et examiner les mécanismes de résistance en
cisaillement des poutres en BA renforcées à l’aide de PRF sous chargement de fatigue, en
particulier les poutres de ponts. À ceci s’ajoute le manque de procédures de vérifications et
de règles de conception à l’ÉLF adoptées par les normes et standards en vigueur relativement
à ce sujet.
Il est donc à espérer que les résultats obtenus vont préparer le terrain pour de futures
recherches afin de proposer des règles simples de dimensionnement, pouvant être intégrées
dans les normes de conception et qui permettront aux ingénieurs d’aborder d’une manière
rationnelle les problèmes inhabituelles de conception associés à ce sujet. Plus
spécifiquement, les résultats de la recherche projetée vont :
1. Renseigner sur l’efficacité du renforcement en cisaillement des poutres en BA à l’aide de
PRF collés en surface sous charges cycliques.
2. Enrichir la base de données sur la fatigue et ajouter à la littérature des résultats qui
peuvent s’avérer utiles pour l’industrie de la construction afin d’outiller l’ingénieur aux
prises avec des projets de réhabilitation des ponts.
13
1.7 Organisation de la thèse
La présente thèse est organisée en sept chapitres et comportera deux volets distincts et
complémentaires : théorique et expérimental, tel que présenté à la Figure 1.6 :
1. Les trois premiers chapitres forment le volet théorique : (i) Chapitre 1 présente les
contextes et problématiques vécus par l’industrie de la construction quant à la fatigue des
structures en béton, notamment les ponts; (ii) Chapitre 2 traite des systèmes en PRF et
leur utilisation pour le renforcement des structures en béton; il traite en particulier des
propriétés mécaniques et physiques des composites PRF, de la durabilité à long terme des
PRF, des différents systèmes de renforcement, de l’historique de l’évolution des normes
et guides de conception quant à l’utilisation des PRF, ainsi que les modes de rupture en
cisaillement des poutres renforcées; et (iii) Chapitre 3 consiste en une revue de la
littérature sur le comportement en fatigue des poutres renforcées à l’aide de PRF collés en
surface; il présente les recommandations des normes en vigueur sur la conception à
l’ÉLF, la durée de service en fatigue, et la fatigue des matériaux. Une analyse de toutes
les recherches expérimentales antérieures est également présentée dans ce chapitre, sous
forme d’un tableau sommaire et tableau base de données, tout en incluant les paramètres
d’études, la dégradation accumulée par fatigue, les modes de rupture, ainsi qu’une
description des recherches effectuées sur le renforcement en cisaillement.
2. Les chapitres 4 à 7 forment le volet expérimental relatif à l’étude et l’évaluation
expérimentale du comportement en fatigue des poutres de sections en Té en BA
renforcées en cisaillement à l’aide de PRF collés en surface : (i) Chapitre 4 intitulé
“Extending the fatigue life of reinforced concrete T-beams strengthened in shear with
externally bonded FRP: upgrading versus repairing” présente l’article publié concernant
des poutres renforcées à l’aide de tissus continus en PRFC en forme de U. On distingue
deux options de chargement cyclique, réparation versus renforcement, dans cette étude;
au total, neuf spécimens sont mis à l’essai sous charges cycliques (Phase I); (ii) Chapitre
5 intitulé “Fatigue behavior or RC T-beams strengthened in shear with EB CFRP L-
shaped laminates” présente l’article publié concernant des poutres renforcées à l’aide de
14
lamelles préfabriquées en PRFC en forme de L; au total, six spécimens sont examinés
sous chargement cyclique (Phase II); (iii) Chapitre 6 intitulé “Cyclic performance of RC
T-beams strengthened in shear with FRP composites: sheets versus laminates” présente
l’article soumis basé sur une étude comparative entre deux techniques de renforcement
externes pour évaluer et optimiser les techniques de réhabilitation utilisées ; et (iv)
Chapitre 7 intitulé “New anchorage technique for FRP shear-strengthened RC T-beams
using CFRP rope” présente l’article publié qui consiste à évaluer l’efficacité d’un
nouveau système d’ancrage, avec des cordages en PRFC, sur le renforcement des poutres
à l’aide de lamelles préfabriquées en PRFC en L. Pour ce faire, des tests sous chargement
statique comprenant douze spécimens sont effectués (Phase III).
Enfin, des conclusions et des recommandations pour des recherches futures sont présentées à
la fin de la thèse.
CHAPITRE 2
UTILISATION DES MATÉRIAUX COMPOSITES AVANCÉS POUR LE RENFORCEMENT DES STRUCTURES EN BÉTON – GÉNÉRALITÉS
2.1 Matériaux composites avancés (MCA) en polymères renforcés de fibres (PRF)
Les structures existantes en béton armé ont une durée de service limitée et se voient affectés
par des problèmes de fonctionnalité, de résistance et de durabilité sous différents types de
chargement (flexion, cisaillement, torsion, fatigue, etc.). Pour cela, les ingénieurs doivent être
capable de maintenir ces structures à un niveau de performance acceptable, de les réparer
après un certain niveau de dégradation, ou de les renforcer pour amener leur capacité à un
niveau plus élevé afin de résister à une éventuelle augmentation du chargement. Ces procédés
de construction sont définis par le terme “réhabilitation”.
Les performances remarquables des matériaux composites avancés (MCA) en polymères
renforcés de fibres (PRF) pour le renforcement des poutres en BA ont permis des innovations
importantes dans le développement des techniques de réhabilitation. En plus de surmonter les
limitations associées aux techniques conventionnelles de renforcement (poids propre,
corrosion, installation et ancrage), cette méthode émergente de renforcement à l’aide de PRF
offre plusieurs avantages et sa fiabilité technique et sa viabilité économique sont désormais
établies. Ce chapitre présente l’état des connaissances sur les caractéristiques physiques et les
propriétés mécaniques des constituants des matériaux composites PRF, l’évolution de leur
utilisation ainsi que les techniques de renforcement. L’accent est mis sur les modes de
rupture en cisaillement observées à date dans les poutres en BA renforcées. Un historique de
l’évolution des normes et guides de conception complète le chapitre.
2.1.1 Les constituants d’un composite PRF
Un matériau composite est, par définition, une combinaison de plusieurs matériaux de nature
et composition différentes. Plus spécifiquement, les MCA combinent un noyau à base de
16
renforts souvent en fibres, et de matrice en résine polymère (PRF = Fibres + Résine), comme
illustré à la Figure 2.1.
Figure 2.1 Combinaison fibres et polymère d’un MCA Adaptée d’ISIS Canada (2006)
2.1.2 Les fibres (renforts)
Les renforts en fibres, en phase discontinue souvent filamentaire, absorbent la majorité des
contraintes mécaniques et assurent la résistance et la rigidité des composites PRF (Bathias
2009). La fibre est donc l’élément porteur de charge principal qui influe fortement sur les
caractéristiques mécaniques d’un PRF. Plusieurs types de fibres sont fréquemment utilisés
dans les composites : à base de carbone (PRFC), de verre (PRFV), d’aramide (PRFA), et plus
récemment fibres d’acier et fibres hybrides.
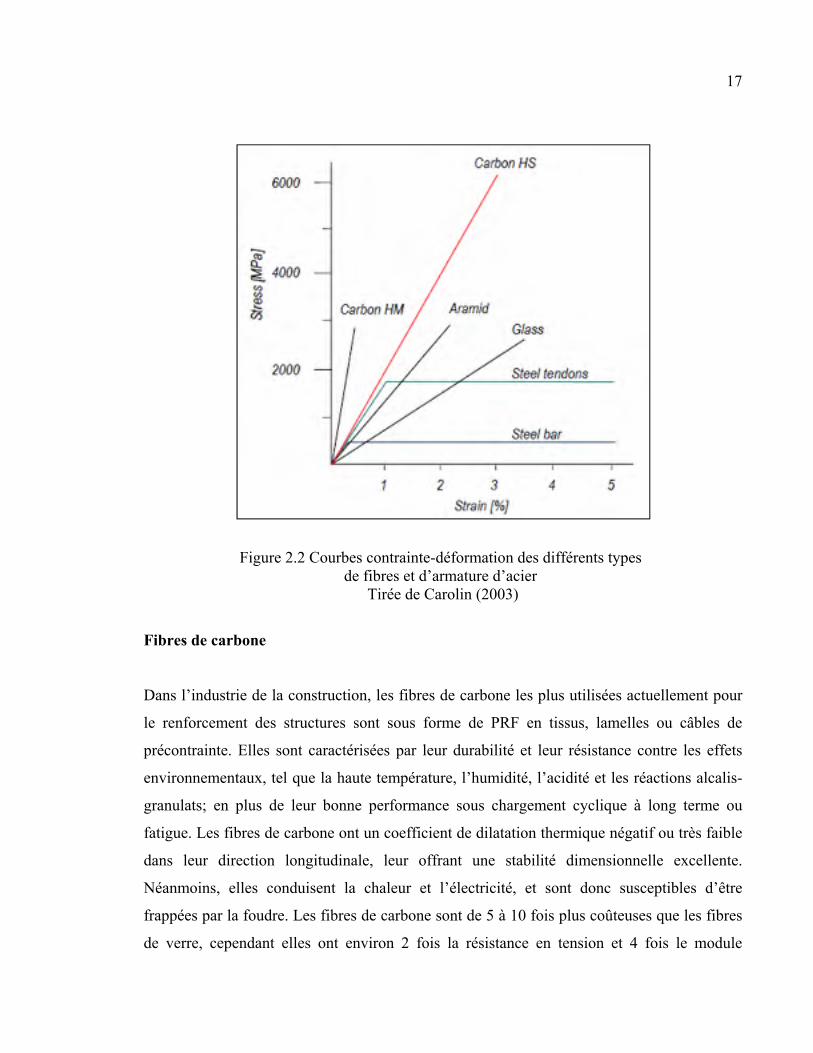
La Figure 2.2 montre les relations contrainte-déformation typiques des fibres souvent
utilisées pour la fabrication des composites PRF. On observe que les fibres, tous types
confondus, développent un comportement linéaire en tension jusqu’à la rupture,
contrairement à la plastification que subissent les armatures d’acier. Par conséquent, les PRF
présentent un comportement fragile comparé au comportement ductile de l’acier. Le choix
d’utiliser un type de fibre donné va dépendre des caractéristiques spécifiques puisque chacun
offre des avantages comparatifs.
17
Figure 2.2 Courbes contrainte-déformation des différents types de fibres et d’armature d’acier
Tirée de Carolin (2003)
Fibres de carbone
Dans l’industrie de la construction, les fibres de carbone les plus utilisées actuellement pour
le renforcement des structures sont sous forme de PRF en tissus, lamelles ou câbles de
précontrainte. Elles sont caractérisées par leur durabilité et leur résistance contre les effets
environnementaux, tel que la haute température, l’humidité, l’acidité et les réactions alcalis-
granulats; en plus de leur bonne performance sous chargement cyclique à long terme ou
fatigue. Les fibres de carbone ont un coefficient de dilatation thermique négatif ou très faible
dans leur direction longitudinale, leur offrant une stabilité dimensionnelle excellente.
Néanmoins, elles conduisent la chaleur et l’électricité, et sont donc susceptibles d’être
frappées par la foudre. Les fibres de carbone sont de 5 à 10 fois plus coûteuses que les fibres
de verre, cependant elles ont environ 2 fois la résistance en tension et 4 fois le module
18
d’élasticité que les fibres de verre. Elles ont, par ailleurs, des déformations à la rupture
inférieures à celles des fibres de verre ou d’aramide (ACI 440R 2007; Bank 2006).
Fibres de verre
Le choix des fibres de verre a prédominé pour de nombreuses structures d’ingénierie, dû à
leur faible coût et leurs propriétés spécifiques de résistance, les classant parmi les fibres de
haute performance. Elles sont de deux types : 1) les fibres de type E utilisées pour produire
la grande majorité des PRF à base de verre utilisés dans l’industrie de la construction, en
raison de leur haute résistivité électrique, 2) celles de type S utilisées pour produire des fibres
de haute performance utilisées principalement dans l’industrie aérospatiale. Contrairement
aux fibres de carbone, les fibres de verre sont des excellents isolants thermiques et
électriques. Par contre, les fibres de verre sont sensibles à l’humidité, surtout en présence des
sels et alcalis et susceptibles à une rupture par fluage due à une perte de résistance sous
charges soutenues à long-terme. De plus, elles sont plus denses que les fibres de carbone et
d’aramide (ACI 440R 2007; Bank 2006).
Fibres d’aramide
Les fibres d’aramide ont été utilisées pour produire la première génération des câbles de
précontrainte en PRF dans les années 1980 en Europe et au Japon. Cependant, peu de
manufacturiers produisent encore des barres d’armature ou câbles de précontrainte à base de
fibres d’aramide. En effet, une combinaison du prix relativement élevé, la difficulté de
traitement, leur faible résistance en compression, ainsi qu’une sensibilité à l’humidité et la
haute température ont contribué à la diminution de l’utilisation des PRF à base d’aramide
dans l’industrie de la construction. Par contre, les fibres d’aramide sont caractérisées par une
résistance élevée en tension supérieure à celle des fibres de verre, par un module d’élasticité
moyen d’environ 50% plus élevé que celui du verre, ainsi qu’une densité faible comparée à
celle du carbone ou du verre. De plus, les fibres d’aramide sont des bons isolants thermiques
et électriques, et comme les fibres de carbone, elles ont un coefficient de dilatation thermique
19
négatif dans leur direction longitudinale. Elles sont fréquemment utilisées dans des
applications balistiques (ACI 440R 2007; Bank 2006).
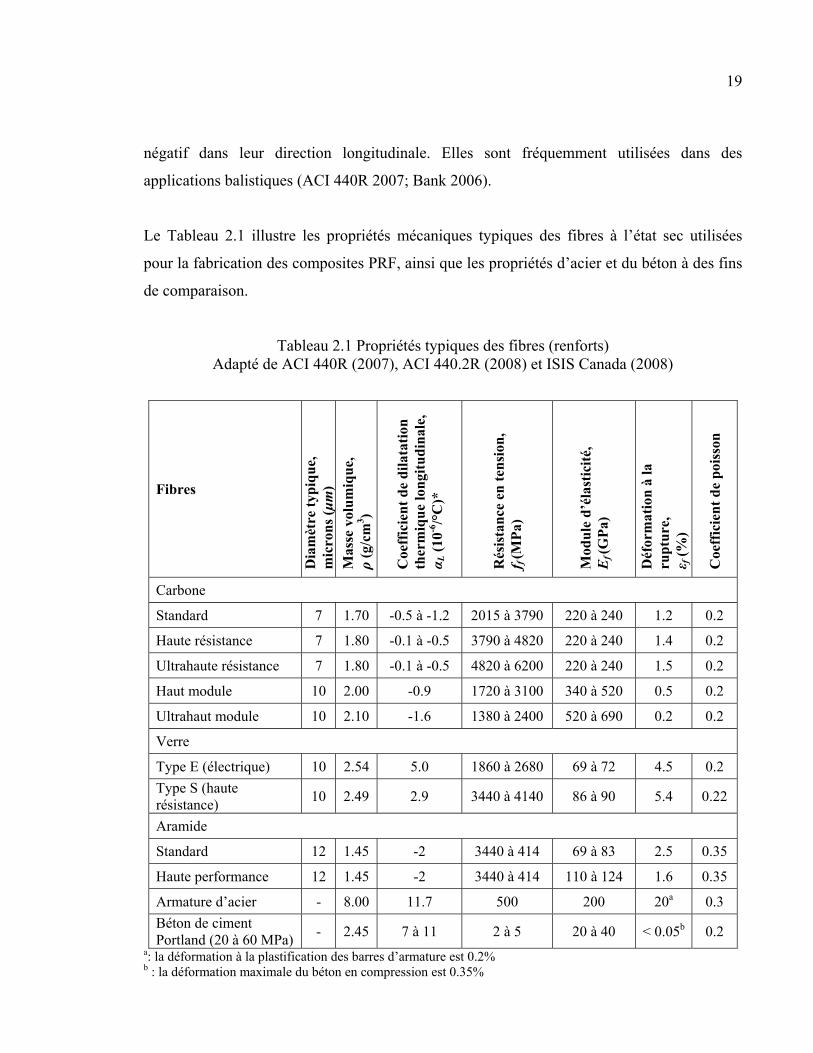
Le Tableau 2.1 illustre les propriétés mécaniques typiques des fibres à l’état sec utilisées
pour la fabrication des composites PRF, ainsi que les propriétés d’acier et du béton à des fins
de comparaison.
Tableau 2.1 Propriétés typiques des fibres (renforts) Adapté de ACI 440R (2007), ACI 440.2R (2008) et ISIS Canada (2008)
Fibres
Dia
mèt
re t
ypiq
ue,
m
icro
ns
(μm
)
Mas
se v
olu
miq
ue,
ρ
(g/c
m3 )
Coe
ffic
ien
t d
e d
ilat
atio
n
ther
miq
ue
lon
gitu
din
ale,
α L
(10
-6/°
C)*
Rés
ista
nce
en
ten
sion
, f f
(MP
a)
Mod
ule
d’é
last
icit
é,
Ef (G
Pa)
Déf
orm
atio
n à
la
rup
ture
, ε f
(%
)
Coe
ffic
ien
t d
e p
oiss
on
Carbone
Standard 7 1.70 -0.5 à -1.2 2015 à 3790 220 à 240 1.2 0.2
Haute résistance 7 1.80 -0.1 à -0.5 3790 à 4820 220 à 240 1.4 0.2
Ultrahaute résistance 7 1.80 -0.1 à -0.5 4820 à 6200 220 à 240 1.5 0.2
Haut module 10 2.00 -0.9 1720 à 3100 340 à 520 0.5 0.2
Ultrahaut module 10 2.10 -1.6 1380 à 2400 520 à 690 0.2 0.2
Verre
Type E (électrique) 10 2.54 5.0 1860 à 2680 69 à 72 4.5 0.2
Type S (haute résistance)
10 2.49 2.9 3440 à 4140 86 à 90 5.4 0.22
Aramide
Standard 12 1.45 -2 3440 à 414 69 à 83 2.5 0.35
Haute performance 12 1.45 -2 3440 à 414 110 à 124 1.6 0.35
Armature d’acier - 8.00 11.7 500 200 20a 0.3
Béton de ciment Portland (20 à 60 MPa)
- 2.45 7 à 11 2 à 5 20 à 40 < 0.05b 0.2 a: la déformation à la plastification des barres d’armature est 0.2% b : la déformation maximale du béton en compression est 0.35%
20
2.1.3 Les résines polymères (matrice)
La matrice, polymère en phase continue qui sert de liant, joue un rôle physico-chimique et
thermique essentiel, comme la protection des fibres, la répartition et le transfert des
contraintes par l’intermédiaire de l’interface fibres/résine polymère. Plus particulièrement, la
matrice a un rôle mécanique très important dans le transfert des efforts internes en tension ou
en compression. En plus, les résines polymères sont des bons isolants thermiques et
électriques; elles sont divisées en deux groupes : les thermoplastiques et les
thermodurcissables.
Les thermoplastiques
Les résines thermoplastiques peuvent passer de façon réversible de l’état solide à l’état
liquide. Sous l’effet de haute température, les résines thermoplastiques mûries à l’état solide
se fondent et se transforment à l’état pâteux d’origine. Les résines thermoplastiques utilisées
pour la fabrication des matériaux composites sont : les polymères grande diffusion
(polypropylène-PP), les polymères techniques (polyamide-PA), et les polymères hautes
performances (polyétheréthercétone-PEEK) (Bathias 2009).
Les thermodurcissables
Contrairement aux résines précédentes, une fois mûries, les résines thermodurcissables
deviennent solides et ne peuvent plus retrouver leur état liquide d’origine. Elles vont, par
ailleurs, s’adoucir et perdre leur résistance sous l’effet de la chaleur. Les résines
thermodurcissables les plus couramment utilisées dans l’industrie sont : les polyesters
insaturés, les époxydes, les vinylesters et les phénoliques.
Les PRF à base de résines thermoplastiques sont généralement utilisées dans l’industrie
aérospatiales des composites à haute température, alors que les matériaux composites à haute
performance comprennent essentiellement des résines thermodurcissables, qui comptent
environ 70% de l’ensemble des polymères. Les thermodurcissables sont compétitifs par
21
rapport aux thermoplastiques en raison de leur bas prix, la facilité de mise en œuvre,
l’ajustement de propriétés et leur performance (Bathias 2009).
Les résines époxydes sont parmi les thermodurcissables les plus utilisées dans l’industrie de
la construction, surtout pour la réparation et le renforcement des structures en béton. La
majorité des lamelles et barres en PRF préfabriquées en usine par pultrusion sont imprégnées
par de résines époxydes. Par ailleurs, l’époxyde est largement utilisé comme un adhésif qui
sert à coller le composite PRF directement sur la surface du béton pour les systèmes de
renforcement à l’aide de PRF collés en surface. Ceci est dû à plusieurs avantages que
présente la résine époxyde comparée aux autres types de thermodurcissables : une adaptation
aux conditions environnementales, une résistance à la haute température, un faible retrait,
une forte adhésion aux renforts en fibres (carbone, verre ou aramide), un bon isolement
thermique et électrique ainsi qu’une bonne tenue mécanique et une haute performance,
surtout sous chargement de fatigue (ACI 440R 2007).
Sous l’effet de la haute température, c’est la matrice qui commence à perdre sa résistance.
Cette perte commence lorsque la température d’opération du composite PRF dépasse une
température Tg, dite de transition vitreuse. C’est la température médiane à laquelle un
composite PRF passe d’un état rigide ou vitreux à un état ductile ou visqueux. En génie civil,
les composites PRF devraient toujours rester à leur état rigide et ainsi, la température
maximale du PRF ne doit pas dépasser Tg pour assurer l’intégrité structurale du système. Une
fois que la température dépasse Tg, le module d’élasticité et la résistance de la résine
polymère diminuent considérablement, et par conséquent, le composite PRF va perdre sa
durabilité et sa résistance d’adhérence fibres/matrice. De plus, une augmentation de la teneur
en eau dans les composites peut provoquer une réduction de Tg (ACI 440R 2007; Bank
2006). À noter que la température Tg dépend du type de la résine choisie, mais elle est
normalement de l’ordre de 60 à 82˚C dépendamment du taux d’absorption d’eau (ou
d’humidité) de la matrice (ACI 440.2R 2008).
22
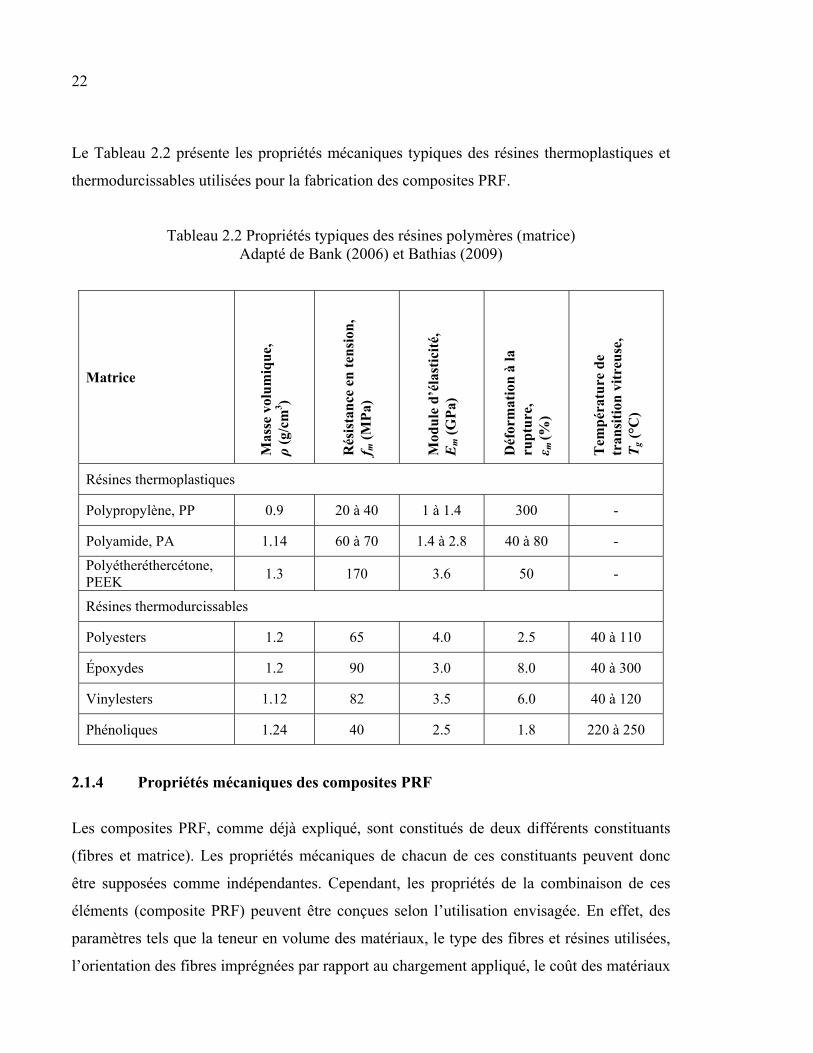
Le Tableau 2.2 présente les propriétés mécaniques typiques des résines thermoplastiques et
thermodurcissables utilisées pour la fabrication des composites PRF.
Tableau 2.2 Propriétés typiques des résines polymères (matrice) Adapté de Bank (2006) et Bathias (2009)
Matrice
Mas
se v
olu
miq
ue,
ρ
(g/c
m3 )
Rés
ista
nce
en
ten
sion
, f m
(M
Pa)
Mod
ule
d’é
last
icit
é,
Em (
GP
a)
Déf
orm
atio
n à
la
rup
ture
, ε m
(%)
Tem
pér
atu
re d
e tr
ansi
tion
vit
reu
se,
Tg
(°C
)
Résines thermoplastiques
Polypropylène, PP 0.9 20 à 40 1 à 1.4 300 -
Polyamide, PA 1.14 60 à 70 1.4 à 2.8 40 à 80 -
Polyétheréthercétone, PEEK
1.3 170 3.6 50 -
Résines thermodurcissables
Polyesters 1.2 65 4.0 2.5 40 à 110
Époxydes 1.2 90 3.0 8.0 40 à 300
Vinylesters 1.12 82 3.5 6.0 40 à 120
Phénoliques 1.24 40 2.5 1.8 220 à 250
2.1.4 Propriétés mécaniques des composites PRF
Les composites PRF, comme déjà expliqué, sont constitués de deux différents constituants
(fibres et matrice). Les propriétés mécaniques de chacun de ces constituants peuvent donc
être supposées comme indépendantes. Cependant, les propriétés de la combinaison de ces
éléments (composite PRF) peuvent être conçues selon l’utilisation envisagée. En effet, des
paramètres tels que la teneur en volume des matériaux, le type des fibres et résines utilisées,
l’orientation des fibres imprégnées par rapport au chargement appliqué, le coût des matériaux
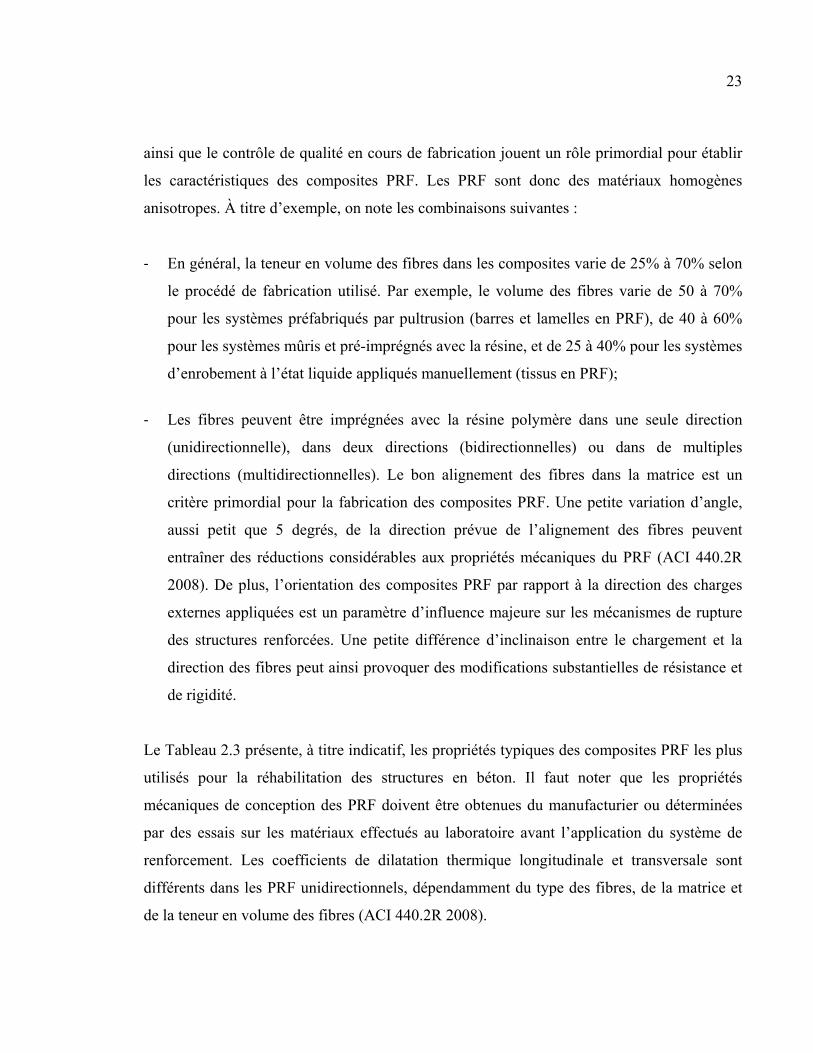
23
ainsi que le contrôle de qualité en cours de fabrication jouent un rôle primordial pour établir
les caractéristiques des composites PRF. Les PRF sont donc des matériaux homogènes
anisotropes. À titre d’exemple, on note les combinaisons suivantes :
- En général, la teneur en volume des fibres dans les composites varie de 25% à 70% selon
le procédé de fabrication utilisé. Par exemple, le volume des fibres varie de 50 à 70%
pour les systèmes préfabriqués par pultrusion (barres et lamelles en PRF), de 40 à 60%
pour les systèmes mûris et pré-imprégnés avec la résine, et de 25 à 40% pour les systèmes
d’enrobement à l’état liquide appliqués manuellement (tissus en PRF);
- Les fibres peuvent être imprégnées avec la résine polymère dans une seule direction
(unidirectionnelle), dans deux directions (bidirectionnelles) ou dans de multiples
directions (multidirectionnelles). Le bon alignement des fibres dans la matrice est un
critère primordial pour la fabrication des composites PRF. Une petite variation d’angle,
aussi petit que 5 degrés, de la direction prévue de l’alignement des fibres peuvent
entraîner des réductions considérables aux propriétés mécaniques du PRF (ACI 440.2R
2008). De plus, l’orientation des composites PRF par rapport à la direction des charges
externes appliquées est un paramètre d’influence majeure sur les mécanismes de rupture
des structures renforcées. Une petite différence d’inclinaison entre le chargement et la
direction des fibres peut ainsi provoquer des modifications substantielles de résistance et
de rigidité.
Le Tableau 2.3 présente, à titre indicatif, les propriétés typiques des composites PRF les plus
utilisés pour la réhabilitation des structures en béton. Il faut noter que les propriétés
mécaniques de conception des PRF doivent être obtenues du manufacturier ou déterminées
par des essais sur les matériaux effectués au laboratoire avant l’application du système de
renforcement. Les coefficients de dilatation thermique longitudinale et transversale sont
différents dans les PRF unidirectionnels, dépendamment du type des fibres, de la matrice et
de la teneur en volume des fibres (ACI 440.2R 2008).
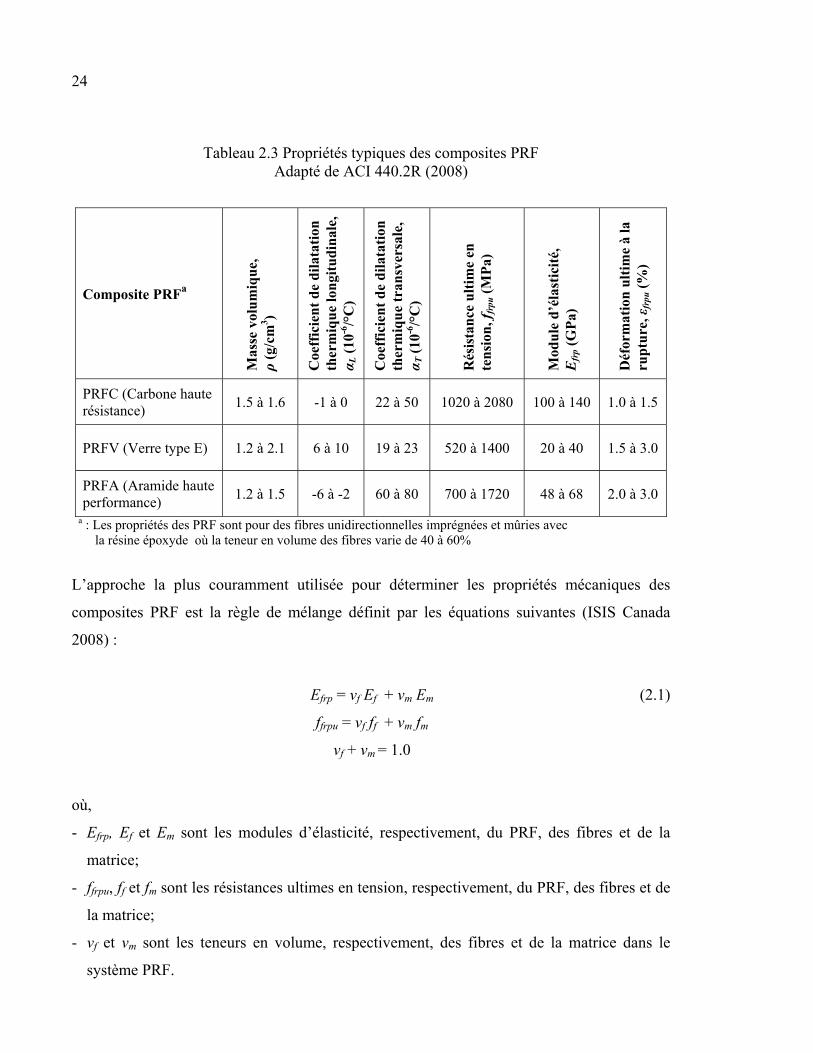
24
Tableau 2.3 Propriétés typiques des composites PRF Adapté de ACI 440.2R (2008)
Composite PRFa
Mas
se v
olu
miq
ue,
ρ
(g/c
m3 )
Coe
ffic
ien
t d
e d
ilat
atio
n
ther
miq
ue
lon
gitu
din
ale,
α L
(10
-6/°
C)
Coe
ffic
ien
t d
e d
ilat
atio
n
ther
miq
ue
tran
sver
sale
, α T
(10
-6/°
C)
Rés
ista
nce
ult
ime
en
ten
sion
, ffr
pu (
MP
a)
Mod
ule
d’é
last
icit
é,
Efr
p (G
Pa)
Déf
orm
atio
n u
ltim
e à
la
rup
ture
, εfr
pu (
%)
PRFC (Carbone haute résistance)
1.5 à 1.6 -1 à 0 22 à 50 1020 à 2080 100 à 140 1.0 à 1.5
PRFV (Verre type E) 1.2 à 2.1 6 à 10 19 à 23 520 à 1400 20 à 40 1.5 à 3.0
PRFA (Aramide haute performance)
1.2 à 1.5 -6 à -2 60 à 80 700 à 1720 48 à 68 2.0 à 3.0
a : Les propriétés des PRF sont pour des fibres unidirectionnelles imprégnées et mûries avec la résine époxyde où la teneur en volume des fibres varie de 40 à 60%
L’approche la plus couramment utilisée pour déterminer les propriétés mécaniques des
composites PRF est la règle de mélange définit par les équations suivantes (ISIS Canada
2008) :
Efrp = νf Ef + νm Em
ffrpu = νf ff + νm fm
νf + νm = 1.0
(2.1)
où,
- Efrp, Ef et Em sont les modules d’élasticité, respectivement, du PRF, des fibres et de la
matrice;
- ffrpu, ff et fm sont les résistances ultimes en tension, respectivement, du PRF, des fibres et de
la matrice;
- νf et νm sont les teneurs en volume, respectivement, des fibres et de la matrice dans le
système PRF.
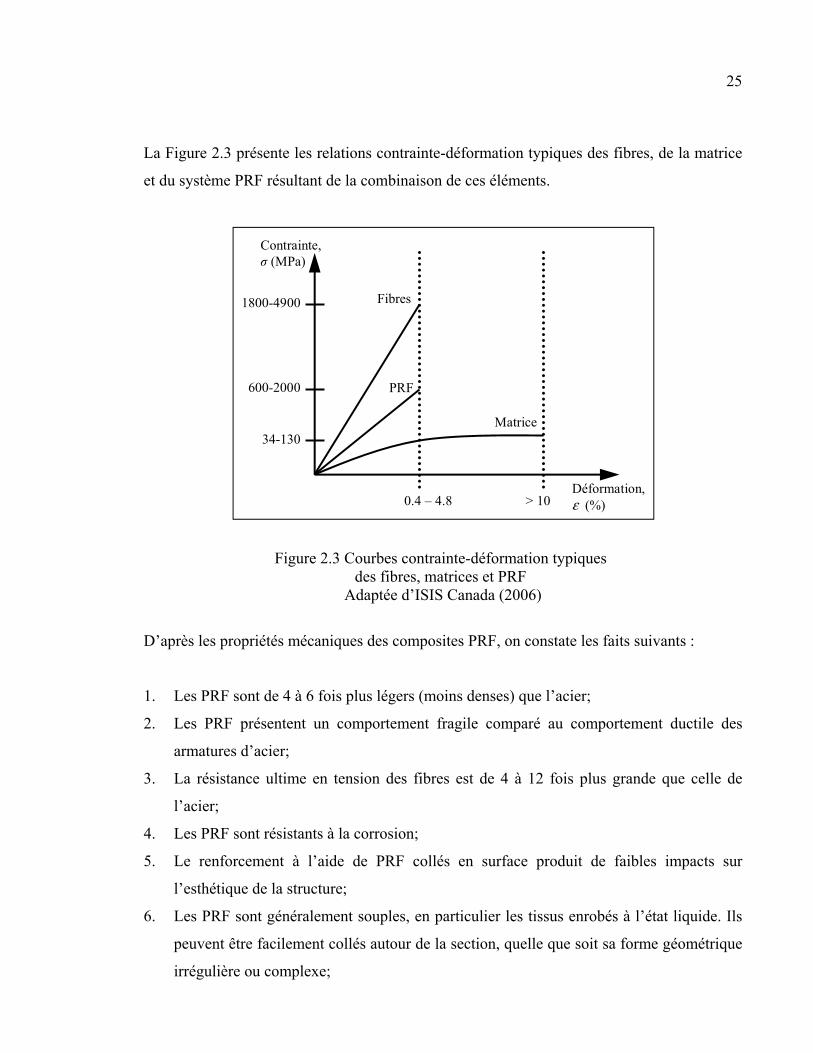
25
La Figure 2.3 présente les relations contrainte-déformation typiques des fibres, de la matrice
et du système PRF résultant de la combinaison de ces éléments.
Figure 2.3 Courbes contrainte-déformation typiques des fibres, matrices et PRF
Adaptée d’ISIS Canada (2006)
D’après les propriétés mécaniques des composites PRF, on constate les faits suivants :
1. Les PRF sont de 4 à 6 fois plus légers (moins denses) que l’acier;
2. Les PRF présentent un comportement fragile comparé au comportement ductile des
armatures d’acier;
3. La résistance ultime en tension des fibres est de 4 à 12 fois plus grande que celle de
l’acier;
4. Les PRF sont résistants à la corrosion;
5. Le renforcement à l’aide de PRF collés en surface produit de faibles impacts sur
l’esthétique de la structure;
6. Les PRF sont généralement souples, en particulier les tissus enrobés à l’état liquide. Ils
peuvent être facilement collés autour de la section, quelle que soit sa forme géométrique
irrégulière ou complexe;
Matrice
Déformation, ε (%)
Fibres
PRF
0.4 – 4.8 > 10
Contrainte, σ (MPa)
1800-4900
600-2000
34-130
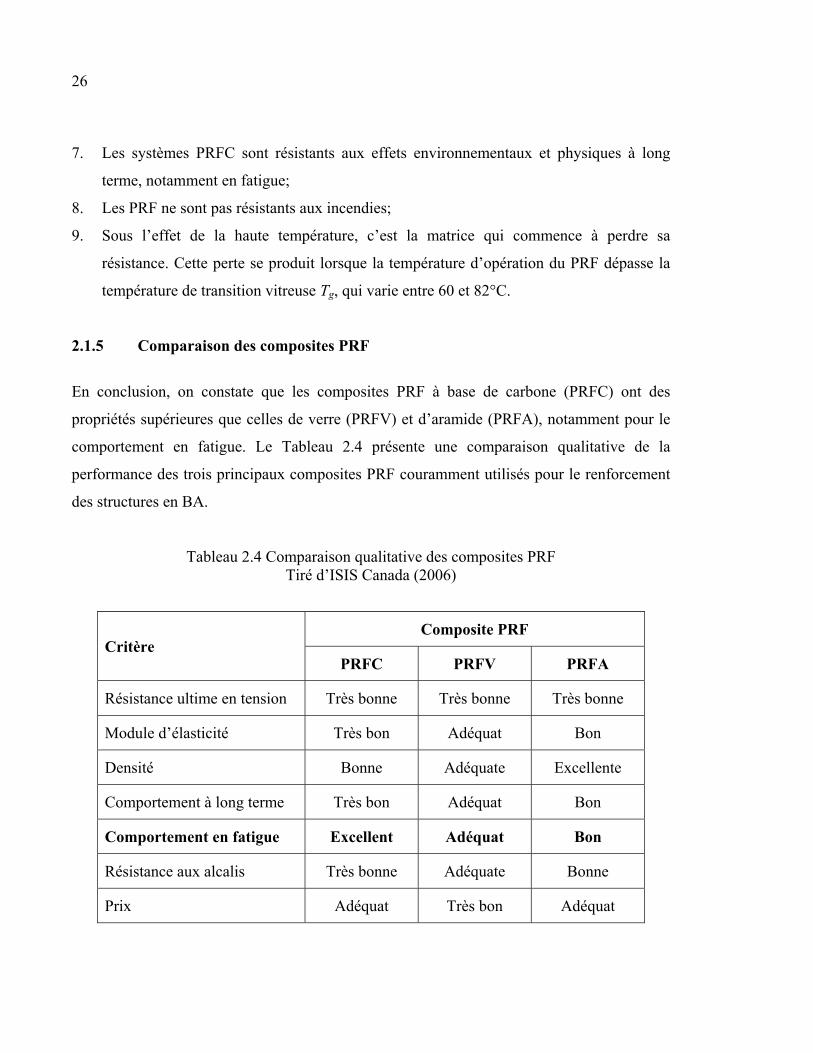
26
7. Les systèmes PRFC sont résistants aux effets environnementaux et physiques à long
terme, notamment en fatigue;
8. Les PRF ne sont pas résistants aux incendies;
9. Sous l’effet de la haute température, c’est la matrice qui commence à perdre sa
résistance. Cette perte se produit lorsque la température d’opération du PRF dépasse la
température de transition vitreuse Tg, qui varie entre 60 et 82°C.
2.1.5 Comparaison des composites PRF
En conclusion, on constate que les composites PRF à base de carbone (PRFC) ont des
propriétés supérieures que celles de verre (PRFV) et d’aramide (PRFA), notamment pour le
comportement en fatigue. Le Tableau 2.4 présente une comparaison qualitative de la
performance des trois principaux composites PRF couramment utilisés pour le renforcement
des structures en BA.
Tableau 2.4 Comparaison qualitative des composites PRF Tiré d’ISIS Canada (2006)
Critère Composite PRF
PRFC PRFV PRFA
Résistance ultime en tension Très bonne Très bonne Très bonne
Module d’élasticité Très bon Adéquat Bon
Densité Bonne Adéquate Excellente
Comportement à long terme Très bon Adéquat Bon
Comportement en fatigue Excellent Adéquat Bon
Résistance aux alcalis Très bonne Adéquate Bonne
Prix Adéquat Très bon Adéquat
27
2.2 Généralités sur le renforcement des structures en béton à l’aide de PRF
Cette section présente les données disponibles sur les matériaux composites avancés en PRF.
2.2.1 Historique de l’évolution des normes en vigueur quant à l’utilisation de PRF
Aujourd’hui, la réhabilitation des structures en BA à l’aide de PRF est une technique
largement acceptée et utilisée universellement.
Organisation Japonaise JSCE
Au Japon, les efforts visant à prescrire des spécifications et des recommandations pour la
conception et la construction des structures à l’aide de PRF ont débuté dans les années 1980.
Cependant, ces spécifications ont été publiées pour la première fois en 1997, sur la base
d’études menées par l’organisation JSCE (Japan Society of Civil Engineers 1986a; 1986b)
pour l’utilisation des PRF dans les structures en béton. En ce qui concerne l’utilisation de
PRF dans la construction des bâtiments, les spécifications et les méthodes de conception ont
été développées d’après les résultats du projet de recherche «Effective Utilization of
Advanced Composite on Construction», qui était commandité par le ministère de construction
du gouvernement japonais en 1993. À noter que le renforcement sismique des structures en
BA à l’aide de PRF en carbone (PRFC), surtout les colonnes et piles des ponts, ne s’est
considérablement élargi qu’après le tremblement de terre Hyogoken-Nanbu qui a frappé le
Japon en 1995.
Comité Américain ACI 440
Aux États-Unis, les développements et recherches sur l’utilisation des composites PRF ont
commencé dans les années 1980 grâce aux initiatives de l’administration «the National
Science Foundation and the Federal Highway Administration», qui avait soutenu les
recherches des universités et des institutions. En 1991, la norme américaine ACI «American
Concrete Institute» a crée le comité 440 qui traite de l’utilisation des PRF dans les structures
28
en béton. Ce comité a publié en 1996 un rapport bibliographique sur les composites PRF
(ACI 440R 1996), suivie d’une deuxième édition en 2007 (ACI 440R 2007). En 2001 et
2002, le comité 440 a publié les deux guides de conception ACI 440.1R (2001) et ACI
440.2R (2002). Le premier guide traite de la conception et construction des structures en
béton armé de barres en PRF, alors que le deuxième traite du renforcement des structures en
béton à l’aide de PRF collés en surface.
Les dispositions de ACI 440.2R sur le renforcement en cisaillement des poutres en BA
étaient basées sur l’étude effectuée par les chercheurs (Khalifa et al. 1998). En 2008, le
comité 440 de la norme américaine a publié une deuxième édition du guide (ACI 440.2R
2008). Cette nouvelle édition a apporté des améliorations et des modifications, ainsi que des
sujets additionnels qui n’avaient pas été traités dans la version originale du guide. On peut
citer : (i) la méthode de vérification de la résistance d’adhérence en flexion à l’interface
PRF/béton afin d’éviter une rupture par décollement, où la déformation effective du PRF,
εfrpe, a été limitée à un niveau de déformation, εfrpd, auquel un décollement des composites
collés en surface peut se produire (εfrpe ≤ εfrpd); (ii) l’article additionnel 10.3 concernant le
renforcement en flexion des structures en béton précontraint; (iii) l’article additionnel 13.3
concernant l’application du système NSM de renforcement (Near Surface Mounted system).
De plus, des exemples de conception supplémentaires relatifs aux sujets mentionnés ci-haut
ont été incorporés (ACI 440.2R 2008).
Comités Canadiens S6, S806 et groupe ISIS
Au Canada, l’utilisation de PRF dans l’industrie de la construction a commencé vers la fin
des années 1980, lorsque la société Canadienne de génie civil a créé un comité technique
pour l’utilisation de PRF dans les ponts et les structures en BA. Ce comité, soutenu par le
gouvernement fédéral canadien, a formé en 1992 l’organisation intitulé «Network on
Advanced Composite Materials in Bridges and Structures», consacré aux travaux relatifs à
l’utilisation des matériaux composites dans les ouvrages d’infrastructure. En 1995, le
29
gouvernement fédéral canadien a financé le groupe ISIS «Intelligent Sensing for Innovative
Structures», qui s’occupe de l’utilisation de PRF.
En 2000, le comité sur le calcul des ponts routiers S6 de l’Association Canadienne de
Normalisation (CAN/CSA) a publié la section concernant l’utilisation de PRF dans les
travaux d’infrastructure (CSA S6 2000). Des modifications majeures dans la partie consacrée
à la conception à l’aide de PRF ont été introduites dans la dernière version de la norme S6
publiée en 2006 et réimprimée en 2011 (CSA S6 2006). En 2002, CSA a créé le comité S806
pour développer des règles de calcul et de construction des structures de bâtiment contenant
des PRF (CSA S806 2002). Une deuxième édition de la norme S806 a été publiée en 2012
(CSA S806 2012), où des modifications ont été apportées, par exemple, à la méthode de
calcul de la contribution des PRF collés en surface à la résistance en cisaillement, Vfrp, pour
les poutres en béton, ainsi qu’à la vérification de la déformation effective correspondante,
εfrpe.
Le groupe ISIS a publié en 2001 les deux manuels No. 3 et 4 qui traitent, respectivement, du
calcul des structures en béton armé de barres en PRF et du renforcement externe de structures
en béton à l’aide de PRF (ISIS Canada 2001). La deuxième édition du manuel de conception
No. 4 a été publié en 2008 (ISIS Canada 2008). À noter que ce manuel réunit, pour des
raisons de comparaison, les procédures et modèles de conception des deux normes CSA S806
(2002) et CSA S6 (2006) sur le calcul des bâtiments et des ponts routiers.
Comité Européen TG9.3
En Europe, les premières recherches sur l’utilisation de PRF ont commencé dans les années
1960. La Fédération Internationale du Béton (FIB) a créé en 1993 le comité de travail TG9.3
“Task Group 9.3” dans le but d’établir des méthodes de conception basées sur l’Eurocode 2.
Le comité TG9.3 est constitué par des membres représentant la plupart des universités, des
compagnies et des institutions européennes, concernées par les études sur le renforcement à
l’aide de PRF. Des représentants du Canada, des États-Unis et du Japon font également partie
30
de ces membres. En 2001, le comité a complété le développement du bulletin 14 de FIB, qui
s’occupe de la conception des structures en béton renforcées à l’aide de PRF collés en
surface (FIB TG9.3 2001). Les dispositions de la norme sur le renforcement en cisaillement
des poutres en BA sont basées sur la régression des résultats expérimentaux menés par les
chercheurs Triantafillou et Antonopoulos (2000).
Comités Italiens CNR DT-200 et DT-204
Parmi les pays impliqués dans les activités de recherche et de conception concernant la
réhabilitation des structures existantes à l’aide de PRF, se trouve l’Italie qui a récemment
produit ses propres guides. En effet, le conseil national de la recherche (CNR) italien a
publié, au cours des dernières années, deux guides de conception et construction relatifs à
l’utilisation des PRF. Le premier guide, publié en 2004, a présenté les dispositions
réglementaires numéro 200 (CNR DT200 2004) qui traite de la conception et le renforcement
des structures existantes à l’aide de PRF collés en surface. Le deuxième guide, publié en
2006, a présenté les dispositions réglementaires numéro 204 (CNR DT204 2006) qui traite de
la conception et construction des nouvelles structures en béton contenant des barres en PRF.
A noter que les dispositions du guide sur le renforcement externe en cisaillement des poutres
en BA sont basées sur l’étude effectuée par les chercheurs Monti et al. (2004).
Rapport technique Britannique TR-55
On constate qu’à partir du milieu des années 1990, un certain nombre d'approches et règles
de calcul pour le renforcement des structures en BA à l’aide de PRF a été intégré aux normes
et guides de conception les plus reconnus au monde, comme au Japon, au Canada et aux
États-Unis. Cependant, ces approches n'étaient pas conformes aux standards britanniques BS
«British Standards» reconnus au Royaume-Uni pour la conception des structures en BA. La
société britannique de béton a donc initié un projet de recherche afin de développer des
guides de conception conformes à leurs standards. Ces guides seraient applicables à tous les
types de PRF utilisés pour le renforcement des structures existantes. Le financement de ce
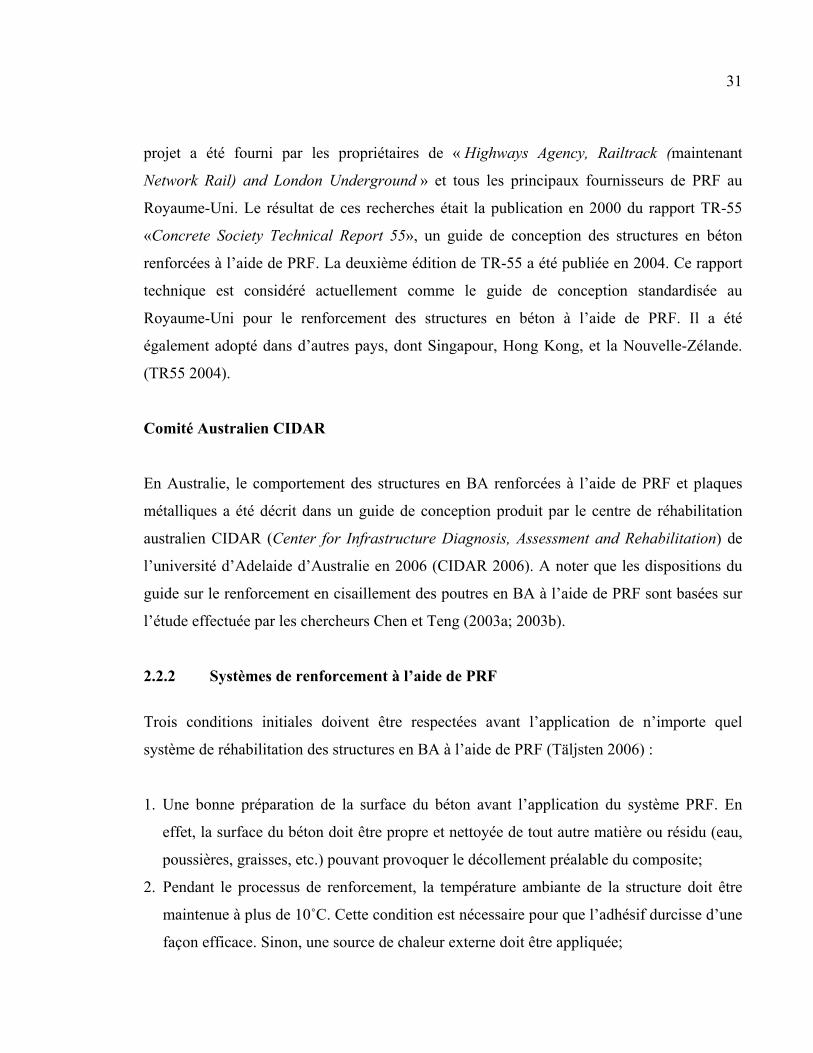
31
projet a été fourni par les propriétaires de « Highways Agency, Railtrack (maintenant
Network Rail) and London Underground » et tous les principaux fournisseurs de PRF au
Royaume-Uni. Le résultat de ces recherches était la publication en 2000 du rapport TR-55
«Concrete Society Technical Report 55», un guide de conception des structures en béton
renforcées à l’aide de PRF. La deuxième édition de TR-55 a été publiée en 2004. Ce rapport
technique est considéré actuellement comme le guide de conception standardisée au
Royaume-Uni pour le renforcement des structures en béton à l’aide de PRF. Il a été
également adopté dans d’autres pays, dont Singapour, Hong Kong, et la Nouvelle-Zélande.
(TR55 2004).
Comité Australien CIDAR
En Australie, le comportement des structures en BA renforcées à l’aide de PRF et plaques
métalliques a été décrit dans un guide de conception produit par le centre de réhabilitation
australien CIDAR (Center for Infrastructure Diagnosis, Assessment and Rehabilitation) de
l’université d’Adelaide d’Australie en 2006 (CIDAR 2006). A noter que les dispositions du
guide sur le renforcement en cisaillement des poutres en BA à l’aide de PRF sont basées sur
l’étude effectuée par les chercheurs Chen et Teng (2003a; 2003b).
2.2.2 Systèmes de renforcement à l’aide de PRF
Trois conditions initiales doivent être respectées avant l’application de n’importe quel
système de réhabilitation des structures en BA à l’aide de PRF (Täljsten 2006) :
1. Une bonne préparation de la surface du béton avant l’application du système PRF. En
effet, la surface du béton doit être propre et nettoyée de tout autre matière ou résidu (eau,
poussières, graisses, etc.) pouvant provoquer le décollement préalable du composite;
2. Pendant le processus de renforcement, la température ambiante de la structure doit être
maintenue à plus de 10˚C. Cette condition est nécessaire pour que l’adhésif durcisse d’une
façon efficace. Sinon, une source de chaleur externe doit être appliquée;
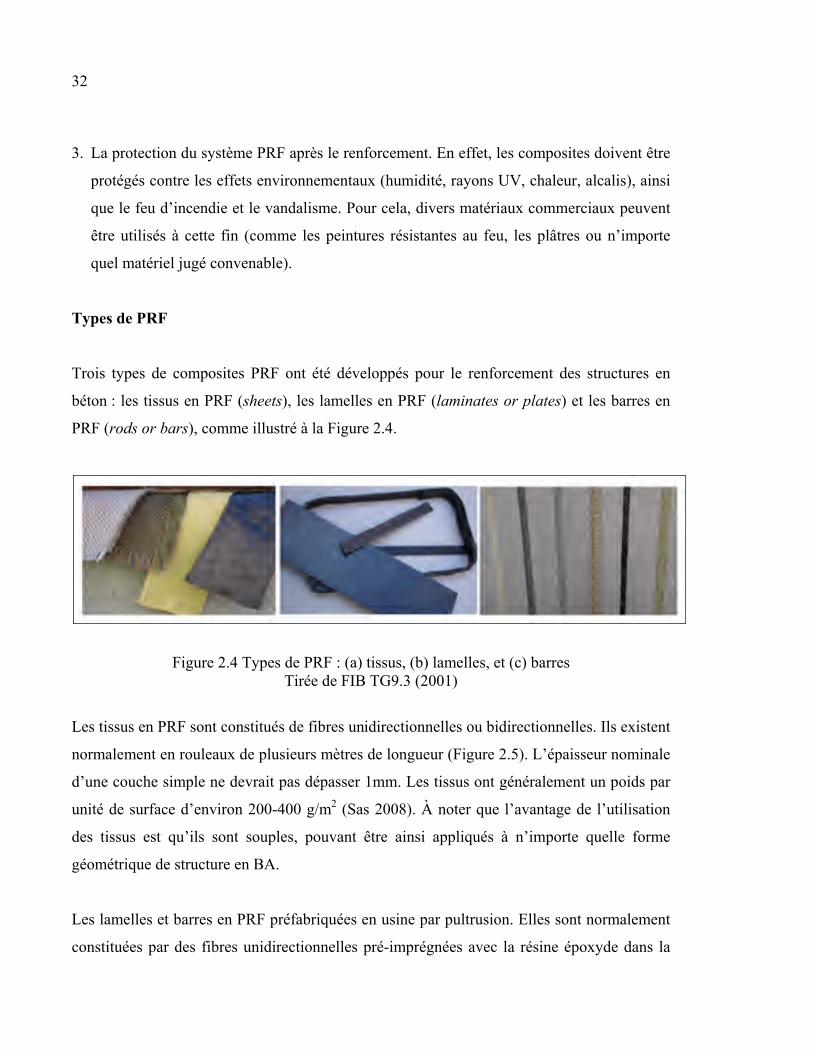
32
3. La protection du système PRF après le renforcement. En effet, les composites doivent être
protégés contre les effets environnementaux (humidité, rayons UV, chaleur, alcalis), ainsi
que le feu d’incendie et le vandalisme. Pour cela, divers matériaux commerciaux peuvent
être utilisés à cette fin (comme les peintures résistantes au feu, les plâtres ou n’importe
quel matériel jugé convenable).
Types de PRF
Trois types de composites PRF ont été développés pour le renforcement des structures en
béton : les tissus en PRF (sheets), les lamelles en PRF (laminates or plates) et les barres en
PRF (rods or bars), comme illustré à la Figure 2.4.
Figure 2.4 Types de PRF : (a) tissus, (b) lamelles, et (c) barres Tirée de FIB TG9.3 (2001)
Les tissus en PRF sont constitués de fibres unidirectionnelles ou bidirectionnelles. Ils existent
normalement en rouleaux de plusieurs mètres de longueur (Figure 2.5). L’épaisseur nominale
d’une couche simple ne devrait pas dépasser 1mm. Les tissus ont généralement un poids par
unité de surface d’environ 200-400 g/m2 (Sas 2008). À noter que l’avantage de l’utilisation
des tissus est qu’ils sont souples, pouvant être ainsi appliqués à n’importe quelle forme
géométrique de structure en BA.
Les lamelles et barres en PRF préfabriquées en usine par pultrusion. Elles sont normalement
constituées par des fibres unidirectionnelles pré-imprégnées avec la résine époxyde dans la
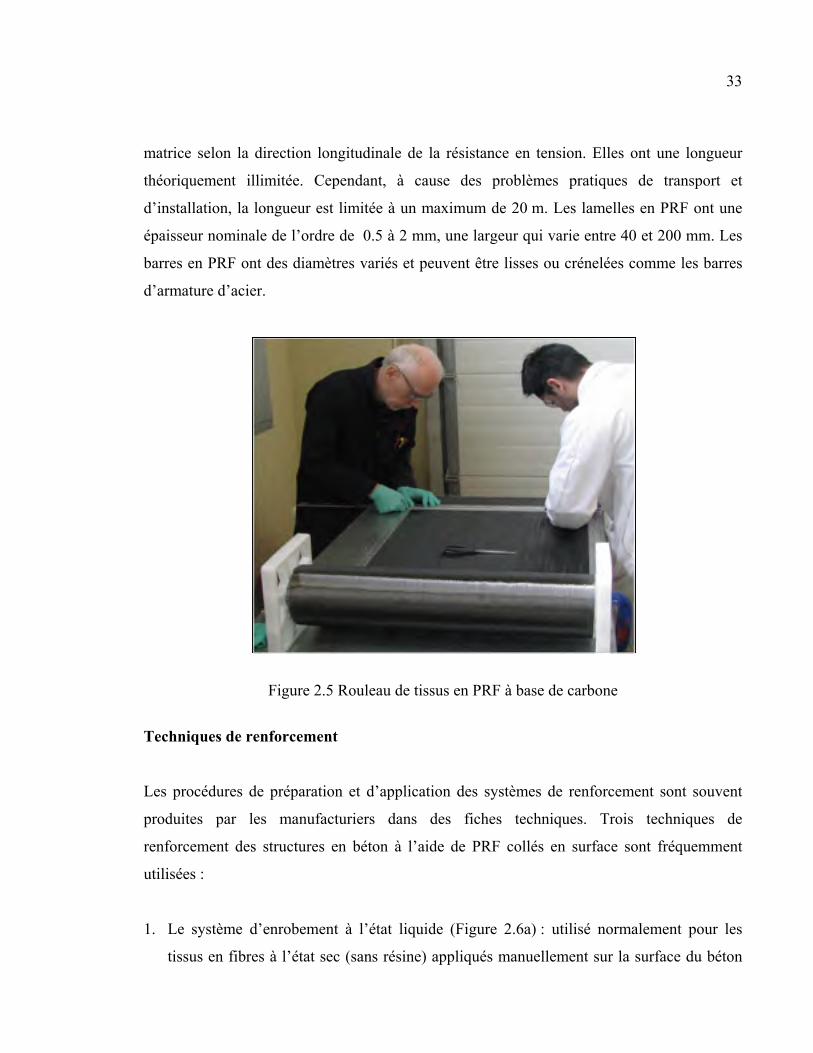
33
matrice selon la direction longitudinale de la résistance en tension. Elles ont une longueur
théoriquement illimitée. Cependant, à cause des problèmes pratiques de transport et
d’installation, la longueur est limitée à un maximum de 20 m. Les lamelles en PRF ont une
épaisseur nominale de l’ordre de 0.5 à 2 mm, une largeur qui varie entre 40 et 200 mm. Les
barres en PRF ont des diamètres variés et peuvent être lisses ou crénelées comme les barres
d’armature d’acier.
Figure 2.5 Rouleau de tissus en PRF à base de carbone
Techniques de renforcement
Les procédures de préparation et d’application des systèmes de renforcement sont souvent
produites par les manufacturiers dans des fiches techniques. Trois techniques de
renforcement des structures en béton à l’aide de PRF collés en surface sont fréquemment
utilisées :
1. Le système d’enrobement à l’état liquide (Figure 2.6a) : utilisé normalement pour les
tissus en fibres à l’état sec (sans résine) appliqués manuellement sur la surface du béton
34
et mûris avec la résine in situ. La technique de renforcement consiste à appliquer une
couche mince de résine polymère à la surface du béton déjà nettoyée et sablée. L’étape
suivante consiste à disposer les tissus déjà taillés à l’état sec dans la résine selon la
direction convenable. L’air emprisonné (air voids) et les irrégularités entre les tissus et la
résine seront ensuite éliminées en se servant d’un rouleau en plastique, permettant ainsi à
la résine de passer à travers les mailles du tissu. Une deuxième couche de la même résine
sera ensuite appliquée sur la surface de tissus déjà imprégnés in situ, suivie d’une couche
de finition appropriée pour résister aux effets environnementaux, s’il y a lieu.
2. Le système préfabriqué collé sur la surface (Figure 2.6b) : utilisé soit pour les lamelles
préfabriquées en usine par pultrusion, soit pour les tissus mûris et imprégnés
complètement au préalable avec la résine. La technique de renforcement consiste à
appliquer une couche mince d’adhésif sur le substrat du béton déjà sablé et, en même
temps, à appliquer une couche épaisse du même adhésif sur les lamelles préfabriquées.
Les lamelles seront ensuite collées aux endroits de renforcement, souvent des bandes, en
se servant d’un rouleau pour obtenir une épaisseur constante répartie sur toute la surface
de renforcement (1 à 2 mm d’épaisseur additionnelle que celle de la lamelle). Ce système
de réhabilitation est efficace pour des surfaces planes comme les poutres, les murs ou les
dalles.
3. Le système NSM (Near Surface Mounted system) ou armature encastrée près de la
surface (Figure 2.6c) : il consiste à tailler des rainures étroites près de la surface du béton
aux endroits de renforcement. Des bandes de lamelles (NSM-strips) ou des barres (NSM-
bars ou rods) préfabriquées en PRF seront ensuite insérées à l’intérieur de ces rainures,
déjà remplies d’époxyde qui sert d’adhésif. Un paramètre important intervient pour
assurer l’efficacité de cette technique, l’épaisseur de recouvrement du béton, qui doit être
vérifiée pour accommoder les profondeurs prévues des rainures sans nuire aux armatures
internes en acier.
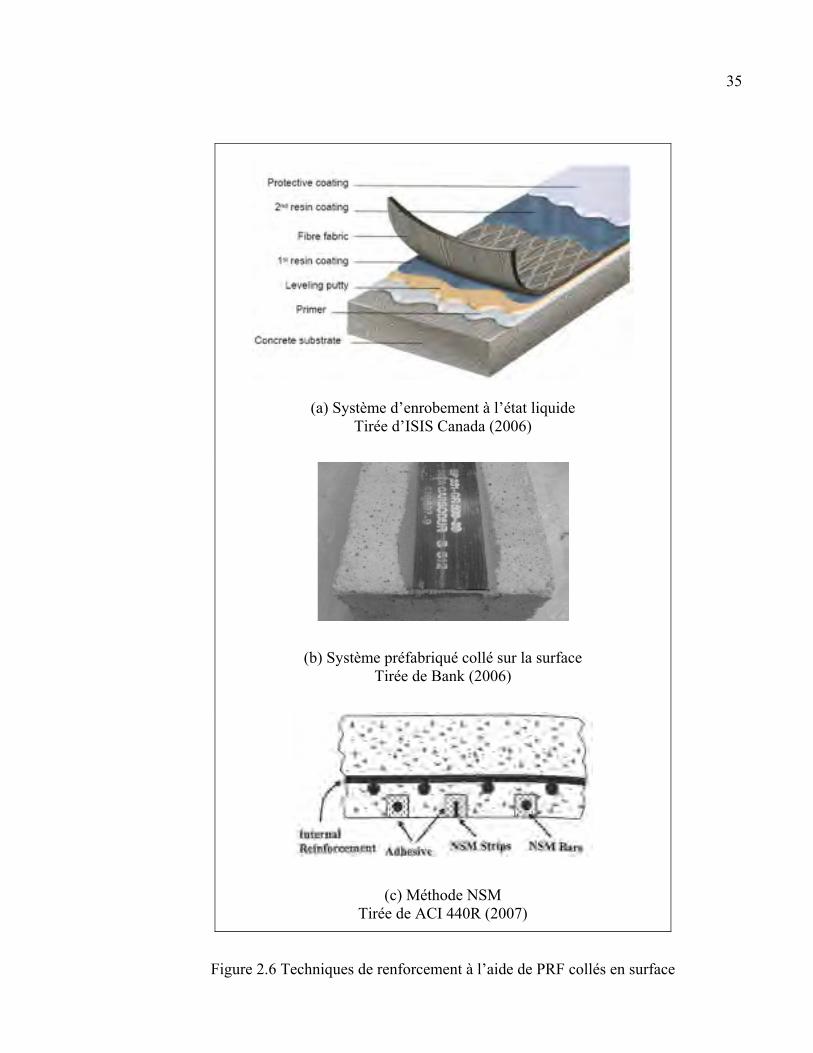
35
(a) Système d’enrobement à l’état liquide Tirée d’ISIS Canada (2006)
(b) Système préfabriqué collé sur la surface Tirée de Bank (2006)
(c) Méthode NSM Tirée de ACI 440R (2007)
Figure 2.6 Techniques de renforcement à l’aide de PRF collés en surface
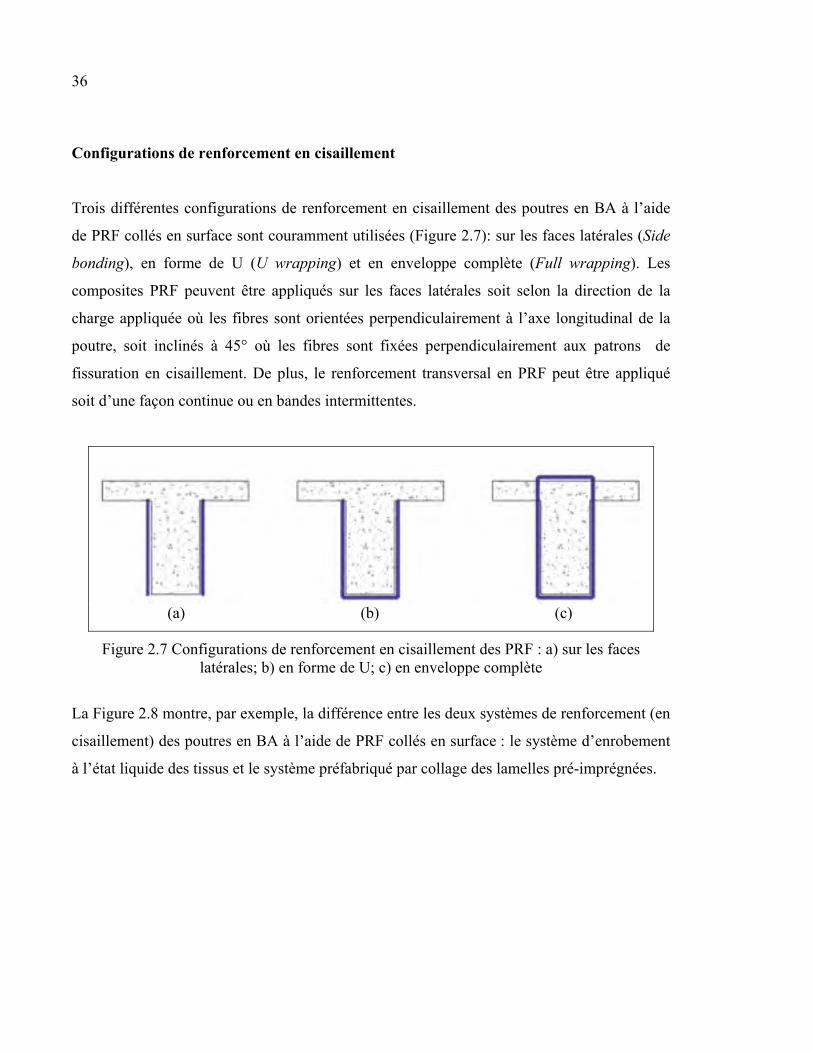
36
Configurations de renforcement en cisaillement
Trois différentes configurations de renforcement en cisaillement des poutres en BA à l’aide
de PRF collés en surface sont couramment utilisées (Figure 2.7): sur les faces latérales (Side
bonding), en forme de U (U wrapping) et en enveloppe complète (Full wrapping). Les
composites PRF peuvent être appliqués sur les faces latérales soit selon la direction de la
charge appliquée où les fibres sont orientées perpendiculairement à l’axe longitudinal de la
poutre, soit inclinés à 45° où les fibres sont fixées perpendiculairement aux patrons de
fissuration en cisaillement. De plus, le renforcement transversal en PRF peut être appliqué
soit d’une façon continue ou en bandes intermittentes.
(a) (b) (c)
Figure 2.7 Configurations de renforcement en cisaillement des PRF : a) sur les faces latérales; b) en forme de U; c) en enveloppe complète
La Figure 2.8 montre, par exemple, la différence entre les deux systèmes de renforcement (en
cisaillement) des poutres en BA à l’aide de PRF collés en surface : le système d’enrobement
à l’état liquide des tissus et le système préfabriqué par collage des lamelles pré-imprégnées.
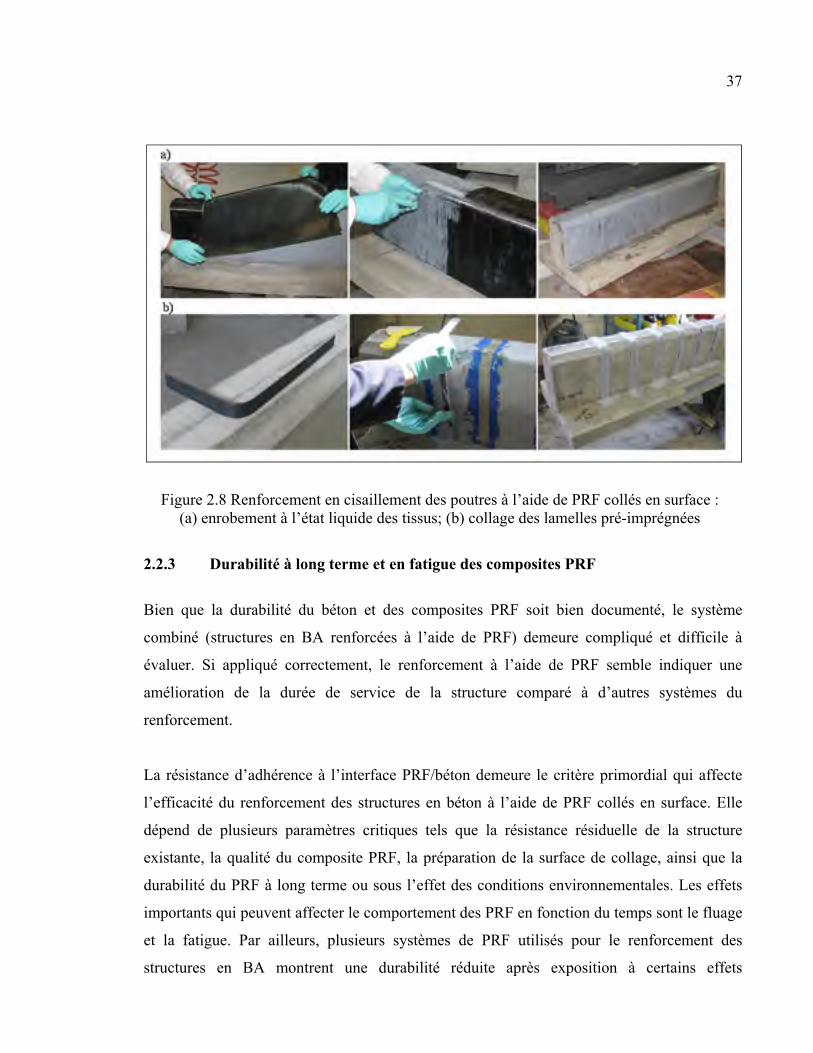
37
Figure 2.8 Renforcement en cisaillement des poutres à l’aide de PRF collés en surface : (a) enrobement à l’état liquide des tissus; (b) collage des lamelles pré-imprégnées
2.2.3 Durabilité à long terme et en fatigue des composites PRF
Bien que la durabilité du béton et des composites PRF soit bien documenté, le système
combiné (structures en BA renforcées à l’aide de PRF) demeure compliqué et difficile à
évaluer. Si appliqué correctement, le renforcement à l’aide de PRF semble indiquer une
amélioration de la durée de service de la structure comparé à d’autres systèmes du
renforcement.
La résistance d’adhérence à l’interface PRF/béton demeure le critère primordial qui affecte
l’efficacité du renforcement des structures en béton à l’aide de PRF collés en surface. Elle
dépend de plusieurs paramètres critiques tels que la résistance résiduelle de la structure
existante, la qualité du composite PRF, la préparation de la surface de collage, ainsi que la
durabilité du PRF à long terme ou sous l’effet des conditions environnementales. Les effets
importants qui peuvent affecter le comportement des PRF en fonction du temps sont le fluage
et la fatigue. Par ailleurs, plusieurs systèmes de PRF utilisés pour le renforcement des
structures en BA montrent une durabilité réduite après exposition à certains effets
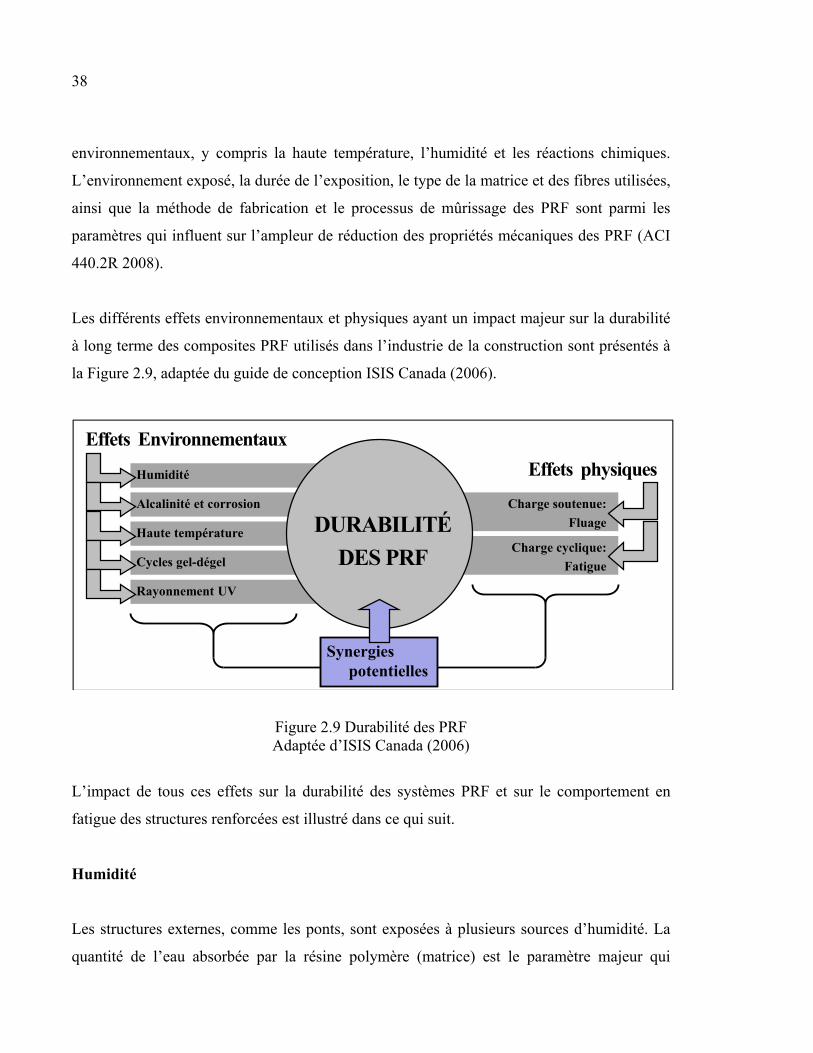
38
environnementaux, y compris la haute température, l’humidité et les réactions chimiques.
L’environnement exposé, la durée de l’exposition, le type de la matrice et des fibres utilisées,
ainsi que la méthode de fabrication et le processus de mûrissage des PRF sont parmi les
paramètres qui influent sur l’ampleur de réduction des propriétés mécaniques des PRF (ACI
440.2R 2008).
Les différents effets environnementaux et physiques ayant un impact majeur sur la durabilité
à long terme des composites PRF utilisés dans l’industrie de la construction sont présentés à
la Figure 2.9, adaptée du guide de conception ISIS Canada (2006).
Figure 2.9 Durabilité des PRF Adaptée d’ISIS Canada (2006)
L’impact de tous ces effets sur la durabilité des systèmes PRF et sur le comportement en
fatigue des structures renforcées est illustré dans ce qui suit.
Humidité
Les structures externes, comme les ponts, sont exposées à plusieurs sources d’humidité. La
quantité de l’eau absorbée par la résine polymère (matrice) est le paramètre majeur qui
Effets Environnementaux
Effets physiques Humidité
Alcalinité et corrosion
Haute température
Cycles gel-dégel
Charge soutenue:
Fluage
Charge cyclique:
Fatigue
Rayonnement UV
Synergies potentielles
DURABILITÉ
DES PRF
39
affecte la durabilité du composite PRF. Les conséquences principales de l’absorption de l’eau
par la matrice sont la baisse de la température de transition vitreuse (Tg) de la matrice et la
dégradation des propriétés mécaniques du PRF. L’absorption d’humidité par la matrice
s’effectue généralement à proximité des fibres, ce qui entraine une réduction de la résistance
et de module de la matrice tout en endommageant la surface des fibres imprégnées. Pour les
composites en fibres unidirectionnelles, la résistance en tension des PRF, qui est moins
dépendante des propriétés de la matrice, est relativement peu affectée par l'absorption
d'humidité, tandis que les propriétés dépendantes de la matrice, telles que les résistances en
cisaillement et en compression, peuvent être fortement affectées. Ainsi, des précautions
doivent être prises pour protéger de l’exposition à l’humidité les composites PRF ayant un
potentiel d’absorption d’eau relativement élevé. En effet, les PRF les plus sensibles à
l’humidité sont ceux à base d’aramide puisque les fibres d’aramide elles-mêmes sont
susceptibles à l’absorption d’humidité et au gonflement, causant la fissuration de la matrice
et le développement des contraintes internes. De plus, les résines époxydes et vinylesters sont
considérées comme les meilleures matrices pour prévenir les effets d’humidité dans les PRF
utilisés en génie civil. Les polyesters sont par contre peu performants et ne doivent pas être
utilisés dans des zones d’humidité élevée. Par ailleurs, il est très important de prendre en
considération les conditions résiduelles de la structure existante à renforcer, notamment le
béton et les barres d’armature, avant l’application du PRF. Comme ce dernier constitue une
couche imperméable pour les surfaces externes du béton, il est préférable de fournir des
moyens adéquats pour permettre à l’humidité de s’échapper de la structure en béton, et
surtout dans les zones où la transmission des vapeurs d’eau est prévue (ACI 440R 2007; ISIS
Canada 2006).
Haute température
La haute température est un paramètre d’influence majeure qui peut avoir des effets
importants sur la durabilité à long terme du composite PRF. En effet, la résine mûrie de la
matrice peut passer d’un état rigide ou vitreux à un état ductile ou visqueux sous l’effet de la
chaleur. Pour empêcher ce phénomène et puisque les composites PRF doivent demeurer à
40
leur état rigide, la température de transition vitreuse Tg a été identifiée, comme déjà expliqué
précédemment. Une fois la température d’opération du composite PRF dépasse Tg, la résine
polymère va s’adoucir et perdre sa résistance, empêchant ainsi le transfert des contraintes
entre les fibres à travers la matrice. Par conséquent, une concentration très élevée des
contraintes va se produire dans les fibres à des endroits distincts de la matrice provoquant
une rupture prématurée. Pour éviter une telle rupture, le guide de conception ISIS Canada
(2006) a recommandé de limiter la température d’opération maximale à environ 20˚C en
dessous de Tg pour une matrice fabriquée de résine époxyde. Il est à noter qu’une
augmentation de la teneur en eau dans le composite PRF provoque une baisse de Tg. De plus,
la haute température peut augmenter le taux de fluage et la dégradation des PRF dû aux
attaques chimiques et à l’absorption d’humidité. Les températures très élevées, comme celles
causées par le feu d’incendie, ne sont pas prises en compte dans l’évaluation de la durabilité
des composites PRF puisque ce type d’exposition est exceptionnel (ACI 440R 2007; Bank
2006; ISIS Canada 2008).
Cycles gel-dégel
Puisque la réhabilitation s’effectue sur des structures déficientes existantes, alors la
possibilité d’avoir des fissures et des vides dans le béton avant l’application du système de
renforcement est très probable. L’expansion de l’eau due à la congélation dans ces fissures
peut causer le décollement à l’interface béton/PRF. Par conséquent, l’effet des cycles de gel-
dégel sur le comportement des structures en béton renforcées à l’aide de PRF doit être
considéré (FIB TG9.3 2001). En raison des conditions climatiques froides du Canada, les
températures très basses et les cycles thermiques peuvent endommager les PRF soit par
fissuration de la matrice ou rupture des fibres. De plus, la variation de température et la
dilatation thermique différentielle entre la matrice et les fibres ou entre le substrat du béton et
la matrice peut affecter l’adhérence à l’interface béton/PRF. Ainsi, les cycles de gel-dégel
peuvent avoir un impact majeur sur la durabilité des PRF par le changement des propriétés
mécaniques des matériaux et par conséquent, cet effet doit être pris en considération chaque
41
fois que les PRF sont envisagés pour le renforcement des structures exposées (ISIS Canada
2006).
Rayonnement UV
Tous les matériaux exposés directement ou indirectement à la lumière du soleil sont soumis
au rayonnement ultraviolet (UV). Ainsi, les rayons UV peuvent endommager les composites
PRF utilisés pour le renforcement externe des structures en béton. Les fibres d’aramide sont
les plus sensibles à l’exposition aux rayons UV, tandis que les fibres de carbone et de verre
sont connues pour être plus résistantes. La plupart des matrices utilisées dans les PRF en
construction sont susceptibles de se dégrader légèrement en raison du rayonnement UV,
pouvant endommager de façon considérable les propriétés mécaniques des PRF
dépendamment du type de résine utilisé et de l’orientation des fibres dans la matrice. Les
résines époxydes sont, par exemple, plus résistantes au rayonnement UV que les résines
polyesters. La dégradation des propriétés due à cet effet peut être évitée en utilisant des
adjuvants dans la matrice, ou en appliquant une couche protectrice de peinture résistante aux
UV sur le PRF (FIB TG9.3 2001; ISIS Canada 2008).
Attaque chimique et réaction alcalis-granulats
L’effet des attaques chimiques et des réactions alcalis-granulats sur le comportement des
structures renforcées à l’aide de PRF dépend du type de résine et des fibres. Les fibres de
carbone sont résistantes à cet effet, tandis que les fibres de verre sont plus sensibles aux
effets d’alcalinité et d’acidité. De ce fait, les composites PRF sont souvent fabriqués en
utilisant des matrices de polymères résistantes aux alcalis, surtout pour les PRF en fibres de
verre. Une matrice de polymère résistante aux alcalis proprement appliquée peut protéger et
empêcher la rupture des fibres provenant des attaques chimiques. Ainsi, les structures situées
dans des endroits de haute alcalinité et/ou acidité sont souvent renforcées à l’aide de PRF en
fibres de carbone (ACI 440.2R 2008; FIB TG9.3 2001).
42
Fluage
Tous les types de fibres (carbone, verre et aramide) utilisés pour les systèmes PRF dans
l’industrie de la construction présentent un faible fluage. En général, les fibres de carbone
sont les plus résistantes à la rupture par fluage, suivi par les fibres d’aramide qui sont
modérément sensibles, puis les fibres de verre qui sont les plus sensibles. Cependant, les
matrices polymères utilisées dans les PRF peuvent subir d’important fluage sous charges
soutenues. Les résines thermodurcissables sont souvent plus résistantes au fluage que les
thermoplastiques. Le taux de fluage dans les composites PRF dépend de la teneur en volume
des fibres par rapport à la matrice et de l’orientation des fibres par rapport aux charges
appliquées. De plus, la haute température et l’humidité peuvent avoir des effets significatifs
sur le taux de fluage dans la matrice du PRF. Ainsi, l’effet de fluage joue un rôle important
dans la durabilité des PRF puisqu’il peut affecter la transmission des charges et la répartition
des contraintes entre les fibres à travers la matrice (ACI 440.2R 2008; ISIS Canada 2006).
Fatigue
La plupart des composites PRF utilisés en génie civil montrent un bon comportement en
fatigue, surtout pour les systèmes de fibres unidirectionnels. Le comportement en fatigue des
PRF dépend souvent des propriétés mécaniques des matrices polymères, alors qu’il est moins
dépendant des propriétés des fibres. Ceci est dû au fait que tous les types de fibres sont
résistants à la fatigue. C’est la rigidité de la matrice et sa capacité de résister à la progression
des fissures qui affectent la performance des composites PRF sous chargement cyclique.
La haute température et l’humidité peuvent dégrader le comportement en fatigue des
composites PRF. Cependant, ces effets ont une moindre influence sur la durée de service en
fatigue des PRF à base de carbone. Ceci est attribué au fait que les fibres de carbone sont
plus résistantes que les fibres de verre et d’aramide à la dégradation environnementale causée
par le fluage, le rayonnement UV et les alcalis. Par ailleurs, les fibres de carbone ont une très
grande rigidité, ce qui empêche la fissuration de la matrice tout en protégeant la résistance
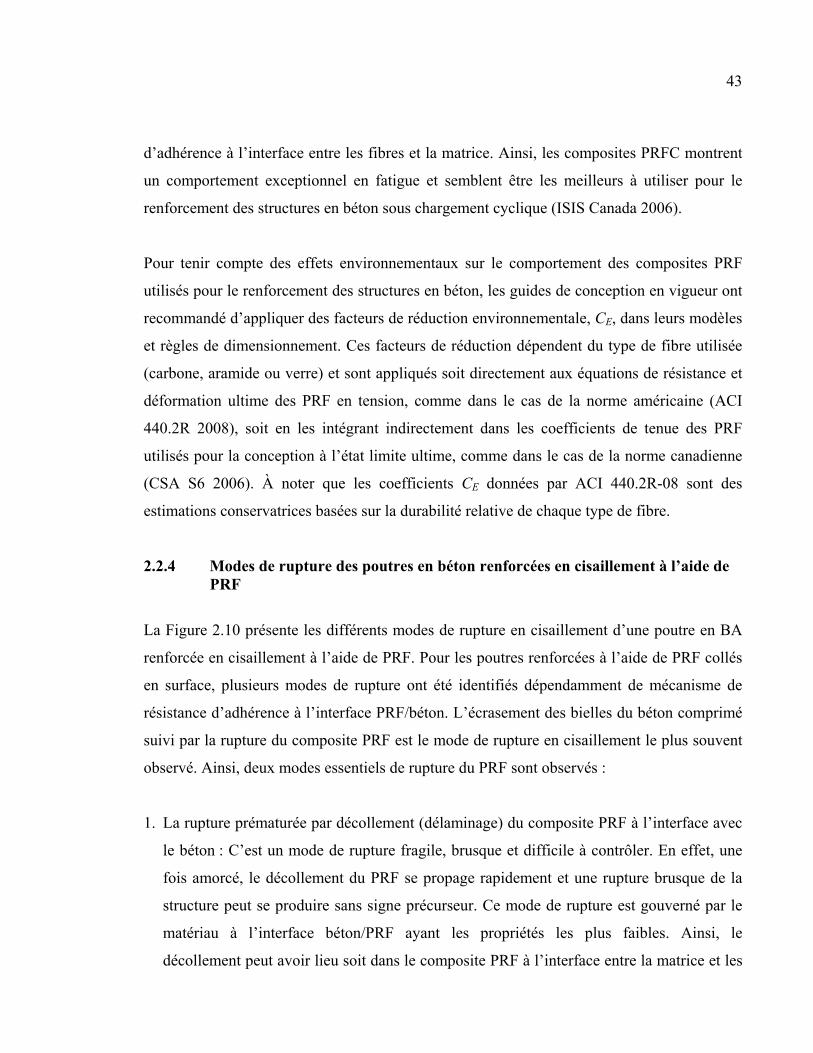
43
d’adhérence à l’interface entre les fibres et la matrice. Ainsi, les composites PRFC montrent
un comportement exceptionnel en fatigue et semblent être les meilleurs à utiliser pour le
renforcement des structures en béton sous chargement cyclique (ISIS Canada 2006).
Pour tenir compte des effets environnementaux sur le comportement des composites PRF
utilisés pour le renforcement des structures en béton, les guides de conception en vigueur ont
recommandé d’appliquer des facteurs de réduction environnementale, CE, dans leurs modèles
et règles de dimensionnement. Ces facteurs de réduction dépendent du type de fibre utilisée
(carbone, aramide ou verre) et sont appliqués soit directement aux équations de résistance et
déformation ultime des PRF en tension, comme dans le cas de la norme américaine (ACI
440.2R 2008), soit en les intégrant indirectement dans les coefficients de tenue des PRF
utilisés pour la conception à l’état limite ultime, comme dans le cas de la norme canadienne
(CSA S6 2006). À noter que les coefficients CE données par ACI 440.2R-08 sont des
estimations conservatrices basées sur la durabilité relative de chaque type de fibre.
2.2.4 Modes de rupture des poutres en béton renforcées en cisaillement à l’aide de PRF
La Figure 2.10 présente les différents modes de rupture en cisaillement d’une poutre en BA
renforcée en cisaillement à l’aide de PRF. Pour les poutres renforcées à l’aide de PRF collés
en surface, plusieurs modes de rupture ont été identifiés dépendamment de mécanisme de
résistance d’adhérence à l’interface PRF/béton. L’écrasement des bielles du béton comprimé
suivi par la rupture du composite PRF est le mode de rupture en cisaillement le plus souvent
observé. Ainsi, deux modes essentiels de rupture du PRF sont observés :
1. La rupture prématurée par décollement (délaminage) du composite PRF à l’interface avec
le béton : C’est un mode de rupture fragile, brusque et difficile à contrôler. En effet, une
fois amorcé, le décollement du PRF se propage rapidement et une rupture brusque de la
structure peut se produire sans signe précurseur. Ce mode de rupture est gouverné par le
matériau à l’interface béton/PRF ayant les propriétés les plus faibles. Ainsi, le
décollement peut avoir lieu soit dans le composite PRF à l’interface entre la matrice et les
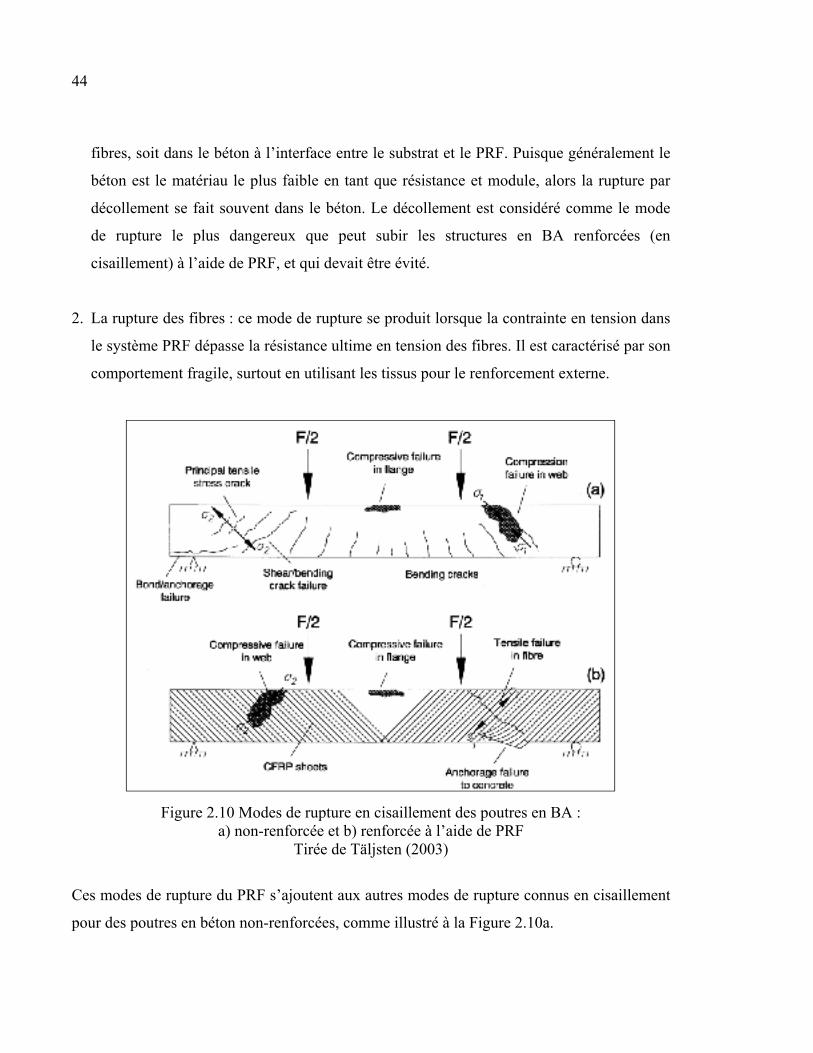
44
fibres, soit dans le béton à l’interface entre le substrat et le PRF. Puisque généralement le
béton est le matériau le plus faible en tant que résistance et module, alors la rupture par
décollement se fait souvent dans le béton. Le décollement est considéré comme le mode
de rupture le plus dangereux que peut subir les structures en BA renforcées (en
cisaillement) à l’aide de PRF, et qui devait être évité.
2. La rupture des fibres : ce mode de rupture se produit lorsque la contrainte en tension dans
le système PRF dépasse la résistance ultime en tension des fibres. Il est caractérisé par son
comportement fragile, surtout en utilisant les tissus pour le renforcement externe.
Figure 2.10 Modes de rupture en cisaillement des poutres en BA : a) non-renforcée et b) renforcée à l’aide de PRF
Tirée de Täljsten (2003)
Ces modes de rupture du PRF s’ajoutent aux autres modes de rupture connus en cisaillement
pour des poutres en béton non-renforcées, comme illustré à la Figure 2.10a.
45
L’identification préalable du mode de rupture représente l’aspect le plus crucial dans la
conception des poutres en BA renforcées en cisaillement à l’aide de PRF. Le comportement
en cisaillement dépend largement du mode de rupture présumé pour chaque poutre testée
(Pellegrino et Modena 2002).
En ce qui concerne la défaillance par rupture des fibres, la résistance en cisaillement de la
poutre en béton sera contrôlée par la résistance ultime en tension des fibres. Un décollement
local dans les composite PRF à l’interface entre les fibres et la matrice précède souvent une
telle rupture, en particulier lorsque le renforcement se fait en enveloppe complète. En effet, le
mécanisme de ce type de rupture s’amorce par un décollement local du PRF aux endroits de
la concentration la plus élevée des contraintes, surtout à l’intersection avec les fissures
inclinées critiques en cisaillement. Cependant, la poutre démontrera une résistance
significative pour supporter un chargement additionnel, même après le décollement local du
PRF dans ces zones critiques, avant de subir la rupture finale des fibres. Dans ce cas, même
si le décollement n’est pas la raison principale de rupture de la structure, il forme quand
même un état limite de service qui peut être considéré comme état limite de conception (Cao
et al. 2005).
La rupture du PRF (décollement du composite ou rupture des fibres) est considérée comme
un mode de rupture de second ordre qui se produit souvent après la rupture principale en
cisaillement des poutres en béton, provoquée soit par la rupture des armatures transversales
ou l’écrasement du béton. Ceci était observé dans l’étude réalisée par Bousselham et Chaallal
(2008), sur la base d’un vaste programme de recherche expérimental concernant le
mécanisme de résistance en cisaillement des poutres renforcées à l’aide de PRF sous charges
statiques.
Pour les poutres en béton renforcées en cisaillement à l’aide de PRF ayant une résistance en
compression faible, la rupture fragile par écrasement du béton est le mode de rupture
prédominant (Bousselham et Chaallal 2006; Chajes et al. 1995; Li et al. 2002; Täljsten 2003).
Ainsi, pour éviter un tel mode de rupture, les normes de conception en vigueur ont imposé
46
des limites supérieures à la résistance nominale en cisaillement des poutres en BA renforcées
à l’aide de PRF. De plus, pour assurer l’intégrité structurale du béton, les normes ACI
440.2R (2008) et CSA S6 (2006) ont recommandé de limiter la déformation effective à la
rupture des composites PRF, εfrpe (utilisée pour déterminer la contribution du PRF à la
résistance en cisaillement de la structure) à une valeur égale ou inférieure à 0.4% (4000με),
selon la configuration du renforcement mise à l’essai. De façon similaire, la norme CSA
S806 (2012) a recommandé de limiter la déformation effective à 0.6% (6000με), 0.5%
(5000με) et 0.4% (4000με) pour les structures renforcées, respectivement, en enveloppe
complète, en U avec un système d’ancrage reconnu, et en U sans système d’ancrage ou sur
les faces latérales.
D’après Teng et al. (2009), la nature fragile et brusque du décollement de PRF peut mener à
ce que les armatures transversales n’atteignent pas leur plastification avant la rupture finale.
Ceci contredit la méthodologie utilisée dans la plupart des modèles de conception existants
(Chaallal et al. 1998; Khalifa et al. 1998; Monti et al. 2004; Täljsten 2003; Triantafillou et
Antonopoulos 2000), où les contributions du béton, Vc, et des étriers, Vs, à la résistance totale
en cisaillement sont évaluées en utilisant les provisions recommandées par les normes en
vigueur, et qui sont basées sur l’hypothèse que la rupture des poutres se produit après la
plastification des armatures.
La direction des fibres dans la matrice et l’orientation du PRF par rapport aux charges
appliquées joue un rôle primordial dans la performance du système PRF de renforcement, et
peut affecter les mécanismes du mode de rupture des structures en BA. La configuration du
système PRF peut également affecter le mode de rupture. En effet, presque toutes les
recherches effectuées sur des poutres renforcées en enveloppe complète ont révélé que la
résistance en cisaillement est liée à la rupture des fibres. Par contre, toutes les poutres
renforcées sur les faces latérales et un nombre considérable des poutres renforcées en forme
de U ont subi une rupture par décollement du PRF. À savoir qu’une fois le décollement
amorcé, la poutre perd rapidement sa résistance et une rupture fragile peut se produire. En
47
d’autres termes, les poutres qui subissent la rupture par décollement du PRF ont un
comportement ductile très limitée (Chen et Teng 2003b).
Le renforcement en enveloppe complète est donc le plus performant et le plus efficace, mais
l’utilisation d’une telle configuration est rare vu la difficulté de l’appliquer sur des poutres
existantes de sections en T coulées de façon monolithique avec les dalles qu’elles supportent.
Le renforcement en U est, par conséquent, le plus utilisé pour les poutres de sections en T.
Cependant, pour empêcher le décollement du PRF en forme de U, des ancrages mécaniques
peuvent être appliqués aux extrémités du système appliqué dans la zone comprimée de la
section. Le renforcement sur les faces latérales est donc le moins performant et le plus fragile
dû à la rupture brusque par décollement qui peut se produire à cause de la longueur effective
d’ancrage, Le, insuffisante du système PRF collés en surface (Sas 2008).

CHAPITRE 3
COMPORTEMENT EN FATIGUE DES POUTRES EN BÉTON RENFORCÉES À L’AIDE DE PRF COLLÉS EN SURFACE – REVUE DE LA LITTÉRATURE
3.1 Notions générales et définitions
La fatigue est un phénomène qui caractérise les structures soumises en service à des
contraintes ou déformations variables dans le temps, en particulier les ponts en béton. Ceci se
traduit par des variations cycliques des contraintes induites à long terme, entrainant la
modification des propriétés des matériaux et la dégradation de la rigidité et de la résistance
des structures. Sous chargement cyclique, les structures présentent des résistances inférieures
à celles développées sous chargement statique. Les ponts sont généralement soumis à des
cycles de contraintes de valeurs bien en deçà de la résistance ultime statique. Cette réduction
de résistance dépend de plusieurs paramètres tels que les conditions de chargement cyclique
(amplitude, fréquence et nombre de cycles de contraintes appliquées) et les propriétés des
éléments structuraux. En raison de leur caractère répétitif, les charges cycliques peuvent
accélérer la progression des fissures qui se développent lentement dans le temps. En
s’accumulant, ces fissures provoquent la perte de rigidité et éventuellement la rupture par
fatigue de la structure provoquée par la dégradation accumulée de la résistance.
Pour pouvoir évaluer le comportement en fatigue des structures en béton sous chargement
cyclique, il est important de définir les notions de base qui lui sont associées suivantes
(Brand et Sutterlin 1980) :
Cycle de contrainte : C’est la période de temps durant laquelle l’amplitude des contraintes
variable dans le temps se répète. Le cycle sinusoïdal est celui qui est utilisé pour étudier le
comportement des structures en fatigue. Dans ce cycle, la contrainte varie dans le temps de sa
valeur minimale, σmin, à sa valeur maximale, σmax, par rapport à une contrainte moyenne, σm,
comme illustré à la Figure 3.1.
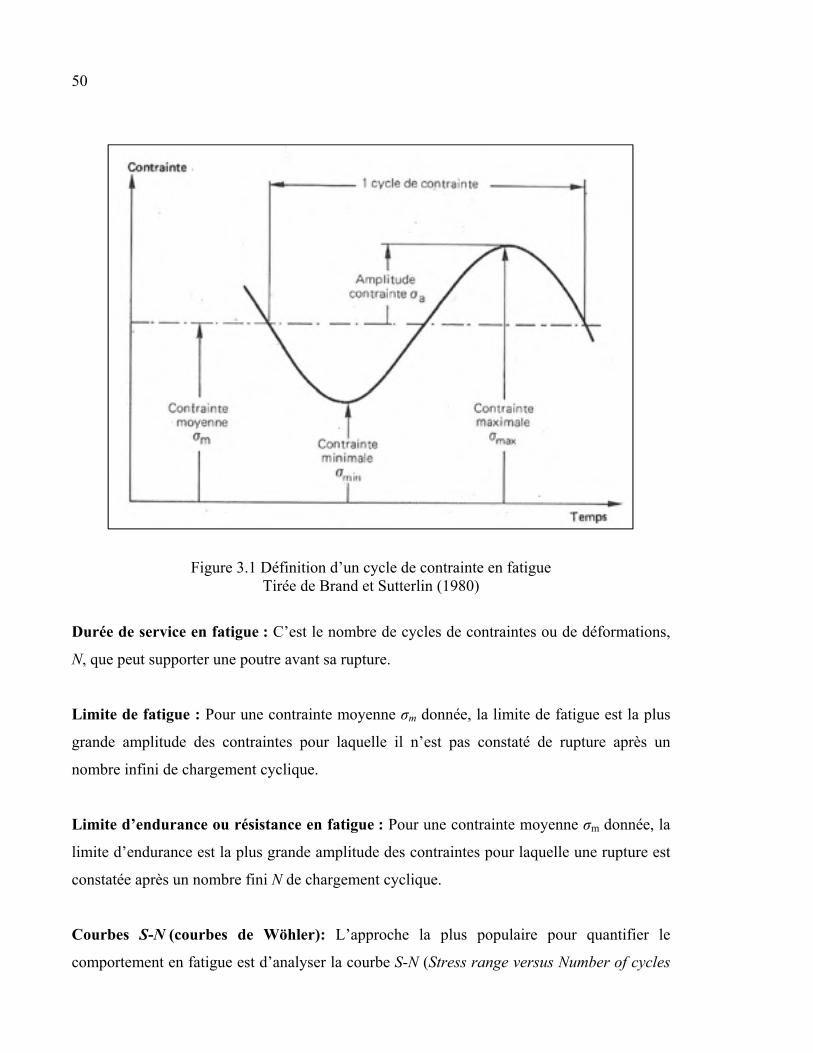
50
Figure 3.1 Définition d’un cycle de contrainte en fatigue Tirée de Brand et Sutterlin (1980)
Durée de service en fatigue : C’est le nombre de cycles de contraintes ou de déformations,
N, que peut supporter une poutre avant sa rupture.
Limite de fatigue : Pour une contrainte moyenne σm donnée, la limite de fatigue est la plus
grande amplitude des contraintes pour laquelle il n’est pas constaté de rupture après un
nombre infini de chargement cyclique.
Limite d’endurance ou résistance en fatigue : Pour une contrainte moyenne σm donnée, la
limite d’endurance est la plus grande amplitude des contraintes pour laquelle une rupture est
constatée après un nombre fini N de chargement cyclique.
Courbes S-N (courbes de Wöhler): L’approche la plus populaire pour quantifier le
comportement en fatigue est d’analyser la courbe S-N (Stress range versus Number of cycles
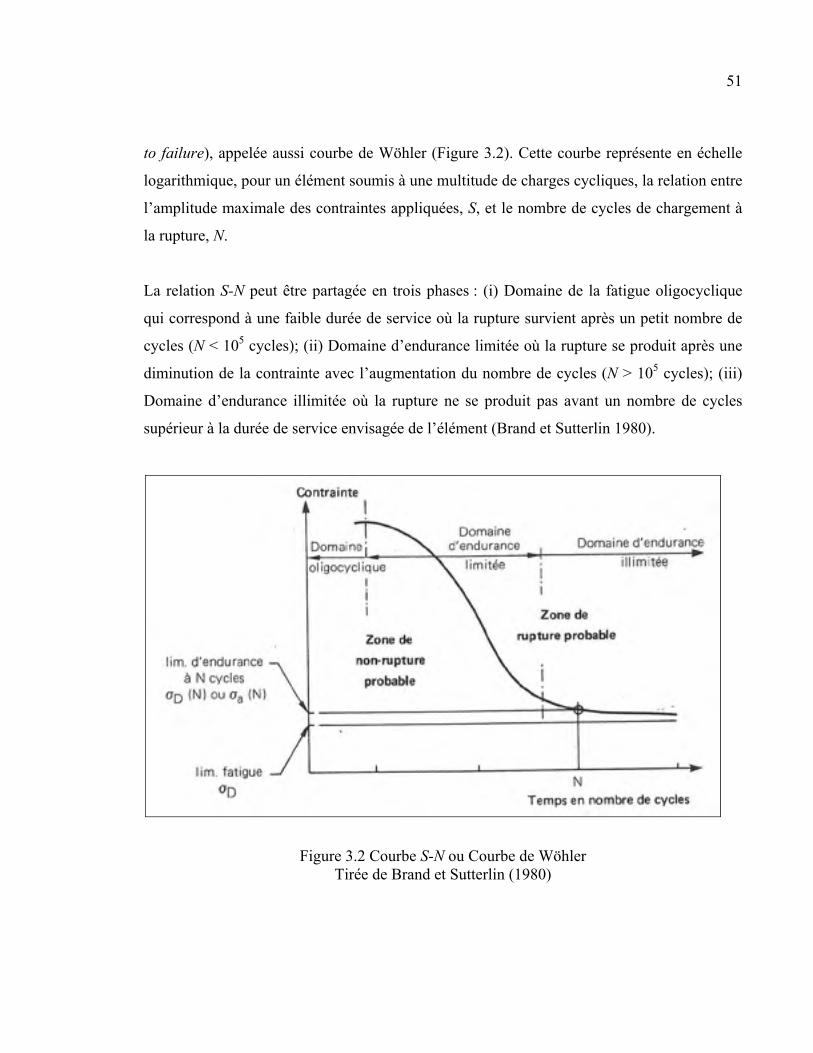
51
to failure), appelée aussi courbe de Wöhler (Figure 3.2). Cette courbe représente en échelle
logarithmique, pour un élément soumis à une multitude de charges cycliques, la relation entre
l’amplitude maximale des contraintes appliquées, S, et le nombre de cycles de chargement à
la rupture, N.
La relation S-N peut être partagée en trois phases : (i) Domaine de la fatigue oligocyclique
qui correspond à une faible durée de service où la rupture survient après un petit nombre de
cycles (N < 105 cycles); (ii) Domaine d’endurance limitée où la rupture se produit après une
diminution de la contrainte avec l’augmentation du nombre de cycles (N > 105 cycles); (iii)
Domaine d’endurance illimitée où la rupture ne se produit pas avant un nombre de cycles
supérieur à la durée de service envisagée de l’élément (Brand et Sutterlin 1980).
Figure 3.2 Courbe S-N ou Courbe de Wöhler Tirée de Brand et Sutterlin (1980)
52
3.2 Limites de contraintes recommandées par les normes en vigueur pour la conception à l’état limite de fatigue (ÉLF)
Les normes et guides de conception en vigueur n’ont pas fourni ni de procédures de
vérifications ni de règles de dimensionnement à l’ÉLF concernant le renforcement en
cisaillement des structures en béton à l’aide de PRF sous charges cycliques. De plus, ils
n’exigent pas à ce jour des limitations sur l’amplitude des contraintes dans les armatures
transversales sous chargement de fatigue. Cependant, les normes recommandent de limiter
les niveaux des contraintes dans les armatures longitudinales et les composites PRF, pour les
poutres en BA renforcées en flexion, lors de la conception à l’ÉLF comme suit :
Limites de contraintes dans les armatures d’acier
La norme américaine ACI 215R-74 (ACI 215R 1974) exige que l’amplitude des contraintes
dans les barres d’armature longitudinales rectilignes des poutres en BA sous charges
cycliques ne dépasse pas la valeur déterminée selon l’équation suivante, avec une limite
supérieure de 138 MPa :
S = 161 – 0.33 σmin (MPa) (3.1)
où,
S = Amplitude maximale des contraintes dans les barres d’armature longitudinales à la
rupture, c’est la différence entre les contraintes maximale et minimale (σmax - σmin) sous
chargement de fatigue;
σmin = Contrainte minimale (positive en tension et négative en compression) dans les barres
d’armature. C’est la contrainte générée par les charges soutenues (charges permanentes plus
une portion des surcharges appliquées);
σmax = Contrainte maximale dans les barres d’armature. Elle est générée par la combinaison
des deux charges soutenues et cycliques (permanentes plus surcharges) due à la fatigue.
Par ailleurs, la norme recommande de réduire à 50% la valeur de l’amplitude calculée pour
des barres d’armature relevées ou inclinées.
53
La même équation a été proposée par AASHTO (2010) pour le calcul de l’amplitude des
contraintes dans les barres d’armatures, avec une limite supérieure de 162 MPa. Dans le cas
de conception à l’ÉLF des structures en béton précontraint, l’AASHTO limite le niveau
d’amplitude des contraintes à 125 MPa dans les torons ayant des rayons de courbure
supérieurs à 9 m, et à 70 MPa pour des rayons de courbure inférieurs à 3.6 m. Une
interpolation linéaire peut être utilisée pour les torons ayant des rayons de courbure entre 3.6
et 9 m. À noter que ces limites ont été vérifiées expérimentalement pour des structures en
béton précontraint avec des torons rectilignes et inclinés renforcées à l’aide de PRF collés en
surface (Rosenboom et Rizkalla 2006).
De façon similaire, la norme canadienne CSA S6 (2006) recommande de limiter l’amplitude
des contraintes à 125 MPa dans les barres d’armature longitudinales rectilignes des structures
en BA, et dans les torons précontraints ayant des rayons de courbure supérieurs à 10 m. Des
valeurs inférieures ont été recommandées pour les barres d’acier relevées ou inclinées (65
MPa), et pour les torons précontraints ayant des rayons de courbure inférieurs à 3.5 m (70
MPa).
Les barres d'armature internes ne doivent pas se plastifier sous charges de service, afin
d’éviter toute déformation inélastique (plastique) dans les structures en BA renforcées à
l’aide de PRF collés en surface, et notamment les structures soumises à des charges cycliques
(El-Tawil et al. 2001). Pour cela, la norme ACI 440.2R (2008) exige de limiter la contrainte
en tension dans les armatures longitudinales sous charges de service, fs,s, à 80% de la
contrainte limite élastique, fy. La norme exige également de limiter la contrainte dans le béton
comprimé sous charges de service, fc,s, à 45% de la résistance spécifiée en compression du
béton, fc’. Il s’ensuit :
fs,s ≤ 0.80 fy (3.2)
fc,s ≤ 0.45 fc’ (3.3)
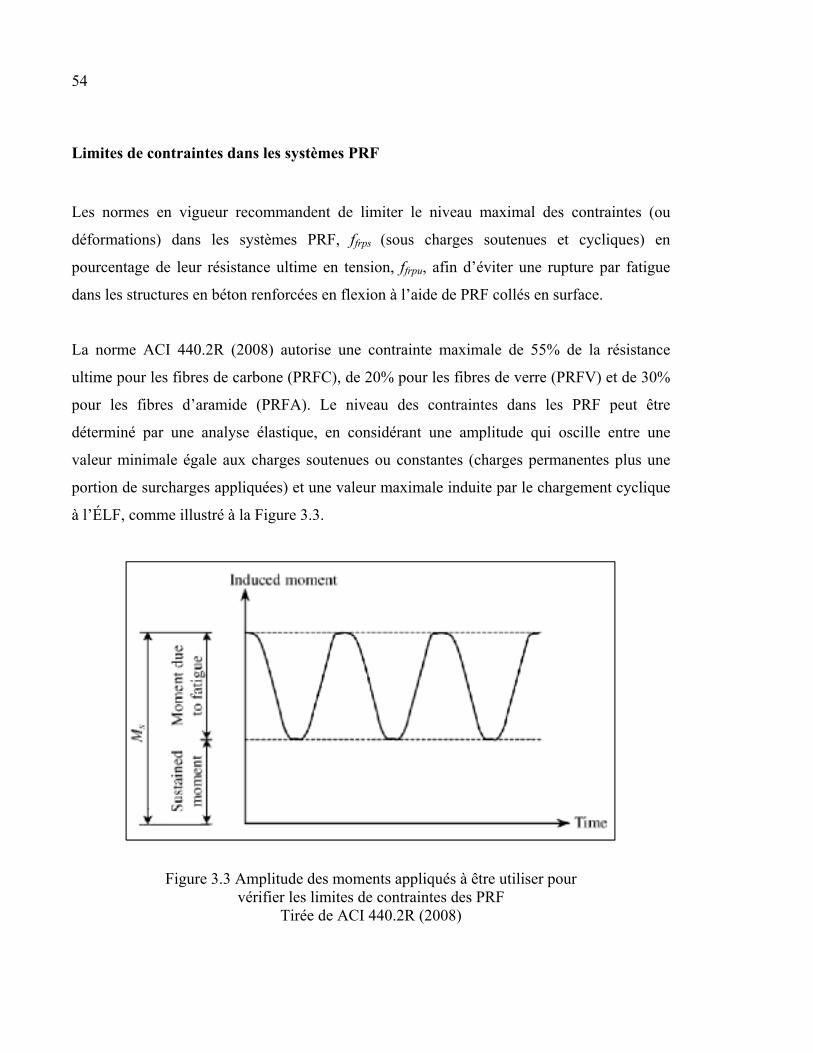
54
Limites de contraintes dans les systèmes PRF
Les normes en vigueur recommandent de limiter le niveau maximal des contraintes (ou
déformations) dans les systèmes PRF, ffrps (sous charges soutenues et cycliques) en
pourcentage de leur résistance ultime en tension, ffrpu, afin d’éviter une rupture par fatigue
dans les structures en béton renforcées en flexion à l’aide de PRF collés en surface.
La norme ACI 440.2R (2008) autorise une contrainte maximale de 55% de la résistance
ultime pour les fibres de carbone (PRFC), de 20% pour les fibres de verre (PRFV) et de 30%
pour les fibres d’aramide (PRFA). Le niveau des contraintes dans les PRF peut être
déterminé par une analyse élastique, en considérant une amplitude qui oscille entre une
valeur minimale égale aux charges soutenues ou constantes (charges permanentes plus une
portion de surcharges appliquées) et une valeur maximale induite par le chargement cyclique
à l’ÉLF, comme illustré à la Figure 3.3.
Figure 3.3 Amplitude des moments appliqués à être utiliser pour vérifier les limites de contraintes des PRF
Tirée de ACI 440.2R (2008)
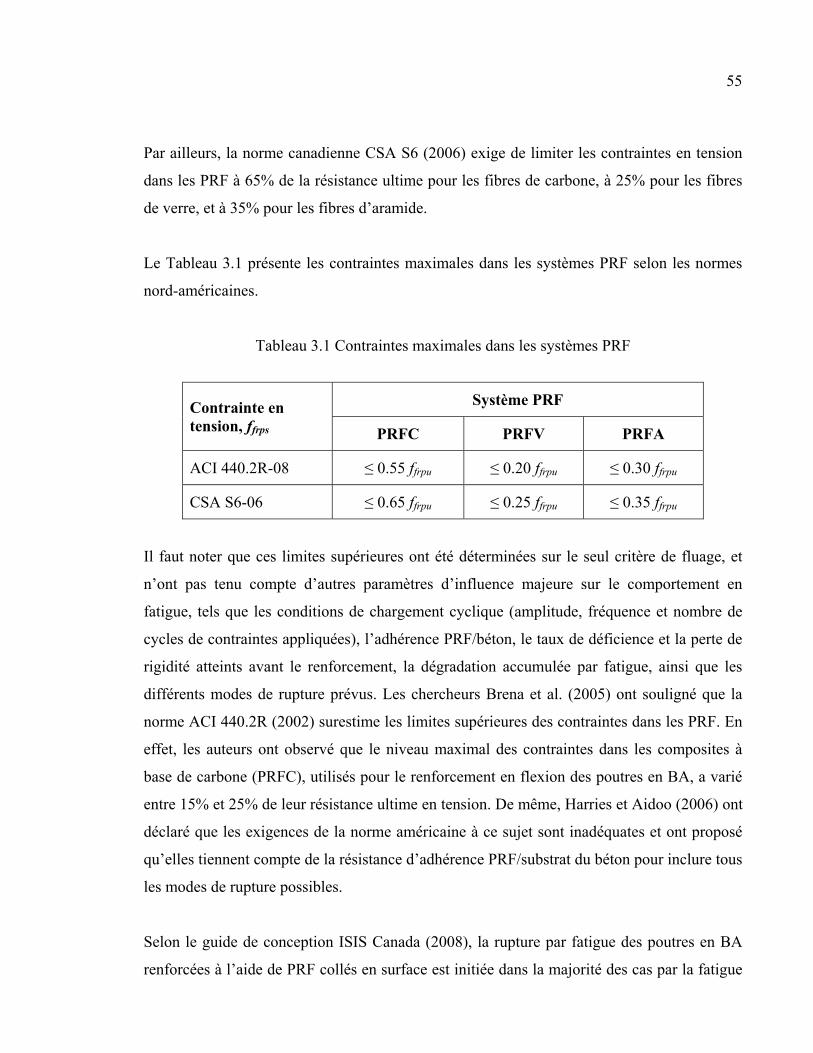
55
Par ailleurs, la norme canadienne CSA S6 (2006) exige de limiter les contraintes en tension
dans les PRF à 65% de la résistance ultime pour les fibres de carbone, à 25% pour les fibres
de verre, et à 35% pour les fibres d’aramide.
Le Tableau 3.1 présente les contraintes maximales dans les systèmes PRF selon les normes
nord-américaines.
Tableau 3.1 Contraintes maximales dans les systèmes PRF
Contrainte en tension, ffrps
Système PRF
PRFC PRFV PRFA
ACI 440.2R-08 ≤ 0.55 ffrpu ≤ 0.20 ffrpu ≤ 0.30 ffrpu
CSA S6-06 ≤ 0.65 ffrpu ≤ 0.25 ffrpu ≤ 0.35 ffrpu
Il faut noter que ces limites supérieures ont été déterminées sur le seul critère de fluage, et
n’ont pas tenu compte d’autres paramètres d’influence majeure sur le comportement en
fatigue, tels que les conditions de chargement cyclique (amplitude, fréquence et nombre de
cycles de contraintes appliquées), l’adhérence PRF/béton, le taux de déficience et la perte de
rigidité atteints avant le renforcement, la dégradation accumulée par fatigue, ainsi que les
différents modes de rupture prévus. Les chercheurs Brena et al. (2005) ont souligné que la
norme ACI 440.2R (2002) surestime les limites supérieures des contraintes dans les PRF. En
effet, les auteurs ont observé que le niveau maximal des contraintes dans les composites à
base de carbone (PRFC), utilisés pour le renforcement en flexion des poutres en BA, a varié
entre 15% et 25% de leur résistance ultime en tension. De même, Harries et Aidoo (2006) ont
déclaré que les exigences de la norme américaine à ce sujet sont inadéquates et ont proposé
qu’elles tiennent compte de la résistance d’adhérence PRF/substrat du béton pour inclure tous
les modes de rupture possibles.
Selon le guide de conception ISIS Canada (2008), la rupture par fatigue des poutres en BA
renforcées à l’aide de PRF collés en surface est initiée dans la majorité des cas par la fatigue
56
des barres d’armature internes, suivi par le décollement des PRF. Le guide a donc
recommandé de maintenir les contraintes en tension des PRF sous charges cycliques à un
niveau où les barres d’armature n’atteignent pas la plastification ni la rupture. La norme
canadienne sur la conception des bâtiments CSA S806 (2012) ne donne aucune
recommandation quant à la conception à l’ÉLF des poutres en BA renforcées à l’aide de
PRF.
Le rapport technique du guide britannique TR55 (2004) décrit le comportement en fatigue
des poutres renforcées à l’aide de PRF et souligne, comme toutes les autres normes de
conception, que la rupture par fatigue des structures renforcées sous charges cycliques est
initiée par la plastification des barres d’armature internes, suivi par le décollement du PRF.
Le guide de conception recommande alors une limite supérieure de contraintes dans les
systèmes PRF (carbone, aramide ou verre) égale à 80% de leur résistance ultime en tension.
Cependant, il n’est pas possible dans la pratique d’atteindre un tel niveau des contraintes en
tension avant qu’une rupture du PRF ne survienne, soit par décollement du composite ou par
rupture des fibres (Zorn 2006).
Le guide de conception italien CNR DT200 (2004) recommande d’appliquer un facteur de
réduction additionnel de 0.5 (soit 50%) aux résistances ultimes des PRF à l’ÉLF, afin d’éviter
une rupture prématurée des structures en béton renforcées à l’aide de PRF collés en surface.
Ce facteur doit être utilisé pour tous les systèmes PRF (carbone, aramide ou verre), et ajouté
aux autres facteurs de réduction qui tiennent compte de la durabilité à long terme, tels que le
fluage et les effets environnementaux.
3.3 Durée de service en fatigue (relation S-N de Wöhler)
Une rupture par fatigue des poutres en BA sous chargement cyclique se produit généralement
par la rupture des barres d’armature, à proximité des fissures formées dans le béton. Pour
évaluer le comportement et estimer la durée de service en fatigue des poutres en BA, il est
donc nécessaire d’établir la relation qui existe entre le niveau des contraintes dans les barres
57
d’armature internes et le nombre de cycles de contraintes à la rupture. En d’autres termes,
établir la relation S-N de Wöhler.
Helgason et Hanson (1974) ont procédé à une analyse statistique sur une série d’essais
effectués sur des barres d’armature de différents diamètres noyées dans le béton de poutres
de sections rectangulaires et en Té. Il est instructif de noter que selon cette analyse, la plus
petite amplitude des contraintes connue à avoir provoqué la rupture par fatigue des barres
d’armature est de 145 MPa. Les auteurs ont ainsi développé une relation S-N considérée
comme une limite inférieure, adoptée par la norme américaine ACI 215R-74 (ACI 215R
1974), qui semble fournir des estimations raisonnables de la durée de service en fatigue :
log N = 6.969 – 0.0055 S (3.4)
où, S = σmax - σmin = Amplitude maximale des contraintes dans les barres d’armature
longitudinales à la rupture = la différence entre les valeurs maximales, σmax, et minimales,
σmin, des contraintes dues aux charges cycliques appliquées.
Moss (1982) a développé une relation générale S-N, basée sur une analyse de régression
linéaire par corrélation, en effectuant des essais expérimentaux en flexion sur des barres
d’armature longitudinales noyées dans le béton :
N Sm = K (3.5)
où, m = la pente inverse de la courbe logarithmique S-N = 8.7; K = coefficient = 0.11x1029
(courbe moyenne de la corrélation) ou K = 0.59 x 1027 (valeur de conception pour une courbe
moyenne moins deux fois l’écart type).
L’approche la plus conservatrice, en se basant sur les résultats des barres longitudinales
testées axialement à l’air, a été ensuite privilégiée à des fins de conception. Ceci est dû au fait
que la conception en flexion des poutres en BA est toujours conditionnée par une adhérence
58
parfaite acier/béton, ce qui ne correspond pas à la réalité (Tilly et Moss 1982). Pour cela, les
auteurs ont proposé les coefficients suivants :
m = 9; K = 0.75x1027 pour des barres d’armature longitudinales inférieures à 16 mm et K =
0.007x1027 pour des barres d’armature longitudinales supérieures à 16 mm.
La même approche a été proposée dans le rapport du Comité Euro-International du Béton
(CEB, 1988) relatif aux règlements de conception à l’ÉLF. Des modifications ont été ensuite
établies par TRRL (Transport and Road Research Laboratory; Crowthorne, UK) au sujet des
barres noyées dans le béton ayant des diamètres inférieurs à 16 mm (Mallet 1991), comme
suit :
m = 5 et K = 4.33x10¹⁷ pour une limite d’endurance N < 500000 cycles de contraintes.
m = 9 et K = 1.54x1027 pour une limite d’endurance 500000 < N < 107 cycles de contraintes.
m = 11 et K = 1.54x1031 pour une limite d’endurance N > 107 cycles de contraintes.
Plusieurs modèles de régression ont été ensuite développés pour estimer la durée de service
en fatigue des poutres en BA renforcées à l’aide de PRF collés en surface. Les coefficients de
la relation générale S-N ont été calibrés par les chercheurs selon les résultats de leurs essais
expérimentaux, pour tenir compte des effets du renforcement sous charges cycliques en
utilisant les composites PRF.
Papakonstantinou et al. (2001) ont calibré les coefficients de la relation S-N, en se basant sur
des essais effectués en flexion sur des poutres en BA renforcées à l’aide de tissus en PRFV :
log N = 6.677 – 0.00613 S (3.6)
Katakalos et Papakonstantinou (2009) ont développé un modèle de régression en tenant
compte des résultats des essais qu’ils ont effectués sur des poutres en BA renforcées à l’aide
de PRF à base d’acier :
log N = 9.368 – 0.01 S (3.7)
59
Zhao (2005) a proposé une relation entre l’amplitude des déformations dans les barres
d’armature longitudinales, Δεs, et la durée de service en fatigue des poutres en BA renforcées
à l’aide de tissus en PRFC:
log N = 8.068 – 2140 Δεs (3.8)
Toutanji et al. (2006) ont ensuite modifié la relation proposé par Zhao pour estimer la durée
de service en fatigue totale, d’avant la rupture des barres d’armature longitudinales et jusqu’à
la rupture des PRF, lorsque l’adhérence PRF/béton demeure maintenue après la rupture des
barres d’armature. Dans ce cas, la corrélation entre la durée de service et le niveau des
contraintes est basée sur le niveau des déformations dans les composites PRF qui survient
après la rupture des barres d’armature :
log N = 7.987 – 5.238 Δεfrp /εfrpu (3.9)
où, Δεfrp = amplitude des déformations dans les PRF; εfrpu = déformation ultime en tension
des PRF; et Δεfrp /εfrpu = taux de déformation dans les PRF.
Il convient de noter que cette relation peut surestimer la durée de service réelle due au fait
que la performance des PRF dépend fortement du système d’ancrage utilisé. Ainsi, il est
recommandé d’estimer la durée de service en fatigue des poutres en BA renforcées à l’aide
de PRFC en se basant sur le niveau des contraintes dans les barres d’armature longitudinales
des poutres en BA non-renforcées (Barnes et Mays 1999).
Pour estimer la performance en fatigue des poutres en BA renforcées à l’aide de tissus en
PRFC, Dong et al. (2011) ont effectué une analyse de régression incluant les résultats de
leurs propres essais et d’essais effectués par d’autres chercheurs (p. ex., Barnes et Mays
1999; Shahawy et Beitelman 1999; Papakonstantinou et al. 2001; et Aidoo et al. 2004):
log N = 7.253 – 0.0056 S (3.10)
60
Cette relation impose que S ne devrait pas dépasser 169 MPa pour que la poutre puisse
résister 2 millions de cycles de contraintes.
Harries (2005) a étudié l’effet du système de renforcement (enrobement à l’état liquide des
tissus, lamelles préfabriquées et système NSM), le rapport de la longueur de cisaillement sur
la profondeur effective de la poutre (ratio a/d), ainsi que l’effet d’échelle sur la relation S-N
des poutres renforcées à l’aide de PRF. La même procédure suivie par Harries a été ensuite
utilisée par Oudah el El-Hacha (2013), où les auteurs ont rassemblé une base de données de
la littérature d’environ 89 poutres en BA testées sous charges de fatigue. Soixante-cinq
poutres étaient renforcées en flexion à l’aide de PRF (tissus, lamelles ou NSM), et les autres
non-renforcées. Par conséquent, les auteurs ont procédé à une analyse de régression linéaire
par corrélation de toutes les poutres et ont abouti aux relations S-N suivantes :
log N = 8.315 – 0.00949 S
(courbe moyenne de la corrélation)
(3.11)
log N = 7.318 – 0.00958 S
(courbe de limite inférieure)
(3.12)
Il faut noter que la relation de limite inférieure a été proposée à des fins de conception,
puisqu’elle peut être utilisée pour estimer la durée de service en fatigue de façon
conservatrice. Par ailleurs, Oudah el El-Hacha (2013) ont développé des relations S-N qui
correspondent aux poutres en BA renforcées à l’aide de chacun des systèmes de renforcement
collés en surface, comme suit :
log N = 8.458 – 0.0106 S
(enrobement à l’état liquide des tissus en PRF)
(3.13)
log N = 8.389 – 0.00846 S
(lamelles préfabriquées en PRF)
(3.14)
61
log N = 7.951 – 0.00752 S
(système NSM en PRF)
(3.15)
Xie et al. (2012) ont établi la relation S-N suivante, où des poutres en BA renforcées en
flexion à l’aide de lamelles en PRFC précontraints ont été utilisées :
log N = 18.2 – 5.11 log S (3.16)
Selon les auteurs, une limite de fatigue semble être raisonnable pour une durée de service de
plus de 2 millions de cycles de contraintes. Ce qui correspond à une limite supérieure de 215
MPa d’amplitude des contraintes dans les armatures d’acier.
3.4 Fatigue des matériaux : béton, armatures d’acier, béton armé et PRF
Fatigue du béton
Le mécanisme de rupture par fatigue du béton sous chargement cyclique est caractérisé par
des déformations et des microfissures beaucoup plus grandes que celles obtenues sous
chargement statique. Malgré que le béton ne semble pas avoir une limite d’endurance, la
résistance à la fatigue du béton, pour une durée de service de 10 millions de cycles de
contraintes, est d’environ 55% de la résistance ultime statique (ACI 215R 1974). La
progression des fissures dans le béton provoque la rupture de l’élément. En effet, la fatigue
du béton fait l’objet d’un processus progressif : dans un premier temps des microfissures
apparaissent et se propagent. Puis, ce premier phénomène provoque des macro-fissures. La
diffusion de ces dernières achève le processus en provoquant la rupture brusque du béton
(Wu 2004).
Fatigue des armatures d’acier
La fatigue des armatures d’acier, comme celle du béton, se manifeste par l’apparition et la
progression des microfissures. La rupture par fatigue est amorcée par une microfissure à
62
l’endroit de concentration des contraintes à la surface des barres d’armature. Puis, elle se
propage graduellement à mesure que le chargement cyclique se poursuit. Une rupture
brusque survient une fois que la microfissure atteint une longueur critique où sa progression
devient instable. Ainsi, la durée de service en fatigue des barres d’armatures équivaut au
nombre de cycles de contraintes (ou durée) qui correspond à l’apparition de la première
fissure plus la durée de sa progression jusqu’à la rupture (Papakonstantinou et al. 2001).
La complexité des mécanismes liés au comportement et aux propriétés de l’armature d’acier
(plasticité, écrouissage, relaxation, etc.) entraîne une sensibilité de la résistance en fatigue à
de nombreux paramètres (Wu 2004). Les paramètres dont dépend la résistance sont
nombreux (ACI 215R 1974). On peut citer la composition chimique et microstructurale, le
niveau minimal des contraintes et le type de chargement appliqué, la classe et la taille des
barres d’acier, la résistance en tension et à la plastification, et la soudure.
Fatigue du béton armé
La résistance en fatigue des poutres en BA dépend de l’action composée du béton et des
armatures d’acier. Le paramètre majeur qui affecte la fatigue du béton armé est le niveau des
contraintes dans les barres d’armature. Alors que la performance en fatigue d’une poutre
sous-armée est régie par la flexion des armatures d’acier, une poutre surarmée peut subir une
rupture en flexion ou en cisaillement selon la résistance critique du béton ou de l’acier.
D’après une recherche menée par Mallet (1991) sur la fatigue des poutres et dalles en BA,
une rupture en cisaillement par fatigue peut se produire dans des poutres avec ou sans étriers.
La durée de service en fatigue des armatures est la même qu’il s’agisse des armatures
longitudinales en flexion ou transversales en cisaillement. Le mécanisme de rupture par
fatigue des structures en BA peut être différent de celui sous chargement statique, à cause de
la redistribution des contraintes internes qui se produit à mesure que les cycles se poursuivent
et les fissures se propagent (Aidoo et al. 2004; Barnes et Mays 1999; Ekenel et Myers 2009;
Papakonstantinou et al. 2001).
63
Fatigue des PRF
Les mécanismes de rupture par fatigue des composites PRF sont contrôlés par l’apparition et
la multiplication des fissures, plutôt que par l’apparition et la progression des fissures
(Ekenel et Myers 2009). Le comportement en fatigue des PRF dépend des propriétés de la
matrice et, dans une moindre mesure, du type de fibre. Les fibres reprennent la majorité du
chargement, leur grande résistance en tension procure alors au composite une excellente
performance en fatigue (Curtis 1989). Cependant, cette performance dépend de la direction
d'application du chargement; on obtient une plus grande résistance lorsque les fibres sont
parallèles au chargement appliqué. La fatigue est un processus de dégradation. Le caractère
répétitif des charges cycliques provoque la modification des propriétés mécaniques des PRF.
La limite de fatigue dépend de la nature des fibres, de la matrice et de la qualité de l’interface
fibres/matrice. La résistance en fatigue de la matrice est inférieure à celle des fibres. La
résistance en fatigue des composites dépend donc, en grande partie, de cette matrice (Wu
2004).
Les fibres dans les composites unidirectionnels ont peu ou presque pas de défauts et sont
donc résistantes à la fissuration. Ainsi, toute fissure qui se forme se propage à travers la
matrice et ne se transmet pas à travers les fibres adjacentes. Ce sont ces propriétés de
résistance et d’arrêt des fissures qui contribuent au bon comportement en fatigue des PRF
(Aidoo et al. 2004).
On distingue quatre mécanismes élémentaires de rupture dans les composites PRF
unidirectionnels, où le chargement cyclique est parallèle à la direction des fibres (Figure
3.4) : (a) le décollement à l’interface provenant de la rupture des fibres; (b) la fissuration
dans la matrice; (c) la rupture à l’interface suivie de l’arrachement des fibres; et (d) la rupture
brusque du PRF. Une combinaison de ces mécanismes est souvent constatée dans les essais
de fatigue des PRF. Ceci est attribué à la dégradation accumulée par fatigue subie par les
PRF, due à la fissuration de la matrice, le délaminage, la rupture des fibres, et le décollement
à l’interface fibres/matrice (Barnes et Garden 1999).
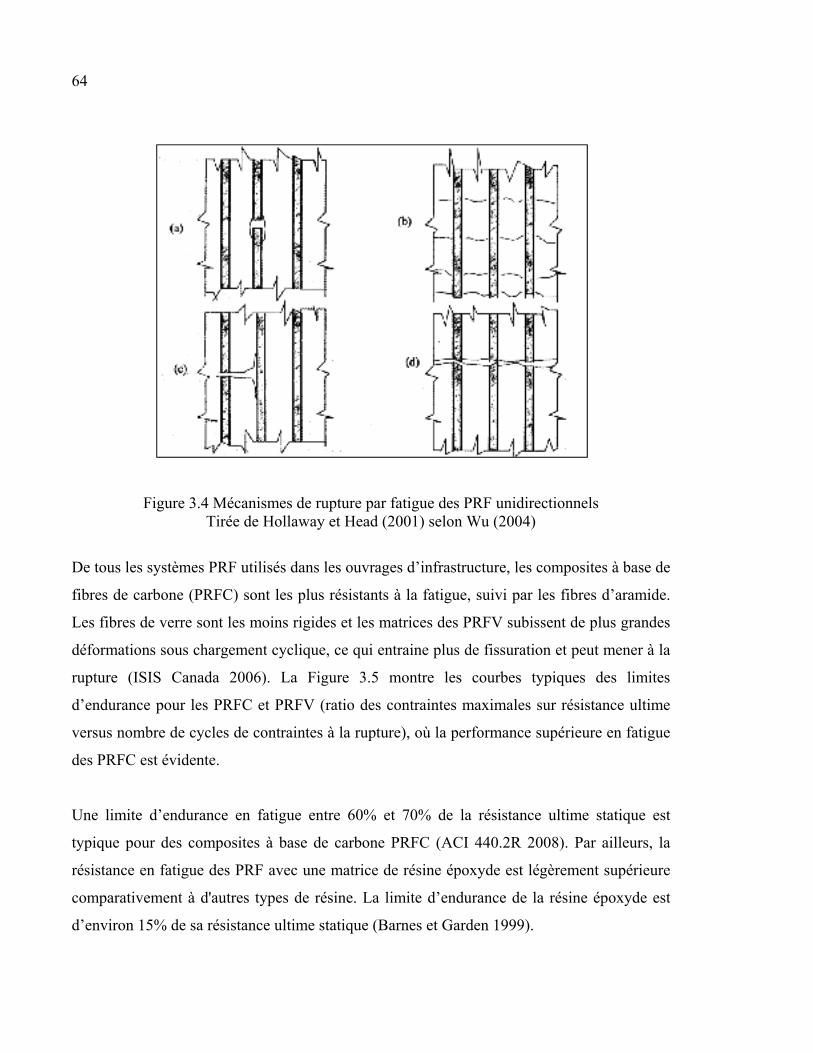
64
Figure 3.4 Mécanismes de rupture par fatigue des PRF unidirectionnels Tirée de Hollaway et Head (2001) selon Wu (2004)
De tous les systèmes PRF utilisés dans les ouvrages d’infrastructure, les composites à base de
fibres de carbone (PRFC) sont les plus résistants à la fatigue, suivi par les fibres d’aramide.
Les fibres de verre sont les moins rigides et les matrices des PRFV subissent de plus grandes
déformations sous chargement cyclique, ce qui entraine plus de fissuration et peut mener à la
rupture (ISIS Canada 2006). La Figure 3.5 montre les courbes typiques des limites
d’endurance pour les PRFC et PRFV (ratio des contraintes maximales sur résistance ultime
versus nombre de cycles de contraintes à la rupture), où la performance supérieure en fatigue
des PRFC est évidente.
Une limite d’endurance en fatigue entre 60% et 70% de la résistance ultime statique est
typique pour des composites à base de carbone PRFC (ACI 440.2R 2008). Par ailleurs, la
résistance en fatigue des PRF avec une matrice de résine époxyde est légèrement supérieure
comparativement à d'autres types de résine. La limite d’endurance de la résine époxyde est
d’environ 15% de sa résistance ultime statique (Barnes et Garden 1999).
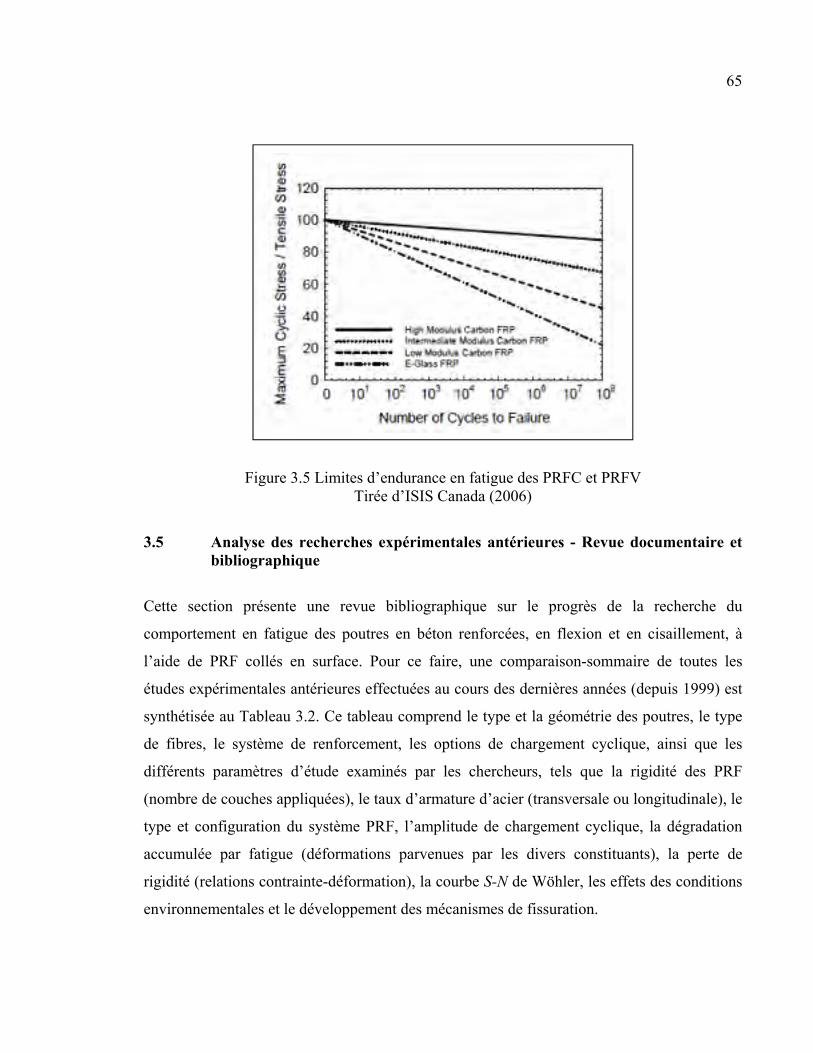
65
Figure 3.5 Limites d’endurance en fatigue des PRFC et PRFV Tirée d’ISIS Canada (2006)
3.5 Analyse des recherches expérimentales antérieures - Revue documentaire et bibliographique
Cette section présente une revue bibliographique sur le progrès de la recherche du
comportement en fatigue des poutres en béton renforcées, en flexion et en cisaillement, à
l’aide de PRF collés en surface. Pour ce faire, une comparaison-sommaire de toutes les
études expérimentales antérieures effectuées au cours des dernières années (depuis 1999) est
synthétisée au Tableau 3.2. Ce tableau comprend le type et la géométrie des poutres, le type
de fibres, le système de renforcement, les options de chargement cyclique, ainsi que les
différents paramètres d’étude examinés par les chercheurs, tels que la rigidité des PRF
(nombre de couches appliquées), le taux d’armature d’acier (transversale ou longitudinale), le
type et configuration du système PRF, l’amplitude de chargement cyclique, la dégradation
accumulée par fatigue (déformations parvenues par les divers constituants), la perte de
rigidité (relations contrainte-déformation), la courbe S-N de Wöhler, les effets des conditions
environnementales et le développement des mécanismes de fissuration.
66
Une base de données qui décrit chaque poutre en béton renforcée à l’aide de PRF sous
chargement cyclique, couvrant toutes les recherches expérimentales antérieures mentionnées
au Tableau 3.2, est présentée dans le Tableau-A I-1 de l’annexe I. Cette base de données
inclut les propriétés géométriques (dimensions) des poutres, le ratio de cisaillement a/d, les
propriétés des armatures internes (longitudinales et transversales), les propriétés des
composites PRF (largeur, épaisseur, résistance ultime en tension, module d’élasticité, etc.),
les procédures de renforcement (pré-endommagement, systèmes de renforcement et
d’ancrage appliqués), les paramètres de chargement cyclique (amplitude, fréquence et
nombre de cycles de contraintes appliquées), ainsi que les modes de rupture par fatigue
observés.
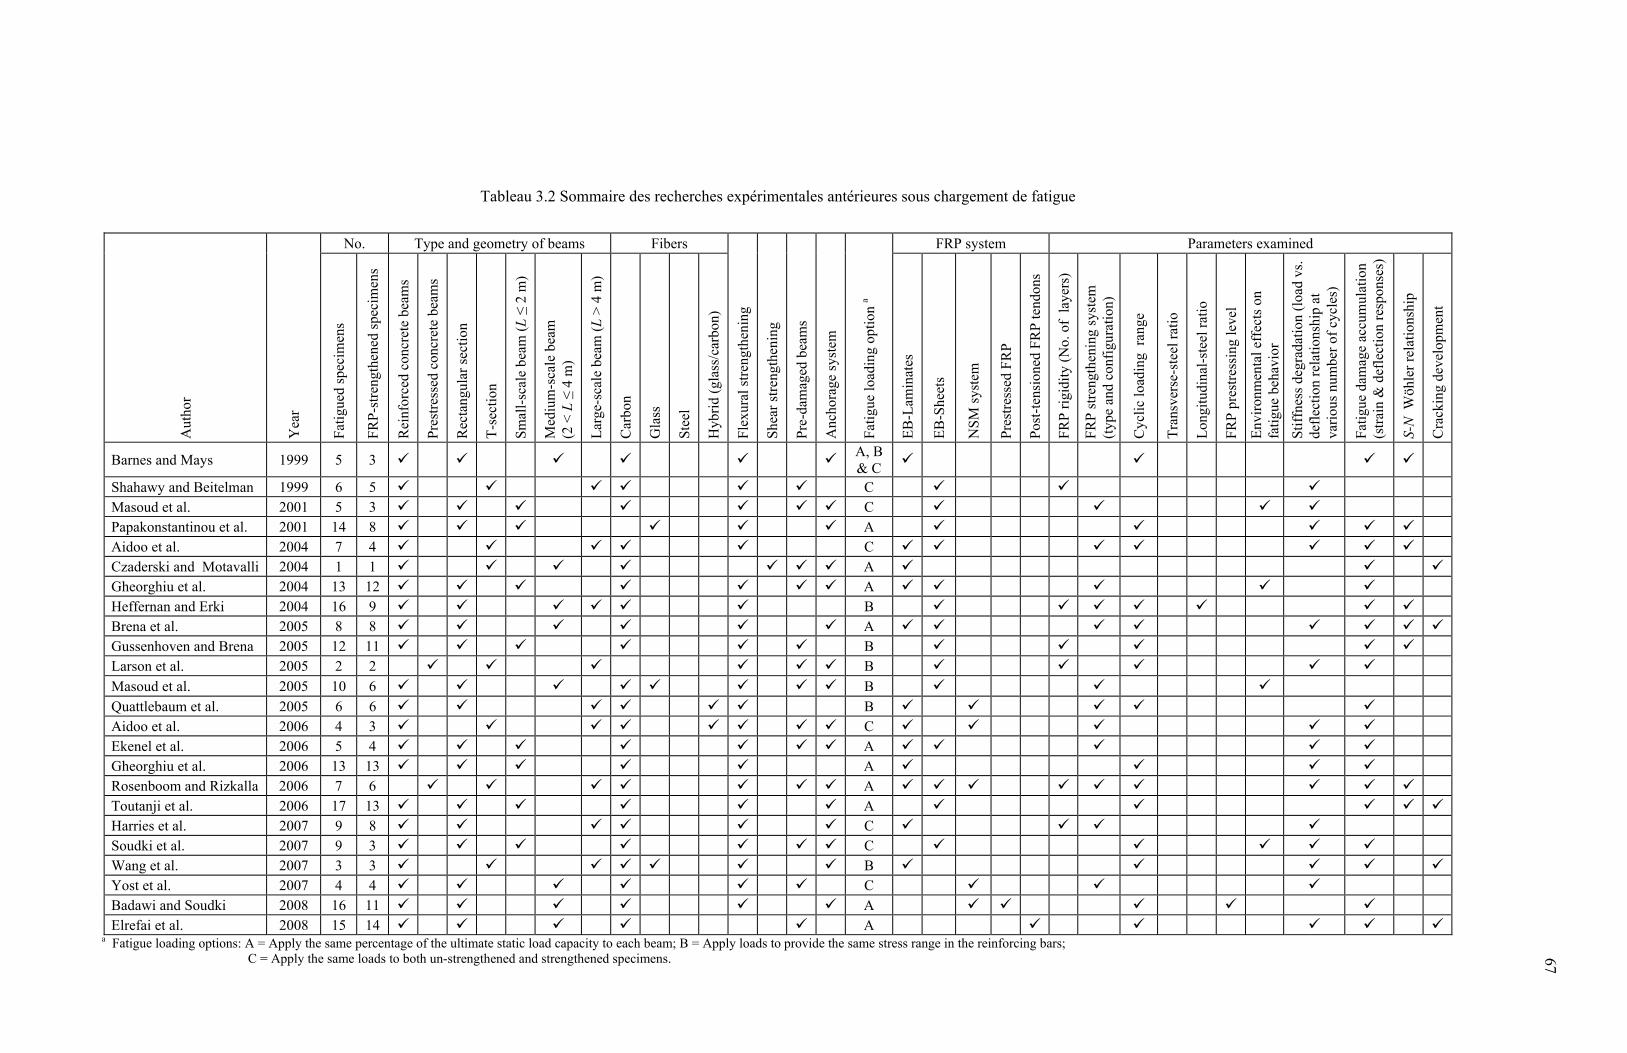
Tableau 3.2 Sommaire des recherches expérimentales antérieures sous chargement de fatigue
Aut
hor
Yea
r
No. Type and geometry of beams Fibers
Fle
xura
l str
engt
heni
ng
She
ar s
tren
gthe
ning
Pre
-dam
aged
bea
ms
Fat
igue
load
ing
opti
on a
FRP system Parameters examined
Fat
igue
d sp
ecim
ens
FR
P-s
tren
gthe
ned
spec
imen
s
Rei
nfor
ced
conc
rete
bea
ms
Pre
stre
ssed
con
cret
e be
ams
Rec
tang
ular
sec
tion
T-s
ecti
on
Sm
all-
scal
e be
am (
L ≤
2 m
)
Med
ium
-sca
le b
eam
(2
< L
≤ 4
m)
Lar
ge-s
cale
bea
m (
L >
4 m
)
Car
bon
Gla
ss
Ste
el
Hyb
rid
(gla
ss/c
arbo
n)
Anc
hora
ge s
yste
m
EB
-Lam
inat
es
EB
-She
ets
NS
M s
yste
m
Pre
stre
ssed
FR
P
Pos
t-te
nsio
ned
FR
P te
ndon
s
FR
P r
igid
ity
(No.
of
laye
rs)
FR
P s
tren
gthe
ning
sys
tem
(t
ype
and
conf
igur
atio
n)
Cyc
lic
load
ing
ran
ge
Tra
nsve
rse-
stee
l rat
io
Lon
gitu
dina
l-st
eel r
atio
FR
P p
rest
ress
ing
leve
l
Env
iron
men
tal e
ffec
ts o
n fa
tigu
e be
havi
or
Sti
ffne
ss d
egra
dati
on (
load
vs.
de
flec
tion
rel
atio
nshi
p at
va
riou
s nu
mbe
r of
cyc
les)
Fat
igue
dam
age
accu
mul
atio
n (s
trai
n &
def
lect
ion
resp
onse
s)
S-N
Wöh
ler
rela
tion
ship
Cra
ckin
g de
velo
pmen
t
Barnes and Mays 1999 5 3 A, B & C
Shahawy and Beitelman 1999 6 5 C Masoud et al. 2001 5 3 C Papakonstantinou et al. 2001 14 8 A Aidoo et al. 2004 7 4 C Czaderski and Motavalli 2004 1 1 A Gheorghiu et al. 2004 13 12 A Heffernan and Erki 2004 16 9 B Brena et al. 2005 8 8 A Gussenhoven and Brena 2005 12 11 B Larson et al. 2005 2 2 B Masoud et al. 2005 10 6 B Quattlebaum et al. 2005 6 6 B Aidoo et al. 2006 4 3 C Ekenel et al. 2006 5 4 A Gheorghiu et al. 2006 13 13 A Rosenboom and Rizkalla 2006 7 6 A Toutanji et al. 2006 17 13 A Harries et al. 2007 9 8 C Soudki et al. 2007 9 3 C Wang et al. 2007 3 3 B Yost et al. 2007 4 4 C Badawi and Soudki 2008 16 11 A Elrefai et al. 2008 15 14 A
a Fatigue loading options: A = Apply the same percentage of the ultimate static load capacity to each beam; B = Apply loads to provide the same stress range in the reinforcing bars; C = Apply the same loads to both un-strengthened and strengthened specimens.
67
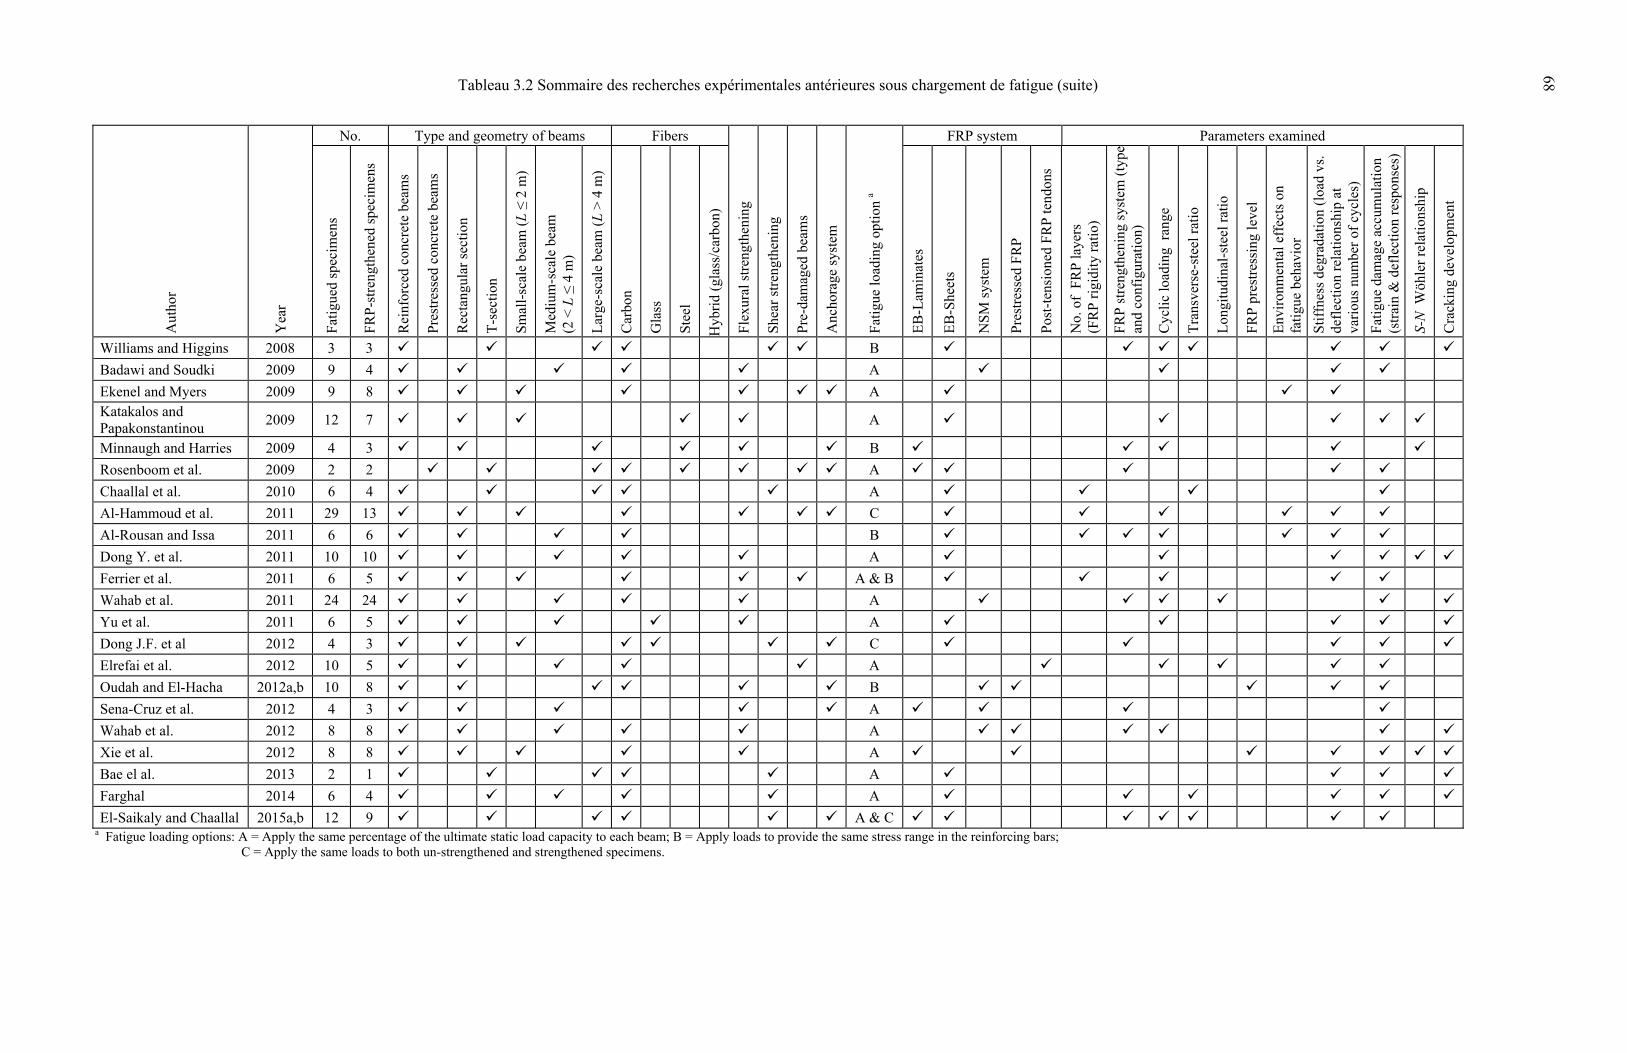
Tableau 3.2 Sommaire des recherches expérimentales antérieures sous chargement de fatigue (suite)
Aut
hor
Yea
r
No. Type and geometry of beams Fibers
Fle
xura
l str
engt
heni
ng
She
ar s
tren
gthe
ning
Pre
-dam
aged
bea
ms
Fat
igue
load
ing
opti
on a
FRP system Parameters examined
Fat
igue
d sp
ecim
ens
FR
P-s
tren
gthe
ned
spec
imen
s
Rei
nfor
ced
conc
rete
bea
ms
Pre
stre
ssed
con
cret
e be
ams
Rec
tang
ular
sec
tion
T-s
ecti
on
Sm
all-
scal
e be
am (
L ≤
2 m
)
Med
ium
-sca
le b
eam
(2
< L
≤ 4
m)
Lar
ge-s
cale
bea
m (
L >
4 m
)
Car
bon
Gla
ss
Ste
el
Hyb
rid
(gla
ss/c
arbo
n)
Anc
hora
ge s
yste
m
EB
-Lam
inat
es
EB
-She
ets
NS
M s
yste
m
Pre
stre
ssed
FR
P
Pos
t-te
nsio
ned
FR
P te
ndon
s
No.
of
FR
P la
yers
(F
RP
rig
idit
y ra
tio)
FR
P s
tren
gthe
ning
sys
tem
(ty
pe
and
conf
igur
atio
n)
Cyc
lic
load
ing
ran
ge
Tra
nsve
rse-
stee
l rat
io
Lon
gitu
dina
l-st
eel r
atio
FR
P p
rest
ress
ing
leve
l
Env
iron
men
tal e
ffec
ts o
n fa
tigu
e be
havi
or
Sti
ffne
ss d
egra
dati
on (
load
vs.
de
flec
tion
rel
atio
nshi
p at
va
riou
s nu
mbe
r of
cyc
les)
Fat
igue
dam
age
accu
mul
atio
n (s
trai
n &
def
lect
ion
resp
onse
s)
S-N
Wöh
ler
rela
tion
ship
Cra
ckin
g de
velo
pmen
t
Williams and Higgins 2008 3 3 B Badawi and Soudki 2009 9 4 A Ekenel and Myers 2009 9 8 A Katakalos and Papakonstantinou
2009 12 7 A
Minnaugh and Harries 2009 4 3 B Rosenboom et al. 2009 2 2 A Chaallal et al. 2010 6 4 A Al-Hammoud et al. 2011 29 13 C Al-Rousan and Issa 2011 6 6 B Dong Y. et al. 2011 10 10 A Ferrier et al. 2011 6 5 A & B Wahab et al. 2011 24 24 A Yu et al. 2011 6 5 A Dong J.F. et al 2012 4 3 C Elrefai et al. 2012 10 5 A Oudah and El-Hacha 2012a,b 10 8 B Sena-Cruz et al. 2012 4 3 A Wahab et al. 2012 8 8 A Xie et al. 2012 8 8 A Bae el al. 2013 2 1 A Farghal 2014 6 4 A El-Saikaly and Chaallal 2015a,b 12 9 A & C
a Fatigue loading options: A = Apply the same percentage of the ultimate static load capacity to each beam; B = Apply loads to provide the same stress range in the reinforcing bars; C = Apply the same loads to both un-strengthened and strengthened specimens.
68
69
3.5.1 Paramètres d’étude en fatigue
Le choix des paramètres d’étude est d’une importance capitale pour évaluer le comportement
en fatigue des poutres en béton renforcées à l’aide de PRF, surtout les conditions de
chargement cyclique. Par conséquent, l’amplitude, la fréquence et le nombre de cycles de
contraintes appliquées peuvent affecter substantiellement les mécanismes de résistance et de
rupture de la structure.
Amplitude de chargement cyclique
Il est primordial de bien établir les arguments derrière les tests avant de tirer des observations
et conclusions sur le comportement en fatigue. Trois options de chargement cyclique ont été
envisagées par les chercheurs pour examiner le comportement en fatigue des poutres en
béton renforcées à l’aide de PRF (voir Tableau 3.2), comme suit (Barnes et Mays 1999) :
1. Option A : Appliquer le même pourcentage de la résistance ultime statique à chaque
poutre. Il est raisonnable d’estimer que la durée de service en fatigue d’une poutre non-
renforcée est obtenue par la poutre renforcée sous des niveaux de chargement plus élevés.
Afin d’établir une comparaison fiable, si une poutre non-renforcée est testée à un certain
pourcentage de sa capacité ultime, la poutre renforcée devra être testée au même
pourcentage de sa capacité mais en tenant compte de la contribution à la résistance des
PRF. Observons que la majorité des auteurs ont adopté cette option de chargement
(Badawi et Soudki 2008; 2009; Bae et al. 2013; Barnes et Mays 1999; Brena et al. 2005;
Chaallal et al. 2010; Czaderski et Motavalli 2004; Dong et al. 2011; Ekenel et Myers
2009; Ekenel et al. 2006; El-Saikaly et Chaallal 2015a; 2015b; Elrefai et al. 2008; 2012;
Farghal 2014; Ferrier et al. 2011; Gheorghiu et al. 2006; Gheorghiu et al. 2004; Katakalos
et Papakonstantinou 2009; Papakonstantinou et al. 2001; Rosenboom et Rizkalla 2006;
Rosenboom et al. 2009; Sena-Cruz et al. 2012; Toutanji et al. 2006; Wahab et al. 2011;
2012; Xie et al. 2012; Yu et al. 2011);
70
2. Option B : Appliquer des charges cycliques pour fournir la même amplitude des
contraintes dans les barres d’armature pour les poutres renforcées et non-renforcées.
Comme le mode primaire de rupture par fatigue des poutres en BA sous chargement
cyclique est la plastification des barres d’armature, alors la durée de service en fatigue
dépend du niveau des contraintes dans ces barres d’armature. Ainsi, cette option fournit
une meilleure comparaison puisque les poutres renforcées et non-renforcées ont une durée
de service comparable (Al-Rousan et Issa 2011; Barnes et Mays 1999; Ferrier et al. 2011;
Gussenhoven et Brena 2005; Heffernan et Erki 2004; Larson et al. 2005; Masoud et al.
2005; Minnaugh et Harries 2009; Oudah et El-Hacha 2012a; 2012b; Quattlebaum et al.
2005; Wang et al. 2007; Williams et Higgins 2008);
3. Option C : Appliquer le même chargement cyclique pour les poutres renforcées et non-
renforcées (poutres de contrôle). Il est peu probable que la charge réelle appliquée soit
considérablement modifiée après le renforcement des poutres en béton à l’aide de PRF, et
par conséquent, cette option peut être étroitement liée à la pratique (Aidoo et al. 2004;
2006; Al-Hammoud et al. 2011; Barnes et Mays 1999; Dong et al. 2012; El-Saikaly et
Chaallal 2015a; Harries et al. 2007; Masoud et al. 2001; Shahawy et Beitelman 1999;
Soudki et al. 2007; Yost et al. 2007).
L’amplitude de chargement appliqué est le critère majeur qui peut influencer la durée de
service en fatigue des structures en béton renforcées à l’aide de PRF. D’après la revue de la
littérature réalisée par Kim et Heffernan (2008), les auteurs ont constaté qu’un intervalle de
chargement cyclique de 30% à 60% de la résistance ultime de la poutre peut éviter une
rupture par fatigue provoquée par la dégradation accumulée de la résistance.
Chaallal et al. (2010) ont choisi des valeurs limites, inférieures et supérieures, de chargement
cyclique, respectivement, de 35% et 65% de la résistance en cisaillement de la poutre, P. Ces
pourcentages ont été calculés en se basant sur une valeur moyenne de la charge en service,
égale au poids propre plus la surcharge, estimée à 50% de P :
71
Pmax = Pmoy (1 + CMD)
Pmin = Pmoy (1 - CMD)
(3.17)
où, Pmax = charge cyclique maximale; Pmin = charge cyclique minimale; Pmoy = charge
cyclique moyenne en service; CMD = coefficient de majoration dynamique, qui varie entre
0.25 et 0.4 selon la norme canadienne CSA S6 (2006). Les pourcentages de 35% et 65% sont
ainsi obtenues pour une valeur de CMD égale à 0.3.
Ainsi, chaque poutre a été soumise au même pourcentage de sa résistance ultime, calculée
théoriquement selon les normes de conception. Une telle approche pour le choix du
chargement est, selon les auteurs, la plus réaliste et la plus représentative des cas pratiques
(Chaallal et al. 2010). À noter que ces limites de chargement cyclique, 35% et 65%, ont été
utilisées par d’autres chercheurs (p.ex., Czaderski et Motavalli 2004; Rosenboom et Rizkalla
2006; Ekenel et Myers 2009).
Selon Ekenel et Myers (2009), appliquer à chaque poutre en BA le même pourcentage de sa
résistance ultime semble être raisonnable pour une analyse fiable et une comparaison
adéquate entre les poutres non-renforcées et celles renforcées à l’aide de PRF.
Nombre de cycles de chargement appliqué
Une structure typique en BA peut atteindre 107 à 108 cycles de contraintes pendant sa durée
de service en fatigue. Une dalle de pont en BA peut supporter jusqu’à 7x10⁸ cycles de
contraintes au cours de sa durée de service, qui correspond à environ 120 ans (Barnes et
Mays 1999). Les auteurs ont ainsi choisi un chargement de 10 millions de cycles de
contraintes à une fréquence de 1 Hz pour des poutres en BA renforcées en flexion à l’aide des
lamelles en PRFC. Le même nombre de cycles a été adopté par Aidoo et al. (2004) pour des
poutres en BA renforcées en flexion à l’aide des tissus et des lamelles en PRFC.
72
Selon la norme canadienne sur le calcul des ponts routiers CSA S6-06, un pont d’autoroute
de classe A conçu pour une durée de service de 40 ans peut éprouver un minimum de 58x106
cycles de contraintes de différentes intensités durant sa vie utile (Oudah et El-Hacha 2012a).
Ekenel et Myers (2009) ont indiqué que 2 millions de cycles de contraintes correspondent à
une période de temps normale pour effectuer des essais sous conditions de laboratoire, même
si des structures, tels les ponts en béton, peuvent être exposées à un nombre plus élevé de
cycles des contraintes. Selon les auteurs, ce n’était pas pratique d’appliquer un chargement
de plus de 2 millions de cycles à une fréquence de 2 Hz pour une durée de plus de 12 jours
d’essais par spécimen. Une autre raison pour laquelle les auteurs ont limité le nombre de
cycles de contraintes est que les poutres renforcées n’ont pas enregistré des pertes
considérables de rigidité à partir de 500,000 cycles de chargement.
Selon Chaallal et al. (2010), une limite supérieure de 5 millions de cycles de contraintes
semble être raisonnable pour évaluer le comportement en fatigue des poutres renforcées à
l’aide de PRF, compte tenu de la résistance résiduelle et la durée de service en fatigue d’une
structure existante en BA. Ainsi, les auteurs ont envisagé 5 millions de cycles à une
fréquence de 2 Hz pour des poutres en BA renforcées en cisaillement à l’aide de tissus en
PRFC. Czaderski et Motavalli (2004) ont aussi choisi 5 millions de cycles de chargement,
mais à une fréquence de 4.4 Hz, pour une poutre renforcée en cisaillement à l’aide des
lamelles préfabriquées en PRFC en forme de L.
Fréquence de chargement cyclique
La fréquence de chargement cyclique doit être relativement faible pour tester des poutres de
ponts en béton, afin d’éviter certains phénomènes difficiles à cerner tels que les effets
d’hystérésis, l’émission d’une énergie indésirable, ou la possibilité de ne pas pouvoir
récupérer toutes les données entre deux cycles consécutifs (Chaallal et al. 2010). Selon les
auteurs, une fréquence au plus égale à 3 Hz semble être adéquate.
73
Barnes et Mays (1999) ont choisi une fréquence de 1Hz, en se basant sur une recherche
antérieure effectuée par Emberson et Mays (1996). Dans cette recherche, les auteurs ont
révélé que pour une fréquence supérieure à 2 Hz, la poutre devient incapable de se rétablir
complètement entre deux charges cycliques consécutives. Le taux de chargement cyclique
provenant des charges mobiles de circulation (véhicules) peut varier selon le trafic (de très
lent à relativement rapide), et par conséquent, une fréquence typique de 1 Hz semble être
raisonnable pour représenter la circulation sur des dalles de ponts en béton (Mays et Tilly
1982).
Pour évaluer la résistance des barres d’armature, des tests axiaux sous tension directe à l’air
peuvent être aisément effectués en utilisant de petits spécimens (échantillons). La fréquence
de chargement pour exécuter ces tests peut être élevée, et les données seront ainsi obtenues
rapidement. Cependant, les conditions de ces tests ne peuvent pas représenter le cas réel des
structures en BA où les barres d’armature sont noyées dans le béton. Des tests sur des poutres
en BA sont donc nécessaires. Pour de telles poutres, la fréquence de chargement doit être
maintenue faible, moins de 3 Hz, afin d’éviter les effets d’hystérésis. Ce type de tests est
relativement couteux et de longue durée (Barnes et Garden 1999). Le temps nécessaire pour
terminer 107 cycles de contraintes (durée de service en fatigue d’une structure typique en BA)
à une fréquence de 1Hz est d’environ 4 mois. Il ne paraît toutefois pas faisable, selon les
auteurs, de mener un chargement à chaque poutre en BA pour une si longue période.
3.5.2 Dégradation accumulée par fatigue
Une évaluation du comportement en fatigue des poutres en BA renforcées à l’aide de PRF ne
peut s’accomplir que par une analyse de la dégradation accumulée de résistance sous
chargement cyclique.
La durée de service en fatigue d’une poutre en BA renforcée passe généralement par trois
phases consécutives, comme illustré à la Figure 3.6 (Kim et Heffernan 2008) : (i)
accumulation rapide de dégradation de résistance et de perte de rigidité pendant les premiers
cycles de contraintes appliquées. Cette phase est caractérisée par des augmentations
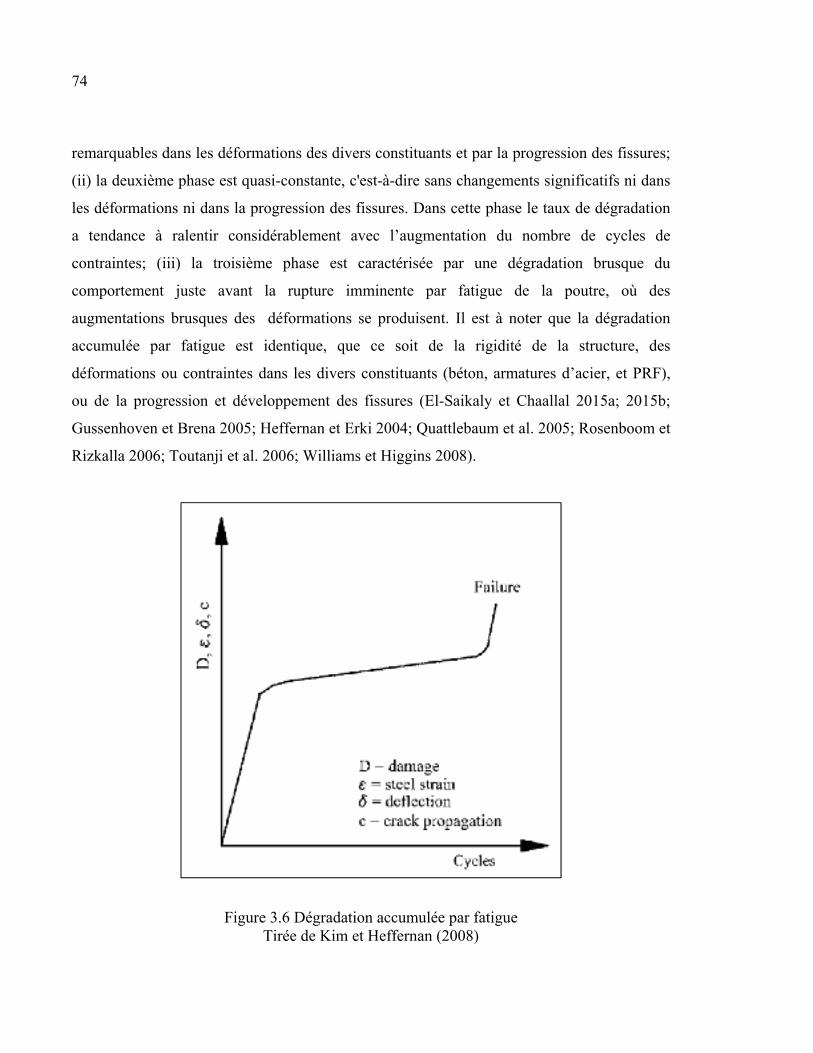
74
remarquables dans les déformations des divers constituants et par la progression des fissures;
(ii) la deuxième phase est quasi-constante, c'est-à-dire sans changements significatifs ni dans
les déformations ni dans la progression des fissures. Dans cette phase le taux de dégradation
a tendance à ralentir considérablement avec l’augmentation du nombre de cycles de
contraintes; (iii) la troisième phase est caractérisée par une dégradation brusque du
comportement juste avant la rupture imminente par fatigue de la poutre, où des
augmentations brusques des déformations se produisent. Il est à noter que la dégradation
accumulée par fatigue est identique, que ce soit de la rigidité de la structure, des
déformations ou contraintes dans les divers constituants (béton, armatures d’acier, et PRF),
ou de la progression et développement des fissures (El-Saikaly et Chaallal 2015a; 2015b;
Gussenhoven et Brena 2005; Heffernan et Erki 2004; Quattlebaum et al. 2005; Rosenboom et
Rizkalla 2006; Toutanji et al. 2006; Williams et Higgins 2008).
Figure 3.6 Dégradation accumulée par fatigue Tirée de Kim et Heffernan (2008)
75
3.5.3 Modes de rupture
Il est généralement admis que la rupture par fatigue des poutres en BA renforcées est
similaire à celle des poutres non-renforcées puisque dans tous les cas, la rupture est contrôlée
par la performance des barres d’armature internes sous charges cycliques. D’après la base des
données présentée dans le Tableau-A I-1 de l’annexe I, on constate que la majorité des
poutres renforcées à l’aide de PRF collés en surface ont subi une rupture (ou plastification)
des barres d’armature internes (considérée comme le mode primaire de rupture par fatigue),
suivi par la rupture du PRF soit par décollement du composite ou par rupture des fibres
(considérée comme le mode de rupture de second ordre) (Aidoo et al. 2004; Al-Hammoud et
al. 2011; Barnes et Mays 1999; Gussenhoven et Brena 2005; Harries et al. 2007; Heffernan et
Erki 2004; Katakalos et Papakonstantinou 2009; Papakonstantinou et al. 2001; Rosenboom et
Rizkalla 2006; Shahawy et Beitelman 1999; Soudki et al. 2007; Toutanji et al. 2006; Xie et
al. 2012; Yu et al. 2011).
Cependant, plusieurs chercheurs ont signalé une rupture par décollement du composite à
l’interface PRF/béton avant la plastification des barres d’armature, notamment pour les
poutres ayant des niveaux très élevées de chargement cyclique (Badawi et Soudki 2008;
Brena et al. 2005; Dong et al. 2011; Gheorghiu et al. 2006; Wahab et al. 2011; 2012). Une
fois le décollement initié, la contribution à la résistance du PRF est transférée directement
aux barres d’armature internes, ce qui peut entrainer une rupture fragile de la structure. Il est
donc important d’envisager un système d’ancrage fiable des PRF afin d’empêcher un
décollement prématuré et prolonger la durée de service en fatigue de la structure renforcée.
Sous un chargement de fatigue donné, une partie des efforts est reprise par le composite collé
en surface, et le niveau des contraintes dans les armatures d’acier est plus faible que pour une
poutre non renforcé. De plus, le composite a pour effet de diminuer la progression des
fissures et améliorer ainsi l’endurance en fatigue des poutres renforcées. Puisque la résistance
en fatigue du PRF est supérieure à celle de l’armature d’acier, pour un même niveau
d’amplitude des contraintes, la performance des poutres renforcées est déterminée par la
durée de service en fatigue des armatures d’acier. En d’autres termes, le renforcement à
76
l’aide de PRF contribue considérablement à la prolongation de la durée de service en fatigue
des structures en BA, compte tenu de la redistribution des contraintes dans les barres
d’armature internes causée par l’application du composite (Aidoo et al. 2004; El-Saikaly et
Chaallal 2015a; 2015b; Heffernan et Erki 2004; Masoud et al. 2005; Toutanji et al. 2006).
3.5.4 Poutres en BA renforcées en cisaillement à l’aide de PRF collés en surface
De toutes les quarante-huit études expérimentales (plus de 300 poutres renforcées) réalisées
sur des poutres en béton renforcées à l’aide de PRF sous chargement cyclique (voir Tableau
3.2), seulement huit études (34 poutres au total), incluant celles produites dans le cadre de la
présente thèse, ont été dédiées à l’évaluation de la performance des poutres renforcées en
cisaillement (Bae et al. 2013; Chaallal et al. 2010; Czaderski et Motavalli 2004; Dong et al.
2012; El-Saikaly et Chaallal 2015a; 2015b; Farghal 2014; Williams et Higgins 2008).
Ce qui suit est une description des recherches entreprises sur l’évaluation du comportement
en fatigue des poutres en BA renforcées en cisaillement à l’aide de PRF collés en surface.
Czaderski et Motavalli (2004)
L’objectif de la recherche menée par Czaderski et Motavalli (2004) était de vérifier la
faisabilité d’utiliser des lamelles (plaques) en PRFC en forme de L, pour le renforcement en
cisaillement des poutres en BA de section en Té. Les lamelles ont été produites par la
compagnie suisse Sika AG (Sika CarboShear-L), d’épaisseur 1.4 mm, de largeur 40 mm et
d’angle droit avec un rayon de courbure interne de 25 mm. Quatre poutres de portée 3500
mm ont été testées dans cette étude, dont une seule poutre testée sous chargement de fatigue
jusqu’à 5 millions de cycles de contraintes à une fréquence d’environ 4.4 Hz. Le niveau de
chargement a été fixé de manière à ne pas avoir une rupture prématurée par fatigue des
armatures d’acier. Pour cela, les limites inférieure et supérieure de chargement ont été fixées
à 39% et 59% de la résistance ultime statique de la poutre renforcée. Quatre lamelles
espacées de 300 mm ont été collées dans la zone de cisaillement, aux deux extrémités de la
poutre, et ancrées dans les semelles de la poutre en Té.
77
La poutre n’a pas subi une rupture par fatigue pendant le chargement cyclique. De plus, les
auteurs ont remarqué que les lamelles sont demeurées intactes, sans décollement ni rupture,
après 5 millions de cycles de contraintes. Ceci démontre l’efficacité d’utiliser un tel système
de renforcement en cisaillement pour les poutres en BA sous chargement cyclique de fatigue.
Il est établi que la résistance en fatigue des barres d’armature internes constitue le paramètre
d’influence majeure sur le comportement en fatigue des poutres renforcées. La norme
européenne FIB TG9.3 (2001) recommande, pour la conception des poutres renforcées, de
limiter l’amplitude des contraintes dans les barres d’armature à celle attribuée aux poutres
non-renforcées. Néanmoins, le renforcement s’effectue sur des structures existantes et dans la
plupart des cas, l’historique de chargement (amplitude, fréquence et nombre de cycles de
contraintes appliquées), la résistance résiduelle et le taux des barres d’armature internes
(longitudinales et transversales) ne sont pas connus. Les auteurs ont donc recommandé
d’établir les vérifications de conception à l’ÉLF sans tenir compte de la contribution à la
résistance des barres d’armature transversales, afin d’éviter une rupture prématurée en
cisaillement par fatigue.
Les vérifications usuelles (classiques) pour la conception à l’ÉLF des poutres en BA doivent
être prises en considération, tel qu’exigé par les normes en vigueur. Cependant, des essais
spécifiques sont essentiels pour évaluer la résistance résiduelle dans les poutres existantes
avant de les renforcer. Il a été démontré que la déformation dans les bielles du béton
comprimé augmente avec le nombre de cycles de chargement. L’ingénieur responsable doit
donc décider si le béton résistera aux contraintes additionnelles prévues dans la zone des
bielles comprimées au cours de la durée de service en fatigue de la poutre renforcée.
Puisque le composite PRF est un matériau élastique jusqu’à la rupture, la redistribution des
contraintes entre les lamelles espacées n’est pas réalisable. Les auteurs ont donc proposé de
prendre une valeur minimale de θ = 45˚ pour l’angle d’inclinaison des bielles ou l’angle de
fissuration en cisaillement, qui correspond au cas le plus critique pour la conception à l’ÉLF.
78
Par ailleurs, étant donné que la grande partie de la déformation des PRF s’effectue pendant
les premiers cycles de chargement appliqué, les auteurs ont proposé de limiter dès le premier
cycle le niveau des déformations, εfrp, à 0.2% (2000με) et l’amplitude des déformations, Δεfrp,
à 0.04% (400με) dans les PRF, afin d’éviter une rupture prématurée par fatigue.
Williams et Higgins (2008)
Les essais menés par les chercheurs Williams et Higgins (2008) consiste en cinq poutres en
BA de section en Té de portée 7300 mm, dont trois sont soumises à des charges cycliques.
Ces spécimens ont été conçus pour refléter les propriétés, les matériaux et la conception des
poutres de ponts existants, construits durant les années 1940 à 1960.
L’objectif de la recherche était d’évaluer la capacité des poutres en Té et en Té-inversées,
renforcées en cisaillement à l’aide de PRF sous chargement de fatigue. Les poutres ont été
initialement chargées pour produire des pré-fissurations diagonales similaires à celles
observées sur les ponts existants. Elles ont ensuite été renforcées à l’aide de tissus
unidirectionnels en PRFC (bandes intermittentes en forme de U) de largeur 305 mm espacées
de 51 mm, en utilisant le système d’enrobement à l’état liquide. Les poutres ont été testées
sous chargement de fatigue jusqu’à 1 million de cycles à une fréquence de 1 et 1.2 Hz. Les
auteurs ont analysé l’efficacité du renforcement en flexion positive (poutres en Té) et en
flexion négative (poutres en Té-inversées), ainsi que les effets de variation d’amplitude des
contraintes. Le niveau de chargement cyclique a été déterminé pour assurer une durée de
service en fatigue d’au moins 1 million de cycles avec une amplitude des contraintes dans les
barres d’armature inférieure à 165 MPa.
La réponse des déformations dans les tissus en PRFC a varié selon l’endroit où les jauges de
déformations ont été placées, soit par rapport aux fissures inclinées en cisaillement à mi-
hauteur de l’âme soit aux extrémités des tissus en U à l’intersection âme/semelle (zone en
tension pour les poutres en Té-inversées et en compression pour les poutres en Té). La
variation des amplitudes de déformations durant le chargement cyclique a montré un
79
comportement non-linéaire, en cisaillement et dans les zones en tension des poutres en Té-
inversées. Ce comportement est caractérisé par une augmentation considérable des
déformations pendant les premiers cycles de contraintes, suivi par un ralentissement du taux
de croissance avec l’augmentation du nombre de cycles. En revanche, les déformations n’ont
pas changé pendant les premiers cycles dans les poutres en Té aux extrémités des tissus en U
(zone en compression), parce qu’aucune fissuration (ou décollement de tissus) n’a été
amorcée.
Les fissures s’ouvrent et se ferment sous chargement cyclique de fatigue, pendant que le
chargement-déchargement d’un cycle de contrainte s’effectue. Les lèvres de fissures en se
frottant les unes contre les autres provoquent des débris de béton. Ces débris s’accumulent à
l’intérieur des fissures, à mesure que les cycles se poursuivent, les empêchant de se fermer
complètement pendant le déchargement. Ainsi, des contraintes additionnelles se forment,
justifiées par une augmentation dans les valeurs des déformations, et un décollement local du
PRF se produit à l’interface avec les fissures diagonales et aux extrémités des tissus dans les
zones en tension des poutres en Té-inversées.
Les résultats importants obtenus par les auteurs peuvent être résumés comme suit :
1. Le renforcement en cisaillement à l’aide de PRFC mène à une réduction du niveau des
contraintes dans les armatures transversales, alors qu’il n’a pas d’effet sur les armatures
longitudinales;
2. L’espacement entre les renforts verticaux adjacents a permis d’identifier les fissures
inclinées tout au long de la poutre. Il est donc recommandé de procéder à un renforcement
à l’aide de PRF en bandes intermittentes;
3. La rupture a été contrôlée par décollement prématuré des PRFC au voisinage des fissures
diagonales et aux extrémités des tissus en U à l’intersection âme/semelle dans les zones en
tension;
4. Le maintien des extrémités des tissus dans la zone comprimée de la section a empêché le
décollement du PRFC sous chargement de fatigue.
80
Chaallal et al. (2010)
Chaallal et al. (2010) ont étudié le comportement en fatigue des poutres en BA renforcées en
cisaillement à l’aide de tissus unidirectionnels continus en PRFC en forme de U, selon le
système d’enrobement à l’état liquide. Six essais ont été effectués sur des poutres en BA de
section en Té de 4520 mm de longueur, dont quatre ont été renforcées. Plusieurs paramètres
d’influence majeure ont été examinés, tels que la rigidité du PRFC (poutres renforcées avec
une et deux couches de tissus) et la présence des armatures d’acier transversales (poutres sans
étriers et avec étriers espacés de d/2). Les poutres ont été soumises à des charges cycliques
jusqu’à 5 millions de cycles de contraintes à une fréquence de 2 Hz. Les poutres qui n’ont
pas subi la rupture par fatigue ont été ensuite testées sous charges statiques jusqu’à leur
rupture. Les auteurs ont choisi un chargement cyclique entre 35% et 65% de la résistance
ultime statique de chaque poutre (c.-à-d., en tenant compte de la contribution à la résistance
des PRF). La logique derrière ce choix est expliquée dans la section 3.5.1.
Les poutres renforcées avec une seule couche de tissus en PRFC n’ont pas subi de rupture par
fatigue et ont résisté 5 millions de cycles de contraintes sans aucun décollement. En
revanche, les poutres renforcées avec deux couches ont subi une rupture en cisaillement par
fatigue. En effet, la rupture de la poutre sans armatures transversales a été produite à 0.7
million de cycles de contraintes par écrasement des bielles du béton comprimé, suivi par un
décollement de tissus. La rupture de la poutre avec étriers a, quant à elle, été produite à 2.1
millions de cycles due à la rupture des étriers accompagnée par un décollement partiel du
renfort, suivi par l’écrasement des bielles du béton comprimé. Il est à noter que cette rupture
par fatigue pourrait également être attribuée au niveau élevé de l’amplitude des contraintes
appliquées.
La valeur de l’amplitude des contraintes dans l’étrier qui a subi la rupture par fatigue était de
125.4 MPa au premier cycle de chargement appliqué. Cette valeur est comparable aux limites
supérieures des normes en vigueur, pour la conception à l’ÉLF des poutres en BA,
concernant les barres d’armature longitudinales (voir section 3.2).
81
Sur la base des résultats obtenus, les observations suivantes ont été rapportées par les auteurs:
1. L’efficacité du renforcement en cisaillement à l’aide de PRFC en termes de gain en
résistance et prolongation de la durée de service en fatigue des poutres en BA;
2. Une rigidité élevée du système PRF peut provoquer une rupture prématurée par fatigue, en
changeant la distribution des contraintes entre les divers constituants qui entrent en jeu;
3. Les spécifications requises par les normes pour la conception à l’ÉLF des structures en
BA non-renforcées peuvent également être utilisées pour le calcul des structures
renforcées à l’aide de PRF;
4. Une prolongation de la durée de service en fatigue a été observée avec la présence des
armatures transversales, en comparant les poutres renforcées sans et avec étriers;
5. Les résultats des tests ont enregistré une déformation maximale et une amplitude des
déformations des composites PRFC en dessous des valeurs limites proposées par les
auteurs Czaderski et Motavalli (2004).
Bae et al. (2013)
Bae et al. (2013) ont étudié la performance en fatigue des poutres en BA renforcées en
cisaillement à l’aide de PRF. Deux poutres ont été examinées sous chargement cyclique, dont
une seule renforcée à l’aide de tissus en PRFC. Cette dernière a été renforcée à l’aide de
tissus unidirectionnels (bandes intermittentes en forme de U) de 254 mm de largeur espacés
de 127 mm, en utilisant le système d’enrobement à l’état liquide. Les poutres ont été
soumises à des charges cycliques jusqu’à 2 millions de cycles de contraintes à une fréquence
de 1 Hz. Le taux d’armature transversale interne était 0.1% et ne répondait donc pas aux
exigences minimales du standard AASHTO (2010); le but était de représenter le cas d’une
perte de section due à la corrosion ou d’une erreur de conception. Le taux du système PRF
collé en surface était 0.048%.
82
Deux sur trois étriers interceptant le patron de fissuration ont atteint la plastification. Un
décollement des bandes PRFC a eu lieu à 1 million de cycles, où la contrainte d'adhérence à
l'interface PRFC/béton a atteint une valeur maximale de 2.38 MPa. Les auteurs ont ainsi
recommandé de limiter la contrainte d'adhérence des PRFC à 1.5 MPa, afin d’éviter un
décollement avant 1 million de cycles de contraintes. Cette limite correspond à 25% de la
résistance d’adhérence ultime (6 MPa) qui a été déterminée expérimentalement par Nakaba et
al. (2001). La même limite de 1.5 MPa a été proposée par Dai et al. (2005) en se basant sur la
courbe S-N effectuée par une série de tests sur des blocs en béton, avec une résistance en
compression entre 23.4 et 34.8 MPa.
La poutre renforcée n’a pas subi la rupture par fatigue pendant les 2 millions de cycles de
chargement appliqué, malgré le décollement total des tissus. De plus, la résistance résiduelle
en cisaillement de la poutre testée statiquement après 2 millions de cycles était légèrement
supérieure à celle de la poutre de contrôle non-renforcée. Il est donc constaté que le
renforcement en cisaillement à l’aide des tissus en PRFC peut augmenter la durée de service
en fatigue des poutres en BA, même avec des niveaux très élevés des contraintes dues au
chargement cyclique.
3.6 Synthèses des résultats des recherches expérimentales antérieures
Le renforcement en cisaillement sous charges statiques a récemment gagné en popularité et
de nombreuses études, notamment expérimentales, lui ont été dédiées. Ainsi, les études sur le
renforcement sous charges statiques sont nombreuses et bien documentées, que ce soit en
flexion ou en cisaillement. Par contre, peu de recherches ont été effectuées sur le
comportement en fatigue des poutres renforcées à l’aide de PRF sous chargement cyclique.
De plus, la majorité de ces études portent sur le renforcement en flexion, à l’exception de
quelques recherches, dont celles produites par le candidat dans le cadre de cette thèse, qui
traitent exclusivement du renforcement en cisaillement des poutres en BA (Bae et al. 2013;
Chaallal et al. 2010; Czaderski et Motavalli 2004; Dong et al. 2012; El-Saikaly et Chaallal
2015a; 2015b; Farghal 2014; Williams et Higgins 2008).

83
Selon les chercheurs, plusieurs paramètres d’influence majeure sur la durée de service en
fatigue des poutres renforcées à l’aide de PRF collés en surface entrent en jeu, tels que les
conditions de chargement cyclique (amplitude, fréquence, et nombre de cycles de contraintes
appliquées), la résistance résiduelle, l’effet des conditions environnementales, la résistance
d’adhérence à l’interface PRF/béton, le système de renforcement et d’ancrage de PRF, ainsi
que les mécanismes de rupture envisagés.
On constate à l’issue du sommaire présenté au Tableau 3.2 que :
1. Très peu d’études ont été menées sur la performance des poutres en béton armé
renforcées en cisaillement à l’aide de PRF collés en surface sous chargement cyclique de
fatigue (huit parmi les quarante-huit au total);
2. Seulement trois études ont été menées sur la performance des poutres en béton
précontraint renforcées en flexion à l’aide de PRF collés en surface sous chargement
cyclique de fatigue;
3. Le nombre de recherches sur la performance des poutres en Té est moindre par rapport à
celui des poutres rectangulaires (14 versus 34 recherches);
4. La majorité des recherches ont utilisé des systèmes PRFC à base de fibres de carbone.
Aucune recherche n’a été réalisée en utilisant des PRFA, cinq en PRFV, trois en fibres
d’acier et deux hybrides;
5. Cinq recherches ont examiné la présence et la variation du taux d’armature transversale et
trois recherches la variation du taux d’armature longitudinale;
6. Sept recherches ont examiné l’effet des conditions environnementales sur le
comportement en fatigue des poutres renforcées;
7. Dix recherches ont examiné la variation du taux de rigidité dans les systèmes PRF
(nombre de couches de PRF appliquées);
8. La plupart des chercheurs ont adopté l’option A de chargement cyclique, c’est-à-
dire d’appliquer le même pourcentage de la résistance ultime statique à chaque poutre, en
tenant compte de la contribution des PRF à la résistance.
84
Sur la base de la revue de la littérature exhaustive réalisée sur le comportement en fatigue
des poutres renforcées à l’aide de PRF collés en surface, les conclusions essentielles
suivantes peuvent être tirées:
1. Le renforcement à l’aide de PRF contribue considérablement à la prolongation de la
durée de service en fatigue des structures en BA, compte tenu de la redistribution des
contraintes dans les barres d’armature internes causée par l’application du composite;
2. Les tests ont démontré la faisabilité du renforcement en flexion des poutres en BA à
l’aide de PRF collés en surface sous charges cycliques;
3. La majorité des recherches ont constaté que la performance des poutres renforcées en
flexion sous charges cycliques est contrôlée par la fatigue des barres d’armature
longitudinales (mode primaire de rupture), suivi par le décollement du PRF à l’interface
avec le substrat du béton (mode secondaire);
4. Une augmentation de la rigidité du système PRF peut provoquer une rupture prématurée
par fatigue;
5. La dégradation accumulée par fatigue des poutres renforcées est caractérisée par une
augmentation significative du taux de dégradation (rigidité de la structure, déformations
dans les divers constituants et progression des fissures) pendant les premiers cycles de
contraintes appliquées, suivie par une phase quasi-constante, où le taux de dégradation
ralentit considérablement avec l’augmentation du nombre de cycles de contraintes. Une
dégradation brusque peut se produire juste avant la rupture finale de la structure;
6. Czaderski et Motavalli (2004) ont proposé de limiter la déformation maximale dans les
PRF à 0.2% et l’amplitude des déformations à 0.04%, afin d’éviter une rupture
prématurée en fatigue;
7. Pour le renforcement en cisaillement, maintenir les extrémités du composite transversal
dans la zone comprimée de la section peut empêcher une rupture prématurée par fatigue
due au décollement du PRF;
8. Le renforcement en cisaillement à l’aide de PRFC mène à une réduction du niveau des
contraintes dans les armatures transversales, alors qu’il n’a pas d’effet sur les armatures
longitudinales;
85
9. Il est recommandé de limiter la contrainte d'adhérence à l’interface PRF/béton à 1.5 MPa,
afin d’éviter un décollement avant 1 million de cycles de contraintes;
3.7 Les besoins en recherche
En raison de sa complexité, le renforcement en cisaillement des poutres en BA à l’aide de
PRF collés en surface sous chargement de fatigue reste un sujet sur lequel peu de recherches
ont été dédiées malgré son importance. Bien que quelques éléments de réponse sont pourvus
par les études exploratoires antérieures, plusieurs questions essentielles demeurent: Quelle
est la faisabilité d’utiliser le système de renforcement en cisaillement pour les poutres en BA
sous charges cycliques? Est-ce qu’un tel système peut empêcher une rupture fragile en
cisaillement par fatigue? Quel est l’effet de la présence des étriers sur la performance des
poutres renforcées? Est-ce qu’il existe une interaction entre les armatures transversales
internes et les renforts en PRF externes sous chargement cyclique, comme c’est le cas sous
chargement statique? Quelles conditions de chargement cyclique faut-il choisir pour mieux
évaluer le comportement en fatigue? Quelle approche devons-nous donc adopter pour
représenter le cas le plus réaliste dans la pratique ? Etc.
Par conséquent, des recherches additionnelles sont cruciales pour l’industrie de la
construction afin d’évaluer l’efficacité des systèmes de renforcement en cisaillement pour les
poutres en BA sous chargement cyclique de fatigue. Ces recherches vont aider à enrichir la
littérature et confirmer, infirmer ou circonstancier les résultats des recherches antérieures peu
nombreuses sur le sujet. Ceci peut être réalisé en mettant l’accent sur les différents
paramètres d’influence majeure, ceux qui ont déjà été abordés et sur lesquels on a déjà des
éléments de réponse et ceux qui n’ont pas encore été élucidés. On peut citer : les conditions
de chargement cyclique, la présence et la variation du taux des armatures transversales, le
système de renforcement et d’ancrage de PRF, la rigidité, la dégradation accumulée par
fatigue, ainsi que la résistance résiduelle de la structure.

CHAPITRE 4
EXTENDING THE FATIGUE LIFE OF REINFORCED CONCRETE T-BEAMS STRENGTHENED IN SHEAR WITH EXTERNALLY BONDED FRP:
UPGRADING VERSUS REPAIRING
Georges El-Saikaly1 and Omar Chaallal2
Department of Construction Engineering, École de Technologie Supérieure,
1100 Notre-Dame St. West, Montreal, QC, Canada H3C 1K3
Article Published in Journal of Composites for Construction, American Society of Civil
Engineers (ASCE), Volume 19, Issue 1, 04014027, February 2015.
4.1 Abstract
Rehabilitation and upgrading of existing civil infrastructures have become a major concern
that definitely requires attention. The use of externally bonded carbon-fiber-reinforced
polymer (EB-CFRP) to strengthen deficient RC beams has gained in popularity and has
become a viable and cost-effective method. Fatigue behavior of RC beams strengthened with
fiber-reinforced polymer (FRP) is a complex issue due to the contribution of many variables
such as the load range, the applied frequency, and the number of cycles. Very few studies
have been conducted in shear under cyclic loading. This study has examined the fatigue
performance of RC beams strengthened in shear using EB-CFRP sheets. The investigation
involved nine laboratory tests performed on full-size 4,520-mm long T-beams. The
specimens were subjected to fatigue loading up to 6 million load cycles at a rate of 3 Hz.
Two retrofit (loading) options (upgrading and repairing) and three different transverse-steel
reinforcement ratios (Series S0, S1, and S3 specimens) were considered. Test results were
compared with the upper fatigue limits specified by codes and standards. The specimens that
1 Ph.D. Candidate, Department of Construction Engineering, University of Quebec, École de Technologie Supérieure. E-mail: [email protected]
2 Professor of Construction Engineering, Department of Construction Engineering, University of Quebec, École de Technologie Supérieure. E-mail: [email protected]
88
did not fail in fatigue were then subjected to static loading up to failure to evaluate their
residual capacity. The test results confirmed the feasibility of using the EB-CFRP sheets to
extend the fatigue service life of RC T-beams for both loading options. They also revealed
that the presence of transverse steel enhanced the fatigue performance of strengthened RC
beams. Finally, it was found that the gain contributed by EB-FRP sheets to shear resistance
decreased with the addition of internal steel stirrups, confirming the existence of an
interaction between transverse-steel reinforcement and EB-FRP.
CE Database subject headings: Reinforced concrete beams; Fatigue service life; Cyclic
loading; Shear; Upgrading; Repairing; Strengthening; Externally bonded FRP; Sheets.
4.2 Introduction
In North America, RC bridges exhibit serious signs of damage due to deterioration of
concrete and corrosion of steel combined with the continuous increase in service loads and
traffic volumes. As a result, many of these deficient bridges are under-designed in shear
according to current design codes (Bonacci and Maalej 2000; Higgins et al. 2006). This
situation presents a formidable challenge for the construction industry and highlights the
need to develop innovative strengthening techniques that are efficient and cost effective.
In the last two decades, the use of externally bonded (EB) fiber-reinforced polymer (FRP)
has gained worldwide acceptance in the construction engineering community, particularly for
rehabilitation of RC structures. Strengthening RC members subjected to monotonic loading is
relatively well documented. In contrast, research studies involving fatigue loading are
limited. Moreover, all the studies on the behavior of strengthened members under fatigue
loading have been related either to strengthening of beams in flexure (e.g., Ekenel et al.
2006; Heffernan and Erki 2004; Masoud et al. 2005) or to the FRP-concrete interface (e.g.,
Bizindavyi et al. 2003; Ferrier et al. 2005), with the exception of a very few studies carried
out on RC beams retrofitted in shear by Czaderski and Motavalli (2004) and more recently
by Williams and Higgins (2008), Chaallal et al. (2010), and Bae et al. (2013).
89
The study by Bae et al. (2013) investigated the shear performance of RC girders strengthened
in shear with EB carbon FRP (CFRP) strips under cyclic loading for 2 million cycles at 1 Hz.
They considered three specimens under cyclic loading. One control was not strengthened,
and two specimens were strengthened with a single ply of EB-CFRP strips. Each strip was
254-mm wide with a clear space of 127 mm. The internal steel reinforcement ratio was 0.1%,
which did not meet the minimum AASHTO requirements. This was intended to represent the
case of cross-sectional loss due to corrosion or design error. The FRP ratio was 0.048%. The
following observations were made: (1) two out of three stirrups yielded, and (2) debonding of
CFRP occurred at 1 million cycles and the interface bond stress reached a maximum of 2.38
MPa. The authors recommended limiting the interfacial bond stress in the CFRP strips to 1.5
MPa or 25% of the interfacial strength to avoid debonding.
The study by Williams and Higgins (2008) considered five specimens spanning 7.3 m: three
under fatigue and two (control) tested monotonically. The specimens were designed to reflect
1950s vintage properties, materials, and design. Two designs were used to test both positive
(T-beam) and negative moment-bending regions (inverted T-beams). The beams were then
repaired with CFRP fabric and fatigued for 1 million cycles at 1.0 to 1.25 Hz. The CFRP
strips were 305-mm wide with an open space of 51 mm and were applied in a U-shape to the
prepared surface in a wet layup procedure. No anchorage was provided for the CFRP
strengthening. The low levels of loads considered were determined on the basis of the levels
of strains monitored at ambient traffic loading on an in-service bridge for 32.6 days. The
following observations were made: (1) under ambient loading, the largest strain on an
instrumented CFRP strip on the in-service bridge was 34 μstrains; (2) vertical strips reduced
service-level stirrup stresses, but did not reduce flexural steel stresses; (3) failure was
controlled by debonding of CFRP strips along diagonal cracks and at extremities located in
the flexural tension zone; and (4) the maximum CFRP strain measured at mid-height during
the fatigue test varied from 50 to 210 μstrains.
Czaderski and Motavalli (2004) tested four T-beams spanning 3.5 m, three of which were
retrofitted in shear with spaced CFRP L-shaped rigid plates; one was used as a control
90
(unstrengthened). However, only one strengthened specimen was tested in fatigue, whereas
the three others were tested under monotonic loading. The objective of their study in fatigue
was to investigate the feasibility of using the prefabricated L-shaped plates. These consist of
carbon fibers in an epoxy matrix and have a 90° bend, a width of 40 mm, and a thickness of
1.4 mm. The plate has an elastic modulus of 120 GPa. The CFRP plates were anchored in the
flange. The specimen tested in fatigue was submitted to 5 million load cycles at 4.4 Hz. The
load levels were fixed at 59 and 39% of ultimate load of the control specimen. The strains
measured on CFRP L-shaped plates during the fatigue test varied from 850 to 2,710 μstrains.
The authors suggest, for fatigue design, the use of a fatigue strain of 0.2% corresponding to
the upper load and a strain amplitude (range) of 0.04% for the strengthening system anchored
to the flange under study.
The exploratory research study carried out by Chaallal et al. (2010) was intended to
investigate the feasibility of the EB technique for extending the service life of existing RC
structures, which are deficient in shear, but under high stress levels (35 to 65% of ultimate),
and to compare the results with those obtained by Williams and Higgins (2008). In addition,
the purpose of strengthening was to upgrade the existing beams. Therefore, the fatigue
loading was calculated taking into account the capacity of the strengthened beams. The
research considered specimens with no stirrups and with one single stirrup spacing,
strengthened with one-ply or two-ply CFRP fabrics. The study showed in particular that (1)
the presence of transverse steel contributed to extending the service life of the strengthened
beams, and (2) the use of CFRP composite with high rigidity may result in premature
debonding of CFRP and yielding of stirrups.
The research study presented in this paper aims to examine experimentally the fatigue
behavior of RC beams strengthened in shear using EB-CFRP sheets and to provide fatigue
data and information that could be valuable for fatigue design of girders strengthened in
shear with EB-CFRP. The originality of this study stems from the fact that it considers two
practical situations that can prevail in practice: (1) Category A, in which the objective of the
91
FRP retrofit is to strengthen the existing RC structure to increase its original capacity due to
an increase in the projected applied load; and (2) Category B, in which the objective of the
FRP retrofit is to extend the service life of the existing deficient structure by repairing it to its
original shear capacity with no projected increase in applied load. These two situations call
for two different applied cyclic loadings, as will be seen subsequently.
The specific objectives of this study are as follows:
1. To investigate the feasibility of EB-FRP shear-strengthening techniques for extending the
fatigue life of structures for both retrofit options: upgrading the service load (Category A)
and repairing with no increase in service load (Category B);
2. To investigate the influence of internal steel stirrups; and
3. To evaluate the effect of steel-stirrup ratio and spacing on the fatigue performance of EB-
FRP sheets.
4.3 Experimental program
The present study involved nine laboratory tests performed on full-size T-beams. The test
specimens were subjected to fatigue loading up to failure, with an upper limit of six million
load cycles. This limit is thought to be reasonable for the residual life of an existing
retrofitted beam. The specimens which did not fail under fatigue loading were then tested
monotonically to failure to measure their residual resistance.
The experimental program matrix of test specimens is presented in Table 4.1. The control
specimens not strengthened with CFRP are labelled CON (for control), and the specimens
retrofitted with one ply of CFRP are labeled EBS (for externally bonded sheet). The symbol
S0 is used to designate specimens with no steel stirrups, while S1 and S3 refer to specimens
made with internal transverse-steel reinforcement spaced at s = d/2 and s = 3d/4 respectively,
where d = 350 mm represents the effective depth of the beam cross section (see Figure 4.1).
Finally, the letters A and B designate the retrofitting category. For example, specimen CON-
S0 has no transverse steel and is not retrofitted with CFRP sheet, whereas specimen EBS-S1-
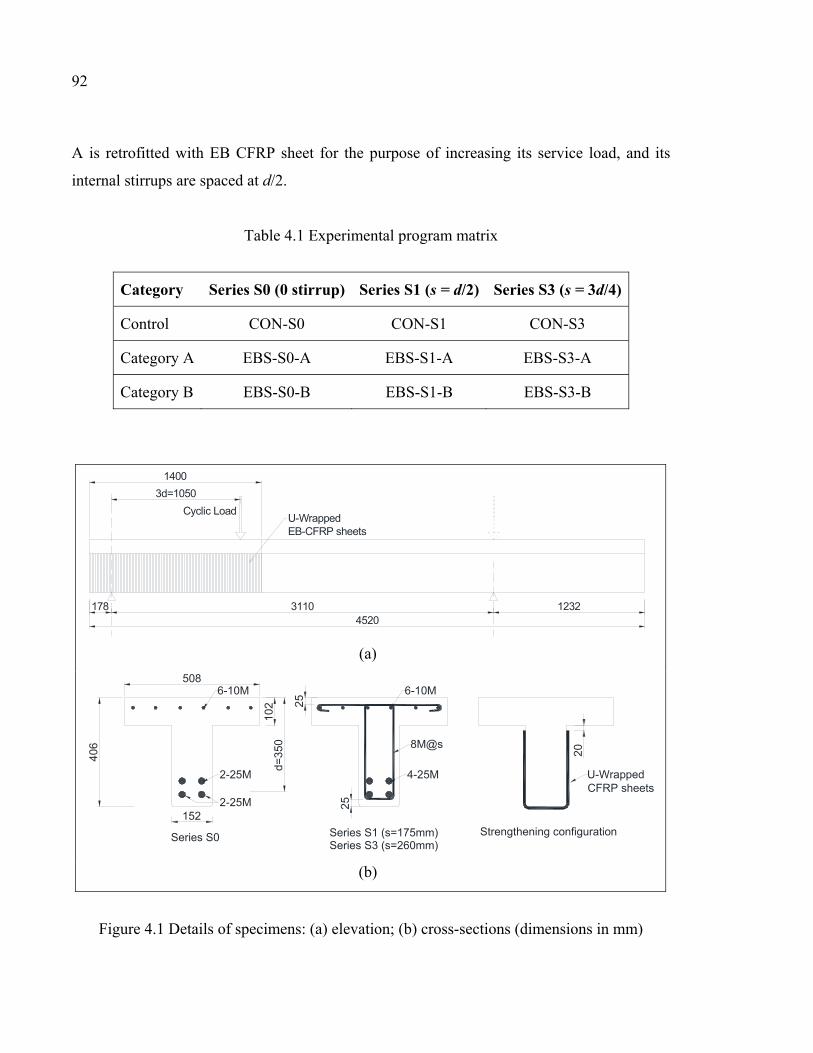
92
A is retrofitted with EB CFRP sheet for the purpose of increasing its service load, and its
internal stirrups are spaced at d/2.
Table 4.1 Experimental program matrix
Category Series S0 (0 stirrup) Series S1 (s = d/2) Series S3 (s = 3d/4)
Control CON-S0 CON-S1 CON-S3
Category A EBS-S0-A EBS-S1-A EBS-S3-A
Category B EBS-S0-B EBS-S1-B EBS-S3-B
(a)
(b)
Figure 4.1 Details of specimens: (a) elevation; (b) cross-sections (dimensions in mm)
Cyclic Load
178 3110 1232
3d=1050
4520
1400
U-WrappedEB-CFRP sheets
508
102
d=35
0
2-25M
6-10M
8M@s
152
Series S0 Series S1 (s=175mm)
4-25M
6-10M
2-25M
20
Strengthening configuration
U-WrappedCFRP sheets
Series S3 (s=260mm)
406
25
25
93
4.3.1 Description of specimens
The T-beams used in this research were 4,520 mm-long. Details of their cross sections are
presented in Figure 4.1b. The longitudinal-steel reinforcement consisted of four M25 bars
(diameter = 25.2 mm) laid in two layers. The transverse-steel reinforcements were 8 mm in
diameter (area = 50 mm2) and were spaced at s = d/2 for the S1 series and s = 3d/4 for the
S3 series. The composite material was a unidirectional carbon-fiber fabric applied
continuously over the test zone in a U shape around the web using a wet lay-up procedure.
The thickness of the one-ply CFRP used was 0.1 mm before saturation.
4.3.2 Properties of materials
A commercially available concrete, delivered to the laboratory by a local supplier, was used.
The concrete mix design is presented in Table 4.2. Standard compression tests on control
cylinders yielded a concrete compressive strength of 35 MPa on average. The steel
reinforcing bars used were also tested in tension according to the ASTM A370-97a (ASTM
1997) standard, and a summary of the results of these tests is presented in Table 4.3. A
commercially available CFRP system, including a unidirectional carbon fiber fabric, an
impregnating epoxy resin, and a primer, was used in this study. Table 4.4 provides a
summary of the properties of cured laminate sheets as provided by the manufacturer. The
CFRP fabric was applied according to the manufacturer’s specifications.
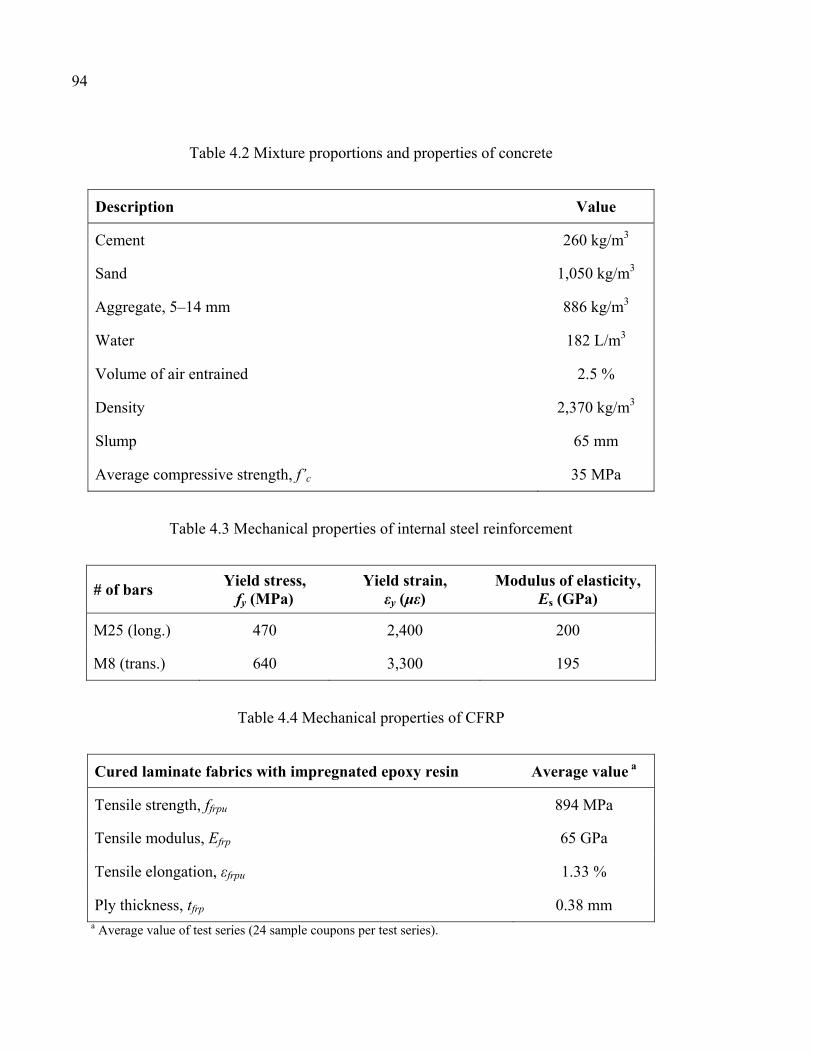
94
Table 4.2 Mixture proportions and properties of concrete
Description Value
Cement 260 kg/m3
Sand 1,050 kg/m3
Aggregate, 5–14 mm 886 kg/m3
Water 182 L/m3
Volume of air entrained 2.5 %
Density 2,370 kg/m3
Slump 65 mm
Average compressive strength, f’c 35 MPa
Table 4.3 Mechanical properties of internal steel reinforcement
# of bars Yield stress,
fy (MPa) Yield strain,
εy (με) Modulus of elasticity,
Es (GPa)
M25 (long.) 470 2,400 200
M8 (trans.) 640 3,300 195
Table 4.4 Mechanical properties of CFRP
Cured laminate fabrics with impregnated epoxy resin Average value a
Tensile strength, ffrpu 894 MPa
Tensile modulus, Efrp 65 GPa
Tensile elongation, εfrpu 1.33 %
Ply thickness, tfrp 0.38 mm a Average value of test series (24 sample coupons per test series).
95
4.3.3 Variables examined
The variables examined in the experimental test matrix were the following:
1. Loading option: Two different cyclic loading situations were considered: (1) Category A,
representing the case of upgrading the service load, and (2) Category B, representing the
case of repair with no increase in service load;
2. Presence of internal steel stirrups: Three series of beams were considered: S0 with no
transverse steel, and S1 and S3 with steel stirrups spaced at 175 and 260 mm,
respectively;
3. Spacing of steel stirrups: Two different spacing were examined, 175 and 260 mm.
The experimental results obtained from the fatigue tests and the subsequent monotonic tests
on those specimens that did not fail under cyclic loading will be successively presented and
analyzed. The test results will be presented in terms of (1) modes of failure, (2) load versus
deflection relationship, and (3) the strains undergone by the various components, including
concrete, longitudinal, and transverse-steel reinforcements and CFRP. The results will be
discussed for both Categories A and B of loading options and in terms of presence and
spacing of internal stirrups, as well as considering the effectiveness of EB-CFRP sheets to
extend the service life of RC girders under fatigue loading and to attenuate the rate of
damage. Comparisons with recommended design code values and perspectives for design
practice will also be discussed. Experimental results from the static tests will be discussed
with regard to the residual response and the cumulative damage and rigidity loss. Of
particular interest will be the capacity load attained at rupture and the gain in capacity due to
CFRP, as well as the deflection response and the gain in stiffness due to CFRP.
4.3.4 Test setup and procedure
The specimens were first subjected to fatigue loading up to failure, with an upper limit of 6
million load cycles. Those specimens that did not fail under fatigue loading were then tested
monotonically to failure. The beams were tested in three-point load flexure. The load was
96
applied at a distance a = 3d from the nearest support, which corresponds to a slender beam
test. This type of loading was chosen because it enabled two tests to be performed on each
specimen: (1) one beam end zone was first tested, keeping the other overhung and unstressed
(Figure 4.1a); and (2) the other beam end zone was tested, but this time, the end zone already
tested was overhung and unstressed.
In the fatigue tests, all the specimens were loaded at a rate of 3 Hz. This relatively low
frequency was selected on the basis of the available equipment, but also to avoid phenomena
such as hysteresis effects (Barnes and Mays 1999), undesirable heating, or lack of full
recovery between successive cycles (Emberson and Mays 1996).
The fatigue load was cycled from 35 to 65% of the load (P), where P depended on the
category as follows: for Category A, the load P corresponded to the total shear resistance of
the specimen under study (i.e., including the contribution of CFRP), whereas for Category B,
the load P corresponded to the shear resistance of the corresponding control (unstrengthened)
specimen. For all test specimens, the ultimate loads at rupture (P) were obtained from similar
specimens tested only under static loading in a previous study (Chaallal et al. 2011). It may
be argued that the use of different load levels for the different test beams in each category
makes comparison between the specimens difficult. However, the loading approach used
here was thought to be more realistic and representative of real-world situations because it is
linked to the level of load to be supported by the retrofitted beams. The same approach has
been used elsewhere for CFRP-strengthened beams (e.g., Barnes and Mays 1999).
The upper and lower limits were calculated on the basis of common service-load conditions
that a structure like a bridge might experience during its service life. These limits evolve with
respect to a mean value, Pmean, estimated at 50% of ultimate, corresponding to the passage of
a standard vehicle at a crawling speed. The lower and upper limits Pmin and Pmax are given as
a function of the dynamic load allowance (DLA) by Pmin = Pmean (1-DLA) and Pmax = Pmean
(1+DLA). Depending on the code used, the DLA values range between 0.25 and 0.40. In this
paper, a value of 0.3 was considered for DLA, which resulted in values of 35% and 65% of
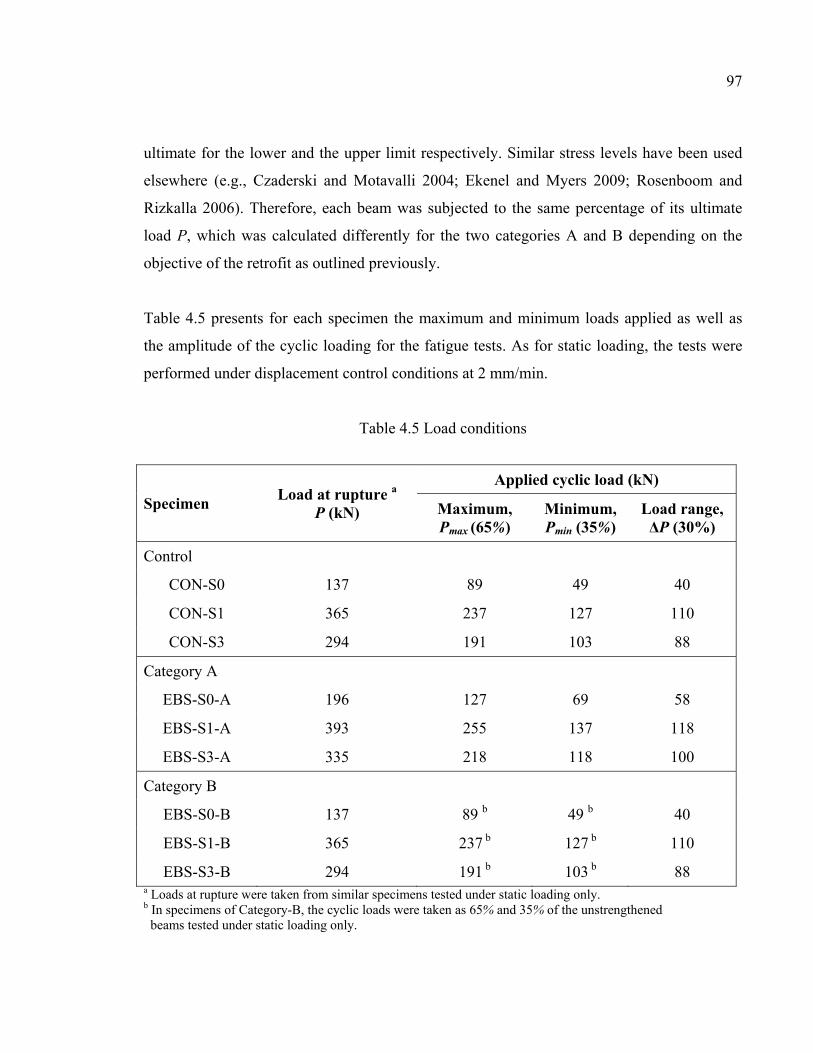
97
ultimate for the lower and the upper limit respectively. Similar stress levels have been used
elsewhere (e.g., Czaderski and Motavalli 2004; Ekenel and Myers 2009; Rosenboom and
Rizkalla 2006). Therefore, each beam was subjected to the same percentage of its ultimate
load P, which was calculated differently for the two categories A and B depending on the
objective of the retrofit as outlined previously.
Table 4.5 presents for each specimen the maximum and minimum loads applied as well as
the amplitude of the cyclic loading for the fatigue tests. As for static loading, the tests were
performed under displacement control conditions at 2 mm/min.
Table 4.5 Load conditions
Specimen Load at rupture a
P (kN)
Applied cyclic load (kN)
Maximum, Pmax (65%)
Minimum, Pmin (35%)
Load range, ΔP (30%)
Control
CON-S0 137 89 49 40
CON-S1 365 237 127 110
CON-S3 294 191 103 88
Category A
EBS-S0-A 196 127 69 58
EBS-S1-A 393 255 137 118
EBS-S3-A 335 218 118 100
Category B
EBS-S0-B 137 89 b 49 b 40
EBS-S1-B 365 237 b 127 b 110
EBS-S3-B 294 191 b 103 b 88 a Loads at rupture were taken from similar specimens tested under static loading only. b In specimens of Category-B, the cyclic loads were taken as 65% and 35% of the unstrengthened beams tested under static loading only.
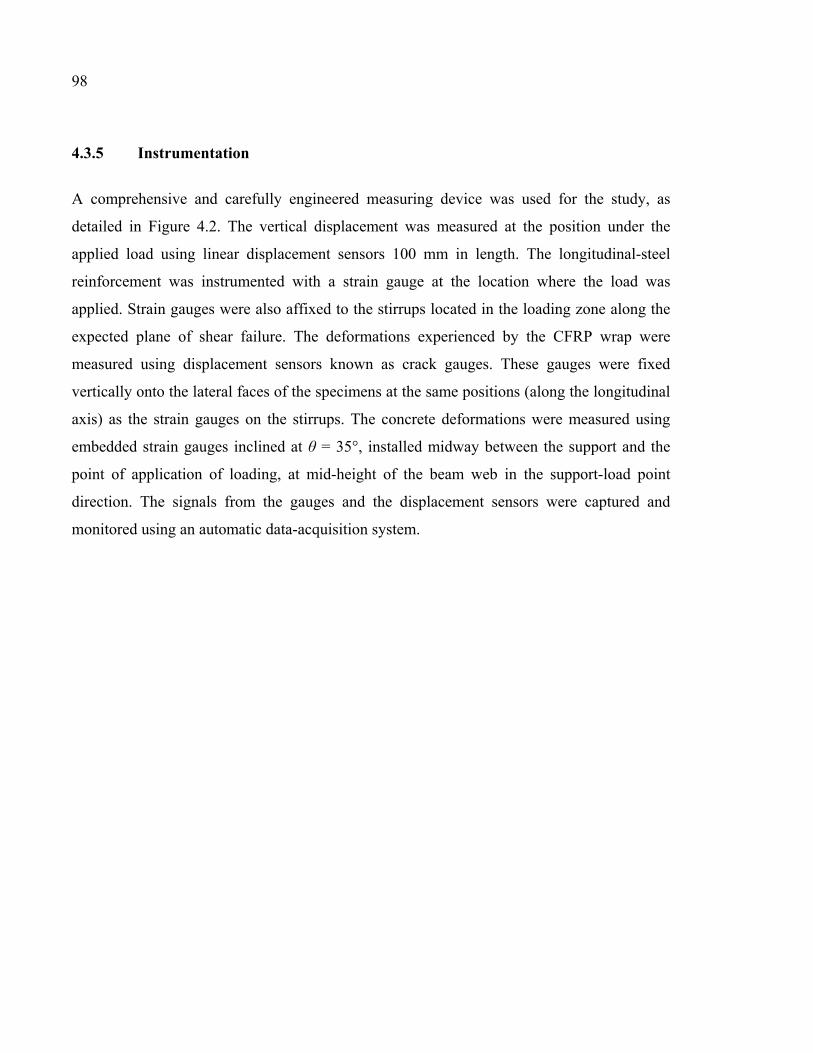
98
4.3.5 Instrumentation
A comprehensive and carefully engineered measuring device was used for the study, as
detailed in Figure 4.2. The vertical displacement was measured at the position under the
applied load using linear displacement sensors 100 mm in length. The longitudinal-steel
reinforcement was instrumented with a strain gauge at the location where the load was
applied. Strain gauges were also affixed to the stirrups located in the loading zone along the
expected plane of shear failure. The deformations experienced by the CFRP wrap were
measured using displacement sensors known as crack gauges. These gauges were fixed
vertically onto the lateral faces of the specimens at the same positions (along the longitudinal
axis) as the strain gauges on the stirrups. The concrete deformations were measured using
embedded strain gauges inclined at θ = 35°, installed midway between the support and the
point of application of loading, at mid-height of the beam web in the support-load point
direction. The signals from the gauges and the displacement sensors were captured and
monitored using an automatic data-acquisition system.
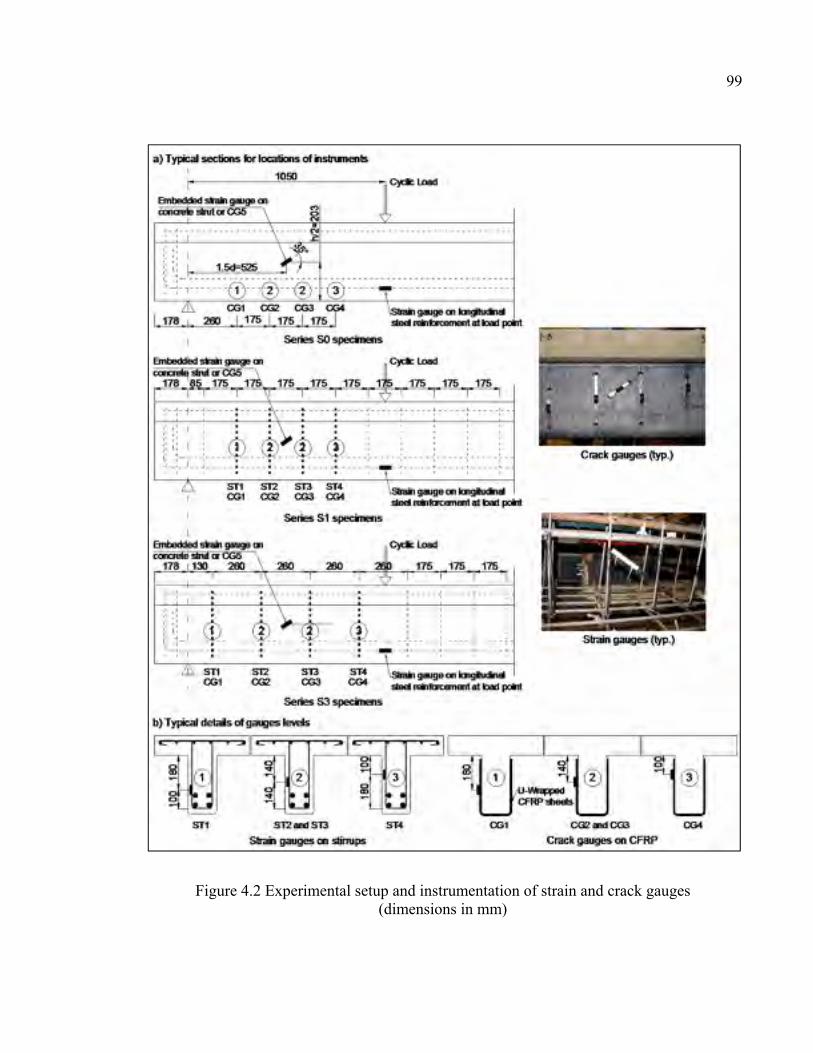
99
Figure 4.2 Experimental setup and instrumentation of strain and crack gauges (dimensions in mm)
100
4.4 Analysis of test results
4.4.1 Overall response
The overall response was typical of fatigued RC beams and illustrates a typical pattern of
damage accumulation in beams subjected to fatigue loading. All the tested specimens
exhibited an accelerated rate of damage propagation characterized by an initial increase in
deflection and strains in the different components (longitudinal and transverse steel as well as
CFRP and concrete) during the early cycles. This was followed by a stable phase in which
the damage accumulation slowed significantly, which was characterized by a gradual
progression of deflection and strains during cyclic loading. This stable phase extended up to
the last, very short phase just before imminent failure, which was characterized by a sudden
increase in deflection and strain before failure.
4.4.2 Modes of failure
Table 4.6 provides a summary of the test results in terms of failure modes, number of load
cycles, and loads attained at failure under monotonic loading for those specimens that did not
fail under cyclic loading.
Control specimens
Of the three control specimens, only specimen CON-S1 failed in shear fatigue (Figure 4.3a).
The other two specimens survived the fatigue test and failed in shear under static loading
(Figure 4.4(a and b)). For specimen CON-S0, the test was stopped at 5 million cycles
because this was the upper limit of the number of cycles fixed at project initiation. For CON-
S1, the steel stirrups ruptured at 3.807 million cycles. The first cycle transverse-steel strain
range and stress ranges were Δεstr (stirrup) = 1,030 με and corresponding Δσstr = 200 MPa.
This may give an idea of a limit to avoid stirrup rupture by fatigue because no limit has yet
been suggested in current codes and standards. Similar results have been reported by Higgins
et al. (2007), who carried out laboratory experiments on full-size RC (unstrengthened)
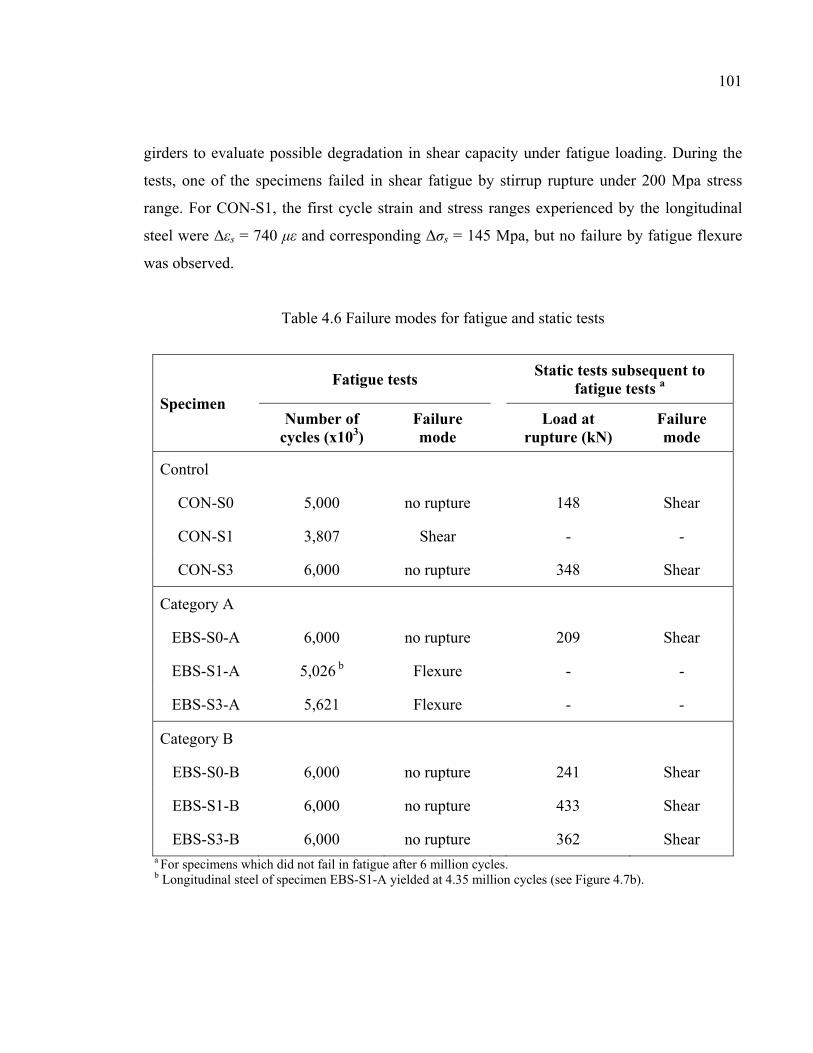
101
girders to evaluate possible degradation in shear capacity under fatigue loading. During the
tests, one of the specimens failed in shear fatigue by stirrup rupture under 200 Mpa stress
range. For CON-S1, the first cycle strain and stress ranges experienced by the longitudinal
steel were Δεs = 740 με and corresponding Δσs = 145 Mpa, but no failure by fatigue flexure
was observed.
Table 4.6 Failure modes for fatigue and static tests
Specimen
Fatigue tests Static tests subsequent to
fatigue tests a
Number of cycles (x103)
Failure mode
Load at rupture (kN)
Failure mode
Control
CON-S0 5,000 no rupture 148 Shear
CON-S1 3,807 Shear - -
CON-S3 6,000 no rupture 348 Shear
Category A
EBS-S0-A 6,000 no rupture 209 Shear
EBS-S1-A 5,026 b Flexure - -
EBS-S3-A 5,621 Flexure - -
Category B
EBS-S0-B 6,000 no rupture 241 Shear
EBS-S1-B 6,000 no rupture 433 Shear
EBS-S3-B 6,000 no rupture 362 Shear a For specimens which did not fail in fatigue after 6 million cycles. b Longitudinal steel of specimen EBS-S1-A yielded at 4.35 million cycles (see Figure 4.7b).
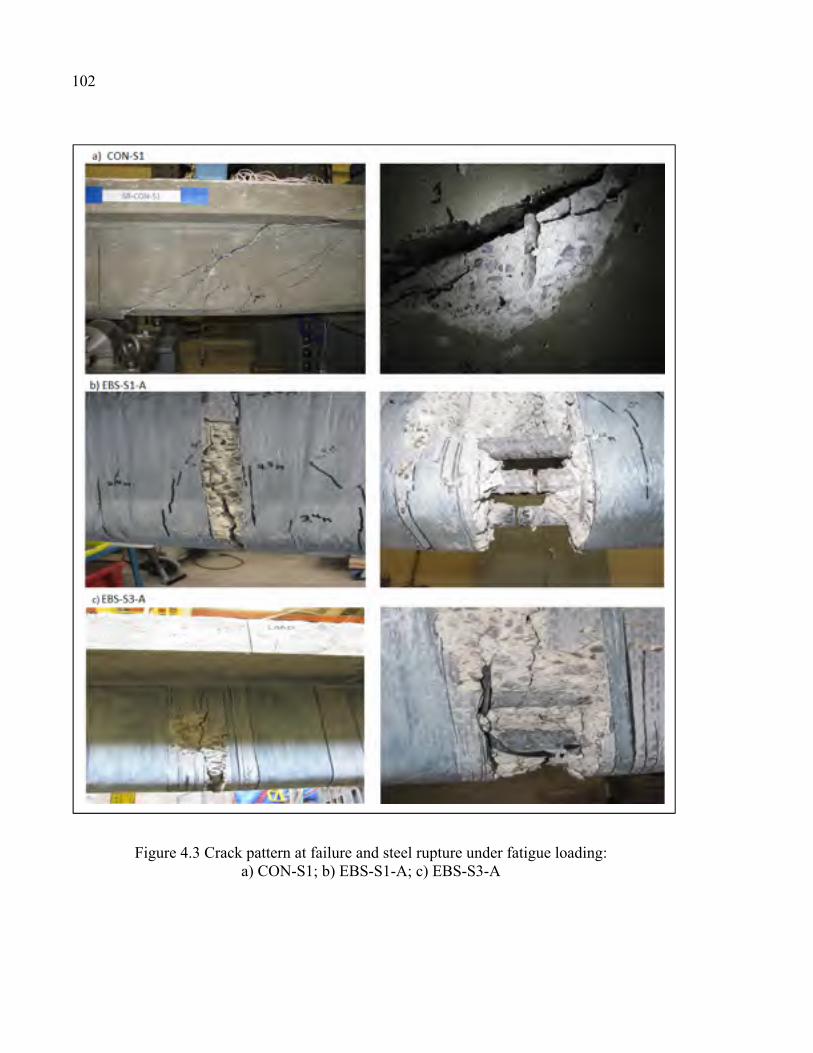
102
Figure 4.3 Crack pattern at failure and steel rupture under fatigue loading: a) CON-S1; b) EBS-S1-A; c) EBS-S3-A
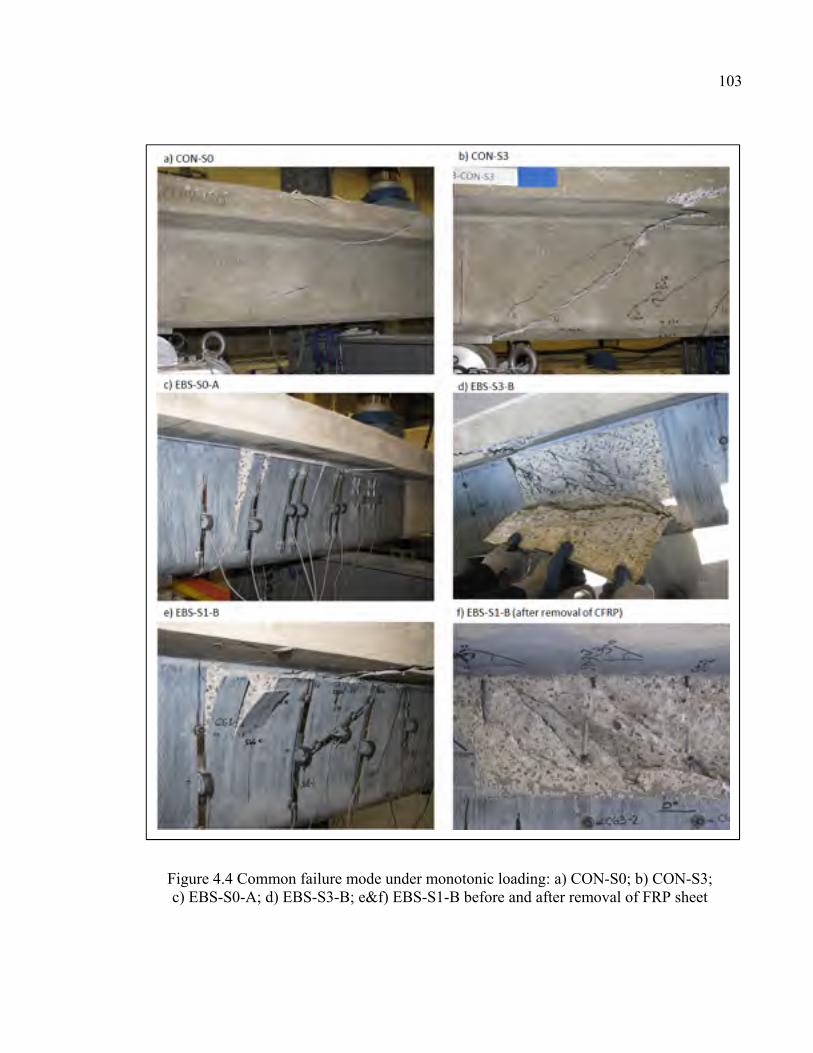
103
Figure 4.4 Common failure mode under monotonic loading: a) CON-S0; b) CON-S3; c) EBS-S0-A; d) EBS-S3-B; e&f) EBS-S1-B before and after removal of FRP sheet
104
Specimens of category A
The two specimens with internal stirrups failed in flexure fatigue (Figure 4.3(b and c)).
However, they endured more than 5 million cycles. For EBS-S1-A, yielding of longitudinal
steel occurred at 4.35 million and rupture at 5.026 million cycles. For this specimen, the first
cycle longitudinal-steel strain and stress ranges were Δεs = 770 με and corresponding Δσs =
151 MPa. This value exceeded the upper limits of 138 and 125 MPa recommended by ACI
215R (1974) and CSA S6 (2006), respectively, but was slightly less than the AASHTO
(2010) Load and Resistance Factor Design (LRFD) upper limit of 162 MPa (Kim and
Heffernan 2008). For specimen EBS-S3-A, the values for the first cycle were Δεs = 680 με
and corresponding Δσs = 133 MPa. This stress range exceeded the limit specified by CSA-S6
(125 MPa), but was slightly less than the limit of ACI 215R (138 MPa). Specimen EBS-S0-
A, which did not fail in fatigue, failed in shear under static loading (Figure 4.4c). The
maximum stirrup strain and stress ranges in specimens of this category in the first cycle
were: Δεstr = 500 με and corresponding Δσstr = 97 MPa. In the last cycle, these values were
Δεstr = 810 με and corresponding Δσstr = 157 MPa. No yielding or rupture of stirrups was
observed in this category under fatigue loading.
Specimens of category B
Both specimens with internal stirrups did not fail under cyclic loading and endured more than
6 million cycles. Specimen EBS-S1-B did not fail in fatigue despite its high longitudinal-
steel first cycle values (Δεs = 680 μstrains and corresponding Δσs = 133 MPa). The stress
range value lies between the upper limits of longitudinal-steel stress ranges specified by
CSA-S6 (125 MPa) and ACI 215R (138 MPa). This may indicate that the code specifications
for fatigue limit-state design of unstrengthened RC members may also be used for FRP
shear-strengthened structures. All the specimens in this category, which did not fail in
fatigue, failed in shear under static loading (Figure 4.4(d-f)).
105
Category A versus category B
Comparison of EBS-S1-B (repair) with the control CON-S1, where both specimens were
subjected to the same fatigue stress range, indicates that EB-CFRP extended the service life
of the retrofitted beam because CON-S1 failed at 3.807 million cycles compared with EBS
S1-B, which endured more than 6 million cycles without failing. Comparison of EBS-S1-A
(upgraded) with the control CON-S1 also indicates that EB-FRP extended the service life of
the strengthened beam, particularly in shear, because EBS-S1-A failed at 5.026 million
cycles. This is particularly true given the greater stress range imposed on EBS-S1-A
(Category A) compared with CON-S1. Moreover, the addition of EB-FRP changed the mode
of failure from undesirable shear to flexure failure. Finally, comparison of EBS-S1-B (repair)
with EBS-S1-A (upgrade) reveals that in both situations, EB-FRP was beneficial in
extending the service life of RC beams because both specimens endured more than 5 million
cycles. However, in RC beams of Category A (upgrade), the longitudinal steel may be the
weakest link and should be looked at with caution, particularly for extended service life in
which it may govern the upper limit of the projected capacity.
4.4.3 Fatigue test results
This section presents the results of fatigue tests for both Categories A and B. The following
aspects will be discussed: the deflection response; the strain response involving (1) strain in
steel stirrups, (2) strain in longitudinal steel, (3) strain in CFRP sheets, and (4) strain in
concrete struts and cumulative fatigue degradation.
Deflection response
Table 4.7 provides, for all the specimens, the deflection range measured in the first and last
cycles of loading, corresponding to maximum minus minimum applied fatigue load (Pmax −
Pmin). The variation of the deflection as the number of cycles increases is shown in Figure
4.5a for the control and Figure 4.5b for strengthened beams of Categories A and B. For all
the specimens, the deflection curves shown were measured at the load point and correspond
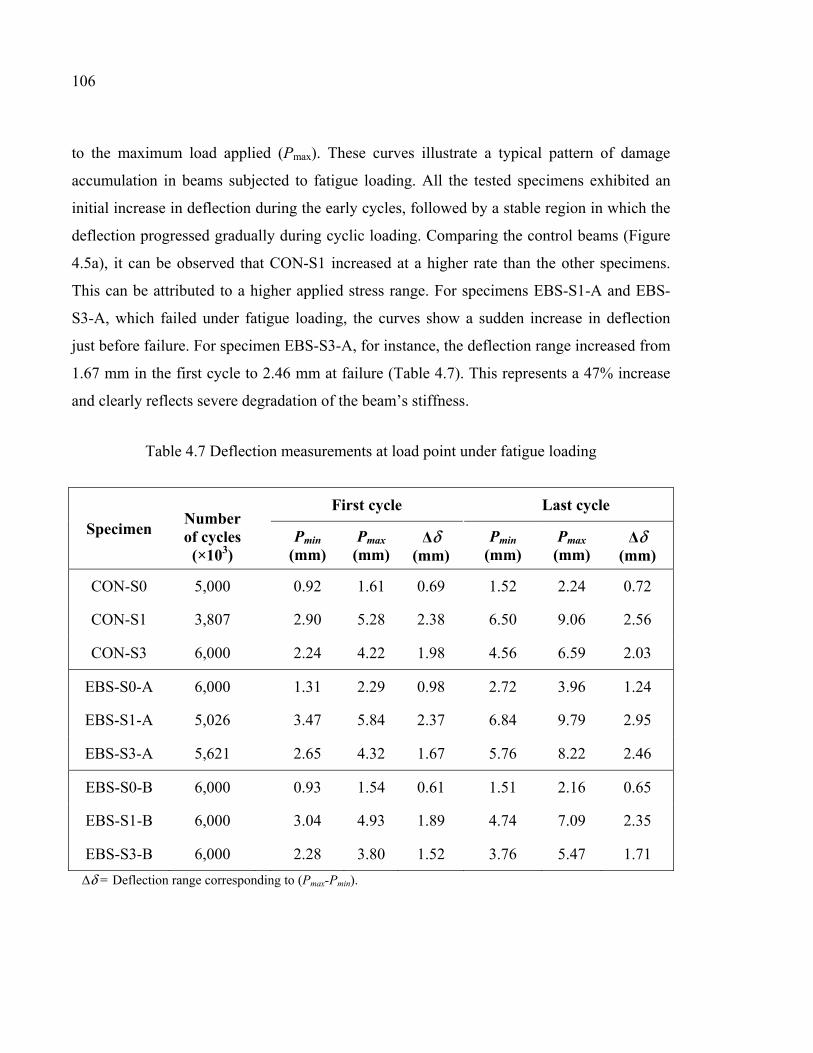
106
to the maximum load applied (Pmax). These curves illustrate a typical pattern of damage
accumulation in beams subjected to fatigue loading. All the tested specimens exhibited an
initial increase in deflection during the early cycles, followed by a stable region in which the
deflection progressed gradually during cyclic loading. Comparing the control beams (Figure
4.5a), it can be observed that CON-S1 increased at a higher rate than the other specimens.
This can be attributed to a higher applied stress range. For specimens EBS-S1-A and EBS-
S3-A, which failed under fatigue loading, the curves show a sudden increase in deflection
just before failure. For specimen EBS-S3-A, for instance, the deflection range increased from
1.67 mm in the first cycle to 2.46 mm at failure (Table 4.7). This represents a 47% increase
and clearly reflects severe degradation of the beam’s stiffness.
Table 4.7 Deflection measurements at load point under fatigue loading
Specimen Number of cycles
(×103)
First cycle Last cycle
Pmin
(mm)
Pmax (mm)
Δδ (mm)
Pmin (mm)
Pmax (mm)
Δδ (mm)
CON-S0 5,000 0.92 1.61 0.69 1.52 2.24 0.72
CON-S1 3,807 2.90 5.28 2.38 6.50 9.06 2.56
CON-S3 6,000 2.24 4.22 1.98 4.56 6.59 2.03
EBS-S0-A 6,000 1.31 2.29 0.98 2.72 3.96 1.24
EBS-S1-A 5,026 3.47 5.84 2.37 6.84 9.79 2.95
EBS-S3-A 5,621 2.65 4.32 1.67 5.76 8.22 2.46
EBS-S0-B 6,000 0.93 1.54 0.61 1.51 2.16 0.65
EBS-S1-B 6,000 3.04 4.93 1.89 4.74 7.09 2.35
EBS-S3-B 6,000 2.28 3.80 1.52 3.76 5.47 1.71
Δδ = Deflection range corresponding to (Pmax-Pmin).
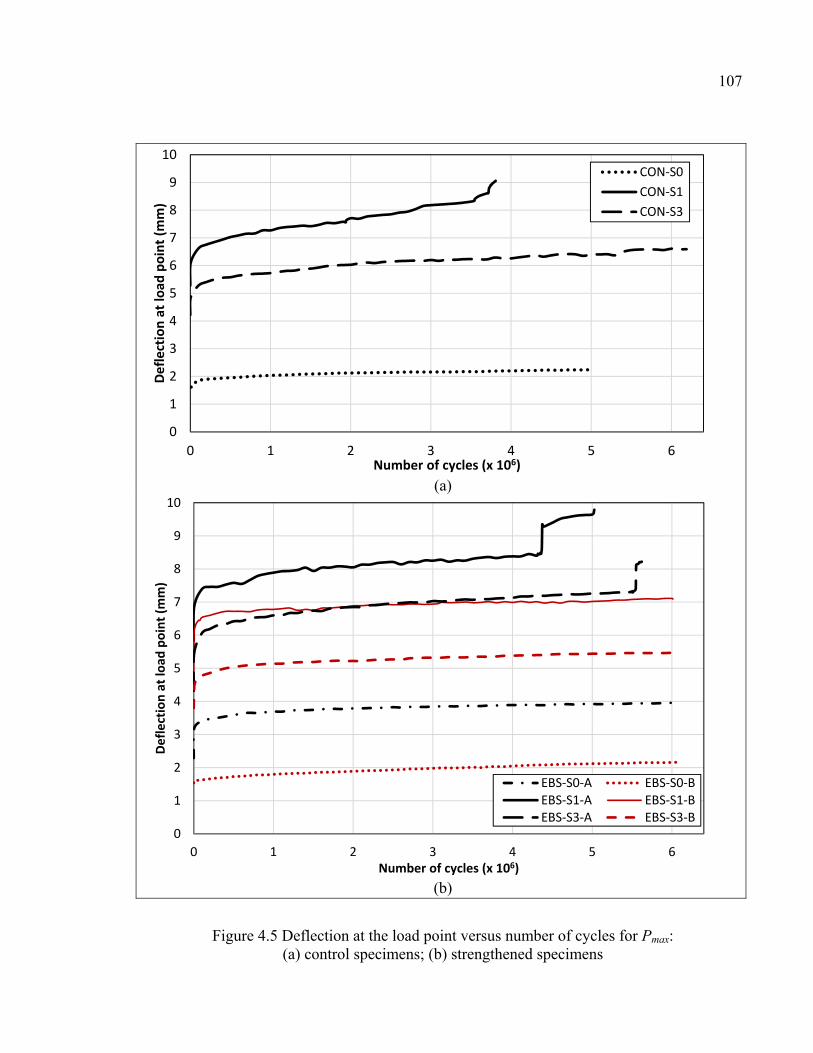
107
(a)
(b)
Figure 4.5 Deflection at the load point versus number of cycles for Pmax: (a) control specimens; (b) strengthened specimens
0
1
2
3
4
5
6
7
8
9
10
0 1 2 3 4 5 6
Defle
ctio
n at
load
poi
nt (m
m)
Number of cycles (x 106)
CON-S0CON-S1CON-S3
0
1
2
3
4
5
6
7
8
9
10
0 1 2 3 4 5 6
Defle
ctio
n at
load
poi
nt (m
m)
Number of cycles (x 106)
EBS-S0-A EBS-S0-BEBS-S1-A EBS-S1-BEBS-S3-A EBS-S3-B
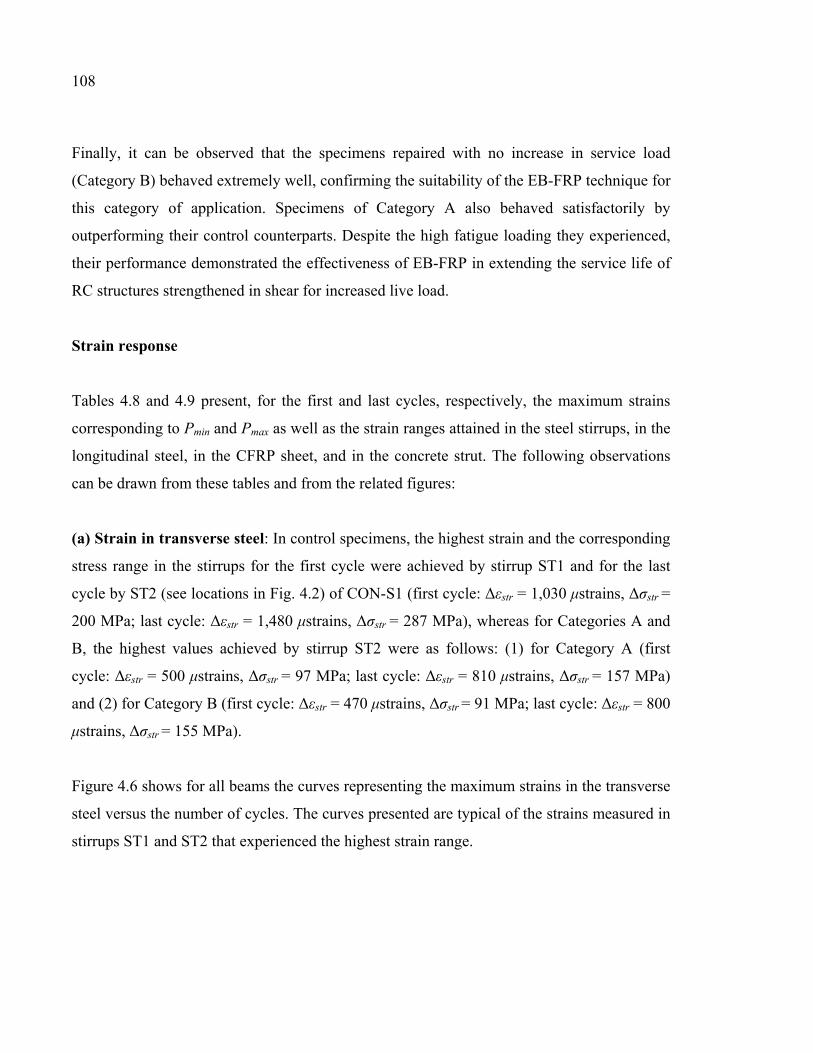
108
Finally, it can be observed that the specimens repaired with no increase in service load
(Category B) behaved extremely well, confirming the suitability of the EB-FRP technique for
this category of application. Specimens of Category A also behaved satisfactorily by
outperforming their control counterparts. Despite the high fatigue loading they experienced,
their performance demonstrated the effectiveness of EB-FRP in extending the service life of
RC structures strengthened in shear for increased live load.
Strain response
Tables 4.8 and 4.9 present, for the first and last cycles, respectively, the maximum strains
corresponding to Pmin and Pmax as well as the strain ranges attained in the steel stirrups, in the
longitudinal steel, in the CFRP sheet, and in the concrete strut. The following observations
can be drawn from these tables and from the related figures:
(a) Strain in transverse steel: In control specimens, the highest strain and the corresponding
stress range in the stirrups for the first cycle were achieved by stirrup ST1 and for the last
cycle by ST2 (see locations in Fig. 4.2) of CON-S1 (first cycle: Δεstr = 1,030 μstrains, Δσstr =
200 MPa; last cycle: Δεstr = 1,480 μstrains, Δσstr = 287 MPa), whereas for Categories A and
B, the highest values achieved by stirrup ST2 were as follows: (1) for Category A (first
cycle: Δεstr = 500 μstrains, Δσstr = 97 MPa; last cycle: Δεstr = 810 μstrains, Δσstr = 157 MPa)
and (2) for Category B (first cycle: Δεstr = 470 μstrains, Δσstr = 91 MPa; last cycle: Δεstr = 800
μstrains, Δσstr = 155 MPa).
Figure 4.6 shows for all beams the curves representing the maximum strains in the transverse
steel versus the number of cycles. The curves presented are typical of the strains measured in
stirrups ST1 and ST2 that experienced the highest strain range.
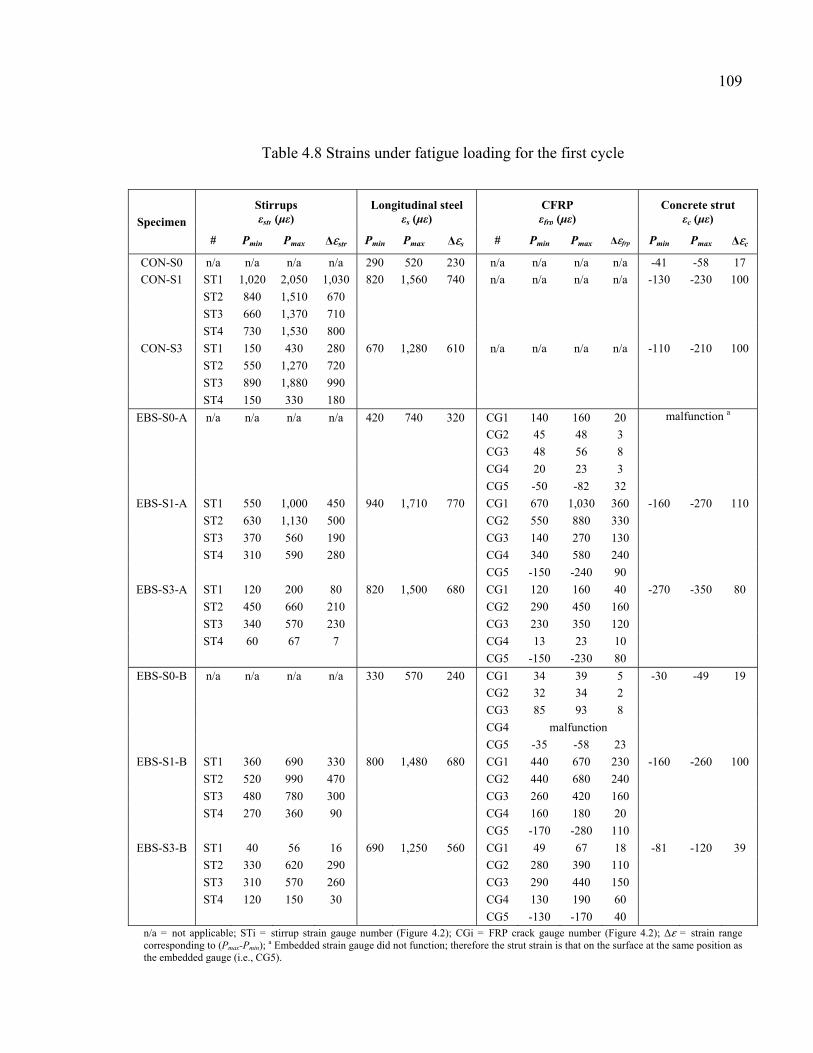
109
Table 4.8 Strains under fatigue loading for the first cycle
Specimen
Stirrups εstr (με)
Longitudinal steel εs (με)
CFRP εfrp (με)
Concrete strut εc (με)
# Pmin Pmax Δεstr Pmin Pmax Δεs # Pmin Pmax Δεfrp Pmin Pmax Δεc
CON-S0 n/a n/a n/a n/a 290 520 230 n/a n/a n/a n/a -41 -58 17
CON-S1 ST1 1,020 2,050 1,030 820 1,560 740 n/a n/a n/a n/a -130 -230 100
ST2 840 1,510 670
ST3 660 1,370 710
ST4 730 1,530 800
CON-S3 ST1 150 430 280 670 1,280 610 n/a n/a n/a n/a -110 -210 100
ST2 550 1,270 720
ST3 890 1,880 990
ST4 150 330 180
EBS-S0-A n/a n/a n/a n/a 420 740 320 CG1 140 160 20 malfunction a
CG2 45 48 3
CG3 48 56 8
CG4 20 23 3
CG5 -50 -82 32
EBS-S1-A ST1 550 1,000 450 940 1,710 770 CG1 670 1,030 360 -160 -270 110
ST2 630 1,130 500 CG2 550 880 330
ST3 370 560 190 CG3 140 270 130
ST4 310 590 280 CG4 340 580 240
CG5 -150 -240 90
EBS-S3-A ST1 120 200 80 820 1,500 680 CG1 120 160 40 -270 -350 80
ST2 450 660 210 CG2 290 450 160
ST3 340 570 230 CG3 230 350 120
ST4 60 67 7 CG4 13 23 10
CG5 -150 -230 80
EBS-S0-B n/a n/a n/a n/a 330 570 240 CG1 34 39 5 -30 -49 19
CG2 32 34 2
CG3 85 93 8
CG4 malfunction
CG5 -35 -58 23
EBS-S1-B ST1 360 690 330 800 1,480 680 CG1 440 670 230 -160 -260 100
ST2 520 990 470 CG2 440 680 240
ST3 480 780 300 CG3 260 420 160
ST4 270 360 90 CG4 160 180 20
CG5 -170 -280 110
EBS-S3-B ST1 40 56 16 690 1,250 560 CG1 49 67 18 -81 -120 39
ST2 330 620 290 CG2 280 390 110
ST3 310 570 260 CG3 290 440 150
ST4 120 150 30 CG4 130 190 60
CG5 -130 -170 40 n/a = not applicable; STi = stirrup strain gauge number (Figure 4.2); CGi = FRP crack gauge number (Figure 4.2); Δε = strain range corresponding to (Pmax-Pmin);
a Embedded strain gauge did not function; therefore the strut strain is that on the surface at the same position as the embedded gauge (i.e., CG5).
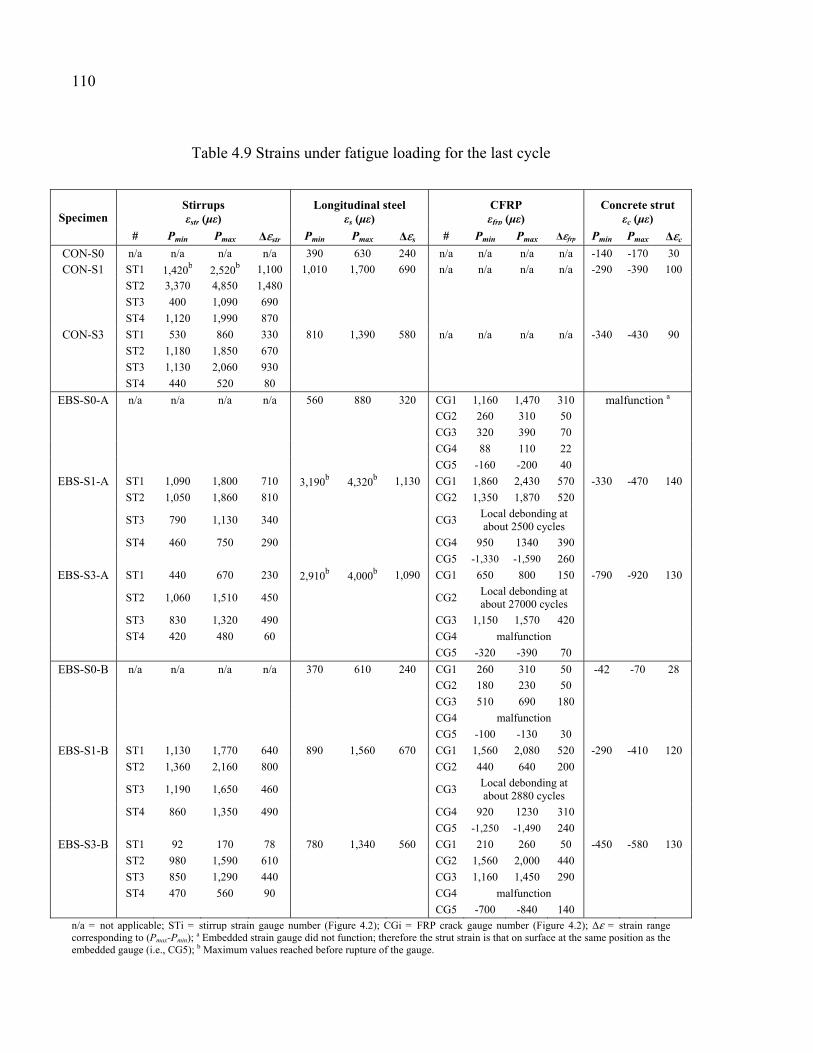
110
Table 4.9 Strains under fatigue loading for the last cycle
Specimen Stirrups εstr (με)
Longitudinal steel εs (με)
CFRP εfrp (με)
Concrete strut εc (με)
# Pmin Pmax Δεstr Pmin Pmax Δεs # Pmin Pmax Δεfrp Pmin Pmax Δεc
CON-S0 n/a n/a n/a n/a 390 630 240 n/a n/a n/a n/a -140 -170 30
CON-S1 ST1 1,420b 2,520b 1,100 1,010 1,700 690 n/a n/a n/a n/a -290 -390 100
ST2 3,370 4,850 1,480
ST3 400 1,090 690
ST4 1,120 1,990 870
CON-S3 ST1 530 860 330 810 1,390 580 n/a n/a n/a n/a -340 -430 90
ST2 1,180 1,850 670
ST3 1,130 2,060 930
ST4 440 520 80
EBS-S0-A n/a n/a n/a n/a 560 880 320 CG1 1,160 1,470 310 malfunction a CG2 260 310 50 CG3 320 390 70
CG4 88 110 22
CG5 -160 -200 40
EBS-S1-A ST1 1,090 1,800 710 3,190b 4,320b 1,130 CG1 1,860 2,430 570 -330 -470 140
ST2 1,050 1,860 810 CG2 1,350 1,870 520
ST3 790 1,130 340 CG3 Local debonding at about 2500 cycles
ST4 460 750 290 CG4 950 1340 390
CG5 -1,330 -1,590 260
EBS-S3-A ST1 440 670 230 2,910b 4,000b 1,090 CG1 650 800 150 -790 -920 130
ST2 1,060 1,510 450 CG2 Local debonding at about 27000 cycles
ST3 830 1,320 490 CG3 1,150 1,570 420
ST4 420 480 60 CG4 malfunction
CG5 -320 -390 70
EBS-S0-B n/a n/a n/a n/a 370 610 240 CG1 260 310 50 -42 -70 28
CG2 180 230 50
CG3 510 690 180
CG4 malfunction
CG5 -100 -130 30
EBS-S1-B ST1 1,130 1,770 640 890 1,560 670 CG1 1,560 2,080 520 -290 -410 120
ST2 1,360 2,160 800 CG2 440 640 200
ST3 1,190 1,650 460 CG3 Local debonding at about 2880 cycles
ST4 860 1,350 490 CG4 920 1230 310
CG5 -1,250 -1,490 240
EBS-S3-B ST1 92 170 78 780 1,340 560 CG1 210 260 50 -450 -580 130
ST2 980 1,590 610 CG2 1,560 2,000 440
ST3 850 1,290 440 CG3 1,160 1,450 290
ST4 470 560 90 CG4 malfunction
CG5 -700 -840 140 n/a = not applicable; STi = stirrup strain gauge number (Figure 4.2); CGi = FRP crack gauge number (Figure 4.2); Δε = strain range corresponding to (Pmax-Pmin);
a Embedded strain gauge did not function; therefore the strut strain is that on surface at the same position as the embedded gauge (i.e., CG5); b Maximum values reached before rupture of the gauge.
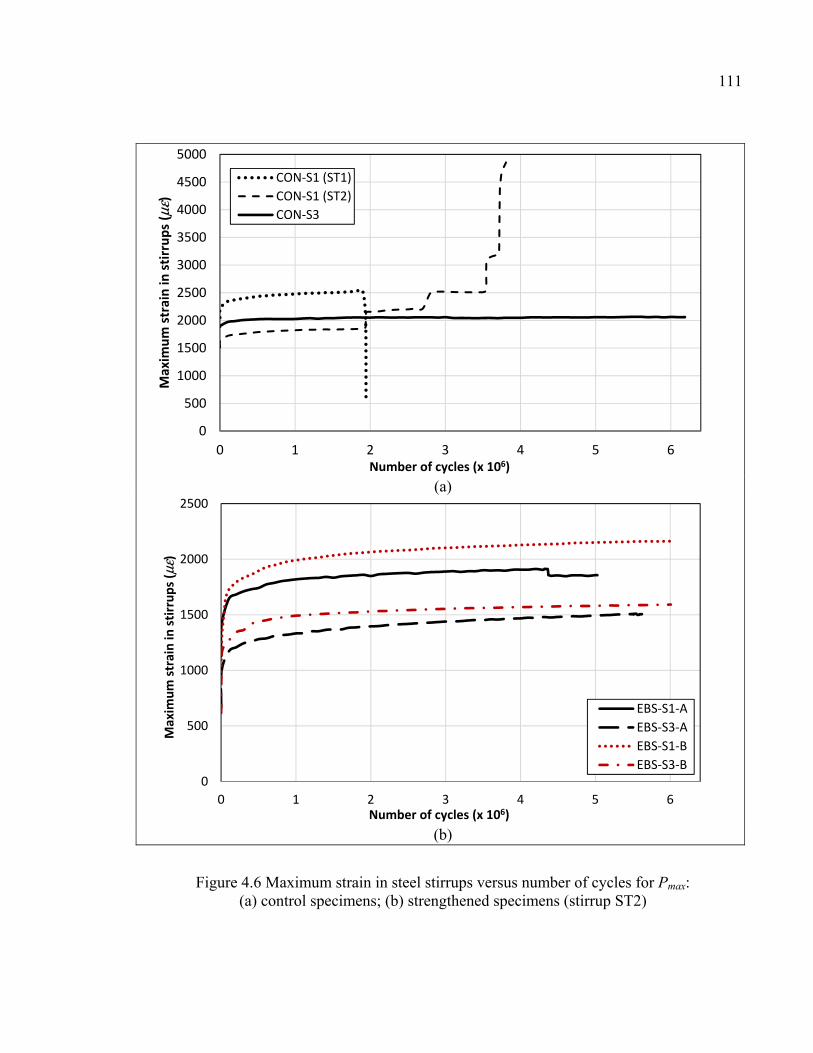
111
(a)
(b)
Figure 4.6 Maximum strain in steel stirrups versus number of cycles for Pmax: (a) control specimens; (b) strengthened specimens (stirrup ST2)
0
500
1000
1500
2000
2500
3000
3500
4000
4500
5000
0 1 2 3 4 5 6
Max
imum
stra
in in
stirr
ups
(με)
Number of cycles (x 106)
CON-S1 (ST1)CON-S1 (ST2)CON-S3
0
500
1000
1500
2000
2500
0 1 2 3 4 5 6
Max
imum
stra
in in
stirr
ups (
με)
Number of cycles (x 106)
EBS-S1-AEBS-S3-AEBS-S1-BEBS-S3-B
112
1. Control specimens: For CON-S1, it can be observed that stirrup ST1 ruptured at 1.9
million cycles and ST2 took over, as shown by an abrupt increase in the strain in that
stirrup just after rupture of ST1. Thereafter, stirrup ST2 continued to support the fatigue
loading until it ruptured, and with it the specimen, at 3.807 million cycles. For CON-S3,
even if the stirrup strain at the first cycle for Pmax was 1,880 με (corresponding to Δεstr =
990 με and Δσstr = 192 MPa), the specimen did not fail and the strain remained quasi-
constant during 6 million cycles, reaching 2,060 με in the last cycle. Comparison of
stirrup stress ranges between CON-S1 (200 MPa) and CON-S3 (192 MPa) may suggest
an upper limit to avoid fatigue rupture in the stirrups.
2. Strengthened specimens: For EBS specimens, as expected, the stirrup strains in the
strengthened specimens increased as the spacing decreased due to the increased capacity
and hence the applied fatigue loads. Comparison of specimens of Category A (upgrade)
with those of Category B (repair) reveals a decrease in the strain range of specimens of
both categories compared with the corresponding control specimens. This holds true for
both the first and last cycle values. Given the specimen series, the strain decrease is seen
to be similar for both categories. However, fatigue life extension of Category B
specimens (which did not fail in fatigue) was greater than that of Category A specimens
(which failed before 6 million cycles, but in flexure).
At failure, the measured maximum strain for control specimens was experienced by stirrups
ST1 and ST2 of CON-S1 with about 2,500 μstrains, just before their abrupt rupture (see
Figure 4.6a), which represents 76% of their yield strain of 3,300 μstrains. As for specimens
of Category A and Category B, the maximum strain was experienced by ST2 with 2,160
μstrains, that is, 65% of its yield value. For comparison, the current ACI 440.2R (2008)
guidelines state, in this context, that the stress in longitudinal-steel reinforcement under
fatigue service load should be limited to 80% of the yield stress. No specific
recommendations were provided for limits on stirrups; however, research seems to indicate
that the fatigue service life of reinforcement is similar whether it is longitudinal tensile
reinforcement or stirrups (Barnes and Mays 1999).
113
(b) Strain in longitudinal steel: In control specimens, the highest strain range in
longitudinal steel was achieved in specimen CON-S1 (first cycle: Δεs = 740 μstrains, Δσs =
145 MPa; last cycle: Δεs = 690 μstrains, Δσs = 135 MPa), whereas for Categories A and B,
the highest value was achieved in EBS-S1-A (first cycle: Δεs = 770 μstrains, Δσs = 151 MPa;
last cycle: Δεs = 1,130 μstrains, Δσs = 221 MPa) and EBS-S1-B (first cycle: Δεs = 680
μstrains, Δσs = 133 MPa; last cycle: Δεs = 670 μstrains, Δσs = 131 MPa). The stress ranges
corresponding to the first cycle appear to be high, particularly for EBS-S1-A (151 MPa), and
are within the upper limit for fatigue limit-state design specified by AASHTO LRFD (162
MPa), but are greater than the CSA-S6 (125 MPa) and the ACI 215R (138 MPa) limits for
(unstrengthened) RC members.
The recorded strains for longitudinal steel are presented in Figure 4.7:
1. Control: For all the test specimens and up to failure of some specimens, there was no
significant increase in strain as the number of cycles increased. This is due to the
relatively high flexural capacity of the tested specimens compared with their shear
capacity. For CON-S1, even if the longitudinal steel was heavily strained for Pmax (last
cycle: εs = 1,700 με, corresponding to Δεs = 690 με and Δσs = 135 MPa), the specimen
failed in shear and not in flexure and the strain remained quasi-constant during the 3.807
million cycles.
2. Strengthened specimens: For EBS specimens, as expected, the longitudinal strains in the
strengthened specimens were greater in Category A specimens than in Category B due to
the extra fatigue loading imposed on Category A specimens. In terms of stirrup spacing,
EBS-S0 survived 6 million cycles and the longitudinal steel of EBS-S3-A yielded at 5.47
million cycles, in comparison with EBS-S1-A, which yielded at 4.35 million cycles.
However, it should be noted that the specimens were subjected to different loading ranges
(Table 4.5). All specimens with stirrups in Category A failed in flexure, whereas no
failure occurred in the corresponding specimens of Category B. Specimens EBS-S1-A and
EBS-S3-A were heavily strained, and the maximum strains attained just before flexure
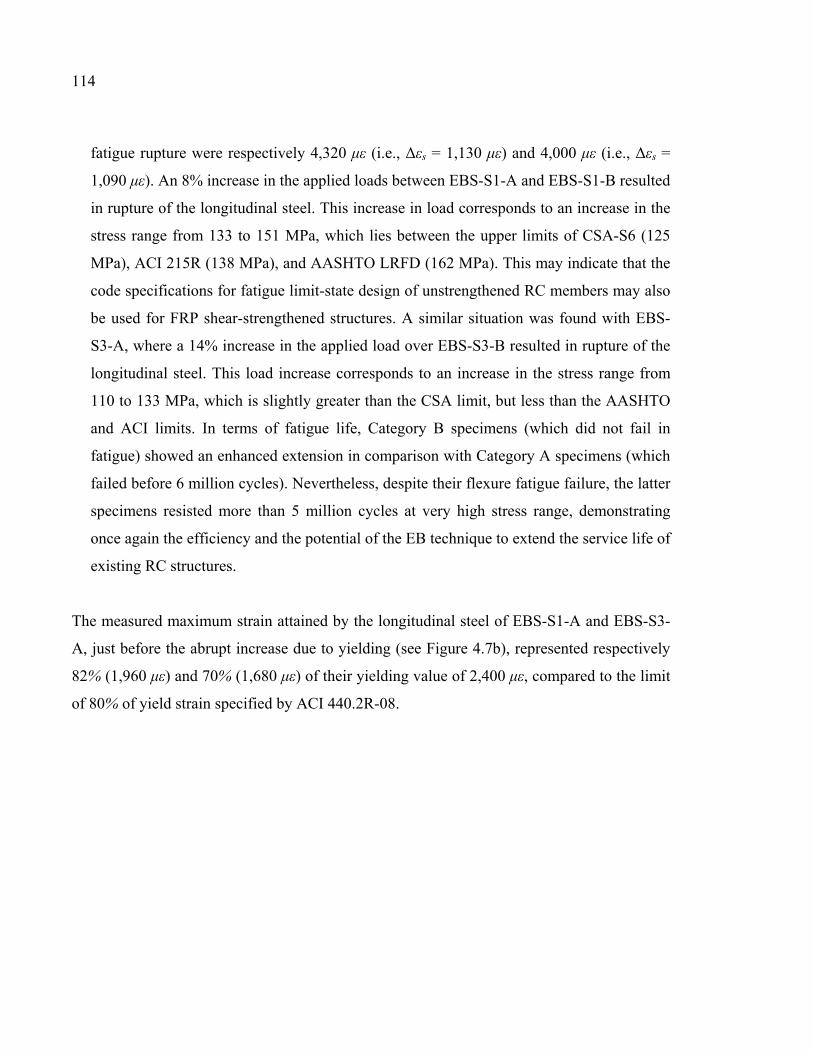
114
fatigue rupture were respectively 4,320 με (i.e., Δεs = 1,130 με) and 4,000 με (i.e., Δεs =
1,090 με). An 8% increase in the applied loads between EBS-S1-A and EBS-S1-B resulted
in rupture of the longitudinal steel. This increase in load corresponds to an increase in the
stress range from 133 to 151 MPa, which lies between the upper limits of CSA-S6 (125
MPa), ACI 215R (138 MPa), and AASHTO LRFD (162 MPa). This may indicate that the
code specifications for fatigue limit-state design of unstrengthened RC members may also
be used for FRP shear-strengthened structures. A similar situation was found with EBS-
S3-A, where a 14% increase in the applied load over EBS-S3-B resulted in rupture of the
longitudinal steel. This load increase corresponds to an increase in the stress range from
110 to 133 MPa, which is slightly greater than the CSA limit, but less than the AASHTO
and ACI limits. In terms of fatigue life, Category B specimens (which did not fail in
fatigue) showed an enhanced extension in comparison with Category A specimens (which
failed before 6 million cycles). Nevertheless, despite their flexure fatigue failure, the latter
specimens resisted more than 5 million cycles at very high stress range, demonstrating
once again the efficiency and the potential of the EB technique to extend the service life of
existing RC structures.
The measured maximum strain attained by the longitudinal steel of EBS-S1-A and EBS-S3-
A, just before the abrupt increase due to yielding (see Figure 4.7b), represented respectively
82% (1,960 με) and 70% (1,680 με) of their yielding value of 2,400 με, compared to the limit
of 80% of yield strain specified by ACI 440.2R-08.
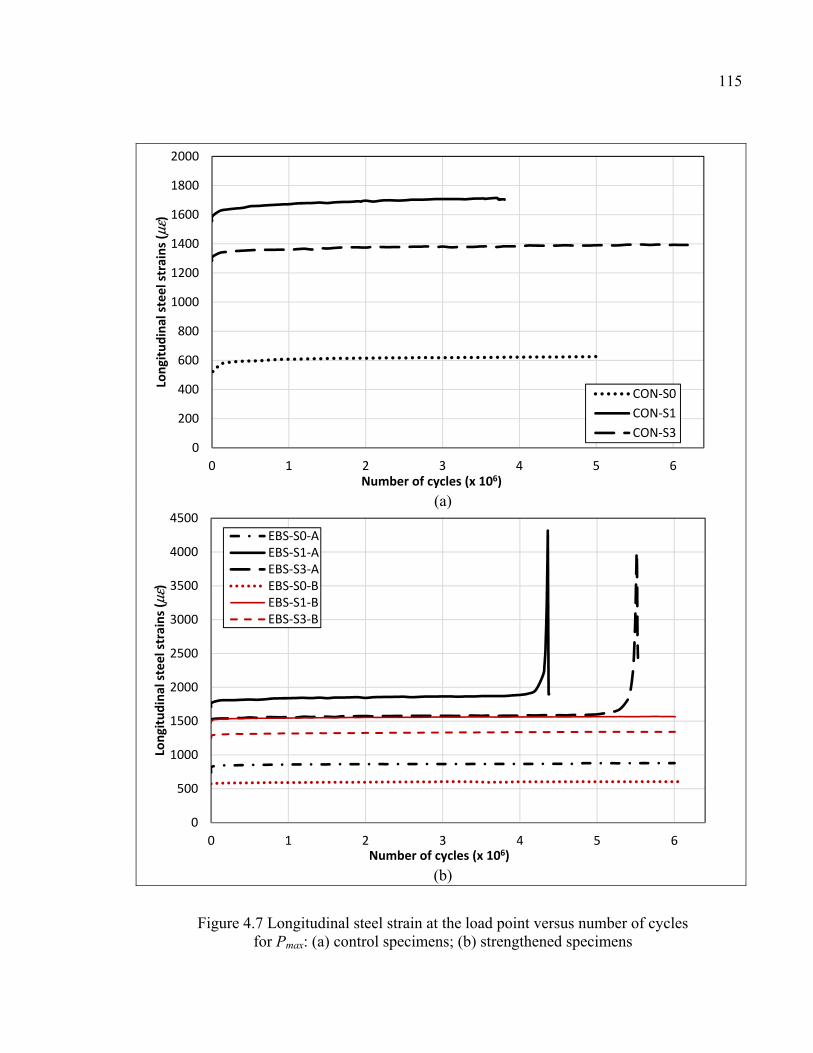
115
(a)
(b)
Figure 4.7 Longitudinal steel strain at the load point versus number of cycles for Pmax: (a) control specimens; (b) strengthened specimens
0
200
400
600
800
1000
1200
1400
1600
1800
2000
0 1 2 3 4 5 6
Long
itudi
nal s
teel
stra
ins (
με)
Number of cycles (x 106)
CON-S0CON-S1CON-S3
0
500
1000
1500
2000
2500
3000
3500
4000
4500
0 1 2 3 4 5 6
Long
itudi
nal s
teel
stra
ins (
με)
Number of cycles (x 106)
EBS-S0-AEBS-S1-AEBS-S3-AEBS-S0-BEBS-S1-BEBS-S3-B
116
(c) Strain in CFRP: The highest strain range in CFRP for Category A in the first cycle was
achieved by CG1 for EBS-S1-A (360 μstrains), and CG2 for EBS-S3-A (160 μstrains) (see
locations in Figure 4.2). In the last cycle, the maximum strain range measured in CG1 for
EBS-S1-A was 570 μstrains. The measurement of CG2 for EBS-S3-A could not be obtained
due to local debonding. However, CG3 (next to CG2) attained 420 μstrains. For Category B,
the greatest CFRP strain range in the first cycle was achieved by CG2 for EBS-S1-B (240
μstrains) and CG3 for EBS-S3-B (150 μstrains). In the last cycle, the maximum measured
strain range (and corresponding stress range) shifted to CG1 (520 μstrains) for EBS-S1-B and
to CG2 (440 μstrains) for EBS-S3-B. The highest strains recorded in the first cycle for
Categories A and B were equal to 1,030 and 680 μstrains, respectively. The maximum strain
and the maximum strain range in the CFRP in both categories were below the maximum
threshold values of 0.2 and 0.04% (i.e., corresponding to the first cycle), respectively, as
recommended by Czaderski and Motavalli (2004) for the L-shaped CFRP shear-
strengthening system that they studied. In the last cycle, the highest strains recorded in the
CFRP were 2,430 and 2,080 μstrains for Categories A and B, respectively.
The measured CFRP strains versus the number of cycles for all test specimens are illustrated
in Figure 4.8. The curves shown are typical of the CFRP strains measured and correspond to
the crack gauges that measured the highest strains in the CFRP wrap, as presented
previously. The response is characterized by a rapid increase in strain during the early cycles,
followed by a stable region, in particular for specimens with steel stirrups in which the strain
remains relatively constant until more than 5 million cycles. Although local debonding
occurred in some specimens of both categories at early cycles during fatigue testing, the fact
that no sign of failure due to debonding was observed during the course of the test
demonstrates the effectiveness of the FRP U-wrap scheme for strengthening beams subjected
to fatigue loadings. The observed debonding of FRP is based on the laboratory conditions
and the variables examined in this research. Other parameters that can reduce the bond
strength like the effect of environmental exposures were not considered in this study.
However, it must be recognized that the effect of FRP stiffness and applied fatigue loads may
117
be of importance in fatigue performance, as highlighted in a study by Chaallal et al. (2010),
which considered two-ply CFRP wrap.
Figure 4.8 Maximum CFRP strain versus number of cycles for Pmax
(d) Strain in the concrete struts: The maximum strains captured in the concrete struts were
low and varied between 58 and 350 μstrains in the first cycle and between 70 and 920
μstrains in the last cycle. Figure 4.9 shows the curves representing the strains in the concrete
struts versus the number of cycles for all test specimens. On the whole, the curves exhibit a
trend similar to that shown by the deflection response. For specimen CON-S1, the erratic
curve observed was due to the load transfer from stirrup ST1, which ruptured at 1.9 million
cycles (see Figure 4.6a). This was also observed in specimen EBS-S1-A, this time due to
longitudinal-steel yielding that occurred around 4.35 million cycles (see Figure 4.7b) and in
specimen EBS-S3-A at the end of the curve, just after the longitudinal steel yielded at 5.47
million cycles. However, it can be observed that the changes in the strut strain were not
abrupt. This is attributed to the presence of transverse steel and its ability to redistribute to
0
500
1000
1500
2000
2500
3000
0 1 2 3 4 5 6
Max
imum
CFR
P st
rain
(με)
Number of cycles (x 106)
EBS-S0-A EBS-S0-BEBS-S1-A EBS-S1-BEBS-S3-A EBS-S3-B
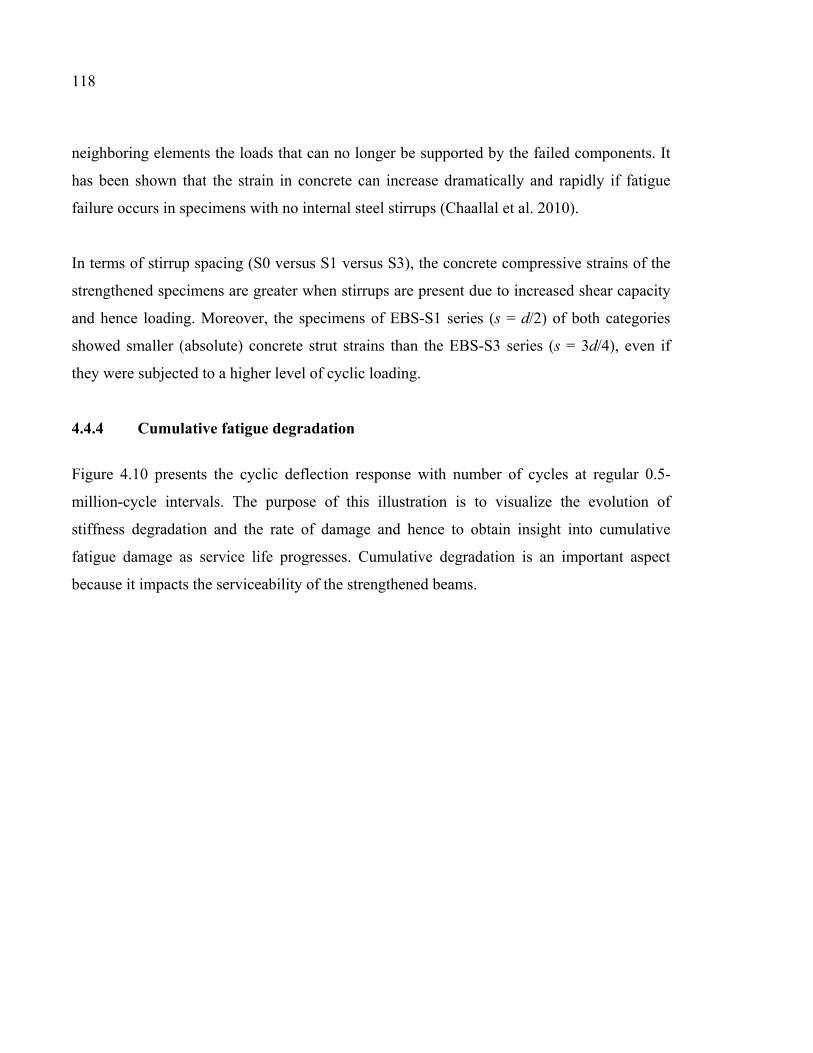
118
neighboring elements the loads that can no longer be supported by the failed components. It
has been shown that the strain in concrete can increase dramatically and rapidly if fatigue
failure occurs in specimens with no internal steel stirrups (Chaallal et al. 2010).
In terms of stirrup spacing (S0 versus S1 versus S3), the concrete compressive strains of the
strengthened specimens are greater when stirrups are present due to increased shear capacity
and hence loading. Moreover, the specimens of EBS-S1 series (s = d/2) of both categories
showed smaller (absolute) concrete strut strains than the EBS-S3 series (s = 3d/4), even if
they were subjected to a higher level of cyclic loading.
4.4.4 Cumulative fatigue degradation
Figure 4.10 presents the cyclic deflection response with number of cycles at regular 0.5-
million-cycle intervals. The purpose of this illustration is to visualize the evolution of
stiffness degradation and the rate of damage and hence to obtain insight into cumulative
fatigue damage as service life progresses. Cumulative degradation is an important aspect
because it impacts the serviceability of the strengthened beams.
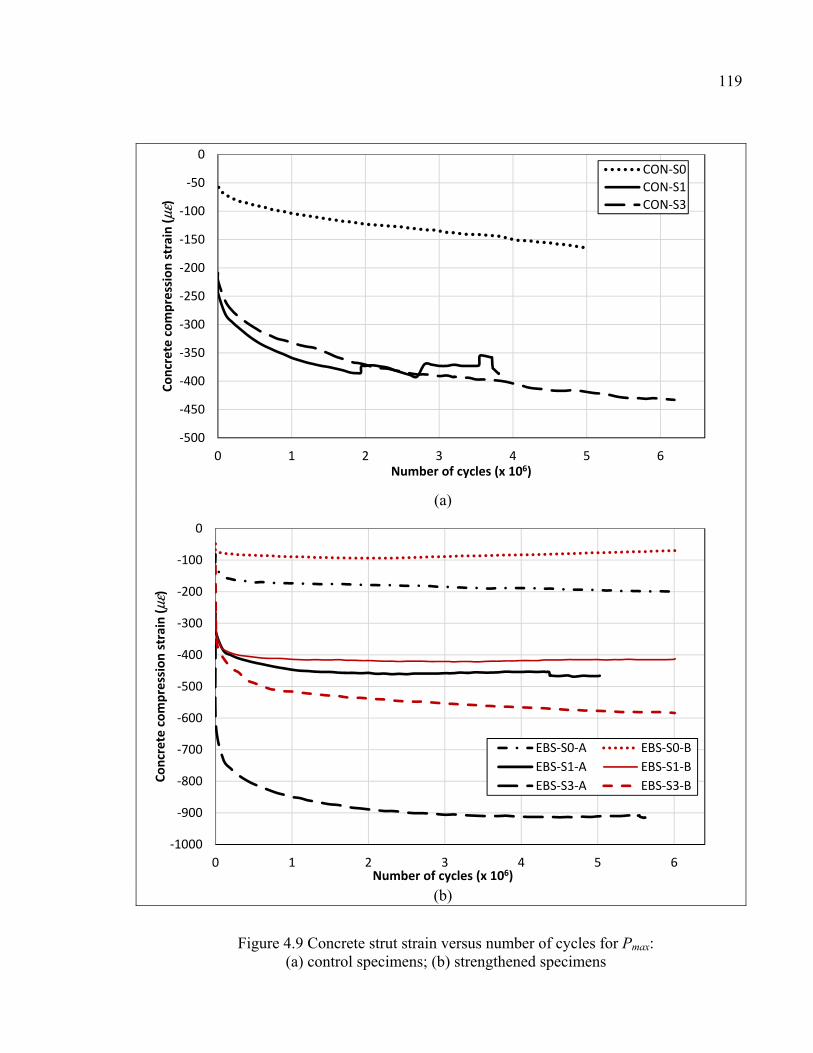
119
(a)
(b)
Figure 4.9 Concrete strut strain versus number of cycles for Pmax: (a) control specimens; (b) strengthened specimens
-500
-450
-400
-350
-300
-250
-200
-150
-100
-50
0
0 1 2 3 4 5 6
Conc
rete
com
pres
sion
stra
in (μ
ε)
Number of cycles (x 106)
CON-S0CON-S1CON-S3
-1000
-900
-800
-700
-600
-500
-400
-300
-200
-100
0
0 1 2 3 4 5 6
Conc
rete
com
pres
sion
stra
in (μ
ε)
Number of cycles (x 106)
EBS-S0-A EBS-S0-BEBS-S1-A EBS-S1-BEBS-S3-A EBS-S3-B
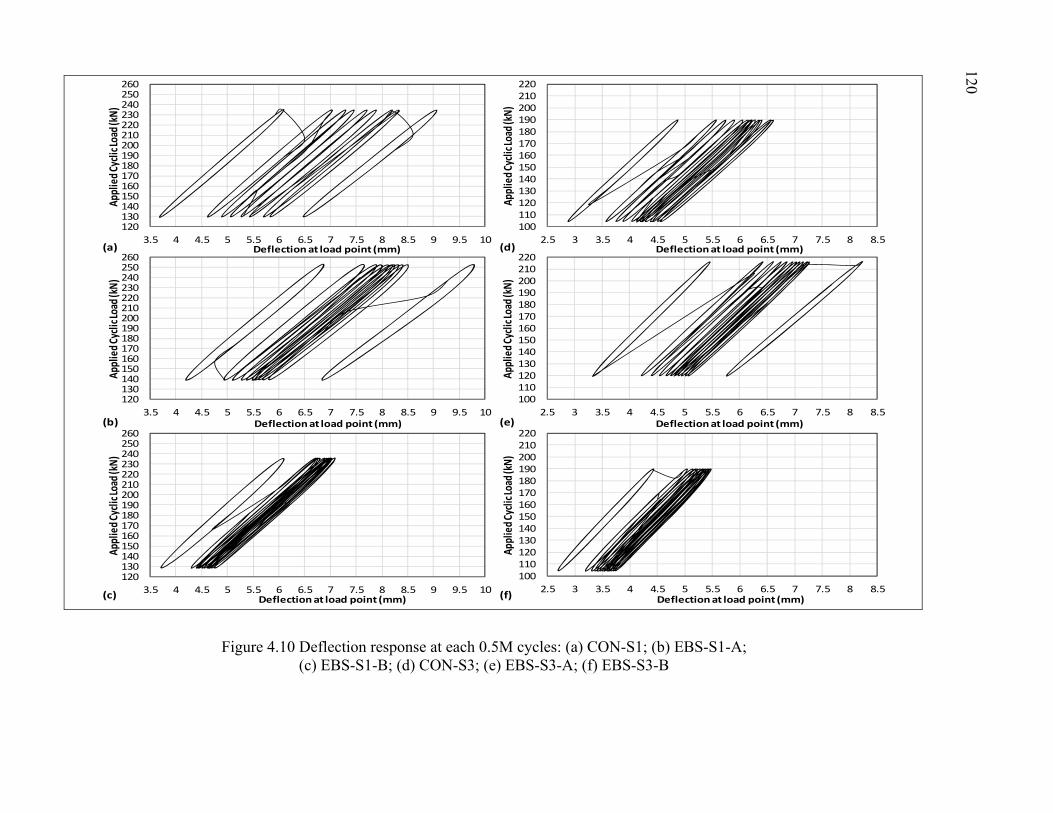
Figure 4.10 Deflection response at each 0.5M cycles: (a) CON-S1; (b) EBS-S1-A; (c) EBS-S1-B; (d) CON-S3; (e) EBS-S3-A; (f) EBS-S3-B
100110120130140150160170180190200210220
2.5 3 3.5 4 4.5 5 5.5 6 6.5 7 7.5 8 8.5
Appl
ied C
yclic
Load
(kN)
Deflection at load point (mm)
120130140150160170180190200210220230240250260
3.5 4 4.5 5 5.5 6 6.5 7 7.5 8 8.5 9 9.5 10
Appl
ied C
yclic
Load
(kN)
Deflection at load point (mm)
100110120130140150160170180190200210220
2.5 3 3.5 4 4.5 5 5.5 6 6.5 7 7.5 8 8.5
Appl
ied C
yclic
Load
(kN)
Deflection at load point (mm)
100110120130140150160170180190200210220
2.5 3 3.5 4 4.5 5 5.5 6 6.5 7 7.5 8 8.5
Appl
ied C
yclic
Load
(kN)
Deflection at load point (mm)
120130140150160170180190200210220230240250260
3.5 4 4.5 5 5.5 6 6.5 7 7.5 8 8.5 9 9.5 10
Appl
ied C
yclic
Load
(kN)
Deflection at load point (mm)
120130140150160170180190200210220230240250260
3.5 4 4.5 5 5.5 6 6.5 7 7.5 8 8.5 9 9.5 10
Appl
ied C
yclic
Load
(kN)
Deflection at load point (mm)
(b)
(d)(a)
(c)
(e)
(f)
120
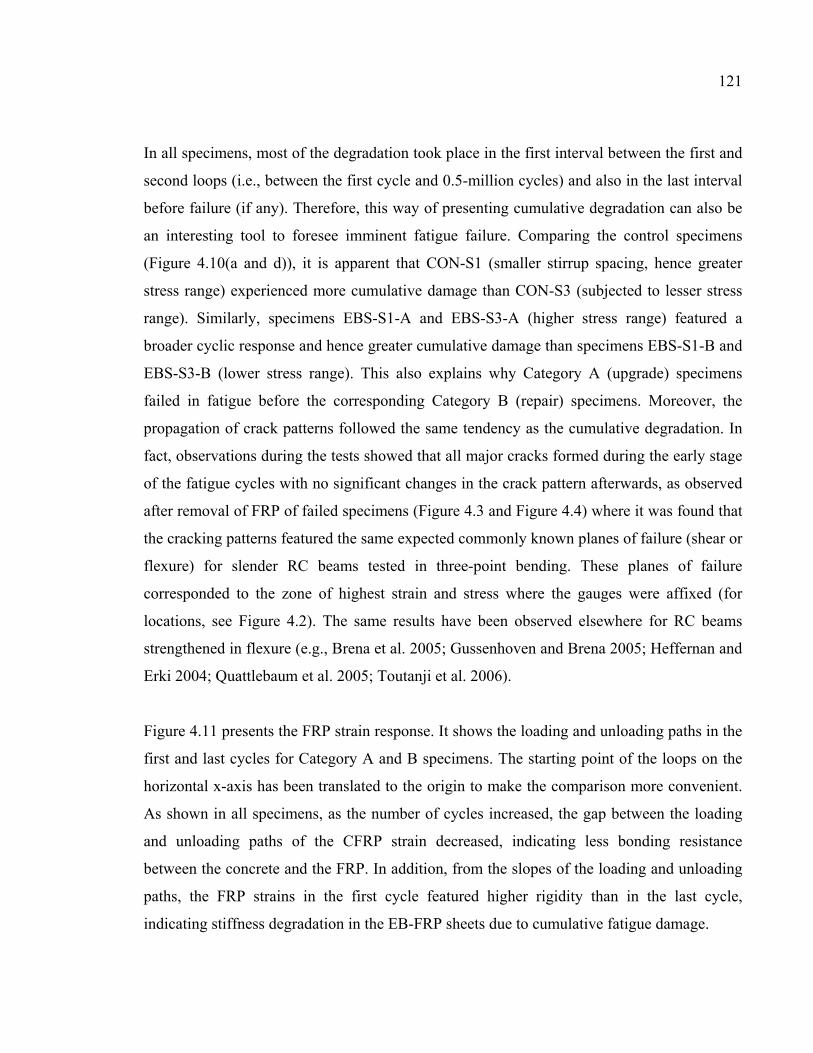
121
In all specimens, most of the degradation took place in the first interval between the first and
second loops (i.e., between the first cycle and 0.5-million cycles) and also in the last interval
before failure (if any). Therefore, this way of presenting cumulative degradation can also be
an interesting tool to foresee imminent fatigue failure. Comparing the control specimens
(Figure 4.10(a and d)), it is apparent that CON-S1 (smaller stirrup spacing, hence greater
stress range) experienced more cumulative damage than CON-S3 (subjected to lesser stress
range). Similarly, specimens EBS-S1-A and EBS-S3-A (higher stress range) featured a
broader cyclic response and hence greater cumulative damage than specimens EBS-S1-B and
EBS-S3-B (lower stress range). This also explains why Category A (upgrade) specimens
failed in fatigue before the corresponding Category B (repair) specimens. Moreover, the
propagation of crack patterns followed the same tendency as the cumulative degradation. In
fact, observations during the tests showed that all major cracks formed during the early stage
of the fatigue cycles with no significant changes in the crack pattern afterwards, as observed
after removal of FRP of failed specimens (Figure 4.3 and Figure 4.4) where it was found that
the cracking patterns featured the same expected commonly known planes of failure (shear or
flexure) for slender RC beams tested in three-point bending. These planes of failure
corresponded to the zone of highest strain and stress where the gauges were affixed (for
locations, see Figure 4.2). The same results have been observed elsewhere for RC beams
strengthened in flexure (e.g., Brena et al. 2005; Gussenhoven and Brena 2005; Heffernan and
Erki 2004; Quattlebaum et al. 2005; Toutanji et al. 2006).
Figure 4.11 presents the FRP strain response. It shows the loading and unloading paths in the
first and last cycles for Category A and B specimens. The starting point of the loops on the
horizontal x-axis has been translated to the origin to make the comparison more convenient.
As shown in all specimens, as the number of cycles increased, the gap between the loading
and unloading paths of the CFRP strain decreased, indicating less bonding resistance
between the concrete and the FRP. In addition, from the slopes of the loading and unloading
paths, the FRP strains in the first cycle featured higher rigidity than in the last cycle,
indicating stiffness degradation in the EB-FRP sheets due to cumulative fatigue damage.
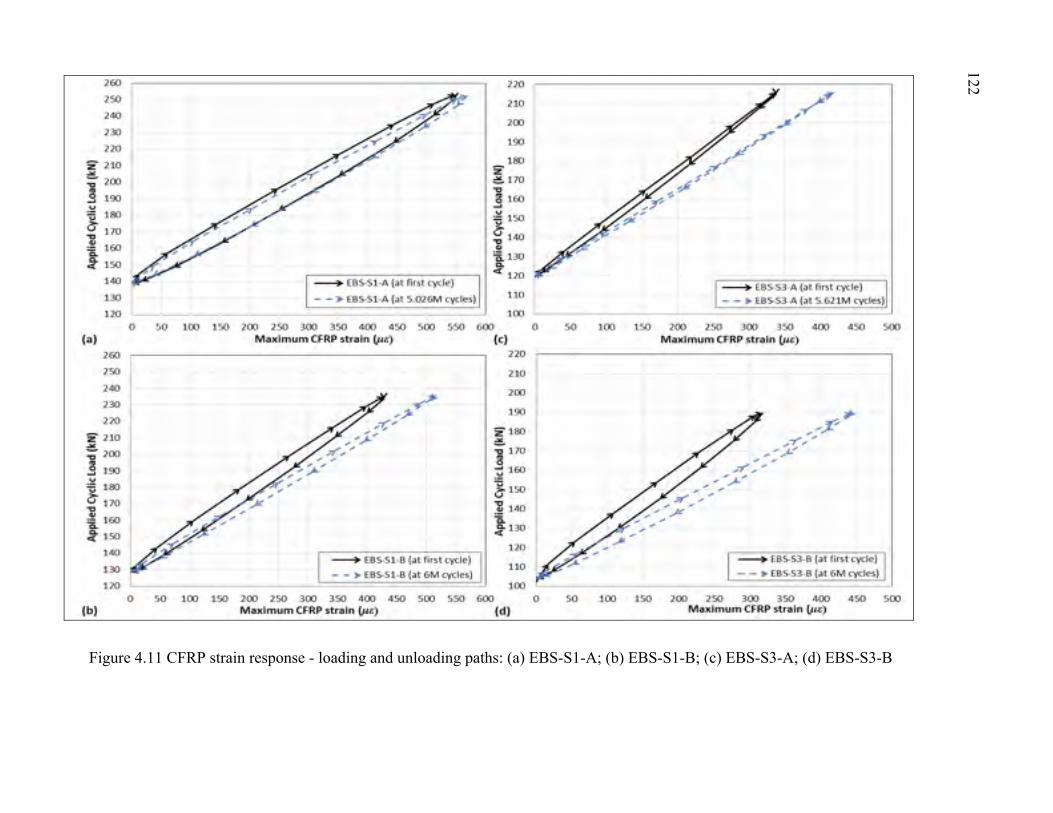
Figure 4.11 CFRP strain response - loading and unloading paths: (a) EBS-S1-A; (b) EBS-S1-B; (c) EBS-S3-A; (d) EBS-S3-B
122
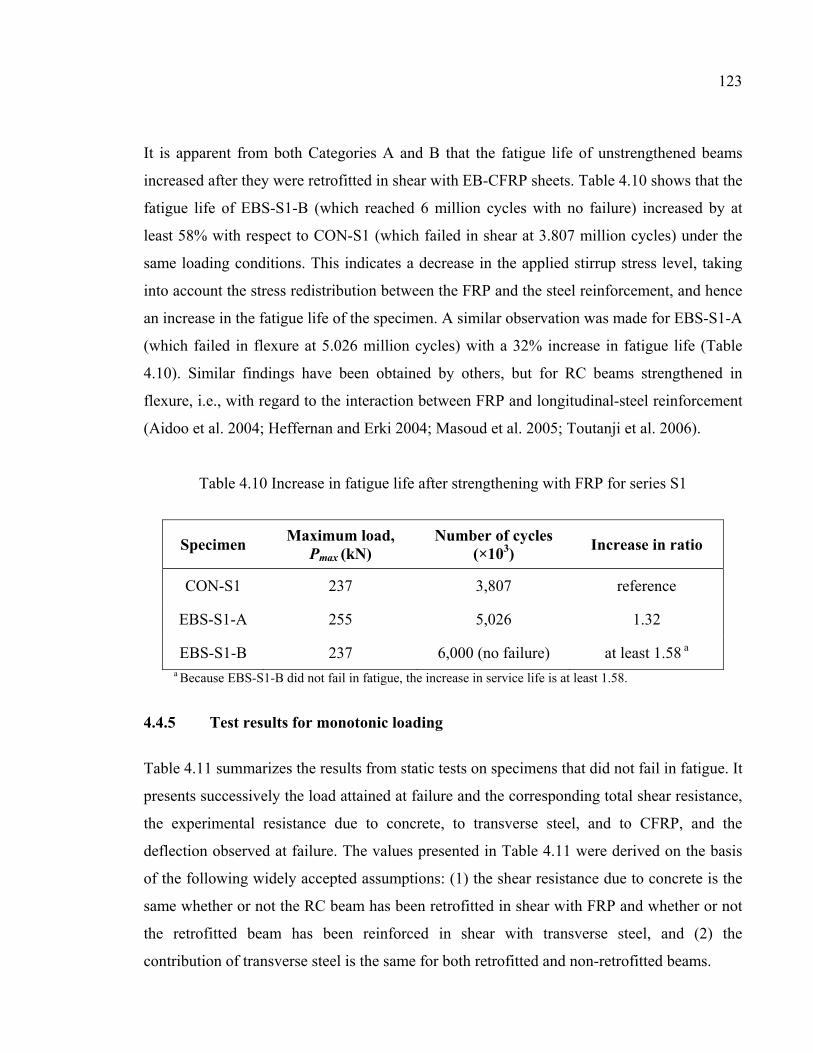
123
It is apparent from both Categories A and B that the fatigue life of unstrengthened beams
increased after they were retrofitted in shear with EB-CFRP sheets. Table 4.10 shows that the
fatigue life of EBS-S1-B (which reached 6 million cycles with no failure) increased by at
least 58% with respect to CON-S1 (which failed in shear at 3.807 million cycles) under the
same loading conditions. This indicates a decrease in the applied stirrup stress level, taking
into account the stress redistribution between the FRP and the steel reinforcement, and hence
an increase in the fatigue life of the specimen. A similar observation was made for EBS-S1-A
(which failed in flexure at 5.026 million cycles) with a 32% increase in fatigue life (Table
4.10). Similar findings have been obtained by others, but for RC beams strengthened in
flexure, i.e., with regard to the interaction between FRP and longitudinal-steel reinforcement
(Aidoo et al. 2004; Heffernan and Erki 2004; Masoud et al. 2005; Toutanji et al. 2006).
Table 4.10 Increase in fatigue life after strengthening with FRP for series S1
Specimen Maximum load,
Pmax (kN)
Number of cycles (×103)
Increase in ratio
CON-S1 237 3,807 reference
EBS-S1-A 255 5,026 1.32
EBS-S1-B 237 6,000 (no failure) at least 1.58 a a Because EBS-S1-B did not fail in fatigue, the increase in service life is at least 1.58.
4.4.5 Test results for monotonic loading
Table 4.11 summarizes the results from static tests on specimens that did not fail in fatigue. It
presents successively the load attained at failure and the corresponding total shear resistance,
the experimental resistance due to concrete, to transverse steel, and to CFRP, and the
deflection observed at failure. The values presented in Table 4.11 were derived on the basis
of the following widely accepted assumptions: (1) the shear resistance due to concrete is the
same whether or not the RC beam has been retrofitted in shear with FRP and whether or not
the retrofitted beam has been reinforced in shear with transverse steel, and (2) the
contribution of transverse steel is the same for both retrofitted and non-retrofitted beams.
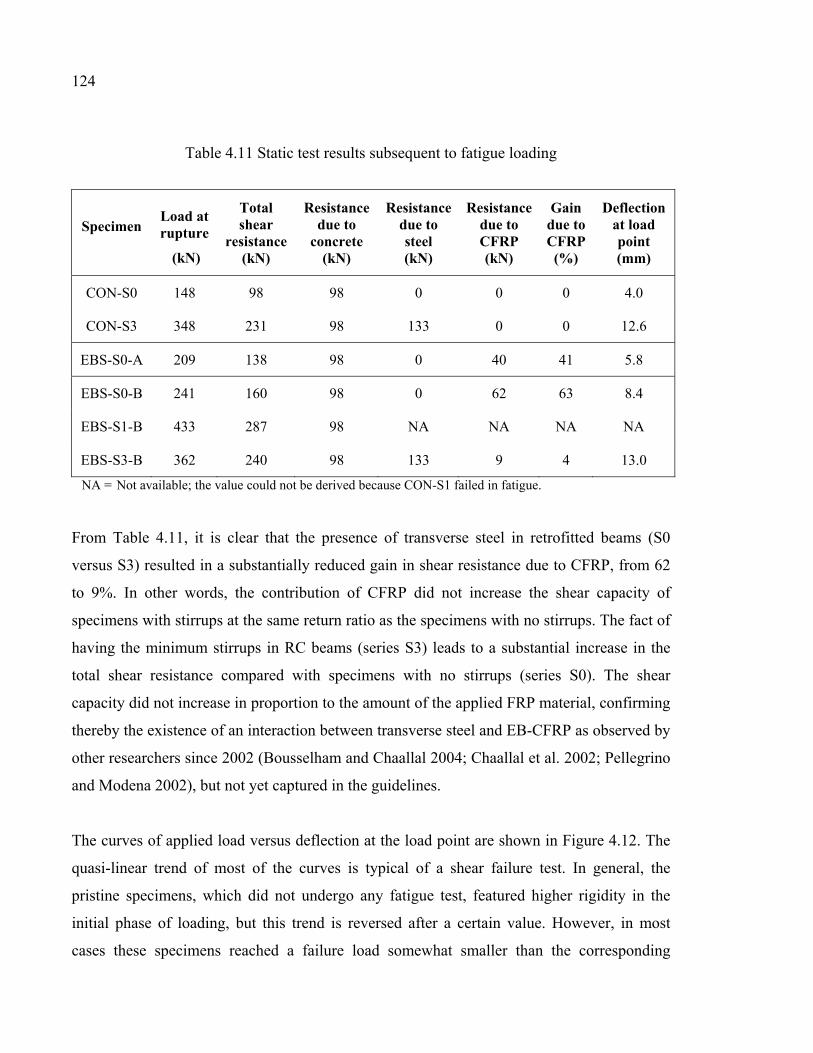
124
Table 4.11 Static test results subsequent to fatigue loading
Specimen Load at rupture
(kN)
Total shear
resistance (kN)
Resistance due to
concrete (kN)
Resistance due to steel (kN)
Resistance due to CFRP (kN)
Gain due to CFRP (%)
Deflection at load point (mm)
CON-S0 148 98 98 0 0 0 4.0
CON-S3 348 231 98 133 0 0 12.6
EBS-S0-A 209 138 98 0 40 41 5.8
EBS-S0-B 241 160 98 0 62 63 8.4
EBS-S1-B 433 287 98 NA NA NA NA
EBS-S3-B 362 240 98 133 9 4 13.0
NA = Not available; the value could not be derived because CON-S1 failed in fatigue.
From Table 4.11, it is clear that the presence of transverse steel in retrofitted beams (S0
versus S3) resulted in a substantially reduced gain in shear resistance due to CFRP, from 62
to 9%. In other words, the contribution of CFRP did not increase the shear capacity of
specimens with stirrups at the same return ratio as the specimens with no stirrups. The fact of
having the minimum stirrups in RC beams (series S3) leads to a substantial increase in the
total shear resistance compared with specimens with no stirrups (series S0). The shear
capacity did not increase in proportion to the amount of the applied FRP material, confirming
thereby the existence of an interaction between transverse steel and EB-CFRP as observed by
other researchers since 2002 (Bousselham and Chaallal 2004; Chaallal et al. 2002; Pellegrino
and Modena 2002), but not yet captured in the guidelines.
The curves of applied load versus deflection at the load point are shown in Figure 4.12. The
quasi-linear trend of most of the curves is typical of a shear failure test. In general, the
pristine specimens, which did not undergo any fatigue test, featured higher rigidity in the
initial phase of loading, but this trend is reversed after a certain value. However, in most
cases these specimens reached a failure load somewhat smaller than the corresponding
125
specimens that underwent fatigue tests. It has been shown that once a crack forms during the
early cycles, significant changes in the crack pattern will develop. Therefore, it is thought
that the initial phase of monotonic loading corresponds to a cracking or damage state of the
RC beam relating to early fatigue cycles.
It is observed from Figure 4.12 that shear capacities of specimens that underwent fatigue
(i.e., considering residual strength) are greater than that of specimens subjected to static
loading only. For most specimens, the increased residual ultimate load varies between 6 and
10%, which is comparable to other research studies where no significant changes (less than
10%) were observed (e.g., Chen et al. 2010; Ekenel et al. 2006; Kim and Heffernan 2008;
Rosenboom and Rizkalla 2006). However, for EBS-S0-B, the increase was approximately
23%, which is rather high. This can be attributed to the inaccuracy that may occur during
laboratory experiments, particularly for specimens with no stirrups, the increase in concrete
strength during the relatively long period of fatigue tests, as well as the adjustment of loads
to take into consideration differences in f’c for specimens that were tested in the past under
static loading. Misalignment of CFRP during installation is another source of error that might
also affect the results. Therefore, these findings should be interpreted with caution until
further research is made available.
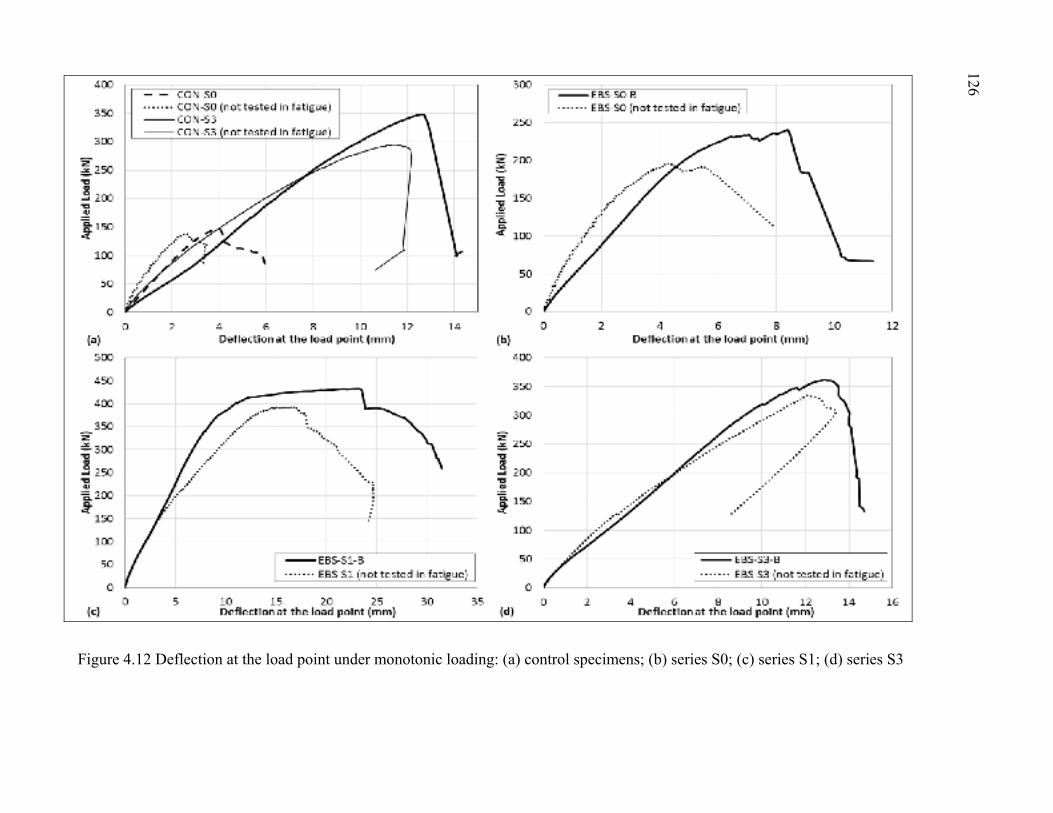
Figure 4.12 Deflection at the load point under monotonic loading: (a) control specimens; (b) series S0; (c) series S1; (d) series S3
126
127
4.5 Conclusions
On the basis of the results of the present investigation, the following conclusions can be
drawn:
1. The results demonstrate the effectiveness of the EB-FRP shear-strengthening technique
for extending the service life of RC beams under fatigue loading;
2. The overall response exhibited a typical trend of cumulative fatigue degradation, which
was characterized by an accelerated rate of damage propagation during the early cycles,
followed by a stable phase in which the damage accumulation slowed significantly;
3. In beams of Category A (upgrade), the longitudinal steel may be the weakest link and
should be looked at with caution, particularly for extended service life, where it may
govern the upper limit of the projected capacity. A comparison of Category A specimens
(failure in flexure fatigue) with Category B specimens (no fatigue failure) reveals that the
range of longitudinal-steel stress lies between the upper limits specified by the codes.
This may indicate that the code specifications for fatigue limit-state design of
unstrengthened RC members may also be used for FRP shear-strengthened structures;
4. The specimens repaired with no increase in service load (Category B) behaved extremely
well, confirming the suitability of the EB-FRP technique for this category of applications
in extending the fatigue service life. Specimens of Category A also behaved satisfactorily
by outperforming their control counterparts. Despite the high fatigue loading they
experienced, their performance demonstrated the effectiveness of EB-FRP in extending
the service life of RC structures strengthened in shear for increased live load;
5. A comparison of stirrup strain ranges of unstrengthened specimens may provide a
guideline for an upper limit (200 MPa) to avoid stirrup rupture by fatigue because no
limit has yet been recommended in that regard in the current codes and standards;
6. The fact that no sign of failure due to debonding was observed during the course of the
test clearly demonstrates the effectiveness of the FRP U-wrap scheme for shear-
strengthening RC beams subjected to fatigue loading;
128
7. The maximum strain (1,030 με) and strain range (360 με) in CFRP in both categories
were below the maximum threshold values of 0.2 and 0.04%, respectively, recommended
by Czaderski and Motavalli (2004) for the L-shaped CFRP shear-strengthening system;
8. The presence of transverse steel in retrofitted beams resulted in a substantial gain
reduction in shear resistance due to CFRP, confirming thereby the existence of an
interaction between internal transverse steel and EB-CFRP.
4.6 Acknowledgments
The financial support of the Natural Sciences and Engineering Research Council of Canada
(NSERC), the Fonds québécois de la recherche sur la nature et les technologies (FQRNT
Research Team Project), and the Ministère des transports du Québec (MTQ) through
operating grants is gratefully acknowledged. The authors thank Sika Canada Inc. (Pointe
Claire, Quebec) for contributing to the cost of the materials. The efficient collaboration of
John Lescelleur (senior technician) and Juan Mauricio Rios (technician) at ETS in
conducting the tests is acknowledged.
CHAPITRE 5
FATIGUE BEHAVIOR OF RC T-BEAMS STRENGTHENED IN SHEAR WITH EB CFRP L-SHAPED LAMINATES
Georges El-Saikaly and Omar Chaallal
Department of Construction Engineering, École de Technologie Supérieure,
1100 Notre-Dame St. West, Montreal, QC, Canada H3C 1K3
Article Published in Journal Composites part B: Engineering, Elsevier, Volume 68,
pp.100-112, January 2015.
5.1 Abstract
The use of externally bonded carbon fiber-reinforced polymer (EB-CFRP) to strengthen
deficient reinforced concrete (RC) beams has gained in popularity and has become a viable
and cost-effective method. Fatigue behavior of RC beams strengthened with FRP is a
complex issue due to the multiple variables that affect it (applied load range, frequency,
number of cycles). Very few research studies have been conducted in shear under cyclic
loading. The use of prefabricated CFRP L-shaped laminates (plates) for strengthening RC
beams under static loading has proven to be technically feasible and very efficient. This
study aimed to examine the fatigue performance of RC T-beams strengthened in shear for
increased service load using prefabricated CFRP L-shaped laminates. The investigation
involved six laboratory tests performed on full-size 4520 mm-long T-beams. The specimens
were subjected to fatigue loading up to six million load cycles at a rate of 3 Hz. Two
categories of specimens (unstrengthened and strengthened) and three different transverse-
steel reinforcement ratios (Series S0, S1, and S3) were considered. Test results were
compared with the upper fatigue limits specified by codes and standards. The specimens that
did not fail in fatigue were then subjected to static loading up to failure. The test results
confirmed the feasibility of using CFRP L-shaped laminates to extend the service life of RC
T-beams subjected to fatigue loading. The overall response was characterized by an
accelerated rate of damage accumulation during the early cycles, followed by a stable phase
130
in which the rate slowed significantly. In addition, the strains in the stirrups decreased after
the specimens were strengthened with CFRP, despite the higher applied fatigue loading.
Moreover, the addition of L-shaped laminates enhanced the shear capacity of the specimens
and changed the failure mode from brittle to ductile under static loading. Finally, the
presence of transverse steel in strengthened beams resulted in a substantially reduced gain in
shear resistance due to CFRP, confirming the existence of an interaction between the
transverse steel and the CFRP.
CE Database subject headings: Reinforced concrete; Beams; Fatigue; Service life; Shear;
Strengthening; L-shaped; FRP Laminates.
5.2 Introduction
In the last two decades, the use of externally bonded fiber-reinforced polymer (FRP) has
attracted enormous interest, and this material is being successfully used in construction
engineering, particularly for the rehabilitation of RC structures to increase their capacity and
extend their service life. Different techniques have been proposed and valuable experimental
research has been conducted worldwide in shear strengthening of RC beams and girders with
FRP composites under static loadings, including externally bonded (EB) FRP sheets, near-
surface mounted (NSM) FRP rods and laminates, and embedded through-section (ETS) FRP
rods (e.g., Uji 1992; Chaallal et al. 1998; Täljsten and Elfgren 2000; Khalifa and Nanni 2000;
De Lorenzis and Nanni 2001; Chen and Teng 2003b; Bousselham and Chaallal 2006; Monti
and Liotta 2007; Dias and Barros 2012; Mofidi et al. 2012a; 2012b). Moreover, many design
procedures and analytical models have been conducted to date either for the use of EB FRP
composites in shear-strengthening or for the evaluation of the FRP-concrete bond strength.
Databases for the assessment of these conducted studies have been recently published by
Pellegrino and Vasic (2013) and by D’Antino and Pellegrino (2014). Few studies have been
conducted on RC beams strengthened in shear using EB CFRP composites under fatigue
loading, by Czaderski and Motavalli (2004), Williams and Higgins (2008), Chaallal et al.
(2010), and recently by Bae et al. (2013).
131
Mosallam and Banerjee (2007) conducted an experimental investigation to evaluate the shear
strength enhancement of repaired and retrofitted RC rectangular beams under static loading
using three composite systems: carbon/epoxy wet layout, E-glass/epoxy wet layout and
carbon/epoxy pre-cured strips. The pre-cured strips were bonded perpendicularly to both
sides (two-side bonding) along the shear span without any anchorage system. The results
indicated a substantial increase in ultimate shear capacity of the strengthened beams
compared to the control ones. The authors suggested that the ACI 440.2R model for ultimate
shear capacity calculation of FRP strengthened beams should be revised to take into
consideration the effect of shear span-to-depth ratio (a/d), and to properly estimate the
influence of wrapping scheme with pre-cured strips on the ultimate shear capacity.
In addition to the standard straight CFRP plates which are mainly used for flexural
strengthening, prefabricated CFRP L-shaped laminates have been proposed as a new
technique for shear strengthening that presents a potential alternative to the known
retrofitting systems (EB sheets, NSM rods, and ETS rods). Various tests have been
performed to date to evaluate the feasibility of these prefabricated L-shaped laminates. Most
of these were conducted on shear strengthening of RC T-beams under static loading. In 1998,
EMPA (Eidgenössische Materialprüfungs und Forschungsanstalt - Swiss Federal
Laboratories for Materials Science and Technology) carried out tests on full-size RC T-
beams (up to 6 m span) shear-strengthened with CFRP L-shaped laminates and CFRP sheets.
The investigation demonstrated the effectiveness of L-shaped laminates for static shear
strengthening over CFRP sheets for such applications. In 2002, a second test study was
carried out by the EMPA laboratories, in which six RC T-beams were tested as follows: (i)
four beams (S1 to S4) were tested under static loading up to failure with different internal
transverse-steel ratios: two shear-strengthened with CFRP L-shaped laminates and two
unstrengthened (as a control); (ii) one static test was conducted on a preloaded RC beam (S5)
post-strengthened in shear with CFRP L-shaped laminates; and (iii) one CFRP-strengthened
RC beam (S6) with L-shaped laminates was tested under fatigue loading. The results of this
experimental investigation were reported by Czaderski (2002). Czaderski and Motavalli
132
(2004) used the results of the EMPA tests to study the fatigue behavior of a T-beam (S6)
strengthened in shear with CFRP L-shaped laminates. Meier (1998) performed a pullout test
series on CFRP L-shaped plates bonded to concrete blocks to investigate the strength of L-
shaped FRP/concrete joints. Chen and Robertson (2004) carried out a series of tests on a pre-
cracked, pre-stressed concrete T-beam retrofitted in shear using CFRP L-shaped laminates.
The objective of their study was to evaluate the performance of these L-shaped laminates
applied over existing shear cracks, particularly under cyclic loading. The results
demonstrated that they were effective at controlling the width of the existing shear cracks and
preventing further growth of cracks.
Very few tests have been performed worldwide on RC beams strengthened in shear with FRP
L-shaped laminates. Most of these tests were conducted under static loading, and only one
test was performed under fatigue loading. Therefore, the need for further research on such
applications is of utmost importance. The research study presented in this paper aims to
examine experimentally the fatigue behavior of RC T-beams strengthened in shear with
prefabricated EB CFRP L-shaped laminates and to provide information that could be
valuable for fatigue design of girders strengthened in shear with this technique. This
investigation considers the situation that can prevail in practice where the objective of the
FRP retrofit is to strengthen the existing RC structure to increase its original capacity due to
an increase in the projected applied load (i.e., use of CFRP to upgrade the service load).
The experimental results obtained from the fatigue tests and the subsequent monotonic tests
on those specimens which did not fail under cyclic loading will be successively presented
and analyzed. The results will be presented in terms of (a) modes of failure; (b) load versus
deflection relationship; and (c) the strains undergone by the various components, including
concrete struts, longitudinal and transverse steel reinforcements, and EB-CFRP. The results
will be discussed in terms of the presence and spacing of internal stirrups, as well as the
effectiveness of the L-shaped CFRP-laminate strengthening technique in extending the
service life of RC girders under fatigue loading and in attenuating the rate of damage.
Comparisons with recommended design code values and perspectives for design practice will
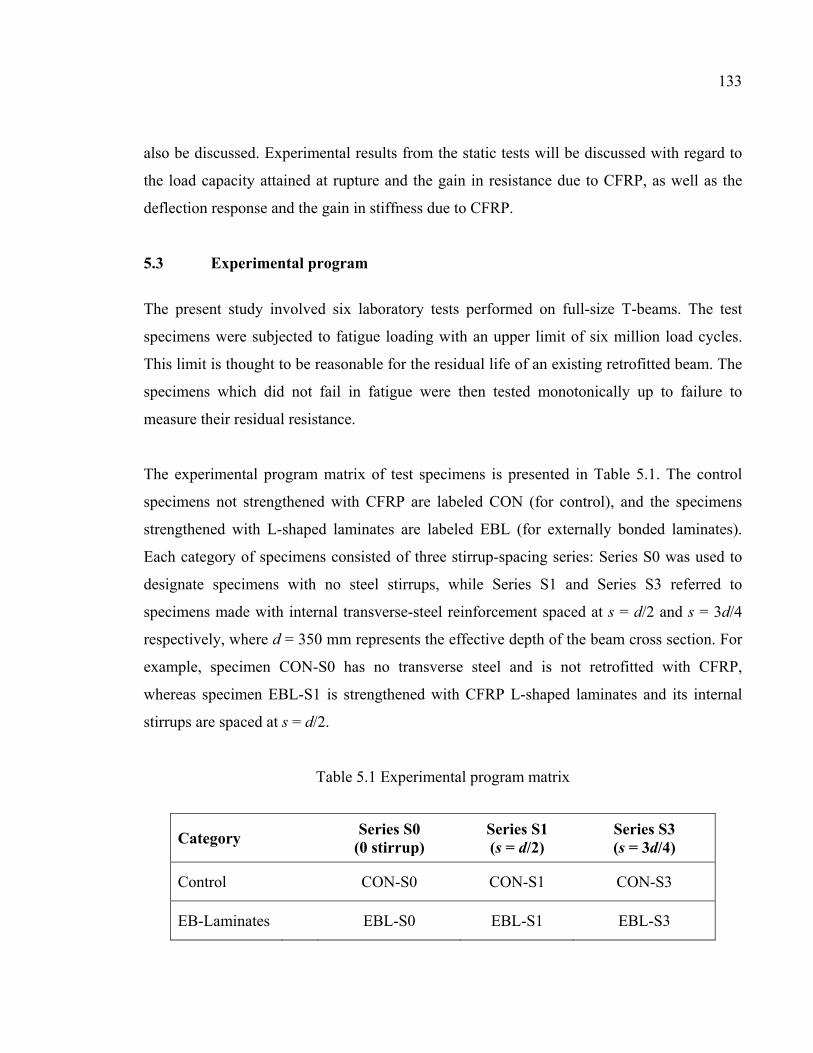
133
also be discussed. Experimental results from the static tests will be discussed with regard to
the load capacity attained at rupture and the gain in resistance due to CFRP, as well as the
deflection response and the gain in stiffness due to CFRP.
5.3 Experimental program
The present study involved six laboratory tests performed on full-size T-beams. The test
specimens were subjected to fatigue loading with an upper limit of six million load cycles.
This limit is thought to be reasonable for the residual life of an existing retrofitted beam. The
specimens which did not fail in fatigue were then tested monotonically up to failure to
measure their residual resistance.
The experimental program matrix of test specimens is presented in Table 5.1. The control
specimens not strengthened with CFRP are labeled CON (for control), and the specimens
strengthened with L-shaped laminates are labeled EBL (for externally bonded laminates).
Each category of specimens consisted of three stirrup-spacing series: Series S0 was used to
designate specimens with no steel stirrups, while Series S1 and Series S3 referred to
specimens made with internal transverse-steel reinforcement spaced at s = d/2 and s = 3d/4
respectively, where d = 350 mm represents the effective depth of the beam cross section. For
example, specimen CON-S0 has no transverse steel and is not retrofitted with CFRP,
whereas specimen EBL-S1 is strengthened with CFRP L-shaped laminates and its internal
stirrups are spaced at s = d/2.
Table 5.1 Experimental program matrix
Category Series S0
(0 stirrup) Series S1 (s = d/2)
Series S3 (s = 3d/4)
Control CON-S0 CON-S1 CON-S3
EB-Laminates EBL-S0 EBL-S1 EBL-S3
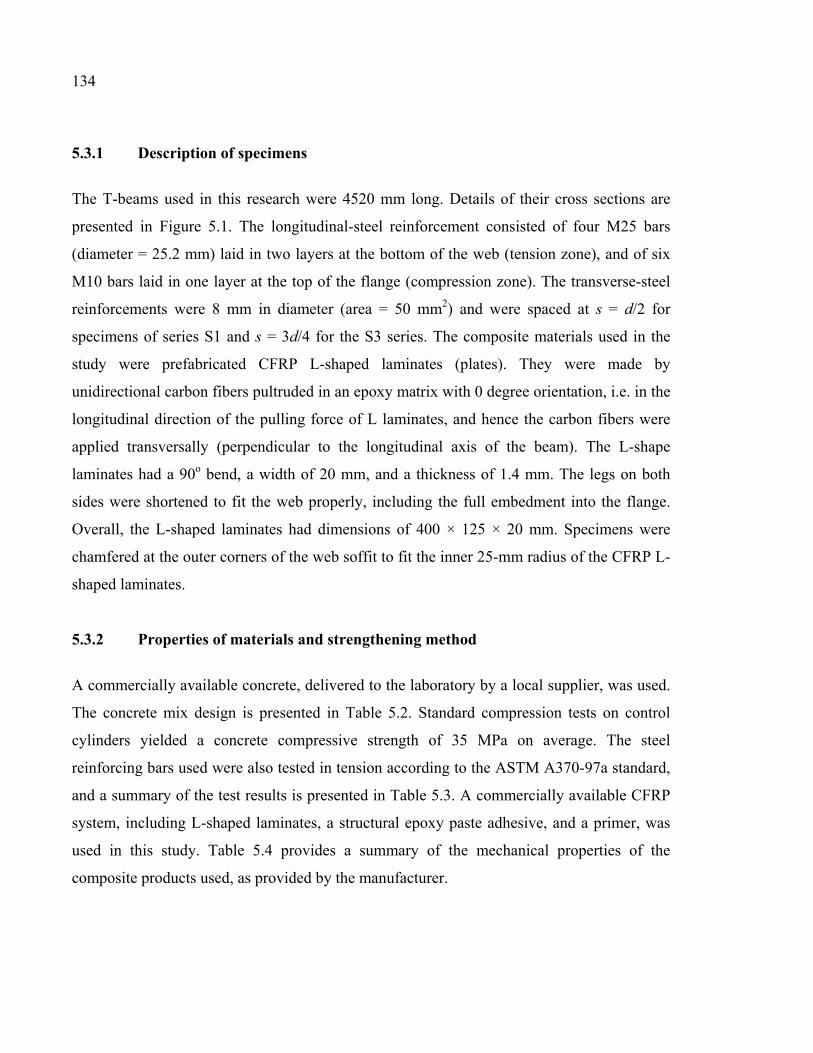
134
5.3.1 Description of specimens
The T-beams used in this research were 4520 mm long. Details of their cross sections are
presented in Figure 5.1. The longitudinal-steel reinforcement consisted of four M25 bars
(diameter = 25.2 mm) laid in two layers at the bottom of the web (tension zone), and of six
M10 bars laid in one layer at the top of the flange (compression zone). The transverse-steel
reinforcements were 8 mm in diameter (area = 50 mm2) and were spaced at s = d/2 for
specimens of series S1 and s = 3d/4 for the S3 series. The composite materials used in the
study were prefabricated CFRP L-shaped laminates (plates). They were made by
unidirectional carbon fibers pultruded in an epoxy matrix with 0 degree orientation, i.e. in the
longitudinal direction of the pulling force of L laminates, and hence the carbon fibers were
applied transversally (perpendicular to the longitudinal axis of the beam). The L-shape
laminates had a 90o bend, a width of 20 mm, and a thickness of 1.4 mm. The legs on both
sides were shortened to fit the web properly, including the full embedment into the flange.
Overall, the L-shaped laminates had dimensions of 400 × 125 × 20 mm. Specimens were
chamfered at the outer corners of the web soffit to fit the inner 25-mm radius of the CFRP L-
shaped laminates.
5.3.2 Properties of materials and strengthening method
A commercially available concrete, delivered to the laboratory by a local supplier, was used.
The concrete mix design is presented in Table 5.2. Standard compression tests on control
cylinders yielded a concrete compressive strength of 35 MPa on average. The steel
reinforcing bars used were also tested in tension according to the ASTM A370-97a standard,
and a summary of the test results is presented in Table 5.3. A commercially available CFRP
system, including L-shaped laminates, a structural epoxy paste adhesive, and a primer, was
used in this study. Table 5.4 provides a summary of the mechanical properties of the
composite products used, as provided by the manufacturer.
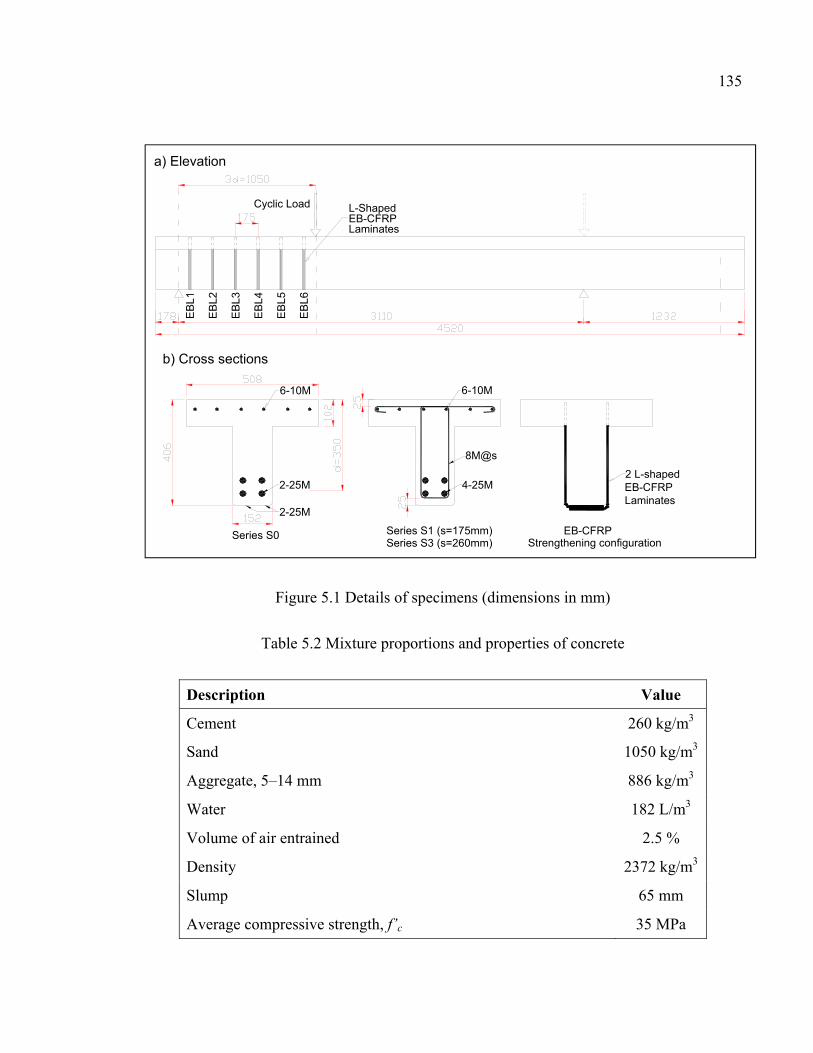
135
Figure 5.1 Details of specimens (dimensions in mm)
Table 5.2 Mixture proportions and properties of concrete
Description Value
Cement 260 kg/m3
Sand 1050 kg/m3
Aggregate, 5–14 mm 886 kg/m3
Water 182 L/m3
Volume of air entrained 2.5 %
Density 2372 kg/m3
Slump 65 mm
Average compressive strength, f’c 35 MPa
Cyclic Load
2-25M
8M@s
Series S0 Series S1 (s=175mm)
4-25M
2-25M
b) Cross sections
EB-CFRPSeries S3 (s=260mm)
a) Elevation
2 L-shapedEB-CFRPLaminates
L-ShapedEB-CFRPLaminates
EBL
1
Strengthening configuration
6-10M 6-10M
EBL
2
EBL
3
EBL
4
EBL
5
EBL
6
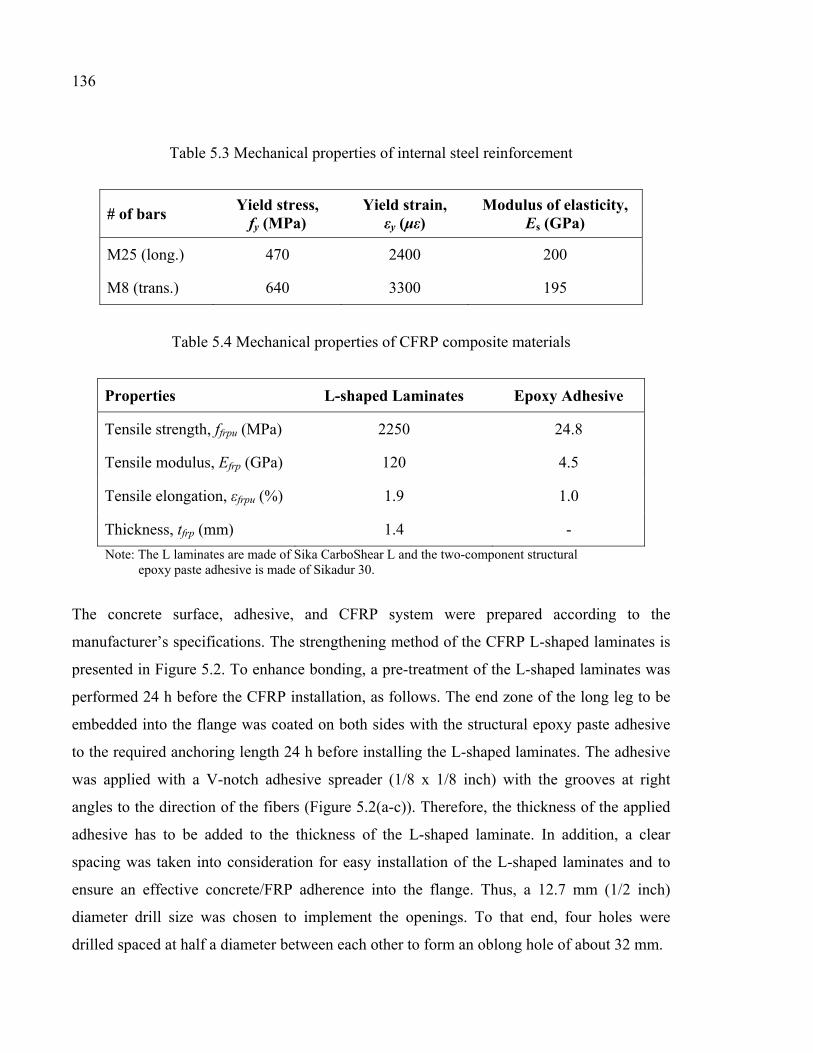
136
Table 5.3 Mechanical properties of internal steel reinforcement
# of bars Yield stress,
fy (MPa) Yield strain,
εy (με) Modulus of elasticity,
Es (GPa)
M25 (long.) 470 2400 200
M8 (trans.) 640 3300 195
Table 5.4 Mechanical properties of CFRP composite materials
Properties L-shaped Laminates Epoxy Adhesive
Tensile strength, ffrpu (MPa) 2250 24.8
Tensile modulus, Efrp (GPa) 120 4.5
Tensile elongation, εfrpu (%) 1.9 1.0
Thickness, tfrp (mm) 1.4 -
Note: The L laminates are made of Sika CarboShear L and the two-component structural epoxy paste adhesive is made of Sikadur 30.
The concrete surface, adhesive, and CFRP system were prepared according to the
manufacturer’s specifications. The strengthening method of the CFRP L-shaped laminates is
presented in Figure 5.2. To enhance bonding, a pre-treatment of the L-shaped laminates was
performed 24 h before the CFRP installation, as follows. The end zone of the long leg to be
embedded into the flange was coated on both sides with the structural epoxy paste adhesive
to the required anchoring length 24 h before installing the L-shaped laminates. The adhesive
was applied with a V-notch adhesive spreader (1/8 x 1/8 inch) with the grooves at right
angles to the direction of the fibers (Figure 5.2(a-c)). Therefore, the thickness of the applied
adhesive has to be added to the thickness of the L-shaped laminate. In addition, a clear
spacing was taken into consideration for easy installation of the L-shaped laminates and to
ensure an effective concrete/FRP adherence into the flange. Thus, a 12.7 mm (1/2 inch)
diameter drill size was chosen to implement the openings. To that end, four holes were
drilled spaced at half a diameter between each other to form an oblong hole of about 32 mm.
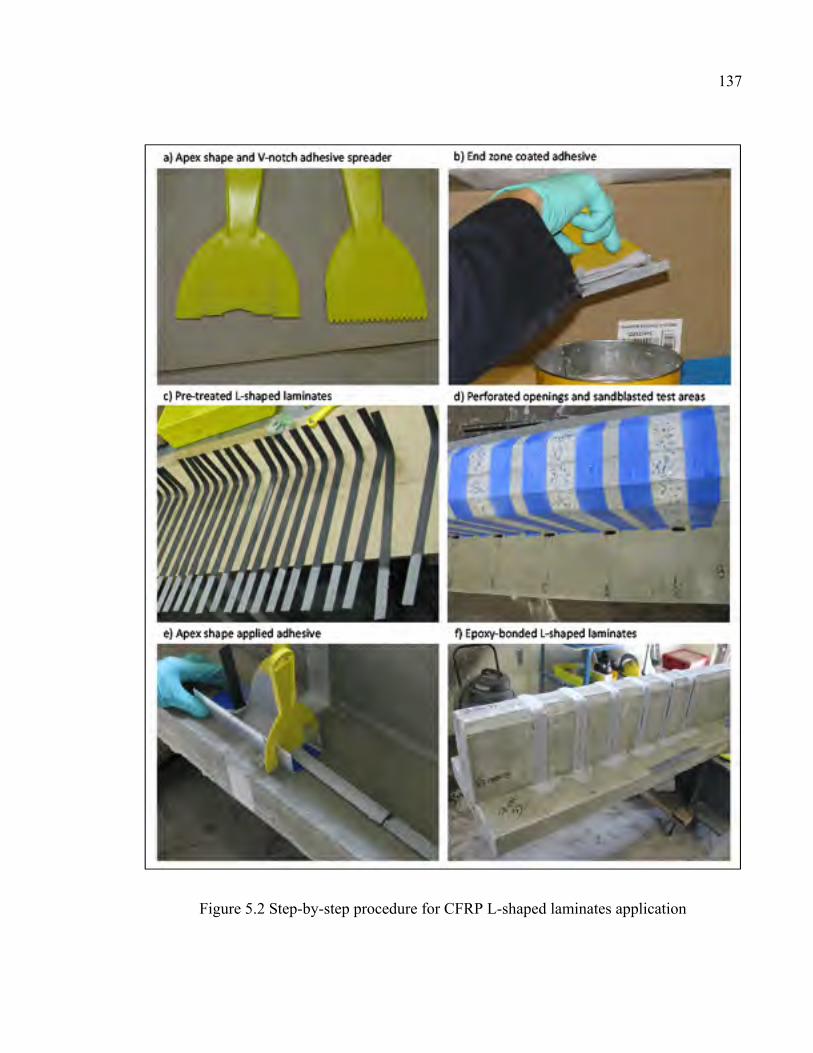
137
Figure 5.2 Step-by-step procedure for CFRP L-shaped laminates application
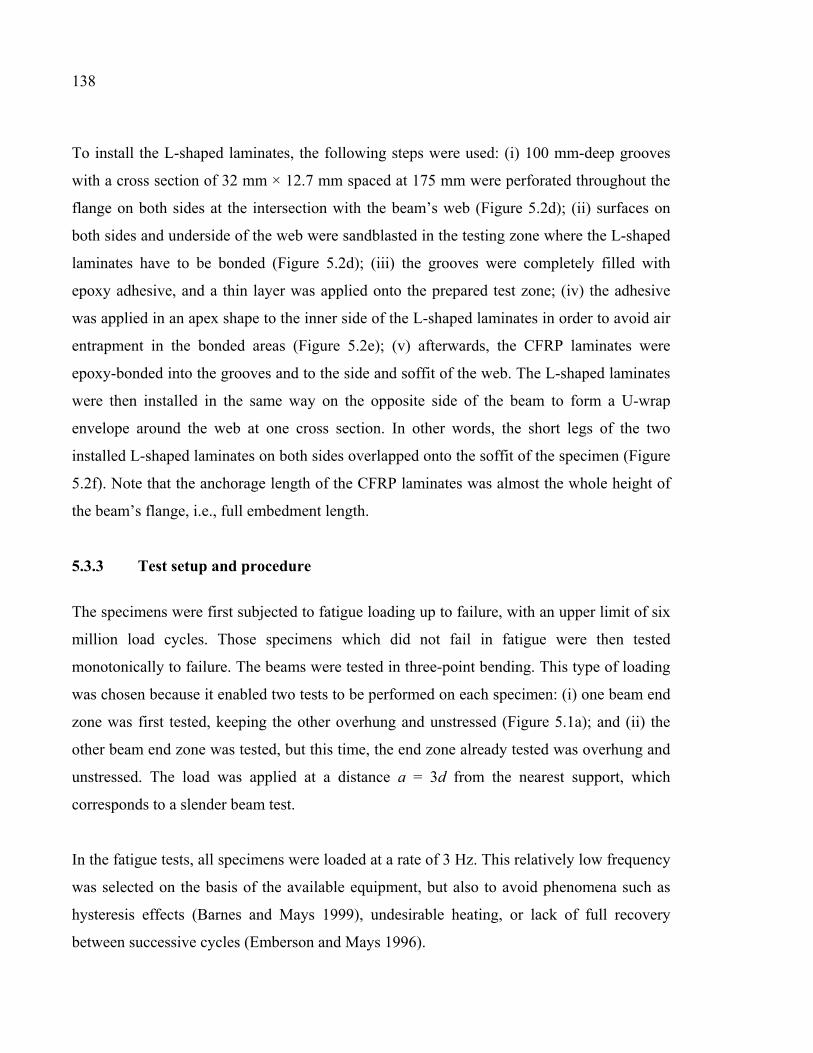
138
To install the L-shaped laminates, the following steps were used: (i) 100 mm-deep grooves
with a cross section of 32 mm × 12.7 mm spaced at 175 mm were perforated throughout the
flange on both sides at the intersection with the beam’s web (Figure 5.2d); (ii) surfaces on
both sides and underside of the web were sandblasted in the testing zone where the L-shaped
laminates have to be bonded (Figure 5.2d); (iii) the grooves were completely filled with
epoxy adhesive, and a thin layer was applied onto the prepared test zone; (iv) the adhesive
was applied in an apex shape to the inner side of the L-shaped laminates in order to avoid air
entrapment in the bonded areas (Figure 5.2e); (v) afterwards, the CFRP laminates were
epoxy-bonded into the grooves and to the side and soffit of the web. The L-shaped laminates
were then installed in the same way on the opposite side of the beam to form a U-wrap
envelope around the web at one cross section. In other words, the short legs of the two
installed L-shaped laminates on both sides overlapped onto the soffit of the specimen (Figure
5.2f). Note that the anchorage length of the CFRP laminates was almost the whole height of
the beam’s flange, i.e., full embedment length.
5.3.3 Test setup and procedure
The specimens were first subjected to fatigue loading up to failure, with an upper limit of six
million load cycles. Those specimens which did not fail in fatigue were then tested
monotonically to failure. The beams were tested in three-point bending. This type of loading
was chosen because it enabled two tests to be performed on each specimen: (i) one beam end
zone was first tested, keeping the other overhung and unstressed (Figure 5.1a); and (ii) the
other beam end zone was tested, but this time, the end zone already tested was overhung and
unstressed. The load was applied at a distance a = 3d from the nearest support, which
corresponds to a slender beam test.
In the fatigue tests, all specimens were loaded at a rate of 3 Hz. This relatively low frequency
was selected on the basis of the available equipment, but also to avoid phenomena such as
hysteresis effects (Barnes and Mays 1999), undesirable heating, or lack of full recovery
between successive cycles (Emberson and Mays 1996).
139
The fatigue load was cycled from 35% to 65% of the load (P), where P corresponded to the
total shear resistance of the specimen under study (i.e., including the contribution of CFRP
for strengthened specimens). The upper and lower limits were calculated on the basis of
common service-load conditions that a structure like a bridge might experience during its
service life. These limits evolve with respect to a mean value, Pmean, estimated at 50% of
ultimate, corresponding to the passage of a standard vehicle at a crawling speed. The lower
and upper limits Pmin and Pmax are given as functions of the dynamic load allowance (DLA)
by Pmin = Pmean (1-DLA) and Pmax = Pmean (1+DLA). Depending on the code used, the DLA
values ranged between 0.25 and 0.40. In this paper, a value of 0.3 was assumed for DLA,
which resulted in values of 35% and 65% of ultimate for the lower and the upper limit
respectively. Similar stress levels have been used elsewhere (e.g., Czaderski and Motavalli
2004; Rosenboom and Rizkalla 2006; and Ekenel and Myers 2009). Therefore, each beam
was subjected to the same percentages of its ultimate load, which was obtained from identical
specimens tested in previous work under static loading only (Chaallal et al. 2011).
Table 5.5 presents for each specimen the maximum and minimum loads applied as well as
the amplitude of cyclic loading for the fatigue tests. As for static loading, the tests were
performed under displacement-control conditions at 2 mm/min.
5.3.4 Instrumentation
A comprehensive and carefully engineered measuring device was used for the study, as
detailed in Figure 5.3. The vertical displacement was measured at the position under the
applied load using linear-displacement sensors 100 mm in length. The longitudinal-steel
reinforcement was instrumented with a strain gauge at the location where the load was
applied. Strain gauges were also affixed to the stirrups located in the loading zone along the
expected plane of shear failure. The deformations experienced by the CFRP laminates were
measured using displacement sensors known as crack gauges. These gauges were fixed
vertically onto each EB L-shaped laminate on the lateral face of the web at the same
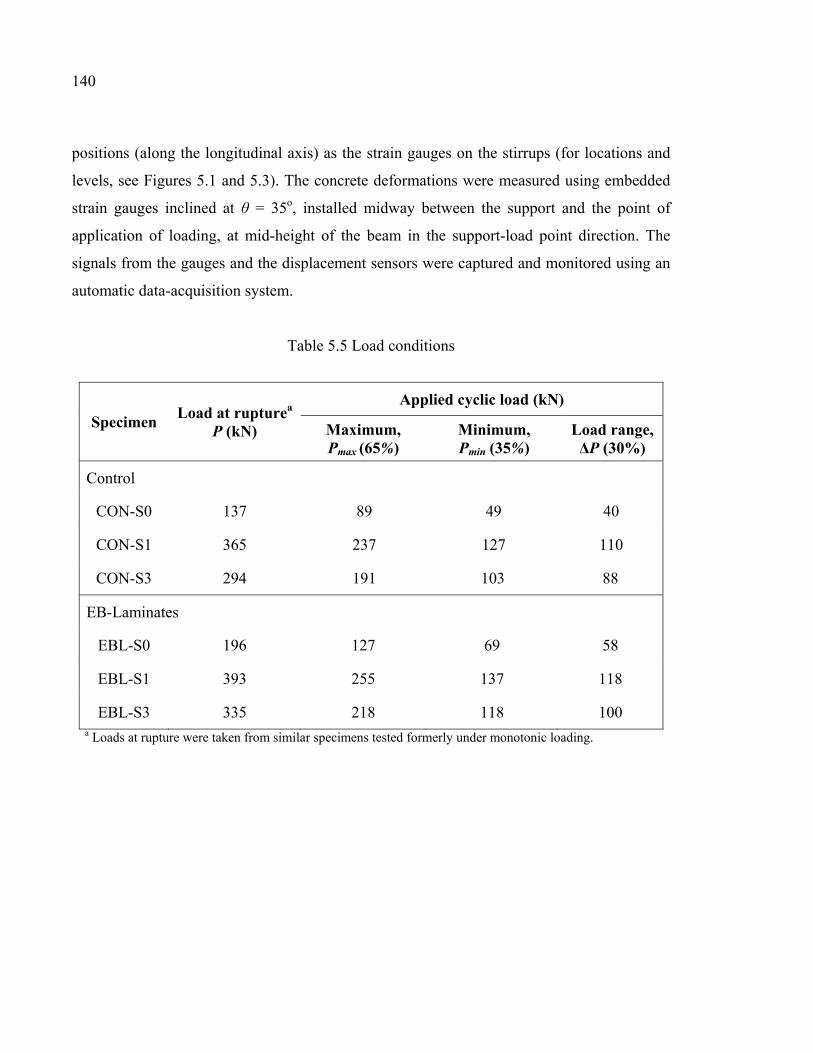
140
positions (along the longitudinal axis) as the strain gauges on the stirrups (for locations and
levels, see Figures 5.1 and 5.3). The concrete deformations were measured using embedded
strain gauges inclined at θ = 35o, installed midway between the support and the point of
application of loading, at mid-height of the beam in the support-load point direction. The
signals from the gauges and the displacement sensors were captured and monitored using an
automatic data-acquisition system.
Table 5.5 Load conditions
Specimen Load at rupturea
P (kN)
Applied cyclic load (kN)
Maximum, Pmax (65%)
Minimum, Pmin (35%)
Load range, ΔP (30%)
Control
CON-S0 137 89 49 40
CON-S1 365 237 127 110
CON-S3 294 191 103 88
EB-Laminates
EBL-S0 196 127 69 58
EBL-S1 393 255 137 118
EBL-S3 335 218 118 100
a Loads at rupture were taken from similar specimens tested formerly under monotonic loading.
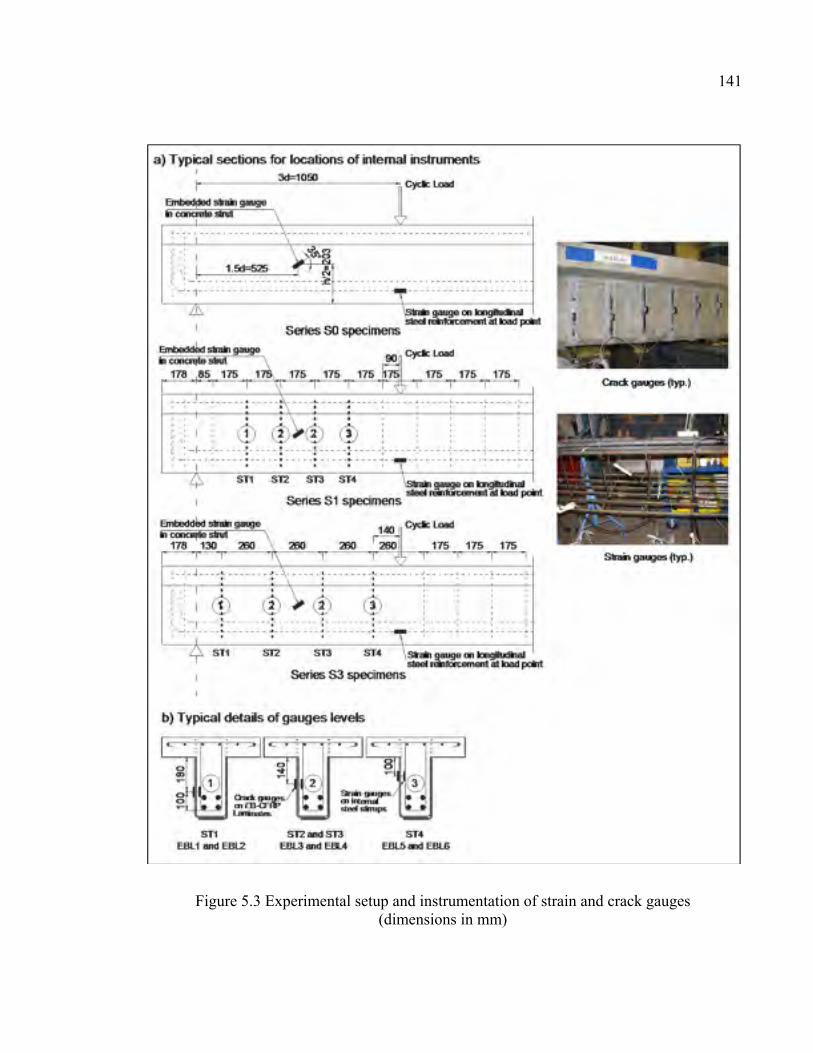
141
Figure 5.3 Experimental setup and instrumentation of strain and crack gauges (dimensions in mm)
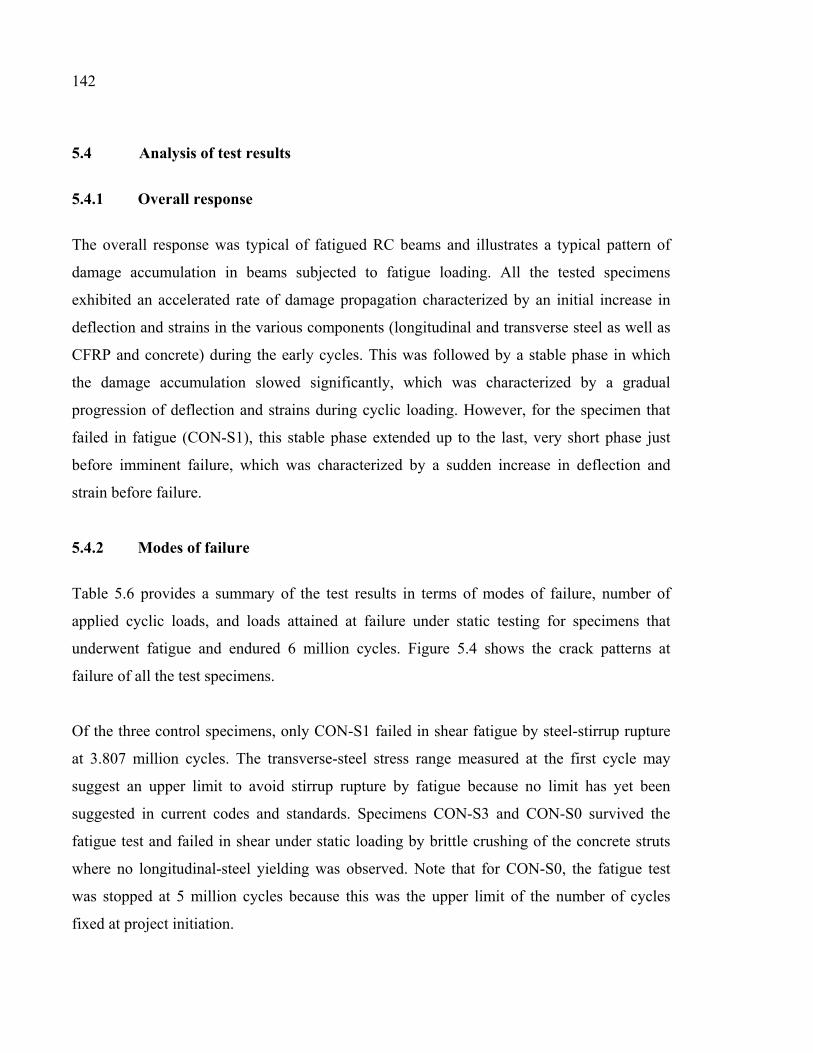
142
5.4 Analysis of test results
5.4.1 Overall response
The overall response was typical of fatigued RC beams and illustrates a typical pattern of
damage accumulation in beams subjected to fatigue loading. All the tested specimens
exhibited an accelerated rate of damage propagation characterized by an initial increase in
deflection and strains in the various components (longitudinal and transverse steel as well as
CFRP and concrete) during the early cycles. This was followed by a stable phase in which
the damage accumulation slowed significantly, which was characterized by a gradual
progression of deflection and strains during cyclic loading. However, for the specimen that
failed in fatigue (CON-S1), this stable phase extended up to the last, very short phase just
before imminent failure, which was characterized by a sudden increase in deflection and
strain before failure.
5.4.2 Modes of failure
Table 5.6 provides a summary of the test results in terms of modes of failure, number of
applied cyclic loads, and loads attained at failure under static testing for specimens that
underwent fatigue and endured 6 million cycles. Figure 5.4 shows the crack patterns at
failure of all the test specimens.
Of the three control specimens, only CON-S1 failed in shear fatigue by steel-stirrup rupture
at 3.807 million cycles. The transverse-steel stress range measured at the first cycle may
suggest an upper limit to avoid stirrup rupture by fatigue because no limit has yet been
suggested in current codes and standards. Specimens CON-S3 and CON-S0 survived the
fatigue test and failed in shear under static loading by brittle crushing of the concrete struts
where no longitudinal-steel yielding was observed. Note that for CON-S0, the fatigue test
was stopped at 5 million cycles because this was the upper limit of the number of cycles
fixed at project initiation.
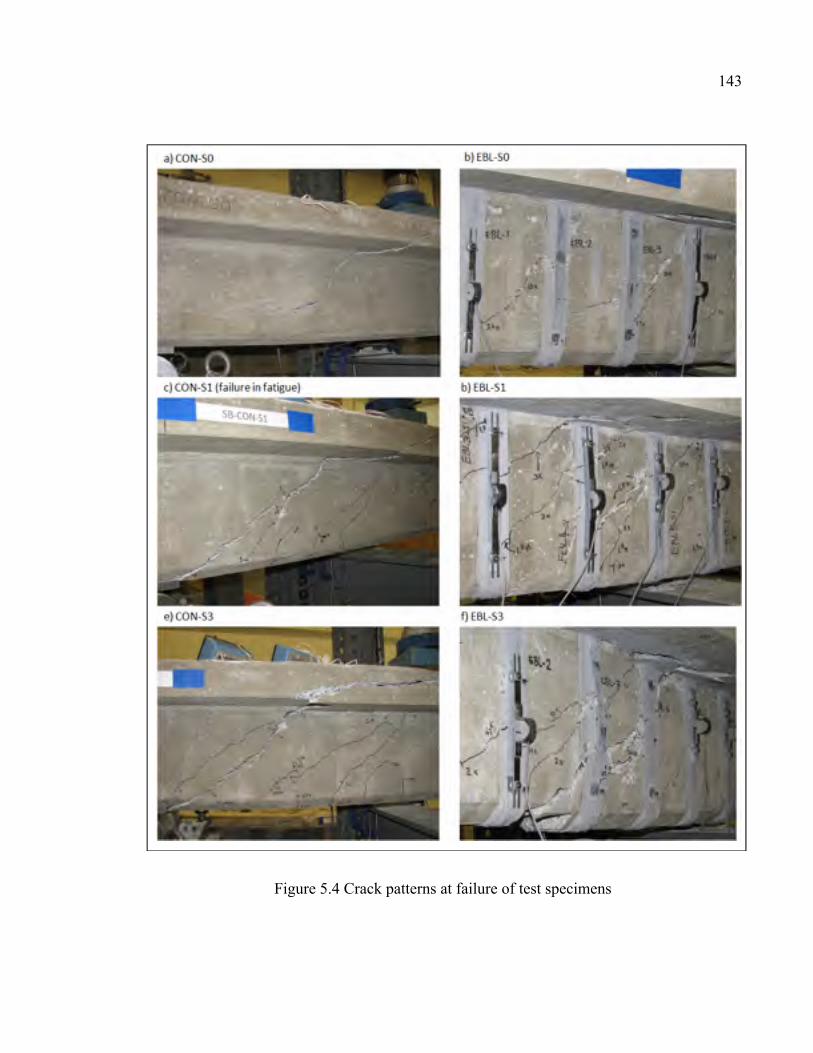
143
Figure 5.4 Crack patterns at failure of test specimens
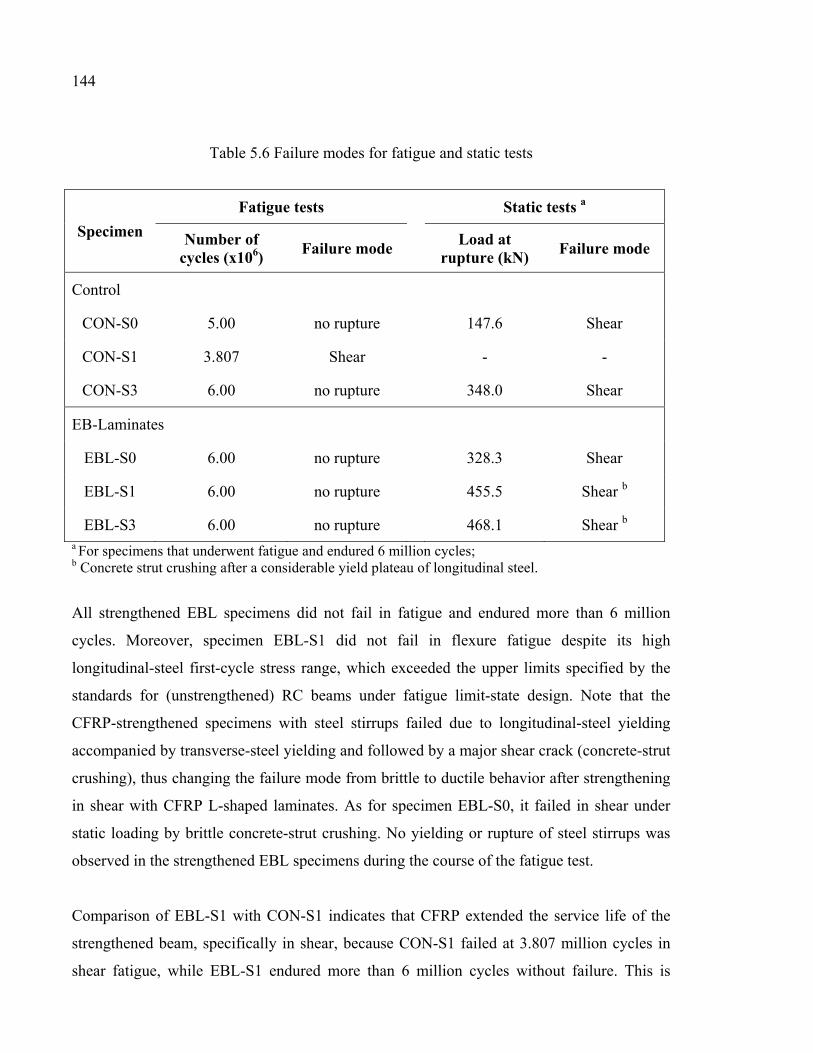
144
Table 5.6 Failure modes for fatigue and static tests
Specimen
Fatigue tests Static tests a
Number of cycles (x106)
Failure mode Load at
rupture (kN) Failure mode
Control
CON-S0 5.00 no rupture 147.6 Shear
CON-S1 3.807 Shear - -
CON-S3 6.00 no rupture 348.0 Shear
EB-Laminates
EBL-S0 6.00 no rupture 328.3 Shear
EBL-S1 6.00 no rupture 455.5 Shear b
EBL-S3 6.00 no rupture 468.1 Shear b a For specimens that underwent fatigue and endured 6 million cycles; b Concrete strut crushing after a considerable yield plateau of longitudinal steel.
All strengthened EBL specimens did not fail in fatigue and endured more than 6 million
cycles. Moreover, specimen EBL-S1 did not fail in flexure fatigue despite its high
longitudinal-steel first-cycle stress range, which exceeded the upper limits specified by the
standards for (unstrengthened) RC beams under fatigue limit-state design. Note that the
CFRP-strengthened specimens with steel stirrups failed due to longitudinal-steel yielding
accompanied by transverse-steel yielding and followed by a major shear crack (concrete-strut
crushing), thus changing the failure mode from brittle to ductile behavior after strengthening
in shear with CFRP L-shaped laminates. As for specimen EBL-S0, it failed in shear under
static loading by brittle concrete-strut crushing. No yielding or rupture of steel stirrups was
observed in the strengthened EBL specimens during the course of the fatigue test.
Comparison of EBL-S1 with CON-S1 indicates that CFRP extended the service life of the
strengthened beam, specifically in shear, because CON-S1 failed at 3.807 million cycles in
shear fatigue, while EBL-S1 endured more than 6 million cycles without failure. This is
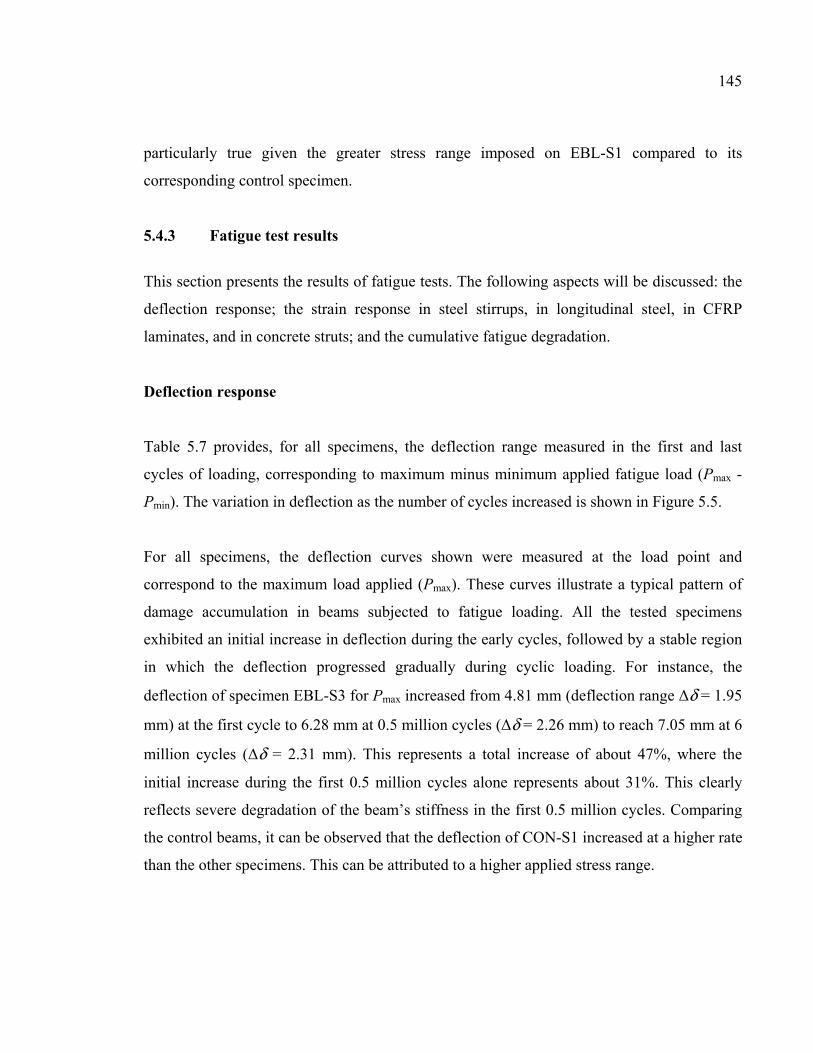
145
particularly true given the greater stress range imposed on EBL-S1 compared to its
corresponding control specimen.
5.4.3 Fatigue test results
This section presents the results of fatigue tests. The following aspects will be discussed: the
deflection response; the strain response in steel stirrups, in longitudinal steel, in CFRP
laminates, and in concrete struts; and the cumulative fatigue degradation.
Deflection response
Table 5.7 provides, for all specimens, the deflection range measured in the first and last
cycles of loading, corresponding to maximum minus minimum applied fatigue load (Pmax -
Pmin). The variation in deflection as the number of cycles increased is shown in Figure 5.5.
For all specimens, the deflection curves shown were measured at the load point and
correspond to the maximum load applied (Pmax). These curves illustrate a typical pattern of
damage accumulation in beams subjected to fatigue loading. All the tested specimens
exhibited an initial increase in deflection during the early cycles, followed by a stable region
in which the deflection progressed gradually during cyclic loading. For instance, the
deflection of specimen EBL-S3 for Pmax increased from 4.81 mm (deflection range Δδ = 1.95
mm) at the first cycle to 6.28 mm at 0.5 million cycles (Δδ = 2.26 mm) to reach 7.05 mm at 6
million cycles (Δδ = 2.31 mm). This represents a total increase of about 47%, where the
initial increase during the first 0.5 million cycles alone represents about 31%. This clearly
reflects severe degradation of the beam’s stiffness in the first 0.5 million cycles. Comparing
the control beams, it can be observed that the deflection of CON-S1 increased at a higher rate
than the other specimens. This can be attributed to a higher applied stress range.
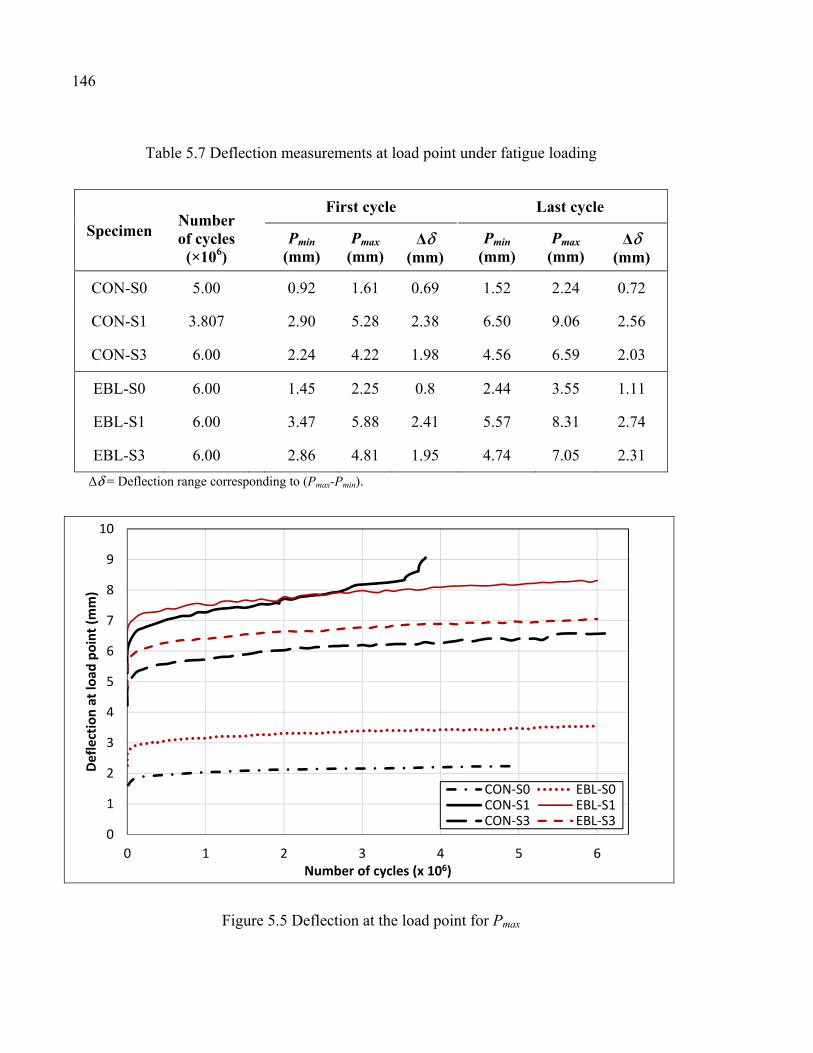
146
Table 5.7 Deflection measurements at load point under fatigue loading
Specimen Number of cycles
(×106)
First cycle Last cycle
Pmin
(mm)
Pmax (mm)
Δδ (mm)
Pmin (mm)
Pmax (mm)
Δδ (mm)
CON-S0 5.00 0.92 1.61 0.69 1.52 2.24 0.72
CON-S1 3.807 2.90 5.28 2.38 6.50 9.06 2.56
CON-S3 6.00 2.24 4.22 1.98 4.56 6.59 2.03
EBL-S0 6.00 1.45 2.25 0.8 2.44 3.55 1.11
EBL-S1 6.00 3.47 5.88 2.41 5.57 8.31 2.74
EBL-S3 6.00 2.86 4.81 1.95 4.74 7.05 2.31
Δδ = Deflection range corresponding to (Pmax-Pmin).
Figure 5.5 Deflection at the load point for Pmax
0
1
2
3
4
5
6
7
8
9
10
0 1 2 3 4 5 6
Defle
ctio
n at
load
poi
nt (m
m)
Number of cycles (x 106)
CON-S0 EBL-S0CON-S1 EBL-S1CON-S3 EBL-S3
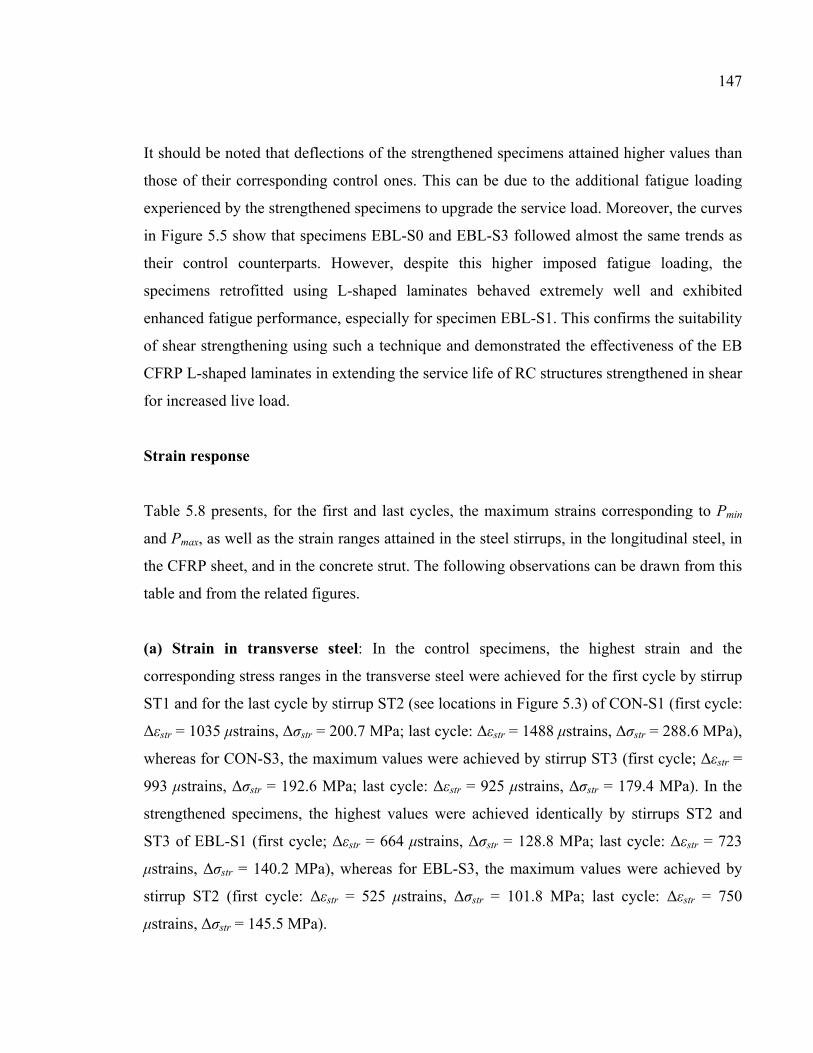
147
It should be noted that deflections of the strengthened specimens attained higher values than
those of their corresponding control ones. This can be due to the additional fatigue loading
experienced by the strengthened specimens to upgrade the service load. Moreover, the curves
in Figure 5.5 show that specimens EBL-S0 and EBL-S3 followed almost the same trends as
their control counterparts. However, despite this higher imposed fatigue loading, the
specimens retrofitted using L-shaped laminates behaved extremely well and exhibited
enhanced fatigue performance, especially for specimen EBL-S1. This confirms the suitability
of shear strengthening using such a technique and demonstrated the effectiveness of the EB
CFRP L-shaped laminates in extending the service life of RC structures strengthened in shear
for increased live load.
Strain response
Table 5.8 presents, for the first and last cycles, the maximum strains corresponding to Pmin
and Pmax, as well as the strain ranges attained in the steel stirrups, in the longitudinal steel, in
the CFRP sheet, and in the concrete strut. The following observations can be drawn from this
table and from the related figures.
(a) Strain in transverse steel: In the control specimens, the highest strain and the
corresponding stress ranges in the transverse steel were achieved for the first cycle by stirrup
ST1 and for the last cycle by stirrup ST2 (see locations in Figure 5.3) of CON-S1 (first cycle:
Δεstr = 1035 μstrains, Δσstr = 200.7 MPa; last cycle: Δεstr = 1488 μstrains, Δσstr = 288.6 MPa),
whereas for CON-S3, the maximum values were achieved by stirrup ST3 (first cycle; Δεstr =
993 μstrains, Δσstr = 192.6 MPa; last cycle: Δεstr = 925 μstrains, Δσstr = 179.4 MPa). In the
strengthened specimens, the highest values were achieved identically by stirrups ST2 and
ST3 of EBL-S1 (first cycle; Δεstr = 664 μstrains, Δσstr = 128.8 MPa; last cycle: Δεstr = 723
μstrains, Δσstr = 140.2 MPa), whereas for EBL-S3, the maximum values were achieved by
stirrup ST2 (first cycle: Δεstr = 525 μstrains, Δσstr = 101.8 MPa; last cycle: Δεstr = 750
μstrains, Δσstr = 145.5 MPa).
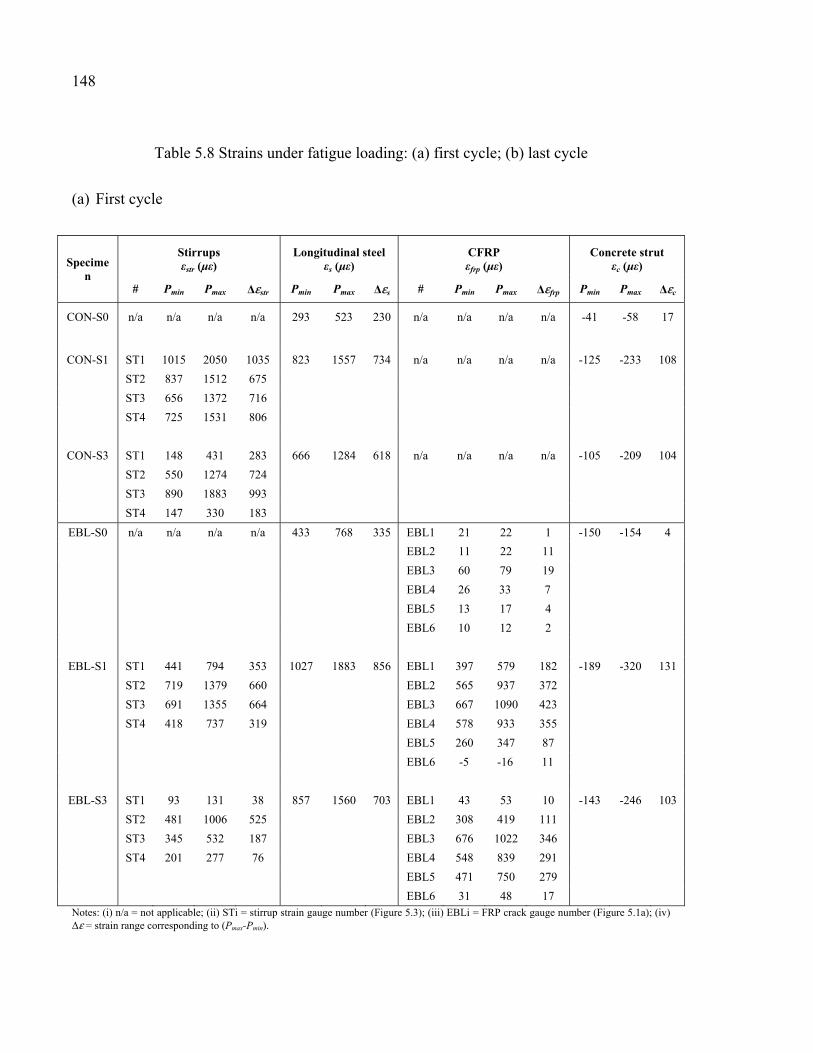
148
Table 5.8 Strains under fatigue loading: (a) first cycle; (b) last cycle
(a) First cycle
Specimen
Stirrups εstr (με)
Longitudinal steel εs (με)
CFRP εfrp (με)
Concrete strut εc (με)
# Pmin Pmax Δεstr Pmin Pmax Δεs # Pmin Pmax Δεfrp Pmin Pmax Δεc
CON-S0 n/a n/a n/a n/a 293 523 230 n/a n/a n/a n/a -41 -58 17
CON-S1 ST1 1015 2050 1035 823 1557 734 n/a n/a n/a n/a -125 -233 108
ST2 837 1512 675
ST3 656 1372 716
ST4 725 1531 806
CON-S3 ST1 148 431 283 666 1284 618 n/a n/a n/a n/a -105 -209 104
ST2 550 1274 724
ST3 890 1883 993
ST4 147 330 183
EBL-S0 n/a n/a n/a n/a 433 768 335 EBL1 21 22 1 -150 -154 4
EBL2 11 22 11
EBL3 60 79 19
EBL4 26 33 7
EBL5 13 17 4
EBL6 10 12 2
EBL-S1 ST1 441 794 353 1027 1883 856 EBL1 397 579 182 -189 -320 131
ST2 719 1379 660 EBL2 565 937 372
ST3 691 1355 664 EBL3 667 1090 423
ST4 418 737 319 EBL4 578 933 355
EBL5 260 347 87
EBL6 -5 -16 11
EBL-S3 ST1 93 131 38 857 1560 703 EBL1 43 53 10 -143 -246 103
ST2 481 1006 525 EBL2 308 419 111
ST3 345 532 187 EBL3 676 1022 346
ST4 201 277 76 EBL4 548 839 291
EBL5 471 750 279
EBL6 31 48 17 Notes: (i) n/a = not applicable; (ii) STi = stirrup strain gauge number (Figure 5.3); (iii) EBLi = FRP crack gauge number (Figure 5.1a); (iv) Δε = strain range corresponding to (Pmax-Pmin).
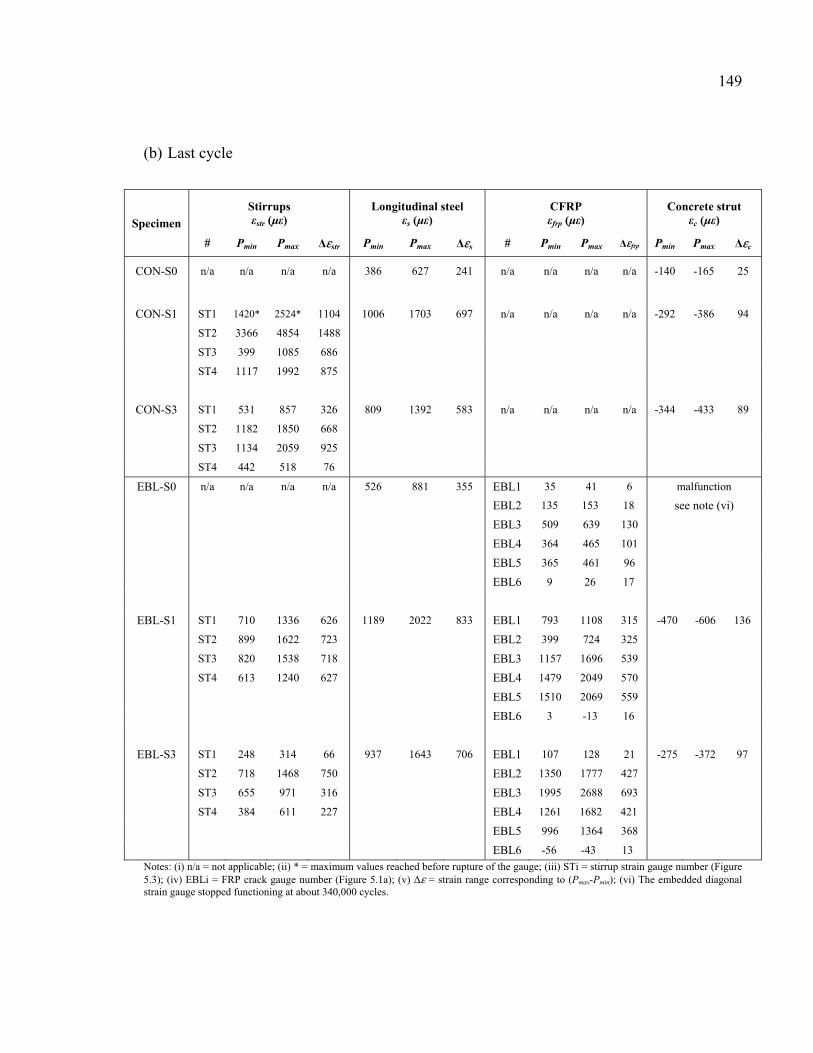
149
(b) Last cycle
Specimen
Stirrups εstr (με)
Longitudinal steel εs (με)
CFRP εfrp (με)
Concrete strut εc (με)
# Pmin Pmax Δεstr Pmin Pmax Δεs # Pmin Pmax Δεfrp Pmin Pmax Δεc
CON-S0 n/a n/a n/a n/a 386 627 241 n/a n/a n/a n/a -140 -165 25
CON-S1 ST1 1420* 2524* 1104 1006 1703 697 n/a n/a n/a n/a -292 -386 94
ST2 3366 4854 1488
ST3 399 1085 686
ST4 1117 1992 875
CON-S3 ST1 531 857 326 809 1392 583 n/a n/a n/a n/a -344 -433 89
ST2 1182 1850 668
ST3 1134 2059 925
ST4 442 518 76
EBL-S0 n/a n/a n/a n/a 526 881 355 EBL1 35 41 6 malfunction
EBL2 135 153 18 see note (vi)
EBL3 509 639 130
EBL4 364 465 101
EBL5 365 461 96
EBL6 9 26 17
EBL-S1 ST1 710 1336 626 1189 2022 833 EBL1 793 1108 315 -470 -606 136
ST2 899 1622 723 EBL2 399 724 325
ST3 820 1538 718 EBL3 1157 1696 539
ST4 613 1240 627 EBL4 1479 2049 570
EBL5 1510 2069 559
EBL6 3 -13 16
EBL-S3 ST1 248 314 66 937 1643 706 EBL1 107 128 21 -275 -372 97
ST2 718 1468 750 EBL2 1350 1777 427
ST3 655 971 316 EBL3 1995 2688 693
ST4 384 611 227 EBL4 1261 1682 421
EBL5 996 1364 368
EBL6 -56 -43 13
Notes: (i) n/a = not applicable; (ii) * = maximum values reached before rupture of the gauge; (iii) STi = stirrup strain gauge number (Figure 5.3); (iv) EBLi = FRP crack gauge number (Figure 5.1a); (v) Δε = strain range corresponding to (Pmax-Pmin); (vi) The embedded diagonal strain gauge stopped functioning at about 340,000 cycles.
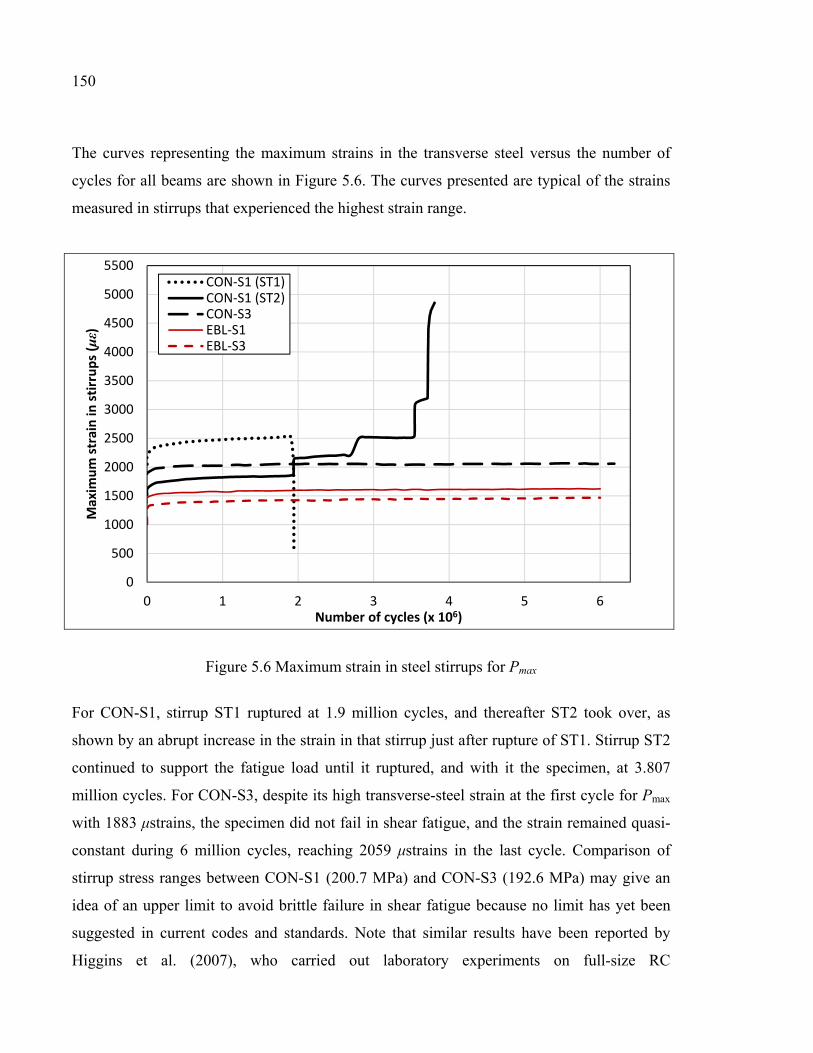
150
The curves representing the maximum strains in the transverse steel versus the number of
cycles for all beams are shown in Figure 5.6. The curves presented are typical of the strains
measured in stirrups that experienced the highest strain range.
Figure 5.6 Maximum strain in steel stirrups for Pmax
For CON-S1, stirrup ST1 ruptured at 1.9 million cycles, and thereafter ST2 took over, as
shown by an abrupt increase in the strain in that stirrup just after rupture of ST1. Stirrup ST2
continued to support the fatigue load until it ruptured, and with it the specimen, at 3.807
million cycles. For CON-S3, despite its high transverse-steel strain at the first cycle for Pmax
with 1883 μstrains, the specimen did not fail in shear fatigue, and the strain remained quasi-
constant during 6 million cycles, reaching 2059 μstrains in the last cycle. Comparison of
stirrup stress ranges between CON-S1 (200.7 MPa) and CON-S3 (192.6 MPa) may give an
idea of an upper limit to avoid brittle failure in shear fatigue because no limit has yet been
suggested in current codes and standards. Note that similar results have been reported by
Higgins et al. (2007), who carried out laboratory experiments on full-size RC
0
500
1000
1500
2000
2500
3000
3500
4000
4500
5000
5500
0 1 2 3 4 5 6
Max
imum
stra
in in
stirr
ups
(με)
Number of cycles (x 106)
CON-S1 (ST1)CON-S1 (ST2)CON-S3EBL-S1EBL-S3
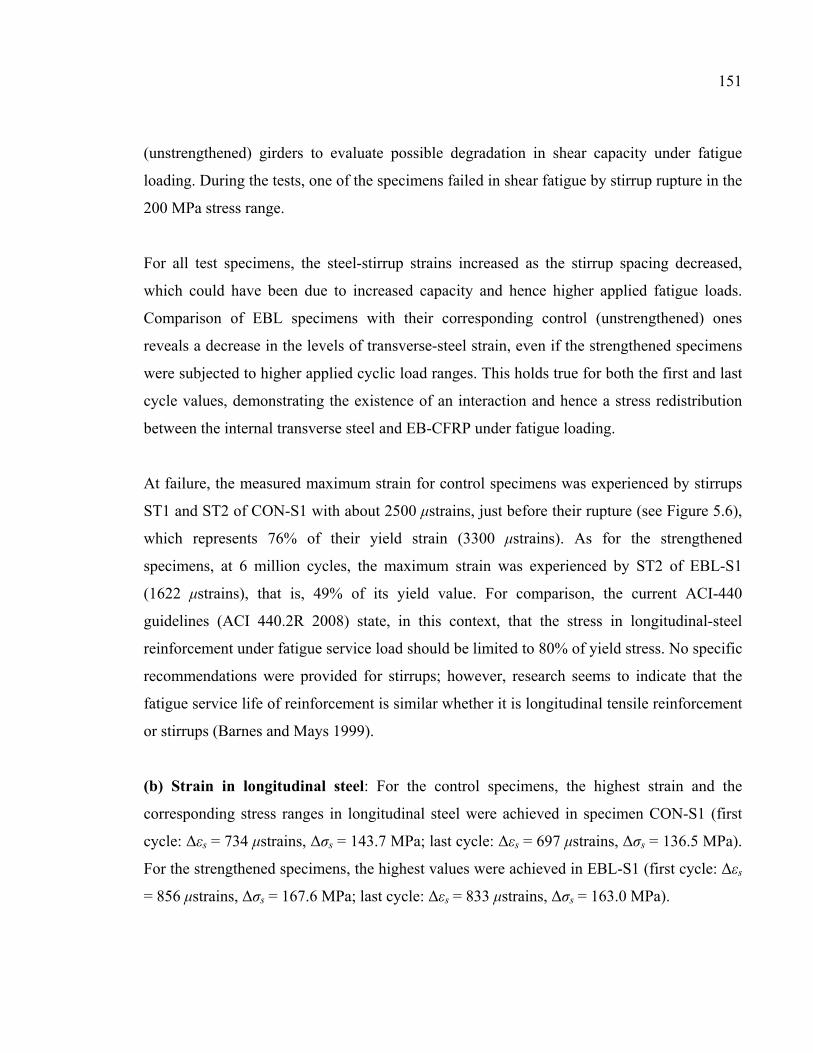
151
(unstrengthened) girders to evaluate possible degradation in shear capacity under fatigue
loading. During the tests, one of the specimens failed in shear fatigue by stirrup rupture in the
200 MPa stress range.
For all test specimens, the steel-stirrup strains increased as the stirrup spacing decreased,
which could have been due to increased capacity and hence higher applied fatigue loads.
Comparison of EBL specimens with their corresponding control (unstrengthened) ones
reveals a decrease in the levels of transverse-steel strain, even if the strengthened specimens
were subjected to higher applied cyclic load ranges. This holds true for both the first and last
cycle values, demonstrating the existence of an interaction and hence a stress redistribution
between the internal transverse steel and EB-CFRP under fatigue loading.
At failure, the measured maximum strain for control specimens was experienced by stirrups
ST1 and ST2 of CON-S1 with about 2500 μstrains, just before their rupture (see Figure 5.6),
which represents 76% of their yield strain (3300 μstrains). As for the strengthened
specimens, at 6 million cycles, the maximum strain was experienced by ST2 of EBL-S1
(1622 μstrains), that is, 49% of its yield value. For comparison, the current ACI-440
guidelines (ACI 440.2R 2008) state, in this context, that the stress in longitudinal-steel
reinforcement under fatigue service load should be limited to 80% of yield stress. No specific
recommendations were provided for stirrups; however, research seems to indicate that the
fatigue service life of reinforcement is similar whether it is longitudinal tensile reinforcement
or stirrups (Barnes and Mays 1999).
(b) Strain in longitudinal steel: For the control specimens, the highest strain and the
corresponding stress ranges in longitudinal steel were achieved in specimen CON-S1 (first
cycle: Δεs = 734 μstrains, Δσs = 143.7 MPa; last cycle: Δεs = 697 μstrains, Δσs = 136.5 MPa).
For the strengthened specimens, the highest values were achieved in EBL-S1 (first cycle: Δεs
= 856 μstrains, Δσs = 167.6 MPa; last cycle: Δεs = 833 μstrains, Δσs = 163.0 MPa).
152
The recorded strains for longitudinal steel are presented in Figure 5.7. As for all the test
specimens, there was no significant increase in strain as the number of cycles increased. This
was due to the relatively high flexural capacity of the tested specimens compared with their
shear capacity.
Figure 5.7 Longitudinal steel strain at the load point for Pmax
For CON-S1, even if the longitudinal steel was heavily strained for Pmax (1557 μstrains at
first cycle to 1703 μstrains at last cycle before failure), the specimen failed in shear fatigue
and not in flexure, and the strain remained quasi-constant during the 3.807M loading cycles.
Moreover, the stress range corresponding to the first cycle (Δσs = 143.7 MPa) was greater
than the upper limits of 125 MPa and 138 MPa specified by standards CSA S6 (2006) and
ACI 215R (1974) respectively, but was within the upper limit of 162 MPa specified by
AASHTO (2010) (Kim and Heffernan 2008) for fatigue limit-state design for
(unstrengthened) RC members.
0
500
1000
1500
2000
2500
0 1 2 3 4 5 6
Long
itudi
nal s
teel
stra
ins (με)
Number of cycles (x 106)
CON-S0CON-S1CON-S3EBL-S0EBL-S1EBL-S3
153
For the EBL specimens, the longitudinal strains were greater than those of the control
specimens due to the extra fatigue loading imposed on the strengthened specimens to
upgrade the service load (Figure 5.7). Note that specimen EBL-S1 did not fail in fatigue and
endured 6 million cycles despite its high longitudinal-steel strain for Pmax (1883 μstrains at
first cycle to 2022 μstrains at 6 million cycles). In fact, the strain remained quasi-constant
during 6 million cycles, even if the corresponding first-cycle stress range (Δσs = 167.6 MPa)
exceeded the upper limits specified by the codes. This also holds true for specimen EBL-S3,
where the longitudinal-steel strain for Pmax varied from 1560 μstrains at the first cycle to
1643 μstrains at 6 million cycles, and the stress range in the first cycle corresponded to Δσs =
137.7 MPa.
(c) Strain in CFRP: The highest strain range in CFRP for EBL specimens in the first cycle
was achieved by laminate EBL3 of EBL-S1 (Δεfrp = 423 μstrains), whereas for specimens
EBL-S3 and EBL-S0, the maximum values were 346 μstrains and 19 μstrains respectively
(see locations of laminates in Figure 5.1). At 6 million loading cycles, the maximum
measured strain range shifted to laminate EBL4 for EBL-S1 (570 μstrains) and remained in
EBL3 for EBL-S3 (693 μstrains) and EBL-S0 (130 μstrains). The highest CFRP strains
recorded for Pmax were equal to 1090 μstrains in the first cycle and 2688 μstrains in the last
cycle (Table 5.8). Note that for all the test specimens, the maximum strain and strain range
measured in CFRP were in agreement with the maximum threshold values of 0.2% and
0.04% respectively (i.e., corresponding to the first cycle), as suggested by Czaderski and
Motavalli (2004) for the L-shaped CFRP shear-strengthening system that they studied.
The measured CFRP strains versus the number of cycles for all test specimens are illustrated
in Figure 5.8. The curves shown are typical of the measured CFRP strains and correspond to
the crack gauges that measured the highest strains in the CFRP L-shaped laminates, as
presented earlier. The response is characterized by a rapid increase in strain during the early
cycles, followed by a stable region in which the strain remains relatively constant for more
than 6 million fatigue loading cycles. The fact that no sign of failure due to debonding was
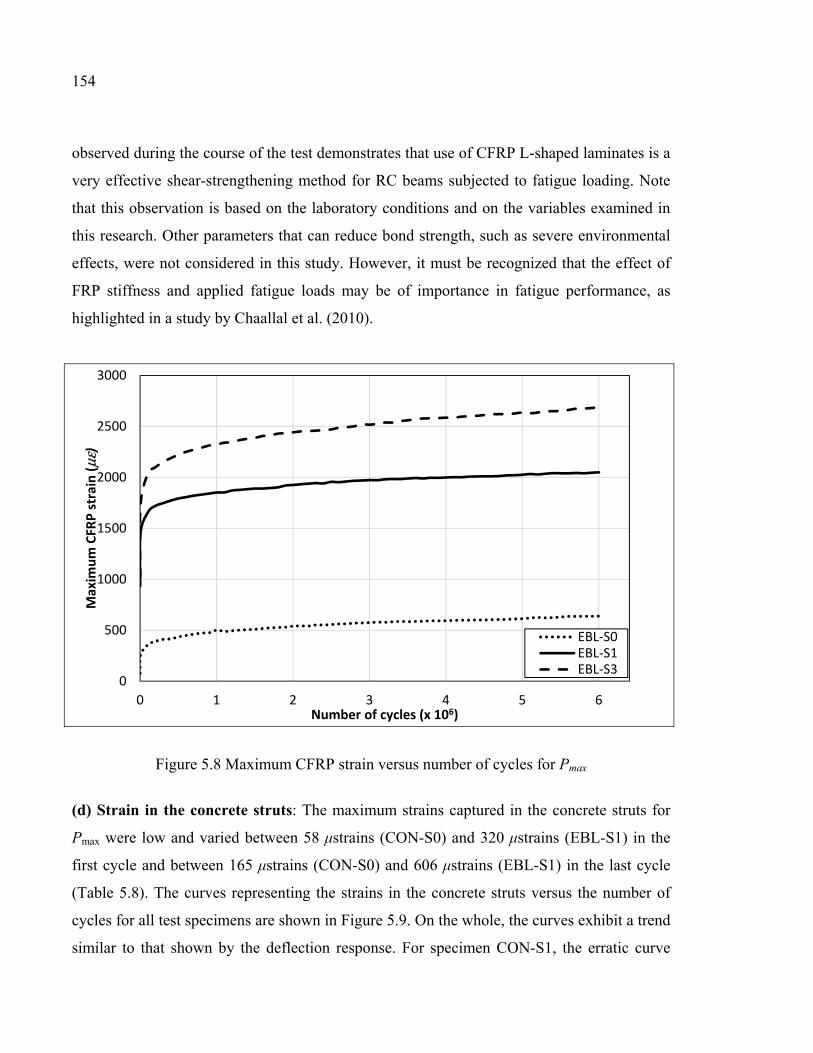
154
observed during the course of the test demonstrates that use of CFRP L-shaped laminates is a
very effective shear-strengthening method for RC beams subjected to fatigue loading. Note
that this observation is based on the laboratory conditions and on the variables examined in
this research. Other parameters that can reduce bond strength, such as severe environmental
effects, were not considered in this study. However, it must be recognized that the effect of
FRP stiffness and applied fatigue loads may be of importance in fatigue performance, as
highlighted in a study by Chaallal et al. (2010).
Figure 5.8 Maximum CFRP strain versus number of cycles for Pmax
(d) Strain in the concrete struts: The maximum strains captured in the concrete struts for
Pmax were low and varied between 58 μstrains (CON-S0) and 320 μstrains (EBL-S1) in the
first cycle and between 165 μstrains (CON-S0) and 606 μstrains (EBL-S1) in the last cycle
(Table 5.8). The curves representing the strains in the concrete struts versus the number of
cycles for all test specimens are shown in Figure 5.9. On the whole, the curves exhibit a trend
similar to that shown by the deflection response. For specimen CON-S1, the erratic curve
0
500
1000
1500
2000
2500
3000
0 1 2 3 4 5 6
Max
imum
CFR
P st
rain
(με)
Number of cycles (x 106)
EBL-S0EBL-S1EBL-S3
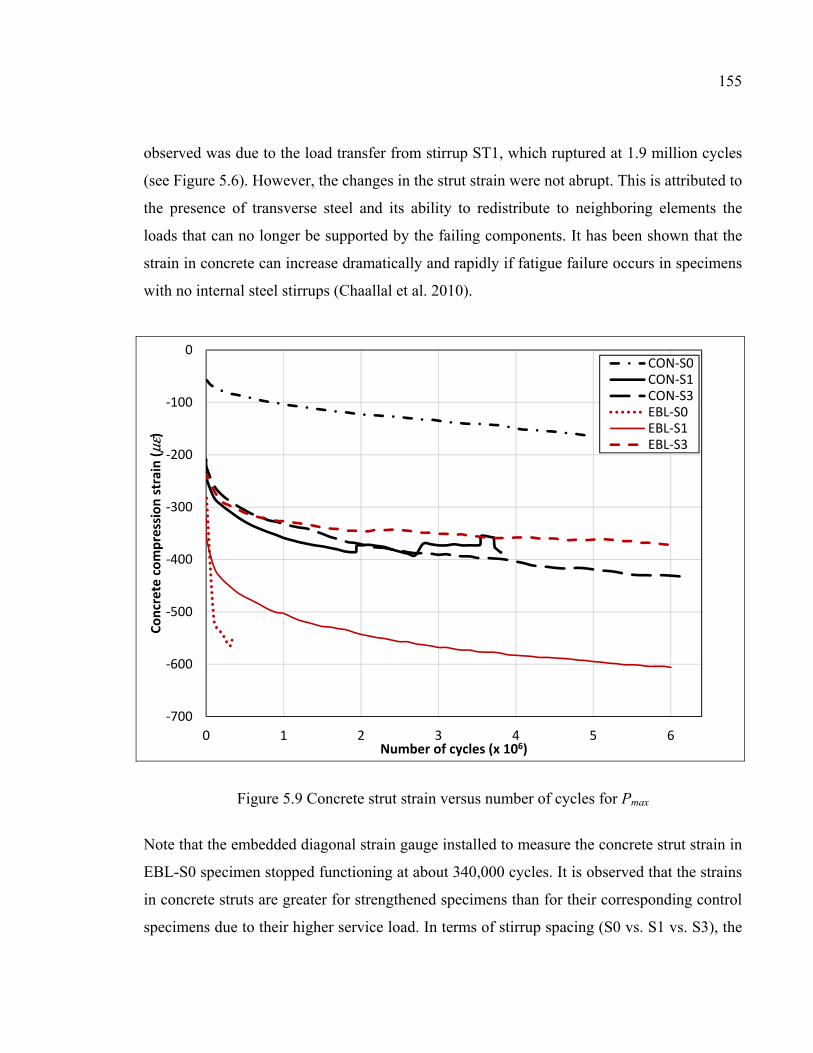
155
observed was due to the load transfer from stirrup ST1, which ruptured at 1.9 million cycles
(see Figure 5.6). However, the changes in the strut strain were not abrupt. This is attributed to
the presence of transverse steel and its ability to redistribute to neighboring elements the
loads that can no longer be supported by the failing components. It has been shown that the
strain in concrete can increase dramatically and rapidly if fatigue failure occurs in specimens
with no internal steel stirrups (Chaallal et al. 2010).
Figure 5.9 Concrete strut strain versus number of cycles for Pmax
Note that the embedded diagonal strain gauge installed to measure the concrete strut strain in
EBL-S0 specimen stopped functioning at about 340,000 cycles. It is observed that the strains
in concrete struts are greater for strengthened specimens than for their corresponding control
specimens due to their higher service load. In terms of stirrup spacing (S0 vs. S1 vs. S3), the
-700
-600
-500
-400
-300
-200
-100
0
0 1 2 3 4 5 6
Conc
rete
com
pres
sion
str
ain
(με)
Number of cycles (x 106)
CON-S0CON-S1CON-S3EBL-S0EBL-S1EBL-S3
156
concrete compressive strains are greater when stirrups are present due to increased shear
capacity and hence higher applied fatigue loading. In addition, the strut-strain ranges of
series S1 specimens (s = d/2) showed greater (absolute) values than specimens of series S3 (s
= 3d/4).
5.4.4 Cumulative fatigue degradation
Figure 5.10 presents the cyclic deflection response with the number of cycles at regular 0.5M
cycle intervals. The purpose of this illustration is to visualize the evolution of stiffness
degradation and the rate of damage and hence to obtain insight into cumulative fatigue
damage as service life progresses. Cumulative degradation is an important aspect of
strengthening because it impacts the serviceability of the strengthened beams.
In all specimens, most of the degradation took place in the first interval between the first and
second loops (i.e., between the first cycle and 0.5 million cycles) and also in the last interval
before failure (CON-S1). Therefore, this way of presenting cumulative degradation can also
be an interesting tool to foresee imminent fatigue failure. Considering the steel-stirrup
spacing effect (S1 vs. S3), it is apparent that Series S1 specimens (smaller stirrup spacing,
hence greater stress range) experienced more cumulative damage than specimens of Series
S3 (subjected to a lesser stress range).
Comparing the strengthened specimens to their corresponding control ones, it can be
observed from Fig. 5.10 that the unstrengthened beams exhibited enhanced fatigue
performance after they were strengthened in shear with EB-CFRP. This confirms the
suitability of using the L-shaped laminate strengthening technique to extend the service life
of existing RC structures subjected to fatigue loading. In fact, Table 5.9 shows that the
fatigue life of EBL-S1 (which reached 6 million cycles with no failure) increased by at least
58% with respect to CON-S1 (which failed in shear fatigue at 3.807 million cycles), even if
EBL-S1 was subjected to a greater fatigue loading (about an 8% increase). This increase in
fatigue life was due to a decrease in the stirrup stress level, taking into account the stress
redistribution between the EB FRP and the internal shear reinforcement. As for EBL-S3, it is
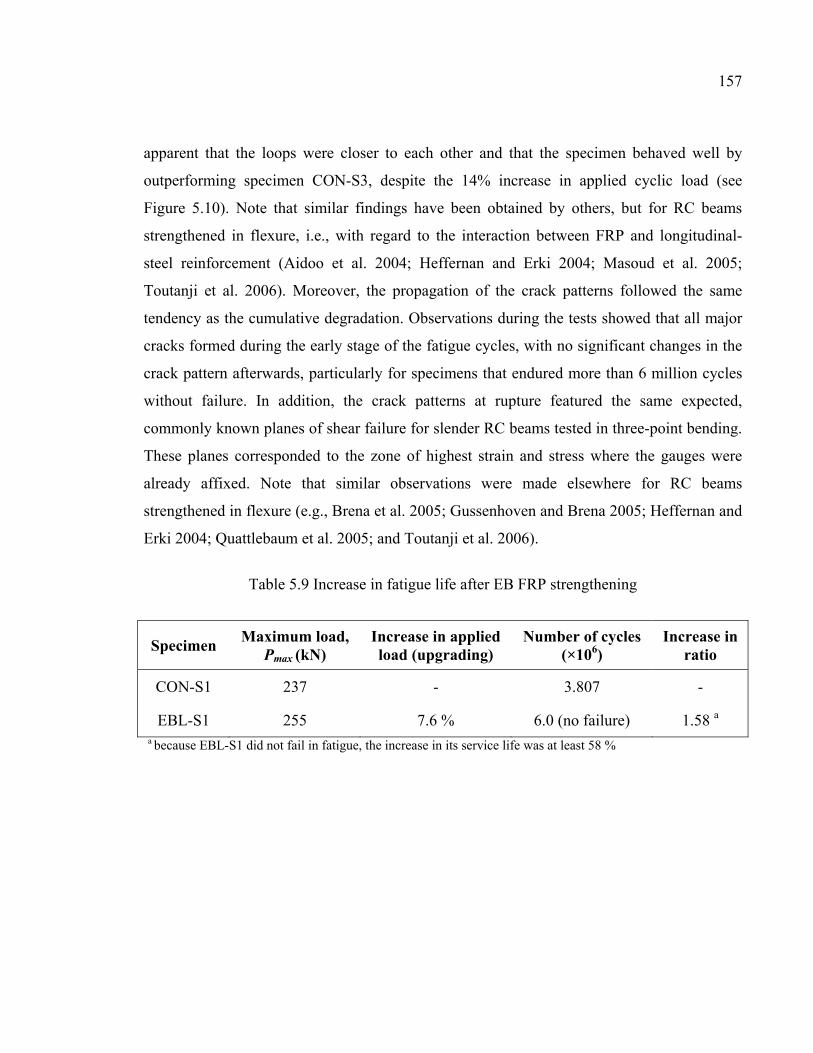
157
apparent that the loops were closer to each other and that the specimen behaved well by
outperforming specimen CON-S3, despite the 14% increase in applied cyclic load (see
Figure 5.10). Note that similar findings have been obtained by others, but for RC beams
strengthened in flexure, i.e., with regard to the interaction between FRP and longitudinal-
steel reinforcement (Aidoo et al. 2004; Heffernan and Erki 2004; Masoud et al. 2005;
Toutanji et al. 2006). Moreover, the propagation of the crack patterns followed the same
tendency as the cumulative degradation. Observations during the tests showed that all major
cracks formed during the early stage of the fatigue cycles, with no significant changes in the
crack pattern afterwards, particularly for specimens that endured more than 6 million cycles
without failure. In addition, the crack patterns at rupture featured the same expected,
commonly known planes of shear failure for slender RC beams tested in three-point bending.
These planes corresponded to the zone of highest strain and stress where the gauges were
already affixed. Note that similar observations were made elsewhere for RC beams
strengthened in flexure (e.g., Brena et al. 2005; Gussenhoven and Brena 2005; Heffernan and
Erki 2004; Quattlebaum et al. 2005; and Toutanji et al. 2006).
Table 5.9 Increase in fatigue life after EB FRP strengthening
Specimen Maximum load,
Pmax (kN) Increase in applied load (upgrading)
Number of cycles (×106)
Increase in ratio
CON-S1 237 - 3.807 -
EBL-S1 255 7.6 % 6.0 (no failure) 1.58 a a because EBL-S1 did not fail in fatigue, the increase in its service life was at least 58 %
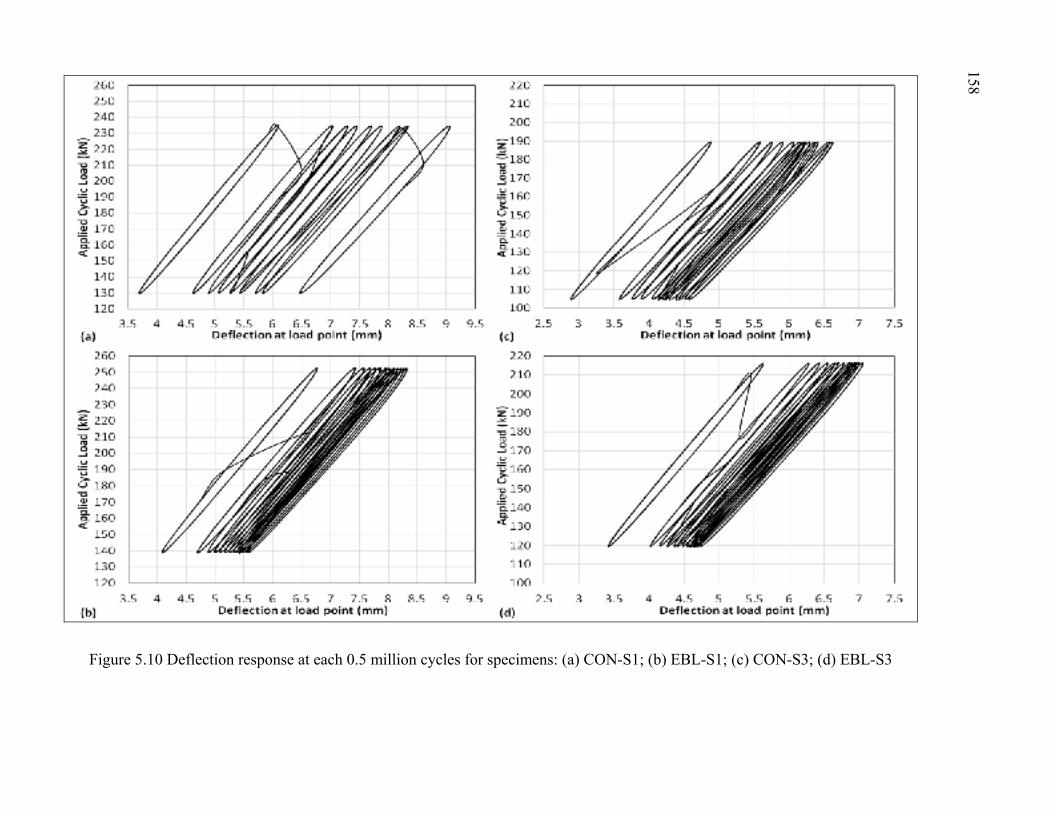
Figure 5.10 Deflection response at each 0.5 million cycles for specimens: (a) CON-S1; (b) EBL-S1; (c) CON-S3; (d) EBL-S3
158
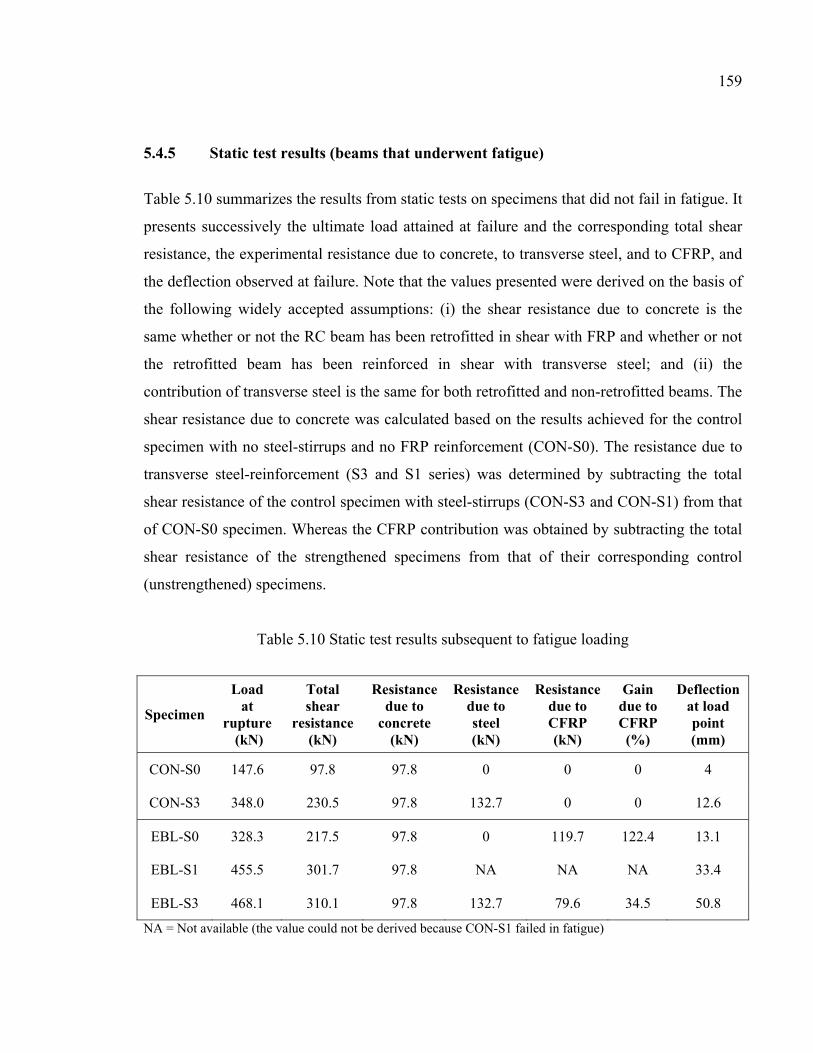
159
5.4.5 Static test results (beams that underwent fatigue)
Table 5.10 summarizes the results from static tests on specimens that did not fail in fatigue. It
presents successively the ultimate load attained at failure and the corresponding total shear
resistance, the experimental resistance due to concrete, to transverse steel, and to CFRP, and
the deflection observed at failure. Note that the values presented were derived on the basis of
the following widely accepted assumptions: (i) the shear resistance due to concrete is the
same whether or not the RC beam has been retrofitted in shear with FRP and whether or not
the retrofitted beam has been reinforced in shear with transverse steel; and (ii) the
contribution of transverse steel is the same for both retrofitted and non-retrofitted beams. The
shear resistance due to concrete was calculated based on the results achieved for the control
specimen with no steel-stirrups and no FRP reinforcement (CON-S0). The resistance due to
transverse steel-reinforcement (S3 and S1 series) was determined by subtracting the total
shear resistance of the control specimen with steel-stirrups (CON-S3 and CON-S1) from that
of CON-S0 specimen. Whereas the CFRP contribution was obtained by subtracting the total
shear resistance of the strengthened specimens from that of their corresponding control
(unstrengthened) specimens.
Table 5.10 Static test results subsequent to fatigue loading
Specimen
Load at
rupture (kN)
Total shear
resistance (kN)
Resistance due to
concrete (kN)
Resistance due to steel (kN)
Resistance due to CFRP (kN)
Gain due to CFRP (%)
Deflection at load point (mm)
CON-S0 147.6 97.8 97.8 0 0 0 4
CON-S3 348.0 230.5 97.8 132.7 0 0 12.6
EBL-S0 328.3 217.5 97.8 0 119.7 122.4 13.1
EBL-S1 455.5 301.7 97.8 NA NA NA 33.4
EBL-S3 468.1 310.1 97.8 132.7 79.6 34.5 50.8
NA = Not available (the value could not be derived because CON-S1 failed in fatigue)
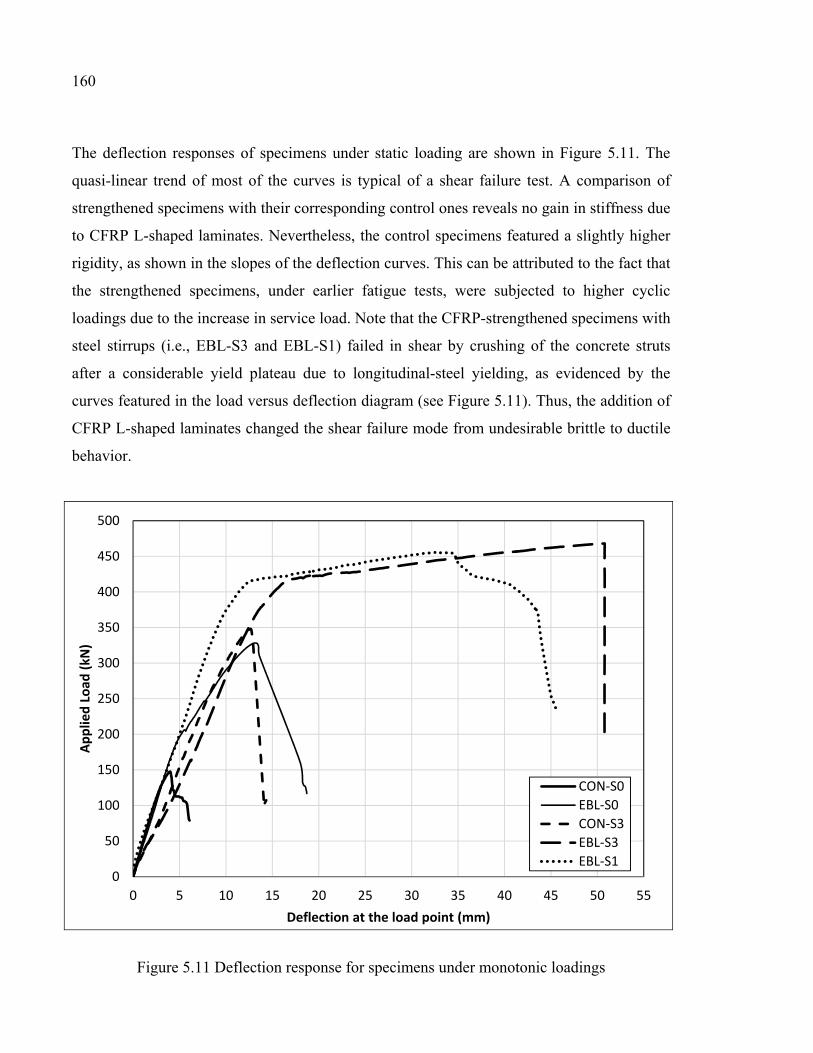
160
The deflection responses of specimens under static loading are shown in Figure 5.11. The
quasi-linear trend of most of the curves is typical of a shear failure test. A comparison of
strengthened specimens with their corresponding control ones reveals no gain in stiffness due
to CFRP L-shaped laminates. Nevertheless, the control specimens featured a slightly higher
rigidity, as shown in the slopes of the deflection curves. This can be attributed to the fact that
the strengthened specimens, under earlier fatigue tests, were subjected to higher cyclic
loadings due to the increase in service load. Note that the CFRP-strengthened specimens with
steel stirrups (i.e., EBL-S3 and EBL-S1) failed in shear by crushing of the concrete struts
after a considerable yield plateau due to longitudinal-steel yielding, as evidenced by the
curves featured in the load versus deflection diagram (see Figure 5.11). Thus, the addition of
CFRP L-shaped laminates changed the shear failure mode from undesirable brittle to ductile
behavior.
Figure 5.11 Deflection response for specimens under monotonic loadings
0
50
100
150
200
250
300
350
400
450
500
0 5 10 15 20 25 30 35 40 45 50 55
Appl
ied
Load
(kN
)
Deflection at the load point (mm)
CON-S0EBL-S0CON-S3EBL-S3EBL-S1
161
Comparison of the retrofitted beams with their corresponding control ones reveals an
increase in beam shear capacity due to CFRP. In fact, Table 5.10 shows that the gain
attributed to CFRP is 122.4% for EBL-S0 (from 97.8 kN for CON-S0 to 217.5 kN), whereas
for EBL-S3, the gain is 34.5% (from 230.5 kN for CON-S3 to 310.1 kN). This demonstrates
the potential of CFRP L-shaped laminates to enhance the shear performance of strengthened
RC T-beams.
In addition, it is clear that the presence of transverse steel in strengthened beams resulted in a
substantial reduction of the gain in shear resistance due to CFRP. Indeed, a comparison
between specimens EBL-S3 and EBL-S0 (with the same amount of applied FRP material)
showed that the presence of internal stirrups reduced the gain from 122.4% to 34.5% (from
119.7 kN to 79.6 kN). In other words, the contribution of CFRP did not increase the shear
capacity of RC beams with stirrups at the same return ratio as for specimens with no stirrups.
This confirms the existence of an interaction between transverse steel and EB-CFRP under
static loading, as observed by other researchers since 2002 (Bousselham and Chaallal 2004;
Chaallal et al. 2002; Pellegrino and Modena 2002), but not yet captured in the guidelines.
5.5 Conclusions
On the basis of the results of the present investigation, the following conclusions can be
drawn:
1. Specimens strengthened in shear with CFRP L-shaped laminates behaved extremely well
by outperforming their control counterparts. Despite the high fatigue loading they
experienced, their performance demonstrated the feasibility of using this technique to
extend the service life of RC beams subjected to fatigue loading for increased live load;
2. The overall response exhibited a typical trend of cumulative fatigue degradation, which
was characterized by an accelerated rate of damage propagation during the early cycles,
followed by a stable phase in which the damage accumulation slowed significantly;
162
3. Comparison of the stirrup strain ranges of unstrengthened specimens may provide a
guideline for an upper limit of the stress range to avoid stirrup rupture by fatigue because
no such limit has yet been recommended in the current codes and standards. Further
investigations need to be performed for this purpose;
4. Considering the steel-stirrup spacing effect, it is apparent that Series S1 specimens
experienced more cumulative damage than Series S3 specimens. However, this may be
attributed to increased capacity and hence higher applied fatigue loading;
5. Comparison of strengthened RC beams with their corresponding unstrengthened ones
reveals a decrease in steel-stirrup strains despite higher applied cyclic loads. This
demonstrates the existence of an interaction and hence a stress redistribution between
internal shear reinforcement and FRP under fatigue loading;
6. At failure, the measured maximum stress in transverse steel of CON-S1 represented 76%
of its yield stress value. The ACI-440 guidelines state that the stress in longitudinal steel
under fatigue service load should be limited to 80% of its yield stress. No specific
recommendations were provided on stirrups, but a literature review indicates that the
fatigue life of reinforcement is similar whether it is longitudinal tensile or transverse
reinforcement;
7. Specimen EBL-S1 did not fail in flexure fatigue despite its high longitudinal-steel strain,
and the strain remained quasi-constant during 6 million cycles, even though its first-cycle
stress range exceeded the upper limits for fatigue limit-state design of (unstrengthened)
RC beams as specified by standards CSA S6, ACI 215, and AASHTO LRFD;
8. The fact that no sign of failure due to debonding was observed during the course of the
test clearly demonstrates the suitability of CFRP L-shaped laminate scheme for shear-
strengthening RC beams subjected to fatigue loading;
9. The maximum strain (1090 με) and strain range (423 με) reached in CFRP are in
agreement with the maximum threshold values of 0.2% and 0.04% suggested by
Czaderski and Motavalli (2004) for the L-shaped CFRP shear-strengthening system;
10. The use of CFRP L-shaped laminates to shear-strengthen RC beams with steel stirrups
changed the failure mode from brittle to ductile behavior under static loading;
163
11. The contribution of CFRP did not increase the shear capacity of retrofitted RC beams
with steel stirrups at the same return ratio as for specimens with no stirrups, confirming
thereby the existence of an interaction between transverse steel and EB-CFRP under
static loading.
5.6 Acknowledgments
The financial support of the Natural Sciences and Engineering Research Council of Canada
(NSERC), the Fonds québécois de la recherche sur la nature et les technologies (FQRNT
Research Team Project), and the Ministère des transports du Québec (MTQ) through
operating grants is gratefully acknowledged. The authors thank Sika Canada Inc. (Pointe
Claire, Quebec) for contributing to the cost of the materials. The efficient collaboration of
John Lescelleur (senior technician) and Juan Mauricio Rios (technician) at ETS in
conducting the tests is acknowledged.

CHAPITRE 6
CYCLIC PERFORMANCE OF RC T-BEAMS STRENGTHENED IN SHEAR WITH FRP COMPOSITES: SHEETS VERSUS LAMINATES
Georges El-Saikaly and Omar Chaallal
Department of Construction Engineering, École de Technologie Supérieure,
1100 Notre-Dame St. West, Montreal, QC, Canada H3C 1K3
Paper submitted for publication in Journal of Reinforced Plastics and Composites,
Sage Publications, January 2015.
6.1 Abstract
Much existing reinforced concrete (RC) civil infrastructure worldwide is in need of shear
strengthening and rehabilitation. The use of externally bonded (EB) carbon fiber-reinforced
polymer (CFRP) sheets and laminates to strengthen deficient RC beams in shear is now an
acceptable and cost-effective practice, particularly under static loads. However, due to its
complexity, the cyclic (fatigue) behavior and performance of shear-strengthened beams is not
fully documented. Recently, use of CFRP continuous sheets wrapped over the shear length
for fatigue upgrade has been studied. This technique may present drawbacks related to
surface preparation and FRP debonding. Therefore, when possible, prefabricated CFRP L-
shaped laminates can be a cost-effective alternative because they require less surface
preparation and do not peel off easily. The objective of this paper was to present the results
of an experimental investigation that compared cyclic (fatigue) and static (post-fatigue)
behavior of two EB CFRP techniques (sheets vs. laminates) for shear retrofit of RC T-beams.
In total, six laboratory tests on full-size 4520 mm-long beams were conducted. The
specimens were subjected to fatigue loading up to 6 million load cycles at a rate of 3 Hz.
Specimens that sustained 6 million cycles were then tested monotonically up to failure. The
variables examined in the paper were: (1) the EB CFRP strengthening scheme, and (2) the
presence and ratio (spacing) of internal shear reinforcement. The test results confirmed the
effectiveness of using EB CFRP shear-strengthening methods under cyclic loading. They
166
also revealed that the fatigue performance of RC T-beams strengthened with L-shaped
laminates is significantly superior in extending fatigue life compared to corresponding T-
beams strengthened with U-wrapped sheets.
List of Keywords: Shear Strengthening; Cyclic loading; CFRP; Sheets; Laminates; RC
beams.
6.2 Introduction
Many RC bridges have either reached the end of their design service lives or were originally
designed for live loads lower than those required in current design codes. As a result, many
of these bridges are deficient in shear and are therefore in urgent need of strengthening or
rehabilitation. These structures are usually subjected to cyclic loadings well below their static
capacities. However, due to their repetitive nature, these cyclic loadings may increase the rate
of damage of RC structures by accelerating crack propagation and stiffness loss due to
cumulative fatigue degradation, compromising thereby the safety of the structure. This
situation calls for the development of innovative and cost-effective strengthening techniques
to enhance the fatigue service lives of existing RC structures.
CFRP advanced composites have been developed in recent decades, and their use for
strengthening existing RC structures is now an accepted and well-documented technology. In
particular, use of EB FRP in the form of fabrics (U-wrapped sheets) or plates (strip
laminates) has gained in popularity for shear strengthening of RC beams. These FRP
composites are generally applied externally on the side surfaces of RC beams to increase
their shear resistance. Short-term behavior of CFRP shear-strengthened RC beams subjected
to static loadings is well-documented both for experimental research and analytical design
procedures, including EB FRP sheets, EB FRP laminates, and near-surface-mounted (NSM)
FRP strips or rods (e.g., Bousselham and Chaallal 2004; 2006; 2013; Chaallal et al. 1998;
Chaallal et al. 2002; Chen and Teng 2003b; De Lorenzis and Teng 2007; Dias and Barros
2012; Khalifa and Nanni 2000; Mofidi and Chaallal 2011a; 2014; Mofidi et al. 2012b;
Mosallam and Banerjee 2007; Pellegrino and Modena 2002; Pellegrino and Vasic 2013;
167
Täljsten and Elfgren 2000). In addition to the standard straight CFRP plates, which are used
mainly for flexural strengthening, prefabricated CFRP L-shaped laminates have been
developed as a new shear strengthening technique that presents a potential alternative to
current strengthening systems. Various tests have been performed to evaluate the feasibility
of these prefabricated L-shaped laminates, but most of these were conducted under static
loading (Chen and Robertson 2004; Czaderski 2002; Meier 1998; Mofidi et al. 2014a; Mofidi
et al. 2014b).
Although a reasonable amount of research has been conducted on the long-term flexural
behavior of structures strengthened with EB CFRP composites, research data on long-term
shear behavior is very limited, particularly under fatigue. Very few investigations dealing
with RC beams shear-strengthened with CFRP under fatigue have been performed to date
(Bae et al. 2013; Chaallal et al. 2010; Czaderski and Motavalli 2004; El-Saikaly and Chaallal
2015a; El-Saikaly and Chaallal 2015b; Williams and Higgins 2008).
The conventional technique for installing FRP materials on a concrete surface is the manual
wet lay-up method using a two-component adhesive. The externally bonded FRP technique
may present some drawbacks related to surface preparation and FRP debonding. Such
debonding generally occurs at crack locations or at FRP ends and is caused by stress
concentrations and the low tensile strength of the concrete surface. FRP debonding can also
occur due to vertical displacement of concrete caused by shear cracking under repeated loads.
This may result in premature FRP debonding, which can result in brittle failure that limits the
maximum FRP strain to a value well below its ultimate strength and hence limits the
efficiency of the strengthening method. Exploratory studies have shown that if there were no
obvious debonding at the FRP/concrete interface, the fatigue performance of strengthened
RC beams could be enhanced. To understand more fully the long-term performance of
structures strengthened in shear using such application techniques, more research is therefore
needed.
168
Use of CFRP L-shaped laminates presents advantages over U-wrapped sheets. In fact, these
laminates can be easily bonded to concrete surfaces, require less workmanship for concrete
surface preparation, and have minimal effects on structural esthetics. In addition,
strengthening using these techniques seems to be a good solution to bypass premature
debonding because L-shaped laminates do not easily peel off, especially when they are
embedded into the flange of RC T-beams within the slab.
This observation has been the main impetus to carry out the present experimental research
study, which compares the fatigue and post-fatigue (static) performance and behavior of RC
T-beams shear-strengthened using two EB CFRP application methods (U-wrapped sheets
versus L-shaped laminates) and also, given the scarcity of experimental data, provides
knowledgebase information that could be useful for research as well as for fatigue design
using such strengthening techniques. The study considered a situation in which the FRP
retrofit was intended to increase the original capacity of deficient RC beams due to an
increase in projected applied load (i.e., use of CFRP to upgrade the service load). It focused
on comparing the effectiveness of both EB CFRP systems in extending the service life of RC
beams shear-strengthened for increased live load, as well as evaluating their shear
contribution to load-carrying capacity under static loading.
6.3 Experimental program
Six laboratory test specimens obtained from full-size RC T-beams were investigated in this
research study. They were subjected to fatigue loading up to 6 million load cycles. The
specimens that underwent fatigue and sustained 6 million cycles were then tested
monotonically to failure to measure their residual load-carrying capacity.
Table 6.1 presents the experimental program matrix for the test specimens. The specimens
strengthened with one-ply EB CFRP U-wrapped sheets are labeled EBS, and the specimens
strengthened with EB CFRP L-shaped laminates are labeled EBL. Each strengthening
scheme consisted of three series for various steel stirrup ratios: series S0 included specimens
with no steel stirrups, whereas series S1 and S3 consisted of specimens with transverse steel
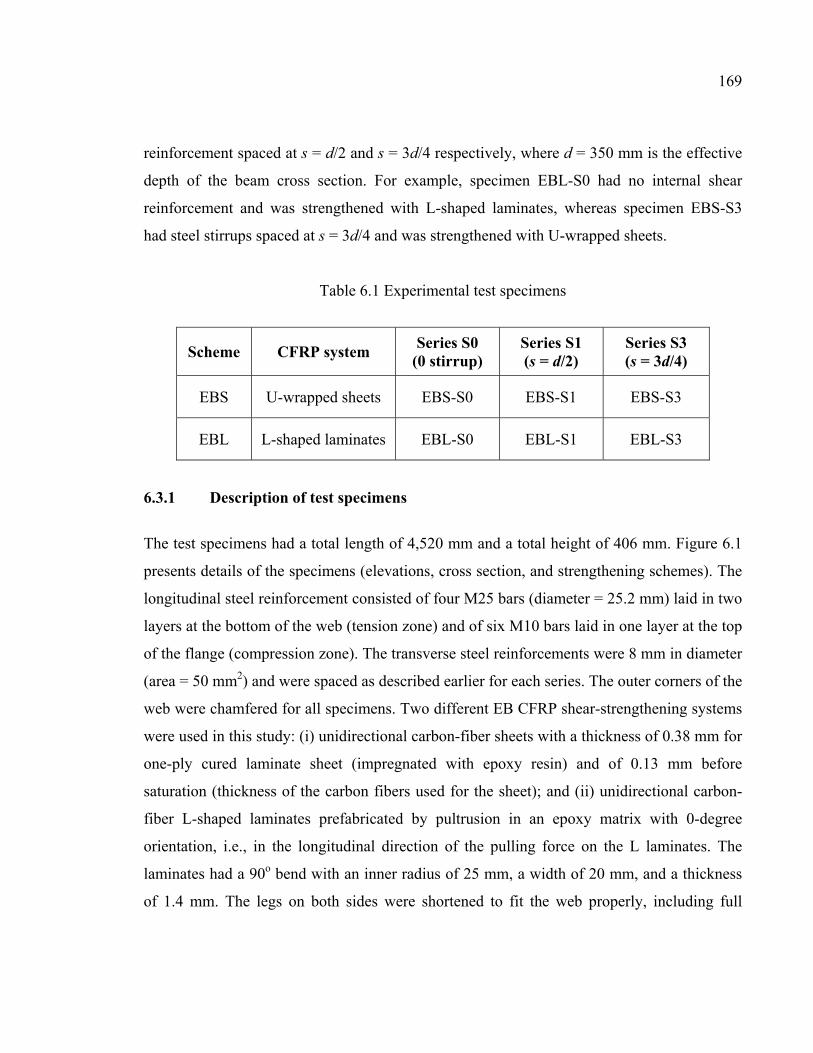
169
reinforcement spaced at s = d/2 and s = 3d/4 respectively, where d = 350 mm is the effective
depth of the beam cross section. For example, specimen EBL-S0 had no internal shear
reinforcement and was strengthened with L-shaped laminates, whereas specimen EBS-S3
had steel stirrups spaced at s = 3d/4 and was strengthened with U-wrapped sheets.
Table 6.1 Experimental test specimens
Scheme CFRP system Series S0
(0 stirrup) Series S1 (s = d/2)
Series S3 (s = 3d/4)
EBS U-wrapped sheets EBS-S0 EBS-S1 EBS-S3
EBL L-shaped laminates EBL-S0 EBL-S1 EBL-S3
6.3.1 Description of test specimens
The test specimens had a total length of 4,520 mm and a total height of 406 mm. Figure 6.1
presents details of the specimens (elevations, cross section, and strengthening schemes). The
longitudinal steel reinforcement consisted of four M25 bars (diameter = 25.2 mm) laid in two
layers at the bottom of the web (tension zone) and of six M10 bars laid in one layer at the top
of the flange (compression zone). The transverse steel reinforcements were 8 mm in diameter
(area = 50 mm2) and were spaced as described earlier for each series. The outer corners of the
web were chamfered for all specimens. Two different EB CFRP shear-strengthening systems
were used in this study: (i) unidirectional carbon-fiber sheets with a thickness of 0.38 mm for
one-ply cured laminate sheet (impregnated with epoxy resin) and of 0.13 mm before
saturation (thickness of the carbon fibers used for the sheet); and (ii) unidirectional carbon-
fiber L-shaped laminates prefabricated by pultrusion in an epoxy matrix with 0-degree
orientation, i.e., in the longitudinal direction of the pulling force on the L laminates. The
laminates had a 90o bend with an inner radius of 25 mm, a width of 20 mm, and a thickness
of 1.4 mm. The legs on both sides were shortened to fit the web properly, including full
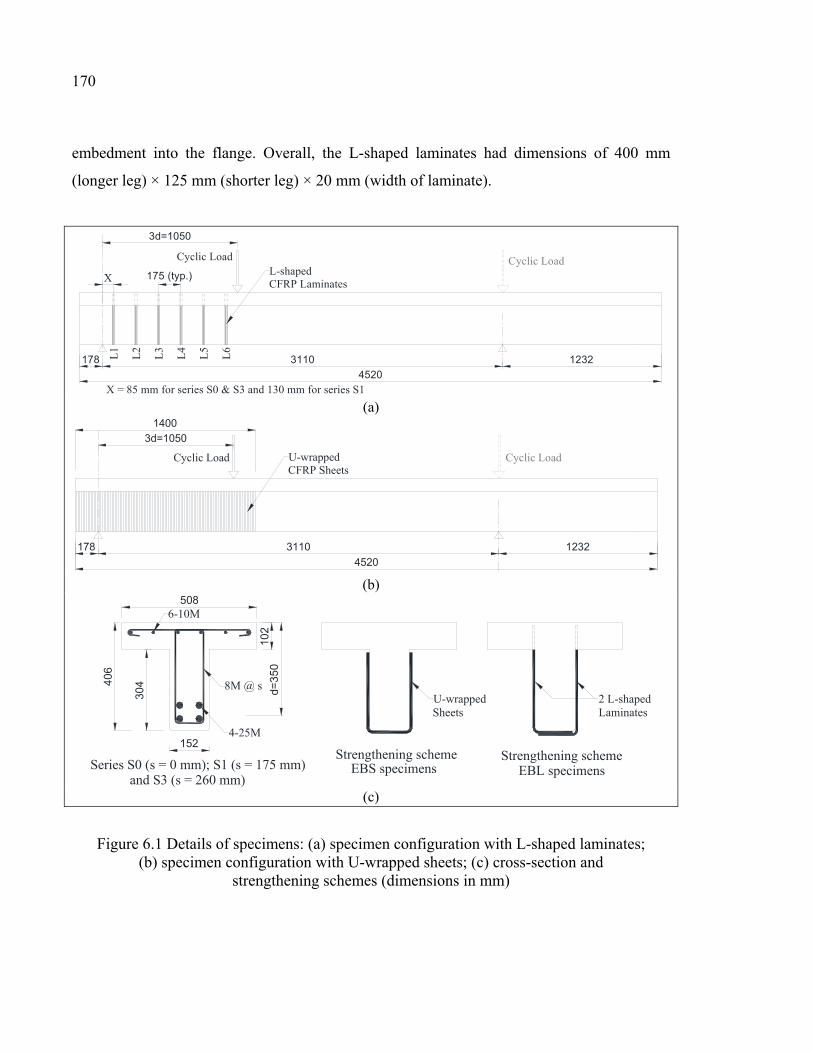
170
embedment into the flange. Overall, the L-shaped laminates had dimensions of 400 mm
(longer leg) × 125 mm (shorter leg) × 20 mm (width of laminate).
(a)
(b)
(c)
Figure 6.1 Details of specimens: (a) specimen configuration with L-shaped laminates; (b) specimen configuration with U-wrapped sheets; (c) cross-section and
strengthening schemes (dimensions in mm)
Cyclic Load
3d=1050
L1
L2
L3
L4
L5
L6
Cyclic LoadL-shapedCFRP Laminates
175 (typ.)X
X = 85 mm for series S0 & S3 and 130 mm for series S1
178 3110 12324520
Cyclic Load
3d=10501400
178 3110 1232
Cyclic LoadU-wrappedCFRP Sheets
4520
508
102
d=35
0
152
Series S0 (s = 0 mm); S1 (s = 175 mm)
406
EBL specimensStrengthening scheme
EBS specimensStrengthening scheme
304
6-10M
8M @ s
4-25M
U-wrappedSheets
2 L-shapedLaminates
and S3 (s = 260 mm)
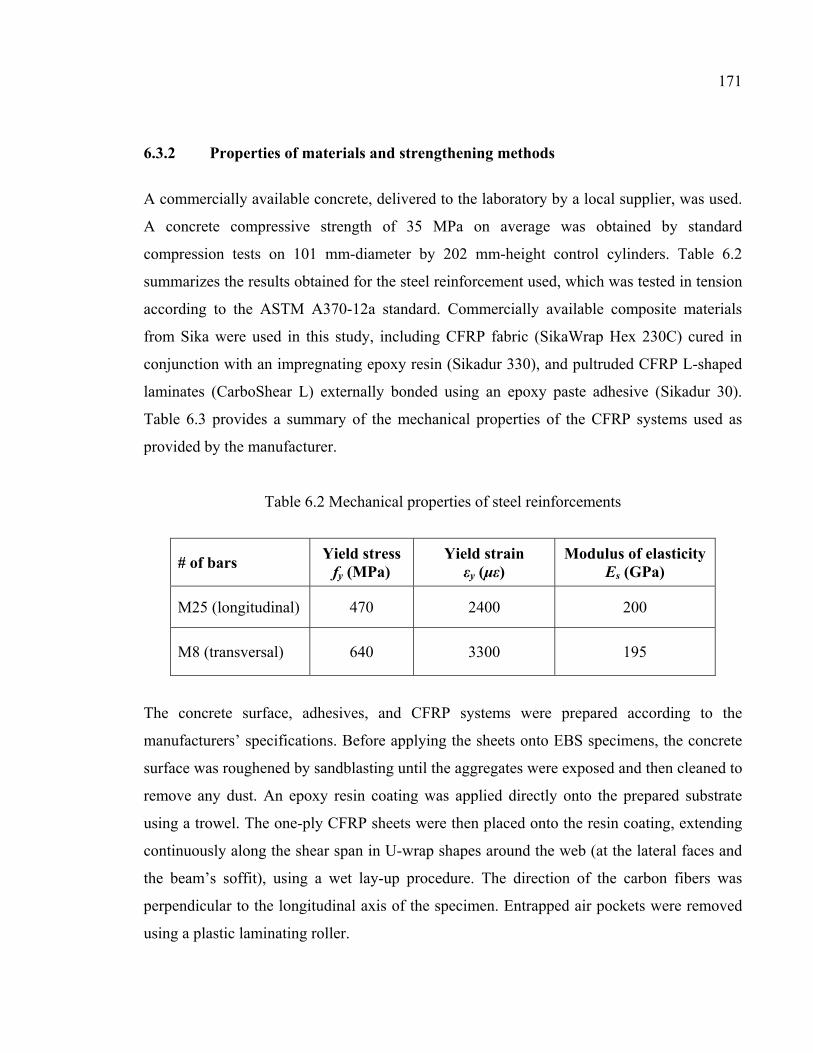
171
6.3.2 Properties of materials and strengthening methods
A commercially available concrete, delivered to the laboratory by a local supplier, was used.
A concrete compressive strength of 35 MPa on average was obtained by standard
compression tests on 101 mm-diameter by 202 mm-height control cylinders. Table 6.2
summarizes the results obtained for the steel reinforcement used, which was tested in tension
according to the ASTM A370-12a standard. Commercially available composite materials
from Sika were used in this study, including CFRP fabric (SikaWrap Hex 230C) cured in
conjunction with an impregnating epoxy resin (Sikadur 330), and pultruded CFRP L-shaped
laminates (CarboShear L) externally bonded using an epoxy paste adhesive (Sikadur 30).
Table 6.3 provides a summary of the mechanical properties of the CFRP systems used as
provided by the manufacturer.
Table 6.2 Mechanical properties of steel reinforcements
# of bars Yield stress
fy (MPa) Yield strain
εy (με) Modulus of elasticity
Es (GPa)
M25 (longitudinal) 470 2400 200
M8 (transversal) 640 3300 195
The concrete surface, adhesives, and CFRP systems were prepared according to the
manufacturers’ specifications. Before applying the sheets onto EBS specimens, the concrete
surface was roughened by sandblasting until the aggregates were exposed and then cleaned to
remove any dust. An epoxy resin coating was applied directly onto the prepared substrate
using a trowel. The one-ply CFRP sheets were then placed onto the resin coating, extending
continuously along the shear span in U-wrap shapes around the web (at the lateral faces and
the beam’s soffit), using a wet lay-up procedure. The direction of the carbon fibers was
perpendicular to the longitudinal axis of the specimen. Entrapped air pockets were removed
using a plastic laminating roller.
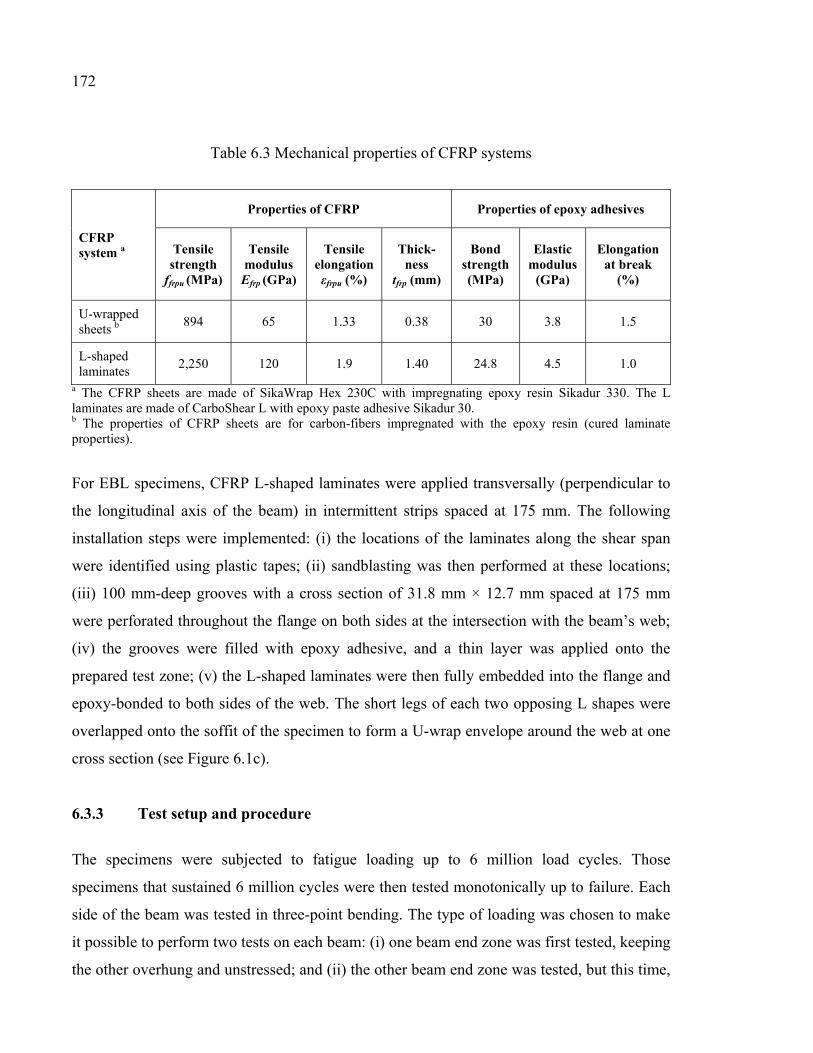
172
Table 6.3 Mechanical properties of CFRP systems
CFRP system a
Properties of CFRP Properties of epoxy adhesives
Tensile strength
ffrpu (MPa)
Tensile modulus
Efrp (GPa)
Tensile elongation εfrpu (%)
Thick-ness
tfrp (mm)
Bond strength (MPa)
Elastic modulus
(GPa)
Elongation at break
(%)
U-wrapped sheets b
894 65 1.33 0.38 30 3.8 1.5
L-shaped laminates
2,250 120 1.9 1.40 24.8 4.5 1.0
a The CFRP sheets are made of SikaWrap Hex 230C with impregnating epoxy resin Sikadur 330. The L laminates are made of CarboShear L with epoxy paste adhesive Sikadur 30. b The properties of CFRP sheets are for carbon-fibers impregnated with the epoxy resin (cured laminate properties).
For EBL specimens, CFRP L-shaped laminates were applied transversally (perpendicular to
the longitudinal axis of the beam) in intermittent strips spaced at 175 mm. The following
installation steps were implemented: (i) the locations of the laminates along the shear span
were identified using plastic tapes; (ii) sandblasting was then performed at these locations;
(iii) 100 mm-deep grooves with a cross section of 31.8 mm × 12.7 mm spaced at 175 mm
were perforated throughout the flange on both sides at the intersection with the beam’s web;
(iv) the grooves were filled with epoxy adhesive, and a thin layer was applied onto the
prepared test zone; (v) the L-shaped laminates were then fully embedded into the flange and
epoxy-bonded to both sides of the web. The short legs of each two opposing L shapes were
overlapped onto the soffit of the specimen to form a U-wrap envelope around the web at one
cross section (see Figure 6.1c).
6.3.3 Test setup and procedure
The specimens were subjected to fatigue loading up to 6 million load cycles. Those
specimens that sustained 6 million cycles were then tested monotonically up to failure. Each
side of the beam was tested in three-point bending. The type of loading was chosen to make
it possible to perform two tests on each beam: (i) one beam end zone was first tested, keeping
the other overhung and unstressed; and (ii) the other beam end zone was tested, but this time,
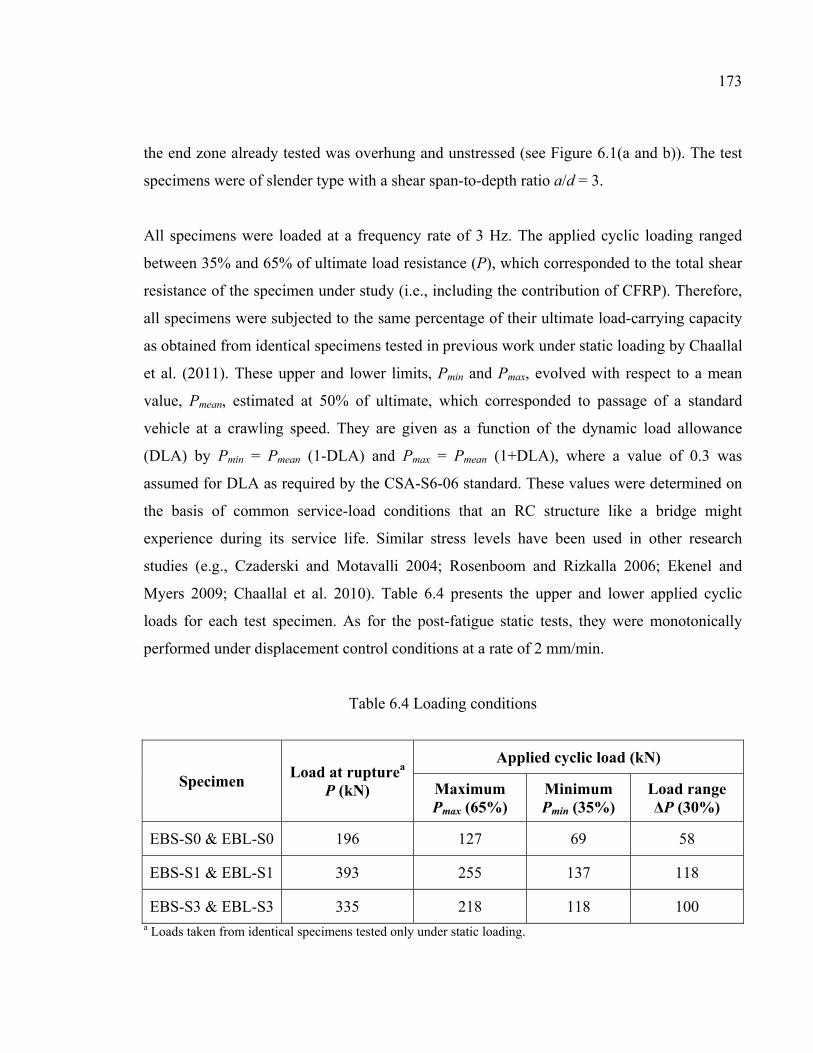
173
the end zone already tested was overhung and unstressed (see Figure 6.1(a and b)). The test
specimens were of slender type with a shear span-to-depth ratio a/d = 3.
All specimens were loaded at a frequency rate of 3 Hz. The applied cyclic loading ranged
between 35% and 65% of ultimate load resistance (P), which corresponded to the total shear
resistance of the specimen under study (i.e., including the contribution of CFRP). Therefore,
all specimens were subjected to the same percentage of their ultimate load-carrying capacity
as obtained from identical specimens tested in previous work under static loading by Chaallal
et al. (2011). These upper and lower limits, Pmin and Pmax, evolved with respect to a mean
value, Pmean, estimated at 50% of ultimate, which corresponded to passage of a standard
vehicle at a crawling speed. They are given as a function of the dynamic load allowance
(DLA) by Pmin = Pmean (1-DLA) and Pmax = Pmean (1+DLA), where a value of 0.3 was
assumed for DLA as required by the CSA-S6-06 standard. These values were determined on
the basis of common service-load conditions that an RC structure like a bridge might
experience during its service life. Similar stress levels have been used in other research
studies (e.g., Czaderski and Motavalli 2004; Rosenboom and Rizkalla 2006; Ekenel and
Myers 2009; Chaallal et al. 2010). Table 6.4 presents the upper and lower applied cyclic
loads for each test specimen. As for the post-fatigue static tests, they were monotonically
performed under displacement control conditions at a rate of 2 mm/min.
Table 6.4 Loading conditions
Specimen Load at rupturea
P (kN)
Applied cyclic load (kN)
Maximum Pmax (65%)
Minimum Pmin (35%)
Load range ΔP (30%)
EBS-S0 & EBL-S0 196 127 69 58
EBS-S1 & EBL-S1 393 255 137 118
EBS-S3 & EBL-S3 335 218 118 100 a Loads taken from identical specimens tested only under static loading.
174
6.3.4 Instrumentation
The vertical displacement of the specimens was measured using 100 mm-long linear
displacement sensors located under the applied load. The longitudinal steel reinforcement
was instrumented with a strain gauge at the location where the load was applied. Strain
gauges were also affixed to the stirrups located in the loading zone along the anticipated
plane of shear failure. The strains experienced by the CFRP materials were measured using
crack gauges as displacement sensors. These crack gauges were fixed vertically onto the
lateral faces at the same positions (along the longitudinal axis) as the strain gauges on the
steel stirrups for EBS specimens, and onto each L-shaped laminate for EBL specimens. The
arrangement of steel stirrups and the locations of strain and crack gauges are shown in Figure
6.2.
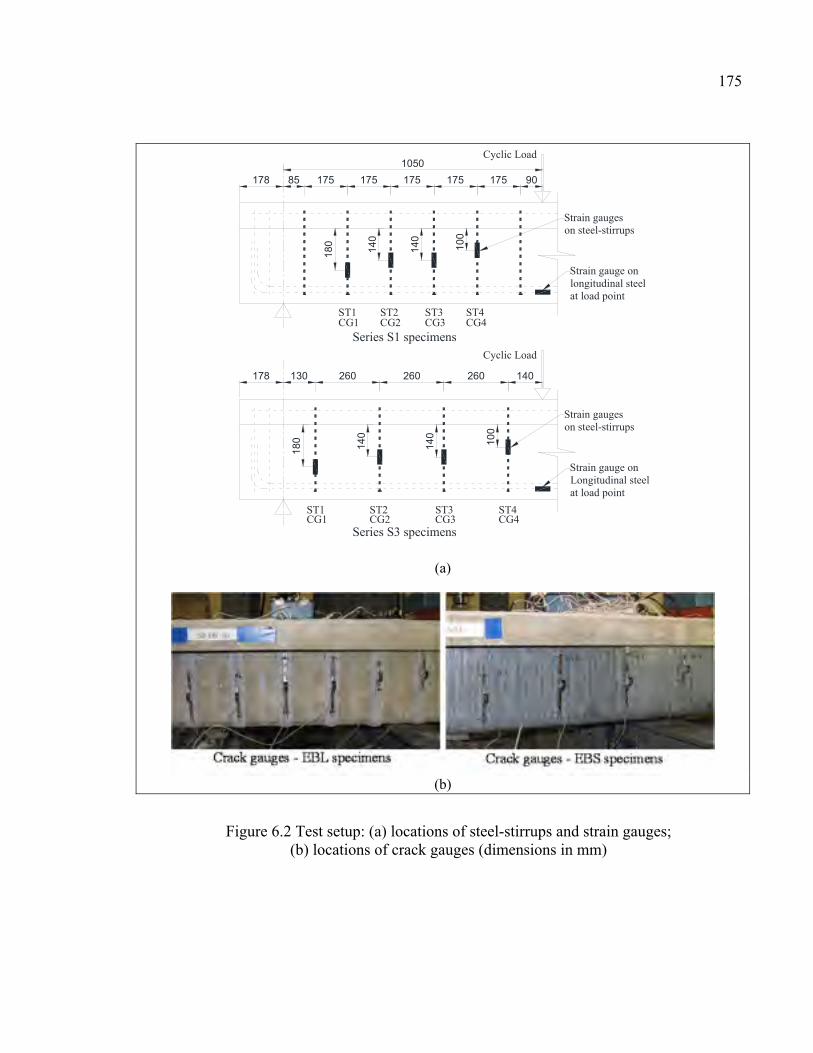
175
(a)
(b)
Figure 6.2 Test setup: (a) locations of steel-stirrups and strain gauges; (b) locations of crack gauges (dimensions in mm)
CG1 CG2 CG3 CG4
ST1 ST2 ST3 ST4
ST1 ST2 ST3 ST4
Series S3 specimens
1050Cyclic Load
260 260 260 140130
175 175 175 175 17585
178
178 90
100
140
180 140
180 140
140
100
Strain gaugeson steel-stirrups
Strain gauge onLongitudinal steelat load point
Strain gaugeson steel-stirrups
Strain gauge onlongitudinal steelat load point
Cyclic Load
Series S1 specimens
CG1 CG2 CG3 CG4
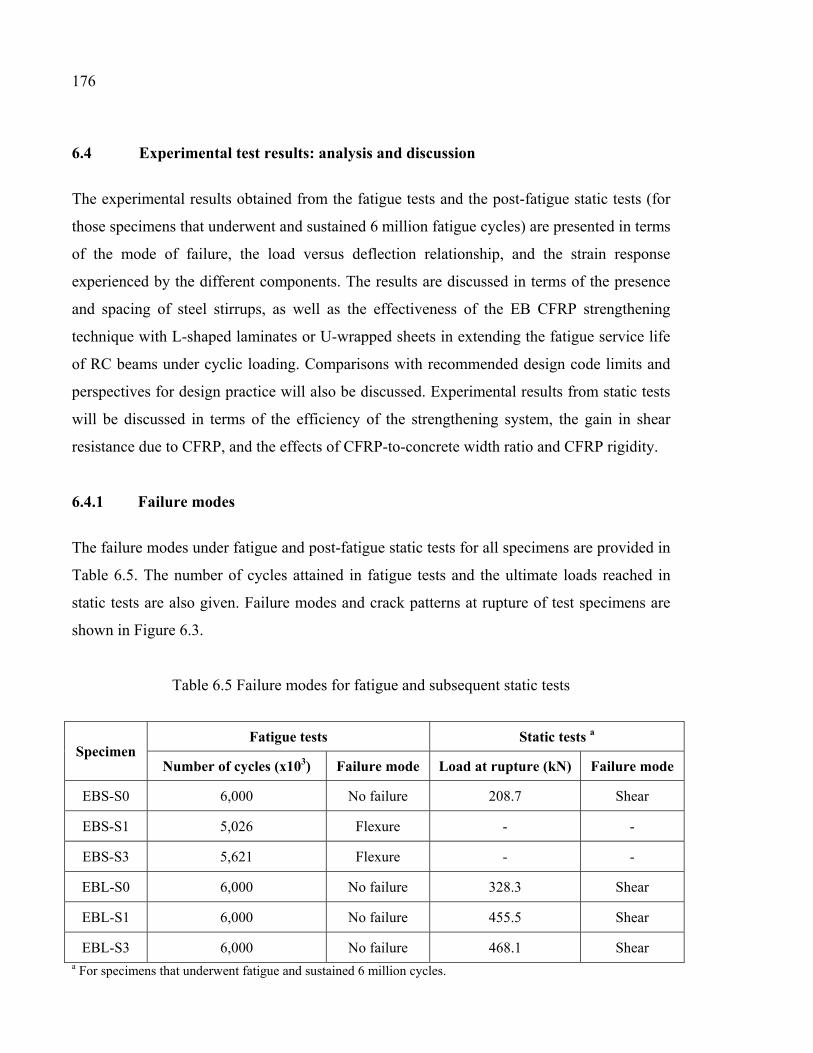
176
6.4 Experimental test results: analysis and discussion
The experimental results obtained from the fatigue tests and the post-fatigue static tests (for
those specimens that underwent and sustained 6 million fatigue cycles) are presented in terms
of the mode of failure, the load versus deflection relationship, and the strain response
experienced by the different components. The results are discussed in terms of the presence
and spacing of steel stirrups, as well as the effectiveness of the EB CFRP strengthening
technique with L-shaped laminates or U-wrapped sheets in extending the fatigue service life
of RC beams under cyclic loading. Comparisons with recommended design code limits and
perspectives for design practice will also be discussed. Experimental results from static tests
will be discussed in terms of the efficiency of the strengthening system, the gain in shear
resistance due to CFRP, and the effects of CFRP-to-concrete width ratio and CFRP rigidity.
6.4.1 Failure modes
The failure modes under fatigue and post-fatigue static tests for all specimens are provided in
Table 6.5. The number of cycles attained in fatigue tests and the ultimate loads reached in
static tests are also given. Failure modes and crack patterns at rupture of test specimens are
shown in Figure 6.3.
Table 6.5 Failure modes for fatigue and subsequent static tests
Specimen Fatigue tests Static tests a
Number of cycles (x103) Failure mode Load at rupture (kN) Failure mode
EBS-S0 6,000 No failure 208.7 Shear
EBS-S1 5,026 Flexure - -
EBS-S3 5,621 Flexure - -
EBL-S0 6,000 No failure 328.3 Shear
EBL-S1 6,000 No failure 455.5 Shear
EBL-S3 6,000 No failure 468.1 Shear a For specimens that underwent fatigue and sustained 6 million cycles.
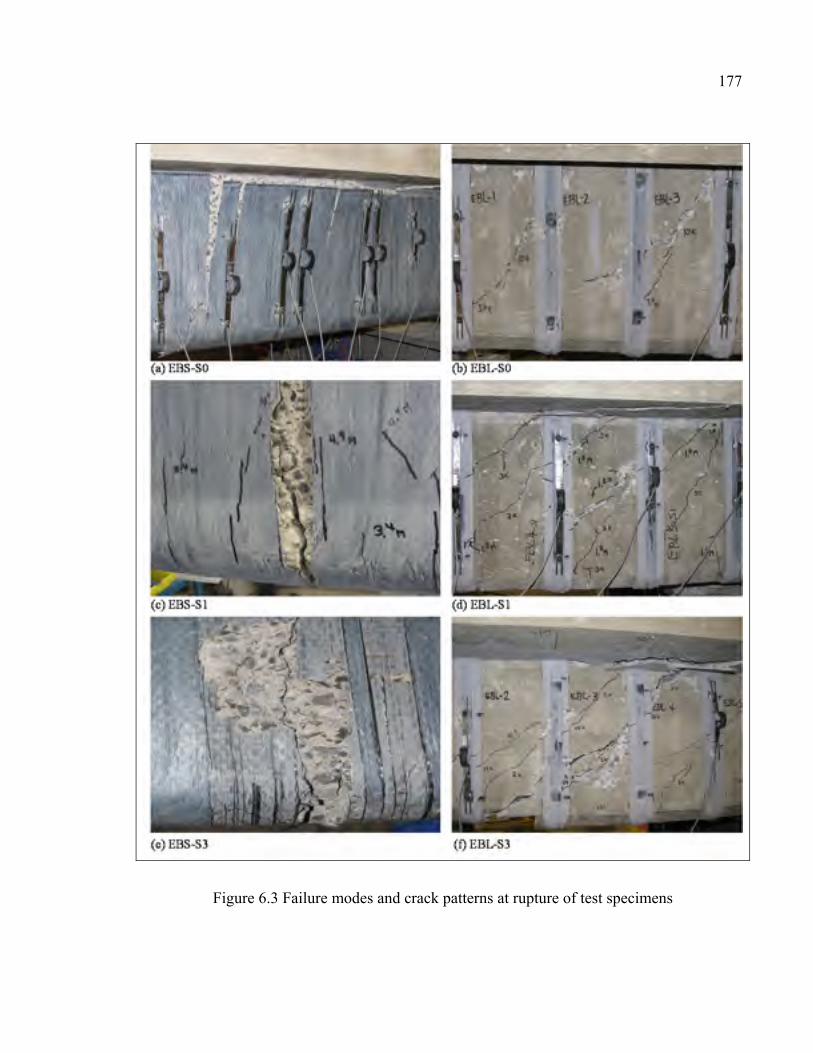
177
Figure 6.3 Failure modes and crack patterns at rupture of test specimens
178
The two EBS specimens with steel stirrups, i.e., EBS-S1 and EBS-S3, exhibited a similar
primary flexural mode of failure, due to the fatigue of longitudinal steel reinforcement, rather
than shear failure (Figure 6.3(c and e)). Yielding of the longitudinal steel was evident by the
strain measurements, but was also indicated by the recorded deflections at the load
application point, as discussed below in the corresponding sections. Indeed, the longitudinal
reinforcing bars in EBS-S1 yielded at 4.35 million cycles and the complete failure of the
beam occurred at 5.026 million cycles. For EBS-S3, the longitudinal reinforcing bars yielded
at 5.47 million cycles and the specimen ruptured at 5.621 million cycles. Both specimens
collapsed suddenly by rupture of the outer layer of the reinforcing bars in the tension zone
under the load application point, as shown in Figure 6.4a. This is attributed to the relatively
high stress range measured at the first cycle (Δσs = 151 MPa for EBS-S1 and 133 MPa for
EBS-S3). In other words, these specimens were tested at a cyclic load range which exceeded
the fatigue service load level. Flexural cracks were initiated at the bottom of the beam’s web
(tension zone) under the load application point, and then propagated to the top of the beam as
the number of cycles increased (Figure 6.4b). It may be instructive to note that no significant
major shear cracks occurred during the course of fatigue loading, and hence no yielding or
rupture of steel stirrups was observed in these specimens before failure. The only noticeable
difference in failure mechanism between the two specimens is that the fatigue service life of
EBS-S3 was longer than EBS-S1 (5.621 versus 5.026 million cycles). This may be attributed
to the higher applied load range for series S1 specimens, due to increased shear capacity and
hence higher level of cyclic loading. However, the flexure fatigue failure of EBS-S1 was
more ductile compared to the failure of EBS-S3. In fact, EBS-S1 sustained an additional
675,000 cycles after yielding of the longitudinal steel, whereas EBS-S3 resisted only 150,000
cycles after steel yielding. The increase in the amount of transverse steel in the strengthened
RC beams resulted in an enhanced ductile behavior, even if higher cyclic loading was
applied. Specimen EBS-S0 did not fail in fatigue, but rather in shear under static loading by
concrete crushing after debonding of the CFRP sheet (Figure 6.3a).
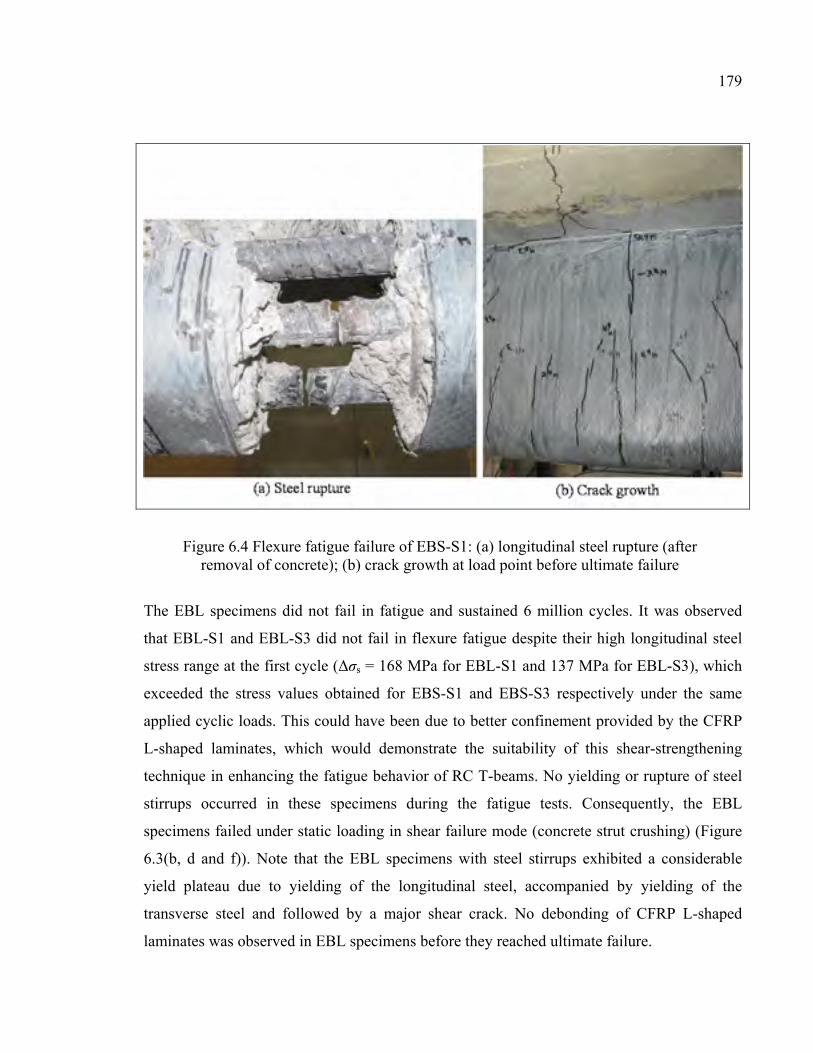
179
Figure 6.4 Flexure fatigue failure of EBS-S1: (a) longitudinal steel rupture (after removal of concrete); (b) crack growth at load point before ultimate failure
The EBL specimens did not fail in fatigue and sustained 6 million cycles. It was observed
that EBL-S1 and EBL-S3 did not fail in flexure fatigue despite their high longitudinal steel
stress range at the first cycle (Δσs = 168 MPa for EBL-S1 and 137 MPa for EBL-S3), which
exceeded the stress values obtained for EBS-S1 and EBS-S3 respectively under the same
applied cyclic loads. This could have been due to better confinement provided by the CFRP
L-shaped laminates, which would demonstrate the suitability of this shear-strengthening
technique in enhancing the fatigue behavior of RC T-beams. No yielding or rupture of steel
stirrups occurred in these specimens during the fatigue tests. Consequently, the EBL
specimens failed under static loading in shear failure mode (concrete strut crushing) (Figure
6.3(b, d and f)). Note that the EBL specimens with steel stirrups exhibited a considerable
yield plateau due to yielding of the longitudinal steel, accompanied by yielding of the
transverse steel and followed by a major shear crack. No debonding of CFRP L-shaped
laminates was observed in EBL specimens before they reached ultimate failure.
180
Comparison between EBS and EBL specimens, where both were subjected to the same
loading conditions, revealed that strengthening with CFRP L-shaped laminates was more
effective than strengthening with U-wrapped sheets in extending specimen service life. In
fact, the results demonstrated that the service life of EBL-S1 was increased by at least 20%
compared to EBS-S1. Similarly, the service life of EBL-S3 was increased by at least 7%
compared to EBS-S3. Note that, despite the flexure fatigue failure experienced by EBS-S1
and EBS-S3, shear strengthening with CFRP sheets was nevertheless efficient because both
specimens endured more than 5 million cycles in a very high stress range. However, in RC
beams shear-strengthened with CFRP sheets to upgrade their service load, the longitudinal
steel may be the weakest link and should be looked at with caution, particularly for extending
the service life, where it may govern the upper limit of the projected capacity.
6.4.2 Fatigue behavior under cyclic loading
The overall behavior of the specimens during the fatigue tests illustrated a typical damage
accumulation trend for fatigued RC beams. In fact, all specimens exhibited an accelerated
rate of damage propagation during early cycles, characterized by an initial increase in
deflection and strain in all components. This was followed by a stable phase, characterized
by a gradual progression of deflection and strain responses, in which damage accumulation
slowed significantly during cyclic loading. However, for the specimens that failed in fatigue,
this stable phase extended up to the last, very short phase just before imminent failure, when
a sudden increase in deflection and strain occurred.
Deflection response
The deflection measurements under the load application point at the first and last loading
cycles for all specimens are provided in Table 6.6. The deflection range, Δδ, corresponding
to maximum minus minimum applied fatigue load (Pmax - Pmin), is also provided in this table.
Figure 6.5 presents the variation of the deflection response for the maximum applied load
(Pmax) with increasing number of cycles. As shown, all specimens exhibited an initial
181
increase in deflection during the early cycles, followed by a stable phase in which the
deflection progressed gradually with increasing number of cycles. For specimens EBS-S1
and EBS-S3 that failed in flexure fatigue, their deflection response exhibited a sudden
increase due to yielding of the longitudinal steel before failure. For instance, the deflection of
EBS-S1 increased suddenly from 8.45 mm to 9.35 mm at 4.35 million cycles, whereas EBS-
S3 exhibited an abrupt increase from 7.31 mm to 8.12 mm at 5.47 million cycles.
It can be observed that the specimens strengthened with L-shaped laminates behaved
extremely well by outperforming those strengthened with U-wrapped sheets. Indeed, the
EBL specimens followed almost the same trends, but attained lower deflections than their
corresponding EBS specimens during the fatigue tests, confirming the suitability of CFRP
strengthening for this application category. For instance, specimen EBL-S3 exhibited an
increase in maximum deflection from 4.81 mm (deflection range Δδ = 1.95 mm) in the first
cycle to 6.28 mm at 0.5 million cycles to reach 7.05 mm (Δδ = 2.31 mm) at 6 million cycles;
this represents a 47% total increase, starting with a 31% initial increase during the first 0.5
million cycles. In contrast, for specimen EBS-S3, under the same loading conditions, the
maximum deflection increased from 4.32 mm (Δδ = 1.67 mm) in the first cycle to 6.42 mm at
0.5 million cycles to reach 8.22 mm (Δδ = 2.46 mm) before ultimate failure at 5.621 million
cycles; this represents a 90% total increase and clearly reflects severe degradation of beam
stiffness; the initial increase during the first 0.5 million cycles alone was 49%. This
demonstrates the greater efficiency of L-shaped laminates in shear strengthening under
fatigue loading compared to U-wrapped sheets. However, it is worth mentioning that despite
the fatigue failure experienced by certain EBS specimens, they endured more than 5 million
cycles and behaved well in a very high applied cyclic load range. This confirms the
effectiveness of EB CFRP sheets in enhancing the fatigue behavior of RC beams shear-
strengthened for increased live load.
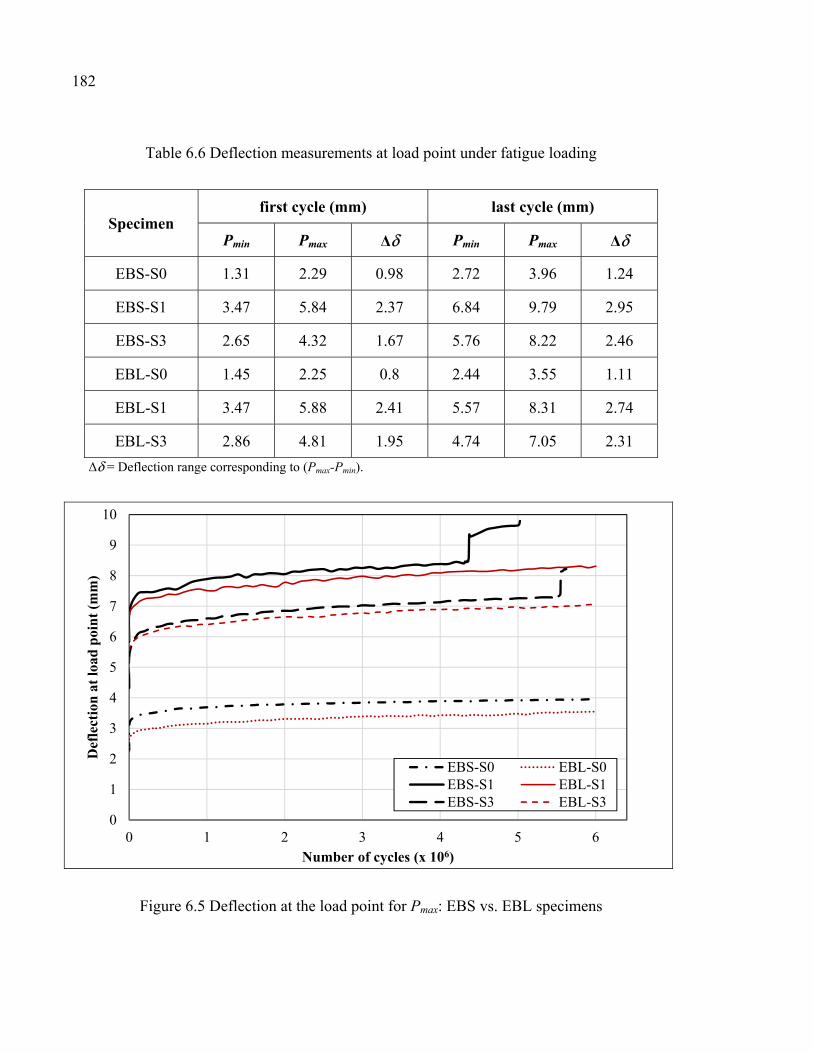
182
Table 6.6 Deflection measurements at load point under fatigue loading
Specimen first cycle (mm) last cycle (mm)
Pmin Pmax Δδ Pmin Pmax Δδ
EBS-S0 1.31 2.29 0.98 2.72 3.96 1.24
EBS-S1 3.47 5.84 2.37 6.84 9.79 2.95
EBS-S3 2.65 4.32 1.67 5.76 8.22 2.46
EBL-S0 1.45 2.25 0.8 2.44 3.55 1.11
EBL-S1 3.47 5.88 2.41 5.57 8.31 2.74
EBL-S3 2.86 4.81 1.95 4.74 7.05 2.31
Δδ = Deflection range corresponding to (Pmax-Pmin).
Figure 6.5 Deflection at the load point for Pmax: EBS vs. EBL specimens
0
1
2
3
4
5
6
7
8
9
10
0 1 2 3 4 5 6
Def
lect
ion
at
load
poi
nt
(mm
)
Number of cycles (x 106)
EBS-S0 EBL-S0EBS-S1 EBL-S1EBS-S3 EBL-S3
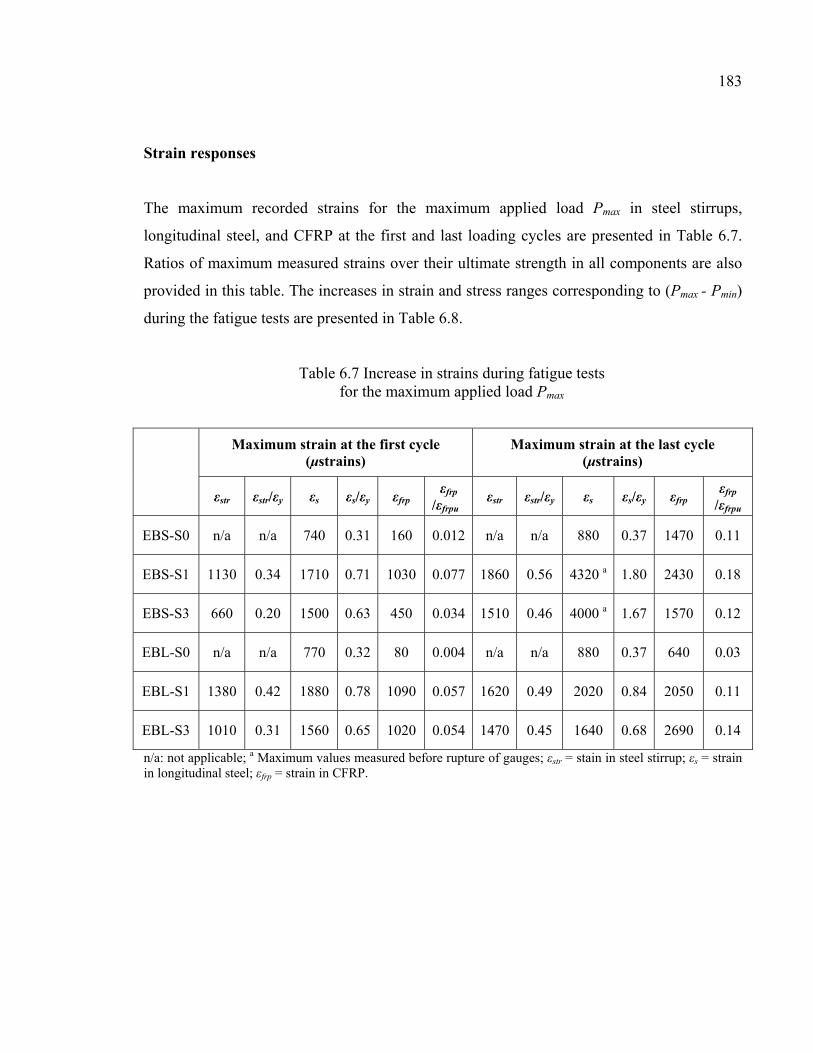
183
Strain responses
The maximum recorded strains for the maximum applied load Pmax in steel stirrups,
longitudinal steel, and CFRP at the first and last loading cycles are presented in Table 6.7.
Ratios of maximum measured strains over their ultimate strength in all components are also
provided in this table. The increases in strain and stress ranges corresponding to (Pmax - Pmin)
during the fatigue tests are presented in Table 6.8.
Table 6.7 Increase in strains during fatigue tests for the maximum applied load Pmax
Maximum strain at the first cycle (μstrains)
Maximum strain at the last cycle (μstrains)
εstr εstr/εy εs εs/εy εfrp εfrp
/εfrpu εstr εstr/εy εs εs/εy εfrp
εfrp
/εfrpu
EBS-S0 n/a n/a 740 0.31 160 0.012 n/a n/a 880 0.37 1470 0.11
EBS-S1 1130 0.34 1710 0.71 1030 0.077 1860 0.56 4320 a 1.80 2430 0.18
EBS-S3 660 0.20 1500 0.63 450 0.034 1510 0.46 4000 a 1.67 1570 0.12
EBL-S0 n/a n/a 770 0.32 80 0.004 n/a n/a 880 0.37 640 0.03
EBL-S1 1380 0.42 1880 0.78 1090 0.057 1620 0.49 2020 0.84 2050 0.11
EBL-S3 1010 0.31 1560 0.65 1020 0.054 1470 0.45 1640 0.68 2690 0.14
n/a: not applicable; a Maximum values measured before rupture of gauges; εstr = stain in steel stirrup; εs = strain in longitudinal steel; εfrp = strain in CFRP.
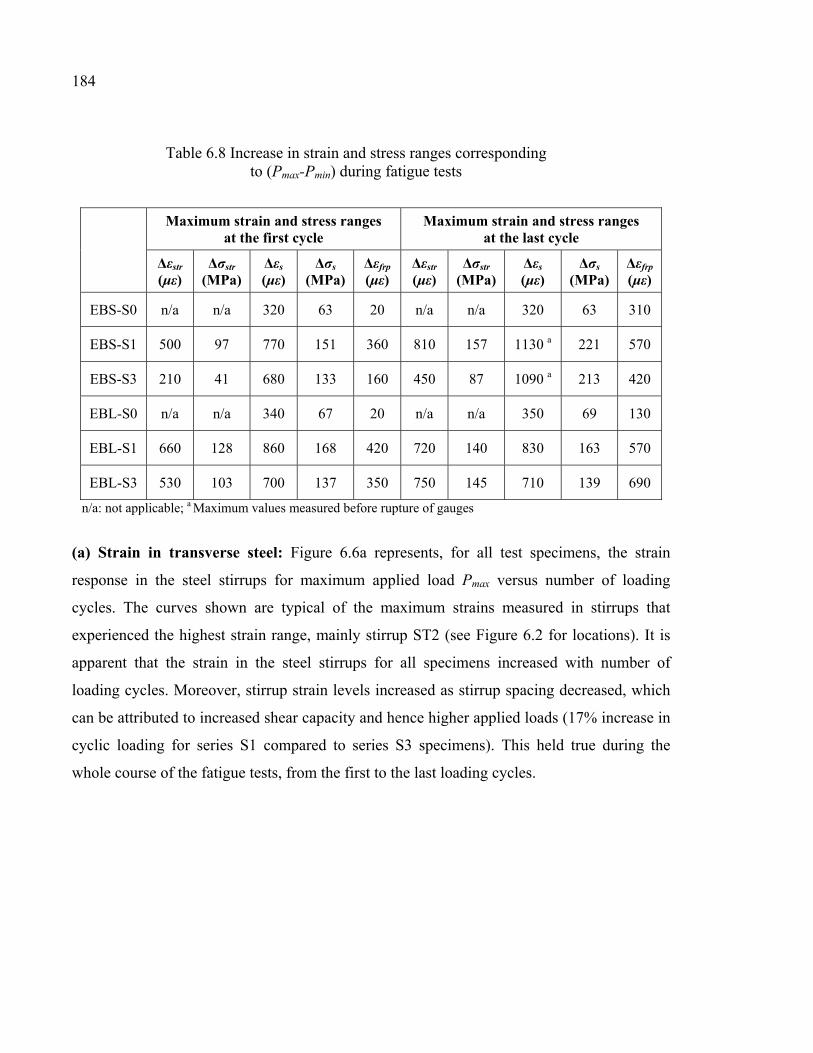
184
Table 6.8 Increase in strain and stress ranges corresponding to (Pmax-Pmin) during fatigue tests
Maximum strain and stress ranges at the first cycle
Maximum strain and stress ranges at the last cycle
Δεstr (με)
Δσstr (MPa)
Δεs (με)
Δσs (MPa)
Δεfrp (με)
Δεstr (με)
Δσstr (MPa)
Δεs (με)
Δσs (MPa)
Δεfrp (με)
EBS-S0 n/a n/a 320 63 20 n/a n/a 320 63 310
EBS-S1 500 97 770 151 360 810 157 1130 a 221 570
EBS-S3 210 41 680 133 160 450 87 1090 a 213 420
EBL-S0 n/a n/a 340 67 20 n/a n/a 350 69 130
EBL-S1 660 128 860 168 420 720 140 830 163 570
EBL-S3 530 103 700 137 350 750 145 710 139 690
n/a: not applicable; a Maximum values measured before rupture of gauges
(a) Strain in transverse steel: Figure 6.6a represents, for all test specimens, the strain
response in the steel stirrups for maximum applied load Pmax versus number of loading
cycles. The curves shown are typical of the maximum strains measured in stirrups that
experienced the highest strain range, mainly stirrup ST2 (see Figure 6.2 for locations). It is
apparent that the strain in the steel stirrups for all specimens increased with number of
loading cycles. Moreover, stirrup strain levels increased as stirrup spacing decreased, which
can be attributed to increased shear capacity and hence higher applied loads (17% increase in
cyclic loading for series S1 compared to series S3 specimens). This held true during the
whole course of the fatigue tests, from the first to the last loading cycles.
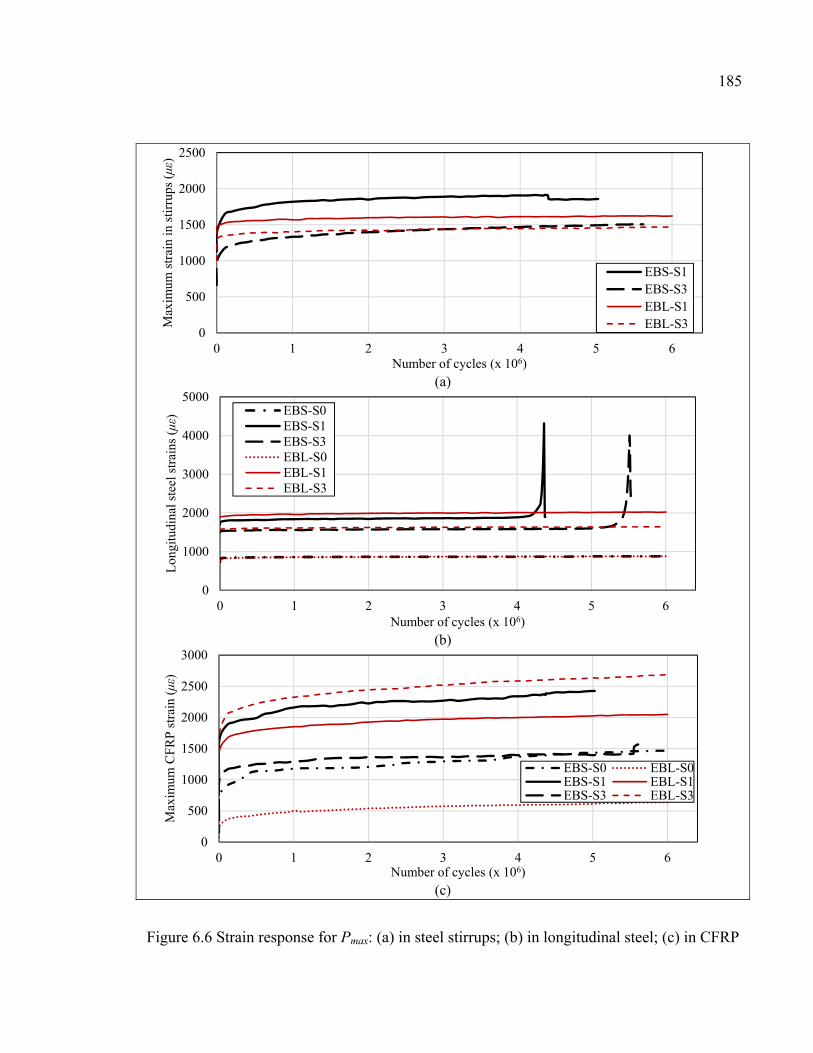
185
(a)
(b)
(c)
Figure 6.6 Strain response for Pmax: (a) in steel stirrups; (b) in longitudinal steel; (c) in CFRP
0
500
1000
1500
2000
2500
0 1 2 3 4 5 6
Max
imum
str
ain
in s
tirr
ups
(με)
Number of cycles (x 106)
EBS-S1EBS-S3EBL-S1EBL-S3
0
1000
2000
3000
4000
5000
0 1 2 3 4 5 6
Lon
gitu
dina
l ste
el s
trai
ns (με
)
Number of cycles (x 106)
EBS-S0EBS-S1EBS-S3EBL-S0EBL-S1EBL-S3
0
500
1000
1500
2000
2500
3000
0 1 2 3 4 5 6
Max
imum
CF
RP
str
ain
(με)
Number of cycles (x 106)
EBS-S0 EBL-S0EBS-S1 EBL-S1EBS-S3 EBL-S3
186
For both EBS and EBL-strengthened specimens, the maximum stirrup strains were achieved
by specimens of series S1: EBS-S1 (first cycle: εstr = 1,130 μstrains, strain range Δεstr = 500
μstrains and corresponding stress range Δσstr = 97 MPa; last cycle before failure: εstr = 1,860
μstrains, Δεstr = 810 μstrains and Δσstr = 157 MPa) and EBL-S1 (first cycle: εstr = 1,380
μstrains, Δεstr = 660 μstrains and Δσstr = 128 MPa; last cycle εstr = 1,620 μstrains, Δεstr = 720
μstrains and Δσstr = 140 MPa). A comparison between EBS and EBL specimens of the same
series, which were subjected to the same loading conditions, revealed an enhanced fatigue
behavior of the transverse steel reinforcement when strengthening using L-shaped laminates.
In fact, a 62% increase in stress (strain) range was obtained for EBS-S1 during fatigue testing
between the first and the last loading cycles, compared to only a 9% increase for EBL-S1.
For specimens of series S3, a 114% increase in stress range was obtained for EBS-S3,
compared to a 42% increase for EBL-S3. This reflects a reduction in fatigue damage
accumulation for RC beams shear-strengthened using L-shaped laminates with respect to U-
wrapped sheets, confirming once again that EBL outperformed the EBS specimens.
On the other hand, a comparison between S1 (spaced at d/2) and S3 (spaced at 3d/4) series of
the same strengthening method revealed an enhanced fatigue behavior of the transverse steel
for S1 specimens, even if they were subjected to a higher level of cyclic loading. As already
indicated, a 114% increase in stress range was obtained for EBS-S3 compared to 62% for
EBS-S1, and a 42% increase for EBL-S3 compared to 9% for EBL-S1. Therefore, the
strengthened specimens exhibited a more ductile behavior with the increase in the amount of
transverse steel reinforcement.
The maximum stirrup strain recorded at failure in EBS-S1 (1,860 μstrains) represented 56%
of its yield stress (3,300 μstrains), whereas that of EBL-S1 measured at 6 million cycles
(1,620 μstrains) represented 49% of its yield value. For comparison, the current ACI 440.2R-
08 guidelines state in this context that the stress in longitudinal steel reinforcement under
fatigue service load should be limited to 80% of the yield stress. No specific limits were
provided for steel stirrups; however, research seems to indicate that the fatigue service life of
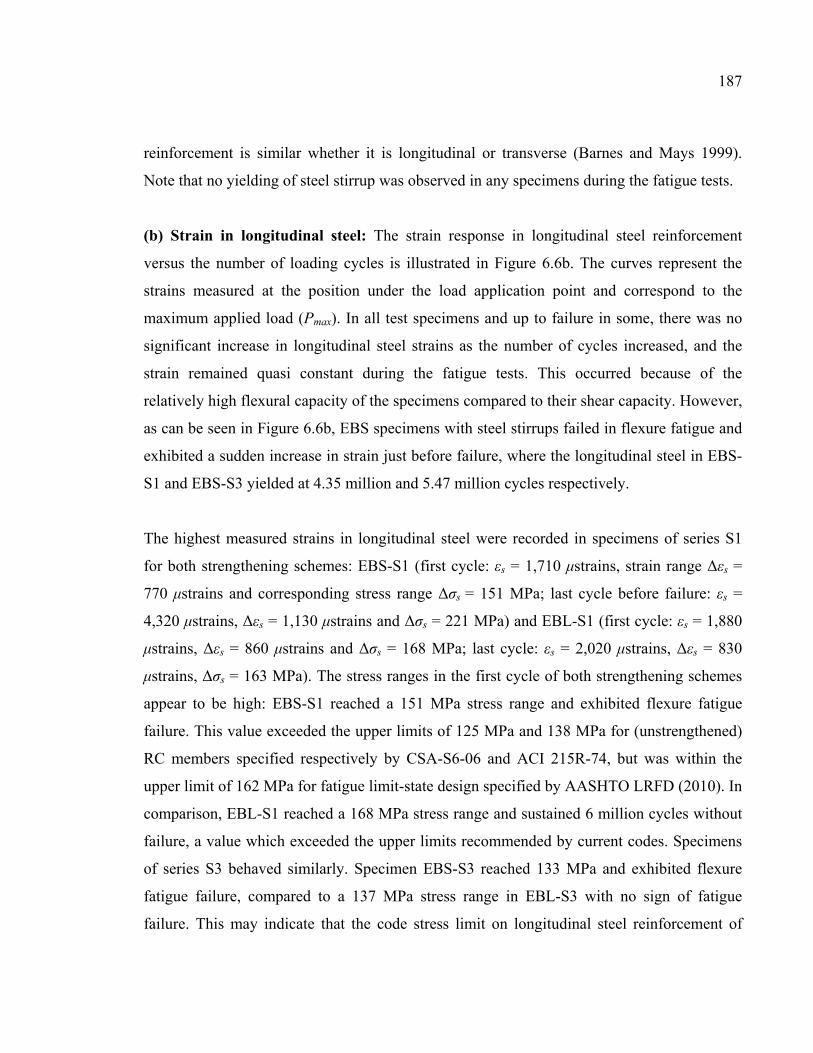
187
reinforcement is similar whether it is longitudinal or transverse (Barnes and Mays 1999).
Note that no yielding of steel stirrup was observed in any specimens during the fatigue tests.
(b) Strain in longitudinal steel: The strain response in longitudinal steel reinforcement
versus the number of loading cycles is illustrated in Figure 6.6b. The curves represent the
strains measured at the position under the load application point and correspond to the
maximum applied load (Pmax). In all test specimens and up to failure in some, there was no
significant increase in longitudinal steel strains as the number of cycles increased, and the
strain remained quasi constant during the fatigue tests. This occurred because of the
relatively high flexural capacity of the specimens compared to their shear capacity. However,
as can be seen in Figure 6.6b, EBS specimens with steel stirrups failed in flexure fatigue and
exhibited a sudden increase in strain just before failure, where the longitudinal steel in EBS-
S1 and EBS-S3 yielded at 4.35 million and 5.47 million cycles respectively.
The highest measured strains in longitudinal steel were recorded in specimens of series S1
for both strengthening schemes: EBS-S1 (first cycle: εs = 1,710 μstrains, strain range Δεs =
770 μstrains and corresponding stress range Δσs = 151 MPa; last cycle before failure: εs =
4,320 μstrains, Δεs = 1,130 μstrains and Δσs = 221 MPa) and EBL-S1 (first cycle: εs = 1,880
μstrains, Δεs = 860 μstrains and Δσs = 168 MPa; last cycle: εs = 2,020 μstrains, Δεs = 830
μstrains, Δσs = 163 MPa). The stress ranges in the first cycle of both strengthening schemes
appear to be high: EBS-S1 reached a 151 MPa stress range and exhibited flexure fatigue
failure. This value exceeded the upper limits of 125 MPa and 138 MPa for (unstrengthened)
RC members specified respectively by CSA-S6-06 and ACI 215R-74, but was within the
upper limit of 162 MPa for fatigue limit-state design specified by AASHTO LRFD (2010). In
comparison, EBL-S1 reached a 168 MPa stress range and sustained 6 million cycles without
failure, a value which exceeded the upper limits recommended by current codes. Specimens
of series S3 behaved similarly. Specimen EBS-S3 reached 133 MPa and exhibited flexure
fatigue failure, compared to a 137 MPa stress range in EBL-S3 with no sign of fatigue
failure. This may indicate that the code stress limit on longitudinal steel reinforcement of
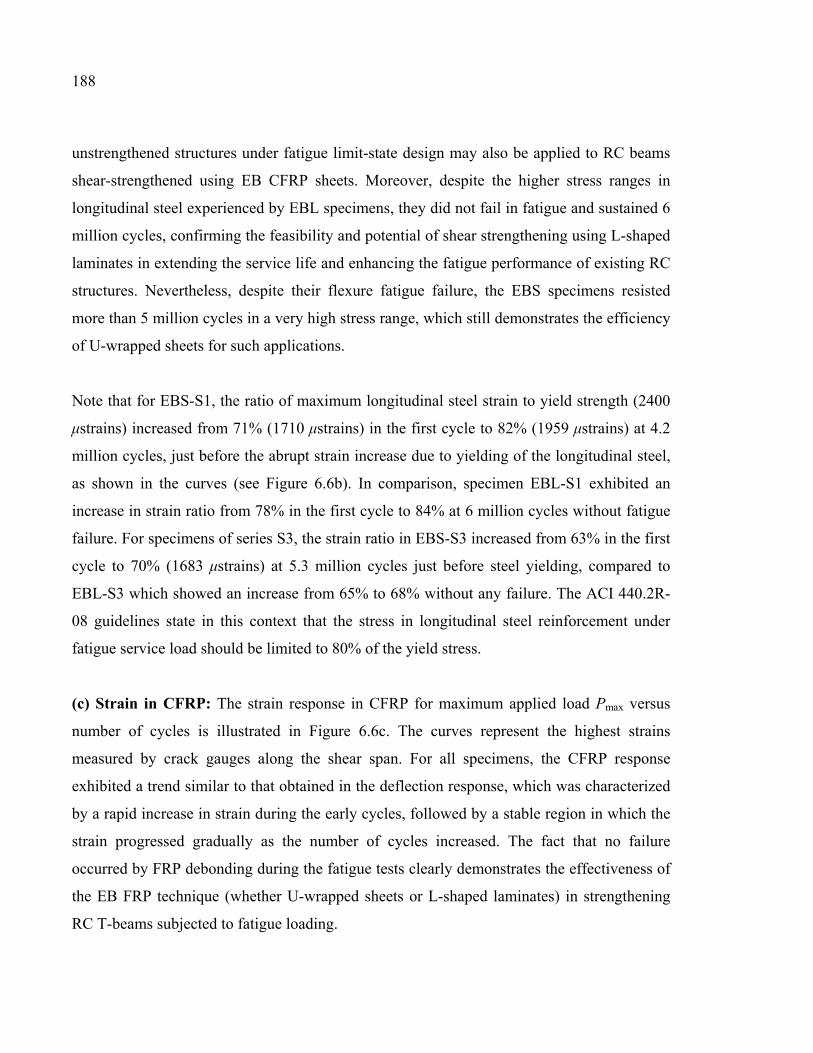
188
unstrengthened structures under fatigue limit-state design may also be applied to RC beams
shear-strengthened using EB CFRP sheets. Moreover, despite the higher stress ranges in
longitudinal steel experienced by EBL specimens, they did not fail in fatigue and sustained 6
million cycles, confirming the feasibility and potential of shear strengthening using L-shaped
laminates in extending the service life and enhancing the fatigue performance of existing RC
structures. Nevertheless, despite their flexure fatigue failure, the EBS specimens resisted
more than 5 million cycles in a very high stress range, which still demonstrates the efficiency
of U-wrapped sheets for such applications.
Note that for EBS-S1, the ratio of maximum longitudinal steel strain to yield strength (2400
μstrains) increased from 71% (1710 μstrains) in the first cycle to 82% (1959 μstrains) at 4.2
million cycles, just before the abrupt strain increase due to yielding of the longitudinal steel,
as shown in the curves (see Figure 6.6b). In comparison, specimen EBL-S1 exhibited an
increase in strain ratio from 78% in the first cycle to 84% at 6 million cycles without fatigue
failure. For specimens of series S3, the strain ratio in EBS-S3 increased from 63% in the first
cycle to 70% (1683 μstrains) at 5.3 million cycles just before steel yielding, compared to
EBL-S3 which showed an increase from 65% to 68% without any failure. The ACI 440.2R-
08 guidelines state in this context that the stress in longitudinal steel reinforcement under
fatigue service load should be limited to 80% of the yield stress.
(c) Strain in CFRP: The strain response in CFRP for maximum applied load Pmax versus
number of cycles is illustrated in Figure 6.6c. The curves represent the highest strains
measured by crack gauges along the shear span. For all specimens, the CFRP response
exhibited a trend similar to that obtained in the deflection response, which was characterized
by a rapid increase in strain during the early cycles, followed by a stable region in which the
strain progressed gradually as the number of cycles increased. The fact that no failure
occurred by FRP debonding during the fatigue tests clearly demonstrates the effectiveness of
the EB FRP technique (whether U-wrapped sheets or L-shaped laminates) in strengthening
RC T-beams subjected to fatigue loading.
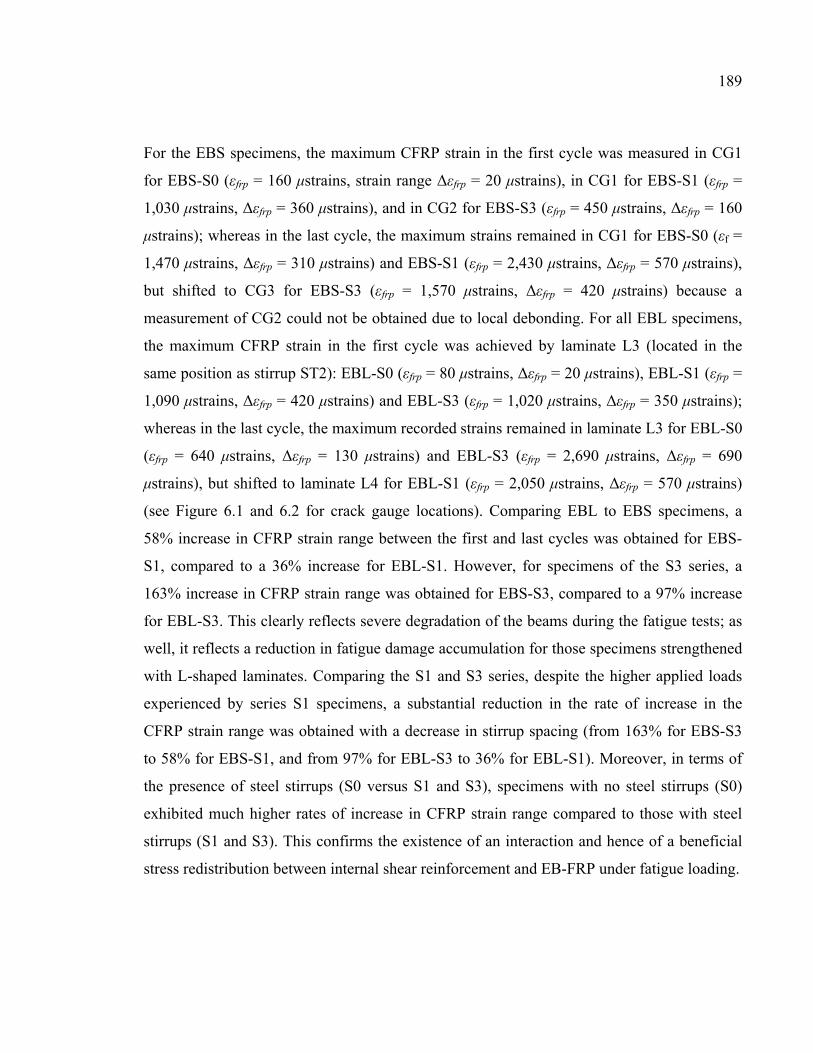
189
For the EBS specimens, the maximum CFRP strain in the first cycle was measured in CG1
for EBS-S0 (εfrp = 160 μstrains, strain range Δεfrp = 20 μstrains), in CG1 for EBS-S1 (εfrp =
1,030 μstrains, Δεfrp = 360 μstrains), and in CG2 for EBS-S3 (εfrp = 450 μstrains, Δεfrp = 160
μstrains); whereas in the last cycle, the maximum strains remained in CG1 for EBS-S0 (εf =
1,470 μstrains, Δεfrp = 310 μstrains) and EBS-S1 (εfrp = 2,430 μstrains, Δεfrp = 570 μstrains),
but shifted to CG3 for EBS-S3 (εfrp = 1,570 μstrains, Δεfrp = 420 μstrains) because a
measurement of CG2 could not be obtained due to local debonding. For all EBL specimens,
the maximum CFRP strain in the first cycle was achieved by laminate L3 (located in the
same position as stirrup ST2): EBL-S0 (εfrp = 80 μstrains, Δεfrp = 20 μstrains), EBL-S1 (εfrp =
1,090 μstrains, Δεfrp = 420 μstrains) and EBL-S3 (εfrp = 1,020 μstrains, Δεfrp = 350 μstrains);
whereas in the last cycle, the maximum recorded strains remained in laminate L3 for EBL-S0
(εfrp = 640 μstrains, Δεfrp = 130 μstrains) and EBL-S3 (εfrp = 2,690 μstrains, Δεfrp = 690
μstrains), but shifted to laminate L4 for EBL-S1 (εfrp = 2,050 μstrains, Δεfrp = 570 μstrains)
(see Figure 6.1 and 6.2 for crack gauge locations). Comparing EBL to EBS specimens, a
58% increase in CFRP strain range between the first and last cycles was obtained for EBS-
S1, compared to a 36% increase for EBL-S1. However, for specimens of the S3 series, a
163% increase in CFRP strain range was obtained for EBS-S3, compared to a 97% increase
for EBL-S3. This clearly reflects severe degradation of the beams during the fatigue tests; as
well, it reflects a reduction in fatigue damage accumulation for those specimens strengthened
with L-shaped laminates. Comparing the S1 and S3 series, despite the higher applied loads
experienced by series S1 specimens, a substantial reduction in the rate of increase in the
CFRP strain range was obtained with a decrease in stirrup spacing (from 163% for EBS-S3
to 58% for EBS-S1, and from 97% for EBL-S3 to 36% for EBL-S1). Moreover, in terms of
the presence of steel stirrups (S0 versus S1 and S3), specimens with no steel stirrups (S0)
exhibited much higher rates of increase in CFRP strain range compared to those with steel
stirrups (S1 and S3). This confirms the existence of an interaction and hence of a beneficial
stress redistribution between internal shear reinforcement and EB-FRP under fatigue loading.
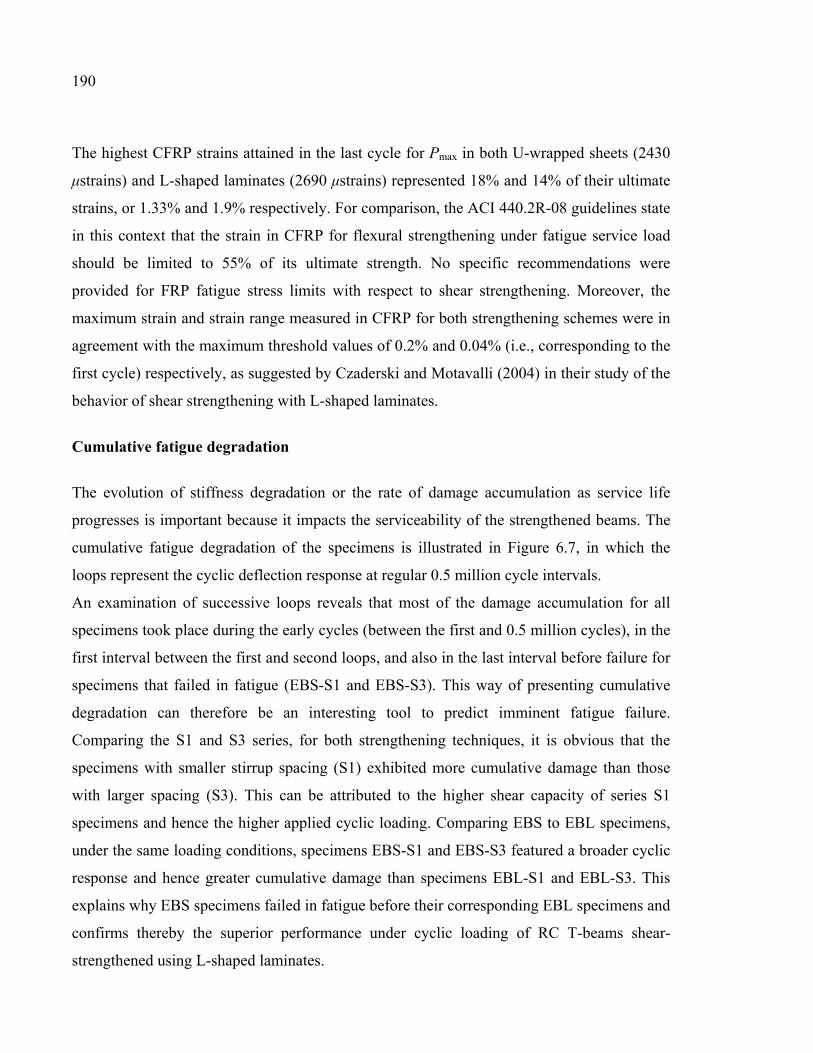
190
The highest CFRP strains attained in the last cycle for Pmax in both U-wrapped sheets (2430
μstrains) and L-shaped laminates (2690 μstrains) represented 18% and 14% of their ultimate
strains, or 1.33% and 1.9% respectively. For comparison, the ACI 440.2R-08 guidelines state
in this context that the strain in CFRP for flexural strengthening under fatigue service load
should be limited to 55% of its ultimate strength. No specific recommendations were
provided for FRP fatigue stress limits with respect to shear strengthening. Moreover, the
maximum strain and strain range measured in CFRP for both strengthening schemes were in
agreement with the maximum threshold values of 0.2% and 0.04% (i.e., corresponding to the
first cycle) respectively, as suggested by Czaderski and Motavalli (2004) in their study of the
behavior of shear strengthening with L-shaped laminates.
Cumulative fatigue degradation
The evolution of stiffness degradation or the rate of damage accumulation as service life
progresses is important because it impacts the serviceability of the strengthened beams. The
cumulative fatigue degradation of the specimens is illustrated in Figure 6.7, in which the
loops represent the cyclic deflection response at regular 0.5 million cycle intervals.
An examination of successive loops reveals that most of the damage accumulation for all
specimens took place during the early cycles (between the first and 0.5 million cycles), in the
first interval between the first and second loops, and also in the last interval before failure for
specimens that failed in fatigue (EBS-S1 and EBS-S3). This way of presenting cumulative
degradation can therefore be an interesting tool to predict imminent fatigue failure.
Comparing the S1 and S3 series, for both strengthening techniques, it is obvious that the
specimens with smaller stirrup spacing (S1) exhibited more cumulative damage than those
with larger spacing (S3). This can be attributed to the higher shear capacity of series S1
specimens and hence the higher applied cyclic loading. Comparing EBS to EBL specimens,
under the same loading conditions, specimens EBS-S1 and EBS-S3 featured a broader cyclic
response and hence greater cumulative damage than specimens EBL-S1 and EBL-S3. This
explains why EBS specimens failed in fatigue before their corresponding EBL specimens and
confirms thereby the superior performance under cyclic loading of RC T-beams shear-
strengthened using L-shaped laminates.
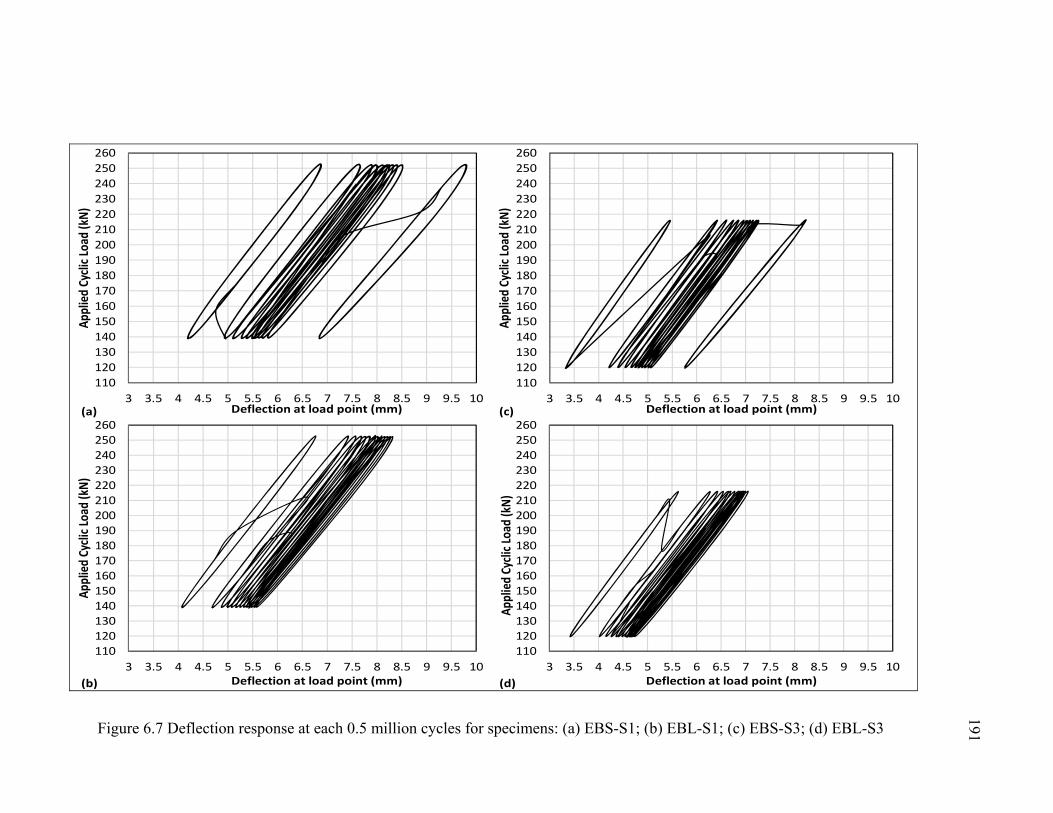
Figure 6.7 Deflection response at each 0.5 million cycles for specimens: (a) EBS-S1; (b) EBL-S1; (c) EBS-S3; (d) EBL-S3
110120130140150160170180190200210220230240250260
3 3.5 4 4.5 5 5.5 6 6.5 7 7.5 8 8.5 9 9.5 10
Appl
ied
Cycli
c Loa
d (k
N)
Deflection at load point (mm)(a)
110120130140150160170180190200210220230240250260
3 3.5 4 4.5 5 5.5 6 6.5 7 7.5 8 8.5 9 9.5 10
Appl
ied
Cycli
c Loa
d (k
N)
Deflection at load point (mm)
110120130140150160170180190200210220230240250260
3 3.5 4 4.5 5 5.5 6 6.5 7 7.5 8 8.5 9 9.5 10
Appl
ied
Cycli
c Loa
d (k
N)
Deflection at load point (mm)
110120130140150160170180190200210220230240250260
3 3.5 4 4.5 5 5.5 6 6.5 7 7.5 8 8.5 9 9.5 10
Appl
ied
Cycli
c Loa
d (k
N)
Deflection at load point (mm)(d)(b)
(c)
191
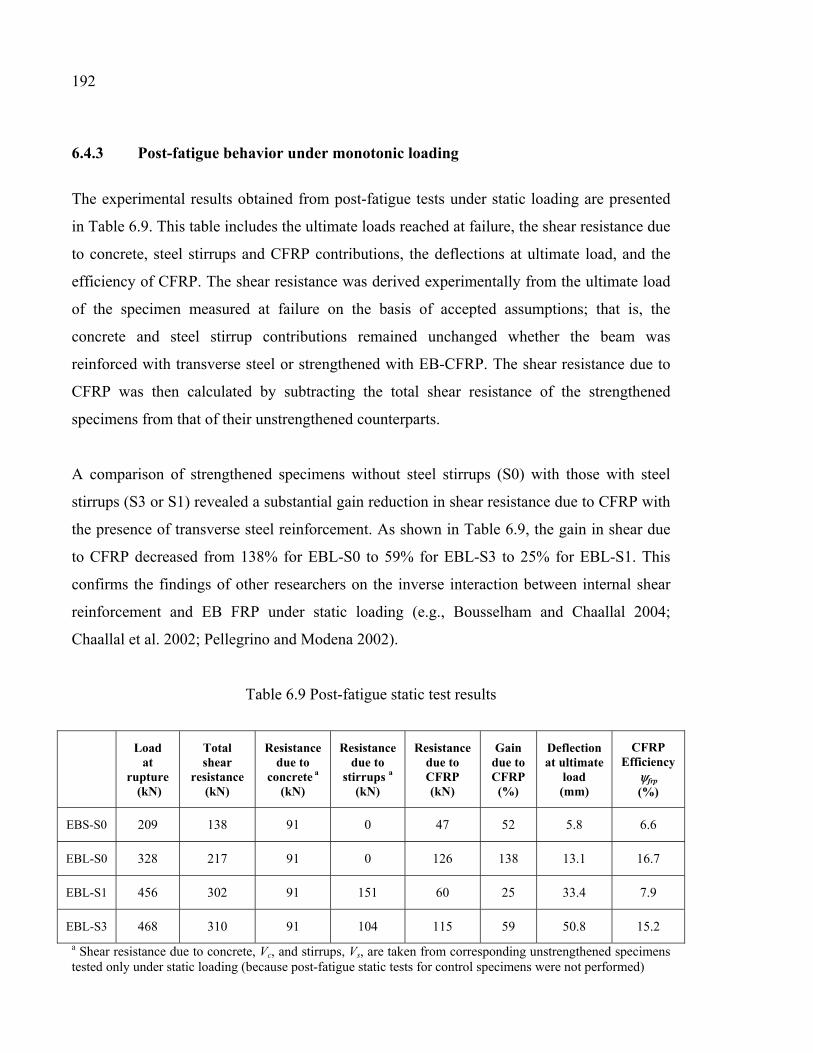
192
6.4.3 Post-fatigue behavior under monotonic loading
The experimental results obtained from post-fatigue tests under static loading are presented
in Table 6.9. This table includes the ultimate loads reached at failure, the shear resistance due
to concrete, steel stirrups and CFRP contributions, the deflections at ultimate load, and the
efficiency of CFRP. The shear resistance was derived experimentally from the ultimate load
of the specimen measured at failure on the basis of accepted assumptions; that is, the
concrete and steel stirrup contributions remained unchanged whether the beam was
reinforced with transverse steel or strengthened with EB-CFRP. The shear resistance due to
CFRP was then calculated by subtracting the total shear resistance of the strengthened
specimens from that of their unstrengthened counterparts.
A comparison of strengthened specimens without steel stirrups (S0) with those with steel
stirrups (S3 or S1) revealed a substantial gain reduction in shear resistance due to CFRP with
the presence of transverse steel reinforcement. As shown in Table 6.9, the gain in shear due
to CFRP decreased from 138% for EBL-S0 to 59% for EBL-S3 to 25% for EBL-S1. This
confirms the findings of other researchers on the inverse interaction between internal shear
reinforcement and EB FRP under static loading (e.g., Bousselham and Chaallal 2004;
Chaallal et al. 2002; Pellegrino and Modena 2002).
Table 6.9 Post-fatigue static test results
Load at
rupture (kN)
Total shear
resistance (kN)
Resistance due to
concrete a (kN)
Resistance due to
stirrups a (kN)
Resistance due to CFRP (kN)
Gain due to CFRP (%)
Deflection at ultimate
load (mm)
CFRP Efficiency
ψfrp
(%)
EBS-S0 209 138 91 0 47 52 5.8 6.6
EBL-S0 328 217 91 0 126 138 13.1 16.7
EBL-S1 456 302 91 151 60 25 33.4 7.9
EBL-S3 468 310 91 104 115 59 50.8 15.2
a Shear resistance due to concrete, Vc, and stirrups, Vs, are taken from corresponding unstrengthened specimens tested only under static loading (because post-fatigue static tests for control specimens were not performed)
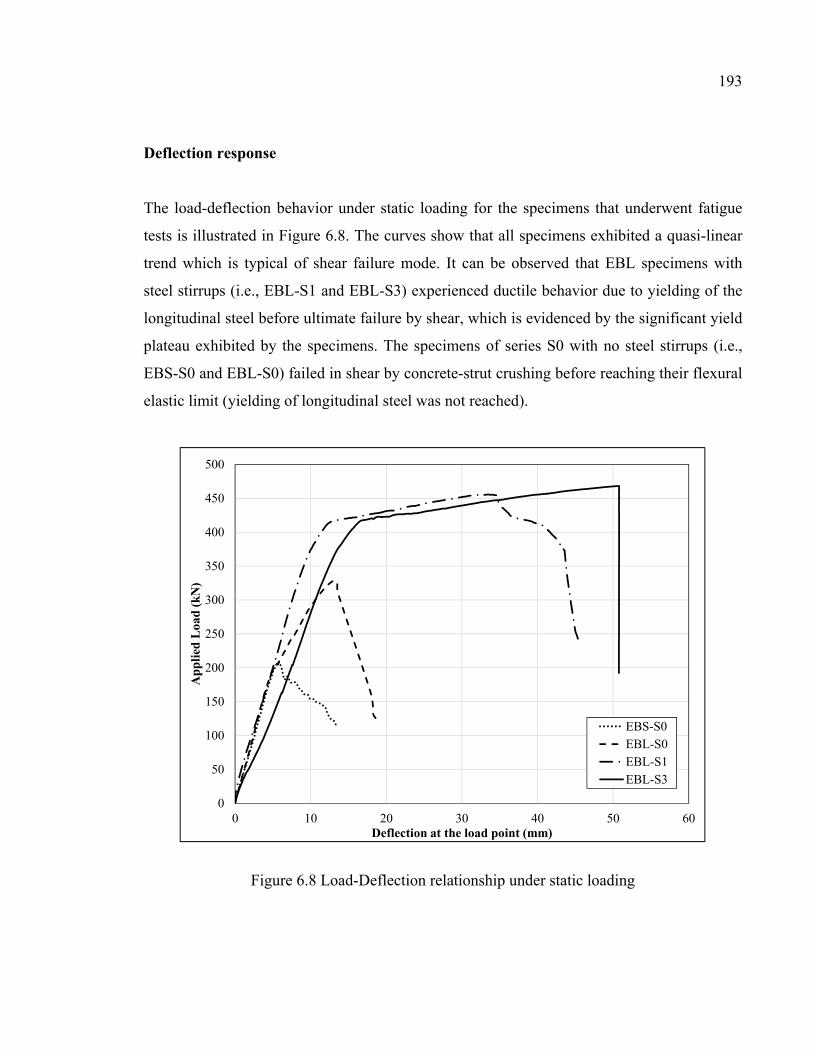
193
Deflection response
The load-deflection behavior under static loading for the specimens that underwent fatigue
tests is illustrated in Figure 6.8. The curves show that all specimens exhibited a quasi-linear
trend which is typical of shear failure mode. It can be observed that EBL specimens with
steel stirrups (i.e., EBL-S1 and EBL-S3) experienced ductile behavior due to yielding of the
longitudinal steel before ultimate failure by shear, which is evidenced by the significant yield
plateau exhibited by the specimens. The specimens of series S0 with no steel stirrups (i.e.,
EBS-S0 and EBL-S0) failed in shear by concrete-strut crushing before reaching their flexural
elastic limit (yielding of longitudinal steel was not reached).
Figure 6.8 Load-Deflection relationship under static loading
0
50
100
150
200
250
300
350
400
450
500
0 10 20 30 40 50 60
App
lied
Loa
d (
kN)
Deflection at the load point (mm)
EBS-S0EBL-S0EBL-S1EBL-S3
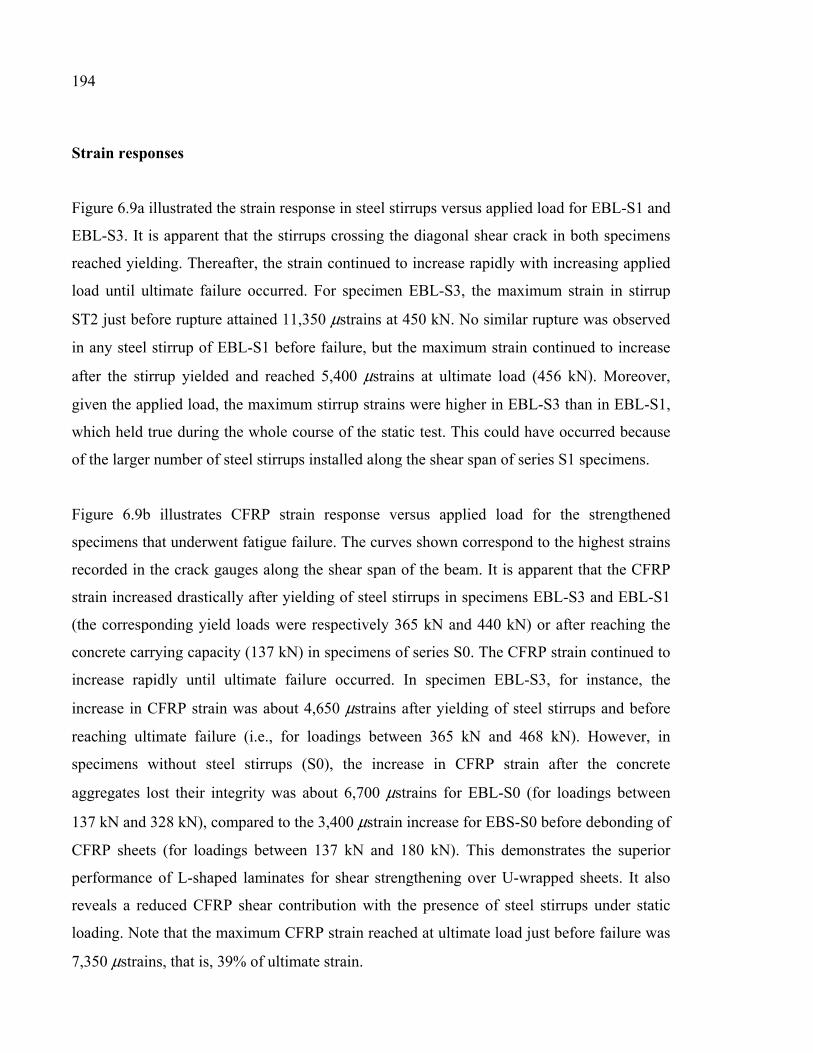
194
Strain responses
Figure 6.9a illustrated the strain response in steel stirrups versus applied load for EBL-S1 and
EBL-S3. It is apparent that the stirrups crossing the diagonal shear crack in both specimens
reached yielding. Thereafter, the strain continued to increase rapidly with increasing applied
load until ultimate failure occurred. For specimen EBL-S3, the maximum strain in stirrup
ST2 just before rupture attained 11,350 μstrains at 450 kN. No similar rupture was observed
in any steel stirrup of EBL-S1 before failure, but the maximum strain continued to increase
after the stirrup yielded and reached 5,400 μstrains at ultimate load (456 kN). Moreover,
given the applied load, the maximum stirrup strains were higher in EBL-S3 than in EBL-S1,
which held true during the whole course of the static test. This could have occurred because
of the larger number of steel stirrups installed along the shear span of series S1 specimens.
Figure 6.9b illustrates CFRP strain response versus applied load for the strengthened
specimens that underwent fatigue failure. The curves shown correspond to the highest strains
recorded in the crack gauges along the shear span of the beam. It is apparent that the CFRP
strain increased drastically after yielding of steel stirrups in specimens EBL-S3 and EBL-S1
(the corresponding yield loads were respectively 365 kN and 440 kN) or after reaching the
concrete carrying capacity (137 kN) in specimens of series S0. The CFRP strain continued to
increase rapidly until ultimate failure occurred. In specimen EBL-S3, for instance, the
increase in CFRP strain was about 4,650 μstrains after yielding of steel stirrups and before
reaching ultimate failure (i.e., for loadings between 365 kN and 468 kN). However, in
specimens without steel stirrups (S0), the increase in CFRP strain after the concrete
aggregates lost their integrity was about 6,700 μstrains for EBL-S0 (for loadings between
137 kN and 328 kN), compared to the 3,400 μstrain increase for EBS-S0 before debonding of
CFRP sheets (for loadings between 137 kN and 180 kN). This demonstrates the superior
performance of L-shaped laminates for shear strengthening over U-wrapped sheets. It also
reveals a reduced CFRP shear contribution with the presence of steel stirrups under static
loading. Note that the maximum CFRP strain reached at ultimate load just before failure was
7,350 μstrains, that is, 39% of ultimate strain.
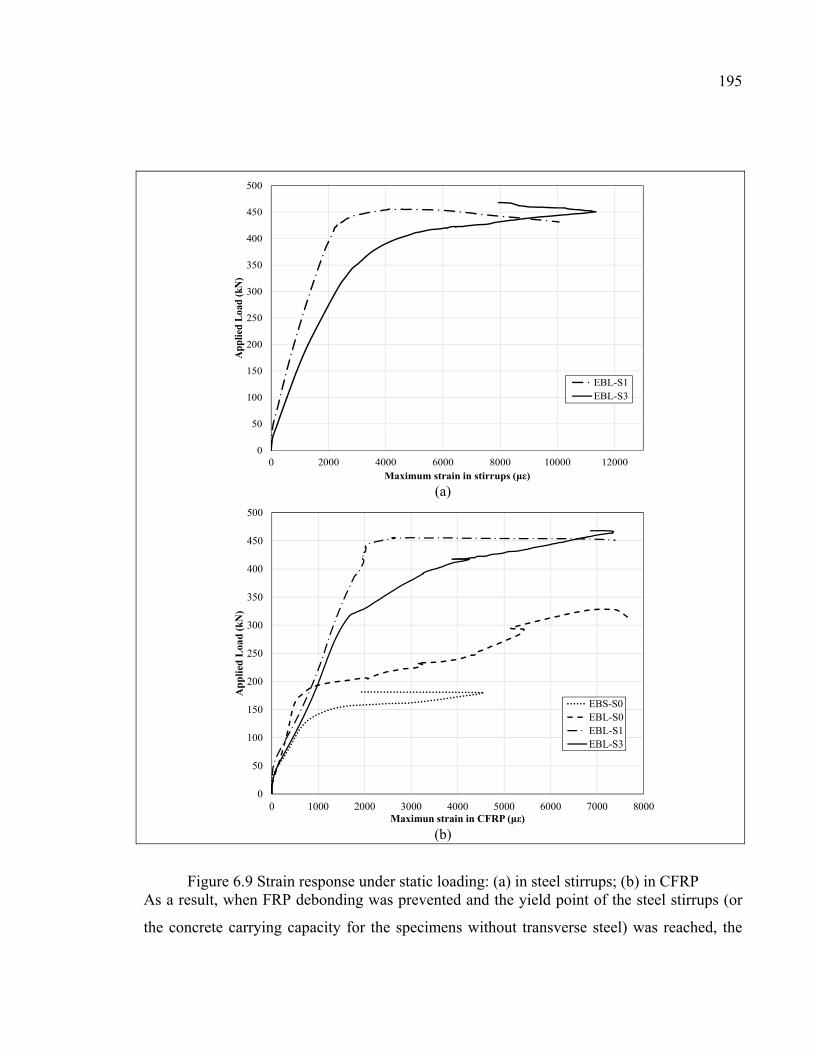
195
(a)
(b)
Figure 6.9 Strain response under static loading: (a) in steel stirrups; (b) in CFRP As a result, when FRP debonding was prevented and the yield point of the steel stirrups (or
the concrete carrying capacity for the specimens without transverse steel) was reached, the
0
50
100
150
200
250
300
350
400
450
500
0 2000 4000 6000 8000 10000 12000
App
lied
Loa
d (k
N)
Maximum strain in stirrups (με)
EBL-S1EBL-S3
0
50
100
150
200
250
300
350
400
450
500
0 1000 2000 3000 4000 5000 6000 7000 8000
Ap
pli
ed L
oad
(kN
)
Maximun strain in CFRP (με)
EBS-S0EBL-S0EBL-S1EBL-S3
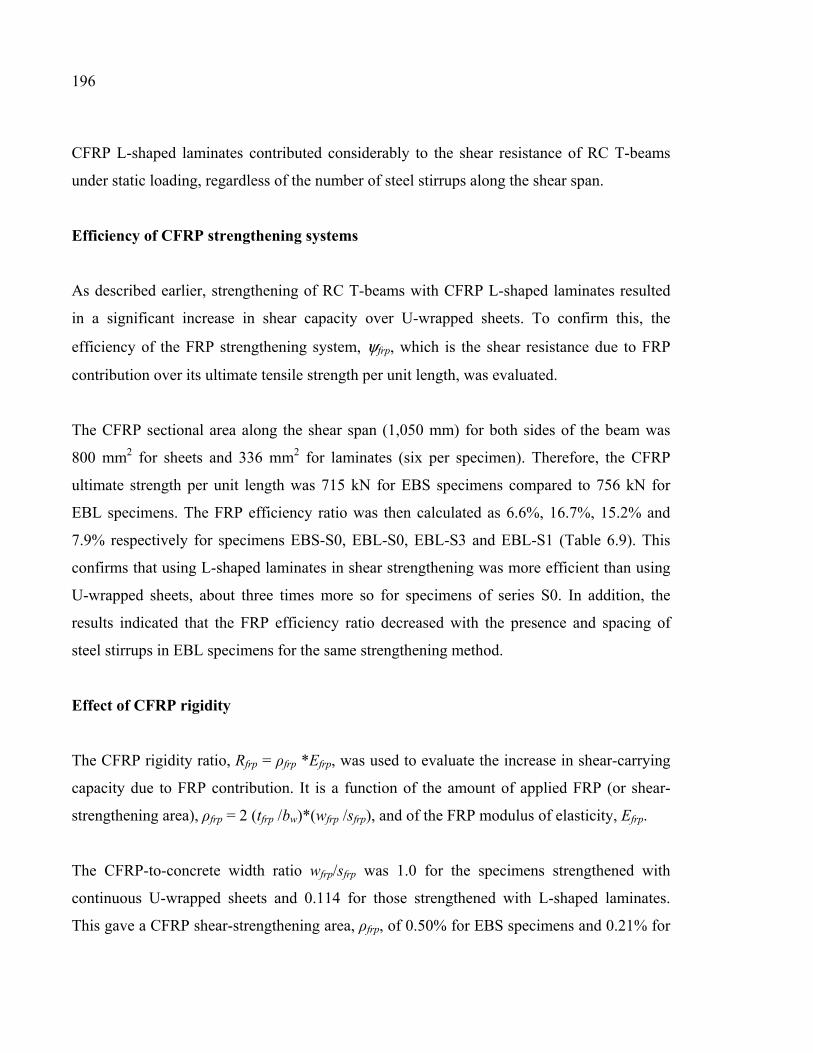
196
CFRP L-shaped laminates contributed considerably to the shear resistance of RC T-beams
under static loading, regardless of the number of steel stirrups along the shear span.
Efficiency of CFRP strengthening systems
As described earlier, strengthening of RC T-beams with CFRP L-shaped laminates resulted
in a significant increase in shear capacity over U-wrapped sheets. To confirm this, the
efficiency of the FRP strengthening system, ψfrp, which is the shear resistance due to FRP
contribution over its ultimate tensile strength per unit length, was evaluated.
The CFRP sectional area along the shear span (1,050 mm) for both sides of the beam was
800 mm2 for sheets and 336 mm2 for laminates (six per specimen). Therefore, the CFRP
ultimate strength per unit length was 715 kN for EBS specimens compared to 756 kN for
EBL specimens. The FRP efficiency ratio was then calculated as 6.6%, 16.7%, 15.2% and
7.9% respectively for specimens EBS-S0, EBL-S0, EBL-S3 and EBL-S1 (Table 6.9). This
confirms that using L-shaped laminates in shear strengthening was more efficient than using
U-wrapped sheets, about three times more so for specimens of series S0. In addition, the
results indicated that the FRP efficiency ratio decreased with the presence and spacing of
steel stirrups in EBL specimens for the same strengthening method.
Effect of CFRP rigidity
The CFRP rigidity ratio, Rfrp = ρfrp *Efrp, was used to evaluate the increase in shear-carrying
capacity due to FRP contribution. It is a function of the amount of applied FRP (or shear-
strengthening area), ρfrp = 2 (tfrp /bw)*(wfrp /sfrp), and of the FRP modulus of elasticity, Efrp.
The CFRP-to-concrete width ratio wfrp/sfrp was 1.0 for the specimens strengthened with
continuous U-wrapped sheets and 0.114 for those strengthened with L-shaped laminates.
This gave a CFRP shear-strengthening area, ρfrp, of 0.50% for EBS specimens and 0.21% for
197
EBL specimens. The CFRP rigidity ratio was then calculated as 0.33 GPa for sheets and 0.25
GPa for laminates.
It is well known that an increase in the FRP-to-concrete width ratio produces a uniform and
greater transfer between FRP and concrete, thereby leading to an increase in the shear
capacity of specimens. Moreover, higher shear capacity can be also attributed to higher
rigidity due to the FRP strengthening system used. Nevertheless, the results in this study
revealed that despite the smaller CFRP rigidity ratio and CFRP-to-concrete width ratio
attributed to the L-shaped laminates, the gain in shear resistance was higher for EBL
specimens than for EBS specimens, assuming that the CFRP ultimate strength per unit length
was equivalent for both strengthening schemes. For instance, the gain in shear resistance due
to CFRP was 138% for EBL-S0, compared to a gain of 52% for EBS-S0 (Table 6.9). This
demonstrates the superior potential of L-shaped laminates over U-wrapped sheets in
enhancing the shear performance of RC T-beams. However, the test results confirmed the
feasibility of both EB-CFRP techniques (whether U-wrapped sheets or L-shaped laminates)
in increasing the load-carrying capacity of RC T-beams shear-strengthened under static
loading.
6.5 Conclusions
This paper presents the results of an experimental investigation that compared the fatigue and
post-fatigue (static) behavior of two EB CFRP techniques (sheets vs. laminates) for shear
retrofit of RC T-beams. On the basis of the findings, the following conclusions can be drawn:
1. The overall response was typical of RC beams under fatigue. All specimens exhibited a
typical trend of cumulative fatigue degradation, which was characterized by an
accelerated rate of damage propagation during early cycles, followed by a stable phase in
which the damage accumulation slowed significantly;
198
2. Shear strengthening with L-shaped laminates of RC T-beams under cyclic loading has
been shown to be potentially more effective than use of U-wrapped sheets in extending
the fatigue life of RC structures. This was demonstrated in terms of number of cycles,
deflection response, level of strain in steel stirrups, gain in shear resistance, and fatigue
damage accumulation;
3. Despite the flexure fatigue failure experienced by EBS specimens, they still behaved well
because longitudinal steel rupture occurred only after 5 million cycles in a very high
stress range. However, for RC beams shear-strengthened using U-wrapped sheets, the
longitudinal steel may be the weakest link and should be looked at with caution,
particularly for extending service life, where it may govern the upper limit of the
projected capacity. This may indicate that code specifications for fatigue limit-state
design of unstrengthened structures may also be used for RC beams shear-strengthened
using EB CFRP sheets;
4. The ratio of maximum longitudinal steel stress over its yield strength reached 82% before
yielding of longitudinal reinforcing bars in EBS-S1, whereas it reached 84% at 6 million
cycles in EBL-S1 without any failure. The ACI 440.2R-08 guidelines state in this context
that the stress in longitudinal steel reinforcement under fatigue service load should be
limited to 80% of the yield stress;
5. The fact that no failure by FRP debonding occurred during the fatigue test clearly
demonstrates the effectiveness of the EB FRP technique (whether U-wrapped sheets or L-
shaped laminates) in strengthening RC T-beams under cyclic loading;
6. The highest recorded strains in CFRP represented about 18% (U-wrapped sheets) and
14% (L-shaped laminates) of their ultimate strength. The maximum measured strain and
strain ranges in CFRP were in agreement with the maximum threshold values of 0.2%
and 0.04% (i.e., corresponding to the first cycle) suggested by Czaderski and Motavalli
(2004). Note that the ACI 440.2R-08 guidelines state in this context that the strain in
CFRP for flexural strengthening under fatigue service load should be limited to 55% of
its ultimate strength;
7. The presence of steel stirrups in the strengthened specimens resulted in a substantial
reduction in the gain in shear resistance due to CFRP under cyclic (fatigue) and static
199
(post-fatigue) loadings, confirming the inverse interaction between presence of internal
shear reinforcement and EB FRP documented earlier by researchers, but for static
loading.
6.6 Acknowledgments
The financial support of the Natural Sciences and Engineering Research Council of Canada
(NSERC), and the Fonds québécois de la recherche sur la nature et les technologies (FQRNT
Research Team Project) through operating grants is gratefully acknowledged. The authors
thank Sika Canada Inc. (Pointe Claire, Quebec) for contributing to the cost of the materials.
The efficient collaboration of John Lescelleur (senior technician) and Juan Mauricio Rios
(technician) at ETS in conducting the tests is acknowledged.

CHAPITRE 7
NEW ANCHORAGE TECHNIQUE FOR FRP SHEAR-STRENGTHENED RC T-BEAMS USING CFRP ROPE
Georges El-Saikaly1, Ahmed Godat2 and Omar Chaallal3
Department of Construction Engineering, École de Technologie Supérieure,
1100 Notre-Dame St. West, Montreal, QC, Canada H3C 1K3
Article Published in Journal of Composites for Construction, American Society of Civil
Engineers (ASCE), available online in ASCE web; DOI: 10.1061/(ASCE)CC.1943-
5614.0000530, 04014064, September 2014.
7.1 Abstract
This study investigates the effectiveness of a new anchorage technique for fiber-reinforced
polymer (FRP) shear-strengthened reinforced concrete T-beams using carbon fiber-
reinforced polymer (CFRP) ropes. The rope is a bundle of flexible CFRP strands held
together using a thin tissue net. In this technique, holes are drilled through the web at the
web-flange intersection, where the CFRP ropes are inserted and flared onto the two free ends
of the U-wrap scheme. This converts the U-wrap scheme to a full-wrap scheme. The
experimental program includes three series based on the number of steel stirrups. No steel
stirrups are provided in the first series, whereas the spacing between steel stirrups is 260 and
175 mm in the second and the third series, respectively. Each series includes a control
specimen, with no external CFRP for shear strengthening, a specimen strengthened with
CFRP sheets, a specimen strengthened with CFRP L-strips, and a specimen strengthened
with CFRP L-strips and anchored with CFRP ropes. Two strengthening procedures are used
in this study to investigate the effect of the FRP-width to concrete-width ratio. In the
anchored specimens, the CFRP rope covers half the depth of the L-strips. The results of this 1 Ph.D. Candidate, École de Technologie Supérieure. E-mail: [email protected] 2 Research Associate, École de Technologie Supérieure. E-mail: [email protected] 3 Professor of Construction Engineering, École de Technologie Supérieure. E-mail: [email protected]
202
study reveal that the beams anchored with CFRP ropes achieve an enhanced contribution to
the shear resistance compared to the beams with CFRP sheets and CFRP L-strips with no
rope. In addition, the method eliminates CFRP debonding and achieves rupture of steel
stirrups.
Keywords: Reinforced concrete beam; Fiber-reinforced polymers; Strengthening; Shear;
Anchorage; CFRP rope.
7.2 Introduction
The use of epoxy-bonded fiber-reinforced polymers (FRPs) for shear strengthening is an
effective technique for restoring and upgrading the capacity of existing reinforced-concrete
(RC) beams. However, with this technique, there is often a concern that premature failures
may occur as a result of FRP debonding from concrete. Such failure occurs in a brittle
manner and prevents the beam from attaining its full capacity. In FRP shear-strengthened
beams, experimental tests have shown that the debonding failure mode is related to the
strengthening scheme utilized. Based on available experimental data, side-bonded plates are
the most vulnerable to premature failure. Full wrapping is the most effective technique;
however, most RC beams are cast monolithically with slabs, and therefore the technique is
rarely adopted in the field. The U-wrapping scheme is commonly used in practice to
strengthen such beams in shear; however, debonding remains its governing failure mode.
Therefore, anchorage of the U-wrap strengthening scheme to prevent debonding and thereby
increase the FRP contribution to shear resistance is deemed one of the most important
challenges facing the research community.
Several anchorage systems have been proposed in the literature to delay or prevent the
debonding failure mode of externally bonded (EB) FRP shear-strengthened RC beams.
Recently, Kalfat et al. (2013) summarized the various devices used to anchor FRP shear-
strengthened beams. Steel plates and bolts were used as an anchorage solution by Sato et al.
(1997). The steel plates were placed at the FRP end and held in place by bolting the plates
into the concrete. However, corrosion of the steel anchorage remains a possibility in the long
203
term. The anchorage system proposed by Khalifa and Nanni (2000) was intended to eliminate
the corrosion issue. It was installed by grooving the concrete at the web-flange corner along
the entire length of the strengthened portion. The FRP sheets were then bonded to the
concrete surface and to the walls of the groove using FRP rods. Melo et al. (2003) studied the
anchoring of U-wrapped FRP sheets with horizontal FRP plates. The plates were applied
beneath the flange, on top of the FRP plies. However, the proposed anchorage system was
not able to prevent debonding. Deniaud (2000) investigated the FRP shear contribution when
the U-wrap was extended to the underside of the flange. The anchored beams were
characterized by FRP debonding failure. Lee (2003) and Mofidi et al. (2014b) investigated an
anchorage system involving L-strips embedded into the flange. This method is difficult to use
since drilling the slab requires previous knowledge of the slab reinforcement. In addition, it is
practically difficult to make a longitudinal groove using available drilling instruments. Galal
and Mofidi (2010) investigated the performance of an unbonded CFRP U-jacket anchored to
RC T-beams with two steel rods. The steel rods were fixed to the corners of the web-flange
intersection of the T-beam with mechanical bolts. Eshwar et al. (2008) and Koutas and
Triantafillou (2013) examined the performance of spike anchors in FRP shear-strengthened
beams. One end of the spikes was shaped as a fan, while the other end was inserted and
bonded into a hole drilled at the web-flange intersection. In the research study of Eshwar et
al. (2008), many of the spike anchors failed prematurely and did not add to FRP/concrete
bond resistance. Mofidi et al. (2012b) compared the effectiveness of various anchorage
systems proposed in the literature. Among the systems considered, beams strengthened with
a double-plate mechanical end-anchorage system and an embedded CFRP laminate end-
anchorage system showed the highest FRP shear contribution. Some design guidelines
recommend the use of anchorage systems for FRP shear-strengthened beams. The FIB-
International Federation for Structural Concrete 2001 (fib TG9.3-01) recommends anchorage
for shear strengthening of RC beams either using FRP strips anchored with bolts or bonding
the ends of the strips into core holes drilled through the flange of a T-beam. The Canadian
bridge design code CSA/S6-06 (2006) specifies bonding of additional longitudinal FRP strips
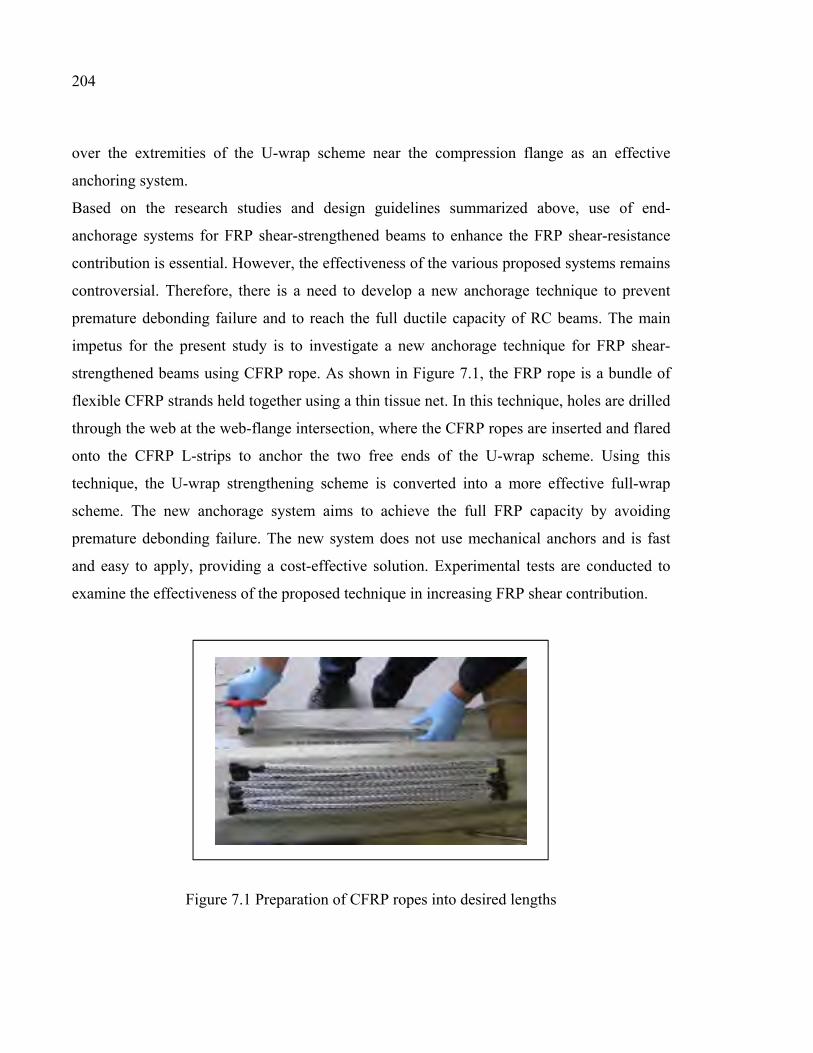
204
over the extremities of the U-wrap scheme near the compression flange as an effective
anchoring system.
Based on the research studies and design guidelines summarized above, use of end-
anchorage systems for FRP shear-strengthened beams to enhance the FRP shear-resistance
contribution is essential. However, the effectiveness of the various proposed systems remains
controversial. Therefore, there is a need to develop a new anchorage technique to prevent
premature debonding failure and to reach the full ductile capacity of RC beams. The main
impetus for the present study is to investigate a new anchorage technique for FRP shear-
strengthened beams using CFRP rope. As shown in Figure 7.1, the FRP rope is a bundle of
flexible CFRP strands held together using a thin tissue net. In this technique, holes are drilled
through the web at the web-flange intersection, where the CFRP ropes are inserted and flared
onto the CFRP L-strips to anchor the two free ends of the U-wrap scheme. Using this
technique, the U-wrap strengthening scheme is converted into a more effective full-wrap
scheme. The new anchorage system aims to achieve the full FRP capacity by avoiding
premature debonding failure. The new system does not use mechanical anchors and is fast
and easy to apply, providing a cost-effective solution. Experimental tests are conducted to
examine the effectiveness of the proposed technique in increasing FRP shear contribution.
Figure 7.1 Preparation of CFRP ropes into desired lengths
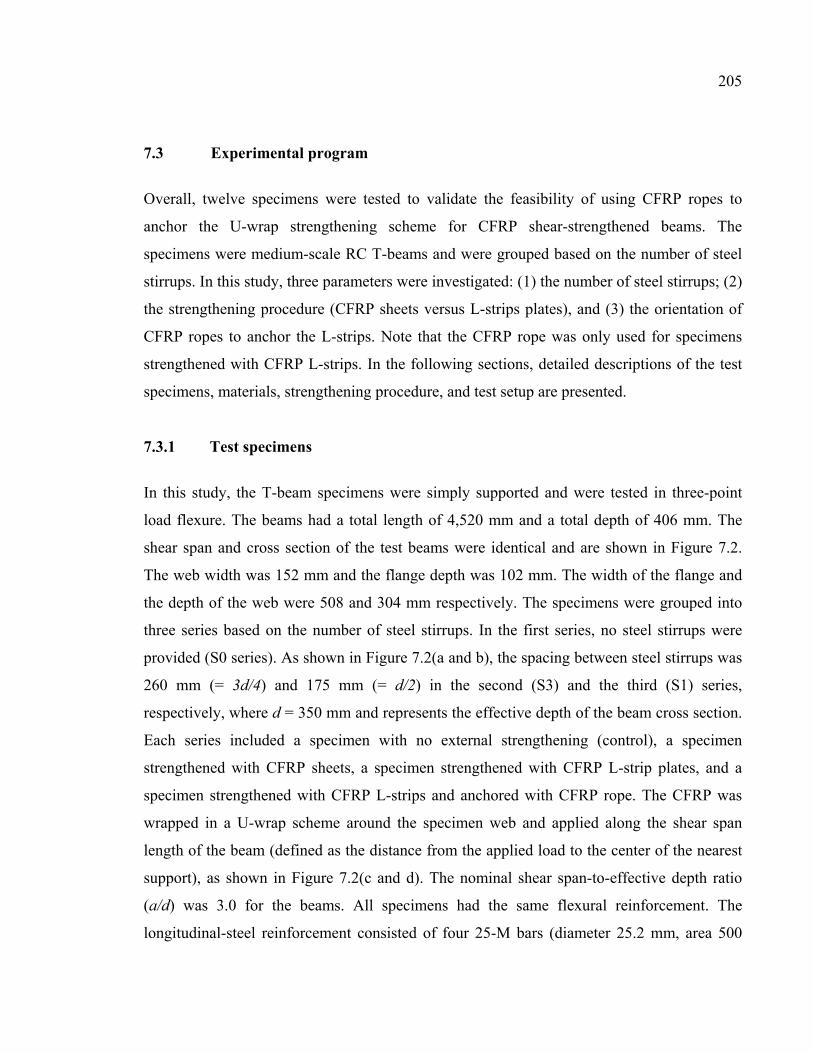
205
7.3 Experimental program
Overall, twelve specimens were tested to validate the feasibility of using CFRP ropes to
anchor the U-wrap strengthening scheme for CFRP shear-strengthened beams. The
specimens were medium-scale RC T-beams and were grouped based on the number of steel
stirrups. In this study, three parameters were investigated: (1) the number of steel stirrups; (2)
the strengthening procedure (CFRP sheets versus L-strips plates), and (3) the orientation of
CFRP ropes to anchor the L-strips. Note that the CFRP rope was only used for specimens
strengthened with CFRP L-strips. In the following sections, detailed descriptions of the test
specimens, materials, strengthening procedure, and test setup are presented.
7.3.1 Test specimens
In this study, the T-beam specimens were simply supported and were tested in three-point
load flexure. The beams had a total length of 4,520 mm and a total depth of 406 mm. The
shear span and cross section of the test beams were identical and are shown in Figure 7.2.
The web width was 152 mm and the flange depth was 102 mm. The width of the flange and
the depth of the web were 508 and 304 mm respectively. The specimens were grouped into
three series based on the number of steel stirrups. In the first series, no steel stirrups were
provided (S0 series). As shown in Figure 7.2(a and b), the spacing between steel stirrups was
260 mm (= 3d/4) and 175 mm (= d/2) in the second (S3) and the third (S1) series,
respectively, where d = 350 mm and represents the effective depth of the beam cross section.
Each series included a specimen with no external strengthening (control), a specimen
strengthened with CFRP sheets, a specimen strengthened with CFRP L-strip plates, and a
specimen strengthened with CFRP L-strips and anchored with CFRP rope. The CFRP was
wrapped in a U-wrap scheme around the specimen web and applied along the shear span
length of the beam (defined as the distance from the applied load to the center of the nearest
support), as shown in Figure 7.2(c and d). The nominal shear span-to-effective depth ratio
(a/d) was 3.0 for the beams. All specimens had the same flexural reinforcement. The
longitudinal-steel reinforcement consisted of four 25-M bars (diameter 25.2 mm, area 500
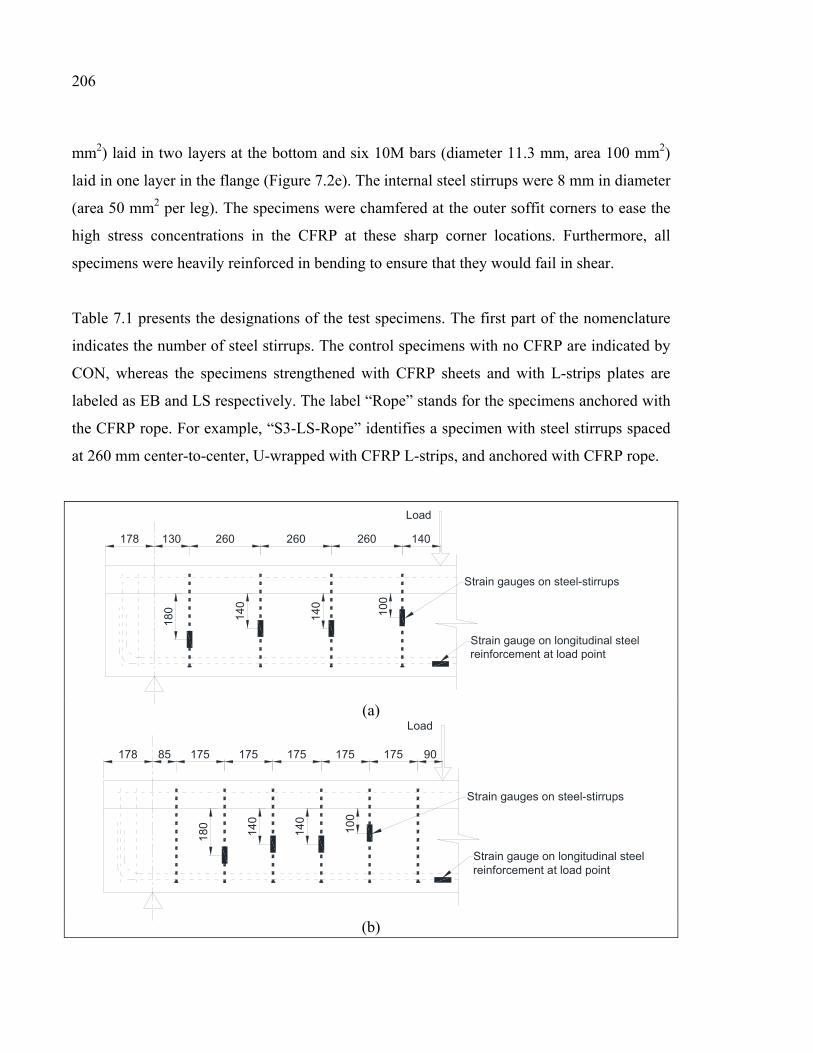
206
mm2) laid in two layers at the bottom and six 10M bars (diameter 11.3 mm, area 100 mm2)
laid in one layer in the flange (Figure 7.2e). The internal steel stirrups were 8 mm in diameter
(area 50 mm2 per leg). The specimens were chamfered at the outer soffit corners to ease the
high stress concentrations in the CFRP at these sharp corner locations. Furthermore, all
specimens were heavily reinforced in bending to ensure that they would fail in shear.
Table 7.1 presents the designations of the test specimens. The first part of the nomenclature
indicates the number of steel stirrups. The control specimens with no CFRP are indicated by
CON, whereas the specimens strengthened with CFRP sheets and with L-strips plates are
labeled as EB and LS respectively. The label “Rope” stands for the specimens anchored with
the CFRP rope. For example, “S3-LS-Rope” identifies a specimen with steel stirrups spaced
at 260 mm center-to-center, U-wrapped with CFRP L-strips, and anchored with CFRP rope.
(a)
(b)
Load
260 260 260 140130178
100
140
180 140
Strain gauges on steel-stirrups
Strain gauge on longitudinal steelreinforcement at load point
Load
175 175 175 175 17585178 90
180 140
140
100
Strain gauges on steel-stirrups
Strain gauge on longitudinal steelreinforcement at load point
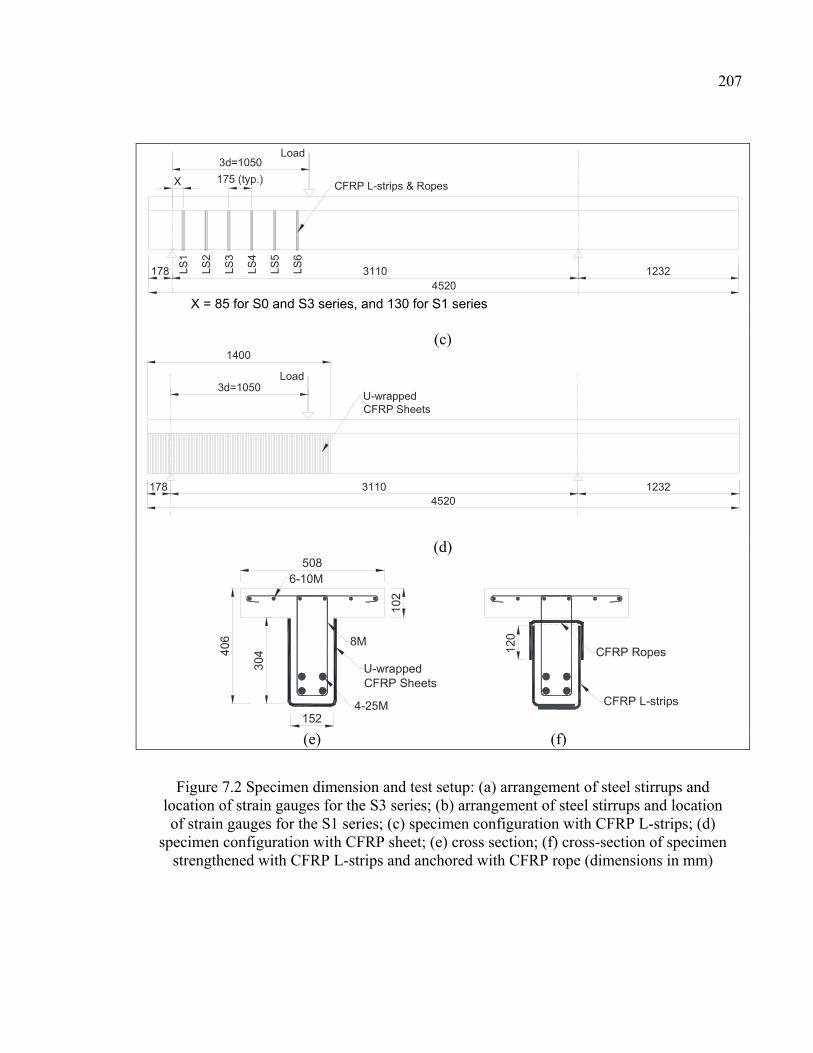
207
X = 85 for S0 and S3 series, and 130 for S1 series
(c)
(d)
(e) (f)
Figure 7.2 Specimen dimension and test setup: (a) arrangement of steel stirrups and location of strain gauges for the S3 series; (b) arrangement of steel stirrups and location of strain gauges for the S1 series; (c) specimen configuration with CFRP L-strips; (d)
specimen configuration with CFRP sheet; (e) cross section; (f) cross-section of specimen strengthened with CFRP L-strips and anchored with CFRP rope (dimensions in mm)
Load
178 3110 1232
3d=1050
4520
175 (typ.)
LS2
LS3
LS4
LS5
LS6
XLS
1CFRP L-strips & Ropes
178 3110 1232
3d=1050
4520
1400
Load
U-wrappedCFRP Sheets
508
102
6-10M
152
406
304 12
08M
U-wrappedCFRP Sheets
4-25M
CFRP Ropes
CFRP L-strips
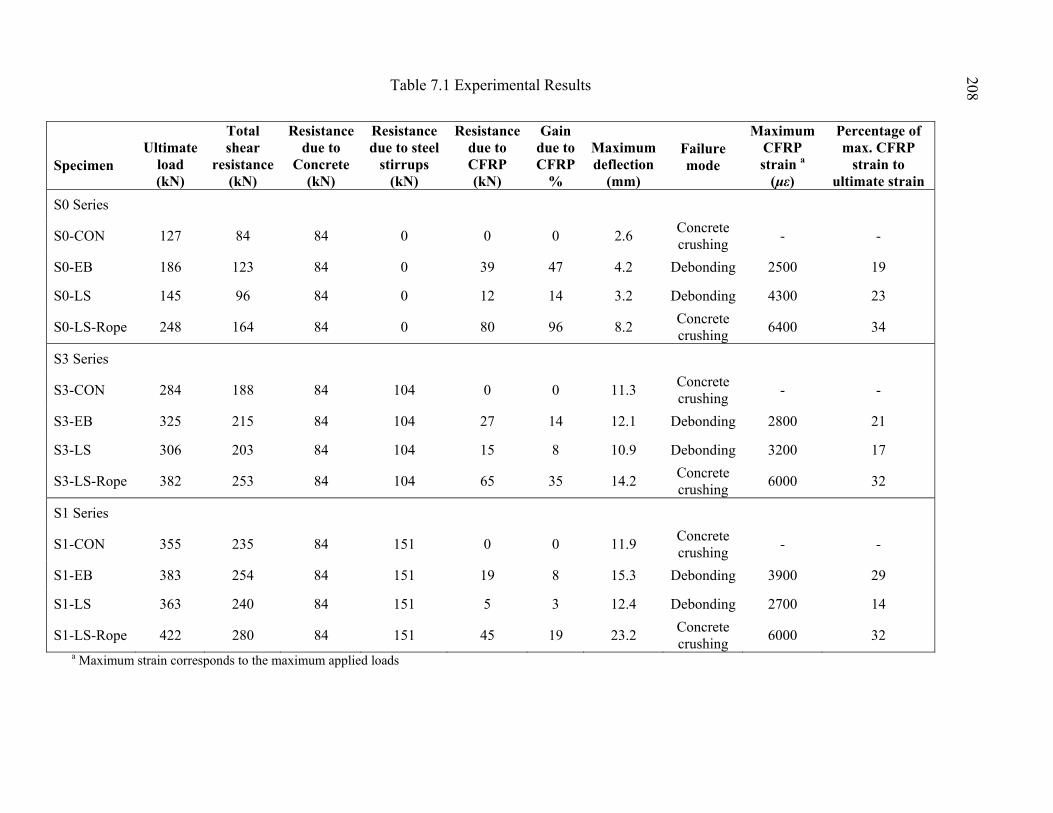
Table 7.1 Experimental Results
Specimen Ultimate
load (kN)
Total shear
resistance (kN)
Resistance due to
Concrete (kN)
Resistance due to steel
stirrups (kN)
Resistance due to CFRP (kN)
Gain due to CFRP
%
Maximum deflection
(mm)
Failure mode
Maximum CFRP strain a
(με)
Percentage of max. CFRP
strain to ultimate strain
S0 Series
S0-CON 127 84 84 0 0 0 2.6 Concrete crushing
- -
S0-EB 186 123 84 0 39 47 4.2 Debonding 2500 19
S0-LS 145 96 84 0 12 14 3.2 Debonding 4300 23
S0-LS-Rope 248 164 84 0 80 96 8.2 Concrete crushing
6400 34
S3 Series
S3-CON 284 188 84 104 0 0 11.3 Concrete crushing
- -
S3-EB 325 215 84 104 27 14 12.1 Debonding 2800 21
S3-LS 306 203 84 104 15 8 10.9 Debonding 3200 17
S3-LS-Rope 382 253 84 104 65 35 14.2 Concrete crushing
6000 32
S1 Series
S1-CON 355 235 84 151 0 0 11.9 Concrete crushing
- -
S1-EB 383 254 84 151 19 8 15.3 Debonding 3900 29
S1-LS 363 240 84 151 5 3 12.4 Debonding 2700 14
S1-LS-Rope 422 280 84 151 45 19 23.2 Concrete crushing
6000 32 a Maximum strain corresponds to the maximum applied loads
208
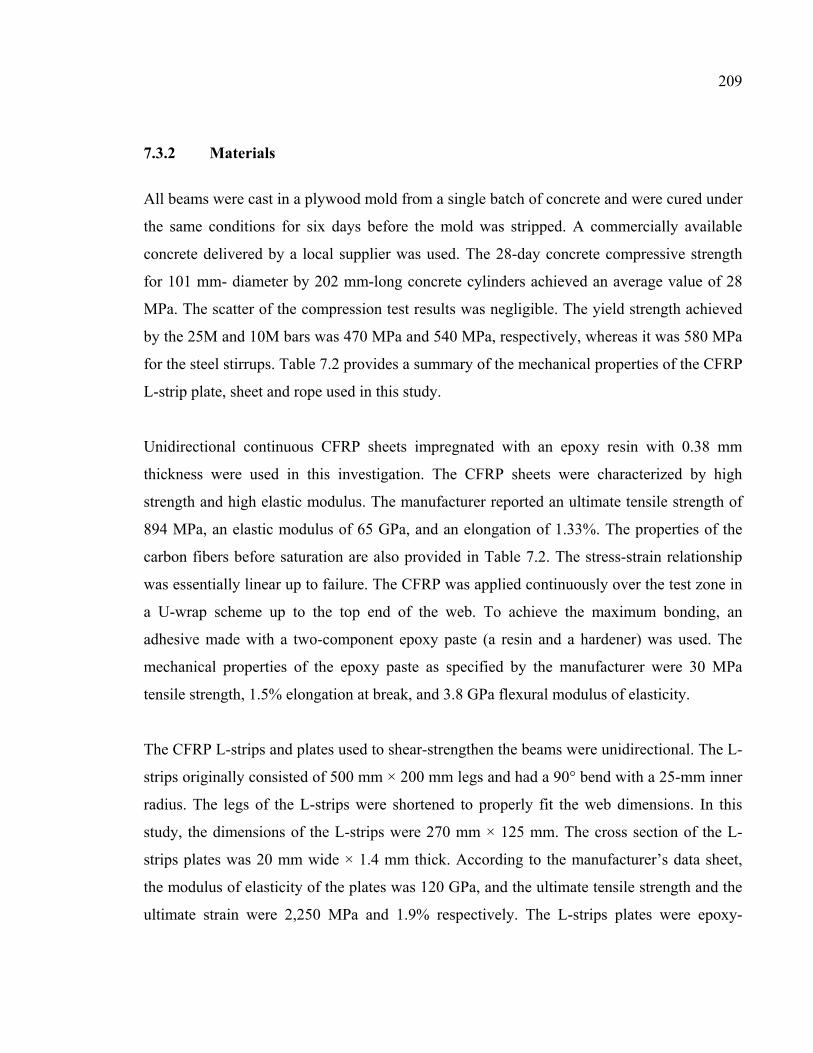
209
7.3.2 Materials
All beams were cast in a plywood mold from a single batch of concrete and were cured under
the same conditions for six days before the mold was stripped. A commercially available
concrete delivered by a local supplier was used. The 28-day concrete compressive strength
for 101 mm- diameter by 202 mm-long concrete cylinders achieved an average value of 28
MPa. The scatter of the compression test results was negligible. The yield strength achieved
by the 25M and 10M bars was 470 MPa and 540 MPa, respectively, whereas it was 580 MPa
for the steel stirrups. Table 7.2 provides a summary of the mechanical properties of the CFRP
L-strip plate, sheet and rope used in this study.
Unidirectional continuous CFRP sheets impregnated with an epoxy resin with 0.38 mm
thickness were used in this investigation. The CFRP sheets were characterized by high
strength and high elastic modulus. The manufacturer reported an ultimate tensile strength of
894 MPa, an elastic modulus of 65 GPa, and an elongation of 1.33%. The properties of the
carbon fibers before saturation are also provided in Table 7.2. The stress-strain relationship
was essentially linear up to failure. The CFRP was applied continuously over the test zone in
a U-wrap scheme up to the top end of the web. To achieve the maximum bonding, an
adhesive made with a two-component epoxy paste (a resin and a hardener) was used. The
mechanical properties of the epoxy paste as specified by the manufacturer were 30 MPa
tensile strength, 1.5% elongation at break, and 3.8 GPa flexural modulus of elasticity.
The CFRP L-strips and plates used to shear-strengthen the beams were unidirectional. The L-
strips originally consisted of 500 mm × 200 mm legs and had a 90° bend with a 25-mm inner
radius. The legs of the L-strips were shortened to properly fit the web dimensions. In this
study, the dimensions of the L-strips were 270 mm × 125 mm. The cross section of the L-
strips plates was 20 mm wide × 1.4 mm thick. According to the manufacturer’s data sheet,
the modulus of elasticity of the plates was 120 GPa, and the ultimate tensile strength and the
ultimate strain were 2,250 MPa and 1.9% respectively. The L-strips plates were epoxy-
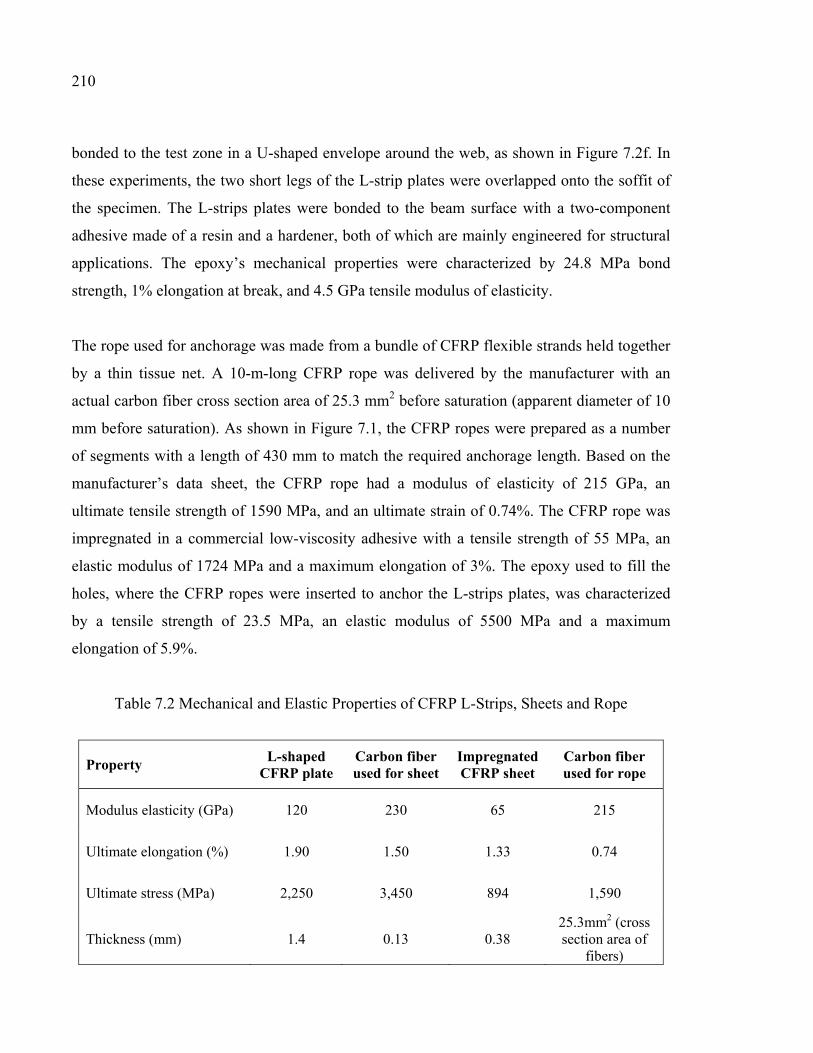
210
bonded to the test zone in a U-shaped envelope around the web, as shown in Figure 7.2f. In
these experiments, the two short legs of the L-strip plates were overlapped onto the soffit of
the specimen. The L-strips plates were bonded to the beam surface with a two-component
adhesive made of a resin and a hardener, both of which are mainly engineered for structural
applications. The epoxy’s mechanical properties were characterized by 24.8 MPa bond
strength, 1% elongation at break, and 4.5 GPa tensile modulus of elasticity.
The rope used for anchorage was made from a bundle of CFRP flexible strands held together
by a thin tissue net. A 10-m-long CFRP rope was delivered by the manufacturer with an
actual carbon fiber cross section area of 25.3 mm2 before saturation (apparent diameter of 10
mm before saturation). As shown in Figure 7.1, the CFRP ropes were prepared as a number
of segments with a length of 430 mm to match the required anchorage length. Based on the
manufacturer’s data sheet, the CFRP rope had a modulus of elasticity of 215 GPa, an
ultimate tensile strength of 1590 MPa, and an ultimate strain of 0.74%. The CFRP rope was
impregnated in a commercial low-viscosity adhesive with a tensile strength of 55 MPa, an
elastic modulus of 1724 MPa and a maximum elongation of 3%. The epoxy used to fill the
holes, where the CFRP ropes were inserted to anchor the L-strips plates, was characterized
by a tensile strength of 23.5 MPa, an elastic modulus of 5500 MPa and a maximum
elongation of 5.9%.
Table 7.2 Mechanical and Elastic Properties of CFRP L-Strips, Sheets and Rope
Property L-shaped
CFRP plate Carbon fiber used for sheet
Impregnated CFRP sheet
Carbon fiber used for rope
Modulus elasticity (GPa) 120 230 65 215
Ultimate elongation (%) 1.90 1.50 1.33 0.74
Ultimate stress (MPa) 2,250 3,450 894 1,590
Thickness (mm) 1.4 0.13 0.38 25.3mm2 (cross section area of
fibers)
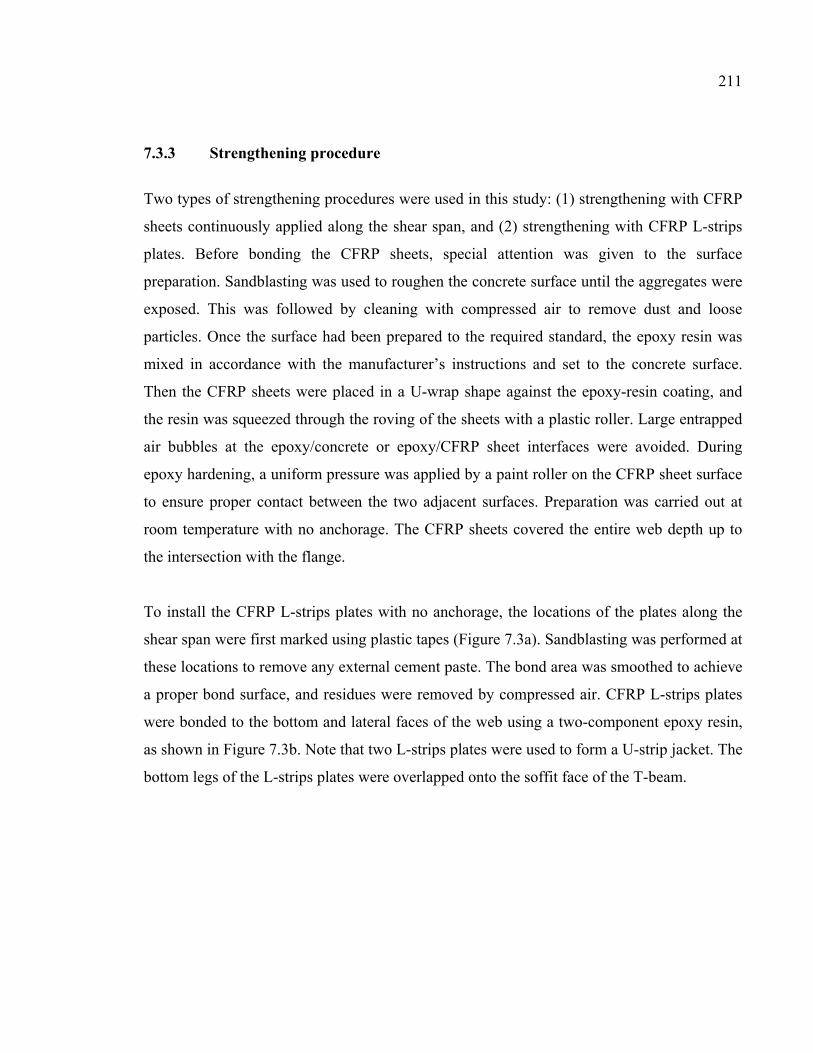
211
7.3.3 Strengthening procedure
Two types of strengthening procedures were used in this study: (1) strengthening with CFRP
sheets continuously applied along the shear span, and (2) strengthening with CFRP L-strips
plates. Before bonding the CFRP sheets, special attention was given to the surface
preparation. Sandblasting was used to roughen the concrete surface until the aggregates were
exposed. This was followed by cleaning with compressed air to remove dust and loose
particles. Once the surface had been prepared to the required standard, the epoxy resin was
mixed in accordance with the manufacturer’s instructions and set to the concrete surface.
Then the CFRP sheets were placed in a U-wrap shape against the epoxy-resin coating, and
the resin was squeezed through the roving of the sheets with a plastic roller. Large entrapped
air bubbles at the epoxy/concrete or epoxy/CFRP sheet interfaces were avoided. During
epoxy hardening, a uniform pressure was applied by a paint roller on the CFRP sheet surface
to ensure proper contact between the two adjacent surfaces. Preparation was carried out at
room temperature with no anchorage. The CFRP sheets covered the entire web depth up to
the intersection with the flange.
To install the CFRP L-strips plates with no anchorage, the locations of the plates along the
shear span were first marked using plastic tapes (Figure 7.3a). Sandblasting was performed at
these locations to remove any external cement paste. The bond area was smoothed to achieve
a proper bond surface, and residues were removed by compressed air. CFRP L-strips plates
were bonded to the bottom and lateral faces of the web using a two-component epoxy resin,
as shown in Figure 7.3b. Note that two L-strips plates were used to form a U-strip jacket. The
bottom legs of the L-strips plates were overlapped onto the soffit face of the T-beam.
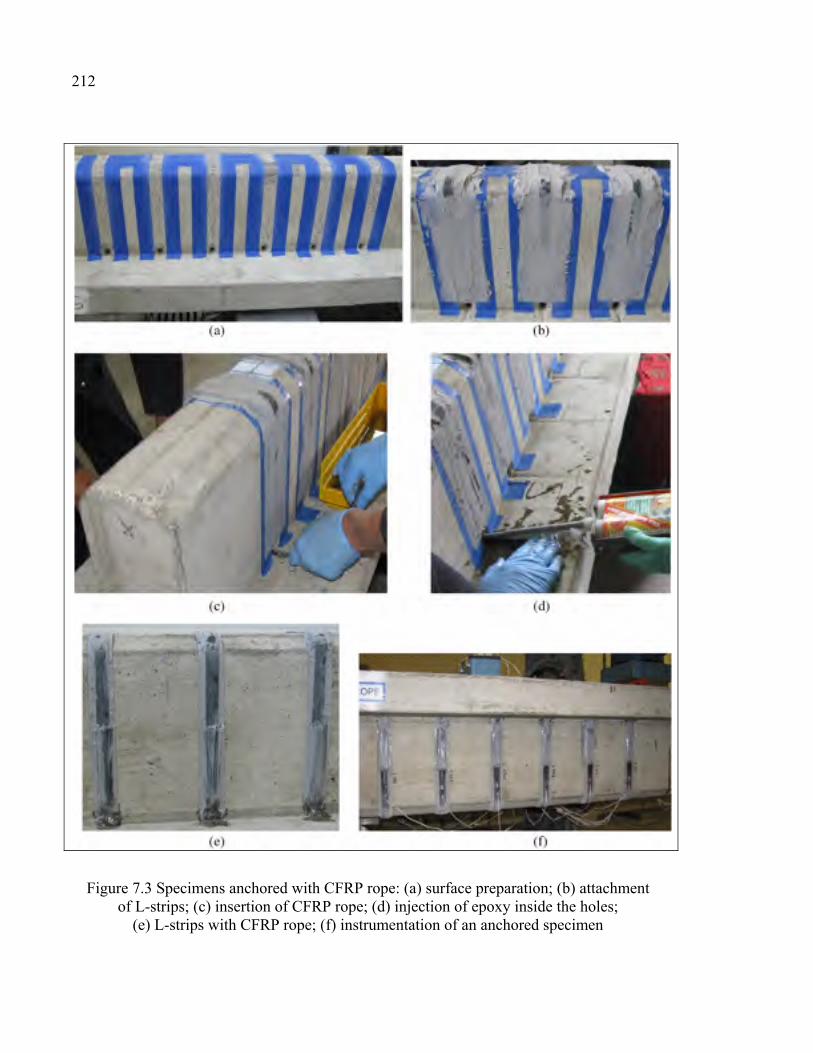
212
Figure 7.3 Specimens anchored with CFRP rope: (a) surface preparation; (b) attachment of L-strips; (c) insertion of CFRP rope; (d) injection of epoxy inside the holes;
(e) L-strips with CFRP rope; (f) instrumentation of an anchored specimen
213
To apply the CFRP rope for anchorage, the locations of the holes were determined at the
midpoints of the width of the CFRP L-strips plates. Then holes with a diameter of 15 mm
were drilled at the web/flange intersection before applying the L-strips (Figure 7.3a). A
commonly used drilling procedure was carried out in accordance with CSA/S806-12 (CSA
2012). Neither local cracking nor local damage to the concrete was observed around the hole.
After all the holes were drilled through the web of the beams, they were cleaned using
compressed air and water to prevent bonding of the rope along the plug. All CFRP ropes
were impregnated for 30 minutes in a low-viscosity epoxy before inserting them into the
holes to enhance the bonding performance. After the CFRP L-strips plates were bonded
(Figure 7.3b), a CFRP rope was inserted inside each hole and was extended out the two sides
of the hole, as shown in Figure 7.3c. Note that for each L-strip, the CFRP rope was adjusted
to a length that overlapped the L-strip depth by 120 mm. The hole was partially filled with an
epoxy adhesive using a beaker with a narrow spout, starting from the far end. The spout was
gradually pulled out of the hole as the process was completed, as shown in Figure 7.3d. Then
the thin tissue netting was removed from the rope, and the two ends of the rope were flared
onto the L-strips. Care was taken to avoid leaving any air pockets inside the hole; to ensure
this, epoxy adhesive was again injected into the hole, and the excess epoxy at the hole
surface was removed. The flared CFRP strands were gently pressed onto the L-strips to
ensure proper bond between the two adjacent surfaces (Figure 7.3e). The specimens were left
at room temperature for two weeks before the test.
7.3.4 Test setup
All test specimens were subjected to three-point loading, as shown in Figure 7.2. The load
was applied at a shear span of 1050 mm (a = 3d) from the support under displacement-
control conditions in incremental steps of 2 mm/min until failure by means of a hydraulic
jack. As shown in Figure 7.2, each side of the specimen was subjected to a three-point test. It
is worth mentioning that the failure occurred at the region between the load and the support,
and the other overhung side was unaffected as planned. The load was monitored using a
214
combination of load cells on the beam and digital pressure gauges on the hydraulic lines.
Deflections were measured at the load point and at mid-span using linear voltage
displacement transducers (LVDTs). The vertical displacement was measured at the applied-
load point and at mid-span. Comprehensive and carefully engineered strain gauges were
used. Transverse strains in the CFRP laminates were measured at various locations along the
shear span, as shown in Figure 7.3f. The longitudinal-steel reinforcement was instrumented
with strain gauges at the location of the applied load. Strain gauges were also affixed to the
steel stirrups located along the shear span at the expected shear-cracking locations. The
locations of strain gauges are presented in Figure 7.2(a and b) for the S3 and S1 series,
respectively.
7.4 Results and discussion
The results presented in the following sections are expressed in terms of ultimate load-
carrying capacities, failure modes, and load-deflection relationships. The load versus strain
relationships for the longitudinal steel, steel stirrups and CFRP are also presented in this
study. This study highlights the difference between the two strengthening procedures: CFRP
sheets, and L-strips plates. The CFRP to concrete width ratio was 1.0 for the CFRP sheets
and 0.11 for the L-strips. The shear-strengthening area, ρfrp =2(tfrp /bw)*(wfrp /sfrp), was about
0.50% for the impregnated CFRP sheets and 0.21% for the CFRP L-strip laminates. The
CFRP rigidity ratio, Rfrp = ρfrp * Efrp, was thereby 0.33 GPa for the sheets and 0.25 GPa for
the L-strips. The CFRP ultimate tensile strength along the shear span (1050 mm), based on
the manufacturer’s FRP properties, was about 715 kN for the sheets compared to 756 kN for
the L-strip laminates.
7.4.1 Ultimate load-carrying capacities and failure modes
Failure modes
As for the failure mode of the control specimen of the S0 series (S0-CON), onset of a main
shear crack located close to the mid-depth was observed at a load of approximately 80 kN.
215
With increasing the applied load, the shear crack propagated towards the bottom and top
edges of the beam and widened until failure. The mode of failure was brittle shear crushing
of concrete under the applied load. Note that the beam failed with one principal diagonal
crack. For the control specimens of the other series (S3-CON and S1-CON), the failure
occurred in the same manner. The load corresponding to initiation and propagation of the
shear crack was similar to that observed in the control specimen of the S0 series. However,
distributed shear cracks formed around the main shear crack in the control specimens with
steel stirrups. The number of distributed cracks increased with the number of steel stirrups
along the shear span. This agrees with the findings of other researchers, who stated that
reinforced-concrete beams with transverse steel fail with a diagonal cracked area consisting
of one major shear crack and few minor shear cracks, whereas those without steel stirrups fail
with one principal diagonal crack (Pellegrino and Modena 2002).
For the specimens strengthened with CFRP sheets, it was not possible during the test to
observe cracks on the sides of the beam because of the presence of the bonded sheets.
However, during loading, clicking sounds occasionally emitted from the beam. The sounds
increased in frequency as the beam was loaded closer to its maximum load. Other than these
sounds, no significant warning signals preceded the sudden failure of the specimen. As the
load increased, the major shear crack propagated upward through the flange towards the
loading point. The governing failure mode was rapid delamination of the CFRP sheets from
the sides of the specimen, followed by shear crushing of concrete under the applied load. The
debonding initiated at the region near the applied load and propagated to the support while
peeling off a thin layer of concrete. Immediately after the test, the CFRP sheets were
removed to observe the crack distribution along the shear span. The formation of the major
shear cracks was similar to those reported for the control specimens. Distributed shear cracks
were seen in the wrapped specimens of the S3 and S1 series, whereas one major shear crack
was observed in the strengthened specimen of the S0 series. This appears to be the only
difference in failure mode between the CFRP sheet-strengthened specimens in the three
series.
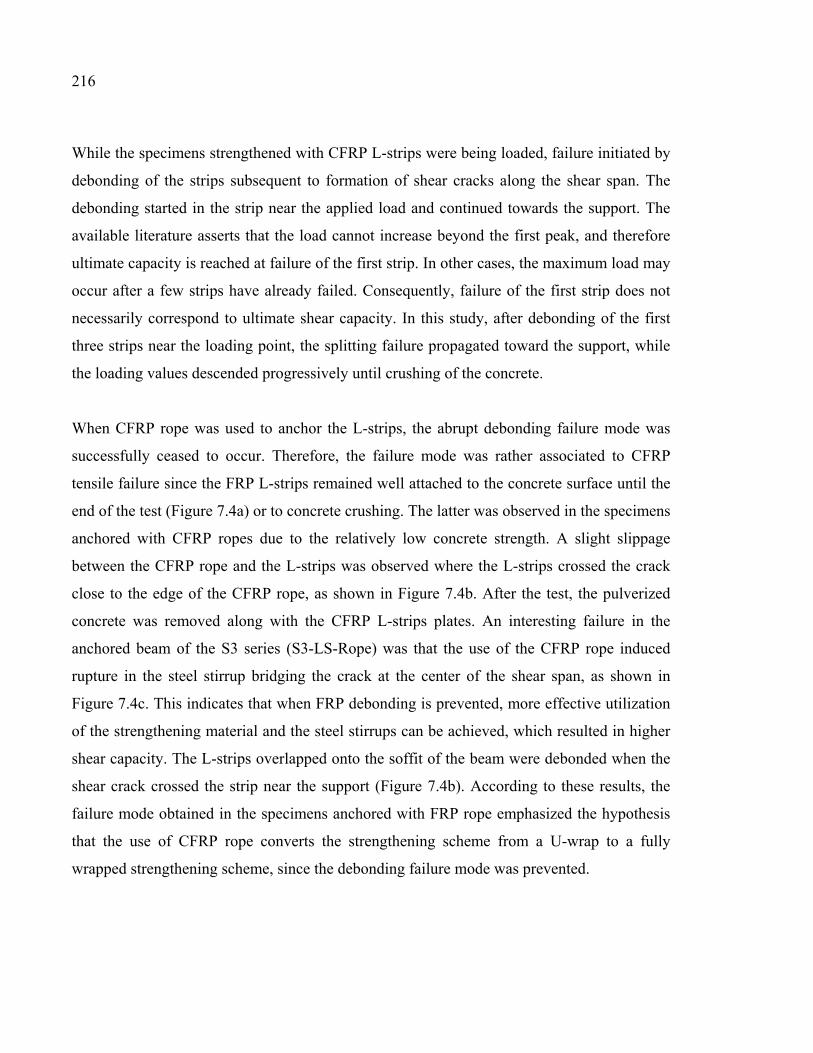
216
While the specimens strengthened with CFRP L-strips were being loaded, failure initiated by
debonding of the strips subsequent to formation of shear cracks along the shear span. The
debonding started in the strip near the applied load and continued towards the support. The
available literature asserts that the load cannot increase beyond the first peak, and therefore
ultimate capacity is reached at failure of the first strip. In other cases, the maximum load may
occur after a few strips have already failed. Consequently, failure of the first strip does not
necessarily correspond to ultimate shear capacity. In this study, after debonding of the first
three strips near the loading point, the splitting failure propagated toward the support, while
the loading values descended progressively until crushing of the concrete.
When CFRP rope was used to anchor the L-strips, the abrupt debonding failure mode was
successfully ceased to occur. Therefore, the failure mode was rather associated to CFRP
tensile failure since the FRP L-strips remained well attached to the concrete surface until the
end of the test (Figure 7.4a) or to concrete crushing. The latter was observed in the specimens
anchored with CFRP ropes due to the relatively low concrete strength. A slight slippage
between the CFRP rope and the L-strips was observed where the L-strips crossed the crack
close to the edge of the CFRP rope, as shown in Figure 7.4b. After the test, the pulverized
concrete was removed along with the CFRP L-strips plates. An interesting failure in the
anchored beam of the S3 series (S3-LS-Rope) was that the use of the CFRP rope induced
rupture in the steel stirrup bridging the crack at the center of the shear span, as shown in
Figure 7.4c. This indicates that when FRP debonding is prevented, more effective utilization
of the strengthening material and the steel stirrups can be achieved, which resulted in higher
shear capacity. The L-strips overlapped onto the soffit of the beam were debonded when the
shear crack crossed the strip near the support (Figure 7.4b). According to these results, the
failure mode obtained in the specimens anchored with FRP rope emphasized the hypothesis
that the use of CFRP rope converts the strengthening scheme from a U-wrap to a fully
wrapped strengthening scheme, since the debonding failure mode was prevented.
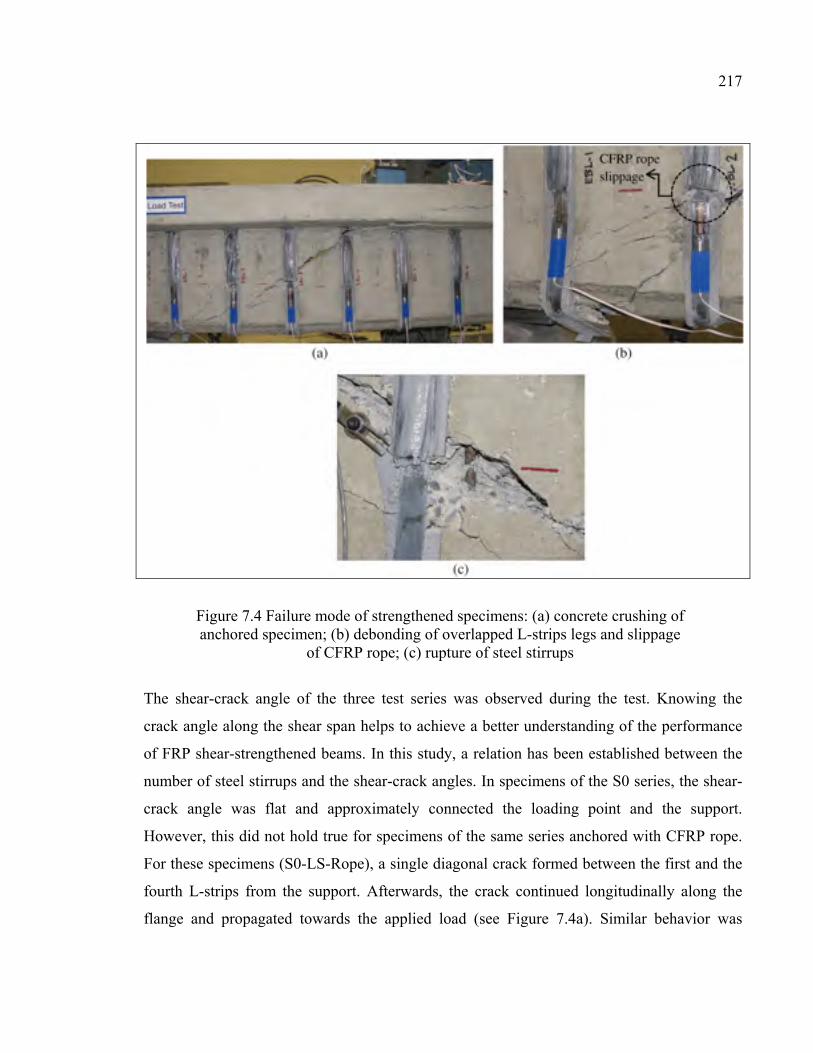
217
Figure 7.4 Failure mode of strengthened specimens: (a) concrete crushing of anchored specimen; (b) debonding of overlapped L-strips legs and slippage
of CFRP rope; (c) rupture of steel stirrups
The shear-crack angle of the three test series was observed during the test. Knowing the
crack angle along the shear span helps to achieve a better understanding of the performance
of FRP shear-strengthened beams. In this study, a relation has been established between the
number of steel stirrups and the shear-crack angles. In specimens of the S0 series, the shear-
crack angle was flat and approximately connected the loading point and the support.
However, this did not hold true for specimens of the same series anchored with CFRP rope.
For these specimens (S0-LS-Rope), a single diagonal crack formed between the first and the
fourth L-strips from the support. Afterwards, the crack continued longitudinally along the
flange and propagated towards the applied load (see Figure 7.4a). Similar behavior was
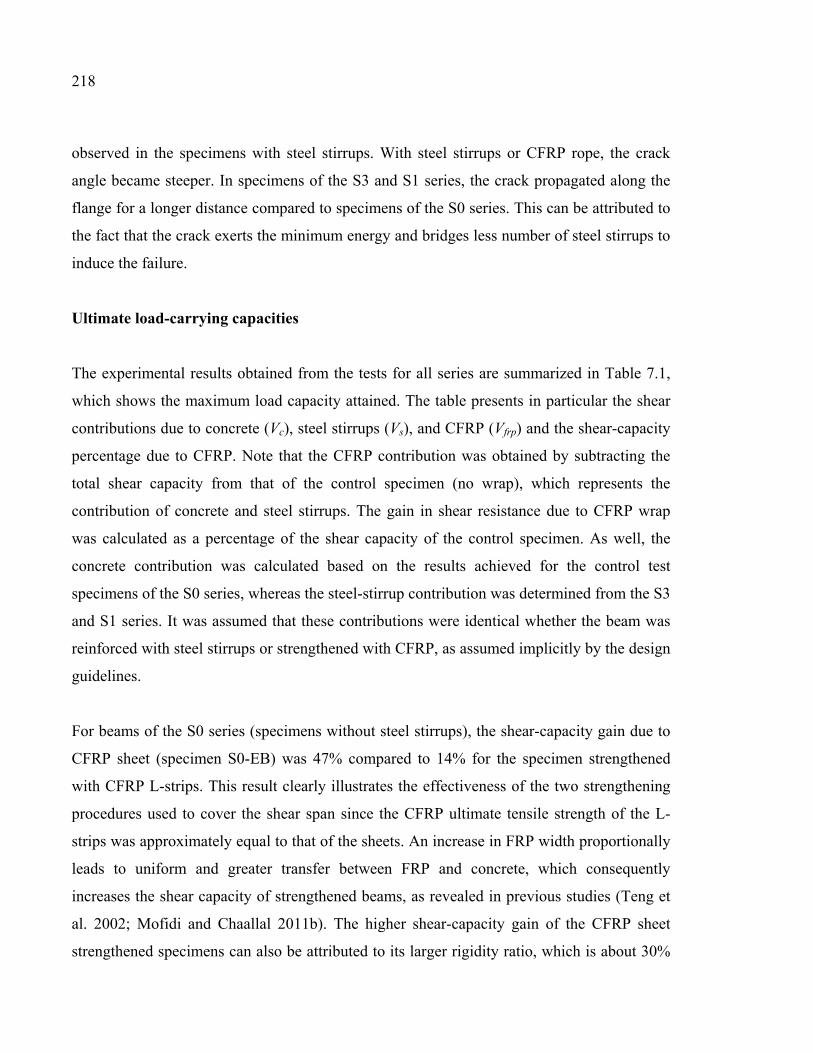
218
observed in the specimens with steel stirrups. With steel stirrups or CFRP rope, the crack
angle became steeper. In specimens of the S3 and S1 series, the crack propagated along the
flange for a longer distance compared to specimens of the S0 series. This can be attributed to
the fact that the crack exerts the minimum energy and bridges less number of steel stirrups to
induce the failure.
Ultimate load-carrying capacities
The experimental results obtained from the tests for all series are summarized in Table 7.1,
which shows the maximum load capacity attained. The table presents in particular the shear
contributions due to concrete (Vc), steel stirrups (Vs), and CFRP (Vfrp) and the shear-capacity
percentage due to CFRP. Note that the CFRP contribution was obtained by subtracting the
total shear capacity from that of the control specimen (no wrap), which represents the
contribution of concrete and steel stirrups. The gain in shear resistance due to CFRP wrap
was calculated as a percentage of the shear capacity of the control specimen. As well, the
concrete contribution was calculated based on the results achieved for the control test
specimens of the S0 series, whereas the steel-stirrup contribution was determined from the S3
and S1 series. It was assumed that these contributions were identical whether the beam was
reinforced with steel stirrups or strengthened with CFRP, as assumed implicitly by the design
guidelines.
For beams of the S0 series (specimens without steel stirrups), the shear-capacity gain due to
CFRP sheet (specimen S0-EB) was 47% compared to 14% for the specimen strengthened
with CFRP L-strips. This result clearly illustrates the effectiveness of the two strengthening
procedures used to cover the shear span since the CFRP ultimate tensile strength of the L-
strips was approximately equal to that of the sheets. An increase in FRP width proportionally
leads to uniform and greater transfer between FRP and concrete, which consequently
increases the shear capacity of strengthened beams, as revealed in previous studies (Teng et
al. 2002; Mofidi and Chaallal 2011b). The higher shear-capacity gain of the CFRP sheet
strengthened specimens can also be attributed to its larger rigidity ratio, which is about 30%
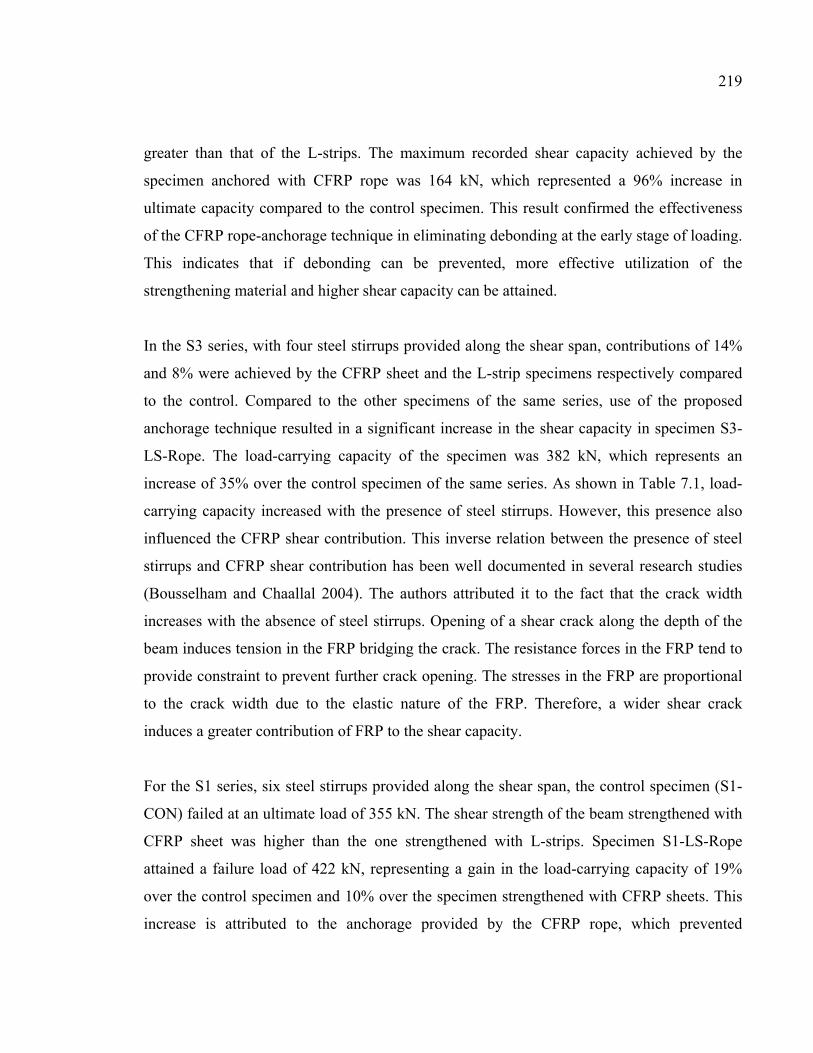
219
greater than that of the L-strips. The maximum recorded shear capacity achieved by the
specimen anchored with CFRP rope was 164 kN, which represented a 96% increase in
ultimate capacity compared to the control specimen. This result confirmed the effectiveness
of the CFRP rope-anchorage technique in eliminating debonding at the early stage of loading.
This indicates that if debonding can be prevented, more effective utilization of the
strengthening material and higher shear capacity can be attained.
In the S3 series, with four steel stirrups provided along the shear span, contributions of 14%
and 8% were achieved by the CFRP sheet and the L-strip specimens respectively compared
to the control. Compared to the other specimens of the same series, use of the proposed
anchorage technique resulted in a significant increase in the shear capacity in specimen S3-
LS-Rope. The load-carrying capacity of the specimen was 382 kN, which represents an
increase of 35% over the control specimen of the same series. As shown in Table 7.1, load-
carrying capacity increased with the presence of steel stirrups. However, this presence also
influenced the CFRP shear contribution. This inverse relation between the presence of steel
stirrups and CFRP shear contribution has been well documented in several research studies
(Bousselham and Chaallal 2004). The authors attributed it to the fact that the crack width
increases with the absence of steel stirrups. Opening of a shear crack along the depth of the
beam induces tension in the FRP bridging the crack. The resistance forces in the FRP tend to
provide constraint to prevent further crack opening. The stresses in the FRP are proportional
to the crack width due to the elastic nature of the FRP. Therefore, a wider shear crack
induces a greater contribution of FRP to the shear capacity.
For the S1 series, six steel stirrups provided along the shear span, the control specimen (S1-
CON) failed at an ultimate load of 355 kN. The shear strength of the beam strengthened with
CFRP sheet was higher than the one strengthened with L-strips. Specimen S1-LS-Rope
attained a failure load of 422 kN, representing a gain in the load-carrying capacity of 19%
over the control specimen and 10% over the specimen strengthened with CFRP sheets. This
increase is attributed to the anchorage provided by the CFRP rope, which prevented
220
premature debonding failure. The results obtained in this study indicate clearly that the CFRP
rope-anchorage technique considerably increases the shear capacity of strengthened beams. It
provided an increase in shear capacity more than twice that obtained by the CFRP sheets. In
addition, the technique is highly effective to overcome the drawback of the small width ratio
of L-strips compared to CFRP sheets. Note that the presence of steel stirrups in the beams
resulted in a substantial reduction in the CFRP gain in shear resistance.
7.4.2 Load-deflection behavior
The load-deflection relationships at the load application point are presented in Figure 7.5(a-c)
for the S0, S3, and S1 series respectively. The maximum deflections corresponding to the
maximum applied loads are reported in Table 7.1. Prior to cracking, the load-deflection
relationships and the shear force corresponding to crack initiation for all specimens were
essentially similar for all series. This indicates that applying CFRP for shear strengthening
does not change the initial stiffness of the specimen. In addition, the locations where cracks
occurred were identical regardless of the presence of the CFRP. Discrepancies in the load-
deflection curves were observed in the cracking zone. The maximum loading capacity and
maximum deflection increased in the specimens strengthened with CFRP sheets compared to
those strengthened with L-strips (not anchored), which implies that the presence of CFRP
sheets increases the loading capacity of the strengthened specimens. In the three series, the
deflection of the specimens strengthened with CFRP sheets was higher than that of the
specimens strengthened by non-anchored L-strips. However, neither specimen in the S0
series exhibited a yield plateau, despite the considerable increase in the loading capacity and
the deflection achieved by the CFRP rope-anchored specimen. For specimens of the S3
series, the maximum deflection of the beams increased with the presence of steel stirrups.
Specimen S3-LS-Rope exhibited a short yield plateau. There was no significant difference in
the maximum deflection among the specimens of the S3 series. Overall, an increase in the
number of steel stirrups in the S1 series greatly enhanced the ductility performance of the
beams. The control specimen and the CFRP L-strip-strengthened specimen failed before
reaching their flexural elastic limit. The specimen strengthened with CFRP sheets (S1-EB)
reached its flexural capacity limit. Therefore, the failure of this specimen was more ductile
221
compared to the other strengthened unanchored specimens. Note that specimen S1-LS-Rope
also exhibited a considerable yield plateau and failed at a higher deflection compared to the
other specimens, which is a favorable failure scenario. The longitudinal steel in the specimen
yielded before the ultimate shear failure.
From the results presented, it is clear that the maximum shear force and the ultimate
deflection at the loading point are mainly affected by the number of steel stirrups along the
shear span (Table 7.1). In order to figure out the effect of steel stirrups, a ductility factor was
used only for the specimens that experienced yielding. The ductility factor is defined as the
ratio between the maximum deflection to the deflection corresponding to the yielding of the
longitudinal steel. This factor was 1.4, 1.4, and 2.0 for the S3-LS-Rope, S1-EB, and S1-LS-
Rope specimens respectively. Based on these results, it can be summarized that use of CFRP
rope as an anchorage system increases both the load-carrying capacity and the ductility of
beams.
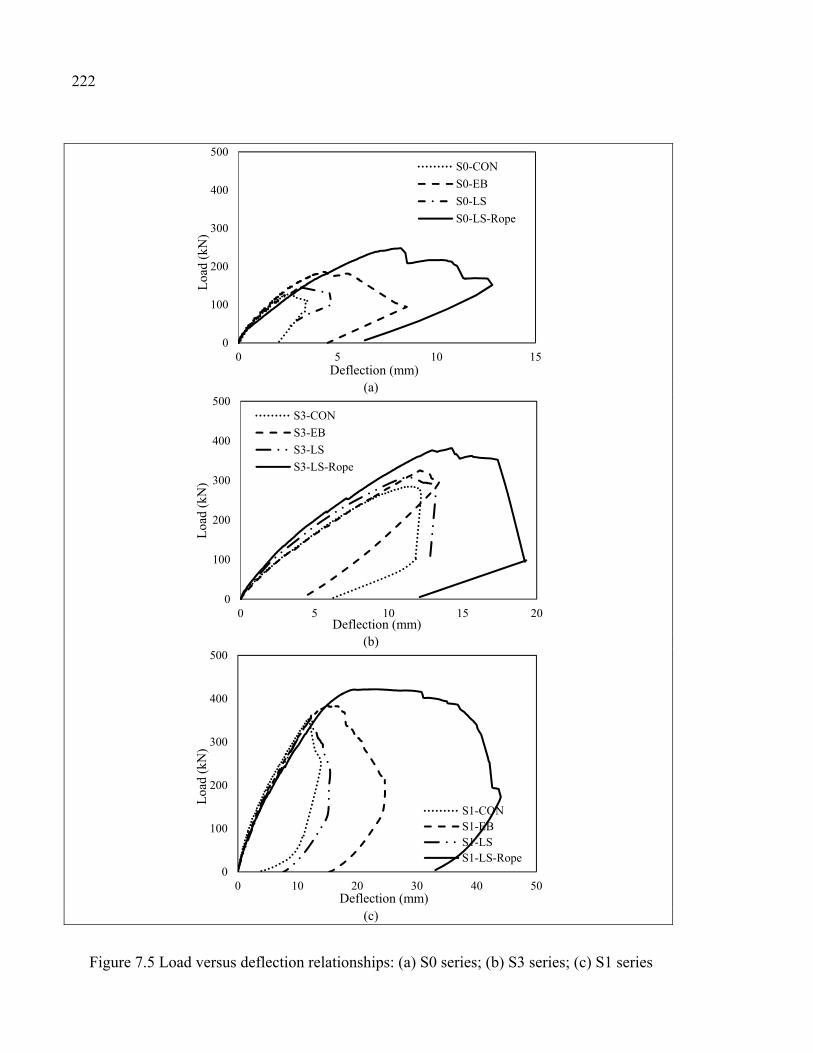
222
(a)
(b)
(c)
Figure 7.5 Load versus deflection relationships: (a) S0 series; (b) S3 series; (c) S1 series
0
100
200
300
400
500
0 5 10 15
Loa
d (k
N)
Deflection (mm)
S0-CON
S0-EB
S0-LS
S0-LS-Rope
0
100
200
300
400
500
0 5 10 15 20
Loa
d (k
N)
Deflection (mm)
S3-CON
S3-EB
S3-LS
S3-LS-Rope
0
100
200
300
400
500
0 10 20 30 40 50
Loa
d (k
N)
Deflection (mm)
S1-CONS1-EBS1-LSS1-LS-Rope
223
7.4.3 Strain response
To gain insight into the influence of the CFRP rope-anchorage technique on the behavior of
FRP shear-strengthened beams, the strain readings in longitudinal steel, steel stirrups, and
CFRP were analyzed. The use of a comprehensive measuring device enabled the collection
of valuable data that are needed for better understanding the behavior.
Longitudinal steel strain
Figure 7.6 presents the applied load versus strain curves for longitudinal tensile
reinforcement at the load application point for the three CFRP rope-anchored specimens. The
results represent the average of two strain gauges. It is clear that the applied load versus
strain curves for longitudinal steel in the three specimens followed the same track of behavior
until failure regardless of the number of steel stirrups. Overall, the longitudinal-steel
reinforcement reached yielding under applied loads of about 330 kN. The longitudinal steel
in the S0 series did not experience yielding in all specimens. With the presence of steel
stirrups along the shear span, the loading capacity of the beams increased, and the strain in
the longitudinal steel also increased. Yielding was reached for specimen S1-EB and the two
anchored specimens in the S3 and S1 series. A short yield plateau was observed for the
anchored specimen in the S3 series and the CFRP sheet-strengthened specimen in the S1
series. The results obtained in this study indicate that although an increase in the number of
steel stirrups along the shear span reduced the FRP contribution to shear resistance, it
nevertheless produced yielding in the longitudinal steel, which is a favorable behavior at
ultimate capacity. Therefore, the FRP contribution is inversely proportional to the number of
steel stirrups as well as to the strain in longitudinal steel. The result obtained here is similar
to those reported by Bousselham and Chaallal (2004) and Dirar et al. (2012).
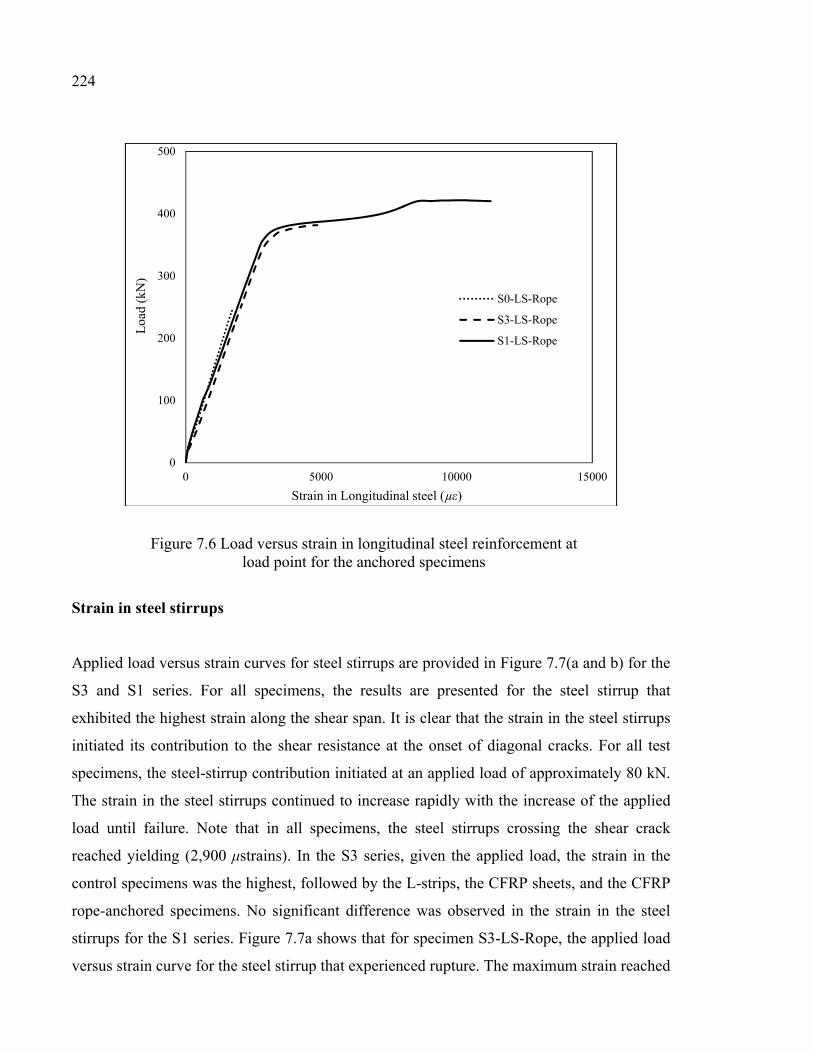
224
Figure 7.6 Load versus strain in longitudinal steel reinforcement at load point for the anchored specimens
Strain in steel stirrups
Applied load versus strain curves for steel stirrups are provided in Figure 7.7(a and b) for the
S3 and S1 series. For all specimens, the results are presented for the steel stirrup that
exhibited the highest strain along the shear span. It is clear that the strain in the steel stirrups
initiated its contribution to the shear resistance at the onset of diagonal cracks. For all test
specimens, the steel-stirrup contribution initiated at an applied load of approximately 80 kN.
The strain in the steel stirrups continued to increase rapidly with the increase of the applied
load until failure. Note that in all specimens, the steel stirrups crossing the shear crack
reached yielding (2,900 μstrains). In the S3 series, given the applied load, the strain in the
control specimens was the highest, followed by the L-strips, the CFRP sheets, and the CFRP
rope-anchored specimens. No significant difference was observed in the strain in the steel
stirrups for the S1 series. Figure 7.7a shows that for specimen S3-LS-Rope, the applied load
versus strain curve for the steel stirrup that experienced rupture. The maximum strain reached
0
100
200
300
400
500
0 5000 10000 15000
Loa
d (k
N)
Strain in Longitudinal steel (µε)
S0-LS-Rope
S3-LS-Rope
S1-LS-Rope
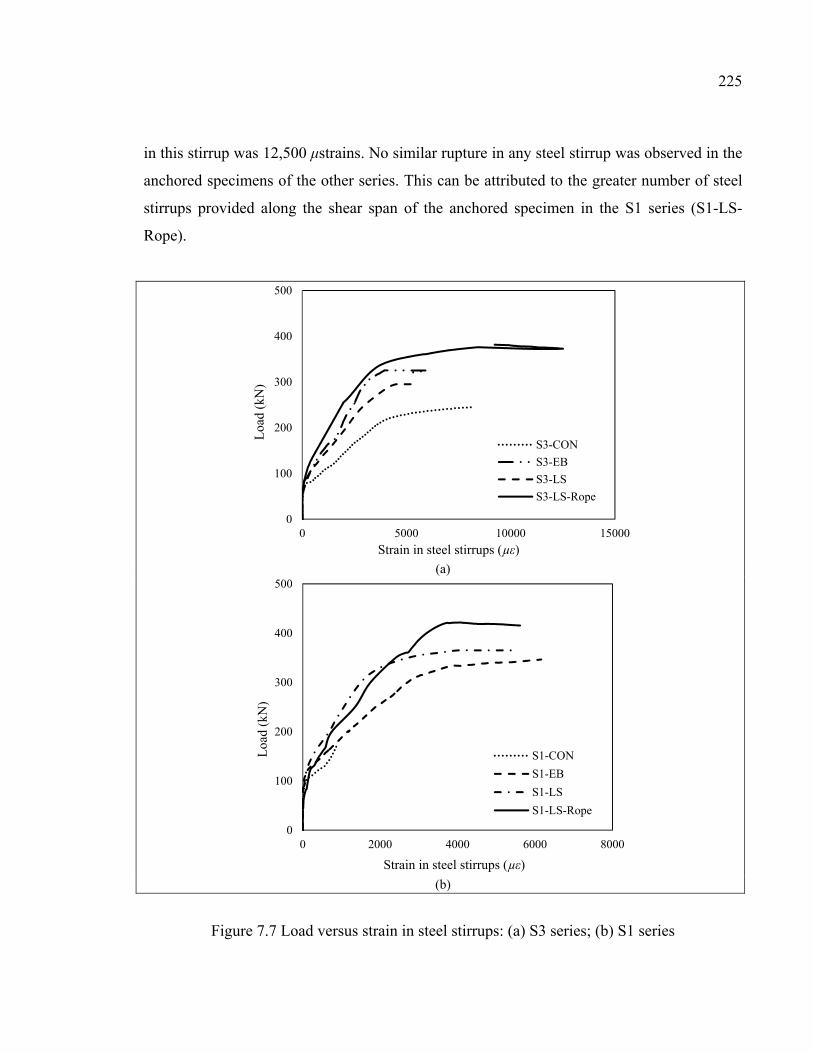
225
in this stirrup was 12,500 μstrains. No similar rupture in any steel stirrup was observed in the
anchored specimens of the other series. This can be attributed to the greater number of steel
stirrups provided along the shear span of the anchored specimen in the S1 series (S1-LS-
Rope).
(a)
(b)
Figure 7.7 Load versus strain in steel stirrups: (a) S3 series; (b) S1 series
0
100
200
300
400
500
0 5000 10000 15000
Loa
d (k
N)
Strain in steel stirrups (µε)
S3-CON
S3-EB
S3-LS
S3-LS-Rope
0
100
200
300
400
500
0 2000 4000 6000 8000
Loa
d (k
N)
Strain in steel stirrups (µε)
S1-CON
S1-EB
S1-LS
S1-LS-Rope
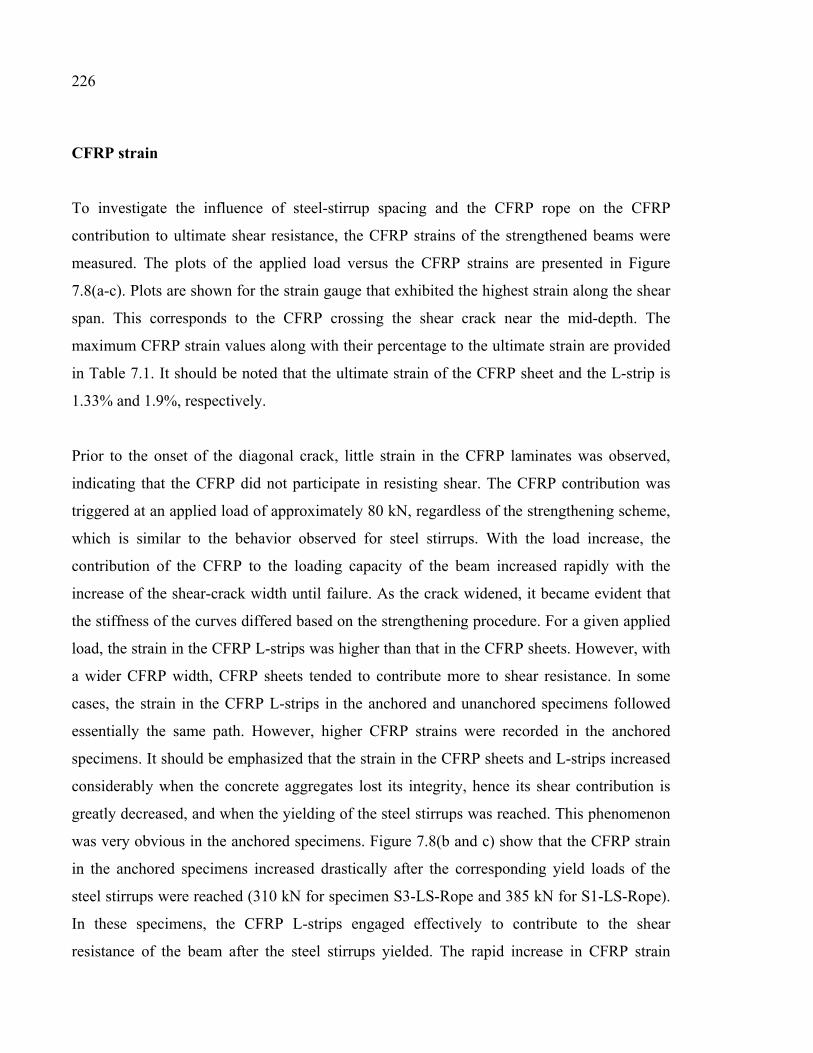
226
CFRP strain
To investigate the influence of steel-stirrup spacing and the CFRP rope on the CFRP
contribution to ultimate shear resistance, the CFRP strains of the strengthened beams were
measured. The plots of the applied load versus the CFRP strains are presented in Figure
7.8(a-c). Plots are shown for the strain gauge that exhibited the highest strain along the shear
span. This corresponds to the CFRP crossing the shear crack near the mid-depth. The
maximum CFRP strain values along with their percentage to the ultimate strain are provided
in Table 7.1. It should be noted that the ultimate strain of the CFRP sheet and the L-strip is
1.33% and 1.9%, respectively.
Prior to the onset of the diagonal crack, little strain in the CFRP laminates was observed,
indicating that the CFRP did not participate in resisting shear. The CFRP contribution was
triggered at an applied load of approximately 80 kN, regardless of the strengthening scheme,
which is similar to the behavior observed for steel stirrups. With the load increase, the
contribution of the CFRP to the loading capacity of the beam increased rapidly with the
increase of the shear-crack width until failure. As the crack widened, it became evident that
the stiffness of the curves differed based on the strengthening procedure. For a given applied
load, the strain in the CFRP L-strips was higher than that in the CFRP sheets. However, with
a wider CFRP width, CFRP sheets tended to contribute more to shear resistance. In some
cases, the strain in the CFRP L-strips in the anchored and unanchored specimens followed
essentially the same path. However, higher CFRP strains were recorded in the anchored
specimens. It should be emphasized that the strain in the CFRP sheets and L-strips increased
considerably when the concrete aggregates lost its integrity, hence its shear contribution is
greatly decreased, and when the yielding of the steel stirrups was reached. This phenomenon
was very obvious in the anchored specimens. Figure 7.8(b and c) show that the CFRP strain
in the anchored specimens increased drastically after the corresponding yield loads of the
steel stirrups were reached (310 kN for specimen S3-LS-Rope and 385 kN for S1-LS-Rope).
In these specimens, the CFRP L-strips engaged effectively to contribute to the shear
resistance of the beam after the steel stirrups yielded. The rapid increase in CFRP strain
227
continued until ultimate failure occurred. In specimen S1-LS-Rope, the increase in CFRP
strain was large (approximately 2,500 μstrains) for loadings between 385 and 422 kN. It is
noteworthy that the considerable increase in CFRP strain was related to the difference
between the yield load of the steel stirrups and the maximum load attained.
Several research studies have noted that the maximum strain in the FRP laminate decreased
with the increase of the number of steel stirrups along the shear span. In other words, the
strain in the FRP laminates decreased as the spacing between steel stirrups decreased. In the
present study, to assess the relation between the strain in the FRP laminates and the number
of steel stirrups, the maximum CFRP strain was investigated. The specimens strengthened
with L-strips and with no anchorage in Figure 7.8(a-c) show that the maximum strain in the
L-strip laminate decreased with the increase of the number of steel stirrups along the shear
span. This tendency was true when the FRP debonding was the governing failure mode for
the L-strips. For the CFRP sheets, when the steel stirrups yielded and the sheets still attached
to the concrete, an interesting result was observed that can highlight the difference between
the two strengthening procedures. The strain in the CFRP sheets increased rapidly under
approximately the same loading before the debonding failure. This can be explained by
noting that the CFRP strain increased considerably while the CFRP sheets hold the two
cracked pieces of concrete until the FRP debonding failure. When FRP debonding was
prevented and the yielding of the steel stirrups was reached, as exemplified by the CFRP
rope-anchored specimens (as discussed in the previous paragraph), the CFRP strain was
observed to increase rapidly regardless of the number of steel stirrups along the shear span.
In this case, the anchored L-strips greatly contributed to shear strength. This tendency was
demonstrated by the CFRP strains measured in specimens S3-LS-Rope and S1-LS-Rope
compared to that measured in specimen S0-LS-Rope.
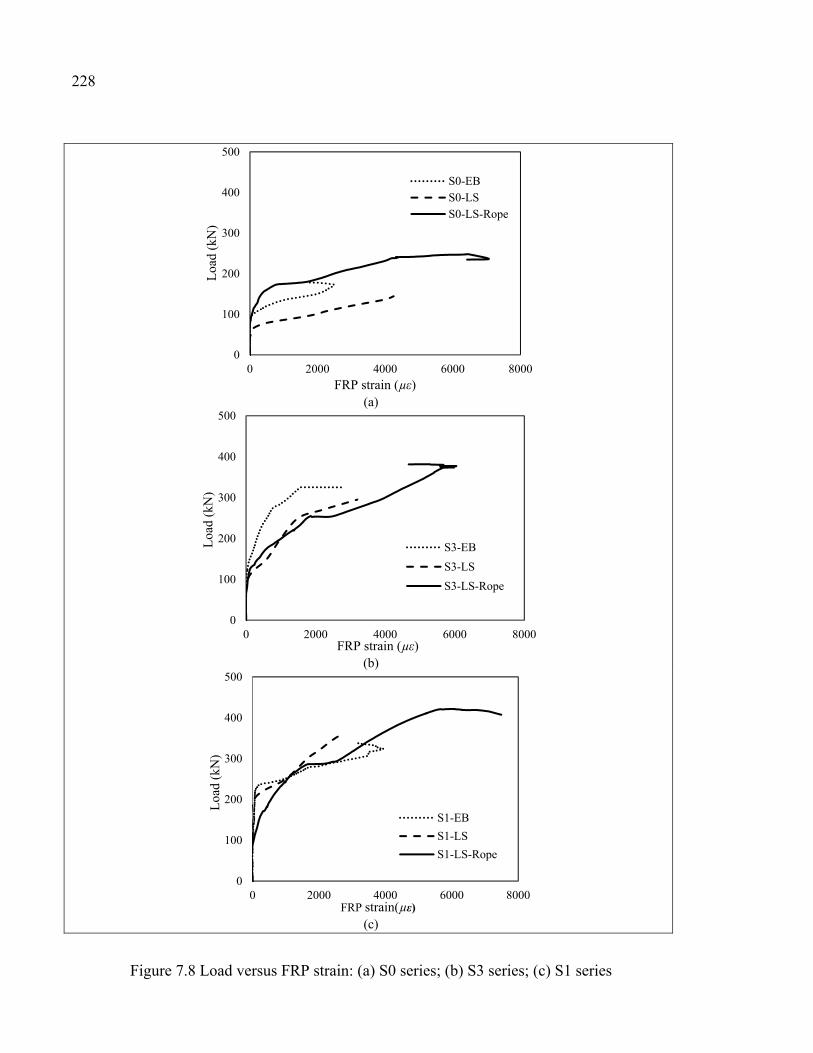
228
(a)
(b)
(c)
Figure 7.8 Load versus FRP strain: (a) S0 series; (b) S3 series; (c) S1 series
0
100
200
300
400
500
0 2000 4000 6000 8000
Loa
d (k
N)
FRP strain (µε)
S0-EBS0-LSS0-LS-Rope
0
100
200
300
400
500
0 2000 4000 6000 8000
Loa
d (k
N)
FRP strain (µε)
S3-EB
S3-LS
S3-LS-Rope
0
100
200
300
400
500
0 2000 4000 6000 8000
Loa
d (k
N)
FRP strain(µε)
S1-EB
S1-LS
S1-LS-Rope
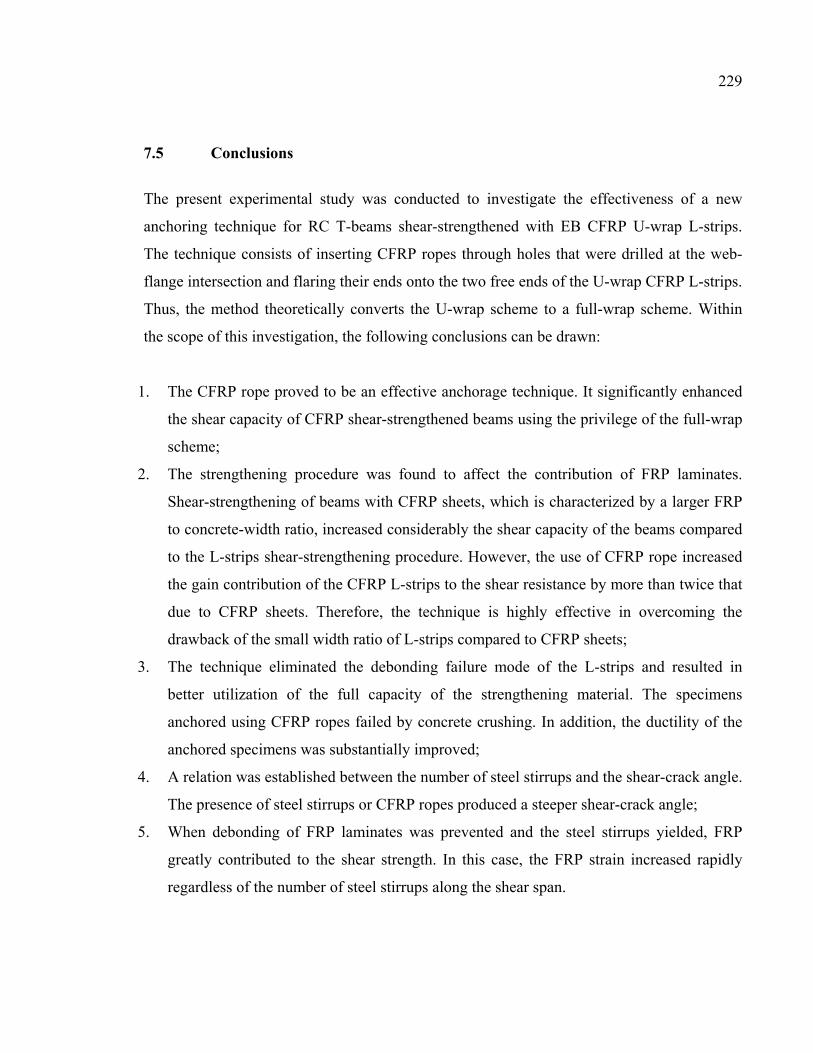
229
7.5 Conclusions
The present experimental study was conducted to investigate the effectiveness of a new
anchoring technique for RC T-beams shear-strengthened with EB CFRP U-wrap L-strips.
The technique consists of inserting CFRP ropes through holes that were drilled at the web-
flange intersection and flaring their ends onto the two free ends of the U-wrap CFRP L-strips.
Thus, the method theoretically converts the U-wrap scheme to a full-wrap scheme. Within
the scope of this investigation, the following conclusions can be drawn:
1. The CFRP rope proved to be an effective anchorage technique. It significantly enhanced
the shear capacity of CFRP shear-strengthened beams using the privilege of the full-wrap
scheme;
2. The strengthening procedure was found to affect the contribution of FRP laminates.
Shear-strengthening of beams with CFRP sheets, which is characterized by a larger FRP
to concrete-width ratio, increased considerably the shear capacity of the beams compared
to the L-strips shear-strengthening procedure. However, the use of CFRP rope increased
the gain contribution of the CFRP L-strips to the shear resistance by more than twice that
due to CFRP sheets. Therefore, the technique is highly effective in overcoming the
drawback of the small width ratio of L-strips compared to CFRP sheets;
3. The technique eliminated the debonding failure mode of the L-strips and resulted in
better utilization of the full capacity of the strengthening material. The specimens
anchored using CFRP ropes failed by concrete crushing. In addition, the ductility of the
anchored specimens was substantially improved;
4. A relation was established between the number of steel stirrups and the shear-crack angle.
The presence of steel stirrups or CFRP ropes produced a steeper shear-crack angle;
5. When debonding of FRP laminates was prevented and the steel stirrups yielded, FRP
greatly contributed to the shear strength. In this case, the FRP strain increased rapidly
regardless of the number of steel stirrups along the shear span.
230
The results obtained in this study have demonstrated that the proposed method is promising
and can make FRP shear-strengthening more attractive. In addition, the method is potentially
cost-effective for the anchorage of FRP shear-strengthened RC beams.
7.6 Acknowledgments
The financial support of the Natural Sciences and Engineering Research Council of Canada
(NSERC), the Fonds Québécois de la Recherche sur la Nature et les Technologies (FQRNT),
and the Ministère des Transports du Québec (MTQ) through operating grants is gratefully
acknowledged. The authors thank Sika Canada Inc. (Pointe Claire, Quebec) for their
contribution towards the cost of CFRP materials. The efficient collaboration of John
Lescelleur (senior technician) and Andres Barco (technician) of the École de Technologie
Supérieure in conducting the tests is also acknowledged.
CONCLUSION
Les études sur le renforcement des poutres en BA à l’aide de PRF sous charges statiques sont
nombreuses et bien documentées, que ce soit en flexion ou en cisaillement. Par contre, peu de
recherches à ce jour ont été effectuées sur la performance des poutres en béton renforcées à
l’aide de PRF sous chargement cyclique de fatigue. De plus, la majorité de ces études portent
sur le renforcement en flexion, à l’exception de quelques recherches qui traitent
exclusivement du renforcement en cisaillement des poutres en BA.
L’objectif de la présente thèse consiste à élucider le comportement en fatigue des poutres en
béton renforcées à l’aide de PRF collés en surface. Il s’agit spécifiquement d’examiner la
faisabilité du renforcement en cisaillement sous chargement cyclique, de mettre en évidence
les paramètres d’étude en fatigue et leurs effets sur la performance des poutres renforcées,
ainsi que d’évaluer les limites supérieures recommandées à l’ÉLF par les normes et guides de
conception en vigueur.
La réalisation de ces objectifs repose sur des investigations théoriques, incluant une revue
synthèse de la littérature, et des investigations expérimentales, conduites par un vaste
programme d’essais en trois phases (I, II et III). Ceci ne pouvait être accompli qu’en
élaborant une approche méthodologique qui permet de dévoiler les lacunes et identifier les
besoins en recherche dans le domaine du renforcement des structures en béton à l’aide de
PRF.
Pour ce faire, un état exhaustif des connaissances sur l’utilisation des PRF pour le
renforcement externe sous chargement cyclique a été entrepris. L’analyse de cette
documentation consacrée au comportement en fatigue nous a amenés à dresser un tableau
sommaire des recherches expérimentales antérieures et une base de données de plus de 300
poutres en béton renforcées à l’aide de PRF collés en surface. Toutes les données pertinentes
y sont répertoriées. On peut citer : les caractéristiques techniques, les propriétés des
matériaux, les systèmes de renforcement et d’ancrage, les conditions de chargement de
232
fatigue, les modes de rupture ainsi que les différentes variables examinées des essais.
L’accent est mis notamment sur le renforcement en cisaillement où une description détaillée
des études effectuées a été fournie. Enrichie de manière significative par les nombreux essais
conduits dans le cadre de la présente thèse, cette base constitue une importante source de
données pour l’industrie de la construction afin d’outiller l’ingénieur dans la prise de
décisions quant à la réhabilitation des ponts existants.
Plusieurs paramètres d’influence majeure entrent en jeu pour évaluer la durée de service en
fatigue des poutres renforcées à l’aide de PRF collés en surface, paramètres complexes et
difficiles à estimer. La présente recherche se veut une réponse à quelques-uns de ces besoins,
notamment (i) les conditions de chargement cyclique appliqué; (ii) les contributions et
interactions que développent en cisaillement les divers constituants durant le chargement de
fatigue, à savoir : le béton, l'armature transversale, l’armature longitudinale, et le renfort en
PRFC ; ainsi que (iii) le système de renforcement et d’ancrage appliqué.
Trois différents taux d’armature transversale ont été considérés pour tous les systèmes de
renforcement examinés. Les poutres des phases I et II d’essais étaient soumises à des charges
cycliques jusqu’à 6 millions de cycles de contraintes à une fréquence de 3 Hz. Les poutres
qui endurent les 6 millions de cycles sont alors testées à la rupture sous charges statiques
pour mesurer leur résistance résiduelle. Une comparaison avec les limites en fatigue
recommandées par les normes et guides de conception a été établie. Les résultats ont été
présentés en termes de modes de rupture, charges ultimes et gains en résistance dus aux PRF,
relations contrainte-déformation, déformations subies par les divers constituants, ainsi que
résistance résiduelle et dégradation accumulée par fatigue.
Phase I: Dans cette phase le comportement en fatigue des poutres renforcées en cisaillement
à l’aide de tissus continus en PRFC en forme de U a été évalué. Outre la présence et la
variation du taux d’armature transversale, deux options de réhabilitation ont été investiguées
: (i) renforcement des poutres existantes en BA (spécimens de catégorie A) dans le but
d’augmenter leurs capacités initiales dû à une augmentation des surcharges de service (ceci
233
se traduit par une augmentation du chargement appliqué pour tenir compte de la contribution
à la résistance en cisaillement des PRF); et (ii) réhabilitation des poutres (spécimens de
catégorie B) à leurs capacités initiales afin de prolonger la durée de service en fatigue sans
aucune augmentation des surcharges (ceci traduit par un même chargement cyclique pour les
poutres renforcées et non-renforcées, donc sans tenir compte de la contribution des PRF).
Phase II : Cette phase évalue le comportement en fatigue des poutres renforcées en
cisaillement à l’aide de lamelles préfabriquées en PRFC en forme de L. Ceci constitue une
contribution importante puisque la littérature ne reporte qu’un seul spécimen renforcé selon
cette technique et soumis à un chargement cyclique. Deux lamelles en L ont été placées de
façon opposée sur les faces latérales de l’âme et superposées sur la face en tension pour
former un renforcement en forme de U. Les lamelles ont été ancrées dans la semelle de la
section en Té sur presque toute la hauteur de la dalle.
Une comparaison des deux techniques de renforcement en cisaillement à l’aide de PRFC
collés en surface (tissus en U versus lamelles en L) sous chargement cyclique (fatigue) et
statique (post-fatigue) a été ensuite entreprise.
Les résultats des essais des phases I et II ont montré une augmentation de la résistance en
cisaillement des poutres renforcées et une prolongation de la durée de service en fatigue des
poutres réhabilitées. Ils démontrent ainsi l’efficacité du renforcement en cisaillement des
poutres en BA à l’aide de FRP collés en surface sous chargement cyclique. Plus
spécifiquement les conclusions suivantes relatives aux phases I et II peuvent être énoncées:
1. Le comportement en fatigue des poutres renforcées en cisaillement a montré une réponse
typique de la dégradation accumulée par fatigue, qui est caractérisée par une
augmentation significative du taux de dégradation pendant les premiers cycles de
contraintes, suivie par une phase quasi-constante, où le taux de dégradation ralentit
234
considérablement avec l’augmentation du nombre de cycles. Une dégradation brusque
peut se produire juste avant la rupture imminente de la structure;
2. Les spécimens de catégorie A (phase I) ont subi une rupture en flexion par fatigue.
L’armature longitudinale peut être le point faible et devrait être examinée avec
précaution, notamment pour la prolongation de la durée de service, où elle peut régir la
capacité ultime prévue de la poutre et donc le mode de rupture. L’amplitude des
contraintes dans les barres d’armature était dans l’intervalle des limites supérieures
recommandées par les normes. Ceci peut indiquer que les recommandations des normes
en vigueur pour la conception à l’ÉLF des poutres en BA non-renforcées peuvent
également être utilisées pour les poutres renforcées en cisaillement à l’aide de PRF collés
en surface;
3. Une comparaison des poutres renforcées avec celles non-renforcées révèle une réduction
du niveau des déformations dans les armatures transversales après le renforcement, et ce
malgré le chargement cyclique plus élevé. Ceci confirme l’efficacité du renforcement en
cisaillement des poutres en BA à l’aide de PRF sous chargement de fatigue;
4. Une comparaison des déformations dans les armatures transversales des poutres non-
renforcées peut fournir une ligne directrice pour une limite supérieure de l’amplitude des
contraintes, afin d’éviter une rupture des étriers sous chargement de fatigue. D’autres
investigations doivent être effectuées puisqu’aucune limite n’a encore été recommandée
par les normes en vigueur à ce sujet;
5. Le niveau des déformations dans les composites PRF a augmenté avec le taux d’armature
transversale. Cependant, les résultats ont montré une amélioration de la performance en
fatigue des PRFC avec la présence des étriers. Ceci démontre la redistribution des
contraintes grâce au composite et confirme l’existence d’une interaction entre les étriers
d’acier internes et les PRF collés en surface sous chargement cyclique;
6. Le fait qu’aucun indice de rupture par décollement n’a été observé pendant les essais de
fatigue démontre clairement la faisabilité des deux systèmes de renforcement en
cisaillement sous charges cycliques (enrobement à l’état liquide des tissus en U et collage
des lamelles préfabriquées en L);
235
7. Le renforcement en cisaillement des poutres en BA à l’aide de lamelles préfabriquées en
PRFC en L a été plus efficace que le renforcement à l’aide de tissus continus en U dans la
prolongation de la durée de service en fatigue. Ceci a été confirmé en termes du nombre
de cycles de contraintes, modes de rupture, niveau des déformations dans les divers
constituants, gain en résistance au cisaillement dû aux PRF, ainsi que la dégradation
accumulée par fatigue;
8. Le renforcement en cisaillement des poutres à l’aide de lamelles préfabriquées en L a
changé le mode de rupture de la poutre, passant d’un comportement fragile avant
renforcement à un autre plus ductile après renforcement;
9. La présence et l’augmentation du taux d’armature transversale dans les poutres
renforcées ont entrainé une réduction substantielle du gain en résistance à l’effort
tranchant dû aux PRFC, ce qui confirme l’existence d’une interaction entre les étriers
d’acier internes et les PRF collés en surface sous chargement statique.
Phase III : Cette phase évalue la faisabilité d’un nouveau système d’ancrage pour le
renforcement en cisaillement sous chargement statique. Des poutres en BA ont été renforcées
en cisaillement à l’aide des lamelles préfabriquées en PRFC en forme de L et ancrées ensuite
en utilisant des cordages en PRFC. La technique de renforcement consiste à insérer des
cordages à travers des trous perforés horizontalement à l’intersection de l’âme et de la
semelle de la section en Té, et les coller ensuite aux extrémités des lamelles en L déjà
installées sur les faces latérales de l’âme pour former un étrier fermé donc un renforcement
en enveloppe complète. La méthode proposée semble être prometteuse et peut rendre le
renforcement en cisaillement plus efficace et donc populaire, notamment pour des structures
soumises à des charges cycliques. Les résultats obtenus ont démontré que ce système
d’ancrage est d’une efficacité remarquable, et plus spécifiquement :
1. L’utilisation des cordages en PRFC a considérablement amélioré la résistance en
cisaillement des poutres renforcées en agissant comme un renfort en enveloppe complète.
236
La contribution à la résistance en cisaillement dû aux lamelles ancrées avec cordages est
plus que le double du gain attribué aux tissus continus en U;
2. Les cordages ont éliminé le mode de rupture prématuré par décollement des lamelles, qui
s’est produit pour les poutres renforcées sans ancrage, et ont ainsi permis l’utilisation de
la pleine capacité du système de renforcement. De plus, la ductilité des poutres renforcées
à l’aide des lamelles en L et ancrées avec des cordages en PRFC a été améliorée de façon
significative;
3. Lorsque le décollement des lamelles est empêché et la plastification des armatures
transversales atteinte, les renforts PRFC contribuent substantiellement à la capacité en
cisaillement de la poutre. Dans ce cas, la déformation dans les PRFC augmente
rapidement avant la rupture finale de la poutre, indépendamment du taux ou du nombre
d’étriers le long de la zone de cisaillement.
RECOMMANDATIONS
Bien que les résultats obtenus à partir des investigations théoriques et expérimentales menées
dans le cadre de cette thèse ont enrichi, on ose le croire, la base de données existante et
constitué un outil indispensable au développement des méthodes de réhabilitation en
cisaillement, le nombre d’essais réalisé, bien qu’important, demeure insuffisant pour : (i)
pouvoir développer des procédures de vérification et des modèles analytiques rationnels,
permettant de mettre à la disposition des ingénieurs des règles de calcul aisément utilisables
pour la conception à l’ÉLF; (ii) élucider les mécanismes mis en jeu dans la répartition des
efforts et l’interaction qui existe entre les armatures transversales internes et les renforts PRF
collés en surface; (iii) fournir des lignes directrices définitives pour les limites supérieures de
l’amplitude des contraintes dans les armatures transversales sous chargement de fatigue,
limites qui font défaut présentement.
Chacun de ces aspects mentionnés constitue, à lui seul, toute une thématique de recherche et
nécessite davantage d’investigations, dont les objectifs ne peuvent être atteints qu’à travers
un effort soutenu, afin d’optimiser la technique de renforcement en cisaillement des poutres
en BA à l’aide de PRF collés en surface.
Les résultats pertinents obtenus des essais conduits dans cette recherche nous incitent à
proposer de nouveaux projets de recherche plus ciblés. Plus spécifiquement :
1. Évaluer l’efficacité du système d’ancrage en utilisant les cordages en PRF pour le
renforcement en cisaillement sous chargement cyclique (fatigue). Ceci semble être un
sujet incontournable, notamment pour la réhabilitation sismique des poutres de ponts en
béton existants, en utilisant l’avantage du renfort en enveloppe complète, ce qui peut
s’avérer utile pour l’industrie de la construction afin d’outiller l’ingénieur aux prises avec
des projets de réhabilitation en vue d’une mise en conformité sismique;

238
2. Examiner le comportement en fatigue des poutres en béton précontraint renforcées en
cisaillement à l’aide de PRF collés en surface. Ce sujet est très peu documenté;
3. Étudier l’influence de l’effet d’échelle sur la performance des poutres en BA renforcées
en cisaillement à l’aide de PRF collés en surface. Les spécimens utilisés dans le cadre de
cette étude sont certes de grandeur nature, mais ils demeurent néanmoins en deçà des
poutres de ponts existants, d’où l’importance d’un tel projet.
ANNEXE I
BASE DE DONNÉES DES RECHERCHES EXPÉRIMENTALES ANTÉRIEURES SUR LE COMPORTEMENT EN FATIGUE DES POUTRES
EN BÉTON RENFORCÉES À L’AIDE DE PRF COLLÉS EN SURFACE
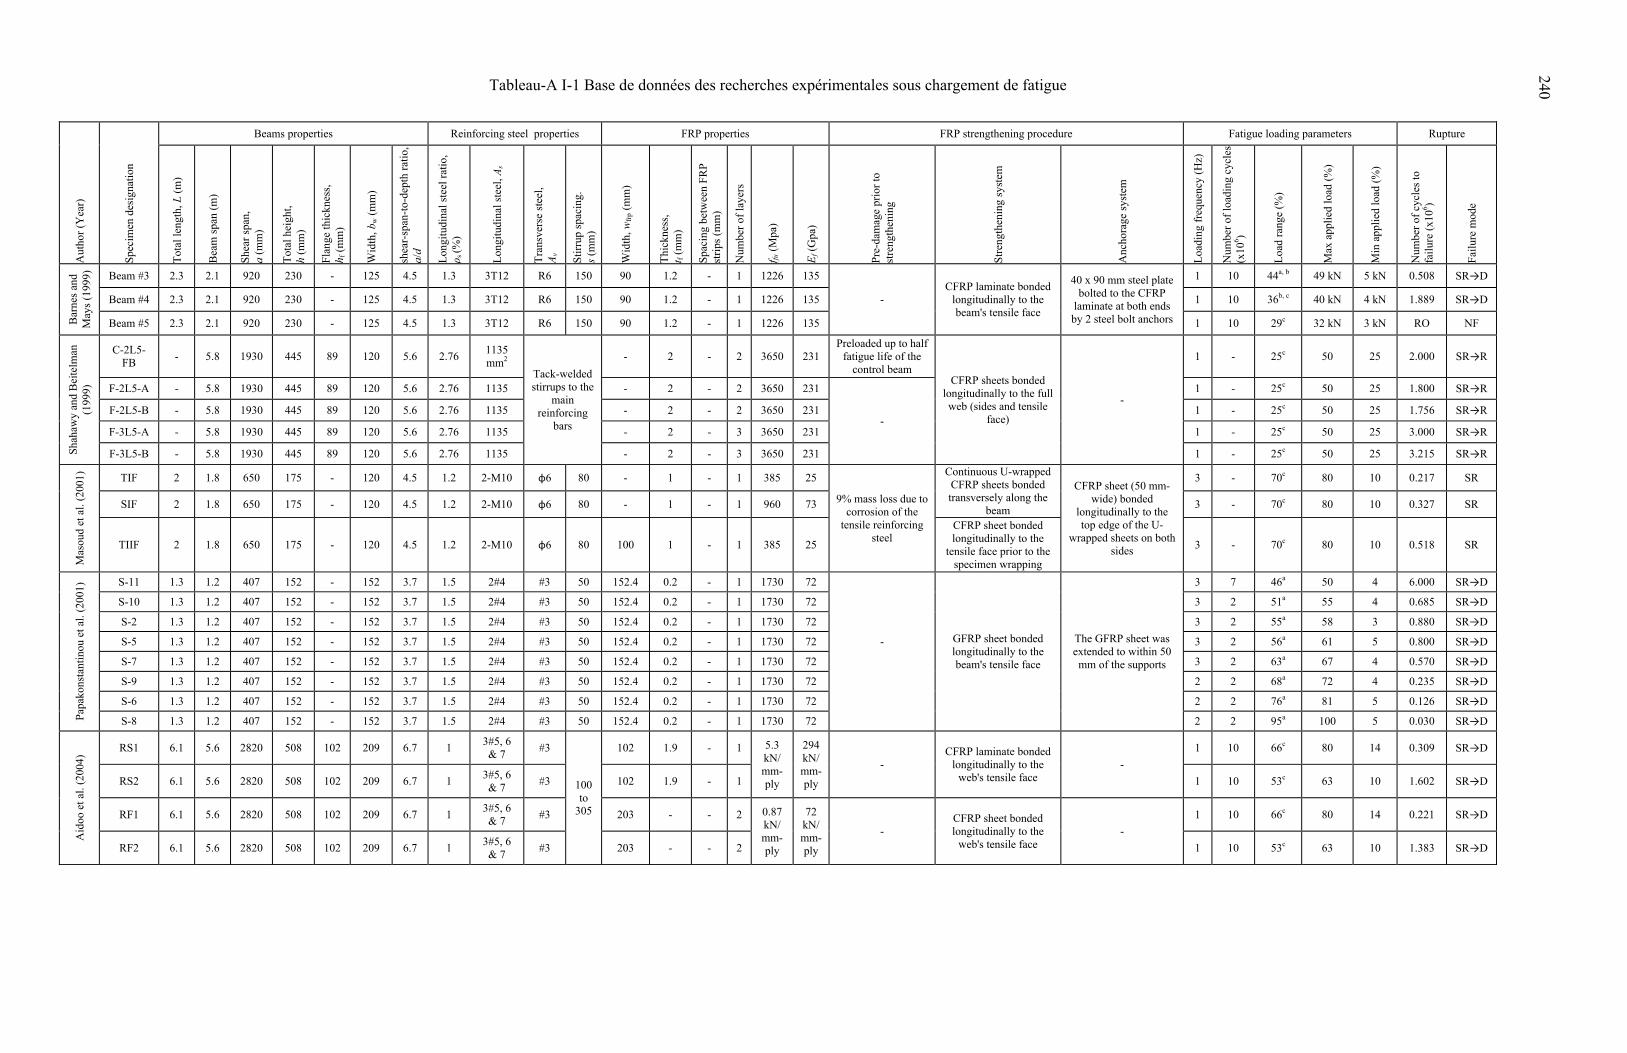
Tableau-A I-1 Base de données des recherches expérimentales sous chargement de fatigue
Aut
hor
(Yea
r)
Spe
cim
en d
esig
nati
on
Beams properties Reinforcing steel properties FRP properties FRP strengthening procedure Fatigue loading parameters Rupture
Tot
al le
ngth
, L (
m)
Bea
m s
pan
(m)
She
ar s
pan,
a
(mm
)
Tot
al h
eigh
t,
h (m
m)
Fla
nge
thic
knes
s,
h f (
mm
)
Wid
th, b
w (
mm
)
shea
r-sp
an-t
o-de
pth
rati
o,
a/d
Lon
gitu
dina
l ste
el r
atio
, ρ s
(%)
Lon
gitu
dina
l ste
el, A
s
Tra
nsve
rse
stee
l,
Av
Stir
rup
spac
ing.
s
(mm
)
Wid
th, w
frp
(mm
)
Thi
ckne
ss,
t f (m
m)
Spa
cing
bet
wee
n F
RP
stri
ps (
mm
)
Num
ber
of la
yers
f fu (
Mpa
)
Ef (
Gpa
)
Pre
-dam
age
prio
r to
st
reng
then
ing
Str
engt
heni
ng s
yste
m
Anc
hora
ge s
yste
m
Loa
ding
fre
quen
cy (
Hz)
Num
ber
of lo
adin
g cy
cles
(x
106 )
Loa
d ra
nge
(%)
Max
app
lied
load
(%
)
Min
app
lied
load
(%
)
Num
ber
of c
ycle
s to
fa
ilur
e (x
106 )
Fai
lure
mod
e
Bar
nes
and
May
s (1
999)
Beam #3 2.3 2.1 920 230 - 125 4.5 1.3 3T12 R6 150 90 1.2 - 1 1226 135
- CFRP laminate bonded
longitudinally to the beam's tensile face
40 x 90 mm steel plate bolted to the CFRP
laminate at both ends by 2 steel bolt anchors
1 10 44a, b 49 kN 5 kN 0.508 SR→D
Beam #4 2.3 2.1 920 230 - 125 4.5 1.3 3T12 R6 150 90 1.2 - 1 1226 135 1 10 36b, c 40 kN 4 kN 1.889 SR→D
Beam #5 2.3 2.1 920 230 - 125 4.5 1.3 3T12 R6 150 90 1.2 - 1 1226 135 1 10 29c 32 kN 3 kN RO NF
Sha
haw
y an
d B
eite
lman
(1
999)
C-2L5-FB
- 5.8 1930 445 89 120 5.6 2.76 1135 mm2
Tack-welded stirrups to the
main reinforcing
bars
- 2 - 2 3650 231 Preloaded up to half
fatigue life of the control beam
CFRP sheets bonded longitudinally to the full web (sides and tensile
face)
-
1 - 25c 50 25 2.000 SR→R
F-2L5-A - 5.8 1930 445 89 120 5.6 2.76 1135 - 2 - 2 3650 231
-
1 - 25c 50 25 1.800 SR→R
F-2L5-B - 5.8 1930 445 89 120 5.6 2.76 1135 - 2 - 2 3650 231 1 - 25c 50 25 1.756 SR→R
F-3L5-A - 5.8 1930 445 89 120 5.6 2.76 1135 - 2 - 3 3650 231 1 - 25c 50 25 3.000 SR→R
F-3L5-B - 5.8 1930 445 89 120 5.6 2.76 1135 - 2 - 3 3650 231 1 - 25c 50 25 3.215 SR→R
Mas
oud
et a
l. (2
001)
TIF 2 1.8 650 175 - 120 4.5 1.2 2-M10 φ6 80 - 1 - 1 385 25
9% mass loss due to corrosion of the
tensile reinforcing steel
Continuous U-wrapped CFRP sheets bonded transversely along the
beam
CFRP sheet (50 mm-wide) bonded
longitudinally to the top edge of the U-
wrapped sheets on both sides
3 - 70c 80 10 0.217 SR
SIF 2 1.8 650 175 - 120 4.5 1.2 2-M10 φ6 80 - 1 - 1 960 73 3 - 70c 80 10 0.327 SR
TIIF 2 1.8 650 175 - 120 4.5 1.2 2-M10 φ6 80 100 1 - 1 385 25
CFRP sheet bonded longitudinally to the
tensile face prior to the specimen wrapping
3 - 70c 80 10 0.518 SR
Pap
akon
stan
tino
u et
al.
(200
1) S-11 1.3 1.2 407 152 - 152 3.7 1.5 2#4 #3 50 152.4 0.2 - 1 1730 72
- GFRP sheet bonded longitudinally to the beam's tensile face
The GFRP sheet was extended to within 50 mm of the supports
3 7 46a 50 4 6.000 SR→D
S-10 1.3 1.2 407 152 - 152 3.7 1.5 2#4 #3 50 152.4 0.2 - 1 1730 72 3 2 51a 55 4 0.685 SR→D
S-2 1.3 1.2 407 152 - 152 3.7 1.5 2#4 #3 50 152.4 0.2 - 1 1730 72 3 2 55a 58 3 0.880 SR→D
S-5 1.3 1.2 407 152 - 152 3.7 1.5 2#4 #3 50 152.4 0.2 - 1 1730 72 3 2 56a 61 5 0.800 SR→D
S-7 1.3 1.2 407 152 - 152 3.7 1.5 2#4 #3 50 152.4 0.2 - 1 1730 72 3 2 63a 67 4 0.570 SR→D
S-9 1.3 1.2 407 152 - 152 3.7 1.5 2#4 #3 50 152.4 0.2 - 1 1730 72 2 2 68a 72 4 0.235 SR→D
S-6 1.3 1.2 407 152 - 152 3.7 1.5 2#4 #3 50 152.4 0.2 - 1 1730 72 2 2 76a 81 5 0.126 SR→D
S-8 1.3 1.2 407 152 - 152 3.7 1.5 2#4 #3 50 152.4 0.2 - 1 1730 72 2 2 95a 100 5 0.030 SR→D
Aid
oo e
t al.
(200
4) RS1 6.1 5.6 2820 508 102 209 6.7 1
3#5, 6 & 7
#3
100 to
305
102 1.9 - 1 5.3 kN/ mm-ply
294kN/ mm-ply
- CFRP laminate bonded
longitudinally to the web's tensile face
-
1 10 66c 80 14 0.309 SR→D
RS2 6.1 5.6 2820 508 102 209 6.7 1 3#5, 6 & 7
#3 102 1.9 - 1 1 10 53c 63 10 1.602 SR→D
RF1 6.1 5.6 2820 508 102 209 6.7 1 3#5, 6 & 7
#3 203 - - 2 0.87 kN/ mm-ply
72 kN/ mm-ply
- CFRP sheet bonded longitudinally to the
web's tensile face -
1 10 66c 80 14 0.221 SR→D
RF2 6.1 5.6 2820 508 102 209 6.7 1 3#5, 6 & 7
#3 203 - - 2 1 10 53c 63 10 1.383 SR→D
240
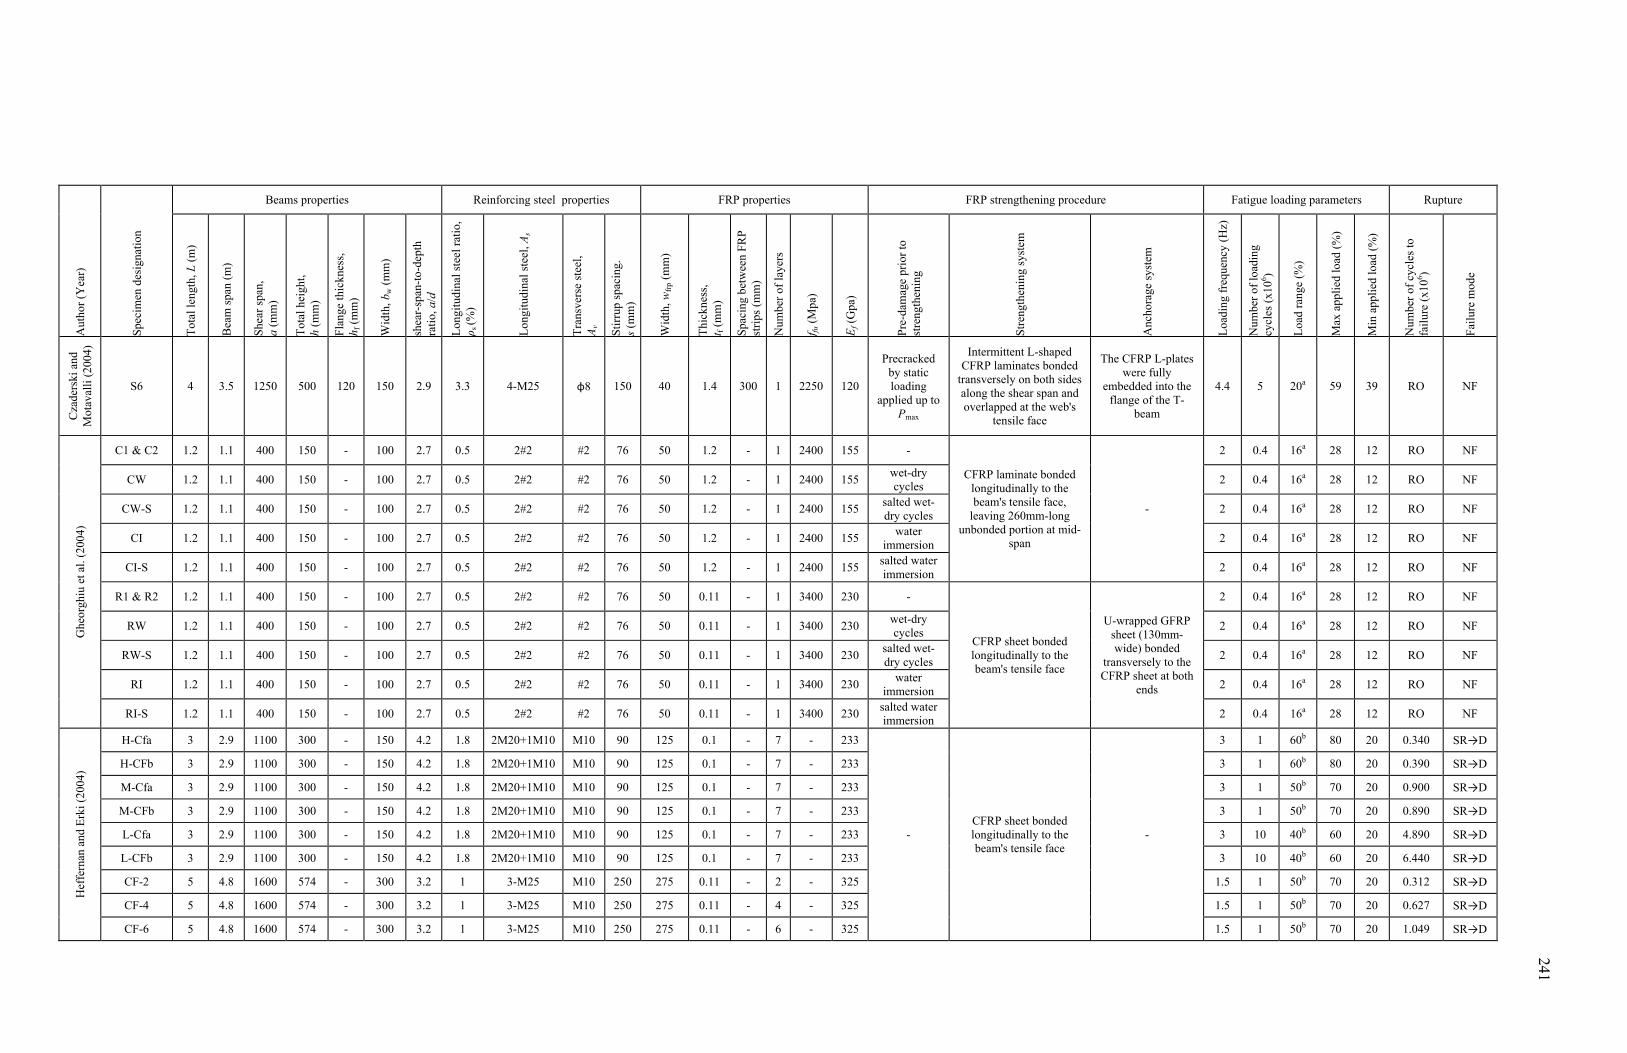
A
utho
r (Y
ear)
Spe
cim
en d
esig
nati
on
Beams properties Reinforcing steel properties FRP properties FRP strengthening procedure Fatigue loading parameters Rupture T
otal
leng
th, L
(m
)
Bea
m s
pan
(m)
Shea
r sp
an,
a (m
m)
Tot
al h
eigh
t,
h (m
m)
Fla
nge
thic
knes
s,
h f (
mm
)
Wid
th, b
w (
mm
)
shea
r-sp
an-t
o-de
pth
rati
o, a
/d
Lon
gitu
dina
l ste
el r
atio
, ρ s
(%)
Lon
gitu
dina
l ste
el, A
s
Tra
nsve
rse
stee
l,
Av
Sti
rrup
spa
cing
. s
(mm
)
Wid
th, w
frp
(mm
)
Thi
ckne
ss,
t f (m
m)
Spac
ing
betw
een
FRP
stri
ps (
mm
)
Num
ber
of la
yers
f fu (
Mpa
)
Ef (
Gpa
)
Pre
-dam
age
prio
r to
st
reng
then
ing
Str
engt
heni
ng s
yste
m
Anc
hora
ge s
yste
m
Loa
ding
fre
quen
cy (
Hz)
Num
ber
of lo
adin
g cy
cles
(x1
06 )
Loa
d ra
nge
(%)
Max
app
lied
load
(%
)
Min
app
lied
load
(%
)
Num
ber
of c
ycle
s to
fa
ilur
e (x
106 )
Fai
lure
mod
e
Cza
ders
ki a
nd
Mot
aval
li (
2004
)
S6 4 3.5 1250 500 120 150 2.9 3.3 4-M25 φ8 150 40 1.4 300 1 2250 120
Precracked by static loading
applied up to Pmax
Intermittent L-shaped CFRP laminates bonded
transversely on both sides along the shear span and overlapped at the web's
tensile face
The CFRP L-plates were fully
embedded into the flange of the T-
beam
4.4 5 20a 59 39 RO NF
Ghe
orgh
iu e
t al.
(200
4)
C1 & C2 1.2 1.1 400 150 - 100 2.7 0.5 2#2 #2 76 50 1.2 - 1 2400 155 -
CFRP laminate bonded longitudinally to the beam's tensile face,
leaving 260mm-long unbonded portion at mid-
span
-
2 0.4 16a 28 12 RO NF
CW 1.2 1.1 400 150 - 100 2.7 0.5 2#2 #2 76 50 1.2 - 1 2400 155 wet-dry cycles
2 0.4 16a 28 12 RO NF
CW-S 1.2 1.1 400 150 - 100 2.7 0.5 2#2 #2 76 50 1.2 - 1 2400 155 salted wet-dry cycles
2 0.4 16a 28 12 RO NF
CI 1.2 1.1 400 150 - 100 2.7 0.5 2#2 #2 76 50 1.2 - 1 2400 155 water
immersion 2 0.4 16a 28 12 RO NF
CI-S 1.2 1.1 400 150 - 100 2.7 0.5 2#2 #2 76 50 1.2 - 1 2400 155 salted water immersion
2 0.4 16a 28 12 RO NF
R1 & R2 1.2 1.1 400 150 - 100 2.7 0.5 2#2 #2 76 50 0.11 - 1 3400 230 -
CFRP sheet bonded longitudinally to the beam's tensile face
U-wrapped GFRP sheet (130mm-wide) bonded
transversely to the CFRP sheet at both
ends
2 0.4 16a 28 12 RO NF
RW 1.2 1.1 400 150 - 100 2.7 0.5 2#2 #2 76 50 0.11 - 1 3400 230 wet-dry cycles
2 0.4 16a 28 12 RO NF
RW-S 1.2 1.1 400 150 - 100 2.7 0.5 2#2 #2 76 50 0.11 - 1 3400 230 salted wet-dry cycles
2 0.4 16a 28 12 RO NF
RI 1.2 1.1 400 150 - 100 2.7 0.5 2#2 #2 76 50 0.11 - 1 3400 230 water
immersion 2 0.4 16a 28 12 RO NF
RI-S 1.2 1.1 400 150 - 100 2.7 0.5 2#2 #2 76 50 0.11 - 1 3400 230 salted water immersion
2 0.4 16a 28 12 RO NF
Hef
fern
an a
nd E
rki (
2004
)
H-Cfa 3 2.9 1100 300 - 150 4.2 1.8 2M20+1M10 M10 90 125 0.1 - 7 - 233
- CFRP sheet bonded longitudinally to the beam's tensile face
-
3 1 60b 80 20 0.340 SR→D
H-CFb 3 2.9 1100 300 - 150 4.2 1.8 2M20+1M10 M10 90 125 0.1 - 7 - 233 3 1 60b 80 20 0.390 SR→D
M-Cfa 3 2.9 1100 300 - 150 4.2 1.8 2M20+1M10 M10 90 125 0.1 - 7 - 233 3 1 50b 70 20 0.900 SR→D
M-CFb 3 2.9 1100 300 - 150 4.2 1.8 2M20+1M10 M10 90 125 0.1 - 7 - 233 3 1 50b 70 20 0.890 SR→D
L-Cfa 3 2.9 1100 300 - 150 4.2 1.8 2M20+1M10 M10 90 125 0.1 - 7 - 233 3 10 40b 60 20 4.890 SR→D
L-CFb 3 2.9 1100 300 - 150 4.2 1.8 2M20+1M10 M10 90 125 0.1 - 7 - 233 3 10 40b 60 20 6.440 SR→D
CF-2 5 4.8 1600 574 - 300 3.2 1 3-M25 M10 250 275 0.11 - 2 - 325 1.5 1 50b 70 20 0.312 SR→D
CF-4 5 4.8 1600 574 - 300 3.2 1 3-M25 M10 250 275 0.11 - 4 - 325 1.5 1 50b 70 20 0.627 SR→D
CF-6 5 4.8 1600 574 - 300 3.2 1 3-M25 M10 250 275 0.11 - 6 - 325 1.5 1 50b 70 20 1.049 SR→D
241
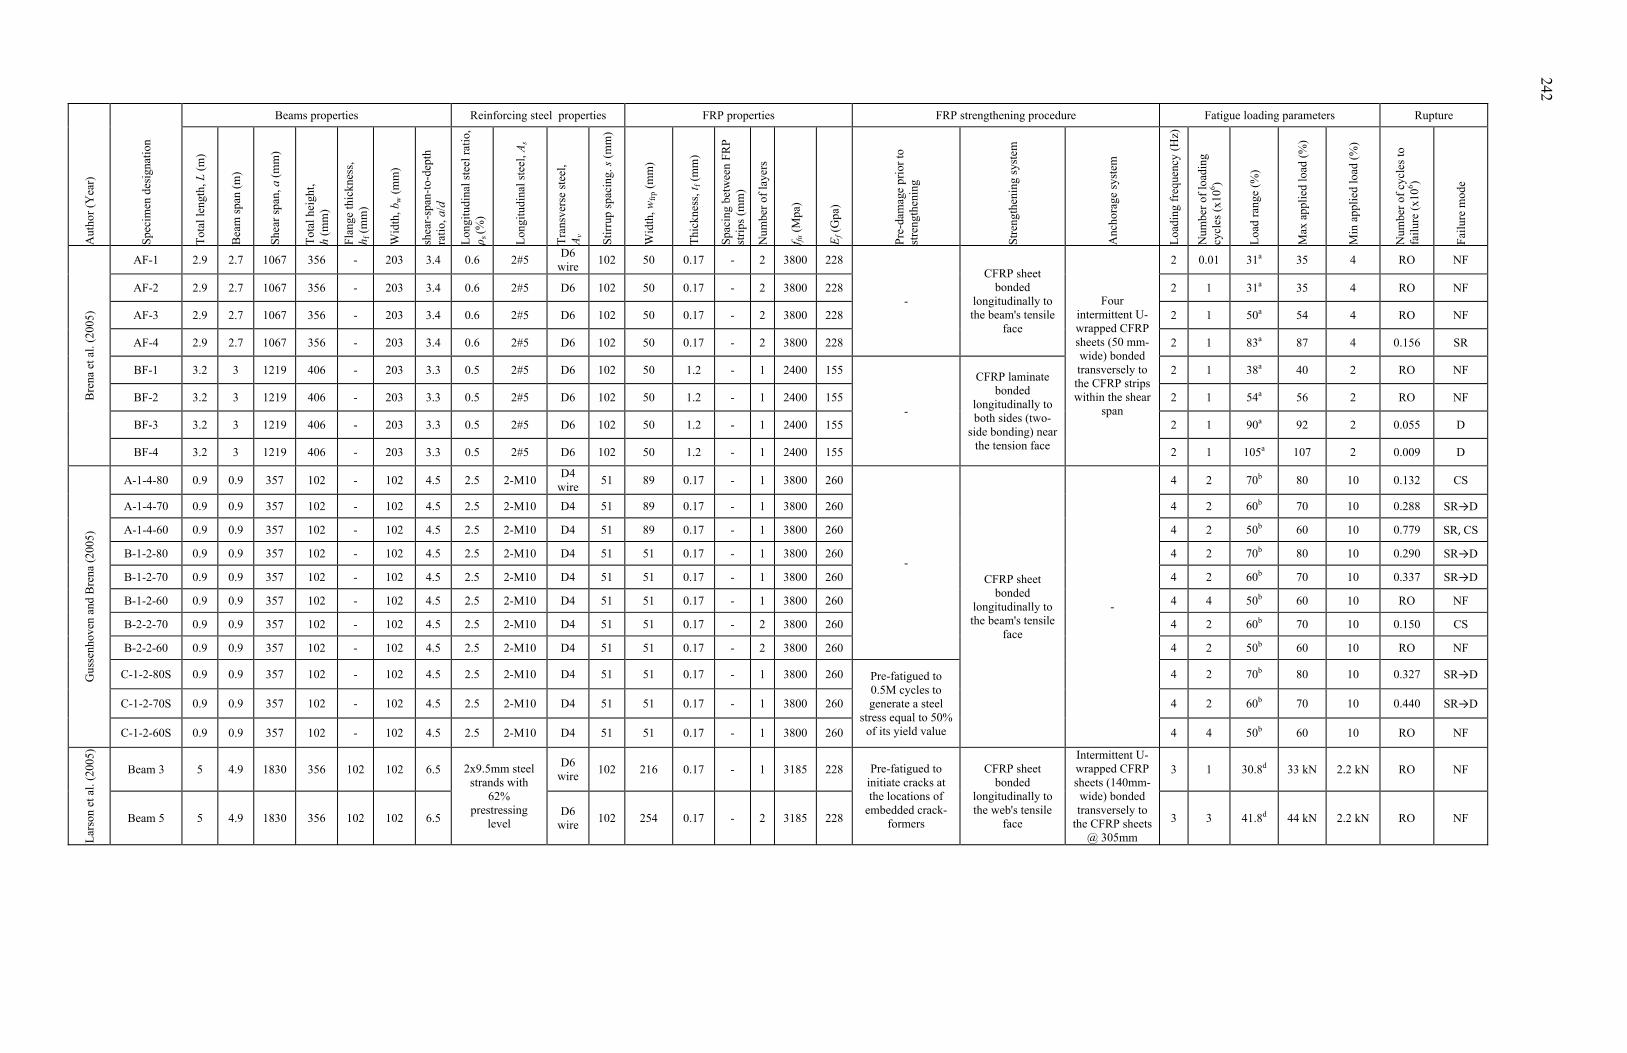
A
utho
r (Y
ear)
Spe
cim
en d
esig
nati
on
Beams properties Reinforcing steel properties FRP properties FRP strengthening procedure Fatigue loading parameters Rupture
Tot
al le
ngth
, L (
m)
Bea
m s
pan
(m)
Shea
r sp
an, a
(m
m)
Tot
al h
eigh
t,
h (m
m)
Fla
nge
thic
knes
s,
h f (
mm
)
Wid
th, b
w (
mm
)
shea
r-sp
an-t
o-de
pth
rati
o, a
/d
Lon
gitu
dina
l ste
el r
atio
, ρ s
(%)
Lon
gitu
dina
l ste
el, A
s
Tra
nsve
rse
stee
l,
Av
Sti
rrup
spa
cing
. s (
mm
)
Wid
th, w
frp
(mm
)
Thi
ckne
ss, t
f (m
m)
Spac
ing
betw
een
FRP
stri
ps (
mm
)
Num
ber
of la
yers
f fu (
Mpa
)
Ef (
Gpa
)
Pre
-dam
age
prio
r to
st
reng
then
ing
Str
engt
heni
ng s
yste
m
Anc
hora
ge s
yste
m
Loa
ding
fre
quen
cy (
Hz)
Num
ber
of lo
adin
g cy
cles
(x1
06 )
Loa
d ra
nge
(%)
Max
app
lied
load
(%
)
Min
app
lied
load
(%
)
Num
ber
of c
ycle
s to
fa
ilur
e (x
106 )
Fai
lure
mod
e
Bre
na e
t al.
(200
5)
AF-1 2.9 2.7 1067 356 - 203 3.4 0.6 2#5 D6
wire 102 50 0.17 - 2 3800 228
-
CFRP sheet bonded
longitudinally to the beam's tensile
face
Four intermittent U-wrapped CFRP sheets (50 mm-wide) bonded transversely to the CFRP strips within the shear
span
2 0.01 31a 35 4 RO NF
AF-2 2.9 2.7 1067 356 - 203 3.4 0.6 2#5 D6 102 50 0.17 - 2 3800 228 2 1 31a 35 4 RO NF
AF-3 2.9 2.7 1067 356 - 203 3.4 0.6 2#5 D6 102 50 0.17 - 2 3800 228 2 1 50a 54 4 RO NF
AF-4 2.9 2.7 1067 356 - 203 3.4 0.6 2#5 D6 102 50 0.17 - 2 3800 228 2 1 83a 87 4 0.156 SR
BF-1 3.2 3 1219 406 - 203 3.3 0.5 2#5 D6 102 50 1.2 - 1 2400 155
-
CFRP laminate bonded
longitudinally to both sides (two-
side bonding) near the tension face
2 1 38a 40 2 RO NF
BF-2 3.2 3 1219 406 - 203 3.3 0.5 2#5 D6 102 50 1.2 - 1 2400 155 2 1 54a 56 2 RO NF
BF-3 3.2 3 1219 406 - 203 3.3 0.5 2#5 D6 102 50 1.2 - 1 2400 155 2 1 90a 92 2 0.055 D
BF-4 3.2 3 1219 406 - 203 3.3 0.5 2#5 D6 102 50 1.2 - 1 2400 155 2 1 105a 107 2 0.009 D
Gus
senh
oven
and
Bre
na (
2005
)
A-1-4-80 0.9 0.9 357 102 - 102 4.5 2.5 2-M10 D4
wire 51 89 0.17 - 1 3800 260
- CFRP sheet
bonded longitudinally to the beam's tensile
face
-
4 2 70b 80 10 0.132 CS
A-1-4-70 0.9 0.9 357 102 - 102 4.5 2.5 2-M10 D4 51 89 0.17 - 1 3800 260 4 2 60b 70 10 0.288 SR→D
A-1-4-60 0.9 0.9 357 102 - 102 4.5 2.5 2-M10 D4 51 89 0.17 - 1 3800 260 4 2 50b 60 10 0.779 SR, CS
B-1-2-80 0.9 0.9 357 102 - 102 4.5 2.5 2-M10 D4 51 51 0.17 - 1 3800 260 4 2 70b 80 10 0.290 SR→D
B-1-2-70 0.9 0.9 357 102 - 102 4.5 2.5 2-M10 D4 51 51 0.17 - 1 3800 260 4 2 60b 70 10 0.337 SR→D
B-1-2-60 0.9 0.9 357 102 - 102 4.5 2.5 2-M10 D4 51 51 0.17 - 1 3800 260 4 4 50b 60 10 RO NF
B-2-2-70 0.9 0.9 357 102 - 102 4.5 2.5 2-M10 D4 51 51 0.17 - 2 3800 260 4 2 60b 70 10 0.150 CS
B-2-2-60 0.9 0.9 357 102 - 102 4.5 2.5 2-M10 D4 51 51 0.17 - 2 3800 260 4 2 50b 60 10 RO NF
C-1-2-80S 0.9 0.9 357 102 - 102 4.5 2.5 2-M10 D4 51 51 0.17 - 1 3800 260 Pre-fatigued to 0.5M cycles to generate a steel
stress equal to 50% of its yield value
4 2 70b 80 10 0.327 SR→D
C-1-2-70S 0.9 0.9 357 102 - 102 4.5 2.5 2-M10 D4 51 51 0.17 - 1 3800 260 4 2 60b 70 10 0.440 SR→D
C-1-2-60S 0.9 0.9 357 102 - 102 4.5 2.5 2-M10 D4 51 51 0.17 - 1 3800 260 4 4 50b 60 10 RO NF
Lar
son
et a
l. (2
005)
Beam 3 5 4.9 1830 356 102 102 6.5 2x9.5mm steel strands with
62% prestressing
level
D6 wire
102 216 0.17 - 1 3185 228 Pre-fatigued to initiate cracks at the locations of
embedded crack-formers
CFRP sheet bonded
longitudinally to the web's tensile
face
Intermittent U-wrapped CFRP sheets (140mm-wide) bonded transversely to
the CFRP sheets @ 305mm
3 1 30.8d 33 kN 2.2 kN RO NF
Beam 5 5 4.9 1830 356 102 102 6.5 D6
wire 102 254 0.17 - 2 3185 228 3 3 41.8d 44 kN 2.2 kN RO NF
242
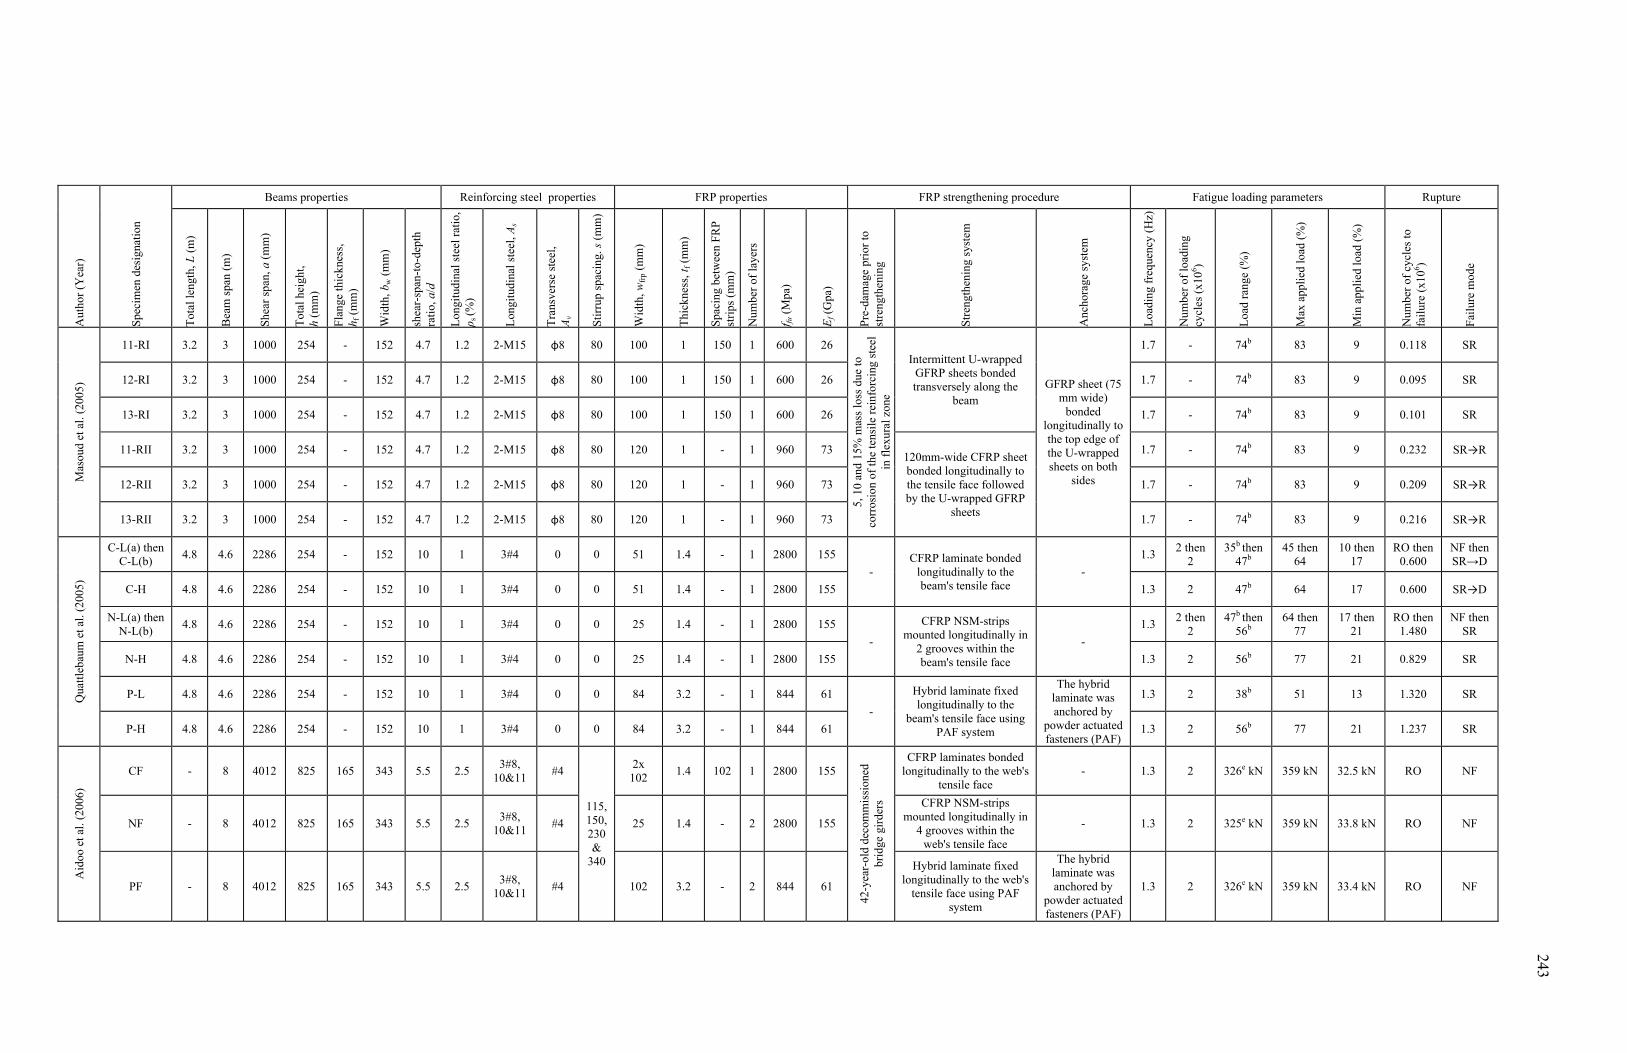
Aut
hor
(Yea
r)
Spe
cim
en d
esig
nati
on
Beams properties Reinforcing steel properties FRP properties FRP strengthening procedure Fatigue loading parameters Rupture T
otal
leng
th, L
(m
)
Bea
m s
pan
(m)
Shea
r sp
an, a
(m
m)
Tot
al h
eigh
t,
h (m
m)
Fla
nge
thic
knes
s,
h f (
mm
)
Wid
th, b
w (
mm
)
shea
r-sp
an-t
o-de
pth
rati
o, a
/d
Lon
gitu
dina
l ste
el r
atio
, ρ s
(%)
Lon
gitu
dina
l ste
el, A
s
Tra
nsve
rse
stee
l,
Av
Sti
rrup
spa
cing
. s (
mm
)
Wid
th, w
frp
(mm
)
Thi
ckne
ss, t
f (m
m)
Spac
ing
betw
een
FRP
stri
ps (
mm
)
Num
ber
of la
yers
f fu (
Mpa
)
Ef (
Gpa
)
Pre
-dam
age
prio
r to
st
reng
then
ing
Str
engt
heni
ng s
yste
m
Anc
hora
ge s
yste
m
Loa
ding
fre
quen
cy (
Hz)
Num
ber
of lo
adin
g cy
cles
(x1
06 )
Loa
d ra
nge
(%)
Max
app
lied
load
(%
)
Min
app
lied
load
(%
)
Num
ber
of c
ycle
s to
fa
ilur
e (x
106 )
Fai
lure
mod
e
Mas
oud
et a
l. (2
005)
11-RI 3.2 3 1000 254 - 152 4.7 1.2 2-M15 φ8 80 100 1 150 1 600 26
5, 1
0 an
d 15
% m
ass
loss
due
to
corr
osio
n of
the
tens
ile
rein
forc
ing
stee
l in
fle
xura
l zon
e
Intermittent U-wrapped GFRP sheets bonded transversely along the
beam GFRP sheet (75
mm wide) bonded
longitudinally to the top edge of the U-wrapped sheets on both
sides
1.7 - 74b 83 9 0.118 SR
12-RI 3.2 3 1000 254 - 152 4.7 1.2 2-M15 φ8 80 100 1 150 1 600 26 1.7 - 74b 83 9 0.095 SR
13-RI 3.2 3 1000 254 - 152 4.7 1.2 2-M15 φ8 80 100 1 150 1 600 26 1.7 - 74b 83 9 0.101 SR
11-RII 3.2 3 1000 254 - 152 4.7 1.2 2-M15 φ8 80 120 1 - 1 960 73 120mm-wide CFRP sheet bonded longitudinally to the tensile face followed by the U-wrapped GFRP
sheets
1.7 - 74b 83 9 0.232 SR→R
12-RII 3.2 3 1000 254 - 152 4.7 1.2 2-M15 φ8 80 120 1 - 1 960 73 1.7 - 74b 83 9 0.209 SR→R
13-RII 3.2 3 1000 254 - 152 4.7 1.2 2-M15 φ8 80 120 1 - 1 960 73 1.7 - 74b 83 9 0.216 SR→R
Qua
ttle
baum
et a
l. (2
005)
C-L(a) then C-L(b)
4.8 4.6 2286 254 - 152 10 1 3#4 0 0 51 1.4 - 1 2800 155
- CFRP laminate bonded
longitudinally to the beam's tensile face
-
1.3 2 then
2 35b then
47b 45 then
64 10 then
17 RO then
0.600 NF then SR→D
C-H 4.8 4.6 2286 254 - 152 10 1 3#4 0 0 51 1.4 - 1 2800 155 1.3 2 47b 64 17 0.600 SR→D
N-L(a) then N-L(b)
4.8 4.6 2286 254 - 152 10 1 3#4 0 0 25 1.4 - 1 2800 155
-
CFRP NSM-strips mounted longitudinally in
2 grooves within the beam's tensile face
-
1.3 2 then
2 47b then
56b 64 then
77 17 then
21 RO then
1.480 NF then
SR
N-H 4.8 4.6 2286 254 - 152 10 1 3#4 0 0 25 1.4 - 1 2800 155 1.3 2 56b 77 21 0.829 SR
P-L 4.8 4.6 2286 254 - 152 10 1 3#4 0 0 84 3.2 - 1 844 61
-
Hybrid laminate fixed longitudinally to the
beam's tensile face using PAF system
The hybrid laminate was anchored by
powder actuated fasteners (PAF)
1.3 2 38b 51 13 1.320 SR
P-H 4.8 4.6 2286 254 - 152 10 1 3#4 0 0 84 3.2 - 1 844 61 1.3 2 56b 77 21 1.237 SR
Aid
oo e
t al.
(200
6)
CF - 8 4012 825 165 343 5.5 2.5 3#8,
10&11 #4
115, 150, 230 &
340
2x 10²
1.4 102 1 2800 155
42-y
ear-
old
deco
mm
issi
oned
br
idge
gir
ders
CFRP laminates bonded longitudinally to the web's
tensile face - 1.3 2 326e kN 359 kN 32.5 kN RO NF
NF - 8 4012 825 165 343 5.5 2.5 3#8,
10&11 #4 25 1.4 - 2 2800 155
CFRP NSM-strips mounted longitudinally in
4 grooves within the web's tensile face
- 1.3 2 325e kN 359 kN 33.8 kN RO NF
PF - 8 4012 825 165 343 5.5 2.5 3#8,
10&11 #4 102 3.2 - 2 844 61
Hybrid laminate fixed longitudinally to the web's
tensile face using PAF system
The hybrid laminate was anchored by
powder actuated fasteners (PAF)
1.3 2 326e kN 359 kN 33.4 kN RO NF
243
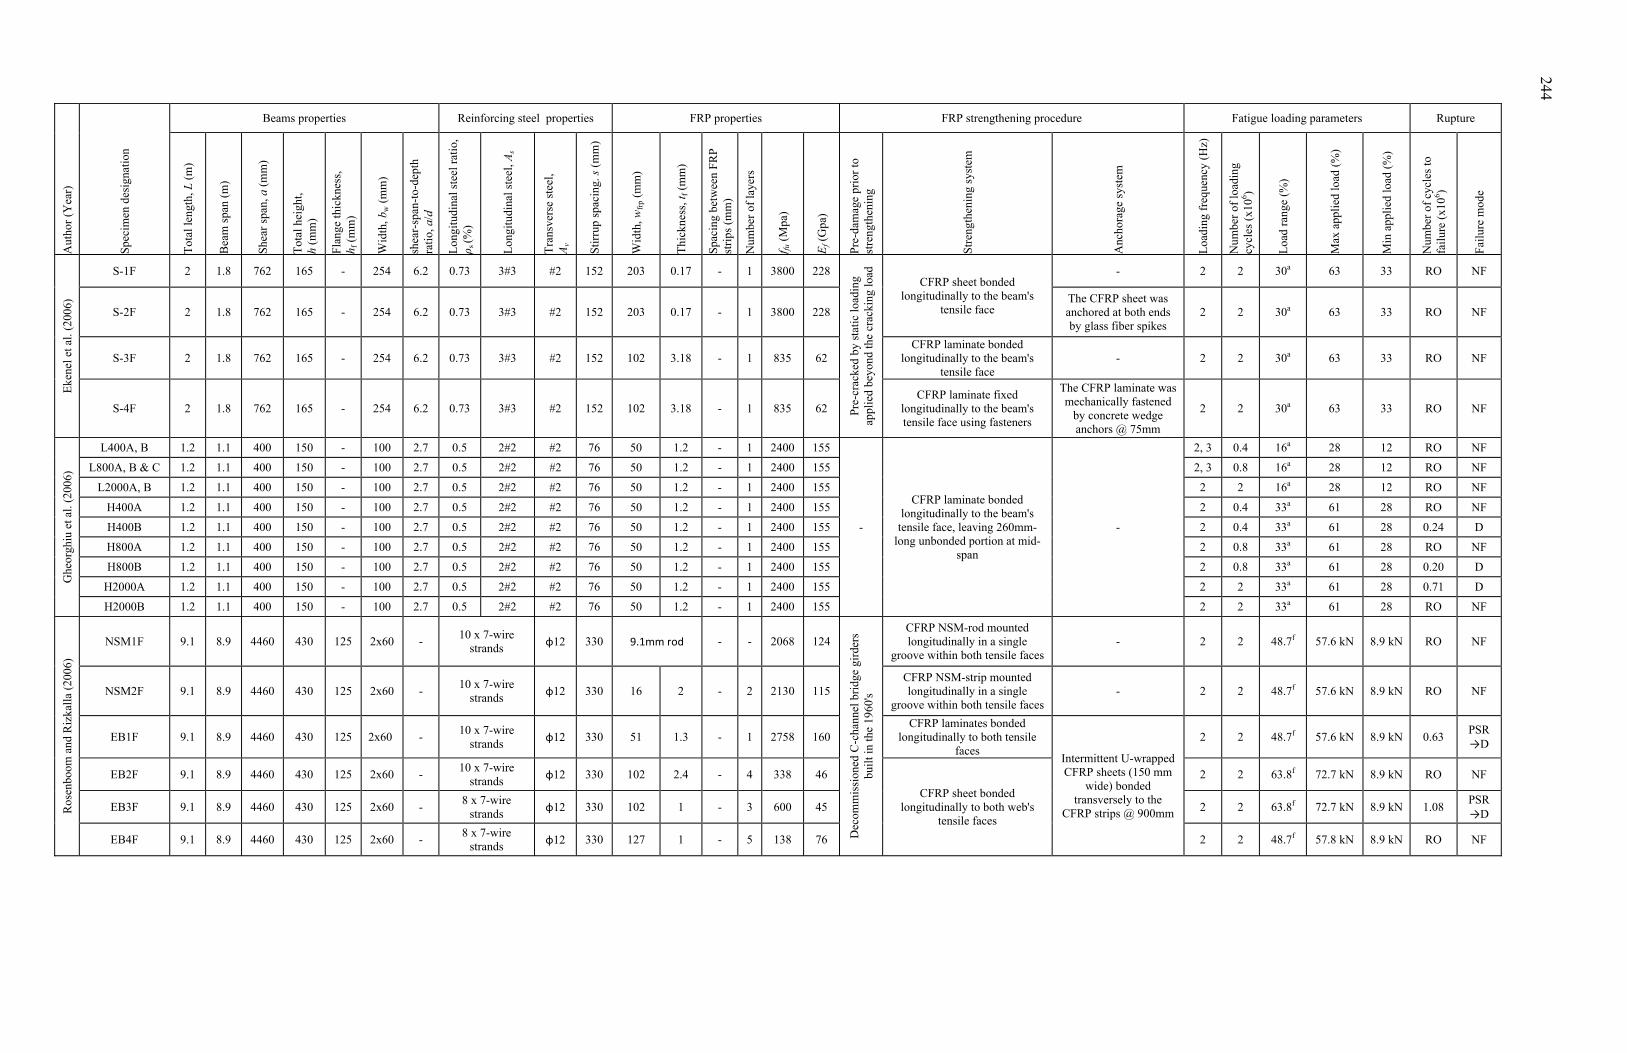
A
utho
r (Y
ear)
Spe
cim
en d
esig
nati
on
Beams properties Reinforcing steel properties FRP properties FRP strengthening procedure Fatigue loading parameters Rupture
Tot
al le
ngth
, L (
m)
Bea
m s
pan
(m)
Shea
r sp
an, a
(m
m)
Tot
al h
eigh
t,
h (m
m)
Fla
nge
thic
knes
s,
h f (
mm
)
Wid
th, b
w (
mm
)
shea
r-sp
an-t
o-de
pth
rati
o, a
/d
Lon
gitu
dina
l ste
el r
atio
, ρ s
(%)
Lon
gitu
dina
l ste
el, A
s
Tra
nsve
rse
stee
l,
Av
Sti
rrup
spa
cing
. s (
mm
)
Wid
th, w
frp
(mm
)
Thi
ckne
ss, t
f (m
m)
Spac
ing
betw
een
FRP
stri
ps (
mm
)
Num
ber
of la
yers
f fu (
Mpa
)
Ef (
Gpa
)
Pre
-dam
age
prio
r to
st
reng
then
ing
Str
engt
heni
ng s
yste
m
Anc
hora
ge s
yste
m
Loa
ding
fre
quen
cy (
Hz)
Num
ber
of lo
adin
g cy
cles
(x1
06 )
Loa
d ra
nge
(%)
Max
app
lied
load
(%
)
Min
app
lied
load
(%
)
Num
ber
of c
ycle
s to
fa
ilur
e (x
106 )
Fai
lure
mod
e
Eke
nel e
t al.
(200
6)
S-1F 2 1.8 762 165 - 254 6.2 0.73 3#3 #2 152 203 0.17 - 1 3800 228
Pre-
crac
ked
by s
tatic
load
ing
appl
ied
beyo
nd th
e cr
acki
ng lo
ad
CFRP sheet bonded longitudinally to the beam's
tensile face
- 2 2 30a 63 33 RO NF
S-2F 2 1.8 762 165 - 254 6.2 0.73 3#3 #2 152 203 0.17 - 1 3800 228 The CFRP sheet was anchored at both ends by glass fiber spikes
2 2 30a 63 33 RO NF
S-3F 2 1.8 762 165 - 254 6.2 0.73 3#3 #2 152 102 3.18 - 1 835 62 CFRP laminate bonded
longitudinally to the beam's tensile face
- 2 2 30a 63 33 RO NF
S-4F 2 1.8 762 165 - 254 6.2 0.73 3#3 #2 152 102 3.18 - 1 835 62 CFRP laminate fixed
longitudinally to the beam's tensile face using fasteners
The CFRP laminate was mechanically fastened
by concrete wedge anchors @ 75mm
2 2 30a 63 33 RO NF
Ghe
orgh
iu e
t al.
(200
6)
L400A, B 1.2 1.1 400 150 - 100 2.7 0.5 2#2 #2 76 50 1.2 - 1 2400 155
-
CFRP laminate bonded longitudinally to the beam's
tensile face, leaving 260mm-long unbonded portion at mid-
span
-
2, 3 0.4 16a 28 12 RO NF
L800A, B & C 1.2 1.1 400 150 - 100 2.7 0.5 2#2 #2 76 50 1.2 - 1 2400 155 2, 3 0.8 16a 28 12 RO NF
L2000A, B 1.2 1.1 400 150 - 100 2.7 0.5 2#2 #2 76 50 1.2 - 1 2400 155 2 2 16a 28 12 RO NF
H400A 1.2 1.1 400 150 - 100 2.7 0.5 2#2 #2 76 50 1.2 - 1 2400 155 2 0.4 33a 61 28 RO NF
H400B 1.2 1.1 400 150 - 100 2.7 0.5 2#2 #2 76 50 1.2 - 1 2400 155 2 0.4 33a 61 28 0.24 D
H800A 1.2 1.1 400 150 - 100 2.7 0.5 2#2 #2 76 50 1.2 - 1 2400 155 2 0.8 33a 61 28 RO NF
H800B 1.2 1.1 400 150 - 100 2.7 0.5 2#2 #2 76 50 1.2 - 1 2400 155 2 0.8 33a 61 28 0.20 D
H2000A 1.2 1.1 400 150 - 100 2.7 0.5 2#2 #2 76 50 1.2 - 1 2400 155 2 2 33a 61 28 0.71 D
H2000B 1.2 1.1 400 150 - 100 2.7 0.5 2#2 #2 76 50 1.2 - 1 2400 155 2 2 33a 61 28 RO NF
Ros
enbo
om a
nd R
izka
lla
(200
6)
NSM1F 9.1 8.9 4460 430 125 2x60 - 10 x 7-wire
strands φ12 330 9.1mm rod - - 2068 124
Dec
omm
issi
oned
C-c
hann
el b
ridg
e gi
rder
s bu
ilt i
n th
e 19
60's
CFRP NSM-rod mounted longitudinally in a single
groove within both tensile faces - 2 2 48.7f 57.6 kN 8.9 kN RO NF
NSM2F 9.1 8.9 4460 430 125 2x60 - 10 x 7-wire
strands φ12 330 16 2 - 2 2130 115
CFRP NSM-strip mounted longitudinally in a single
groove within both tensile faces - 2 2 48.7f 57.6 kN 8.9 kN RO NF
EB1F 9.1 8.9 4460 430 125 2x60 - 10 x 7-wire
strands φ12 330 51 1.3 - 1 2758 160
CFRP laminates bonded longitudinally to both tensile
faces Intermittent U-wrapped CFRP sheets (150 mm
wide) bonded transversely to the
CFRP strips @ 900mm
2 2 48.7f 57.6 kN 8.9 kN 0.63 PSR→D
EB2F 9.1 8.9 4460 430 125 2x60 - 10 x 7-wire
strands φ12 330 102 2.4 - 4 338 46
CFRP sheet bonded longitudinally to both web's
tensile faces
2 2 63.8f 72.7 kN 8.9 kN RO NF
EB3F 9.1 8.9 4460 430 125 2x60 - 8 x 7-wire
strands φ12 330 102 1 - 3 600 45 2 2 63.8f 72.7 kN 8.9 kN 1.08
PSR→D
EB4F 9.1 8.9 4460 430 125 2x60 - 8 x 7-wire
strands φ12 330 127 1 - 5 138 76 2 2 48.7f 57.8 kN 8.9 kN RO NF
244
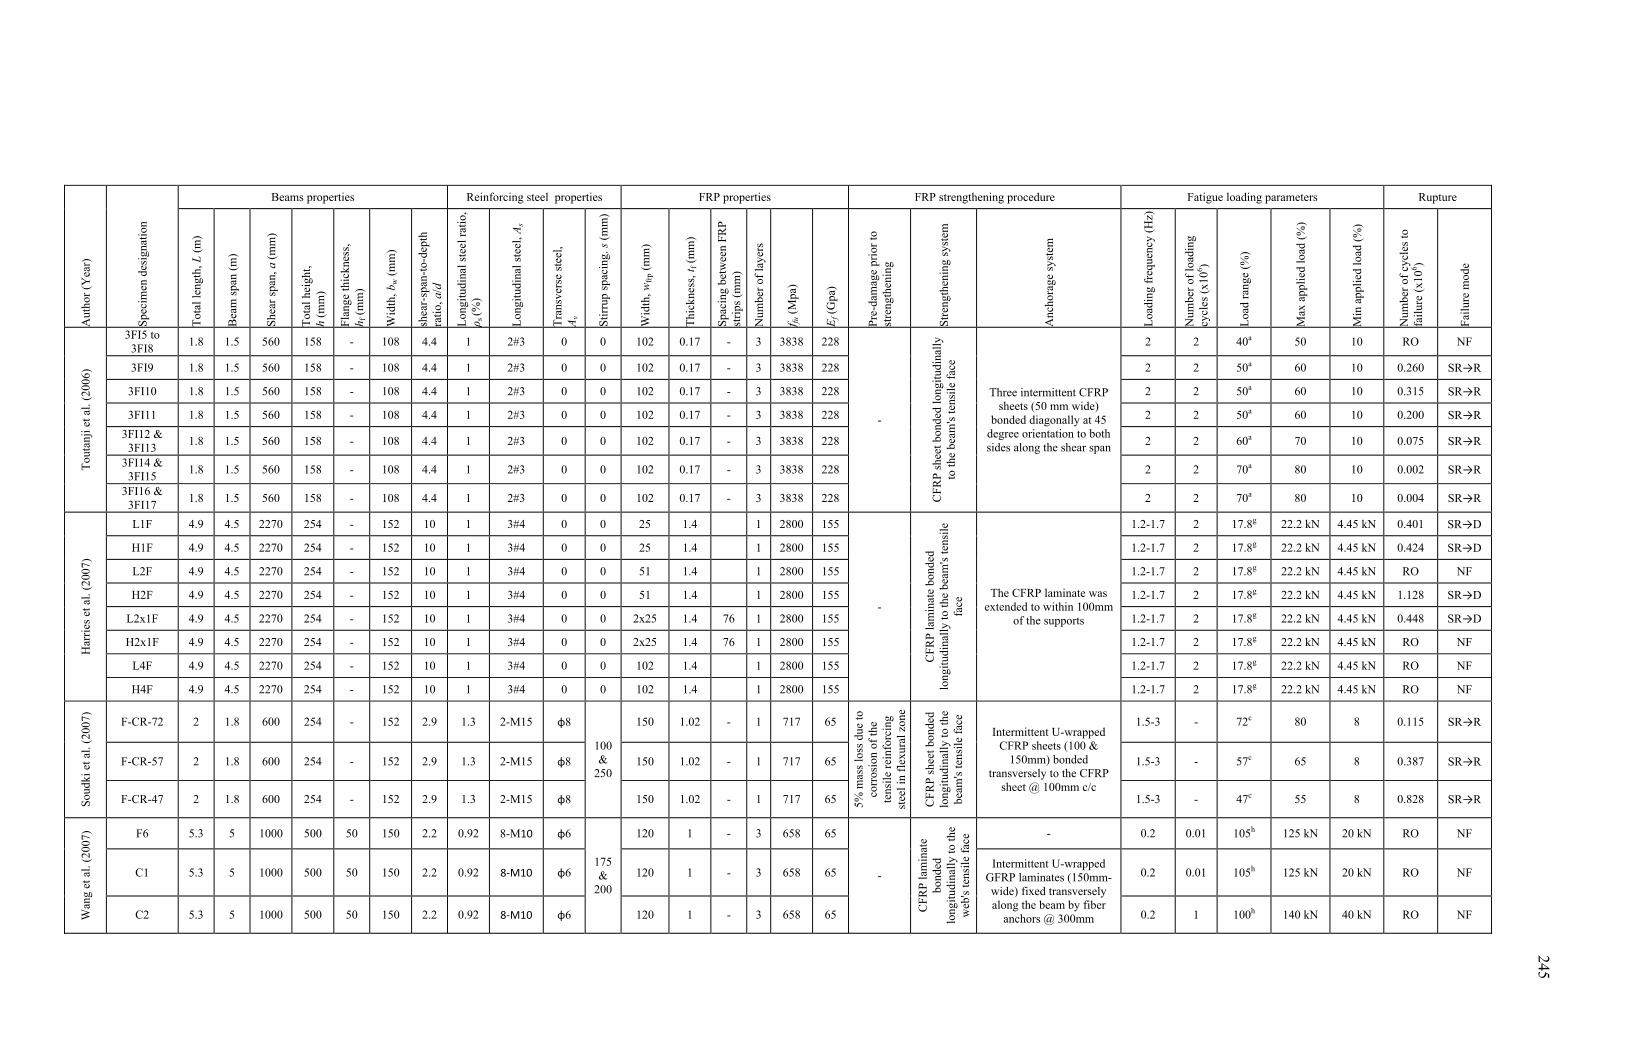
Aut
hor
(Yea
r)
Spe
cim
en d
esig
nati
on
Beams properties Reinforcing steel properties FRP properties FRP strengthening procedure Fatigue loading parameters Rupture T
otal
leng
th, L
(m
)
Bea
m s
pan
(m)
Shea
r sp
an, a
(m
m)
Tot
al h
eigh
t,
h (m
m)
Fla
nge
thic
knes
s,
h f (
mm
)
Wid
th, b
w (
mm
)
shea
r-sp
an-t
o-de
pth
rati
o, a
/d
Lon
gitu
dina
l ste
el r
atio
, ρ s
(%)
Lon
gitu
dina
l ste
el, A
s
Tra
nsve
rse
stee
l,
Av
Sti
rrup
spa
cing
. s (
mm
)
Wid
th, w
frp
(mm
)
Thi
ckne
ss, t
f (m
m)
Spac
ing
betw
een
FRP
stri
ps (
mm
)
Num
ber
of la
yers
f fu (
Mpa
)
Ef (
Gpa
)
Pre
-dam
age
prio
r to
st
reng
then
ing
Str
engt
heni
ng s
yste
m
Anc
hora
ge s
yste
m
Loa
ding
fre
quen
cy (
Hz)
Num
ber
of lo
adin
g cy
cles
(x1
06 )
Loa
d ra
nge
(%)
Max
app
lied
load
(%
)
Min
app
lied
load
(%
)
Num
ber
of c
ycle
s to
fa
ilur
e (x
106 )
Fai
lure
mod
e
Tou
tanj
i et a
l. (2
006)
3FI5 to 3FI8
1.8 1.5 560 158 - 108 4.4 1 2#3 0 0 102 0.17 - 3 3838 228
-
CF
RP
she
et b
onde
d lo
ngit
udin
ally
to
the
beam
's te
nsil
e fa
ce
Three intermittent CFRP sheets (50 mm wide)
bonded diagonally at 45 degree orientation to both sides along the shear span
2 2 40a 50 10 RO NF
3FI9 1.8 1.5 560 158 - 108 4.4 1 2#3 0 0 102 0.17 - 3 3838 228 2 2 50a 60 10 0.260 SR→R
3FI10 1.8 1.5 560 158 - 108 4.4 1 2#3 0 0 102 0.17 - 3 3838 228 2 2 50a 60 10 0.315 SR→R
3FI11 1.8 1.5 560 158 - 108 4.4 1 2#3 0 0 102 0.17 - 3 3838 228 2 2 50a 60 10 0.200 SR→R
3FI12 & 3FI13
1.8 1.5 560 158 - 108 4.4 1 2#3 0 0 102 0.17 - 3 3838 228 2 2 60a 70 10 0.075 SR→R
3FI14 & 3FI15
1.8 1.5 560 158 - 108 4.4 1 2#3 0 0 102 0.17 - 3 3838 228 2 2 70a 80 10 0.002 SR→R
3FI16 & 3FI17
1.8 1.5 560 158 - 108 4.4 1 2#3 0 0 102 0.17 - 3 3838 228 2 2 70a 80 10 0.004 SR→R
Har
ries
et a
l. (2
007)
L1F 4.9 4.5 2270 254 - 152 10 1 3#4 0 0 25 1.4 1 2800 155
-
CF
RP
lam
inat
e bo
nded
lo
ngit
udin
ally
to th
e be
am's
tens
ile
face
The CFRP laminate was extended to within 100mm
of the supports
1.2-1.7 2 17.8g 22.2 kN 4.45 kN 0.401 SR→D
H1F 4.9 4.5 2270 254 - 152 10 1 3#4 0 0 25 1.4 1 2800 155 1.2-1.7 2 17.8g 22.2 kN 4.45 kN 0.424 SR→D
L2F 4.9 4.5 2270 254 - 152 10 1 3#4 0 0 51 1.4 1 2800 155 1.2-1.7 2 17.8g 22.2 kN 4.45 kN RO NF
H2F 4.9 4.5 2270 254 - 152 10 1 3#4 0 0 51 1.4 1 2800 155 1.2-1.7 2 17.8g 22.2 kN 4.45 kN 1.128 SR→D
L2x1F 4.9 4.5 2270 254 - 152 10 1 3#4 0 0 2x25 1.4 76 1 2800 155 1.2-1.7 2 17.8g 22.2 kN 4.45 kN 0.448 SR→D
H2x1F 4.9 4.5 2270 254 - 152 10 1 3#4 0 0 2x25 1.4 76 1 2800 155 1.2-1.7 2 17.8g 22.2 kN 4.45 kN RO NF
L4F 4.9 4.5 2270 254 - 152 10 1 3#4 0 0 102 1.4 1 2800 155 1.2-1.7 2 17.8g 22.2 kN 4.45 kN RO NF
H4F 4.9 4.5 2270 254 - 152 10 1 3#4 0 0 102 1.4 1 2800 155 1.2-1.7 2 17.8g 22.2 kN 4.45 kN RO NF
Sou
dki e
t al.
(200
7)
F-CR-72 2 1.8 600 254 - 152 2.9 1.3 2-M15 φ8
100 &
250
150 1.02 - 1 717 65
5% m
ass
loss
due
to
corr
osio
n of
the
tens
ile
rein
forc
ing
stee
l in
flex
ural
zon
e
CF
RP
she
et b
onde
d lo
ngit
udin
ally
to th
e be
am's
tens
ile f
ace
Intermittent U-wrapped CFRP sheets (100 &
150mm) bonded transversely to the CFRP
sheet @ 100mm c/c
1.5-3 - 72c 80 8 0.115 SR→R
F-CR-57 2 1.8 600 254 - 152 2.9 1.3 2-M15 φ8 150 1.02 - 1 717 65 1.5-3 - 57c 65 8 0.387 SR→R
F-CR-47 2 1.8 600 254 - 152 2.9 1.3 2-M15 φ8 150 1.02 - 1 717 65 1.5-3 - 47c 55 8 0.828 SR→R
Wan
g et
al.
(200
7)
F6 5.3 5 1000 500 50 150 2.2 0.92 8-M10 φ6
175 &
200
120 1 - 3 658 65
-
CF
RP
lam
inat
e bo
nded
lo
ngit
udin
ally
to th
e w
eb's
tens
ile
face
- 0.2 0.01 105h 125 kN 20 kN RO NF
C1 5.3 5 1000 500 50 150 2.2 0.92 8-M10 φ6 120 1 - 3 658 65 Intermittent U-wrapped
GFRP laminates (150mm-wide) fixed transversely along the beam by fiber
anchors @ 300mm
0.2 0.01 105h 125 kN 20 kN RO NF
C2 5.3 5 1000 500 50 150 2.2 0.92 8-M10 φ6 120 1 - 3 658 65 0.2 1 100h 140 kN 40 kN RO NF
245
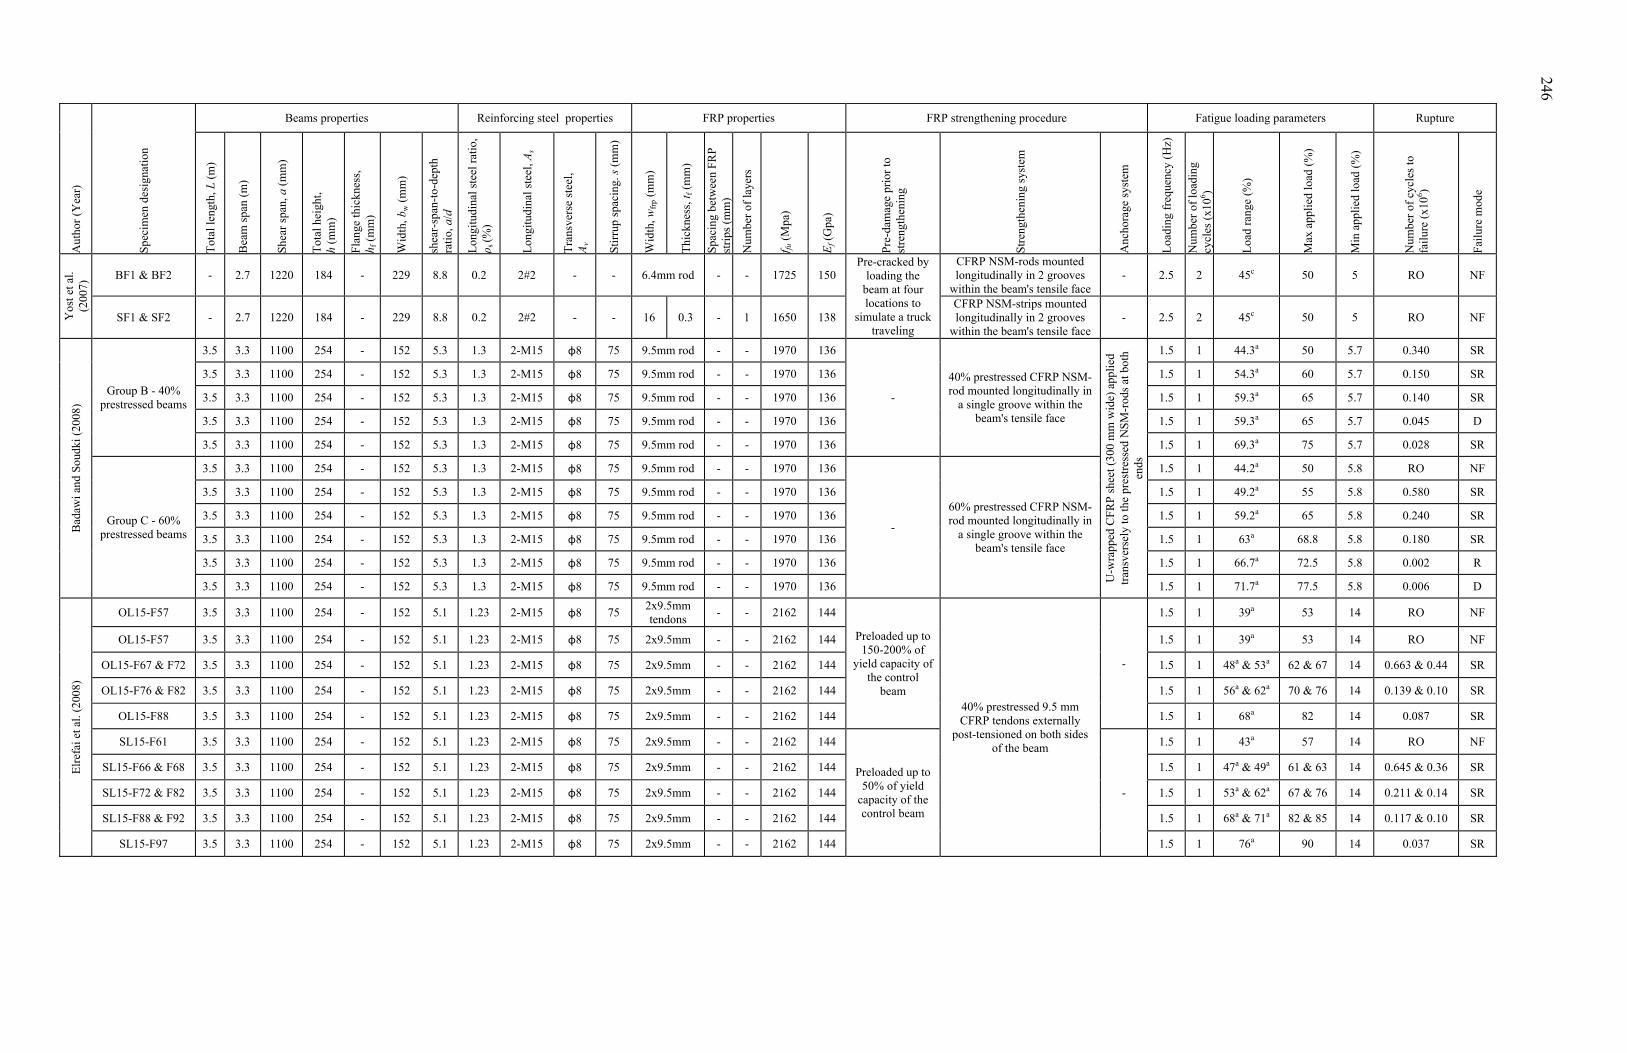
A
utho
r (Y
ear)
Spe
cim
en d
esig
nati
on
Beams properties Reinforcing steel properties FRP properties FRP strengthening procedure Fatigue loading parameters Rupture
Tot
al le
ngth
, L (
m)
Bea
m s
pan
(m)
Shea
r sp
an, a
(m
m)
Tot
al h
eigh
t,
h (m
m)
Fla
nge
thic
knes
s,
h f (
mm
)
Wid
th, b
w (
mm
)
shea
r-sp
an-t
o-de
pth
rati
o, a
/d
Lon
gitu
dina
l ste
el r
atio
, ρ s
(%)
Lon
gitu
dina
l ste
el, A
s
Tra
nsve
rse
stee
l,
Av
Sti
rrup
spa
cing
. s (
mm
)
Wid
th, w
frp
(mm
)
Thi
ckne
ss, t
f (m
m)
Spac
ing
betw
een
FRP
stri
ps (
mm
)
Num
ber
of la
yers
f fu (
Mpa
)
Ef (
Gpa
)
Pre
-dam
age
prio
r to
st
reng
then
ing
Str
engt
heni
ng s
yste
m
Anc
hora
ge s
yste
m
Loa
ding
fre
quen
cy (
Hz)
Num
ber
of lo
adin
g cy
cles
(x1
06 )
Loa
d ra
nge
(%)
Max
app
lied
load
(%
)
Min
app
lied
load
(%
)
Num
ber
of c
ycle
s to
fa
ilur
e (x
106 )
Fai
lure
mod
e
Yos
t et a
l. (2
007)
BF1 & BF2 - 2.7 1220 184 - 229 8.8 0.2 2#2 - - 6.4mm rod - - 1725 150 Pre-cracked by
loading the beam at four locations to
simulate a truck traveling
CFRP NSM-rods mounted longitudinally in 2 grooves
within the beam's tensile face - 2.5 2 45c 50 5 RO NF
SF1 & SF2 - 2.7 1220 184 - 229 8.8 0.2 2#2 - - 16 0.3 - 1 1650 138 CFRP NSM-strips mounted longitudinally in 2 grooves
within the beam's tensile face - 2.5 2 45c 50 5 RO NF
Bad
awi a
nd S
oudk
i (20
08)
Group B - 40% prestressed beams
3.5 3.3 1100 254 - 152 5.3 1.3 2-M15 φ8 75 9.5mm rod - - 1970 136
-
40% prestressed CFRP NSM-rod mounted longitudinally in
a single groove within the beam's tensile face
U-w
rapp
ed C
FR
P s
heet
(30
0 m
m w
ide)
app
lied
tr
ansv
erse
ly to
the
pres
tres
sed
NSM
-rod
s at
bot
h en
ds
1.5 1 44.3a 50 5.7 0.340 SR
3.5 3.3 1100 254 - 152 5.3 1.3 2-M15 φ8 75 9.5mm rod - - 1970 136 1.5 1 54.3a 60 5.7 0.150 SR
3.5 3.3 1100 254 - 152 5.3 1.3 2-M15 φ8 75 9.5mm rod - - 1970 136 1.5 1 59.3a 65 5.7 0.140 SR
3.5 3.3 1100 254 - 152 5.3 1.3 2-M15 φ8 75 9.5mm rod - - 1970 136 1.5 1 59.3a 65 5.7 0.045 D
3.5 3.3 1100 254 - 152 5.3 1.3 2-M15 φ8 75 9.5mm rod - - 1970 136 1.5 1 69.3a 75 5.7 0.028 SR
Group C - 60% prestressed beams
3.5 3.3 1100 254 - 152 5.3 1.3 2-M15 φ8 75 9.5mm rod - - 1970 136
-
60% prestressed CFRP NSM-rod mounted longitudinally in
a single groove within the beam's tensile face
1.5 1 44.2a 50 5.8 RO NF
3.5 3.3 1100 254 - 152 5.3 1.3 2-M15 φ8 75 9.5mm rod - - 1970 136 1.5 1 49.2a 55 5.8 0.580 SR
3.5 3.3 1100 254 - 152 5.3 1.3 2-M15 φ8 75 9.5mm rod - - 1970 136 1.5 1 59.2a 65 5.8 0.240 SR
3.5 3.3 1100 254 - 152 5.3 1.3 2-M15 φ8 75 9.5mm rod - - 1970 136 1.5 1 63a 68.8 5.8 0.180 SR
3.5 3.3 1100 254 - 152 5.3 1.3 2-M15 φ8 75 9.5mm rod - - 1970 136 1.5 1 66.7a 72.5 5.8 0.002 R
3.5 3.3 1100 254 - 152 5.3 1.3 2-M15 φ8 75 9.5mm rod - - 1970 136 1.5 1 71.7a 77.5 5.8 0.006 D
Elr
efai
et a
l. (2
008)
OL15-F57 3.5 3.3 1100 254 - 152 5.1 1.23 2-M15 φ8 75 2x9.5mm tendons
- - 2162 144
Preloaded up to 150-200% of
yield capacity of the control
beam 40% prestressed 9.5 mm CFRP tendons externally
post-tensioned on both sides of the beam
-
1.5 1 39a 53 14 RO NF
OL15-F57 3.5 3.3 1100 254 - 152 5.1 1.23 2-M15 φ8 75 2x9.5mm - - 2162 144 1.5 1 39a 53 14 RO NF
OL15-F67 & F72 3.5 3.3 1100 254 - 152 5.1 1.23 2-M15 φ8 75 2x9.5mm - - 2162 144 1.5 1 48a & 53a 62 & 67 14 0.663 & 0.44 SR
OL15-F76 & F82 3.5 3.3 1100 254 - 152 5.1 1.23 2-M15 φ8 75 2x9.5mm - - 2162 144 1.5 1 56a & 62a 70 & 76 14 0.139 & 0.10 SR
OL15-F88 3.5 3.3 1100 254 - 152 5.1 1.23 2-M15 φ8 75 2x9.5mm - - 2162 144 1.5 1 68a 82 14 0.087 SR
SL15-F61 3.5 3.3 1100 254 - 152 5.1 1.23 2-M15 φ8 75 2x9.5mm - - 2162 144
Preloaded up to 50% of yield
capacity of the control beam
-
1.5 1 43a 57 14 RO NF
SL15-F66 & F68 3.5 3.3 1100 254 - 152 5.1 1.23 2-M15 φ8 75 2x9.5mm - - 2162 144 1.5 1 47a & 49a 61 & 63 14 0.645 & 0.36 SR
SL15-F72 & F82 3.5 3.3 1100 254 - 152 5.1 1.23 2-M15 φ8 75 2x9.5mm - - 2162 144 1.5 1 53a & 62a 67 & 76 14 0.211 & 0.14 SR
SL15-F88 & F92 3.5 3.3 1100 254 - 152 5.1 1.23 2-M15 φ8 75 2x9.5mm - - 2162 144 1.5 1 68a & 71a 82 & 85 14 0.117 & 0.10 SR
SL15-F97 3.5 3.3 1100 254 - 152 5.1 1.23 2-M15 φ8 75 2x9.5mm - - 2162 144 1.5 1 76a 90 14 0.037 SR
246
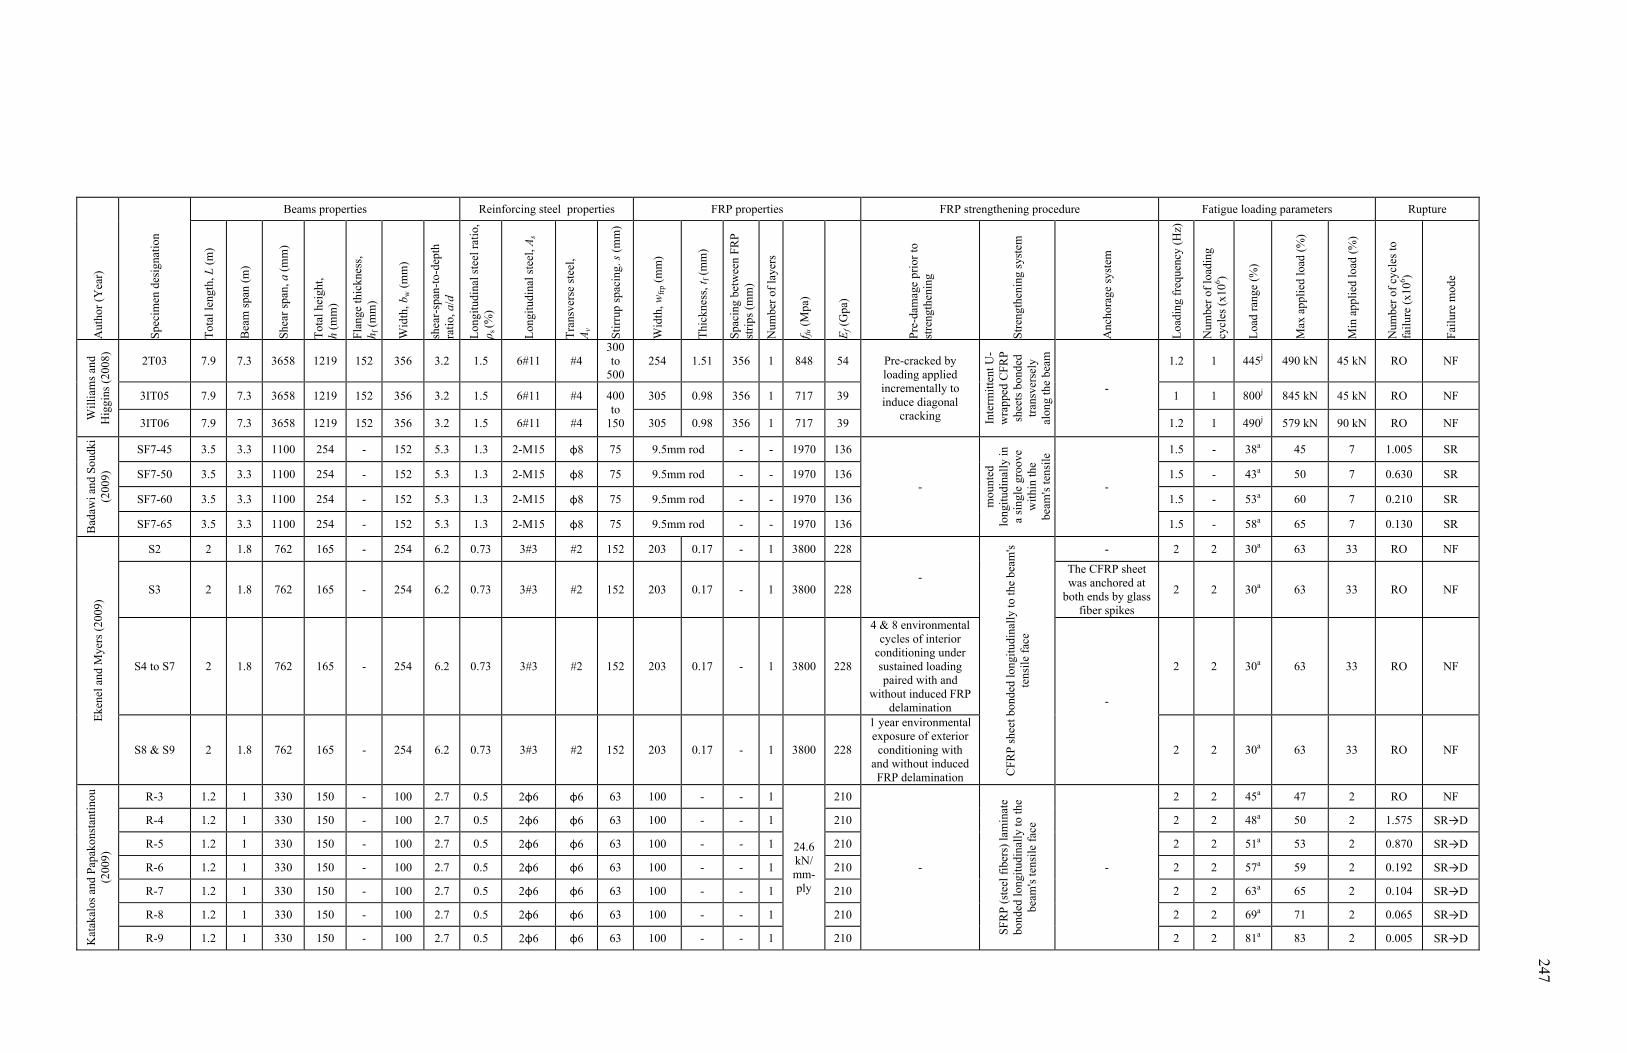
Aut
hor
(Yea
r)
Spe
cim
en d
esig
nati
on
Beams properties Reinforcing steel properties FRP properties FRP strengthening procedure Fatigue loading parameters Rupture T
otal
leng
th, L
(m
)
Bea
m s
pan
(m)
Shea
r sp
an, a
(m
m)
Tot
al h
eigh
t,
h (m
m)
Fla
nge
thic
knes
s,
h f (
mm
)
Wid
th, b
w (
mm
)
shea
r-sp
an-t
o-de
pth
rati
o, a
/d
Lon
gitu
dina
l ste
el r
atio
, ρ s
(%)
Lon
gitu
dina
l ste
el, A
s
Tra
nsve
rse
stee
l,
Av
Sti
rrup
spa
cing
. s (
mm
)
Wid
th, w
frp
(mm
)
Thi
ckne
ss, t
f (m
m)
Spac
ing
betw
een
FRP
stri
ps (
mm
)
Num
ber
of la
yers
f fu (
Mpa
)
Ef (
Gpa
)
Pre
-dam
age
prio
r to
st
reng
then
ing
Str
engt
heni
ng s
yste
m
Anc
hora
ge s
yste
m
Loa
ding
fre
quen
cy (
Hz)
Num
ber
of lo
adin
g cy
cles
(x1
06 )
Loa
d ra
nge
(%)
Max
app
lied
loa d
(%
)
Min
app
lied
load
(%
)
Num
ber
of c
ycle
s to
fa
ilur
e (x
106 )
Fai
lure
mod
e
Wil
liam
s an
d H
iggi
ns (
2008
)
2T03 7.9 7.3 3658 1219 152 356 3.2 1.5 6#11 #4 300 to
500 254 1.51 356 1 848 54 Pre-cracked by
loading applied incrementally to induce diagonal
cracking Inte
rmit
tent
U-
wra
pped
CF
RP
sh
eets
bon
ded
tran
sver
sely
al
ong
the
beam
-
1.2 1 445j 490 kN 45 kN RO NF
3IT05 7.9 7.3 3658 1219 152 356 3.2 1.5 6#11 #4 400 to
150
305 0.98 356 1 717 39 1 1 800j 845 kN 45 kN RO NF
3IT06 7.9 7.3 3658 1219 152 356 3.2 1.5 6#11 #4 305 0.98 356 1 717 39 1.2 1 490j 579 kN 90 kN RO NF
Bad
awi a
nd S
oudk
i (2
009)
SF7-45 3.5 3.3 1100 254 - 152 5.3 1.3 2-M15 φ8 75 9.5mm rod - - 1970 136
-
mou
nted
lo
ngit
udin
ally
in
a si
ngle
gro
ove
wit
hin
the
beam
's te
nsile
-
1.5 - 38a 45 7 1.005 SR
SF7-50 3.5 3.3 1100 254 - 152 5.3 1.3 2-M15 φ8 75 9.5mm rod - - 1970 136 1.5 - 43a 50 7 0.630 SR
SF7-60 3.5 3.3 1100 254 - 152 5.3 1.3 2-M15 φ8 75 9.5mm rod - - 1970 136 1.5 - 53a 60 7 0.210 SR
SF7-65 3.5 3.3 1100 254 - 152 5.3 1.3 2-M15 φ8 75 9.5mm rod - - 1970 136 1.5 - 58a 65 7 0.130 SR
Eke
nel a
nd M
yers
(20
09)
S2 2 1.8 762 165 - 254 6.2 0.73 3#3 #2 152 203 0.17 - 1 3800 228
-
CF
RP
she
et b
onde
d lo
ngit
udin
ally
to th
e be
am's
te
nsil
e fa
ce
- 2 2 30a 63 33 RO NF
S3 2 1.8 762 165 - 254 6.2 0.73 3#3 #2 152 203 0.17 - 1 3800 228
The CFRP sheet was anchored at
both ends by glass fiber spikes
2 2 30a 63 33 RO NF
S4 to S7 2 1.8 762 165 - 254 6.2 0.73 3#3 #2 152 203 0.17 - 1 3800 228
4 & 8 environmental cycles of interior
conditioning under sustained loading paired with and
without induced FRP delamination -
2 2 30a 63 33 RO NF
S8 & S9 2 1.8 762 165 - 254 6.2 0.73 3#3 #2 152 203 0.17 - 1 3800 228
1 year environmental exposure of exterior conditioning with
and without induced FRP delamination
2 2 30a 63 33 RO NF
Kat
akal
os a
nd P
apak
onst
anti
nou
(200
9)
R-3 1.2 1 330 150 - 100 2.7 0.5 2φ6 φ6 63 100 - - 1
24.6 kN/ mm-ply
210
-
SF
RP
(st
eel f
iber
s) la
min
ate
bond
ed lo
ngit
udin
ally
to th
e be
am's
tens
ile f
ace
-
2 2 45a 47 2 RO NF
R-4 1.2 1 330 150 - 100 2.7 0.5 2φ6 φ6 63 100 - - 1 210 2 2 48a 50 2 1.575 SR→D
R-5 1.2 1 330 150 - 100 2.7 0.5 2φ6 φ6 63 100 - - 1 210 2 2 51a 53 2 0.870 SR→D
R-6 1.2 1 330 150 - 100 2.7 0.5 2φ6 φ6 63 100 - - 1 210 2 2 57a 59 2 0.192 SR→D
R-7 1.2 1 330 150 - 100 2.7 0.5 2φ6 φ6 63 100 - - 1 210 2 2 63a 65 2 0.104 SR→D
R-8 1.2 1 330 150 - 100 2.7 0.5 2φ6 φ6 63 100 - - 1 210 2 2 69a 71 2 0.065 SR→D
R-9 1.2 1 330 150 - 100 2.7 0.5 2φ6 φ6 63 100 - - 1 210 2 2 81a 83 2 0.005 SR→D
247
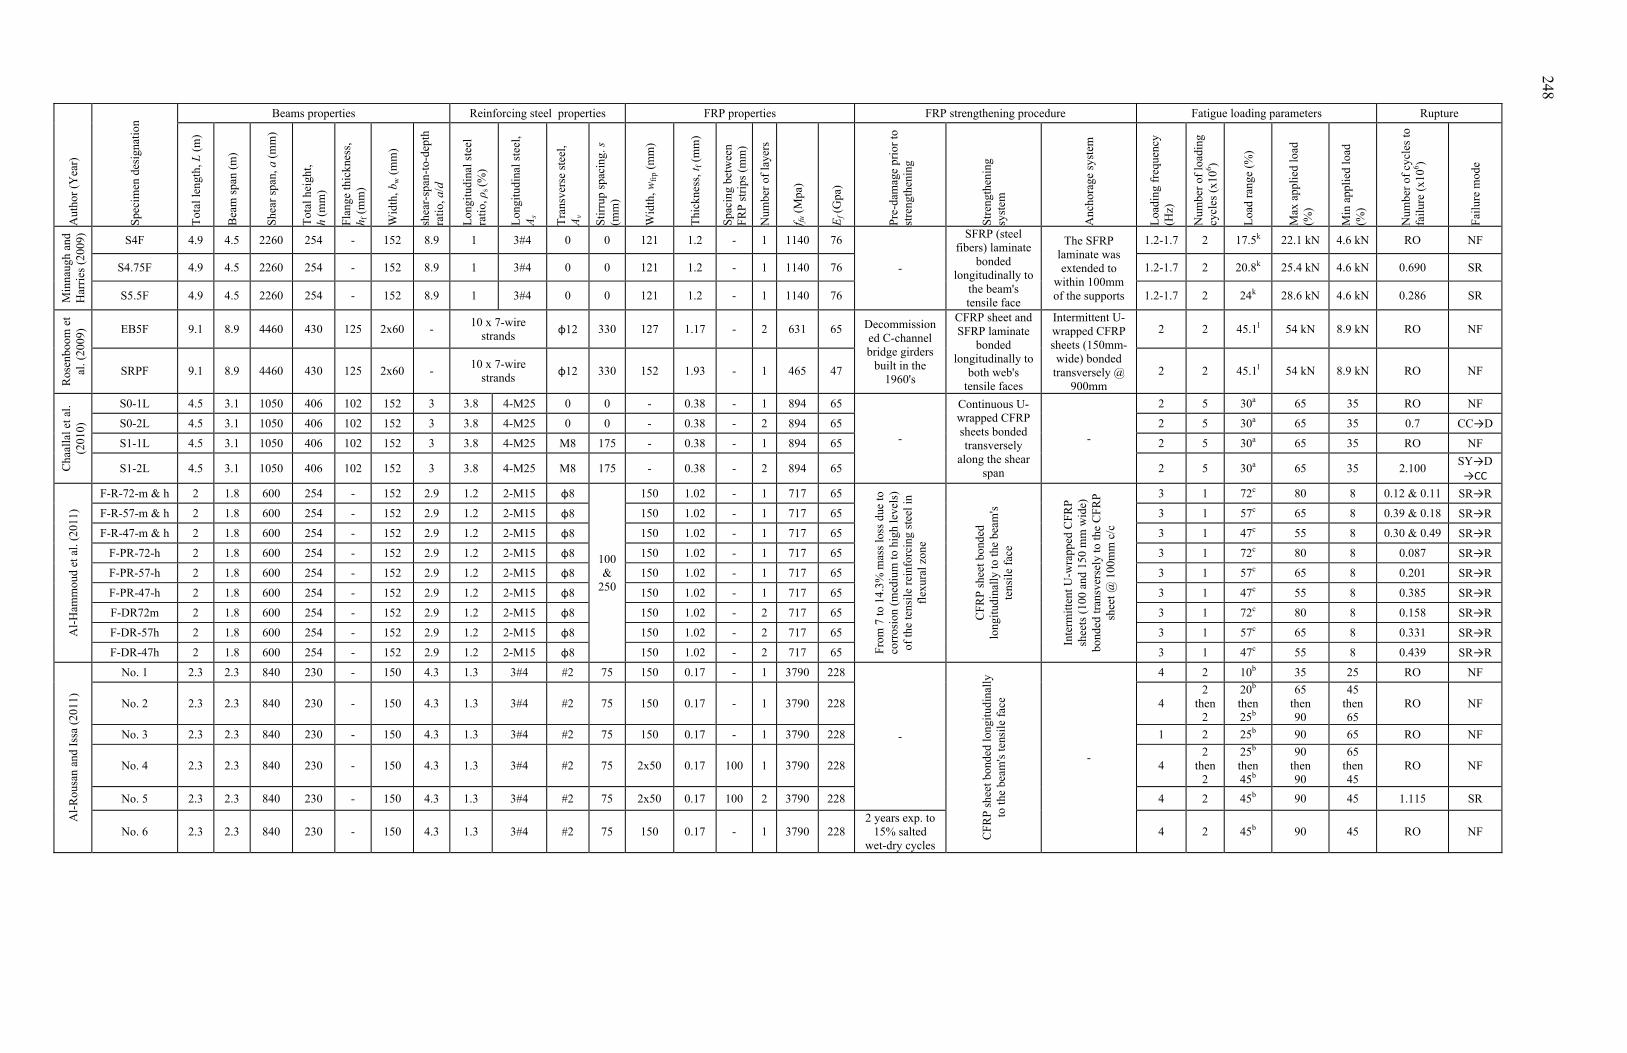
A
utho
r (Y
ear)
Spe
cim
en d
esig
nati
on Beams properties Reinforcing steel properties FRP properties FRP strengthening procedure Fatigue loading parameters Rupture
Tot
al le
ngth
, L (
m)
Bea
m s
pan
(m)
Shea
r sp
an, a
(m
m)
Tot
al h
eigh
t,
h (m
m)
Fla
nge
thic
knes
s,
h f (
mm
)
Wid
th, b
w (
mm
)
shea
r-sp
an-t
o-de
pth
rati
o, a
/d
Lon
gitu
dina
l ste
el
rati
o, ρ
s (%
)
Lon
gitu
dina
l ste
el,
As
Tra
nsve
rse
stee
l,
Av
Sti
rrup
spa
cing
. s
(mm
)
Wid
th, w
frp
(mm
)
Thi
ckne
ss, t
f (m
m)
Spac
ing
betw
een
FR
P s
trip
s (m
m)
Num
ber
of la
yers
f fu (
Mpa
)
Ef (
Gpa
)
Pre
-dam
age
prio
r to
st
reng
then
ing
Str
engt
heni
ng
syst
em
Anc
hora
ge s
yste
m
Loa
ding
fre
quen
cy
(Hz)
Num
ber
of lo
adin
g cy
cles
(x1
06 )
Loa
d ra
nge
(%)
Max
app
lied
load
(%
)
Min
app
lied
load
(%
)
Num
ber
of c
ycle
s to
fa
ilur
e (x
106 )
Fai
lure
mod
e
Min
naug
h an
d H
arri
es (
2009
)
S4F 4.9 4.5 2260 254 - 152 8.9 1 3#4 0 0 121 1.2 - 1 1140 76
-
SFRP (steel fibers) laminate
bonded longitudinally to
the beam's tensile face
The SFRP laminate was extended to
within 100mm of the supports
1.2-1.7 2 17.5k 22.1 kN 4.6 kN RO NF
S4.75F 4.9 4.5 2260 254 - 152 8.9 1 3#4 0 0 121 1.2 - 1 1140 76 1.2-1.7 2 20.8k 25.4 kN 4.6 kN 0.690 SR
S5.5F 4.9 4.5 2260 254 - 152 8.9 1 3#4 0 0 121 1.2 - 1 1140 76 1.2-1.7 2 24k 28.6 kN 4.6 kN 0.286 SR
Ros
enbo
om e
t al
. (20
09) EB5F 9.1 8.9 4460 430 125 2x60 -
10 x 7-wire strands
φ12 330 127 1.17 - 2 631 65 Decommissioned C-channel bridge girders
built in the 1960's
CFRP sheet and SFRP laminate
bonded longitudinally to
both web's tensile faces
Intermittent U-wrapped CFRP sheets (150mm-wide) bonded
transversely @ 900mm
2 2 45.1l 54 kN 8.9 kN RO NF
SRPF 9.1 8.9 4460 430 125 2x60 - 10 x 7-wire
strands φ12 330 152 1.93 - 1 465 47 2 2 45.1l 54 kN 8.9 kN RO NF
Cha
alla
l et a
l. (2
010)
S0-1L 4.5 3.1 1050 406 102 152 3 3.8 4-M25 0 0 - 0.38 - 1 894 65
-
Continuous U-wrapped CFRP sheets bonded transversely
along the shear span
-
2 5 30a 65 35 RO NF
S0-2L 4.5 3.1 1050 406 102 152 3 3.8 4-M25 0 0 - 0.38 - 2 894 65 2 5 30a 65 35 0.7 CC→D
S1-1L 4.5 3.1 1050 406 102 152 3 3.8 4-M25 M8 175 - 0.38 - 1 894 65 2 5 30a 65 35 RO NF
S1-2L 4.5 3.1 1050 406 102 152 3 3.8 4-M25 M8 175 - 0.38 - 2 894 65 2 5 30a 65 35 2.100 SY→D →CC
Al-
Ham
mou
d et
al.
(201
1)
F-R-72-m & h 2 1.8 600 254 - 152 2.9 1.2 2-M15 φ8
100 &
250
150 1.02 - 1 717 65
Fro
m 7
to 1
4.3%
mas
s lo
ss d
ue to
co
rros
ion
(med
ium
to h
igh
leve
ls)
of th
e te
nsil
e re
info
rcin
g st
eel i
n fl
exur
al z
one
CF
RP
she
et b
onde
d lo
ngit
udin
ally
to th
e be
am's
te
nsil
e fa
ce
Inte
rmit
tent
U-w
rapp
ed C
FR
P
shee
ts (
100
and
150
mm
wid
e)
bond
ed tr
ansv
erse
ly to
the
CF
RP
sh
eet @
100
mm
c/c
3 1 72c 80 8 0.12 & 0.11 SR→R
F-R-57-m & h 2 1.8 600 254 - 152 2.9 1.2 2-M15 φ8 150 1.02 - 1 717 65 3 1 57c 65 8 0.39 & 0.18 SR→R
F-R-47-m & h 2 1.8 600 254 - 152 2.9 1.2 2-M15 φ8 150 1.02 - 1 717 65 3 1 47c 55 8 0.30 & 0.49 SR→R
F-PR-72-h 2 1.8 600 254 - 152 2.9 1.2 2-M15 φ8 150 1.02 - 1 717 65 3 1 72c 80 8 0.087 SR→R
F-PR-57-h 2 1.8 600 254 - 152 2.9 1.2 2-M15 φ8 150 1.02 - 1 717 65 3 1 57c 65 8 0.201 SR→R
F-PR-47-h 2 1.8 600 254 - 152 2.9 1.2 2-M15 φ8 150 1.02 - 1 717 65 3 1 47c 55 8 0.385 SR→R
F-DR72m 2 1.8 600 254 - 152 2.9 1.2 2-M15 φ8 150 1.02 - 2 717 65 3 1 72c 80 8 0.158 SR→R
F-DR-57h 2 1.8 600 254 - 152 2.9 1.2 2-M15 φ8 150 1.02 - 2 717 65 3 1 57c 65 8 0.331 SR→R
F-DR-47h 2 1.8 600 254 - 152 2.9 1.2 2-M15 φ8 150 1.02 - 2 717 65 3 1 47c 55 8 0.439 SR→R
Al-
Rou
san
and
Issa
(20
11)
No. 1 2.3 2.3 840 230 - 150 4.3 1.3 3#4 #2 75 150 0.17 - 1 3790 228
-
CF
RP
she
et b
onde
d lo
ngit
udin
ally
to
the
beam
's te
nsil
e fa
ce
-
4 2 10b 35 25 RO NF
No. 2 2.3 2.3 840 230 - 150 4.3 1.3 3#4 #2 75 150 0.17 - 1 3790 228 4 2
then 2
20b
then 25b
65 then 90
45 then 65
RO NF
No. 3 2.3 2.3 840 230 - 150 4.3 1.3 3#4 #2 75 150 0.17 - 1 3790 228 1 2 25b 90 65 RO NF
No. 4 2.3 2.3 840 230 - 150 4.3 1.3 3#4 #2 75 2x50 0.17 100 1 3790 228 4 2
then 2
25b
then 45b
90 then 90
65 then 45
RO NF
No. 5 2.3 2.3 840 230 - 150 4.3 1.3 3#4 #2 75 2x50 0.17 100 2 3790 228 4 2 45b 90 45 1.115 SR
No. 6 2.3 2.3 840 230 - 150 4.3 1.3 3#4 #2 75 150 0.17 - 1 3790 228 2 years exp. to
15% salted wet-dry cycles
4 2 45b 90 45 RO NF
248
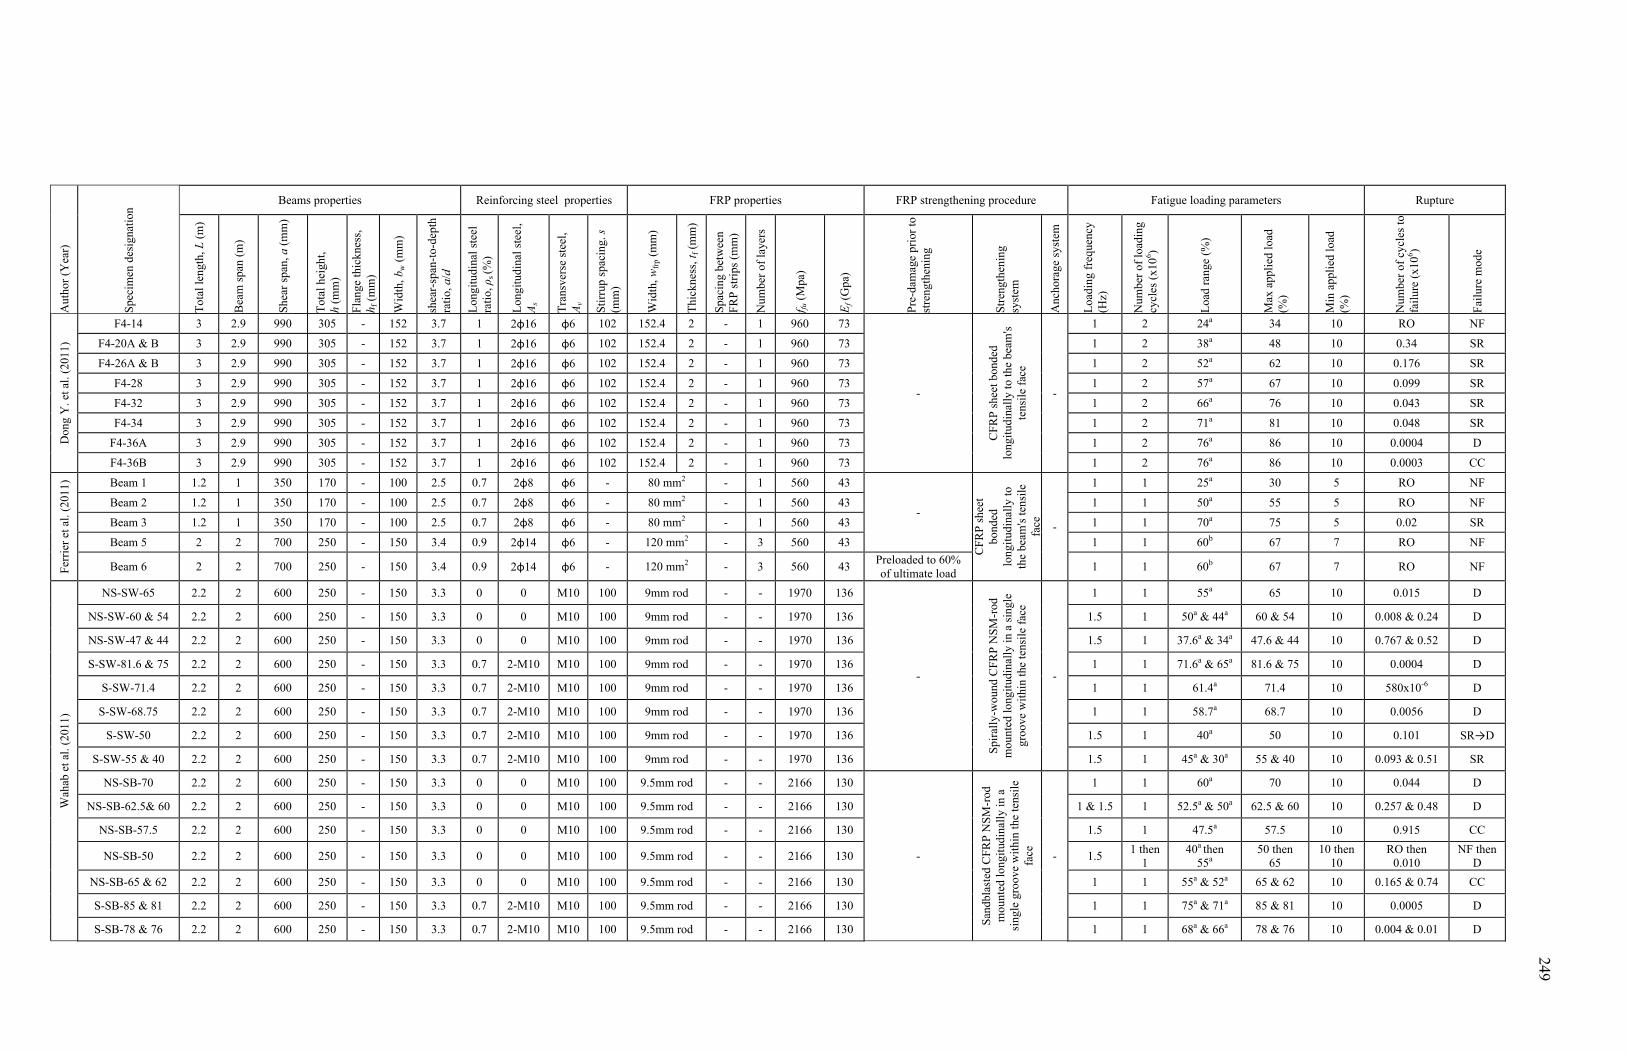
A
utho
r (Y
ear)
Spe
cim
en d
esig
nati
on Beams properties Reinforcing steel properties FRP properties FRP strengthening procedure Fatigue loading parameters Rupture
Tot
al le
ngth
, L (
m)
Bea
m s
pan
(m)
Shea
r sp
an, a
(m
m)
Tot
al h
eigh
t,
h (m
m)
Fla
nge
thic
knes
s,
h f (
mm
)
Wid
th, b
w (
mm
)
shea
r-sp
an-t
o-de
pth
rati
o, a
/d
Lon
gitu
dina
l ste
el
rati
o, ρ
s (%
)
Lon
gitu
dina
l ste
el,
As
Tra
nsve
rse
stee
l,
Av
Sti
rrup
spa
cing
. s
(mm
)
Wid
th, w
frp
(mm
)
Thi
ckne
ss, t
f (m
m)
Spac
ing
betw
een
FR
P s
trip
s (m
m)
Num
ber
of la
yers
f fu (
Mpa
)
Ef (
Gpa
)
Pre
-dam
age
prio
r to
st
reng
then
ing
Str
engt
heni
ng
syst
em
Anc
hora
ge s
yste
m
Loa
ding
fre
quen
cy
(Hz)
Num
ber
of lo
adin
g cy
cles
(x1
06 )
Loa
d ra
nge
(%)
Max
app
lied
load
(%
)
Min
app
lied
load
(%
)
Num
ber
of c
ycle
s to
fa
ilur
e (x
106 )
Fai
lure
mod
e
Don
g Y
. et a
l. (2
011)
F4-14 3 2.9 990 305 - 152 3.7 1 2φ16 φ6 102 152.4 2 - 1 960 73
-
CF
RP
she
et b
onde
d lo
ngit
udin
ally
to th
e be
am's
te
nsil
e fa
ce
-
1 2 24a 34 10 RO NF
F4-20A & B 3 2.9 990 305 - 152 3.7 1 2φ16 φ6 102 152.4 2 - 1 960 73 1 2 38a 48 10 0.34 SR
F4-26A & B 3 2.9 990 305 - 152 3.7 1 2φ16 φ6 102 152.4 2 - 1 960 73 1 2 52a 62 10 0.176 SR
F4-28 3 2.9 990 305 - 152 3.7 1 2φ16 φ6 102 152.4 2 - 1 960 73 1 2 57a 67 10 0.099 SR
F4-32 3 2.9 990 305 - 152 3.7 1 2φ16 φ6 102 152.4 2 - 1 960 73 1 2 66a 76 10 0.043 SR
F4-34 3 2.9 990 305 - 152 3.7 1 2φ16 φ6 102 152.4 2 - 1 960 73 1 2 71a 81 10 0.048 SR
F4-36A 3 2.9 990 305 - 152 3.7 1 2φ16 φ6 102 152.4 2 - 1 960 73 1 2 76a 86 10 0.0004 D
F4-36B 3 2.9 990 305 - 152 3.7 1 2φ16 φ6 102 152.4 2 - 1 960 73 1 2 76a 86 10 0.0003 CC
Ferr
ier
et a
l. (2
011)
Beam 1 1.2 1 350 170 - 100 2.5 0.7 2φ8 φ6 - 80 mm2 - 1 560 43
-
CF
RP
she
et
bond
ed
long
itud
inal
ly to
th
e be
am's
tens
ile
face
-
1 1 25a 30 5 RO NF
Beam 2 1.2 1 350 170 - 100 2.5 0.7 2φ8 φ6 - 80 mm2 - 1 560 43 1 1 50a 55 5 RO NF
Beam 3 1.2 1 350 170 - 100 2.5 0.7 2φ8 φ6 - 80 mm2 - 1 560 43 1 1 70a 75 5 0.02 SR
Beam 5 2 2 700 250 - 150 3.4 0.9 2φ14 φ6 - 120 mm2 - 3 560 43 1 1 60b 67 7 RO NF
Beam 6 2 2 700 250 - 150 3.4 0.9 2φ14 φ6 - 120 mm2 - 3 560 43 Preloaded to 60% of ultimate load
1 1 60b 67 7 RO NF
Wah
ab e
t al.
(201
1)
NS-SW-65 2.2 2 600 250 - 150 3.3 0 0 M10 100 9mm rod - - 1970 136
-
Spi
rall
y-w
ound
CF
RP
NS
M-r
od
mou
nted
long
itud
inal
ly in
a s
ingl
e gr
oove
wit
hin
the
tens
ile
face
-
1 1 55a 65 10 0.015 D
NS-SW-60 & 54 2.2 2 600 250 - 150 3.3 0 0 M10 100 9mm rod - - 1970 136 1.5 1 50a & 44a 60 & 54 10 0.008 & 0.24 D
NS-SW-47 & 44 2.2 2 600 250 - 150 3.3 0 0 M10 100 9mm rod - - 1970 136 1.5 1 37.6a & 34a 47.6 & 44 10 0.767 & 0.52 D
S-SW-81.6 & 75 2.2 2 600 250 - 150 3.3 0.7 2-M10 M10 100 9mm rod - - 1970 136 1 1 71.6a & 65a 81.6 & 75 10 0.0004 D
S-SW-71.4 2.2 2 600 250 - 150 3.3 0.7 2-M10 M10 100 9mm rod - - 1970 136 1 1 61.4a 71.4 10 580x10-6 D
S-SW-68.75 2.2 2 600 250 - 150 3.3 0.7 2-M10 M10 100 9mm rod - - 1970 136 1 1 58.7a 68.7 10 0.0056 D
S-SW-50 2.2 2 600 250 - 150 3.3 0.7 2-M10 M10 100 9mm rod - - 1970 136 1.5 1 40a 50 10 0.101 SR→D
S-SW-55 & 40 2.2 2 600 250 - 150 3.3 0.7 2-M10 M10 100 9mm rod - - 1970 136 1.5 1 45a & 30a 55 & 40 10 0.093 & 0.51 SR
NS-SB-70 2.2 2 600 250 - 150 3.3 0 0 M10 100 9.5mm rod - - 2166 130
-
San
dbla
sted
CF
RP
NS
M-r
od
mou
nted
long
itud
inal
ly in
a
sing
le g
roov
e w
ithi
n th
e te
nsil
e fa
ce
-
1 1 60a 70 10 0.044 D
NS-SB-62.5& 60 2.2 2 600 250 - 150 3.3 0 0 M10 100 9.5mm rod - - 2166 130 1 & 1.5 1 52.5a & 50a 62.5 & 60 10 0.257 & 0.48 D
NS-SB-57.5 2.2 2 600 250 - 150 3.3 0 0 M10 100 9.5mm rod - - 2166 130 1.5 1 47.5a 57.5 10 0.915 CC
NS-SB-50 2.2 2 600 250 - 150 3.3 0 0 M10 100 9.5mm rod - - 2166 130 1.5 1 then
1 40a then
55a 50 then
65 10 then
10 RO then
0.010 NF then
D
NS-SB-65 & 62 2.2 2 600 250 - 150 3.3 0 0 M10 100 9.5mm rod - - 2166 130 1 1 55a & 52a 65 & 62 10 0.165 & 0.74 CC
S-SB-85 & 81 2.2 2 600 250 - 150 3.3 0.7 2-M10 M10 100 9.5mm rod - - 2166 130 1 1 75a & 71a 85 & 81 10 0.0005 D
S-SB-78 & 76 2.2 2 600 250 - 150 3.3 0.7 2-M10 M10 100 9.5mm rod - - 2166 130 1 1 68a & 66a 78 & 76 10 0.004 & 0.01 D
249
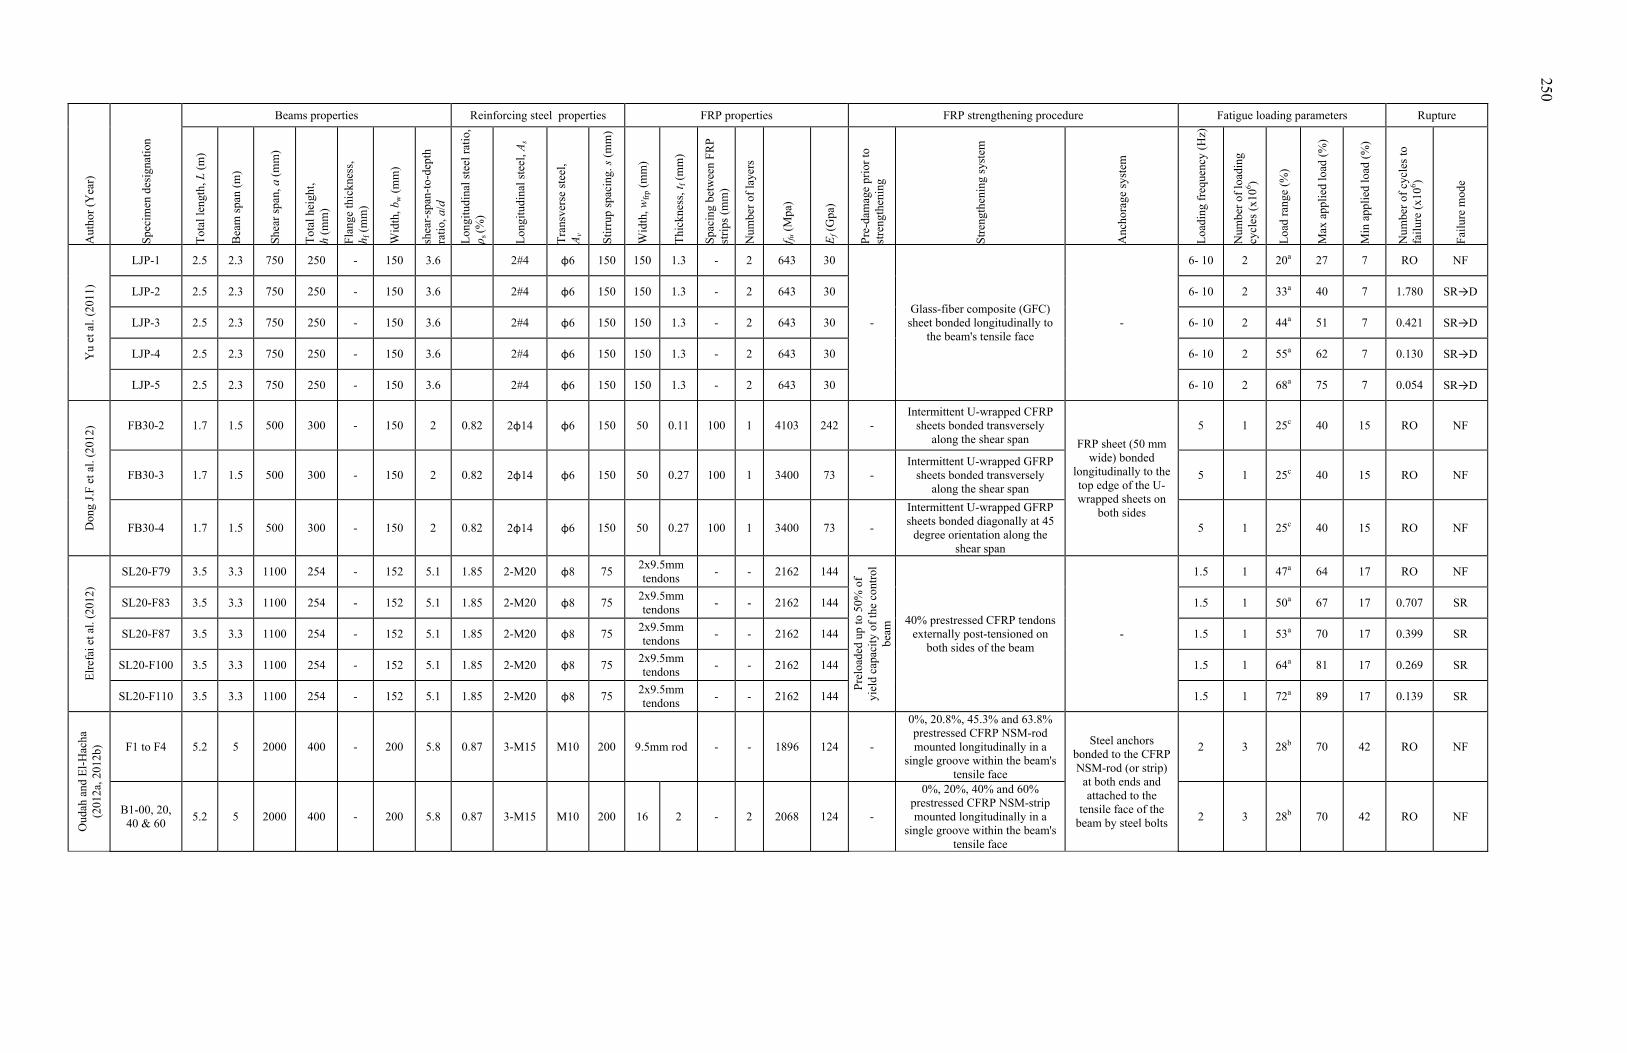
A
utho
r (Y
ear)
Spe
cim
en d
esig
nati
on
Beams properties Reinforcing steel properties FRP properties FRP strengthening procedure Fatigue loading parameters Rupture
Tot
al le
ngth
, L (
m)
Bea
m s
pan
(m)
Shea
r sp
an, a
(m
m)
Tot
al h
eigh
t,
h (m
m)
Fla
nge
thic
knes
s,
h f (
mm
)
Wid
th, b
w (
mm
)
shea
r-sp
an-t
o-de
pth
rati
o, a
/d
Lon
gitu
dina
l ste
el r
atio
, ρ s
(%)
Lon
gitu
dina
l ste
el, A
s
Tra
nsve
rse
stee
l,
Av
Sti
rrup
spa
cing
. s (
mm
)
Wid
th, w
frp
(mm
)
Thi
ckne
ss, t
f (m
m)
Spac
ing
betw
een
FRP
stri
ps (
mm
)
Num
ber
of la
yers
f fu (
Mpa
)
Ef (
Gpa
)
Pre
-dam
age
prio
r to
st
reng
then
ing
Str
engt
heni
ng s
yste
m
Anc
hora
ge s
yste
m
Loa
ding
fre
quen
cy (
Hz)
Num
ber
of lo
adin
g cy
cles
(x1
06 )
Loa
d ra
nge
(%)
Max
app
lied
load
(%
)
Min
app
lied
load
(%
)
Num
ber
of c
ycle
s to
fa
ilur
e (x
106 )
Fai
lure
mod
e
Yu
et a
l. (2
011)
LJP-1 2.5 2.3 750 250 - 150 3.6 2#4 φ6 150 150 1.3 - 2 643 30
- Glass-fiber composite (GFC) sheet bonded longitudinally to
the beam's tensile face -
6- 10 2 20a 27 7 RO NF
LJP-2 2.5 2.3 750 250 - 150 3.6 2#4 φ6 150 150 1.3 - 2 643 30 6- 10 2 33a 40 7 1.780 SR→D
LJP-3 2.5 2.3 750 250 - 150 3.6 2#4 φ6 150 150 1.3 - 2 643 30 6- 10 2 44a 51 7 0.421 SR→D
LJP-4 2.5 2.3 750 250 - 150 3.6 2#4 φ6 150 150 1.3 - 2 643 30 6- 10 2 55a 62 7 0.130 SR→D
LJP-5 2.5 2.3 750 250 - 150 3.6 2#4 φ6 150 150 1.3 - 2 643 30 6- 10 2 68a 75 7 0.054 SR→D
Don
g J.
F e
t al.
(201
2) FB30-2 1.7 1.5 500 300 - 150 2 0.82 2φ14 φ6 150 50 0.11 100 1 4103 242 -
Intermittent U-wrapped CFRP sheets bonded transversely
along the shear span FRP sheet (50 mm wide) bonded
longitudinally to the top edge of the U-wrapped sheets on
both sides
5 1 25c 40 15 RO NF
FB30-3 1.7 1.5 500 300 - 150 2 0.82 2φ14 φ6 150 50 0.27 100 1 3400 73 - Intermittent U-wrapped GFRP
sheets bonded transversely along the shear span
5 1 25c 40 15 RO NF
FB30-4 1.7 1.5 500 300 - 150 2 0.82 2φ14 φ6 150 50 0.27 100 1 3400 73 -
Intermittent U-wrapped GFRP sheets bonded diagonally at 45
degree orientation along the shear span
5 1 25c 40 15 RO NF
Elr
efai
et a
l. (2
012)
SL20-F79 3.5 3.3 1100 254 - 152 5.1 1.85 2-M20 φ8 75 2x9.5mm tendons
- - 2162 144
Pre
load
ed u
p to
50%
of
yiel
d ca
paci
ty o
f th
e co
ntro
l be
am 40% prestressed CFRP tendons
externally post-tensioned on both sides of the beam
-
1.5 1 47a 64 17 RO NF
SL20-F83 3.5 3.3 1100 254 - 152 5.1 1.85 2-M20 φ8 75 2x9.5mm tendons
- - 2162 144 1.5 1 50a 67 17 0.707 SR
SL20-F87 3.5 3.3 1100 254 - 152 5.1 1.85 2-M20 φ8 75 2x9.5mm tendons
- - 2162 144 1.5 1 53a 70 17 0.399 SR
SL20-F100 3.5 3.3 1100 254 - 152 5.1 1.85 2-M20 φ8 75 2x9.5mm tendons
- - 2162 144 1.5 1 64a 81 17 0.269 SR
SL20-F110 3.5 3.3 1100 254 - 152 5.1 1.85 2-M20 φ8 75 2x9.5mm tendons
- - 2162 144 1.5 1 72a 89 17 0.139 SR
Oud
ah a
nd E
l-H
acha
(2
012a
, 201
2b) F1 to F4 5.2 5 2000 400 - 200 5.8 0.87 3-M15 M10 200 9.5mm rod - - 1896 124 -
0%, 20.8%, 45.3% and 63.8% prestressed CFRP NSM-rod mounted longitudinally in a
single groove within the beam's tensile face
Steel anchors bonded to the CFRP NSM-rod (or strip)
at both ends and attached to the
tensile face of the beam by steel bolts
2 3 28b 70 42 RO NF
B1-00, 20, 40 & 60
5.2 5 2000 400 - 200 5.8 0.87 3-M15 M10 200 16 2 - 2 2068 124 -
0%, 20%, 40% and 60% prestressed CFRP NSM-strip mounted longitudinally in a
single groove within the beam's tensile face
2 3 28b 70 42 RO NF
250
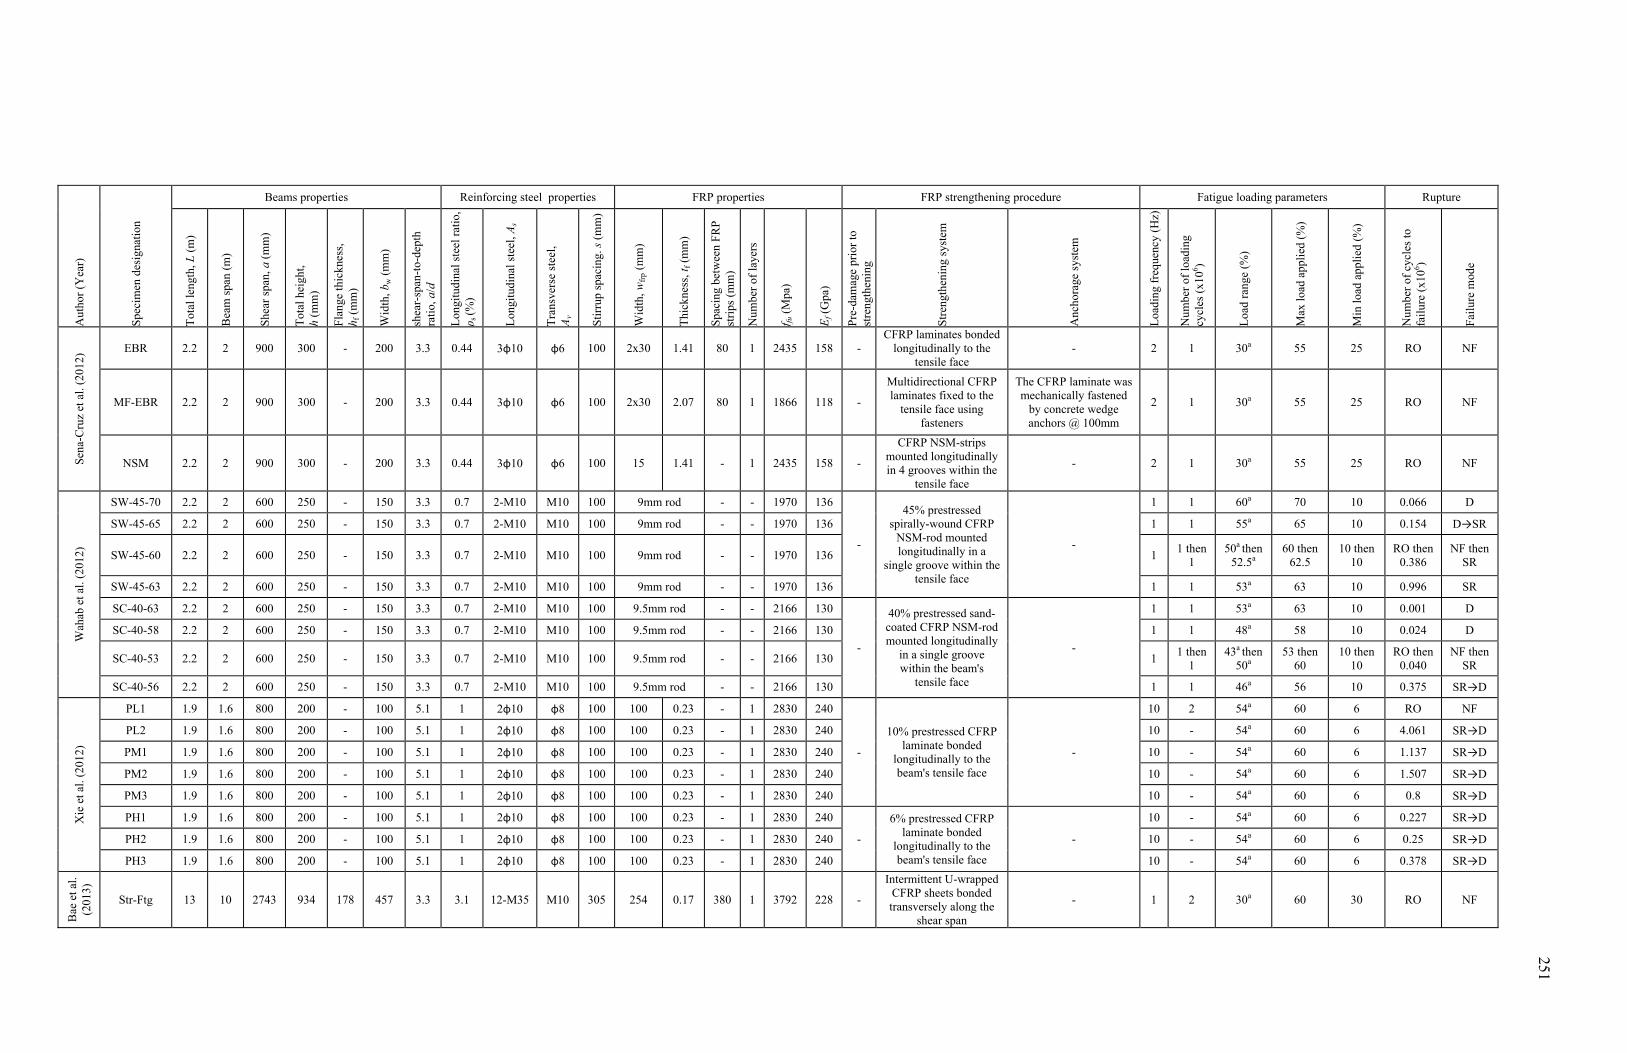
A
utho
r (Y
ear)
Spe
cim
en d
esig
nati
on
Beams properties Reinforcing steel properties FRP properties FRP strengthening procedure Fatigue loading parameters Rupture T
otal
leng
th, L
(m
)
Bea
m s
pan
(m)
Shea
r sp
an, a
(m
m)
Tot
al h
eigh
t,
h (m
m)
Fla
nge
thic
knes
s,
h f (
mm
)
Wid
th, b
w (
mm
)
shea
r-sp
an-t
o-de
pth
rati
o, a
/d
Lon
gitu
dina
l ste
el r
atio
, ρ s
(%)
Lon
gitu
dina
l ste
el, A
s
Tra
nsve
rse
stee
l,
Av
Sti
rrup
spa
cing
. s (
mm
)
Wid
th, w
frp
(mm
)
Thi
ckne
ss, t
f (m
m)
Spac
ing
betw
een
FRP
stri
ps (
mm
)
Num
ber
of la
yers
f fu (
Mpa
)
Ef (
Gpa
)
Pre
-dam
age
prio
r to
st
reng
then
ing
Str
engt
heni
ng s
yste
m
Anc
hora
ge s
yste
m
Loa
ding
fre
quen
cy (
Hz)
Num
ber
of lo
adin
g cy
cles
(x1
06 )
Loa
d ra
nge
(%)
Max
load
app
lied
(%
)
Min
load
app
lied
(%
)
Num
ber
of c
ycle
s to
fa
ilur
e (x
106 )
Fai
lure
mod
e
Sen
a-C
ruz
et a
l. (2
012)
EBR 2.2 2 900 300 - 200 3.3 0.44 3φ10 φ6 100 2x30 1.41 80 1 2435 158 - CFRP laminates bonded
longitudinally to the tensile face
- 2 1 30a 55 25 RO NF
MF-EBR 2.2 2 900 300 - 200 3.3 0.44 3φ10 φ6 100 2x30 2.07 80 1 1866 118 -
Multidirectional CFRP laminates fixed to the
tensile face using fasteners
The CFRP laminate was mechanically fastened
by concrete wedge anchors @ 100mm
2 1 30a 55 25 RO NF
NSM 2.2 2 900 300 - 200 3.3 0.44 3φ10 φ6 100 15 1.41 - 1 2435 158 -
CFRP NSM-strips mounted longitudinally in 4 grooves within the
tensile face
- 2 1 30a 55 25 RO NF
Wah
ab e
t al.
(201
2)
SW-45-70 2.2 2 600 250 - 150 3.3 0.7 2-M10 M10 100 9mm rod - - 1970 136
-
45% prestressed spirally-wound CFRP
NSM-rod mounted longitudinally in a
single groove within the tensile face
-
1 1 60a 70 10 0.066 D
SW-45-65 2.2 2 600 250 - 150 3.3 0.7 2-M10 M10 100 9mm rod - - 1970 136 1 1 55a 65 10 0.154 D→SR
SW-45-60 2.2 2 600 250 - 150 3.3 0.7 2-M10 M10 100 9mm rod - - 1970 136 1 1 then
1 50a then
52.5a 60 then
62.5 10 then
10 RO then
0.386 NF then
SR
SW-45-63 2.2 2 600 250 - 150 3.3 0.7 2-M10 M10 100 9mm rod - - 1970 136 1 1 53a 63 10 0.996 SR
SC-40-63 2.2 2 600 250 - 150 3.3 0.7 2-M10 M10 100 9.5mm rod - - 2166 130
-
40% prestressed sand-coated CFRP NSM-rod mounted longitudinally
in a single groove within the beam's
tensile face
-
1 1 53a 63 10 0.001 D
SC-40-58 2.2 2 600 250 - 150 3.3 0.7 2-M10 M10 100 9.5mm rod - - 2166 130 1 1 48a 58 10 0.024 D
SC-40-53 2.2 2 600 250 - 150 3.3 0.7 2-M10 M10 100 9.5mm rod - - 2166 130 1 1 then
1 43a then
50a 53 then
60 10 then
10 RO then
0.040 NF then
SR
SC-40-56 2.2 2 600 250 - 150 3.3 0.7 2-M10 M10 100 9.5mm rod - - 2166 130 1 1 46a 56 10 0.375 SR→D
Xie
et a
l. (2
012)
PL1 1.9 1.6 800 200 - 100 5.1 1 2φ10 φ8 100 100 0.23 - 1 2830 240
-
10% prestressed CFRP laminate bonded
longitudinally to the beam's tensile face
-
10 2 54a 60 6 RO NF
PL2 1.9 1.6 800 200 - 100 5.1 1 2φ10 φ8 100 100 0.23 - 1 2830 240 10 - 54a 60 6 4.061 SR→D
PM1 1.9 1.6 800 200 - 100 5.1 1 2φ10 φ8 100 100 0.23 - 1 2830 240 10 - 54a 60 6 1.137 SR→D
PM2 1.9 1.6 800 200 - 100 5.1 1 2φ10 φ8 100 100 0.23 - 1 2830 240 10 - 54a 60 6 1.507 SR→D
PM3 1.9 1.6 800 200 - 100 5.1 1 2φ10 φ8 100 100 0.23 - 1 2830 240 10 - 54a 60 6 0.8 SR→D
PH1 1.9 1.6 800 200 - 100 5.1 1 2φ10 φ8 100 100 0.23 - 1 2830 240
-
6% prestressed CFRP laminate bonded
longitudinally to the beam's tensile face
-
10 - 54a 60 6 0.227 SR→D
PH2 1.9 1.6 800 200 - 100 5.1 1 2φ10 φ8 100 100 0.23 - 1 2830 240 10 - 54a 60 6 0.25 SR→D
PH3 1.9 1.6 800 200 - 100 5.1 1 2φ10 φ8 100 100 0.23 - 1 2830 240 10 - 54a 60 6 0.378 SR→D
Bae
et a
l. (2
013)
Str-Ftg 13 10 2743 934 178 457 3.3 3.1 12-M35 M10 305 254 0.17 380 1 3792 228 -
Intermittent U-wrapped CFRP sheets bonded transversely along the
shear span
- 1 2 30a 60 30 RO NF
251
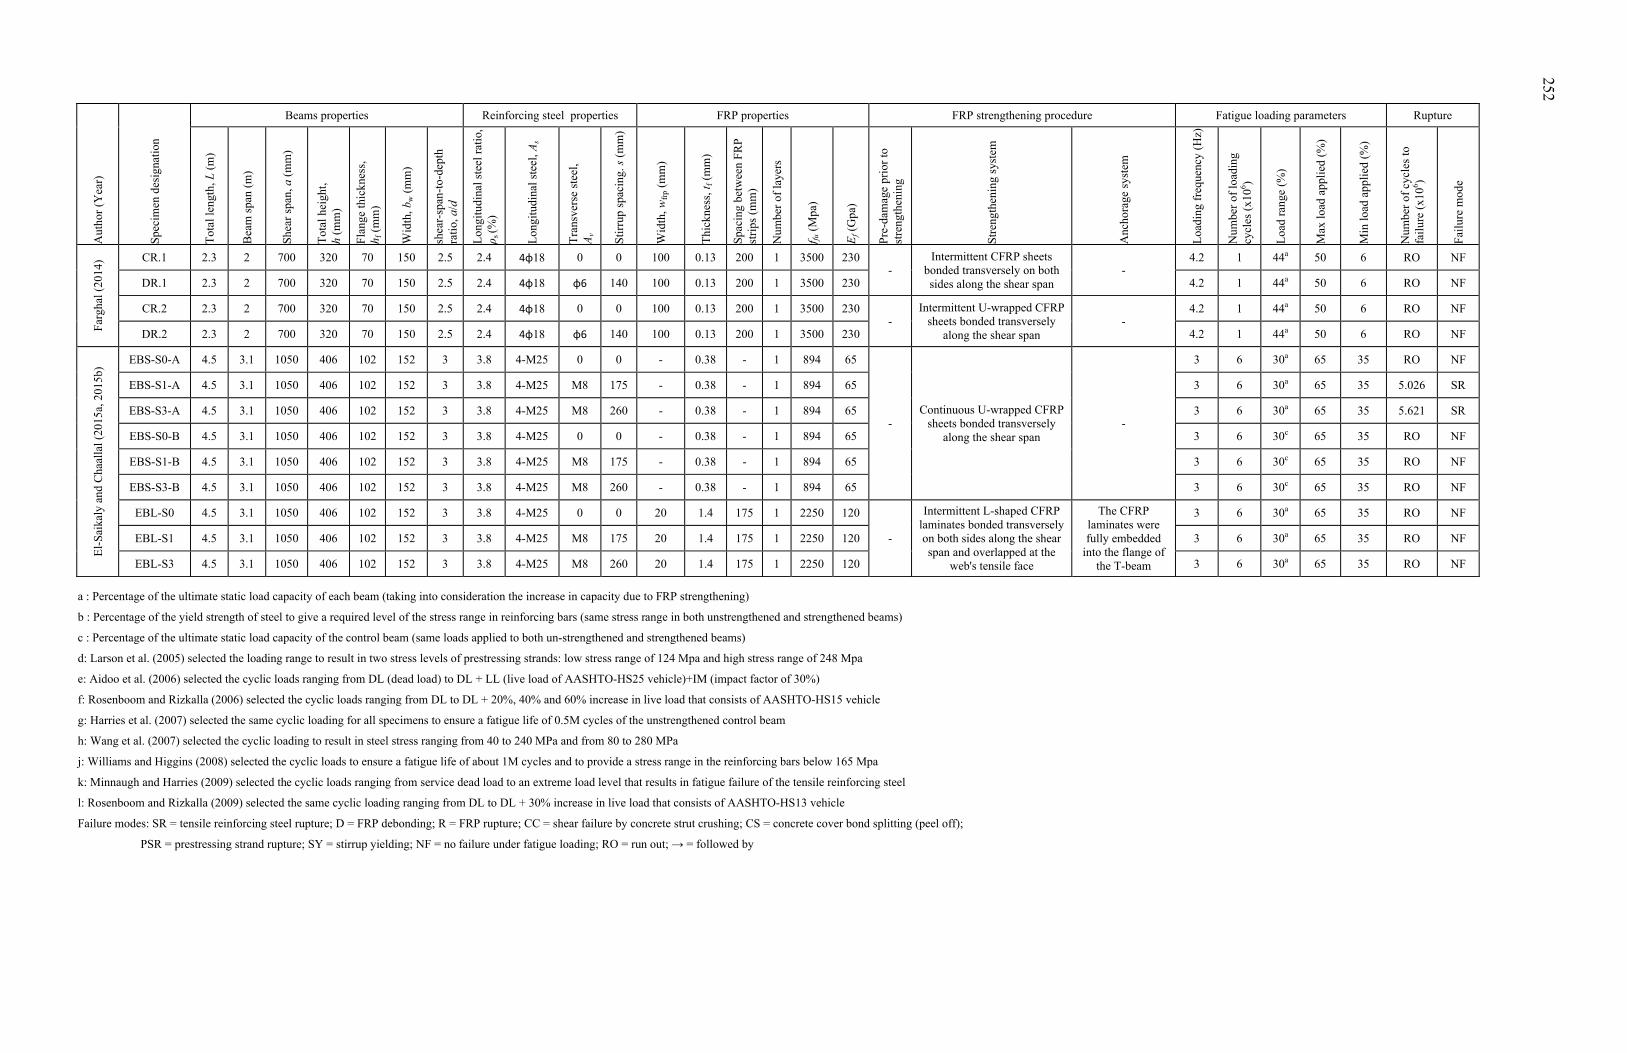
a : Percentage of the ultimate static load capacity of each beam (taking into consideration the increase in capacity due to FRP strengthening)
b : Percentage of the yield strength of steel to give a required level of the stress range in reinforcing bars (same stress range in both unstrengthened and strengthened beams)
c : Percentage of the ultimate static load capacity of the control beam (same loads applied to both un-strengthened and strengthened beams)
d: Larson et al. (2005) selected the loading range to result in two stress levels of prestressing strands: low stress range of 124 Mpa and high stress range of 248 Mpa
e: Aidoo et al. (2006) selected the cyclic loads ranging from DL (dead load) to DL + LL (live load of AASHTO-HS25 vehicle)+IM (impact factor of 30%)
f: Rosenboom and Rizkalla (2006) selected the cyclic loads ranging from DL to DL + 20%, 40% and 60% increase in live load that consists of AASHTO-HS15 vehicle
g: Harries et al. (2007) selected the same cyclic loading for all specimens to ensure a fatigue life of 0.5M cycles of the unstrengthened control beam
h: Wang et al. (2007) selected the cyclic loading to result in steel stress ranging from 40 to 240 MPa and from 80 to 280 MPa
j: Williams and Higgins (2008) selected the cyclic loads to ensure a fatigue life of about 1M cycles and to provide a stress range in the reinforcing bars below 165 Mpa
k: Minnaugh and Harries (2009) selected the cyclic loads ranging from service dead load to an extreme load level that results in fatigue failure of the tensile reinforcing steel
l: Rosenboom and Rizkalla (2009) selected the same cyclic loading ranging from DL to DL + 30% increase in live load that consists of AASHTO-HS13 vehicle
Failure modes: SR = tensile reinforcing steel rupture; D = FRP debonding; R = FRP rupture; CC = shear failure by concrete strut crushing; CS = concrete cover bond splitting (peel off);
PSR = prestressing strand rupture; SY = stirrup yielding; NF = no failure under fatigue loading; RO = run out; → = followed by
Aut
hor
(Yea
r)
Spe
cim
en d
esig
nati
on
Beams properties Reinforcing steel properties FRP properties FRP strengthening procedure Fatigue loading parameters Rupture
Tot
al le
ngth
, L (
m)
Bea
m s
pan
(m)
Shea
r sp
an, a
(m
m)
Tot
al h
eigh
t,
h (m
m)
Fla
nge
thic
knes
s,
h f (
mm
)
Wid
th, b
w (
mm
)
shea
r-sp
an-t
o-de
pth
rati
o, a
/d
Lon
gitu
dina
l ste
el r
atio
, ρ s
(%)
Lon
gitu
dina
l ste
el, A
s
Tra
nsve
rse
stee
l,
Av
Sti
rrup
spa
cing
. s (
mm
)
Wid
th, w
frp
(mm
)
Thi
ckne
ss, t
f (m
m)
Spac
ing
betw
een
FRP
stri
ps (
mm
)
Num
ber
of la
yers
f fu (
Mpa
)
Ef (
Gpa
)
Pre
-dam
age
prio
r to
st
reng
then
ing
Str
engt
heni
ng s
yste
m
Anc
hora
ge s
yste
m
Loa
ding
fre
quen
cy (
Hz)
Num
ber
of lo
adin
g cy
cles
(x1
06 )
Loa
d ra
nge
(%)
Max
load
app
lied
(%
)
Min
load
app
lied
(%
)
Num
ber
of c
ycle
s to
fa
ilur
e (x
106 )
Fai
lure
mod
e
Far
ghal
(20
14) CR.1 2.3 2 700 320 70 150 2.5 2.4 4φ18 0 0 100 0.13 200 1 3500 230
- Intermittent CFRP sheets
bonded transversely on both sides along the shear span
- 4.2 1 44a 50 6 RO NF
DR.1 2.3 2 700 320 70 150 2.5 2.4 4φ18 φ6 140 100 0.13 200 1 3500 230 4.2 1 44a 50 6 RO NF
CR.2 2.3 2 700 320 70 150 2.5 2.4 4φ18 0 0 100 0.13 200 1 3500 230 -
Intermittent U-wrapped CFRP sheets bonded transversely
along the shear span -
4.2 1 44a 50 6 RO NF
DR.2 2.3 2 700 320 70 150 2.5 2.4 4φ18 φ6 140 100 0.13 200 1 3500 230 4.2 1 44a 50 6 RO NF
El-
Sai
kaly
and
Cha
alla
l (20
15a,
201
5b)
EBS-S0-A 4.5 3.1 1050 406 102 152 3 3.8 4-M25 0 0 - 0.38 - 1 894 65
- Continuous U-wrapped CFRP
sheets bonded transversely along the shear span
-
3 6 30a 65 35 RO NF
EBS-S1-A 4.5 3.1 1050 406 102 152 3 3.8 4-M25 M8 175 - 0.38 - 1 894 65 3 6 30a 65 35 5.026 SR
EBS-S3-A 4.5 3.1 1050 406 102 152 3 3.8 4-M25 M8 260 - 0.38 - 1 894 65 3 6 30a 65 35 5.621 SR
EBS-S0-B 4.5 3.1 1050 406 102 152 3 3.8 4-M25 0 0 - 0.38 - 1 894 65 3 6 30c 65 35 RO NF
EBS-S1-B 4.5 3.1 1050 406 102 152 3 3.8 4-M25 M8 175 - 0.38 - 1 894 65 3 6 30c 65 35 RO NF
EBS-S3-B 4.5 3.1 1050 406 102 152 3 3.8 4-M25 M8 260 - 0.38 - 1 894 65 3 6 30c 65 35 RO NF
EBL-S0 4.5 3.1 1050 406 102 152 3 3.8 4-M25 0 0 20 1.4 175 1 2250 120
-
Intermittent L-shaped CFRP laminates bonded transversely on both sides along the shear span and overlapped at the
web's tensile face
The CFRP laminates were fully embedded
into the flange of the T-beam
3 6 30a 65 35 RO NF
EBL-S1 4.5 3.1 1050 406 102 152 3 3.8 4-M25 M8 175 20 1.4 175 1 2250 120 3 6 30a 65 35 RO NF
EBL-S3 4.5 3.1 1050 406 102 152 3 3.8 4-M25 M8 260 20 1.4 175 1 2250 120 3 6 30a 65 35 RO NF
252
BIBLIOGRAPHIE
AASHTO. 2010. AASHTO LRFD Bridge Design Specifications, 5th Edition. AASHTO LRFD, Washington, DC: American Association of State Highway and Transportation Officials.
ACI 215R. 1974. Considerations for design of concrete structures subjected to fatigue
loading. ACI 215R-74 (Revised 1992/Reapproved 1997), Farmington Hills, Michigan: American Concrete Institute Committee 215.
ACI 440.1R. 2001. Guide for the design and construction of concrete reinforced with FRP
bars. ACI 440.1R-01, Farmington Hills, Michigan: American Concrete Institute Committee 440.
ACI 440.2R. 2002. Guide for the design and construction of externally bonded FRP systems
for strengthening concrete structures. ACI 440.2R-02, Farmington Hills, Michigan: American Concrete Institute Committee 440.
ACI 440.2R. 2008. Guide for the design and construction of externally bonded FRP systems
for strengthening concrete structures. ACI 440.2R-08, Farmington Hills, Michigan: American Concrete Institute Committee 440.
ACI 440R. 1996. State-of-the-art report on fiber reinforced plastic (FRP) reinforcement for
concrete structures. ACI 440R-96, Farmington Hills, Michigan: American Concrete Institute Committee 440.
ACI 440R. 2007. Report on Fiber-Reinforced Polymer (FRP) Reinforcement for Concrete
Structures. ACI 440R-07, Farmington Hills, Michigan: American Concrete Institute Committee 440, 100 p.
Aidoo, J., Harries, K. A., Petrou, M. F. 2004. « Fatigue behavior of carbon fiber reinforced
polymer-strengthened reinforced concrete bridge girders ». Journal of Composites for Construction, vol. 8, No. 6, p. 501-509.
Aidoo, J., Harries, K. A., Petrou, M. F. 2006. « Full-scale experimental investigation of
repair of reinforced concrete interstate bridge using CFRP materials ». Journal of Bridge Engineering, vol. 11, No. 3, p. 350-358.
Al-Hammoud, R., Soudki, K., Topper, T. H. 2011. « Fatigue flexural behavior of corroded
reinforced concrete beams repaired with CFRP sheets ». Journal of Composites for Construction, vol. 15, No. 1, p. 42-51.
254
Al-Rousan, R., Issa, M. 2011. « Fatigue performance of reinforced concrete beams strengthened with CFRP sheets ». Construction and Building Materials, vol. 25, No. 8, p. 3520-3529.
ASCE. 2013. Report Card for America’s Infrastructure - Bridges. American Society of Civil
Engineers. < http://www.infrastructurereportcard.org/bridges/ >. ASTM. 1997. Standard test methods and definitions for mechanical testing of steel products.
ASTM A370-97a, West Conshohocken, PA: American Society for Testing and Materials.
Badawi, M., Soudki, K. 2008. “Fatigue of RC beams strengthened with prestressed NSM
CFRP rods.“. In Fourth International Conference on FRP Composites in Civil Engineering (CICE2008). (Zurich, Switzerland).
Badawi, M., Soudki, K. 2009. « Fatigue behavior of RC beams strengthened with NSM
CFRP rods ». Journal of Composites for Construction, vol. 13, No. 5, p. 415-421. Bae, S. W., Murphy, M., Mirmiran, A., Belarbi, A. 2013. « Behavior of RC T-beams
strengthened in shear with CFRP under cyclic loading ». Journal of Bridge Engineering, vol. 18, No. 2, p. 99-109.
Bank, L. C. 2006. « Materials and manufacturing ». In Composites for construction:
structural design with FRP materials. p. 40-77. Hoboken, NJ, USA: John Wiley & Sons, Inc.
Barnes, R., Garden, H. N. 1999. « Time-dependent behaviour and fatigue ». In Strengthening
of Reinforced Concrete Structures - Using Externally-Bonded FRP Composities in Structural and Civil Engineering, sous la dir. de Hollaway L. C. and Leeming M. B., p. 183-221. Cambridge, UK: Woodhead Publishing Limited.
Barnes, R. A., Mays, G. C. 1999. « Fatigue performance of concrete beams strengthened with
CFRP plates ». Journal of Composites for Construction, vol. 3, No. 2, p. 63-72. Bathias, C. 2009. Matériaux composites, 2ème édition. Paris: Dunod, 512p. Bizindavyi, L., Neale, K., Erki, M. 2003. « Experimental investigation of bonded fiber
reinforced polymer-concrete joints under cyclic loading ». Journal of Composites for Construction, vol. 7, No. 2, p. 127-134.
Bonacci, J., Maalej, M. 2000. « Externally bonded FRP for service-life extension of RC
infrastructure ». Journal of Infrastructure Systems, vol. 6, No. 1, p. 41-51.
255
Bousselham, A., Chaallal, O. 2004. « Shear strengthening reinforced concrete beams with fiber-reinforced polymer: Assessment of influencing parameters and required research ». ACI Structural Journal, vol. 101, No. 2, p. 219-227.
Bousselham, A., Chaallal, O. 2006. « Effect of transverse steel and shear span on the
performance of RC beams strengthened in shear with CFRP ». Composites Part B: Engineering, vol. 37, No. 1, p. 37-46.
Bousselham, A., Chaallal, O. 2008. « Mechanisms of shear resistance of concrete beams
strengthened in shear with externally bonded FRP ». Journal of Composites for Construction, vol. 12, No. 5, p. 499-512.
Bousselham, A., Chaallal, O. 2013. « Experimental investigations on the influence of size on
the performance of RC T-beams retrofitted in shear with CFRP fabrics ». Engineering Structures, vol. 56, No. 0, p. 1070-1079.
Brand, A., Sutterlin, R. 1980. Calcul des pieces a la fatigue : methode du gradient. Senlis,
France: Centre technique des industries mécaniques, 157 p. Brena, S. F., Benouaich, M. A., Kreger, M. E., Wood, S. L. 2005. « Fatigue tests of
reinforced concrete beams strengthened using carbon fiber-reinforced polymer composites ». ACI Structural Journal, vol. 102, No. 2, p. 305-313.
Cao, S. Y., Chen, J. F., Teng, J. G., Hao, Z., Chen, J. 2005. « Debonding in RC beams shear
strengthened with complete FRP wraps ». Journal of Composites for Construction, vol. 9, No. 5, p. 417-428.
Carolin, A. 2003. « Carbon fibre reinforced polymers for strengthening of structural
elements ». Doctoral thesis, Lulea University of Technology, 194 p. CEB. 1988. Fatigue of concrete structures, state-of-the-art report. CEB Bulletin 188, Paris:
Comité Euro-International du Béton. Chaallal, O., Boussaha, F., Bousselham, A. 2010. « Fatigue performance of RC beams
strengthened in shear with CFRP fabrics ». Journal of Composites for Construction, vol. 14, No. 4, p. 415-423.
Chaallal, O., Mofidi, A., Benmokrane, B., Neale, K. 2011. « Embedded through-section FRP
rod method for shear strengthening of RC beams: Performance and comparison with existing techniques ». Journal of Composites for Construction, vol. 15, No. 3, p. 374-383.
256
Chaallal, O., Nollet, M. J., Perraton, D. 1998. « Strengthening of reinforced concrete beams with externally bonded fiber-reinforced-plastic plates: Design guidelines for shear and flexure ». Canadian Journal of Civil Engineering, vol. 25, No. 4, p. 692-704.
Chaallal, O., Shahawy, M., Hassan, M. 2002. « Performance of reinforced concrete T-girders
strengthened in shear with carbon fiber-reinforced polymer fabric ». ACI Structural Journal, vol. 99, No. 3, p. 335-343.
Chajes, M. J., Januszka, T. F., Mertz, D. R., Thomson Jr, T. A., Finch Jr, W. W. 1995. «
Shear strengthening of reinforced concrete beams using externally applied composite fabrics ». ACI Structural Journal, vol. 92, No. 3, p. 295-303.
Chen, H. J., Liu, T. H., Tang, C. W. 2010. « Pre-failure deflection and residual load capacity
of reinforced lightweight aggregate concrete beams under high-cycle fatigue ». Advanced Materials Research, vol. 146-147, p. 926-936.
Chen, J., Robertson, I. N. 2004. Test of cracked pre-stressed concrete T-beam retrofitted for
shear using CFRP L-shaped plates. Research Report UHM/CEE/04-06. Manoa, HI University of Hawaii-Department of Civil and Environmental Engineering, 188 p.
Chen, J. F., Teng, J. G. 2003a. « Shear capacity of fiber-reinforced polymer-strengthened
reinforced concrete beams: Fiber reinforced polymer rupture ». Journal of Structural Engineering, vol. 129, No. 5, p. 615-625.
Chen, J. F., Teng, J. G. 2003b. « Shear capacity of FRP-strengthened RC beams: FRP
debonding ». Construction and Building Materials, vol. 17, No. 1, p. 27-41. CIDAR. 2006. Design guideline for RC structures retroffited with FRP and metal plates :
Beams and slabs. CIDAR-06, University of Adelaide, Australia: Center for Infrastructure Diagnosis, Assessment and Rehabilitation.
CNR DT200. 2004. Guide for the Design and Construction of Externally Bonded FRP
Systems for Strengthening Existing Structures. CNR-DT 200/2004, Rome, Italy: Council National Research.
CNR DT204. 2006. Guide for the Design and Construction of Fiber-Reinforced Concrete
Structures. CNR-DT 204/2006, Rome, Italy: Council National Research. CSA S6. 2000. Canadian Highway Bridge Design Code. CAN/CSA-S6-00, Mississauga,
Ontario: Canadian Standards Association Committee S6. CSA S6. 2006. Canadian Highway Bridge Design Code. CAN/CSA-S6-06 (Reprinted 2011),
Mississauga, Ontario: Canadian Standards Association Committee S6.
257
CSA S806. 2002. Design and construction of building components with fiber reinforced polymers. CAN/CSA-S806-02, Rexdale, Ontario: Canadian Standards Association Committee S806.
CSA S806. 2012. Règles de calcul et de construction des structures de bâtiment contenant
des polymères renforcés de fibres. CAN/CSA-S806-12, Mississauga, Ontario: Association canadienne de normalisation Comité S806.
Curtis, P. 1989. « The fatigue behaviour of fibrous composite materials ». The Journal of
Strain Analysis for Engineering Design, vol. 24, No. 4, p. 235-244. Czaderski, C. 2002. Shear strengthening with prefabricated CFRP L-shaped plates: test
beams S1 to S6., EMPA Report No. 116/7. Switzerland: Eidgenössische Materialprüfungs und Forschungsanstalt, 79 p.
Czaderski, C., Motavalli, M. 2004. « Fatigue behaviour of CFRP L-shaped plates for shear
strengthening of RC T-beams ». Composites Part B: Engineering, vol. 35, No. 4, p. 279-290.
D’Antino, T., Pellegrino, C. 2014. « Bond between FRP composites and concrete:
Assessment of design procedures and analytical models ». Composites Part B: Engineering, vol. 60, No. 0, p. 440-456.
Dai, J., Saito, Y., Ueda, T., Sato, Y. 2005. « Static and fatigue bond characteristics of
interfaces between CFRP sheets and frost damage experienced concrete ». ACI Special Publication, vol. 230, No. 86, p. 1515-1530.
De Lorenzis, L., Nanni, A. 2001. « Shear strengthening of reinforced concrete beams with
near-surface mounted fiber-reinforced polymer rods ». ACI Structural Journal, vol. 98, No. 1, p. 60-68.
De Lorenzis, L., Teng, J. G. 2007. « Near-surface mounted FRP reinforcement: An emerging
technique for strengthening structures ». Composites Part B: Engineering, vol. 38, No. 2, p. 119-143.
Deniaud, C. 2000. « Behaviour of reinforced concrete beams strengthened in shear with FRP
sheets ». Doctoral thesis, Univ. of Alberta, Edmonton, AB, Canada. Dias, S. J. E., Barros, J. A. O. 2012. « NSM shear strengthening technique with CFRP
laminates applied in high-strength concrete beams with or without pre-cracking ». Composites Part B: Engineering, vol. 43, No. 2, p. 290-301.
258
Dirar, S., Lees, J., Morley, C. 2012. « Precracked reinforced concrete T-beams repaired in shear with bonded carbon fiber-reinforced polymer sheets ». ACI Struct. J., vol. 109, No. 2, p. 215–224.
Dong, J. F., Wang, Q. Y., Guan, Z. W. 2012. « Structural behaviour of RC beams externally
strengthened with FRP sheets under fatigue and monotonic loading ». Engineering Structures, vol. 41, No. 0, p. 24-33.
Dong, Y., Ansari, F., Karbhari, V. M. 2011. « Fatigue performance of reinforced concrete
beams with externally bonded CFRP reinforcement ». Structure and Infrastructure Engineering, vol. 7, No. 3, p. 229-241.
Ekenel, M., Myers, J. J. 2009. « Fatigue Performance of CFRP Strengthened RC Beams
under Environmental Conditioning and Sustained Load ». Journal of Composites for Construction, vol. 13, No. 2, p. 93-102.
Ekenel, M., Rizzo, A., Myers, J. J., Nanni, A. 2006. « Flexural fatigue behavior of reinforced
concrete beams strengthened with FRP fabric and precured laminate systems ». Journal of Composites for Construction, vol. 10, No. 5, p. 433-442.
El-Saikaly, G., Chaallal, O. 2015a. « Extending the fatigue life of reinforced concrete T-
beams strengthened in shear with externally bonded FRP: Upgrading versus repairing ». Journal of Composites for Construction, vol. 19, No. 1, p. 04014027.
El-Saikaly, G., Chaallal, O. 2015b. « Fatigue behavior of RC T-beams strengthened in shear
with EB CFRP L-shaped laminates ». Composites Part B: Engineering, vol. 68, p. 100-112.
El-Tawil, S., Ogunc, C., Okeil, A., Shahawy, M. 2001. « Static and fatigue analyses of RC
beams strengthened with CFRP laminates ». Journal of Composites for Construction, vol. 5, No. 4, p. 258-267.
Elrefai, A., West, J. S., Soudki, K. A. 2012. « Fatigue of reinforced concrete beams
strengthened with externally post-tensioned CFRP tendons ». Construction and Building Materials, vol. 29, p. 246-256.
Elrefai, A., West, J. S., Soudki, K. A. 2008. « Effect of overloading on fatigue performance
of reinforced concrete beams strengthened with externally post-tensioned carbon-fibre-reinforced polymer tendons ». Canadian Journal of Civil Engineering, vol. 35, No. 11, p. 1294-1307.
Emberson, N. K., Mays, G. C. 1996. « Significance of property mismatch in the patch repair
of structural concrete. Part 3: Reinforced concrete members in flexure ». Magazine of Concrete Research. p. 45-57.
259
Eshwar, N., Nanni, A., Ibell, T. J. 2008. « Performance of two anchor systems of externally bonded fiber-reinforced polymer laminates ». ACI Mater. J., vol. 105, No.1, p. 72–80.
Farghal, O. A. 2014. « Fatigue behavior of RC T-beams strengthened in shear with CFRP
sheets ». Ain Shams Engineering Journal, vol. 5, No. 3, p. 667-680. Ferrier, E., Bigaud, D., Clément, J. C., Hamelin, P. 2011. « Fatigue-loading effect on RC
beams strengthened with externally bonded FRP ». Construction and Building Materials, vol. 25, No. 2, p. 539-546.
Ferrier, E., Bigaud, D., Hamelin, P., Bizindavyi, L., Neale, K. 2005. « Fatigue of CFRPs
externally bonded to concrete ». Materials and Structures, vol. 38, No. 1, p. 39-46. FHWA. 2013. 2006, 2008, 2010 and 2013 Status of the Nation’s Highways, Bridges, and
Transit: Conditions & Performance Federal Highway Administration – U.S. department of transportation. < http://www.fta.dot.gov/about/about_FTA_5208.html >.
FIB TG9.3. 2001. Externally bonded FRP reinforcement for RC structures. FIB TG9.3-01,
Lausanne, Switzerland: Fédération Internationale du Béton Bulletin 14 Task Group 9.3.
Galal, K., Mofidi, A. 2010. « Shear strengthening of RC T-beams using mechanically
anchored unbonded dry carbon fiber sheets ». J. Perform. Constr. Facil., 10.1061/(ASCE)CF.1943-5509.0000067, p. 31–39.
Gheorghiu, C., Labossière, P., Proulx, J. 2006. « Fatigue and monotonic strength of RC
beams strengthened with CFRPs ». Composites Part A: Applied Science and Manufacturing, vol. 37, No. 8, p. 1111-1118.
Gheorghiu, C., Labossière, P., Raîche, A. 2004. « Environmental Fatigue and Static Behavior
of RC Beams Strengthened with Carbon-Fiber-Reinforced Polymer ». Journal of Composites for Construction, vol. 8, No. 3, p. 211-218.
Gussenhoven, R., Brena, S. F. 2005. « Fatigue behavior of reinforced concrete beams
strengthened with different FRP laminate configurations ». Fiber-reinforced polymer (FRP) reinforcement for concrete structures (SP-230), vol. 230, p. 613-630.
Harries, K. A. 2005. "Fatigue behaviour of bonded FRP used for flexural retrofit." In
Proceedings of international symposium on bond behaviour of FRP in structures (BBFS 2005). p. 547-552.
260
Harries, K. A., Aidoo, J. 2006. « Debonding- and fatigue-related strain limits for externally bonded FRP ». Journal of Composites for Construction, vol. 10, No. 1, p. 87-90.
Harries, K. A., Reeve, B., Zorn, A. 2007. « Experimental evaluation of factors affecting
monotonic and fatigue behavior of fiber-reinforced polymer-to-concrete bond in reinforced concrete beams ». ACI Structural Journal, vol. 104, No. 6, p. 667-674.
Heffernan, P. J., Erki, M. A. 2004. « Fatigue behavior of reinforced concrete beams
strengthened with carbon fiber reinforced plastic laminates ». Journal of Composites for Construction, vol. 8, No. 2, p. 132-140.
Helgason, T., Hanson, J. 1974. « Investigation of design factors affecting fatigue strength of
reinforcing bars-statistical analysis ». ACI Special Publication, vol. 41, p. 107-138. Higgins, C., Farrow, W., Nicholas, B., Potisuk, T. 2006. « High-cycle fatigue of diagonally
cracked reinforced concrete bridge girders: Field tests ». Journal of Bridge Engineering, vol. 11, No. 6, p. 699-706.
Higgins, C., Lee, A., Potisuk, T., Forrest, R. 2007. « High-cycle fatigue of diagonally
cracked RC bridge girders: Laboratory tests ». Journal of Bridge Engineering, vol. 12, No. 2, p. 226-236.
Hollaway, L. C., Head, P. R. 2001. Advanced polymer composites and polymers in the civil
infrastructure, first edition. Oxford, UK: Elsevier, 336p. ISIS Canada. 2001. Strengthening reinforced concrete structures with externally bonded
fiber reinforced polymer. ISIS, Winnipeg, Manitoba: The Canadian Network of Centers of Excellence on Intelligent Sensing of Innovative Structures.
ISIS Canada. 2006. ISIS Canada Educational Modules 2, 4, 6 and 8 on Fibre Reinforced
Polymers and Structural Health Monitoring. ISIS, Winnipeg Manitoba, Canada: The Canadian Network of Centres of Excellence on Intelligent Sensing for Innovative Structures. < http://www.isiscanada.com/publications/educational-modules/ >.
ISIS Canada. 2008. FRP Rehabilitation of Reinforced Concrete Structures - Design Manual
4 Version 2,. ISIS Winnipeg Manitoba, Canada: The Canadian Network of Centres of Excellence on Intelligent Sensing for Innovative Structures.
Japan Society of Civil Engineers. 1986a. Standard specification for design and construction
of concrete structures. part 1 (design). JSCE-86, Tokyo: SP1. Japan Society of Civil Engineers. 1986b. Standard specification for design and construction
of concrete structures. part 2 (construction). JSCE-86, Tokyo: SP2.
261
Kalfat, R., Al-Mahaidi, R., Smith, S. T. 2013. « Anchorage devices used to improve the performance of reinforced concrete beams retrofitted with FRP composites: State-of-the-art review ». J. Compos. Constr., 10.1061/(ASCE)CC.1943-5614.0000276, p. 14–33.
Katakalos, K., Papakonstantinou, C. 2009. « Fatigue of reinforced concrete beams
strengthened with steel-reinforced inorganic polymers ». Journal of Composites for Construction, vol. 13, No. 2, p. 103-112.
Khalifa, A., Gold, W. J., Nanni, A., M.I, A. A. 1998. « Contribution of externally bonded
FRP to shear capacity of RC flexural members ». Journal of Composites for Construction, vol. 2, No. 4, p. 195-202.
Khalifa, A., Nanni, A. 2000. « Improving shear capacity of existing RC T-section beams
using CFRP composites ». Cement and Concrete Composites, vol. 22, No. 3, p. 165-174.
Kim, Y. J., Heffernan, P. J. 2008. « Fatigue behavior of externally strengthened concrete
beams with fiber-reinforced polymers: State of the art ». Journal of Composites for Construction, vol. 12, No. 3, p. 246-256.
Koutas, L., Triantafillou, T. C. 2013. « Use of anchors in shear strengthening of reinforced
concrete T-beams with FRP ». J. Compos. Constr., 10.1061/(ASCE)CC.1943-5614.0000316, 101-107.
Larson, K. H., Peterman, R. J., Rasheed, H. A. 2005. « Strength-fatigue behavior of fiber
reinforced polymer strengthened prestressed concrete T-beams ». Journal of Composites for Construction, vol. 9, No. 4, p. 313-326.
Lee, T. 2003. « Shear strengthening of reinforced concrete T-beams strengthened using
carbon fibre reinforced polymer (CFRP) laminates ». Doctoral thesis, Monash Univ., Melbourne, VIC, Australia.
Li, A., Diagana, C., Delmas, Y. 2002. « Shear strengthening effect by bonded composite
fabrics on RC beams ». Composites Part B: Engineering, vol. 33, No. 3, p. 225-239. Mallet, G. P. 1991. Fatigue of reinforced concrete, 2, State-of-the-art review / TRRL. H.M.
Stationery Office, London: Transport Road Research Laboratory, 166 p. Masoud, S., Soudki, K., Topper, T. 2001. « CFRP-strengthened and corroded RC beams
under monotonic and fatigue loads ». Journal of Composites for Construction, vol. 5, No. 4, p. 228-236.
262
Masoud, S., Soudki, K., Topper, T. 2005. « Postrepair fatigue performance of FRP-repaired corroded RC beams: Experimental and Analytical Investigation ». Journal of Composites for Construction, vol. 9, No. 5, p. 441-449.
Mays, G. C., Tilly, G. P. 1982. « Long endurance fatigue performance of bonded structural
joints ». International Journal of Adhesion and Adhesives, vol. 2, No. 2, p. 109-113. Meier, H. 1998. « CFK-Schubverstärkungselemente ». Schweizer Ingenieur und Architekt (SI
+ A), No. 43, p. 819-821 (in German). Melo, G., Araujo, A., Nagato, Y. 2003. « Strengthening of RC beams in shear with carbon
sheet laminates (CFRP) ». Proc. 6th Int. Symp., FRP Reinforcement for Concrete Structures (FRPRCS-6), National University of Singapore (NUS), Singapore, p. 477–486.
Minnaugh, P., Harries, K. 2009. « Fatigue behavior of externally bonded steel fiber
reinforced polymer (SFRP) for retrofit of reinforced concrete ». Materials and Structures, vol. 42, No. 2, p. 271-278.
Mofidi, A., Chaallal, O. 2011a. « Shear strengthening of RC beams with EB FRP:
Influencing factors and conceptual debonding model ». Journal of Composites for Construction, vol. 15, No. 1, p. 62-74.
Mofidi, A., Chaallal, O. 2011b. « Shear strengthening of RC beams with externally bonded
FRP composites: Effect of strip-width-to-strip-spacing ratio ». Journal of Composites for Construction, vol. 15, No. 5, p. 732-742.
Mofidi, A., Chaallal, O. 2014. « Tests and design provisions for reinforced-concrete beams
strengthened in shear using FRP sheets and strips ». International Journal of Concrete Structures and Materials, vol. 8, No. 2, p. 117-128.
Mofidi, A., Chaallal, O., Benmokrane, B., Neale, K. 2012a. « Experimental tests and design
model for RC beams strengthened in shear using the embedded through-section FRP method ». Journal of Composites for Construction, vol. 16, No. 5, p. 540-550.
Mofidi, A., Chaallal, O., Benmokrane, B., Neale, K. 2012b. « Performance of end-anchorage
systems for RC beams strengthened in shear with epoxy-bonded FRP ». Journal of Composites for Construction, vol. 16, No. 3, p. 322-331.
Mofidi, A., Chaallal, O., Shao, Y. 2014a. « Analytical design model for reinforced-concrete
beams strengthened in shear using L-shaped CFRP plates ». Journal of Composites for Construction, vol. 18, No. 1, p. 04013024.
263
Mofidi, A., Thivierge, S., Chaallal, O., Shao, Y. 2014b. « Behavior of reinforced concrete beams strengthened in shear using L-shaped CFRP plates: Experimental investigation ». Journal of Composites for Construction, vol. 18, No. 2, p. 04013033.
Monti, G., Liotta, M., Santinelli, F. 2004. « Shear strengthening of beams with composite
materials ». In FRP Composites in Civil Engineering - CICE 2004. p. 569-577. Taylor & Francis.
Monti, G., Liotta, M. A. 2007. « Tests and design equations for FRP-strengthening in
shear ». Construction and Building Materials, vol. 21, No. 4, p. 799-809. Mosallam, A. S., Banerjee, S. 2007. « Shear enhancement of reinforced concrete beams
strengthened with FRP composite laminates ». Composites Part B: Engineering, vol. 38, No. 5-6, p. 781-793.
Moss, D. S. 1982. Bending fatigue of high-yield reinforcing bars in concrete. TRRL
Supplementary Rep. 748. Transport and Road Research Laboratory, Crowthorne, U.K., 8 p.
MTQ. 2011. Bilan de l’état des structures du réseau routier supérieur (RRS). Bibliothèque et
Archives nationales du Québec: Gouvernement du Québec, Ministère des Transports du Québec. <https://www.ceic.gouv.qc.ca/fileadmin/Fichiers_client/centre_documentaire/Piece_3P-42.pdf >.
MTQ. 2014. Rapport annuel de gestion de 1999 à 2014. Bibliothèque et Archives nationales
du Québec: Gouvernement du Québec, Ministère des Transports du Québec. < http://www.mtq.gouv.qc.ca/ministere/Pages/rapport-annuel-gestion.aspx >.
MTQ. 2015. Investissements routiers 2015-2017 : Faits saillants. Gouvernement du Québec,
Ministère des Transports du Québec. <http://www.mtq.gouv.qc.ca/centredocumentation/Documents/Infrastructures/Investissements/2015-2017/national/faits-saillants-national.pdf >.
Nakaba, K., Kanakubo, T., Furuta, T., Yoshizawa, H. 2001. « Bond behavior between fiber-
reinforced polymer laminates and concrete ». Structural Journal, vol. 98, No. 3, p. 1-9.
Oudah, F., El-Hacha, R. 2012a. « Fatigue behavior of RC beams strengthened with
prestressed NSM CFRP rods ». Composite Structures, vol. 94, No. 4, p. 1333-1342.
264
Oudah, F., El-Hacha, R. 2012b. « Performance of RC beams strengthened using prestressed NSM-CFRP strips subjected to fatigue loading ». Journal of Composites for Construction, vol. 16, No. 3, p. 300-307.
Oudah, F., El-Hacha, R. 2013. « Research progress on the fatigue performance of RC beams
strengthened in flexure using Fiber Reinforced Polymers ». Composites Part B: Engineering, vol. 47, No. 0, p. 82-95.
Papakonstantinou, C. G., Petrou, M. F., Harries, K. A. 2001. « Fatigue behavior of RC beams
strengthened with GFRP sheets ». Journal of Composites for Construction, vol. 5, No. 4, p. 246-253.
Pellegrino, C., Modena, C. 2002. « Fiber reinforced polymer shear strengthening of
reinforced concrete beams with transverse steel reinforcement ». Journal of Composites for Construction, vol. 6, No. 2, p. 104-111.
Pellegrino, C., Vasic, M. 2013. « Assessment of design procedures for the use of externally
bonded FRP composites in shear strengthening of reinforced concrete beams ». Composites Part B: Engineering, vol. 45, No. 1, p. 727-741.
Quattlebaum, J., Harries, K., Petrou, M. 2005. « Comparison of three flexural retrofit systems
under monotonic and fatigue loads ». Journal of Bridge Engineering, vol. 10, No. 6, p. 731-740.
Rosenboom, O., Rizkalla, S. 2006. « Behavior of prestressed concrete strengthened with
various CFRP systems subjected to fatigue loading ». Journal of Composites for Construction, vol. 10, No. 6, p. 492-502.
Rosenboom, O., Walter, C., Rizkalla, S. 2009. « Strengthening of prestressed concrete
girders with composites: Installation, design and inspection ». Construction and Building Materials, vol. 23, No. 4, p. 1495-1507.
Sas, G. 2008. « FRP shear strengthening of RC beams and walls ». Licentiate thesis LTU-
LIC-0839-SE, Sweden, Luleå, Luleå University of Technology, 107 p. Sato, Y., Katsumata, H., Kobatake, Y. 1997. « Shear strengthening of existing reinforced
concrete beams by CFRP sheet ». Proc. 3rd Int. Symp., Non-Metallic (FRP) Reinforcement for Concrete Structures (FRPRCS-3), Japan Concrete Institute (JCI), Tokyo, 507–514.
Sena-Cruz, J. M., Barros, J. A. O., Coelho, M. R. F., Silva, L. F. F. T. 2012. « Efficiency of
different techniques in flexural strengthening of RC beams under monotonic and fatigue loading ». Construction and Building Materials, vol. 29, No. 0, p. 175-182.
265
Shahawy, M., Beitelman, T. 1999. « Static and fatigue performance of RC beams strengthened with CFRP laminates ». Journal of Structural Engineering, vol. 125, No. 6, p. 613-621.
Soudki, K. A., Rteil, A. A., Al-Hammoud, R., Topper, T. H. 2007. « Fatigue strength of
fibre-reinforced-polymer-repaired beams subjected to mild corrosion ». Canadian Journal of Civil Engineering, vol. 34, No. 3, p. 414-421.
Täljsten, B. 2003. « Strengthening concrete beams for shear with CFRP sheets ».
Construction and Building Materials, vol. 17, No. 1, p. 15-26. Täljsten, B. 2006. FRP strengthening of existing concrete structures-design guideline, fourth
edition. Sweden: Luleå University of Technology, 228 p. Täljsten, B., Elfgren, L. 2000. « Strengthening concrete beams for shear using CFRP-
materials: evaluation of different application methods ». Composites Part B: Engineering, vol. 31, No. 2, p. 87-96.
Teng, J. G., Chen, G. M., Chen, J. F., Rosenboom, O. A., Lam, L. 2009. « Behavior of RC
beams shear strengthened with bonded or unbonded FRP wraps ». Journal of Composites for Construction, vol. 13, No. 5, p. 394-404.
Teng, J., Chen, J., Smith, S., Lam, L. 2002. FRP-strengthened RC structures, first edition.
UK: Wiley, 266p. Tilly, G. P., Moss, D. S. 1982. « Long endurance fatigue of steel reinforcement ». Fatigue of
Steel and Concrete Structures, p. 229-238. Toutanji, H., Zhao, L., Deng, Y., Zhang, Y., Balaguru, P. 2006. « Cyclic behavior of RC
beams strengthened with carbon fiber sheets bonded by inorganic matrix ». Journal of Materials in Civil Engineering, vol. 18, No. 1, p. 28-35.
TR55. 2004. Design guidance for strengthening concrete structures using fibre composite
materials TR55-04, Crowthorne, UK: Britich Concrete Society Concrete Society Technical Report 55.
Triantafillou, T. C., Antonopoulos, C. P. 2000. « Design of concrete flexural members
strengthened in shear with FRP ». Journal of Composites for Construction, vol. 4, No. 4, p. 198-205.
Uji, K. 1992. « Improving shear capacity of existing reinforced concrete members by
applying carbon fiber sheets ». Transactions of the Japan Concrete Institute, vol. 14, p. 253-266.
266
Wahab, N., Soudki, K. A., Topper, T. 2011. « Mechanics of bond fatigue behavior of concrete beams strengthened with NSM CFRP rods ». Journal of Composites for Construction, vol. 15, No. 6, p. 934-942.
Wahab, N., Soudki, K. A., Topper, T. 2012. « Experimental investigation of bond fatigue
behavior of concrete beams strengthened with NSM prestressed CFRP rods ». Journal of Composites for Construction, vol. 16, No. 6, p. 684-692.
Wang, Y. C., Lee, M. G., Chen, B. C. 2007. « Experimental study of FRP-strengthened RC
bridge girders subjected to fatigue loading ». Composite Structures, vol. 81, No. 4, p. 491-498.
Williams, G., Higgins, C. 2008. « Fatigue of diagonally cracked RC girders repaired with
CFRP ». Journal of Bridge Engineering, vol. 13, No. 1, p. 24-33. Wu, Z. Y. 2004. « Etude expérimentale du comportement des poutres courtes en béton armé
pré-fissurées et renforcées par matériaux composites sous chargement statique et de fatigue ». Doctoral thesis, France, Ecole des Ponts ParisTech, 242 p.
Xie, J. H., Huang, P. Y., Guo, Y. C. 2012. « Fatigue behavior of reinforced concrete beams
strengthened with prestressed fiber reinforced polymer ». Construction and Building Materials, vol. 27, No. 1, p. 149-157.
Yost, J. R., Gross, S. P., Deitch, M. J. 2007. "Fatigue behavior of concrete beams
strengthened in flexure with near surface mounted CFRP." In Proceedings of the 8th International Symposium on Fiber Reinforced Polymer Reinforcement for Reinforced Concrete Structures (FRPRCS8), University of Patras, Patras, Greece. p. 16-18.
Yu, T., Li, C., Lei, J., Zhang, H. 2011. « Fatigue of concrete beams strengthened with glass-
fiber composite under flexure ». Journal of Composites for Construction, vol. 15, No. 4, p. 557-564.
Zhao, L. 2005. « Characterizations of RC beams strengthened with carbon fiber sheets : a
dissertation ». PhD thesis, University of Alabama, Tuscaloosa, AL, USA, 197 p. Zorn, A. V. 2006. « Effect of adhesive stiffness and CFRP geometry on the behavior of
externally bonded CFRP retrofit measures subject to fatigue loads ». Master of Science thesis, United States, University of Piffsburgh, 93 p.