Embed Size (px)
Citation preview
1
FACULTÉS UNIVERSITAIRES NOTRE-DAME DE LA PAIX
NAMUR ____________________________________________________________________________________________________________________________________________________________________________________
Faculté des Sciences économiques et sociales CRED Centre de Recherche en Économie du Développement
LAND TENURE UNDER UNENDURABLE STRESS:
RWANDA CAUGHT IN THE MALTHUSIAN TRAP
Catherine ANDRÉ Jean-Philippe PLATTEAU
January 1996
CAHIERS DE LA FACULTÉ DES SCIENCES ÉCONOMIQUES ET SOCIALES N° 164 Collection «Développements
2
CAHIERS DE LA FACULTE DES SCIENCES ECONOMIQUES ET SOCIALES DE NAMUR
SERIE RECHERCHE - N° 164 - 1996/7
Collection "Développement"
LAND TENURE
UNDER UNENDURABLE STRESS:
RWANDA CAUGHT IN THE MALTHUSIAN TRAP
by Catherine ANDRÉ and Jean-Philippe PLATTEAU
January 1996 Centre de Recherche en Économie du Développement (CRED) Facultés Universitaires Notre-Dame de la Paix
Faculté des Sciences économiques et sociales
8 Rempart de la Vierge
B - 5000 NAMUR (Belgique)

3
Les Cahiers de la Faculté des Sciences économiques et sociales de Namur présentent des travaux du corps académique et scientifique de la Faculté et sont regroupés en trois séries :
Série : Cahiers de Recherche (couverture bleue)
Série : Synthèses
(couverture beige) Cette série remplace la série
Cahiers de Formation Continuée
Série : Points de Vue
(couverture verte)
Ces cahiers reflètent les opinions et réflexions de leur auteur. Elles ne sont pas nécessairement partagées par ses collègues et n'engagent pas les Facultés.
Adresse de contact
Faculté des Sciences économiques et sociales, Facultés Universitaires Notre-Dame de la Paix, Rempart de la Vierge, 8 B - 5000 NAMUR Belgique
4
LAND TENURE UNDER UNENDURABLE STRESS : RWANDA CAUGHT IN THE MALTHUSIAN TRAP
by
Catherine André and Jean-Philippe Platteau
Centre de Recherche en Economie du Développement (CRED) Faculty of Economics, University of Namur,
8, Rempart de la Vierge B - 5000 Namur, Belgium
Tel: (81) 724860, Fax: (81) 724840
September 1995 Abstract: This paper reports the findings of an in-depth case study of a highly densely populated area in the Northwest of Rwanda which has been conducted during the period 1988-1993. It demonstrates that acute competition for land in a context characterized by too slow expansion of non-agricultural income opportunities has resulted in increasingly unequal land distribution and rapid processes of land dispossession through both operation of the (illegal) land market and evolution of indigenous tenure arrangements. It is also shown that pervasive incidence of land disputes and the threat of landlessness have led to rising tensions in social relations and even within the core of family li&, thus paving the way for more and more overt expressions of disharmony and violence. A connection between these ominous conditions and the civil rear that broke out in 1994 is established.
5
I. Objective and framework of the study* The statement of the problem
The question of which land tenure system is appropriate for present-day Sub-Saharan Africa (henceforth denoted by SSA) has come to the foreground of discussions of structural reforms in the agricultural sector of African countries. This is so because there is much worry not only about the stagnation of agricultural production and the mismanagement of natural resources in these countries but also about the allocation problems that inevitably arise when land becomes scarce and there are no well-defined, legally sanctioned rights to protect the land possessors.
An important strand of the economic literature makes the point that nothing short of full-fledged land titling or fully developed private property rights (including the right to freely dispose of the land without requiring any sort of approval) can maintain the growth potential of (African) regions subject to rapid population growth and increasing commercialization of agriculture [see, e.g., Demsetz, 1967; Johnson, 197?; Alchian and Demsetz, 1973; Posner, 1977; Ault and Rutman, 1979; Feeny, 1988]. It strongly emphasizes the positive economic effects that will result from formal registration of land rights, on the planes of allocative efficiency as well as capital accumulation and resource conservation.
Very few countries in SSA have actually followed that path. The most outstanding case is Kenya (where land pressure is indeed very acute) which has had the most extensive land registration program over the past three or four decades and has therefore attracted a lot of attention from researchers interested in assessing the impact of individualized land titling. Contrary to the optimistic predictions of the property rights doctrine, however, the evidence accumulated so far raises serious doubts about the effectiveness of land titling as a means to enhance agricultural growth and to increase security of tenure in SSA [for recent surveys, see Atwood, 1990; Bruce, 1993; Bruce and Migot-Adholla, 1994; Platteau, 1996]i. More specifically, empirical studies tend to show that land registration creates room for increased insecurity among vulnerable sections of the population; that it does not activate the land market in any significant way and, in particular, it does not cause a reversal of land fragmentation processes nor does it lead to a better allocation of land (in many cases, land buyers turn out to be absentee owners), that it does not perceptibly improve smallholders' access to credit (through the land collateral effect); and, finally, that there is no unambiguous indication that it stimulates land improvements and increases agricultural yields.
In view of such evidence, a growing number of Africa specialists have come to share the view that, except in some particular circumstances where indigenous tenure systems are obviously unable to regulate access to land in an orderly manner (either because they do not exist, like in new settlement areas, or because traditional lines of authority have been severed and loyalties to lineage and communal groups eroded), the state should refrain from following the costly route of systematic land titling [see, e.g., Bruce, 1986; Atwood, 1990, Migot-Adholla et al., 1991; Lawry, 1993; Saul, 1993; Bruce et al., 1994; Blarel, 1994; Platteau, 1996; Hesseling, 1992; Pinckney and Kimuyu, 1994). This is especially so because, under the joint impact of population growth and agricultural
6
commercialization, African rural societies do gradually evolve towards more and more individualized land tenure, that is, towards forms of land possession more suitable to an intensive agriculture that requires sizeable capital investments and land improvements is well as many husbandry skills and difficult-to-monitor labour efforts where quality matters a great deal. To formalize the newly emerging rights through a centralized procedure of land titling would thus involve heavy avoidable costs (particularly so in conditions of highly fragmented holdings as are typically observed in SSA) while bringing dubious benefits (which is obvious when land records hardly reflect the current reality because changes in land rights are too frequent and complex to be diligently recorded).
As a consequence, rather than trying to overrule or supersede village communities and their indigenous land tenure arrangements through the imposition of a formal centralized system of regulation, African states ought to adopt an approach aimed at strenghtening local capacities for management, information and dispute settlement. Such an approach stressing cooperation and negotiation instead of confrontation with local communities would rest on the realistic assessment that they form living and continuously evolving systems that have at their disposal many effective means to preempt or subvert any change ushered in from without which has not met their prior approval.
Although, as a matter of principle. we are sympathetic to this flexible approach that relies as much as possible on informal decentralized mechanisms, there is a basic fact that cannot be overlooked: when land pressure becomes too strong and there are no alternative outlets for the excess numbers depending on land resources. no mechanism, decentralized though it may be, can succeed in deflecting or suppressing the tensions arising from land scarcity. Whatever the adaptability of indigenous land tenure systems under conditions of changing factor endowments, the evolving land rights will sooner or later lead to a stalemate if the creation of viable income opportunities through technical advances in agriculture or the expansion of non-agricultural employment is not rapid enough to catch up with population growth.
In such circumstances where the evolutionary mechanism is more successful in adapting rights and rules than in creating new income-earning possibilities, the absence of vigorous public intervention aimed at correcting this partial evolutionary failure is bound to lead to a crisis situation in which the new rules themselves cannot any more regulate the relations between people and the scarce assets. Chaos ensues because stress is so acute that the prevailing rules or practices come increasingly to be viewed by many people as profoundly unfair, implying that they lack the basic attribute of a rights system, that is, social recognition by others or mutual agreement in the sense of "equal and reciprocal respect" [Buchanan, 1975: 12). The task set for the present paper is precisely to illustrate this disheartening possibility with specific reference to the tragic case of Rwanda and, more particularly, to a very densely populated area of that country. In that area, indeed, land pressure had reached (before the recent civil war) such alarming proportions that the customary system of land tenure could not any more cope satisfactorily with the current challenges in spite of profound transformations induced from within. As will be suggested, this deadlock is not unrelated to the appalling bloodshed that devastated Rwanda in April 1994.
7
Study area and methodology used
The study area is located in the northwestern part of Rwanda which is among the country's most fertile regions (since its soils are volcanic) but also among the most densely populated ones. It belongs to the commune of Kanama in the Prefecture of Gisenyi and corresponds to the lowest administrative unit known as the rellule (cell). It is worth stressing that the cell surveyed (henceforth denoted by N) is particularly privileged because it is situated closely to the administrative centre of the commune, to an important school centre (with both primary and secondary cycles), to one of the most active markets of the region, and to the main road link between Kigali (the capital city) and Gisenyi (on the border with Zaire). In 1993, N comprised 596 inhabitants, to be compared with 509 inhabitants in 1988, an increase corresponding to an annual growth rate of 3.290. The corresponding population densities are exceptionally high: 787 persons per square kilometer in 1993 as against 672 in 1988.
Agriculture constitutes the dominant occupation in N. Beans and sweet potatoes are the mainstay of local subsistence production (maize is clearly on the decline) while bananas (for beer-making), tea and coffee (the latter in a declining proportion) are the most significant cash crops. Like elsewhere in Rwanda, agricultural techniques remain rudimentary: the hoe is still the main tool used by the farmers and modern inputs (e.g., compost, chemical fertilizers, new seed varieties) are very rarely used in the production process. Intensification of agricultural practices is clearly not sufficient to satisfy food requirements for many households and this compels them to look for alternative income-earning opportunities'-. In Kanama commune, it has been estimated that only 77% of calorie, 73% of protein and 1590 of lipid needs are currently met, which is comparatively low even in terms of Rwandan standards (Government of Rwanda, 1988]. Many pastures have been graduallly converted into agricultural lands and cattle has practically disappeared from N3. Finally, given the tragic events that were soon to break out, it bears emphasis that the population of N is ethnically homogeneous, all the people (except one woman) heing Hutus.
This study seeks to characterize the impact of land tenure individualization and the rising incidence of market transactions on the social fabric of village communities subject to rapid population growth. In other words, while many recent studies have predominantly dealt with the effects of tenure security on agricultural yields and investment, the present effort will focus on equity impacts, variations in tenure security, and the distribution of land rights. This implies that attention be drawn to land conflicts and litigation so as to better identify the points of tension that are created by rising land pressure. In particular, exclusionary processes need to be highlighted as well as the respective roles of indigenous modes of access to land and market transactions in shaping these processes.
A thorough understanding of these issues requires a kind of information that is especially hard to come by because it concerns the sphere of private relations between individuals who may be closely related. To win the inhabitants' trust, a long period of immersion in their daily life experiences is necessary and participant observation must complement data collected more formally through the usual channel of survey questionnaires. This is why one of the authors (C. André)
8
spent about sixteen months in N in two different periods separated by a five-year interval (1988-1993). The second, actually longer period spent in N enabled us, besides gathering new information on aspects left aside in the earlier period (such as daily patterns of household expenditures and asset transactions), to follow up and to systematize the collection of certain informations collected in 1988 (on landholdings, land transactions, land disputes, credit and incomes). Particularly noteworthy is the fact that in the latter survey year land disputes have been carefully recorded from a day-to-day observation of events occurring in all the sampled households over a course of almost one year (whereas in 1988 information about them was obtained by just calling up the memory of the households surveyed).
The remainder of the paper comprises two main sections followed by a conclusion. In section 11, the distribution of landholdings and the way it is influenced by market-mediated modes of land acquisition are examined. This is with a view to determining whether population pressure has led to to an "involution" process affecting all local people more or less similarly, or, else, to the marginalization or even exclusion of some categories of insiders. In the latter eventuality, one of the main advantages of indigenous systems of land tenure would be destroyed, namely that of providing economic security to all the group members, which should be regarded as a positive contribution in a generally insecure economic environment4. After a brief summary of the main findings obtained so far, this line of inquiry is actually pursued in section III where land conflicts are scrutinized in order to check whether marginalization and exclusion can occur not only via the market but also through re-interpretations or restrictive applications of indigenous land customs and practices. Our findings are then used to put the civil war which tore the country apart during 1994 into the right perspective. In Section IV, the conclusive part, policy implications are drawn and, in particular, the question is asked whether the establishment of formal private property rights could have alleviated land-tenure problems both from an efficiency and an equity points of view. II Patterns of landholdings and the impact of land transactions Farm Sizes and bind Fragmentation
Our sample for the year 1993 comprises 87 households out of a total of 124 households living in N (that is, a proportion of 70%) while the size of our 1988 sample is 56 households out of a total of 108 (a proportion of 52%). In constructing the samples, we have partially followed the 'permanent population' approach in the sense that we ignored all households which joined or left the hill of N during the period 1988-1993 but retained those which splitted or persisted after the father's death in the same period. Note that two household heads passed away between our two survey years and both of them owned comparatively large amounts of land in 19885. The lands of one of these households were inherited by the (unique) son who formed his own household after his father's death. As for the lands of the other deceased household head, they were transferred to non-residents (following a land dispute which prevented the sons to inherit) and were therefore subtracted from the land asset base available to N residents in 1993. Allowing for splitting households, we find that 57 of the households included in the 1993 sample can be traced hack to the 1988 sample. Note carefully that, for the year 1993, there are no substantial
9
differences in the results whether they are based on the restricted sample of 57 households coming from the 1988 survey or on the larger set of 87 households actually interviewed in 1993. By retaining the larger sample, we do not therefore alter the outcome of the permanent population method while we make maximum use of the data available to us.
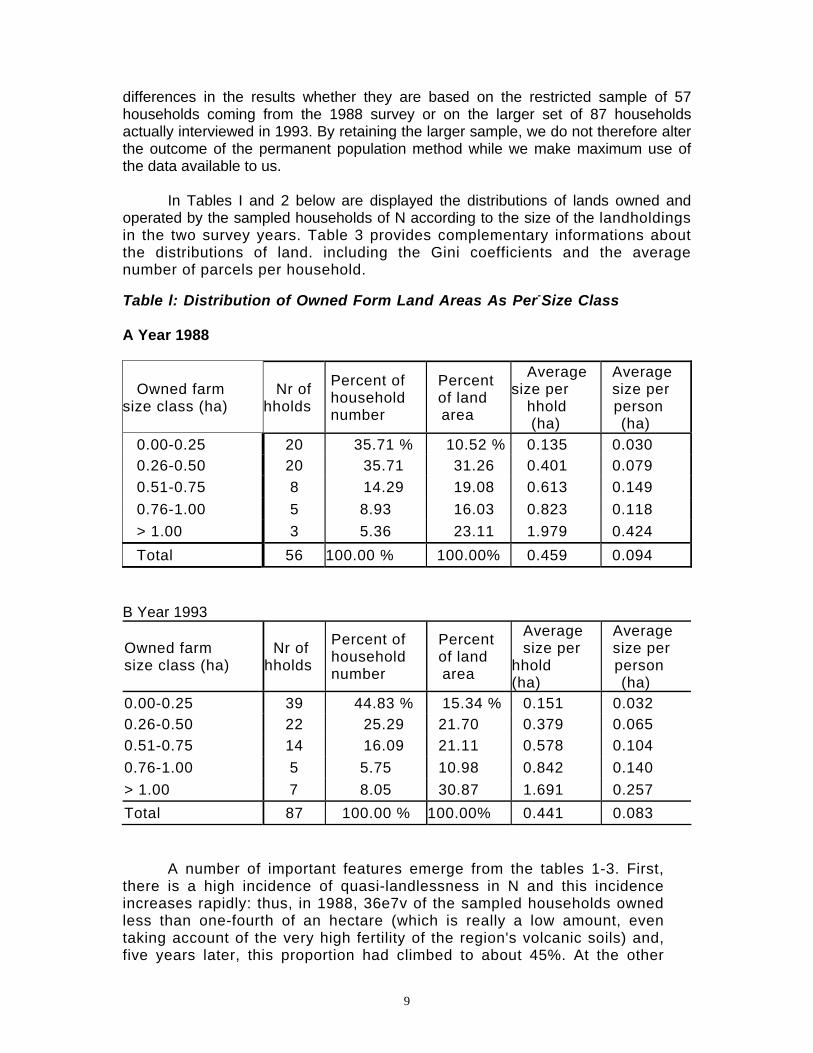
In Tables I and 2 below are displayed the distributions of lands owned and operated by the sampled households of N according to the size of the landholdings in the two survey years. Table 3 provides complementary informations about the distributions of land. including the Gini coefficients and the average number of parcels per household.
Table l: Distribution of Owned Form Land Areas As Per-Size Class
A Year 1988
Owned farm size class (ha)
Nr of hholds
Percent of household number
Percent of land area
Average size per
hhold (ha)
Average size per person (ha)
0.00-0.25 20 35.71 % 10.52 % 0.135 0.030 0.26-0.50 20 35.71 31.26 0.401 0.079 0.51-0.75 8 14.29 19.08 0.613 0.149 0.76-1.00 5 8.93 16.03 0.823 0.118 > 1.00 3 5.36 23.11 1.979 0.424 Total 56 100.00 % 100.00% 0.459 0.094
B Year 1993
Owned farm size class (ha)
Nr of hholds
Percent of household number
Percent of land area
Average size per
hhold (ha)
Average size per person (ha)
0.00-0.25 39 44.83 % 15.34 % 0.151 0.032 0.26-0.50 22 25.29 21.70 0.379 0.065 0.51-0.75 14 16.09 21.11 0.578 0.104 0.76-1.00 5 5.75 10.98 0.842 0.140 > 1.00 7 8.05 30.87 1.691 0.257 Total 87 100.00 % 100.00% 0.441 0.083
A number of important features emerge from the tables 1-3. First, there is a high incidence of quasi-landlessness in N and this incidence increases rapidly: thus, in 1988, 36e7v of the sampled households owned less than one-fourth of an hectare (which is really a low amount, even taking account of the very high fertility of the region's volcanic soils) and, five years later, this proportion had climbed to about 45%. At the other
10
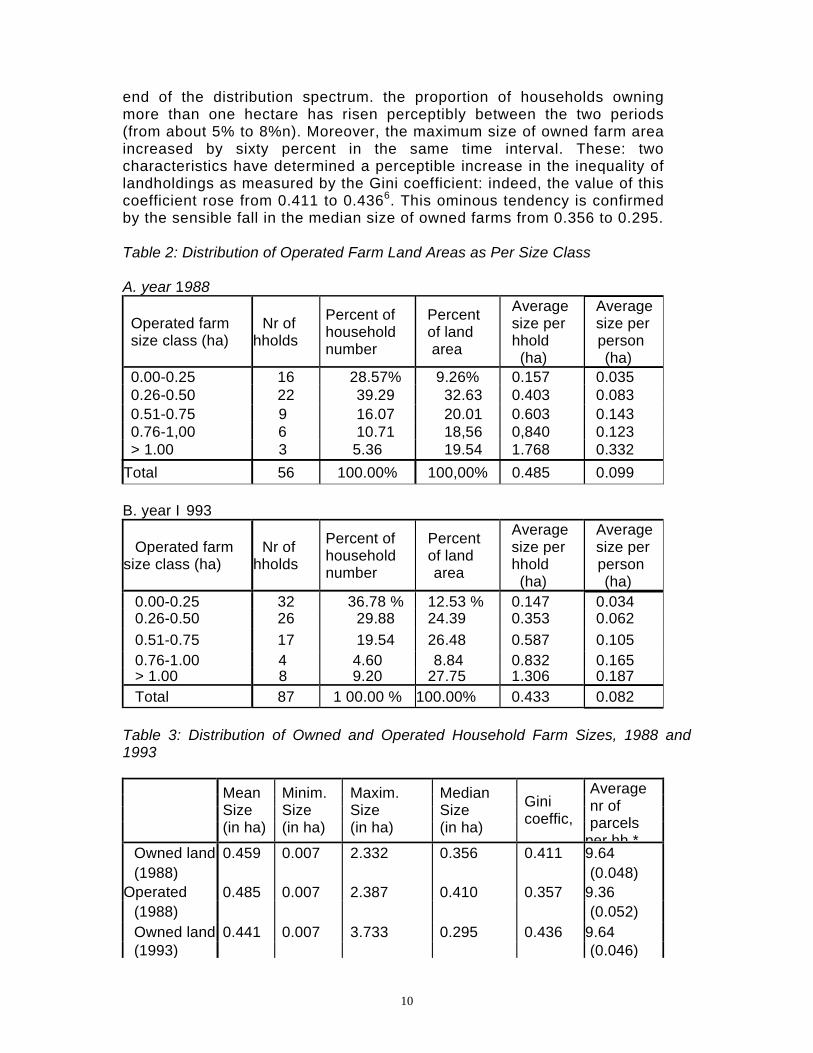
end of the distribution spectrum. the proportion of households owning more than one hectare has risen perceptibly between the two periods (from about 5% to 8%n). Moreover, the maximum size of owned farm area increased by sixty percent in the same time interval. These: two characteristics have determined a perceptible increase in the inequality of landholdings as measured by the Gini coefficient: indeed, the value of this coefficient rose from 0.411 to 0.4366. This ominous tendency is confirmed by the sensible fall in the median size of owned farms from 0.356 to 0.295. Table 2: Distribution of Operated Farm Land Areas as Per Size Class A. year 1988
Operated farm size class (ha)
Nr of hholds
Percent of household number
Percent of land area
Average size per hhold (ha)
Average size per person (ha)
0.00-0.25 16 28.57% 9.26% 0.157 0.035 0.26-0.50 22 39.29 32.63 0.403 0.083 0.51-0.75 9 16.07 20.01 0.603 0.143 0.76-1,00 6 10.71 18,56 0,840 0.123 > 1.00 3 5.36 19.54 1.768 0.332
Total 56 100.00% 100,00% 0.485 0.099 B. year I 993
Operated farm size class (ha)
Nr of hholds
Percent of household number
Percent of land area
Average size per hhold (ha)
Average size per person (ha)
0.00-0.25 32 36.78 % 12.53 % 0.147 0.034 0.26-0.50 26 29.88 24.39 0.353 0.062 0.51-0.75 17 19.54 26.48 0.587 0.105 0.76-1.00 4 4.60 8.84 0.832 0.165 > 1.00 8 9.20 27.75 1.306 0.187 Total 87 1 00.00 % 100.00% 0.433 0.082
Table 3: Distribution of Owned and Operated Household Farm Sizes, 1988 and 1993
Mean Size (in ha)
Minim. Size (in ha)
Maxim. Size (in ha)
Median Size (in ha)
Gini coeffic,
Average nr of parcels
per hh *Owned land 0.459 0.007 2.332 0.356 0.411 9.64 (1988) (0.048)
Operated 0.485 0.007 2.387 0.410 0.357 9.36 (1988) (0.052) Owned land 0.441 0.007 3.733 0.295 0.436 9.64 (1993) (0.046)
11
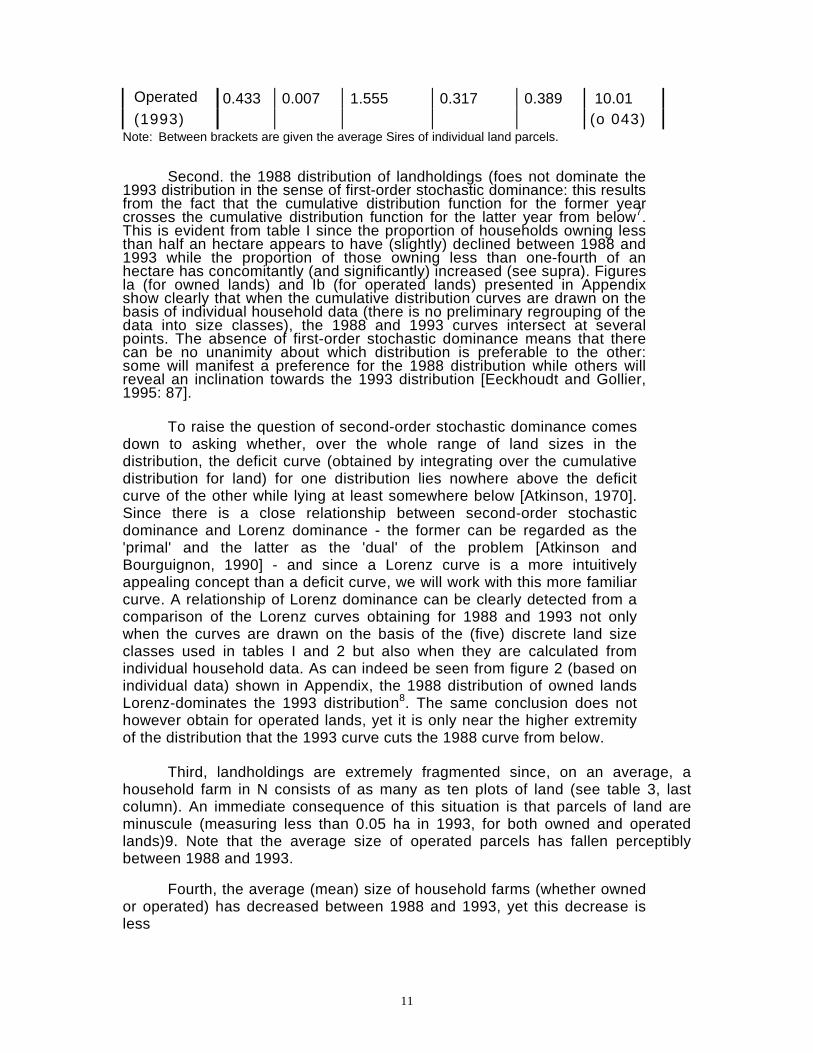
Operated 0.433 0.007 1.555 0.317 0.389 10.01 (1993) (o 043)
Note: Between brackets are given the average Sires of individual land parcels.
Second. the 1988 distribution of landholdings (foes not dominate the 1993 distribution in the sense of first-order stochastic dominance: this results from the fact that the cumulative distribution function for the former year crosses the cumulative distribution function for the latter year from below7. This is evident from table I since the proportion of households owning less than half an hectare appears to have (slightly) declined between 1988 and 1993 while the proportion of those owning less than one-fourth of an hectare has concomitantly (and significantly) increased (see supra). Figures la (for owned lands) and Ib (for operated lands) presented in Appendix show clearly that when the cumulative distribution curves are drawn on the basis of individual household data (there is no preliminary regrouping of the data into size classes), the 1988 and 1993 curves intersect at several points. The absence of first-order stochastic dominance means that there can be no unanimity about which distribution is preferable to the other: some will manifest a preference for the 1988 distribution while others will reveal an inclination towards the 1993 distribution [Eeckhoudt and Gollier, 1995: 87].
To raise the question of second-order stochastic dominance comes down to asking whether, over the whole range of land sizes in the distribution, the deficit curve (obtained by integrating over the cumulative distribution for land) for one distribution lies nowhere above the deficit curve of the other while lying at least somewhere below [Atkinson, 1970]. Since there is a close relationship between second-order stochastic dominance and Lorenz dominance - the former can be regarded as the 'primal' and the latter as the 'dual' of the problem [Atkinson and Bourguignon, 1990] - and since a Lorenz curve is a more intuitively appealing concept than a deficit curve, we will work with this more familiar curve. A relationship of Lorenz dominance can be clearly detected from a comparison of the Lorenz curves obtaining for 1988 and 1993 not only when the curves are drawn on the basis of the (five) discrete land size classes used in tables I and 2 but also when they are calculated from individual household data. As can indeed be seen from figure 2 (based on individual data) shown in Appendix, the 1988 distribution of owned lands Lorenz-dominates the 1993 distribution8. The same conclusion does not however obtain for operated lands, yet it is only near the higher extremity of the distribution that the 1993 curve cuts the 1988 curve from below.
Third, landholdings are extremely fragmented since, on an average, a household farm in N consists of as many as ten plots of land (see table 3, last column). An immediate consequence of this situation is that parcels of land are minuscule (measuring less than 0.05 ha in 1993, for both owned and operated lands)9. Note that the average size of operated parcels has fallen perceptibly between 1988 and 1993.
Fourth, the average (mean) size of household farms (whether owned or operated) has decreased between 1988 and 1993, yet this decrease is less
12
important than the decline in the average amount of land available per person (compare the first column of table 3 with the last column of tables 1 and 2, A and B)10. This discrepancy arises because the average size of households in N has significantly increased between 1988 and 1993: thus, while a household contained 4.87 persons. on an average, in 1988, this number rose to 5.28 persons 1993. What this finding seems to indicate is that growing land hunger has the effect of making it increasingly difficult for young adults to leave their parents and to set up their own household. Thus, it is revealing that the average size of households headed by relatively old persons (more than fifty years of age) increased appreciably between 1988 and 1993 (from 3.95 to 4.26); as will be seen later (table 14), the rise is much more important still when only households headed by persons in their fifties are considered. The presumption is therefore that youngsters in the lower landownership classe, marry later and later owing to a lack of inheritable land and to insufficient opportunities to acquire additional land through the market. Since we do not have data about ages at marriage, the proportion of children in age of marriage who are still living with their parents is used as a proxy. As is evident from table 4, the proportion of boys living with their parents has increased perceptibly between the two survey years, whether we consider youth belonging to the 20-25 or to the 25-30 age category11. As shall be argued in the next section. such a situation is not without creating serious tensions between older and younger members of the households. Table 4 : Proportions of Children in Age of Marriage Still Living with their Parents, 1988 and 1993 Year Children aged 20-25 years Children aged 25-30 years
Boys Girls Total Boys Girls Total 1988 71.4% 39.9% 48.0% 20.0% 18.2% 19.2% 1993 100.0% 66.7% 80.5% 33.3% 8.3% 16.7%
The above situation is not specific to N but has characterized the whole region during the eighties and early nineties. In the words of Jennifer Olson: "Meanwhile, population densities continued to increase but the outlet of migration became less of an option since almost all land in the East had been claimed and settled. The capital city Kigali offered some opportunities for educated young people but jobs were restricted because the economy had grown very slowly. The result was that income earned by farmers declined, that the number and proportion of extremely poor farmers increased, and that many young people were unable to afford marriage and foresaw a bleak future for themselves" [Olson, 1995: 219].
Fifth, the incidence of various sorts of temporary land transfers (land rentals,
loans and possessory mortgages) in N is not large, especially in the latter year: as a matter of fact, contrary to expectations, lands rented in (or borrowed or taken under a mortgage contract) as a percentage of lands operated in our sample has decreased dramatically from about 11% in 1988 to barely 570 in 1993 (see infra, table 8). A plausible explanation for this atypical evolution is the following: rising tensions arising both from more and more acute scarcity of land at the local level and from dangerously increasing political instability at the national and regional
13
levels have made people increasingly wary of getting involved in land rental transactions.
Land rentals and other temporary transfers have had a moderate impact on the situation of the lowest landowning groups. As is evident from a comparison of tables I and 2. the proportion of households with less than one-fourth of an hectare is somewhat smaller when operated rather than owned lands are considered (297• as against 36/v in 1988 and 3790 as against 45% in 1993). As for the (cumulative) proportion of households with less than half an hectare, it also falls, but only slightly, when allowance is made for land rentals: from 7170 to 68.0% in 1988 and from 70% to 67% in 1993. In addition, the average farm size per household member in the quasi-landless group increased from 0.030 to 0.035 ha in 1988 and from 0.032 to 0.034 ha in 1993 through non-sale land transactions. Also, the median farm size for operated lands is larger than for owned lands, more significantly so in 1988 when the incidence of these transactions was relatively important (see table 3). Finally, we expect to see the role of nonsale land transactions as a factor mitigating land endowment differentials to be reflected in lower Gini values for operated lands. This is confirmed in table 3 from where it is apparent that the Gini value has decreased by more than 1070 between owned and operated lands. The same finding comes out of a comparison of Lorenz curves for both types of lands in either year: the distribution of operated lands Lorenz-dominates the distribution of owned lands (see Figure 2 in Appendix).
The importance of off-farm monetary incomes
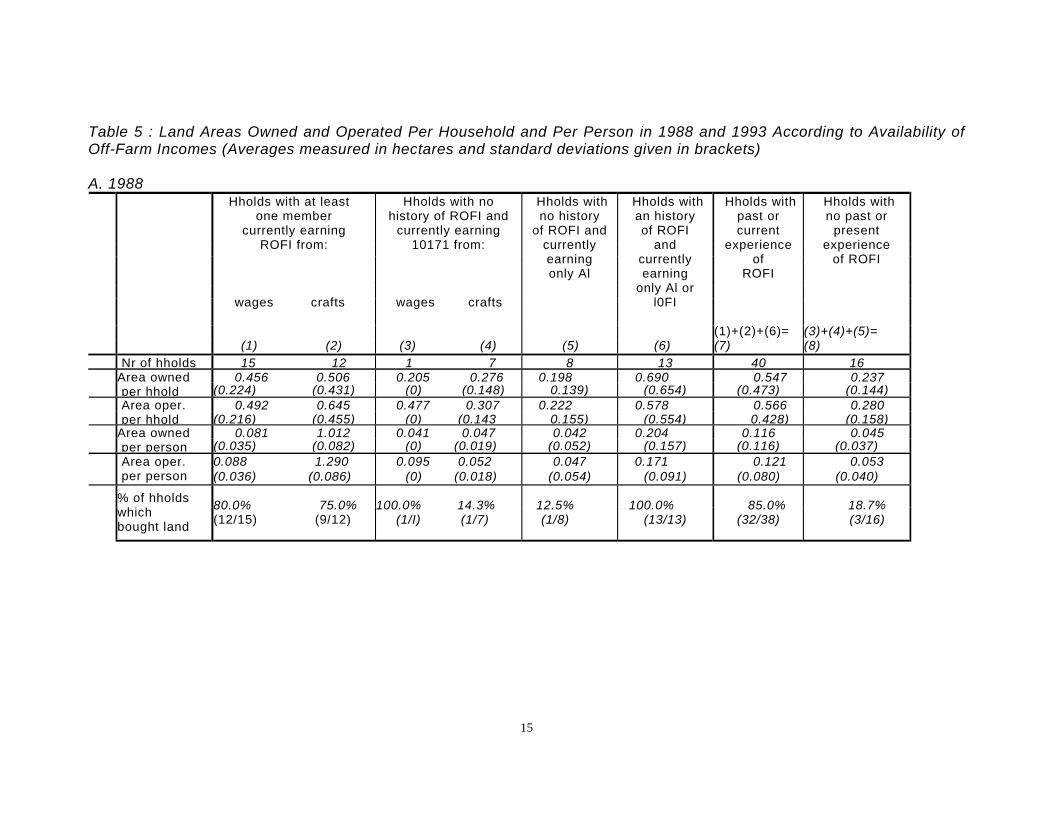
Since most landholdings are so small and since no technological breakthrough has occurred in agriculture to drive land productivity up in a significant and continuous manner, it is evident that the residents of N must rely on off-farm incomes to be able to make ends meet. An idea regarding the incidence of alternative income sources and its relationship to landownership position can be gleaned from table 5. A first thing to note is that a large majority of the sampled households currently earn off-farm incomes, whether from wage labour or from independent craftsmanship (carpentry, brick-making, etc): this was the case for almost 6370 of them in 1988 (35 out of a total of 56 households) and for 69% of them in 1993 (60 out of a total of 87). If attention is limited to regular off-farm incomes only, these proportions decrease to 48% (27/56 households) and 45% (39/87), respectively. Yet, if we club together the households currently earning regular off-farm incomes with those which earned such incomes for at least five consecutive years some time in the past but do not earn them any more in the present (see column 7 in table 4), the proportions work out to 71% (40/56 households) and 64% (56/87), respectively.
As for the relationship between the ownership position of the sampled households (in 1988 and 1993) and access to regular off-farm incomes, it is u priori ambiguous since it is the net outcome of two contradictory forces, one running from ownership position to off-farm incomes and the other one going in the opposite direction. Indeed, on the one hand, households located at the lowest rungs of the landownership ladder are those most in need of complementary off-farm incomes and they are therefore expected to be most actively searching for the corresponding employments. Yet, on the other hand, households with good
14
access to off-farm employment opportunities can use the proceeds of the incomes thus earned to purchase land and enlarge their farms. When the first effect outweighs the second effect, off-farm incomes cause incomes to equalize between unequally endowed households while, in the reverse case, they strengthen inequality by giving rise to a cumulative process of land accumulation in the hands of the better-endowed households. For the latter result to obtain, a crucial condition is that off-farm income opportunities, especially those of the regular type, are rationed and that, in the process of rationing, a category of people (particularly, those without the right connections or without the professional skills and experience) are discriminated against.
The results displayed in table 5 show that it is the latter eventuality that prevails in N. As a matter of fact, contrary to what is generally observed in Asia (see, e.g., Ho, 1979: 91-2, for Taiwan), the average farm size for households which have no history of regular off-farm incomes and currently earn only farm incomes is significantly lower than the earning regular off-farm incomes or having earned such incomes in the past for at least five consecutive years (statistical significance is obtained at 1% confidence level for both survey years)12. Thus, the area owned per household with present or past experience of regular off-farm incomes was 0.51 ha in 1993 (0.55 ha in 1988) to be compared with less than 0.20 ha for other types of households (0.24 ha in 1988). Differences in ownership position remain significant when the area owned (or operated) per household member is considered instead of the area per household. On the other hand, differences between farm sizes owned or operated by households with no experience of regular off-farm incomes (see column S) and those owned or operated by households which currently earn irregular off-farm incomes (see columns 3 and 4) are not statistically significant. Again, this result holds true whether the average farm size is calculated in terms of households or in terms of household members
It is worth noting, however, that in the 1993 sample the biggest landowner earned only agricultural incomes and did not have any history of regular off-farm incomes. By including it in column's 5 type, we would have increased the variance to such an extent that all comparisons with other categories would have been completely distorted (see the footnote below table 4). It must therefore be borne in mind that the conclusion stated above hold true, for 1993, only because we have ruled out an a-typical case. Granted this exception, it is correct to say that in N households with no access to regular off-farm income opportunities are households owning and operating comparatively small farms.
15
Table 5 : Land Areas Owned and Operated Per Household and Per Person in 1988 and 1993 According to Availability of Off-Farm Incomes (Averages measured in hectares and standard deviations given in brackets) A. 1988
Hholds with at least one member
currently earning ROFI from:
wages crafts (1) (2)
Hholds with no history of ROFI and
currently earning 10171 from:
wages crafts (3) (4)
Hholds with no history
of ROFI and currently earning only Al
(5)
Hholds with an history of ROFI
and currently earning
only Al or l0FI
(6)
Hholds withpast or current
experience of
ROFI (1)+(2)+(6)= (7)
Hholds with no past or
present experience
of ROFI (3)+(4)+(5)= (8)
Nr of hholds 15 12 1 7 8 13 40 16 0.456 0.506 0.205 0.276 0.198 0.690 0.547 0.237
Area owned per hhold (0.224) (0.431) (0) (0.148) 0.139) (0.654) (0.473) (0.144)
0.492 0.645 0.477 0.307 0.222 0.578 0.566 0.280
Area oper. per hhold (0.216) (0.455) (0) (0.143 0.155) (0.554) 0.428) (0.158)
0.081 1.012 0.041 0.047 0.042 0.204 0.116 0.045
Area owned per person (0.035) (0.082) (0) (0.019) (0.052) (0.157) (0.116) (0.037)
0.088 1.290 0.095 0.052 0.047 0.171 0.121 0.053
Area oper. per person (0.036) (0.086) (0) (0.018) (0.054) (0.091) (0.080) (0.040)
% of hholds which bought land
80.0% 75.0% (12/15) (9/12)
100.0% 14.3% (1/I) (1/7)
12.5% (1/8)
100.0% (13/13)
85.0% (32/38)
18.7% (3/16)
16
B 1993
Hholds with at least one member
currently earning ROM from:
wages crafts (1) (2)
Hholds with no history of ROFI andcurrently earning
IOFI from:
Wages crafts (3) (4)
Hholds with no history
of ROFI and currently earning only AI*
(5)
Hholds with an history
of ROFI and
currently earning
only AI or IOFI
(6)
Hholds with past or current
experience of
ROFI (1)+(2)+(6) =
(7)
Hholds with no past or
present experience
of ROM (3)+(4)+(5) =
(8)
Nr of hholds 12 27 5 16 9 17 56 30
0.478 0.514 0.184 0.213 0.160 0.534 0.512 0.198 Area owned per hhold 0.396) (0.349) (0.143) (0.197) (0.049) (0.388) (0.354) (0.159)
0.509 0.534 0.244 0.224 0.197 0.541 0.531 0.219Area oper. per hhold (0.399) (0.336) (0.181) (0.197) (0.056) (0.335) (0.350) (0.166)
0.072 0.087 0.042 0.041 0.047 0.121 0.091 0.043 Area owned per person (0.055) (0.059) (0.012) (0.069) (0.074) (0.106) (0.082) (0.067)
0.076 . 0.091 0.055 4.31 0.052 0.123 0.095 0.042Area oper. per person (0.054) (0.057) (0.024) (0.069) (0.072) (0.106) 0.081) (0.066)
% of hholds which
bought land
66.7% 81.5% (8/12) (22/27)
20.0% 18.7% (1/5) (3/16)
0.0% (0/9)
100.090 (17/17)
83.9% (47/56)
13.3% (4/30)
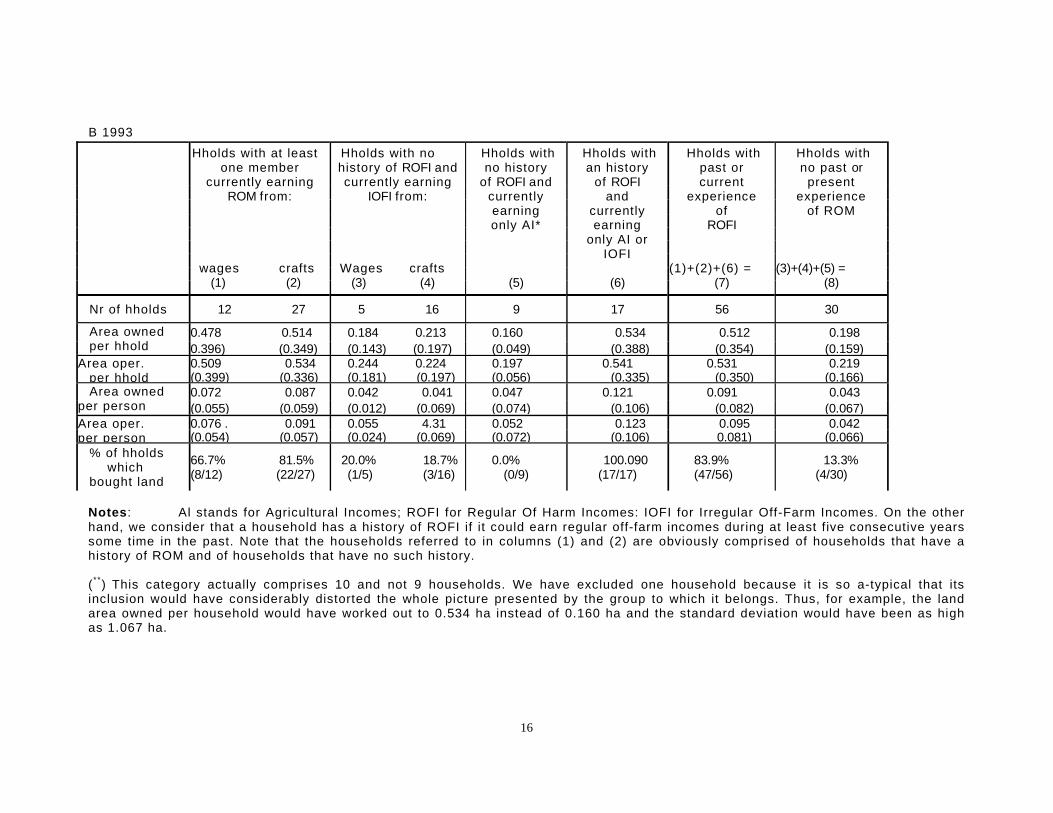
Notes: Al stands for Agricultural Incomes; ROFI for Regular Of Harm Incomes: IOFI for Irregular Off-Farm Incomes. On the other hand, we consider that a household has a history of ROFI if it could earn regular off-farm incomes during at least five consecutive years some time in the past. Note that the households referred to in columns (1) and (2) are obviously comprised of households that have a history of ROM and of households that have no such history. (**) This category actually comprises 10 and not 9 households. We have excluded one household because it is so a-typical that its inclusion would have considerably distorted the whole picture presented by the group to which it belongs. Thus, for example, the land area owned per household would have worked out to 0.534 ha instead of 0.160 ha and the standard deviation would have been as high as 1.067 ha.
17
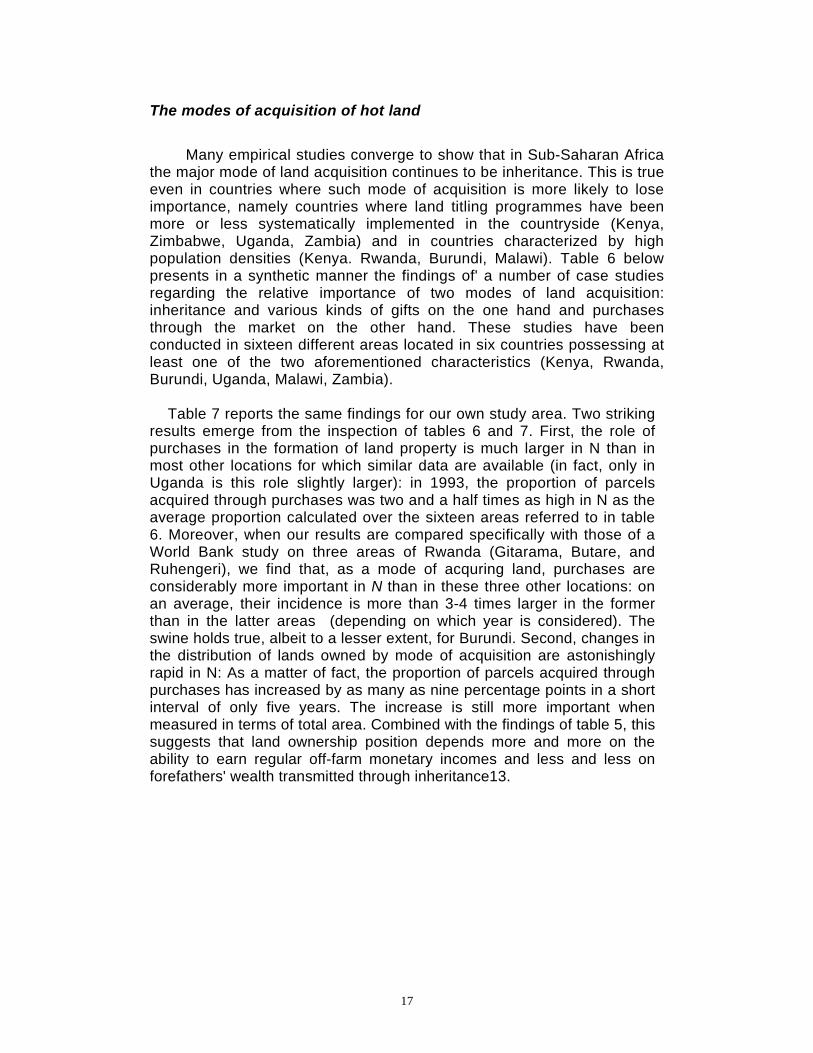
The modes of acquisition of hot land
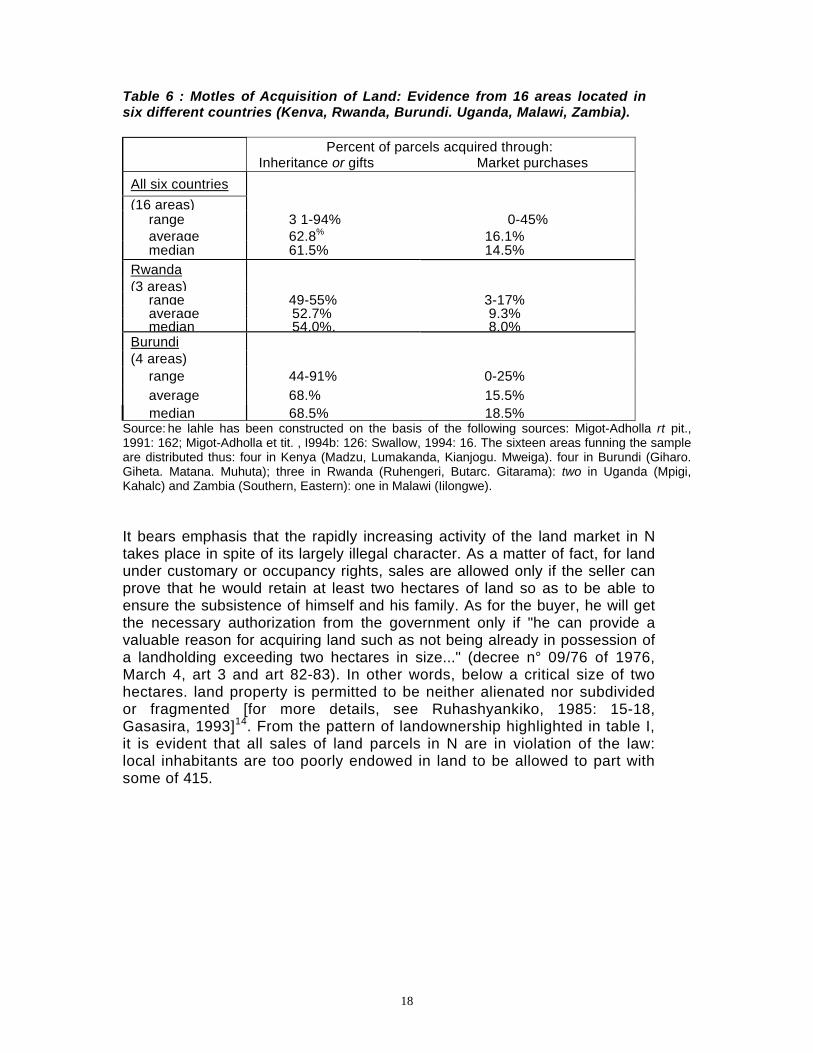
Many empirical studies converge to show that in Sub-Saharan Africa the major mode of land acquisition continues to be inheritance. This is true even in countries where such mode of acquisition is more likely to lose importance, namely countries where land titling programmes have been more or less systematically implemented in the countryside (Kenya, Zimbabwe, Uganda, Zambia) and in countries characterized by high population densities (Kenya. Rwanda, Burundi, Malawi). Table 6 below presents in a synthetic manner the findings of' a number of case studies regarding the relative importance of two modes of land acquisition: inheritance and various kinds of gifts on the one hand and purchases through the market on the other hand. These studies have been conducted in sixteen different areas located in six countries possessing at least one of the two aforementioned characteristics (Kenya, Rwanda, Burundi, Uganda, Malawi, Zambia).
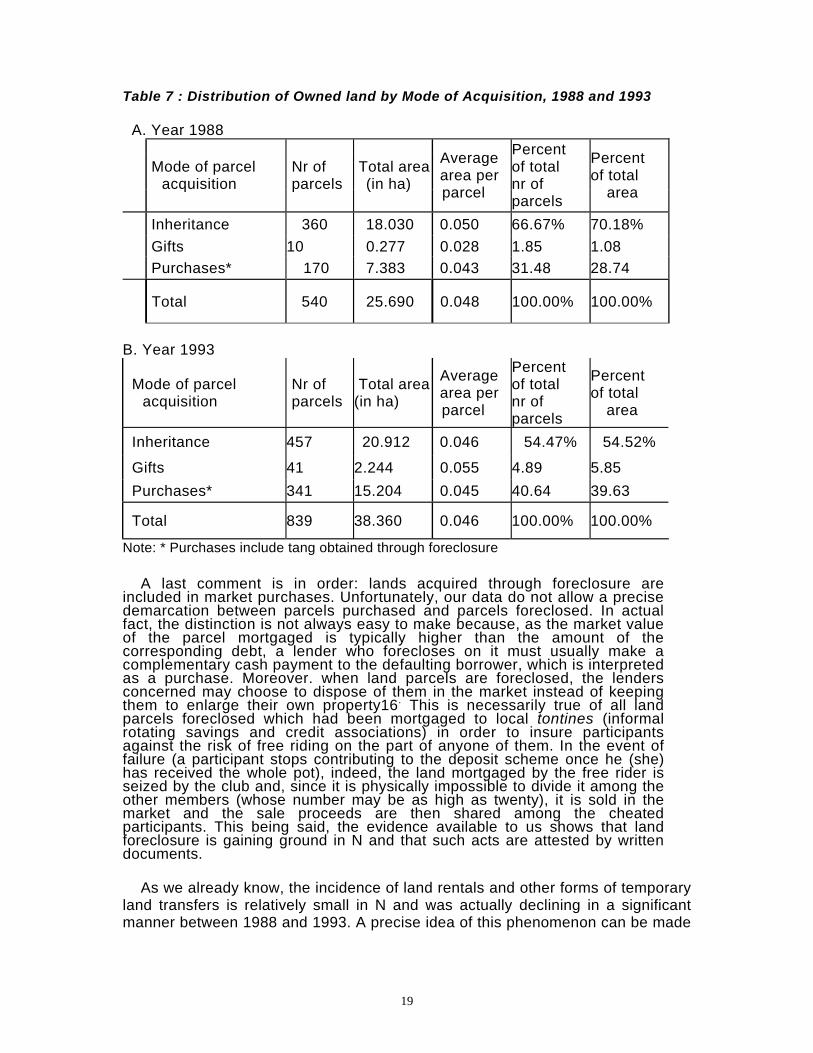
Table 7 reports the same findings for our own study area. Two striking results emerge from the inspection of tables 6 and 7. First, the role of purchases in the formation of land property is much larger in N than in most other locations for which similar data are available (in fact, only in Uganda is this role slightly larger): in 1993, the proportion of parcels acquired through purchases was two and a half times as high in N as the average proportion calculated over the sixteen areas referred to in table 6. Moreover, when our results are compared specifically with those of a World Bank study on three areas of Rwanda (Gitarama, Butare, and Ruhengeri), we find that, as a mode of acquring land, purchases are considerably more important in N than in these three other locations: on an average, their incidence is more than 3-4 times larger in the former than in the latter areas (depending on which year is considered). The swine holds true, albeit to a lesser extent, for Burundi. Second, changes in the distribution of lands owned by mode of acquisition are astonishingly rapid in N: As a matter of fact, the proportion of parcels acquired through purchases has increased by as many as nine percentage points in a short interval of only five years. The increase is still more important when measured in terms of total area. Combined with the findings of table 5, this suggests that land ownership position depends more and more on the ability to earn regular off-farm monetary incomes and less and less on forefathers' wealth transmitted through inheritance13.
18
Table 6 : Motles of Acquisition of Land: Evidence from 16 areas located in six different countries (Kenva, Rwanda, Burundi. Uganda, Malawi, Zambia).
Percent of parcels acquired through: Inheritance or gifts Market purchases
All six countries (16 areas)
range 3 1-94% 0-45% average 62.8% 16.1%median 61.5% 14.5%
Rwanda (3 areas)
range 49-55% 3-17%average 52.7% 9.3%median 54.0%. 8.0%
Burundi (4 areas)
range 44-91% 0-25% average 68.% 15.5% median 68.5% 18.5%
Source: he lahle has been constructed on the basis of the following sources: Migot-Adholla rt pit., 1991: 162; Migot-Adholla et tit. , I994b: 126: Swallow, 1994: 16. The sixteen areas funning the sample are distributed thus: four in Kenya (Madzu, Lumakanda, Kianjogu. Mweiga). four in Burundi (Giharo. Giheta. Matana. Muhuta); three in Rwanda (Ruhengeri, Butarc. Gitarama): two in Uganda (Mpigi, Kahalc) and Zambia (Southern, Eastern): one in Malawi (Iilongwe). It bears emphasis that the rapidly increasing activity of the land market in N takes place in spite of its largely illegal character. As a matter of fact, for land under customary or occupancy rights, sales are allowed only if the seller can prove that he would retain at least two hectares of land so as to be able to ensure the subsistence of himself and his family. As for the buyer, he will get the necessary authorization from the government only if "he can provide a valuable reason for acquiring land such as not being already in possession of a landholding exceeding two hectares in size..." (decree n° 09/76 of 1976, March 4, art 3 and art 82-83). In other words, below a critical size of two hectares. land property is permitted to be neither alienated nor subdivided or fragmented [for more details, see Ruhashyankiko, 1985: 15-18, Gasasira, 1993]14. From the pattern of landownership highlighted in table I, it is evident that all sales of land parcels in N are in violation of the law: local inhabitants are too poorly endowed in land to be allowed to part with some of 415.
19
Table 7 : Distribution of Owned land by Mode of Acquisition, 1988 and 1993
A. Year 1988
Mode of parcel acquisition
Nr of parcels
Total area(in ha)
Average area per parcel
Percent of total nr of parcels
Percent of total
area
Inheritance 360 18.030 0.050 66.67% 70.18% Gifts 10 0.277 0.028 1.85 1.08 Purchases* 170 7.383 0.043 31.48 28.74
Total 540 25.690 0.048 100.00% 100.00%
B. Year 1993
Mode of parcel acquisition
Nr of parcels
Total area(in ha)
Average area per parcel
Percent of total nr of parcels
Percent of total
area
Inheritance 457 20.912 0.046 54.47% 54.52%
Gifts 41 2.244 0.055 4.89 5.85 Purchases* 341 15.204 0.045 40.64 39.63
Total 839 38.360 0.046 100.00% 100.00%
Note: * Purchases include tang obtained through foreclosure
A last comment is in order: lands acquired through foreclosure are included in market purchases. Unfortunately, our data do not allow a precise demarcation between parcels purchased and parcels foreclosed. In actual fact, the distinction is not always easy to make because, as the market value of the parcel mortgaged is typically higher than the amount of the corresponding debt, a lender who forecloses on it must usually make a complementary cash payment to the defaulting borrower, which is interpreted as a purchase. Moreover. when land parcels are foreclosed, the lenders concerned may choose to dispose of them in the market instead of keeping them to enlarge their own property16. This is necessarily true of all land parcels foreclosed which had been mortgaged to local tontines (informal rotating savings and credit associations) in order to insure participants against the risk of free riding on the part of anyone of them. In the event of failure (a participant stops contributing to the deposit scheme once he (she) has received the whole pot), indeed, the land mortgaged by the free rider is seized by the club and, since it is physically impossible to divide it among the other members (whose number may be as high as twenty), it is sold in the market and the sale proceeds are then shared among the cheated participants. This being said, the evidence available to us shows that land foreclosure is gaining ground in N and that such acts are attested by written documents.
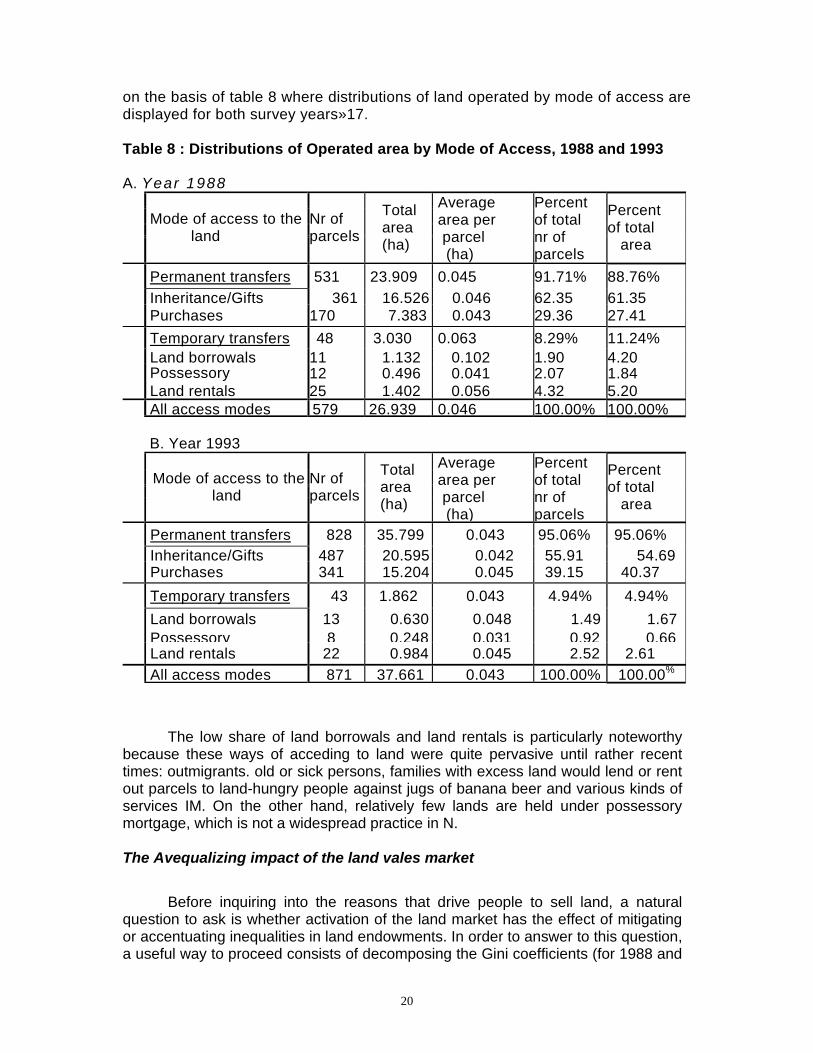
As we already know, the incidence of land rentals and other forms of temporary land transfers is relatively small in N and was actually declining in a significant manner between 1988 and 1993. A precise idea of this phenomenon can be made
20
on the basis of table 8 where distributions of land operated by mode of access are displayed for both survey years»17. Table 8 : Distributions of Operated area by Mode of Access, 1988 and 1993 A. Year 1988
Mode of access to the land
Nr of parcels
Total area (ha)
Average area per parcel (ha)
Percent of total nr of parcels
Percent of total
area
Permanent transfers 531 23.909 0.045 91.71% 88.76% Inheritance/Gifts 361 16.526 0.046 62.35 61.35 Purchases 170 7.383 0.043 29.36 27.41 Temporary transfers 48 3.030 0.063 8.29% 11.24% Land borrowals 11 1.132 0.102 1.90 4.20 Possessory 12 0.496 0.041 2.07 1.84 Land rentals 25 1.402 0.056 4.32 5.20 All access modes 579 26.939 0.046 100.00% 100.00%
B. Year 1993
Mode of access to the land
Nr of parcels
Total area (ha)
Average area per parcel (ha)
Percent of total nr of parcels
Percent of total
area
Permanent transfers 828 35.799 0.043 95.06% 95.06% Inheritance/Gifts 487 20.595 0.042 55.91 54.69 Purchases 341 15.204 0.045 39.15 40.37 Temporary transfers 43 1.862 0.043 4.94% 4.94% Land borrowals 13 0.630 0.048 1.49 1.67
Possessory 8 0.248 0.031 0.92 0.66 Land rentals 22 0.984 0.045 2.52 2.61 All access modes 871 37.661 0.043 100.00% 100.00%
The low share of land borrowals and land rentals is particularly noteworthy because these ways of acceding to land were quite pervasive until rather recent times: outmigrants. old or sick persons, families with excess land would lend or rent out parcels to land-hungry people against jugs of banana beer and various kinds of services IM. On the other hand, relatively few lands are held under possessory mortgage, which is not a widespread practice in N. The Avequalizing impact of the land vales market
Before inquiring into the reasons that drive people to sell land, a natural question to ask is whether activation of the land market has the effect of mitigating or accentuating inequalities in land endowments. In order to answer to this question, a useful way to proceed consists of decomposing the Gini coefficients (for 1988 and
21
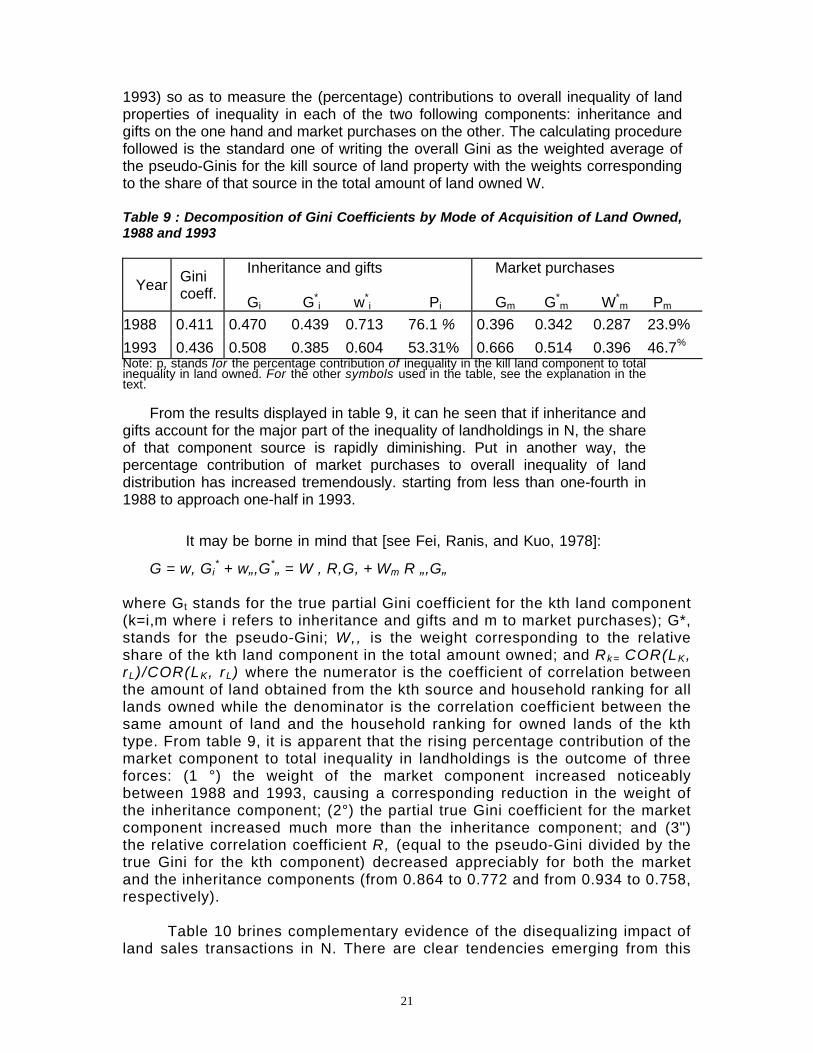
1993) so as to measure the (percentage) contributions to overall inequality of land properties of inequality in each of the two following components: inheritance and gifts on the one hand and market purchases on the other. The calculating procedure followed is the standard one of writing the overall Gini as the weighted average of the pseudo-Ginis for the kill source of land property with the weights corresponding to the share of that source in the total amount of land owned W. Table 9 : Decomposition of Gini Coefficients by Mode of Acquisition of Land Owned, 1988 and 1993
Year Gini coeff.
Inheritance and gifts Gi G*
i w*i Pi
Market purchases Gm G*
m W*m Pm
1988 0.411 0.470 0.439 0.713 76.1 % 0.396 0.342 0.287 23.9% 1993 0.436 0.508 0.385 0.604 53.31% 0.666 0.514 0.396 46.7% Note: p, stands Ior the percentage contribution of inequality in the kill land component to total inequality in land owned. For the other symbols used in the table, see the explanation in the text.
From the results displayed in table 9, it can he seen that if inheritance and gifts account for the major part of the inequality of landholdings in N, the share of that component source is rapidly diminishing. Put in another way, the percentage contribution of market purchases to overall inequality of land distribution has increased tremendously. starting from less than one-fourth in 1988 to approach one-half in 1993.
It may be borne in mind that [see Fei, Ranis, and Kuo, 1978]:
G = w, Gi* + w„,G*„ = W , R,G, + Wm R „,G„
where Gt stands for the true partial Gini coefficient for the kth land component (k=i,m where i refers to inheritance and gifts and m to market purchases); G*, stands for the pseudo-Gini; W,, is the weight corresponding to the relative share of the kth land component in the total amount owned; and Rk= COR(LK, rL)/COR(LK, rL) where the numerator is the coefficient of correlation between the amount of land obtained from the kth source and household ranking for all lands owned while the denominator is the correlation coefficient between the same amount of land and the household ranking for owned lands of the kth type. From table 9, it is apparent that the rising percentage contribution of the market component to total inequality in landholdings is the outcome of three forces: (1 °) the weight of the market component increased noticeably between 1988 and 1993, causing a corresponding reduction in the weight of the inheritance component; (2°) the partial true Gini coefficient for the market component increased much more than the inheritance component; and (3") the relative correlation coefficient R, (equal to the pseudo-Gini divided by the true Gini for the kth component) decreased appreciably for both the market and the inheritance components (from 0.864 to 0.772 and from 0.934 to 0.758, respectively).
Table 10 brines complementary evidence of the disequalizing impact of land sales transactions in N. There are clear tendencies emerging from this
22
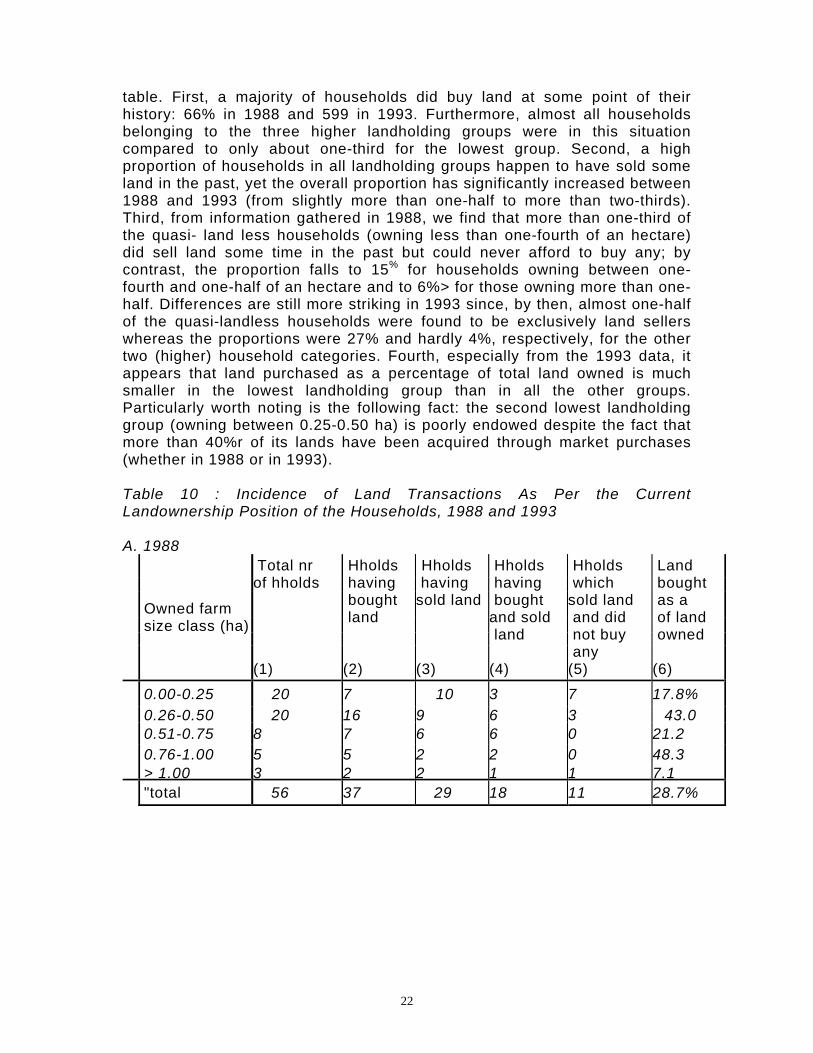
table. First, a majority of households did buy land at some point of their history: 66% in 1988 and 599 in 1993. Furthermore, almost all households belonging to the three higher landholding groups were in this situation compared to only about one-third for the lowest group. Second, a high proportion of households in all landholding groups happen to have sold some land in the past, yet the overall proportion has significantly increased between 1988 and 1993 (from slightly more than one-half to more than two-thirds). Third, from information gathered in 1988, we find that more than one-third of the quasi- land less households (owning less than one-fourth of an hectare) did sell land some time in the past but could never afford to buy any; by contrast, the proportion falls to 15% for households owning between one-fourth and one-half of an hectare and to 6%> for those owning more than one-half. Differences are still more striking in 1993 since, by then, almost one-half of the quasi-landless households were found to be exclusively land sellers whereas the proportions were 27% and hardly 4%, respectively, for the other two (higher) household categories. Fourth, especially from the 1993 data, it appears that land purchased as a percentage of total land owned is much smaller in the lowest landholding group than in all the other groups. Particularly worth noting is the following fact: the second lowest landholding group (owning between 0.25-0.50 ha) is poorly endowed despite the fact that more than 40%r of its lands have been acquired through market purchases (whether in 1988 or in 1993). Table 10 : Incidence of Land Transactions As Per the Current Landownership Position of the Households, 1988 and 1993 A. 1988
Owned farm size class (ha)
Total nr of hholds (1)
Hholds having bought land
(2)
Hholds having
sold land (3)
Hholds having bought
and sold land
(4)
Hholds which
sold land and did not buy any
(5)
Land bought as a of land owned
(6)
0.00-0.25 20 7 10 3 7 17.8% 0.26-0.50 20 16 9 6 3 43.0 0.51-0.75 8 7 6 6 0 21.2 0.76-1.00 5 5 2 2 0 48.3 > 1.00 3 2 2 1 1 7.1 "total 56 37 29 18 11 28.7%
23
Owned farm size class (ha)
Total nr of hholds (l)
Hholds having bought land
(2)
Hholds having
sold land (3)
Hholds having both
sold and bought land
(4)
Hholds which
sold land and did not buy any
(5)
Land bought as a % of land owned
(6)
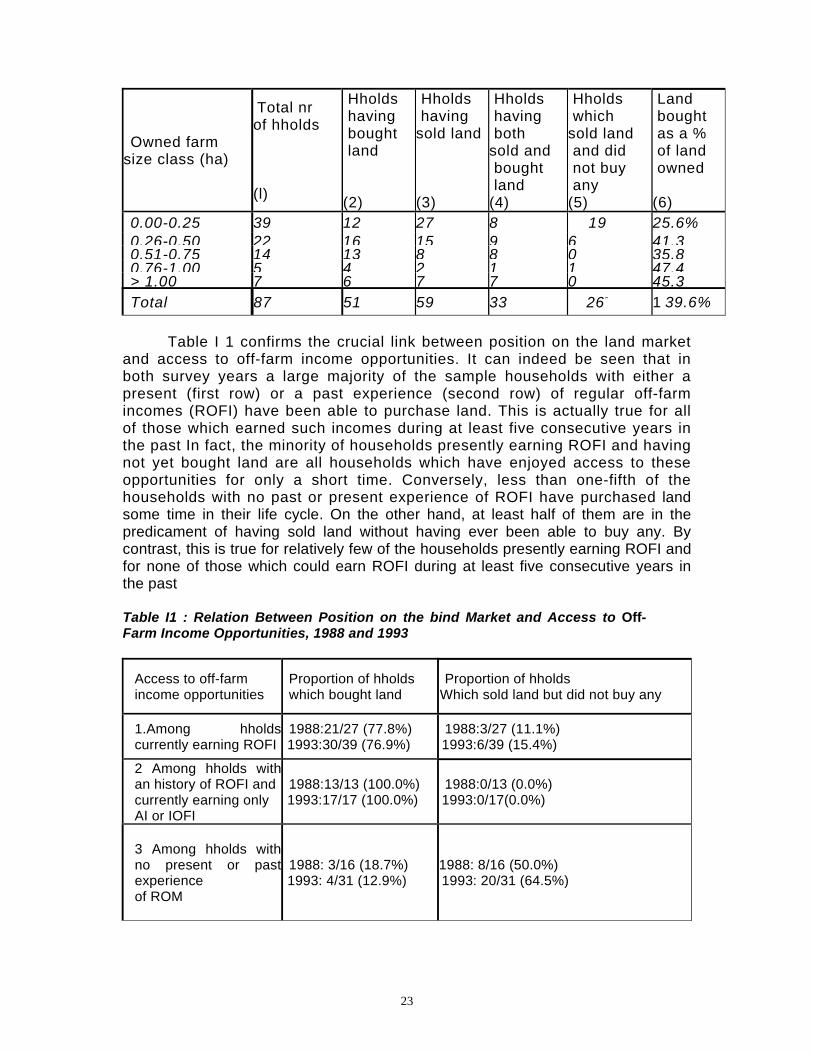
0.00-0.25 39 12 27 8 19 25.6% 0.26-0.50 22 16 15 9 6 41.30.51-0.75 14 13 8 8 0 35.80.76-1.00 5 4 2 1 1 47.4> 1.00 7 6 7 7 0 45.3Total 87 51 59 33 26- 1 39.6%
Table I 1 confirms the crucial link between position on the land market
and access to off-farm income opportunities. It can indeed be seen that in both survey years a large majority of the sample households with either a present (first row) or a past experience (second row) of regular off-farm incomes (ROFI) have been able to purchase land. This is actually true for all of those which earned such incomes during at least five consecutive years in the past In fact, the minority of households presently earning ROFI and having not yet bought land are all households which have enjoyed access to these opportunities for only a short time. Conversely, less than one-fifth of the households with no past or present experience of ROFI have purchased land some time in their life cycle. On the other hand, at least half of them are in the predicament of having sold land without having ever been able to buy any. By contrast, this is true for relatively few of the households presently earning ROFI and for none of those which could earn ROFI during at least five consecutive years in the past Table I1 : Relation Between Position on the bind Market and Access to Off-Farm Income Opportunities, 1988 and 1993
Access to off-farm income opportunities
Proportion of hholds which bought land
Proportion of hholds Which sold land but did not buy any
1.Among hholdscurrently earning ROFI
1988:21/27 (77.8%) 1993:30/39 (76.9%)
1988:3/27 (11.1%) 1993:6/39 (15.4%)
2 Among hholds withan history of ROFI and currently earning only AI or IOFI
1988:13/13 (100.0%) 1993:17/17 (100.0%)
1988:0/13 (0.0%) 1993:0/17(0.0%)
3 Among hholds withno present or pastexperience of ROM
1988: 3/16 (18.7%) 1993: 4/31 (12.9%)
1988: 8/16 (50.0%) 1993: 20/31 (64.5%)
24
Motives.for land sales
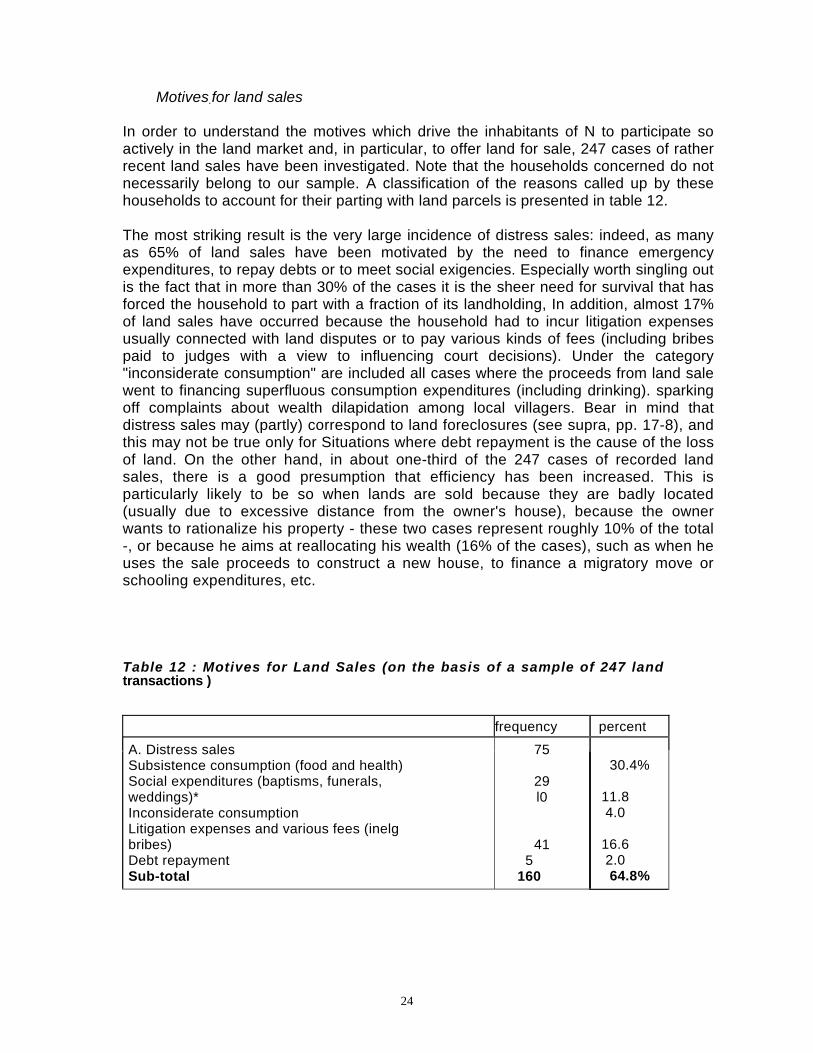
In order to understand the motives which drive the inhabitants of N to participate so actively in the land market and, in particular, to offer land for sale, 247 cases of rather recent land sales have been investigated. Note that the households concerned do not necessarily belong to our sample. A classification of the reasons called up by these households to account for their parting with land parcels is presented in table 12.
The most striking result is the very large incidence of distress sales: indeed, as many as 65% of land sales have been motivated by the need to finance emergency expenditures, to repay debts or to meet social exigencies. Especially worth singling out is the fact that in more than 30% of the cases it is the sheer need for survival that has forced the household to part with a fraction of its landholding, In addition, almost 17%of land sales have occurred because the household had to incur litigation expensesusually connected with land disputes or to pay various kinds of fees (including bribespaid to judges with a view to influencing court decisions). Under the category "inconsiderate consumption" are included all cases where the proceeds from land sale went to financing superfluous consumption expenditures (including drinking). sparking off complaints about wealth dilapidation among local villagers. Bear in mind thatdistress sales may (partly) correspond to land foreclosures (see supra, pp. 17-8), and this may not be true only for Situations where debt repayment is the cause of the lossof land. On the other hand, in about one-third of the 247 cases of recorded land sales, there is a good presumption that efficiency has been increased. This isparticularly likely to be so when lands are sold because they are badly located (usually due to excessive distance from the owner's house), because the ownerwants to rationalize his property - these two cases represent roughly 10% of the total-, or because he aims at reallocating his wealth (16% of the cases), such as when he uses the sale proceeds to construct a new house, to finance a migratory move orschooling expenditures, etc.
Table 12 : Motives for Land Sales (on the basis of a sample of 247 land transactions )
frequency percent
A. Distress sales Subsistence consumption (food and health) Social expenditures (baptisms, funerals, weddings)* Inconsiderate consumption Litigation expenses and various fees (inelg bribes) Debt repayment Sub-total
75
29 l0
41 5
160
30.4%
11.8 4.0
16.6 2.0 64.8%
25
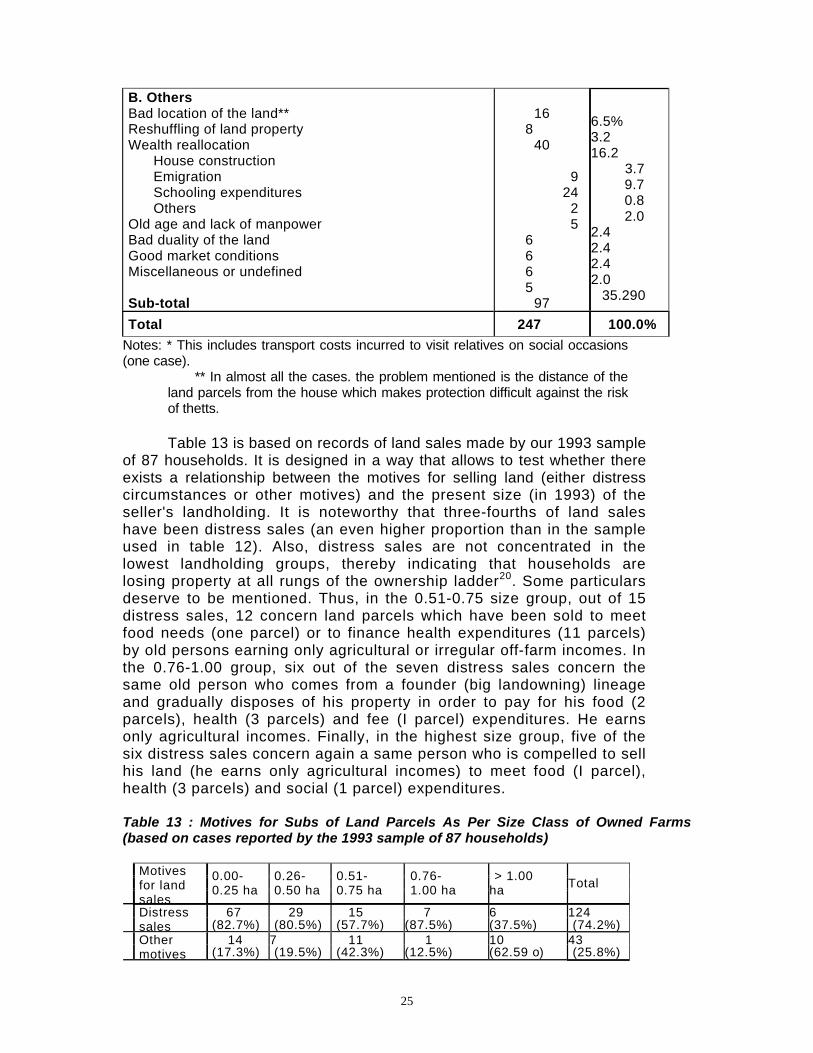
B. Others Bad location of the land** Reshuffling of land property Wealth reallocation
House construction Emigration Schooling expenditures Others
Old age and lack of manpower Bad duality of the land Good market conditions Miscellaneous or undefined Sub-total
16
8 40
9
24 2 5
6 6 6 5
97
6.5% 3.2 16.2
3.7 9.7 0.8 2.0
2.4 2.4 2.4 2.0
35.290
Total 247 100.0% Notes: * This includes transport costs incurred to visit relatives on social occasions (one case).
** In almost all the cases. the problem mentioned is the distance of the land parcels from the house which makes protection difficult against the risk of thetts.
Table 13 is based on records of land sales made by our 1993 sample of 87 households. It is designed in a way that allows to test whether there exists a relationship between the motives for selling land (either distress circumstances or other motives) and the present size (in 1993) of the seller's landholding. It is noteworthy that three-fourths of land sales have been distress sales (an even higher proportion than in the sample used in table 12). Also, distress sales are not concentrated in the lowest landholding groups, thereby indicating that households are losing property at all rungs of the ownership ladder20. Some particulars deserve to be mentioned. Thus, in the 0.51-0.75 size group, out of 15 distress sales, 12 concern land parcels which have been sold to meet food needs (one parcel) or to finance health expenditures (11 parcels) by old persons earning only agricultural or irregular off-farm incomes. In the 0.76-1.00 group, six out of the seven distress sales concern the same old person who comes from a founder (big landowning) lineage and gradually disposes of his property in order to pay for his food (2 parcels), health (3 parcels) and fee (I parcel) expenditures. He earns only agricultural incomes. Finally, in the highest size group, five of the six distress sales concern again a same person who is compelled to sell his land (he earns only agricultural incomes) to meet food (I parcel), health (3 parcels) and social (1 parcel) expenditures. Table 13 : Motives for Subs of Land Parcels As Per Size Class of Owned Farms (based on cases reported by the 1993 sample of 87 households)
Motives for land sales
0.00- 0.25 ha
0.26- 0.50 ha
0.51- 0.75 ha
0.76- 1.00 ha
> 1.00 ha Total
67 29 15 7 6 124 Distress sales (82.7%) (80.5%) (57.7%) (87.5%) (37.5%) (74.2%)
14 7 11 1 10 43
Other motives (17.3%) (19.5%) (42.3%) (12.5%) (62.59 o) (25.8%)
26
81 36 26 8 16 167
Total (100.0%) (100.0%) (100.0%) (100.0%), (100.0%) (100.0%)
It could be argued that sales of land to meet subsistence needs in old
age are not genuine distress events in so far as old persons dissave by disposing of assets accumulated earlier in their life cycle. (In other words, land sales in old age could be the outcome of intertemporal welfare maximization). This is nevertheless ignoring that, due to such disposals. the lands passed down to younger generations tend to shrink further and further, thus giving rise to increasing intergenerational inequality of landholdings. As will be seen now and in the next section dealing with land disputes, this is a serious problem that lies at the heart of many tensions in the everyday life of N’s inhabitants. Intergenerational inequality of landholdings
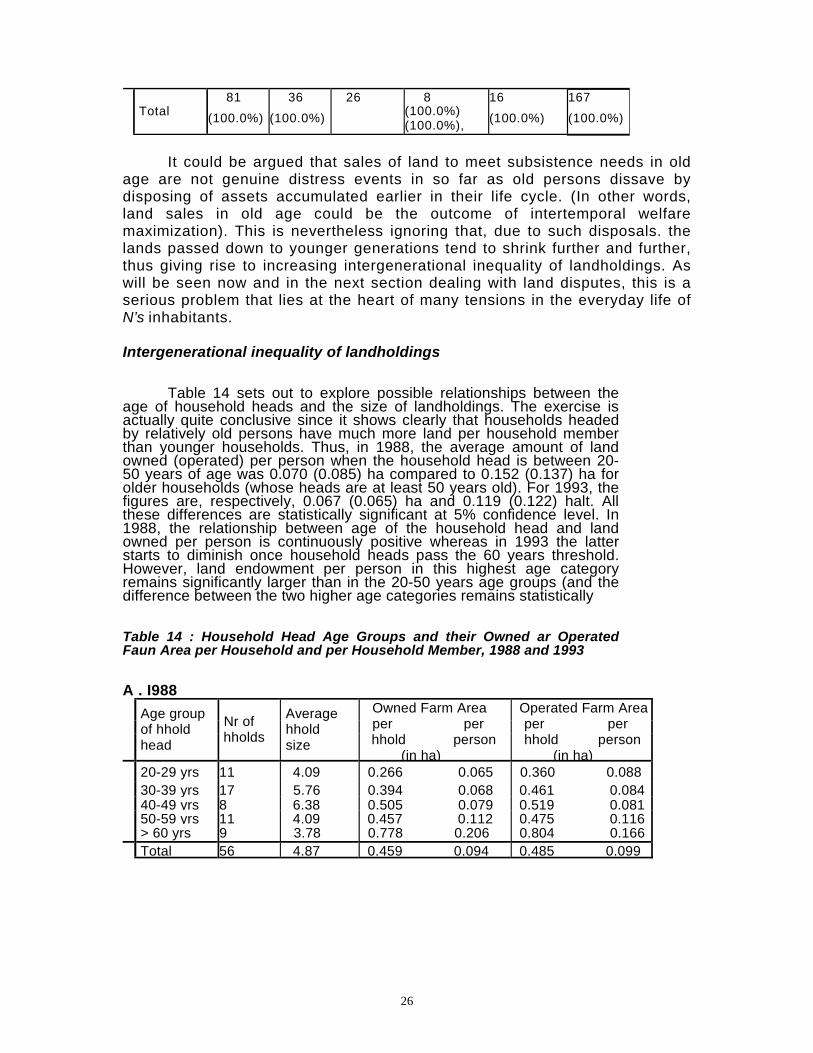
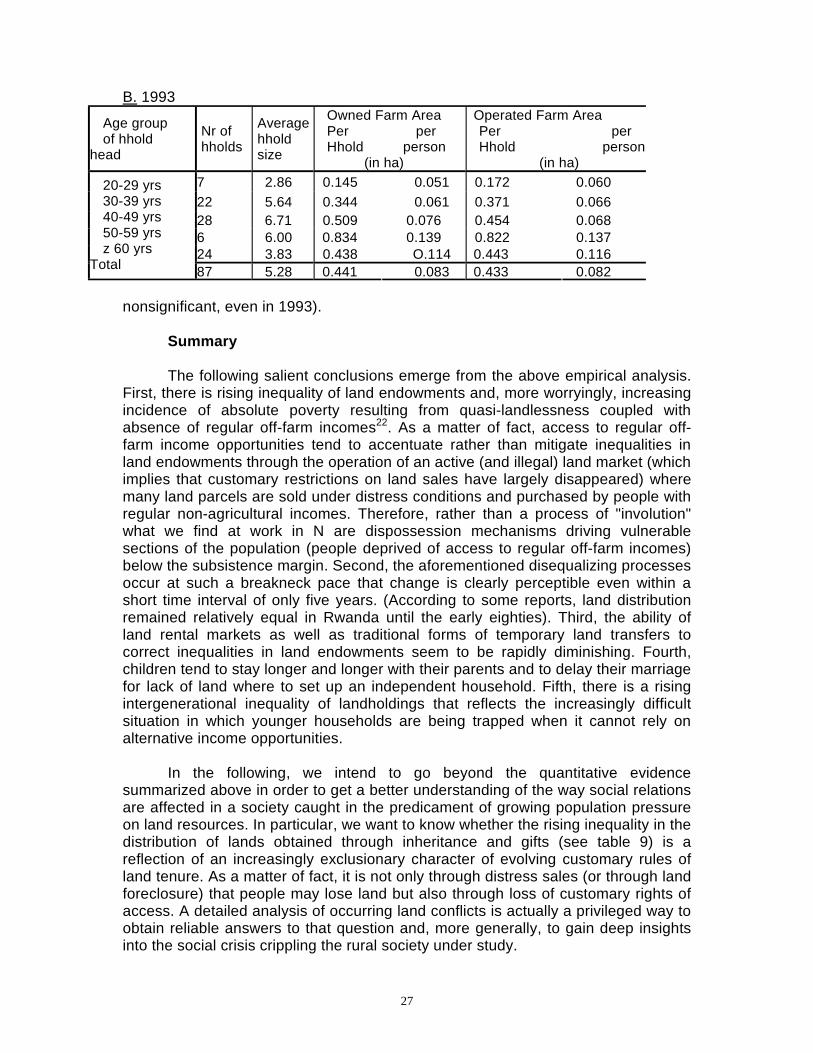
Table 14 sets out to explore possible relationships between the age of household heads and the size of landholdings. The exercise is actually quite conclusive since it shows clearly that households headed by relatively old persons have much more land per household member than younger households. Thus, in 1988, the average amount of land owned (operated) per person when the household head is between 20-50 years of age was 0.070 (0.085) ha compared to 0.152 (0.137) ha for older households (whose heads are at least 50 years old). For 1993, the figures are, respectively, 0.067 (0.065) ha and 0.119 (0.122) halt. All these differences are statistically significant at 5% confidence level. In 1988, the relationship between age of the household head and land owned per person is continuously positive whereas in 1993 the latter starts to diminish once household heads pass the 60 years threshold. However, land endowment per person in this highest age category remains significantly larger than in the 20-50 years age groups (and the difference between the two higher age categories remains statistically
Table 14 : Household Head Age Groups and their Owned ar Operated Faun Area per Household and per Household Member, 1988 and 1993
A . I988 Age group
of hhold head
Nr of hholds
Average hhold size
Owned Farm Area per per
hhold person (in ha)
Operated Farm Area per per hhold person
(in ha) 20-29 yrs 11 4.09 0.266 0.065 0.360 0.088 30-39 yrs 17 5.76 0.394 0.068 0.461 0.084
40-49 yrs 8 6.38 0.505 0.079 0.519 0.081 50-59 yrs 11 4.09 0.457 0.112 0.475 0.116
> 60 yrs 9 3.78 0.778 0.206 0.804 0.166 Total 56 4.87 0.459 0.094 0.485 0.099
27
B. 1993
Age group of hhold
head
Nr of hholds
Average hhold size
Owned Farm Area Per per Hhold person
(in ha)
Operated Farm Area Per per Hhold person
(in ha) 7 2.86 0.145 0.051 0.172 0.060 22 5.64 0.344 0.061 0.371 0.066 28 6.71 0.509 0.076 0.454 0.068 6 6.00 0.834 0.139 0.822 0.137 24 3.83 0.438 O.114 0.443 0.116
20-29 yrs 30-39 yrs 40-49 yrs 50-59 yrs z 60 yrs
Total 87 5.28 0.441 0.083 0.433 0.082 nonsignificant, even in 1993).
Summary
The following salient conclusions emerge from the above empirical analysis. First, there is rising inequality of land endowments and, more worryingly, increasing incidence of absolute poverty resulting from quasi-landlessness coupled with absence of regular off-farm incomes22. As a matter of fact, access to regular off-farm income opportunities tend to accentuate rather than mitigate inequalities in land endowments through the operation of an active (and illegal) land market (which implies that customary restrictions on land sales have largely disappeared) where many land parcels are sold under distress conditions and purchased by people with regular non-agricultural incomes. Therefore, rather than a process of "involution" what we find at work in N are dispossession mechanisms driving vulnerable sections of the population (people deprived of access to regular off-farm incomes) below the subsistence margin. Second, the aforementioned disequalizing processes occur at such a breakneck pace that change is clearly perceptible even within a short time interval of only five years. (According to some reports, land distribution remained relatively equal in Rwanda until the early eighties). Third, the ability of land rental markets as well as traditional forms of temporary land transfers to correct inequalities in land endowments seem to be rapidly diminishing. Fourth, children tend to stay longer and longer with their parents and to delay their marriage for lack of land where to set up an independent household. Fifth, there is a rising intergenerational inequality of landholdings that reflects the increasingly difficult situation in which younger households are being trapped when it cannot rely on alternative income opportunities.
In the following, we intend to go beyond the quantitative evidence summarized above in order to get a better understanding of the way social relations are affected in a society caught in the predicament of growing population pressure on land resources. In particular, we want to know whether the rising inequality in the distribution of lands obtained through inheritance and gifts (see table 9) is a reflection of an increasingly exclusionary character of evolving customary rules of land tenure. As a matter of fact, it is not only through distress sales (or through land foreclosure) that people may lose land but also through loss of customary rights of access. A detailed analysis of occurring land conflicts is actually a privileged way to obtain reliable answers to that question and, more generally, to gain deep insights into the social crisis crippling the rural society under study.
28
Ill. Land disputes, social crisis and violence An
Overview Careful observation of everyday life in N reveals a large incidence of
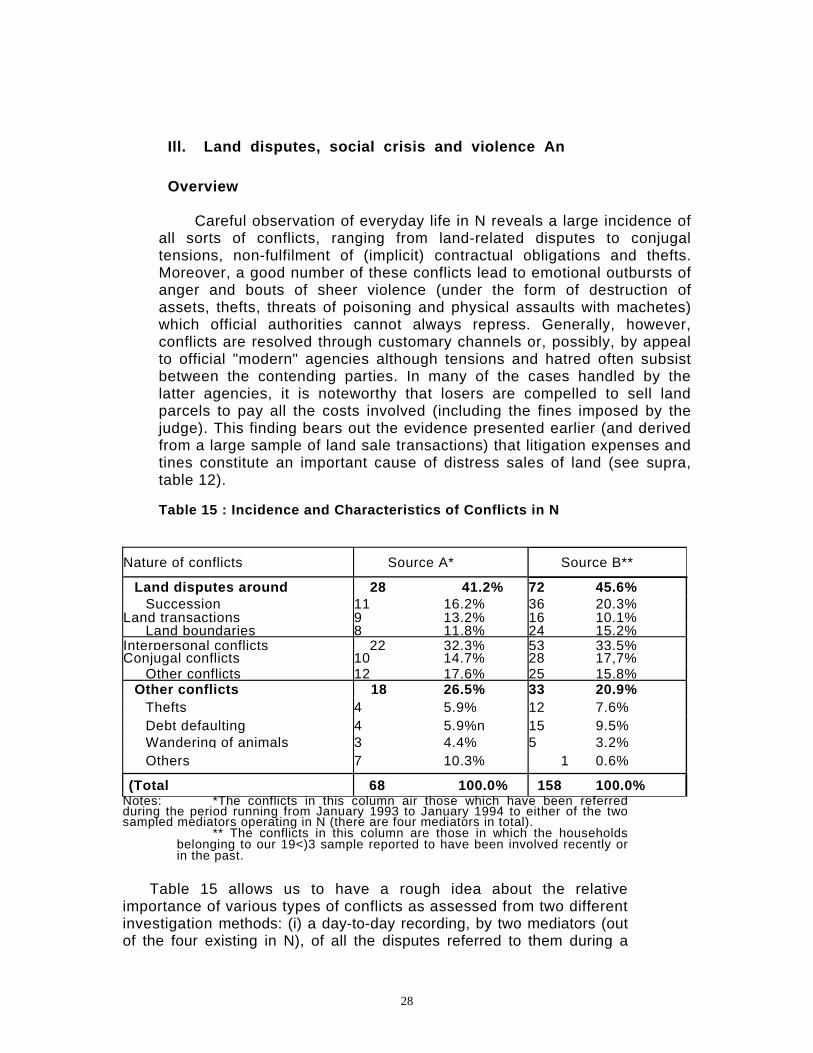
all sorts of conflicts, ranging from land-related disputes to conjugal tensions, non-fulfilment of (implicit) contractual obligations and thefts. Moreover, a good number of these conflicts lead to emotional outbursts of anger and bouts of sheer violence (under the form of destruction of assets, thefts, threats of poisoning and physical assaults with machetes) which official authorities cannot always repress. Generally, however, conflicts are resolved through customary channels or, possibly, by appeal to official "modern" agencies although tensions and hatred often subsist between the contending parties. In many of the cases handled by the latter agencies, it is noteworthy that losers are compelled to sell land parcels to pay all the costs involved (including the fines imposed by the judge). This finding bears out the evidence presented earlier (and derived from a large sample of land sale transactions) that litigation expenses and tines constitute an important cause of distress sales of land (see supra, table 12).
Table 15 : Incidence and Characteristics of Conflicts in N
Nature of conflicts Source A* Source B**
Land disputes around 28 41.2% 72 45.6% Succession 11 16.2% 36 20.3%
Land transactions 9 13.2% 16 10.1% Land boundaries 8 11.8% 24 15.2%
Interpersonal conflicts 22 32.3% 53 33.5%Conjugal conflicts 10 14.7% 28 17,7%
Other conflicts 12 17.6% 25 15.8% Other conflicts 18 26.5% 33 20.9%
Thefts 4 5.9% 12 7.6% Debt defaulting 4 5.9%n 15 9.5% Wandering of animals 3 4.4% 5 3.2% Others 7 10.3% 1 0.6%
(Total 68 100.0% 158 100.0% Notes: *The conflicts in this column air those which have been referred during the period running from January 1993 to January 1994 to either of the two sampled mediators operating in N (there are four mediators in total).
** The conflicts in this column are those in which the households belonging to our 19<)3 sample reported to have been involved recently or in the past.
Table 15 allows us to have a rough idea about the relative importance of various types of conflicts as assessed from two different investigation methods: (i) a day-to-day recording, by two mediators (out of the four existing in N), of all the disputes referred to them during a
29
one-year period (from January 1993 to January 1994), and (ii) a specific inquiry among the 87 households comprising the 1993 sample about the conflicts in which they themselves have been involved. Assuming that half of the conflicts are reported to the two sampled mediators, we reach the conclusion that there has been more than one conflict per household (68X2/124), or about one conflict every three days during the year 1993. These are truly high ratios given the fact that only serious conflicts are referred to mediators who call for many witnesses and give a public character to their procedures and judgements. The number of conflicts recorded according to the second approach (see source B in the table) is obviously an underestimate of the reality owing to the limitations of the interview method for questions that possibly involve a recall of events located in a distant past
This being said, it is striking that the relative shares of various types of conflicts does not differ significantly between the two methods used to assess them. Yet, it must be emphasized that in both cases the relative incidence of land disputes is grossly underestimated. This is because many interpersonal conflicts (including conjugal conflicts) have as their root cause a contest about land rights. It is therefore certain that at least half of the conflicts breaking out in N arise from land problems. Notice that such a conclusion is a far cry from that reached by Blarel (on the basis of a study of three different locations) for whom the incidence of land disputes is low in Rwanda and land tenure security is fairly high as a result [Blarel, 1994: 86-7]2?. Our surmise is that so discrepant findings cannot be entirely explained by the comparatively high population density in our survey area. Most probably, they also arise from exclusive reliance on recall method of data collection in the World Bank survey on which Blarel's analysis is based.
The nature and effects of land disputes
(i) Disempowerment of vulnerable groups through the market
Not unsurprisingly, the rapidly rising incidence of land market transactions documented in the previous section (see tables 7 and 9) has the effect of eroding mechanisms of social insurance which traditionally operated through the land tenure system. This is simply because customary obligations attached to lineage lands, in particular obligations to redistribute land in favour of land-scarce kith and kin, cease to apply when the lands are acquired through purchase instead of being handed down within the lineage. For instance, a resident of N refused to give a parcel of land to his sister who came back to her village after having separated from her husband. He thus violated a custom aimed at preventing social destitution among women who have lost access to land (bear in mind that women are allocated land for usufruct as wives in their husband's lineage) and this he did on the ground that he built up his whole property by purchasing land on the market
(ii) Exclusionary trends in indigenous land tenure.
Even within the category of lineage lands rules of access and rights of use
tend to be defined more and more restrictively as land becomes scarcer. More precisely, the evolution of indigenous tenure arrangements involves increasing exclusion of vulnerable categories of the population which were socially protected
30
under erstwhile customary rules. This holds especially true for return migrants, separated or divorced women, wives under polygamous arrangements, widows, handicapped children, orphans, children of broken marriages and whose father has remarried. For example, orphans are still accommodated by their grandparents, yet upon the death of the latter they risk being excluded from the (patrilineal) succession. Not very dissimilar is the situation of children of broken marriages: they also live with their paternal grandparents and they suffer from their half-brothers' attempts to evict them from access to the lands of the patrilineage. Or, separated women coming back to their native village along with their children may find their brothers opposing their return lest there should be too little land left for patrilineal descendants. Widows seem to be in an especially difficult position: at least, they often express insecurity feelings and continuous fear of reprisals from their brothers-in-law who tend to view her children as competing claimants for the lineage's land.
(iii) The decline of customary marriages and its effects.
In some instances, customary rules have apparently not evolved and poor
people tend to suffer from this situation because these rules are more and more difficult to abide by. A vivid illustration is provided by the case of young villagers who evade erstwhile marriage customs because their parents are too poor to make the wedding gifts traditionally pledged to the wife's family in order to seal the alliance thereby contracted (the inkwano). According to our estimate, roughly two-thirds of the couples in N. have been married without inkwano, and the proportion is obviously much higher among young couples. Under stress, the wives (when they separate from their husband) and children of these "illegitimate" couples are more vulnerable, the former because they have little bargaining power in their lineage given that their marriage did not bring wealth to their parents (especially, the male elders whose privilege it is to negotiate the inkwano) and the latter because children of non-customary unions are less and less recognized as legitimate descendants either by the father's or the mother's lineage 24. Traditionally, these children were considered to belong to the mother's lineage. Yet, owing to acute land scarcity, their customary rights are increasingly called into question by maternal uncles and this is why it has become common practice for the mother to return to her lineage accompanied only by her daughters (since they do not compete for land). The sons are thus left with their father with all the attendant risks of being denied access to his lineage's lands. A genuine vicious circle of poverty is therefore at work: children of poor parents cannot get married according to the custom, which makes them more liable to lose security of access to land and to become landless, thereby perpetuating or accentuating the poverty of their parents.
It would be wrong to believe that the above types of' conflicts are always resolved in a manner contrary to the interests of the vulnerable sections of the population. When a land dispute is referred to customary mediators, the solution is generally grounded in the basic principle (typical of justice in all traditional societies) that social order and cohesion ought to be preserved. This may or may not imply that the vulnerable party will be proven right Whenever possible, a decent compromise will be worked out which implies that the customary rights of vulnerable persons are encroached upon, at least to some extent
31
When a conflict is brought before an official court, the outcome is likewise indeterminate. This is partly due to the fact that official judges may take traditional mores into account while pronouncing their judgements. When referring instead to the formal law, they will favour vulnerable persons in some cases but not in others, depending on the type of conflict Thus, for example, wives from polygamous marriages (except the first one) will have no chance to win a case because they are not legitimate wives under the modern law (since May 1952). Contrariwise, chidren from unions without inkwano but duly registered with the civil authorities will afford more protection under an official trial than under a customary procedure. In addition, official judges are too often prone to corruption through connections or bribes (known in local parlance as ruswa) and this obviously makes the weaker and poorer party more likely to lose the case. Finally, it is worth emphasizing that official judges base their judgements on the evidence of written documents, whenever these are available. This is likely to favour educated persons and also dubious persons who do not hesitate to produce false documents or documents written under duress. Yet, in some cases, vulnerable persons who are evidently well-informed may resort to written procedures to protect rights which they know are being increasingly threatened.
(iv) Intra-family conflicts.
Without any doubt, the most disquieting and socially disruptive land disputes occurring in N are those which oppose father and sons and thereby strike deep at the heart of family life. To understand this, it is useful to briefly recall the local pattern of land inheritance and its evolution during the last decades. As already pointed out, the mode of succession is patrilineal. Traditionally, upon the death of the father, the land was passed on to the elder son who was expected to manage the family assets in the interests of the family (under a form of corporate ownership). This implied that he granted to his younger brothers enough land to allow them to subsist As land scarcity increased and rights over land became more individualized, direct transmission to all sons became the norm and the prerogatives of the elder son became limited to the role of settling intra-family conflicts. As a reward, he was entitled to an additional share of the lineage land. Today, even this practice is being increasingly opposed and the request is for strictly equal sharing of the land between all the sons.
Another important evolution is reflected in the earlier apportioning of family lands between sons. This evolution is the result of two concomitant forces: the children's desire to emancipate themselves from the father's rule and to manage their own assets even when their father is alive (which is more and more true whether the sons are married or not), on the one hand, and the latter's concern to avoid devastating conflicts between brothers upon his death, on the other hand. Under the present circumstances, a son receives some land from the father upon his marriage and a more definite allocation takes place as soon as the last son is being married. The inheritance process is complete only when, upon the father's death, the lands which he had retained for his own use is distributed.
The above arrangement gives rise to two main sources of land disputes. First, elder sons may resist the withdrawal of lands over which they have been previously granted use rights (at the time of their marriage or even later). Such
32
withdrawals are more and more frequent because respect of the equal sharing rule in a context of extreme land scarcity implies that some land must be redistributed from elder to younger male members of the family. As a matter of fact, it often turns out that the father has given to the elder sons more land than they can be awarded under this rule. This situation can be caused by an unanticipated increase in the number of children (bear in mind that polygamy is a widespread practice) or by the reduction of the total lineage land following market sales by the father. For the same reasons, adjustments in the land parcels held by the different sons can possibly take place during the period between the first and the last marriages.
Second, serious tensions may develop between father and sons because, being land-hungry and pushed to the subsistence margin, the latter may consider that the land retained by the former for his own use is too large given his present subsistence needs. As a result, and against a deep-rooted taboo, they may then demand that additional land parcels be redistributed to them. Likewise, children may contest the right of their father to rent out land to a stranger while they are themselves lacking property. It is worth recalling here that the farm area owned or operated per household member has been found to be significantly smaller among young than among old households (see supra, table 13). Note that, when some part of the land has been acquired through purchase, it is easier for tire father to withstand the pressure exercised by his sons to obtain more parcels. The message conveyed to them is then that, if they need more land, they will have to fend for themselves and to find a way to buy it as he himself did.
Mutual understanding is all the more difficult as the strategy of the father is likely to be influenced by feelings of insecurity which drive him to retain some land as precautionary savings. Such feelings are actually encouraged by the erosion of arrangements of old age support following the equalization of status among all the sons. Traditionally, indeed, the youngest son was bearing special responsibility for the subsistence of his father during old age, and, in return, he was entitled to an additional parcel upon his death and had the right of first choice during the ultimate apportioning of the father's lands. Nowadays, these rights and duties of the youngest son have largely fallen into disuse. Also, conflicts arise because when a father had to sell a land parcel to meet expenditures caused by the misdeeds of a son (such as when he had to pay a compensation for a theft committed by his son, or to get him released from jail on bail) he usually subtracts this parcel from his inheritance share. All occasions thus cause suspicions, frustrations and antagonisms to grow between the two generations, thereby embittering and poisoning the core of family life. Scarcity of land is so acute that the passing away of parents brings considerable relief to the successors and parents have painful feelings of neglect and abandonment during their old age.
Like in the cases mentioned under points (ii) and (iii), examination of stories of land disputes between father and sons shows that the outcome is subject to variation. Sometimes, the father gives in to his sons' requests because he believes they will sooner or later seize parcels through sheer force. Or, on the contrary, he may feel strong enough to resist their pressures. When the matter is referred to them, local mediators may accept or reject the sons' claims for further redistribution of the (living) father's lands depending on the prevailing circumstances as they are deemed to affect the ability of both parties to survive.
33
Thus, for example, a mediator sided with a poor young villager by requiring his father to rent out a land parcel to him rather than to a stranger. Note that such a solution represents a compromise in so far as the father is not requested to give the land to his son, in accordance with an old social norm providing that (lineage) land can be transferred only upon the father's death (see supra). Finally, sons may bring the case before an official court and, in one instance at least, the father's refusal to grant parcels of land to his children was disavowed by the judge.
Intergenerational disputes also revolve around land gifts made by a father to his daughters during his lifetime. According to custom, a father may indeed give land (called ingobyi or icyali) to a daughter on the occasion of the birth of a new child. Opposition from the sons is especially strong if they are badly in need of land 25 and if their sister chooses to sell the land received. Moreover, conflicts often arise when a daughter receives amalira land ("land for the tears") from one of her parents to console her for the death of the other parent Finally, heated argument takes place if the sons suspect or discover that their father has promised to donate land (e.g., in a written testimony) to a person (a daughter or a non-relative) who attends to him during his old age. Hostility from the sons is generally all the more violent as they are convinced that caring strangers are opportunists guided by the secret hope of inheriting their father's land upon his death. And there is actually no doubt, as interviews with caring strangers reveals, that such is indeed the motive driving most of them in their dealings with old lonely persons.
(v) Insecurity of land tenure.
From the above account, it is evident that customary land . arrangements are heavily disputed, thus making many land rights increasingly insecure. This holds true, in particular, for vulnerable categories of persons who represent a significant and growing proportion of the population. To counter the threat of land withdrawal, members of these groups choose not infrequently to sell the disputed land. Such behaviour, it should be noted, only shifts the problem to the buyer who may not be aware of the dispute at the time of purchase. When, on the other hand, the person with contested claim is extremely eager to keep the land (say, because his house is located on it), securization of his right is sometimes achieved by buying the land from the person who disputes his claim to it Under these circumstances, contrary to what happens when the land is surreptitiously sold, land security is restored with all the attendant beneficial effects on efficiency and investment
The civil war in the context of extreme land pressure
Rural communities are far from being the havens of peace and the models of altruistic behaviour which they are depicted to be in popular accounts inspired by a romantic view of indigenous life. Often concealed behind the veil of multiple reciprocal exchange arrangements, there are often at work pervasive tensions and rivalries that must be carefully held in check to avoid disruptions of social order. As rightly pointed out by many anthropologists, social peace and collective survival are the ultimate end of predominant modes of apparently altruistic
34
exchange which actually serve to bind people together by ties of mutual obligation [see, e.g., Belshaw, 1965; Sahlins, 1974; Bourdieu, 1980; Evans-Pritchard, 1940; Gregory, 1982; ]. In N, however, collective survival and social peace appeared to be under severe threat at the time of our field study (as early as 1988). Due to extreme scarcity of land and to the harsch realities of struggle for bare survival, tensions had developed to such an extent that the social fabric was at the risk of falling asunder. This dreadful diagnosis is grounded in plain evidence of more and more numerous land disputes which proved increasingly difficult to settle satisfactorily (in spite of the efforts of local mediators anxious to preserve social order and to prevent economic deprivation and social destitution), which penetrated into the very heart of family life and led to disquieting displays of violence. An atmosphere of fear and isolation undoubtedly reigned in N, compounded by the ominous rise of a more and more uncontrollable group of young thieves and delinquents (often but not always landless youth with no access to regular income opportunities)'26. This was so much true that local inhabitants would forbid their children to go into the house of some neighbours or relatives for fear that they could be hurt or poisoned.
The Northwest (Ruhengeri and Gisenyi) region of Rwanda to which N belongs was particularly involved in the outburst of violence which tore the country apart in 1994. First, it gained the most from president Habyarimana's rule (since it was his home region) and had therefore the most to lose from the Arusha agreements which provided for a good amount of power-sharing with the opposition and the RPF (the Rwanda Patriotic Front dominated by Tutsis in exile). Second, having had a different history in which they escaped the Tutsi king's rule, it considers itself unlike the rest of the country and had always been especially hostile to the Tutsis27 Third, being very near to the site of the 1990-1994 RPF armed incursions, it has been living in fear of the RPF [Olson, 1995: 220].
The reasons which led to the civil war are obviously complex and it is not the purpose of this paper to discuss them in any detail. What we want to emphasize is just that the prevailing state of extreme land hunger created an enabling environment which made the most desperate people (particularly young people with only bleak prospects) ready to seize any opportunity to change their present predicament Moreover, the climate of violence which had got a hold over the people in the area produced the right predispositions and circumstances for the slaughter that was to ensue. After the bloodshed was over, we tried our best to get information about people from N who had survived the traumatic events. This necessitates a special trip to a refugee camp in Zaire where such people or investigators who worked with us could be met From talks with them, we have been able to reconstruct a list of the people who died during the war. This list is not complete since no news could be obtained about a number of people. Yet, it is sufficiently complete to allow us to use it with a view to determining whether people were killed haphazardly and, if not, which are the specific characteristics of those who passed away. Table 16 presents the results of that exercise.
35
An unexpected clear picture emerges from this table. As a matter of fact, victims of the 1994 events seem to belong to one of the following three categories of people. First, we find persons (or children of persons) who were not well accepted socially or whose success was resented before the civil war broke out Among the main reasons why they were disliked or feared are the facts that they enjoyed relatively large landholdings or that they were considered as trouble-makers. In the former group are either old persons who had accumulated much land or relatively young persons (less than 50 years) who could purchase numerous land parcels thanks to their having access to regular off-farm income opportunities. To the latter group belong the people suspected and accused of thefts and poisoning, or notoriously involved in many land disputes. All together, this category represents as much as 54 percent of the casualties of the civil war. This suggests that the 1994 events provided an unique opportunity to settle scores28 or to reshuffle land properties29, even among Hutu villagers, a well-known but ugly feature of all civil wars. This also holds true with respect to
Table 16 : Relevant Characteristics of N's People Killed during the 1994 Events
(incomplete list)
Personal characteristics frequency percent Persons with comparatively large land property
- old persons (> 50 years)' - persons who had aroused jealousy and hatred owing to their relative success
- Tutsi Persons considered to be trouble-makers Land-poor and malnourished people Youth engaged in militias Unknown
10 7* 2 1
5 ** 7 *** 5 I
35.7 %
17.9% 25.0 17.9
3.5
Total 28 100.0%
Notes: People are considered to he old when they have children to age to marry and, therefore, when tensions over land can arise between father and sins. * Four people out of these seven belonged to the same family whose father, mother and two adolescent children were killed; ** two persons in this group belonged to the same family (one father and a child); *** four out of these seven persons were children. old people (among which victims was a local mediator) since local inhabitants do not believe they have neccessarily died of natural causes 30
Note that one Tutsi woman lived in N and was the first to be killed. She was actually the victim of a failed murder attempt by an anti-Tutsi young radical in January 1993. Yet, it is probably a simplification to view her assassination as a purely racial act As a matter of fact, she was hated for many reasons, particularly because she came from the south of the country and was therefore considered to be a stranger, and because she inherited a relatively large land property upon the death of her husband of whom she was the fourth wife (an anomaly in a society where women do not inherit from their husband)31. She was involved in many land disputes which were clearly not of her own making32. Revealingly, the only witness of the 1993 murder attempt refused to say what he had seen before local arbitrators.
36
The second category of persons who fell victims of the war were young people (all in their twenties) who engaged in militias and were thus directly involved in the massacres and the fightings. It is not clear how exactly they were killed and, even here, the hypothesis that some of them were eliminated because they were trouble-makers cannot be ruled out a priori. (At least three of the five youth reported in our list were shady characters: two of them were landless people who used to commit thefts in order to survive while the third one was a violent radical who actually attempted to murder a Tutsi woman in January 1993 - see supra). This category accounts for 18 % of the war casualties.
Finally, the third category, which makes up one-fourth of the victims, corresponds to very poor people who were clearly malnourished before the war broke out Four out of the seven persons listed under that category were children. It is likely that all these people could not go through the harshness of war times owing to a lack of physical resistance and financial reserves.
III Conclusion
As has been pointed out in the introductory section, evidence available for Sub-saharan Africa does not suggest that the absence of formal private property rights over land is a serious hindrance to agricultural investment and land conservation. This is all the more likely to apply to our study area as people possess well-individualized rights and usually secure land tenure. When this happens not to be the case, by buying parcels subject to contestation (if such an option is feasible), a villager may establish incontrovertible claims, since as a rule land sales transactions are attested by written documents elaborated in the presence of witnesses, which normally ensures the validity of the transfer effected. Clearly, the main problem is not that people have insufficient incentives to carry out new investments but rather that new technical packages liable to increase land (and, possibly, labour) productivity in a significant manner are not available to them.
In a context of extremely rapid expansion of numbers such as is observed in Rwanda, boserupean processes of privately induced innovations cannot be expected to be able to match population growth [Platteau, 1995]. If public supply of technical innovations suitable for intensive agriculture proves to be also deficient, swift creation of non-agricultural income opportunities and/or drastic measures to bring down fertility rates become necessary to relax the pressure of numbers on limited land resources. When such steps are not taken, a rural society like N is dragged into the Malthusian trap and falls prey to extremely dangerous centrifugal tendencies that undermine the very basis of social life and strike deep at the heart of family life. It is illusory to think that formal private property rights recorded in an official land registry following a procedure of land titling can provide a solution to the problem. On the one hand, there is no reason to believe that formalization of land rights could in any way reduce the incidence of distress sales of land. If anything, it is the opposite outcome that should be expected. Moreover, it is unlikely that land rental transactions could be thereby stimulated given the
37
climate of extremely severe social tensions engendered by acute land scarcity and macro-level political instability.
On the other hand, unequalizing tendencies do not only stem from market processes but also from increasingly exclusionary applications of indigenous land practices. This said, the picture which emerges from our analysis is quite complex because while in some instances customary rules still serve to protect the interests of vulnerable sections of the population, or at least to mitigate the most anti-social consequences of individualization tendencies, in other instances they may have the opposite effect In the latter circumstances, formal laws can sometimes help to redress inequalities (e.g., official courts recognize the inheritance rights of children born of legally married couples even if customary marriage rituals have not been abided by), yet it is not clear why land titling as such should be necessary to achieve more equal allocation of rights of access to land.
Now, even assuming that some positive effects can be derived from formalization of land rights, on the grounds of efficiency or equity, they have to be set against the considerable costs which land titling programs involve, particularly so in conditions of highly fragmented landholdings (such as have been observed in N). Indeed, the experience available amply shows that cadastral surveys are often incomplete and there is a lack of diligent record keeping of all intervening changes in land ownership. As a result, land records hardly reflect the current reality, thus destroying the utility of the whole operation33. We are therefore on solid grounds to argue that the government of a country like Rwanda (and its foreign donors) would be better advised to use the scarce public resources available by diversifying economic activities and sources of employment as well as by promoting agricultural research and extension than by attempting to establish centralized control of land rights and transfers.
38
Notes
• We gratefully acknowledge financial support from the University of Namur both for a first field study during the year 1988 and for the processing of the data collected in 1988 and 1993. Also gratefully acknowledged is the support for a second field study in 1993 that has come from the Musée Royal tie l'Afrique Centrale (MRAC) of Tcrvuren, Belgium within the framework of a cooperation project between the lnstitut rte Recherche Scientifique et Technique (IRST), Butare, Rwanda, and the MRAC (coordinator: D. de Lame). This study would not have been possible without the effective assistance of a number of Rwandan collaborators who participated in the field studies and the diverse comments of many knowledgeable persons who spent much time with us discussing various issues raised in this paper (particularly, M. Charles Ntampaka, Michel André. Jean-Pierre Godding. Framçois Migeotte and Paul Malhicu).
I This applies not only to Kenya but also to other countries such as Zimbabwe and Somalia [Harrison. 1992: Roth et at, 1994: 224-51 as well as to Ghana (Besley, 19941. 2. For a study of soil degradation resulting from an insufficient intensification process to support the added number of people in the Highland prefecture of Gikongoro, see Olson, 1994. 3. Disappearance of cattle is due to several factors. the most important of which are the lack of grazelands, the threats of cattle thefts. and the imposition of permanent stalling by the government. 4. Other advantages usually ascribed to indigenous systems of land tenure are their flexibility and the fact that they economize on transaction (including information) costs.
5 One of them owned 2.33 ha and the other one 1.96 ha, which places them in the upper ownership strata of N.
6 Note that even the latter Gini value is lower than Gini values calculated for Murang'a district. about 80 km northeast of Nairobi [Pinckney and Kimuyu, 1994: 191. The comparison is instructive in so far as, like N, Murang'a is characterized by exceptionally high population density and is relatively favourably located with respect to market outlets. This said, it must he stressed that a Gini value of 0.436 is very high given the fact that Rwanda's rural society was known to be comparatively egalitarian even during the seventies, a feature which was reflected ill a relatively egalitarian distribution of land. It is apparently during the eighties that asset and income distributions started to deteriorate (Maton, 1994). Note that in the ease study of a village located in the South of the country (not far from Butare), the Gini coefficient measuring the inequality of income distribution was recently found to be as high as 0.53 (Marijsse el at., 1994 :271. 7. That the 1988 distribution cannot dominate the 1993 distribution in the sense of first-order stochastic dominance does immediately follow from the application of a
39
well-known theorem (see. e.g., Eeckhoudi and Gollier, 1995:88]. According to this theorem, indeed, for a random variable y to dominate another variable x in the sense of first-order stochastic dominance, it is necessary (but not sufficient) that E(y) > E(x). From table 1. it is evident that the average size of landholdings in 1988 was actually smaller than that obtaining in 1993, a finding that will soon be commented upon.
8 Bear lut mind that the concept of second-order stochastic dominance (or, equivalently, that of Lorenz dominance) is less requiring than that of first-order stochastic dominance: first-order implies second-order stochastic dominance but not vice versa.
9. For the sake of comparison, notice (flat a recent World Bank study of four areas in Kenya (no doubt a heavily populated country) shows that the smallest average parcel size is 0.53 ha [Migot-Adholla et tit., 1994b: 125[. To understand such an enormous difference, it must he remembered that the area of our study possesses volcanic soils which are highly fertile. 10 The considerable fall in the latter is due to a large extent to the aforementioned transfer of a comparatively large property to non-residents following the death of a household head between 1988 and 1993. 11 Note that the figures used in the denominators are not exact since our data miss the youth (boys and girls) who have left N in order to take jobs, follow training programmes or move with their husband outside the native hilt The percentages given in the table therefore overestimate the reality of dependence of children in their twenties vis-a-vis their parents. As a consequence, the only valid conclusion which can be drawn from the table is that, among the youth remaining on the native land, there is a tendency to stay longer and longer within the parental household. A direct implication of this finding is the following: if there has been an acceleration in outmigraiion (a phenomenon which we are unable ut) document), it has not proven sufficient to release the remaining youth from the pressure of numbers on N's lands and to get emancipated from parental tutelage as early as they would wish.
12 Remittances from relatives working as regular wage-earners in rather distant places (mainly Kigali) are included in the first column of the table. There are no remittances from irregular employments in our sample.
13 Note that variations in average size of individual parcels of land according to mode of acquisition are not statistically significant.
14 Bear in mind that in Rwanda "all nonregistered land belongs it) the state on which individuals are granted exclusive private and inviolable usufruct rights, protected by the law" [Blare(, 1994: 81]. Yet, as a matter of principle. traditional land owners and tenants are allowed to convert their rights to full ownership by registering their land libidem; see also Ruhashyankiko. 1985: 12-13]. In actual practice, however, this opportunity does not exist because registration procedures have not been established.
15 The intense activity of the land market in N is perhaps also surprising given the fact that N belongs to an area of the country (the Highland Northwest) which long resisted the Tutsi rule in the pre-independence period and where, as a result, customary land tenure based on lineage ownership
40
was not directly attacked by the new agrarian relations of the patron-client type established by the Tutsi caille-owners [André, 1994: 202; Olson, 1995[.
16 In reality, fenders are usually quite willing to enlarge their land property, yet the location of the parcels foreclosed may not be suitable and they may therefore prefer to sell them so that they can use the safe proceeds to acquire better situated parcels in the (active) land market. 17 Operated land is obtained by subtracting from owned land the amount of land rented (or loaned) out or mortgaged to creditors and by adding the amount of land rented (or loaned) in or taken under possessory mortgage. 18 Note that while in 1988 net renting in of land was positive the reverse was true in 1993. Also, the drastic decline in the percentage of total operated area rented in between the two survey years (from 11% to 5%) is largely due to the dramatic fall of the average size of parcels borrowed by the sample households (from roughly 0.1 to 0.05 ha). 19. Bear in mind that the pseudo-Gini coefficient for a particular component of inequality is the Gini that would be obtained if households were ranked in terms of their total (rather than component) landholding. 20 Since under distress conditions households usually sell one parcel of land at a time and since parcels are minuscule (see supra), descending down the five-category ownership scale may actually take many years. The same actually holds true of households which are climbing up the ladder: they indeed accumulate land properly in a gradual manner by purchasing a land parcel as soon as they have earned enough regular off-farm incomes to be able to do so. Thus, if we measure mobility along the ownership scale between 1988 and 1993 (corresponding to a time interval of only five years), we trust expect it to he rather low. This is confirmed by looking at the transition matrix of per household distribution of land owned (not shown here) and by computing a summary measure of mobility such as the Distance Measure (MD) from this matrix. The value of MD is 0.054 and, it' The number of fracliles used in the transition matrix is raised from five to ten in order to follow more closely movements along the landownership scale, the MD value increases but only to 0.066.
Bear in mind that the Distance Measure takes the extent of "off-diagonalness" or distance from the diagonal into account whelk representing the degree of mobility (Swaminathan. 1988; Lanjouw. 1992: 180-81[. The value of MD is equal to zero when all non-diagonal cells are empty and a value of one when mobility is perfect, i.e. when ones are observed in the cells along the diagonal from the top right hand corner to the lower left hand corner (except for the middle fractile), i.e. when the greatest distances have been jumped. It is formally defined as refers to the probability of occurring in the cell corresponding to row i and column j: n stands for the number of fractiles used in the transition matrix and max is the maximum value that MD can take on (when mobility is perfect). When is odd, max is given by
41
21 Note that the average land owned per person is much lower in 1993 than in 1988, which is due to the fact that an old person (a descendant of a founder lineage) who owned a considerable amount of land on N's scale died between the two survey years. Since. following a land dispute. all his lands were transferred outside N (instead of going to his sons). the land endowment per person in younger age classes was bound to decrease. Since this decline is nevertheless less important than the fall in endowments of older age classes, the agewise difference in land owned per person is smaller In 1993 than in 1988.
22 According to some estimate based on aggregate data, the proportion of rural people with a dally intake of less than 1,600 calories has risen from hardly 9% in 1982 to a staggering 40%, in 1990 and much more in the following years. Even it these estimates have it) he considered with olmost caution. the incontrovertible fact remains that absolute poverty has increased at amazing speed since the early eighties in rural Rwanda.
23 Blarel also writes that in Rwanda "the indigenous tenure systems seem to have adapted efficiently to the prevailing socioeconomic conditions" (BIarel. 1994: 89[.
24 For more details on the effects on children of the non-payment of the inkwano , see Ntampaka. 1979.
25 We thus came across instances of disputes caused by the forced appropriation of icyali land by brothers who refuse to recognize the tight of their sister to such land previously donated by the father.
26 In a revealing manner. before the war a statistically significant relationship was found between regional variations in the incidence of juvenile delinquency on the one hand and regional variations in per capita availability of calories on the other hand. As a matter of fact, together with population density, the latter variable explained as much as 58% of the regional variations in offences committed by persons between 21 and 25 years old (Mason, 1994: 27-8[.
27 There were much fewer Tuisis and mixed marriages were much less common in the Northwest than in the South and the Center of the country.
28 Thus, before the outbreak of the 1994 events. one of the poorest and most marginalized members of N was a person wrongly accused of a murder actually committed by a powerful lineage leader who was strongly "protected" during the investigation. As a result of the iniquitous judgement passed by an ill-informed official court, this member spent ten years in jail and lost all his property. Yet, the war enabled him to completely reverse the situation since, after the victory of the RPF, he became rich again and presently lives in a beautiful house.
42
29 It is not rare, even today, to hear Rwandans :ague that a war is necessary to wipe out an excess of population and to bring numbers into line with the available land resources.
30 There is the possible exception of a very old man (aged 78 years) who is among the seven victims belonging to that category. 31 Note also that her (Hutu) husband was not a native of N either since he migrated to N after having been forced to leave his native village by his half-brothers.
32 Among many (apparently fabricated) indictments, she was accused of having falsified her husband's testimony. Any pretext seemed good to threaten to kill her. sometimes openly. 33 See, e.g.. Bruce. 1986: 58; Green, 1987: 11; Feeny, 1988: 295; Saul, 1988: 273; Shipton, 1988: 123; Golan. 1990: 51; Pinckney and Kimuyu, 1994: 23; Migot-Adholla et at- 1994x: 116.
43
REFERENCES
ALCHIAN, A., and H. DEMSETZ, 1973, "The Property Right Paradigm", Journal of Economic History, Vol. 33, No. l, 16-27. ANDRE, C., 1994, "Evolution des droits fonciers au Rwanda: une main invisible?", in Croissance, répartition, environnement: Quelles regulations pour un développement durable?, Eleventh Congress of French-Speaking Belgian Economists, CIFOP, Charleroi, 197-217.
ATKINSON, A.B., 1970, "On the Measurement of Inequality", Journal of Economic Theory, Vol. 2, N° 3, 244-63. ATKINSON, A.B., and F. BOURGUIGNON, 1990, "The Design of Direct Taxation and Family Benefits", Journal oj'Public Economics, Vol. 41, N° 1, 3-29. ATWOOD, D.A., 1990, "Land Registration in Africa : The Impact on Agricultural Production", World Development, Vol. 18, No. 5, 659671. AULT, D.E., and G.L. RUTMAN, 1979, "The Development of Individual Rights to Property in Tribal Africa", Journal of Law and Economics , Vol. 22, No. 1, 163-182.
BELSHAW, C., 1965, Traditional Exchange and Modern Markets, Englewood Cliffs, NJ: Prentice-Hall. BESLEY, T., 1994, "Property Rights and Investment Incentives: Theory and Evidence from Ghana", Research Program in Development Studies, Princeton University (mimeo). BLAREL, B., 1994, "Tenure Security and Agricultural Production.Under Land Scarcity: The Case of Rwanda", in Bruce, J.W., and S.E. Migot-Adholla (eds), Searching for Land Tenure Security in Africa, Dubuque, Iowa: Kendall/Hunt Publishing Cy, 71-95.
BOURDIEU, P., 1980, Le sens pratique, Paris: Editions de Minuit
BRUCE, J.W., 1986, "Land Tenure Issues in Project Design and Strategies for Agricultural Development in Sub-Saharan Africa", Land Tenure Center, LTC Paper No. [28, University of Wisconsin-Madison.
BRUCE, J.W., 1993, "Do Indigenous Tenure Systems Constrain Agricultural Development?", in Bassett, T.J., and D.E. Crummey (eds.), Land in African Agrarian Systems, Madison, Wisconsin: The University of Wisconsin Press, 35-56.
BRUCE, J.W., and S.E. MIGOT-ADHOLLA (eds), 1994, Searching for Land Tenure Security in Africa, Dubuque, Iowa: Kendall/Hunt Publishing Cy'.
BRUCE, J.W., S.E. MIGOT-ADHOLLA, and 1. ATHERTON, 1994, "The Findings and their Policy Implications: Institutional Adaptation or Replacement ?", in Bruce, J.W., and S.E. Migot-Adholla (eds), Searching far Land Tenure Security in Africa, Dubuque, Iowa: Kendall/Hunt Publishing Cy, 251-65.
BUCHANAN, l.M., 1975, The Limits of Liberty - Between Anarchy and Leviathan , Chicago & London : University of Chicago Press.
DEMSETZ, H., 1967, "Towards a Theory of Property Rights", American Economic Review, Papers and Proceedings, Vol. 57, No. 2, 347-359.
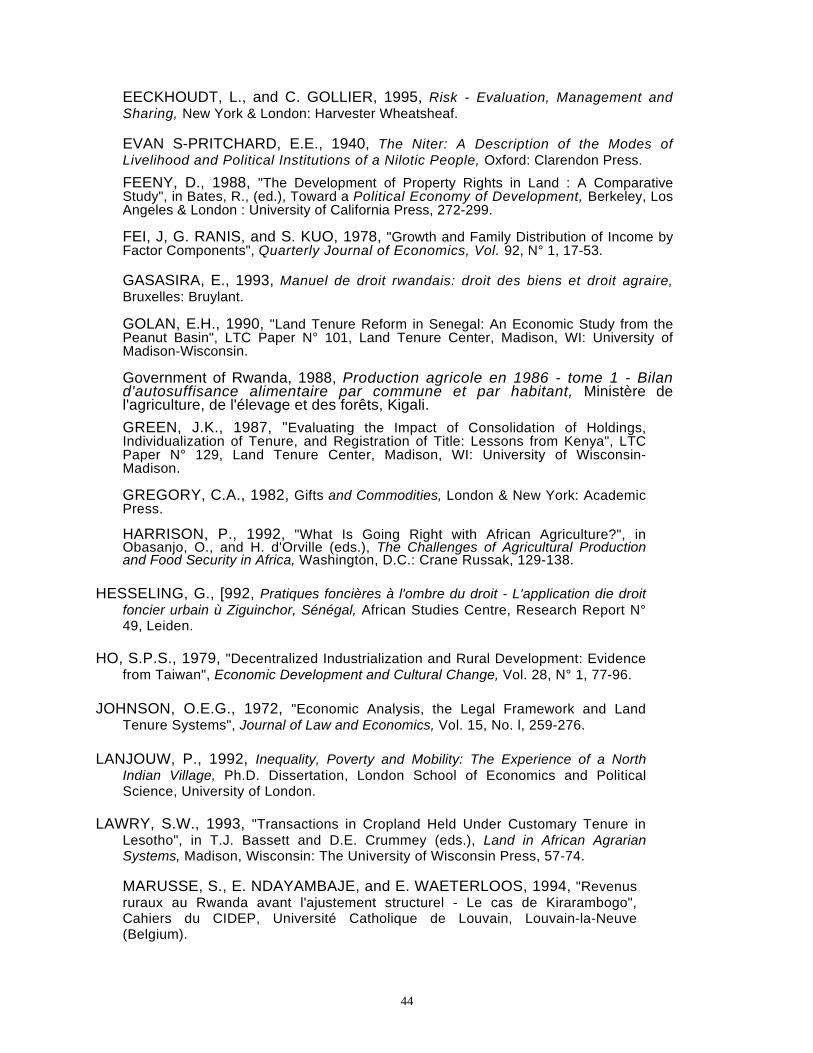
44
EECKHOUDT, L., and C. GOLLIER, 1995, Risk - Evaluation, Management and Sharing, New York & London: Harvester Wheatsheaf.
EVAN S-PRITCHARD, E.E., 1940, The Niter: A Description of the Modes of Livelihood and Political Institutions of a Nilotic People, Oxford: Clarendon Press. FEENY, D., 1988, "The Development of Property Rights in Land : A Comparative Study", in Bates, R., (ed.), Toward a Political Economy of Development, Berkeley, Los Angeles & London : University of California Press, 272-299.
FEI, J, G. RANIS, and S. KUO, 1978, "Growth and Family Distribution of Income by Factor Components", Quarterly Journal of Economics, Vol. 92, N° 1, 17-53.
GASASIRA, E., 1993, Manuel de droit rwandais: droit des biens et droit agraire, Bruxelles: Bruylant.
GOLAN, E.H., 1990, "Land Tenure Reform in Senegal: An Economic Study from the Peanut Basin", LTC Paper N° 101, Land Tenure Center, Madison, WI: University of Madison-Wisconsin.
Government of Rwanda, 1988, Production agricole en 1986 - tome 1 - Bilan d'autosuffisance alimentaire par commune et par habitant, Ministère de l'agriculture, de l'élevage et des forêts, Kigali. GREEN, J.K., 1987, "Evaluating the Impact of Consolidation of Holdings, Individualization of Tenure, and Registration of Title: Lessons from Kenya", LTC Paper N° 129, Land Tenure Center, Madison, WI: University of Wisconsin-Madison.
GREGORY, C.A., 1982, Gifts and Commodities, London & New York: Academic Press. HARRISON, P., 1992, "What Is Going Right with African Agriculture?", in Obasanjo, O., and H. d'Orville (eds.), The Challenges of Agricultural Production and Food Security in Africa, Washington, D.C.: Crane Russak, 129-138.
HESSELING, G., [992, Pratiques foncières à l'ombre du droit - L'application die droit
foncier urbain ù Ziguinchor, Sénégal, African Studies Centre, Research Report N° 49, Leiden.
HO, S.P.S., 1979, "Decentralized Industrialization and Rural Development: Evidence
from Taiwan", Economic Development and Cultural Change, Vol. 28, N° 1, 77-96. JOHNSON, O.E.G., 1972, "Economic Analysis, the Legal Framework and Land
Tenure Systems", Journal of Law and Economics, Vol. 15, No. l, 259-276. LANJOUW, P., 1992, Inequality, Poverty and Mobility: The Experience of a North
Indian Village, Ph.D. Dissertation, London School of Economics and Political Science, University of London.
LAWRY, S.W., 1993, "Transactions in Cropland Held Under Customary Tenure in
Lesotho", in T.J. Bassett and D.E. Crummey (eds.), Land in African Agrarian Systems, Madison, Wisconsin: The University of Wisconsin Press, 57-74.
MARUSSE, S., E. NDAYAMBAJE, and E. WAETERLOOS, 1994, "Revenus ruraux au Rwanda avant l'ajustement structurel - Le cas de Kirarambogo", Cahiers du CIDEP, Université Catholique de Louvain, Louvain-la-Neuve (Belgium).
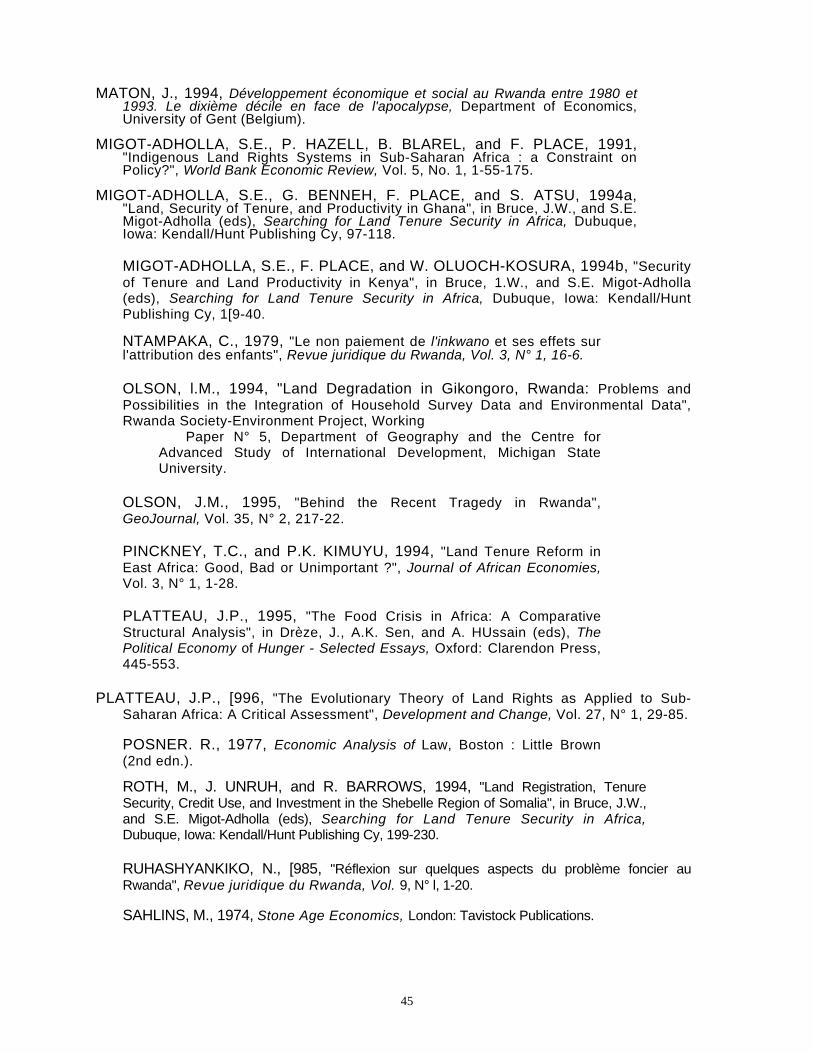
45
MATON, J., 1994, Développement économique et social au Rwanda entre 1980 et 1993. Le dixième décile en face de l'apocalypse, Department of Economics, University of Gent (Belgium).
MIGOT-ADHOLLA, S.E., P. HAZELL, B. BLAREL, and F. PLACE, 1991,
"Indigenous Land Rights Systems in Sub-Saharan Africa : a Constraint on Policy?", World Bank Economic Review, Vol. 5, No. 1, 1-55-175.
MIGOT-ADHOLLA, S.E., G. BENNEH, F. PLACE, and S. ATSU, 1994a,
"Land, Security of Tenure, and Productivity in Ghana", in Bruce, J.W., and S.E. Migot-Adholla (eds), Searching for Land Tenure Security in Africa, Dubuque, Iowa: Kendall/Hunt Publishing Cy, 97-118. MIGOT-ADHOLLA, S.E., F. PLACE, and W. OLUOCH-KOSURA, 1994b, "Security of Tenure and Land Productivity in Kenya", in Bruce, 1.W., and S.E. Migot-Adholla (eds), Searching for Land Tenure Security in Africa, Dubuque, Iowa: Kendall/Hunt Publishing Cy, 1[9-40.
NTAMPAKA, C., 1979, "Le non paiement de l'inkwano et ses effets sur l'attribution des enfants", Revue juridique du Rwanda, Vol. 3, N° 1, 16-6. OLSON, l.M., 1994, "Land Degradation in Gikongoro, Rwanda: Problems and Possibilities in the Integration of Household Survey Data and Environmental Data", Rwanda Society-Environment Project, Working
Paper N° 5, Department of Geography and the Centre for Advanced Study of International Development, Michigan State University.
OLSON, J.M., 1995, "Behind the Recent Tragedy in Rwanda", GeoJournal, Vol. 35, N° 2, 217-22. PINCKNEY, T.C., and P.K. KIMUYU, 1994, "Land Tenure Reform in East Africa: Good, Bad or Unimportant ?", Journal of African Economies, Vol. 3, N° 1, 1-28. PLATTEAU, J.P., 1995, "The Food Crisis in Africa: A Comparative Structural Analysis", in Drèze, J., A.K. Sen, and A. HUssain (eds), The Political Economy of Hunger - Selected Essays, Oxford: Clarendon Press, 445-553.
PLATTEAU, J.P., [996, "The Evolutionary Theory of Land Rights as Applied to Sub-
Saharan Africa: A Critical Assessment", Development and Change, Vol. 27, N° 1, 29-85.
POSNER. R., 1977, Economic Analysis of Law, Boston : Little Brown (2nd edn.).
ROTH, M., J. UNRUH, and R. BARROWS, 1994, "Land Registration, Tenure Security, Credit Use, and Investment in the Shebelle Region of Somalia", in Bruce, J.W., and S.E. Migot-Adholla (eds), Searching for Land Tenure Security in Africa, Dubuque, Iowa: Kendall/Hunt Publishing Cy, 199-230. RUHASHYANKIKO, N., [985, "Réflexion sur quelques aspects du problème foncier au Rwanda", Revue juridique du Rwanda, Vol. 9, N° l, 1-20.
SAHLINS, M., 1974, Stone Age Economics, London: Tavistock Publications.
46
SAUL, M., 1988, "Money and Land Tenure as Factors in Farm Size Differentiation in Burkina Faso", in Downs, R.E., and S.P. Reyna (eds), Land and Society in Contemporary Africa, Hanover, NH, and London: University Press of New England, 243-79. SAUL, M., 1993, "Land Custom in Bare: Agnatic Corporation and Rural Capitalism in Western Burkina", in Bassett, T.J., and D.E. Crummey (eds.), land in African Agrarian Systems, Madison, Wisconsin: The University of Wisconsin Press, 75-100. SHIPTON, P., 1988, "The Kenyan Land Tenure Reform: Misunderstandings in the Public Creation of Private Property", in Downs, R.E., and S.P. Reyna (eds), land and Society in Contemporary Africa, Hanover, NH, and London: University Press of New England, 91-135. SWALLOW, B., (ed), 1994, "Evaluating the Relationship Between Property Rights, Risk, Technology and Productivity in Sub-Saharan Africa", Socio-Economics and Policy Research, Working Document N° 18, International Livestock Centre for Africa, Addis Ababa.
SWAMINATHAN, 1988, Inequality and Economic Mobility: An Analysis of Panel Data from a
South Indian Village, Ph.D. Dissertation, Oxford University.
47
APPENDIX Figure la : Cumulative Distribution Functions for Landholdings - Owned lands measured in ares) 1988 and 1993
Figure lb : Cumulative Distribution Functions for Landholdings Operated Lands (measured in ares) 1988 and 1993
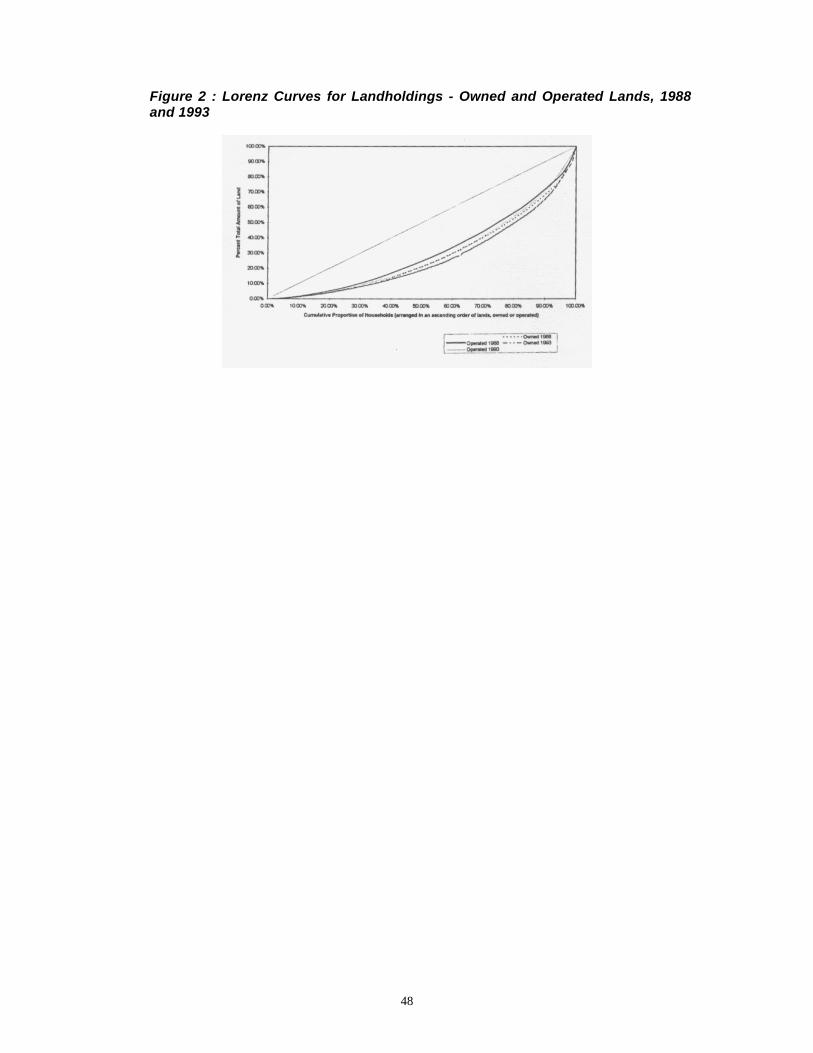
48
Figure 2 : Lorenz Curves for Landholdings - Owned and Operated Lands, 1988 and 1993
49
SERIE : CAHIERS DE RECHERCHE
Les cahiers de la collection "Développement" sont repris en caractères gras.
109. .-Ph. PLATTEAU, The Evolutionist Theory of Institutional Development : A Comparative Analysis of the Agricultural and Fishing Sectors, September 1990; in : I. TVEDTEN and B. HERSOUG (eds.), 1992, Fishing for Development - Small scale Fisheries in Africa, The Scandinavian Institute of African Studies, Uppsala, pp. 91-114.
110. . BUGHIN, Pricing behavior with exports-oriented trade strategies in a small open economy : an exploratory econometric approach within a quantity-constraint framework, January 1991.
111. . BUGHIN, More on the schumpeterian link between firm size and its innovative activity, January 199[.
112. . SAPIN, l'optimisation d'un portefeuille obligatoire,Février 1991
113. h. GOLLIER & S. WIBAUT, A note on portfolio selection by insurance companies and optimal participating insurance policies, March 1991; forthcoming in Insurance : Mathematics and Economics. 114. . WIBAUT, Optimal public deficit rules in a discrete time setting, March 1991.
115. r. LOUVEAUX, Stochastic programs with simple integer recourse, June 199[.
116. .-M. BALAND, Foodgrain stocks and macrodynamic adjustment mechanisms in a dual semi-industrialized economy, October 1991; forthcoming in Journal of Development Economics (1992).
117. .-Ph. PLATTEAU, The free market is not readily transferable : reflections on the links between market, social relations, and moral norms, November 1991; in Journal of Development Studies, Vol. 30, N° 3, April 1994 and Vol. 31, N° 4, July 1994.
118. r. MANIQUET, Surplus-value and inequality measurement, February [992.
119. l. DEHENEFFE, Analyse régionale des dépenses de chômage, Mars 1992. Papier présenté au 9ème Congrès des économistes belges de langue française, Commission 3, CIFOP, Charleroi 1990, pp. 123139. Paru également dans Wallonie, CESRW, n° 24, 1992, pp. 1118 (version plus courte). 120. . BUGHIN et J.-M. JACQUES, De l'Ethique dans l'entreprise à l'Ethique de l'entreprise : émergence d'un nouveau concept de la politique générale, Avril 1992. 121. . HINDRIKS, Optimal targeting with screening loopholes, November [992; papier présenté au 8ème Congrès de la European Economic Association à Helsinki, Finland du 27 au 29 août [993.
50
122. . REDING, Les critères de convergence du Traité de Maastricht, Novembre 1992. Communication préparée pour la Journée d'Etudes "Le Budget de l'Etat Belge 1993" organisé le 23 octobre 1992 par l'Institut Belge des Finances Publiques - Bruxelles. Le texte de cette communication est à paraître dans les Cahiers de l'Institut Belge des Finances Publiques.
123. Fr. MANIQUET, Distribution Rules for a Commonly Owned Technology : the Average Cost Lower Bound, January 1993.
124. .-M. DIEU, Spécificité des systèmes de prise de décision stratégique dans les organisations de défense des droits de l'homme, Mars 1993.
125. r. V. LOUVEAUX, Stochastic location analysis. March 1993.
126. . BUGHIN & 1.-M. JACQUES, Managerial efficiency and the schumpeterian link between size, market structure and innovation revisited, April 1993.
127. . de la CROIX & E. TOULEMONDE, Union-monopoly "efficient" bargaining reconsidered, June [993. 128. .-Ph. PLATTEAU, Sub-Saharan Africa as a special case : the role of (infra)structural constraints, August 1993. 129. M. BOUCHET, Les perspectives budgétaires de la Communauté française dans le nouvel environnement institutionnel, Janvier 1994. [30. Fr. MANIQUET, On the Coalition-Proof Nash Implementation of The Pareto and No-Envy Correspondence, January 1994. 131. Fr. MANIQUET, Informational Efficiency, Horizontal Equity and the Equal Income Walrasian Rule, January 1994.
132. H. GLEJSER, The Effect of Prices on Trade during the First Twelve Years of the European Community, January 1994. 133. M. MIGNOLET (Groupe d'Économie Wallonne), Effective tax rates : a generalization of Iwamotos (1992) result, January 1994. 134. J. HINDRIKS, The Limits to Redistribution by Targeting : the Case of Income-Testing, February 1994. 135. M. BOUCHET (Centre de Recherches sur l'Économie Wallonne), Les perspectives budgétaires de la Région wallonne dans le nouvel environnement institutionnel, sous la direction scientifique de R. Deschamps et J.-Ch. Jacquemin, Mai 1994.
136. J. HINDRIKS, Optimal Nonlinear Taxes under Multilateral Tax Evasion and the Decentralization of Public Good Supply, June 1994. 137. E. TOULEMONDE, The insider-outsider and efficiency wage theories : The interaction with labor turnover costs, June 1994. 138. V. BODART, Permanent-transitory confusion and the predictive power of the yield curve, June 1994.
51
139. M. LONA, Budgets de la Flandre et de la Wallonie : Comparaison interrégionale, Août 1994.
140. J.-Ph. I'LATTEAU, A framework for the analysis of evolving patron-client ties in agrarian economies, October 1994. 141. J. HINDRIKS, On the equity-compliance tradeoff, October 1994 142. J-M BALAND J.-Ph. PLATTEAU, Coordination problems in resource conservation programs, October 1994.
143. J.-M. BALAND & J.-Ph. PLATTEAU, Should common property resources be privatized ? A re-examination of the Tragedy of the Commons, May 1994.
144. Fr. MANIQUET, The average cost lower bound and informational simplicity in the cooperative production problem, December 1994.
145. J.-Ph. PLATTEAU, The evolutionary theory of land rights as applied to Subsaharan Africa : a critical assessment, January 1995. 146. J.-M. BALAND & J.-Ph. PLATTEAU, Does heterogeneity hinder collective action ?, May 1995.
147. A. ABRAHAM & J.-Ph. PLATTEAU, Mutual insurance as a problematic concept in traditional risk-prone societies towards resolving the paradox, May 1995.
148. J. HINDRIKS, The targeting of social security : a tax reform approach, May 1995.
149. J. HINDRIKS, Income tax compliance : the no-commitment game, May 1995.
150. H. GLEJSER, Structural factors, government size and macro-conomic stability, August [995.
151. H. GLEJSER, National x - efficiency, August 1995.
152. J.-Ph. PLATTEAU & L. VIESLET, Food market liberalization against public opinion : some bitter lessons from the physiocratic experiment in eighteenth-century France, August 1995.
153. M. MIGNOLET, The multinational companies cost of capital : what is the impact of regional policy ?, October 1995; paper presented at the Conference intitled "New Models Explaining the Development of Regions", Tinbergen Institute Rotterdam, June 16-17, 1995; to be published in Girardy R. (ed.), New Models Explaining the Development of Regions, Essays in honour of J.H.P. Paelinck, Groningen.
52
154. M. MIGNOLET & St GUIOT, Politiques régionales et coût du capital : un outil d'évaluation, Octobre 1995, paru dans la revue "Région et développement", L'Harmattan, 1995-1.
155. M. MIGNOLET & St GUIOT, La politique régionale européenne et le coût du capital : application à la Martinique et au Hainaut d'un modèle de taxation internationale, Octobre 1995; paru dans la "Revue d'Économie Régionale et Urbaine", 1995-2.
156. X. DEBRUN, The design of monetary policy co-ordination and delegation under incomplete monetary union, October 1995.
157. J.-M. BALAND & P. FRANCOIS, Innovation, monopolies and the poverty trap,
November 1995; forthcoming in Journal of Development Economics (1996). 158. M. MIGNOLET, T. PIRAUX & A. VEREECKE, La localisation d'activités, le
coût du capital, la politique régionale et la taxation internationale, Novembre 1995; article présenté au colloque international de l'association de science régionale de langue française, Toulouse, 30-31 août et 1er septembre 1995.
159. P.K.M. THARAKAN, B. KERSTENS & H. GLEJSER, The puzzle of North-South horizontal intra-industry trade revisited, January 1996.
160. H. GLEJSER & S. MORO, Estimates of trade effects of Portugal's and Spain's entry to the European union, January 1996.
161. H. GLEJSER, Le commerce extérieur et les politiques commerciales, Janvier 1996. 162. B. FAKIN & A. de CROMBRUGGHE, Patterns of government expenditure and taxation in transition vs. DECD economies, January 1996. 163. Fr. MIGEOTTE, L'émergence d'un marché de location du bétail dans des conditions de forte pression démographique, Janvier 1996.
164. C. ANDRÉ & J.-Ph. PLATTEAU, Land tenure under unendurable stress : Rwanda caught in the malthusian trap, January 1996.
53
SERIE : POINTS DE VUE
25. Fr. DUCHESNE, Les modalités d'intervention des pouvoirs publics à la recherche d'un contrôle des dépenses médicales, Octobre [991; paru in Reflets & perspectives de la vie économique, tome XXXII, numéro spécial "économie et santé", Mai 1992.
26. O. SEPULCHRE, 1. HUSSON, J.-M. JACQUES et J.-Ch. JACQUEMIN, La gestion anticipative dans l'entreprise, Juillet 1992. 27. J. de GROOTE, Le raisonnement économique influence-t-il les décisions ? Quelques leçons de l'expérience récente, Janvier 1993; cours donné par J. de Groote, le 8 mai 1992, à la Faculté des Sciences économiques et sociales de Namur, à l'occasion de la fin de son enseignement 28. R. DESCHAMPS, Perspectives du Fédéralisme Belge, solidarités et intérêts communs, Août 1994.
29. A. de CROMBRUGGHE, Z. MINTON-BEDDOES & J.D. SACHS, EU membership for central Europe : commitments, speed and conditionality, January [996.
SERIE : SYNTHESES
1. J. NIZET, Le modèle d'analyse des organisations de H. Mintzberg, présentation et discussion, Juin 1989.