Embed Size (px)
Citation preview
Chapitre 3 : Systèmes biphasiques “S-G”
Fluides complexes
N.Vandewalle, Professeur Ordinaire, Université de Liège
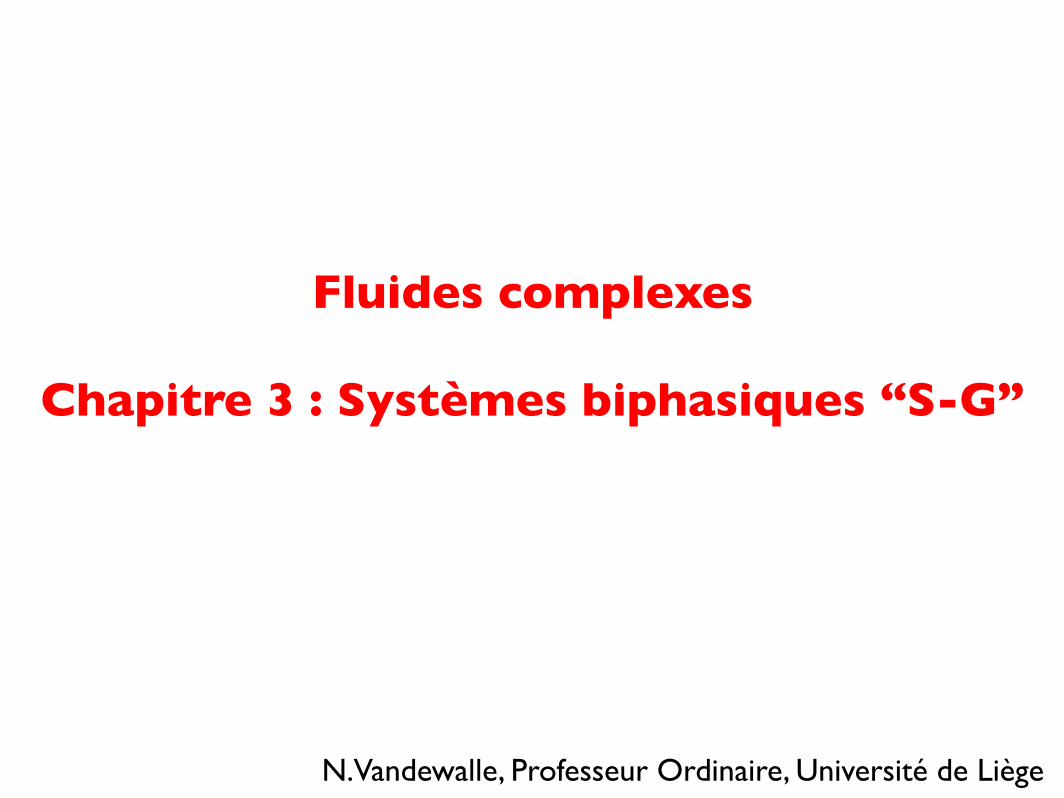
0. Plan
1. Systèmes
2. Empilements statiques
3. Empilements quasi-statiques
4. Ecoulements
5. Gaz
6. Cohésion
agitationrepos verser vibrer
agitation
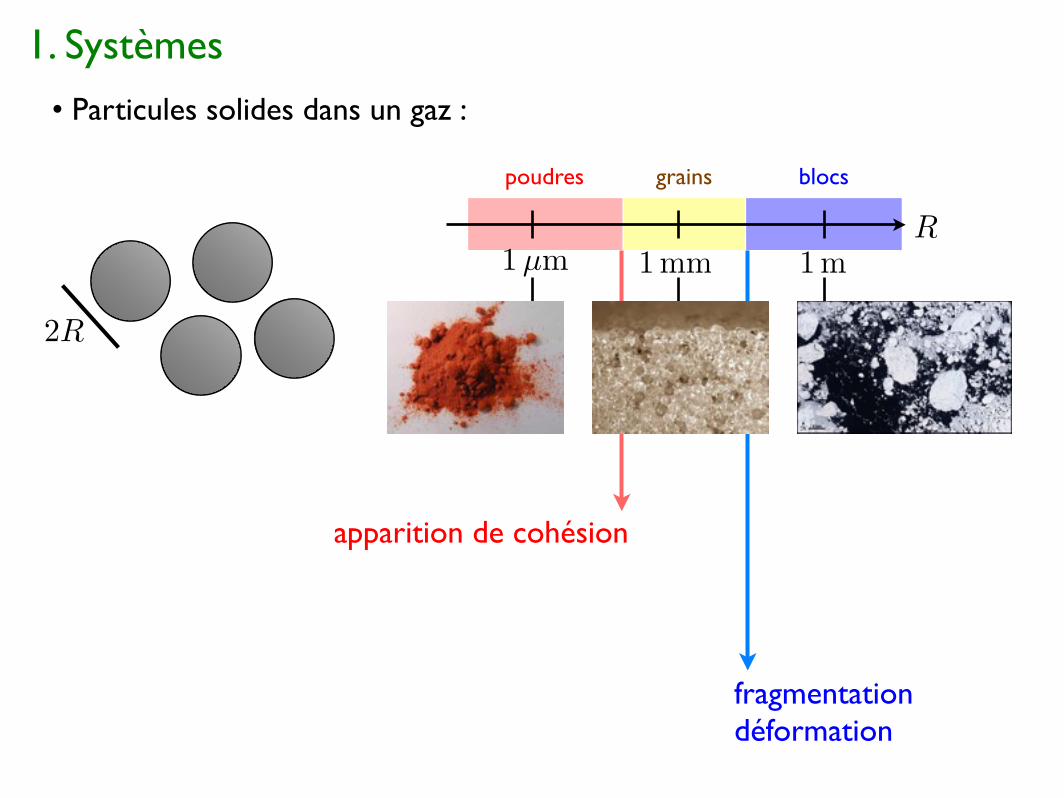
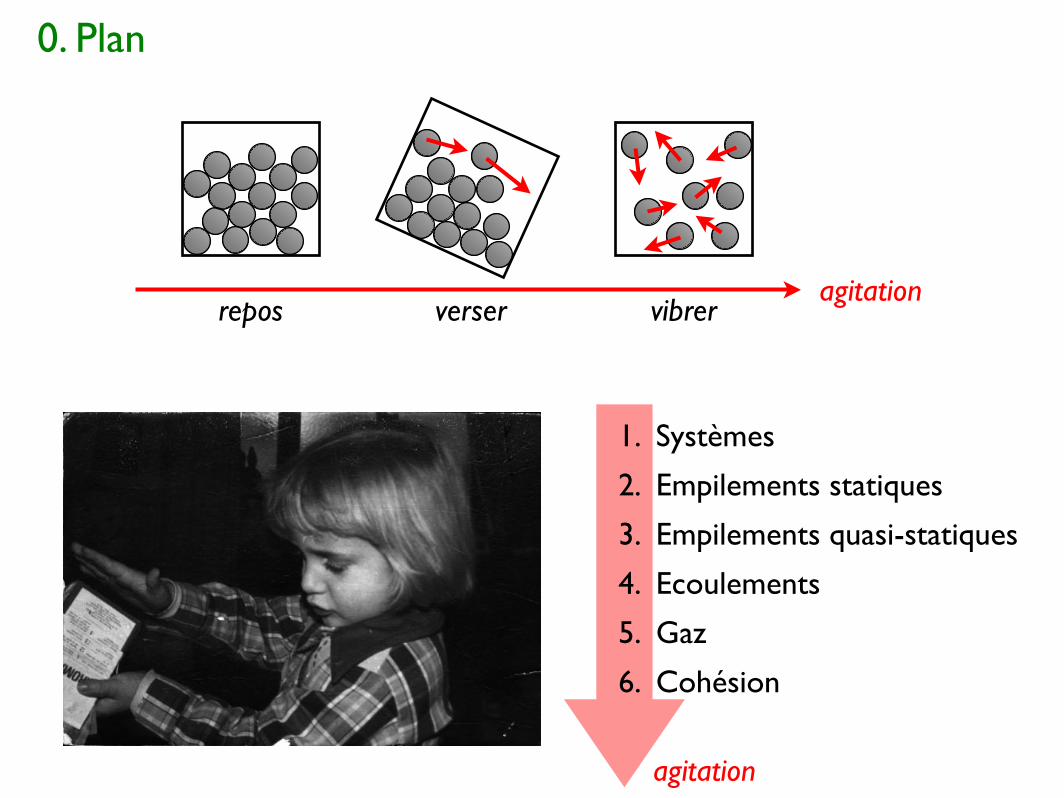
1. Systèmes• Particules solides dans un gaz :
2R
R1 mm 1 m1 µm
poudres blocsgrains
apparition de cohésion
fragmentationdéformation

• Systèmes cohésifs :
- cohesive forces [wet] : liquid bridges, capillary forces
Rc ��
�
⇥g� 1 mm
Rc ⇡ 50µm
Powdered sugarGranular sugar (b)(a)
Figure 2: Two typical heap shapes. (a) Conical heap shape obtained with a non cohesive
granular sugar. (b) An irregular heap of powdered sugar which is a cohesive granular
material.
34
sucre impalpablesucre en grains
châteaux de sable
- cohesive forces [dry] : Van der waals forces, electrical charges
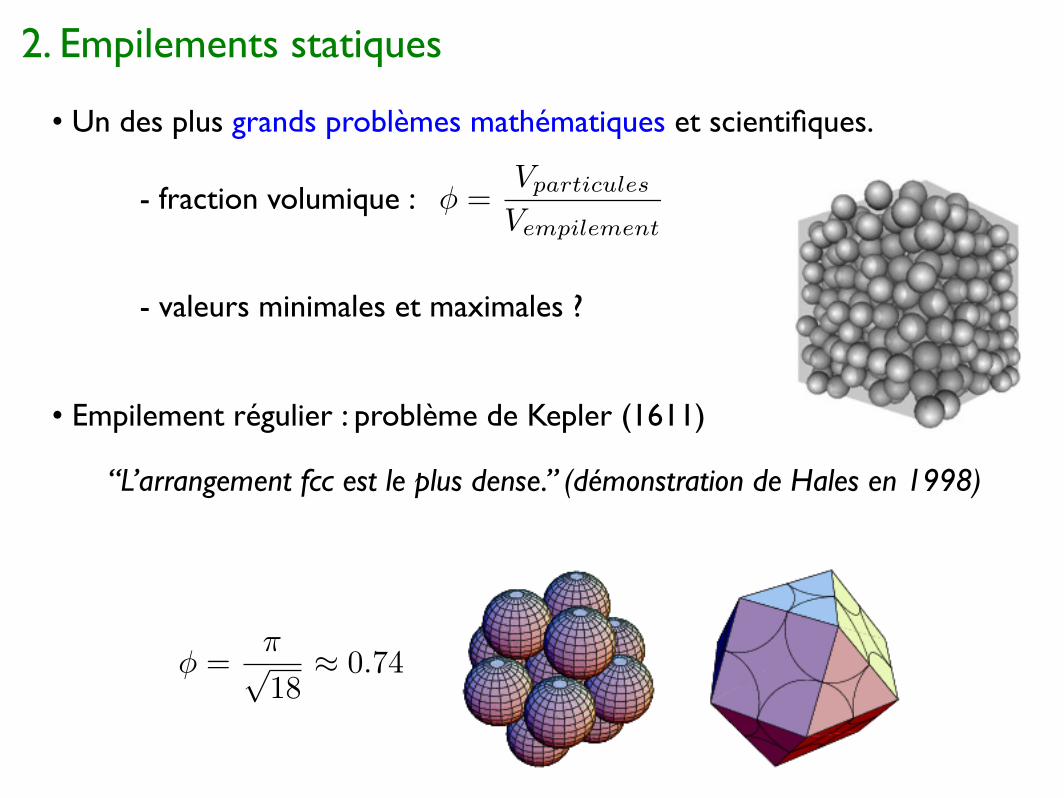
2. Empilements statiques
• Un des plus grands problèmes mathématiques et scientifiques.
• Empilement régulier : problème de Kepler (1611)
“L’arrangement fcc est le plus dense.” (démonstration de Hales en 1998)
- fraction volumique : � =Vparticules
Vempilement
⇥ =�⇥18� 0.74
- valeurs minimales et maximales ?

• Empilements aléatoires :
- désordre non thermodynamique : - empilement stable mais désordonné de sphères- pas ou peu de résultats exacts- empilements numériques et expérimentaux- nombreuses applications en théorie des liquides (Bernal 1961)
Microtomographie X - ESRF (2003)
kBT � mgd
namic!. A thin scintillation layer deposited on glass convertsx rays to visible light. Light optics magnify the image of the
scintillator and project it onto the CCD. With such a setup,
the resolution is 9.81 "m by pixel. Each reconstructed pack-ing contains around 15 000 grains. An example is reported in
Fig. 1.
Using an image processing software, the size and the lo-
cation of each particle are recovered. Then a complete set of
information is available to study the geometry of the pack-
ing. In the following we note #R$ and #w$ the mean radiusand the mean volume of a sphere, respectively.
The first characteristics reported are the classical pair cor-
relation function g(r). Figure 2%a! represents the variation ofthe pair correlation function before and after more than 104
excitations of intensity &!3.0. Note that the initial packingfraction, measured with the image processing software, is
equal to 0.57, whereas the steady-state packing fraction, ob-
tained after a large number of excitations, is approximately
0.62. It appears that the different peaks of g(r) slowly move
with the number of taps. In particular the second peak
slightly progresses from r!4#R$ to r!2!3#R$, which ischaracteristic of developing structure. Besides, one can also
remark that unlike Seidler et al. '8(, we do not observe adouble peak around r!4#R$. This is due to large size dis-tribution of the grains in our experimental work %in Ref. '8(it is significantly weaker.! Nevertheless the evolutions ob-served for g(r) are not significant. It is even more striking if
one compares g(r) for steady states corresponding to differ-
ent intensities of excitation, as reported in Fig 2%b!. Here thesteady-state pair correlation functions obtained for &!0.95, 1.6, and 3.0 have been plotted; their packing frac-tions are, respectively, 0.617, 0.639, and 0.624. These cor-
relation functions do not differ significantly. It means that the
pair correlation function is not a suitable tool to study struc-
tural changes during granular compaction. Compaction is
then a process more subtle than a simple decrease of the
mean distance between grains. Since this function is aver-
aged over all the angles of orientation, angular reorganiza-
tions cannot be seen. In contrast to the numerical work of
Rosato and Yacoub '12(, we do not observe the appearanceof secondary sharp peaks in the pair correlation function.
This may be due to the difference in terms of vibration in-
tensity & %up to 3 in this work, 6.4 in Ref. '12(! and to thesmall size of the vessel they used, which can induce strong
wall effects as crystallization. Note that by using a local
bond order parameter '13( we do not observe crystallizationdue to the walls. This is not surprising since the size distri-
bution of our grains is rather large.
Further evidence of a transformation in the packing mi-
crostructure is provided by the study of the size of the inter-
stitial voids. This can also be an experimental test for the free
volume theory '4,14( that postulates an exponential decay forthe distribution of these voids )(v)*exp("v/v0). Followingprevious works '15,16( we define a pore size via the Voronoıtessellation. A Voronoı polyhedron around a sphere is the
region of space in which all points are closer to this sphere
than to any other sphere in the packing. The Voronoı network
that is the whole collection of the vertices and of the edges of
the polyhedra maps the pore space. Each vertex of this tes-
sellation is equidistant to four neighboring spheres and there-
fore defines the center of a pore. The volume of a pore is
then the size of a virtual sphere centered on the vertex and in
contact with the four neighboring spheres. The vol-
FIG. 1. Part of the 3D reconstruction of the initial packing (+,0.57).
FIG. 2. %a! Evolution of thepair correlation function for &!3.0. %b! Steady-state pair corre-lation functions obtained for &!0.95, 1.6, and 3.0.
RAPID COMMUNICATIONS
RICHARD et al. PHYSICAL REVIEW E 68, 020301%R! %2003!
020301-2fonction de corrélation g(r)
P.Richard et al., PRE 68, 020301R (2003)

• Fraction volumique d’empilements aléatoires :
- Random Close Packing (RCP) :
- Random Loose Packing (RLP) :
- on peut descendre plus bas avec la cohésion
0.740.640.55 0.60
RCPRLP fcc
fluide dense air
�
0.60 < �RCP < 0.64
0.55 < �RLP < 0.60

• Préparation d’un empilement : vitesse de déposition
- vitesse de déposition : empilement dans un liquide dense- limite de la gravité effective
VOLUME 64, NUMBER 22 PHYSICAL REVIEW LETTERS 28 MAY 1990
are coupled. As packings increase in density above theRLP, hydrostatic compaction forces are supportedwithout internal shear displacements. As packings in-crease in density above the dilatancy onset, shear dis-placements cause an outward acting, hydrostatic stresson confining boundaries. A coupling between hydrostaticand shear stresses is fundamental to the critical-statetheory in soil mechanics, where the resistance to shear isproportional to the hydrostatic stress and the propor-tionality constant increases with increasing density. As-suming this relationship, we expect that the onset for di-latancy would correspond to the soil density where theproportionality constant diminishes to zero. This limithas been of little interest in soil mechanics since mostsoils of interest are under the influence of the Earth' sgravity. But this limit is of interest in physics because itrepresents an important transition in how hard spheresinteract, and as such may provide additional insights onthe factors that determine the hard-sphere liquid-solidand glass transitions. In this paper, we also show in factthat the RLP limit and the dilatancy onset occur at thesame packing fraction.The approach taken in the experiments described
below is to minimize the effects of gravity by studyingthe behavior of glass spheres in a liquid where the densi-ty can be adjusted to include neutrally bouyant condi-tions. The glass spheres' had a diameter of 250~20pm and a specific gravity of 2.46; these spheres werecoarse enough for interparticle forces (e.g. , van derWaals force) to be negligible compared with inertialforces so that aggregation effects are not present. Amixture of 64% di-iodomethane and 36% toluene withthe same specific gravity as the glass beads provided neu-tral bouyancy. The density of the liquid is adjusted tolower densities by increasing the concentration of to-luene, so that hg, the effective gravitational force on thespheres, could be varied. Isopropopyl alcohol and waterwere also used for greater hg.The qRLp as g 0 was determined for loose packings
by allowing the spheres to settle gently in a 500-ml-graduated cylinder while immersed in liquids of varyingdg. The ratio of the diameter of the cylinder to thesphere diameter was 200 to 1. The variations in g withhg are shown in Fig. 1, curve A. Extrapolating thesedata to hg =0 gives rlRLp(g 0) =0.555+ 0.005.Dilatancy was measured directly by shearing material
in the gap between two concentric, cylindrical surfaces,with the inner surface rotating about its verticallyaligned axis and with the outer surface stationary. Thevolumetric expansion resulting from shear is measureddirectly by observing the rise of the material in the cell.The inner cylindrical surface consists of the surface of analuminum rod with diameter of 3.5 cm. The surface ofthe rod is roughened to reduce slippage of the beads dur-ing rotation. The outer cylinder was clear acrylic, withan inside diameter of 4.0 cm, so that the gap between it
0.62
p- 0.60
O0.58
&C
0.56
0
0.54—
0.4 0.8
FIG. 1. Variation in packing fractions of spheres with theeffective gravitational acceleration. Curve A is for the randomloose packings obtained in the settling experiments, while curve8 is for the expanded packings obtained in the shear-cell exper-iments.
and the rod is 0.25 cm. This narrow gap width wasnecessary to insure adequate shear strains in the materi-al. The ratio of the gap width to sphere diameter is 10 to1, which is large enough to avoid large errors in themean packing density due to wall effects, but errors onthe order of 1% on the low side can be expected. Thelength of the cell is 20 cm, and the height of material inthe cell is of order 10 cm. The bottom of the cell issealed to allow liquid to be contained in the gap with thespheres. The inner cell is coupled to an electric motor sothat its rotational speed could be varied from 0 to 300rpm. Dry material was evaluated by placing it in thegap and tapping the outer cylinder to obtain difl'erentpacking densities. Spheres in liquids were studied byfilling the gap with liquid and then allowing the spheresto settle in the liquid, with tapping. The inner rod wasthen rotated and the expansion of the material was ob-served. The quantity of liquid present was alwayssufficient to insure the presence of a supernatant layerabove the packing after expansion. It was found that thevolume increased in the 0-150-rpm range and remainedconstant at higher rpm. This limiting volume was usedfor the calculating g.Dry, glass beads with initial packing fractions between
0.61 and 0.63 all expanded to a packing fraction of 0.59.When the beads were immersed in a liquid, the expan-sion packing fraction varied with hg as shown in Fig. 1.The value of g at hg 0 is 0.550+ 0.006.The g of curve 8 are about 1% lower than the corre-
sponding g values of curve A. However, it is likely that
2728
G.Y.Onoda and E.G.Liniger, PRL 64, 2727 (1990)
�
0.64
0.55
1/v
RLP
RCP
- RCP : problème géométrique- RLP : problème physique
zone accessible
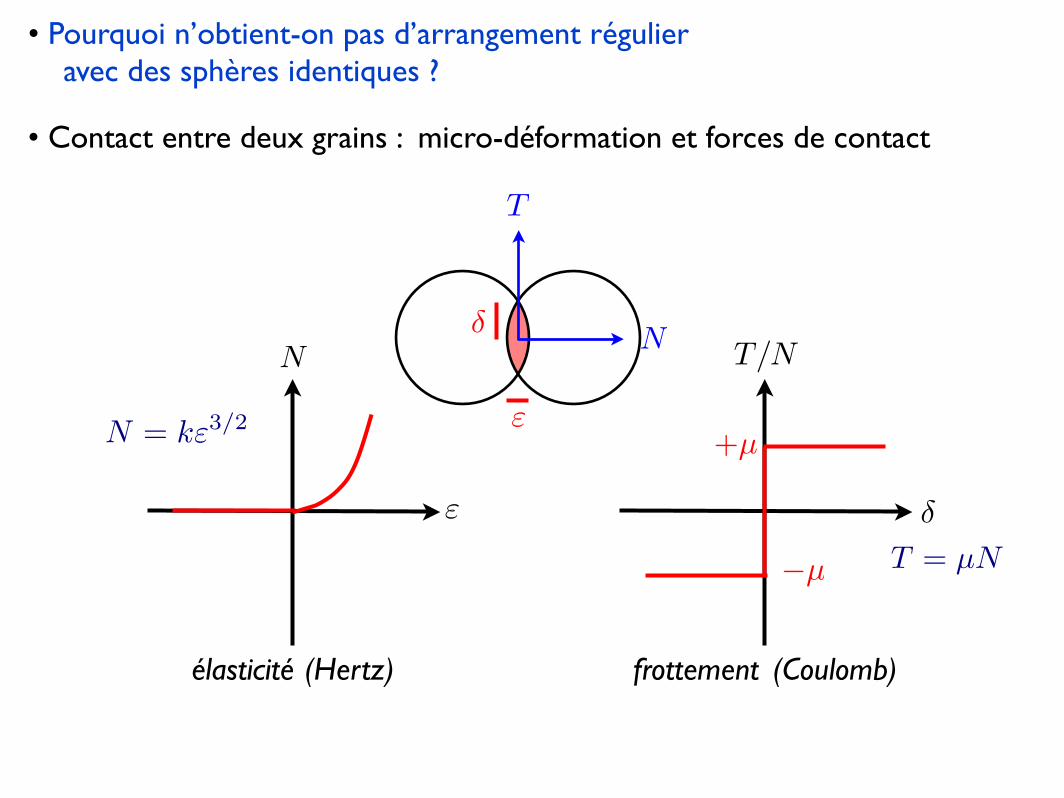
• Contact entre deux grains : micro-déformation et forces de contact
N
T
�
�
élasticité frottement(Hertz) (Coulomb)
+µ
�µ
T/N
�
T = µN
�
N
N = k�3/2
• Pourquoi n’obtient-on pas d’arrangement régulier avec des sphères identiques ?
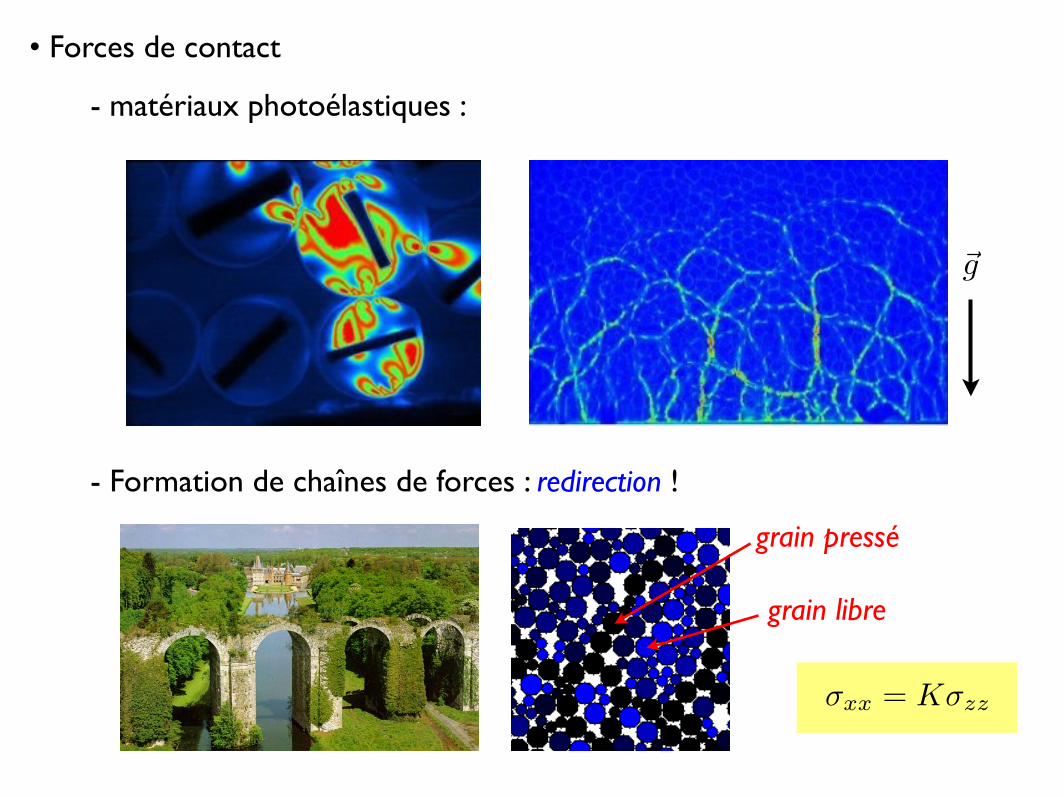
• Forces de contact
- matériaux photoélastiques :
⇥g
- Formation de chaînes de forces : redirection !
grain pressé
grain libre
�xx = K�zz
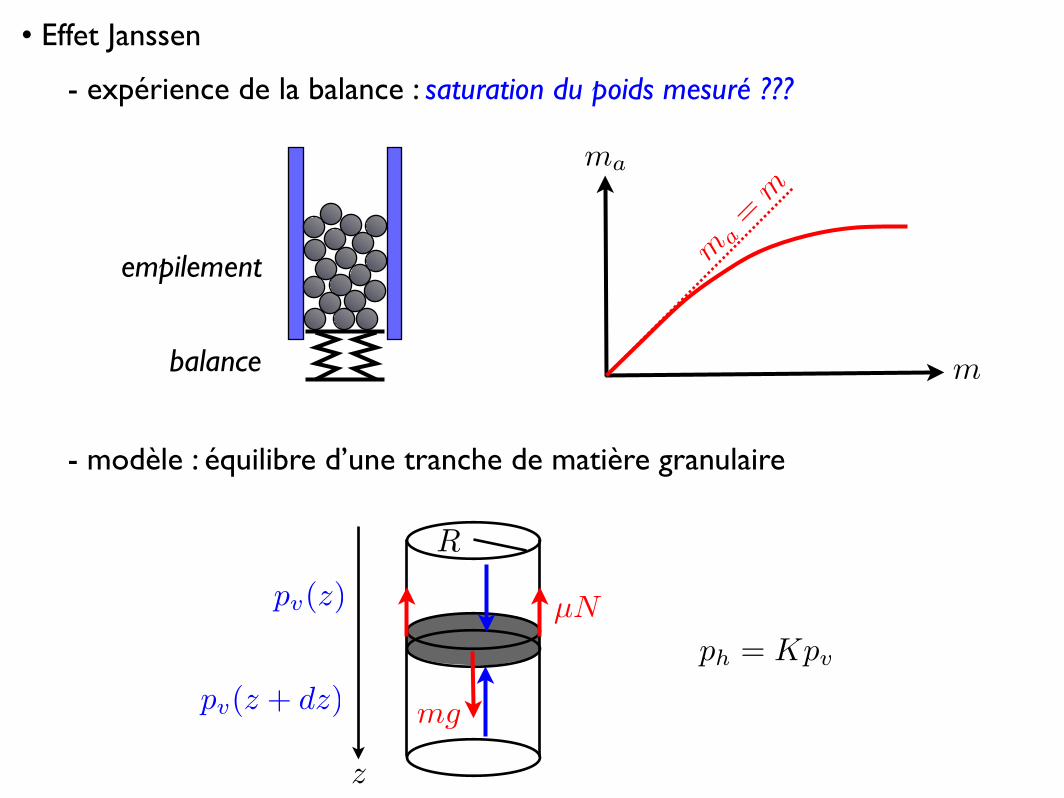
• Effet Janssen
balance
empilement
m
ma
m a=
m
- expérience de la balance : saturation du poids mesuré ???
- modèle : équilibre d’une tranche de matière granulaire
R
z
µN
mg
pv(z)
pv(z + dz)ph = Kpv

⇥R2[pv(z)� pv(z + dz)] + ⇤g⇥R2dz � 2⇥RdzKµpv = 0
ph = Kpv
µN = µ(2⇥Rdzph) = 2⇥RdzKµpv
dpv
dz+
2Kµ
Rp = ⇥g
p(z) = p�⇤1� exp
�� z
�
⇥⌅� =
R
2Kµ
- effet Janssen, clepsydres et sabliers

• Empilements polydisperses :
- fractions volumiques élevées
- empilement d’Appollonius :
R21 + R2
2 + R23 + x2 =
12(R1 + R2 + R3 + x)2 Descartes (1643)
R1 = R2 = R3
x> 6.5
R1
R2
R3
- percolation des petits grains au travers des trous

• Empilements bidisperses : optimum ?
�
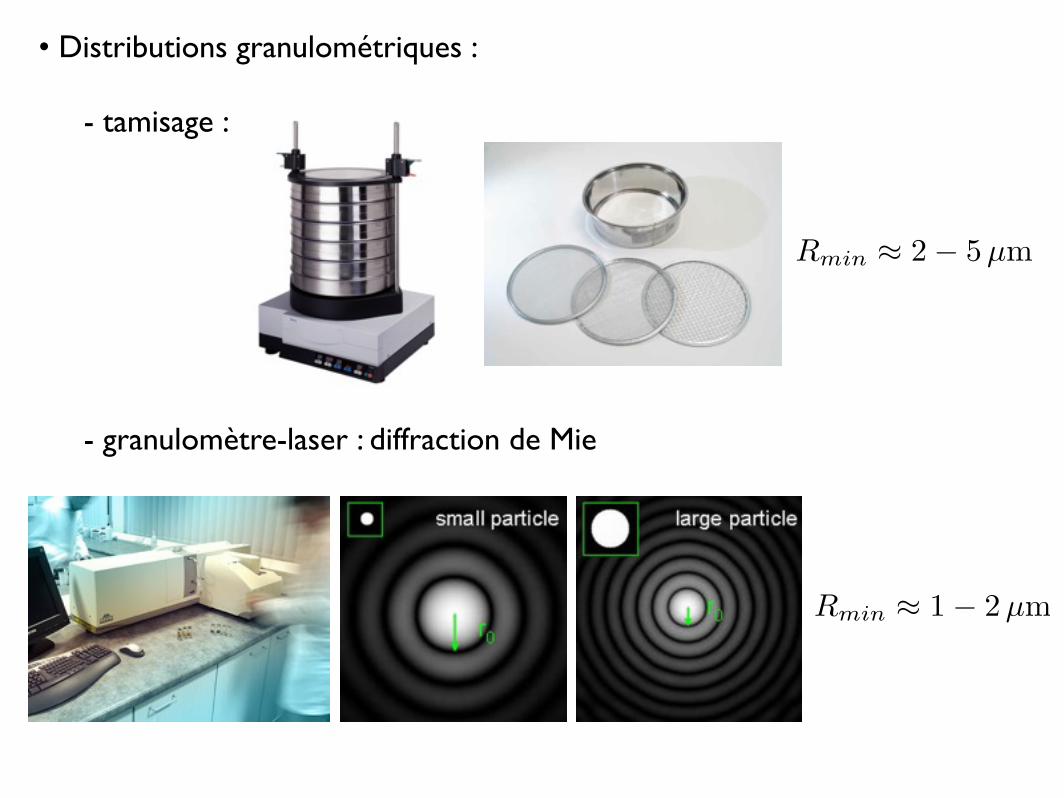
• Distributions granulométriques :
- tamisage :
- granulomètre-laser : diffraction de Mie
Rmin ⇥ 1� 2 µm
Rmin ⇥ 2� 5 µm
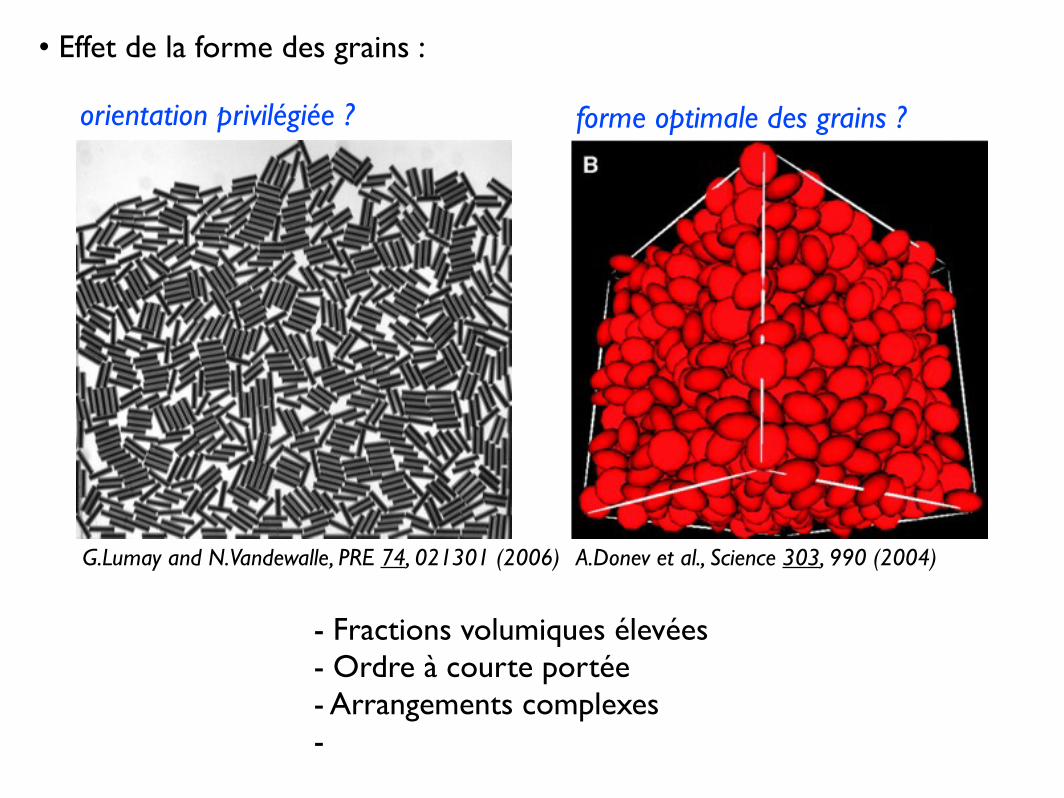
• Effet de la forme des grains :
- Fractions volumiques élevées- Ordre à courte portée- Arrangements complexes-
G.Lumay and N.Vandewalle, PRE 74, 021301 (2006)
orientation privilégiée ? forme optimale des grains ?
A.Donev et al., Science 303, 990 (2004)

of freedom of the ellipsoids. More contacts perparticle are needed to eliminate all local andcollective degrees of freedom and ensure jam-ming, and forming more contacts requires adenser packing of the particles. In the inset inFig. 2B, the central circle is locally jammed. Auniform vertical compression preserves !, butthe central ellipsoid can rotate and free itselfand the packing can densify. The decrease inthe density for very aspherical particles couldbe explained by strong exclusion-volume ef-fects in orientationally disordered packings(23). Results resembling those shown in Fig.2A are also obtained for isotropic random pack-ings of spherocylinders (23, 24), but an argu-ment based on “caging” (not jamming) of theparticles was given to explain the increase indensity as asphericity is introduced. Spherocyl-inders have a very different behavior for or-dered packings from ellipsoids (the conjecturedmaximal density is "/#12 $ 0.91, which issignificantly higher than for ellipsoids), andalso cannot be oblate and are always axisym-metric. The similar positioning of the maximaldensity peak for different packing algorithmsand particle shapes indicates the relevance of asimple geometrical explanation.
By introducing orientational and transla-tional order, it is expected that the density ofthe packings can be further increased, at leastup to 0.74. As shown in Fig. 3 for twodimensions, an affine deformation (stretch)of the densest disk packing produces an el-lipse packing with the same volume fraction.However, this packing, although the densestpossible, is not strictly jammed (i.e., it is notrigid under shear transformations). The figure
shows through a sequence of frames how onecan distort this collectively jammed packing(20), traversing a whole family of densestconfigurations. This mechanical instability ofthe ellipse packing as well as the three-dimensional ellipsoid packing arises from theadditional rotational degrees of freedom anddoes not exist for the disk or sphere packing.
There have been conjectures (25, 26) thatfrictionless random packings have justenough constraints to completely staticallydefine the system (27), Z % 2f (i.e., that thesystem is isostatic), where f is the number ofdegrees of freedom per particle (f % 3 forspheres, f % 5 for spheroids, and f % 6 forgeneral ellipsoids) (28). If friction is strong,then fewer contacts are needed, Z % f & 1(29). Experimentally, Z for spheres was de-termined by Bernal and Mason by coating asystem of ball bearings with paint, drainingthe paint, letting it dry, and counting thenumber of paint spots per particle when thesystem was disassembled (30). Their resultsgave Z $ 6.4, surprisingly close to isostatic-ity for frictionless spheres (31).
We performed the same experiments withthe M&M’s, counting the number of true con-tacts between the particles (32). A histogram ofthe number of touching neighbors per particlefor the regular candies is shown in Fig. 4. Theaverage number is Z % 9.82. In simulations acontact is typically defined by a cutoff on thegap between the particles. Fortunately, over awide range (10'9 to 10'4) of contact toleranc-es, Z is reasonably constant. Superposed in Fig.4 is the histogram of contact numbers obtainedfor simulated packings of oblate ellipsoids for
( % 0.526, from which we found Z $ 9.80. InFig. 2B we show Z as a function of aspect ratio( (33). As with the volume fraction, the contactnumber appears singular at the sphere value andrises sharply for small deviations. Unlike !,however, Z does not decrease for large aspectratios, but rather appears to remain constant.
We expect that fully aspherical ellipsoids,which have f % 6, will require even morecontacts for jamming (Z % 12 according tothe isostatic conjecture) and larger !. Resultsfrom simulations of ellipsoids with axes a %('1, b % 1, and c % ( (where ( measures theasphericity) are included in Fig. 2A. At ( $1.3 we obtain a surprisingly high density of! $ 0.735, with no significant orientationalordering. The maximum contact number ob-served in Fig. 2B is Z $ 11.4. It is interestingthat for both spheroids and general ellipsoids,Z reaches a constant value at approximatelythe aspect ratio for which the density has amaximum. This supports the claim that thedecrease in density for large ( is due toexclusion volume effects.
The putative nonanalytic behavior of Z and! at ( % 1 is striking and is evidently related tothe randomness of the jammed state. Crystalclose packings of spheres and ellipsoids showno such singular behavior, and in fact ! and Zare independent of ( for small deviations fromunity. On the other hand, for random packings,
Fig. 2. (A) Density !versus aspect ratio (from simulations, forboth prolate (circles)and oblate (squares)ellipsoids as well asfully aspherical (dia-monds) ellipsoids. Themost reliable experi-mental result for theregular candies (errorbar) is also shown;this likely underpre-dicts the true density(38). (B) Mean contactnumber Z versus as-pect ratio ( from sim-ulations [same sym-bols as in (A)], along with the experimental result for the regular candies (cross). Inset: Introducing asphericity makes a locally jammed particle freeto rotate and escape the cage of neighbors.
Fig. 3. Shearing the dens-est packing of ellipses.
Fig. 4. Comparison of experimental (black bars,from 489 regular candies) and simulated (whitebars, from 1000 particles) distribution of parti-cle contact numbers.
R E P O R T S
13 FEBRUARY 2004 VOL 303 SCIENCE www.sciencemag.org992
• Ellispsoïdes (de révolution) :
oblate prolate
A.Donev et al., Science 303, 990 (2004)
↵ =a
b
a, b = c
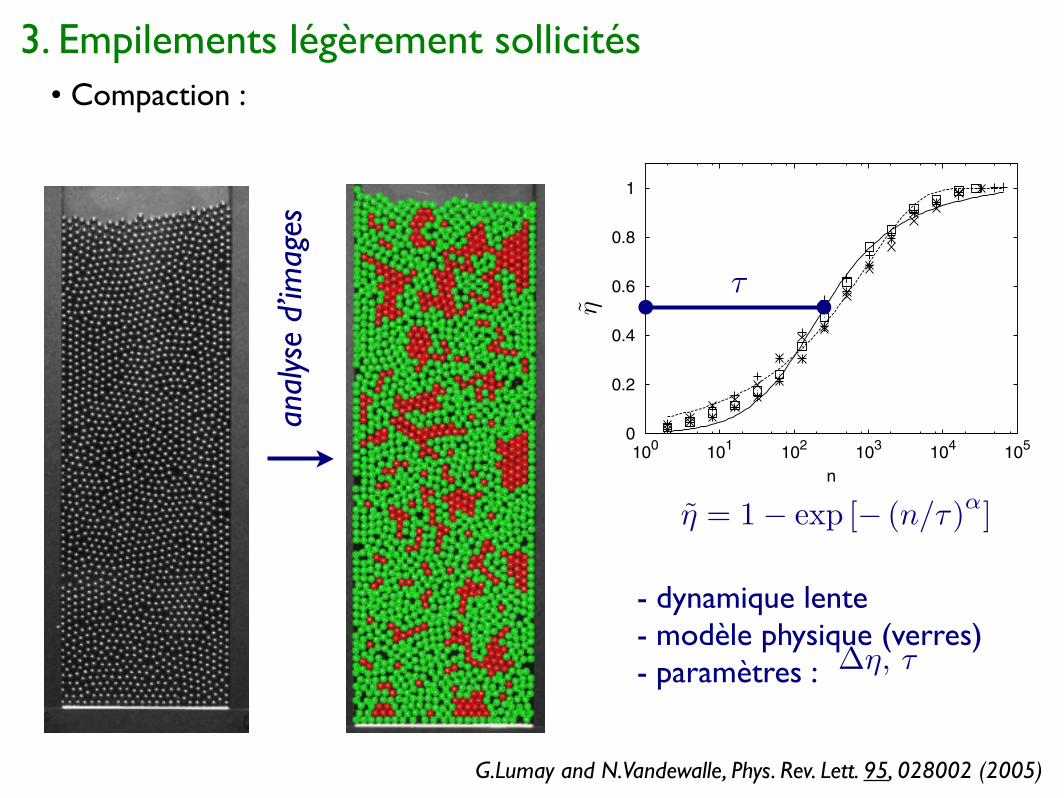
3. Empilements légèrement sollicités
anal
yse
d’im
ages
G.Lumay and N.Vandewalle, Phys. Rev. Lett. 95, 028002 (2005)
! = 1 ! exp [! (n/")!]
sketch and a picture of the setup are given in Fig. 1. Toproduce the successive taps, an electro-mechanic hammeris placed below the container. The hammer is tuned by amicro-controller that can adjust the intensity, the numberand the frequency of the taps. The acceleration experiencedby the system at each tap is measured with the help of anaccelerometer connected to an oscilloscope. During onetap, the system undergoes a short peak of acceleration (thewidth of the peak is 0.25 ms and the maximum intensity is15 g) and some damped oscillations during 2 ms. Twosuccessive taps are separated by 500 ms. This time islonger than the relaxation time of the system after eachacceleration peak.
The pile is illuminated with a single light source. In sucha way, the center of each particle appears bright on thepictures taken by a high-resolution CCD camera. The areaof a grain corresponds to about 150 pixels on a picture. Thecamera can record an image of the packing after each tap.The position of each grain in the packing is later deter-mined by image analysis. All grain positions are tracked bystudying the correlations between successive images [15].Figure 2 presents a part of the pile after numerical treat-ment of the pictures and for different values of the tapnumber n. The global packing fraction ! of the pile is theratio between the total area of the grains (N"D2=4) and thetotal area of the packing. The latter area is evaluated bydetermining the positions of the particles being placed onthe top of the heap.
Since the dynamics of the system slows down with thenumber of taps n, we recorded images of the system onlyfor n ! 2i with i ! 1; 2; . . . ; 16. The maximum number oftaps in our experiments is n ! 65 536.
We have repeated the experiment many times for statis-tical reasons. Obviously, small changes in the initial con-figurations of the packing give different values for !0 and!1. Nevertheless, measurements of !0 ! 0:825" 0:002are reproducible. The last measurement !#65 536$ ofeach series is assumed to be the asymptotic value !1 !0:862" 0:004. This value is slightly smaller than the 2Dhexagonal packing fraction !h ’ 0:91. This difference canbe explained by the presence of defects due to edge effects,by the presence of trapped defects, and by the smallpolydispersity of the grains. It is important to note that,in this experiment, we do not observe any convection,contrary to others [9,10].
The evolution of the normalized packing fraction ~! as afunction of the tap number n is presented in Fig. 3. Fourdifferent experiments are represented. After 65 536 taps,the saturation of the packing fraction is clearly obtained.One should note the collapse of all data sets when consid-ering ~! instead of !.
Since all the grain positions (xi; yi) are determined, it ispossible to measure the displacement #i of the grain i
during a tap: #i !!!!!!!!!!!!!!!!!!!!!!!
#x2i % #y2iq
=Ntap, Ntap being the num-ber of taps realized between two successive pictures. A
Accelerometer
hammerelectro!mechanic
FIG. 1. A sketch (left) and a picture (right) of our experimentalsetup. Approximately 2000 beads are placed between two par-allel plates. An electromechanic hammer is placed below the pileand is tuned by a microcontroller. An accelerometer is placed onthe vessel to measure the acceleration experienced by the wholesystem.
n=64n=0 n=4096 n=65536
FIG. 2. A part of the pile after image analysis. Different valuesof the tap number n are illustrated. For n ! 0, disorder isobserved. When n increases, some hexagonal domains appearand grow thereafter. One should note that after n ! 65 536 taps,a few defects are still observed in the hexagonal structure.
0
0.2
0.4
0.6
0.8
1
100 101 102 103 104 105
~ !
n
FIG. 3. Four typical curves (squares, circles, triangles, andcrosses) giving the normalized packing fraction ~! as a functionof the tap number n. The solid curve is a fit using Eq. (1). Thedashed curve is a fit using Eq. (7).
PRL 95, 028002 (2005) P H Y S I C A L R E V I E W L E T T E R S week ending8 JULY 2005
028002-2
!- dynamique lente- modèle physique (verres)- paramètres : ��, ⇥
�
• Compaction :
0,20
0,22
0,24
0,26
0,28
0,30
0,32
0,34
0,36
1 10 100 1000
lactose
lactose + 0.25% aerosil
�
n
�
�
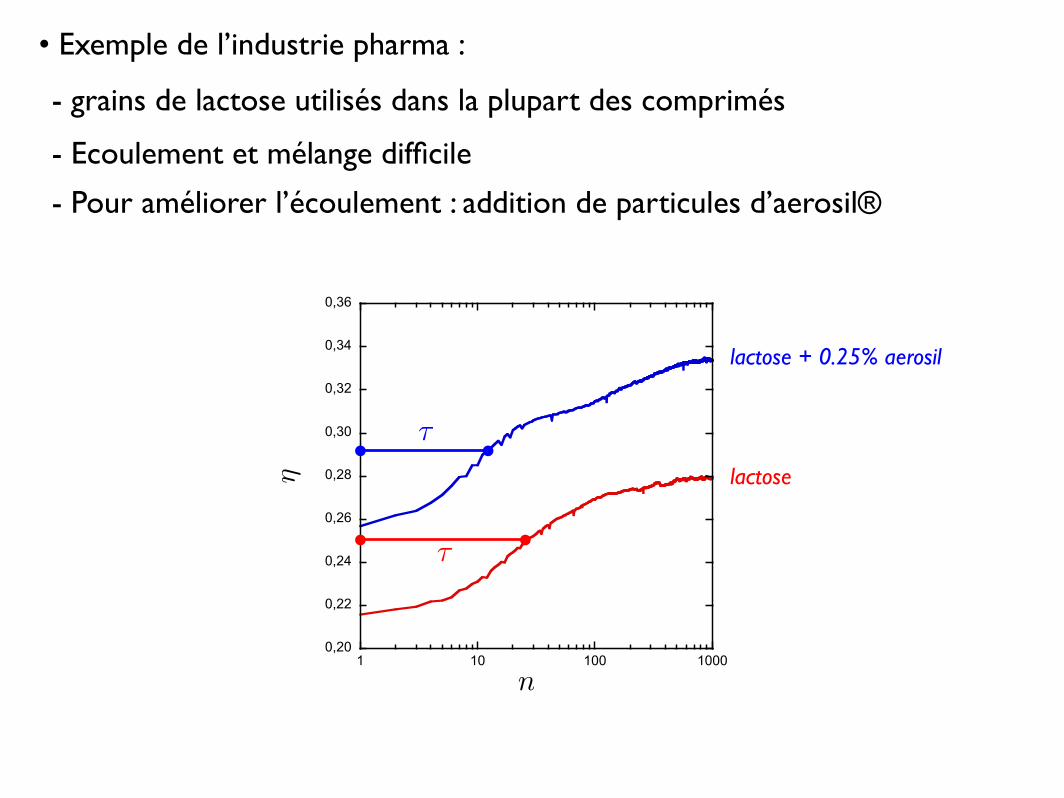
- grains de lactose utilisés dans la plupart des comprimés
- Ecoulement et mélange difficile
- Pour améliorer l’écoulement : addition de particules d’aerosil®
• Exemple de l’industrie pharma :

• Dilatance de Reynolds (1885)
4. Ecoulements de grains
- une expérience simple :
- interprétation : un empilement dense doit gonfler pour se déformer
?
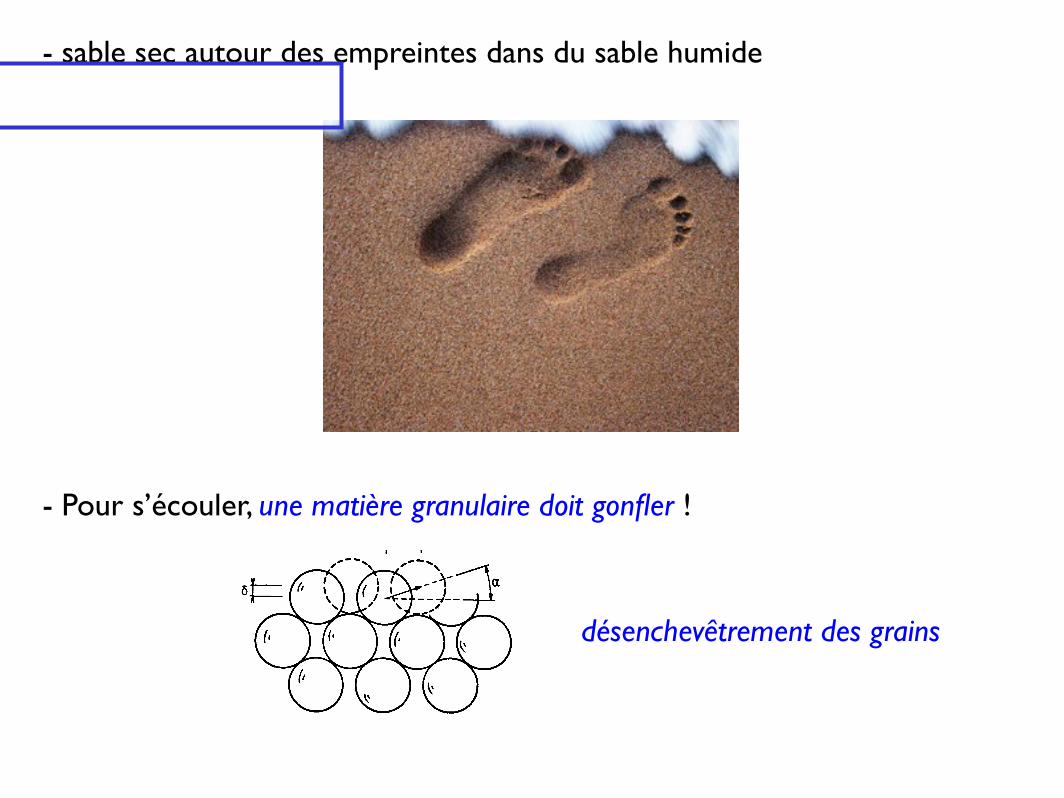
- Pour s’écouler, une matière granulaire doit gonfler !
- sable sec autour des empreintes dans du sable humide
!"#$%$&'( )(*+(,&-#).!
!
"!
#
"!
#/'0(
)(&.(
#
1&*(23"#(2(&%*"&"%"$#(2(&%*#/'0(*.(*1&*(23"#(2(&%*"&"%"$#(2(&%*#/'0(*.(*'-&%4$'%(5*'-&%4$'%(5*
1&*(23"#(2(&%*"&"%"$#(2(&%*)(&.(*.(*)"#$%(51&*(23"#(2(&%*"&"%"$#(2(&%*)(&.(*.(*)"#$%(5
66)7.(&'0(89%4(2(&%)7.(&'0(89%4(2(&% )(.*:4$"&.;)(.*:4$"&.;
désenchevêtrement des grains
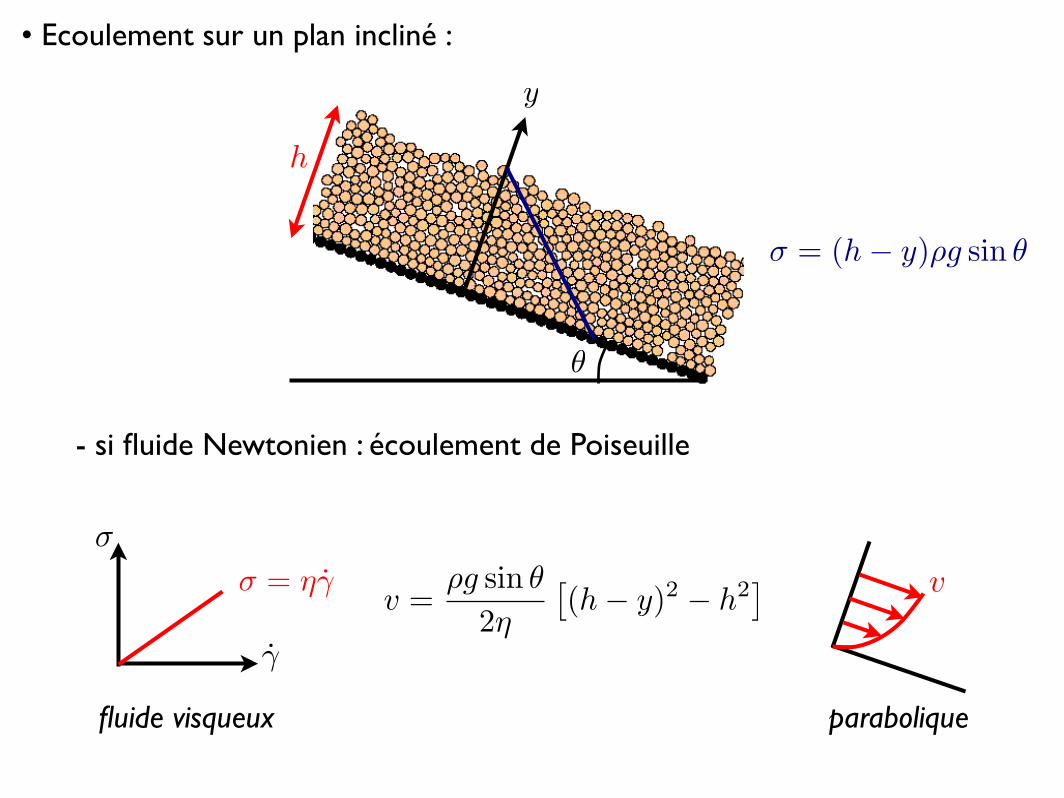
• Ecoulement sur un plan incliné :!"#$%$&'#()#*(+,-#!',./(&!,0.%,'!#*(1(!"#$%$&'#()#*(+,-#!',./(&!,0.%,'!#*(1(
#2$.%#+#0-(#-(3%$2,&##2$.%#+#0-(#-(3%$2,&#
456789:;(2"#<$'!456789:;(2"#<$'!%+*&2(%+*&2(== .+!(%2>2.+!(%2>2??#0>2#0>2??20!*(20!*(== '7;@:@A@(06B:C5'7;@:@A@(06B:C5
!DE9F9G:C(!DE9F9G:C(?? 297;9F:H6@:97(297;9F:H6@:97(?? 3F9I6GC(3F9I6GC(,B5:F(JKKL,B5:F(JKKL
�
y
h
⇤ = (h� y)⇥g sin �
- si fluide Newtonien : écoulement de Poiseuille
�
�
⇤ = ⇥�
paraboliquefluide visqueux
v =⇤g sin ⇥
2�
�(h� y)2 � h2
⇥ v

- si fluide à seuil (Bingham) :
bouchonseuil
�
�
⇤ = ⇤0 + ⇥�
arrêt
hstop =⇤0
⇥g sin �
- origine du seuil : friction ?
frottements
�
h
v v = 0
µsmg cos � = mg sin �
tan � = µs
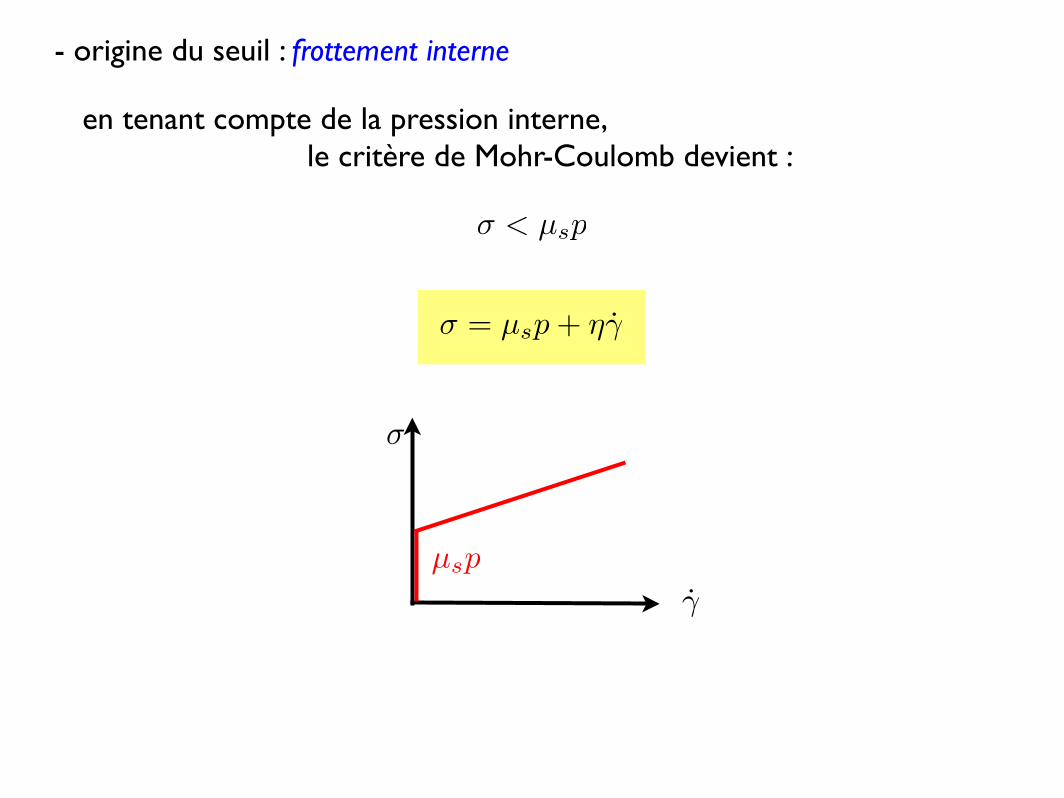
- origine du seuil : frottement interne
en tenant compte de la pression interne, le critère de Mohr-Coulomb devient :
⇥ < µsp
⌅ = µsp + ⇥�
�
�
µsp
2 G.D.R. Milieux Divises: On dense granular flows.
ing aside very important questions such as avalanche trig-gering, intermittent flows or segregation. Second, since thedata presented here come from the research group GDRMidi and collaborators, many important contributions arenot included. We refer to them in the citations. However,the huge activity in the domain makes the exercise di!-cult. We take refuge behind this excuse for all the contri-butions that have been omitted.
2 Six di!erent configurations
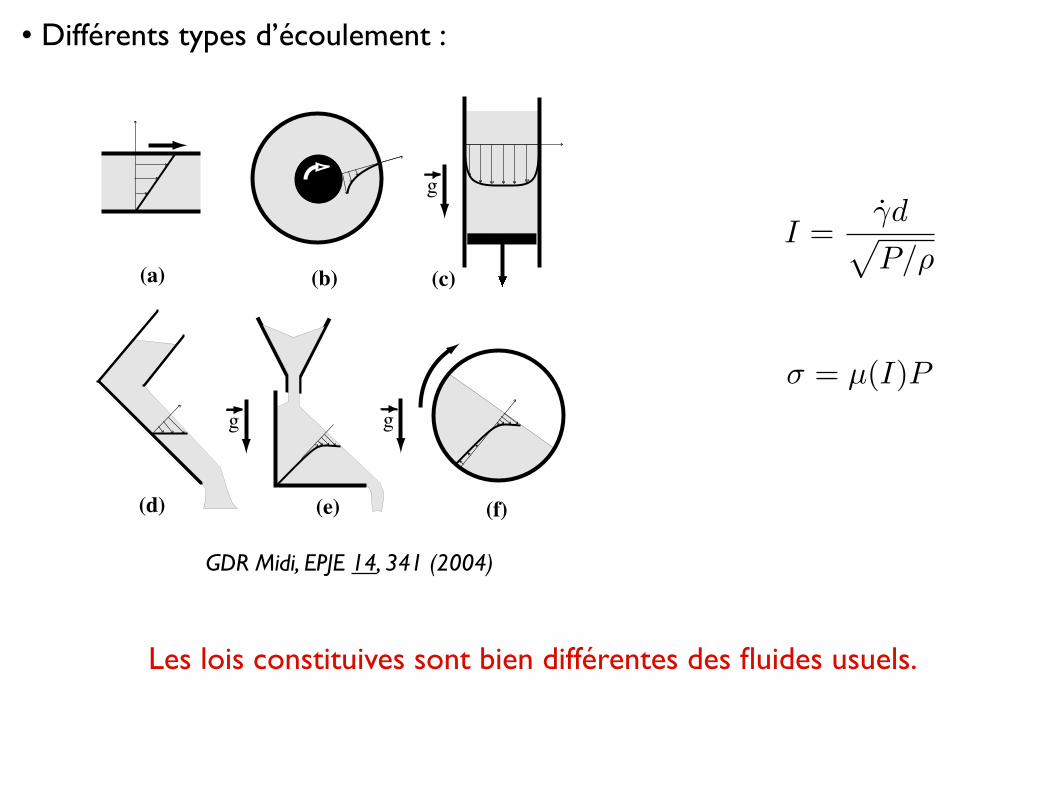
Dense granular flows are mainly studied in six di"erentconfigurations (Fig. 1), where a simple shear is achievedand rheological properties can be measured. These geome-tries are divided in two families: confined and free surfaceflows.
The confined flows are the plane shear geometry (Fig. 1a)where a shear is applied due to the motion of one wall,the annular shear (Fig. 1b) where the material confinedin between two cylinders is sheared by the rotation of theinner cylinder and the vertical chute flow configuration(Fig. 1c) where material flows due to the gravity in be-tween two vertical rough walls. Free surface flows are flowof granular material on a rough inclined plane (Fig. 1d),flow at the surface of a pile (Fig. 1e) and flow in a rotat-ing drum (Fig. 1f). The driving force is in these last threecases the gravity. In the following we consider successively
g
g g
(c)(a) (b)
(d) (e) (f)
Fig. 1. The six configurations of granular flows: (a) planeshear, (b) annular shear, (c) vertical chute flows, (d) Inclinedplane, (e) heap flow, (f) rotating drum.
the six configurations. The data comes from di"erent ex-periments and numerical simulations briefly described in atable at the beginning of each section. We report for eachof them the flowing threshold, the kinematic properties
(velocity V (y), volume fraction !(y) and velocity fluctu-ations "V 2(y) profiles) and the rheological behaviour, be-fore discussing the influence of the various experimental ornumerical parameters. Both the notations and the dimen-sionless quantities naturally used to present the results aregiven in appendix A.
3 Plane shear flow
3.1 Set-up
In the aim of studying flow rheology, the plane shear (Fig. 2a)is conceptually the simplest geometry one naturally thinksof. The flow is obtained between two parallel rough walls, adistance L apart and moving at the relative velocity Vw. Inthe following we note #w = Vw/L the mean shear rate. Inthis configuration, the stress distribution is uniform insidethe sheared layer. However, because of gravity, this homo-geneous state is not achieved in existing experiments [15,16] but is obtained in discrete particles simulations. Mostof the results found in the literature are obtained imposingthe wall velocity and measuring the shear stress [17–21].Some are carried out controlling the shear force applied tothe moving wall in order to study the flow thresholds [22].
In the following, we present results of two dimensionaldiscrete particles simulations where Vw is imposed andthe number of grains (size d and mass m) within the cellis fixed (periodic boundary conditions are used along theshear direction). The data are summarised in table 1. Inone case the volume - the cell width L – and thereby thedensity $ – or the volume fraction ! – are controlled andthe pressure P is measured, while in the other case thepressure is controlled and the density is measured. Oncethe inter-particle contact laws are fixed, the simulationsdepend on two parameters : the wall velocity Vw and thenormal stress P or the density $. This define a single di-mensionless numbers describing the relative importance ofinertia and confining stresses,
I =#wd!P/$
. (1)
Both simulations are performed in the limit of rigid grains,so that the macroscopic time scale L/Vw is much largerthan the microscopic timescales i.e. the elastic and thedissipative ones. The inter-particle friction coe!cient µp
is null when not specified. The roughness of the walls ismade of glued grains similar to the flowing grains.
3.2 Kinematic properties
3.2.1 Velocity profiles
Fig. 2b displays the velocity profiles obtained in di"erentflow regimes. As long as I remains small (smaller thansay 0.1), the velocity profile v(y) is linear. Accordinglythe shear rate is uniform and imposed by the geometry:
# = #w =Vw
L(2)
• Différents types d’écoulement :
I =�dpP/⇢
� = µ(I)P
Les lois constituives sont bien différentes des fluides usuels.
GDR Midi, EPJE 14, 341 (2004)
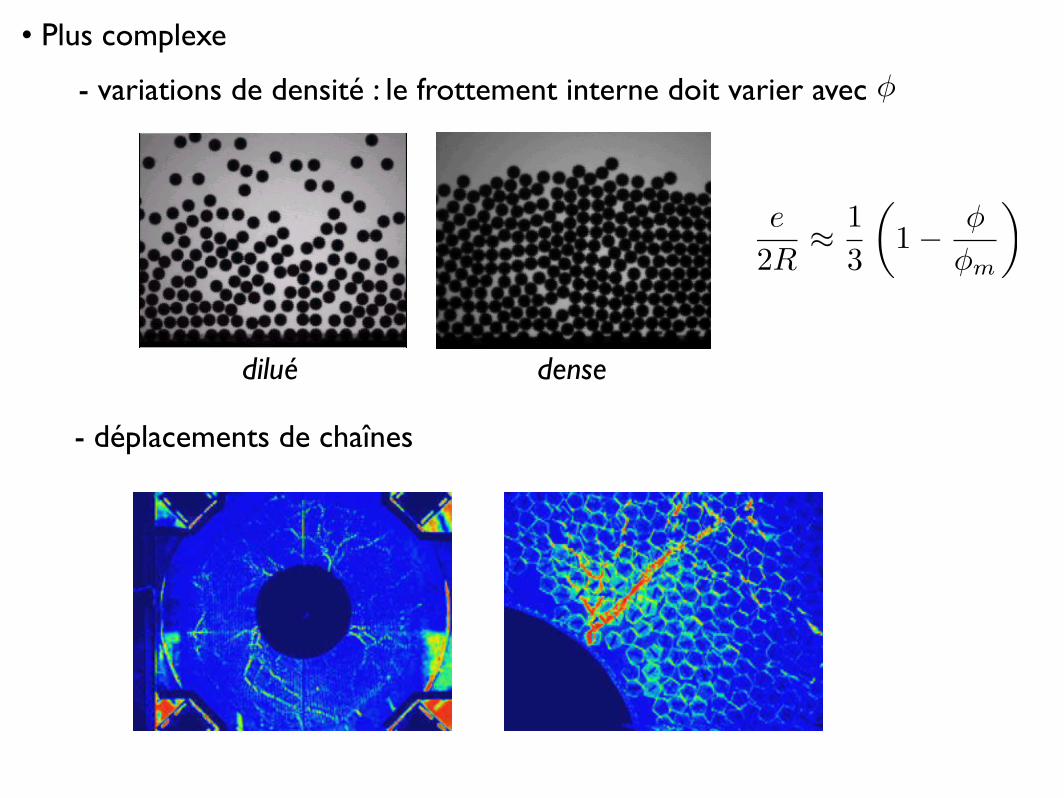
• Plus complexe
- déplacements de chaînes
- variations de densité : le frottement interne doit varier avec
!"#$%&'#()*"+(#,-#.'/0&/'1)#2
!"#$%"$#&'()"&#)&'*+',-.&'/&'.0'/&)1("2
3(.$2 3&)1&
!"#$%&'#()*"+(#,-#.'/0&/'1)#2
!"#$%"$#&'()"&#)&'*+',-.&'/&'.0'/&)1("2
3(.$2 3&)1&
dilué dense
�
e
2R⇥ 1
3
�1� �
�m
⇥
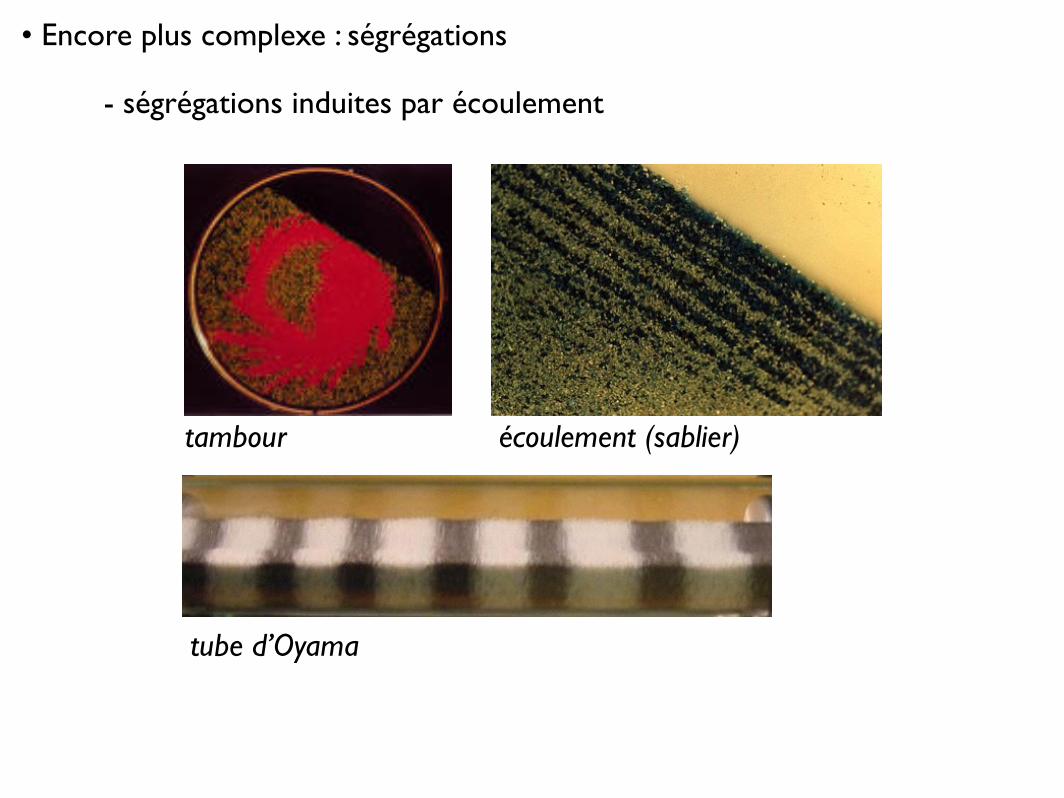
• Encore plus complexe : ségrégations
tambour écoulement (sablier)
tube d’Oyama
- ségrégations induites par écoulement
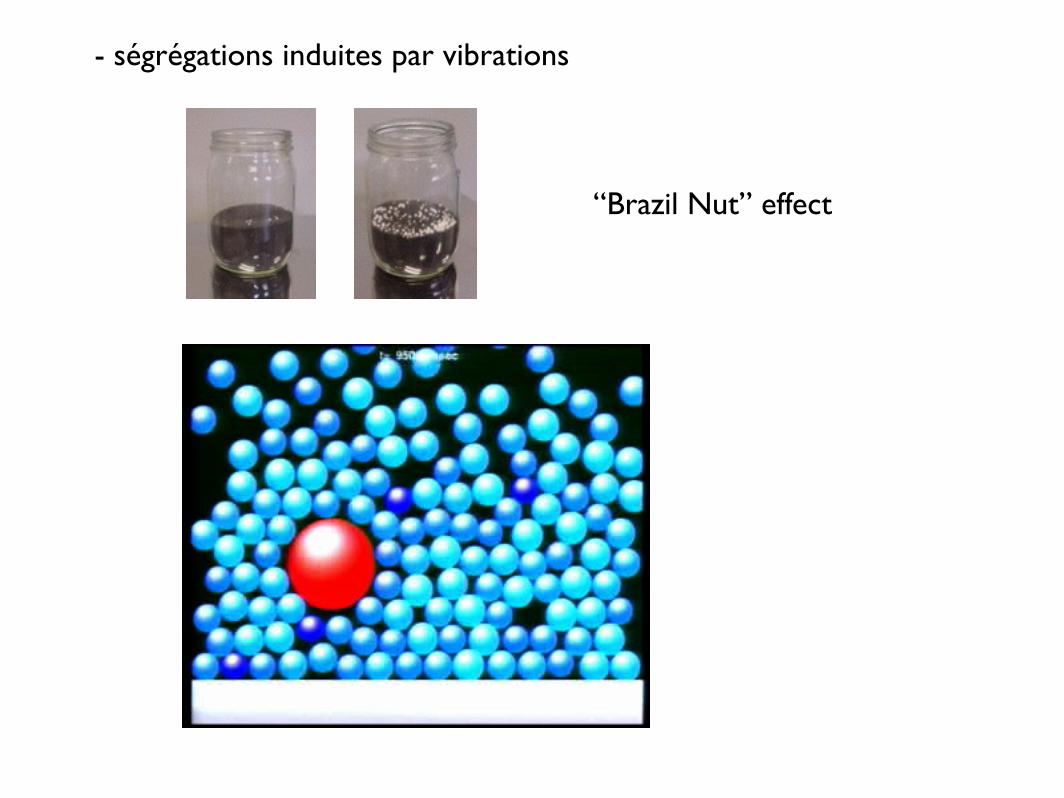
- ségrégations induites par vibrations
“Brazil Nut” effect
5. Gaz granulaire

6. Cohésion• Problème de la cohésion : aujourd’hui méconnu
• Interactions Dipole-dipole
• Forces répulsives et attractives : formation de chaînes
⇥µi
⇥µj⇥B
⇥rij
Uij =µ0
4⇥
�⌃µi.⌃µj
r3ij
� 3(⌃µi.⌃rij)(⌃µj .⌃rij)
r5ij
⇥
z
x
attractive
attractive
repulsive
repulsive55�

G.Lumay and N.Vandewalle, New J. Phys. 9, 406 (2007)
- modification significative de la fraction volumique
0,52
0,54
0,56
0,58
0,60
0,62
0 10 20 30 40 50
�
B(G)
OFF
B �= 0
B � 0
chains ?
Bo=
1
• Empilements affectés par la cohésion :

B�
B||
COIL
COIL
B
• Ecoulements affectés par la cohésion :