Embed Size (px)
Citation preview
Bioresource Technology 131 (2013) 159–165
Contents lists available at SciVerse ScienceDirect
Bioresource Technology
journal homepage: www.elsevier .com/locate /bior tech
Fluorescence detection to determine proteins and humic-like substancesfingerprints of exopolymeric substances (EPS) from biological sludgesperformed by size exclusion chromatography (SEC)
0960-8524/$ - see front matter � 2012 Elsevier Ltd. All rights reserved.http://dx.doi.org/10.1016/j.biortech.2012.12.078
⇑ Corresponding author. Tel.: +33 (0) 5 55 45 74 28; fax: +33 (0) 5 55 45 72 03.E-mail address: [email protected] (G. Guibaud).
Divya Bhatia a,b,c, Isabelle Bourven a, Stéphane Simon a, François Bordas a, Eric D. van Hullebusch b,Stéphanie Rossano b, Piet N.L. Lens c, Gilles Guibaud a,⇑a Groupement de Recherche Eau Sol Environnement (GRESE) – EA 4330, Université de Limoges, Faculté des Sciences et Techniques, 123 Avenue A. Thomas, 87060 Limoges Cedex, Franceb Université Paris-Est, Laboratoire Géomatériaux et Environnement (LGE), EA 4119, 5 bd Descartes, 77454 Marne la Vallée Cedex 2, Francec Core Pollution Prevention and Control, UNESCO-IHE, Institute for Water Education, P.O. Box 3015, 2601 DA Delft, The Netherlands
h i g h l i g h t s
" EPS were studied by size exclusionchromatography with UV andfluorescence detection.
" Fluorescence detection allows toobtain specific proteins and humic-like substances fingerprints.
" Changes in peak intensity andnumber are highlighted between UVand fluorescence detection.
" EPS display a protein-like fractionwith a wide range of aMW (from>600 kDa to <10 kDa).
" EPS show a humic-like fraction withlow aMW (from 6 kDa to <1.2 kDa).
g r a p h i c a l a b s t r a c t
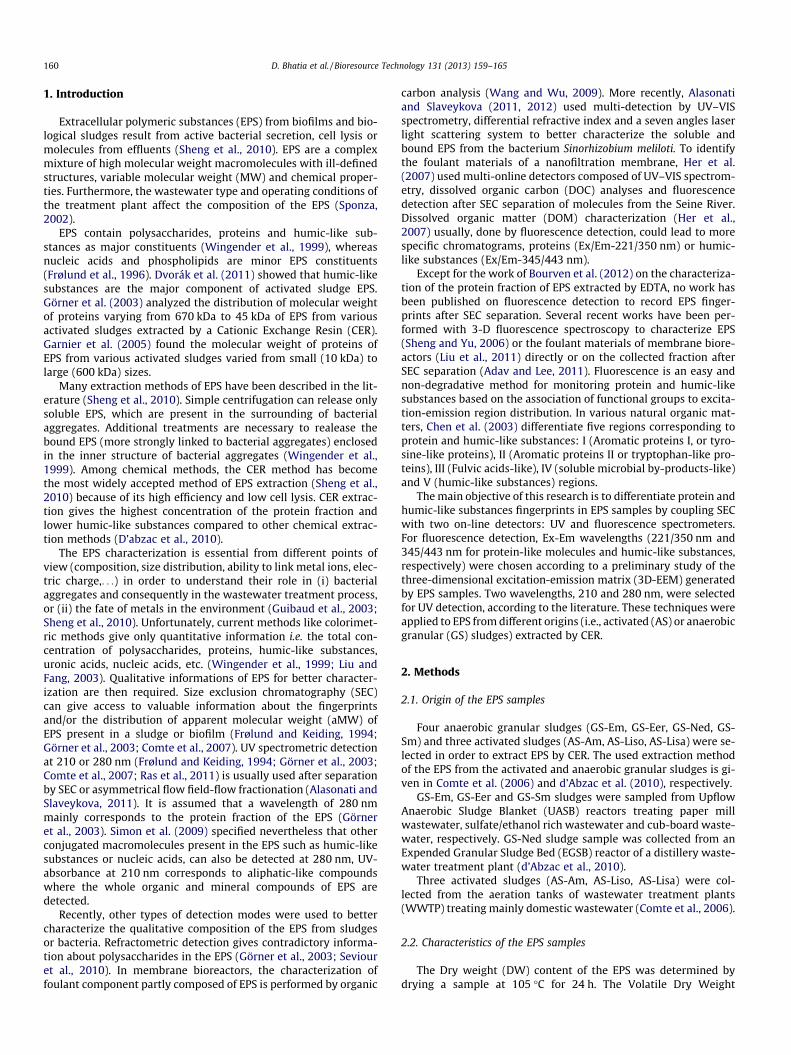
SEC chromatograms of EPS from anaerobic granular sludge (GS-Sm) with fluorescence (221 nm–350 nm)of protein-like molecules and fluorescence (345 nm–443 nm) of humic-like substances using a mobilephase (phosphate buffer (50 mM) with NaCl (150 mM) at pH 7.0 ± 0.1) at flow-rate 0.5 mL.min�1 withHMW Superdex 200 10/300 GL column, Amersham Biosciences. MWp: apparent molecular weight uponprotein standard.
a r t i c l e i n f o
Article history:Received 14 July 2012Received in revised form 10 December 2012Accepted 11 December 2012Available online 20 December 2012
Keywords:Extracellular polymeric substances (EPS)Size exclusion chromatography (SEC)Fluorescence detectorProtein-like macromoleculesHumic-like substances
a b s t r a c t
Fingerprints of extracellular polymeric substances (EPS) from activated and anaerobic granular sludgeswere obtained by size exclusion chromatography coupled to UV (210 and 280 nm) and fluorescence(221/350 nm (protein-like molecules) and 345/443 nm (humic-like substances)) detection. The total areabelow the peaks obtained with fluorescence detection is linked to the protein or humic-like substancesEPS content. The EPS protein fingerprints, usually recorded with UV-280 nm, change dramatically, mainlyin the relative size of peaks when they were measured by a florescence detection method. It means thatthe apparent molecular weight (aMW) distribution of EPS chomatophores and fluorophores is different.Protein-like and humic-like substances were found to be specific fingerprints of the EPS, affected by thetype and origin of the bacterial aggregate and improve EPS sample differentiation. The protein-like frac-tion of EPS displays a wide range of aMW (>600 kDa–<10 kDa) whereas the humic-like substances frac-tion is composed of molecules of low aMW (6–<1.2 kDa).
� 2012 Elsevier Ltd. All rights reserved.
160 D. Bhatia et al. / Bioresource Technology 131 (2013) 159–165
1. Introduction
Extracellular polymeric substances (EPS) from biofilms and bio-logical sludges result from active bacterial secretion, cell lysis ormolecules from effluents (Sheng et al., 2010). EPS are a complexmixture of high molecular weight macromolecules with ill-definedstructures, variable molecular weight (MW) and chemical proper-ties. Furthermore, the wastewater type and operating conditions ofthe treatment plant affect the composition of the EPS (Sponza,2002).
EPS contain polysaccharides, proteins and humic-like sub-stances as major constituents (Wingender et al., 1999), whereasnucleic acids and phospholipids are minor EPS constituents(Frølund et al., 1996). Dvorák et al. (2011) showed that humic-likesubstances are the major component of activated sludge EPS.Görner et al. (2003) analyzed the distribution of molecular weightof proteins varying from 670 kDa to 45 kDa of EPS from variousactivated sludges extracted by a Cationic Exchange Resin (CER).Garnier et al. (2005) found the molecular weight of proteins ofEPS from various activated sludges varied from small (10 kDa) tolarge (600 kDa) sizes.
Many extraction methods of EPS have been described in the lit-erature (Sheng et al., 2010). Simple centrifugation can release onlysoluble EPS, which are present in the surrounding of bacterialaggregates. Additional treatments are necessary to realease thebound EPS (more strongly linked to bacterial aggregates) enclosedin the inner structure of bacterial aggregates (Wingender et al.,1999). Among chemical methods, the CER method has becomethe most widely accepted method of EPS extraction (Sheng et al.,2010) because of its high efficiency and low cell lysis. CER extrac-tion gives the highest concentration of the protein fraction andlower humic-like substances compared to other chemical extrac-tion methods (D’abzac et al., 2010).
The EPS characterization is essential from different points ofview (composition, size distribution, ability to link metal ions, elec-tric charge,. . .) in order to understand their role in (i) bacterialaggregates and consequently in the wastewater treatment process,or (ii) the fate of metals in the environment (Guibaud et al., 2003;Sheng et al., 2010). Unfortunately, current methods like colorimet-ric methods give only quantitative information i.e. the total con-centration of polysaccharides, proteins, humic-like substances,uronic acids, nucleic acids, etc. (Wingender et al., 1999; Liu andFang, 2003). Qualitative informations of EPS for better character-ization are then required. Size exclusion chromatography (SEC)can give access to valuable information about the fingerprintsand/or the distribution of apparent molecular weight (aMW) ofEPS present in a sludge or biofilm (Frølund and Keiding, 1994;Görner et al., 2003; Comte et al., 2007). UV spectrometric detectionat 210 or 280 nm (Frølund and Keiding, 1994; Görner et al., 2003;Comte et al., 2007; Ras et al., 2011) is usually used after separationby SEC or asymmetrical flow field-flow fractionation (Alasonati andSlaveykova, 2011). It is assumed that a wavelength of 280 nmmainly corresponds to the protein fraction of the EPS (Görneret al., 2003). Simon et al. (2009) specified nevertheless that otherconjugated macromolecules present in the EPS such as humic-likesubstances or nucleic acids, can also be detected at 280 nm, UV-absorbance at 210 nm corresponds to aliphatic-like compoundswhere the whole organic and mineral compounds of EPS aredetected.
Recently, other types of detection modes were used to bettercharacterize the qualitative composition of the EPS from sludgesor bacteria. Refractometric detection gives contradictory informa-tion about polysaccharides in the EPS (Görner et al., 2003; Seviouret al., 2010). In membrane bioreactors, the characterization offoulant component partly composed of EPS is performed by organic
carbon analysis (Wang and Wu, 2009). More recently, Alasonatiand Slaveykova (2011, 2012) used multi-detection by UV–VISspectrometry, differential refractive index and a seven angles laserlight scattering system to better characterize the soluble andbound EPS from the bacterium Sinorhizobium meliloti. To identifythe foulant materials of a nanofiltration membrane, Her et al.(2007) used multi-online detectors composed of UV–VIS spectrom-etry, dissolved organic carbon (DOC) analyses and fluorescencedetection after SEC separation of molecules from the Seine River.Dissolved organic matter (DOM) characterization (Her et al.,2007) usually, done by fluorescence detection, could lead to morespecific chromatograms, proteins (Ex/Em-221/350 nm) or humic-like substances (Ex/Em-345/443 nm).
Except for the work of Bourven et al. (2012) on the characteriza-tion of the protein fraction of EPS extracted by EDTA, no work hasbeen published on fluorescence detection to record EPS finger-prints after SEC separation. Several recent works have been per-formed with 3-D fluorescence spectroscopy to characterize EPS(Sheng and Yu, 2006) or the foulant materials of membrane biore-actors (Liu et al., 2011) directly or on the collected fraction afterSEC separation (Adav and Lee, 2011). Fluorescence is an easy andnon-degradative method for monitoring protein and humic-likesubstances based on the association of functional groups to excita-tion-emission region distribution. In various natural organic mat-ters, Chen et al. (2003) differentiate five regions corresponding toprotein and humic-like substances: I (Aromatic proteins I, or tyro-sine-like proteins), II (Aromatic proteins II or tryptophan-like pro-teins), III (Fulvic acids-like), IV (soluble microbial by-products-like)and V (humic-like substances) regions.
The main objective of this research is to differentiate protein andhumic-like substances fingerprints in EPS samples by coupling SECwith two on-line detectors: UV and fluorescence spectrometers.For fluorescence detection, Ex-Em wavelengths (221/350 nm and345/443 nm for protein-like molecules and humic-like substances,respectively) were chosen according to a preliminary study of thethree-dimensional excitation-emission matrix (3D-EEM) generatedby EPS samples. Two wavelengths, 210 and 280 nm, were selectedfor UV detection, according to the literature. These techniques wereapplied to EPS from different origins (i.e., activated (AS) or anaerobicgranular (GS) sludges) extracted by CER.
2. Methods
2.1. Origin of the EPS samples
Four anaerobic granular sludges (GS-Em, GS-Eer, GS-Ned, GS-Sm) and three activated sludges (AS-Am, AS-Liso, AS-Lisa) were se-lected in order to extract EPS by CER. The used extraction methodof the EPS from the activated and anaerobic granular sludges is gi-ven in Comte et al. (2006) and d’Abzac et al. (2010), respectively.
GS-Em, GS-Eer and GS-Sm sludges were sampled from UpflowAnaerobic Sludge Blanket (UASB) reactors treating paper millwastewater, sulfate/ethanol rich wastewater and cub-board waste-water, respectively. GS-Ned sludge sample was collected from anExpended Granular Sludge Bed (EGSB) reactor of a distillery waste-water treatment plant (d’Abzac et al., 2010).
Three activated sludges (AS-Am, AS-Liso, AS-Lisa) were col-lected from the aeration tanks of wastewater treatment plants(WWTP) treating mainly domestic wastewater (Comte et al., 2006).
2.2. Characteristics of the EPS samples
The Dry weight (DW) content of the EPS was determined bydrying a sample at 105 �C for 24 h. The Volatile Dry Weight
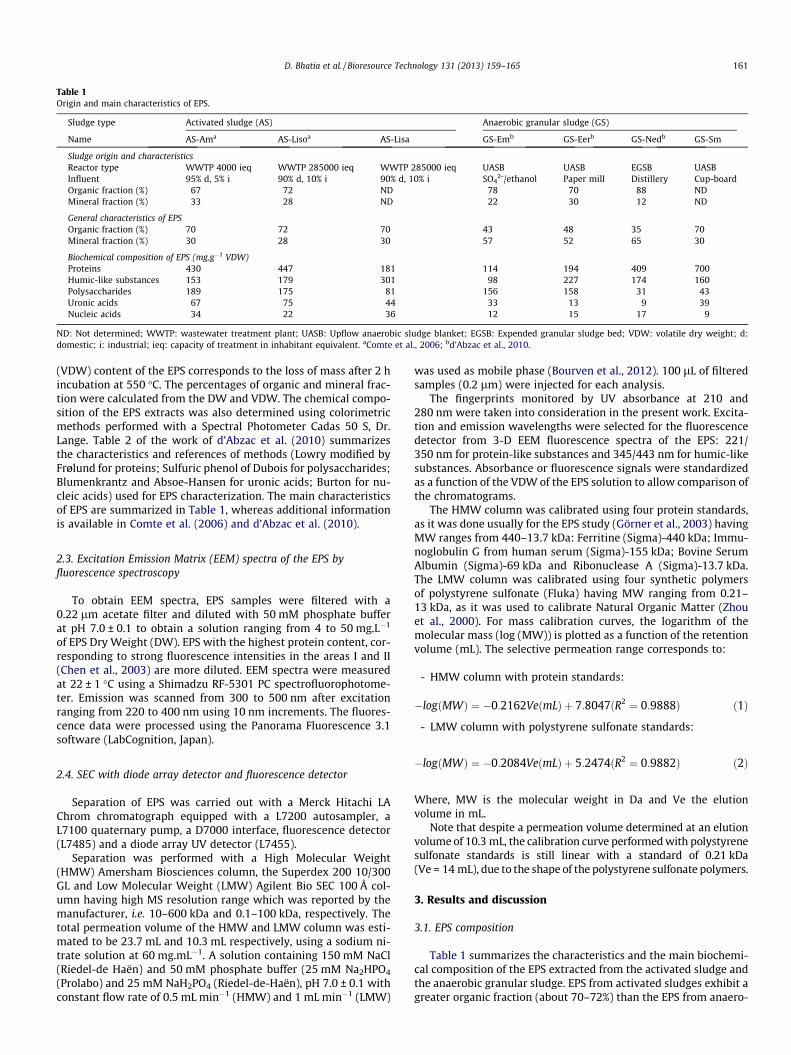
Table 1Origin and main characteristics of EPS.
Sludge type Activated sludge (AS) Anaerobic granular sludge (GS)
Name AS-Ama AS-Lisoa AS-Lisa GS-Emb GS-Eerb GS-Nedb GS-Sm
Sludge origin and characteristicsReactor type WWTP 4000 ieq WWTP 285000 ieq WWTP 285000 ieq UASB UASB EGSB UASBInfluent 95% d, 5% i 90% d, 10% i 90% d, 10% i SO4
2-/ethanol Paper mill Distillery Cup-boardOrganic fraction (%) 67 72 ND 78 70 88 NDMineral fraction (%) 33 28 ND 22 30 12 ND
General characteristics of EPSOrganic fraction (%) 70 72 70 43 48 35 70Mineral fraction (%) 30 28 30 57 52 65 30
Biochemical composition of EPS (mg.g�1 VDW)Proteins 430 447 181 114 194 409 700Humic-like substances 153 179 301 98 227 174 160Polysaccharides 189 175 81 156 158 31 43Uronic acids 67 75 44 33 13 9 39Nucleic acids 34 22 36 12 15 17 9
ND: Not determined; WWTP: wastewater treatment plant; UASB: Upflow anaerobic sludge blanket; EGSB: Expended granular sludge bed; VDW: volatile dry weight; d:domestic; i: industrial; ieq: capacity of treatment in inhabitant equivalent. aComte et al., 2006; bd’Abzac et al., 2010.
D. Bhatia et al. / Bioresource Technology 131 (2013) 159–165 161
(VDW) content of the EPS corresponds to the loss of mass after 2 hincubation at 550 �C. The percentages of organic and mineral frac-tion were calculated from the DW and VDW. The chemical compo-sition of the EPS extracts was also determined using colorimetricmethods performed with a Spectral Photometer Cadas 50 S, Dr.Lange. Table 2 of the work of d’Abzac et al. (2010) summarizesthe characteristics and references of methods (Lowry modified byFrølund for proteins; Sulfuric phenol of Dubois for polysaccharides;Blumenkrantz and Absoe-Hansen for uronic acids; Burton for nu-cleic acids) used for EPS characterization. The main characteristicsof EPS are summarized in Table 1, whereas additional informationis available in Comte et al. (2006) and d’Abzac et al. (2010).
2.3. Excitation Emission Matrix (EEM) spectra of the EPS byfluorescence spectroscopy
To obtain EEM spectra, EPS samples were filtered with a0.22 lm acetate filter and diluted with 50 mM phosphate bufferat pH 7.0 ± 0.1 to obtain a solution ranging from 4 to 50 mg.L�1
of EPS Dry Weight (DW). EPS with the highest protein content, cor-responding to strong fluorescence intensities in the areas I and II(Chen et al., 2003) are more diluted. EEM spectra were measuredat 22 ± 1 �C using a Shimadzu RF-5301 PC spectrofluorophotome-ter. Emission was scanned from 300 to 500 nm after excitationranging from 220 to 400 nm using 10 nm increments. The fluores-cence data were processed using the Panorama Fluorescence 3.1software (LabCognition, Japan).
2.4. SEC with diode array detector and fluorescence detector
Separation of EPS was carried out with a Merck Hitachi LAChrom chromatograph equipped with a L7200 autosampler, aL7100 quaternary pump, a D7000 interface, fluorescence detector(L7485) and a diode array UV detector (L7455).
Separation was performed with a High Molecular Weight(HMW) Amersham Biosciences column, the Superdex 200 10/300GL and Low Molecular Weight (LMW) Agilent Bio SEC 100 Å col-umn having high MS resolution range which was reported by themanufacturer, i.e. 10–600 kDa and 0.1–100 kDa, respectively. Thetotal permeation volume of the HMW and LMW column was esti-mated to be 23.7 mL and 10.3 mL respectively, using a sodium ni-trate solution at 60 mg.mL�1. A solution containing 150 mM NaCl(Riedel-de Haën) and 50 mM phosphate buffer (25 mM Na2HPO4
(Prolabo) and 25 mM NaH2PO4 (Riedel-de-Haën), pH 7.0 ± 0.1 withconstant flow rate of 0.5 mL min�1 (HMW) and 1 mL min�1 (LMW)
was used as mobile phase (Bourven et al., 2012). 100 lL of filteredsamples (0.2 lm) were injected for each analysis.
The fingerprints monitored by UV absorbance at 210 and280 nm were taken into consideration in the present work. Excita-tion and emission wavelengths were selected for the fluorescencedetector from 3-D EEM fluorescence spectra of the EPS: 221/350 nm for protein-like substances and 345/443 nm for humic-likesubstances. Absorbance or fluorescence signals were standardizedas a function of the VDW of the EPS solution to allow comparison ofthe chromatograms.
The HMW column was calibrated using four protein standards,as it was done usually for the EPS study (Görner et al., 2003) havingMW ranges from 440–13.7 kDa: Ferritine (Sigma)-440 kDa; Immu-noglobulin G from human serum (Sigma)-155 kDa; Bovine SerumAlbumin (Sigma)-69 kDa and Ribonuclease A (Sigma)-13.7 kDa.The LMW column was calibrated using four synthetic polymersof polystyrene sulfonate (Fluka) having MW ranging from 0.21–13 kDa, as it was used to calibrate Natural Organic Matter (Zhouet al., 2000). For mass calibration curves, the logarithm of themolecular mass (log (MW)) is plotted as a function of the retentionvolume (mL). The selective permeation range corresponds to:
- HMW column with protein standards:
�logðMWÞ ¼ �0:2162VeðmLÞ þ 7:8047ðR2 ¼ 0:9888Þ ð1Þ
- LMW column with polystyrene sulfonate standards:
�logðMWÞ ¼ �0:2084VeðmLÞ þ 5:2474ðR2 ¼ 0:9882Þ ð2Þ
Where, MW is the molecular weight in Da and Ve the elutionvolume in mL.
Note that despite a permeation volume determined at an elutionvolume of 10.3 mL, the calibration curve performed with polystyrenesulfonate standards is still linear with a standard of 0.21 kDa(Ve = 14 mL), due to the shape of the polystyrene sulfonate polymers.
3. Results and discussion
3.1. EPS composition
Table 1 summarizes the characteristics and the main biochemi-cal composition of the EPS extracted from the activated sludge andthe anaerobic granular sludge. EPS from activated sludges exhibit agreater organic fraction (about 70–72%) than the EPS from anaero-
162 D. Bhatia et al. / Bioresource Technology 131 (2013) 159–165
bic granular sludges (about 35–70%). Whatever their origin, EPS aremainly composed of proteins, humic-like substances and polysac-charides. Uronic acid and nucleic acid are also present in the EPS,but at low concentrations. The composition of EPS is in accordancewith the results of the literature (Wingender et al., 1999; Liu andFang, 2003) and their composition mainly depends on the sludgeorigin and characteristics of the wastewater treated (Sponza, 2002).
The protein content in the organic fraction of the EPS extractedfrom anaerobic granular sludges varies over a wide range: from114 mg.g�1 VDW for GS-Em to 700 mg.g�1 VDW for GS-Sm. In con-trast, the protein content in the organic fraction of the EPS fromactivated sludges shows a lower variation range (i.e. from181 mg.g�1 VDW for AS-Lisa to 447 mg.g�1 VDW for AS-Liso).
Except for the AS-Lisa EPS sample (which contains the highesthumic-like substance content), the content of humic-like sub-stances is equal or lower than the protein content. The organicfraction of the EPS extracted from activated sludges containsslightly more humic-like substances than EPS extracted from gran-ular sludges, from 153 to 301 mg.g�1 VDW and from 98 to227 mg.g�1 VDW, respectively (Table 1).
3.2. Fluorescence properties of the EPS
3-D fluorescence spectra of EPS samples were monitored fordetermining the specific excitation/emission wavelengths for pro-tein-like and humic-like substances. These wavelengths have beenused later for the SEC-fluorescence analysis. Fig. 1 presents some 3-D fluorescence spectra corresponding to different extracted EPS.
The 3-D spectra were divided into five regions, each region isassociated with different compounds: derived from proteins - tyro-sine and tryptophan (I or II) corresponding to aromatic proteins, ful-vic-like acids (III), soluble microbial by-product-like compounds (IV)and humic-like substances (V) (Coble, 1996; Chen et al., 2003; Chenet al., 2003; Dominguez et al., 2010; Xu et al., 2010; Liu et al., 2011).
All EPS samples (Fig. 1) display fluorescence in the area zonesassociated with the proteins - tyrosine and tryptophan (I or II), sol-uble microbial by-products-like (IV), and humic-like (V) sub-stances. The relative intensity of fluorescence of humic-like
Fig. 1. Fluorescence EEM (Excitation Emission Matrix) of extracted EPS in phosphate buf250/380 nm for aromatic proteins; IV - <250/380 nm for soluble microbial by-products-
substances (V) is very low as compared to the fluorescence ofaromatic protein-like (areas I and II) and soluble microbial by-products-like (IV) compounds.
Some variations in the locations of peaks of protein-likemolecules and humic-like substances are observed, but commonexcitation/emission wavelengths can be found. One commoncouple of wavelengths Ex/Em-221/350 nm was selected for pro-tein-like molecules (aromatic proteins (I and II) and soluble micro-bial by-products-like compounds (IV)), whatever the origin of theEPS. The same couple of wavelengths for fingerprints of the trypto-phan protein-like fraction of activated sludge and granular sludgewere obtained by Bourven et al. (2012). Similar couples of wave-lengths (278/353 nm) were also selected by Her et al. (2003) fordissolved organic matter.
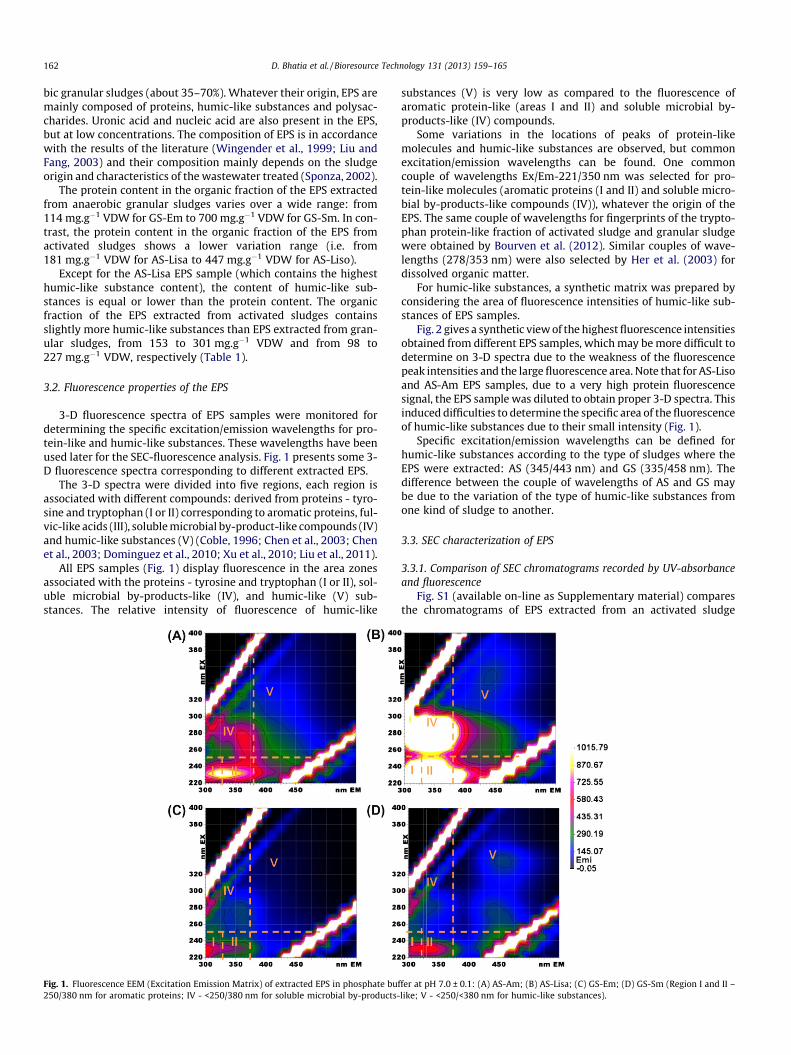
For humic-like substances, a synthetic matrix was prepared byconsidering the area of fluorescence intensities of humic-like sub-stances of EPS samples.
Fig. 2 gives a synthetic view of the highest fluorescence intensitiesobtained from different EPS samples, which may be more difficult todetermine on 3-D spectra due to the weakness of the fluorescencepeak intensities and the large fluorescence area. Note that for AS-Lisoand AS-Am EPS samples, due to a very high protein fluorescencesignal, the EPS sample was diluted to obtain proper 3-D spectra. Thisinduced difficulties to determine the specific area of the fluorescenceof humic-like substances due to their small intensity (Fig. 1).
Specific excitation/emission wavelengths can be defined forhumic-like substances according to the type of sludges where theEPS were extracted: AS (345/443 nm) and GS (335/458 nm). Thedifference between the couple of wavelengths of AS and GS maybe due to the variation of the type of humic-like substances fromone kind of sludge to another.
3.3. SEC characterization of EPS
3.3.1. Comparison of SEC chromatograms recorded by UV-absorbanceand fluorescence
Fig. S1 (available on-line as Supplementary material) comparesthe chromatograms of EPS extracted from an activated sludge
fer at pH 7.0 ± 0.1: (A) AS-Am; (B) AS-Lisa; (C) GS-Em; (D) GS-Sm (Region I and II –like; V - <250/<380 nm for humic-like substances).
Fig. 2. Peak maxima location from 3D EEM spectra for humic-like substances for EPS from activated sludge (AS-Lisa) and EPS from anaerobic granular sludge (GS-Eer, GS-Sm,GS-Ned).
D. Bhatia et al. / Bioresource Technology 131 (2013) 159–165 163
(AS-Liso) and an anaerobic granular sludge (GS-Eer) with twodetection modes: UV- absorbance at 210 nm and 280 nm and fluo-rescence for protein-like molecules (221/350 nm) and humic-likesubstances (345/443 nm). The fingerprints were recorded fromthe HMW column (Superdex, Amersham Biosciences, 200 10/300GL). Note that all EPS samples were monitored at both wavelengths(345/443 nm for activated sludge samples and 335/458 nm foranaerobic granular sludge samples), according to the results ofFig. S2 (available on-line as Supplementary material) for the spe-cific detection of humic-like substances. The fingerprints of theEPS of the humic-like substance fraction obtained at both wave-lengths show only differences in the fluorescence intensity peaks(Fig. S2). Therefore, the fingerprints of only one couple ofwavelengths (345/443 nm) are displayed for characterizing EPShumic-like substances fraction.
Figs. S1(A) and S1(B) show similar fingerprints of UV-absor-bance at 210 nm and 280 nm for each type of EPS. The differencesare mainly in the relative absorbance intensities of the peaks. Thefingerprints obtained at 210 nm show higher absorbance intensi-ties than at 280 nm, but according to the results, it is not possibleto differentiate properly aromatic and aliphatic molecules withonly UV detection. The fingerprints of protein-like molecules ob-tained with fluorescence detection (Fig. S1(C)) are also quite simi-lar to those obtained with UV detection (280 nm), but the maindifference is in the peak intensities.
The UV absorbance at 280 nm is frequently used for proteindetection in EPS (Görner et al., 2003), thus Figs. S1(B) and S1(C)should be similar. According to our results, it appears that bothdetections methods lead to different conclusions: UV absorbanceat 280 nm displays only one main type (or apparent molecularweight) of protein-like substances, while fluorescence detection at221/350 nm leads to four major types of protein-like substances. In-deed, with UV detection at 280 nm (Fig. S1(B)), the surface area ofthe main peak around an elution volume of 19 mL represents 62%and 57% of the total area of the chromatograms for EPS from AS-Liso
and GS-Eer, respectively. In contrast, with specific fluorescencedetection for protein-like molecules at 221/350 nm (Fig. S1(C)),the surface area of the 4 main peaks around an elution volume of8, 15, 19, 26 mL represents 16, 35, 25, 17% and 17, 34, 19, 17% ofthe total area of the chromatograms for EPS from AS-Liso andGS-Eer, respectively. Thus, it would be very difficult and even erro-neous, to directly link the protein MW distribution in EPS or foulantmaterials from membrane bioreactors to chromatographic peaksobtained in a given detection condition, as it is often mentioned inthe literature. Concerning the quantification, the intensity of chro-matographic peaks is linked to the quantity of molecules, but alsoto their intrinsic properties (i.e. fluorescence or absorbance ability).
The differences between the chromatograms recorded with UVdetection at 280 nm (Fig. S1(B)) and with specific fluorescencedetection for protein-like molecules at 221/350 nm (Fig. S1(C)),nevertheless underline differences in molecule compositionaccording to their aMW distribution. For instance, protein-likemolecules with an aMW <10 kDa (corresponding to the peak elut-ing at a Ve of about 19 mL) are composed of a higher level of chro-mophores (high UV absorbance at 280 nm), as compared with theother size classes, but a similar level of fluorophores than the otherthree size classes eluting at 8, 15 and 27 mL, corresponding respec-tively to a MW of >600 kDa, 13–60 kDa and out the column resolu-tion. Chromatographic peaks eluting at 15 mL contain very fewchromophores (very low absorbance at 280 nm (Fig. S1(B)), butdisplay the higher content of fluorophores (Fig. S1(C)) for the twoEPS samples considered.
According to Table 1, AS-Liso contains more proteins than GS-Eer. The total peak area of the chromatograms of these samples(750,000 versus 362,400 arbitrary units, for EPS from AS-Liso andGS-Eer, respectively) appears to be in accordance: total peak areaobtained by AS-Liso is higher than GS-Eer (447 versus 194 mg ofprotein .g�1 VDW, respectively; Table 1).
The chromatograms of humic-like substances (Fig. S1(D)) de-tected by fluorescence (345/443 nm) are very different from the
164 D. Bhatia et al. / Bioresource Technology 131 (2013) 159–165
previous ones since no peak is under an elution volume of 19 mL.This shows that humic-like substances have a lower aMW thanprotein-like substances. The humic-like substances content (179versus 227 mg of humic like substances.g�1 VDW for EPS fromAS-Liso and GS-Eer, respectively; Table 1) and the total peak areasof the two considered samples are again in agreement: AS-Liso val-ues are lower than those of GS-Eer (30,400 versus 31,900 arbitraryunits, for EPS from AS-Liso and GS-Eer, respectively).
Moreover, the chromatograms obtained using specific proteins-like excitation/emission wavelength seem to be more similar withUV detection at 210 nm than 280 nm, whereas specific chromato-grams for humic-like substance have some similarities with thefingerprints at 280 nm UV detection, particularly for AS sampleand especially after an elution volume of 19 mL. The conclusionfrom the literature for the protein fraction of EPS performed withUV detection at 280 nm is clearly confirmed by the fluorescencespecific detection at an EEM of 221/350 nm. It shows that pro-tein-like molecules from EPS of the biological aggregates used forwastewater treatment display a wide range of apparent MW distri-bution (Görner et al., 2003; Park et al., 2008; Simon et al., 2009;Bourven et al., 2012).
To confirm the previous observations, three activated sludges(AS-Am, AS-Liso, AS-Lisa) and four anaerobic granular sludges(GS-Em, GS-Eer, GS-Ned, GS-Sm) were analyzed with the sametechnique. Figs. S3 and S4 (available on-line as Supplementarymaterial) show the corresponding chromatograms of UV detectionat 280 nm and specific fluorescence detection for protein-like mol-ecules (221/350 nm) and humic-like substances (345/443 nm).
These chromatograms lead to the same observations and conclu-sions as Fig. S1. Very different profiles or behavior of chromato-grams are obtained depending the detection methods: UV-280 nmdetection and protein specific fluorescence detection chromato-grams do not match each other, the latter display more significantpeaks, which could mean more complex size separation of the com-pounds. In the case of AS samples, UV-280 nm detection appearsmore similar to the fluorescence detection of humic-like substances.
When comparing the total peak area with the total amount ofproteins and humic-like substances, correlation is again observedbetween the protein and humic-like substances content and theirspecific fluorescence detection. For example, the GS-Sm EPS samplehas a higher protein content of 700 mg proteins.g�1 VDW (Table 1)than the other three GS samples (Table 1), which lead to more in-tense peaks, mainly in the elution volume from 10 to 17 mL and after25 mL, and the highest surface area (1,257,000 arbitrary units) (Fig.S4 (B)) on the chromatogram recorded using protein specific fluores-cence detection. In contrast, the EPS sample GS-Em displays the low-est content in protein (114 mg proteins.g�1 VDW, Table 1) and thelowest total surface area on the chromatogram (Fig. S4 (B)), i.e.221,000 arbitrary units). Only one exception can be noticed: AS-Lisahas the highest content of humic-like substances (301 mg of humic-like substances.g�1 VDW for EPS from AS-Lisa, Table 1) but leads tothe chromatogram with the lowest intensity and total surface area(161,000 arbitrary units, Supplementary Figure S3(C)). In contrast,the EPS AS-Liso sample displays a total peak surface area of 30 400arbitrary units for a humic-like substances content of 179 mg.g�1
VDW (Table 1). This could be due to differences in the compositionof the humic-like substances, which has a lower fluorescence capac-ity at the selected wavelengths (Fig. 1).
The chromatograms of Fig. S3 (A, B) and S4 (A, B) also confirmthat a different aMW distribution exits for the chromophores andfluorophores present in the EPS proteins-like macromolecules.The chromophores for EPS protein-like macromolecules are mainlypresent around an elution volume about 19 mL corresponding tomolecules with an aMW <10 kDa (Fig. S1(B)). In contrast, fluoro-phores for proteins-like macromolecules of the EPS are presentover a wide range of aMW (Fig. S1(C)).
3.3.2. Fluorescence detection with SEC separation for a better EPScharacterization
The interest of using specific fluorescence detection instead ofclassical UV detection enhances the differentiation of EPS on SECfingerprints by obtaining specific fingerprints of protein-like mole-cules or humic-like-substances present in the EPS.
For the same type of sludge (activated (Fig. S3) or granule(Fig. S4)), the origin does not strongly affect the specific fingerprintof protein-like molecules or humic-like-substances which composethe EPS: only the relative intensities of the different peaks areaffected, but no significant modification can be observed i.e. local-ization and/or the number of peaks. This is in accordance with theresults obtained by Villain et al. (2010) with UV detection at280 nm.
In contrast, EPS fingerprints are affected by the change in thetype of sludge, with different variations according to the detectionmode (UV or fluorescence). For all detectors, peak intensities for ASsamples are higher than for GS, which can be linked to a highercontent of protein and humic-like substances (Table 1). In the caseof UV 280 nm detection, except for intensities, few differences canbe observed between the AS and GS profiles. For protein specificfluorescence detection, more peaks are present in the elutionvolumes between 12 and 17 mL in the GS samples (Fig. S4). Theseelution volumes are in the range of the column for determinationof aMW.
The specific fluorescence detection for humic-like substancesgives more contrasted fingerprints between AS (Fig. S3) and GS(Fig. S4). For AS, only one major broad peak can be observed closeto 20 mL, whereas the same peak followed by two sharper onesaround 25 mL is obtained for GS. These elution volumes corre-spond to small molecules, all EPS samples were also analyzed usinga Low Molecular Weight Agilent column, Bio SEC 100 Å. Chromato-grams corresponding to humic-like specific fluorescence obtainedwith this column are presented in Fig. S5 (available on-line as Sup-plementary material).
These chromatograms confirm the previous observations(Figs. S3 and S4): the fingerprints corresponding to humic-likesubstances are very different for AS and GS sludges (Fig. S5). Thefingerprints of the humic-like substances fraction of AS show onlytwo main peaks, whereas the fingerprints of the humic-like sub-stances fraction of GS fingerprints display several sharp peaks,which could be linked to a more complex molecules size separa-tion (Figs. S3 and S4). The chromatograms of Fig. S5 were obtainedwith a LMW range separation column which specifies the results ofchromatograms of Figs. S3 and S4. The use of fluorescence specificdetection highlights differences in the fingerprints of humic-likessubstances which are not seen using UV-280 nm detection.
3.3.3. Apparent molecular weight (aMW) distribution of protein-likeand humic-like substances in the EPS
On all chromatograms, several peaks are eluted after the totalpermeation volume of the column (Ve = 23.7 mL and Ve = 10.3 mLfor HMW and LMW column, respectively) which clearly demon-strate that interactions occur between the column packing andsome EPS molecules (either proteins-like or humic-like) as previ-ously shown (Simon et al., 2009). This means that the determina-tion of aMW must be cautiously considered. Nevertheless,regarding the UV detection, specific fluorescence detection allowsto specify the aMW range of protein-like and humic-like sub-stances in the EPS from bacterial aggregates used in wastewatertreatment.
The aMW of protein-like molecules is almost similar for all EPSsamples extracted from the same type of sludge, but differencesappear in their molecular distribution when comparing EPS fromAS and GS. Based on UV-280 nm detection, the main compoundscorrespond to molecular weights >600 kDa and in the range from
D. Bhatia et al. / Bioresource Technology 131 (2013) 159–165 165
13–1 kDa (17–22 mL) for GS and only in the range from 13–1 kDa(17–22 mL) for AS (Figs. S3 and S4, respectively). These results arein accordance with our previous works (Simon et al., 2009;Bourven et al., 2012), but also with the protein MW determinedby Görner et al. (2003) and Park et al. (2008) who worked on EPSextracted from activated sludges. In this work, using protein spe-cific fluorescence detection, the main molecular weights of theproteins are in the range from >600 kDa (7–9 mL), 162 kDa(12 mL), 60–13 kDa (14–17 mL) and <10 kDa (20–22 mL and26 mL) for GS and in the range from >600 kDa (7–9 mL), 162–13 kDa (12–17 mL) and <10 kDa (18–22 mL and 26 mL) for AS.
The main aMW for humic-like substances is in the broad rangefrom 6–1.4 kDa (7–10 mL), for EPS from AS and more evenly dis-tributed around 4.8 kDa (7.5 mL), 2.3KDa (9 mL), 1.8 kDa (9.5 mL)and <1.2 kDa (12 mL, 14 mL and 15 mL) for EPS from anaerobicgranular sludges (Figs. S5(A) and S5(B), respectively). These resultsare in accordance with the work of Adav and Lee (2011) who foundhumic-like substances in EPS from aerobic granules in the MWfraction lower than 4 kDa (calculation made from authors results).The humic-like substances display a higher variation range com-pared to humic substances from aquatic Natural Organic Matter(NOM), which show an aMW ranging between 2.3 and 0.6 kDa(Zhou et al., 2000).
4. Conclusions
With SEC, fluorescence detection by using protein-like and hu-mic-like substances specific excitation/emission wavelengths givesmore specific and detailed EPS fingerprints than UV detection.Detection comparison underlines that the aMW distribution ofEPS chomatophores and fluorophores is different. The proteins-likeand humic-like substances fingerprint and aMW distributions arelinked to the type of bacterial aggregates but also to the origin ofthe sludges. Protein-like molecules are distributed on variousaMW in a wide range (from >600 kDa to <10 kDa), whereas hu-mic-like substances correspond to low aMW (from 6 kDa to<1.2 kDa) with a more complex distribution for EPS extracted fromanaerobic granular sludges.
Acknowledgements
The authors would like to thank the European Commission forproviding financial support through the Erasmus Mundus JointDoctorate Programme ETeCoS3 (Environmental Technologies forContaminated Solids, Soils and Sediments) under the grant agree-ment FPA no. 2010-0009. The authors thank also the RegionalCouncil of Limousin for its financial support.
Appendix A. Supplementary data
Supplementary data associated with this article can be found,in the online version, at http://dx.doi.org/10.1016/j.biortech.2012.12.078.
References
Adav, S.S., Lee, D.-J., 2011. Characterization of extracellular polymeric substances(EPS) from phenol degrading aerobic granules. J. Taiwan Inst. Chem. Eng. 42,645–651.
Alasonati, E., Slaveykova, V.I., 2011. Composition and molar mass characterizationof bacterial extracellular polymeric substances by using chemical, spectroscopicand fractionation techniques. Environ. Chem. 8, 155–162.
Alasonati, E., Slaveykova, V.I., 2012. Effects of extraction methods on thecomposition and molar mass distributions of exopolymeric substances of thebacterium Sinorhizobium meliloti. Bioresour. Technol. 114, 603–609.
Bourven, I., Costa, G., Guibaud, G., 2012. Qualitative characterization of the proteinfraction of exopolymeric substances (EPS) extracted with EDTA from sludge.Bioresour. Technol. 104, 486–496.
Chen, W., Westerhoff, P., Leenheer, J.A., Booksh, K., 2003. Fluorescence excitation-emission matrix regional integration to quantify spectra for dissolved organicmatter. Environ. Sci. Technol. 37, 5701–5710.
Coble, P.G., 1996. Characterization of marine and terrestrial DOM in seawater usingexcitation-emission matrix spectroscopy. Mar. Chem. 51, 325–346.
Comte, S., Guibaud, G., Baudu, M., 2006. Relations between extraction protocols foractivated sludge extracellular polymeric substances (EPS) and EPScomplexation properties Part I. Comparison of the efficiency of eight EPSextraction methods. Enzyme Microb. Technol. 38, 237–245.
Comte, S., Guibaud, G., Baudu, M., 2007. Effect of extraction method on EPS fromactivated sludge: an HPSEC investigation. J. Hazard. Mater. 140, 129–137.
D’Abzac, P., Bordas, F., Van Hullebusch, E., Lens, P.N.L., Guibaud, G., 2010. Extractionof extracellular polymeric substances (EPS) from anaerobic granular sludges:comparison of chemical and physical extraction protocols. Appl. Microbiol.Biotechnol. 85, 1589–1599.
Dominguez, L., Rodriguez, M., Prats, D., 2010. Effect of different extraction methods onbound EPS from MBR sludges. Part I: influences of extractions over three-dimensional EEM fluorescence spectroscopy fingerprint. Desalination 261, 19–26.
Dvorák, L., Gómez, M., Dvoráková, M., Ruzickovà, I., Wanner, J., 2011. The impact ofdifferent operating conditions on membrane fouling and EPS production.Bioresour. Technol. 102, 6870–6875.
Frølund, B., Keiding, K., 1994. Implementation of an HPLC polystyrenedivinylbenzene column for the separation of activated sludge exopolymers.Appl. Microbiol. Biotechnol. 41, 708–716.
Frølund, B., Palmgren, R., Keiding, K., Nielsen, P.H., 1996. Extraction of extracellularsludge using cation exchange resin. Water Res. 33, 1749–1758.
Garnier, C., Görner, T., Lartiges, B.S., Abdelouhab, S., de Donato, P., 2005.Characterization of activated sludge exopolymers from various origins: acombined size-exclusion chromatography and infrared microscopy study.Water Res. 39, 3044–3054.
Görner, T., De Donato, P., Ameil, M., Montarges-Pelletier, E., Lartiges, B.S., 2003.Activated sludge exopolymers: separation and identification using sizeexclusion chromatography and infrared micro-spectroscopy. Water Res. 37,2388–2393.
Guibaud, G., Tixier, N., Bouju, A., Baudu, M., 2003. Relation between extracellularpolymers composition and its ability to complex Cd, Cu, and Pb. Chemosphere52, 1701–1710.
Her, N., Amy, G., McKnight, D., Sohn, J., Yoon, Y., 2003. Characterization of DOM as afunction of MW by fluorescence EEM and HPLC-SEC using UVA, DOC, andfluorescence detection. Water Res. 37, 4295–4303.
Her, N., Amy, G., Plottu-Pecheux, A., Yoon, Y., 2007. Identification of nanofiltrationmembrane foulants. Water Res. 41, 3936–3947.
Liu, T., Chen, Z.-L., Yu, W.-Z., You, S.-J., 2011. Characterization of organic membranefoulants in a submerged membrane bioreactor with pre-ozonation using three-dimensional excitation-emission matrix fluorescence spectroscopy. Water Res.45, 2111–2121.
Liu, Y., Fang, H.H.P., 2003. Influences of extracellular polymeric substances (EPS) onflocculation, settling and dewatering of activated sludge. Crit. Rev. Environ. Sci.Technol. 33, 237–273.
Park, C., Novak, J.T., Helm, R.H., Ahn, Y.O., Esen, A., 2008. Evaluation of theextracellular proteins in full-scale activated sludges. Water Res. 42, 3879–3889.
Ras, M., Lefebvre, D., Derlon, N., Paul, E., Girbal-Neuhauser, E., 2011. Extracellularpolymeric substances diversity of biofilms grown under contrastedenvironmental conditions. Water Res. 45, 1529–1538.
Seviour, T., Lambert, L.K., Pijuan, M., Yuan, Z., 2010. Structural determination of akey exopolysaccharide in mixed culture aerobic sludge granules using NMRspectroscopy. Environ. Sci. Technol. 44 (23), 8964–8970.
Sheng, G.-P., Yu, H.-Q., 2006. Characterization of extracellular polymeric substancesof aerobic and anaerobic sludge using three-dimensional excitation andemission matrix fluorescence spectroscopy. Water Res. 40, 1233–1239.
Sheng, G.P., Yu, H.Q., Li, X.Y., 2010. Extracellular polymeric substances (EPS) ofmicrobial aggregates in biological wastewater treatment systems, a review.Biotechnol. Adv. 28, 882–894.
Simon, S., Païro, B., Villain, M., D’Abzac, P., van Hullebusch, E., Lens, P., Guibaud, G.,2009. Evaluation of size exclusion chromatography (SEC) for thecharacterization of extracellular polymeric substances (EPS) in anaerobicgranular sludges. Bioresour. Technol. 100, 6258–6268.
Sponza, D.T., 2002. Extracellular polymer substances and physicochemicalproperties of flocs in steady- and unsteady-state activated sludge systems.Process Biochem. 37, 983–998.
Villain, M., Simon, S., Bourven, I., Guibaud, G., 2010. The use of a new mobile phase,with no multivalent cation binding properties, to differentiate extracellularpolymeric substances (EPS), by size exclusion chromatography (SEC), frombiomass used for wastewater treatment. Process Biochem. 45, 1415–1421.
Wang, Z., Wu, Z., 2009. Distribution and transformation of molecular weight oforganic matters in membrane bioreactor and conventional activated sludgeprocess. Chem. Eng. J. 150, 396–402.
Wingender, J., Neu, T.R., Flemming, H.C., 1999. Microbial Extracellular PolymericSubstances Characterization Structures and Function. Springer, Berlin, Heidelberg.
Xu, H., He, P., Wang, G., Shao, L., 2010. Three-dimensional excitation emissionmatrix fluorescence spectroscopy and gel-permeating chromatography tocharacterize extracellular polymeric substances in aerobic granulation. WaterSci. Technol., 2931–2942.
Zhou, Q., Cabaniss, S.E., Maurice, P.A., 2000. Considerations in the use of high-pressure size exclusion chromatography (HPSEC) for determining molecularweights of aquatic humic substances. Water Res. 34, 3505–3514.